
|
|
|
|
|
|
|
|
|
|
Previous: HOLIDAY RV SUPERSTORES INC, 3, 2000-12-19 |
Next: GOLDMAN SACHS TRUST, 485BPOS, EX-99.J1, 2000-12-19 |
As filed with the Securities and Exchange Commission on December 19, 2000
1933 Act Registration No. 33-17619
1940 Act Registration No. 811-5349
================================================================================
SECURITIES AND EXCHANGE COMMISSION
Washington, D. C. 20549
------------
Form N-1A
REGISTRATION STATEMENT UNDER THE
SECURITIES ACT OF 1933 ( X )
Post-Effective Amendment No. 69 ( X )
and/or
REGISTRATION STATEMENT UNDER THE
INVESTMENT COMPANY ACT OF 1940 ( X )
Amendment No. 71 ( X )
(Check appropriate box or boxes)
----------
GOLDMAN SACHS TRUST
(Exact name of registrant as specified in charter)
4900 Sears Tower
Chicago, Illinois 60606-6303
(Address of principal executive offices)
Registrant's Telephone Number,
including Area Code 312-655-4400
------------
Howard B. Surloff, Esq. Copies to:
Goldman Sachs Asset Management Jeffrey A. Dalke, Esq.
32 Old Slip Drinker Biddle & Reath LLP
New York, New York 10005 One Logan Square
18th and Cherry Streets
(Name and address of agent for service) Philadelphia, PA 19103
It is proposed that this filing will become effective (check appropriate box)
( ) Immediately upon filing pursuant to paragraph (b)
(x) On December 29, 2000 pursuant to paragraph (b)
( ) 60 days after filing pursuant to paragraph (a)(1)
( ) On (date) pursuant to paragraph (a)(1)
( ) 75 days after filing pursuant to paragraph (a)(2)
( ) On (date) pursuant to paragraph (a)(2) of rule 485.
| Prospectus
|

| GOLDMAN SACHS INTERNATIONAL EQUITY FUNDS
|
n
|
Goldman Sachs
CORE
SM
International Equity Fund
|
n
|
Goldman Sachs
International Equity Fund
|
n
|
Goldman Sachs
European Equity Fund
|
n
|
Goldman Sachs
Japanese Equity Fund
|
n
|
Goldman Sachs
International Growth Opportunities Fund (formerly International Small Cap Fund)
|
n
|
Goldman Sachs
Emerging Markets Equity Fund
|
n
|
Goldman Sachs
Asia Growth Fund |

| THE SECURITIES AND EXCHANGE COMMISSION HAS NOT APPROVED OR DISAPPROVED THESE SECURITIES OR PASSED UPON THE ADEQUACY OF THIS PROSPECTUS.
ANY REPRESENTATION TO THE CONTRARY IS A CRIMINAL OFFENSE.
|
| AN INVESTMENT IN A FUND IS NOT A BANK DEPOSIT AND IS NOT INSURED BY THE FEDERAL DEPOSIT INSURANCE CORPORATION OR ANY OTHER GOVERNMENT
AGENCY. AN INVESTMENT IN A FUND INVOLVES INVESTMENT RISKS, INCLUDING POSSIBLE LOSS OF PRINCIPAL.
|
| NOT FDIC-INSURED
|
May Lose Value
|
No Bank Guarantee
|
| Goldman Sachs Asset Management, a unit of the Investment Management Division of Goldman, Sachs & Co. (“Goldman
Sachs”), serves as investment adviser to the CORE International Equity Fund. Goldman Sachs Asset Management International serves as investment adviser to International Equity, European Equity, Japanese Equity, International Growth Opportunities,
Emerging Markets Equity and Asia Growth Funds. Goldman Sachs Asset Management and Goldman Sachs Asset Management International are each referred to in this Prospectus as the “Investment Adviser.”
|
| ACTIVE INTERNATIONAL STYLE FUNDS
|
| Goldman Sachs’ Active International Investment Philosophy:
|
| Belief | How the Investment Adviser Acts on Belief | ||
|---|---|---|---|
| n Equity markets are inefficient | Seeks excess return through team driven, research
intensive and bottom-up stock selection. |
||
| n Returns are variable | Seeks to capitalize on variability of market and regional
returns through asset allocation decisions. |
||
| n
Corporate fundamentals
ultimately drive share price |
Seeks to conduct rigorous, first-hand research of business
and company management. |
||
| n A
business’ intrinsic value will be
achieved over time |
Seeks to realize value through a long-term investment
horizon. |
||
| n
Portfolio risk must be carefully
analyzed and monitored |
Seeks to systematically monitor and manage risk through
diversification, multifactor risk models and currency management. |
||
| The Investment Adviser attempts to manage risk in these Funds through disciplined portfolio construction and continual portfolio
review and analysis. As a result, bottom-up stock selection, driven by fundamental research, should be a main driver of returns.
|
| QUANTITATIVE (“CORE”) STYLE FUNDS
|
| Goldman Sachs’ CORE Investment Philosophy:
|
| Goldman Sachs’ quantitative style of funds—CORE—emphasizes the two building blocks of active management: stock
selection and portfolio construction.
|
| I. CORE STOCK SELECTION
|
| The CORE Fund uses the Goldman Sachs proprietary multifactor model (“Multifactor Model”), a rigorous computerized rating
system, to forecast the returns of securities held in the Fund’s portfolio. The Multifactor Model incorporates common variables covering measures of:
|
n
|
Value (How is the company priced relative to fundamental accounting measures?)
|
n
|
Price Momentum (What are medium-term price trends?)
|
n
|
Earnings Momentum (Are company profit expectations growing?)
|
n
|
Stability (How likely is the risk of earnings disappointment?)
|
| All of the above factors are carefully evaluated within the Multifactor Model since each has demonstrated a significant
impact on the performance of the securities and markets they were designed to forecast. Stock selection in this process combines both our quantitative and qualitative analysis.
|
| II. CORE PORTFOLIO CONSTRUCTION
|
| Portfolio risk is monitored with the use of a sophisticated risk model, which measures the portfolio’s exposure to a variety
of risk factors and estimates the associated volatility. In this process, the Investment Adviser manages risk by attempting to limit deviations from the benchmark and by attempting to run a size and sector neutral portfolio. A computer optimizer evaluates many different security combinations (considering many possible weightings) in an effort to construct the most efficient risk/return portfolio given each CORE Fund benchmark. In addition, the CORE International
Equity Fund utilizes proprietary quantitative models to allocate assets across countries.
|
| Goldman Sachs CORE Funds are fully invested, broadly diversified and offer consistent overall portfolio characteristics. They may
serve as good foundations on which to build a portfolio.
|
| FUND FACTS
|
|
| Objective:
|
Long-term growth of capital
|
|
Benchmark:
|
MSCI® Europe, Australasia, Far East (“EAFE®”) Index (unhedged)
|
| Investment Focus:
|
Large-capitalization equity securities of companies that are organized outside the United States or whose securities are primarily traded outside
the United States
|
| Investment Style:
|
Quantitative
|
| INVESTMENT OBJECTIVE
|
| The Fund seeks long-term growth of capital. The Fund seeks this objective through a broadly diversified portfolio of equity
securities of large-cap companies that are organized outside the United States or whose securities are principally traded outside the United States.
|
| PRINCIPAL INVESTMENT STRATEGIES
|
| Equity Securities. The Fund invests, under normal circumstances, at least 90% of its total assets in equity securities of companies that are organized outside the United States or whose securities are principally traded outside the United States.
|
| The Fund may allocate its assets among countries as determined by the Investment Adviser from time to time, provided the Fund’
s assets are invested in at least three foreign countries. The Fund may invest in the securities of issuers in countries with emerging markets or economies (“emerging countries”).
|
| The Fund seeks broad representation of large-cap issuers across major countries and sectors of the international economy. The
Fund’s investments are selected using both a variety of quantitative techniques and fundamental research in seeking to maximize the Fund’s expected return, while maintaining risk, style, capitalization and industry characteristics similar to the
EAFE® Index. In addition, the Fund seeks a portfolio composed of companies with attractive valuations and stronger momentum characteristics than the EAFE® Index.
|
| Other.
The Fund’s investments in fixed-income securities are limited to securities that are considered to be cash equivalents.
|
| FUND FACTS
|
|
| Objective:
|
Long-term capital appreciation
|
| Benchmark:
|
MSCI® EAFE® Index (unhedged)
|
| Investment Focus:
|
Equity securities of companies organized outside the United States or whose securities are principally traded outside the United States
|
| Investment Style:
|
Active International
|
| INVESTMENT OBJECTIVE
|
| The Fund seeks long-term capital appreciation.
|
| PRINCIPAL INVESTMENT STRATEGIES
|
| Equity Securities. The Fund invests, under normal circumstances, substantially all, and at least 65% of its total assets in equity securities of companies that are organized outside the United States or whose securities are principally traded outside the United States. The
Fund intends to invest in companies with public stock market capitalizations that are larger than $1 billion at the time of investment.
|
| The Fund may allocate its assets among countries as determined by the Investment Adviser from time to time provided that the
Fund’s assets are invested in at least three foreign countries.
|
| The Fund expects to invest a substantial portion of its assets in the securities of issuers located in the developed countries of
Western Europe and in Japan. However, the Fund may also invest in the securities of issuers located in Australia, Canada, New Zealand and in emerging countries. Currently, emerging countries include, among others, most Latin American, African, Asian and
Eastern European nations.
|
| Other.
The Fund may also invest up to 35% of its total assets in fixed-income securities, such as government, corporate and bank debt obligations.
|
| FUND FACTS
|
|
| Objective:
|
Long-term capital appreciation
|
| Benchmark:
|
MSCI® Europe Index (unhedged)
|
| Investment Focus:
|
Equity securities of European companies
|
| Investment Style:
|
Active International
|
| INVESTMENT OBJECTIVE
|
| The Fund seeks long-term capital appreciation.
|
| PRINCIPAL INVESTMENT STRATEGIES
|
| Equity Securities. The Fund invests, under normal circumstances, substantially all, and at least 65% of its total assets in equity securities of European companies. Because of its focus, the Fund will be more susceptible to European economic, market, political and local
risks than a fund that is more geographically diversified.
|
| A European issuer is a company that either:
|
n
|
Has a class of its securities whose principal securities markets are in European countries;
|
n
|
Is organized under the laws of, or has a principal office in, a European country;
|
n
|
Derives 50% or more of its total revenue from goods produced, sales made or services provided in one or more of the European
countries; or
|
n
|
Maintains 50% or more of its assets in one or more of the European countries.
|
| The Fund may allocate its assets among different countries as determined by the Investment Adviser from time to time, provided
that the Fund’s assets are invested in at least three European countries. It is currently anticipated that a majority of the Fund’s assets will be invested in the equity securities of large cap companies located in the developed countries of
Western Europe. However, the Fund may also invest, without limit, in mid cap companies and small cap companies, as well as companies located in emerging countries. Currently, emerging countries include among others, most Latin and South American, African,
Asian and Eastern European nations, including the states that formerly comprised the Soviet Union and Yugoslavia.
|
| Other.
The Fund may invest in the aggregate up to 35% of its total assets in equity securities of non-European countries and in fixed-income securities, such as government, corporate and bank debt obligations.
|
| FUND FACTS
|
|
| Objective:
|
Long-term capital appreciation
|
| Benchmark:
|
Tokyo Price Index (“TOPIX”) (unhedged)
|
| Investment Focus:
|
Equity securities of Japanese companies
|
| Investment Style:
|
Active International
|
| INVESTMENT OBJECTIVE
|
| The Fund seeks long-term capital appreciation.
|
| PRINCIPAL INVESTMENT STRATEGIES
|
| Equity Securities. The Fund invests, under normal circumstances, substantially all, and at least 65% of its total assets in equity securities of Japanese companies. A Japanese issuer is a company that either:
|
n
|
Has a class of its securities whose principal securities markets is in Japan;
|
n
|
Is organized under the laws of, or has a principal office in, Japan;
|
n
|
Derives 50% or more of its total revenue from goods produced, sales made or services provided in Japan; or
|
n
|
Maintains 50% or more of its assets in Japan.
|
| The Fund’s concentration in Japanese companies will expose it to the risk of adverse social, political and economic events
which occur in Japan or affect the Japanese markets.
|
| Japan’s economy, the second largest in the world, has grown substantially over the last three decades. Japan’s economic
growth in the 1990’s, however, was substantially below the level of earlier decades, and its economy drifted between modest growth and recession. In calendar year 1998, Japan’s gross national product contracted by 2.8% — its worst
performance in the post-war period. To address this economic downturn, Japan has attempted to implement changes related to high wages and taxes, currency valuations, structural rigidities, political reform and the deregulation of its economy. These
initiatives have, however, resulted in notable uncertainty and loss of public confidence. These conditions present risks to the Japanese Equity Fund and its ability to attain its investment objective.
|
| Japan’s economy is heavily dependent upon international trade, and is especially sensitive to trade barriers and disputes.
In particular, Japan relies on large imports of agricultural products, raw materials and fuels. A substantial rise in world oil or commodity prices, or a fall-off in Japan’s manufactured exports, could be expected to adversely affect Japan’s
economy. In addition, Japan is vulnerable to earthquakes, volcanoes and other natural disasters. Japan’s banking industry has recently suffered from non-performing loans, lower real estate values and lower valuations of securities holdings.
|
| The Japanese securities markets are less regulated than the U.S. markets. Evidence has emerged from time to time of distortion of
market prices to serve political or other purposes. Shareholders’ rights are also not always equally enforced.
|
| For most of the 1990’s, Japanese securities markets experienced significant declines. Although the stock markets exhibited
strength in 1999, they have again generally declined through the first three quarters of 2000.
|
| The common stocks of many Japanese companies have historically traded at high price-earnings ratios. Differences in accounting
methods have made it difficult to compare the earnings of Japanese companies with those of companies in other countries, especially the United States. Reported net income in Japan has been generally understated relative to U.S. accounting standards and
this has been one reason price-earnings ratios of the stocks of Japanese companies have tended historically to be higher than those of U.S. stocks. In addition, Japanese companies have tended to have higher growth rates than U.S. companies, and Japanese
interest rates have generally been lower than U.S. interest rates. These factors have contributed to lower discount rates and higher price-earnings ratios in Japan than in the United States.
|
| Other.
The Fund may invest in the aggregate up to 35% of its total assets in equity securities of non-Japanese companies and in fixed-income securities, such as government, corporate and bank debt obligations.
|
| FUND FACTS
|
|
| Objective:
|
Long-term capital appreciation
|
| Benchmark:
|
MSCI® EAFE® Small Cap Index (unhedged)
|
| Investment Focus:
|
Small-capitalization foreign equity securities
|
| Investment Style:
|
Active International
|
| INVESTMENT OBJECTIVE
|
| The Fund seeks long-term capital appreciation.
|
| PRINCIPAL INVESTMENT STRATEGIES
|
| Equity Securities. The Fund invests, under normal circumstances, substantially all, and at least 65% of its total assets in equity securities of companies:
|
n
|
With public stock market capitalizations (based upon shares available for trading on an unrestricted basis) within $100 million
and $3 billion, at the time of investment; and
|
n
|
That are organized outside the United States or whose securities are principally traded outside the United States.
|
| The Fund seeks to achieve its investment objective by investing in a diversified portfolio of equity securities that are
considered by the Investment Adviser to be strategically positioned for long-term growth.
|
| The Fund may allocate its assets among countries as determined by the Investment Adviser from time to time provided that the
Fund’s assets are invested in at least three foreign countries. The Fund expects to invest a substantial portion of its assets in securities of companies in the developed countries of Western Europe, Japan and Asia. However, the Fund may also invest
in the securities of issuers located in Australia, Canada, New Zealand and in emerging countries. Currently, emerging countries include, among others, most Latin American, African, Asian and Eastern European nations.
|
| Other.
The Fund may invest in the aggregate up to 35% of its total assets in equity securities of companies with public stock market capitalizations outside the range of the market capitalization range stated above at the time of investment and in fixed-income
securities, such as government, corporate and bank debt obligations. If the market capitalization of a company held by the Fund moves outside the range stated above, the Fund may, consistent with its investment objective, continue to hold the security.
|
| FUND FACTS
|
|
| Objective:
|
Long-term capital appreciation
|
| Benchmark:
|
MSCI® Emerging Markets Free Index
|
| Investment Focus:
|
Equity securities of emerging country issuers
|
| Investment Style:
|
Active International
|
| INVESTMENT OBJECTIVE
|
| The Fund seeks long-term capital appreciation.
|
| PRINCIPAL INVESTMENT STRATEGIES
|
| Equity Securities. The Fund invests, under normal circumstances, substantially all, and at least 65% of its total assets in equity securities of emerging country issuers. The Investment Adviser may consider classifications by the World Bank, the International Finance
Corporation or the United Nations and its agencies in determining whether a country is emerging or developed. Currently, emerging countries include, among others, most Latin and South American, African, Asian and Eastern European nations. The Investment
Adviser currently intends that the Fund’s investment focus will be in the following emerging countries as well as any other emerging country to the extent that foreign investors are permitted by applicable law to make such investments:
|
| n Argentina | n Egypt | n Jordan | n Philippines | n Taiwan | ||||
| n Botswana | n Greece | n Kenya | n Poland | n Thailand | ||||
| n Brazil | n Hong Kong | n Malaysia | n Russia | n Turkey | ||||
| n Chile | n Hungary | n Mexico | n Singapore | n Venezuela | ||||
| n China | n India | n Morocco | n South Africa | n Zimbabwe | ||||
| n Colombia | n Indonesia | n Pakistan | n South Korea | |||||
| n Czech Republic | n Israel | n Peru | n Sri Lanka |
| An emerging country issuer is any company that either:
|
n
|
Has a class of its securities whose principal securities market is in an emerging country;
|
n
|
Is organized under the laws of, or has a principal office in, an emerging country;
|
n
|
Derives 50% or more of its total revenue from goods produced, sales made or services provided in one or more emerging countries; or
|
n
|
Maintains 50% or more of its assets in one or more of the emerging countries.
|
| Under normal circumstances, the Fund maintains investments in at least six emerging countries, and will not invest more than 35%
of its total assets in securities of issuers in any one emerging country. Allocation of the Fund’s investments will depend upon the relative attractiveness of the emerging country markets and particular issuers. In addition, macro-economic factors
and the portfolio managers’ and Goldman Sachs economists’ views of the relative attractiveness of emerging countries and currencies are considered in allocating the Fund’s assets among emerging countries.
|
| Other.
The Fund may invest in the aggregate up to 35% of its total assets in (i) fixed-income securities of private and government emerging country issuers; and (ii) equity and fixed-income securities, such as government, corporate and bank debt obligations, of
issuers in developed countries.
|
| FUND FACTS
|
|
| Objective:
|
Long-term capital appreciation
|
| Benchmark:
|
MSCI® All Country Asia Free
ex-Japan Index (unhedged) |
| Investment Focus:
|
Equity securities of companies in Asian countries
|
| Investment Process:
|
Active International
|
| INVESTMENT OBJECTIVE
|
| The Fund seeks long-term capital appreciation.
|
| PRINCIPAL INVESTMENT STRATEGIES
|
| Equity Securities. The Fund invests, under normal circumstances, substantially all, and at least 65% of its total assets in equity securities of Asian issuers.
|
| An Asian issuer is any company that either:
|
n
|
Has a class of its securities whose principal securities markets is in one or more Asian countries;
|
n
|
Is organized under the laws of, or has a principal office in, an Asian country;
|
n
|
Derives 50% or more of its total revenue from goods produced, sales made or services provided in one or more Asian countries; or
|
n
|
Maintains 50% or more of its assets in one or more Asian countries.
|
| The Fund may allocate its assets among the Asian countries as determined from time to time by the Investment Adviser. For purposes
of the Fund’s investment policies, Asian countries are:
|
| n China
n
Hong Kong
n
India
n
Indonesia
|
n Malaysia
n
Pakistan
n
Philippines
n
Singapore
|
n South Korea
n
Sri Lanka
n
Taiwan
n
Thailand
|
| as well as any other country in Asia (other than Japan) to the extent that foreign investors are permitted by applicable law to
make such investments.
|
| Allocation of the Fund’s investments will depend upon the Investment Adviser’s views of the relative attractiveness of
the Asian markets and particular issuers.
|
| Concentration of the Fund’s assets in one or a few of the Asian countries and Asian currencies will subject the Fund to
greater risks than if the Fund’s assets were not so concentrated. For example, on August 31, 2000 (the end of the Fund’s last fiscal year), more than 25% of the Fund’s assets were invested in securities that traded in Hong Kong.
|
| Starting in mid-1997 some Pacific region countries began to experience currency devaluations that resulted in high interest rate
levels and sharp reductions in economic activity. This situation resulted in a significant drop in the securities prices of companies located in the region. Some countries have recently experienced government intervention, have sought assistance from the
International Monetary Fund and have experienced substantial domestic unrest. Although some restructuring has been undertaken, there can be no assurance that these efforts will be successful or that their recent problems will not persist. At the end of
its last fiscal year, a substantial portion of the Asia Growth Fund was invested in securities traded in the Hong Kong market. In 1997, the sovereignty of Hong Kong reverted from the United Kingdom to China. Although Hong Kong is, by law, to maintain a
high degree of autonomy, there can be no assurance that Hong Kong will not be adversely affected by Chinese sovereignty or political developments. Furthermore, the reversion of Hong Kong to China has created additional uncertainty as to future currency
valuations relative to the U.S. dollar. Because the Hong Kong stock market has significant exposure to the property market in Hong Kong, the Fund’s investments could be adversely affected by a decline in that market.
|
| Other.
The Fund may invest in the aggregate up to 35% of its total assets in equity securities of issuers in non-Asian countries and Japan, and in fixed-income securities, such as government, corporate and bank debt obligations.
|
| CORE
International Equity Fund |
International
Equity Fund |
European
Equity Fund |
|||||
|---|---|---|---|---|---|---|---|
| Investment Practices | |||||||
| Borrowings | 33 1
/3
|
33 1
/3
|
33 1
/3
|
||||
| Cross Hedging of Currencies | Ÿ | Ÿ | Ÿ | ||||
| Currency Swaps* | 15 | 15 | 15 | ||||
| Custodial Receipts | Ÿ | Ÿ | Ÿ | ||||
| Equity Swaps* | 15 | 15 | 15 | ||||
| Foreign Currency Transactions | Ÿ | Ÿ | Ÿ | ||||
| Futures Contracts and Options on Futures Contracts | Ÿ | Ÿ | Ÿ | ||||
| Investment Company Securities (including iShares
SM
and Standard & Poor’s Depositary Receipts TM ) |
10 | 10 | 10 | ||||
| Options on Foreign Currencies 1 | Ÿ | Ÿ | Ÿ | ||||
| Options on Securities and Securities Indices 2 | Ÿ | Ÿ | Ÿ | ||||
| Unseasoned Companies | Ÿ | Ÿ | Ÿ | ||||
| Warrants and Stock Purchase Rights | Ÿ | Ÿ | Ÿ | ||||
| Repurchase Agreements | Ÿ | Ÿ | Ÿ | ||||
| Securities Lending | 33 1
/3
|
33 1
/3
|
33 1
/3
|
||||
| Short Sales Against the Box | — | 25 | 25 | ||||
| When-Issued Securities and Forward Commitments | Ÿ | Ÿ | Ÿ | ||||
|
Japanese Equity Fund |
International
Growth Opportunities Fund |
Emerging Markets Equity Fund |
Asia Growth Fund |
||||
|---|---|---|---|---|---|---|---|
| 33 1
/3
|
33 1
/3
|
33 1
/3
|
33 1
/3
|
||||
| Ÿ | Ÿ | Ÿ | Ÿ | ||||
| 15 | 15 | 15 | 15 | ||||
| Ÿ | Ÿ | Ÿ | Ÿ | ||||
| 15 | 15 | 15 | 15 | ||||
| Ÿ | Ÿ | Ÿ | Ÿ | ||||
| Ÿ | Ÿ | Ÿ | Ÿ | ||||
| 10 | 10 | 10 | 10 | ||||
| Ÿ | Ÿ | Ÿ | Ÿ | ||||
| Ÿ | Ÿ | Ÿ | Ÿ | ||||
| Ÿ | Ÿ | Ÿ | Ÿ | ||||
| Ÿ | Ÿ | Ÿ | Ÿ | ||||
| Ÿ | Ÿ | Ÿ | Ÿ | ||||
| 33 1
/3
|
33 1
/3
|
33 1
/3
|
33 1
/3
|
||||
| 25 | 25 | 25 | 25 | ||||
| Ÿ | Ÿ | Ÿ | Ÿ | ||||
Ÿ
|
No specific percentage limitation on usage;
limited only by the objectives and strategies of the Fund |
| CORE
International Equity Fund |
International
Equity Fund |
European
Equity Fund |
|||||
|---|---|---|---|---|---|---|---|
| Investment Securities | |||||||
| American, European and Global Depositary Receipts | Ÿ | Ÿ | Ÿ | ||||
| Asset-Backed and Mortgage-Backed Securities 2 | — | Ÿ | Ÿ | ||||
| Bank Obligations 1 , 2 | Ÿ | Ÿ | Ÿ | ||||
| Convertible Securities | Ÿ | Ÿ | Ÿ | ||||
| Corporate Debt Obligations 2 | Ÿ 4 | Ÿ | Ÿ | ||||
| Equity Securities | 90+ | 65+ | 65+ | ||||
| Emerging Country Securities | 25 | Ÿ | Ÿ | ||||
| Fixed Income Securities 3 | 10 4 | 35 | 35 5 | ||||
| Foreign Securities | Ÿ | Ÿ | Ÿ | ||||
| Foreign Government Securities 2 | Ÿ | Ÿ | Ÿ | ||||
| Non-Investment Grade Fixed Income Securities 2 | — | Ÿ 6 | Ÿ 6 | ||||
| Real Estate Investment Trusts | Ÿ | Ÿ | Ÿ | ||||
| Structured Securities * | Ÿ | Ÿ | Ÿ | ||||
| Temporary Investments | 35 | 100 | 100 | ||||
| U.S. Government Securities 2 | Ÿ | Ÿ | Ÿ | ||||
*
|
Limited to 15% of net assets (together with other illiquid securities) for all structured securities which are not
deemed to be liquid and all swap transactions.
|
1
|
Issued by U.S. or foreign banks.
|
2
|
Limited by the amount the Fund invests in fixed-income securities.
|
3
|
Except as noted under “Non-Investment Grade Fixed Income Securities,” fixed-income securities are investment
grade (e.g., BBB or higher by Standard & Poor’s Rating Group (“Standard & Poor’s”) or Baa or higher by Moody’s Investor’s Service, Inc. (“Moody’s”)).
|
4
|
Cash equivalents only.
|
5
|
The European Equity Fund may invest in the aggregate up to 35% of its total assets in: (1) equity securities of
non-European countries; and (2) fixed-income securities.
|
6
|
May be BB or lower by Standard & Poor’s or Ba or lower by Moody’s.
|
| Japanese
Equity Fund |
International
Growth Opportunities Fund |
Emerging
Markets Equity Fund |
Asia Growth
Fund |
|||||||
|---|---|---|---|---|---|---|---|---|---|---|
| Ÿ | Ÿ | Ÿ | Ÿ | |||||||
| Ÿ | Ÿ | Ÿ | Ÿ | |||||||
| Ÿ | Ÿ | Ÿ | Ÿ | |||||||
| Ÿ | Ÿ | Ÿ | Ÿ | |||||||
| Ÿ | Ÿ | Ÿ | Ÿ | |||||||
| 65 | + | 65+ | 65 | + | 65 | + | ||||
| Ÿ | Ÿ | Ÿ | Ÿ | |||||||
| 35 | 7 | 35 8 | 35 | 9 | 35 | 10 | ||||
| Ÿ | Ÿ | Ÿ | Ÿ | |||||||
| Ÿ | Ÿ | Ÿ | Ÿ | |||||||
| Ÿ | 6 | Ÿ |
Ÿ | 6 | Ÿ | 6 | ||||
| Ÿ | Ÿ | Ÿ | Ÿ | |||||||
| Ÿ | Ÿ | Ÿ | Ÿ | |||||||
| 100 | 100 | 35 | 100 | |||||||
| Ÿ | Ÿ | Ÿ | Ÿ | |||||||
7
|
The Japanese Equity Fund may invest in the aggregate up to 35% of its total assets in: (1) fixed-income securities; and
(2) equity securities of non-Japanese companies.
|
8
|
The International Growth Opportunities Fund may invest in the aggregate up to 35% of its total assets in (1) fixed-income
securities; and (2) equity securities of companies with public stock market capitalizations of less than $100 million or more than $3 billion at the time of investment.
|
9
|
The Emerging Markets Equity Fund may invest in the aggregate up to 35% of its total assets in: (1) fixed-income
securities of private and government emerging country issuers; and (2) equity and fixed-income securities of issuers in developed countries.
|
10
|
The Asia Growth Fund may invest in the aggregate up to 35% of its total assets in: (1) fixed-income securities; and (2)
equity securities of issuers in non-Asian countries and Japan.
|
| CORE
International Equity |
International
Equity |
European
Equity |
Japanese
Equity |
International
Growth Opportunities |
Emerging
Markets Equity |
Asia
Growth |
|||||||||
|---|---|---|---|---|---|---|---|---|---|---|---|---|---|---|---|
| Credit/Default | Ÿ | Ÿ | Ÿ | Ÿ | Ÿ | Ÿ | Ÿ | ||||||||
| Emerging Countries | Ÿ | Ÿ | Ÿ | Ÿ | Ÿ | Ÿ | Ÿ | ||||||||
| Interest Rate | Ÿ | Ÿ | Ÿ | Ÿ | Ÿ | Ÿ | Ÿ | ||||||||
| Small Cap | — | — | Ÿ | — | Ÿ | — | — | ||||||||
| Foreign | Ÿ | Ÿ | Ÿ | Ÿ | Ÿ | Ÿ | Ÿ | ||||||||
| Derivatives | Ÿ | Ÿ | Ÿ | Ÿ | Ÿ | Ÿ | Ÿ | ||||||||
| Management | Ÿ | Ÿ | Ÿ | Ÿ | Ÿ | Ÿ | Ÿ | ||||||||
| Market | Ÿ | Ÿ | Ÿ | Ÿ | Ÿ | Ÿ | Ÿ | ||||||||
| Liquidity | Ÿ | Ÿ | Ÿ | Ÿ | Ÿ | Ÿ | Ÿ | ||||||||
| Stock | Ÿ | Ÿ | Ÿ | Ÿ | Ÿ | Ÿ | Ÿ | ||||||||
| Geographic | — | — | Ÿ | Ÿ | — | Ÿ | — | ||||||||
| Initial Public
Offering (“IPO”) |
— | — | Ÿ | Ÿ | Ÿ | Ÿ | Ÿ | ||||||||
n
|
Credit/Default Risk—The risk that an issuer or guarantor of fixed-income securities held by a Fund may default
on its obligation to pay interest and repay principal.
|
n
|
Emerging Countries Risk—The securities markets of Asian, Latin and South American, Eastern European,
African and other emerging countries are less liquid, are especially subject to greater price volatility, have smaller market capitalizations, have less government regulation and are not subject to as extensive and frequent accounting, financial and other
reporting requirements as the securities markets of more developed countries. Further, investment in equity securities of issuers located in Russia and certain other emerging countries involves risk of loss result
-
|
| ing from problems in share registration and custody and substantial economic and political disruptions. These risks are not
normally associated with investment in more developed countries.
|
n
|
Interest Rate Risk—The risk that when interest rates increase, securities held by a Fund will decline in value.
Long-term fixed-income securities will normally have more price volatility because of this risk than short-term fixed-income securities.
|
n
|
Foreign Risk—The risk that when a Fund invests in foreign securities, it will be subject to risk of loss not
typically associated with domestic issuers. Loss may result because of less foreign government regulation, less public information and less economic, political and social stability. Loss may also result from the imposition of exchange controls,
confiscations and other government restrictions. A Fund will also be subject to the risk of negative foreign currency rate fluctuations. Foreign risks will normally be greatest when a Fund invests in issuers located in emerging countries.
|
n
|
Derivatives Risk—The risk that loss may result from a Fund’s investments in options, futures, swaps,
structured securities and other derivative instruments. These instruments may be leveraged so that small changes may produce disproportionate losses to a Fund.
|
n
|
Management Risk—The risk that a strategy used by the Investment Adviser may fail to produce the intended results.
|
n
|
Market Risk—The risk that the value of the securities in which a Fund invests may go up or down in response to
the prospects of individual companies, particular industry sectors and/or general economic conditions. Price changes may be temporary or last for extended periods. A Fund’s investments may be overweighted from time to time in one or more industry
sectors, which will increase the Fund’s exposure to risk of loss from adverse developments affecting those sectors.
|
n
|
Liquidity Risk—The risk that a Fund will not be able to pay redemption proceeds within the time period stated
in this Prospectus because of unusual market conditions, an unusually high volume of redemption requests, or other reasons. Funds that invest in non-investment grade fixed-income securities, small capitalization stocks, REITs or emerging country issuers
will be especially subject to the risk that during certain periods the liquidity of particular issuers or industries, or all securities within particular investment categories, will shrink or disappear suddenly and without warning as a result of adverse
economic, market or political events, or adverse investor perceptions whether or not accurate. The Goldman Sachs Asset Allocation Portfolios (the “Asset Allocation Portfolios”) expect to invest a significant percentage of their assets in the
Funds and other funds for which Goldman Sachs now or in the future acts as investment adviser or underwriter. Redemptions by an Asset Allocation Portfolio of its position in a Fund may further increase liquidity risk and may impact a Fund’s net asset
value (“NAV”).
|
| n
|
Stock Risk—The risk that stock prices have historically risen and fallen in periodic cycles. Recently, U.S.
stock markets and certain foreign stock markets have experienced substantial price volatility and, at times, have traded at or close to record high levels. There is no guarantee that such levels will be reached or maintained in the future.
|
n
|
Geographic Risk—The European Equity Fund invests primarily in equity securities of European companies. The
Japanese Equity Fund invests primarily in equity securities of Japanese equity companies. The Asia Growth Fund invests primarily in equity securities of Asian issuers. Concentration of the investments of these or other Funds in issuers located in a
particular country or region will subject a Fund, to a greater extent than if investments were less concentrated, to the risks of adverse securities markets, exchange rates and social, political, regulatory or economic events which may occur in that
country or region.
|
n
|
Small Cap Risk—The securities of small capitalization stocks involve greater risks than those associated with
larger, more established companies and may be subject to more abrupt or erratic price movements. Securities of such issuers may lack sufficient market liquidity to enable a Fund to effect sales at an advantageous time or without a substantial drop in price.
|
n
|
IPO Risk—The risk that the market value of IPO shares will fluctuate considerably due to factors such as the
absence of a prior public market, unseasoned trading, the small number of shares available for trading and limited information about the issuer. The purchase of IPO shares may involve high transaction costs. IPO shares are subject to market risk and
liquidity risk. When a Fund’s asset base is small, a significant portion of the Fund’s performance could be attributable to investments in IPOs, because such investments would have a magnified impact on the Fund. As the Fund’s assets grow,
the effect of the Fund’s investments in IPOs on the Fund’s performance probably will decline, which could reduce the Fund’s performance.
|
| HOW THE FUNDS HAVE PERFORMED
|
| The bar chart and table below provide an indication of the risks of investing in a Fund by showing: (a) changes in the performance
of a Fund’s Institutional Shares from year to year; and (b) how the average annual returns of a Fund’s Institutional Shares compare to those of broad-based securities market indices. The bar chart and table assume reinvestment of dividends and
distributions. A Fund’s past performance is not necessarily an indication of how the Fund will perform in the future. Performance reflects expense limitations in effect. If expense limitations were not in place, a Fund’s performance would have
been reduced.
|
| TOTAL RETURN
|
CALENDAR YEAR
|
| The total return for Institutional Shares for the 9-month period ended September 30, 2000 was -13.15%.
Best Quarter
Q4 ’98 +19.05%
Worst Quarter
Q3 ’98 -15.84%
|
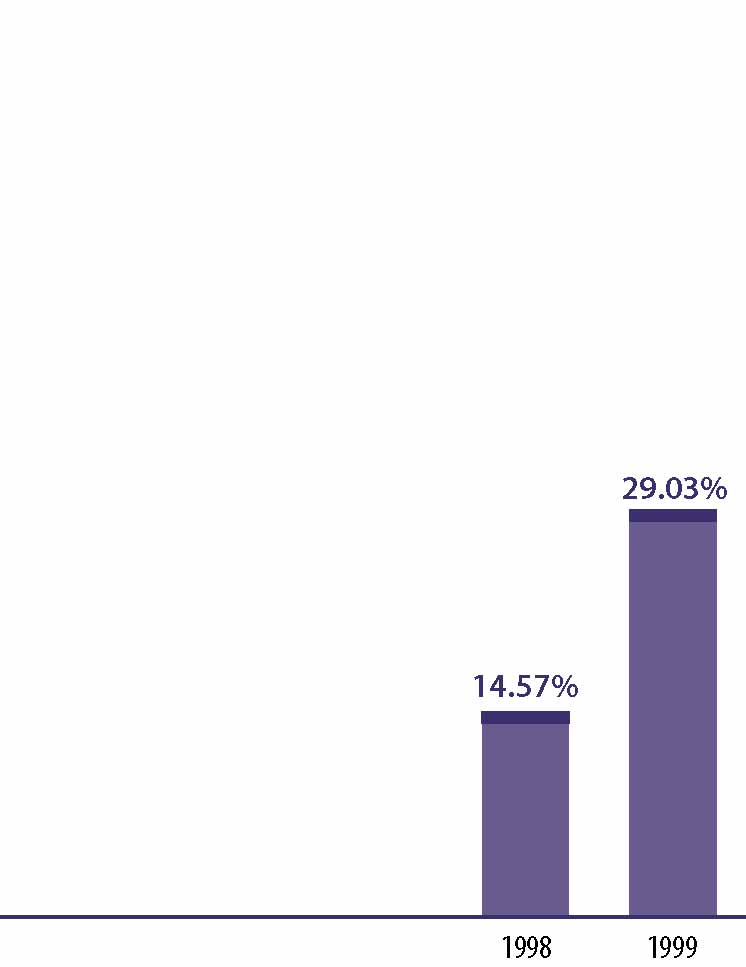 |
| AVERAGE ANNUAL TOTAL RETURN
|
| For the period ended December 31, 1999 | 1 Year | Since Inception | |||
|---|---|---|---|---|---|
| Institutional Shares (Inception 8/15/97) | 29.03% | 11.65% | |||
| Morgan Stanley Capital International (MSCI®) Europe,
Australasia, Far East (EAFE®) Index (unhedged)* |
27.29% | 15.99% | |||
*
|
The unmanaged MSCI® EAFE® Index (unhedged) is a market capitalization-weighted composite of securities in 20 developed
markets. The Index figures do not reflect any fees or expenses.
|
| TOTAL RETURN
|
CALENDAR YEAR
|
| The total return for Institutional Shares for the 9-month period ended September 30, 2000 was -10.15%.
Best Quarter
Q4 ’99 +21.89%
Worst Quarter
Q3 ’98 -14.25%
|
|
| AVERAGE ANNUAL TOTAL RETURN
|
| For the period ended December 31, 1999 | 1 Year | Since Inception | |||
|---|---|---|---|---|---|
| Institutional Shares (Inception 2/7/96) | 31.78% | 18.02% | |||
| MSCI® EAFE® (unhedged)* | 27.29% | 13.60% | |||
*
|
The MSCI® EAFE® Index (unhedged) is an unmanaged index of common stock prices. The Index figures do not reflect any
fees or expenses.
|
|
TOTAL RETURN
|
CALENDAR YEAR
|
| The total return for Institutional Shares for the 9-month period ended September 30, 2000 was -5.40%.
Best Quarter
Q4 ’99 +24.93%
Worst Quarter
Q2 ’99 -2.86%
|
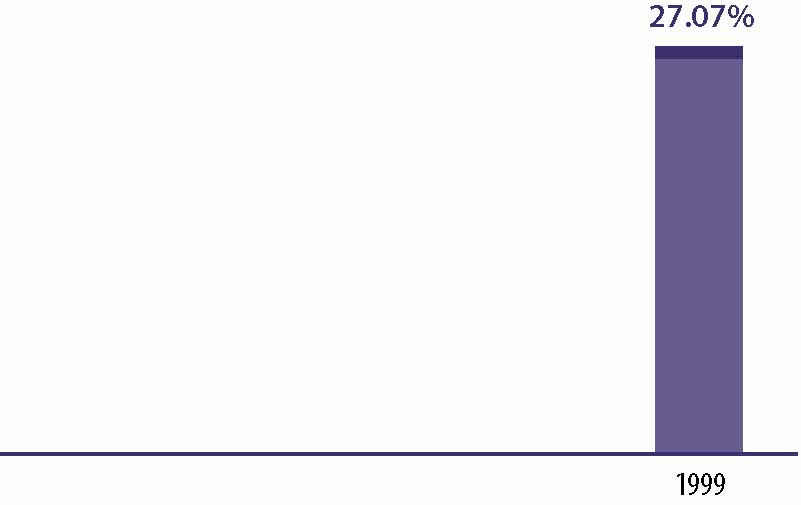 |
| AVERAGE ANNUAL TOTAL RETURN
|
| For the period ended December 31, 1999 | 1 Year | Since Inception | |||
|---|---|---|---|---|---|
| Institutional Shares (Inception 10/1/98) | 27.07% | 37.08% | |||
| MSCI® Europe Index (unhedged)* | 16.21% | 29.39% | |||
| FT/S&P Actuaries Europe Index (unhedged)** | 16.14% | 29.20% | |||
*
|
The MSCI® Europe Index (unhedged), an unmanaged index of common stock prices, replaced the FT/S&P Actuaries Europe
Index (unhedged) as the European Equity Fund’s performance benchmark. The MSCI® Europe Index is widely used throughout the investment management industry to represent the investment opportunities available to a large cap, developed country
European equity strategy and, in the Investment Adviser’s opinion, is a more appropriate benchmark against which to measure the performance of the European Equity Fund. The Index figures do not reflect any fees or expenses.
|
**
|
The unmanaged FT/S&P Actuaries Europe Index (unhedged) is a market capitalization-weighted composite of approximately 750
stocks from 16 countries in Europe. The Index figures do not reflect any fees or expenses.
|
|
TOTAL RETURN
|
CALENDAR YEAR
|
|
The total return for Institutional Shares for the 9-month period ended September 30, 2000 was -12.12%.
Best Quarter*
Q3 ’99 +23.29%
Worst Quarter*
Q1 ’99 +9.64%
|
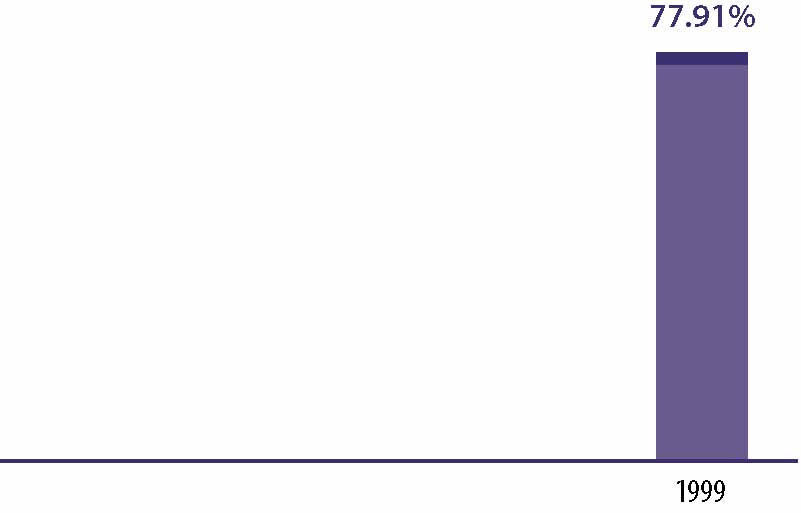 |
| AVERAGE ANNUAL TOTAL RETURN
|
| For the period ended December 31, 1999 | 1 Year | Since Inception | |||
|---|---|---|---|---|---|
| Institutional Shares (Inception 5/1/98) | 77.91% | 50.30% | |||
| Tokyo Price Index (“TOPIX”) (unhedged)** | 75.32% | 43.28% | |||
*
|
Please note that “Best Quarter” and “Worst Quarter” figures are applicable only to the time period covered
by the bar chart.
|
**
|
The TOPIX (unhedged) is an unmanaged composite of all stocks on the first section of the Tokyo Stock Exchange. The Index
figures do not reflect any fees or expenses.
|
|
TOTAL RETURN
|
CALENDAR YEAR
|
|
The total return for Institutional Shares for the 9-month period ended September 30, 2000 was 2.54%.
Best Quarter*
Q4 ’99 +12.79%
Worst Quarter*
Q1 ’99 +4.98%
|
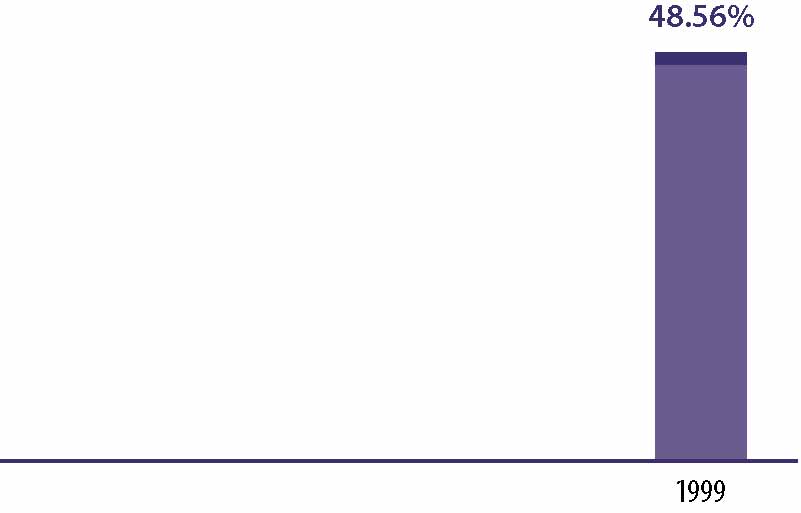 |
| AVERAGE ANNUAL TOTAL RETURN
|
| For the period ended December 31, 1999 | 1 Year | Since Inception | |||
|---|---|---|---|---|---|
| Institutional Shares (Inception 5/1/98) | 48.56% | 30.08% | |||
| MSCI® EAFE® Small Cap Index (unhedged)** | 17.67% | 3.00% | |||
*
|
Please note that “Best Quarter” and “Worst Quarter” figures are applicable only to the time period covered
by the bar chart.
|
**
|
The MSCI® EAFE® Small Cap Index (unhedged), inception date 1/15/98, includes 1,502 securities from 23 developed markets
with a capitalization range of $200-800 million and a general regional allocation of 60% Europe, 30% Japan and 10% Asia. The Index figures do not reflect any fees or expenses.
|
| TOTAL RETURN
|
CALENDAR YEAR
|
|
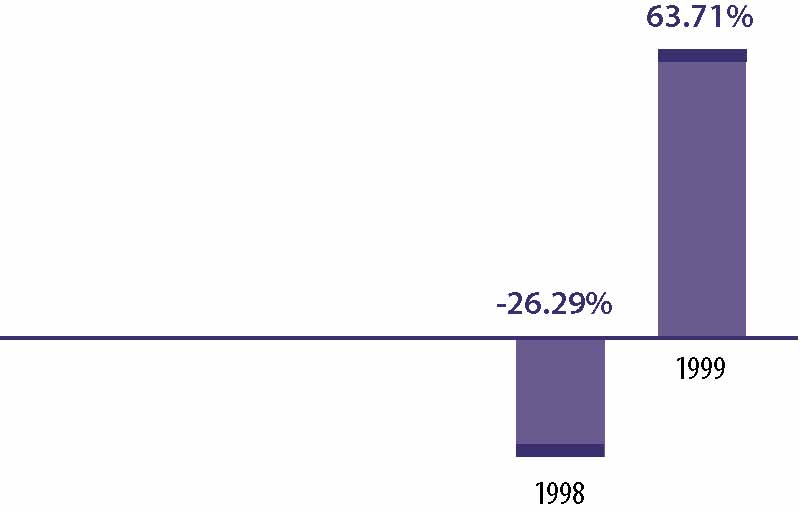
The total return for Institutional Shares for the 9-month period ended September 30, 2000 was -15.40%.
Best Quarter
Q4 ’99
+30.18%
Worst Quarter
Q3 ’98
-22.78%
|
 |
| AVERAGE ANNUAL TOTAL RETURN
|
| For the period ended December 31, 1999 | 1 Year | Since Inception | |||
|---|---|---|---|---|---|
| Institutional Shares (Inception 12/15/97) | 63.71% | 10.84% | |||
| MSCI® Emerging Markets Free (EMF) Index* | 66.42% | 14.52% | |||
*
|
The unmanaged MSCI® EMF Index is a market capitalization-weighted composite of securities in over 30 emerging market
countries. “Free” indicates an index that excludes shares in otherwise free markets that are not purchasable by foreigners. The Index figures do not reflect any fees or expenses.
|
| TOTAL RETURN
|
CALENDAR YEAR
|
|
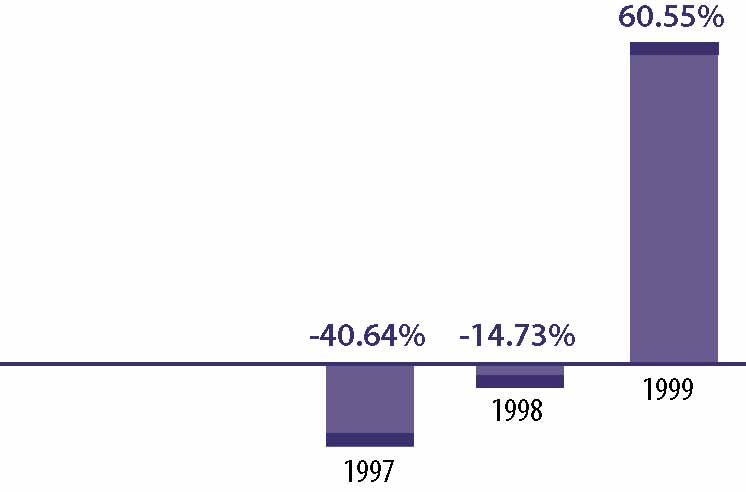
The total return for Institutional Shares for the 9-month period ended September 30, 2000 was -21.29%.
Best Quarter
Q2 ’99 +31.32%
Worst Quarter
Q4 ’97 -27.19%
|
 |
| AVERAGE ANNUAL TOTAL RETURN
|
| For the period ended December 31, 1999 | 1 Year | Since Inception | |||
|---|---|---|---|---|---|
| Institutional Shares (Inception 2/2/96) | 60.55% | (5.50)% | |||
| MSCI® All Country Asia Free ex-Japan Index (unhedged)* | 61.95% | (4.05)% | |||
*
|
The unmanaged MSCI® All Country Asia Free ex-Japan Index (unhedged) is a market capitalization-weighted composite of
securities in ten Asian countries. “Free” indicates an index that excludes shares in otherwise free markets that are not purchasable by foreigners. The Index figures do not reflect any fees or expenses.
|
| CORE
International Equity Fund |
International
Equity Fund |
European
Equity Fund |
|||||
|---|---|---|---|---|---|---|---|
| Shareholder Fees | |||||||
| (fees paid directly from your investment): | |||||||
| Maximum Sales Charge (Load) Imposed on
Purchases |
None | None | None | ||||
| Maximum Sales Charge (Load) Imposed on
Reinvested Dividends |
None | None | None | ||||
| Redemption Fees | None | None | None | ||||
| Exchange Fees | None | None | None | ||||
| Annual Fund Operating Expenses | |||||||
| (expenses that are deducted from Fund assets):1 | |||||||
| Management Fees | 0.85% | 1.00% | 1.00% | ||||
| Distribution and Service (12b-1) Fees | None | None | None | ||||
| Other Expenses 2 | 0.25% | 0.19% | 0.52% | ||||
| Total Fund Operating Expenses * | 1.10% | 1.19% | 1.52% | ||||
*
|
As a result of the current expense limitations, “Other Expenses” and “Total Fund Operating Expenses” of the
Funds which are actually incurred as of the date of this Prospectus are as set forth below. The expense limitations may be terminated at any time at the option of the Investment Adviser. If this occurs, “Other Expenses” and “Total Fund
Operating Expenses” may increase without shareholder approval.
|
| CORE
International Equity Fund |
International
Equity Fund |
European
Equity Fund |
|||||
|---|---|---|---|---|---|---|---|
| Annual Fund Operating Expenses | |||||||
| (expenses that are deducted from Fund assets): 1 | |||||||
| Management Fees | 0.85% | 1.00% | 1.00% | ||||
| Distribution and Service (12b-1) Fees | None | None | None | ||||
| Other Expenses 2 | 0.16% | 0.14% | 0.14% | ||||
| Total Fund Operating Expenses (after
current expense limitations) |
1.01% | 1.14% | 1.14% | ||||
| Japanese
Equity Fund |
International
Growth Opportunities Fund |
Emerging
Markets Equity Fund |
Asia
Growth Fund |
||||
|---|---|---|---|---|---|---|---|
| None | None | None | None | ||||
| None | None | None | None | ||||
| None | None | None | None | ||||
| None | None | None | None | ||||
| 1.00% | 1.20% | 1.20% | 1.00% | ||||
| None | None | None | None | ||||
| 0.45% | 0.37% | 0.45% | 0.65% | ||||
| 1.45% | 1.57% | 1.65% | 1.65% | ||||
| Japanese
Equity Fund |
International
Growth Opportunities Fund |
Emerging
Markets Equity Fund |
Asia
Growth Fund |
||||
|---|---|---|---|---|---|---|---|
| 1.00% | 1.20% | 1.20% | 1.00% | ||||
| None | None | None | None | ||||
| 0.15% | 0.20% | 0.39% | 0.20% | ||||
| 1.15% | 1.40% | 1.59% | 1.20% | ||||
1
|
The Funds’ annual operating expenses are based on actual expenses.
|
2
|
“Other Expenses” include transfer agency fees equal to 0.04% of the average daily net assets of each Fund’
s Institutional Shares plus all other ordinary expenses of the Funds not detailed above. The Investment Adviser has voluntarily agreed to reduce or limit “Other Expenses” (excluding management fees, transfer agency fees, taxes, interest and
brokerage fees and litigation, indemnification and other extraordinary expenses) to the following percentages of each Fund’s average daily net assets:
|
| Fund | Other
Expenses |
||
|---|---|---|---|
| CORE International Equity | 0.12% | ||
| International Equity | 0.10% | ||
| European Equity | 0.10% | ||
| Japanese Equity | 0.11% | ||
| International Growth
Opportunities |
0.16% | ||
| Emerging Markets Equity | 0.35% | ||
| Asia Growth | 0.16% | ||
| Fund | 1 Year | 3 Years | 5 Years | 10 Years | |||||
|---|---|---|---|---|---|---|---|---|---|
| CORE International Equity | $112 | $350 | $606 | $1,340 | |||||
| International Equity | $121 | $378 | $654 | $1,443 | |||||
| European Equity | $155 | $480 | $829 | $1,813 | |||||
| Japanese Equity | $148 | $459 | $792 | $1,735 | |||||
| International Growth Opportunities | $160 | $496 | $855 | $1,867 | |||||
| Emerging Markets Equity | $168 | $520 | $897 | $1,955 | |||||
| Asia Growth | $168 | $520 | $897 | $1,955 | |||||
| INVESTMENT ADVISERS
|
| Investment Adviser | Fund | ||
|---|---|---|---|
| Goldman Sachs Asset Management (“GSAM”) | CORE International Equity | ||
| 32 Old Slip | |||
| New York, New York 10005 | |||
| Goldman Sachs Asset Management International (“GSAMI”) | International Equity | ||
| Procession House | European Equity | ||
| 55 Ludgate Hill | Japanese Equity | ||
| London, England EC4M 7JW | International Growth Opportunities | ||
| Emerging Markets Equity | |||
| Asia Growth | |||
| GSAM and GSAMI are separate business units of the Investment Management Division (“IMD”) of Goldman Sachs. Goldman Sachs
registered as an investment adviser in 1981. GSAMI, a member of the Investment Management Regulatory Organization Limited since 1990 and a registered investment adviser since 1991, is an affiliate of Goldman Sachs. As of September 30, 2000, GSAM and
GSAMI, along with other units of IMD, had assets under management of $281.3 billion.
|
| The Investment Adviser provides day-to-day advice regarding the Funds’ portfolio transactions. The Investment Adviser makes
the investment decisions for the Funds and places purchase and sale orders for the Funds’ portfolio transactions in U.S. and foreign markets. As permitted by applicable law, these orders may be directed to any brokers, including Goldman Sachs and its
affiliates. While the Investment Adviser is ultimately responsible for the management of the Funds, it is able to draw upon the research and expertise of its asset management affiliates for portfolio decisions and management with respect to certain
portfolio securities. In addition, the Investment Adviser has access to the research and certain proprietary technical models developed by Goldman Sachs, and will apply quantitative and qualitative analysis in determining the appropriate allocations among
categories of issuers and types of securities.
|
| The Investment Adviser also performs the following additional services for the Funds:
|
n
|
Supervises all non-advisory operations of the Funds
|
n
|
Provides personnel to perform necessary executive, administrative and clerical services to the Funds
|
n
|
Arranges for the preparation of all required tax returns, reports to shareholders, prospectuses and statements of additional
information and other reports filed with the Securities and Exchange Commission (the “SEC”) and other regulatory authorities
|
n
|
Maintains the records of each Fund
|
n
|
Provides office space and all necessary office equipment and services
|
| MANAGEMENT FEES
|
| As compensation for its services and its assumption of certain expenses, the Investment Adviser is entitled to the following fees,
computed daily and payable monthly, at the annual rates (as a percentage of each respective portfolio’s average daily net assets) listed below:
|
| Contractual Rate | Actual Rate
For the Fiscal Year Ended August 31, 2000 |
||||||
|---|---|---|---|---|---|---|---|
| GSAM: | |||||||
| CORE International Equity | 0.85 | % | 0.85 | % | |||
| GSAMI: | |||||||
| International Equity | 1.00 | % | 1.00 | % | |||
| European Equity | 1.00 | % | 1.00 | % | |||
| Japanese Equity | 1.00 | % | 1.00 | % | |||
| International Growth Opportunities | 1.20 | % | 1.20 | % | |||
| Emerging Markets Equity | 1.20 | % | 1.20 | % | |||
| Asia Growth | 1.00 | % | 1.00 | % | |||
| The difference, if any, between the stated fees and the actual fees paid by the Funds reflects that the Investment Adviser did not
charge the full amount of the fees to which it would have been entitled. The Investment Adviser may discontinue or modify any such voluntary limitations in the future at its discretion.
|
| FUND MANAGERS
|
| M. Roch Hillenbrand, a Managing Director of Goldman Sachs since 1997, is the Head of Global Equities for GSAM, overseeing the
United States, Europe, Japan, and non-Japan Asia. In this capacity, he is responsible for managing the group as it defines and implements global portfolio management processes that are consistent, reliable and predictable. Mr. Hillenbrand joined Goldman
Sachs in 1997
|
| upon its acquisition of Commodities Corporation, LLC where he was and continues as President. Over the course of his 20-year
career at Commodities Corporation, Mr. Hillenbrand has had extensive experience in dealing with internal and external investment managers who have managed a range of futures and equities strategies across multiple markets, using a variety of styles.
|
| International Equity Portfolio Management Team
|
n
|
Global portfolio teams based in London, Singapore, Tokyo and New York. Local presence is a key to the Investment Adviser’s
fundamental research capabilities
|
n
|
Team manages over $45.9 billion in international equities for retail, institutional and high net worth clients
|
n
|
Focus on bottom-up stock selection as main driver of returns, though the team leverages the asset allocation, currency and risk
management capabilities of GSAM
|
| Name and Title | Fund Responsibility | Years Primarily
Responsible |
Five Year Employment History | ||||
|---|---|---|---|---|---|---|---|
| David Dick
Executive Director |
Senior Portfolio Manager—
European Equity Fund |
Since
1998 |
Mr. Dick joined the Investment
Adviser as a senior portfolio manager on the European Equity team in 1998. From 1990 to 1998, he was with Mercury Asset Management, where he was a portfolio manager for European equity and was head of Mercury’s European sector strategy. |
||||
| Gary Greenberg
Vice President Co-Head of Emerging Markets Equity |
Senior Portfolio Manager—
Emerging Markets Equity Fund |
Since
1999 |
Mr. Greenberg joined the
Investment Adviser as a portfolio manager in 1999. From 1998 to 1999, he was a Managing Director and the lead international portfolio manager at Van Eck Global Asset Management. Prior to that, he was Chief Investment Officer for Peregrine Asset Management in Hong Kong from 1994 to 1998. |
||||
| Name and Title | Fund Responsibility | Years Primarily
Responsible |
Five Year Employment History | ||||
|---|---|---|---|---|---|---|---|
| James P. Hordern
Executive Director |
Senior Portfolio Manager—
International Growth Opportunities Fund |
Since
1998 |
Mr. Hordern joined the
Investment Adviser as a portfolio manager in 1997. From 1991 to 1997, he was an Assistant Director and portfolio manager at Mercury Asset Management on the European Specialist Team. |
||||
| Ralf Laier
Vice President |
Portfolio Manager—
Emerging Markets Equity Fund |
Since
1998 |
Mr. Laier joined the Investment
Adviser as a portfolio manager with a focus on Central/Eastern European (CEE) and the Commonwealth of Independent States (CIS) in 1997. Prior to joining the Investment Adviser, from 1995 to 1997, he was Vice President of Soros Global Research, where he analyzed investment opportunities in CEE/CIS. |
||||
| Susan Noble
Managing Director |
Senior Portfolio Manager—
European Equity Fund International Equity Fund |
Since
1998 1998 |
Ms. Noble joined the Investment
Adviser as a senior portfolio manager and head of the European Equity Team in October 1997. From 1986 to 1997, she worked at Fleming Investment Management in London, where she most recently was Portfolio Management Director for the European equity investment strategy and process. |
||||
| Andrew Orchard
Executive Director |
Senior Portfolio Manager—
European Equity Fund International Equity Fund |
Since
1999 1999 |
Mr. Orchard joined the
Investment Adviser as a portfolio manager in 1999. From 1994 to 1999 he was a portfolio manager at Morgan Grenfell Asset Management where he managed global equity portfolios and chaired Morgan Grenfell’s Global Sector Committee. |
||||
| Name and Title | Fund Responsibility | Years Primarily
Responsible |
Five Year Employment History | ||||
|---|---|---|---|---|---|---|---|
| Robert Stewart
Executive Director |
Senior Portfolio Manager—
European Equity Fund International Equity Fund |
Since
1999 1999 |
Mr. Stewart joined the
Investment Adviser as a portfolio manager in 1996. He is a member of the European Equity Team. From 1996 to 1998 he was a portfolio manager in Japan where he managed Japanese Equity Institutional Portfolios. Prior to that Mr. Stewart was a portfolio manager at CINMan from 1989 to 1996 where he managed international equities. |
||||
| Danny Truell
Managing Director |
Senior Portfolio Manager—
European Equity Fund International Equity |
Since
1998 2000 |
Mr. Truell joined the Investment
Adviser as a senior portfolio manager and head of UK equities in 1998. From 1992 to 1996, he was Investment Banking Executive Director for SBC Warburg and Chief Asian Equity Strategist. |
||||
| Gabriella Antici
Vice President Co-Head of Emerging Markets Equity |
Senior Portfolio Manager—
Emerging Markets Equity Fund |
Since
1998 |
Ms. Antici joined the Investment
Adviser as a portfolio manager in 1997. From 1994 to 1997, she was a Vice President for HSBC Asset Management, where she was a portfolio manager for emerging markets and head of the Latin American Department. |
||||
| Rory Bateman
Executive Director |
Portfolio Manager—
European Equity Fund |
Since
2000 |
Mr. Bateman joined the
Investment Adviser as an equity analyst in 1996. Prior to that he was an analyst at CINMan covering European equities. |
||||
| Name and Title | Fund Responsibility | Years Primarily
Responsible |
Five Year Employment History | ||||
|---|---|---|---|---|---|---|---|
| Melissa Brown
Managing Director |
Senior Portfolio Manager—
CORE International Equity Fund |
Since
1998 |
Ms. Brown joined the Investment
Adviser as a portfolio manager in 1998. From 1984 to 1998, she was the director of Quantitative Equity Research and served on the Investment Policy Committee at Prudential Securities. |
||||
| Mark M. Carhart
Managing Director |
Portfolio Manager—
CORE International Equity Fund |
Since
1998 |
Mr. Carhart joined the
Investment Adviser as a member of the Quantitative Research and Risk Management team in 1997. From August 1995 to September 1997, he was Assistant Professor of Finance at the Marshall School of Business at USC and a Senior Fellow of the Wharton Financial Institutions Center. |
||||
| Raymond J.
Iwanowski Managing Director |
Portfolio Manager—
CORE International Equity Fund |
Since
1998 |
Mr. Iwanowski joined the
Investment Adviser as an associate and portfolio manager in 1997. From 1993 to 1997, he was a Vice President and head of the Fixed Derivatives Client Research group at Salomon Brothers. |
||||
| Robert C. Jones
Managing Director |
Senior Portfolio Manager—
CORE International Equity Fund |
Since
1997 |
Mr. Jones joined the
Investment Adviser as a portfolio manager in 1989. |
||||
| Name and Title | Fund Responsibility | Years Primarily
Responsible |
Five Year Employment History | ||||
|---|---|---|---|---|---|---|---|
| Alice Lui
Vice President |
Portfolio Manager—
Asia Growth Fund Emerging Markets Equity Fund International Equity Fund International Growth Opportunities Fund |
Since
1994 1999 1999 1999 |
Ms. Lui joined the Investment
Adviser as a portfolio manager in 1990. |
||||
| Ravi Shanker
Vice President |
Senior Portfolio Manager—
Asia Growth Fund Emerging Markets Equity Fund International Equity Fund International Growth Opportunities Fund |
Since
1997 1998 1999 1999 |
Mr. Shanker joined the
Investment Adviser as an operations manager in 1997. From July 1996 to 1997, he worked for Goldman Sachs in Singapore as a strategic advisor for transactions involving infrastructure industries in Asia. From 1988 to 1996, he worked for Goldman Sachs as an investment banker in the Investment Banking Division. |
||||
| Siew-Hua Thio
Vice President |
Portfolio Manager—
Asia Growth Fund Emerging Markets Equity Fund International Equity Fund International Growth Opportunities Fund |
Since
1998 1998 1998 1998 |
Ms. Thio joined the Investment
Adviser as a portfolio manager in 1998. From 1997 to 1998, she was Head of Research for Indosuez WI Carr in Singapore. From 1993 to 1997, she was a research analyst at the same firm. |
||||
| Name and Title | Fund Responsibility | Years Primarily
Responsible |
Five Year Employment History | ||||
|---|---|---|---|---|---|---|---|
| Toshiyuki Ejima
Vice President |
Portfolio Manager—
Japanese Equity Fund |
Since
1999 |
Mr. Ejima joined the Investment
Adviser as a portfolio manager in April 1999. Prior to that he was a portfolio manager at Daiichi Mutual Life from 1993 to 1999 where he managed Japanese equities. |
||||
| Shigeka Kouda
Vice President |
Portfolio Manager—
International Growth Opportunities Fund |
Since
1998 |
Mr. Kouda joined the
Investment Adviser as a portfolio manager in 1997. From 1992 to 1997, he was at the Fixed Income Division of Goldman Sachs (Japan) Limited, where he was extensively involved in emerging markets trading as well as International Fixed Income institutional sales. |
||||
| Shogo Maeda
Managing Director |
Senior Portfolio Manager—
Japanese Equity Fund International Equity Fund International Growth Opportunities Fund |
Since
1994 1994 1998 |
Mr. Maeda joined the
Investment Adviser as a portfolio manager in 1994. |
||||
| Miyako Shibamoto
Vice President |
Portfolio Manager—
Japanese Equity Fund |
Since
1998 |
Ms. Shibamoto joined the
Investment Adviser as a member of the Japanese Equity team in March 1998. From 1993 to 1998, she was a Vice President at Scudder Stevens and Clark (Japan). |
||||
| Takeya Suzuki
Vice President |
Portfolio Manager—
Japanese Equity Fund |
Since
1998 |
Mr. Suzuki joined the
Investment Adviser as a portfolio manager in 1996. From 1990 to 1996, he was a Japanese equity portfolio manager at Nomura Investment Management where he actively managed assets for U.S. pension funds. |
||||
| DISTRIBUTOR AND TRANSFER AGENT
|
| Goldman Sachs, 85 Broad Street, New York, New York 10004, serves as the exclusive distributor (the “Distributor”) of
each Fund’s shares. Goldman Sachs, 4900 Sears Tower, Chicago, Illinois 60606-6372, also serves as the Funds’ transfer agent (the “Transfer Agent”) and, as such, performs various shareholder servicing functions.
|
| From time to time, Goldman Sachs or any of its affiliates may purchase and hold shares of the Funds. Goldman Sachs reserves the
right to redeem at any time some or all of the shares acquired for its own account.
|
| ACTIVITIES OF GOLDMAN SACHS AND ITS AFFILIATES AND OTHER ACCOUNTS MANAGED BY GOLDMAN SACHS
|
| The involvement of the Investment Adviser, Goldman Sachs and their affiliates in the management of, or their interest in, other
accounts and other activities of Goldman Sachs may present conflicts of interest with respect to a Fund or limit a Fund’s investment activities. Goldman Sachs and its affiliates engage in proprietary trading and advise accounts and funds which have
investment objectives similar to those of the Funds and/or which engage in and compete for transactions in the same types of securities, currencies and instruments as the Funds. Goldman Sachs and its affiliates will not have any obligation to make
available any information regarding their proprietary activities or strategies, or the activities or strategies used for other accounts managed by them, for the benefit of the management of the Funds. The results of a Fund’s investment activities,
therefore, may differ from those of Goldman Sachs and its affiliates, and it is possible that a Fund could sustain losses during periods in which Goldman Sachs and its affiliates and other accounts achieve significant profits on their trading for
proprietary or other accounts. In addition, the Funds may, from time to time, enter into transactions in which other clients of Goldman Sachs have an adverse interest. A Fund’s activities may be limited because of regulatory restrictions applicable
to Goldman Sachs and its affiliates, and/or their internal policies designed to comply with such restrictions.
|
| Each Fund pays dividends from its investment company taxable income and distributions from net realized capital gains. You may
choose to have dividends and distributions paid in:
|
n
|
Cash
|
n
|
Additional shares of the same class of the same Fund
|
n
|
Shares of the same or an equivalent class of another Goldman Sachs Fund. Special restrictions may apply for certain ILA
Portfolios. See the Additional Statement.
|
| You may indicate your election on your Account Application. Any changes may be submitted in writing to Goldman Sachs at any time
before the record date for a particular dividend or distribution. If you do not indicate any choice, dividends and distributions will be reinvested automatically in the applicable Fund.
|
| The election to reinvest dividends and distributions in additional shares will not affect the tax treatment of such dividends and
distributions, which will be treated as received by you and then used to purchase the shares.
|
| The Funds’ investments in foreign securities may be subject to foreign withholding taxes. Under certain circumstances, the
Funds may elect to pass-through these taxes to you. If this election is made, a proportionate amount of such taxes will constitute a distribution to you, which would allow you either (1) to credit such proportionate amount of foreign taxes against your
U.S. federal income tax liability or (2) to take such amount as an itemized deduction.
|
| Dividends from investment company taxable income and distributions from net capital gains are declared and paid annually.
|
| From time to time a portion of a Fund’s dividends may constitute a return of capital.
|
| At the time of an investor’s purchase of shares of a Fund, a portion of the NAV per share may be represented by undistributed
income or undistributed realized appreciation of the Fund’s portfolio securities. Therefore, subsequent distributions on such shares from such income or realized appreciation may be taxable to you even if the NAV of the shares is, as a result of the
distributions, reduced below the cost of such shares and the distributions (or portions thereof) represent a return of a portion of the purchase price.
|
| The following section will provide you with answers to some of the most often asked questions regarding buying and selling the
Funds’ Institutional Shares.
|
| How Can I Purchase Institutional Shares Of The Funds?
|
| You may purchase Institutional Shares on any business day at their NAV next determined after receipt of an order. No sales load is
charged. You should place an order with Goldman Sachs at 1-800-621-2550 and either:
|
n
|
Wire federal funds to The Northern Trust Company (“Northern”), as subcustodian for State Street Bank and Trust Company
(“State Street”) (each Fund’s custodian) on the next business day; or
|
n
|
Send a check or Federal Reserve draft payable to Goldman Sachs Funds—(Name of Fund and Class of Shares), 4900 Sears Tower,
Chicago, IL 60606-6372. The Fund will not accept a check drawn on a foreign bank or a third-party check.
|
| In order to make an initial investment in a Fund, you must furnish to the Fund or Goldman Sachs the Account Application attached
to this Prospectus. Purchases of Institutional Shares must be settled within three business days of receipt of a complete purchase order.
|
| In certain instances, the Trust may require a signature guarantee in order to effect purchase, redemption or exchange
transactions. Signature guarantees must be obtained from a bank, brokerage firm or other financial intermediary that is a member of an approved Medallion Guarantee Program or that is otherwise approved by Goldman Sachs. A notary public cannot provide a
signature guarantee.
|
| How Do I Purchase Shares Through A Financial Institution?
|
| Certain institutions (including banks, trust companies, brokers and investment advisers) that provide recordkeeping, reporting and
processing services to their customers may be authorized to accept, on behalf of Goldman Sachs Trust (the “Trust”), purchase, redemption and exchange orders placed by or on behalf of their customers, and may designate other intermediaries to
accept such orders, if approved by the Trust. In these cases:
|
n
|
A Fund will be deemed to have received an order in proper form when the order is accepted by the authorized institution or
intermediary on a business day, and the order will be priced at the Fund’s NAV next determined after such acceptance.
|
n
|
Authorized institutions and intermediaries will be responsible for transmitting accepted orders and payments to the Trust within
the time period agreed upon by them.
|
| You should contact your institution or intermediary to learn whether it is authorized to accept orders for the Trust.
|
| These institutions may receive payments from the Funds or Goldman Sachs for the services provided by them with respect to the
Funds’ Institutional Shares. These payments may be in addition to other payments borne by the Funds.
|
| The Investment Adviser, Distributor and/or their affiliates may pay additional compensation from time to time, out of their assets
and not as an additional charge to the Funds, to certain institutions and other persons in connection with the sale, distribution and/or servicing of shares of the Funds and other Goldman Sachs Funds. Additional compensation based on sales may, but is
currently not expected to, exceed 0.50% (annualized) of the amount invested.
|
| In addition to Institutional Shares, each Fund also offers other classes of shares to investors. These other share classes are
subject to different fees and expenses (which affect performance), have different minimum investment requirements and are entitled to different services than Institutional Shares. Information regarding these other share classes may be obtained from your
sales representative or from Goldman Sachs by calling the number on the back cover of this Prospectus.
|
| What Is My Minimum Investment In The Funds?
|
| Type of Investor | Minimum Investment | ||
|---|---|---|---|
| n
Banks, trust companies or other
depository institutions investing for their own account or on behalf of clients |
$1,000,000 in Institutional Shares of a Fund
alone or in combination with other assets under the management of GSAM and its affiliates |
||
| n
Section 401(k), profit sharing,
money purchase pension, tax- sheltered annuity, defined benefit pension, or other employee benefit plans that are sponsored by one or more employers (including governmental or church employers) or employee organizations |
|||
| n
State, county, city or any
instrumentality, department, authority or agency thereof |
|||
| n
Corporations with at least $100
million in assets or in outstanding publicly traded securities |
|||
| n
“Wrap” account sponsors (provided
they have an agreement covering the arrangement with GSAM) |
|||
| n
Registered investment advisers
investing for accounts for which they receive asset-based fees |
|||
| n Individual investors | $10,000,000 | ||
| n
Qualified non-profit organizations,
charitable trusts, foundations and endowments |
|||
| n
Accounts over which GSAM or its
advisory affiliates have investment discretion |
|||
| The minimum investment requirement may be waived for current and former officers, partners, directors or employees of Goldman
Sachs or any of its affiliates or for other investors at the discretion of the Trust’s officers. No minimum amount is required for subsequent investments.
|
| What Else Should I Know About Share Purchases?
|
| The Trust reserves the right to:
|
n
|
Modify or waive the minimum investment amounts.
|
n
|
Reject or restrict any purchase or exchange orders by a particular purchaser (or group of related purchasers). This may occur, for
example, when a pattern of frequent purchases, sales or exchanges of Institutional Shares of a Fund is evident, or if purchases, sales or exchanges are, or a subsequent abrupt redemption might be, of a size that would disrupt the management of a Fund.
|
| n
|
Close a Fund to new investors from time to time and reopen a Fund whenever it is deemed appropriate by a Fund’s Investment
Adviser.
|
| The Funds may allow you to purchase shares with securities instead of cash if consistent with a Fund’s investment policies
and operations and if approved by the Fund’s Investment Adviser.
|
| How Are Shares Priced?
|
| The price you pay or receive when you buy, sell or exchange Institutional Shares is determined by a Fund’s NAV. The Funds
calculate NAV as follows:
|
| (Value of Assets of the Class) | ||
| – (Liabilities of the Class) | ||
| NAV = | ||
| Number of Outstanding Shares of the Class |
| The Funds’ investments are valued based on market quotations or, if accurate quotations are not readily available, the fair
value of the Fund’s investments may be determined in good faith under procedures established by the Trustees.
|
n
|
NAV per share of each class is calculated by State Street on each business day as of the close of regular trading on the New York
Stock Exchange (normally 4:00 p.m. New York time). Fund shares will not be priced on any day the New York Stock Exchange is closed.
|
n
|
When you buy shares, you pay the NAV next calculated after the Funds receive your order in proper form.
|
n
|
When you sell shares, you receive the NAV next calculated after the Funds receive your order in proper form.
|
| Note: The time at which transactions and shares are priced and the time by which orders must be received may be changed in
case of an emergency or if regular trading on the New York Stock Exchange is stopped at a time other than 4:00 p.m. New York time.
|
| Foreign securities may trade in their local markets on days a Fund is closed. As a result, the NAV of a Fund that holds foreign
securities may be impacted on days when investors may not purchase or redeem Fund shares.
|
| In addition, the impact of events that occur after the publication of market quotations used by a Fund to price its securities but
before the close of regular trading on the New York Stock Exchange will normally not be reflected in a Fund’s next determined NAV unless the Trust, in its discretion, makes an adjustment in light of the nature and materiality of the event, its effect
on Fund operations and other relevant factors.
|
| How Can I Sell Institutional Shares Of The Funds?
|
| You may arrange to take money out of your account by selling (redeeming) some or all of your shares. Generally, each Fund will
redeem its Institutional Shares upon request on any business day at their NAV next determined after receipt of such request in proper form. You may request that redemption proceeds be sent to you by check or by wire (if the wire instructions are on record). Redemptions may be requested in writing or by telephone.
|
| Instructions For Redemptions: | |||||
|---|---|---|---|---|---|
| By Writing: | n Write a letter of instruction that includes: | ||||
| n Your name(s) and signature(s) | |||||
| n Your account number | |||||
| n The Fund name and Class of Shares | |||||
| n The dollar amount you want to sell | |||||
| n How and where to send the proceeds | |||||
| n Mail your request to: | |||||
| Goldman Sachs Funds | |||||
| 4900 Sears Tower | |||||
| Chicago, IL 60606-6372 | |||||
| By Telephone: | If you have elected the telephone | ||||
| redemption privilege on your Account Application: | |||||
| n 1-800-621-2550 | |||||
| (8:00 a.m. to 4:00 p.m. New York time) | |||||
| Certain institutions and intermediaries are authorized to accept redemption requests on behalf of the Funds as described under
“How Do I Purchase Shares Through A Financial Institution?”
|
| What Do I Need To Know About Telephone Redemption Requests?
|
| The Trust, the Distributor and the Transfer Agent will not be liable for any loss you may incur in the event that the Trust
accepts unauthorized telephone redemption requests that the Trust reasonably believes to be genuine. In an effort to prevent unauthorized or fraudulent redemption and exchange requests by telephone, Goldman Sachs employs reasonable procedures specified by
the Trust to confirm that such instructions are genuine. If reasonable procedures are not employed, the Trust may be liable for any loss due to unauthorized or fraudulent transactions. The following general policies are currently in effect:
|
n
|
All telephone requests are recorded.
|
n
|
Any redemption request that requires money to go to an account or address other than that designated on the Account Application
must be in writing and signed by an authorized person designated on the Account Application. The
|
| written request may be confirmed by telephone with both the requesting party and the designated bank account to verify instructions
.
|
n
|
The telephone redemption option may be modified or terminated at any time.
|
| Note: It may be difficult to make telephone redemptions in times of drastic economic or market conditions.
|
| How Are Redemption Proceeds Paid?
|
| By Wire: You may arrange for your redemption proceeds to be wired as federal funds to the bank account designated in
your Account Application. The following general policies govern wiring redemption proceeds:
|
n
|
Redemption proceeds will normally be wired on the next business day in federal funds (for a total of one business day delay), but
may be paid up to three business days following receipt of a properly executed wire transfer redemption request. If you are selling shares you recently paid for by check, the Fund will pay you when your check has cleared, which may take up to 15 days. If
the Federal Reserve Bank is closed on the day that the redemption proceeds would ordinarily be wired, wiring the redemption proceeds may be delayed one additional business day.
|
n
|
To change the bank designated on your Account Application, you must send written instructions signed by an authorized person
designated on the account application to the Transfer Agent.
|
n
|
Neither the Trust, Goldman Sachs nor any other institution assumes any responsibility for the performance of your bank or any
intermediaries in the transfer process. If a problem with such performance arises, you should deal directly with your bank or any such intermediaries.
|
| By Check: You may elect in writing to receive your redemption proceeds by check. Redemption proceeds paid by check
will normally be mailed to the address of record within three business days of a properly executed redemption request. If you are selling shares you recently paid for by check, the Fund will pay you when your check has cleared, which may take up to 15 days.
|
| What Else Do I Need To Know About Redemptions?
|
| The following generally applies to redemption requests:
|
n
|
Additional documentation may be required when deemed appropriate by the Transfer Agent. A redemption request will not be in proper
form until such additional documentation has been received.
|
n
|
Institutions (including banks, trust companies, brokers and investment advisers) are responsible for the timely transmittal of
redemption requests by their customers to the Transfer Agent. In order to facilitate the timely transmittal of redemption requests, these institutions may set times by which they must receive
|
|
| redemption requests. These institutions may also require additional documentation from you. |
| The Trust reserves the right to:
|
n
|
Redeem your shares if your account balance falls below $50 as a result of earlier redemptions. The Funds will not redeem your
shares on this basis if the value of your account falls below the minimum account balance solely as a result of market conditions. The Fund will give you 60 days’ prior written notice to allow you to purchase sufficient additional shares of the Fund
in order to avoid such redemption.
|
n
|
Redeem your shares in other circumstances determined by the Board of Trustees to be in the best interest of the Trust.
|
n
|
Pay redemptions by a distribution in-kind of securities (instead of cash). If you receive redemption proceeds in-kind, you should
expect to incur transaction costs upon the disposition of those securities.
|
n
|
Reinvest any dividends or other distributions which you have elected to receive in cash should your check for such dividends or
other distributions be returned to the Fund as undeliverable or remain uncashed for six months. In addition, that distribution and all future distributions payable to you will be reinvested at NAV in additional Institutional Shares of the Fund that pays
the distributions. No interest will accrue on amounts represented by uncashed distribution or redemption checks.
|
| Can I Exchange My Investment From One Fund To Another?
|
| You may exchange Institutional Shares of a Fund at NAV for Institutional Shares of any other Goldman Sachs Fund. The exchange
privilege may be materially modified or withdrawn at any time upon 60 days’ written notice to you.
|
| Instructions For Exchanging Shares: | |||||
|---|---|---|---|---|---|
| By Writing: | n Write a letter of instruction that includes: | ||||
| n Your name(s) and signature(s) | |||||
| n Your account number | |||||
| n The Fund names and Class of Shares | |||||
| n The dollar amount to be exchanged | |||||
| n
Mail the request to:
Goldman Sachs Funds 4900 Sears Tower Chicago, IL 60606-6372 |
|||||
| By Telephone: | If you have elected the telephone exchange
privilege on your Account Application: |
||||
| n
1-800-621-2550
(8:00 a.m. to 4:00 p.m. New York time) |
|||||
| You should keep in mind the following factors when making or considering an exchange:
|
n
|
You should obtain and carefully read the prospectus of the Fund you are acquiring before making an exchange.
|
n
|
All exchanges which represent an initial investment in a Fund must satisfy the minimum initial investment requirements of that
Fund, except that this requirement may be waived at the discretion of the Trust.
|
n
|
Telephone exchanges normally will be made only to an identically registered account.
|
n
|
Shares may be exchanged among accounts with different names, addresses and social security or other taxpayer identification
numbers only if the exchange instructions are in writing and are signed by an authorized person designated on the Account Application.
|
n
|
Exchanges are available only in states where exchanges may be legally made.
|
n
|
It may be difficult to make telephone exchanges in times of drastic economic or market conditions.
|
n
|
Goldman Sachs may use reasonable procedures described under “What Do I Need To Know About Telephone Redemption Requests?”
in an effort to prevent unauthorized or fraudulent telephone exchange requests.
|
n
|
Exchanges into Funds that are closed to new investors may be restricted.
|
| For federal income tax purposes, an exchange from one Fund to another is treated as a redemption of the shares surrendered in the
exchange, on which you may be subject to tax, followed by a purchase of shares received in the exchange. You should consult your tax adviser concerning the tax consequences of an exchange.
|
| Restrictions on Excessive Trading Practices. The Trust does not permit market-timing or other excessive trading
practices. Purchases and exchanges should be made for long-term investment purposes only. The Trust and Goldman Sachs reserve the right to reject or restrict purchase or exchange requests for any investor. Excessive, short-term (market-timing) trading
practices may disrupt portfolio management strategies, harm Fund performance and negatively impact long-term shareholders. The Trust and Goldman Sachs will not be held liable for any loss resulting from rejected purchase or exchange orders. To minimize
harm to the Trust (or Goldman Sachs) and its shareholders, the Trust (or Goldman Sachs) will exercise these rights if, in the Trust’s (or Goldman Sachs’) judgment, an investor has a history of excessive trading or if an investor’s trading,
in the judgment of the Trust (or Goldman Sachs) has been or may be disruptive to a Fund. In making this judgment, trades executed in multiple accounts under common ownership or control may be considered together.
|
| What Types of Reports Will I Be Sent Regarding Investments In Institutional Shares?
|
| You will receive an annual report containing audited financial statements and a semi-annual report. To eliminate unnecessary
duplication, only one copy of such reports will be sent to shareholders with the same mailing address. If you would like a duplicate copy to be mailed to you, please contact Goldman Sachs Funds at 1-800-621-2550. You will also be provided with a printed
confirmation for each transaction in your account and a monthly account statement. The Funds do not generally provide sub-accounting services.
|
| As with any investment, you should consider how your investment in the Funds will be taxed. The tax information below is provided
as general information. More tax information is available in the Additional Statement. You should consult your tax adviser about the federal, state, local or foreign tax consequences of your investment in the Funds.
|
| Unless your investment is an IRA or other tax-advantaged account, you should consider the possible tax consequences of Fund
distributions and the sale of your Fund shares.
|
| DISTRIBUTIONS
|
| Distributions you receive from the Funds are generally subject to federal income tax, and may also be subject to state or local
taxes. This is true whether you reinvest your distributions in additional Fund shares or receive them in cash. For federal tax purposes, the Funds’ income dividend distributions and short-term capital gain distributions are taxable to you as ordinary
income. Any long-term capital gain distributions are taxable as long-term capital gains, no matter how long you have owned your Fund shares.
|
| Although distributions are generally treated as taxable to you in the year they are paid, distributions declared in October,
November or December but paid in January are taxable as if they were paid in December. A percentage of the Funds’ dividends paid to corporate shareholders may be eligible for the corporate dividends-received deduction. The Funds will inform
shareholders of the source and tax status of all distributions promptly after the close of each calendar year.
|
| Each Fund may be subject to foreign withholding or other foreign taxes on income or gain from certain foreign securities. In
general, the Funds may deduct these taxes in computing their taxable income.
|
| If you buy shares of a Fund before it makes a distribution, the distribution will be taxable to you even though it may actually be
a return of a portion of your investment. This is known as “buying a dividend.”
|
| SALES AND EXCHANGES
|
| Your sale of Fund shares is a taxable transaction for federal income tax purposes, and may also be subject to state and local
taxes. For tax purposes, the exchange of your Fund shares for shares of a different Goldman Sachs Fund is the same as a sale. When you sell your shares, you will generally recognize a capital gain or loss in an amount equal to the difference between your
adjusted tax basis in the shares and the amount received. Generally, this gain or loss is long-term or short-term depending on whether your holding period exceeds twelve months, except that any loss realized on shares held for six months or less will be
treated as a long-term capital loss to the extent of any capital gain dividends that were received on the shares.
|
| OTHER INFORMATION
|
| When you open your account, you should provide your social security or tax identification number on your Account Application. By
law, each Fund must withhold 31% of your taxable distributions and any redemption proceeds if you do not provide your correct taxpayer identification number, or certify that it is correct, or if the IRS instructs the Fund to do so. Non-U.S. investors may
be subject to U.S. withholding and estate tax.
|
| A. General Portfolio Risks
|
| The Funds will be subject to the risks associated with equity securities. “Equity securities” include common stocks,
preferred stocks, interests in real estate investment trusts, convertible debt obligations, convertible preferred stocks, equity interests in trusts, partnerships, joint ventures, limited liability companies and similar enterprises, warrants and stock
purchase rights. In general, stock values fluctuate in response to the activities of individual companies and in response to general market and economic conditions. Accordingly, the value of the stocks that a Fund holds may decline over short or extended
periods. The stock markets tend to be cyclical, with periods when stock prices generally rise and periods when prices generally decline. The volatility of equity securities means that the value of your investment in the Funds may increase or decrease.
Recently, certain stock markets have experienced substantial price volatility and, at times, have traded at or close to record high levels. There can be no guarantee that such levels will be reached or maintained in the future.
|
| To the extent that a Fund invests in fixed-income securities, that Fund will also be subject to the risks associated with its
fixed-income securities. These risks include interest rate risk, credit risk and call/extension risk. In general, interest rate risk involves the risk that when interest rates decline, the market value of fixed-income securities tends to increase
(although many mortgage related securities will have less potential than other debt securities for capital appreciation during periods of declining rates). Conversely, when interest rates increase, the market value of fixed-income securities tends to
decline. Credit risk involves the risk that an issuer or guarantor could default on its obligations, and a Fund will not recover its investment. Call risk and extension risk are normally present in mortgage-backed securities and asset-backed securities.
For example, homeowners have the option to prepay their mortgages. Therefore, the duration of a security backed by home mortgages can either shorten (call risk) or lengthen (extension risk). In general, if interest rates on new mortgage loans fall
sufficiently below the interest rates on existing outstanding mortgage loans, the rate of prepayment would be expected to increase. Conversely, if mortgage loan interest rates rise above the interest rates on existing outstanding mortgage loans, the rate
of prepayment would be expected to decrease. In either case, a change in the prepayment rate can result in losses to investors.
|
| The Investment Adviser will not consider the portfolio turnover rate a limiting factor in making investment decisions for a Fund.
A high rate of portfolio turnover (100% or more) involves correspondingly greater expenses which must be borne by a Fund and its shareholders, and is also likely to result in higher short-term capital gains taxable to shareholders. The portfolio turnover
rate is calculated by dividing the lesser of the dollar amount of sales or purchases of portfolio securities by the average monthly value of a Fund’s portfolio securities, excluding securities having a maturity at the date of purchase of one year or
less. See “Financial Highlights” in Appendix B for a statement of the Funds’ historical portfolio turnover rates.
|
| The following sections provide further information on certain types of securities and investment techniques that may be used by
the Funds, including their associated risks. Additional information is provided in the Additional Statement, which is available upon request. Among other things, the Additional Statement describes certain fundamental investment restrictions that cannot be
changed without shareholder approval. You should note, however, that all investment objectives, and all investment policies not specifically designated as fundamental are non-fundamental and may be changed without shareholder approval. If there is a
change in a Fund’s investment objective, you should consider whether that Fund remains an appropriate investment in light of your then current financial position and needs.
|
| B. Other Portfolio Risks
|
| Risks of Investing in Small Capitalization Companies. Each Fund may invest in small capitalization companies.
Investments in small capitalization companies involve greater risk and portfolio price volatility than investments in larger capitalization stocks. Among the reasons for the greater price volatility of these investments are the less certain growth
prospects of smaller firms and the lower degree of liquidity in the markets for such securities. Small capitalization companies may be thinly traded and may have to be sold at a discount from current market prices or in small lots over an extended period
of time. In addition, these securities are subject to the risk that during certain periods the liquidity of particular issuers or industries, or all securities in these investment categories, will shrink or disappear suddenly and without warning as a
result of adverse economic or market conditions, or adverse investor perceptions whether or not accurate. Because of the lack of sufficient market liquidity, a Fund may incur losses because it will be required to effect sales at a disadvantageous time and
only then at a substantial drop in price. Small capitalization companies include “unseasoned” issuers that do not have an established financial history; often have limited product lines, markets or financial
|
| resources; may depend on or use a few key personnel for management; and may be susceptible to losses and risks of bankruptcy.
Transaction costs for these investments are often higher than those of larger capitalization companies. Investments in small capitalization companies may be more difficult to price precisely than other types of securities because of their characteristics
and lower trading volumes.
|
| Risks of Foreign Investments. The Funds may make foreign investments. Foreign investments involve special risks that
are not typically associated with U.S. dollar denominated or quoted securities of U.S. issuers. Foreign investments may be affected by changes in currency rates, changes in foreign or U.S. laws or restrictions applicable to such investments and changes in
exchange control regulations (e.g., currency blockage). A decline in the exchange rate of the currency (i.e., weakening of the currency against the U.S. dollar) in which a portfolio security is quoted or denominated relative to the U.S. dollar would reduce the value of
the portfolio security. In addition, if the currency in which a Fund receives dividends, interest or other payments declines in value against the U.S. dollar before such income is distributed as dividends to shareholders or converted to U.S. dollars, the
Fund may have to sell portfolio securities to obtain sufficient cash to pay such dividends.
|
| The introduction of a single currency, the euro, on January 1, 1999 for participating nations in the European Economic and
Monetary Union has presented unique uncertainties, including the fluctuation of the euro relative to non-euro currencies during the transition period from January 1, 1999 to December 31, 2001 and beyond; whether the interest rate, tax and labor regimes of
European countries participating in the euro will converge over time; and whether the conversion of the currencies of other countries that now are or may in the future become members of the European Union (“EU”), may have an impact on the euro.
Also, it is possible that the euro could be abandoned in the future by countries that have already adopted its use. These or other events, including political and economic developments, could cause market disruptions, and could adversely affect the value
of securities held by the Funds. Because of the number of countries using this single currency, a significant portion of the assets held by the Funds may be denominated in the euro.
|
| Brokerage commissions, custodial services and other costs relating to investment in international securities markets generally are
more expensive than in the United States. In addition, clearance and settlement procedures may be different in foreign countries and, in certain markets, such procedures have been unable to keep pace with the volume of securities transactions, thus making
it difficult to conduct such transactions.
|
| Foreign issuers are not generally subject to uniform accounting, auditing and financial reporting standards comparable to those
applicable to U.S. issuers. There may be less publicly available information about a foreign issuer than about a U.S. issuer. In addition, there is generally less government regulation of foreign markets, companies and securities dealers than in the
United States. Foreign securities markets may have substantially less volume than U.S. securities markets and secu-
|
| rities of many foreign issuers are less liquid and more volatile than securities of comparable domestic issuers. Furthermore, with
respect to certain foreign countries, there is a possibility of nationalization, expropriation or confiscatory taxation, imposition of withholding or other taxes on dividend or interest payments (or, in some cases, capital gains distributions),
limitations on the removal of funds or other assets from such countries, and risks of political or social instability or diplomatic developments which could adversely affect investments in those countries.
|
| Concentration of a Fund’s assets in one or a few countries and currencies will subject a Fund to greater risks than if a
Fund’s assets were not geographically concentrated.
|
| Investment in sovereign debt obligations by certain Funds involves risks not present in debt obligations of corporate issuers. The
issuer of the debt or the governmental authorities that control the repayment of the debt may be unable or unwilling to repay principal or interest when due in accordance with the terms of such debt, and a Fund may have limited recourse to compel payment
in the event of a default. Periods of economic uncertainty may result in the volatility of market prices of sovereign debt, and in turn a Fund’s NAV, to a greater extent than the volatility inherent in debt obligations of U.S. issuers.
|
| A sovereign debtor’s willingness or ability to repay principal and pay interest in a timely manner may be affected by, among
other factors, its cash flow situation, the extent of its foreign currency reserves, the availability of sufficient foreign exchange on the date a payment
is due, the relative size of the debt service burden to the economy as a whole, the sovereign debtor’s policy toward international lenders, and the political constraints to which a sovereign debtor may be subject.
|
| Investments in foreign securities may take the form of sponsored and unsponsored American Depositary Receipts (“ADRs”)
and Global Depositary Receipts (“GDRs”). Certain Funds may also invest in European Depositary Receipts (“EDRs”) or other similar instruments representing securities of foreign issuers. ADRs represent the right to receive securities of
foreign issuers deposited in a domestic bank or a correspondent bank. Prices of ADRs are quoted in U.S. dollars, and ADRs are traded in the United States. EDRs and GDRs are receipts evidencing an arrangement with a non-U.S. bank. EDRs and GDRs are not
necessarily quoted in the same currency as the underlying security.
|
| Risks of Emerging Countries. Certain Funds may invest in securities of issuers located in emerging countries. The
risks of foreign investment are heightened when the issuer is located in an emerging country. Emerging countries are generally located in the Asia-Pacific region, Eastern Europe, Latin and South America and Africa. A Fund’s purchase and sale of
portfolio securities in certain emerging countries may be constrained by limitations relating to daily changes in the prices of listed securities, periodic trading or settlement volume and/or limitations on aggregate holdings of foreign investors. Such
limitations may be computed based on the aggregate trading volume by or holdings of a Fund, the Investment Adviser, its affiliates and their respective clients and other service providers. A Fund may not be able to sell securities in circumstances where
price, trading or settlement volume limitations have been reached.
|
| Foreign investment in the securities markets of certain emerging countries is restricted or controlled to varying degrees which
may limit investment in such countries or increase the administrative costs of such investments. For example, certain Asian countries require governmental approval prior to investments by foreign persons or limit investment by foreign persons to only a
specified percentage of an issuer’s outstanding securities or a specific class of securities which may have less advantageous terms (including price) than securities of the issuer available for purchase by nationals. In addition, certain countries
may restrict or prohibit investment opportunities in issuers or industries deemed important to national interests. Such restrictions may affect the market price, liquidity and rights of securities that may be purchased by a Fund. The repatriation of both
investment income and capital from certain emerging countries is subject to restrictions such as the need for governmental consents. Due to restrictions on direct investment in equity securities in certain Asian and other countries, it is anticipated that
a Fund may invest in such countries through other investment funds in such countries.
|
| Many emerging countries have recently experienced currency devaluations and substantial (and, in some cases, extremely high) rates
of inflation. Other emerging countries have experienced economic recessions. These circumstances have had a negative effect on the economies and securities markets of such emerging countries. Economies in emerging countries generally are dependent heavily
upon commodity prices and international trade and, accordingly, have been and may continue to be affected adversely by the economies of their trading partners, trade barriers, exchange controls, managed adjustments in relative currency values and other
protectionist measures imposed or negotiated by the countries with which they trade.
|
| Many emerging countries are subject to a substantial degree of economic, political and social instability. Governments of some
emerging countries are authoritarian in nature or have been installed or removed as a result of military coups, while governments in other emerging countries have periodically used force to suppress
|
| civil dissent. Disparities of wealth, the pace and success of democratization, and ethnic, religious and racial disaffection,
among other factors, have also led to social unrest, violence and/or labor unrest in some emerging countries. Unanticipated political or social developments may result in sudden and significant investment losses. Investing in emerging countries involves
greater risk of loss due to expropriation, nationalization, confiscation of assets and property or the imposition of restrictions on foreign investments and on repatriation of capital invested. As an example, in the past some Eastern European governments
have expropriated substantial amounts of private property, and many claims of the property owners have never been fully settled. There is no assurance that similar expropriations will not recur in Eastern Europe or other countries.
|
| A Fund’s investment in emerging countries may also be subject to withholding or other taxes, which may be significant and may
reduce the return from an investment in such countries to the Fund.
|
| Settlement procedures in emerging countries are frequently less developed and reliable than those in the United States and often
may involve a Fund’s delivery of securities before receipt of payment for their sale. In addition, significant delays are common in certain markets in registering the transfer of securities. Settlement or registration problems may make it more
difficult for a Fund to value its portfolio securities and could cause the Fund to miss attractive investment opportunities, to have a portion of its assets uninvested or to incur losses due to the failure of a counterparty to pay for securities the Fund
has delivered or the Fund’s inability to complete its contractual obligations because of theft or other reasons. The creditworthiness of the local securities firms used by the Fund in emerging countries may not be as sound as the creditworthiness of
firms used in more developed countries. As a result, the Fund may be subject to a greater risk of loss if a securities firm defaults in the performance of its responsibilities.
|
| The small size and inexperience of the securities markets in certain emerging countries and the limited volume of trading in
securities in those countries may make a Fund’s investments in such countries less liquid and more volatile than investments in countries with more developed securities markets (such as the United States, Japan and most Western European countries). A
Fund’s investments in emerging countries are subject to the risk that the liquidity of a particular investment, or investments generally, in such countries will shrink or disappear suddenly and without warning as a result of adverse economic, market
or political conditions or adverse investor perceptions, whether or not accurate. Because of the lack of sufficient market liquidity, a Fund may incur losses because it will be required to effect sales at a disadvantageous time and only then at a
substantial drop in price. Investments in emerging countries may be more difficult to price precisely because of the characteristics discussed above and lower trading volumes.
|
| A Fund’s use of foreign currency management techniques in emerging countries may be limited. Due to the limited market for
these instruments in emerging countries, the Investment Adviser does not currently anticipate that a significant portion of the Funds’ currency exposure in emerging countries, if any, will be covered by such instruments.
|
| Risks of Derivative Investments. A Fund’s transactions, if any, in options, futures, options on futures, swaps,
interest rate caps, floors and collars, structured securities and currency transactions involve additional risk of loss. Loss can result from a lack of correlation between changes in the value of derivative instruments and the portfolio assets (if any)
being hedged, the potential illiquidity of the markets for derivative instruments, or the risks arising from margin requirements and related leverage factors associated with such transactions. The use of these management techniques also involves the risk
of loss if the Investment Adviser is incorrect in its expectation of fluctuations in securities prices, interest rates or currency prices. Each Fund may also invest in derivative investments for non-hedging purposes (that is, to seek to increase total
return). Investing for non-hedging purposes is considered a speculative practice and presents even greater risk of loss.
|
| Risks of Illiquid Securities. Each Fund may invest up to 15% of its net assets in illiquid securities which cannot
be disposed of in seven days in the ordinary course of business at fair value. Illiquid securities include:
|
n
|
Both domestic and foreign securities that are not readily marketable
|
n
|
Certain stripped mortgage-backed securities
|
n
|
Repurchase agreements and time deposits with a notice or demand period of more than seven days
|
n
|
Certain over-the-counter options
|
n
|
Certain structured securities and all swap transactions
|
n
|
Certain restricted securities, unless it is determined, based upon a review of the trading markets for a specific restricted
security, that such restricted security is eligible for resale pursuant to Rule 144A under the Securities Act of 1933 (“144A Securities”) and, therefore, is liquid.
|
| Investing in 144A Securities may decrease the liquidity of a Fund’s portfolio to the extent that qualified institutional
buyers become for a time uninterested in purchasing these restricted securities. The purchase price and subsequent valuation of restricted and illiquid securities normally reflect a discount, which may be significant, from the market price of comparable
securities for which a liquid market exists.
|
| Credit Risks. Debt securities purchased by the Funds may include securities (including zero coupon bonds) issued by
the U.S. government (and its agencies, instrumentalities and sponsored enterprises), foreign governments, domestic and foreign corporations, banks and other issuers. Further information is provided in the Additional Statement.
|
| Debt securities rated BBB or higher by Standard & Poor’s or Baa or higher by Moody’s are considered “investment
grade.” Securities rated BBB or Baa are considered medium-grade obligations with speculative characteristics, and adverse economic conditions or changing circumstances may weaken their issuers’ capacity to pay interest and repay principal. A
security will be deemed to have met a rating requirement if it receives the minimum required rating from at least one such rating organization even though it has been rated below the minimum rating by one or more other rating organizations, or if unrated
by such rating organizations, determined by the Investment Adviser to be of comparable credit quality.
|
| Certain Funds may invest in fixed-income securities rated BB or Ba or below (or comparable unrated securities) which are commonly
referred to as “junk bonds.” Junk bonds are considered predominantly speculative and may be questionable as to principal and interest payments.
|
| In some cases, junk bonds may be highly speculative, have poor prospects for reaching investment grade standing and be in default.
As a result, investment in such bonds will present greater speculative risks than those associated with investment in investment grade bonds. Also, to the extent that the rating assigned to a security in a Fund’s portfolio is downgraded by a rating
organization, the market price and liquidity of such security may be adversely affected.
|
| Risks of Initial Public Offerings. The Funds may invest in IPOs. An IPO is a company’s first offering of stock
to the public. IPO risk is the risk that the market value of IPO shares will fluctuate considerably due to factors such as the absence of a prior public market, unseasoned trading, the small number of shares available for trading and limited information
about the issuer. The purchase of IPO shares may involve high transaction costs. IPO shares are subject to market risk and liquidity risk. When a Fund’s asset base is small, a significant portion of the Fund’s performance could be attributable
to investments in IPOs, because such investments would have a magnified impact on the Fund. As the Fund’s assets grow, the effect of the Fund’s investments in IPOs on the Fund’s performance probably will decline, which could reduce the
Fund’s performance. Because of the price volatility of IPO shares, a Fund may choose to hold IPO shares for a very short period of time. This may increase the turnover of the Fund’s portfolio and may lead to increased expenses to the Fund, such
as commissions and transaction costs. By selling IPO shares, the Fund may realize taxable gains it will subse
-
|
| quently distribute to shareholders. In addition, the market for IPO shares can be speculative and/or inactive for extended
periods of time. There is no assurance that a Fund will be able to obtain allocable portions of IPO shares. The limited number of shares available for trading in some IPOs may make it more difficult for a Fund to buy or sell significant amounts of shares
without an unfavorable impact on prevailing prices. Investors in IPO shares can be affected by substantial dilution in the value of their shares, by sales of additional shares and by concentration of control in existing management and principal shareholders
.
|
| Temporary Investment Risks. Each Fund may, for temporary defensive purposes, invest a certain percentage of its
total assets in:
|
n
|
U.S. government securities
|
n
|
Commercial paper rated at least A-2 by Standard & Poor’s or P-2 by Moody’s
|
n
|
Certificates of deposit
|
n
|
Bankers’ acceptances
|
n
|
Repurchase agreements
|
n
|
Non-convertible preferred stocks and non-convertible corporate bonds with a remaining maturity of less than one year
|
| When a Fund’s assets are invested in such instruments, the Fund may not be achieving its investment objective.
|
| C. Portfolio Securities and Techniques
|
| This section provides further information on certain types of securities and investment techniques that may be used by the Funds,
including their associated risks. Further information is provided in the Additional Statement, which is available upon request.
|
| Convertible Securities. Each Fund may invest in convertible securities. Convertible securities are preferred stock
or debt obligations that are convertible into common stock. Convertible securities generally offer lower interest or dividend yields than non-convertible securities of similar quality. Convertible securities in which a Fund invests are subject to the same
rating criteria as its other investments in fixed-income securities. Convertible securities have both equity and fixed-income risk characteristics. Like all fixed-income securities, the value of convertible securities is susceptible to the risk of market
losses attributable to changes in interest rates. Generally, the market value of convertible securities tends to decline as interest rates increase and, conversely, to increase as interest rates decline. However, when the market price of the common stock
underlying a convertible security exceeds the conversion price of the convertible security, the convertible security tends to reflect the market price of the underlying common stock. As the market
|
| price of the underlying common stock declines, the convertible security, like a fixed-income security, tends to trade
increasingly on a yield basis, and thus may not decline in price to the same extent as the underlying common stock.
|
| Foreign Currency Transactions. A Fund may, to the extent consistent with its investment policies, purchase or sell
foreign currencies on a cash basis or through forward contracts. A forward contract involves an obligation to purchase or sell a specific currency at a future date at a price set at the time of the contract. A Fund may engage in foreign currency
transactions for hedging purposes and to seek to protect against anticipated changes in future foreign currency exchange rates. In addition, certain Funds may also enter into such transactions to seek to increase total return, which is considered a
speculative practice.
|
| Some Funds may also engage in cross-hedging by using forward contracts in a currency different from that in which the hedged
security is denominated or quoted. A Fund may hold foreign currency received in connection with investments in foreign securities when, in the judgment of the Investment Adviser, it would be beneficial to convert such currency into U.S. dollars at a later
date (e.g., the Investment Adviser may anticipate the foreign currency to appreciate against the U.S. dollar).
|
| Currency exchange rates may fluctuate significantly over short periods of time, causing, along with other factors, a Fund’s
NAV to fluctuate (when the Fund’s NAV fluctuates, the value of your shares may go up or down). Currency exchange rates also can be affected unpredictably by the intervention of U.S. or foreign governments or central banks, or the failure to
intervene, or by currency controls or political developments in the United States or abroad.
|
| The market in forward foreign currency exchange contracts, currency swaps and other privately negotiated currency instruments
offers less protection against defaults by the other party to such instruments than is available for currency instruments traded on an exchange. Such contracts are subject to the risk that the counterparty to the contract will default on its obligations.
Since these contracts are not guaranteed by an exchange or clearinghouse, a default on a contract would deprive a Fund of unrealized profits, transaction costs or the benefits of a currency hedge or could force the Fund to cover its purchase or sale
commitments, if any, at the current market price.
|
| Structured Securities. Each Fund may invest in structured securities. Structured securities are securities whose
value is determined by reference to changes in the value of specific currencies, interest rates, commodities, indices or other financial indicators (the “Reference”) or the relative change in two or more References.
|
| The interest rate or the principal amount payable upon maturity or redemption may be increased or decreased depending upon
changes in the applicable Reference. Structured securities may be positively or negatively indexed, so that appreciation of the Reference may produce an increase or decrease in the interest rate or value of the security at maturity. In addition, changes
in the interest rates or the value of the security at maturity may be a multiple of changes in the value of the Reference. Consequently, structured securities may present a greater degree of market risk than other types of fixed-income securities and may
be more volatile, less liquid and more difficult to price accurately than less complex securities.
|
| REITs. Each Fund may invest in REITs. REITs are pooled investment vehicles that invest primarily in either real
estate or real estate related loans. The value of a REIT is affected by changes in the value of the properties owned by the REIT or securing mortgage loans held by the REIT. REITs are dependent upon the ability of the REITs’ managers, and are subject
to heavy cash flow dependency, default by borrowers and the qualification of the REITs under applicable regulatory requirements for favorable income tax treatment. REITs are also subject to risks generally associated with investments in real estate
including possible declines in the value of real estate, general and local economic conditions, environmental problems and changes in interest rates. To the extent that assets underlying a REIT are concentrated geographically, by property type or in
certain other respects, these risks may be heightened. A Fund will indirectly bear its proportionate share of any expenses, including management fees, paid by a REIT in which it invests.
|
| Options on Securities, Securities Indices and Foreign Currencies. A put option gives the purchaser of the option the
right to sell, and the writer (seller) of the option the obligation to buy, the underlying instrument during the option period. A call option gives the purchaser of the option the right to buy, and the writer (seller) of the option the obligation to sell,
the underlying instrument during the option period. Each Fund may write (sell) covered call and put options and purchase put and call options on any securities in which they may invest or on any securities index consisting of securities in which they may
invest. A Fund may also, to the extent that it invests in foreign securities, purchase and sell (write) put and call options on foreign currencies.
|
| The writing and purchase of options is a highly specialized activity which involves special investment risks. Options may be used
for either hedging or cross-hedging purposes, or to seek to increase total return (which is considered a speculative activity). The successful use of options depends in part on the ability of the Investment Adviser to manage future price fluctuations and
the degree of correlation between the options and securities (or currency) markets. If the Invest-
|
| ment Adviser is incorrect in its expectation of changes in market prices or determination of the correlation between the
instruments or indices on which options are written and purchased and the instruments in a Fund’s investment portfolio, the Fund may incur losses that it would not otherwise incur. The use of options can also increase a Fund’s transaction costs.
Options written or purchased by the Funds may be traded on either U.S. or foreign exchanges or over-the-counter. Foreign and over-the-counter options will present greater possibility of loss because of their greater illiquidity and credit risks.
|
| Futures Contracts and Options on Futures Contracts. Futures contracts are standardized, exchange-traded contracts
that provide for the sale or purchase of a specified financial instrument or currency at a future time at a specified price. An option on a futures contract gives the purchaser the right (and the writer of the option the obligation) to assume a position
in a futures contract at a specified exercise price within a specified period of time. A futures contract may be based on various securities (such as U.S. government securities), foreign currencies, securities indices and other financial instruments and
indices. The Funds may engage in futures transactions on both U.S. and foreign exchanges.
|
| Each Fund may purchase and sell futures contracts, and purchase and write call and put options on futures contracts, in order to
seek to increase total return or to hedge against changes in interest rates, securities prices or, to the extent a Fund invests in foreign securities, currency exchange rates, or to otherwise manage their term structures, sector selection and durations in
accordance with their investment objectives and policies. Each Fund may also enter into closing purchase and sale transactions with respect to such contracts and options. A Fund will engage in futures and related options transactions for bona fide hedging
purposes as defined in regulations of the Commodity Futures Trading Commission or to seek to increase total return to the extent permitted by such regulations. A Fund may not purchase or sell futures contracts or purchase or sell related options to seek
to increase total return, except for closing purchase or sale transactions, if immediately thereafter the sum of the amount of initial margin deposits and premiums paid on the Fund’s outstanding positions in futures and related options entered into
for the purpose of seeking to increase total return would exceed 5% of the market value of the Fund’s net assets.
|
| Futures contracts and related options present the following risks:
|
n
|
While a Fund may benefit from the use of futures and options on futures, unanticipated changes in interest rates, securities
prices or currency exchange rates may result in poorer overall performance than if the Fund had not entered into any futures contracts or options transactions.
|
| n
|
Because perfect correlation between a futures position and portfolio position that is intended to be protected is impossible to
achieve, the desired protection may not be obtained and a Fund may be exposed to additional risk of loss.
|
n
|
The loss incurred by a Fund in entering into futures contracts and in writing call options on futures is potentially unlimited and
may exceed the amount of the premium received.
|
n
|
Futures markets are highly volatile and the use of futures may increase the volatility of a Fund’s NAV.
|
n
|
As a result of the low margin deposits normally required in futures trading, a relatively small price movement in a futures
contract may result in substantial losses to a Fund.
|
n
|
Futures contracts and options on futures may be illiquid, and exchanges may limit fluctuations in futures contract prices during a
single day.
|
n
|
Foreign exchanges may not provide the same protection as U.S. exchanges.
|
| Equity Swaps. Each Fund may invest in equity swaps. Equity swaps allow the parties to a swap agreement to exchange
the dividend income or other components of return on an equity investment (for example, a group of equity securities or an index) for a component of return on another non-equity or equity investment.
|
| An equity swap may be used by a Fund to invest in a market without owning or taking physical custody of securities in
circumstances in which direct investment may be restricted for legal reasons or is otherwise impractical. Equity swaps are derivatives and their value can be very volatile. To the extent that the Investment Adviser does not accurately analyze and predict
the potential relative fluctuation of the components swapped with another party, a Fund may suffer a loss, which may be substantial. The value of some components of an equity swap (such as the dividends on a common stock) may also be sensitive to changes
in interest rates. Furthermore, a Fund may suffer a loss if the counterparty defaults. Because equity swaps are normally illiquid, a Fund may be unable to terminate its obligations when desired.
|
| When-Issued Securities and Forward Commitments. Each Fund may purchase when-issued securities and make contracts to
purchase or sell securities for a fixed price at a future date beyond customary settlement time. When-issued securities are securities that have been authorized, but not yet issued. When-issued securities are purchased in order to secure what is
considered to be an advantageous price and yield to the Fund at the time of entering into the transaction. A forward commitment involves the entering into a contract to purchase or sell securities for a fixed price at a future date beyond the customary
settlement period.
|
| The purchase of securities on a when-issued or forward commitment basis involves a risk of loss if the value of the security to be
purchased declines before the settlement date. Conversely, the sale of securities on a forward commitment basis involves the risk that the value of the securities sold may increase before the
|
| settlement date. Although a Fund will generally purchase securities on a when-issued or forward commitment basis with the
intention of acquiring the securities for its portfolio, a Fund may dispose of when-issued securities or forward commitments prior to settlement if the Investment Adviser deems it appropriate.
|
| Repurchase Agreements. Repurchase agreements involve the purchase of securities subject to the seller’s
agreement to repurchase them at a mutually agreed upon date and price. Each Fund may enter into repurchase agreements with dealers in U.S. government securities and member banks of the Federal Reserve System which furnish collateral at least equal in
value or market price to the amount of their repurchase obligation.
|
| If the other party or “seller” defaults, a Fund might suffer a loss to the extent that the proceeds from the sale of the
underlying securities and other collateral held by the Fund are less than the repurchase price and the Fund’s costs associated with delay and enforcement of the repurchase agreement. In addition, in the event of bankruptcy of the seller, a Fund could
suffer additional losses if a court determines that the Fund’s interest in the collateral is not enforceable.
|
| In evaluating whether to enter into a repurchase agreement, the Investment Adviser will carefully consider the creditworthiness of
the seller. Certain Funds, together with other registered investment companies having advisory agreements with the Investment Adviser or any of its affiliates, may transfer uninvested cash balances into a single joint account, the daily aggregate balance
of which will be invested in one or more repurchase agreements.
|
| Lending of Portfolio Securities. Each Fund may engage in securities lending. Securities lending involves the lending
of securities owned by a Fund to financial institutions such as certain broker-dealers. The borrowers are required to secure their loan continuously with cash, cash equivalents, U.S. government securities or letters of credit in an amount at least equal
to the market value of the securities loaned. Cash collateral may be invested in cash equivalents. To the extent that cash collateral is invested in other investment securities, such collateral will be subject to market depreciation or appreciation, and a
Fund will be responsible for any loss that might result from its investment of the borrowers’ collateral. If the Investment Adviser determines to make securities loans, the value of the securities loaned may not exceed 33 1
/3% of the value of the total assets of a
Fund (including the loan collateral).
|
| A Fund may lend its securities to increase its income. A Fund may, however, experience delay in the recovery of its securities if
the institution with which it has engaged in a portfolio loan transaction breaches its agreement with the Fund.
|
| Short Sales Against-the-Box. Certain Funds may make short sales against-the-box. A short sale against-the-box means
that at all times when a short position is open the Fund will own an equal amount of securities sold short, or securities convertible into or exchangeable for, without payment of any further consideration, an equal amount of the securities of the same
issuer as the securities sold short.
|
| Preferred Stock, Warrants and Rights. Each Fund may invest in preferred stock, warrants and rights. Preferred stocks
are securities that represent an ownership interest providing the holder with claims on the issuer’s earnings and assets before common stock owners but after bond owners. Unlike debt securities, the obligations of an issuer of preferred stock,
including dividend and other payment obligations, may not typically be accelerated by the holders of such preferred stock on the occurrence of an event of default or other non-compliance by the issuer of the preferred stock.
|
| Warrants and other rights are options to buy a stated number of shares of common stock at a specified price at any time during the
life of the warrant or right. The holders of warrants and rights have no voting rights, receive no dividends and have no rights with respect to the assets of the issuer.
|
| Other Investment Companies. Each Fund may invest in securities of other investment companies (including
exchange-traded funds such as SPDRs and iShares
SM
, as defined below) subject to statutory limitations prescribed by the Act. These limitations include a
prohibition on any Fund acquiring more than 3% of the voting shares of any other investment company, and a prohibition on investing more than 5% of a Fund’s total assets in securities of any one investment company or more than 10% of its total assets
in securities of all investment companies. A Fund will indirectly bear its proportionate share of any management fees and other expenses paid by such other investment companies. Exchange-traded funds such as SPDRs and iShares
SM
are shares of unaffiliated investment companies which are traded like traditional equity securities on a national
securities exchange or the NASDAQ® National Market System.
|
n
|
Standard & Poor’s Depositary Receipts™.
The Funds may, consistent with their investment policies, purchase Standard & Poor’s Depositary Receipts™ (“SPDRs”). SPDRs are securities traded on the American Stock Exchange (“AMEX”) that represent
ownership in the SPDR Trust, a trust which has been established to accumulate and hold a portfolio of common stocks that is intended to track the price performance and dividend yield of the S&P 500®. The SPDR Trust is sponsored by a subsidiary of
the AMEX. SPDRs may be used for several reasons, including, but not limited to, facilitating the handling
|
| of cash flows or trading, or reducing transaction costs. The price movement of SPDRs may not perfectly parallel the price action
of the S&P 500®.
|
n
|
iShares
SM
(formerly World Equity Benchmark Shares or WEBs). iShares are shares of an investment company that invests substantially all of its assets in securities included
in the MSCI indices for specified countries. iShares are listed on the AMEX and were initially offered to the public in 1996. The market prices of iShares are expected to fluctuate in accordance with both changes in the NAVs of their underlying indices
and supply and demand of iShares on the AMEX. To date, iShares have traded at relatively modest discounts and premiums to their NAVs. However, iShares have a limited operating history and information is lacking regarding the actual performance and trading
liquidity of iShares for extended periods or over complete market cycles. In addition, there is no assurance that the requirements of the AMEX necessary to maintain the listing of iShares will continue to be met or will remain unchanged. In the event
substantial market or other disruptions affecting iShares should occur in the future, the liquidity and value of a Fund’s shares could also be substantially and adversely affected. If such disruptions were to occur, a Fund could be required to
reconsider the use of iShares as part of its investment strategy.
|
| Unseasoned Companies. Each Fund may invest in companies (including predecessors) which have operated less than three
years. The securities of such companies may have limited liquidity, which can result in their being priced higher or lower than might otherwise be the case. In addition, investments in unseasoned companies are more speculative and entail greater risk than
do investments in companies with an established operating record.
|
| Corporate Debt Obligations. Corporate debt obligations include bonds, notes, debentures, commercial paper and other
obligations of corporations to pay interest and repay principal, and include securities issued by banks and other financial institutions. Each Fund may invest in corporate debt obligations issued by U.S. and certain non-U.S. issuers which issue securities
denominated in the U.S. dollar (including Yankee and Euro obligations). In addition to obligations of corporations, corporate debt obligations include securities issued by banks and other financial institutions and supranational entities (i.e., the World Bank, the International Monetary Fund, etc.).
|
| Bank Obligations. Each Fund may invest in obligations issued or guaranteed by U.S. or foreign banks. Bank
obligations, including without limitations, time deposits, bankers’ acceptances and certificates of deposit, may be general obligations of the parent bank or may be limited to the issuing branch by the terms of the specific obligations or by
government regulations. Banks are subject to extensive but different governmental regulations which may limit both the amount and types of
|
| loans which may be made and interest rates which may be charged. In addition, the profitability of the banking industry is
largely dependent upon the availability and cost of funds for the purpose of financing lending operations under prevailing money market conditions. General economic conditions as well as exposure to credit losses arising from possible financial
difficulties of borrowers play an important part in the operation of this industry.
|
| U.S. Government Securities. Each Fund may invest in U.S. government securities. U.S. government securities include
U.S. Treasury obligations and obligations issued or guaranteed by U.S. government agencies, instrumentalities or sponsored enterprises. U.S. government securities may be supported by (a) the full faith and credit of the U.S. Treasury (such as the
Government National Mortgage Association (“Ginnie Mae”)); (b) the right of the issuer to borrow from the U.S. Treasury (such as securities of the Student Loan Marketing Association); (c) the discretionary authority of the U.S. government to
purchase certain obligations of the issuer; or (d) only the credit of the issuer. U.S. government securities also include Treasury receipts, zero coupon bonds and other stripped U.S. government securities, where the interest and principal components of
stripped U.S. government securities are traded independently.
|
| Custodial Receipts. Interests in U.S. government securities may be purchased in the form of custodial receipts that
evidence ownership of future interest payments, principal payments or both on certain notes or bonds issued or guaranteed as to principal and interest by the U.S. government, its agencies, instrumentalities, political subdivisions or authorities. For
certain securities law purposes, custodial receipts are not considered obligations of the U.S. government.
|
| Mortgage-Backed Securities. Certain Funds may invest in mortgage-backed securities. Mortgage-backed securities
represent direct or indirect participations in, or are collateralized by and payable from, mortgage loans secured by real property. Mortgage-backed securities can be backed by either fixed rate mortgage loans or adjustable rate mortgage loans, and may be
issued by either a governmental or non-governmental entity. Privately issued mortgage-backed securities are normally structured with one or more types of “credit enhancement.” However, these mortgage-backed securities typically do not have the
same credit standing as U.S. government guaranteed mortgage-backed securities.
|
| Mortgage-backed securities may include multiple class securities, including collateralized mortgage obligations (“CMOs”)
and Real Estate Mortgage Investment Conduit (“REMIC”) pass-through or participation certificates. CMOs provide an investor with a specified interest in the cash flow from a pool of underlying mortgages or of other mortgage-backed securities.
CMOs are issued in multiple classes. In many cases, payments of principal are applied to the CMO classes in the
|
| order of their respective stated maturities, so that no principal payments will be made on a CMO class until all other classes
having an earlier stated maturity date are paid in full. A REMIC is a CMO that qualifies for special tax treatment and invests in certain mortgages principally secured by interests in real property and other permitted investments.
|
| Mortgaged-backed securities also include stripped mortgage-backed securities (“SMBS”), which are derivative multiple
class mortgage-backed securities. SMBS are usually structured with two different classes: one that receives substantially all of the interest payments and the other that receives substantially all of the principal payments from a pool of mortgage loans.
The market value of SMBS consisting entirely of principal payments generally is unusually volatile in response to changes in interest rates. The yields on SMBS that receive all or most of the interest from mortgage loans are generally higher than
prevailing market yields on other mortgage-backed securities because their cash flow patterns are more volatile and there is a greater risk that the initial investment will not be fully recouped.
|
| Asset-Backed Securities. Certain Funds may invest in asset-backed securities. Asset-backed securities are securities
whose principal and interest payments are collateralized by pools of assets such as auto loans, credit card receivables, leases, installment contracts and personal property. Asset-backed securities are often subject to more rapid repayment than their
stated maturity date would indicate as a result of the pass-through of prepayments of principal on the underlying loans. During periods of declining interest rates, prepayment of loans underlying asset-backed securities can be expected to accelerate.
Accordingly, a Fund’s ability to maintain positions in such securities will be affected by reductions in the principal amount of such securities resulting from prepayments, and its ability to reinvest the returns of principal at comparable yields is
subject to generally prevailing interest rates at that time. Asset-backed securities present credit risks that are not presented by mortgage-backed securities. This is because asset-backed securities generally do not have the benefit of a security
interest in collateral that is comparable to mortgage assets. If the issuer of an asset-backed security defaults on its payment obligations, there is the possibility that, in some cases, the Fund will be unable to possess and sell the underlying
collateral and that the Fund’s recoveries on repossessed collateral may not be available to support payments on the securities. In the event of a default, a Fund may suffer a loss if it cannot sell collateral quickly and receive the amount it is owed.
|
| Borrowings. Each Fund can borrow money from banks and other financial institutions in amounts not exceeding
one-third of its total assets for temporary or emergency purposes. A Fund may not make additional investments if borrowings exceed 5% of its total assets.
|
| The financial highlights tables are intended to help you understand a Fund’s financial performance for the past five years
(or less if the Fund has been in operation for less than five years). Certain information reflects financial results for a single Fund share. The total returns in the table represent the rate that an investor would have earned or lost on an investment in
a Fund (assuming reinvestment of all dividends and distributions). This information for the periods ended August 31, 2000 has been audited by PricewaterhouseCoopers LLP, whose report, along with the Funds’ financial statements, is included in the
Funds’ annual reports (available upon request without charge). The information for all periods prior to the periods ended August 31, 2000, has been audited by the Funds’ previous independent accountants.
|
| CORE INTERNATIONAL EQUITY FUND
|
| Income from
investment operations |
|||||||||
|---|---|---|---|---|---|---|---|---|---|
|
Net asset value, beginning of period |
Net
investment income (loss) |
Net realized
and unrealized gain (loss) |
|||||||
| For the Year Ended August 31, | |||||||||
| 2000 - Class A Shares | $10.87 | $ 0.02 | c | $ 0.74 | |||||
| 2000 - Class B Shares | 10.81 | (0.04 | ) c | 0.73 | |||||
| 2000 - Class C Shares | 10.82 | (0.03 | ) c | 0.72 | |||||
| 2000 - Institutional Shares | 11.00 | 0.09 | c | 0.75 | |||||
| 2000 - Service Shares | 10.93 | 0.05 | c | 0.73 | |||||
| For the Seven-month Period Ended August 31, | |||||||||
| 1999 - Class A Shares | 9.98 | 0.05 | 0.84 | ||||||
| 1999 - Class B Shares | 9.95 | 0.01 | 0.85 | ||||||
| 1999 - Class C Shares | 9.96 | 0.01 | 0.85 | ||||||
| 1999 - Institutional Shares | 10.06 | 0.09 | 0.85 | ||||||
| 1999 - Service Shares | 10.02 | 0.01 | 0.90 | ||||||
| For the Year Ended January 31, | |||||||||
| 1999 - Class A Shares | 9.22 | (0.01 | ) | 0.79 | |||||
| 1999 - Class B Shares | 9.21 | — | 0.74 | ||||||
| 1999 - Class C Shares | 9.22 | — | 0.74 | ||||||
| 1999 - Institutional Shares | 9.24 | 0.05 | 0.80 | ||||||
| 1999 - Service Shares | 9.23 | — | 0.81 | ||||||
| For the Period Ended January 31, | |||||||||
| 1998 - Class A Shares (commenced August 15, 1997) | 10.00 | — | (0.78 | ) | |||||
| 1998 - Class B Shares (commenced August 15, 1997) | 10.00 | (0.02 | ) | (0.77 | ) | ||||
| 1998 - Class C Shares (commenced August 15, 1997) | 10.00 | (0.02 | ) | (0.76 | ) | ||||
| 1998 - Institutional Shares (commenced August 15, 1997) | 10.00 | 0.02 | (0.76 | ) | |||||
| 1998 - Service Shares (commenced August 15, 1997) | 10.00 | 0.01 | (0.78 | ) | |||||
|
Distributions to shareholders |
|||||||||||||||||||||
|---|---|---|---|---|---|---|---|---|---|---|---|---|---|---|---|---|---|---|---|---|---|
| Total from
investment operations |
From net
investment income |
From net
realized gains |
Total
distributions |
Net asset
value, end of period |
Total
returna |
Net assets at end of period (in 000s) |
Ratio of net
expenses to average net assets |
||||||||||||||
| $ 0.76 | $(0.05 | ) | $(0.26 | ) | $(0.31 | ) | $11.32 | 6.92 | % | $147,409 | 1.66 | % | |||||||||
| 0.69 | (0.02 | ) | (0.26 | ) | (0.28 | ) | 11.22 | 6.36 | 12,032 | 2.16 | |||||||||||
| 0.69 | (0.02 | ) | (0.26 | ) | (0.28 | ) | 11.23 | 6.34 | 6,887 | 2.16 | |||||||||||
| 0.84 | (0.10 | ) | (0.26 | ) | (0.36 | ) | 11.48 | 7.62 | 308,074 | 1.01 | |||||||||||
| 0.78 | (0.09 | ) | (0.26 | ) | (0.35 | ) | 11.36 | 7.05 | 27 | 1.51 | |||||||||||
| 0.89 | — | — | — | 10.87 | 8.92 | 114,502 | 1.66 | b | |||||||||||||
| 0.86 | — | — | — | 10.81 | 8.64 | 9,171 | 2.16 | b | |||||||||||||
| 0.86 | — | — | — | 10.82 | 8.63 | 4,913 | 2.16 | b | |||||||||||||
| 0.94 | — | — | — | 11.00 | 9.34 | 271,212 | 1.01 | b | |||||||||||||
| 0.91 | — | — | — | 10.93 | 9.08 | 8 | 1.51 | b | |||||||||||||
| 0.78 | (0.02 | ) | — | (0.02 | ) | 9.98 | 8.37 | 110,338 | 1.63 | ||||||||||||
| 0.74 | — | — | — | 9.95 | 8.03 | 7,401 | 2.08 | ||||||||||||||
| 0.74 | — | — | — | 9.96 | 8.03 | 3,742 | 2.08 | ||||||||||||||
| 0.85 | (0.03 | ) | — | (0.03 | ) | 10.06 | 9.20 | 280,731 | 1.01 | ||||||||||||
| 0.81 | (0.02 | ) | — | (0.02 | ) | 10.02 | 8.74 | 22 | 1.50 | ||||||||||||
| (0.78 | ) | — | — | — | 9.22 | (7.66 | ) | 7,087 | 1.50 | b | |||||||||||
| (0.79 | ) | — | — | — | 9.21 | (7.90 | ) | 2,721 | 2.00 | b | |||||||||||
| (0.78 | ) | — | — | — | 9.22 | (7.80 | ) | 1,608 | 2.00 | b | |||||||||||
| (0.74 | ) | (0.02 | ) | — | (0.02 | ) | 9.24 | (7.45 | ) | 17,719 | 1.00 | b | |||||||||
| (0.77 | ) | — | — | — | 9.23 | (7.70 | ) | 1 | 1.50 | b | |||||||||||
| CORE INTERNATIONAL EQUITY FUND (continued)
|
| Ratios assuming no
expense reductions |
|||||||||||||
|---|---|---|---|---|---|---|---|---|---|---|---|---|---|
| Ratio of
net investment income (loss) to average net assets |
Ratio of
expenses to average net assets |
Ratio of
net investment income (loss) to average net assets |
Portfolio
turnover rate |
||||||||||
| For the Year Ended August 31, | |||||||||||||
| 2000 - Class A Shares | 0.14 | % | 1.75 | % | 0.05 | % | 92.10 | % | |||||
| 2000 - Class B Shares | (0.36 | ) | 2.25 | (0.45 | ) | 92.10 | |||||||
| 2000 - Class C Shares | (0.34 | ) | 2.25 | (0.43 | ) | 92.10 | |||||||
| 2000 - Institutional Shares | 0.78 | 1.10 | 0.69 | 92.10 | |||||||||
| 2000 - Service Shares | 0.33 | 1.60 | 0.24 | 92.10 | |||||||||
| For the Seven-month Period Ended August 31, | |||||||||||||
| 1999 - Class A Shares | 0.78 | b | 1.76 | b | 0.68 | b | 64.97 | ||||||
| 1999 - Class B Shares | 0.26 | b | 2.26 | b | 0.16 | b | 64.97 | ||||||
| 1999 - Class C Shares | 0.23 | b | 2.26 | b | 0.13 | b | 64.97 | ||||||
| 1999 - Institutional Shares | 1.43 | b | 1.11 | b | 1.33 | b | 64.97 | ||||||
| 1999 - Service Shares | 0.07 | b | 1.61 | b | (0.03 | ) b | 64.97 | ||||||
| For the Year Ended January 31, | |||||||||||||
| 1999 - Class A Shares | (0.11 | ) | 1.94 | (0.42 | ) | 194.61 | |||||||
| 1999 - Class B Shares | (0.03 | ) | 2.39 | (0.34 | ) | 194.61 | |||||||
| 1999 - Class C Shares | (0.04 | ) | 2.39 | (0.35 | ) | 194.61 | |||||||
| 1999 - Institutional Shares | 0.84 | 1.32 | 0.53 | 194.61 | |||||||||
| 1999 - Service Shares | 0.02 | 1.81 | (0.29 | ) | 194.61 | ||||||||
| For the Period Ended January 31, | |||||||||||||
| 1998 - Class A Shares (commenced August 15, 1997) | (0.27 | ) b | 4.87 | b | (3.90 | ) b | 25.16 | ||||||
| 1998 - Class B Shares (commenced August 15, 1997) | (0.72 | ) b | 5.12 | b | (3.84 | ) b | 25.16 | ||||||
| 1998 - Class C Shares (commenced August 15, 1997) | (0.73 | ) b | 5.12 | b | (3.85 | ) b | 25.16 | ||||||
| 1998 - Institutional Shares (commenced August 15, 1997) | 0.59 | b | 4.12 | b | (2.53 | ) b | 25.16 | ||||||
| 1998 - Service Shares (commenced August 15, 1997) | 0.26 | b | 4.62 | b | (2.86 | ) b | 25.16 | ||||||
| INTERNATIONAL EQUITY FUND
|
| Income from
investment operations |
||||||||||||
|---|---|---|---|---|---|---|---|---|---|---|---|---|
|
Net asset value, beginning of period |
Net
investment income (loss) |
Net realized
and unrealized gain (loss) |
Total from
investment operations |
|||||||||
| For the Year Ended August 31, | ||||||||||||
| 2000 - Class A Shares | $23.12 | $(0.03 | ) c | $3.41 | $3.38 | |||||||
| 2000 - Class B Shares | 22.73 | (0.16 | ) c | 3.38 | 3.22 | |||||||
| 2000 - Class C Shares | 22.54 | (0.14 | ) c | 3.35 | 3.21 | |||||||
| 2000 - Institutional Shares | 23.49 | 0.14 | c | 3.46 | 3.60 | |||||||
| 2000 - Service Shares | 23.14 | (0.01 | ) c | 3.45 | 3.44 | |||||||
| For the Seven Months Ended August 31, | ||||||||||||
| 1999 - Class A Shares | 21.92 | 0.04 | 1.16 | 1.20 | ||||||||
| 1999 - Class B Shares | 21.63 | (0.02 | ) | 1.12 | 1.10 | |||||||
| 1999 - Class C Shares | 21.45 | (0.03 | ) | 1.12 | 1.09 | |||||||
| 1999 - Institutional Shares | 22.20 | 0.12 | c | 1.17 | c | 1.29 | ||||||
| 1999 - Service Shares | 21.93 | 0.06 | 1.15 | 1.21 | ||||||||
| For the Years Ended January 31, | ||||||||||||
| 1999 - Class A Shares | 19.85 | (0.06 | ) | 3.24 | 3.18 | |||||||
| 1999 - Class B Shares | 19.70 | (0.17 | ) | 3.21 | 3.04 | |||||||
| 1999 - Class C Shares | 19.56 | (0.15 | ) | 3.15 | 3.00 | |||||||
| 1999 - Institutional Shares | 19.97 | 0.03 | 3.31 | 3.34 | ||||||||
| 1999 - Service Shares | 19.84 | (0.04 | ) | 3.24 | 3.20 | |||||||
| 1998 - Class A Shares | 19.32 | 0.03 | 2.04 | 2.07 | ||||||||
| 1998 - Class B Shares | 19.24 | (0.08 | ) | 2.02 | 1.94 | |||||||
| 1998 - Class C Shares (commenced August 15, 1997) | 22.60 | (0.04 | ) | (1.38 | ) | (1.42 | ) | |||||
| 1998 - Institutional Shares | 19.40 | 0.10 | 2.11 | 2.21 | ||||||||
| 1998 - Service Shares | 19.34 | 0.02 | 2.06 | 2.08 | ||||||||
| 1997 - Class A Shares | 17.20 | 0.10 | 2.23 | 2.33 | ||||||||
| 1997 - Class B Shares (commenced May 1, 1996) | 18.91 | (0.06 | ) | 0.60 | 0.54 | |||||||
| 1997 - Institutional Shares (commenced February 7, 1996) | 17.45 | 0.04 | 2.15 | 2.19 | ||||||||
| 1997 - Service Shares (commenced March 6, 1996) | 17.70 | (0.02 | ) | 1.87 | 1.85 | |||||||
| 1996 - Class A Shares | 14.52 | 0.13 | 4.00 | 4.13 | ||||||||
| Distributions to shareholders |
|||||||||||||||||||||
|---|---|---|---|---|---|---|---|---|---|---|---|---|---|---|---|---|---|---|---|---|---|
| From net
investment income |
In excess of net investment income |
From net
realized gains |
Total
distributions |
Net asset
value, end of period |
Total
returna |
Net assets
at end of period (in 000s) |
Ratio of
net expenses to average net assets |
||||||||||||||
| $(0.10 | ) | $(0.24) | $(2.57 | ) | $(2.91 | ) | $23.59 | 14.68 | % | $1,343,869 | 1.79 | % | |||||||||
| (0.07 | ) | (0.17) | (2.57 | ) | (2.81 | ) | 23.14 | 14.20 | 80,274 | 2.29 | |||||||||||
| (0.09 | ) | (0.20) | (2.57 | ) | (2.86 | ) | 22.89 | 14.28 | 22,031 | 2.29 | |||||||||||
| (0.14 | ) | (0.32) | (2.57 | ) | (3.03 | ) | 24.06 | 15.45 | 325,161 | 1.14 | |||||||||||
| (0.11 | ) | (0.25) | (2.57 | ) | (2.93 | ) | 23.65 | 15.00 | 3,789 | 1.64 | |||||||||||
| — | — | — | — | 23.12 | 5.47 | 943,473 | 1.79 | b | |||||||||||||
| — | — | — | — | 22.73 | 5.09 | 68,691 | 2.29 | b | |||||||||||||
| — | — | — | — | 22.54 | 5.08 | 11,241 | 2.29 | b | |||||||||||||
| — | — | — | — | 23.49 | 5.81 | 180,564 | 1.14 | b | |||||||||||||
| — | — | — | — | 23.14 | 5.52 | 3,852 | 1.64 | b | |||||||||||||
| — | — | (1.11 | ) | (1.11 | ) | 21.92 | 16.39 | 947,973 | 1.73 | ||||||||||||
| — | — | (1.11 | ) | (1.11 | ) | 21.63 | 15.80 | 69,231 | 2.24 | ||||||||||||
| — | — | (1.11 | ) | (1.11 | ) | 21.45 | 15.70 | 11,619 | 2.24 | ||||||||||||
| — | — | (1.11 | ) | (1.11 | ) | 22.20 | 17.09 | 111,315 | 1.13 | ||||||||||||
| — | — | (1.11 | ) | (1.11 | ) | 21.93 | 16.49 | 3,568 | 1.63 | ||||||||||||
| — | (0.30 | ) | (1.24 | ) | (1.54 | ) | 19.85 | 11.12 | 697,590 | 1.67 | |||||||||||
| — | (0.25 | ) | (1.23 | ) | (1.48 | ) | 19.70 | 10.51 | 55,324 | 2.20 | |||||||||||
| — | (0.38 | ) | (1.24 | ) | (1.62 | ) | 19.56 | (5.92 | ) | 3,369 | 2.27 | b | |||||||||
| (0.07 | ) | (0.33 | ) | (1.24 | ) | (1.64 | ) | 19.97 | 11.82 | 56,263 | 1.08 | ||||||||||
| — | (0.35 | ) | (1.23 | ) | (1.58 | ) | 19.84 | 11.25 | 3,035 | 1.55 | |||||||||||
| — | — | (0.21 | ) | (0.21 | ) | 19.32 | 13.48 | 536,283 | 1.69 | ||||||||||||
| — | — | (0.21 | ) | (0.21 | ) | 19.24 | 2.83 | 19,198 | 2.23 | b | |||||||||||
| (0.03 | ) | — | (0.21 | ) | (0.24 | ) | 19.40 | 12.53 | 68,374 | 1.10 | b | ||||||||||
| — | — | (0.21 | ) | (0.21 | ) | 19.34 | 10.42 | 674 | 1.60 | b | |||||||||||
| (0.58 | ) | — | (0.87 | ) | (1.45 | ) | 17.20 | 28.68 | 330,860 | 1.52 | |||||||||||
| INTERNATIONAL EQUITY FUND (continued)
|
| Ratios assuming no
expense reductions |
|||||||||||||
|---|---|---|---|---|---|---|---|---|---|---|---|---|---|
| Ratio of
net investment income (loss) to average net assets |
Ratio of
expenses to average net assets |
Ratio of
net investment income (loss) to average net assets |
Portfolio
turnover rate |
||||||||||
| For the Year Ended August 31, | |||||||||||||
| 2000 - Class A Shares | (0.12 | )% | 1.84 | % | (0.17 | )% | 79.79 | % | |||||
| 2000 - Class B Shares | (0.65 | ) | 2.34 | (0.70 | ) | 79.79 | |||||||
| 2000 - Class C Shares | (0.59 | ) | 2.34 | (0.64 | ) | 79.79 | |||||||
| 2000 - Institutional Shares | 0.54 | 1.19 | 0.49 | 79.79 | |||||||||
| 2000 - Service Shares | (0.02 | ) | 1.69 | (0.07 | ) | 79.79 | |||||||
| For the Seven Months Ended August 31, | |||||||||||||
| 1999 - Class A Shares | 0.31 | b | 1.84 | b | 0.26 | b | 61.10 | ||||||
| 1999 - Class B Shares | (0.19 | ) b | 2.34 | b | (0.24 | ) b | 61.10 | ||||||
| 1999 - Class C Shares | (0.26 | ) b | 2.34 | b | (0.31 | ) b | 61.10 | ||||||
| 1999 - Institutional Shares | 0.89 | b | 1.19 | b | 0.84 | b | 61.10 | ||||||
| 1999 - Service Shares | 0.47 | b | 1.69 | b | 0.42 | b | 61.10 | ||||||
| For the Years Ended January 31, | |||||||||||||
| 1999 - Class A Shares | (0.28 | ) | 1.82 | (0.37 | ) | 113.79 | |||||||
| 1999 - Class B Shares | (0.79 | ) | 2.32 | (0.87 | ) | 113.79 | |||||||
| 1999 - Class C Shares | (0.98 | ) | 2.32 | (1.06 | ) | 113.79 | |||||||
| 1999 - Institutional Shares | 0.23 | 1.21 | 0.15 | 113.79 | |||||||||
| 1999 - Service Shares | (0.18 | ) | 1.71 | (0.26 | ) | 113.79 | |||||||
| 1998 - Class A Shares | (0.27 | ) | 1.80 | (0.40 | ) | 40.82 | |||||||
| 1998 - Class B Shares | (0.90 | ) | 2.30 | (1.00 | ) | 40.82 | |||||||
| 1998 - Class C Shares (commenced August 15, 1997) | (1.43 | ) b | 2.37 | b | (1.53 | ) b | 40.82 | ||||||
| 1998 - Institutional Shares | 0.30 | 1.18 | 0.20 | 40.82 | |||||||||
| 1998 - Service Shares | (0.36 | ) | 1.65 | (0.46 | ) | 40.82 | |||||||
| 1997 - Class A Shares | (0.07 | ) | 1.88 | (0.26 | ) | 38.01 | |||||||
| 1997 - Class B Shares (commenced May 1, 1996) | (0.97 | ) b | 2.38 | b | (1.12 | ) b | 38.01 | ||||||
| 1997 - Institutional Shares (commenced February 7, 1996) | 0.43 | b | 1.25 | b | 0.28 | b | 38.01 | ||||||
| 1997 - Service Shares (commenced March 6, 1996) | (0.40 | ) b | 1.75 | b | (0.55 | ) b | 38.01 | ||||||
| 1996 - Class A Shares | 0.26 | 1.77 | 0.01 | 68.48 | |||||||||
| EUROPEAN EQUITY FUND
|
| Income from
investment operations |
|||||||||
|---|---|---|---|---|---|---|---|---|---|
| Net asset
value, beginning of period |
Net investment income (loss) |
Net realized
and unrealized gain (loss) |
|||||||
| For the Year Ended August 31, | |||||||||
| 2000 - Class A Shares | $11.75 | $ — | c | $ 2.78 | |||||
| 2000 - Class B Shares | 11.71 | (0.04 | ) c | 2.73 | |||||
| 2000 - Class C Shares | 11.72 | (0.04 | ) c | 2.75 | |||||
| 2000 - Institutional Shares | 11.82 | 0.10 | c | 2.79 | |||||
| 2000 - Service Shares | 11.76 | 0.01 | c | 2.80 | |||||
| For the Seven Months Ended August 31, | |||||||||
| 1999 - Class A Shares | 12.20 | 0.05 | (0.50 | ) | |||||
| 1999 - Class B Shares | 12.19 | 0.03 | (0.51 | ) | |||||
| 1999 - Class C Shares | 12.20 | 0.04 | (0.52 | ) | |||||
| 1999 - Institutional Shares | 12.23 | 0.18 | (0.59 | ) | |||||
| 1999 - Service Shares | 12.20 | 0.08 | (0.52 | ) | |||||
| For the Period Ended January 31, | |||||||||
| 1999 - Class A Shares (commenced October 1, 1998) | 10.00 | (0.03 | ) | 2.23 | |||||
| 1999 - Class B Shares (commenced October 1, 1998) | 10.00 | (0.02 | ) | 2.21 | |||||
| 1999 - Class C Shares (commenced October 1, 1998) | 10.00 | (0.01 | ) | 2.21 | |||||
| 1999 - Institutional Shares (commenced October 1, 1998) | 10.00 | (0.01 | ) | 2.24 | |||||
| 1999 - Service Shares (commenced October 1, 1998) | 10.00 | (0.03 | ) | 2.23 | |||||
| Distributions to
shareholders |
||||||||||||||||||
|---|---|---|---|---|---|---|---|---|---|---|---|---|---|---|---|---|---|---|
| Total from
investment operations |
From net
realized gains |
Total
distributions |
Net asset
value, end of period |
Total
returna |
Net assets at end of period (in 000s) |
Ratio of
net expenses to average net assets |
||||||||||||
| $ 2.78 | $(0.71 | ) | $(0.71 | ) | $13.82 | 24.04 | % | $139,966 | 1.79 | % | ||||||||
| 2.69 | (0.71 | ) | (0.71 | ) | 13.69 | 23.32 | 4,538 | 2.29 | ||||||||||
| 2.71 | (0.71 | ) | (0.71 | ) | 13.72 | 23.48 | 1,482 | 2.29 | ||||||||||
| 2.89 | (0.71 | ) | (0.71 | ) | 14.00 | 24.85 | 14,630 | 1.14 | ||||||||||
| 2.81 | (0.71 | ) | (0.71 | ) | 13.86 | 24.28 | 2 | 1.64 | ||||||||||
| (0.45 | ) | — | — | 11.75 | (3.69 | ) | 74,862 | 1.79 | b | |||||||||
| (0.48 | ) | — | — | 11.71 | (3.94 | ) | 879 | 2.29 | b | |||||||||
| (0.48 | ) | — | — | 11.72 | (3.93 | ) | 388 | 2.29 | b | |||||||||
| (0.41 | ) | — | — | 11.82 | (3.35 | ) | 5,965 | 1.14 | b | |||||||||
| (0.44 | ) | — | — | 11.76 | (3.61 | ) | 2 | 1.64 | b | |||||||||
| 2.20 | — | — | 12.20 | 22.00 | 61,151 | 1.79 | b | |||||||||||
| 2.19 | — | — | 12.19 | 21.90 | 432 | 2.29 | b | |||||||||||
| 2.20 | — | — | 12.20 | 22.00 | 587 | 2.29 | b | |||||||||||
| 2.23 | — | — | 12.23 | 22.30 | 12,740 | 1.14 | b | |||||||||||
| 2.20 | — | — | 12.20 | 22.00 | 2 | 1.64 | b | |||||||||||
| EUROPEAN EQUITY FUND (continued)
|
| Ratios assuming no
expense reductions |
|||||||||||||
|---|---|---|---|---|---|---|---|---|---|---|---|---|---|
| Ratio of
net investment income (loss) to average net assets |
Ratio of
expenses to average net assets |
Ratio of
net investment income (loss) to average net assets |
Portfolio
turnover rate |
||||||||||
| For the Year Ended August 31, | |||||||||||||
| 2000 - Class A Shares | 0.02 | % | 2.17 | % | (0.36 | )% | 98.10 | % | |||||
| 2000 - Class B Shares | (0.27 | ) | 2.67 | (0.65 | ) | 98.10 | |||||||
| 2000 - Class C Shares | (0.26 | ) | 2.67 | (0.64 | ) | 98.10 | |||||||
| 2000 - Institutional Shares | 0.70 | 1.52 | 0.32 | 98.10 | |||||||||
| 2000 - Service Shares | 0.09 | 2.02 | (0.29 | ) | 98.10 | ||||||||
| For the Seven Months Ended August 31, | |||||||||||||
| 1999 - Class A Shares | 0.80 | b | 2.29 | b | 0.30 | b | 54.98 | ||||||
| 1999 - Class B Shares | 0.43 | b | 2.79 | b | (0.07 | ) b | 54.98 | ||||||
| 1999 - Class C Shares | 0.42 | b | 2.79 | b | (0.08 | ) b | 54.98 | ||||||
| 1999 - Institutional Shares | 1.53 | b | 1.64 | b | 1.03 | b | 54.98 | ||||||
| 1999 - Service Shares | 1.10 | b | 2.14 | b | 0.60 | b | 54.98 | ||||||
| For the Period Ended January 31, | |||||||||||||
| 1999 - Class A Shares (commenced October 1, 1998) | (1.19 | ) b | 2.80 | b | (2.20 | ) b | 70.77 | ||||||
| 1999 - Class B Shares (commenced October 1, 1998) | (1.78 | ) b | 3.30 | b | (2.79 | ) b | 70.77 | ||||||
| 1999 - Class C Shares (commenced October 1, 1998) | (1.83 | ) b | 3.30 | b | (2.84 | ) b | 70.77 | ||||||
| 1999 - Institutional Shares (commenced October 1, 1998) | (0.33 | ) b | 2.15 | b | (1.34 | ) b | 70.77 | ||||||
| 1999 - Service Shares (commenced October 1, 1998) | (0.69 | ) b | 2.65 | b | (1.70 | ) b | 70.77 | ||||||
| JAPANESE EQUITY FUND
|
| Income from
investment operations |
||||||||||
|---|---|---|---|---|---|---|---|---|---|---|
|
Net asset value, beginning of period |
Net
investment loss |
Net realized
and unrealized gains |
Total from
investment operations |
|||||||
| For the Year Ended August 31, | ||||||||||
| 2000 - Class A Shares | $16.24 | $(0.20 | ) c | $1.67 | $1.47 | |||||
| 2000 - Class B Shares | 16.14 | (0.28 | ) c | 1.68 | 1.40 | |||||
| 2000 - Class C Shares | 16.16 | (0.28 | ) c | 1.64 | 1.36 | |||||
| 2000 - Institutional Shares | 16.36 | (0.09 | ) c | 1.67 | 1.58 | |||||
| 2000 - Service Shares | 16.22 | (0.16 | ) c | 1.65 | 1.49 | |||||
| For the Seven Months Ended August 31, | ||||||||||
| 1999 - Class A Shares | 11.06 | (0.06 | ) | 5.24 | 5.18 | |||||
| 1999 - Class B Shares | 11.03 | (0.09 | ) | 5.20 | 5.11 | |||||
| 1999 - Class C Shares | 11.04 | (0.08 | ) | 5.20 | 5.12 | |||||
| 1999 - Institutional Shares | 11.10 | (0.03 | ) | 5.29 | 5.26 | |||||
| 1999 - Service Shares | 11.04 | (0.06 | ) | 5.24 | 5.18 | |||||
| For the Period Ended January 31, | ||||||||||
| 1999 - Class A Shares (commenced May 1, 1998) | 10.00 | (0.06 | ) | 1.12 | 1.06 | |||||
| 1999 - Class B Shares (commenced May 1, 1998) | 10.00 | (0.08 | ) | 1.11 | 1.03 | |||||
| 1999 - Class C Shares (commenced May 1, 1998) | 10.00 | (0.09 | ) | 1.13 | 1.04 | |||||
| 1999 - Institutional Shares (commenced May 1, 1998) | 10.00 | (0.02 | ) | 1.13 | 1.11 | |||||
| 1999 - Service Shares (commenced May 1, 1998) | 10.00 | (0.05 | ) | 1.09 | 1.04 | |||||
|
Distributions to shareholders |
|||||||||||||||||||||
|---|---|---|---|---|---|---|---|---|---|---|---|---|---|---|---|---|---|---|---|---|---|
| From net
investment income |
In excess of net investment income |
From net
realized gains |
Total
distributions |
Net asset
value, end of period |
Total
returnb |
Net assets
at end of period (in 000s) |
Ratio of
net expenses to average net assets |
||||||||||||||
| $ — | $(0.21 | ) | $(1.73 | ) | $(1.94 | ) | $15.77 | 8.47 | % | $69,741 | 1.74 | % | |||||||||
| — | (0.18 | ) | (1.73 | ) | (1.91 | ) | 15.63 | 8.12 | 5,783 | 2.24 | |||||||||||
| — | (0.21 | ) | (1.73 | ) | (1.94 | ) | 15.58 | 7.82 | 4,248 | 2.24 | |||||||||||
| — | (0.25 | ) | (1.73 | ) | (1.98 | ) | 15.96 | 9.14 | 27,768 | 1.09 | |||||||||||
| — | (0.15 | ) | (1.73 | ) | (1.88 | ) | 15.83 | 8.65 | 3 | 1.59 | |||||||||||
| — | — | — | — | 16.24 | 46.84 | 34,279 | 1.70 | b | |||||||||||||
| — | — | — | — | 16.14 | 46.33 | 4,219 | 2.20 | b | |||||||||||||
| — | — | — | — | 16.16 | 46.41 | 3,584 | 2.20 | b | |||||||||||||
| — | — | — | — | 16.36 | 47.40 | 22,709 | 1.05 | b | |||||||||||||
| — | — | — | — | 16.22 | 46.92 | 3 | 1.55 | b | |||||||||||||
| — | — | — | — | 11.06 | 10.60 | 8,391 | 1.64 | b | |||||||||||||
| — | — | — | — | 11.03 | 10.30 | 1,427 | 2.15 | b | |||||||||||||
| — | — | — | — | 11.04 | 10.40 | 284 | 2.15 | b | |||||||||||||
| (0.01 | ) | — | — | (0.01 | ) | 11.10 | 11.06 | 11,418 | 1.03 | b | |||||||||||
| — | — | — | — | 11.04 | 10.43 | 2 | 1.53 | b | |||||||||||||
| JAPANESE EQUITY FUND (continued)
|
| Ratios assuming no
expense reductions |
|||||||||||||
|---|---|---|---|---|---|---|---|---|---|---|---|---|---|
| Ratio of
net investment loss to average net assets |
Ratio of
expenses to average net assets |
Ratio of
net investment loss to average net assets |
Portfolio
turnover rate |
||||||||||
| For the Year Ended August 31, | |||||||||||||
| 2000 - Class A Shares | (1.20 | )% | 2.10 | % | (1.56 | )% | 60.76 | % | |||||
| 2000 - Class B Shares | (1.67 | ) | 2.60 | (2.03 | ) | 60.76 | |||||||
| 2000 - Class C Shares | (1.66 | ) | 2.60 | (2.02 | ) | 60.76 | |||||||
| 2000 - Institutional Shares | (0.53 | ) | 1.45 | (0.89 | ) | 60.76 | |||||||
| 2000 - Service Shares | (0.94 | ) | 1.95 | (1.30 | ) | 60.76 | |||||||
| For the Seven Months Ended August 31, | |||||||||||||
| 1999 - Class A Shares | (1.17 | ) b | 2.62 | b | (2.09 | ) b | 44.83 | ||||||
| 1999 - Class B Shares | (1.57 | ) b | 3.12 | b | (2.49 | ) b | 44.83 | ||||||
| 1999 - Class C Shares | (1.81 | ) b | 3.12 | b | (2.73 | ) b | 44.83 | ||||||
| 1999 - Institutional Shares | (0.37 | ) b | 1.97 | b | (1.29 | ) b | 44.83 | ||||||
| 1999 - Service Shares | (0.74 | ) b | 2.47 | b | (1.66 | ) b | 44.83 | ||||||
| For the Period Ended January 31, | |||||||||||||
| 1999 - Class A Shares (commenced May 1, 1998) | (1.20 | ) b | 4.18 | b | (3.74 | ) b | 53.29 | ||||||
| 1999 - Class B Shares (commenced May 1, 1998) | (1.76 | ) b | 4.69 | b | (4.30 | ) b | 53.29 | ||||||
| 1999 - Class C Shares (commenced May 1, 1998) | (1.69 | ) b | 4.69 | b | (4.23 | ) b | 53.29 | ||||||
| 1999 - Institutional Shares (commenced May 1, 1998) | (0.36 | ) b | 3.57 | b | (2.90 | ) b | 53.29 | ||||||
| 1999 - Service Shares (commenced May 1, 1998) | (0.68 | ) b | 4.07 | b | (3.22 | ) b | 53.29 | ||||||
| INTERNATIONAL GROWTH OPPORTUNITIES FUND
|
| (formerly International Small Cap Fund)
|
| Income from
investment operations |
||||||||||
|---|---|---|---|---|---|---|---|---|---|---|
|
Net asset value, beginning of period |
Net
investment loss |
Net realized
and unrealized gain |
Total from investment operations |
|||||||
| For the Year Ended August 31, | ||||||||||
| 2000 - Class A Shares ; | $13.24 | $(0.12 | ) c | $3.52 | $3.40 | |||||
| 2000 - Class B Shares | 13.19 | (0.18 | ) c | 3.49 | 3.31 | |||||
| 2000 - Class C Shares | 13.19 | (0.19 | ) c | 3.49 | 3.30 | |||||
| 2000 - Institutional Shares | 13.35 | (0.03 | ) c | 3.57 | 3.54 | |||||
| 2000 - Service Shares | 13.24 | (0.10 | ) c | 3.54 | 3.44 | |||||
| For the Seven-month Period Ended August 31, | ||||||||||
| 1999 - Class A Shares | 10.62 | (0.03 | ) | 2.65 | 2.62 | |||||
| 1999 - Class B Shares | 10.61 | (0.08 | ) c | 2.66 | 2.58 | |||||
| 1999 - Class C Shares | 10.61 | (0.08 | ) c | 2.66 | 2.58 | |||||
| 1999 - Institutional Shares | 10.66 | — | 2.69 | 2.69 | ||||||
| 1999 - Service Shares | 10.61 | (0.02 | ) | 2.65 | 2.63 | |||||
| For the Period Ended January 31, | ||||||||||
| 1999 - Class A Shares (commenced May 1, 1998) | 10.00 | (0.04 | ) | 0.66 | 0.62 | |||||
| 1999 - Class B Shares (commenced May 1, 1998) | 10.00 | (0.10 | ) | 0.71 | 0.61 | |||||
| 1999 - Class C Shares (commenced May 1, 1998) | 10.00 | (0.06 | ) | 0.67 | 0.61 | |||||
| 1999 - Institutional Shares (commenced May 1, 1998) | 10.00 | — | 0.67 | 0.67 | ||||||
| 1999 - Service Shares (commenced May 1, 1998) | 10.00 | (0.02 | ) | 0.63 | 0.61 | |||||
|
Distributions to shareholders |
||||||||||||||||||
|---|---|---|---|---|---|---|---|---|---|---|---|---|---|---|---|---|---|---|
| In excess
of net investment income |
From net
realized gains |
Total
distributions |
Net asset
value, end of period |
Total
returna |
Net assets
at end of period (in 000s) |
Ratio of
net expenses to average net assets |
||||||||||||
| $ — | $(0.52 | ) | $(0.52 | ) | $16.12 | 26.26 | % | $327,697 | 2.05 | % | ||||||||
| — | (0.52 | ) | (0.52 | ) | 15.98 | 25.66 | 2,827 | 2.55 | ||||||||||
| — | (0.52 | ) | (0.52 | ) | 15.97 | 25.58 | 3,672 | 2.55 | ||||||||||
| — | (0.52 | ) | (0.52 | ) | 16.37 | 27.12 | 187,075 | 1.40 | ||||||||||
| — | (0.52 | ) | (0.52 | ) | 16.16 | 26.57 | 3 | 1.90 | ||||||||||
| — | — | — | 13.24 | 24.67 | 69,458 | 2.05 | b | |||||||||||
| — | — | — | 13.19 | 24.32 | 303 | 2.55 | b | |||||||||||
| — | — | — | 13.19 | 24.32 | 419 | 2.55 | b | |||||||||||
| — | — | — | 13.35 | 25.24 | 65,772 | 1.40 | b | |||||||||||
| — | — | — | 13.24 | 24.79 | 2 | 1.90 | b | |||||||||||
| — | — | — | 10.62 | 6.20 | 33,002 | 2.02 | b | |||||||||||
| — | — | — | 10.61 | 6.10 | 213 | 2.51 | b | |||||||||||
| — | — | — | 10.61 | 6.10 | 175 | 2.51 | b | |||||||||||
| (0.01 | ) | — | (0.01 | ) | 10.66 | 6.67 | 36,992 | 1.40 | b | |||||||||
| — | — | — | 10.61 | 6.10 | 2 | 1.90 | b | |||||||||||
| INTERNATIONAL GROWTH OPPORTUNITIES FUND
|
| (formerly International Small Cap Fund) (continued)
|
| Ratios assuming no
expense reductions |
|||||||||||||
|---|---|---|---|---|---|---|---|---|---|---|---|---|---|
| Ratio of
net investment loss to average net assets |
Ratio of
expenses to average net assets |
Ratio of
net investment loss to average net assets |
Portfolio
turnover rate |
||||||||||
| For the Year Ended August 31, | |||||||||||||
| 2000 - Class A Shares ; | (0.79 | )% | 2.22 | % | (0.96 | )% | 73.43 | % | |||||
| 2000 - Class B Shares | (1.16 | ) | 2.72 | (1.33 | ) | 73.43 | |||||||
| 2000 - Class C Shares | (1.23 | ) | 2.72 | (1.40 | ) | 73.43 | |||||||
| 2000 - Institutional Shares | (0.19 | ) | 1.57 | (0.36 | ) | 73.43 | |||||||
| 2000 - Service Shares | (0.63 | ) | 2.07 | (0.80 | ) | 73.43 | |||||||
| For the Seven-month Period Ended August 31, | |||||||||||||
| 1999 - Class A Shares | (0.68 | ) b | 2.42 | b | (1.05 | ) b | 58.81 | ||||||
| 1999 - Class B Shares | (1.16 | ) b | 2.92 | b | (1.53 | ) b | 58.81 | ||||||
| 1999 - Class C Shares | (1.21 | ) b | 2.92 | b | (1.58 | ) b | 58.81 | ||||||
| 1999 - Institutional Shares | (0.05 | ) b | 1.77 | b | (0.42 | ) b | 58.81 | ||||||
| 1999 - Service Shares | (0.35 | ) b | 2.27 | b | (0.72 | ) b | 58.81 | ||||||
| For the Period Ended January 31, | |||||||||||||
| 1999 - Class A Shares (commenced May 1, 1998) | (1.03 | ) b | 3.60 | b | (2.61 | ) b | 96.11 | ||||||
| 1999 - Class B Shares (commenced May 1, 1998) | (1.30 | ) b | 4.09 | b | (2.88 | ) b | 96.11 | ||||||
| 1999 - Class C Shares (commenced May 1, 1998) | (1.45 | ) b | 4.09 | b | (3.03 | ) b | 96.11 | ||||||
| 1999 - Institutional Shares (commenced May 1, 1998) | (0.19 | ) b | 2.98 | b | (1.77 | ) b | 96.11 | ||||||
| 1999 - Service Shares (commenced May 1, 1998) | (0.26 | ) b | 3.48 | b | (1.84 | ) b | 96.11 | ||||||
| EMERGING MARKETS EQUITY FUND
|
| Income from
investment operations |
||||||||||||
|---|---|---|---|---|---|---|---|---|---|---|---|---|
| Net asset
value, beginning of period |
Net
investment income (loss) |
Net
realized and unrealized gain (loss) |
Total from
investment operations |
|||||||||
| For the Year Ended August 31, | ||||||||||||
| 2000 - Class A Shares | $ 9.26 | $(0.05 | ) c | $ 1.62 | $ 1.57 | |||||||
| 2000 - Class B Shares | 9.21 | (0.11 | ) c | 1.62 | 1.51 | |||||||
| 2000 - Class C Shares | 9.24 | (0.10 | ) c | 1.61 | 1.51 | |||||||
| 2000 - Institutional Shares | 9.37 | 0.01 | c | 1.64 | 1.65 | |||||||
| 2000 - Service Shares | 9.05 | 0.01 | c | 1.57 | 1.58 | |||||||
| For the Seven Months Ended August 31, | ||||||||||||
| 1999 - Class A Shares | 7.04 | (0.01 | ) | 2.23 | 2.22 | |||||||
| 1999 - Class B Shares | 7.03 | (0.03 | ) | 2.21 | 2.18 | |||||||
| 1999 - Class C Shares | 7.05 | (0.03 | ) | 2.22 | 2.19 | |||||||
| 1999 - Institutional Shares | 7.09 | 0.02 | 2.26 | 2.28 | ||||||||
| 1999 - Service Shares | 6.87 | 0.01 | 2.17 | 2.18 | ||||||||
| For the Year Ended January 31, | ||||||||||||
| 1999 - Class A Shares | 9.69 | 0.04 | (2.40 | ) | (2.36 | ) | ||||||
| 1999 - Class B Shares | 9.69 | 0.03 | (2.41 | ) | (2.38 | ) | ||||||
| 1999 - Class C Shares | 9.70 | 0.01 | (2.39 | ) | (2.38 | ) | ||||||
| 1999 - Institutional Shares | 9.70 | 0.06 | (2.36 | ) | (2.30 | ) | ||||||
| 1999 - Service Shares | 9.69 | (0.13 | ) | (2.41 | ) | (2.28 | ) | |||||
| For the Period Ended January 31, | ||||||||||||
| 1998 - Class A Shares (commenced December 15, 1997) | 10.00 | — | (0.31 | ) | (0.31 | ) | ||||||
| 1998 - Class B Shares (commenced December 15, 1997) | 10.00 | — | (0.31 | ) | (0.31 | ) | ||||||
| 1998 - Class C Shares (commenced December 15, 1997) | 10.00 | — | (0.30 | ) | (0.30 | ) | ||||||
| 1998 - Institutional Shares (commenced December 15, 1997) | 10.00 | 0.01 | (0.31 | ) | (0.30 | ) | ||||||
| 1998 - Service Shares (commenced December 15, 1997) | 10.00 | — | (0.31 | ) | (0.31 | ) | ||||||
|
Distributions to shareholders |
|||||||||||||||||
|---|---|---|---|---|---|---|---|---|---|---|---|---|---|---|---|---|---|
| From net
investment income |
In excess of net investment income |
Total
distributions |
Net asset
value, end of period |
Total
returna |
Net assets
at end of period (in 000s) |
Ratio of
net expenses to average net assets |
|||||||||||
| $ — | $ — | $ — | $10.83 | 16.95 | % | $64,279 | 2.11 | % | |||||||||
| — | — | — | 10.72 | 16.40 | 2,187 | 2.61 | |||||||||||
| — | — | — | 10.75 | 16.34 | 1,304 | 2.61 | |||||||||||
| — | — | — | 11.02 | 17.61 | 145,774 | 1.46 | |||||||||||
| — | — | — | 10.63 | 17.46 | 2 | 1.96 | |||||||||||
| — | — | — | 9.26 | 31.53 | 65,698 | 2.04 | b | ||||||||||
| — | — | — | 9.21 | 31.01 | 972 | 2.54 | b | ||||||||||
| — | — | — | 9.24 | 31.06 | 1,095 | 2.54 | b | ||||||||||
| — | — | — | 9.37 | 32.16 | 108,574 | 1.39 | b | ||||||||||
| — | — | — | 9.05 | 31.73 | 2 | 1.89 | b | ||||||||||
| (0.07 | ) | (0.22) | (0.29 | ) | 7.04 | (24.32 | ) | 52,704 | 2.09 | ||||||||
| (0.07 | ) | (0.21) | (0.28 | ) | 7.03 | (24.51 | ) | 459 | 2.59 | ||||||||
| (0.07 | ) | (0.20) | (0.27 | ) | 7.05 | (24.43 | ) | 273 | 2.59 | ||||||||
| (0.08 | ) | (0.23) | (0.31 | ) | 7.09 | (23.66 | ) | 90,189 | 1.35 | ||||||||
| (0.07 | ) | (0.21) | (0.28 | ) | 6.87 | (26.17 | ) | 1 | 1.85 | ||||||||
| — | — | — | 9.69 | (3.10 | ) | 17,681 | 1.90 | b | |||||||||
| — | — | — | 9.69 | (3.10 | ) | 64 | 2.41 | b | |||||||||
| — | — | — | 9.70 | (3.00 | ) | 73 | 2.48 | b | |||||||||
| — | — | — | 9.70 | (3.00 | ) | 19,120 | 1.30 | b | |||||||||
| — | — | — | 9.69 | (3.10 | ) | 2 | 2.72 | b | |||||||||
| EMERGING MARKETS EQUITY FUND (continued)
|
| Ratios assuming no
expense reductions |
|||||||||||||
|---|---|---|---|---|---|---|---|---|---|---|---|---|---|
| Ratio of net
investment income (loss) to average net assets |
Ratio of
expenses to average net assets |
Ratio of net
investment income (loss) to average net assets |
Portfolio
turnover rate |
||||||||||
| For the Year Ended August 31, | |||||||||||||
| 2000 - Class A Shares | (0.49 | )% | 2.30 | % | (0.68 | )% | 125.35 | % | |||||
| 2000 - Class B Shares | (1.00 | ) | 2.80 | (1.19 | ) | 125.35 | |||||||
| 2000 - Class C Shares | (0.96 | ) | 2.80 | (1.15 | ) | 125.35 | |||||||
| 2000 - Institutional Shares | 0.13 | 1.65 | (0.06 | ) | 125.35 | ||||||||
| 2000 - Service Shares | 0.14 | 2.15 | (0.05 | ) | 125.35 | ||||||||
| For the Seven Months Ended August 31, | |||||||||||||
| 1999 - Class A Shares | (0.15 | ) b | 2.41 | b | (0.52 | ) b | 63.24 | ||||||
| 1999 - Class B Shares | (0.71 | ) b | 2.91 | b | (281.08 | ) b | 63.24 | ||||||
| 1999 - Class C Shares | (0.85 | ) b | 2.91 | b | (1.22 | ) b | 63.24 | ||||||
| 1999 - Institutional Shares | 0.50 | b | 1.76 | b | 0.13 | b | 63.24 | ||||||
| 1999 - Service Shares | 0.12 | b | 2.26 | b | (0.25 | ) b | 63.24 | ||||||
| For the Year Ended January 31, | |||||||||||||
| 1999 - Class A Shares | 0.80 | 2.53 | 0.36 | 153.67 | |||||||||
| 1999 - Class B Shares | 0.19 | 3.03 | (0.25 | ) | 153.67 | ||||||||
| 1999 - Class C Shares | 0.28 | 3.03 | (0.16 | ) | 153.67 | ||||||||
| 1999 - Institutional Shares | 1.59 | 1.79 | 1.15 | 153.67 | |||||||||
| 1999 - Service Shares | (1.84 | ) | 2.29 | (2.28 | ) | 153.67 | |||||||
| For the Period Ended January 31, | |||||||||||||
| 1998 - Class A Shares (commenced December 15, 1997) | 0.55 | b | 5.88 | b | (3.43 | ) b | 3.35 | ||||||
| 1998 - Class B Shares (commenced December 15, 1997) | 0.05 | b | 6.39 | b | (3.93 | ) b | 3.35 | ||||||
| 1998 - Class C Shares (commenced December 15, 1997) | (0.27 | ) b | 6.46 | b | (4.25 | ) b | 3.35 | ||||||
| 1998 - Institutional Shares (commenced December 15, 1997) | 0.80 | b | 5.28 | b | (3.18 | ) b | 3.35 | ||||||
| 1998 - Service Shares (commenced December 15, 1997) | (0.05 | ) b | 6.70 | b | (4.03 | ) b | 3.35 | ||||||
| ASIA GROWTH FUND
|
| Income from
investment operations |
||||||||||||
|---|---|---|---|---|---|---|---|---|---|---|---|---|
|
Net asset value, beginning of period |
Net
investment income (loss) |
Net realized
and unrealized gain (loss) |
Total
from investment operations |
|||||||||
| For the Year Ended August 31, | ||||||||||||
| 2000 - Class A Shares | $11.07 | $(0.05 | ) c | $0.14 | $ 0.09 | |||||||
| 2000 - Class B Shares | 10.88 | (0.11 | ) c | 0.14 | 0.03 | |||||||
| 2000 - Class C Shares | 10.85 | (0.11 | ) c | 0.14 | 0.03 | |||||||
| 2000 - Institutional Shares | 11.24 | 0.01 | c | 0.16 | 0.17 | |||||||
| For the Seven-Month Period Ended August 31, | ||||||||||||
| 1999 - Class A Shares | 7.79 | (0.02 | ) | 3.30 | 3.28 | |||||||
| 1999 - Class B Shares | 7.68 | (0.04 | ) | 3.24 | 3.20 | |||||||
| 1999 - Class C Shares | 7.68 | (0.04 | ) | 3.21 | 3.17 | |||||||
| 1999 - Institutional Shares | 7.91 | 0.01 | 3.36 | 3.37 | ||||||||
| For the Years Ended January 31, | ||||||||||||
| 1999 - Class A Shares | 8.38 | 0.07 | (0.66 | ) | (0.59 | ) | ||||||
| 1999 - Class B Shares | 8.31 | 0.01 | (0.64 | ) | (0.63 | ) | ||||||
| 1999 - Class C Shares | 8.29 | — | (0.61 | ) | (0.61 | ) | ||||||
| 1999 - Institutional Shares | 8.44 | 0.03 | (0.56 | ) | (0.53 | ) | ||||||
| 1998 - Class A Shares | 16.31 | — | (7.90 | ) | (7.90 | ) | ||||||
| 1998 - Class B Shares | 16.24 | 0.01 | (7.91 | ) | (7.90 | ) | ||||||
| 1998 - Class C Shares (commenced August 15, 1997) | 15.73 | 0.01 | (7.42 | ) | (7.41 | ) | ||||||
| 1998 - Institutional Shares | 16.33 | 0.10 | (7.96 | ) | (7.86 | ) | ||||||
| 1997 - Class A Shares | 16.49 | 0.06 | (0.11 | ) | (0.05 | ) | ||||||
| 1997 - Class B Shares (commenced May 1, 1996) | 17.31 | (0.05 | ) | (0.48 | ) | (0.53 | ) | |||||
| 1997 - Institutional Shares (commenced February 2, 1996) | 16.61 | 0.04 | (0.11 | ) | (0.07 | ) | ||||||
| 1996 - Class A Shares | 13.31 | 0.17 | 3.44 | 3.61 | ||||||||
|
Distributions to shareholders |
|||||||||||||||||||||
|---|---|---|---|---|---|---|---|---|---|---|---|---|---|---|---|---|---|---|---|---|---|
| From net
investment income |
In excess
of net investment income |
From net
realized gains |
Total
distributions |
Net asset
value, end of period |
Total
returna |
Net assets
at end of period (in 000s) |
Ratio of
net expenses to average net assets |
||||||||||||||
| $ — | $ — | $ — | $ — | $11.16 | 0.72 | % | $ 86,458 | 1.85 | % | ||||||||||||
| — | — | — | — | 10.91 | 0.18 | 6,849 | 2.35 | ||||||||||||||
| — | — | — | — | 10.88 | 0.18 | 2,265 | 2.35 | ||||||||||||||
| — | — | — | — | 11.41 | 1.42 | 5,236 | 1.20 | ||||||||||||||
| — | |||||||||||||||||||||
| — | — | — | — | 11.07 | 42.11 | 84,269 | 1.85 | b | |||||||||||||
| — | — | — | — | 10.88 | 41.67 | 7,258 | 2.35 | b | |||||||||||||
| — | — | — | — | 10.85 | 41.28 | 2,281 | 2.35 | b | |||||||||||||
| — | (0.04 | ) | — | (0.04 | ) | 11.24 | 42.61 | 12,363 | 1.20 | b | |||||||||||
| — | |||||||||||||||||||||
| — | — | — | — | 7.79 | (7.04 | ) | 59,940 | 1.93 | |||||||||||||
| — | — | — | — | 7.68 | (7.58 | ) | 4,190 | 2.45 | |||||||||||||
| — | — | — | — | 7.68 | (7.36 | ) | 999 | 2.45 | |||||||||||||
| — | — | — | — | 7.91 | (6.28 | ) | 4,200 | 1.16 | |||||||||||||
| — | (0.03 | ) | — | (0.03 | ) | 8.38 | (48.49 | ) | 87,437 | 1.75 | |||||||||||
| — | (0.03 | ) | — | (0.03 | ) | 8.31 | (48.70 | ) | 3,359 | 2.30 | |||||||||||
| — | (0.03 | ) | — | (0.03 | ) | 8.29 | (47.17 | ) | 436 | 2.35 | b | ||||||||||
| (0.03 | ) | — | — | (0.03 | ) | 8.44 | (48.19 | ) | 874 | 1.11 | |||||||||||
| (0.12 | ) | — | (0.01 | ) | (0.13 | ) | 16.31 | (1.01 | ) | 263,014 | 1.67 | ||||||||||
| (0.51 | ) | (0.03 | ) | — | (0.54 | ) | 16.24 | (6.02 | ) | 3,354 | 2.21 | b | |||||||||
| (0.11 | ) | (0.06 | ) | (0.04 | ) | (0.21 | ) | 16.33 | (1.09 | ) | 13,322 | 1.10 | b | ||||||||
| (0.12 | ) | (0.14 | ) | (0.17 | ) | (0.43 | ) | 16.49 | 26.49 | 205,539 | 1.77 | ||||||||||
| ASIA GROWTH FUND (continued)
|
| Ratios assuming no
expense reductions |
|||||||||||||
|---|---|---|---|---|---|---|---|---|---|---|---|---|---|
| Ratio of net
investment income (loss) to average net assets |
Ratio of
expenses to average net assets |
Ratio of net
investment income (loss) to average net assets |
Portfolio
turnover rate |
||||||||||
| For the Year Ended August 31, | |||||||||||||
| 2000 - Class A Shares | (0.39 | )% | 2.30 | % | (0.84 | )% | 207.22 | % | |||||
| 2000 - Class B Shares | (0.91 | ) | 2.80 | (1.36 | ) | 207.22 | |||||||
| 2000 - Class C Shares | (0.91 | ) | 2.80 | (1.36 | ) | 207.22 | |||||||
| 2000 - Institutional Shares | 0.12 | 1.65 | (0.33 | ) | 207.22 | ||||||||
| For the Seven-Month Period Ended August 31, | |||||||||||||
| 1999 - Class A Shares | (0.38 | ) b | 2.27 | b | (0.80 | ) b | 96.58 | ||||||
| 1999 - Class B Shares | (0.90 | ) b | 2.77 | b | (1.32 | ) b | 96.58 | ||||||
| 1999 - Class C Shares | (0.89 | ) b | 2.77 | b | (1.31 | ) b | 96.58 | ||||||
| 1999 - Institutional Shares | (0.14 | ) b | 1.62 | b | (0.28 | ) b | 96.58 | ||||||
| For the Years Ended January 31, | |||||||||||||
| 1999 - Class A Shares | 0.63 | 2.48 | 0.08 | 106.00 | |||||||||
| 1999 - Class B Shares | 0.10 | 2.97 | (0.42 | ) | 106.00 | ||||||||
| 1999 - Class C Shares | 0.10 | 2.97 | (0.42 | ) | 106.00 | ||||||||
| 1999 - Institutional Shares | 1.10 | 1.68 | 0.58 | 106.00 | |||||||||
| 1998 - Class A Shares | 0.31 | 1.99 | 0.07 | 105.16 | |||||||||
| 1998 - Class B Shares | (0.29 | ) | 2.50 | (0.49 | ) | 105.16 | |||||||
| 1998 - Class C Shares (commenced August 15, 1997) | (0.26 | ) b | 2.55 | b | (0.46 | ) b | 105.16 | ||||||
| 1998 - Institutional Shares | 0.87 | 1.31 | 0.67 | 105.16 | |||||||||
| 1997 - Class A Shares | 0.20 | 1.87 | — | 48.40 | |||||||||
| 1997 - Class B Shares (commenced May 1, 1996) | (0.56 | ) b | 2.37 | b | (0.72 | ) b | 48.40 | ||||||
| 1997 - Institutional Shares (commenced February 2, 1996) | 0.54 | b | 1.26 | b | 0.38 | b | 48.40 | ||||||
| 1996 - Class A Shares | 1.05 | 2.02 | 0.80 | 88.80 | |||||||||
a
|
Assumes investment at the net asset value at the beginning of the period, reinvestment of all dividends and
distributions, a complete redemption of the investment at the net asset value at the end of the period and no sales or redemption charges. Total return would be reduced if a sales or redemption charge were taken into account. Total returns for periods
less than one full year are not annualized.
|
b
|
Annualized.
|
c
|
Calculated based on the average shares outstanding methodology.
|
| FOR MORE INFORMATION
|
| Annual/Semi-annual Report
|
| Additional information about the Funds’ investments is available in the Funds’ annual and semi-annual reports to
shareholders. In the Funds’ annual reports, you will find a discussion of the market conditions and investment strategies that significantly affected the Funds’ performance during the last fiscal year.
|
| Statement of Additional Information
|
| Additional information about the Funds and their policies is also available in the Funds’ Statement of Additional Information
(“Additional Statement”). The Additional Statement is incorporated by reference into this Prospectus (is legally considered part of this Prospectus).
|
| The Funds’ annual and semi-annual reports, and the Additional Statement, are available free upon request by calling Goldman
Sachs at 1-800-621-2550.
|
| To obtain other information and for shareholder inquiries:
|
| By telephone – Call 1-800-621-2550
|
| By mail – Goldman Sachs Funds, 4900 Sears Tower, Chicago, IL 60606-6372
|
| By e-mail – [email protected]
|
| On the Internet – Text-only versions of the Funds’ documents are located online and may be downloaded from:
|
| SEC EDGAR database – http://www.sec.gov
|
| You may review and obtain copies of Fund documents by visiting the SEC’s Public Reference Room in Washington, D.C. You may
also obtain copies of Fund documents, after paying a duplicating fee, by writing to the SEC’s Public Reference Section, Washington, D.C. 20549-0102 or by electronic request to: [email protected]. Information on the operation of the public reference
room may be obtained by calling the SEC at (202) 942-8090.
|
| The Funds’ investment company registration number is 811-5349.
|
| CORE
SM
is a service mark of Goldman, Sachs & Co.
|
| Prospectus
|
| GOLDMAN SACHS INTERNATIONAL EQUITY FUNDS
|

| THE SECURITIES AND EXCHANGE COMMISSION HAS NOT APPROVED OR DISAPPROVED THESE SECURITIES OR PASSED UPON THE ADEQUACY OF THIS PROSPECTUS.
ANY REPRESENTATION TO THE CONTRARY IS A CRIMINAL OFFENSE.
|
| AN INVESTMENT IN A FUND IS NOT A BANK DEPOSIT AND IS NOT INSURED BY THE FEDERAL DEPOSIT INSURANCE CORPORATION OR ANY OTHER GOVERNMENT
AGENCY. AN INVESTMENT IN A FUND INVOLVES INVESTMENT RISKS, INCLUDING POSSIBLE LOSS OF PRINCIPAL.
|
n
|
Goldman Sachs CORE
SM
International Equity Fund
|
n
|
Goldman Sachs International Equity Fund
|
n
|
Goldman Sachs European Equity Fund
|
n
|
Goldman Sachs Japanese Equity Fund
|
n
|
Goldman Sachs International Growth Opportunities Fund (formerly
International Small Cap Fund)
|
n
|
Goldman Sachs Emerging Markets Equity Fund
|
n
|
Goldman Sachs Asia Growth Fund
|

| NOT FDIC-INSURED
|
May Lose Value
|
No Bank Guarantee
|
| Goldman Sachs Asset Management, a unit of the Investment Management Division of Goldman, Sachs & Co. (“Goldman
Sachs”), serves as investment adviser to the CORE International Equity Fund. Goldman Sachs Asset Management International serves as investment adviser to International Equity, European Equity, Japanese Equity, International Growth Opportunities,
Emerging Markets Equity and Asia Growth Funds. Goldman Sachs Asset Management and Goldman Sachs Asset Management International are each referred to in this Prospectus as the “Investment Adviser.”
|
| ACTIVE INTERNATIONAL STYLE FUNDS
|
| Goldman Sachs’ Active International Investment Philosophy:
|
| Belief | How the Investment Adviser Acts on Belief | ||
|---|---|---|---|
| n Equity markets are inefficient | Seeks excess return through team driven, research
intensive and bottom-up stock selection. |
||
| n Returns are variable | Seeks to capitalize on variability of market and regional
returns through asset allocation decisions. |
||
| n
Corporate fundamentals
ultimately drive share price |
Seeks to conduct rigorous, first-hand research of business
and company management. |
||
| n A
business’ intrinsic value will be
achieved over time |
Seeks to realize value through a long-term investment
horizon. |
||
| n
Portfolio risk must be carefully
analyzed and monitored |
Seeks to systematically monitor and manage risk through
diversification, multifactor risk models and currency management. |
||
| The Investment Adviser attempts to manage risk in these Funds through disciplined portfolio construction and continual portfolio
review and analysis. As a result, bottom-up stock selection, driven by fundamental research, should be a main driver of returns.
|
| QUANTITATIVE (“CORE”) STYLE FUNDS
|
| Goldman Sachs’ CORE Investment Philosophy:
|
| Goldman Sachs’ quantitative style of funds—CORE—emphasizes the two building blocks of active management: stock
selection and portfolio construction.
|
| I. CORE STOCK SELECTION
|
| The CORE Fund uses the Goldman Sachs proprietary multifactor model (“Multifactor Model”), a rigorous computerized rating
system, to forecast the returns of securities held in the Fund’s portfolio. The Multifactor Model incorporates common variables covering measures of:
|
n
|
Value (How is the company priced relative to fundamental accounting measures?)
|
n
|
Price Momentum (What are medium-term price trends?)
|
n
|
Earnings Momentum (Are company profit expectations growing?)
|
n
|
Stability (How likely is the risk of earnings disappointment?)
|
| All of the above factors are carefully evaluated within the Multifactor Model since each has demonstrated a significant
impact on the performance of the securities and markets they were designed to forecast. Stock selection in this process combines both our quantitative and qualitative analysis.
|
| II. CORE PORTFOLIO CONSTRUCTION
|
| Portfolio risk is monitored with the use of a sophisticated risk model, which measures the portfolio’s exposure to a variety
of risk factors and estimates the associated volatility. In this process, the Investment Adviser manages risk by attempting to limit deviations from the benchmark and by attempting to run a size and sector neutral portfolio. A computer optimizer evaluates many different security combinations (considering many possible weightings) in an effort to construct the most efficient risk/return portfolio given each CORE Fund benchmark. In addition, the CORE International
Equity Fund utilizes proprietary quantitative models to allocate assets across countries.
|
| Goldman Sachs CORE Funds are fully invested, broadly diversified and offer consistent overall portfolio characteristics. They may
serve as good foundations on which to build a portfolio.
|
| FUND FACTS
|
|
| Objective:
|
Long-term growth of capital
|
| Benchmark
|
MSCI® Europe, Australasia, Far East (“EAFE®”) Index (unhedged) |
| Investment Focus:
|
Large-capitalization equity securities of companies that are organized outside the United States or whose securities are primarily traded outside
the United States
|
| Investment Style:
|
Quantitative
|
| INVESTMENT OBJECTIVE
|
| The Fund seeks long-term growth of capital. The Fund seeks this objective through a broadly diversified portfolio of equity
securities of large-cap companies that are organized outside the United States or whose securities are principally traded outside the United States.
|
| PRINCIPAL INVESTMENT STRATEGIES
|
| Equity Securities. The Fund invests, under normal circumstances, at least 90% of its total assets in equity securities of companies that are organized outside the United States or whose securities are principally traded outside the United States.
|
| The Fund may allocate its assets among countries as determined by the Investment Adviser from time to time, provided the Fund’
s assets are invested in at least three foreign countries. The Fund may invest in the securities of issuers in countries with emerging markets or economies (“emerging countries”).
|
| The Fund seeks broad representation of large-cap issuers across major countries and sectors of the international economy. The
Fund’s investments are selected using both a variety of quantitative techniques and fundamental research in seeking to maximize the Fund’s expected return, while maintaining risk, style, capitalization and industry characteristics similar to the
EAFE® Index. In addition, the Fund seeks a portfolio composed of companies with attractive valuations and stronger momentum characteristics than the EAFE® Index.
|
| Other.
The Fund’s investments in fixed-income securities are limited to securities that are considered to be cash equivalents.
|
| FUND FACTS
|
|
| Objective:
|
Long-term capital appreciation
|
| Benchmark:
|
MSCI® EAFE® Index (unhedged)
|
| Investment Focus:
|
Equity securities of companies organized outside the United States or whose securities are principally traded outside the United States
|
| Investment Style:
|
Active International
|
| INVESTMENT OBJECTIVE
|
| The Fund seeks long-term capital appreciation.
|
| PRINCIPAL INVESTMENT STRATEGIES
|
| Equity Securities. The Fund invests, under normal circumstances, substantially all, and at least 65% of its total assets in equity securities of companies that are organized outside the United States or whose securities are principally traded outside the United States. The
Fund intends to invest in companies with public stock market capitalizations that are larger than $1 billion at the time of investment.
|
| The Fund may allocate its assets among countries as determined by the Investment Adviser from time to time provided that the
Fund’s assets are invested in at least three foreign countries.
|
| The Fund expects to invest a substantial portion of its assets in the securities of issuers located in the developed countries of
Western Europe and in Japan. However, the Fund may also invest in the securities of issuers located in Australia, Canada, New Zealand and in emerging countries. Currently, emerging countries include, among others, most Latin American, African, Asian and
Eastern European nations.
|
| Other.
The Fund may also invest up to 35% of its total assets in fixed-income securities, such as government, corporate and bank debt obligations.
|
| FUND FACTS
|
|
| Objective:
|
Long-term capital appreciation
|
| Benchmark:
|
MSCI® Europe Index (unhedged)
|
| Investment Focus:
|
Equity securities of European companies
|
| Investment Style:
|
Active International
|
| INVESTMENT OBJECTIVE
|
| The Fund seeks long-term capital appreciation.
|
| PRINCIPAL INVESTMENT STRATEGIES
|
| Equity Securities. The Fund invests, under normal circumstances, substantially all, and at least 65% of its total assets in equity securities of European companies. Because of its focus, the Fund will be more susceptible to European economic, market, political and local
risks than a fund that is more geographically diversified.
|
| A European issuer is a company that either:
|
n
|
Has a class of its securities whose principal securities markets are in European countries;
|
n
|
Is organized under the laws of, or has a principal office in, a European country;
|
n
|
Derives 50% or more of its total revenue from goods produced, sales made or services provided in one or more of the European
countries; or
|
n
|
Maintains 50% or more of its assets in one or more of the European countries.
|
| The Fund may allocate its assets among different countries as determined by the Investment Adviser from time to time, provided
that the Fund’s assets are invested in at least three European countries. It is currently anticipated that a majority of the Fund’s assets will be invested in the equity securities of large cap companies located in the developed countries of
Western Europe. However, the Fund may also invest, without limit, in mid cap companies and small cap companies, as well as companies located in emerging countries. Currently, emerging countries include among others, most Latin and South American, African,
Asian and Eastern European nations, including the states that formerly comprised the Soviet Union and Yugoslavia.
|
| Other.
The Fund may invest in the aggregate up to 35% of its total assets in equity securities of non-European countries and in fixed-income securities, such as government, corporate and bank debt obligations.
|
| FUND FACTS
|
|
| Objective:
|
Long-term capital appreciation
|
| Benchmark:
|
Tokyo Price Index (“TOPIX”) (unhedged)
|
| Investment Focus:
|
Equity securities of Japanese companies
|
| Investment Style:
|
Active International
|
| INVESTMENT OBJECTIVE
|
| The Fund seeks long-term capital appreciation.
|
| PRINCIPAL INVESTMENT STRATEGIES
|
| Equity Securities. The Fund invests, under normal circumstances, substantially all, and at least 65% of its total assets in equity securities of Japanese companies. A Japanese issuer is a company that either:
|
n
|
Has a class of its securities whose principal securities markets is in Japan;
|
n
|
Is organized under the laws of, or has a principal office in, Japan;
|
n
|
Derives 50% or more of its total revenue from goods produced, sales made or services provided in Japan; or
|
n
|
Maintains 50% or more of its assets in Japan.
|
| The Fund’s concentration in Japanese companies will expose it to the risk of adverse social, political and economic events
which occur in Japan or affect the Japanese markets.
|
| Japan’s economy, the second largest in the world, has grown substantially over the last three decades. Japan’s economic
growth in the 1990’s, however, was substantially below the level of earlier decades, and its economy drifted between modest growth and recession. In calendar year 1998, Japan’s gross national product contracted by 2.8% — its worst
performance in the post-war period. To address this economic downturn, Japan has attempted to implement changes related to high wages and taxes, currency valuations, structural rigidities, political reform and the deregulation of its economy. These
initiatives have, however, resulted in
|
| notable uncertainty and loss of public confidence. These conditions present risks to the Japanese Equity Fund and its ability to
attain its investment objective.
|
| Japan’s economy is heavily dependent upon international trade, and is especially sensitive to trade barriers and disputes. In
particular, Japan relies on large imports of agricultural products, raw materials and fuels. A substantial rise in world oil or commodity prices, or a fall-off in Japan’s manufactured exports, could be expected to adversely affect Japan’s
economy. In addition, Japan is vulnerable to earthquakes, volcanoes and other natural disasters. Japan’s banking industry has recently suffered from non-performing loans, lower real estate values and lower valuations of securities holdings.
|
| The Japanese securities markets are less regulated than the U.S. markets. Evidence has emerged from time to time of distortion of
market prices to serve political or other purposes. Shareholders’ rights are also not always equally enforced.
|
| For most of the 1990’s, Japanese securities markets experienced significant declines. Although the stock markets exhibited
strength in 1999, they have again generally declined through the first three quarters of 2000.
|
| The common stocks of many Japanese companies have historically traded at high price-earnings ratios. Differences in accounting
methods have made it difficult to compare the earnings of Japanese companies with those of companies in other countries, especially the United States. Reported net income in Japan has been generally understated relative to U.S. accounting standards and
this has been one reason price-earnings ratios of the stocks of Japanese companies have tended historically to be higher than those of U.S. stocks. In addition, Japanese companies have tended to have higher growth rates than U.S. companies, and Japanese
interest rates have generally been lower than U.S. interest rates. These factors have contributed to lower discount rates and higher price-earnings ratios in Japan than in the United States.
|
| Other.
The Fund may invest in the aggregate up to 35% of its total assets in equity securities of non-Japanese companies and in fixed-income securities, such as government, corporate and bank debt obligations.
|
| FUND FACTS
|
|
| Objective:
|
Long-term capital appreciation
|
| Benchmark:
|
MSCI® EAFE® Small Cap Index (unhedged)
|
| Investment Focus:
|
Small-capitalization foreign equity securities
|
| Investment Style:
|
Active International
|
| INVESTMENT OBJECTIVE
|
| The Fund seeks long-term capital appreciation.
|
| PRINCIPAL INVESTMENT STRATEGIES
|
| Equity Securities. The Fund invests, under normal circumstances, substantially all, and at least 65% of its total assets in equity securities of companies:
|
n
|
With public stock market capitalizations (based upon shares available for trading on an unrestricted basis) within $100 million
and $3 billion, at the time of investment; and
|
n
|
That are organized outside the United States or whose securities are principally traded outside the United States.
|
| The Fund seeks to achieve its investment objective by investing in a diversified portfolio of equity securities that are
considered by the Investment Adviser to be strategically positioned for long-term growth.
|
| The Fund may allocate its assets among countries as determined by the Investment Adviser from time to time provided that the
Fund’s assets are invested in at least three foreign countries. The Fund expects to invest a substantial portion of its assets in securities of companies in the developed countries of Western Europe, Japan and Asia. However, the Fund may also invest
in the securities of issuers located in Australia, Canada, New Zealand and in emerging countries. Currently, emerging countries include, among others, most Latin American, African, Asian and Eastern European nations.
|
| Other.
The Fund may invest in the aggregate up to 35% of its total assets in equity securities of companies with public stock market capitalizations outside the range of the market capitalization range stated above at the time of investment and in fixed-income
securities, such as government, corporate and bank debt obligations. If the market capitalization of a company held by the Fund moves outside the range stated above, the Fund may, consistent with its investment objective, continue to hold the security.
|
| FUND FACTS
|
|
| Objective:
|
Long-term capital appreciation
|
| Benchmark:
|
MSCI® Emerging Markets Free Index
|
| Investment Focus:
|
Equity securities of emerging country issuers
|
| Investment Style:
|
Active International
|
| INVESTMENT OBJECTIVE
|
| The Fund seeks long-term capital appreciation.
|
| PRINCIPAL INVESTMENT STRATEGIES
|
| Equity Securities. The Fund invests, under normal circumstances, substantially all, and at least 65% of its total assets in equity securities of emerging country issuers. The Investment Adviser may consider classifications by the World Bank, the International Finance
Corporation or the United Nations and its agencies in determining whether a country is emerging or developed. Currently, emerging countries include, among others, most Latin and South American, African, Asian and Eastern European nations. The Investment
Adviser currently intends that the Fund’s investment focus will be in the following emerging countries as well as any other emerging country to the extent that foreign investors are permitted by applicable law to make such investments:
|
| n Argentina | n Egypt | n Jordan | n Philippines | n Taiwan | ||||
| n Botswana | n Greece | n Kenya | n Poland | n Thailand | ||||
| n Brazil | n Hong Kong | n Malaysia | n Russia | n Turkey | ||||
| n Chile | n Hungary | n Mexico | n Singapore | n Venezuela | ||||
| n China | n India | n Morocco | n South Africa | n Zimbabwe | ||||
| n Colombia | n Indonesia | n Pakistan | n South Korea | |||||
| n Czech Republic | n Israel | n Peru | n Sri Lanka |
| An emerging country issuer is any company that either:
|
n
|
Has a class of its securities whose principal securities market is in an emerging country;
|
n
|
Is organized under the laws of, or has a principal office in, an emerging country;
|
n
|
Derives 50% or more of its total revenue from goods produced, sales made or services provided in one or more emerging countries; or
|
n
|
Maintains 50% or more of its assets in one or more of the emerging countries.
|
| Under normal circumstances, the Fund maintains investments in at least six emerging countries, and will not invest more than 35%
of its total assets in securities of issuers in any one emerging country. Allocation of the Fund’s investments will depend upon the relative attractiveness of the emerging country markets and particular issuers. In addition, macro-economic factors
and the portfolio managers’ and Goldman Sachs economists’ views of the relative attractiveness of emerging countries and currencies are considered in allocating the Fund’s assets among emerging countries.
|
| Other.
The Fund may invest in the aggregate up to 35% of its total assets in (i) fixed-income securities of private and government emerging country issuers; and (ii) equity and fixed-income securities, such as government, corporate and bank debt obligations, of
issuers in developed countries.
|
| FUND FACTS
|
|
| Objective:
|
Long-term capital appreciation
|
| Benchmark:
|
MSCI® All Country Asia Free
ex-Japan Index (unhedged) |
| Investment Focus:
|
Equity securities of companies in Asian countries
|
| Investment Process:
|
Active International
|
| INVESTMENT OBJECTIVE
|
| The Fund seeks long-term capital appreciation.
|
| PRINCIPAL INVESTMENT STRATEGIES
|
| Equity Securities. The Fund invests, under normal circumstances, substantially all, and at least 65% of its total assets in equity securities of Asian issuers.
|
| An Asian issuer is any company that either:
|
n
|
Has a class of its securities whose principal securities markets is in one or more Asian countries;
|
n
|
Is organized under the laws of, or has a principal office in, an Asian country;
|
n
|
Derives 50% or more of its total revenue from goods produced, sales made or services provided in one or more Asian countries; or
|
n
|
Maintains 50% or more of its assets in one or more Asian countries.
|
| The Fund may allocate its assets among the Asian countries as determined from time to time by the Investment Adviser. For purposes
of the Fund’s investment policies, Asian countries are:
|
| n China
n
Hong Kong
n
India
n
Indonesia
|
n Malaysia
n
Pakistan
n
Philippines
n
Singapore
|
n South Korea
n
Sri Lanka
n
Taiwan
n
Thailand
|
| as well as any other country in Asia (other than Japan) to the extent that foreign investors are permitted by applicable law to
make such investments.
|
| Allocation of the Fund’s investments will depend upon the Investment Adviser’s views of the relative attractiveness of
the Asian markets and particular issuers.
|
| Concentration of the Fund’s assets in one or a few of the Asian countries and Asian currencies will subject the Fund to
greater risks than if the Fund’s assets were not so concentrated. For example, on August 31, 2000 (the end of the Fund’s last fiscal year), more than 25% of the Fund’s assets were invested in securities that traded in Hong Kong.
|
| Starting in mid-1997 some Pacific region countries began to experience currency devaluations that resulted in high interest rate
levels and sharp reductions in economic activity. This situation resulted in a significant drop in the securities prices of companies located in the region. Some countries have recently experienced government intervention, have sought assistance from the
International Monetary Fund and have experienced substantial domestic unrest. Although some restructuring has been undertaken, there can be no assurance that these efforts will be successful or that their recent problems will not persist. At the end of
its last fiscal year, a substantial portion of the Asia Growth Fund was invested in securities traded in the Hong Kong market. In 1997, the sovereignty of Hong Kong reverted from the United Kingdom to China. Although Hong Kong is, by law, to maintain a
high degree of autonomy, there can be no assurance that Hong Kong will not be adversely affected by Chinese sovereignty or political developments. Furthermore, the reversion of Hong Kong to China has created additional uncertainty as to future currency
valuations relative to the U.S. dollar. Because the Hong Kong stock market has significant exposure to the property market in Hong Kong, the Fund’s investments could be adversely affected by a decline in that market.
|
| Other.
The Fund may invest in the aggregate up to 35% of its total assets in equity securities of issuers in non-Asian countries and Japan, and in fixed-income securities, such as government, corporate and bank debt obligations.
|
| CORE
International Equity Fund |
International
Equity Fund |
European
Equity Fund |
|||||
|---|---|---|---|---|---|---|---|
| Investment Practices | |||||||
| Borrowings | 33 1
/3
|
33 1
/3
|
33 1
/3
|
||||
| Cross Hedging of Currencies | Ÿ | Ÿ | Ÿ | ||||
| Currency Swaps* | 15 | 15 | 15 | ||||
| Custodial Receipts | Ÿ | Ÿ | Ÿ | ||||
| Equity Swaps* | 15 | 15 | 15 | ||||
| Foreign Currency Transactions | Ÿ | Ÿ | Ÿ | ||||
| Futures Contracts and Options on Futures Contracts | Ÿ | Ÿ | Ÿ | ||||
| Investment Company Securities (including iShares
SM
and Standard & Poor’s Depositary Receipts TM ) |
10 | 10 | 10 | ||||
| Options on Foreign Currencies 1 | Ÿ | Ÿ | Ÿ | ||||
| Options on Securities and Securities Indices 2 | Ÿ | Ÿ | Ÿ | ||||
| Unseasoned Companies | Ÿ | Ÿ | Ÿ | ||||
| Warrants and Stock Purchase Rights | Ÿ | Ÿ | Ÿ | ||||
| Repurchase Agreements | Ÿ | Ÿ | Ÿ | ||||
| Securities Lending | 33 1
/3
|
33 1
/3
|
33 1
/3
|
||||
| Short Sales Against the Box | — | 25 | 25 | ||||
| When-Issued Securities and Forward Commitments | Ÿ | Ÿ | Ÿ | ||||
|
Japanese Equity Fund |
International
Growth Opportunities Fund |
Emerging Markets Equity Fund |
Asia Growth Fund |
||||
|---|---|---|---|---|---|---|---|
| 33 1
/3
|
33 1
/3
|
33 1
/3
|
33 1
/3
|
||||
| Ÿ | Ÿ | Ÿ | Ÿ | ||||
| 15 | 15 | 15 | 15 | ||||
| Ÿ | Ÿ | Ÿ | Ÿ | ||||
| 15 | 15 | 15 | 15 | ||||
| Ÿ | Ÿ | Ÿ | Ÿ | ||||
| Ÿ | Ÿ | Ÿ | Ÿ | ||||
| 10 | 10 | 10 | 10 | ||||
| Ÿ | Ÿ | Ÿ | Ÿ | ||||
| Ÿ | Ÿ | Ÿ | Ÿ | ||||
| Ÿ | Ÿ | Ÿ | Ÿ | ||||
| Ÿ | Ÿ | Ÿ | Ÿ | ||||
| Ÿ | Ÿ | Ÿ | Ÿ | ||||
| 33 1
/3
|
33 1
/3
|
33 1
/3
|
33 1
/3
|
||||
| 25 | 25 | 25 | 25 | ||||
| Ÿ | Ÿ | Ÿ | Ÿ | ||||
Ÿ
|
No specific percentage limitation on usage;
limited only by the objectives and strategies of the Fund |
| CORE
International Equity Fund |
International
Equity Fund |
European
Equity Fund |
|||||
|---|---|---|---|---|---|---|---|
| Investment Securities | |||||||
| American, European and Global Depositary Receipts | Ÿ | Ÿ | Ÿ | ||||
| Asset-Backed and Mortgage-Backed Securities 2 | — | Ÿ | Ÿ | ||||
| Bank Obligations 1 , 2 | Ÿ | Ÿ | Ÿ | ||||
| Convertible Securities | Ÿ | Ÿ | Ÿ | ||||
| Corporate Debt Obligations 2 | Ÿ 4 | Ÿ | Ÿ | ||||
| Equity Securities | 90+ | 65+ | 65+ | ||||
| Emerging Country Securities | 25 | Ÿ | Ÿ | ||||
| Fixed Income Securities 3 | 10 4 | 35 | 35 5 | ||||
| Foreign Securities | Ÿ | Ÿ | Ÿ | ||||
| Foreign Government Securities 2 | Ÿ | Ÿ | Ÿ | ||||
| Non-Investment Grade Fixed Income Securities 2 | — | Ÿ 6 | Ÿ 6 | ||||
| Real Estate Investment Trusts | Ÿ | Ÿ | Ÿ | ||||
| Structured Securities * | Ÿ | Ÿ | Ÿ | ||||
| Temporary Investments | 35 | 100 | 100 | ||||
| U.S. Government Securities 2 | Ÿ | Ÿ | Ÿ | ||||
*
|
Limited to 15% of net assets (together with other illiquid securities) for all structured securities which are not
deemed to be liquid and all swap transactions.
|
1
|
Issued by U.S. or foreign banks.
|
2
|
Limited by the amount the Fund invests in fixed-income securities.
|
3
|
Except as noted under “Non-Investment Grade Fixed Income Securities,” fixed-income securities are investment
grade (e.g., BBB or higher by Standard & Poor’s Rating Group (“Standard & Poor’s”) or Baa or higher by Moody’s Investor’s Service, Inc. (“Moody’s”)).
|
4
|
Cash equivalents only.
|
5
|
The European Equity Fund may invest in the aggregate up to 35% of its total assets in: (1) equity securities of
non-European countries; and (2) fixed-income securities.
|
6
|
May be BB or lower by Standard & Poor’s or Ba or lower by Moody’s.
|
| Japanese
Equity Fund |
International
Growth Opportunities Fund |
Emerging
Markets Equity Fund |
Asia Growth
Fund |
|||||||
|---|---|---|---|---|---|---|---|---|---|---|
| Ÿ | Ÿ | Ÿ | Ÿ | |||||||
| Ÿ | Ÿ | Ÿ | Ÿ | |||||||
| Ÿ | Ÿ | Ÿ | Ÿ | |||||||
| Ÿ | Ÿ | Ÿ | Ÿ | |||||||
| Ÿ | Ÿ | Ÿ | Ÿ | |||||||
| 65 | + | 65+ | 65 | + | 65 | + | ||||
| Ÿ | Ÿ | Ÿ | Ÿ | |||||||
| 35 | 7 | 35 8 | 35 | 9 | 35 | 10 | ||||
| Ÿ | Ÿ | Ÿ | Ÿ | |||||||
| Ÿ | Ÿ | Ÿ | Ÿ | |||||||
| Ÿ | 6 | Ÿ |
Ÿ | 6 | Ÿ | 6 | ||||
| Ÿ | Ÿ | Ÿ | Ÿ | |||||||
| Ÿ | Ÿ | Ÿ | Ÿ | |||||||
| 100 | 100 | 35 | 100 | |||||||
| Ÿ | Ÿ | Ÿ | Ÿ | |||||||
7
|
The Japanese Equity Fund may invest in the aggregate up to 35% of its total assets in: (1) fixed-income securities; and
(2) equity securities of non-Japanese companies.
|
8
|
The International Growth Opportunities Fund may invest in the aggregate up to 35% of its total assets in (1) fixed-income
securities; and (2) equity securities of companies with public stock market capitalizations of less than $100 million or more than $3 billion at the time of investment.
|
9
|
The Emerging Markets Equity Fund may invest in the aggregate up to 35% of its total assets in: (1) fixed-income
securities of private and government emerging country issuers; and (2) equity and fixed-income securities of issuers in developed countries.
|
10
|
The Asia Growth Fund may invest in the aggregate up to 35% of its total assets in: (1) fixed-income securities; and (2)
equity securities of issuers in non-Asian countries and Japan.
|
| CORE
International Equity |
International
Equity |
European
Equity |
Japanese
Equity |
International
Growth Opportunities |
Emerging
Markets Equity |
Asia
Growth |
|||||||||
|---|---|---|---|---|---|---|---|---|---|---|---|---|---|---|---|
| Credit/Default | Ÿ | Ÿ | Ÿ | Ÿ | Ÿ | Ÿ | Ÿ | ||||||||
| Emerging Countries | Ÿ | Ÿ | Ÿ | Ÿ | Ÿ | Ÿ | Ÿ | ||||||||
| Interest Rate | Ÿ | Ÿ | Ÿ | Ÿ | Ÿ | Ÿ | Ÿ | ||||||||
| Small Cap | — | — | Ÿ | — | Ÿ | — | — | ||||||||
| Foreign | Ÿ | Ÿ | Ÿ | Ÿ | Ÿ | Ÿ | Ÿ | ||||||||
| Derivatives | Ÿ | Ÿ | Ÿ | Ÿ | Ÿ | Ÿ | Ÿ | ||||||||
| Management | Ÿ | Ÿ | Ÿ | Ÿ | Ÿ | Ÿ | Ÿ | ||||||||
| Market | Ÿ | Ÿ | Ÿ | Ÿ | Ÿ | Ÿ | Ÿ | ||||||||
| Liquidity | Ÿ | Ÿ | Ÿ | Ÿ | Ÿ | Ÿ | Ÿ | ||||||||
| Stock | Ÿ | Ÿ | Ÿ | Ÿ | Ÿ | Ÿ | Ÿ | ||||||||
| Geographic | — | — | Ÿ | Ÿ | — | Ÿ | — | ||||||||
| Initial Public
Offering (“IPO”) |
— | — | Ÿ | Ÿ | Ÿ | Ÿ | Ÿ | ||||||||
n
|
Credit/Default Risk—The risk that an issuer or guarantor of fixed-income securities held by a Fund may default
on its obligation to pay interest and repay principal.
|
n
|
Emerging Countries Risk—The securities markets of Asian, Latin and South American, Eastern European,
African and other emerging countries are less liquid, are especially subject to greater price volatility, have smaller market capitalizations, have less government regulation and are not subject to as extensive and frequent accounting, financial and other
reporting requirements as the securities markets of more developed countries. Further, investment in equity securities of issuers located in Russia and certain other emerging countries involves risk of loss result
ing from problems in share registration and custody and substantial economic and political disruptions. These risks are not normally associated with investment in more developed countries.
|
n
|
Interest Rate Risk—The risk that when interest rates increase, securities held by a Fund will decline in value.
Long-term fixed-income securities will normally have more price volatility because of this risk than short-term fixed-income securities.
|
n
|
Foreign Risk—The risk that when a Fund invests in foreign securities, it will be subject to risk of loss not
typically associated with domestic issuers. Loss may result because of less foreign government regulation, less public information and less economic, political and social stability. Loss may also result from the imposition of exchange controls,
confiscations and other government restrictions. A Fund will also be subject to the risk of negative foreign currency rate fluctuations. Foreign risks will normally be greatest when a Fund invests in issuers located in emerging countries.
|
n
|
Derivatives Risk—The risk that loss may result from a Fund’s investments in options, futures, swaps,
structured securities and other derivative instruments. These instruments may be leveraged so that small changes may produce disproportionate losses to a Fund.
|
n
|
Management Risk—The risk that a strategy used by the Investment Adviser may fail to produce the intended results.
|
n
|
Market Risk—The risk that the value of the securities in which a Fund invests may go up or down in response to
the prospects of individual companies, particular industry sectors and/or general economic conditions. Price changes may be temporary or last for extended periods. A Fund’s investments may be overweighted from time to time in one or more industry
sectors, which will increase the Fund’s exposure to risk of loss from adverse developments affecting those sectors.
|
n
|
Liquidity Risk—The risk that a Fund will not be able to pay redemption proceeds within the time period stated
in this Prospectus because of unusual market conditions, an unusually high volume of redemption requests, or other reasons. Funds that invest in non-investment grade fixed-income securities, small capitalization stocks, REITs or emerging country issuers
will be especially subject to the risk that during certain periods the liquidity of particular issuers or industries, or all securities within particular investment categories, will shrink or disappear suddenly and without warning as a result of adverse
economic, market or political events, or adverse investor perceptions whether or not accurate. The Goldman Sachs Asset Allocation Portfolios (the “Asset Allocation Portfolios”) expect to invest a significant percentage of their assets in the
Funds and other funds for which Goldman Sachs now or in the future acts as investment adviser or underwriter. Redemptions by an Asset Allocation Portfolio of its position in a Fund may further increase liquidity risk and may impact a Fund’s net asset
value (“NAV”).
|
n
|
Stock Risk—The risk that stock prices have historically risen and fallen in periodic cycles. Recently, U.S.
stock markets and certain foreign stock markets have experienced substantial price volatility and, at times, have traded at or close to record high levels. There is no guarantee that such levels will be reached or maintained in the future.
|
n
|
Geographic Risk—The European Equity Fund invests primarily in equity securities of European companies. The
Japanese Equity Fund invests primarily in equity securities of Japanese equity companies. The Asia Growth Fund invests primarily in equity securities of Asian issuers. Concentration of the investments of these or other Funds in issuers located in a
particular country or region will subject a Fund, to a greater extent than if investments were less concentrated, to the risks of adverse securities markets, exchange rates and social, political, regulatory or economic events which may occur in that
country or region.
|
n
|
Small Cap Risk—The securities of small capitalization stocks involve greater risks than those associated with
larger, more established companies and may be subject to more abrupt or erratic price movements. Securities of such issuers may lack sufficient market liquidity to enable a Fund to effect sales at an advantageous time or without a substantial drop in price.
|
n
|
IPO Risk—The risk that the market value of IPO shares will fluctuate considerably due to factors such as the
absence of a prior public market, unseasoned trading, the small number of shares available for trading and limited information about the issuer. The purchase of IPO shares may involve high transaction costs. IPO shares are subject to market risk and
liquidity risk. When a Fund’s asset base is small, a significant portion of the Fund’s performance could be attributable to investments in IPOs, because such investments would have a magnified impact on the Fund. As the Fund’s assets grow,
the effect of the Fund’s investments in IPOs on the Fund’s performance probably will decline, which could reduce the Fund’s performance.
|
| HOW THE FUNDS HAVE PERFORMED
|
| The bar chart and table below provide an indication of the risks of investing in a Fund by showing: (a) changes in the performance
of a Fund’s Class A Shares from year to year; and (b) how the average annual returns of a Fund’s Class A, B and C Shares compare to those of broad-based securities market indices. The bar chart and table assume reinvestment of dividends and
distributions. A Fund’s past performance is not necessarily an indication of how the Fund will perform in the future. The average annual total return calculation reflects a maximum initial sales charge of 5.5% for Class A Shares, the assumed
contingent deferred sales charge (“CDSC”) for Class B Shares (5% maximum declining to 0% after six years), and the assumed CDSC for Class C Shares (1% if redeemed within 12 months of purchase). The bar chart does not reflect the sales loads
applicable to Class A Shares. If the sales loads were reflected, returns would be less. Performance reflects expense limitations in effect. If expense limitations were not in place, a Fund’s performance would have been reduced.
|
| TOTAL RETURN
|
| The total return for Class A Shares for the 9-month period ended September 30, 2000 was -13.52%.
Best Quarter
Q4 ’98 +18.84%
Worst Quarter
Q3 ’98 -16.00%
|
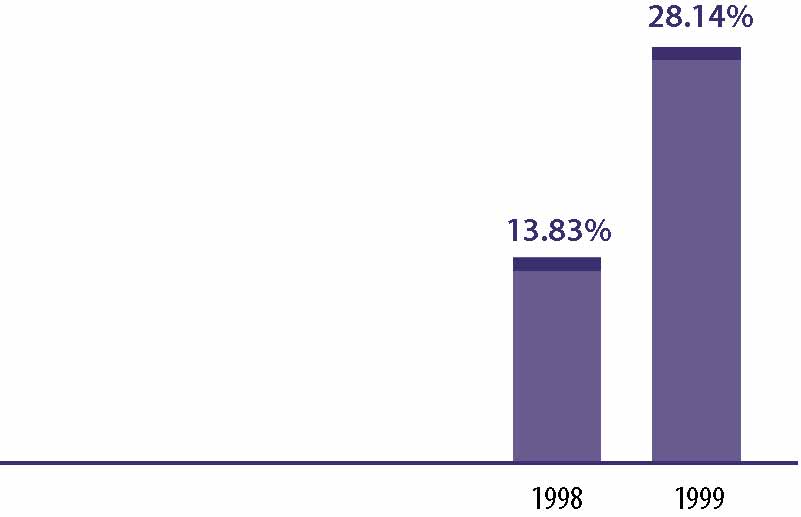 |
| AVERAGE ANNUAL TOTAL RETURN
|
| For the period ended December 31, 1999 | 1 Year | Since Inception | |||
|---|---|---|---|---|---|
| Class A (Inception 8/15/97) | |||||
| Including Sales Charges | 21.09% | 8.32% | |||
| Morgan Stanley Capital International (MSCI®) Europe, Australasia,
Far East (EAFE®) Index (unhedged)* |
27.29% | 15.99% | |||
| Class B (Inception 8/15/97) | |||||
| Including CDSC | 22.42% | 9.30% | |||
| MSCI® EAFE® Index (unhedged)* | 27.29% | 15.99% | |||
| Class C (Inception 8/15/97) | |||||
| Including CDSC | 26.48% | 10.47% | |||
| MSCI® EAFE® Index (unhedged)* | 27.29% | 15.99% | |||
*
|
The unmanaged MSCI® EAFE® Index (unhedged) is a market capitalization-weighted composite of securities in 20 developed
markets. The Index figures do not reflect any fees or expenses.
|
| TOTAL RETURN
|
CALENDAR YEAR (CLASS A)
|
| The total return for Class A Shares for the 9-month period ended September 30, 2000 was -10.59%.
Best Quarter
Q4 ’99 +21.70%
Worst Quarter
Q3 ’98 -14.37%
|
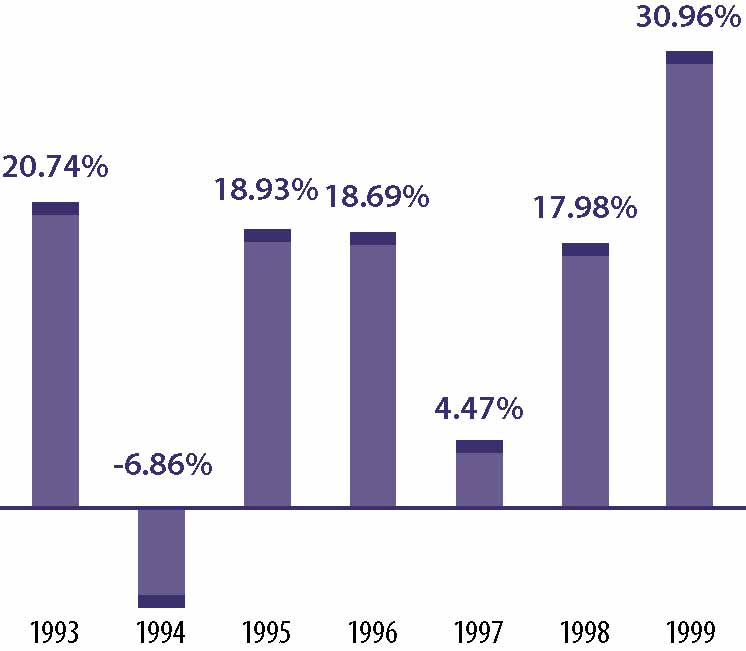 |
| AVERAGE ANNUAL TOTAL RETURN
|
| For the period ended December 31, 1999 | 1 Year | 5 Years | Since Inception | ||||
|---|---|---|---|---|---|---|---|
| Class A (Inception 12/1/92) | |||||||
| Including Sales Charges | 23.78% | 16.58% | 13.46% | ||||
| MSCI® EAFE® Index (unhedged)* | 27.29% | 13.14% | 14.91% | ||||
| Class B (Inception 5/1/96) | |||||||
| Including CDSC | 24.65% | N/A | 14.57% | ||||
| MSCI® EAFE® Index (unhedged)* | 27.29% | N/A | 13.04% | ||||
| Class C (Inception 8/15/97) | |||||||
| Including CDSC | 29.16% | N/A | 15.03% | ||||
| MSCI® EAFE® Index (unhedged)* | 27.29% | N/A | 15.99% | ||||
*
|
The MSCI® EAFE® Index (unhedged) is an unmanaged index of common stock prices. The Index figures do not reflect any
fees or expenses.
|
| TOTAL RETURN
|
| The total return for Class A Shares for the 9-month period ended September 30, 2000 was -5.87%.
Best Quarter
Q4 ’99 +24.66%
Worst Quarter
Q2 ’99 -3.04%
|
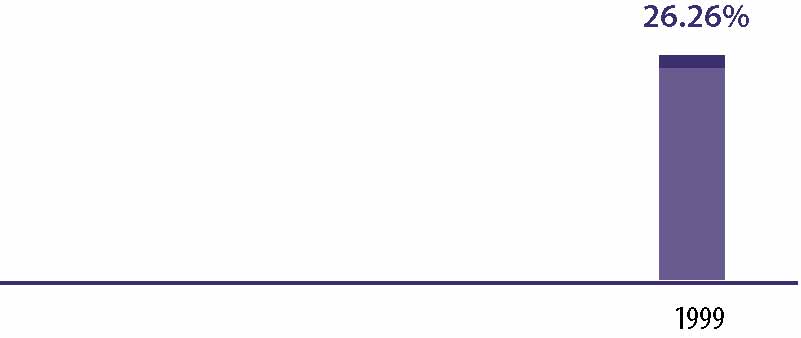 |
| AVERAGE ANNUAL TOTAL RETURN
|
| For the period ended December 31, 1999 | 1 Year | Since Inception | |||
|---|---|---|---|---|---|
| Class A (Inception 10/1/98) | |||||
| Including Sales Charges | 19.30% | 30.20% | |||
| MSCI® Europe Index (unhedged)* | 16.21% | 29.39% | |||
| FT/S&P Actuaries Europe Index (unhedged)** | 16.14% | 29.20% | |||
| Class B (Inception 10/1/98) | |||||
| Including CDSC | 20.30% | 32.47% | |||
| MSCI® Europe Index (unhedged)* | 16.21% | 29.39% | |||
| FT/S&P Actuaries Europe Index (unhedged)** | 16.14% | 29.20% | |||
| Class C (Inception 10/1/98) | |||||
| Including CDSC | 24.69% | 35.75% | |||
| MSCI® Europe Index (unhedged)* | 16.21% | 29.39% | |||
| FT/S&P Actuaries Europe Index (unhedged)** | 16.14% | 29.20% | |||
*
|
The MSCI® Europe Index (unhedged), an unmanaged index of common stock prices, replaced the FT/S&P Actuaries Europe
Index (unhedged) as the European Equity Fund’s performance benchmark. The MSCI® Europe Index is widely used throughout the investment management industry to represent the investment opportunities available to a large cap, developed country
European equity strategy and, in the Investment Adviser’s opinion, is a more appropriate benchmark against which to measure the performance of the European Equity Fund. The Index figures do not reflect any fees or expenses.
|
**
|
The unmanaged FT/S&P Actuaries Europe Index (unhedged) is a market capitalization-weighted composite of approximately 750
stocks from 16 countries in Europe. The Index figures do not reflect any fees or expenses.
|
| TOTAL RETURN
|
CALENDAR YEAR (CLASS A)
|
| The total return for Class A Shares for the 9-month period ended September 30, 2000 was -12.61%.
Best Quarter*
Q3 ’99 +23.08%
Worst Quarter*
Q1 ’99 +9.49%
|
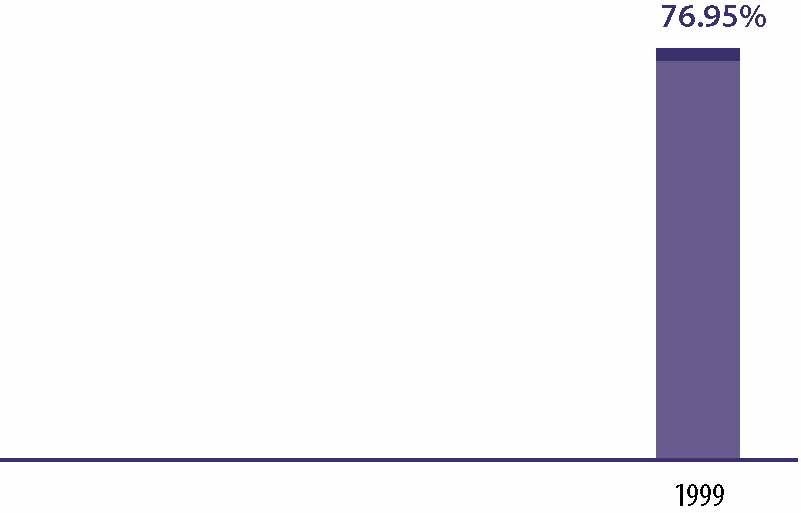 |
| AVERAGE ANNUAL TOTAL RETURN
|
| For the period ended December 31, 1999 | 1 Year | Since Inception | |||
|---|---|---|---|---|---|
| Class A (Inception 5/1/98) | |||||
| Including Sales Charges | 67.28% | 44.49% | |||
| Tokyo Price Index (“TOPIX”) (unhedged)** | 75.32% | 43.28% | |||
| Class B (Inception 5/1/98) | |||||
| Including CDSC | 70.28% | 46.68% | |||
| Tokyo Price Index (“TOPIX”) (unhedged)** | 75.32% | 43.28% | |||
| Class C (Inception 5/1/98) | |||||
| Including CDSC | 74.82% | 48.85% | |||
| Tokyo Price Index (“TOPIX”) (unhedged)** | 75.32% | 43.28% | |||
*
|
Please note that “Best Quarter” and “Worst Quarter” figures are applicable only to the time period covered
by the bar chart.
|
**
|
The TOPIX (unhedged) is an unmanaged composite of all stocks on the first section of the Tokyo Stock Exchange. The Index
figures do not reflect any fees or expenses.
|
| TOTAL RETURN
|
| The total return for Class A Shares for the
9-month period ended September 30, 2000 was 2.03%. Best Quarter*
Q4 ’99 +12.52%
Worst Quarter*
Q1 ’99 +4.81%
|
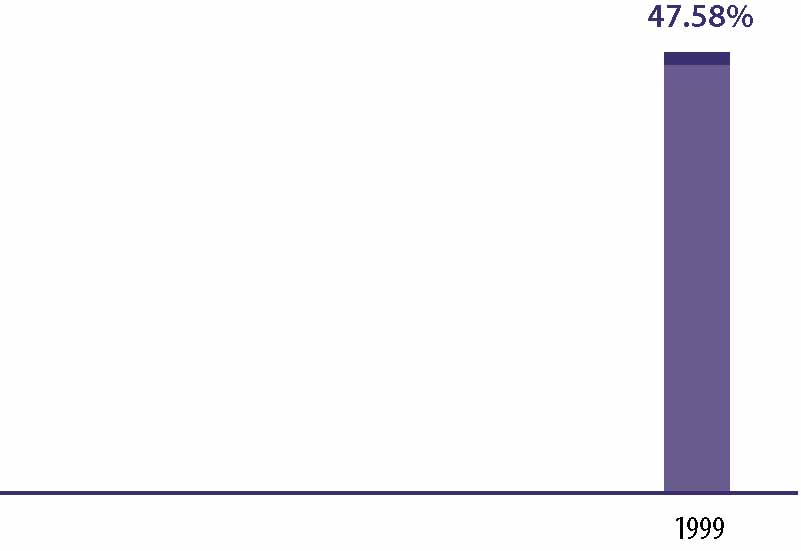 |
| AVERAGE ANNUAL TOTAL RETURN
|
| For the period ended December 31, 1999 | 1 Year | Since Inception | |||
|---|---|---|---|---|---|
| Class A (Inception 5/1/98) | |||||
| Including Sales Charges | 39.40% | 24.93% | |||
| MSCI® EAFE® Small Cap Index (unhedged)** | 17.67% | 3.00% | |||
| Class B (Inception 5/1/98) | |||||
| Including CDSC | 41.62% | 26.71% | |||
| MSCI® EAFE® Small Cap Index (unhedged)** | 17.67% | 3.00% | |||
| Class C (Inception 5/1/98) | |||||
| Including CDSC | 45.67% | 28.76% | |||
| MSCI® EAFE® Small Cap Index (unhedged)** | 17.67% | 3.00% | |||
*
|
Please note that “Best Quarter” and “Worst Quarter” figures are applicable only to the time period covered
by the bar chart.
|
**
|
The MSCI® EAFE® Small Cap Index (unhedged), inception date 1/15/98, includes 1,502 securities from 23 developed markets
with a capitalization range of $200-800 million and a general regional allocation of 60% Europe, 30% Japan and 10% Asia. The Index figures do not reflect any fees or expenses.
|
| TOTAL RETURN
|
| The total return for Class A Shares for the
9-month period ended September 30, 2000 was -15.78%. Best Quarter
Q4 ’99 +29.84%
Worst Quarter
Q3 ’98 -22.94%
|
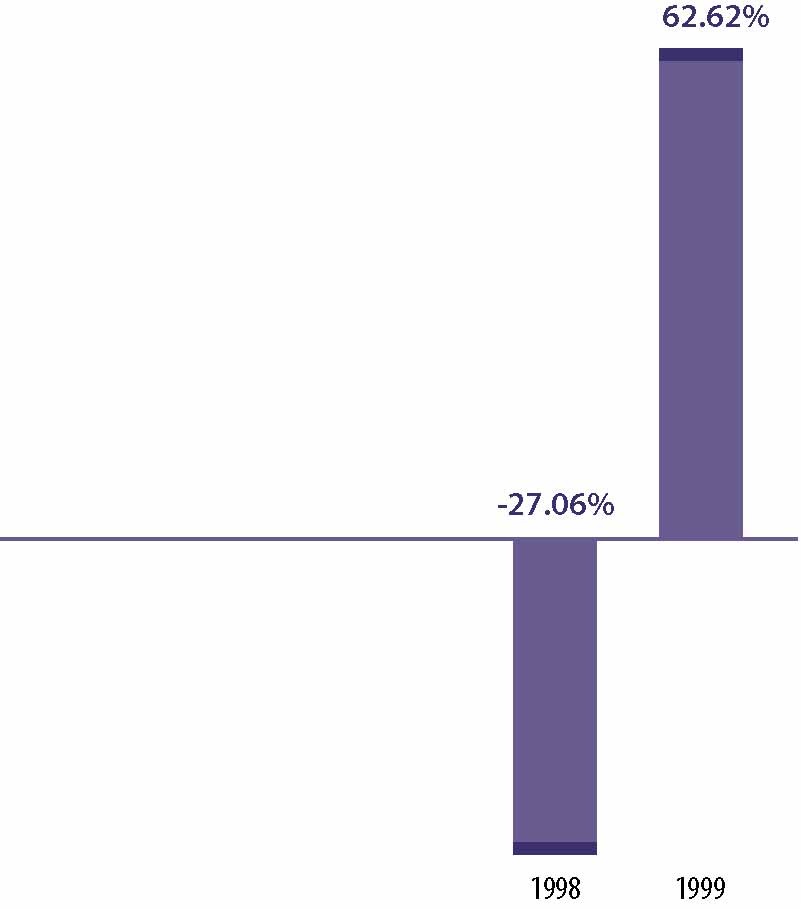 |
| AVERAGE ANNUAL TOTAL RETURN
|
| For the period ended December 31, 1999 | 1 Year | Since Inception | |||
|---|---|---|---|---|---|
| Class A (Inception 12/15/97) | |||||
| Including Sales Charges | 53.62% | 6.98% | |||
| MSCI® Emerging Markets Free (EMF) Index* | 66.42% | 14.52% | |||
| Class B (Inception 12/15/97) | |||||
| Including CDSC | 56.59% | 8.10% | |||
| MSCI® EMF Index* | 66.42% | 14.52% | |||
| Class C (Inception 12/15/97) | |||||
| Including CDSC | 60.84% | 9.69% | |||
| MSCI® EMF Index* | 66.42% | 14.52% | |||
*
|
The unmanaged MSCI® EMF Index is a market capitalization-weighted composite of securities in over 30 emerging markets
countries. “Free” indicates an index that excludes shares in otherwise free markets that are not purchasable by foreigners. The Index figures do not reflect any fees or expenses.
|
| TOTAL RETURN
|
| The total return for Class A Shares for the 9-month period ended September 30, 2000 was -21.73%.
Best Quarter
Q2 ’99 +30.97%
Worst Quarter
Q4 ‘97 -27.33%
|
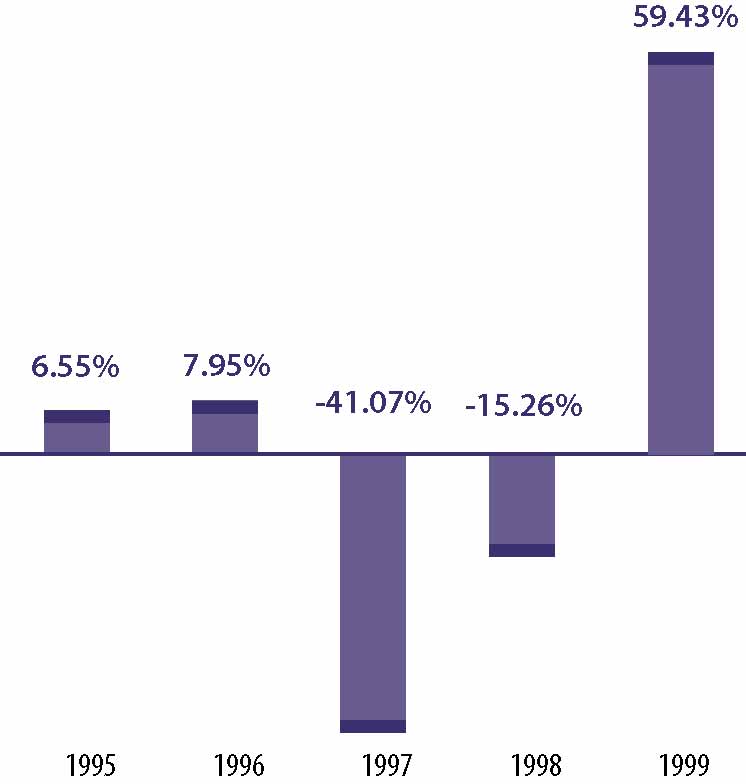 |
| AVERAGE ANNUAL TOTAL RETURN
|
| For the period ended December 31, 1999 | 1 Year | 5 Years | Since Inception | ||||
|---|---|---|---|---|---|---|---|
| Class A (Inception 7/8/94) | |||||||
| Including Sales Charges | 50.70% | (2.84)% | (2.12)% | ||||
| MSCI® All Country Asia Free ex-Japan (unhedged)* | 61.95% | (1.28)% | (0.94)% | ||||
| Class B (Inception 5/1/96) | |||||||
| Including CDSC | 53.70% | N/A | (8.78)% | ||||
| MSCI® All Country Asia Free ex-Japan (unhedged)* | 61.95% | N/A | (5.50)% | ||||
| Class C (Inception 8/15/97) | |||||||
| Including CDSC | 57.52% | N/A | (8.65)% | ||||
| MSCI® All Country Asia Free ex-Japan (unhedged)* | 61.95% | N/A | (5.65)% | ||||
*
|
The unmanaged MSCI® All Country Asia Free ex-Japan Index (unhedged) is a market
capitalization-weighted composite of securities in ten Asian countries. “Free” indicates an index that excludes shares in otherwise free markets that are not purchasable by foreigners. The Index figures do not reflect any fees or expenses. |
| CORE International Equity Fund |
||||||||||
|---|---|---|---|---|---|---|---|---|---|---|
| Class A | Class B | Class C | ||||||||
| Shareholder Fees | ||||||||||
| (fees paid directly from your investment): | ||||||||||
| Maximum Sales Charge (Load) Imposed on
Purchases |
5.5% | 1 | None | None | ||||||
| Maximum Deferred Sales Charge (Load) 2 | None | 1 | 5.0% | 3 | 1.0% | 4 | ||||
| Maximum Sales Charge (Load) Imposed on
Reinvested Dividends |
None | None | None | |||||||
| Redemption Fees 5 | None | None | None | |||||||
| Exchange Fees | None | None | None | |||||||
| Annual Fund Operating Expenses | ||||||||||
| (expenses that are deducted from Fund assets):6 | ||||||||||
| Management Fees | 0.85% | 0.85% | 0.85% | |||||||
| Distribution and Service (12b-1) Fees | 0.50% | 1.00% | 1.00% | |||||||
| Other Expenses 7 | 0.40% | 0.40% | 0.40% | |||||||
| Total Fund Operating Expenses* | 1.75% | 2.25% | 2.25% | |||||||
| See page 37 for all other footnotes.
|
*
|
As a result of the current expense limitations, “Other Expenses” and “Total Fund Operating Expenses” of the
Fund which are actually incurred as of the date of this Prospectus are as set forth below. The expense limitations may be terminated at any time at the option of the Investment Adviser. If this occurs, “Other Expenses” and “Total Fund
Operating Expenses” may increase without shareholder approval.
|
| CORE International Equity Fund |
|||||||
|---|---|---|---|---|---|---|---|
| Class A | Class B | Class C | |||||
| Annual Fund Operating Expenses | |||||||
| (expenses that are deducted from Fund assets): 6 | |||||||
| Management Fees | 0.85% | 0.85% | 0.85% | ||||
| Distribution and Service (12b-1) Fees | 0.50% | 1.00% | 1.00% | ||||
| Other Expenses 7 | 0.31% | 0.31% | 0.31% | ||||
| Total Fund Operating Expenses (after
current expense limitations) |
1.66% | 2.16% | 2.16% | ||||
| International Equity Fund |
||||||||||
|---|---|---|---|---|---|---|---|---|---|---|
| Class A | Class B | Class C | ||||||||
| Shareholder Fees | ||||||||||
| (fees paid directly from your investment): | ||||||||||
| Maximum Sales Charge (Load) Imposed on
Purchases |
5.5% | 1 | None | None | ||||||
| Maximum Deferred Sales Charge (Load) 2 | None | 1 | 5.0% | 3 | 1.0% | 4 | ||||
| Maximum Sales Charge (Load) Imposed on
Reinvested Dividends |
None | None | None | |||||||
| Redemption Fees 5 | None | None | None | |||||||
| Exchange Fees | None | None | None | |||||||
| Annual Fund Operating Expenses | ||||||||||
| (expenses that are deducted from Fund assets):6 | ||||||||||
| Management Fees | 1.00% | 1.00% | 1.00% | |||||||
| Distribution and Service (12b-1) Fees | 0.50% | 1.00% | 1.00% | |||||||
| Other Expenses 7 | 0.34% | 0.34% | 0.34% | |||||||
| Total Fund Operating Expenses* | 1.84% | 2.34% | 2.34% | |||||||
| See page 37 for all other footnotes.
|
*
|
As a result of the current expense limitations, “Other Expenses” and “Total Fund Operating Expenses” of the
Fund which are actually incurred as of the date of this Prospectus are as set forth below. The expense limitations may be terminated at any time at the option of the Investment Adviser. If this occurs, “Other Expenses” and “Total Fund
Operating Expenses” may increase without shareholder approval.
|
| International Equity Fund |
|||||||
|---|---|---|---|---|---|---|---|
| Class A | Class B | Class C | |||||
| Annual Fund Operating Expenses | |||||||
| (expenses that are deducted from Fund assets): 6 | |||||||
| Management Fees | 1.00% | 1.00% | 1.00% | ||||
| Distribution and Service (12b-1) Fees | 0.50% | 1.00% | 1.00% | ||||
| Other Expenses 7 | 0.29% | 0.29% | 0.29% | ||||
| Total Fund Operating Expenses (after
current expense limitations) |
1.79% | 2.29% | 2.29% | ||||
| European Equity Fund |
||||||||||
|---|---|---|---|---|---|---|---|---|---|---|
| Class A | Class B | Class C | ||||||||
| Shareholder Fees | ||||||||||
| (fees paid directly from your investment): | ||||||||||
| Maximum Sales Charge (Load) Imposed on
Purchases |
5.5% | 1 | None | None | ||||||
| Maximum Deferred Sales Charge (Load) 2 | None | 1 | 5.0% | 3 | 1.0% | 4 | ||||
| Maximum Sales Charge (Load) Imposed on
Reinvested Dividends |
None | None | None | |||||||
| Redemption Fees 5 | None | None | None | |||||||
| Exchange Fees | None | None | None | |||||||
| Annual Fund Operating Expenses | ||||||||||
| (expenses that are deducted from Fund assets):6 | ||||||||||
| Management Fees | 1.00% | 1.00% | 1.00% | |||||||
| Distribution and Service (12b-1) Fees | 0.50% | 1.00% | 1.00% | |||||||
| Other Expenses 7 | 0.67% | 0.67% | 0.67% | |||||||
| Total Fund Operating Expenses* | 2.17% | 2.67% | 2.67% | |||||||
| See page 37 for all other footnotes.
|
*
|
As a result of the current expense limitations, “Other Expenses” and “Total Fund Operating Expenses” of the
Fund which are actually incurred as of the date of this Prospectus are as set forth below. The expense limitations may be terminated at any time at the option of the Investment Adviser. If this occurs, “Other Expenses” and “Total Fund
Operating Expenses” may increase without shareholder approval.
|
| European Equity Fund |
|||||||
|---|---|---|---|---|---|---|---|
| Class A | Class B | Class C | |||||
| Annual Fund Operating Expenses | |||||||
| (expenses that are deducted from Fund assets): 6 | |||||||
| Management Fees | 1.00% | 1.00% | 1.00% | ||||
| Distribution and Service (12b-1) Fees | 0.50% | 1.00% | 1.00% | ||||
| Other Expenses 7 | 0.29% | 0.29% | 0.29% | ||||
| Total Fund Operating Expenses (after
current expense limitations) |
1.79% | 2.29% | 2.29% | ||||
| Japanese Equity Fund |
||||||||||
|---|---|---|---|---|---|---|---|---|---|---|
| Class A | Class B | Class C | ||||||||
| Shareholder Fees | ||||||||||
| (fees paid directly from your investment): | ||||||||||
| Maximum Sales Charge (Load) Imposed on
Purchases |
5.5% | 1 | None | None | ||||||
| Maximum Deferred Sales Charge (Load) 2 | None | 1 | 5.0% | 3 | 1.0% | 4 | ||||
| Maximum Sales Charge (Load) Imposed on
Reinvested Dividends |
None | None | None | |||||||
| Redemption Fees 5 | None | None | None | |||||||
| Exchange Fees | None | None | None | |||||||
| Annual Fund Operating Expenses | ||||||||||
| (expenses that are deducted from Fund assets):6 | ||||||||||
| Management Fees | 1.00% | 1.00% | 1.00% | |||||||
| Distribution and Service (12b-1) Fees | 0.50% | 1.00% | 1.00% | |||||||
| Other Expenses 7 | 0.60% | 0.60% | 0.60% | |||||||
| Total Fund Operating Expenses* | 2.10% | 2.60% | 2.60% | |||||||
| See page 37 for all other footnotes.
|
*
|
As a result of the current expense limitations, “Other Expenses” and “Total Fund Operating Expenses” of the
Fund which are actually incurred as of the date of this Prospectus are as set forth below. The expense limitations may be terminated at any time at the option of the Investment Adviser. If this occurs, “Other Expenses” and “Total Fund
Operating Expenses” may increase without shareholder approval.
|
| Japanese Equity Fund |
|||||||
|---|---|---|---|---|---|---|---|
| Class A | Class B | Class C | |||||
| Annual Fund Operating Expenses | |||||||
| (expenses that are deducted from Fund assets): 6 | |||||||
| Management Fees | 1.00% | 1.00% | 1.00% | ||||
| Distribution and Service (12b-1) Fees | 0.50% | 1.00% | 1.00% | ||||
| Other Expenses 7 | 0.30% | 0.30% | 0.30% | ||||
| Total Fund Operating Expenses (after
current expense limitations) |
1.80% | 2.30% | 2.30% | ||||
| International Growth Opportunities Fund |
||||||||||
|---|---|---|---|---|---|---|---|---|---|---|
| Class A | Class B | Class C | ||||||||
| Shareholder Fees | ||||||||||
| (fees paid directly from your investment): | ||||||||||
| Maximum Sales Charge (Load) Imposed on
Purchases |
5.5% | 1 | None | None | ||||||
| Maximum Deferred Sales Charge (Load) 2 | None | 1 | 5.0% | 3 | 1.0% | 4 | ||||
| Maximum Sales Charge (Load) Imposed on
Reinvested Dividends |
None | None | None | |||||||
| Redemption Fees 5 | None | None | None | |||||||
| Exchange Fees | None | None | None | |||||||
| Annual Fund Operating Expenses | ||||||||||
| (expenses that are deducted from Fund assets):6 | ||||||||||
| Management Fees | 1.20% | 1.20% | 1.20% | |||||||
| Distribution and Service (12b-1) Fees | 0.50% | 1.00% | 1.00% | |||||||
| Other Expenses 7 | 0.52% | 0.52% | 0.52% | |||||||
| Total Fund Operating Expenses* | 2.22% | 2.72% | 2.72% | |||||||
| See page 37 for all other footnotes.
|
*
|
As a result of the current expense limitations, “Other Expenses” and “Total Fund Operating Expenses” of the
Fund which are actually incurred as of the date of this Prospectus are as set forth below. The expense limitations may be terminated at any time at the option of the Investment Adviser. If this occurs, “Other Expenses” and “Total Fund
Operating Expenses” may increase without shareholder approval.
|
| International Growth Opportunities Fund |
|||||||
|---|---|---|---|---|---|---|---|
| Class A | Class B | Class C | |||||
| Annual Fund Operating Expenses | |||||||
| (expenses that are deducted from Fund assets): 6 | |||||||
| Management Fees | 1.20% | 1.20% | 1.20% | ||||
| Distribution and Service (12b-1) Fees | 0.50% | 1.00% | 1.00% | ||||
| Other Expenses 7 | 0.35% | 0.35% | 0.35% | ||||
| Total Fund Operating Expenses (after
current expense limitations) |
2.05% | 2.55% | 2.55% | ||||
| Emerging Markets Equity Fund |
||||||||||
|---|---|---|---|---|---|---|---|---|---|---|
| Class A | Class B | Class C | ||||||||
| Shareholder Fees | ||||||||||
| (fees paid directly from your investment): | ||||||||||
| Maximum Sales Charge (Load) Imposed on
Purchases |
5.5% | 1 | None | None | ||||||
| Maximum Deferred Sales Charge (Load) 2 | None | 1 | 5.0% | 3 | 1.0% | 4 | ||||
| Maximum Sales Charge (Load) Imposed on
Reinvested Dividends |
None | None | None | |||||||
| Redemption Fees 5 | None | None | None | |||||||
| Exchange Fees | None | None | None | |||||||
| Annual Fund Operating Expenses | ||||||||||
| (expenses that are deducted from Fund assets):6 | ||||||||||
| Management Fees | 1.20% | 1.20% | 1.20% | |||||||
| Distribution and Service (12b-1) Fees | 0.50% | 1.00% | 1.00% | |||||||
| Other Expenses 7 | 0.60% | 0.60% | 0.60% | |||||||
| Total Fund Operating Expenses* | 2.30% | 2.80% | 2.80% | |||||||
| See page 37 for all other footnotes.
|
*
|
As a result of the current expense limitations, “Other Expenses” and “Total Fund Operating Expenses” of the
Fund which are actually incurred as of the date of this Prospectus are as set forth below. The expense limitations may be terminated at any time at the option of the Investment Adviser. If this occurs, “Other Expenses” and “Total Fund
Operating Expenses” may increase without shareholder approval.
|
| Emerging Markets Equity Fund |
|||||||
|---|---|---|---|---|---|---|---|
| Class A | Class B | Class C | |||||
| Annual Fund Operating Expenses | |||||||
| (expenses that are deducted from Fund assets): 6 | |||||||
| Management Fees | 1.20% | 1.20% | 1.20% | ||||
| Distribution and Service (12b-1) Fees | 0.50% | 1.00% | 1.00% | ||||
| Other Expenses 7 | 0.54% | 0.54% | 0.54% | ||||
| Total Fund Operating Expenses (after
current expense limitations) |
2.24% | 2.74% | 2.74% | ||||
| Asia Growth Fund |
||||||||||
|---|---|---|---|---|---|---|---|---|---|---|
| Class A | Class B | Class C | ||||||||
| Shareholder Fees | ||||||||||
| (fees paid directly from your investment): | ||||||||||
| Maximum Sales Charge (Load) Imposed on
Purchases |
5.5% | 1 | None | None | ||||||
| Maximum Deferred Sales Charge (Load) 2 | None | 1 | 5.0% | 3 | 1.0% | 4 | ||||
| Maximum Sales Charge (Load) Imposed on
Reinvested Dividends |
None | None | None | |||||||
| Redemption Fees 5 | None | None | None | |||||||
| Exchange Fees | None | None | None | |||||||
| Annual Fund Operating Expenses | ||||||||||
| (expenses that are deducted from Fund assets):6 | ||||||||||
| Management Fees | 1.00% | 1.00% | 1.00% | |||||||
| Distribution and Service (12b-1) Fees | 0.50% | 1.00% | 1.00% | |||||||
| Other Expenses 7 | 0.80% | 0.80% | 0.80% | |||||||
| Total Fund Operating Expenses* | 2.30% | 2.80% | 2.80% | |||||||
| See page 37 for all other footnotes.
|
*
|
As a result of the current expense limitations, “Other Expenses” and “Total Fund Operating Expenses” of the
Fund which are actually incurred as of the date of this Prospectus are as set forth below. The expense limitations may be terminated at any time at the option of the Investment Adviser. If this occurs, “Other Expenses” and “Total Fund
Operating Expenses” may increase without shareholder approval.
|
| Asia Growth Fund |
|||||||
|---|---|---|---|---|---|---|---|
| Class A | Class B | Class C | |||||
| Annual Fund Operating Expenses | |||||||
| (expenses that are deducted from Fund assets): 6 | |||||||
| Management Fees | 1.00% | 1.00% | 1.00% | ||||
| Distribution and Service (12b-1) Fees | 0.50% | 1.00% | 1.00% | ||||
| Other Expenses 7 | 0.35% | 0.35% | 0.35% | ||||
| Total Fund Operating Expenses (after
current expense limitations) |
1.85% | 2.35% | 2.35% | ||||
1
|
The maximum sales charge is a percentage of the offering price. A CDSC of 1% is imposed on certain redemptions (within
18 months of purchase) of Class A Shares sold without an initial sales charge as part of an investment of $1 million or more.
|
2
|
The maximum CDSC is a percentage of the lesser of the NAV at the time of the redemption or the NAV when the shares were
originally purchased.
|
3
|
A CDSC is imposed upon Class B Shares redeemed within six years of purchase at a rate of 5% in the first year, declining
to 1% in the sixth year, and eliminated thereafter.
|
4
|
A CDSC of 1% is imposed on Class C Shares redeemed within 12 months of purchase.
|
5
|
A transaction fee of $7.50 may be charged for redemption proceeds paid by wire.
|
6
|
The Funds’ annual operating expenses are based on actual expenses.
|
7
|
“Other Expenses” include transfer agency fees equal to 0.19% of the average daily net assets of each Fund’
s Class A, B and C Shares, plus all other ordinary expenses not detailed above. The Investment Adviser has voluntarily agreed to reduce or limit certain “Other Expenses” (excluding management fees, distribution and service fees, transfer agency
fees, taxes, interest and brokerage fees and litigation, indemnification and other extraordinary expenses) to the following percentages of each Fund’s average daily net assets:
|
| Fund | Other
Expenses |
||
|---|---|---|---|
| CORE International Equity | 0.12% | ||
| International Equity | 0.10% | ||
| European Equity | 0.10% | ||
| Japanese Equity | 0.11% | ||
| International Growth
Opportunities |
0.16% | ||
| Emerging Markets Equity | 0.35% | ||
| Asia Growth | 0.16% | ||
| Fund | 1 Year | 3 Years | 5 Years | 10 Years | |||||
|---|---|---|---|---|---|---|---|---|---|
| CORE International Equity | |||||||||
| Class A Shares | $718 | $1,071 | $1,447 | $2,499 | |||||
| Class B Shares | |||||||||
| – Assuming complete redemption at end of period | $728 | $1,003 | $1,405 | $2,459 | |||||
| – Assuming no redemption | $228 | $ 703 | $1,205 | $2,459 | |||||
| Class C Shares | |||||||||
| – Assuming complete redemption at end of period | $328 | $ 703 | $1,205 | $2,585 | |||||
| – Assuming no redemption | $228 | $ 703 | $1,205 | $2,585 | |||||
| International Equity | |||||||||
| Class A Shares | $727 | $1,097 | $1,491 | $2,590 | |||||
| Class B Shares | |||||||||
| – Assuming complete redemption at end of period | $737 | $1,030 | $1,450 | $2,552 | |||||
| – Assuming no redemption | $237 | $ 730 | $1,250 | $2,552 | |||||
| Class C Shares | |||||||||
| – Assuming complete redemption at end of period | $337 | $ 730 | $1,250 | $2,676 | |||||
| – Assuming no redemption | $237 | $ 730 | $1,250 | $2,676 | |||||
| European Equity | |||||||||
| Class A Shares | $758 | $1,192 | $1,650 | $2,916 | |||||
| Class B Shares | |||||||||
| – Assuming complete redemption at end of period | $770 | $1,129 | $1,615 | $2,882 | |||||
| – Assuming no redemption | $270 | $ 829 | $1,415 | $2,882 | |||||
| Class C Shares | |||||||||
| – Assuming complete redemption at end of period | $370 | $ 829 | $1,415 | $3,003 | |||||
| – Assuming no redemption | $270 | $ 829 | $1,415 | $3,003 | |||||
| Fund | 1 Year | 3 Years | 5 Years | 10 Years | |||||
|---|---|---|---|---|---|---|---|---|---|
| Japanese Equity | |||||||||
| Class A Shares | $751 | $1,172 | $1,617 | $2,847 | |||||
| Class B Shares | |||||||||
| – Assuming complete redemption at end of period | $763 | $1,108 | $1,580 | $2,813 | |||||
| – Assuming no redemption | $263 | $ 808 | $1,380 | $2,813 | |||||
| Class C Shares | |||||||||
| – Assuming complete redemption at end of period | $363 | $ 808 | $1,380 | $2,934 | |||||
| – Assuming no redemption | $263 | $ 808 | $1,380 | $2,934 | |||||
| International Growth Opportunities | |||||||||
| Class A Shares | $763 | $1,206 | $1,674 | $2,964 | |||||
| Class B Shares | |||||||||
| – Assuming complete redemption at end of period | $775 | $1,144 | $1,640 | $2,931 | |||||
| – Assuming no redemption | $275 | $ 844 | $1,440 | $2,931 | |||||
| Class C Shares | |||||||||
| – Assuming complete redemption at end of period | $375 | $ 844 | $1,440 | $3,051 | |||||
| – Assuming no redemption | $275 | $ 844 | $1,440 | $3,051 | |||||
| Emerging Markets Equity | |||||||||
| Class A Shares | $770 | $1,229 | $1,713 | $3,041 | |||||
| Class B Shares | |||||||||
| – Assuming complete redemption at end of period | $783 | $1,168 | $1,679 | $3,009 | |||||
| – Assuming no redemption | $283 | $ 868 | $1,479 | $3,009 | |||||
| Class C Shares | |||||||||
| – Assuming complete redemption at end of period | $383 | $ 868 | $1,479 | $3,128 | |||||
| – Assuming no redemption | $283 | $ 868 | $1,479 | $3,128 | |||||
| Asia Growth | |||||||||
| Class A Shares | $770 | $1,229 | $1,713 | $3,041 | |||||
| Class B Shares | |||||||||
| – Assuming complete redemption at end of period | $783 | $1,168 | $1,679 | $3,009 | |||||
| – Assuming no redemption | $283 | $ 868 | $1,479 | $3,009 | |||||
| Class C Shares | |||||||||
| – Assuming complete redemption at end of period | $383 | $ 868 | $1,479 | $3,128 | |||||
| – Assuming no redemption | $283 | $ 868 | $1,479 | $3,128 | |||||
| INVESTMENT ADVISERS
|
| Investment Adviser | Fund | ||
|---|---|---|---|
| Goldman Sachs Asset Management (“GSAM”) | CORE International Equity | ||
| 32 Old Slip | |||
| New York, New York 10005 | |||
| Goldman Sachs Asset Management International (“GSAMI”) | International Equity | ||
| Procession House | European Equity | ||
| 55 Ludgate Hill | Japanese Equity | ||
| London, England EC4M 7JW | International Growth Opportunities | ||
| Emerging Markets Equity | |||
| Asia Growth | |||
| GSAM and GSAMI are separate business units of the Investment Management Division (“IMD”) of Goldman Sachs. Goldman Sachs
registered as an investment adviser in 1981. GSAMI, a member of the Investment Management Regulatory Organization Limited since 1990 and a registered investment adviser since 1991, is an affiliate of Goldman Sachs. As of September 30, 2000, GSAM and
GSAMI, along with other units of IMD, had assets under management of $281.3 billion.
|
| The Investment Adviser provides day-to-day advice regarding the Funds’ portfolio transactions. The Investment Adviser makes
the investment decisions for the Funds and places purchase and sale orders for the Funds’ portfolio transactions in U.S. and foreign markets. As permitted by applicable law, these orders may be directed to any brokers, including Goldman Sachs and its
affiliates. While the Investment Adviser is ultimately responsible for the management of the Funds, it is able to draw upon the research and expertise of its asset management affiliates for portfolio decisions and management with respect to certain
portfolio securities. In addition, the Investment Adviser has access to the research and certain proprietary technical models developed by Goldman Sachs, and will apply quantitative and qualitative analysis in determining the appropriate allocations among
categories of issuers and types of securities.
|
| The Investment Adviser also performs the following additional services for the Funds:
|
n
|
Supervises all non-advisory operations of the Funds
|
n
|
Provides personnel to perform necessary executive, administrative and clerical services to the Funds
|
n
|
Arranges for the preparation of all required tax returns, reports to shareholders, prospectuses and statements of additional
information and other reports filed with the Securities and Exchange Commission (the “SEC”) and other regulatory authorities
|
n
|
Maintains the records of each Fund
|
n
|
Provides office space and all necessary office equipment and services
|
| MANAGEMENT FEES
|
| As compensation for its services and its assumption of certain expenses, the Investment Adviser is entitled to the following fees,
computed daily and payable monthly, at the annual rates (as a percentage of each respective portfolio’s average daily net assets) listed below:
|
| Contractual Rate | Actual Rate
For the Fiscal Year Ended August 31, 2000 |
||||
|---|---|---|---|---|---|
| GSAM: | |||||
| CORE International Equity | 0.85% | 0.85% | |||
| GSAMI: | |||||
| International Equity | 1.00% | 1.00% | |||
| European Equity | 1.00% | 1.00% | |||
| Japanese Equity | 1.00% | 1.00% | |||
| International Growth Opportunities | 1.20% | 1.20% | |||
| Emerging Markets Equity | 1.20% | 1.20% | |||
| Asia Growth | 1.00% | 1.00% | |||
| The difference, if any, between the stated fees and the actual fees paid by the Funds reflects that the Investment Adviser did not
charge the full amount of the fees to which it would have been entitled. The Investment Adviser may discontinue or modify any such voluntary limitations in the future at its discretion.
|
| FUND MANAGERS
|
| M. Roch Hillenbrand, a Managing Director of Goldman Sachs since 1997, is the Head of Global Equities for GSAM, overseeing the
United States, Europe, Japan, and non-Japan Asia. In this capacity, he is responsible for managing the group as it defines and implements global portfolio management processes that are consistent, reliable and predictable. Mr. Hillenbrand joined Goldman
Sachs in 1997
|
| upon its acquisition of Commodities Corporation, LLC where he was and continues as President. Over the course of his 20-year
career at Commodities Corporation, Mr. Hillenbrand has had extensive experience in dealing with internal and external investment managers who have managed a range of futures and equities strategies across multiple markets, using a variety of styles.
|
| International Equity Portfolio Management Team
|
n
|
Global portfolio teams based in London, Singapore, Tokyo and New York. Local presence is a key to the Investment Adviser’s
fundamental research capabilities
|
n
|
Team manages over $45.9 billion in international equities for retail, institutional and high net worth clients
|
n
|
Focus on bottom-up stock selection as main driver of returns, though the team leverages the asset allocation, currency and risk
management capabilities of GSAM
|
| Name and Title | Fund Responsibility | Years Primarily
Responsible |
Five Year Employment History | ||||
|---|---|---|---|---|---|---|---|
| David Dick
Executive Director |
Senior Portfolio Manager—
European Equity Fund |
Since
1998 |
Mr. Dick joined the Investment
Adviser as a senior portfolio manager on the European Equity team in 1998. From 1990 to 1998, he was with Mercury Asset Management, where he was a portfolio manager for European equity and was head of Mercury’s European sector strategy. |
||||
| Gary Greenberg
Vice President Co-Head of Emerging Markets Equity |
Senior Portfolio Manager—
Emerging Markets Equity Fund |
Since
1999 |
Mr. Greenberg joined the
Investment Adviser as a portfolio manager in 1999. From 1998 to 1999, he was a Managing Director and the lead international portfolio manager at Van Eck Global Asset Management. Prior to that, he was Chief Investment Officer for Peregrine Asset Management in Hong Kong from 1994 to 1998. |
||||
| Name and Title | Fund Responsibility | Years Primarily
Responsible |
Five Year Employment History | ||||
|---|---|---|---|---|---|---|---|
| James P. Hordern
Executive Director |
Senior Portfolio Manager—
International Growth Opportunities Fund |
Since
1998 |
Mr. Hordern joined the
Investment Adviser as a portfolio manager in 1997. From 1991 to 1997, he was an Assistant Director and portfolio manager at Mercury Asset Management on the European Specialist Team. |
||||
| Ralf Laier
Vice President |
Portfolio Manager—
Emerging Markets Equity Fund |
Since
1998 |
Mr. Laier joined the Investment
Adviser as a portfolio manager with a focus on Central/Eastern European (CEE) and the Commonwealth of Independent States (CIS) in 1997. Prior to joining the Investment Adviser, from 1995 to 1997, he was Vice President of Soros Global Research, where he analyzed investment opportunities in CEE/CIS. |
||||
| Susan Noble
Managing Director |
Senior Portfolio Manager—
European Equity Fund International Equity Fund |
Since
1998 1998 |
Ms. Noble joined the Investment
Adviser as a senior portfolio manager and head of the European Equity Team in October 1997. From 1986 to 1997, she worked at Fleming Investment Management in London, where she most recently was Portfolio Management Director for the European equity investment strategy and process. |
||||
| Andrew Orchard
Executive Director |
Senior Portfolio Manager—
European Equity Fund International Equity Fund |
Since
1999 1999 |
Mr. Orchard joined the
Investment Adviser as a portfolio manager in 1999. From 1994 to 1999 he was a portfolio manager at Morgan Grenfell Asset Management where he managed global equity portfolios and chaired Morgan Grenfell’s Global Sector Committee. |
||||
| Name and Title | Fund Responsibility | Years Primarily
Responsible |
Five Year Employment History | ||||
|---|---|---|---|---|---|---|---|
| Robert Stewart
Executive Director |
Senior Portfolio Manager—
European Equity Fund International Equity Fund |
Since
1999 1999 |
Mr. Stewart joined the
Investment Adviser as a portfolio manager in 1996. He is a member of the European Equity Team. From 1996 to 1998 he was a portfolio manager in Japan where he managed Japanese Equity Institutional Portfolios. Prior to that Mr. Stewart was a portfolio manager at CINMan from 1989 to 1996 where he managed international equities. |
||||
| Danny Truell
Managing Director |
Senior Portfolio Manager—
European Equity Fund International Equity |
Since
1998 2000 |
Mr. Truell joined the Investment
Adviser as a senior portfolio manager and head of UK equities in 1998. From 1992 to 1996, he was Investment Banking Executive Director for SBC Warburg and Chief Asian Equity Strategist. |
||||
| Gabriella Antici
Vice President Co-Head of Emerging Markets Equity |
Senior Portfolio Manager—
Emerging Markets Equity Fund |
Since
1998 |
Ms. Antici joined the Investment
Adviser as a portfolio manager in 1997. From 1994 to 1997, she was a Vice President for HSBC Asset Management, where she was a portfolio manager for emerging markets and head of the Latin American Department. |
||||
| Rory Bateman
Executive Director |
Portfolio Manager—
European Equity Fund |
Since
2000 |
Mr. Bateman joined the
Investment Adviser as an equity analyst in 1996. Prior to that he was an analyst at CINMan covering European equities. |
||||
| Name and Title | Fund Responsibility | Years Primarily
Responsible |
Five Year Employment History | ||||
|---|---|---|---|---|---|---|---|
| Melissa Brown
Managing Director |
Senior Portfolio Manager—
CORE International Equity Fund |
Since
1998 |
Ms. Brown joined the Investment
Adviser as a portfolio manager in 1998. From 1984 to 1998, she was the director of Quantitative Equity Research and served on the Investment Policy Committee at Prudential Securities. |
||||
| Mark M. Carhart
Managing Director |
Portfolio Manager—
CORE International Equity Fund |
Since
1998 |
Mr. Carhart joined the
Investment Adviser as a member of the Quantitative Research and Risk Management team in 1997. From August 1995 to September 1997, he was Assistant Professor of Finance at the Marshall School of Business at USC and a Senior Fellow of the Wharton Financial Institutions Center. |
||||
| Raymond J.
Iwanowski Managing Director |
Portfolio Manager—
CORE International Equity Fund |
Since
1998 |
Mr. Iwanowski joined the
Investment Adviser as an associate and portfolio manager in 1997. From 1993 to 1997, he was a Vice President and head of the Fixed Derivatives Client Research group at Salomon Brothers. |
||||
| Robert C. Jones
Managing Director |
Senior Portfolio Manager—
CORE International Equity Fund |
Since
1997 |
Mr. Jones joined the
Investment Adviser as a portfolio manager in 1989. |
||||
| Name and Title | Fund Responsibility | Years Primarily
Responsible |
Five Year Employment History | ||||
|---|---|---|---|---|---|---|---|
| Alice Lui
Vice President |
Portfolio Manager—
Asia Growth Fund Emerging Markets Equity Fund International Equity Fund International Growth Opportunities Fund |
Since
1994 1999 1999 1999 |
Ms. Lui joined the Investment
Adviser as a portfolio manager in 1990. |
||||
| Ravi Shanker
Vice President |
Senior Portfolio Manager—
Asia Growth Fund Emerging Markets Equity Fund International Equity Fund International Growth Opportunities Fund |
Since
1997 1998 1999 1999 |
Mr. Shanker joined the
Investment Adviser as an operations manager in 1997. From July 1996 to 1997, he worked for Goldman Sachs in Singapore as a strategic advisor for transactions involving infrastructure industries in Asia. From 1988 to 1996, he worked for Goldman Sachs as an investment banker in the Investment Banking Division. |
||||
| Siew-Hua Thio
Vice President |
Portfolio Manager—
Asia Growth Fund Emerging Markets Equity Fund International Equity Fund International Growth Opportunities Fund |
Since
1998 1998 1998 1998 |
Ms. Thio joined the Investment
Adviser as a portfolio manager in 1998. From 1997 to 1998, she was Head of Research for Indosuez WI Carr in Singapore. From 1993 to 1997, she was a research analyst at the same firm. |
||||
| Name and Title | Fund Responsibility | Years Primarily
Responsible |
Five Year Employment History | ||||
|---|---|---|---|---|---|---|---|
| Toshiyuki Ejima
Vice President |
Portfolio Manager—
Japanese Equity Fund |
Since
1999 |
Mr. Ejima joined the Investment
Adviser as a portfolio manager in April 1999. Prior to that he was a portfolio manager at Daiichi Mutual Life from 1993 to 1999 where he managed Japanese equities. |
||||
| Shigeka Kouda
Vice President |
Portfolio Manager—
International Growth Opportunities Fund |
Since
1998 |
Mr. Kouda joined the
Investment Adviser as a portfolio manager in 1997. From 1992 to 1997, he was at the Fixed Income Division of Goldman Sachs (Japan) Limited, where he was extensively involved in emerging markets trading as well as International Fixed Income institutional sales. |
||||
| Shogo Maeda
Managing Director |
Senior Portfolio Manager—
Japanese Equity Fund International Equity Fund International Growth Opportunities Fund |
Since
1994 1994 1998 |
Mr. Maeda joined the
Investment Adviser as a portfolio manager in 1994. |
||||
| Miyako Shibamoto
Vice President |
Portfolio Manager—
Japanese Equity Fund |
Since
1998 |
Ms. Shibamoto joined the
Investment Adviser as a member of the Japanese Equity team in March 1998. From 1993 to 1998, she was a Vice President at Scudder Stevens and Clark (Japan). |
||||
| Takeya Suzuki
Vice President |
Portfolio Manager—
Japanese Equity Fund |
Since
1998 |
Mr. Suzuki joined the
Investment Adviser as a portfolio manager in 1996. From 1990 to 1996, he was a Japanese equity portfolio manager at Nomura Investment Management where he actively managed assets for U.S. pension funds. |
||||
| DISTRIBUTOR AND TRANSFER AGENT
|
| Goldman Sachs, 85 Broad Street, New York, New York 10004, serves as the exclusive distributor (the “Distributor”) of
each Fund’s shares. Goldman Sachs, 4900 Sears Tower, Chicago, Illinois 60606-6372, also serves as the Funds’ transfer agent (the “Transfer Agent”) and, as such, performs various shareholder servicing functions.
|
| From time to time, Goldman Sachs or any of its affiliates may purchase and hold shares of the Funds. Goldman Sachs reserves the
right to redeem at any time some or all of the shares acquired for its own account.
|
| ACTIVITIES OF GOLDMAN SACHS AND ITS AFFILIATES AND OTHER ACCOUNTS MANAGED BY GOLDMAN SACHS
|
| The involvement of the Investment Adviser, Goldman Sachs and their affiliates in the management of, or their interest in, other
accounts and other activities of Goldman Sachs may present conflicts of interest with respect to a Fund or limit a Fund’s investment activities. Goldman Sachs and its affiliates engage in proprietary trading and advise accounts and funds which have
investment objectives similar to those of the Funds and/or which engage in and compete for transactions in the same types of securities, currencies and instruments as the Funds. Goldman Sachs and its affiliates will not have any obligation to make
available any information regarding their proprietary activities or strategies, or the activities or strategies used for other accounts managed by them, for the benefit of the management of the Funds. The results of a Fund’s investment activities,
therefore, may differ from those of Goldman Sachs and its affiliates, and it is possible that a Fund could sustain losses during periods in which Goldman Sachs and its affiliates and other accounts achieve significant profits on their trading for
proprietary or other accounts. In addition, the Funds may, from time to time, enter into transactions in which other clients of Goldman Sachs have an adverse interest. A Fund’s activities may be limited because of regulatory restrictions applicable
to Goldman Sachs and its affiliates, and/or their internal policies designed to comply with such restrictions.
|
| Each Fund pays dividends from its investment company taxable income and distributions from net realized capital gains. You may
choose to have dividends and distributions paid in:
|
n
|
Cash
|
n
|
Additional shares of the same class of the same Fund
|
n
|
Shares of the same or an equivalent class of another Goldman Sachs Fund. Special restrictions may apply for certain ILA
Portfolios. See the Additional Statement.
|
| You may indicate your election on your Account Application. Any changes may be submitted in writing to Goldman Sachs at any time
before the record date for a particular dividend or distribution. If you do not indicate any choice, dividends and distributions will be reinvested automatically in the applicable Fund.
|
| The election to reinvest dividends and distributions in additional shares will not affect the tax treatment of such dividends and
distributions, which will be treated as received by you and then used to purchase the shares.
|
| The Funds’ investments in foreign securities may be subject to foreign withholding taxes. Under certain circumstances, the
Funds may elect to pass-through these taxes to you. If this election is made, a proportionate amount of such taxes will constitute a distribution to you, which would allow you either (1) to credit such proportionate amount of foreign taxes against your
U.S. federal income tax liability or (2) to take such amount as an itemized deduction.
|
| Dividends from investment company taxable income and distributions from net capital gains are declared and paid annually.
|
| From time to time a portion of a Fund’s dividends may constitute a return of capital.
|
| At the time of an investor’s purchase of shares of a Fund, a portion of the NAV per share may be represented by undistributed
income or undistributed realized appreciation of the Fund’s portfolio securities. Therefore, subsequent distributions on such shares from such income or realized appreciation may be taxable to you even if the NAV of the shares is, as a result of the
distributions, reduced below the cost of such shares and the distributions (or portions thereof) represent a return of a portion of the purchase price.
|
| The following section will provide you with answers to some of the most often asked questions regarding buying and selling the
Funds’ shares.
|
| How Can I Purchase Class A, Class B And Class C Shares Of The Funds?
|
| You may purchase shares of the Funds through:
|
n
|
Goldman Sachs;
|
n
|
Authorized Dealers; or
|
n
|
Directly from Goldman Sachs Trust (the “Trust”).
|
| In order to make an initial investment in a Fund, you must furnish to the Fund, Goldman Sachs or your Authorized Dealer the
information in the Account Application attached to this Prospectus.
|
| To Open an Account:
|
n
|
Complete the enclosed Account Application
|
n
|
Mail your payment and Account Application to:
|
| Your Authorized Dealer
|
–
|
Purchases by check or Federal Reserve draft should be made payable to your Authorized Dealer
|
–
|
Your Authorized Dealer is responsible for forwarding payment promptly (within three business days) to the Fund
|
| or
|
| Goldman Sachs Funds c/o National Financial Data Services, Inc. (“NFDS”), P.O. Box 219711, Kansas
City, MO 64121-9711
|
–
|
Purchases by check or Federal Reserve draft should be made payable to Goldman Sachs Funds – (Name of Fund and
Class of Shares)
|
–
|
NFDS will not accept a check drawn on a foreign bank, a third-party check, cash, money orders, travelers cheques or credit card
checks
|
–
|
Federal funds wire, Automated Clearing House Network (“ACH”) transfer or bank wires should be sent to State Street Bank
and Trust Company (“State Street”) (each Fund’s custodian). Please call the Funds at 1-800-526-7384 to get detailed instructions on how to wire your money.
|
| What Is My Minimum Investment In The Funds?
|
| Initial | Additional | ||||
|---|---|---|---|---|---|
| Regular Accounts | $1,000 | $50 | |||
| Tax-Sheltered Retirement Plans (excluding SIMPLE IRAs and
Education IRAs) |
$250 | $50 | |||
| Uniform Gift to Minors Act Accounts/Uniform Transfer to
Minors Act Accounts |
$250 | $50 | |||
| 403(b) Plan Accounts | $200 | $50 | |||
| SIMPLE IRAs and Education IRAs | $50 | $50 | |||
| Automatic Investment Plan Accounts | $50 | $50 | |||
| What Alternative Sales Arrangements Are Available?
|
| The Funds offer three classes of shares through this Prospectus.
|
| Maximum Amount You Can
Buy In The Aggregate Across Funds |
Class A | No limit | |||
| Class B | $250,000 | ||||
| Class C | $1,000,000 | ||||
| Initial Sales Charge | Class A | Applies to purchases of less than $1 million—
varies by size of investment with a maximum of 5.5% |
|||
| Class B | None | ||||
| Class C | None | ||||
| CDSC | Class A | 1.00% on certain investments of $1 million or
more if you sell within 18 months |
|||
| Class B | 6 year declining CDSC with a maximum of 5% | ||||
| Class C | 1% if shares are redeemed within 12 months
of purchase |
||||
| Conversion Feature | Class A | None | |||
| Class B | Class B Shares convert to Class A Shares after
8 years |
||||
| Class C | None | ||||
| What Else Should I Know About Share Purchases?
|
| The Trust reserves the right to:
|
n
|
Refuse to open an account if you fail to (i) provide a social security number or other taxpayer identification number; or (ii)
certify that such number is correct (if required to do so under applicable law).
|
n
|
Reject or restrict any purchase or exchange order by a particular purchaser (or group of related purchasers). This may occur, for
example, when a pattern of
frequent purchases, sales or exchanges of shares of a Fund is evident, or if purchases, sales or exchanges are, or a subsequent abrupt redemption might be, of a size that would disrupt management of a Fund.
|
n
|
Close a Fund to new investors from time to time and reopen a
Fund whenever it is deemed appropriate by a Fund’s Investment Adviser.
|
n
|
Modify or waive the minimum investment amounts.
|
n
|
Modify the manner in which shares are offered.
|
n
|
Modify the sales charge rates applicable to future purchases of shares.
|
| The Funds may allow you to purchase shares with securities instead of cash if consistent with a Fund’s investment policies
and operations and if approved by the Fund’s Investment Adviser.
|
| How Are Shares Priced?
|
| The price you pay or receive when you buy, sell or exchange shares is determined by a Fund’s NAV and share class. Each class
calculates its NAV as follows:
|
| |
(Value of Assets of the Class)
|
|
| NAV =
|
– (Liabilities of the Class)
|
|
| |
Number of Outstanding Shares of the Class
|
|
| The Funds’ investments are valued based on market quotations or if accurate quotations are not readily available, the fair
value of the Fund’s investments may be determined in good faith under procedures established by the Trustees.
|
n
|
NAV per share of each share class is calculated by the Fund’s custodian on each business day as of the close of regular
trading on the New York Stock Exchange (normally 4:00 p.m. New York time). Fund shares will not be priced on any day the New York Stock Exchange is closed.
|
n
|
When you buy shares, you pay the NAV next calculated after the Funds receive your order in proper form, plus any applicable
sales charge.
|
n
|
When you sell shares, you receive the NAV next calculated after the Funds receive your order in proper form, less any
applicable CDSC.
|
| Note: The time at which transactions and shares are priced and the time by which orders must be received may be changed in
case of an emergency or if regular trading on the New York Stock Exchange is stopped at a time other than 4:00 p.m. New York time.
|
| Foreign securities may trade in their local markets on days a Fund is closed. As a result, the NAV of a Fund that holds foreign
securities may be impacted on days when investors may not purchase or redeem Fund shares.
|
| In addition, the impact of events that occur after the publication of market quotations used by a Fund to price its securities but
before the close of regular trading
on the New York Stock Exchange will normally not be reflected in a Fund’s next determined NAV unless the Trust, in its discretion, makes an adjustment in light of the nature and materiality of the event, its effect on Fund operations and other
relevant factors.
|
| COMMON QUESTIONS ABOUT THE PURCHASE OF CLASS A SHARES
|
| What Is The Offering Price Of Class A Shares?
|
| The offering price of Class A Shares of each Fund is the next determined NAV per share plus an initial sales charge paid to
Goldman Sachs at the time of purchase of shares. The sales charge varies depending upon the amount you purchase. In some cases, described below, the initial sales charge may be eliminated altogether, and the offering price will be the NAV per share. The current sales charges and commissions paid
to Authorized Dealers are as follows:
|
| Amount of Purchase
(including sales charge, if any) |
Sales Charge as
Percentage of Offering Price |
Sales Charge
as Percentage of Net Amount Invested |
Maximum Dealer
Allowance as Percentage of Offering Price* |
|||||||
|---|---|---|---|---|---|---|---|---|---|---|
| Less than $50,000 | 5.50 | % | 5.82 | % | 5.00 | % | ||||
| $50,000 up to (but less than) $100,000 | 4.75 | 4.99 | 4.00 | |||||||
| $100,000 up to (but less than) $250,000 | 3.75 | 3.90 | 3.00 | |||||||
| $250,000 up to (but less than) $500,000 | 2.75 | 2.83 | 2.25 | |||||||
| $500,000 up to (but less than) $1 million | 2.00 | 2.04 | 1.75 | |||||||
| $1 million or more | 0.00 | ** | 0.00 | ** | *** | |||||
*
|
Dealer’s allowance may be changed periodically. During special promotions, the entire sales charge may be allowed
to Authorized Dealers. Authorized Dealers to whom substantially the entire sales charge is allowed may be deemed to be “underwriters” under the Securities Act of 1933.
|
**
|
No sales charge is payable at the time of purchase of Class A Shares of $1 million or more, but a CDSC of 1% may be
imposed in the event of certain redemptions within 18 months of purchase.
|
***
|
The Distributor may pay a one-time commission to Authorized Dealers who initiate or are responsible for purchases of $1
million or more of shares of the Funds equal to 1.00% of the amount under $3 million, 0.50% of the next $2 million, and 0.25% thereafter. The Distributor may also pay, with respect to all or a portion of the amount purchased, a commission in accordance
with the foregoing schedule to Authorized Dealers who initiate or are responsible for purchases of $500,000 or more by certain Section 401(k), profit sharing, money purchase pension, tax-sheltered annuity, defined benefit pension, or other employee
benefit plans that are sponsored by one or more employers (including governmental or church employers) or employee organizations investing in the Funds which satisfy the criteria set forth below in “When Are Class A Shares Not Subject To A Sales
Load?” or $1 million or more by certain “wrap” accounts. Purchases by such plans will be made at NAV with no initial sales charge, but if all of the shares held are redeemed within 18 months after the end of the calendar month in which such
purchase was made, a CDSC of 1% may be imposed upon the plan sponsor or the third party administrator. In addition, Authorized Dealers will remit to the Distributor such payments received in connection with “wrap” accounts in the event that
shares are redeemed within 18 months after the end of the calendar month in which the purchase was made.
|
| What Else Do I Need To Know About Class A Shares’ CDSC?
|
| Purchases of $1 million or more of Class A Shares will be made at NAV with no initial sales charge. However, if you redeem shares
within 18 months after the end of the calendar month in which the purchase was made, excluding any period of time in which the shares were exchanged into and remained invested in an equivalent class of an ILA Portfolio, a CDSC of 1% may be imposed. The
CDSC may not be imposed if your Authorized Dealer enters into an agreement with the Distributor to return all or an applicable prorated portion of its commission to the Distributor. The CDSC is waived on redemptions in certain circumstances. See “In
What Situations May The CDSC On Class A, B Or C Shares Be Waived Or Reduced?” below.
|
| When Are Class A Shares Not Subject To A Sales Load?
|
| Class A Shares of the Funds may be sold at NAV without payment of any sales charge to the following individuals and entities:
|
n
|
Goldman Sachs, its affiliates or their respective officers, partners, directors or employees (including retired employees and
former partners), any partnership of which Goldman Sachs is a general partner, any Trustee or officer of the Trust and designated family members of any of these individuals;
|
n
|
Qualified retirement plans of Goldman Sachs;
|
n
|
Trustees or directors of investment companies for which Goldman Sachs or an affiliate acts as sponsor;
|
n
|
Any employee or registered representative of any Authorized Dealer or their respective spouses, children and parents;
|
n
|
Banks, trust companies or other types of depository institutions investing for their own account or investing for discretionary or
non-discretionary accounts;
|
n
|
Any state, county or city, or any instrumentality, department, authority or agency thereof, which is prohibited by applicable
investment laws from paying a sales charge or commission in connection with the purchase of shares of a Fund;
|
n
|
Section 401(k), profit sharing, money purchase pension, tax-sheltered annuity, defined benefit pension, or other employee benefit
plans that are sponsored by one or more employers (including governmental or church employers) or employee organizations (“Retirement Plans”) that:
|
n
|
Buy shares of Goldman Sachs Funds worth $500,000 or more; or
|
n
|
Have 100 or more eligible employees at the time of purchase; or
|
n
|
Certify that they expect to have annual plan purchases of shares of Goldman Sachs Funds of $200,000 or more; or
|
n
|
Are provided administrative services by certain third-party administrators that have entered into a special service arrangement
with Goldman Sachs relating to such plans; or
|
n
|
Have at the time of purchase aggregate assets of at least $2,000,000;
|
n
|
“Wrap” accounts for the benefit of clients of broker-dealers, financial institutions or financial planners, provided
they have entered into an agreement with GSAM specifying aggregate minimums and certain operating policies and standards;
|
n
|
Registered investment advisers investing for accounts for which they receive asset-based fees;
|
n
|
Accounts over which GSAM or its advisory affiliates have investment discretion;
|
n
|
Shareholders receiving distributions from a qualified retirement plan invested in the Goldman Sachs Funds and reinvesting such
proceeds in a Goldman Sachs IRA;
|
n
|
Shareholders who roll over distributions from any tax-qualified retirement plan or tax-sheltered annuity to an IRA which invests
in the Goldman Sachs Funds if the tax-qualified retirement plan or tax-sheltered annuity receives administrative services provided by certain third-party administrators that have entered into a special service arrangement with Goldman Sachs relating to
such plan or annuity; or
|
n
|
Other exemptions may be stated from time to time in the Additional Statement.
|
| You must certify eligibility for any of the above exemptions on your Account Application and notify the Fund if you no longer
are eligible for the exemption. The Fund will grant you an exemption subject to confirmation of your entitlement. You may be charged a fee if you effect your transactions through a broker or agent.
|
| How Can The Sales Charge On Class A Shares Be Reduced?
|
n
|
Right of Accumulation: When buying Class A Shares in Goldman Sachs Funds, your current aggregate
investment determines the initial sales load you pay. You may qualify for reduced sales charges when the current market value of holdings (shares at current offering price), plus new purchases, reaches $50,000 or more. Class A Shares of any of the Goldman
Sachs Funds may be combined under the Right of Accumulation. To qualify for a reduced sales load, you or your Authorized Dealer must notify the Funds’ Transfer Agent at the time of investment that a quantity discount is applicable. Use of this
service is subject to a check of appropriate records. The Additional Statement has more information about the Right of Accumulation.
|
n
|
Statement of Intention: You may obtain a reduced sales charge by means of a written Statement of
Intention which expresses your non-binding commitment to invest in the aggregate $50,000 or more (not counting reinvestments of dividends and distributions) within a period of 13 months in Class A Shares of one or more Goldman Sachs Fund. Any investments
you make during the period
will receive the discounted sales load based on the full amount of your investment commitment. If the investment commitment of the Statement of Intention is not met prior to the expiration of the 13-month period, the entire amount will be subject to the
higher applicable sales charge. By signing the Statement of Intention, you authorize the Transfer Agent to escrow and redeem Class A Shares in your account to pay this additional charge. The Additional Statement has more information about the Statement of
Intention, which you should read carefully.
|
| COMMON QUESTIONS ABOUT THE PURCHASE OF CLASS B SHARES
|
| What Is The Offering Price Of Class B Shares?
|
| You may purchase Class B Shares of the Funds at the next determined NAV without an initial sales charge. However, Class B
Shares redeemed within six years of purchase will be subject to a CDSC at the rates shown in the table below based on how long you held your shares.
|
| The CDSC schedule is as follows:
|
| Year Since Purchase | CDSC as a
Percentage of Dollar Amount Subject to CDSC |
||
|---|---|---|---|
| First | 5% | ||
| Second | 4% | ||
| Third | 3% | ||
| Fourth | 3% | ||
| Fifth | 2% | ||
| Sixth | 1% | ||
| Seventh and thereafter | None | ||
| Proceeds from the CDSC are payable to the Distributor and may be used in whole or in part to defray the Distributor’s
expenses related to providing distribution-related services to the Funds in connection with the sale of Class B Shares, including the payment of compensation to Authorized Dealers. A commission equal to 4% of the amount invested is paid to Authorized
Dealers.
|
| What Should I Know About The Automatic Conversion Of Class B Shares?
|
| Class B Shares of a Fund will automatically convert into Class A Shares of the same Fund at the end of the calendar quarter that
is eight years after the purchase date.
|
| If you acquire Class B Shares of a Fund by exchange from Class B Shares of another Goldman Sachs Fund, your Class B Shares will
convert into Class A Shares of such Fund based on the date of the initial purchase and the CDSC schedule of that purchase.
|
| If you acquire Class B Shares through reinvestment of distributions, your Class B Shares will convert into Class A Shares based on
the date of the initial purchase of the shares on which the distribution was paid.
|
| The conversion of Class B Shares to Class A Shares will not occur at any time the Funds are advised that such conversions may
constitute taxable events for federal tax purposes, which the Funds believe is unlikely. If conversions do not occur as a result of possible taxability, Class B Shares would continue to be subject to higher expenses than Class A Shares for an
indeterminate period.
|
| A COMMON QUESTION ABOUT THE PURCHASE OF CLASS C SHARES
|
| What Is The Offering Price Of Class C Shares?
|
| You may purchase Class C Shares of the Funds at the next determined NAV without paying an initial sales charge. However, if you
redeem Class C Shares within 12 months of purchase, a CDSC of 1% will normally be deducted from the redemption proceeds; provided that in connection with purchases by Retirement Plans, where all of the Class C Shares are redeemed within 12 months of
purchase, a CDSC of 1% may be imposed upon the plan sponsor or third-party administrator.
|
| Proceeds from the CDSC are payable to the Distributor and may be used in whole or in part to defray the Distributor’s
expenses related to providing distribution-related services to the Funds in connection with the sale of Class C Shares, including the payment of compensation to Authorized Dealers. An amount equal to 1% of the amount invested is normally paid by the
Distributor to Authorized Dealers.
|
| COMMON QUESTIONS APPLICABLE TO THE PURCHASE OF CLASS A, B AND C SHARES
|
| What Else Do I Need To Know About The CDSC On Class A, B Or C Shares?
|
n
|
The CDSC is based on the lesser of the NAV of the shares at the time of redemption or the original offering price (which is the
original NAV).
|
n
|
No CDSC is charged on shares acquired from reinvested dividends or capital gains distributions.
|
n
|
No CDSC is charged on the per share appreciation of your account over the initial purchase price.
|
n
|
When counting the number of months since a purchase of Class B or Class C Shares was made, all payments made during a month will
be combined and considered to have been made on the first day of that month.
|
n
|
To keep your CDSC as low as possible, each time you place a request to sell shares, the Funds will first sell any shares in your
account that do not carry a CDSC and then the shares in your account that have been held the longest.
|
| In What Situations May The CDSC On Class A, B Or C Shares Be Waived Or Reduced?
|
| The CDSC on Class A, Class B and Class C Shares that are subject to a CDSC may be waived or reduced if the redemption relates to:
|
n
|
Retirement distributions or loans to participants or beneficiaries from Retirement Plans;
|
n
|
The death or disability (as defined in Section 72(m)(7) of the Internal Revenue Code of 1986, as amended (the “Code”))
of a participant or beneficiary in a Retirement Plan;
|
n
|
Hardship withdrawals by a participant or beneficiary in a Retirement Plan;
|
n
|
Satisfying the minimum distribution requirements of the Code;
|
n
|
Establishing “substantially equal periodic payments” as described under Section 72(t)(2) of the Code;
|
n
|
The separation from service by a participant or beneficiary in a Retirement Plan;
|
n
|
The death or disability (as defined in Section 72(m)(7) of the Code) of a shareholder if the redemption is made within one year of
the event;
|
n
|
Excess contributions distributed from a Retirement Plan;
|
n
|
Distributions from a qualified Retirement Plan invested in the Goldman Sachs Funds which are being rolled over to a Goldman Sachs
IRA; or
|
n
|
Redemption proceeds which are to be reinvested in accounts or non-registered products over which GSAM or its advisory affiliates
have investment discretion.
|
| In addition, Class A, B and C Shares subject to a systematic withdrawal plan may be redeemed without a CDSC. The Funds reserve the
right to limit such redemptions, on an annual basis, to 12% each of the value of your Class B and C Shares and 10% of the value of your Class A Shares.
|
| How Do I Decide Whether To Buy Class A, B Or C Shares?
|
| The decision as to which Class to purchase depends on the amount you invest, the intended length of the investment and your
personal situation.
|
n
|
Class A Shares. If you are making an investment of $50,000 or more that qualifies for a reduced sales
charge, you should consider purchasing Class A Shares.
|
n
|
Class B Shares. If you plan to hold your investment for at least six years and would prefer not to pay
an initial sales charge, you might consider purchasing Class B Shares. By not paying a front-end sales charge, your entire investment in Class B Shares is available to work for you from the time you make your initial investment. However, the distribution
and service fee paid by Class B Shares will cause your Class B Shares (until conversion to Class A Shares) to have a higher expense ratio, and thus lower performance and lower dividend payments (to the extent dividends are paid) than Class A Shares. A
maximum purchase limitation of $250,000 in the aggregate normally applies to Class B Shares. Individual purchases exceeding $250,000 will be rejected.
|
n
|
Class C Shares. If you are unsure of the length of your investment or plan to hold your investment for
less than six years and would prefer not to pay an initial sales charge, you may prefer Class C Shares. By not paying a front-end sales charge, your entire investment in Class C Shares is available to work for you from the time you make your initial
investment. However, the distribution and service fee paid by Class C Shares will cause your Class C Shares to have a higher expense ratio, and thus lower performance and lower dividend payments (to the extent dividends are paid) than Class A Shares (or
Class B Shares after conversion to Class A Shares).
|
| Although Class C Shares are subject to a CDSC for only 12 months, Class C Shares do not have the automatic eight year conversion
feature applicable to Class B Shares and your investment may pay higher distribution fees indefinitely.
|
| A maximum purchase limitation of $1,000,000 in the aggregate normally applies to purchases of Class C Shares. Individual purchases
exceeding $1,000,000 will be rejected.
|
| Note: Authorized Dealers may receive different compensation for selling Class A, Class B or Class C Shares.
|
| In addition to Class A, Class B and Class C Shares, each Fund also offers other classes of shares to investors. These other share
classes are subject to different fees and expenses (which affect performance), have different minimum investment requirements and are entitled to different services. Information regarding these other share classes may be obtained from your sales
representative or from Goldman Sachs by calling the number on the back cover of this Prospectus.
|
| How Can I Sell Class A, Class B And Class C Shares Of The Funds?
|
| You may arrange to take money out of your account by selling (redeeming) some or all of your shares. Each Fund will redeem its
shares upon request on any business day at the NAV next determined after receipt of such request in proper form, subject to any applicable CDSC. You may request that redemption proceeds be sent to you by check or by wire (if the wire instructions are on record). Redemptions may be requested in writing or by telephone.
|
| Instructions For Redemptions: | |||
|---|---|---|---|
| By Writing: | n Write a letter of instruction that includes: | ||
| n Your name(s) and signature(s) | |||
| n Your account number | |||
| n The Fund name and Class of Shares | |||
| n The dollar amount you want to sell | |||
| n How and where to send the proceeds | |||
| n Obtain a signature guarantee (see details below) | |||
| n
Mail your request to:
Goldman Sachs Funds c/o NFDS P.O. Box 219711 Kansas City, MO 64121-9711 |
|||
| By Telephone: | If you have not declined the telephone redemption
privilege on your Account Application: |
||
| n
1-800-526-7384
(8:00 a.m. to 4:00 p.m. New York time) |
|||
| n
You may redeem up to $50,000 of your shares
within any 7 calendar day period |
|||
| n
Proceeds which are sent directly to a Goldman
Sachs brokerage account are not subject to the $50,000 limit |
|||
| When Do I Need A Signature Guarantee To Redeem Shares?
|
| A signature guarantee is required if:
|
n
|
You are requesting in writing to redeem shares in an amount over $50,000;
|
n
|
You would like the redemption proceeds sent to an address that is not your address of record; or
|
n
|
You would like to change the bank designated on your Account Application.
|
| A signature guarantee must be obtained from a bank, brokerage firm or other financial intermediary that is a member of an approved
Medallion Guarantee Program or that is otherwise approved by Goldman Sachs. A notary public cannot provide a signature guarantee. Additional documentation may be required for executors, trustees or corporations or when deemed appropriate by the Transfer
Agent.
|
| What Do I Need To Know About Telephone Redemption Requests?
|
| The Trust, the Distributor and the Transfer Agent will not be liable for any loss you may incur in the event that the Trust
accepts unauthorized telephone redemption requests that the Trust reasonably believes to be genuine. The Trust may accept telephone redemption instructions from any person identifying himself or herself as the owner of an account or the owner’s
registered representative where the owner has not declined in writing to use this service. Thus, you risk possible losses if a telephone redemption is not authorized by you.
|
| In an effort to prevent unauthorized or fraudulent redemption and exchange requests by telephone, Goldman Sachs and NFDS each
employ reasonable procedures specified by the Trust to confirm that such instructions are genuine. If reasonable procedures are not employed, the Trust may be liable for any loss due to unauthorized or fraudulent transactions. The following general
policies are currently in effect:
|
n
|
All telephone requests are recorded.
|
n
|
Proceeds of telephone redemption requests will be sent only to your address of record or authorized bank account designated in the
Account Application (unless you provide written instructions and a signature guarantee, indicating another address or account) and exchanges of shares normally will be made only to an identically registered account.
|
n
|
Telephone redemptions will not be accepted during the 30-day period following any change in your address of record.
|
n
|
The telephone redemption option does not apply to shares held in a “street name” account. “Street name”
accounts are accounts maintained and serviced by your Authorized Dealer. If your account is held in “street name,” you should contact your registered representative of record, who may make telephone redemptions on your behalf.
|
n
|
The telephone redemption option may be modified or terminated at any time.
|
| Note: It may be difficult to make telephone redemptions in times of drastic economic or market conditions.
|
| How Are Redemption Proceeds Paid?
|
| By Wire: You may arrange for your redemption proceeds to be wired as federal funds to the bank account designated in
your Account Application. The following general policies govern wiring redemption proceeds:
|
n
|
Redemption proceeds will normally be wired on the next business day in federal funds (for a total of one business day delay), but
may be paid up to three business days following receipt of a properly executed wire transfer redemption request. If you are selling shares you recently paid for by check, the Fund will pay you when your check has cleared, which may take up to 15 days. If th
e
|
| Federal Reserve Bank is closed on the day that the redemption proceeds would ordinarily be wired, wiring the redemption proceeds
may be delayed one additional business day.
|
n
|
A transaction fee of $7.50 may be charged for payments of redemption proceeds by wire. Your bank may also charge wiring fees. You
should contact your bank directly to learn whether it charges such fees.
|
n
|
To change the bank designated on your Account Application, you must send written instructions (with your signature guaranteed) to
the Transfer Agent.
|
n
|
Neither the Trust, Goldman Sachs nor any Authorized Dealer assumes any responsibility for the performance of your bank or any
intermediaries in the transfer process. If a problem with such performance arises, you should deal directly with your bank or any such intermediaries.
|
| By Check: You may elect to receive your redemption proceeds by check. Redemption proceeds paid by check will
normally be mailed to the address of record within three business days of a properly executed redemption request. If you are selling shares you recently paid for by check, the Fund will pay you when your check has cleared, which may take up to 15 days.
|
| What Else Do I Need To Know About Redemptions?
|
| The following generally applies to redemption requests:
|
n
|
Additional documentation may be required when deemed appropriate by the Transfer Agent. A redemption request will not be in proper
form until such additional documentation has been received.
|
| The Trust reserves the right to:
|
n
|
Redeem your shares if your account balance is less than $50 as a result of a redemption. The Funds will not redeem your shares on
this basis if the value of your account falls below the minimum account balance solely as a result of market conditions. The Funds will give you 60 days’ prior written notice to allow you to purchase sufficient additional shares of the Fund in order
to avoid such redemption.
|
n
|
Redeem your shares in other circumstances determined by the Board of Trustees to be in the best interests of the Trust.
|
n
|
Pay redemptions by a distribution in-kind of securities (instead of cash). If you receive redemption proceeds in-kind, you should
expect to incur transaction costs upon the disposition of those securities.
|
n
|
Reinvest any dividends or other distributions which you have elected to receive in cash should your check for such dividends or
other distributions be returned to the Fund as undeliverable or remain uncashed for six months. In addition, that distribution and all future distributions payable to you will be reinvested at NAV in additional shares of the same class of the Fund on
which the distribu-
|
| tions are paid. No interest will accrue on amounts represented by uncashed distribution or redemption checks.
|
| Can I Reinvest Redemption Proceeds In The Same Or Another Goldman Sachs Fund?
|
| You may redeem shares of a Fund and reinvest a portion or all of the redemption proceeds (plus any additional amounts needed to
round off purchases to the nearest full share) at NAV. To be eligible for this privilege, you must hold the shares you want to redeem for at least 30 days and you must reinvest the share proceeds within 90 days after you redeem. You may reinvest as follows:
|
n
|
Class A or B Shares—Class A Shares of the same Fund or any other Goldman Sachs Fund
|
n
|
Class C Shares—Class C Shares of the same Fund or any other Goldman Sachs Fund
|
n
|
You should obtain and read the applicable prospectuses before investing in any other Funds.
|
n
|
If you pay a CDSC upon redemption of Class A or Class C Shares and then reinvest in Class A or Class C Shares as described above,
your account will be credited with the amount of the CDSC you paid. The reinvested shares will, however, continue to be subject to a CDSC. The holding period of the shares acquired through reinvestment will include the holding period of the redeemed
shares for purposes of computing the CDSC payable upon a subsequent redemption. For Class B Shares, you may reinvest the redemption proceeds in Class A Shares at NAV but the amount of the CDSC paid upon redemption of the Class B Shares will not be
credited to your account.
|
n
|
The reinvestment privilege may be exercised at any time in connection with transactions in which the proceeds are reinvested at
NAV in a tax-sheltered retirement plan. In other cases, the reinvestment privilege may be exercised once per year upon receipt of a written request.
|
n
|
You may be subject to tax as a result of a redemption. You should consult your tax adviser concerning the tax consequences of a
redemption and reinvestment.
|
| Can I Exchange My Investment From One Fund To Another?
|
| You may exchange shares of a Fund at NAV without the imposition of an initial sales charge or CDSC at the time of exchange for
shares of the same class or an equivalent class of any other Goldman Sachs Fund. The exchange privilege may be materially modified or withdrawn at any time upon 60 days’ written notice to you.
|
| Instructions For Exchanging Shares: | |||
|---|---|---|---|
| By Writing: | n Write a letter of instruction that includes: | ||
| n Your name(s) and signature(s) | |||
| n Your account number | |||
| n The Fund names and Class of Shares | |||
| n The dollar amount you want to exchange | |||
| n Obtain a signature guarantee (see details above) | |||
| n Mail the request to: | |||
| Goldman Sachs Funds | |||
| c/o NFDS | |||
| P.O. Box 219711 | |||
| Kansas City, MO 64121-9711 | |||
| or for overnight delivery - | |||
| Goldman Sachs Funds | |||
| c/o NFDS | |||
| 330 West 9th St. | |||
| Poindexter Bldg., 1st Floor | |||
| Kansas City, MO 64105 | |||
| By Telephone: | If you have not declined the telephone exchange
privilege on your Account Application: |
||
| n
1-800-526-7384 (8:00 a.m. to 4:00 p.m.
New York time) |
|||
| You should keep in mind the following factors when making or considering an exchange:
|
n
|
You should obtain and carefully read the prospectus of the Fund you are acquiring before making an exchange.
|
n
|
Currently, there is no charge for exchanges, although the Funds may impose a charge in the future.
|
n
|
The exchanged shares may later be exchanged for shares of the same class (or an equivalent class) of the original Fund at the next
determined NAV without the imposition of an initial sales charge or CDSC if the amount in the Fund resulting from such exchanges is less than the largest amount on which you have previously paid the applicable sales charge.
|
n
|
When you exchange shares subject to a CDSC, no CDSC will be charged at that time. The exchanged shares will be subject to the CDSC
of the shares originally held. For purposes of determining the amount of the applicable CDSC, the length of time you have owned the shares will be measured from the date you acquired the original shares subject to a CDSC and will not be affected by a
subsequent exchange.
|
n
|
Eligible investors may exchange certain classes of shares for another class of shares of the same Fund. For further information,
call Goldman Sachs Funds at 1-800-526-7384 and see the Additional Statement.
|
n
|
All exchanges which represent an initial investment in a Fund must satisfy the minimum initial investment requirements of that Fund.
|
| n
|
Exchanges are available only in states where exchanges may be legally made.
|
n
|
It may be difficult to make telephone exchanges in times of drastic economic or market conditions.
|
n
|
Goldman Sachs and NFDS may use reasonable procedures described under “What Do I Need to Know About Telephone Redemption
Requests?” in an effort to prevent unauthorized or fraudulent telephone exchange requests.
|
n
|
Telephone exchanges normally will be made only to an identically registered account. Shares may be exchanged among accounts with
different names, addresses and social security or other taxpayer identification numbers only if the exchange instructions are in writing and accompanied by a signature guarantee.
|
n
|
Exchanges into Funds that are closed to new investors may be restricted.
|
| For federal income tax purposes, an exchange from one Fund to another is treated as a redemption of the shares surrendered in the
exchange, on which you may be subject to tax, followed by a purchase of shares received in the exchange. You should consult your tax adviser concerning the tax consequences of an exchange.
|
| Restrictions on Excessive Trading Practices. The Trust does not permit market-timing or other excessive trading
practices. Purchases and exchanges should be made for long-term investment purposes only. The Trust and Goldman Sachs reserve the right to reject or restrict purchase or exchange requests from any investor. Excessive, short-term (market-timing) trading
practices may disrupt portfolio management strategies, harm Fund performance and negatively impact long-term shareholders. The Trust and Goldman Sachs will not be held liable for any loss resulting from rejected purchase or exchange orders. To minimize
harm to the Trust (or Goldman Sachs) and its shareholders, the Trust (or Goldman Sachs) will exercise these rights if, in the Trust’s (or Goldman Sachs’) judgment, an investor has a history of excessive trading or if an investor’s trading,
in the judgment of the Trust (or Goldman Sachs) has been or may be disruptive to a Fund. In making this judgment, trades executed in multiple accounts under common ownership or control may be considered together.
|
| SHAREHOLDER SERVICES
|
| Can I Arrange To Have Automatic Investments Made On A Regular Basis?
|
| You may be able to make systematic cash investments through your bank via ACH transfer or your checking account via bank draft
each month. Forms for this option are available from Goldman Sachs, your Authorized Dealer or you may check the appropriate box on the Account Application.
|
| Can My Dividends And Distributions From A Fund Be Invested In Other Funds?
|
| You may elect to cross-reinvest dividends and capital gain distributions paid by a Fund in shares of the same class or an
equivalent class of any other Goldman Sachs Fund.
|
n
|
Shares will be purchased at NAV.
|
n
|
No initial sales charge or CDSC will be imposed.
|
n
|
You may elect cross-reinvestment into an identically registered account or an account registered in a different name or with a
different address, social security number or taxpayer identification number provided that the account has been properly established, appropriate signature guarantees obtained and the minimum initial investment has been satisfied.
|
| Can I Arrange To Have Automatic Exchanges Made On A Regular Basis?
|
| You may elect to exchange automatically a specified dollar amount of shares of a Fund for shares of the same class or an
equivalent class of any other Goldman Sachs Fund.
|
n
|
Shares will be purchased at NAV.
|
n
|
No initial sales charge is imposed.
|
n
|
Shares subject to a CDSC acquired under this program may be subject to a CDSC at the time of redemption from the Fund into which
the exchange is made depending upon the date and value of your original purchase.
|
n
|
Automatic exchanges are made monthly on the 15th day of each month or the first business day thereafter.
|
n
|
Minimum dollar amount: $50 per month.
|
| What Else Should I Know About Cross-Reinvestments And Automatic Exchanges?
|
| Cross-reinvestments and automatic exchanges are subject to the following conditions:
|
n
|
You must hold $5,000 or more in the Fund which is paying the dividend or from which the exchange is being made.
|
n
|
You must invest an amount in the Fund into which cross-reinvestments or automatic exchanges are being made that is equal to that
Fund’s minimum initial investment or continue to cross-reinvest or to make automatic exchanges until such minimum initial investment is met.
|
n
|
You should obtain and read the prospectus of the Fund into which dividends are invested or automatic exchanges are made.
|
| Can I Have Automatic Withdrawals Made On A Regular Basis?
|
| You may draw on your account systematically via check or ACH transfer in any amount of $50 or more.
|
n
|
It is normally undesirable to maintain a systematic withdrawal plan at the same time that you are purchasing additional Class A,
Class B or Class C Shares because of the sales charge imposed on your purchases of Class A Shares or the imposition of a CDSC on your redemptions of Class A, Class B or Class C Shares.
|
n
|
You must have a minimum balance of $5,000 in a Fund.
|
n
|
Checks are mailed on or about the 25th day of each month.
|
n
|
Each systematic withdrawal is a redemption and therefore a taxable transaction.
|
n
|
The CDSC applicable to Class A, Class B or Class C Shares redeemed under the systematic withdrawal plan may be waived.
|
| What Types of Reports Will I Be Sent Regarding My Investment?
|
| You will be provided with a printed confirmation of each transaction in your account and an individual quarterly account
statement. A year-to-date statement for your account will be provided upon request made to Goldman Sachs. If your account is held in “street name” you may receive your statements and confirmations on a different schedule.
|
| You will also receive an annual shareholder report containing audited financial statements and a semi-annual shareholder report.
If you have consented to the delivery of a single copy of shareholder reports, prospectuses and other information to all shareholders who share the same mailing address with your account, you may revoke your consent at any time by contacting Goldman Sachs
Funds by phone at 1-800-526-7384 or by mail at Goldman Sachs Funds, 4900 Sears Tower, Chicago, IL 60606-6372. The Funds will begin sending individual copies to you within 30 days after receipt of your revocation.
|
| The Funds do not generally provide sub-accounting services.
|
| What Should I Know When I Purchase Shares Through An Authorized Dealer?
|
| Authorized Dealers and other financial intermediaries may provide varying arrangements for their clients to purchase and redeem
Fund shares. They may charge additional fees not described in this Prospectus to their customers for such services.
|
| If shares of a Fund are held in a “street name” account with an Authorized Dealer, all recordkeeping, transaction
processing and payments of distributions relating to your account will be performed by the Authorized Dealer, and not by the Fund and its Transfer Agent. Since the Funds will have no record of your transactions, you should contact the Authorized Dealer to
purchase, redeem or exchange shares, to make changes in or give instructions concerning the account or to obtain information about your account. The transfer of shares in a “street name” account to an account with another dealer or to an account
directly with the Fund involves special procedures and will require you to obtain historical purchase information about the shares in the account from the Authorized Dealer.
|
| Authorized Dealers and other financial intermediaries may be authorized to accept, on behalf of the Trust, purchase, redemption
and exchange orders placed by or on behalf of their customers, and if approved by the Trust, to designate other intermediaries to accept such orders. In these cases:
|
n
|
A Fund will be deemed to have received an order that is in proper form when the order is accepted by an Authorized Dealer or
intermediary on a business day, and the order will be priced at the Fund’s NAV per share (adjusted for any applicable sales charge) next determined after such acceptance.
|
n
|
Authorized Dealers and intermediaries are responsible for transmitting accepted orders to the Funds within the time period agreed
upon by them.
|
| You should contact your Authorized Dealer or intermediary to learn whether it is authorized to accept orders for the Trust.
|
| The Investment Adviser, Distributor and/or their affiliates may pay additional compensation from time to time, out of their assets
and not as an additional charge to the Funds, to selected Authorized Dealers and other persons in connection with the sale, distribution and/or servicing of shares of the Funds and other Goldman Sachs Funds. Additional compensation based on sales may, but
is currently not expected to, exceed 0.50% (annualized) of the amount invested.
|
| DISTRIBUTION SERVICES AND FEES
|
| What Are The Different Distribution And Service Fees Paid By Class A, B and C Shares?
|
| The Trust has adopted distribution and service plans (each a “Plan”) under which Class A, Class B and Class C Shares
bear distribution and service fees paid to Authorized Dealers and Goldman Sachs. If the fees received by Goldman Sachs pursuant to the Plans exceed its expenses, Goldman Sachs may realize a profit from these arrangements. Goldman Sachs pays the
distribution and service fees on a quarterly basis.
|
| Under the Plans, Goldman Sachs is entitled to a monthly fee from each Fund for distribution services equal, on an annual basis,
to 0.25%, 0.75% and 0.75%, respectively, of a Fund’s average daily net assets attributed to Class A, Class B and Class C Shares. Because these fees are paid out of the Fund’s assets on an ongoing basis, over time, these fees will increase the
cost of your investment and may cost you more than paying other types of such charges.
|
| The distribution fees are subject to the requirements of Rule 12b-1 under the Act, and may be used (among other things) for:
|
n
|
Compensation paid to and expenses incurred by Authorized Dealers, Goldman Sachs and their respective officers, employees and sales
representatives;
|
n
|
Commissions paid to Authorized Dealers;
|
n
|
Allocable overhead;
|
n
|
Telephone and travel expenses;
|
n
|
Interest and other costs associated with the financing of such compensation and expenses;
|
n
|
Printing of prospectuses for prospective shareholders;
|
n
|
Preparation and distribution of sales literature or advertising of any type; and
|
n
|
All other expenses incurred in connection with activities primarily intended to result in the sale of Class A, Class B and Class C
Shares.
|
| In connection with the sale of Class C Shares, Goldman Sachs normally begins paying the 0.75% distribution fee as an ongoing
commission to Authorized Dealers after the shares have been held for one year.
|
| PERSONAL ACCOUNT MAINTENANCE SERVICES AND FEES
|
| Under the Plans, Goldman Sachs is also entitled to receive a separate fee equal on an annual basis to 0.25% of each Fund’s
average daily net assets attributed to Class A (applicable to Goldman Sachs International Equity Funds), Class B or Class C Shares. This fee is for personal and account maintenance services, and may be used to make payments to Goldman Sachs, Authorized
Dealers and their officers, sales representatives and employees for responding to inquiries of, and furnishing assistance to, shareholders regarding ownership of their shares or their accounts or similar services not otherwise provided on behalf of the
Funds. If the fees received by Goldman Sachs pursuant to the Plans exceed its expenses, Goldman Sachs may realize a profit from this arrangement.
|
| In connection with the sale of Class C Shares, Goldman Sachs normally begins paying the 0.25% ongoing service fee to Authorized
Dealers after the shares have been held for one year.
|
| As with any investment, you should consider how your investment in the Funds will be taxed. The tax information below is provided
as general information. More tax information is available in the Additional Statement. You should consult your tax adviser about the federal, state, local or foreign tax consequences of your investment in the Funds.
|
| Unless your investment is an IRA or other tax-advantaged account, you should consider the possible tax consequences of Fund
distributions and the sale of your Fund shares.
|
| DISTRIBUTIONS
|
| Distributions you receive from the Funds are generally subject to federal income tax, and may also be subject to state or local
taxes. This is true whether you reinvest your distributions in additional Fund shares or receive them in cash. For federal tax purposes, the Funds’ income dividend distributions and short-term capital gain distributions are taxable to you as ordinary
income. Any long-term capital gain distributions are taxable as long-term capital gains, no matter how long you have owned your Fund shares.
|
| Although distributions are generally treated as taxable to you in the year they are paid, distributions declared in October,
November or December but paid in January are taxable as if they were paid in December. A percentage of the Funds’ dividends paid to corporate shareholders may be eligible for the corporate dividends-received deduction. The Funds will inform
shareholders of the source and tax status of all distributions promptly after the close of each calendar year.
|
| Each Fund may be subject to foreign withholding or other foreign taxes on income or gain from certain foreign securities. In
general, the Funds may deduct these taxes in computing their taxable income.
|
| If you buy shares of a Fund before it makes a distribution, the distribution will be taxable to you even though it may actually be
a return of a portion of your investment. This is known as “buying a dividend.”
|
| SALES AND EXCHANGES
|
| Your sale of Fund shares is a taxable transaction for federal income tax purposes, and may also be subject to state and local
taxes. For tax purposes, the exchange of your Fund shares for shares of a different Goldman Sachs Fund is the same as a sale. When you sell your shares, you will generally recognize a capital gain or loss in an amount equal to the difference between your
adjusted tax basis in the shares and the amount received. Generally, this gain or loss is long-term or short-term depending on whether your holding period exceeds twelve months, except that any loss realized on shares held for six months or less will be
treated as a long-term capital loss to the extent of any capital gain dividends that were received on the shares.
|
| OTHER INFORMATION
|
| When you open your account, you should provide your social security or tax identification number on your Account Application. By
law, each Fund must withhold 31% of your taxable distributions and any redemption proceeds if you do not provide your correct taxpayer identification number, or certify that it is correct, or if the IRS instructs the Fund to do so. Non-U.S. investors may
be subject to U.S. withholding and estate tax.
|
| A. General Portfolio Risks
|
| The Funds will be subject to the risks associated with equity securities. “Equity securities” include common stocks,
preferred stocks, interests in real estate investment trusts, convertible debt obligations, convertible preferred stocks, equity interests in trusts, partnerships, joint ventures, limited liability companies and similar enterprises, warrants and stock
purchase rights. In general, stock values fluctuate in response to the activities of individual companies and in response to general market and economic conditions. Accordingly, the value of the stocks that a Fund holds may decline over short or extended
periods. The stock markets tend to be cyclical, with periods when stock prices generally rise and periods when prices generally decline. The volatility of equity securities means that the value of your investment in the Funds may increase or decrease.
Recently, certain stock markets have experienced substantial price volatility and, at times, have traded at or close to record high levels. There can be no guarantee that such levels will be reached or maintained in the future.
|
| To the extent that a Fund invests in fixed-income securities, that Fund will also be subject to the risks associated with its
fixed-income securities. These risks include interest rate risk, credit risk and call/extension risk. In general, interest rate risk involves the risk that when interest rates decline, the market value of fixed-income securities tends to increase
(although many mortgage related securities will have less potential than other debt securities for capital appreciation during periods of declining rates). Conversely, when interest rates increase, the market value of fixed-income securities tends to
decline. Credit risk involves the risk that an issuer or guarantor could default on its obligations, and a Fund will not recover its investment. Call risk and extension risk are normally present in mortgage-backed securities and asset-backed securities.
For example, homeowners have the option to prepay their mortgages. Therefore, the duration of a security backed by home mortgages can either shorten (call risk) or lengthen (extension risk). In general, if interest rates on new mortgage loans fall
sufficiently below the interest rates on existing outstanding mortgage loans, the rate of prepayment would be expected to increase. Conversely, if mortgage loan interest rates rise above the interest rates on existing outstanding mortgage loans, the rate
of prepayment would be expected to decrease. In either case, a change in the prepayment rate can result in losses to investors.
|
| The Investment Adviser will not consider the portfolio turnover rate a limiting factor in making investment decisions for a Fund.
A high rate of portfolio turnover (100% or more) involves correspondingly greater expenses which must be borne by a Fund and its shareholders, and is also likely to result in higher short-term capital gains taxable to shareholders. The portfolio turnover
rate is calculated by dividing the lesser of the dollar amount of sales or purchases of portfolio securities by the average monthly value of a Fund’s portfolio securities, excluding securities having a maturity at the date of purchase of one year or
less. See “Financial Highlights” in Appendix B for a statement of the Funds’ historical portfolio turnover rates.
|
| The following sections provide further information on certain types of securities and investment techniques that may be used by
the Funds, including their associated risks. Additional information is provided in the Additional Statement, which is available upon request. Among other things, the Additional Statement describes certain fundamental investment restrictions that cannot be
changed without shareholder approval. You should note, however, that all investment objectives, and all investment policies not specifically designated as fundamental are non-fundamental and may be changed without shareholder approval. If there is a
change in a Fund’s investment objective, you should consider whether that Fund remains an appropriate investment in light of your then current financial position and needs.
|
| B. Other Portfolio Risks
|
| Risks of Investing in Small Capitalization Companies. Each Fund may invest in small capitalization companies.
Investments in small capitalization companies involve greater risk and portfolio price volatility than investments in larger capitalization stocks. Among the reasons for the greater price volatility of these investments are the less certain growth
prospects of smaller firms and the lower degree of liquidity in the markets for such securities. Small capitalization companies may be thinly traded and may have to be sold at a discount from current market prices or in small lots over an extended period
of time. In addition, these securities are subject to the risk that during certain periods the liquidity of particular issuers or industries, or all securities in these investment categories, will shrink or disappear suddenly and without warning as a
result of adverse economic or market conditions, or adverse investor perceptions whether or not accurate. Because of the lack of sufficient market liquidity, a Fund may incur losses because it will be required to effect sales at a disadvantageous time and
only then at a substantial drop in price. Small capitalization companies include “unseasoned” issuers that do not have an established financial history; often have limited product lines, markets or financial
|
| resources; may depend on or use a few key personnel for management; and may be susceptible to losses and risks of bankruptcy.
Transaction costs for these investments are often higher than those of larger capitalization companies. Investments in small capitalization companies may be more difficult to price precisely than other types of securities because of their characteristics
and lower trading volumes.
|
| Risks of Foreign Investments. The Funds may make foreign investments. Foreign investments involve special risks that
are not typically associated with U.S. dollar denominated or quoted securities of U.S. issuers. Foreign investments may be affected by changes in currency rates, changes in foreign or U.S. laws or restrictions applicable to such investments and changes in
exchange control regulations (e.g., currency blockage). A decline in the exchange rate of the currency (i.e., weakening of the currency against the U.S. dollar) in which a portfolio security is quoted or denominated relative to the U.S. dollar would reduce the value of
the portfolio security. In addition, if the currency in which a Fund receives dividends, interest or other payments declines in value against the U.S. dollar before such income is distributed as dividends to shareholders or converted to U.S. dollars, the
Fund may have to sell portfolio securities to obtain sufficient cash to pay such dividends.
|
| The introduction of a single currency, the euro, on January 1, 1999 for participating nations in the European Economic and
Monetary Union has presented unique uncertainties, including the fluctuation of the euro relative to non-euro currencies during the transition period from January 1, 1999 to December 31, 2001 and beyond; whether the interest rate, tax and labor regimes of
European countries participating in the euro will converge over time; and whether the conversion of the currencies of other countries that now are or may in the future become members of the European Union (“EU”), may have an impact on the euro.
Also, it is possible that the euro could be abandoned in the future by countries that have already adopted its use. These or other events, including political and economic developments, could cause market disruptions, and could adversely affect the value
of securities held by the Funds. Because of the number of countries using this single currency, a significant portion of the assets held by the Funds may be denominated in the euro.
|
| Brokerage commissions, custodial services and other costs relating to investment in international securities markets generally are
more expensive than in the United States. In addition, clearance and settlement procedures may be different in foreign countries and, in certain markets, such procedures have been unable to keep pace with the volume of securities transactions, thus making
it difficult to conduct such transactions.
|
| Foreign issuers are not generally subject to uniform accounting, auditing and financial reporting standards comparable to those
applicable to U.S. issuers. There may be less publicly available information about a foreign issuer than about a U.S. issuer. In addition, there is generally less government regulation of foreign markets, companies and securities dealers than in the
United States. Foreign securities markets may have substantially less volume than U.S. securities markets and secu-
|
| rities of many foreign issuers are less liquid and more volatile than securities of comparable domestic issuers. Furthermore, with
respect to certain foreign countries, there is a possibility of nationalization, expropriation or confiscatory taxation, imposition of withholding or other taxes on dividend or interest payments (or, in some cases, capital gains distributions),
limitations on the removal of funds or other assets from such countries, and risks of political or social instability or diplomatic developments which could adversely affect investments in those countries.
|
| Concentration of a Fund’s assets in one or a few countries and currencies will subject a Fund to greater risks than if a
Fund’s assets were not geographically concentrated.
|
| Investment in sovereign debt obligations by certain Funds involves risks not present in debt obligations of corporate issuers. The
issuer of the debt or the governmental authorities that control the repayment of the debt may be unable or unwilling to repay principal or interest when due in accordance with the terms of such debt, and a Fund may have limited recourse to compel payment
in the event of a default. Periods of economic uncertainty may result in the volatility of market prices of sovereign debt, and in turn a Fund’s NAV, to a greater extent than the volatility inherent in debt obligations of U.S. issuers.
|
| A sovereign debtor’s willingness or ability to repay principal and pay interest in a timely manner may be affected by, among
other factors, its cash flow situation, the extent of its foreign currency reserves, the availability of sufficient foreign exchange on the date a payment
is due, the relative size of the debt service burden to the economy as a whole, the sovereign debtor’s policy toward international lenders, and the political constraints to which a sovereign debtor may be subject.
|
| Investments in foreign securities may take the form of sponsored and unsponsored American Depositary Receipts (“ADRs”)
and Global Depositary Receipts (“GDRs”). Certain Funds may also invest in European Depositary Receipts (“EDRs”) or other similar instruments representing securities of foreign issuers. ADRs represent the right to receive securities of
foreign issuers deposited in a domestic bank or a correspondent bank. Prices of ADRs are quoted in U.S. dollars, and ADRs are traded in the United States. EDRs and GDRs are receipts evidencing an arrangement with a non-U.S. bank. EDRs and GDRs are not
necessarily quoted in the same currency as the underlying security.
|
| Risks of Emerging Countries. Certain Funds may invest in securities of issuers located in emerging countries. The
risks of foreign investment are heightened when the issuer is located in an emerging country. Emerging countries are generally located in the Asia-Pacific region, Eastern Europe, Latin and South America and Africa. A Fund’s purchase and sale of
portfolio securities in certain emerging countries may be constrained by limitations relating to daily changes in the prices of listed securities, periodic trading or settlement volume and/or limitations on aggregate holdings of foreign investors. Such
limitations may be computed based on the aggregate trading volume by or holdings of a Fund, the Investment Adviser, its affiliates and their respective clients and other service providers. A Fund may not be able to sell securities in circumstances where
price, trading or settlement volume limitations have been reached.
|
| Foreign investment in the securities markets of certain emerging countries is restricted or controlled to varying degrees which
may limit investment in such countries or increase the administrative costs of such investments. For example, certain Asian countries require governmental approval prior to investments by foreign persons or limit investment by foreign persons to only a
specified percentage of an issuer’s outstanding securities or a specific class of securities which may have less advantageous terms (including price) than securities of the issuer available for purchase by nationals. In addition, certain countries
may restrict or prohibit investment opportunities in issuers or industries deemed important to national interests. Such restrictions may affect the market price, liquidity and rights of securities that may be purchased by a Fund. The repatriation of both
investment income and capital from certain emerging countries is subject to restrictions such as the need for governmental consents. Due to restrictions on direct investment in equity securities in certain Asian and other countries, it is anticipated that
a Fund may invest in such countries through other investment funds in such countries.
|
| Many emerging countries have recently experienced currency devaluations and substantial (and, in some cases, extremely high) rates
of inflation. Other emerging countries have experienced economic recessions. These circumstances have had a negative effect on the economies and securities markets of such emerging countries. Economies in emerging countries generally are dependent heavily
upon commodity prices and international trade and, accordingly, have been and may continue to be affected adversely by the economies of their trading partners, trade barriers, exchange controls, managed adjustments in relative currency values and other
protectionist measures imposed or negotiated by the countries with which they trade.
|
| Many emerging countries are subject to a substantial degree of economic, political and social instability. Governments of some
emerging countries are authoritarian in nature or have been installed or removed as a result of military coups, while
|
| governments in other emerging countries have periodically used force to suppress civil dissent. Disparities of wealth, the pace
and success of democratization, and ethnic, religious and racial disaffection, among other factors, have also led to social unrest, violence and/or labor unrest in some emerging countries. Unanticipated political or social developments may result in
sudden and significant investment losses. Investing in emerging countries involves greater risk of loss due to expropriation, nationalization, confiscation of assets and property or the imposition of restrictions on foreign investments and on repatriation
of capital invested. As an example, in the past some Eastern European governments have expropriated substantial amounts of private property, and many claims of the property owners have never been fully settled. There is no assurance that similar
expropriations will not recur in Eastern Europe or other countries.
|
| A Fund’s investment in emerging countries may also be subject to withholding or other taxes, which may be significant and may
reduce the return from an investment in such countries to the Fund.
|
| Settlement procedures in emerging countries are frequently less developed and reliable than those in the United States and often
may involve a Fund’s delivery of securities before receipt of payment for their sale. In addition, significant delays are common in certain markets in registering the transfer of securities. Settlement or registration problems may make it more
difficult for a Fund to value its portfolio securities and could cause the Fund to miss attractive investment opportunities, to have a portion of its assets uninvested or to incur losses due to the failure of a counterparty to pay for securities the Fund
has delivered or the Fund’s inability to complete its contractual obligations because of theft or other reasons. The creditworthiness of the local securities firms used by the Fund in emerging countries may not be as sound as the creditworthiness of
firms used in more developed countries. As a result, the Fund may be subject to a greater risk of loss if a securities firm defaults in the performance of its responsibilities.
|
| The small size and inexperience of the securities markets in certain emerging countries and the limited volume of trading in
securities in those countries may make a Fund’s investments in such countries less liquid and more volatile than investments in countries with more developed securities markets (such as the United States, Japan and most Western European countries). A
Fund’s investments in emerging countries are subject to the risk that the liquidity of a particular investment, or investments generally, in such countries will shrink or disappear suddenly and without warning as a result of adverse economic, market
or political conditions or adverse investor perceptions, whether or not accurate. Because of the lack of sufficient market liquidity, a Fund may incur losses because it will be required to effect sales at a disadvantageous time and only then at a
substantial drop in price. Invest
ments in emerging countries may be more difficult to price precisely because of the characteristics discussed above and lower trading volumes.
|
| A Fund’s use of foreign currency management techniques in emerging countries may be limited. Due to the limited market for
these instruments in emerging countries, the Investment Adviser does not currently anticipate that a significant portion of the Funds’ currency exposure in emerging countries, if any, will be covered by such instruments.
|
| Risks of Derivative Investments. A Fund’s transactions, if any, in options, futures, options on futures, swaps,
interest rate caps, floors and collars, structured securities and currency transactions involve additional risk of loss. Loss can result from a lack of correlation between changes in the value of derivative instruments and the portfolio assets (if any)
being hedged, the potential illiquidity of the markets for derivative instruments, or the risks arising from margin requirements and related leverage factors associated with such transactions. The use of these management techniques also involves the risk
of loss if the Investment Adviser is incorrect in its expectation of fluctuations in securities prices, interest rates or currency prices. Each Fund may also invest in derivative investments for non-hedging purposes (that is, to seek to increase total
return). Investing for non-hedging purposes is considered a speculative practice and presents even greater risk of loss.
|
| Risks of Illiquid Securities. Each Fund may invest up to 15% of its net assets in illiquid securities which cannot
be disposed of in seven days in the ordinary course of business at fair value. Illiquid securities include:
|
n
|
Both domestic and foreign securities that are not readily marketable
|
n
|
Certain stripped mortgage-backed securities
|
n
|
Repurchase agreements and time deposits with a notice or demand period of more than seven days
|
n
|
Certain over-the-counter options
|
n
|
Certain structured securities and all swap transactions
|
n
|
Certain restricted securities, unless it is determined, based upon a review of the trading markets for a specific restricted
security, that such restricted security is eligible for resale pursuant to Rule 144A under the Securities Act of 1933 (“144A Securities”) and, therefore, is liquid.
|
| Investing in 144A Securities may decrease the liquidity of a Fund’s portfolio to the extent that qualified institutional
buyers become for a time uninterested in purchasing these restricted securities. The purchase price and subsequent valuation of restricted and illiquid securities normally reflect a discount, which may be significant, from the market price of comparable
securities for which a liquid market exists.
|
| Credit Risks. Debt securities purchased by the Funds may include securities (including zero coupon bonds) issued by
the U.S. government (and its agencies, instrumentalities and sponsored enterprises), foreign governments, domestic and foreign corporations, banks and other issuers. Further information is provided in the Additional Statement.
|
| Debt securities rated BBB or higher by Standard & Poor’s or Baa or higher by Moody’s are considered “investment
grade.” Securities rated BBB or Baa are considered medium-grade obligations with speculative characteristics, and adverse economic conditions or changing circumstances may weaken their issuers’ capacity to pay interest and repay principal. A
security will be deemed to have met a rating requirement if it receives the minimum required rating from at least one such rating organization even though it has been rated below the minimum rating by one or more other rating organizations, or if unrated
by such rating organizations, determined by the Investment Adviser to be of comparable credit quality.
|
| Certain Funds may invest in fixed-income securities rated BB or Ba or below (or comparable unrated securities) which are commonly
referred to as “junk bonds.” Junk bonds are considered predominantly speculative and may be questionable as to principal and interest payments.
|
| In some cases, junk bonds may be highly speculative, have poor prospects for reaching investment grade standing and be in default.
As a result, investment in such bonds will present greater speculative risks than those associated with investment in investment grade bonds. Also, to the extent that the rating assigned to a security in a Fund’s portfolio is downgraded by a rating
organization, the market price and liquidity of such security may be adversely affected.
|
| Risks of Initial Public Offerings. The Funds may invest in IPOs. An IPO is a company’s first offering of stock
to the public. IPO risk is the risk that the market value of IPO shares will fluctuate considerably due to factors such as the absence of a prior public market, unseasoned trading, the small number of shares available for trading and limited information
about the issuer. The purchase of IPO shares may involve high transaction costs. IPO shares are subject to market risk and liquidity risk. When a Fund’s asset base is small, a significant portion of the Fund’s performance could be attributable
to investments in IPOs, because such investments would have a magnified impact on the Fund. As the Fund’s assets grow, the effect of the Fund’s investments in IPOs on the Fund’s performance probably will decline, which could reduce the
Fund’s performance. Because of the price volatility of IPO shares, a Fund may choose to hold IPO shares for a very short period of time. This may increase the turnover of the Fund’s portfolio and may lead to increased expenses to the Fund, such
as commissions and transaction costs. By selling IPO shares, the Fund may realize taxable gains it will subse-
|
| quently distribute to shareholders. In addition, the market for IPO shares can be speculative and/or inactive for extended
periods of time. There is no assurance that a Fund will be able to obtain allocable portions of IPO shares. The limited number of shares available for trading in some IPOs may make it more difficult for a Fund to buy or sell significant amounts of shares
without an unfavorable impact on prevailing prices. Investors in IPO shares can be affected by substantial dilution in the value of their shares, by sales of additional shares and by concentration of control in existing management and principal shareholders
.
|
| Temporary Investment Risks. Each Fund may, for temporary defensive purposes, invest a certain percentage of its
total assets in:
|
n
|
U.S. government securities
|
n
|
Commercial paper rated at least A-2 by Standard & Poor’s or P-2 by Moody’s
|
n
|
Certificates of deposit
|
n
|
Bankers’ acceptances
|
n
|
Repurchase agreements
|
n
|
Non-convertible preferred stocks and non-convertible corporate bonds with a remaining maturity of less than one year
|
| When a Fund’s assets are invested in such instruments, the Fund may not be achieving its investment objective.
|
| C. Portfolio Securities and Techniques
|
| This section provides further information on certain types of securities and investment techniques that may be used by the Funds,
including their associated risks. Further information is provided in the Additional Statement, which is available upon request.
|
| Convertible Securities. Each Fund may invest in convertible securities. Convertible securities are preferred stock
or debt obligations that are convertible into common stock. Convertible securities generally offer lower interest or dividend yields than non-convertible securities of similar quality. Convertible securities in which a Fund invests are subject to the same
rating criteria as its other investments in fixed-income securities. Convertible securities have both equity and fixed-income risk characteristics. Like all fixed-income securities, the value of convertible securities is susceptible to the risk of market
losses attributable to changes in interest rates. Generally, the market value of convertible securities tends to decline as interest rates increase and, conversely, to increase as interest rates decline. However, when the market price of the common stock
underlying a convertible security exceeds the conversion price of the convertible security, the convertible security tends to reflect the market price of the underlying common stock. As the market
price of the underlying common stock declines, the convertible security, like a fixed-income security, tends to trade increasingly on a yield basis, and thus may not decline in price to the same extent as the underlying common stock.
|
| Foreign Currency Transactions. A Fund may, to the extent consistent with its investment policies, purchase or sell
foreign currencies on a cash basis or through forward contracts. A forward contract involves an obligation to purchase or sell a specific currency at a future date at a price set at the time of the contract. A Fund may engage in foreign currency
transactions for hedging purposes and to seek to protect against anticipated changes in future foreign currency exchange rates. In addition, certain Funds may also enter into such transactions to seek to increase total return, which is considered a
speculative practice.
|
| Some Funds may also engage in cross-hedging by using forward contracts in a currency different from that in which the hedged
security is denominated or quoted. A Fund may hold foreign currency received in connection with investments in foreign securities when, in the judgment of the Investment Adviser, it would be beneficial to convert such currency into U.S. dollars at a later
date (e.g., the Investment Adviser may anticipate the foreign currency to appreciate against the U.S. dollar).
|
| Currency exchange rates may fluctuate significantly over short periods of time, causing, along with other factors, a Fund’s
NAV to fluctuate (when the Fund’s NAV fluctuates, the value of your shares may go up or down). Currency exchange rates also can be affected unpredictably by the intervention of U.S. or foreign governments or central banks, or the failure to
intervene, or by currency controls or political developments in the United States or abroad.
|
| The market in forward foreign currency exchange contracts, currency swaps and other privately negotiated currency instruments
offers less protection against defaults by the other party to such instruments than is available for currency instruments traded on an exchange. Such contracts are subject to the risk that the counterparty to the contract will default on its obligations.
Since these contracts are not guaranteed by an exchange or clearinghouse, a default on a contract would deprive a Fund of unrealized profits, transaction costs or the benefits of a currency hedge or could force the Fund to cover its purchase or sale
commitments, if any, at the current market price.
|
| Structured Securities. Each Fund may invest in structured securities. Structured securities are securities whose
value is determined by reference to changes in the value of specific currencies, interest rates, commodities, indices or other financial indicators (the “Reference”) or the relative change in two or more References.
The interest rate or the principal amount payable upon maturity or redemption may be increased or decreased depending upon changes in the applicable Reference. Structured securities may be positively or negatively indexed, so that appreciation of the
Reference may produce an increase or decrease in the interest rate or value of the security at maturity. In addition, changes in the interest rates or the value of the security at maturity may be a multiple of changes in the value of the Reference.
Consequently, structured securities may present a greater degree of market risk than other types of fixed-income securities and may be more volatile, less liquid and more difficult to price accurately than less complex securities.
|
| REITs. Each Fund may invest in REITs. REITs are pooled investment vehicles that invest primarily in either real
estate or real estate related loans. The value of a REIT is affected by changes in the value of the properties owned by the REIT or securing mortgage loans held by the REIT. REITs are dependent upon the ability of the REITs’ managers, and are subject
to heavy cash flow dependency, default by borrowers and the qualification of the REITs under applicable regulatory requirements for favorable income tax treatment. REITs are also subject to risks generally associated with investments in real estate
including possible declines in the value of real estate, general and local economic conditions, environmental problems and changes in interest rates. To the extent that assets underlying a REIT are concentrated geographically, by property type or in
certain other respects, these risks may be heightened. A Fund will indirectly bear its proportionate share of any expenses, including management fees, paid by a REIT in which it invests.
|
| Options on Securities, Securities Indices and Foreign Currencies. A put option gives the purchaser of the option the
right to sell, and the writer (seller) of the option the obligation to buy, the underlying instrument during the option period. A call option gives the purchaser of the option the right to buy, and the writer (seller) of the option the obligation to sell,
the underlying instrument during the option period. Each Fund may write (sell) covered call and put options and purchase put and call options on any securities in which they may invest or on any securities index consisting of securities in which they may
invest. A Fund may also, to the extent that it invests in foreign securities, purchase and sell (write) put and call options on foreign currencies.
|
| The writing and purchase of options is a highly specialized activity which involves special investment risks. Options may be used
for either hedging or cross-hedging purposes, or to seek to increase total return (which is considered a speculative activity). The successful use of options depends in part on the ability of the Investment Adviser to manage future price fluctuations and
the degree of correlation between the options and securities (or currency) markets. If the Invest
ment Adviser is incorrect in its expectation of changes in market prices or determination of the correlation between the instruments or indices on which options are written and purchased and the instruments in a Fund’s investment portfolio, the Fund
may incur losses that it would not otherwise incur. The use of options can also increase a Fund’s transaction costs. Options written or purchased by the Funds may be traded on either U.S. or foreign exchanges or over-the-counter. Foreign and
over-the-counter options will present greater possibility of loss because of their greater illiquidity and credit risks.
|
| Futures Contracts and Options on Futures Contracts. Futures contracts are standardized, exchange-traded contracts
that provide for the sale or purchase of a specified financial instrument or currency at a future time at a specified price. An option on a futures contract gives the purchaser the right (and the writer of the option the obligation) to assume a position
in a futures contract at a specified exercise price within a specified period of time. A futures contract may be based on various securities (such as U.S. government securities), foreign currencies, securities indices and other financial instruments and
indices. The Funds may engage in futures transactions on both U.S. and foreign exchanges.
|
| Each Fund may purchase and sell futures contracts, and purchase and write call and put options on futures contracts, in order to
seek to increase total return or to hedge against changes in interest rates, securities prices or, to the extent a Fund invests in foreign securities, currency exchange rates, or to otherwise manage their term structures, sector selection and durations in
accordance with their investment objectives and policies. Each Fund may also enter into closing purchase and sale transactions with respect to such contracts and options. A Fund will engage in futures and related options transactions for bona fide hedging
purposes as defined in regulations of the Commodity Futures Trading Commission or to seek to increase total return to the extent permitted by such regulations. A Fund may not purchase or sell futures contracts or purchase or sell related options to seek
to increase total return, except for closing purchase or sale transactions, if immediately thereafter the sum of the amount of initial margin deposits and premiums paid on the Fund’s outstanding positions in futures and related options entered into
for the purpose of seeking to increase total return would exceed 5% of the market value of the Fund’s net assets.
|
| Futures contracts and related options present the following risks:
|
n
|
While a Fund may benefit from the use of futures and options on futures, unanticipated changes in interest rates, securities
prices or currency exchange rates may result in poorer overall performance than if the Fund had not entered into any futures contracts or options transactions.
|
n
|
Because perfect correlation between a futures position and portfolio position that is intended to be protected is impossible to
achieve, the desired protection may not be obtained and a Fund may be exposed to additional risk of loss.
|
n
|
The loss incurred by a Fund in entering into futures contracts and in writing call options on futures is potentially unlimited and
may exceed the amount of the premium received.
|
n
|
Futures markets are highly volatile and the use of futures may increase the volatility of a Fund’s NAV.
|
n
|
As a result of the low margin deposits normally required in futures trading, a relatively small price movement in a futures
contract may result in substantial losses to a Fund.
|
n
|
Futures contracts and options on futures may be illiquid, and exchanges may limit fluctuations in futures contract prices during a
single day.
|
n
|
Foreign exchanges may not provide the same protection as U.S. exchanges.
|
| Equity Swaps. Each Fund may invest in equity swaps. Equity swaps allow the parties to a swap agreement to exchange
the dividend income or other components of return on an equity investment (for example, a group of equity securities or an index) for a component of return on another non-equity or equity investment.
|
| An equity swap may be used by a Fund to invest in a market without owning or taking physical custody of securities in
circumstances in which direct investment may be restricted for legal reasons or is otherwise impractical. Equity swaps are derivatives and their value can be very volatile. To the extent that the Investment Adviser does not accurately analyze and predict
the potential relative fluctuation of the components swapped with another party, a Fund may suffer a loss, which may be substantial. The value of some components of an equity swap (such as the dividends on a common stock) may also be sensitive to changes
in interest rates. Furthermore, a Fund may suffer a loss if the counterparty defaults. Because equity swaps are normally illiquid, a Fund may be unable to terminate its obligations when desired.
|
| When-Issued Securities and Forward Commitments. Each Fund may purchase when-issued securities and make contracts to
purchase or sell securities for a fixed price at a future date beyond customary settlement time. When-issued securities are securities that have been authorized, but not yet issued. When-issued securities are purchased in order to secure what is
considered to be an advantageous price and yield to the Fund at the time of entering into the transaction. A forward commitment involves the entering into a contract to purchase or sell securities for a fixed price at a future date beyond the customary
settlement period.
|
| The purchase of securities on a when-issued or forward commitment basis involves a risk of loss if the value of the security to be
purchased declines before the settlement date. Conversely, the sale of securities on a forward commitment
basis involves the risk that the value of the securities sold may increase before the settlement date. Although a Fund will generally purchase securities on a when-issued or forward commitment basis with the intention of acquiring the securities for its
portfolio, a Fund may dispose of when-issued securities or forward commitments prior to settlement if the Investment Adviser deems it appropriate.
|
| Repurchase Agreements. Repurchase agreements involve the purchase of securities subject to the seller’s
agreement to repurchase them at a mutually agreed upon date and price. Each Fund may enter into repurchase agreements with dealers in U.S. government securities and member banks of the Federal Reserve System which furnish collateral at least equal in
value or market price to the amount of their repurchase obligation.
|
| If the other party or “seller” defaults, a Fund might suffer a loss to the extent that the proceeds from the sale of the
underlying securities and other collateral held by the Fund are less than the repurchase price and the Fund’s costs associated with delay and enforcement of the repurchase agreement. In addition, in the event of bankruptcy of the seller, a Fund could
suffer additional losses if a court determines that the Fund’s interest in the collateral is not enforceable.
|
| In evaluating whether to enter into a repurchase agreement, the Investment Adviser will carefully consider the creditworthiness of
the seller. Certain Funds, together with other registered investment companies having advisory agreements with the Investment Adviser or any of its affiliates, may transfer uninvested cash balances into a single joint account, the daily aggregate balance
of which will be invested in one or more repurchase agreements.
|
| Lending of Portfolio Securities. Each Fund may engage in securities lending. Securities lending involves the lending
of securities owned by a Fund to financial institutions such as certain broker-dealers. The borrowers are required to secure their loan continuously with cash, cash equivalents, U.S. government securities or letters of credit in an amount at least equal
to the market value of the securities loaned. Cash collateral may be invested in cash equivalents. To the extent that cash collateral is invested in other investment securities, such collateral will be subject to market depreciation or appreciation, and a
Fund will be responsible for any loss that might result from its investment of the borrowers’ collateral. If the Investment Adviser determines to make securities loans, the value of the securities loaned may not exceed 33 1
/3% of the value of the total assets of a
Fund (including the loan collateral).
|
| A Fund may lend its securities to increase its income. A Fund may, however, experience delay in the recovery of its securities if
the institution with which it has engaged in a portfolio loan transaction breaches its agreement with the Fund.
|
| Short Sales Against-the-Box. Certain Funds may make short sales against-the-box. A short sale against-the-box means
that at all times when a short position is open the Fund will own an equal amount of securities sold short, or securities convertible into or exchangeable for, without payment of any further consideration, an equal amount of the securities of the same
issuer as the securities sold short.
|
| Preferred Stock, Warrants and Rights. Each Fund may invest in preferred stock, warrants and rights. Preferred stocks
are securities that represent an ownership interest providing the holder with claims on the issuer’s earnings and assets before common stock owners but after bond owners. Unlike debt securities, the obligations of an issuer of preferred stock,
including dividend and other payment obligations, may not typically be accelerated by the holders of such preferred stock on the occurrence of an event of default or other non-compliance by the issuer of the preferred stock.
|
| Warrants and other rights are options to buy a stated number of shares of common stock at a specified price at any time during the
life of the warrant or right. The holders of warrants and rights have no voting rights, receive no dividends and have no rights with respect to the assets of the issuer.
|
| Other Investment Companies. Each Fund may invest in securities of other investment companies (including
exchange-traded funds such as SPDRs and iShares
SM
, as defined below) subject to statutory limitations prescribed by the Act. These limitations include a
prohibition on any Fund acquiring more than 3% of the voting shares of any other investment company, and a prohibition on investing more than 5% of a Fund’s total assets in securities of any one investment company or more than 10% of its total assets
in securities of all investment companies. A Fund will indirectly bear its proportionate share of any management fees and other expenses paid by such other investment companies. Exchange-traded funds such as SPDRs and iShares
SM
are shares of unaffiliated investment companies which are traded like traditional equity securities on a national
securities exchange or the NASDAQ® National Market System.
|
n
|
Standard & Poor’s Depositary Receipts™.
The Funds may, consistent with their investment policies, purchase Standard & Poor’s Depositary Receipts™ (“SPDRs”). SPDRs are securities traded on the American Stock Exchange (“AMEX”) that represent
ownership in the SPDR Trust, a trust which has been established to accumulate and hold a portfolio of common stocks that is intended to track the price performance and dividend yield of the S&P 500®. The SPDR Trust is sponsored by a subsidiary of
the AMEX. SPDRs may be used for several reasons, including, but not limited to, facilitating the handling
|
| of cash flows or trading, or reducing transaction costs. The price movement of SPDRs may not perfectly parallel the price action
of the S&P 500®.
|
n
|
iShares
SM
(formerly World Equity Benchmark Shares or WEBs). iShares are shares of an investment company that invests substantially all of its assets in securities included
in the MSCI indices for specified countries. iShares are listed on the AMEX and were initially offered to the public in 1996. The market prices of iShares are expected to fluctuate in accordance with both changes in the NAVs of their underlying indices
and supply and demand of iShares on the AMEX. To date, iShares have traded at relatively modest discounts and premiums to their NAVs. However, iShares have a limited operating history and information is lacking regarding the actual performance and trading
liquidity of iShares for extended periods or over complete market cycles. In addition, there is no assurance that the requirements of the AMEX necessary to maintain the listing of iShares will continue to be met or will remain unchanged. In the event
substantial market or other disruptions affecting iShares should occur in the future, the liquidity and value of a Fund’s shares could also be substantially and adversely affected. If such disruptions were to occur, a Fund could be required to
reconsider the use of iShares as part of its investment strategy.
|
| Unseasoned Companies. Each Fund may invest in companies (including predecessors) which have operated less than three
years. The securities of such companies may have limited liquidity, which can result in their being priced higher or lower than might otherwise be the case. In addition, investments in unseasoned companies are more speculative and entail greater risk than
do investments in companies with an established operating record.
|
| Corporate Debt Obligations. Corporate debt obligations include bonds, notes, debentures, commercial paper and other
obligations of corporations to pay interest and repay principal, and include securities issued by banks and other financial institutions. Each Fund may invest in corporate debt obligations issued by U.S. and certain non-U.S. issuers which issue securities
denominated in the U.S. dollar (including Yankee and Euro obligations). In addition to obligations of corporations, corporate debt obligations include securities issued by banks and other financial institutions and supranational entities (i.e., the World Bank, the International Monetary Fund, etc.).
|
| Bank Obligations. Each Fund may invest in obligations issued or guaranteed by U.S. or foreign banks. Bank
obligations, including without limitations, time deposits, bankers’ acceptances and certificates of deposit, may be general obligations of the parent bank or may be limited to the issuing branch by the terms of the specific obligations or by
government regulations. Banks are subject to extensive but different governmental regulations which may limit both the amount and types of
loans which may be made and interest rates which may be charged. In addition, the profitability of the banking industry is largely dependent upon the availability and cost of funds for the purpose of financing lending operations under prevailing money
market conditions. General economic conditions as well as exposure to credit losses arising from possible financial difficulties of borrowers play an important part in the operation of this industry.
|
| U.S. Government Securities. Each Fund may invest in U.S. government securities. U.S. government securities include
U.S. Treasury obligations and obligations issued or guaranteed by U.S. government agencies, instrumentalities or sponsored enterprises. U.S. government securities may be supported by (a) the full faith and credit of the U.S. Treasury (such as the
Government National Mortgage Association (“Ginnie Mae”)); (b) the right of the issuer to borrow from the U.S. Treasury (such as securities of the Student Loan Marketing Association); (c) the discretionary authority of the U.S. government to
purchase certain obligations of the issuer; or (d) only the credit of the issuer. U.S. government securities also include Treasury receipts, zero coupon bonds and other stripped U.S. government securities, where the interest and principal components of
stripped U.S. government securities are traded independently.
|
| Custodial Receipts. Interests in U.S. government securities may be purchased in the form of custodial receipts that
evidence ownership of future interest payments, principal payments or both on certain notes or bonds issued or guaranteed as to principal and interest by the U.S. government, its agencies, instrumentalities, political subdivisions or authorities. For
certain securities law purposes, custodial receipts are not considered obligations of the U.S. government.
|
| Mortgage-Backed Securities. Certain Funds may invest in mortgage-backed securities. Mortgage-backed securities
represent direct or indirect participations in, or are collateralized by and payable from, mortgage loans secured by real property. Mortgage-backed securities can be backed by either fixed rate mortgage loans or adjustable rate mortgage loans, and may be
issued by either a governmental or non-governmental entity. Privately issued mortgage-backed securities are normally structured with one or more types of “credit enhancement.” However, these mortgage-backed securities typically do not have the
same credit standing as U.S. government guaranteed mortgage-backed securities.
|
| Mortgage-backed securities may include multiple class securities, including collateralized mortgage obligations (“CMOs”)
and Real Estate Mortgage Investment Conduit (“REMIC”) pass-through or participation certificates. CMOs provide an investor with a specified interest in the cash flow from a pool of underlying mortgages or of other mortgage-backed securities.
CMOs are issued in multiple classes. In many cases, payments of principal are applied to the CMO classes in the
order of their respective stated maturities, so that no principal payments will be made on a CMO class until all other classes having an earlier stated maturity date are paid in full. A REMIC is a CMO that qualifies for special tax treatment and invests
in certain mortgages principally secured by interests in real property and other permitted investments.
|
| Mortgaged-backed securities also include stripped mortgage-backed securities (“SMBS”), which are derivative multiple
class mortgage-backed securities. SMBS are usually structured with two different classes: one that receives substantially all of the interest payments and the other that receives substantially all of the principal payments from a pool of mortgage loans.
The market value of SMBS consisting entirely of principal payments generally is unusually volatile in response to changes in interest rates. The yields on SMBS that receive all or most of the interest from mortgage loans are generally higher than
prevailing market yields on other mortgage-backed securities because their cash flow patterns are more volatile and there is a greater risk that the initial investment will not be fully recouped.
|
| Asset-Backed Securities. Certain Funds may invest in asset-backed securities. Asset-backed securities are securities
whose principal and interest payments are collateralized by pools of assets such as auto loans, credit card receivables, leases, installment contracts and personal property. Asset-backed securities are often subject to more rapid repayment than their
stated maturity date would indicate as a result of the pass-through of prepayments of principal on the underlying loans. During periods of declining interest rates, prepayment of loans underlying asset-backed securities can be expected to accelerate.
Accordingly, a Fund’s ability to maintain positions in such securities will be affected by reductions in the principal amount of such securities resulting from prepayments, and its ability to reinvest the returns of principal at comparable yields is
subject to generally prevailing interest rates at that time. Asset-backed securities present credit risks that are not presented by mortgage-backed securities. This is because asset-backed securities generally do not have the benefit of a security
interest in collateral that is comparable to mortgage assets. If the issuer of an asset-backed security defaults on its payment obligations, there is the possibility that, in some cases, the Fund will be unable to possess and sell the underlying
collateral and that the Fund’s recoveries on repossessed collateral may not be available to support payments on the securities. In the event of a default, a Fund may suffer a loss if it cannot sell collateral quickly and receive the amount it is owed.
|
| Borrowings. Each Fund can borrow money from banks and other financial institutions in amounts not exceeding
one-third of its total assets for temporary or emergency purposes. A Fund may not make additional investments if borrowings exceed 5% of its total assets.
|
| The financial highlights tables are intended to help you understand a Fund’s financial performance for the past five years
(or less if the Fund has been in operation for less than five years). Certain information reflects financial results for a single Fund share. The total returns in the table represent the rate that an investor would have earned or lost on an investment in
a Fund (assuming reinvestment of all dividends and distributions). This information for the periods ended August 31, 2000 has been audited by PriceWaterhouseCoopers LLP, whose report, along with the Funds’ financial statements, is included in the
Funds’ annual reports (available upon request without charge). The information for all periods prior to the periods ended August 31, 2000, has been audited by the Funds’ previous independent accountants.
|
| CORE INTERNATIONAL EQUITY FUND
|
| Income from
investment operations |
|||||||||
|---|---|---|---|---|---|---|---|---|---|
|
Net asset value, beginning of period |
Net
investment income (loss) |
Net realized
and unrealized gain (loss) |
|||||||
| For the Year Ended August 31, | |||||||||
| 2000 - Class A Shares | $10.87 | $ 0.02 | c | $ 0.74 | |||||
| 2000 - Class B Shares | 10.81 | (0.04 | ) c | 0.73 | |||||
| 2000 - Class C Shares | 10.82 | (0.03 | ) c | 0.72 | |||||
| 2000 - Institutional Shares | 11.00 | 0.09 | c | 0.75 | |||||
| 2000 - Service Shares | 10.93 | 0.05 | c | 0.73 | |||||
| For the Seven-month Period Ended August 31, | |||||||||
| 1999 - Class A Shares | 9.98 | 0.05 | 0.84 | ||||||
| 1999 - Class B Shares | 9.95 | 0.01 | 0.85 | ||||||
| 1999 - Class C Shares | 9.96 | 0.01 | 0.85 | ||||||
| 1999 - Institutional Shares | 10.06 | 0.09 | 0.85 | ||||||
| 1999 - Service Shares | 10.02 | 0.01 | 0.90 | ||||||
| For the Year Ended January 31, | |||||||||
| 1999 - Class A Shares | 9.22 | (0.01 | ) | 0.79 | |||||
| 1999 - Class B Shares | 9.21 | — | 0.74 | ||||||
| 1999 - Class C Shares | 9.22 | — | 0.74 | ||||||
| 1999 - Institutional Shares | 9.24 | 0.05 | 0.80 | ||||||
| 1999 - Service Shares | 9.23 | — | 0.81 | ||||||
| For the Period Ended January 31, | |||||||||
| 1998 - Class A Shares (commenced August 15, 1997) | 10.00 | — | (0.78 | ) | |||||
| 1998 - Class B Shares (commenced August 15, 1997) | 10.00 | (0.02 | ) | (0.77 | ) | ||||
| 1998 - Class C Shares (commenced August 15, 1997) | 10.00 | (0.02 | ) | (0.76 | ) | ||||
| 1998 - Institutional Shares (commenced August 15, 1997) | 10.00 | 0.02 | (0.76 | ) | |||||
| 1998 - Service Shares (commenced August 15, 1997) | 10.00 | 0.01 | (0.78 | ) | |||||
|
Distributions to shareholders |
|||||||||||||||||||||
|---|---|---|---|---|---|---|---|---|---|---|---|---|---|---|---|---|---|---|---|---|---|
| Total from
investment operations |
From net
investment income |
From net
realized gains |
Total
distributions |
Net asset
value, end of period |
Total
returna |
Net assets at end of period (in 000s) |
Ratio of net
expenses to average net assets |
||||||||||||||
| $ 0.76 | $(0.05 | ) | $(0.26 | ) | $(0.31 | ) | $11.32 | 6.92 | % | $147,409 | 1.66 | % | |||||||||
| 0.69 | (0.02 | ) | (0.26 | ) | (0.28 | ) | 11.22 | 6.36 | 12,032 | 2.16 | |||||||||||
| 0.69 | (0.02 | ) | (0.26 | ) | (0.28 | ) | 11.23 | 6.34 | 6,887 | 2.16 | |||||||||||
| 0.84 | (0.10 | ) | (0.26 | ) | (0.36 | ) | 11.48 | 7.62 | 308,074 | 1.01 | |||||||||||
| 0.78 | (0.09 | ) | (0.26 | ) | (0.35 | ) | 11.36 | 7.05 | 27 | 1.51 | |||||||||||
| 0.89 | — | — | — | 10.87 | 8.92 | 114,502 | 1.66 | b | |||||||||||||
| 0.86 | — | — | — | 10.81 | 8.64 | 9,171 | 2.16 | b | |||||||||||||
| 0.86 | — | — | — | 10.82 | 8.63 | 4,913 | 2.16 | b | |||||||||||||
| 0.94 | — | — | — | 11.00 | 9.34 | 271,212 | 1.01 | b | |||||||||||||
| 0.91 | — | — | — | 10.93 | 9.08 | 8 | 1.51 | b | |||||||||||||
| 0.78 | (0.02 | ) | — | (0.02 | ) | 9.98 | 8.37 | 110,338 | 1.63 | ||||||||||||
| 0.74 | — | — | — | 9.95 | 8.03 | 7,401 | 2.08 | ||||||||||||||
| 0.74 | — | — | — | 9.96 | 8.03 | 3,742 | 2.08 | ||||||||||||||
| 0.85 | (0.03 | ) | — | (0.03 | ) | 10.06 | 9.20 | 280,731 | 1.01 | ||||||||||||
| 0.81 | (0.02 | ) | — | (0.02 | ) | 10.02 | 8.74 | 22 | 1.50 | ||||||||||||
| (0.78 | ) | — | — | — | 9.22 | (7.66 | ) | 7,087 | 1.50 | b | |||||||||||
| (0.79 | ) | — | — | — | 9.21 | (7.90 | ) | 2,721 | 2.00 | b | |||||||||||
| (0.78 | ) | — | — | — | 9.22 | (7.80 | ) | 1,608 | 2.00 | b | |||||||||||
| (0.74 | ) | (0.02 | ) | — | (0.02 | ) | 9.24 | (7.45 | ) | 17,719 | 1.00 | b | |||||||||
| (0.77 | ) | — | — | — | 9.23 | (7.70 | ) | 1 | 1.50 | b | |||||||||||
| CORE INTERNATIONAL EQUITY FUND (continued)
|
| Ratios assuming no
expense reductions |
|||||||||||||
|---|---|---|---|---|---|---|---|---|---|---|---|---|---|
| Ratio of
net investment income (loss) to average net assets |
Ratio of
expenses to average net assets |
Ratio of
net investment income (loss) to average net assets |
Portfolio
turnover rate |
||||||||||
| For the Year Ended August 31, | |||||||||||||
| 2000 - Class A Shares | 0.14 | % | 1.75 | % | 0.05 | % | 92.10 | % | |||||
| 2000 - Class B Shares | (0.36 | ) | 2.25 | (0.45 | ) | 92.10 | |||||||
| 2000 - Class C Shares | (0.34 | ) | 2.25 | (0.43 | ) | 92.10 | |||||||
| 2000 - Institutional Shares | 0.78 | 1.10 | 0.69 | 92.10 | |||||||||
| 2000 - Service Shares | 0.33 | 1.60 | 0.24 | 92.10 | |||||||||
| For the Seven-month Period Ended August 31, | |||||||||||||
| 1999 - Class A Shares | 0.78 | b | 1.76 | b | 0.68 | b | 64.97 | ||||||
| 1999 - Class B Shares | 0.26 | b | 2.26 | b | 0.16 | b | 64.97 | ||||||
| 1999 - Class C Shares | 0.23 | b | 2.26 | b | 0.13 | b | 64.97 | ||||||
| 1999 - Institutional Shares | 1.43 | b | 1.11 | b | 1.33 | b | 64.97 | ||||||
| 1999 - Service Shares | 0.07 | b | 1.61 | b | (0.03 | ) b | 64.97 | ||||||
| For the Year Ended January 31, | |||||||||||||
| 1999 - Class A Shares | (0.11 | ) | 1.94 | (0.42 | ) | 194.61 | |||||||
| 1999 - Class B Shares | (0.03 | ) | 2.39 | (0.34 | ) | 194.61 | |||||||
| 1999 - Class C Shares | (0.04 | ) | 2.39 | (0.35 | ) | 194.61 | |||||||
| 1999 - Institutional Shares | 0.84 | 1.32 | 0.53 | 194.61 | |||||||||
| 1999 - Service Shares | 0.02 | 1.81 | (0.29 | ) | 194.61 | ||||||||
| For the Period Ended January 31, | |||||||||||||
| 1998 - Class A Shares (commenced August 15, 1997) | (0.27 | ) b | 4.87 | b | (3.90 | ) b | 25.16 | ||||||
| 1998 - Class B Shares (commenced August 15, 1997) | (0.72 | ) b | 5.12 | b | (3.84 | ) b | 25.16 | ||||||
| 1998 - Class C Shares (commenced August 15, 1997) | (0.73 | ) b | 5.12 | b | (3.85 | ) b | 25.16 | ||||||
| 1998 - Institutional Shares (commenced August 15, 1997) | 0.59 | b | 4.12 | b | (2.53 | ) b | 25.16 | ||||||
| 1998 - Service Shares (commenced August 15, 1997) | 0.26 | b | 4.62 | b | (2.86 | ) b | 25.16 | ||||||
| INTERNATIONAL EQUITY FUND
|
| Income from
investment operations |
||||||||||||
|---|---|---|---|---|---|---|---|---|---|---|---|---|
|
Net asset value, beginning of period |
Net
investment income (loss) |
Net realized
and unrealized gain (loss) |
Total from
investment operations |
|||||||||
| For the Year Ended August 31, | ||||||||||||
| 2000 - Class A Shares | $23.12 | $(0.03 | ) c | $3.41 | $3.38 | |||||||
| 2000 - Class B Shares | 22.73 | (0.16 | ) c | 3.38 | 3.22 | |||||||
| 2000 - Class C Shares | 22.54 | (0.14 | ) c | 3.35 | 3.21 | |||||||
| 2000 - Institutional Shares | 23.49 | 0.14 | c | 3.46 | 3.60 | |||||||
| 2000 - Service Shares | 23.14 | (0.01 | ) c | 3.45 | 3.44 | |||||||
| For the Seven Months Ended August 31, | ||||||||||||
| 1999 - Class A Shares | 21.92 | 0.04 | 1.16 | 1.20 | ||||||||
| 1999 - Class B Shares | 21.63 | (0.02 | ) | 1.12 | 1.10 | |||||||
| 1999 - Class C Shares | 21.45 | (0.03 | ) | 1.12 | 1.09 | |||||||
| 1999 - Institutional Shares | 22.20 | 0.12 | c | 1.17 | c | 1.29 | ||||||
| 1999 - Service Shares | 21.93 | 0.06 | 1.15 | 1.21 | ||||||||
| For the Years Ended January 31, | ||||||||||||
| 1999 - Class A Shares | 19.85 | (0.06 | ) | 3.24 | 3.18 | |||||||
| 1999 - Class B Shares | 19.70 | (0.17 | ) | 3.21 | 3.04 | |||||||
| 1999 - Class C Shares | 19.56 | (0.15 | ) | 3.15 | 3.00 | |||||||
| 1999 - Institutional Shares | 19.97 | 0.03 | 3.31 | 3.34 | ||||||||
| 1999 - Service Shares | 19.84 | (0.04 | ) | 3.24 | 3.20 | |||||||
| 1998 - Class A Shares | 19.32 | 0.03 | 2.04 | 2.07 | ||||||||
| 1998 - Class B Shares | 19.24 | (0.08 | ) | 2.02 | 1.94 | |||||||
| 1998 - Class C Shares (commenced August 15, 1997) | 22.60 | (0.04 | ) | (1.38 | ) | (1.42 | ) | |||||
| 1998 - Institutional Shares | 19.40 | 0.10 | 2.11 | 2.21 | ||||||||
| 1998 - Service Shares | 19.34 | 0.02 | 2.06 | 2.08 | ||||||||
| 1997 - Class A Shares | 17.20 | 0.10 | 2.23 | 2.33 | ||||||||
| 1997 - Class B Shares (commenced May 1, 1996) | 18.91 | (0.06 | ) | 0.60 | 0.54 | |||||||
| 1997 - Institutional Shares (commenced February 7, 1996) | 17.45 | 0.04 | 2.15 | 2.19 | ||||||||
| 1997 - Service Shares (commenced March 6, 1996) | 17.70 | (0.02 | ) | 1.87 | 1.85 | |||||||
| 1996 - Class A Shares | 14.52 | 0.13 | 4.00 | 4.13 | ||||||||
| Distributions to shareholders |
|||||||||||||||||||||
|---|---|---|---|---|---|---|---|---|---|---|---|---|---|---|---|---|---|---|---|---|---|
| From net
investment income |
In excess of net investment income |
From net
realized gains |
Total
distributions |
Net asset
value, end of period |
Total
returna |
Net assets
at end of period (in 000s) |
Ratio of
net expenses to average net assets |
||||||||||||||
| $(0.10 | ) | $(0.24) | $(2.57 | ) | $(2.91 | ) | $23.59 | 14.68 | % | $1,343,869 | 1.79 | % | |||||||||
| (0.07 | ) | (0.17) | (2.57 | ) | (2.81 | ) | 23.14 | 14.20 | 80,274 | 2.29 | |||||||||||
| (0.09 | ) | (0.20) | (2.57 | ) | (2.86 | ) | 22.89 | 14.28 | 22,031 | 2.29 | |||||||||||
| (0.14 | ) | (0.32) | (2.57 | ) | (3.03 | ) | 24.06 | 15.45 | 325,161 | 1.14 | |||||||||||
| (0.11 | ) | (0.25) | (2.57 | ) | (2.93 | ) | 23.65 | 15.00 | 3,789 | 1.64 | |||||||||||
| — | — | — | — | 23.12 | 5.47 | 943,473 | 1.79 | b | |||||||||||||
| — | — | — | — | 22.73 | 5.09 | 68,691 | 2.29 | b | |||||||||||||
| — | — | — | — | 22.54 | 5.08 | 11,241 | 2.29 | b | |||||||||||||
| — | — | — | — | 23.49 | 5.81 | 180,564 | 1.14 | b | |||||||||||||
| — | — | — | — | 23.14 | 5.52 | 3,852 | 1.64 | b | |||||||||||||
| — | — | (1.11 | ) | (1.11 | ) | 21.92 | 16.39 | 947,973 | 1.73 | ||||||||||||
| — | — | (1.11 | ) | (1.11 | ) | 21.63 | 15.80 | 69,231 | 2.24 | ||||||||||||
| — | — | (1.11 | ) | (1.11 | ) | 21.45 | 15.70 | 11,619 | 2.24 | ||||||||||||
| — | — | (1.11 | ) | (1.11 | ) | 22.20 | 17.09 | 111,315 | 1.13 | ||||||||||||
| — | — | (1.11 | ) | (1.11 | ) | 21.93 | 16.49 | 3,568 | 1.63 | ||||||||||||
| — | (0.30 | ) | (1.24 | ) | (1.54 | ) | 19.85 | 11.12 | 697,590 | 1.67 | |||||||||||
| — | (0.25 | ) | (1.23 | ) | (1.48 | ) | 19.70 | 10.51 | 55,324 | 2.20 | |||||||||||
| — | (0.38 | ) | (1.24 | ) | (1.62 | ) | 19.56 | (5.92 | ) | 3,369 | 2.27 | b | |||||||||
| (0.07 | ) | (0.33 | ) | (1.24 | ) | (1.64 | ) | 19.97 | 11.82 | 56,263 | 1.08 | ||||||||||
| — | (0.35 | ) | (1.23 | ) | (1.58 | ) | 19.84 | 11.25 | 3,035 | 1.55 | |||||||||||
| — | — | (0.21 | ) | (0.21 | ) | 19.32 | 13.48 | 536,283 | 1.69 | ||||||||||||
| — | — | (0.21 | ) | (0.21 | ) | 19.24 | 2.83 | 19,198 | 2.23 | b | |||||||||||
| (0.03 | ) | — | (0.21 | ) | (0.24 | ) | 19.40 | 12.53 | 68,374 | 1.10 | b | ||||||||||
| — | — | (0.21 | ) | (0.21 | ) | 19.34 | 10.42 | 674 | 1.60 | b | |||||||||||
| (0.58 | ) | — | (0.87 | ) | (1.45 | ) | 17.20 | 28.68 | 330,860 | 1.52 | |||||||||||
| INTERNATIONAL EQUITY FUND (continued)
|
| Ratios assuming no
expense reductions |
|||||||||||||
|---|---|---|---|---|---|---|---|---|---|---|---|---|---|
| Ratio of
net investment income (loss) to average net assets |
Ratio of
expenses to average net assets |
Ratio of
net investment income (loss) to average net assets |
Portfolio
turnover rate |
||||||||||
| For the Year Ended August 31, | |||||||||||||
| 2000 - Class A Shares | (0.12 | )% | 1.84 | % | (0.17 | )% | 79.79 | % | |||||
| 2000 - Class B Shares | (0.65 | ) | 2.34 | (0.70 | ) | 79.79 | |||||||
| 2000 - Class C Shares | (0.59 | ) | 2.34 | (0.64 | ) | 79.79 | |||||||
| 2000 - Institutional Shares | 0.54 | 1.19 | 0.49 | 79.79 | |||||||||
| 2000 - Service Shares | (0.02 | ) | 1.69 | (0.07 | ) | 79.79 | |||||||
| For the Seven Months Ended August 31, | |||||||||||||
| 1999 - Class A Shares | 0.31 | b | 1.84 | b | 0.26 | b | 61.10 | ||||||
| 1999 - Class B Shares | (0.19 | ) b | 2.34 | b | (0.24 | ) b | 61.10 | ||||||
| 1999 - Class C Shares | (0.26 | ) b | 2.34 | b | (0.31 | ) b | 61.10 | ||||||
| 1999 - Institutional Shares | 0.89 | b | 1.19 | b | 0.84 | b | 61.10 | ||||||
| 1999 - Service Shares | 0.47 | b | 1.69 | b | 0.42 | b | 61.10 | ||||||
| For the Years Ended January 31, | |||||||||||||
| 1999 - Class A Shares | (0.28 | ) | 1.82 | (0.37 | ) | 113.79 | |||||||
| 1999 - Class B Shares | (0.79 | ) | 2.32 | (0.87 | ) | 113.79 | |||||||
| 1999 - Class C Shares | (0.98 | ) | 2.32 | (1.06 | ) | 113.79 | |||||||
| 1999 - Institutional Shares | 0.23 | 1.21 | 0.15 | 113.79 | |||||||||
| 1999 - Service Shares | (0.18 | ) | 1.71 | (0.26 | ) | 113.79 | |||||||
| 1998 - Class A Shares | (0.27 | ) | 1.80 | (0.40 | ) | 40.82 | |||||||
| 1998 - Class B Shares | (0.90 | ) | 2.30 | (1.00 | ) | 40.82 | |||||||
| 1998 - Class C Shares (commenced August 15, 1997) | (1.43 | ) b | 2.37 | b | (1.53 | ) b | 40.82 | ||||||
| 1998 - Institutional Shares | 0.30 | 1.18 | 0.20 | 40.82 | |||||||||
| 1998 - Service Shares | (0.36 | ) | 1.65 | (0.46 | ) | 40.82 | |||||||
| 1997 - Class A Shares | (0.07 | ) | 1.88 | (0.26 | ) | 38.01 | |||||||
| 1997 - Class B Shares (commenced May 1, 1996) | (0.97 | ) b | 2.38 | b | (1.12 | ) b | 38.01 | ||||||
| 1997 - Institutional Shares (commenced February 7, 1996) | 0.43 | b | 1.25 | b | 0.28 | b | 38.01 | ||||||
| 1997 - Service Shares (commenced March 6, 1996) | (0.40 | ) b | 1.75 | b | (0.55 | ) b | 38.01 | ||||||
| 1996 - Class A Shares | 0.26 | 1.77 | 0.01 | 68.48 | |||||||||
| EUROPEAN EQUITY FUND
|
| Income from
investment operations |
|||||||||
|---|---|---|---|---|---|---|---|---|---|
| Net asset
value, beginning of period |
Net investment income (loss) |
Net realized
and unrealized gain (loss) |
|||||||
| For the Year Ended August 31, | |||||||||
| 2000 - Class A Shares | $11.75 | $ — | c | $ 2.78 | |||||
| 2000 - Class B Shares | 11.71 | (0.04 | ) c | 2.73 | |||||
| 2000 - Class C Shares | 11.72 | (0.04 | ) c | 2.75 | |||||
| 2000 - Institutional Shares | 11.82 | 0.10 | c | 2.79 | |||||
| 2000 - Service Shares | 11.76 | 0.01 | c | 2.80 | |||||
| For the Seven Months Ended August 31, | |||||||||
| 1999 - Class A Shares | 12.20 | 0.05 | (0.50 | ) | |||||
| 1999 - Class B Shares | 12.19 | 0.03 | (0.51 | ) | |||||
| 1999 - Class C Shares | 12.20 | 0.04 | (0.52 | ) | |||||
| 1999 - Institutional Shares | 12.23 | 0.18 | (0.59 | ) | |||||
| 1999 - Service Shares | 12.20 | 0.08 | (0.52 | ) | |||||
| For the Period Ended January 31, | |||||||||
| 1999 - Class A Shares (commenced October 1, 1998) | 10.00 | (0.03 | ) | 2.23 | |||||
| 1999 - Class B Shares (commenced October 1, 1998) | 10.00 | (0.02 | ) | 2.21 | |||||
| 1999 - Class C Shares (commenced October 1, 1998) | 10.00 | (0.01 | ) | 2.21 | |||||
| 1999 - Institutional Shares (commenced October 1, 1998) | 10.00 | (0.01 | ) | 2.24 | |||||
| 1999 - Service Shares (commenced October 1, 1998) | 10.00 | (0.03 | ) | 2.23 | |||||
| Distributions to
shareholders |
||||||||||||||||||
|---|---|---|---|---|---|---|---|---|---|---|---|---|---|---|---|---|---|---|
| Total from
investment operations |
From net
realized gains |
Total
distributions |
Net asset
value, end of period |
Total
returna |
Net assets at end of period (in 000s) |
Ratio of
net expenses to average net assets |
||||||||||||
| $ 2.78 | $(0.71 | ) | $(0.71 | ) | $13.82 | 24.04 | % | $139,966 | 1.79 | % | ||||||||
| 2.69 | (0.71 | ) | (0.71 | ) | 13.69 | 23.32 | 4,538 | 2.29 | ||||||||||
| 2.71 | (0.71 | ) | (0.71 | ) | 13.72 | 23.48 | 1,482 | 2.29 | ||||||||||
| 2.89 | (0.71 | ) | (0.71 | ) | 14.00 | 24.85 | 14,630 | 1.14 | ||||||||||
| 2.81 | (0.71 | ) | (0.71 | ) | 13.86 | 24.28 | 2 | 1.64 | ||||||||||
| (0.45 | ) | — | — | 11.75 | (3.69 | ) | 74,862 | 1.79 | b | |||||||||
| (0.48 | ) | — | — | 11.71 | (3.94 | ) | 879 | 2.29 | b | |||||||||
| (0.48 | ) | — | — | 11.72 | (3.93 | ) | 388 | 2.29 | b | |||||||||
| (0.41 | ) | — | — | 11.82 | (3.35 | ) | 5,965 | 1.14 | b | |||||||||
| (0.44 | ) | — | — | 11.76 | (3.61 | ) | 2 | 1.64 | b | |||||||||
| 2.20 | — | — | 12.20 | 22.00 | 61,151 | 1.79 | b | |||||||||||
| 2.19 | — | — | 12.19 | 21.90 | 432 | 2.29 | b | |||||||||||
| 2.20 | — | — | 12.20 | 22.00 | 587 | 2.29 | b | |||||||||||
| 2.23 | — | — | 12.23 | 22.30 | 12,740 | 1.14 | b | |||||||||||
| 2.20 | — | — | 12.20 | 22.00 | 2 | 1.64 | b | |||||||||||
| EUROPEAN EQUITY FUND (continued)
|
| Ratios assuming no
expense reductions |
|||||||||||||
|---|---|---|---|---|---|---|---|---|---|---|---|---|---|
| Ratio of
net investment income (loss) to average net assets |
Ratio of
expenses to average net assets |
Ratio of
net investment income (loss) to average net assets |
Portfolio
turnover rate |
||||||||||
| For the Year Ended August 31, | |||||||||||||
| 2000 - Class A Shares | 0.02 | % | 2.17 | % | (0.36 | )% | 98.10 | % | |||||
| 2000 - Class B Shares | (0.27 | ) | 2.67 | (0.65 | ) | 98.10 | |||||||
| 2000 - Class C Shares | (0.26 | ) | 2.67 | (0.64 | ) | 98.10 | |||||||
| 2000 - Institutional Shares | 0.70 | 1.52 | 0.32 | 98.10 | |||||||||
| 2000 - Service Shares | 0.09 | 2.02 | (0.29 | ) | 98.10 | ||||||||
| For the Seven Months Ended August 31, | |||||||||||||
| 1999 - Class A Shares | 0.80 | b | 2.29 | b | 0.30 | b | 54.98 | ||||||
| 1999 - Class B Shares | 0.43 | b | 2.79 | b | (0.07 | ) b | 54.98 | ||||||
| 1999 - Class C Shares | 0.42 | b | 2.79 | b | (0.08 | ) b | 54.98 | ||||||
| 1999 - Institutional Shares | 1.53 | b | 1.64 | b | 1.03 | b | 54.98 | ||||||
| 1999 - Service Shares | 1.10 | b | 2.14 | b | 0.60 | b | 54.98 | ||||||
| For the Period Ended January 31, | |||||||||||||
| 1999 - Class A Shares (commenced October 1, 1998) | (1.19 | ) b | 2.80 | b | (2.20 | ) b | 70.77 | ||||||
| 1999 - Class B Shares (commenced October 1, 1998) | (1.78 | ) b | 3.30 | b | (2.79 | ) b | 70.77 | ||||||
| 1999 - Class C Shares (commenced October 1, 1998) | (1.83 | ) b | 3.30 | b | (2.84 | ) b | 70.77 | ||||||
| 1999 - Institutional Shares (commenced October 1, 1998) | (0.33 | ) b | 2.15 | b | (1.34 | ) b | 70.77 | ||||||
| 1999 - Service Shares (commenced October 1, 1998) | (0.69 | ) b | 2.65 | b | (1.70 | ) b | 70.77 | ||||||
| JAPANESE EQUITY FUND
|
| Income from
investment operations |
||||||||||
|---|---|---|---|---|---|---|---|---|---|---|
|
Net asset value, beginning of period |
Net
investment loss |
Net realized
and unrealized gains |
Total
from investment operations |
|||||||
| For the Year Ended August 31, | ||||||||||
| 2000 - Class A Shares | $16.24 | $(0.20 | ) c | $1.67 | $1.47 | |||||
| 2000 - Class B Shares | 16.14 | (0.28 | ) c | 1.68 | 1.40 | |||||
| 2000 - Class C Shares | 16.16 | (0.28 | ) c | 1.64 | 1.36 | |||||
| 2000 - Institutional Shares | 16.36 | (0.09 | ) c | 1.67 | 1.58 | |||||
| 2000 - Service Shares | 16.22 | (0.16 | ) c | 1.65 | 1.49 | |||||
| For the Seven Months Ended August 31, | ||||||||||
| 1999 - Class A Shares | 11.06 | (0.06 | ) | 5.24 | 5.18 | |||||
| 1999 - Class B Shares | 11.03 | (0.09 | ) | 5.20 | 5.11 | |||||
| 1999 - Class C Shares | 11.04 | (0.08 | ) | 5.20 | 5.12 | |||||
| 1999 - Institutional Shares | 11.10 | (0.03 | ) | 5.29 | 5.26 | |||||
| 1999 - Service Shares | 11.04 | (0.06 | ) | 5.24 | 5.18 | |||||
| For the Period Ended January 31, | ||||||||||
| 1999 - Class A Shares (commenced May 1, 1998) | 10.00 | (0.06 | ) | 1.12 | 1.06 | |||||
| 1999 - Class B Shares (commenced May 1, 1998) | 10.00 | (0.08 | ) | 1.11 | 1.03 | |||||
| 1999 - Class C Shares (commenced May 1, 1998) | 10.00 | (0.09 | ) | 1.13 | 1.04 | |||||
| 1999 - Institutional Shares (commenced May 1, 1998) | 10.00 | (0.02 | ) | 1.13 | 1.11 | |||||
| 1999 - Service Shares (commenced May 1, 1998) | 10.00 | (0.05 | ) | 1.09 | 1.04 | |||||
|
Distributions to shareholders |
|||||||||||||||||||||
|---|---|---|---|---|---|---|---|---|---|---|---|---|---|---|---|---|---|---|---|---|---|
| From net
investment income |
In excess of net investment income |
From net
realized gains |
Total
distributions |
Net asset
value, end of period |
Total
returnb |
Net assets
at end of period (in 000s) |
Ratio of
net expenses to average net assets |
||||||||||||||
| $ — | $(0.21 | ) | $(1.73 | ) | $(1.94 | ) | $15.77 | 8.47 | % | $69,741 | 1.74 | % | |||||||||
| — | (0.18 | ) | (1.73 | ) | (1.91 | ) | 15.63 | 8.12 | 5,783 | 2.24 | |||||||||||
| — | (0.21 | ) | (1.73 | ) | (1.94 | ) | 15.58 | 7.82 | 4,248 | 2.24 | |||||||||||
| — | (0.25 | ) | (1.73 | ) | (1.98 | ) | 15.96 | 9.14 | 27,768 | 1.09 | |||||||||||
| — | (0.15 | ) | (1.73 | ) | (1.88 | ) | 15.83 | 8.65 | 3 | 1.59 | |||||||||||
| — | — | — | — | 16.24 | 46.84 | 34,279 | 1.70 | b | |||||||||||||
| — | — | — | — | 16.14 | 46.33 | 4,219 | 2.20 | b | |||||||||||||
| — | — | — | — | 16.16 | 46.41 | 3,584 | 2.20 | b | |||||||||||||
| — | — | — | — | 16.36 | 47.40 | 22,709 | 1.05 | b | |||||||||||||
| — | — | — | — | 16.22 | 46.92 | 3 | 1.55 | b | |||||||||||||
| — | — | — | — | 11.06 | 10.60 | 8,391 | 1.64 | b | |||||||||||||
| — | — | — | — | 11.03 | 10.30 | 1,427 | 2.15 | b | |||||||||||||
| — | — | — | — | 11.04 | 10.40 | 284 | 2.15 | b | |||||||||||||
| (0.01 | ) | — | — | (0.01 | ) | 11.10 | 11.06 | 11,418 | 1.03 | b | |||||||||||
| — | — | — | — | 11.04 | 10.43 | 2 | 1.53 | b | |||||||||||||
| JAPANESE EQUITY FUND (continued)
|
| Ratios assuming no
expense reductions |
|||||||||||||
|---|---|---|---|---|---|---|---|---|---|---|---|---|---|
| Ratio of
net investment loss to average net assets |
Ratio of
expenses to average net assets |
Ratio of
net investment loss to average net assets |
Portfolio
turnover rate |
||||||||||
| For the Year Ended August 31, | |||||||||||||
| 2000 - Class A Shares | (1.20 | )% | 2.10 | % | (1.56 | )% | 60.76 | % | |||||
| 2000 - Class B Shares | (1.67 | ) | 2.60 | (2.03 | ) | 60.76 | |||||||
| 2000 - Class C Shares | (1.66 | ) | 2.60 | (2.02 | ) | 60.76 | |||||||
| 2000 - Institutional Shares | (0.53 | ) | 1.45 | (0.89 | ) | 60.76 | |||||||
| 2000 - Service Shares | (0.94 | ) | 1.95 | (1.30 | ) | 60.76 | |||||||
| For the Seven Months Ended August 31, | |||||||||||||
| 1999 - Class A Shares | (1.17 | ) b | 2.62 | b | (2.09 | ) b | 44.83 | ||||||
| 1999 - Class B Shares | (1.57 | ) b | 3.12 | b | (2.49 | ) b | 44.83 | ||||||
| 1999 - Class C Shares | (1.81 | ) b | 3.12 | b | (2.73 | ) b | 44.83 | ||||||
| 1999 - Institutional Shares | (0.37 | ) b | 1.97 | b | (1.29 | ) b | 44.83 | ||||||
| 1999 - Service Shares | (0.74 | ) b | 2.47 | b | (1.66 | ) b | 44.83 | ||||||
| For the Period Ended January 31, | |||||||||||||
| 1999 - Class A Shares (commenced May 1, 1998) | (1.20 | ) b | 4.18 | b | (3.74 | ) b | 53.29 | ||||||
| 1999 - Class B Shares (commenced May 1, 1998) | (1.76 | ) b | 4.69 | b | (4.30 | ) b | 53.29 | ||||||
| 1999 - Class C Shares (commenced May 1, 1998) | (1.69 | ) b | 4.69 | b | (4.23 | ) b | 53.29 | ||||||
| 1999 - Institutional Shares (commenced May 1, 1998) | (0.36 | ) b | 3.57 | b | (2.90 | ) b | 53.29 | ||||||
| 1999 - Service Shares (commenced May 1, 1998) | (0.68 | ) b | 4.07 | b | (3.22 | ) b | 53.29 | ||||||
| INTERNATIONAL GROWTH OPPORTUNITIES FUND
|
| (formerly International Small Cap Fund)
|
| Income from
investment operations |
||||||||||
|---|---|---|---|---|---|---|---|---|---|---|
| Net asset
value, beginning of period |
Net
investment loss |
Net realized
and unrealized gain |
Total from investment operations |
|||||||
| For the Year Ended August 31, | ||||||||||
| 2000 - Class A Shares ; | $13.24 | $(0.12 | ) c | $3.52 | $3.40 | |||||
| 2000 - Class B Shares | 13.19 | (0.18 | ) c | 3.49 | 3.31 | |||||
| 2000 - Class C Shares | 13.19 | (0.19 | ) c | 3.49 | 3.30 | |||||
| 2000 - Institutional Shares | 13.35 | (0.03 | ) c | 3.57 | 3.54 | |||||
| 2000 - Service Shares | 13.24 | (0.10 | ) c | 3.54 | 3.44 | |||||
| For the Seven-month Period Ended August 31, | ||||||||||
| 1999 - Class A Shares | 10.62 | (0.03 | ) | 2.65 | 2.62 | |||||
| 1999 - Class B Shares | 10.61 | (0.08 | ) c | 2.66 | 2.58 | |||||
| 1999 - Class C Shares | 10.61 | (0.08 | ) c | 2.66 | 2.58 | |||||
| 1999 - Institutional Shares | 10.66 | — | 2.69 | 2.69 | ||||||
| 1999 - Service Shares | 10.61 | (0.02 | ) | 2.65 | 2.63 | |||||
| For the Period Ended January 31, | ||||||||||
| 1999 - Class A Shares (commenced May 1, 1998) | 10.00 | (0.04 | ) | 0.66 | 0.62 | |||||
| 1999 - Class B Shares (commenced May 1, 1998) | 10.00 | (0.10 | ) | 0.71 | 0.61 | |||||
| 1999 - Class C Shares (commenced May 1, 1998) | 10.00 | (0.06 | ) | 0.67 | 0.61 | |||||
| 1999 - Institutional Shares (commenced May 1, 1998) | 10.00 | — | 0.67 | 0.67 | ||||||
| 1999 - Service Shares (commenced May 1, 1998) | 10.00 | (0.02 | ) | 0.63 | 0.61 | |||||
|
Distributions to shareholders |
||||||||||||||||||
|---|---|---|---|---|---|---|---|---|---|---|---|---|---|---|---|---|---|---|
| In excess
of net investment income |
From net
realized gains |
Total
distributions |
Net asset
value, end of period |
Total
returna |
Net assets
at end of period (in 000s) |
Ratio of net expenses to average net assets |
||||||||||||
| $ — | $(0.52 | ) | $(0.52 | ) | $16.12 | 26.26 | % | $327,697 | 2.05 | % | ||||||||
| — | (0.52 | ) | (0.52 | ) | 15.98 | 25.66 | 2,827 | 2.55 | ||||||||||
| — | (0.52 | ) | (0.52 | ) | 15.97 | 25.58 | 3,672 | 2.55 | ||||||||||
| — | (0.52 | ) | (0.52 | ) | 16.37 | 27.12 | 187,075 | 1.40 | ||||||||||
| — | (0.52 | ) | (0.52 | ) | 16.16 | 26.57 | 3 | 1.90 | ||||||||||
| — | — | — | 13.24 | 24.67 | 69,458 | 2.05 | b | |||||||||||
| — | — | — | 13.19 | 24.32 | 303 | 2.55 | b | |||||||||||
| — | — | — | 13.19 | 24.32 | 419 | 2.55 | b | |||||||||||
| — | — | — | 13.35 | 25.24 | 65,772 | 1.40 | b | |||||||||||
| — | — | — | 13.24 | 24.79 | 2 | 1.90 | b | |||||||||||
| — | — | — | 10.62 | 6.20 | 33,002 | 2.02 | b | |||||||||||
| — | — | — | 10.61 | 6.10 | 213 | 2.51 | b | |||||||||||
| — | — | — | 10.61 | 6.10 | 175 | 2.51 | b | |||||||||||
| (0.01 | ) | — | (0.01 | ) | 10.66 | 6.67 | 36,992 | 1.40 | b | |||||||||
| — | — | — | 10.61 | 6.10 | 2 | 1.90 | b | |||||||||||
| INTERNATIONAL GROWTH OPPORTUNITIES FUND
|
| (formerly International Small Cap Fund) (continued)
|
| Ratios assuming no
expense reductions |
|||||||||||||
|---|---|---|---|---|---|---|---|---|---|---|---|---|---|
| Ratio of
net investment loss to average net assets |
Ratio of
expenses to average net assets |
Ratio of
net investment loss to average net assets |
Portfolio
turnover rate |
||||||||||
| For the Year Ended August 31, | |||||||||||||
| 2000 - Class A Shares ; | (0.79 | )% | 2.22 | % | (0.96 | )% | 73.43 | % | |||||
| 2000 - Class B Shares | (1.16 | ) | 2.72 | (1.33 | ) | 73.43 | |||||||
| 2000 - Class C Shares | (1.23 | ) | 2.72 | (1.40 | ) | 73.43 | |||||||
| 2000 - Institutional Shares | (0.19 | ) | 1.57 | (0.36 | ) | 73.43 | |||||||
| 2000 - Service Shares | (0.63 | ) | 2.07 | (0.80 | ) | 73.43 | |||||||
| For the Seven-month Period Ended August 31, | |||||||||||||
| 1999 - Class A Shares | (0.68 | ) b | 2.42 | b | (1.05 | ) b | 58.81 | ||||||
| 1999 - Class B Shares | (1.16 | ) b | 2.92 | b | (1.53 | ) b | 58.81 | ||||||
| 1999 - Class C Shares | (1.21 | ) b | 2.92 | b | (1.58 | ) b | 58.81 | ||||||
| 1999 - Institutional Shares | (0.05 | ) b | 1.77 | b | (0.42 | ) b | 58.81 | ||||||
| 1999 - Service Shares | (0.35 | ) b | 2.27 | b | (0.72 | ) b | 58.81 | ||||||
| For the Period Ended January 31, | |||||||||||||
| 1999 - Class A Shares (commenced May 1, 1998) | (1.03 | ) b | 3.60 | b | (2.61 | ) b | 96.11 | ||||||
| 1999 - Class B Shares (commenced May 1, 1998) | (1.30 | ) b | 4.09 | b | (2.88 | ) b | 96.11 | ||||||
| 1999 - Class C Shares (commenced May 1, 1998) | (1.45 | ) b | 4.09 | b | (3.03 | ) b | 96.11 | ||||||
| 1999 - Institutional Shares (commenced May 1, 1998) | (0.19 | ) b | 2.98 | b | (1.77 | ) b | 96.11 | ||||||
| 1999 - Service Shares (commenced May 1, 1998) | (0.26 | ) b | 3.48 | b | (1.84 | ) b | 96.11 | ||||||
| EMERGING MARKETS EQUITY FUND
|
| Income from
investment operations |
||||||||||||
|---|---|---|---|---|---|---|---|---|---|---|---|---|
| Net asset
value, beginning of period |
Net
investment income (loss) |
Net
realized and unrealized gain (loss) |
Total
from investment operations |
|||||||||
| For the Year Ended August 31, | ||||||||||||
| 2000 - Class A Shares | $ 9.26 | $(0.05 | ) c | $ 1.62 | $ 1.57 | |||||||
| 2000 - Class B Shares | 9.21 | (0.11 | ) c | 1.62 | 1.51 | |||||||
| 2000 - Class C Shares | 9.24 | (0.10 | ) c | 1.61 | 1.51 | |||||||
| 2000 - Institutional Shares | 9.37 | 0.01 | c | 1.64 | 1.65 | |||||||
| 2000 - Service Shares | 9.05 | 0.01 | c | 1.57 | 1.58 | |||||||
| For the Seven Months Ended August 31, | ||||||||||||
| 1999 - Class A Shares | 7.04 | (0.01 | ) | 2.23 | 2.22 | |||||||
| 1999 - Class B Shares | 7.03 | (0.03 | ) | 2.21 | 2.18 | |||||||
| 1999 - Class C Shares | 7.05 | (0.03 | ) | 2.22 | 2.19 | |||||||
| 1999 - Institutional Shares | 7.09 | 0.02 | 2.26 | 2.28 | ||||||||
| 1999 - Service Shares | 6.87 | 0.01 | 2.17 | 2.18 | ||||||||
| For the Year Ended January 31, | ||||||||||||
| 1999 - Class A Shares | 9.69 | 0.04 | (2.40 | ) | (2.36 | ) | ||||||
| 1999 - Class B Shares | 9.69 | 0.03 | (2.41 | ) | (2.38 | ) | ||||||
| 1999 - Class C Shares | 9.70 | 0.01 | (2.39 | ) | (2.38 | ) | ||||||
| 1999 - Institutional Shares | 9.70 | 0.06 | (2.36 | ) | (2.30 | ) | ||||||
| 1999 - Service Shares | 9.69 | (0.13 | ) | (2.41 | ) | (2.28 | ) | |||||
| For the Period Ended January 31, | ||||||||||||
| 1998 - Class A Shares (commenced December 15, 1997) | 10.00 | — | (0.31 | ) | (0.31 | ) | ||||||
| 1998 - Class B Shares (commenced December 15, 1997) | 10.00 | — | (0.31 | ) | (0.31 | ) | ||||||
| 1998 - Class C Shares (commenced December 15, 1997) | 10.00 | — | (0.30 | ) | (0.30 | ) | ||||||
| 1998 - Institutional Shares (commenced December 15, 1997) | 10.00 | 0.01 | (0.31 | ) | (0.30 | ) | ||||||
| 1998 - Service Shares (commenced December 15, 1997) | 10.00 | — | (0.31 | ) | (0.31 | ) | ||||||
|
Distributions to shareholders |
|||||||||||||||||
|---|---|---|---|---|---|---|---|---|---|---|---|---|---|---|---|---|---|
| From net
investment income |
In excess of net investment income |
Total
distributions |
Net asset
value, end of period |
Total
returna |
Net assets
at end of period (in 000s) |
Ratio of
net expenses to average net assets |
|||||||||||
| $ — | $ — | $ — | $10.83 | 16.95 | % | $64,279 | 2.11 | % | |||||||||
| — | — | — | 10.72 | 16.40 | 2,187 | 2.61 | |||||||||||
| — | — | — | 10.75 | 16.34 | 1,304 | 2.61 | |||||||||||
| — | — | — | 11.02 | 17.61 | 145,774 | 1.46 | |||||||||||
| — | — | — | 10.63 | 17.46 | 2 | 1.96 | |||||||||||
| — | — | — | 9.26 | 31.53 | 65,698 | 2.04 | b | ||||||||||
| — | — | — | 9.21 | 31.01 | 972 | 2.54 | b | ||||||||||
| — | — | — | 9.24 | 31.06 | 1,095 | 2.54 | b | ||||||||||
| — | — | — | 9.37 | 32.16 | 108,574 | 1.39 | b | ||||||||||
| — | — | — | 9.05 | 31.73 | 2 | 1.89 | b | ||||||||||
| (0.07 | ) | (0.22) | (0.29 | ) | 7.04 | (24.32 | ) | 52,704 | 2.09 | ||||||||
| (0.07 | ) | (0.21) | (0.28 | ) | 7.03 | (24.51 | ) | 459 | 2.59 | ||||||||
| (0.07 | ) | (0.20) | (0.27 | ) | 7.05 | (24.43 | ) | 273 | 2.59 | ||||||||
| (0.08 | ) | (0.23) | (0.31 | ) | 7.09 | (23.66 | ) | 90,189 | 1.35 | ||||||||
| (0.07 | ) | (0.21) | (0.28 | ) | 6.87 | (26.17 | ) | 1 | 1.85 | ||||||||
| — | — | — | 9.69 | (3.10 | ) | 17,681 | 1.90 | b | |||||||||
| — | — | — | 9.69 | (3.10 | ) | 64 | 2.41 | b | |||||||||
| — | — | — | 9.70 | (3.00 | ) | 73 | 2.48 | b | |||||||||
| — | — | — | 9.70 | (3.00 | ) | 19,120 | 1.30 | b | |||||||||
| — | — | — | 9.69 | (3.10 | ) | 2 | 2.72 | b | |||||||||
| EMERGING MARKETS EQUITY FUND (continued)
|
| Ratios assuming no
expense reductions |
|||||||||||||
|---|---|---|---|---|---|---|---|---|---|---|---|---|---|
| Ratio of net
investment income (loss) to average net assets |
Ratio of
expenses to average net assets |
Ratio of net
investment income (loss) to average net assets |
Portfolio
turnover rate |
||||||||||
| For the Year Ended August 31, | |||||||||||||
| 2000 - Class A Shares | (0.49 | )% | 2.30 | % | (0.68 | )% | 125.35 | % | |||||
| 2000 - Class B Shares | (1.00 | ) | 2.80 | (1.19 | ) | 125.35 | |||||||
| 2000 - Class C Shares | (0.96 | ) | 2.80 | (1.15 | ) | 125.35 | |||||||
| 2000 - Institutional Shares | 0.13 | 1.65 | (0.06 | ) | 125.35 | ||||||||
| 2000 - Service Shares | 0.14 | 2.15 | (0.05 | ) | 125.35 | ||||||||
| For the Seven Months Ended August 31, | |||||||||||||
| 1999 - Class A Shares | (0.15 | ) b | 2.41 | b | (0.52 | ) b | 63.24 | ||||||
| 1999 - Class B Shares | (0.71 | ) b | 2.91 | b | (281.08 | ) b | 63.24 | ||||||
| 1999 - Class C Shares | (0.85 | ) b | 2.91 | b | (1.22 | ) b | 63.24 | ||||||
| 1999 - Institutional Shares | 0.50 | b | 1.76 | b | 0.13 | b | 63.24 | ||||||
| 1999 - Service Shares | 0.12 | b | 2.26 | b | (0.25 | ) b | 63.24 | ||||||
| For the Year Ended January 31, | |||||||||||||
| 1999 - Class A Shares | 0.80 | 2.53 | 0.36 | 153.67 | |||||||||
| 1999 - Class B Shares | 0.19 | 3.03 | (0.25 | ) | 153.67 | ||||||||
| 1999 - Class C Shares | 0.28 | 3.03 | (0.16 | ) | 153.67 | ||||||||
| 1999 - Institutional Shares | 1.59 | 1.79 | 1.15 | 153.67 | |||||||||
| 1999 - Service Shares | (1.84 | ) | 2.29 | (2.28 | ) | 153.67 | |||||||
| For the Period Ended January 31, | |||||||||||||
| 1998 - Class A Shares (commenced December 15, 1997) | 0.55 | b | 5.88 | b | (3.43 | ) b | 3.35 | ||||||
| 1998 - Class B Shares (commenced December 15, 1997) | 0.05 | b | 6.39 | b | (3.93 | ) b | 3.35 | ||||||
| 1998 - Class C Shares (commenced December 15, 1997) | (0.27 | ) b | 6.46 | b | (4.25 | ) b | 3.35 | ||||||
| 1998 - Institutional Shares (commenced December 15, 1997) | 0.80 | b | 5.28 | b | (3.18 | ) b | 3.35 | ||||||
| 1998 - Service Shares (commenced December 15, 1997) | (0.05 | ) b | 6.70 | b | (4.03 | ) b | 3.35 | ||||||
| ASIA GROWTH FUND
|
| Income from
investment operations |
||||||||||||
|---|---|---|---|---|---|---|---|---|---|---|---|---|
|
Net asset value, beginning of period |
Net
investment income (loss) |
Net realized
and unrealized gain (loss) |
Total from
investment operations |
|||||||||
| For the Year Ended August 31, | ||||||||||||
| 2000 - Class A Shares | $11.07 | $(0.05 | ) c | $0.14 | $ 0.09 | |||||||
| 2000 - Class B Shares | 10.88 | (0.11 | ) c | 0.14 | 0.03 | |||||||
| 2000 - Class C Shares | 10.85 | (0.11 | ) c | 0.14 | 0.03 | |||||||
| 2000 - Institutional Shares | 11.24 | 0.01 | c | 0.16 | 0.17 | |||||||
| For the Seven-Month Period Ended August 31, | ||||||||||||
| 1999 - Class A Shares | 7.79 | (0.02 | ) | 3.30 | 3.28 | |||||||
| 1999 - Class B Shares | 7.68 | (0.04 | ) | 3.24 | 3.20 | |||||||
| 1999 - Class C Shares | 7.68 | (0.04 | ) | 3.21 | 3.17 | |||||||
| 1999 - Institutional Shares | 7.91 | 0.01 | 3.36 | 3.37 | ||||||||
| For the Years Ended January 31, | ||||||||||||
| 1999 - Class A Shares | 8.38 | 0.07 | (0.66 | ) | (0.59 | ) | ||||||
| 1999 - Class B Shares | 8.31 | 0.01 | (0.64 | ) | (0.63 | ) | ||||||
| 1999 - Class C Shares | 8.29 | — | (0.61 | ) | (0.61 | ) | ||||||
| 1999 - Institutional Shares | 8.44 | 0.03 | (0.56 | ) | (0.53 | ) | ||||||
| 1998 - Class A Shares | 16.31 | — | (7.90 | ) | (7.90 | ) | ||||||
| 1998 - Class B Shares | 16.24 | 0.01 | (7.91 | ) | (7.90 | ) | ||||||
| 1998 - Class C Shares (commenced August 15, 1997) | 15.73 | 0.01 | (7.42 | ) | (7.41 | ) | ||||||
| 1998 - Institutional Shares | 16.33 | 0.10 | (7.96 | ) | (7.86 | ) | ||||||
| 1997 - Class A Shares | 16.49 | 0.06 | (0.11 | ) | (0.05 | ) | ||||||
| 1997 - Class B Shares (commenced May 1, 1996) | 17.31 | (0.05 | ) | (0.48 | ) | (0.53 | ) | |||||
| 1997 - Institutional Shares (commenced February 2, 1996) | 16.61 | 0.04 | (0.11 | ) | (0.07 | ) | ||||||
| 1996 - Class A Shares | 13.31 | 0.17 | 3.44 | 3.61 | ||||||||
|
Distributions to shareholders |
|||||||||||||||||||||
|---|---|---|---|---|---|---|---|---|---|---|---|---|---|---|---|---|---|---|---|---|---|
| From net
investment income |
In excess
of net investment income |
From net
realized gains |
Total
distributions |
Net asset
value, end of period |
Total
returna |
Net assets
at end of period (in 000s) |
Ratio of
net expenses to average net assets |
||||||||||||||
| $ — | $ — | $ — | $ — | $11.16 | 0.72 | % | $ 86,458 | 1.85 | % | ||||||||||||
| — | — | — | — | 10.91 | 0.18 | 6,849 | 2.35 | ||||||||||||||
| — | — | — | — | 10.88 | 0.18 | 2,265 | 2.35 | ||||||||||||||
| — | — | — | — | 11.41 | 1.42 | 5,236 | 1.20 | ||||||||||||||
| — | |||||||||||||||||||||
| — | — | — | — | 11.07 | 42.11 | 84,269 | 1.85 | b | |||||||||||||
| — | — | — | — | 10.88 | 41.67 | 7,258 | 2.35 | b | |||||||||||||
| — | — | — | — | 10.85 | 41.28 | 2,281 | 2.35 | b | |||||||||||||
| — | (0.04 | ) | — | (0.04 | ) | 11.24 | 42.61 | 12,363 | 1.20 | b | |||||||||||
| — | — | — | — | 7.79 | (7.04 | ) | 59,940 | 1.93 | |||||||||||||
| — | — | — | — | 7.68 | (7.58 | ) | 4,190 | 2.45 | |||||||||||||
| — | — | — | — | 7.68 | (7.36 | ) | 999 | 2.45 | |||||||||||||
| — | — | — | — | 7.91 | (6.28 | ) | 4,200 | 1.16 | |||||||||||||
| — | (0.03 | ) | — | (0.03 | ) | 8.38 | (48.49 | ) | 87,437 | 1.75 | |||||||||||
| — | (0.03 | ) | — | (0.03 | ) | 8.31 | (48.70 | ) | 3,359 | 2.30 | |||||||||||
| — | (0.03 | ) | — | (0.03 | ) | 8.29 | (47.17 | ) | 436 | 2.35 | b | ||||||||||
| (0.03 | ) | — | — | (0.03 | ) | 8.44 | (48.19 | ) | 874 | 1.11 | |||||||||||
| (0.12 | ) | — | (0.01 | ) | (0.13 | ) | 16.31 | (1.01 | ) | 263,014 | 1.67 | ||||||||||
| (0.51 | ) | (0.03 | ) | — | (0.54 | ) | 16.24 | (6.02 | ) | 3,354 | 2.21 | b | |||||||||
| (0.11 | ) | (0.06 | ) | (0.04 | ) | (0.21 | ) | 16.33 | (1.09 | ) | 13,322 | 1.10 | b | ||||||||
| (0.12 | ) | (0.14 | ) | (0.17 | ) | (0.43 | ) | 16.49 | 26.49 | 205,539 | 1.77 | ||||||||||
| ASIA GROWTH FUND (continued)
|
| Ratios assuming no
expense reductions |
|||||||||||||
|---|---|---|---|---|---|---|---|---|---|---|---|---|---|
| Ratio of net
investment income (loss) to average net assets |
Ratio of
expenses to average net assets |
Ratio of net
investment income (loss) to average net assets |
Portfolio
turnover rate |
||||||||||
| For the Year Ended August 31, | |||||||||||||
| 2000 - Class A Shares | (0.39 | )% | 2.30 | % | (0.84 | )% | 207.22 | % | |||||
| 2000 - Class B Shares | (0.91 | ) | 2.80 | (1.36 | ) | 207.22 | |||||||
| 2000 - Class C Shares | (0.91 | ) | 2.80 | (1.36 | ) | 207.22 | |||||||
| 2000 - Institutional Shares | 0.12 | 1.65 | (0.33 | ) | 207.22 | ||||||||
| For the Seven-Month Period Ended August 31, | |||||||||||||
| 1999 - Class A Shares | (0.38 | ) b | 2.27 | b | (0.80 | ) b | 96.58 | ||||||
| 1999 - Class B Shares | (0.90 | ) b | 2.77 | b | (1.32 | ) b | 96.58 | ||||||
| 1999 - Class C Shares | (0.89 | ) b | 2.77 | b | (1.31 | ) b | 96.58 | ||||||
| 1999 - Institutional Shares | (0.14 | ) b | 1.62 | b | (0.28 | ) b | 96.58 | ||||||
| For the Years Ended January 31, | |||||||||||||
| 1999 - Class A Shares | 0.63 | 2.48 | 0.08 | 106.00 | |||||||||
| 1999 - Class B Shares | 0.10 | 2.97 | (0.42 | ) | 106.00 | ||||||||
| 1999 - Class C Shares | 0.10 | 2.97 | (0.42 | ) | 106.00 | ||||||||
| 1999 - Institutional Shares | 1.10 | 1.68 | 0.58 | 106.00 | |||||||||
| 1998 - Class A Shares | 0.31 | 1.99 | 0.07 | 105.16 | |||||||||
| 1998 - Class B Shares | (0.29 | ) | 2.50 | (0.49 | ) | 105.16 | |||||||
| 1998 - Class C Shares (commenced August 15, 1997) | (0.26 | ) b | 2.55 | b | (0.46 | ) b | 105.16 | ||||||
| 1998 - Institutional Shares | 0.87 | 1.31 | 0.67 | 105.16 | |||||||||
| 1997 - Class A Shares | 0.20 | 1.87 | — | 48.40 | |||||||||
| 1997 - Class B Shares (commenced May 1, 1996) | (0.56 | ) b | 2.37 | b | (0.72 | ) b | 48.40 | ||||||
| 1997 - Institutional Shares (commenced February 2, 1996) | 0.54 | b | 1.26 | b | 0.38 | b | 48.40 | ||||||
| 1996 - Class A Shares | 1.05 | 2.02 | 0.80 | 88.80 | |||||||||
a
|
Assumes investment at the net asset value at the beginning of the period, reinvestment of all dividends and
distributions, a complete redemption of the investment at the net asset value at the end of the period and no sales or redemption charges. Total return would be reduced if a sales or redemption charge were taken into account. Total returns for periods
less than one full year are not annualized.
|
b
|
Annualized.
|
c
|
Calculated based on the average shares outstanding methodology.
|
| FOR MORE INFORMATION
|
| Annual/Semi-annual Report
|
| Additional information about the Funds’ investments is available in the Funds’ annual and semi-annual reports to
shareholders. In the Funds’ annual reports, you will find a discussion of the market conditions and investment strategies that significantly affected the Funds’ performance during the last fiscal year.
|
| Statement of Additional Information
|
| Additional information about the Funds and their policies is also available in the Funds’ Statement of Additional Information
(“Additional Statement”). The Additional Statement is incorporated by reference into this Prospectus (is legally considered part of this Prospectus).
|
| The Funds’ annual and semi-annual reports, and the Additional Statement, are available free upon request by calling Goldman
Sachs at 1-800-526-7384.
|
| To obtain other information and for shareholder inquiries:
|
| By telephone – Call 1-800-526-7384
|
| By mail – Goldman Sachs Funds, 4900 Sears Tower, Chicago, IL 60606-6372
|
| By e-mail – [email protected]
|
| On the Internet – Text-only versions of the Funds’ documents are located online and may be downloaded from:
|
| SEC EDGAR database – http://www.sec.gov
|
| Goldman Sachs – http://www.gs.com (Prospectus Only)
|
| You may review and obtain copies of Fund documents by visiting the SEC’s Public Reference Room in Washington, D.C. You may
also obtain copies of Fund documents, after paying a duplicating fee, by writing to the SEC’s Public Reference Section, Washington, D.C. 20549-0102 or by electronic request to: [email protected]. Information on the operation of the public reference
room may be obtained by calling the SEC at (202) 942-8090.
|
| The Funds’ investment company registration number is 811-5349.
|
| CORE
SM
is a service mark of Goldman, Sachs & Co.
|
| Prospectus
|
n
|
Goldman Sachs
CORE
SM
International Equity Fund
|
n
|
Goldman Sachs
International Equity Fund
|
n
|
Goldman Sachs
European Equity Fund
|
n
|
Goldman Sachs
Japanese Equity Fund
|
n
|
Goldman Sachs
International Growth Opportunities Fund (formerly International Small Cap Fund)
|
n
|
Goldman Sachs
Emerging Markets Equity Fund
|
n
|
Goldman Sachs
Asia Growth Fund |
| GOLDMAN SACHS INTERNATIONAL EQUITY FUNDS
|
| THE SECURITIES AND EXCHANGE COMMISSION HAS NOT APPROVED OR DISAPPROVED THESE SECURITIES OR PASSED UPON THE ADEQUACY OF THIS PROSPECTUS.
ANY REPRESENTATION TO THE CONTRARY IS A CRIMINAL OFFENSE.
|
| AN INVESTMENT IN A FUND IS NOT A BANK DEPOSIT AND IS NOT INSURED BY THE FEDERAL DEPOSIT INSURANCE CORPORATION OR ANY OTHER GOVERNMENT
AGENCY. AN INVESTMENT IN A FUND INVOLVES INVESTMENT RISKS, INCLUDING POSSIBLE LOSS OF PRINCIPAL.
|
| No Bank Guarantee
|
| Goldman Sachs Asset Management, a unit of the Investment Management Division of Goldman, Sachs & Co. (“Goldman
Sachs”), serves as investment adviser to the CORE International Equity Fund. Goldman Sachs Asset Management International serves as investment adviser to International Equity, European Equity, Japanese Equity, International Growth Opportunities,
Emerging Markets Equity and Asia Growth Funds. Goldman Sachs Asset Management and Goldman Sachs Asset Management International are each referred to in this Prospectus as the “Investment Adviser.”
|
| ACTIVE INTERNATIONAL STYLE FUNDS
|
| Goldman Sachs’ Active International Investment Philosophy:
|
| Belief | How the Investment Adviser Acts on Belief | ||
|---|---|---|---|
| n Equity markets are inefficient | Seeks excess return through team driven, research
intensive and bottom-up stock selection. |
||
| n Returns are variable | Seeks to capitalize on variability of market and regional
returns through asset allocation decisions. |
||
| n
Corporate fundamentals
ultimately drive share price |
Seeks to conduct rigorous, first-hand research of business
and company management. |
||
| n A
business’ intrinsic value will be
achieved over time |
Seeks to realize value through a long-term investment
horizon. |
||
| n
Portfolio risk must be carefully
analyzed and monitored |
Seeks to systematically monitor and manage risk through
diversification, multifactor risk models and currency management. |
||
| The Investment Adviser attempts to manage risk in these Funds through disciplined portfolio construction and continual portfolio
review and analysis. As a result, bottom-up stock selection, driven by fundamental research, should be a main driver of returns.
|
| QUANTITATIVE (“CORE”) STYLE FUNDS
|
| Goldman Sachs’ CORE Investment Philosophy:
|
| Goldman Sachs’ quantitative style of funds—CORE—emphasizes the two building blocks of active management: stock
selection and portfolio construction.
|
| I. CORE STOCK SELECTION
|
| The CORE Fund uses the Goldman Sachs proprietary multifactor model (“Multifactor Model”), a rigorous computerized rating
system, to forecast the returns of securities held in the Fund’s portfolio. The Multifactor Model incorporates common variables covering measures of:
|
n
|
Value (How is the company priced relative to fundamental accounting measures?)
|
n
|
Price Momentum (What are medium-term price trends?)
|
n
|
Earnings Momentum (Are company profit expectations growing?)
|
n
|
Stability (How likely is the risk of earnings disappointment?)
|
| All of the above factors are carefully evaluated within the Multifactor Model since each has demonstrated a significant
impact on the performance of the securities and markets they were designed to forecast. Stock selection in this process combines both our quantitative and qualitative analysis.
|
| II. CORE PORTFOLIO CONSTRUCTION
|
| Portfolio risk is monitored with the use of a sophisticated risk model, which measures the portfolio’s exposure to a variety
of risk factors and estimates the associated volatility. In this process, the Investment Adviser manages risk by attempting to limit deviations from the benchmark and by attempting to run a size and sector neutral portfolio. A computer optimizer evaluates many different security combinations (considering many possible weightings) in an effort to construct the most efficient risk/return portfolio given each CORE Fund benchmark. In addition, the CORE International
Equity Fund utilizes proprietary quantitative models to allocate assets across countries.
|
| Goldman Sachs CORE Funds are fully invested, broadly diversified and offer consistent overall portfolio characteristics. They may
serve as good foundations on which to build a portfolio.
|
| FUND FACTS
|
|
| Objective:
|
Long-term growth of capital
|
|
Benchmark:
|
MSCI® Europe, Australasia, Far East (“EAFE®”) Index (unhedged)
|
| Investment Focus:
|
Large-capitalization equity securities of companies that are organized outside the United States or whose securities are primarily traded outside
the United States
|
| Investment Style:
|
Quantitative
|
| INVESTMENT OBJECTIVE
|
| The Fund seeks long-term growth of capital. The Fund seeks this objective through a broadly diversified portfolio of equity
securities of large-cap companies that are organized outside the United States or whose securities are principally traded outside the United States.
|
| PRINCIPAL INVESTMENT STRATEGIES
|
| Equity Securities. The Fund invests, under normal circumstances, at least 90% of its total assets in equity securities of companies that are organized outside the United States or whose securities are principally traded outside the United States.
|
| The Fund may allocate its assets among countries as determined by the Investment Adviser from time to time, provided the Fund’
s assets are invested in at least three foreign countries. The Fund may invest in the securities of issuers in countries with emerging markets or economies (“emerging countries”).
|
| The Fund seeks broad representation of large-cap issuers across major countries and sectors of the international economy. The
Fund’s investments are selected using both a variety of quantitative techniques and fundamental research in seeking to maximize the Fund’s expected return, while maintaining risk, style, capitalization and industry characteristics similar to the
EAFE® Index. In addition, the Fund seeks a portfolio composed of companies with attractive valuations and stronger momentum characteristics than the EAFE® Index.
|
| Other.
The Fund’s investments in fixed-income securities are limited to securities that are considered to be cash equivalents.
|
| FUND FACTS
|
|
| Objective:
|
Long-term capital appreciation
|
| Benchmark:
|
MSCI® EAFE® Index (unhedged)
|
| Investment Focus:
|
Equity securities of companies organized outside the United States or whose securities are principally traded outside the United States
|
| Investment Style:
|
Active International
|
| INVESTMENT OBJECTIVE
|
| The Fund seeks long-term capital appreciation.
|
| PRINCIPAL INVESTMENT STRATEGIES
|
| Equity Securities. The Fund invests, under normal circumstances, substantially all, and at least 65% of its total assets in equity securities of companies that are organized outside the United States or whose securities are principally traded outside the United States. The
Fund intends to invest in companies with public stock market capitalizations that are larger than $1 billion at the time of investment.
|
| The Fund may allocate its assets among countries as determined by the Investment Adviser from time to time provided that the
Fund’s assets are invested in at least three foreign countries.
|
| The Fund expects to invest a substantial portion of its assets in the securities of issuers located in the developed countries of
Western Europe and in Japan. However, the Fund may also invest in the securities of issuers located in Australia, Canada, New Zealand and in emerging countries. Currently, emerging countries include, among others, most Latin American, African, Asian and
Eastern European nations.
|
| Other.
The Fund may also invest up to 35% of its total assets in fixed-income securities, such as government, corporate and bank debt obligations.
|
| FUND FACTS
|
|
| Objective:
|
Long-term capital appreciation
|
| Benchmark:
|
MSCI® Europe Index (unhedged)
|
| Investment Focus:
|
Equity securities of European companies
|
| Investment Style:
|
Active International
|
| INVESTMENT OBJECTIVE
|
| The Fund seeks long-term capital appreciation.
|
| PRINCIPAL INVESTMENT STRATEGIES
|
| Equity Securities. The Fund invests, under normal circumstances, substantially all, and at least 65% of its total assets in equity securities of European companies. Because of its focus, the Fund will be more susceptible to European economic, market, political and local
risks than a fund that is more geographically diversified.
|
| A European issuer is a company that either:
|
n
|
Has a class of its securities whose principal securities markets are in European countries;
|
n
|
Is organized under the laws of, or has a principal office in, a European country;
|
n
|
Derives 50% or more of its total revenue from goods produced, sales made or services provided in one or more of the European
countries; or
|
n
|
Maintains 50% or more of its assets in one or more of the European countries.
|
| The Fund may allocate its assets among different countries as determined by the Investment Adviser from time to time, provided
that the Fund’s assets are invested in at least three European countries. It is currently anticipated that a majority of the Fund’s assets will be invested in the equity securities of large cap companies located in the developed countries of
Western Europe. However, the Fund may also invest, without limit, in mid cap companies and small cap companies, as well as companies located in emerging countries. Currently, emerging countries include among others, most Latin and South American, African,
Asian and Eastern European nations, including the states that formerly comprised the Soviet Union and Yugoslavia.
|
| Other.
The Fund may invest in the aggregate up to 35% of its total assets in equity securities of non-European countries and in fixed-income securities, such as government, corporate and bank debt obligations.
|
| FUND FACTS
|
|
| Objective:
|
Long-term capital appreciation
|
| Benchmark:
|
Tokyo Price Index (“TOPIX”) (unhedged)
|
| Investment Focus:
|
Equity securities of Japanese companies
|
| Investment Style:
|
Active International
|
| INVESTMENT OBJECTIVE
|
| The Fund seeks long-term capital appreciation.
|
| PRINCIPAL INVESTMENT STRATEGIES
|
| Equity Securities. The Fund invests, under normal circumstances, substantially all, and at least 65% of its total assets in equity securities of Japanese companies. A Japanese issuer is a company that either:
|
n
|
Has a class of its securities whose principal securities markets is in Japan;
|
n
|
Is organized under the laws of, or has a principal office in, Japan;
|
n
|
Derives 50% or more of its total revenue from goods produced, sales made or services provided in Japan; or
|
n
|
Maintains 50% or more of its assets in Japan.
|
| The Fund’s concentration in Japanese companies will expose it to the risk of adverse social, political and economic events
which occur in Japan or affect the Japanese markets.
|
| Japan’s economy, the second largest in the world, has grown substantially over the last three decades. Japan’s economic
growth in the 1990’s, however, was substantially below the level of earlier decades, and its economy drifted between modest growth and recession. In calendar year 1998, Japan’s gross national product contracted by 2.8% — its worst
performance in the post-war period. To address this economic downturn, Japan has attempted to implement changes related to high wages and taxes, currency valuations, structural rigidities, political reform and the deregulation of its economy. These
initiatives have, however, resulted in notable uncertainty and loss of public confidence. These conditions pres-
|
| ent risks to the Japanese Equity Fund and its ability to attain its investment objective.
|
| Japan’s economy is heavily dependent upon international trade, and is especially sensitive to trade barriers and disputes. In
particular, Japan relies on large imports of agricultural products, raw materials and fuels. A substantial rise in world oil or commodity prices, or a fall-off in Japan’s manufactured exports, could be expected to adversely affect Japan’s
economy. In addition, Japan is vulnerable to earthquakes, volcanoes and other natural disasters. Japan’s banking industry has recently suffered from non-performing loans, lower real estate values and lower valuations of securities holdings.
|
| The Japanese securities markets are less regulated than the U.S. markets. Evidence has emerged from time to time of distortion of
market prices to serve political or other purposes. Shareholders’ rights are also not always equally enforced.
|
| For most of the 1990’s, Japanese securities markets experienced significant declines. Although the stock markets exhibited
strength in 1999, they have again generally declined through the first three quarters of 2000.
|
| The common stocks of many Japanese companies have historically traded at high price-earnings ratios. Differences in accounting
methods have made it difficult to compare the earnings of Japanese companies with those of companies in other countries, especially the United States. Reported net income in Japan has been generally understated relative to U.S. accounting standards and
this has been one reason price-earnings ratios of the stocks of Japanese companies have tended historically to be higher than those of U.S. stocks. In addition, Japanese companies have tended to have higher growth rates than U.S. companies, and Japanese
interest rates have generally been lower than U.S. interest rates. These factors have contributed to lower discount rates and higher price-earnings ratios in Japan than in the United States.
|
| Other.
The Fund may invest in the aggregate up to 35% of its total assets in equity securities of non-Japanese companies and in fixed-income securities, such as government, corporate and bank debt obligations.
|
| FUND FACTS
|
|
| Objective:
|
Long-term capital appreciation
|
| Benchmark:
|
MSCI® EAFE® Small Cap Index (unhedged)
|
| Investment Focus:
|
Small-capitalization foreign equity securities
|
| Investment Style:
|
Active International
|
| INVESTMENT OBJECTIVE
|
| The Fund seeks long-term capital appreciation.
|
| PRINCIPAL INVESTMENT STRATEGIES
|
| Equity Securities. The Fund invests, under normal circumstances, substantially all, and at least 65% of its total assets in equity securities of companies:
|
n
|
With public stock market capitalizations (based upon shares available for trading on an unrestricted basis) within $100 million
and $3 billion, at the time of investment; and
|
n
|
That are organized outside the United States or whose securities are principally traded outside the United States.
|
| The Fund seeks to achieve its investment objective by investing in a diversified portfolio of equity securities that are
considered by the Investment Adviser to be strategically positioned for long-term growth.
|
| The Fund may allocate its assets among countries as determined by the Investment Adviser from time to time provided that the
Fund’s assets are invested in at least three foreign countries. The Fund expects to invest a substantial portion of its assets in securities of companies in the developed countries of Western Europe, Japan and Asia. However, the Fund may also invest
in the securities of issuers located in Australia, Canada, New Zealand and in emerging countries. Currently, emerging countries include, among others, most Latin American, African, Asian and Eastern European nations.
|
| Other.
The Fund may invest in the aggregate up to 35% of its total assets in equity securities of companies with public stock market capitalizations outside the range of the market capitalization range stated above at the time of investment and in fixed-income
securities, such as government, corporate and bank debt obligations. If the market capitalization of a company held by the Fund moves outside the range stated above, the Fund may, consistent with its investment objective, continue to hold the security.
|
| FUND FACTS
|
|
| Objective:
|
Long-term capital appreciation
|
| Benchmark:
|
MSCI® Emerging Markets Free Index
|
| Investment Focus:
|
Equity securities of emerging country issuers
|
| Investment Style:
|
Active International
|
| INVESTMENT OBJECTIVE
|
| The Fund seeks long-term capital appreciation.
|
| PRINCIPAL INVESTMENT STRATEGIES
|
| Equity Securities. The Fund invests, under normal circumstances, substantially all, and at least 65% of its total assets in equity securities of emerging country issuers. The Investment Adviser may consider classifications by the World Bank, the International Finance
Corporation or the United Nations and its agencies in determining whether a country is emerging or developed. Currently, emerging countries include, among others, most Latin and South American, African, Asian and Eastern European nations. The Investment
Adviser currently intends that the Fund’s investment focus will be in the following emerging countries as well as any other emerging country to the extent that foreign investors are permitted by applicable law to make such investments:
|
| n Argentina | n Egypt | n Jordan | n Philippines | n Taiwan | ||||
| n Botswana | n Greece | n Kenya | n Poland | n Thailand | ||||
| n Brazil | n Hong Kong | n Malaysia | n Russia | n Turkey | ||||
| n Chile | n Hungary | n Mexico | n Singapore | n Venezuela | ||||
| n China | n India | n Morocco | n South Africa | n Zimbabwe | ||||
| n Colombia | n Indonesia | n Pakistan | n South Korea | |||||
| n Czech Republic | n Israel | n Peru | n Sri Lanka |
| An emerging country issuer is any company that either:
|
n
|
Has a class of its securities whose principal securities market is in an emerging country;
|
n
|
Is organized under the laws of, or has a principal office in, an emerging country;
|
n
|
Derives 50% or more of its total revenue from goods produced, sales made or services provided in one or more emerging countries; or
|
n
|
Maintains 50% or more of its assets in one or more of the emerging countries.
|
| Under normal circumstances, the Fund maintains investments in at least six emerging countries, and will not invest more than 35%
of its total assets in securities of issuers in any one emerging country. Allocation of the Fund’s investments will depend upon the relative attractiveness of the emerging country markets and particular issuers. In addition, macro-economic factors
and the portfolio managers’ and Goldman Sachs economists’ views of the relative attractiveness of emerging countries and currencies are considered in allocating the Fund’s assets among emerging countries.
|
| Other.
The Fund may invest in the aggregate up to 35% of its total assets in (i) fixed-income securities of private and government emerging country issuers; and (ii) equity and fixed-income securities, such as government, corporate and bank debt obligations, of
issuers in developed countries.
|
| FUND FACTS
|
|
| Objective:
|
Long-term capital appreciation
|
| Benchmark:
|
MSCI® All Country Asia Free
ex-Japan Index (unhedged) |
| Investment Focus:
|
Equity securities of companies in Asian countries
|
| Investment Process:
|
Active International
|
| INVESTMENT OBJECTIVE
|
| The Fund seeks long-term capital appreciation.
|
| PRINCIPAL INVESTMENT STRATEGIES
|
| Equity Securities. The Fund invests, under normal circumstances, substantially all, and at least 65% of its total assets in equity securities of Asian issuers.
|
| An Asian issuer is any company that either:
|
n
|
Has a class of its securities whose principal securities markets is in one or more Asian countries;
|
n
|
Is organized under the laws of, or has a principal office in, an Asian country;
|
n
|
Derives 50% or more of its total revenue from goods produced, sales made or services provided in one or more Asian countries; or
|
n
|
Maintains 50% or more of its assets in one or more Asian countries.
|
| The Fund may allocate its assets among the Asian countries as determined from time to time by the Investment Adviser. For purposes
of the Fund’s investment policies, Asian countries are:
|
| n China
n
Hong Kong
n
India
n
Indonesia
|
n Malaysia
n
Pakistan
n
Philippines
n
Singapore
|
n South Korea
n
Sri Lanka
n
Taiwan
n
Thailand
|
| as well as any other country in Asia (other than Japan) to the extent that foreign investors are permitted by applicable law to
make such investments.
|
| Allocation of the Fund’s investments will depend upon the Investment Adviser’s views of the relative attractiveness of
the Asian markets and particular issuers.
|
| Concentration of the Fund’s assets in one or a few of the Asian countries and Asian currencies will subject the Fund to
greater risks than if the Fund’s assets were not so concentrated. For example, on August 31, 2000 (the end of the Fund’s last fiscal year), more than 25% of the Fund’s assets were invested in securities that traded in Hong Kong.
|
| Starting in mid-1997 some Pacific region countries began to experience currency devaluations that resulted in high interest rate
levels and sharp reductions in economic activity. This situation resulted in a significant drop in the securities prices of companies located in the region. Some countries have recently experienced government intervention, have sought assistance from the
International Monetary Fund and have experienced substantial domestic unrest. Although some restructuring has been undertaken, there can be no assurance that these efforts will be successful or that their recent problems will not persist. At the end of
its last fiscal year, a substantial portion of the Asia Growth Fund was invested in securities traded in the Hong Kong market. In 1997, the sovereignty of Hong Kong reverted from the United Kingdom to China. Although Hong Kong is, by law, to maintain a
high degree of autonomy, there can be no assurance that Hong Kong will not be adversely affected by Chinese sovereignty or political developments. Furthermore, the reversion of Hong Kong to China has created additional uncertainty as to future currency
valuations relative to the U.S. dollar. Because the Hong Kong stock market has significant exposure to the property market in Hong Kong, the Fund’s investments could be adversely affected by a decline in the market.
|
| Other.
The Fund may invest in the aggregate up to 35% of its total assets in equity securities of issuers in non-Asian countries and Japan, and in fixed-income securities, such as government, corporate and bank debt obligations.
|
| CORE
International Equity Fund |
International
Equity Fund |
European
Equity Fund |
|||||
|---|---|---|---|---|---|---|---|
| Investment Practices | |||||||
| Borrowings | 33 1
/3
|
33 1
/3
|
33 1
/3
|
||||
| Cross Hedging of Currencies | Ÿ | Ÿ | Ÿ | ||||
| Currency Swaps* | 15 | 15 | 15 | ||||
| Custodial Receipts | Ÿ | Ÿ | Ÿ | ||||
| Equity Swaps* | 15 | 15 | 15 | ||||
| Foreign Currency Transactions | Ÿ | Ÿ | Ÿ | ||||
| Futures Contracts and Options on Futures Contracts | Ÿ | Ÿ | Ÿ | ||||
| Investment Company Securities (including iShares
SM
and Standard & Poor’s Depositary Receipts TM ) |
10 | 10 | 10 | ||||
| Options on Foreign Currencies 1 | Ÿ | Ÿ | Ÿ | ||||
| Options on Securities and Securities Indices 2 | Ÿ | Ÿ | Ÿ | ||||
| Unseasoned Companies | Ÿ | Ÿ | Ÿ | ||||
| Warrants and Stock Purchase Rights | Ÿ | Ÿ | Ÿ | ||||
| Repurchase Agreements | Ÿ | Ÿ | Ÿ | ||||
| Securities Lending | 33 1
/3
|
33 1
/3
|
33 1
/3
|
||||
| Short Sales Against the Box | — | 25 | 25 | ||||
| When-Issued Securities and Forward Commitments | Ÿ | Ÿ | Ÿ | ||||
|
Japanese Equity Fund |
International
Growth Opportunities Fund |
Emerging Markets Equity Fund |
Asia Growth Fund |
||||
|---|---|---|---|---|---|---|---|
| 33 1
/3
|
33 1
/3
|
33 1
/3
|
33 1
/3
|
||||
| Ÿ | Ÿ | Ÿ | Ÿ | ||||
| 15 | 15 | 15 | 15 | ||||
| Ÿ | Ÿ | Ÿ | Ÿ | ||||
| 15 | 15 | 15 | 15 | ||||
| Ÿ | Ÿ | Ÿ | Ÿ | ||||
| Ÿ | Ÿ | Ÿ | Ÿ | ||||
| 10 | 10 | 10 | 10 | ||||
| Ÿ | Ÿ | Ÿ | Ÿ | ||||
| Ÿ | Ÿ | Ÿ | Ÿ | ||||
| Ÿ | Ÿ | Ÿ | Ÿ | ||||
| Ÿ | Ÿ | Ÿ | Ÿ | ||||
| Ÿ | Ÿ | Ÿ | Ÿ | ||||
| 33 1
/3
|
33 1
/3
|
33 1
/3
|
33 1
/3
|
||||
| 25 | 25 | 25 | 25 | ||||
| Ÿ | Ÿ | Ÿ | Ÿ | ||||
Ÿ
|
No specific percentage limitation on usage;
limited only by the objectives and strategies of the Fund |
| CORE
International Equity Fund |
International
Equity Fund |
European
Equity Fund |
|||||
|---|---|---|---|---|---|---|---|
| Investment Securities | |||||||
| American, European and Global Depositary Receipts | Ÿ | Ÿ | Ÿ | ||||
| Asset-Backed and Mortgage-Backed Securities 2 | — | Ÿ | Ÿ | ||||
| Bank Obligations 1 , 2 | Ÿ | Ÿ | Ÿ | ||||
| Convertible Securities | Ÿ | Ÿ | Ÿ | ||||
| Corporate Debt Obligations 2 | Ÿ 4 | Ÿ | Ÿ | ||||
| Equity Securities | 90+ | 65+ | 65+ | ||||
| Emerging Country Securities | 25 | Ÿ | Ÿ | ||||
| Fixed Income Securities 3 | 10 4 | 35 | 35 5 | ||||
| Foreign Securities | Ÿ | Ÿ | Ÿ | ||||
| Foreign Government Securities 2 | Ÿ | Ÿ | Ÿ | ||||
| Non-Investment Grade Fixed Income Securities 2 | — | Ÿ 6 | Ÿ 6 | ||||
| Real Estate Investment Trusts | Ÿ | Ÿ | Ÿ | ||||
| Structured Securities * | Ÿ | Ÿ | Ÿ | ||||
| Temporary Investments | 35 | 100 | 100 | ||||
| U.S. Government Securities 2 | Ÿ | Ÿ | Ÿ | ||||
*
|
Limited to 15% of net assets (together with other illiquid securities) for all structured securities which are not
deemed to be liquid and all swap transactions.
|
1
|
Issued by U.S. or foreign banks.
|
2
|
Limited by the amount the Fund invests in fixed-income securities.
|
3
|
Except as noted under “Non-Investment Grade Fixed Income Securities,” fixed-income securities are investment
grade (e.g., BBB or higher by Standard & Poor’s Rating Group (“Standard & Poor’s”) or Baa or higher by Moody’s Investor’s Service, Inc. (“Moody’s”)).
|
4
|
Cash equivalents only.
|
5
|
The European Equity Fund may invest in the aggregate up to 35% of its total assets in: (1) equity securities of
non-European countries; and (2) fixed-income securities.
|
6
|
May be BB or lower by Standard & Poor’s or Ba or lower by Moody’s.
|
| Japanese
Equity Fund |
International
Growth Opportunities Fund |
Emerging
Markets Equity Fund |
Asia Growth
Fund |
|||||||
|---|---|---|---|---|---|---|---|---|---|---|
| Ÿ | Ÿ | Ÿ | Ÿ | |||||||
| Ÿ | Ÿ | Ÿ | Ÿ | |||||||
| Ÿ | Ÿ | Ÿ | Ÿ | |||||||
| Ÿ | Ÿ | Ÿ | Ÿ | |||||||
| Ÿ | Ÿ | Ÿ | Ÿ | |||||||
| 65 | + | 65+ | 65 | + | 65 | + | ||||
| Ÿ | Ÿ | Ÿ | Ÿ | |||||||
| 35 | 7 | 35 8 | 35 | 9 | 35 | 10 | ||||
| Ÿ | Ÿ | Ÿ | Ÿ | |||||||
| Ÿ | Ÿ | Ÿ | Ÿ | |||||||
| Ÿ | 6 | Ÿ |
Ÿ | 6 | Ÿ | 6 | ||||
| Ÿ | Ÿ | Ÿ | Ÿ | |||||||
| Ÿ | Ÿ | Ÿ | Ÿ | |||||||
| 100 | 100 | 35 | 100 | |||||||
| Ÿ | Ÿ | Ÿ | Ÿ | |||||||
7
|
The Japanese Equity Fund may invest in the aggregate up to 35% of its total assets in: (1) fixed-income securities; and
(2) equity securities of non-Japanese companies.
|
8
|
The International Growth Opportunities Fund may invest in the aggregate up to 35% of its total assets in (1) fixed-income
securities; and (2) equity securities of companies with public stock market capitalizations of less than $100 million or more than $3 billion at the time of investment.
|
9
|
The Emerging Markets Equity Fund may invest in the aggregate up to 35% of its total assets in: (1) fixed-income
securities of private and government emerging country issuers; and (2) equity and fixed-income securities of issuers in developed countries.
|
10
|
The Asia Growth Fund may invest in the aggregate up to 35% of its total assets in: (1) fixed-income securities; and (2)
equity securities of issuers in non-Asian countries and Japan.
|
| CORE
International Equity |
International
Equity |
European
Equity |
Japanese
Equity |
International
Growth Opportunities |
Emerging
Markets Equity |
Asia
Growth |
|||||||||
|---|---|---|---|---|---|---|---|---|---|---|---|---|---|---|---|
| Credit/Default | Ÿ | Ÿ | Ÿ | Ÿ | Ÿ | Ÿ | Ÿ | ||||||||
| Emerging Countries | Ÿ | Ÿ | Ÿ | Ÿ | Ÿ | Ÿ | Ÿ | ||||||||
| Interest Rate | Ÿ | Ÿ | Ÿ | Ÿ | Ÿ | Ÿ | Ÿ | ||||||||
| Small Cap | — | — | Ÿ | — | Ÿ | — | — | ||||||||
| Foreign | Ÿ | Ÿ | Ÿ | Ÿ | Ÿ | Ÿ | Ÿ | ||||||||
| Derivatives | Ÿ | Ÿ | Ÿ | Ÿ | Ÿ | Ÿ | Ÿ | ||||||||
| Management | Ÿ | Ÿ | Ÿ | Ÿ | Ÿ | Ÿ | Ÿ | ||||||||
| Market | Ÿ | Ÿ | Ÿ | Ÿ | Ÿ | Ÿ | Ÿ | ||||||||
| Liquidity | Ÿ | Ÿ | Ÿ | Ÿ | Ÿ | Ÿ | Ÿ | ||||||||
| Stock | Ÿ | Ÿ | Ÿ | Ÿ | Ÿ | Ÿ | Ÿ | ||||||||
| Geographic | — | — | Ÿ | Ÿ | — | Ÿ | — | ||||||||
| Initial Public
Offering (“IPO”) |
— | — | Ÿ | Ÿ | Ÿ | Ÿ | Ÿ | ||||||||
n
|
Credit/Default Risk—The risk that an issuer or guarantor of fixed-income securities held by a Fund may default
on its obligation to pay interest and repay principal.
|
n
|
Emerging Countries Risk—The securities markets of Asian, Latin and South American, Eastern European,
African and other emerging countries are less liquid, are especially subject to greater price volatility, have smaller market capitalizations, have less government regulation and are not subject to as extensive and frequent accounting, financial and other
reporting requirements as the securities markets of more developed countries. Further, investment in equity securities of issuers located in Russia and certain other emerging countries involves risk of loss result
ing from problems in share registration and custody and substantial economic and political disruptions. These risks are not normally associated with investment in more developed countries.
|
n
|
Interest Rate Risk—The risk that when interest rates increase, securities held by a Fund will decline in value.
Long-term fixed-income securities will normally have more price volatility because of this risk than short-term fixed-income securities.
|
n
|
Foreign Risk—The risk that when a Fund invests in foreign securities, it will be subject to risk of loss not
typically associated with domestic issuers. Loss may result because of less foreign government regulation, less public information and less economic, political and social stability. Loss may also result from the imposition of exchange controls,
confiscations and other government restrictions. A Fund will also be subject to the risk of negative foreign currency rate fluctuations. Foreign risks will normally be greatest when a Fund invests in issuers located in emerging countries.
|
n
|
Derivatives Risk—The risk that loss may result from a Fund’s investments in options, futures, swaps,
structured securities and other derivative instruments. These instruments may be leveraged so that small changes may produce disproportionate losses to a Fund.
|
n
|
Management Risk—The risk that a strategy used by the Investment Adviser may fail to produce the intended results.
|
n
|
Market Risk—The risk that the value of the securities in which a Fund invests may go up or down in response to
the prospects of individual companies, particular industry sectors and/or general economic conditions. Price changes may be temporary or last for extended periods. A Fund’s investments may be overweighted from time to time in one or more industry
sectors, which will increase the Fund’s exposure to risk of loss from adverse developments affecting those sectors.
|
n
|
Liquidity Risk—The risk that a Fund will not be able to pay redemption proceeds within the time period stated
in this Prospectus because of unusual market conditions, an unusually high volume of redemption requests, or other reasons. Funds that invest in non-investment grade fixed-income securities, small capitalization stocks, REITs or emerging country issuers
will be especially subject to the risk that during certain periods the liquidity of particular issuers or industries, or all securities within particular investment categories, will shrink or disappear suddenly and without warning as a result of adverse
economic, market or political events, or adverse investor perceptions whether or not accurate. The Goldman Sachs Asset Allocation Portfolios (the “Asset Allocation Portfolios”) expect to invest a significant percentage of their assets in the
Funds and other funds for which Goldman Sachs now or in the future acts as investment adviser or underwriter. Redemptions by an Asset Allocation Portfolio of its position in a Fund may further increase liquidity risk and may impact a Fund’s net asset
value (“NAV”).
|
n
|
Stock Risk—The risk that stock prices have historically risen and fallen in periodic cycles. Recently, U.S.
stock markets and certain foreign stock markets have experienced substantial price volatility and, at times, have traded at or close to record high levels. There is no guarantee that such levels will be reached or maintained in the future.
|
n
|
Geographic Risk—The European Equity Fund invests primarily in equity securities of European companies. The
Japanese Equity Fund invests primarily in equity securities of Japanese equity companies. The Asia Growth Fund invests primarily in equity securities of Asian issuers. Concentration of the investments of these or other Funds in issuers located in a
particular country or region will subject a Fund, to a greater extent than if investments were less concentrated, to the risks of adverse securities markets, exchange rates and social, political, regulatory or economic events which may occur in that
country or region.
|
n
|
Small Cap Risk—The securities of small capitalization stocks involve greater risks than those associated with
larger, more established companies and may be subject to more abrupt or erratic price movements. Securities of such issuers may lack sufficient market liquidity to enable a Fund to effect sales at an advantageous time or without a substantial drop in price.
|
n
|
IPO Risk—The risk that the market value of IPO shares will fluctuate considerably due to factors such as the
absence of a prior public market, unseasoned trading, the small number of shares available for trading and limited information about the issuer. The purchase of IPO shares may involve high transaction costs. IPO shares are subject to market risk and
liquidity risk. When a Fund’s asset base is small, a significant portion of the Fund’s performance could be attributable to investments in IPOs, because such investments would have a magnified impact on the Fund. As the Fund’s assets grow,
the effect of the Fund’s investments in IPOs on the Fund’s performance probably will decline, which could reduce the Fund’s performance.
|
| HOW THE FUNDS HAVE PERFORMED
|
| The bar chart and table below provide an indication of the risks of investing in a Fund by showing: (a) changes in the performance
of a Fund’s Service Shares from year to year; and (b) how the average annual returns of a Fund’s Service Shares compare to those of broad-based securities market indices. The bar chart and table assume reinvestment of dividends and
distributions. A Fund’s past performance is not necessarily an indication of how the Fund will perform in the future. Performance reflects expense limitations in effect. If expense limitations were not in place, a Fund’s performance would have
been reduced. As of the date of this Prospectus, Service Shares of the Asia Growth Fund had not commenced operations. Performance of the Asia Growth Fund is represented by the Fund’s Class A Shares. Class A Shares are not offered in this Prospectus
but have substantially similar annual returns because the shares are invested in the same investment portfolio of securities. Annual returns differ only to the extent that Class A Shares have a 0.50% distribution and service fee and a 0.19% transfer
agency fee while Service Shares have a 0.50% service fee and a 0.04% transfer agency fee. In addition, Class A Shares, unlike Service Shares, are subject to a maximum sales charge of 5.5%.
|
| TOTAL RETURN
|
| The total return for Service Shares for the 9-month period ended September 30, 2000 was -13.40%.
Best Quarter
Q4 ’98
+18.97%
Worst Quarter
Q3 ’98
-15.97%
|
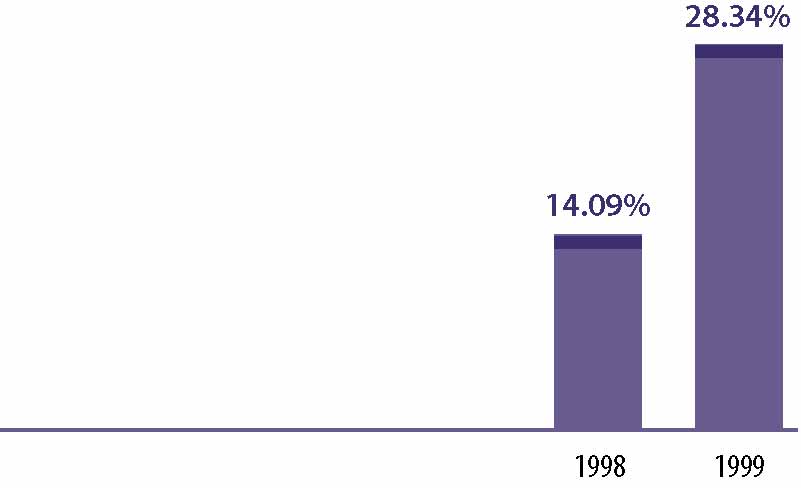 |
| AVERAGE ANNUAL TOTAL RETURN
|
| For the period ended December 31, 1999 | 1 Year | Since Inception | |||||
|---|---|---|---|---|---|---|---|
| Service Shares (Inception 8/15/97) | 28.34 | % | 11.13 | % | |||
| Morgan Stanley Capital International (MSCI®) Europe,
Australasia, Far East (EAFE®) Index (unhedged)* |
27.29 | % | 15.99 | % | |||
*
|
The unmanaged MSCI® EAFE® Index is a market capitalization-weighted composite of securities in 20 developed markets.
The Index figures do not reflect any fees or expenses.
|
| TOTAL RETURN
|
| The total return for Service Shares for the 9-month period ended September 30, 2000 was -10.46%.
Best Quarter
Q4 ’99
+21.77%
Worst Quarter
Q3 ’98
-14.37%
|
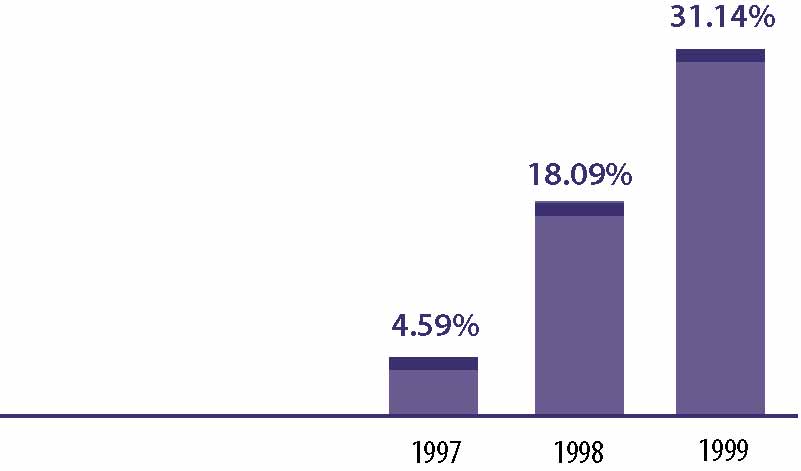 |
| AVERAGE ANNUAL TOTAL RETURN
|
| For the period ended December 31, 1999 | 1 Year | Since Inception | |||||
|---|---|---|---|---|---|---|---|
| Service Shares (Inception 3/6/96) | 31.14 | % | 17.23 | % | |||
| MSCI® EAFE® (unhedged)* | 27.29 | % | 13.96 | % | |||
*
|
The MSCI® EAFE® Index (unhedged) is an unmanaged index of common stock prices. The Index figures do not reflect any
fees or expenses.
|
| TOTAL RETURN
|
| The total return for Service Shares for the 9-month period ended September 30, 2000 was -5.72%.
Best Quarter
Q4 ’99
+24.91%
Worst Quarter
Q2 ’99
-3.04%
|
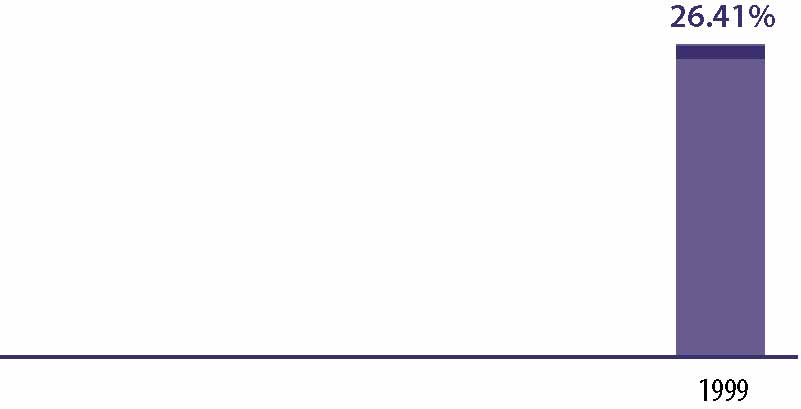 |
| AVERAGE ANNUAL TOTAL RETURN
|
| For the period ended December 31, 1999 | 1 Year | Since Inception | |||||
|---|---|---|---|---|---|---|---|
| Service Shares (Inception 10/1/98) | 26.41 | % | 36.41 | % | |||
| MSCI® Europe Index (unhedged)* | 16.21 | % | 29.39 | % | |||
| FT/S&P Actuaries Europe Index (unhedged)** | 16.14 | % | 29.20 | % | |||
*
|
The MSCI® Europe Index (unhedged), an unmanaged index of common stock prices, replaced the FT/S&P Actuaries Europe
Index (unhedged) as the European Equity Fund’s performance benchmark. The MSCI® Europe Index is widely used throughout the investment management industry to represent the investment opportunities available to a large cap, developed country
European equity strategy and, in the Investment Adviser’s opinion, is a more appropriate benchmark against which to increase the performance of the European Equity Fund. The Index figures do not reflect any fees or expenses.
|
**
|
The unmanaged FT/S&P Actuaries Europe Index (unhedged) is a market capitalization-weighted composite of approximately 750
stocks from 16 countries in Europe. The Index figures do not reflect any fees or expenses.
|
| TOTAL RETURN
|
| The total return for Service Shares for the 9-month period ended September 30, 2000 was -12.41%.
Best Quarter*
Q3 ’99
+23.18%
Worst Quarter*
Q1 ’99
+9.31%
|
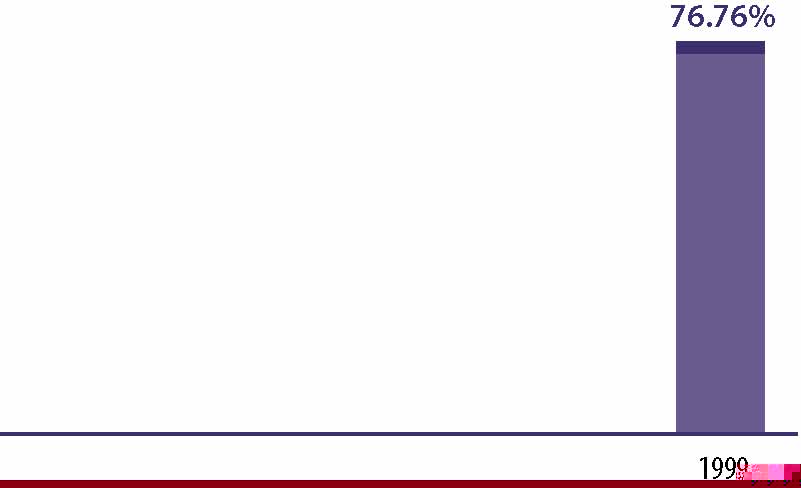 |
| AVERAGE ANNUAL TOTAL RETURN
|
| For the period ended December 31, 1999 | 1 Year | Since Inception | |||||
|---|---|---|---|---|---|---|---|
| Service Shares (Inception 5/1/98) | 76.76 | % | 49.37 | % | |||
| Tokyo Price Index (“TOPIX”) (unhedged)** | 75.32 | % | 43.28 | % | |||
*
|
Please note that “Best Quarter” and “Worst Quarter” figures are applicable only to the time period covered
by the bar chart.
|
**
|
The TOPIX (unhedged) is an unmanaged composite of all stocks on the first section of the Tokyo Stock Exchange. The Index
figures do not reflect any fees or expenses.
|
| TOTAL RETURN
|
| The total return for the Service Shares for the 9-month period ended September 30, 2000 was 2.23%.
Best Quarter*
Q4 ’99
+12.60%
Worst Quarter*
Q1 ’99
+4.71%
|
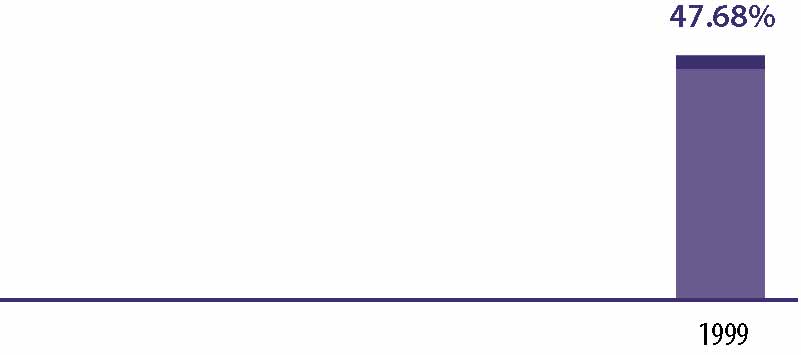 |
| AVERAGE ANNUAL TOTAL RETURN
|
| For the period ended December 31, 1999 | 1 Year | Since Inception | |||||
|---|---|---|---|---|---|---|---|
| Service Shares (Inception 5/1/98) | 47.68 | % | 29.27 | % | |||
| MSCI® EAFE® Small Cap Index (unhedged)** | 17.67 | % | 3.00 | % | |||
*
|
Please note that “Best Quarter” and “Worst Quarter” figures are applicable only to the time period covered
by the bar chart.
|
**
|
The MSCI® EAFE® Small Cap Index (unhedged), inception date 1/15/98, includes 1,502 securities from 23 developed markets
with a capitalization range of $200-800 million and a general regional allocation of 60% Europe, 30% Japan and 10% Asia. The Index figures do not reflect any fees or expenses.
|
| TOTAL RETURN
|
| The total return for Service Shares for the 9-month period ended September 30, 2000 was -15.43%.
Best Quarter
Q4 ’99
+30.10%
Worst Quarter
Q3 ’98
-23.84 %
|
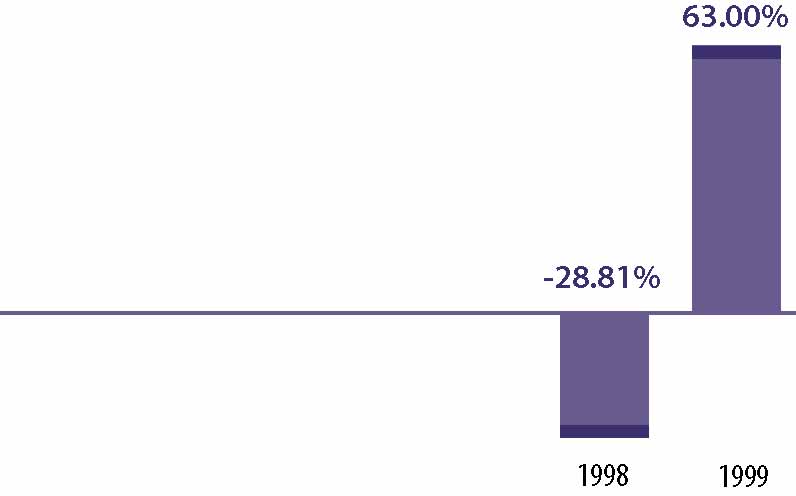 |
| AVERAGE ANNUAL TOTAL RETURN
|
| For the period ended December 31, 1999 | 1 Year | Since Inception | |||
|---|---|---|---|---|---|
| Service Shares (Inception 12/15/97) | 63.00% | 8.79% | |||
| MSCI® Emerging Markets Free (EMF) Index* | 66.42% | 14.52% | |||
*
|
The unmanaged MSCI® EMF Index is a market capitalization-weighted composite of securities in over 30 emerging market
countries. “Free” indicates an index that excludes shares in otherwise free markets that are not purchasable by foreigners. The Index figures do not reflect any fees or expenses.
|
| TOTAL RETURN
|
| The total return for Class A Shares for the 9-month period ended September 30, 2000 was -21.73%.
Best Quarter
Q2 ’99
+30.97%
Worst Quarter
Q4 ‘97
-27.33%
|
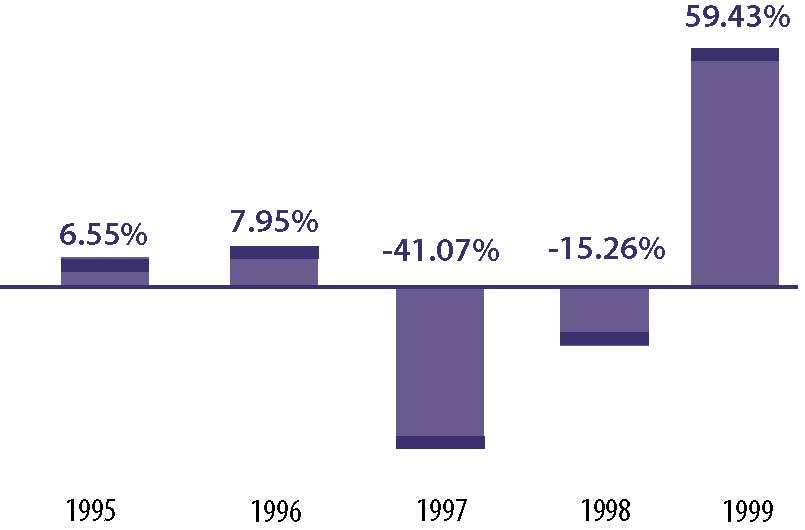 |
| AVERAGE ANNUAL TOTAL RETURN
|
| For the period ended December 31, 1999 | 1 Year | 5 Years | Since Inception | ||||
|---|---|---|---|---|---|---|---|
| Class A (Inception 7/8/94) | |||||||
| Including 5.5% Sales Charge | 50.70% | (2.84) | (2.12)% | ||||
| MSCI® All Country Asia Free ex-Japan (unhedged)* | 61.95% | (1.28) | (.94)% | ||||
*
|
The unmanaged MSCI® All Country Asia Free ex-Japan Index (unhedged) is a market capitalization-weighted composite of
securities in ten Asian countries. “Free” indicates an index that excludes shares in otherwise free markets that are not purchasable by foreigners. The Index figures do not reflect any fees or expenses.
|
| CORE
International Equity Fund |
International
Equity Fund |
European
Equity Fund |
|||||
|---|---|---|---|---|---|---|---|
| Shareholder Fees | |||||||
| (fees paid directly from your investment): | |||||||
| Maximum Sales Charge (Load) Imposed on
Purchases |
None | None | None | ||||
| Maximum Sales Charge (Load) Imposed on
Reinvested Dividends |
None | None | None | ||||
| Redemption Fees | None | None | None | ||||
| Exchange Fees | None | None | None | ||||
| Annual Fund Operating Expenses | |||||||
| (expenses that are deducted from Fund assets):2 | |||||||
| Management Fees | 0.85% | 1.00% | 1.00% | ||||
| Service Fees 3 | 0.50% | 0.50% | 0.50% | ||||
| Other Expenses 4 | 0.25% | 0.19% | 0.52% | ||||
| Total Fund Operating Expenses* | 1.60% | 1.69% | 2.02% | ||||
| See page 32 for all other footnotes.
|
*
|
As a result of the current expense limitations, “Other Expenses” and “Total Fund Operating Expenses” of the
Funds which are actually incurred as of the date of this Prospectus are as set forth below. The expense limitations may be terminated at any time at the option of the Investment Adviser. If this occurs, “Other Expenses” and “Total Fund
Operating Expenses” may increase without shareholder approval.
|
| CORE
International Equity Fund |
International
Equity Fund |
European
Equity Fund |
|||||
|---|---|---|---|---|---|---|---|
| Annual Fund Operating Expenses | |||||||
| (expenses that are deducted from
Fund assets): 2 |
|||||||
| Management Fees | 0.85% | 1.00% | 1.00% | ||||
| Service Fees 3 | 0.50% | 0.50% | 0.50% | ||||
| Other Expenses 4 | 0.16% | 0.14% | 0.14% | ||||
| Total Fund Operating Expenses
(after current expense limitations) |
1.51% | 1.64% | 1.64% | ||||
| Japanese
Equity Fund |
International Growth
Opportunities Fund |
Emerging
Markets Equity Fund |
Asia
Growth Fund 1 |
||||
|---|---|---|---|---|---|---|---|
| None | None | None | None | ||||
| None | None | None | None | ||||
| None | None | None | None | ||||
| None | None | None | None | ||||
| 1.00% | 1.20% | 1.20% | 1.00% | ||||
| 0.50% | 0.50% | 0.50% | 0.50% | ||||
| 0.45% | 0.37% | 0.45% | 0.65% | ||||
| 1.95% | 2.07% | 2.15% | 2.15% | ||||
| Japanese
Equity Fund |
International Growth
Opportunities Fund |
Emerging
Markets Equity Fund |
Asia
Growth Fund 1 |
||||
|---|---|---|---|---|---|---|---|
| 1.00% | 1.20% | 1.20% | 1.00% | ||||
| 0.50% | 0.50% | 0.50% | 0.50% | ||||
| 0.15% | 0.20% | 0.39% | 0.20% | ||||
| 1.65% | 1.90% | 2.09% | 1.70% | ||||
1
|
Service Shares had not commenced operations as of the date of this Prospectus.
|
2
|
The Funds’ annual operating expenses are based on actual expenses.
|
3
|
Service Organizations may charge other fees to their customers who are beneficial owners of Service Shares in connection
with their customers’ accounts. Such fees may affect the return customers realize with respect to their investments.
|
4
|
“Other Expenses” include transfer agency fees equal to 0.04% of the average daily net assets of each Fund’
s Service Shares, plus all other ordinary expenses not detailed above. The Investment Adviser has voluntarily agreed to reduce or limit “Other Expenses” (excluding management fees, transfer agency fees, service fees, taxes, interest and
brokerage fees and litigation, indemnification and other extraordinary expenses) to the following percentages of each Fund’s average daily net assets:
|
| Fund | Other
Expenses |
||
|---|---|---|---|
| CORE International Equity | 0.12% | ||
| International Equity | 0.10% | ||
| European Equity | 0.10% | ||
| Japanese Equity | 0.11% | ||
| International Growth
Opportunities |
0.16% | ||
| Emerging Markets Equity | 0.35% | ||
| Asia Growth | 0.16% | ||
| Fund | 1 Year | 3 Years | 5 Years | 10 Years | |||||
|---|---|---|---|---|---|---|---|---|---|
| CORE International Equity | $163 | $505 | $ 871 | $1,900 | |||||
| International Equity | $172 | $533 | $ 918 | $1,998 | |||||
| European Equity | $205 | $634 | $1,088 | $2,348 | |||||
| Japanese Equity | $198 | $612 | $1,052 | $2,275 | |||||
| International Growth Opportunities | $210 | $649 | $1,114 | $2,400 | |||||
| Emerging Markets Equity | $218 | $673 | $1,154 | $2,483 | |||||
| Asia Growth | $218 | $673 | $1,154 | $2,483 | |||||
| INVESTMENT ADVISERS
|
| Investment Adviser | Fund | ||
|---|---|---|---|
| Goldman Sachs Asset Management (“GSAM”) | CORE International Equity | ||
| 32 Old Slip | |||
| New York, New York 10005 | |||
| Goldman Sachs Asset Management International (“GSAMI”) | International Equity | ||
| Procession House | European Equity | ||
| 55 Ludgate Hill | Japanese Equity | ||
| London, England EC4M 7JW | International Growth Opportunities | ||
| Emerging Markets Equity | |||
| Asia Growth | |||
| GSAM and GSAMI are separate business units of the Investment Management Division (“IMD”) of Goldman Sachs. Goldman Sachs
registered as an investment adviser in 1981. GSAMI, a member of the Investment Management Regulatory Organization Limited since 1990 and a registered investment adviser since 1991, is an affiliate of Goldman Sachs. As of September 30, 2000, GSAM and
GSAMI, along with other units of IMD, had assets under management of $281.3 billion.
|
| The Investment Adviser provides day-to-day advice regarding the Funds’ portfolio transactions. The Investment Adviser makes
the investment decisions for the Funds and places purchase and sale orders for the Funds’ portfolio transactions in U.S. and foreign markets. As permitted by applicable law, these orders may be directed to any brokers, including Goldman Sachs and its
affiliates. While the Investment Adviser is ultimately responsible for the management of the Funds, it is able to draw upon the research and expertise of its asset management affiliates for portfolio decisions and management with respect to certain
portfolio securities. In addition, the Investment Adviser has access to the research and certain proprietary technical models developed by Goldman Sachs, and will apply quantitative and qualitative analysis in determining the appropriate allocations among
categories of issuers and types of securities.
|
| The Investment Adviser also performs the following additional services for the Funds:
|
n
|
Supervises all non-advisory operations of the Funds
|
n
|
Provides personnel to perform necessary executive, administrative and clerical services to the Funds
|
| n
|
Arranges for the preparation of all required tax returns, reports to shareholders, prospectuses and statements of additional
information and other reports filed with the Securities and Exchange Commission (the “SEC”) and other regulatory authorities
|
n
|
Maintains the records of each Fund
|
n
|
Provides office space and all necessary office equipment and services
|
| MANAGEMENT FEES
|
| As compensation for its services and its assumption of certain expenses, the Investment Adviser is entitled to the following fees,
computed daily and payable monthly, at the annual rates (as a percentage of each respective portfolio’s average daily net assets) listed below:
|
| Contractual Rate | Actual Rate
For the Fiscal Year Ended August 31, 2000 |
||||||
|---|---|---|---|---|---|---|---|
| GSAM: | |||||||
| CORE International Equity | 0.85 | % | 0.85 | % | |||
| GSAMI: | |||||||
| International Equity | 1.00 | % | 1.00 | % | |||
| European Equity | 1.00 | % | 1.00 | % | |||
| Japanese Equity | 1.00 | % | 1.00 | % | |||
| International Growth Opportunities | 1.20 | % | 1.20 | % | |||
| Emerging Markets Equity | 1.20 | % | 1.20 | % | |||
| Asia Growth | 1.00 | % | 1.00 | % | |||
| The difference, if any, between the stated fees and the actual fees paid by the Funds reflects that the Investment Adviser did not
charge the full amount of the fees to which it would have been entitled. The Investment Adviser may discontinue or modify any such voluntary limitations in the future at its discretion.
|
| FUND MANAGERS
|
| M. Roch Hillenbrand, a Managing Director of Goldman Sachs since 1997, is the Head of Global Equities for GSAM, overseeing the
United States, Europe, Japan, and non-Japan Asia. In this capacity, he is responsible for managing the group as it defines and implements global portfolio management processes that are consistent, reliable and predictable. Mr. Hillenbrand joined Goldman
Sachs in 1997
|
| upon its acquisition of Commodities Corporation, LLC where he was and continues as President. Over the course of his 20-year
career at Commodities Corporation, Mr. Hillenbrand has had extensive experience in dealing with internal and external investment managers who have managed a range of futures and equities strategies across multiple markets, using a variety of styles.
|
| International Equity Portfolio Management Team
|
n
|
Global portfolio teams based in London, Singapore, Tokyo and New York. Local presence is a key to the Investment Adviser’s
fundamental research capabilities
|
n
|
Team manages over $45.9 billion in international equities for retail, institutional and high net worth clients
|
n
|
Focus on bottom-up stock selection as main driver of returns, though the team leverages the asset allocation, currency and risk
management capabilities of GSAM
|
| Name and Title | Fund Responsibility | Years Primarily
Responsible |
Five Year Employment History | ||||
|---|---|---|---|---|---|---|---|
| David Dick
Executive Director |
Senior Portfolio Manager—
European Equity Fund |
Since
1998 |
Mr. Dick joined the Investment
Adviser as a senior portfolio manager on the European Equity team in 1998. From 1990 to 1998, he was with Mercury Asset Management, where he was a portfolio manager for European equity and was head of Mercury’s European sector strategy. |
||||
| Gary Greenberg
Vice President Co-Head of Emerging Markets Equity |
Senior Portfolio Manager—
Emerging Markets Equity Fund |
Since
1999 |
Mr. Greenberg joined the
Investment Adviser as a portfolio manager in 1999. From 1998 to 1999, he was a Managing Director and the lead international portfolio manager at Van Eck Global Asset Management. Prior to that, he was Chief Investment Officer for Peregrine Asset Management in Hong Kong from 1994 to 1998. |
||||
| Name and Title | Fund Responsibility | Years Primarily
Responsible |
Five Year Employment History | ||||
|---|---|---|---|---|---|---|---|
| James P. Hordern
Executive Director |
Senior Portfolio Manager—
International Growth Opportunities Fund |
Since
1998 |
Mr. Hordern joined the
Investment Adviser as a portfolio manager in 1997. From 1991 to 1997, he was an Assistant Director and portfolio manager at Mercury Asset Management on the European Specialist Team. |
||||
| Ralf Laier
Vice President |
Portfolio Manager—
Emerging Markets Equity Fund |
Since
1998 |
Mr. Laier joined the Investment
Adviser as a portfolio manager with a focus on Central/Eastern European (CEE) and the Commonwealth of Independent States (CIS) in 1997. Prior to joining the Investment Adviser, from 1995 to 1997, he was Vice President of Soros Global Research, where he analyzed investment opportunities in CEE/CIS. |
||||
| Susan Noble
Managing Director |
Senior Portfolio Manager—
European Equity Fund International Equity Fund |
Since
1998 1998 |
Ms. Noble joined the Investment
Adviser as a senior portfolio manager and head of the European Equity Team in October 1997. From 1986 to 1997, she worked at Fleming Investment Management in London, where she most recently was Portfolio Management Director for the European equity investment strategy and process. |
||||
| Andrew Orchard
Executive Director |
Senior Portfolio Manager—
European Equity Fund International Equity Fund |
Since
1999 1999 |
Mr. Orchard joined the
Investment Adviser as a portfolio manager in 1999. From 1994 to 1999 he was a portfolio manager at Morgan Grenfell Asset Management where he managed global equity portfolios and chaired Morgan Grenfell’s Global Sector Committee. |
||||
| Name and Title | Fund Responsibility | Years Primarily
Responsible |
Five Year Employment History | ||||
|---|---|---|---|---|---|---|---|
| Robert Stewart
Executive Director |
Senior Portfolio Manager—
European Equity Fund International Equity Fund |
Since
1999 1999 |
Mr. Stewart joined the
Investment Adviser as a portfolio manager in 1996. He is a member of the European Equity Team. From 1996 to 1998 he was a portfolio manager in Japan where he managed Japanese Equity Institutional Portfolios. Prior to that Mr. Stewart was a portfolio manager at CINMan from 1989 to 1996 where he managed international equities. |
||||
| Danny Truell
Managing Director |
Senior Portfolio Manager—
European Equity Fund International Equity |
Since
1998 2000 |
Mr. Truell joined the Investment
Adviser as a senior portfolio manager and head of UK equities in 1998. From 1992 to 1996, he was Investment Banking Executive Director for SBC Warburg and Chief Asian Equity Strategist. |
||||
| Gabriella Antici
Vice President Co-Head of Emerging Markets Equity |
Senior Portfolio Manager—
Emerging Markets Equity Fund |
Since
1998 |
Ms. Antici joined the Investment
Adviser as a portfolio manager in 1997. From 1994 to 1997, she was a Vice President for HSBC Asset Management, where she was a portfolio manager for emerging markets and head of the Latin American Department. |
||||
| Rory Bateman
Executive Director |
Portfolio Manager—
European Equity Fund |
Since
2000 |
Mr. Bateman joined the
Investment Adviser as an equity analyst in 1996. Prior to that he was an analyst at CINMan covering European equities. |
||||
| Name and Title | Fund Responsibility | Years Primarily
Responsible |
Five Year Employment History | ||||
|---|---|---|---|---|---|---|---|
| Melissa Brown
Managing Director |
Senior Portfolio Manager—
CORE International Equity Fund |
Since
1998 |
Ms. Brown joined the Investment
Adviser as a portfolio manager in 1998. From 1984 to 1998, she was the director of Quantitative Equity Research and served on the Investment Policy Committee at Prudential Securities. |
||||
| Mark M. Carhart
Managing Director |
Portfolio Manager—
CORE International Equity Fund |
Since
1998 |
Mr. Carhart joined the
Investment Adviser as a member of the Quantitative Research and Risk Management team in 1997. From August 1995 to September 1997, he was Assistant Professor of Finance at the Marshall School of Business at USC and a Senior Fellow of the Wharton Financial Institutions Center. |
||||
| Raymond J.
Iwanowski Managing Director |
Portfolio Manager—
CORE International Equity Fund |
Since
1998 |
Mr. Iwanowski joined the
Investment Adviser as an associate and portfolio manager in 1997. From 1993 to 1997, he was a Vice President and head of the Fixed Derivatives Client Research group at Salomon Brothers. |
||||
| Robert C. Jones
Managing Director |
Senior Portfolio Manager—
CORE International Equity Fund |
Since
1997 |
Mr. Jones joined the
Investment Adviser as a portfolio manager in 1989. |
||||
| Name and Title | Fund Responsibility | Years Primarily
Responsible |
Five Year Employment History | ||||
|---|---|---|---|---|---|---|---|
| Alice Lui
Vice President |
Portfolio Manager—
Asia Growth Fund Emerging Markets Equity Fund International Equity Fund International Growth Opportunities Fund |
Since
1994 1999 1999 1999 |
Ms. Lui joined the Investment
Adviser as a portfolio manager in 1990. |
||||
| Ravi Shanker
Vice President |
Senior Portfolio Manager—
Asia Growth Fund Emerging Markets Equity Fund International Equity Fund International Growth Opportunities Fund |
Since
1997 1998 1999 1999 |
Mr. Shanker joined the
Investment Adviser as an operations manager in 1997. From July 1996 to 1997, he worked for Goldman Sachs in Singapore as a strategic advisor for transactions involving infrastructure industries in Asia. From 1988 to 1996, he worked for Goldman Sachs as an investment banker in the Investment Banking Division. |
||||
| Siew-Hua Thio
Vice President |
Portfolio Manager—
Asia Growth Fund Emerging Markets Equity Fund International Equity Fund International Growth Opportunities Fund |
Since
1998 1998 1998 1998 |
Ms. Thio joined the Investment
Adviser as a portfolio manager in 1998. From 1997 to 1998, she was Head of Research for Indosuez WI Carr in Singapore. From 1993 to 1997, she was a research analyst at the same firm. |
||||
| Name and Title | Fund Responsibility | Years Primarily
Responsible |
Five Year Employment History | ||||
|---|---|---|---|---|---|---|---|
| Toshiyuki Ejima
Vice President |
Portfolio Manager—
Japanese Equity Fund |
Since
1999 |
Mr. Ejima joined the Investment
Adviser as a portfolio manager in April 1999. Prior to that he was a portfolio manager at Daiichi Mutual Life from 1993 to 1999 where he managed Japanese equities. |
||||
| Shigeka Kouda
Vice President |
Portfolio Manager—
International Growth Opportunities Fund |
Since
1998 |
Mr. Kouda joined the
Investment Adviser as a portfolio manager in 1997. From 1992 to 1997, he was at the Fixed Income Division of Goldman Sachs (Japan) Limited, where he was extensively involved in emerging markets trading as well as International Fixed Income institutional sales. |
||||
| Shogo Maeda
Managing Director |
Senior Portfolio Manager—
Japanese Equity Fund International Equity Fund International Growth Opportunities Fund |
Since
1994 1994 1998 |
Mr. Maeda joined the
Investment Adviser as a portfolio manager in 1994. |
||||
| Miyako Shibamoto
Vice President |
Portfolio Manager—
Japanese Equity Fund |
Since
1998 |
Ms. Shibamoto joined the
Investment Adviser as a member of the Japanese Equity team in March 1998. From 1993 to 1998, she was a Vice President at Scudder Stevens and Clark (Japan). |
||||
| Takeya Suzuki
Vice President |
Portfolio Manager—
Japanese Equity Fund |
Since
1998 |
Mr. Suzuki joined the
Investment Adviser as a portfolio manager in 1996. From 1990 to 1996, he was a Japanese equity portfolio manager at Nomura Investment Management where he actively managed assets for U.S. pension funds. |
||||
| DISTRIBUTOR AND TRANSFER AGENT
|
| Goldman Sachs, 85 Broad Street, New York, New York 10004, serves as the exclusive distributor (the “Distributor”) of
each Fund’s shares. Goldman Sachs, 4900 Sears Tower, Chicago, Illinois 60606-6372, also serves as the Funds’ transfer agent (the “Transfer Agent”) and, as such, performs various shareholder servicing functions.
|
| From time to time, Goldman Sachs or any of its affiliates may purchase and hold shares of the Funds. Goldman Sachs reserves the
right to redeem at any time some or all of the shares acquired for its own account.
|
| ACTIVITIES OF GOLDMAN SACHS AND ITS AFFILIATES AND OTHER ACCOUNTS MANAGED BY GOLDMAN SACHS
|
| The involvement of the Investment Adviser, Goldman Sachs and their affiliates in the management of, or their interest in, other
accounts and other activities of Goldman Sachs may present conflicts of interest with respect to a Fund or limit a Fund’s investment activities. Goldman Sachs and its affiliates engage in proprietary trading and advise accounts and funds which have
investment objectives similar to those of the Funds and/or which engage in and compete for transactions in the same types of securities, currencies and instruments as the Funds. Goldman Sachs and its affiliates will not have any obligation to make
available any information regarding their proprietary activities or strategies, or the activities or strategies used for other accounts managed by them, for the benefit of the management of the Funds. The results of a Fund’s investment activities,
therefore, may differ from those of Goldman Sachs and its affiliates, and it is possible that a Fund could sustain losses during periods in which Goldman Sachs and its affiliates and other accounts achieve significant profits on their trading for
proprietary or other accounts. In addition, the Funds may, from time to time, enter into transactions in which other clients of Goldman Sachs have an adverse interest. A Fund’s activities may be limited because of regulatory restrictions applicable
to Goldman Sachs and its affiliates, and/or their internal policies designed to comply with such restrictions.
|
| Each Fund pays dividends from its investment company taxable income and distributions from net realized capital gains. You may
choose to have dividends and distributions paid in:
|
n
|
Cash
|
n
|
Additional shares of the same class of the same Fund
|
n
|
Shares of the same or an equivalent class of another Goldman Sachs Fund. Special restrictions may apply for certain ILA
Portfolios. See the Additional Statement.
|
| You may indicate your election on your Account Application. Any changes may be submitted in writing to Goldman Sachs at any time
before the record date for a particular dividend or distribution. If you do not indicate any choice, dividends and distributions will be reinvested automatically in the applicable Fund.
|
| The election to reinvest dividends and distributions in additional shares will not affect the tax treatment of such dividends and
distributions, which will be treated as received by you and then used to purchase the shares.
|
| The Funds’ investments in foreign securities may be subject to foreign withholding taxes. Under certain circumstances, the
Funds may elect to pass-through these taxes to you. If this election is made, a proportionate amount of such taxes will constitute a distribution to you, which would allow you either (1) to credit such proportionate amount of foreign taxes against your
U.S. federal income tax liability or (2) to take such amount as an itemized deduction.
|
| Dividends from investment company taxable income and distributions from net capital gains are declared and paid annually.
|
| From time to time a portion of a Fund’s dividends may constitute a return of capital.
|
| At the time of an investor’s purchase of shares of a Fund, a portion of the NAV per share may be represented by undistributed
income or undistributed realized appreciation of the Fund’s portfolio securities. Therefore, subsequent distributions on such shares from such income or realized appreciation may be taxable to you even if the NAV of the shares is, as a result of the
distributions, reduced below the cost of such shares and the distributions (or portions thereof) represent a return of a portion of the purchase price.
|
| The following section will provide you with answers to some of the most often asked questions regarding buying and selling the
Funds’ Service Shares.
|
| How Can I Purchase Service Shares Of The Funds?
|
| Generally, Service Shares may be purchased only through institutions that have agreed to provide account administration and
personal and account maintenance services to their customers who are the beneficial owners of Service Shares. These institutions are called “Service Organizations.” Customers of a Service Organization will normally give their purchase
instructions to the Service Organization, and the Service Organization will, in turn, place purchase orders with Goldman Sachs. Service Organizations will set times by which purchase orders and payments must be received by them from their customers.
Generally, Service Shares may be purchased from the Funds on any business day at their NAV next determined after receipt of an order by Goldman Sachs from a Service Organization. No sales load is charged. Purchases of Service Shares must be settled within
three business days of receipt of a complete purchase order.
|
| Service Organizations are responsible for transmitting purchase orders and payments to Goldman Sachs in a timely fashion. Service
Organizations should place an order with Goldman Sachs at 1-800-621-2550 and either:
|
n
|
Wire federal funds to The Northern Trust Company (“Northern”), as subcustodian for State Street Bank and Trust Company
(“State Street”) (each Fund’s custodian) on the next business day; or
|
n
|
Send a check or Federal Reserve draft payable to Goldman Sachs Funds—(Name of Fund and Class of Shares), 4900 Sears Tower,
Chicago, IL 60606-6372. The Fund will not accept a check drawn on a foreign bank or a third-party check.
|
| In certain instances, the Trust may require a signature guarantee in order to effect purchase, redemption or exchange
transactions. Signature guarantees must be obtained from a bank, brokerage firm or other financial intermediary that is a member of an approved Medallion Guarantee Program or that is otherwise approved by Goldman Sachs. A notary public cannot provide a
signature guarantee.
|
| What Do I Need To Know About Service Organizations?
|
| Service Organizations may provide the following services in connection with their customers’ investments in Service Shares:
|
n
|
Acting, directly or through an agent, as the sole shareholder of record
|
n
|
Maintaining account records for customers
|
n
|
Processing orders to purchase, redeem or exchange shares for customers
|
n
|
Responding to inquiries from prospective and existing shareholders
|
n
|
Assisting customers with investment procedures
|
| In addition, some (but not all) Service Organizations are authorized to accept, on behalf of Goldman Sachs Trust (the “
Trust”), purchase, redemption and exchange orders placed by or on behalf of their customers, and may designate other intermediaries to accept such orders, if approved by the Trust. In these cases:
|
n
|
A Fund will be deemed to have received an order in proper form when the order is accepted by the authorized Service Organization
or intermediary on a business day, and the order will be priced at the Fund’s NAV next determined after such acceptance.
|
n
|
Service Organizations or intermediaries will be responsible for transmitting accepted orders and payments to the Trust within the
time period agreed upon by them.
|
| You should contact your Service Organization directly to learn whether it is authorized to accept orders for the Trust.
|
| Pursuant to a service plan adopted by the Trust’s Board of Trustees, Service Organizations are entitled to receive payment
for their services from the Trust of up to 0.50% (on an annualized basis) of the average daily net assets of the Service Shares of the Funds, which are attributable to or held in the name of the Service Organization for its customers.
|
| The Investment Adviser, Distributor and/or their affiliates may pay additional compensation from time to time, out of their assets
and not as an additional charge to the Funds, to selected Service Organizations and other persons in connection with the sale, distribution and/or servicing of shares of the Funds and other Goldman Sachs Funds. Additional compensation based on sales may,
but is currently not expected to, exceed 0.50% (annualized) of the amount invested.
|
| In addition to Service Shares, each Fund also offers other classes of shares to investors. These other share classes are subject
to different fees and expenses (which affect performance), have different minimum investment requirements and
|
| are entitled to different services than Service Shares. Information regarding these other share classes may be obtained from your
sales representative or from Goldman Sachs by calling the number on the back cover of this Prospectus.
|
| What Is My Minimum Investment In The Funds?
|
| The Funds do not have any minimum purchase or account requirements with respect to Service Shares. A Service Organization may,
however, impose a minimum amount for initial and subsequent investments in Service Shares, and may establish other requirements such as a minimum account balance. A Service Organization may redeem Service Shares held by non-complying accounts, and may
impose a charge for any special services.
|
| What Else Should I Know About Share Purchases?
|
| The Trust reserves the right to:
|
n
|
Reject or restrict any purchase or exchange orders by a particular purchaser (or group of related purchasers). This may occur, for
example, when a pattern of frequent purchases, sales or exchanges of Service Shares of a Fund is evident, or if purchases, sales or exchanges are, or a subsequent abrupt redemption might be, of a size that would disrupt the management of a Fund.
|
n
|
Close a Fund to new investors from time to time and reopen a
Fund whenever it is deemed appropriate by a Fund’s Investment Adviser.
|
| The Funds may allow Service Organizations to purchase shares with securities instead of cash if consistent with a Fund’s
investment policies and operations and if approved by the Fund’s Investment Adviser.
|
| How Are Shares Priced?
|
| The price you pay or receive when you buy, sell or exchange Service Shares is determined by a Fund’s NAV. The Funds calculate
NAV as follows:
|
| |
(Value of Assets of the Class)
|
|
| NAV =
|
– (Liabilities of the Class)
|
|
| |
Number of Outstanding Shares of the Class
|
|
| The Funds’ investments are valued based on market quotations or, if accurate quotations are not readily available, the fair
value of the Fund’s investments may be determined in good faith under procedures established by the Trustees.
|
n
|
NAV per share of each class is calculated by State Street on each business day as of the close of regular trading on the New York
Stock Exchange (normally 4:00 p.m. New York time). Fund shares will not be priced on any day the New York Stock Exchange is closed.
|
n
|
When you buy shares, you pay the NAV next calculated after the Funds receive your order in proper form.
|
n
|
When you sell shares, you receive the NAV next calculated after the Funds receive your order in proper form.
|
| Note: The time at which transactions and shares are priced and the time by which orders must be received may be
changed in case of an emergency or if regular trading on the New York Stock Exchange is stopped at a time other than 4:00 p.m. New York time.
|
| Foreign securities may trade in their local markets on days a Fund is closed. As a result, the NAV of a Fund that holds foreign
securities may be impacted on days when investors may not purchase or redeem Fund shares.
|
| In addition, the impact of events that occur after the publication of market quotations used by a Fund to price its securities but
before the close of regular trading on the New York Stock Exchange will normally not be reflected in a Fund’s next determined NAV unless the Trust, in its discretion, makes an adjustment in light of the nature and materiality of the event, its effect
on Fund operations and other relevant factors.
|
| How Can I Sell Service Shares Of The Funds?
|
| Generally, Service Shares may be sold (redeemed) only through Service Organizations. Customers of a Service Organization will
normally give their redemption instructions to the Service Organization, and the Service Organization will, in turn, place redemption orders with the Funds. Generally, each Fund will redeem its Service Shares upon request on any business day at their NAV next determined after receipt of such request in proper form. Redemption proceeds may be sent to recordholders by check or by wire (if the wire
instructions are on record).
|
| A Service Organization may request redemptions in writing or by telephone if the optional telephone redemption privilege is
elected on the Account Application.
|
| By Writing: | Goldman Sachs Funds
4900 Sears Tower Chicago, IL 60606-6372 |
||
| By Telephone: | 1-800-621-2550
(8:00 a.m. to 4:00 p.m. New York time) |
||
| What Do I Need To Know About Telephone Redemption Requests?
|
| The Trust, the Distributor and the Transfer Agent will not be liable for any loss you may incur in the event that the Trust
accepts unauthorized telephone redemption requests that the Trust reasonably believes to be genuine. In an effort to prevent unauthorized or fraudulent redemption and exchange requests by tele
phone, Goldman Sachs employs reasonable procedures specified by the Trust to confirm that such instructions are genuine. If reasonable procedures are not employed, the Trust may be liable for any loss due to unauthorized or fraudulent transactions. The
following general policies are currently in effect:
|
n
|
All telephone requests are recorded.
|
n
|
Any redemption request that requires money to go to an account or address other than that designated on the Account Application
must be in writing and signed by an authorized person designated on the Account Application. The written request may be confirmed by telephone with both the requesting party and the designated bank account to verify instructions.
|
n
|
The telephone redemption option may be modified or terminated at any time.
|
| Note: It may be difficult to make telephone redemptions in times of drastic economic or market conditions.
|
| How Are Redemption Proceeds Paid?
|
| By Wire: The Funds will arrange for redemption proceeds to be wired as federal funds to the bank account
designated in the recordholder’s Account Application. The following general policies govern wiring redemption proceeds:
|
n
|
Redemption proceeds will normally be wired on the next business day in federal funds (for a total of one business day delay), but
may be paid up to three business days following receipt of a properly executed wire transfer redemption request. If the shares to be sold were recently paid for by check, the Fund will pay the redemption proceeds when the check has cleared, which may take
up to 15 days. If the Federal Reserve Bank is closed on the day that the redemption proceeds would ordinarily be wired, wiring the redemption proceeds may be delayed one additional business day.
|
n
|
To change the bank designated on your Account Application, you must send written instructions signed by an authorized person
designated on the Account Application to the Service Organization.
|
n
|
Neither the Trust nor Goldman Sachs assumes any responsibility for the performance of intermediaries or your Service Organization
in the transfer process. If a problem with such performance arises, you should deal directly with such intermediaries or Service Organization.
|
| By Check: A recordholder may elect in writing to receive redemption proceeds by check. Redemption
proceeds paid by check will normally be mailed to the address of record within three business days of receipt of a properly executed redemption request. If the shares to be sold were recently paid for by check, the Fund will pay the redemption proceeds
when the check has cleared, which may take up to 15 days.
|
| What Else Do I Need To Know About Redemptions?
|
| The following generally applies to redemption requests:
|
n
|
Additional documentation may be required when deemed appropriate by the Transfer Agent. A redemption request will not be in proper
form until such additional documentation has been received.
|
n
|
Service Organizations are responsible for the timely transmittal of redemption requests by their customers to the Transfer Agent.
In order to facilitate the timely transmittal of redemption requests, Service Organizations may set times by which they must receive redemption requests. Service Organizations may also require additional documentation from you.
|
| The Trust reserves the right to:
|
n
|
Redeem the Service Shares of any Service Organization whose account balance falls below $50 as a result of a redemption. The Funds
will not redeem Service Shares on this basis if the value of the account falls below the minimum account balance solely as a result of market conditions. The Fund will give 60 days’ prior written notice to allow a Service Organization to purchase
sufficient additional shares of the Fund in order to avoid such redemption.
|
n
|
Redeem your shares in other circumstances determined by the Board of Trustees to be in the best interest of the Trust.
|
n
|
Pay redemptions by a distribution in-kind of securities (instead of cash). If you receive redemption proceeds in-kind, you should
expect to incur transaction costs upon the disposition of those securities.
|
n
|
Reinvest any dividends or other distributions which you have elected to receive in cash should your check for such dividends or
other distributions be returned to the Fund as undeliverable or remain uncashed for six months. In addition, that distribution and all future distributions payable to you will be reinvested at NAV in additional Service shares of the Fund that pays the
distributions. No interest will accrue on amounts represented by uncashed distribution or redemption checks.
|
| Can I Exchange My Investment From One Fund To Another?
|
| A Service Organization may exchange Service Shares of a Fund at NAV for Service Shares of any other Goldman Sachs Fund. The
exchange privilege may be materially modified or withdrawn at any time upon 60 days’ written notice.
|
| Instructions For Exchanging Shares: | |||||
|---|---|---|---|---|---|
| By Writing: | n Write a letter of instruction that includes: | ||||
| n The recordholder name(s) and signature(s) | |||||
| n The account number | |||||
| n The Fund names and Class of Shares | |||||
| n The dollar amount to be exchanged | |||||
| n
Mail the request to:
Goldman Sachs Funds 4900 Sears Tower Chicago, IL 60606-6372 |
|||||
| By Telephone: | If you have elected the telephone exchange
privilege on your Account Application: |
||||
| n
1-800-621-2550
(8:00 a.m. to 4:00 p.m. New York time) |
|||||
| You should keep in mind the following factors when making or considering an exchange:
|
n
|
You should obtain and carefully read the prospectus of the Fund you are acquiring before making an exchange.
|
n
|
All exchanges which represent an initial investment in a Fund must satisfy the minimum initial investment requirement of that
Fund, except that this requirement may be waived at the discretion of the Trust.
|
n
|
Telephone exchanges normally will be made only to an identically registered account.
|
n
|
Shares may be exchanged among accounts with different names, addresses and social security or other taxpayer identification
numbers only if the exchange instructions are in writing and are signed by an authorized person designated on the Account Application.
|
n
|
Exchanges are available only in states where exchanges may be legally made.
|
n
|
It may be difficult to make telephone exchanges in times of drastic economic or market conditions.
|
n
|
Goldman Sachs may use reasonable procedures described under “What Do I Need To Know About Telephone Redemption Requests?”
in an effort to prevent unauthorized or fraudulent telephone exchange requests.
|
n
|
Exchanges into Funds that are closed to new investors may be restricted.
|
| For federal income tax purposes, an exchange from one Fund to another is treated as a redemption of the shares surrendered in the
exchange, on which you may be subject to tax, followed by a purchase of shares received in the exchange. You should consult your tax adviser concerning the tax consequences of an exchange.
|
| Restrictions on Excessive Trading Practices. The Trust does not permit market-timing or other excessive trading
practices. Purchases and exchanges should be made for long-term investment purposes only. The Trust and Goldman Sachs reserve the right to reject or restrict purchase or exchange requests from any investor. Excessive, short-term (market-timing) trading
practices may disrupt portfolio management strategies, harm Fund performance and negatively impact long-term shareholders. The Trust and Goldman Sachs will not be held liable for any loss resulting from rejected purchase or exchange orders. To minimize
harm to the Trust (or Goldman Sachs) and its shareholders, the Trust (or Goldman Sachs) will exercise these rights if, in the Trust’s (or Goldman Sachs’) judgment, an investor has a history of excessive trading or if an investor’s trading,
in the judgment of the Trust (or Goldman Sachs) has been or may be disruptive to a Fund. In making this judgment, trades executed in multiple accounts under common ownership or control may be considered together.
|
| What Types Of Reports Will Be Sent Regarding Investments In Service Shares?
|
| Service Organizations will receive from the Funds annual reports containing audited financial statements and semi-annual reports.
Service Organizations will also be provided with a printed confirmation for each transaction in their account and a monthly account statement. Service Organizations are responsible for providing these or other reports to their customers who are the
beneficial owners of Service Shares in accordance with the rules that apply to their accounts with the Service Organizations.
|
| As with any investment, you should consider how your investment in the Funds will be taxed. The tax information below is provided
as general information. More tax information is available in the Additional Statement. You should consult your tax adviser about the federal, state, local or foreign tax consequences of your investment in the Funds.
|
| Unless your investment is an IRA or other tax-advantaged account, you should consider the possible tax consequences of Fund
distributions and the sale of your Fund shares.
|
| DISTRIBUTIONS
|
| Distributions you receive from the Funds are generally subject to federal income tax, and may also be subject to state or local
taxes. This is true whether you reinvest your distributions in additional Fund shares or receive them in cash. For federal tax purposes, the Funds’ income dividend distributions and short-term capital gain distributions are taxable to you as ordinary
income. Any long-term capital gain distributions are taxable as long-term capital gains, no matter how long you have owned your Fund shares.
|
| Although distributions are generally treated as taxable to you in the year they are paid, distributions declared in October,
November or December but paid in January are taxable as if they were paid in December. A percentage of the Funds’ dividends paid to corporate shareholders may be eligible for the corporate dividends-received deduction. The Funds will inform
shareholders of the source and tax status of all distributions promptly after the close of each calendar year.
|
| Each Fund may be subject to foreign withholding or other foreign taxes on income or gain from certain foreign securities. In
general, the Funds may deduct these taxes in computing their taxable income.
|
| If you buy shares of a Fund before it makes a distribution, the distribution will be taxable to you even though it may actually be
a return of a portion of your investment. This is known as “buying a dividend.”
|
| SALES AND EXCHANGES
|
| Your sale of Fund shares is a taxable transaction for federal income tax purposes, and may also be subject to state and local
taxes. For tax purposes, the exchange of your Fund shares for shares of a different Goldman Sachs Fund is the same as a sale. When you sell your shares, you will generally recognize a capital gain or loss in an amount equal to the difference between your
adjusted tax basis in the shares and the amount received. Generally, this gain or loss is long-term or short-term depending on whether your holding period exceeds twelve months, except that any loss realized on shares held for six months or less will be
treated as a long-term capital loss to the extent of any capital gain dividends that were received on the shares.
|
| OTHER INFORMATION
|
| When you open your account, you should provide your social security or tax identification number on your Account Application. By
law, each Fund must withhold 31% of your taxable distributions and any redemption proceeds if you do not provide your correct taxpayer identification number, or certify that it is correct, or if the IRS instructs the Fund to do so. Non-U.S. investors may
be subject to U.S. withholding and estate tax.
|
| A. General Portfolio Risks
|
| The Funds will be subject to the risks associated with equity securities. “Equity securities” include common stocks,
preferred stocks, interests in real estate investment trusts, convertible debt obligations, convertible preferred stocks, equity interests in trusts, partnerships, joint ventures, limited liability companies and similar enterprises, warrants and stock
purchase rights. In general, stock values fluctuate in response to the activities of individual companies and in response to general market and economic conditions. Accordingly, the value of the stocks that a Fund holds may decline over short or extended
periods. The stock markets tend to be cyclical, with periods when stock prices generally rise and periods when prices generally decline. The volatility of equity securities means that the value of your investment in the Funds may increase or decrease.
Recently, certain stock markets have experienced substantial price volatility and, at times, have traded at or close to record high levels. There can be no guarantee that such levels will be reached or maintained in the future.
|
| To the extent that a Fund invests in fixed-income securities, that Fund will also be subject to the risks associated with its
fixed-income securities. These risks include interest rate risk, credit risk and call/extension risk. In general, interest rate risk involves the risk that when interest rates decline, the market value of fixed-income securities tends to increase
(although many mortgage related securities will have less potential than other debt securities for capital appreciation during periods of declining rates). Conversely, when interest rates increase, the market value of fixed-income securities tends to
decline. Credit risk involves the risk that an issuer or guarantor could default on its obligations, and a Fund will not recover its investment. Call risk and extension risk are normally present in mortgage-backed securities and asset-backed securities.
For example, homeowners have the option to prepay their mortgages. Therefore, the duration of a security backed by home mortgages can either shorten (call risk) or lengthen (extension risk). In general, if interest rates on new mortgage loans fall
sufficiently below the interest rates on existing outstanding mortgage loans, the rate of prepayment would be expected to increase. Conversely, if mortgage loan interest rates rise above the interest rates on existing outstanding mortgage loans, the rate
of prepayment would be expected to decrease. In either case, a change in the prepayment rate can result in losses to investors.
|
| The Investment Adviser will not consider the portfolio turnover rate a limiting factor in making investment decisions for a Fund.
A high rate of portfolio turnover (100% or more) involves correspondingly greater expenses which must be borne by a Fund and its shareholders, and is also likely to result in higher short-term capital gains taxable to shareholders. The portfolio turnover
rate is calculated by dividing the lesser of the dollar amount of sales or purchases of portfolio securities by the average monthly value of a Fund’s portfolio securities, excluding securities having a maturity at the date of purchase of one year or
less. See “Financial Highlights” in Appendix B for a statement of the Funds’ historical portfolio turnover rates.
|
| The following sections provide further information on certain types of securities and investment techniques that may be used by
the Funds, including their associated risks. Additional information is provided in the Additional Statement, which is available upon request. Among other things, the Additional Statement describes certain fundamental investment restrictions that cannot be
changed without shareholder approval. You should note, however, that all investment objectives, and all investment policies not specifically designated as fundamental are non-fundamental and may be changed without shareholder approval. If there is a
change in a Fund’s investment objective, you should consider whether that Fund remains an appropriate investment in light of your then current financial position and needs.
|
| B. Other Portfolio Risks
|
| Risks of Investing in Small Capitalization Companies. Each Fund may invest in small capitalization companies.
Investments in small capitalization companies involve greater risk and portfolio price volatility than investments in larger capitalization stocks. Among the reasons for the greater price volatility of these investments are the less certain growth
prospects of smaller firms and the lower degree of liquidity in the markets for such securities. Small capitalization companies may be thinly traded and may have to be sold at a discount from current market prices or in small lots over an extended period
of time. In addition, these securities are subject to the risk that during certain periods the liquidity of particular issuers or industries, or all securities in these investment categories, will shrink or disappear suddenly and without warning as a
result of adverse economic or market conditions, or adverse investor perceptions whether or not accurate. Because of the lack of sufficient market liquidity, a Fund may incur losses because it will be required to effect sales at a disadvantageous time and
only then at a substantial drop in price. Small capitalization companies include “unseasoned” issuers that do not have an established financial history; often have limited product lines, markets or financial
|
| resources; may depend on or use a few key personnel for management; and may be susceptible to losses and risks of bankruptcy.
Transaction costs for these investments are often higher than those of larger capitalization companies. Investments in small capitalization companies may be more difficult to price precisely than other types of securities because of their characteristics
and lower trading volumes.
|
| Risks of Foreign Investments. The Funds may make foreign investments. Foreign investments involve special risks that
are not typically associated with U.S. dollar denominated or quoted securities of U.S. issuers. Foreign investments may be affected by changes in currency rates, changes in foreign or U.S. laws or restrictions applicable to such investments and changes in
exchange control regulations (e.g., currency blockage). A decline in the exchange rate of the currency (i.e., weakening of the currency against the U.S. dollar) in which a portfolio security is quoted or denominated relative to the U.S. dollar would reduce the value of
the portfolio security. In addition, if the currency in which a Fund receives dividends, interest or other payments declines in value against the U.S. dollar before such income is distributed as dividends to shareholders or converted to U.S. dollars, the
Fund may have to sell portfolio securities to obtain sufficient cash to pay such dividends.
|
| The introduction of a single currency, the euro, on January 1, 1999 for participating nations in the European Economic and
Monetary Union has presented unique uncertainties, including the fluctuation of the euro relative to non-euro currencies during the transition period from January 1, 1999 to December 31, 2001 and beyond; whether the interest rate, tax and labor regimes of
European countries participating in the euro will converge over time; and whether the conversion of the currencies of other countries that now are or may in the future become members of the European Union (“EU”), may have an impact on the euro.
Also, it is possible that the euro could be abandoned in the future by countries that have already adopted its use. These or other events, including political and economic developments, could cause market disruptions, and could adversely affect the value
of securities held by the Funds. Because of the number of countries using this single currency, a significant portion of the assets held by the Funds may be denominated in the euro.
|
| Brokerage commissions, custodial services and other costs relating to investment in international securities markets generally are
more expensive than in the United States. In addition, clearance and settlement procedures may be different in foreign countries and, in certain markets, such procedures have been unable to keep pace with the volume of securities transactions, thus making
it difficult to conduct such transactions.
|
| Foreign issuers are not generally subject to uniform accounting, auditing and financial reporting standards comparable to those
applicable to U.S. issuers. There may be less publicly available information about a foreign issuer than about a U.S. issuer. In addition, there is generally less government regulation of foreign markets, companies and securities dealers than in the
United States. Foreign securities markets may have substantially less volume than U.S. securities markets and secu-
|
| rities of many foreign issuers are less liquid and more volatile than securities of comparable domestic issuers. Furthermore, with
respect to certain foreign countries, there is a possibility of nationalization, expropriation or confiscatory taxation, imposition of withholding or other taxes on dividend or interest payments (or, in some cases, capital gains distributions),
limitations on the removal of funds or other assets from such countries, and risks of political or social instability or diplomatic developments which could adversely affect investments in those countries.
|
| Concentration of a Fund’s assets in one or a few countries and currencies will subject a Fund to greater risks than if a
Fund’s assets were not geographically concentrated.
|
| Investment in sovereign debt obligations by certain Funds involves risks not present in debt obligations of corporate issuers. The
issuer of the debt or the governmental authorities that control the repayment of the debt may be unable or unwilling to repay principal or interest when due in accordance with the terms of such debt, and a Fund may have limited recourse to compel payment
in the event of a default. Periods of economic uncertainty may result in the volatility of market prices of sovereign debt, and in turn a Fund’s NAV, to a greater extent than the volatility inherent in debt obligations of U.S. issuers.
|
| A sovereign debtor’s willingness or ability to repay principal and pay interest in a timely manner may be affected by, among
other factors, its cash flow situation, the extent of its foreign currency reserves, the availability of sufficient foreign exchange on the date a payment
is due, the relative size of the debt service burden to the economy as a whole, the sovereign debtor’s policy toward international lenders, and the political constraints to which a sovereign debtor may be subject.
|
| Investments in foreign securities may take the form of sponsored and unsponsored American Depositary Receipts (“ADRs”)
and Global Depositary Receipts (“GDRs”). Certain Funds may also invest in European Depositary Receipts (“EDRs”) or other similar instruments representing securities of foreign issuers. ADRs represent the right to receive securities of
foreign issuers deposited in a domestic bank or a correspondent bank. Prices of ADRs are quoted in U.S. dollars, and ADRs are traded in the United States. EDRs and GDRs are receipts evidencing an arrangement with a non-U.S. bank. EDRs and GDRs are not
necessarily quoted in the same currency as the underlying security.
|
| Risks of Emerging Countries. Certain Funds may invest in securities of issuers located in emerging countries. The
risks of foreign investment are heightened when the issuer is located in an emerging country. Emerging countries are generally located in the Asia-Pacific region, Eastern Europe, Latin and South America and Africa. A Fund’s purchase and sale of
portfolio securities in certain emerging countries may be constrained by limitations relating to daily changes in the prices of listed securities, periodic trading or settlement volume and/or limitations on aggregate holdings of foreign investors. Such
limitations may be computed based on the aggregate trading volume by or holdings of a Fund, the Investment Adviser, its affiliates and their respective clients and other service providers. A Fund may not be able to sell securities in circumstances where
price, trading or settlement volume limitations have been reached.
|
| Foreign investment in the securities markets of certain emerging countries is restricted or controlled to varying degrees which
may limit investment in such countries or increase the administrative costs of such investments. For example, certain Asian countries require governmental approval prior to investments by foreign persons or limit investment by foreign persons to only a
specified percentage of an issuer’s outstanding securities or a specific class of securities which may have less advantageous terms (including price) than securities of the issuer available for purchase by nationals. In addition, certain countries
may restrict or prohibit investment opportunities in issuers or industries deemed important to national interests. Such restrictions may affect the market price, liquidity and rights of securities that may be purchased by a Fund. The repatriation of both
investment income and capital from certain emerging countries is subject to restrictions such as the need for governmental consents. Due to restrictions on direct investment in equity securities in certain Asian and other countries, it is anticipated that
a Fund may invest in such countries through other investment funds in such countries.
|
| Many emerging countries have recently experienced currency devaluations and substantial (and, in some cases, extremely high) rates
of inflation. Other emerging countries have experienced economic recessions. These circumstances have had a negative effect on the economies and securities markets of such emerging countries. Economies in emerging countries generally are dependent heavily
upon commodity prices and international trade and, accordingly, have been and may continue to be affected adversely by the economies of their trading partners, trade barriers, exchange controls, managed adjustments in relative currency values and other
protectionist measures imposed or negotiated by the countries with which they trade.
|
| Many emerging countries are subject to a substantial degree of economic, political and social instability. Governments of some
emerging countries are authoritarian in nature or have been installed or removed as a result of military coups, while governments in other emerging countries have periodically used force to suppress
|
| civil dissent. Disparities of wealth, the pace and success of democratization, and ethnic, religious and racial disaffection,
among other factors, have also led to social unrest, violence and/or labor unrest in some emerging countries. Unanticipated political or social developments may result in sudden and significant investment losses. Investing in emerging countries involves
greater risk of loss due to expropriation, nationalization, confiscation of assets and property or the imposition of restrictions on foreign investments and on repatriation of capital invested. As an example, in the past some Eastern European governments
have expropriated substantial amounts of private property, and many claims of the property owners have never been fully settled. There is no assurance that similar expropriations will not recur in Eastern Europe or other countries.
|
| A Fund’s investment in emerging countries may also be subject to withholding or other taxes, which may be significant and may
reduce the return from an investment in such countries to the Fund.
|
| Settlement procedures in emerging countries are frequently less developed and reliable than those in the United States and often
may involve a Fund’s delivery of securities before receipt of payment for their sale. In addition, significant delays are common in certain markets in registering the transfer of securities. Settlement or registration problems may make it more
difficult for a Fund to value its portfolio securities and could cause the Fund to miss attractive investment opportunities, to have a portion of its assets uninvested or to incur losses due to the failure of a counterparty to pay for securities the Fund
has delivered or the Fund’s inability to complete its contractual obligations because of theft or other reasons. The creditworthiness of the local securities firms used by the Fund in emerging countries may not be as sound as the creditworthiness of
firms used in more developed countries. As a result, the Fund may be subject to a greater risk of loss if a securities firm defaults in the performance of its responsibilities.
|
| The small size and inexperience of the securities markets in certain emerging countries and the limited volume of trading in
securities in those countries may make a Fund’s investments in such countries less liquid and more volatile than investments in countries with more developed securities markets (such as the United States, Japan and most Western European countries). A
Fund’s investments in emerging countries are subject to the risk that the liquidity of a particular investment, or investments generally, in such countries will shrink or disappear suddenly and without warning as a result of adverse economic, market
or political conditions or adverse investor perceptions, whether or not accurate. Because of the lack of sufficient market liquidity, a Fund may incur losses because it will be required to effect sales at a disadvantageous time and only then at a
substantial drop in price. Investments in emerging countries may be more difficult to price precisely because of the characteristics discussed above and lower trading volumes.
|
| A Fund’s use of foreign currency management techniques in emerging countries may be limited. Due to the limited market for
these instruments in emerging countries, the Investment Adviser does not currently anticipate that a significant portion of the Funds’ currency exposure in emerging countries, if any, will be covered by such instruments.
|
| Risks of Derivative Investments. A Fund’s transactions, if any, in options, futures, options on futures, swaps,
interest rate caps, floors and collars, structured securities and currency transactions involve additional risk of loss. Loss can result from a lack of correlation between changes in the value of derivative instruments and the portfolio assets (if any)
being hedged, the potential illiquidity of the markets for derivative instruments, or the risks arising from margin requirements and related leverage factors associated with such transactions. The use of these management techniques also involves the risk
of loss if the Investment Adviser is incorrect in its expectation of fluctuations in securities prices, interest rates or currency prices. Each Fund may also invest in derivative investments for non-hedging purposes (that is, to seek to increase total
return). Investing for non-hedging purposes is considered a speculative practice and presents even greater risk of loss.
|
| Risks of Illiquid Securities. Each Fund may invest up to 15% of its net assets in illiquid securities which cannot
be disposed of in seven days in the ordinary course of business at fair value. Illiquid securities include:
|
n
|
Both domestic and foreign securities that are not readily marketable
|
n
|
Certain stripped mortgage-backed securities
|
n
|
Repurchase agreements and time deposits with a notice or demand period of more than seven days
|
n
|
Certain over-the-counter options
|
n
|
Certain structured securities and all swap transactions
|
n
|
Certain restricted securities, unless it is determined, based upon a review of the trading markets for a specific restricted
security, that such restricted security is eligible for resale pursuant to Rule 144A under the Securities Act of 1933 (“144A Securities”) and, therefore, is liquid.
|
| Investing in 144A Securities may decrease the liquidity of a Fund’s portfolio to the extent that qualified institutional
buyers become for a time uninterested in purchasing these restricted securities. The purchase price and subsequent valuation of restricted and illiquid securities normally reflect a discount, which may be significant, from the market price of comparable
securities for which a liquid market exists.
|
| Credit Risks. Debt securities purchased by the Funds may include securities (including zero coupon bonds) issued by
the U.S. government (and its agencies, instrumentalities and sponsored enterprises), foreign governments, domestic and foreign corporations, banks and other issuers. Further information is provided in the Additional Statement.
|
| Debt securities rated BBB or higher by Standard & Poor’s or Baa or higher by Moody’s are considered “investment
grade.” Securities rated BBB or Baa are considered medium-grade obligations with speculative characteristics, and adverse economic conditions or changing circumstances may weaken their issuers’ capacity to pay interest and repay principal. A
security will be deemed to have met a rating requirement if it receives the minimum required rating from at least one such rating organization even though it has been rated below the minimum rating by one or more other rating organizations, or if unrated
by such rating organizations, determined by the Investment Adviser to be of comparable credit quality.
|
| Certain Funds may invest in fixed-income securities rated BB or Ba or below (or comparable unrated securities) which are commonly
referred to as “junk bonds.” Junk bonds are considered predominantly speculative and may be questionable as to principal and interest payments.
|
| In some cases, junk bonds may be highly speculative, have poor prospects for reaching investment grade standing and be in default.
As a result, investment in such bonds will present greater speculative risks than those associated with investment in investment grade bonds. Also, to the extent that the rating assigned to a security in a Fund’s portfolio is downgraded by a rating
organization, the market price and liquidity of such security may be adversely affected.
|
| Risks of Initial Public Offerings. The Funds may invest in IPOs. An IPO is a company’s first offering of stock
to the public. IPO risk is the risk that the market value of IPO shares will fluctuate considerably due to factors such as the absence of a prior public market, unseasoned trading, the small number of shares available for trading and limited information
about the issuer. The purchase of IPO shares may involve high transaction costs. IPO shares are subject to market risk and liquidity risk. When a Fund’s asset base is small, a significant portion of the Fund’s performance could be attributable
to investments in IPOs, because such investments would have a magnified impact on the Fund. As the Fund’s assets grow, the effect of the Fund’s investments in IPOs on the Fund’s performance probably will decline, which could reduce the
Fund’s performance. Because of the price volatility of IPO shares, a Fund may choose to hold IPO shares for a very short period of time. This may increase the turnover of the Fund’s portfolio and may lead to increased expenses to the Fund, such
as commissions and transaction costs. By selling IPO shares, the Fund may realize taxable gains it will subse
-
|
| quently distribute to shareholders. In addition, the market for IPO shares can be speculative and/or inactive for extended
periods of time. There is no assurance that a Fund will be able to obtain allocable portions of IPO shares. The limited number of shares available for trading in some IPOs may make it more difficult for a Fund to buy or sell significant amounts of shares
without an unfavorable impact on prevailing prices. Investors in IPO shares can be affected by substantial dilution in the value of their shares, by sales of additional shares and by concentration of control in existing management and principal shareholders
.
|
| Temporary Investment Risks. Each Fund may, for temporary defensive purposes, invest a certain percentage of its
total assets in:
|
n
|
U.S. government securities
|
n
|
Commercial paper rated at least A-2 by Standard & Poor’s or P-2 by Moody’s
|
n
|
Certificates of deposit
|
n
|
Bankers’ acceptances
|
n
|
Repurchase agreements
|
n
|
Non-convertible preferred stocks and non-convertible corporate bonds with a remaining maturity of less than one year
|
| When a Fund’s assets are invested in such instruments, the Fund may not be achieving its investment objective.
|
| C. Portfolio Securities and Techniques
|
| This section provides further information on certain types of securities and investment techniques that may be used by the Funds,
including their associated risks. Further information is provided in the Additional Statement, which is available upon request.
|
| Convertible Securities. Each Fund may invest in convertible securities. Convertible securities are preferred stock
or debt obligations that are convertible into common stock. Convertible securities generally offer lower interest or dividend yields than non-convertible securities of similar quality. Convertible securities in which a Fund invests are subject to the same
rating criteria as its other investments in fixed-income securities. Convertible securities have both equity and fixed-income risk characteristics. Like all fixed-income securities, the value of convertible securities is susceptible to the risk of market
losses attributable to changes in interest rates. Generally, the market value of convertible securities tends to decline as interest rates increase and, conversely, to increase as interest rates decline. However, when the market price of the common stock
underlying a convertible security exceeds the conversion price of the convertible security, the convertible security tends to reflect the market price of the underlying common stock. As the market
|
|
| price of the underlying common stock declines, the convertible security, like a fixed-income security, tends to trade increasingly on a yield basis, and thus may not decline in price to the same extent as the underlying common stock. |
| Foreign Currency Transactions. A Fund may, to the extent consistent with its investment policies, purchase or sell
foreign currencies on a cash basis or through forward contracts. A forward contract involves an obligation to purchase or sell a specific currency at a future date at a price set at the time of the contract. A Fund may engage in foreign currency
transactions for hedging purposes and to seek to protect against anticipated changes in future foreign currency exchange rates. In addition, certain Funds may also enter into such transactions to seek to increase total return, which is considered a
speculative practice.
|
| Some Funds may also engage in cross-hedging by using forward contracts in a currency different from that in which the hedged
security is denominated or quoted. A Fund may hold foreign currency received in connection with investments in foreign securities when, in the judgment of the Investment Adviser, it would be beneficial to convert such currency into U.S. dollars at a later
date (e.g., the Investment Adviser may anticipate the foreign currency to appreciate against the U.S. dollar).
|
| Currency exchange rates may fluctuate significantly over short periods of time, causing, along with other factors, a Fund’s
NAV to fluctuate (when the Fund’s NAV fluctuates, the value of your shares may go up or down). Currency exchange rates also can be affected unpredictably by the intervention of U.S. or foreign governments or central banks, or the failure to
intervene, or by currency controls or political developments in the United States or abroad.
|
| The market in forward foreign currency exchange contracts, currency swaps and other privately negotiated currency instruments
offers less protection against defaults by the other party to such instruments than is available for currency instruments traded on an exchange. Such contracts are subject to the risk that the counterparty to the contract will default on its obligations.
Since these contracts are not guaranteed by an exchange or clearinghouse, a default on a contract would deprive a Fund of unrealized profits, transaction costs or the benefits of a currency hedge or could force the Fund to cover its purchase or sale
commitments, if any, at the current market price.
|
| Structured Securities. Each Fund may invest in structured securities. Structured securities are securities whose
value is determined by reference to changes in the value of specific currencies, interest rates, commodities, indices or other financial indicators (the “Reference”) or the relative change in two or more References.
The interest rate or the principal amount payable upon maturity or redemption may be increased or decreased depending upon changes in the applicable Reference. Structured securities may be positively or negatively indexed, so that appreciation of the
Reference may produce an increase or decrease in the interest rate or value of the security at maturity. In addition, changes in the interest rates or the value of the security at maturity may be a multiple of changes in the value of the Reference.
Consequently, structured securities may present a greater degree of market risk than other types of fixed-income securities and may be more volatile, less liquid and more difficult to price accurately than less complex securities.
|
| REITs. Each Fund may invest in REITs. REITs are pooled investment vehicles that invest primarily in either real
estate or real estate related loans. The value of a REIT is affected by changes in the value of the properties owned by the REIT or securing mortgage loans held by the REIT. REITs are dependent upon the ability of the REITs’ managers, and are subject
to heavy cash flow dependency, default by borrowers and the qualification of the REITs under applicable regulatory requirements for favorable income tax treatment. REITs are also subject to risks generally associated with investments in real estate
including possible declines in the value of real estate, general and local economic conditions, environmental problems and changes in interest rates. To the extent that assets underlying a REIT are concentrated geographically, by property type or in
certain other respects, these risks may be heightened. A Fund will indirectly bear its proportionate share of any expenses, including management fees, paid by a REIT in which it invests.
|
| Options on Securities, Securities Indices and Foreign Currencies. A put option gives the purchaser of the option the
right to sell, and the writer (seller) of the option the obligation to buy, the underlying instrument during the option period. A call option gives the purchaser of the option the right to buy, and the writer (seller) of the option the obligation to sell,
the underlying instrument during the option period. Each Fund may write (sell) covered call and put options and purchase put and call options on any securities in which they may invest or on any securities index consisting of securities in which they may
invest. A Fund may also, to the extent that it invests in foreign securities, purchase and sell (write) put and call options on foreign currencies.
|
| The writing and purchase of options is a highly specialized activity which involves special investment risks. Options may be used
for either hedging or cross-hedging purposes, or to seek to increase total return (which is considered a speculative activity). The successful use of options depends in part on the ability of the Investment Adviser to manage future price fluctuations and
the degree of correlation between the options and securities (or currency) markets. If the Invest
ment Adviser is incorrect in its expectation of changes in market prices or determination of the correlation between the instruments or indices on which options are written and purchased and the instruments in a Fund’s investment portfolio, the Fund
may incur losses that it would not otherwise incur. The use of options can also increase a Fund’s transaction costs. Options written or purchased by the Funds may be traded on either U.S. or foreign exchanges or over-the-counter. Foreign and
over-the-counter options will present greater possibility of loss because of their greater illiquidity and credit risks.
|
| Futures Contracts and Options on Futures Contracts. Futures contracts are standardized, exchange-traded contracts
that provide for the sale or purchase of a specified financial instrument or currency at a future time at a specified price. An option on a futures contract gives the purchaser the right (and the writer of the option the obligation) to assume a position
in a futures contract at a specified exercise price within a specified period of time. A futures contract may be based on various securities (such as U.S. government securities), foreign currencies, securities indices and other financial instruments and
indices. The Funds may engage in futures transactions on both U.S. and foreign exchanges.
|
| Each Fund may purchase and sell futures contracts, and purchase and write call and put options on futures contracts, in order to
seek to increase total return or to hedge against changes in interest rates, securities prices or, to the extent a Fund invests in foreign securities, currency exchange rates, or to otherwise manage their term structures, sector selection and durations in
accordance with their investment objectives and policies. Each Fund may also enter into closing purchase and sale transactions with respect to such contracts and options. A Fund will engage in futures and related options transactions for bona fide hedging
purposes as defined in regulations of the Commodity Futures Trading Commission or to seek to increase total return to the extent permitted by such regulations. A Fund may not purchase or sell futures contracts or purchase or sell related options to seek
to increase total return, except for closing purchase or sale transactions, if immediately thereafter the sum of the amount of initial margin deposits and premiums paid on the Fund’s outstanding positions in futures and related options entered into
for the purpose of seeking to increase total return would exceed 5% of the market value of the Fund’s net assets.
|
| Futures contracts and related options present the following risks:
|
n
|
While a Fund may benefit from the use of futures and options on futures, unanticipated changes in interest rates, securities
prices or currency exchange rates may result in poorer overall performance than if the Fund had not entered into any futures contracts or options transactions.
|
n
|
Because perfect correlation between a futures position and portfolio position that is intended to be protected is impossible to
achieve, the desired protection may not be obtained and a Fund may be exposed to additional risk of loss.
|
n
|
The loss incurred by a Fund in entering into futures contracts and in writing call options on futures is potentially unlimited and
may exceed the amount of the premium received.
|
n
|
Futures markets are highly volatile and the use of futures may increase the volatility of a Fund’s NAV.
|
n
|
As a result of the low margin deposits normally required in futures trading, a relatively small price movement in a futures
contract may result in substantial losses to a Fund.
|
n
|
Futures contracts and options on futures may be illiquid, and exchanges may limit fluctuations in futures contract prices during a
single day.
|
n
|
Foreign exchanges may not provide the same protection as U.S. exchanges.
|
| Equity Swaps. Each Fund may invest in equity swaps. Equity swaps allow the parties to a swap agreement to exchange
the dividend income or other components of return on an equity investment (for example, a group of equity securities or an index) for a component of return on another non-equity or equity investment.
|
| An equity swap may be used by a Fund to invest in a market without owning or taking physical custody of securities in
circumstances in which direct investment may be restricted for legal reasons or is otherwise impractical. Equity swaps are derivatives and their value can be very volatile. To the extent that the Investment Adviser does not accurately analyze and predict
the potential relative fluctuation of the components swapped with another party, a Fund may suffer a loss, which may be substantial. The value of some components of an equity swap (such as the dividends on a common stock) may also be sensitive to changes
in interest rates. Furthermore, a Fund may suffer a loss if the counterparty defaults. Because equity swaps are normally illiquid, a Fund may be unable to terminate its obligations when desired.
|
| When-Issued Securities and Forward Commitments. Each Fund may purchase when-issued securities and make contracts to
purchase or sell securities for a fixed price at a future date beyond customary settlement time. When-issued securities are securities that have been authorized, but not yet issued. When-issued securities are purchased in order to secure what is
considered to be an advantageous price and yield to the Fund at the time of entering into the transaction. A forward commitment involves the entering into a contract to purchase or sell securities for a fixed price at a future date beyond the customary
settlement period.
|
| The purchase of securities on a when-issued or forward commitment basis involves a risk of loss if the value of the security to be
purchased declines before
the settlement date. Conversely, the sale of securities on a forward commitment basis involves the risk that the value of the securities sold may increase before the settlement date. Although a Fund will generally purchase securities on a when-issued or
forward commitment basis with the intention of acquiring the securities for its portfolio, a Fund may dispose of when-issued securities or forward commitments prior to settlement if the Investment Adviser deems it appropriate.
|
| Repurchase Agreements. Repurchase agreements involve the purchase of securities subject to the seller’s
agreement to repurchase them at a mutually agreed upon date and price. Each Fund may enter into repurchase agreements with dealers in U.S. government securities and member banks of the Federal Reserve System which furnish collateral at least equal in
value or market price to the amount of their repurchase obligation.
|
| If the other party or “seller” defaults, a Fund might suffer a loss to the extent that the proceeds from the sale of the
underlying securities and other collateral held by the Fund are less than the repurchase price and the Fund’s costs associated with delay and enforcement of the repurchase agreement. In addition, in the event of bankruptcy of the seller, a Fund could
suffer additional losses if a court determines that the Fund’s interest in the collateral is not enforceable.
|
| In evaluating whether to enter into a repurchase agreement, the Investment Adviser will carefully consider the creditworthiness of
the seller. Certain Funds, together with other registered investment companies having advisory agreements with the Investment Adviser or any of its affiliates, may transfer uninvested cash balances into a single joint account, the daily aggregate balance
of which will be invested in one or more repurchase agreements.
|
| Lending of Portfolio Securities. Each Fund may engage in securities lending. Securities lending involves the lending
of securities owned by a Fund to financial institutions such as certain broker-dealers. The borrowers are required to secure their loan continuously with cash, cash equivalents, U.S. government securities or letters of credit in an amount at least equal
to the market value of the securities loaned. Cash collateral may be invested in cash equivalents. To the extent that cash collateral is invested in other investment securities, such collateral will be subject to market depreciation or appreciation, and a
Fund will be responsible for any loss that might result from its investment of the borrowers’ collateral. If the Investment Adviser determines to make securities loans, the value of the securities loaned may not exceed 33 1
/3% of the value of the total assets of a
Fund (including the loan collateral).
|
| A Fund may lend its securities to increase its income. A Fund may, however, experience delay in the recovery of its securities if
the institution with which it has engaged in a portfolio loan transaction breaches its agreement with the Fund.
|
| Short Sales Against-the-Box. Certain Funds may make short sales against-the-box. A short sale against-the-box means
that at all times when a short position is open the Fund will own an equal amount of securities sold short, or securities convertible into or exchangeable for, without payment of any further consideration, an equal amount of the securities of the same
issuer as the securities sold short.
|
| Preferred Stock, Warrants and Rights. Each Fund may invest in preferred stock, warrants and rights. Preferred stocks
are securities that represent an ownership interest providing the holder with claims on the issuer’s earnings and assets before common stock owners but after bond owners. Unlike debt securities, the obligations of an issuer of preferred stock,
including dividend and other payment obligations, may not typically be accelerated by the holders of such preferred stock on the occurrence of an event of default or other non-compliance by the issuer of the preferred stock.
|
| Warrants and other rights are options to buy a stated number of shares of common stock at a specified price at any time during the
life of the warrant or right. The holders of warrants and rights have no voting rights, receive no dividends and have no rights with respect to the assets of the issuer.
|
| Other Investment Companies. Each Fund may invest in securities of other investment companies (including
exchange-traded funds such as SPDRs and iShares
SM
, as defined below) subject to statutory limitations prescribed by the Act. These limitations include a
prohibition on any Fund acquiring more than 3% of the voting shares of any other investment company, and a prohibition on investing more than 5% of a Fund’s total assets in securities of any one investment company or more than 10% of its total assets
in securities of all investment companies. A Fund will indirectly bear its proportionate share of any management fees and other expenses paid by such other investment companies. Exchange-traded funds such as SPDRs and iShares
SM
are shares of unaffiliated investment companies which are traded like traditional equity securities on a national
securities exchange or the NASDAQ® National Market System.
|
n
|
Standard & Poor’s Depositary Receipts™.
The Funds may, consistent with their investment policies, purchase Standard & Poor’s Depositary Receipts™ (“SPDRs”). SPDRs are securities traded on the American Stock Exchange (“AMEX”) that represent
ownership in the SPDR Trust, a trust which has been established to accumulate and hold a portfolio of common stocks that is intended to track the price performance and dividend yield of the S&P 500®. The SPDR Trust is sponsored by a subsidiary of
the AMEX. SPDRs may be used for several reasons, including, but not limited to, facilitating the handling
|
| of cash flows or trading, or reducing transaction costs. The price movement of SPDRs may not perfectly parallel the price action
of the S&P 500®.
|
n
|
iShares
SM
(formerly World Equity Benchmark Shares or WEBs). iShares are shares of an investment company that invests substantially all of its assets in securities included
in the MSCI indices for specified countries. iShares are listed on the AMEX and were initially offered to the public in 1996. The market prices of iShares are expected to fluctuate in accordance with both changes in the NAVs of their underlying indices
and supply and demand of iShares on the AMEX. To date, iShares have traded at relatively modest discounts and premiums to their NAVs. However, iShares have a limited operating history and information is lacking regarding the actual performance and trading
liquidity of iShares for extended periods or over complete market cycles. In addition, there is no assurance that the requirements of the AMEX necessary to maintain the listing of iShares will continue to be met or will remain unchanged. In the event
substantial market or other disruptions affecting iShares should occur in the future, the liquidity and value of a Fund’s shares could also be substantially and adversely affected. If such disruptions were to occur, a Fund could be required to
reconsider the use of iShares as part of its investment strategy.
|
| Unseasoned Companies. Each Fund may invest in companies (including predecessors) which have operated less than three
years. The securities of such companies may have limited liquidity, which can result in their being priced higher or lower than might otherwise be the case. In addition, investments in unseasoned companies are more speculative and entail greater risk than
do investments in companies with an established operating record.
|
| Corporate Debt Obligations. Corporate debt obligations include bonds, notes, debentures, commercial paper and other
obligations of corporations to pay interest and repay principal, and include securities issued by banks and other financial institutions. Each Fund may invest in corporate debt obligations issued by U.S. and certain non-U.S. issuers which issue securities
denominated in the U.S. dollar (including Yankee and Euro obligations). In addition to obligations of corporations, corporate debt obligations include securities issued by banks and other financial institutions and supranational entities (i.e., the World Bank, the International Monetary Fund, etc.).
|
| Bank Obligations. Each Fund may invest in obligations issued or guaranteed by U.S. or foreign banks. Bank
obligations, including without limitations, time deposits, bankers’ acceptances and certificates of deposit, may be general obligations of the parent bank or may be limited to the issuing branch by the terms of the specific obligations or by
government regulations. Banks are subject to extensive but different governmental regulations which may limit both the amount and types of
|
|
| loans which may be made and interest rates which may be charged. In addition, the profitability of the banking industry is largely dependent upon the availability and cost of funds for the purpose of financing lending operations under prevailing money market conditions. General economic conditions as well as exposure to credit losses arising from possible financial difficulties of borrowers play an important part in the operation of this industry. |
| U.S. Government Securities. Each Fund may invest in U.S. government securities. U.S. government securities include
U.S. Treasury obligations and obligations issued or guaranteed by U.S. government agencies, instrumentalities or sponsored enterprises. U.S. government securities may be supported by (a) the full faith and credit of the U.S. Treasury (such as the
Government National Mortgage Association (“Ginnie Mae”)); (b) the right of the issuer to borrow from the U.S. Treasury (such as securities of the Student Loan Marketing Association); (c) the discretionary authority of the U.S. government to
purchase certain obligations of the issuer; or (d) only the credit of the issuer. U.S. government securities also include Treasury receipts, zero coupon bonds and other stripped U.S. government securities, where the interest and principal components of
stripped U.S. government securities are traded independently.
|
| Custodial Receipts. Interests in U.S. government securities may be purchased in the form of custodial receipts that
evidence ownership of future interest payments, principal payments or both on certain notes or bonds issued or guaranteed as to principal and interest by the U.S. government, its agencies, instrumentalities, political subdivisions or authorities. For
certain securities law purposes, custodial receipts are not considered obligations of the U.S. government.
|
| Mortgage-Backed Securities. Certain Funds may invest in mortgage-backed securities. Mortgage-backed securities
represent direct or indirect participations in, or are collateralized by and payable from, mortgage loans secured by real property. Mortgage-backed securities can be backed by either fixed rate mortgage loans or adjustable rate mortgage loans, and may be
issued by either a governmental or non-governmental entity. Privately issued mortgage-backed securities are normally structured with one or more types of “credit enhancement.” However, these mortgage-backed securities typically do not have the
same credit standing as U.S. government guaranteed mortgage-backed securities.
|
| Mortgage-backed securities may include multiple class securities, including collateralized mortgage obligations (“CMOs”)
and Real Estate Mortgage Investment Conduit (“REMIC”) pass-through or participation certificates. CMOs provide an investor with a specified interest in the cash flow from a pool of underlying mortgages or of other mortgage-backed securities.
CMOs are issued in multiple classes. In many cases, payments of principal are applied to the CMO classes in the
order of their respective stated maturities, so that no principal payments will be made on a CMO class until all other classes having an earlier stated maturity date are paid in full. A REMIC is a CMO that qualifies for special tax treatment and invests
in certain mortgages principally secured by interests in real property and other permitted investments.
|
| Mortgaged-backed securities also include stripped mortgage-backed securities (“SMBS”), which are derivative multiple
class mortgage-backed securities. SMBS are usually structured with two different classes: one that receives substantially all of the interest payments and the other that receives substantially all of the principal payments from a pool of mortgage loans.
The market value of SMBS consisting entirely of principal payments generally is unusually volatile in response to changes in interest rates. The yields on SMBS that receive all or most of the interest from mortgage loans are generally higher than
prevailing market yields on other mortgage-backed securities because their cash flow patterns are more volatile and there is a greater risk that the initial investment will not be fully recouped.
|
| Asset-Backed Securities. Certain Funds may invest in asset-backed securities. Asset-backed securities are securities
whose principal and interest payments are collateralized by pools of assets such as auto loans, credit card receivables, leases, installment contracts and personal property. Asset-backed securities are often subject to more rapid repayment than their
stated maturity date would indicate as a result of the pass-through of prepayments of principal on the underlying loans. During periods of declining interest rates, prepayment of loans underlying asset-backed securities can be expected to accelerate.
Accordingly, a Fund’s ability to maintain positions in such securities will be affected by reductions in the principal amount of such securities resulting from prepayments, and its ability to reinvest the returns of principal at comparable yields is
subject to generally prevailing interest rates at that time. Asset-backed securities present credit risks that are not presented by mortgage-backed securities. This is because asset-backed securities generally do not have the benefit of a security
interest in collateral that is comparable to mortgage assets. If the issuer of an asset-backed security defaults on its payment obligations, there is the possibility that, in some cases, the Fund will be unable to possess and sell the underlying
collateral and that the Fund’s recoveries on repossessed collateral may not be available to support payments on the securities. In the event of a default, a Fund may suffer a loss if it cannot sell collateral quickly and receive the amount it is owed.
|
| Borrowings. Each Fund can borrow money from banks and other financial institutions in amounts not exceeding
one-third of its total assets for temporary or emergency purposes. A Fund may not make additional investments if borrowings exceed 5% of its total assets.
|
| The financial highlights tables are intended to help you understand a Fund’s financial performance for the past five years
(or less if the Fund has been in operation for less than five years). Certain information reflects financial results for a single Fund share. The total returns in the table represent the rate that an investor would have earned or lost on an investment in
a Fund (assuming reinvestment of all dividends and distributions). This information for the periods ended August 31, 2000 has been audited by PriceWaterhouseCoopers LLP whose report, along with the Funds’ financial statements, is included in the
Funds’ annual reports (available upon request without charge). The information for all periods prior to the periods ended August 31, 2000, has been audited by the Funds’ previous independent accountants.
|
| CORE INTERNATIONAL EQUITY FUND
|
| Income from
investment operations |
|||||||||
|---|---|---|---|---|---|---|---|---|---|
| Net asset
value, beginning of period |
Net
investment income (loss) |
Net realized
and unrealized gain (loss) |
|||||||
| For the Year Ended August 31, | |||||||||
| 2000 - Class A Shares | $10.87 | $ 0.02 | c | $ 0.74 | |||||
| 2000 - Class B Shares | 10.81 | (0.04 | ) c | 0.73 | |||||
| 2000 - Class C Shares | 10.82 | (0.03 | ) c | 0.72 | |||||
| 2000 - Institutional Shares | 11.00 | 0.09 | c | 0.75 | |||||
| 2000 - Service Shares | 10.93 | 0.05 | c | 0.73 | |||||
| For the Seven-month Period Ended August 31, | |||||||||
| 1999 - Class A Shares | 9.98 | 0.05 | 0.84 | ||||||
| 1999 - Class B Shares | 9.95 | 0.01 | 0.85 | ||||||
| 1999 - Class C Shares | 9.96 | 0.01 | 0.85 | ||||||
| 1999 - Institutional Shares | 10.06 | 0.09 | 0.85 | ||||||
| 1999 - Service Shares | 10.02 | 0.01 | 0.90 | ||||||
| For the Year Ended January 31, | |||||||||
| 1999 - Class A Shares | 9.22 | (0.01 | ) | 0.79 | |||||
| 1999 - Class B Shares | 9.21 | — | 0.74 | ||||||
| 1999 - Class C Shares | 9.22 | — | 0.74 | ||||||
| 1999 - Institutional Shares | 9.24 | 0.05 | 0.80 | ||||||
| 1999 - Service Shares | 9.23 | — | 0.81 | ||||||
| For the Period Ended January 31, | |||||||||
| 1998 - Class A Shares (commenced August 15, 1997) | 10.00 | — | (0.78 | ) | |||||
| 1998 - Class B Shares (commenced August 15, 1997) | 10.00 | (0.02 | ) | (0.77 | ) | ||||
| 1998 - Class C Shares (commenced August 15, 1997) | 10.00 | (0.02 | ) | (0.76 | ) | ||||
| 1998 - Institutional Shares (commenced August 15, 1997) | 10.00 | 0.02 | (0.76 | ) | |||||
| 1998 - Service Shares (commenced August 15, 1997) | 10.00 | 0.01 | (0.78 | ) | |||||
|
Distributions to shareholders |
|||||||||||||||||||||
|---|---|---|---|---|---|---|---|---|---|---|---|---|---|---|---|---|---|---|---|---|---|
| Total from
investment operations |
From net
investment income |
From net
realized gains |
Total
distributions |
Net asset
value, end of period |
Total
returna |
Net assets
at end of period (in 000s) |
Ratio of net
expenses to average net assets |
||||||||||||||
| $ 0.76 | $(0.05 | ) | $(0.26 | ) | $(0.31 | ) | $11.32 | 6.92 | % | $147,409 | 1.66 | % | |||||||||
| 0.69 | (0.02 | ) | (0.26 | ) | (0.28 | ) | 11.22 | 6.36 | 12,032 | 2.16 | |||||||||||
| 0.69 | (0.02 | ) | (0.26 | ) | (0.28 | ) | 11.23 | 6.34 | 6,887 | 2.16 | |||||||||||
| 0.84 | (0.10 | ) | (0.26 | ) | (0.36 | ) | 11.48 | 7.62 | 308,074 | 1.01 | |||||||||||
| 0.78 | (0.09 | ) | (0.26 | ) | (0.35 | ) | 11.36 | 7.05 | 27 | 1.51 | |||||||||||
| 0.89 | — | — | — | 10.87 | 8.92 | 114,502 | 1.66 | b | |||||||||||||
| 0.86 | — | — | — | 10.81 | 8.64 | 9,171 | 2.16 | b | |||||||||||||
| 0.86 | — | — | — | 10.82 | 8.63 | 4,913 | 2.16 | b | |||||||||||||
| 0.94 | — | — | — | 11.00 | 9.34 | 271,212 | 1.01 | b | |||||||||||||
| 0.91 | — | — | — | 10.93 | 9.08 | 8 | 1.51 | b | |||||||||||||
| 0.78 | (0.02 | ) | — | (0.02 | ) | 9.98 | 8.37 | 110,338 | 1.63 | ||||||||||||
| 0.74 | — | — | — | 9.95 | 8.03 | 7,401 | 2.08 | ||||||||||||||
| 0.74 | — | — | — | 9.96 | 8.03 | 3,742 | 2.08 | ||||||||||||||
| 0.85 | (0.03 | ) | — | (0.03 | ) | 10.06 | 9.20 | 280,731 | 1.01 | ||||||||||||
| 0.81 | (0.02 | ) | — | (0.02 | ) | 10.02 | 8.74 | 22 | 1.50 | ||||||||||||
| (0.78 | ) | — | — | — | 9.22 | (7.66 | ) | 7,087 | 1.50 | b | |||||||||||
| (0.79 | ) | — | — | — | 9.21 | (7.90 | ) | 2,721 | 2.00 | b | |||||||||||
| (0.78 | ) | — | — | — | 9.22 | (7.80 | ) | 1,608 | 2.00 | b | |||||||||||
| (0.74 | ) | (0.02 | ) | — | (0.02 | ) | 9.24 | (7.45 | ) | 17,719 | 1.00 | b | |||||||||
| (0.77 | ) | — | — | — | 9.23 | (7.70 | ) | 1 | 1.50 | b | |||||||||||
| CORE INTERNATIONAL EQUITY FUND (continued)
|
| Ratios assuming no
expense reductions |
|||||||||||||
|---|---|---|---|---|---|---|---|---|---|---|---|---|---|
| Ratio of
net investment income (loss) to average net assets |
Ratio of
expenses to average net assets |
Ratio of
net investment income (loss) to average net assets |
Portfolio
turnover rate |
||||||||||
| For the Year Ended August 31, | |||||||||||||
| 2000 - Class A Shares | 0.14 | % | 1.75 | % | 0.05 | % | 92.10 | % | |||||
| 2000 - Class B Shares | (0.36 | ) | 2.25 | (0.45 | ) | 92.10 | |||||||
| 2000 - Class C Shares | (0.34 | ) | 2.25 | (0.43 | ) | 92.10 | |||||||
| 2000 - Institutional Shares | 0.78 | 1.10 | 0.69 | 92.10 | |||||||||
| 2000 - Service Shares | 0.33 | 1.60 | 0.24 | 92.10 | |||||||||
| For the Seven-month Period Ended August 31, | |||||||||||||
| 1999 - Class A Shares | 0.78 | b | 1.76 | b | 0.68 | b | 64.97 | ||||||
| 1999 - Class B Shares | 0.26 | b | 2.26 | b | 0.16 | b | 64.97 | ||||||
| 1999 - Class C Shares | 0.23 | b | 2.26 | b | 0.13 | b | 64.97 | ||||||
| 1999 - Institutional Shares | 1.43 | b | 1.11 | b | 1.33 | b | 64.97 | ||||||
| 1999 - Service Shares | 0.07 | b | 1.61 | b | (0.03 | ) b | 64.97 | ||||||
| For the Year Ended January 31, | |||||||||||||
| 1999 - Class A Shares | (0.11 | ) | 1.94 | (0.42 | ) | 194.61 | |||||||
| 1999 - Class B Shares | (0.03 | ) | 2.39 | (0.34 | ) | 194.61 | |||||||
| 1999 - Class C Shares | (0.04 | ) | 2.39 | (0.35 | ) | 194.61 | |||||||
| 1999 - Institutional Shares | 0.84 | 1.32 | 0.53 | 194.61 | |||||||||
| 1999 - Service Shares | 0.02 | 1.81 | (0.29 | ) | 194.61 | ||||||||
| For the Period Ended January 31, | |||||||||||||
| 1998 - Class A Shares (commenced August 15, 1997) | (0.27 | ) b | 4.87 | b | (3.90 | ) b | 25.16 | ||||||
| 1998 - Class B Shares (commenced August 15, 1997) | (0.72 | ) b | 5.12 | b | (3.84 | ) b | 25.16 | ||||||
| 1998 - Class C Shares (commenced August 15, 1997) | (0.73 | ) b | 5.12 | b | (3.85 | ) b | 25.16 | ||||||
| 1998 - Institutional Shares (commenced August 15, 1997) | 0.59 | b | 4.12 | b | (2.53 | ) b | 25.16 | ||||||
| 1998 - Service Shares (commenced August 15, 1997) | 0.26 | b | 4.62 | b | (2.86 | ) b | 25.16 | ||||||
| INTERNATIONAL EQUITY FUND
|
|
Income from investment operations |
||||||||||||
|---|---|---|---|---|---|---|---|---|---|---|---|---|
|
Net asset value, beginning of period |
Net
investment income (loss) |
Net realized
and unrealized gain (loss) |
Total from
investment operations |
|||||||||
| For the Year Ended August 31, | ||||||||||||
| 2000 - Class A Shares | $23.12 | $(0.03 | ) c | $3.41 | $3.38 | |||||||
| 2000 - Class B Shares | 22.73 | (0.16 | ) c | 3.38 | 3.22 | |||||||
| 2000 - Class C Shares | 22.54 | (0.14 | ) c | 3.35 | 3.21 | |||||||
| 2000 - Institutional Shares | 23.49 | 0.14 | c | 3.46 | 3.60 | |||||||
| 2000 - Service Shares | 23.14 | (0.01 | ) c | 3.45 | 3.44 | |||||||
| For the Seven Months Ended August 31, | ||||||||||||
| 1999 - Class A Shares | 21.92 | 0.04 | 1.16 | 1.20 | ||||||||
| 1999 - Class B Shares | 21.63 | (0.02 | ) | 1.12 | 1.10 | |||||||
| 1999 - Class C Shares | 21.45 | (0.03 | ) | 1.12 | 1.09 | |||||||
| 1999 - Institutional Shares | 22.20 | 0.12 | c | 1.17 | c | 1.29 | ||||||
| 1999 - Service Shares | 21.93 | 0.06 | 1.15 | 1.21 | ||||||||
| For the Years Ended January 31, | ||||||||||||
| 1999 - Class A Shares | 19.85 | (0.06 | ) | 3.24 | 3.18 | |||||||
| 1999 - Class B Shares | 19.70 | (0.17 | ) | 3.21 | 3.04 | |||||||
| 1999 - Class C Shares | 19.56 | (0.15 | ) | 3.15 | 3.00 | |||||||
| 1999 - Institutional Shares | 19.97 | 0.03 | 3.31 | 3.34 | ||||||||
| 1999 - Service Shares | 19.84 | (0.04 | ) | 3.24 | 3.20 | |||||||
| 1998 - Class A Shares | 19.32 | 0.03 | 2.04 | 2.07 | ||||||||
| 1998 - Class B Shares | 19.24 | (0.08 | ) | 2.02 | 1.94 | |||||||
| 1998 - Class C Shares (commenced August 15, 1997) | 22.60 | (0.04 | ) | (1.38 | ) | (1.42 | ) | |||||
| 1998 - Institutional Shares | 19.40 | 0.10 | 2.11 | 2.21 | ||||||||
| 1998 - Service Shares | 19.34 | 0.02 | 2.06 | 2.08 | ||||||||
| 1997 - Class A Shares | 17.20 | 0.10 | 2.23 | 2.33 | ||||||||
| 1997 - Class B Shares (commenced May 1, 1996) | 18.91 | (0.06 | ) | 0.60 | 0.54 | |||||||
| 1997 - Institutional Shares (commenced February 7, 1996) | 17.45 | 0.04 | 2.15 | 2.19 | ||||||||
| 1997 - Service Shares (commenced March 6, 1996) | 17.70 | (0.02 | ) | 1.87 | 1.85 | |||||||
| 1996 - Class A Shares | 14.52 | 0.13 | 4.00 | 4.13 | ||||||||
|
Distributions to shareholders |
|||||||||||||||||||||
|---|---|---|---|---|---|---|---|---|---|---|---|---|---|---|---|---|---|---|---|---|---|
| From net
investment income |
In excess of net investment income |
From net
realized gains |
Total
distributions |
Net asset
value, end of period |
Total
returna |
Net assets
at end of period (in 000s) |
Ratio of
net expenses to average net assets |
||||||||||||||
| $(0.10 | ) | $(0.24) | $(2.57 | ) | $(2.91 | ) | $23.59 | 14.68 | % | $1,343,869 | 1.79 | % | |||||||||
| (0.07 | ) | (0.17) | (2.57 | ) | (2.81 | ) | 23.14 | 14.20 | 80,274 | 2.29 | |||||||||||
| (0.09 | ) | (0.20) | (2.57 | ) | (2.86 | ) | 22.89 | 14.28 | 22,031 | 2.29 | |||||||||||
| (0.14 | ) | (0.32) | (2.57 | ) | (3.03 | ) | 24.06 | 15.45 | 325,161 | 1.14 | |||||||||||
| (0.11 | ) | (0.25) | (2.57 | ) | (2.93 | ) | 23.65 | 15.00 | 3,789 | 1.64 | |||||||||||
| — | — | — | — | 23.12 | 5.47 | 943,473 | 1.79 | b | |||||||||||||
| — | — | — | — | 22.73 | 5.09 | 68,691 | 2.29 | b | |||||||||||||
| — | — | — | — | 22.54 | 5.08 | 11,241 | 2.29 | b | |||||||||||||
| — | — | — | — | 23.49 | 5.81 | 180,564 | 1.14 | b | |||||||||||||
| — | — | — | — | 23.14 | 5.52 | 3,852 | 1.64 | b | |||||||||||||
| — | — | (1.11 | ) | (1.11 | ) | 21.92 | 16.39 | 947,973 | 1.73 | ||||||||||||
| — | — | (1.11 | ) | (1.11 | ) | 21.63 | 15.80 | 69,231 | 2.24 | ||||||||||||
| — | — | (1.11 | ) | (1.11 | ) | 21.45 | 15.70 | 11,619 | 2.24 | ||||||||||||
| — | — | (1.11 | ) | (1.11 | ) | 22.20 | 17.09 | 111,315 | 1.13 | ||||||||||||
| — | — | (1.11 | ) | (1.11 | ) | 21.93 | 16.49 | 3,568 | 1.63 | ||||||||||||
| — | (0.30 | ) | (1.24 | ) | (1.54 | ) | 19.85 | 11.12 | 697,590 | 1.67 | |||||||||||
| — | (0.25 | ) | (1.23 | ) | (1.48 | ) | 19.70 | 10.51 | 55,324 | 2.20 | |||||||||||
| — | (0.38 | ) | (1.24 | ) | (1.62 | ) | 19.56 | (5.92 | ) | 3,369 | 2.27 | b | |||||||||
| (0.07 | ) | (0.33 | ) | (1.24 | ) | (1.64 | ) | 19.97 | 11.82 | 56,263 | 1.08 | ||||||||||
| — | (0.35 | ) | (1.23 | ) | (1.58 | ) | 19.84 | 11.25 | 3,035 | 1.55 | |||||||||||
| — | — | (0.21 | ) | (0.21 | ) | 19.32 | 13.48 | 536,283 | 1.69 | ||||||||||||
| — | — | (0.21 | ) | (0.21 | ) | 19.24 | 2.83 | 19,198 | 2.23 | b | |||||||||||
| (0.03 | ) | — | (0.21 | ) | (0.24 | ) | 19.40 | 12.53 | 68,374 | 1.10 | b | ||||||||||
| — | — | (0.21 | ) | (0.21 | ) | 19.34 | 10.42 | 674 | 1.60 | b | |||||||||||
| (0.58 | ) | — | (0.87 | ) | (1.45 | ) | 17.20 | 28.68 | 330,860 | 1.52 | |||||||||||
| INTERNATIONAL EQUITY FUND (continued)
|
|
Ratios assuming no expense reductions |
|||||||||||||
|---|---|---|---|---|---|---|---|---|---|---|---|---|---|
| Ratio of
net investment income (loss) to average net assets |
Ratio of
expenses to average net assets |
Ratio of
net investment income (loss) to average net assets |
Portfolio
turnover rate |
||||||||||
| For the Year Ended August 31, | |||||||||||||
| 2000 - Class A Shares | (0.12 | )% | 1.84 | % | (0.17 | )% | 79.79 | % | |||||
| 2000 - Class B Shares | (0.65 | ) | 2.34 | (0.70 | ) | 79.79 | |||||||
| 2000 - Class C Shares | (0.59 | ) | 2.34 | (0.64 | ) | 79.79 | |||||||
| 2000 - Institutional Shares | 0.54 | 1.19 | 0.49 | 79.79 | |||||||||
| 2000 - Service Shares | (0.02 | ) | 1.69 | (0.07 | ) | 79.79 | |||||||
| For the Seven Months Ended August 31, | |||||||||||||
| 1999 - Class A Shares | 0.31 | b | 1.84 | b | 0.26 | b | 61.10 | ||||||
| 1999 - Class B Shares | (0.19 | ) b | 2.34 | b | (0.24 | ) b | 61.10 | ||||||
| 1999 - Class C Shares | (0.26 | ) b | 2.34 | b | (0.31 | ) b | 61.10 | ||||||
| 1999 - Institutional Shares | 0.89 | b | 1.19 | b | 0.84 | b | 61.10 | ||||||
| 1999 - Service Shares | 0.47 | b | 1.69 | b | 0.42 | b | 61.10 | ||||||
| For the Years Ended January 31, | |||||||||||||
| 1999 - Class A Shares | (0.28 | ) | 1.82 | (0.37 | ) | 113.79 | |||||||
| 1999 - Class B Shares | (0.79 | ) | 2.32 | (0.87 | ) | 113.79 | |||||||
| 1999 - Class C Shares | (0.98 | ) | 2.32 | (1.06 | ) | 113.79 | |||||||
| 1999 - Institutional Shares | 0.23 | 1.21 | 0.15 | 113.79 | |||||||||
| 1999 - Service Shares | (0.18 | ) | 1.71 | (0.26 | ) | 113.79 | |||||||
| 1998 - Class A Shares | (0.27 | ) | 1.80 | (0.40 | ) | 40.82 | |||||||
| 1998 - Class B Shares | (0.90 | ) | 2.30 | (1.00 | ) | 40.82 | |||||||
| 1998 - Class C Shares (commenced August 15, 1997) | (1.43 | ) b | 2.37 | b | (1.53 | ) b | 40.82 | ||||||
| 1998 - Institutional Shares | 0.30 | 1.18 | 0.20 | 40.82 | |||||||||
| 1998 - Service Shares | (0.36 | ) | 1.65 | (0.46 | ) | 40.82 | |||||||
| 1997 - Class A Shares | (0.07 | ) | 1.88 | (0.26 | ) | 38.01 | |||||||
| 1997 - Class B Shares (commenced May 1, 1996) | (0.97 | ) b | 2.38 | b | (1.12 | ) b | 38.01 | ||||||
| 1997 - Institutional Shares (commenced February 7, 1996) | 0.43 | b | 1.25 | b | 0.28 | b | 38.01 | ||||||
| 1997 - Service Shares (commenced March 6, 1996) | (0.40 | ) b | 1.75 | b | (0.55 | ) b | 38.01 | ||||||
| 1996 - Class A Shares | 0.26 | 1.77 | 0.01 | 68.48 | |||||||||
| EUROPEAN EQUITY FUND
|
| Income from
investment operations |
|||||||||
|---|---|---|---|---|---|---|---|---|---|
| Net asset
value, beginning of period |
Net investment income (loss) |
Net realized
and unrealized gain (loss) |
|||||||
| For the Year Ended August 31, | |||||||||
| 2000 - Class A Shares | $11.75 | $ — | c | $ 2.78 | |||||
| 2000 - Class B Shares | 11.71 | (0.04 | ) c | 2.73 | |||||
| 2000 - Class C Shares | 11.72 | (0.04 | ) c | 2.75 | |||||
| 2000 - Institutional Shares | 11.82 | 0.10 | c | 2.79 | |||||
| 2000 - Service Shares | 11.76 | 0.01 | c | 2.80 | |||||
| For the Seven Months Ended August 31, | |||||||||
| 1999 - Class A Shares | 12.20 | 0.05 | (0.50 | ) | |||||
| 1999 - Class B Shares | 12.19 | 0.03 | (0.51 | ) | |||||
| 1999 - Class C Shares | 12.20 | 0.04 | (0.52 | ) | |||||
| 1999 - Institutional Shares | 12.23 | 0.18 | (0.59 | ) | |||||
| 1999 - Service Shares | 12.20 | 0.08 | (0.52 | ) | |||||
| For the Period Ended January 31, | |||||||||
| 1999 - Class A Shares (commenced October 1, 1998) | 10.00 | (0.03 | ) | 2.23 | |||||
| 1999 - Class B Shares (commenced October 1, 1998) | 10.00 | (0.02 | ) | 2.21 | |||||
| 1999 - Class C Shares (commenced October 1, 1998) | 10.00 | (0.01 | ) | 2.21 | |||||
| 1999 - Institutional Shares (commenced October 1, 1998) | 10.00 | (0.01 | ) | 2.24 | |||||
| 1999 - Service Shares (commenced October 1, 1998) | 10.00 | (0.03 | ) | 2.23 | |||||
| Distributions to
shareholders |
||||||||||||||||||
|---|---|---|---|---|---|---|---|---|---|---|---|---|---|---|---|---|---|---|
| Total from
investment operations |
From net
realized gains |
Total
distributions |
Net asset
value, end of period |
Total
returna |
Net assets at end of period (in 000s) |
Ratio of
net expenses to average net assets |
||||||||||||
| $ 2.78 | $(0.71 | ) | $(0.71 | ) | $13.82 | 24.04 | % | $139,966 | 1.79 | % | ||||||||
| 2.69 | (0.71 | ) | (0.71 | ) | 13.69 | 23.32 | 4,538 | 2.29 | ||||||||||
| 2.71 | (0.71 | ) | (0.71 | ) | 13.72 | 23.48 | 1,482 | 2.29 | ||||||||||
| 2.89 | (0.71 | ) | (0.71 | ) | 14.00 | 24.85 | 14,630 | 1.14 | ||||||||||
| 2.81 | (0.71 | ) | (0.71 | ) | 13.86 | 24.28 | 2 | 1.64 | ||||||||||
| (0.45 | ) | — | — | 11.75 | (3.69 | ) | 74,862 | 1.79 | b | |||||||||
| (0.48 | ) | — | — | 11.71 | (3.94 | ) | 879 | 2.29 | b | |||||||||
| (0.48 | ) | — | — | 11.72 | (3.93 | ) | 388 | 2.29 | b | |||||||||
| (0.41 | ) | — | — | 11.82 | (3.35 | ) | 5,965 | 1.14 | b | |||||||||
| (0.44 | ) | — | — | 11.76 | (3.61 | ) | 2 | 1.64 | b | |||||||||
| 2.20 | — | — | 12.20 | 22.00 | 61,151 | 1.79 | b | |||||||||||
| 2.19 | — | — | 12.19 | 21.90 | 432 | 2.29 | b | |||||||||||
| 2.20 | — | — | 12.20 | 22.00 | 587 | 2.29 | b | |||||||||||
| 2.23 | — | — | 12.23 | 22.30 | 12,740 | 1.14 | b | |||||||||||
| 2.20 | — | — | 12.20 | 22.00 | 2 | 1.64 | b | |||||||||||
| EUROPEAN EQUITY FUND (continued)
|
| Ratios assuming no
expense reductions |
|||||||||||||
|---|---|---|---|---|---|---|---|---|---|---|---|---|---|
| Ratio of
net investment income (loss) to average net assets |
Ratio of
expenses to average net assets |
Ratio of
net investment income (loss) to average net assets |
Portfolio
turnover rate |
||||||||||
| For the Year Ended August 31, | |||||||||||||
| 2000 - Class A Shares | 0.02 | % | 2.17 | % | (0.36 | )% | 98.10 | % | |||||
| 2000 - Class B Shares | (0.27 | ) | 2.67 | (0.65 | ) | 98.10 | |||||||
| 2000 - Class C Shares | (0.26 | ) | 2.67 | (0.64 | ) | 98.10 | |||||||
| 2000 - Institutional Shares | 0.70 | 1.52 | 0.32 | 98.10 | |||||||||
| 2000 - Service Shares | 0.09 | 2.02 | (0.29 | ) | 98.10 | ||||||||
| For the Seven Months Ended August 31, | |||||||||||||
| 1999 - Class A Shares | 0.80 | b | 2.29 | b | 0.30 | b | 54.98 | ||||||
| 1999 - Class B Shares | 0.43 | b | 2.79 | b | (0.07 | ) b | 54.98 | ||||||
| 1999 - Class C Shares | 0.42 | b | 2.79 | b | (0.08 | ) b | 54.98 | ||||||
| 1999 - Institutional Shares | 1.53 | b | 1.64 | b | 1.03 | b | 54.98 | ||||||
| 1999 - Service Shares | 1.10 | b | 2.14 | b | 0.60 | b | 54.98 | ||||||
| For the Period Ended January 31, | |||||||||||||
| 1999 - Class A Shares (commenced October 1, 1998) | (1.19 | ) b | 2.80 | b | (2.20 | ) b | 70.77 | ||||||
| 1999 - Class B Shares (commenced October 1, 1998) | (1.78 | ) b | 3.30 | b | (2.79 | ) b | 70.77 | ||||||
| 1999 - Class C Shares (commenced October 1, 1998) | (1.83 | ) b | 3.30 | b | (2.84 | ) b | 70.77 | ||||||
| 1999 - Institutional Shares (commenced October 1, 1998) | (0.33 | ) b | 2.15 | b | (1.34 | ) b | 70.77 | ||||||
| 1999 - Service Shares (commenced October 1, 1998) | (0.69 | ) b | 2.65 | b | (1.70 | ) b | 70.77 | ||||||
| JAPANESE EQUITY FUND
|
| Income from
investment operations |
||||||||||
|---|---|---|---|---|---|---|---|---|---|---|
|
Net asset value, beginning of period |
Net
investment loss |
Net realized
and unrealized gains |
Total from
investment operations |
|||||||
| For the Year Ended August 31, | ||||||||||
| 2000 - Class A Shares | $16.24 | $(0.20 | ) c | $1.67 | $1.47 | |||||
| 2000 - Class B Shares | 16.14 | (0.28 | ) c | 1.68 | 1.40 | |||||
| 2000 - Class C Shares | 16.16 | (0.28 | ) c | 1.64 | 1.36 | |||||
| 2000 - Institutional Shares | 16.36 | (0.09 | ) c | 1.67 | 1.58 | |||||
| 2000 - Service Shares | 16.22 | (0.16 | ) c | 1.65 | 1.49 | |||||
| For the Seven Months Ended August 31, | ||||||||||
| 1999 - Class A Shares | 11.06 | (0.06 | ) | 5.24 | 5.18 | |||||
| 1999 - Class B Shares | 11.03 | (0.09 | ) | 5.20 | 5.11 | |||||
| 1999 - Class C Shares | 11.04 | (0.08 | ) | 5.20 | 5.12 | |||||
| 1999 - Institutional Shares | 11.10 | (0.03 | ) | 5.29 | 5.26 | |||||
| 1999 - Service Shares | 11.04 | (0.06 | ) | 5.24 | 5.18 | |||||
| For the Period Ended January 31, | ||||||||||
| 1999 - Class A Shares (commenced May 1, 1998) | 10.00 | (0.06 | ) | 1.12 | 1.06 | |||||
| 1999 - Class B Shares (commenced May 1, 1998) | 10.00 | (0.08 | ) | 1.11 | 1.03 | |||||
| 1999 - Class C Shares (commenced May 1, 1998) | 10.00 | (0.09 | ) | 1.13 | 1.04 | |||||
| 1999 - Institutional Shares (commenced May 1, 1998) | 10.00 | (0.02 | ) | 1.13 | 1.11 | |||||
| 1999 - Service Shares (commenced May 1, 1998) | 10.00 | (0.05 | ) | 1.09 | 1.04 | |||||
|
Distributions to shareholders |
|||||||||||||||||||||
|---|---|---|---|---|---|---|---|---|---|---|---|---|---|---|---|---|---|---|---|---|---|
| From net
investment income |
In excess of net investment income |
From net
realized gains |
Total
distributions |
Net asset
value, end of period |
Total
returnb |
Net assets
at end of period (in 000s) |
Ratio of
net expenses to average net assets |
||||||||||||||
| $ — | $(0.21 | ) | $(1.73 | ) | $(1.94 | ) | $15.77 | 8.47 | % | $69,741 | 1.74 | % | |||||||||
| — | (0.18 | ) | (1.73 | ) | (1.91 | ) | 15.63 | 8.12 | 5,783 | 2.24 | |||||||||||
| — | (0.21 | ) | (1.73 | ) | (1.94 | ) | 15.58 | 7.82 | 4,248 | 2.24 | |||||||||||
| — | (0.25 | ) | (1.73 | ) | (1.98 | ) | 15.96 | 9.14 | 27,768 | 1.09 | |||||||||||
| — | (0.15 | ) | (1.73 | ) | (1.88 | ) | 15.83 | 8.65 | 3 | 1.59 | |||||||||||
| — | — | — | — | 16.24 | 46.84 | 34,279 | 1.70 | b | |||||||||||||
| — | — | — | — | 16.14 | 46.33 | 4,219 | 2.20 | b | |||||||||||||
| — | — | — | — | 16.16 | 46.41 | 3,584 | 2.20 | b | |||||||||||||
| — | — | — | — | 16.36 | 47.40 | 22,709 | 1.05 | b | |||||||||||||
| — | — | — | — | 16.22 | 46.92 | 3 | 1.55 | b | |||||||||||||
| — | — | — | — | 11.06 | 10.60 | 8,391 | 1.64 | b | |||||||||||||
| — | — | — | — | 11.03 | 10.30 | 1,427 | 2.15 | b | |||||||||||||
| — | — | — | — | 11.04 | 10.40 | 284 | 2.15 | b | |||||||||||||
| (0.01 | ) | — | — | (0.01 | ) | 11.10 | 11.06 | 11,418 | 1.03 | b | |||||||||||
| — | — | — | — | 11.04 | 10.43 | 2 | 1.53 | b | |||||||||||||
| JAPANESE EQUITY FUND (continued)
|
| Ratios assuming no
expense reductions |
|||||||||||||
|---|---|---|---|---|---|---|---|---|---|---|---|---|---|
| Ratio of
net investment loss to average net assets |
Ratio of
expenses to average net assets |
Ratio of
net investment loss to average net assets |
Portfolio
turnover rate |
||||||||||
| For the Year Ended August 31, | |||||||||||||
| 2000 - Class A Shares | (1.20 | )% | 2.10 | % | (1.56 | )% | 60.76 | % | |||||
| 2000 - Class B Shares | (1.67 | ) | 2.60 | (2.03 | ) | 60.76 | |||||||
| 2000 - Class C Shares | (1.66 | ) | 2.60 | (2.02 | ) | 60.76 | |||||||
| 2000 - Institutional Shares | (0.53 | ) | 1.45 | (0.89 | ) | 60.76 | |||||||
| 2000 - Service Shares | (0.94 | ) | 1.95 | (1.30 | ) | 60.76 | |||||||
| For the Seven Months Ended August 31, | |||||||||||||
| 1999 - Class A Shares | (1.17 | ) b | 2.62 | b | (2.09 | ) b | 44.83 | ||||||
| 1999 - Class B Shares | (1.57 | ) b | 3.12 | b | (2.49 | ) b | 44.83 | ||||||
| 1999 - Class C Shares | (1.81 | ) b | 3.12 | b | (2.73 | ) b | 44.83 | ||||||
| 1999 - Institutional Shares | (0.37 | ) b | 1.97 | b | (1.29 | ) b | 44.83 | ||||||
| 1999 - Service Shares | (0.74 | ) b | 2.47 | b | (1.66 | ) b | 44.83 | ||||||
| For the Period Ended January 31, | |||||||||||||
| 1999 - Class A Shares (commenced May 1, 1998) | (1.20 | ) b | 4.18 | b | (3.74 | ) b | 53.29 | ||||||
| 1999 - Class B Shares (commenced May 1, 1998) | (1.76 | ) b | 4.69 | b | (4.30 | ) b | 53.29 | ||||||
| 1999 - Class C Shares (commenced May 1, 1998) | (1.69 | ) b | 4.69 | b | (4.23 | ) b | 53.29 | ||||||
| 1999 - Institutional Shares (commenced May 1, 1998) | (0.36 | ) b | 3.57 | b | (2.90 | ) b | 53.29 | ||||||
| 1999 - Service Shares (commenced May 1, 1998) | (0.68 | ) b | 4.07 | b | (3.22 | ) b | 53.29 | ||||||
| INTERNATIONAL GROWTH OPPORTUNITIES FUND
|
| (formerly International Small Cap Fund)
|
| Income from
investment operations |
||||||||||
|---|---|---|---|---|---|---|---|---|---|---|
| Net asset
value, beginning of period |
Net
investment loss |
Net realized
and unrealized gain |
Total from investment operations |
|||||||
| For the Year Ended August 31, | ||||||||||
| 2000 - Class A Shares ; | $13.24 | $(0.12 | ) c | $3.52 | $3.40 | |||||
| 2000 - Class B Shares | 13.19 | (0.18 | ) c | 3.49 | 3.31 | |||||
| 2000 - Class C Shares | 13.19 | (0.19 | ) c | 3.49 | 3.30 | |||||
| 2000 - Institutional Shares | 13.35 | (0.03 | ) c | 3.57 | 3.54 | |||||
| 2000 - Service Shares | 13.24 | (0.10 | ) c | 3.54 | 3.44 | |||||
| For the Seven-month Period Ended August 31, | ||||||||||
| 1999 - Class A Shares | 10.62 | (0.03 | ) | 2.65 | 2.62 | |||||
| 1999 - Class B Shares | 10.61 | (0.08 | ) c | 2.66 | 2.58 | |||||
| 1999 - Class C Shares | 10.61 | (0.08 | ) c | 2.66 | 2.58 | |||||
| 1999 - Institutional Shares | 10.66 | — | 2.69 | 2.69 | ||||||
| 1999 - Service Shares | 10.61 | (0.02 | ) | 2.65 | 2.63 | |||||
| For the Period Ended January 31, | ||||||||||
| 1999 - Class A Shares (commenced May 1, 1998) | 10.00 | (0.04 | ) | 0.66 | 0.62 | |||||
| 1999 - Class B Shares (commenced May 1, 1998) | 10.00 | (0.10 | ) | 0.71 | 0.61 | |||||
| 1999 - Class C Shares (commenced May 1, 1998) | 10.00 | (0.06 | ) | 0.67 | 0.61 | |||||
| 1999 - Institutional Shares (commenced May 1, 1998) | 10.00 | — | 0.67 | 0.67 | ||||||
| 1999 - Service Shares (commenced May 1, 1998) | 10.00 | (0.02 | ) | 0.63 | 0.61 | |||||
|
Distributions to shareholders |
||||||||||||||||||
|---|---|---|---|---|---|---|---|---|---|---|---|---|---|---|---|---|---|---|
| In excess
of net investment income |
From net
realized gains |
Total
distributions |
Net asset
value, end of period |
Total
returna |
Net assets
at end of period (in 000s) |
Ratio of
net expenses to average net assets |
||||||||||||
| $ — | $(0.52 | ) | $(0.52 | ) | $16.12 | 26.26 | % | $327,697 | 2.05 | % | ||||||||
| — | (0.52 | ) | (0.52 | ) | 15.98 | 25.66 | 2,827 | 2.55 | ||||||||||
| — | (0.52 | ) | (0.52 | ) | 15.97 | 25.58 | 3,672 | 2.55 | ||||||||||
| — | (0.52 | ) | (0.52 | ) | 16.37 | 27.12 | 187,075 | 1.40 | ||||||||||
| — | (0.52 | ) | (0.52 | ) | 16.16 | 26.57 | 3 | 1.90 | ||||||||||
| — | — | — | 13.24 | 24.67 | 69,458 | 2.05 | b | |||||||||||
| — | — | — | 13.19 | 24.32 | 303 | 2.55 | b | |||||||||||
| — | — | — | 13.19 | 24.32 | 419 | 2.55 | b | |||||||||||
| — | — | — | 13.35 | 25.24 | 65,772 | 1.40 | b | |||||||||||
| — | — | — | 13.24 | 24.79 | 2 | 1.90 | b | |||||||||||
| — | — | — | 10.62 | 6.20 | 33,002 | 2.02 | b | |||||||||||
| — | — | — | 10.61 | 6.10 | 213 | 2.51 | b | |||||||||||
| — | — | — | 10.61 | 6.10 | 175 | 2.51 | b | |||||||||||
| (0.01 | ) | — | (0.01 | ) | 10.66 | 6.67 | 36,992 | 1.40 | b | |||||||||
| — | — | — | 10.61 | 6.10 | 2 | 1.90 | b | |||||||||||
| INTERNATIONAL GROWTH OPPORTUNITIES FUND
|
| (formerly International Small Cap Fund) (continued)
|
| Ratios assuming no
expense reductions |
|||||||||||||
|---|---|---|---|---|---|---|---|---|---|---|---|---|---|
| Ratio of
net investment loss to average net assets |
Ratio of
expenses to average net assets |
Ratio of
net investment loss to average net assets |
Portfolio
turnover rate |
||||||||||
| For the Year Ended August 31, | |||||||||||||
| 2000 - Class A Shares ; | (0.79 | )% | 2.22 | % | (0.96 | )% | 73.43 | % | |||||
| 2000 - Class B Shares | (1.16 | ) | 2.72 | (1.33 | ) | 73.43 | |||||||
| 2000 - Class C Shares | (1.23 | ) | 2.72 | (1.40 | ) | 73.43 | |||||||
| 2000 - Institutional Shares | (0.19 | ) | 1.57 | (0.36 | ) | 73.43 | |||||||
| 2000 - Service Shares | (0.63 | ) | 2.07 | (0.80 | ) | 73.43 | |||||||
| For the Seven-month Period Ended August 31, | |||||||||||||
| 1999 - Class A Shares | (0.68 | ) b | 2.42 | b | (1.05 | ) b | 58.81 | ||||||
| 1999 - Class B Shares | (1.16 | ) b | 2.92 | b | (1.53 | ) b | 58.81 | ||||||
| 1999 - Class C Shares | (1.21 | ) b | 2.92 | b | (1.58 | ) b | 58.81 | ||||||
| 1999 - Institutional Shares | (0.05 | ) b | 1.77 | b | (0.42 | ) b | 58.81 | ||||||
| 1999 - Service Shares | (0.35 | ) b | 2.27 | b | (0.72 | ) b | 58.81 | ||||||
| For the Period Ended January 31, | |||||||||||||
| 1999 - Class A Shares (commenced May 1, 1998) | (1.03 | ) b | 3.60 | b | (2.61 | ) b | 96.11 | ||||||
| 1999 - Class B Shares (commenced May 1, 1998) | (1.30 | ) b | 4.09 | b | (2.88 | ) b | 96.11 | ||||||
| 1999 - Class C Shares (commenced May 1, 1998) | (1.45 | ) b | 4.09 | b | (3.03 | ) b | 96.11 | ||||||
| 1999 - Institutional Shares (commenced May 1, 1998) | (0.19 | ) b | 2.98 | b | (1.77 | ) b | 96.11 | ||||||
| 1999 - Service Shares (commenced May 1, 1998) | (0.26 | ) b | 3.48 | b | (1.84 | ) b | 96.11 | ||||||
| EMERGING MARKETS EQUITY FUND
|
| Income from
investment operations |
||||||||||||
|---|---|---|---|---|---|---|---|---|---|---|---|---|
| Net asset
value, beginning of period |
Net
investment income (loss) |
Net
realized and unrealized gain (loss) |
Total from
investment operations |
|||||||||
| For the Year Ended August 31, | ||||||||||||
| 2000 - Class A Shares | $ 9.26 | $(0.05 | ) c | $ 1.62 | $ 1.57 | |||||||
| 2000 - Class B Shares | 9.21 | (0.11 | ) c | 1.62 | 1.51 | |||||||
| 2000 - Class C Shares | 9.24 | (0.10 | ) c | 1.61 | 1.51 | |||||||
| 2000 - Institutional Shares | 9.37 | 0.01 | c | 1.64 | 1.65 | |||||||
| 2000 - Service Shares | 9.05 | 0.01 | c | 1.57 | 1.58 | |||||||
| For the Seven Months Ended August 31, | ||||||||||||
| 1999 - Class A Shares | 7.04 | (0.01 | ) | 2.23 | 2.22 | |||||||
| 1999 - Class B Shares | 7.03 | (0.03 | ) | 2.21 | 2.18 | |||||||
| 1999 - Class C Shares | 7.05 | (0.03 | ) | 2.22 | 2.19 | |||||||
| 1999 - Institutional Shares | 7.09 | 0.02 | 2.26 | 2.28 | ||||||||
| 1999 - Service Shares | 6.87 | 0.01 | 2.17 | 2.18 | ||||||||
| For the Year Ended January 31, | ||||||||||||
| 1999 - Class A Shares | 9.69 | 0.04 | (2.40 | ) | (2.36 | ) | ||||||
| 1999 - Class B Shares | 9.69 | 0.03 | (2.41 | ) | (2.38 | ) | ||||||
| 1999 - Class C Shares | 9.70 | 0.01 | (2.39 | ) | (2.38 | ) | ||||||
| 1999 - Institutional Shares | 9.70 | 0.06 | (2.36 | ) | (2.30 | ) | ||||||
| 1999 - Service Shares | 9.69 | (0.13 | ) | (2.41 | ) | (2.28 | ) | |||||
| For the Period Ended January 31, | ||||||||||||
| 1998 - Class A Shares (commenced December 15, 1997) | 10.00 | — | (0.31 | ) | (0.31 | ) | ||||||
| 1998 - Class B Shares (commenced December 15, 1997) | 10.00 | — | (0.31 | ) | (0.31 | ) | ||||||
| 1998 - Class C Shares (commenced December 15, 1997) | 10.00 | — | (0.30 | ) | (0.30 | ) | ||||||
| 1998 - Institutional Shares (commenced December 15, 1997) | 10.00 | 0.01 | (0.31 | ) | (0.30 | ) | ||||||
| 1998 - Service Shares (commenced December 15, 1997) | 10.00 | — | (0.31 | ) | (0.31 | ) | ||||||
|
Distributions to shareholders |
||||||||||||||||||
|---|---|---|---|---|---|---|---|---|---|---|---|---|---|---|---|---|---|---|
| From net
investment income |
In excess of net investment income |
Total
distributions |
Net asset
value, end of period |
Total
returna |
Net assets
at end of period (in 000s) |
Ratio of
net expenses to average net assets |
||||||||||||
| $ — | $ — | $ — | $10.83 | 16.95 | % | $64,279 | 2.11 | % | ||||||||||
| — | — | — | 10.72 | 16.40 | 2,187 | 2.61 | ||||||||||||
| — | — | — | 10.75 | 16.34 | 1,304 | 2.61 | ||||||||||||
| — | — | — | 11.02 | 17.61 | 145,774 | 1.46 | ||||||||||||
| — | — | — | 10.63 | 17.46 | 2 | 1.96 | ||||||||||||
| — | — | — | 9.26 | 31.53 | 65,698 | 2.04 | b | |||||||||||
| — | — | — | 9.21 | 31.01 | 972 | 2.54 | b | |||||||||||
| — | — | — | 9.24 | 31.06 | 1,095 | 2.54 | b | |||||||||||
| — | — | — | 9.37 | 32.16 | 108,574 | 1.39 | b | |||||||||||
| — | — | — | 9.05 | 31.73 | 2 | 1.89 | b | |||||||||||
| (0.07 | ) | (0.22 | ) | (0.29 | ) | 7.04 | (24.32 | ) | 52,704 | 2.09 | ||||||||
| (0.07 | ) | (0.21 | ) | (0.28 | ) | 7.03 | (24.51 | ) | 459 | 2.59 | ||||||||
| (0.07 | ) | (0.20 | ) | (0.27 | ) | 7.05 | (24.43 | ) | 273 | 2.59 | ||||||||
| (0.08 | ) | (0.23 | ) | (0.31 | ) | 7.09 | (23.66 | ) | 90,189 | 1.35 | ||||||||
| (0.07 | ) | (0.21 | ) | (0.28 | ) | 6.87 | (26.17 | ) | 1 | 1.85 | ||||||||
| — | — | — | 9.69 | (3.10 | ) | 17,681 | 1.90 | b | ||||||||||
| — | — | — | 9.69 | (3.10 | ) | 64 | 2.41 | b | ||||||||||
| — | — | — | 9.70 | (3.00 | ) | 73 | 2.48 | b | ||||||||||
| — | — | — | 9.70 | (3.00 | ) | 19,120 | 1.30 | b | ||||||||||
| — | — | — | 9.69 | (3.10 | ) | 2 | 2.72 | b | ||||||||||
| EMERGING MARKETS EQUITY FUND (continued)
|
| Ratios assuming no
expense reductions |
|||||||||||||
|---|---|---|---|---|---|---|---|---|---|---|---|---|---|
| Ratio of net
investment income (loss) to average net assets |
Ratio of
expenses to average net assets |
Ratio of net
investment income (loss) to average net assets |
Portfolio
turnover rate |
||||||||||
| For the Year Ended August 31, | |||||||||||||
| 2000 - Class A Shares | (0.49 | )% | 2.30 | % | (0.68 | )% | 125.35 | % | |||||
| 2000 - Class B Shares | (1.00 | ) | 2.80 | (1.19 | ) | 125.35 | |||||||
| 2000 - Class C Shares | (0.96 | ) | 2.80 | (1.15 | ) | 125.35 | |||||||
| 2000 - Institutional Shares | 0.13 | 1.65 | (0.06 | ) | 125.35 | ||||||||
| 2000 - Service Shares | 0.14 | 2.15 | (0.05 | ) | 125.35 | ||||||||
| For the Seven Months Ended August 31, | |||||||||||||
| 1999 - Class A Shares | (0.15 | ) b | 2.41 | b | (0.52 | ) b | 63.24 | ||||||
| 1999 - Class B Shares | (0.71 | ) b | 2.91 | b | (281.08 | ) b | 63.24 | ||||||
| 1999 - Class C Shares | (0.85 | ) b | 2.91 | b | (1.22 | ) b | 63.24 | ||||||
| 1999 - Institutional Shares | 0.50 | b | 1.76 | b | 0.13 | b | 63.24 | ||||||
| 1999 - Service Shares | 0.12 | b | 2.26 | b | (0.25 | ) b | 63.24 | ||||||
| For the Year Ended January 31, | |||||||||||||
| 1999 - Class A Shares | 0.80 | 2.53 | 0.36 | 153.67 | |||||||||
| 1999 - Class B Shares | 0.19 | 3.03 | (0.25 | ) | 153.67 | ||||||||
| 1999 - Class C Shares | 0.28 | 3.03 | (0.16 | ) | 153.67 | ||||||||
| 1999 - Institutional Shares | 1.59 | 1.79 | 1.15 | 153.67 | |||||||||
| 1999 - Service Shares | (1.84 | ) | 2.29 | (2.28 | ) | 153.67 | |||||||
| For the Period Ended January 31, | |||||||||||||
| 1998 - Class A Shares (commenced December 15, 1997) | 0.55 | b | 5.88 | b | (3.43 | ) b | 3.35 | ||||||
| 1998 - Class B Shares (commenced December 15, 1997) | 0.05 | b | 6.39 | b | (3.93 | ) b | 3.35 | ||||||
| 1998 - Class C Shares (commenced December 15, 1997) | (0.27 | ) b | 6.46 | b | (4.25 | ) b | 3.35 | ||||||
| 1998 - Institutional Shares (commenced December 15, 1997) | 0.80 | b | 5.28 | b | (3.18 | ) b | 3.35 | ||||||
| 1998 - Service Shares (commenced December 15, 1997) | (0.05 | ) b | 6.70 | b | (4.03 | ) b | 3.35 | ||||||
| ASIA GROWTH FUND
|
|
Income from investment operations |
||||||||||||
|---|---|---|---|---|---|---|---|---|---|---|---|---|
|
Net asset value, beginning of period |
Net
investment income (loss) |
Net realized
and unrealized gain (loss) |
Total from
investment operations |
|||||||||
| For the Year Ended August 31, | ||||||||||||
| 2000 - Class A Shares | $11.07 | $(0.05 | ) c | $ 0.14 | $ 0.09 | |||||||
| 2000 - Class B Shares | 10.88 | (0.11 | ) c | 0.14 | 0.03 | |||||||
| 2000 - Class C Shares | 10.85 | (0.11 | ) c | 0.14 | 0.03 | |||||||
| 2000 - Institutional Shares | 11.24 | 0.01 | c | 0.16 | 0.17 | |||||||
| For the Seven-Month Period Ended August 31, | ||||||||||||
| 1999 - Class A Shares | 7.79 | (0.02 | ) | 3.30 | 3.28 | |||||||
| 1999 - Class B Shares | 7.68 | (0.04 | ) | 3.24 | 3.20 | |||||||
| 1999 - Class C Shares | 7.68 | (0.04 | ) | 3.21 | 3.17 | |||||||
| 1999 - Institutional Shares | 7.91 | 0.01 | 3.36 | 3.37 | ||||||||
| For the Years Ended January 31, | ||||||||||||
| 1999 - Class A Shares | 8.38 | 0.07 | (0.66 | ) | (0.59 | ) | ||||||
| 1999 - Class B Shares | 8.31 | 0.01 | (0.64 | ) | (0.63 | ) | ||||||
| 1999 - Class C Shares | 8.29 | — | (0.61 | ) | (0.61 | ) | ||||||
| 1999 - Institutional Shares | 8.44 | 0.03 | (0.56 | ) | (0.53 | ) | ||||||
| 1998 - Class A Shares | 16.31 | — | (7.90 | ) | (7.90 | ) | ||||||
| 1998 - Class B Shares | 16.24 | 0.01 | (7.91 | ) | (7.90 | ) | ||||||
| 1998 - Class C Shares (commenced August 15, 1997) | 15.73 | 0.01 | (7.42 | ) | (7.41 | ) | ||||||
| 1998 - Institutional Shares | 16.33 | 0.10 | (7.96 | ) | (7.86 | ) | ||||||
| 1997 - Class A Shares | 16.49 | 0.06 | (0.11 | ) | (0.05 | ) | ||||||
| 1997 - Class B Shares (commenced May 1, 1996) | 17.31 | (0.05 | ) | (0.48 | ) | (0.53 | ) | |||||
| 1997 - Institutional Shares (commenced February 2, 1996) | 16.61 | 0.04 | (0.11 | ) | (0.07 | ) | ||||||
| 1996 - Class A Shares | 13.31 | 0.17 | 3.44 | 3.61 | ||||||||
|
Distributions to shareholders |
|||||||||||||||||||||
|---|---|---|---|---|---|---|---|---|---|---|---|---|---|---|---|---|---|---|---|---|---|
| From net
investment income |
In excess
of net investment income |
From net
realized gains |
Total
distributions |
Net asset
value, end of period |
Total
returna |
Net assets
at end of period (in 000s) |
Ratio of
net expenses to average net assets |
||||||||||||||
| $ — | $ — | $ — | $ — | $11.16 | 0.72 | % | $ 86,458 | 1.85 | % | ||||||||||||
| — | — | — | — | 10.91 | 0.18 | 6,849 | 2.35 | ||||||||||||||
| — | — | — | — | 10.88 | 0.18 | 2,265 | 2.35 | ||||||||||||||
| — | — | — | — | 11.41 | 1.42 | 5,236 | 1.20 | ||||||||||||||
| — | |||||||||||||||||||||
| — | — | — | — | 11.07 | 42.11 | 84,269 | 1.85 | b | |||||||||||||
| — | — | — | — | 10.88 | 41.67 | 7,258 | 2.35 | b | |||||||||||||
| — | — | — | — | 10.85 | 41.28 | 2,281 | 2.35 | b | |||||||||||||
| — | (0.04 | ) | — | (0.04 | ) | 11.24 | 42.61 | 12,363 | 1.20 | b | |||||||||||
| — | |||||||||||||||||||||
| — | — | — | — | 7.79 | (7.04 | ) | 59,940 | 1.93 | |||||||||||||
| — | — | — | — | 7.68 | (7.58 | ) | 4,190 | 2.45 | |||||||||||||
| — | — | — | — | 7.68 | (7.36 | ) | 999 | 2.45 | |||||||||||||
| — | — | — | — | 7.91 | (6.28 | ) | 4,200 | 1.16 | |||||||||||||
| — | (0.03 | ) | — | (0.03 | ) | 8.38 | (48.49 | ) | 87,437 | 1.75 | |||||||||||
| — | (0.03 | ) | — | (0.03 | ) | 8.31 | (48.70 | ) | 3,359 | 2.30 | |||||||||||
| — | (0.03 | ) | — | (0.03 | ) | 8.29 | (47.17 | ) | 436 | 2.35 | b | ||||||||||
| (0.03 | ) | — | — | (0.03 | ) | 8.44 | (48.19 | ) | 874 | 1.11 | |||||||||||
| (0.12 | ) | — | (0.01 | ) | (0.13 | ) | 16.31 | (1.01 | ) | 263,014 | 1.67 | ||||||||||
| (0.51 | ) | (0.03 | ) | — | (0.54 | ) | 16.24 | (6.02 | ) | 3,354 | 2.21 | b | |||||||||
| (0.11 | ) | (0.06 | ) | (0.04 | ) | (0.21 | ) | 16.33 | (1.09 | ) | 13,322 | 1.10 | b | ||||||||
| (0.12 | ) | (0.14 | ) | (0.17 | ) | (0.43 | ) | 16.49 | 26.49 | 205,539 | 1.77 | ||||||||||
| ASIA GROWTH FUND (continued)
|
|
Ratios assuming no expense reductions |
|||||||||||||
|---|---|---|---|---|---|---|---|---|---|---|---|---|---|
| Ratio of net
investment income (loss) to average net assets |
Ratio of
expenses to average net assets |
Ratio of net
investment income (loss) to average net assets |
Portfolio
turnover rate |
||||||||||
| For the Year Ended August 31, | |||||||||||||
| 2000 - Class A Shares | (0.39 | )% | 2.30 | % | (0.84 | )% | 207.22 | % | |||||
| 2000 - Class B Shares | (0.91 | ) | 2.80 | (1.36 | ) | 207.22 | |||||||
| 2000 - Class C Shares | (0.91 | ) | 2.80 | (1.36 | ) | 207.22 | |||||||
| 2000 - Institutional Shares | 0.12 | 1.65 | (0.33 | ) | 207.22 | ||||||||
| For the Seven-Month Period Ended August 31, | |||||||||||||
| 1999 - Class A Shares | (0.38 | ) b | 2.27 | b | (0.80 | ) b | 96.58 | ||||||
| 1999 - Class B Shares | (0.90 | ) b | 2.77 | b | (1.32 | ) b | 96.58 | ||||||
| 1999 - Class C Shares | (0.89 | ) b | 2.77 | b | (1.31 | ) b | 96.58 | ||||||
| 1999 - Institutional Shares | (0.14 | ) b | 1.62 | b | (0.28 | ) b | 96.58 | ||||||
| For the Years Ended January 31, | |||||||||||||
| 1999 - Class A Shares | 0.63 | 2.48 | 0.08 | 106.00 | |||||||||
| 1999 - Class B Shares | 0.10 | 2.97 | (0.42 | ) | 106.00 | ||||||||
| 1999 - Class C Shares | 0.10 | 2.97 | (0.42 | ) | 106.00 | ||||||||
| 1999 - Institutional Shares | 1.10 | 1.68 | 0.58 | 106.00 | |||||||||
| 1998 - Class A Shares | 0.31 | 1.99 | 0.07 | 105.16 | |||||||||
| 1998 - Class B Shares | (0.29 | ) | 2.50 | (0.49 | ) | 105.16 | |||||||
| 1998 - Class C Shares (commenced August 15, 1997) | (0.26 | ) b | 2.55 | b | (0.46 | ) b | 105.16 | ||||||
| 1998 - Institutional Shares | 0.87 | 1.31 | 0.67 | 105.16 | |||||||||
| 1997 - Class A Shares | 0.20 | 1.87 | — | 48.40 | |||||||||
| 1997 - Class B Shares (commenced May 1, 1996) | (0.56 | ) b | 2.37 | b | (0.72 | ) b | 48.40 | ||||||
| 1997 - Institutional Shares (commenced February 2, 1996) | 0.54 | b | 1.26 | b | 0.38 | b | 48.40 | ||||||
| 1996 - Class A Shares | 1.05 | 2.02 | 0.80 | 88.80 | |||||||||
a
|
Assumes investment at the net asset value at the beginning of the period, reinvestment of all dividends and
distributions, a complete redemption of the investment at the net asset value at the end of the period and no sales or redemption charges. Total return would be reduced if a sales or redemption charge were taken into account. Total returns for periods
less than one full year are not annualized.
|
b
|
Annualized.
|
c
|
Calculated based on the average shares outstanding methodology.
|
| FOR MORE INFORMATION
|
| Annual/Semi-annual Report
|
| Additional information about the Funds’ investments is available in the Funds’ annual and semi-annual reports to
shareholders. In the Funds’ annual reports, you will find a discussion of the market conditions and investment strategies that significantly affected the Funds’ performance during the last fiscal year.
|
| Statement of Additional Information
|
| Additional information about the Funds and their policies is also available in the Funds’ Statement of Additional Information
(“Additional Statement”). The Additional Statement is incorporated by reference into this Prospectus (is legally considered part of this Prospectus).
|
| The Funds’ annual and semi-annual reports, and the Additional Statement, are available free upon request by calling Goldman
Sachs at 1-800-621-2550.
|
| To obtain other information and for shareholder inquiries:
|
| By telephone – Call 1-800-621-2550
|
| By mail – Goldman Sachs Funds, 4900 Sears Tower, Chicago, IL 60606-6372
|
| By e-mail – [email protected]
|
| On the Internet – Text-only versions of the Funds’ documents are located online and may be downloaded from:
|
| SEC EDGAR database – http://www.sec.gov
|
| You may review and obtain copies of Fund documents by visiting the SEC’s Public Reference Room in Washington, D.C. You may
also obtain copies of Fund documents, after paying a duplicating fee, by writing to the SEC’s Public Reference Section, Washington, D.C. 20549-0102 or by electronic request to: [email protected]. Information on the operation of the public reference
room may be obtained by calling the SEC at (202) 942-8090.
|
| The Funds’ investment company registration number is 811-5349.
|
| CORE
SM
is a service mark of Goldman, Sachs & Co.
|
| Prospectus
|
| GOLDMAN SACHS DOMESTIC EQUITY FUNDS
|
n
|
Goldman Sachs Balanced Fund
|
n
|
Goldman Sachs Growth and Income Fund
|
n
|
Goldman Sachs CORE
SM
Large Cap Value Fund
|
n
|
Goldman Sachs CORE
SM
U.S. Equity Fund
|
n
|
Goldman Sachs CORE
SM
Large Cap Growth Fund
|
n
|
Goldman Sachs CORE
SM
Small Cap Equity Fund
|
n
|
Goldman Sachs Capital Growth Fund
|
n
|
Goldman Sachs Strategic Growth Fund
|
n
|
Goldman Sachs Growth Opportunities Fund
|
n
|
Goldman Sachs Mid Cap Value Fund (formerly Mid Cap Equity)
|
n
|
Goldman Sachs Small Cap Value Fund
|
n
|
Goldman Sachs Large Cap Value Fund
|


| THE SECURITIES AND EXCHANGE COMMISSION HAS NOT APPROVED OR DISAPPROVED THESE SECURITIES OR PASSED UPON THE ADEQUACY OF THIS PROSPECTUS.
ANY REPRESENTATION TO THE CONTRARY IS A CRIMINAL OFFENSE.
|
| AN INVESTMENT IN A FUND IS NOT A BANK DEPOSIT AND IS NOT INSURED BY THE FEDERAL DEPOSIT INSURANCE CORPORATION OR ANY OTHER GOVERNMENT
AGENCY. AN INVESTMENT IN A FUND INVOLVES INVESTMENT RISKS, INCLUDING POSSIBLE LOSS OF PRINCIPAL.
|
| NOT FDIC-INSURED
|
May Lose Value
|
No Bank Guarantee
|
| Goldman Sachs Asset Management, a unit of the Investment Management Division of Goldman, Sachs & Co. (“Goldman
Sachs”), serves as investment adviser to the Balanced, Growth and Income, CORE Large Cap Value, CORE Large Cap Growth, CORE Small Cap Equity, Strategic Growth, Growth Opportunities, Mid Cap Value, Small Cap Value and Large Cap Value Funds. Goldman
Sachs Funds Management, L.P. serves as investment adviser to the CORE U.S. Equity and Capital Growth Funds. Goldman Sachs Asset Management and Goldman Sachs Funds Management, L.P. are each referred to in this Prospectus as the “Investment Adviser.”
;
|
| VALUE STYLE FUNDS
|
| Goldman Sachs’ Value Investment Philosophy:
|
| Through intensive, hands-on research our portfolio team seeks to identify:
|
1.
|
Well-positioned businesses that have:
|
n
|
Attractive returns on capital.
|
n
|
Sustainable earnings and cash flow.
|
n
|
Strong company management focused on long-term returns to shareholders.
|
2.
|
Attractive valuation opportunities where:
|
n
|
The intrinsic value of the business is not reflected in the stock price.
|
| Business quality, conservative valuation, and thoughtful portfolio construction are the key elements of our value approach.
|
| GROWTH STYLE FUNDS
|
| Goldman Sachs’ Growth Investment Philosophy:
|
1.
|
Invest as if buying the company/business, not simply trading its stock:
|
n
|
Understand the business, management, products and competition.
|
n
|
Perform intensive, hands-on fundamental research.
|
n
|
Seek businesses with strategic competitive advantages.
|
n
|
Over the long-term, expect each company’s stock price ultimately to track the growth in the value of the business.
|
2.
|
Buy high-quality growth businesses that possess strong business franchises, favorable long-term prospects and
excellent management.
|
3.
|
Purchase superior long-term growth companies at a favorable price—seek to purchase at a fair valuation,
giving the investor the potential to fully capture returns from above-average growth rates.
|
| Growth companies have earnings expectations that exceed those of the stock market as a whole.
|
| QUANTITATIVE (“CORE”) STYLE FUNDS
|
| Goldman Sachs’ CORE Investment Philosophy:
|
| Goldman Sachs’ quantitative style of funds—CORE—emphasizes the two building blocks of active management: stock
selection and portfolio construction.
|
| I. CORE Stock Selection
|
| The CORE Funds use the Goldman Sachs’ proprietary multifactor model (“Multifactor Model”), a rigorous computerized
rating system, to forecast the returns of securities held in each Fund’s portfolio. The Multifactor Model incorporates common variables covering measures of:
|
n
|
Research (What do fundamental analysts think about the company and its prospects?)
|
n
|
Value (How is the company priced relative to fundamental accounting measures?)
|
n
|
Momentum (What are medium-term price trends? How has the price responded to new information?)
|
n
|
Profitability (What is the company’s margin on sales? How efficient are its operations?)
|
n
|
Earnings Quality (Were earnings derived from sustainable (cash-based) sources?)
|
| All of the above factors are carefully evaluated within the Multifactor Model since each has demonstrated a significant
impact on the performance of the securities and markets they were designed to forecast. Stock selection in this process combines both our quantitative and qualitative analysis.
|
| II. CORE Portfolio Construction
|
| A proprietary risk model, which is intended to identify and measure risk as accurately as possible, includes all the above factors
used in the return model to select stocks, as well as several other factors associated with risk but not return. In this process, the Investment Adviser manages risk by attempting to limit deviations from the benchmark, and by attempting to run a size and
sector neutral portfolio. A computer optimizer evaluates many different security combinations (considering many possible weightings) in an effort to construct the most efficient risk/return portfolio given each CORE Fund benchmark.
|
| Goldman Sachs CORE Funds are fully invested, broadly diversified and offer consistent overall portfolio characteristics. They may
serve as good foundations on which to build a portfolio.
|
| Balanced Fund
|
|
Objective:
|
Long-term growth of capital and current income
|
|
Benchmarks:
|
S&P 500® Index and Lehman Brothers Aggregate Bond Index
|
|
Investment Focus:
|
Large capitalization U.S. stocks and fixed-income securities
|
|
Investment Style:
|
Asset Allocation, with growth and value (blend) equity components
|
| INVESTMENT OBJECTIVE
|
| The Fund seeks to provide long-term growth of capital and current income. The Fund seeks growth of capital primarily through
investments in equity securities (stocks). The Fund seeks to provide current income through investment in fixed-income securities (bonds).
|
| PRINCIPAL INVESTMENT STRATEGIES
|
| Historically, stock and bond markets have often had different cycles, with one asset class rising when the other is falling. A
balanced objective seeks to reduce the volatility associated with investing in a single market. There is no guarantee, however, that market cycles will move in opposition to one another or that a balanced investment program will successfully reduce
volatility.
|
| The percentage of the portfolio invested in equity and fixed-income securities will vary from time to time as the Investment
Adviser evaluates such securities’ relative attractiveness based on market valuations, economic growth and inflation prospects. The allocation between equity and fixed-income securities is subject to the Fund’s intention to pay regular quarterly
dividends. The amount of quarterly dividends can also be expected to fluctuate in accordance with factors such as prevailing interest rates and the percentage of the Fund’s assets invested in fixed-income securities.
|
| Equity Securities. The Fund invests, under normal circumstances, between 45% and 65% of its total assets in equity securities. Although the Fund’s equity investments consist primarily of publicly traded U.S. securities, the Fund may invest up to 10% of its total
assets in the equity securities of foreign issuers, including issuers in countries with emerging markets or economies (“emerging countries”) and equity securities quoted in foreign currencies. A portion of the Fund’s portfolio of equity
securities may be selected primarily to provide current income (including interests in real estate investment trusts (“REITs”), convertible securities, preferred stocks, utility stocks, and interests in limited partnerships).
|
| Fixed Income Securities. The Fund invests at least 25% of its total assets in fixed-income senior securities. The remainder of the Fund’s assets are invested in other fixed-income securities and cash.
|
| The Fund’s fixed-income securities primarily include:
|
n
|
Securities issued by the U.S. government, its agencies, instrumentalities or sponsored enterprises
|
n
|
Securities issued by corporations, banks and other issuers
|
n
|
Mortgage-backed and asset-backed securities
|
| The Fund may also invest up to 10% of its total assets in debt obligations (U.S. dollar and non-U.S.-dollar denominated) issued or
guaranteed by one or more foreign governments or any of their political subdivisions, agencies or instrumentalities and foreign corporations or other entities. The issuers of these securities may be located in emerging countries.
|
|
Objective:
|
Long-term growth of capital and growth of income
|
|
Benchmark:
|
S&P 500® Index
|
|
Investment Focus:
|
Large capitalization U.S. equity securities with an emphasis on undervalued stocks
|
|
Investment Style:
|
Value
|
| INVESTMENT OBJECTIVE
|
| The Fund seeks long-term growth of capital and growth of income.
|
| PRINCIPAL INVESTMENT STRATEGIES
|
| Equity Securities. The Fund invests, under normal circumstances, at least 65% of its total assets in equity securities that the Investment Adviser considers to have favorable prospects for capital appreciation and/or dividend-paying ability. Although the Fund will invest
primarily in publicly traded U.S. securities, it may invest up to 25% of its total assets in foreign securities, including securities of issuers in emerging countries and securities quoted in foreign currencies.
|
| Other.
The Fund may also invest up to 35% of its total assets in fixed-income securities, such as government, corporate and bank debt obligations, that offer the potential to further the Fund’s investment objective.
|
|
Objective:
|
Long-term growth of capital and dividend income
|
|
Benchmark:
|
Russell 1000® Value Index
|
|
Investment Focus:
|
Diversified portfolio of equity securities of large-cap U.S. issuers selling at low to modest valuations
|
|
Investment Style:
|
Quantitative, applied to large-cap value stocks
|
| INVESTMENT OBJECTIVE
|
| The Fund seeks long-term growth of capital and dividend income. The Fund seeks this objective through a broadly diversified
portfolio of equity securities of large-cap U.S. issuers that are selling at low to modest valuations relative to general market measures, such as earnings, book value and other fundamental accounting measures, and that are expected to have favorable
prospects for capital appreciation and/or dividend-paying ability.
|
| PRINCIPAL INVESTMENT STRATEGIES
|
| Equity Securities. The Fund invests, under normal circumstances, at least 90% of its total assets in equity securities of U.S. issuers, including foreign issuers that are traded in the United States.
|
| The Fund’s investments are selected using both a variety of quantitative techniques and fundamental research in seeking to
maximize the Fund’s expected return, while maintaining risk, style, capitalization and industry characteristics similar to the Russell 1000® Value Index. The Fund seeks a portfolio consisting of companies with above average capitalizations and
low to moderate valuations as measured by price/earnings ratios, book value and other fundamental accounting measures.
|
| Other.
The Fund’s investments in fixed-income securities are limited to securities that are considered cash equivalents.
|
|
Objective:
|
Long-term growth of capital and dividend income
|
|
Benchmark:
|
S&P 500® Index
|
|
Investment Focus:
|
Large-cap U.S. equity securities
|
|
Investment Style:
|
Quantitative, applied to large-cap growth and value (blend) stocks
|
| INVESTMENT OBJECTIVE
|
| The Fund seeks long-term growth of capital and dividend income. The Fund seeks this objective through a broadly diversified
portfolio of large-cap and blue chip equity securities representing all major sectors of the U.S. economy.
|
| PRINCIPAL INVESTMENT STRATEGIES
|
| Equity Securities. The Fund invests, under normal circumstances, at least 90% of its total assets in equity securities of U.S. issuers, including foreign issuers that are traded in the United States.
|
| The Fund’s investments are selected using both a variety of quantitative techniques and fundamental research in seeking to
maximize the Fund’s expected return, while maintaining risk, style, capitalization and industry characteristics similar to the S&P 500® Index. The Fund seeks a broad representation in most major sectors of the U.S. economy and a portfolio
consisting of companies with average long-term earnings growth expectations and dividend yields.
|
| Other.
The Fund’s investments in fixed-income securities are limited to securities that are considered cash equivalents.
|
|
Objective:
|
Long-term growth of capital; dividend income is a secondary consideration
|
|
Benchmark:
|
Russell 1000® Growth Index
|
|
Investment Focus:
|
Large-cap, growth-oriented U.S. stocks
|
|
Investment Style:
|
Quantitative, applied to large-cap growth stocks
|
| INVESTMENT OBJECTIVE
|
| The Fund seeks long-term growth of capital. The Fund seeks this objective through a broadly diversified portfolio of equity
securities of large-cap U.S. issuers that are expected to have better prospects for earnings growth than the growth rate of the general domestic economy. Dividend income is a secondary consideration.
|
| PRINCIPAL INVESTMENT STRATEGIES
|
| Equity Securities. The Fund invests, under normal circumstances, at least 90% of its total assets in equity securities of U.S. issuers, including foreign issuers that are traded in the United States.
|
| The Investment Adviser emphasizes a company’s growth prospects in analyzing equity securities to be purchased by the Fund.
The Fund’s investments are selected using both a variety of quantitative techniques and fundamental research in seeking to maximize the Fund’s expected return, while maintaining risk, style, capitalization and industry characteristics similar to
the Russell 1000® Growth Index. The Fund seeks a portfolio consisting of companies with above average capitalizations and earnings growth expectations and below average dividend yields.
|
| Other.
The Fund’s investments in fixed-income securities are limited to securities that are considered cash equivalents.
|
|
Objective:
|
Long-term growth of capital
|
|
Benchmark:
|
Russell 2000® Index
|
|
Investment Focus:
|
Stocks of small capitalization U.S. companies
|
|
Investment Style:
|
Quantitative, applied to small-cap growth and value (blend) stocks
|
| INVESTMENT OBJECTIVE
|
| The Fund seeks long-term growth of capital. The Fund seeks this objective through a broadly diversified portfolio of equity
securities of U.S. issuers which are included in the Russell 2000® Index at the time of investment.
|
| PRINCIPAL INVESTMENT STRATEGIES
|
| Equity Securities. The Fund invests, under normal circumstances, at least 90% of its total assets in equity securities of U.S. issuers, including foreign issuers that are traded in the United States.
|
| The Fund’s investments are selected using both a variety of quantitative techniques and fundamental research in seeking to
maximize the Fund’s expected return, while maintaining risk, style, capitalization and industry characteristics similar to the Russell 2000® Index. The Fund seeks a portfolio consisting of companies with small market capitalizations, strong
expected earnings growth and momentum, and better valuation and risk characteristics than the Russell 2000® Index. If the issuer of a portfolio security held by the Fund is no longer included in the Russell 2000® Index, the Fund may, but is not
required to, sell the security.
|
| Other.
The Fund’s investments in fixed-income securities are limited to securities that are considered cash equivalents.
|
|
Objective:
|
Long-term growth of capital
|
|
Benchmark:
|
S&P 500® Index
|
|
Investment Focus:
|
Large-cap U.S. equity securities that offer long-term capital appreciation potential
|
|
Investment Style:
|
Growth
|
| INVESTMENT OBJECTIVE
|
| The Fund seeks long-term growth of capital.
|
| PRINCIPAL INVESTMENT STRATEGIES
|
| Equity Securities. The Fund invests, under normal circumstances, at least 90% of its total assets in equity securities. The Fund seeks to achieve its investment objective by investing in a diversified portfolio of equity securities that are considered by the Investment
Adviser to have long-term capital appreciation potential. Although the Fund invests primarily in publicly traded U.S. securities, it may invest up to 10% of its total assets in foreign securities, including securities of issuers in emerging countries and
securities quoted in foreign currencies.
|
|
Objective:
|
Long-term growth of capital
|
|
Benchmark:
|
S&P 500® Index
|
|
Investment Focus:
|
Large-cap U.S. equity securities that are considered to be strategically positioned for consistent long-term growth
|
|
Investment Style:
|
Growth
|
| INVESTMENT OBJECTIVE
|
| The Fund seeks long-term growth of capital.
|
| PRINCIPAL INVESTMENT STRATEGIES
|
| Equity Securities. The Fund invests, under normal circumstances, at least 90% of its total assets in equity securities. The Fund seeks to achieve its investment objective by investing in a diversified portfolio of equity securities that are considered by the Investment
Adviser to be strategically positioned for consistent long-term growth. Although the Fund invests primarily in publicly traded U.S. securities, it may invest up to 10% of its total assets in foreign securities, including securities of issuers in emerging
countries and securities quoted in foreign currencies.
|
|
Objective:
|
Long-term growth of capital
|
|
Benchmark:
|
S&P Midcap 400 Index
|
|
Investment Focus:
|
U.S. equity securities that offer long-term capital appreciation
with a primary focus on mid-capitalization companies |
|
Investment Style:
|
Growth
|
| INVESTMENT OBJECTIVE
|
| The Fund seeks long-term growth of capital.
|
| PRINCIPAL INVESTMENT STRATEGIES
|
| Equity Securities. The Fund invests, under normal circumstances, at least 90% of its total assets in equity securities with a primary focus on mid-cap companies. The Fund seeks to achieve its investment objective by investing in a diversified portfolio of equity securities
that are considered by the Investment Adviser to be strategically positioned for long-term growth. Although the Fund invests primarily in publicly traded U.S. securities, it may invest up to 10% of its total assets in foreign securities, including
securities of issuers in emerging countries and securities quoted in foreign currencies.
|
|
Objective:
|
Long-term capital appreciation
|
|
Benchmark:
|
Russell Midcap Value Index
|
|
Investment Focus:
|
Mid-capitalization U.S. stocks that are believed to be undervalued or undiscovered by the marketplace
|
|
Investment Style:
|
Value
|
| INVESTMENT OBJECTIVE
|
| The Fund seeks long-term capital appreciation.
|
| PRINCIPAL INVESTMENT STRATEGIES
|
| Equity Securities. The Fund invests, under normal circumstances, substantially all of its assets in equity securities and at least 65% of its total assets in equity securities of mid-cap companies with public stock market capitalizations (based upon shares available for
trading on an unrestricted basis) within the range of the market capitalization of companies constituting the Russell Midcap Value Index at the time of investment (currently between $300 million and $15 billion). If the market capitalization of a company
held by the Fund moves outside this range, the Fund may, but is not required to, sell the securities. Although the Fund will invest primarily in publicly traded U.S. securities, it may invest up to 25% of its total assets in foreign securities, including
securities of issuers in emerging countries and securities quoted in foreign currencies.
|
| Other.
The Fund may invest in the aggregate up to 35% of its total assets in companies with public stock market capitalizations outside the range of companies constituting the Russell Midcap Value Index at the time of investment and in fixed-income securities,
such as government, corporate and bank debt obligations.
|
|
Objective:
|
Long-term growth of capital
|
|
Benchmark:
|
Russell 2000® Value Index
|
|
Investment Focus:
|
Small-capitalization U.S. stocks that are believed to be undervalued or undiscovered by the marketplace
|
|
Investment Style:
|
Value
|
| INVESTMENT OBJECTIVE
|
| The Fund seeks long-term growth of capital.
|
| PRINCIPAL INVESTMENT STRATEGIES
|
| Equity Securities. The Fund invests, under normal circumstances, at least 65% of its total assets in equity securities of companies with public stock market capitalizations (based upon shares available for trading on an unrestricted basis) within the range of the market
capitalization of companies constituting the Russell 2000® Value Index at the time of investment (currently between $20 million and $3 billion). If the market capitalization of a company held by the Fund moves outside this range, the Fund may, but is
not required to, sell the securities. Under normal circumstances, the Fund’s investment horizon for ownership of stocks will be two to three years. Although the Fund will invest primarily in publicly traded U.S. securities, it may invest up to 25% of
its total assets in foreign securities, including securities of issuers in emerging countries and securities quoted in foreign currencies.
|
| Other.
The Fund may invest in the aggregate up to 35% of its total assets in companies with public stock market capitalizations outside the range of companies constituting the Russell 2000® Value Index at the time of investment and in fixed-income
securities, such as government, corporate and bank debt obligations.
|
|
Objective:
|
Long-term capital appreciation
|
|
Benchmark:
|
Russell 1000® Value Index
|
|
Investment Focus:
|
Large capitalization U.S. equity securities that are believed to be undervalued
|
|
Investment Style:
|
Value
|
| INVESTMENT OBJECTIVE
|
| The Fund seeks long-term capital appreciation.
|
| PRINCIPAL INVESTMENT STRATEGIES
|
| Equity Securities. The Fund invests, under normal circumstances, at least 90% of its total assets in equity securities. The Fund seeks its investment objective by investing in value opportunities that the Investment Adviser defines as companies with identifiable
competitive advantages whose intrinsic value is not reflected in the stock price. Although the Fund will invest primarily in publicly traded U.S. securities, it may invest up to 25% of its total assets in foreign securities, including securities quoted in
foreign currencies.
|
| Other.
The Fund may invest up to 10% of its total assets in fixed-income securities, such as government, corporate and bank debt obligations.
|
Ÿ
|
No specific percentage limitation on usage;
limited only by the objectives and strategies of the Fund |
| Balanced
Fund |
Growth
and Income Fund |
CORE
Large Cap Value Fund |
CORE
U.S. Equity Fund |
||||||
|---|---|---|---|---|---|---|---|---|---|
| Investment Practices | |||||||||
| Borrowings | 33 1
/3
|
33 1
/3
|
33 1
/3
|
33 1
/3
|
|||||
| Credit, Currency, Index, Interest Rate and
Mortgage Swaps* |
15 | — | — | — | |||||
| Cross Hedging of Currencies | Ÿ | Ÿ | Ÿ | Ÿ | |||||
| Custodial Receipts | Ÿ | Ÿ | Ÿ | Ÿ | |||||
| Equity Swaps* | 15 | 15 | 15 | 15 | |||||
| Foreign Currency Transactions** | Ÿ 1 | Ÿ | Ÿ | Ÿ | |||||
| Futures Contracts and Options on Futures
Contracts |
Ÿ | Ÿ | Ÿ 2 | Ÿ 3 | |||||
| Interest Rate Caps, Floors and Collars | Ÿ | — | — | — | |||||
| Investment Company Securities (including
iShares SM and Standard & Poor’s Depositary Receipts TM ) |
10 | 10 | 10 | 10 | |||||
| Loan Participations | Ÿ | — | — | — | |||||
| Mortgage Dollar Rolls | Ÿ | — | — | — | |||||
| Options on Foreign Currencies 4 | Ÿ | Ÿ | Ÿ | Ÿ | |||||
| Options on Securities and Securities Indices 5 | Ÿ | Ÿ | Ÿ | Ÿ | |||||
| Repurchase Agreements | Ÿ | Ÿ | Ÿ | Ÿ | |||||
| Reverse Repurchase Agreements (for investment
purposes) |
Ÿ | — | — | — | |||||
| Securities Lending | 33 1
/3
|
33 1
/3
|
33 1
/3
|
33 1
/3
|
|||||
| Short Sales Against the Box | 25 | 25 | — | — | |||||
| Unseasoned Companies | Ÿ | Ÿ | Ÿ | Ÿ | |||||
| Warrants and Stock Purchase Rights | Ÿ | Ÿ | Ÿ | Ÿ | |||||
| When-Issued Securities and Forward
Commitments |
Ÿ | Ÿ | Ÿ | Ÿ | |||||
*
|
Limited to 15% of net assets (together with other illiquid securities) for all structured securities which are not
deemed to be liquid and all swap transactions.
|
**
|
Limited by the amount the Fund invests in foreign securities.
|
1
|
The Balanced Fund may also enter into forward foreign currency exchange contracts to seek to increase total return.
|
2
|
The CORE Large Cap Value, CORE Large Cap Growth and CORE Small Cap Equity Funds may enter into futures transactions only
with respect to a representative index.
|
3
|
The CORE U.S. Equity Fund may enter into futures transactions only with respect to the S&P 500 Index.
|
4
|
The Funds may purchase and sell call and put options.
|
5
|
The Funds may sell covered call and put options and purchase call and put options.
|
| CORE
Large Cap Growth Fund |
CORE
Small Cap Equity Fund |
Capital
Growth Fund |
Strategic
Growth Fund |
Growth
Opportunities Fund |
Mid Cap
Value Fund |
Small Cap
Value Fund |
Large Cap
Value Fund |
||||||||
|---|---|---|---|---|---|---|---|---|---|---|---|---|---|---|---|
| 33 1
/3
|
33 1
/3
|
33 1
/3
|
33 1
/3
|
33 1
/3
|
33 1
/3
|
33 1
/3
|
33 1
/3
|
||||||||
| — | — | — | — | — | — | — | — | ||||||||
| Ÿ | Ÿ | Ÿ | Ÿ | Ÿ | Ÿ | Ÿ | Ÿ | ||||||||
| Ÿ | Ÿ | Ÿ | Ÿ | Ÿ | Ÿ | Ÿ | Ÿ | ||||||||
| 15 | 15 | 15 | 15 | 15 | 15 | 15 | 15 | ||||||||
| Ÿ | Ÿ | Ÿ | Ÿ | Ÿ | Ÿ | Ÿ | Ÿ | ||||||||
| Ÿ 2 | Ÿ 2 | Ÿ | Ÿ | Ÿ | Ÿ | Ÿ | Ÿ | ||||||||
| — | — | — | — | — | — | — | — | ||||||||
| 10 | 10 | 10 | 10 | 10 | 10 | 10 | 10 | ||||||||
| — | — | — | — | — | — | — | — | ||||||||
| — | — | — | — | — | — | — | — | ||||||||
| Ÿ | Ÿ | Ÿ | Ÿ | Ÿ | Ÿ | Ÿ | Ÿ | ||||||||
| Ÿ | Ÿ | Ÿ | Ÿ | Ÿ | Ÿ | Ÿ | Ÿ | ||||||||
| Ÿ | Ÿ | Ÿ | Ÿ | Ÿ | Ÿ | Ÿ | Ÿ | ||||||||
| — | — | — | — | — | — | — | — | ||||||||
| 33 1
/3
|
33 1
/3
|
33 1
/3
|
33 1
/3
|
33 1
/3
|
33 1
/3
|
33 1
/3
|
33 1
/3
|
||||||||
| — | — | 25 | 25 | 25 | 25 | 25 | 25 | ||||||||
| Ÿ | Ÿ | Ÿ | Ÿ | Ÿ | Ÿ | Ÿ | Ÿ | ||||||||
| Ÿ | Ÿ | Ÿ | Ÿ | Ÿ | Ÿ | Ÿ | Ÿ | ||||||||
| Ÿ | Ÿ | Ÿ | Ÿ | Ÿ | Ÿ | Ÿ | Ÿ | ||||||||
Ÿ
|
No specific percentage limitation on usage;
limited only by the objectives and strategies of the Fund |
| Balanced
Fund |
Growth
and Income Fund |
CORE
Large Cap Value Fund |
CORE
U.S. Equity Fund |
||||||||||
|---|---|---|---|---|---|---|---|---|---|---|---|---|---|
| Investment Securities | |||||||||||||
| American, European and Global Depositary
Receipts |
Ÿ | Ÿ | Ÿ 6 | Ÿ 6 | |||||||||
| Asset-Backed and Mortgage-Backed Securities 7 | Ÿ | Ÿ | — | — | |||||||||
| Bank Obligations 7 | Ÿ | Ÿ | Ÿ | Ÿ | |||||||||
| Convertible Securities 8 | Ÿ | Ÿ | Ÿ | Ÿ | |||||||||
| Corporate Debt Obligations 7 | Ÿ | Ÿ | Ÿ 9 | Ÿ 9 | |||||||||
| Equity Securities | 45-65 | 65 | + | 90 | + | 90 | + | ||||||
| Emerging Country Securities | 10 10 | 25 | 10 | — | — | ||||||||
| Fixed Income Securities 11 | 35-45 | 18 | 35 | 10 | 9 | 10 | 9 | ||||||
| Foreign Securities | 10 10 | 25 | 10 | Ÿ 14 | Ÿ 14 | ||||||||
| Foreign Government Securities 7 | Ÿ | — | — | — | |||||||||
| Municipal Securities | Ÿ | — | — | — | |||||||||
| Non-Investment Grade Fixed Income Securities | 10 15 | 10 | 16 | — | — | ||||||||
| Real Estate Investment Trusts | Ÿ | Ÿ | Ÿ | Ÿ | |||||||||
| Stripped Mortgage Backed Securities 7 | Ÿ | — | — | — | |||||||||
| Structured Securities* | Ÿ | Ÿ | Ÿ | Ÿ | |||||||||
| Temporary Investments | 100 | 100 | 35 | 35 | |||||||||
| U.S. Government Securities 7 | Ÿ | Ÿ | Ÿ | Ÿ | |||||||||
| Yield Curve Options and Inverse Floating Rate
Securities |
Ÿ | — | — | — | |||||||||
*
|
Limited to 15% of net assets (together with other illiquid securities) for all structured securities which are not
deemed to be liquid and all swap transactions.
|
6
|
The CORE Funds may not invest in European Depositary Receipts.
|
7
|
Limited by the amount the Fund invests in fixed-income securities.
|
8
|
Convertible securities purchased by the Balanced Fund must be B or higher by Standard & Poor’s Rating Group
(“Standard & Poor’s”) or Moody’s Investor’s Service, Inc. (“Moody’s”). The CORE Funds have no minimum rating criteria and all other Funds use the same rating criteria for convertible and non-convertible debt
securities.
|
9
|
Cash equivalents only.
|
10
|
The Balanced, Growth and Income, Capital Growth, Strategic Growth, Growth Opportunities, Mid Cap Value and Small Cap
Value Funds may invest in the aggregate up to 10%, 25%, 10%, 10%, 10%, 25% and 25%, respectively, of their total assets in foreign securities, including emerging country securities.
|
11
|
Except as noted under “Non-Investment Grade Fixed Income Securities,” fixed-income securities must be
investment grade (i.e., BBB or higher by Standard & Poor’s or Baa or higher by Moody’s).
|
12
|
The Mid Cap Value Fund may invest in the aggregate up to 35% of its total assets is (1) securities of companies with
public stock market capitalizations outside the range of companies constituting the Russell Midcap Value Index at the time of investment and (2) fixed-income securities.
|
13
|
The Small Cap Value Fund may invest in the aggregate up to 35% of its total assets in: (1) securities of companies with
public stock market capitalizations outside the range of companies constituting the Russell 2000® Value Index at the time of investment and (2) fixed-income securities.
|
| CORE
Large Cap Growth Fund |
CORE
Small Cap Equity Fund |
Capital
Growth Fund |
Strategic
Growth Fund |
Growth
Opportunities Fund |
Mid Cap
Value Fund |
Small Cap
Value Fund |
Large Cap
Value Fund |
|||||||||
|---|---|---|---|---|---|---|---|---|---|---|---|---|---|---|---|---|
| Ÿ 6 | Ÿ 6 | Ÿ | Ÿ | Ÿ | Ÿ | Ÿ | Ÿ | |||||||||
| — | — | Ÿ | Ÿ | Ÿ | Ÿ | Ÿ | Ÿ | |||||||||
| Ÿ | Ÿ | Ÿ | Ÿ | Ÿ | Ÿ | Ÿ | Ÿ | |||||||||
| Ÿ | Ÿ | Ÿ | Ÿ | Ÿ | Ÿ | Ÿ | Ÿ | |||||||||
| Ÿ 9 | Ÿ 9 | Ÿ | Ÿ | Ÿ | Ÿ | Ÿ | Ÿ | |||||||||
| 90+ | 90+ | 90 | + | 90+ | 90+ | 65+ | 65+ | 90+ | ||||||||
| — | — | 10 | 10 | 10 10 | 10 10 | 25 10 | 25 10 | — | ||||||||
| 10 9 | 10 9 | Ÿ | Ÿ | Ÿ | 35 12 | 35 13 | 10 | |||||||||
| Ÿ |
Ÿ 14 | 10 | 10 | 10 10 | 10 10 | 25 10 | 25 10 | 25 | ||||||||
| — | — | — | — | — | — | — | — | |||||||||
| — | — | — | — | — | — | — | — | |||||||||
| — | — | 10 | 16 | 10 16 | 10 16 | 10 17 | 35 16 | 10 16 | ||||||||
| Ÿ | Ÿ | Ÿ | Ÿ | Ÿ | Ÿ | Ÿ | Ÿ | |||||||||
| — | — | — | — | — | — | — | — | |||||||||
| Ÿ | Ÿ | Ÿ | Ÿ | Ÿ | Ÿ | Ÿ | Ÿ | |||||||||
| 35 | 35 | 100 | 100 | 100 | 100 | 100 | 100 | |||||||||
| Ÿ | Ÿ | Ÿ | Ÿ | Ÿ | Ÿ | Ÿ | Ÿ | |||||||||
| — | — | — | — | — | — | — | — | |||||||||
14
|
Equity securities of foreign issuers must be traded in the United States.
|
15
|
Must be at least BB or B by Standard & Poor’s or Ba or B by Moody’s.
|
16
|
May be BB or lower by Standard & Poor’s or Ba or lower by Moody’s.
|
17
|
Must be B or higher by Standard & Poor’s or B or higher by Moody’s.
|
18
|
The Balanced Fund invests at least 25% of its total assets in fixed-income senior securities; the remainder may be
invested in other fixed-income securities and cash.
|
| Ÿ
Applicable
— Not applicable |
Balanced
Fund |
Growth
and Income Fund |
CORE
Large Cap Value Fund |
CORE
U.S. Equity Fund |
CORE
Large Cap Growth Fund |
CORE
Small Cap Equity Fund |
|||||||
|---|---|---|---|---|---|---|---|---|---|---|---|---|---|
| Credit/Default | Ÿ | Ÿ | Ÿ | Ÿ | Ÿ | Ÿ | |||||||
| Foreign | Ÿ | Ÿ | Ÿ | Ÿ | Ÿ | Ÿ | |||||||
| Emerging Countries | Ÿ | Ÿ | Ÿ | Ÿ | Ÿ | Ÿ | |||||||
| Small Cap | — | — | — | — | — | Ÿ | |||||||
| Stock | Ÿ | Ÿ | Ÿ | Ÿ | Ÿ | Ÿ | |||||||
| Derivatives | Ÿ | Ÿ | Ÿ | Ÿ | Ÿ | Ÿ | |||||||
| Interest Rate | Ÿ | Ÿ | Ÿ | Ÿ | Ÿ | Ÿ | |||||||
| Management | Ÿ | Ÿ | Ÿ | Ÿ | Ÿ | Ÿ | |||||||
| Market | Ÿ | Ÿ | Ÿ | Ÿ | Ÿ | Ÿ | |||||||
| Liquidity | Ÿ | Ÿ | Ÿ | Ÿ | Ÿ | Ÿ | |||||||
| Initial Public Offering (“IPO”) | — | — | — | — | — | — | |||||||
| Capital
Growth Fund |
Strategic
Growth Fund |
Growth
Opportunities Fund |
Mid
Cap Value Fund |
Small Cap Value Fund |
Large
Cap Value Fund |
||||||
|---|---|---|---|---|---|---|---|---|---|---|---|
| Ÿ | Ÿ | Ÿ | Ÿ | Ÿ | Ÿ | ||||||
| Ÿ | Ÿ | Ÿ | Ÿ | Ÿ | Ÿ | ||||||
| Ÿ | Ÿ | Ÿ | Ÿ | Ÿ | Ÿ | ||||||
| — | — | — | Ÿ | Ÿ | — | ||||||
| Ÿ | Ÿ | Ÿ | Ÿ | Ÿ | Ÿ | ||||||
| Ÿ | Ÿ | Ÿ | Ÿ | Ÿ | Ÿ | ||||||
| Ÿ | Ÿ | Ÿ | Ÿ | Ÿ | Ÿ | ||||||
| Ÿ | Ÿ | Ÿ | Ÿ | Ÿ | Ÿ | ||||||
| Ÿ | Ÿ | Ÿ | Ÿ | Ÿ | Ÿ | ||||||
| Ÿ | Ÿ | Ÿ | Ÿ | Ÿ | Ÿ | ||||||
| — | Ÿ | Ÿ | Ÿ | Ÿ | — | ||||||
n
|
Credit/Default Risk—The risk that an issuer or guarantor of fixed-income securities held by a Fund may default
on its obligation to pay interest and repay principal.
|
n
|
Foreign Risk—The risk that when a Fund invests in foreign securities, it will be subject to risk of loss not
typically associated with domestic issuers. Loss may result because of less foreign government regulation, less public information and less economic, political and social stability. Loss may also result from the imposition of exchange controls,
confiscations and other government restrictions. A
Fund will also be subject to the risk of negative foreign currency rate fluctuations. Foreign risks will normally be greatest when a Fund invests in issuers located in emerging countries. |
n
|
Emerging Countries Risk—The securities markets of Asian, Latin and South American, Eastern European, African
and other emerging countries are less liquid, are especially subject to greater price volatility, have smaller market capitalizations, have less government regulation and are not subject to as extensive and frequent accounting, financial and other
reporting requirements as the securities markets of more developed countries. Further, investment in equity securities of issuers located in Russia and certain other emerging countries involves risk of loss resulting from problems in share registration
and custody and substantial economic and political disruptions. These risks are not normally associated with investments in more developed countries.
|
n
|
Stock Risk—The risk that stock prices
have historically risen and fallen in periodic cycles. Recently, U.S. stock markets and certain foreign stock markets have experienced substantial price volatility and, at times, have traded at or close to record high levels. There is no guarantee that
such levels will be reached or maintained in the future.
|
n
|
Derivatives Risk—The risk that loss may result from a Fund’s investments in options, futures, swaps,
structured securities and other derivative instruments. These instruments may be leveraged so that small changes may produce disproportionate losses to a Fund.
|
n
|
Interest Rate Risk—The risk that when interest rates increase, securities held by a Fund will decline in value.
Long-term fixed-income securities will normally have more price volatility because of this risk than short-term fixed-income securities.
|
n
|
Management Risk—The risk that a strategy used by the Investment Adviser may fail to produce the intended results.
|
n
|
Market Risk—The risk that the value of the securities in which a Fund invests may go up or down in response to
the prospects of individual companies, particular industry sectors and/or general economic conditions. Price changes may be temporary or last for extended periods. A Fund’s investments may be overweighted
|
| from time to time in one or more industry sectors, which will increase the Fund’s exposure to risk of loss from adverse
developments affecting those sectors.
|
n
|
Liquidity Risk—The risk that a Fund will not be able to pay redemption proceeds within the time period stated
in this Prospectus because of unusual market conditions, an unusually high volume of redemption requests, or other reasons. Funds that invest in non-investment grade fixed-income securities, small capitalization stocks, REITs and emerging country issuers
will be especially subject to the risk that during certain periods the liquidity of particular issuers or industries, or all securities within particular investment categories, will shrink or disappear suddenly and without warning as a result of adverse
economic, market or political events, or adverse investor perceptions whether or not accurate. The Goldman Sachs Asset Allocation Portfolios (the “Asset Allocation Portfolios”) expect to invest a significant percentage of their assets in the
Funds and other funds for which Goldman Sachs now or in the future acts as investment adviser or underwriter. Redemptions by an Asset Allocation Portfolio of its position in a Fund may further increase liquidity risk and may impact a Fund’s net asset
value (“NAV”).
|
n
|
Small Cap Risk—The securities of small capitalization stocks involve greater risks than those associated with
larger, more established companies and may be subject to more abrupt or erratic price movements. Securities of such issuers may lack sufficient market liquidity to enable a Fund to effect sales at an advantageous time or without a substantial drop in price.
|
n
|
IPO Risk—The risk that the market value of IPO shares will fluctuate considerably due to factors such as the
absence of a prior public market, unseasoned trading, the small number of shares available for trading and limited information about the issuer. The purchase of IPO shares may involve high transaction costs. IPO shares are subject to market risk and
liquidity risk. When a Fund’s asset base is small, a significant portion of the Fund’s performance could be attributable to investments in IPOs, because such investments would have a magnified impact on the Fund. As the Fund’s assets grow,
the effect of the Fund’s investments in IPOs on the Fund’s performance probably will decline, which could reduce the Fund’s performance.
|
| HOW THE FUNDS HAVE PERFORMED
|
| The bar chart and table below provide an indication of the risks of investing in a Fund by showing: (a) changes in the performance
of a Fund’s Class A Shares from year to year; and (b) how the average annual returns of a Fund’s Class A, B and C Shares compare to those of broad-based securities market indices. The bar chart and table assume reinvestment of dividends and
distributions. A Fund’s past performance is not necessarily an indication of how the Fund will perform in the future. The average annual total return calculation reflects a maximum initial sales charge of 5.5% for Class A Shares, the assumed
contingent deferred sales charge (“CDSC”) for Class B Shares (5% maximum declining to 0% after six years), and the assumed CDSC for Class C Shares (1% if redeemed within 12 months of purchase). The bar chart does not reflect the sales loads
applicable to Class A Shares. If the sales loads were reflected, returns would be less. Performance reflects expense limitations in effect. If expense limitations were not in place, a Fund’s performance would have been reduced. The Strategic Growth,
Growth Opportunities and Large Cap Value Funds commenced operations on May 24, 1999, May 24, 1999 and December 15, 1999, respectively. Since these Funds have less than one calendar year’s performance, no performance information is provided in this
section.
|
| TOTAL RETURN
|
| The total return for Class A Shares for the 9-month period ended September 30, 2000 was 2.16%.
Best Quarter
Q2 ’97 +9.92%
Worst Quarter
Q3 ’98 -8.71%
|
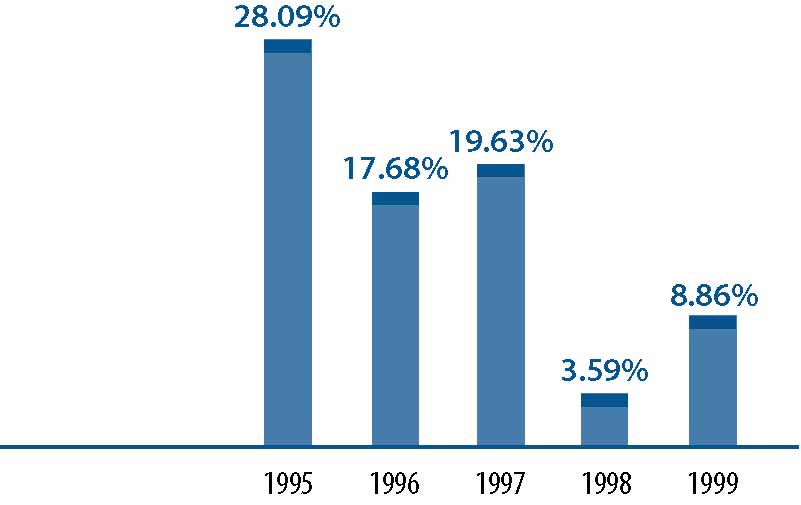 |
| AVERAGE ANNUAL TOTAL RETURN
|
| For the period ended December 31, 1999 | 1 Year | 5 Years | Since Inception | ||||
|---|---|---|---|---|---|---|---|
| Class A (Inception 10/12/94) | |||||||
| Including Sales Charges | 2.86% | 13.96% | 13.10% | ||||
| S&P 500® Index* | 21.04% | 28.54% | 27.00% | ||||
| Lehman Brothers Aggregate Bond Index** | (0.82)% | 7.73% | 7.46% | ||||
| Class B (Inception 5/1/96) | |||||||
| Including CDSC | 2.78% | N/A | 10.76% | ||||
| S&P 500® Index* | 21.04% | N/A | 26.74% | ||||
| Lehman Brothers Aggregate Bond Index** | (0.82)% | N/A | 6.36% | ||||
| Class C (Inception 8/15/97) | |||||||
| Including CDSC | 7.01% | N/A | 5.20% | ||||
| S&P 500® Index* | 21.04% | N/A | 23.21% | ||||
| Lehman Brothers Aggregate Bond Index** | (0.82)% | N/A | 5.14% | ||||
*
|
The S&P 500® Index is the Standard & Poor’s Composite Index of 500 stocks, an unmanaged index of common stock
prices. The Index figures do not reflect any fees or expenses.
|
**
|
The Lehman Brothers Aggregate Bond Index is an unmanaged index of bond prices. The Index figures do not reflect any fees or
expenses.
|
| TOTAL RETURN
|
| The total return for Class A Shares for the
9-month period ended September 30, 2000 was -.92%.
Best Quarter
Q2 ’97 +15.18%
Worst Quarter
Q3 ’98 -16.97%
|
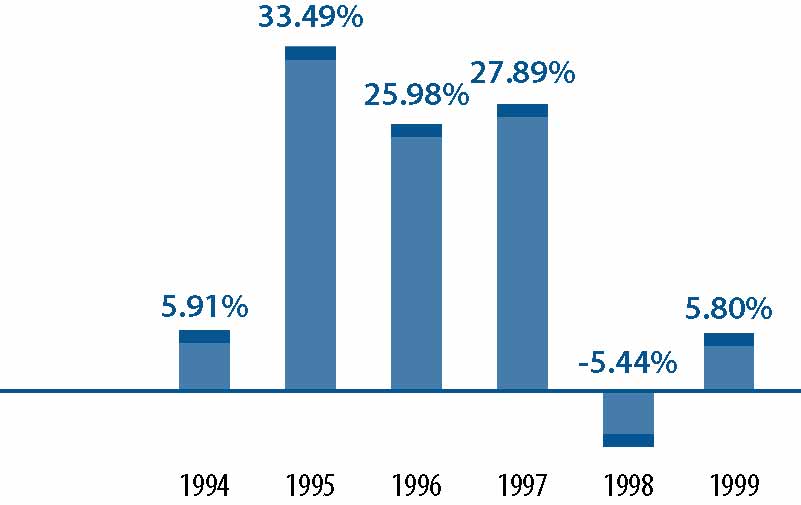 |
| AVERAGE ANNUAL TOTAL RETURN
|
| For the period ended December 31, 1999 | 1 Year | 5 Years | Since Inception | ||||
|---|---|---|---|---|---|---|---|
| Class A (Inception 2/5/93) | |||||||
| Including Sales Charges | 0.00% | 15.26% | 12.98% | ||||
| S&P 500® Index* | 21.04% | 28.54% | 21.37% | ||||
| Class B (Inception 5/1/96) | |||||||
| Including CDSC | (0.29)% | N/A | 10.26% | ||||
| S&P 500® Index* | 21.04% | N/A | 26.74% | ||||
| Class C (Inception 8/15/97) | |||||||
| Including CDSC | 3.94% | N/A | (0.71)% | ||||
| S&P 500® Index* | 21.04% | N/A | 23.21% | ||||
*
|
The S&P 500® Index is the Standard & Poor’s Composite Index of 500 stocks, an unmanaged index of common stock
prices. The Index figures do not reflect any fees or expenses.
|
| TOTAL RETURN
|
| The total return for Class A Shares for the 9-month period ended September 30, 2000 was 2.48%.
Best Quarter
Q2 ’99 +10.41%
Worst Quarter
Q3 ’99 -8.52%
|
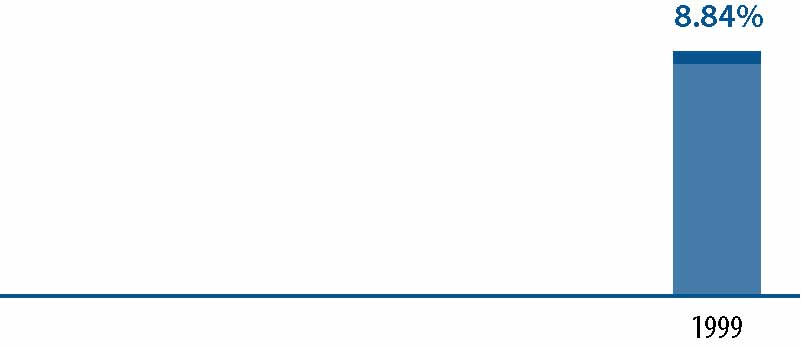 |
| AVERAGE ANNUAL TOTAL RETURN
|
| For the period ended December 31, 1999 | 1 Year | Since Inception | |||
|---|---|---|---|---|---|
| Class A (Inception 12/31/98) | |||||
| Including Sales Charges | 2.87% | 2.86% | |||
| Russell 1000® Value Index* | 7.34% | 7.34% | |||
| Class B (Inception 12/31/98) | |||||
| Including CDSC | 2.95% | 3.95% | |||
| Russell 1000® Value Index* | 7.34% | 7.34% | |||
| Class C (Inception 12/31/98) | |||||
| Including CDSC | 7.06% | 8.05% | |||
| Russell 1000® Value Index* | 7.34% | 7.34% | |||
*
|
The Russell 1000® Value Index (inception date 1/1/99) is a market capitalization weighted index of the 1,000 highest
ranking U.S. stocks with below-average growth orientation. The Index figures do not reflect any fees or expenses.
|
| TOTAL RETURN
|
| The total return for Class A Shares for the 9-month period ended September 30, 2000 was -0.40%.
Best Quarter
Q4 ’98 +21.44%
Worst Quarter
Q3 ’98 -14.69%
|
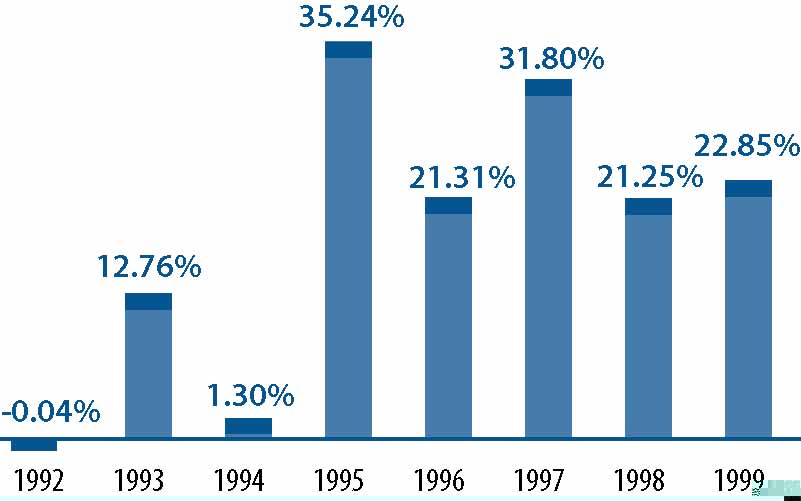 |
| AVERAGE ANNUAL TOTAL RETURN
|
| For the period ended December 31, 1999 | 1 Year | 5 Years | Since Inception | ||||
|---|---|---|---|---|---|---|---|
| Class A (Inception 5/24/91) | |||||||
| Including Sales Charges | 16.08% | 24.93% | 16.84% | ||||
| S&P 500® Index* | 21.04% | 28.54% | 19.87% | ||||
| Class B (Inception 5/1/96) | |||||||
| Including CDSC | 16.39% | N/A | 22.70% | ||||
| S&P 500® Index* | 21.04% | N/A | 26.74% | ||||
| Class C (Inception 8/15/97) | |||||||
| Including CDSC | 20.84% | N/A | 19.73% | ||||
| S&P 500® Index* | 21.04% | N/A | 23.21% | ||||
*
|
The S&P 500® Index is the Standard & Poor’s Composite Index of 500 stocks, an unmanaged index of common stock
prices. The Index figures do not reflect any fees or expenses.
|
| TOTAL RETURN
|
| The total return for Class A Shares for the 9-month period ended September 30, 2000 was -0.87%.
Best Quarter
Q4 ’98 +25.47%
Worst Quarter
Q3 ’98 -13.95%
|
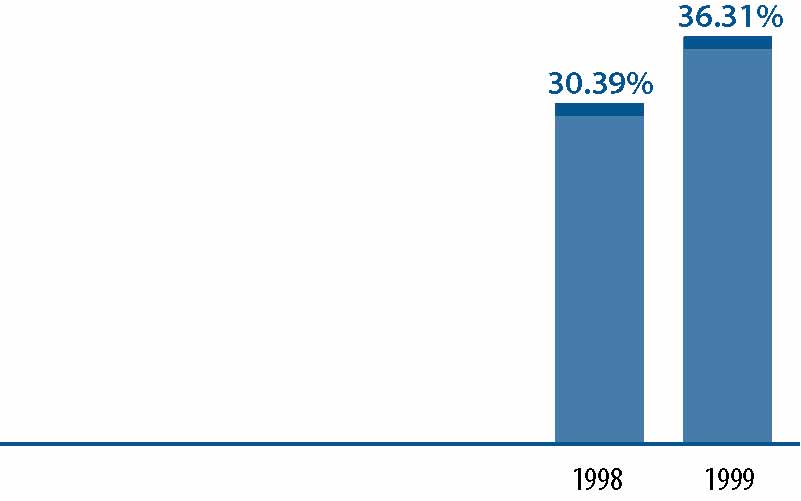 |
| AVERAGE ANNUAL TOTAL RETURN
|
| For the period ended December 31, 1999 | 1 Year | Since Inception | |||
|---|---|---|---|---|---|
| Class A (Inception 5/1/97) | |||||
| Including Sales Charges | 28.83% | 30.63% | |||
| Russell 1000® Growth Index* | 33.15% | 35.42% | |||
| Class B (Inception 5/1/97) | |||||
| Including CDSC | 30.31% | 31.76% | |||
| Russell 1000® Growth Index* | 33.15% | 35.42% | |||
| Class C (Inception 8/15/97) | |||||
| Including CDSC | 34.40% | 27.94% | |||
| Russell 1000® Growth Index* | 33.15% | 31.26% | |||
*
|
The Russell 1000® Growth Index is an unmanaged index of common stock prices. The Index figures do not reflect any fees or
expenses.
|
| TOTAL RETURN
|
| The total return for Class A Shares for the 9-month period ended September 30, 2000 was 6.96%.
Best Quarter
Q4 ’99 +15.26%
Worst Quarter
Q3 ’98 -24.34%
|
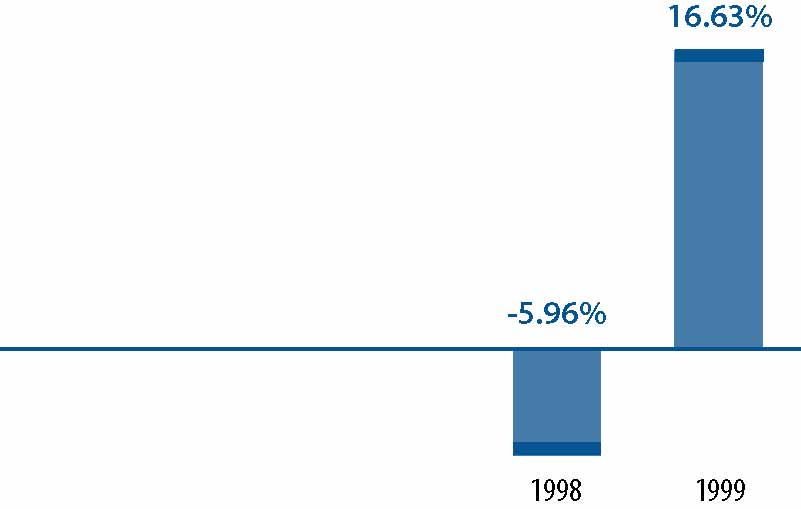 |
| AVERAGE ANNUAL TOTAL RETURN
|
| For the period ended December 31, 1999 | 1 Year | Since Inception | |||
|---|---|---|---|---|---|
| Class A (Inception 8/15/97) | |||||
| Including Sales Charges | 10.20% | 4.85% | |||
| Russell 2000® Index* | 21.26% | 10.21% | |||
| Class B (Inception 8/15/97) | |||||
| Including CDSC | 10.78% | 5.42% | |||
| Russell 2000® Index* | 21.26% | 10.21% | |||
| Class C (Inception 8/15/97) | |||||
| Including CDSC | 14.97% | 6.71% | |||
| Russell 2000® Index* | 21.26% | 10.21% | |||
*
|
The Russell 2000® Index is an unmanaged index of common stock prices. The Index figures do not reflect any fees or expenses.
|
| TOTAL RETURN
|
| The total return for Class A Shares for the 9-month period ended September 30, 2000 was 0.29%.
Best Quarter
Q4 ’98 +24.31%
Worst Quarter
Q3 ’98 -11.44%
|
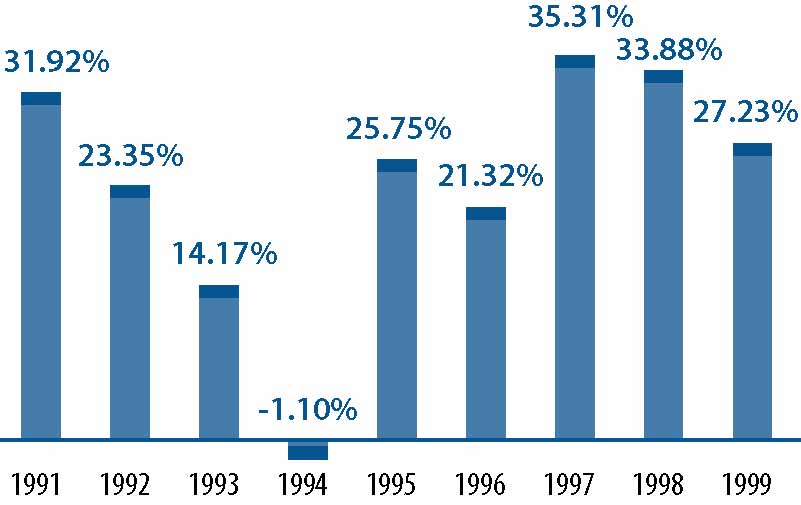 |
| AVERAGE ANNUAL TOTAL RETURN
|
| For the period ended December 31, 1999 | 1 Year | 5 Years | Since Inception | ||||
|---|---|---|---|---|---|---|---|
| Class A (Inception 4/20/90) | |||||||
| Including Sales Charges | 20.24% | 27.15% | 19.81% | ||||
| S&P 500® Index* | 21.04% | 28.54% | 19.33% | ||||
| Class B (Inception 5/1/96) | |||||||
| Including CDSC | 20.78% | N/A | 28.09% | ||||
| S&P 500® Index* | 21.04% | N/A | 26.74% | ||||
| Class C (Inception 8/15/97) | |||||||
| Including CDSC | 25.22% | N/A | 27.67% | ||||
| S&P 500® Index* | 21.04% | N/A | 23.21% | ||||
*
|
The S&P 500® Index is the Standard & Poor’s Composite Index of 500 stocks, an unmanaged index of common stock
prices. The Index figures do not reflect any fees or expenses.
|
| TOTAL RETURN
|
| The total return for Class A Shares for the 9-month period ended September 30, 2000 was 17.88%.
Best Quarter
Q2 ’99 +21.13%
Worst Quarter
Q3 ’98 -20.87%
|
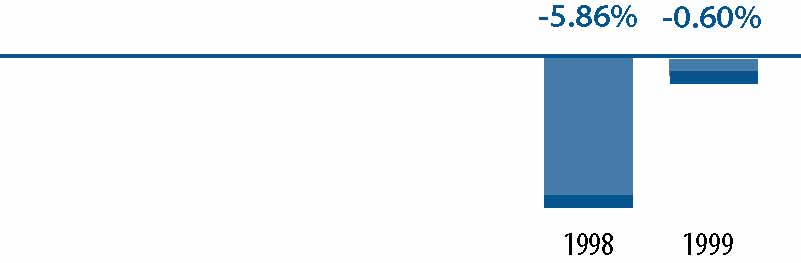 |
| AVERAGE ANNUAL TOTAL RETURN
|
| For the period ended December 31, 1999 | 1 Year | Since Inception | |||
|---|---|---|---|---|---|
| Class A (Inception 8/15/97) | |||||
| Including Sales Charges | (6.07)% | (4.27)% | |||
| Russell Midcap Value Index* | (0.10)% | 6.38% | |||
| Class B (Inception 8/15/97) | |||||
| Including CDSC | (6.32)% | (3.87)% | |||
| Russell Midcap Value Index* | (0.10)% | 6.38% | |||
| Class C (Inception 8/15/97) | |||||
| Including CDSC | (2.37)% | (2.58)% | |||
| Russell Midcap Value Index* | (0.10)% | 6.38% | |||
| *The Russell Midcap Value Index is an unmanaged index of common stock prices. The Index figures do not reflect any fees or expenses.
|
| TOTAL RETURN
|
| The total return for Class A Shares for the 9-month period ended September 30, 2000 was 26.61%.
Best Quarter
Q2 ’99 +30.13%
Worst Quarter
Q3 ’98 -32.23%
|
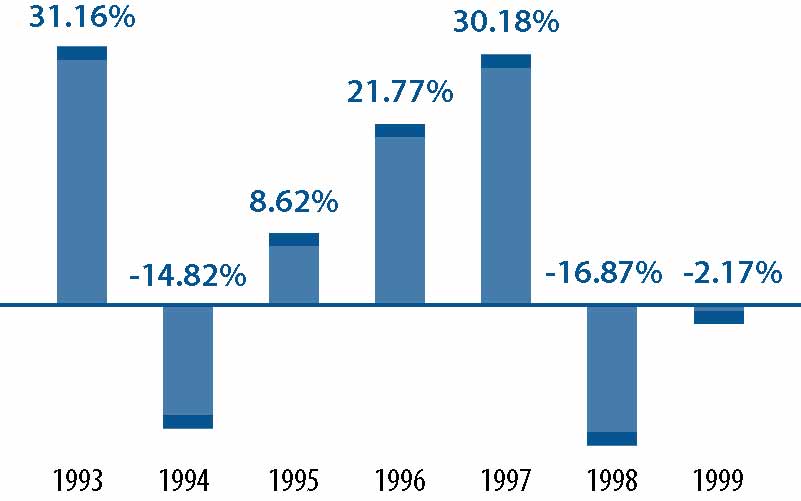 |
| AVERAGE ANNUAL TOTAL RETURN
|
| For the period ended December 31, 1999 | 1 Year | 5 Years | Since Inception | ||||
|---|---|---|---|---|---|---|---|
| Class A (Inception 10/22/92) | |||||||
| Including Sales Charges | (7.55)% | 5.77% | 7.65% | ||||
| Russell 2000® Value Index* | (1.49)% | 13.13% | 13.94% | ||||
| Class B (Inception 5/1/96) | |||||||
| Including CDSC | (7.72)% | N/A | 1.13% | ||||
| Russell 2000® Value Index* | (1.49)% | N/A | 9.06% | ||||
| Class C (Inception 8/15/97) | |||||||
| Including CDSC | (3.84)% | N/A | (6.15)% | ||||
| Russell 2000® Value Index* | (1.49)% | N/A | 0.81% | ||||
| *The Russell 2000® Value Index is an unmanaged index of common stock prices. The Index figures do not reflect any
fees or expenses.
|
| Balanced Fund |
||||||||||
|---|---|---|---|---|---|---|---|---|---|---|
| Class A | Class B | Class C | ||||||||
| Shareholder Fees | ||||||||||
| (fees paid directly from your investment): | ||||||||||
| Maximum Sales Charge (Load) Imposed on
Purchases |
5.5% | 1 | None | None | ||||||
| Maximum Deferred Sales Charge (Load) 2 | None | 1 | 5.0% | 3 | 1.0% | 4 | ||||
| Maximum Sales Charge (Load) Imposed on
Reinvested Dividends |
None | None | None | |||||||
| Redemption Fees 5 | None | None | None | |||||||
| Exchange Fees | None | None | None | |||||||
| Annual Fund Operating Expenses | ||||||||||
| (expenses that are deducted from Fund assets):6 | ||||||||||
| Management Fees | 0.65% | 0.65% | 0.65% | |||||||
| Distribution and Service (12b-1) Fees | 0.25% | 1.00% | 1.00% | |||||||
| Other Expenses 8 | 0.39% | 0.39% | 0.39% | |||||||
| Total Fund Operating Expenses* | 1.29% | 2.04% | 2.04% | |||||||
| See page 48 for all other footnotes.
|
*
|
As a result of the current expense limitations, “Other Expenses” and “Total Fund Operating Expenses” of the
Fund which are actually incurred as of the date of this Prospectus are as set forth below. The expense limitations may be terminated at any time at the option of the Investment Adviser. If this occurs, “Other Expenses” and “Total Fund
Operating Expenses” may increase without shareholder approval.
|
| Balanced Fund |
|||||||
|---|---|---|---|---|---|---|---|
| Class A | Class B | Class C | |||||
| Annual Fund Operating Expenses | |||||||
| (expenses that are deducted from Fund assets): 6 | |||||||
| Management Fees | 0.65% | 0.65% | 0.65% | ||||
| Distribution and Service (12b-1) Fees | 0.25% | 1.00% | 1.00% | ||||
| Other Expenses 8 | 0.25% | 0.25% | 0.25% | ||||
| Total Fund Operating Expenses (after
current expense limitations) |
1.15% | 1.90% | 1.90% | ||||
| Growth and Income Fund |
||||||||||
|---|---|---|---|---|---|---|---|---|---|---|
| Class A | Class B | Class C | ||||||||
| Shareholder Fees | ||||||||||
| (fees paid directly from your investment): | ||||||||||
| Maximum Sales Charge (Load) Imposed on
Purchases |
5.5% | 1 | None | None | ||||||
| Maximum Deferred Sales Charge (Load) 2 | None | 1 | 5.0% | 3 | 1.0% | 4 | ||||
| Maximum Sales Charge (Load) Imposed on
Reinvested Dividends |
None | None | None | |||||||
| Redemption Fees 5 | None | None | None | |||||||
| Exchange Fees | None | None | None | |||||||
| Annual Fund Operating Expenses | ||||||||||
| (expenses that are deducted from Fund assets):6 | ||||||||||
| Management Fees | 0.70% | 0.70% | 0.70% | |||||||
| Distribution and Service (12b-1) Fees | 0.25% | 1.00% | 1.00% | |||||||
| Other Expenses 8 | 0.23% | 0.23% | 0.23% | |||||||
| Total Fund Operating Expenses* | 1.18% | 1.93% | 1.93% | |||||||
| See page 48 for all other footnotes.
|
*
|
As a result of the current expense limitations, “Other Expenses” and “Total Fund Operating Expenses” of the
Fund which are actually incurred as of the date of this Prospectus are as set forth below. The expense limitations may be terminated at any time at the option of the Investment Adviser. If this occurs, “Other Expenses” and “Total Fund
Operating Expenses” may increase without shareholder approval.
|
| Growth and Income Fund |
|||||||
|---|---|---|---|---|---|---|---|
| Class A | Class B | Class C | |||||
| Annual Fund Operating Expenses | |||||||
| (expenses that are deducted from Fund assets): 6 | |||||||
| Management Fees | 0.70% | 0.70% | 0.70% | ||||
| Distribution and Service (12b-1) Fees | 0.25% | 1.00% | 1.00% | ||||
| Other Expenses 8 | 0.23% | 0.23% | 0.23% | ||||
| Total Fund Operating Expenses (after
current expense limitations) |
1.18% | 1.93% | 1.93% | ||||
| CORE Large Cap Value Fund |
||||||||||
|---|---|---|---|---|---|---|---|---|---|---|
| Class A | Class B | Class C | ||||||||
| Shareholder Fees | ||||||||||
| (fees paid directly from your investment): | ||||||||||
| Maximum Sales Charge (Load) Imposed on
Purchases |
5.5% | 1 | None | None | ||||||
| Maximum Deferred Sales Charge (Load) 2 | None | 1 | 5.0% | 3 | 1.0% | 4 | ||||
| Maximum Sales Charge (Load) Imposed on
Reinvested Dividends |
None | None | None | |||||||
| Redemption Fees 5 | None | None | None | |||||||
| Exchange Fees | None | None | None | |||||||
| Annual Fund Operating Expenses | ||||||||||
| (expenses that are deducted from Fund assets):6 | ||||||||||
| Management Fees | 0.60% | 0.60% | 0.60% | |||||||
| Distribution and Service (12b-1) Fees | 0.25% | 1.00% | 1.00% | |||||||
| Other Expenses 8 | 0.32% | 0.32% | 0.32% | |||||||
| Total Fund Operating Expenses* | 1.17% | 1.92% | 1.92% | |||||||
| See page 48 for all other footnotes.
|
*
|
As a result of the current expense limitations, “Other Expenses” and “Total Fund Operating Expenses” of the
Fund which are actually incurred as of the date of this Prospectus are as set forth below. The expense limitations may be terminated at any time at the option of the Investment Adviser. If this occurs, “Other Expenses” and “Total Fund
Operating Expenses” may increase without shareholder approval.
|
| CORE Large Cap Value Fund |
|||||||
|---|---|---|---|---|---|---|---|
| Class A | Class B | Class C | |||||
| Annual Fund Operating Expenses | |||||||
| (expenses that are deducted from Fund assets): 6 | |||||||
| Management Fees | 0.60% | 0.60% | 0.60% | ||||
| Distribution and Service (12b-1) Fees | 0.25% | 1.00% | 1.00% | ||||
| Other Expenses 8 | 0.25% | 0.25% | 0.25% | ||||
| Total Fund Operating Expenses (after
current expense limitations) |
1.10% | 1.85% | 1.85% | ||||
| CORE U.S. Equity Fund |
||||||||||
|---|---|---|---|---|---|---|---|---|---|---|
| Class A | Class B | Class C | ||||||||
| Shareholder Fees | ||||||||||
| (fees paid directly from your investment): | ||||||||||
| Maximum Sales Charge (Load) Imposed on
Purchases |
5.5% | 1 | None | None | ||||||
| Maximum Deferred Sales Charge (Load) 2 | None | 1 | 5.0% | 3 | 1.0% | 4 | ||||
| Maximum Sales Charge (Load) Imposed on
Reinvested Dividends |
None | None | None | |||||||
| Redemption Fees 5 | None | None | None | |||||||
| Exchange Fees | None | None | None | |||||||
| Annual Fund Operating Expenses | ||||||||||
| (expenses that are deducted from Fund assets):6 | ||||||||||
| Management Fees 7 | 0.75% | 0.75% | 0.75% | |||||||
| Distribution and Service (12b-1) Fees | 0.25% | 1.00% | 1.00% | |||||||
| Other Expenses 8 | 0.23% | 0.23% | 0.23% | |||||||
| Total Fund Operating Expenses* | 1.23% | 1.98% | 1.98% | |||||||
| See page 48 for all other footnotes.
|
*
|
As a result of the current waivers and expense limitations, “Other Expenses” and “Total Fund Operating
Expenses” of the Fund which are actually incurred as of the date of this Prospectus are as set forth below. The waivers and expense limitations may be terminated at any time at the option of the Investment Adviser. If this occurs, “Other
Expenses” and “Total Fund Operating Expenses” may increase without shareholder approval.
|
| CORE U.S. Equity Fund |
|||||||
|---|---|---|---|---|---|---|---|
| Class A | Class B | Class C | |||||
| Annual Fund Operating Expenses | |||||||
| (expenses that are deducted from Fund assets): 6 | |||||||
| Management Fees 7 | 0.70% | 0.70% | 0.70% | ||||
| Distribution and Service (12b-1) Fees | 0.25% | 1.00% | 1.00% | ||||
| Other Expenses 8 | 0.19% | 0.19% | 0.19% | ||||
| Total Fund Operating Expenses (after current
waivers and expense limitations) |
1.14% | 1.89% | 1.89% | ||||
| CORE Large Cap Growth Fund |
||||||||||
|---|---|---|---|---|---|---|---|---|---|---|
| Class A | Class B | Class C | ||||||||
| Shareholder Fees | ||||||||||
| (fees paid directly from your investment): | ||||||||||
| Maximum Sales Charge (Load) Imposed on
Purchases |
5.5% | 1 | None | None | ||||||
| Maximum Deferred Sales Charge (Load) 2 | None | 1 | 5.0% | 3 | 1.0% | 4 | ||||
| Maximum Sales Charge (Load) Imposed on
Reinvested Dividends |
None | None | None | |||||||
| Redemption Fees 5 | None | None | None | |||||||
| Exchange Fees | None | None | None | |||||||
| Annual Fund Operating Expenses | ||||||||||
| (expenses that are deducted from Fund assets):6 | ||||||||||
| Management Fees 7 | 0.75% | 0.75% | 0.75% | |||||||
| Distribution and Service (12b-1) Fees | 0.25% | 1.00% | 1.00% | |||||||
| Other Expenses 8 | 0.24% | 0.24% | 0.24% | |||||||
| Total Fund Operating Expenses* | 1. 24% | 1.99% | 1.99% | |||||||
| See page 48 for all other footnotes.
|
*
|
As a result of the current waivers and expense limitations, “Other Expenses” and “Total Fund Operating
Expenses” of the Fund which are actually incurred as of the date of this Prospectus are as set forth below. The waivers and expense limitations may be terminated at any time at the option of the Investment Adviser. If this occurs, “Other
Expenses” and “Total Fund Operating Expenses” may increase without shareholder approval.
|
| CORE Large Cap Growth Fund |
|||||||
|---|---|---|---|---|---|---|---|
| Class A | Class B | Class C | |||||
| Annual Fund Operating Expenses | |||||||
| (expenses that are deducted from Fund assets): 6 | |||||||
| Management Fees 7 | 0.70% | 0.70% | 0.70% | ||||
| Distribution and Service (12b-1) Fees | 0.25% | 1.00% | 1.00% | ||||
| Other Expenses 8 | 0.21% | 0.21% | 0.21% | ||||
| Total Fund Operating Expenses (after current
waivers and expense limitations) |
1.16% | 1.91% | 1.91% | ||||
| CORE Small Cap Equity Fund |
||||||||||
|---|---|---|---|---|---|---|---|---|---|---|
| Class A | Class B | Class C | ||||||||
| Shareholder Fees | ||||||||||
| (fees paid directly from your investment): | ||||||||||
| Maximum Sales Charge (Load) Imposed on
Purchases |
5.5% | 1 | None | None | ||||||
| Maximum Deferred Sales Charge (Load) 2 | None | 1 | 5.0% | 3 | 1.0% | 4 | ||||
| Maximum Sales Charge (Load) Imposed on
Reinvested Dividends |
None | None | None | |||||||
| Redemption Fees 5 | None | None | None | |||||||
| Exchange Fees | None | None | None | |||||||
| Annual Fund Operating Expenses | ||||||||||
| (expenses that are deducted from Fund assets):6 | ||||||||||
| Management Fees | 0.85% | 0.85% | 0.85% | |||||||
| Distribution and Service (12b-1) Fees | 0.25% | 1.00% | 1.00% | |||||||
| Other Expenses 8 | 0.45% | 0.45% | 0.45% | |||||||
| Total Fund Operating Expenses* | 1.55% | 2.30% | 2.30% | |||||||
| See page 48 for all other footnotes.
|
*
|
As a result of the current expense limitations, “Other Expenses” and “Total Fund Operating Expenses” of the
Fund which are actually incurred as of the date of this Prospectus are as set forth below. The expense limitations may be terminated at any time at the option of the Investment Adviser. If this occurs, “Other Expenses” and “Total Fund
Operating Expenses” may increase without shareholder approval.
|
| CORE Small Cap Equity Fund |
|||||||
|---|---|---|---|---|---|---|---|
| Class A | Class B | Class C | |||||
| Annual Fund Operating Expenses | |||||||
| (expenses that are deducted from Fund assets): 6 | |||||||
| Management Fees | 0.85% | 0.85% | 0.85% | ||||
| Distribution and Service (12b-1) Fees | 0.25% | 1.00% | 1.00% | ||||
| Other Expenses 8 | 0.23% | 0.23% | 0.23% | ||||
| Total Fund Operating Expenses (after current
expense limitations) |
1.33% | 2.08% | 2.08% | ||||
| Capital Growth Fund |
||||||||||
|---|---|---|---|---|---|---|---|---|---|---|
| Class A | Class B | Class C | ||||||||
| Shareholder Fees | ||||||||||
| (fees paid directly from your investment): | ||||||||||
| Maximum Sales Charge (Load) Imposed on
Purchases |
5.5% | 1 | None | None | ||||||
| Maximum Deferred Sales Charge (Load) 2 | None | 1 | 5.0% | 3 | 1.0% | 4 | ||||
| Maximum Sales Charge (Load) Imposed on
Reinvested Dividends |
None | None | None | |||||||
| Redemption Fees 5 | None | None | None | |||||||
| Exchange Fees | None | None | None | |||||||
| Annual Fund Operating Expenses | ||||||||||
| (expenses that are deducted from Fund assets):6 | ||||||||||
| Management Fees | 1.00% | 1.00% | 1.00% | |||||||
| Distribution and Service (12b-1) Fees | 0.25% | 1.00% | 1.00% | |||||||
| Other Expenses 8 | 0.22% | 0.22% | 0.22% | |||||||
| Total Fund Operating Expenses* | 1.47% | 2.22% | 2.22% | |||||||
| See page 48 for all other footnotes.
|
*
|
As a result of the current expense limitations, “Other Expenses” and “Total Fund Operating Expenses” of the
Fund which are actually incurred as of the date of this Prospectus are as set forth below. The expense limitations may be terminated at any time at the option of the Investment Adviser. If this occurs, “Other Expenses” and “Total Fund
Operating Expenses” may increase without shareholder approval.
|
| Capital Growth Fund |
|||||||
|---|---|---|---|---|---|---|---|
| Class A | Class B | Class C | |||||
| Annual Fund Operating Expenses | |||||||
| (expenses that are deducted from Fund assets): 6 | |||||||
| Management Fees | 1.00% | 1.00% | 1.00% | ||||
| Distribution and Service (12b-1) Fees | 0.25% | 1.00% | 1.00% | ||||
| Other Expenses 8 | 0.19% | 0.19% | 0.19% | ||||
| Total Fund Operating Expenses (after
current expense limitations) |
1.44% | 2.19% | 2.19% | ||||
| Strategic Growth Fund |
||||||||||
|---|---|---|---|---|---|---|---|---|---|---|
| Class A | Class B | Class C | ||||||||
| Shareholder Fees | ||||||||||
| (fees paid directly from your investment): | ||||||||||
| Maximum Sales Charge (Load) Imposed on
Purchases |
5.5% | 1 | None | None | ||||||
| Maximum Deferred Sales Charge (Load) 2 | None | 1 | 5.0% | 3 | 1.0% | 4 | ||||
| Maximum Sales Charge (Load) Imposed on
Reinvested Dividends |
None | None | None | |||||||
| Redemption Fees 5 | None | None | None | |||||||
| Exchange Fees | None | None | None | |||||||
| Annual Fund Operating Expenses | ||||||||||
| (expenses that are deducted from Fund assets):6 | ||||||||||
| Management Fees | 1.00% | 1.00% | 1.00% | |||||||
| Distribution and Service (12b-1) Fees | 0.25% | 1.00% | 1.00% | |||||||
| Other Expenses 8 | 0.38% | 0.38% | 0.38% | |||||||
| Total Fund Operating Expenses* | 1.63% | 2.38% | 2.38% | |||||||
| See page 48 for all other footnotes.
|
*
|
As a result of the current expense limitations, “Other Expenses” and “Total Fund Operating Expenses” of the
Fund which are actually incurred as of the date of this Prospectus are as set forth below. The expense limitations may be terminated at any time at the option of the Investment Adviser. If this occurs, “Other Expenses” and “Total Fund
Operating Expenses” may increase without shareholder approval.
|
| Strategic Growth Fund |
|||||||
|---|---|---|---|---|---|---|---|
| Class A | Class B | Class C | |||||
| Annual Fund Operating Expenses | |||||||
| (expenses that are deducted from Fund assets): 6 | |||||||
| Management Fees | 1.00% | 1.00% | 1.00% | ||||
| Distribution and Service (12b-1) Fees | 0.25% | 1.00% | 1.00% | ||||
| Other Expenses 8 | 0.19% | 0.19% | 0.19% | ||||
| Total Fund Operating Expenses (after
current expense limitations) |
1.44% | 2.19% | 2.19% | ||||
| Growth Opportunities Fund |
||||||||||
|---|---|---|---|---|---|---|---|---|---|---|
| Class A | Class B | Class C | ||||||||
| Shareholder Fees | ||||||||||
| (fees paid directly from your investment): | ||||||||||
| Maximum Sales Charge (Load) Imposed on
Purchases |
5.5% | 1 | None | None | ||||||
| Maximum Deferred Sales Charge (Load) 2 | None | 1 | 5.0% | 3 | 1.0% | 4 | ||||
| Maximum Sales Charge (Load) Imposed on
Reinvested Dividends |
None | None | None | |||||||
| Redemption Fees 5 | None | None | None | |||||||
| Exchange Fees | None | None | None | |||||||
| Annual Fund Operating Expenses | ||||||||||
| (expenses that are deducted from Fund assets):6 | ||||||||||
| Management Fees | 1.00% | 1.00% | 1.00% | |||||||
| Distribution and Service (12b-1) Fees | 0.25% | 1.00% | 1.00% | |||||||
| Other Expenses 8 | 0.36% | 0.36% | 0.36% | |||||||
| Total Fund Operating Expenses* | 1.61% | 2.36% | 2.36% | |||||||
| See page 48 for all other footnotes.
|
*
|
As a result of the current expense limitations, “Other Expenses” and “Total Fund Operating Expenses” of the
Fund which are actually incurred as of the date of this Prospectus are as set forth below. The expense limitations may be terminated at any time at the option of the Investment Adviser. If this occurs, “Other Expenses” and “Total Fund
Operating Expenses” may increase without shareholder approval.
|
| Growth Opportunities Fund |
|||||||
|---|---|---|---|---|---|---|---|
| Class A | Class B | Class C | |||||
| Annual Fund Operating Expenses | |||||||
| (expenses that are deducted from Fund assets): 6 | |||||||
| Management Fees | 1.00% | 1.00% | 1.00% | ||||
| Distribution and Service (12b-1) Fees | 0.25% | 1.00% | 1.00% | ||||
| Other Expenses 8 | 0.30% | 0.30% | 0.30% | ||||
| Total Fund Operating Expenses (after
current expense limitations) |
1.55% | 2.30% | 2.30% | ||||
| Mid Cap Value Fund |
||||||||||
|---|---|---|---|---|---|---|---|---|---|---|
| Class A | Class B | Class C | ||||||||
| Shareholder Fees | ||||||||||
| (fees paid directly from your investment): | ||||||||||
| Maximum Sales Charge (Load) Imposed on
Purchases |
5.5% | 1 | None | None | ||||||
| Maximum Deferred Sales Charge (Load) 2 | None | 1 | 5.0% | 3 | 1.0% | 4 | ||||
| Maximum Sales Charge (Load) Imposed on
Reinvested Dividends |
None | None | None | |||||||
| Redemption Fees 5 | None | None | None | |||||||
| Exchange Fees | None | None | None | |||||||
| Annual Fund Operating Expenses | ||||||||||
| (expenses that are deducted from Fund assets):6 | ||||||||||
| Management Fees | 0.75% | 0.75% | 0.75% | |||||||
| Distribution and Service (12b-1) Fees | 0.25% | 1.00% | 1.00% | |||||||
| Other Expenses 8 | 0.34% | 0.34% | 0.34% | |||||||
| Total Fund Operating Expenses* | 1.34% | 2.09% | 2.09% | |||||||
| See page 48 for all other footnotes.
|
*
|
As a result of the current expense limitations, “Other Expenses” and “Total Fund Operating Expenses” of the
Fund which are actually incurred as of the date of this Prospectus are as set forth below. The expense limitations may be terminated at any time at the option of the Investment Adviser. If this occurs, “Other Expenses” and “Total Fund
Operating Expenses” may increase without shareholder approval.
|
| Mid Cap Value Fund |
|||||||
|---|---|---|---|---|---|---|---|
| Class A | Class B | Class C | |||||
| Annual Fund Operating Expenses | |||||||
| (expenses that are deducted from Fund assets): 6 | |||||||
| Management Fees | 0.75% | 0.75% | 0.75% | ||||
| Distribution and Service (12b-1) Fees | 0.25% | 1.00% | 1.00% | ||||
| Other Expenses 8 | 0.29% | 0.29% | 0.29% | ||||
| Total Fund Operating Expenses (after
current expense limitations) |
1.29% | 2.04% | 2.04% | ||||
| Small Cap Value Fund |
||||||||||
|---|---|---|---|---|---|---|---|---|---|---|
| Class A | Class B | Class C | ||||||||
| Shareholder Fees | ||||||||||
| (fees paid directly from your investment): | ||||||||||
| Maximum Sales Charge (Load) Imposed on
Purchases |
5.5% | 1 | None | None | ||||||
| Maximum Deferred Sales Charge (Load) 2 | None | 1 | 5.0% | 3 | 1.0% | 4 | ||||
| Maximum Sales Charge (Load) Imposed on
Reinvested Dividends |
None | None | None | |||||||
| Redemption Fees 5 | None | None | None | |||||||
| Exchange Fees | None | None | None | |||||||
| Annual Fund Operating Expenses | ||||||||||
| (expenses that are deducted from Fund assets):6 | ||||||||||
| Management Fees | 1.00% | 1.00% | 1.00% | |||||||
| Distribution and Service (12b-1) Fees | 0.25% | 1.00% | 1.00% | |||||||
| Other Expenses 8 | 0.32% | 0.32% | 0.32% | |||||||
| Total Fund Operating Expenses* | 1.57% | 2.32% | 2.32% | |||||||
| See page 48 for all other footnotes.
|
*
|
As a result of the current expense limitations, “Other Expenses” and “Total Fund Operating Expenses” of the
Fund which are actually incurred as of the date of this Prospectus are as set forth below. The expense limitations may be terminated at any time at the option of the Investment Adviser. If this occurs, “Other Expenses” and “Total Fund
Operating Expenses” may increase without shareholder approval.
|
| Small Cap Value Fund |
|||||||
|---|---|---|---|---|---|---|---|
| Class A | Class B | Class C | |||||
| Annual Fund Operating Expenses | |||||||
| (expenses that are deducted from Fund assets): 6 | |||||||
| Management Fees | 1.00% | 1.00% | 1.00% | ||||
| Distribution and Service (12b-1) Fees | 0.25% | 1.00% | 1.00% | ||||
| Other Expenses 8 | 0.25% | 0.25% | 0.25% | ||||
| Total Fund Operating Expenses (after
current expense limitations) |
1.50% | 2.25% | 2.25% | ||||
| Large Cap Value Fund |
||||||||||
|---|---|---|---|---|---|---|---|---|---|---|
| Class A | Class B | Class C | ||||||||
| Shareholder Fees | ||||||||||
| (fees paid directly from your investment): | ||||||||||
| Maximum Sales Charge (Load) Imposed on
Purchases |
5.5% | 1 | None | None | ||||||
| Maximum Deferred Sales Charge (Load) 2 | None | 1 | 5.0% | 3 | 1.0% | 4 | ||||
| Maximum Sales Charge (Load) Imposed on
Reinvested Dividends |
None | None | None | |||||||
| Redemption Fees 5 | None | None | None | |||||||
| Exchange Fees | None | None | None | |||||||
| Annual Fund Operating Expenses | ||||||||||
| (expenses that are deducted from Fund assets):6 | ||||||||||
| Management Fees | 0.75% | 0.75% | 0.75% | |||||||
| Distribution and Service (12b-1) Fees | 0.25% | 1.00% | 1.00% | |||||||
| Other Expenses 8 | 2.30% | 2.30% | 2.30% | |||||||
| Total Fund Operating Expenses* | 3.30% | 4.05% | 4.05% | |||||||
| See page 48 for all other footnotes.
|
*
|
As a result of the current waivers and expense limitations, “Other Expenses” and “Total Fund Operating
Expenses” of the Fund which are actually incurred as of the date of this Prospectus are as set forth below. The waivers and expense limitations may be terminated at any time at the option of the Investment Adviser. If this occurs, “Other
Expenses” and “Total Fund Operating Expenses” may increase without shareholder approval.
|
| Large Cap Value Fund |
|||||||
|---|---|---|---|---|---|---|---|
| Class A | Class B | Class C | |||||
| Annual Fund Operating Expenses | |||||||
| (expenses that are deducted from Fund assets): 6 | |||||||
| Management Fees | 0.75% | 0.75% | 0.75% | ||||
| Distribution and Service (12b-1) Fees | 0.25% | 1.00% | 1.00% | ||||
| Other Expenses 8 | 0.25% | 0.25% | 0.25% | ||||
| Total Fund Operating Expenses (after
current waivers and expense limitations) |
1.25% | 2.00% | 2.00% | ||||
1
|
The maximum sales charge is a percentage of the offering price. A CDSC of 1% is imposed on certain redemptions (within
18 months of purchase) of Class A Shares sold without an initial sales charge as part of an investment of $1 million or more.
|
2
|
The maximum CDSC is a percentage of the lesser of the NAV at the time of the redemption or the NAV when the shares were
originally purchased.
|
3
|
A CDSC is imposed upon Class B Shares redeemed within six years of purchase at a rate of 5% in the first year, declining
to 1% in the sixth year, and eliminated thereafter.
|
4
|
A CDSC of 1% is imposed on Class C Shares redeemed within 12 months of purchase.
|
5
|
A transaction fee of $7.50 may be charged for redemption proceeds paid by wire.
|
6
|
The Funds’ annual operating expenses are based on actual expenses.
|
7
|
The Investment Adviser has voluntarily agreed not to impose a portion of the management fee on the CORE U.S. Equity Fund
and the CORE Large Cap Growth Fund equal to 0.05% and 0.05%, respectively, of such Funds’ average daily net assets. As a result of fee waivers, the current management fees of the CORE U.S. Equity Fund and CORE Large Cap Growth Fund are 0.70% and 0.70%, respectively, of such Fund’s average daily net assets. The waivers may be terminated at any time at the option
of the Investment Adviser.
|
8
|
“Other Expenses” include transfer agency fees equal to 0.19% of the average daily net assets of each Fund’
s Class A, B and C Shares, plus all other ordinary expenses not detailed above. The Investment Adviser has voluntarily agreed to reduce or limit “Other Expenses” (excluding management fees, distribution and service fees, transfer agency fees,
taxes, interest and brokerage fees and litigation, indemnification and other extraordinary expenses) to the following percentages of each Fund’s average daily net assets:
|
| Fund | Other
Expenses |
||
|---|---|---|---|
| Balanced | 0.06% | ||
| Growth and Income | 0.05% | ||
| CORE Large Cap Value | 0.06% | ||
| CORE U.S. Equity | 0.00% | ||
| CORE Large Cap Growth | 0.02% | ||
| CORE Small Cap Equity | 0.04% | ||
| Capital Growth | 0.00% | ||
| Strategic Growth | 0.00% | ||
| Growth Opportunities | 0.11% | ||
| Mid Cap Value | 0.10% | ||
| Small Cap Value | 0.06% | ||
| Large Cap Value | 0.06% | ||
| Fund | 1 Year | 3 Years | 5 Years | 10 Years | |||||
|---|---|---|---|---|---|---|---|---|---|
| Balanced | |||||||||
| Class A Shares | $674 | $936 | $1,219 | $2,021 | |||||
| Class B Shares | |||||||||
| – Assuming complete redemption at end of period | $707 | $940 | $1,298 | $2,176 | |||||
| – Assuming no redemption | $207 | $640 | $1,098 | $2,176 | |||||
| Class C Shares | |||||||||
| – Assuming complete redemption at end of period | $307 | $640 | $1,098 | $2,369 | |||||
| – Assuming no redemption | $207 | $640 | $1,098 | $2,369 | |||||
| Growth and Income | |||||||||
| Class A Shares | $664 | $904 | $1,163 | $1,903 | |||||
| Class B Shares | |||||||||
| – Assuming complete redemption at end of period | $696 | $906 | $1,242 | $2,059 | |||||
| – Assuming no redemption | $196 | $606 | $1,042 | $2,059 | |||||
| Class C Shares | |||||||||
| – Assuming complete redemption at end of period | $296 | $606 | $1,042 | $2,254 | |||||
| – Assuming no redemption | $196 | $606 | $1,042 | $2,254 | |||||
| CORE Large Cap Value | |||||||||
| Class A Shares | $663 | $901 | $1,158 | $1,892 | |||||
| Class B Shares | |||||||||
| – Assuming complete redemption at end of period | $695 | $903 | $1,237 | $2,048 | |||||
| – Assuming no redemption | $195 | $603 | $1,037 | $2,048 | |||||
| Class C Shares | |||||||||
| – Assuming complete redemption at end of period | $295 | $603 | $1,037 | $2,243 | |||||
| – Assuming no redemption | $195 | $603 | $1,037 | $2,243 | |||||
| Fund | 1 Year | 3 Years | 5 Years | 10 Years | |||||
|---|---|---|---|---|---|---|---|---|---|
| CORE U.S. Equity | |||||||||
| Class A Shares | $668 | $ 919 | $1,188 | $1,957 | |||||
| Class B Shares | |||||||||
| – Assuming complete redemption at end of period | $701 | $ 921 | $1,268 | $2,113 | |||||
| – Assuming no redemption | $201 | $ 621 | $1,068 | $2,113 | |||||
| Class C Shares | |||||||||
| – Assuming complete redemption at end of period | $301 | $ 621 | $1,068 | $2,306 | |||||
| – Assuming no redemption | $201 | $ 621 | $1,068 | $2,306 | |||||
| CORE Large Cap Growth | |||||||||
| Class A Shares | $669 | $ 922 | $1,194 | $1,967 | |||||
| Class B Shares | |||||||||
| – Assuming complete redemption at end of period | $702 | $ 924 | $1,273 | $2,123 | |||||
| – Assuming no redemption | $202 | $ 624 | $1,073 | $2,123 | |||||
| Class C Shares | |||||||||
| – Assuming complete redemption at end of period | $302 | $ 624 | $1,073 | $2,317 | |||||
| – Assuming no redemption | $202 | $ 624 | $1,073 | $2,317 | |||||
| CORE Small Cap Equity | |||||||||
| Class A Shares | $699 | $1,013 | $1,348 | $2,294 | |||||
| Class B Shares | |||||||||
| – Assuming complete redemption at end of period | $733 | $1,118 | $1,430 | $2,448 | |||||
| – Assuming no redemption | $233 | $ 718 | $1,230 | $2,448 | |||||
| Class C Shares | |||||||||
| – Assuming complete redemption at end of period | $333 | $ 718 | $1,230 | $2,636 | |||||
| – Assuming no redemption | $233 | $ 718 | $1,230 | $2,636 | |||||
| Capital Growth | |||||||||
| Class A Shares | $691 | $ 989 | $1,309 | $2,211 | |||||
| Class B Shares | |||||||||
| – Assuming complete redemption at end of period | $725 | $1,094 | $1,390 | $2,365 | |||||
| – Assuming no redemption | $225 | $ 694 | $1,190 | $2,365 | |||||
| Class C Shares | |||||||||
| – Assuming complete redemption at end of period | $325 | $ 694 | $1,190 | $2,554 | |||||
| – Assuming no redemption | $225 | $ 694 | $1,190 | $2,554 | |||||
| Strategic Growth | |||||||||
| Class A Shares | $707 | $1,036 | $1,388 | $2,376 | |||||
| Class B Shares | |||||||||
| – Assuming complete redemption at end of period | $741 | $1,042 | $1,470 | $2,530 | |||||
| – Assuming no redemption | $241 | $ 742 | $1,270 | $2,530 | |||||
| Class C Shares | |||||||||
| – Assuming complete redemption at end of period | $341 | $ 742 | $1,270 | $2,716 | |||||
| – Assuming no redemption | $241 | $ 742 | $1,270 | $2,716 | |||||
| Fund | 1 Year | 3 Years | 5 Years | 10 Years | |||||
|---|---|---|---|---|---|---|---|---|---|
| Growth Opportunities | |||||||||
| Class A Shares | $ 705 | $ 1,030 | $ 1,378 | $ 2,356 | |||||
| Class B Shares | |||||||||
| – Assuming complete redemption at end of period | $ 739 | $ 1,036 | $ 1,460 | $ 2,510 | |||||
| – Assuming no redemption | $ 239 | $ 736 | $ 1,260 | $ 2,510 | |||||
| Class C Shares | |||||||||
| – Assuming complete redemption at end of period | $ 339 | $ 736 | $ 1,260 | $ 2,696 | |||||
| – Assuming no redemption | $ 239 | $ 736 | $ 1,260 | $ 2,696 | |||||
| Mid Cap Value | |||||||||
| Class A Shares | $ 679 | $ 951 | $ 1,244 | $ 2,074 | |||||
| Class B Shares | |||||||||
| – Assuming complete redemption at end of period | $ 712 | $ 955 | $ 1,344 | $ 2,229 | |||||
| – Assuming no redemption | $ 212 | $ 655 | $ 1,124 | $ 2,229 | |||||
| Class C Shares | |||||||||
| – Assuming complete redemption at end of period | $ 312 | $ 655 | $ 1,124 | $ 2,421 | |||||
| – Assuming no redemption | $ 212 | $ 655 | $ 1,124 | $ 2,421 | |||||
| Small Cap Value | |||||||||
| Class A Shares | $ 701 | $ 1,018 | $ 1,358 | $ 2,315 | |||||
| Class B Shares | |||||||||
| – Assuming complete redemption at end of period | $ 735 | $ 1,024 | $ 1,440 | $ 2,468 | |||||
| – Assuming no redemption | $ 235 | $ 724 | $ 1,240 | $ 2,468 | |||||
| Class C Shares | |||||||||
| – Assuming complete redemption at end of period | $ 335 | $ 724 | $ 1,240 | $ 2,656 | |||||
| – Assuming no redemption | $ 235 | $ 724 | $ 1,240 | $ 2,656 | |||||
| Large Cap Value | |||||||||
| Class A Shares | $ 865 | $ 1,510 | $ 2,177 | $ 3,947 | |||||
| Class B Shares | |||||||||
| – Assuming complete redemption at end of period | $ 907 | $ 1,532 | $ 2,274 | $ 4,090 | |||||
| – Assuming no redemption | $ 407 | $ 1,232 | $ 2,074 | $ 4,090 | |||||
| Class C Shares | |||||||||
| – Assuming complete redemption at end of period | $ 507 | $ 1,232 | $ 2,074 | $ 4,248 | |||||
| – Assuming no redemption | $ 407 | $ 1,232 | $ 2,074 | $ 4,248 | |||||
| The hypothetical example assumes that a CDSC will not apply to redemptions of Class A Shares within the first 18 months. Class B
Shares convert to Class A Shares eight years after purchase; therefore, Class A expenses are used in the hypothetical example after year eight.
|
| Certain institutions that sell Fund shares and/or their salespersons may receive other compensation in connection with the sale
and distribution of Class A, Class B and Class C Shares for services to their customers’ accounts and/or the Funds. For additional information regarding such compensation, see “What Should I Know When I Purchase Shares Through An Authorized
Dealer?”
|
| INVESTMENT ADVISERS
|
| Investment Adviser | Fund | ||
|---|---|---|---|
| Goldman Sachs Asset Management (“GSAM”) | Balanced | ||
| 32 Old Slip | Growth and Income | ||
| New York, New York 10005 | CORE Large Cap Value | ||
| CORE Large Cap Growth | |||
| CORE Small Cap Equity | |||
| Strategic Growth | |||
| Growth Opportunities | |||
| Mid Cap Value | |||
| Small Cap Value | |||
| Large Cap Value | |||
| Goldman Sachs Funds Management, L.P. (“GSFM”) | CORE U.S. Equity | ||
| 32 Old Slip | Capital Growth | ||
| New York, New York 10005 | |||
| GSAM and GSFM are separate business units of the Investment Management Division (“IMD”) of Goldman Sachs. Goldman Sachs
registered as an investment adviser in 1981. GSFM, a registered investment adviser since 1990, is a Delaware limited partnership which is an affiliate of Goldman Sachs. As of September 30, 2000, GSAM and GSFM, along with other units of IMD, had assets
under management of $281.3 billion.
|
| The Investment Adviser provides day-to-day advice regarding the Funds’ portfolio transactions. The Investment Adviser makes
the investment decisions for the Funds and places purchase and sale orders for the Funds’ portfolio transactions in U.S. and foreign markets. As permitted by applicable law, these orders may be directed to any brokers, including Goldman Sachs and its
affiliates. While the Investment Adviser is ultimately responsible for the management of the Funds, it is able to draw upon the research and expertise of its asset management affiliates for portfolio decisions and management with respect to certain
portfolio securities. In addition, the Investment Adviser has access to the research and certain proprietary technical models developed by Goldman Sachs, and will apply quantitative and qualitative analysis in determining the appropriate allocations among
categories of issuers and types of securities.
|
| The Investment Adviser also performs the following additional services for the Funds:
|
n
|
Supervises all non-advisory operations of the Funds
|
n
|
Provides personnel to perform necessary executive, administrative and clerical services to the Funds
|
n
|
Arranges for the preparation of all required tax returns,
reports to shareholders, prospectuses and statements of additional information and other reports filed with the Securities and Exchange Commission (the “SEC”) and other regulatory authorities
|
n
|
Maintains the records of each Fund
|
n
|
Provides office space and all necessary office equipment and services
|
| MANAGEMENT FEES
|
| As compensation for its services and its assumption of certain expenses, the Investment Adviser is entitled to the following fees,
computed daily and payable monthly, at the annual rates listed below (as a percentage of each respective Fund’s average daily net assets):
|
| Contractual Rate | Actual Rate
For the Fiscal Year Ended August 31, 2000 |
||||
|---|---|---|---|---|---|
| GSAM: | |||||
| Balanced | 0.65% | 0.65% | |||
| Growth and Income | 0.70% | 0.70% | |||
| CORE Large Cap Value | 0.60% | 0.60% | |||
| CORE Large Cap Growth | 0.75% | 0.64% | |||
| CORE Small Cap Equity | 0.85% | 0.85% | |||
| Strategic Growth | 1.00% | 1.00% | |||
| Growth Opportunities | 1.00% | 1.00% | |||
| Mid Cap Value | 0.75% | 0.75% | |||
| Small Cap Value | 1.00% | 1.00% | |||
| Large Cap Value | 0.75% | 0.75% | |||
| GSFM: | |||||
| CORE U.S. Equity | 0.75% | 0.70% | |||
| Capital Growth | 1.00% | 1.00% | |||
| The difference, if any, between the stated fees and the actual fees paid by the Funds reflects that the Investment Adviser did not
charge the full amount of the fees to which it would have been entitled. The Investment Adviser may discontinue or modify any such voluntary limitations in the future at its discretion.
|
| FUND MANAGERS
|
| M. Roch Hillenbrand, a Managing Director of Goldman Sachs since 1997, is the Head of Global Equities for GSAM, overseeing the
United States, Europe, Japan, and non-Japan Asia. In this capacity, he is responsible for managing the group as it defines and implements global portfolio management processes that are consistent, reliable and predictable. Mr. Hillenbrand joined Goldman
Sachs in 1997 upon its acquisition of Commodities Corporation, LLC where he was and continues as President. Over the course of his 19-year career at Commodities Corporation, Mr. Hillenbrand has had extensive experience in dealing with internal and
external investment managers who have managed a range of futures and equities strategies across multiple markets, using a variety of styles.
|
| Value Team
|
n
|
Twelve portfolio managers/analysts with over 100 years of combined financial experience comprise the Investment Adviser’s
value investment team
|
n
|
Multi-sector focus provides a balanced perspective and in-depth industry
knowledge |
n
|
Across all value products, the Investment Adviser leverages the industry research expertise of its small, mid and large cap
investment teams
|
| Name and Title | Fund Responsibility | Years
Primarily Responsible |
Five Year Employment History | ||||
|---|---|---|---|---|---|---|---|
| Eileen A. Aptman
Vice President |
Senior Portfolio Manager—
Mid Cap Value Small Cap Value |
Since
1996 1997 |
Ms. Aptman joined the Investment
Adviser as a research analyst in 1993. She became a portfolio manager in 1996. |
||||
| Matthew B.
McLennan Vice President |
Senior Portfolio Manager—
Small Cap Value Mid Cap Value |
Since
1996 1998 |
Mr. McLennan joined the
Investment Adviser as a research analyst in 1995 and became a portfolio manager in 1996. From 1994 to 1995, he worked in the Investment Banking Division of Goldman Sachs in Australia. |
||||
| Meera Mayer
Vice President |
Senior Portfolio Manager—
Growth and Income Large Cap Value Balanced (Equity) |
Since
1999 1999 1999 |
Ms. Mayer joined the Investment
Adviser as a senior portfolio manager in November 1999. From July 1999 to November 1999, she worked at Oppenheimer Funds as a senior equity analyst. From 1995 to March 1999, she worked at Spears, Benzak, Salomon and Farrell as a managing director and portfolio manager. |
||||
| Name and Title | Fund Responsibility | Years
Primarily Responsible |
Five Year Employment History | ||||
|---|---|---|---|---|---|---|---|
| Chip Otness
Vice President |
Senior Portfolio Manager—
Small Cap Value Mid Cap Value |
Since
2000 2000 |
Mr. Otness joined the Investment
Adviser as a senior portfolio manager in 2000. From 1998 to 2000, he headed Dolphin Asset Management. From 1970 to 1998, he worked at J.P. Morgan, most recently as a managing director and senior portfolio manager responsible for small-cap institutional equity investments. |
||||
| Eileen Rominger
Managing Director |
Senior Portfolio Manager—
Growth and Income Large Cap Value Balanced (Equity) |
Since
1999 1999 1999 |
Ms. Rominger joined the
Investment Adviser as a senior portfolio manager and Chief Investment Officer of the Value Equity team in 1999. From 1981 to 1999, she worked at Oppenheimer Capital, most recently as a senior portfolio manager. |
||||
| Quantitative Equity Team
|
n
|
A stable and growing team supported by an extensive internal staff
|
n
|
Access to the research ideas of Goldman Sachs’ renowned Global Investment Research Department
|
n
|
More than $34 billion in equities currently under management
|
| Name and Title | Fund Responsibility | Years
Primarily Responsible |
Five Year Employment History | ||||
|---|---|---|---|---|---|---|---|
| Melissa Brown
Managing Director |
Senior Portfolio Manager—
CORE Large Cap Value CORE U.S. Equity CORE Large Cap Growth CORE Small Cap Equity |
Since
1998 1998 1998 1998 |
Ms. Brown joined the
Investment Adviser as a portfolio manager in 1998. From 1984 to 1998, she was the director of Quantitative Equity Research and served on the Investment Policy Committee at Prudential Securities. |
||||
| Robert C. Jones
Managing Director |
Senior Portfolio Manager—
CORE U.S. Equity CORE Large Cap Growth CORE Small Cap Equity CORE Large Cap Value |
Since
1991 1997 1997 1998 |
Mr. Jones joined the
Investment Adviser as a portfolio manager in 1989. |
||||
| Victor H. Pinter
Vice President |
Senior Portfolio Manager—
CORE U.S. Equity CORE Large Cap Growth CORE Small Cap Equity CORE Large Cap Value |
Since
1996 1997 1997 1998 |
Mr. Pinter joined the
Investment Adviser as a research analyst in 1989. He became a portfolio manager in 1992. |
||||
| Growth Equity Investment Team
|
n
|
18 year consistent investment style applied through diverse and complete market cycles
|
n
|
More than $22 billion in equities currently under management
|
n
|
More than 300 client account relationships
|
n
|
A portfolio management and analytical team with more than 150 years combined investment experience
|
| Name and Title | Fund Responsibility | Years
Primarily Responsible |
Five Year Employment History | ||||
|---|---|---|---|---|---|---|---|
| George D. Adler
Vice President |
Senior Portfolio Manager—
Balanced (Equity) Capital Growth Strategic Growth Growth Opportunities |
Since
1997 1997 1999 1999 |
Mr. Adler joined the
Investment Adviser as a portfolio manager in 1997. From 1990 to 1997, he was a portfolio manager at Liberty Investment Management, Inc. (“Liberty”). |
||||
| Steve Barry
Vice President |
Senior Portfolio Manager—
Growth Opportunities Capital Growth Balanced (Equity) Strategic Growth |
Since
1999 2000 2000 2000 |
Mr. Barry joined the Investment
Adviser as a portfolio manager in 1999. From 1988 to 1999, he was a portfolio manager at Alliance Capital Management. |
||||
| Kenneth T. Berents
Managing Director |
Senior Portfolio Manager—
Capital Growth Balanced (Equity) Strategic Growth Growth Opportunities |
Since
2000 2000 2000 2000 |
Mr. Berents joined the Investment
Adviser as a portfolio manager in 2000. From 1992 to 1999, he was Director of Research and head of the Investment Committee at Wheat First Union. |
||||
| Robert G. Collins
Managing Director |
Senior Portfolio Manager—
Capital Growth Balanced (Equity) Strategic Growth Growth Opportunities |
Since
1997 1998 1999 1999 |
Mr. Collins joined the Investment
Adviser as portfolio manager and Co-Chair of the Growth Equity Investment Committee in 1997. From 1991 to 1997, he was a portfolio manager at Liberty. |
||||
| Herbert E. Ehlers
Managing Director |
Senior Portfolio Manager—
Capital Growth Balanced (Equity) Strategic Growth Growth Opportunities |
Since
1997 1998 1999 1999 |
Mr. Ehlers joined the Investment
Adviser as a senior portfolio manager and Chief Investment Officer of the Growth Equity team in 1997. From 1994 to 1997, he was the Chief Investment Officer and Chairman of Liberty. |
||||
| Name and Title | Fund Responsibility | Years
Primarily Responsible |
Five Year Employment History | ||||
|---|---|---|---|---|---|---|---|
| Gregory H. Ekizian
Managing Director |
Senior Portfolio Manager—
Capital Growth Balanced (Equity) Strategic Growth Growth Opportunities |
Since
1997 1998 1999 1999 |
Mr. Ekizian joined the Investment
Adviser as portfolio manager and Co-Chair of the Growth Equity Investment Committee in 1997. From 1990 to 1997, he was a portfolio manager at Liberty and its predecessor firm, Eagle. |
||||
| Scott Kolar
Vice President |
Portfolio Manager—
Growth Opportunities Capital Growth Balanced (Equity) Strategic Growth |
Since
1999 2000 2000 2000 |
Mr. Kolar joined the Investment
Adviser as an equity analyst in 1997 and became a portfolio manager in 1999. From 1994 to 1997, he was an equity analyst and information systems specialist at Liberty. |
||||
| David G. Shell
Managing Director |
Senior Portfolio Manager—
Capital Growth Balanced (Equity) Strategic Growth Growth Opportunities |
Since
1997 1998 1999 1999 |
Mr. Shell joined the Investment
Adviser as a portfolio manager in 1997. From 1987 to 1997, he was a portfolio manager at Liberty and its predecessor firm, Eagle. |
||||
| Ernest C. Segundo, Jr.
Vice President |
Senior Portfolio Manager—
Capital Growth Balanced (Equity) Strategic Growth Growth Opportunities |
Since
1997 1998 1999 1999 |
Mr. Segundo joined the Investment
Adviser as a portfolio manager in 1997. From 1992 to 1997, he was a portfolio manager at Liberty. |
||||
| Fixed-Income Portfolio Management Team
|
n
|
Fixed-income portfolio management is comprised of a deep team of sector specialists
|
n
|
The team strives to maximize risk-adjusted returns by de-emphasizing interest rate anticipation and focusing on security selection
and sector allocation
|
n
|
The team manages approximately $49 billion in fixed-income assets for retail, institutional and high net worth clients
|
| Name and Title | Fund Responsibility | Years
Primarily Responsible |
Five Year Employment History | ||||
|---|---|---|---|---|---|---|---|
| Jonathan A. Beinner
Managing Director and Co-Head U.S. Fixed Income |
Senior Portfolio Manager—
Balanced (Fixed-Income) |
Since
1994 |
Mr. Beinner joined the Investment
Adviser as a portfolio manager in 1990. |
||||
| C. Richard Lucy
Managing Director and Co-Head U.S. Fixed Income |
Senior Portfolio Manager—
Balanced (Fixed-Income) |
Since
1994 |
Mr. Lucy joined the Investment
Adviser as a portfolio manager in 1992. |
||||
| DISTRIBUTOR AND TRANSFER AGENT
|
| Goldman Sachs, 85 Broad Street, New York, New York 10004, serves as the exclusive distributor (the “Distributor”) of
each Fund’s shares. Goldman Sachs, 4900 Sears Tower, Chicago, Illinois 60606-6372, also serves as the Funds’ transfer agent (the “Transfer Agent”) and, as such, performs various shareholder servicing functions.
|
| From time to time, Goldman Sachs or any of its affiliates may purchase and hold shares of the Funds. Goldman Sachs reserves the
right to redeem at any time some or all of the shares acquired for its own account.
|
| ACTIVITIES OF GOLDMAN SACHS AND ITS AFFILIATES AND OTHER ACCOUNTS MANAGED BY GOLDMAN SACHS
|
| The involvement of the Investment Adviser, Goldman Sachs and their affiliates in the management of, or their interest in, other
accounts and other activities of Goldman Sachs may present conflicts of interest with respect to a Fund or limit a Fund’s investment activities. Goldman Sachs and its affiliates engage in proprietary trading and advise accounts and funds which have
investment objectives similar to those of the Funds and/or which engage in and compete for transactions in the same types of securities, currencies and instruments as the Funds. Goldman Sachs and its affiliates will not have any obligation to make
available any information regarding their proprietary activities or strategies, or the activities or strategies used for other accounts managed by them, for the benefit of the management of the Funds. The results of a Fund’s investment activities,
therefore, may differ from those of Goldman Sachs and its affiliates, and it is possible that a Fund could sustain losses during periods in which Goldman Sachs and its affiliates and other accounts achieve significant profits on their trading for
proprietary or other
accounts. In addition, the Funds may, from time to time, enter into transactions in which other clients of Goldman Sachs have an adverse interest. A Fund’s activities may be limited because of regulatory restrictions applicable to Goldman Sachs and its affiliates, and/or their internal policies designed to comply with such restrictions. |
n
|
Cash
|
n
|
Additional shares of the same class of the same Fund
|
n
|
Shares of the same or an equivalent class of another Goldman Sachs Fund. Special restrictions may apply for certain ILA
Portfolios. See the Additional Statement.
|
| Fund | Investment
Income Dividends |
Capital Gains
Distributions |
|||
|---|---|---|---|---|---|
| Balanced | Quarterly | Annually | |||
| Growth and Income | Quarterly | Annually | |||
| CORE Large Cap Value | Quarterly | Annually | |||
| CORE U.S. Equity | Annually | Annually | |||
| CORE Large Cap Growth | Annually | Annually | |||
| CORE Small Cap Equity | Annually | Annually | |||
| Capital Growth | Annually | Annually | |||
| Strategic Growth | Annually | Annually | |||
| Growth Opportunities | Annually | Annually | |||
| Mid Cap Value | Annually | Annually | |||
| Small Cap Value | Annually | Annually | |||
| Large Cap Value | Annually | Annually | |||
| The following section will provide you with answers to some of the most often asked questions regarding buying and selling the
Funds’ shares.
|
| How Can I Purchase Class A, Class B And Class C Shares Of The Funds?
|
| You may purchase shares of the Funds through:
|
n
|
Goldman Sachs;
|
n
|
Authorized Dealers; or
|
n
|
Directly from Goldman Sachs Trust (the “Trust”).
|
| In order to make an initial investment in a Fund, you must furnish to the Fund, Goldman Sachs or your Authorized Dealer the
information in the Account Application attached to this Prospectus.
|
| To Open an Account:
|
n
|
Complete the enclosed Account Application
|
n
|
Mail your payment and Account Application to:
|
| Your Authorized Dealer
|
–
|
Purchases by check or Federal Reserve draft should be made payable to your Authorized Dealer
|
–
|
Your Authorized Dealer is responsible for forwarding payment promptly (within three business days) to the Fund
|
| or
|
| Goldman Sachs Funds c/o National Financial Data Services, Inc. (“NFDS”), P.O. Box 219711, Kansas
City, MO 64121-9711
|
–
|
Purchases by check or Federal Reserve draft should be made payable to Goldman Sachs Funds – (Name of Fund and
Class of Shares)
|
–
|
NFDS will not accept a check drawn on a foreign bank, a third-party check, cash, money orders, travelers cheques or credit card
checks
|
–
|
Federal funds wire, Automated Clearing House Network (“ACH”) transfer or bank wires should be sent to State Street Bank
and Trust Company (“State Street”) (each Fund’s custodian). Please call the Funds at 1-800-526-7384 to get detailed instructions on how to wire your money.
|
| What Is My Minimum Investment In The Funds?
|
| Initial | Additional | ||||
|---|---|---|---|---|---|
| Regular Accounts | $1,000 | $50 | |||
| Tax-Sheltered Retirement Plans (excluding SIMPLE IRAs and
Education IRAs) |
$250 | $50 | |||
| Uniform Gift to Minors Act Accounts/Uniform Transfer to
Minors Act Accounts |
$250 | $50 | |||
| 403(b) Plan Accounts | $200 | $50 | |||
| SIMPLE IRAs and Education IRAs | $50 | $50 | |||
| Automatic Investment Plan Accounts | $50 | $50 | |||
| What Alternative Sales Arrangements Are Available?
|
| The Funds offer three classes of shares through this Prospectus.
|
| Maximum Amount You Can
Buy In The Aggregate Across Funds |
Class A | No limit | |||
| Class B | $250,000 | ||||
| Class C | $1,000,000 | ||||
| Initial Sales Charge | Class A | Applies to purchases of less than $1 million—
varies by size of investment with a maximum of 5.5% |
|||
| Class B | None | ||||
| Class C | None | ||||
| CDSC | Class A | 1.00% on certain investments of $1 million or
more if you sell within 18 months |
|||
| Class B | 6 year declining CDSC with a maximum of 5% | ||||
| Class C | 1% if shares are redeemed within 12 months
of purchase |
||||
| Conversion Feature | Class A | None | |||
| Class B | Class B Shares convert to Class A Shares after
8 years |
||||
| Class C | None | ||||
| What Else Should I Know About Share Purchases?
|
| The Trust reserves the right to:
|
n
|
Refuse to open an account if you fail to (i) provide a social security number or other taxpayer identification number; or (ii)
certify that such number is correct (if required to do so under applicable law).
|
n
|
Reject or restrict any purchase or exchange order by a particular purchaser (or group of related purchasers). This may occur, for
example, when a pattern of
frequent purchases, sales or exchanges of shares of a Fund is evident, or if purchases, sales or exchanges are, or a subsequent abrupt redemption might be, of a size that would disrupt management of a Fund.
|
n
|
Close a Fund to new investors from time to time and reopen a
Fund whenever it is deemed appropriate by a Fund’s Investment Adviser.
|
n
|
Modify or waive the minimum investment amounts.
|
n
|
Modify the manner in which shares are offered.
|
n
|
Modify the sales charge rates applicable to future purchases of shares.
|
| The Funds may allow you to purchase shares with securities instead of cash if consistent with a Fund’s investment policies
and operations and if approved by the Fund’s Investment Adviser.
|
| How Are Shares Priced?
|
| The price you pay or receive when you buy, sell or exchange shares is determined by a Fund’s NAV and share class. Each class
calculates its NAV as follows:
|
| (Value of Assets of the Class) | ||
| – (Liabilities of the Class) | ||
| NAV = | ||
| Number of Outstanding Shares of the Class |
| The Funds’ investments are valued based on market quotations or if accurate quotations are not readily available, the fair
value of the Fund’s investments may be determined in good faith under procedures established by the Trustees.
|
n
|
NAV per share of each share class is calculated by the Fund’s custodian on each business day as of the close of regular
trading on the New York Stock Exchange (normally 4:00 p.m. New York time). Fund shares will not be priced on any day the New York Stock Exchange is closed.
|
n
|
When you buy shares, you pay the NAV next calculated after the Funds receive your order in proper form, plus any applicable
sales charge.
|
n
|
When you sell shares, you receive the NAV next calculated after the Funds receive your order in proper form, less any
applicable CDSC.
|
| Note: The time at which transactions and shares are priced and the time by which orders must be received may be changed in
case of an emergency or if regular trading on the New York Stock Exchange is stopped at a time other than 4:00 p.m. New York time.
|
| Foreign securities may trade in their local markets on days a Fund is closed. As a result, the NAV of a Fund that holds foreign
securities may be impacted on days when investors may not purchase or redeem Fund shares.
|
| In addition, the impact of events that occur after the publication of market quotations used by a Fund to price its securities but
before the close of regular trading
on the New York Stock Exchange will normally not be reflected in a Fund’s next determined NAV unless the Trust, in its discretion, makes an adjustment in light of the nature and materiality of the event, its effect on Fund operations and other
relevant factors.
|
| COMMON QUESTIONS ABOUT THE PURCHASE OF CLASS A SHARES
|
| What Is The Offering Price Of Class A Shares?
|
| The offering price of Class A Shares of each Fund is the next determined NAV per share plus an initial sales charge paid to
Goldman Sachs at the time of purchase of shares. The sales charge varies depending upon the amount you purchase. In some cases, described below, the initial sales charge may be eliminated altogether, and the offering price will be the NAV per share. The current sales charges and commissions paid
to Authorized Dealers are as follows:
|
| Amount of Purchase
(including sales charge, if any) |
Sales Charge as
Percentage of Offering Price |
Sales Charge
as Percentage of Net Amount Invested |
Maximum Dealer
Allowance as Percentage of Offering Price* |
|||||||
|---|---|---|---|---|---|---|---|---|---|---|
| Less than $50,000 | 5.50 | % | 5.82 | % | 5.00 | % | ||||
| $50,000 up to (but less than) $100,000 | 4.75 | 4.99 | 4.00 | |||||||
| $100,000 up to (but less than) $250,000 | 3.75 | 3.90 | 3.00 | |||||||
| $250,000 up to (but less than) $500,000 | 2.75 | 2.83 | 2.25 | |||||||
| $500,000 up to (but less than) $1 million | 2.00 | 2.04 | 1.75 | |||||||
| $1 million or more | 0.00 | ** | 0.00 | ** | *** | |||||
*
|
Dealer’s allowance may be changed periodically. During special promotions, the entire sales charge may be allowed
to Authorized Dealers. Authorized Dealers to whom substantially the entire sales charge is allowed may be deemed to be “underwriters” under the Securities Act of 1933.
|
**
|
No sales charge is payable at the time of purchase of Class A Shares of $1 million or more, but a CDSC of 1% may be
imposed in the event of certain redemptions within 18 months of purchase.
|
***
|
The Distributor may pay a one-time commission to Authorized Dealers who initiate or are responsible for purchases of $1
million or more of shares of the Funds equal to 1.00% of the amount under $3 million, 0.50% of the next $2 million, and 0.25% thereafter. The Distributor may also pay, with respect to all or a portion of the amount purchased, a commission in accordance
with the foregoing schedule to Authorized Dealers who initiate or are responsible for purchases of $500,000 or more by certain Section 401(k), profit sharing, money purchase pension, tax-sheltered annuity, defined benefit pension, or other employee
benefit plans that are sponsored by one or more employers (including governmental or church employers) or employee organizations investing in the Funds which satisfy the criteria set forth below in “When Are Class A Shares Not Subject To A Sales
Load?” or $1 million or more by certain “wrap” accounts. Purchases by such plans will be made at NAV with no initial sales charge, but if all of the shares held are redeemed within 18 months after the end of the calendar month in which such
purchase was made, a CDSC of 1% may be imposed upon the plan sponsor or the third party administrator. In addition, Authorized Dealers will remit to the Distributor such payments received in connection with “wrap” accounts in the event that
shares are redeemed within 18 months after the end of the calendar month in which the purchase was made.
|
| What Else Do I Need To Know About Class A Shares’ CDSC?
|
| Purchases of $1 million or more of Class A Shares will be made at NAV with no initial sales charge. However, if you redeem shares
within 18 months after the end of the calendar month in which the purchase was made, excluding any period of time in which the shares were exchanged into and remained invested in an equivalent class of an ILA Portfolio, a CDSC of 1% may be imposed. The
CDSC may not be imposed if your Authorized Dealer enters into an agreement with the Distributor to return all or an applicable prorated portion of its commission to the Distributor. The CDSC is waived on redemptions in certain circumstances. See “In
What Situations May The CDSC On Class A, B Or C Shares Be Waived Or Reduced?” below.
|
| When Are Class A Shares Not Subject To A Sales Load?
|
| Class A Shares of the Funds may be sold at NAV without payment of any sales charge to the following individuals and entities:
|
n
|
Goldman Sachs, its affiliates or their respective officers, partners, directors or employees (including retired employees and
former partners), any partnership of which Goldman Sachs is a general partner, any Trustee or officer of the Trust and designated family members of any of these individuals;
|
n
|
Qualified retirement plans of Goldman Sachs;
|
n
|
Trustees or directors of investment companies for which Goldman Sachs or an affiliate acts as sponsor;
|
n
|
Any employee or registered representative of any Authorized Dealer or their respective spouses, children and parents;
|
n
|
Banks, trust companies or other types of depository institutions investing for their own account or investing for discretionary or
non-discretionary accounts;
|
n
|
Any state, county or city, or any instrumentality, department, authority or agency thereof, which is prohibited by applicable
investment laws from paying a sales charge or commission in connection with the purchase of shares of a Fund;
|
n
|
Section 401(k), profit sharing, money purchase pension, tax-sheltered annuity, defined benefit pension, or other employee benefit
plans that are sponsored by one or more employers (including governmental or church employers) or employee organizations (“Retirement Plans”) that:
|
n
|
Buy shares of Goldman Sachs Funds worth $500,000 or more; or
|
n
|
Have 100 or more eligible employees at the time of purchase; or
|
n
|
Certify that they expect to have annual plan purchases of shares of Goldman Sachs Funds of $200,000 or more; or
|
n
|
Are provided administrative services by certain third-party administrators that have entered into a special service arrangement
with Goldman Sachs relating to such plans; or
|
n
|
Have at the time of purchase aggregate assets of at least $2,000,000;
|
n
|
“Wrap” accounts for the benefit of clients of broker-dealers, financial institutions or financial planners, provided
they have entered into an agreement with GSAM specifying aggregate minimums and certain operating policies and standards;
|
n
|
Registered investment advisers investing for accounts for which they receive asset-based fees;
|
n
|
Accounts over which GSAM or its advisory affiliates have investment discretion;
|
n
|
Shareholders receiving distributions from a qualified retirement plan invested in the Goldman Sachs Funds and reinvesting such
proceeds in a Goldman Sachs IRA;
|
n
|
Shareholders who roll over distributions from any tax-qualified retirement plan or tax-sheltered annuity to an IRA which invests
in the Goldman Sachs Funds if the tax-qualified retirement plan or tax-sheltered annuity receives administrative services provided by certain third-party administrators that have entered into a special service arrangement with Goldman Sachs relating to
such plan or annuity; or
|
n
|
Other exemptions may be stated from time to time in the Additional Statement.
|
| You must certify eligibility for any of the above exemptions on your Account Application and notify the Fund if you no longer
are eligible for the exemption. The Fund will grant you an exemption subject to confirmation of your entitlement. You may be charged a fee if you effect your transactions through a broker or agent.
|
| How Can The Sales Charge On Class A Shares Be Reduced?
|
n
|
Right of Accumulation: When buying Class A Shares in Goldman Sachs Funds, your current aggregate
investment determines the initial sales load you pay. You may qualify for reduced sales charges when the current market value of holdings (shares at current offering price), plus new purchases, reaches $50,000 or more. Class A Shares of any of the Goldman
Sachs Funds may be combined under the Right of Accumulation. To qualify for a reduced sales load, you or your Authorized Dealer must notify the Funds’ Transfer Agent at the time of investment that a quantity discount is applicable. Use of this
service is subject to a check of appropriate records. The Additional Statement has more information about the Right of Accumulation.
|
n
|
Statement of Intention: You may obtain a reduced sales charge by means of a written Statement of
Intention which expresses your non-binding commitment to invest in the aggregate $50,000 or more (not counting reinvestments of dividends and distributions) within a period of 13 months in Class A Shares of one or more Goldman Sachs Fund. Any investments
you make during the period will receive the discounted sales load based on the full amount of your invest
ment commitment. If the investment commitment of the Statement of Intention is not met prior to the expiration of the 13-month period, the entire amount will be subject to the higher applicable sales charge. By signing the Statement of Intention, you
authorize the Transfer Agent to escrow and redeem Class A Shares in your account to pay this additional charge. The Additional Statement has more information about the Statement of Intention, which you should read carefully.
|
| COMMON QUESTIONS ABOUT THE PURCHASE OF CLASS B SHARES
|
| What Is The Offering Price Of Class B Shares?
|
| You may purchase Class B Shares of the Funds at the next determined NAV without an initial sales charge. However, Class B
Shares redeemed within six years of purchase will be subject to a CDSC at the rates shown in the table below based on how long you held your shares.
|
| The CDSC schedule is as follows:
|
| Year Since Purchase | CDSC as a
Percentage of Dollar Amount Subject to CDSC |
||
|---|---|---|---|
| First | 5% | ||
| Second | 4% | ||
| Third | 3% | ||
| Fourth | 3% | ||
| Fifth | 2% | ||
| Sixth | 1% | ||
| Seventh and thereafter | None | ||
| Proceeds from the CDSC are payable to the Distributor and may be used in whole or in part to defray the Distributor’s
expenses related to providing distribution-related services to the Funds in connection with the sale of Class B Shares, including the payment of compensation to Authorized Dealers. A commission equal to 4% of the amount invested is paid to Authorized
Dealers.
|
| What Should I Know About The Automatic Conversion Of Class B Shares?
|
| Class B Shares of a Fund will automatically convert into Class A Shares of the same Fund at the end of the calendar quarter that
is eight years after the purchase date.
|
| If you acquire Class B Shares of a Fund by exchange from Class B Shares of another Goldman Sachs Fund, your Class B Shares will
convert into Class A Shares of such Fund based on the date of the initial purchase and the CDSC schedule of that purchase.
|
| If you acquire Class B Shares through reinvestment of distributions, your Class B Shares will convert into Class A Shares based
on the date of the initial purchase of the shares on which the distribution was paid.
|
| The conversion of Class B Shares to Class A Shares will not occur at any time the Funds are advised that such conversions may
constitute taxable events for federal tax purposes, which the Funds believe is unlikely. If conversions do not occur as a result of possible taxability, Class B Shares would continue to be subject to higher expenses than Class A Shares for an
indeterminate period.
|
| A COMMON QUESTION ABOUT THE PURCHASE OF CLASS C SHARES
|
| What Is The Offering Price Of Class C Shares?
|
| You may purchase Class C Shares of the Funds at the next determined NAV without paying an initial sales charge. However, if you
redeem Class C Shares within 12 months of purchase, a CDSC of 1% will normally be deducted from the redemption proceeds; provided that in connection with purchases by Retirement Plans, where all of the Class C Shares are redeemed within 12 months of
purchase, a CDSC of 1% may be imposed upon the plan sponsor or third-party administrator.
|
| Proceeds from the CDSC are payable to the Distributor and may be used in whole or in part to defray the Distributor’s
expenses related to providing distribution-related services to the Funds in connection with the sale of Class C Shares, including the payment of compensation to Authorized Dealers. An amount equal to 1% of the amount invested is normally paid by the
Distributor to Authorized Dealers.
|
| COMMON QUESTIONS APPLICABLE TO THE PURCHASE OF CLASS A, B AND C SHARES
|
| What Else Do I Need To Know About The CDSC On Class A, B Or C Shares?
|
n
|
The CDSC is based on the lesser of the NAV of the shares at the time of redemption or the original offering price (which is the
original NAV).
|
n
|
No CDSC is charged on shares acquired from reinvested dividends or capital gains distributions.
|
n
|
No CDSC is charged on the per share appreciation of your account over the initial purchase price.
|
n
|
When counting the number of months since a purchase of Class B or Class C Shares was made, all payments made during a month will
be combined and considered to have been made on the first day of that month.
|
| n
|
To keep your CDSC as low as possible, each time you place a request to sell shares, the Funds will first sell any shares in your
account that do not carry a CDSC and then the shares in your account that have been held the longest.
|
| In What Situations May The CDSC On Class A, B Or C Shares Be Waived Or Reduced?
|
| The CDSC on Class A, Class B and Class C Shares that are subject to a CDSC may be waived or reduced if the redemption relates to:
|
n
|
Retirement distributions or loans to participants or beneficiaries from Retirement Plans;
|
n
|
The death or disability (as defined in Section 72(m)(7) of the Internal Revenue Code of 1986, as amended (the “Code”))
of a participant or beneficiary in a Retirement Plan;
|
n
|
Hardship withdrawals by a participant or beneficiary in a Retirement Plan;
|
n
|
Satisfying the minimum distribution requirements of the Code;
|
n
|
Establishing “substantially equal periodic payments” as described under Section 72(t)(2) of the Code;
|
n
|
The separation from service by a participant or beneficiary in a Retirement Plan;
|
n
|
The death or disability (as defined in Section 72(m)(7) of the Code) of a shareholder if the redemption is made within one year of
the event;
|
n
|
Excess contributions distributed from a Retirement Plan;
|
n
|
Distributions from a qualified Retirement Plan invested in the Goldman Sachs Funds which are being rolled over to a Goldman Sachs
IRA; or
|
n
|
Redemption proceeds which are to be reinvested in accounts or non-registered products over which GSAM or its advisory affiliates
have investment discretion.
|
| In addition, Class A, B and C Shares subject to a systematic withdrawal plan may be redeemed without a CDSC. The Funds reserve the
right to limit such redemptions, on an annual basis, to 12% each of the value of your Class B and C Shares and 10% of the value of your Class A Shares.
|
| How Do I Decide Whether To Buy Class A, B Or C Shares?
|
| The decision as to which Class to purchase depends on the amount you invest, the intended length of the investment and your
personal situation.
|
n
|
Class A Shares. If you are making an investment of $50,000 or more that qualifies for a reduced sales
charge, you should consider purchasing Class A Shares.
|
n
|
Class B Shares. If you plan to hold your investment for at least six years and would prefer not to pay
an initial sales charge, you might consider purchasing Class B Shares. By not paying a front-end sales charge, your entire investment
|
| in Class B Shares is available to work for you from the time you make your initial investment. However, the distribution and
service fee paid by Class B Shares will cause your Class B Shares (until conversion to Class A Shares) to have a higher expense ratio, and thus lower performance and lower dividend payments (to the extent dividends are paid) than Class A Shares. A maximum
purchase limitation of $250,000 in the aggregate normally applies to Class B Shares. Individual purchases exceeding $250,000 will be rejected.
|
n
|
Class C Shares. If you are unsure of the length of your investment or plan to hold your investment for
less than six years and would prefer not to pay an initial sales charge, you may prefer Class C Shares. By not paying a front-end sales charge, your entire investment in Class C Shares is available to work for you from the time you make your initial
investment. However, the distribution and service fee paid by Class C Shares will cause your Class C Shares to have a higher expense ratio, and thus lower performance and lower dividend payments (to the extent dividends are paid) than Class A Shares (or
Class B Shares after conversion to Class A Shares).
|
| Although Class C Shares are subject to a CDSC for only 12 months, Class C Shares do not have the automatic eight year conversion
feature applicable to Class B Shares and your investment may pay higher distribution fees indefinitely.
|
| A maximum purchase limitation of $1,000,000 in the aggregate normally applies to purchases of Class C Shares. Individual purchases
exceeding $1,000,000 will be rejected.
|
| Note: Authorized Dealers may receive different compensation for selling Class A, Class B or Class C Shares.
|
| In addition to Class A, Class B and Class C Shares, each Fund also offers other classes of shares to investors. These other share
classes are subject to different fees and expenses (which affect performance), have different minimum investment requirements and are entitled to different services. Information regarding these other share classes may be obtained from your sales
representative or from Goldman Sachs by calling the number on the back cover of this Prospectus.
|
| How Can I Sell Class A, Class B And Class C Shares Of The Funds?
|
| You may arrange to take money out of your account by selling (redeeming) some or all of your shares. Each Fund will redeem its
shares upon request on any business day at the NAV next determined after receipt of such request in proper form, subject to any applicable CDSC. You may request that redemption proceeds be sent to you by check or by wire (if the wire instructions are on record). Redemptions may be requested in writing or by telephone.
|
| Instructions For Redemptions: | |||
|---|---|---|---|
| By Writing: | n Write a letter of instruction that includes: | ||
| n Your name(s) and signature(s) | |||
| n Your account number | |||
| n The Fund name and Class of Shares | |||
| n The dollar amount you want to sell | |||
| n How and where to send the proceeds | |||
| n Obtain a signature guarantee (see details below) | |||
| n
Mail your request to:
Goldman Sachs Funds c/o NFDS P.O. Box 219711 Kansas City, MO 64121-9711 |
|||
| By Telephone: | If you have not declined the telephone redemption
privilege on your Account Application: |
||
| n
1-800-526-7384
(8:00 a.m. to 4:00 p.m. New York time) |
|||
| n
You may redeem up to $50,000 of your shares
within any 7 calendar day period |
|||
| n
Proceeds which are sent directly to a Goldman
Sachs brokerage account are not subject to the $50,000 limit |
|||
| When Do I Need A Signature Guarantee To Redeem Shares?
|
| A signature guarantee is required if:
|
n
|
You are requesting in writing to redeem shares in an amount over $50,000;
|
n
|
You would like the redemption proceeds sent to an address that is not your address of record; or
|
n
|
You would like to change the bank designated on your Account Application.
|
| A signature guarantee must be obtained from a bank, brokerage firm or other financial intermediary that is a member of an approved
Medallion Guarantee Program or that is otherwise approved by Goldman Sachs. A notary public cannot provide a signature guarantee. Additional documentation may be required for executors, trustees or corporations or when deemed appropriate by the Transfer
Agent.
|
| What Do I Need To Know About Telephone Redemption Requests?
|
| The Trust, the Distributor and the Transfer Agent will not be liable for any loss you may incur in the event that the Trust
accepts unauthorized telephone redemption requests that the Trust reasonably believes to be genuine. The Trust may accept telephone redemption instructions from any person identifying himself or herself as the owner of an account or the owner’s
registered representative where the owner has not declined in writing to use this service. Thus, you risk possible losses if a telephone redemption is not authorized by you.
|
| In an effort to prevent unauthorized or fraudulent redemption and exchange requests by telephone, Goldman Sachs and NFDS each
employ reasonable procedures specified by the Trust to confirm that such instructions are genuine. If reasonable procedures are not employed, the Trust may be liable for any loss due to unauthorized or fraudulent transactions. The following general
policies are currently in effect:
|
n
|
All telephone requests are recorded.
|
n
|
Proceeds of telephone redemption requests will be sent only to your address of record or authorized bank account designated in the
Account Application (unless you provide written instructions and a signature guarantee, indicating another address or account) and exchanges of shares normally will be made only to an identically registered account.
|
n
|
Telephone redemptions will not be accepted during the 30-day period following any change in your address of record.
|
n
|
The telephone redemption option does not apply to shares held in a “street name” account. “Street name”
accounts are accounts maintained and serviced by your Authorized Dealer. If your account is held in “street name,” you should contact your registered representative of record, who may make telephone redemptions on your behalf.
|
n
|
The telephone redemption option may be modified or terminated at any time.
|
| Note: It may be difficult to make telephone redemptions in times of drastic economic or market conditions.
|
| How Are Redemption Proceeds Paid?
|
| By Wire: You may arrange for your redemption proceeds to be wired as federal funds to the bank account designated in
your Account Application. The following general policies govern wiring redemption proceeds:
|
n
|
Redemption proceeds will normally be wired on the next business day in federal funds (for a total of one business day delay), but
may be paid up to three business days following receipt of a properly executed wire transfer redemption request. If you are selling shares you recently paid for by check, the Fund will pay you when your check has cleared, which may take up to 15 days. If
the Federal Reserve Bank is closed on the day that the redemption proceeds would ordinarily be wired, wiring the redemption proceeds may be delayed one additional business day.
|
n
|
A transaction fee of $7.50 may be charged for payments of redemption proceeds by wire. Your bank may also charge wiring fees. You
should contact your bank directly to learn whether it charges such fees.
|
n
|
To change the bank designated on your Account Application, you must send written instructions (with your signature guaranteed) to
the Transfer Agent.
|
n
|
Neither the Trust, Goldman Sachs nor any Authorized Dealer assumes any responsibility for the performance of your bank or any
intermediaries in the transfer process. If a problem with such performance arises, you should deal directly with your bank or any such intermediaries.
|
| By Check: You may elect to receive your redemption proceeds by check. Redemption proceeds paid by check will
normally be mailed to the address of record within three business days of a properly executed redemption request. If you are selling shares you recently paid for by check, the Fund will pay you when your check has cleared, which may take up to 15 days.
|
| What Else Do I Need To Know About Redemptions?
|
| The following generally applies to redemption requests:
|
n
|
Additional documentation may be required when deemed appropriate by the Transfer Agent. A redemption request will not be in proper
form until such additional documentation has been received.
|
| The Trust reserves the right to:
|
n
|
Redeem your shares if your account balance is less than $50 as a result of a redemption. The Funds will not redeem your shares on
this basis if the value of your account falls below the minimum account balance solely as a result of market conditions. The Funds will give you 60 days’ prior written notice to allow you to purchase sufficient additional shares of the Fund in order
to avoid such redemption.
|
n
|
Redeem your shares in other circumstances determined by the Board of Trustees to be in the best interests of the Trust.
|
n
|
Pay redemptions by a distribution in-kind of securities (instead of cash). If you receive redemption proceeds in-kind, you should
expect to incur transaction costs upon the disposition of those securities.
|
n
|
Reinvest any dividends or other distributions which you have elected to receive in cash should your check for such dividends or
other distributions be returned to the Fund as undeliverable or remain uncashed for six months. In addition, that distribution and all future distributions payable to you will be reinvested at NAV in additional shares of the same class of the Fund on
which the distributions are paid. No interest will accrue on amounts represented by uncashed distribution or redemption checks.
|
| Can I Reinvest Redemption Proceeds In The Same Or Another Goldman Sachs Fund?
|
| You may redeem shares of a Fund and reinvest a portion or all of the redemption proceeds (plus any additional amounts needed to
round off purchases to the nearest full share) at NAV. To be eligible for this privilege, you must hold the shares
you want to redeem for at least 30 days and you must reinvest the share proceeds within 90 days after you redeem. You may reinvest as follows:
|
n
|
Class A or B Shares—Class A Shares of the same Fund or any other Goldman Sachs Fund
|
n
|
Class C Shares—Class C Shares of the same Fund or any other Goldman Sachs Fund
|
n
|
You should obtain and read the applicable prospectuses before investing in any other Funds.
|
n
|
If you pay a CDSC upon redemption of Class A or Class C Shares and then reinvest in Class A or Class C Shares as described above,
your account will be credited with the amount of the CDSC you paid. The reinvested shares will, however, continue to be subject to a CDSC. The holding period of the shares acquired through reinvestment will include the holding period of the redeemed
shares for purposes of computing the CDSC payable upon a subsequent redemption. For Class B Shares, you may reinvest the redemption proceeds in Class A Shares at NAV but the amount of the CDSC paid upon redemption of the Class B Shares will not be
credited to your account.
|
n
|
The reinvestment privilege may be exercised at any time in connection with transactions in which the proceeds are reinvested at
NAV in a tax-sheltered retirement plan. In other cases, the reinvestment privilege may be exercised once per year upon receipt of a written request.
|
n
|
You may be subject to tax as a result of a redemption. You should consult your tax adviser concerning the tax consequences of a
redemption and reinvestment.
|
| Can I Exchange My Investment From One Fund To Another?
|
| You may exchange shares of a Fund at NAV without the imposition of an initial sales charge or CDSC at the time of exchange for
shares of the same class or an equivalent class of any other Goldman Sachs Fund. The exchange privilege may be materially modified or withdrawn at any time upon 60 days’ written notice to you.
|
| Instructions For Exchanging Shares: | |||
|---|---|---|---|
| By Writing: | n Write a letter of instruction that includes: | ||
| n Your name(s) and signature(s) | |||
| n Your account number | |||
| n The Fund names and Class of Shares | |||
| n The dollar amount you want to exchange | |||
| n Obtain a signature guarantee (see details above) | |||
| n Mail the request to: | |||
| Goldman Sachs Funds | |||
| c/o NFDS | |||
| P.O. Box 219711 | |||
| Kansas City, MO 64121-9711 | |||
| or for overnight delivery - | |||
| Goldman Sachs Funds | |||
| c/o NFDS | |||
| 330 West 9th St. | |||
| Poindexter Bldg., 1st Floor | |||
| Kansas City, MO 64105 | |||
| By Telephone: | If you have not declined the telephone exchange
privilege on your Account Application: |
||
| n
1-800-526-7384 (8:00 a.m. to 4:00 p.m.
New York time) |
|||
| You should keep in mind the following factors when making or considering an exchange:
|
n
|
You should obtain and carefully read the prospectus of the Fund you are acquiring before making an exchange.
|
n
|
Currently, there is no charge for exchanges, although the Funds may impose a charge in the future.
|
n
|
The exchanged shares may later be exchanged for shares of the same class (or an equivalent class) of the original Fund at the next
determined NAV without the imposition of an initial sales charge or CDSC if the amount in the Fund resulting from such exchanges is less than the largest amount on which you have previously paid the applicable sales charge.
|
n
|
When you exchange shares subject to a CDSC, no CDSC will be charged at that time. The exchanged shares will be subject to the CDSC
of the shares originally held. For purposes of determining the amount of the applicable CDSC, the length of time you have owned the shares will be measured from the date you acquired the original shares subject to a CDSC and will not be affected by a
subsequent exchange.
|
n
|
Eligible investors may exchange certain classes of shares for another class of shares of the same Fund. For further information,
call Goldman Sachs Funds at 1-800-526-7384 and see the Additional Statement.
|
n
|
All exchanges which represent an initial investment in a Fund must satisfy the minimum initial investment requirements of that Fund.
|
n
|
Exchanges are available only in states where exchanges may be legally made.
|
n
|
It may be difficult to make telephone exchanges in times of drastic economic or market conditions.
|
n
|
Goldman Sachs and NFDS may use reasonable procedures described under “What Do I Need to Know About Telephone Redemption
Requests?” in an effort to prevent unauthorized or fraudulent telephone exchange requests.
|
n
|
Telephone exchanges normally will be made only to an identically registered account. Shares may be exchanged among accounts with
different names, addresses and social security or other taxpayer identification numbers only if the exchange instructions are in writing and accompanied by a signature guarantee.
|
n
|
Exchanges into Funds that are closed to new investors may be
restricted.
|
| For federal income tax purposes, an exchange from one Fund to another is treated as a redemption of the shares surrendered in the
exchange, on which you may be subject to tax, followed by a purchase of shares received in the exchange. You should consult your tax adviser concerning the tax consequences of an exchange.
|
| Restrictions on Excessive Trading Practices. The Trust does not permit market-timing or other excessive trading
practices. Purchases and exchanges should be made for long-term investment purposes only. The Trust and Goldman Sachs reserve the right to reject or restrict purchase or exchange requests from any investor. Excessive, short-term (market-timing) trading
practices may disrupt portfolio management strategies, harm Fund performance and negatively impact long-term shareholders. The Trust and Goldman Sachs will not be held liable for any loss resulting from rejected purchase or exchange orders. To minimize
harm to the Trust (or Goldman Sachs) and its shareholders, the Trust (or Goldman Sachs) will exercise these rights if, in the Trust’s (or Goldman Sachs’) judgment, an investor has a history of excessive trading or if an investor’s trading,
in the judgment of the Trust (or Goldman Sachs) has been or may be disruptive to a Fund. In making this judgment, trades executed in multiple accounts under common ownership or control may be considered together.
|
| SHAREHOLDER SERVICES
|
| Can I Arrange To Have Automatic Investments Made On A Regular Basis?
|
| You may be able to make systematic cash investments through your bank via ACH transfer or your checking account via bank draft
each month. Forms for this option are available from Goldman Sachs, your Authorized Dealer or you may check the appropriate box on the Account Application.
|
| Can My Dividends And Distributions From A Fund Be Invested In Other Funds?
|
| You may elect to cross-reinvest dividends and capital gain distributions paid by a Fund in shares of the same class or an
equivalent class of any other Goldman Sachs Fund.
|
n
|
Shares will be purchased at NAV.
|
n
|
No initial sales charge or CDSC will be imposed.
|
n
|
You may elect cross-reinvestment into an identically registered account or an account registered in a different name or with a
different address, social security number or taxpayer identification number provided that the account has been properly established, appropriate signature guarantees obtained and the minimum initial investment has been satisfied.
|
| Can I Arrange To Have Automatic Exchanges Made On A Regular Basis?
|
| You may elect to exchange automatically a specified dollar amount of shares of a Fund for shares of the same class or an
equivalent class of any other Goldman Sachs Fund.
|
n
|
Shares will be purchased at NAV.
|
n
|
No initial sales charge is imposed.
|
n
|
Shares subject to a CDSC acquired under this program may be subject to a CDSC at the time of redemption from the Fund into which
the exchange is made depending upon the date and value of your original purchase.
|
n
|
Automatic exchanges are made monthly on the 15th day of each month or the first business day thereafter.
|
n
|
Minimum dollar amount: $50 per month.
|
| What Else Should I Know About Cross-Reinvestments And Automatic Exchanges?
|
| Cross-reinvestments and automatic exchanges are subject to the following conditions:
|
n
|
You must hold $5,000 or more in the Fund which is paying the dividend or from which the exchange is being made.
|
n
|
You must invest an amount in the Fund into which cross-reinvestments or automatic exchanges are being made that is equal to that
Fund’s minimum initial investment or continue to cross-reinvest or to make automatic exchanges until such minimum initial investment is met.
|
n
|
You should obtain and read the prospectus of the Fund into which dividends are invested or automatic exchanges are made.
|
| Can I Have Automatic Withdrawals Made On A Regular Basis?
|
| You may draw on your account systematically via check or ACH transfer in any amount of $50 or more.
|
n
|
It is normally undesirable to maintain a systematic withdrawal plan at the same time that you are purchasing additional Class A,
Class B or Class C Shares because of the sales charge imposed on your purchases of Class A Shares or the imposition of a CDSC on your redemptions of Class A, Class B or Class C Shares.
|
n
|
You must have a minimum balance of $5,000 in a Fund.
|
n
|
Checks are mailed on or about the 25th day of each month.
|
n
|
Each systematic withdrawal is a redemption and therefore a taxable transaction.
|
n
|
The CDSC applicable to Class A, Class B or Class C Shares redeemed under the systematic withdrawal plan may be waived.
|
| What Types of Reports Will I Be Sent Regarding My Investment?
|
| You will be provided with a printed confirmation of each transaction in your account and an individual quarterly account
statement. A year-to-date statement for your account will be provided upon request made to Goldman Sachs. If your account is held in “street name” you may receive your statements and confirmations on a different schedule.
|
| You will also receive an annual shareholder report containing audited financial statements and a semi-annual shareholder report.
If you have consented to the delivery of a single copy of shareholder reports, prospectuses and other information to all shareholders who share the same mailing address with your account, you may revoke your consent at any time by contacting Goldman Sachs
Funds by phone at 1-800-526-7384 or by mail at Goldman Sachs Funds, 4900 Sears Tower, Chicago, IL 60606-6372. The Funds will begin sending individual copies to you within 30 days after receipt of your revocation.
|
| The Funds do not generally provide sub-accounting services.
|
| What Should I Know When I Purchase Shares Through An Authorized Dealer?
|
| Authorized Dealers and other financial intermediaries may provide varying arrangements for their clients to purchase and redeem
Fund shares. They may charge additional fees not described in this Prospectus to their customers for such services.
|
| If shares of a Fund are held in a “street name” account with an Authorized Dealer, all recordkeeping, transaction
processing and payments of distributions relating to your account will be performed by the Authorized Dealer, and not by the Fund and its Transfer Agent. Since the Funds will have no record of your transactions, you should contact the Authorized Dealer to
purchase, redeem or exchange shares, to make changes in or give instructions concerning the account or to obtain information about your account. The transfer of shares in a “street name” account to an account with another dealer or to an account
directly with the Fund involves special procedures and will require you to obtain historical purchase information about the shares in the account from the Authorized Dealer.
|
| Authorized Dealers and other financial intermediaries may be authorized to accept, on behalf of the Trust, purchase, redemption
and exchange orders placed by or on behalf of their customers, and if approved by the Trust, to designate other intermediaries to accept such orders. In these cases:
|
n
|
A Fund will be deemed to have received an order that is in proper form when the order is accepted by an Authorized Dealer or
intermediary on a business day, and the order will be priced at the Fund’s NAV per share (adjusted for any applicable sales charge) next determined after such acceptance.
|
n
|
Authorized Dealers and intermediaries are responsible for transmitting accepted orders to the Funds within the time period agreed
upon by them.
|
| You should contact your Authorized Dealer or intermediary to learn whether it is authorized to accept orders for the Trust.
|
| The Investment Adviser, Distributor and/or their affiliates may pay additional compensation from time to time, out of their assets
and not as an additional charge to the Funds, to selected Authorized Dealers and other persons in connection with the sale, distribution and/or servicing of shares of the Funds and other Goldman Sachs Funds. Additional compensation based on sales may, but
is currently not expected to, exceed 0.50% (annualized) of the amount invested.
|
| DISTRIBUTION SERVICES AND FEES
|
| What Are The Different Distribution And Service Fees Paid By Class A, B and C Shares?
|
| The Trust has adopted distribution and service plans (each a “Plan”) under which Class A, Class B and Class C Shares
bear distribution and service fees paid to Authorized Dealers and Goldman Sachs. If the fees received by Goldman Sachs pursuant to the Plans exceed its expenses, Goldman Sachs may realize a profit from these arrangements. Goldman Sachs pays the
distribution and service fees on a quarterly basis.
|
| Under the Plans, Goldman Sachs is entitled to a monthly fee from each Fund for distribution services equal, on an annual basis,
to 0.25%, 0.75% and 0.75%, respectively, of a Fund’s average daily net assets attributed to Class A, Class B and Class C Shares. Because these fees are paid out of the Fund’s assets on an ongoing basis, over time, these fees will increase the
cost of your investment and may cost you more than paying other types of such charges.
|
| The distribution fees are subject to the requirements of Rule 12b-1 under the Act, and may be used (among other things) for:
|
n
|
Compensation paid to and expenses incurred by Authorized Dealers, Goldman Sachs and their respective officers, employees and sales
representatives;
|
n
|
Commissions paid to Authorized Dealers;
|
n
|
Allocable overhead;
|
n
|
Telephone and travel expenses;
|
n
|
Interest and other costs associated with the financing of such compensation and expenses;
|
n
|
Printing of prospectuses for prospective shareholders;
|
n
|
Preparation and distribution of sales literature or advertising of any type; and
|
n
|
All other expenses incurred in connection with activities primarily intended to result in the sale of Class A, Class B and Class C
Shares.
|
| In connection with the sale of Class C Shares, Goldman Sachs normally begins paying the 0.75% distribution fee as an ongoing
commission to Authorized Dealers after the shares have been held for one year.
|
| PERSONAL ACCOUNT MAINTENANCE SERVICES AND FEES
|
| Under the Plans, Goldman Sachs is also entitled to receive a separate fee equal on an annual basis to 0.25% of each Fund’s
average daily net assets attributed to Class A (applicable to Goldman Sachs International Equity Funds), Class B or Class C Shares. This fee is for personal and account maintenance services, and may be used to make payments to Goldman Sachs, Authorized
Dealers and their officers, sales representatives and employees for responding to inquiries of, and furnishing assistance to, shareholders regarding ownership of their shares or their accounts or similar services not otherwise provided on behalf of the
Funds. If the fees received by Goldman Sachs pursuant to the Plans exceed its expenses, Goldman Sachs may realize a profit from this arrangement.
|
| In connection with the sale of Class C Shares, Goldman Sachs normally begins paying the 0.25% ongoing service fee to Authorized
Dealers after the shares have been held for one year.
|
| As with any investment, you should consider how your investment in the Funds will be taxed. The tax information below is provided
as general information. More tax information is available in the Additional Statement. You should consult your tax adviser about the federal, state, local or foreign tax consequences of your investment in the Funds.
|
| Unless your investment is an IRA or other tax-advantaged account, you should consider the possible tax consequences of Fund
distributions and the sale of your Fund shares.
|
| DISTRIBUTIONS
|
| Distributions you receive from the Funds are generally subject to federal income tax, and may also be subject to state or local
taxes. This is true whether you reinvest your distributions in additional Fund shares or receive them in cash. For federal tax purposes, the Funds’ income dividend distributions and short-term capital gain distributions are taxable to you as ordinary
income. Any long-term capital gain distributions are taxable as long-term capital gains, no matter how long you have owned your Fund shares.
|
| Although distributions are generally treated as taxable to you in the year they are paid, distributions declared in October,
November or December but paid in January are taxable as if they were paid in December. A percentage of the Funds’ dividends paid to corporate shareholders may be eligible for the corporate dividends-received deduction. The Funds will inform
shareholders of the source and tax status of all distributions promptly after the close of each calendar year.
|
| Each Fund may be subject to foreign withholding or other foreign taxes on income or gain from certain foreign securities. In
general, the Funds may deduct these taxes in computing their taxable income.
|
| If you buy shares of a Fund before it makes a distribution, the distribution will be taxable to you even though it may actually be
a return of a portion of your investment. This is known as “buying a dividend.”
|
| SALES AND EXCHANGES
|
| Your sale of Fund shares is a taxable transaction for federal income tax purposes, and may also be subject to state and local
taxes. For tax purposes, the exchange of your Fund shares for shares of a different Goldman Sachs Fund is the same as a sale. When you sell your shares, you will generally recognize a capital gain or loss in an amount equal to the difference between your
adjusted tax basis in the shares and the amount received. Generally, this gain or loss is long-term or short-term depending on whether your holding period exceeds twelve months, except that any loss realized on shares held for six months or less will be
treated as a long-term capital loss to the extent of any capital gain dividends that were received on the shares.
|
| OTHER INFORMATION
|
| When you open your account, you should provide your social security or tax identification number on your Account Application. By
law, each Fund must withhold 31% of your taxable distributions and any redemption proceeds if you do not provide your correct taxpayer identification number, or certify that it is correct, or if the IRS instructs the Fund to do so. Non-U.S. investors may
be subject to U.S. withholding and estate tax.
|
| A. General Portfolio Risks
|
| The Funds will be subject to the risks associated with equity securities. “Equity securities” include common stocks,
preferred stocks, interests in real estate investment trusts, convertible debt obligations, convertible preferred stocks, equity interests in trusts, partnerships, joint ventures, limited liability companies and similar enterprises, warrants and stock
purchase rights. In general, stock values fluctuate in response to the activities of individual companies and in response to general market and economic conditions. Accordingly, the value of the stocks that a Fund holds may decline over short or extended
periods. The stock markets tend to be cyclical, with periods when stock prices generally rise and periods when prices generally decline. The volatility of equity securities means that the value of your investment in the Funds may increase or decrease.
Recently, certain stock markets have experienced substantial price volatility and, at times, have traded at or close to record high levels. There can be no guarantee that such levels will be reached or maintained in the future.
|
| To the extent that a Fund invests in fixed-income securities, that Fund will also be subject to the risks associated with its
fixed-income securities. These risks include interest rate risk, credit risk and call/extension risk. In general, interest rate risk involves the risk that when interest rates decline, the market value of fixed-income securities tends to increase
(although many mortgage related securities will have less potential than other debt securities for capital appreciation during periods of declining rates). Conversely, when interest rates increase, the market value of fixed-income securities tends to
decline. Credit risk involves the risk that an issuer or guarantor could default on its obligations, and a Fund will not recover its investment. Call risk and extension risk are normally present in mortgage-backed securities and asset-backed securities.
For example, homeowners have the option to prepay their mortgages. Therefore, the duration of a security backed by home mortgages can either shorten (call risk) or lengthen (extension risk). In general, if interest rates on new mortgage loans fall
sufficiently below the interest rates on existing outstanding mortgage loans, the rate of prepayment would be expected to increase. Conversely, if mortgage loan interest rates rise above the interest rates on existing outstanding mortgage loans, the rate
of prepayment would be expected to decrease. In either case, a change in the prepayment rate can result in losses to investors.
|
| The Investment Adviser will not consider the portfolio turnover rate a limiting factor in making investment decisions for a Fund.
A high rate of portfolio turnover (100% or more) involves correspondingly greater expenses which must be borne by a Fund and its shareholders, and is also likely to result in higher short-term capital gains taxable to shareholders. The portfolio turnover
rate is calculated by dividing the lesser of the dollar amount of sales or purchases of portfolio securities by the average monthly value of a Fund’s portfolio securities, excluding securities having a maturity at the date of purchase of one year or
less. See “Financial Highlights” in Appendix B for a statement of the Funds’ historical portfolio turnover rates.
|
| The following sections provide further information on certain types of securities and investment techniques that may be used by
the Funds, including their associated risks. Additional information is provided in the Additional Statement, which is available upon request. Among other things, the Additional Statement describes certain fundamental investment restrictions that cannot be
changed without shareholder approval. You should note, however, that all investment objectives, and all investment policies not specifically designated as fundamental are non-fundamental and may be changed without shareholder approval. If there is a
change in a Fund’s investment objective, you should consider whether that Fund remains an appropriate investment in light of your then current financial position and needs.
|
| B. Other Portfolio Risks
|
| Risks of Investing in Small Capitalization Companies. Each Fund may invest in small capitalization companies.
Investments in small capitalization companies involve greater risk and portfolio price volatility than investments in larger capitalization stocks. Among the reasons for the greater price volatility of these investments are the less certain growth
prospects of smaller firms and the lower degree of liquidity in the markets for such securities. Small capitalization companies may be thinly traded and may have to be sold at a discount from current market prices or in small lots over an extended period
of time. In addition, these securities are subject to the risk that during certain periods the liquidity of particular issuers or industries, or all securities in these investment categories, will shrink or disappear suddenly and without warning as a
result of adverse economic or market conditions, or adverse investor perceptions whether or not accurate. Because of the lack of sufficient market liquidity, a Fund may incur losses because it will be required to effect sales at a disadvantageous time and
only then at a substantial drop in price. Small capitalization companies include “unseasoned” issuers that do not have an established financial history; often have limited product lines, markets or financial
|
| resources; may depend on or use a few key personnel for management; and may be susceptible to losses and risks of bankruptcy.
Transaction costs for these investments are often higher than those of larger capitalization companies. Investments in small capitalization companies may be more difficult to price precisely than other types of securities because of their characteristics
and lower trading volumes.
|
| Risks of Foreign Investments. The Funds may make foreign investments. Foreign investments involve special risks that
are not typically associated with U.S. dollar denominated or quoted securities of U.S. issuers. Foreign investments may be affected by changes in currency rates, changes in foreign or U.S. laws or restrictions applicable to such investments and changes in
exchange control regulations (e.g., currency blockage). A decline in the exchange rate of the currency (i.e., weakening of the currency against the U.S. dollar) in which a portfolio security is quoted or denominated relative to the U.S. dollar would reduce the value of
the portfolio security. In addition, if the currency in which a Fund receives dividends, interest or other payments declines in value against the U.S. dollar before such income is distributed as dividends to shareholders or converted to U.S. dollars, the
Fund may have to sell portfolio securities to obtain sufficient cash to pay such dividends.
|
| The introduction of a single currency, the euro, on January 1, 1999 for participating nations in the European Economic and
Monetary Union has presented unique uncertainties, including the fluctuation of the euro relative to non-euro currencies during the transition period from January 1, 1999 to December 31, 2001 and beyond; whether the interest rate, tax and labor regimes of
European countries participating in the euro will converge over time; and whether the conversion of the currencies of other countries that now are or may in the future become members of the European Union (“EU”), may have an impact on the euro.
Also, it is possible that the euro could be abandoned in the future by countries that have already adopted its use. These or other events, including political and economic developments, could cause market disruptions, and could adversely affect the value
of securities held by the Funds. Because of the number of countries using this single currency, a significant portion of the assets held by the Funds may be denominated in the euro.
|
| Brokerage commissions, custodial services and other costs relating to investment in international securities markets generally are
more expensive than in the United States. In addition, clearance and settlement procedures may be different in foreign countries and, in certain markets, such procedures have been unable to keep pace with the volume of securities transactions, thus making
it difficult to conduct such transactions.
|
| Foreign issuers are not generally subject to uniform accounting, auditing and financial reporting standards comparable to those
applicable to U.S. issuers. There may be less publicly available information about a foreign issuer than about a U.S. issuer. In addition, there is generally less government regulation of foreign markets, companies and securities dealers than in the
United States. Foreign securities markets may have substantially less volume than U.S. securities markets and secu-
|
| rities of many foreign issuers are less liquid and more volatile than securities of comparable domestic issuers. Furthermore, with
respect to certain foreign countries, there is a possibility of nationalization, expropriation or confiscatory taxation, imposition of withholding or other taxes on dividend or interest payments (or, in some cases, capital gains distributions),
limitations on the removal of funds or other assets from such countries, and risks of political or social instability or diplomatic developments which could adversely affect investments in those countries.
|
| Concentration of a Fund’s assets in one or a few countries and currencies will subject a Fund to greater risks than if a
Fund’s assets were not geographically concentrated.
|
| Investment in sovereign debt obligations by certain Funds involves risks not present in debt obligations of corporate issuers. The
issuer of the debt or the governmental authorities that control the repayment of the debt may be unable or unwilling to repay principal or interest when due in accordance with the terms of such debt, and a Fund may have limited recourse to compel payment
in the event of a default. Periods of economic uncertainty may result in the volatility of market prices of sovereign debt, and in turn a Fund’s NAV, to a greater extent than the volatility inherent in debt obligations of U.S. issuers.
|
| A sovereign debtor’s willingness or ability to repay principal and pay interest in a timely manner may be affected by, among
other factors, its cash flow situation, the extent of its foreign currency reserves, the availability of sufficient foreign exchange on the date a payment
is due, the relative size of the debt service burden to the economy as a whole, the sovereign debtor’s policy toward international lenders, and the political constraints to which a sovereign debtor may be subject.
|
| Investments in foreign securities may take the form of sponsored and unsponsored American Depositary Receipts (“ADRs”)
and Global Depositary Receipts (“GDRs”). Certain Funds may also invest in European Depositary Receipts (“EDRs”) or other similar instruments representing securities of foreign issuers. ADRs represent the right to receive securities of
foreign issuers deposited in a domestic bank or a correspondent bank. Prices of ADRs are quoted in U.S. dollars, and ADRs are traded in the United States. EDRs and GDRs are receipts evidencing an arrangement with a non-U.S. bank. EDRs and GDRs are not
necessarily quoted in the same currency as the underlying security.
|
| Risks of Emerging Countries. Certain Funds may invest in securities of issuers located in emerging countries. The
risks of foreign investment are heightened when the issuer is located in an emerging country. Emerging countries are generally located in the Asia-Pacific region, Eastern Europe, Latin and South America and Africa. A Fund’s purchase and sale of
portfolio securities in certain emerging countries may be constrained by limitations relating to daily changes in the prices of listed securities, periodic trading or settlement volume and/or limitations on aggregate holdings of foreign investors. Such
limitations may be computed based on the aggregate trading volume by or holdings of a Fund, the Investment Adviser, its affiliates and their respective clients and other service providers. A Fund may not be able to sell securities in circumstances where
price, trading or settlement volume limitations have been reached.
|
| Foreign investment in the securities markets of certain emerging countries is restricted or controlled to varying degrees which
may limit investment in such countries or increase the administrative costs of such investments. For example, certain Asian countries require governmental approval prior to investments by foreign persons or limit investment by foreign persons to only a
specified percentage of an issuer’s outstanding securities or a specific class of securities which may have less advantageous terms (including price) than securities of the issuer available for purchase by nationals. In addition, certain countries
may restrict or prohibit investment opportunities in issuers or industries deemed important to national interests. Such restrictions may affect the market price, liquidity and rights of securities that may be purchased by a Fund. The repatriation of both
investment income and capital from certain emerging countries is subject to restrictions such as the need for governmental consents. Due to restrictions on direct investment in equity securities in certain Asian and other countries, it is anticipated that
a Fund may invest in such countries through other investment funds in such countries.
|
| Many emerging countries have recently experienced currency devaluations and substantial (and, in some cases, extremely high) rates
of inflation. Other emerging countries have experienced economic recessions. These circumstances have had a negative effect on the economies and securities markets of such emerging countries. Economies in emerging countries generally are dependent heavily
upon commodity prices and international trade and, accordingly, have been and may continue to be affected adversely by the economies of their trading partners, trade barriers, exchange controls, managed adjustments in relative currency values and other
protectionist measures imposed or negotiated by the countries with which they trade.
|
| Many emerging countries are subject to a substantial degree of economic, political and social instability. Governments of some
emerging countries are authoritarian
|
| in nature or have been installed or removed as a result of military coups, while governments in other emerging countries have
periodically used force to suppress civil dissent. Disparities of wealth, the pace and success of democratization, and ethnic, religious and racial disaffection, among other factors, have also led to social unrest, violence and/or labor unrest in some
emerging countries. Unanticipated political or social developments may result in sudden and significant investment losses. Investing in emerging countries involves greater risk of loss due to expropriation, nationalization, confiscation of assets and
property or the imposition of restrictions on foreign investments and on repatriation of capital invested. As an example, in the past some Eastern European governments have expropriated substantial amounts of private property, and many claims of the
property owners have never been fully settled. There is no assurance that similar expropriations will not recur in Eastern Europe or other countries.
|
| A Fund’s investment in emerging countries may also be subject to withholding or other taxes, which may be significant and may
reduce the return from an investment in such countries to the Fund.
|
| Settlement procedures in emerging countries are frequently less developed and reliable than those in the United States and often
may involve a Fund’s delivery of securities before receipt of payment for their sale. In addition, significant delays are common in certain markets in registering the transfer of securities. Settlement or registration problems may make it more
difficult for a Fund to value its portfolio securities and could cause the Fund to miss attractive investment opportunities, to have a portion of its assets uninvested or to incur losses due to the failure of a counterparty to pay for securities the Fund
has delivered or the Fund’s inability to complete its contractual obligations because of theft or other reasons. The creditworthiness of the local securities firms used by the Fund in emerging countries may not be as sound as the creditworthiness of
firms used in more developed countries. As a result, the Fund may be subject to a greater risk of loss if a securities firm defaults in the performance of its responsibilities.
|
| The small size and inexperience of the securities markets in certain emerging countries and the limited volume of trading in
securities in those countries may make a Fund’s investments in such countries less liquid and more volatile than investments in countries with more developed securities markets (such as the United States, Japan and most Western European countries). A
Fund’s investments in emerging countries are subject to the risk that the liquidity of a particular investment, or investments generally, in such countries will shrink or disappear suddenly and without warning as a result of adverse economic, market
or political conditions or adverse investor perceptions, whether or not accurate. Because of the lack of sufficient market liquidity, a Fund may incur losses because it will be required to effect
|
| sales at a disadvantageous time and only then at a substantial drop in price. Investments in emerging countries may be more
difficult to price precisely because of the characteristics discussed above and lower trading volumes.
|
| A Fund’s use of foreign currency management techniques in emerging countries may be limited. Due to the limited market for
these instruments in emerging countries, the Investment Adviser does not currently anticipate that a significant portion of the Funds’ currency exposure in emerging countries, if any, will be covered by such instruments.
|
| Risks of Derivative Investments. A Fund’s transactions, if any, in options, futures, options on futures, swaps,
interest rate caps, floors and collars, structured securities and currency transactions involve additional risk of loss. Loss can result from a lack of correlation between changes in the value of derivative instruments and the portfolio assets (if any)
being hedged, the potential illiquidity of the markets for derivative instruments, or the risks arising from margin requirements and related leverage factors associated with such transactions. The use of these management techniques also involves the risk
of loss if the Investment Adviser is incorrect in its expectation of fluctuations in securities prices, interest rates or currency prices. Each Fund may also invest in derivative investments for non-hedging purposes (that is, to seek to increase total
return). Investing for non-hedging purposes is considered a speculative practice and presents even greater risk of loss.
|
| Risks of Illiquid Securities. Each Fund may invest up to 15% of its net assets in illiquid securities which cannot
be disposed of in seven days in the ordinary course of business at fair value. Illiquid securities include:
|
n
|
Both domestic and foreign securities that are not readily marketable
|
n
|
Certain stripped mortgage-backed securities
|
n
|
Repurchase agreements and time deposits with a notice or demand period of more than seven days
|
n
|
Certain over-the-counter options
|
n
|
Certain structured securities and all swap transactions
|
n
|
Certain restricted securities, unless it is determined, based upon a review of the trading markets for a specific restricted
security, that such restricted security is eligible for resale pursuant to Rule 144A under the Securities Act of 1933 (“144A Securities”) and, therefore, is liquid.
|
| Investing in 144A Securities may decrease the liquidity of a Fund’s portfolio to the extent that qualified institutional
buyers become for a time uninterested in purchasing these restricted securities. The purchase price and subsequent valuation of restricted and illiquid securities normally reflect a discount, which may be significant, from the market price of comparable
securities for which a liquid market exists.
|
| Credit Risks. Debt securities purchased by the Funds may include securities (including zero coupon bonds) issued by
the U.S. government (and its agencies, instrumentalities and sponsored enterprises), foreign governments, domestic and foreign corporations, banks and other issuers. Further information is provided in the Additional Statement.
|
| Debt securities rated BBB or higher by Standard & Poor’s or Baa or higher by Moody’s are considered “investment
grade.” Securities rated BBB or Baa are considered medium-grade obligations with speculative characteristics, and adverse economic conditions or changing circumstances may weaken their issuers’ capacity to pay interest and repay principal. A
security will be deemed to have met a rating requirement if it receives the minimum required rating from at least one such rating organization even though it has been rated below the minimum rating by one or more other rating organizations, or if unrated
by such rating organizations, determined by the Investment Adviser to be of comparable credit quality.
|
| Certain Funds may invest in fixed-income securities rated BB or Ba or below (or comparable unrated securities) which are commonly
referred to as “junk bonds.” Junk bonds are considered predominantly speculative and may be questionable as to principal and interest payments.
|
| In some cases, junk bonds may be highly speculative, have poor prospects for reaching investment grade standing and be in default.
As a result, investment in such bonds will present greater speculative risks than those associated with investment in investment grade bonds. Also, to the extent that the rating assigned to a security in a Fund’s portfolio is downgraded by a rating
organization, the market price and liquidity of such security may be adversely affected.
|
| Risks of Initial Public Offerings. The Funds may invest in IPOs. An IPO is a company’s first offering of stock
to the public. IPO risk is the risk that the market value of IPO shares will fluctuate considerably due to factors such as the absence of a prior public market, unseasoned trading, the small number of shares available for trading and limited information
about the issuer. The purchase of IPO shares may involve high transaction costs. IPO shares are subject to market risk and liquidity risk. When a Fund’s asset base is small, a significant portion of the Fund’s performance could be attributable
to investments in IPOs, because such investments would have a magnified impact on the Fund. As the Fund’s assets grow, the effect of the Fund’s investments in IPOs on the Fund’s performance probably will decline, which could reduce the
Fund’s performance. Because of the price volatility of IPO shares, a Fund may choose to hold IPO shares for a very short period of time. This may increase the turnover of the Fund’s portfolio and may lead to increased expenses to the Fund, such
as commissions and transaction costs. By selling IPO shares, the Fund may realize taxable gains it will subse-
|
| quently distribute to shareholders. In addition, the market for IPO shares can be speculative and/or inactive for extended
periods of time. There is no assurance that a Fund will be able to obtain allocable portions of IPO shares. The limited number of shares available for trading in some IPOs may make it more difficult for a Fund to buy or sell significant amounts of shares
without an unfavorable impact on prevailing prices. Investors in IPO shares can be affected by substantial dilution in the value of their shares, by sales of additional shares and by concentration of control in existing management and principal shareholders
.
|
| Temporary Investment Risks. Each Fund may, for temporary defensive purposes, invest a certain percentage of its
total assets in:
|
n
|
U.S. government securities
|
n
|
Commercial paper rated at least A-2 by Standard & Poor’s or P-2 by Moody’s
|
n
|
Certificates of deposit
|
n
|
Bankers’ acceptances
|
n
|
Repurchase agreements
|
n
|
Non-convertible preferred stocks and non-convertible corporate bonds with a remaining maturity of less than one year
|
| When a Fund’s assets are invested in such instruments, the Fund may not be achieving its investment objective.
|
| C. Portfolio Securities and Techniques
|
| This section provides further information on certain types of securities and investment techniques that may be used by the Funds,
including their associated risks. Further information is provided in the Additional Statement, which is available upon request.
|
| Convertible Securities. Each Fund may invest in convertible securities. Convertible securities are preferred stock
or debt obligations that are convertible into common stock. Convertible securities generally offer lower interest or dividend yields than non-convertible securities of similar quality. Convertible securities in which a Fund invests are subject to the same
rating criteria as its other investments in fixed-income securities. Convertible securities have both equity and fixed-income risk characteristics. Like all fixed-income securities, the value of convertible securities is susceptible to the risk of market
losses attributable to changes in interest rates. Generally, the market value of convertible securities tends to decline as interest rates increase and, conversely, to increase as interest rates decline. However, when the market price of the common stock
underlying a convertible security exceeds the conversion price of the convertible security, the convertible security tends to reflect the market price of the underlying common stock. As the market
|
| price of the underlying common stock declines, the convertible security, like a fixed-income security, tends to trade
increasingly on a yield basis, and thus may not decline in price to the same extent as the underlying common stock.
|
| Foreign Currency Transactions. A Fund may, to the extent consistent with its investment policies, purchase or sell
foreign currencies on a cash basis or through forward contracts. A forward contract involves an obligation to purchase or sell a specific currency at a future date at a price set at the time of the contract. A Fund may engage in foreign currency
transactions for hedging purposes and to seek to protect against anticipated changes in future foreign currency exchange rates. In addition, certain Funds may also enter into such transactions to seek to increase total return, which is considered a
speculative practice.
|
| Some Funds may also engage in cross-hedging by using forward contracts in a currency different from that in which the hedged
security is denominated or quoted. A Fund may hold foreign currency received in connection with investments in foreign securities when, in the judgment of the Investment Adviser, it would be beneficial to convert such currency into U.S. dollars at a later
date (e.g., the Investment Adviser may anticipate the foreign currency to appreciate against the U.S. dollar).
|
| Currency exchange rates may fluctuate significantly over short periods of time, causing, along with other factors, a Fund’s
NAV to fluctuate (when the Fund’s NAV fluctuates, the value of your shares may go up or down). Currency exchange rates also can be affected unpredictably by the intervention of U.S. or foreign governments or central banks, or the failure to
intervene, or by currency controls or political developments in the United States or abroad.
|
| The market in forward foreign currency exchange contracts, currency swaps and other privately negotiated currency instruments
offers less protection against defaults by the other party to such instruments than is available for currency instruments traded on an exchange. Such contracts are subject to the risk that the counterparty to the contract will default on its obligations.
Since these contracts are not guaranteed by an exchange or clearinghouse, a default on a contract would deprive a Fund of unrealized profits, transaction costs or the benefits of a currency hedge or could force the Fund to cover its purchase or sale
commitments, if any, at the current market price.
|
| Structured Securities. Each Fund may invest in structured securities. Structured securities are securities whose
value is determined by reference to changes in the value of specific currencies, interest rates, commodities, indices or other financial indicators (the “Reference”) or the relative change in two or more References.
|
| The interest rate or the principal amount payable upon maturity or redemption may be increased or decreased depending upon
changes in the applicable Reference. Structured securities may be positively or negatively indexed, so that appreciation of the Reference may produce an increase or decrease in the interest rate or value of the security at maturity. In addition, changes
in the interest rates or the value of the security at maturity may be a multiple of changes in the value of the Reference. Consequently, structured securities may present a greater degree of market risk than other types of fixed-income securities and may
be more volatile, less liquid and more difficult to price accurately than less complex securities.
|
| REITs. Each Fund may invest in REITs. REITs are pooled investment vehicles that invest primarily in either real
estate or real estate related loans. The value of a REIT is affected by changes in the value of the properties owned by the REIT or securing mortgage loans held by the REIT. REITs are dependent upon the ability of the REITs’ managers, and are subject
to heavy cash flow dependency, default by borrowers and the qualification of the REITs under applicable regulatory requirements for favorable income tax treatment. REITs are also subject to risks generally associated with investments in real estate
including possible declines in the value of real estate, general and local economic conditions, environmental problems and changes in interest rates. To the extent that assets underlying a REIT are concentrated geographically, by property type or in
certain other respects, these risks may be heightened. A Fund will indirectly bear its proportionate share of any expenses, including management fees, paid by a REIT in which it invests.
|
| Options on Securities, Securities Indices and Foreign Currencies. A put option gives the purchaser of the option the
right to sell, and the writer (seller) of the option the obligation to buy, the underlying instrument during the option period. A call option gives the purchaser of the option the right to buy, and the writer (seller) of the option the obligation to sell,
the underlying instrument during the option period. Each Fund may write (sell) covered call and put options and purchase put and call options on any securities in which they may invest or on any securities index consisting of securities in which they may
invest. A Fund may also, to the extent that it invests in foreign securities, purchase and sell (write) put and call options on foreign currencies.
|
| The writing and purchase of options is a highly specialized activity which involves special investment risks. Options may be used
for either hedging or cross-hedging purposes, or to seek to increase total return (which is considered a speculative activity). The successful use of options depends in part on the ability of the Investment Adviser to manage future price fluctuations and
the degree of correlation between the options and securities (or currency) markets. If the Invest-
|
|
| ment Adviser is incorrect in its expectation of changes in market prices or determination of the correlation between the instruments or indices on which options are written and purchased and the instruments in a Fund’s investment portfolio, the Fund may incur losses that it would not otherwise incur. The use of options can also increase a Fund’s transaction costs. Options written or purchased by the Funds may be traded on either U.S. or foreign exchanges or over-the-counter. Foreign and over-the-counter options will present greater possibility of loss because of their greater illiquidity and credit risks. |
| Futures Contracts and Options on Futures Contracts. Futures contracts are standardized, exchange-traded contracts
that provide for the sale or purchase of a specified financial instrument or currency at a future time at a specified price. An option on a futures contract gives the purchaser the right (and the writer of the option the obligation) to assume a position
in a futures contract at a specified exercise price within a specified period of time. A futures contract may be based on various securities (such as U.S. government securities), foreign currencies, securities indices and other financial instruments and
indices. The Funds may engage in futures transactions on both U.S. and foreign exchanges.
|
| Each Fund may purchase and sell futures contracts, and purchase and write call and put options on futures contracts, in order to
seek to increase total return or to hedge against changes in interest rates, securities prices or, to the extent a Fund invests in foreign securities, currency exchange rates, or to otherwise manage their term structures, sector selection and durations in
accordance with their investment objectives and policies. Each Fund may also enter into closing purchase and sale transactions with respect to such contracts and options. A Fund will engage in futures and related options transactions for bona fide hedging
purposes as defined in regulations of the Commodity Futures Trading Commission or to seek to increase total return to the extent permitted by such regulations. A Fund may not purchase or sell futures contracts or purchase or sell related options to seek
to increase total return, except for closing purchase or sale transactions, if immediately thereafter the sum of the amount of initial margin deposits and premiums paid on the Fund’s outstanding positions in futures and related options entered into
for the purpose of seeking to increase total return would exceed 5% of the market value of the Fund’s net assets.
|
| Futures contracts and related options present the following risks:
|
n
|
While a Fund may benefit from the use of futures and options on futures, unanticipated changes in interest rates, securities
prices or currency exchange rates may result in poorer overall performance than if the Fund had not entered into any futures contracts or options transactions.
|
n
|
Because perfect correlation between a futures position and portfolio position that is intended to be protected is impossible to
achieve, the desired protection may not be obtained and a Fund may be exposed to additional risk of loss.
|
n
|
The loss incurred by a Fund in entering into futures contracts and in writing call options on futures is potentially unlimited and
may exceed the amount of the premium received.
|
n
|
Futures markets are highly volatile and the use of futures may increase the volatility of a Fund’s NAV.
|
n
|
As a result of the low margin deposits normally required in futures trading, a relatively small price movement in a futures
contract may result in substantial losses to a Fund.
|
n
|
Futures contracts and options on futures may be illiquid, and exchanges may limit fluctuations in futures contract prices during a
single day.
|
n
|
Foreign exchanges may not provide the same protection as U.S. exchanges.
|
| Equity Swaps. Each Fund may invest in equity swaps. Equity swaps allow the parties to a swap agreement to exchange
the dividend income or other components of return on an equity investment (for example, a group of equity securities or an index) for a component of return on another non-equity or equity investment.
|
| An equity swap may be used by a Fund to invest in a market without owning or taking physical custody of securities in
circumstances in which direct investment may be restricted for legal reasons or is otherwise impractical. Equity swaps are derivatives and their value can be very volatile. To the extent that the Investment Adviser does not accurately analyze and predict
the potential relative fluctuation of the components swapped with another party, a Fund may suffer a loss, which may be substantial. The value of some components of an equity swap (such as the dividends on a common stock) may also be sensitive to changes
in interest rates. Furthermore, a Fund may suffer a loss if the counterparty defaults. Because equity swaps are normally illiquid, a Fund may be unable to terminate its obligations when desired.
|
| When-Issued Securities and Forward Commitments. Each Fund may purchase when-issued securities and make contracts to
purchase or sell securities for a fixed price at a future date beyond customary settlement time. When-issued securities are securities that have been authorized, but not yet issued. When-issued securities are purchased in order to secure what is
considered to be an advantageous price and yield to the Fund at the time of entering into the transaction. A forward commitment involves the entering into a contract to purchase or sell securities for a fixed price at a future date beyond the customary
settlement period.
|
| The purchase of securities on a when-issued or forward commitment basis involves a risk of loss if the value of the security to be
purchased declines before
the settlement date. Conversely, the sale of securities on a forward commitment basis involves the risk that the value of the securities sold may increase before the settlement date. Although a Fund will generally purchase securities on a when-issued or
forward commitment basis with the intention of acquiring the securities for its portfolio, a Fund may dispose of when-issued securities or forward commitments prior to settlement if the Investment Adviser deems it appropriate.
|
| Repurchase Agreements. Repurchase agreements involve the purchase of securities subject to the seller’s
agreement to repurchase them at a mutually agreed upon date and price. Each Fund may enter into repurchase agreements with dealers in U.S. government securities and member banks of the Federal Reserve System which furnish collateral at least equal in
value or market price to the amount of their repurchase obligation.
|
| If the other party or “seller” defaults, a Fund might suffer a loss to the extent that the proceeds from the sale of the
underlying securities and other collateral held by the Fund are less than the repurchase price and the Fund’s costs associated with delay and enforcement of the repurchase agreement. In addition, in the event of bankruptcy of the seller, a Fund could
suffer additional losses if a court determines that the Fund’s interest in the collateral is not enforceable.
|
| In evaluating whether to enter into a repurchase agreement, the Investment Adviser will carefully consider the creditworthiness of
the seller. Certain Funds, together with other registered investment companies having advisory agreements with the Investment Adviser or any of its affiliates, may transfer uninvested cash balances into a single joint account, the daily aggregate balance
of which will be invested in one or more repurchase agreements.
|
| Lending of Portfolio Securities. Each Fund may engage in securities lending. Securities lending involves the lending
of securities owned by a Fund to financial institutions such as certain broker-dealers. The borrowers are required to secure their loan continuously with cash, cash equivalents, U.S. government securities or letters of credit in an amount at least equal
to the market value of the securities loaned. Cash collateral may be invested in cash equivalents. To the extent that cash collateral is invested in other investment securities, such collateral will be subject to market depreciation or appreciation, and a
Fund will be responsible for any loss that might result from its investment of the borrowers’ collateral. If the Investment Adviser determines to make securities loans, the value of the securities loaned may not exceed 33 1
/3% of the value of the total assets of a
Fund (including the loan collateral).
|
| A Fund may lend its securities to increase its income. A Fund may, however, experience delay in the recovery of its securities if
the institution with which it has engaged in a portfolio loan transaction breaches its agreement with the Fund.
|
| Short Sales Against-the-Box. Certain Funds may make short sales against-the-box. A short sale against-the-box means
that at all times when a short position is open the Fund will own an equal amount of securities sold short, or securities convertible into or exchangeable for, without payment of any further consideration, an equal amount of the securities of the same
issuer as the securities sold short.
|
| Preferred Stock, Warrants and Rights. Each Fund may invest in preferred stock, warrants and rights. Preferred stocks
are securities that represent an ownership interest providing the holder with claims on the issuer’s earnings and assets before common stock owners but after bond owners. Unlike debt securities, the obligations of an issuer of preferred stock,
including dividend and other payment obligations, may not typically be accelerated by the holders of such preferred stock on the occurrence of an event of default or other non-compliance by the issuer of the preferred stock.
|
| Warrants and other rights are options to buy a stated number of shares of common stock at a specified price at any time during the
life of the warrant or right. The holders of warrants and rights have no voting rights, receive no dividends and have no rights with respect to the assets of the issuer.
|
| Other Investment Companies. Each Fund may invest in securities of other investment companies (including
exchange-traded funds such as SPDRs and iShares
SM
, as defined below) subject to statutory limitations prescribed by the Act. These limitations include a
prohibition on any Fund acquiring more than 3% of the voting shares of any other investment company, and a prohibition on investing more than 5% of a Fund’s total assets in securities of any one investment company or more than 10% of its total assets
in securities of all investment companies. A Fund will indirectly bear its proportionate share of any management fees and other expenses paid by such other investment companies. Exchange-traded funds such as SPDRs and iShares
SM
are shares of unaffiliated investment companies which are traded like traditional equity securities on a national
securities exchange or the NASDAQ® National Market System.
|
n
|
Standard & Poor’s Depositary Receipts™.
The Funds may, consistent with their investment policies, purchase Standard & Poor’s Depositary Receipts™ (“SPDRs”). SPDRs are securities traded on the American Stock Exchange (“AMEX”) that represent
ownership in the SPDR Trust, a trust which has been established to accumulate and hold a portfolio of common stocks that is intended to track the price performance and dividend yield of the S&P 500®. The SPDR Trust is sponsored by a subsidiary of
the AMEX. SPDRs may be used for several reasons, including, but not limited to, facilitating the handling
|
| of cash flows or trading, or reducing transaction costs. The price movement of SPDRs may not perfectly parallel the price action
of the S&P 500®.
|
n
|
iShares
SM
(formerly World Equity Benchmark Shares or WEBs). iShares are shares of an investment company that invests substantially all of its assets in securities included
in the MSCI indices for specified countries. iShares are listed on the AMEX and were initially offered to the public in 1996. The market prices of iShares are expected to fluctuate in accordance with both changes in the NAVs of their underlying indices
and supply and demand of iShares on the AMEX. To date, iShares have traded at relatively modest discounts and premiums to their NAVs. However, iShares have a limited operating history and information is lacking regarding the actual performance and trading
liquidity of iShares for extended periods or over complete market cycles. In addition, there is no assurance that the requirements of the AMEX necessary to maintain the listing of iShares will continue to be met or will remain unchanged. In the event
substantial market or other disruptions affecting iShares should occur in the future, the liquidity and value of a Fund’s shares could also be substantially and adversely affected. If such disruptions were to occur, a Fund could be required to
reconsider the use of iShares as part of its investment strategy.
|
| Unseasoned Companies. Each Fund may invest in companies (including predecessors) which have operated less than three
years. The securities of such companies may have limited liquidity, which can result in their being priced higher or lower than might otherwise be the case. In addition, investments in unseasoned companies are more speculative and entail greater risk than
do investments in companies with an established operating record.
|
| Corporate Debt Obligations. Corporate debt obligations include bonds, notes, debentures, commercial paper and other
obligations of corporations to pay interest and repay principal, and include securities issued by banks and other financial institutions. Each Fund may invest in corporate debt obligations issued by U.S. and certain non-U.S. issuers which issue securities
denominated in the U.S. dollar (including Yankee and Euro obligations). In addition to obligations of corporations, corporate debt obligations include securities issued by banks and other financial institutions and supranational entities (i.e., the World Bank, the International Monetary Fund, etc.).
|
| Bank Obligations. Each Fund may invest in obligations issued or guaranteed by U.S. or foreign banks. Bank
obligations, including without limitations, time deposits, bankers’ acceptances and certificates of deposit, may be general obligations of the parent bank or may be limited to the issuing branch by the terms of the specific obligations or by
government regulations. Banks are subject to extensive but different governmental regulations which may limit both the amount and types of
|
| loans which may be made and interest rates which may be charged. In addition, the profitability of the banking industry is
largely dependent upon the availability and cost of funds for the purpose of financing lending operations under prevailing money market conditions. General economic conditions as well as exposure to credit losses arising from possible financial
difficulties of borrowers play an important part in the operation of this industry.
|
| U.S. Government Securities. Each Fund may invest in U.S. government securities. U.S. government securities include
U.S. Treasury obligations and obligations issued or guaranteed by U.S. government agencies, instrumentalities or sponsored enterprises. U.S. government securities may be supported by (a) the full faith and credit of the U.S. Treasury (such as the
Government National Mortgage Association (“Ginnie Mae”)); (b) the right of the issuer to borrow from the U.S. Treasury (such as securities of the Student Loan Marketing Association); (c) the discretionary authority of the U.S. government to
purchase certain obligations of the issuer; or (d) only the credit of the issuer. U.S. government securities also include Treasury receipts, zero coupon bonds and other stripped U.S. government securities, where the interest and principal components of
stripped U.S. government securities are traded independently.
|
| Custodial Receipts. Interests in U.S. government securities may be purchased in the form of custodial receipts that
evidence ownership of future interest payments, principal payments or both on certain notes or bonds issued or guaranteed as to principal and interest by the U.S. government, its agencies, instrumentalities, political subdivisions or authorities. For
certain securities law purposes, custodial receipts are not considered obligations of the U.S. government.
|
| Mortgage-Backed Securities. Certain Funds may invest in mortgage-backed securities. Mortgage-backed securities
represent direct or indirect participations in, or are collateralized by and payable from, mortgage loans secured by real property. Mortgage-backed securities can be backed by either fixed rate mortgage loans or adjustable rate mortgage loans, and may be
issued by either a governmental or non-governmental entity. Privately issued mortgage-backed securities are normally structured with one or more types of “credit enhancement.” However, these mortgage-backed securities typically do not have the
same credit standing as U.S. government guaranteed mortgage-backed securities.
|
| Mortgage-backed securities may include multiple class securities, including collateralized mortgage obligations (“CMOs”)
and Real Estate Mortgage Investment Conduit (“REMIC”) pass-through or participation certificates. CMOs provide an investor with a specified interest in the cash flow from a pool of underlying mortgages or of other mortgage-backed securities.
CMOs are issued in multiple classes. In many cases, payments of principal are applied to the CMO classes in the
|
| order of their respective stated maturities, so that no principal payments will be made on a CMO class until all other classes
having an earlier stated maturity date are paid in full. A REMIC is a CMO that qualifies for special tax treatment and invests in certain mortgages principally secured by interests in real property and other permitted investments.
|
| Mortgaged-backed securities also include stripped mortgage-backed securities (“SMBS”), which are derivative multiple
class mortgage-backed securities. SMBS are usually structured with two different classes: one that receives substantially all of the interest payments and the other that receives substantially all of the principal payments from a pool of mortgage loans.
The market value of SMBS consisting entirely of principal payments generally is unusually volatile in response to changes in interest rates. The yields on SMBS that receive all or most of the interest from mortgage loans are generally higher than
prevailing market yields on other mortgage-backed securities because their cash flow patterns are more volatile and there is a greater risk that the initial investment will not be fully recouped.
|
| Asset-Backed Securities. Certain Funds may invest in asset-backed securities. Asset-backed securities are securities
whose principal and interest payments are collateralized by pools of assets such as auto loans, credit card receivables, leases, installment contracts and personal property. Asset-backed securities are often subject to more rapid repayment than their
stated maturity date would indicate as a result of the pass-through of prepayments of principal on the underlying loans. During periods of declining interest rates, prepayment of loans underlying asset-backed securities can be expected to accelerate.
Accordingly, a Fund’s ability to maintain positions in such securities will be affected by reductions in the principal amount of such securities resulting from prepayments, and its ability to reinvest the returns of principal at comparable yields is
subject to generally prevailing interest rates at that time. Asset-backed securities present credit risks that are not presented by mortgage-backed securities. This is because asset-backed securities generally do not have the benefit of a security
interest in collateral that is comparable to mortgage assets. If the issuer of an asset-backed security defaults on its payment obligations, there is the possibility that, in some cases, the Fund will be unable to possess and sell the underlying
collateral and that the Fund’s recoveries on repossessed collateral may not be available to support payments on the securities. In the event of a default, a Fund may suffer a loss if it cannot sell collateral quickly and receive the amount it is owed.
|
| Borrowings. Each Fund can borrow money from banks and other financial institutions in amounts not exceeding
one-third of its total assets for temporary or emergency purposes. A Fund may not make additional investments if borrowings exceed 5% of its total assets.
|
| Mortgage Dollar Rolls. Certain Funds may enter into mortgage dollar rolls. A mortgage dollar roll involves the sale
by a Fund of securities for delivery in the current month. The Fund simultaneously contracts with the same counterparty to repurchase substantially similar (same type, coupon and maturity) but not identical securities on a specified future date. During
the roll period, the Fund loses the right to receive principal and interest paid on the securities sold. However, the Fund benefits to the extent of any difference between (a) the price received for the securities sold and (b) the lower forward price for
the future purchase and/or fee income plus the interest earned on the cash proceeds of the securities sold. Unless the benefits of a mortgage dollar roll exceed the income, capital appreciation and gain or loss due to mortgage prepayments that would have
been realized on the securities sold as part of the roll, the use of this technique will diminish the Fund’s performance.
|
| Successful use of mortgage dollar rolls depends upon the Investment Adviser’s ability to predict correctly interest rates and
mortgage prepayments. If the Investment Adviser is incorrect in its prediction, a Fund may experience a loss. For financial reporting and tax purposes, the Funds treat mortgage dollar rolls as two separate transactions: one involving the purchase of a
security and a separate transaction involving a sale. The Funds do not currently intend to enter into mortgage dollar rolls that are accounted for as a financing and do not treat them as borrowings.
|
| Yield Curve Options. Certain Funds may enter into options on the yield “spread” or differential between
two securities. Such transactions are referred to as “yield curve” options. In contrast to other types of options, a yield curve option is based on the difference between the yields of designated securities, rather than the prices of the
individual securities, and is settled through cash payments. Accordingly, a yield curve option is profitable to the holder if this differential widens (in the case of a call) or narrows (in the case of a put), regardless of whether the yields of the
underlying securities increase or decrease.
|
| The trading of yield curve options is subject to all of the risks associated with the trading of other types of options. In
addition, such options present a risk of loss even if the yield of one of the underlying securities remains constant, or if the spread moves in a direction or to an extent which was not anticipated.
|
| Reverse Repurchase Agreements. Certain Funds may enter into reverse repurchase agreements. Reverse repurchase
agreements involve the sale of securities held by a Fund subject to the Fund’s agreement to repurchase them at a mutually agreed upon date and price (including interest). These transactions may be entered into as a temporary measure for emergency
purposes or to meet redemption requests. Reverse repurchase agreements may also be entered into when the Invest
ment Adviser expects that the interest income to be earned from the investment of the transaction proceeds will be greater than the related interest expense. Reverse repurchase agreements involve leveraging. If the securities held by a Fund decline in
value while these transactions are outstanding, the NAV of the Fund’s outstanding shares will decline in value by proportionately more than the decline in value of the securities. In addition, reverse repurchase agreements involve the risk that the
interest income earned by a Fund (from the investment of the proceeds) will be less than the interest expense of the transaction, that the market value of the securities sold by a Fund will decline below the price the Fund is obligated to pay to
repurchase the securities, and that the securities may not be returned to the Fund.
|
| Municipal Securities. Certain Funds may invest in securities and instruments issued by state and local government
issuers. Municipal securities in which a Fund may invest consist of bonds, notes, commercial paper and other instruments (including participating interests in such securities) issued by or on behalf of states, territories and possessions of the United
States (including the District of Columbia) and their political subdivisions, agencies or instrumentalities. Such securities may pay fixed, variable or floating rates of interest. Municipal securities are often issued to obtain funds for various public
purposes, including the construction of a wide range of public facilities such as bridges, highways, housing, hospitals, mass transportation, schools, streets and water and sewer works. Other public purposes for which municipal securities may be issued
include refunding outstanding obligations, obtaining funds for general operating expenses, and obtaining funds to lend to other public institutions and facilities. Municipal securities in which a Fund may invest include private activity bonds, municipal
leases, certificates of participation, pre-funded municipal securities and auction rate securities.
|
| Interest Rate Swaps, Mortgage Swaps, Credit Swaps, Currency Swaps and Interest Rate Caps, Floors and Collars.
Interest rate swaps involve the exchange by a Fund with another party of their respective commitments to pay or receive interest, such as an exchange of fixed-rate payments for floating rate payments. Mortgage swaps are similar to interest rate swaps in
that they represent commitments to pay and receive interest. The notional principal amount, however, is tied to a reference pool or pools of mortgages. Credit swaps involve the receipt of floating or fixed rate payments in exchange for assuming potential
credit losses of an underlying security. Credit swaps give one party to a transaction the right to dispose of or acquire an asset (or group of assets), or the right to receive or make a payment from the other party, upon the occurrence of specified credit
events. Currency swaps involve the exchange of the parties’ respective rights to make or receive payments in specified currencies. The purchase of an interest rate cap entitles the purchaser, to the extent that a specified index exceeds a
predetermined interest
rate, to receive payment of interest on a notional principal amount from the party selling such interest rate cap. The purchase of an interest rate floor entitles the purchaser, to the extent that a specified index falls below a predetermined interest
rate, to receive payments of interest on a notional principal amount from the party selling the interest rate floor. An interest rate collar is the combination of a cap and a floor that preserves a certain return within a predetermined range of interest
rates.
|
| Certain Funds may enter into swap transactions for hedging purposes or to seek to increase total return. The use of interest rate,
mortgage, credit and currency swaps, as well as interest rate caps, floors and collars, is a highly specialized activity which involves investment techniques and risks different from those associated with ordinary portfolio securities transactions. If the
Investment Adviser is incorrect in its forecasts of market value, interest rates and currency exchange rates, the investment performance of a Fund would be less favorable than it would have been if these investment techniques were not used.
|
| Loan Participations. Certain Funds may invest in loan participations. A loan participation is an interest in a loan
to a U.S. or foreign company or other borrower which is administered and sold by a financial intermediary. A Fund may only invest in loans to issuers in whose obligations it may otherwise invest. Loan participation interests may take the form of a direct
or co-lending relationship with the corporate borrower, an assignment of an interest in the loan by a co-lender or another participant, or a participation in the seller’s share of the loan. When a Fund acts as co-lender in connection with a
participation interest or when it acquires certain participation interests, the Fund will have direct recourse against the borrower if the borrower fails to pay scheduled principal and interest. In cases where the Fund lacks direct recourse, it will look
to the agent bank to enforce appropriate credit remedies against the borrower. In these cases, the Fund may be subject to delays, expenses and risks that are greater than those that would have been involved if the Fund had purchased a direct obligation
(such as commercial paper) of such borrower. Moreover, under the terms of the loan participation, the Fund may be regarded as a creditor of the agent bank (rather than of the underlying corporate borrower), so that the Fund may also be subject to the risk
that the agent bank may become insolvent.
|
| Inverse Floaters. Certain Funds may invest in inverse floating rate debt securities (“inverse floaters”).
The interest rate on inverse floaters resets in the opposite direction from the market rate of interest to which the inverse floater is indexed. An inverse floater may be considered to be leveraged to the extent that its interest rate varies by a
magnitude that exceeds the magnitude of the change in the index rate of interest. The higher the degree of leverage of an inverse floater, the greater the volatility of its market value.
|
| The financial highlights tables are intended to help you understand a Fund’s financial performance for the past five years
(or less if the Fund has not been in operation for less than five years). Certain information reflects financial results for a single Fund share. The total returns in the table represent the rate that an investor would have earned or lost on an investment
in a Fund (assuming reinvestment of all dividends and distributions). This information for the periods ended August 31, 2000 has been audited by PricewaterhouseCoopers LLP, whose report, along with a Fund’s financial statements, is included in the
Fund’s annual report (available upon request). The information for all periods prior to the periods ended August 31, 2000 has been audited by the Funds’ previous independent accountants.
|
| BALANCED FUND
|
|
Income from investment operations |
|||||||||||
|---|---|---|---|---|---|---|---|---|---|---|---|
|
Net asset value, beginning of period |
Net
investment Income |
Net realized
and unrealized gain (loss) |
Total from
investment operations |
||||||||
| For The Year Ended August 31, | |||||||||||
| 2000 - Class A Shares | $20.38 | $0.60 | c | $ 1.75 | $2.35 | ||||||
| 2000 - Class B Shares | 20.26 | 0.45 | c | 1.73 | 2.18 | ||||||
| 2000 - Class C Shares | 20.23 | 0.45 | c | 1.74 | 2.19 | ||||||
| 2000 - Institutional Shares | 20.39 | 0.71 | c | 1.75 | 2.46 | ||||||
| 2000 - Service Shares | 20.37 | 0.59 | c | 1.74 | 2.33 | ||||||
| For The Seven Months Ended August 31, | |||||||||||
| 1999 - Class A Shares | 20.48 | 0.32 | (0.19 | ) | 0.13 | ||||||
| 1999 - Class B Shares | 20.37 | 0.22 | (0.18 | ) | 0.04 | ||||||
| 1999 - Class C Shares | 20.34 | 0.23 | (0.19 | ) | 0.04 | ||||||
| 1999 - Institutional Shares | 20.48 | 0.53 | (0.35 | ) | 0.18 | ||||||
| 1999 - Service Shares | 20.47 | 1.22 | (1.14 | ) | 0.08 | ||||||
| For The Years Ended January 31, | |||||||||||
| 1999 - Class A Shares | 20.29 | 0.58 | 0.20 | 0.78 | |||||||
| 1999 - Class B Shares | 20.20 | 0.41 | 0.21 | 0.62 | |||||||
| 1999 - Class C Shares | 20.17 | 0.41 | 0.21 | 0.62 | |||||||
| 1999 - Institutional Shares | 20.29 | 0.64 | 0.20 | 0.84 | |||||||
| 1999 - Service Shares | 20.28 | 0.53 | 0.21 | 0.74 | |||||||
| 1998 - Class A Shares | 18.78 | 0.57 | 2.66 | 3.23 | |||||||
| 1998 - Class B Shares | 18.73 | 0.50 | 2.57 | 3.07 | |||||||
| 1998 - Class C Shares (commenced August 15, 1997) | 21.10 | 0.25 | 0.24 | 0.49 | |||||||
| 1998 - Institutional Shares (commenced August 15, 1997) | 21.18 | 0.26 | 0.32 | 0.58 | |||||||
| 1998 - Service Shares (commenced August 15, 1997) | 21.18 | 0.22 | 0.32 | 0.54 | |||||||
| 1997 - Class A Shares | 17.31 | 0.66 | 2.47 | 3.13 | |||||||
| 1997 - Class B Shares (commenced May 1, 1996) | 17.46 | 0.42 | 2.34 | 2.76 | |||||||
| 1996 - Class A Shares | 14.22 | 0.51 | 3.43 | 3.94 | |||||||
|
Distributions to shareholders |
|||||||||||||||||||||
|---|---|---|---|---|---|---|---|---|---|---|---|---|---|---|---|---|---|---|---|---|---|
| From net
investment income |
In excess of net investment income |
From net
realized gains |
Total
distributions |
Net asset
value, end of period |
Total
return a |
Net assets
at end of period (in 000s) |
Ratio of
net expenses to average net assets |
||||||||||||||
| $(0.50 | ) | $ — | $(0.81 | ) | $(1.31 | ) | $21.42 | 12.00 | % | $135,632 | 1.12 | % | |||||||||
| (0.36 | ) | — | (0.81 | ) | (1.17 | ) | 21.27 | 11.17 | 33,759 | 1.87 | |||||||||||
| (0.36 | ) | — | (0.81 | ) | (1.17 | ) | 21.25 | 11.23 | 8,658 | 1.87 | |||||||||||
| (0.58 | ) | — | (0.81 | ) | (1.39 | ) | 21.46 | 12.59 | 2,509 | 0.72 | |||||||||||
| (0.48 | ) | — | (0.81 | ) | (1.29 | ) | 21.41 | 11.89 | 17 | 1.22 | |||||||||||
| (0.23 | ) | — | — | (0.23 | ) | 20.38 | 0.62 | 169,395 | 1.10 | b | |||||||||||
| (0.15 | ) | — | — | (0.15 | ) | 20.26 | 0.20 | 40,515 | 1.85 | b | |||||||||||
| (0.15 | ) | — | — | (0.15 | ) | 20.23 | 0.18 | 11,284 | 1.85 | b | |||||||||||
| (0.27 | ) | — | — | (0.27 | ) | 20.39 | 0.86 | 2,361 | 0.70 | b | |||||||||||
| (0.18 | ) | — | — | (0.18 | ) | 20.37 | 0.39 | 15 | 1.20 | b | |||||||||||
| (0.59 | ) | — | — | (0.59 | ) | 20.48 | 3.94 | 192,453 | 1.04 | ||||||||||||
| (0.45 | ) | — | — | (0.45 | ) | 20.37 | 3.15 | 43,926 | 1.80 | ||||||||||||
| (0.45 | ) | — | — | (0.45 | ) | 20.34 | 3.14 | 14,286 | 1.80 | ||||||||||||
| (0.65 | ) | — | — | (0.65 | ) | 20.48 | 4.25 | 8,010 | 0.73 | ||||||||||||
| (0.55 | ) | — | — | (0.55 | ) | 20.47 | 3.80 | 490 | 1.23 | ||||||||||||
| (0.56 | ) | — | (1.16 | ) | (1.72 | ) | 20.29 | 17.54 | 163,636 | 1.00 | |||||||||||
| (0.42 | ) | (0.02 | ) | (1.16 | ) | (1.60 | ) | 20.20 | 16.71 | 23,639 | 1.76 | ||||||||||
| (0.22 | ) | (0.04 | ) | (1.16 | ) | (1.42 | ) | 20.17 | 2.49 | 8,850 | 1.77 | b | |||||||||
| (0.23 | ) | (0.08 | ) | (1.16 | ) | (1.47 | ) | 20.29 | 2.93 | 8,367 | 0.76 | b | |||||||||
| (0.22 | ) | (0.06 | ) | (1.16 | ) | (1.44 | ) | 20.28 | 2.66 | 16 | 1.26 | b | |||||||||
| (0.66 | ) | — | (1.00 | ) | (1.66 | ) | 18.78 | 18.59 | 81,410 | 1.00 | |||||||||||
| (0.42 | ) | (0.07 | ) | (1.00 | ) | (1.49 | ) | 18.73 | 16.22 | 2,110 | 1.75 | b | |||||||||
| (0.50 | ) | — | (0.35 | ) | (0.85 | ) | 17.31 | 28.10 | 50,928 | 1.00 | |||||||||||
| BALANCED FUND (continued)
|
|
Ratios assuming no expense reductions |
|||||||||||||
|---|---|---|---|---|---|---|---|---|---|---|---|---|---|
| Ratio of
net investment income to average net assets |
Ratio of
expenses to average net assets |
Ratio of
net investment income to average net assets |
Portfolio
turnover rated |
||||||||||
| For The Year Ended August 31, | |||||||||||||
| 2000 - Class A Shares | 2.94 | % | 1.29 | % | 2.77 | % | 153.69 | % | |||||
| 2000 - Class B Shares | 2.19 | 2.04 | 2.02 | 153.69 | |||||||||
| 2000 - Class C Shares | 2.19 | 2.04 | 2.02 | 153.69 | |||||||||
| 2000 - Institutional Shares | 3.46 | 0.89 | 3.29 | 153.69 | |||||||||
| 2000 - Service Shares | 2.86 | 1.39 | 2.69 | 153.69 | |||||||||
| For The Seven Months Ended August 31, | |||||||||||||
| 1999 - Class A Shares | 2.58 | b | 1.32 | b | 2.36 | b | 90.41 | ||||||
| 1999 - Class B Shares | 1.83 | b | 2.07 | b | 1.61 | b | 90.41 | ||||||
| 1999 - Class C Shares | 1.84 | b | 62.07 | b | 1.62 | b | 90.41 | ||||||
| 1999 - Institutional Shares | 2.96 | b | 60.92 | b | 2.74 | b | 90.41 | ||||||
| 1999 - Service Shares | 2.46 | b | 1.42 | b | 2.24 | b | 90.41 | ||||||
| For The Years Ended January 31, | |||||||||||||
| 1999 - Class A Shares | 2.90 | 1.45 | 2.49 | 175.06 | |||||||||
| 1999 - Class B Shares | 2.16 | 2.02 | 1.94 | 175.06 | |||||||||
| 1999 - Class C Shares | 2.17 | 2.02 | 1.95 | 175.06 | |||||||||
| 1999 - Institutional Shares | 3.22 | 0.95 | 3.00 | 175.06 | |||||||||
| 1999 - Service Shares | 2.77 | 1.45 | 2.55 | 175.06 | |||||||||
| 1998 - Class A Shares | 2.94 | 1.57 | 2.37 | 190.43 | |||||||||
| 1998 - Class B Shares | 2.14 | 2.07 | 1.83 | 190.43 | |||||||||
| 1998 - Class C Shares (commenced August 15, 1997) | 2.13 | b | 2.08 | b | 1.82 | b | 190.43 | ||||||
| 1998 - Institutional Shares (commenced August 15, 1997) | 3.13 | b | 1.07 | b | 2.82 | b | 190.43 | ||||||
| 1998 - Service Shares (commenced August 15, 1997) | 2.58 | b | 1.57 | b | 2.27 | b | 190.43 | ||||||
| 1997 - Class A Shares | 3.76 | 1.77 | 2.99 | 208.11 | |||||||||
| 1997 - Class B Shares (commenced May 1, 1996) | 2.59 | b | 2.27 | b | 2.07 | b | 208.11 | ||||||
| 1996 - Class A Shares | 3.65 | 1.90 | 2.75 | 197.10 | |||||||||
| GROWTH AND INCOME FUND
|
|
Income from investment operations |
||||||||||||
|---|---|---|---|---|---|---|---|---|---|---|---|---|
|
Net asset value, beginning of period |
Net
investment income (loss) |
Net realized
and unrealized gain (loss) |
Total from
investment operations |
|||||||||
| For The Year Ended August 31, | ||||||||||||
| 2000 - Class A Shares | $24.68 | $ 0.07 | c | $1.44 | $1.51 | |||||||
| 2000 - Class B Shares | 24.46 | (0.10 | ) c | 1.42 | 1.32 | |||||||
| 2000 - Class C Shares | 24.41 | (0.09 | ) c | 1.40 | 1.31 | |||||||
| 2000 - Institutional Shares | 24.72 | 0.16 | c | 1.49 | 1.65 | |||||||
| 2000 - Service Shares | 24.68 | 0.05 | c | 1.44 | 1.49 | |||||||
| For The Seven Months Ended August 31, | ||||||||||||
| 1999 - Class A Shares | 24.33 | 0.19 | 0.31 | 0.50 | ||||||||
| 1999 - Class B Shares | 24.13 | 0.08 | 0.31 | 0.39 | ||||||||
| 1999 - Class C Shares | 24.08 | 0.08 | 0.30 | 0.38 | ||||||||
| 1999 - Institutional Shares | 24.35 | 0.34 | 0.23 | 0.57 | ||||||||
| 1999 - Service Shares | 24.33 | 0.17 | 0.32 | 0.49 | ||||||||
| For The Years Ended January 31, | ||||||||||||
| 1999 - Class A Shares | 25.93 | 0.20 | (1.60 | ) | (1.40 | ) | ||||||
| 1999 - Class B Shares | 25.73 | 0.02 | (1.58 | ) | (1.56 | ) | ||||||
| 1999 - Class C Shares | 25.70 | 0.02 | (1.59 | ) | (1.57 | ) | ||||||
| 1999 - Institutional Shares | 25.95 | 0.29 | (1.58 | ) | (1.29 | ) | ||||||
| 1999 - Service Shares | 25.92 | 0.17 | (1.58 | ) | (1.41 | ) | ||||||
| 1998 - Class A Shares | 23.18 | 0.11 | 5.27 | 5.38 | ||||||||
| 1998 - Class B Shares | 23.10 | 0.04 | 5.14 | 5.18 | ||||||||
| 1998 - Class C Shares (commenced August 15, 1997) | 28.20 | (0.01 | ) | 0.06 | 0.05 | |||||||
| 1998 - Institutional Shares | 23.19 | 0.27 | 5.23 | 5.50 | ||||||||
| 1998 - Service Shares | 23.17 | 0.14 | 5.23 | 5.37 | ||||||||
| 1997 - Class A Shares | 19.98 | 0.35 | 5.18 | 5.53 | ||||||||
| 1997 - Class B Shares (commenced May 1, 1996) | 20.82 | 0.17 | 4.31 | 4.48 | ||||||||
| 1997 - Institutional Shares (commenced June 3, 1996) | 21.25 | 0.29 | 3.96 | 4.25 | ||||||||
| 1997 - Service Shares (commenced March 6, 1996) | 20.71 | 0.28 | 4.50 | 4.78 | ||||||||
| 1996 - Class A Shares | 15.80 | 0.33 | 4.75 | 5.08 | ||||||||
|
Distributions to shareholders |
|||||||||||||||||||||
|---|---|---|---|---|---|---|---|---|---|---|---|---|---|---|---|---|---|---|---|---|---|
| From net
investment income |
In excess of net investment income |
From net
realized gains |
Total
distributions |
Net asset
value, end of period |
Total
returna |
Net assets
at end of period (in 000s) |
Ratio of
net expenses to average net assets |
||||||||||||||
| $(0.05 | ) | $(0.03 | ) | $(1.33 | ) | $(1.41 | ) | $24.78 | 6.48 | % | $ 576,354 | 1.18 | % | ||||||||
| (0.02 | ) | (0.01 | ) | (1.33 | ) | (1.36 | ) | 24.42 | 5.70 | 155,527 | 1.93 | ||||||||||
| (0.01 | ) | (0.01 | ) | (1.33 | ) | (1.35 | ) | 24.37 | 5.67 | 15,746 | 1.93 | ||||||||||
| (0.09 | ) | (0.04 | ) | (1.33 | ) | (1.46 | ) | 24.91 | 7.05 | 28,543 | 0.78 | ||||||||||
| (0.05 | ) | (0.02 | ) | (1.33 | ) | (1.40 | ) | 24.77 | 6.40 | 7,926 | 1.28 | ||||||||||
| (0.15 | ) | — | — | (0.15 | ) | 24.68 | 2.05 | 855,174 | 1.19 | b | |||||||||||
| (0.06 | ) | — | — | (0.06 | ) | 24.46 | 1.60 | 271,912 | 1.94 | b | |||||||||||
| (0.05 | ) | — | — | (0.05 | ) | 24.41 | 1.58 | 31,328 | 1.94 | b | |||||||||||
| (0.20 | ) | — | — | (0.20 | ) | 24.72 | 2.32 | 32,181 | 0.79 | b | |||||||||||
| (0.14 | ) | — | — | (0.14 | ) | 24.68 | 2.01 | 10,008 | 1.29 | b | |||||||||||
| (0.19 | ) | (0.01 | ) | — | (0.20 | ) | 24.33 | (5.40 | ) | 1,122,157 | 1.22 | ||||||||||
| (0.04 | ) | — | — | (0.04 | ) | 24.13 | (6.07 | ) | 349,662 | 1.92 | |||||||||||
| (0.05 | ) | — | — | (0.05 | ) | 24.08 | (6.12 | ) | 48,146 | 1.92 | |||||||||||
| (0.30 | ) | (0.01 | ) | — | (0.31 | ) | 24.35 | (5.00 | ) | 173,696 | 0.80 | ||||||||||
| (0.17 | ) | (0.01 | ) | — | (0.18 | ) | 24.33 | (5.44 | ) | 11,943 | 1.30 | ||||||||||
| (0.11 | ) | — | (2.52 | ) | (2.63 | ) | 25.93 | 23.71 | 1,216,582 | 1.25 | |||||||||||
| — | (0.03 | ) | (2.52 | ) | (2.55 | ) | 25.73 | 22.87 | 307,815 | 1.94 | |||||||||||
| — | (0.03 | ) | (2.52 | ) | (2.55 | ) | 25.70 | 0.51 | 31,686 | 1.99 | b | ||||||||||
| (0.22 | ) | — | (2.52 | ) | (2.74 | ) | 25.95 | 24.24 | 36,225 | 0.83 | |||||||||||
| (0.06 | ) | (0.04 | ) | (2.52 | ) | (2.62 | ) | 25.92 | 23.63 | 8,893 | 1.32 | ||||||||||
| (0.35 | ) | (0.01 | ) | (1.97 | ) | (2.33 | ) | 23.18 | 28.42 | 615,103 | 1.22 | ||||||||||
| (0.17 | ) | (0.06 | ) | (1.97 | ) | (2.20 | ) | 23.10 | 22.23 | 17,346 | 1.93 | b | |||||||||
| (0.30 | ) | (0.04 | ) | (1.97 | ) | (2.31 | ) | 23.19 | 20.77 | 193 | 0.82 | b | |||||||||
| (0.28 | ) | (0.07 | ) | (1.97 | ) | (2.32 | ) | 23.17 | 23.87 | 3,174 | 1.32 | b | |||||||||
| (0.30 | ) | — | (0.60 | ) | (0.90 | ) | 19.98 | 32.45 | 436,757 | 1.20 | |||||||||||
| GROWTH AND INCOME FUND (continued)
|
|
Ratios assuming no expense reductions |
|||||||||||||
|---|---|---|---|---|---|---|---|---|---|---|---|---|---|
| Ratio of
net investment income (loss) to average net assets |
Ratio of
expenses to average net assets |
Ratio of
net investment income (loss) to average net assets |
Portfolio
turnover rate |
||||||||||
| For The Year Ended August 31, | |||||||||||||
| 2000 - Class A Shares | 0.31 | % | 1.18 | % | 0.31 | % | 86.84 | % | |||||
| 2000 - Class B Shares | (0.41 | ) | 1.93 | (0.41 | ) | 86.84 | |||||||
| 2000 - Class C Shares | (0.40 | ) | 1.93 | (0.40 | ) | 86.84 | |||||||
| 2000 - Institutional Shares | 0.69 | 0.78 | 0.69 | 86.84 | |||||||||
| 2000 - Service Shares | 0.20 | 1.28 | 0.20 | 86.84 | |||||||||
| For The Seven Months Ended August 31, | |||||||||||||
| 1999 - Class A Shares | 1.26 | b | 1.20 | b | 1.25 | b | 55.43 | ||||||
| 1999 - Class B Shares | 0.51 | b | 1.95 | b | 0.50 | b | 55.43 | ||||||
| 1999 - Class C Shares | 0.51 | b | 1.95 | b | 0.50 | b | 55.43 | ||||||
| 1999 - Institutional Shares | 1.72 | b | 0.80 | b | 1.71 | b | 55.43 | ||||||
| 1999 - Service Shares | 1.16 | b | 1.30 | b | 1.15 | b | 55.43 | ||||||
| For The Years Ended January 31, | |||||||||||||
| 1999 - Class A Shares | 0.78 | 1.32 | 0.68 | 125.79 | |||||||||
| 1999 - Class B Shares | 0.09 | 1.92 | 0.09 | 125.79 | |||||||||
| 1999 - Class C Shares | 0.10 | 1.92 | 0.10 | 125.79 | |||||||||
| 1999 - Institutional Shares | 1.25 | 0.80 | 1.25 | 125.79 | |||||||||
| 1999 - Service Shares | 0.72 | 1.30 | 0.72 | 125.79 | |||||||||
| 1998 - Class A Shares | 0.43 | 1.42 | 0.26 | 61.95 | |||||||||
| 1998 - Class B Shares | (0.35 | ) | 1.94 | (0.35 | ) | 61.95 | |||||||
| 1998 - Class C Shares (commenced August 15, 1997) | (0.48 | ) b | 1.99 | b | (0.48 | ) b | 61.95 | ||||||
| 1998 - Institutional Shares | 0.76 | 0.83 | 0.76 | 61.95 | |||||||||
| 1998 - Service Shares | 0.32 | 1.32 | 0.32 | 61.95 | |||||||||
| 1997 - Class A Shares | 1.60 | 1.43 | 1.39 | 53.03 | |||||||||
| 1997 - Class B Shares (commenced May 1, 1996) | 0.15 | b | 1.93 | b | 0.15 | b | 53.03 | ||||||
| 1997 - Institutional Shares (commenced June 3, 1996) | 1.36 | b | 0.82 | b | 1.36 | b | 53.03 | ||||||
| 1997 - Service Shares (commenced March 6, 1996) | 0.94 | b | 1.32 | b | 0.94 | b | 53.03 | ||||||
| 1996 - Class A Shares | 1.67 | 1.45 | 1.42 | 57.93 | |||||||||
| CORE LARGE CAP VALUE FUND
|
|
Income from investment operations |
||||||||||||
|---|---|---|---|---|---|---|---|---|---|---|---|---|
| Net asset
value, beginning of period |
Net
investment income |
Net realized
and unrealized gain |
Total from
investment operations |
|||||||||
| For the Year Ended August 31, | ||||||||||||
| 2000 - Class A Shares | $10.55 | $0.12 | c | $0.36 | $0.48 | |||||||
| 2000 - Class B Shares | 10.50 | 0.05 | c | 0.36 | 0.41 | |||||||
| 2000 - Class C Shares | 10.51 | 0.04 | c | 0.37 | 0.41 | |||||||
| 2000 - Institutional Shares | 10.55 | 0.16 | c | 0.37 | 0.53 | |||||||
| 2000 - Service Shares | 10.55 | 0.11 | c | 0.36 | 0.47 | |||||||
| For the Seven-Month Period Ended August 31, | ||||||||||||
| 1999 - Class A Shares | 10.15 | 0.04 | 0.40 | 0.44 | ||||||||
| 1999 - Class B Shares | 10.15 | 0.01 | 0.36 | 0.37 | ||||||||
| 1999 - Class C Shares | 10.15 | 0.01 | 0.37 | 0.38 | ||||||||
| 1999 - Institutional Shares | 10.16 | 0.06 | 0.38 | 0.44 | ||||||||
| 1999 - Service Shares | 10.16 | 0.02 | 0.40 | 0.42 | ||||||||
| For the Period Ended January 31, | ||||||||||||
| 1999 - Class A Shares (commenced December 31, 1998) | 10.00 | 0.01 | 0.14 | 0.15 | ||||||||
| 1999 - Class B Shares (commenced December 31, 1998) | 10.00 | — | 0.15 | 0.15 | ||||||||
| 1999 - Class C Shares (commenced December 31, 1998) | 10.00 | — | 0.15 | 0.15 | ||||||||
| 1999 - Institutional Shares (commenced December 31, 1998) | 10.00 | 0.01 | 0.15 | 0.16 | ||||||||
| 1999 - Service Shares (commenced December 31, 1998) | 10.00 | 0.02 | 0.14 | 0.16 | ||||||||
|
Distributions to shareholders |
|||||||||||||||||||||
|---|---|---|---|---|---|---|---|---|---|---|---|---|---|---|---|---|---|---|---|---|---|
| From net
investment income |
From net
realized gains |
Total
distributions |
Net asset
value, end of period |
Total
returna |
Net assets
at end of period (in 000s) |
Ratio of
net expenses to average net assets |
Ratio of
net investment income to average net assets |
||||||||||||||
| $(0.10 | ) | $(0.12 | ) | $(0.22 | ) | $10.81 | 4.68 | % | $100,972 | 1.06 | % | 1.14 | % | ||||||||
| (0.04 | ) | (0.12 | ) | (0.16 | ) | 10.75 | 3.96 | 19,069 | 1.81 | 0.44 | |||||||||||
| (0.04 | ) | (0.12 | ) | (0.16 | ) | 10.76 | 3.97 | 11,178 | 1.81 | 0.45 | |||||||||||
| (0.14 | ) | (0.12 | ) | (0.26 | ) | 10.82 | 5.20 | 175,493 | 0.66 | 1.54 | |||||||||||
| (0.09 | ) | (0.12 | ) | (0.21 | ) | 10.81 | 4.60 | 12 | 1.16 | 1.07 | |||||||||||
| (0.04 | ) | — | (0.04 | ) | 10.55 | 4.31 | 91,072 | 1.04 | b | 0.87 | b | ||||||||||
| (0.02 | ) | — | (0.02 | ) | 10.50 | 3.68 | 14,464 | 1.79 | b | 0.05 | b | ||||||||||
| (0.02 | ) | — | (0.02 | ) | 10.51 | 3.73 | 8,032 | 1.79 | b | 0.09 | b | ||||||||||
| (0.05 | ) | — | (0.05 | ) | 10.55 | 4.35 | 189,540 | 0.64 | b | 1.29 | b | ||||||||||
| (0.03 | ) | — | (0.03 | ) | 10.55 | 4.11 | 13 | 1.14 | b | 0.72 | b | ||||||||||
| — | — | — | 10.15 | 1.50 | 6,665 | 1.08 | b | 1.45 | b | ||||||||||||
| — | — | — | 10.15 | 1.50 | 340 | 1.82 | b | 0.84 | b | ||||||||||||
| — | — | — | 10.15 | 1.50 | 268 | 1.83 | b | 0.70 | b | ||||||||||||
| — | — | — | 10.16 | 1.60 | 53,396 | 0.66 | b | 1.97 | b | ||||||||||||
| — | — | — | 10.16 | 1.60 | 2 | 1.16 | b | 2.17 | b | ||||||||||||
| CORE LARGE CAP VALUE FUND (continued)
|
|
Ratios assuming no expense reductions |
||||||||||
|---|---|---|---|---|---|---|---|---|---|---|
| Ratio of
expenses to average net assets |
Ratio of
net investment income (loss) to average net assets |
Portfolio
turnover rate |
||||||||
| For the Year Ended August 31, | ||||||||||
| 2000 - Class A Shares | 1.17 | % | 1.03 | % | 83.30 | % | ||||
| 2000 - Class B Shares | 1.92 | 0.33 | 83.30 | |||||||
| 2000 - Class C Shares | 1.92 | 0.34 | 83.30 | |||||||
| 2000 - Institutional Shares | 0.77 | 1.43 | 83.30 | |||||||
| 2000 - Service Shares | 1.27 | 0.96 | 83.30 | |||||||
| For the Seven-Month Period Ended August 31, | ||||||||||
| 1999 - Class A Shares | 1.21 | b | 0.70 | b | 36.10 | |||||
| 1999 - Class B Shares | 1.96 | b | (0.12 | ) b | 36.10 | |||||
| 1999 - Class C Shares | 1.96 | b | (0.08 | ) b | 36.10 | |||||
| 1999 - Institutional Shares | 0.81 | b | 1.12 | b | 36.10 | |||||
| 1999 - Service Shares | 1.31 | b | 0.55 | b | 36.10 | |||||
| For the Period Ended January 31, | ||||||||||
| 1999 - Class A Shares (commenced December 31, 1998) | 8.03 | b | (5.50 | ) b | 0.00 | |||||
| 1999 - Class B Shares (commenced December 31, 1998) | 8.77 | b | (6.11 | ) b | 0.00 | |||||
| 1999 - Class C Shares (commenced December 31, 1998) | 8.78 | b | (6.25 | ) b | 0.00 | |||||
| 1999 - Institutional Shares (commenced December 31, 1998) | 7.61 | b | (4.98 | ) b | 0.00 | |||||
| 1999 - Service Shares (commenced December 31, 1998) | 8.11 | b | (4.78 | ) b | 0.00 | |||||
| CORE U.S. EQUITY FUND
|
|
Income from investment operations |
||||||||||
|---|---|---|---|---|---|---|---|---|---|---|
|
Net asset value, beginning of period |
Net
investment income (loss) |
Net realized
and unrealized gain |
Total from
investment operations |
|||||||
| For The Year Ended August 31, | ||||||||||
| 2000 - Class A Shares | $34.21 | $ 0.10 | c | $6.00 | $6.10 | |||||
| 2000 - Class B Shares | 33.56 | (0.14 | ) c | 5.83 | 5.69 | |||||
| 2000 - Class C Shares | 33.46 | (0.13 | ) c | 5.80 | 5.67 | |||||
| 2000 - Institutional Shares | 34.61 | 0.24 | c | 6.07 | 6.31 | |||||
| 2000 - Service Shares | 34.05 | 0.07 | c | 5.96 | 6.03 | |||||
| For The Seven-Month Period Ended August 31, | ||||||||||
| 1999 - Class A Shares | 32.98 | 0.03 | 1.20 | 1.23 | ||||||
| 1999 - Class B Shares | 32.50 | (0.11 | ) | 1.17 | 1.06 | |||||
| 1999 - Class C Shares | 32.40 | (0.10 | ) | 1.16 | 1.06 | |||||
| 1999 - Institutional Shares | 33.29 | 0.11 | 1.21 | 1.32 | ||||||
| 1999 - Service Shares | 32.85 | 0.01 | 1.19 | 1.20 | ||||||
| For The Years Ended January 31, | ||||||||||
| 1999 - Class A Shares | 26.59 | 0.04 | 7.02 | 7.06 | ||||||
| 1999 - Class B Shares | 26.32 | (0.10 | ) | 6.91 | 6.81 | |||||
| 1999 - Class C Shares | 26.24 | (0.10 | ) | 6.89 | 6.79 | |||||
| 1999 - Institutional Shares | 26.79 | 0.20 | 7.11 | 7.31 | ||||||
| 1999 - Service Shares | 26.53 | 0.06 | 7.01 | 7.07 | ||||||
| 1998 - Class A Shares | 23.32 | 0.11 | 5.63 | 5.74 | ||||||
| 1998 - Class B Shares | 23.18 | 0.11 | 5.44 | 5.55 | ||||||
| 1998 - Class C Shares (commenced August 15, 1997) | 27.48 | 0.03 | 1.22 | 1.25 | ||||||
| 1998 - Institutional Shares | 23.44 | 0.30 | 5.65 | 5.95 | ||||||
| 1998 - Service Shares | 23.27 | 0.19 | 5.57 | 5.76 | ||||||
| 1997 - Class A Shares | 19.66 | 0.16 | 4.46 | 4.62 | ||||||
| 1997 - Class B Shares (commenced May 1, 1996) | 20.44 | 0.04 | 3.70 | 3.74 | ||||||
| 1997 - Institutional Shares | 19.71 | 0.30 | 4.51 | 4.81 | ||||||
| 1997 - Service Shares (commenced June 7, 1996) | 21.02 | 0.13 | 3.15 | 3.28 | ||||||
| 1996 - Class A Shares | 14.61 | 0.19 | 5.43 | 5.62 | ||||||
| 1996 - Institutional Shares (commenced June 15, 1995) | 16.97 | 0.16 | 3.23 | 3.39 | ||||||
|
Distributions to shareholders |
||||||||||||||||||||||||
|---|---|---|---|---|---|---|---|---|---|---|---|---|---|---|---|---|---|---|---|---|---|---|---|---|
| From net
investment income |
In excess
of net investment income |
From net
realized gains |
Total
distributions |
Net asset
value, end of period |
Total
returna |
Net assets
at end of period (in 000s) |
Ratio of
net expenses to average net assets |
Ratio of
net investment income (loss) to average net assets |
||||||||||||||||
| $ — | $ — | $(3.54 | ) | $(3.54 | ) | $36.77 | 18.96 | % | $715,775 | 1.14 | % | 0.31 | % | |||||||||||
| — | — | (3.54 | ) | (3.54 | ) | 35.71 | 18.03 | 275,673 | 1.89 | (0.44 | ) | |||||||||||||
| — | — | (3.54 | ) | (3.54 | ) | 35.59 | 18.03 | 62,820 | 1.89 | (0.43 | ) | |||||||||||||
| (0.08 | ) | — | (3.54 | ) | (3.62 | ) | 37.30 | 19.41 | 379,172 | 0.74 | 0.71 | |||||||||||||
| — | — | (3.54 | ) | (3.54 | ) | 36.54 | 18.83 | 11,879 | 1.24 | 0.19 | ||||||||||||||
| — | — | — | — | 34.21 | 3.73 | 614,310 | 1.14 | b | 0.15 | b | ||||||||||||||
| — | — | — | — | 33.56 | 3.26 | 214,087 | 1.89 | b | (0.60 | ) b | ||||||||||||||
| — | — | — | — | 33.46 | 3.27 | 43,361 | 1.89 | b | (0.61 | ) b | ||||||||||||||
| — | — | — | — | 34.61 | 3.97 | 335,465 | 0.74 | b | 0.54 | b | ||||||||||||||
| — | — | — | — | 34.05 | 3.65 | 11,204 | 1.24 | b | 0.06 | b | ||||||||||||||
| (0.03 | ) | (0.01 | ) | (0.63 | ) | (0.67 | ) | 32.98 | 26.89 | 605,566 | 1.23 | 0.15 | ||||||||||||
| — | — | (0.63 | ) | (0.63 | ) | 32.50 | 26.19 | 152,347 | 1.85 | (0.50 | ) | |||||||||||||
| — | — | (0.63 | ) | (0.63 | ) | 32.40 | 26.19 | 26,912 | 1.87 | (0.53 | ) | |||||||||||||
| (0.15 | ) | (0.03 | ) | (0.63 | ) | (0.81 | ) | 33.29 | 27.65 | 307,200 | 0.69 | 0.69 | ||||||||||||
| (0.10 | ) | (0.02 | ) | (0.63 | ) | (0.75 | ) | 32.85 | 27.00 | 11,600 | 1.19 | 0.19 | ||||||||||||
| (0.12 | ) | — | (2.35 | ) | (2.47 | ) | 26.59 | 24.96 | 398,393 | 1.28 | 0.51 | |||||||||||||
| — | (0.06 | ) | (2.35 | ) | (2.41 | ) | 26.32 | 24.28 | 59,208 | 1.79 | (0.05 | ) | ||||||||||||
| — | (0.14 | ) | (2.35 | ) | (2.49 | ) | 26.24 | 4.85 | 6,267 | 1.78 | b | (0.21 | ) b | |||||||||||
| (0.24 | ) | (0.01 | ) | (2.35 | ) | (2.60 | ) | 26.79 | 25.76 | 202,893 | 0.65 | 1.16 | ||||||||||||
| (0.07 | ) | (0.08 | ) | (2.35 | ) | (2.50 | ) | 26.53 | 25.11 | 7,841 | 1.15 | 0.62 | ||||||||||||
| (0.16 | ) | — | (0.80 | ) | (0.96 | ) | 23.32 | 23.75 | 225,968 | 1.29 | 0.91 | |||||||||||||
| (0.04 | ) | (0.16 | ) | (0.80 | ) | (1.00 | ) | 23.18 | 18.59 | 17,258 | 1.83 | b | 0.06 | b | ||||||||||
| (0.28 | ) | — | (0.80 | ) | (1.08 | ) | 23.44 | 24.63 | 148,942 | 0.65 | 1.52 | |||||||||||||
| (0.13 | ) | (0.10 | ) | (0.80 | ) | (1.03 | ) | 23.27 | 15.92 | 3,666 | 1.15 | b | 0.69 | b | ||||||||||
| (0.16 | ) | — | (0.41 | ) | (0.57 | ) | 19.66 | 38.63 | 129,045 | 1.25 | 1.01 | |||||||||||||
| (0.24 | ) | — | (0.41 | ) | (0.65 | ) | 19.71 | 20.14 | 64,829 | 0.65 | b | 1.49 | b | |||||||||||
| CORE U.S. EQUITY FUND (continued)
|
|
Ratios assuming no expense reductions |
||||||||||
|---|---|---|---|---|---|---|---|---|---|---|
| Ratio of
expenses to average net assets |
Ratio of
net investment income (loss) to average net assets |
Portfolio
turnover rate |
||||||||
| For The Year Ended August 31, | ||||||||||
| 2000 - Class A Shares | 1.23 | % | 0.22 | % | 59.27 | % | ||||
| 2000 - Class B Shares | 1.98 | (0.53 | ) | 59.27 | ||||||
| 2000 - Class C Shares | 1.98 | (0.52 | ) | 59.27 | ||||||
| 2000 - Institutional Shares | 0.83 | 0.62 | 59.27 | |||||||
| 2000 - Service Shares | 1.33 | 0.10 | 59.27 | |||||||
| For The Seven-Month Period Ended August 31, | ||||||||||
| 1999 - Class A Shares | 1.24 | b | 0.05 | b | 41.84 | |||||
| 1999 - Class B Shares | 1.99 | b | (0.70 | ) b | 41.84 | |||||
| 1999 - Class C Shares | 1.99 | b | (0.71 | ) b | 41.84 | |||||
| 1999 - Institutional Shares | 0.84 | b | 0.44 | b | 41.84 | |||||
| 1999 - Service Shares | 1.34 | b | (0.04 | ) b | 41.84 | |||||
| For The Years Ended January 31, | ||||||||||
| 1999 - Class A Shares | 1.36 | 0.02 | 63.79 | |||||||
| 1999 - Class B Shares | 1.98 | (0.63 | ) | 63.79 | ||||||
| 1999 - Class C Shares | 2.00 | (0.66 | ) | 63.79 | ||||||
| 1999 - Institutional Shares | 0.82 | 0.56 | 63.79 | |||||||
| 1999 - Service Shares | 1.32 | 0.06 | 63.79 | |||||||
| 1998 - Class A Shares | 1.47 | 0.32 | 65.89 | |||||||
| 1998 - Class B Shares | 1.96 | (0.22 | ) | 65.89 | ||||||
| 1998 - Class C Shares (commenced August 15, 1997) | 1.95 | b | (0.38 | ) b | 65.89 | |||||
| 1998 - Institutional Shares | 0.82 | 0.99 | 65.89 | |||||||
| 1998 - Service Shares | 1.32 | 0.45 | 65.89 | |||||||
| 1997 - Class A Shares | 1.53 | 0.67 | 37.28 | |||||||
| 1997 - Class B Shares (commenced May 1, 1996) | 2.00 | b | (0.11 | ) b | 37.28 | |||||
| 1997 - Institutional Shares | 0.85 | 1.32 | 37.28 | |||||||
| 1997 - Service Shares (commenced June 7, 1996) | 1.35 | b | 0.49 | b | 37.28 | |||||
| 1996 - Class A Shares | 1.55 | 0.71 | 39.35 | |||||||
| 1996 - Institutional Shares (commenced June 15, 1995) | 0.96 | b | 1.18 | b | 39.35 | |||||
| CORE LARGE CAP GROWTH FUND
|
|
Income from investment operations |
||||||||||
|---|---|---|---|---|---|---|---|---|---|---|
|
Net asset value, beginning of period |
Net
investment income (loss) |
Net realized
and unrealized gain |
Total from
investment operations |
|||||||
| For the Year Ended August 31, | ||||||||||
| 2000 - Class A Shares | $17.02 | $ 0.06 | c | $5.67 | $5.73 | |||||
| 2000 - Class B Shares | 16.75 | (0.09 | ) c | 5.57 | 5.48 | |||||
| 2000 - Class C Shares | 16.75 | (0.08 | ) c | 5.57 | 5.49 | |||||
| 2000 - Institutional Shares | 17.10 | 0.13 | c | 5.73 | 5.86 | |||||
| 2000 - Service Shares | 16.95 | 0.03 | c | 5.66 | 5.69 | |||||
| For the Seven-Month Period Ended August 31, | ||||||||||
| 1999 - Class A Shares | 16.17 | (0.01 | ) | 0.86 | 0.85 | |||||
| 1999 - Class B Shares | 15.98 | (0.07 | ) | 0.84 | 0.77 | |||||
| 1999 - Class C Shares | 15.99 | (0.07 | ) | 0.83 | 0.76 | |||||
| 1999 - Institutional Shares | 16.21 | 0.03 | 0.86 | 0.89 | ||||||
| 1999 - Service Shares | 16.11 | (0.02 | ) | 0.86 | 0.84 | |||||
| For the Year Ended January 31, | ||||||||||
| 1999 - Class A Shares | 11.97 | 0.01 | 4.19 | 4.20 | ||||||
| 1999 - Class B Shares | 11.92 | (0.06 | ) | 4.12 | 4.06 | |||||
| 1999 - Class C Shares | 11.93 | (0.05 | ) | 4.11 | 4.06 | |||||
| 1999 - Institutional Shares | 11.97 | 0.02 | 4.23 | 4.25 | ||||||
| 1999 - Service Shares | 11.95 | (0.01 | ) | 4.17 | 4.16 | |||||
| For the Period Ended January 31, | ||||||||||
| 1998 - Class A Shares (commenced May 1, 1997) | 10.00 | 0.01 | 2.35 | 2.36 | ||||||
| 1998 - Class B Shares (commenced May 1, 1997) | 10.00 | (0.03 | ) | 2.33 | 2.30 | |||||
| 1998 - Class C Shares (commenced August 15, 1997) | 11.80 | (0.02 | ) | 0.54 | 0.52 | |||||
| 1998 - Institutional Shares (commenced May 1, 1997) | 10.00 | 0.01 | 2.35 | 2.36 | ||||||
| 1998 - Service Shares (commenced May 1, 1997) | 10.00 | (0.02 | ) | 2.35 | 2.33 | |||||
|
Distributions to Shareholders |
|||||||||||||||||||||
|---|---|---|---|---|---|---|---|---|---|---|---|---|---|---|---|---|---|---|---|---|---|
|
From Net Investment Income |
In excess
of net investment income |
From net
realized gains |
Total
distributions |
Net asset
value, end of period |
Total
returna |
Net assets
at end of period (in 000s) |
Ratio of
net expenses to average net assets |
||||||||||||||
| $ — | $ — | $(0.09 | ) | $(0.09 | ) | $22.66 | 33.73 | % | $545,763 | 1.09 | % | ||||||||||
| — | — | (0.09 | ) | (0.09 | ) | 22.14 | 32.78 | 338,128 | 1.84 | ||||||||||||
| — | — | (0.09 | ) | (0.09 | ) | 22.15 | 32.84 | 154,966 | 1.84 | ||||||||||||
| — | — | (0.09 | ) | (0.09 | ) | 22.87 | 34.34 | 322,900 | 0.69 | ||||||||||||
| — | — | (0.09 | ) | (0.09 | ) | 22.55 | 33.64 | 3,879 | 1.19 | ||||||||||||
| — | — | — | — | 17.02 | 5.26 | 300,684 | 1.04 | b | |||||||||||||
| — | — | — | — | 16.75 | 4.82 | 181,626 | 1.79 | b | |||||||||||||
| — | — | — | — | 16.75 | 4.75 | 75,502 | 1.79 | b | |||||||||||||
| — | — | — | — | 17.10 | 5.49 | 310,704 | 0.64 | b | |||||||||||||
| — | — | — | — | 16.95 | 5.21 | 2,510 | 1.14 | b | |||||||||||||
| — | — | — | — | 16.17 | 35.10 | 175,510 | 0.97 | ||||||||||||||
| — | — | — | — | 15.98 | 34.07 | 93,711 | 1.74 | ||||||||||||||
| — | — | — | — | 15.99 | 34.04 | 37,081 | 1.74 | ||||||||||||||
| — | (0.01 | ) | — | (0.01 | ) | 16.21 | 35.54 | 295,734 | 0.65 | ||||||||||||
| — | — | — | — | 16.11 | 34.85 | 1,663 | 1.15 | ||||||||||||||
| (0.01 | ) | — | (0.38 | ) | (0.39 | ) | 11.97 | 23.79 | 53,786 | 0.91 | b | ||||||||||
| — | — | (0.38 | ) | (0.38 | ) | 11.92 | 23.26 | 13,857 | 1.67 | b | |||||||||||
| — | (0.01 | ) | (0.38 | ) | (0.39 | ) | 11.93 | 4.56 | 4,132 | 1.68 | b | ||||||||||
| (0.01 | ) | — | (0.38 | ) | (0.39 | ) | 11.97 | 23.89 | 4,656 | 0.72 | b | ||||||||||
| — | — | (0.38 | ) | (0.38 | ) | 11.95 | 23.56 | 115 | 1.17 | b | |||||||||||
| CORE LARGE CAP GROWTH FUND (continued)
|
|
Ratios assuming no expense reductions |
|||||||||||||
|---|---|---|---|---|---|---|---|---|---|---|---|---|---|
| Ratio of
net investment income (loss) to average net assets |
Ratio of
expenses to average net assets |
Ratio of net
investment income (loss) to average net assets |
Portfolio
turnover rate |
||||||||||
| For the Year Ended August 31, | |||||||||||||
| 2000 - Class A Shares | 0.31 | % | 1.24 | % | 0.16 | % | 72.59 | % | |||||
| 2000 - Class B Shares | (0.44 | ) | 1.99 | (0.59 | ) | 72.59 | |||||||
| 2000 - Class C Shares | (0.43 | ) | 1.99 | (0.58 | ) | 72.59 | |||||||
| 2000 - Institutional Shares | 0.65 | 0.84 | 0.50 | 72.59 | |||||||||
| 2000 - Service Shares | 0.15 | 1.34 | — | 72.59 | |||||||||
| For the Seven-Month Period Ended August 31, | |||||||||||||
| 1999 - Class A Shares | (0.11 | ) b | 1.26 | b | (0.33 | ) b | 32.74 | ||||||
| 1999 - Class B Shares | (0.87 | ) b | 2.01 | b | (1.09 | ) b | 32.74 | ||||||
| 1999 - Class C Shares | (0.87 | ) b | 2.01 | b | (1.09 | ) b | 32.74 | ||||||
| 1999 - Institutional Shares | 0.31 | b | 0.86 | b | 0.09 | b | 32.74 | ||||||
| 1999 - Service Shares | (0.21 | ) b | 1.36 | b | (0.43 | ) b | 32.74 | ||||||
| For the Year Ended January 31, | |||||||||||||
| 1999 - Class A Shares | 0.05 | 1.46 | (0.44 | ) | 63.15 | ||||||||
| 1999 - Class B Shares | (0.73 | ) | 2.11 | (1.10 | ) | 63.15 | |||||||
| 1999 - Class C Shares | (0.74 | ) | 2.11 | (1.11 | ) | 63.15 | |||||||
| 1999 - Institutional Shares | 0.35 | 1.02 | (0.02 | ) | 63.15 | ||||||||
| 1999 - Service Shares | (0.16 | ) | 1.52 | (0.53 | ) | 63.15 | |||||||
| For the Period Ended January 31, | |||||||||||||
| 1998 - Class A Shares (commenced May 1, 1997) | 0.12 | b | 2.40 | b | (1.37 | ) b | 74.97 | ||||||
| 1998 - Class B Shares (commenced May 1, 1997) | (0.72 | ) b | 2.91 | b | (1.96 | ) b | 74.97 | ||||||
| 1998 - Class C Shares (commenced August 15, 1997) | (0.76 | ) b | 2.92 | b | (2.00 | ) b | 74.97 | ||||||
| 1998 - Institutional Shares (commenced May 1, 1997) | 0.42 | b | 1.96 | b | (0.82 | ) b | 74.97 | ||||||
| 1998 - Service Shares (commenced May 1, 1997) | (0.21 | ) b | 2.41 | b | (1.45 | ) b | 74.97 | ||||||
| CORE SMALL CAP EQUITY FUND
|
|
Income from investment operations |
||||||||||||
|---|---|---|---|---|---|---|---|---|---|---|---|---|
|
Net asset value, beginning of period |
Net
investment income (loss) |
Net
realized and unrealized gain (loss) |
Total from
investment operations |
|||||||||
| For the Year Ended August 31, | ||||||||||||
| 2000 - Class A Shares | $10.23 | $(0.03 | ) c | $2.70 | $2.67 | |||||||
| 2000 - Class B Shares | 10.09 | (0.11 | ) c | 2.65 | 2.54 | |||||||
| 2000 - Class C Shares | 10.10 | (0.10 | ) c | 2.66 | 2.56 | |||||||
| 2000 - Institutional Shares | 10.30 | 0.02 | c | 2.71 | 2.73 | |||||||
| 2000 - Service Shares | 10.22 | (0.04 | ) c | 2.69 | 2.65 | |||||||
| For the Seven-Month Period Ended August 31, | ||||||||||||
| 1999 - Class A Shares | 10.16 | (0.01 | ) | 0.08 | 0.07 | |||||||
| 1999 - Class B Shares | 10.07 | (0.05 | ) | 0.07 | 0.02 | |||||||
| 1999 - Class C Shares | 10.08 | (0.05 | ) | 0.07 | 0.02 | |||||||
| 1999 - Institutional Shares | 10.20 | 0.02 | 0.08 | 0.10 | ||||||||
| 1999 - Service Shares | 10.16 | (0.01 | ) | 0.07 | 0.06 | |||||||
| For the Year Ended January 31, | ||||||||||||
| 1999 - Class A Shares | 10.59 | 0.01 | (0.43 | ) | (0.42 | ) | ||||||
| 1999 - Class B Shares | 10.56 | (0.05 | ) | (0.44 | ) | (0.49 | ) | |||||
| 1999 - Class C Shares | 10.57 | (0.04 | ) | (0.45 | ) | (0.49 | ) | |||||
| 1999 - Institutional Shares | 10.61 | 0.04 | (0.43 | ) | (0.39 | ) | ||||||
| 1999 - Service Shares | 10.60 | 0.01 | (0.44 | ) | (0.43 | ) | ||||||
| For the Period Ended January 31, | ||||||||||||
| 1998 - Class A Shares (commenced August 15, 1997) | 10.00 | (0.01 | ) | 0.65 | 0.64 | |||||||
| 1998 - Class B Shares (commenced August 15, 1997) | 10.00 | (0.03 | ) | 0.64 | 0.61 | |||||||
| 1998 - Class C Shares (commenced August 15, 1997) | 10.00 | (0.02 | ) | 0.64 | 0.62 | |||||||
| 1998 - Institutional Shares (commenced August 15, 1997) | 10.00 | 0.01 | 0.65 | 0.66 | ||||||||
| 1998 - Service Shares (commenced August 15, 1997) | 10.00 | 0.01 | 0.64 | 0.65 | ||||||||
|
Distributions to Shareholders |
||||||||||||||||||
|---|---|---|---|---|---|---|---|---|---|---|---|---|---|---|---|---|---|---|
|
From net investment income |
From net realized gains |
Total
distributions |
Net asset
value, end of period |
Total
returna |
Net assets
at end of period (in 000s) |
Ratio of
net expenses to average net assets |
||||||||||||
| $ — | $ — | $ — | $12.90 | 26.10 | % | $54,954 | 1.33 | % | ||||||||||
| — | — | — | 12.63 | 25.17 | 17,923 | 2.08 | ||||||||||||
| — | — | — | 12.66 | 25.35 | 8,289 | 2.08 | ||||||||||||
| — | — | — | 13.03 | 26.60 | 86,196 | 0.93 | ||||||||||||
| — | — | — | 12.87 | 25.93 | 63 | 1.43 | ||||||||||||
| — | — | — | 10.23 | 0.69 | 52,660 | 1.33 | b | |||||||||||
| — | — | — | 10.09 | 0.20 | 13,711 | 2.08 | b | |||||||||||
| — | — | — | 10.10 | 0.20 | 6,274 | 2.08 | b | |||||||||||
| — | — | — | 10.30 | 0.98 | 62,633 | 0.93 | b | |||||||||||
| — | — | — | 10.22 | 0.59 | 64 | 1.43 | b | |||||||||||
| (0.01 | ) | — | (0.01 | ) | 10.16 | (3.97 | ) | 64,087 | 1.31 | |||||||||
| — | — | — | 10.07 | (4.64 | ) | 15,406 | 2.00 | |||||||||||
| — | — | — | 10.08 | (4.64 | ) | 6,559 | 2.01 | |||||||||||
| (0.02 | ) | — | (0.02 | ) | 10.20 | (3.64 | ) | 62,763 | 0.94 | |||||||||
| (0.01 | ) | — | (0.01 | ) | 10.16 | (4.07 | ) | 54 | 1.44 | |||||||||
| — | (0.05 | ) | (0.05 | ) | 10.59 | 6.37 | 11,118 | 1.25 | b | |||||||||
| — | (0.05 | ) | (0.05 | ) | 10.56 | 6.07 | 9,957 | 1.95 | b | |||||||||
| — | (0.05 | ) | (0.05 | ) | 10.57 | 6.17 | 2,557 | 1.95 | b | |||||||||
| — | (0.05 | ) | (0.05 | ) | 10.61 | 6.57 | 9,026 | 0.95 | b | |||||||||
| — | (0.05 | ) | (0.05 | ) | 10.60 | 6.47 | 2 | 1.45 | b | |||||||||
| CORE SMALL CAP EQUITY FUND (continued)
|
|
Ratios assuming no expense reductions |
|||||||||||||
|---|---|---|---|---|---|---|---|---|---|---|---|---|---|
| Ratio of net
investment income (loss) to average net assets |
Ratio of
expenses to average net assets |
Ratio of net
investment loss to average net assets |
Portfolio
turnover rate |
||||||||||
| For the Year Ended August 31, | |||||||||||||
| 2000 - Class A Shares | (0.21 | )% | 1.55 | % | (0.43 | ) | 135.36 | % | |||||
| 2000 - Class B Shares | (0.96 | ) | 2.30 | (1.18 | ) | 135.36 | |||||||
| 2000 - Class C Shares | (0.96 | ) | 2.30 | (1.18 | ) | 135.36 | |||||||
| 2000 - Institutional Shares | 0.19 | 1.15 | (0.03 | ) | 135.36 | ||||||||
| 2000 - Service Shares | (0.30 | ) | 1.65 | (0.52 | ) | 135.36 | |||||||
| For the Seven-Month Period Ended August 31, | |||||||||||||
| 1999 - Class A Shares | (0.12 | ) b | 1.67 | b | (0.46 | ) b | 52.03 | ||||||
| 1999 - Class B Shares | (0.86 | ) b | 2.42 | b | (1.20 | ) b | 52.03 | ||||||
| 1999 - Class C Shares | (0.86 | ) b | 2.42 | b | (1.20 | ) b | 52.03 | ||||||
| 1999 - Institutional Shares | 0.28 | b | 1.27 | b | (0.06 | ) b | 52.03 | ||||||
| 1999 - Service Shares | (0.22 | ) b | 1.77 | b | (0.56 | ) b | 52.03 | ||||||
| For the Year Ended January 31, | |||||||||||||
| 1999 - Class A Shares | 0.08 | 2.00 | (0.61 | ) | 75.38 | ||||||||
| 1999 - Class B Shares | (0.55 | ) | 2.62 | (1.17 | ) | 75.38 | |||||||
| 1999 - Class C Shares | (0.56 | ) | 2.63 | (1.18 | ) | 75.38 | |||||||
| 1999 - Institutional Shares | 0.60 | 1.56 | (0.02 | ) | 75.38 | ||||||||
| 1999 - Service Shares | 0.01 | 2.06 | (0.61 | ) | 75.38 | ||||||||
| For the Period Ended January 31, | |||||||||||||
| 1998 - Class A Shares (commenced August 15, 1997) | (0.36 | ) b | 3.92 | b | (3.03 | ) b | 37.65 | ||||||
| 1998 - Class B Shares (commenced August 15, 1997) | (1.04 | ) b | 4.37 | b | (3.46 | ) b | 37.65 | ||||||
| 1998 - Class C Shares (commenced August 15, 1997) | (1.07 | ) b | 4.37 | b | (3.49 | ) b | 37.65 | ||||||
| 1998 - Institutional Shares (commenced August 15, 1997) | 0.15 | b | 3.37 | b | (2.27 | ) b | 37.65 | ||||||
| 1998 - Service Shares (commenced August 15, 1997) | 0.40 | b | 3.87 | b | (2.02 | ) b | 37.65 | ||||||
| CAPITAL GROWTH FUND
|
|
Income from investment operations |
||||||||||
|---|---|---|---|---|---|---|---|---|---|---|
|
Net asset value, beginning of period |
Net
investment income (loss) |
Net realized
and unrealized gains |
Total
income from investment operations |
|||||||
| For the Year Ended August 31, | ||||||||||
| 2000 - Class A Shares | $24.96 | $(0.11 | ) c | $6.29 | $6.18 | |||||
| 2000 - Class B Shares | 24.37 | (0.30 | ) c | 6.11 | 5.81 | |||||
| 2000 - Class C Shares | 24.33 | (0.30 | ) c | 6.10 | 5.80 | |||||
| 2000 - Institutional Shares | 25.06 | — | 6.32 | 6.32 | ||||||
| 2000 - Service Shares | 24.88 | (0.13 | ) c | 6.25 | 6.12 | |||||
| For the Seven Months Ended August 31, | ||||||||||
| 1999 - Class A Shares | 24.03 | (0.08 | ) | 1.01 | 0.93 | |||||
| 1999 - Class B Shares | 23.57 | (0.17 | ) | 0.97 | 0.80 | |||||
| 1999 - Class C Shares | 23.52 | (0.16 | ) | 0.97 | 0.81 | |||||
| 1999 - Institutional Shares | 24.07 | (0.02 | ) | 1.01 | 0.99 | |||||
| 1999 - Service Shares | 23.96 | (0.08 | ) | 1.00 | 0.92 | |||||
| For the Years Ended January 31, | ||||||||||
| 1999 - Class A Shares | 18.48 | (0.03 | ) | 6.35 | 6.32 | |||||
| 1999 - Class B Shares | 18.27 | (0.12 | ) | 6.19 | 6.07 | |||||
| 1999 - Class C Shares | 18.24 | (0.10 | ) | 6.15 | 6.05 | |||||
| 1999 - Institutional Shares | 18.45 | 0.01 | 6.38 | 6.39 | ||||||
| 1999 - Service Shares | 18.46 | (0.04 | ) | 6.31 | 6.27 | |||||
| 1998 - Class A Shares | 16.73 | 0.02 | 4.78 | 4.80 | ||||||
| 1998 - Class B Shares | 16.67 | 0.02 | 4.61 | 4.63 | ||||||
| 1998 - Class C Shares (commenced August 15, 1997) | 19.73 | (0.02 | ) | 1.60 | 1.58 | |||||
| 1998 - Institutional Shares (commenced August 15, 1997) | 19.88 | 0.02 | 1.66 | 1.68 | ||||||
| 1998 - Service Shares (commenced August 15, 1997) | 19.88 | (0.01 | ) | 1.66 | 1.65 | |||||
| 1997 - Class A Shares | 14.91 | 0.10 | 3.56 | 3.66 | ||||||
| 1997 - Class B Shares (commenced May 1, 1996) | 15.67 | 0.01 | 2.81 | 2.82 | ||||||
| 1996 - Class A Shares | 13.67 | 0.12 | 3.93 | 4.05 | ||||||
|
Distributions to shareholders |
|||||||||||||||||||||
|---|---|---|---|---|---|---|---|---|---|---|---|---|---|---|---|---|---|---|---|---|---|
| From net
investment income |
In excess of net investment income |
From net
realized gain |
Total
distributions |
Net asset
value, end of period |
Total
returna |
Net assets
at end of period (in 000s) |
Ratio of
net expenses to average net assets |
||||||||||||||
| $ — | $ — | $(2.19 | ) | $(2.19 | ) | $28.95 | 25.70 | % | $2,736,484 | 1.45 | % | ||||||||||
| — | — | (2.19 | ) | (2.19 | ) | 27.99 | 24.75 | 451,666 | 2.20 | ||||||||||||
| — | — | (2.19 | ) | (2.19 | ) | 27.94 | 24.75 | 143,126 | 2.20 | ||||||||||||
| — | — | (2.19 | ) | (2.19 | ) | 29.19 | 26.18 | 497,986 | 1.05 | ||||||||||||
| — | — | (2.19 | ) | (2.19 | ) | 28.81 | 25.53 | 13,668 | 1.55 | ||||||||||||
| — | — | — | — | 24.96 | 3.87 | 1,971,097 | 1.44 | b | |||||||||||||
| — | — | — | — | 24.37 | 3.39 | 329,870 | 2.19 | b | |||||||||||||
| — | — | — | — | 24.33 | 3.44 | 87,284 | 2.19 | b | |||||||||||||
| — | — | — | — | 25.06 | 4.11 | 255,210 | 1.04 | b | |||||||||||||
| — | — | — | — | 24.88 | 3.84 | 6,466 | 1.54 | b | |||||||||||||
| — | — | (0.77 | ) | (0.77 | ) | 24.03 | 34.58 | 1,992,716 | 1.42 | ||||||||||||
| — | — | (0.77 | ) | (0.77 | ) | 23.57 | 33.60 | 236,369 | 2.19 | ||||||||||||
| — | — | (0.77 | ) | (0.77 | ) | 23.52 | 33.55 | 60,234 | 2.19 | ||||||||||||
| — | — | (0.77 | ) | (0.77 | ) | 24.07 | 35.02 | 41,817 | 1.07 | ||||||||||||
| — | — | (0.77 | ) | (0.77 | ) | 23.96 | 34.34 | 3,085 | 1.57 | ||||||||||||
| (0.01 | ) | (0.01 | ) | (3.03 | ) | (3.05 | ) | 18.48 | 29.71 | 1,256,595 | 1.40 | ||||||||||
| — | — | (3.03 | ) | (3.03 | ) | 18.27 | 28.73 | 40,827 | 2.18 | ||||||||||||
| — | (0.04 | ) | (3.03 | ) | (3.07 | ) | 18.24 | 8.83 | 5,395 | 2.21 | b | ||||||||||
| (0.01 | ) | (0.07 | ) | (3.03 | ) | (3.11 | ) | 18.45 | 9.31 | 7,262 | 1.16 | b | |||||||||
| — | (0.04 | ) | (3.03 | ) | (3.07 | ) | 18.46 | 9.18 | 2 | 1.50 | b | ||||||||||
| (0.10 | ) | (0.02 | ) | (1.72 | ) | (1.84 | ) | 16.73 | 25.97 | 920,646 | 1.40 | ||||||||||
| (0.01 | ) | (0.09 | ) | (1.72 | ) | (1.82 | ) | 16.67 | 19.39 | 3,221 | 2.15 | b | |||||||||
| (0.12 | ) | — | (2.69 | ) | (2.81 | ) | 14.91 | 30.45 | 881,056 | 1.36 | |||||||||||
| CAPITAL GROWTH FUND (continued)
|
|
Ratios assuming no expense reductions |
|||||||||||||
|---|---|---|---|---|---|---|---|---|---|---|---|---|---|
| Ratio of
net investment income (loss) to average net assets |
Ratio of
expenses to average net assets |
Ratio of
net investment income (loss) to average net assets |
Portfolio
turnover rate |
||||||||||
| For the Year Ended August 31, | |||||||||||||
| 2000 - Class A Shares | (0.41 | )% | 1.47 | % | (0.44 | )% | 34.03 | % | |||||
| 2000 - Class B Shares | (1.16 | ) | 2.22 | (1.19 | ) | 34.03 | |||||||
| 2000 - Class C Shares | (1.16 | ) | 2.22 | (1.19 | ) | 34.03 | |||||||
| 2000 - Institutional Shares | — | 1.07 | (0.03 | ) | 34.03 | ||||||||
| 2000 - Service Shares | (0.49 | ) | 1.57 | (0.52 | ) | 34.03 | |||||||
| For the Seven Months Ended August 31, | |||||||||||||
| 1999 - Class A Shares | (0.53 | ) b | 1.47 | b | (0.56 | ) b | 18.16 | ||||||
| 1999 - Class B Shares | (1.29 | ) b | 2.22 | b | (1.32 | ) b | 18.16 | ||||||
| 1999 - Class C Shares | (1.29 | ) b | 2.22 | b | (1.32 | ) b | 18.16 | ||||||
| 1999 - Institutional Shares | (0.20 | ) b | 1.07 | b | (0.23 | ) b | 18.16 | ||||||
| 1999 - Service Shares | (0.65 | ) b | 1.57 | b | (0.68 | ) b | 18.16 | ||||||
| For the Years Ended January 31, | |||||||||||||
| 1999 - Class A Shares | (0.18 | ) | 1.58 | (0.34 | ) | 30.17 | |||||||
| 1999 - Class B Shares | (0.98 | ) | 2.21 | (1.00 | ) | 30.17 | |||||||
| 1999 - Class C Shares | (1.00 | ) | 2.21 | (1.02 | ) | 30.17 | |||||||
| 1999 - Institutional Shares | 0.11 | 1.09 | 0.09 | 30.17 | |||||||||
| 1999 - Service Shares | (0.37 | ) | 1.59 | (0.39 | ) | 30.17 | |||||||
| 1998 - Class A Shares | 0.08 | 1.65 | (0.17 | ) | 61.50 | ||||||||
| 1998 - Class B Shares | (0.77 | ) | 2.18 | (0.77 | ) | 61.50 | |||||||
| 1998 - Class C Shares (commenced August 15, 1997) | (0.86 | ) b | 2.21 | b | (0.86 | ) b | 61.50 | ||||||
| 1998 - Institutional Shares (commenced August 15, 1997) | 0.18 | b | 1.16 | b | 0.18 | b | 61.50 | ||||||
| 1998 - Service Shares (commenced August 15, 1997) | (0.16 | ) b | 1.50 | b | (0.16 | ) b | 61.50 | ||||||
| 1997 - Class A Shares | 0.62 | 1.65 | 0.37 | 52.92 | |||||||||
| 1997 - Class B Shares (commenced May 1, 1996) | (0.39 | ) b | 2.15 | b | (0.39 | ) b | 52.92 | ||||||
| 1996 - Class A Shares | 0.65 | 1.61 | 0.40 | 63.90 | |||||||||
| STRATEGIC GROWTH FUND
|
|
Income from investment operations |
||||||||||
|---|---|---|---|---|---|---|---|---|---|---|
| Net asset
value, beginning of period |
Net
investment income (loss) |
Net
realized and unrealized gain |
Total
income from investment operations |
|||||||
| For The Year Ended August 31, | ||||||||||
| 2000 - Class A Shares | $10.06 | $(0.06 | ) c | $2.52 | $2.46 | |||||
| 2000 - Class B Shares | 10.04 | (0.14 | ) c | 2.50 | 2.36 | |||||
| 2000 - Class C Shares | 10.05 | (0.14 | ) c | 2.51 | 2.37 | |||||
| 2000 - Institutional Shares | 10.07 | (0.01 | ) c | 2.52 | 2.51 | |||||
| 2000 - Service Shares | 10.06 | (0.04 | ) c | 2.50 | 2.46 | |||||
| For The Period Ended August 31, | ||||||||||
| 1999 - Class A Shares (commenced May 24) | 10.00 | — | 0.06 | 0.06 | ||||||
| 1999 - Class B Shares (commenced May 24) | 10.00 | (0.03 | ) c | 0.07 | 0.04 | |||||
| 1999 - Class C Shares (commenced May 24) | 10.00 | (0.03 | ) c | 0.08 | 0.05 | |||||
| 1999 - Institutional Shares (commenced May 24) | 10.00 | 0.01 | 0.06 | 0.07 | ||||||
| 1999 - Service Shares (commenced May 24) | 10.00 | (0.01 | ) | 0.07 | 0.06 | |||||
|
|
||||||||||||
|---|---|---|---|---|---|---|---|---|---|---|---|---|
| Net asset
value, end of period |
Total
returna |
Net assets
at end of period (in 000s) |
Ratio of
net expenses to average net assets |
Ratio of
net investment income (loss) to average net assets |
||||||||
| $12.52 | 24.46 | % | $92,271 | 1.44 | % | (0.50 | )% | |||||
| 12.40 | 23.51 | 17,149 | 2.19 | (1.24 | ) | |||||||
| 12.42 | 23.58 | 7,287 | 2.19 | (1.24 | ) | |||||||
| 12.58 | 24.93 | 22,910 | 1.04 | (0.09 | ) | |||||||
| 12.52 | 24.45 | 2 | 1.54 | (0.35 | ) | |||||||
| 10.06 | 0.60 | 10,371 | 1.44 | b | (0.17 | ) b | ||||||
| 10.04 | 0.40 | 3,393 | 2.19 | b | (0.97 | ) b | ||||||
| 10.05 | 0.50 | 2,388 | 2.19 | b | (0.99 | ) b | ||||||
| 10.07 | 0.70 | 5,981 | 1.04 | b | 0.24 | b | ||||||
| 10.06 | 0.60 | 2 | 1.54 | b | (0.24 | ) b | ||||||
| STRATEGIC GROWTH FUND (continued)
|
|
Ratios assuming no expense reductions |
||||||||||
|---|---|---|---|---|---|---|---|---|---|---|
|
Ratio of expenses to average net assets |
Ratio of
net investment loss to average net assets |
Portfolio
turnover rate |
||||||||
| For The Year Ended August 31, | ||||||||||
| 2000 - Class A Shares | 1.63 | % | (0.69 | )% | 19.28 | % | ||||
| 2000 - Class B Shares | 2.38 | (1.43 | ) | 19.28 | ||||||
| 2000 - Class C Shares | 2.38 | (1.43 | ) | 19.28 | ||||||
| 2000 - Institutional Shares | 1.23 | (0.28 | ) | 19.28 | ||||||
| 2000 - Service Shares | 1.73 | (0.54 | ) | 19.28 | ||||||
| For The Period Ended August 31, | ||||||||||
| 1999 - Class A Shares (commenced May 24) | 11.70 | b | (10.43 | ) b | 6.98 | |||||
| 1999 - Class B Shares (commenced May 24) | 12.45 | b | (11.23 | ) b | 6.98 | |||||
| 1999 - Class C Shares (commenced May 24) | 12.45 | b | (11.25 | ) b | 6.98 | |||||
| 1999 - Institutional Shares (commenced May 24) | 11.30 | b | (10.02 | ) b | 6.98 | |||||
| 1999 - Service Shares (commenced May 24) | 11.80 | b | (10.50 | ) b | 6.98 | |||||
| GROWTH OPPORTUNITIES FUND
|
|
Income from investment operations |
||||||||
|---|---|---|---|---|---|---|---|---|
|
Net asset value, beginning of period |
Net
investment income (loss) |
Net realized
and unrealized gain |
||||||
| For the Year Ended August 31, | ||||||||
| 2000 - Class A Shares | $10.13 | $(0.11 | ) c | $9.71 | ||||
| 2000 - Class B Shares | 10.18 | (0.24 | ) c | 9.74 | ||||
| 2000 - Class C Shares | 10.10 | (0.24 | ) c | 9.68 | ||||
| 2000 - Institutional Shares | 10.13 | (0.04 | ) c | 9.73 | ||||
| 2000 - Service Shares | 10.12 | (0.12 | ) c | 9.68 | ||||
| For the Period Ended August 31, | ||||||||
| 1999 - Class A Shares (commenced May 24) | 10.00 | (0.01 | ) c | 0.14 | ||||
| 1999 - Class B Shares (commenced May 24) | 10.00 | (0.03 | ) c | 0.21 | ||||
| 1999 - Class C Shares (commenced May 24) | 10.00 | (0.03 | ) c | 0.13 | ||||
| 1999 - Institutional Shares (commenced May 24) | 10.00 | 0.01 | 0.12 | |||||
| 1999 - Service Shares (commenced May 24) | 10.00 | — | 0.12 | |||||
|
Distributions to shareholders |
||||||||||||||
|---|---|---|---|---|---|---|---|---|---|---|---|---|---|---|
| Total from
investment operations |
From net
realized gains |
Net asset
value, end of period |
Total
returna |
Net assets at end of period (in 000s) |
Ratio of
net expenses to average net assets |
|||||||||
| $9.60 | $(0.23 | ) | $19.50 | 95.73 | % | $188,199 | 1.52 | % | ||||||
| 9.50 | (0.23 | ) | 19.45 | 94.27 | 42,061 | 2.27 | ||||||||
| 9.44 | (0.23 | ) | 19.31 | 94.43 | 26,826 | 2.27 | ||||||||
| 9.69 | (0.23 | ) | 19.59 | 96.67 | 49,921 | 1.12 | ||||||||
| 9.56 | (0.23 | ) | 19.45 | 95.41 | 3 | 1.62 | ||||||||
| 0.13 | — | 10.13 | 1.30 | 8,204 | 1.44 | b | ||||||||
| 0.18 | — | 10.18 | 1.80 | 520 | 2.19 | b | ||||||||
| 0.10 | — | 10.10 | 1.00 | 256 | 2.19 | b | ||||||||
| 0.13 | — | 10.13 | 1.30 | 5,223 | 1.04 | b | ||||||||
| 0.12 | — | 10.12 | 1.20 | 2 | 1.54 | b | ||||||||
| GROWTH OPPORTUNITIES FUND (continued)
|
|
Ratios assuming no expense reductions |
|||||||||||||
|---|---|---|---|---|---|---|---|---|---|---|---|---|---|
| Ratio
of net investment income (loss) to average net assets |
Ratio of
expenses to average net assets |
Ratio
of net investment loss to average net assets |
Portfolio
turnover rate |
||||||||||
| For the Year Ended August 31, | |||||||||||||
| 2000 - Class A Shares | (0.64 | )% | 1.61 | % | (0.73 | )% | 73.35 | % | |||||
| 2000 - Class B Shares | (1.38 | ) | 2.36 | (1.47 | ) | 73.35 | |||||||
| 2000 - Class C Shares | (1.38 | ) | 2.36 | (1.47 | ) | 73.35 | |||||||
| 2000 - Institutional Shares | (0.23 | ) | 1.21 | (0.32 | ) | 73.35 | |||||||
| 2000 - Service Shares | (0.69 | ) | 1.71 | (0.78 | ) | 73.35 | |||||||
| For the Period Ended August 31, | |||||||||||||
| 1999 - Class A Shares (commenced May 24) | (0.27 | ) b | 14.15 | b | (12.98 | ) b | 26.53 | ||||||
| 1999 - Class B Shares (commenced May 24) | (1.04 | ) b | 14.90 | b | (13.75 | ) b | 26.53 | ||||||
| 1999 - Class C Shares (commenced May 24) | (1.12 | ) b | 14.90 | b | (13.83 | ) b | 26.53 | ||||||
| 1999 - Institutional Shares (commenced May 24) | 0.39 | b | 13.75 | b | (12.32 | ) b | 26.53 | ||||||
| 1999 - Service Shares (commenced May 24) | 0.03 | b | 14.25 | b | (12.68 | ) b | 26.53 | ||||||
| MID CAP VALUE FUND
|
|
Income from investment operations |
|||||||||||
|---|---|---|---|---|---|---|---|---|---|---|---|
|
Net asset value, beginning of period |
Net
investment income (loss) |
Net realized
and unrealized gain (loss) |
Total income
from investment operations |
||||||||
| For the Year Ended August 31, | |||||||||||
| 2000 - Class A Shares | $18.42 | $0.20 | c | $1.38 | $1.58 | ||||||
| 2000 - Class B Shares | 18.23 | 0.06 | c | 1.40 | 1.46 | ||||||
| 2000 - Class C Shares | 18.24 | 0.06 | c | 1.37 | 1.43 | ||||||
| 2000 - Institutional Shares | 18.45 | 0.27 | c | 1.36 | 1.63 | ||||||
| 2000 - Service Shares | 18.31 | 0.18 | c | 1.35 | 1.53 | ||||||
| For the Seven Months Ended August 31, | |||||||||||
| 1999 - Class A Shares | 18.38 | 0.06 | 1.71 | 1.77 | |||||||
| 1999 - Class B Shares | 18.29 | (0.04 | ) | 1.71 | 1.67 | ||||||
| 1999 - Class C Shares | 18.30 | (0.04 | ) | 1.71 | 1.67 | ||||||
| 1999 - Institutional Shares | 18.37 | 0.09 | 1.72 | 1.81 | |||||||
| 1999 - Service Shares | 18.29 | 0.05 | 1.70 | 1.75 | |||||||
| For the Years Ended January 31, | |||||||||||
| 1999 - Class A Shares | 21.61 | 0.10 | (2.38 | ) | (2.28 | ) | |||||
| 1999 - Class B Shares | 21.57 | (0.05 | ) | (2.35 | ) | (2.40 | ) | ||||
| 1999 - Class C Shares | 21.59 | (0.05 | ) | (2.34 | ) | (2.39 | ) | ||||
| 1999 - Institutional Shares | 21.65 | 0.19 | (2.38 | ) | (2.19 | ) | |||||
| 1999 - Service Shares | 21.62 | 0.03 | (2.31 | ) | (2.28 | ) | |||||
| 1998 - Class A Shares (commenced August 15, 1997) | 23.63 | 0.09 | 0.76 | 0.85 | |||||||
| 1998 - Class B Shares (commenced August 15, 1997) | 23.63 | 0.06 | 0.74 | 0.80 | |||||||
| 1998 - Class C Shares (commenced August 15, 1997) | 23.63 | 0.06 | 0.76 | 0.82 | |||||||
| 1998 - Institutional Shares | 18.73 | 0.16 | 5.66 | 5.82 | |||||||
| 1998 - Service Shares (commenced July 18, 1997) | 23.01 | 0.09 | 1.40 | 1.49 | |||||||
| 1997 - Institutional Shares | 15.91 | 0.24 | 3.77 | 4.01 | |||||||
| For the Period Ended January 31, | |||||||||||
| 1996 - Institutional Shares (commenced August 1, 1995) | 15.00 | 0.13 | 0.90 | 1.03 | |||||||
|
Distributions to shareholders |
|||||||||||||||||||||
|---|---|---|---|---|---|---|---|---|---|---|---|---|---|---|---|---|---|---|---|---|---|
| From net
investment income |
In excess of net investment income |
From net
realized gains |
Total
Distributions |
Net asset
value, end of period |
Total
returna |
Net assets
at end of period (in 000s) |
Ratio of
net expenses to average net assets |
||||||||||||||
| $(0.12 | ) | $ — | $ — | $(0.12 | ) | $19.88 | 8.70 | % | $ 39,142 | 1.29 | % | ||||||||||
| — | — | — | — | 19.69 | 8.01 | 22,284 | 2.04 | ||||||||||||||
| — | — | — | — | 19.67 | 7.84 | 5,720 | 2.04 | ||||||||||||||
| (0.22 | ) | — | — | (0.22 | ) | 19.86 | 9.08 | 158,188 | 0.89 | ||||||||||||
| (0.11 | ) | — | — | (0.11 | ) | 19.73 | 8.48 | 206 | 1.39 | ||||||||||||
| — | — | (1.73 | ) | (1.73 | ) | 18.42 | 9.04 | 49,081 | 1.29 | b | |||||||||||
| — | — | (1.73 | ) | (1.73 | ) | 18.23 | 8.53 | 31,824 | 2.04 | b | |||||||||||
| — | — | (1.73 | ) | (1.73 | ) | 18.24 | 8.52 | 9,807 | 2.04 | b | |||||||||||
| — | — | (1.73 | ) | (1.73 | ) | 18.45 | 9.26 | 190,549 | 0.89 | b | |||||||||||
| — | — | (1.73 | ) | (1.73 | ) | 18.31 | 8.97 | 190 | 1.39 | b | |||||||||||
| (0.07 | ) | — | (0.88 | ) | (0.95 | ) | 18.38 | (10.48 | ) | 70,578 | 1.33 | ||||||||||
| — | — | (0.88 | ) | (0.88 | ) | 18.29 | (11.07 | ) | 37,821 | 1.93 | |||||||||||
| (0.02 | ) | — | (0.88 | ) | (0.90 | ) | 18.30 | (11.03 | ) | 10,800 | 1.93 | ||||||||||
| (0.21 | ) | — | (0.88 | ) | (1.09 | ) | 18.37 | (10.07 | ) | 196,512 | 0.87 | ||||||||||
| (0.17 | ) | — | (0.88 | ) | (1.05 | ) | 18.29 | (10.48 | ) | 289 | 1.37 | ||||||||||
| (0.06 | ) | (0.04 | ) | (2.77 | ) | (2.87 | ) | 21.61 | 3.42 | 90,588 | 1.35 | b | |||||||||
| (0.09 | ) | — | (2.77 | ) | (2.86 | ) | 21.57 | 3.17 | 28,743 | 1.85 | b | ||||||||||
| (0.09 | ) | — | (2.77 | ) | (2.86 | ) | 21.59 | 3.27 | 6,445 | 1.85 | b | ||||||||||
| (0.13 | ) | — | (2.77 | ) | (2.90 | ) | 21.65 | 30.86 | 236,440 | 0.85 | |||||||||||
| (0.11 | ) | — | (2.77 | ) | (2.88 | ) | 21.62 | 6.30 | 8 | 1.35 | b | ||||||||||
| (0.24 | ) | (0.93 | ) | (0.02 | ) | (1.19 | ) | 18.73 | 25.63 | 145,253 | 0.85 | ||||||||||
| (0.12 | ) | — | — | (0.12 | ) | 15.91 | 6.89 | 135,671 | 0.85 | b | |||||||||||
| MID CAP VALUE FUND (continued)
|
|
Ratios assuming no expense reductions |
||||||||||||
|---|---|---|---|---|---|---|---|---|---|---|---|---|
| Ratio of
net investment income (loss) to average net assets |
Ratio of
expenses to average net assets |
Ratio of
net investment income (loss) to average net assets |
Portfolio
turnover rate |
|||||||||
| For the Year Ended August 31, | ||||||||||||
| 2000 - Class A Shares | 1.11 | % | 1.34 | % | 1.06 | % | 82.92 | % | ||||
| 2000 - Class B Shares | 0.35 | 2.09 | 0.30 | 82.92 | ||||||||
| 2000 - Class C Shares | 0.32 | 2.09 | 0.27 | 82.92 | ||||||||
| 2000 - Institutional Shares | 1.51 | 0.94 | 1.46 | 82.92 | ||||||||
| 2000 - Service Shares | 1.03 | 1.44 | 0.98 | 82.92 | ||||||||
| For the Seven-Months Ended August 31, | ||||||||||||
| 1999 - Class A Shares | 0.43 | b | 1.37 | b | 0.35 | b | 68.84 | |||||
| 1999 - Class B Shares | (0.33 | ) b | 2.12 | b | (0.41 | ) b | 68.84 | |||||
| 1999 - Class C Shares | (0.34 | ) b | 2.12 | b | (0.42 | ) b | 68.84 | |||||
| 1999 - Institutional Shares | 0.79 | b | 0.97 | b | 0.71 | b | 68.84 | |||||
| 1999 - Service Shares | 0.38 | b | 1.47 | b | 0.30 | b | 68.84 | |||||
| For the Years Ended January 31, | ||||||||||||
| 1999 - Class A Shares | 0.38 | 1.41 | 0.30 | 92.18 | ||||||||
| 1999 - Class B Shares | (0.22 | ) | 2.01 | (0.30 | ) | 92.18 | ||||||
| 1999 - Class C Shares | (0.22 | ) | 2.01 | (0.30 | ) | 92.18 | ||||||
| 1999 - Institutional Shares | 0.83 | 0.95 | 0.75 | 92.18 | ||||||||
| 1999 - Service Shares | 0.32 | 1.45 | 0.24 | 92.18 | ||||||||
| 1998 - Class A Shares (commenced August 15, 1997) | 0.33 | b | 1.47 | b | 0.21 | b | 62.60 | |||||
| 1998 - Class B Shares (commenced August 15, 1997) | (0.20 | ) b | 1.97 | b | (0.32 | ) b | 62.60 | |||||
| 1998 - Class C Shares (commenced August 15, 1997) | (0.23 | ) b | 1.97 | b | (0.35 | ) b | 62.60 | |||||
| 1998 - Institutional Shares | 0.78 | 0.97 | 0.66 | 62.60 | ||||||||
| 1998 - Service Shares (commenced July 18, 1997) | 0.63 | b | 1.43 | b | 0.51 | b | 62.60 | |||||
| 1997 - Institutional Shares | 1.35 | 0.91 | 1.29 | 74.03 | ||||||||
| For the Period Ended January 31, | ||||||||||||
| 1996 - Institutional Shares (commenced August 1, 1995) | 1.67 | b | 0.98 | b | 1.54 | b | 58.77 | |||||
| SMALL CAP VALUE FUND
|
|
Income (loss) from investment operations |
||||||||||||
|---|---|---|---|---|---|---|---|---|---|---|---|---|
| Net asset
value, beginning of period |
Net
investment income (loss) |
Net realized and unrealized gain (loss) |
Total
income (loss) from investment operations |
|||||||||
| For the Year Ended August 31, | ||||||||||||
| 2000 - Class A Shares | $19.80 | $ 0.01 | c | $ 3.40 | $ 3.41 | |||||||
| 2000 - Class B Shares | 19.27 | (0.13 | ) c | 3.26 | 3.13 | |||||||
| 2000 - Class C Shares | 19.28 | (0.12 | ) c | 3.26 | 3.14 | |||||||
| 2000 - Institutional Shares | 19.95 | 0.10 | c | 3.42 | 3.52 | |||||||
| 2000 - Service Shares | 19.76 | 0.01 | c | 3.36 | 3.37 | |||||||
| For the Seven-Month Period Ended August 31, | ||||||||||||
| 1999 - Class A Shares | 18.51 | (0.05 | ) | 1.34 | 1.29 | |||||||
| 1999 - Class B Shares | 18.10 | (0.12 | ) | 1.29 | 1.17 | |||||||
| 1999 - Class C Shares | 18.12 | (0.11 | ) | 1.27 | 1.16 | |||||||
| 1999 - Institutional Shares | 18.62 | — | 1.33 | 1.33 | ||||||||
| 1999 - Service Shares | 18.50 | (0.13 | ) | 1.39 | 1.26 | |||||||
| For the Years Ended January 31, | ||||||||||||
| 1999 - Class A Shares | 24.05 | (0.06 | ) | (4.48 | ) | (4.54 | ) | |||||
| 1999 - Class B Shares | 23.73 | (0.21 | ) | (4.42 | ) | (4.63 | ) | |||||
| 1999 - Class C Shares | 23.73 | (0.18 | ) | (4.43 | ) | (4.61 | ) | |||||
| 1999 - Institutional Shares | 24.09 | 0.03 | (4.50 | ) | (4.47 | ) | ||||||
| 1999 - Service Shares | 24.05 | (0.04 | ) | (4.51 | ) | (4.55 | ) | |||||
| 1998 - Class A Shares | 20.91 | 0.14 | 5.33 | 5.47 | ||||||||
| 1998 - Class B Shares | 20.80 | (0.01 | ) | 5.27 | 5.26 | |||||||
| 1998 - Class C Shares (commenced August 15, 1997) | 24.69 | (0.06 | ) | 1.43 | 1.37 | |||||||
| 1998 - Institutional Shares (commenced August 15, 1997) | 24.91 | 0.03 | 1.48 | 1.51 | ||||||||
| 1998 - Service Shares (commenced August 15, 1997) | 24.91 | (0.01 | ) | 1.48 | 1.47 | |||||||
| 1997 - Class A Shares | 17.29 | (0.21 | ) | 4.92 | 4.71 | |||||||
| 1997 - Class B Shares (commenced May 1, 1996) | 20.79 | (0.11 | ) | 1.21 | 1.10 | |||||||
| 1996 - Class A Shares | 16.14 | (0.23 | ) | 1.39 | 1.16 | |||||||
|
Distributions to shareholders |
|||||||||||||||||
|---|---|---|---|---|---|---|---|---|---|---|---|---|---|---|---|---|---|
| In excess
of net investment income |
From net
realized gains |
Total
distributions |
Net asset value, end of period |
Total
returna |
Net assets
at end of period (in 000s) |
Ratio of
net expenses to average net assets |
|||||||||||
| $ — | $ — | $ — | $23.21 | 17.22 | % | $157,791 | 1.50 | % | |||||||||
| — | — | — | 22.40 | 16.24 | 29,199 | 2.25 | |||||||||||
| — | — | — | 22.42 | 16.34 | 8,428 | 2.25 | |||||||||||
| — | — | — | 23.47 | 17.64 | 26,445 | 1.10 | |||||||||||
| — | — | — | 23.13 | 17.05 | 83 | 1.60 | |||||||||||
| — | — | — | 19.80 | 6.97 | 210,500 | 1.50 | b | ||||||||||
| — | — | — | 19.27 | 6.46 | 37,386 | 2.25 | b | ||||||||||
| — | — | — | 19.28 | 6.40 | 8,079 | 2.25 | b | ||||||||||
| — | — | — | 19.95 | 7.14 | 27,023 | 1.10 | b | ||||||||||
| — | — | — | 19.76 | 6.81 | 57 | 1.60 | b | ||||||||||
| — | (1.00 | ) | (1.00 | ) | 18.51 | (17.37 | ) | 261,661 | 1.50 | ||||||||
| — | (1.00 | ) | (1.00 | ) | 18.10 | (18.00 | ) | 42,879 | 2.25 | ||||||||
| — | (1.00 | ) | (1.00 | ) | 18.12 | (17.91 | ) | 8,212 | 2.25 | ||||||||
| — | (1.00 | ) | (1.00 | ) | 18.62 | (17.04 | ) | 15,351 | 1.13 | ||||||||
| — | (1.00 | ) | (1.00 | ) | 18.50 | (17.41 | ) | 261 | 1.62 | ||||||||
| — | (2.33 | ) | (2.33 | ) | 24.05 | 26.17 | 370,246 | 1.54 | |||||||||
| — | (2.33 | ) | (2.33 | ) | 23.73 | 25.29 | 42,677 | 2.29 | |||||||||
| — | (2.33 | ) | (2.33 | ) | 23.73 | 5.51 | 5,604 | 2.09 | b | ||||||||
| — | (2.33 | ) | (2.33 | ) | 24.09 | 6.08 | 14,626 | 1.16 | b | ||||||||
| — | (2.33 | ) | (2.33 | ) | 24.05 | 5.91 | 2 | 1.45 | b | ||||||||
| — | (1.09 | ) | (1.09 | ) | 20.91 | 27.28 | 212,061 | 1.60 | |||||||||
| — | (1.09 | ) | (1.09 | ) | 20.80 | 5.39 | 3,674 | 2.35 | b | ||||||||
| — | (0.01 | ) | (0.01 | ) | 17.29 | 7.20 | 204,994 | 1.41 | |||||||||
| SMALL CAP VALUE FUND (continued)
|
|
Ratios assuming no expense reductions |
|||||||||||||
|---|---|---|---|---|---|---|---|---|---|---|---|---|---|
| Ratio of
net investment income (loss) to average net assets |
Ratio of
expenses to average net assets |
Ratio of
net investment income (loss) to average net assets |
Portfolio
turnover rate |
||||||||||
| For the Year Ended August 31, | |||||||||||||
| 2000 - Class A Shares | 0.07 | % | 1.57 | % | — | % | 75.31 | % | |||||
| 2000 - Class B Shares | (0.68 | ) | 2.32 | (0.75 | ) | 75.31 | |||||||
| 2000 - Class C Shares | (0.65 | ) | 2.32 | (0.72 | ) | 75.31 | |||||||
| 2000 - Institutional Shares | 0.49 | 1.17 | 0.42 | 75.31 | |||||||||
| 2000 - Service Shares | 0.03 | 1.67 | (0.04 | ) | 75.31 | ||||||||
| For the Seven-Month Period Ended August 31, | |||||||||||||
| 1999 - Class A Shares | (0.35 | ) b | 1.61 | b | (0.46 | ) b | 46.95 | ||||||
| 1999 - Class B Shares | (1.10 | ) b | 2.36 | b | (1.21 | ) b | 46.95 | ||||||
| 1999 - Class C Shares | (1.10 | ) b | 2.36 | b | (1.21 | ) b | 46.95 | ||||||
| 1999 - Institutional Shares | 0.05 | b | 1.21 | b | (0.06 | ) b | 46.95 | ||||||
| 1999 - Service Shares | (0.41 | ) b | 1.71 | b | (0.52 | ) b | 46.95 | ||||||
| For the Years Ended January 31, | |||||||||||||
| 1999 - Class A Shares | (0.24 | ) | 1.74 | (0.48 | ) | 98.46 | |||||||
| 1999 - Class B Shares | (0.99 | ) | 2.29 | (1.03 | ) | 98.46 | |||||||
| 1999 - Class C Shares | (0.99 | ) | 2.29 | (1.03 | ) | 98.46 | |||||||
| 1999 - Institutional Shares | 0.13 | 1.17 | 0.09 | 98.46 | |||||||||
| 1999 - Service Shares | (0.47 | ) | 1.66 | (0.51 | ) | 98.46 | |||||||
| 1998 - Class A Shares | (0.28 | ) | 1.76 | (0.50 | ) | 84.81 | |||||||
| 1998 - Class B Shares | (0.92 | ) | 2.29 | (0.92 | ) | 84.81 | |||||||
| 1998 - Class C Shares (commenced August 15, 1997) | (0.79 | ) b | 2.09 | b | (0.79 | ) b | 84.81 | ||||||
| 1998 - Institutional Shares (commenced August 15, 1997) | 0.27 | b | 1.16 | b | 0.27 | b | 84.81 | ||||||
| 1998 - Service Shares (commenced August 15, 1997) | (0.07 | ) b | 1.45 | b | (0.07 | ) b | 84.81 | ||||||
| 1997 - Class A Shares | (0.72 | ) | 1.85 | (0.97 | ) | 99.46 | |||||||
| 1997 - Class B Shares (commenced May 1, 1996) | (1.63 | ) b | 2.35 | b | (1.63 | ) b | 99.46 | ||||||
| 1996 - Class A Shares | (0.59 | ) | 1.66 | (0.84 | ) | 57.58 | |||||||
| LARGE CAP VALUE FUND
|
|
Income from investment operations |
|||||||||||
|---|---|---|---|---|---|---|---|---|---|---|---|
|
Net asset value, beginning of period |
Net
investment incomec |
Net
realized and unrealized gain |
Total from
investment operations |
Net asset
value, end of period |
|||||||
| For the Period Ended August 31, | |||||||||||
| 2000 - Class A Shares (commenced Dec. 15, 1999) | $10.00 | $0.06 | $0.33 | $0.39 | $10.39 | ||||||
| 2000 - Class B Shares (commenced Dec. 15, 1999) | 10.00 | — | 0.33 | 0.33 | 10.33 | ||||||
| 2000 - Class C Shares (commenced Dec. 15, 1999) | 10.00 | 0.01 | 0.31 | 0.32 | 10.32 | ||||||
| 2000 - Institutional Shares (commenced Dec. 15, 1999) | 10.00 | 0.09 | 0.31 | 0.40 | 10.40 | ||||||
| 2000 - Service Shares (commenced Dec. 15, 1999) | 10.00 | 0.07 | 0.31 | 0.38 | 10.38 | ||||||
a
|
Assumes investment at the net asset value at the beginning of the period, reinvestment of all dividends and
distributions, a complete redemption of the investment at the net asset value at the end of the period and no sales or redemption charges. Total return would be reduced if a sales or redemption charge were taken into account. Total returns for periods
less than one full year are not annualized.
|
b
|
Annualized.
|
c
|
Calculated based on average shares outstanding methodology.
|
d
|
Includes the effect of mortgage dollar roll transactions.
|
|
Ratios assuming no expense reductions |
||||||||||||||||||
|---|---|---|---|---|---|---|---|---|---|---|---|---|---|---|---|---|---|---|
| Total
returna |
Net assets
at end of period (in 000s) |
Ratio of net
expenses to average net assetsb |
Ratio of net
investment income to average net assetsb |
Ratio of
expenses to average net assetsb |
Ratio of net
investment income to average net assetsb |
Portfolio
turnover rate |
||||||||||||
| 3.90 | % | $7,181 | 1.25 | % | 0.84 | % | 3.30 | % | (1.21 | )% | 66.79 | % | ||||||
| 3.30 | 1,582 | 2.00 | 0.06 | 4.05 | (1.99 | ) | 66.79 | |||||||||||
| 3.20 | 850 | 2.00 | 0.15 | 4.05 | (1.90 | ) | 66.79 | |||||||||||
| 4.00 | 16,155 | 0.85 | 1.31 | 2.90 | (0.74 | ) | 66.79 | |||||||||||
| 3.80 | 2 | 1.35 | 0.95 | 3.40 | (1.10 | ) | 66.79 | |||||||||||
| FOR MORE INFORMATION
|
| Annual/Semi-annual Report
|
| Additional information about the Funds’ investments is available in the Funds’ annual and semi-annual reports to
shareholders. In the Funds’ annual reports, you will find a discussion of the market conditions and investment strategies that significantly affected the Funds’ performance during the last fiscal year.
|
| Statement of Additional Information
|
| Additional information about the Funds and their policies is also available in the Funds’ Additional Statement. The
Additional Statement is incorporated by reference into this Prospectus (is legally considered part of this Prospectus).
|
| The Funds’ annual and semi-annual reports, and the Additional Statement, are available free upon request by calling Goldman
Sachs at 1-800-526-7384.
|
| To obtain other information and for shareholder inquiries:
|
| By telephone – Call 1-800-526-7384
|
| By mail – Goldman Sachs Funds, 4900 Sears Tower, Chicago, IL 60606-6372
|
| By e-mail – [email protected]
|
| On the Internet – Text-only versions of the Funds’ documents are located online and may be downloaded from:
|
| SEC EDGAR database – http://www.sec.gov
|
| Goldman Sachs – http://www.gs.com (Prospectus Only)
|
| You may review and obtain copies of Fund documents by visiting the SEC’s Public Reference Room in Washington, D.C. You may
also obtain copies of Fund documents, after paying a duplicating fee, by writing to the SEC’s Public Reference Section, Washington, D.C. 20549-0102 or by electronic request to: [email protected]. Information on the operation of the public reference
room may be obtained by calling the SEC at (202) 942-8090.
|

| The Funds’ investment company registration number is 811-5349.
|
| Prospectus
|
| GOLDMAN SACHS DOMESTIC EQUITY FUNDS
|
n
|
Goldman Sachs Balanced Fund
|
n
|
Goldman Sachs Growth and Income Fund
|
n
|
Goldman Sachs CORE
SM
|
| Large Cap Value Fund
|
n
|
Goldman Sachs CORE
SM
U.S. Equity Fund
|
n
|
Goldman Sachs CORE
SM
Large Cap Growth Fund
|
n
|
Goldman Sachs CORE
SM
Small Cap Equity Fund
|
n
|
Goldman Sachs Capital Growth Fund
|
n
|
Goldman Sachs Strategic Growth Fund
|
n
|
Goldman Sachs Growth Opportunities Fund
|
n
|
Goldman Sachs Mid Cap Value Fund (formerly Mid Cap Equity)
|
n
|
Goldman Sachs Small Cap Value Fund
|
n
|
Goldman Sachs Large Cap Value Fund
|
| THE SECURITIES AND EXCHANGE COMMISSION HAS NOT APPROVED OR DISAPPROVED THESE SECURITIES OR PASSED UPON THE ADEQUACY OF THIS PROSPECTUS.
ANY REPRESENTATION TO THE CONTRARY IS A CRIMINAL OFFENSE.
|
| AN INVESTMENT IN A FUND IS NOT A BANK DEPOSIT AND IS NOT INSURED BY THE FEDERAL DEPOSIT INSURANCE CORPORATION OR ANY OTHER GOVERNMENT
AGENCY. AN INVESTMENT IN A FUND INVOLVES INVESTMENT RISKS, INCLUDING POSSIBLE LOSS OF PRINCIPAL.
|
| NOT FDIC-INSURED
|
May Lose Value
|
No Bank Guarantee
|
| Goldman Sachs Asset Management, a unit of the Investment Management Division of Goldman, Sachs & Co. (“Goldman
Sachs”), serves as investment adviser to the Balanced, Growth and Income, CORE Large Cap Value, CORE Large Cap Growth, CORE Small Cap Equity, Strategic Growth, Growth Opportunities, Mid Cap Value, Small Cap Value and Large Cap Value Funds. Goldman
Sachs Funds Management, L.P. serves as investment adviser to the CORE U.S. Equity and Capital Growth Funds. Goldman Sachs Asset Management and Goldman Sachs Funds Management, L.P. are each referred to in this Prospectus as the “Investment Adviser.”
;
|
| VALUE STYLE FUNDS
|
| Goldman Sachs’ Value Investment Philosophy:
|
| Through intensive, hands-on research our portfolio team seeks to identify:
|
1.
|
Well-positioned businesses that have:
|
n
|
Attractive returns on capital.
|
n
|
Sustainable earnings and cash flow.
|
n
|
Strong company management focused on long-term returns to shareholders.
|
2.
|
Attractive valuation opportunities where:
|
n
|
The intrinsic value of the business is not reflected in the stock price.
|
| Business quality, conservative valuation, and thoughtful portfolio construction are the key elements of our value approach.
|
| GROWTH STYLE FUNDS
|
| Goldman Sachs’ Growth Investment Philosophy:
|
1.
|
Invest as if buying the company/business, not simply trading its stock:
|
n
|
Understand the business, management, products and competition.
|
n
|
Perform intensive, hands-on fundamental research.
|
n
|
Seek businesses with strategic competitive advantages.
|
n
|
Over the long-term, expect each company’s stock price ultimately to track the growth in the value of the business.
|
2.
|
Buy high-quality growth businesses that possess strong business franchises, favorable long-term prospects and
excellent management.
|
3.
|
Purchase superior long-term growth companies at a favorable price—seek to purchase at a fair valuation,
giving the investor the potential to fully capture returns from above-average growth rates.
|
| Growth companies have earnings expectations that exceed those of the stock market as a whole.
|
| QUANTITATIVE (“CORE”) STYLE FUNDS
|
| Goldman Sachs’ CORE Investment Philosophy:
|
| Goldman Sachs’ quantitative style of funds—CORE—emphasizes the two building blocks of active management: stock
selection and portfolio construction.
|
| I. CORE Stock Selection
|
| The CORE Funds use the Goldman Sachs’ proprietary multifactor model (“Multifactor Model”), a rigorous computerized
rating system, to forecast the returns of securities held in each Fund’s portfolio. The Multifactor Model incorporates common variables covering measures of:
|
n
|
Research (What do fundamental analysts think about the company and its prospects?)
|
n
|
Value (How is the company priced relative to fundamental accounting measures?)
|
n
|
Momentum (What are medium-term price trends? How has the price responded to new information?)
|
n
|
Profitability (What is the company’s margin on sales? How efficient are its operations?)
|
n
|
Earnings Quality (Were earnings derived from sustainable (cash-based) sources?)
|
| All of the above factors are carefully evaluated within the Multifactor Model since each has demonstrated a significant
impact on the performance of the securities and markets they were designed to forecast. Stock selection in this process combines both our quantitative and qualitative analysis.
|
| II. CORE Portfolio Construction
|
| A proprietary risk model, which is intended to identify and measure risk as accurately as possible, includes all the above factors
used in the return model to select stocks, as well as several other factors associated with risk but not return. In this process, the Investment Adviser manages risk by attempting to limit deviations from the benchmark, and by attempting to run a size and
sector neutral portfolio. A computer optimizer evaluates many different security combinations (considering many possible weightings) in an effort to construct the most efficient risk/return portfolio given each CORE Fund benchmark.
|
| Goldman Sachs CORE Funds are fully invested, broadly diversified and offer consistent overall portfolio characteristics. They may
serve as good foundations on which to build a portfolio.
|
| Balanced Fund
|
|
Objective:
|
Long-term growth of capital and current income
|
|
Benchmarks:
|
S&P 500® Index and Lehman Brothers Aggregate Bond Index
|
|
Investment Focus:
|
Large capitalization U.S. stocks and fixed-income securities
|
|
Investment Style:
|
Asset Allocation, with growth and value (blend) equity components
|
| INVESTMENT OBJECTIVE
|
| The Fund seeks to provide long-term growth of capital and current income. The Fund seeks growth of capital primarily through
investments in equity securities (stocks). The Fund seeks to provide current income through investment in fixed-income securities (bonds).
|
| PRINCIPAL INVESTMENT STRATEGIES
|
| Historically, stock and bond markets have often had different cycles, with one asset class rising when the other is falling. A
balanced objective seeks to reduce the volatility associated with investing in a single market. There is no guarantee, however, that market cycles will move in opposition to one another or that a balanced investment program will successfully reduce
volatility.
|
| The percentage of the portfolio invested in equity and fixed-income securities will vary from time to time as the Investment
Adviser evaluates such securities’ relative attractiveness based on market valuations, economic growth and inflation prospects. The allocation between equity and fixed-income securities is subject to the Fund’s intention to pay regular quarterly
dividends. The amount of quarterly dividends can also be expected to fluctuate in accordance with factors such as prevailing interest rates and the percentage of the Fund’s assets invested in fixed-income securities.
|
| Equity Securities. The Fund invests, under normal circumstances, between 45% and 65% of its total assets in equity securities. Although the Fund’s equity investments consist primarily of publicly traded U.S. securities, the Fund may invest up to 10% of its total
assets in the equity securities of foreign issuers, including issuers in countries with emerging markets or economies (“emerging countries”) and equity securities quoted in foreign currencies. A portion of the Fund’s portfolio of equity
securities may be selected primarily to provide current income (including interests in real estate investment trusts (“REITs”), convertible securities, preferred stocks, utility stocks, and interests in limited partnerships).
|
| Fixed Income Securities. The Fund invests at least 25% of its total assets in fixed-income senior securities. The remainder of the Fund’s assets are invested in other fixed-income securities and cash.
|
| The Fund’s fixed-income securities primarily include:
|
n
|
Securities issued by the U.S. government, its agencies, instrumentalities or sponsored enterprises
|
n
|
Securities issued by corporations, banks and other issuers
|
n
|
Mortgage-backed and asset-backed securities
|
| The Fund may also invest up to 10% of its total assets in debt obligations (U.S. dollar and non-U.S.-dollar denominated) issued or
guaranteed by one or more foreign governments or any of their political subdivisions, agencies or instrumentalities and foreign corporations or other entities. The issuers of these securities may be located in emerging countries.
|
|
Objective:
|
Long-term growth of capital and growth of income
|
|
Benchmark:
|
S&P 500® Index
|
|
Investment Focus:
|
Large capitalization U.S. equity securities with an emphasis on undervalued stocks
|
|
Investment Style:
|
Value
|
| INVESTMENT OBJECTIVE
|
| The Fund seeks long-term growth of capital and growth of income.
|
| PRINCIPAL INVESTMENT STRATEGIES
|
| Equity Securities. The Fund invests, under normal circumstances, at least 65% of its total assets in equity securities that the Investment Adviser considers to have favorable prospects for capital appreciation and/or dividend-paying ability. Although the Fund will invest
primarily in publicly traded U.S. securities, it may invest up to 25% of its total assets in foreign securities, including securities of issuers in emerging countries and securities quoted in foreign currencies.
|
| Other.
The Fund may also invest up to 35% of its total assets in fixed-income securities, such as government, corporate and bank debt obligations, that offer the potential to further the Fund’s investment objective.
|
|
Objective:
|
Long-term growth of capital and dividend income
|
|
Benchmark:
|
Russell 1000® Value Index
|
|
Investment Focus:
|
Diversified portfolio of equity securities of large-cap U.S. issuers selling at low to modest valuations
|
|
Investment Style:
|
Quantitative, applied to large-cap value stocks
|
| INVESTMENT OBJECTIVE
|
| The Fund seeks long-term growth of capital and dividend income. The Fund seeks this objective through a broadly diversified
portfolio of equity securities of large-cap U.S. issuers that are selling at low to modest valuations relative to general market measures, such as earnings, book value and other fundamental accounting measures, and that are expected to have favorable
prospects for capital appreciation and/or dividend-paying ability.
|
| PRINCIPAL INVESTMENT STRATEGIES
|
| Equity Securities. The Fund invests, under normal circumstances, at least 90% of its total assets in equity securities of U.S. issuers, including foreign issuers that are traded in the United States.
|
| The Fund’s investments are selected using both a variety of quantitative techniques and fundamental research in seeking to
maximize the Fund’s expected return, while maintaining risk, style, capitalization and industry characteristics similar to the Russell 1000® Value Index. The Fund seeks a portfolio consisting of companies with above average capitalizations and
low to moderate valuations as measured by price/earnings ratios, book value and other fundamental accounting measures.
|
| Other.
The Fund’s investments in fixed-income securities are limited to securities that are considered cash equivalents.
|
|
Objective:
|
Long-term growth of capital and dividend income
|
|
Benchmark:
|
S&P 500® Index
|
|
Investment Focus:
|
Large-cap U.S. equity securities
|
|
Investment Style:
|
Quantitative, applied to large-cap growth and value (blend) stocks
|
| INVESTMENT OBJECTIVE
|
| The Fund seeks long-term growth of capital and dividend income. The Fund seeks this objective through a broadly diversified
portfolio of large-cap and blue chip equity securities representing all major sectors of the U.S. economy.
|
| PRINCIPAL INVESTMENT STRATEGIES
|
| Equity Securities. The Fund invests, under normal circumstances, at least 90% of its total assets in equity securities of U.S. issuers, including foreign issuers that are traded in the United States.
|
| The Fund’s investments are selected using both a variety of quantitative techniques and fundamental research in seeking to
maximize the Fund’s expected return, while maintaining risk, style, capitalization and industry characteristics similar to the S&P 500® Index. The Fund seeks a broad representation in most major sectors of the U.S. economy and a portfolio
consisting of companies with average long-term earnings growth expectations and dividend yields.
|
| Other.
The Fund’s investments in fixed-income securities are limited to securities that are considered cash equivalents.
|
|
Objective:
|
Long-term growth of capital; dividend income is a secondary consideration
|
|
Benchmark:
|
Russell 1000® Growth Index
|
|
Investment Focus:
|
Large-cap, growth-oriented U.S. stocks
|
|
Investment Style:
|
Quantitative, applied to large-cap growth stocks
|
| INVESTMENT OBJECTIVE
|
| The Fund seeks long-term growth of capital. The Fund seeks this objective through a broadly diversified portfolio of equity
securities of large-cap U.S. issuers that are expected to have better prospects for earnings growth than the growth rate of the general domestic economy. Dividend income is a secondary consideration.
|
| PRINCIPAL INVESTMENT STRATEGIES
|
| Equity Securities. The Fund invests, under normal circumstances, at least 90% of its total assets in equity securities of U.S. issuers, including foreign issuers that are traded in the United States.
|
| The Investment Adviser emphasizes a company’s growth prospects in analyzing equity securities to be purchased by the Fund.
The Fund’s investments are selected using both a variety of quantitative techniques and fundamental research in seeking to maximize the Fund’s expected return, while maintaining risk, style, capitalization and industry characteristics similar to
the Russell 1000® Growth Index. The Fund seeks a portfolio consisting of companies with above average capitalizations and earnings growth expectations and below average dividend yields.
|
| Other.
The Fund’s investments in fixed-income securities are limited to securities that are considered cash equivalents.
|
|
Objective:
|
Long-term growth of capital
|
|
Benchmark:
|
Russell 2000® Index
|
|
Investment Focus:
|
Stocks of small capitalization U.S. companies
|
|
Investment Style:
|
Quantitative, applied to small-cap growth and value (blend) stocks
|
| INVESTMENT OBJECTIVE
|
| The Fund seeks long-term growth of capital. The Fund seeks this objective through a broadly diversified portfolio of equity
securities of U.S. issuers which are included in the Russell 2000® Index at the time of investment.
|
| PRINCIPAL INVESTMENT STRATEGIES
|
| Equity Securities. The Fund invests, under normal circumstances, at least 90% of its total assets in equity securities of U.S. issuers, including foreign issuers that are traded in the United States.
|
| The Fund’s investments are selected using both a variety of quantitative techniques and fundamental research in seeking to
maximize the Fund’s expected return, while maintaining risk, style, capitalization and industry characteristics similar to the Russell 2000® Index. The Fund seeks a portfolio consisting of companies with small market capitalizations, strong
expected earnings growth and momentum, and better valuation and risk characteristics than the Russell 2000® Index. If the issuer of a portfolio security held by the Fund is no longer included in the Russell 2000® Index, the Fund may, but is not
required to, sell the security.
|
| Other.
The Fund’s investments in fixed-income securities are limited to securities that are considered cash equivalents.
|
|
Objective:
|
Long-term growth of capital
|
|
Benchmark:
|
S&P 500® Index
|
|
Investment Focus:
|
Large-cap U.S. equity securities that offer long-term capital appreciation potential
|
|
Investment Style:
|
Growth
|
| INVESTMENT OBJECTIVE
|
| The Fund seeks long-term growth of capital.
|
| PRINCIPAL INVESTMENT STRATEGIES
|
| Equity Securities. The Fund invests, under normal circumstances, at least 90% of its total assets in equity securities. The Fund seeks to achieve its investment objective by investing in a diversified portfolio of equity securities that are considered by the Investment
Adviser to have long-term capital appreciation potential. Although the Fund invests primarily in publicly traded U.S. securities, it may invest up to 10% of its total assets in foreign securities, including securities of issuers in emerging countries and
securities quoted in foreign currencies.
|
|
Objective:
|
Long-term growth of capital
|
|
Benchmark:
|
S&P 500® Index
|
|
Investment Focus:
|
Large-cap U.S. equity securities that are considered to be strategically positioned for consistent long-term growth
|
|
Investment Style:
|
Growth
|
| INVESTMENT OBJECTIVE
|
| The Fund seeks long-term growth of capital.
|
| PRINCIPAL INVESTMENT STRATEGIES
|
| Equity Securities. The Fund invests, under normal circumstances, at least 90% of its total assets in equity securities. The Fund seeks to achieve its investment objective by investing in a diversified portfolio of equity securities that are considered by the Investment
Adviser to be strategically positioned for consistent long-term growth. Although the Fund invests primarily in publicly traded U.S. securities, it may invest up to 10% of its total assets in foreign securities, including securities of issuers in emerging
countries and securities quoted in foreign currencies.
|
|
Objective:
|
Long-term growth of capital
|
|
Benchmark:
|
S&P Midcap 400 Index
|
|
Investment Focus:
|
U.S. equity securities that offer long-term capital appreciation
with a primary focus on mid-capitalization companies |
|
Investment Style:
|
Growth
|
| INVESTMENT OBJECTIVE
|
| The Fund seeks long-term growth of capital.
|
| PRINCIPAL INVESTMENT STRATEGIES
|
| Equity Securities. The Fund invests, under normal circumstances, at least 90% of its total assets in equity securities with a primary focus on mid-cap companies. The Fund seeks to achieve its investment objective by investing in a diversified portfolio of equity securities
that are considered by the Investment Adviser to be strategically positioned for long-term growth. Although the Fund invests primarily in publicly traded U.S. securities, it may invest up to 10% of its total assets in foreign securities, including
securities of issuers in emerging countries and securities quoted in foreign currencies.
|
|
Objective:
|
Long-term capital appreciation
|
|
Benchmark:
|
Russell Midcap Value Index
|
|
Investment Focus:
|
Mid-capitalization U.S. stocks that are believed to be undervalued or undiscovered by the marketplace
|
|
Investment Style:
|
Value
|
| INVESTMENT OBJECTIVE
|
| The Fund seeks long-term capital appreciation.
|
| PRINCIPAL INVESTMENT STRATEGIES
|
| Equity Securities. The Fund invests, under normal circumstances, substantially all of its assets in equity securities and at least 65% of its total assets in equity securities of mid-cap companies with public stock market capitalizations (based upon shares available for
trading on an unrestricted basis) within the range of the market capitalization of companies constituting the Russell Midcap Value Index at the time of investment (currently between $300 million and $15 billion). If the market capitalization of a company
held by the Fund moves outside this range, the Fund may, but is not required to, sell the securities. Although the Fund will invest primarily in publicly traded U.S. securities, it may invest up to 25% of its total assets in foreign securities, including
securities of issuers in emerging countries and securities quoted in foreign currencies.
|
| Other.
The Fund may invest in the aggregate up to 35% of its total assets in companies with public stock market capitalizations outside the range of companies constituting the Russell Midcap Value Index at the time of investment and in fixed-income securities,
such as government, corporate and bank debt obligations.
|
|
Objective:
|
Long-term growth of capital
|
|
Benchmark:
|
Russell 2000® Value Index
|
|
Investment Focus:
|
Small-capitalization U.S. stocks that are believed to be undervalued or undiscovered by the marketplace
|
|
Investment Style:
|
Value
|
| INVESTMENT OBJECTIVE
|
| The Fund seeks long-term growth of capital.
|
| PRINCIPAL INVESTMENT STRATEGIES
|
| Equity Securities. The Fund invests, under normal circumstances, at least 65% of its total assets in equity securities of companies with public stock market capitalizations (based upon shares available for trading on an unrestricted basis) within the range of the market
capitalization of companies constituting the Russell 2000® Value Index at the time of investment (currently between $20 million and $3 billion). If the market capitalization of a company held by the Fund moves outside this range, the Fund may, but is
not required to, sell the securities. Under normal circumstances, the Fund’s investment horizon for ownership of stocks will be two to three years. Although the Fund will invest primarily in publicly traded U.S. securities, it may invest up to 25% of
its total assets in foreign securities, including securities of issuers in emerging countries and securities quoted in foreign currencies.
|
| Other.
The Fund may invest in the aggregate up to 35% of its total assets in companies with public stock market capitalizations outside the range of companies constituting the Russell 2000® Value Index at the time of investment and in fixed-income
securities, such as government, corporate and bank debt obligations.
|
|
Objective:
|
Long-term capital appreciation
|
|
Benchmark:
|
Russell 1000® Value Index
|
|
Investment Focus:
|
Large capitalization U.S. equity securities that are believed to be undervalued
|
|
Investment Style:
|
Value
|
| INVESTMENT OBJECTIVE
|
| The Fund seeks long-term capital appreciation.
|
| PRINCIPAL INVESTMENT STRATEGIES
|
| Equity Securities. The Fund invests, under normal circumstances, at least 90% of its total assets in equity securities. The Fund seeks its investment objective by investing in value opportunities that the Investment Adviser defines as companies with identifiable
competitive advantages whose intrinsic value is not reflected in the stock price. Although the Fund will invest primarily in publicly traded U.S. securities, it may invest up to 25% of its total assets in foreign securities, including securities quoted in
foreign currencies.
|
| Other.
The Fund may invest up to 10% of its total assets in fixed-income securities, such as government, corporate and bank debt obligations.
|
Ÿ
|
No specific percentage limitation on usage;
limited only by the objectives and strategies of the Fund |
| Balanced
Fund |
Growth
and Income Fund |
CORE
Large Cap Value Fund |
CORE
U.S. Equity Fund |
||||||
|---|---|---|---|---|---|---|---|---|---|
| Investment Practices | |||||||||
| Borrowings | 33 1
/3
|
33 1
/3
|
33 1
/3
|
33 1
/3
|
|||||
| Credit, Currency, Index, Interest Rate and
Mortgage Swaps* |
15 | — | — | — | |||||
| Cross Hedging of Currencies | Ÿ | Ÿ | Ÿ | Ÿ | |||||
| Custodial Receipts | Ÿ | Ÿ | Ÿ | Ÿ | |||||
| Equity Swaps* | 15 | 15 | 15 | 15 | |||||
| Foreign Currency Transactions** | Ÿ 1 | Ÿ | Ÿ | Ÿ | |||||
| Futures Contracts and Options on Futures
Contracts |
Ÿ | Ÿ | Ÿ 2 | Ÿ 3 | |||||
| Interest Rate Caps, Floors and Collars | Ÿ | — | — | — | |||||
| Investment Company Securities (including
iShares SM and Standard & Poor’s Depositary Receipts TM ) |
10 | 10 | 10 | 10 | |||||
| Loan Participations | Ÿ | — | — | — | |||||
| Mortgage Dollar Rolls | Ÿ | — | — | — | |||||
| Options on Foreign Currencies 4 | Ÿ | Ÿ | Ÿ | Ÿ | |||||
| Options on Securities and Securities Indices 5 | Ÿ | Ÿ | Ÿ | Ÿ | |||||
| Repurchase Agreements | Ÿ | Ÿ | Ÿ | Ÿ | |||||
| Reverse Repurchase Agreements (for investment
purposes) |
Ÿ | — | — | — | |||||
| Securities Lending | 33 1
/3
|
33 1
/3
|
33 1
/3
|
33 1
/3
|
|||||
| Short Sales Against the Box | 25 | 25 | — | — | |||||
| Unseasoned Companies | Ÿ | Ÿ | Ÿ | Ÿ | |||||
| Warrants and Stock Purchase Rights | Ÿ | Ÿ | Ÿ | Ÿ | |||||
| When-Issued Securities and Forward
Commitments |
Ÿ | Ÿ | Ÿ | Ÿ | |||||
*
|
Limited to 15% of net assets (together with other illiquid securities) for all structured securities which are not
deemed to be liquid and all swap transactions.
|
**
|
Limited by the amount the Fund invests in foreign securities.
|
1
|
The Balanced Fund may also enter into forward foreign currency exchange contracts to seek to increase total return.
|
2
|
The CORE Large Cap Value, CORE Large Cap Growth and CORE Small Cap Equity Funds may enter into futures transactions only
with respect to a representative index.
|
3
|
The CORE U.S. Equity Fund may enter into futures transactions only with respect to the S&P 500 Index.
|
4
|
The Funds may purchase and sell call and put options.
|
5
|
The Funds may sell covered call and put options and purchase call and put options.
|
| CORE
Large Cap Growth Fund |
CORE
Small Cap Equity Fund |
Capital
Growth Fund |
Strategic
Growth Fund |
Growth
Opportunities Fund |
Mid Cap
Value Fund |
Small Cap
Value Fund |
Large Cap
Value Fund |
||||||||
|---|---|---|---|---|---|---|---|---|---|---|---|---|---|---|---|
| 33 1
/3
|
33 1
/3
|
33 1
/3
|
33 1
/3
|
33 1
/3
|
33 1
/3
|
33 1
/3
|
33 1
/3
|
||||||||
| — | — | — | — | — | — | — | — | ||||||||
| Ÿ | Ÿ | Ÿ | Ÿ | Ÿ | Ÿ | Ÿ | Ÿ | ||||||||
| Ÿ | Ÿ | Ÿ | Ÿ | Ÿ | Ÿ | Ÿ | Ÿ | ||||||||
| 15 | 15 | 15 | 15 | 15 | 15 | 15 | 15 | ||||||||
| Ÿ | Ÿ | Ÿ | Ÿ | Ÿ | Ÿ | Ÿ | Ÿ | ||||||||
| Ÿ 2 | Ÿ 2 | Ÿ | Ÿ | Ÿ | Ÿ | Ÿ | Ÿ | ||||||||
| — | — | — | — | — | — | — | — | ||||||||
| 10 | 10 | 10 | 10 | 10 | 10 | 10 | 10 | ||||||||
| — | — | — | — | — | — | — | — | ||||||||
| — | — | — | — | — | — | — | — | ||||||||
| Ÿ | Ÿ | Ÿ | Ÿ | Ÿ | Ÿ | Ÿ | Ÿ | ||||||||
| Ÿ | Ÿ | Ÿ | Ÿ | Ÿ | Ÿ | Ÿ | Ÿ | ||||||||
| Ÿ | Ÿ | Ÿ | Ÿ | Ÿ | Ÿ | Ÿ | Ÿ | ||||||||
| — | — | — | — | — | — | — | — | ||||||||
| 33 1
/3
|
33 1
/3
|
33 1
/3
|
33 1
/3
|
33 1
/3
|
33 1
/3
|
33 1
/3
|
33 1
/3
|
||||||||
| — | — | 25 | 25 | 25 | 25 | 25 | 25 | ||||||||
| Ÿ | Ÿ | Ÿ | Ÿ | Ÿ | Ÿ | Ÿ | Ÿ | ||||||||
| Ÿ | Ÿ | Ÿ | Ÿ | Ÿ | Ÿ | Ÿ | Ÿ | ||||||||
| Ÿ | Ÿ | Ÿ | Ÿ | Ÿ | Ÿ | Ÿ | Ÿ | ||||||||
Ÿ
|
No specific percentage limitation on usage;
limited only by the objectives and strategies of the Fund |
| Balanced
Fund |
Growth
and Income Fund |
CORE
Large Cap Value Fund |
CORE
U.S. Equity Fund |
||||||||||
|---|---|---|---|---|---|---|---|---|---|---|---|---|---|
| Investment Securities | |||||||||||||
| American, European and Global Depositary
Receipts |
Ÿ | Ÿ | Ÿ 6 | Ÿ 6 | |||||||||
| Asset-Backed and Mortgage-Backed Securities 7 | Ÿ | Ÿ | — | — | |||||||||
| Bank Obligations 7 | Ÿ | Ÿ | Ÿ | Ÿ | |||||||||
| Convertible Securities 8 | Ÿ | Ÿ | Ÿ | Ÿ | |||||||||
| Corporate Debt Obligations 7 | Ÿ | Ÿ | Ÿ 9 | Ÿ 9 | |||||||||
| Equity Securities | 45-65 | 65 | + | 90 | + | 90 | + | ||||||
| Emerging Country Securities | 10 10 | 25 | 10 | — | — | ||||||||
| Fixed Income Securities 11 | 35-45 | 18 | 35 | 10 | 9 | 10 | 9 | ||||||
| Foreign Securities | 10 10 | 25 | 10 | Ÿ 14 | Ÿ 14 | ||||||||
| Foreign Government Securities 7 | Ÿ | — | — | — | |||||||||
| Municipal Securities | Ÿ | — | — | — | |||||||||
| Non-Investment Grade Fixed Income Securities | 10 15 | 10 | 16 | — | — | ||||||||
| Real Estate Investment Trusts | Ÿ | Ÿ | Ÿ | Ÿ | |||||||||
| Stripped Mortgage Backed Securities 7 | Ÿ | — | — | — | |||||||||
| Structured Securities* | Ÿ | Ÿ | Ÿ | Ÿ | |||||||||
| Temporary Investments | 100 | 100 | 35 | 35 | |||||||||
| U.S. Government Securities 7 | Ÿ | Ÿ | Ÿ | Ÿ | |||||||||
| Yield Curve Options and Inverse Floating Rate
Securities |
Ÿ | — | — | — | |||||||||
*
|
Limited to 15% of net assets (together with other illiquid securities) for all structured securities which are not
deemed to be liquid and all swap transactions.
|
6
|
The CORE Funds may not invest in European Depositary Receipts.
|
7
|
Limited by the amount the Fund invests in fixed-income securities.
|
8
|
Convertible securities purchased by the Balanced Fund must be B or higher by Standard & Poor’s Rating Group
(“Standard & Poor’s”) or Moody’s Investor’s Service, Inc. (“Moody’s”). The CORE Funds have no minimum rating criteria and all other Funds use the same rating criteria for convertible and non-convertible debt
securities.
|
9
|
Cash equivalents only.
|
10
|
The Balanced, Growth and Income, Capital Growth, Strategic Growth, Growth Opportunities, Mid Cap Value and Small Cap
Value Funds may invest in the aggregate up to 10%, 25%, 10%, 10%, 10%, 25% and 25%, respectively, of their total assets in foreign securities, including emerging country securities.
|
11
|
Except as noted under “Non-Investment Grade Fixed Income Securities,” fixed-income securities must be
investment grade (i.e., BBB or higher by Standard & Poor’s or Baa or higher by Moody’s).
|
12
|
The Mid Cap Value Fund may invest in the aggregate up to 35% of its total assets in: (1) securities of companies with
public stock market capitalizations outside the range of companies constituting the Russell Midcap Value Index at the time of investment; and (2) fixed-income securities.
|
13
|
The Small Cap Value Fund may invest in the aggregate up to 35% of its total assets in: (1) securities of companies with
public stock market capitalizations outside the range of companies constituting the Russell 2000® Value Index at the time of investment; and (2) fixed-income securities.
|
| CORE
Large Cap Growth Fund |
CORE
Small Cap Equity Fund |
Capital
Growth Fund |
Strategic
Growth Fund |
Growth
Opportunities Fund |
Mid Cap
Value Fund |
Small Cap
Value Fund |
Large Cap
Value Fund |
|||||||||
|---|---|---|---|---|---|---|---|---|---|---|---|---|---|---|---|---|
| Ÿ 6 | Ÿ 6 | Ÿ | Ÿ | Ÿ | Ÿ | Ÿ | Ÿ | |||||||||
| — | — | Ÿ | Ÿ | Ÿ | Ÿ | Ÿ | Ÿ | |||||||||
| Ÿ | Ÿ | Ÿ | Ÿ | Ÿ | Ÿ | Ÿ | Ÿ | |||||||||
| Ÿ | Ÿ | Ÿ | Ÿ | Ÿ | Ÿ | Ÿ | Ÿ | |||||||||
| Ÿ 9 | Ÿ 9 | Ÿ | Ÿ | Ÿ | Ÿ | Ÿ | Ÿ | |||||||||
| 90+ | 90+ | 90 | + | 90+ | 90+ | 65+ | 65+ | 90+ | ||||||||
| — | — | 10 | 10 | 10 10 | 10 10 | 25 10 | 25 10 | — | ||||||||
| 10 9 | 10 9 | Ÿ | Ÿ | Ÿ | 35 12 | 35 13 | 10 | |||||||||
| Ÿ |
Ÿ 14 | 10 | 10 | 10 10 | 10 10 | 25 10 | 25 10 | 25 | ||||||||
| — | — | — | — | — | — | — | — | |||||||||
| — | — | — | — | — | — | — | — | |||||||||
| — | — | 10 | 16 | 10 16 | 10 16 | 10 17 | 35 16 | 10 16 | ||||||||
| Ÿ | Ÿ | Ÿ | Ÿ | Ÿ | Ÿ | Ÿ | Ÿ | |||||||||
| — | — | — | — | — | — | — | — | |||||||||
| Ÿ | Ÿ | Ÿ | Ÿ | Ÿ | Ÿ | Ÿ | Ÿ | |||||||||
| 35 | 35 | 100 | 100 | 100 | 100 | 100 | 100 | |||||||||
| Ÿ | Ÿ | Ÿ | Ÿ | Ÿ | Ÿ | Ÿ | Ÿ | |||||||||
| — | — | — | — | — | — | — | — | |||||||||
14
|
Equity securities of foreign issuers must be traded in the United States.
|
15
|
Must be at least BB or B by Standard & Poor’s or Ba or B by Moody’s.
|
16
|
May be BB or lower by Standard & Poor’s or Ba or lower by Moody’s.
|
17
|
Must be B or higher by Standard & Poor’s or B or higher by Moody’s.
|
18
|
The Balanced Fund invests at least 25% of its total assets in fixed-income senior securities; the remainder may be
invested in other fixed-income securities and cash.
|
| Ÿ
Applicable
— Not applicable |
Balanced
Fund |
Growth
and Income Fund |
CORE
Large Cap Value Fund |
CORE
U.S. Equity Fund |
CORE
Large Cap Growth Fund |
CORE
Small Cap Equity Fund |
|||||||
|---|---|---|---|---|---|---|---|---|---|---|---|---|---|
| Credit/Default | Ÿ | Ÿ | Ÿ | Ÿ | Ÿ | Ÿ | |||||||
| Foreign | Ÿ | Ÿ | Ÿ | Ÿ | Ÿ | Ÿ | |||||||
| Emerging Countries | Ÿ | Ÿ | Ÿ | Ÿ | Ÿ | Ÿ | |||||||
| Small Cap | — | — | — | — | — | Ÿ | |||||||
| Stock | Ÿ | Ÿ | Ÿ | Ÿ | Ÿ | Ÿ | |||||||
| Derivatives | Ÿ | Ÿ | Ÿ | Ÿ | Ÿ | Ÿ | |||||||
| Interest Rate | Ÿ | Ÿ | Ÿ | Ÿ | Ÿ | Ÿ | |||||||
| Management | Ÿ | Ÿ | Ÿ | Ÿ | Ÿ | Ÿ | |||||||
| Market | Ÿ | Ÿ | Ÿ | Ÿ | Ÿ | Ÿ | |||||||
| Liquidity | Ÿ | Ÿ | Ÿ | Ÿ | Ÿ | Ÿ | |||||||
| Initial Public Offering (“IPO”) | — | — | — | — | — | — | |||||||
| Capital
Growth Fund |
Strategic
Growth Fund |
Growth
Opportunities Fund |
Mid
Cap Value Fund |
Small Cap Value Fund |
Large
Cap Value Fund |
||||||
|---|---|---|---|---|---|---|---|---|---|---|---|
| Ÿ | Ÿ | Ÿ | Ÿ | Ÿ | Ÿ | ||||||
| Ÿ | Ÿ | Ÿ | Ÿ | Ÿ | Ÿ | ||||||
| Ÿ | Ÿ | Ÿ | Ÿ | Ÿ | Ÿ | ||||||
| — | — | — | Ÿ | Ÿ | — | ||||||
| Ÿ | Ÿ | Ÿ | Ÿ | Ÿ | Ÿ | ||||||
| Ÿ | Ÿ | Ÿ | Ÿ | Ÿ | Ÿ | ||||||
| Ÿ | Ÿ | Ÿ | Ÿ | Ÿ | Ÿ | ||||||
| Ÿ | Ÿ | Ÿ | Ÿ | Ÿ | Ÿ | ||||||
| Ÿ | Ÿ | Ÿ | Ÿ | Ÿ | Ÿ | ||||||
| Ÿ | Ÿ | Ÿ | Ÿ | Ÿ | Ÿ | ||||||
| — | Ÿ | Ÿ | Ÿ | Ÿ | — | ||||||
n
|
Credit/Default Risk—The risk that an issuer or guarantor of fixed-income securities held by a Fund may default
on its obligation to pay interest and repay principal.
|
n
|
Foreign Risk—The risk that when a Fund invests in foreign securities, it will be subject to risk of loss not
typically associated with domestic issuers. Loss may result because of less foreign government regulation, less public information and less economic, political and social stability. Loss may also result from the imposition of exchange controls,
confiscations and other government restrictions. A
Fund will also be subject to the risk of negative foreign currency rate fluctuations. Foreign risks will normally be greatest when a Fund invests in issuers located in emerging countries. |
n
|
Emerging Countries Risk—The securities markets of Asian, Latin and South American, Eastern European, African
and other emerging countries are less liquid, are especially subject to greater price volatility, have smaller market capitalizations, have less government regulation and are not subject to as extensive and frequent accounting, financial and other
reporting requirements as the securities markets of more developed countries. Further, investment in equity securities of issuers located in Russia and certain other emerging countries involves risk of loss resulting from problems in share registration
and custody and substantial economic and political disruptions. These risks are not normally associated with investments in more developed countries.
|
n
|
Stock Risk—The risk that stock prices
have historically risen and fallen in periodic cycles. Recently, U.S. stock markets and certain foreign stock markets have experienced substantial price volatility and, at times, have traded at or close to record high levels. There is no guarantee that
such levels will be reached or maintained in the future.
|
n
|
Derivatives Risk—The risk that loss may result from a Fund’s investments in options, futures, swaps,
structured securities and other derivative instruments. These instruments may be leveraged so that small changes may produce disproportionate losses to a Fund.
|
n
|
Interest Rate Risk—The risk that when interest rates increase, securities held by a Fund will decline in value.
Long-term fixed-income securities will normally have more price volatility because of this risk than short-term fixed income securities.
|
n
|
Management Risk—The risk that a strategy used by the Investment Adviser may fail to produce the intended results.
|
n
|
Market Risk—The risk that the value of the securities in which a Fund invests may go up or down in response to
the prospects of individual companies, particular industry sectors and/or general economic conditions. Price changes may be temporary or last for extended periods. A Fund’s investments may be overweighted
|
| from time to time in one or more industry sectors, which will increase the Fund’s exposure to risk of loss from adverse
developments affecting those sectors.
|
n
|
Liquidity Risk—The risk that a Fund will not be able to pay redemption proceeds within the time period stated
in this Prospectus because of unusual market conditions, an unusually high volume of redemption requests, or other reasons. Funds that invest in non-investment grade fixed-income securities, small capitalization stocks, REITs and emerging country issuers
will be especially subject to the risk that during certain periods the liquidity of particular issuers or industries, or all securities within particular investment categories, will shrink or disappear suddenly and without warning as a result of adverse
economic, market or political events, or adverse investor perceptions whether or not accurate. The Goldman Sachs Asset Allocation Portfolios (the “Asset Allocation Portfolios”) expect to invest a significant percentage of their assets in the
Funds and other funds for which Goldman Sachs now or in the future acts as investment adviser or underwriter. Redemptions by an Asset Allocation Portfolio of its position in a Fund may further increase liquidity risk and may impact a Fund’s net asset
value (“NAV”).
|
n
|
Small Cap Risk—The securities of small capitalization stocks involve greater risks than those associated with
larger, more established companies and may be subject to more abrupt or erratic price movements. Securities of such issuers may lack sufficient market liquidity to enable a Fund to effect sales at an advantageous time or without a substantial drop in price.
|
n
|
IPO Risk—The risk that the market value of IPO shares will fluctuate considerably due to factors such as the
absence of a prior public market, unseasoned trading, the small number of shares available for trading and limited information about the issuer. The purchase of IPO shares may involve high transaction costs. IPO shares are subject to market risk and
liquidity risk. When a Fund’s asset base is small, a significant portion of the Fund’s performance could be attributanble to investments in IPOs, because such investments would have a magnified impact on the Fund. As the Fund’s assets grow,
the effect of the Fund’s investments in IPOs on the Fund’s performance probably will decline, which could reduce the Fund’s performance.
|
| HOW THE FUNDS HAVE PERFORMED
|
| The bar chart and table below provide an indication of the risks of investing in a Fund by showing: (a) changes in the performance
of a Fund’s Institutional Shares from year to year; and (b) how the average annual returns of a Fund’s Institutional Shares compare to those of broad-based securities market indices. The bar chart and table assume reinvestment of dividends and
distributions. A Fund’s past performance is not necessarily an indication of how the Fund will perform in the future. Performance reflects expense limitations in effect. If expense limitations were not in place, a Fund’s performance would have
been reduced. The Strategic Growth, Growth Opportunities and Large Cap Value Funds commenced operations on May 24, 1999, May 24, 1999 and December 15, 1999, respectively. Since these Funds have less than one calendar year’s performance, no
performance information is provided in this section.
|
| TOTAL RETURN
|
| The total return for Institutional Shares for the 9-month period ended September 30, 2000 was 2.65%.
Best Quarter
Q4 ’99 +8.29%
Worst Quarter
Q3 ’98 -8.69%
|
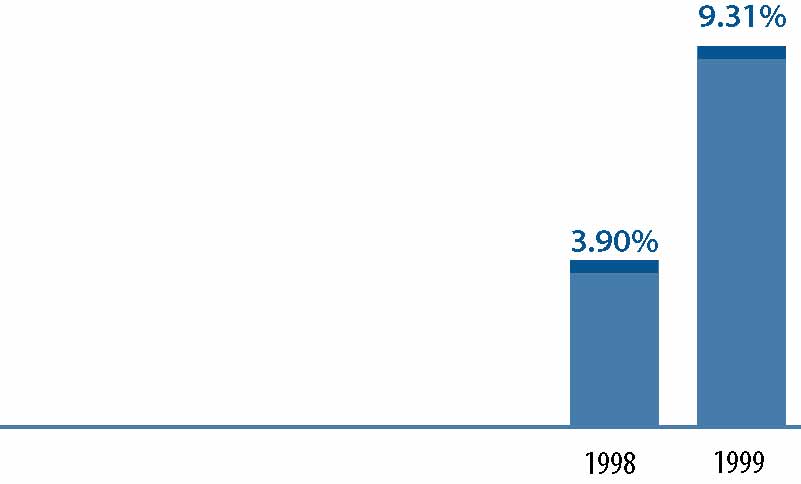 |
| AVERAGE ANNUAL TOTAL RETURN
|
| For the period ended December 31, 1999 | 1 Year | Since Inception | |||
|---|---|---|---|---|---|
| Institutional Shares (Inception 8/15/97) | 9.31% | 6.33% | |||
| S&P 500® Index* | 21.04% | 23.21% | |||
| Lehman Brothers Aggregate Bond Index** | (0.82)% | 5.14% | |||
*
|
The S&P 500® Index is the Standard & Poor’s Composite Index of 500 stocks, an unmanaged index of common stock
prices. The Index figures do not reflect any fees or expenses.
|
**
|
The Lehman Brothers Aggregate Bond Index is an unmanaged index of bond prices. The Index figures do not reflect any fees or
expenses.
|
| TOTAL RETURN
|
| The total return for Institutional Shares for the
9-month period ended September 30, 2000 was -0.46%.
Best Quarter
Q2 ’97
+15.24%
Worst Quarter
Q3 ’98
-16.86%
|
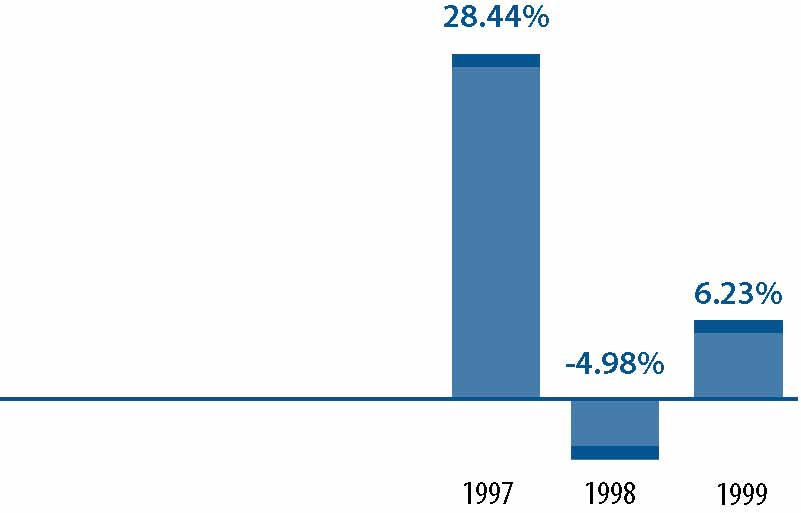 |
| AVERAGE ANNUAL TOTAL RETURN
|
| For the period ended December 31, 1999 | 1 Year | Since Inception | |||
|---|---|---|---|---|---|
| Institutional Shares (Inception 6/3/96) | 6.23% | 12.03% | |||
| S&P 500® Index* | 21.04% | 26.60% | |||
*
|
The S&P 500® Index is the Standard & Poor’s Composite Index of 500 stocks, an unmanaged index of common stock
prices. The Index figures do not reflect any fees or expenses.
|
| TOTAL RETURN
|
| The total return for Institutional Shares for the 9-month period ended September 30, 2000 was 2.68%.
Best Quarter
Q2 ’99 +10.50%
Worst Quarter
Q3 ’99 ¹-8.52%
|
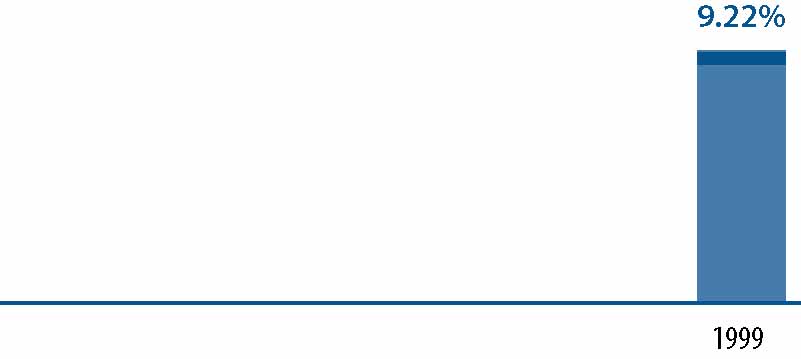 |
| AVERAGE ANNUAL TOTAL RETURN
|
| For the period ended December 31, 1999 | 1 Year | Since Inception | |||
|---|---|---|---|---|---|
| Institutional Shares (Inception 12/31/98) | 9.22% | 9.19% | |||
| Russell 1000 Value Index | 7.34% | 7.34% | |||
*
|
The Russell 1000® Value Index (inception date 1/1/99) is a market capitalization weighted index of the 1000 highest ranking
U.S. stocks with below-average growth orientation. The Index figures do not reflect any fees or expenses.
|
| TOTAL RETURN
|
| The total return for Institutional Shares for the 9-month period ended September 30, 2000 was -0.09%.
Best Quarter
Q4 ’98 +21.60%
Worst Quarter
Q3 ’98 -14.57%
|
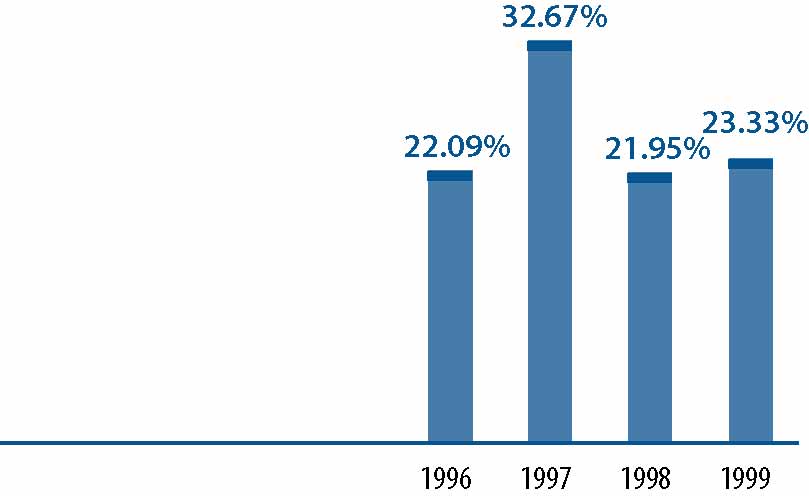 |
| AVERAGE ANNUAL TOTAL RETURN
|
| For the period ended December 31, 1999 | 1 Year | Since Inception | |||
|---|---|---|---|---|---|
| Institutional Shares (Inception 6/15/95) | 23.33% | 25.59% | |||
| S&P 500® Index* | 21.04% | 27.01% | |||
*
|
The S&P 500® Index is the Standard & Poor’s Composite Index of 500 stocks, an unmanaged index of common stock
prices. The Index figures do not reflect any fees or expenses.
|
| TOTAL RETURN
|
| The total return for Institutional Shares for the 9-month period ended September 30, 2000 was -0.53%.
Best Quarter
Q4 ’98 +25.61%
Worst Quarter
Q3 ’98 -13.87%
|
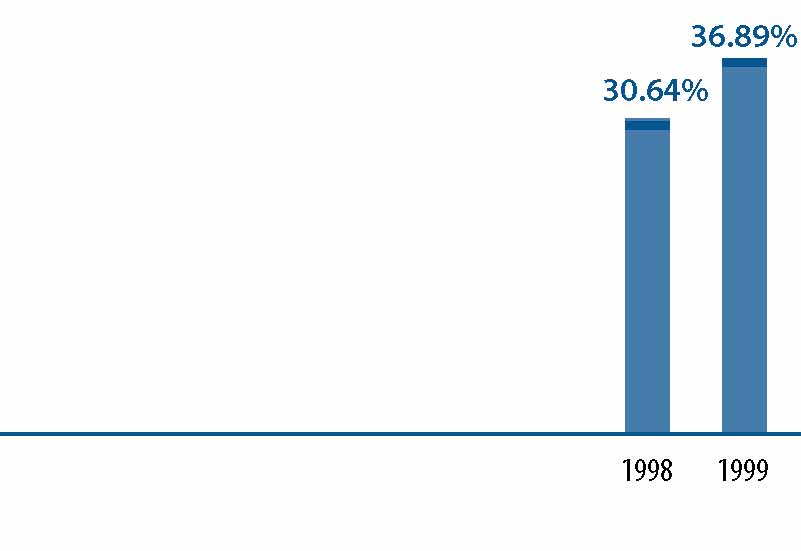 |
| AVERAGE ANNUAL TOTAL RETURN
|
| For the period ended December 31, 1999 | 1 Year | Since Inception | |||
|---|---|---|---|---|---|
| Institutional Shares (Inception 5/1/97) | 36.89% | 33.80% | |||
| Russell 1000® Growth Index* | 33.15% | 35.42% | |||
*
|
The Russell 1000® Growth Index is an unmanaged index of common stock prices. The Index figures do not reflect any fees or
expenses.
|
| TOTAL RETURN
|
| The total return for Institutional Shares for the 9-month period ended September 30, 2000 was 7.25%.
Best Quarter
Q4 ’99 +15.35%
Worst Quarter
Q3 ’98 -24.25%
|
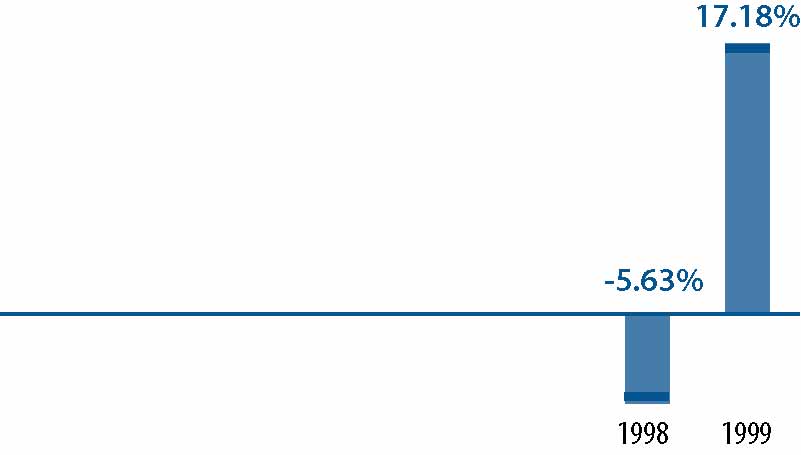 |
| AVERAGE ANNUAL TOTAL RETURN
|
| For the period ended December 31, 1999 | 1 Year | Since Inception | |||
|---|---|---|---|---|---|
| Institutional Shares (Inception 8/15/97) | 17.18% | 7.77% | |||
| Russell 2000® Index* | 21.26% | 10.21% | |||
*
|
The Russell 2000® Index is an unmanaged index of common stock prices. The Index figures do not reflect any fees or expenses.
|
| TOTAL RETURN
|
| The total return for Institutional Shares for the 9-month period ended September 30, 2000 was 0.58%
Best Quarter
Q4 ’98 +24.46%
Worst Quarter
Q3 ’98 -11.40%
|
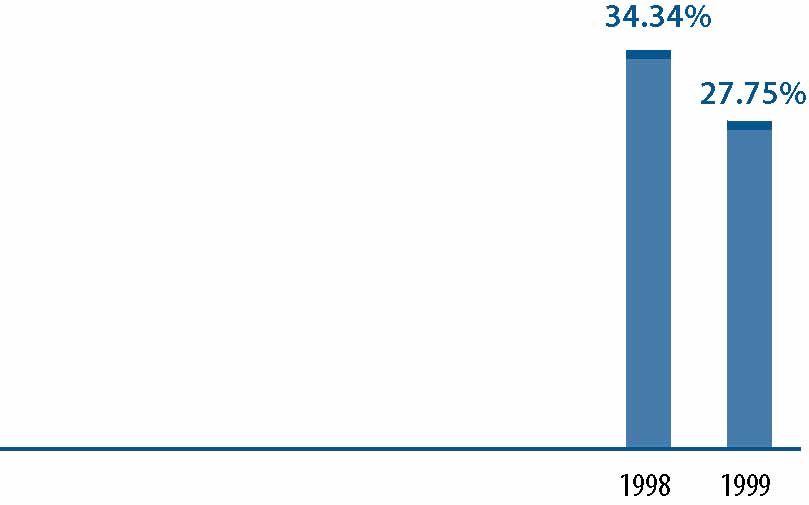 |
| AVERAGE ANNUAL TOTAL RETURN
|
| For the period ended December 31, 1999 | 1 Year | Since Inception | |||
|---|---|---|---|---|---|
| Institutional Shares (Inception 8/15/97) | 27.75% | 29.05% | |||
| S&P 500® Index* | 21.04% | 23.21% | |||
*
|
The S&P 500® Index is the Standard & Poor’s Composite Index of 500 stocks, an unmanaged index of common stock
prices. The Index figures do not reflect any fees or expenses.
|
| TOTAL RETURN
|
| The total return for Institutional Shares for the 9-month period ended September 30, 2000 was 18.17%.
Best Quarter
Q2 ’99 +21.23%
Worst Quarter
Q3 ’98 -20.78%
|
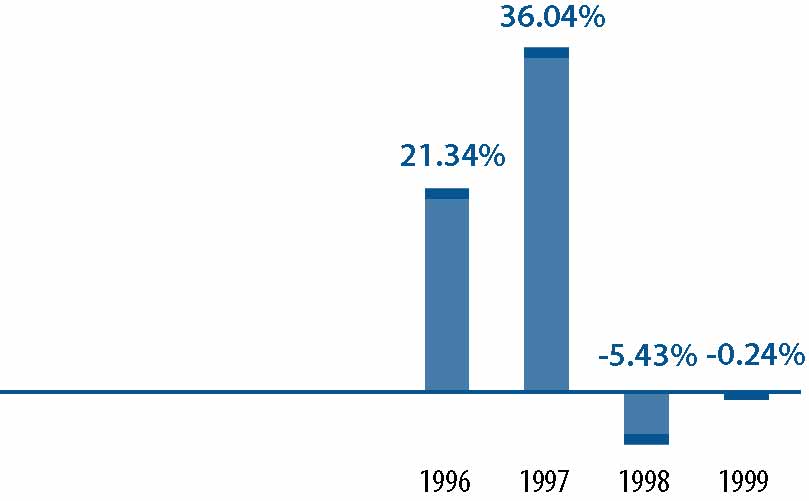 |
| AVERAGE ANNUAL TOTAL RETURN
|
| For the period ended December 31, 1999 | 1 Year | Since Inception | |||
|---|---|---|---|---|---|
| Institutional Shares (Inception 8/1/95) | (0.24)% | 11.76% | |||
| Russell Midcap Value Index* | (0.10)% | 14.92% | |||
*
|
The Russell Midcap Value Index is an unmanaged index of common stock prices. The Index figures do not reflect any fees or
expenses.
|
| TOTAL RETURN
|
| The total return for Institutional Shares for the 9-month period ended September 30, 2000 was 26.83%.
Best Quarter
Q2 ’99 +30.23%
Worst Quarter
Q3 ’98 -32.16%
|
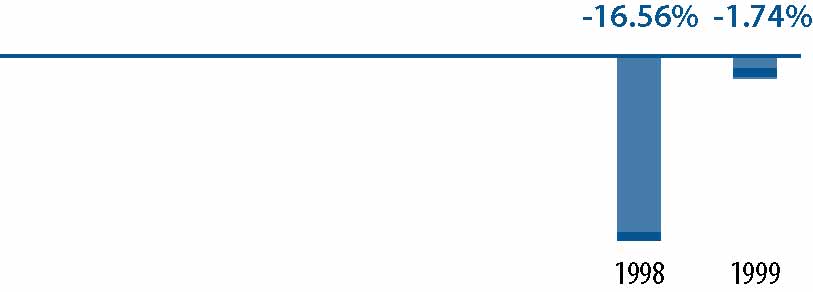 |
| AVERAGE ANNUAL TOTAL RETURN
|
| For the period ended December 31, 1999 | 1 Year | Since Inception | |||
|---|---|---|---|---|---|
| Institutional Shares (Inception 8/15/97) | (1.74)% | (5.12)% | |||
| Russell 2000® Value Index * | (1.49)% | 0.81% | |||
*
|
The Russell 2000® Value Index is an unmanaged index of common stock prices. The Index figures do not reflect any fees or
expenses.
|
| Balanced
Fund |
Growth and
Income Fund |
CORE
Large Cap Value Fund |
CORE
U.S. Equity Fund |
||||||
|---|---|---|---|---|---|---|---|---|---|
| Shareholder Fees | |||||||||
| (fees paid directly from your investment): | |||||||||
| Maximum Sales Charge (Load) Imposed on
Purchases |
None | None | None | None | |||||
| Maximum Sales Charge (Load) Imposed on
Reinvested Dividends |
None | None | None | None | |||||
| Redemption Fees | None | None | None | None | |||||
| Exchange Fees | None | None | None | None | |||||
| Annual Fund Operating Expenses | |||||||||
| (expenses that are deducted from Fund assets):1 | |||||||||
| Management Fees 2 | 0.65% | 0.70% | 0.60% | 0.75% | |||||
| Distribution and Service (12b-1) Fees | None | None | None | None | |||||
| Other Expenses 3 | 0.24% | 0.08% | 0.17% | 0.08% | |||||
| Total Fund Operating Expenses* | 0.89% | 0.78% | 0.77% | 0.83% | |||||
| See page 38 for all other footnotes.
|
*
|
As a result of current waivers and expense limitations, “Other Expenses” and “Total Fund Operating Expenses”
of the Funds which are actually incurred as of the date of this Prospectus are as set forth below. The waivers and expense limitations may be terminated at any time at the option of the Investment Adviser. If this occurs, “Other Expenses” and
“Total Fund Operating Expenses” may increase without shareholder approval.
|
| Balanced
Fund |
Growth and
Income Fund |
CORE
Large Cap Value Fund |
CORE
U.S. Equity Fund |
||||||
|---|---|---|---|---|---|---|---|---|---|
| Annual Fund Operating Expenses | |||||||||
| (expenses that are deducted from Fund assets): 1 | |||||||||
| Management Fees 2 | 0.65% | 0.70% | 0.60% | 0.70% | |||||
| Distribution and Service (12b-1) Fees | None | None | None | None | |||||
| Other Expenses 3 | 0.10% | 0.08% | 0.10% | 0.04% | |||||
| Total Fund Operating Expenses (after current
waivers and expense limitations) |
0.75% | 0.78% | 0.70% | 0.74% | |||||
| CORE
Large Cap Growth Fund |
CORE
Small Cap Equity Fund |
Capital
Growth Fund |
Strategic
Growth Fund |
Growth
Opportunities Fund |
Mid Cap
Value Fund |
Small Cap
Value Fund |
Large Cap
Value Fund |
||||||||
|---|---|---|---|---|---|---|---|---|---|---|---|---|---|---|---|
| None | None | None | None | None | None | None | None | ||||||||
| None | None | None | None | None | None | None | None | ||||||||
| None | None | None | None | None | None | None | None | ||||||||
| None | None | None | None | None | None | None | None | ||||||||
| 0.75% | 0.85% | 1.00% | 1.00% | 1.00% | 0.75% | 1.00% | 0.75% | ||||||||
| None | None | None | None | None | None | None | None | ||||||||
| 0.09% | 0.30% | 0.07% | 0.23% | 0.21% | 0.19% | 0.17% | 2.15% | ||||||||
| 0.84% | 1.15% | 1.07% | 1.23% | 1.21% | 0.94% | 1.17% | 2.90% | ||||||||
| CORE
Large Cap Growth Fund |
CORE
Small Cap Equity Fund |
Capital
Growth Fund |
Strategic
Growth Fund |
Growth
Opportunities Fund |
Mid Cap
Value Fund |
Small Cap
Value Fund |
Large Cap
Value Fund |
||||||||
|---|---|---|---|---|---|---|---|---|---|---|---|---|---|---|---|
| 0.70% | 0.85% | 1.00% | 1.00% | 1.00% | 0.75% | 1.00% | 0.75% | ||||||||
| None | None | None | None | None | None | None | None | ||||||||
| 0.06% | 0.08% | 0.04% | 0.04% | 0.15% | 0.14% | 0.10% | 0.10% | ||||||||
| 0.76% | 0.93% | 1.04% | 1.04% | 1.15% | 0.89% | 1.10% | 0.85% | ||||||||
1
|
The Funds’ annual operating expenses are based on actual expenses.
|
2
|
The Investment Adviser has voluntarily agreed not to impose a portion of the management fee on the CORE U.S. Equity Fund
and the CORE Large Cap Growth Fund equal to 0.05% and 0.05%, respectively, of such Funds’ average daily net assets. As a result of fee waivers, the current management fees of the CORE U.S. Equity Fund and CORE Large Cap Growth Fund are 0.70% and 0.70%, respectively, of such Funds’ average daily net assets. The waivers may be terminated at any time at the option
of the Investment Adviser.
|
3
|
“Other Expenses” include transfer agency fees equal to 0.04% of the average daily net assets of each Fund’
s Institutional Shares plus all other ordinary expenses not detailed above. The Investment Adviser has voluntarily agreed to reduce or limit “Other Expenses”(excluding management fees, transfer agency fees, taxes, interest and brokerage fees and
litigation, indemnification and other extraordinary expenses) to the following percentages of each Fund’s average daily net assets:
|
| Fund | Other
Expenses |
||
|---|---|---|---|
| Balanced | 0.06% | ||
| Growth and Income | 0.05% | ||
| CORE Large Cap Value | 0.06% | ||
| CORE U.S. Equity | 0.00% | ||
| CORE Large Cap Growth | 0.02% | ||
| CORE Small Cap Equity | 0.04% | ||
| Capital Growth | 0.00% | ||
| Strategic Growth | 0.00% | ||
| Growth Opportunities | 0.11% | ||
| Mid Cap Value | 0.10% | ||
| Small Cap Value | 0.06% | ||
| Large Cap Value | 0.06% | ||
| Fund | 1 Year | 3 Years | 5 Years | 10 Years | |||||
|---|---|---|---|---|---|---|---|---|---|
| Balanced | $ 91 | $284 | $ 493 | $1,096 | |||||
| Growth and Income | $ 80 | $249 | $ 433 | $ 966 | |||||
| CORE Large Cap Value | $ 79 | $246 | $ 428 | $ 954 | |||||
| CORE U.S. Equity | $ 85 | $265 | $ 460 | $1,025 | |||||
| CORE Large Cap Growth | $ 86 | $268 | $ 466 | $1,037 | |||||
| CORE Small Cap Equity | $117 | $365 | $ 633 | $1,398 | |||||
| Capital Growth | $109 | $340 | $ 590 | $1,306 | |||||
| Strategic Growth | $125 | $390 | $ 676 | $1,489 | |||||
| Growth Opportunities | $123 | $384 | $ 665 | $1,466 | |||||
| Mid Cap Value | $ 96 | $300 | $ 520 | $1,155 | |||||
| Small Cap Value | $119 | $372 | $ 644 | $1,420 | |||||
| Large Cap Value | $293 | $898 | $1,528 | $3,223 | |||||
| INVESTMENT ADVISERS
|
| Investment Adviser | Fund | ||
|---|---|---|---|
| Goldman Sachs Asset Management (“GSAM”) | Balanced | ||
| 32 Old Slip | Growth and Income | ||
| New York, New York 10005 | CORE Large Cap Value | ||
| CORE Large Cap Growth | |||
| CORE Small Cap Equity | |||
| Strategic Growth | |||
| Growth Opportunities | |||
| Mid Cap Value | |||
| Small Cap Value | |||
| Large Cap Value | |||
| Goldman Sachs Funds Management, L.P. (“GSFM”) | CORE U.S. Equity | ||
| 32 Old Slip | Capital Growth | ||
| New York, New York 10005 | |||
| GSAM and GSFM are separate business units of the Investment Management Division (“IMD”) of Goldman Sachs. Goldman Sachs
registered as an investment adviser in 1981. GSFM, a registered investment adviser since 1990, is a Delaware limited partnership which is an affiliate of Goldman Sachs. As of September 30, 2000, GSAM and GSFM, along with other units of IMD, had assets
under management of $281.3 billion.
|
| The Investment Adviser provides day-to-day advice regarding the Funds’ portfolio transactions. The Investment Adviser makes
the investment decisions for the Funds and places purchase and sale orders for the Funds’ portfolio transactions in U.S. and foreign markets. As permitted by applicable law, these orders may be directed to any brokers, including Goldman Sachs and its
affiliates. While the Investment Adviser is ultimately responsible for the management of the Funds, it is able to draw upon the research and expertise of its asset management affiliates for portfolio decisions and management with respect to certain
portfolio securities. In addition, the Investment Adviser has access to the research and certain proprietary technical models developed by Goldman Sachs, and will apply quantitative and qualitative analysis in determining the appropriate allocations among
categories of issuers and types of securities.
|
| The Investment Adviser also performs the following additional services for the Funds:
|
n
|
Supervises all non-advisory operations of the Funds
|
n
|
Provides personnel to perform necessary executive, administrative and clerical services to the Funds
|
n
|
Arranges for the preparation of all required tax returns,
reports to shareholders, prospectuses and statements of additional information and other reports filed with the Securities and Exchange Commission (the “SEC”) and other regulatory authorities
|
n
|
Maintains the records of each Fund
|
n
|
Provides office space and all necessary office equipment and services
|
| MANAGEMENT FEES
|
| As compensation for its services and its assumption of certain expenses, the Investment Adviser is entitled to the following fees,
computed daily and payable monthly, at the annual rates listed below (as a percentage of each respective Fund’s average daily net assets):
|
| Contractual Rate | Actual Rate
For the Fiscal Year Ended August 31, 2000 |
||||
|---|---|---|---|---|---|
| GSAM: | |||||
| Balanced | 0.65% | 0.65% | |||
| Growth and Income | 0.70% | 0.70% | |||
| CORE Large Cap Value | 0.60% | 0.60% | |||
| CORE Large Cap Growth | 0.75% | 0.64% | |||
| CORE Small Cap Equity | 0.85% | 0.85% | |||
| Strategic Growth | 1.00% | 1.00% | |||
| Growth Opportunities | 1.00% | 1.00% | |||
| Mid Cap Value | 0.75% | 0.75% | |||
| Small Cap Value | 1.00% | 1.00% | |||
| Large Cap Value | 0.75% | 0.75% | |||
| GSFM: | |||||
| CORE U.S. Equity | 0.75% | 0.70% | |||
| Capital Growth | 1.00% | 1.00% | |||
| The difference, if any, between the stated fees and the actual fees paid by the Funds reflects that the Investment Adviser did not
charge the full amount of the fees to which it would have been entitled. The Investment Adviser may discontinue or modify any such voluntary limitations in the future at its discretion.
|
| FUND MANAGERS
|
| M. Roch Hillenbrand, a Managing Director of Goldman Sachs since 1997, is the Head of Global Equities for GSAM, overseeing the
United States, Europe, Japan, and non-Japan Asia. In this capacity, he is responsible for managing the group as it defines and implements global portfolio management processes that are consistent, reliable and predictable. Mr. Hillenbrand joined Goldman
Sachs in 1997 upon its acquisition of Commodities Corporation, LLC where he was and continues as President. Over the course of his 19-year career at Commodities Corporation, Mr. Hillenbrand has had extensive experience in dealing with internal and
external investment managers who have managed a range of futures and equities strategies across multiple markets, using a variety of styles.
|
| Value Team
|
n
|
Twelve portfolio managers/analysts with over 100 years of combined financial experience comprise the Investment Adviser’s
value investment team
|
n
|
Multi-sector focus provides a balanced perspective and in-depth industry
knowledge |
n
|
Across all value products, the Investment Adviser leverages the industry research expertise of its small, mid and large cap
investment teams
|
| Name and Title | Fund Responsibility | Years
Primarily Responsible |
Five Year Employment History | ||||
|---|---|---|---|---|---|---|---|
| Eileen A. Aptman
Vice President |
Senior Portfolio Manager—
Mid Cap Value Small Cap Value |
Since
1996 1997 |
Ms. Aptman joined the Investment
Adviser as a research analyst in 1993. She became a portfolio manager in 1996. |
||||
| Matthew B.
McLennan Vice President |
Senior Portfolio Manager—
Small Cap Value Mid Cap Value |
Since
1996 1998 |
Mr. McLennan joined the
Investment Adviser as a research analyst in 1995 and became a portfolio manager in 1996. From 1994 to 1995, he worked in the Investment Banking Division of Goldman Sachs in Australia. |
||||
| Meera Mayer
Vice President |
Senior Portfolio Manager—
Growth and Income Large Cap Value Balanced (Equity) |
Since
1999 1999 1999 |
Ms. Mayer joined the Investment
Adviser as a senior portfolio manager in November 1999. From July 1999 to November 1999, she worked at Oppenheimer Funds as a senior equity analyst. From 1995 to March 1999, she worked at Spears, Benzak, Salomon and Farrell as a managing director and portfolio manager. |
||||
| Name and Title | Fund Responsibility | Years
Primarily Responsible |
Five Year Employment History | ||||
|---|---|---|---|---|---|---|---|
| Chip Otness
Vice President |
Senior Portfolio Manager—
Small Cap Value Mid Cap Value |
Since
2000 2000 |
Mr. Otness joined the Investment
Adviser as a senior portfolio manager in 2000. From 1998 to 2000, he headed Dolphin Asset Management. From 1970 to 1998, he worked at J.P. Morgan, most recently as a managing director and senior portfolio manager responsible for small-cap institutional equity investments. |
||||
| Eileen Rominger
Managing Director |
Senior Portfolio Manager—
Growth and Income Large Cap Value Balanced (Equity) |
Since
1999 1999 1999 |
Ms. Rominger joined the
Investment Adviser as a senior portfolio manager and Chief Investment Officer of the Value Equity team in 1999. From 1981 to 1999, she worked at Oppenheimer Capital, most recently as a senior portfolio manager. |
||||
| Quantitative Equity Team
|
n
|
A stable and growing team supported by an extensive internal staff
|
n
|
Access to the research ideas of Goldman Sachs’ renowned Global Investment Research Department
|
n
|
More than $34 billion in equities currently under management
|
| Name and Title | Fund Responsibility | Years
Primarily Responsible |
Five Year Employment History | ||||
|---|---|---|---|---|---|---|---|
| Melissa Brown
Managing Director |
Senior Portfolio Manager—
CORE Large Cap Value CORE U.S. Equity CORE Large Cap Growth CORE Small Cap Equity |
Since
1998 1998 1998 1998 |
Ms. Brown joined the
Investment Adviser as a portfolio manager in 1998. From 1984 to 1998, she was the director of Quantitative Equity Research and served on the Investment Policy Committee at Prudential Securities. |
||||
| Robert C. Jones
Managing Director |
Senior Portfolio Manager—
CORE U.S. Equity CORE Large Cap Growth CORE Small Cap Equity CORE Large Cap Value |
Since
1991 1997 1997 1998 |
Mr. Jones joined the
Investment Adviser as a portfolio manager in 1989. |
||||
| Victor H. Pinter
Vice President |
Senior Portfolio Manager—
CORE U.S. Equity CORE Large Cap Growth CORE Small Cap Equity CORE Large Cap Value |
Since
1996 1997 1997 1998 |
Mr. Pinter joined the
Investment Adviser as a research analyst in 1989. He became a portfolio manager in 1992. |
||||
| Growth Equity Investment Team
|
n
|
18 year consistent investment style applied through diverse and complete market cycles
|
n
|
More than $22 billion in equities currently under management
|
n
|
More than 300 client account relationships
|
n
|
A portfolio management and analytical team with more than 150 years combined investment experience
|
| Name and Title | Fund Responsibility | Years
Primarily Responsible |
Five Year Employment History | ||||
|---|---|---|---|---|---|---|---|
| George D. Adler
Vice President |
Senior Portfolio Manager—
Balanced (Equity) Capital Growth Strategic Growth Growth Opportunities |
Since
1997 1997 1999 1999 |
Mr. Adler joined the
Investment Adviser as a portfolio manager in 1997. From 1990 to 1997, he was a portfolio manager at Liberty Investment Management, Inc. (“Liberty”). |
||||
| Steve Barry
Vice President |
Senior Portfolio Manager—
Growth Opportunities Capital Growth Balanced (Equity) Strategic Growth |
Since
1999 2000 2000 2000 |
Mr. Barry joined the Investment
Adviser as a portfolio manager in 1999. From 1988 to 1999, he was a portfolio manager at Alliance Capital Management. |
||||
| Kenneth T. Berents
Managing Director |
Senior Portfolio Manager—
Capital Growth Balanced (Equity) Strategic Growth Growth Opportunities |
Since
2000 2000 2000 2000 |
Mr. Berents joined the Investment
Adviser as a portfolio manager in 2000. From 1992 to 1999, he was Director of Research and head of the Investment Committee at Wheat First Union. |
||||
| Robert G. Collins
Managing Director |
Senior Portfolio Manager—
Capital Growth Balanced (Equity) Strategic Growth Growth Opportunities |
Since
1997 1998 1999 1999 |
Mr. Collins joined the Investment
Adviser as portfolio manager and Co-Chair of the Growth Equity Investment Committee in 1997. From 1991 to 1997, he was a portfolio manager at Liberty. |
||||
| Herbert E. Ehlers
Managing Director |
Senior Portfolio Manager—
Capital Growth Balanced (Equity) Strategic Growth Growth Opportunities |
Since
1997 1998 1999 1999 |
Mr. Ehlers joined the Investment
Adviser as a senior portfolio manager and Chief Investment Officer of the Growth Equity team in 1997. From 1994 to 1997, he was the Chief Investment Officer and Chairman of Liberty. |
||||
| Name and Title | Fund Responsibility | Years
Primarily Responsible |
Five Year Employment History | ||||
|---|---|---|---|---|---|---|---|
| Gregory H. Ekizian
Managing Director |
Senior Portfolio Manager—
Capital Growth Balanced (Equity) Strategic Growth Growth Opportunities |
Since
1997 1998 1999 1999 |
Mr. Ekizian joined the Investment
Adviser as portfolio manager and Co-Chair of the Growth Equity Investment Committee in 1997. From 1990 to 1997, he was a portfolio manager at Liberty and its predecessor firm, Eagle. |
||||
| Scott Kolar
Vice President |
Portfolio Manager—
Growth Opportunities Capital Growth Balanced (Equity) Strategic Growth |
Since
1999 2000 2000 2000 |
Mr. Kolar joined the Investment
Adviser as an equity analyst in 1997 and became a portfolio manager in 1999. From 1994 to 1997, he was an equity analyst and information systems specialist at Liberty. |
||||
| David G. Shell
Managing Director |
Senior Portfolio Manager—
Capital Growth Balanced (Equity) Strategic Growth Growth Opportunities |
Since
1997 1998 1999 1999 |
Mr. Shell joined the Investment
Adviser as a portfolio manager in 1997. From 1987 to 1997, he was a portfolio manager at Liberty and its predecessor firm, Eagle. |
||||
| Ernest C. Segundo, Jr.
Vice President |
Senior Portfolio Manager—
Capital Growth Balanced (Equity) Strategic Growth Growth Opportunities |
Since
1997 1998 1999 1999 |
Mr. Segundo joined the Investment
Adviser as a portfolio manager in 1997. From 1992 to 1997, he was a portfolio manager at Liberty. |
||||
| Fixed-Income Portfolio Management Team
|
n
|
Fixed-income portfolio management is comprised of a deep team of sector specialists
|
n
|
The team strives to maximize risk-adjusted returns by de-emphasizing interest rate anticipation and focusing on security selection
and sector allocation
|
n
|
The team manages approximately $49 billion in fixed-income assets for retail, institutional and high net worth clients
|
| Name and Title | Fund Responsibility | Years
Primarily Responsible |
Five Year Employment History | ||||
|---|---|---|---|---|---|---|---|
| Jonathan A. Beinner
Managing Director and Co-Head U.S. Fixed Income |
Senior Portfolio Manager—
Balanced (Fixed-Income) |
Since
1994 |
Mr. Beinner joined the Investment
Adviser as a portfolio manager in 1990. |
||||
| C. Richard Lucy
Managing Director and Co-Head U.S. Fixed Income |
Senior Portfolio Manager—
Balanced (Fixed-Income) |
Since
1994 |
Mr. Lucy joined the Investment
Adviser as a portfolio manager in 1992. |
||||
| DISTRIBUTOR AND TRANSFER AGENT
|
| Goldman Sachs, 85 Broad Street, New York, New York 10004, serves as the exclusive distributor (the “Distributor”) of
each Fund’s shares. Goldman Sachs, 4900 Sears Tower, Chicago, Illinois 60606-6372, also serves as the Funds’ transfer agent (the “Transfer Agent”) and, as such, performs various shareholder servicing functions.
|
| From time to time, Goldman Sachs or any of its affiliates may purchase and hold shares of the Funds. Goldman Sachs reserves the
right to redeem at any time some or all of the shares acquired for its own account.
|
| ACTIVITIES OF GOLDMAN SACHS AND ITS AFFILIATES AND OTHER ACCOUNTS MANAGED BY GOLDMAN SACHS
|
| The involvement of the Investment Adviser, Goldman Sachs and their affiliates in the management of, or their interest in, other
accounts and other activities of Goldman Sachs may present conflicts of interest with respect to a Fund or limit a Fund’s investment activities. Goldman Sachs and its affiliates engage in proprietary trading and advise accounts and funds which have
investment objectives similar to those of the Funds and/or which engage in and compete for transactions in the same types of securities, currencies and instruments as the Funds. Goldman Sachs and its affiliates will not have any obligation to make
available any information regarding their proprietary activities or strategies, or the activities or strategies used for other accounts managed by them, for the benefit of the management of the Funds. The results of a Fund’s investment activities,
therefore, may differ from those of Goldman Sachs and its affiliates, and it is possible that a Fund could sustain losses during periods in which Goldman Sachs and its affiliates and other accounts achieve significant profits on their trading for
proprietary or other accounts. In addition, the Funds may, from time to time, enter into transactions in which other clients of Goldman Sachs have an adverse interest. A Fund’s activities may be limited because of regulatory restrictions applicable
to Goldman Sachs and its affiliates, and/or their internal policies designed to comply with such restrictions.
|
n
|
Cash
|
n
|
Additional shares of the same class of the same Fund
|
n
|
Shares of the same or an equivalent class of another Goldman Sachs Fund. Special restrictions may apply for certain ILA
Portfolios. See the Additional Statement.
|
| Fund | Investment
Income Dividends |
Capital Gains
Distributions |
|||
|---|---|---|---|---|---|
| Balanced | Quarterly | Annually | |||
| Growth and Income | Quarterly | Annually | |||
| CORE Large Cap Value | Quarterly | Annually | |||
| CORE U.S. Equity | Annually | Annually | |||
| CORE Large Cap Growth | Annually | Annually | |||
| CORE Small Cap Equity | Annually | Annually | |||
| Capital Growth | Annually | Annually | |||
| Strategic Growth | Annually | Annually | |||
| Growth Opportunities | Annually | Annually | |||
| Mid Cap Value | Annually | Annually | |||
| Small Cap Value | Annually | Annually | |||
| Large Cap Value | Annually | Annually | |||
| The following section will provide you with answers to some of the most often asked questions regarding buying and selling the
Funds’ Institutional Shares.
|
| How Can I Purchase Institutional Shares Of The Funds?
|
| You may purchase Institutional Shares on any business day at their NAV next determined after receipt of an order. No sales load is
charged. You should place an order with Goldman Sachs at 1-800-621-2550 and either:
|
n
|
Wire federal funds to The Northern Trust Company (“Northern”), as subcustodian for State Street Bank and Trust Company
(“State Street”) (each Fund’s custodian) on the next business day; or
|
n
|
Send a check or Federal Reserve draft payable to Goldman Sachs Funds—(Name of Fund and Class of Shares), 4900 Sears Tower,
Chicago, IL 60606-6372. The Fund will not accept a check drawn on a foreign bank or a third-party check.
|
| In order to make an initial investment in a Fund, you must furnish to the Fund or Goldman Sachs the Account Application attached
to this Prospectus. Purchases of Institutional Shares must be settled within three business days of receipt of a complete purchase order.
|
| In certain instances, the Trust may require a signature guarantee in order to effect purchase, redemption or exchange
transactions. Signature guarantees must be obtained from a bank, brokerage firm or other financial intermediary that is a member of an approved Medallion Guarantee Program or that is otherwise approved by Goldman Sachs. A notary public cannot provide a
signature guarantee.
|
| How Do I Purchase Shares Through A Financial Institution?
|
| Certain institutions (including banks, trust companies, brokers and investment advisers) that provide recordkeeping, reporting and
processing services to their customers may be authorized to accept, on behalf of Goldman Sachs Trust (the “Trust”), purchase, redemption and exchange orders placed by or on behalf of their customers, and may designate other intermediaries to
accept such orders, if approved by the Trust. In these cases:
|
n
|
A Fund will be deemed to have received an order in proper form when the order is accepted by the authorized institution or
intermediary on a business day, and the order will be priced at the Fund’s NAV next determined after such acceptance.
|
n
|
Authorized institutions and intermediaries will be responsible for transmitting accepted orders and payments to the Trust within
the time period agreed upon by them.
|
| You should contact your institution or intermediary to learn whether it is authorized to accept orders for the Trust.
|
| These institutions may receive payments from the Funds or Goldman Sachs for the services provided by them with respect to the
Funds’ Institutional Shares. These payments may be in addition to other payments borne by the Funds.
|
| The Investment Adviser, Distributor and/or their affiliates may pay additional compensation from time to time, out of their assets
and not as an additional charge to the Funds, to certain institutions and other persons in connection with the sale, distribution and/or servicing of shares of the Funds and other Goldman Sachs Funds. Additional compensation based on sales may, but is
currently not expected to, exceed 0.50% (annualized) of the amount invested.
|
| In addition to Institutional Shares, each Fund also offers other classes of shares to investors. These other share classes are
subject to different fees and expenses (which affect performance), have different minimum investment requirements and are entitled to different services than Institutional Shares. Information regarding these other share classes may be obtained from your
sales representative or from Goldman Sachs by calling the number on the back cover of this Prospectus.
|
| What Is My Minimum Investment In The Funds?
|
| Type of Investor | Minimum Investment | ||
|---|---|---|---|
| n
Banks, trust companies or other
depository institutions investing for their own account or on behalf of clients |
$1,000,000 in Institutional Shares of a Fund
alone or in combination with other assets under the management of GSAM and its affiliates |
||
| n
Section 401(k), profit sharing,
money purchase pension, tax- sheltered annuity, defined benefit pension, or other employee benefit plans that are sponsored by one or more employers (including governmental or church employers) or employee organizations |
|||
| n
State, county, city or any
instrumentality, department, authority or agency thereof |
|||
| n
Corporations with at least $100
million in assets or in outstanding publicly traded securities |
|||
| n
“Wrap” account sponsors (provided
they have an agreement covering the arrangement with GSAM) |
|||
| n
Registered investment advisers
investing for accounts for which they receive asset-based fees |
|||
| n Individual investors | $10,000,000 | ||
| n
Qualified non-profit organizations,
charitable trusts, foundations and endowments |
|||
| n
Accounts over which GSAM or its
advisory affiliates have investment discretion |
|||
| The minimum investment requirement may be waived for current and former officers, partners, directors or employees of Goldman
Sachs or any of its affiliates or for other investors at the discretion of the Trust’s officers. No minimum amount is required for subsequent investments.
|
| What Else Should I Know About Share Purchases?
|
| The Trust reserves the right to:
|
n
|
Modify or waive the minimum investment amounts.
|
n
|
Reject or restrict any purchase or exchange orders by a particular purchaser (or group of related purchasers). This may occur, for
example, when a pattern of
frequent purchases, sales or exchanges of Institutional Shares of a Fund is evident, or if purchases, sales or exchanges are, or a subsequent abrupt redemption might be, of a size that would disrupt the management of a Fund.
|
n
|
Close a Fund to new investors from time to time and reopen a Fund whenever it is deemed appropriate by a Fund’s Investment
Adviser.
|
| The Funds may allow you to purchase shares with securities instead of cash if consistent with a Fund’s investment policies
and operations and if approved by the Fund’s Investment Adviser.
|
| How Are Shares Priced?
|
| The price you pay or receive when you buy, sell or exchange Institutional Shares is determined by a Fund’s NAV. The Funds
calculate NAV as follows:
|
| |
(Value of Assets of the Class)
|
|
| NAV =
|
– (Liabilities of the Class)
|
|
| |
Number of Outstanding Shares of the Class
|
|
| The Funds’ investments are valued based on market quotations or, if accurate quotations are not readily available, the fair
value of the Fund’s investments may be determined in good faith under procedures established by the Trustees.
|
n
|
NAV per share of each class is calculated by State Street on each business day as of the close of regular trading on the New York
Stock Exchange (normally 4:00 p.m. New York time). Fund shares will not be priced on any day the New York Stock Exchange is closed.
|
n
|
When you buy shares, you pay the NAV next calculated after the Funds receive your order in proper form.
|
n
|
When you sell shares, you receive the NAV next calculated after the Funds receive your order in proper form.
|
| Note: The time at which transactions and shares are priced and the time by which orders must be received may be changed in
case of an emergency or if regular trading on the New York Stock Exchange is stopped at a time other than 4:00 p.m. New York time.
|
| Foreign securities may trade in their local markets on days a Fund is closed. As a result, the NAV of a Fund that holds foreign
securities may be impacted on days when investors may not purchase or redeem Fund shares.
|
| In addition, the impact of events that occur after the publication of market quotations used by a Fund to price its securities but
before the close of regular trading on the New York Stock Exchange will normally not be reflected in a Fund’s next determined NAV unless the Trust, in its discretion, makes an adjustment in light of the nature and materiality of the event, its effect
on Fund operations and other relevant factors.
|
| How Can I Sell Institutional Shares Of The Funds?
|
| You may arrange to take money out of your account by selling (redeeming) some or all of your shares. Generally, each Fund will
redeem its Institutional Shares upon request on any business day at their NAV next determined after receipt of such request in proper form. You may request that redemption proceeds be sent to you by check or by wire (if the wire instructions are on record). Redemptions may be requested in writing or by telephone.
|
| Instructions For Redemptions: | |||||
|---|---|---|---|---|---|
| By Writing: | n Write a letter of instruction that includes: | ||||
| n Your name(s) and signature(s) | |||||
| n Your account number | |||||
| n The Fund name and Class of Shares | |||||
| n The dollar amount you want to sell | |||||
| n How and where to send the proceeds | |||||
| n Mail your request to: | |||||
| Goldman Sachs Funds | |||||
| 4900 Sears Tower | |||||
| Chicago, IL 60606-6372 | |||||
| By Telephone: | If you have elected the telephone | ||||
| redemption privilege on your Account Application: | |||||
| n 1-800-621-2550 | |||||
| (8:00 a.m. to 4:00 p.m. New York time) | |||||
| Certain institutions and intermediaries are authorized to accept redemption requests on behalf of the Funds as described under
“How Do I Purchase Shares Through A Financial Institution?”
|
| What Do I Need To Know About Telephone Redemption Requests?
|
| The Trust, the Distributor and the Transfer Agent will not be liable for any loss you may incur in the event that the Trust
accepts unauthorized telephone redemption requests that the Trust reasonably believes to be genuine. In an effort to prevent unauthorized or fraudulent redemption and exchange requests by telephone, Goldman Sachs employs reasonable procedures specified by
the Trust to confirm that such instructions are genuine. If reasonable procedures are not employed, the Trust may be liable for any loss due to unauthorized or fraudulent transactions. The following general policies are currently in effect:
|
n
|
All telephone requests are recorded.
|
n
|
Any redemption request that requires money to go to an account or address other than that designated on the Account Application
must be in writing and signed by an authorized person designated on the Account Application. The
written request may be confirmed by telephone with both the requesting party and the designated bank account to verify instructions.
|
n
|
The telephone redemption option may be modified or terminated at any time.
|
| Note: It may be difficult to make telephone redemptions in times of drastic economic or market conditions.
|
| How Are Redemption Proceeds Paid?
|
| By Wire: You may arrange for your redemption proceeds to be wired as federal funds to the bank account designated in
your Account Application. The following general policies govern wiring redemption proceeds:
|
n
|
Redemption proceeds will normally be wired on the next business day in federal funds (for a total of one business day delay), but
may be paid up to three business days following receipt of a properly executed wire transfer redemption request. If you are selling shares you recently paid for by check, the Fund will pay you when your check has cleared, which may take up to 15 days. If
the Federal Reserve Bank is closed on the day that the redemption proceeds would ordinarily be wired, wiring the redemption proceeds may be delayed one additional business day.
|
n
|
To change the bank designated on your Account Application, you must send written instructions signed by an authorized person
designated on the account application to the Transfer Agent.
|
n
|
Neither the Trust, Goldman Sachs nor any other institution assumes any responsibility for the performance of your bank or any
intermediaries in the transfer process. If a problem with such performance arises, you should deal directly with your bank or any such intermediaries.
|
| By Check: You may elect in writing to receive your redemption proceeds by check. Redemption proceeds paid by check
will normally be mailed to the address of record within three business days of a properly executed redemption request. If you are selling shares you recently paid for by check, the Fund will pay you when your check has cleared, which may take up to 15 days.
|
| What Else Do I Need To Know About Redemptions?
|
| The following generally applies to redemption requests:
|
n
|
Additional documentation may be required when deemed appropriate by the Transfer Agent. A redemption request will not be in proper
form until such additional documentation has been received.
|
n
|
Institutions (including banks, trust companies, brokers and investment advisers) are responsible for the timely transmittal of
redemption requests by their customers to the Transfer Agent. In order to facilitate the timely transmittal of redemption requests, these institutions may set times by which they must receive
redemption requests. These institutions may also require additional documentation from you.
|
| The Trust reserves the right to:
|
n
|
Redeem your shares if your account balance falls below $50 as a result of earlier redemptions. The Funds will not redeem your
shares on this basis if the value of your account falls below the minimum account balance solely as a result of market conditions. The Fund will give you 60 days’ prior written notice to allow you to purchase sufficient additional shares of the Fund
in order to avoid such redemption.
|
n
|
Redeem your shares in other circumstances determined by the Board of Trustees to be in the best interest of the Trust.
|
n
|
Pay redemptions by a distribution in-kind of securities (instead of cash). If you receive redemption proceeds in-kind, you should
expect to incur transaction costs upon the disposition of those securities.
|
n
|
Reinvest any dividends or other distributions which you have elected to receive in cash should your check for such dividends or
other distributions be returned to the Fund as undeliverable or remain uncashed for six months. In addition, that distribution and all future distributions payable to you will be reinvested at NAV in additional Institutional shares of the Fund that pays
the distributions. No interest will accrue on amounts represented by uncashed distribution or redemption checks.
|
| Can I Exchange My Investment From One Fund To Another?
|
| You may exchange Institutional Shares of a Fund at NAV for Institutional Shares of any other Goldman Sachs Fund. The exchange
privilege may be materially modified or withdrawn at any time upon 60 days’ written notice to you.
|
| Instructions For Exchanging Shares: | |||||
|---|---|---|---|---|---|
| By Writing: | n Write a letter of instruction that includes: | ||||
| n Your name(s) and signature(s) | |||||
| n Your account number | |||||
| n The Fund names and Class of Shares | |||||
| n The dollar amount to be exchanged | |||||
| n
Mail the request to:
Goldman Sachs Funds 4900 Sears Tower Chicago, IL 60606-6372 |
|||||
| By Telephone: | If you have elected the telephone exchange
privilege on your Account Application: |
||||
| n
1-800-621-2550
(8:00 a.m. to 4:00 p.m. New York time) |
|||||
| You should keep in mind the following factors when making or considering an exchange:
|
n
|
You should obtain and carefully read the prospectus of the Fund you are acquiring before making an exchange.
|
n
|
All exchanges which represent an initial investment in a Fund must satisfy the minimum initial investment requirements of that
Fund, except that this requirement may be waived at the discretion of the Trust.
|
n
|
Telephone exchanges normally will be made only to an identically registered account.
|
n
|
Shares may be exchanged among accounts with different names, addresses and social security or other taxpayer identification
numbers only if the exchange instructions are in writing and are signed by an authorized person designated on the Account Application.
|
n
|
Exchanges are available only in states where exchanges may be legally made.
|
n
|
It may be difficult to make telephone exchanges in times of drastic economic or market conditions.
|
n
|
Goldman Sachs may use reasonable procedures described under “What Do I Need To Know About Telephone Redemption Requests?”
in an effort to prevent unauthorized or fraudulent telephone exchange requests.
|
n
|
Exchanges into Funds that are closed to new investors may be restricted.
|
| For federal income tax purposes, an exchange from one Fund to another is treated as a redemption of the shares surrendered in the
exchange, on which you may be subject to tax, followed by a purchase of shares received in the exchange. You should consult your tax adviser concerning the tax consequences of an exchange.
|
| Restrictions on Excessive Trading Practices. The Trust does not permit market-timing or other excessive trading
practices. Purchases and exchanges should be made for long-term investment purposes only. The Trust and Goldman Sachs reserve the right to reject or restrict purchase or exchange requests from any investor. Excessive, short-term (market-timing) trading
practices may disrupt portfolio management strategies, harm Fund performance and negatively impact long-term shareholders. The Trust and Goldman Sachs will not be held liable for any loss resulting from rejected purchase or exchange orders. To minimize
harm to the Trust (or Goldman Sachs) and its shareholders, the Trust (or Goldman Sachs) will exercise these rights if, in the Trust’s (or Goldman Sachs’) judgment, an investor has a history of excessive trading or if an investor’s trading,
in the judgment of the Trust (or Goldman Sachs) has been or may be disruptive to a Fund. In making this judgment, trades executed in multiple accounts under common ownership or control may be considered together.
|
| What Types of Reports Will I Be Sent Regarding Investments In Institutional Shares?
|
| You will receive an annual report containing audited financial statements and a semi-annual report. To eliminate unnecessary
duplication, only one copy of such reports will be sent to shareholders with the same mailing address. If you would like a duplicate copy to be mailed to you, please contact Goldman Sachs Funds at 1-800-621-2550. You will also be provided with a printed
confirmation for each transaction in your account and a monthly account statement. The Funds do not generally provide sub-accounting services.
|
| As with any investment, you should consider how your investment in the Funds will be taxed. The tax information below is provided
as general information. More tax information is available in the Additional Statement. You should consult your tax adviser about the federal, state, local or foreign tax consequences of your investment in the Funds.
|
| Unless your investment is an IRA or other tax-advantaged account, you should consider the possible tax consequences of Fund
distributions and the sale of your Fund shares.
|
| DISTRIBUTIONS
|
| Distributions you receive from the Funds are generally subject to federal income tax, and may also be subject to state or local
taxes. This is true whether you reinvest your distributions in additional Fund shares or receive them in cash. For federal tax purposes, the Funds’ income dividend distributions and short-term capital gain distributions are taxable to you as ordinary
income. Any long-term capital gain distributions are taxable as long-term capital gains, no matter how long you have owned your Fund shares.
|
| Although distributions are generally treated as taxable to you in the year they are paid, distributions declared in October,
November or December but paid in January are taxable as if they were paid in December. A percentage of the Funds’ dividends paid to corporate shareholders may be eligible for the corporate dividends-received deduction. The Funds will inform
shareholders of the source and tax status of all distributions promptly after the close of each calendar year.
|
| Each Fund may be subject to foreign withholding or other foreign taxes on income or gain from certain foreign securities. In
general, the Funds may deduct these taxes in computing their taxable income.
|
| If you buy shares of a Fund before it makes a distribution, the distribution will be taxable to you even though it may actually be
a return of a portion of your investment. This is known as “buying a dividend.”
|
| SALES AND EXCHANGES
|
| Your sale of Fund shares is a taxable transaction for federal income tax purposes, and may also be subject to state and local
taxes. For tax purposes, the exchange of your Fund shares for shares of a different Goldman Sachs Fund is the same as a sale. When you sell your shares, you will generally recognize a capital gain or loss in an amount equal to the difference between your
adjusted tax basis in the shares and the amount received. Generally, this gain or loss is long-term or short-term depending on whether your holding period exceeds twelve months, except that any loss realized on shares held for six months or less will be
treated as a long-term capital loss to the extent of any capital gain dividends that were received on the shares.
|
| OTHER INFORMATION
|
| When you open your account, you should provide your social security or tax identification number on your Account Application. By
law, each Fund must withhold 31% of your taxable distributions and any redemption proceeds if you do not provide your correct taxpayer identification number, or certify that it is correct, or if the IRS instructs the Fund to do so. Non-U.S. investors may
be subject to U.S. withholding and estate tax.
|
| A. General Portfolio Risks
|
| The Funds will be subject to the risks associated with equity securities. “Equity securities” include common stocks,
preferred stocks, interests in real estate investment trusts, convertible debt obligations, convertible preferred stocks, equity interests in trusts, partnerships, joint ventures, limited liability companies and similar enterprises, warrants and stock
purchase rights. In general, stock values fluctuate in response to the activities of individual companies and in response to general market and economic conditions. Accordingly, the value of the stocks that a Fund holds may decline over short or extended
periods. The stock markets tend to be cyclical, with periods when stock prices generally rise and periods when prices generally decline. The volatility of equity securities means that the value of your investment in the Funds may increase or decrease.
Recently, certain stock markets have experienced substantial price volatility and, at times, have traded at or close to record high levels. There can be no guarantee that such levels will be reached or maintained in the future.
|
| To the extent that a Fund invests in fixed-income securities, that Fund will also be subject to the risks associated with its
fixed-income securities. These risks include interest rate risk, credit risk and call/extension risk. In general, interest rate risk involves the risk that when interest rates decline, the market value of fixed-income securities tends to increase
(although many mortgage related securities will have less potential than other debt securities for capital appreciation during periods of declining rates). Conversely, when interest rates increase, the market value of fixed-income securities tends to
decline. Credit risk involves the risk that an issuer or guarantor could default on its obligations, and a Fund will not recover its investment. Call risk and extension risk are normally present in mortgage-backed securities and asset-backed securities.
For example, homeowners have the option to prepay their mortgages. Therefore, the duration of a security backed by home mortgages can either shorten (call risk) or lengthen (extension risk). In general, if interest rates on new mortgage loans fall
sufficiently below the interest rates on existing outstanding mortgage loans, the rate of prepayment would be expected to increase. Conversely, if mortgage loan interest rates rise above the interest rates on existing outstanding mortgage loans, the rate
of prepayment would be expected to decrease. In either case, a change in the prepayment rate can result in losses to investors.
|
| The Investment Adviser will not consider the portfolio turnover rate a limiting factor in making investment decisions for a Fund.
A high rate of portfolio turnover (100% or more) involves correspondingly greater expenses which must be borne by a Fund and its shareholders, and is also likely to result in higher short-term capital gains taxable to shareholders. The portfolio turnover
rate is calculated by dividing the lesser of the dollar amount of sales or purchases of portfolio securities by the average monthly value of a Fund’s portfolio securities, excluding securities having a maturity at the date of purchase of one year or
less. See “Financial Highlights” in Appendix B for a statement of the Funds’ historical portfolio turnover rates.
|
| The following sections provide further information on certain types of securities and investment techniques that may be used by
the Funds, including their associated risks. Additional information is provided in the Additional Statement, which is available upon request. Among other things, the Additional Statement describes certain fundamental investment restrictions that cannot be
changed without shareholder approval. You should note, however, that all investment objectives, and all investment policies not specifically designated as fundamental are non-fundamental and may be changed without shareholder approval. If there is a
change in a Fund’s investment objective, you should consider whether that Fund remains an appropriate investment in light of your then current financial position and needs.
|
| B. Other Portfolio Risks
|
| Risks of Investing in Small Capitalization Companies. Each Fund may invest in small capitalization companies.
Investments in small capitalization companies involve greater risk and portfolio price volatility than investments in larger capitalization stocks. Among the reasons for the greater price volatility of these investments are the less certain growth
prospects of smaller firms and the lower degree of liquidity in the markets for such securities. Small capitalization companies may be thinly traded and may have to be sold at a discount from current market prices or in small lots over an extended period
of time. In addition, these securities are subject to the risk that during certain periods the liquidity of particular issuers or industries, or all securities in these investment categories, will shrink or disappear suddenly and without warning as a
result of adverse economic or market conditions, or adverse investor perceptions whether or not accurate. Because of the lack of sufficient market liquidity, a Fund may incur losses because it will be required to effect sales at a disadvantageous time and
only then at a substantial drop in price. Small capitalization companies include “unseasoned” issuers that do not have an established financial history; often have limited product lines, markets or financial
|
| resources; may depend on or use a few key personnel for management; and may be susceptible to losses and risks of bankruptcy.
Transaction costs for these investments are often higher than those of larger capitalization companies. Investments in small capitalization companies may be more difficult to price precisely than other types of securities because of their characteristics
and lower trading volumes.
|
| Risks of Foreign Investments. The Funds may make foreign investments. Foreign investments involve special risks that
are not typically associated with U.S. dollar denominated or quoted securities of U.S. issuers. Foreign investments may be affected by changes in currency rates, changes in foreign or U.S. laws or restrictions applicable to such investments and changes in
exchange control regulations (e.g., currency blockage). A decline in the exchange rate of the currency (i.e., weakening of the currency against the U.S. dollar) in which a portfolio security is quoted or denominated relative to the U.S. dollar would reduce the value of
the portfolio security. In addition, if the currency in which a Fund receives dividends, interest or other payments declines in value against the U.S. dollar before such income is distributed as dividends to shareholders or converted to U.S. dollars, the
Fund may have to sell portfolio securities to obtain sufficient cash to pay such dividends.
|
| The introduction of a single currency, the euro, on January 1, 1999 for participating nations in the European Economic and
Monetary Union has presented unique uncertainties, including the fluctuation of the euro relative to non-euro currencies during the transition period from January 1, 1999 to December 31, 2001 and beyond; whether the interest rate, tax and labor regimes of
European countries participating in the euro will converge over time; and whether the conversion of the currencies of other countries that now are or may in the future become members of the European Union (“EU”), may have an impact on the euro.
Also, it is possible that the euro could be abandoned in the future by countries that have already adopted its use. These or other events, including political and economic developments, could cause market disruptions, and could adversely affect the value
of securities held by the Funds. Because of the number of countries using this single currency, a significant portion of the assets held by the Funds may be denominated in the euro.
|
| Brokerage commissions, custodial services and other costs relating to investment in international securities markets generally are
more expensive than in the United States. In addition, clearance and settlement procedures may be different in foreign countries and, in certain markets, such procedures have been unable to keep pace with the volume of securities transactions, thus making
it difficult to conduct such transactions.
|
| Foreign issuers are not generally subject to uniform accounting, auditing and financial reporting standards comparable to those
applicable to U.S. issuers. There may be less publicly available information about a foreign issuer than about a U.S. issuer. In addition, there is generally less government regulation of foreign markets, companies and securities dealers than in the
United States. Foreign securities markets may have substantially less volume than U.S. securities markets and secu-
|
| rities of many foreign issuers are less liquid and more volatile than securities of comparable domestic issuers. Furthermore, with
respect to certain foreign countries, there is a possibility of nationalization, expropriation or confiscatory taxation, imposition of withholding or other taxes on dividend or interest payments (or, in some cases, capital gains distributions),
limitations on the removal of funds or other assets from such countries, and risks of political or social instability or diplomatic developments which could adversely affect investments in those countries.
|
| Concentration of a Fund’s assets in one or a few countries and currencies will subject a Fund to greater risks than if a
Fund’s assets were not geographically concentrated.
|
| Investment in sovereign debt obligations by certain Funds involves risks not present in debt obligations of corporate issuers. The
issuer of the debt or the governmental authorities that control the repayment of the debt may be unable or unwilling to repay principal or interest when due in accordance with the terms of such debt, and a Fund may have limited recourse to compel payment
in the event of a default. Periods of economic uncertainty may result in the volatility of market prices of sovereign debt, and in turn a Fund’s NAV, to a greater extent than the volatility inherent in debt obligations of U.S. issuers.
|
| A sovereign debtor’s willingness or ability to repay principal and pay interest in a timely manner may be affected by, among
other factors, its cash flow situation, the extent of its foreign currency reserves, the availability of sufficient foreign exchange on the date a payment
is due, the relative size of the debt service burden to the economy as a whole, the sovereign debtor’s policy toward international lenders, and the political constraints to which a sovereign debtor may be subject.
|
| Investments in foreign securities may take the form of sponsored and unsponsored American Depositary Receipts (“ADRs”)
and Global Depositary Receipts (“GDRs”). Certain Funds may also invest in European Depositary Receipts (“EDRs”) or other similar instruments representing securities of foreign issuers. ADRs represent the right to receive securities of
foreign issuers deposited in a domestic bank or a correspondent bank. Prices of ADRs are quoted in U.S. dollars, and ADRs are traded in the United States. EDRs and GDRs are receipts evidencing an arrangement with a non-U.S. bank. EDRs and GDRs are not
necessarily quoted in the same currency as the underlying security.
|
| Risks of Emerging Countries. Certain Funds may invest in securities of issuers located in emerging countries. The
risks of foreign investment are heightened when the issuer is located in an emerging country. Emerging countries are generally located in the Asia-Pacific region, Eastern Europe, Latin and South America and Africa. A Fund’s purchase and sale of
portfolio securities in certain emerging countries may be constrained by limitations relating to daily changes in the prices of listed securities, periodic trading or settlement volume and/or limitations on aggregate holdings of foreign investors. Such
limitations may be computed based on the aggregate trading volume by or holdings of a Fund, the Investment Adviser, its affiliates and their respective clients and other service providers. A Fund may not be able to sell securities in circumstances where
price, trading or settlement volume limitations have been reached.
|
| Foreign investment in the securities markets of certain emerging countries is restricted or controlled to varying degrees which
may limit investment in such countries or increase the administrative costs of such investments. For example, certain Asian countries require governmental approval prior to investments by foreign persons or limit investment by foreign persons to only a
specified percentage of an issuer’s outstanding securities or a specific class of securities which may have less advantageous terms (including price) than securities of the issuer available for purchase by nationals. In addition, certain countries
may restrict or prohibit investment opportunities in issuers or industries deemed important to national interests. Such restrictions may affect the market price, liquidity and rights of securities that may be purchased by a Fund. The repatriation of both
investment income and capital from certain emerging countries is subject to restrictions such as the need for governmental consents. Due to restrictions on direct investment in equity securities in certain Asian and other countries, it is anticipated that
a Fund may invest in such countries through other investment funds in such countries.
|
| Many emerging countries have recently experienced currency devaluations and substantial (and, in some cases, extremely high) rates
of inflation. Other emerging countries have experienced economic recessions. These circumstances have had a negative effect on the economies and securities markets of such emerging countries. Economies in emerging countries generally are dependent heavily
upon commodity prices and international trade and, accordingly, have been and may continue to be affected adversely by the economies of their trading partners, trade barriers, exchange controls, managed adjustments in relative currency values and other
protectionist measures imposed or negotiated by the countries with which they trade.
|
| Many emerging countries are subject to a substantial degree of economic, political and social instability. Governments of some
emerging countries are authoritarian in nature or have been installed or removed as a result of military coups, while
|
| governments in other emerging countries have periodically used force to suppress civil dissent. Disparities of wealth, the pace
and success of democratization, and ethnic, religious and racial disaffection, among other factors, have also led to social unrest, violence and/or labor unrest in some emerging countries. Unanticipated political or social developments may result in
sudden and significant investment losses. Investing in emerging countries involves greater risk of loss due to expropriation, nationalization, confiscation of assets and property or the imposition of restrictions on foreign investments and on repatriation
of capital invested. As an example, in the past some Eastern European governments have expropriated substantial amounts of private property, and many claims of the property owners have never been fully settled. There is no assurance that similar
expropriations will not recur in Eastern Europe or other countries.
|
| A Fund’s investment in emerging countries may also be subject to withholding or other taxes, which may be significant and may
reduce the return from an investment in such countries to the Fund.
|
| Settlement procedures in emerging countries are frequently less developed and reliable than those in the United States and often
may involve a Fund’s delivery of securities before receipt of payment for their sale. In addition, significant delays are common in certain markets in registering the transfer of securities. Settlement or registration problems may make it more
difficult for a Fund to value its portfolio securities and could cause the Fund to miss attractive investment opportunities, to have a portion of its assets uninvested or to incur losses due to the failure of a counterparty to pay for securities the Fund
has delivered or the Fund’s inability to complete its contractual obligations because of theft or other reasons. The creditworthiness of the local securities firms used by the Fund in emerging countries may not be as sound as the creditworthiness of
firms used in more developed countries. As a result, the Fund may be subject to a greater risk of loss if a securities firm defaults in the performance of its responsibilities.
|
| The small size and inexperience of the securities markets in certain emerging countries and the limited volume of trading in
securities in those countries may make a Fund’s investments in such countries less liquid and more volatile than investments in countries with more developed securities markets (such as the United States, Japan and most Western European countries). A
Fund’s investments in emerging countries are subject to the risk that the liquidity of a particular investment, or investments generally, in such countries will shrink or disappear suddenly and without warning as a result of adverse economic, market
or political conditions or adverse investor perceptions, whether or not accurate. Because of the lack of sufficient market liquidity, a Fund may incur losses because it will be required to effect sales at a disadvantageous time and only then at a
substantial drop in price. Invest-
|
|
| ments in emerging countries may be more difficult to price precisely because of the characteristics discussed above and lower trading volumes. |
| A Fund’s use of foreign currency management techniques in emerging countries may be limited. Due to the limited market for
these instruments in emerging countries, the Investment Adviser does not currently anticipate that a significant portion of the Funds’ currency exposure in emerging countries, if any, will be covered by such instruments.
|
| Risks of Derivative Investments. A Fund’s transactions, if any, in options, futures, options on futures, swaps,
interest rate caps, floors and collars, structured securities and currency transactions involve additional risk of loss. Loss can result from a lack of correlation between changes in the value of derivative instruments and the portfolio assets (if any)
being hedged, the potential illiquidity of the markets for derivative instruments, or the risks arising from margin requirements and related leverage factors associated with such transactions. The use of these management techniques also involves the risk
of loss if the Investment Adviser is incorrect in its expectation of fluctuations in securities prices, interest rates or currency prices. Each Fund may also invest in derivative investments for non-hedging purposes (that is, to seek to increase total
return). Investing for non-hedging purposes is considered a speculative practice and presents even greater risk of loss.
|
| Risks of Illiquid Securities. Each Fund may invest up to 15% of its net assets in illiquid securities which cannot
be disposed of in seven days in the ordinary course of business at fair value. Illiquid securities include:
|
n
|
Both domestic and foreign securities that are not readily marketable
|
n
|
Certain stripped mortgage-backed securities
|
n
|
Repurchase agreements and time deposits with a notice or demand period of more than seven days
|
n
|
Certain over-the-counter options
|
n
|
Certain structured securities and all swap transactions
|
n
|
Certain restricted securities, unless it is determined, based upon a review of the trading markets for a specific restricted
security, that such restricted security is eligible for resale pursuant to Rule 144A under the Securities Act of 1933 (“144A Securities”) and, therefore, is liquid.
|
| Investing in 144A Securities may decrease the liquidity of a Fund’s portfolio to the extent that qualified institutional
buyers become for a time uninterested in purchasing these restricted securities. The purchase price and subsequent valuation of restricted and illiquid securities normally reflect a discount, which may be significant, from the market price of comparable
securities for which a liquid market exists.
|
| Credit Risks. Debt securities purchased by the Funds may include securities (including zero coupon bonds) issued by
the U.S. government (and its agencies, instrumentalities and sponsored enterprises), foreign governments, domestic and foreign corporations, banks and other issuers. Further information is provided in the Additional Statement.
|
| Debt securities rated BBB or higher by Standard & Poor’s or Baa or higher by Moody’s are considered “investment
grade.” Securities rated BBB or Baa are considered medium-grade obligations with speculative characteristics, and adverse economic conditions or changing circumstances may weaken their issuers’ capacity to pay interest and repay principal. A
security will be deemed to have met a rating requirement if it receives the minimum required rating from at least one such rating organization even though it has been rated below the minimum rating by one or more other rating organizations, or if unrated
by such rating organizations, determined by the Investment Adviser to be of comparable credit quality.
|
| Certain Funds may invest in fixed-income securities rated BB or Ba or below (or comparable unrated securities) which are commonly
referred to as “junk bonds.” Junk bonds are considered predominantly speculative and may be questionable as to principal and interest payments.
|
| In some cases, junk bonds may be highly speculative, have poor prospects for reaching investment grade standing and be in default.
As a result, investment in such bonds will present greater speculative risks than those associated with investment in investment grade bonds. Also, to the extent that the rating assigned to a security in a Fund’s portfolio is downgraded by a rating
organization, the market price and liquidity of such security may be adversely affected.
|
| Risks of Initial Public Offerings. The Funds may invest in IPOs. An IPO is a company’s first offering of stock
to the public. IPO risk is the risk that the market value of IPO shares will fluctuate considerably due to factors such as the absence of a prior public market, unseasoned trading, the small number of shares available for trading and limited information
about the issuer. The purchase of IPO shares may involve high transaction costs. IPO shares are subject to market risk and liquidity risk. When a Fund’s asset base is small, a significant portion of the Fund’s performance could be attributable
to investments in IPOs, because such investments would have a magnified impact on the Fund. As the Fund’s assets grow, the effect of the Fund’s investments in IPOs on the Fund’s performance probably will decline, which could reduce the
Fund’s performance. Because of the price volatility of IPO shares, a Fund may choose to hold IPO shares for a very short period of time. This may increase the turnover of the Fund’s portfolio and may lead to increased expenses to the Fund, such
as commissions and transaction costs. By selling IPO shares, the Fund may realize taxable gains it will subse-
|
| quently distribute to shareholders. In addition, the market for IPO shares can be speculative and/or inactive for extended
periods of time. There is no assurance that a Fund will be able to obtain allocable portions of IPO shares. The limited number of shares available for trading in some IPOs may make it more difficult for a Fund to buy or sell significant amounts of shares
without an unfavorable impact on prevailing prices. Investors in IPO shares can be affected by substantial dilution in the value of their shares, by sales of additional shares and by concentration of control in existing management and principal shareholders
.
|
| Temporary Investment Risks. Each Fund may, for temporary defensive purposes, invest a certain percentage of its
total assets in:
|
n
|
U.S. government securities
|
n
|
Commercial paper rated at least A-2 by Standard & Poor’s or P-2 by Moody’s
|
n
|
Certificates of deposit
|
n
|
Bankers’ acceptances
|
n
|
Repurchase agreements
|
n
|
Non-convertible preferred stocks and non-convertible corporate bonds with a remaining maturity of less than one year
|
| When a Fund’s assets are invested in such instruments, the Fund may not be achieving its investment objective.
|
| C. Portfolio Securities and Techniques
|
| This section provides further information on certain types of securities and investment techniques that may be used by the Funds,
including their associated risks. Further information is provided in the Additional Statement, which is available upon request.
|
| Convertible Securities. Each Fund may invest in convertible securities. Convertible securities are preferred stock
or debt obligations that are convertible into common stock. Convertible securities generally offer lower interest or dividend yields than non-convertible securities of similar quality. Convertible securities in which a Fund invests are subject to the same
rating criteria as its other investments in fixed-income securities. Convertible securities have both equity and fixed-income risk characteristics. Like all fixed-income securities, the value of convertible securities is susceptible to the risk of market
losses attributable to changes in interest rates. Generally, the market value of convertible securities tends to decline as interest rates increase and, conversely, to increase as interest rates decline. However, when the market price of the common stock
underlying a convertible security exceeds the conversion price of the convertible security, the convertible security tends to reflect the market price of the underlying common stock. As the market
|
|
| price of the underlying common stock declines, the convertible security, like a fixed-income security, tends to trade increasingly on a yield basis, and thus may not decline in price to the same extent as the underlying common stock. |
| Foreign Currency Transactions. A Fund may, to the extent consistent with its investment policies, purchase or sell
foreign currencies on a cash basis or through forward contracts. A forward contract involves an obligation to purchase or sell a specific currency at a future date at a price set at the time of the contract. A Fund may engage in foreign currency
transactions for hedging purposes and to seek to protect against anticipated changes in future foreign currency exchange rates. In addition, certain Funds may also enter into such transactions to seek to increase total return, which is considered a
speculative practice.
|
| Some Funds may also engage in cross-hedging by using forward contracts in a currency different from that in which the hedged
security is denominated or quoted. A Fund may hold foreign currency received in connection with investments in foreign securities when, in the judgment of the Investment Adviser, it would be beneficial to convert such currency into U.S. dollars at a later
date (e.g., the Investment Adviser may anticipate the foreign currency to appreciate against the U.S. dollar).
|
| Currency exchange rates may fluctuate significantly over short periods of time, causing, along with other factors, a Fund’s
NAV to fluctuate (when the Fund’s NAV fluctuates, the value of your shares may go up or down). Currency exchange rates also can be affected unpredictably by the intervention of U.S. or foreign governments or central banks, or the failure to
intervene, or by currency controls or political developments in the United States or abroad.
|
| The market in forward foreign currency exchange contracts, currency swaps and other privately negotiated currency instruments
offers less protection against defaults by the other party to such instruments than is available for currency instruments traded on an exchange. Such contracts are subject to the risk that the counterparty to the contract will default on its obligations.
Since these contracts are not guaranteed by an exchange or clearinghouse, a default on a contract would deprive a Fund of unrealized profits, transaction costs or the benefits of a currency hedge or could force the Fund to cover its purchase or sale
commitments, if any, at the current market price.
|
| Structured Securities. Each Fund may invest in structured securities. Structured securities are securities whose
value is determined by reference to changes in the value of specific currencies, interest rates, commodities, indices or other financial indicators (the “Reference”) or the relative change in two or more References.
The interest rate or the principal amount payable upon maturity or redemption may be increased or decreased depending upon changes in the applicable Reference. Structured securities may be positively or negatively indexed, so that appreciation of the
Reference may produce an increase or decrease in the interest rate or value of the security at maturity. In addition, changes in the interest rates or the value of the security at maturity may be a multiple of changes in the value of the Reference.
Consequently, structured securities may present a greater degree of market risk than other types of fixed-income securities and may be more volatile, less liquid and more difficult to price accurately than less complex securities.
|
| REITs. Each Fund may invest in REITs. REITs are pooled investment vehicles that invest primarily in either real
estate or real estate related loans. The value of a REIT is affected by changes in the value of the properties owned by the REIT or securing mortgage loans held by the REIT. REITs are dependent upon the ability of the REITs’ managers, and are subject
to heavy cash flow dependency, default by borrowers and the qualification of the REITs under applicable regulatory requirements for favorable income tax treatment. REITs are also subject to risks generally associated with investments in real estate
including possible declines in the value of real estate, general and local economic conditions, environmental problems and changes in interest rates. To the extent that assets underlying a REIT are concentrated geographically, by property type or in
certain other respects, these risks may be heightened. A Fund will indirectly bear its proportionate share of any expenses, including management fees, paid by a REIT in which it invests.
|
| Options on Securities, Securities Indices and Foreign Currencies. A put option gives the purchaser of the option the
right to sell, and the writer (seller) of the option the obligation to buy, the underlying instrument during the option period. A call option gives the purchaser of the option the right to buy, and the writer (seller) of the option the obligation to sell,
the underlying instrument during the option period. Each Fund may write (sell) covered call and put options and purchase put and call options on any securities in which they may invest or on any securities index consisting of securities in which they may
invest. A Fund may also, to the extent that it invests in foreign securities, purchase and sell (write) put and call options on foreign currencies.
|
| The writing and purchase of options is a highly specialized activity which involves special investment risks. Options may be used
for either hedging or cross-hedging purposes, or to seek to increase total return (which is considered a speculative activity). The successful use of options depends in part on the ability of the Investment Adviser to manage future price fluctuations and
the degree of correlation between the options and securities (or currency) markets. If the Invest
ment Adviser is incorrect in its expectation of changes in market prices or determination of the correlation between the instruments or indices on which options are written and purchased and the instruments in a Fund’s investment portfolio, the Fund
may incur losses that it would not otherwise incur. The use of options can also increase a Fund’s transaction costs. Options written or purchased by the Funds may be traded on either U.S. or foreign exchanges or over-the-counter. Foreign and
over-the-counter options will present greater possibility of loss because of their greater illiquidity and credit risks.
|
| Futures Contracts and Options on Futures Contracts. Futures contracts are standardized, exchange-traded contracts
that provide for the sale or purchase of a specified financial instrument or currency at a future time at a specified price. An option on a futures contract gives the purchaser the right (and the writer of the option the obligation) to assume a position
in a futures contract at a specified exercise price within a specified period of time. A futures contract may be based on various securities (such as U.S. government securities), foreign currencies, securities indices and other financial instruments and
indices. The Funds may engage in futures transactions on both U.S. and foreign exchanges.
|
| Each Fund may purchase and sell futures contracts, and purchase and write call and put options on futures contracts, in order to
seek to increase total return or to hedge against changes in interest rates, securities prices or, to the extent a Fund invests in foreign securities, currency exchange rates, or to otherwise manage their term structures, sector selection and durations in
accordance with their investment objectives and policies. Each Fund may also enter into closing purchase and sale transactions with respect to such contracts and options. A Fund will engage in futures and related options transactions for bona fide hedging
purposes as defined in regulations of the Commodity Futures Trading Commission or to seek to increase total return to the extent permitted by such regulations. A Fund may not purchase or sell futures contracts or purchase or sell related options to seek
to increase total return, except for closing purchase or sale transactions, if immediately thereafter the sum of the amount of initial margin deposits and premiums paid on the Fund’s outstanding positions in futures and related options entered into
for the purpose of seeking to increase total return would exceed 5% of the market value of the Fund’s net assets.
|
| Futures contracts and related options present the following risks:
|
n
|
While a Fund may benefit from the use of futures and options on futures, unanticipated changes in interest rates, securities
prices or currency exchange rates may result in poorer overall performance than if the Fund had not entered into any futures contracts or options transactions.
|
n
|
Because perfect correlation between a futures position and portfolio position that is intended to be protected is impossible to
achieve, the desired protection may not be obtained and a Fund may be exposed to additional risk of loss.
|
n
|
The loss incurred by a Fund in entering into futures contracts and in writing call options on futures is potentially unlimited and
may exceed the amount of the premium received.
|
n
|
Futures markets are highly volatile and the use of futures may increase the volatility of a Fund’s NAV.
|
n
|
As a result of the low margin deposits normally required in futures trading, a relatively small price movement in a futures
contract may result in substantial losses to a Fund.
|
n
|
Futures contracts and options on futures may be illiquid, and exchanges may limit fluctuations in futures contract prices during a
single day.
|
n
|
Foreign exchanges may not provide the same protection as U.S. exchanges.
|
| Equity Swaps. Each Fund may invest in equity swaps. Equity swaps allow the parties to a swap agreement to exchange
the dividend income or other components of return on an equity investment (for example, a group of equity securities or an index) for a component of return on another non-equity or equity investment.
|
| An equity swap may be used by a Fund to invest in a market without owning or taking physical custody of securities in
circumstances in which direct investment may be restricted for legal reasons or is otherwise impractical. Equity swaps are derivatives and their value can be very volatile. To the extent that the Investment Adviser does not accurately analyze and predict
the potential relative fluctuation of the components swapped with another party, a Fund may suffer a loss, which may be substantial. The value of some components of an equity swap (such as the dividends on a common stock) may also be sensitive to changes
in interest rates. Furthermore, a Fund may suffer a loss if the counterparty defaults. Because equity swaps are normally illiquid, a Fund may be unable to terminate its obligations when desired.
|
| When-Issued Securities and Forward Commitments. Each Fund may purchase when-issued securities and make contracts to
purchase or sell securities for a fixed price at a future date beyond customary settlement time. When-issued securities are securities that have been authorized, but not yet issued. When-issued securities are purchased in order to secure what is
considered to be an advantageous price and yield to the Fund at the time of entering into the transaction. A forward commitment involves the entering into a contract to purchase or sell securities for a fixed price at a future date beyond the customary
settlement period.
|
| The purchase of securities on a when-issued or forward commitment basis involves a risk of loss if the value of the security to be
purchased declines before
the settlement date. Conversely, the sale of securities on a forward commitment basis involves the risk that the value of the securities sold may increase before the settlement date. Although a Fund will generally purchase securities on a when-issued or
forward commitment basis with the intention of acquiring the securities for its portfolio, a Fund may dispose of when-issued securities or forward commitments prior to settlement if the Investment Adviser deems it appropriate.
|
| Repurchase Agreements. Repurchase agreements involve the purchase of securities subject to the seller’s
agreement to repurchase them at a mutually agreed upon date and price. Each Fund may enter into repurchase agreements with dealers in U.S. government securities and member banks of the Federal Reserve System which furnish collateral at least equal in
value or market price to the amount of their repurchase obligation.
|
| If the other party or “seller” defaults, a Fund might suffer a loss to the extent that the proceeds from the sale of the
underlying securities and other collateral held by the Fund are less than the repurchase price and the Fund’s costs associated with delay and enforcement of the repurchase agreement. In addition, in the event of bankruptcy of the seller, a Fund could
suffer additional losses if a court determines that the Fund’s interest in the collateral is not enforceable.
|
| In evaluating whether to enter into a repurchase agreement, the Investment Adviser will carefully consider the creditworthiness of
the seller. Certain Funds, together with other registered investment companies having advisory agreements with the Investment Adviser or any of its affiliates, may transfer uninvested cash balances into a single joint account, the daily aggregate balance
of which will be invested in one or more repurchase agreements.
|
| Lending of Portfolio Securities. Each Fund may engage in securities lending. Securities lending involves the lending
of securities owned by a Fund to financial institutions such as certain broker-dealers. The borrowers are required to secure their loan continuously with cash, cash equivalents, U.S. government securities or letters of credit in an amount at least equal
to the market value of the securities loaned. Cash collateral may be invested in cash equivalents. To the extent that cash collateral is invested in other investment securities, such collateral will be subject to market depreciation or appreciation, and a
Fund will be responsible for any loss that might result from its investment of the borrowers’ collateral. If the Investment Adviser determines to make securities loans, the value of the securities loaned may not exceed 33 1
/3% of the value of the total assets of a
Fund (including the loan collateral).
|
| A Fund may lend its securities to increase its income. A Fund may, however, experience delay in the recovery of its securities if
the institution with which it has engaged in a portfolio loan transaction breaches its agreement with the Fund.
|
| Short Sales Against-the-Box. Certain Funds may make short sales against-the-box. A short sale against-the-box means
that at all times when a short position is open the Fund will own an equal amount of securities sold short, or securities convertible into or exchangeable for, without payment of any further consideration, an equal amount of the securities of the same
issuer as the securities sold short.
|
| Preferred Stock, Warrants and Rights. Each Fund may invest in preferred stock, warrants and rights. Preferred stocks
are securities that represent an ownership interest providing the holder with claims on the issuer’s earnings and assets before common stock owners but after bond owners. Unlike debt securities, the obligations of an issuer of preferred stock,
including dividend and other payment obligations, may not typically be accelerated by the holders of such preferred stock on the occurrence of an event of default or other non-compliance by the issuer of the preferred stock.
|
| Warrants and other rights are options to buy a stated number of shares of common stock at a specified price at any time during the
life of the warrant or right. The holders of warrants and rights have no voting rights, receive no dividends and have no rights with respect to the assets of the issuer.
|
| Other Investment Companies. Each Fund may invest in securities of other investment companies (including
exchange-traded funds such as SPDRs and iShares
SM
, as defined below) subject to statutory limitations prescribed by the Act. These limitations include a
prohibition on any Fund acquiring more than 3% of the voting shares of any other investment company, and a prohibition on investing more than 5% of a Fund’s total assets in securities of any one investment company or more than 10% of its total assets
in securities of all investment companies. A Fund will indirectly bear its proportionate share of any management fees and other expenses paid by such other investment companies. Exchange-traded funds such as SPDRs and iShares
SM
are shares of unaffiliated investment companies which are traded like traditional equity securities on a national
securities exchange or the NASDAQ® National Market System.
|
n
|
Standard & Poor’s Depositary Receipts™.
The Funds may, consistent with their investment policies, purchase Standard & Poor’s Depositary Receipts™ (“SPDRs”). SPDRs are securities traded on the American Stock Exchange (“AMEX”) that represent
ownership in the SPDR Trust, a trust which has been established to accumulate and hold a portfolio of common stocks that is intended to track the price performance and dividend yield of the S&P 500®. The SPDR Trust is sponsored by a subsidiary of
the AMEX. SPDRs may be used for several reasons, including, but not limited to, facilitating the handling
|
| of cash flows or trading, or reducing transaction costs. The price movement of SPDRs may not perfectly parallel the price action
of the S&P 500®.
|
n
|
iShares
SM
(formerly World Equity Benchmark Shares or WEBs). iShares are shares of an investment company that invests substantially all of its assets in securities included
in the MSCI indices for specified countries. iShares are listed on the AMEX and were initially offered to the public in 1996. The market prices of iShares are expected to fluctuate in accordance with both changes in the NAVs of their underlying indices
and supply and demand of iShares on the AMEX. To date, iShares have traded at relatively modest discounts and premiums to their NAVs. However, iShares have a limited operating history and information is lacking regarding the actual performance and trading
liquidity of iShares for extended periods or over complete market cycles. In addition, there is no assurance that the requirements of the AMEX necessary to maintain the listing of iShares will continue to be met or will remain unchanged. In the event
substantial market or other disruptions affecting iShares should occur in the future, the liquidity and value of a Fund’s shares could also be substantially and adversely affected. If such disruptions were to occur, a Fund could be required to
reconsider the use of iShares as part of its investment strategy.
|
| Unseasoned Companies. Each Fund may invest in companies (including predecessors) which have operated less than three
years. The securities of such companies may have limited liquidity, which can result in their being priced higher or lower than might otherwise be the case. In addition, investments in unseasoned companies are more speculative and entail greater risk than
do investments in companies with an established operating record.
|
| Corporate Debt Obligations. Corporate debt obligations include bonds, notes, debentures, commercial paper and other
obligations of corporations to pay interest and repay principal, and include securities issued by banks and other financial institutions. Each Fund may invest in corporate debt obligations issued by U.S. and certain non-U.S. issuers which issue securities
denominated in the U.S. dollar (including Yankee and Euro obligations). In addition to obligations of corporations, corporate debt obligations include securities issued by banks and other financial institutions and supranational entities (i.e., the World Bank, the International Monetary Fund, etc.).
|
| Bank Obligations. Each Fund may invest in obligations issued or guaranteed by U.S. or foreign banks. Bank
obligations, including without limitations, time deposits, bankers’ acceptances and certificates of deposit, may be general obligations of the parent bank or may be limited to the issuing branch by the terms of the specific obligations or by
government regulations. Banks are subject to extensive but different governmental regulations which may limit both the amount and types of
|
|
| loans which may be made and interest rates which may be charged. In addition, the profitability of the banking industry is largely dependent upon the availability and cost of funds for the purpose of financing lending operations under prevailing money market conditions. General economic conditions as well as exposure to credit losses arising from possible financial difficulties of borrowers play an important part in the operation of this industry. |
| U.S. Government Securities. Each Fund may invest in U.S. government securities. U.S. government securities include
U.S. Treasury obligations and obligations issued or guaranteed by U.S. government agencies, instrumentalities or sponsored enterprises. U.S. government securities may be supported by (a) the full faith and credit of the U.S. Treasury (such as the
Government National Mortgage Association (“Ginnie Mae”)); (b) the right of the issuer to borrow from the U.S. Treasury (such as securities of the Student Loan Marketing Association); (c) the discretionary authority of the U.S. government to
purchase certain obligations of the issuer; or (d) only the credit of the issuer. U.S. government securities also include Treasury receipts, zero coupon bonds and other stripped U.S. government securities, where the interest and principal components of
stripped U.S. government securities are traded independently.
|
| Custodial Receipts. Interests in U.S. government securities may be purchased in the form of custodial receipts that
evidence ownership of future interest payments, principal payments or both on certain notes or bonds issued or guaranteed as to principal and interest by the U.S. government, its agencies, instrumentalities, political subdivisions or authorities. For
certain securities law purposes, custodial receipts are not considered obligations of the U.S. government.
|
| Mortgage-Backed Securities. Certain Funds may invest in mortgage-backed securities. Mortgage-backed securities
represent direct or indirect participations in, or are collateralized by and payable from, mortgage loans secured by real property. Mortgage-backed securities can be backed by either fixed rate mortgage loans or adjustable rate mortgage loans, and may be
issued by either a governmental or non-governmental entity. Privately issued mortgage-backed securities are normally structured with one or more types of “credit enhancement.” However, these mortgage-backed securities typically do not have the
same credit standing as U.S. government guaranteed mortgage-backed securities.
|
| Mortgage-backed securities may include multiple class securities, including collateralized mortgage obligations (“CMOs”)
and Real Estate Mortgage Investment Conduit (“REMIC”) pass-through or participation certificates. CMOs provide an investor with a specified interest in the cash flow from a pool of underlying mortgages or of other mortgage-backed securities.
CMOs are issued in multiple classes. In many cases, payments of principal are applied to the CMO classes in the
order of their respective stated maturities, so that no principal payments will be made on a CMO class until all other classes having an earlier stated maturity date are paid in full. A REMIC is a CMO that qualifies for special tax treatment and invests
in certain mortgages principally secured by interests in real property and other permitted investments.
|
| Mortgaged-backed securities also include stripped mortgage-backed securities (“SMBS”), which are derivative multiple
class mortgage-backed securities. SMBS are usually structured with two different classes: one that receives substantially all of the interest payments and the other that receives substantially all of the principal payments from a pool of mortgage loans.
The market value of SMBS consisting entirely of principal payments generally is unusually volatile in response to changes in interest rates. The yields on SMBS that receive all or most of the interest from mortgage loans are generally higher than
prevailing market yields on other mortgage-backed securities because their cash flow patterns are more volatile and there is a greater risk that the initial investment will not be fully recouped.
|
| Asset-Backed Securities. Certain Funds may invest in asset-backed securities. Asset-backed securities are securities
whose principal and interest payments are collateralized by pools of assets such as auto loans, credit card receivables, leases, installment contracts and personal property. Asset-backed securities are often subject to more rapid repayment than their
stated maturity date would indicate as a result of the pass-through of prepayments of principal on the underlying loans. During periods of declining interest rates, prepayment of loans underlying asset-backed securities can be expected to accelerate.
Accordingly, a Fund’s ability to maintain positions in such securities will be affected by reductions in the principal amount of such securities resulting from prepayments, and its ability to reinvest the returns of principal at comparable yields is
subject to generally prevailing interest rates at that time. Asset-backed securities present credit risks that are not presented by mortgage-backed securities. This is because asset-backed securities generally do not have the benefit of a security
interest in collateral that is comparable to mortgage assets. If the issuer of an asset-backed security defaults on its payment obligations, there is the possibility that, in some cases, the Fund will be unable to possess and sell the underlying
collateral and that the Fund’s recoveries on repossessed collateral may not be available to support payments on the securities. In the event of a default, a Fund may suffer a loss if it cannot sell collateral quickly and receive the amount it is owed.
|
| Borrowings. Each Fund can borrow money from banks and other financial institutions in amounts not exceeding
one-third of its total assets for temporary or emergency purposes. A Fund may not make additional investments if borrowings exceed 5% of its total assets.
|
| Mortgage Dollar Rolls. Certain Funds may enter into mortgage dollar rolls. A mortgage dollar roll involves the sale
by a Fund of securities for delivery in the current month. The Fund simultaneously contracts with the same counterparty to repurchase substantially similar (same type, coupon and maturity) but not identical securities on a specified future date. During
the roll period, the Fund loses the right to receive principal and interest paid on the securities sold. However, the Fund benefits to the extent of any difference between (a) the price received for the securities sold and (b) the lower forward price for
the future purchase and/or fee income plus the interest earned on the cash proceeds of the securities sold. Unless the benefits of a mortgage dollar roll exceed the income, capital appreciation and gain or loss due to mortgage prepayments that would have
been realized on the securities sold as part of the roll, the use of this technique will diminish the Fund’s performance.
|
| Successful use of mortgage dollar rolls depends upon the Investment Adviser’s ability to predict correctly interest rates and
mortgage prepayments. If the Investment Adviser is incorrect in its prediction, a Fund may experience a loss. For financial reporting and tax purposes, the Funds treat mortgage dollar rolls as two separate transactions: one involving the purchase of a
security and a separate transaction involving a sale. The Funds do not currently intend to enter into mortgage dollar rolls that are accounted for as a financing and do not treat them as borrowings.
|
| Yield Curve Options. Certain Funds may enter into options on the yield “spread” or differential between
two securities. Such transactions are referred to as “yield curve” options. In contrast to other types of options, a yield curve option is based on the difference between the yields of designated securities, rather than the prices of the
individual securities, and is settled through cash payments. Accordingly, a yield curve option is profitable to the holder if this differential widens (in the case of a call) or narrows (in the case of a put), regardless of whether the yields of the
underlying securities increase or decrease.
|
| The trading of yield curve options is subject to all of the risks associated with the trading of other types of options. In
addition, such options present a risk of loss even if the yield of one of the underlying securities remains constant, or if the spread moves in a direction or to an extent which was not anticipated.
|
| Reverse Repurchase Agreements. Certain Funds may enter into reverse repurchase agreements. Reverse repurchase
agreements involve the sale of securities held by a Fund subject to the Fund’s agreement to repurchase them at a mutually agreed upon date and price (including interest). These transactions may be entered into as a temporary measure for emergency
purposes or to meet redemption requests. Reverse repurchase agreements may also be entered into when the Invest
ment Adviser expects that the interest income to be earned from the investment of the transaction proceeds will be greater than the related interest expense. Reverse repurchase agreements involve leveraging. If the securities held by a Fund decline in
value while these transactions are outstanding, the NAV of the Fund’s outstanding shares will decline in value by proportionately more than the decline in value of the securities. In addition, reverse repurchase agreements involve the risk that the
interest income earned by a Fund (from the investment of the proceeds) will be less than the interest expense of the transaction, that the market value of the securities sold by a Fund will decline below the price the Fund is obligated to pay to
repurchase the securities, and that the securities may not be returned to the Fund.
|
| Municipal Securities. Certain Funds may invest in securities and instruments issued by state and local government
issuers. Municipal securities in which a Fund may invest consist of bonds, notes, commercial paper and other instruments (including participating interests in such securities) issued by or on behalf of states, territories and possessions of the United
States (including the District of Columbia) and their political subdivisions, agencies or instrumentalities. Such securities may pay fixed, variable or floating rates of interest. Municipal securities are often issued to obtain funds for various public
purposes, including the construction of a wide range of public facilities such as bridges, highways, housing, hospitals, mass transportation, schools, streets and water and sewer works. Other public purposes for which municipal securities may be issued
include refunding outstanding obligations, obtaining funds for general operating expenses, and obtaining funds to lend to other public institutions and facilities. Municipal securities in which a Fund may invest include private activity bonds, municipal
leases, certificates of participation, pre-funded municipal securities and auction rate securities.
|
| Interest Rate Swaps, Mortgage Swaps, Credit Swaps, Currency Swaps and Interest Rate Caps, Floors and Collars.
Interest rate swaps involve the exchange by a Fund with another party of their respective commitments to pay or receive interest, such as an exchange of fixed-rate payments for floating rate payments. Mortgage swaps are similar to interest rate swaps in
that they represent commitments to pay and receive interest. The notional principal amount, however, is tied to a reference pool or pools of mortgages. Credit swaps involve the receipt of floating or fixed rate payments in exchange for assuming potential
credit losses of an underlying security. Credit swaps give one party to a transaction the right to dispose of or acquire an asset (or group of assets), or the right to receive or make a payment from the other party, upon the occurrence of specified credit
events. Currency swaps involve the exchange of the parties’ respective rights to make or receive payments in specified currencies. The purchase of an interest rate cap entitles the purchaser, to the extent that a specified index exceeds a
predetermined interest
rate, to receive payment of interest on a notional principal amount from the party selling such interest rate cap. The purchase of an interest rate floor entitles the purchaser, to the extent that a specified index falls below a predetermined interest
rate, to receive payments of interest on a notional principal amount from the party selling the interest rate floor. An interest rate collar is the combination of a cap and a floor that preserves a certain return within a predetermined range of interest
rates.
|
| Certain Funds may enter into swap transactions for hedging purposes or to seek to increase total return. The use of interest rate,
mortgage, credit and currency swaps, as well as interest rate caps, floors and collars, is a highly specialized activity which involves investment techniques and risks different from those associated with ordinary portfolio securities transactions. If the
Investment Adviser is incorrect in its forecasts of market value, interest rates and currency exchange rates, the investment performance of a Fund would be less favorable than it would have been if these investment techniques were not used.
|
| Loan Participations. Certain Funds may invest in loan participations. A loan participation is an interest in a loan
to a U.S. or foreign company or other borrower which is administered and sold by a financial intermediary. A Fund may only invest in loans to issuers in whose obligations it may otherwise invest. Loan participation interests may take the form of a direct
or co-lending relationship with the corporate borrower, an assignment of an interest in the loan by a co-lender or another participant, or a participation in the seller’s share of the loan. When a Fund acts as co-lender in connection with a
participation interest or when it acquires certain participation interests, the Fund will have direct recourse against the borrower if the borrower fails to pay scheduled principal and interest. In cases where the Fund lacks direct recourse, it will look
to the agent bank to enforce appropriate credit remedies against the borrower. In these cases, the Fund may be subject to delays, expenses and risks that are greater than those that would have been involved if the Fund had purchased a direct obligation
(such as commercial paper) of such borrower. Moreover, under the terms of the loan participation, the Fund may be regarded as a creditor of the agent bank (rather than of the underlying corporate borrower), so that the Fund may also be subject to the risk
that the agent bank may become insolvent.
|
| Inverse Floaters. Certain Funds may invest in inverse floating rate debt securities (“inverse floaters”).
The interest rate on inverse floaters resets in the opposite direction from the market rate of interest to which the inverse floater is indexed. An inverse floater may be considered to be leveraged to the extent that its interest rate varies by a
magnitude that exceeds the magnitude of the change in the index rate of interest. The higher the degree of leverage of an inverse floater, the greater the volatility of its market value.
|
| The financial highlights tables are intended to help you understand a Fund’s financial performance for the past five years
(or less if the Fund has not been in operation for less than five years). Certain information reflects financial results for a single Fund share. The total returns in the table represent the rate that an investor would have earned or lost on an investment
in a Fund (assuming reinvestment of all dividends and distributions). This information for the periods ended August 30, 2000 has been audited by PricewaterhouseCoopers LLP, whose report, along with a Fund’s financial statements, is included in the
Fund’s annual report (available upon request). The information for all periods prior to the periods ended August 31, 2000 has been audited by the Funds’ previous independent accountants.
|
| BALANCED FUND
|
|
Income from investment operations |
|||||||||||
|---|---|---|---|---|---|---|---|---|---|---|---|
|
Net asset value, beginning of period |
Net
investment Income |
Net realized
and unrealized gain(loss) |
Total from
investment operations |
||||||||
| For The Year Ended August 31, | |||||||||||
| 2000 - Class A Shares | $20.38 | $0.60 | c | $ 1.75 | $2.35 | ||||||
| 2000 - Class B Shares | 20.26 | 0.45 | c | 1.73 | 2.18 | ||||||
| 2000 - Class C Shares | 20.23 | 0.45 | c | 1.74 | 2.19 | ||||||
| 2000 - Institutional Shares | 20.39 | 0.71 | c | 1.75 | 2.46 | ||||||
| 2000 - Service Shares | 20.37 | 0.59 | c | 1.74 | 2.33 | ||||||
| For The Seven Months Ended August 31, | |||||||||||
| 1999 - Class A Shares | 20.48 | 0.32 | (0.19 | ) | 0.13 | ||||||
| 1999 - Class B Shares | 20.37 | 0.22 | (0.18 | ) | 0.04 | ||||||
| 1999 - Class C Shares | 20.34 | 0.23 | (0.19 | ) | 0.04 | ||||||
| 1999 - Institutional Shares | 20.48 | 0.53 | (0.35 | ) | 0.18 | ||||||
| 1999 - Service Shares | 20.47 | 1.22 | (1.14 | ) | 0.08 | ||||||
| For The Years Ended January 31, | |||||||||||
| 1999 - Class A Shares | 20.29 | 0.58 | 0.20 | 0.78 | |||||||
| 1999 - Class B Shares | 20.20 | 0.41 | 0.21 | 0.62 | |||||||
| 1999 - Class C Shares | 20.17 | 0.41 | 0.21 | 0.62 | |||||||
| 1999 - Institutional Shares | 20.29 | 0.64 | 0.20 | 0.84 | |||||||
| 1999 - Service Shares | 20.28 | 0.53 | 0.21 | 0.74 | |||||||
| 1998 - Class A Shares | 18.78 | 0.57 | 2.66 | 3.23 | |||||||
| 1998 - Class B Shares | 18.73 | 0.50 | 2.57 | 3.07 | |||||||
| 1998 - Class C Shares (commenced August 15, 1997) | 21.10 | 0.25 | 0.24 | 0.49 | |||||||
| 1998 - Institutional Shares (commenced August 15, 1997) | 21.18 | 0.26 | 0.32 | 0.58 | |||||||
| 1998 - Service Shares (commenced August 15, 1997) | 21.18 | 0.22 | 0.32 | 0.54 | |||||||
| 1997 - Class A Shares | 17.31 | 0.66 | 2.47 | 3.13 | |||||||
| 1997 - Class B Shares (commenced May 1, 1996) | 17.46 | 0.42 | 2.34 | 2.76 | |||||||
| 1996 - Class A Shares | 14.22 | 0.51 | 3.43 | 3.94 | |||||||
|
Distributions to shareholders |
|||||||||||||||||||||
|---|---|---|---|---|---|---|---|---|---|---|---|---|---|---|---|---|---|---|---|---|---|
| From net
investment income |
In excess of net investment income |
From net
realized gains |
Total
distributions |
Net asset
value, end of period |
Total
return a |
Net assets
at end of period (in 000s) |
Ratio of
net expenses to average net assets |
||||||||||||||
| $(0.50 | ) | $ — | $(0.81 | ) | $(1.31 | ) | $21.42 | 12.00 | % | $135,632 | 1.12 | % | |||||||||
| (0.36 | ) | — | (0.81 | ) | (1.17 | ) | 21.27 | 11.17 | 33,759 | 1.87 | |||||||||||
| (0.36 | ) | — | (0.81 | ) | (1.17 | ) | 21.25 | 11.23 | 8,658 | 1.87 | |||||||||||
| (0.58 | ) | — | (0.81 | ) | (1.39 | ) | 21.46 | 12.59 | 2,509 | 0.72 | |||||||||||
| (0.48 | ) | — | (0.81 | ) | (1.29 | ) | 21.41 | 11.89 | 17 | 1.22 | |||||||||||
| (0.23 | ) | — | — | (0.23 | ) | 20.38 | 0.62 | 169,395 | 1.10 | b | |||||||||||
| (0.15 | ) | — | — | (0.15 | ) | 20.26 | 0.20 | 40,515 | 1.85 | b | |||||||||||
| (0.15 | ) | — | — | (0.15 | ) | 20.23 | 0.18 | 11,284 | 1.85 | b | |||||||||||
| (0.27 | ) | — | — | (0.27 | ) | 20.39 | 0.86 | 2,361 | 0.70 | b | |||||||||||
| (0.18 | ) | — | — | (0.18 | ) | 20.37 | 0.39 | 15 | 1.20 | b | |||||||||||
| (0.59 | ) | — | — | (0.59 | ) | 20.48 | 3.94 | 192,453 | 1.04 | ||||||||||||
| (0.45 | ) | — | — | (0.45 | ) | 20.37 | 3.15 | 43,926 | 1.80 | ||||||||||||
| (0.45 | ) | — | — | (0.45 | ) | 20.34 | 3.14 | 14,286 | 1.80 | ||||||||||||
| (0.65 | ) | — | — | (0.65 | ) | 20.48 | 4.25 | 8,010 | 0.73 | ||||||||||||
| (0.55 | ) | — | — | (0.55 | ) | 20.47 | 3.80 | 490 | 1.23 | ||||||||||||
| (0.56 | ) | — | (1.16 | ) | (1.72 | ) | 20.29 | 17.54 | 163,636 | 1.00 | |||||||||||
| (0.42 | ) | (0.02 | ) | (1.16 | ) | (1.60 | ) | 20.20 | 16.71 | 23,639 | 1.76 | ||||||||||
| (0.22 | ) | (0.04 | ) | (1.16 | ) | (1.42 | ) | 20.17 | 2.49 | 8,850 | 1.77 | b | |||||||||
| (0.23 | ) | (0.08 | ) | (1.16 | ) | (1.47 | ) | 20.29 | 2.93 | 8,367 | 0.76 | b | |||||||||
| (0.22 | ) | (0.06 | ) | (1.16 | ) | (1.44 | ) | 20.28 | 2.66 | 16 | 1.26 | b | |||||||||
| (0.66 | ) | — | (1.00 | ) | (1.66 | ) | 18.78 | 18.59 | 81,410 | 1.00 | |||||||||||
| (0.42 | ) | (0.07 | ) | (1.00 | ) | (1.49 | ) | 18.73 | 16.22 | 2,110 | 1.75 | b | |||||||||
| (0.50 | ) | — | (0.35 | ) | (0.85 | ) | 17.31 | 28.10 | 50,928 | 1.00 | |||||||||||
| BALANCED FUND (continued)
|
|
Ratios assuming no expense reductions |
|||||||||||||
|---|---|---|---|---|---|---|---|---|---|---|---|---|---|
| Ratio of
net investment income to average net assets |
Ratio of
expenses to average net assets |
Ratio of
net investment income to average net assets |
Portfolio
turnover rate d |
||||||||||
| For The Year Ended August 31, | |||||||||||||
| 2000 - Class A Shares | 2.94 | % | 1.29 | % | 2.77 | % | 153.69 | % | |||||
| 2000 - Class B Shares | 2.19 | 2.04 | 2.02 | 153.69 | |||||||||
| 2000 - Class C Shares | 2.19 | 2.04 | 2.02 | 153.69 | |||||||||
| 2000 - Institutional Shares | 3.46 | 0.89 | 3.29 | 153.69 | |||||||||
| 2000 - Service Shares | 2.86 | 1.39 | 2.69 | 153.69 | |||||||||
| For The Seven Months Ended August 31, | |||||||||||||
| 1999 - Class A Shares | 2.58 | b | 1.32 | b | 2.36 | b | 90.41 | ||||||
| 1999 - Class B Shares | 1.83 | b | 2.07 | b | 1.61 | b | 90.41 | ||||||
| 1999 - Class C Shares | 1.84 | b | 2.07 | b | 1.62 | b | 90.41 | ||||||
| 1999 - Institutional Shares | 2.96 | b | 0.92 | b | 2.74 | b | 90.41 | ||||||
| 1999 - Service Shares | 2.46 | b | 1.42 | b | 2.24 | b | 90.41 | ||||||
| For The Years Ended January 31, | |||||||||||||
| 1999 - Class A Shares | 2.90 | 1.45 | 2.49 | 175.06 | |||||||||
| 1999 - Class B Shares | 2.16 | 2.02 | 1.94 | 175.06 | |||||||||
| 1999 - Class C Shares | 2.17 | 2.02 | 1.95 | 175.06 | |||||||||
| 1999 - Institutional Shares | 3.22 | 0.95 | 3.00 | 175.06 | |||||||||
| 1999 - Service Shares | 2.77 | 1.45 | 2.55 | 175.06 | |||||||||
| 1998 - Class A Shares | 2.94 | 1.57 | 2.37 | 190.43 | |||||||||
| 1998 - Class B Shares | 2.14 | 2.07 | 1.83 | 190.43 | |||||||||
| 1998 - Class C Shares (commenced August 15, 1997) | 2.13 | b | 2.08 | b | 1.82 | b | 190.43 | ||||||
| 1998 - Institutional Shares (commenced August 15, 1997) | 3.13 | b | 1.07 | b | 2.82 | b | 190.43 | ||||||
| 1998 - Service Shares (commenced August 15, 1997) | 2.58 | b | 1.57 | b | 2.27 | b | 190.43 | ||||||
| 1997 - Class A Shares | 3.76 | 1.77 | 2.99 | 208.11 | |||||||||
| 1997 - Class B Shares (commenced May 1, 1996) | 2.59 | b | 2.27 | b | 2.07 | b | 208.11 | ||||||
| 1996 - Class A Shares | 3.65 | 1.90 | 2.75 | 197.10 | |||||||||
| GROWTH AND INCOME FUND
|
|
Income from investment operations |
||||||||||||
|---|---|---|---|---|---|---|---|---|---|---|---|---|
|
Net asset value, beginning of period |
Net
investment income (loss) |
Net realized
and unrealized gain (loss) |
Total from
investment operations |
|||||||||
| For The Year Ended August 31, | ||||||||||||
| 2000 - Class A Shares | $24.68 | $ 0.07 | c | $1.44 | $1.51 | |||||||
| 2000 - Class B Shares | 24.46 | (0.10 | ) c | 1.42 | 1.32 | |||||||
| 2000 - Class C Shares | 24.41 | (0.09 | ) c | 1.40 | 1.31 | |||||||
| 2000 - Institutional Shares | 24.72 | 0.16 | c | 1.49 | 1.65 | |||||||
| 2000 - Service Shares | 24.68 | 0.05 | c | 1.44 | 1.49 | |||||||
| For The Seven Months Ended August 31, | ||||||||||||
| 1999 - Class A Shares | 24.33 | 0.19 | 0.31 | 0.50 | ||||||||
| 1999 - Class B Shares | 24.13 | 0.08 | 0.31 | 0.39 | ||||||||
| 1999 - Class C Shares | 24.08 | 0.08 | 0.30 | 0.38 | ||||||||
| 1999 - Institutional Shares | 24.35 | 0.34 | 0.23 | 0.57 | ||||||||
| 1999 - Service Shares | 24.33 | 0.17 | 0.32 | 0.49 | ||||||||
| For The Years Ended January 31, | ||||||||||||
| 1999 - Class A Shares | 25.93 | 0.20 | (1.60 | ) | (1.40 | ) | ||||||
| 1999 - Class B Shares | 25.73 | 0.02 | (1.58 | ) | (1.56 | ) | ||||||
| 1999 - Class C Shares | 25.70 | 0.02 | (1.59 | ) | (1.57 | ) | ||||||
| 1999 - Institutional Shares | 25.95 | 0.29 | (1.58 | ) | (1.29 | ) | ||||||
| 1999 - Service Shares | 25.92 | 0.17 | (1.58 | ) | (1.41 | ) | ||||||
| 1998 - Class A Shares | 23.18 | 0.11 | 5.27 | 5.38 | ||||||||
| 1998 - Class B Shares | 23.10 | 0.04 | 5.14 | 5.18 | ||||||||
| 1998 - Class C Shares (commenced August 15, 1997) | 28.20 | (0.01 | ) | 0.06 | 0.05 | |||||||
| 1998 - Institutional Shares | 23.19 | 0.27 | 5.23 | 5.50 | ||||||||
| 1998 - Service Shares | 23.17 | 0.14 | 5.23 | 5.37 | ||||||||
| 1997 - Class A Shares | 19.98 | 0.35 | 5.18 | 5.53 | ||||||||
| 1997 - Class B Shares (commenced May 1, 1996) | 20.82 | 0.17 | 4.31 | 4.48 | ||||||||
| 1997 - Institutional Shares (commenced June 3, 1996) | 21.25 | 0.29 | 3.96 | 4.25 | ||||||||
| 1997 - Service Shares (commenced March 6, 1996) | 20.71 | 0.28 | 4.50 | 4.78 | ||||||||
| 1996 - Class A Shares | 15.80 | 0.33 | 4.75 | 5.08 | ||||||||
|
Distributions to shareholders |
|||||||||||||||||||||
|---|---|---|---|---|---|---|---|---|---|---|---|---|---|---|---|---|---|---|---|---|---|
| From net
investment income |
In excess of net investment income |
From net
realized gains |
Total
distributions |
Net asset
value, end of period |
Total
returna |
Net assets
at end of period (in 000s) |
Ratio of
net expenses to average net assets |
||||||||||||||
| $(0.05 | ) | $(0.03 | ) | $(1.33 | ) | $(1.41 | ) | $24.78 | 6.48 | % | $ 576,354 | 1.18 | % | ||||||||
| (0.02 | ) | (0.01 | ) | (1.33 | ) | (1.36 | ) | 24.42 | 5.70 | 155,527 | 1.93 | ||||||||||
| (0.01 | ) | (0.01 | ) | (1.33 | ) | (1.35 | ) | 24.37 | 5.67 | 15,746 | 1.93 | ||||||||||
| (0.09 | ) | (0.04 | ) | (1.33 | ) | (1.46 | ) | 24.91 | 7.05 | 28,543 | 0.78 | ||||||||||
| (0.05 | ) | (0.02 | ) | (1.33 | ) | (1.40 | ) | 24.77 | 6.40 | 7,926 | 1.28 | ||||||||||
| (0.15 | ) | — | — | (0.15 | ) | 24.68 | 2.05 | 855,174 | 1.19 | b | |||||||||||
| (0.06 | ) | — | — | (0.06 | ) | 24.46 | 1.60 | 271,912 | 1.94 | b | |||||||||||
| (0.05 | ) | — | — | (0.05 | ) | 24.41 | 1.58 | 31,328 | 1.94 | b | |||||||||||
| (0.20 | ) | — | — | (0.20 | ) | 24.72 | 2.32 | 32,181 | 0.79 | b | |||||||||||
| (0.14 | ) | — | — | (0.14 | ) | 24.68 | 2.01 | 10,008 | 1.29 | b | |||||||||||
| (0.19 | ) | (0.01 | ) | — | (0.20 | ) | 24.33 | (5.40 | ) | 1,122,157 | 1.22 | ||||||||||
| (0.04 | ) | — | — | (0.04 | ) | 24.13 | (6.07 | ) | 349,662 | 1.92 | |||||||||||
| (0.05 | ) | — | — | (0.05 | ) | 24.08 | (6.12 | ) | 48,146 | 1.92 | |||||||||||
| (0.30 | ) | (0.01 | ) | — | (0.31 | ) | 24.35 | (5.00 | ) | 173,696 | 0.80 | ||||||||||
| (0.17 | ) | (0.01 | ) | — | (0.18 | ) | 24.33 | (5.44 | ) | 11,943 | 1.30 | ||||||||||
| (0.11 | ) | — | (2.52 | ) | (2.63 | ) | 25.93 | 23.71 | 1,216,582 | 1.25 | |||||||||||
| — | (0.03 | ) | (2.52 | ) | (2.55 | ) | 25.73 | 22.87 | 307,815 | 1.94 | |||||||||||
| — | (0.03 | ) | (2.52 | ) | (2.55 | ) | 25.70 | 0.51 | 31,686 | 1.99 | b | ||||||||||
| (0.22 | ) | — | (2.52 | ) | (2.74 | ) | 25.95 | 24.24 | 36,225 | 0.83 | |||||||||||
| (0.06 | ) | (0.04 | ) | (2.52 | ) | (2.62 | ) | 25.92 | 23.63 | 8,893 | 1.32 | ||||||||||
| (0.35 | ) | (0.01 | ) | (1.97 | ) | (2.33 | ) | 23.18 | 28.42 | 615,103 | 1.22 | ||||||||||
| (0.17 | ) | (0.06 | ) | (1.97 | ) | (2.20 | ) | 23.10 | 22.23 | 17,346 | 1.93 | b | |||||||||
| (0.30 | ) | (0.04 | ) | (1.97 | ) | (2.31 | ) | 23.19 | 20.77 | 193 | 0.82 | b | |||||||||
| (0.28 | ) | (0.07 | ) | (1.97 | ) | (2.32 | ) | 23.17 | 23.87 | 3,174 | 1.32 | b | |||||||||
| (0.30 | ) | — | (0.60 | ) | (0.90 | ) | 19.98 | 32.45 | 436,757 | 1.20 | |||||||||||
| GROWTH AND INCOME FUND (continued)
|
|
Ratios assuming no expense reductions |
||||||||||||
|---|---|---|---|---|---|---|---|---|---|---|---|---|
| Ratio of
net investment income (loss) to average net assets |
Ratio of
expenses to average net assets |
Ratio of
net investment income (loss) to average net assets |
Portfolio
turnover rate |
|||||||||
| For The Year Ended August 31, | ||||||||||||
| 2000 - Class A Shares | 0.31 | % | 1.18 | % | 0.31 | % | 86.84 | % | ||||
| 2000 - Class B Shares | (0.41 | ) | 1.93 | (0.41 | ) | 86.84 | ||||||
| 2000 - Class C Shares | (0.40 | ) | 1.93 | (0.40 | ) | 86.84 | ||||||
| 2000 - Institutional Shares | 0.69 | 0.78 | 0.69 | 86.84 | ||||||||
| 2000 - Service Shares | 0.20 | 1.28 | 0.20 | 86.84 | ||||||||
| For The Seven Months Ended August 31, | ||||||||||||
| 1999 - Class A Shares | 1.26 | b | 1.20 | b | 1.25 | b | 55.43 | |||||
| 1999 - Class B Shares | 0.51 | b | 1.95 | b | 0.50 | b | 55.43 | |||||
| 1999 - Class C Shares | 0.51 | b | 1.95 | b | 0.50 | b | 55.43 | |||||
| 1999 - Institutional Shares | 1.72 | b | 0.80 | b | 1.71 | b | 55.43 | |||||
| 1999 - Service Shares | 1.16 | b | 1.30 | b | 1.15 | b | 55.43 | |||||
| For The Years Ended January 31, | ||||||||||||
| 1999 - Class A Shares | 0.78 | 1.32 | 0.68 | 125.79 | ||||||||
| 1999 - Class B Shares | 0.09 | 1.92 | 0.09 | 125.79 | ||||||||
| 1999 - Class C Shares | 0.10 | 1.92 | 0.10 | 125.79 | ||||||||
| 1999 - Institutional Shares | 1.25 | 0.80 | 1.25 | 125.79 | ||||||||
| 1999 - Service Shares | 0.72 | 1.30 | 0.72 | 125.79 | ||||||||
| 1998 - Class A Shares | 0.43 | 1.42 | 0.26 | 61.95 | ||||||||
| 1998 - Class B Shares | (0.35 | ) | 1.94 | (0.35 | ) | 61.95 | ||||||
| 1998 - Class C Shares (commenced August 15, 1997) | (0.48 | ) b | 1.99 | b | (0.48 | ) b | 61.95 | |||||
| 1998 - Institutional Shares | 0.76 | 0.83 | 0.76 | 61.95 | ||||||||
| 1998 - Service Shares | 0.32 | 1.32 | 0.32 | 61.95 | ||||||||
| 1997 - Class A Shares | 1.60 | 1.43 | 1.39 | 53.03 | ||||||||
| 1997 - Class B Shares (commenced May 1, 1996) | 0.15 | b | 1.93 | b | 0.15 | b | 53.03 | |||||
| 1997 - Institutional Shares (commenced June 3, 1996) | 1.36 | b | 0.82 | b | 1.36 | b | 53.03 | |||||
| 1997 - Service Shares (commenced March 6, 1996) | 0.94 | b | 1.32 | b | 0.94 | b | 53.03 | |||||
| 1996 - Class A Shares | 1.67 | 1.45 | 1.42 | 57.93 | ||||||||
| CORE LARGE CAP VALUE FUND
|
|
Income from investment operations |
||||||||||||
|---|---|---|---|---|---|---|---|---|---|---|---|---|
| Net asset
value, beginning of period |
Net
investment income |
Net realized
and unrealized gain |
Total from
investment operations |
|||||||||
| For the Year Ended August 31, | ||||||||||||
| 2000 - Class A Shares | $10.55 | $0.12 | c | $0.36 | $0.48 | |||||||
| 2000 - Class B Shares | 10.50 | 0.05 | c | 0.36 | 0.41 | |||||||
| 2000 - Class C Shares | 10.51 | 0.04 | c | 0.37 | 0.41 | |||||||
| 2000 - Institutional Shares | 10.55 | 0.16 | c | 0.37 | 0.53 | |||||||
| 2000 - Service Shares | 10.55 | 0.11 | c | 0.36 | 0.47 | |||||||
| For the Seven-Month Period Ended August 31, | ||||||||||||
| 1999 - Class A Shares | 10.15 | 0.04 | 0.40 | 0.44 | ||||||||
| 1999 - Class B Shares | 10.15 | 0.01 | 0.36 | 0.37 | ||||||||
| 1999 - Class C Shares | 10.15 | 0.01 | 0.37 | 0.38 | ||||||||
| 1999 - Institutional Shares | 10.16 | 0.06 | 0.38 | 0.44 | ||||||||
| 1999 - Service Shares | 10.16 | 0.02 | 0.40 | 0.42 | ||||||||
| For the Period Ended January 31, | ||||||||||||
| 1999 - Class A Shares (commenced December 31, 1998) | 10.00 | 0.01 | 0.14 | 0.15 | ||||||||
| 1999 - Class B Shares (commenced December 31, 1998) | 10.00 | — | 0.15 | 0.15 | ||||||||
| 1999 - Class C Shares (commenced December 31, 1998) | 10.00 | — | 0.15 | 0.15 | ||||||||
| 1999 - Institutional Shares (commenced December 31, 1998) | 10.00 | 0.01 | 0.15 | 0.16 | ||||||||
| 1999 - Service Shares (commenced December 31, 1998) | 10.00 | 0.02 | 0.14 | 0.16 | ||||||||
|
Distributions to shareholders |
|||||||||||||||||||||
|---|---|---|---|---|---|---|---|---|---|---|---|---|---|---|---|---|---|---|---|---|---|
| From net
investment income |
From net
realized gains |
Total
distributions |
Net asset
value, end of period |
Total
returna |
Net assets
at end of period (in 000s) |
Ratio of
net expenses to average net assets |
Ratio of
net investment income to average net assets |
||||||||||||||
| $(0.10 | ) | $(0.12 | ) | $(0.22 | ) | $10.81 | 4.68 | % | $100,972 | 1.06 | % | 1.14 | % | ||||||||
| (0.04 | ) | (0.12 | ) | (0.16 | ) | 10.75 | 3.96 | 19,069 | 1.81 | 0.44 | |||||||||||
| (0.04 | ) | (0.12 | ) | (0.16 | ) | 10.76 | 3.97 | 11,178 | 1.81 | 0.45 | |||||||||||
| (0.14 | ) | (0.12 | ) | (0.26 | ) | 10.82 | 5.20 | 175,493 | 0.66 | 1.54 | |||||||||||
| (0.09 | ) | (0.12 | ) | (0.21 | ) | 10.81 | 4.60 | 12 | 1.16 | 1.07 | |||||||||||
| (0.04 | ) | — | (0.04 | ) | 10.55 | 4.31 | 91,072 | 1.04 | b | 0.87 | b | ||||||||||
| (0.02 | ) | — | (0.02 | ) | 10.50 | 3.68 | 14,464 | 1.79 | b | 0.05 | b | ||||||||||
| (0.02 | ) | — | (0.02 | ) | 10.51 | 3.73 | 8,032 | 1.79 | b | 0.09 | b | ||||||||||
| (0.05 | ) | — | (0.05 | ) | 10.55 | 4.35 | 189,540 | 0.64 | b | 1.29 | b | ||||||||||
| (0.03 | ) | — | (0.03 | ) | 10.55 | 4.11 | 13 | 1.14 | b | 0.72 | b | ||||||||||
| — | — | — | 10.15 | 1.50 | 6,665 | 1.08 | b | 1.45 | b | ||||||||||||
| — | — | — | 10.15 | 1.50 | 340 | 1.82 | b | 0.84 | b | ||||||||||||
| — | — | — | 10.15 | 1.50 | 268 | 1.83 | b | 0.70 | b | ||||||||||||
| — | — | — | 10.16 | 1.60 | 53,396 | 0.66 | b | 1.97 | b | ||||||||||||
| — | — | — | 10.16 | 1.60 | 2 | 1.16 | b | 2.17 | b | ||||||||||||
| CORE LARGE CAP VALUE FUND (continued)
|
|
Ratios assuming no expense reductions |
||||||||||
|---|---|---|---|---|---|---|---|---|---|---|
| Ratio of
expenses to average net assets |
Ratio of
net investment income (loss) to average net assets |
Portfolio
turnover rate |
||||||||
| For the Year Ended August 31, | ||||||||||
| 2000 - Class A Shares | 1.17 | % | 1.03 | % | 83.30 | % | ||||
| 2000 - Class B Shares | 1.92 | 0.33 | 83.30 | |||||||
| 2000 - Class C Shares | 1.92 | 0.34 | 83.30 | |||||||
| 2000 - Institutional Shares | 0.77 | 1.43 | 83.30 | |||||||
| 2000 - Service Shares | 1.27 | 0.96 | 83.30 | |||||||
| For the Seven-Month Period Ended August 31, | ||||||||||
| 1999 - Class A Shares | 1.21 | b | 0.70 | b | 36.10 | |||||
| 1999 - Class B Shares | 1.96 | b | (0.12 | ) b | 36.10 | |||||
| 1999 - Class C Shares | 1.96 | b | (0.08 | ) b | 36.10 | |||||
| 1999 - Institutional Shares | 0.81 | b | 1.12 | b | 36.10 | |||||
| 1999 - Service Shares | 1.31 | b | 0.55 | b | 36.10 | |||||
| For the Period Ended January 31, | ||||||||||
| 1999 - Class A Shares (commenced December 31, 1998) | 8.03 | b | (5.50 | ) b | 0.00 | |||||
| 1999 - Class B Shares (commenced December 31, 1998) | 8.77 | b | (6.11 | ) b | 0.00 | |||||
| 1999 - Class C Shares (commenced December 31, 1998) | 8.78 | b | (6.25 | ) b | 0.00 | |||||
| 1999 - Institutional Shares (commenced December 31, 1998) | 7.61 | b | (4.98 | ) b | 0.00 | |||||
| 1999 - Service Shares (commenced December 31, 1998) | 8.11 | b | (4.78 | ) b | 0.00 | |||||
| CORE U.S. EQUITY FUND
|
|
Income from investment operations |
||||||||||
|---|---|---|---|---|---|---|---|---|---|---|
|
Net asset value, beginning of period |
Net
investment income (loss) |
Net realized
and unrealized gain |
Total from
investment operations |
|||||||
| For The Year Ended August 31, | ||||||||||
| 2000 - Class A Shares | $34.21 | $ 0.10 | c | $6.00 | $6.10 | |||||
| 2000 - Class B Shares | 33.56 | (0.14 | ) c | 5.83 | 5.69 | |||||
| 2000 - Class C Shares | 33.46 | (0.13 | ) c | 5.80 | 5.67 | |||||
| 2000 - Institutional Shares | 34.61 | 0.24 | c | 6.07 | 6.31 | |||||
| 2000 - Service Shares | 34.05 | 0.07 | c | 5.96 | 6.03 | |||||
| For The Seven-Month Period Ended August 31, | ||||||||||
| 1999 - Class A Shares | 32.98 | 0.03 | 1.20 | 1.23 | ||||||
| 1999 - Class B Shares | 32.50 | (0.11 | ) | 1.17 | 1.06 | |||||
| 1999 - Class C Shares | 32.40 | (0.10 | ) | 1.16 | 1.06 | |||||
| 1999 - Institutional Shares | 33.29 | 0.11 | 1.21 | 1.32 | ||||||
| 1999 - Service Shares | 32.85 | 0.01 | 1.19 | 1.20 | ||||||
| For The Years Ended January 31, | ||||||||||
| 1999 - Class A Shares | 26.59 | 0.04 | 7.02 | 7.06 | ||||||
| 1999 - Class B Shares | 26.32 | (0.10 | ) | 6.91 | 6.81 | |||||
| 1999 - Class C Shares | 26.24 | (0.10 | ) | 6.89 | 6.79 | |||||
| 1999 - Institutional Shares | 26.79 | 0.20 | 7.11 | 7.31 | ||||||
| 1999 - Service Shares | 26.53 | 0.06 | 7.01 | 7.07 | ||||||
| 1998 - Class A Shares | 23.32 | 0.11 | 5.63 | 5.74 | ||||||
| 1998 - Class B Shares | 23.18 | 0.11 | 5.44 | 5.55 | ||||||
| 1998 - Class C Shares (commenced August 15, 1997) | 27.48 | 0.03 | 1.22 | 1.25 | ||||||
| 1998 - Institutional Shares | 23.44 | 0.30 | 5.65 | 5.95 | ||||||
| 1998 - Service Shares | 23.27 | 0.19 | 5.57 | 5.76 | ||||||
| 1997 - Class A Shares | 19.66 | 0.16 | 4.46 | 4.62 | ||||||
| 1997 - Class B Shares (commenced May 1, 1996) | 20.44 | 0.04 | 3.70 | 3.74 | ||||||
| 1997 - Institutional Shares | 19.71 | 0.30 | 4.51 | 4.81 | ||||||
| 1997 - Service Shares (commenced June 7, 1996) | 21.02 | 0.13 | 3.15 | 3.28 | ||||||
| 1996 - Class A Shares | 14.61 | 0.19 | 5.43 | 5.62 | ||||||
| 1996 - Institutional Shares (commenced June 15, 1995) | 16.97 | 0.16 | 3.23 | 3.39 | ||||||
|
Distributions to shareholders |
||||||||||||||||||||||||
|---|---|---|---|---|---|---|---|---|---|---|---|---|---|---|---|---|---|---|---|---|---|---|---|---|
| From net
investment income |
In excess
of net investment income |
From net
realized gains |
Total
distributions |
Net asset
value, end of period |
Total
returna |
Net assets
at end of period (in 000s) |
Ratio of
net expenses to average net assets |
Ratio of
net investment income (loss) to average net assets |
||||||||||||||||
| $ — | $ — | $(3.54 | ) | $(3.54 | ) | $36.77 | 18.96 | % | $715,775 | 1.14 | % | 0.31 | % | |||||||||||
| — | — | (3.54 | ) | (3.54 | ) | 35.71 | 18.03 | 275,673 | 1.89 | (0.44 | ) | |||||||||||||
| — | — | (3.54 | ) | (3.54 | ) | 35.59 | 18.03 | 62,820 | 1.89 | (0.43 | ) | |||||||||||||
| (0.08 | ) | — | (3.54 | ) | (3.62 | ) | 37.30 | 19.41 | 379,172 | 0.74 | 0.71 | |||||||||||||
| — | — | (3.54 | ) | (3.54 | ) | 36.54 | 18.83 | 11,879 | 1.24 | 0.19 | ||||||||||||||
| — | — | — | — | 34.21 | 3.73 | 614,310 | 1.14 | b | 0.15 | b | ||||||||||||||
| — | — | — | — | 33.56 | 3.26 | 214,087 | 1.89 | b | (0.60 | ) b | ||||||||||||||
| — | — | — | — | 33.46 | 3.27 | 43,361 | 1.89 | b | (0.61 | ) b | ||||||||||||||
| — | — | — | — | 34.61 | 3.97 | 335,465 | 0.74 | b | 0.54 | b | ||||||||||||||
| — | — | — | — | 34.05 | 3.65 | 11,204 | 1.24 | b | 0.06 | b | ||||||||||||||
| (0.03 | ) | (0.01 | ) | (0.63 | ) | (0.67 | ) | 32.98 | 26.89 | 605,566 | 1.23 | 0.15 | ||||||||||||
| — | — | (0.63 | ) | (0.63 | ) | 32.50 | 26.19 | 152,347 | 1.85 | (0.50 | ) | |||||||||||||
| — | — | (0.63 | ) | (0.63 | ) | 32.40 | 26.19 | 26,912 | 1.87 | (0.53 | ) | |||||||||||||
| (0.15 | ) | (0.03 | ) | (0.63 | ) | (0.81 | ) | 33.29 | 27.65 | 307,200 | 0.69 | 0.69 | ||||||||||||
| (0.10 | ) | (0.02 | ) | (0.63 | ) | (0.75 | ) | 32.85 | 27.00 | 11,600 | 1.19 | 0.19 | ||||||||||||
| (0.12 | ) | — | (2.35 | ) | (2.47 | ) | 26.59 | 24.96 | 398,393 | 1.28 | 0.51 | |||||||||||||
| — | (0.06 | ) | (2.35 | ) | (2.41 | ) | 26.32 | 24.28 | 59,208 | 1.79 | (0.05 | ) | ||||||||||||
| — | (0.14 | ) | (2.35 | ) | (2.49 | ) | 26.24 | 4.85 | 6,267 | 1.78 | b | (0.21 | ) b | |||||||||||
| (0.24 | ) | (0.01 | ) | (2.35 | ) | (2.60 | ) | 26.79 | 25.76 | 202,893 | 0.65 | 1.16 | ||||||||||||
| (0.07 | ) | (0.08 | ) | (2.35 | ) | (2.50 | ) | 26.53 | 25.11 | 7,841 | 1.15 | 0.62 | ||||||||||||
| (0.16 | ) | — | (0.80 | ) | (0.96 | ) | 23.32 | 23.75 | 225,968 | 1.29 | 0.91 | |||||||||||||
| (0.04 | ) | (0.16 | ) | (0.80 | ) | (1.00 | ) | 23.18 | 18.59 | 17,258 | 1.83 | b | 0.06 | b | ||||||||||
| (0.28 | ) | — | (0.80 | ) | (1.08 | ) | 23.44 | 24.63 | 148,942 | 0.65 | 1.52 | |||||||||||||
| (0.13 | ) | (0.10 | ) | (0.80 | ) | (1.03 | ) | 23.27 | 15.92 | 3,666 | 1.15 | b | 0.69 | b | ||||||||||
| (0.16 | ) | — | (0.41 | ) | (0.57 | ) | 19.66 | 38.63 | 129,045 | 1.25 | 1.01 | |||||||||||||
| (0.24 | ) | — | (0.41 | ) | (0.65 | ) | 19.71 | 20.14 | 64,829 | 0.65 | b | 1.49 | b | |||||||||||
| CORE U.S. EQUITY FUND (continued)
|
|
Ratios assuming no expense reductions |
||||||||||
|---|---|---|---|---|---|---|---|---|---|---|
| Ratio of
expenses to average net assets |
Ratio of
net investment income (loss) to average net assets |
Portfolio
turnover rate |
||||||||
| For The Year Ended August 31, | ||||||||||
| 2000 - Class A Shares | 1.23 | % | 0.22 | % | 59.27 | % | ||||
| 2000 - Class B Shares | 1.98 | (0.53 | ) | 59.27 | ||||||
| 2000 - Class C Shares | 1.98 | (0.52 | ) | 59.27 | ||||||
| 2000 - Institutional Shares | 0.83 | 0.62 | 59.27 | |||||||
| 2000 - Service Shares | 1.33 | 0.10 | 59.27 | |||||||
| For The Seven-Month Period Ended August 31, | ||||||||||
| 1999 - Class A Shares | 1.24 | b | 0.05 | b | 41.84 | |||||
| 1999 - Class B Shares | 1.99 | b | (0.70 | ) b | 41.84 | |||||
| 1999 - Class C Shares | 1.99 | b | (0.71 | ) b | 41.84 | |||||
| 1999 - Institutional Shares | 0.84 | b | 0.44 | b | 41.84 | |||||
| 1999 - Service Shares | 1.34 | b | (0.04 | ) b | 41.84 | |||||
| For The Years Ended January 31, | ||||||||||
| 1999 - Class A Shares | 1.36 | 0.02 | 63.79 | |||||||
| 1999 - Class B Shares | 1.98 | (0.63 | ) | 63.79 | ||||||
| 1999 - Class C Shares | 2.00 | (0.66 | ) | 63.79 | ||||||
| 1999 - Institutional Shares | 0.82 | 0.56 | 63.79 | |||||||
| 1999 - Service Shares | 1.32 | 0.06 | 63.79 | |||||||
| 1998 - Class A Shares | 1.47 | 0.32 | 65.89 | |||||||
| 1998 - Class B Shares | 1.96 | (0.22 | ) | 65.89 | ||||||
| 1998 - Class C Shares (commenced August 15, 1997) | 1.95 | b | (0.38 | ) b | 65.89 | |||||
| 1998 - Institutional Shares | 0.82 | 0.99 | 65.89 | |||||||
| 1998 - Service Shares | 1.32 | 0.45 | 65.89 | |||||||
| 1997 - Class A Shares | 1.53 | 0.67 | 37.28 | |||||||
| 1997 - Class B Shares (commenced May 1, 1996) | 2.00 | b | (0.11 | ) b | 37.28 | |||||
| 1997 - Institutional Shares | 0.85 | 1.32 | 37.28 | |||||||
| 1997 - Service Shares (commenced June 7, 1996) | 1.35 | b | 0.49 | b | 37.28 | |||||
| 1996 - Class A Shares | 1.55 | 0.71 | 39.35 | |||||||
| 1996 - Institutional Shares (commenced June 15, 1995) | 0.96 | b | 1.18 | b | 39.35 | |||||
| CORE LARGE CAP GROWTH FUND
|
|
Income from investment operations |
||||||||||
|---|---|---|---|---|---|---|---|---|---|---|
|
Net asset value, beginning of period |
Net
investment income (loss) |
Net realized
and unrealized gain |
Total from
investment operations |
|||||||
| For the Year Ended August 31, | ||||||||||
| 2000 - Class A Shares | $17.02 | $ 0.06 | c | $5.67 | $5.73 | |||||
| 2000 - Class B Shares | 16.75 | (0.09 | ) c | 5.57 | 5.48 | |||||
| 2000 - Class C Shares | 16.75 | (0.08 | ) c | 5.57 | 5.49 | |||||
| 2000 - Institutional Shares | 17.10 | 0.13 | c | 5.73 | 5.86 | |||||
| 2000 - Service Shares | 16.95 | 0.03 | c | 5.66 | 5.69 | |||||
| For the Seven-Month Period Ended August 31, | ||||||||||
| 1999 - Class A Shares | 16.17 | (0.01 | ) | 0.86 | 0.85 | |||||
| 1999 - Class B Shares | 15.98 | (0.07 | ) | 0.84 | 0.77 | |||||
| 1999 - Class C Shares | 15.99 | (0.07 | ) | 0.83 | 0.76 | |||||
| 1999 - Institutional Shares | 16.21 | 0.03 | 0.86 | 0.89 | ||||||
| 1999 - Service Shares | 16.11 | (0.02 | ) | 0.86 | 0.84 | |||||
| For the Year Ended January 31, | ||||||||||
| 1999 - Class A Shares | 11.97 | 0.01 | 4.19 | 4.20 | ||||||
| 1999 - Class B Shares | 11.92 | (0.06 | ) | 4.12 | 4.06 | |||||
| 1999 - Class C Shares | 11.93 | (0.05 | ) | 4.11 | 4.06 | |||||
| 1999 - Institutional Shares | 11.97 | 0.02 | 4.23 | 4.25 | ||||||
| 1999 - Service Shares | 11.95 | (0.01 | ) | 4.17 | 4.16 | |||||
| For the Period Ended January 31, | ||||||||||
| 1998 - Class A Shares (commenced May 1, 1997) | 10.00 | 0.01 | 2.35 | 2.36 | ||||||
| 1998 - Class B Shares (commenced May 1, 1997) | 10.00 | (0.03 | ) | 2.33 | 2.30 | |||||
| 1998 - Class C Shares (commenced August 15, 1997) | 11.80 | (0.02 | ) | 0.54 | 0.52 | |||||
| 1998 - Institutional Shares (commenced May 1, 1997) | 10.00 | 0.01 | 2.35 | 2.36 | ||||||
| 1998 - Service Shares (commenced May 1, 1997) | 10.00 | (0.02 | ) | 2.35 | 2.33 | |||||
|
Distributions to Shareholders |
|||||||||||||||||||||
|---|---|---|---|---|---|---|---|---|---|---|---|---|---|---|---|---|---|---|---|---|---|
|
From Net Investment Income |
In excess
of net investment income |
From net
realized gains |
Total
distributions |
Net asset
value, end of period |
Total
returna |
Net assets
at end of period (in 000s) |
Ratio of
net expenses to average net assets |
||||||||||||||
| $ — | $ — | $(0.09 | ) | $(0.09 | ) | $22.66 | 33.73 | % | $545,763 | 1.09 | % | ||||||||||
| — | — | (0.09 | ) | (0.09 | ) | 22.14 | 32.78 | 338,128 | 1.84 | ||||||||||||
| — | — | (0.09 | ) | (0.09 | ) | 22.15 | 32.84 | 154,966 | 1.84 | ||||||||||||
| — | — | (0.09 | ) | (0.09 | ) | 22.87 | 34.34 | 322,900 | 0.69 | ||||||||||||
| — | — | (0.09 | ) | (0.09 | ) | 22.55 | 33.64 | 3,879 | 1.19 | ||||||||||||
| — | — | — | — | 17.02 | 5.26 | 300,684 | 1.04 | b | |||||||||||||
| — | — | — | — | 16.75 | 4.82 | 181,626 | 1.79 | b | |||||||||||||
| — | — | — | — | 16.75 | 4.75 | 75,502 | 1.79 | b | |||||||||||||
| — | — | — | — | 17.10 | 5.49 | 310,704 | 0.64 | b | |||||||||||||
| — | — | — | — | 16.95 | 5.21 | 2,510 | 1.14 | b | |||||||||||||
| — | — | — | — | 16.17 | 35.10 | 175,510 | 0.97 | ||||||||||||||
| — | — | — | — | 15.98 | 34.07 | 93,711 | 1.74 | ||||||||||||||
| — | — | — | — | 15.99 | 34.04 | 37,081 | 1.74 | ||||||||||||||
| — | (0.01 | ) | — | (0.01 | ) | 16.21 | 35.54 | 295,734 | 0.65 | ||||||||||||
| — | — | — | — | 16.11 | 34.85 | 1,663 | 1.15 | ||||||||||||||
| (0.01 | ) | — | (0.38 | ) | (0.39 | ) | 11.97 | 23.79 | 53,786 | 0.91 | b | ||||||||||
| — | — | (0.38 | ) | (0.38 | ) | 11.92 | 23.26 | 13,857 | 1.67 | b | |||||||||||
| — | (0.01 | ) | (0.38 | ) | (0.39 | ) | 11.93 | 4.56 | 4,132 | 1.68 | b | ||||||||||
| (0.01 | ) | — | (0.38 | ) | (0.39 | ) | 11.97 | 23.89 | 4,656 | 0.72 | b | ||||||||||
| — | — | (0.38 | ) | (0.38 | ) | 11.95 | 23.56 | 115 | 1.17 | b | |||||||||||
| CORE LARGE CAP GROWTH FUND (continued)
|
|
Ratios assuming no expense reductions |
|||||||||||||
|---|---|---|---|---|---|---|---|---|---|---|---|---|---|
| Ratio of
net investment income (loss) to average net assets |
Ratio of
expenses to average net assets |
Ratio of net
investment income (loss) to average net assets |
Portfolio
turnover rate |
||||||||||
| For the Year Ended August 31, | |||||||||||||
| 2000 - Class A Shares | 0.31 | % | 1.24 | % | 0.16 | % | 72.59 | % | |||||
| 2000 - Class B Shares | (0.44 | ) | 1.99 | (0.59 | ) | 72.59 | |||||||
| 2000 - Class C Shares | (0.43 | ) | 1.99 | (0.58 | ) | 72.59 | |||||||
| 2000 - Institutional Shares | 0.65 | 0.84 | 0.50 | 72.59 | |||||||||
| 2000 - Service Shares | 0.15 | 1.34 | — | 72.59 | |||||||||
| For the Seven-Month Period Ended August 31, | |||||||||||||
| 1999 - Class A Shares | (0.11 | ) b | 1.26 | b | (0.33 | ) b | 32.74 | ||||||
| 1999 - Class B Shares | (0.87 | ) b | 2.01 | b | (1.09 | ) b | 32.74 | ||||||
| 1999 - Class C Shares | (0.87 | ) b | 2.01 | b | (1.09 | ) b | 32.74 | ||||||
| 1999 - Institutional Shares | 0.31 | b | 0.86 | b | 0.09 | b | 32.74 | ||||||
| 1999 - Service Shares | (0.21 | ) b | 1.36 | b | (0.43 | ) b | 32.74 | ||||||
| For the Year Ended January 31, | |||||||||||||
| 1999 - Class A Shares | 0.05 | 1.46 | (0.44 | ) | 63.15 | ||||||||
| 1999 - Class B Shares | (0.73 | ) | 2.11 | (1.10 | ) | 63.15 | |||||||
| 1999 - Class C Shares | (0.74 | ) | 2.11 | (1.11 | ) | 63.15 | |||||||
| 1999 - Institutional Shares | 0.35 | 1.02 | (0.02 | ) | 63.15 | ||||||||
| 1999 - Service Shares | (0.16 | ) | 1.52 | (0.53 | ) | 63.15 | |||||||
| For the Period Ended January 31, | |||||||||||||
| 1998 - Class A Shares (commenced May 1, 1997) | 0.12 | b | 2.40 | b | (1.37 | ) b | 74.97 | ||||||
| 1998 - Class B Shares (commenced May 1, 1997) | (0.72 | ) b | 2.91 | b | (1.96 | ) b | 74.97 | ||||||
| 1998 - Class C Shares (commenced August 15, 1997) | (0.76 | ) b | 2.92 | b | (2.00 | ) b | 74.97 | ||||||
| 1998 - Institutional Shares (commenced May 1, 1997) | 0.42 | b | 1.96 | b | (0.82 | ) b | 74.97 | ||||||
| 1998 - Service Shares (commenced May 1, 1997) | (0.21 | ) b | 2.41 | b | (1.45 | ) b | 74.97 | ||||||
| CORE SMALL CAP EQUITY FUND
|
|
Income from investment operations |
||||||||||||
|---|---|---|---|---|---|---|---|---|---|---|---|---|
|
Net asset value, beginning of period |
Net
investment income (loss) |
Net
realized and unrealized gain (loss) |
Total from
investment operations |
|||||||||
| For the Year Ended August 31, | ||||||||||||
| 2000 - Class A Shares | $10.23 | $(0.03 | ) c | $2.70 | $2.67 | |||||||
| 2000 - Class B Shares | 10.09 | (0.11 | ) c | 2.65 | 2.54 | |||||||
| 2000 - Class C Shares | 10.10 | (0.10 | ) c | 2.66 | 2.56 | |||||||
| 2000 - Institutional Shares | 10.30 | 0.02 | c | 2.71 | 2.73 | |||||||
| 2000 - Service Shares | 10.22 | (0.04 | ) c | 2.69 | 2.65 | |||||||
| For the Seven-Month Period Ended August 31, | ||||||||||||
| 1999 - Class A Shares | 10.16 | (0.01 | ) | 0.08 | 0.07 | |||||||
| 1999 - Class B Shares | 10.07 | (0.05 | ) | 0.07 | 0.02 | |||||||
| 1999 - Class C Shares | 10.08 | (0.05 | ) | 0.07 | 0.02 | |||||||
| 1999 - Institutional Shares | 10.20 | 0.02 | 0.08 | 0.10 | ||||||||
| 1999 - Service Shares | 10.16 | (0.01 | ) | 0.07 | 0.06 | |||||||
| For the Year Ended January 31, | ||||||||||||
| 1999 - Class A Shares | 10.59 | 0.01 | (0.43 | ) | (0.42 | ) | ||||||
| 1999 - Class B Shares | 10.56 | (0.05 | ) | (0.44 | ) | (0.49 | ) | |||||
| 1999 - Class C Shares | 10.57 | (0.04 | ) | (0.45 | ) | (0.49 | ) | |||||
| 1999 - Institutional Shares | 10.61 | 0.04 | (0.43 | ) | (0.39 | ) | ||||||
| 1999 - Service Shares | 10.60 | 0.01 | (0.44 | ) | (0.43 | ) | ||||||
| For the Period Ended January 31, | ||||||||||||
| 1998 - Class A Shares (commenced August 15, 1997) | 10.00 | (0.01 | ) | 0.65 | 0.64 | |||||||
| 1998 - Class B Shares (commenced August 15, 1997) | 10.00 | (0.03 | ) | 0.64 | 0.61 | |||||||
| 1998 - Class C Shares (commenced August 15, 1997) | 10.00 | (0.02 | ) | 0.64 | 0.62 | |||||||
| 1998 - Institutional Shares (commenced August 15, 1997) | 10.00 | 0.01 | 0.65 | 0.66 | ||||||||
| 1998 - Service Shares (commenced August 15, 1997) | 10.00 | 0.01 | 0.64 | 0.65 | ||||||||
|
Distributions to Shareholders |
||||||||||||||||||
|---|---|---|---|---|---|---|---|---|---|---|---|---|---|---|---|---|---|---|
|
From net investment income |
From net realized gains |
Total
distributions |
Net asset
value, end of period |
Total
returna |
Net assets
at end of period (in 000s) |
Ratio of
net expenses to average net assets |
||||||||||||
| $ — | $ — | $ — | $12.90 | 26.10 | % | $54,954 | 1.33 | % | ||||||||||
| — | — | — | 12.63 | 25.17 | 17,923 | 2.08 | ||||||||||||
| — | — | — | 12.66 | 25.35 | 8,289 | 2.08 | ||||||||||||
| — | — | — | 13.03 | 26.60 | 86,196 | 0.93 | ||||||||||||
| — | — | — | 12.87 | 25.93 | 63 | 1.43 | ||||||||||||
| — | — | — | 10.23 | 0.69 | 52,660 | 1.33 | b | |||||||||||
| — | — | — | 10.09 | 0.20 | 13,711 | 2.08 | b | |||||||||||
| — | — | — | 10.10 | 0.20 | 6,274 | 2.08 | b | |||||||||||
| — | — | — | 10.30 | 0.98 | 62,633 | 0.93 | b | |||||||||||
| — | — | — | 10.22 | 0.59 | 64 | 1.43 | b | |||||||||||
| (0.01 | ) | — | (0.01 | ) | 10.16 | (3.97 | ) | 64,087 | 1.31 | |||||||||
| — | — | — | 10.07 | (4.64 | ) | 15,406 | 2.00 | |||||||||||
| — | — | — | 10.08 | (4.64 | ) | 6,559 | 2.01 | |||||||||||
| (0.02 | ) | — | (0.02 | ) | 10.20 | (3.64 | ) | 62,763 | 0.94 | |||||||||
| (0.01 | ) | — | (0.01 | ) | 10.16 | (4.07 | ) | 54 | 1.44 | |||||||||
| — | (0.05 | ) | (0.05 | ) | 10.59 | 6.37 | 11,118 | 1.25 | b | |||||||||
| — | (0.05 | ) | (0.05 | ) | 10.56 | 6.07 | 9,957 | 1.95 | b | |||||||||
| — | (0.05 | ) | (0.05 | ) | 10.57 | 6.17 | 2,557 | 1.95 | b | |||||||||
| — | (0.05 | ) | (0.05 | ) | 10.61 | 6.57 | 9,026 | 0.95 | b | |||||||||
| — | (0.05 | ) | (0.05 | ) | 10.60 | 6.47 | 2 | 1.45 | b | |||||||||
| CORE SMALL CAP EQUITY FUND (continued)
|
|
Ratios assuming no expense reductions |
|||||||||||||
|---|---|---|---|---|---|---|---|---|---|---|---|---|---|
| Ratio of net
investment income (loss) to average net assets |
Ratio of
expenses to average net assets |
Ratio of net
investment loss to average net assets |
Portfolio
turnover rate |
||||||||||
| For the Year Ended August 31, | |||||||||||||
| 2000 - Class A Shares | (0.21 | )% | 1.55 | % | (0.43 | ) | 135.36 | % | |||||
| 2000 - Class B Shares | (0.96 | ) | 2.30 | (1.18 | ) | 135.36 | |||||||
| 2000 - Class C Shares | (0.96 | ) | 2.30 | (1.18 | ) | 135.36 | |||||||
| 2000 - Institutional Shares | 0.19 | 1.15 | (0.03 | ) | 135.36 | ||||||||
| 2000 - Service Shares | (0.30 | ) | 1.65 | (0.52 | ) | 135.36 | |||||||
| For the Seven-Month Period Ended August 31, | |||||||||||||
| 1999 - Class A Shares | (0.12 | ) b | 1.67 | b | (0.46 | ) b | 52.03 | ||||||
| 1999 - Class B Shares | (0.86 | ) b | 2.42 | b | (1.20 | ) b | 52.03 | ||||||
| 1999 - Class C Shares | (0.86 | ) b | 2.42 | b | (1.20 | ) b | 52.03 | ||||||
| 1999 - Institutional Shares | 0.28 | b | 1.27 | b | (0.06 | ) b | 52.03 | ||||||
| 1999 - Service Shares | (0.22 | ) b | 1.77 | b | (0.56 | ) b | 52.03 | ||||||
| For the Year Ended January 31, | |||||||||||||
| 1999 - Class A Shares | 0.08 | 2.00 | (0.61 | ) | 75.38 | ||||||||
| 1999 - Class B Shares | (0.55 | ) | 2.62 | (1.17 | ) | 75.38 | |||||||
| 1999 - Class C Shares | (0.56 | ) | 2.63 | (1.18 | ) | 75.38 | |||||||
| 1999 - Institutional Shares | 0.60 | 1.56 | (0.02 | ) | 75.38 | ||||||||
| 1999 - Service Shares | 0.01 | 2.06 | (0.61 | ) | 75.38 | ||||||||
| For the Period Ended January 31, | |||||||||||||
| 1998 - Class A Shares (commenced August 15, 1997) | (0.36 | ) b | 3.92 | b | (3.03 | ) b | 37.65 | ||||||
| 1998 - Class B Shares (commenced August 15, 1997) | (1.04 | ) b | 4.37 | b | (3.46 | ) b | 37.65 | ||||||
| 1998 - Class C Shares (commenced August 15, 1997) | (1.07 | ) b | 4.37 | b | (3.49 | ) b | 37.65 | ||||||
| 1998 - Institutional Shares (commenced August 15, 1997) | 0.15 | b | 3.37 | b | (2.27 | ) b | 37.65 | ||||||
| 1998 - Service Shares (commenced August 15, 1997) | 0.40 | b | 3.87 | b | (2.02 | ) b | 37.65 | ||||||
| CAPITAL GROWTH FUND
|
|
Income from investment operations |
||||||||||
|---|---|---|---|---|---|---|---|---|---|---|
|
Net asset value, beginning of period |
Net
investment income (loss) |
Net realized
and unrealized gains |
Total
income from investment operations |
|||||||
| For the Year Ended August 31, | ||||||||||
| 2000 - Class A Shares | $24.96 | $(0.11 | ) c | $6.29 | $6.18 | |||||
| 2000 - Class B Shares | 24.37 | (0.30 | ) c | 6.11 | 5.81 | |||||
| 2000 - Class C Shares | 24.33 | (0.30 | ) c | 6.10 | 5.80 | |||||
| 2000 - Institutional Shares | 25.06 | — | 6.32 | 6.32 | ||||||
| 2000 - Service Shares | 24.88 | (0.13 | ) c | 6.25 | 6.12 | |||||
| For the Seven Months Ended August 31, | ||||||||||
| 1999 - Class A Shares | 24.03 | (0.08 | ) | 1.01 | 0.93 | |||||
| 1999 - Class B Shares | 23.57 | (0.17 | ) | 0.97 | 0.80 | |||||
| 1999 - Class C Shares | 23.52 | (0.16 | ) | 0.97 | 0.81 | |||||
| 1999 - Institutional Shares | 24.07 | (0.02 | ) | 1.01 | 0.99 | |||||
| 1999 - Service Shares | 23.96 | (0.08 | ) | 1.00 | 0.92 | |||||
| For the Years Ended January 31, | ||||||||||
| 1999 - Class A Shares | 18.48 | (0.03 | ) | 6.35 | 6.32 | |||||
| 1999 - Class B Shares | 18.27 | (0.12 | ) | 6.19 | 6.07 | |||||
| 1999 - Class C Shares | 18.24 | (0.10 | ) | 6.15 | 6.05 | |||||
| 1999 - Institutional Shares | 18.45 | 0.01 | 6.38 | 6.39 | ||||||
| 1999 - Service Shares | 18.46 | (0.04 | ) | 6.31 | 6.27 | |||||
| 1998 - Class A Shares | 16.73 | 0.02 | 4.78 | 4.80 | ||||||
| 1998 - Class B Shares | 16.67 | 0.02 | 4.61 | 4.63 | ||||||
| 1998 - Class C Shares (commenced August 15, 1997) | 19.73 | (0.02 | ) | 1.60 | 1.58 | |||||
| 1998 - Institutional Shares (commenced August 15, 1997) | 19.88 | 0.02 | 1.66 | 1.68 | ||||||
| 1998 - Service Shares (commenced August 15, 1997) | 19.88 | (0.01 | ) | 1.66 | 1.65 | |||||
| 1997 - Class A Shares | 14.91 | 0.10 | 3.56 | 3.66 | ||||||
| 1997 - Class B Shares (commenced May 1, 1996) | 15.67 | 0.01 | 2.81 | 2.82 | ||||||
| 1996 - Class A Shares | 13.67 | 0.12 | 3.93 | 4.05 | ||||||
|
Distributions to shareholders |
|||||||||||||||||||||
|---|---|---|---|---|---|---|---|---|---|---|---|---|---|---|---|---|---|---|---|---|---|
| From net
investment income |
In excess of net investment income |
From net
realized gain |
Total
distributions |
Net asset
value, end of period |
Total
returna |
Net assets
at end of period (in 000s) |
Ratio of
net expenses to average net assets |
||||||||||||||
| $ — | $ — | $(2.19 | ) | $(2.19 | ) | $28.95 | 25.70 | % | $2,736,484 | 1.45 | % | ||||||||||
| — | — | (2.19 | ) | (2.19 | ) | 27.99 | 24.75 | 451,666 | 2.20 | ||||||||||||
| — | — | (2.19 | ) | (2.19 | ) | 27.94 | 24.75 | 143,126 | 2.20 | ||||||||||||
| — | — | (2.19 | ) | (2.19 | ) | 29.19 | 26.18 | 497,986 | 1.05 | ||||||||||||
| — | — | (2.19 | ) | (2.19 | ) | 28.81 | 25.53 | 13,668 | 1.55 | ||||||||||||
| — | — | — | — | 24.96 | 3.87 | 1,971,097 | 1.44 | b | |||||||||||||
| — | — | — | — | 24.37 | 3.39 | 329,870 | 2.19 | b | |||||||||||||
| — | — | — | — | 24.33 | 3.44 | 87,284 | 2.19 | b | |||||||||||||
| — | — | — | — | 25.06 | 4.11 | 255,210 | 1.04 | b | |||||||||||||
| — | — | — | — | 24.88 | 3.84 | 6,466 | 1.54 | b | |||||||||||||
| — | — | (0.77 | ) | (0.77 | ) | 24.03 | 34.58 | 1,992,716 | 1.42 | ||||||||||||
| — | — | (0.77 | ) | (0.77 | ) | 23.57 | 33.60 | 236,369 | 2.19 | ||||||||||||
| — | — | (0.77 | ) | (0.77 | ) | 23.52 | 33.55 | 60,234 | 2.19 | ||||||||||||
| — | — | (0.77 | ) | (0.77 | ) | 24.07 | 35.02 | 41,817 | 1.07 | ||||||||||||
| — | — | (0.77 | ) | (0.77 | ) | 23.96 | 34.34 | 3,085 | 1.57 | ||||||||||||
| (0.01 | ) | (0.01 | ) | (3.03 | ) | (3.05 | ) | 18.48 | 29.71 | 1,256,595 | 1.40 | ||||||||||
| — | — | (3.03 | ) | (3.03 | ) | 18.27 | 28.73 | 40,827 | 2.18 | ||||||||||||
| — | (0.04 | ) | (3.03 | ) | (3.07 | ) | 18.24 | 8.83 | 5,395 | 2.21 | b | ||||||||||
| (0.01 | ) | (0.07 | ) | (3.03 | ) | (3.11 | ) | 18.45 | 9.31 | 7,262 | 1.16 | b | |||||||||
| — | (0.04 | ) | (3.03 | ) | (3.07 | ) | 18.46 | 9.18 | 2 | 1.50 | b | ||||||||||
| (0.10 | ) | (0.02 | ) | (1.72 | ) | (1.84 | ) | 16.73 | 25.97 | 920,646 | 1.40 | ||||||||||
| (0.01 | ) | (0.09 | ) | (1.72 | ) | (1.82 | ) | 16.67 | 19.39 | 3,221 | 2.15 | b | |||||||||
| (0.12 | ) | — | (2.69 | ) | (2.81 | ) | 14.91 | 30.45 | 881,056 | 1.36 | |||||||||||
| CAPITAL GROWTH FUND (continued)
|
|
Ratios assuming no expense reductions |
|||||||||||||
|---|---|---|---|---|---|---|---|---|---|---|---|---|---|
| Ratio of
net investment income (loss) to average net assets |
Ratio of
expenses to average net assets |
Ratio of
net investment income (loss) to average net assets |
Portfolio
turnover rate |
||||||||||
| For the Year Ended August 31, | |||||||||||||
| 2000 - Class A Shares | (0.41 | )% | 1.47 | % | (0.44 | )% | 34.03 | % | |||||
| 2000 - Class B Shares | (1.16 | ) | 2.22 | (1.19 | ) | 34.03 | |||||||
| 2000 - Class C Shares | (1.16 | ) | 2.22 | (1.19 | ) | 34.03 | |||||||
| 2000 - Institutional Shares | — | 1.07 | (0.03 | ) | 34.03 | ||||||||
| 2000 - Service Shares | (0.49 | ) | 1.57 | (0.52 | ) | 34.03 | |||||||
| For the Seven Months Ended August 31, | |||||||||||||
| 1999 - Class A Shares | (0.53 | ) b | 1.47 | b | (0.56 | ) b | 18.16 | ||||||
| 1999 - Class B Shares | (1.29 | ) b | 2.22 | b | (1.32 | ) b | 18.16 | ||||||
| 1999 - Class C Shares | (1.29 | ) b | 2.22 | b | (1.32 | ) b | 18.16 | ||||||
| 1999 - Institutional Shares | (0.20 | ) b | 1.07 | b | (0.23 | ) b | 18.16 | ||||||
| 1999 - Service Shares | (0.65 | ) b | 1.57 | b | (0.68 | ) b | 18.16 | ||||||
| For the Years Ended January 31, | |||||||||||||
| 1999 - Class A Shares | (0.18 | ) | 1.58 | (0.34 | ) | 30.17 | |||||||
| 1999 - Class B Shares | (0.98 | ) | 2.21 | (1.00 | ) | 30.17 | |||||||
| 1999 - Class C Shares | (1.00 | ) | 2.21 | (1.02 | ) | 30.17 | |||||||
| 1999 - Institutional Shares | 0.11 | 1.09 | 0.09 | 30.17 | |||||||||
| 1999 - Service Shares | (0.37 | ) | 1.59 | (0.39 | ) | 30.17 | |||||||
| 1998 - Class A Shares | 0.08 | 1.65 | (0.17 | ) | 61.50 | ||||||||
| 1998 - Class B Shares | (0.77 | ) | 2.18 | (0.77 | ) | 61.50 | |||||||
| 1998 - Class C Shares (commenced August 15, 1997) | (0.86 | ) b | 2.21 | b | (0.86 | ) b | 61.50 | ||||||
| 1998 - Institutional Shares (commenced August 15, 1997) | 0.18 | b | 1.16 | b | 0.18 | b | 61.50 | ||||||
| 1998 - Service Shares (commenced August 15, 1997) | (0.16 | ) b | 1.50 | b | (0.16 | ) b | 61.50 | ||||||
| 1997 - Class A Shares | 0.62 | 1.65 | 0.37 | 52.92 | |||||||||
| 1997 - Class B Shares (commenced May 1, 1996) | (0.39 | ) b | 2.15 | b | (0.39 | ) b | 52.92 | ||||||
| 1996 - Class A Shares | 0.65 | 1.61 | 0.40 | 63.90 | |||||||||
| STRATEGIC GROWTH FUND
|
|
Income from investment operations |
|||||||||
|---|---|---|---|---|---|---|---|---|---|
| Net asset
value, beginning of period |
Net
investment income (loss) |
Net
realized and unrealized gain |
Total
income from investment operations |
||||||
| For The Year Ended August 31, | |||||||||
| 2000 - Class A Shares | $10.06 | $(0.06 | ) c | $2.52 | $2.46 | ||||
| 2000 - Class B Shares | 10.04 | (0.14 | ) c | 2.50 | 2.36 | ||||
| 2000 - Class C Shares | 10.05 | (0.14 | ) c | 2.51 | 2.37 | ||||
| 2000 - Institutional Shares | 10.07 | (0.01 | ) c | 2.52 | 2.51 | ||||
| 2000 - Service Shares | 10.06 | (0.04 | ) c | 2.50 | 2.46 | ||||
| For The Period Ended August 31, | |||||||||
| 1999 - Class A Shares (commenced May 24) | 10.00 | — | 0.06 | 0.06 | |||||
| 1999 - Class B Shares (commenced May 24) | 10.00 | (0.03 | ) c | 0.07 | 0.04 | ||||
| 1999 - Class C Shares (commenced May 24) | 10.00 | (0.03 | ) c | 0.08 | 0.05 | ||||
| 1999 - Institutional Shares (commenced May 24) | 10.00 | 0.01 | 0.06 | 0.07 | |||||
| 1999 - Service Shares (commenced May 24) | 10.00 | (0.01 | ) | 0.07 | 0.06 | ||||
|
|
||||||||||||
|---|---|---|---|---|---|---|---|---|---|---|---|---|
| Net asset
value, end of period |
Total
returna |
Net assets
at end of period (in 000s) |
Ratio of
net expenses to average net assets |
Ratio of
net investment income (loss) to average net assets |
||||||||
| $12.52 | 24.46 | % | $92,271 | 1.44 | % | (0.50 | )% | |||||
| 12.40 | 23.51 | 17,149 | 2.19 | (1.24 | ) | |||||||
| 12.42 | 23.58 | 7,287 | 2.19 | (1.24 | ) | |||||||
| 12.58 | 24.93 | 22,910 | 1.04 | (0.09 | ) | |||||||
| 12.52 | 24.45 | 2 | 1.54 | (0.35 | ) | |||||||
| 10.06 | 0.60 | 10,371 | 1.44 | b | (0.17 | ) b | ||||||
| 10.04 | 0.40 | 3,393 | 2.19 | b | (0.97 | ) b | ||||||
| 10.05 | 0.50 | 2,388 | 2.19 | b | (0.99 | ) b | ||||||
| 10.07 | 0.70 | 5,981 | 1.04 | b | 0.24 | b | ||||||
| 10.06 | 0.60 | 2 | 1.54 | b | (0.24 | ) b | ||||||
| STRATEGIC GROWTH FUND (continued)
|
|
Ratios assuming no expense reductions |
||||||||||
|---|---|---|---|---|---|---|---|---|---|---|
|
Ratio of expenses to average net assets |
Ratio of
net investment loss to average net assets |
Portfolio
turnover rate |
||||||||
| For The Year Ended August 31, | ||||||||||
| 2000 - Class A Shares | 1.63 | % | (0.69 | )% | 19.28 | % | ||||
| 2000 - Class B Shares | 2.38 | (1.43 | ) | 19.28 | ||||||
| 2000 - Class C Shares | 2.38 | (1.43 | ) | 19.28 | ||||||
| 2000 - Institutional Shares | 1.23 | (0.28 | ) | 19.28 | ||||||
| 2000 - Service Shares | 1.73 | (0.54 | ) | 19.28 | ||||||
| For The Period Ended August 31, | ||||||||||
| 1999 - Class A Shares (commenced May 24) | 11.70 | b | (10.43 | ) b | 6.98 | |||||
| 1999 - Class B Shares (commenced May 24) | 12.45 | b | (11.23 | ) b | 6.98 | |||||
| 1999 - Class C Shares (commenced May 24) | 12.45 | b | (11.25 | ) b | 6.98 | |||||
| 1999 - Institutional Shares (commenced May 24) | 11.30 | b | (10.02 | ) b | 6.98 | |||||
| 1999 - Service Shares (commenced May 24) | 11.80 | b | (10.50 | ) b | 6.98 | |||||
| GROWTH OPPORTUNITIES FUND
|
|
Income from investment operations |
||||||||
|---|---|---|---|---|---|---|---|---|
|
Net asset value, beginning of period |
Net
investment income (loss) |
Net realized
and unrealized gain |
||||||
| For the Year Ended August 31, | ||||||||
| 2000 - Class A Shares | $10.13 | $(0.11 | ) c | $9.71 | ||||
| 2000 - Class B Shares | 10.18 | (0.24 | ) c | 9.74 | ||||
| 2000 - Class C Shares | 10.10 | (0.24 | ) c | 9.68 | ||||
| 2000 - Institutional Shares | 10.13 | (0.04 | ) c | 9.73 | ||||
| 2000 - Service Shares | 10.12 | (0.12 | ) c | 9.68 | ||||
| For the Period Ended August 31, | ||||||||
| 1999 - Class A Shares (commenced May 24) | 10.00 | (0.01 | ) c | 0.14 | ||||
| 1999 - Class B Shares (commenced May 24) | 10.00 | (0.03 | ) c | 0.21 | ||||
| 1999 - Class C Shares (commenced May 24) | 10.00 | (0.03 | ) c | 0.13 | ||||
| 1999 - Institutional Shares (commenced May 24) | 10.00 | 0.01 | 0.12 | |||||
| 1999 - Service Shares (commenced May 24) | 10.00 | — | 0.12 | |||||
|
Distributions to shareholders |
||||||||||||||
|---|---|---|---|---|---|---|---|---|---|---|---|---|---|---|
| Total from
investment operations |
From net
realized gains |
Net asset
value, end of period |
Total
returna |
Net assets at end of period (in 000s) |
Ratio of
net expenses to average net assets |
|||||||||
| $9.60 | $(0.23 | ) | $19.50 | 95.73 | % | $188,199 | 1.52 | % | ||||||
| 9.50 | (0.23 | ) | 19.45 | 94.27 | 42,061 | 2.27 | ||||||||
| 9.44 | (0.23 | ) | 19.31 | 94.43 | 26,826 | 2.27 | ||||||||
| 9.69 | (0.23 | ) | 19.59 | 96.67 | 49,921 | 1.12 | ||||||||
| 9.56 | (0.23 | ) | 19.45 | 95.41 | 3 | 1.62 | ||||||||
| 0.13 | — | 10.13 | 1.30 | 8,204 | 1.44 | b | ||||||||
| 0.18 | — | 10.18 | 1.80 | 520 | 2.19 | b | ||||||||
| 0.10 | — | 10.10 | 1.00 | 256 | 2.19 | b | ||||||||
| 0.13 | — | 10.13 | 1.30 | 5,223 | 1.04 | b | ||||||||
| 0.12 | — | 10.12 | 1.20 | 2 | 1.54 | b | ||||||||
| GROWTH OPPORTUNITIES FUND (continued)
|
|
Ratios assuming no expense reductions |
|||||||||||||
|---|---|---|---|---|---|---|---|---|---|---|---|---|---|
| Ratio
of net investment income (loss) to average net assets |
Ratio of
expenses to average net assets |
Ratio
of net investment loss to average net assets |
Portfolio
turnover rate |
||||||||||
| For the Year Ended August 31, | |||||||||||||
| 2000 - Class A Shares | (0.64 | )% | 1.61 | % | (0.73 | )% | 73.35 | % | |||||
| 2000 - Class B Shares | (1.38 | ) | 2.36 | (1.47 | ) | 73.35 | |||||||
| 2000 - Class C Shares | (1.38 | ) | 2.36 | (1.47 | ) | 73.35 | |||||||
| 2000 - Institutional Shares | (0.23 | ) | 1.21 | (0.32 | ) | 73.35 | |||||||
| 2000 - Service Shares | (0.69 | ) | 1.71 | (0.78 | ) | 73.35 | |||||||
| For the Period Ended August 31, | |||||||||||||
| 1999 - Class A Shares (commenced May 24) | (0.27 | ) b | 14.15 | b | (12.98 | ) b | 26.53 | ||||||
| 1999 - Class B Shares (commenced May 24) | (1.04 | ) b | 14.90 | b | (13.75 | ) b | 26.53 | ||||||
| 1999 - Class C Shares (commenced May 24) | (1.12 | ) b | 14.90 | b | (13.83 | ) b | 26.53 | ||||||
| 1999 - Institutional Shares (commenced May 24) | 0.39 | b | 13.75 | b | (12.32 | ) b | 26.53 | ||||||
| 1999 - Service Shares (commenced May 24) | 0.03 | b | 14.25 | b | (12.68 | ) b | 26.53 | ||||||
| MID CAP VALUE FUND
|
|
Income from investment operations |
|||||||||||
|---|---|---|---|---|---|---|---|---|---|---|---|
|
Net asset value, beginning of period |
Net
investment income (loss) |
Net realized
and unrealized gain (loss) |
Total income
from investment operations |
||||||||
| For the Year Ended August 31, | |||||||||||
| 2000 - Class A Shares | $18.42 | $0.20 | c | $1.38 | $1.58 | ||||||
| 2000 - Class B Shares | 18.23 | 0.06 | c | 1.40 | 1.46 | ||||||
| 2000 - Class C Shares | 18.24 | 0.06 | c | 1.37 | 1.43 | ||||||
| 2000 - Institutional Shares | 18.45 | 0.27 | c | 1.36 | 1.63 | ||||||
| 2000 - Service Shares | 18.31 | 0.18 | c | 1.35 | 1.53 | ||||||
| For the Seven Months Ended August 31, | |||||||||||
| 1999 - Class A Shares | 18.38 | 0.06 | 1.71 | 1.77 | |||||||
| 1999 - Class B Shares | 18.29 | (0.04 | ) | 1.71 | 1.67 | ||||||
| 1999 - Class C Shares | 18.30 | (0.04 | ) | 1.71 | 1.67 | ||||||
| 1999 - Institutional Shares | 18.37 | 0.09 | 1.72 | 1.81 | |||||||
| 1999 - Service Shares | 18.29 | 0.05 | 1.70 | 1.75 | |||||||
| For the Years Ended January 31, | |||||||||||
| 1999 - Class A Shares | 21.61 | 0.10 | (2.38 | ) | (2.28 | ) | |||||
| 1999 - Class B Shares | 21.57 | (0.05 | ) | (2.35 | ) | (2.40 | ) | ||||
| 1999 - Class C Shares | 21.59 | (0.05 | ) | (2.34 | ) | (2.39 | ) | ||||
| 1999 - Institutional Shares | 21.65 | 0.19 | (2.38 | ) | (2.19 | ) | |||||
| 1999 - Service Shares | 21.62 | 0.03 | (2.31 | ) | (2.28 | ) | |||||
| 1998 - Class A Shares (commenced August 15, 1997) | 23.63 | 0.09 | 0.76 | 0.85 | |||||||
| 1998 - Class B Shares (commenced August 15, 1997) | 23.63 | 0.06 | 0.74 | 0.80 | |||||||
| 1998 - Class C Shares (commenced August 15, 1997) | 23.63 | 0.06 | 0.76 | 0.82 | |||||||
| 1998 - Institutional Shares | 18.73 | 0.16 | 5.66 | 5.82 | |||||||
| 1998 - Service Shares (commenced July 18, 1997) | 23.01 | 0.09 | 1.40 | 1.49 | |||||||
| 1997 - Institutional Shares | 15.91 | 0.24 | 3.77 | 4.01 | |||||||
| For the Period Ended January 31, | |||||||||||
| 1996 - Institutional Shares (commenced August 1, 1995) | 15.00 | 0.13 | 0.90 | 1.03 | |||||||
|
Distributions to shareholders |
|||||||||||||||||||||
|---|---|---|---|---|---|---|---|---|---|---|---|---|---|---|---|---|---|---|---|---|---|
| From net
investment income |
In excess of net investment income |
From net
realized gains |
Total
Distributions |
Net asset
value, end of period |
Total
returna |
Net assets
at end of period (in 000s) |
Ratio of
net expenses to average net assets |
||||||||||||||
| $(0.12 | ) | $ — | $ — | $(0.12 | ) | $19.88 | 8.70 | % | $ 39,142 | 1.29 | % | ||||||||||
| — | — | — | — | 19.69 | 8.01 | 22,284 | 2.04 | ||||||||||||||
| — | — | — | — | 19.67 | 7.84 | 5,720 | 2.04 | ||||||||||||||
| (0.22 | ) | — | — | (0.22 | ) | 19.86 | 9.08 | 158,188 | 0.89 | ||||||||||||
| (0.11 | ) | — | — | (0.11 | ) | 19.73 | 8.48 | 206 | 1.39 | ||||||||||||
| — | — | (1.73 | ) | (1.73 | ) | 18.42 | 9.04 | 49,081 | 1.29 | b | |||||||||||
| — | — | (1.73 | ) | (1.73 | ) | 18.23 | 8.53 | 31,824 | 2.04 | b | |||||||||||
| — | — | (1.73 | ) | (1.73 | ) | 18.24 | 8.52 | 9,807 | 2.04 | b | |||||||||||
| — | — | (1.73 | ) | (1.73 | ) | 18.45 | 9.26 | 190,549 | 0.89 | b | |||||||||||
| — | — | (1.73 | ) | (1.73 | ) | 18.31 | 8.97 | 190 | 1.39 | b | |||||||||||
| (0.07 | ) | — | (0.88 | ) | (0.95 | ) | 18.38 | (10.48 | ) | 70,578 | 1.33 | ||||||||||
| — | — | (0.88 | ) | (0.88 | ) | 18.29 | (11.07 | ) | 37,821 | 1.93 | |||||||||||
| (0.02 | ) | — | (0.88 | ) | (0.90 | ) | 18.30 | (11.03 | ) | 10,800 | 1.93 | ||||||||||
| (0.21 | ) | — | (0.88 | ) | (1.09 | ) | 18.37 | (10.07 | ) | 196,512 | 0.87 | ||||||||||
| (0.17 | ) | — | (0.88 | ) | (1.05 | ) | 18.29 | (10.48 | ) | 289 | 1.37 | ||||||||||
| (0.06 | ) | (0.04 | ) | (2.77 | ) | (2.87 | ) | 21.61 | 3.42 | 90,588 | 1.35 | b | |||||||||
| (0.09 | ) | — | (2.77 | ) | (2.86 | ) | 21.57 | 3.17 | 28,743 | 1.85 | b | ||||||||||
| (0.09 | ) | — | (2.77 | ) | (2.86 | ) | 21.59 | 3.27 | 6,445 | 1.85 | b | ||||||||||
| (0.13 | ) | — | (2.77 | ) | (2.90 | ) | 21.65 | 30.86 | 236,440 | 0.85 | |||||||||||
| (0.11 | ) | — | (2.77 | ) | (2.88 | ) | 21.62 | 6.30 | 8 | 1.35 | b | ||||||||||
| (0.24 | ) | (0.93 | ) | (0.02 | ) | (1.19 | ) | 18.73 | 25.63 | 145,253 | 0.85 | ||||||||||
| (0.12 | ) | — | — | (0.12 | ) | 15.91 | 6.89 | 135,671 | 0.85 | b | |||||||||||
| MID CAP VALUE FUND (continued)
|
|
Ratios assuming no expense reductions |
||||||||||||
|---|---|---|---|---|---|---|---|---|---|---|---|---|
| Ratio of
net investment income (loss) to average net assets |
Ratio of
expenses to average net assets |
Ratio of
net investment income (loss) to average net assets |
Portfolio
turnover rate |
|||||||||
| For the Year Ended August 31, | ||||||||||||
| 2000 - Class A Shares | 1.11 | % | 1.34 | % | 1.06 | % | 82.92 | % | ||||
| 2000 - Class B Shares | 0.35 | 2.09 | 0.30 | 82.92 | ||||||||
| 2000 - Class C Shares | 0.32 | 2.09 | 0.27 | 82.92 | ||||||||
| 2000 - Institutional Shares | 1.51 | 0.94 | 1.46 | 82.92 | ||||||||
| 2000 - Service Shares | 1.03 | 1.44 | 0.98 | 82.92 | ||||||||
| For the Seven-Months Ended August 31, | ||||||||||||
| 1999 - Class A Shares | 0.43 | b | 1.37 | b | 0.35 | b | 68.84 | |||||
| 1999 - Class B Shares | (0.33 | ) b | 2.12 | b | (0.41 | ) b | 68.84 | |||||
| 1999 - Class C Shares | (0.34 | ) b | 2.12 | b | (0.42 | ) b | 68.84 | |||||
| 1999 - Institutional Shares | 0.79 | b | 0.97 | b | 0.71 | b | 68.84 | |||||
| 1999 - Service Shares | 0.38 | b | 1.47 | b | 0.30 | b | 68.84 | |||||
| For the Years Ended January 31, | ||||||||||||
| 1999 - Class A Shares | 0.38 | 1.41 | 0.30 | 92.18 | ||||||||
| 1999 - Class B Shares | (0.22 | ) | 2.01 | (0.30 | ) | 92.18 | ||||||
| 1999 - Class C Shares | (0.22 | ) | 2.01 | (0.30 | ) | 92.18 | ||||||
| 1999 - Institutional Shares | 0.83 | 0.95 | 0.75 | 92.18 | ||||||||
| 1999 - Service Shares | 0.32 | 1.45 | 0.24 | 92.18 | ||||||||
| 1998 - Class A Shares (commenced August 15, 1997) | 0.33 | b | 1.47 | b | 0.21 | b | 62.60 | |||||
| 1998 - Class B Shares (commenced August 15, 1997) | (0.20 | ) b | 1.97 | b | (0.32 | ) b | 62.60 | |||||
| 1998 - Class C Shares (commenced August 15, 1997) | (0.23 | ) b | 1.97 | b | (0.35 | ) b | 62.60 | |||||
| 1998 - Institutional Shares | 0.78 | 0.97 | 0.66 | 62.60 | ||||||||
| 1998 - Service Shares (commenced July 18, 1997) | 0.63 | b | 1.43 | b | 0.51 | b | 62.60 | |||||
| 1997 - Institutional Shares | 1.35 | 0.91 | 1.29 | 74.03 | ||||||||
| For the Period Ended January 31, | ||||||||||||
| 1996 - Institutional Shares (commenced August 1, 1995) | 1.67 | b | 0.98 | b | 1.54 | b | 58.77 | |||||
| SMALL CAP VALUE FUND
|
|
Income (loss) from investment operations |
|||||||||||
|---|---|---|---|---|---|---|---|---|---|---|---|
| Net asset
value, beginning of period |
Net
investment income (loss) |
Net realized and unrealized gain (loss) |
Total
income (loss) from investment operations |
||||||||
| For the Year Ended August 31, | |||||||||||
| 2000 - Class A Shares | $19.80 | $ 0.01 | c | $ 3.40 | $ 3.41 | ||||||
| 2000 - Class B Shares | 19.27 | (0.13 | ) c | 3.26 | 3.13 | ||||||
| 2000 - Class C Shares | 19.28 | (0.12 | ) c | 3.26 | 3.14 | ||||||
| 2000 - Institutional Shares | 19.95 | 0.10 | c | 3.42 | 3.52 | ||||||
| 2000 - Service Shares | 19.76 | 0.01 | c | 3.36 | 3.37 | ||||||
| For the Seven-Month Period Ended August 31, | |||||||||||
| 1999 - Class A Shares | 18.51 | (0.05 | ) | 1.34 | 1.29 | ||||||
| 1999 - Class B Shares | 18.10 | (0.12 | ) | 1.29 | 1.17 | ||||||
| 1999 - Class C Shares | 18.12 | (0.11 | ) | 1.27 | 1.16 | ||||||
| 1999 - Institutional Shares | 18.62 | — | 1.33 | 1.33 | |||||||
| 1999 - Service Shares | 18.50 | (0.13 | ) | 1.39 | 1.26 | ||||||
| For the Years Ended January 31, | |||||||||||
| 1999 - Class A Shares | 24.05 | (0.06 | ) | (4.48 | ) | (4.54 | ) | ||||
| 1999 - Class B Shares | 23.73 | (0.21 | ) | (4.42 | ) | (4.63 | ) | ||||
| 1999 - Class C Shares | 23.73 | (0.18 | ) | (4.43 | ) | (4.61 | ) | ||||
| 1999 - Institutional Shares | 24.09 | 0.03 | (4.50 | ) | (4.47 | ) | |||||
| 1999 - Service Shares | 24.05 | (0.04 | ) | (4.51 | ) | (4.55 | ) | ||||
| 1998 - Class A Shares | 20.91 | 0.14 | 5.33 | 5.47 | |||||||
| 1998 - Class B Shares | 20.80 | (0.01 | ) | 5.27 | 5.26 | ||||||
| 1998 - Class C Shares (commenced August 15, 1997) | 24.69 | (0.06 | ) | 1.43 | 1.37 | ||||||
| 1998 - Institutional Shares (commenced August 15, 1997) | 24.91 | 0.03 | 1.48 | 1.51 | |||||||
| 1998 - Service Shares (commenced August 15, 1997) | 24.91 | (0.01 | ) | 1.48 | 1.47 | ||||||
| 1997 - Class A Shares | 17.29 | (0.21 | ) | 4.92 | 4.71 | ||||||
| 1997 - Class B Shares (commenced May 1, 1996) | 20.79 | (0.11 | ) | 1.21 | 1.10 | ||||||
| 1996 - Class A Shares | 16.14 | (0.23 | ) | 1.39 | 1.16 | ||||||
|
Distributions to shareholders |
||||||||||||||||
|---|---|---|---|---|---|---|---|---|---|---|---|---|---|---|---|---|
| In excess
of net investment income |
From net
realized gains |
Total
distributions |
Net asset value, end of period |
Total
returna |
Net assets
at end of period (in 000s) |
Ratio of
net expenses to average net assets |
||||||||||
| $— | $ — | $ — | $23.21 | 17.22 | % | $157,791 | 1.50 | % | ||||||||
| — | — | — | 22.40 | 16.24 | 29,199 | 2.25 | ||||||||||
| — | — | — | 22.42 | 16.34 | 8,428 | 2.25 | ||||||||||
| — | — | — | 23.47 | 17.64 | 26,445 | 1.10 | ||||||||||
| — | — | — | 23.13 | 17.05 | 83 | 1.60 | ||||||||||
| — | — | — | 19.80 | 6.97 | 210,500 | 1.50 | b | |||||||||
| — | — | — | 19.27 | 6.46 | 37,386 | 2.25 | b | |||||||||
| — | — | — | 19.28 | 6.40 | 8,079 | 2.25 | b | |||||||||
| — | — | — | 19.95 | 7.14 | 27,023 | 1.10 | b | |||||||||
| — | — | — | 19.76 | 6.81 | 57 | 1.60 | b | |||||||||
| — | (1.00 | ) | (1.00 | ) | 18.51 | (17.37 | ) | 261,661 | 1.50 | |||||||
| — | (1.00 | ) | (1.00 | ) | 18.10 | (18.00 | ) | 42,879 | 2.25 | |||||||
| — | (1.00 | ) | (1.00 | ) | 18.12 | (17.91 | ) | 8,212 | 2.25 | |||||||
| — | (1.00 | ) | (1.00 | ) | 18.62 | (17.04 | ) | 15,351 | 1.13 | |||||||
| — | (1.00 | ) | (1.00 | ) | 18.50 | (17.41 | ) | 261 | 1.62 | |||||||
| — | (2.33 | ) | (2.33 | ) | 24.05 | 26.17 | 370,246 | 1.54 | ||||||||
| — | (2.33 | ) | (2.33 | ) | 23.73 | 25.29 | 42,677 | 2.29 | ||||||||
| — | 2.33 | (2.33 | ) | 23.73 | 5.51 | 5,604 | 2.09 | b | ||||||||
| — | 2.33 | (2.33 | ) | 24.09 | 6.08 | 14,626 | 1.16 | b | ||||||||
| — | 2.33 | (2.33 | ) | 24.05 | 5.91 | 2 | 1.45 | b | ||||||||
| — | (1.09 | ) | (1.09 | ) | 20.91 | 27.28 | 212,061 | 1.60 | ||||||||
| — | (1.09 | ) | (1.09 | ) | 20.80 | 5.39 | 3,674 | 2.35 | b | |||||||
| — | (0.01 | ) | (0.01 | ) | 17.29 | 7.20 | 204,994 | 1.41 | ||||||||
| SMALL CAP VALUE FUND (continued)
|
|
Ratios assuming no expense reductions |
|||||||||||||
|---|---|---|---|---|---|---|---|---|---|---|---|---|---|
| Ratio of
net investment income (loss) to average net assets |
Ratio of
expenses to average net assets |
Ratio of
net investment income (loss) to average net assets |
Portfolio
turnover rate |
||||||||||
| For the Year Ended August 31, | |||||||||||||
| 2000 - Class A Shares | 0.07 | % | 1.57 | % | — | % | 75.31 | % | |||||
| 2000 - Class B Shares | (0.68 | ) | 2.32 | (0.75 | ) | 75.31 | |||||||
| 2000 - Class C Shares | (0.65 | ) | 2.32 | (0.72 | ) | 75.31 | |||||||
| 2000 - Institutional Shares | 0.49 | 1.17 | 0.42 | 75.31 | |||||||||
| 2000 - Service Shares | 0.03 | 1.67 | (0.04 | ) | 75.31 | ||||||||
| For the Seven-Month Period Ended August 31, | |||||||||||||
| 1999 - Class A Shares | (0.35 | ) b | 1.61 | b | (0.46 | ) b | 46.95 | ||||||
| 1999 - Class B Shares | (1.10 | ) b | 2.36 | b | (1.21 | ) b | 46.95 | ||||||
| 1999 - Class C Shares | (1.10 | ) b | 2.36 | b | (1.21 | ) b | 46.95 | ||||||
| 1999 - Institutional Shares | 0.05 | b | 1.21 | b | (0.06 | ) b | 46.95 | ||||||
| 1999 - Service Shares | (0.41 | ) b | 1.71 | b | (0.52 | ) b | 46.95 | ||||||
| For the Years Ended January 31, | |||||||||||||
| 1999 - Class A Shares | (0.24 | ) | 1.74 | (0.48 | ) | 98.46 | |||||||
| 1999 - Class B Shares | (0.99 | ) | 2.29 | (1.03 | ) | 98.46 | |||||||
| 1999 - Class C Shares | (0.99 | ) | 2.29 | (1.03 | ) | 98.46 | |||||||
| 1999 - Institutional Shares | 0.13 | 1.17 | 0.09 | 98.46 | |||||||||
| 1999 - Service Shares | (0.47 | ) | 1.66 | (0.51 | ) | 98.46 | |||||||
| 1998 - Class A Shares | (0.28 | ) | 1.76 | (0.50 | ) | 84.81 | |||||||
| 1998 - Class B Shares | (0.92 | ) | 2.29 | (0.92 | ) | 84.81 | |||||||
| 1998 - Class C Shares (commenced August 15, 1997) | (0.79 | ) b | 2.09 | b | (0.79 | ) b | 84.81 | ||||||
| 1998 - Institutional Shares (commenced August 15, 1997) | 0.27 | b | 1.16 | b | 0.27 | b | 84.81 | ||||||
| 1998 - Service Shares (commenced August 15, 1997) | (0.07 | ) b | 1.45 | b | (0.07 | ) b | 84.81 | ||||||
| 1997 - Class A Shares | (0.72 | ) | 1.85 | (0.97 | ) | 99.46 | |||||||
| 1997 - Class B Shares (commenced May 1, 1996) | (1.63 | ) b | 2.35 | b | (1.63 | ) b | 99.46 | ||||||
| 1996 - Class A Shares | (0.59 | ) | 1.66 | (0.84 | ) | 57.58 | |||||||
| LARGE CAP VALUE FUND
|
|
Income from investment operations |
|||||||||||
|---|---|---|---|---|---|---|---|---|---|---|---|
|
Net asset value, beginning of period |
Net
investment incomec |
Net
realized and unrealized gain |
Total from
investment operations |
Net asset
value, end of period |
|||||||
| For the Period Ended August 31, | |||||||||||
| 2000 - Class A Shares (commenced Dec. 15, 1999) | $10.00 | $0.06 | $0.33 | $0.39 | $10.39 | ||||||
| 2000 - Class B Shares (commenced Dec. 15, 1999) | 10.00 | — | 0.33 | 0.33 | 10.33 | ||||||
| 2000 - Class C Shares (commenced Dec. 15, 1999) | 10.00 | 0.01 | 0.31 | 0.32 | 10.32 | ||||||
| 2000 - Institutional Shares (commenced Dec. 15, 1999) | 10.00 | 0.09 | 0.31 | 0.40 | 10.40 | ||||||
| 2000 - Service Shares (commenced Dec. 15, 1999) | 10.00 | 0.07 | 0.31 | 0.38 | 10.38 | ||||||
a
|
Assumes investment at the net asset value at the beginning of the period, reinvestment of all dividends and
distributions, a complete redemption of the investment at the net asset value at the end of the period and no sales or redemption charges. Total return would be reduced if a sales or redemption charge were taken into account. Total returns for periods
less than one full year are not annualized.
|
b
|
Annualized.
|
c
|
Calculated based on average shares outstanding methodology.
|
d
|
Includes the effect of mortgage dollar roll transactions.
|
|
Ratios assuming no expense reductions |
||||||||||||||||||
|---|---|---|---|---|---|---|---|---|---|---|---|---|---|---|---|---|---|---|
| Total
returna |
Net assets
at end of period (in 000s) |
Ratio of net
expenses to average net assetsb |
Ratio of net
investment income to average net assetsb |
Ratio of
expenses to average net assetsb |
Ratio of net
investment income to average net assetsb |
Portfolio
turnover rate |
||||||||||||
| 3.90 | % | $7,181 | 1.25 | % | 0.84 | % | 3.30 | % | (1.21 | )% | 66.79 | % | ||||||
| 3.30 | 1,582 | 2.00 | 0.06 | 4.05 | (1.99 | ) | 66.79 | |||||||||||
| 3.20 | 850 | 2.00 | 0.15 | 4.05 | (1.90 | ) | 66.79 | |||||||||||
| 4.00 | 16,155 | 0.85 | 1.31 | 2.90 | (0.74 | ) | 66.79 | |||||||||||
| 3.80 | 2 | 1.35 | 0.95 | 3.40 | (1.10 | ) | 66.79 | |||||||||||
| FOR MORE INFORMATION
|
| Annual/Semi-annual Report
|
| Additional information about the Funds’ investments is available in the Funds’ annual and semi-annual reports to
shareholders. In the Funds’ annual reports, you will find a discussion of the market conditions and investment strategies that significantly affected the Funds’ performance during the last fiscal year.
|
| Statement of Additional Information
|
| Additional information about the Funds and their policies is also available in the Funds’ Additional Statement. The
Additional Statement is incorporated by reference into this Prospectus (is legally considered part of this Prospectus).
|
| The Funds’ annual and semi-annual reports, and the Additional Statement, are available free upon request by calling Goldman
Sachs at 1-800-621-2550.
|
| To obtain other information and for shareholder inquiries:
|
| By telephone – Call 1-800-621-2550
|
| By mail – Goldman Sachs Funds, 4900 Sears Tower, Chicago, IL 60606-6372
|
| By e-mail – [email protected]
|
| On the Internet – Text-only versions of the Funds’ documents are located online and may be downloaded from:
|
| SEC EDGAR database – http://www.sec.gov
|
| You may review and obtain copies of Fund documents by visiting the SEC’s Public Reference Room in Washington, D.C. You may
also obtain copies of Fund documents, after paying a duplicating fee, by writing to the SEC’s Public Reference Section, Washington, D.C. 20549-0102 or by electronic request to: [email protected]. Information on the operation of the public reference
room may be obtained by calling the SEC at (202) 942-8090.
|
| Prospectus
|
n
|
Goldman Sachs
Balanced Fund
|
n
|
Goldman Sachs
Growth and Income Fund
|
n
|
Goldman Sachs
CORE
SM
Large Cap Value Fund
|
n
|
Goldman Sachs
CORE
SM
U.S. Equity Fund
|
n
|
Goldman Sachs
CORE
SM
Large Cap Growth Fund
|
n
|
Goldman Sachs
CORE
SM
Small Cap Equity Fund
|
n
|
Goldman Sachs
Capital Growth Fund
|
n
|
Goldman Sachs
Strategic Growth Fund
|
n
|
Goldman Sachs
Growth Opportunities Fund
|
n
|
Goldman Sachs
Mid Cap Value Fund (formerly Mid Cap Equity)
|
n
|
Goldman Sachs
Small Cap Value Fund
|
n
|
Goldman Sachs
Large Cap Value Fund
|

| GOLDMAN SACHS DOMESTIC EQUITY FUNDS
|
| THE SECURITIES AND EXCHANGE COMMISSION HAS NOT APPROVED OR DISAPPROVED THESE SECURITIES OR PASSED UPON THE ADEQUACY OF THIS PROSPECTUS.
ANY REPRESENTATION TO THE CONTRARY IS A CRIMINAL OFFENSE.
|
| AN INVESTMENT IN A FUND IS NOT A BANK DEPOSIT AND IS NOT INSURED BY THE FEDERAL DEPOSIT INSURANCE CORPORATION OR ANY OTHER GOVERNMENT
AGENCY. AN INVESTMENT IN A FUND INVOLVES INVESTMENT RISKS, INCLUDING POSSIBLE LOSS OF PRINCIPAL.
|
| NOT FDIC-INSURED
|
May Lose Value
|
No Bank Guarantee
|
| Goldman Sachs Asset Management, a unit of the Investment Management Division of Goldman, Sachs & Co. (“Goldman
Sachs”), serves as investment adviser to the Balanced, Growth and Income, CORE Large Cap Value, CORE Large Cap Growth, CORE Small Cap Equity, Strategic Growth, Growth Opportunities, Mid Cap Value, Small Cap Value and Large Cap Value Funds. Goldman
Sachs Funds Management, L.P. serves as investment adviser to the CORE U.S. Equity and Capital Growth Funds. Goldman Sachs Asset Management and Goldman Sachs Funds Management, L.P. are each referred to in this Prospectus as the “Investment Adviser.”
;
|
| VALUE STYLE FUNDS
|
| Goldman Sachs’ Value Investment Philosophy:
|
| Through intensive, hands-on research our portfolio team seeks to identify:
|
1.
|
Well-positioned businesses that have:
|
n
|
Attractive returns on capital.
|
n
|
Sustainable earnings and cash flow.
|
n
|
Strong company management focused on long-term returns to shareholders.
|
2.
|
Attractive valuation opportunities where:
|
n
|
The intrinsic value of the business is not reflected in the stock price.
|
| Business quality, conservative valuation, and thoughtful portfolio construction are the key elements of our value approach.
|
| GROWTH STYLE FUNDS
|
| Goldman Sachs’ Growth Investment Philosophy:
|
1.
|
Invest as if buying the company/business, not simply trading its stock:
|
n
|
Understand the business, management, products and competition.
|
n
|
Perform intensive, hands-on fundamental research.
|
n
|
Seek businesses with strategic competitive advantages.
|
n
|
Over the long-term, expect each company’s stock price ultimately to track the growth in the value of the business.
|
2.
|
Buy high-quality growth businesses that possess strong business franchises, favorable long-term prospects and
excellent management.
|
3.
|
Purchase superior long-term growth companies at a favorable price—seek to purchase at a fair valuation,
giving the investor the potential to fully capture returns from above-average growth rates.
|
| Growth companies have earnings expectations that exceed those of the stock market as a whole.
|
| QUANTITATIVE (“CORE”) STYLE FUNDS
|
| Goldman Sachs’ CORE Investment Philosophy:
|
| Goldman Sachs’ quantitative style of funds—CORE—emphasizes the two building blocks of active management: stock
selection and portfolio construction.
|
| I. CORE Stock Selection
|
| The CORE Funds use the Goldman Sachs’ proprietary multifactor model (“Multifactor Model”), a rigorous computerized
rating system, to forecast the returns of securities held in each Fund’s portfolio. The Multifactor Model incorporates common variables covering measures of:
|
n
|
Research (What do fundamental analysts think about the company and its prospects?)
|
n
|
Value (How is the company priced relative to fundamental accounting measures?)
|
n
|
Momentum (What are medium-term price trends? How has the price responded to new information?)
|
n
|
Profitability (What is the company’s margin on sales? How efficient are its operations?)
|
n
|
Earnings Quality (Were earnings derived from sustainable (cash-based) sources?)
|
| All of the above factors are carefully evaluated within the Multifactor Model since each has demonstrated a significant
impact on the performance of the securities and markets they were designed to forecast. Stock selection in this process combines both our quantitative and qualitative analysis.
|
| II. CORE Portfolio Construction
|
| A proprietary risk model, which is intended to identify and measure risk as accurately as possible, includes all the above factors
used in the return model to select stocks, as well as several other factors associated with risk but not return. In this process, the Investment Adviser manages risk by attempting to limit deviations from the benchmark, and by attempting to run a size and
sector neutral portfolio. A computer optimizer evaluates many different security combinations (considering many possible weightings) in an effort to construct the most efficient risk/return portfolio given each CORE Fund benchmark.
|
| Goldman Sachs CORE Funds are fully invested, broadly diversified and offer consistent overall portfolio characteristics. They may
serve as good foundations on which to build a portfolio.
|
| Balanced Fund
|
|
Objective:
|
Long-term growth of capital and current income
|
|
Benchmarks:
|
S&P 500® Index and Lehman Brothers Aggregate Bond Index
|
|
Investment Focus:
|
Large capitalization U.S. stocks and fixed-income securities
|
|
Investment Style:
|
Asset Allocation, with growth and value (blend) equity components
|
| INVESTMENT OBJECTIVE
|
| The Fund seeks to provide long-term growth of capital and current income. The Fund seeks growth of capital primarily through
investments in equity securities (stocks). The Fund seeks to provide current income through investment in fixed-income securities (bonds).
|
| PRINCIPAL INVESTMENT STRATEGIES
|
| Historically, stock and bond markets have often had different cycles, with one asset class rising when the other is falling. A
balanced objective seeks to reduce the volatility associated with investing in a single market. There is no guarantee, however, that market cycles will move in opposition to one another or that a balanced investment program will successfully reduce
volatility.
|
| The percentage of the portfolio invested in equity and fixed-income securities will vary from time to time as the Investment
Adviser evaluates such securities’ relative attractiveness based on market valuations, economic growth and inflation prospects. The allocation between equity and fixed-income securities is subject to the Fund’s intention to pay regular quarterly
dividends. The amount of quarterly dividends can also be expected to fluctuate in accordance with factors such as prevailing interest rates and the percentage of the Fund’s assets invested in fixed-income securities.
|
| Equity Securities. The Fund invests, under normal circumstances, between 45% and 65% of its total assets in equity securities. Although the Fund’s equity investments consist primarily of publicly traded U.S. securities, the Fund may invest up to 10% of its total
assets in the equity securities of foreign issuers, including issuers in countries with emerging markets or economies (“emerging countries”) and equity securities quoted in foreign currencies. A portion of the Fund’s portfolio of equity
securities may be selected primarily to provide current income (including interests in real estate investment trusts (“REITs”), convertible securities, preferred stocks, utility stocks, and interests in limited partnerships).
|
| Fixed Income Securities. The Fund invests at least 25% of its total assets in fixed-income senior securities. The remainder of the Fund’s assets are invested in other fixed-income securities and cash.
|
| The Fund’s fixed-income securities primarily include:
|
n
|
Securities issued by the U.S. government, its agencies, instrumentalities or sponsored enterprises
|
n
|
Securities issued by corporations, banks and other issuers
|
n
|
Mortgage-backed and asset-backed securities
|
| The Fund may also invest up to 10% of its total assets in debt obligations (U.S. dollar and non-U.S.-dollar denominated) issued or
guaranteed by one or more foreign governments or any of their political subdivisions, agencies or instrumentalities and foreign corporations or other entities. The issuers of these securities may be located in emerging countries.
|
|
Objective:
|
Long-term growth of capital and growth of income
|
|
Benchmark:
|
S&P 500® Index
|
|
Investment Focus:
|
Large capitalization U.S. equity securities with an emphasis on undervalued stocks
|
|
Investment Style:
|
Value
|
| INVESTMENT OBJECTIVE
|
| The Fund seeks long-term growth of capital and growth of income.
|
| PRINCIPAL INVESTMENT STRATEGIES
|
| Equity Securities. The Fund invests, under normal circumstances, at least 65% of its total assets in equity securities that the Investment Adviser considers to have favorable prospects for capital appreciation and/or dividend-paying ability. Although the Fund will invest
primarily in publicly traded U.S. securities, it may invest up to 25% of its total assets in foreign securities, including securities of issuers in emerging countries and securities quoted in foreign currencies.
|
| Other.
The Fund may also invest up to 35% of its total assets in fixed-income securities, such as government, corporate and bank debt obligations, that offer the potential to further the Fund’s investment objective.
|
|
Objective:
|
Long-term growth of capital and dividend income
|
|
Benchmark:
|
Russell 1000® Value Index
|
|
Investment Focus:
|
Diversified portfolio of equity securities of large-cap U.S. issuers selling at low to modest valuations
|
|
Investment Style:
|
Quantitative, applied to large-cap value stocks
|
| INVESTMENT OBJECTIVE
|
| The Fund seeks long-term growth of capital and dividend income. The Fund seeks this objective through a broadly diversified
portfolio of equity securities of large-cap U.S. issuers that are selling at low to modest valuations relative to general market measures, such as earnings, book value and other fundamental accounting measures, and that are expected to have favorable
prospects for capital appreciation and/or dividend-paying ability.
|
| PRINCIPAL INVESTMENT STRATEGIES
|
| Equity Securities. The Fund invests, under normal circumstances, at least 90% of its total assets in equity securities of U.S. issuers, including foreign issuers that are traded in the United States.
|
| The Fund’s investments are selected using both a variety of quantitative techniques and fundamental research in seeking to
maximize the Fund’s expected return, while maintaining risk, style, capitalization and industry characteristics similar to the Russell 1000® Value Index. The Fund seeks a portfolio consisting of companies with above average capitalizations and
low to moderate valuations as measured by price/earnings ratios, book value and other fundamental accounting measures.
|
| Other.
The Fund’s investments in fixed-income securities are limited to securities that are considered cash equivalents.
|
|
Objective:
|
Long-term growth of capital and dividend income
|
|
Benchmark:
|
S&P 500® Index
|
|
Investment Focus:
|
Large-cap U.S. equity securities
|
|
Investment Style:
|
Quantitative, applied to large-cap growth and value (blend) stocks
|
| INVESTMENT OBJECTIVE
|
| The Fund seeks long-term growth of capital and dividend income. The Fund seeks this objective through a broadly diversified
portfolio of large-cap and blue chip equity securities representing all major sectors of the U.S. economy.
|
| PRINCIPAL INVESTMENT STRATEGIES
|
| Equity Securities. The Fund invests, under normal circumstances, at least 90% of its total assets in equity securities of U.S. issuers, including foreign issuers that are traded in the United States.
|
| The Fund’s investments are selected using both a variety of quantitative techniques and fundamental research in seeking to
maximize the Fund’s expected return, while maintaining risk, style, capitalization and industry characteristics similar to the S&P 500® Index. The Fund seeks a broad representation in most major sectors of the U.S. economy and a portfolio
consisting of companies with average long-term earnings growth expectations and dividend yields.
|
| Other.
The Fund’s investments in fixed-income securities are limited to securities that are considered cash equivalents.
|
|
Objective:
|
Long-term growth of capital; dividend income is a secondary consideration
|
|
Benchmark:
|
Russell 1000® Growth Index
|
|
Investment Focus:
|
Large-cap, growth-oriented U.S. stocks
|
|
Investment Style:
|
Quantitative, applied to large-cap growth stocks
|
| INVESTMENT OBJECTIVE
|
| The Fund seeks long-term growth of capital. The Fund seeks this objective through a broadly diversified portfolio of equity
securities of large-cap U.S. issuers that are expected to have better prospects for earnings growth than the growth rate of the general domestic economy. Dividend income is a secondary consideration.
|
| PRINCIPAL INVESTMENT STRATEGIES
|
| Equity Securities. The Fund invests, under normal circumstances, at least 90% of its total assets in equity securities of U.S. issuers, including foreign issuers that are traded in the United States.
|
| The Investment Adviser emphasizes a company’s growth prospects in analyzing equity securities to be purchased by the Fund.
The Fund’s investments are selected using both a variety of quantitative techniques and fundamental research in seeking to maximize the Fund’s expected return, while maintaining risk, style, capitalization and industry characteristics similar to
the Russell 1000® Growth Index. The Fund seeks a portfolio consisting of companies with above average capitalizations and earnings growth expectations and below average dividend yields.
|
| Other.
The Fund’s investments in fixed-income securities are limited to securities that are considered cash equivalents.
|
|
Objective:
|
Long-term growth of capital
|
|
Benchmark:
|
Russell 2000® Index
|
|
Investment Focus:
|
Stocks of small capitalization U.S. companies
|
|
Investment Style:
|
Quantitative, applied to small-cap growth and value (blend) stocks
|
| INVESTMENT OBJECTIVE
|
| The Fund seeks long-term growth of capital. The Fund seeks this objective through a broadly diversified portfolio of equity
securities of U.S. issuers which are included in the Russell 2000® Index at the time of investment.
|
| PRINCIPAL INVESTMENT STRATEGIES
|
| Equity Securities. The Fund invests, under normal circumstances, at least 90% of its total assets in equity securities of U.S. issuers, including foreign issuers that are traded in the United States.
|
| The Fund’s investments are selected using both a variety of quantitative techniques and fundamental research in seeking to
maximize the Fund’s expected return, while maintaining risk, style, capitalization and industry characteristics similar to the Russell 2000® Index. The Fund seeks a portfolio consisting of companies with small market capitalizations, strong
expected earnings growth and momentum, and better valuation and risk characteristics than the Russell 2000® Index. If the issuer of a portfolio security held by the Fund is no longer included in the Russell 2000® Index, the Fund may, but is not
required to, sell the security.
|
| Other.
The Fund’s investments in fixed-income securities are limited to securities that are considered cash equivalents.
|
|
Objective:
|
Long-term growth of capital
|
|
Benchmark:
|
S&P 500® Index
|
|
Investment Focus:
|
Large-cap U.S. equity securities that offer long-term capital appreciation potential
|
|
Investment Style:
|
Growth
|
| INVESTMENT OBJECTIVE
|
| The Fund seeks long-term growth of capital.
|
| PRINCIPAL INVESTMENT STRATEGIES
|
| Equity Securities. The Fund invests, under normal circumstances, at least 90% of its total assets in equity securities. The Fund seeks to achieve its investment objective by investing in a diversified portfolio of equity securities that are considered by the Investment
Adviser to have long-term capital appreciation potential. Although the Fund invests primarily in publicly traded U.S. securities, it may invest up to 10% of its total assets in foreign securities, including securities of issuers in emerging countries and
securities quoted in foreign currencies.
|
|
Objective:
|
Long-term growth of capital
|
|
Benchmark:
|
S&P 500® Index
|
|
Investment Focus:
|
Large-cap U.S. equity securities that are considered to be strategically positioned for consistent long-term growth
|
|
Investment Style:
|
Growth
|
| INVESTMENT OBJECTIVE
|
| The Fund seeks long-term growth of capital.
|
| PRINCIPAL INVESTMENT STRATEGIES
|
| Equity Securities. The Fund invests, under normal circumstances, at least 90% of its total assets in equity securities. The Fund seeks to achieve its investment objective by investing in a diversified portfolio of equity securities that are considered by the Investment
Adviser to be strategically positioned for consistent long-term growth. Although the Fund invests primarily in publicly traded U.S. securities, it may invest up to 10% of its total assets in foreign securities, including securities of issuers in emerging
countries and securities quoted in foreign currencies.
|
|
Objective:
|
Long-term growth of capital
|
|
Benchmark:
|
S&P Midcap 400 Index
|
|
Investment Focus:
|
U.S. equity securities that offer long-term capital appreciation
with a primary focus on mid-capitalization companies |
|
Investment Style:
|
Growth
|
| INVESTMENT OBJECTIVE
|
| The Fund seeks long-term growth of capital.
|
| PRINCIPAL INVESTMENT STRATEGIES
|
| Equity Securities. The Fund invests, under normal circumstances, at least 90% of its total assets in equity securities with a primary focus on mid-cap companies. The Fund seeks to achieve its investment objective by investing in a diversified portfolio of equity securities
that are considered by the Investment Adviser to be strategically positioned for long-term growth. Although the Fund invests primarily in publicly traded U.S. securities, it may invest up to 10% of its total assets in foreign securities, including
securities of issuers in emerging countries and securities quoted in foreign currencies.
|
|
Objective:
|
Long-term capital appreciation
|
|
Benchmark:
|
Russell Midcap Value Index
|
|
Investment Focus:
|
Mid-capitalization U.S. stocks that are believed to be undervalued or undiscovered by the marketplace
|
|
Investment Style:
|
Value
|
| INVESTMENT OBJECTIVE
|
| The Fund seeks long-term capital appreciation.
|
| PRINCIPAL INVESTMENT STRATEGIES
|
| Equity Securities. The Fund invests, under normal circumstances, substantially all of its assets in equity securities and at least 65% of its total assets in equity securities of mid-cap companies with public stock market capitalizations (based upon shares available for
trading on an unrestricted basis) within the range of the market capitalization of companies constituting the Russell Midcap Value Index at the time of investment (currently between $300 million and $15 billion). If the market capitalization of a company
held by the Fund moves outside this range, the Fund may, but is not required to, sell the securities. Although the Fund will invest primarily in publicly traded U.S. securities, it may invest up to 25% of its total assets in foreign securities, including
securities of issuers in emerging countries and securities quoted in foreign currencies.
|
| Other.
The Fund may invest in the aggregate up to 35% of its total assets in companies with public stock market capitalizations outside the range of companies constituting the Russell Midcap Value Index at the time of investment and in fixed-income securities,
such as government, corporate and bank debt obligations.
|
|
Objective:
|
Long-term growth of capital
|
|
Benchmark:
|
Russell 2000® Value Index
|
|
Investment Focus:
|
Small-capitalization U.S. stocks that are believed to be undervalued or undiscovered by the marketplace
|
|
Investment Style:
|
Value
|
| INVESTMENT OBJECTIVE
|
| The Fund seeks long-term growth of capital.
|
| PRINCIPAL INVESTMENT STRATEGIES
|
| Equity Securities. The Fund invests, under normal circumstances, at least 65% of its total assets in equity securities of companies with public stock market capitalizations (based upon shares available for trading on an unrestricted basis) within the range of the market
capitalization of companies constituting the Russell 2000® Value Index at the time of investment (currently between $20 million and $3 billion). If the market capitalization of a company held by the Fund moves outside this range, the Fund may, but is
not required to sell the securities. Under normal circumstances, the Fund’s investment horizon for ownership of stocks will be two to three years. Although the Fund will invest primarily in publicly traded U.S. securities, it may invest up to 25% of
its total assets in foreign securities, including securities of issuers in emerging countries and securities quoted in foreign currencies.
|
| Other.
The Fund may invest in the aggregate up to 35% of its total assets in companies with public stock market capitalizations outside the range of companies constituting the Russell 2000® Value Index at the time of investment and in fixed-income
securities, such as government, corporate and bank debt obligations.
|
|
Objective:
|
Long-term capital appreciation
|
|
Benchmark:
|
Russell 1000® Value Index
|
|
Investment Focus:
|
Large capitalization U.S. equity securities that are believed to be undervalued
|
|
Investment Style:
|
Value
|
| INVESTMENT OBJECTIVE
|
| The Fund seeks long-term capital appreciation.
|
| PRINCIPAL INVESTMENT STRATEGIES
|
| Equity Securities. The Fund invests, under normal circumstances, at least 90% of its total assets in equity securities. The Fund seeks its investment objective by investing in value opportunities that the Investment Adviser defines as companies with identifiable
competitive advantages whose intrinsic value is not reflected in the stock price. Although the Fund will invest primarily in publicly traded U.S. securities, it may invest up to 25% of its total assets in foreign securities, including securities quoted in
foreign currencies.
|
| Other.
The Fund may invest up to 10% of its total assets in fixed-income securities, such as government, corporate and bank debt obligations.
|
Ÿ
|
No specific percentage limitation on usage;
limited only by the objectives and strategies of the Fund |
| Balanced
Fund |
Growth
and Income Fund |
CORE
Large Cap Value Fund |
CORE
U.S. Equity Fund |
||||||
|---|---|---|---|---|---|---|---|---|---|
| Investment Practices | |||||||||
| Borrowings | 33 1
/3
|
33 1
/3
|
33 1
/3
|
33 1
/3
|
|||||
| Credit, Currency, Index, Interest Rate and
Mortgage Swaps* |
15 | — | — | — | |||||
| Cross Hedging of Currencies | Ÿ | Ÿ | Ÿ | Ÿ | |||||
| Custodial Receipts | Ÿ | Ÿ | Ÿ | Ÿ | |||||
| Equity Swaps* | 15 | 15 | 15 | 15 | |||||
| Foreign Currency Transactions** | Ÿ 1 | Ÿ | Ÿ | Ÿ | |||||
| Futures Contracts and Options on Futures
Contracts |
Ÿ | Ÿ | Ÿ 2 | Ÿ 3 | |||||
| Interest Rate Caps, Floors and Collars | Ÿ | — | — | — | |||||
| Investment Company Securities (including
iShares SM and Standard & Poor’s Depositary Receipts TM ) |
10 | 10 | 10 | 10 | |||||
| Loan Participations | Ÿ | — | — | — | |||||
| Mortgage Dollar Rolls | Ÿ | — | — | — | |||||
| Options on Foreign Currencies 4 | Ÿ | Ÿ | Ÿ | Ÿ | |||||
| Options on Securities and Securities Indices 5 | Ÿ | Ÿ | Ÿ | Ÿ | |||||
| Repurchase Agreements | Ÿ | Ÿ | Ÿ | Ÿ | |||||
| Reverse Repurchase Agreements (for investment
purposes) |
Ÿ | — | — | — | |||||
| Securities Lending | 33 1
/3
|
33 1
/3
|
33 1
/3
|
33 1
/3
|
|||||
| Short Sales Against the Box | 25 | 25 | — | — | |||||
| Unseasoned Companies | Ÿ | Ÿ | Ÿ | Ÿ | |||||
| Warrants and Stock Purchase Rights | Ÿ | Ÿ | Ÿ | Ÿ | |||||
| When-Issued Securities and Forward
Commitments |
Ÿ | Ÿ | Ÿ | Ÿ | |||||
*
|
Limited to 15% of net assets (together with other illiquid securities) for all structured securities which are not
deemed to be liquid and all swap transactions.
|
**
|
Limited by the amount the Fund invests in foreign securities.
|
1
|
The Balanced Fund may also enter into forward foreign currency exchange contracts to seek to increase total return.
|
2
|
The CORE Large Cap Value, CORE Large Cap Growth and CORE Small Cap Equity Funds may enter into futures transactions only
with respect to a representative index.
|
3
|
The CORE U.S. Equity Fund may enter into futures transactions only with respect to the S&P 500 Index.
|
4
|
The Funds may purchase and sell call and put options.
|
5
|
The Funds may sell covered call and put options and purchase call and put options.
|
| CORE
Large Cap Growth Fund |
CORE
Small Cap Equity Fund |
Capital
Growth Fund |
Strategic
Growth Fund |
Growth
Opportunities Fund |
Mid Cap
Value Fund |
Small Cap
Value Fund |
Large Cap
Value Fund |
||||||||
|---|---|---|---|---|---|---|---|---|---|---|---|---|---|---|---|
| 33 1
/3
|
33 1
/3
|
33 1
/3
|
33 1
/3
|
33 1
/3
|
33 1
/3
|
33 1
/3
|
33 1
/3
|
||||||||
| — | — | — | — | — | — | — | — | ||||||||
| Ÿ | Ÿ | Ÿ | Ÿ | Ÿ | Ÿ | Ÿ | Ÿ | ||||||||
| Ÿ | Ÿ | Ÿ | Ÿ | Ÿ | Ÿ | Ÿ | Ÿ | ||||||||
| 15 | 15 | 15 | 15 | 15 | 15 | 15 | 15 | ||||||||
| Ÿ | Ÿ | Ÿ | Ÿ | Ÿ | Ÿ | Ÿ | Ÿ | ||||||||
| Ÿ 2 | Ÿ 2 | Ÿ | Ÿ | Ÿ | Ÿ | Ÿ | Ÿ | ||||||||
| — | — | — | — | — | — | — | — | ||||||||
| 10 | 10 | 10 | 10 | 10 | 10 | 10 | 10 | ||||||||
| — | — | — | — | — | — | — | — | ||||||||
| — | — | — | — | — | — | — | — | ||||||||
| Ÿ | Ÿ | Ÿ | Ÿ | Ÿ | Ÿ | Ÿ | Ÿ | ||||||||
| Ÿ | Ÿ | Ÿ | Ÿ | Ÿ | Ÿ | Ÿ | Ÿ | ||||||||
| Ÿ | Ÿ | Ÿ | Ÿ | Ÿ | Ÿ | Ÿ | Ÿ | ||||||||
| — | — | — | — | — | — | — | — | ||||||||
| 33 1
/3
|
33 1
/3
|
33 1
/3
|
33 1
/3
|
33 1
/3
|
33 1
/3
|
33 1
/3
|
33 1
/3
|
||||||||
| — | — | 25 | 25 | 25 | 25 | 25 | 25 | ||||||||
| Ÿ | Ÿ | Ÿ | Ÿ | Ÿ | Ÿ | Ÿ | Ÿ | ||||||||
| Ÿ | Ÿ | Ÿ | Ÿ | Ÿ | Ÿ | Ÿ | Ÿ | ||||||||
| Ÿ | Ÿ | Ÿ | Ÿ | Ÿ | Ÿ | Ÿ | Ÿ | ||||||||
Ÿ
|
No specific percentage limitation on usage;
limited only by the objectives and strategies of the Fund |
| Balanced
Fund |
Growth
and Income Fund |
CORE
Large Cap Value Fund |
CORE
U.S. Equity Fund |
||||||||||
|---|---|---|---|---|---|---|---|---|---|---|---|---|---|
| Investment Securities | |||||||||||||
| American, European and Global Depositary
Receipts |
Ÿ | Ÿ | Ÿ 6 | Ÿ 6 | |||||||||
| Asset-Backed and Mortgage-Backed Securities 7 | Ÿ | Ÿ | — | — | |||||||||
| Bank Obligations 7 | Ÿ | Ÿ | Ÿ | Ÿ | |||||||||
| Convertible Securities 8 | Ÿ | Ÿ | Ÿ | Ÿ | |||||||||
| Corporate Debt Obligations 7 | Ÿ | Ÿ | Ÿ 9 | Ÿ 9 | |||||||||
| Equity Securities | 45-65 | 65 | + | 90 | + | 90 | + | ||||||
| Emerging Country Securities | 10 10 | 25 | 10 | — | — | ||||||||
| Fixed Income Securities 11 | 35-45 | 18 | 35 | 10 | 9 | 10 | 9 | ||||||
| Foreign Securities | 10 10 | 25 | 10 | Ÿ 14 | Ÿ 14 | ||||||||
| Foreign Government Securities 7 | Ÿ | — | — | — | |||||||||
| Municipal Securities | Ÿ | — | — | — | |||||||||
| Non-Investment Grade Fixed Income Securities | 10 15 | 10 | 16 | — | — | ||||||||
| Real Estate Investment Trusts | Ÿ | Ÿ | Ÿ | Ÿ | |||||||||
| Stripped Mortgage Backed Securities 7 | Ÿ | — | — | — | |||||||||
| Structured Securities* | Ÿ | Ÿ | Ÿ | Ÿ | |||||||||
| Temporary Investments | 100 | 100 | 35 | 35 | |||||||||
| U.S. Government Securities 7 | Ÿ | Ÿ | Ÿ | Ÿ | |||||||||
| Yield Curve Options and Inverse Floating Rate
Securities |
Ÿ | — | — | — | |||||||||
*
|
Limited to 15% of net assets (together with other illiquid securities) for all structured securities which are not
deemed to be liquid and all swap transactions.
|
6
|
The CORE Funds may not invest in European Depositary Receipts.
|
7
|
Limited by the amount the Fund invests in fixed-income securities.
|
8
|
Convertible securities purchased by the Balanced Fund must be B or higher by Standard & Poor’s Rating Group
(“Standard & Poor’s”) or Moody’s Investor’s Service, Inc. (“Moody’s”). The CORE Funds have no minimum rating criteria and all other Funds use the same rating criteria for convertible and non-convertible debt
securities.
|
9
|
Cash equivalents only.
|
10
|
The Balanced, Growth and Income, Capital Growth, Strategic Growth, Growth Opportunities, Mid Cap Value and Small Cap
Value Funds may invest in the aggregate up to 10%, 25%, 10%, 10%, 10%, 25% and 25%, respectively, of their total assets in foreign securities, including emerging country securities.
|
11
|
Except as noted under “Non-Investment Grade Fixed Income Securities,” fixed-income securities must be
investment grade (i.e., BBB or higher by Standard & Poor’s or Baa or higher by Moody’s).
|
12
|
The Mid Cap Value Fund may invest in the aggregate up to 35% of its total assets in: (1) securities of companies with
public stock market capitalizations outside the range of companies constituting the Russell Midcap Value Index at the time of investment and (2) fixed-income securities.
|
| CORE
Large Cap Growth Fund |
CORE
Small Cap Equity Fund |
Capital
Growth Fund |
Strategic
Growth Fund |
Growth
Opportunities Fund |
Mid Cap
Value Fund |
Small Cap
Value Fund |
Large Cap
Value Fund |
|||||||||
|---|---|---|---|---|---|---|---|---|---|---|---|---|---|---|---|---|
| Ÿ 6 | Ÿ 6 | Ÿ | Ÿ | Ÿ | Ÿ | Ÿ | Ÿ | |||||||||
| — | — | Ÿ | Ÿ | Ÿ | Ÿ | Ÿ | Ÿ | |||||||||
| Ÿ | Ÿ | Ÿ | Ÿ | Ÿ | Ÿ | Ÿ | Ÿ | |||||||||
| Ÿ | Ÿ | Ÿ | Ÿ | Ÿ | Ÿ | Ÿ | Ÿ | |||||||||
| Ÿ 9 | Ÿ 9 | Ÿ | Ÿ | Ÿ | Ÿ | Ÿ | Ÿ | |||||||||
| 90+ | 90+ | 90 | + | 90+ | 90+ | 65+ | 65+ | 90+ | ||||||||
| — | — | 10 | 10 | 10 10 | 10 10 | 25 10 | 25 10 | — | ||||||||
| 10 9 | 10 9 | Ÿ | Ÿ | Ÿ | 35 12 | 35 13 | 10 | |||||||||
| Ÿ |
Ÿ 14 | 10 | 10 | 10 10 | 10 10 | 25 10 | 25 10 | 25 | ||||||||
| — | — | — | — | — | — | — | — | |||||||||
| — | — | — | — | — | — | — | — | |||||||||
| — | — | 10 | 16 | 10 16 | 10 16 | 10 17 | 35 16 | 10 16 | ||||||||
| Ÿ | Ÿ | Ÿ | Ÿ | Ÿ | Ÿ | Ÿ | Ÿ | |||||||||
| — | — | — | — | — | — | — | — | |||||||||
| Ÿ | Ÿ | Ÿ | Ÿ | Ÿ | Ÿ | Ÿ | Ÿ | |||||||||
| 35 | 35 | 100 | 100 | 100 | 100 | 100 | 100 | |||||||||
| Ÿ | Ÿ | Ÿ | Ÿ | Ÿ | Ÿ | Ÿ | Ÿ | |||||||||
| — | — | — | — | — | — | — | — | |||||||||
13
|
The Small Cap Value Fund may invest in the aggregate up to 35% of its total assets in:
(1) securities of companies with public stock market capitalizations outside the range of companies constituting the Russell 2000® Value Index at the time of investment; and (2) fixed-income securities. |
14
|
Equity securities of foreign issuers must be traded in the United States.
|
15
|
Must be at least BB or B by Standard & Poor’s or Ba or B by Moody’s.
|
16
|
May be BB or lower by Standard & Poor’s or Ba or lower by Moody’s.
|
17
|
Must be B or higher by Standard & Poor’s or B or higher by Moody’s.
|
18
|
The Balanced Fund invests at least 25% of its total assets in fixed-income senior securities; the remainder may be
invested in other fixed-income securities and cash.
|
| Ÿ
Applicable
— Not applicable |
Balanced
Fund |
Growth
and Income Fund |
CORE
Large Cap Value Fund |
CORE
U.S. Equity Fund |
CORE
Large Cap Growth Fund |
CORE
Small Cap Equity Fund |
|||||||
|---|---|---|---|---|---|---|---|---|---|---|---|---|---|
| Credit/Default | Ÿ | Ÿ | Ÿ | Ÿ | Ÿ | Ÿ | |||||||
| Foreign | Ÿ | Ÿ | Ÿ | Ÿ | Ÿ | Ÿ | |||||||
| Emerging Countries | Ÿ | Ÿ | Ÿ | Ÿ | Ÿ | Ÿ | |||||||
| Small Cap | — | — | — | — | — | Ÿ | |||||||
| Stock | Ÿ | Ÿ | Ÿ | Ÿ | Ÿ | Ÿ | |||||||
| Derivatives | Ÿ | Ÿ | Ÿ | Ÿ | Ÿ | Ÿ | |||||||
| Interest Rate | Ÿ | Ÿ | Ÿ | Ÿ | Ÿ | Ÿ | |||||||
| Management | Ÿ | Ÿ | Ÿ | Ÿ | Ÿ | Ÿ | |||||||
| Market | Ÿ | Ÿ | Ÿ | Ÿ | Ÿ | Ÿ | |||||||
| Liquidity | Ÿ | Ÿ | Ÿ | Ÿ | Ÿ | Ÿ | |||||||
| Initial Public Offering (“IPO”) | — | — | — | — | — | — | |||||||
| Capital
Growth Fund |
Strategic
Growth Fund |
Growth
Opportunities Fund |
Mid
Cap Value Fund |
Small Cap Value Fund |
Large
Cap Value Fund |
||||||
|---|---|---|---|---|---|---|---|---|---|---|---|
| Ÿ | Ÿ | Ÿ | Ÿ | Ÿ | Ÿ | ||||||
| Ÿ | Ÿ | Ÿ | Ÿ | Ÿ | Ÿ | ||||||
| Ÿ | Ÿ | Ÿ | Ÿ | Ÿ | Ÿ | ||||||
| — | — | — | Ÿ | Ÿ | — | ||||||
| Ÿ | Ÿ | Ÿ | Ÿ | Ÿ | Ÿ | ||||||
| Ÿ | Ÿ | Ÿ | Ÿ | Ÿ | Ÿ | ||||||
| Ÿ | Ÿ | Ÿ | Ÿ | Ÿ | Ÿ | ||||||
| Ÿ | Ÿ | Ÿ | Ÿ | Ÿ | Ÿ | ||||||
| Ÿ | Ÿ | Ÿ | Ÿ | Ÿ | Ÿ | ||||||
| Ÿ | Ÿ | Ÿ | Ÿ | Ÿ | Ÿ | ||||||
| — | Ÿ | Ÿ | Ÿ | Ÿ | — | ||||||
n
|
Credit/Default Risk—The risk that an issuer or guarantor of fixed-income securities held by a Fund may default
on its obligation to pay interest and repay principal.
|
n
|
Foreign Risk—The risk that when a Fund invests in foreign securities, it will be subject to risk of loss not
typically associated with domestic issuers. Loss may result because of less foreign government regulation, less public information and less economic, political and social stability. Loss may also result from the imposition of exchange controls,
confiscations and other government restrictions. A
Fund will also be subject to the risk of negative foreign currency rate fluctuations. Foreign risks will normally be greatest when a Fund invests in issuers located in emerging countries. |
n
|
Emerging Countries Risk—The securities markets of Asian, Latin and South American, Eastern European, African
and other emerging countries are less liquid, are especially subject to greater price volatility, have smaller market capitalizations, have less government regulation and are not subject to as extensive and frequent accounting, financial and other
reporting requirements as the securities markets of more developed countries. Further, investment in equity securities of issuers located in Russia and certain other emerging countries involves risk of loss resulting from problems in share registration
and custody and substantial economic and political disruptions. These risks are not normally associated with investments in more developed countries.
|
n
|
Stock Risk—The risk that stock prices
have historically risen and fallen in periodic cycles. Recently, U.S. stock markets and certain foreign stock markets have experienced substantial price volatility and, at times, have traded at or close to record high levels. There is no guarantee that
such levels will be reached or maintained in the future.
|
n
|
Derivatives Risk—The risk that loss may result from a Fund’s investments in options, futures, swaps,
structured securities and other derivative instruments. These instruments may be leveraged so that small changes may produce disproportionate losses to a Fund.
|
n
|
Interest Rate Risk—The risk that when interest rates increase, securities held by a Fund will decline in value.
Long-term fixed-income securities will normally have more price volatility because of this risk than short-term fixed-income securities.
|
n
|
Management Risk—The risk that a strategy used by the Investment Adviser may fail to produce the intended results.
|
n
|
Market Risk—The risk that the value of the securities in which a Fund invests may go up or down in response to
the prospects of individual companies, particular industry sectors and/or general economic conditions. Price changes may be temporary or last for extended periods. A Fund’s investments may be overweighted
from time to time in one or more industry sectors, which will increase the Fund’s exposure to risk of loss from adverse developements affecting those sectors.
|
n
|
Liquidity Risk—The risk that a Fund will not be able to pay redemption proceeds within the time period stated
in this Prospectus because of unusual market conditions, an unusually high volume of redemption requests, or other reasons. Funds that invest in non-investment grade fixed-income securities, small capitalization stocks, REITs and emerging country issuers
will be especially subject to the risk that during certain periods the liquidity of particular issuers or industries, or all securities within particular investment categories, will shrink or disappear suddenly and without warning as a result of adverse
economic, market or political events, or adverse investor perceptions whether or not accurate. The Goldman Sachs Asset Allocation Portfolios (the “Asset Allocation Portfolios”) expect to invest a significant percentage of their assets in the
Funds and other funds for which Goldman Sachs now or in the future acts as investment adviser or underwriter. Redemptions by an Asset Allocation Portfolio of its position in a Fund may further increase liquidity risk and may impact a Fund’s net asset
value (“NAV”).
|
n
|
Small Cap Risk—The securities of small capitalization stocks involve greater risks than those associated with
larger, more established companies and may be subject to more abrupt or erratic price movements. Securities of such issuers may lack sufficient market liquidity to enable a Fund to effect sales at an advantageous time or without a substantial drop in price.
|
n
|
IPO Risk—The risk that the market value of IPO shares will fluctuate considerably due to factors such as the
absence of a prior public market, unseasoned trading, the small number of shares available for trading and limited information about the issuer. The purchase of IPO shares may involve high transaction costs. IPO shares are subject to market risk and
liquidity risk. When a Fund’s asset base is small, a significant portion of the Fund’s performance could be attributable to investments in IPOs, because such investments would have a magnified impact on the Fund. As the Fund’s assets grow,
the effect of the Fund’s investments in IPOs on the Fund’s performance probably will decline, which could reduce the Fund’s performance.
|
| HOW THE FUNDS HAVE PERFORMED
|
| The bar chart and table below provide an indication of the risks of investing in a Fund by showing: (a) changes in the performance
of a Fund’s Service Shares from year to year; and (b) how the average annual returns of a Fund’s Service Shares compare to those of broad-based securities market indices. The bar chart and table assume reinvestment of dividends and
distributions. A Fund’s past performance is not necessarily an indication of how the Fund will perform in the future. Performance reflects expense limitations in effect. If expense limitations were not in place, a Fund’s performance would have
been reduced. The Strategic Growth, Growth Opportunities and Large Cap Value Funds commenced operations on May 24, 1999, May 24, 1999 and December 15, 1999, respectively. Since these Funds have less than one calendar year’s performance, no
performance information is provided in this section.
|
| TOTAL RETURN
|
| The total return for Service Shares for the 9-month period ended September 30, 2000 was
2.10%.
Best Quarter
Q4 ’99 +8.14%
Worst Quarter
Q3 ’98 -8.76%
|
|
| AVERAGE ANNUAL TOTAL RETURN
|
| For the period ended December 31, 1999 | 1 Year | Since Inception | ||||
|---|---|---|---|---|---|---|
| Service Shares (Inception 8/15/97) | 8.56 | % | 5.74% | |||
| S&P 500® Index* | 21.04 | % | 23.21% | |||
| Lehman Brothers Aggregate Bond Index** | (0.82 | )% | 5.14% | |||
*
|
The S&P 500® Index is the Standard & Poor’s Composite Index of 500 stocks, an unmanaged index of common stock
prices. The Index figures do not reflect any fees or expenses.
|
**
|
The Lehman Brothers Aggregate Bond Index is an unmanaged index of bond prices. The Index figures do not reflect any fees or
expenses.
|
| TOTAL RETURN
|
| The total return for Service Shares for the 9-month period ended September 30, 2000 was
-0.92%.
Best Quarter
Q2 ’97 +15.16%
Worst Quarter
Q3 ’98 -16.98%
|
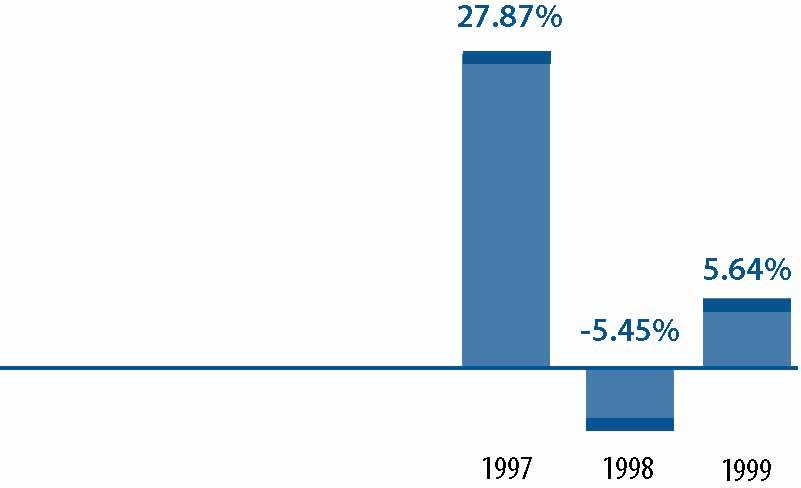 |
| AVERAGE ANNUAL TOTAL RETURN
|
| For the period ended December 31, 1999 | 1 Year | Since Inception | |||
|---|---|---|---|---|---|
| Service Shares (Inception 3/6/96) | 5.64% | 11.53% | |||
| S&P 500® Index* | 21.04% | 25.79% | |||
*
|
The S&P 500® Index is the Standard & Poor’s Composite Index of 500 stocks, an unmanaged index of common stock
prices. The Index figures do not reflect any fees or expenses.
|
| TOTAL RETURN
|
| The total return for Service Shares for the
9-month period ended September 30, 2000 was 2.41%. Best Quarter
Q2 ’99 +10.38%
Worst Quarter
Q3 ’99 -8.53%
|
 |
| AVERAGE ANNUAL TOTAL RETURN
|
| For the period ended December 31, 1999 | 1 Year | Since Inception | |||
|---|---|---|---|---|---|
| Service Shares (Inception 12/31/98) | 8.70% | 8.68% | |||
| Russell 1000® Value Index* | 7.34% | 7.34% | |||
*
|
The Russell 1000® Value Index, (inception date 1/1/99), is a market capitalization weighted index of the 1,000 highest
ranking U.S. stocks with below-average growth orientation. The Index figures do not reflect any fees or expenses.
|
| TOTAL RETURN
|
| The total return for Service Shares for the
9-month period ended September 30, 2000 was -0.46%. Best Quarter
Q4 ’98 +21.46%
Worst Quarter
Q3 ’98 -14.68%
|
 |
| AVERAGE ANNUAL TOTAL RETURN
|
| For the period ended December 31, 1999 | 1 Year | Since Inception | |||
|---|---|---|---|---|---|
| Service Shares (Inception 6/7/96) | 22.71% | 23.91% | |||
| S&P 500® Index* | 21.04% | 26.47% | |||
*
|
The S&P 500® Index is the Standard & Poor’s Composite Index of 500 stocks, an unmanaged index of common stock
prices. The Index figures do not reflect any fees or expenses.
|
| TOTAL RETURN
|
| The total return for Service Shares for the
9-month period ended September 30, 2000 was -0.92%.
Best Quarter
Q4 ’98 +25.52%
Worst Quarter
Q3 ’98 -14.00%
|
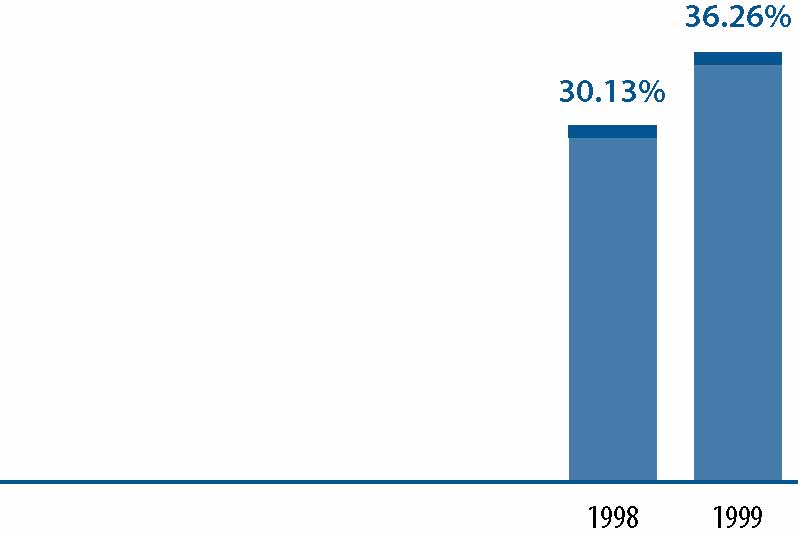 |
| AVERAGE ANNUAL TOTAL RETURN
|
| For the period ended December 31, 1999 | 1 Year | Since Inception | |||
|---|---|---|---|---|---|
| Service Shares (Inception 5/1/97) | 36.26% | 33.20% | |||
| Russell 1000® Growth Index* | 33.15% | 35.42% | |||
*
|
The Russell 1000® Growth Index is an unmanaged index of common stock prices. The Index figures do not reflect any fees or
expenses.
|
| TOTAL RETURN
|
| The total return for Service Shares the
9-month period ended September 30, 2000 was 6.80%.
Best Quarter
Q4 ’99 +15.28%
Worst Quarter
Q3 ’98 -24.34%
|
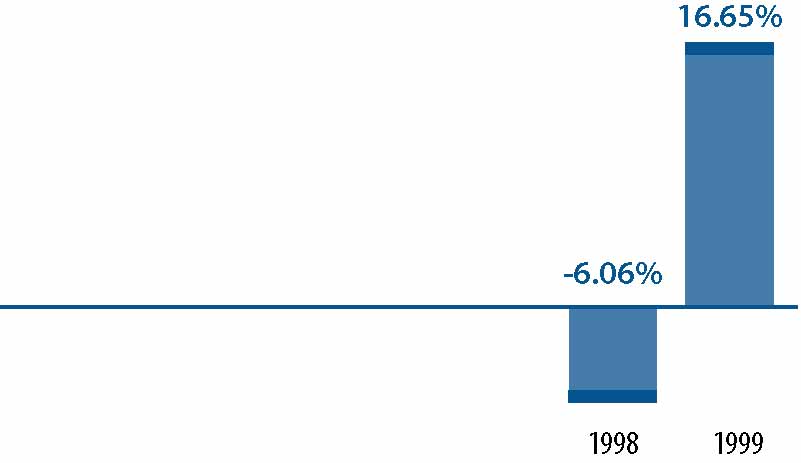 |
| AVERAGE ANNUAL TOTAL RETURN
|
| For the period ended December 31, 1999 | 1 Year | Since Inception | |||
|---|---|---|---|---|---|
| Service Shares (Inception 8/15/97) | 16.65% | 7.32% | |||
| Russell 2000® Index* | 21.26% | 10.21% | |||
*
|
The Russell 2000® Index is an unmanaged index of common stock prices. The Index figures do not reflect any fees or expenses.
|
| TOTAL RETURN
|
| The total return for Service Shares for the 9-month period ended September 30, 2000 was
0.22%.
Best Quarter
Q4 ’98 +24.32%
Worst Quarter
Q3 ’98 -11.51%
|
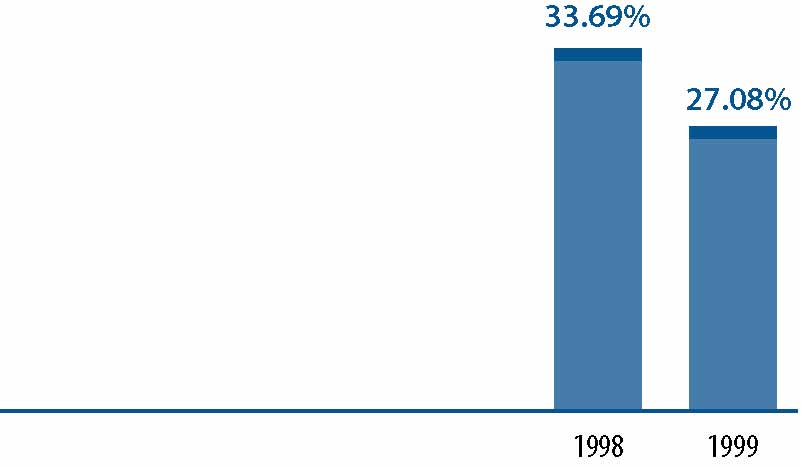 |
| AVERAGE ANNUAL TOTAL RETURN
|
| For the period ended December 31, 1999 | 1 Year | Since Inception | |||
|---|---|---|---|---|---|
| Service Shares (Inception 8/15/97) | 27.08% | 28.47% | |||
| S&P 500® Index* | 21.04% | 23.21% | |||
*
|
The S&P 500® Index is the Standard & Poor’s Composite Index of 500 stocks, an unmanaged index of common stock
prices. The Index figures do not reflect any fees or expenses.
|
| TOTAL RETURN
|
| The total return for Service Shares for the 9-month period ended September 30, 2000 was 17.69%.
Best Quarter
Q2 ’99 +21.13%
Worst Quarter
Q3 ’98 -20.81%
|
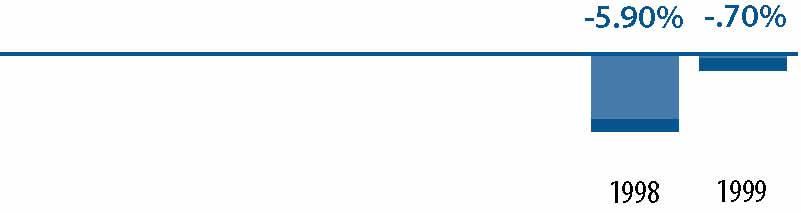 |
| AVERAGE ANNUAL TOTAL RETURN
|
| For the period ended December 31, 1999 | 1 Year | Since Inception | |||||
|---|---|---|---|---|---|---|---|
| Service Shares (Inception 7/18/97) | (0.70 | )% | (0.84 | )% | |||
| Russell Midcap Value Index* | (0.10 | )% | 7.04 | % | |||
*
|
The Russell Midcap Value Index is an unmanaged index of common stock prices. The Index figures do not reflect any fees or
expenses.
|
| TOTAL RETURN
|
| The total return for Service Shares for the 9-month period ended September 30, 2000 was
26.33%.
Best Quarter
Q2 ’99 +30.02%
Worst Quarter
Q3 ’98 -32.23%
|
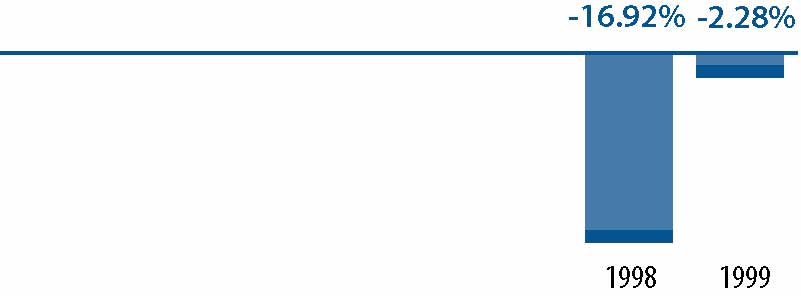 |
| AVERAGE ANNUAL TOTAL RETURN
|
| For the period ended December 31, 1999 | 1 Year | Since Inception | |||
|---|---|---|---|---|---|
| Service Shares (Inception 8/15/97) | (2.28)% | (5.56)% | |||
| Russell 2000® Value Index* | (1.49)% | 0.81% | |||
*
|
The Russell 2000® Value Index is an unmanaged index of common stock prices. The Index figures do not reflect any fees or
expenses.
|
| Balanced
Fund |
Growth
and Income Fund |
CORE
Large Cap Value Fund |
CORE
U.S. Equity Fund |
||||||
|---|---|---|---|---|---|---|---|---|---|
| Shareholder Fees | |||||||||
| (fees paid directly from your investment): | |||||||||
| Maximum Sales Charge (Load) Imposed
on Purchases |
None | None | None | None | |||||
| Maximum Sales Charge (Load) Imposed on
Reinvested Dividends |
None | None | None | None | |||||
| Redemption Fees | None | None | None | None | |||||
| Exchange Fees | None | None | None | None | |||||
| Annual Fund Operating Expenses | |||||||||
| (expenses that are deducted from Fund assets):1 | |||||||||
| Management Fees 2 | 0.65% | 0.70% | 0.60% | 0.75% | |||||
| Service Fees 3 | 0.50% | 0.50% | 0.50% | 0.50% | |||||
| Other Expenses 4 | 0.24% | 0.08% | 0.17% | 0.08% | |||||
| Total Fund Operating Expenses* | 1.39% | 1.28% | 1.27% | 1.33% | |||||
| See page 38 for all other footnotes.
|
*
|
As a result of current waivers and expense limitations, “Other Expenses” and “Total Fund Operating Expenses”
of the Funds which are actually incurred as of the date of this Prospectus are as set forth below. The waivers and expense limitations may be terminated at any time at the option of the Investment Adviser. If this occurs, “Other Expenses” and
“Total Fund Operating Expenses” may increase without shareholder approval.
|
| Balanced
Fund |
Growth
and Income Fund |
CORE
Large Cap Value Fund |
CORE
U.S. Equity Fund |
||||||
|---|---|---|---|---|---|---|---|---|---|
| Annual Fund Operating Expenses | |||||||||
| (expenses that are deducted from Fund assets): 1 | |||||||||
| Management Fees 2 | 0.65% | 0.70% | 0.60% | 0.70% | |||||
| Service Fees 3 | 0.50% | 0.50% | 0.50% | 0.50% | |||||
| Other Expenses 4 | 0.10% | 0.08% | 0.10% | 0.04% | |||||
| Total Fund Operating Expenses (after current
waivers and expense limitations) |
1.25% | 1.28% | 1.20% | 1.24% | |||||
| CORE
Large Cap Growth Fund |
CORE
Small Cap Equity Fund |
Capital
Growth Fund |
Strategic
Growth Fund |
Growth
Opportunities Fund |
Mid Cap
Value Fund |
Small Cap
Value Fund |
Large Cap
Value Fund |
||||||||
|---|---|---|---|---|---|---|---|---|---|---|---|---|---|---|---|
| None | None | None | None | None | None | None | None | ||||||||
| None | None | None | None | None | None | None | None | ||||||||
| None | None | None | None | None | None | None | None | ||||||||
| None | None | None | None | None | None | None | None | ||||||||
| 0.75% | 0.85% | 1.00% | 1.00% | 1.00% | 0.75% | 1.00% | 0.75% | ||||||||
| 0.50% | 0.50% | 0.50% | 0.50% | 0.50% | 0.50% | 0.50% | 0.50% | ||||||||
| 0.09% | 0.30% | 0.07% | 0.23% | 0.21% | 0.19% | 0.17% | 2.15% | ||||||||
| 1.34% | 1.65% | 1.57% | 1.73% | 1.71% | 1.44% | 1.67% | 3.40% | ||||||||
| CORE
Large Cap Growth Fund |
CORE
Small Cap Equity Fund |
Capital
Growth Fund |
Strategic
Growth Fund |
Growth
Opportunities Fund |
Mid Cap
Value Fund |
Small Cap
Value Fund |
Large Cap
Value Fund |
||||||||
|---|---|---|---|---|---|---|---|---|---|---|---|---|---|---|---|
| 0.70% | 0.85% | 1.00% | 1.00% | 1.00% | 0.75% | 1.00% | 0.75% | ||||||||
| 0.50% | 0.50% | 0.50% | 0.50% | 0.50% | 0.50% | 0.50% | 0.50% | ||||||||
| 0.06% | 0.08% | 0.04% | 0.04% | 0.15% | 0.14% | 0.10% | 0.10% | ||||||||
| 1.26% | 1.43% | 1.54% | 1.54% | 1.65% | 1.39% | 1.60% | 1.35% | ||||||||
1
|
The Funds’ annual operating expenses are based on actual expenses.
|
2
|
The Investment Adviser has voluntarily agreed not to impose a portion of the management fee on the CORE U.S. Equity Fund
and the CORE Large Cap Growth Fund equal to 0.05% and 0.05%, respectively, of such Funds’ average daily net assets. As a result of fee waivers, the current management fees of the CORE U.S. Equity Fund and CORE Large Cap Growth Fund are 0.70% and 0.70%, respectively, of such Funds’ average daily net assets. The waivers may be terminated at any time at the option
of the Investment Adviser.
|
3
|
Service Organizations may charge other fees to their customers who are beneficial owners of Service Shares in connection
with their customers’ accounts. Such fees may affect the return customers realize with respect to their investments.
|
4
|
“Other Expenses” include transfer agency fees equal to 0.04% of the average daily net assets of each Fund’
s Service Shares, plus all other ordinary expenses not detailed above. The Investment Adviser has voluntarily agreed to reduce or limit “Other Expenses” (excluding management fees, transfer agency fees, service fees, taxes, interest and
brokerage fees and litigation, indemnification and other extraordinary expenses) to the following percentages of each Fund’s average daily net assets:
|
| Fund | Other
Expenses |
|
|---|---|---|
| Balanced | 0.06% | |
| Growth and Income | 0.05% | |
| CORE Large Cap Value | 0.06% | |
| CORE U.S. Equity | 0.00% | |
| CORE Large Cap Growth | 0.02% | |
| CORE Small Cap Equity | 0.04% | |
| Capital Growth | 0.00% | |
| Strategic Growth | 0.00% | |
| Growth Opportunities | 0.11% | |
| Mid Cap Value | 0.10% | |
| Small Cap Value | 0.06% | |
| Large Cap Value | 0.06% | |
| Fund | 1 Year | 3 Years | 5 Years | 10 Years | |||||
|---|---|---|---|---|---|---|---|---|---|
| Balanced | $142 | $ 440 | $ 761 | $1,669 | |||||
| Growth and Income | $130 | $ 406 | $ 702 | $1,545 | |||||
| CORE Large Cap Value | $129 | $ 403 | $ 697 | $1,534 | |||||
| CORE U.S. Equity | $135 | $ 421 | $ 729 | $1,601 | |||||
| CORE Large Cap Growth | $136 | $ 425 | $ 734 | $1,613 | |||||
| CORE Small Cap Equity | $168 | $ 520 | $ 897 | $1,955 | |||||
| Capital Growth | $160 | $ 496 | $ 855 | $1,867 | |||||
| Strategic Growth | $176 | $ 545 | $ 939 | $2,041 | |||||
| Growth Opportunities | $174 | $ 539 | $ 928 | $2,019 | |||||
| Mid Cap Value | $147 | $ 456 | $ 787 | $1,724 | |||||
| Small Cap Value | $170 | $ 526 | $ 907 | $1,976 | |||||
| Large Cap Value | $343 | $1,045 | $1,769 | $3,685 | |||||
| INVESTMENT ADVISERS
|
| Investment Adviser | Fund | ||
|---|---|---|---|
| Goldman Sachs Asset Management (“GSAM”) | Balanced | ||
| 32 Old Slip | Growth and Income | ||
| New York, New York 10005 | CORE Large Cap Value | ||
| CORE Large Cap Growth | |||
| CORE Small Cap Equity | |||
| Strategic Growth | |||
| Growth Opportunities | |||
| Mid Cap Value | |||
| Small Cap Value | |||
| Large Cap Value | |||
| Goldman Sachs Funds Management, L.P. (“GSFM”) | CORE U.S. Equity | ||
| 32 Old Slip | Capital Growth | ||
| New York, New York 10005 | |||
| GSAM and GSFM are separate business units of the Investment Management Division (“IMD”) of Goldman Sachs. Goldman Sachs
registered as an investment adviser in 1981. GSFM, a registered investment adviser since 1990, is a Delaware limited partnership which is an affiliate of Goldman Sachs. As of September 30, 2000, GSAM and GSFM, along with other units of IMD, had assets
under management of $281.3 billion.
|
| The Investment Adviser provides day-to-day advice regarding the Funds’ portfolio transactions. The Investment Adviser makes
the investment decisions for the Funds and places purchase and sale orders for the Funds’ portfolio transactions in U.S. and foreign markets. As permitted by applicable law, these orders may be directed to any brokers, including Goldman Sachs and its
affiliates. While the Investment Adviser is ultimately responsible for the management of the Funds, it is able to draw upon the research and expertise of its asset management affiliates for portfolio decisions and management with respect to certain
portfolio securities. In addition, the Investment Adviser has access to the research and certain proprietary technical models developed by Goldman Sachs, and will apply quantitative and qualitative analysis in determining the appropriate allocations among
categories of issuers and types of securities.
|
| The Investment Adviser also performs the following additional services for the Funds:
|
n
|
Supervises all non-advisory operations of the Funds
|
n
|
Provides personnel to perform necessary executive, administrative and clerical services to the Funds
|
n
|
Arranges for the preparation of all required tax returns,
reports to shareholders, prospectuses and statements of additional information and other reports filed with the Securities and Exchange Commission (the “SEC”) and other regulatory authorities
|
n
|
Maintains the records of each Fund
|
n
|
Provides office space and all necessary office equipment and services
|
| MANAGEMENT FEES
|
| As compensation for its services and its assumption of certain expenses, the Investment Adviser is entitled to the following fees,
computed daily and payable monthly, at the annual rates listed below (as a percentage of each respective Fund’s average daily net assets):
|
| Contractual Rate | Actual Rate
For the Fiscal Year Ended August 31, 2000 |
||||
|---|---|---|---|---|---|
| GSAM: | |||||
| Balanced | 0.65% | 0.65% | |||
| Growth and Income | 0.70% | 0.70% | |||
| CORE Large Cap Value | 0.60% | 0.60% | |||
| CORE Large Cap Growth | 0.75% | 0.64% | |||
| CORE Small Cap Equity | 0.85% | 0.85% | |||
| Strategic Growth | 1.00% | 1.00% | |||
| Growth Opportunities | 1.00% | 1.00% | |||
| Mid Cap Value | 0.75% | 0.75% | |||
| Small Cap Value | 1.00% | 1.00% | |||
| Large Cap Value | 0.75% | 0.75% | |||
| GSFM: | |||||
| CORE U.S. Equity | 0.75% | 0.70% | |||
| Capital Growth | 1.00% | 1.00% | |||
| The difference, if any, between the stated fees and the actual fees paid by the Funds reflects that the Investment Adviser did not
charge the full amount of the fees to which it would have been entitled. The Investment Adviser may discontinue or modify any such voluntary limitations in the future at its discretion.
|
| FUND MANAGERS
|
| M. Roch Hillenbrand, a Managing Director of Goldman Sachs since 1997, is the Head of Global Equities for GSAM, overseeing the
United States, Europe, Japan, and non-Japan Asia. In this capacity, he is responsible for managing the group as it defines and implements global portfolio management processes that are consistent, reliable and predictable. Mr. Hillenbrand joined Goldman
Sachs in 1997 upon its acquisition of Commodities Corporation, LLC where he was and continues as President. Over the course of his 19-year career at Commodities Corporation, Mr. Hillenbrand has had extensive experience in dealing with internal and
external investment managers who have managed a range of futures and equities strategies across multiple markets, using a variety of styles.
|
| Value Team
|
n
|
Twelve portfolio managers/analysts with over 100 years of combined financial experience comprise the Investment Adviser’s
value investment team
|
n
|
Multi-sector focus provides a balanced perspective and in-depth industry
knowledge |
n
|
Across all value products, the Investment Adviser leverages the industry research expertise of its small, mid and large cap
investment teams
|
| Name and Title | Fund Responsibility | Years
Primarily Responsible |
Five Year Employment History | ||||
|---|---|---|---|---|---|---|---|
| Eileen A. Aptman
Vice President |
Senior Portfolio Manager—
Mid Cap Value Small Cap Value |
Since
1996 1997 |
Ms. Aptman joined the Investment
Adviser as a research analyst in 1993. She became a portfolio manager in 1996. |
||||
| Matthew B.
McLennan Vice President |
Senior Portfolio Manager—
Small Cap Value Mid Cap Value |
Since
1996 1998 |
Mr. McLennan joined the
Investment Adviser as a research analyst in 1995 and became a portfolio manager in 1996. From 1994 to 1995, he worked in the Investment Banking Division of Goldman Sachs in Australia. |
||||
| Meera Mayer
Vice President |
Senior Portfolio Manager—
Growth and Income Large Cap Value Balanced (Equity) |
Since
1999 1999 1999 |
Ms. Mayer joined the Investment
Adviser as a senior portfolio manager in November 1999. From July 1999 to November 1999, she worked at Oppenheimer Funds as a senior equity analyst. From 1995 to March 1999, she worked at Spears, Benzak, Salomon and Farrell as a managing director and portfolio manager. |
||||
| Name and Title | Fund Responsibility | Years
Primarily Responsible |
Five Year Employment History | ||||
|---|---|---|---|---|---|---|---|
| Chip Otness
Vice President |
Senior Portfolio Manager—
Small Cap Value Mid Cap Value |
Since
2000 2000 |
Mr. Otness joined the Investment
Adviser as a senior portfolio manager in 2000. From 1998 to 2000, he headed Dolphin Asset Management. From 1970 to 1998, he worked at J.P. Morgan, most recently as a managing director and senior portfolio manager responsible for small-cap institutional equity investments. |
||||
| Eileen Rominger
Managing Director |
Senior Portfolio Manager—
Growth and Income Large Cap Value Balanced (Equity) |
Since
1999 1999 1999 |
Ms. Rominger joined the
Investment Adviser as a senior portfolio manager and Chief Investment Officer of the Value Equity team in 1999. From 1981 to 1999, she worked at Oppenheimer Capital, most recently as a senior portfolio manager. |
||||
| Quantitative Equity Team
|
n
|
A stable and growing team supported by an extensive internal staff
|
n
|
Access to the research ideas of Goldman Sachs’ renowned Global Investment Research Department
|
n
|
More than $34 billion in equities currently under management
|
| Name and Title | Fund Responsibility | Years
Primarily Responsible |
Five Year Employment History | ||||
|---|---|---|---|---|---|---|---|
| Melissa Brown
Managing Director |
Senior Portfolio Manager—
CORE Large Cap Value CORE U.S. Equity CORE Large Cap Growth CORE Small Cap Equity |
Since
1998 1998 1998 1998 |
Ms. Brown joined the
Investment Adviser as a portfolio manager in 1998. From 1984 to 1998, she was the director of Quantitative Equity Research and served on the Investment Policy Committee at Prudential Securities. |
||||
| Robert C. Jones
Managing Director |
Senior Portfolio Manager—
CORE U.S. Equity CORE Large Cap Growth CORE Small Cap Equity CORE Large Cap Value |
Since
1991 1997 1997 1998 |
Mr. Jones joined the
Investment Adviser as a portfolio manager in 1989. |
||||
| Victor H. Pinter
Vice President |
Senior Portfolio Manager—
CORE U.S. Equity CORE Large Cap Growth CORE Small Cap Equity CORE Large Cap Value |
Since
1996 1997 1997 1998 |
Mr. Pinter joined the
Investment Adviser as a research analyst in 1989. He became a portfolio manager in 1992. |
||||
| Growth Equity Investment Team
|
n
|
18 year consistent investment style applied through diverse and complete market cycles
|
n
|
More than $22 billion in equities currently under management
|
n
|
More than 300 client account relationships
|
n
|
A portfolio management and analytical team with more than 150 years combined investment experience
|
| Name and Title | Fund Responsibility | Years
Primarily Responsible |
Five Year Employment History | ||||
|---|---|---|---|---|---|---|---|
| George D. Adler
Vice President |
Senior Portfolio Manager—
Balanced (Equity) Capital Growth Strategic Growth Growth Opportunities |
Since
1997 1997 1999 1999 |
Mr. Adler joined the
Investment Adviser as a portfolio manager in 1997. From 1990 to 1997, he was a portfolio manager at Liberty Investment Management, Inc. (“Liberty”). |
||||
| Steve Barry
Vice President |
Senior Portfolio Manager—
Growth Opportunities Capital Growth Balanced (Equity) Strategic Growth |
Since
1999 2000 2000 2000 |
Mr. Barry joined the Investment
Adviser as a portfolio manager in 1999. From 1988 to 1999, he was a portfolio manager at Alliance Capital Management. |
||||
| Kenneth T. Berents
Managing Director |
Senior Portfolio Manager—
Capital Growth Balanced (Equity) Strategic Growth Growth Opportunities |
Since
2000 2000 2000 2000 |
Mr. Berents joined the Investment
Adviser as a portfolio manager in 2000. From 1992 to 1999, he was Director of Research and head of the Investment Committee at Wheat First Union. |
||||
| Robert G. Collins
Managing Director |
Senior Portfolio Manager—
Capital Growth Balanced (Equity) Strategic Growth Growth Opportunities |
Since
1997 1998 1999 1999 |
Mr. Collins joined the Investment
Adviser as portfolio manager and Co-Chair of the Growth Equity Investment Committee in 1997. From 1991 to 1997, he was a portfolio manager at Liberty. |
||||
| Herbert E. Ehlers
Managing Director |
Senior Portfolio Manager—
Capital Growth Balanced (Equity) Strategic Growth Growth Opportunities |
Since
1997 1998 1999 1999 |
Mr. Ehlers joined the Investment
Adviser as a senior portfolio manager and Chief Investment Officer of the Growth Equity team in 1997. From 1994 to 1997, he was the Chief Investment Officer and Chairman of Liberty. |
||||
| Name and Title | Fund Responsibility | Years
Primarily Responsible |
Five Year Employment History | ||||
|---|---|---|---|---|---|---|---|
| Gregory H. Ekizian
Managing Director |
Senior Portfolio Manager—
Capital Growth Balanced (Equity) Strategic Growth Growth Opportunities |
Since
1997 1998 1999 1999 |
Mr. Ekizian joined the Investment
Adviser as portfolio manager and Co-Chair of the Growth Equity Investment Committee in 1997. From 1990 to 1997, he was a portfolio manager at Liberty and its predecessor firm, Eagle. |
||||
| Scott Kolar
Vice President |
Portfolio Manager—
Growth Opportunities Capital Growth Balanced (Equity) Strategic Growth |
Since
1999 2000 2000 2000 |
Mr. Kolar joined the Investment
Adviser as an equity analyst in 1997 and became a portfolio manager in 1999. From 1994 to 1997, he was an equity analyst and information systems specialist at Liberty. |
||||
| David G. Shell
Managing Director |
Senior Portfolio Manager—
Capital Growth Balanced (Equity) Strategic Growth Growth Opportunities |
Since
1997 1998 1999 1999 |
Mr. Shell joined the Investment
Adviser as a portfolio manager in 1997. From 1987 to 1997, he was a portfolio manager at Liberty and its predecessor firm, Eagle. |
||||
| Ernest C. Segundo, Jr.
Vice President |
Senior Portfolio Manager—
Capital Growth Balanced (Equity) Strategic Growth Growth Opportunities |
Since
1997 1998 1999 1999 |
Mr. Segundo joined the Investment
Adviser as a portfolio manager in 1997. From 1992 to 1997, he was a portfolio manager at Liberty. |
||||
| Fixed-Income Portfolio Management Team
|
n
|
Fixed-income portfolio management is comprised of a deep team of sector specialists
|
n
|
The team strives to maximize risk-adjusted returns by de-emphasizing interest rate anticipation and focusing on security selection
and sector allocation
|
n
|
The team manages approximately $49 billion in fixed-income assets for retail, institutional and high net worth clients
|
| Name and Title | Fund Responsibility | Years
Primarily Responsible |
Five Year Employment History | ||||
|---|---|---|---|---|---|---|---|
| Jonathan A. Beinner
Managing Director and Co-Head U.S. Fixed Income |
Senior Portfolio Manager—
Balanced (Fixed-Income) |
Since
1994 |
Mr. Beinner joined the Investment
Adviser as a portfolio manager in 1990. |
||||
| C. Richard Lucy
Managing Director and Co-Head U.S. Fixed Income |
Senior Portfolio Manager—
Balanced (Fixed-Income) |
Since
1994 |
Mr. Lucy joined the Investment
Adviser as a portfolio manager in 1992. |
||||
| DISTRIBUTOR AND TRANSFER AGENT
|
| Goldman Sachs, 85 Broad Street, New York, New York 10004, serves as the exclusive distributor (the “Distributor”) of
each Fund’s shares. Goldman Sachs, 4900 Sears Tower, Chicago, Illinois 60606-6372, also serves as the Funds’ transfer agent (the “Transfer Agent”) and, as such, performs various shareholder servicing functions.
|
| From time to time, Goldman Sachs or any of its affiliates may purchase and hold shares of the Funds. Goldman Sachs reserves the
right to redeem at any time some or all of the shares acquired for its own account.
|
| ACTIVITIES OF GOLDMAN SACHS AND ITS AFFILIATES AND OTHER ACCOUNTS MANAGED BY GOLDMAN SACHS
|
| The involvement of the Investment Adviser, Goldman Sachs and their affiliates in the management of, or their interest in, other
accounts and other activities of Goldman Sachs may present conflicts of interest with respect to a Fund or limit a Fund’s investment activities. Goldman Sachs and its affiliates engage in proprietary trading and advise accounts and funds which have
investment objectives similar to those of the Funds and/or which engage in and compete for transactions in the same types of securities, currencies and instruments as the Funds. Goldman Sachs and its affiliates will not have any obligation to make
available any information regarding their proprietary activities or strategies, or the activities or strategies used for other accounts managed by them, for the benefit of the management of the Funds. The results of a Fund’s investment activities,
therefore, may differ from those of Goldman Sachs and its affiliates, and it is possible that a Fund could sustain losses during periods in which Goldman Sachs and its affiliates and other accounts achieve significant profits on their trading for
proprietary or other
accounts. In addition, the Funds may, from time to time, enter into transactions in which other clients of Goldman Sachs have an adverse interest. A Fund’s activities may be limited because of regulatory restrictions applicable to Goldman Sachs and
its affiliates, and/or their internal policies designed to comply with such restrictions.
|
n
|
Cash
|
n
|
Additional shares of the same class of the same Fund
|
n
|
Shares of the same or an equivalent class of another Goldman Sachs Fund. Special restrictions may apply for certain ILA
Portfolios. See the Additional Statement.
|
| Fund | Investment
Income Dividends |
Capital Gains
Distributions |
|||
|---|---|---|---|---|---|
| Balanced | Quarterly | Annually | |||
| Growth and Income | Quarterly | Annually | |||
| CORE Large Cap Value | Quarterly | Annually | |||
| CORE U.S. Equity | Annually | Annually | |||
| CORE Large Cap Growth | Annually | Annually | |||
| CORE Small Cap Equity | Annually | Annually | |||
| Capital Growth | Annually | Annually | |||
| Strategic Growth | Annually | Annually | |||
| Growth Opportunities | Annually | Annually | |||
| Mid Cap Value | Annually | Annually | |||
| Small Cap Value | Annually | Annually | |||
| Large Cap Value | Annually | Annually | |||
| The following section will provide you with answers to some of the most often asked questions regarding buying and selling the
Funds’ Service Shares.
|
| How Can I Purchase Service Shares Of The Funds?
|
| Generally, Service Shares may be purchased only through institutions that have agreed to provide account administration and
personal and account maintenance services to their customers who are the beneficial owners of Service Shares. These institutions are called “Service Organizations.” Customers of a Service Organization will normally give their purchase
instructions to the Service Organization, and the Service Organization will, in turn, place purchase orders with Goldman Sachs. Service Organizations will set times by which purchase orders and payments must be received by them from their customers.
Generally, Service Shares may be purchased from the Funds on any business day at their NAV next determined after receipt of an order by Goldman Sachs from a Service Organization. No sales load is charged. Purchases of Service Shares must be settled within
three business days of receipt of a complete purchase order.
|
| Service Organizations are responsible for transmitting purchase orders and payments to Goldman Sachs in a timely fashion. Service
Organizations should place an order with Goldman Sachs at 1-800-621-2550 and either:
|
n
|
Wire federal funds to The Northern Trust Company (“Northern”), as subcustodian for State Street Bank and Trust Company
(“State Street”) (each Fund’s custodian) on the next business day; or
|
n
|
Send a check or Federal Reserve draft payable to Goldman Sachs Funds—(Name of Fund and Class of Shares), 4900 Sears Tower,
Chicago, IL 60606-6372. The Fund will not accept a check drawn on a foreign bank or a third-party check.
|
| In certain instances, the Trust may require a signature guarantee in order to effect purchase, redemption or exchange
transactions. Signature guarantees must be obtained from a bank, brokerage firm or other financial intermediary that is a member of an approved Medallion Guarantee Program or that is otherwise approved by Goldman Sachs. A notary public cannot provide a
signature guarantee.
|
| What Do I Need To Know About Service Organizations?
|
| Service Organizations may provide the following services in connection with their customers’ investments in Service Shares:
|
n
|
Acting, directly or through an agent, as the sole shareholder of record
|
n
|
Maintaining account records for customers
|
n
|
Processing orders to purchase, redeem or exchange shares for customers
|
n
|
Responding to inquiries from prospective and existing shareholders
|
n
|
Assisting customers with investment procedures
|
| In addition, some (but not all) Service Organizations are authorized to accept, on behalf of Goldman Sachs Trust (the “
Trust”), purchase, redemption and exchange orders placed by or on behalf of their customers, and may designate other intermediaries to accept such orders, if approved by the Trust. In these cases:
|
n
|
A Fund will be deemed to have received an order in proper form when the order is accepted by the authorized Service Organization
or intermediary on a business day, and the order will be priced at the Fund’s NAV next determined after such acceptance.
|
n
|
Service Organizations or intermediaries will be responsible for transmitting accepted orders and payments to the Trust within the
time period agreed upon by them.
|
| You should contact your Service Organization directly to learn whether it is authorized to accept orders for the Trust.
|
| Pursuant to a service plan adopted by the Trust’s Board of Trustees, Service Organizations are entitled to receive payment
for their services from the Trust of up to 0.50% (on an annualized basis) of the average daily net assets of the Service Shares of the Funds, which are attributable to or held in the name of the Service Organization for its customers.
|
| The Investment Adviser, Distributor and/or their affiliates may pay additional compensation from time to time, out of their assets
and not as an additional charge to the Funds, to selected Service Organizations and other persons in connection with the sale, distribution and/or servicing of shares of the Funds and other Goldman Sachs Funds. Additional compensation based on sales may,
but is currently not expected to, exceed 0.50% (annualized) of the amount invested.
|
| In addition to Service Shares, each Fund also offers other classes of shares to investors. These other share classes are subject
to different fees and expenses (which affect performance), have different minimum investment requirements and
|
| are entitled to different services than Service Shares. Information regarding these other share classes may be obtained from your
sales representative or from Goldman Sachs by calling the number on the back cover of this Prospectus.
|
| What Is My Minimum Investment In The Funds?
|
| The Funds do not have any minimum purchase or account requirements with respect to Service Shares. A Service Organization may,
however, impose a minimum amount for initial and subsequent investments in Service Shares, and may establish other requirements such as a minimum account balance. A Service Organization may redeem Service Shares held by non-complying accounts, and may
impose a charge for any special services.
|
| What Else Should I Know About Share Purchases?
|
| The Trust reserves the right to:
|
n
|
Reject or restrict any purchase or exchange orders by a particular purchaser (or group of related purchasers). This may occur, for
example, when a pattern of frequent purchases, sales or exchanges of Service Shares of a Fund is evident, or if purchases, sales or exchanges are, or a subsequent abrupt redemption might be, of a size that would disrupt the management of a Fund.
|
n
|
Close a Fund to new investors from time to time and reopen a
Fund whenever it is deemed appropriate by a Fund’s Investment Adviser.
|
| The Funds may allow Service Organizations to purchase shares with securities instead of cash if consistent with a Fund’s
investment policies and operations and if approved by the Fund’s Investment Adviser.
|
| How Are Shares Priced?
|
| The price you pay or receive when you buy, sell or exchange Service Shares is determined by a Fund’s NAV. The Funds calculate
NAV as follows:
|
| |
(Value of Assets of the Class)
|
|
| NAV =
|
– (Liabilities of the Class)
|
|
| |
Number of Outstanding Shares of the Class
|
|
| The Funds’ investments are valued based on market quotations or, if accurate quotations are not readily available, the fair
value of the Fund’s investments may be determined in good faith under procedures established by the Trustees.
|
n
|
NAV per share of each class is calculated by State Street on each business day as of the close of regular trading on the New York
Stock Exchange (normally 4:00 p.m. New York time). Fund shares will not be priced on any day the New York Stock Exchange is closed.
|
n
|
When you buy shares, you pay the NAV next calculated after the Funds receive your order in proper form.
|
n
|
When you sell shares, you receive the NAV next calculated after the Funds receive your order in proper form.
|
| Note: The time at which transactions and shares are priced and the time by which orders must be received may be
changed in case of an emergency or if regular trading on the New York Stock Exchange is stopped at a time other than 4:00 p.m. New York time.
|
| Foreign securities may trade in their local markets on days a Fund is closed. As a result, if a Fund holds foriegn securities, its
NAV may be impacted on days when investors may not purchase or redeem Fund shares.
|
| In addition, the impact of events that occur after the publication of market quotations used by a Fund to price its securities but
before the close of regular trading on the New York Stock Exchange will normally not be reflected in a Fund’s next determined NAV unless the Trust, in its discretion, makes an adjustment in light of the nature and materiality of the event, its effect
on Fund operations and other relevant factors.
|
| How Can I Sell Service Shares Of The Funds?
|
| Generally, Service Shares may be sold (redeemed) only through Service Organizations. Customers of a Service Organization will
normally give their redemption instructions to the Service Organization, and the Service Organization will, in turn, place redemption orders with the Funds. Generally, each Fund will redeem its Service Shares upon request on any business day at their NAV next determined after receipt of such request in proper form. Redemption proceeds may be sent to recordholders by check or by wire (if the wire
instructions are on record).
|
| A Service Organization may request redemptions in writing or by telephone if the optional telephone redemption privilege is
elected on the Account Application.
|
| By Writing: | Goldman Sachs Funds
4900 Sears Tower Chicago, IL 60606-6372 |
||
| By Telephone: | 1-800-621-2550
(8:00 a.m. to 4:00 p.m. New York time) |
||
| What Do I Need To Know About Telephone Redemption Requests?
|
| The Trust, the Distributor and the Transfer Agent will not be liable for any loss you may incur in the event that the Trust
accepts unauthorized telephone redemption requests that the Trust reasonably believes to be genuine. In an effort to prevent unauthorized or fraudulent redemption and exchange requests by tele
phone, Goldman Sachs employs reasonable procedures specified by the Trust to confirm that such instructions are genuine. If reasonable procedures are not employed, the Trust may be liable for any loss due to unauthorized or fraudulent transactions. The
following general policies are currently in effect:
|
n
|
All telephone requests are recorded.
|
n
|
Any redemption request that requires money to go to an account or address other than that designated on the Account Application
must be in writing and signed by an authorized person designated on the Account Application. The written request may be confirmed by telephone with both the requesting party and the designated bank account to verify instructions.
|
n
|
The telephone redemption option may be modified or terminated at any time.
|
| Note: It may be difficult to make telephone redemptions in times of drastic economic or market conditions.
|
| How Are Redemption Proceeds Paid?
|
| By Wire: The Funds will arrange for redemption proceeds to be wired as federal funds to the bank account
designated in the recordholder’s Account Application. The following general policies govern wiring redemption proceeds:
|
n
|
Redemption proceeds will normally be wired on the next business day in federal funds (for a total of one business day delay), but
may be paid up to three business days following receipt of a properly executed wire transfer redemption request. If the shares to be sold were recently paid for by check, the Fund will pay the redemption proceeds when the check has cleared, which may take
up to 15 days. If the Federal Reserve Bank is closed on the day that the redemption proceeds would ordinarily be wired, wiring the redemption proceeds may be delayed one additional business day.
|
n
|
To change the bank designated on your Account Application, you must send written instructions signed by an authorized person
designated on the Account Application to the Service Organization.
|
n
|
Neither the Trust nor Goldman Sachs assumes any responsibility for the performance of intermediaries or your Service Organization
in the transfer process. If a problem with such performance arises, you should deal directly with such intermediaries or Service Organization.
|
| By Check: A recordholder may elect in writing to receive redemption proceeds by check. Redemption
proceeds paid by check will normally be mailed to the address of record within three business days of receipt of a properly executed redemption request. If the shares to be sold were recently paid for by check, the Fund will pay the redemption proceeds
when the check has cleared, which may take up to 15 days.
|
| What Else Do I Need To Know About Redemptions?
|
| The following generally applies to redemption requests:
|
n
|
Additional documentation may be required when deemed appropriate by the Transfer Agent. A redemption request will not be in proper
form until such additional documentation has been received.
|
n
|
Service Organizations are responsible for the timely transmittal of redemption requests by their customers to the Transfer Agent.
In order to facilitate the timely transmittal of redemption requests, Service Organizations may set times by which they must receive redemption requests. Service Organizations may also require additional documentation from you.
|
| The Trust reserves the right to:
|
n
|
Redeem the Service Shares of any Service Organization whose account balance falls below $50 as a result of a redemption. The Funds
will not redeem Service Shares on this basis if the value of the account falls below the minimum account balance solely as a result of market conditions. The Fund will give 60 days’ prior written notice to allow a Service Organization to purchase
sufficient additional shares of the Fund in order to avoid such redemption.
|
n
|
Redeem your shares in other circumstances determined by the Board of Trustees to be in the best interest of the Trust.
|
n
|
Pay redemptions by a distribution in-kind of securities (instead of cash). If you receive redemption proceeds in-kind, you should
expect to incur transaction costs upon the disposition of those securities.
|
n
|
Reinvest any dividends or other distributions which you have elected to receive in cash should your check for such dividends or
other distributions be returned to the Fund as undeliverable or remain uncashed for six months. In addition, that distribution and all future distributions payable to you will be reinvested at NAV in additional Service shares of the Fund that pays the
distributions. No interest will accrue on amounts represented by uncashed distribution or redemption checks.
|
| Can I Exchange My Investment From One Fund To Another?
|
| A Service Organization may exchange Service Shares of a Fund at NAV for Service Shares of any other Goldman Sachs Fund. The
exchange privilege may be materially modified or withdrawn at any time upon 60 days’ written notice.
|
| Instructions For Exchanging Shares: | |||||
|---|---|---|---|---|---|
| By Writing: | n Write a letter of instruction that includes: | ||||
| n The recordholder name(s) and signature(s) | |||||
| n The account number | |||||
| n The Fund names and Class of Shares | |||||
| n The dollar amount to be exchanged | |||||
| n
Mail the request to:
Goldman Sachs Funds 4900 Sears Tower Chicago, IL 60606-6372 |
|||||
| By Telephone: | If you have elected the telephone exchange
privilege on your Account Application: |
||||
| n
1-800-621-2550
(8:00 a.m. to 4:00 p.m. New York time) |
|||||
| You should keep in mind the following factors when making or considering an exchange:
|
n
|
You should obtain and carefully read the prospectus of the Fund you are acquiring before making an exchange.
|
n
|
All exchanges which represent an initial investment in a Fund must satisfy the minimum initial investment requirement of that
Fund, except that this requirement may be waived at the discretion of the Trust.
|
n
|
Telephone exchanges normally will be made only to an identically registered account.
|
n
|
Shares may be exchanged among accounts with different names, addresses and social security or other taxpayer identification
numbers only if the exchange instructions are in writing and are signed by an authorized person designated on the Account Application.
|
n
|
Exchanges are available only in states where exchanges may be legally made.
|
n
|
It may be difficult to make telephone exchanges in times of drastic economic or market conditions.
|
n
|
Goldman Sachs may use reasonable procedures described under “What Do I Need To Know About Telephone Redemption Requests?”
in an effort to prevent unauthorized or fraudulent telephone exchange requests.
|
n
|
Exchanges into Funds that are closed to new investors may be restricted.
|
| For federal income tax purposes, an exchange from one Fund to another is treated as a redemption of the shares surrendered in the
exchange, on which you may be subject to tax, followed by a purchase of shares received in the exchange. You should consult your tax adviser concerning the tax consequences of an exchange.
|
| Restrictions on Excessive Trading Practices. The Trust does not permit market-timing or other excessive trading
practices. Purchases and exchanges should be made for long-term investment purposes only. The Trust and Goldman Sachs reserve the right to reject or restrict purchase or exchange requests from any investor. Excessive, short-term (market-timing) trading
practices may disrupt portfolio management strategies, harm Fund performance and negatively impact long-term shareholders. The Trust and Goldman Sachs will not be held liable for any loss resulting from rejected purchase or exchange orders. To minimize
harm to the Trust (or Goldman Sachs) and its shareholders, the Trust (or Goldman Sachs) will exercise these rights if, in the Trust’s (or Goldman Sachs’) judgment, an investor has a history of excessive trading or if an investor’s trading,
in the judgment of the Trust (or Goldman Sachs) has been or may be disruptive to a Fund. In making this judgment, trades executed in multiple accounts under common ownership or control may be considered together.
|
| What Types Of Reports Will Be Sent Regarding Investments In Service Shares?
|
| Service Organizations will receive from the Funds annual reports containing audited financial statements and semi-annual reports.
Service Organizations will also be provided with a printed confirmation for each transaction in their account and a monthly account statement. Service Organizations are responsible for providing these or other reports to their customers who are the
beneficial owners of Service Shares in accordance with the rules that apply to their accounts with the Service Organizations.
|
| As with any investment, you should consider how your investment in the Funds will be taxed. The tax information below is provided
as general information. More tax information is available in the Additional Statement. You should consult your tax adviser about the federal, state, local or foreign tax consequences of your investment in the Funds.
|
| Unless your investment is an IRA or other tax-advantaged account, you should consider the possible tax consequences of Fund
distributions and the sale of your Fund shares.
|
| DISTRIBUTIONS
|
| Distributions you receive from the Funds are generally subject to federal income tax, and may also be subject to state or local
taxes. This is true whether you reinvest your distributions in additional Fund shares or receive them in cash. For federal tax purposes, the Funds’ income dividend distributions and short-term capital gain distributions are taxable to you as ordinary
income. Any long-term capital gain distributions are taxable as long-term capital gains, no matter how long you have owned your Fund shares.
|
| Although distributions are generally treated as taxable to you in the year they are paid, distributions declared in October,
November or December but paid in January are taxable as if they were paid in December. A percentage of the Funds’ dividends paid to corporate shareholders may be eligible for the corporate dividends-received deduction. The Funds will inform
shareholders of the source and tax status of all distributions promptly after the close of each calendar year.
|
| Each Fund may be subject to foreign withholding or other foreign taxes on income or gain from certain foreign securities. In
general, the Funds may deduct these taxes in computing their taxable income.
|
| If you buy shares of a Fund before it makes a distribution, the distribution will be taxable to you even though it may actually be
a return of a portion of your investment. This is known as “buying a dividend.”
|
| SALES AND EXCHANGES
|
| Your sale of Fund shares is a taxable transaction for federal income tax purposes, and may also be subject to state and local
taxes. For tax purposes, the exchange of your Fund shares for shares of a different Goldman Sachs Fund is the same as a sale. When you sell your shares, you will generally recognize a capital gain or loss in an amount equal to the difference between your
adjusted tax basis in the shares and the amount received. Generally, this gain or loss is long-term or short-term depending on whether your holding period exceeds twelve months, except that any loss realized on shares held for six months or less will be
treated as a long-term capital loss to the extent of any capital gain dividends that were received on the shares.
|
| OTHER INFORMATION
|
| When you open your account, you should provide your social security or tax identification number on your Account Application. By
law, each Fund must withhold 31% of your taxable distributions and any redemption proceeds if you do not provide your correct taxpayer identification number, or certify that it is correct, or if the IRS instructs the Fund to do so. Non-U.S. investors may
be subject to U.S. withholding and estate tax.
|
| A. General Portfolio Risks
|
| The Funds will be subject to the risks associated with equity securities. “Equity securities” include common stocks,
preferred stocks, interests in real estate investment trusts, convertible debt obligations, convertible preferred stocks, equity interests in trusts, partnerships, joint ventures, limited liability companies and similar enterprises, warrants and stock
purchase rights. In general, stock values fluctuate in response to the activities of individual companies and in response to general market and economic conditions. Accordingly, the value of the stocks that a Fund holds may decline over short or extended
periods. The stock markets tend to be cyclical, with periods when stock prices generally rise and periods when prices generally decline. The volatility of equity securities means that the value of your investment in the Funds may increase or decrease.
Recently, certain stock markets have experienced substantial price volatility and, at times, have traded at or close to record high levels. There can be no guarantee that such levels will be reached or maintained in the future.
|
| To the extent that a Fund invests in fixed-income securities, that Fund will also be subject to the risks associated with its
fixed-income securities. These risks include interest rate risk, credit risk and call/extension risk. In general, interest rate risk involves the risk that when interest rates decline, the market value of fixed-income securities tends to increase
(although many mortgage related securities will have less potential than other debt securities for capital appreciation during periods of declining rates). Conversely, when interest rates increase, the market value of fixed-income securities tends to
decline. Credit risk involves the risk that an issuer or guarantor could default on its obligations, and a Fund will not recover its investment. Call risk and extension risk are normally present in mortgage-backed securities and asset-backed securities.
For example, homeowners have the option to prepay their mortgages. Therefore, the duration of a security backed by home mortgages can either shorten (call risk) or lengthen (extension risk). In general, if interest rates on new mortgage loans fall
sufficiently below the interest rates on existing outstanding mortgage loans, the rate of prepayment would be expected to increase. Conversely, if mortgage loan interest rates rise above the interest rates on existing outstanding mortgage loans, the rate
of prepayment would be expected to decrease. In either case, a change in the prepayment rate can result in losses to investors.
|
| The Investment Adviser will not consider the portfolio turnover rate a limiting factor in making investment decisions for a Fund.
A high rate of portfolio turnover (100% or more) involves correspondingly greater expenses which must be borne by a Fund and its shareholders, and is also likely to result in higher short-term capital gains taxable to shareholders. The portfolio turnover
rate is calculated by dividing the lesser of the dollar amount of sales or purchases of portfolio securities by the average monthly value of a Fund’s portfolio securities, excluding securities having a maturity at the date of purchase of one year or
less. See “Financial Highlights” in Appendix B for a statement of the Funds’ historical portfolio turnover rates.
|
| The following sections provide further information on certain types of securities and investment techniques that may be used by
the Funds, including their associated risks. Additional information is provided in the Additional Statement, which is available upon request. Among other things, the Additional Statement describes certain fundamental investment restrictions that cannot be
changed without shareholder approval. You should note, however, that all investment objectives, and all investment policies not specifically designated as fundamental are non-fundamental and may be changed without shareholder approval. If there is a
change in a Fund’s investment objective, you should consider whether that Fund remains an appropriate investment in light of your then current financial position and needs.
|
| B. Other Portfolio Risks
|
| Risks of Investing in Small Capitalization Companies. Each Fund may invest in small capitalization companies.
Investments in small capitalization companies involve greater risk and portfolio price volatility than investments in larger capitalization stocks. Among the reasons for the greater price volatility of these investments are the less certain growth
prospects of smaller firms and the lower degree of liquidity in the markets for such securities. Small capitalization companies may be thinly traded and may have to be sold at a discount from current market prices or in small lots over an extended period
of time. In addition, these securities are subject to the risk that during certain periods the liquidity of particular issuers or industries, or all securities in these investment categories, will shrink or disappear suddenly and without warning as a
result of adverse economic or market conditions, or adverse investor perceptions whether or not accurate. Because of the lack of sufficient market liquidity, a Fund may incur losses because it will be required to effect sales at a disadvantageous time and
only then at a substantial drop in price. Small capitalization companies include “unseasoned” issuers that do not have an established financial history; often have limited product lines, markets or financial
resources; may depend on or use a few key personnel for management; and may be susceptible to losses and risks of bankruptcy. Transaction costs for these investments are often higher than those of larger capitalization companies. Investments in small
capitalization companies may be more difficult to price precisely than other types of securities because of their characteristics and lower trading volumes.
|
| Risks of Foreign Investments. The Funds may make foreign investments. Foreign investments involve special risks that
are not typically associated with U.S. dollar denominated or quoted securities of U.S. issuers. Foreign investments may be affected by changes in currency rates, changes in foreign or U.S. laws or restrictions applicable to such investments and changes in
exchange control regulations (e.g., currency blockage). A decline in the exchange rate of the currency (i.e., weakening of the currency against the U.S. dollar) in which a portfolio security is quoted or denominated relative to the U.S. dollar would reduce the value of
the portfolio security. In addition, if the currency in which a Fund receives dividends, interest or other payments declines in value against the U.S. dollar before such income is distributed as dividends to shareholders or converted to U.S. dollars, the
Fund may have to sell portfolio securities to obtain sufficient cash to pay such dividends.
|
| The introduction of a single currency, the euro, on January 1, 1999 for participating nations in the European Economic and
Monetary Union has presented unique uncertainties, including the fluctuation of the euro relative to non-euro currencies during the transition period from January 1, 1999 to December 31, 2001 and beyond; whether the interest rate, tax and labor regimes of
European countries participating in the euro will converge over time; and whether the conversion of the currencies of other countries that now are or may in the future become members of the European Union (“EU”), may have an impact on the euro.
Also, it is possible that the euro could be abandoned in the future by countries that have already adopted its use. These or other events, including political and economic developments, could cause market disruptions, and could adversely affect the value
of securities held by the Funds. Because of the number of countries using this single currency, a significant portion of the assets held by the Funds may be denominated in the euro.
|
| Brokerage commissions, custodial services and other costs relating to investment in international securities markets generally are
more expensive than in the United States. In addition, clearance and settlement procedures may be different in foreign countries and, in certain markets, such procedures have been unable to keep pace with the volume of securities transactions, thus making
it difficult to conduct such transactions.
|
| Foreign issuers are not generally subject to uniform accounting, auditing and financial reporting standards comparable to those
applicable to U.S. issuers. There may be less publicly available information about a foreign issuer than about a U.S. issuer. In addition, there is generally less government regulation of foreign markets, companies and securities dealers than in the
United States. Foreign securities markets may have substantially less volume than U.S. securities markets and secu-
|
| rities of many foreign issuers are less liquid and more volatile than securities of comparable domestic issuers. Furthermore, with
respect to certain foreign countries, there is a possibility of nationalization, expropriation or confiscatory taxation, imposition of withholding or other taxes on dividend or interest payments (or, in some cases, capital gains distributions),
limitations on the removal of funds or other assets from such countries, and risks of political or social instability or diplomatic developments which could adversely affect investments in those countries.
|
| Concentration of a Fund’s assets in one or a few countries and currencies will subject a Fund to greater risks than if a
Fund’s assets were not geographically concentrated.
|
| Investment in sovereign debt obligations by certain Funds involves risks not present in debt obligations of corporate issuers. The
issuer of the debt or the governmental authorities that control the repayment of the debt may be unable or unwilling to repay principal or interest when due in accordance with the terms of such debt, and a Fund may have limited recourse to compel payment
in the event of a default. Periods of economic uncertainty may result in the volatility of market prices of sovereign debt, and in turn a Fund’s NAV, to a greater extent than the volatility inherent in debt obligations of U.S. issuers.
|
| A sovereign debtor’s willingness or ability to repay principal and pay interest in a timely manner may be affected by, among
other factors, its cash flow situation, the extent of its foreign currency reserves, the availability of sufficient foreign exchange on the date a payment
is due, the relative size of the debt service burden to the economy as a whole, the sovereign debtor’s policy toward international lenders, and the political constraints to which a sovereign debtor may be subject.
|
| Investments in foreign securities may take the form of sponsored and unsponsored American Depositary Receipts (“ADRs”)
and Global Depositary Receipts (“GDRs”). Certain Funds may also invest in European Depositary Receipts (“EDRs”) or other similar instruments representing securities of foreign issuers. ADRs represent the right to receive securities of
foreign issuers deposited in a domestic bank or a correspondent bank. Prices of ADRs are quoted in U.S. dollars, and ADRs are traded in the United States. EDRs and GDRs are receipts evidencing an arrangement with a non-U.S. bank. EDRs and GDRs are not
necessarily quoted in the same currency as the underlying security.
|
| Risks of Emerging Countries. Certain Funds may invest in securities of issuers located in emerging countries. The
risks of foreign investment are heightened when the issuer is located in an emerging country. Emerging countries are generally located in the Asia-Pacific region, Eastern Europe, Latin and South America and Africa. A Fund’s purchase and sale of
portfolio securities in certain emerging countries may be constrained by limitations relating to daily changes in the prices of listed securities, periodic trading or settlement volume and/or limitations on aggregate holdings of foreign investors. Such
limitations may be computed based on the aggregate trading volume by or holdings of a Fund, the Investment Adviser, its affiliates and their respective clients and other service providers. A Fund may not be able to sell securities in circumstances where
price, trading or settlement volume limitations have been reached.
|
| Foreign investment in the securities markets of certain emerging countries is restricted or controlled to varying degrees which
may limit investment in such countries or increase the administrative costs of such investments. For example, certain Asian countries require governmental approval prior to investments by foreign persons or limit investment by foreign persons to only a
specified percentage of an issuer’s outstanding securities or a specific class of securities which may have less advantageous terms (including price) than securities of the issuer available for purchase by nationals. In addition, certain countries
may restrict or prohibit investment opportunities in issuers or industries deemed important to national interests. Such restrictions may affect the market price, liquidity and rights of securities that may be purchased by a Fund. The repatriation of both
investment income and capital from certain emerging countries is subject to restrictions such as the need for governmental consents. Due to restrictions on direct investment in equity securities in certain Asian and other countries, it is anticipated that
a Fund may invest in such countries through other investment funds in such countries.
|
| Many emerging countries have recently experienced currency devaluations and substantial (and, in some cases, extremely high) rates
of inflation. Other emerging countries have experienced economic recessions. These circumstances have had a negative effect on the economies and securities markets of such emerging countries. Economies in emerging countries generally are dependent heavily
upon commodity prices and international trade and, accordingly, have been and may continue to be affected adversely by the economies of their trading partners, trade barriers, exchange controls, managed adjustments in relative currency values and other
protectionist measures imposed or negotiated by the countries with which they trade.
|
| Many emerging countries are subject to a substantial degree of economic, political and social instability. Governments of some
emerging countries are authoritarian in nature or have been installed or removed as a result of military coups, while
governments in other emerging countries have periodically used force to suppress civil dissent. Disparities of wealth, the pace and success of democratization, and ethnic, religious and racial disaffection, among other factors, have also led to social
unrest, violence and/or labor unrest in some emerging countries. Unanticipated political or social developments may result in sudden and significant investment losses. Investing in emerging countries involves greater risk of loss due to expropriation,
nationalization, confiscation of assets and property or the imposition of restrictions on foreign investments and on repatriation of capital invested. As an example, in the past some Eastern European governments have expropriated substantial amounts of
private property, and many claims of the property owners have never been fully settled. There is no assurance that similar expropriations will not recur in Eastern Europe or other countries.
|
| A Fund’s investment in emerging countries may also be subject to withholding or other taxes, which may be significant and may
reduce the return from an investment in such countries to the Fund.
|
| Settlement procedures in emerging countries are frequently less developed and reliable than those in the United States and often
may involve a Fund’s delivery of securities before receipt of payment for their sale. In addition, significant delays are common in certain markets in registering the transfer of securities. Settlement or registration problems may make it more
difficult for a Fund to value its portfolio securities and could cause the Fund to miss attractive investment opportunities, to have a portion of its assets uninvested or to incur losses due to the failure of a counterparty to pay for securities the Fund
has delivered or the Fund’s inability to complete its contractual obligations because of theft or other reasons. The creditworthiness of the local securities firms used by the Fund in emerging countries may not be as sound as the creditworthiness of
firms used in more developed countries. As a result, the Fund may be subject to a greater risk of loss if a securities firm defaults in the performance of its responsibilities.
|
| The small size and inexperience of the securities markets in certain emerging countries and the limited volume of trading in
securities in those countries may make a Fund’s investments in such countries less liquid and more volatile than investments in countries with more developed securities markets (such as the United States, Japan and most Western European countries). A
Fund’s investments in emerging countries are subject to the risk that the liquidity of a particular investment, or investments generally, in such countries will shrink or disappear suddenly and without warning as a result of adverse economic, market
or political conditions or adverse investor perceptions, whether or not accurate. Because of the lack of sufficient market liquidity, a Fund may incur losses because it will be required to effect sales at a disadvantageous time and only then at a
substantial drop in price. Invest
ments in emerging countries may be more difficult to price precisely because of the characteristics discussed above and lower trading volumes.
|
| A Fund’s use of foreign currency management techniques in emerging countries may be limited. Due to the limited market for
these instruments in emerging countries, the Investment Adviser does not currently anticipate that a significant portion of the Funds’ currency exposure in emerging countries, if any, will be covered by such instruments.
|
| Risks of Derivative Investments. A Fund’s transactions, if any, in options, futures, options on futures, swaps,
interest rate caps, floors and collars, structured securities and currency transactions involve additional risk of loss. Loss can result from a lack of correlation between changes in the value of derivative instruments and the portfolio assets (if any)
being hedged, the potential illiquidity of the markets for derivative instruments, or the risks arising from margin requirements and related leverage factors associated with such transactions. The use of these management techniques also involves the risk
of loss if the Investment Adviser is incorrect in its expectation of fluctuations in securities prices, interest rates or currency prices. Each Fund may also invest in derivative investments for non-hedging purposes (that is, to seek to increase total
return). Investing for non-hedging purposes is considered a speculative practice and presents even greater risk of loss.
|
| Risks of Illiquid Securities. Each Fund may invest up to 15% of its net assets in illiquid securities which cannot
be disposed of in seven days in the ordinary course of business at fair value. Illiquid securities include:
|
n
|
Both domestic and foreign securities that are not readily marketable
|
n
|
Certain stripped mortgage-backed securities
|
n
|
Repurchase agreements and time deposits with a notice or demand period of more than seven days
|
n
|
Certain over-the-counter options
|
n
|
Certain structured securities and all swap transactions
|
n
|
Certain restricted securities, unless it is determined, based upon a review of the trading markets for a specific restricted
security, that such restricted security is eligible for resale pursuant to Rule 144A under the Securities Act of 1933 (“144A Securities”) and, therefore, is liquid.
|
| Investing in 144A Securities may decrease the liquidity of a Fund’s portfolio to the extent that qualified institutional
buyers become for a time uninterested in purchasing these restricted securities. The purchase price and subsequent valuation of restricted and illiquid securities normally reflect a discount, which may be significant, from the market price of comparable
securities for which a liquid market exists.
|
| Credit Risks. Debt securities purchased by the Funds may include securities (including zero coupon bonds) issued by
the U.S. government (and its agencies, instrumentalities and sponsored enterprises), foreign governments, domestic and foreign corporations, banks and other issuers. Further information is provided in the Additional Statement.
|
| Debt securities rated BBB or higher by Standard & Poor’s or Baa or higher by Moody’s are considered “investment
grade.” Securities rated BBB or Baa are considered medium-grade obligations with speculative characteristics, and adverse economic conditions or changing circumstances may weaken their issuers’ capacity to pay interest and repay principal. A
security will be deemed to have met a rating requirement if it receives the minimum required rating from at least one such rating organization even though it has been rated below the minimum rating by one or more other rating organizations, or if unrated
by such rating organizations, determined by the Investment Adviser to be of comparable credit quality.
|
| Certain Funds may invest in fixed-income securities rated BB or Ba or below (or comparable unrated securities) which are commonly
referred to as “junk bonds.” Junk bonds are considered predominantly speculative and may be questionable as to principal and interest payments.
|
| In some cases, junk bonds may be highly speculative, have poor prospects for reaching investment grade standing and be in default.
As a result, investment in such bonds will present greater speculative risks than those associated with investment in investment grade bonds. Also, to the extent that the rating assigned to a security in a Fund’s portfolio is downgraded by a rating
organization, the market price and liquidity of such security may be adversely affected.
|
| Risks of Initial Public Offerings. The Funds may invest in IPOs. An IPO is a company’s first offering of stock
to the public. IPO risk is the risk that the market value of IPO shares will fluctuate considerably due to factors such as the absence of a prior public market, unseasoned trading, the small number of shares available for trading and limited information
about the issuer. The purchase of IPO shares may involve high transaction costs. IPO shares are subject to market risk and liquidity risk. When a Fund’s asset base is small, a significant portion of the Fund’s performance could be attributable
to investments in IPOs, because such investments would have a magnified impact on the Fund. As the Fund’s assets grow, the effect of the Fund’s investments in IPOs on the Fund’s performance probably will decline, which could reduce the
Fund’s performance. Because of the price volatility of IPO shares, a Fund may choose to hold IPO shares for a very short period of time. This may increase the turnover of the Fund’s portfolio and may lead to increased expenses to the Fund, such
as commissions and transaction costs. By selling IPO shares, the Fund may realize taxable gains it will subse
quently distribute to shareholders. In addition, the market for IPO shares can be speculative and/or inactive for extended periods of time. There is no assurance that a Fund will be able to obtain allocable portions of IPO shares. The limited number of
shares available for trading in some IPOs may make it more difficult for a Fund to buy or sell significant amounts of shares without an unfavorable impact on prevailing prices. Investors in IPO shares can be affected by substantial dilution in the value
of their shares, by sales of additional shares and by concentration of control in existing management and principal shareholders.
|
| Temporary Investment Risks. Each Fund may, for temporary defensive purposes, invest a certain percentage of its
total assets in:
|
n
|
U.S. government securities
|
n
|
Commercial paper rated at least A-2 by Standard & Poor’s or P-2 by Moody’s
|
n
|
Certificates of deposit
|
n
|
Bankers’ acceptances
|
n
|
Repurchase agreements
|
n
|
Non-convertible preferred stocks and non-convertible corporate bonds with a remaining maturity of less than one year
|
| When a Fund’s assets are invested in such instruments, the Fund may not be achieving its investment objective.
|
| C. Portfolio Securities and Techniques
|
| This section provides further information on certain types of securities and investment techniques that may be used by the Funds,
including their associated risks. Further information is provided in the Additional Statement, which is available upon request.
|
| Convertible Securities. Each Fund may invest in convertible securities. Convertible securities are preferred stock
or debt obligations that are convertible into common stock. Convertible securities generally offer lower interest or dividend yields than non-convertible securities of similar quality. Convertible securities in which a Fund invests are subject to the same
rating criteria as its other investments in fixed-income securities. Convertible securities have both equity and fixed-income risk characteristics. Like all fixed-income securities, the value of convertible securities is susceptible to the risk of market
losses attributable to changes in interest rates. Generally, the market value of convertible securities tends to decline as interest rates increase and, conversely, to increase as interest rates decline. However, when the market price of the common stock
underlying a convertible security exceeds the conversion price of the convertible security, the convertible security tends to reflect the market price of the underlying common stock. As the market
price of the underlying common stock declines, the convertible security, like a fixed-income security, tends to trade increasingly on a yield basis, and thus may not decline in price to the same extent as the underlying common stock.
|
| Foreign Currency Transactions. A Fund may, to the extent consistent with its investment policies, purchase or sell
foreign currencies on a cash basis or through forward contracts. A forward contract involves an obligation to purchase or sell a specific currency at a future date at a price set at the time of the contract. A Fund may engage in foreign currency
transactions for hedging purposes and to seek to protect against anticipated changes in future foreign currency exchange rates. In addition, certain Funds may also enter into such transactions to seek to increase total return, which is considered a
speculative practice.
|
| Some Funds may also engage in cross-hedging by using forward contracts in a currency different from that in which the hedged
security is denominated or quoted. A Fund may hold foreign currency received in connection with investments in foreign securities when, in the judgment of the Investment Adviser, it would be beneficial to convert such currency into U.S. dollars at a later
date (e.g., the Investment Adviser may anticipate the foreign currency to appreciate against the U.S. dollar).
|
| Currency exchange rates may fluctuate significantly over short periods of time, causing, along with other factors, a Fund’s
NAV to fluctuate (when the Fund’s NAV fluctuates, the value of your shares may go up or down). Currency exchange rates also can be affected unpredictably by the intervention of U.S. or foreign governments or central banks, or the failure to
intervene, or by currency controls or political developments in the United States or abroad.
|
| The market in forward foreign currency exchange contracts, currency swaps and other privately negotiated currency instruments
offers less protection against defaults by the other party to such instruments than is available for currency instruments traded on an exchange. Such contracts are subject to the risk that the counterparty to the contract will default on its obligations.
Since these contracts are not guaranteed by an exchange or clearinghouse, a default on a contract would deprive a Fund of unrealized profits, transaction costs or the benefits of a currency hedge or could force the Fund to cover its purchase or sale
commitments, if any, at the current market price.
|
| Structured Securities. Each Fund may invest in structured securities. Structured securities are securities whose
value is determined by reference to changes in the value of specific currencies, interest rates, commodities, indices or other financial indicators (the “Reference”) or the relative change in two or more References.
|
| The interest rate or the principal amount payable upon maturity or redemption may be increased or decreased depending upon
changes in the applicable Reference. Structured securities may be positively or negatively indexed, so that appreciation of the Reference may produce an increase or decrease in the interest rate or value of the security at maturity. In addition, changes
in the interest rates or the value of the security at maturity may be a multiple of changes in the value of the Reference. Consequently, structured securities may present a greater degree of market risk than other types of fixed-income securities and may
be more volatile, less liquid and more difficult to price accurately than less complex securities.
|
| REITs. Each Fund may invest in REITs. REITs are pooled investment vehicles that invest primarily in either real
estate or real estate related loans. The value of a REIT is affected by changes in the value of the properties owned by the REIT or securing mortgage loans held by the REIT. REITs are dependent upon the ability of the REITs’ managers, and are subject
to heavy cash flow dependency, default by borrowers and the qualification of the REITs under applicable regulatory requirements for favorable income tax treatment. REITs are also subject to risks generally associated with investments in real estate
including possible declines in the value of real estate, general and local economic conditions, environmental problems and changes in interest rates. To the extent that assets underlying a REIT are concentrated geographically, by property type or in
certain other respects, these risks may be heightened. A Fund will indirectly bear its proportionate share of any expenses, including management fees, paid by a REIT in which it invests.
|
| Options on Securities, Securities Indices and Foreign Currencies. A put option gives the purchaser of the option the
right to sell, and the writer (seller) of the option the obligation to buy, the underlying instrument during the option period. A call option gives the purchaser of the option the right to buy, and the writer (seller) of the option the obligation to sell,
the underlying instrument during the option period. Each Fund may write (sell) covered call and put options and purchase put and call options on any securities in which they may invest or on any securities index consisting of securities in which they may
invest. A Fund may also, to the extent that it invests in foreign securities, purchase and sell (write) put and call options on foreign currencies.
|
| The writing and purchase of options is a highly specialized activity which involves special investment risks. Options may be used
for either hedging or cross-hedging purposes, or to seek to increase total return (which is considered a speculative activity). The successful use of options depends in part on the ability of the Investment Adviser to manage future price fluctuations and
the degree of correlation between the options and securities (or currency) markets. If the Invest
ment Adviser is incorrect in its expectation of changes in market prices or determination of the correlation between the instruments or indices on which options are written and purchased and the instruments in a Fund’s investment portfolio, the Fund
may incur losses that it would not otherwise incur. The use of options can also increase a Fund’s transaction costs. Options written or purchased by the Funds may be traded on either U.S. or foreign exchanges or over-the-counter. Foreign and
over-the-counter options will present greater possibility of loss because of their greater illiquidity and credit risks.
|
| Futures Contracts and Options on Futures Contracts. Futures contracts are standardized, exchange-traded contracts
that provide for the sale or purchase of a specified financial instrument or currency at a future time at a specified price. An option on a futures contract gives the purchaser the right (and the writer of the option the obligation) to assume a position
in a futures contract at a specified exercise price within a specified period of time. A futures contract may be based on various securities (such as U.S. government securities), foreign currencies, securities indices and other financial instruments and
indices. The Funds may engage in futures transactions on both U.S. and foreign exchanges.
|
| Each Fund may purchase and sell futures contracts, and purchase and write call and put options on futures contracts, in order to
seek to increase total return or to hedge against changes in interest rates, securities prices or, to the extent a Fund invests in foreign securities, currency exchange rates, or to otherwise manage their term structures, sector selection and durations in
accordance with their investment objectives and policies. Each Fund may also enter into closing purchase and sale transactions with respect to such contracts and options. A Fund will engage in futures and related options transactions for bona fide hedging
purposes as defined in regulations of the Commodity Futures Trading Commission or to seek to increase total return to the extent permitted by such regulations. A Fund may not purchase or sell futures contracts or purchase or sell related options to seek
to increase total return, except for closing purchase or sale transactions, if immediately thereafter the sum of the amount of initial margin deposits and premiums paid on the Fund’s outstanding positions in futures and related options entered into
for the purpose of seeking to increase total return would exceed 5% of the market value of the Fund’s net assets.
|
| Futures contracts and related options present the following risks:
|
n
|
While a Fund may benefit from the use of futures and options on futures, unanticipated changes in interest rates, securities
prices or currency exchange rates may result in poorer overall performance than if the Fund had not entered into any futures contracts or options transactions.
|
n
|
Because perfect correlation between a futures position and portfolio position that is intended to be protected is impossible to
achieve, the desired protection may not be obtained and a Fund may be exposed to additional risk of loss.
|
n
|
The loss incurred by a Fund in entering into futures contracts and in writing call options on futures is potentially unlimited and
may exceed the amount of the premium received.
|
n
|
Futures markets are highly volatile and the use of futures may increase the volatility of a Fund’s NAV.
|
n
|
As a result of the low margin deposits normally required in futures trading, a relatively small price movement in a futures
contract may result in substantial losses to a Fund.
|
n
|
Futures contracts and options on futures may be illiquid, and exchanges may limit fluctuations in futures contract prices during a
single day.
|
n
|
Foreign exchanges may not provide the same protection as U.S. exchanges.
|
| Equity Swaps. Each Fund may invest in equity swaps. Equity swaps allow the parties to a swap agreement to exchange
the dividend income or other components of return on an equity investment (for example, a group of equity securities or an index) for a component of return on another non-equity or equity investment.
|
| An equity swap may be used by a Fund to invest in a market without owning or taking physical custody of securities in
circumstances in which direct investment may be restricted for legal reasons or is otherwise impractical. Equity swaps are derivatives and their value can be very volatile. To the extent that the Investment Adviser does not accurately analyze and predict
the potential relative fluctuation of the components swapped with another party, a Fund may suffer a loss, which may be substantial. The value of some components of an equity swap (such as the dividends on a common stock) may also be sensitive to changes
in interest rates. Furthermore, a Fund may suffer a loss if the counterparty defaults. Because equity swaps are normally illiquid, a Fund may be unable to terminate its obligations when desired.
|
| When-Issued Securities and Forward Commitments. Each Fund may purchase when-issued securities and make contracts to
purchase or sell securities for a fixed price at a future date beyond customary settlement time. When-issued securities are securities that have been authorized, but not yet issued. When-issued securities are purchased in order to secure what is
considered to be an advantageous price and yield to the Fund at the time of entering into the transaction. A forward commitment involves the entering into a contract to purchase or sell securities for a fixed price at a future date beyond the customary
settlement period.
|
| The purchase of securities on a when-issued or forward commitment basis involves a risk of loss if the value of the security to be
purchased declines before the settlement date. Conversely, the sale of securities on a forward commitment
basis involves the risk that the value of the securities sold may increase before the settlement date. Although a Fund will generally purchase securities on a when-issued or forward commitment basis with the intention of acquiring the securities for its
portfolio, a Fund may dispose of when-issued securities or forward commitments prior to settlement if the Investment Adviser deems it appropriate.
|
| Repurchase Agreements. Repurchase agreements involve the purchase of securities subject to the seller’s
agreement to repurchase them at a mutually agreed upon date and price. Each Fund may enter into repurchase agreements with dealers in U.S. government securities and member banks of the Federal Reserve System which furnish collateral at least equal in
value or market price to the amount of their repurchase obligation.
|
| If the other party or “seller” defaults, a Fund might suffer a loss to the extent that the proceeds from the sale of the
underlying securities and other collateral held by the Fund are less than the repurchase price and the Fund’s costs associated with delay and enforcement of the repurchase agreement. In addition, in the event of bankruptcy of the seller, a Fund could
suffer additional losses if a court determines that the Fund’s interest in the collateral is not enforceable.
|
| In evaluating whether to enter into a repurchase agreement, the Investment Adviser will carefully consider the creditworthiness of
the seller. Certain Funds, together with other registered investment companies having advisory agreements with the Investment Adviser or any of its affiliates, may transfer uninvested cash balances into a single joint account, the daily aggregate balance
of which will be invested in one or more repurchase agreements.
|
| Lending of Portfolio Securities. Each Fund may engage in securities lending. Securities lending involves the lending
of securities owned by a Fund to financial institutions such as certain broker-dealers. The borrowers are required to secure their loan continuously with cash, cash equivalents, U.S. government securities or letters of credit in an amount at least equal
to the market value of the securities loaned. Cash collateral may be invested in cash equivalents. To the extent that cash collateral is invested in other investment securities, such collateral will be subject to market depreciation or appreciation, and a
Fund will be responsible for any loss that might result from its investment of the borrowers’ collateral. If the Investment Adviser determines to make securities loans, the value of the securities loaned may not exceed 33 1
/3% of the value of the total assets of a
Fund (including the loan collateral).
|
| A Fund may lend its securities to increase its income. A Fund may, however, experience delay in the recovery of its securities if
the institution with which it has engaged in a portfolio loan transaction breaches its agreement with the Fund.
|
| Short Sales Against-the-Box. Certain Funds may make short sales against-the-box. A short sale against-the-box means
that at all times when a short position is open the Fund will own an equal amount of securities sold short, or securities convertible into or exchangeable for, without payment of any further consideration, an equal amount of the securities of the same
issuer as the securities sold short.
|
| Preferred Stock, Warrants and Rights. Each Fund may invest in preferred stock, warrants and rights. Preferred stocks
are securities that represent an ownership interest providing the holder with claims on the issuer’s earnings and assets before common stock owners but after bond owners. Unlike debt securities, the obligations of an issuer of preferred stock,
including dividend and other payment obligations, may not typically be accelerated by the holders of such preferred stock on the occurrence of an event of default or other non-compliance by the issuer of the preferred stock.
|
| Warrants and other rights are options to buy a stated number of shares of common stock at a specified price at any time during the
life of the warrant or right. The holders of warrants and rights have no voting rights, receive no dividends and have no rights with respect to the assets of the issuer.
|
| Other Investment Companies. Each Fund may invest in securities of other investment companies (including
exchange-traded funds such as SPDRs and iShares
SM
, as defined below) subject to statutory limitations prescribed by the Act. These limitations include a prohibition on any Fund acquiring more than 3% of the voting shares of any other
investment company, and a prohibition on investing more than 5% of a Fund’s total assets in securities of any one investment company or more than 10% of its total assets in securities of all investment companies. A Fund will indirectly bear its
proportionate share of any management fees and other expenses paid by such other investment companies. Exchange-traded funds such as SPDRs and iShares
SM
are shares of unaffiliated investment companies which are traded like traditional equity securities on a national securities exchange or the NASDAQ® National Market System.
|
n
|
Standard & Poor’s Depositary Receipts™.
The Funds may, consistent with their investment policies, purchase Standard & Poor’s Depositary Receipts™ (“SPDRs”). SPDRs are securities traded on the American Stock Exchange (“AMEX”) that represent
ownership in the SPDR Trust, a trust which has been established to accumulate and hold a portfolio of common stocks that is intended to track the price performance and dividend yield of the S&P 500®. The SPDR Trust is sponsored by a subsidiary of
the AMEX. SPDRs may be used for several reasons, including, but not limited to, facilitating the handling
of cash flows or trading, or reducing transaction costs. The price movement of SPDRs may not perfectly parallel the price action of the S&P 500®.
|
n
|
iShares
SM
(formerly World Equity Benchmark Shares or WEBs). iShares are shares of an investment company that invests substantially all of its assets in securities included
in the MSCI indices for specified countries. iShares are listed on the AMEX and were initially offered to the public in 1996. The market prices of iShares are expected to fluctuate in accordance with both changes in the NAVs of their underlying indices
and supply and demand of iShares on the AMEX. To date, iShares have traded at relatively modest discounts and premiums to their NAVs. However, iShares have a limited operating history and information is lacking regarding the actual performance and trading
liquidity of iShares for extended periods or over complete market cycles. In addition, there is no assurance that the requirements of the AMEX necessary to maintain the listing of iShares will continue to be met or will remain unchanged. In the event
substantial market or other disruptions affecting iShares should occur in the future, the liquidity and value of a Fund’s shares could also be substantially and adversely affected. If such disruptions were to occur, a Fund could be required to
reconsider the use of iShares as part of its investment strategy.
|
| Unseasoned Companies. Each Fund may invest in companies (including predecessors) which have operated less than three
years. The securities of such companies may have limited liquidity, which can result in their being priced higher or lower than might otherwise be the case. In addition, investments in unseasoned companies are more speculative and entail greater risk than
do investments in companies with an established operating record.
|
| Corporate Debt Obligations. Corporate debt obligations include bonds, notes, debentures, commercial paper and other
obligations of corporations to pay interest and repay principal, and include securities issued by banks and other financial institutions. Each Fund may invest in corporate debt obligations issued by U.S. and certain non-U.S. issuers which issue securities
denominated in the U.S. dollar (including Yankee and Euro obligations). In addition to obligations of corporations, corporate debt obligations include securities issued by banks and other financial institutions and supranational entities (i.e., the World Bank, the International Monetary Fund, etc.).
|
| Bank Obligations. Each Fund may invest in obligations issued or guaranteed by U.S. or foreign banks. Bank
obligations, including without limitations, time deposits, bankers’ acceptances and certificates of deposit, may be general obligations of the parent bank or may be limited to the issuing branch by the terms of the specific obligations or by
government regulations. Banks are subject to extensive but different governmental regulations which may limit both the amount and types of
loans which may be made and interest rates which may be charged. In addition, the profitability of the banking industry is largely dependent upon the availability and cost of funds for the purpose of financing lending operations under prevailing money
market conditions. General economic conditions as well as exposure to credit losses arising from possible financial difficulties of borrowers play an important part in the operation of this industry.
|
| U.S. Government Securities. Each Fund may invest in U.S. government securities. U.S. government securities include
U.S. Treasury obligations and obligations issued or guaranteed by U.S. government agencies, instrumentalities or sponsored enterprises. U.S. government securities may be supported by (a) the full faith and credit of the U.S. Treasury (such as the
Government National Mortgage Association (“Ginnie Mae”)); (b) the right of the issuer to borrow from the U.S. Treasury (such as securities of the Student Loan Marketing Association); (c) the discretionary authority of the U.S. government to
purchase certain obligations of the issuer; or (d) only the credit of the issuer. U.S. government securities also include Treasury receipts, zero coupon bonds and other stripped U.S. government securities, where the interest and principal components of
stripped U.S. government securities are traded independently.
|
| Custodial Receipts. Interests in U.S. government securities may be purchased in the form of custodial receipts that
evidence ownership of future interest payments, principal payments or both on certain notes or bonds issued or guaranteed as to principal and interest by the U.S. government, its agencies, instrumentalities, political subdivisions or authorities. For
certain securities law purposes, custodial receipts are not considered obligations of the U.S. government.
|
| Mortgage-Backed Securities. Certain Funds may invest in mortgage-backed securities. Mortgage-backed securities
represent direct or indirect participations in, or are collateralized by and payable from, mortgage loans secured by real property. Mortgage-backed securities can be backed by either fixed rate mortgage loans or adjustable rate mortgage loans, and may be
issued by either a governmental or non-governmental entity. Privately issued mortgage-backed securities are normally structured with one or more types of “credit enhancement.” However, these mortgage-backed securities typically do not have the
same credit standing as U.S. government guaranteed mortgage-backed securities.
|
| Mortgage-backed securities may include multiple class securities, including collateralized mortgage obligations (“CMOs”)
and Real Estate Mortgage Investment Conduit (“REMIC”) pass-through or participation certificates. CMOs provide an investor with a specified interest in the cash flow from a pool of underlying mortgages or of other mortgage-backed securities.
CMOs are issued in multiple classes. In many cases, payments of principal are applied to the CMO classes in the
order of their respective stated maturities, so that no principal payments will be made on a CMO class until all other classes having an earlier stated maturity date are paid in full. A REMIC is a CMO that qualifies for special tax treatment and invests
in certain mortgages principally secured by interests in real property and other permitted investments.
|
| Mortgaged-backed securities also include stripped mortgage-backed securities (“SMBS”), which are derivative multiple
class mortgage-backed securities. SMBS are usually structured with two different classes: one that receives substantially all of the interest payments and the other that receives substantially all of the principal payments from a pool of mortgage loans.
The market value of SMBS consisting entirely of principal payments generally is unusually volatile in response to changes in interest rates. The yields on SMBS that receive all or most of the interest from mortgage loans are generally higher than
prevailing market yields on other mortgage-backed securities because their cash flow patterns are more volatile and there is a greater risk that the initial investment will not be fully recouped.
|
| Asset-Backed Securities. Certain Funds may invest in asset-backed securities. Asset-backed securities are securities
whose principal and interest payments are collateralized by pools of assets such as auto loans, credit card receivables, leases, installment contracts and personal property. Asset-backed securities are often subject to more rapid repayment than their
stated maturity date would indicate as a result of the pass-through of prepayments of principal on the underlying loans. During periods of declining interest rates, prepayment of loans underlying asset-backed securities can be expected to accelerate.
Accordingly, a Fund’s ability to maintain positions in such securities will be affected by reductions in the principal amount of such securities resulting from prepayments, and its ability to reinvest the returns of principal at comparable yields is
subject to generally prevailing interest rates at that time. Asset-backed securities present credit risks that are not presented by mortgage-backed securities. This is because asset-backed securities generally do not have the benefit of a security
interest in collateral that is comparable to mortgage assets. If the issuer of an asset-backed security defaults on its payment obligations, there is the possibility that, in some cases, the Fund will be unable to possess and sell the underlying
collateral and that the Fund’s recoveries on repossessed collateral may not be available to support payments on the securities. In the event of a default, a Fund may suffer a loss if it cannot sell collateral quickly and receive the amount it is owed.
|
| Borrowings. Each Fund can borrow money from banks and other financial institutions in amounts not exceeding
one-third of its total assets for temporary or emergency purposes. A Fund may not make additional investments if borrowings exceed 5% of its total assets.
|
| Mortgage Dollar Rolls. Certain Funds may enter into mortgage dollar rolls. A mortgage dollar roll involves the sale
by a Fund of securities for delivery in the current month. The Fund simultaneously contracts with the same counterparty to repurchase substantially similar (same type, coupon and maturity) but not identical securities on a specified future date. During
the roll period, the Fund loses the right to receive principal and interest paid on the securities sold. However, the Fund benefits to the extent of any difference between (a) the price received for the securities sold and (b) the lower forward price for
the future purchase and/or fee income plus the interest earned on the cash proceeds of the securities sold. Unless the benefits of a mortgage dollar roll exceed the income, capital appreciation and gain or loss due to mortgage prepayments that would have
been realized on the securities sold as part of the roll, the use of this technique will diminish the Fund’s performance.
|
| Successful use of mortgage dollar rolls depends upon the Investment Adviser’s ability to predict correctly interest rates and
mortgage prepayments. If the Investment Adviser is incorrect in its prediction, a Fund may experience a loss. For financial reporting and tax purposes, the Funds treat mortgage dollar rolls as two separate transactions: one involving the purchase of a
security and a separate transaction involving a sale. The Funds do not currently intend to enter into mortgage dollar rolls that are accounted for as a financing and do not treat them as borrowings.
|
| Yield Curve Options. Certain Funds may enter into options on the yield “spread” or differential between
two securities. Such transactions are referred to as “yield curve” options. In contrast to other types of options, a yield curve option is based on the difference between the yields of designated securities, rather than the prices of the
individual securities, and is settled through cash payments. Accordingly, a yield curve option is profitable to the holder if this differential widens (in the case of a call) or narrows (in the case of a put), regardless of whether the yields of the
underlying securities increase or decrease.
|
| The trading of yield curve options is subject to all of the risks associated with the trading of other types of options. In
addition, such options present a risk of loss even if the yield of one of the underlying securities remains constant, or if the spread moves in a direction or to an extent which was not anticipated.
|
| Reverse Repurchase Agreements. Certain Funds may enter into reverse repurchase agreements. Reverse repurchase
agreements involve the sale of securities held by a Fund subject to the Fund’s agreement to repurchase them at a mutually agreed upon date and price (including interest). These transactions may be entered into as a temporary measure for emergency
purposes or to meet redemption requests. Reverse repurchase agreements may also be entered into when the Invest
ment Adviser expects that the interest income to be earned from the investment of the transaction proceeds will be greater than the related interest expense. Reverse repurchase agreements involve leveraging. If the securities held by a Fund decline in
value while these transactions are outstanding, the NAV of the Fund’s outstanding shares will decline in value by proportionately more than the decline in value of the securities. In addition, reverse repurchase agreements involve the risk that the
interest income earned by a Fund (from the investment of the proceeds) will be less than the interest expense of the transaction, that the market value of the securities sold by a Fund will decline below the price the Fund is obligated to pay to
repurchase the securities, and that the securities may not be returned to the Fund.
|
| Municipal Securities. Certain Funds may invest in securities and instruments issued by state and local government
issuers. Municipal securities in which a Fund may invest consist of bonds, notes, commercial paper and other instruments (including participating interests in such securities) issued by or on behalf of states, territories and possessions of the United
States (including the District of Columbia) and their political subdivisions, agencies or instrumentalities. Such securities may pay fixed, variable or floating rates of interest. Municipal securities are often issued to obtain funds for various public
purposes, including the construction of a wide range of public facilities such as bridges, highways, housing, hospitals, mass transportation, schools, streets and water and sewer works. Other public purposes for which municipal securities may be issued
include refunding outstanding obligations, obtaining funds for general operating expenses, and obtaining funds to lend to other public institutions and facilities. Municipal securities in which a Fund may invest include private activity bonds, municipal
leases, certificates of participation, pre-funded municipal securities and auction rate securities.
|
| Interest Rate Swaps, Mortgage Swaps, Credit Swaps, Currency Swaps and Interest Rate Caps, Floors and Collars.
Interest rate swaps involve the exchange by a Fund with another party of their respective commitments to pay or receive interest, such as an exchange of fixed-rate payments for floating rate payments. Mortgage swaps are similar to interest rate swaps in
that they represent commitments to pay and receive interest. The notional principal amount, however, is tied to a reference pool or pools of mortgages. Credit swaps involve the receipt of floating or fixed rate payments in exchange for assuming potential
credit losses of an underlying security. Credit swaps give one party to a transaction the right to dispose of or acquire an asset (or group of assets), or the right to receive or make a payment from the other party, upon the occurrence of specified credit
events. Currency swaps involve the exchange of the parties’ respective rights to make or receive payments in specified currencies. The purchase of an interest rate cap entitles the purchaser, to the extent that a specified index exceeds a
predetermined interest
rate, to receive payment of interest on a notional principal amount from the party selling such interest rate cap. The purchase of an interest rate floor entitles the purchaser, to the extent that a specified index falls below a predetermined interest
rate, to receive payments of interest on a notional principal amount from the party selling the interest rate floor. An interest rate collar is the combination of a cap and a floor that preserves a certain return within a predetermined range of interest
rates.
|
| Certain Funds may enter into swap transactions for hedging purposes or to seek to increase total return. The use of interest rate,
mortgage, credit and currency swaps, as well as interest rate caps, floors and collars, is a highly specialized activity which involves investment techniques and risks different from those associated with ordinary portfolio securities transactions. If the
Investment Adviser is incorrect in its forecasts of market value, interest rates and currency exchange rates, the investment performance of a Fund would be less favorable than it would have been if these investment techniques were not used.
|
| Loan Participations. Certain Funds may invest in loan participations. A loan participation is an interest in a loan
to a U.S. or foreign company or other borrower which is administered and sold by a financial intermediary. A Fund may only invest in loans to issuers in whose obligations it may otherwise invest. Loan participation interests may take the form of a direct
or co-lending relationship with the corporate borrower, an assignment of an interest in the loan by a co-lender or another participant, or a participation in the seller’s share of the loan. When a Fund acts as co-lender in connection with a
participation interest or when it acquires certain participation interests, the Fund will have direct recourse against the borrower if the borrower fails to pay scheduled principal and interest. In cases where the Fund lacks direct recourse, it will look
to the agent bank to enforce appropriate credit remedies against the borrower. In these cases, the Fund may be subject to delays, expenses and risks that are greater than those that would have been involved if the Fund had purchased a direct obligation
(such as commercial paper) of such borrower. Moreover, under the terms of the loan participation, the Fund may be regarded as a creditor of the agent bank (rather than of the underlying corporate borrower), so that the Fund may also be subject to the risk
that the agent bank may become insolvent.
|
| Inverse Floaters. Certain Funds may invest in inverse floating rate debt securities (“inverse floaters”).
The interest rate on inverse floaters resets in the opposite direction from the market rate of interest to which the inverse floater is indexed. An inverse floater may be considered to be leveraged to the extent that its interest rate varies by a
magnitude that exceeds the magnitude of the change in the index rate of interest. The higher the degree of leverage of an inverse floater, the greater the volatility of its market value.
|
| The financial highlights tables are intended to help you understand a Fund’s financial performance for the past five years
(or less if the Fund has not been in operation for less than five years). Certain information reflects financial results for a single Fund share. The total returns in the table represent the rate that an investor would have earned or lost on an investment
in a Fund (assuming reinvestment of all dividends and distributions). This information for the periods ended August 31, 2000 has been audited by PricewaterhouseCoopers LLP, whose report, along with a Fund’s financial statements, is included in the
Fund’s annual report (available upon request). The information for all periods prior to the periods ended August 31, 2000 has been audited by the Funds’ previous independent accountants.
|
| BALANCED FUND
|
|
Income from investment operations |
|||||||||||
|---|---|---|---|---|---|---|---|---|---|---|---|
|
Net asset value, beginning of period |
Net
investment Income |
Net realized
and unrealized gain(loss) |
Total from
investment operations |
||||||||
| For The Year Ended August 31, | |||||||||||
| 2000 - Class A Shares | $20.38 | $0.60 | c | $ 1.75 | $2.35 | ||||||
| 2000 - Class B Shares | 20.26 | 0.45 | c | 1.73 | 2.18 | ||||||
| 2000 - Class C Shares | 20.23 | 0.45 | c | 1.74 | 2.19 | ||||||
| 2000 - Institutional Shares | 20.39 | 0.71 | c | 1.75 | 2.46 | ||||||
| 2000 - Service Shares | 20.37 | 0.59 | c | 1.74 | 2.33 | ||||||
| For The Seven Months Ended August 31, | |||||||||||
| 1999 - Class A Shares | 20.48 | 0.32 | (0.19 | ) | 0.13 | ||||||
| 1999 - Class B Shares | 20.37 | 0.22 | (0.18 | ) | 0.04 | ||||||
| 1999 - Class C Shares | 20.34 | 0.23 | (0.19 | ) | 0.04 | ||||||
| 1999 - Institutional Shares | 20.48 | 0.53 | (0.35 | ) | 0.18 | ||||||
| 1999 - Service Shares | 20.47 | 1.22 | (1.14 | ) | 0.08 | ||||||
| For The Years Ended January 31, | |||||||||||
| 1999 - Class A Shares | 20.29 | 0.58 | 0.20 | 0.78 | |||||||
| 1999 - Class B Shares | 20.20 | 0.41 | 0.21 | 0.62 | |||||||
| 1999 - Class C Shares | 20.17 | 0.41 | 0.21 | 0.62 | |||||||
| 1999 - Institutional Shares | 20.29 | 0.64 | 0.20 | 0.84 | |||||||
| 1999 - Service Shares | 20.28 | 0.53 | 0.21 | 0.74 | |||||||
| 1998 - Class A Shares | 18.78 | 0.57 | 2.66 | 3.23 | |||||||
| 1998 - Class B Shares | 18.73 | 0.50 | 2.57 | 3.07 | |||||||
| 1998 - Class C Shares (commenced August 15, 1997) | 21.10 | 0.25 | 0.24 | 0.49 | |||||||
| 1998 - Institutional Shares (commenced August 15, 1997) | 21.18 | 0.26 | 0.32 | 0.58 | |||||||
| 1998 - Service Shares (commenced August 15, 1997) | 21.18 | 0.22 | 0.32 | 0.54 | |||||||
| 1997 - Class A Shares | 17.31 | 0.66 | 2.47 | 3.13 | |||||||
| 1997 - Class B Shares (commenced May 1, 1996) | 17.46 | 0.42 | 2.34 | 2.76 | |||||||
| 1996 - Class A Shares | 14.22 | 0.51 | 3.43 | 3.94 | |||||||
|
Distributions to shareholders |
|||||||||||||||||||||
|---|---|---|---|---|---|---|---|---|---|---|---|---|---|---|---|---|---|---|---|---|---|
| From net
investment income |
In excess of net investment income |
From net
realized gains |
Total
distributions |
Net asset
value, end of period |
Total
return a |
Net assets
at end of period (in 000s) |
Ratio of
net expenses to average net assets |
||||||||||||||
| $(0.50 | ) | $ — | $(0.81 | ) | $(1.31 | ) | $21.42 | 12.00 | % | $135,632 | 1.12 | % | |||||||||
| (0.36 | ) | — | (0.81 | ) | (1.17 | ) | 21.27 | 11.17 | 33,759 | 1.87 | |||||||||||
| (0.36 | ) | — | (0.81 | ) | (1.17 | ) | 21.25 | 11.23 | 8,658 | 1.87 | |||||||||||
| (0.58 | ) | — | (0.81 | ) | (1.39 | ) | 21.46 | 12.59 | 2,509 | 0.72 | |||||||||||
| (0.48 | ) | — | (0.81 | ) | (1.29 | ) | 21.41 | 11.89 | 17 | 1.22 | |||||||||||
| (0.23 | ) | — | — | (0.23 | ) | 20.38 | 0.62 | 169,395 | 1.10 | b | |||||||||||
| (0.15 | ) | — | — | (0.15 | ) | 20.26 | 0.20 | 40,515 | 1.85 | b | |||||||||||
| (0.15 | ) | — | — | (0.15 | ) | 20.23 | 0.18 | 11,284 | 1.85 | b | |||||||||||
| (0.27 | ) | — | — | (0.27 | ) | 20.39 | 0.86 | 2,361 | 0.70 | b | |||||||||||
| (0.18 | ) | — | — | (0.18 | ) | 20.37 | 0.39 | 15 | 1.20 | b | |||||||||||
| (0.59 | ) | — | — | (0.59 | ) | 20.48 | 3.94 | 192,453 | 1.04 | ||||||||||||
| (0.45 | ) | — | — | (0.45 | ) | 20.37 | 3.15 | 43,926 | 1.80 | ||||||||||||
| (0.45 | ) | — | — | (0.45 | ) | 20.34 | 3.14 | 14,286 | 1.80 | ||||||||||||
| (0.65 | ) | — | — | (0.65 | ) | 20.48 | 4.25 | 8,010 | 0.73 | ||||||||||||
| (0.55 | ) | — | — | (0.55 | ) | 20.47 | 3.80 | 490 | 1.23 | ||||||||||||
| (0.56 | ) | — | (1.16 | ) | (1.72 | ) | 20.29 | 17.54 | 163,636 | 1.00 | |||||||||||
| (0.42 | ) | (0.02 | ) | (1.16 | ) | (1.60 | ) | 20.20 | 16.71 | 23,639 | 1.76 | ||||||||||
| (0.22 | ) | (0.04 | ) | (1.16 | ) | (1.42 | ) | 20.17 | 2.49 | 8,850 | 1.77 | b | |||||||||
| (0.23 | ) | (0.08 | ) | (1.16 | ) | (1.47 | ) | 20.29 | 2.93 | 8,367 | 0.76 | b | |||||||||
| (0.22 | ) | (0.06 | ) | (1.16 | ) | (1.44 | ) | 20.28 | 2.66 | 16 | 1.26 | b | |||||||||
| (0.66 | ) | — | (1.00 | ) | (1.66 | ) | 18.78 | 18.59 | 81,410 | 1.00 | |||||||||||
| (0.42 | ) | (0.07 | ) | (1.00 | ) | (1.49 | ) | 18.73 | 16.22 | 2,110 | 1.75 | b | |||||||||
| (0.50 | ) | — | (0.35 | ) | (0.85 | ) | 17.31 | 28.10 | 50,928 | 1.00 | |||||||||||
| BALANCED FUND (continued)
|
|
Ratios assuming no expense reductions |
|||||||||||||
|---|---|---|---|---|---|---|---|---|---|---|---|---|---|
| Ratio of
net investment income to average net assets |
Ratio of
expenses to average net assets |
Ratio of
net investment income to average net assets |
Portfolio
turnover rate d |
||||||||||
| For The Year Ended August 31, | |||||||||||||
| 2000 - Class A Shares | 2.94 | % | 1.29 | % | 2.77 | % | 153.69 | % | |||||
| 2000 - Class B Shares | 2.19 | 2.04 | 2.02 | 153.69 | |||||||||
| 2000 - Class C Shares | 2.19 | 2.04 | 2.02 | 153.69 | |||||||||
| 2000 - Institutional Shares | 3.46 | 0.89 | 3.29 | 153.69 | |||||||||
| 2000 - Service Shares | 2.86 | 1.39 | 2.69 | 153.69 | |||||||||
| For The Seven Months Ended August 31, | |||||||||||||
| 1999 - Class A Shares | 2.58 | b | 1.32 | b | 2.36 | b | 90.41 | ||||||
| 1999 - Class B Shares | 1.83 | b | 2.07 | b | 1.61 | b | 90.41 | ||||||
| 1999 - Class C Shares | 1.84 | b | 2.07 | b | 1.62 | b | 90.41 | ||||||
| 1999 - Institutional Shares | 2.96 | b | 0.92 | b | 2.74 | b | 90.41 | ||||||
| 1999 - Service Shares | 2.46 | b | 1.42 | b | 2.24 | b | 90.41 | ||||||
| For The Years Ended January 31, | |||||||||||||
| 1999 - Class A Shares | 2.90 | 1.45 | 2.49 | 175.06 | |||||||||
| 1999 - Class B Shares | 2.16 | 2.02 | 1.94 | 175.06 | |||||||||
| 1999 - Class C Shares | 2.17 | 2.02 | 1.95 | 175.06 | |||||||||
| 1999 - Institutional Shares | 3.22 | 0.95 | 3.00 | 175.06 | |||||||||
| 1999 - Service Shares | 2.77 | 1.45 | 2.55 | 175.06 | |||||||||
| 1998 - Class A Shares | 2.94 | 1.57 | 2.37 | 190.43 | |||||||||
| 1998 - Class B Shares | 2.14 | 2.07 | 1.83 | 190.43 | |||||||||
| 1998 - Class C Shares (commenced August 15, 1997) | 2.13 | b | 2.08 | b | 1.82 | b | 190.43 | ||||||
| 1998 - Institutional Shares (commenced August 15, 1997) | 3.13 | b | 1.07 | b | 2.82 | b | 190.43 | ||||||
| 1998 - Service Shares (commenced August 15, 1997) | 2.58 | b | 1.57 | b | 2.27 | b | 190.43 | ||||||
| 1997 - Class A Shares | 3.76 | 1.77 | 2.99 | 208.11 | |||||||||
| 1997 - Class B Shares (commenced May 1, 1996) | 2.59 | b | 2.27 | b | 2.07 | b | 208.11 | ||||||
| 1996 - Class A Shares | 3.65 | 1.90 | 2.75 | 197.10 | |||||||||
| GROWTH AND INCOME FUND
|
|
Income from investment operations |
||||||||||||
|---|---|---|---|---|---|---|---|---|---|---|---|---|
|
Net asset value, beginning of period |
Net
investment income (loss) |
Net realized
and unrealized gain (loss) |
Total from
investment operations |
|||||||||
| For The Year Ended August 31, | ||||||||||||
| 2000 - Class A Shares | $24.68 | $ 0.07 | c | $1.44 | $1.51 | |||||||
| 2000 - Class B Shares | 24.46 | (0.10 | ) c | 1.42 | 1.32 | |||||||
| 2000 - Class C Shares | 24.41 | (0.09 | ) c | 1.40 | 1.31 | |||||||
| 2000 - Institutional Shares | 24.72 | 0.16 | c | 1.49 | 1.65 | |||||||
| 2000 - Service Shares | 24.68 | 0.05 | c | 1.44 | 1.49 | |||||||
| For The Seven Months Ended August 31, | ||||||||||||
| 1999 - Class A Shares | 24.33 | 0.19 | 0.31 | 0.50 | ||||||||
| 1999 - Class B Shares | 24.13 | 0.08 | 0.31 | 0.39 | ||||||||
| 1999 - Class C Shares | 24.08 | 0.08 | 0.30 | 0.38 | ||||||||
| 1999 - Institutional Shares | 24.35 | 0.34 | 0.23 | 0.57 | ||||||||
| 1999 - Service Shares | 24.33 | 0.17 | 0.32 | 0.49 | ||||||||
| For The Years Ended January 31, | ||||||||||||
| 1999 - Class A Shares | 25.93 | 0.20 | (1.60 | ) | (1.40 | ) | ||||||
| 1999 - Class B Shares | 25.73 | 0.02 | (1.58 | ) | (1.56 | ) | ||||||
| 1999 - Class C Shares | 25.70 | 0.02 | (1.59 | ) | (1.57 | ) | ||||||
| 1999 - Institutional Shares | 25.95 | 0.29 | (1.58 | ) | (1.29 | ) | ||||||
| 1999 - Service Shares | 25.92 | 0.17 | (1.58 | ) | (1.41 | ) | ||||||
| 1998 - Class A Shares | 23.18 | 0.11 | 5.27 | 5.38 | ||||||||
| 1998 - Class B Shares | 23.10 | 0.04 | 5.14 | 5.18 | ||||||||
| 1998 - Class C Shares (commenced August 15, 1997) | 28.20 | (0.01 | ) | 0.06 | 0.05 | |||||||
| 1998 - Institutional Shares | 23.19 | 0.27 | 5.23 | 5.50 | ||||||||
| 1998 - Service Shares | 23.17 | 0.14 | 5.23 | 5.37 | ||||||||
| 1997 - Class A Shares | 19.98 | 0.35 | 5.18 | 5.53 | ||||||||
| 1997 - Class B Shares (commenced May 1, 1996) | 20.82 | 0.17 | 4.31 | 4.48 | ||||||||
| 1997 - Institutional Shares (commenced June 3, 1996) | 21.25 | 0.29 | 3.96 | 4.25 | ||||||||
| 1997 - Service Shares (commenced March 6, 1996) | 20.71 | 0.28 | 4.50 | 4.78 | ||||||||
| 1996 - Class A Shares | 15.80 | 0.33 | 4.75 | 5.08 | ||||||||
|
Distributions to shareholders |
|||||||||||||||||||||
|---|---|---|---|---|---|---|---|---|---|---|---|---|---|---|---|---|---|---|---|---|---|
| From net
investment income |
In excess of net investment income |
From net
realized gains |
Total
distributions |
Net asset
value, end of period |
Total
returna |
Net assets
at end of period (in 000s) |
Ratio of
net expenses to average net assets |
||||||||||||||
| $(0.05 | ) | $(0.03 | ) | $(1.33 | ) | $(1.41 | ) | $24.78 | 6.48 | % | $ 576,354 | 1.18 | % | ||||||||
| (0.02 | ) | (0.01 | ) | (1.33 | ) | (1.36 | ) | 24.42 | 5.70 | 155,527 | 1.93 | ||||||||||
| (0.01 | ) | (0.01 | ) | (1.33 | ) | (1.35 | ) | 24.37 | 5.67 | 15,746 | 1.93 | ||||||||||
| (0.09 | ) | (0.04 | ) | (1.33 | ) | (1.46 | ) | 24.91 | 7.05 | 28,543 | 0.78 | ||||||||||
| (0.05 | ) | (0.02 | ) | (1.33 | ) | (1.40 | ) | 24.77 | 6.40 | 7,926 | 1.28 | ||||||||||
| (0.15 | ) | — | — | (0.15 | ) | 24.68 | 2.05 | 855,174 | 1.19 | b | |||||||||||
| (0.06 | ) | — | — | (0.06 | ) | 24.46 | 1.60 | 271,912 | 1.94 | b | |||||||||||
| (0.05 | ) | — | — | (0.05 | ) | 24.41 | 1.58 | 31,328 | 1.94 | b | |||||||||||
| (0.20 | ) | — | — | (0.20 | ) | 24.72 | 2.32 | 32,181 | 0.79 | b | |||||||||||
| (0.14 | ) | — | — | (0.14 | ) | 24.68 | 2.01 | 10,008 | 1.29 | b | |||||||||||
| (0.19 | ) | (0.01 | ) | — | (0.20 | ) | 24.33 | (5.40 | ) | 1,122,157 | 1.22 | ||||||||||
| (0.04 | ) | — | — | (0.04 | ) | 24.13 | (6.07 | ) | 349,662 | 1.92 | |||||||||||
| (0.05 | ) | — | — | (0.05 | ) | 24.08 | (6.12 | ) | 48,146 | 1.92 | |||||||||||
| (0.30 | ) | (0.01 | ) | — | (0.31 | ) | 24.35 | (5.00 | ) | 173,696 | 0.80 | ||||||||||
| (0.17 | ) | (0.01 | ) | — | (0.18 | ) | 24.33 | (5.44 | ) | 11,943 | 1.30 | ||||||||||
| (0.11 | ) | — | (2.52 | ) | (2.63 | ) | 25.93 | 23.71 | 1,216,582 | 1.25 | |||||||||||
| — | (0.03 | ) | (2.52 | ) | (2.55 | ) | 25.73 | 22.87 | 307,815 | 1.94 | |||||||||||
| — | (0.03 | ) | (2.52 | ) | (2.55 | ) | 25.70 | 0.51 | 31,686 | 1.99 | b | ||||||||||
| (0.22 | ) | — | (2.52 | ) | (2.74 | ) | 25.95 | 24.24 | 36,225 | 0.83 | |||||||||||
| (0.06 | ) | (0.04 | ) | (2.52 | ) | (2.62 | ) | 25.92 | 23.63 | 8,893 | 1.32 | ||||||||||
| (0.35 | ) | (0.01 | ) | (1.97 | ) | (2.33 | ) | 23.18 | 28.42 | 615,103 | 1.22 | ||||||||||
| (0.17 | ) | (0.06 | ) | (1.97 | ) | (2.20 | ) | 23.10 | 22.23 | 17,346 | 1.93 | b | |||||||||
| (0.30 | ) | (0.04 | ) | (1.97 | ) | (2.31 | ) | 23.19 | 20.77 | 193 | 0.82 | b | |||||||||
| (0.28 | ) | (0.07 | ) | (1.97 | ) | (2.32 | ) | 23.17 | 23.87 | 3,174 | 1.32 | b | |||||||||
| (0.30 | ) | — | (0.60 | ) | (0.90 | ) | 19.98 | 32.45 | 436,757 | 1.20 | |||||||||||
| GROWTH AND INCOME FUND (continued)
|
|
Ratios assuming no expense reductions |
||||||||||||
|---|---|---|---|---|---|---|---|---|---|---|---|---|
| Ratio of
net investment income (loss) to average net assets |
Ratio of
expenses to average net assets |
Ratio of
net investment income (loss) to average net assets |
Portfolio
turnover rate |
|||||||||
| For The Year Ended August 31, | ||||||||||||
| 2000 - Class A Shares | 0.31 | % | 1.18 | % | 0.31 | % | 86.84 | % | ||||
| 2000 - Class B Shares | (0.41 | ) | 1.93 | (0.41 | ) | 86.84 | ||||||
| 2000 - Class C Shares | (0.40 | ) | 1.93 | (0.40 | ) | 86.84 | ||||||
| 2000 - Institutional Shares | 0.69 | 0.78 | 0.69 | 86.84 | ||||||||
| 2000 - Service Shares | 0.20 | 1.28 | 0.20 | 86.84 | ||||||||
| For The Seven Months Ended August 31, | ||||||||||||
| 1999 - Class A Shares | 1.26 | b | 1.20 | b | 1.25 | b | 55.43 | |||||
| 1999 - Class B Shares | 0.51 | b | 1.95 | b | 0.50 | b | 55.43 | |||||
| 1999 - Class C Shares | 0.51 | b | 1.95 | b | 0.50 | b | 55.43 | |||||
| 1999 - Institutional Shares | 1.72 | b | 0.80 | b | 1.71 | b | 55.43 | |||||
| 1999 - Service Shares | 1.16 | b | 1.30 | b | 1.15 | b | 55.43 | |||||
| For The Years Ended January 31, | ||||||||||||
| 1999 - Class A Shares | 0.78 | 1.32 | 0.68 | 125.79 | ||||||||
| 1999 - Class B Shares | 0.09 | 1.92 | 0.09 | 125.79 | ||||||||
| 1999 - Class C Shares | 0.10 | 1.92 | 0.10 | 125.79 | ||||||||
| 1999 - Institutional Shares | 1.25 | 0.80 | 1.25 | 125.79 | ||||||||
| 1999 - Service Shares | 0.72 | 1.30 | 0.72 | 125.79 | ||||||||
| 1998 - Class A Shares | 0.43 | 1.42 | 0.26 | 61.95 | ||||||||
| 1998 - Class B Shares | (0.35 | ) | 1.94 | (0.35 | ) | 61.95 | ||||||
| 1998 - Class C Shares (commenced August 15, 1997) | (0.48 | ) b | 1.99 | b | (0.48 | ) b | 61.95 | |||||
| 1998 - Institutional Shares | 0.76 | 0.83 | 0.76 | 61.95 | ||||||||
| 1998 - Service Shares | 0.32 | 1.32 | 0.32 | 61.95 | ||||||||
| 1997 - Class A Shares | 1.60 | 1.43 | 1.39 | 53.03 | ||||||||
| 1997 - Class B Shares (commenced May 1, 1996) | 0.15 | b | 1.93 | b | 0.15 | b | 53.03 | |||||
| 1997 - Institutional Shares (commenced June 3, 1996) | 1.36 | b | 0.82 | b | 1.36 | b | 53.03 | |||||
| 1997 - Service Shares (commenced March 6, 1996) | 0.94 | b | 1.32 | b | 0.94 | b | 53.03 | |||||
| 1996 - Class A Shares | 1.67 | 1.45 | 1.42 | 57.93 | ||||||||
| CORE LARGE CAP VALUE FUND
|
|
Income from investment operations |
||||||||||||
|---|---|---|---|---|---|---|---|---|---|---|---|---|
| Net asset
value, beginning of period |
Net
investment income |
Net realized
and unrealized gain |
Total from
investment operations |
|||||||||
| For the Year Ended August 31, | ||||||||||||
| 2000 - Class A Shares | $10.55 | $0.12 | c | $0.36 | $0.48 | |||||||
| 2000 - Class B Shares | 10.50 | 0.05 | c | 0.36 | 0.41 | |||||||
| 2000 - Class C Shares | 10.51 | 0.04 | c | 0.37 | 0.41 | |||||||
| 2000 - Institutional Shares | 10.55 | 0.16 | c | 0.37 | 0.53 | |||||||
| 2000 - Service Shares | 10.55 | 0.11 | c | 0.36 | 0.47 | |||||||
| For the Seven-Month Period Ended August 31, | ||||||||||||
| 1999 - Class A Shares | 10.15 | 0.04 | 0.40 | 0.44 | ||||||||
| 1999 - Class B Shares | 10.15 | 0.01 | 0.36 | 0.37 | ||||||||
| 1999 - Class C Shares | 10.15 | 0.01 | 0.37 | 0.38 | ||||||||
| 1999 - Institutional Shares | 10.16 | 0.06 | 0.38 | 0.44 | ||||||||
| 1999 - Service Shares | 10.16 | 0.02 | 0.40 | 0.42 | ||||||||
| For the Period Ended January 31, | ||||||||||||
| 1999 - Class A Shares (commenced December 31, 1998) | 10.00 | 0.01 | 0.14 | 0.15 | ||||||||
| 1999 - Class B Shares (commenced December 31, 1998) | 10.00 | — | 0.15 | 0.15 | ||||||||
| 1999 - Class C Shares (commenced December 31, 1998) | 10.00 | — | 0.15 | 0.15 | ||||||||
| 1999 - Institutional Shares (commenced December 31, 1998) | 10.00 | 0.01 | 0.15 | 0.16 | ||||||||
| 1999 - Service Shares (commenced December 31, 1998) | 10.00 | 0.02 | 0.14 | 0.16 | ||||||||
|
Distributions to shareholders |
|||||||||||||||||||||
|---|---|---|---|---|---|---|---|---|---|---|---|---|---|---|---|---|---|---|---|---|---|
| From net
investment income |
From net
realized gains |
Total
distributions |
Net asset
value, end of period |
Total
returna |
Net assets
at end of period (in 000s) |
Ratio of
net expenses to average net assets |
Ratio of
net investment income to average net assets |
||||||||||||||
| $(0.10 | ) | $(0.12 | ) | $(0.22 | ) | $10.81 | 4.68 | % | $100,972 | 1.06 | % | 1.14 | % | ||||||||
| (0.04 | ) | (0.12 | ) | (0.16 | ) | 10.75 | 3.96 | 19,069 | 1.81 | 0.44 | |||||||||||
| (0.04 | ) | (0.12 | ) | (0.16 | ) | 10.76 | 3.97 | 11,178 | 1.81 | 0.45 | |||||||||||
| (0.14 | ) | (0.12 | ) | (0.26 | ) | 10.82 | 5.20 | 175,493 | 0.66 | 1.54 | |||||||||||
| (0.09 | ) | (0.12 | ) | (0.21 | ) | 10.81 | 4.60 | 12 | 1.16 | 1.07 | |||||||||||
| (0.04 | ) | — | (0.04 | ) | 10.55 | 4.31 | 91,072 | 1.04 | b | 0.87 | b | ||||||||||
| (0.02 | ) | — | (0.02 | ) | 10.50 | 3.68 | 14,464 | 1.79 | b | 0.05 | b | ||||||||||
| (0.02 | ) | — | (0.02 | ) | 10.51 | 3.73 | 8,032 | 1.79 | b | 0.09 | b | ||||||||||
| (0.05 | ) | — | (0.05 | ) | 10.55 | 4.35 | 189,540 | 0.64 | b | 1.29 | b | ||||||||||
| (0.03 | ) | — | (0.03 | ) | 10.55 | 4.11 | 13 | 1.14 | b | 0.72 | b | ||||||||||
| — | — | — | 10.15 | 1.50 | 6,665 | 1.08 | b | 1.45 | b | ||||||||||||
| — | — | — | 10.15 | 1.50 | 340 | 1.82 | b | 0.84 | b | ||||||||||||
| — | — | — | 10.15 | 1.50 | 268 | 1.83 | b | 0.70 | b | ||||||||||||
| — | — | — | 10.16 | 1.60 | 53,396 | 0.66 | b | 1.97 | b | ||||||||||||
| — | — | — | 10.16 | 1.60 | 2 | 1.16 | b | 2.17 | b | ||||||||||||
| CORE LARGE CAP VALUE FUND (continued)
|
|
Ratios assuming no expense reductions |
||||||||||
|---|---|---|---|---|---|---|---|---|---|---|
| Ratio of
expenses to average net assets |
Ratio of
net investment income (loss) to average net assets |
Portfolio
turnover rate |
||||||||
| For the Year Ended August 31, | ||||||||||
| 2000 - Class A Shares | 1.17 | % | 1.03 | % | 83.30 | % | ||||
| 2000 - Class B Shares | 1.92 | 0.33 | 83.30 | |||||||
| 2000 - Class C Shares | 1.92 | 0.34 | 83.30 | |||||||
| 2000 - Institutional Shares | 0.77 | 1.43 | 83.30 | |||||||
| 2000 - Service Shares | 1.27 | 0.96 | 83.30 | |||||||
| For the Seven-Month Period Ended August 31, | ||||||||||
| 1999 - Class A Shares | 1.21 | b | 0.70 | b | 36.10 | |||||
| 1999 - Class B Shares | 1.96 | b | (0.12 | ) b | 36.10 | |||||
| 1999 - Class C Shares | 1.96 | b | (0.08 | ) b | 36.10 | |||||
| 1999 - Institutional Shares | 0.81 | b | 1.12 | b | 36.10 | |||||
| 1999 - Service Shares | 1.31 | b | 0.55 | b | 36.10 | |||||
| For the Period Ended January 31, | ||||||||||
| 1999 - Class A Shares (commenced December 31, 1998) | 8.03 | b | (5.50 | ) b | 0.00 | |||||
| 1999 - Class B Shares (commenced December 31, 1998) | 8.77 | b | (6.11 | ) b | 0.00 | |||||
| 1999 - Class C Shares (commenced December 31, 1998) | 8.78 | b | (6.25 | ) b | 0.00 | |||||
| 1999 - Institutional Shares (commenced December 31, 1998) | 7.61 | b | (4.98 | ) b | 0.00 | |||||
| 1999 - Service Shares (commenced December 31, 1998) | 8.11 | b | (4.78 | ) b | 0.00 | |||||
| CORE U.S. EQUITY FUND
|
|
Income from investment operations |
||||||||||
|---|---|---|---|---|---|---|---|---|---|---|
|
Net asset value, beginning of period |
Net
investment income (loss) |
Net realized
and unrealized gain |
Total from
investment operations |
|||||||
| For The Year Ended August 31, | ||||||||||
| 2000 - Class A Shares | $34.21 | $ 0.10 | c | $6.00 | $6.10 | |||||
| 2000 - Class B Shares | 33.56 | (0.14 | ) c | 5.83 | 5.69 | |||||
| 2000 - Class C Shares | 33.46 | (0.13 | ) c | 5.80 | 5.67 | |||||
| 2000 - Institutional Shares | 34.61 | 0.24 | c | 6.07 | 6.31 | |||||
| 2000 - Service Shares | 34.05 | 0.07 | c | 5.96 | 6.03 | |||||
| For The Seven-Month Period Ended August 31, | ||||||||||
| 1999 - Class A Shares | 32.98 | 0.03 | 1.20 | 1.23 | ||||||
| 1999 - Class B Shares | 32.50 | (0.11 | ) | 1.17 | 1.06 | |||||
| 1999 - Class C Shares | 32.40 | (0.10 | ) | 1.16 | 1.06 | |||||
| 1999 - Institutional Shares | 33.29 | 0.11 | 1.21 | 1.32 | ||||||
| 1999 - Service Shares | 32.85 | 0.01 | 1.19 | 1.20 | ||||||
| For The Years Ended January 31, | ||||||||||
| 1999 - Class A Shares | 26.59 | 0.04 | 7.02 | 7.06 | ||||||
| 1999 - Class B Shares | 26.32 | (0.10 | ) | 6.91 | 6.81 | |||||
| 1999 - Class C Shares | 26.24 | (0.10 | ) | 6.89 | 6.79 | |||||
| 1999 - Institutional Shares | 26.79 | 0.20 | 7.11 | 7.31 | ||||||
| 1999 - Service Shares | 26.53 | 0.06 | 7.01 | 7.07 | ||||||
| 1998 - Class A Shares | 23.32 | 0.11 | 5.63 | 5.74 | ||||||
| 1998 - Class B Shares | 23.18 | 0.11 | 5.44 | 5.55 | ||||||
| 1998 - Class C Shares (commenced August 15, 1997) | 27.48 | 0.03 | 1.22 | 1.25 | ||||||
| 1998 - Institutional Shares | 23.44 | 0.30 | 5.65 | 5.95 | ||||||
| 1998 - Service Shares | 23.27 | 0.19 | 5.57 | 5.76 | ||||||
| 1997 - Class A Shares | 19.66 | 0.16 | 4.46 | 4.62 | ||||||
| 1997 - Class B Shares (commenced May 1, 1996) | 20.44 | 0.04 | 3.70 | 3.74 | ||||||
| 1997 - Institutional Shares | 19.71 | 0.30 | 4.51 | 4.81 | ||||||
| 1997 - Service Shares (commenced June 7, 1996) | 21.02 | 0.13 | 3.15 | 3.28 | ||||||
| 1996 - Class A Shares | 14.61 | 0.19 | 5.43 | 5.62 | ||||||
| 1996 - Institutional Shares (commenced June 15, 1995) | 16.97 | 0.16 | 3.23 | 3.39 | ||||||
|
Distributions to shareholders |
||||||||||||||||||||||||
|---|---|---|---|---|---|---|---|---|---|---|---|---|---|---|---|---|---|---|---|---|---|---|---|---|
| From net
investment income |
In excess
of net investment income |
From net
realized gains |
Total
distributions |
Net asset
value, end of period |
Total
returna |
Net assets
at end of period (in 000s) |
Ratio of
net expenses to average net assets |
Ratio of
net investment income (loss) to average net assets |
||||||||||||||||
| $ — | $ — | $(3.54 | ) | $(3.54 | ) | $36.77 | 18.96 | % | $715,775 | 1.14 | % | 0.31 | % | |||||||||||
| — | — | (3.54 | ) | (3.54 | ) | 35.71 | 18.03 | 275,673 | 1.89 | (0.44 | ) | |||||||||||||
| — | — | (3.54 | ) | (3.54 | ) | 35.59 | 18.03 | 62,820 | 1.89 | (0.43 | ) | |||||||||||||
| (0.08 | ) | — | (3.54 | ) | (3.62 | ) | 37.30 | 19.41 | 379,172 | 0.74 | 0.71 | |||||||||||||
| — | — | (3.54 | ) | (3.54 | ) | 36.54 | 18.83 | 11,879 | 1.24 | 0.19 | ||||||||||||||
| — | — | — | — | 34.21 | 3.73 | 614,310 | 1.14 | b | 0.15 | b | ||||||||||||||
| — | — | — | — | 33.56 | 3.26 | 214,087 | 1.89 | b | (0.60 | ) b | ||||||||||||||
| — | — | — | — | 33.46 | 3.27 | 43,361 | 1.89 | b | (0.61 | ) b | ||||||||||||||
| — | — | — | — | 34.61 | 3.97 | 335,465 | 0.74 | b | 0.54 | b | ||||||||||||||
| — | — | — | — | 34.05 | 3.65 | 11,204 | 1.24 | b | 0.06 | b | ||||||||||||||
| (0.03 | ) | (0.01 | ) | (0.63 | ) | (0.67 | ) | 32.98 | 26.89 | 605,566 | 1.23 | 0.15 | ||||||||||||
| — | — | (0.63 | ) | (0.63 | ) | 32.50 | 26.19 | 152,347 | 1.85 | (0.50 | ) | |||||||||||||
| — | — | (0.63 | ) | (0.63 | ) | 32.40 | 26.19 | 26,912 | 1.87 | (0.53 | ) | |||||||||||||
| (0.15 | ) | (0.03 | ) | (0.63 | ) | (0.81 | ) | 33.29 | 27.65 | 307,200 | 0.69 | 0.69 | ||||||||||||
| (0.10 | ) | (0.02 | ) | (0.63 | ) | (0.75 | ) | 32.85 | 27.00 | 11,600 | 1.19 | 0.19 | ||||||||||||
| (0.12 | ) | — | (2.35 | ) | (2.47 | ) | 26.59 | 24.96 | 398,393 | 1.28 | 0.51 | |||||||||||||
| — | (0.06 | ) | (2.35 | ) | (2.41 | ) | 26.32 | 24.28 | 59,208 | 1.79 | (0.05 | ) | ||||||||||||
| — | (0.14 | ) | (2.35 | ) | (2.49 | ) | 26.24 | 4.85 | 6,267 | 1.78 | b | (0.21 | ) b | |||||||||||
| (0.24 | ) | (0.01 | ) | (2.35 | ) | (2.60 | ) | 26.79 | 25.76 | 202,893 | 0.65 | 1.16 | ||||||||||||
| (0.07 | ) | (0.08 | ) | (2.35 | ) | (2.50 | ) | 26.53 | 25.11 | 7,841 | 1.15 | 0.62 | ||||||||||||
| (0.16 | ) | — | (0.80 | ) | (0.96 | ) | 23.32 | 23.75 | 225,968 | 1.29 | 0.91 | |||||||||||||
| (0.04 | ) | (0.16 | ) | (0.80 | ) | (1.00 | ) | 23.18 | 18.59 | 17,258 | 1.83 | b | 0.06 | b | ||||||||||
| (0.28 | ) | — | (0.80 | ) | (1.08 | ) | 23.44 | 24.63 | 148,942 | 0.65 | 1.52 | |||||||||||||
| (0.13 | ) | (0.10 | ) | (0.80 | ) | (1.03 | ) | 23.27 | 15.92 | 3,666 | 1.15 | b | 0.69 | b | ||||||||||
| (0.16 | ) | — | (0.41 | ) | (0.57 | ) | 19.66 | 38.63 | 129,045 | 1.25 | 1.01 | |||||||||||||
| (0.24 | ) | — | (0.41 | ) | (0.65 | ) | 19.71 | 20.14 | 64,829 | 0.65 | b | 1.49 | b | |||||||||||
| CORE U.S. EQUITY FUND (continued)
|
|
Ratios assuming no expense reductions |
||||||||||
|---|---|---|---|---|---|---|---|---|---|---|
| Ratio of
expenses to average net assets |
Ratio of
net investment income (loss) to average net assets |
Portfolio
turnover rate |
||||||||
| For The Year Ended August 31, | ||||||||||
| 2000 - Class A Shares | 1.23 | % | 0.22 | % | 59.27 | % | ||||
| 2000 - Class B Shares | 1.98 | (0.53 | ) | 59.27 | ||||||
| 2000 - Class C Shares | 1.98 | (0.52 | ) | 59.27 | ||||||
| 2000 - Institutional Shares | 0.83 | 0.62 | 59.27 | |||||||
| 2000 - Service Shares | 1.33 | 0.10 | 59.27 | |||||||
| For The Seven-Month Period Ended August 31, | ||||||||||
| 1999 - Class A Shares | 1.24 | b | 0.05 | b | 41.84 | |||||
| 1999 - Class B Shares | 1.99 | b | (0.70 | ) b | 41.84 | |||||
| 1999 - Class C Shares | 1.99 | b | (0.71 | ) b | 41.84 | |||||
| 1999 - Institutional Shares | 0.84 | b | 0.44 | b | 41.84 | |||||
| 1999 - Service Shares | 1.34 | b | (0.04 | ) b | 41.84 | |||||
| For The Years Ended January 31, | ||||||||||
| 1999 - Class A Shares | 1.36 | 0.02 | 63.79 | |||||||
| 1999 - Class B Shares | 1.98 | (0.63 | ) | 63.79 | ||||||
| 1999 - Class C Shares | 2.00 | (0.66 | ) | 63.79 | ||||||
| 1999 - Institutional Shares | 0.82 | 0.56 | 63.79 | |||||||
| 1999 - Service Shares | 1.32 | 0.06 | 63.79 | |||||||
| 1998 - Class A Shares | 1.47 | 0.32 | 65.89 | |||||||
| 1998 - Class B Shares | 1.96 | (0.22 | ) | 65.89 | ||||||
| 1998 - Class C Shares (commenced August 15, 1997) | 1.95 | b | (0.38 | ) b | 65.89 | |||||
| 1998 - Institutional Shares | 0.82 | 0.99 | 65.89 | |||||||
| 1998 - Service Shares | 1.32 | 0.45 | 65.89 | |||||||
| 1997 - Class A Shares | 1.53 | 0.67 | 37.28 | |||||||
| 1997 - Class B Shares (commenced May 1, 1996) | 2.00 | b | (0.11 | ) b | 37.28 | |||||
| 1997 - Institutional Shares | 0.85 | 1.32 | 37.28 | |||||||
| 1997 - Service Shares (commenced June 7, 1996) | 1.35 | b | 0.49 | b | 37.28 | |||||
| 1996 - Class A Shares | 1.55 | 0.71 | 39.35 | |||||||
| 1996 - Institutional Shares (commenced June 15, 1995) | 0.96 | b | 1.18 | b | 39.35 | |||||
| CORE LARGE CAP GROWTH FUND
|
|
Income from investment operations |
||||||||||
|---|---|---|---|---|---|---|---|---|---|---|
|
Net asset value, beginning of period |
Net
investment income (loss) |
Net realized
and unrealized gain |
Total from
investment operations |
|||||||
| For the Year Ended August 31, | ||||||||||
| 2000 - Class A Shares | $17.02 | $ 0.06 | c | $5.67 | $5.73 | |||||
| 2000 - Class B Shares | 16.75 | (0.09 | ) c | 5.57 | 5.48 | |||||
| 2000 - Class C Shares | 16.75 | (0.08 | ) c | 5.57 | 5.49 | |||||
| 2000 - Institutional Shares | 17.10 | 0.13 | c | 5.73 | 5.86 | |||||
| 2000 - Service Shares | 16.95 | 0.03 | c | 5.66 | 5.69 | |||||
| For the Seven-Month Period Ended August 31, | ||||||||||
| 1999 - Class A Shares | 16.17 | (0.01 | ) | 0.86 | 0.85 | |||||
| 1999 - Class B Shares | 15.98 | (0.07 | ) | 0.84 | 0.77 | |||||
| 1999 - Class C Shares | 15.99 | (0.07 | ) | 0.83 | 0.76 | |||||
| 1999 - Institutional Shares | 16.21 | 0.03 | 0.86 | 0.89 | ||||||
| 1999 - Service Shares | 16.11 | (0.02 | ) | 0.86 | 0.84 | |||||
| For the Year Ended January 31, | ||||||||||
| 1999 - Class A Shares | 11.97 | 0.01 | 4.19 | 4.20 | ||||||
| 1999 - Class B Shares | 11.92 | (0.06 | ) | 4.12 | 4.06 | |||||
| 1999 - Class C Shares | 11.93 | (0.05 | ) | 4.11 | 4.06 | |||||
| 1999 - Institutional Shares | 11.97 | 0.02 | 4.23 | 4.25 | ||||||
| 1999 - Service Shares | 11.95 | (0.01 | ) | 4.17 | 4.16 | |||||
| For the Period Ended January 31, | ||||||||||
| 1998 - Class A Shares (commenced May 1, 1997) | 10.00 | 0.01 | 2.35 | 2.36 | ||||||
| 1998 - Class B Shares (commenced May 1, 1997) | 10.00 | (0.03 | ) | 2.33 | 2.30 | |||||
| 1998 - Class C Shares (commenced August 15, 1997) | 11.80 | (0.02 | ) | 0.54 | 0.52 | |||||
| 1998 - Institutional Shares (commenced May 1, 1997) | 10.00 | 0.01 | 2.35 | 2.36 | ||||||
| 1998 - Service Shares (commenced May 1, 1997) | 10.00 | (0.02 | ) | 2.35 | 2.33 | |||||
|
Distributions to Shareholders |
|||||||||||||||||||||
|---|---|---|---|---|---|---|---|---|---|---|---|---|---|---|---|---|---|---|---|---|---|
|
From Net Investment Income |
In excess
of net investment income |
From net
realized gains |
Total
distributions |
Net asset
value, end of period |
Total
returna |
Net assets
at end of period (in 000s) |
Ratio of
net expenses to average net assets |
||||||||||||||
| $ — | $ — | $(0.09 | ) | $(0.09 | ) | $22.66 | 33.73 | % | $545,763 | 1.09 | % | ||||||||||
| — | — | (0.09 | ) | (0.09 | ) | 22.14 | 32.78 | 338,128 | 1.84 | ||||||||||||
| — | — | (0.09 | ) | (0.09 | ) | 22.15 | 32.84 | 154,966 | 1.84 | ||||||||||||
| — | — | (0.09 | ) | (0.09 | ) | 22.87 | 34.34 | 322,900 | 0.69 | ||||||||||||
| — | — | (0.09 | ) | (0.09 | ) | 22.55 | 33.64 | 3,879 | 1.19 | ||||||||||||
| — | — | — | — | 17.02 | 5.26 | 300,684 | 1.04 | b | |||||||||||||
| — | — | — | — | 16.75 | 4.82 | 181,626 | 1.79 | b | |||||||||||||
| — | — | — | — | 16.75 | 4.75 | 75,502 | 1.79 | b | |||||||||||||
| — | — | — | — | 17.10 | 5.49 | 310,704 | 0.64 | b | |||||||||||||
| — | — | — | — | 16.95 | 5.21 | 2,510 | 1.14 | b | |||||||||||||
| — | — | — | — | 16.17 | 35.10 | 175,510 | 0.97 | ||||||||||||||
| — | — | — | — | 15.98 | 34.07 | 93,711 | 1.74 | ||||||||||||||
| — | — | — | — | 15.99 | 34.04 | 37,081 | 1.74 | ||||||||||||||
| — | (0.01 | ) | — | (0.01 | ) | 16.21 | 35.54 | 295,734 | 0.65 | ||||||||||||
| — | — | — | — | 16.11 | 34.85 | 1,663 | 1.15 | ||||||||||||||
| (0.01 | ) | — | (0.38 | ) | (0.39 | ) | 11.97 | 23.79 | 53,786 | 0.91 | b | ||||||||||
| — | — | (0.38 | ) | (0.38 | ) | 11.92 | 23.26 | 13,857 | 1.67 | b | |||||||||||
| — | (0.01 | ) | (0.38 | ) | (0.39 | ) | 11.93 | 4.56 | 4,132 | 1.68 | b | ||||||||||
| (0.01 | ) | — | (0.38 | ) | (0.39 | ) | 11.97 | 23.89 | 4,656 | 0.72 | b | ||||||||||
| — | — | (0.38 | ) | (0.38 | ) | 11.95 | 23.56 | 115 | 1.17 | b | |||||||||||
| CORE LARGE CAP GROWTH FUND (continued)
|
|
Ratios assuming no expense reductions |
|||||||||||||
|---|---|---|---|---|---|---|---|---|---|---|---|---|---|
| Ratio of
net investment income (loss) to average net assets |
Ratio of
expenses to average net assets |
Ratio of net
investment income (loss) to average net assets |
Portfolio
turnover rate |
||||||||||
| For the Year Ended August 31, | |||||||||||||
| 2000 - Class A Shares | 0.31 | % | 1.24 | % | 0.16 | % | 72.59 | % | |||||
| 2000 - Class B Shares | (0.44 | ) | 1.99 | (0.59 | ) | 72.59 | |||||||
| 2000 - Class C Shares | (0.43 | ) | 1.99 | (0.58 | ) | 72.59 | |||||||
| 2000 - Institutional Shares | 0.65 | 0.84 | 0.50 | 72.59 | |||||||||
| 2000 - Service Shares | 0.15 | 1.34 | — | 72.59 | |||||||||
| For the Seven-Month Period Ended August 31, | |||||||||||||
| 1999 - Class A Shares | (0.11 | ) b | 1.26 | b | (0.33 | ) b | 32.74 | ||||||
| 1999 - Class B Shares | (0.87 | ) b | 2.01 | b | (1.09 | ) b | 32.74 | ||||||
| 1999 - Class C Shares | (0.87 | ) b | 2.01 | b | (1.09 | ) b | 32.74 | ||||||
| 1999 - Institutional Shares | 0.31 | b | 0.86 | b | 0.09 | b | 32.74 | ||||||
| 1999 - Service Shares | (0.21 | ) b | 1.36 | b | (0.43 | ) b | 32.74 | ||||||
| For the Year Ended January 31, | |||||||||||||
| 1999 - Class A Shares | 0.05 | 1.46 | (0.44 | ) | 63.15 | ||||||||
| 1999 - Class B Shares | (0.73 | ) | 2.11 | (1.10 | ) | 63.15 | |||||||
| 1999 - Class C Shares | (0.74 | ) | 2.11 | (1.11 | ) | 63.15 | |||||||
| 1999 - Institutional Shares | 0.35 | 1.02 | (0.02 | ) | 63.15 | ||||||||
| 1999 - Service Shares | (0.16 | ) | 1.52 | (0.53 | ) | 63.15 | |||||||
| For the Period Ended January 31, | |||||||||||||
| 1998 - Class A Shares (commenced May 1, 1997) | 0.12 | b | 2.40 | b | (1.37 | ) b | 74.97 | ||||||
| 1998 - Class B Shares (commenced May 1, 1997) | (0.72 | ) b | 2.91 | b | (1.96 | ) b | 74.97 | ||||||
| 1998 - Class C Shares (commenced August 15, 1997) | (0.76 | ) b | 2.92 | b | (2.00 | ) b | 74.97 | ||||||
| 1998 - Institutional Shares (commenced May 1, 1997) | 0.42 | b | 1.96 | b | (0.82 | ) b | 74.97 | ||||||
| 1998 - Service Shares (commenced May 1, 1997) | (0.21 | ) b | 2.41 | b | (1.45 | ) b | 74.97 | ||||||
| CORE SMALL CAP EQUITY FUND
|
|
Income from investment operations |
||||||||||||
|---|---|---|---|---|---|---|---|---|---|---|---|---|
|
Net asset value, beginning of period |
Net
investment income (loss) |
Net
realized and unrealized gain (loss) |
Total from
investment operations |
|||||||||
| For the Year Ended August 31, | ||||||||||||
| 2000 - Class A Shares | $10.23 | $(0.03 | ) c | $2.70 | $2.67 | |||||||
| 2000 - Class B Shares | 10.09 | (0.11 | ) c | 2.65 | 2.54 | |||||||
| 2000 - Class C Shares | 10.10 | (0.10 | ) c | 2.66 | 2.56 | |||||||
| 2000 - Institutional Shares | 10.30 | 0.02 | c | 2.71 | 2.73 | |||||||
| 2000 - Service Shares | 10.22 | (0.04 | ) c | 2.69 | 2.65 | |||||||
| For the Seven-Month Period Ended August 31, | ||||||||||||
| 1999 - Class A Shares | 10.16 | (0.01 | ) | 0.08 | 0.07 | |||||||
| 1999 - Class B Shares | 10.07 | (0.05 | ) | 0.07 | 0.02 | |||||||
| 1999 - Class C Shares | 10.08 | (0.05 | ) | 0.07 | 0.02 | |||||||
| 1999 - Institutional Shares | 10.20 | 0.02 | 0.08 | 0.10 | ||||||||
| 1999 - Service Shares | 10.16 | (0.01 | ) | 0.07 | 0.06 | |||||||
| For the Year Ended January 31, | ||||||||||||
| 1999 - Class A Shares | 10.59 | 0.01 | (0.43 | ) | (0.42 | ) | ||||||
| 1999 - Class B Shares | 10.56 | (0.05 | ) | (0.44 | ) | (0.49 | ) | |||||
| 1999 - Class C Shares | 10.57 | (0.04 | ) | (0.45 | ) | (0.49 | ) | |||||
| 1999 - Institutional Shares | 10.61 | 0.04 | (0.43 | ) | (0.39 | ) | ||||||
| 1999 - Service Shares | 10.60 | 0.01 | (0.44 | ) | (0.43 | ) | ||||||
| For the Period Ended January 31, | ||||||||||||
| 1998 - Class A Shares (commenced August 15, 1997) | 10.00 | (0.01 | ) | 0.65 | 0.64 | |||||||
| 1998 - Class B Shares (commenced August 15, 1997) | 10.00 | (0.03 | ) | 0.64 | 0.61 | |||||||
| 1998 - Class C Shares (commenced August 15, 1997) | 10.00 | (0.02 | ) | 0.64 | 0.62 | |||||||
| 1998 - Institutional Shares (commenced August 15, 1997) | 10.00 | 0.01 | 0.65 | 0.66 | ||||||||
| 1998 - Service Shares (commenced August 15, 1997) | 10.00 | 0.01 | 0.64 | 0.65 | ||||||||
|
Distributions to Shareholders |
||||||||||||||||||
|---|---|---|---|---|---|---|---|---|---|---|---|---|---|---|---|---|---|---|
|
From net investment income |
From net realized gains |
Total
distributions |
Net asset
value, end of period |
Total
returna |
Net assets
at end of period (in 000s) |
Ratio of
net expenses to average net assets |
||||||||||||
| $ — | $ — | $ — | $12.90 | 26.10 | % | $54,954 | 1.33 | % | ||||||||||
| — | — | — | 12.63 | 25.17 | 17,923 | 2.08 | ||||||||||||
| — | — | — | 12.66 | 25.35 | 8,289 | 2.08 | ||||||||||||
| — | — | — | 13.03 | 26.60 | 86,196 | 0.93 | ||||||||||||
| — | — | — | 12.87 | 25.93 | 63 | 1.43 | ||||||||||||
| — | — | — | 10.23 | 0.69 | 52,660 | 1.33 | b | |||||||||||
| — | — | — | 10.09 | 0.20 | 13,711 | 2.08 | b | |||||||||||
| — | — | — | 10.10 | 0.20 | 6,274 | 2.08 | b | |||||||||||
| — | — | — | 10.30 | 0.98 | 62,633 | 0.93 | b | |||||||||||
| — | — | — | 10.22 | 0.59 | 64 | 1.43 | b | |||||||||||
| (0.01 | ) | — | (0.01 | ) | 10.16 | (3.97 | ) | 64,087 | 1.31 | |||||||||
| — | — | — | 10.07 | (4.64 | ) | 15,406 | 2.00 | |||||||||||
| — | — | — | 10.08 | (4.64 | ) | 6,559 | 2.01 | |||||||||||
| (0.02 | ) | — | (0.02 | ) | 10.20 | (3.64 | ) | 62,763 | 0.94 | |||||||||
| (0.01 | ) | — | (0.01 | ) | 10.16 | (4.07 | ) | 54 | 1.44 | |||||||||
| — | (0.05 | ) | (0.05 | ) | 10.59 | 6.37 | 11,118 | 1.25 | b | |||||||||
| — | (0.05 | ) | (0.05 | ) | 10.56 | 6.07 | 9,957 | 1.95 | b | |||||||||
| — | (0.05 | ) | (0.05 | ) | 10.57 | 6.17 | 2,557 | 1.95 | b | |||||||||
| — | (0.05 | ) | (0.05 | ) | 10.61 | 6.57 | 9,026 | 0.95 | b | |||||||||
| — | (0.05 | ) | (0.05 | ) | 10.60 | 6.47 | 2 | 1.45 | b | |||||||||
| CORE SMALL CAP EQUITY FUND (continued)
|
|
Ratios assuming no expense reductions |
|||||||||||||
|---|---|---|---|---|---|---|---|---|---|---|---|---|---|
| Ratio of net
investment income (loss) to average net assets |
Ratio of
expenses to average net assets |
Ratio of net
investment loss to average net assets |
Portfolio
turnover rate |
||||||||||
| For the Year Ended August 31, | |||||||||||||
| 2000 - Class A Shares | (0.21 | )% | 1.55 | % | (0.43 | ) | 135.36 | % | |||||
| 2000 - Class B Shares | (0.96 | ) | 2.30 | (1.18 | ) | 135.36 | |||||||
| 2000 - Class C Shares | (0.96 | ) | 2.30 | (1.18 | ) | 135.36 | |||||||
| 2000 - Institutional Shares | 0.19 | 1.15 | (0.03 | ) | 135.36 | ||||||||
| 2000 - Service Shares | (0.30 | ) | 1.65 | (0.52 | ) | 135.36 | |||||||
| For the Seven-Month Period Ended August 31, | |||||||||||||
| 1999 - Class A Shares | (0.12 | ) b | 1.67 | b | (0.46 | ) b | 52.03 | ||||||
| 1999 - Class B Shares | (0.86 | ) b | 2.42 | b | (1.20 | ) b | 52.03 | ||||||
| 1999 - Class C Shares | (0.86 | ) b | 2.42 | b | (1.20 | ) b | 52.03 | ||||||
| 1999 - Institutional Shares | 0.28 | b | 1.27 | b | (0.06 | ) b | 52.03 | ||||||
| 1999 - Service Shares | (0.22 | ) b | 1.77 | b | (0.56 | ) b | 52.03 | ||||||
| For the Year Ended January 31, | |||||||||||||
| 1999 - Class A Shares | 0.08 | 2.00 | (0.61 | ) | 75.38 | ||||||||
| 1999 - Class B Shares | (0.55 | ) | 2.62 | (1.17 | ) | 75.38 | |||||||
| 1999 - Class C Shares | (0.56 | ) | 2.63 | (1.18 | ) | 75.38 | |||||||
| 1999 - Institutional Shares | 0.60 | 1.56 | (0.02 | ) | 75.38 | ||||||||
| 1999 - Service Shares | 0.01 | 2.06 | (0.61 | ) | 75.38 | ||||||||
| For the Period Ended January 31, | |||||||||||||
| 1998 - Class A Shares (commenced August 15, 1997) | (0.36 | ) b | 3.92 | b | (3.03 | ) b | 37.65 | ||||||
| 1998 - Class B Shares (commenced August 15, 1997) | (1.04 | ) b | 4.37 | b | (3.46 | ) b | 37.65 | ||||||
| 1998 - Class C Shares (commenced August 15, 1997) | (1.07 | ) b | 4.37 | b | (3.49 | ) b | 37.65 | ||||||
| 1998 - Institutional Shares (commenced August 15, 1997) | 0.15 | b | 3.37 | b | (2.27 | ) b | 37.65 | ||||||
| 1998 - Service Shares (commenced August 15, 1997) | 0.40 | b | 3.87 | b | (2.02 | ) b | 37.65 | ||||||
| CAPITAL GROWTH FUND
|
|
Income from investment operations |
||||||||||
|---|---|---|---|---|---|---|---|---|---|---|
|
Net asset value, beginning of period |
Net
investment income (loss) |
Net realized
and unrealized gains |
Total
income from investment operations |
|||||||
| For the Year Ended August 31, | ||||||||||
| 2000 - Class A Shares | $24.96 | $(0.11 | ) c | $6.29 | $6.18 | |||||
| 2000 - Class B Shares | 24.37 | (0.30 | ) c | 6.11 | 5.81 | |||||
| 2000 - Class C Shares | 24.33 | (0.30 | ) c | 6.10 | 5.80 | |||||
| 2000 - Institutional Shares | 25.06 | — | 6.32 | 6.32 | ||||||
| 2000 - Service Shares | 24.88 | (0.13 | ) c | 6.25 | 6.12 | |||||
| For the Seven Months Ended August 31, | ||||||||||
| 1999 - Class A Shares | 24.03 | (0.08 | ) | 1.01 | 0.93 | |||||
| 1999 - Class B Shares | 23.57 | (0.17 | ) | 0.97 | 0.80 | |||||
| 1999 - Class C Shares | 23.52 | (0.16 | ) | 0.97 | 0.81 | |||||
| 1999 - Institutional Shares | 24.07 | (0.02 | ) | 1.01 | 0.99 | |||||
| 1999 - Service Shares | 23.96 | (0.08 | ) | 1.00 | 0.92 | |||||
| For the Years Ended January 31, | ||||||||||
| 1999 - Class A Shares | 18.48 | (0.03 | ) | 6.35 | 6.32 | |||||
| 1999 - Class B Shares | 18.27 | (0.12 | ) | 6.19 | 6.07 | |||||
| 1999 - Class C Shares | 18.24 | (0.10 | ) | 6.15 | 6.05 | |||||
| 1999 - Institutional Shares | 18.45 | 0.01 | 6.38 | 6.39 | ||||||
| 1999 - Service Shares | 18.46 | (0.04 | ) | 6.31 | 6.27 | |||||
| 1998 - Class A Shares | 16.73 | 0.02 | 4.78 | 4.80 | ||||||
| 1998 - Class B Shares | 16.67 | 0.02 | 4.61 | 4.63 | ||||||
| 1998 - Class C Shares (commenced August 15, 1997) | 19.73 | (0.02 | ) | 1.60 | 1.58 | |||||
| 1998 - Institutional Shares (commenced August 15, 1997) | 19.88 | 0.02 | 1.66 | 1.68 | ||||||
| 1998 - Service Shares (commenced August 15, 1997) | 19.88 | (0.01 | ) | 1.66 | 1.65 | |||||
| 1997 - Class A Shares | 14.91 | 0.10 | 3.56 | 3.66 | ||||||
| 1997 - Class B Shares (commenced May 1, 1996) | 15.67 | 0.01 | 2.81 | 2.82 | ||||||
| 1996 - Class A Shares | 13.67 | 0.12 | 3.93 | 4.05 | ||||||
|
Distributions to shareholders |
|||||||||||||||||||||
|---|---|---|---|---|---|---|---|---|---|---|---|---|---|---|---|---|---|---|---|---|---|
| From net
investment income |
In excess of net investment income |
From net
realized gain |
Total
distributions |
Net asset
value, end of period |
Total
returna |
Net assets
at end of period (in 000s) |
Ratio of
net expenses to average net assets |
||||||||||||||
| $ — | $ — | $(2.19 | ) | $(2.19 | ) | $28.95 | 25.70 | % | $2,736,484 | 1.45 | % | ||||||||||
| — | — | (2.19 | ) | (2.19 | ) | 27.99 | 24.75 | 451,666 | 2.20 | ||||||||||||
| — | — | (2.19 | ) | (2.19 | ) | 27.94 | 24.75 | 143,126 | 2.20 | ||||||||||||
| — | — | (2.19 | ) | (2.19 | ) | 29.19 | 26.18 | 497,986 | 1.05 | ||||||||||||
| — | — | (2.19 | ) | (2.19 | ) | 28.81 | 25.53 | 13,668 | 1.55 | ||||||||||||
| — | — | — | — | 24.96 | 3.87 | 1,971,097 | 1.44 | b | |||||||||||||
| — | — | — | — | 24.37 | 3.39 | 329,870 | 2.19 | b | |||||||||||||
| — | — | — | — | 24.33 | 3.44 | 87,284 | 2.19 | b | |||||||||||||
| — | — | — | — | 25.06 | 4.11 | 255,210 | 1.04 | b | |||||||||||||
| — | — | — | — | 24.88 | 3.84 | 6,466 | 1.54 | b | |||||||||||||
| — | — | (0.77 | ) | (0.77 | ) | 24.03 | 34.58 | 1,992,716 | 1.42 | ||||||||||||
| — | — | (0.77 | ) | (0.77 | ) | 23.57 | 33.60 | 236,369 | 2.19 | ||||||||||||
| — | — | (0.77 | ) | (0.77 | ) | 23.52 | 33.55 | 60,234 | 2.19 | ||||||||||||
| — | — | (0.77 | ) | (0.77 | ) | 24.07 | 35.02 | 41,817 | 1.07 | ||||||||||||
| — | — | (0.77 | ) | (0.77 | ) | 23.96 | 34.34 | 3,085 | 1.57 | ||||||||||||
| (0.01 | ) | (0.01 | ) | (3.03 | ) | (3.05 | ) | 18.48 | 29.71 | 1,256,595 | 1.40 | ||||||||||
| — | — | (3.03 | ) | (3.03 | ) | 18.27 | 28.73 | 40,827 | 2.18 | ||||||||||||
| — | (0.04 | ) | (3.03 | ) | (3.07 | ) | 18.24 | 8.83 | 5,395 | 2.21 | b | ||||||||||
| (0.01 | ) | (0.07 | ) | (3.03 | ) | (3.11 | ) | 18.45 | 9.31 | 7,262 | 1.16 | b | |||||||||
| — | (0.04 | ) | (3.03 | ) | (3.07 | ) | 18.46 | 9.18 | 2 | 1.50 | b | ||||||||||
| (0.10 | ) | (0.02 | ) | (1.72 | ) | (1.84 | ) | 16.73 | 25.97 | 920,646 | 1.40 | ||||||||||
| (0.01 | ) | (0.09 | ) | (1.72 | ) | (1.82 | ) | 16.67 | 19.39 | 3,221 | 2.15 | b | |||||||||
| (0.12 | ) | — | (2.69 | ) | (2.81 | ) | 14.91 | 30.45 | 881,056 | 1.36 | |||||||||||
| CAPITAL GROWTH FUND (continued)
|
|
Ratios assuming no expense reductions |
|||||||||||||
|---|---|---|---|---|---|---|---|---|---|---|---|---|---|
| Ratio of
net investment income (loss) to average net assets |
Ratio of
expenses to average net assets |
Ratio of
net investment income (loss) to average net assets |
Portfolio
turnover rate |
||||||||||
| For the Year Ended August 31, | |||||||||||||
| 2000 - Class A Shares | (0.41 | )% | 1.47 | % | (0.44 | )% | 34.03 | % | |||||
| 2000 - Class B Shares | (1.16 | ) | 2.22 | (1.19 | ) | 34.03 | |||||||
| 2000 - Class C Shares | (1.16 | ) | 2.22 | (1.19 | ) | 34.03 | |||||||
| 2000 - Institutional Shares | — | 1.07 | (0.03 | ) | 34.03 | ||||||||
| 2000 - Service Shares | (0.49 | ) | 1.57 | (0.52 | ) | 34.03 | |||||||
| For the Seven Months Ended August 31, | |||||||||||||
| 1999 - Class A Shares | (0.53 | ) b | 1.47 | b | (0.56 | ) b | 18.16 | ||||||
| 1999 - Class B Shares | (1.29 | ) b | 2.22 | b | (1.32 | ) b | 18.16 | ||||||
| 1999 - Class C Shares | (1.29 | ) b | 2.22 | b | (1.32 | ) b | 18.16 | ||||||
| 1999 - Institutional Shares | (0.20 | ) b | 1.07 | b | (0.23 | ) b | 18.16 | ||||||
| 1999 - Service Shares | (0.65 | ) b | 1.57 | b | (0.68 | ) b | 18.16 | ||||||
| For the Years Ended January 31, | |||||||||||||
| 1999 - Class A Shares | (0.18 | ) | 1.58 | (0.34 | ) | 30.17 | |||||||
| 1999 - Class B Shares | (0.98 | ) | 2.21 | (1.00 | ) | 30.17 | |||||||
| 1999 - Class C Shares | (1.00 | ) | 2.21 | (1.02 | ) | 30.17 | |||||||
| 1999 - Institutional Shares | 0.11 | 1.09 | 0.09 | 30.17 | |||||||||
| 1999 - Service Shares | (0.37 | ) | 1.59 | (0.39 | ) | 30.17 | |||||||
| 1998 - Class A Shares | 0.08 | 1.65 | (0.17 | ) | 61.50 | ||||||||
| 1998 - Class B Shares | (0.77 | ) | 2.18 | (0.77 | ) | 61.50 | |||||||
| 1998 - Class C Shares (commenced August 15, 1997) | (0.86 | ) b | 2.21 | b | (0.86 | ) b | 61.50 | ||||||
| 1998 - Institutional Shares (commenced August 15, 1997) | 0.18 | b | 1.16 | b | 0.18 | b | 61.50 | ||||||
| 1998 - Service Shares (commenced August 15, 1997) | (0.16 | ) b | 1.50 | b | (0.16 | ) b | 61.50 | ||||||
| 1997 - Class A Shares | 0.62 | 1.65 | 0.37 | 52.92 | |||||||||
| 1997 - Class B Shares (commenced May 1, 1996) | (0.39 | ) b | 2.15 | b | (0.39 | ) b | 52.92 | ||||||
| 1996 - Class A Shares | 0.65 | 1.61 | 0.40 | 63.90 | |||||||||
| STRATEGIC GROWTH FUND
|
|
Income from investment operations |
||||||||||
|---|---|---|---|---|---|---|---|---|---|---|
| Net asset
value, beginning of period |
Net
investment income (loss) |
Net
realized and unrealized gain |
Total
income from investment operations |
|||||||
| For The Year Ended August 31, | ||||||||||
| 2000 - Class A Shares | $10.06 | $(0.06 | ) c | $2.52 | $2.46 | |||||
| 2000 - Class B Shares | 10.04 | (0.14 | ) c | 2.50 | 2.36 | |||||
| 2000 - Class C Shares | 10.05 | (0.14 | ) c | 2.51 | 2.37 | |||||
| 2000 - Institutional Shares | 10.07 | (0.01 | ) c | 2.52 | 2.51 | |||||
| 2000 - Service Shares | 10.06 | (0.04 | ) c | 2.50 | 2.46 | |||||
| For The Period Ended August 31, | ||||||||||
| 1999 - Class A Shares (commenced May 24) | 10.00 | — | 0.06 | 0.06 | ||||||
| 1999 - Class B Shares (commenced May 24) | 10.00 | (0.03 | ) c | 0.07 | 0.04 | |||||
| 1999 - Class C Shares (commenced May 24) | 10.00 | (0.03 | ) c | 0.08 | 0.05 | |||||
| 1999 - Institutional Shares (commenced May 24) | 10.00 | 0.01 | 0.06 | 0.07 | ||||||
| 1999 - Service Shares (commenced May 24) | 10.00 | (0.01 | ) | 0.07 | 0.06 | |||||
|
|
||||||||||||
|---|---|---|---|---|---|---|---|---|---|---|---|---|
| Net asset
value, end of period |
Total
returna |
Net assets
at end of period (in 000s) |
Ratio of
net expenses to average net assets |
Ratio of
net investment income (loss) to average net assets |
||||||||
| $12.52 | 24.46 | % | $92,271 | 1.44 | % | (0.50 | )% | |||||
| 12.40 | 23.51 | 17,149 | 2.19 | (1.24 | ) | |||||||
| 12.42 | 23.58 | 7,287 | 2.19 | (1.24 | ) | |||||||
| 12.58 | 24.93 | 22,910 | 1.04 | (0.09 | ) | |||||||
| 12.52 | 24.45 | 2 | 1.54 | (0.35 | ) | |||||||
| 10.06 | 0.60 | 10,371 | 1.44 | b | (0.17 | ) b | ||||||
| 10.04 | 0.40 | 3,393 | 2.19 | b | (0.97 | ) b | ||||||
| 10.05 | 0.50 | 2,388 | 2.19 | b | (0.99 | ) b | ||||||
| 10.07 | 0.70 | 5,981 | 1.04 | b | 0.24 | b | ||||||
| 10.06 | 0.60 | 2 | 1.54 | b | (0.24 | ) b | ||||||
| STRATEGIC GROWTH FUND (continued)
|
|
Ratios assuming no expense reductions |
||||||||||
|---|---|---|---|---|---|---|---|---|---|---|
|
Ratio of expenses to average net assets |
Ratio of
net investment loss to average net assets |
Portfolio
turnover rate |
||||||||
| For The Year Ended August 31, | ||||||||||
| 2000 - Class A Shares | 1.63 | % | (0.69 | )% | 19.28 | % | ||||
| 2000 - Class B Shares | 2.38 | (1.43 | ) | 19.28 | ||||||
| 2000 - Class C Shares | 2.38 | (1.43 | ) | 19.28 | ||||||
| 2000 - Institutional Shares | 1.23 | (0.28 | ) | 19.28 | ||||||
| 2000 - Service Shares | 1.73 | (0.54 | ) | 19.28 | ||||||
| For The Period Ended August 31, | ||||||||||
| 1999 - Class A Shares (commenced May 24) | 11.70 | b | (10.43 | ) b | 6.98 | |||||
| 1999 - Class B Shares (commenced May 24) | 12.45 | b | (11.23 | ) b | 6.98 | |||||
| 1999 - Class C Shares (commenced May 24) | 12.45 | b | (11.25 | ) b | 6.98 | |||||
| 1999 - Institutional Shares (commenced May 24) | 11.30 | b | (10.02 | ) b | 6.98 | |||||
| 1999 - Service Shares (commenced May 24) | 11.80 | b | (10.50 | ) b | 6.98 | |||||
| GROWTH OPPORTUNITIES FUND
|
|
Income from investment operations |
||||||||
|---|---|---|---|---|---|---|---|---|
|
Net asset value, beginning of period |
Net
investment income (loss) |
Net realized
and unrealized gain |
||||||
| For the Year Ended August 31, | ||||||||
| 2000 - Class A Shares | $10.13 | $(0.11 | ) c | $9.71 | ||||
| 2000 - Class B Shares | 10.18 | (0.24 | ) c | 9.74 | ||||
| 2000 - Class C Shares | 10.10 | (0.24 | ) c | 9.68 | ||||
| 2000 - Institutional Shares | 10.13 | (0.04 | ) c | 9.73 | ||||
| 2000 - Service Shares | 10.12 | (0.12 | ) c | 9.68 | ||||
| For the Period Ended August 31, | ||||||||
| 1999 - Class A Shares (commenced May 24) | 10.00 | (0.01 | ) c | 0.14 | ||||
| 1999 - Class B Shares (commenced May 24) | 10.00 | (0.03 | ) c | 0.21 | ||||
| 1999 - Class C Shares (commenced May 24) | 10.00 | (0.03 | ) c | 0.13 | ||||
| 1999 - Institutional Shares (commenced May 24) | 10.00 | 0.01 | 0.12 | |||||
| 1999 - Service Shares (commenced May 24) | 10.00 | — | 0.12 | |||||
|
Distributions to shareholders |
||||||||||||||
|---|---|---|---|---|---|---|---|---|---|---|---|---|---|---|
| Total from
investment operations |
From net
realized gains |
Net asset
value, end of period |
Total
returna |
Net assets at end of period (in 000s) |
Ratio of
net expenses to average net assets |
|||||||||
| $9.60 | $(0.23 | ) | $19.50 | 95.73 | % | $188,199 | 1.52 | % | ||||||
| 9.50 | (0.23 | ) | 19.45 | 94.27 | 42,061 | 2.27 | ||||||||
| 9.44 | (0.23 | ) | 19.31 | 94.43 | 26,826 | 2.27 | ||||||||
| 9.69 | (0.23 | ) | 19.59 | 96.67 | 49,921 | 1.12 | ||||||||
| 9.56 | (0.23 | ) | 19.45 | 95.41 | 3 | 1.62 | ||||||||
| 0.13 | — | 10.13 | 1.30 | 8,204 | 1.44 | b | ||||||||
| 0.18 | — | 10.18 | 1.80 | 520 | 2.19 | b | ||||||||
| 0.10 | — | 10.10 | 1.00 | 256 | 2.19 | b | ||||||||
| 0.13 | — | 10.13 | 1.30 | 5,223 | 1.04 | b | ||||||||
| 0.12 | — | 10.12 | 1.20 | 2 | 1.54 | b | ||||||||
| GROWTH OPPORTUNITIES FUND (continued)
|
|
Ratios assuming no expense reductions |
|||||||||||||
|---|---|---|---|---|---|---|---|---|---|---|---|---|---|
| Ratio
of net investment income (loss) to average net assets |
Ratio of
expenses to average net assets |
Ratio
of net investment loss to average net assets |
Portfolio
turnover rate |
||||||||||
| For the Year Ended August 31, | |||||||||||||
| 2000 - Class A Shares | (0.64 | )% | 1.61 | % | (0.73 | )% | 73.35 | % | |||||
| 2000 - Class B Shares | (1.38 | ) | 2.36 | (1.47 | ) | 73.35 | |||||||
| 2000 - Class C Shares | (1.38 | ) | 2.36 | (1.47 | ) | 73.35 | |||||||
| 2000 - Institutional Shares | (0.23 | ) | 1.21 | (0.32 | ) | 73.35 | |||||||
| 2000 - Service Shares | (0.69 | ) | 1.71 | (0.78 | ) | 73.35 | |||||||
| For the Period Ended August 31, | |||||||||||||
| 1999 - Class A Shares (commenced May 24) | (0.27 | ) b | 14.15 | b | (12.98 | ) b | 26.53 | ||||||
| 1999 - Class B Shares (commenced May 24) | (1.04 | ) b | 14.90 | b | (13.75 | ) b | 26.53 | ||||||
| 1999 - Class C Shares (commenced May 24) | (1.12 | ) b | 14.90 | b | (13.83 | ) b | 26.53 | ||||||
| 1999 - Institutional Shares (commenced May 24) | 0.39 | b | 13.75 | b | (12.32 | ) b | 26.53 | ||||||
| 1999 - Service Shares (commenced May 24) | 0.03 | b | 14.25 | b | (12.68 | ) b | 26.53 | ||||||
| MID CAP VALUE FUND
|
|
Income from investment operations |
|||||||||||
|---|---|---|---|---|---|---|---|---|---|---|---|
|
Net asset value, beginning of period |
Net
investment income (loss) |
Net realized
and unrealized gain (loss) |
Total income
from investment operations |
||||||||
| For the Year Ended August 31, | |||||||||||
| 2000 - Class A Shares | $18.42 | $0.20 | c | $1.38 | $1.58 | ||||||
| 2000 - Class B Shares | 18.23 | 0.06 | c | 1.40 | 1.46 | ||||||
| 2000 - Class C Shares | 18.24 | 0.06 | c | 1.37 | 1.43 | ||||||
| 2000 - Institutional Shares | 18.45 | 0.27 | c | 1.36 | 1.63 | ||||||
| 2000 - Service Shares | 18.31 | 0.18 | c | 1.35 | 1.53 | ||||||
| For the Seven Months Ended August 31, | |||||||||||
| 1999 - Class A Shares | 18.38 | 0.06 | 1.71 | 1.77 | |||||||
| 1999 - Class B Shares | 18.29 | (0.04 | ) | 1.71 | 1.67 | ||||||
| 1999 - Class C Shares | 18.30 | (0.04 | ) | 1.71 | 1.67 | ||||||
| 1999 - Institutional Shares | 18.37 | 0.09 | 1.72 | 1.81 | |||||||
| 1999 - Service Shares | 18.29 | 0.05 | 1.70 | 1.75 | |||||||
| For the Years Ended January 31, | |||||||||||
| 1999 - Class A Shares | 21.61 | 0.10 | (2.38 | ) | (2.28 | ) | |||||
| 1999 - Class B Shares | 21.57 | (0.05 | ) | (2.35 | ) | (2.40 | ) | ||||
| 1999 - Class C Shares | 21.59 | (0.05 | ) | (2.34 | ) | (2.39 | ) | ||||
| 1999 - Institutional Shares | 21.65 | 0.19 | (2.38 | ) | (2.19 | ) | |||||
| 1999 - Service Shares | 21.62 | 0.03 | (2.31 | ) | (2.28 | ) | |||||
| 1998 - Class A Shares (commenced August 15, 1997) | 23.63 | 0.09 | 0.76 | 0.85 | |||||||
| 1998 - Class B Shares (commenced August 15, 1997) | 23.63 | 0.06 | 0.74 | 0.80 | |||||||
| 1998 - Class C Shares (commenced August 15, 1997) | 23.63 | 0.06 | 0.76 | 0.82 | |||||||
| 1998 - Institutional Shares | 18.73 | 0.16 | 5.66 | 5.82 | |||||||
| 1998 - Service Shares (commenced July 18, 1997) | 23.01 | 0.09 | 1.40 | 1.49 | |||||||
| 1997 - Institutional Shares | 15.91 | 0.24 | 3.77 | 4.01 | |||||||
| For the Period Ended January 31, | |||||||||||
| 1996 - Institutional Shares (commenced August 1, 1995) | 15.00 | 0.13 | 0.90 | 1.03 | |||||||
|
Distributions to shareholders |
|||||||||||||||||||||
|---|---|---|---|---|---|---|---|---|---|---|---|---|---|---|---|---|---|---|---|---|---|
| From net
investment income |
In excess of net investment income |
From net
realized gains |
Total
Distributions |
Net asset
value, end of period |
Total
returna |
Net assets
at end of period (in 000s) |
Ratio of
net expenses to average net assets |
||||||||||||||
| $(0.12 | ) | $ — | $ — | $(0.12 | ) | $19.88 | 8.70 | % | $ 39,142 | 1.29 | % | ||||||||||
| — | — | — | — | 19.69 | 8.01 | 22,284 | 2.04 | ||||||||||||||
| — | — | — | — | 19.67 | 7.84 | 5,720 | 2.04 | ||||||||||||||
| (0.22 | ) | — | — | (0.22 | ) | 19.86 | 9.08 | 158,188 | 0.89 | ||||||||||||
| (0.11 | ) | — | — | (0.11 | ) | 19.73 | 8.48 | 206 | 1.39 | ||||||||||||
| — | — | (1.73 | ) | (1.73 | ) | 18.42 | 9.04 | 49,081 | 1.29 | b | |||||||||||
| — | — | (1.73 | ) | (1.73 | ) | 18.23 | 8.53 | 31,824 | 2.04 | b | |||||||||||
| — | — | (1.73 | ) | (1.73 | ) | 18.24 | 8.52 | 9,807 | 2.04 | b | |||||||||||
| — | — | (1.73 | ) | (1.73 | ) | 18.45 | 9.26 | 190,549 | 0.89 | b | |||||||||||
| — | — | (1.73 | ) | (1.73 | ) | 18.31 | 8.97 | 190 | 1.39 | b | |||||||||||
| (0.07 | ) | — | (0.88 | ) | (0.95 | ) | 18.38 | (10.48 | ) | 70,578 | 1.33 | ||||||||||
| — | — | (0.88 | ) | (0.88 | ) | 18.29 | (11.07 | ) | 37,821 | 1.93 | |||||||||||
| (0.02 | ) | — | (0.88 | ) | (0.90 | ) | 18.30 | (11.03 | ) | 10,800 | 1.93 | ||||||||||
| (0.21 | ) | — | (0.88 | ) | (1.09 | ) | 18.37 | (10.07 | ) | 196,512 | 0.87 | ||||||||||
| (0.17 | ) | — | (0.88 | ) | (1.05 | ) | 18.29 | (10.48 | ) | 289 | 1.37 | ||||||||||
| (0.06 | ) | (0.04 | ) | (2.77 | ) | (2.87 | ) | 21.61 | 3.42 | 90,588 | 1.35 | b | |||||||||
| (0.09 | ) | — | (2.77 | ) | (2.86 | ) | 21.57 | 3.17 | 28,743 | 1.85 | b | ||||||||||
| (0.09 | ) | — | (2.77 | ) | (2.86 | ) | 21.59 | 3.27 | 6,445 | 1.85 | b | ||||||||||
| (0.13 | ) | — | (2.77 | ) | (2.90 | ) | 21.65 | 30.86 | 236,440 | 0.85 | |||||||||||
| (0.11 | ) | — | (2.77 | ) | (2.88 | ) | 21.62 | 6.30 | 8 | 1.35 | b | ||||||||||
| (0.24 | ) | (0.93 | ) | (0.02 | ) | (1.19 | ) | 18.73 | 25.63 | 145,253 | 0.85 | ||||||||||
| (0.12 | ) | — | — | (0.12 | ) | 15.91 | 6.89 | 135,671 | 0.85 | b | |||||||||||
| MID CAP VALUE FUND (continued)
|
|
Ratios assuming no expense reductions |
||||||||||||
|---|---|---|---|---|---|---|---|---|---|---|---|---|
| Ratio of
net investment income (loss) to average net assets |
Ratio of
expenses to average net assets |
Ratio of
net investment income (loss) to average net assets |
Portfolio
turnover rate |
|||||||||
| For the Year Ended August 31, | ||||||||||||
| 2000 - Class A Shares | 1.11 | % | 1.34 | % | 1.06 | % | 82.92 | % | ||||
| 2000 - Class B Shares | 0.35 | 2.09 | 0.30 | 82.92 | ||||||||
| 2000 - Class C Shares | 0.32 | 2.09 | 0.27 | 82.92 | ||||||||
| 2000 - Institutional Shares | 1.51 | 0.94 | 1.46 | 82.92 | ||||||||
| 2000 - Service Shares | 1.03 | 1.44 | 0.98 | 82.92 | ||||||||
| For the Seven-Months Ended August 31, | ||||||||||||
| 1999 - Class A Shares | 0.43 | b | 1.37 | b | 0.35 | b | 68.84 | |||||
| 1999 - Class B Shares | (0.33 | ) b | 2.12 | b | (0.41 | ) b | 68.84 | |||||
| 1999 - Class C Shares | (0.34 | ) b | 2.12 | b | (0.42 | ) b | 68.84 | |||||
| 1999 - Institutional Shares | 0.79 | b | 0.97 | b | 0.71 | b | 68.84 | |||||
| 1999 - Service Shares | 0.38 | b | 1.47 | b | 0.30 | b | 68.84 | |||||
| For the Years Ended January 31, | ||||||||||||
| 1999 - Class A Shares | 0.38 | 1.41 | 0.30 | 92.18 | ||||||||
| 1999 - Class B Shares | (0.22 | ) | 2.01 | (0.30 | ) | 92.18 | ||||||
| 1999 - Class C Shares | (0.22 | ) | 2.01 | (0.30 | ) | 92.18 | ||||||
| 1999 - Institutional Shares | 0.83 | 0.95 | 0.75 | 92.18 | ||||||||
| 1999 - Service Shares | 0.32 | 1.45 | 0.24 | 92.18 | ||||||||
| 1998 - Class A Shares (commenced August 15, 1997) | 0.33 | b | 1.47 | b | 0.21 | b | 62.60 | |||||
| 1998 - Class B Shares (commenced August 15, 1997) | (0.20 | ) b | 1.97 | b | (0.32 | ) b | 62.60 | |||||
| 1998 - Class C Shares (commenced August 15, 1997) | (0.23 | ) b | 1.97 | b | (0.35 | ) b | 62.60 | |||||
| 1998 - Institutional Shares | 0.78 | 0.97 | 0.66 | 62.60 | ||||||||
| 1998 - Service Shares (commenced July 18, 1997) | 0.63 | b | 1.43 | b | 0.51 | b | 62.60 | |||||
| 1997 - Institutional Shares | 1.35 | 0.91 | 1.29 | 74.03 | ||||||||
| For the Period Ended January 31, | ||||||||||||
| 1996 - Institutional Shares (commenced August 1, 1995) | 1.67 | b | 0.98 | b | 1.54 | b | 58.77 | |||||
| SMALL CAP VALUE FUND
|
|
Income (loss) from investment operations |
|||||||||||
|---|---|---|---|---|---|---|---|---|---|---|---|
| Net asset
value, beginning of period |
Net
investment income (loss) |
Net realized and unrealized gain (loss) |
Total
income (loss) from investment operations |
||||||||
| For the Year Ended August 31, | |||||||||||
| 2000 - Class A Shares | $19.80 | $ 0.01 | c | $ 3.40 | $ 3.41 | ||||||
| 2000 - Class B Shares | 19.27 | (0.13 | ) c | 3.26 | 3.13 | ||||||
| 2000 - Class C Shares | 19.28 | (0.12 | ) c | 3.26 | 3.14 | ||||||
| 2000 - Institutional Shares | 19.95 | 0.10 | c | 3.42 | 3.52 | ||||||
| 2000 - Service Shares | 19.76 | 0.01 | c | 3.36 | 3.37 | ||||||
| For the Seven-Month Period Ended August 31, | |||||||||||
| 1999 - Class A Shares | 18.51 | (0.05 | ) | 1.34 | 1.29 | ||||||
| 1999 - Class B Shares | 18.10 | (0.12 | ) | 1.29 | 1.17 | ||||||
| 1999 - Class C Shares | 18.12 | (0.11 | ) | 1.27 | 1.16 | ||||||
| 1999 - Institutional Shares | 18.62 | — | 1.33 | 1.33 | |||||||
| 1999 - Service Shares | 18.50 | (0.13 | ) | 1.39 | 1.26 | ||||||
| For the Years Ended January 31, | |||||||||||
| 1999 - Class A Shares | 24.05 | (0.06 | ) | (4.48 | ) | (4.54 | ) | ||||
| 1999 - Class B Shares | 23.73 | (0.21 | ) | (4.42 | ) | (4.63 | ) | ||||
| 1999 - Class C Shares | 23.73 | (0.18 | ) | (4.43 | ) | (4.61 | ) | ||||
| 1999 - Institutional Shares | 24.09 | 0.03 | (4.50 | ) | (4.47 | ) | |||||
| 1999 - Service Shares | 24.05 | (0.04 | ) | (4.51 | ) | (4.55 | ) | ||||
| 1998 - Class A Shares | 20.91 | 0.14 | 5.33 | 5.47 | |||||||
| 1998 - Class B Shares | 20.80 | (0.01 | ) | 5.27 | 5.26 | ||||||
| 1998 - Class C Shares (commenced August 15, 1997) | 24.69 | (0.06 | ) | 1.43 | 1.37 | ||||||
| 1998 - Institutional Shares (commenced August 15, 1997) | 24.91 | 0.03 | 1.48 | 1.51 | |||||||
| 1998 - Service Shares (commenced August 15, 1997) | 24.91 | (0.01 | ) | 1.48 | 1.47 | ||||||
| 1997 - Class A Shares | 17.29 | (0.21 | ) | 4.92 | 4.71 | ||||||
| 1997 - Class B Shares (commenced May 1, 1996) | 20.79 | (0.11 | ) | 1.21 | 1.10 | ||||||
| 1996 - Class A Shares | 16.14 | (0.23 | ) | 1.39 | 1.16 | ||||||
|
Distributions to shareholders |
|||||||||||||||||
|---|---|---|---|---|---|---|---|---|---|---|---|---|---|---|---|---|---|
| In excess
of net investment income |
From net
realized gains |
Total
distributions |
Net asset value, end of period |
Total
returna |
Net assets
at end of period (in 000s) |
Ratio of
net expenses to average net assets |
|||||||||||
| $— | $ — | $ — | $23.21 | 17.22 | % | $157,791 | 1.50 | % | |||||||||
| — | — | — | 22.40 | 16.24 | 29,199 | 2.25 | |||||||||||
| — | — | — | 22.42 | 16.34 | 8,428 | 2.25 | |||||||||||
| — | — | — | 23.47 | 17.64 | 26,445 | 1.10 | |||||||||||
| — | — | — | 23.13 | 17.05 | 83 | 1.60 | |||||||||||
| — | — | — | 19.80 | 6.97 | 210,500 | 1.50 | b | ||||||||||
| — | — | — | 19.27 | 6.46 | 37,386 | 2.25 | b | ||||||||||
| — | — | — | 19.28 | 6.40 | 8,079 | 2.25 | b | ||||||||||
| — | — | — | 19.95 | 7.14 | 27,023 | 1.10 | b | ||||||||||
| — | — | — | 19.76 | 6.81 | 57 | 1.60 | b | ||||||||||
| — | (1.00 | ) | (1.00 | ) | 18.51 | (17.37 | ) | 261,661 | 1.50 | ||||||||
| — | (1.00 | ) | (1.00 | ) | 18.10 | (18.00 | ) | 42,879 | 2.25 | ||||||||
| — | (1.00 | ) | (1.00 | ) | 18.12 | (17.91 | ) | 8,212 | 2.25 | ||||||||
| — | (1.00 | ) | (1.00 | ) | 18.62 | (17.04 | ) | 15,351 | 1.13 | ||||||||
| — | (1.00 | ) | (1.00 | ) | 18.50 | (17.41 | ) | 261 | 1.62 | ||||||||
| — | (2.33 | ) | (2.33 | ) | 24.05 | 26.17 | 370,246 | 1.54 | |||||||||
| — | (2.33 | ) | (2.33 | ) | 23.73 | 25.29 | 42,677 | 2.29 | |||||||||
| — | 2.33 | (2.33 | ) | 23.73 | 5.51 | 5,604 | 2.09 | b | |||||||||
| — | 2.33 | (2.33 | ) | 24.09 | 6.08 | 14,626 | 1.16 | b | |||||||||
| — | 2.33 | (2.33 | ) | 24.05 | 5.91 | 2 | 1.45 | b | |||||||||
| — | (1.09 | ) | (1.09 | ) | 20.91 | 27.28 | 212,061 | 1.60 | |||||||||
| — | (1.09 | ) | (1.09 | ) | 20.80 | 5.39 | 3,674 | 2.35 | b | ||||||||
| — | (0.01 | ) | (0.01 | ) | 17.29 | 7.20 | 204,994 | 1.41 | |||||||||
| SMALL CAP VALUE FUND (continued)
|
|
Ratios assuming no expense reductions |
|||||||||||||
|---|---|---|---|---|---|---|---|---|---|---|---|---|---|
| Ratio of
net investment income (loss) to average net assets |
Ratio of
expenses to average net assets |
Ratio of
net investment income (loss) to average net assets |
Portfolio
turnover rate |
||||||||||
| For the Year Ended August 31, | |||||||||||||
| 2000 - Class A Shares | 0.07 | % | 1.57 | % | — | % | 75.31 | % | |||||
| 2000 - Class B Shares | (0.68 | ) | 2.32 | (0.75 | ) | 75.31 | |||||||
| 2000 - Class C Shares | (0.65 | ) | 2.32 | (0.72 | ) | 75.31 | |||||||
| 2000 - Institutional Shares | 0.49 | 1.17 | 0.42 | 75.31 | |||||||||
| 2000 - Service Shares | 0.03 | 1.67 | (0.04 | ) | 75.31 | ||||||||
| For the Seven-Month Period Ended August 31, | |||||||||||||
| 1999 - Class A Shares | (0.35 | ) b | 1.61 | b | (0.46 | ) b | 46.95 | ||||||
| 1999 - Class B Shares | (1.10 | ) b | 2.36 | b | (1.21 | ) b | 46.95 | ||||||
| 1999 - Class C Shares | (1.10 | ) b | 2.36 | b | (1.21 | ) b | 46.95 | ||||||
| 1999 - Institutional Shares | 0.05 | b | 1.21 | b | (0.06 | ) b | 46.95 | ||||||
| 1999 - Service Shares | (0.41 | ) b | 1.71 | b | (0.52 | ) b | 46.95 | ||||||
| For the Years Ended January 31, | |||||||||||||
| 1999 - Class A Shares | (0.24 | ) | 1.74 | (0.48 | ) | 98.46 | |||||||
| 1999 - Class B Shares | (0.99 | ) | 2.29 | (1.03 | ) | 98.46 | |||||||
| 1999 - Class C Shares | (0.99 | ) | 2.29 | (1.03 | ) | 98.46 | |||||||
| 1999 - Institutional Shares | 0.13 | 1.17 | 0.09 | 98.46 | |||||||||
| 1999 - Service Shares | (0.47 | ) | 1.66 | (0.51 | ) | 98.46 | |||||||
| 1998 - Class A Shares | (0.28 | ) | 1.76 | (0.50 | ) | 84.81 | |||||||
| 1998 - Class B Shares | (0.92 | ) | 2.29 | (0.92 | ) | 84.81 | |||||||
| 1998 - Class C Shares (commenced August 15, 1997) | (0.79 | ) b | 2.09 | b | (0.79 | ) b | 84.81 | ||||||
| 1998 - Institutional Shares (commenced August 15, 1997) | 0.27 | b | 1.16 | b | 0.27 | b | 84.81 | ||||||
| 1998 - Service Shares (commenced August 15, 1997) | (0.07 | ) b | 1.45 | b | (0.07 | ) b | 84.81 | ||||||
| 1997 - Class A Shares | (0.72 | ) | 1.85 | (0.97 | ) | 99.46 | |||||||
| 1997 - Class B Shares (commenced May 1, 1996) | (1.63 | ) b | 2.35 | b | (1.63 | ) b | 99.46 | ||||||
| 1996 - Class A Shares | (0.59 | ) | 1.66 | (0.84 | ) | 57.58 | |||||||
| LARGE CAP VALUE FUND
|
|
Income from investment operations |
|||||||||||
|---|---|---|---|---|---|---|---|---|---|---|---|
|
Net asset value, beginning of period |
Net
investment incomec |
Net
realized and unrealized gain |
Total from
investment operations |
Net asset
value, end of period |
|||||||
| For the Period Ended August 31, | |||||||||||
| 2000 - Class A Shares (commenced Dec. 15, 1999) | $10.00 | $0.06 | $0.33 | $0.39 | $10.39 | ||||||
| 2000 - Class B Shares (commenced Dec. 15, 1999) | 10.00 | — | 0.33 | 0.33 | 10.33 | ||||||
| 2000 - Class C Shares (commenced Dec. 15, 1999) | 10.00 | 0.01 | 0.31 | 0.32 | 10.32 | ||||||
| 2000 - Institutional Shares (commenced Dec. 15, 1999) | 10.00 | 0.09 | 0.31 | 0.40 | 10.40 | ||||||
| 2000 - Service Shares (commenced Dec. 15, 1999) | 10.00 | 0.07 | 0.31 | 0.38 | 10.38 | ||||||
a
|
Assumes investment at the net asset value at the beginning of the period, reinvestment of all dividends and
distributions, a complete redemption of the investment at the net asset value at the end of the period and no sales or redemption charges. Total return would be reduced if a sales or redemption charge were taken into account. Total returns for periods
less than one full year are not annualized.
|
b
|
Annualized.
|
c
|
Calculated based on average shares outstanding methodology.
|
d
|
Includes the effect of mortgage dollar roll transactions.
|
|
Ratios assuming no expense reductions |
||||||||||||||||||
|---|---|---|---|---|---|---|---|---|---|---|---|---|---|---|---|---|---|---|
| Total
returna |
Net assets
at end of period (in 000s) |
Ratio of net
expenses to average net assetsb |
Ratio of net
investment income to average net assetsb |
Ratio of
expenses to average net assetsb |
Ratio of net
investment income to average net assetsb |
Portfolio
turnover rate |
||||||||||||
| 3.90 | % | $7,181 | 1.25 | % | 0.84 | % | 3.30 | % | (1.21 | )% | 66.79 | % | ||||||
| 3.30 | 1,582 | 2.00 | 0.06 | 4.05 | (1.99 | ) | 66.79 | |||||||||||
| 3.20 | 850 | 2.00 | 0.15 | 4.05 | (1.90 | ) | 66.79 | |||||||||||
| 4.00 | 16,155 | 0.85 | 1.31 | 2.90 | (0.74 | ) | 66.79 | |||||||||||
| 3.80 | 2 | 1.35 | 0.95 | 3.40 | (1.10 | ) | 66.79 | |||||||||||
| FOR MORE INFORMATION
|
| Annual/Semi-annual Report
|
| Additional information about the Funds’ investments is available in the Funds’ annual and semi-annual reports to
shareholders. In the Funds’ annual reports, you will find a discussion of the market conditions and investment strategies that significantly affected the Funds’ performance during the last fiscal year.
|
| Statement of Additional Information
|
| Additional information about the Funds and their policies is also available in the Funds’ Additional Statement. The
Additional Statement is incorporated by reference into this Prospectus (is legally considered part of this Prospectus).
|
| The Funds’ annual and semi-annual reports, and the Additional Statement, are available free upon request by calling Goldman
Sachs at 1-800-621-2550.
|
| To obtain other information and for shareholder inquiries:
|
| By telephone – Call 1-800-621-2550
|
| By mail – Goldman Sachs Funds, 4900 Sears Tower, Chicago, IL 60606-6372
|
| By e-mail – [email protected]
|
| On the Internet – Text-only versions of the Funds’ documents are located online and may be downloaded from:
|
| SEC EDGAR database – http://www.sec.gov
|
| You may review and obtain copies of Fund documents by visiting the SEC’s Public Reference Room in Washington, D.C. You may
also obtain copies of Fund documents, after paying a duplicating fee, by writing to the SEC’s Public Reference Section, Washington, D.C. 20549-0102 or by electronic request to: [email protected]. Information on the operation of the public reference
room may be obtained by calling the SEC at (202) 942-8090.
|
| The Funds’ investment company registration number is 811-5349.
|
|
EQDOMPROSVC
|
| Prospectus
|
| Service
|
| Shares
|
| December 29, 2000
|
| GOLDMAN SACHS RESEARCH SELECT FUND
SM
|

| THE SECURITIES AND EXCHANGE COMMISSION HAS NOT APPROVED OR DISAPPROVED THESE SECURITIES OR PASSED UPON THE ADEQUACY OF THIS PROSPECTUS.
ANY REPRESENTATION TO THE CONTRARY IS A CRIMINAL OFFENSE.
|
| AN INVESTMENT IN THE FUND IS NOT A BANK DEPOSIT AND IS NOT INSURED BY THE FEDERAL DEPOSIT INSURANCE CORPORATION OR ANY OTHER GOVERNMENT
AGENCY. AN INVESTMENT IN THE FUND INVOLVES INVESTMENT RISKS, INCLUDING POSSIBLE LOSS OF PRINCIPAL.
|
| NOT FDIC-INSURED
|
May Lose Value
|
No Bank Guarantee
|
| Goldman Sachs Asset Management, a unit of the Investment Management Division of Goldman, Sachs & Co. (“Goldman
Sachs”), serves as investment adviser to the Research Select Fund (the “Fund”). Goldman Sachs Asset Management is referred to in this Prospectus as the “Investment Adviser.”
|
| RESEARCH STYLE FUNDS—RESEARCH SELECT FUND
|
| The Goldman Sachs Research Select Fund selects substantially all of its securities from the U.S. Select List developed by
the Goldman Sachs Investment Research Division. The Fund leverages the resources of Goldman Sachs by applying the Investment Management Division’s portfolio management expertise to the equity securities included in the U.S. Select List.
|
| The Fund has determined to discontinue public sales of its shares to new investors when the Fund’s total net assets reach
approximately $1.2 billion. As of the close of business on December 15, 2000, the Fund’s total net assets equaled $771.5 million. A shareholder who has an open Fund account on the date the Fund is closed may make additional investments and reinvest
dividends and capital gains distributions in that account after that date if the account remains open. Current shareholders may also open additional Fund accounts under certain conditions. If a Fund account is closed, however, additional investments in
the Fund may not be possible.
|
| Research Select Fund
|
|
Objective:
|
Long-term growth of capital
|
|
Benchmark:
|
S&P 500® Index
|
|
Investment Focus:
|
A focused portfolio of U.S. equity securities that offer the potential for long-term capital appreciation
|
| INVESTMENT OBJECTIVE
|
| The Fund seeks to provide long-term growth of capital by investing in a focused portfolio of U.S. equity securities.
|
| PRINCIPAL INVESTMENT STRATEGIES
|
| Equity Securities. The Fund invests, under normal circumstances, at least 90% of its total assets in U.S. equity securities, including securities of foreign issuers that are traded in the United States. Under normal circumstances, the Fund will only
purchase equity securities that are included in the Goldman Sachs Global Investment Research Division’s U.S. Select List and will sell securities that have been removed from the U.S. Select List. Notification of changes to the U.S. Select List is made to clients of Goldman Sachs and to the Fund’s portfolio management team at the
same time. The Fund will purchase a security that has been added to, or sell a security that has been removed from, the list after publication of that change. In addition, the Investment Adviser may apply the techniques described below in managing the
Fund and in purchasing and selling securities that are included in the U.S. Select List.
|
| The Goldman Sachs Global Investment Research Division’s U.S. Select List.
The U.S. Select List was introduced on September 9, 1998 and comprises approximately 25 to 35 equity securities that the Goldman Sachs U.S. Stock Selection
Committee expects, as a portfolio, to outperform its benchmark, the S&P 500® Index over the next 12 to 18 months. The list is consistent with overall investment policy and emphasizes strategically favored economic sectors. The U.S. Select List is updated on a regular basis. Historically, the U.S. Select List has consisted primarily of common stocks of relatively large U.S. companies, although the list is not restricted to those types of companies.
|
| The U.S. Select List is used primarily by institutional clients.
|
| Our Approach to Portfolio Management.
To the extent practicable, the Fund will seek to deliver returns that are comparable to the price returns of the U.S. Select List. Generally, the Fund will seek to maintain approximate equal weightings of its assets among the securities included
in the list. Any remaining assets may be invested by the Investment Adviser in the other instruments described in this Prospectus, including short-term debt obligations, options and futures contracts.
|
| Investors should be aware, however, that the performance of the Fund will differ from the price returns of the U.S. Select List
for a variety of reasons, including the change in securities prices that may occur between the time when a security is added to or removed from the list and when it is bought or sold for the Fund; the Fund’s investment of cash flow from purchases
and sales of Fund shares, which can occur daily and will result in portfolio purchases and sales; modifications in the Fund’s stock weights in order to control trading costs; the timing and amount of dividend and distribution payments; and the
Fund’s use of investment techniques and instruments that are not included in the U.S. Select List. In addition, unlike the U.S. Select List, the Fund will incur transactional costs (such as brokerage commissions) and operational expenses (such as investment advisory fees).
|
| While the Fund intends to track the composition of the U.S. Select List, the Fund’s purchases and sales of securities
that are added to and deleted from the list may not be completed on the first trading day after changes to the list are announced, and in certain cases may take several days or weeks to complete. Moreover, purchases and sales of the Fund and other
investors following the U.S. Select List could create a temporary imbalance between the supply and demand of the securities on the list. The imbalance could affect the time it takes the Fund to complete its transactions, as well as the price the Fund pays or receives. In
order to reduce impact of these trading costs, the Investment Adviser may decide for a period of time not to buy a security that is included in the U.S. Select List or to continue to hold a security that has been removed from the list.
|
| The Fund will periodically rebalance its portfolio in an effort to maintain approximate equal weightings of its assets among the
securities on the U.S. Select List.
|
| Other. The Fund’s investments in fixed-income securities are limited to securities that are considered cash equivalents.
|
Ÿ
|
No specific percentage limitation on usage;
limited only by the objective and strategies of the Fund |
| Research
Select Fund |
|||
|---|---|---|---|
| Investment Practices | |||
| Borrowings | 33 1
/3
|
||
| Custodial Receipts | — | ||
| Equity Swaps* | 15 | ||
| Futures Contracts and Options on Futures Contracts | Ÿ | ||
| Investment Company Securities (including exchange-traded funds) | 10 | ||
| Options on Securities and Securities Indices 1 | Ÿ | ||
| Repurchase Agreements | Ÿ | ||
| Securities Lending | 33 1
/3
|
||
| Short Sales Against the Box | 25 | ||
| Unseasoned Companies | Ÿ | ||
| Warrants and Stock Purchase Rights | Ÿ | ||
| When-Issued Securities and Forward Commitments | Ÿ | ||
*
|
Limited to 15% of net assets (together with other illiquid securities) for all structured securities which are not
deemed to be liquid and all swap transactions.
|
1
|
The Fund may sell covered call and put options and purchase call and put options.
|
Ÿ
|
No specific percentage limitation on usage;
limited only by the objective and strategies of the Fund |
| Research
Select Fund |
||||
|---|---|---|---|---|
| Investment Securities | ||||
| American and Global Depositary Receipts | — | |||
| Asset-Backed and Mortgage-Backed Securities | — | |||
| Bank Obligations 2 | Ÿ | |||
| Convertible Securities 3 | Ÿ | |||
| Corporate Debt Obligations 2 | Ÿ | |||
| Equity Securities | 90 | + | ||
| Emerging Country Securities | — | |||
| Fixed Income Securities | Ÿ | |||
| Foreign Issuers | Ÿ | |||
| Non-Investment Grade Fixed Income Securities | — | |||
| Real Estate Investment Trusts (“REITs”) | Ÿ | |||
| Structured Securities * | Ÿ | |||
| Temporary Investments | 100 | |||
| U.S. Government Securities 2 | Ÿ | |||
*
|
Limited to 15% of net assets (together with other illiquid securities) for all structured securities which are not
deemed to be liquid and all swap transactions.
|
2
|
Limited by the amount the Fund invests in fixed-income securities. Cash equivalents only.
|
3
|
The Fund has no minimum rating criteria.
|
| Loss of money is a risk of investing in the Fund. An investment in the Fund is not a deposit of any bank and is not insured or
guaranteed by the Federal Deposit Insurance Corporation or any other governmental agency. The following summarizes important risks that apply to the Fund and may result in a loss of your investment. The Fund should not be relied upon as a complete
investment program. There can be no assurance that the Fund will achieve its investment objective.
|
| Research
Select Fund |
|||
|---|---|---|---|
| Ÿ Applicable | |||
| U.S. Select List | Ÿ | ||
| Stock | Ÿ | ||
| Credit/Default | Ÿ | ||
| Foreign | Ÿ | ||
| Derivatives | Ÿ | ||
| Interest Rate | Ÿ | ||
| Management | Ÿ | ||
| Market | Ÿ | ||
| Liquidity | Ÿ | ||
| Small Cap | Ÿ | ||
n
|
U.S. Select List Risk—The Fund invests
principally in securities included in the U.S. Select List, which comprises approximately 25 to 35 stocks. As a result of the small universe of stocks in which the Fund generally invests, it may be subject to greater risks than would a more diversified fund.
|
| Price returns reported for the U.S. Select List do not predict or reflect the future results of the U.S. Select List
or the Fund. In addition, unlike the Fund, the securities included in the U.S. Select List constitute only a “paper portfolio” that does not reflect actual trading and does not have an actual performance record.
|
| Although the Goldman Sachs U.S. Stock Selection Committee periodically makes subjective decisions to add or delete companies for the
U.S. Select List, the list is not compiled with any particular client or product in mind and is not (and will not be) compiled with the Fund in mind. The Global Investment Research Division could at any time cease publishing the U.S. Select List
. In that event, the Board of Trustees will make a determination on how to proceed
|
| in the best interest of shareholders of the Fund, consistent with the Fund’s investment objective. Goldman Sachs publishes
similar lists of recommended securities that may be appropriate for shareholders of the Fund but which will not be used by the Investment Adviser for the Fund at this time.
|
| The Fund’s purchases and sales for its portfolio will be affected by market conditions following the publication of changes
to the U.S. Select List and will be subject to competing orders by Goldman Sachs clients who invest in the securities included on the list.
|
| The activities of Goldman Sachs and its affiliates may occasionally limit the Fund’s ability to purchase or sell securities
included in the U.S. Select List. The U.S. Select List is also subject to restrictions related to Goldman Sachs’ other businesses. In addition, certain securities may or may not appear on the U.S. Select List or may or may not be removed from
the list due to legal restrictions applicable to, or other business concerns of, Goldman Sachs. An investor should understand that these concerns will generally not be related to whether a particular security on the list or a security not on the list is
an attractive investment opportunity.
|
| As a global financial services firm, Goldman Sachs provides a wide range of financial services to issuers of securities and
investors in securities. Goldman Sachs, its affiliates and others associated with it may create markets or specialize in, have positions in and affect transactions in, securities of companies included in the U.S. Select List and may also perform or seek to perform financial services for those companies. Within the last three years, Goldman Sachs or its affiliates may have managed or co-managed public security offerings for companies included in the
U.S. Select List, and they or their employees may have a long or short position on holdings in the securities, or options on securities, or other related investments of companies included in the U.S. Select List.
|
| The Fund’s ability to invest in particular securities included in the U.S. Select List may be limited by the
diversification and other restrictions imposed on it as a registered mutual fund under the Investment Company Act of 1940 (the “Act”).
|
n
|
Stock Risk—The risk that stock prices
have historically risen and fallen in periodic cycles. Recently, U.S. stock markets and certain foreign stock markets have experienced substantial price volatility and, at times, have traded at or close to record high levels. There is no guarantee that
such levels will be reached or maintained in the future.
|
n
|
Credit/Default Risk—The risk that an issuer or guarantor of fixed-income securities held by the Fund may
default on its obligation to pay interest and repay principal.
|
n
|
Foreign Risk—The risk that when the Fund invests in foreign issuers, it will be subject to risk of loss not
typically associated with domestic issuers. Loss may result because of less foreign government regulation, less public information and
less economic, political and social stability. Loss may also result from the imposition of exchange controls, confiscations and other government restrictions.
|
n
|
Derivatives Risk—The risk that loss may result from the Fund’s investments in options, futures, swaps,
structured securities and other derivative instruments. These instruments may be leveraged so that small changes may produce disproportionate losses to the Fund.
|
n
|
Interest Rate Risk—The risk that when interest rates increase, fixed-income securities held by the Fund will
decline in value.
|
n
|
Management Risk—The risk that a strategy used by the Investment Adviser may fail to produce the intended results.
|
n
|
Market Risk—The risk that the value of the securities in which the Fund invests may go up or down in response
to the prospects of individual companies, particular industry sectors and/or general economic conditions. Price changes may be temporary or last for extended periods. The Fund’s investments may be overweighted from time to time in one or more
industry sectors, which will increase the Fund’s exposure to risk of loss from adverse developments affecting those sectors.
|
n
|
Liquidity Risk—The risk that the Fund will not be able to pay redemption proceeds within the time period stated
in this Prospectus because of unusual market conditions, an unusually high volume of redemption requests, or other reasons. Because the Fund may invest in small capitalization stocks and REITs, the Fund will be especially subject to the risk that during
certain periods the liquidity of particular issuers or industries, or all securities within particular investment categories, will shrink or disappear suddenly and without warning as a result of adverse economic, market or political events, or adverse
investor perceptions whether or not accurate.
|
n
|
Small Cap Stock Risk—The securities of small capitalization stocks involve greater risks than those associated
with larger, more established companies and may be subject to more abrupt or erratic price movements. Securities of such issuers may lack sufficient market liquidity to enable the Fund to effect sales at an advantageous time or without a substantial drop
in price.
|
| More information about the Fund’s portfolio securities and investment techniques, and their associated risks, is provided in
Appendix A. You should consider the investment risks discussed in this section and in Appendix A. Both are important to your investment choice.
|
| HOW THE FUND HAS PERFORMED
|
| The Fund commenced operations on June 19, 2000. Since the Fund has less than one calendar year’s performance, no performance
information is provided in this section.
|
| Research
Select Fund |
|||
|---|---|---|---|
| Shareholder Fees | |||
| (fees paid directly from your investment): | |||
| Maximum Sales Charge (Load) Imposed
on Purchases |
None | ||
| Maximum Sales Charge (Load) Imposed on Reinvested Dividends | None | ||
| Redemption Fees | None | ||
| Exchange Fees | None | ||
| Annual Fund Operating Expenses | |||
| (expenses that are deducted from Fund assets):1 | |||
| Management Fees | 1.00% | ||
| Service Fees 2 | 0.50% | ||
| Other Expenses 3 | 0.65% | ||
| Total Fund Operating Expenses* | 2.15% | ||
| See page 11 for all other footnotes.
|
*
|
As a result of current expense limitations, the estimated “Other Expenses” and “Total Fund Operating Expenses”
of the Fund which are actually incurred as of the date of this Prospectus are as set forth below. The expense limitations may be terminated at any time at the option of the Investment Adviser. If this occurs, “Other Expenses” and “Total
Fund Operating Expenses” may increase without shareholder approval.
|
| Research
Select Fund |
|||
|---|---|---|---|
| Annual Fund Operating Expenses | |||
| (expenses that are deducted from Fund assets): 1 | |||
| Management Fees | 1.00% | ||
| Service Fees 2 | 0.50% | ||
| Other Expenses 3 | 0.10% | ||
| Total Fund Operating Expenses (after current expense limitations) | 1.60% | ||
1
|
The operating expenses for the Fund are estimated for the current year.
|
2
|
Service Organizations may charge other fees to their customers who are beneficial owners of Service Shares in connection
with their customers’ accounts. Such fees may affect the return customers realize with respect to their investments.
|
3
|
Estimated “Other Expenses” include transfer agency fees equal to 0.04% of the average daily net assets of the
Fund’s Service Shares, plus all other ordinary expenses not detailed above. The Investment Adviser has voluntarily agreed to reduce or limit “Other Expenses” (excluding management fees, transfer agency fees, service fees, taxes, interest
and brokerage fees and litigation, indemnification and other extraordinary expenses) to the following percentage of the Fund’s average daily net assets:
|
| Fund | Other
Expenses |
||
|---|---|---|---|
| Research Select | 0.06% | ||
| Fund | 1 Year | 3 Years | 5 Years | 10 Years | |||||
|---|---|---|---|---|---|---|---|---|---|
| Research Select | $218 | $673 | N/A | N/A | |||||
| INVESTMENT ADVISER
|
| Investment Adviser | Fund | ||
|---|---|---|---|
| Goldman Sachs Asset Management (“GSAM”) | Research Select | ||
| 32 Old Slip | |||
| New York, New York 10005 | |||
| GSAM is a business unit of the Investment Management Division (“IMD”) of Goldman Sachs. Goldman Sachs registered as an
investment adviser in 1981. As of September 30, 2000, GSAM, along with other units of IMD, had assets under management of $281.3 billion.
|
| The Investment Adviser provides day-to-day investment management services regarding the Fund’s portfolio transactions. The
Investment Adviser makes the investment decisions for the Fund and places purchase and sale orders for the Fund’s portfolio transactions in U.S. markets. As permitted by applicable law, these orders may be directed to any brokers, including Goldman
Sachs and its affiliates. In addition, the Investment Adviser has access to the research and certain proprietary technical models developed by Goldman Sachs.
|
| The Investment Adviser also performs the following additional services for the Fund:
|
n
|
Supervises all non-advisory operations of the Fund
|
n
|
Provides personnel to perform necessary executive, administrative and clerical services to the Fund
|
n
|
Arranges for the preparation of all required tax returns,
reports to shareholders, prospectuses and statements of additional information and other reports filed with the Securities and Exchange Commission (the “SEC”) and other regulatory authorities
|
n
|
Maintains the records of the Fund
|
n
|
Provides office space and all necessary office equipment and services
|
| MANAGEMENT FEES
|
| As compensation for its services and its assumption of certain expenses, the Investment Adviser is entitled to the following fee,
computed daily and payable monthly, at the annual rate listed below (as a percentage of the Fund’s average daily net assets):
|
| Contractual Rate | Actual Rate for the
Fiscal Period Ended August 31, 2000 |
||||
|---|---|---|---|---|---|
| Research Select | 1.00% | 1.00% | |||
| The Investment Adviser may voluntarily waive a portion of its advisory fee from time to time, and may discontinue any voluntary
waiver at any time at its discretion.
|
| FUND MANAGERS
|
| Robert B. Litterman, Ph.D., a Managing Director of Goldman Sachs, is the co-developer, along with the late Fischer Black, of the
Black-Litterman Global Asset Allocation Model, a key tool in IMD’s asset allocation process. As Director of Quantitative Resources, Dr. Litterman oversees Quantitative Equities, the Quantitative Strategies Group, the Investment Performance &
Valuation Oversight Group, and the Client Research Groups. In total, these groups include over 120 professionals. Prior to moving to IMD, Dr. Litterman was the head of the Firmwide Risk department of Goldman Sachs since becoming a Partner in 1994.
Preceding his time in the Operations, Technology & Finance Division, Dr. Litterman spent eight years in the Fixed Income Division’s research department where he was co-director of the research and model development group.
|
| Quantitative Equity Team
|
n
|
A stable and growing team supported by an extensive internal staff
|
n
|
Access to the research ideas of Goldman Sachs’ renowned Global Investment Research Department
|
n
|
More than $34 billion in equities currently under management
|
n
|
Proprietary research on quantitative models and tax-advantaged strategies
|
| Name and Title | Fund Responsibility | Years
Primarily Responsible |
Five Year Employment History | ||||
|---|---|---|---|---|---|---|---|
| Melissa Brown
Managing Director Product Manager for Quantitative Equities |
Senior Portfolio Manager —
Research Select |
Since
2000 |
Ms. Brown joined the
Investment Adviser as a portfolio manager in 1998. From 1984 to 1998, she was the director of Quantitative Equity Research and served on the Investment Policy Committee at Prudential Securities. |
||||
| Robert C. Jones
Managing Director Head of Quantitative Equities |
Senior Portfolio Manager—
Research Select |
Since
2000 |
Mr. Jones joined the
Investment Adviser as a portfolio manager in 1989. |
||||
| Victor H. Pinter
Vice President Head of Portfolio Construction |
Senior Portfolio Manager—
Research Select |
Since
2000 |
Mr. Pinter joined the
Investment Adviser as a research analyst in 1989. He became a portfolio manager in 1992. |
||||
| DISTRIBUTOR AND TRANSFER AGENT
|
| Goldman Sachs, 85 Broad Street, New York, New York 10004, serves as the exclusive distributor (the “Distributor”) of the
Fund’s shares. Goldman Sachs, 4900 Sears Tower, Chicago, Illinois 60606-6372, also serves as the Fund’s transfer agent (the “Transfer Agent”) and, as such, performs various shareholder servicing functions.
|
| From time to time, Goldman Sachs or any of its affiliates may purchase and hold shares of the Fund. Goldman Sachs reserves the
right to redeem at any time some or all of the shares acquired for its own account.
|
| ACTIVITIES OF GOLDMAN SACHS AND ITS AFFILIATES AND OTHER ACCOUNTS MANAGED BY GOLDMAN SACHS
|
| The involvement of the Investment Adviser, Goldman Sachs and their affiliates in the management of, or their interest in, other
accounts and other activities of Goldman Sachs may present conflicts of interest with respect to the Fund or limit the Fund’s investment activities. Goldman Sachs and its affiliates engage in proprietary trading and advise accounts and funds which
have investment objectives similar to those of the Fund and/or which engage in and compete for transactions in the same types of securities, currencies and instruments as the Fund. Goldman Sachs and its affiliates will not have any obligation to make
available any information regarding their proprietary activities or strategies, or the activities or strategies used for other accounts managed by them, for the benefit of the management of the Fund. The results of the Fund’s investment activities,
therefore, may differ from those of Goldman Sachs and its affiliates, and it is possible that the Fund could sustain losses during periods in which Goldman Sachs and its affiliates and other accounts achieve significant profits on their trading for
proprietary or other accounts. In addition, the Fund may, from time to time, enter into transactions in which other clients of Goldman Sachs have an adverse interest. The Fund’s activities may be limited because of regulatory restrictions applicable
to Goldman Sachs and its affiliates, and/or their internal policies designed to comply with such restrictions.
|
| In
providing its investment management services for the Fund, the Investment Adviser invests in equity securities that are included in the Goldman Sachs Global Investment Research Division’s U.S. Select List. Goldman Sachs is a leading, full service global investment banking and securities firm. The firm’s Global Investment Research Division provides far-reaching and comprehensive analysis and commentary on portfolio strategy,
economics, industries and companies. For over two decades, Goldman Sachs has committed the resources on a global scale to develop an industry-leading position for the firm’s investment research products.
|
| Goldman Sachs has achieved worldwide recognition for its value-added research products. The Global Investment Research Division
has a well-regarded staff of approximately 900 professionals including more than 300 equity analysts, 25 global research teams, and 12 portfolio strategists, covering approximately 2400 companies, over 50 economies and over 25 stock markets.
|
| The U.S. Stock Selection Committee comprises approximately twelve senior professionals, including the head of Global Investment
Research and the Director of U.S. Investment Research, as well as a senior market strategist, an economist, and sector specialists.
|
n
|
Cash
|
n
|
Additional shares of the same class of the Fund
|
n
|
Shares of the same or an equivalent class of another Goldman Sachs Fund. Special restrictions may apply for certain ILA
Portfolios. See the Additional Statement.
|
| Fund | Investment
Income Dividends |
Capital Gains
Distributions |
|||
|---|---|---|---|---|---|
| Research Select | Annually | Annually | |||
| The following section will provide you with answers to some of the most often asked questions regarding buying and selling the
Fund’s Service Shares.
|
| How Can I Purchase Service Shares Of The Fund?
|
| Generally, Service Shares may be purchased only through institutions that have agreed to provide account administration and
personal and account maintenance services to their customers who are the beneficial owners of Service Shares. These institutions are called “Service Organizations.” Customers of a Service Organization will normally give their purchase
instructions to the Service Organization, and the Service Organization will, in turn, place purchase orders with Goldman Sachs. Service Organizations will set times by which purchase orders and payments must be received by them from their customers.
Generally, Service Shares may be purchased from the Fund on any business day at their NAV next determined after receipt of an order by Goldman Sachs from a Service Organization. No sales load is charged. Purchases of Service Shares must be settled within
three business days of receipt of a complete purchase order.
|
| Service Organizations are responsible for transmitting purchase orders and payments to Goldman Sachs in a timely fashion. Service
Organizations should place an order with Goldman Sachs at 1-800-621-2550 and either:
|
n
|
Wire federal funds to The Northern Trust Company (“Northern”), as subcustodian for State Street Bank and Trust Company
(“State Street”) (the Fund’s custodian) on the next business day; or
|
n
|
Send a check or Federal Reserve draft payable to Goldman Sachs Funds—(Name of Fund and Class of Shares), 4900 Sears Tower,
Chicago, IL 60606-6372. The Fund will not accept a check drawn on a foreign bank or a third-party check.
|
| In certain instances, the Trust may require a signature guarantee in order to effect purchase, redemption or exchange
transactions. Signature guarantees must be obtained from a bank, brokerage firm or other financial intermediary that is a member of an approved Medallion Guarantee Program or that is otherwise approved by Goldman Sachs. A notary public cannot provide a
signature guarantee.
|
| What Do I Need To Know About Service Organizations?
|
| Service Organizations may provide the following services in connection with their customers’ investments in Service Shares:
|
n
|
Acting, directly or through an agent, as the sole shareholder of record
|
n
|
Maintaining account records for customers
|
n
|
Processing orders to purchase, redeem or exchange shares for customers
|
n
|
Responding to inquiries from prospective and existing shareholders
|
n
|
Assisting customers with investment procedures
|
| In addition, some (but not all) Service Organizations are authorized to accept, on behalf of Goldman Sachs Trust (the “
Trust”), purchase, redemption and exchange orders placed by or on behalf of their customers, and may designate other intermediaries to accept such orders, if approved by the Trust. In these cases:
|
n
|
The Fund will be deemed to have received an order in proper form when the order is accepted by the authorized Service Organization
or intermediary on a business day, and the order will be priced at the Fund’s NAV next determined after such acceptance.
|
n
|
Service Organizations or intermediaries will be responsible for transmitting accepted orders and payments to the Trust within the
time period agreed upon by them.
|
| You should contact your Service Organization directly to learn whether it is authorized to accept orders for the Trust.
|
| Pursuant to a service plan adopted by the Trust’s Board of Trustees, Service Organizations are entitled to receive payment
for their services from the Trust of up to 0.50% (on an annualized basis) of the average daily net assets of the Service Shares of the Fund, which are attributable to or held in the name of the Service Organization for its customers.
|
| The Investment Adviser, Distributor and/or their affiliates may pay additional compensation from time to time, out of their assets
and not as an additional charge to the Fund, to selected Service Organizations and other persons in connection with the sale, distribution and/or servicing of shares of the Fund and other Goldman Sachs Funds. Additional compensation based on sales may,
but is currently not expected to, exceed 0.50% (annualized) of the amount invested.
|
| In addition to Service Shares, the Fund also offers other classes of shares to investors. These other share classes are subject to
different fees and expenses (which affect performance), have different minimum investment requirements and
|
| are entitled to different services than Service Shares. Information regarding these other share classes may be obtained from your
sales representative or from Goldman Sachs by calling the number on the back cover of this Prospectus.
|
| What Is My Minimum Investment In The Fund?
|
| The Fund does not have any minimum purchase or account requirements with respect to Service Shares. A Service Organization may,
however, impose a mini
mum amount for initial and subsequent investments in Service Shares, and may establish other requirements such as a minimum account balance. A Service Organization may redeem Service Shares held by non-complying accounts, and may impose a charge for any
special services.
|
| What Else Should I Know About Share Purchases?
|
| The Trust reserves the right to:
|
n
|
Reject or restrict any purchase or exchange orders by a particular purchaser (or group of related purchasers). This may occur, for
example, when a pattern of frequent purchases, sales or exchanges of Service Shares of the Fund is evident, or if purchases, sales or exchanges are, or a subsequent abrupt redemption might be, of a size that would disrupt the management of the Fund.
|
n
|
Close the Fund to new investors from time to time and reopen
the Fund whenever it is deemed appropriate by the Fund’s Investment Adviser.
|
| The Fund may allow Service Organizations to purchase shares with securities instead of cash if consistent with the Fund’s
investment policies and operations and if approved by the Fund’s Investment Adviser.
|
| How Are Shares Priced?
|
| The price you pay or receive when you buy, sell or exchange Service Shares is determined by the Fund’s NAV. The Fund
calculates NAV as follows:
|
| |
(Value of Assets of the Class)
|
|
| NAV =
|
– (Liabilities of the Class)
|
|
| |
Number of Outstanding Shares of the Class
|
|
| The Fund’s investments are valued based on market quotations or, if accurate quotations are not readily available, the fair
value of the Fund’s investments may be determined in good faith under procedures established by the Trustees.
|
n
|
NAV per share of each class is calculated by State Street on each business day as of the close of regular trading on the New York
Stock Exchange (normally 4:00 p.m. New York time). Fund shares will not be priced on any day the New York Stock Exchange is closed.
|
n
|
When you buy shares, you pay the NAV next calculated after the Fund receives your order in proper form.
|
n
|
When you sell shares, you receive the NAV next calculated after the Fund receives your order in proper form.
|
| Note: The time at which transactions and shares are priced and the time by which orders must be received may be
changed in case of an emergency or if regular trading on the New York Stock Exchange is stopped at a time other than 4:00 p.m. New York time.
|
| In addition, the impact of events that occur after the publication of market quotations used by the Fund to price its securities
(for example, in foreign markets), but before the close of regular trading on the New York Stock Exchange will normally not be reflected in the Fund’s next determined NAV unless the Trust, in its discretion, makes an adjustment in light of the nature
and materiality of the event, its effect on Fund operations and other relevant factors.
|
| How Can I Sell Service Shares Of The Fund?
|
| Generally, Service Shares may be sold (redeemed) only through Service Organizations. Customers of a Service Organization will
normally give their redemption instructions to the Service Organization, and the Service Organization will, in turn, place redemption orders with the Fund. Generally, the Fund will redeem its Service Shares upon request on any business day at their NAV next determined after receipt of such request in proper form. Redemption proceeds may be sent to recordholders by check or by wire (if the wire
instructions are on record).
|
| A Service Organization may request redemptions in writing or by telephone if the optional telephone redemption privilege is
elected on the Account Application.
|
| |
| By Writing: | Goldman Sachs Funds
4900 Sears Tower Chicago, IL 60606-6372 |
||
| By Telephone: | If you have elected the telephone redemption
privilege on your Account Application: 1-800-621-2550 (8:00 a.m. to 4:00 p.m. New York time) |
||
| What Do I Need To Know About Telephone Redemption Requests?
|
| The Trust, the Distributor and the Transfer Agent will not be liable for any loss you may incur in the event that the Trust
accepts unauthorized telephone redemption requests that the Trust reasonably believes to be genuine. In an effort to prevent unauthorized or fraudulent redemption and exchange requests by telephone, Goldman Sachs employs reasonable procedures specified by
the Trust to confirm that such instructions are genuine. If reasonable procedures are not employed, the Trust may be liable for any loss due to unauthorized or fraudulent transactions. The following general policies are currently in effect:
|
n
|
All telephone requests are recorded.
|
n
|
Any redemption request that requires money to go to an account or address other than that designated on the Account Application
must be in writing and
signed by an authorized person designated on the Account Application. The written request may be confirmed by telephone with both the requesting party and the designated bank account to verify instructions.
|
n
|
The telephone redemption option may be modified or terminated at any time.
|
| Note: It may be difficult to make telephone redemptions in times of drastic economic or market conditions.
|
| How Are Redemption Proceeds Paid?
|
| By Wire: The Fund will arrange for redemption proceeds to be wired as federal funds to the bank account
designated in the recordholder’s Account Application. The following general policies govern wiring redemption proceeds:
|
n
|
Redemption proceeds will normally be wired on the next business day in federal funds (for a total of one business day delay), but
may be paid up to three business days following receipt of a properly executed wire transfer redemption request. If the shares to be sold were recently paid for by check, the Fund will pay the redemption proceeds when the check has cleared, which may take
up to 15 days. If the Federal Reserve Bank is closed on the day that the redemption proceeds would ordinarily be wired, wiring the redemption proceeds may be delayed one additional business day.
|
n
|
To change the bank designated on your Account Application, you must send written instructions signed by an authorized person
designated on the Account Application to the Service Organization.
|
n
|
Neither the Trust, Goldman Sachs nor any other institution assumes any responsibility for the performance of intermediaries or
your Service Organization in the transfer process. If a problem with such performance arises, you should deal directly with such intermediaries or Service Organization.
|
| By Check: A recordholder may elect in writing to receive redemption proceeds by check. Redemption
proceeds paid by check will normally be mailed to the address of record within three business days of receipt of a properly executed redemption request. If the shares to be sold were recently paid for by check, the Fund will pay the redemption proceeds
when the check has cleared, which may take up to 15 days.
|
| What Else Do I Need To Know About Redemptions?
|
| The following generally applies to redemption requests:
|
n
|
Additional documentation may be required when deemed appropriate by the Transfer Agent. A redemption request will not be in proper
form until such additional documentation has been received.
|
n
|
Service Organizations are responsible for the timely transmittal of redemption requests by their customers to the Transfer Agent.
In order to facilitate the timely transmittal of redemption requests, Service Organizations may set times by which they must receive redemption requests. Service Organizations may also require additional documentation from you.
|
| The Trust reserves the right to:
|
n
|
Redeem the Service Shares of any Service Organization whose account balance falls below $50 as a result of earlier redemptions.
The Fund will not redeem Service Shares on this basis if the value of the account falls below the minimum account balance solely as a result of market conditions. The Fund will give 60 days’ prior written notice to allow a Service Organization to
purchase sufficient additional shares of the Fund in order to avoid such redemption.
|
n
|
Redeem your shares in other circumstances determined by the Board of Trustees to be in the best interest of the Trust.
|
n
|
Pay redemptions by a distribution in-kind of securities (instead of cash). If you receive redemption proceeds in-kind, you should
expect to incur transaction costs upon the disposition of those securities.
|
n
|
Reinvest any dividends or other distributions which you have elected to receive in cash should your check for such dividends or
other distributions be returned to the Fund as undeliverable or remain uncashed for six months. In addition, that distribution and all future distributions payable to you will be reinvested at NAV in additional Fund Service Shares of the Fund. No interest
will accrue on amounts represented by uncashed distribution or redemption checks.
|
| Can I Exchange My Investment From One Fund To Another?
|
| A Service Organization may exchange Service Shares of the Fund at NAV for Service Shares of any other Goldman Sachs Fund. The
exchange privilege may be materially modified or withdrawn at any time upon 60 days’ written notice.
|
| Instructions For Exchanging Shares: | |||||
|---|---|---|---|---|---|
| By Writing: | n Write a letter of instruction that includes: | ||||
| n The recordholder name(s) and signature(s) | |||||
| n The account number | |||||
| n The Fund names and Class of Shares | |||||
| n The dollar amount to be exchanged | |||||
| n
Mail the request to:
Goldman Sachs Funds 4900 Sears Tower Chicago, IL 60606-6372 |
|||||
| By Telephone: | If you have elected the telephone exchange
privilege on your Account Application: |
||||
| n
1-800-621-2550
(8:00 a.m. to 4:00 p.m. New York time) |
|||||
| You should keep in mind the following factors when making or considering an exchange:
|
n
|
You should obtain and carefully read the prospectus of the Fund you are acquiring before making an exchange.
|
n
|
All exchanges which represent an initial investment in a Fund must satisfy the minimum initial investment requirement of that
Fund, except that this requirement may be waived at the discretion of the Trust.
|
n
|
Telephone exchanges normally will be made only to an identically registered account.
|
n
|
Shares may be exchanged among accounts with different names, addresses and social security or other taxpayer identification
numbers only if the exchange instructions are in writing and are signed by an authorized person designated on the Account Application.
|
n
|
Exchanges are available only in states where exchanges may be legally made.
|
n
|
It may be difficult to make telephone exchanges in times of drastic economic or market conditions.
|
n
|
Goldman Sachs may use reasonable procedures described under “What Do I Need To Know About Telephone Redemption Requests?”
in an effort to prevent unauthorized or fraudulent telephone exchange requests.
|
n
|
Exchanges into Funds that are closed to new investors may be restricted.
|
| For federal income tax purposes, an exchange from one fund to another, is treated as a redemption of the shares surrendered in the
exchange, on which you may be
|
| subject to tax, followed by a purchase of shares received in the exchange. You should consult your tax adviser concerning the tax
consequences of an exchange.
|
| Restrictions on Excessive Trading Practices. The Trust does not permit market-timing or other excessive trading
practices. Purchases and exchanges should be made for long-term investment purposes only. The Trust and Goldman Sachs reserve the right to reject or restrict purchase or exchange requests from any investor. Excessive, short-term (market-timing) trading
practices may disrupt portfolio management strategies, harm Fund performance and negatively impact long-term shareholders. The Trust and Goldman Sachs will not be held liable for any loss resulting from rejected purchase or exchange orders. To minimize
harm to the Trust (or Goldman Sachs) and its shareholders, the Trust (or Goldman Sachs) will exercise these rights if, in the Trust’s (or Goldman Sachs’) judgment, an investor has a history of excessive trading or if an investor’s trading,
in the judgment of the Trust (or Goldman Sachs), has been or may be disruptive to the Fund. In making this judgment, trades executed in multiple accounts under common ownership or control may be considered together.
|
| What Types Of Reports Will Be Sent Regarding Investments In Service Shares?
|
| Service Organizations will receive from the Fund annual reports containing audited financial statements and semi-annual reports.
Service Organizations will also be provided with a printed confirmation for each transaction in their account and a monthly account statement. Service Organizations are responsible for providing these or other reports to their customers who are the
beneficial owners of Service Shares in accordance with the rules that apply to their accounts with the Service Organizations.
|
| As with any investment, you should consider how your investment in the Fund will be taxed. The tax information below is provided
as general information. More tax information is available in the Additional Statement. You should consult your tax adviser about the federal, state, local or foreign tax consequences of your investment in the Fund.
|
| Unless your investment is in an IRA or other tax-advantaged account, you should consider the possible tax consequences of Fund
distributions and the sale of your Fund shares.
|
| DISTRIBUTIONS
|
| Distributions you receive from the Fund are generally subject to federal income tax, and may also be subject to state or local
taxes. This is true whether you reinvest your distributions in additional Fund shares or receive them in cash. For federal tax purposes, the Fund’s income dividend distributions and short-term capital gain distributions are taxable to you as ordinary
income. Any long-term capital gain distributions are taxable as long-term capital gains, no matter how long you have owned your Fund shares.
|
| Although distributions are generally treated as taxable to you in the year they are paid, distributions declared in October,
November or December but paid in January are taxable as if they were paid in December. A percentage of the Fund’s dividends paid to corporate shareholders may be eligible for the corporate dividends-received deduction. The Fund will inform
shareholders of the character and tax status of all distributions promptly after the close of each calendar year.
|
| The Fund may be subject to foreign withholding or other foreign taxes on income or gain from certain foreign securities. In
general, the Fund may deduct these taxes in computing its taxable income.
|
| If you buy shares of the Fund before it makes a distribution, the distribution will be taxable to you even though it may actually
be a return of a portion of your investment. This is known as “buying a dividend.”
|
| SALES AND EXCHANGES
|
| Your sale of Fund shares is a taxable transaction for federal income tax purposes, and may also be subject to state and local
taxes. For tax purposes, the exchange of your Fund shares for shares of a different Goldman Sachs Fund is the same as a sale. When you sell your shares, you will generally recognize a capital gain or loss in an amount equal to the difference between your
adjusted tax basis in the shares and the amount received. Generally, this gain or loss is long-term or short-term depending on whether your holding period exceeds twelve months, except that any loss realized on shares held for six months or less will be
treated as a long-term capital loss to the extent of any long-term capital gain dividends that were received on the shares.
|
| RETIREMENT PLANS
|
| The one major exception to these tax principles is that distributions on, and sales, exchanges and redemptions of, shares held in
an IRA (or other tax-qualified plan) will not be currently taxable.
|
| OTHER INFORMATION
|
| When you open your account, you should provide your social security or tax identification number on your Account Application. By
law, the Fund must withhold 31% of your taxable distributions and any redemption proceeds if you do not provide your correct taxpayer identification number, or certify that it is correct, or if the IRS instructs the Fund to do so. Non-U.S. investors may
be subject to U.S. withholding and estate tax.
|
| A. General Portfolio Risks
|
| The Fund will be subject to the risks associated with equity securities. “Equity securities” may include common stocks,
preferred stocks, interests in real estate investment trusts, convertible debt obligations, convertible preferred stocks, equity interests in trusts, partnerships, joint ventures, limited liability companies and similar enterprises, warrants, and stock
purchase rights. In general, stock values fluctuate in response to the activities of individual companies and in response to general market and economic conditions. Accordingly, the value of the stocks that the Fund holds may decline over short or
extended periods. The stock markets tend to be cyclical, with periods when stock prices generally rise and periods when prices generally decline. The volatility of equity securities means that the value of your investment in the Fund may increase or
decrease. Recently, certain stock markets have experienced substantial price volatility and, at times, have traded at or close to record high levels. There can be no guarantee that such levels will be reached or maintained in the future.
|
| To the extent that the Fund invests in fixed-income securities, the Fund will also be subject to the risks associated with its
fixed-income securities. These risks include interest rate risk and credit risk. In general, interest rate risk involves the risk that when interest rates decline, the market value of fixed-income securities tends to increase. Conversely, when interest
rates increase, the market value of fixed-income securities tends to decline. Credit risk involves the risk that an issuer or guarantor could default on its obligations, and the Fund will not recover its investment.
|
| The Investment Adviser will not consider the portfolio turnover rate a limiting factor in making investment decisions for the
Fund. Trading to keep the Fund’s portfolio holdings consistent with, and equally weighted among, the securities in the U.S. Select List may increase the Fund’s portfolio turnover rate. A high rate of portfolio turnover (100% or more) involves correspondingly greater expenses which must be borne by the Fund and its shareholders, and is also likely to result in
higher short-term capital gains taxable to shareholders. The portfolio turnover rate is calculated by dividing the lesser of the dollar amount of sales or purchases of portfolio securities by the average monthly value of the Fund’s portfolio
securities, excluding securities having a maturity at the date of purchase of one year or less.
|
| The following sections provide further information on certain types of securities and investment techniques that may be used by
the Fund, including their associated risks. Additional information is provided in the Additional Statement, which is available upon request. Among other things, the Additional Statement describes certain fundamental investment restrictions that cannot be
changed without shareholder approval. You should note, however, that the investment objective, and all investment policies not specifically designated as fundamental, are non-fundamental and may be changed without shareholder approval. If there is a
change in the Fund’s investment objective, you should consider whether the Fund remains an appropriate investment in light of your then current financial position and needs.
|
| B. Other Portfolio Risks
|
| Risks of Investing in Small Capitalization Companies. The Fund may invest in small capitalization companies.
Investments in small capitalization companies involve greater risk and portfolio price volatility than investments in larger capitalization stocks. Among the reasons for the greater price volatility of these investments are the less certain growth
prospects of smaller firms and the lower degree of liquidity in the markets for such securities. Small capitalization companies may be thinly traded and may have to be sold at a discount from current market prices or in small lots over an extended period
of time. In addition, these securities are subject to the risk that during certain periods the liquidity of particular issuers or industries, or all securities in particular investment categories, will shrink or disappear suddenly and without warning as a
result of adverse economic or market conditions, or adverse investor perceptions whether or not accurate. Because of the lack of sufficient market liquidity, the Fund may incur losses because it will be required to effect sales at a disadvantageous time
and only then at a substantial drop in price. Small capitalization companies include “unseasoned” issuers that do not have an established financial history; often have limited product lines, markets or financial resources; may depend on or use a
few key personnel for management; and may be susceptible to losses and risks of bankruptcy. Transaction costs for these investments are often higher than those of larger capitalization companies. Investments in small capitalization companies may be more
difficult to price precisely than other types of securities because of their characteristics and lower trading volumes.
|
| Risks of Foreign Issuers. The Fund may invest in foreign issuers. Foreign issuers involve special risks that are not
typically associated with U.S. issuers. There may be less publicly available information about a foreign issuer than about a U.S. issuer. In addition, there is generally less government regulation of foreign compa-
|
| nies than in the United States. The securities of many foreign issuers are less liquid and more volatile than securities of
comparable domestic issuers. Furthermore, with respect to certain foreign countries, there is a possibility of nationalization, expropriation or confiscatory taxation, imposition of withholding or other taxes on dividend or interest payments (or, in some
cases, capital gains), limitations on the removal of funds or other assets, and political or social instability or diplomatic developments which could affect the Fund’s investments.
|
| Risks of Derivative Investments. The Fund’s transactions in options, futures, options on futures, swaps and
structured securities involve additional risk of loss. Loss can result from a lack of correlation between changes in the value of derivative instruments and the portfolio assets (if any) being hedged, the potential illiquidity of the markets for
derivative instruments, or the risks arising from margin requirements and related leverage factors associated with such transactions. The use of these management techniques also involves the risk of loss if the Investment Adviser is incorrect in its
expectation of fluctuations in securities prices or interest rates. The Fund may also invest in derivative investments for non-hedging purposes (that is, to seek to increase total return). Investing for non-hedging purposes is considered a speculative
practice and presents even greater risk of loss.
|
| Risks of Illiquid Securities. The Fund may invest up to 15% of its net assets in illiquid securities which cannot be
disposed of in seven days in the ordinary course of business at fair value. Illiquid securities include:
|
n
|
Securities that are not readily marketable
|
n
|
Repurchase agreements and time deposits with a notice or demand period of more than seven days
|
n
|
Certain over-the-counter options
|
n
|
Certain structured securities and all swap transactions
|
n
|
Certain restricted securities, unless it is determined, based upon a review of the trading markets for a specific restricted
security, that such restricted security is eligible for resale pursuant to Rule 144A under the Securities Act of 1933 (“144A Securities”) and, therefore, is liquid.
|
| Investing in 144A Securities may decrease the liquidity of the Fund’s portfolio to the extent that qualified institutional
buyers become for a time uninterested in purchasing these restricted securities. The purchase price and subsequent valuation of restricted and illiquid securities normally reflect a discount, which may be significant, from the market price of comparable
securities for which a liquid market exists.
|
| Credit Risks. Debt securities purchased by the Fund may include securities (including zero coupon bonds) issued by
the U.S. government (and its agencies, instru-
|
|
| mentalities and sponsored enterprises), domestic and foreign corporations, banks and other issuers. Further information is provided in the Additional Statement. |
| Temporary Investment Risks. The Fund may, for temporary defensive purposes, invest a certain percentage of its total
assets in:
|
n
|
U.S. government securities
|
n
|
Commercial paper rated at least A-2 by Standard & Poor’s or P-2 by Moody’s
|
n
|
Certificates of deposit
|
n
|
Bankers’ acceptances
|
n
|
Repurchase agreements
|
n
|
Non-convertible preferred stocks and non-convertible corporate bonds with a remaining maturity of less than one year
|
| When the Fund’s assets are invested in such instruments, the Fund may not be achieving its investment objective.
|
| C. Portfolio Securities and Techniques
|
| This section provides further information on certain types of securities and investment techniques that may be used by the Fund,
including their associated risks. Further information is provided in the Additional Statement, which is available upon request.
|
| Structured Securities. The Fund may invest in structured securities. Structured securities are securities whose
value is determined by reference to changes in the value of specific currencies, interest rates, commodities, indices or other financial indicators (the “Reference”) or the relative change in two or more References. The interest rate or the
principal amount payable upon maturity or redemption may be increased or decreased depending upon changes in the applicable Reference. Structured securities may be positively or negatively indexed, so that appreciation of the Reference may produce an
increase or decrease in the interest rate or value of the security at maturity. In addition, changes in the interest rates or the value of the security at maturity may be a multiple of changes in the value of the Reference. Consequently, structured
securities may present a greater degree of market risk than other types of securities and may be more volatile, less liquid and more difficult to price accurately than less complex securities.
|
| REITs. The Fund may invest in REITs. REITs are pooled investment vehicles that invest primarily in either real
estate or real estate related loans. The value of a REIT is affected by changes in the value of the properties owned by the REIT or securing mortgage loans held by the REIT. REITs are dependent upon the ability of the REITs’ managers, and are subject
to heavy cash flow dependency,
|
|
| default by borrowers and the qualification of the REITs under applicable regulatory requirements for favorable income tax treatment. REITs are also subject to risks generally associated with investments in real estate including possible declines in the value of real estate, general and local economic conditions, environmental problems and changes in interest rates. To the extent that assets underlying a REIT are concentrated geographically, by property type or in certain other respects, these risks may be heightened. The Fund will indirectly bear its proportionate share of any expenses, including management fees, paid by a REIT in which it invests. |
| Options on Securities and Securities Indices. A put option gives the purchaser of the option the right to sell, and
the writer (seller) of the option the obligation to buy, the underlying instrument during the option period. A call option gives the purchaser of the option the right to buy, and the writer (seller) of the option the obligation to sell, the underlying
instrument during the option period. The Fund may write (sell) covered call and put options and purchase put and call options on any securities in which it may invest or on any securities index consisting of securities in which it may invest.
|
| The writing and purchase of options is a highly specialized activity which involves special investment risks. Options may be used
for either hedging or cross-hedging purposes, or to seek to increase total return (which is considered a speculative activity). The successful use of options depends in part on the ability of the Investment Adviser to manage future price fluctuations and
the degree of correlation between the options and securities markets. If the Investment Adviser is incorrect in its expectation of changes in market prices or determination of the correlation between the instruments or indices on which options are written
and purchased and the instruments in the Fund’s investment portfolio, the Fund may incur losses that it would not otherwise incur. The use of options can also increase the Fund’s transaction costs. Options written or purchased by the Fund may be
traded on U.S. exchanges or over-the-counter. Over-the-counter options will present greater possibility of loss because of their greater illiquidity and credit risks.
|
| Futures Contracts and Options on Futures Contracts. Futures contracts are standardized, exchange-traded contracts
that provide for the sale or purchase of a specified financial instrument at a future time at a specified price. An option on a futures contract gives the purchaser the right (and the writer of the option the obligation) to assume a position in a futures
contract at a specified exercise price within a specified period of time. A futures contract may be based on various securities (such as U.S. government securities), securities indices, and other financial instruments and indices. The Fund may engage in
futures transactions on U.S. exchanges.
|
| The Fund may purchase and sell futures contracts, and purchase and write call and put options on futures contracts, in order to
seek to increase total return or to hedge against changes in interest rates or securities prices. The Fund may also enter into closing purchase and sale transactions with respect to such contracts and options. The Fund will engage in futures and related
options transactions for bona fide hedging purposes as defined in regulations of the Commodity Futures Trading Commission or to seek to increase total return to the extent permitted by such regulations. The Fund may not purchase or sell futures contracts
or purchase or sell related options to seek to increase total return, except for closing purchase or sale transactions, if immediately thereafter the sum of the amount of initial margin deposits and premiums paid on the Fund’s outstanding positions
in futures and related options entered into for the purpose of seeking to increase total return would exceed 5% of the market value of the Fund’s net assets.
|
| Futures contracts and related options present the following risks:
|
n
|
While the Fund may benefit from the use of futures and options on futures, unanticipated changes in interest rates or securities
prices may result in poorer overall performance than if the Fund had not entered into any futures contracts or options transactions.
|
n
|
Because perfect correlation between a futures position and portfolio position that is intended to be protected is impossible to
achieve, the desired protection may not be obtained and the Fund may be exposed to additional risk of loss.
|
n
|
The loss incurred by the Fund in entering into futures contracts and in writing call options on futures is potentially unlimited
and may exceed the amount of the premium received.
|
n
|
Futures markets are highly volatile and the use of futures may increase the volatility of the Fund’s NAV.
|
n
|
As a result of the low margin deposits normally required in futures trading, a relatively small price movement in a futures
contract may result in substantial losses to the Fund.
|
n
|
Futures contracts and options on futures may be illiquid, and exchanges may limit fluctuations in futures contract prices during a
single day.
|
| Equity Swaps. The Fund may invest in equity swaps. Equity swaps allow the parties to a swap agreement to exchange
the dividend income or other components of return on an equity investment (for example, a group of equity securities or an index) for a component of return on another non-equity or equity investment.
|
| An equity swap may be used by the Fund to invest in a market without owning or taking physical custody of securities in
circumstances in which direct investment may be restricted for legal reasons or is otherwise impractical. Equity swaps are derivatives and their value can be very volatile. To the extent that the Investment
|
| Adviser does not accurately analyze and predict the potential relative fluctuation of the components swapped with another party,
the Fund may suffer a loss, which may be substantial. The value of some components of an equity swap (such as the dividends on a common stock) may also be sensitive to changes in interest rates. Furthermore, the Fund may suffer a loss if the counterparty
defaults. Because equity swaps are normally illiquid, the Fund may be unable to terminate its obligations when desired.
|
| When-Issued Securities and Forward Commitments. The Fund may purchase when-issued securities and enter into forward
commitments. When-issued securities are securities that have been authorized, but not yet issued. When-issued securities are purchased in order to secure what is considered to be an advantageous price or yield to the Fund at the time of entering into the
transaction. A forward commitment involves the entering into a contract to purchase or sell securities for a fixed price at a future date beyond the customary settlement period.
|
| The purchase of securities on a when-issued or forward commitment basis involves a risk of loss if the value of the security to be
purchased declines before the settlement date. Conversely, the sale of securities on a forward commitment basis involves the risk that the value of the securities sold may increase before the settlement date. Although the Fund will generally purchase
securities on a when-issued or forward commitment basis with the intention of acquiring the securities for its portfolio, the Fund may dispose of when-issued securities or forward commitments prior to settlement if the Investment Adviser deems it
appropriate.
|
| Repurchase Agreements. Repurchase agreements involve the purchase of securities subject to the seller’s
agreement to repurchase them at a mutually agreed upon date and price. The Fund may enter into repurchase agreements with dealers in U.S. government securities and member banks of the Federal Reserve System which furnish collateral at least equal in value
or market price to the amount of their repurchase obligation.
|
| If the other party or “seller” defaults, the Fund might suffer a loss to the extent that the proceeds from the sale of
the underlying securities and other collateral held by the Fund are less than the repurchase price and the Fund’s costs associated with delay and enforcement of the repurchase agreement. In addition, in the event of bankruptcy of the seller, the Fund
could suffer additional losses if a court determines that the Fund’s interest in the collateral is not enforceable.
|
| In evaluating whether to enter into a repurchase agreement, the Investment Adviser will carefully consider the creditworthiness of
the seller. The Fund, together with other registered investment companies having advisory agreements with the Investment Adviser or any of its affiliates, may transfer uninvested cash balances into a single joint account, the daily aggregate balance of
which will be invested in one or more repurchase agreements.
|
| Lending of Portfolio Securities. The Fund may engage in securities lending. Securities lending involves the lending
of securities owned by the Fund to financial institutions such as certain broker-dealers. The borrowers are required to secure their loan continuously with cash, cash equivalents, U.S. government securities or letters of credit in an amount at least equal
to the market value of the securities loaned. Cash collateral may be invested in cash equivalents. To the extent that cash collateral is invested in other investment securities, such collateral will be subject to market depreciation or appreciation, and
the Fund will be responsible for any loss that might result from its investment of the borrowers’ collateral. If the Investment Adviser determines to make securities loans, the value of the securities loaned may not exceed 33 1
/3% of the value of the total assets of the
Fund (including the loan collateral).
|
| The Fund may lend its securities to increase its income. The Fund may, however, experience delay in the recovery of its securities
or a capital loss if the institution with which it has engaged in a portfolio loan transaction breaches its agreement with the Fund.
|
| Preferred Stock, Warrants and Rights. The Fund may invest in preferred stock, warrants and rights. Preferred stocks
are securities that represent an ownership interest providing the holder with claims on the issuer’s earnings and assets before common stock owners but after bond owners. Unlike debt securities, the obligations of an issuer of preferred stock,
including dividend and other payment obligations, may not typically be accelerated by the holders of such preferred stock on the occurrence of an event of default or other non-compliance by the issuer of the preferred stock.
|
| Warrants and other rights are options to buy a stated number of shares of common stock at a specified price at any time during the
life of the warrant or right. The holders of warrants and rights have no voting rights, receive no dividends and have no rights with respect to the assets of the issuer.
|
| Other Investment Companies. The Fund may invest in securities of other investment companies (including
exchange-traded funds such as SPDRs as defined below) subject to statutory limitations prescribed by the Act. These limitations include a prohibition on the Fund acquiring more than 3% of the voting shares of any other investment company, and a
prohibition on investing more than 5% of the Fund’s total assets in securities of any one investment company or more than 10% of its total assets in securities of all investment companies. The Fund will indirectly bear its proportionate share of any
management fees and other expenses paid by such other investment companies. Exchange-traded funds such as SPDRs are shares of unaffiliated investment companies which are traded like traditional equity securities on a national securities exchange or the
NASDAQ® National Market System.
|
| n
|
Standard & Poor’s Depositary
Receipts
TM
. The Fund may, consistent with its investment policies, purchase Standard &
Poor’s Depositary Receipts™ (“SPDRs”). SPDRs are securities traded on the American Stock Exchange (“AMEX”) that represent ownership in the SPDR Trust, a trust which has been established to accumulate and hold a portfolio of
common stocks that is intended to track the price performance and dividend yield of the S&P 500®. The SPDR Trust is sponsored by a subsidiary of the AMEX. SPDRs may be used for several reasons, including, but not limited to, facilitating the
handling of cash flows or trading, or reducing transaction costs. The price movement of SPDRs may not perfectly parallel the price action of the S&P 500®.
|
| Unseasoned Companies. The Fund may invest in companies (including predecessors) which have operated less than three
years. The securities of such companies may have limited liquidity, which can result in their being priced higher or lower than might otherwise be the case. In addition, investments in unseasoned companies are more speculative and entail greater risk than
do investments in companies with an established operating record.
|
| Corporate Debt Obligations. Corporate debt obligations include bonds, notes, debentures, commercial paper and other
obligations of corporations to pay interest and repay principal, and include securities issued by banks and other financial institutions. The Fund may invest in corporate debt obligations issued by U.S. and certain non-U.S. issuers which issue securities
denominated in the U.S. dollar (including Yankee and Euro obligations). In addition to obligations of corporations, corporate debt obligations include securities issued by banks and other financial institutions and supranational entities (i.e., the World Bank, the International Monetary Fund, etc.).
|
| Bank Obligations. The Fund may invest in obligations issued or guaranteed by U.S. or foreign banks. Bank
obligations, including without limitations, time deposits, bankers’ acceptances and certificates of deposit, may be general obligations of the parent bank or may be limited to the issuing branch by the terms of the specific obligations or by
government regulations. Banks are subject to extensive but different governmental regulations which may limit both the amount and types of loans which may be made and interest rates which may be charged. In addition, the profitability of the banking
industry is largely dependent upon the availability and cost of funds for the purpose of financing lending operations under prevailing money market conditions. General economic conditions as well as exposure to credit losses arising from possible
financial difficulties of borrowers play an important part in the operation of this industry.
|
| U.S. Government Securities. The Fund may invest in U.S. government securities. U.S. government securities include
U.S. Treasury obligations and obligations
|
|
| issued or guaranteed by U.S. government agencies, instrumentalities or sponsored enterprises. U.S. government securities may be supported by (a) the full faith and credit of the U.S. Treasury (such as the Government National Mortgage Association (“ Ginnie Mae”)); (b) the right of the issuer to borrow from the U.S. Treasury (such as securities of the Student Loan Marketing Association); (c) the discretionary authority of the U.S. government to purchase certain obligations of the issuer (such as the Federal National Mortgage Association (“Fannie Mae”) and Federal Home Loan Mortgage Corporation (“Freddie Mac”)); or (d) only the credit of the issuer. |
| Borrowings. The Fund can borrow money from banks and other financial institutions in amounts not exceeding one-third
of its total assets for temporary or emergency purposes. The Fund may not make additional investments if borrowings exceed 5% of its total assets.
|
| Short Sales Against-the-Box. The Fund may make short sales against-the-box. A short sale against-the-box means that
at all times when a short position is open the Fund will own an equal amount of securities sold short, or securities convertible into or exchangeable for, without payment of any further consideration, an equal amount of the securities of the same issuer
as the securities sold short.
|
| The financial highlights table is intended to help you understand the Fund’s financial performance from its commencement
(June 19, 2000) to August 31, 2000. Certain information reflects financial results for a single Fund share. The total returns in the table represent the rate that an investor would have earned or lost on an investment in the Fund (assuming reinvestment of
all dividends and distributions). This information for the period ended August 31, 2000 has been audited by PricewaterhouseCoopers LLP, whose report, along with the Fund’s financial statements, is included in the Fund’s annual report (available
upon request).
|
| RESEARCH SELECT FUND
|
| Income from
investment operations |
|||||||||||||||||||
|---|---|---|---|---|---|---|---|---|---|---|---|---|---|---|---|---|---|---|---|
| Net asset
value, beginning of period |
Net
investment loss(c) |
Net realized
and unrealized gain |
Total from
investment operations |
||||||||||||||||
| For the Period Ended August 31, | |||||||||||||||||||
| 2000 - Class A Shares (commenced June 19, 2000) | $10.00 | $(0.02 | ) | $0.79 | $0.77 | ||||||||||||||
| 2000 - Class B Shares (commenced June 19, 2000) | 10.00 | (0.04 | ) | 0.80 | 0.76 | ||||||||||||||
| 2000 - Class C Shares (commenced June 19, 2000) | 10.00 | (0.04 | ) | 0.81 | 0.77 | ||||||||||||||
| 2000 - Institutional Shares (commenced June 19, 2000) | 10.00 | (0.01 | ) | 0.79 | 0.78 | ||||||||||||||
| 2000 - Service Shares (commenced June 19, 2000) | 10.00 | (0.02 | ) | 0.80 | 0.78 | ||||||||||||||
(a)
|
Assumes investment at the net asset value at the beginning of the period, reinvestment of all dividends and
distributions, a complete redemption of the investment at the net asset value at the end of the period and no sales or redemption charges. Total return would be reduced if a sales or redemption charge were taken into account. Total returns for periods
less than one full year are not annualized.
|
(b)
|
Annualized.
|
(c)
|
Calculated based on the average shares outstanding methodology.
|
| Ratios assuming
no expense reductions |
|||||||||||||||||||||
|---|---|---|---|---|---|---|---|---|---|---|---|---|---|---|---|---|---|---|---|---|---|
| Net asset
value, end of period |
Total
return(a) |
Net assets
at end of period (in 000s) |
Ratio of
net expenses to average net assets(b) |
Ratio of
net investment loss to average net assets(b) |
Ratio of
expenses to average net assets(b) |
Ratio of
net investment loss to average net assets(b) |
Portfolio
turnover rate |
||||||||||||||
| $10.77 | 7.70 | % | $217,861 | 1.50 | % | (1.04 | )% | 2.05 | % | (1.59 | )% | 5.04 | % | ||||||||
| 10.76 | 7.60 | 201,437 | 2.25 | (1.79 | ) | 2.80 | (2.34 | ) | 5.04 | ||||||||||||
| 10.77 | 7.70 | 96,393 | 2.25 | (1.78 | ) | 2.80 | (2.33 | ) | 5.04 | ||||||||||||
| 10.78 | 7.80 | 12,677 | 1.10 | (0.50 | ) | 1.65 | (1.05 | ) | 5.04 | ||||||||||||
| 10.78 | 7.70 | 12 | 1.60 | (1.13 | ) | 2.15 | (1.68 | ) | 5.04 | ||||||||||||
| U.S. Select List
|
| As mentioned in “Fund Investment Objective and Strategies,” the U.S. Select List was introduced on September 9,
1998 and comprises approximately 25 to 35 stocks that the Goldman Sachs U.S. Stock Selection Committee expects, as a portfolio, to outperform its benchmark, the S&P 500® Index, over the next twelve to eighteen months. The U.S. Select List changes regularly. While the companies on the list generally have been relatively large U.S. companies, the list is not restricted to those types of companies. It is expected that, under normal market conditions, the quarterly
performance of the Fund, before expenses, will track the price return of the U.S. Select List within a .90 correlation coefficient.
|
| The Fund’s portfolio management team does not have access to information regarding additions or deletions for the U.S.
Select List prior to their publication. Goldman Sachs publishes other lists of recommended securities that could be appropriate for Fund investors but that are not used by the Fund’s portfolio management team.
|
| The chart below reflects historical information regarding the U.S. Select List. The U.S. Select List is not
maintained for the purpose of managing any account or investment company such as the Fund. The number of stocks on the U.S. Select List and the frequency of additions to and deletions from the U.S. Select List change from time to time. The stocks included in the U.S. Select List constitute only a “paper portfolio” that does not reflect
actual trading and does not have an actual performance record. The U.S. Select List’s price return does not represent the return on any fund or any other account that involves actual trading. The price returns are not indicative of the returns on any fund or account because, among other things, they do not
reflect actual prices when stocks are purchased or sold, transaction costs and account fees. In addition, because the U.S. Select List does not include a cash component, price returns are based on a constant 100% investment in the stocks on the U.S. Select List. Also, the information below does not reflect the impact that the Investment Adviser’s
portfolio management decisions and techniques may have on performance. Further, the actual performance of the Fund may differ from that of the U.S. Select List because of time delays between when a stock is added to or removed from the list and when it is bought or sold for the Fund. Investors should not consider this price return information as a substitute for, or an indication of,
future performance of the Research Select Fund or
|
| the Investment Adviser. Finally, past price returns of the U.S. Select List are not representative of future price returns
of the list.
|
| 9/9/98
(inception) to 12/31/98 |
1/1/99
to 12/31/99 |
1/1/00
to 10/31/00 |
9/9/98
(inception) to 10/31/00 |
||||||
|---|---|---|---|---|---|---|---|---|---|
| U.S. Select List Stock Price Return* | 37.57% | 33.81% | 18.1% | 117.5% | |||||
| S&P 500® Index Price Return** | 22.73% | 21.06% | -1.8% | 45.9% | |||||
*
|
The results for the U.S. Select List portfolio represent an equal-weighted arithmetic average of the stocks held at any
point during the month. The results are calculated monthly using each stock’s capital appreciation or depreciation during the period that it is on the U.S. Select List and dividing that by the highest number of stocks that were on the U.S. Select
List at any point during the month. Prior to June 1999, the divisor was the time-weighted number of stocks on the list for the specified period. The results are calculated using the prices of the stocks at the close of trading of the stock market one full
day after the stock was added to the U.S. Select List (e.g., if the stock was added on the afternoon of 5/5, the recorded price is at the close on 5/6). The results do not reflect the execution of actual purchases or sales, and there is no guarantee that
a mutual fund following the U.S. Select List would be able to execute purchases and sales at the prices used to calculate the price returns. Because the U.S. Select List is a paper portfolio that is not managed to a target number of stocks, no “
re-balancing” of actual investments is done when stocks are added to or deleted from the U.S. Select List. Price returns are based on 100% investment in the stocks on the U.S. Select List.
|
| Price returns are calculated to include the price return plus dividends for the stock during the month in which they are
paid without being reinvested into the security. They do not reflect the market impact on the stock prices that may occur between the time the publication is made of additions to and deletions from the U.S. Select List and the time a mutual fund following
the U.S. Select List would be able to execute purchases and sales. They also do not reflect transaction fees, such as commissions, fees and interest charges, or the costs of running a mutual fund, such as management fees, distribution fees and other
expenses. They do not reflect the impact that an investment adviser’s portfolio management decisions and techniques may have on a mutual fund’s returns. Actual transactions and the effect of dividends, fees and costs will result in returns that
differ from those of the U.S. Select List.
|
**
|
The S&P 500® Index is an unmanaged index containing common stocks of 500 industrial, transportation, utility and
financial companies, regarded as generally representative of the U.S. stock market. The S&P 500® Index performance numbers shown are price returns reflecting the reinvestment of dividends. They do not reflect fees, brokerage commissions or other
costs of investing that are not incurred by an index.
|
| FOR MORE INFORMATION
|
| Annual/Semi-annual Report
|
| Additional information about the Fund’s investments is available in the Fund’s annual and semi-annual reports to
shareholders. In the Fund’s annual report, you will find a discussion of the market conditions and investment strategies that significantly affected the Fund’s performance during the last fiscal year.
|
| Statement of Additional Information
|
| Additional information about the Fund and its policies is also available in the Fund’s Additional Statement. The Additional
Statement is incorporated by reference into this Prospectus (is legally considered part of this Prospectus).
|
| The Fund’s annual and semi-annual reports, and the Additional Statement, are available free upon request by calling Goldman
Sachs at 1-800-621-2550.
|
| To obtain other information and for shareholder inquiries:
|
| By telephone – Call 1-800-621-2550
|
| By mail – Goldman Sachs Funds, 4900 Sears Tower, Chicago, IL 60606-6372
|
| By e-mail – [email protected]
|
| On the Internet – Text-only versions of the Fund’s documents are located online and may be downloaded from:
|
| SEC EDGAR database – http://www.sec.gov
|
| You may review and obtain copies of Fund documents by visiting the SEC’s Public Reference Room in Washington, D.C. You may
also obtain copies of Fund documents, after paying a duplicating fee, by writing to the SEC’s Public Reference Section, Washington, D.C. 20549-0102 or by electronic request to: [email protected]. Information on the operation of the public reference
room may be obtained by calling the SEC at (202) 942-8090.
|
| The Goldman Sachs Research Select Fund
SM
is a service mark of Goldman Sachs & Co.
|
| The Fund’s investment company registration number is 811-5349.
|
| Prospectus
|
| GOLDMAN SACHS RESEARCH SELECT FUND
SM
|
| THE SECURITIES AND EXCHANGE COMMISSION HAS NOT APPROVED OR DISAPPROVED THESE SECURITIES OR PASSED UPON THE ADEQUACY OF THIS PROSPECTUS.
ANY REPRESENTATION TO THE CONTRARY IS A CRIMINAL OFFENSE.
|
| AN INVESTMENT IN THE FUND IS NOT A BANK DEPOSIT AND IS NOT INSURED BY THE FEDERAL DEPOSIT INSURANCE CORPORATION OR ANY OTHER GOVERNMENT
AGENCY. AN INVESTMENT IN THE FUND INVOLVES INVESTMENT RISKS, INCLUDING POSSIBLE LOSS OF PRINCIPAL.
|
| NOT FDIC-INSURED
|
May Lose Value
|
No Bank Guarantee
|
| Goldman Sachs Asset Management, a unit of the Investment Management Division of Goldman, Sachs & Co. (“Goldman
Sachs”), serves as investment adviser to the Research Select Fund (the “Fund”). Goldman Sachs Asset Management is referred to in this Prospectus as the “Investment Adviser.”
|
| RESEARCH STYLE FUNDS—RESEARCH SELECT FUND
|
| The Goldman Sachs Research Select Fund selects substantially all of its securities from the U.S. Select List developed by
the Goldman Sachs Investment Research Division. The Fund leverages the resources of Goldman Sachs by applying the Investment Management Division’s portfolio management expertise to the equity securities included in the U.S. Select List.
|
| The Fund has determined to discontinue public sales of its shares to new investors when the Fund’s total net assets reach
approximately $1.2 billion. As of the close of business on December 15, 2000, the Fund’s total net assets equaled $771.5 million. A shareholder who has an open Fund account on the date the Fund is closed may make additional investments and reinvest
dividends and capital gains distributions in that account after that date if the account remains open. Current shareholders may also open additional Fund accounts under certain conditions. If a Fund account is closed, however, additional investments in
the Fund may not be possible.
|
|
Objective:
|
Long-term growth of capital
|
|
Benchmark:
|
S&P 500® Index
|
|
Investment Focus:
|
A focused portfolio of U.S. equity securities that offer the potential for long-term capital appreciation
|
| INVESTMENT OBJECTIVE
|
| The Fund seeks to provide long-term growth of capital by investing in a focused portfolio of U.S. equity securities.
|
| PRINCIPAL INVESTMENT STRATEGIES
|
| Equity Securities. The Fund invests, under normal circumstances, at least 90% of its total assets in U.S. equity securities, including securities of foreign issuers that are traded in the United States. Under normal circumstances, the Fund will only
purchase equity securities that are included in the Goldman Sachs Global Investment Research Division’s U.S. Select List and will sell securities that have been removed from the U.S. Select List. Notification of changes to the U.S. Select List is made to clients of Goldman Sachs and to the Fund’s portfolio management team at the
same time. The Fund will purchase a security that has been added to, or sell a security that has been removed from, the list after publication of that change. In addition, the Investment Adviser may apply the techniques described below in managing the
Fund and in purchasing and selling securities that are included in the U.S. Select List.
|
| The Goldman Sachs Global Investment Research Division’s U.S. Select List.
The U.S. Select List was introduced on September 9, 1998 and comprises approximately 25 to 35 equity securities that the Goldman Sachs U.S. Stock Selection
Committee expects, as a portfolio, to outperform its benchmark, the S&Ps 500® Index over the next 12 to 18 months. The list is consistent with overall investment policy and emphasizes strategically favored economic sectors. The U.S. Select List is updated on a regular basis. Historically, the U.S. Select List has consisted primarily of common stocks of relatively large U.S. companies, although the list is not restricted to those types of companies.
|
| The U.S. Select List is used primarily by institutional clients.
|
| Our Approach to Portfolio Management.
To the extent practicable, the Fund will seek to deliver returns that are comparable to the price returns of the U.S. Select List. Generally, the Fund will seek to maintain approximate equal weightings of its assets among the securities included
in the list. Any remaining assets may be invested by the Investment Adviser in the other instruments described in this Prospectus, including short-term debt obligations, options and futures contracts.
|
| Investors should be aware, however, that the performance of the Fund will differ from the price returns of the U.S. Select List
for a variety of reasons, including the change in securities prices that may occur between the time when a security is added to or removed from the list and when it is bought or sold for the Fund; the Fund’s investment of cash flow from purchases
and sales of Fund shares, which can occur daily and will result in portfolio purchases and sales; modifications in the Fund’s stock weights in order to control trading costs; the timing and amount of dividend and distribution payments; and the
Fund’s use of investment techniques and instruments that are not included in the U.S. Select List. In addition, unlike the U.S. Select List, the Fund will incur transactional costs (such as brokerage commissions) and operational expenses (such as investment advisory fees).
|
| While the Fund intends to track the composition of the U.S. Select List, the Fund’s purchases and sales of securities
that are added to and deleted from the list may not be completed on the first trading day after changes to the list are announced, and in certain cases may take several days or weeks to complete. Moreover, purchases and sales of the Fund and other
investors following the U.S. Select List could create a temporary imbalance between the supply and demand of the securities on the list. The imbalance could affect the time it takes the Fund to complete its transactions, as well as the price the Fund pays or receives. In
order to reduce impact of these trading costs, the Investment Adviser may decide for a period of time not to buy a security that is included in the U.S. Select List or to continue to hold a security that has been removed from the list.
|
| The Fund will periodically rebalance its portfolio in an effort to maintain approximate equal weightings of its assets among the
securities on the U.S. Select List.
|
| Other. The Fund’s investments in fixed-income securities are limited to securities that are considered cash equivalents.
|
Ÿ
|
No specific percentage limitation on usage;
limited only by the objective and strategies of the Fund |
| Research
Select Fund |
|||
|---|---|---|---|
| Investment Practices | |||
| Borrowings | 33 1
/3
|
||
| Custodial Receipts | — | ||
| Equity Swaps* | 15 | ||
| Futures Contracts and Options on Futures Contracts | Ÿ | ||
| Investment Company Securities (including exchange-traded funds) | 10 | ||
| Options on Securities and Securities Indices 1 | Ÿ | ||
| Repurchase Agreements | Ÿ | ||
| Securities Lending | 33 1
/3
|
||
| Short Sales Against the Box | 25 | ||
| Unseasoned Companies | Ÿ | ||
| Warrants and Stock Purchase Rights | Ÿ | ||
| When-Issued Securities and Forward Commitments | Ÿ | ||
*
|
Limited to 15% of net assets (together with other illiquid securities) for all structured securities which are not
deemed to be liquid and all swap transactions.
|
1
|
The Fund may sell covered call and put options and purchase call and put options.
|
Ÿ
|
No specific percentage limitation on usage;
limited only by the objective and strategies of the Fund |
| Research
Select Fund |
||||
|---|---|---|---|---|
| Investment Securities | ||||
| American and Global Depositary Receipts | — | |||
| Asset-Backed and Mortgage-Backed Securities | — | |||
| Bank Obligations 2 | Ÿ | |||
| Convertible Securities 3 | Ÿ | |||
| Corporate Debt Obligations 2 | Ÿ | |||
| Equity Securities | 90 | + | ||
| Emerging Country Securities | — | |||
| Fixed Income Securities | Ÿ | |||
| Foreign Issuers | Ÿ | |||
| Non-Investment Grade Fixed Income Securities | — | |||
| Real Estate Investment Trusts (“REITs”) | Ÿ | |||
| Structured Securities * | Ÿ | |||
| Temporary Investments | 100 | |||
| U.S. Government Securities 2 | Ÿ | |||
*
|
Limited to 15% of net assets (together with other illiquid securities) for all structured securities which are not
deemed to be liquid and all swap transactions.
|
2
|
Limited by the amount the Fund invests in fixed-income securities. Cash equivalents only.
|
3
|
The Fund has no minimum rating criteria.
|
| Loss of money is a risk of investing in the Fund. An investment in the Fund is not a deposit of any bank and is not insured or
guaranteed by the Federal Deposit Insurance Corporation or any other governmental agency. The following summarizes important risks that apply to the Fund and may result in a loss of your investment. The Fund should not be relied upon as a complete
investment program. There can be no assurance that the Fund will achieve its investment objective.
|
| Research
Select Fund |
|||
|---|---|---|---|
| Ÿ Applicable | |||
| U.S. Select List | Ÿ | ||
| Stock | Ÿ | ||
| Credit/Default | Ÿ | ||
| Foreign | Ÿ | ||
| Derivatives | Ÿ | ||
| Interest Rate | Ÿ | ||
| Management | Ÿ | ||
| Market | Ÿ | ||
| Liquidity | Ÿ | ||
| Small Cap | Ÿ | ||
n
|
U.S. Select List Risk—The Fund invests
principally in securities included in the U.S. Select List, which comprises approximately 25 to 35 stocks. As a result of the small universe of stocks in which the Fund generally invests, it may be subject to greater risks than would a more diversified fund.
|
| Price returns reported for the U.S. Select List do not predict or reflect the future results of the U.S. Select List
or the Fund. In addition, unlike the Fund, the securities included in the U.S. Select List constitute only a “paper portfolio” that does not reflect actual trading and does not have an actual performance record.
|
| Although the Goldman Sachs U.S. Stock Selection Committee periodically makes subjective decisions to add or delete companies for the
U.S. Select List, the list is not compiled with any particular client or product in mind and is not (and will not be) compiled with the Fund in mind. The Global Investment Research Division could at any time cease publishing the U.S. Select List
. In that event, the Board of Trustees will make a determination on how to proceed
|
||
| in the best interest of shareholders of the Fund, consistent with the Fund’s investment objective. Goldman Sachs publishes similar lists of recommended securities that may be appropriate for shareholders of the Fund but which will not be used by the Investment Adviser for the Fund at this time. |
| The Fund’s purchases and sales for its portfolio will be affected by market conditions following the publication of changes
to the U.S. Select List and will be subject to competing orders by Goldman Sachs clients who invest in the securities included on the list.
|
| The activities of Goldman Sachs and its affiliates may occasionally limit the Fund’s ability to purchase or sell securities
included in the U.S. Select List. The U.S. Select List is also subject to restrictions related to Goldman Sachs’ other businesses. In addition, certain securities may or may not appear on the U.S. Select List or may or may not be removed from
the list due to legal restrictions applicable to, or other business concerns of, Goldman Sachs. An investor should understand that these concerns will generally not be related to whether a particular security on the list or a security not on the list is
an attractive investment opportunity.
|
| As a global financial services firm, Goldman Sachs provides a wide range of financial services to issuers of securities and
investors in securities. Goldman Sachs, its affiliates and others associated with it may create markets or specialize in, have positions in and affect transactions in, securities of companies included in the U.S. Select List and may also perform or seek to perform financial services for those companies. Within the last three years, Goldman Sachs or its affiliates may have managed or co-managed public security offerings for companies included in the
U.S. Select List, and they or their employees may have a long or short position on holdings in the securities, or options on securities, or other related investments of companies included in the U.S. Select List.
|
| The Fund’s ability to invest in particular securities included in the U.S. Select List may be limited by the
diversification and other restrictions imposed on it as a registered mutual fund under the Investment Company Act of 1940 (the “Act”).
|
n
|
Stock Risk—The risk that stock prices
have historically risen and fallen in periodic cycles. Recently, U.S. stock markets and certain foreign stock markets have experienced substantial price volatility and, at times, have traded at or close to record high levels. There is no guarantee that
such levels will be reached or maintained in the future.
|
n
|
Credit/Default Risk—The risk that an issuer or guarantor of fixed-income securities held by the Fund may
default on its obligation to pay interest and repay principal.
|
n
|
Foreign Risk—The risk that when the Fund invests in foreign issuers, it will be subject to risk of loss not
typically associated with domestic issuers. Loss may result because of less foreign government regulation, less public information and
|
|
| less economic, political and social stability. Loss may also result from the imposition of exchange controls, confiscations and other government restrictions. |
n
|
Derivatives Risk—The risk that loss may result from the Fund’s investments in options, futures, swaps,
structured securities and other derivative instruments. These instruments may be leveraged so that small changes may produce disproportionate losses to the Fund.
|
n
|
Interest Rate Risk—The risk that when interest rates increase, fixed-income securities held by the Fund will
decline in value.
|
n
|
Management Risk—The risk that a strategy used by the Investment Adviser may fail to produce the intended results.
|
n
|
Market Risk—The risk that the value of the securities in which the Fund invests may go up or down in response
to the prospects of individual companies particular industry sectors and/or general economic conditions. Price changes may be temporary or last for extended periods. The Fund’s investments may be overweighted from time to time in one or more industry
sectors, which will increase the Fund’s exposure to risk of loss from adverse developments affecting those sectors.
|
n
|
Liquidity Risk—The risk that the Fund will not be able to pay redemption proceeds within the time period stated
in this Prospectus because of unusual market conditions, an unusually high volume of redemption requests, or other reasons. Because the Fund may invest in small capitalization stocks and REITs, the Fund will be especially subject to the risk that during
certain periods the liquidity of particular issuers or industries, or all securities within particular investment categories, will shrink or disappear suddenly and without warning as a result of adverse economic, market or political events, or adverse
investor perceptions whether or not accurate.
|
n
|
Small Cap Stock Risk—The securities of small capitalization stocks involve greater risks than those associated
with larger, more established companies and may be subject to more abrupt or erratic price movements. Securities of such issuers may lack sufficient market liquidity to enable the Fund to effect sales at an advantageous time or without a substantial drop
in price.
|
| More information about the Fund’s portfolio securities and investment techniques, and their associated risks, is provided in
Appendix A. You should consider the investment risks discussed in this section and in Appendix A. Both are important to your investment choice.
|
| HOW THE FUND HAS PERFORMED
|
| The Fund commenced operations on June 19, 2000. Since the Fund has less than one calendar year’s performance, no performance
information is provided in this section.
|
| Research
Select Fund |
|||
|---|---|---|---|
| Shareholder Fees | |||
| (fees paid directly from your investment): | |||
| Maximum Sales Charge (Load) Imposed on Purchases | None | ||
| Maximum Sales Charge (Load) Imposed on Reinvested Dividends | None | ||
| Redemption Fees | None | ||
| Exchange Fees | None | ||
| Annual Fund Operating Expenses | |||
| (expenses that are deducted from Fund assets):1 | |||
| Management Fees | 1.00% | ||
| Distribution and Service (12b-1) Fees | None | ||
| Other Expenses 2 | 0.65% | ||
| Total Fund Operating Expenses* | 1.65% | ||
| See page 11 for all other footnotes.
|
*
|
As a result of current expense limitations, the estimated “Other Expenses” and “Total Fund Operating Expenses”
of the Fund which are actually incurred as of the date of this Prospectus are as set forth below. The expense limitations may be terminated at any time at the option of the Investment Adviser. If this occurs, “Other Expenses” and “Total
Fund Operating Expenses” may increase without shareholder approval.
|
| Research
Select Fund |
|||
|---|---|---|---|
| Annual Fund Operating Expenses | |||
| (expenses that are deducted from Fund assets):1 | |||
| Management Fees | 1.00% | ||
| Distribution and Service (12b-1) Fees | None | ||
| Other Expenses 2 | 0.10% | ||
| Total Fund Operating Expenses (after current expense limitations) | 1.10% | ||
1
|
The operating expenses for the Fund are estimated for the current year.
|
2
|
Estimated “Other Expenses” include transfer agency fees equal to 0.04% of the average daily net assets of the
Fund’s Institutional Shares plus all other ordinary expenses not detailed above. The Investment Adviser has voluntarily agreed to reduce or limit “Other Expenses” (excluding management fees, transfer agency fees, taxes, interest and
brokerage fees and litigation, indemnification and other extraordinary expenses) to the following percentage of the Fund’s average daily net assets:
|
| Fund | Other
Expenses |
||
|---|---|---|---|
| Research Select | 0.06% | ||
| Fund | 1 Year | 3 Years | 5 Years | 10 Years | |||||
|---|---|---|---|---|---|---|---|---|---|
| Research Select | $168 | $520 | N/A | N/A | |||||
| INVESTMENT ADVISER
|
| Investment Adviser | Fund | ||
|---|---|---|---|
| Goldman Sachs Asset Management (“GSAM”) | Research Select | ||
| 32 Old Slip | |||
| New York, New York 10005 | |||
| GSAM is a business unit of the Investment Management Division (“IMD”) of Goldman Sachs. Goldman Sachs registered as an
investment adviser in 1981. As of September 30, 2000, GSAM, along with other units of IMD, had assets under management of $281.3 billion.
|
| The Investment Adviser provides day-to-day investment management services regarding the Fund’s portfolio transactions. The
Investment Adviser makes the investment decisions for the Fund and places purchase and sale orders for the Fund’s portfolio transactions in U.S. markets. As permitted by applicable law, these orders may be directed to any brokers, including Goldman
Sachs and its affiliates. In addition, the Investment Adviser has access to the research and certain proprietary technical models developed by Goldman Sachs.
|
| The Investment Adviser also performs the following additional services for the Fund:
|
n
|
Supervises all non-advisory operations of the Fund
|
n
|
Provides personnel to perform necessary executive, administrative and clerical services to the Fund
|
n
|
Arranges for the preparation of all required tax returns,
reports to shareholders, prospectuses and statements of additional information and other reports filed with the Securities and Exchange Commission (the “SEC”) and other regulatory authorities
|
n
|
Maintains the records of the Fund
|
n
|
Provides office space and all necessary office equipment and services
|
| MANAGEMENT FEES
|
| As compensation for its services and its assumption of certain expenses, the Investment Adviser is entitled to the following fee,
computed daily and payable monthly, at the annual rate listed below (as a percentage of the Fund’s average daily net assets):
|
| Contractual Rate | Actual Rate for the
Fiscal Period Ended August 31, 2000 |
||||
|---|---|---|---|---|---|
| Research Select | 1.00% | 1.00% | |||
| The Investment Adviser may voluntarily waive a portion of its advisory fee from time to time, and may discontinue any voluntary
waiver at any time at its discretion.
|
| FUND MANAGERS
|
| Robert B. Litterman, Ph.D., a Managing Director of Goldman Sachs, is the co-developer, along with the late Fischer Black, of the
Black-Litterman Global Asset Allocation Model, a key tool in IMD’s asset allocation process. As Director of Quantitative Resources, Dr. Litterman oversees Quantitative Equities, the Quantitative Strategies Group, the Investment Performance &
Valuation Oversight Group, and the Client Research Groups. In total, these groups include over 120 professionals. Prior to moving to IMD, Dr. Litterman was the head of the Firmwide Risk department of Goldman Sachs since becoming a Partner in 1994.
Preceding his time in the Operations, Technology & Finance Division, Dr. Litterman spent eight years in the Fixed Income Division’s research department where he was co-director of the research and model development group.
|
| Quantitative Equity Team
|
n
|
A stable and growing team supported by an extensive internal staff
|
n
|
Access to the research ideas of Goldman Sachs’ renowned Global Investment Research Department
|
n
|
More than $34 billion in equities currently under management
|
n
|
Proprietary research on quantitative models and tax-advantaged strategies
|
| Name and Title | Fund Responsibility | Years
Primarily Responsible |
Five Year Employment History | ||||
|---|---|---|---|---|---|---|---|
| Melissa Brown
Managing Director Product Manager for Quantitative Equities |
Senior Portfolio Manager—
Research Select |
Since
2000 |
Ms. Brown joined the
Investment Adviser as a portfolio manager in 1998. From 1984 to 1998, she was the director of Quantitative Equity Research and served on the Investment Policy Committee at Prudential Securities. |
||||
| Robert C. Jones
Managing Director Head of Quantitative Equities |
Senior Portfolio Manager—
Research Select |
Since
2000 |
Mr. Jones joined the
Investment Adviser as a portfolio manager in 1989. |
||||
| Victor H. Pinter
Vice President Head of Portfolio Construction |
Senior Portfolio Manager—
Research Select |
Since
2000 |
Mr. Pinter joined the
Investment Adviser as a research analyst in 1989. He became a portfolio manager in 1992. |
||||
| DISTRIBUTOR AND TRANSFER AGENT
|
| Goldman Sachs, 85 Broad Street, New York, New York 10004, serves as the exclusive distributor (the “Distributor”) of the
Fund’s shares. Goldman Sachs, 4900 Sears Tower, Chicago, Illinois 60606-6372, also serves as the Fund’s transfer agent (the “Transfer Agent”) and, as such, performs various shareholder servicing functions.
|
| From time to time, Goldman Sachs or any of its affiliates may purchase and hold shares of the Fund. Goldman Sachs reserves the
right to redeem at any time some or all of the shares acquired for its own account.
|
| ACTIVITIES OF GOLDMAN SACHS AND ITS AFFILIATES AND OTHER ACCOUNTS MANAGED BY GOLDMAN SACHS
|
| The involvement of the Investment Adviser, Goldman Sachs and their affiliates in the management of, or their interest in, other
accounts and other activities of Goldman Sachs may present conflicts of interest with respect to the Fund or limit the Fund’s investment activities. Goldman Sachs and its affiliates engage in proprietary trading and advise accounts and funds which
have investment objectives similar to those of the Fund and/or which engage in and compete for transactions in the same types of securities, currencies and instruments as the Fund. Goldman Sachs and its affiliates will not have any obligation to make
available any information regarding their proprietary activities or strategies, or the activities or strategies used for other accounts managed by them, for the benefit of the management of the Fund. The results of the Fund’s investment activities,
therefore, may differ from those of Goldman Sachs and its affiliates, and it is possible that the Fund could sustain losses during periods in which Goldman Sachs and its affiliates and other accounts achieve significant profits on their trading for
proprietary or other accounts. In addition, the Fund may, from time to time, enter into transactions in which other clients of Goldman Sachs have an adverse interest. The Fund’s activities may be limited because of regulatory restrictions applicable
to Goldman Sachs and its affiliates, and/or their internal policies designed to comply with such restrictions.
|
| In
providing its investment management services for the Fund, the Investment Adviser invests in equity securities that are included in the Goldman Sachs Global Investment Research Division’s U.S. Select List. Goldman Sachs is a leading, full service global investment banking and securities firm. The firm’s Global Investment Research Division provides far-reaching and comprehensive analysis and commentary on portfolio strategy,
economics, industries and companies. For over two decades, Goldman Sachs has committed the resources on a global scale to develop an industry-leading position for the firm’s investment research products.
|
| Goldman Sachs has achieved worldwide recognition for its value-added research products. The Global Investment Research Division
has a well-regarded staff of approximately 900 professionals including more than 300 equity analysts, 25 global research teams, and 12 portfolio strategists, covering approximately 2400 companies, over 50 economies and over 25 stock markets.
|
| The U.S. Stock Selection Committee comprises approximately twelve senior professionals, including the head of Global Investment
Research and the Director of U.S. Investment Research, as well as a senior market strategist, an economist, and sector specialists.
|
n
|
Cash
|
n
|
Additional shares of the same class of the Fund
|
n
|
Shares of the same or an equivalent class of another Goldman Sachs Fund. Special restrictions may apply for certain ILA
Portfolios. See the Additional Statement.
|
| Fund | Investment
Income Dividends |
Capital Gains
Distributions |
|||
|---|---|---|---|---|---|
| Research Select | Annually | Annually | |||
| The following section will provide you with answers to some of the most often asked questions regarding buying and selling the
Fund’s Institutional Shares.
|
| How Can I Purchase Institutional Shares Of The Fund?
|
| You may purchase Institutional Shares on any business day at their NAV next determined after receipt of an order. No sales load is
charged. You should place an order with Goldman Sachs at 1-800-621-2550 and either:
|
n
|
Wire federal funds to The Northern Trust Company (“Northern”), as subcustodian for State Street Bank and Trust Company
(“State Street”) (the Fund’s custodian) on the next business day; or
|
n
|
Send a check or Federal Reserve draft payable to Goldman Sachs Funds—(Name of Fund and Class of Shares), 4900 Sears Tower,
Chicago, IL 60606-6372. The Fund will not accept a check drawn on a foreign bank or a third-party check.
|
| In order to make an initial investment in the Fund, you must furnish to the Fund or Goldman Sachs the Account Application attached
to this Prospectus. Purchases of Institutional Shares must be settled within three business days of receipt of a complete purchase order.
|
| In certain instances, the Trust may require a signature guarantee in order to effect purchase, redemption or exchange
transactions. Signature guarantees must be obtained from a bank, brokerage firm or other financial intermediary that is a member of an approved Medallion Guarantee Program or that is otherwise approved by Goldman Sachs. A notary public cannot provide a
signature guarantee.
|
| How Do I Purchase Shares Through A Financial Institution?
|
| Certain institutions (including banks, trust companies, brokers and investment advisers) that provide recordkeeping, reporting and
processing services to their customers may be authorized to accept, on behalf of Goldman Sachs Trust (the “Trust”), purchase, redemption and exchange orders placed by or on behalf of their customers, and may designate other intermediaries to
accept such orders, if approved by the Trust. In these cases:
|
n
|
The Fund will be deemed to have received an order in proper form when the order is accepted by the authorized institution or
intermediary on a business day, and the order will be priced at the Fund’s NAV next determined after such acceptance.
|
n
|
Authorized institutions and intermediaries will be responsible for transmitting accepted orders and payments to the Trust within
the time period agreed upon by them.
|
| You should contact your institution or intermediary to learn whether it is authorized to accept orders for the Trust.
|
| These institutions may receive payments from the Fund or Goldman Sachs for the services provided by them with respect to the
Fund’s Institutional Shares. These payments may be in addition to other payments borne by the Fund.
|
| The Investment Adviser, Distributor and/or their affiliates may pay additional compensation from time to time, out of their assets
and not as an additional charge to the Fund, to certain institutions and other persons in connection with the sale, distribution and/or servicing of shares of the Fund and other Goldman Sachs Funds. Additional compensation based on sales may, but is
currently not expected to, exceed 0.50% (annualized) of the amount invested.
|
| In addition to Institutional Shares, the Fund also offers other classes of shares to investors. These other share classes are
subject to different fees and expenses (which affect performance), have different minimum investment requirements and are entitled to different services than Institutional Shares. Information regarding these other share classes may be obtained from your
sales representative or from Goldman Sachs by calling the number on the back cover of this Prospectus.
|
| What Is My Minimum Investment In The Fund?
|
| Type of Investor | Minimum Investment | ||
|---|---|---|---|
| n
Banks, trust companies or other
depository institutions investing for their own account or on behalf of clients |
$1,000,000 in Institutional Shares of the Fund
alone or in combination with other assets under the management of GSAM and its affiliates |
||
| n
Section 401(k), profit sharing,
money purchase pension, tax- sheltered annuity, defined benefit pension, or other employee benefit plans that are sponsored by one or more employers (including governmental or church employers) or employee organizations |
|||
| n
State, county, city or any
instrumentality, department, authority or agency thereof |
|||
| n
Corporations with at least $100
million in assets or in outstanding publicly traded securities |
|||
| n
“Wrap” account sponsors (provided
they have an agreement covering the arrangement with GSAM) |
|||
| n
Registered investment advisers
investing for accounts for which they receive asset-based fees |
|||
| n Individual investors | $10,000,000 | ||
| n
Qualified non-profit organizations,
charitable trusts, foundations and endowments |
|||
| n
Accounts over which GSAM or its
advisory affiliates have investment discretion |
|||
| The minimum investment requirement may be waived for current and former officers, partners, directors or employees of Goldman
Sachs or any of its affiliates or for other investors at the discretion of the Trust’s officers. No minimum amount is required for subsequent investments.
|
| What Else Should I Know About Share Purchases?
|
| The Trust reserves the right to:
|
n
|
Modify or waive the minimum investment amounts.
|
n
|
Reject or restrict any purchase or exchange orders by a particular purchaser (or group of related purchasers). This may occur, for
example, when a pattern of frequent purchases, sales or exchanges of Institutional Shares of the Fund is evident, or if purchases, sales or exchanges are, or a subsequent abrupt redemption might be, of a size that would disrupt the management of the Fund.
|
n
|
Close the Fund to new investors from time to time and reopen the Fund whenever it is deemed appropriate by the Fund’s
Investment Adviser.
|
| The Fund may allow you to purchase shares with securities instead of cash if consistent with the Fund’s investment policies
and operations and if approved by the Fund’s Investment Adviser.
|
| How Are Shares Priced?
|
| The price you pay or receive when you buy, sell or exchange Institutional Shares is determined by the Fund’s NAV. The Fund
calculates NAV as follows:
|
| (Value of Assets of the Class) | ||
| NAV = | – (Liabilities of the Class) | |
| Number of Outstanding Shares of the Class |
| The Fund’s investments are valued based on market quotations or, if accurate quotations are not readily available, the fair
value of the Fund’s investments may be determined in good faith under procedures established by the Trustees.
|
n
|
NAV per share of each class is calculated by State Street on each business day as of the close of regular trading on the New York
Stock Exchange (normally 4:00 p.m. New York time). Fund shares will not be priced on any day the New York Stock Exchange is closed.
|
n
|
When you buy shares, you pay the NAV next calculated after the Fund receives your order in proper form.
|
n
|
When you sell shares, you receive the NAV next calculated after the Fund receives your order in proper form.
|
| Note: The time at which transactions and shares are priced and the time by which orders must be received may be changed in
case of an emergency or if regular trading on the New York Stock Exchange is stopped at a time other than 4:00 p.m. New York time.
|
| In addition, the impact of events that occur after the publication of market quotations used by the Fund to price its securities
(for example, in foreign markets), but before the close of regular trading on the New York Stock Exchange will normally not be reflected in the Fund’s next determined NAV unless the Trust, in its discretion, makes an adjustment in light of the nature
and materiality of the event, its effect on Fund operations and other relevant factors.
|
| How Can I Sell Institutional Shares Of The Fund?
|
| You may arrange to take money out of your account by selling (redeeming) some or all of your shares. Generally, the Fund will
redeem its Institutional Shares upon request on any business day at their NAV next determined after receipt of such request in proper form. You may request that redemption proceeds be sent to you by check or by wire (if the wire instructions are on record). Redemptions may be requested in writing or by telephone.
|
| Instructions For Redemptions: | |||
|---|---|---|---|
| By Writing: | n Write a letter of instruction that includes: | ||
| n Your name(s) and signature(s) | |||
| n Your account number | |||
| n The Fund name and Class of Shares | |||
| n The dollar amount you want to sell | |||
| n How and where to send the proceeds | |||
| n Mail your request to: | |||
| Goldman Sachs Funds | |||
| 4900 Sears Tower | |||
| Chicago, IL 60606-6372 | |||
| By Telephone: | If you have elected the telephone | ||
| redemption privilege on your Account Application: | |||
| n 1-800-621-2550 | |||
| (8:00 a.m. to 4:00 p.m. New York time) | |||
| Certain institutions and intermediaries are authorized to accept redemption requests on behalf of the Fund as described under
“How Do I Purchase Shares Through A Financial Institution?”
|
| What Do I Need To Know About Telephone Redemption Requests?
|
| The Trust, the Distributor and the Transfer Agent will not be liable for any loss you may incur in the event that the Trust
accepts unauthorized telephone redemption requests that the Trust reasonably believes to be genuine. In an effort to prevent unauthorized or fraudulent redemption and exchange requests by telephone, Goldman Sachs employs reasonable procedures specified by
the Trust to confirm that such instructions are genuine. If reasonable procedures are not employed, the Trust may be liable for any loss due to unauthorized or fraudulent transactions. The following general policies are currently in effect:
|
n
|
All telephone requests are recorded.
|
n
|
Any redemption request that requires money to go to an account or address other than that designated on the Account Application
must be in writing and signed by an authorized person designated on the Account Application. The
|
|
| written request may be confirmed by telephone with both the requesting party and the designated bank account to verify instructions. |
n
|
The telephone redemption option may be modified or terminated at any time.
|
| Note: It may be difficult to make telephone redemptions in times of drastic economic or market conditions.
|
| How Are Redemption Proceeds Paid?
|
| By Wire: You may arrange for your redemption proceeds to be wired as federal funds to the bank account designated in
your Account Application. The following general policies govern wiring redemption proceeds:
|
n
|
Redemption proceeds will normally be wired on the next business day in federal funds (for a total of one business day delay), but
may be paid up to three business days following receipt of a properly executed wire transfer redemption request. If you are selling shares you recently paid for by check, the Fund will pay you when your check has cleared, which may take up to 15 days. If
the Federal Reserve Bank is closed on the day that the redemption proceeds would ordinarily be wired, wiring the redemption proceeds may be delayed one additional business day.
|
n
|
To change the bank designated on your Account Application, you must send written instructions signed by an authorized person
designated on the account application to the Transfer Agent.
|
n
|
Neither the Trust, Goldman Sachs nor any other institution assumes any responsibility for the performance of your bank or any
intermediaries in the transfer process. If a problem with such performance arises, you should deal directly with your bank or any such intermediaries.
|
| By Check: You may elect in writing to receive your redemption proceeds by check. Redemption proceeds paid by check
will normally be mailed to the address of record within three business days of a properly executed redemption request. If you are selling shares you recently paid for by check, the Fund will pay you when your check has cleared, which may take up to 15 days.
|
| What Else Do I Need To Know About Redemptions?
|
| The following generally applies to redemption requests:
|
n
|
Additional documentation may be required when deemed appropriate by the Transfer Agent. A redemption request will not be in proper
form until such additional documentation has been received.
|
n
|
Institutions (including banks, trust companies, brokers and investment advisers) are responsible for the timely transmittal of
redemption requests by their customers to the Transfer Agent. In order to facilitate the timely transmittal of redemption requests, these institutions may set times by which they must receive redemption requests. These institutions may also require
additional documentation from you.
|
| The Trust reserves the right to:
|
n
|
Redeem your shares if your account balance falls below $50 as a result of earlier redemptions. The Fund will not redeem your
shares on this basis if the value of your account falls below the minimum account balance solely as a result of market conditions. The Fund will give you 60 days’ prior written notice to allow you to purchase sufficient additional shares of the Fund
in order to avoid such redemption.
|
n
|
Redeem your shares in other circumstances determined by the Board of Trustees to be in the best interest of the Trust.
|
n
|
Pay redemptions by a distribution in-kind of securities (instead of cash). If you receive redemption proceeds in-kind, you should
expect to incur transaction costs upon the disposition of those securities.
|
n
|
Reinvest any dividends or other distributions which you have elected to receive in cash should your check for such dividends or
other distributions be returned to the Fund as undeliverable or remain uncashed for six months. In addition, that distribution and all future distributions payable to you will be reinvested at NAV in additional Institutional Shares of the Fund. No
interest will accrue on amounts represented by uncashed distribution or redemption checks.
|
| Can I Exchange My Investment From One Fund To Another?
|
| You may exchange Institutional Shares of the Fund at NAV for Institutional Shares of any other Goldman Sachs Fund. The exchange
privilege may be materially modified or withdrawn at any time upon 60 days’ written notice to you.
|
| Instructions For Exchanging Shares: | |||
|---|---|---|---|
| By Writing: | n Write a letter of instruction that includes: | ||
| n Your name(s) and signature(s) | |||
| n Your account number | |||
| n The Fund names and Class of Shares | |||
| n The dollar amount to be exchanged | |||
| n
Mail the request to:
Goldman Sachs Funds 4900 Sears Tower Chicago, IL 60606-6372 |
|||
| By Telephone: | If you have elected the telephone exchange
privilege on your Account Application: |
||
| n
1-800-621-2550
(8:00 a.m. to 4:00 p.m. New York time) |
|||
| You should keep in mind the following factors when making or considering an exchange:
|
n
|
You should obtain and carefully read the prospectus of the Fund you are acquiring before making an exchange.
|
n
|
All exchanges which represent an initial investment in a Fund must satisfy the minimum initial investment requirements of that
Fund, except that this requirement may be waived at the discretion of the Trust.
|
n
|
Telephone exchanges normally will be made only to an identically registered account.
|
n
|
Shares may be exchanged among accounts with different names, addresses and social security or other taxpayer identification
numbers only if the exchange instructions are in writing and are signed by an authorized person designated on the Account Application.
|
n
|
Exchanges are available only in states where exchanges may be legally made.
|
n
|
It may be difficult to make telephone exchanges in times of drastic economic or market conditions.
|
n
|
Goldman Sachs may use reasonable procedures described under “What Do I Need To Know About Telephone Redemption Requests?”
in an effort to prevent unauthorized or fraudulent telephone exchange requests.
|
n
|
Exchanges into Funds that are closed to new investors may be restricted.
|
| For federal income tax purposes, an exchange from one Fund to another is treated as a redemption of the shares surrendered in the
exchange, on which you may be subject to tax, followed by a purchase of shares received in the exchange. You should consult your tax adviser concerning the tax consequences of an exchange.
|
| Restrictions on Excessive Trading Practices. The Trust does not permit market-timing or other excessive trading
practices. Purchases and exchanges should be made for long-term investment purposes only. The Trust and Goldman Sachs reserve the right to reject or restrict purchase or exchange requests from any investor. Excessive, short-term (market-timing) trading
practices may disrupt portfolio management strategies, harm Fund performance and negatively impact long-term shareholders. The Trust and Goldman Sachs will not be held liable for any loss resulting from rejected purchase or exchange orders. To minimize
harm to the Trust (or Goldman Sachs) and its shareholders, the Trust (or Goldman Sachs) will exercise these rights if, in the Trust’s (or Goldman Sachs’) judgment, an investor has a history of excessive trading or if an investor’s trading,
in the judgment of the Trust (or Goldman Sachs), has been or may be disruptive to the Fund. In making this judgment, trades executed in multiple accounts under common ownership or control may be considered together.
|
| What Types Of Reports Will I Be Sent Regarding Investments In Institutional Shares?
|
| You will receive an annual report containing audited financial statements and a semi-annual report. To eliminate unnecessary
duplication, only one copy of such reports will be sent to shareholders with the same mailing address. If you would like a duplicate copy to be mailed to you, please contact Goldman Sachs Funds at 1-800-621-2550. You will also be provided with a printed
confirmation for each transaction in your account and a monthly account statement. The Fund does not generally provide sub-accounting services.
|
| As with any investment, you should consider how your investment in the Fund will be taxed. The tax information below is provided
as general information. More tax information is available in the Additional Statement. You should consult your tax adviser about the federal, state, local or foreign tax consequences of your investment in the Fund.
|
| Unless your investment is in an IRA or other tax-advantaged account, you should consider the possible tax consequences of Fund
distributions and the sale of your Fund shares.
|
| DISTRIBUTIONS
|
| Distributions you receive from the Fund are generally subject to federal income tax, and may also be subject to state or local
taxes. This is true whether you reinvest your distributions in additional Fund shares or receive them in cash. For federal tax purposes, the Fund’s income dividend distributions and short-term capital gain distributions are taxable to you as ordinary
income. Any long-term capital gain distributions are taxable as long-term capital gains, no matter how long you have owned your Fund shares.
|
| Although distributions are generally treated as taxable to you in the year they are paid, distributions declared in October,
November or December but paid in January are taxable as if they were paid in December. A percentage of the Fund’s dividends paid to corporate shareholders may be eligible for the corporate dividends-received deduction. The Fund will inform
shareholders of the character and tax status of all distributions promptly after the close of each calendar year.
|
| The Fund may be subject to foreign withholding or other foreign taxes on income or gain from certain foreign securities. In
general, the Fund may deduct these taxes in computing its taxable income.
|
| If you buy shares of the Fund before it makes a distribution, the distribution will be taxable to you even though it may actually
be a return of a portion of your investment. This is known as “buying a dividend.”
|
| SALES AND EXCHANGES
|
| Your sale of Fund shares is a taxable transaction for federal income tax purposes, and may also be subject to state and local
taxes. For tax purposes, the exchange of your Fund shares for shares of a different Goldman Sachs Fund is the same as a sale. When you sell your shares, you will generally recognize a capital gain or loss in an amount equal to the difference between your
adjusted tax basis in the shares and the amount received. Generally, this gain or loss is long-term or short-term depending on whether your holding period exceeds twelve months, except that any loss realized on shares held for six months or less will be
treated as a long-term capital loss to the extent of any long-term capital gain dividends that were received on the shares.
|
| RETIREMENT PLANS
|
| The one major exception to these tax principles is that distributions on, and sales, exchanges and redemptions of, shares held in
an IRA (or other tax-qualified plan) will not be currently taxable.
|
| OTHER INFORMATION
|
| When you open your account, you should provide your social security or tax identification number on your Account Application. By
law, the Fund must withhold 31% of your taxable distributions and any redemption proceeds if you do not provide your correct taxpayer identification number, or certify that it is correct, or if the IRS instructs the Fund to do so. Non-U.S. investors may
be subject to U.S. withholding and estate tax.
|
| A. General Portfolio Risks
|
| The Fund will be subject to the risks associated with equity securities. “Equity securities” may include common stocks,
preferred stocks, interests in real estate investment trusts, convertible debt obligations, convertible preferred stocks, equity interests in trusts, partnerships, joint ventures, limited liability companies and similar enterprises, warrants, and stock
purchase rights. In general, stock values fluctuate in response to the activities of individual companies and in response to general market and economic conditions. Accordingly, the value of the stocks that the Fund holds may decline over short or
extended periods. The stock markets tend to be cyclical, with periods when stock prices generally rise and periods when prices generally decline. The volatility of equity securities means that the value of your investment in the Fund may increase or
decrease. Recently, certain stock markets have experienced substantial price volatility and, at times, have traded at or close to record high levels. There can be no guarantee that such levels will be reached or maintained in the future.
|
| To the extent that the Fund invests in fixed-income securities, the Fund will also be subject to the risks associated with its
fixed-income securities. These risks include interest rate risk and credit risk. In general, interest rate risk involves the risk that when interest rates decline, the market value of fixed-income securities tends to increase. Conversely, when interest
rates increase, the market value of fixed-income securities tends to decline. Credit risk involves the risk that an issuer or guarantor could default on its obligations, and the Fund will not recover its investment.
|
| The Investment Adviser will not consider the portfolio turnover rate a limiting factor in making investment decisions for the
Fund. Trading to keep the Fund’s portfolio holdings consistent with, and equally weighted among, the securities in the U.S. Select List may increase the Fund’s portfolio turnover rate. A high rate of portfolio turnover (100% or more) involves correspondingly greater expenses which must be borne by the Fund and its shareholders, and is also likely to result in
higher short-term capital gains taxable to shareholders. The portfolio turnover rate is calculated by dividing the lesser of the dollar amount of sales or purchases of portfolio securities by the average monthly value of the Fund’s portfolio
securities, excluding securities having a maturity at the date of purchase of one year or less.
|
| The following sections provide further information on certain types of securities and investment techniques that may be used by
the Fund, including their associated risks. Additional information is provided in the Additional Statement, which is available upon request. Among other things, the Additional Statement describes certain fundamental investment restrictions that cannot be
changed without shareholder approval. You should note, however, that the investment objective, and all investment policies not specifically designated as fundamental, are non-fundamental and may be changed without shareholder approval. If there is a
change in the Fund’s investment objective, you should consider whether the Fund remains an appropriate investment in light of your then current financial position and needs.
|
| B. Other Portfolio Risks
|
| Risks of Investing in Small Capitalization Companies. The Fund may invest in small capitalization companies.
Investments in small capitalization companies involve greater risk and portfolio price volatility than investments in larger capitalization stocks. Among the reasons for the greater price volatility of these investments are the less certain growth
prospects of smaller firms and the lower degree of liquidity in the markets for such securities. Small capitalization companies may be thinly traded and may have to be sold at a discount from current market prices or in small lots over an extended period
of time. In addition, these securities are subject to the risk that during certain periods the liquidity of particular issuers or industries, or all securities in particular investment categories, will shrink or disappear suddenly and without warning as a
result of adverse economic or market conditions, or adverse investor perceptions whether or not accurate. Because of the lack of sufficient market liquidity, the Fund may incur losses because it will be required to effect sales at a disadvantageous time
and only then at a substantial drop in price. Small capitalization companies include “unseasoned” issuers that do not have an established financial history; often have limited product lines, markets or financial resources; may depend on or use a
few key personnel for management; and may be susceptible to losses and risks of bankruptcy. Transaction costs for these investments are often higher than those of larger capitalization companies. Investments in small capitalization companies may be more
difficult to price precisely than other types of securities because of their characteristics and lower trading volumes.
|
| Risks of Foreign Issuers. The Fund may invest in foreign issuers. Foreign issuers involve special risks that are not
typically associated with U.S. issuers. There may be less publicly available information about a foreign issuer than about a U.S. issuer. In addition, there is generally less government regulation of foreign compa-
|
|
| nies than in the United States. The securities of many foreign issuers are less liquid and more volatile than securities of comparable domestic issuers. Furthermore, with respect to certain foreign countries, there is a possibility of nationalization, expropriation or confiscatory taxation, imposition of withholding or other taxes on dividend or interest payments (or, in some cases, capital gains), limitations on the removal of funds or other assets, and political or social instability or diplomatic developments which could affect the Fund’s investments. |
| Risks of Derivative Investments. The Fund’s transactions in options, futures, options on futures, swaps and
structured securities involve additional risk of loss. Loss can result from a lack of correlation between changes in the value of derivative instruments and the portfolio assets (if any) being hedged, the potential illiquidity of the markets for
derivative instruments, or the risks arising from margin requirements and related leverage factors associated with such transactions. The use of these management techniques also involves the risk of loss if the Investment Adviser is incorrect in its
expectation of fluctuations in securities prices or interest rates. The Fund may also invest in derivative investments for non-hedging purposes (that is, to seek to increase total return). Investing for non-hedging purposes is considered a speculative
practice and presents even greater risk of loss.
|
| Risks of Illiquid Securities. The Fund may invest up to 15% of its net assets in illiquid securities which cannot be
disposed of in seven days in the ordinary course of business at fair value. Illiquid securities include:
|
n
|
Securities that are not readily marketable
|
n
|
Repurchase agreements and time deposits with a notice or demand period of more than seven days
|
n
|
Certain over-the-counter options
|
n
|
Certain structured securities and all swap transactions
|
n
|
Certain restricted securities, unless it is determined, based upon a review of the trading markets for a specific restricted
security, that such restricted security is eligible for resale pursuant to Rule 144A under the Securities Act of 1933 (“144A Securities”) and, therefore, is liquid.
|
| Investing in 144A Securities may decrease the liquidity of the Fund’s portfolio to the extent that qualified institutional
buyers become for a time uninterested in purchasing these restricted securities. The purchase price and subsequent valuation of restricted and illiquid securities normally reflect a discount, which may be significant, from the market price of comparable
securities for which a liquid market exists.
|
| Credit Risks. Debt securities purchased by the Fund may include securities (including zero coupon bonds) issued by
the U.S. government (and its agencies, instru-
|
|
| mentalities and sponsored enterprises), domestic and foreign corporations, banks and other issuers. Further information is provided in the Additional Statement. |
| Temporary Investment Risks. The Fund may, for temporary defensive purposes, invest a certain percentage of its total
assets in:
|
n
|
U.S. government securities
|
n
|
Commercial paper rated at least A-2 by Standard & Poor’s or P-2 by Moody’s
|
n
|
Certificates of deposit
|
n
|
Bankers’ acceptances
|
n
|
Repurchase agreements
|
n
|
Non-convertible preferred stocks and non-convertible corporate bonds with a remaining maturity of less than one year
|
| When the Fund’s assets are invested in such instruments, the Fund may not be achieving its investment objective.
|
| C. Portfolio Securities and Techniques
|
| This section provides further information on certain types of securities and investment techniques that may be used by the Fund,
including their associated risks. Further information is provided in the Additional Statement, which is available upon request.
|
| Structured Securities. The Fund may invest in structured securities. Structured securities are securities whose
value is determined by reference to changes in the value of specific currencies, interest rates, commodities, indices or other financial indicators (the “Reference”) or the relative change in two or more References. The interest rate or the
principal amount payable upon maturity or redemption may be increased or decreased depending upon changes in the applicable Reference. Structured securities may be positively or negatively indexed, so that appreciation of the Reference may produce an
increase or decrease in the interest rate or value of the security at maturity. In addition, changes in the interest rates or the value of the security at maturity may be a multiple of changes in the value of the Reference. Consequently, structured
securities may present a greater degree of market risk than other types of securities and may be more volatile, less liquid and more difficult to price accurately than less complex securities.
|
| REITs. The Fund may invest in REITs. REITs are pooled investment vehicles that invest primarily in either real
estate or real estate related loans. The value of a REIT is affected by changes in the value of the properties owned by the REIT or securing mortgage loans held by the REIT. REITs are dependent upon the ability of the REITs’ managers, and are subject
to heavy cash flow dependency,
|
|
| default by borrowers and the qualification of the REITs under applicable regulatory requirements for favorable income tax treatment. REITs are also subject to risks generally associated with investments in real estate including possible declines in the value of real estate, general and local economic conditions, environmental problems and changes in interest rates. To the extent that assets underlying a REIT are concentrated geographically, by property type or in certain other respects, these risks may be heightened. The Fund will indirectly bear its proportionate share of any expenses, including management fees, paid by a REIT in which it invests. |
| Options on Securities and Securities Indices. A put option gives the purchaser of the option the right to sell, and
the writer (seller) of the option the obligation to buy, the underlying instrument during the option period. A call option gives the purchaser of the option the right to buy, and the writer (seller) of the option the obligation to sell, the underlying
instrument during the option period. The Fund may write (sell) covered call and put options and purchase put and call options on any securities in which it may invest or on any securities index consisting of securities in which it may invest.
|
| The writing and purchase of options is a highly specialized activity which involves special investment risks. Options may be used
for either hedging or cross-hedging purposes, or to seek to increase total return (which is considered a speculative activity). The successful use of options depends in part on the ability of the Investment Adviser to manage future price fluctuations and
the degree of correlation between the options and securities markets. If the Investment Adviser is incorrect in its expectation of changes in market prices or determination of the correlation between the instruments or indices on which options are written
and purchased and the instruments in the Fund’s investment portfolio, the Fund may incur losses that it would not otherwise incur. The use of options can also increase the Fund’s transaction costs. Options written or purchased by the Fund may be
traded on U.S. exchanges or over-the-counter. Over-the-counter options will present greater possibility of loss because of their greater illiquidity and credit risks.
|
| Futures Contracts and Options on Futures Contracts. Futures contracts are standardized, exchange-traded contracts
that provide for the sale or purchase of a specified financial instrument at a future time at a specified price. An option on a futures contract gives the purchaser the right (and the writer of the option the obligation) to assume a position in a futures
contract at a specified exercise price within a specified period of time. A futures contract may be based on various securities (such as U.S. government securities), securities indices, and other financial instruments and indices. The Fund may engage in
futures transactions on U.S. exchanges.
|
| The Fund may purchase and sell futures contracts, and purchase and write call and put options on futures contracts, in order to
seek to increase total return or to hedge against changes in interest rates or securities prices. The Fund may also enter into closing purchase and sale transactions with respect to such contracts and options. The Fund will engage in futures and related
options transactions for bona fide hedging purposes as defined in regulations of the Commodity Futures Trading Commission or to seek to increase total return to the extent permitted by such regulations. The Fund may not purchase or sell futures contracts
or purchase or sell related options to seek to increase total return, except for closing purchase or sale transactions, if immediately thereafter the sum of the amount of initial margin deposits and premiums paid on the Fund’s outstanding positions
in futures and related options entered into for the purpose of seeking to increase total return would exceed 5% of the market value of the Fund’s net assets.
|
| Futures contracts and related options present the following risks:
|
n
|
While the Fund may benefit from the use of futures and options on futures, unanticipated changes in interest rates or securities
prices may result in poorer overall performance than if the Fund had not entered into any futures contracts or options transactions.
|
n
|
Because perfect correlation between a futures position and portfolio position that is intended to be protected is impossible to
achieve, the desired protection may not be obtained and the Fund may be exposed to additional risk of loss.
|
n
|
The loss incurred by the Fund in entering into futures contracts and in writing call options on futures is potentially unlimited
and may exceed the amount of the premium received.
|
n
|
Futures markets are highly volatile and the use of futures may increase the volatility of the Fund’s NAV.
|
n
|
As a result of the low margin deposits normally required in futures trading, a relatively small price movement in a futures
contract may result in substantial losses to the Fund.
|
n
|
Futures contracts and options on futures may be illiquid, and exchanges may limit fluctuations in futures contract prices during a
single day.
|
| Equity Swaps. The Fund may invest in equity swaps. Equity swaps allow the parties to a swap agreement to exchange
the dividend income or other components of return on an equity investment (for example, a group of equity securities or an index) for a component of return on another non-equity or equity investment.
|
| An equity swap may be used by the Fund to invest in a market without owning or taking physical custody of securities in
circumstances in which direct investment may be restricted for legal reasons or is otherwise impractical. Equity swaps are derivatives and their value can be very volatile. To the extent that the Investment
|
| Adviser does not accurately analyze and predict the potential relative fluctuation of the components swapped with another party,
the Fund may suffer a loss, which may be substantial. The value of some components of an equity swap (such as the dividends on a common stock) may also be sensitive to changes in interest rates. Furthermore, the Fund may suffer a loss if the counterparty
defaults. Because equity swaps are normally illiquid, the Fund may be unable to terminate its obligations when desired.
|
| When-Issued Securities and Forward Commitments. The Fund may purchase when-issued securities and enter into forward
commitments. When-issued securities are securities that have been authorized, but not yet issued. When-issued securities are purchased in order to secure what is considered to be an advantageous price or yield to the Fund at the time of entering into the
transaction. A forward commitment involves the entering into a contract to purchase or sell securities for a fixed price at a future date beyond the customary settlement period.
|
| The purchase of securities on a when-issued or forward commitment basis involves a risk of loss if the value of the security to be
purchased declines before the settlement date. Conversely, the sale of securities on a forward commitment basis involves the risk that the value of the securities sold may increase before the settlement date. Although the Fund will generally purchase
securities on a when-issued or forward commitment basis with the intention of acquiring the securities for its portfolio, the Fund may dispose of when-issued securities or forward commitments prior to settlement if the Investment Adviser deems it
appropriate.
|
| Repurchase Agreements. Repurchase agreements involve the purchase of securities subject to the seller’s
agreement to repurchase them at a mutually agreed upon date and price. The Fund may enter into repurchase agreements with dealers in U.S. government securities and member banks of the Federal Reserve System which furnish collateral at least equal in value
or market price to the amount of their repurchase obligation.
|
| If the other party or “seller” defaults, the Fund might suffer a loss to the extent that the proceeds from the sale of
the underlying securities and other collateral held by the Fund are less than the repurchase price and the Fund’s costs associated with delay and enforcement of the repurchase agreement. In addition, in the event of bankruptcy of the seller, the Fund
could suffer additional losses if a court determines that the Fund’s interest in the collateral is not enforceable.
|
| In evaluating whether to enter into a repurchase agreement, the Investment Adviser will carefully consider the creditworthiness of
the seller. The Fund, together with other registered investment companies having advisory agreements with the Investment Adviser or any of its affiliates, may transfer uninvested cash balances into a single joint account, the daily aggregate balance of
which will be invested in one or more repurchase agreements.
|
| Lending of Portfolio Securities. The Fund may engage in securities lending. Securities lending involves the lending
of securities owned by the Fund to financial institutions such as certain broker-dealers. The borrowers are required to secure their loan continuously with cash, cash equivalents, U.S. government securities or letters of credit in an amount at least equal
to the market value of the securities loaned. Cash collateral may be invested in cash equivalents. To the extent that cash collateral is invested in other investment securities, such collateral will be subject to market depreciation or appreciation, and
the Fund will be responsible for any loss that might result from its investment of the borrowers’ collateral. If the Investment Adviser determines to make securities loans, the value of the securities loaned may not exceed 33 1
/3% of the value of the total assets of the
Fund (including the loan collateral).
|
| The Fund may lend its securities to increase its income. The Fund may, however, experience delay in the recovery of its securities
or a capital loss if the institution with which it has engaged in a portfolio loan transaction breaches its agreement with the Fund.
|
| Preferred Stock, Warrants and Rights. The Fund may invest in preferred stock, warrants and rights. Preferred stocks
are securities that represent an ownership interest providing the holder with claims on the issuer’s earnings and assets before common stock owners but after bond owners. Unlike debt securities, the obligations of an issuer of preferred stock,
including dividend and other payment obligations, may not typically be accelerated by the holders of such preferred stock on the occurrence of an event of default or other non-compliance by the issuer of the preferred stock.
|
| Warrants and other rights are options to buy a stated number of shares of common stock at a specified price at any time during the
life of the warrant or right. The holders of warrants and rights have no voting rights, receive no dividends and have no rights with respect to the assets of the issuer.
|
| Other Investment Companies. The Fund may invest in securities of other investment companies (including
exchange-traded funds such as SPDRs as defined below) subject to statutory limitations prescribed by the Act. These limitations include a prohibition on the Fund acquiring more than 3% of the voting shares of any other investment company, and a
prohibition on investing more than 5% of the Fund’s total assets in securities of any one investment company or more than 10% of its total assets in securities of all investment companies. The Fund will indirectly bear its proportionate share of any
management fees and other expenses paid by such other investment companies. Exchange-traded funds such as SPDRs are shares of unaffiliated investment companies which are traded like traditional equity securities on a national securities exchange or the
NASDAQ® National Market System.
|
n
|
Standard & Poor’s Depositary Receipts
TM
. The Fund may, consistent with its investment policies, purchase Standard
& Poor’s Depositary Receipts™ (“SPDRs”). SPDRs are securities traded on the American Stock Exchange (“AMEX”) that represent ownership in the SPDR Trust, a trust which has been established to accumulate and hold a
portfolio of common stocks that is intended to track the price performance and dividend yield of the S&P 500®. The SPDR Trust is sponsored by a subsidiary of the AMEX. SPDRs may be used for several reasons, including, but not limited to,
facilitating the handling of cash flows or trading, or reducing transaction costs. The price movement of SPDRs may not perfectly parallel the price action of the S&P 500®.
|
| Unseasoned Companies. The Fund may invest in companies (including predecessors) which have operated less than three
years. The securities of such companies may have limited liquidity, which can result in their being priced higher or lower than might otherwise be the case. In addition, investments in unseasoned companies are more speculative and entail greater risk than
do investments in companies with an established operating record.
|
| Corporate Debt Obligations. Corporate debt obligations include bonds, notes, debentures, commercial paper and other
obligations of corporations to pay interest and repay principal, and include securities issued by banks and other financial institutions. The Fund may invest in corporate debt obligations issued by U.S. and certain non-U.S. issuers which issue securities
denominated in the U.S. dollar (including Yankee and Euro obligations). In addition to obligations of corporations, corporate debt obligations include securities issued by banks and other financial institutions and supranational entities (i.e., the World Bank, the International Monetary Fund, etc.).
|
| Bank Obligations. The Fund may invest in obligations issued or guaranteed by U.S. or foreign banks. Bank
obligations, including without limitations, time deposits, bankers’ acceptances and certificates of deposit, may be general obligations of the parent bank or may be limited to the issuing branch by the terms of the specific obligations or by
government regulations. Banks are subject to extensive but different governmental regulations which may limit both the amount and types of loans which may be made and interest rates which may be charged. In addition, the profitability of the banking
industry is largely dependent upon the availability and cost of funds for the purpose of financing lending operations under prevailing money market conditions. General economic conditions as well as exposure to credit losses arising from possible
financial difficulties of borrowers play an important part in the operation of this industry.
|
| U.S. Government Securities. The Fund may invest in U.S. government securities. U.S. government securities include
U.S. Treasury obligations and obligations
|
|
| issued or guaranteed by U.S. government agencies, instrumentalities or sponsored enterprises. U.S. government securities may be supported by (a) the full faith and credit of the U.S. Treasury (such as the Government National Mortgage Association (“ Ginnie Mae”)); (b) the right of the issuer to borrow from the U.S. Treasury (such as securities of the Student Loan Marketing Association); (c) the discretionary authority of the U.S. government to purchase certain obligations of the issuer (such as the Federal National Mortgage Association (“Fannie Mae”) and Federal Home Loan Mortgage Corporation (“Freddie Mac”)); or (d) only the credit of the issuer. |
| Borrowings. The Fund can borrow money from banks and other financial institutions in amounts not exceeding one-third
of its total assets for temporary or emergency purposes. The Fund may not make additional investments if borrowings exceed 5% of its total assets.
|
| Short Sales Against-the-Box. The Fund may make short sales against-the-box. A short sale against-the-box means that
at all times when a short position is open the Fund will own an equal amount of securities sold short, or securities convertible into or exchangeable for, without payment of any further consideration, an equal amount of the securities of the same issuer
as the securities sold short.
|
| The financial highlights table is intended to help you understand the Fund’s financial performance from its commencement
(June 19, 2000) to August 31, 2000. Certain information reflects financial results for a single Fund share. The total returns in the table represent the rate that an investor would have earned or lost on an investment in the Fund (assuming reinvestment of
all dividends and distributions). This information for the period ended August 31, 2000 has been audited by PricewaterhouseCoopers LLP, whose report, along with the Fund’s financial statements, is included in the Fund’s annual report (available
upon request).
|
| RESEARCH SELECT FUND
|
| Income from
investment operations |
|||||||||||||||||||
|---|---|---|---|---|---|---|---|---|---|---|---|---|---|---|---|---|---|---|---|
| Net asset
value, beginning of period |
Net
investment loss(c) |
Net realized
and unrealized gain |
Total from
investment operations |
||||||||||||||||
| For the Period Ended August 31, | |||||||||||||||||||
| 2000 - Class A Shares (commenced June 19, 2000) | $10.00 | $(0.02 | ) | $0.79 | $0.77 | ||||||||||||||
| 2000 - Class B Shares (commenced June 19, 2000) | 10.00 | (0.04 | ) | 0.80 | 0.76 | ||||||||||||||
| 2000 - Class C Shares (commenced June 19, 2000) | 10.00 | (0.04 | ) | 0.81 | 0.77 | ||||||||||||||
| 2000 - Institutional Shares (commenced June 19, 2000) | 10.00 | (0.01 | ) | 0.79 | 0.78 | ||||||||||||||
| 2000 - Service Shares (commenced June 19, 2000) | 10.00 | (0.02 | ) | 0.80 | 0.78 | ||||||||||||||
(a)
|
Assumes investment at the net asset value at the beginning of the period, reinvestment of all dividends and
distributions, a complete redemption of the investment at the net asset value at the end of the period and no sales or redemption charges. Total return would be reduced if a sales or redemption charge were taken into account. Total returns for periods
less than one full year are not annualized.
|
(b)
|
Annualized.
|
(c)
|
Calculated based on the average shares outstanding methodology.
|
| Ratios assuming
no expense reductions |
|||||||||||||||||||||
|---|---|---|---|---|---|---|---|---|---|---|---|---|---|---|---|---|---|---|---|---|---|
| Net asset
value, end of period |
Total
return(a) |
Net assets
at end of period (in 000s) |
Ratio of
net expenses to average net assets(b) |
Ratio of
net investment loss to average net assets(b) |
Ratio of
expenses to average net assets(b) |
Ratio of
net investment loss to average net assets(b) |
Portfolio
turnover rate |
||||||||||||||
| $10.77 | 7.70 | % | $217,861 | 1.50 | % | (1.04 | )% | 2.05 | % | (1.59 | )% | 5.04 | % | ||||||||
| 10.76 | 7.60 | 201,437 | 2.25 | (1.79 | ) | 2.80 | (2.34 | ) | 5.04 | ||||||||||||
| 10.77 | 7.70 | 96,393 | 2.25 | (1.78 | ) | 2.80 | (2.33 | ) | 5.04 | ||||||||||||
| 10.78 | 7.80 | 12,677 | 1.10 | (0.50 | ) | 1.65 | (1.05 | ) | 5.04 | ||||||||||||
| 10.78 | 7.70 | 12 | 1.60 | (1.13 | ) | 2.15 | (1.68 | ) | 5.04 | ||||||||||||
| U.S. Select List
|
| As mentioned in “Fund Investment Objective and Strategies,” the U.S. Select List was introduced on September 9,
1998 and comprises approximately 25 to 35 stocks that the Goldman Sachs U.S. Stock Selection Committee expects, as a portfolio, to outperform its benchmark, the S&P 500® Index, over the next twelve to eighteen months. The U.S. Select List changes regularly. While the companies on the list generally have been relatively large U.S. companies, the list is not restricted to those types of companies. It is expected that, under normal market conditions, the quarterly
performance of the Fund, before expenses, will track the price return of the U.S. Select List within a .90 correlation coefficient.
|
| The Fund’s portfolio management team does not have access to information regarding additions or deletions for the U.S.
Select List prior to their publication. Goldman Sachs publishes other lists of recommended securities that could be appropriate for Fund investors but that are not used by the Fund’s portfolio management team.
|
| The chart below reflects historical information regarding the U.S. Select List. The U.S. Select List is not
maintained for the purpose of managing any account or investment company such as the Fund. The number of stocks on the U.S. Select List and the frequency of additions to and deletions from the U.S. Select List change from time to time. The stocks included in the U.S. Select List constitute only a “paper portfolio” that does not reflect
actual trading and does not have an actual performance record. The U.S. Select List’s price return does not represent the return on any fund or any other account that involves actual trading. The price returns are not indicative of the returns on any fund or account because, among other things, they do not
reflect actual prices when stocks are purchased or sold, transaction costs and account fees. In addition, because the U.S. Select List does not include a cash component, price returns are based on a constant 100% investment in the stocks on the U.S. Select List. Also, the information below does not reflect the impact that the Investment Adviser’s
portfolio management decisions and techniques may have on performance. Further, the actual performance of the Fund may differ from that of the U.S. Select List because of time delays between when a stock is added to or removed from the list and when it is bought or sold for the Fund. Investors should not consider this price return information as a substitute for, or an indication of,
future performance of the Research Select Fund or
|
| the Investment Adviser. Finally, past price returns of the U.S. Select List are not representative of future price returns
of the list.
|
| 9/9/98
(inception) to 12/31/98 |
1/1/99
to 12/31/99 |
1/1/00
to 10/31/00 |
9/9/98
(inception) to 10/31/00 |
||||||
|---|---|---|---|---|---|---|---|---|---|
| U.S. Select List Stock Price Return* | 37.57% | 33.81% | 18.1% | 117.5% | |||||
| S&P 500® Index Price Return** | 22.73% | 21.06% | -1.8% | 45.9% | |||||
*
|
The results for the U.S. Select List portfolio represent an equal-weighted arithmetic average of the stocks held at any
point during the month. The results are calculated monthly using each stock’s capital appreciation or depreciation during the period that it is on the U.S. Select List and dividing that by the highest number of stocks that were on the U.S. Select
List at any point during the month. Prior to June 1999, the divisor was the time-weighted number of stocks on the list for the specified period. The results are calculated using the prices of the stocks at the close of trading of the stock market one full
day after the stock was added to the U.S. Select List (e.g., if the stock was added on the afternoon of 5/5, the recorded price is at the close on 5/6). The results do not reflect the execution of actual purchases or sales, and there is no guarantee that
a mutual fund following the U.S. Select List would be able to execute purchases and sales at the prices used to calculate the price returns. Because the U.S. Select List is a paper portfolio that is not managed to a target number of stocks, no “
re-balancing” of actual investments is done when stocks are added to or deleted from the U.S. Select List. Price returns are based on 100% investment in the stocks on the U.S. Select List.
|
| Price returns are calculated to include the price return plus dividends for the stock during the month in which they are
paid without being reinvested into the security. They do not reflect the market impact on the stock prices that may occur between the time the publication is made of additions to and deletions from the U.S. Select List and the time a mutual fund following
the U.S. Select List would be able to execute purchases and sales. They also do not reflect transaction fees, such as commissions, fees and interest charges, or the costs of running a mutual fund, such as management fees, distribution fees and other
expenses. They do not reflect the impact that an investment adviser’s portfolio management decisions and techniques may have on a mutual fund’s returns. Actual transactions and the effect of dividends, fees and costs will result in returns that
differ from those of the U.S. Select List.
|
**
|
The S&P 500® Index is an unmanaged index containing common stocks of 500 industrial, transportation, utility and
financial companies, regarded as generally representative of the U.S. stock market. The S&P 500® Index performance numbers shown are price returns reflecting the reinvestment of dividends. They do not reflect fees, brokerage commissions or other
costs of investing that are not incurred by an index.
|
| FOR MORE INFORMATION
|
| Annual/Semi-annual Report
|
| Additional information about the Fund’s investments is available in the Fund’s annual and semi-annual reports to
shareholders. In the Fund’s annual report, you will find a discussion of the market conditions and investment strategies that significantly affected the Fund’s performance during the last fiscal year.
|
| Statement of Additional Information
|
| Additional information about the Fund and its policies is also available in the Fund’s Additional Statement. The Additional
Statement is incorporated by reference into this Prospectus (is legally considered part of this Prospectus).
|
| The Fund’s annual and semi-annual reports, and the Additional Statement, are available free upon request by calling Goldman
Sachs at 1-800-621-2550.
|
| To obtain other information and for shareholder inquiries:
|
| By telephone – Call 1-800-621-2550
|
| By mail – Goldman Sachs Funds, 4900 Sears Tower, Chicago, IL 60606-6372
|
| By e-mail – [email protected]
|
| On the Internet – Text-only versions of the Fund’s documents are located online and may be downloaded from:
|
| SEC EDGAR database – http://www.sec.gov
|
| You may review and obtain copies of Fund documents by visiting the SEC’s Public Reference Room in Washington, D.C. You may
also obtain copies of Fund documents, after paying a duplicating fee, by writing to the SEC’s Public Reference Section, Washington, D.C. 20549-0102 or by electronic request to: [email protected]. Information on the operation of the public reference
room may be obtained by calling the SEC at (202) 942-8090.
|
| Prospectus
|
| GOLDMAN SACHS RESEARCH SELECT FUND
SM
|
| Class A, B
and C Shares |
| December 29, 2000
|
| THE SECURITIES AND EXCHANGE COMMISSION HAS NOT APPROVED OR DISAPPROVED THESE SECURITIES OR PASSED UPON THE ADEQUACY OF THIS PROSPECTUS.
ANY REPRESENTATION TO THE CONTRARY IS A CRIMINAL OFFENSE.
|
| AN INVESTMENT IN THE FUND IS NOT A BANK DEPOSIT AND IS NOT INSURED BY THE FEDERAL DEPOSIT INSURANCE CORPORATION OR ANY OTHER GOVERNMENT
AGENCY. AN INVESTMENT IN THE FUND INVOLVES INVESTMENT RISKS, INCLUDING POSSIBLE LOSS OF PRINCIPAL.
|
| NOT FDIC-INSURED
|
May Lose Value
|
No Bank Guarantee
|
| Goldman Sachs Asset Management, a unit of the Investment Management Division of Goldman, Sachs & Co. (“Goldman
Sachs”), serves as investment adviser to the Research Select Fund (the “Fund”). Goldman Sachs Asset Management is referred to in this Prospectus as the “Investment Adviser.”
|
| RESEARCH STYLE FUNDS—RESEARCH SELECT FUND
|
| The Goldman Sachs Research Select Fund selects substantially all of its securities from the U.S. Select List developed by
the Goldman Sachs Investment Research Division. The Fund leverages the resources of Goldman Sachs by applying the Investment Management Division’s portfolio management expertise to the equity securities included in the U.S. Select List.
|
| The Fund has determined to discontinue public sales of its shares to new investors when the Fund’s total net assets reach
approximately $1.2 billion. As of the close of business on December 15, 2000, the Fund’s total net assets equaled $771.5 million. A shareholder who has an open Fund account on the date the Fund is closed may make additional investments and reinvest
dividends and capital gains distributions in that account after that date if the account remains open. Current shareholders may also open additional Fund accounts under certain conditions. If a Fund account is closed, however, additional investments in
the Fund may not be possible.
|
| Research Select Fund
|
|
Objective:
|
Long-term growth of capital
|
|
Benchmark:
|
S&P 500® Index
|
|
Investment Focus:
|
A focused portfolio of U.S. equity securities that offer the potential for long-term capital appreciation
|
| INVESTMENT OBJECTIVE
|
| The Fund seeks to provide long-term growth of capital by investing in a focused portfolio of U.S. equity securities.
|
| PRINCIPAL INVESTMENT STRATEGIES
|
| Equity Securities. The Fund invests, under normal circumstances, at least 90% of its total assets in U.S. equity securities, including securities of foreign issuers that are traded in the United States. Under normal circumstances, the Fund will only
purchase equity securities that are included in the Goldman Sachs Global Investment Research Division’s U.S. Select List and will sell securities that have been removed from the U.S. Select List. Notification of changes to the U.S. Select List is made to clients of Goldman Sachs and to the Fund’s portfolio management team at the
same time. The Fund will purchase a security that has been added to, or sell a security that has been removed from, the list after publication of that change. In addition, the Investment Adviser may apply the techniques described below in managing the
Fund and in purchasing and selling securities that are included in the U.S. Select List.
|
| The Goldman Sachs Global Investment Research Division’s U.S. Select List.
The U.S. Select List was introduced on September 9, 1998 and comprises approximately 25 to 35 equity securities that the Goldman Sachs U.S. Stock Selection
Committee expects, as a portfolio, to outperform its benchmark, the S&P 500® Index over the next 12 to 18 months. The list is consistent with overall investment policy and emphasizes strategically favored economic sectors. The U.S. Select List is updated on a regular basis. Historically, the U.S. Select List has consisted primarily of common stocks of relatively large U.S. companies, although the list is not restricted to those types of companies.
|
| The U.S. Select List is used primarily by institutional clients.
|
| Our Approach to Portfolio Management.
To the extent practicable, the Fund will seek to deliver returns that are comparable to the price returns of the U.S. Select List. Generally, the Fund will seek to maintain approximate equal weightings of its assets among the securities included
in the list. Any remaining assets may be invested by the Investment Adviser in the other instruments described in this Prospectus, including short-term debt obligations, options and futures contracts.
|
| Investors should be aware, however, that the performance of the Fund will differ from the price returns of the U.S. Select List
for a variety of reasons, including the change in securities prices that may occur between the time when a security is added to or removed from the list and when it is bought or sold for the Fund; the Fund’s investment of cash flow from purchases
and sales of Fund shares, which can occur daily and will result in portfolio purchases and sales; modifications in the Fund’s stock weights in order to control trading costs; the timing and amount of dividend and distribution payments; and the
Fund’s use of investment techniques and instruments that are not included in the U.S. Select List. In addition, unlike the U.S. Select List, the Fund will incur transactional costs (such as brokerage commissions) and operational expenses (such as investment advisory fees).
|
| While the Fund intends to track the composition of the U.S. Select List, the Fund’s purchases and sales of securities
that are added to and deleted from the list may not be completed on the first trading day after changes to the list are announced, and in certain cases may take several days or weeks to complete. Moreover, purchases and sales of the Fund and other
investors following the U.S. Select List could create a temporary imbalance between the supply and demand of the securities on the list. The imbalance could affect the time it takes the Fund to complete its transactions, as well as the price the Fund pays or receives. In
order to reduce impact of these trading costs, the Investment Adviser may decide for a period of time not to buy a security that is included in the U.S. Select List or to continue to hold a security that has been removed from the list.
|
| The Fund will periodically rebalance its portfolio in an effort to maintain approximate equal weightings of its assets among the
securities on the U.S. Select List.
|
| Other. The Fund’s investments in fixed-income securities are limited to securities that are considered cash equivalents.
|
Ÿ
|
No specific percentage limitation on usage;
limited only by the objective and strategies of the Fund |
| Research
Select Fund |
|||
|---|---|---|---|
| Investment Practices | |||
| Borrowings | 33 1
/3
|
||
| Custodial Receipts | — | ||
| Equity Swaps* | 15 | ||
| Futures Contracts and Options on Futures Contracts | Ÿ | ||
| Investment Company Securities (including exchange-traded funds) | 10 | ||
| Options on Securities and Securities Indices 1 | Ÿ | ||
| Repurchase Agreements | Ÿ | ||
| Securities Lending | 33 1
/3
|
||
| Short Sales Against the Box | 25 | ||
| Unseasoned Companies | Ÿ | ||
| Warrants and Stock Purchase Rights | Ÿ | ||
| When-Issued Securities and Forward Commitments | Ÿ | ||
*
|
Limited to 15% of net assets (together with other illiquid securities) for all structured securities which are not
deemed to be liquid and all swap transactions.
|
1
|
The Fund may sell covered call and put options and purchase call and put options.
|
Ÿ
|
No specific percentage limitation on usage;
limited only by the objective and strategies of the Fund |
| Research
Select Fund |
||||
|---|---|---|---|---|
| Investment Securities | ||||
| American and Global Depositary Receipts | — | |||
| Asset-Backed and Mortgage-Backed Securities | — | |||
| Bank Obligations 2 | Ÿ | |||
| Convertible Securities 3 | Ÿ | |||
| Corporate Debt Obligations 2 | Ÿ | |||
| Equity Securities | 90 | + | ||
| Emerging Country Securities | — | |||
| Fixed Income Securities | Ÿ | |||
| Foreign Issuers | Ÿ | |||
| Non-Investment Grade Fixed Income Securities | — | |||
| Real Estate Investment Trusts (“REITs”) | Ÿ | |||
| Structured Securities * | Ÿ | |||
| Temporary Investments | 100 | |||
| U.S. Government Securities 2 | Ÿ | |||
*
|
Limited to 15% of net assets (together with other illiquid securities) for all structured securities which are not
deemed to be liquid and all swap transactions.
|
2
|
Limited by the amount the Fund invests in fixed-income securities. Cash equivalents only.
|
3
|
The Fund has no minimum rating criteria.
|
| Loss of money is a risk of investing in the Fund. An investment in the Fund is not a deposit of any bank and is not insured or
guaranteed by the Federal Deposit Insurance Corporation or any other governmental agency. The following summarizes important risks that apply to the Fund and may result in a loss of your investment. The Fund should not be relied upon as a complete
investment program. There can be no assurance that the Fund will achieve its investment objective.
|
| Research
Select Fund |
|||
|---|---|---|---|
| Ÿ Applicable | |||
| U.S. Select List | Ÿ | ||
| Stock | Ÿ | ||
| Credit/Default | Ÿ | ||
| Foreign | Ÿ | ||
| Derivatives | Ÿ | ||
| Interest Rate | Ÿ | ||
| Management | Ÿ | ||
| Market | Ÿ | ||
| Liquidity | Ÿ | ||
| Small Cap | Ÿ | ||
n
|
U.S. Select List Risk—The Fund invests
principally in securities included in the U.S. Select List, which comprises approximately 25 to 35 stocks. As a result of the small universe of stocks in which the Fund generally invests, it may be subject to greater risks than would a more diversified fund.
|
| Price returns reported for the U.S. Select List do not predict or reflect the future results of the U.S. Select List
or the Fund. In addition, unlike the Fund, the securities included in the U.S. Select List constitute only a “paper portfolio” that does not reflect actual trading and does not have an actual performance record.
|
| Although the Goldman Sachs U.S. Stock Selection Committee periodically makes subjective decisions to add or delete companies for the
U.S. Select List, the list is not compiled with any particular client or product in mind and is not (and will not be) compiled with the Fund in mind. The Global Investment Research Division could at any time cease publishing the U.S. Select List
. In that event, the Board of Trustees will make a determination on how to proceed
in the best interest of shareholders of the Fund, consistent with the Fund’s investment objective. Goldman Sachs publishes similar lists of recommended securities that may be appropriate for shareholders of the Fund but which will not be used by the
Investment Adviser for the Fund at this time.
|
| The Fund’s purchases and sales for its portfolio will be affected by market conditions following the publication of changes
to the U.S. Select List and will be subject to competing orders by Goldman Sachs clients who invest in the securities included on the list.
|
| The activities of Goldman Sachs and its affiliates may occasionally limit the Fund’s ability to purchase or sell securities
included in the U.S. Select List. The U.S. Select List is also subject to restrictions related to Goldman Sachs’ other businesses. In addition, certain securities may or may not appear on the U.S. Select List or may or may not be removed from
the list due to legal restrictions applicable to, or other business concerns of, Goldman Sachs. An investor should understand that these concerns will generally not be related to whether a particular security on the list or a security not on the list is
an attractive investment opportunity.
|
| As a global financial services firm, Goldman Sachs provides a wide range of financial services to issuers of securities and
investors in securities. Goldman Sachs, its affiliates and others associated with it may create markets or specialize in, have positions in and affect transactions in, securities of companies included in the U.S. Select List and may also perform or seek to perform financial services for those companies. Within the last three years, Goldman Sachs or its affiliates may have managed or co-managed public security offerings for companies included in the
U.S. Select List, and they or their employees may have a long or short position on holdings in the securities, or options on securities, or other related investments of companies included in the U.S. Select List.
|
| The Fund’s ability to invest in particular securities included in the U.S. Select List may be limited by the
diversification and other restrictions imposed on it as a registered mutual fund under the Investment Company Act of 1940 (the “Act”).
|
n
|
Stock Risk—The risk that stock prices
have historically risen and fallen in periodic cycles. Recently, U.S. stock markets and certain foreign stock markets have experienced substantial price volatility and, at times, have traded at or close to record high levels. There is no guarantee that
such levels will be reached or maintained in the future.
|
n
|
Credit/Default Risk—The risk that an issuer or guarantor of fixed-income securities held by the Fund may
default on its obligation to pay interest and repay principal.
|
n
|
Foreign Risk—The risk that when the Fund invests in foreign issuers, it will be subject to risk of loss not
typically associated with domestic issuers. Loss may result because of less foreign government regulation, less public information and
less economic, political and social stability. Loss may also result from the imposition of exchange controls, confiscations and other government restrictions.
|
n
|
Derivatives Risk—The risk that loss may result from the Fund’s investments in options, futures, swaps,
structured securities and other derivative instruments. These instruments may be leveraged so that small changes may produce disproportionate losses to the Fund.
|
n
|
Interest Rate Risk—The risk that when interest rates increase, fixed-income securities held by the Fund will
decline in value.
|
n
|
Management Risk—The risk that a strategy used by the Investment Adviser may fail to produce the intended results.
|
n
|
Market Risk—The risk that the value of the securities in which the Fund invests may go up or down in response
to the prospects of individual
companies, particular industry sectors and/or general economic conditions. Price changes may be temporary or last for extended periods. The Fund’s investments may be overweighted from time to time in one or more industry sectors, which will increase the Fund’s exposure to risk of loss from adverse developments affecting those sectors. |
n
|
Liquidity Risk—The risk that the Fund will not be able to pay redemption proceeds within the time period stated
in this Prospectus because of unusual market conditions, an unusually high volume of redemption requests, or other reasons. Because the Fund may invest in small capitalization stocks and REITs, the Fund will be especially subject to the risk that during
certain periods the liquidity of particular issuers or industries, or all securities within particular investment categories, will shrink or disappear suddenly and without warning as a result of adverse economic, market or political events, or adverse
investor perceptions whether or not accurate.
|
n
|
Small Cap Stock Risk—The securities of small capitalization stocks involve greater risks than those associated
with larger, more established companies and may be subject to more abrupt or erratic price movements. Securities of such issuers may lack sufficient market liquidity to enable the Fund to effect sales at an advantageous time or without a substantial drop
in price.
|
| More information about the Fund’s portfolio securities and investment techniques, and their associated risks, is provided in
Appendix A. You should consider the investment risks discussed in this section and in Appendix A. Both are important to your investment choice.
|
| HOW THE FUND HAS PERFORMED
|
| The Fund commenced operations on June 19, 2000. Since the Fund has less than one calendar year’s performance, no performance
information is provided in this section.
|
| Research Select Fund |
||||||||||
|---|---|---|---|---|---|---|---|---|---|---|
| Class A | Class B | Class C | ||||||||
| Shareholder Fees | ||||||||||
| (fees paid directly from your investment): | ||||||||||
| Maximum Sales Charge (Load) Imposed on
Purchases |
5.5% | 1 | None | None | ||||||
| Maximum Deferred Sales Charge (Load) 2 | None | 1 | 5.0% | 3 | 1.0% | 4 | ||||
| Maximum Sales Charge (Load) Imposed on
Reinvested Dividends |
None | None | None | |||||||
| Redemption Fees 5 | None | None | None | |||||||
| Exchange Fees | None | None | None | |||||||
| Annual Fund Operating Expenses | ||||||||||
| (expenses that are deducted from Fund assets):6 | ||||||||||
| Management Fees | 1.00% | 1.00% | 1.00% | |||||||
| Distribution and Service (12b-1) Fees | 0.25% | 1.00% | 1.00% | |||||||
| Other Expenses 7 | 0.80% | 0.80% | 0.80% | |||||||
| Total Fund Operating Expenses* | 2.05% | 2.80% | 2.80% | |||||||
| See page 11 for all other footnotes.
|
*
|
As a result of current expense limitations, the estimated “Other Expenses” and “Total Fund Operating Expenses”
of the Fund which are actually incurred as of the date of this Prospectus are as set forth below. The expense limitations may be terminated at any time at the option of the Investment Adviser. If this occurs, “Other Expenses” and “Total
Fund Operating Expenses” may increase without shareholder approval.
|
| Research Select Fund |
|||||||
|---|---|---|---|---|---|---|---|
| Class A | Class B | Class C | |||||
| Annual Fund Operating Expenses | |||||||
| (expenses that are deducted from Fund assets): 6 | |||||||
| Management Fees | 1.00% | 1.00% | 1.00% | ||||
| Distribution and Service (12b-1) Fees | 0.25% | 1.00% | 1.00% | ||||
| Other Expenses 7 | 0.25% | 0.25% | 0.25% | ||||
| Total Fund Operating Expenses (after current
expense limitations) |
1.50% | 2.25% | 2.25% | ||||
1
|
The maximum sales charge is a percentage of the offering price. A contingent deferred sales charge (“CDSC”) of
1% is imposed on certain redemptions (within 18 months of purchase) of Class A Shares sold without an initial sales charge as part of an investment of $1 million or more.
|
2
|
The maximum CDSC is a percentage of the lesser of the NAV at the time of the redemption or the NAV when the shares were
originally purchased.
|
3
|
A CDSC is imposed upon Class B Shares redeemed within six years of purchase at a rate of 5% in the first year, declining
to 1% in the sixth year, and eliminated thereafter.
|
4
|
A CDSC of 1% is imposed on Class C Shares redeemed within 12 months of purchase.
|
5
|
A transaction fee of $7.50 may be charged for redemption proceeds paid by wire.
|
6
|
The Fund’s operating expenses for the current fiscal year have been estimated.
|
7
|
Estimated “Other Expenses” include transfer agency fees equal to 0.19% of the average daily net assets of the
Fund’s Class A, B and C Shares, plus all other ordinary expenses not detailed above. The Investment Adviser has voluntarily agreed to reduce or limit “Other Expenses” (excluding management fees, distribution and service fees, transfer
agency fees, taxes, interest and brokerage fees and litigation, indemnification and other extraordinary expenses) to the following percentage of the Fund’s average daily net assets:
|
| Fund | Other
Expenses |
||
|---|---|---|---|
| Research Select | 0.06% | ||
| Fund | 1 Year | 3 Years | 5 Years | 10 Years | |||||
|---|---|---|---|---|---|---|---|---|---|
| Research Select | |||||||||
| Class A Shares | $747 | $1,157 | N/A | N/A | |||||
| Class B Shares | |||||||||
| – Assuming complete redemption at end of period | $783 | $1,168 | N/A | N/A | |||||
| – Assuming no redemption | $283 | $ 868 | N/A | N/A | |||||
| Class C Shares | |||||||||
| – Assuming complete redemption at end of period | $383 | $ 868 | N/A | N/A | |||||
| – Assuming no redemption | $283 | $ 868 | N/A | N/A | |||||
| INVESTMENT ADVISER
|
| Investment Adviser | Fund | ||
|---|---|---|---|
| Goldman Sachs Asset Management (“GSAM”) | Research Select | ||
| 32 Old Slip | |||
| New York, New York 10005 | |||
| GSAM is a business unit of the Investment Management Division (“IMD”) of Goldman Sachs. Goldman Sachs registered as an
investment adviser in 1981. As of September 30, 2000, GSAM, along with other units of IMD, had assets under management of $281.3 billion.
|
| The Investment Adviser provides day-to-day investment management services regarding the Fund’s portfolio transactions. The
Investment Adviser makes the investment decisions for the Fund and places purchase and sale orders for the Fund’s portfolio transactions in U.S. markets. As permitted by applicable law, these orders may be directed to any brokers, including Goldman
Sachs and its affiliates. In addition, the Investment Adviser has access to the research and certain proprietary technical models developed by Goldman Sachs.
|
| The Investment Adviser also performs the following additional services for the Fund:
|
n
|
Supervises all non-advisory operations of the Fund
|
n
|
Provides personnel to perform necessary executive, administrative and clerical services to the Fund
|
n
|
Arranges for the preparation of all required tax returns,
reports to shareholders, prospectuses and statements of additional information and other reports filed with the Securities and Exchange Commission (the “SEC”) and other regulatory authorities
|
n
|
Maintains the records of the Fund
|
n
|
Provides office space and all necessary office equipment and services
|
| MANAGEMENT FEES
|
| As compensation for its services and its assumption of certain expenses, the Investment Adviser is entitled to the following fee,
computed daily and payable monthly, at the annual rate listed below (as a percentage of the Fund’s average daily net assets):
|
| Contractual Rate | Actual Rate for the
Fiscal Period Ended August 31, 2000 |
||||
|---|---|---|---|---|---|
| Research Select | 1.00% | 1.00% | |||
| The Investment Adviser may voluntarily waive a portion of its advisory fee from time to time, and may discontinue any voluntary
waiver at any time at its discretion.
|
| FUND MANAGERS
|
| Robert B. Litterman, Ph.D., a Managing Director of Goldman Sachs, is the co-developer, along with the late Fischer Black, of the
Black-Litterman Global Asset Allocation Model, a key tool in IMD’s asset allocation process. As Director of Quantitative Resources, Dr. Litterman oversees Quantitative Equities, the Quantitative Strategies Group, the Investment Performance &
Valuation Oversight Group, and the Client Research Groups. In total, these groups include over 120 professionals. Prior to moving to IMD, Dr. Litterman was the head of the Firmwide Risk department of Goldman Sachs since becoming a Partner in 1994.
Preceding his time in the Operations, Technology & Finance Division, Dr. Litterman spent eight years in the Fixed Income Division’s research department where he was co-director of the research and model development group.
|
| Quantitative Equity Team
|
n
|
A stable and growing team supported by an extensive internal staff
|
n
|
Access to the research ideas of Goldman Sachs’ renowned Global Investment Research Department
|
n
|
More than $34 billion in equities currently under management
|
n
|
Proprietary research on quantitative models and tax-advantaged strategies
|
| Name and Title | Fund Responsibility | Years
Primarily Responsible |
Five Year Employment History | ||||
|---|---|---|---|---|---|---|---|
| Melissa Brown
Managing Director Product Manager for Quantitative Equities |
Senior Portfolio Manager —
Research Select |
Since
2000 |
Ms. Brown joined the
Investment Adviser as a portfolio manager in 1998. From 1984 to 1998, she was the director of Quantitative Equity Research and served on the Investment Policy Committee at Prudential Securities. |
||||
| Robert C. Jones
Managing Director Head of Quantitative Equities |
Senior Portfolio Manager—
Research Select |
Since
2000 |
Mr. Jones joined the
Investment Adviser as a portfolio manager in 1989. |
||||
| Victor H. Pinter
Vice President Head of Portfolio Construction |
Senior Portfolio Manager—
Research Select |
Since
2000 |
Mr. Pinter joined the
Investment Adviser as a research analyst in 1989. He became a portfolio manager in 1992. |
||||
| DISTRIBUTOR AND TRANSFER AGENT
|
| Goldman Sachs, 85 Broad Street, New York, New York 10004, serves as the exclusive distributor (the “Distributor”) of the
Fund’s shares. Goldman Sachs, 4900 Sears Tower, Chicago, Illinois 60606-6372, also serves as the Fund’s transfer agent (the “Transfer Agent”) and, as such, performs various shareholder servicing functions.
|
| From time to time, Goldman Sachs or any of its affiliates may purchase and hold shares of the Fund. Goldman Sachs reserves the
right to redeem at any time some or all of the shares acquired for its own account.
|
| ACTIVITIES OF GOLDMAN SACHS AND ITS AFFILIATES AND OTHER ACCOUNTS MANAGED BY GOLDMAN SACHS
|
| The involvement of the Investment Adviser, Goldman Sachs and their affiliates in the management of, or their interest in, other
accounts and other activities of Goldman Sachs may present conflicts of interest with respect to the Fund or limit the Fund’s investment activities. Goldman Sachs and its affiliates engage in proprietary trading and advise accounts and funds which
have investment objectives similar to those of the Fund and/or which engage in and compete for transactions in the same types of securities, currencies and instruments as the Fund. Goldman Sachs and its affiliates will not have any obligation to make
available any information regarding their proprietary activities or strategies, or the activities or strategies used for other accounts managed by them, for the benefit of the management of the Fund. The results of the Fund’s investment activities,
therefore, may differ from those of Goldman Sachs and its affiliates, and it is possible that the Fund could sustain losses during periods in which Goldman Sachs and its affiliates and other accounts achieve significant profits on their trading for
proprietary or other accounts. In addition, the Fund may, from time to time, enter into transactions in which other clients of Goldman Sachs have an adverse interest. The Fund’s activities may be limited because of regulatory restrictions applicable
to Goldman Sachs and its affiliates, and/or their internal policies designed to comply with such restrictions.
|
| In
providing its investment management services for the Fund, the Investment Adviser invests in equity securities that are included in the Goldman Sachs Global Investment Research Division’s U.S. Select List. Goldman Sachs is a leading, full service global investment banking and securities firm. The firm’s Global Investment Research Division provides far-reaching and comprehensive analysis and commentary on portfolio strategy,
economics, industries and companies. For over two decades, Goldman Sachs has committed the resources on a global scale to develop an industry-leading position for the firm’s investment research products.
|
| Goldman Sachs has achieved worldwide recognition for its value-added research products. The Global Investment Research Division
has a well-regarded staff of approximately 900 professionals including more than 300 equity analysts, 25 global research teams, and 12 portfolio strategists, covering approximately 2400 companies, over 50 economies and over 25 stock markets.
|
| The U.S. Stock Selection Committee comprises approximately twelve senior professionals, including the head of Global Investment
Research and the Director of U.S. Investment Research, as well as a senior market strategist, an economist, and sector specialists.
|
n
|
Cash
|
n
|
Additional shares of the same class of the Fund
|
n
|
Shares of the same or an equivalent class of another Goldman Sachs Fund. Special restrictions may apply for certain ILA
Portfolios. See the Additional Statement.
|
| Fund | Investment
Income Dividends |
Capital Gains
Distributions |
|||
|---|---|---|---|---|---|
| Research Select | Annually | Annually | |||
| The following section will provide you with answers to some of the most often asked questions regarding buying and selling the
Fund’s shares.
|
| How Can I Purchase Class A, Class B And Class C Shares Of The Fund?
|
| You may purchase shares of the Fund through:
|
n
|
Goldman Sachs;
|
n
|
Authorized Dealers; or
|
n
|
Directly from Goldman Sachs Trust (the “Trust”).
|
| In order to make an initial investment in the Fund, you must furnish to the Fund, Goldman Sachs or your Authorized Dealer the
information in the Account Application attached to this Prospectus.
|
| To Open an Account:
|
n
|
Complete the enclosed Account Application
|
n
|
Mail your payment and Account Application to:
|
| Your Authorized Dealer
|
–
|
Purchases by check or Federal Reserve draft should be made payable to your Authorized Dealer
|
–
|
Your Authorized Dealer is responsible for forwarding payment promptly (within three business days) to the Fund
|
| or
|
| Goldman Sachs Funds c/o National Financial Data Services, Inc. (“NFDS”), P.O. Box 219711, Kansas
City, MO 64121-9711
|
–
|
Purchases by check or Federal Reserve draft should be made payable to Goldman Sachs Funds – (Name of Fund and
Class of Shares)
|
–
|
NFDS will not accept a check drawn on a foreign bank, a third-party check, cash, money orders, travelers cheques or credit card
checks
|
–
|
Federal funds wire, Automated Clearing House Network (“ACH”) transfer or bank wires should be sent to State Street Bank
and Trust Company (“State Street”) (the Fund’s custodian). Please call the Fund at 1-800-526-7384 to get detailed instructions on how to wire your money.
|
| What Is My Minimum Investment In The Fund?
|
| Initial | Additional | ||||
|---|---|---|---|---|---|
| Regular Accounts | $1,000 | $50 | |||
| Tax-Sheltered Retirement Plans (excluding SIMPLE IRAs and
Education IRAs) |
$250 | $50 | |||
| Uniform Gift to Minors Act Accounts/Uniform Transfer to
Minors Act Accounts |
$250 | $50 | |||
| 403(b) Plan Accounts | $200 | $50 | |||
| SIMPLE IRAs and Education IRAs | $50 | $50 | |||
| Automatic Investment Plan Accounts | $50 | $50 | |||
| What Alternative Sales Arrangements Are Available?
|
| The Fund offers three classes of shares through this Prospectus.
|
| Maximum Amount You Can | Class A | No limit | |||
| Buy In The Aggregate | Class B | $250,000 | |||
| Class C | $1,000,000 | ||||
| Initial Sales Charge | Class A | Applies to purchases of less than $1 million—
varies by size of investment with a maximum of 5.5% |
|||
| Class B | None | ||||
| Class C | None | ||||
| CDSC | Class A | 1.00% on certain investments of $1 million or
more if you sell within 18 months |
|||
| Class B | 6 year declining CDSC with a maximum of 5% | ||||
| Class C | 1% if shares are redeemed within 12 months
of purchase |
||||
| Conversion Feature | Class A | None | |||
| Class B | Class B Shares convert to Class A Shares after
8 years |
||||
| Class C | None | ||||
| What Else Should I Know About Share Purchases?
|
| The Trust reserves the right to:
|
n
|
Refuse to open an account if you fail to (i) provide a social security number or other taxpayer identification number; or (ii)
certify that such number is correct (if required to do so under applicable law).
|
n
|
Reject or restrict any purchase or exchange order by a particular purchaser (or group of related purchasers). This may occur, for
example, when a pattern of frequent purchases, sales or exchanges of shares of the Fund is evident, or if purchases, sales or exchanges are, or a subsequent abrupt redemption might be, of a size that would disrupt management of the Fund.
|
n
|
Close the Fund to new investors from time to time and reopen
the Fund whenever it is deemed appropriate by the Fund’s Investment Adviser.
|
n
|
Modify or waive the minimum investment amounts.
|
n
|
Modify the manner in which shares are offered.
|
n
|
Modify the sales charge rates applicable to future purchases of shares.
|
| The Fund may allow you to purchase shares with securities instead of cash if consistent with the Fund’s investment policies
and operations and if approved by the Fund’s Investment Adviser.
|
| How Are Shares Priced?
|
| The price you pay or receive when you buy, sell or exchange shares is determined by the Fund’s NAV and share class. Each
class calculates its NAV as follows:
|
| |
(Value of Assets of the Class)
|
|
| NAV =
|
– (Liabilities of the Class)
|
|
| |
Number of Outstanding Shares of the Class
|
|
| The Fund’s investments are valued based on market quotations or, if accurate quotations are not readily available, the fair
value of the Fund’s investments may be determined in good faith under procedures established by the Trustees.
|
n
|
NAV per share of each share class is calculated by the Fund’s custodian on each business day as of the close of regular
trading on the New York Stock Exchange (normally 4:00 p.m. New York time). Fund shares will not be priced on any day the New York Stock Exchange is closed.
|
n
|
When you buy shares, you pay the NAV next calculated after the Fund receives your order in proper form, plus any applicable
sales charge.
|
n
|
When you sell shares, you receive the NAV next calculated after the Fund receives your order in proper form, less any
applicable CDSC.
|
| Note: The time at which transactions and shares are priced and the time by which orders must be received may be changed in
case of an emergency or if regular trading on the New York Stock Exchange is stopped at a time other than 4:00 p.m. New York time.
|
| In addition, the impact of events that occur after the publication of market quotations used by the Fund to price its securities
(for example, in foreign markets), but before the close of regular trading on the New York Stock Exchange will nor
mally not be reflected in the Fund’s next determined NAV unless the Trust, in its discretion, makes an adjustment in light of the nature and materiality of the event, its effect on Fund operations and other relevant factors.
|
| COMMON QUESTIONS ABOUT THE PURCHASE OF CLASS A SHARES
|
| What Is The Offering Price Of Class A Shares?
|
| The offering price of Class A Shares of the Fund is the next determined NAV per share plus an initial sales charge paid to
Goldman Sachs at the time of purchase of shares. The sales charge varies depending upon the amount you purchase. In some cases, described below, the initial sales charge may be eliminated altogether, and the offering price will be the NAV per share. The current sales charges and commissions paid
to Authorized Dealers are as follows:
|
| Amount of Purchase
(including sales charge, if any) |
Sales Charge as
Percentage of Offering Price |
Sales Charge
as Percentage of Net Amount Invested |
Maximum Dealer
Allowance as Percentage of Offering Price* |
|||||||
|---|---|---|---|---|---|---|---|---|---|---|
| Less than $50,000 | 5.50 | % | 5.82 | % | 5.00 | % | ||||
| $50,000 up to (but less than) $100,000 | 4.75 | 4.99 | 4.00 | |||||||
| $100,000 up to (but less than) $250,000 | 3.75 | 3.90 | 3.00 | |||||||
| $250,000 up to (but less than) $500,000 | 2.75 | 2.83 | 2.25 | |||||||
| $500,000 up to (but less than) $1 million | 2.00 | 2.04 | 1.75 | |||||||
| $1 million or more | 0.00 | ** | 0.00 | ** | *** | |||||
*
|
Dealer’s allowance may be changed periodically. During special promotions, the entire sales charge may be allowed
to Authorized Dealers. Authorized Dealers to whom substantially the entire sales charge is allowed may be deemed to be “underwriters” under the Securities Act of 1933.
|
**
|
No sales charge is payable at the time of purchase of Class A Shares of $1 million or more, but a CDSC of 1% may be
imposed in the event of certain redemptions within 18 months of purchase.
|
***
|
The Distributor may pay a one-time commission to Authorized Dealers who initiate or are responsible for purchases of $1
million or more of shares of the Fund equal to 1.00% of the amount under $3 million, 0.50% of the next $2 million, and 0.25% thereafter. The Distributor may also pay, with respect to all or a portion of the amount purchased, a commission in accordance
with the foregoing schedule to Authorized Dealers who initiate or are responsible for purchases of $500,000 or more by certain Section 401(k), profit sharing, money purchase pension, tax-sheltered annuity, defined benefit pension, or other employee
benefit plans that are sponsored by one or more employers (including governmental or church employers) or employee organizations investing in the Fund which satisfy the criteria set forth below in “When Are Class A Shares Not Subject To A Sales
Load?” or $1 million or more by certain “wrap” accounts. Purchases by such plans will be made at NAV with no initial sales charge, but if all of the shares held are redeemed within 18 months after the end of the calendar month in which such
purchase was made, a CDSC of 1% may be imposed upon the plan sponsor or the third party administrator. In addition, Authorized Dealers will remit to the Distributor such payments received in connection with “wrap” accounts in the event that
shares are redeemed within 18 months after the end of the calendar month in which the purchase was made.
|
| What Else Do I Need To Know About Class A Shares’ CDSC?
|
| Purchases of $1 million or more of Class A Shares will be made at NAV with no initial sales charge. However, if you redeem shares
within 18 months after the end of the calendar month in which the purchase was made, excluding any period of time in which the shares were exchanged into and remained invested in an equivalent class of an ILA Portfolio, a CDSC of 1% may be imposed. The
CDSC may not be imposed if your Authorized Dealer enters into an agreement with the Distributor to return all or an applicable prorated portion of its commission to the Distributor. The CDSC is waived on redemptions in certain circumstances. See “In
What Situations May The CDSC On Class A, B Or C Shares Be Waived Or Reduced?” below.
|
| When Are Class A Shares Not Subject To A Sales Load?
|
| Class A Shares of the Fund may be sold at NAV without payment of any sales charge to the following individuals and entities:
|
n
|
Goldman Sachs, its affiliates or their respective officers, partners, directors or employees (including retired employees and
former partners), any partnership of which Goldman Sachs is a general partner, any Trustee or officer of the Trust and designated family members of any of these individuals;
|
n
|
Qualified retirement plans of Goldman Sachs;
|
n
|
Trustees or directors of investment companies for which Goldman Sachs or an affiliate acts as sponsor;
|
n
|
Any employee or registered representative of any Authorized Dealer or their respective spouses, children and parents;
|
n
|
Banks, trust companies or other types of depository institutions investing for their own account or investing for discretionary or
non-discretionary accounts;
|
n
|
Any state, county or city, or any instrumentality, department, authority or agency thereof, which is prohibited by applicable
investment laws from paying a sales charge or commission in connection with the purchase of shares of a Fund;
|
n
|
Section 401(k), profit sharing, money purchase pension, tax-sheltered annuity, defined benefit pension, or other employee benefit
plans that are sponsored by one or more employers (including governmental or church employers) or employee organizations (“Retirement Plans”) that:
|
n
|
Buy shares of Goldman Sachs Funds worth $500,000 or more; or
|
n
|
Have 100 or more eligible employees at the time of purchase; or
|
n
|
Certify that they expect to have annual plan purchases of shares of Goldman Sachs Funds of $200,000 or more; or
|
n
|
Are provided administrative services by certain third-party administrators that have entered into a special service arrangement
with Goldman Sachs relating to such plans; or
|
n
|
Have at the time of purchase aggregate assets of at least $2,000,000;
|
n
|
“Wrap” accounts for the benefit of clients of broker-dealers, financial institutions or financial planners, provided
they have entered into an agreement with GSAM specifying aggregate minimums and certain operating policies and standards;
|
n
|
Registered investment advisers investing for accounts for which they receive asset-based fees;
|
n
|
Accounts over which GSAM or its advisory affiliates have investment discretion;
|
n
|
Shareholders receiving distributions from a qualified retirement plan invested in the Goldman Sachs Funds and reinvesting such
proceeds in a Goldman Sachs IRA;
|
n
|
Shareholders who roll over distributions from any tax-qualified retirement plan or tax-sheltered annuity to an IRA which invests
in the Goldman Sachs Funds if the tax-qualified retirement plan or tax-sheltered annuity receives administrative services provided by certain third-party administrators that have entered into a special service arrangement with Goldman Sachs relating to
such plan or annuity; or
|
n
|
Other exemptions may be stated from time to time in the Additional Statement.
|
| You must certify eligibility for any of the above exemptions on your Account Application and notify the Fund if you no longer
are eligible for the exemption. The Fund will grant you an exemption subject to confirmation of your entitlement. You may be charged a fee if you effect your transactions through a broker or agent.
|
| How Can The Sales Charge On Class A Shares Be Reduced?
|
n
|
Right of Accumulation: When buying Class A Shares in Goldman Sachs Funds, your current aggregate
investment determines the initial sales load you pay. You may qualify for reduced sales charges when the current market value of holdings (shares at current offering price), plus new purchases, reaches $50,000 or more. Class A Shares of any of the Goldman
Sachs Funds may be combined under the Right of Accumulation. To qualify for a reduced sales load, you or your Authorized Dealer must notify the Fund’s Transfer Agent at the time of investment that a quantity discount is applicable. Use of this
service is subject to a check of appropriate records. The Additional Statement has more information about the Right of Accumulation.
|
n
|
Statement of Intention: You may obtain a reduced sales charge by means of a written Statement of
Intention which expresses your non-binding commitment to invest in the aggregate $50,000 or more (not counting reinvestments of dividends and distributions) within a period of 13 months in Class A Shares of one or more Goldman Sachs Funds. Any investments
you make during the period will receive the discounted sales load based on the full amount of your investment commitment. If the investment commitment of the Statement of Intention is not met prior to the expiration of the 13-month period, the entire
amount will be subject to the
higher applicable sales charge. By signing the Statement of Intention, you authorize the Transfer Agent to escrow and redeem Class A Shares in your account to pay this additional charge. The Additional Statement has more information about the Statement
of Intention, which you should read carefully.
|
| COMMON QUESTIONS ABOUT THE PURCHASE OF CLASS B SHARES
|
| What Is The Offering Price Of Class B Shares?
|
| You may purchase Class B Shares of the Fund at the next determined NAV without an initial sales charge. However, Class B Shares
redeemed within six years of purchase will be subject to a CDSC at the rates shown in the table below based on how long you held your shares.
|
| The CDSC schedule is as follows:
|
| Year Since Purchase | CDSC as a
Percentage of Dollar Amount Subject to CDSC |
||
|---|---|---|---|
| First | 5% | ||
| Second | 4% | ||
| Third | 3% | ||
| Fourth | 3% | ||
| Fifth | 2% | ||
| Sixth | 1% | ||
| Seventh and thereafter | None | ||
| Proceeds from the CDSC are payable to the Distributor and may be used in whole or in part to defray the Distributor’s
expenses related to providing distribution-related services to the Fund in connection with the sale of Class B Shares, including the payment of compensation to Authorized Dealers. A commission equal to 4% of the amount invested is paid to Authorized Dealers
.
|
| What Should I Know About The Automatic Conversion Of Class B Shares?
|
| Class B Shares of the Fund will automatically convert into Class A Shares of the Fund at the end of the calendar quarter that is
eight years after the purchase date.
|
| If you acquire Class B Shares of the Fund by exchange from Class B Shares of another Goldman Sachs Fund, your Class B Shares will
convert into Class A Shares of such Fund based on the date of the initial purchase and the CDSC schedule of that purchase.
|
| If you acquire Class B Shares through reinvestment of distributions, your Class B Shares will convert into Class A Shares based on
the date of the initial purchase of the shares on which the distribution was paid.
|
| The conversion of Class B Shares to Class A Shares will not occur at any time the Fund is advised that such conversions may
constitute taxable events for federal tax purposes, which the Fund believes is unlikely. If conversions do not occur as a result of possible taxability, Class B Shares would continue to be subject to higher expenses than Class A Shares for an
indeterminate period.
|
| A COMMON QUESTION ABOUT THE PURCHASE OF CLASS C SHARES
|
| What Is The Offering Price Of Class C Shares?
|
| You may purchase Class C Shares of the Fund at the next determined NAV without paying an initial sales charge. However, if you
redeem Class C Shares within 12 months of purchase, a CDSC of 1% will normally be deducted from the redemption proceeds; provided that in connection with purchases by Retirement Plans, where all of the Class C Shares are redeemed within 12 months of
purchase, a CDSC of 1% may be imposed upon the plan sponsor or third-party administrator.
|
| Proceeds from the CDSC are payable to the Distributor and may be used in whole or in part to defray the Distributor’s
expenses related to providing distribution-related services to the Fund in connection with the sale of Class C Shares, including the payment of compensation to Authorized Dealers. An amount equal to 1% of the amount invested is normally paid by the
Distributor to Authorized Dealers.
|
| COMMON QUESTIONS APPLICABLE TO THE PURCHASE OF CLASS A, B AND C SHARES
|
| What Else Do I Need To Know About The CDSC On Class A, B Or C Shares?
|
n
|
The CDSC is based on the lesser of the NAV of the shares at the time of redemption or the original offering price (which is the
original NAV).
|
n
|
No CDSC is charged on shares acquired from reinvested dividends or capital gains distributions.
|
n
|
No CDSC is charged on the per share appreciation of your account over the initial purchase price.
|
n
|
When counting the number of months since a purchase of Class B or Class C Shares was made, all payments made during a month will
be combined and considered to have been made on the first day of that month.
|
n
|
To keep your CDSC as low as possible, each time you place a request to sell shares, the Fund will first sell any shares in your
account that do not carry a CDSC and then the shares in your account that have been held the longest.
|
| In What Situations May The CDSC On Class A, B Or C Shares Be Waived Or Reduced?
|
| The CDSC on Class A, Class B and Class C Shares that are subject to a CDSC may be waived or reduced if the redemption relates to:
|
n
|
Retirement distributions or loans to participants or beneficiaries from Retirement Plans;
|
n
|
The death or disability (as defined in Section 72(m)(7) of the Internal Revenue Code of 1986, as amended (the “Code”))
of a participant or beneficiary in a Retirement Plan;
|
n
|
Hardship withdrawals by a participant or beneficiary in a Retirement Plan;
|
n
|
Satisfying the minimum distribution requirements of the Code;
|
n
|
Establishing “substantially equal periodic payments” as described under Section 72(t)(2) of the Code;
|
n
|
The separation from service by a participant or beneficiary in a Retirement Plan;
|
n
|
The death or disability (as defined in Section 72(m)(7) of the Code) of a shareholder if the redemption is made within one year of
the event;
|
n
|
Excess contributions distributed from a Retirement Plan;
|
n
|
Distributions from a qualified Retirement Plan invested in the Goldman Sachs Funds which are being rolled over to a Goldman Sachs
IRA; or
|
n
|
Redemption proceeds which are to be reinvested in accounts or non-registered products over which GSAM or its advisory affiliates
have investment discretion.
|
| In addition, Class A, B and C Shares subject to a systematic withdrawal plan may be redeemed without a CDSC. The Fund reserves the
right to limit such redemptions, on an annual basis, to 12% each of the value of your Class B and C Shares and 10% of the value of your Class A Shares.
|
| How Do I Decide Whether To Buy Class A, B Or C Shares?
|
| The decision as to which Class to purchase depends on the amount you invest, the intended length of the investment and your
personal situation.
|
n
|
Class A Shares. If you are making an investment of $50,000 or more that qualifies for a reduced sales
charge, you should consider purchasing Class A Shares.
|
n
|
Class B Shares. If you plan to hold your investment for at least six years and would prefer not to pay
an initial sales charge, you might consider purchasing Class B Shares. By not paying a front-end sales charge, your entire investment in Class B Shares is available to work for you from the time you make your initial investment. However, the distribution
and service fee paid by Class B
|
| Shares will cause your Class B Shares (until conversion to Class A Shares) to have a higher expense ratio, and thus lower
performance and lower dividend payments (to the extent dividends are paid) than Class A Shares. A maximum purchase limitation of $250,000 in the aggregate normally applies to Class B Shares. Individual purchases exceeding $250,000 will be rejected.
|
n
|
Class C Shares. If you are unsure of the length of your investment or plan to hold your investment for
less than six years and would prefer not to pay an initial sales charge, you may prefer Class C Shares. By not paying a front-end sales charge, your entire investment in Class C Shares is available to work for you from the time you make your initial
investment. However, the distribution and service fee paid by Class C Shares will cause your Class C Shares to have a higher expense ratio, and thus lower performance and lower dividend payments (to the extent dividends are paid) than Class A Shares (or
Class B Shares after conversion to Class A Shares).
|
| Although Class C Shares are subject to a CDSC for only 12 months, Class C Shares do not have the automatic eight year conversion
feature applicable to Class B Shares and your investment may pay higher distribution fees indefinitely.
|
| A maximum purchase limitation of $1,000,000 in the aggregate normally applies to purchases of Class C Shares. Individual purchases
exceeding $1,000,000 will be rejected.
|
| Note: Authorized Dealers may receive different compensation for selling Class A, Class B or Class C Shares.
|
| In addition to Class A, Class B and Class C Shares, the Fund also offers other classes of shares to investors. These other share
classes are subject to different fees and expenses (which affect performance), have different minimum investment requirements and are entitled to different services. Information regarding these other share classes may be obtained from your sales
representative or from Goldman Sachs by calling the number on the back cover of this Prospectus.
|
| How Can I Sell Class A, Class B And Class C Shares Of The Fund?
|
| You may arrange to take money out of your account by selling (redeeming) some or all of your shares. The Fund will redeem its
shares upon request on any business day at the NAV next determined after receipt of such request in proper form, subject to any applicable CDSC. You may request that redemption proceeds be sent to you by check or by wire (if the wire instructions are on record). Redemptions may be requested in writing or by telephone.
|
| Instructions For Redemptions: | |||
|---|---|---|---|
| By Writing: | n Write a letter of instruction that includes: | ||
| n Your name(s) and signature(s) | |||
| n Your account number | |||
| n The Fund name and Class of Shares | |||
| n The dollar amount you want to sell | |||
| n How and where to send the proceeds | |||
| n Obtain a signature guarantee (see details below) | |||
| n
Mail your request to:
Goldman Sachs Funds c/o NFDS P.O. Box 219711 Kansas City, MO 64121-9711 |
|||
| By Telephone: | If you have not declined the telephone redemption
privilege on your Account Application: |
||
| n
1-800-526-7384
(8:00 a.m. to 4:00 p.m. New York time) |
|||
| n
You may redeem up to $50,000 of your shares
within any 7 calendar day period |
|||
| n
Proceeds which are sent directly to a Goldman
Sachs brokerage account are not subject to the $50,000 limit |
|||
| When Do I Need A Signature Guarantee To Redeem Shares?
|
| A signature guarantee is required if:
|
n
|
You are requesting in writing to redeem shares in an amount over $50,000;
|
n
|
You would like the redemption proceeds sent to an address that is not your address of record; or
|
n
|
You would like to change the bank designated on your Account Application.
|
| A signature guarantee must be obtained from a bank, brokerage firm or other financial intermediary that is a member of an approved
Medallion Guarantee Program or that is otherwise approved by Goldman Sachs. A notary public cannot provide a signature guarantee. Additional documentation may be required for executors, trustees or corporations or when deemed appropriate by the Transfer
Agent.
|
| What Do I Need To Know About Telephone Redemption Requests?
|
| The Trust, the Distributor and the Transfer Agent will not be liable for any loss you may incur in the event that the Trust
accepts unauthorized telephone redemption requests that the Trust reasonably believes to be genuine. The Trust may accept telephone redemption instructions from any person identifying himself or herself as the owner of an account or the owner’s
registered representative where
|
|
| the owner has not declined in writing to use this service. Thus, you risk possible losses if a telephone redemption is not authorized by you. |
| In an effort to prevent unauthorized or fraudulent redemption and exchange requests by telephone, Goldman Sachs and NFDS each
employ reasonable procedures specified by the Trust to confirm that such instructions are genuine. If reasonable procedures are not employed, the Trust may be liable for any loss due to unauthorized or fraudulent transactions. The following general
policies are currently in effect:
|
n
|
All telephone requests are recorded.
|
n
|
Proceeds of telephone redemption requests will be sent only to your address of record or authorized bank account designated in the
Account Application (unless you provide written instructions and a signature guarantee, indicating another address or account) and exchanges of shares normally will be made only to an identically registered account.
|
n
|
Telephone redemptions by check to your address of record will not be accepted during the 30-day period following any change in
your address of record.
|
n
|
The telephone redemption option does not apply to shares held in a “street name” account. “Street name”
accounts are accounts maintained and serviced by your Authorized Dealer. If your account is held in “street name,” you should contact your registered representative of record, who may make telephone redemptions on your behalf.
|
n
|
The telephone redemption option may be modified or terminated at any time.
|
| Note: It may be difficult to make telephone redemptions in times of drastic economic or market conditions.
|
| How Are Redemption Proceeds Paid?
|
| By Wire: You may arrange for your redemption proceeds to be wired as federal funds to the bank account designated in
your Account Application. The following general policies govern wiring redemption proceeds:
|
n
|
Redemption proceeds will normally be wired on the next business day in federal funds (for a total of one business day delay), but
may be paid up to three business days following receipt of a properly executed wire transfer redemption request. If you are selling shares you recently paid for by check, the Fund will pay you when your check has cleared, which may take up to 15 days. If
the Federal Reserve Bank is closed on the day that the redemption proceeds would ordinarily be wired, wiring the redemption proceeds may be delayed one additional business day.
|
n
|
A transaction fee of $7.50 may be charged for payments of redemption proceeds by wire. Your bank may also charge wiring fees. You
should contact your bank directly to learn whether it charges such fees.
|
n
|
To change the bank designated on your Account Application, you must send written instructions (with your signature guaranteed) to
the Transfer Agent.
|
n
|
Neither the Trust, Goldman Sachs nor any Authorized Dealer assumes any responsibility for the performance of your bank or any
intermediaries in the transfer process. If a problem with such performance arises, you should deal directly with your bank or any such intermediaries.
|
| By Check: You may elect to receive your redemption proceeds by check. Redemption proceeds paid by check will
normally be mailed to the address of record within three business days of a properly executed redemption request. If you are selling shares you recently paid for by check, the Fund will pay you when your check has cleared, which may take up to 15 days.
|
| What Else Do I Need To Know About Redemptions?
|
| The following generally applies to redemption requests:
|
n
|
Additional documentation may be required when deemed appropriate by the Transfer Agent. A redemption request will not be in proper
form until such additional documentation has been received.
|
| The Trust reserves the right to:
|
n
|
Redeem your shares if your account balance is less than $50 as a result of earlier redemptions. The Fund will not redeem your
shares on this basis if the value of your account falls below the minimum account balance solely as a result of market conditions. The Fund will give you 60 days’ prior written notice to allow you to purchase sufficient additional shares of the Fund
in order to avoid such redemption.
|
n
|
Redeem your shares in other circumstances determined by the Board of Trustees to be in the best interests of the Trust.
|
n
|
Pay redemptions by a distribution in-kind of securities (instead of cash). If you receive redemption proceeds in-kind, you should
expect to incur transaction costs upon the disposition of those securities.
|
n
|
Reinvest any dividends or other distributions which you have elected to receive in cash should your check for such dividends or
other distributions be returned to the Fund as undeliverable or remain uncashed for six months. In addition, that distribution and all future distributions payable to you will be reinvested at NAV in additional shares of the same class of the Fund. No
interest will accrue on amounts represented by uncashed distribution or redemption checks.
|
| Can I Reinvest Redemption Proceeds In The Same Or Another Goldman Sachs Fund?
|
| You may redeem shares of the Fund and reinvest a portion or all of the redemption proceeds (plus any additional amounts needed to
round off purchases to the nearest full share) at NAV. To be eligible for this privilege, you must hold the shares you want to redeem for at least 30 days and you must reinvest the share proceeds within 90 days after you redeem. You may reinvest as follows:
|
n
|
Class A or B Shares—Class A Shares of the Fund or any other Goldman Sachs Fund
|
n
|
Class C Shares—Class C Shares of the Fund or any other Goldman Sachs Fund
|
n
|
You should obtain and read the applicable prospectuses before investing in any other Funds.
|
n
|
If you pay a CDSC upon redemption of Class A or Class C Shares and then reinvest in Class A or Class C Shares as described above,
your account will be credited with the amount of the CDSC you paid. The reinvested shares will, however, continue to be subject to a CDSC. The holding period of the shares acquired through reinvestment will include the holding period of the redeemed
shares for purposes of computing the CDSC payable upon a subsequent redemption. For Class B Shares, you may reinvest the redemption proceeds in Class A Shares at NAV but the amount of the CDSC paid upon redemption of the Class B Shares will not be
credited to your account.
|
n
|
The reinvestment privilege may be exercised at any time in connection with transactions in which the proceeds are reinvested at
NAV in a tax-sheltered retirement plan. In other cases, the reinvestment privilege may be exercised once per year upon receipt of a written request.
|
n
|
You may be subject to capital gains tax as a result of a redemption. You should consult your tax adviser concerning the tax
consequences of a redemption and reinvestment.
|
| Can I Exchange My Investment From One Fund To Another?
|
| You may exchange shares of the Fund at NAV without the imposition of an initial sales charge or CDSC at the time of exchange for
shares of the same class or an equivalent class of any other Goldman Sachs Fund. The exchange privilege may be materially modified or withdrawn at any time upon 60 days’ written notice to you.
|
| Instructions For Exchanging Shares: | |||
|---|---|---|---|
| By Writing: | n Write a letter of instruction that includes: | ||
| n Your name(s) and signature(s) | |||
| n Your account number | |||
| n The Fund names and Class of Shares | |||
| n The dollar amount you want to exchange | |||
| n Obtain a signature guarantee (see details above) | |||
| n Mail the request to: | |||
| Goldman Sachs Funds | |||
| c/o NFDS | |||
| P.O. Box 219711 | |||
| Kansas City, MO 64121-9711 | |||
| or for overnight delivery - | |||
| Goldman Sachs Funds | |||
| c/o NFDS | |||
| 330 West 9th St. | |||
| Poindexter Bldg., 1st Floor | |||
| Kansas City, MO 64105 | |||
| By Telephone: | If you have not declined the telephone exchange
privilege on your Account Application: |
||
| n
1-800-526-7384 (8:00 a.m. to 4:00 p.m.
New York time) |
|||
| You should keep in mind the following factors when making or considering an exchange:
|
n
|
You should obtain and carefully read the prospectus of the Fund you are acquiring before making an exchange.
|
n
|
Currently, there is no charge for exchanges, although the Fund may impose a charge in the future.
|
n
|
The exchanged shares may later be exchanged for shares of the same class (or an equivalent class) of the original Fund at the next
determined NAV without the imposition of an initial sales charge or CDSC if the amount in the Fund resulting from such exchanges is less than the largest amount on which you have previously paid the applicable sales charge.
|
n
|
When you exchange shares subject to a CDSC, no CDSC will be charged at that time. The exchanged shares will be subject to the CDSC
of the shares
|
|
| originally held. For purposes of determining the amount of the applicable CDSC, the length of time you have owned the shares will be measured from the date you acquired the original shares subject to a CDSC and will not be affected by a subsequent exchange . |
n
|
Eligible investors may exchange certain classes of shares for another class of shares of the Fund. For further information, call
Goldman Sachs Funds at 1-800-526-7384 and see the Additional Statement.
|
n
|
All exchanges which represent an initial investment in a Fund must satisfy the minimum initial investment requirements of that Fund.
|
n
|
Exchanges are available only in states where exchanges may be legally made.
|
n
|
It may be difficult to make telephone exchanges in times of drastic economic or market conditions.
|
n
|
Goldman Sachs and NFDS may use reasonable procedures described under “What Do I Need to Know About Telephone Redemption
Requests?” in an effort to prevent unauthorized or fraudulent telephone exchange requests.
|
n
|
Telephone exchanges normally will be made only to an identically registered account. Shares may be exchanged among accounts with
different names, addresses and social security or other taxpayer identification numbers only if the exchange instructions are in writing and accompanied by a signature guarantee.
|
n
|
Exchanges into Funds that are closed to new investors may be restricted.
|
| For federal income tax purposes, an exchange from one Fund to another is treated as a redemption of the shares surrendered in the
exchange, on which you may be subject to tax, followed by a purchase of shares received in the exchange. You should consult your tax adviser concerning the tax consequences of an exchange.
|
| Restrictions on Excessive Trading Practices. The Trust does not permit market-timing or other excessive trading
practices. Purchases and exchanges should be made for long-term investment purposes only. The Trust and Goldman Sachs reserve the right to reject or restrict purchase or exchange requests from any investor. Excessive, short-term (market-timing) trading
practices may disrupt portfolio management strategies, harm Fund performance and negatively impact long-term shareholders. The Trust and Goldman Sachs will not be held liable for any loss resulting from rejected purchase or exchange orders. To minimize
harm to the Trust (or Goldman Sachs) and its shareholders, the Trust (or Goldman Sachs) will exercise these rights if, in the Trust’s (or Goldman Sachs’) judgment, an investor has a history of excessive trading or if an investor’s trading,
in the judgment of the Trust (or Goldman Sachs), has been or may be disruptive to the Fund. In making this judgment, trades executed in multiple accounts under common ownership or control may be considered together.
|
| SHAREHOLDER SERVICES
|
| Can I Arrange To Have Automatic Investments Made On A Regular Basis?
|
| You may be able to make systematic cash investments through your bank via ACH transfer or your checking account via bank draft
each month. Forms for this option are available from Goldman Sachs, your Authorized Dealer or you may check the appropriate box on the Account Application.
|
| Can My Dividends From The Fund Be Invested In Other Funds?
|
| You may elect to cross-reinvest dividends paid by the Fund in shares of the same class or an equivalent class of any other Goldman
Sachs Fund.
|
n
|
Shares will be purchased at NAV.
|
n
|
No initial sales charge or CDSC will be imposed.
|
n
|
You may elect cross-reinvestment into an identically registered account or an account registered in a different name or with a
different address, social security number or taxpayer identification number provided that the account has been properly established, appropriate signature guarantees obtained and the minimum initial investment has been satisfied.
|
| Can I Arrange To Have Automatic Exchanges Made On A Regular Basis?
|
| You may elect to exchange automatically a specified dollar amount of shares of the Fund for shares of the same class or an
equivalent class of any other Goldman Sachs Fund.
|
n
|
Shares will be purchased at NAV.
|
n
|
No initial sales charge is imposed.
|
n
|
Shares subject to a CDSC acquired under this program may be subject to a CDSC at the time of redemption from the Fund into which
the exchange is made depending upon the date and value of your original purchase.
|
n
|
Automatic exchanges are made monthly on the 15th day of each month or the first business day thereafter.
|
n
|
Minimum dollar amount: $50 per month.
|
| What Else Should I Know About Cross-Reinvestments And Automatic Exchanges?
|
| Cross-reinvestments and automatic exchanges are subject to the following conditions:
|
n
|
You must hold $5,000 or more in the Fund which is paying the dividend or from which the exchange is being made.
|
n
|
You must invest an amount in the Fund into which cross-reinvestments or automatic exchanges are being made that is equal to that
Fund’s minimum initial investment or continue to cross-reinvest or to make automatic exchanges until such minimum initial investment is met.
|
n
|
You should obtain and read the prospectus of the Fund into which dividends are invested or automatic exchanges are made.
|
| Can I Have Automatic Withdrawals Made On A Regular Basis?
|
| You may draw on your account systematically via check or ACH transfer in any amount of $50 or more.
|
n
|
It is normally undesirable to maintain a systematic withdrawal plan at the same time that you are purchasing additional Class A,
Class B or Class C Shares because of the sales charge imposed on your purchases of Class A Shares or the imposition of a CDSC on your redemptions of Class A, Class B or Class C Shares.
|
n
|
You must have a minimum balance of $5,000 in the Fund.
|
n
|
Checks are mailed on or about the 25th day of each month.
|
n
|
Each systematic withdrawal is a redemption and therefore a taxable transaction.
|
n
|
The CDSC applicable to Class A, Class B or Class C Shares redeemed under the systematic withdrawal plan may be waived.
|
| What Types Of Reports Will I Be Sent Regarding My Investment?
|
| You will be provided with a printed confirmation of each transaction in your account and an individual quarterly account
statement. A year-to-date statement for your account will be provided upon request made to Goldman Sachs. If your account is held in “street name” you may receive your statements and confirmations on a different schedule.
|
| You will also receive an annual shareholder report containing audited financial statements and a semi-annual shareholder report.
If you have consented to the delivery of a single copy of shareholder reports, prospectuses and other information to all shareholders who share the same mailing address with your account, you may revoke your consent at any time by contacting Goldman Sachs
Funds by phone at 1-800-526-7384 or by mail at Goldman Sachs Funds, 4900 Sears Tower, Chicago, IL 60606-6372. The Fund will begin sending individual copies to you within 30 days after receipt of your revocation.
|
| The Fund does not generally provide sub-accounting services.
|
| What Should I Know When I Purchase Shares Through An Authorized Dealer?
|
| Authorized Dealers and other financial intermediaries may provide varying arrangements for their clients to purchase and redeem
Fund shares. They may charge additional fees not described in this Prospectus to their customers for such services.
|
| If shares of the Fund are held in a “street name” account with an Authorized Dealer, all recordkeeping, transaction
processing and payments of distributions relating to your account will be performed by the Authorized Dealer, and not by the Fund and its Transfer Agent. Since the Fund will have no record of your transactions, you should contact the Authorized Dealer to
purchase, redeem or exchange shares, to make changes in or give instructions concerning the account or to obtain information about your account. The transfer of shares in a “street name” account to an account with another dealer or to an account
directly with the Fund involves special procedures and will require you to obtain historical purchase information about the shares in the account from the Authorized Dealer.
|
| Authorized Dealers and other financial intermediaries may be authorized to accept, on behalf of the Trust, purchase, redemption
and exchange orders placed by or on behalf of their customers, and if approved by the Trust, to designate other intermediaries to accept such orders. In these cases:
|
n
|
The Fund will be deemed to have received an order that is in proper form when the order is accepted by an Authorized Dealer or
intermediary on a business day, and the order will be priced at the Fund’s NAV per share (adjusted for any applicable sales charge) next determined after such acceptance.
|
n
|
Authorized Dealers and intermediaries are responsible for transmitting accepted orders to the Fund within the time period agreed
upon by them.
|
| You should contact your Authorized Dealer or intermediary to learn whether it is authorized to accept orders for the Trust.
|
| The Investment Adviser, Distributor and/or their affiliates may pay additional compensation from time to time, out of their assets
and not as an additional charge to the Fund, to selected Authorized Dealers and other persons in connection with the sale, distribution and/or servicing of shares of the Fund and other Goldman Sachs Funds. Additional compensation based on sales may, but
is currently not expected to, exceed 0.50% (annualized) of the amount invested.
|
| DISTRIBUTION SERVICES AND FEES
|
| What Are The Different Distribution And Service Fees Paid By Class A, B and C Shares?
|
| The Trust has adopted distribution and service plans (each a “Plan”) under which Class A, Class B and Class C Shares
bear distribution and service fees paid to Authorized Dealers and Goldman Sachs. If the fees received by Goldman Sachs pursuant to the Plans exceed its expenses, Goldman Sachs may realize a profit from these arrangements. Goldman Sachs pays the
distribution and service fees on a quarterly basis.
|
| Under the Plans, Goldman Sachs is entitled to a monthly fee from the Fund for distribution services equal, on an annual basis, to
0.25%, 0.75% and 0.75%, respectively, of the Fund’s average daily net assets attributed to Class A, Class B and Class C Shares. Because these fees are paid out of the Fund’s assets on an ongoing basis, over time, these fees will increase the
cost of your investment and may cost you more than paying other types of such charges.
|
| The distribution fees are subject to the requirements of Rule 12b-1 under the Act, and may be used (among other things) for:
|
n
|
Compensation paid to and expenses incurred by Authorized Dealers, Goldman Sachs and their respective officers, employees and sales
representatives;
|
n
|
Commissions paid to Authorized Dealers;
|
n
|
Allocable overhead;
|
n
|
Telephone and travel expenses;
|
n
|
Interest and other costs associated with the financing of such compensation and expenses;
|
n
|
Printing of prospectuses for prospective shareholders;
|
n
|
Preparation and distribution of sales literature or advertising of any type; and
|
n
|
All other expenses incurred in connection with activities primarily intended to result in the sale of Class A, Class B and Class C
Shares.
|
| In connection with the sale of Class C Shares, Goldman Sachs normally begins paying the 0.75% distribution fee as an ongoing
commission to Authorized Dealers after the shares have been held for one year.
|
| PERSONAL ACCOUNT MAINTENANCE SERVICES AND FEES
|
| Under the Plans, Goldman Sachs is also entitled to receive a separate fee equal on an annual basis to 0.25% of the Fund’s
average daily net assets attributed to
|
| Class B or Class C Shares. This fee is for personal and account maintenance services, and may be used to make payments to Goldman
Sachs, Authorized Dealers and their officers, sales representatives and employees for responding to inquiries of, and furnishing assistance to, shareholders regarding ownership of their shares or their accounts or similar services not otherwise provided
on behalf of the Fund. If the fees received by Goldman Sachs pursuant to the Plans exceed its expenses, Goldman Sachs may realize a profit from this arrangement.
|
| In connection with the sale of Class C Shares, Goldman Sachs normally begins paying the 0.25% ongoing service fee to Authorized
Dealers after the shares have been held for one year.
|
| As with any investment, you should consider how your investment in the Fund will be taxed. The tax information below is provided
as general information. More tax information is available in the Additional Statement. You should consult your tax adviser about the federal, state, local or foreign tax consequences of your investment in the Fund.
|
| Unless your investment is in an IRA or other tax-advantaged account, you should consider the possible tax consequences of Fund
distributions and the sale of your Fund shares.
|
| DISTRIBUTIONS
|
| Distributions you receive from the Fund are generally subject to federal income tax, and may also be subject to state or local
taxes. This is true whether you reinvest your distributions in additional Fund shares or receive them in cash. For federal tax purposes, the Fund’s income dividend distributions and short-term capital gain distributions are taxable to you as ordinary
income. Any long-term capital gain distributions are taxable as long-term capital gains, no matter how long you have owned your Fund shares.
|
| Although distributions are generally treated as taxable to you in the year they are paid, distributions declared in October,
November or December but paid in January are taxable as if they were paid in December. A percentage of the Fund’s dividends paid to corporate shareholders may be eligible for the corporate dividends-received deduction. The Fund will inform
shareholders of the character and tax status of all distributions promptly after the close of each calendar year.
|
| The Fund may be subject to foreign withholding or other foreign taxes on income or gain from certain foreign securities. In
general, the Fund may deduct these taxes in computing its taxable income.
|
| If you buy shares of the Fund before it makes a distribution, the distribution will be taxable to you even though it may actually
be a return of a portion of your investment. This is known as “buying a dividend.”
|
| SALES AND EXCHANGES
|
| Your sale of Fund shares is a taxable transaction for federal income tax purposes, and may also be subject to state and local
taxes. For tax purposes, the exchange of your Fund shares for shares of a different Goldman Sachs Fund is the same as a sale. When you sell your shares, you will generally recognize a capital gain or loss in an amount equal to the difference between your
adjusted tax basis in the shares and the amount received. Generally, this gain or loss is long-term or short-term depending on whether your holding period exceeds twelve months, except that any loss realized on shares held for six months or less will be
treated as a long-term capital loss to the extent of any long-term capital gain dividends that were received on the shares.
|
| RETIREMENT PLANS
|
| The one major exception to these tax principles is that distributions on, and sales, exchanges and redemptions of, shares held in
an IRA (or other tax-qualified plan) will not be currently taxable.
|
| OTHER INFORMATION
|
| When you open your account, you should provide your social security or tax identification number on your Account Application. By
law, the Fund must withhold 31% of your taxable distributions and any redemption proceeds if you do not provide your correct taxpayer identification number, or certify that it is correct, or if the IRS instructs the Fund to do so. Non-U.S. investors may
be subject to U.S. withholding and estate tax.
|
| A. General Portfolio Risks
|
| The Fund will be subject to the risks associated with equity securities. “Equity securities” may include common stocks,
preferred stocks, interests in real estate investment trusts, convertible debt obligations, convertible preferred stocks, equity interests in trusts, partnerships, joint ventures, limited liability companies and similar enterprises, warrants, and stock
purchase rights. In general, stock values fluctuate in response to the activities of individual companies and in response to general market and economic conditions. Accordingly, the value of the stocks that the Fund holds may decline over short or
extended periods. The stock markets tend to be cyclical, with periods when stock prices generally rise and periods when prices generally decline. The volatility of equity securities means that the value of your investment in the Fund may increase or
decrease. Recently, certain stock markets have experienced substantial price volatility and, at times, have traded at or close to record high levels. There can be no guarantee that such levels will be reached or maintained in the future.
|
| To the extent that the Fund invests in fixed-income securities, the Fund will also be subject to the risks associated with its
fixed-income securities. These risks include interest rate risk and credit risk. In general, interest rate risk involves the risk that when interest rates decline, the market value of fixed-income securities tends to increase. Conversely, when interest
rates increase, the market value of fixed-income securities tends to decline. Credit risk involves the risk that an issuer or guarantor could default on its obligations, and the Fund will not recover its investment.
|
| The Investment Adviser will not consider the portfolio turnover rate a limiting factor in making investment decisions for the
Fund. Trading to keep the Fund’s portfolio holdings consistent with, and equally weighted among, the securities in the U.S. Select List may increase the Fund’s portfolio turnover rate. A high rate of portfolio turnover (100% or more) involves correspondingly greater expenses which must be borne by the Fund and its shareholders, and is also likely to result in
higher short-term capital gains taxable to shareholders. The portfolio turnover rate is calculated by dividing the lesser of the dollar amount of sales or purchases of portfolio securities by the average monthly value of the Fund’s portfolio
securities, excluding securities having a maturity at the date of purchase of one year or less.
|
| The following sections provide further information on certain types of securities and investment techniques that may be used by
the Fund, including their associated risks. Additional information is provided in the Additional Statement, which is available upon request. Among other things, the Additional Statement describes certain fundamental investment restrictions that cannot be
changed without shareholder approval. You should note, however, that the investment objective, and all investment policies not specifically designated as fundamental, are non-fundamental and may be changed without shareholder approval. If there is a
change in the Fund’s investment objective, you should consider whether the Fund remains an appropriate investment in light of your then current financial position and needs.
|
| B. Other Portfolio Risks
|
| Risks of Investing in Small Capitalization Companies. The Fund may invest in small capitalization companies.
Investments in small capitalization companies involve greater risk and portfolio price volatility than investments in larger capitalization stocks. Among the reasons for the greater price volatility of these investments are the less certain growth
prospects of smaller firms and the lower degree of liquidity in the markets for such securities. Small capitalization companies may be thinly traded and may have to be sold at a discount from current market prices or in small lots over an extended period
of time. In addition, these securities are subject to the risk that during certain periods the liquidity of particular issuers or industries, or all securities in particular investment categories, will shrink or disappear suddenly and without warning as a
result of adverse economic or market conditions, or adverse investor perceptions whether or not accurate. Because of the lack of sufficient market liquidity, the Fund may incur losses because it will be required to effect sales at a disadvantageous time
and only then at a substantial drop in price. Small capitalization companies include “unseasoned” issuers that do not have an established financial history; often have limited product lines, markets or financial resources; may depend on or use a
few key personnel for management; and may be susceptible to losses and risks of bankruptcy. Transaction costs for these investments are often higher than those of larger capitalization companies. Investments in small capitalization companies may be more
difficult to price precisely than other types of securities because of their characteristics and lower trading volumes.
|
| Risks of Foreign Issuers. The Fund may invest in foreign issuers. Foreign issuers involve special risks that are not
typically associated with U.S. issuers. There may be less publicly available information about a foreign issuer than about a U.S. issuer. In addition, there is generally less government regulation of foreign compa
nies than in the United States. The securities of many foreign issuers are less liquid and more volatile than securities of comparable domestic issuers. Furthermore, with respect to certain foreign countries, there is a possibility of nationalization,
expropriation or confiscatory taxation, imposition of withholding or other taxes on dividend or interest payments (or, in some cases, capital gains), limitations on the removal of funds or other assets, and political or social instability or diplomatic
developments which could affect the Fund’s investments.
|
| Risks of Derivative Investments. The Fund’s transactions in options, futures, options on futures, swaps and
structured securities involve additional risk of loss. Loss can result from a lack of correlation between changes in the value of derivative instruments and the portfolio assets (if any) being hedged, the potential illiquidity of the markets for
derivative instruments, or the risks arising from margin requirements and related leverage factors associated with such transactions. The use of these management techniques also involves the risk of loss if the Investment Adviser is incorrect in its
expectation of fluctuations in securities prices or interest rates. The Fund may also invest in derivative investments for non-hedging purposes (that is, to seek to increase total return). Investing for non-hedging purposes is considered a speculative
practice and presents even greater risk of loss.
|
| Risks of Illiquid Securities. The Fund may invest up to 15% of its net assets in illiquid securities which cannot be
disposed of in seven days in the ordinary course of business at fair value. Illiquid securities include:
|
n
|
Securities that are not readily marketable
|
n
|
Repurchase agreements and time deposits with a notice or demand period of more than seven days
|
n
|
Certain over-the-counter options
|
n
|
Certain structured securities and all swap transactions
|
n
|
Certain restricted securities, unless it is determined, based upon a review of the trading markets for a specific restricted
security, that such restricted security is eligible for resale pursuant to Rule 144A under the Securities Act of 1933 (“144A Securities”) and, therefore, is liquid.
|
| Investing in 144A Securities may decrease the liquidity of the Fund’s portfolio to the extent that qualified institutional
buyers become for a time uninterested in purchasing these restricted securities. The purchase price and subsequent valuation of restricted and illiquid securities normally reflect a discount, which may be significant, from the market price of comparable
securities for which a liquid market exists.
|
| Credit Risks. Debt securities purchased by the Fund may include securities (including zero coupon bonds) issued by
the U.S. government (and its agencies, instru
mentalities and sponsored enterprises), domestic and foreign corporations, banks and other issuers. Further information is provided in the Additional Statement.
|
| Temporary Investment Risks. The Fund may, for temporary defensive purposes, invest a certain percentage of its total
assets in:
|
n
|
U.S. government securities
|
n
|
Commercial paper rated at least A-2 by Standard & Poor’s or P-2 by Moody’s
|
n
|
Certificates of deposit
|
n
|
Bankers’ acceptances
|
n
|
Repurchase agreements
|
n
|
Non-convertible preferred stocks and non-convertible corporate bonds with a remaining maturity of less than one year
|
| When the Fund’s assets are invested in such instruments, the Fund may not be achieving its investment objective.
|
| C. Portfolio Securities and Techniques
|
| This section provides further information on certain types of securities and investment techniques that may be used by the Fund,
including their associated risks. Further information is provided in the Additional Statement, which is available upon request.
|
| Structured Securities. The Fund may invest in structured securities. Structured securities are securities whose
value is determined by reference to changes in the value of specific currencies, interest rates, commodities, indices or other financial indicators (the “Reference”) or the relative change in two or more References. The interest rate or the
principal amount payable upon maturity or redemption may be increased or decreased depending upon changes in the applicable Reference. Structured securities may be positively or negatively indexed, so that appreciation of the Reference may produce an
increase or decrease in the interest rate or value of the security at maturity. In addition, changes in the interest rates or the value of the security at maturity may be a multiple of changes in the value of the Reference. Consequently, structured
securities may present a greater degree of market risk than other types of securities and may be more volatile, less liquid and more difficult to price accurately than less complex securities.
|
| REITs. The Fund may invest in REITs. REITs are pooled investment vehicles that invest primarily in either real
estate or real estate related loans. The value of a REIT is affected by changes in the value of the properties owned by the REIT or securing mortgage loans held by the REIT. REITs are dependent upon the ability of the REITs’ managers, and are subject
to heavy cash flow dependency,
default by borrowers and the qualification of the REITs under applicable regulatory requirements for favorable income tax treatment. REITs are also subject to risks generally associated with investments in real estate including possible declines in the
value of real estate, general and local economic conditions, environmental problems and changes in interest rates. To the extent that assets underlying a REIT are concentrated geographically, by property type or in certain other respects, these risks may
be heightened. The Fund will indirectly bear its proportionate share of any expenses, including management fees, paid by a REIT in which it invests.
|
| Options on Securities and Securities Indices. A put option gives the purchaser of the option the right to sell, and
the writer (seller) of the option the obligation to buy, the underlying instrument during the option period. A call option gives the purchaser of the option the right to buy, and the writer (seller) of the option the obligation to sell, the underlying
instrument during the option period. The Fund may write (sell) covered call and put options and purchase put and call options on any securities in which it may invest or on any securities index consisting of securities in which it may invest.
|
| The writing and purchase of options is a highly specialized activity which involves special investment risks. Options may be used
for either hedging or cross-hedging purposes, or to seek to increase total return (which is considered a speculative activity). The successful use of options depends in part on the ability of the Investment Adviser to manage future price fluctuations and
the degree of correlation between the options and securities markets. If the Investment Adviser is incorrect in its expectation of changes in market prices or determination of the correlation between the instruments or indices on which options are written
and purchased and the instruments in the Fund’s investment portfolio, the Fund may incur losses that it would not otherwise incur. The use of options can also increase the Fund’s transaction costs. Options written or purchased by the Fund may be
traded on U.S. exchanges or over-the-counter. Over-the-counter options will present greater possibility of loss because of their greater illiquidity and credit risks.
|
| Futures Contracts and Options on Futures Contracts. Futures contracts are standardized, exchange-traded contracts
that provide for the sale or purchase of a specified financial instrument at a future time at a specified price. An option on a futures contract gives the purchaser the right (and the writer of the option the obligation) to assume a position in a futures
contract at a specified exercise price within a specified period of time. A futures contract may be based on various securities (such as U.S. government securities), securities indices, and other financial instruments and indices. The Fund may engage in
futures transactions on U.S. exchanges.
|
| The Fund may purchase and sell futures contracts, and purchase and write call and put options on futures contracts, in order to
seek to increase total return or to hedge against changes in interest rates or securities prices. The Fund may also enter into closing purchase and sale transactions with respect to such contracts and options. The Fund will engage in futures and related
options transactions for bona fide hedging purposes as defined in regulations of the Commodity Futures Trading Commission or to seek to increase total return to the extent permitted by such regulations. The Fund may not purchase or sell futures contracts
or purchase or sell related options to seek to increase total return, except for closing purchase or sale transactions, if immediately thereafter the sum of the amount of initial margin deposits and premiums paid on the Fund’s outstanding positions
in futures and related options entered into for the purpose of seeking to increase total return would exceed 5% of the market value of the Fund’s net assets.
|
| Futures contracts and related options present the following risks:
|
n
|
While the Fund may benefit from the use of futures and options on futures, unanticipated changes in interest rates or securities
prices may result in poorer overall performance than if the Fund had not entered into any futures contracts or options transactions.
|
n
|
Because perfect correlation between a futures position and portfolio position that is intended to be protected is impossible to
achieve, the desired protection may not be obtained and the Fund may be exposed to additional risk of loss.
|
n
|
The loss incurred by the Fund in entering into futures contracts and in writing call options on futures is potentially unlimited
and may exceed the amount of the premium received.
|
n
|
Futures markets are highly volatile and the use of futures may increase the volatility of the Fund’s NAV.
|
n
|
As a result of the low margin deposits normally required in futures trading, a relatively small price movement in a futures
contract may result in substantial losses to the Fund.
|
n
|
Futures contracts and options on futures may be illiquid, and exchanges may limit fluctuations in futures contract prices during a
single day.
|
| Equity Swaps. The Fund may invest in equity swaps. Equity swaps allow the parties to a swap agreement to exchange
the dividend income or other components of return on an equity investment (for example, a group of equity securities or an index) for a component of return on another non-equity or equity investment.
|
| An equity swap may be used by the Fund to invest in a market without owning or taking physical custody of securities in
circumstances in which direct investment may be restricted for legal reasons or is otherwise impractical. Equity swaps are derivatives and their value can be very volatile. To the extent that the Investment
| |
Adviser does not accurately analyze and predict the potential relative fluctuation of the components swapped with another party,
the Fund may suffer a loss, which may be substantial. The value of some components of an equity swap (such as the dividends on a common stock) may also be sensitive to changes in interest rates. Furthermore, the Fund may suffer a loss if the counterparty
defaults. Because equity swaps are normally illiquid, the Fund may be unable to terminate its obligations when desired.
|
| When-Issued Securities and Forward Commitments. The Fund may purchase when-issued securities and enter into forward
commitments. When-issued securities are securities that have been authorized, but not yet issued. When-issued securities are purchased in order to secure what is considered to be an advantageous price or yield to the Fund at the time of entering into the
transaction. A forward commitment involves the entering into a contract to purchase or sell securities for a fixed price at a future date beyond the customary settlement period.
|
| The purchase of securities on a when-issued or forward commitment basis involves a risk of loss if the value of the security to be
purchased declines before the settlement date. Conversely, the sale of securities on a forward commitment basis involves the risk that the value of the securities sold may increase before the settlement date. Although the Fund will generally purchase
securities on a when-issued or forward commitment basis with the intention of acquiring the securities for its portfolio, the Fund may dispose of when-issued securities or forward commitments prior to settlement if the Investment Adviser deems it
appropriate.
|
| Repurchase Agreements. Repurchase agreements involve the purchase of securities subject to the seller’s
agreement to repurchase them at a mutually agreed upon date and price. The Fund may enter into repurchase agreements with dealers in U.S. government securities and member banks of the Federal Reserve System which furnish collateral at least equal in value
or market price to the amount of their repurchase obligation.
|
| If the other party or “seller” defaults, the Fund might suffer a loss to the extent that the proceeds from the sale of
the underlying securities and other collateral held by the Fund are less than the repurchase price and the Fund’s costs associated with delay and enforcement of the repurchase agreement. In addition, in the event of bankruptcy of the seller, the Fund
could suffer additional losses if a court determines that the Fund’s interest in the collateral is not enforceable.
|
| In evaluating whether to enter into a repurchase agreement, the Investment Adviser will carefully consider the creditworthiness of
the seller. The Fund, together with other registered investment companies having advisory agreements with the Investment Adviser or any of its affiliates, may transfer uninvested cash balances into a single joint account, the daily aggregate balance of
which will be invested in one or more repurchase agreements.
|
| Lending of Portfolio Securities. The Fund may engage in securities lending. Securities lending involves the lending
of securities owned by the Fund to financial institutions such as certain broker-dealers. The borrowers are required to secure their loan continuously with cash, cash equivalents, U.S. government securities or letters of credit in an amount at least equal
to the market value of the securities loaned. Cash collateral may be invested in cash equivalents. To the extent that cash collateral is invested in other investment securities, such collateral will be subject to market depreciation or appreciation, and
the Fund will be responsible for any loss that might result from its investment of the borrowers’ collateral. If the Investment Adviser determines to make securities loans, the value of the securities loaned may not exceed 33 1
/3% of the value of the total assets of the
Fund (including the loan collateral).
|
| The Fund may lend its securities to increase its income. The Fund may, however, experience delay in the recovery of its securities
or a capital loss if the institution with which it has engaged in a portfolio loan transaction breaches its agreement with the Fund.
|
| Preferred Stock, Warrants and Rights. The Fund may invest in preferred stock, warrants and rights. Preferred stocks
are securities that represent an ownership interest providing the holder with claims on the issuer’s earnings and assets before common stock owners but after bond owners. Unlike debt securities, the obligations of an issuer of preferred stock,
including dividend and other payment obligations, may not typically be accelerated by the holders of such preferred stock on the occurrence of an event of default or other non-compliance by the issuer of the preferred stock.
|
| Warrants and other rights are options to buy a stated number of shares of common stock at a specified price at any time during the
life of the warrant or right. The holders of warrants and rights have no voting rights, receive no dividends and have no rights with respect to the assets of the issuer.
|
| Other Investment Companies. The Fund may invest in securities of other investment companies (including
exchange-traded funds such as SPDRs as defined below) subject to statutory limitations prescribed by the Act. These limitations include a prohibition on the Fund acquiring more than 3% of the voting shares of any other investment company, and a
prohibition on investing more than 5% of the Fund’s total assets in securities of any one investment company or more than 10% of its total assets in securities of all investment companies. The Fund will indirectly bear its proportionate share of any
management fees and other expenses paid by such other investment companies. Exchange-traded funds such as SPDRs are shares of unaffiliated investment companies which are traded like traditional equity securities on a national securities exchange or the
NASDAQ® National Market System.
|
n
|
Standard & Poor’s Depositary Receipts
TM
. The Fund may, consistent with its investment policies, purchase Standard
& Poor’s Depositary Receipts™ (“SPDRs”). SPDRs are securities traded on the American Stock Exchange (“AMEX”) that represent ownership in the SPDR Trust, a trust which has been established to accumulate and hold a
portfolio of common stocks that is intended to track the price performance and dividend yield of the S&P 500®. The SPDR Trust is sponsored by a subsidiary of the AMEX. SPDRs may be used for several reasons, including, but not limited to,
facilitating the handling of cash flows or trading, or reducing transaction costs. The price movement of SPDRs may not perfectly parallel the price action of the S&P 500®.
|
| Unseasoned Companies. The Fund may invest in companies (including predecessors) which have operated less than three
years. The securities of such companies may have limited liquidity, which can result in their being priced higher or lower than might otherwise be the case. In addition, investments in unseasoned companies are more speculative and entail greater risk than
do investments in companies with an established operating record.
|
| Corporate Debt Obligations. Corporate debt obligations include bonds, notes, debentures, commercial paper and other
obligations of corporations to pay interest and repay principal, and include securities issued by banks and other financial institutions. The Fund may invest in corporate debt obligations issued by U.S. and certain non-U.S. issuers which issue securities
denominated in the U.S. dollar (including Yankee and Euro obligations). In addition to obligations of corporations, corporate debt obligations include securities issued by banks and other financial institutions and supranational entities (i.e., the World Bank, the International Monetary Fund, etc.).
|
| Bank Obligations. The Fund may invest in obligations issued or guaranteed by U.S. or foreign banks. Bank
obligations, including without limitations, time deposits, bankers’ acceptances and certificates of deposit, may be general obligations of the parent bank or may be limited to the issuing branch by the terms of the specific obligations or by
government regulations. Banks are subject to extensive but different governmental regulations which may limit both the amount and types of loans which may be made and interest rates which may be charged. In addition, the profitability of the banking
industry is largely dependent upon the availability and cost of funds for the purpose of financing lending operations under prevailing money market conditions. General economic conditions as well as exposure to credit losses arising from possible
financial difficulties of borrowers play an important part in the operation of this industry.
|
| U.S. Government Securities. The Fund may invest in U.S. government securities. U.S. government securities include
U.S. Treasury obligations and obligations
|
|
| issued or guaranteed by U.S. government agencies, instrumentalities or sponsored enterprises. U.S. government securities may be supported by (a) the full faith and credit of the U.S. Treasury (such as the Government National Mortgage Association (“ Ginnie Mae”)); (b) the right of the issuer to borrow from the U.S. Treasury (such as securities of the Student Loan Marketing Association); (c) the discretionary authority of the U.S. government to purchase certain obligations of the issuer (such as the Federal National Mortgage Association (“Fannie Mae”) and Federal Home Loan Mortgage Corporation (“Freddie Mac”)); or (d) only the credit of the issuer. |
| Borrowings. The Fund can borrow money from banks and other financial institutions in amounts not exceeding one-third
of its total assets for temporary or emergency purposes. The Fund may not make additional investments if borrowings exceed 5% of its total assets.
|
| Short Sales Against-the-Box. The Fund may make short sales against-the-box. A short sale against-the-box means that
at all times when a short position is open the Fund will own an equal amount of securities sold short, or securities convertible into or exchangeable for, without payment of any further consideration, an equal amount of the securities of the same issuer
as the securities sold short.
|
| The financial highlights table is intended to help you understand the Fund’s financial performance from its commencement
(June 19, 2000) to August 31, 2000. Certain information reflects financial results for a single Fund share. The total returns in the table represent the rate that an investor would have earned or lost on an investment in the Fund (assuming reinvestment of
all dividends and distributions). This information for the period ended August 31, 2000 has been audited by PricewaterhouseCoopers LLP, whose report, along with the Fund’s financial statements, is included in the Fund’s annual report (available
upon request).
|
| RESEARCH SELECT FUND
|
| Income from
investment operations |
|||||||||||||||||||
|---|---|---|---|---|---|---|---|---|---|---|---|---|---|---|---|---|---|---|---|
| Net asset
value, beginning of period |
Net
investment loss(c) |
Net realized
and unrealized gain |
Total from
investment operations |
||||||||||||||||
| For the Period Ended August 31, | |||||||||||||||||||
| 2000 - Class A Shares (commenced June 19, 2000) | $10.00 | $(0.02 | ) | $0.79 | $0.77 | ||||||||||||||
| 2000 - Class B Shares (commenced June 19, 2000) | 10.00 | (0.04 | ) | 0.80 | 0.76 | ||||||||||||||
| 2000 - Class C Shares (commenced June 19, 2000) | 10.00 | (0.04 | ) | 0.81 | 0.77 | ||||||||||||||
| 2000 - Institutional Shares (commenced June 19, 2000) | 10.00 | (0.01 | ) | 0.79 | 0.78 | ||||||||||||||
| 2000 - Service Shares (commenced June 19, 2000) | 10.00 | (0.02 | ) | 0.80 | 0.78 | ||||||||||||||
(a)
|
Assumes investment at the net asset value at the beginning of the period, reinvestment of all dividends and
distributions, a complete redemption of the investment at the net asset value at the end of the period and no sales or redemption charges. Total return would be reduced if a sales or redemption charge were taken into account. Total returns for periods
less than one full year are not annualized.
|
(b)
|
Annualized.
|
(c)
|
Calculated based on the average shares outstanding methodology.
|
| Ratios assuming
no expense reductions |
|||||||||||||||||||||
|---|---|---|---|---|---|---|---|---|---|---|---|---|---|---|---|---|---|---|---|---|---|
| Net asset
value, end of period |
Total
return(a) |
Net assets
at end of period (in 000s) |
Ratio of
net expenses to average net assets(b) |
Ratio of
net investment loss to average net assets(b) |
Ratio of
expenses to average net assets(b) |
Ratio of
net investment loss to average net assets(b) |
Portfolio
turnover rate |
||||||||||||||
| $10.77 | 7.70 | % | $217,861 | 1.50 | % | (1.04 | )% | 2.05 | % | (1.59 | )% | 5.04 | % | ||||||||
| 10.76 | 7.60 | 201,437 | 2.25 | (1.79 | ) | 2.80 | (2.34 | ) | 5.04 | ||||||||||||
| 10.77 | 7.70 | 96,393 | 2.25 | (1.78 | ) | 2.80 | (2.33 | ) | 5.04 | ||||||||||||
| 10.78 | 7.80 | 12,677 | 1.10 | (0.50 | ) | 1.65 | (1.05 | ) | 5.04 | ||||||||||||
| 10.78 | 7.70 | 12 | 1.60 | (1.13 | ) | 2.15 | (1.68 | ) | 5.04 | ||||||||||||
| U.S. Select List
|
| As mentioned in “Fund Investment Objective and Strategies,” the U.S. Select List was introduced on September 9,
1998 and comprises approximately 25 to 35 stocks that the Goldman Sachs U.S. Stock Selection Committee expects, as a portfolio, to outperform its benchmark, the S&P 500® Index, over the next twelve to eighteen months. The U.S. Select List changes regularly. While the companies on the list generally have been relatively large U.S. companies, the list is not restricted to those types of companies. It is expected that, under normal market conditions, the quarterly
performance of the Fund, before expenses, will track the price return of the U.S. Select List within a .90 correlation coefficient.
|
| The Fund’s portfolio management team does not have access to information regarding additions or deletions for the U.S.
Select List prior to their publication. Goldman Sachs publishes other lists of recommended securities that could be appropriate for Fund investors but that are not used by the Fund’s portfolio management team.
|
| The chart below reflects historical information regarding the U.S. Select List. The U.S. Select List is not
maintained for the purpose of managing any account or investment company such as the Fund. The number of stocks on the U.S. Select List and the frequency of additions to and deletions from the U.S. Select List change from time to time. The stocks included in the U.S. Select List constitute only a “paper portfolio” that does not reflect
actual trading and does not have an actual performance record. The U.S. Select List’s price return does not represent the return on any fund or any other account that involves actual trading. The price returns are not indicative of the returns on any fund or account because, among other things, they do not
reflect actual prices when stocks are purchased or sold, transaction costs and account fees. In addition, because the U.S. Select List does not include a cash component, price returns are based on a constant 100% investment in the stocks on the U.S. Select List. Also, the information below does not reflect the impact that the Investment Adviser’s
portfolio management decisions and techniques may have on performance. Further, the actual performance of the Fund may differ from that of the U.S. Select List because of time delays between when a stock is added to or removed from the list and when it is bought or sold for the Fund. Investors should not consider this price return information as a substitute for, or an indication of,
future performance of the Research Select Fund or
the Investment Adviser. Finally, past price returns of the U.S. Select List are not representative of future price returns of the list.
|
| 9/9/98
(inception) to 12/31/98 |
1/1/99
to 12/31/99 |
1/1/00
to 10/31/00 |
9/9/98
(inception) to 10/31/00 |
||||||
|---|---|---|---|---|---|---|---|---|---|
| U.S. Select List Stock Price Return* | 37.57% | 33.81% | 18.1% | 117.5% | |||||
| S&P 500® Index Price Return** | 22.73% | 21.06% | -1.8% | 45.9% | |||||
*
|
The results for the U.S. Select List portfolio represent an equal-weighted arithmetic average of the stocks held at any
point during the month. The results are calculated monthly using each stock’s capital appreciation or depreciation during the period that it is on the U.S. Select List and dividing that by the highest number of stocks that were on the U.S. Select
List at any point during the month. Prior to June 1999, the divisor was the time-weighted number of stocks on the list for the specified period. The results are calculated using the prices of the stocks at the close of trading of the stock market one full
day after the stock was added to the U.S. Select List (e.g., if the stock was added on the afternoon of 5/5, the recorded price is at the close on 5/6). The results do not reflect the execution of actual purchases or sales, and there is no guarantee that
a mutual fund following the U.S. Select List would be able to execute purchases and sales at the prices used to calculate the price returns. Because the U.S. Select List is a paper portfolio that is not managed to a target number of stocks, no “
re-balancing” of actual investments is done when stocks are added to or deleted from the U.S. Select List. Price returns are based on 100% investment in the stocks on the U.S. Select List.
|
| Price returns are calculated to include the price return plus dividends for the stock
during the month in which they are paid without being reinvested into the security. They do not reflect the market impact on the stock prices that may occur between the time the publication is made of additions to and deletions from the U.S. Select List
and the time a mutual fund following the U.S. Select List would be able to execute purchases and sales. They also do not reflect transaction fees, such as commissions, fees and interest charges, or the costs of running a mutual fund, such as management
fees, distribution fees and other expenses. They do not reflect the impact that an investment adviser’s portfolio management decisions and techniques may have on a mutual fund’s returns. Actual transactions and the effect of dividends, fees and
costs will result in returns that differ from those of the U.S. Select List.
|
**
|
The S&P 500® Index is an unmanaged index containing common stocks of 500 industrial, transportation, utility and
financial companies, regarded as generally representative of the U.S. stock market. The S&P 500® Index performance numbers shown are price returns reflecting the reinvestment of dividends. They do not reflect fees, brokerage commissions or other
costs of investing that are not incurred by an index.
|
| FOR MORE INFORMATION
|
| Annual/Semi-annual Report
|
| Additional information about the Fund’s investments is available in the Fund’s annual and semi-annual reports to
shareholders. In the Fund’s annual report, you will find a discussion of the market conditions and investment strategies that significantly affected the Fund’s performance during the last fiscal year.
|
| Statement of Additional Information
|
| Additional information about the Fund and its policies is also available in the Fund’s Additional Statement. The Additional
Statement is incorporated by reference into this Prospectus (is legally considered part of this Prospectus).
|
| The Fund’s annual and semi-annual reports, and the Additional Statement, are available free upon request by calling Goldman
Sachs at 1-800-526-7384.
|
| To obtain other information and for shareholder inquiries:
|
| By telephone – Call 1-800-526-7384
|
| By mail – Goldman Sachs Funds, 4900 Sears Tower, Chicago, IL 60606-6372
|
| By e-mail – [email protected]
|
| On the Internet – Text-only versions of the Fund’s documents are located online and may be downloaded from:
|
| SEC EDGAR database – http://www.sec.gov
|
| Goldman Sachs – http://www.gs.com (Prospectus Only)
|
| You may review and obtain copies of Fund documents by visiting the SEC’s Public Reference Room in Washington, D.C. You may
also obtain copies of Fund documents, after paying a duplicating fee, by writing to the SEC’s Public Reference Section, Washington, D.C. 20549-0102 or by electronic request to: [email protected]. Information on the operation of the public reference
room may be obtained by calling the SEC at (202) 942-8090.
|
| The Goldman Sachs Research Select Fund
SM
is a service mark of Goldman, Sachs & Co.
|
| The Fund’s investment company registration number is 811-5349.
|
PART B
STATEMENT OF ADDITIONAL INFORMATION
CLASS A SHARES
CLASS B SHARES
CLASS C SHARES
SERVICE SHARES
INSTITUTIONAL SHARES
GOLDMAN SACHS BALANCED FUND
GOLDMAN SACHS GROWTH AND INCOME FUND
GOLDMAN SACHS CORE/SM/ LARGE CAP VALUE FUND
GOLDMAN SACHS CORE/SM/ U.S. EQUITY FUND
GOLDMAN SACHS CORE/SM/ LARGE CAP GROWTH FUND
GOLDMAN SACHS CORE/SM/ SMALL CAP EQUITY FUND
GOLDMAN SACHS CORE/SM/ INTERNATIONAL EQUITY FUND
GOLDMAN SACHS CAPITAL GROWTH FUND
GOLDMAN SACHS STRATEGIC GROWTH FUND
GOLDMAN SACHS GROWTH OPPORTUNITIES FUND
GOLDMAN SACHS MID CAP VALUE FUND
GOLDMAN SACHS SMALL CAP VALUE FUND
GOLDMAN SACHS LARGE CAP VALUE FUND
GOLDMAN SACHS INTERNATIONAL EQUITY FUND
GOLDMAN SACHS EUROPEAN EQUITY FUND
GOLDMAN SACHS JAPANESE EQUITY FUND
GOLDMAN SACHS INTERNATIONAL GROWTH OPPORTUNITIES FUND
(formerly named International Small Cap Fund)
GOLDMAN SACHS EMERGING MARKETS EQUITY FUND
GOLDMAN SACHS ASIA GROWTH FUND
GOLDMAN SACHS RESEARCH SELECT FUND
(Equity Portfolios of Goldman Sachs Trust)
4900 Sears Tower
Chicago, Illinois 60606-6303
This Statement of Additional Information (the "Additional Statement") is
not a Prospectus. This Additional Statement should be read in conjunction with
the Prospectuses for the Class A Shares, Class B Shares, Class C Shares, Service
Shares and Institutional Shares of: Goldman Sachs Balanced Fund, Goldman Sachs
Growth and Income Fund, Goldman Sachs CORE Large Cap Value Fund, Goldman Sachs
CORE U.S. Equity Fund, Goldman Sachs CORE Large Cap Growth Fund, Goldman Sachs
CORE Small Cap Equity Fund, Goldman Sachs CORE International Equity Fund,
Goldman Sachs Capital Growth Fund, Goldman Sachs Strategic Growth Fund, Goldman
Sachs Growth Opportunities Fund, Goldman Sachs Mid Cap Value
B-1
Fund, Goldman Sachs Small Cap Value Fund, Goldman Sachs Large Cap Value Fund,
Goldman Sachs International Equity Fund, Goldman Sachs European Equity Fund,
Goldman Sachs Japanese Equity Fund, Goldman Sachs International Growth
Opportunities Fund (formerly International Small Cap Fund), Goldman Sachs
Emerging Markets Equity Fund, Goldman Sachs Asia Growth Fund and Goldman Sachs
Research Select Fund dated December 29, 2000 (the "Prospectuses"), which may be
obtained without charge from Goldman, Sachs & Co. by calling the telephone
number, or writing to one of the addresses, listed below.
The audited financial statements and related report of
PricewaterhouseCoopers LLP, independent public accountants, for each Fund
contained in each Fund's 2000 annual report is incorporated herein by reference
in the section "Financial Statements." No other portions of the Fund's Annual
Report are incorporated by reference.
CORE/SM/ is a service mark of Goldman, Sachs & Co.
B-2
TABLE OF CONTENTS Page
----
INTRODUCTION...............................................................B-5
INVESTMENT POLICIES........................................................B-6
INVESTMENT RESTRICTIONS...................................................B-51
MANAGEMENT................................................................B-54
PORTFOLIO TRANSACTIONS AND BROKERAGE......................................B-89
NET ASSET VALUE..........................................................B-102
PERFORMANCE INFORMATION..................................................B-104
SHARES OF THE TRUST......................................................B-127
TAXATION.................................................................B-135
FINANCIAL STATEMENTS.....................................................B-143
OTHER INFORMATION........................................................B-144
DISTRIBUTION AND SERVICE PLANS...........................................B-146
OTHER INFORMATION REGARDING MAXIMUM SALES CHARGE,
PURCHASES, REDEMPTIONS, EXCHANGES AND DIVIDENDS.....................B-165
SERVICE PLAN.............................................................B-170
Appendix A (Description of Securities Ratings).............................1-A
Appendix B (Business Principles of Goldman, Sachs & Co.)...................1-B
Appendix C (Statement of Intention and Escrow Agreement)...................1-C
The date of this Additional Statement is December 29, 2000.
B-3
GOLDMAN SACHS FUNDS MANAGEMENT, L.P.
Investment Adviser to:
Goldman Sachs CORE U.S. Equity Fund
Goldman Sachs Capital Growth Fund
32 Old Slip
New York, New York 10005
GOLDMAN SACHS ASSET MANAGEMENT
Investment Adviser to:
Goldman Sachs Balanced Fund
Goldman Sachs Growth and Income Fund
Goldman Sachs CORE Large Cap Value Fund
Goldman Sachs CORE Large Cap Growth Fund
Goldman Sachs CORE Small Cap Equity Fund
Goldman Sachs CORE International Equity Fund
Goldman Sachs Strategic Growth Fund
Goldman Sachs Growth Opportunities Fund
Goldman Sachs Mid Cap Value Fund
Goldman Sachs Small Cap Value Fund
Goldman Sachs Large Cap Value Fund
Goldman Sachs Research Select Fund
32 Old Slip
New York, New York 10005
GOLDMAN, SACHS & CO.
Distributor
85 Broad Street
New York, New York 10004
GOLDMAN, SACHS & CO.
Transfer Agent
4900 Sears Tower
Chicago, Illinois 60606
GOLDMAN SACHS ASSET
MANAGEMENT INTERNATIONAL
Investment Adviser to:
Goldman Sachs International Equity Fund
Goldman Sachs European Equity Fund
Goldman Sachs Japanese Equity Fund
Goldman Sachs International Growth Opportunities Fund (formerly International
Small Cap Fund)
Goldman Sachs Emerging Markets Equity Fund
Goldman Sachs Asia Growth Fund
Procession House
55 Ludgate Hill
London, England EC4M7JW
Toll free (in U.S.) . . . 800-621-2550
B-4
INTRODUCTION
Goldman Sachs Trust (the "Trust") is an open-end, management investment
company. The Trust is organized as a Delaware business trust, and is a successor
to a Massachusetts business trust that was combined with the Trust on April 30,
1997. The following series of the Trust are described in this Additional
Statement: Goldman Sachs Balanced Fund ("Balanced Fund"), Goldman Sachs Growth
and Income Fund ("Growth and Income Fund"), Goldman Sachs CORE Large Cap Value
Fund ("CORE Large Cap Value Fund"), Goldman Sachs CORE U.S. Equity Fund ("CORE
U.S. Equity Fund")(formerly known as "Goldman Sachs Select Equity Fund"),
Goldman Sachs CORE Large Cap Growth Fund ("CORE Large Cap Growth Fund"), Goldman
Sachs CORE Small Cap Equity Fund ("CORE Small Cap Equity Fund"), Goldman Sachs
CORE International Equity Fund ("CORE International Equity Fund"), Goldman Sachs
Capital Growth Fund ("Capital Growth Fund"), Goldman Sachs Strategic Growth Fund
("Strategic Growth Fund"), Goldman Sachs Growth Opportunities Fund ("Growth
Opportunities Fund"), Goldman Sachs Mid Cap Value Fund ("Mid Cap Value Fund")
(formerly known as "Mid Cap Equity Fund"), Goldman Sachs Small Cap Value Fund
("Small Cap Value Fund"), Goldman Sachs Large Cap Value Fund ("Large Cap Value
Fund"), Goldman Sachs International Equity Fund ("International Equity Fund"),
Goldman Sachs European Equity Fund ("European Equity Fund"), Goldman Sachs
Japanese Equity Fund ("Japanese Equity Fund"), Goldman Sachs International
Growth Opportunities Fund ("International Growth Opportunities Fund") (formerly
known as "International Small Cap Fund"), Goldman Sachs Emerging Markets Equity
Fund ("Emerging Markets Equity Fund"), Goldman Sachs Asia Growth Fund ("Asia
Growth Fund") and Goldman Sachs Research Select Fund ("Research Select Fund")
(collectively referred to herein as the "Funds").
The Funds, except the European Equity, Japanese Equity, International
Growth Opportunities, CORE Large Cap Value, CORE Large Cap Growth, CORE
International Equity, Strategic Growth Fund, Growth Opportunities, CORE Small
Cap Equity, Large Cap Value and Research Select Funds were initially organized
as a series of a corporation formed under the laws of the State of Maryland on
September 27, 1989 and were reorganized as a Delaware business trust as of April
30, 1997. The Trustees have authority under the Trust's charter to create and
classify shares into separate series and to classify and reclassify any series
or portfolio of shares into one or more classes without further action by
shareholders. Pursuant thereto, the Trustees have created the Funds and other
series. Additional series may be added in the future from time to time. Each
Fund currently offers five classes of shares: Class A Shares, Class B Shares,
Class C Shares, Institutional Shares and Service Shares. See "Shares of the
Trust."
Goldman Sachs Asset Management ("GSAM"), a unit of the Investment
Management Division of Goldman, Sachs & Co. ("Goldman Sachs"), serves as the
Investment Adviser to the Balanced, Growth and Income, CORE Large Cap Value,
CORE Large Cap Growth, CORE Small Cap Equity, Strategic Growth, Growth
Opportunities, CORE International Equity, Mid Cap Value, Small Cap Value, Large
Cap Value and Research Select Funds. Goldman Sachs Funds Management, L.P.
("GSFM"), an affiliate of Goldman Sachs, serves as the Investment Adviser to the
CORE U.S. Equity and Capital Growth Funds.
B-5
Goldman Sachs Asset Management International ("GSAMI"), a unit of the Investment
Management Division of Goldman Sachs, serves as the Investment Adviser to the
International Equity, European Equity, Japanese Equity, International Growth
Opportunities, Emerging Markets Equity and Asia Growth Funds. GSAM, GSFM and
GSAMI are sometimes individually referred to as an "Investment Adviser" and
collectively herein as the "Investment Advisers." In addition, Goldman Sachs
serves as each Fund's distributor and transfer agent. Each Fund's custodian is
State Street Bank and Trust Company ("State Street").
The following information relates to and supplements the description of
each Fund's investment policies contained in the Prospectuses. See the
Prospectuses for a more complete description of the Funds' investment objective
and policies. There is no assurance that a Fund will achieve its objective.
Capitalized terms used but not defined herein have the same meaning as in the
Prospectuses.
INVESTMENT POLICIES
Each Fund has a distinct investment objective and policies. There can be no
assurance that a Fund's objective will be achieved. Each Fund is a diversified
open-end management company as defined in the Investment Company Act of 1940, as
amended (the "Act"). The investment objective and policies of each Fund, and the
associated risks of each Fund, are discussed in the Funds' prospectuses, which
should be read carefully before an investment is made. Additional information
about the Funds, their policies, and the investment instruments they may hold,
is provided below.
Each Fund's share price will fluctuate with market, economic and, to the
extent applicable, foreign exchange conditions, so that an investment in any of
the Funds may be worth more or less when redeemed than when purchased. None of
the Funds should be relied upon as a complete investment program.
General Information Regarding The Funds.
---------------------------------------
The Investment Adviser may purchase for the Funds common stocks, preferred
stocks, interests in real estate investment trusts, convertible debt
obligations, convertible preferred stocks, equity interests in trusts,
partnerships, joint ventures, limited liability companies and similar
enterprises, warrants and stock purchase rights ("equity securities"). The
Investment Adviser utilizes first-hand fundamental research, including visiting
company facilities to assess operations and to meet decision-makers, in choosing
a Fund's securities. The Investment Adviser may also use macro analysis of
numerous economic and valuation variables to anticipate changes in company
earnings and the overall investment climate. The Investment Adviser is able to
draw on the research and market expertise of the Goldman Sachs Global Investment
Research Department and other affiliates of the Investment Adviser, as well as
information provided by other securities dealers. Equity securities in a Fund's
portfolio, except the Research Select Fund, will generally be sold when the
Investment Adviser believes that the market price fully reflects or exceeds the
securities'
B-6
securities' fundamental valuation or when other more attractive investments are
identified. Under normal circumstances, the Research Select Fund will sell
securities that have been removed from the U.S. Select List.
Value Style Funds. The Growth and Income Fund, Mid Cap Value Fund, Small
Cap Value Fund, Large Cap Value Fund and a portion of the equity portion of
Balanced Fund are managed using a value oriented approach. (The equity portion
of the Balanced Fund utilizes a blend of value and growth investment styles. See
"Growth Style Funds" below). The Investment Adviser evaluates securities using
fundamental analysis and intends to purchase equity securities that are, in its
view, underpriced relative to a combination of such companies' long-term
earnings prospects, growth rate, free cash flow and/or dividend-paying ability.
Consideration will be given to the business quality of the issuer. Factors
positively affecting the Investment Adviser's view of that quality include the
competitiveness and degree of regulation in the markets in which the company
operates, the existence of a management team with a record of success, the
position of the company in the markets in which it operates, the level of the
company's financial leverage and the sustainable return on capital invested in
the business. The Funds may also purchase securities of companies that have
experienced difficulties and that, in the opinion of the Investment Adviser, are
available at attractive prices.
Growth Style Funds. The Capital Growth, Strategic Growth and Growth
Opportunities Funds and a portion of the equity portion of the Balanced Fund are
managed using a growth equity oriented approach. Equity securities for these
Funds are selected based on their prospects for above average growth. The
Investment Adviser will select securities of growth companies trading, in the
Investment Adviser's opinion, at a reasonable price relative to other
industries, competitors and historical price/earnings multiples. The Funds will
generally invest in companies whose earnings are believed to be in a relatively
strong growth trend, or, to a lesser extent, in companies in which significant
further growth is not anticipated but whose market value per share is thought to
be undervalued. In order to determine whether a security has favorable growth
prospects, the Investment Adviser ordinarily looks for one or more of the
following characteristics in relation to the security's prevailing price:
prospects for above average sales and earnings growth per share; high return on
invested capital; free cash flow generation; sound balance sheet, financial and
accounting policies, and overall financial strength; strong competitive
advantages; effective research, product development, and marketing; pricing
flexibility; strength of management; and general operating characteristics that
will enable the company to compete successfully in its marketplace.
Quantitative Style Funds. CORE U.S. Equity, CORE Large Cap Growth, CORE
Large Cap Value, CORE Small Cap Equity and CORE International Equity Funds (the
"CORE Equity Funds") are managed using both quantitative and fundamental
techniques. CORE is an acronym for "Computer-Optimized, Research-Enhanced,"
which reflects the CORE Funds' investment process. This investment process and
the proprietary multifactor model used to implement it are discussed below.
B-7
Investment Process. The Investment Adviser begins with a broad universe of
U.S. equity securities for CORE Large Cap Value, CORE U.S. Equity, CORE Large
Cap Growth, CORE Small Cap Equity Funds (the "CORE U.S. Equity Funds"), and a
broad universe of foreign equity securities for CORE International Equity Fund.
As described more fully below, the Investment Adviser uses a proprietary
multifactor model (the "Multifactor Model") to forecast the returns of different
markets, currencies and individual securities. In the case of an equity security
followed by the Goldman Sachs Global Investment Research Department (the
"Research Department"), a rating is assigned based upon the Research
Department's evaluation. In the discretion of the Investment Adviser, ratings
may also be assigned to equity securities based on research ratings obtained
from other industry sources.
In building a diversified portfolio for each CORE Equity Fund, the
Investment Adviser utilizes optimization techniques to seek to construct the
most efficient risk/return portfolio given each CORE Fund's benchmark. Each
portfolio is primarily composed of securities rated highest by the foregoing
investment process and has risk characteristics and industry weightings similar
to the relevant Fund's benchmark.
Multifactor Models. The Multifactor Models are rigorous computerized rating
systems for forecasting the returns of different equity markets, currencies and
individual equity securities according to fundamental investment
characteristics. The CORE U.S. Equity Funds use one Multifactor Model to
forecast the returns of securities held in each Fund's portfolio. The CORE
International Equity Fund uses multiple Multifactor Models to forecast returns.
Currently, the CORE International Equity Fund uses one model to forecast equity
market returns, one model to forecast currency returns and 22 separate models to
forecast individual equity security returns in 22 different countries. Despite
this variety, all Multifactor Models incorporate common variables covering
measures of value, price momentum, earnings momentum and stability (e.g.,
book/price ratio, earnings/price ratio, price momentum, price volatility,
consensus growth forecasts, earnings estimate revisions, earnings stability,
and, in the case of models for CORE International Equity Fund, currency momentum
and country political risk ratings). All of the factors used in the Multifactor
Models have been shown to significantly impact the performance of the
securities, currencies and markets they were designed to forecast.
The weightings assigned to the factors in the Multifactor Model used by the
CORE U.S. Equity Funds are derived using a statistical formulation that
considers each factor's historical performance in different market environments.
As such, the U.S. Multifactor Model is designed to evaluate each security using
only the factors that are statistically related to returns in the anticipated
market environment. Because they include many disparate factors, the Investment
Adviser believes that all the Multifactor Models are broader in scope and
provide a more thorough evaluation than most conventional quantitative models.
Securities and markets ranked highest by the relevant Multifactor Model do not
have one dominant investment characteristic; rather, they possess an attractive
combination of investment characteristics. By using a variety of relevant
factors to select securities, currencies or markets, the Investment
B-8
Adviser believes that the Fund will be better balanced and have more consistent
performance than an investment portfolio that uses only one or two factors to
select such investments.
The Investment Adviser will monitor, and may occasionally suggest and make
changes to, the method by which securities, currencies or markets are selected
for or weighted in a Fund. Such changes (which may be the result of changes in
the Multifactor Models or the method of applying the Multifactor Models) may
include: (i) evolutionary changes to the structure of the Multifactor Models
(e.g., the addition of new factors or a new means of weighting the factors);
(ii) changes in trading procedures (e.g., trading frequency or the manner in
which a Fund uses futures); or (iii) changes in the method by which securities,
currencies or markets are weighted in a Fund. Any such changes will preserve a
Fund's basic investment philosophy of combining qualitative and quantitative
methods of selecting securities using a disciplined investment process.
Research Department. In assigning ratings to equity securities, the
Research Department uses a four category rating system ranging from "recommended
for purchase" to "likely to under perform." The ratings reflect the analyst's
judgment as to the investment results of a specific security and incorporate
economic outlook, valuation, risk and a variety of other factors.
By employing both a quantitative (i.e., the Multifactor Models) and a
qualitative (i.e., research enhanced) method of selecting securities, each CORE
Equity Fund seeks to capitalize on the strengths of each discipline.
Other Information. Since normal settlement for equity securities is three
trading days (for certain international markets settlement may be longer), the
Funds will need to hold cash balances to satisfy shareholder redemption
requests. Such cash balances will normally range from 2% to 5% of a Fund's net
assets. CORE U.S. Equity Fund may enter into futures transactions only with
respect to the S&P 500/TM/ Index and the CORE Large Cap Growth, CORE Large Cap
Value and CORE Small Cap Equity Funds may enter into futures transactions only
with respect to a representative index in order to keep a Fund's effective
equity exposure close to 100%. CORE International Equity Fund may purchase other
types of futures contracts. For example, if cash balances are equal to 5% of the
net assets, the Fund may enter into long futures contracts covering an amount
equal to 5% of the Fund's net assets. As cash balances fluctuate based on new
contributions or withdrawals, a Fund may enter into additional contracts or
close out existing positions.
Actively Managed International Funds. The International Equity, European
Equity, Japanese Equity, International Growth Opportunities, Emerging Markets
Equity and Asia Growth Funds are managed using an active international approach,
which utilizes a consistent process of stock selection undertaken by portfolio
management teams located within each of the major investment regions, including
Europe, Japan, Asia and the United States. In selecting securities, the
Investment Adviser uses a long-term, bottom-up strategy based on first-hand
fundamental research that is designed to give broad exposure to the available
opportunities
B-9
while seeking to add return primarily through stock selection. Equity securities
for these Funds are evaluated based on three key factors--the business, the
management and the valuation. The Investment Adviser ordinarily seeks securities
that have, in the Investment Adviser's opinion, superior earnings growth
potential, sustainable franchise value with management attuned to creating
shareholder value and relatively discounted valuations. In addition, the
Investment Adviser uses a multi-factor risk model which seeks to assure that
deviations from the benchmark are justifiable.
Additional Information About the Balanced Fund
----------------------------------------------
The investment objective of the Balanced Fund is to provide long-term
growth of capital and current income. The Fund seeks growth of capital primarily
through investments in equity securities (stocks). The Fund seeks to provide
current income through investment in fixed-income securities (bonds).
The Balanced Fund is intended to provide a foundation on which an investor
can build an investment portfolio or to serve as the core of an investment
program, depending on the investor's goals. The Balanced Fund is designed for
relatively conservative investors who seek a combination of long-term capital
growth and current income in a single investment. The Balanced Fund offers a
portfolio of equity and fixed-income securities intended to provide less
volatility than a portfolio completely invested in equity securities and greater
diversification than a portfolio invested in only one asset class. Balanced Fund
may be appropriate for people who seek capital appreciation but are concerned
about the volatility typically associated with a fund that invests solely in
stocks and other equity securities.
Fixed-Income Strategies Designed to Maximize Return and Manage Risk. GSAM's
approach to managing the fixed-income portion of the Balanced Fund's portfolio
seeks to provide high returns relative to a market benchmark, the Lehman
Brothers Aggregate Bond Index (the "Index"), while also seeking to provide high
current income. This approach emphasizes (1) sector allocation strategies which
enable GSAM to tactically overweight or underweight one sector of the
fixed-income market (i.e., mortgages, corporate bonds, U.S. Treasuries,
non-dollar bonds, emerging market debt) versus another; (2) individual security
selection based on identifying relative value (fixed-income securities
inexpensive relative to others in their sector); and (3) to a lesser extent,
strategies based on GSAM's expectation of the direction of interest rates or the
spread between short-term and long-term interest rates such as yield curve
strategy.
The Index currently includes U.S. Government Securities and fixed-rate,
publicly issued, U.S. dollar-denominated fixed income securities rated at least
BBB or Baa by a nationally recognized statistical ratings organization
("NRSRO"). The securities currently included in the Index have at least one year
remaining to maturity; have an outstanding principal amount of at least $100
million; and are issued by the following types of issuers, with each category
receiving a different weighting in the Index: U.S. Treasury; agencies,
authorities or instrumentalities of the U.S. government; issuers of
mortgage-backed securities; utilities; industrial issuers; financial
institutions; foreign issuers; and issuers of asset-backed securities.
B-10
The Index is a trademark of Lehman Brothers. Inclusion of a security in the
Index does not imply an opinion by Lehman Brothers as to its attractiveness or
appropriateness for investment. Although Lehman Brothers obtains factual
information used in connection with the Index from sources which it considers
reliable, Lehman Brothers claims no responsibility for the accuracy,
completeness or timeliness or such information and has no liability to any
person for any loss arising from results obtained from the use of the Index
data.
GSAM seeks to manage fixed-income portfolio risk in a number of ways. These
include diversifying the fixed-income portion of the Balanced Fund's portfolio
among various types of fixed-income securities and utilizing sophisticated
quantitative models to understand how the fixed-income portion of the portfolio
will perform under a variety of market and economic scenarios. In addition, GSAM
uses extensive credit analysis to select and to monitor any investment-grade or
non-investment grade bonds that may be included in the Balanced Fund's
portfolio. In employing this and other investment strategies, the GSAM team has
access to extensive fundamental research and analysis available through Goldman
Sachs and a broad range of other sources.
A number of investment strategies will be used in selecting fixed-income
securities for the Fund's portfolio. GSAM's fixed-income investment philosophy
is to actively manage the portfolio within a risk-controlled framework. The
Investment Adviser de-emphasizes interest rate anticipation by monitoring the
duration of the portfolio within a narrow range of the Investment Adviser's
target duration, and instead focuses on seeking to add value through sector
selection, security selection and yield curve strategies.
Market Sector Selection. Market sector selection is the underweighting or
overweighting of one or more market sectors (i.e., U.S. Treasuries, U.S.
Government agency securities, corporate securities, mortgage-backed securities
and asset-backed securities). GSAM may decide to overweight or underweight a
given market sector or subsector (e.g., within the corporate sector,
industrials, financial issuers and utilities) based on, among other things,
expectations of future yield spreads between different sectors or subsectors.
Issuer Selection. Issuer selection is the purchase and sale of corporate
securities based on a corporation's current and expected credit standing (within
the constraints imposed by the Balanced Fund's minimum credit quality
requirements). This strategy focuses on four types of investment-grade corporate
issuers. Selection of securities from the first type of issuers - those with low
but stable credit - is intended to enhance total returns by providing
incremental yield. Selecting securities from the second type of issuers - those
with low and intermediate but improving credit quality - is intended to enhance
total returns in two stages. Initially, these securities are expected to provide
incremental yield. Eventually, price appreciation should occur relative to
alternative securities as credit quality improves, the NRSROs upgrade credit
ratings, and credit spreads narrow. Securities from the third type of issuers -
issuers with deteriorating credit quality - will be avoided, since total returns
are typically enhanced by avoiding the widening of credit spreads and the
consequent relative price depreciation. Finally, total returns can be enhanced
by focusing on securities that are rated differently by different rating
organizations. If the securities are trading in line with the higher published
quality rating while
B-11
GSAM concurs with the lower published quality rating, the securities would
generally be sold and any potential price deterioration avoided. On the other
hand, if the securities are trading in line with the lower published quality
rating while the higher published quality rating is considered more realistic,
the securities may be purchased in anticipation of the expected market
reevaluation and relative price appreciation.
Yield Curve Strategy. Yield curve strategy consists of overweighting or
underweighting different maturity sectors relative to a benchmark to take
advantage of the shape of the yield curve. Three alternative maturity sector
selections are available: a "barbell" strategy in which short and long maturity
sectors are overweighted while intermediate maturity sectors are underweighted;
a "bullet" strategy in which, conversely, short-and long-maturity sectors are
underweighted while intermediate-maturity sectors are overweighted; and a
"neutral yield curve" strategy in which the maturity distribution mirrors that
of a benchmark.
Additional Information About the International Equity Fund
----------------------------------------------------------
The International Equity Fund will seek to achieve its investment objective
by investing, under normal circumstances, substantially all, and at least 65% of
its total assets in equity securities of companies that are organized outside
the United States or whose securities are principally traded outside the United
States. Because research coverage outside the United States is fragmented and
relatively unsophisticated, many foreign companies that are well-positioned to
grow and prosper have not come to the attention of investors. GSAMI believes
that the high historical returns and less efficient pricing of foreign markets
create favorable conditions for the International Equity Fund's highly focused
investment approach. For a description of the risks of the International Equity
Fund's investments in Asia, see "Investing in Emerging Markets, including Asia
and Eastern Europe."
A Rigorous Process of Stock Selection. Using fundamental industry and
company research, GSAMI's equity team in London, Singapore and Tokyo seeks to
identify companies that may achieve superior long-term returns. Stocks are
carefully selected for the International Equity Fund's portfolio through a
three-stage investment process. Because the International Equity Fund expects to
be a long-term holder of stocks, the portfolio managers adjust the Fund's
portfolio only when expected returns fall below acceptable levels or when the
portfolio managers identify substantially more attractive investments.
Using the research of Goldman Sachs as well as information gathered from
other sources in Europe and the Asia-Pacific region, the Investment Adviser
seeks to identify attractive industries around the world. Such industries are
expected to have favorable underlying economics and allow companies to generate
sustainable and predictable high returns. As a rule, they are less economically
sensitive, relatively free of regulation and favor strong franchises.
Within these industries the Investment Adviser seeks to identify well-run
companies that enjoy a stable competitive advantage and are able to benefit from
the favorable dynamics of the industry. This stage includes analyzing the
current and expected financial performance of the company; contacting suppliers,
customers and competitors; and meeting with management. In
B-12
particular, the portfolio managers look for companies whose managers have a
strong commitment to both maintaining the high returns of the existing business
and reinvesting the capital generated at high rates of return. Management should
act in the interests of the owners and seek to maximize returns to all
stockholders.
GSAMI's currency team manages the foreign exchange risk embedded in foreign
equities by means of a currency overlay program. The program may be utilized to
protect the value of foreign investments in sustained periods of dollar
appreciation and to add returns by seeking to take advantage of foreign exchange
fluctuations.
The members of GSAMI's international equity team bring together years of
experience in analyzing and investing in companies in Europe and the
Asia-Pacific region. Their expertise spans a wide range of skills including
investment analysis, investment management, investment banking and business
consulting. GSAMI's worldwide staff of over 300 professionals includes portfolio
managers based in London, Singapore and Tokyo who bring firsthand knowledge of
their local markets and companies to every investment decision.
Corporate Debt Obligations
--------------------------
Each Fund may, under normal market conditions, invest in corporate debt
obligations, including obligations of industrial, utility and financial issuers.
CORE Large Cap Value, CORE U.S. Equity, CORE Large Cap Growth, CORE Small Cap
Equity, CORE International Equity and Research Select Funds may only invest in
debt securities that are cash equivalents. Corporate debt obligations are
subject to the risk of an issuer's inability to meet principal and interest
payments on the obligations and may also be subject to price volatility due to
such factors as market interest rates, market perception of the creditworthiness
of the issuer and general market liquidity.
An economic downturn could severely affect the ability of highly leveraged
issuers of junk bond securities to service their debt obligations or to repay
their obligations upon maturity. Factors having an adverse impact on the market
value of junk bonds will have an adverse effect on a Fund's net asset value to
the extent it invests in such securities. In addition, a Fund may incur
additional expenses to the extent it is required to seek recovery upon a default
in payment of principal or interest on its portfolio holdings.
The secondary market for junk bonds, which is concentrated in relatively
few market makers, may not be as liquid as the secondary market for more highly
rated securities. This reduced liquidity may have an adverse effect on the
ability of Balanced, Growth and Income, Capital Growth, Strategic Growth, Growth
Opportunities, Mid Cap Value, Small Cap Value, Large Cap Value, International
Equity, European Equity, Japanese Equity, International Growth Opportunities,
Emerging Markets Equity and Asia Growth Funds to dispose of a particular
security when necessary to meet their redemption requests or other liquidity
needs. Under adverse market or economic conditions, the secondary market for
junk bonds could contract further, independent of any specific adverse changes
in the condition of a particular issuer. As a result, the Investment Advisers
could find it difficult to sell these securities or may
B-13
be able to sell the securities only at prices lower than if such securities were
widely traded. Prices realized upon the sale of such lower rated or unrated
securities, under such circumstances, may be less than the prices used in
calculating a Fund's net asset value.
Since investors generally perceive that there are greater risks associated
with the medium to lower rated securities of the type in which Balanced, Growth
and Income, Capital Growth, Strategic Growth, Growth Opportunities, Mid Cap
Value, Small Cap Value, Large Cap Value, International Equity, European Equity,
Japanese Equity, International Growth Opportunities, Emerging Markets Equity and
Asia Growth Funds may invest, the yields and prices of such securities may tend
to fluctuate more than those for higher rated securities. In the lower quality
segments of the fixed-income securities market, changes in perceptions of
issuers' creditworthiness tend to occur more frequently and in a more pronounced
manner than do changes in higher quality segments of the fixed-income securities
market, resulting in greater yield and price volatility.
Another factor which causes fluctuations in the prices of fixed-income
securities is the supply and demand for similarly rated securities. In addition,
the prices of fixed-income securities fluctuate in response to the general level
of interest rates. Fluctuations in the prices of portfolio securities subsequent
to their acquisition will not affect cash income from such securities but will
be reflected in a Fund's net asset value.
Medium to lower rated and comparable non-rated securities tend to offer
higher yields than higher rated securities with the same maturities because the
historical financial condition of the issuers of such securities may not have
been as strong as that of other issuers. Since medium to lower rated securities
generally involve greater risks of loss of income and principal than higher
rated securities, investors should consider carefully the relative risks
associated with investment in securities which carry medium to lower ratings and
in comparable unrated securities. In addition to the risk of default, there are
the related costs of recovery on defaulted issues. The Investment Adviser will
attempt to reduce these risks through portfolio diversification and by analysis
of each issuer and its ability to make timely payments of income and principal,
as well as broad economic trends and corporate developments.
The Investment Adviser employs its own credit research and analysis, which
includes a study of existing debt, capital structure, ability to service debt
and to pay dividends, the issuer's sensitivity to economic conditions, its
operating history and the current trend of earnings. The Investment Adviser
continually monitors the investments in a Fund's portfolio and evaluates whether
to dispose of or to retain non-investment grade and comparable unrated
securities whose credit ratings or credit quality may have changed.
U.S. Government Securities
--------------------------
Each Fund may invest in U.S. Government securities. Generally, these
securities include U.S. Treasury obligations and obligations issued or
guaranteed by U.S. Government agencies, instrumentalities or sponsored
enterprises. U.S. Government securities also include Treasury
B-14
receipts and other stripped U.S. Government securities, where the interest and
principal components of stripped U.S. Government securities are traded
independently. Each Fund may also invest in zero coupon U.S. Treasury securities
and in zero coupon securities issued by financial institutions, which represent
a proportionate interest in underlying U.S. Treasury securities. A zero coupon
security pays no interest to its holder during its life and its value consists
of the difference between its face value at maturity and its cost. The market
prices of zero coupon securities generally are more volatile than the market
prices of securities that pay interest periodically.
Bank Obligations
----------------
Each Fund may invest in obligations issued or guaranteed by U.S. or foreign
banks. Bank obligations, including without limitation, time deposits, bankers'
acceptances and certificates of deposit, may be general obligations of the
parent bank or may be limited to the issuing branch by the terms of the specific
obligations or by government regulation. Banks are subject to extensive but
different governmental regulations which may limit both the amount and types of
loans which may be made and interest rates which may be charged. In addition,
the profitability of the banking industry is largely dependent upon the
availability and cost of funds for the purpose of financing lending operations
under prevailing money market conditions. General economic conditions as well as
exposure to credit losses arising from possible financial difficulties of
borrowers play an important part in the operation of this industry.
Zero Coupon Bonds
-----------------
A Fund's investments in fixed-income securities may include zero coupon
bonds. Zero coupon bonds are debt obligations issued or purchased at a
significant discount from face value. The discount approximates the total amount
of interest the bonds would have accrued and compounded over the period until
maturity. Zero coupon bonds do not require the periodic payment of interest.
Such investments benefit the issuer by mitigating its need for cash to meet debt
service but also require a higher rate of return to attract investors who are
willing to defer receipt of such cash. Such investments may experience greater
volatility in market value than debt obligations which provide for regular
payments of interest. In addition, if an issuer of zero coupon bonds held by a
Fund defaults, the Fund may obtain no return at all on its investment. A Fund
will accrue income on such investments for each taxable year which (net of
deductible expenses, if any) is distributable to shareholders and which, because
no cash is generally received at the time of accrual, may require the
liquidation of other portfolio securities to obtain sufficient cash to satisfy
the Fund's distribution obligations.
Variable and Floating Rate Securities
-------------------------------------
The interest rates payable on certain fixed-income securities in which a
Fund may invest are not fixed and may fluctuate based upon changes in market
rates. A variable rate obligation has an interest rate which is adjusted at
predesignated periods in response to changes in the market rate of interest on
which the interest rate is based. Variable and floating rate obligations are
less effective than fixed rate instruments at locking in a
B-15
particular yield. Nevertheless, such obligations may fluctuate in value in
response to interest rate changes if there is a delay between changes in market
interest rates and the interest reset date for the obligation.
Custodial Receipts
------------------
Each Fund, except the Research Select Fund, may invest in custodial
receipts in respect of securities issued or guaranteed as to principal and
interest by the U.S. Government, its agencies, instrumentalities, political
subdivisions or authorities. Such custodial receipts evidence ownership of
future interest payments, principal payments or both on certain notes or bonds
issued or guaranteed as to principal and interest by the U.S. Government, its
agencies, instrumentalities, political subdivisions or authorities. These
custodial receipts are known by various names, including "Treasury Receipts,"
"Treasury Investors Growth Receipts" ("TIGRs"), and "Certificates of Accrual on
Treasury Securities" ("CATs"). For certain securities law purposes, custodial
receipts are not considered U.S. Government securities.
Municipal Securities
--------------------
The Balanced Fund may invest in municipal securities. Municipal securities
consist of bonds, notes and other instruments issued by or on behalf of states,
territories and possessions of the United States (including the District of
Columbia) and their political subdivisions, agencies or instrumentalities, the
interest on which is exempt from regular federal income tax. Municipal
securities are often issued to obtain funds for various public purposes.
Municipal securities also include "private activity bonds" or industrial
development bonds, which are issued by or on behalf of public authorities to
obtain funds for privately operated facilities, such as airports and waste
disposal facilities, and, in some cases, commercial and industrial facilities.
The yields and market values of municipal securities are determined
primarily by the general level of interest rates, the creditworthiness of the
issuers of municipal securities and economic and political conditions affecting
such issuers. Due to their tax exempt status, the yields and market prices of
municipal securities may be adversely affected by changes in tax rates and
policies, which may have less effect on the market for taxable fixed-income
securities. Moreover, certain types of municipal securities, such as housing
revenue bonds, involve prepayment risks which could affect the yield on such
securities. The credit rating assigned to municipal securities may reflect the
existence of guarantees, letters of credit or other credit enhancement features
available to the issuers or holders of such municipal securities.
Investments in municipal securities are subject to the risk that the issuer
could default on its obligations. Such a default could result from the
inadequacy of the sources or revenues from which interest and principal payments
are to be made or the assets collateralizing such obligations. Revenue bonds,
including private activity bonds, are backed only by specific assets or revenue
sources and not by the full faith and credit of the governmental issuer.
B-16
Mortgage-Backed Securities
--------------------------
General Characteristics. Each Fund (other than the CORE Large Cap Value,
CORE U.S. Equity, CORE Large Cap Growth, CORE Small Cap Equity, CORE
International Equity and Research Select Funds) may invest in mortgage-backed
securities. Each mortgage pool underlying mortgage-backed securities consists of
mortgage loans evidenced by promissory notes secured by first mortgages or first
deeds of trust or other similar security instruments creating a first lien on
owner occupied and non-owner occupied one-unit to four-unit residential
properties, multifamily (i.e., five or more) properties, agriculture properties,
commercial properties and mixed use properties (the "Mortgaged Properties"). The
Mortgaged Properties may consist of detached individual dwelling units,
multifamily dwelling units, individual condominiums, townhouses, duplexes,
triplexes, fourplexes, row houses, individual units in planned unit developments
and other attached dwelling units. The Mortgaged Properties may also include
residential investment properties and second homes.
The investment characteristics of adjustable and fixed rate mortgage-backed
securities differ from those of traditional fixed-income securities. The major
differences include the payment of interest and principal on mortgage-backed
securities on a more frequent (usually monthly) schedule, and the possibility
that principal may be prepaid at any time due to prepayments on the underlying
mortgage loans or other assets. These differences can result in significantly
greater price and yield volatility than is the case with traditional
fixed-income securities. As a result, if a Fund purchases mortgage-backed
securities at a premium, a faster than expected prepayment rate will reduce both
the market value and the yield to maturity from those which were anticipated. A
prepayment rate that is slower than expected will have the opposite effect of
increasing yield to maturity and market value. Conversely, if a Fund purchases
mortgage-backed securities at a discount, faster than expected prepayments will
increase, while slower than expected prepayments will reduce yield to maturity
and market values. To the extent that a Fund invests in mortgage-backed
securities, its Investment Adviser may seek to manage these potential risks by
investing in a variety of mortgage-backed securities and by using certain
hedging techniques.
Government Guaranteed Mortgage-Backed Securities. There are several types
of guaranteed mortgage-backed securities currently available, including
guaranteed mortgage pass-through certificates and multiple class securities,
which include guaranteed Real Estate Mortgage Investment Conduit Certificates
("REMIC Certificates"), collateralized mortgage obligations and stripped
mortgage-backed securities. A Fund is permitted to invest in other types of
mortgage-backed securities that may be available in the future to the extent
consistent with its investment policies and objective.
A Fund's investments in mortgage-backed securities may include securities
issued or guaranteed by the U.S. Government or one of its agencies, authorities,
instrumentalities or sponsored enterprises, such as the Government National
Mortgage Association ("Ginnie Mae"), the Federal National Mortgage Association
("Fannie Mae") and the Federal Home Loan Mortgage Corporation ("Freddie Mac").
B-17
Ginnie Mae Certificates. Ginnie Mae is a wholly-owned corporate
instrumentality of the United States. Ginnie Mae is authorized to guarantee the
timely payment of the principal of and interest on certificates that are based
on and backed by a pool of mortgage loans insured by the Federal Housing
Administration ("FHA Loans"), or guaranteed by the Veterans Administration ("VA
Loans"), or by pools of other eligible mortgage loans. In order to meet its
obligations under any guaranty, Ginnie Mae is authorized to borrow from the
United States Treasury in an unlimited amount.
Fannie Mae Certificates. Fannie Mae is a stockholder-owned corporation
chartered under an act of the United States Congress. Each Fannie Mae
Certificate is issued and guaranteed by Fannie Mae and represents an undivided
interest in a pool of mortgage loans (a "Pool") formed by Fannie Mae. Each Pool
consists of residential mortgage loans ("Mortgage Loans") either previously
owned by Fannie Mae or purchased by it in connection with the formation of the
Pool. The Mortgage Loans may be either conventional Mortgage Loans (i.e., not
insured or guaranteed by any U.S. Government agency) or Mortgage Loans that are
either insured by the Federal Housing Administration ("FHA") or guaranteed by
the Veterans Administration ("VA"). However, the Mortgage Loans in Fannie Mae
Pools are primarily conventional Mortgage Loans. The lenders originating and
servicing the Mortgage Loans are subject to certain eligibility requirements
established by Fannie Mae.
Fannie Mae has certain contractual responsibilities. With respect to each
Pool, Fannie Mae is obligated to distribute scheduled monthly installments of
principal and interest after Fannie Mae's servicing and guaranty fee, whether or
not received, to Certificate holders. Fannie Mae also is obligated to distribute
to holders of Certificates an amount equal to the full principal balance of any
foreclosed Mortgage Loan, whether or not such principal balance is actually
recovered. The obligations of Fannie Mae under its guaranty of the Fannie Mae
Certificates are obligations solely of Fannie Mae.
Freddie Mac Certificates. Freddie Mac is a publicly held U.S. Government
sponsored enterprise. The principal activity of Freddie Mac currently is the
purchase of first lien, conventional, residential mortgage loans and
participation interests in such mortgage loans and their resale in the form of
mortgage securities, primarily Freddie Mac Certificates. A Freddie Mac
Certificate represents a pro rata interest in a group of mortgage loans or
participation in mortgage loans (a "Freddie Mac Certificate group") purchased by
Freddie Mac.
Freddie Mac guarantees to each registered holder of a Freddie Mac
Certificate the timely payment of interest at the rate provided for by such
Freddie Mac Certificate (whether or not received on the underlying loans).
Freddie Mac also guarantees to each registered Certificate holder ultimate
collection of all principal of the related mortgage loans, without any offset or
deduction, but does not, generally, guarantee the timely payment of scheduled
principal. The obligations of Freddie Mac under its guaranty of Freddie Mac
Certificates are obligations solely of Freddie Mac.
The mortgage loans underlying the Freddie Mac Certificates consist of
adjustable rate or fixed rate mortgage loans with original terms to maturity of
between five and
B-18
thirty years. Substantially all of these mortgage loans are secured by first
liens on one-to-four-family residential properties or multifamily projects. Each
mortgage loan must meet the applicable standards set forth in the law creating
Freddie Mac or Fannie Mae. A Freddie Mac Certificate group may include whole
loans, participation interests in whole loans and undivided interests in whole
loans and participations comprising another Freddie Mac Certificate group.
Mortgage Pass-Through Securities. Each Fund (other than the CORE Large Cap
Value, CORE U.S. Equity, CORE Large Cap Growth, CORE Small Cap Equity, CORE
International Equity and Research Select Funds) may invest in both government
guaranteed and privately issued mortgage pass-through securities ("Mortgage
Pass-Throughs"); that is, fixed or adjustable rate mortgage-backed securities
which provide for monthly payments that are a "pass-through" of the monthly
interest and principal payments (including any prepayments) made by the
individual borrowers on the pooled mortgage loans, net of any fees or other
amounts paid to any guarantor, administrator and/or servicer of the underlying
mortgage loans.
The following discussion describes only a few of the wide variety of
structures of Mortgage Pass-Throughs that are available or may be issued.
Description of Certificates. Mortgage Pass-Throughs may be issued in one or
more classes of senior certificates and one or more classes of subordinate
certificates. Each such class may bear a different pass-through rate. Generally,
each certificate will evidence the specified interest of the holder thereof in
the payments of principal or interest or both in respect of the mortgage pool
comprising part of the trust fund for such certificates.
Any class of certificates may also be divided into subclasses entitled to
varying amounts of principal and interest. If a REMIC election has been made,
certificates of such subclasses may be entitled to payments on the basis of a
stated principal balance and stated interest rate, and payments among different
subclasses may be made on a sequential, concurrent, pro rata or disproportionate
--- ----
basis, or any combination thereof. The stated interest rate on any such subclass
of certificates may be a fixed rate or one which varies in direct or inverse
relationship to an objective interest index.
Generally, each registered holder of a certificate will be entitled to
receive its pro rata share of monthly distributions of all or a portion of
--- ----
principal of the underlying mortgage loans or of interest on the principal
balances thereof, which accrues at the applicable mortgage pass-through rate, or
both. The difference between the mortgage interest rate and the related mortgage
pass-through rate (less the amount, if any, of retained yield) with respect to
each mortgage loan will generally be paid to the servicer as a servicing fee.
Since certain adjustable rate mortgage loans included in a mortgage pool may
provide for deferred interest (i.e., negative amortization), the amount of
interest actually paid by a mortgagor in any month may be less than the amount
of interest accrued on the outstanding principal balance of the related mortgage
loan during the relevant period at the applicable mortgage interest rate. In
such event, the amount of interest that is treated as deferred interest will be
added to the principal balance of the related mortgage loan and will be
distributed pro rata to certificate-holders as principal of such mortgage loan
--- ----
when paid by the mortgagor in subsequent monthly payments or at maturity.
B-19
Ratings. The ratings assigned by a rating organization to Mortgage
Pass-Throughs address the likelihood of the receipt of all distributions on the
underlying mortgage loans by the related certificate-holders under the
agreements pursuant to which such certificates are issued. A rating
organization's ratings take into consideration the credit quality of the related
mortgage pool, including any credit support providers, structural and legal
aspects associated with such certificates, and the extent to which the payment
stream on such mortgage pool is adequate to make payments required by such
certificates. A rating organization's ratings on such certificates do not,
however, constitute a statement regarding frequency of prepayments on the
related mortgage loans. In addition, the rating assigned by a rating
organization to a certificate may not address the remote possibility that, in
the event of the insolvency of the issuer of certificates where a subordinated
interest was retained, the issuance and sale of the senior certificates may be
recharacterized as a financing and, as a result of such recharacterization,
payments on such certificates may be affected.
Credit Enhancement. Credit support falls generally into two categories: (i)
liquidity protection and (ii) protection against losses resulting from default
by an obligor on the underlying assets. Liquidity protection refers to the
provision of advances, generally by the entity administering the pools of
mortgages, the provision of a reserve fund, or a combination thereof, to ensure,
subject to certain limitations, that scheduled payments on the underlying pool
are made in a timely fashion. Protection against losses resulting from default
ensures ultimate payment of the obligations on at least a portion of the assets
in the pool. Such credit support can be provided by, among other things, payment
guarantees, letters of credit, pool insurance, subordination, or any combination
thereof.
Subordination; Shifting of Interest; Reserve Fund. In order to achieve
ratings on one or more classes of Mortgage Pass-Throughs, one or more classes of
certificates may be subordinate certificates which provide that the rights of
the subordinate certificate-holders to receive any or a specified portion of
distributions with respect to the underlying mortgage loans may be subordinated
to the rights of the senior certificate-holders. If so structured, the
subordination feature may be enhanced by distributing to the senior
certificate-holders on certain distribution dates, as payment of principal, a
specified percentage (which generally declines over time) of all principal
payments received during the preceding prepayment period ("shifting interest
credit enhancement"). This will have the effect of accelerating the amortization
of the senior certificates while increasing the interest in the trust fund
evidenced by the subordinate certificates. Increasing the interest of the
subordinate certificates relative to that of the senior certificates is intended
to preserve the availability of the subordination provided by the subordinate
certificates. In addition, because the senior certificate-holders in a shifting
interest credit enhancement structure are entitled to receive a percentage of
principal prepayments which is greater than their proportionate interest in the
trust fund, the rate of principal prepayments on the mortgage loans will have an
even greater effect on the rate of principal payments and the amount of interest
payments on, and the yield to maturity of, the senior certificates.
In addition to providing for a preferential right of the senior
certificate-holders to receive current distributions from the mortgage pool, a
reserve fund may be established relating to such
B-20
certificates (the "Reserve Fund"). The Reserve Fund may be created with an
initial cash deposit by the originator or servicer and augmented by the
retention of distributions otherwise available to the subordinate
certificate-holders or by excess servicing fees until the Reserve Fund reaches a
specified amount.
The subordination feature, and any Reserve Fund, are intended to enhance
the likelihood of timely receipt by senior certificate-holders of the full
amount of scheduled monthly payments of principal and interest due them and will
protect the senior certificate-holders against certain losses; however, in
certain circumstances the Reserve Fund could be depleted and temporary
shortfalls could result. In the event the Reserve Fund is depleted before the
subordinated amount is reduced to zero, senior certificate-holders will
nevertheless have a preferential right to receive current distributions from the
mortgage pool to the extent of the then outstanding subordinated amount. Unless
otherwise specified, until the subordinated amount is reduced to zero, on any
distribution date any amount otherwise distributable to the subordinate
certificates or, to the extent specified, in the Reserve Fund will generally be
used to offset the amount of any losses realized with respect to the mortgage
loans ("Realized Losses"). Realized Losses remaining after application of such
amounts will generally be applied to reduce the ownership interest of the
subordinate certificates in the mortgage pool. If the subordinated amount has
been reduced to zero, Realized Losses generally will be allocated pro rata among
--- ----
all certificate-holders in proportion to their respective outstanding interests
in the mortgage pool.
Alternative Credit Enhancement. As an alternative, or in addition to the
credit enhancement afforded by subordination, credit enhancement for Mortgage
Pass-Throughs may be provided by mortgage insurance, hazard insurance, by the
deposit of cash, certificates of deposit, letters of credit, a limited guaranty
or by such other methods as are acceptable to a rating agency. In certain
circumstances, such as where credit enhancement is provided by guarantees or a
letter of credit, the security is subject to credit risk because of its exposure
to an external credit enhancement provider.
Voluntary Advances. Generally, in the event of delinquencies in payments on
the mortgage loans underlying the Mortgage Pass-Throughs, the servicer agrees to
make advances of cash for the benefit of certificate-holders, but only to the
extent that it determines such voluntary advances will be recoverable from
future payments and collections on the mortgage loans or otherwise.
Optional Termination. Generally, the servicer may, at its option with
respect to any certificates, repurchase all of the underlying mortgage loans
remaining outstanding at such time if the aggregate outstanding principal
balance of such mortgage loans is less than a specified percentage (generally
5-10%) of the aggregate outstanding principal balance of the mortgage loans as
of the cut-off date specified with respect to such series.
Multiple Class Mortgage-Backed Securities and Collateralized Mortgage
Obligations. A Fund may invest in multiple class securities including
collateralized mortgage obligations ("CMOs") and REMIC Certificates. These
securities may be issued by U.S. Government agencies and instrumentalities such
as Fannie Mae or Freddie Mac or by trusts
B-21
formed by private originators of, or investors in, mortgage loans, including
savings and loan associations, mortgage bankers, commercial banks, insurance
companies, investment banks and special purpose subsidiaries of the foregoing.
In general, CMOs are debt obligations of a legal entity that are collateralized
by, and multiple class mortgage-backed securities represent direct ownership
interests in, a pool of mortgage loans or mortgage-backed securities the
payments on which are used to make payments on the CMOs or multiple class
mortgage-backed securities.
Fannie Mae REMIC Certificates are issued and guaranteed as to timely
distribution of principal and interest by Fannie Mae. In addition, Fannie Mae
will be obligated to distribute the principal balance of each class of REMIC
Certificates in full, whether or not sufficient funds are otherwise available.
Freddie Mac guarantees the timely payment of interest on Freddie Mac REMIC
Certificates and also guarantees the payment of principal as payments are
required to be made on the underlying mortgage participation certificates
("PCs"). PCs represent undivided interests in specified level payment,
residential mortgages or participations therein purchased by Freddie Mac and
placed in a PC pool. With respect to principal payments on PCs, Freddie Mac
generally guarantees ultimate collection of all principal of the related
mortgage loans without offset or deduction. Freddie Mac also guarantees timely
payment of principal of certain PCs.
CMOs and guaranteed REMIC Certificates issued by Fannie Mae and Freddie Mac
are types of multiple class mortgage-backed securities. Investors may purchase
beneficial interests in REMICs, which are known as "regular" interests or
"residual" interests. The Funds do not intend to purchase residual interests in
REMICs. The REMIC Certificates represent beneficial ownership interests in a
REMIC trust, generally consisting of mortgage loans or Fannie Mae, Freddie Mac
or Ginnie Mae guaranteed mortgage-backed securities (the "Mortgage Assets"). The
obligations of Fannie Mae or Freddie Mac under their respective guaranty of the
REMIC Certificates are obligations solely of Fannie Mae or Freddie Mac,
respectively.
CMOs and REMIC Certificates are issued in multiple classes. Each class of
CMOs or REMIC Certificates, often referred to as a "tranche," is issued at a
specific adjustable or fixed interest rate and must be fully retired no later
than its final distribution date. Principal prepayments on the Mortgage Loans or
the Mortgage Assets underlying the CMOs or REMIC Certificates may cause some or
all of the classes of CMOs or REMIC Certificates to be retired substantially
earlier than their final distribution dates. Generally, interest is paid or
accrues on all classes of CMOs or REMIC Certificates on a monthly basis.
The principal of and interest on the Mortgage Assets may be allocated among
the several classes of CMOs or REMIC Certificates in various ways. In certain
structures (known as "sequential pay" CMOs or REMIC Certificates), payments of
principal, including any principal prepayments, on the Mortgage Assets generally
are applied to the classes of CMOs or REMIC Certificates in the order of their
respective final distribution dates. Thus, no payment of principal will be made
on any class of sequential pay CMOs or REMIC Certificates until all other
classes having an earlier final distribution date have been paid in full.
B-22
Additional structures of CMOs and REMIC Certificates include, among others,
"parallel pay" CMOs and REMIC Certificates. Parallel pay CMOs or REMIC
Certificates are those which are structured to apply principal payments and
prepayments of the Mortgage Assets to two or more classes concurrently on a
proportionate or disproportionate basis. These simultaneous payments are taken
into account in calculating the final distribution date of each class.
A wide variety of REMIC Certificates may be issued in parallel pay or
sequential pay structures. These securities include accrual certificates (also
known as "Z-Bonds"), which only accrue interest at a specified rate until all
other certificates having an earlier final distribution date have been retired
and are converted thereafter to an interest-paying security, and planned
amortization class ("PAC") certificates, which are parallel pay REMIC
Certificates that generally require that specified amounts of principal be
applied on each payment date to one or more classes or REMIC Certificates (the
"PAC Certificates"), even though all other principal payments and prepayments of
the Mortgage Assets are then required to be applied to one or more other classes
of the PAC Certificates. The scheduled principal payments for the PAC
Certificates generally have the highest priority on each payment date after
interest due has been paid to all classes entitled to receive interest
currently. Shortfalls, if any, are added to the amount payable on the next
payment date. The PAC Certificate payment schedule is taken into account in
calculating the final distribution date of each class of PAC. In order to create
PAC tranches, one or more tranches generally must be created that absorb most of
the volatility in the underlying mortgage assets. These tranches tend to have
market prices and yields that are much more volatile than other PAC classes.
Stripped Mortgage-Backed Securities. The Balanced Fund may invest in
stripped mortgage-backed securities ("SMBS"), which are derivative multiclass
mortgage securities. Although the market for such securities is increasingly
liquid, certain SMBS may not be readily marketable and will be considered
illiquid for purposes of the Fund's limitation on investments in illiquid
securities. The market value of the class consisting entirely of principal
payments generally is unusually volatile in response to changes in interest
rates. The yields on a class of SMBS that receives all or most of the interest
from Mortgage Assets are generally higher than prevailing market yields on other
mortgage-backed securities because their cash flow patterns are more volatile
and there is a greater risk that the initial investment will not be fully
recouped.
Inverse Floating Rate Securities
--------------------------------
The Balanced Fund may invest in leveraged inverse floating rate debt
instruments ("inverse floaters"). The interest rate on an inverse floater resets
in the opposite direction from the market rate of interest to which the inverse
floater is indexed. An inverse floater may be considered to be leveraged to the
extent that its interest rate varies by a magnitude that exceeds the magnitude
of the change in the index rate of interest. The higher degree of leverage
inherent in inverse floaters is associated with greater volatility in their
market values. Accordingly, the duration of an inverse floater may exceed its
stated final maturity. Certain inverse floaters may be deemed to be illiquid
securities for purposes of a Fund's 15% limitation on investments in such
securities.
B-23
Asset-Backed Securities
-----------------------
Each Fund (except the CORE Large Cap Value, CORE U.S. Equity, CORE Large
Cap Growth, CORE Small Cap Equity, CORE International Equity and Research Select
Funds) may invest in asset-backed securities. Asset-backed securities represent
participation in, or are secured by and payable from, assets such as motor
vehicle installment sales, installment loan contracts, leases of various types
of real and personal property, receivables from revolving credit (credit card)
agreements and other categories of receivables. Such assets are securitized
through the use of trusts and special purpose corporations. Payments or
distributions of principal and interest may be guaranteed up to certain amounts
and for a certain time period by a letter of credit or a pool insurance policy
issued by a financial institution unaffiliated with the trust or corporation, or
other credit enhancements may be present.
Like mortgage-backed securities, asset-backed securities are often subject
to more rapid repayment than their stated maturity date would indicate as a
result of the pass-through of prepayments of principal on the underlying loans.
A Fund's ability to maintain positions in such securities will be affected by
reductions in the principal amount of such securities resulting from
prepayments, and its ability to reinvest the returns of principal at comparable
yields is subject to generally prevailing interest rates at that time. To the
extent that a Fund invests in asset-backed securities, the values of such Fund's
portfolio securities will vary with changes in market interest rates generally
and the differentials in yields among various kinds of asset-backed securities.
Asset-backed securities present certain additional risks that are not
presented by mortgage-backed securities because asset-backed securities
generally do not have the benefit of a security interest in collateral that is
comparable to mortgage assets. Credit card receivables are generally unsecured
and the debtors on such receivables are entitled to the protection of a number
of state and federal consumer credit laws, many of which give such debtors the
right to set-off certain amounts owed on the credit cards, thereby reducing the
balance due. Automobile receivables generally are secured, but by automobiles
rather than residential real property. Most issuers of automobile receivables
permit the loan servicers to retain possession of the underlying obligations. If
the servicer were to sell these obligations to another party, there is a risk
that the purchaser would acquire an interest superior to that of the holders of
the asset-backed securities. In addition, because of the large number of
vehicles involved in a typical issuance and technical requirements under state
laws, the trustee for the holders of the automobile receivables may not have a
proper security interest in the underlying automobiles. Therefore, if the issuer
of an asset-backed security defaults on its payment obligations, there is the
possibility that, in some cases, a Fund will be unable to possess and sell the
underlying collateral and that the Fund's recoveries on repossessed collateral
may not be available to support payments on the securities.
Loan Participations
-------------------
The Balanced Fund may invest in loan participations. Such loans must be to
issuers in whose obligations Balanced Fund may invest. A loan participation is
an interest in a loan to a U.S. or foreign company or other borrower which is
administered and sold by a financial
B-24
intermediary. In a typical corporate loan syndication, a number of lenders,
usually banks (co-lenders), lend a corporate borrower a specified sum pursuant
to the terms and conditions of a loan agreement. One of the co-lenders usually
agrees to act as the agent bank with respect to the loan.
Participation interests acquired by the Balanced Fund may take the form of
a direct or co-lending relationship with the corporate borrower, an assignment
of an interest in the loan by a co-lender or another participant, or a
participation in the seller's share of the loan. When the Balanced Fund acts as
co-lender in connection with a participation interest or when the Balanced Fund
acquires certain participation interests, the Balanced Fund will have direct
recourse against the borrower if the borrower fails to pay scheduled principal
and interest. In cases where the Balanced Fund lacks direct recourse, it will
look to the agent bank to enforce appropriate credit remedies against the
borrower. In these cases, the Balanced Fund may be subject to delays, expenses
and risks that are greater than those that would have been involved if the Fund
had purchased a direct obligation (such as commercial paper) of such borrower.
For example, in the event of the bankruptcy or insolvency of the corporate
borrower, a loan participation may be subject to certain defenses by the
borrower as a result of improper conduct by the agent bank. Moreover, under the
terms of the loan participation, the Balanced Fund may be regarded as a creditor
of the agent bank (rather than of the underlying corporate borrower), so that
the Balanced Fund may also be subject to the risk that the agent bank may become
insolvent. The secondary market, if any, for these loan participations is
limited and any loan participations purchased by the Balanced Fund will be
regarded as illiquid.
For purposes of certain investment limitations pertaining to
diversification of the Balanced Fund's portfolio investments, the issuer of a
loan participation will be the underlying borrower. However, in cases where the
Balanced Fund does not have recourse directly against the borrower, both the
borrower and each agent bank and co-lender interposed between the Balanced Fund
and the borrower will be deemed issuers of a loan participation.
Futures Contracts and Options on Futures Contracts
--------------------------------------------------
Each Fund may purchase and sell futures contracts and may also purchase and
write options on futures contracts. The CORE Large Cap Value, CORE Large Cap
Growth and CORE Small Cap Equity Funds may only enter into such transactions
with respect to a representative index. The CORE U.S. Equity Fund may enter into
futures transactions only with respect to the S&P 500 Index. The other Funds may
purchase and sell futures contracts based on various securities (such as U.S.
Government securities), securities indices, foreign currencies and other
financial instruments and indices. Each Fund will engage in futures and related
options transactions only for bona fide hedging purposes as defined below or for
purposes of seeking to increase total return to the extent permitted by
regulations of the Commodity Futures Trading Commission ("CFTC"). Futures
contracts entered into by a Fund are traded on U.S. exchanges or boards of trade
that are licensed and regulated by the CFTC or, with respect to certain Funds,
on foreign exchanges. Neither the CFTC, National Futures Association nor any
domestic exchange regulates activities of any foreign exchange or boards of
trade, including the execution, delivery and clearing of transactions, or has
the power to compel
B-25
enforcement of the rules of a foreign exchange or board of trade or any
applicable foreign law. This is true even if the exchange is formally linked to
a domestic market so that a position taken on the market may be liquidated by a
transaction on another market. Moreover, such laws or regulations will vary
depending on the foreign country in which the foreign futures or foreign options
transaction occurs. For these reasons, persons who trade foreign futures or
foreign options contracts may not be afforded certain of the protective measures
provided by the Commodity Exchange Act, the CFTC's regulations and the rules of
the National Futures Association and any domestic exchange, including the right
to use reparations proceedings before the CFTC and arbitration proceedings
provided by the National Futures Association or any domestic futures exchange.
In particular, a Fund's investments in foreign futures or foreign options
transactions may not be provided the same protections in respect of transactions
on United States futures exchanges.
Futures Contracts. A futures contract may generally be described as an
agreement between two parties to buy and sell particular financial instruments
for an agreed price during a designated month (or to deliver the final cash
settlement price, in the case of a contract relating to an index or otherwise
not calling for physical delivery at the end of trading in the contract).
When interest rates are rising or securities prices are falling, a Fund can
seek through the sale of futures contracts to offset a decline in the value of
its current portfolio securities. When rates are falling or prices are rising, a
Fund, through the purchase of futures contracts, can attempt to secure better
rates or prices than might later be available in the market when it effects
anticipated purchases. Similarly, each Fund (other than the CORE Large Cap
Value, CORE U.S. Equity, CORE Large Cap Growth, CORE Small Cap Equity and
Research Select Funds) can purchase and sell futures contracts on a specified
currency in order to seek to increase total return or to hedge against changes
in currency exchange rates. Each Fund (other than the CORE Large Cap Value, CORE
U.S. Equity, CORE Large Cap Growth, CORE Small Cap Equity and Research Select
Funds) can purchase futures contracts on foreign currency to establish the price
in U.S. dollars of a security quoted or denominated in such currency that such
Fund has acquired or expects to acquire. The Balanced Fund may also use futures
contracts to manage the term structure and duration of its fixed-income
securities holdings in accordance with that Fund's investment objectives and
policies.
Positions taken in the futures market are not normally held to maturity,
but are instead liquidated through offsetting transactions which may result in a
profit or a loss. While a Fund will usually liquidate futures contracts on
securities or currency in this manner, a Fund may instead make or take delivery
of the underlying securities or currency whenever it appears economically
advantageous for the Fund to do so. A clearing corporation associated with the
exchange on which futures are traded guarantees that, if still open, the sale or
purchase will be performed on the settlement date.
Hedging Strategies. Hedging, by use of futures contracts, seeks to
establish with more certainty than would otherwise be possible the effective
price, rate of return or currency exchange rate on portfolio securities or
securities that a Fund owns or proposes to acquire. A Fund may, for example,
take a "short" position in the futures market by selling futures contracts
B-26
to seek to hedge against an anticipated rise in interest rates or a decline in
market prices or (other than the CORE Large Cap Value, CORE U.S. Equity, the
CORE Large Cap Growth, CORE Small Cap Equity and Research Select Funds) foreign
currency rates that would adversely affect the dollar value of such Fund's
portfolio securities. Similarly, each Fund (other than the CORE Large Cap Value,
CORE U.S. Equity, CORE Large Cap Growth, CORE Small Cap Equity and Research
Select Funds) may sell futures contracts on a currency in which its portfolio
securities are quoted or denominated or in one currency to seek to hedge against
fluctuations in the value of securities quoted or denominated in a different
currency if there is an established historical pattern of correlation between
the two currencies. If, in the opinion of the applicable Investment Adviser,
there is a sufficient degree of correlation between price trends for a Fund's
portfolio securities and futures contracts based on other financial instruments,
securities indices or other indices, a Fund may also enter into such futures
contracts as part of its hedging strategy. Although under some circumstances
prices of securities in a Fund's portfolio may be more or less volatile than
prices of such futures contracts, the Investment Advisers will attempt to
estimate the extent of this volatility difference based on historical patterns
and compensate for any such differential by having a Fund enter into a greater
or lesser number of futures contracts or by attempting to achieve only a partial
hedge against price changes affecting a Fund's securities portfolio. When
hedging of this character is successful, any depreciation in the value of
portfolio securities will be substantially offset by appreciation in the value
of the futures position. On the other hand, any unanticipated appreciation in
the value of a Fund's portfolio securities would be substantially offset by a
decline in the value of the futures position.
On other occasions, a Fund may take a "long" position by purchasing such
futures contracts. This may be done, for example, when a Fund anticipates the
subsequent purchase of particular securities when it has the necessary cash, but
expects the prices or currency exchange rates then available in the applicable
market to be less favorable than prices or rates that are currently available.
Options on Futures Contracts. The acquisition of put and call options on
futures contracts will give a Fund the right (but not the obligation), for a
specified price, to sell or to purchase, respectively, the underlying futures
contract at any time during the option period. As the purchaser of an option on
a futures contract, a Fund obtains the benefit of the futures position if prices
move in a favorable direction but limits its risk of loss in the event of an
unfavorable price movement to the loss of the premium and transaction costs.
The writing of a call option on a futures contract generates a premium
which may partially offset a decline in the value of a Fund's assets. By writing
a call option, a Fund becomes obligated, in exchange for the premium, to sell a
futures contract if the option is exercised, which may have a value higher than
the exercise price. Conversely, the writing of a put option on a futures
contract generates a premium, which may partially offset an increase in the
price of securities that a Fund intends to purchase. However, a Fund becomes
obligated (upon the exercise of the option) to purchase a futures contract if
the option is exercised, which may have a value lower than the exercise price.
Thus, the loss incurred by a Fund in writing options on futures is potentially
unlimited and may exceed the amount of the premium received. A Fund will incur
transaction costs in connection with the writing of options on futures.
B-27
The holder or writer of an option on a futures contract may terminate its
position by selling or purchasing an offsetting option on the same financial
instrument. There is no guarantee that such closing transactions can be
effected. A Fund's ability to establish and close out positions on such options
will be subject to the development and maintenance of a liquid market.
Other Considerations. Each Fund will engage in futures transactions and
will engage in related options transactions only for bona fide hedging as
defined in the regulations of the CFTC or to seek to increase total return to
the extent permitted by such regulations.
In addition to bona fide hedging, a CFTC regulation permits a Fund to
engage in other futures transactions if the aggregate initial margin and
premiums required to establish such positions in futures contracts and options
on futures do not exceed 5% of the net asset value of such Fund's portfolio,
after taking into account unrealized profits and losses on any such positions
and excluding the amount by which such options were in-the-money at the time of
purchase. A Fund will engage in transactions in futures contracts and related
options transactions only to the extent such transactions are consistent with
the requirements of the Internal Revenue Code of 1986 as amended (the "Code")
for maintaining its qualification as a regulated investment company for federal
income tax purposes.
Transactions in futures contracts and options on futures involve brokerage
costs, require margin deposits and, in certain cases, require the Fund to
segregate cash or liquid assets in an amount equal to the underlying value of
such contracts and options.
While transactions in futures contracts and options on futures may reduce
certain risks, such transactions themselves entail certain other risks. Thus,
unanticipated changes in interest rates, securities prices or currency exchange
rates may result in a poorer overall performance for a Fund than if it had not
entered into any futures contracts or options transactions. In the event of an
imperfect correlation between a futures position and a portfolio position which
is intended to be protected, the desired protection may not be obtained and a
Fund may be exposed to risk of loss.
Perfect correlation between a Fund's futures positions and portfolio
positions will be difficult to achieve because no futures contracts based on
individual equity or corporate fixed-income securities are currently available.
In addition, it is not possible for a Fund to hedge fully or perfectly against
currency fluctuations affecting the value of securities quoted or denominated in
foreign currencies because the value of such securities is likely to fluctuate
as a result of independent factors not related to currency fluctuations. The
profitability of a Fund's trading in futures depends upon the ability of the
Investment Adviser to analyze correctly the futures markets.
B-28
Options on Securities and Securities Indices
--------------------------------------------
Writing Covered Options. Each Fund may write (sell) covered call and put
options on any securities in which it may invest. A call option written by a
Fund obligates such Fund to sell specified securities to the holder of the
option at a specified price if the option is exercised at any time before the
expiration date. All call options written by a Fund are covered, which means
that such Fund will own the securities subject to the option as long as the
option is outstanding or such Fund will use the other methods described below. A
Fund's purpose in writing covered call options is to realize greater income than
would be realized on portfolio securities transactions alone. However, a Fund
may forego the opportunity to profit from an increase in the market price of the
underlying security.
A put option written by a Fund would obligate such Fund to purchase
specified securities from the option holder at a specified price if the option
is exercised at any time before the expiration date. All put options written by
a Fund would be covered, which means that such Fund will segregate cash or
liquid assets with a value at least equal to the exercise price of the put
option or will use the other methods described below. The purpose of writing
such options is to generate additional income for the Fund. However, in return
for the option premium, each Fund accepts the risk that it may be required to
purchase the underlying securities at a price in excess of the securities'
market value at the time of purchase.
Call and put options written by a Fund will also be considered to be
covered to the extent that the Fund's liabilities under such options are wholly
or partially offset by its rights under call and put options purchased by the
Fund or by an offsetting forward contract which, by virtue of its exercise price
or otherwise, reduces a Fund's net exposure on its written option position.
A Fund may also write (sell) covered call and put options on any securities
index comprised of securities in which it may invest. Options on securities
indices are similar to options on securities, except that the exercise of
securities index options requires cash payments and does not involve the actual
purchase or sale of securities. In addition, securities index options are
designed to reflect price fluctuations in a group of securities or segment of
the securities market rather than price fluctuations in a single security.
A Fund may cover call options on a securities index by owning securities
whose price changes are expected to be similar to those of the underlying index,
or by having an absolute and immediate right to acquire such securities without
additional cash consideration (or for additional consideration which has been
segregated by the Fund) upon conversion or exchange of other securities in its
portfolio. A Fund may cover call and put options on a securities index by
segregating cash or liquid assets with a value equal to the exercise price.
A Fund may terminate its obligations under an exchange traded call or put
option by purchasing an option identical to the one it has written. Obligations
under over-the-counter options may be terminated only by entering into an
offsetting transaction with the counterparty to such option. Such purchases are
referred to as "closing purchase transactions."
B-29
Purchasing Options. Each Fund may purchase put and call options on any
securities in which it may invest or options on any securities index comprised
of securities in which it may invest. A Fund would also be able to enter into
closing sale transactions in order to realize gains or minimize losses on
options it had purchased.
A Fund may purchase call options in anticipation of an increase in the
market value of securities of the type in which it may invest. The purchase of a
call option would entitle a Fund, in return for the premium paid, to purchase
specified securities at a specified price during the option period. A Fund would
ordinarily realize a gain if, during the option period, the value of such
securities exceeded the sum of the exercise price, the premium paid and
transaction costs; otherwise such a Fund would realize either no gain or a loss
on the purchase of the call option.
A Fund may purchase put options in anticipation of a decline in the market
value of securities in its portfolio ("protective puts") or in securities in
which it may invest. The purchase of a put option would entitle a Fund, in
exchange for the premium paid, to sell specified securities at a specified price
during the option period. The purchase of protective puts is designed to offset
or hedge against a decline in the market value of a Fund's securities. Put
options may also be purchased by a Fund for the purpose of affirmatively
benefiting from a decline in the price of securities which it does not own. A
Fund would ordinarily realize a gain if, during the option period, the value of
the underlying securities decreased below the exercise price sufficiently to
more than cover the premium and transaction costs; otherwise such a Fund would
realize either no gain or a loss on the purchase of the put option. Gains and
losses on the purchase of protective put options would tend to be offset by
countervailing changes in the value of the underlying portfolio securities.
A Fund would purchase put and call options on securities indices for the
same purposes as it would purchase options on individual securities. For a
description of options on securities indices, see "Writing Covered Options"
above.
Yield Curve Options. The Balanced Fund may enter into options on the yield
"spread" or differential between two securities. Such transactions are referred
to as "yield curve" options. In contrast to other types of options, a yield
curve option is based on the difference between the yields of designated
securities, rather than the prices of the individual securities, and is settled
through cash payments. Accordingly, a yield curve option is profitable to the
holder if this differential widens (in the case of a call) or narrows (in the
case of a put), regardless of whether the yields of the underlying securities
increase or decrease.
The Balanced Fund may purchase or write yield curve options for the same
purposes as other options on securities. For example, the Fund may purchase a
call option on the yield spread between two securities if it owns one of the
securities and anticipates purchasing the other security and wants to hedge
against an adverse change in the yield spread between the two securities. The
Balanced Fund may also purchase or write yield curve options in an effort to
increase current income if, in the judgment of the Investment Adviser, the Fund
will be able to
B-30
profit from movements in the spread between the yields of the underlying
securities. The trading of yield curve options is subject to all of the risks
associated with the trading of other types of options. In addition, however,
such options present risk of loss even if the yield of one of the underlying
securities remains constant, if the spread moves in a direction or to an extent
which was not anticipated.
Yield curve options written by the Balanced Fund will be "covered." A call
(or put) option is covered if the Fund holds another call (or put) option on the
spread between the same two securities and segregates cash or liquid assets
sufficient to cover the Fund's net liability under the two options. Therefore,
the Fund's liability for such a covered option is generally limited to the
difference between the amount of such Fund's liability under the option written
by the Fund less the value of the option held by the Fund. Yield curve options
may also be covered in such other manner as may be in accordance with the
requirements of the counterparty with which the option is traded and applicable
laws and regulations. Yield curve options are traded over-the-counter, and
because they have been only recently introduced, established trading markets for
these options have not yet developed.
Risks Associated with Options Transactions. There is no assurance that a
liquid secondary market on an options exchange will exist for any particular
exchange-traded option or at any particular time. If a Fund is unable to effect
a closing purchase transaction with respect to covered options it has written,
the Fund will not be able to sell the underlying securities or dispose of
segregated assets until the options expire or are exercised. Similarly, if a
Fund is unable to effect a closing sale transaction with respect to options it
has purchased, it will have to exercise the options in order to realize any
profit and will incur transaction costs upon the purchase or sale of underlying
securities.
Reasons for the absence of a liquid secondary market on an exchange include
the following: (i) there may be insufficient trading interest in certain
options; (ii) restrictions may be imposed by an exchange on opening or closing
transactions or both; (iii) trading halts, suspensions or other restrictions may
be imposed with respect to particular classes or series of options; (iv) unusual
or unforeseen circumstances may interrupt normal operations on an exchange; (v)
the facilities of an exchange or the Options Clearing Corporation may not at all
times be adequate to handle current trading volume; or (vi) one or more
exchanges could, for economic or other reasons, decide or be compelled at some
future date to discontinue the trading of options (or a particular class or
series of options), in which event the secondary market on that exchange (or in
that class or series of options) would cease to exist, although outstanding
options on that exchange that had been issued by the Options Clearing
Corporation as a result of trades on that exchange would continue to be
exercisable in accordance with their terms.
A Fund may purchase and sell both options that are traded on U.S. and
foreign exchanges and options traded over-the-counter with broker-dealers who
make markets in these options. The ability to terminate over-the-counter options
is more limited than with exchange-traded options and may involve the risk that
broker-dealers participating in such transactions will not fulfill their
obligations.
B-31
Transactions by each Fund in options on securities and indices will be
subject to limitations established by each of the exchanges, boards of trade or
other trading facilities governing the maximum number of options in each class
which may be written or purchased by a single investor or group of investors
acting in concert. Thus, the number of options which a Fund may write or
purchase may be affected by options written or purchased by other investment
advisory clients of the Investment Advisers. An exchange, board of trade or
other trading facility may order the liquidation of positions found to be in
excess of these limits, and it may impose certain other sanctions.
The writing and purchase of options is a highly specialized activity which
involves investment techniques and risks different from those associated with
ordinary portfolio securities transactions. The use of options to seek to
increase total return involves the risk of loss if the Investment Adviser is
incorrect in its expectation of fluctuations in securities prices or interest
rates. The successful use of options for hedging purposes also depends in part
on the ability of the Investment Adviser to manage future price fluctuations and
the degree of correlation between the options and securities markets. If the
Investment Adviser is incorrect in its expectation of changes in securities
prices or determination of the correlation between the securities indices on
which options are written and purchased and the securities in a Fund's
investment portfolio, the Fund may incur losses that it would not otherwise
incur. The writing of options could increase a Fund's portfolio turnover rate
and, therefore, associated brokerage commissions or spreads.
Real Estate Investment Trusts
-----------------------------
Each Fund may invest in shares of REITs. REITs are pooled investment
vehicles which invest primarily in real estate or real estate related loans.
REITs are generally classified as equity REITs, mortgage REITs or a combination
of equity and mortgage REITs. Equity REITs invest the majority of their assets
directly in real property and derive income primarily from the collection of
rents. Equity REITs can also realize capital gains by selling properties that
have appreciated in value. Mortgage REITs invest the majority of their assets in
real estate mortgages and derive income from the collection of interest
payments. Like regulated investment companies such as the Funds, REITs are not
taxed on income distributed to shareholders provided they comply with certain
requirements under the Code. A Fund will indirectly bear its proportionate share
of any expenses paid by REITs in which it invests in addition to the expenses
paid by a Fund.
Investing in REITs involves certain unique risks. Equity REITs may be
affected by changes in the value of the underlying property owned by such REITs,
while mortgage REITs may be affected by the quality of any credit extended.
REITs are dependent upon management skills, are not diversified (except to the
extent the Code requires), and are subject to the risks of financing projects.
REITs are subject to heavy cash flow dependency, default by borrowers,
B-32
self-liquidation, and the possibilities of failing to qualify for the exemption
from tax for distributed income under the Code and failing to maintain their
exemptions from the Act. REITs (especially mortgage REITs) are also subject to
interest rate risks.
Warrants and Stock Purchase Rights
----------------------------------
Each Fund may invest in warrants or rights (in addition to those acquired
in units or attached to other securities) which entitle the holder to buy equity
securities at a specific price for a specific period of time. A Fund will invest
in warrants and rights only if such equity securities are deemed appropriate by
the Investment Adviser for investment by the Fund. The CORE Large Cap Value,
CORE U.S. Equity, CORE Large Cap Growth, CORE Small Cap Equity, CORE
International Equity and Research Select Funds have no present intention of
acquiring warrants or rights. Warrants and rights have no voting rights, receive
no dividends and have no rights with respect to the assets of the issuer.
Foreign Securities
------------------
Each Fund may invest in securities of foreign issuers. The Balanced, Growth
and Income, Capital Growth, Strategic Growth, Growth Opportunities, Mid Cap
Value, Small Cap Value and Large Cap Value Funds may invest in the aggregate up
to 10%, 25%, 10%, 10%, 10%, 25%, 25% and 25%, respectively, of their total
assets in foreign securities. The CORE International Equity, International
Equity, European Equity, Japanese Equity, International Growth Opportunities,
Emerging Markets Equity and Asia Growth Fund will invest primarily in foreign
securities under normal circumstances. With respect to the CORE U.S. Equity,
CORE Large Cap Growth, CORE Large Cap Value, CORE Small Cap Equity and Research
Select Funds, equity securities of foreign issuers must be traded in the United
States.
Investments in foreign securities may offer potential benefits not
available from investments solely in U.S. dollar-denominated or quoted
securities of domestic issuers. Such benefits may include the opportunity to
invest in foreign issuers that appear, in the opinion of the applicable
Investment Adviser, to offer the potential for long-term growth of capital and
income, the opportunity to invest in foreign countries with economic policies or
business cycles different from those of the United States and the opportunity to
reduce fluctuations in portfolio value by taking advantage of foreign stock
markets that do not necessarily move in a manner parallel to U.S. markets.
Investing in foreign securities involves certain special risks, including
those discussed in the Funds' Prospectuses and those set forth below, which are
not typically associated with investing in U.S. dollar-denominated or quoted
securities of U.S. issuers. Investments in foreign securities usually involve
currencies of foreign countries. Accordingly, a Fund that invests in foreign
securities may be affected favorably or unfavorably by changes in currency rates
and in exchange control regulations and may incur costs in connection with
conversions between various currencies. The Balanced, Growth and Income, CORE
International Equity, Capital Growth, Strategic Growth, Growth Opportunities,
Mid Cap Value, International Equity, Small Cap Value, Large Cap Value, European
Equity, Japanese Equity, International
B-33
Growth Opportunities, Emerging Markets Equity and Asia Growth Funds may be
subject to currency exposure independent of their securities positions. To the
extent that a Fund is fully invested in foreign securities while also
maintaining currency positions, it may be exposed to greater combined risk.
Currency exchange rates may fluctuate significantly over short periods of
time. They generally are determined by the forces of supply and demand in the
foreign exchange markets and the relative merits of investments in different
countries, actual or anticipated changes in interest rates and other complex
factors, as seen from an international perspective. Currency exchange rates also
can be affected unpredictably by intervention by U.S. or foreign governments or
central banks or the failure to intervene or by currency controls or political
developments in the United States or abroad.
Since foreign issuers generally are not subject to uniform accounting,
auditing and financial reporting standards, practices and requirements
comparable to those applicable to U.S. companies, there may be less publicly
available information about a foreign company than about a U.S. company. Volume
and liquidity in most foreign securities markets are less than in the United
States and securities of many foreign companies are less liquid and more
volatile than securities of comparable U.S. companies. Fixed commissions on
foreign securities exchanges are generally higher than negotiated commissions on
U.S. exchanges, although each Fund endeavors to achieve the most favorable net
results on its portfolio transactions. There is generally less government
supervision and regulation of foreign securities exchanges, brokers, dealers and
listed and unlisted companies than in the United States.
Foreign markets also have different clearance and settlement procedures,
and in certain markets there have been times when settlements have been unable
to keep pace with the volume of securities transactions, making it difficult to
conduct such transactions. Such delays in settlement could result in temporary
periods when some of a Fund's assets are uninvested and no return is earned on
such assets. The inability of a Fund to make intended security purchases due to
settlement problems could cause the Fund to miss attractive investment
opportunities. Inability to dispose of portfolio securities due to settlement
problems could result either in losses to the Fund due to subsequent declines in
value of the portfolio securities or, if the Fund has entered into a contract to
sell the securities, could result in possible liability to the purchaser. In
addition, with respect to certain foreign countries, there is the possibility of
expropriation or confiscatory taxation, political or social instability, or
diplomatic developments which could affect a Fund's investments in those
countries. Moreover, individual foreign economies may differ favorably or
unfavorably from the U.S. economy in such respects as growth of gross national
product, rate of inflation, capital reinvestment, resource self-sufficiency and
balance of payments position.
Each Fund (except the Research Select Fund) may invest in foreign
securities which take the form of sponsored and unsponsored American Depositary
Receipts ("ADRs") and Global Depositary Receipts ("GDRs") and (except for CORE
Large Cap Value, CORE U.S. Equity, CORE Large Cap Growth, CORE Small Cap Equity
and Research Select Funds) may also invest in European Depositary Receipts
("EDRs") or other similar
B-34
instruments representing securities of foreign issuers (together, "Depositary
Receipts").
ADRs represent the right to receive securities of foreign issuers deposited
in a domestic bank or a correspondent bank. ADRs are traded on domestic
exchanges or in the U.S. over-the-counter market and, generally, are in
registered form. EDRs and GDRs are receipts evidencing an arrangement with a
non-U.S. bank similar to that for ADRs and are designed for use in the non-U.S.
securities markets. EDRs and GDRs are not necessarily quoted in the same
currency as the underlying security.
To the extent a Fund acquires Depositary Receipts through banks which do
not have a contractual relationship with the foreign issuer of the security
underlying the Depositary Receipts to issue and service such unsponsored
Depositary Receipts, there may be an increased possibility that the Fund would
not become aware of and be able to respond to corporate actions such as stock
splits or rights offerings involving the foreign issuer in a timely manner. In
addition, the lack of information may result in inefficiencies in the valuation
of such instruments. Investment in Depositary Receipts does not eliminate all
the risks inherent in investing in securities of non-U.S. issuers. The market
value of Depositary Receipts is dependent upon the market value of the
underlying securities and fluctuations in the relative value of the currencies
in which the Depositary Receipts and the underlying securities are quoted.
However, by investing in Depositary Receipts, such as ADRs, that are quoted in
U.S. dollars, a Fund may avoid currency risks during the settlement period for
purchases and sales.
As described more fully below, each Fund (except the CORE Large Cap Value,
CORE U.S. Equity, CORE Large Cap Growth, CORE Small Cap Equity, Large Cap Value
and Research Select Funds) may invest in countries with emerging economies or
securities markets. Political and economic structures in many of such countries
may be undergoing significant evolution and rapid development, and such
countries may lack the social, political and economic stability characteristic
of more developed countries. Certain of such countries have in the past failed
to recognize private property rights and have at times nationalized or
expropriated the assets of private companies. As a result, the risks described
above, including the risks of nationalization or expropriation of assets, may be
heightened. See "Investing in Emerging Markets, including Asia and Eastern
Europe," below.
Investing in Emerging Countries, including Asia and Eastern Europe. CORE
International Equity, International Equity, European Equity, Japanese Equity,
International Growth Opportunities, Asia Growth and Emerging Markets Equity
Funds are intended for long-term investors who can accept the risks associated
with investing primarily in equity and equity-related securities of foreign
issuers, including emerging country issuers, as well as the risks associated
with investments quoted or denominated in foreign currencies. The Balanced,
Growth and Income, Capital Growth, Strategic Growth, Growth Opportunities, Mid
Cap Value and Small Cap Value Funds may invest, to a lesser extent, in equity
and equity-related securities of foreign issuers, including emerging country
issuers.
B-35
The securities markets of emerging countries are less liquid and subject to
greater price volatility, and have a smaller market capitalization, than the
U.S. securities markets. Issuers and securities markets in such countries are
not subject to as extensive and frequent accounting, financial and other
reporting requirements or as comprehensive government regulations as are issuers
and securities markets in the U.S. In particular, the assets and profits
appearing on the financial statements of emerging country issuers may not
reflect their financial position or results of operations in the same manner as
financial statements for U.S. issuers. Substantially less information may be
publicly available about emerging country issuers than is available about
issuers in the United States.
Emerging country securities markets are typically marked by a high
concentration of market capitalization and trading volume in a small number of
issuers representing a limited number of industries, as well as a high
concentration of ownership of such securities by a limited number of investors.
The markets for securities in certain emerging countries are in the earliest
stages of their development. Even the markets for relatively widely traded
securities in emerging countries may not be able to absorb, without price
disruptions, a significant increase in trading volume or trades of a size
customarily undertaken by institutional investors in the securities markets of
developed countries. The limited size of many of these securities markets can
cause prices to be erratic for reasons apart from factors that affect the
soundness and competitiveness of the securities issuers. For example, prices may
be unduly influenced by traders who control large positions in these markets.
Additionally, market making and arbitrage activities are generally less
extensive in such markets, which may contribute to increased volatility and
reduced liquidity of such markets. The limited liquidity of emerging country
markets may also affect a Fund's ability to accurately value its portfolio
securities or to acquire or dispose of securities at the price and time it
wishes to do so or in order to meet redemption requests.
Transaction costs, including brokerage commissions or dealer mark-ups, in
emerging countries may be higher than in the United States and other developed
securities markets. In addition, existing laws and regulations are often
inconsistently applied. As legal systems in emerging countries develop, foreign
investors may be adversely affected by new or amended laws and regulations. In
circumstances where adequate laws exist, it may not be possible to obtain swift
and equitable enforcement of the law.
Foreign investment in the securities markets of certain emerging countries
is restricted or controlled to varying degrees. These restrictions may limit a
Fund's investment in certain emerging countries and may increase the expenses of
the Fund. Certain emerging countries require governmental approval prior to
investments by foreign persons or limit investment by foreign persons to only a
specified percentage of an issuer's outstanding securities or a specific class
of securities which may have less advantageous terms (including price) than
securities of the company available for purchase by nationals. In addition, the
repatriation of both investment income and capital from emerging countries may
be subject to restrictions which require governmental consents or prohibit
repatriation entirely for a period of time. Even where there is no outright
restriction on repatriation of capital, the mechanics of repatriation may
B-36
affect certain aspects of the operation of a Fund. A Fund may be required to
establish special custodial or other arrangements before investing in certain
emerging countries.
Emerging countries may be subject to a substantially greater degree of
economic, political and social instability and disruption than is the case in
the United States, Japan and most Western European countries. This instability
may result from, among other things, the following: (i) authoritarian
governments or military involvement in political and economic decision making,
including changes or attempted changes in governments through
extra-constitutional means; (ii) popular unrest associated with demands for
improved political, economic or social conditions; (iii) internal insurgencies;
(iv) hostile relations with neighboring countries; (v) ethnic, religious and
racial disaffection or conflict; and (vi) the absence of developed legal
structures governing foreign private investments and private property. Such
economic, political and social instability could disrupt the principal financial
markets in which the Funds may invest and adversely affect the value of the
Funds' assets. A Fund's investments can also be adversely affected by any
increase in taxes or by political, economic or diplomatic developments.
Certain Funds may seek investment opportunities within former "east bloc"
countries in Eastern Europe. Most Eastern European countries had a centrally
planned, socialist economy for a substantial period of time. The governments of
many Eastern European countries have more recently been implementing reforms
directed at political and economic liberalization, including efforts to
decentralize the economic decision-making process and move towards a market
economy. However, business entities in many Eastern European countries do not
have an extended history of operating in a market-oriented economy, and the
ultimate impact of Eastern European countries' attempts to move toward more
market-oriented economies is currently unclear. In addition, any change in the
leadership or policies of Eastern European countries may halt the expansion of
or reverse the liberalization of foreign investment policies now occurring and
adversely affect existing investment opportunities.
The economies of emerging countries may differ unfavorably from the U.S.
economy in such respects as growth of gross domestic product, rate of inflation,
capital reinvestment, resources, self-sufficiency and balance of payments. Many
emerging countries have experienced in the past, and continue to experience,
high rates of inflation. In certain countries inflation has at times accelerated
rapidly to hyperinflationary levels, creating a negative interest rate
environment and sharply eroding the value of outstanding financial assets in
those countries. Other emerging countries, on the other hand, have recently
experienced deflationary pressure and are in economic recessions. The economies
of many emerging countries are heavily dependent upon international trade and
are accordingly affected by protective trade barriers and the economic
conditions of their trading partners. In addition, the economies of some
emerging countries are vulnerable to weakness in world prices for their
commodity exports.
B-37
A Fund's income and, in some cases, capital gains from foreign stocks and
securities will be subject to applicable taxation in certain of the countries in
which it invests, and treaties between the U.S. and such countries may not be
available in some cases to reduce the otherwise applicable tax rates. See
"Taxation."
Foreign markets also have different clearance and settlement procedures,
and in certain markets there have been times when settlements have been unable
to keep pace with the volume of securities transactions, making it difficult to
conduct such transactions. Such delays in settlement could result in temporary
periods when a portion of the assets of a Fund remain uninvested and no return
is earned on such assets. The inability of a Fund to make intended security
purchases or sales due to settlement problems could result either in losses to
the Fund due to subsequent declines in value of the portfolio securities or, if
the Fund has entered into a contract to sell the securities, could result in
possible liability to the purchaser.
Investing in Japan. The Japanese Equity Fund invests in the equity
securities of Japanese companies. Japan's economy, the second largest in the
world, has grown substantially over the last three decades. The boom in Japan's
equity and property markets during the expansion of the late 1980's supported
high rates of investment and consumer spending on durable goods, but both of
these components of demand subsequently retreated sharply following a decline in
asset prices. Japan's economic growth in the 1990's has been substantially below
the levels of earlier decades. During this period, Japan's economy drifted
between modest growth and recession. Profits fell sharply, unemployment reached
a historical high and consumer confidence was low. The banking sector continues
to suffer from non-performing loans and the economy generally is subject to
deflationary pressures. Numerous discount-rate cuts since 1991, a succession of
fiscal stimulus packages, support plans for the debt-burdened financial system
and spending for reconstruction following the Kobe earthquake may help to
contain the recessionary forces, but substantial uncertainties remain. In
calendar year 1998, Japan's gross national product contracted by 2.8%, its worse
performance in the post-war period.
In addition to the cyclical downturn, Japan is suffering through structural
adjustments. Like many European countries, Japan has experienced a deterioration
of its competitiveness. Factors contributing to this include high wages, a
strong currency and structural rigidities. Japan is reforming its political
process and deregulating its economy to address this situation. Among other
things, the Japanese labor market is moving from a system of lifetime company
employment in response to the need for increased labor mobility, and corporate
governance systems are being introduced to new accounting rules, decision-making
mechanisms and managerial incentives. However, these changes have resulted in
some turmoil, uncertainty and a crisis of confidence.
While the Japanese governmental system itself seems stable, the dynamics of
the country's politics have been unpredictable in recent years. The economic
crisis of 1990-92 brought the downfall of the conservative Liberal Democratic
Party, which had ruled since 1955. Since then, the country has seen a series of
unstable multi-party coalitions, and
B-38
several prime ministers have left office because of personal scandals. Should
the political instability continue, efforts to establish effective economic and
fiscal policies may be hampered. Future political developments may lead to
changes in policy that might adversely affect a Fund's investments.
Japan's heavy dependence on international trade has been adversely affected
by trade tariffs and other protectionist measures as well as the economic
condition of its trading partners. While Japan subsidizes its agricultural
industry, only 19% of its land is suitable for cultivation and the country is
only 50% self-sufficient in food production. Accordingly, Japan is highly
dependent on large imports of wheat, sorghum and soybeans. In addition, its
export industry, its most important economic sector, depends on imported raw
materials and fuels, including iron ore, copper, oil and many forest products.
Japan's high volume of exports, such as automobiles, machine tools and
semiconductors, have caused trade tensions, particularly with the United States.
Some trade agreements, however, have been implemented to reduce these tensions.
The relaxing of official and de facto barriers to imports, or hardships created
by any pressures brought by trading partners, could adversely affect Japan's
economy. A substantial rise in world oil or commodity prices could also have a
negative effect. The Japanese yen has fluctuated widely during recent periods. A
strong yen could be an impediment to strong continued exports and economic
recovery, because it makes Japanese goods sold in other countries more expensive
and reduces the value of foreign earnings repatriated to Japan. Because the
Japanese economy is so dependent on exports, any fall-off in exports may be seen
as a sign of economic weakness, which may adversely affect the market.
Geologically, Japan is located in a volatile area of the world, and has
historically been vulnerable to earthquakes, volcanoes and other natural
disasters. As demonstrated by the Kobe earthquake in January of 1995, in which
5,000 people were killed and billions of dollars of damage was sustained, these
natural disasters can be significant enough to affect the country's economy.
Forward Foreign Currency Exchange Contracts. The Growth and Income, CORE
Large Cap Value, CORE U.S. Equity, CORE Large Cap Growth, CORE Small Cap Equity,
Capital Growth, Strategic Growth, Growth Opportunities, Mid Cap Value, Small Cap
Value and Large Cap Value Funds may enter into forward foreign currency exchange
contracts for hedging purposes and to seek to protect against anticipated
changes in future foreign currency exchange rates. The Balanced, CORE
International Equity, International Equity, European Equity, Japanese Equity,
International Growth Opportunities, Emerging Markets Equity and Asia Growth
Funds may enter into forward foreign currency exchange contracts for hedging
purposes, to seek to protect against anticipated changes in future foreign
currency exchange rates and to seek to increase total return. A forward foreign
currency exchange contract involves an obligation to purchase or sell a specific
currency at a future date, which may be any fixed
B-39
number of days from the date of the contract agreed upon by the parties, at a
price set at the time of the contract. These contracts are traded in the
interbank market between currency traders (usually large commercial banks) and
their customers. A forward contract generally has no deposit requirement, and no
commissions are generally charged at any stage for trades.
At the maturity of a forward contract a Fund may either accept or make
delivery of the currency specified in the contract or, at or prior to maturity,
enter into a closing transaction involving the purchase or sale of an offsetting
contract. Closing transactions with respect to forward contracts are often, but
not always, effected with the currency trader who is a party to the original
forward contract.
A Fund may enter into forward foreign currency exchange contracts in
several circumstances. First, when a Fund enters into a contract for the
purchase or sale of a security denominated or quoted in a foreign currency, or
when a Fund anticipates the receipt in a foreign currency of dividend or
interest payments on such a security which it holds, the Fund may desire to
"lock in" the U.S. dollar price of the security or the U.S. dollar equivalent of
such dividend or interest payment, as the case may be. By entering into a
forward contract for the purchase or sale, for a fixed amount of dollars, of the
amount of foreign currency involved in the underlying transactions, the Fund
will attempt to protect itself against an adverse change in the relationship
between the U.S. dollar and the subject foreign currency during the period
between the date on which the security is purchased or sold, or on which the
dividend or interest payment is declared, and the date on which such payments
are made or received.
Additionally, when the Investment Adviser believes that the currency of a
particular foreign country may suffer a substantial decline against the U.S.
dollar, it may enter into a forward contract to sell, for a fixed amount of U.S.
dollars, the amount of foreign currency approximating the value of some or all
of such Fund's portfolio securities quoted or denominated in such foreign
currency. The precise matching of the forward contract amounts and the value of
the securities involved will not generally be possible because the future value
of such securities in foreign currencies will change as a consequence of market
movements in the value of those securities between the date on which the
contract is entered into and the date it matures. Using forward contracts to
protect the value of a Fund's portfolio securities against a decline in the
value of a currency does not eliminate fluctuations in the underlying prices of
the securities. It simply establishes a rate of exchange, which a Fund can
achieve at some future point in time. The precise projection of short-term
currency market movements is not possible, and short-term hedging provides a
means of fixing the U.S. dollar value of only a portion of a Fund's foreign
assets.
The Balanced, CORE International Equity, International Equity, European
Equity, Japanese Equity, International Growth Opportunities, Emerging Markets
Equity and Asia Growth Funds may engage in cross-hedging by using forward
contracts in one currency to hedge against fluctuations in the value of
securities quoted or denominated in a different currency.
B-40
The Balanced, CORE International Equity, International Equity, European
Equity, Japanese Equity, International Growth Opportunities, Emerging Markets
Equity and Asia Growth Funds may also enter into forward contracts to seek to
increase total return. Unless otherwise covered in accordance with applicable
regulations, cash or liquid assets of a Fund will be segregated in an amount
equal to the value of the Fund's total assets committed to the consummation of
forward foreign currency exchange contracts. The segregated assets will be
marked-to-market on a daily basis. If the value of the segregated assets
declines, additional cash or liquid assets will be segregated on a daily basis
so that the value of the assets will equal the amount of a Fund's commitments
with respect to such contracts. Although the contracts are not presently
regulated by the CFTC, the CFTC may in the future assert authority to regulate
these contracts. If this happens, a Fund's ability to utilize forward foreign
currency exchange contracts may be restricted.
While a Fund may enter into forward contracts to reduce currency exchange
rate risks, transactions in such contracts involve certain other risks. Thus,
while the Fund may benefit from such transactions, unanticipated changes in
currency prices may result in a poorer overall performance for the Fund than if
it had not engaged in any such transactions. Moreover, there may be imperfect
correlation between a Fund's portfolio holdings of securities quoted or
denominated in a particular currency and forward contracts entered into by such
Fund. Such imperfect correlation may cause a Fund to sustain losses which will
prevent the Fund from achieving a complete hedge or expose the Fund to risk of
foreign exchange loss.
Markets for trading foreign forward currency contracts offer less
protection against defaults than is available when trading in currency
instruments on an exchange. Forward contracts are subject to the risk that the
counterparty to such contract will default on its obligations. Since a forward
foreign currency exchange contract is not guaranteed by an exchange or
clearinghouse, a default on the contract would deprive a Fund of unrealized
profits, transaction costs or the benefits of a currency hedge or force the Fund
to cover its purchase or sale commitments, if any, at the current market price.
A Fund will not enter into forward foreign currency exchange contracts, currency
swaps or other privately negotiated currency instruments unless the credit
quality of the unsecured senior debt or the claims-paying ability of the
counterparty is considered to be investment grade by the Investment Adviser. To
the extent that a substantial portion of a Fund's total assets, adjusted to
reflect the Fund's net position after giving effect to currency transactions, is
denominated or quoted in the currencies of foreign countries, the Fund will be
more susceptible to the risk of adverse economic and political developments
within those countries.
Writing and Purchasing Currency Call and Put Options. A Fund may, to the
extent that it invests in foreign securities, write and purchase put and call
options on foreign currencies for the purpose of protecting against declines in
the U.S. dollar value of foreign portfolio securities and against increases in
the U.S. dollar cost of foreign securities to be acquired. As with other kinds
of option transactions, however, the writing of an option on foreign currency
will constitute only a partial hedge, up to the amount of the premium received.
If and when a Fund seeks to close out an option, the Fund could be required to
purchase or sell foreign currencies at disadvantageous exchange rates, thereby
B-41
incurring losses. The purchase of an option on foreign currency may constitute
an effective hedge against exchange rate fluctuations; however, in the event of
exchange rate movements adverse to a Fund's position, the Fund may forfeit the
entire amount of the premium plus related transaction costs. Options on foreign
currencies to be written or purchased by a Fund will be traded on U.S. and
foreign exchanges or over-the-counter.
Options on currency may be used for either hedging or cross-hedging
purposes, which involves writing or purchasing options on one currency to hedge
against changes in exchange rates for a different currency with a pattern of
correlation, or to seek to increase total return when the Investment Adviser
anticipates that the currency will appreciate or depreciate in value, but the
securities quoted or denominated in that currency do not present attractive
investment opportunities and are not included in the Fund's portfolio.
A call option written by a Fund obligates a Fund to sell a specified
currency to the holder of the option at a specified price if the option is
exercised at any time before the expiration date. A put option written by a Fund
would obligate a Fund to purchase a specified currency from the option holder at
a specified price if the option is exercised at any time before the expiration
date. The writing of currency options involves a risk that a Fund will, upon
exercise of the option, be required to sell currency subject to a call at a
price that is less than the currency's market value or be required to purchase
currency subject to a put at a price that exceeds the currency's market value.
For a description of how to cover written put and call options, see "Writing
Covered Options" above.
A Fund may terminate its obligations under a call or put option by
purchasing an option identical to the one it has written. Such purchases are
referred to as "closing purchase transactions." A Fund may enter into closing
sale transactions in order to realize gains or minimize losses on options
purchased by the Fund.
A Fund would normally purchase call options on foreign currency in
anticipation of an increase in the U.S. dollar value of currency in which
securities to be acquired by a Fund are quoted or denominated. The purchase of a
call option would entitle the Fund, in return for the premium paid, to purchase
specified currency at a specified price during the option period. A Fund would
ordinarily realize a gain if, during the option period, the value of such
currency exceeded the sum of the exercise price, the premium paid and
transaction costs; otherwise the Fund would realize either no gain or a loss on
the purchase of the call option.
A Fund would normally purchase put options in anticipation of a decline in
the U.S. dollar value of currency in which securities in its portfolio are
quoted or denominated ("protective puts"). The purchase of a put option would
entitle a Fund, in exchange for the premium paid, to sell specified currency at
a specified price during the option period. The purchase of protective puts is
designed merely to offset or hedge against a decline in the dollar value of a
Fund's portfolio securities due to currency exchange rate fluctuations. A Fund
would ordinarily realize a gain if, during the option period, the value of the
underlying currency decreased below the exercise price sufficiently to more than
cover the premium and transaction costs; otherwise the Fund would
B-42
realize either no gain or a loss on the purchase of the put option. Gains and
losses on the purchase of protective put options would tend to be offset by
countervailing changes in the value of underlying currency or portfolio
securities.
In addition to using options for the hedging purposes described above, the
Funds may use options on currency to seek to increase total return. The Funds
may write (sell) covered put and call options on any currency in order to
realize greater income than would be realized on portfolio securities
transactions alone. However, in writing covered call options for additional
income, the Funds may forego the opportunity to profit from an increase in the
market value of the underlying currency. Also, when writing put options, the
Funds accept, in return for the option premium, the risk that they may be
required to purchase the underlying currency at a price in excess of the
currency's market value at the time of purchase.
Special Risks Associated with Options on Currency. An exchange-traded
options position may be closed out only on an options exchange, which provides a
secondary market for an option of the same series. Although a Fund will
generally purchase or write only those options for which there appears to be an
active secondary market, there is no assurance that a liquid secondary market on
an exchange will exist for any particular option, or at any particular time. For
some options no secondary market on an exchange may exist. In such event, it
might not be possible to effect closing transactions in particular options, with
the result that a Fund would have to exercise its options in order to realize
any profit and would incur transaction costs upon the sale of underlying
securities pursuant to the exercise of put options. If a Fund as a covered call
option writer is unable to effect a closing purchase transaction in a secondary
market, it will not be able to sell the underlying currency (or security quoted
or denominated in that currency) until the option expires or it delivers the
underlying currency upon exercise.
There is no assurance that higher than anticipated trading activity or
other unforeseen events might not, at times, render certain of the facilities of
the Options Clearing Corporation inadequate, and thereby result in the
institution by an exchange of special procedures which may interfere with the
timely execution of customers' orders.
A Fund may purchase and write over-the-counter options to the extent
consistent with its limitation on investments in illiquid securities. Trading in
over-the-counter options is subject to the risk that the other party will be
unable or unwilling to close out options purchased or written by a Fund.
The amount of the premiums, which a Fund may pay or receive, may be
adversely affected as new or existing institutions, including other investment
companies, engage in or increase their option purchasing and writing activities.
Currency Swaps, Mortgage Swaps, Credit Swaps, Index Swaps and Interest Rate
Swaps, Caps, Floors and Collars
The Balanced, CORE International Equity, International Equity, European
Equity, Japanese Equity, International Growth Opportunities, Emerging Markets
Equity and
B-43
Asia Growth Funds may enter into currency swaps for both hedging purposes and to
seek to increase total return. In addition, the Balanced Fund may enter into
mortgage, credit, index and interest rate swaps and other interest rate swap
arrangements such as rate caps, floors and collars, for hedging purposes or to
seek to increase total return. Currency swaps involve the exchange by a Fund
with another party of their respective rights to make or receive payments in
specified currencies. Interest rate swaps involve the exchange by a Fund with
another party of their respective commitments to pay or receive interest, such
as an exchange of fixed rate payments for floating rate payments. Mortgage swaps
are similar to interest rate swaps in that they represent commitments to pay and
receive interest. The notional principal amount, however, is tied to a reference
pool or pools of mortgages. Index swaps involve the exchange by a Fund with
another party of the respective amounts payable with respect to a notional
principal amount at interest rates equal to two specified indices. Credit swaps
involve the receipt of floating or fixed rate payments in exchange for assuming
potential credit losses of an underlying security. Credit swaps give one party
to a transaction the right to dispose of or acquire an asset (or group of
assets), or the right to receive or make a payment for the other party, upon the
occurrence of specified credit events. The purchase of an interest rate cap
entitles the purchaser, to the extent that a specified index exceeds a
predetermined interest rate, to receive payment of interest on a notional
principal amount from the party selling such interest rate cap. The purchase of
an interest rate floor entitles the purchaser, to the extent that a specified
index falls below a predetermined interest rate, to receive payments of interest
on a notional principal amount from the party selling the interest rate floor.
An interest rate collar is the combination of a cap and a floor that preserves a
certain return within a predetermined range of interest rates.
A Fund will enter into interest rate, mortgage and index swaps only on a
net basis, which means that the two payment streams are netted out, with the
Fund receiving or paying, as the case may be, only the net amount of the two
payments. Interest rate, index and mortgage swaps do not involve the delivery of
securities, other underlying assets or principal. Accordingly, the risk of loss
with respect to interest rate, index and mortgage swaps is limited to the net
amount of interest payments that the Fund is contractually obligated to make. If
the other party to an interest rate, index or mortgage swap defaults, the Fund's
risk of loss consists of the net amount of interest payments that the Fund is
contractually entitled to receive. In contrast, currency swaps usually involve
the delivery of a gross payment stream in one designated currency in exchange
for the gross payment stream in another designated currency. Therefore, the
entire payment stream under a currency swap is subject to the risk that the
other party to the swap will default on its contractual delivery obligations. To
the extent that the Fund's potential exposure in a transaction involving a swap
or an interest rate floor, cap or collar is covered by the segregation of cash
or liquid assets or otherwise, the Funds and the Investment Advisers believe
that swaps do not constitute senior securities under the Act and, accordingly,
will not treat them as being subject to a Fund's borrowing restrictions.
A Fund will not enter into transactions involving swaps, caps, floors or
collars unless the unsecured commercial paper, senior debt or claims paying
ability of the other party thereto is considered to be investment grade by the
Investment Adviser.
B-44
The use of interest rate, mortgage, index, credit and currency swaps, as
well as interest rate caps, floors and collars, is a highly specialized activity
which involves investment techniques and risks different from those associated
with ordinary portfolio securities transactions. If an Investment Adviser is
incorrect in its forecasts of market values, interest rates and currency
exchange rates, the investment performance of a Fund would be less favorable
than it would have been if this investment technique were not used. The
Investment Advisers, under the supervision of the Board of Trustees, are
responsible for determining and monitoring the liquidity of the Funds'
transactions in swaps, caps, floors and collars.
Convertible Securities
----------------------
Each Fund may invest in convertible securities. Convertible securities
include corporate notes or preferred stock but are ordinarily long-term debt
obligation of the issuer convertible at a stated exchange rate into common stock
of the issuer. As with all debt securities, the market value of convertible
securities tends to decline as interest rates increase and, conversely, to
increase as interest rates decline. Convertible securities generally offer lower
interest or dividend yields than non-convertible securities of similar quality.
However, when the market price of the common stock underlying a convertible
security exceeds the conversion price, the price of the convertible security
tends to reflect the value of the underlying common stock. As the market price
of the underlying common stock declines, the convertible security tends to trade
increasingly on a yield basis, and thus may not depreciate to the same extent as
the underlying common stock. Convertible securities rank senior to common stocks
in an issuer's capital structure and consequently entail less risk than the
issuer's common stock. In evaluating a convertible security, the Investment
Adviser will give primary emphasis to the attractiveness of the underlying
common stock. Convertible debt securities are equity investments for purposes of
each Fund's investment policies.
Preferred Securities
--------------------
Each Fund may invest in preferred securities. Unlike debt securities, the
obligations of an issuer of preferred stock, including dividend and other
payment obligations, may not typically be accelerated by the holders of
preferred stock on the occurrence of an event of default (such as a covenant
default or filing of a bankruptcy petition) or other non-compliance by the
issuer with the terms of the preferred stock. Often, however, on the occurrence
of any such event of default or non-compliance by the issuer, preferred
stockholders will be entitled to gain representation on the issuer's board of
directors or increase their existing board representation. In addition,
preferred stockholders may be granted voting rights with respect to certain
issues on the occurrence of any event of default.
Equity Swaps
------------
Each Fund may enter into equity swap contracts to invest in a market
without owning or taking physical custody of securities in circumstances in
which direct investment is restricted for legal reasons or is otherwise
impracticable. Equity swaps may also be used for hedging purposes or to seek to
increase total return. The counterparty to an equity swap contract will
typically be a
B-45
bank, investment banking firm or broker/dealer. Equity swap contracts may be
structured in different ways. For example, a counterparty may agree to pay the
Fund the amount, if any, by which the notional amount of the equity swap
contract would have increased in value had it been invested in the particular
stocks (or an index of stocks), plus the dividends that would have been received
on those stocks. In these cases, the Fund may agree to pay to the counterparty a
floating rate of interest on the notional amount of the equity swap contract
plus the amount, if any, by which that notional amount would have decreased in
value had it been invested in such stocks. Therefore, the return to the Fund on
the equity swap contract should be the gain or loss on the notional amount plus
dividends on the stocks less the interest paid by the Fund on the notional
amount. In other cases, the counterparty and the Fund may each agree to pay the
other the difference between the relative investment performances that would
have been achieved if the notional amount of the equity swap contract had been
invested in different stocks (or indices of stocks).
A Fund will enter into equity swaps only on a net basis, which means that
the two payment streams are netted out, with the Fund receiving or paying, as
the case may be, only the net amount of the two payments. Payments may be made
at the conclusion of an equity swap contract or periodically during its term.
Equity swaps do not involve the delivery of securities or other underlying
assets. Accordingly, the risk of loss with respect to equity swaps is limited to
the net amount of payments that a Fund is contractually obligated to make. If
the other party to an equity swap defaults, a Fund's risk of loss consists of
the net amount of payments that such Fund is contractually entitled to receive,
if any. Inasmuch as these transactions are entered into for hedging purposes or
are offset by segregated cash or liquid assets to cover the Funds' potential
exposure, the Funds and their Investment Advisers believe that transactions do
not constitute senior securities under the Act and, accordingly, will not treat
them as being subject to a Fund's borrowing restrictions.
A Fund will not enter into swap transactions unless the unsecured
commercial paper, senior debt or claims paying ability of the other party
thereto is considered to be investment grade by the Investment Adviser. A Fund's
ability to enter into certain swap transactions may be limited by tax
considerations.
Lending of Portfolio Securities
-------------------------------
Each Fund may lend portfolio securities. Under present regulatory policies,
such loans may be made to institutions, such as brokers or dealers and would be
required to be secured continuously by collateral in cash, cash equivalents,
letters of credit or U.S. Government securities maintained on a current basis at
an amount at least equal to the market value of the securities loaned. A Fund
would be required to have the right to call a loan and obtain the securities
loaned at any time on five days' notice. For the duration of a loan, a Fund
would continue to receive the equivalent of the interest or dividends paid by
the issuer on the securities loaned and would also receive compensation from
investment of the collateral. A Fund would not have the right to vote any
securities having voting rights during the existence of the loan, but a Fund
would call the loan in anticipation of an important vote to be taken among
holders of the securities or the giving or withholding of their consent on a
material matter affecting the investment. As with other extensions of credit
there are risks of delay in recovering, or even loss
B-46
of rights in, the collateral should the borrower of the securities fail
financially. However, the loans would be made only to firms deemed by the
Investment Adviser to be of good standing, and when, in the judgment of the
Investment Adviser, the consideration which can be earned currently from
securities loans of this type justifies the attendant risk. If the Investment
Adviser determines to make securities loans, it is intended that the value of
the securities loaned would not exceed one-third of the value of the total
assets of a Fund (including the loan collateral).
Cash received as collateral for securities lending transactions may be
invested in other investment eligible securities. Investing the collateral
subjects it to market depreciation or appreciation, and the Fund is responsible
for any loss that may result from its investment of the borrowed collateral.
When-Issued Securities and Forward Commitments
----------------------------------------------
Each Fund may purchase securities on a when-issued basis or purchase or
sell securities on a forward commitment basis. These transactions involve a
commitment by a Fund to purchase or sell securities at a future date. The price
of the underlying securities (usually expressed in terms of yield) and the date
when the securities will be delivered and paid for (the settlement date) are
fixed at the time the transaction is negotiated. When-issued purchases and
forward commitment transactions are negotiated directly with the other party,
and such commitments are not traded on exchanges. A Fund will generally purchase
securities on a when-issued basis or purchase or sell securities on a forward
commitment basis only with the intention of completing the transaction and
actually purchasing or selling the securities. If deemed advisable as a matter
of investment strategy, however, a Fund may dispose of or negotiate a commitment
after entering into it. A Fund may realize a capital gain or loss in connection
with these transactions. For purposes of determining a Fund's duration, the
maturity of when-issued or forward commitment securities will be calculated from
the commitment date. A Fund is generally required to segregate until three days
prior to the settlement date, cash and liquid assets in an amount sufficient to
meet the purchase price unless the Fund's obligations are otherwise covered.
Securities purchased or sold on a when-issued or forward commitment basis
involve a risk of loss if the value of the security to be purchased declines
prior to the settlement date or if the value of the security to be sold
increases prior to the settlement date.
Investment in Unseasoned Companies
----------------------------------
Each Fund may invest in companies (including predecessors) which have
operated less than three years. The securities of such companies may have
limited liquidity, which can result in their being priced higher or lower than
might otherwise be the case. In addition, investments in unseasoned companies
are more speculative and entail greater risk than do investments in companies
with an established operating record.
Other Investment Companies
--------------------------
A Fund reserves the right to invest up to 10% of its total assets in the
securities of all investment companies (including exchange-traded funds such as
SPDRs
B-47
and iSharessm, as defined below) but may not acquire more than 3% of the voting
securities of any other investment company. Pursuant to an exemptive order
obtained from the SEC, the Funds may invest in money market funds for which an
Investment Adviser or any of its affiliates serves as investment adviser. A Fund
will indirectly bear its proportionate share of any management fees and other
expenses paid by investment companies in which it invests in addition to the
advisory and administration fees (and other expenses) paid by the Fund. However,
to the extent that the Fund invests in a money market fund for which an
Investment Adviser or any of its affiliates acts as Investment Adviser, the
advisory and administration fees payable by the Fund to an Investment Adviser
will be reduced by an amount equal to the Fund's proportionate share of the
advisory and administration fees paid by such money market fund to its
Investment Adviser.
SPDRs are interests in a unit investment trust ("UIT") that may be obtained
from the UIT or purchased in the secondary market (SPDRs are listed on the
American Stock Exchange). The UIT was established to accumulate and hold a
portfolio of common stocks that is intended to track the price performance and
dividend yield of the S&P 500. The UIT is sponsored by a subsidiary of the AMEX.
SPDRs may be used for several reasons, including, but not limited to,
facilitating the handling of cash flows or trading or reducing transaction
costs. The price movement of SPDRs may not perfectly parallel the price activity
of the S&P 500. The UIT will issue SPDRs in aggregations known as "Creation
Units" in exchange for a "Portfolio Deposit" consisting of (a) a portfolio of
securities substantially similar to the component securities ("Index
Securities") of the Standard & Poor's 500 Composite Stock Price Index (the "S&P
Index"), (b) a cash payment equal to a pro rata portion of the dividends accrued
on the UIT's portfolio securities since the last dividend payment by the UIT,
net of expenses and liabilities, and (c) a cash payment or credit ("Balancing
Amount") designed to equalize the net asset value of the S&P Index and the net
asset value of a Portfolio Deposit.
SPDRs are not individually redeemable, except upon termination of the UIT.
To redeem, an investor must accumulate enough SPDRs to reconstitute a Creation
Unit. The liquidity of small holdings of SPDRs, therefore, will depend upon the
existence of a secondary market. Upon redemption of a Creation Unit, an investor
will receive Index Securities and cash identical to the Portfolio Deposit
required of an investor wishing to purchase a Creation Unit that day.
The price of SPDRs is derived from and based upon the securities held by
the UIT. Accordingly, the level of risk involved in the purchase or sale of a
SPDR is similar to the risk involved in the purchase or sale of traditional
common stock, with the exception that the pricing mechanism for SPDRs is based
on a basket of stocks. Disruptions in the markets for the securities underlying
SPDRs purchased or sold by the Funds could result in losses on SPDRs.
Each Fund (other than the CORE Large Cap Value, CORE U.S. Equity, CORE
Large Cap Growth, CORE Small Cap Equity and Research Select Funds) may also
purchase shares of investment companies investing primarily in foreign
securities, including "country
B-48
funds." Country funds have portfolios consisting primarily of securities of
issuers located in one foreign country or region. Each Fund may, subject to the
limitations stated above, invest in iSharessm (formerly called World Equity
Benchmark Shares or "WEBS") and similar securities that invest in securities
included in foreign securities indices. iSharessm are shares of an investment
company that invests substantially all of its assets in securities included in
the MSCI indices for specified countries. iSharessm are listed on the AMEX and
were initially offered to the public in 1996. The market prices of iSharessm are
expected to fluctuate in accordance with both changes in the NAVs of their
underlying indices and supply and demand of iSharessm on the AMEX. To date,
iSharessm have traded at relatively modest discounts and premiums to the NAVs.
However, iSharessm have a limited operating history and information is lacking
regarding the actual performance and trading liquidity of iSharessm for extended
periods or over complete market cycles. In addition, there is no assurance that
the requirements of the AMEX necessary to maintain the listing of iSharessm will
continue to be met or will remain unchanged. In the event substantial market or
other disruptions affecting iSharessm should occur in the future, the liquidity
and value of a Fund's shares could also be substantially and adversely affected.
If such disruptions were to occur, a Fund could be required to reconsider the
use of iSharessm as part of its investment strategy.
Repurchase Agreements
---------------------
Each Fund may enter into repurchase agreements with dealers in U.S.
Government securities and member banks of the Federal Reserve System which
furnish collateral at least equal in value or market price to the amount of
their repurchase obligation. CORE International Equity, International Equity,
Japanese Equity, European Equity, International Growth Opportunities, Emerging
Markets Equity, Asia Growth and Balanced Funds may also enter into repurchase
agreements involving certain foreign government securities. A repurchase
agreement is an arrangement under which a Fund purchases securities and the
seller agrees to repurchase the securities within a particular time and at a
specified price. Custody of the securities is maintained by a Fund's custodian
(or subcustodian). The repurchase price may be higher than the purchase price,
the difference being income to a Fund, or the purchase and repurchase prices may
be the same, with interest at a stated rate due to a Fund together with the
repurchase price on repurchase. In either case, the income to a Fund is
unrelated to the interest rate on the security subject to the repurchase
agreement.
For purposes of the Act and generally for tax purposes, a repurchase
agreement is deemed to be a loan from a Fund to the seller of the security. For
other purposes, it is not always clear whether a court would consider the
security purchased by a Fund subject to a repurchase agreement as being owned by
a Fund or as being collateral for a loan by a Fund to the seller. In the event
of commencement of bankruptcy or insolvency proceedings with respect to the
seller of the security before repurchase of the security under a repurchase
agreement, a Fund may encounter delay and incur costs before being able to sell
the security. Such a delay may involve loss of interest or a decline in price of
the security. If the court characterizes the transaction as a loan and a Fund
has not perfected a security interest in the security, a Fund may be required to
return the security to the seller's estate and be treated as an unsecured
creditor of the seller. As
B-49
an unsecured creditor, a Fund would be at risk of losing some or all of the
principal and interest involved in the transaction.
The Investment Adviser seeks to minimize the risk of loss from repurchase
agreements by analyzing the creditworthiness of the obligor, in this case the
seller of the security. Apart from the risk of bankruptcy or insolvency
proceedings, there is also the risk that the seller may fail to repurchase the
security. However, if the market value of the security subject to the repurchase
agreement becomes less than the repurchase price (including accrued interest), a
Fund will direct the seller of the security to deliver additional securities so
that the market value of all securities subject to the repurchase agreement
equals or exceeds the repurchase price. Certain repurchase agreements which
provide for settlement in more than seven days can be liquidated before the
nominal fixed term on seven days or less notice. Such repurchase agreements will
be regarded as liquid instruments.
In addition, a Fund, together with other registered investment companies
having advisory agreements with the Investment Advisers or their affiliates, may
transfer uninvested cash balances into a single joint account, the daily
aggregate balance of which will be invested in one or more repurchase
agreements.
Reverse Repurchase Agreements
-----------------------------
A Fund may borrow money by entering into transactions called reverse
repurchase agreements. Under these arrangements, the Fund will sell portfolio
securities to dealers in U.S. Government Securities or members of the Federal
Reserve System, with an agreement to repurchase the security on an agreed date,
price and interest payment. Reverse repurchase agreements involve the possible
risk that the value of portfolio securities the Fund relinquishes may decline
below the price the Fund must pay when the transaction closes. Borrowings may
magnify the potential for gain or loss on amounts invested resulting in an
increase in the speculative character of the Fund's outstanding shares.
When a Fund enters into a reverse repurchase agreement, it places in a
separate custodial account either liquid assets or other high-grade debt
securities that have a value equal to or greater than the repurchase price. The
account is then continuously monitored to make sure that an appropriate value is
maintained. Reverse repurchase agreements are considered to be borrowings under
the Act.
Short Sales
-----------
Short Sales "Against the Box." The Funds (other than the Core Equity Funds)
may engage in short sales against the box. In a short sale, the seller sells a
borrowed security and has a corresponding obligation to the lender to return the
identical security. The seller does not immediately deliver the securities sold
and is said to have a short position in those securities until delivery occurs.
While a short sale is made by selling a security the seller does not own, a
short sale is "against the box" to the extent that the seller contemporaneously
owns or has the right to obtain, at no added cost, securities identical to those
sold short. It may be entered into by a Fund, for example, to lock in a sales
price for a security the Fund does not wish to sell immediately. If a Fund sells
securities short against the box, it may protect itself from loss if the price
of the securities declines in the future, but will lose the opportunity to
profit on such securities if the price rises.
If a Fund effects a short sale of securities at a time when it has an
unrealized gain on the securities, it may be required to recognize that gain as
if it had actually sold the securities (as a "constructive sale") on the date it
effects the short sale. However, such constructive sale treatment may not apply
if the Fund closes out the short sale with securities other than the appreciated
securities held at the time of the short sale and if certain other conditions
are satisfied. Uncertainly regarding the tax consequences of effecting short
sales may limit the extent to which the Fund may effect short sales.
Mortgage Dollar Rolls
---------------------
When the Balanced Fund enters into a mortgage dollar roll, it will
segregate cash or liquid assets in an amount equal to the forward purchase price
until the settlement date.
B-50
Portfolio Turnover
------------------
Each Fund may engage in active short-term trading to benefit from yield
disparities among different issues of securities or among the markets for equity
securities, or for other reasons. It is anticipated that the portfolio turnover
rate of each Fund will vary from year to year.
INVESTMENT RESTRICTIONS
The following investment restrictions have been adopted by the Trust as
fundamental policies that cannot be changed without the affirmative vote of the
holders of a majority (as defined in the Act) of the outstanding voting
securities of the affected Fund. The investment objective of each Fund and all
other investment policies or practices of each Fund are considered by the Trust
not to be fundamental and accordingly may be changed without shareholder
approval. For purposes of the Act, "majority" means the lesser of (a) 67% or
more of the shares of the Trust or a Fund present at a meeting, if the holders
of more than 50% of the outstanding shares of the Trust or a Fund are present or
represented by proxy, or (b) more than 50% of the shares of the Trust or a Fund.
For purposes of the following limitations, any limitation which involves a
maximum percentage shall not be considered violated unless an excess over the
percentage occurs immediately after, and is caused by, an acquisition or
encumbrance of securities or assets of, or borrowings by, a Fund. With respect
to the Funds' fundamental investment restriction no. 3, asset coverage of at
least 300% (as defined in the Act), inclusive of any amounts borrowed, must be
maintained at all times.
A Fund may not:
(1) Make any investment inconsistent with the Fund's classification
as a diversified company under the Investment Company Act of
1940, as amended (the "Act"). This restriction does not, however,
apply to any Fund classified as a non-diversified company under
the Act.
(2) Invest 25% or more of its total assets in the securities of one
or more issuers conducting their principal business activities in
the same industry (excluding the U.S. Government or any of its
agencies or instrumentalities).
(3) Borrow money, except (a) the Fund may borrow from banks (as
defined in the Act) or through reverse repurchase agreements in
amounts up to 33-1/3% of its total assets (including the amount
borrowed), (b) the Fund may, to the extent permitted by
applicable law, borrow up to an additional 5% of its total assets
for temporary purposes, (c) the Fund may obtain such short-term
credits as may be necessary for the clearance of purchases and
sales of portfolio securities, (d) the Fund may purchase
securities on margin to the extent permitted by applicable law
and (e) the Fund may
B-51
engage in transactions in mortgage dollar rolls which are
accounted for as financings.
(4) Make loans, except through (a) the purchase of debt obligations
in accordance with the Fund's investment objective and policies,
(b) repurchase agreements with banks, brokers, dealers and other
financial institutions, and (c) loans of securities as permitted
by applicable law.
(5) Underwrite securities issued by others, except to the extent that
the sale of portfolio securities by the Fund may be deemed to be
an underwriting.
(6) Purchase, hold or deal in real estate, although a Fund may
purchase and sell securities that are secured by real estate or
interests therein, securities of real estate investment trusts
and mortgage-related securities and may hold and sell real estate
acquired by a Fund as a result of the ownership of securities.
(7) Invest in commodities or commodity contracts, except that the
Fund may invest in currency and financial instruments and
contracts that are commodities or commodity contracts.
(8) Issue senior securities to the extent such issuance would violate
applicable law.
Each Fund may, notwithstanding any other fundamental investment restriction
or policy, invest some or all of its assets in a single open-end investment
company or series thereof with substantially the same investment objective,
restrictions and policies as the Fund.
In addition to the fundamental policies mentioned above, the Trustees have
adopted the following non-fundamental policies which can be changed or amended
by action of the Trustees without approval of shareholders.
A Fund may not:
(a) Invest in companies for the purpose of exercising control or
management.
(b) Invest more than 15% of the Fund's net assets in illiquid investments
including repurchase agreements with a notice or demand period of more
than seven days, securities which are not readily marketable and
restricted securities not eligible for resale pursuant to Rule 144A
under the Securities Act of 1933 (the "1933 Act")
(c) Purchase additional securities if the Fund's borrowings (excluding
covered mortgage dollar rolls) exceed 5% of its net assets.
B-52
(d) Make short sales of securities, except short sales against the box.
B-53
MANAGEMENT
The Trustees are responsible for deciding matters of general policy and
reviewing the actions of the Investment Advisers, distributor and transfer
agent. The officers of the Trust conduct and supervise each Fund's daily
business operations.
Information pertaining to the Trustees and officers of the Trust is set
forth below. Trustees and officers deemed to be "interested persons" of the
Trust for purposes of the Act are indicated by an asterisk.
Name, Age Positions Principal Occupation(s)
and Address with Trust During Past 5 Years
----------- ---------- ---------------------
Ashok N. Bakhru, 58 Chairman Chairman of the Board and Trustee -
P.O. Box 143 & Trustee Goldman Sachs Variable Insurance
Lima, PA 19037 Trust (registered investment
company) (since October 1997);
President, ABN Associates (July
1994-March 1996 and November 1998 to
present); Executive Vice President -
Finance and Administration and Chief
Financial Officer, Coty Inc.
(manufacturer of fragrances and
cosmetics) (April 1996-November
1998); Senior Vice President of
Scott Paper Company (until June
1994); Director of Arkwright Mutual
Insurance Company (1984-1999);
Trustee of International House of
Philadelphia (1989-Present); Member
of Cornell University Council
(1992-Present); Trustee of the
Walnut Street Theater
(1992-Present); Director, Private
Equity Investors-III (since November
1998); and Trustee, Citizens
Scholarship Foundation of America
(since 1998).
B-54
Name, Age Positions Principal Occupation(s)
and Address with Trust During Past 5 Years
----------- ---------- ---------------------
*David B. Ford, 55 Trustee Trustee- Goldman Sachs Variable
32 Old Slip Insurance Trust (registered
New York, NY 10005 investment company) (since October
1997); Director, Commodities Corp.
LLC (futures and commodities
traders) (since April 1997);
Managing Director, J. Aron & Company
(commodity dealer and risk
management adviser) (since November
1996); Managing Director, Goldman
Sachs & Co. Investment Banking
Division (since November 1996);
Chief Executive Officer and
Director, CIN Management (investment
adviser) (since August 1996); Chief
Executive Officer & Managing
Director and Director, Goldman Sachs
Asset Management International
(since November 1995 and December
1994, respectively); Co-Head,
Goldman Sachs Asset Management
(since November 1995); Co-Head and
Director, Goldman Sachs Funds
Management, L.P. (since November
1995 and December 1994,
respectively); and Chairman and
Director, Goldman Sachs Asset
Management Japan Limited (since
November 1994).
*Douglas C. Grip, 38 Trustee Trustee and President - Goldman
32 Old Slip & President Sachs Variable Insurance Trust
New York, NY 10005 (registered investment company)
(since October 1997); Trustee, Trust
for Credit Unions (registered
investment company) (since March
1998); Managing Director, Goldman
Sachs (since November 1997);
President, Goldman Sachs Funds Group
(since April 1996); and President,
MFS Retirement Services Inc., of
Massachusetts Financial Services
(prior thereto).
B-55
Name, Age Positions Principal Occupation(s)
and Address with Trust During Past 5 Years
----------- ---------- ---------------------
Patrick T. Harker, 42 Trustee Trustee - Goldman Sachs Variable
Office of the Dean Insurance Trust (registered
The Wharton School investment company) (since August
University of Pennsylvania 2000); Dean and Reliance Professor
1000 SH-DH of Operations and Information
Philadelphia, PA 19104-6364 Management, The Wharton School,
University of Pennsylvania (since
February 2000); Interim and Deputy
Dean, The Wharton School, University
of Pennsylvania (since July 1999);
Professor and Chairman of Department
of Operations and Information
Management, The Wharton School,
University of Pennsylvania (July
1997-August 2000); UPS
Transportation Professor for the
Private Sector, Professor of Systems
Engineering and Chairman of Systems
Engineering, School of Engineering
and Applied Science, University of
Pennsylvania (prior thereto).
B-56
Name, Age Positions Principal Occupation(s)
and Address with Trust During Past 5 Years
----------- ---------- ---------------------
*John P. McNulty, 48 Trustee Trustee - Goldman Sachs Variable
32 Old Slip Insurance Trust (registered
New York, NY 10005 investment company) (since October
1997); Managing Director, Goldman
Sachs (since November 1996) and Head
of Investment Management Division
(since September 1999); General
Partner, J. Aron & Company
(commodity dealer and risk
management adviser) (since November
1995); Director and Co-Head, Goldman
Sachs Funds Management, L.P. (since
November 1995); Director, Goldman
Sachs Asset Management International
(since January 1996); Co-Head, GSAM
(November 1995 - September 1999);
Director, Global Capital Reinsurance
(insurance) (since 1989); Director,
Commodities Corp. LLC (since April
1997); and Limited Partner of
Goldman Sachs (1994 - November
1995).
B-57
Name, Age Positions Principal Occupation(s)
and Address with Trust During Past 5 Years
----------- ---------- ---------------------
Mary P. McPherson, 65 Trustee Trustee - Goldman Sachs Variable
The Andrew W. Mellon Insurance Trust (registered
Foundation investment company) (since October
140 East 62nd Street 1997); Vice President, The Andrew W.
New York, NY 10021 Mellon Foundation (provider of
grants for conservation,
environmental and educational
purposes) (since October 1997);
President of Bryn Mawr College
(1978-1997); Director, Smith College
(since 1998); Director, Josiah Macy,
Jr. Foundation (health educational
programs) (since 1977); Director,
Philadelphia Contributionship
(insurance) (since 1985); Director
Emeritus, Amherst College
(1986-1998); Director, Dayton Hudson
Corporation (general retailing
merchandising) (1988-1997);
Director, The Spencer Foundation
(educational research) (since 1993);
member of PNC Advisory Board
(banking) (since 1993); and
Director, American School of
Classical Studies in Athens (since
1997).
B-58
Name, Age Positions Principal Occupation(s)
and Address with Trust During Past 5 Years
----------- ---------- ---------------------
*Alan A. Shuch, 51 Trustee Trustee - Goldman Sachs Variable
32 Old Slip Insurance Trust (registered
New York, NY 10005 investment company) (since October
1997); Advisory Director - GSAM
(since May 1999); Limited Partner,
Goldman Sachs (prior to May 1994);
Consultant to GSAM (since December
1994).
B-59
Name, Age Positions Principal Occupation(s)
and Address with Trust During Past 5 Years
----------- ---------- ---------------------
William H. Springer, 71 Trustee Trustee - Goldman Sachs Variable
701 Morningside Drive Insurance Trust (registered
Lake Forest, IL 60045 investment company) (since October
1997); Director, The Walgreen Co. (a
retail drug store business) (April
1988 - January 2000); Director of
Baker, Fentress & Co. (a closed-end,
non-diversified management
investment company) (April 1992 -
present); and Chairman and Trustee,
Northern Institutional Funds and
Northern Funds (since April 1984 and
March 2000, respectively).
B-60
Name, Age Positions Principal Occupation(s)
and Address with Trust During Past 5 Years
----------- ---------- ---------------------
Richard P. Strubel, 61 Trustee Trustee - Goldman Sachs Variable
500 Lake Cook Road Insurance Trust (registered
Suite 150 investment company) (since October
Deerfield, IL 60015 1997); President and COO, Unext.com
(provider of educational services
via the internet) (since 1999);
Director, Gildan Activewear Inc.
(since February 1999); Director of
Kaynar Technologies Inc. (since
March 1997); Managing Director,
Tandem Partners, Inc. (1990-1999);
President and Chief Executive
Officer, Microdot, Inc. (a
diversified manufacturer of
fastening systems and connectors)
(January 1984 - October 1994);
Trustee, Northern Institutional
Funds and Northern Funds (since
December 1982 and March 2000,
respectively); and Director,
Cantilever Technologies, Inc. (since
1999).
*John M. Perlowski, 36 Treasurer Treasurer - Goldman Sachs Variable
32 Old Slip Insurance Trust (registered
New York, NY 10005 investment company) (since 1997);
Vice President, Goldman Sachs (since
July 1995); and Director/Fund
Accounting and Custody, Investors
Bank & Trust Company (November 1993
to July 1995).
B-61
Name, Age Positions Principal Occupation(s)
and Address with Trust During Past 5 Years
----------- ---------- ---------------------
*James A. Fitzpatrick, 40 Vice President Vice President - Goldman Sachs
4900 Sears Tower Variable Insurance Trust (registered
Chicago, IL 60606 investment company) (since October
1997); Managing Director, Goldman
Sachs (since October 1999); Vice
President, Goldman Sachs (April
1997-December 1999); and Vice
President and General Manager, First
Data Corporation - Investor Services
Group (1994 to 1997).
*Jesse Cole, 37 Vice President Vice President - Goldman Sachs
4900 Sears Tower Variable Insurance Trust (registered
Chicago, IL 60606 investment company) (since 1998);
Vice President, Goldman Sachs (since
June 1998); Vice President, AIM
Management Group, Inc. (investment
adviser) (April 1996-June 1998); and
Assistant Vice President, The
Northern Trust Company (June
1987-April 1996).
*Kerry K. Daniels, 37 Vice President Vice President--Goldman Sachs
4900 Sears Tower Variable Insurance Trust (registered
Chicago, IL 60606 investment company) (since April
2000); and Manager, Institutional
Account Administration - Shareholder
Services, Goldman Sachs (since
1986).
*Mary F. Hoppa, 36 Vice President Vice President--Goldman Sachs
4900 Sears Tower Variable Insurance Trust (registered
Chicago, IL 60606 investment company) (since April
2000); Vice President, Goldman Sachs
(since October 1999); and Senior
Vice President and Director of
Mutual Fund Operations, Strong
Capital Management (January
1987-September 1999).
B-62
Name, Age Positions Principal Occupation(s)
and Address with Trust During Past 5 Years
----------- ---------- ---------------------
*Christopher Keller, 35 Vice President Vice President, Goldman Sachs
4900 Sears Tower Variable Insurance Trust (registered
Chicago, IL 60606 investment company) (October 2000 -
present); Vice President, Goldman
Sachs (April 1997-present); and
Manager, Andersen Consulting
(August 1989 - April 1997).
*Philip V. Giuca, Jr., 38 Assistant Assistant Treasurer - Goldman Sachs
32 Old Slip Treasurer Variable Insurance Trust (registered
New York, NY 10005 investment company) (since 1997);
and Vice President, Goldman Sachs
(May 1992-Present).
*Peter Fortner, 42 Assistant Assistant Treasurer - Goldman Sachs
32 Old Slip Treasurer Variable Insurance Trust (registered
New York, NY 10005 investment company) (since August
2000); Vice President, Goldman Sachs
(July 2000 - present); and
Associate, Prudential Insurance
Company of America (November 1985 -
June 2000); Assistant Treasurer,
certain closed-end Funds
administered by Prudential (1999
and 2000).
*Michael J. Richman, 40 Secretary Secretary - Goldman Sachs Variable
1 Liberty Plaza Insurance Trust (registered
New York, NY 10004 investment company) (since 1997);
Managing Director, Goldman Sachs
(since 2000); General Counsel of
the Funds Group of GSAM (since
December 1997); Associate General
Counsel of GSAM (February 1994 -
December 1997); Counsel to the Funds
Group, GSAM (June 1992 to December
1997); Associate General Counsel,
Goldman Sachs (since December 1998);
Vice President of Goldman Sachs
(since June 1992); and Assistant
General Counsel of Goldman Sachs
(June 1992 to December 1998).
B-63
Name, Age Positions Principal Occupation(s)
and Address with Trust During Past 5 Years
----------- ---------- ---------------------
*Howard B. Surloff, 35 Assistant Assistant Secretary - Goldman Sachs
32 Old Slip Secretary Variable Insurance Trust (registered
New York, NY 10005 investment company) (since 1997);
Assistant General Counsel, GSAM and
General Counsel to the U.S. Funds
Group (since December 1997);
Assistant General Counsel and Vice
President, Goldman Sachs (since
November 1993 and May 1994,
respectively); and Counsel to the
Funds Group, GSAM (November 1993 -
December 1997).
*Valerie A. Zondorak, 35 Assistant Assistant Secretary - Goldman Sachs
32 Old Slip Secretary Variable Insurance Trust (registered
New York, NY 10005 investment company) (since 1997);
Assistant General Counsel, GSAM and
Assistant General Counsel to the
Funds Group (since December 1997);
Vice President and Assistant General
Counsel, Goldman Sachs (since March
1997); Counsel to the Funds Group,
GSAM (March 1997 - December 1997);
and Associate of Shereff, Friedman,
Hoffman & Goodman (September 1990 to
February 1997).
*Deborah A. Farrell, 29 Assistant Assistant Secretary - Goldman Sachs
32 Old Slip Secretary Variable Insurance Trust (registered
New York, NY 10005 investment company) (since 1997);
Legal Products Analyst, Goldman
Sachs (since December 1998); Legal
Assistant, Goldman Sachs (January
1996-December 1998); Assistant
Secretary to the Funds Group (1996
to present); and Executive
Secretary, Goldman Sachs (January
1994 - January 1996).
B-64
Name, Age Positions Principal Occupation(s)
and Address with Trust During Past 5 Years
----------- ---------- ---------------------
*Kaysie P. Uniacke, 39 Assistant Assistant Secretary - Goldman Sachs
32 Old Slip Secretary Variable Insurance Trust (registered
New York, NY 10005 investment company) (since 1997);
Managing Director, Goldman Sachs
(since 1997); and Vice President and
Senior Fund Manager, GSAM (1988 to
1997).
*Elizabeth D. Anderson, 31 Assistant Assistant Secretary - Goldman Sachs
32 Old Slip Secretary Variable Insurance Trust (registered
New York, NY 10005 investment company) (since 1997);
Vice President, Goldman Sachs (since
May 1997); Fund Manager, GSAM
(since April 1996); Junior Fund
Manager, GSAM (1995 - April 1996);
and Funds Trading Assistant, GSAM
(1993 - 1995).
*Amy E. Belanger, 31 Assistant Assistant Secretary - Goldman Sachs
32 Old Slip Secretary Variable Insurance Trust (registered
New York, NY 10005 investment company) (since 1999);
Vice President, Goldman Sachs (since
June 1999); Counsel, Goldman Sachs
(since 1998); and Associate, Dechert
Price & Rhoads (September
1996-1998).
Each interested Trustee and officer holds comparable positions with certain
other companies of which Goldman Sachs, GSAM or an affiliate thereof is the
investment adviser, administrator and/or distributor. As of November 30, 2000,
the Trustees and Officers of the Trust as a group owned less than 1% of the
outstanding shares of beneficial interest of each Fund.
The Trust pays each Trustee, other than those who are "interested persons"
of Goldman Sachs, a fee for each Trustee meeting attended and an annual fee.
Such Trustees are also reimbursed for travel expenses incurred in connection
with attending such meetings.
B-65
**1 The following table sets forth certain information with respect to the
compensation of each Trustee of the Trust for the fiscal year ended August 31,
2000:
Aggregate Total Compensation from Goldman Sachs
Compensation Pension or Retirement Benefits Trust and the Goldman Sachs Fund complex
Name of Trustee from the Funds/2/ Accrued as Part of Funds' Expenses (including the Funds)/3/
--------------- --------------- ----------------------------------
Ashok N. Bakhru/1/ $31,780 $ - $105,750
David B. Ford 0 - 0
Douglas C. Grip 0 - 0
Patrick T. Harker/4/ 0 - 0
John P. McNulty 0 - 0
Mary P. McPherson 23,842 - 79,500
Alan A. Shuch 0 - 0
Jackson W. Smart/5/ 15,487 - 53,500
William H. Springer 23,207 - 77,500
Richard P. Strubel 23,842 - 79,500
/1/ Includes compensation as Chairman of the Board of Trustees.
B-66
=============
/2/ Reflects amount paid by the Funds during the fiscal year ended August 31,
2000.
/3/ The Goldman Sachs Fund complex consists of the Goldman Sachs Trust and
Goldman Sachs Variable Insurance Trust. Goldman Sachs Trust consisted of 54
mutual funds, including 23 equity funds, as of August 31, 2000. Goldman
Sachs Variable Insurance Trust consisted of 10 mutual funds as of August 31,
2000.
/4/ Mr. Harker was elected to the Board of Trustees on August 29, 2000.
/5/ No longer a trustee of the Trust.
B-67
Class A Shares of the Funds may be sold at net asset value without payment
of any sales charge to Goldman Sachs, its affiliates or their respective
officers, partners, directors or employees (including rehired employees and
former partners), any partnership of which Goldman Sachs is a general partner,
any trustee or officer of the Trust and designated family members of any of the
above individuals. These and the Funds' other sales load waivers are due to the
nature of the investors and/or the reduced sales effort and expense that are
needed to obtain such investments.
The Trust, its Investment Advisers and principal underwriter have adopted
codes of ethics under Rule 17j-1 of the 1940 Act that permit personnel subject
to their particular codes of ethics to invest in securities, including
securities that may be purchased or held by the Funds.
Management Services
-------------------
As stated in the Funds' Prospectus, GSFM, 32 Old Slip, New York, New York,
a Delaware limited partnership and an affiliate of Goldman Sachs, 85 Broad
Street, New York, New York, serves as Investment Adviser to the CORE U.S. Equity
and Capital Growth Funds. GSAM, 32 Old Slip, New York, New York, a unit of the
Investment Management Division of Goldman Sachs, serves as Investment Adviser to
the Balanced, Growth and Income, CORE Large Cap Value, CORE Large Cap Growth,
CORE Small Cap Equity, Strategic Growth, Growth Opportunities, CORE
International Equity, Mid Cap Value, Small Cap Value, Large Cap Value and
Research Select Funds. GSAMI, Procession House, 55 Ludgate Hill, London, England
EC4M 7JW, a unit of the Investment Management Division of Goldman Sachs, serves
as Investment Adviser to the International Equity, European Equity, Japanese
Equity, International Growth Opportunities, Emerging Markets Equity and Asia
Growth Funds. GSAMI is also an affiliate of Goldman Sachs. See "Service
Providers" in the Funds' Prospectus for a description of the applicable
Investment Adviser's duties to the Funds.
The Goldman Sachs Group, L.P. which controlled the Funds' Investment
Advisers, merged into The Goldman Sachs Group, Inc. as a result of an initial
public offering in 1999.
Founded in 1869, Goldman Sachs is among the oldest and largest investment
banking firms in the United States. Goldman Sachs is a leader in developing
portfolio strategies and in many fields of investing and financing,
participating in financial markets worldwide and serving individuals,
institutions, corporations and governments. Goldman Sachs is also among the
principal market sources for current and thorough information on companies,
industrial sectors, markets, economies and currencies, and trades and makes
markets in a wide range of equity and debt securities 24-hours a day. The firm
is headquartered in New York and has offices throughout the United States and in
Beijing, Frankfurt, George Town, Hong Kong, London, Madrid, Mexico City, Milan,
Montreal, Paris, Sao Paulo, Seoul, Shanghai, Singapore, Sydney, Taipei, Tokyo,
Toronto, Vancouver and Zurich. It has trading professionals throughout the
United States, as well as in London, Tokyo, Hong Kong and Singapore. The active
B-68
participation of Goldman Sachs in the world's financial markets enhances its
ability to identify attractive investments. Goldman Sachs has agreed to permit
the Funds to use the name "Goldman Sachs" or a derivative thereof as part of
each Fund's name for as long as a Fund's Management Agreement is in effect.
The Investment Advisers are able to draw on the substantial research and
market expertise of Goldman Sachs, whose investment research effort is one of
the largest in the industry. The Goldman Sachs Global Investment Research
Department covers approximately 2,200 companies, including approximately 1,000
U.S. corporations in 60 industries. The in-depth information and analyses
generated by Goldman Sachs' research analysts are available to the Investment
Advisers.
For more than a decade, Goldman Sachs has been among the top-ranked firms
in Institutional Investor's annual "All-America Research Team" survey. In
addition, many of Goldman Sachs' economists, securities analysts, portfolio
strategists and credit analysts have consistently been highly ranked in
respected industry surveys conducted in the United States and abroad. Goldman
Sachs is also among the leading investment firms using quantitative analytics
(now used by a growing number of investors) to structure and evaluate
portfolios.
In managing the Funds, the Investment Advisers have access to Goldman
Sachs' economics research. The Economics Research Department based in London,
conducts economic, financial and currency markets research which analyzes
economic trends and interest and exchange rate movements worldwide. The
Economics Research Department tracks factors such as inflation and money supply
figures, balance of trade figures, economic growth, commodity prices, monetary
and fiscal policies, and political events that can influence interest rates and
currency trends. The success of Goldman Sachs' international research team has
brought wide recognition to its members. The team has earned top rankings in
various external surveys such as Extel, Institutional Investor and Reuters.
These rankings acknowledge the achievements of the firm's economists,
strategists and equity analysts.
In allocating assets among foreign countries and currencies for the Funds
which can invest in foreign securities (in particular, the CORE International
Equity, International Equity, International Growth Opportunities, Emerging
Markets Equity and Asia Growth Funds), the Investment Advisers will have access
to the Global Asset Allocation Model. The model is based on the observation that
the prices of all financial assets, including foreign currencies, will adjust
until investors globally are comfortable holding the pool of outstanding assets.
Using the model, the Investment Advisers will estimate the total returns from
each currency sector which are consistent with the average investor holding a
portfolio equal to the market capitalization of the financial assets among those
currency sectors. These estimated equilibrium returns are then combined with the
expectations of Goldman Sachs' research professionals to produce an optimal
currency and asset allocation for the level of risk suitable for a Fund given
its investment objectives and criteria.
B-69
The Management Agreements provide that GSAM, GSFM and GSAMI, in their
capacity as Investment Advisers, may render similar services to others as long
as the services under the Management Agreements are not impaired thereby. The
Research Select, Large Cap Value, Strategic Growth, Growth Opportunities, CORE
Large Cap Value, European Equity, Japanese Equity and International Growth
Opportunities Funds' Management Agreements were initially approved by the
Trustees, including a majority of the non-interested Trustees (as defined below)
who are not parties to the Management Agreement on April 26, 2000, October 26,
1999, April 28, 1999, April 28, 1999, November 3, 1998, July 22, 1998, April 23,
1998 and April 23, 1998, respectively. The CORE Small Cap Equity and CORE
International Equity Funds' Management Agreements were initially approved by the
Trustees, including a majority of the non-interested Trustees (as defined below)
who are not parties to the Management Agreements, on July 22, 1997. The CORE
Large Cap Growth and Emerging Markets Equity Funds' Management Agreements were
initially approved by the Trustees, including a majority of the non-interested
Trustees (as defined below) who are not parties to the Management Agreements, on
April 23, 1997 and January 28, 1997, respectively. The Funds' Management
Agreements (except with respect to the Research Select Fund) were most recently
approved by the Trustees, including a majority of the Trustees who are not
parties to the Management Agreements or "interested persons" (as such term is
defined in the Act) of any party thereto (the "non-interested Trustees"), on
April 25, 2000. These arrangements were most recently approved by the
shareholders of each Fund (other than Research Select, Large Cap Value,
Strategic Growth, Growth Opportunities, CORE Large Cap Value, CORE Large Cap
Growth, CORE Small Cap Equity, CORE International Equity, Emerging Markets
Equity, Japanese Equity, International Growth Opportunities and European Equity
Funds) on April 21, 1997. The sole shareholder of the Research Select, Large Cap
Value, Strategic Growth, Growth Opportunities, CORE Large Cap Value, CORE Large
Cap Growth, CORE Small Cap Equity, CORE International Equity, Emerging Markets
Equity, Japanese Equity, International Growth Opportunities and European Equity
Funds approved these arrangements on June 14, 2000, October 26, 1999, April 28,
1999, April 28, 1999, November 3, 1998, April 30, 1997, July 21, 1997, July 21,
1997, January 28, 1997, April 23, 1998, April 23, 1998 and July 22, 1998,
respectively. Each Management Agreement will remain in effect until June 30,
2001 and will continue in effect with respect to the applicable Fund from year
to year thereafter provided such continuance is specifically approved at least
annually by (a) the vote of a majority of such Fund's outstanding voting
securities or a majority of the Trustees of the Trust, and (b) the vote of a
majority of the non-interested Trustees of the Trust, cast in person at a
meeting called for the purpose of voting on such approval.
Each Management Agreement will terminate automatically if assigned (as
defined in the Act). Each Management Agreement is also terminable at any time
without penalty by the Trustees of the Trust or by vote of a majority of the
outstanding voting securities of the applicable Fund on 60 days' written notice
to the applicable Investment Adviser and by the Investment Adviser on 60 days'
written notice to the Trust.
B-70
Pursuant to the Management Agreements the Investment Advisers are entitled
to receive the fees set forth below, payable monthly based on such Fund's
average daily net assets. In addition, as of the date of this Additional
Statement the Investment Advisers were voluntarily limiting their management
fees for certain funds to the annual rates also listed below:
Management Fee Management Fee
With Without
Fund Limitations Limitations
---- ----------- -----------
GSAM
Balanced Fund 0.65% 0.65%
Growth and Income Fund 0.70% 0.70%
CORE Large Cap Value Fund 0.60% 0.60%
CORE Large Cap Growth Fund 0.70% 0.75%
CORE Small Cap Equity Fund 0.85% 0.85%
Strategic Growth Fund 1.00% 1.00%
Growth Opportunities Fund 1.00% 1.00%
CORE International Equity Fund 0.85% 0.85%
Mid Cap Value Fund 0.75% 0.75%
Small Cap Value Fund 1.00% 1.00%
Large Cap Value Fund 0.75% 0.75%
Research Select Fund 1.00% 1.00%
GSFM
CORE U.S. Equity Fund 0.70% 0.75%
Capital Growth Fund 1.00% 1.00%
GSAMI
International Equity Fund 1.00% 1.00%
European Equity 1.00% 1.00%
Japanese Equity Fund 1.00% 1.00%
International Growth Opportunities Fund 1.20% 1.20%
Emerging Markets Equity Fund 1.20% 1.20%
Asia Growth Fund 1.00% 1.00%
B-71
GSAM, GSFM and GSAMI may discontinue or modify the above limitations in the
future at their discretion.
Prior to May 1, 1997, the Funds then in operation had separate investment
advisory (and subadvisory, in the case of the International Equity Fund) and
administration agreements. Effective May 1, 1997, the services under such
agreements were combined in the Management Agreements. The services required to
be performed for the Funds and the combined advisory (and subadvisory, in the
case of the International Equity Fund) and administration fees payable by the
Funds under the former advisory (and subadvisory, in the case of the
International Equity Fund) and administration agreements are identical to the
services and fees under the Management Agreements.
B-72
For the fiscal year ended August 31, 2000, the fiscal period ended August
31, 1999 and the fiscal years ended January 31, 1999 and January 31, 1998 the
amounts of the combined investment advisory (and subadvisory, in the case of the
International Equity Fund) and administration fees incurred by each Fund then in
existence were as follows (with and without the fee limitations that were then
in effect):
Fiscal year ended Fiscal period ended Fiscal year ended
August 31, August 31, January 31,
2000 1999 1999
============================ ============================ ============================
With Fee Without Fee With Fee Without Fee With Fee Without Fee
Limitations Limitations Limitations Limitations Limitations Limitations
=========== =========== =========== =========== =========== ===========
Balanced Fund $ 1,303,563 $ 1,303,563 $ 928,470 $ 928,470 $ 1,609,311 $ 1,609,311
Growth and Income Fund 6,580,727 6,580,727 5,645,766 5,645,766 13,527,887 13,527,887
CORE Large Cap Value Fund\1\ 1,743,960 1,743,960 869,263 869,263 12,245 12,245
CORE U.S. Equity Fund 9,260,137 9,921,575 4,865,259 5,212,778 5,691,415 6,647,941
CORE Large Cap Growth Fund\1\ 7,277,385 8,564,308 2,640,795 3,300,994 1,658,095 2,072,619
CORE Small Cap Equity Fund\1\ 1,322,879 1,322,879 689,175 689,175 730,302 769,013
CORE International Equity Fund\1\ 3,942,495 3,942,495 1,938,801 1,938,801 1,810,772 1,890,475
Capital Growth Fund 32,406,631 32,406,631 15,000,472 15,000,472 17,460,353 17,460,353
Strategic Growth Fund\1\, \2\ 774,259 774,259 29,606 29,606 N/A N/A
Growth Opportunities Fund\1\, \2\ 1,102,761 1,102,761 23,911 23,911 N/A N/A
Mid Cap Value Fund 1,673,380 1,673,380 1,332,432 1,332,432 2,953,154 2,953,154
Small Cap Value Fund 2,219,510 2,219,510 1,733,424 1,733,424 4,417,249 4,417,249
Large Cap Value\1\, \3\ 87,323 87,323 N/A N/A N/A N/A
International Equity Fund 15,633,003 15,633,003 6,475,659 6,475,659 9,243,090 9,814,989
European Equity Fund\1\ 1,253,575 1,253,575 451,498 451,498 171,505 171,505
Japanese Equity Fund\1\ 979,938 979,938 226,009 226,009 118,094 122,901
International Growth
Opportunities Fund\1\ 3,541,196 3,541,196 598,694 598,694 280,977 287,765
Fiscal year ended
January 31,
1998
============================
With Fee Without Fee
Limitations Limitations
=========== ===========
Balanced Fund $ 870,444 $ 870,844
Growth and Income Fund 7,740,380 7,740,380
CORE Large Cap Value Fund\1\ N/A N/A
CORE U.S. Equity Fund 3,087,383 3,924,639
CORE Large Cap Growth Fund\1\ 182,628 228,283
CORE Small Cap Equity Fund\1\ 65,418 74,140
CORE International Equity Fund\1\ 51,031 57,835
Capital Growth Fund 10,913,224 10,913,224
Strategic Growth Fund\1\, \2\ N/A N/A
Growth Opportunities Fund\1\, \2\ N/A N/A
Mid Cap Value Fund 1,653,946 1,653,946
Small Cap Value Fund 3,206,411 3,206,411
Large Cap Value\1\, \3\ N/A N/A
International Equity Fund 6,772,826 7,525,362
European Equity Fund\1\ N/A N/A
Japanese Equity Fund\1\ N/A N/A
International Growth
Opportunities Fund\1\ N/A N/A
B-73
Fiscal year ended Fiscal period ended Fiscal year ended
August 31, August 31, January 31,
2000 1999 1999
============================ ============================ ============================
With Fee Without Fee With Fee Without Fee With Fee Without Fee
Limitations Limitations Limitations Limitations Limitations Limitations
=========== =========== =========== =========== =========== ===========
Emerging Markets Equity Fund\1\ 2,576,018 2,576,018 1,148,664 1,148,664 1,454,673 1,519,721
Asia Growth Fund 1,168,382 1,168,382 501,770 501,770 736,821 808,815
Research Select Fund\4\ 623,564 623,564 N/A N/A N/A N/A
Fiscal year ended
January 31,
1998
============================
With Fee Without Fee
Limitations Limitations
=========== ===========
Emerging Markets Equity Fund\1\ 31,937 34,840
Asia Growth Fund 1,874,193 2,179,299
Research Select Fund\4\ N/A N/A
----------------------------------
1 The CORE Large Cap Value, CORE Large Cap Growth, CORE Small Cap Equity, CORE
International Equity, Strategic Growth, Growth Opportunities, Large Cap
Value, European Equity, Japanese Equity, International Growth Opportunities
and Emerging Markets Equity Funds commenced operations on December 31, 1998,
May 1, 1997, August 15, 1997, August 15, 1997, May 24, 1999, May 24, 1999,
December 15, 1999, October 1, 1998, May 1, 1998, May 1, 1998 and December 15,
1997, respectively.
2 During the fiscal years ended January 31, 1999 and January 31, 1998, no
Shares of the Strategic Growth, Growth Opportunities or Large Cap Value Funds
had been offered.
3 During the fiscal period ended August 31, 1999 and the fiscal years ended
January 31, 1999 and January 31, 1998, no Shares of the Fund had been
offered.
4 The Research Select Fund commenced operations on June 19, 2000. During the
fiscal period ended August 31, 1999 and the fiscal years ended January 31,
1999 and January 31, 1998 no Shares of the Fund had been offered.
B-74
Under its Management Agreement, each Investment Adviser also: (i)
supervises all non-advisory operations of each Fund that it advises; (ii)
provides personnel to perform such executive, administrative and clerical
services as are reasonably necessary to provide effective administration of each
Fund; (iii) arranges for at each Fund's expense: (a) the preparation of all
required tax returns, (b) the preparation and submission of reports to existing
shareholders, (c) the periodic updating of prospectuses and statements of
additional information and (d) the preparation of reports to be filed with the
SEC and other regulatory authorities; (iv) maintains each Fund's records; and
(v) provides office space and all necessary office equipment and services.
Activities of Goldman Sachs and Its Affiliates and Other Accounts Managed
by Goldman Sachs. The involvement of the Investment Advisers and Goldman Sachs
and their affiliates in the management of, or their interest in, other accounts
and other activities of Goldman Sachs may present conflicts of interest with
respect to the Funds or impede their investment activities.
Goldman Sachs and its affiliates, including, without limitation, the
Investment Advisers and their advisory affiliates, have proprietary interests
in, and may manage or advise with respect to, accounts or funds (including
separate accounts and other funds and collective investment vehicles) which have
investment objectives similar to those of the Funds and/or which engage in
transactions in the same types of securities, currencies and instruments as the
Funds. Goldman Sachs and its affiliates are major participants in the global
currency, equities, swap and fixed-income markets, in each case both on a
proprietary basis and for the accounts of customers. As such, Goldman Sachs and
its affiliates are actively engaged in transactions in the same securities,
currencies and instruments in which the Funds invest, which could have an
adverse impact on each Fund's performance. Such transactions, particularly in
respect of proprietary accounts or customer accounts other than those included
in the Investment Advisers' and their advisory affiliates' asset management
activities, will be executed independently of the Funds' transactions and thus
at prices or rates that may be more or less favorable. When the Investment
Advisers and their advisory affiliates seek to purchase or sell the same assets
for their managed accounts, including the Funds, the assets actually purchased
or sold may be allocated among the accounts on a basis determined in its good
faith discretion to be equitable. In some cases, this system may adversely
affect the size or the price of the assets purchased or sold for the Funds.
From time to time, the Funds' activities may be restricted because of
regulatory restrictions applicable to Goldman Sachs and its affiliates, and/or
their internal policies designed to comply with such restrictions. As a result,
there may be periods, for example, when the Investment Advisers and/or their
affiliates will not initiate or recommend certain types of transactions in
certain securities or instruments with respect to which the Investment Advisers
and/or their affiliates are performing services or when position limits have
been reached.
In connection with their management of the Funds, the Investment Advisers
may have access to certain fundamental analysis and proprietary technical models
developed by Goldman Sachs and other affiliates. The Investment Advisers will
not be under any obligation, however, to effect transactions on behalf of the
Funds in accordance with such analysis and models. In
B-75
addition, neither Goldman Sachs nor any of its affiliates will have any
obligation to make available any information regarding their proprietary
activities or strategies, or the activities or strategies used for other
accounts managed by them, for the benefit of the management of the Funds and it
is not anticipated that the Investment Advisers will have access to such
information for the purpose of managing the Funds. The proprietary activities or
portfolio strategies of Goldman Sachs and its affiliates or the activities or
strategies used for accounts managed by them or other customer accounts could
conflict with the transactions and strategies employed by the Investment
Advisers in managing the Funds.
The results of each Fund's investment activities may differ significantly
from the results achieved by the Investment Advisers and their affiliates for
their proprietary accounts or accounts (including investment companies or
collective investment vehicles) managed or advised by them. It is possible that
Goldman Sachs and its affiliates and such other accounts will achieve investment
results which are substantially more or less favorable than the results achieved
by a Fund. Moreover, it is possible that a Fund will sustain losses during
periods in which Goldman Sachs and its affiliates achieve significant profits on
their trading for proprietary or other accounts. The opposite result is also
possible.
The investment activities of Goldman Sachs and its affiliates for their
proprietary accounts and accounts under their management may also limit the
investment opportunities for the Funds in certain emerging markets in which
limitations are imposed upon the aggregate amount of investment, in the
aggregate or individual issuers, by affiliated foreign investors.
An investment policy committee which may include partners of Goldman
Sachs and its affiliates may develop general policies regarding a Fund's
activities but will not be involved in the day-to-day management of such Fund.
In such instances, those individuals may, as a result, obtain information
regarding the Fund's proposed investment activities which is not generally
available to the public. In addition, by virtue of their affiliation with
Goldman Sachs, any such member of an investment policy committee will have
direct or indirect interests in the activities of Goldman Sachs and its
affiliates in securities and investments similar to those in which the Fund
invests.
In addition, certain principals and certain of the employees of the
Investment Advisers are also principals or employees of Goldman Sachs or their
affiliated entities. As a result, the performance by these principals and
employees of their obligations to such other entities may be a consideration of
which investors in the Funds should be aware.
Each Investment Adviser may enter into transactions and invest in
currencies or instruments on behalf of a Fund in which customers of Goldman
Sachs serve as the counterparty, principal or issuer. In such cases, such
party's interests in the transaction will be adverse to the interests of a Fund,
and such party may have no incentive to assure that the Funds obtain the best
possible prices or terms in connection with the transactions. Goldman Sachs and
its affiliates may also create, write or issue derivative instruments for
customers of Goldman Sachs or its affiliates, the underlying securities or
instruments of which may be those in which a Fund invests or which may be based
on the performance of a Fund. The Funds may, subject to applicable law, purchase
investments which are the subject of an underwriting or other distribution by
Goldman
B-76
Sachs or its affiliates and may also enter into transactions with other clients
of Goldman Sachs or its affiliates where such other clients have interests
adverse to those of the Funds. At times, these activities may cause departments
of Goldman Sachs or its affiliates to give advice to clients that may cause
these clients to take actions adverse to the interests of the client. To the
extent affiliated transactions are permitted, the Funds will deal with Goldman
Sachs and its affiliates on an arms-length basis.
Each Fund will be required to establish business relationships with its
counterparties based on the Fund's own credit standing. Neither Goldman Sachs
nor its affiliates will have any obligation to allow their credit to be used in
connection with a Fund's establishment of its business relationships, nor is it
expected that a Fund's counterparties will rely on the credit of Goldman Sachs
or any of its affiliates in evaluating the Fund's creditworthiness.
From time to time, Goldman Sachs or any of its affiliates may, but is not
required to, purchase and hold shares of a Fund in order to increase the assets
of the Fund. Increasing a Fund's assets may enhance investment flexibility and
diversification and may contribute to economies of scale that tend to reduce the
Fund's expense ratio. Goldman Sachs reserves the right to redeem at any time
some or all of the shares of a Fund acquired for its own account. A large
redemption of shares of a Fund by Goldman Sachs could significantly reduce the
asset size of the Fund, which might have an adverse effect on the Fund's
investment flexibility, portfolio diversification and expense ratio.
It is possible that a Fund's holdings will include securities of entities
for which Goldman Sachs performs investment banking services as well as
securities of entities in which Goldman Sachs makes a market. From time to time,
Goldman Sachs' activities may limit the Funds' flexibility in purchases and
sales of securities. When Goldman Sachs is engaged in an underwriting or other
distribution of securities of an entity, the Investment Advisers may be
prohibited from purchasing or recommending the purchase of certain securities of
that entity for the Funds.
Distributor and Transfer Agent
------------------------------
Goldman Sachs, 85 Broad Street, New York, New York 10004, serves as the
exclusive distributor of shares of the Funds pursuant to a "best efforts"
arrangement as provided by a distribution agreement with the Trust on behalf of
each Fund. Shares of the Funds are offered and sold on a continuous basis by
Goldman Sachs, acting as agent. Pursuant to the distribution agreement, after
the Prospectuses and periodic reports have been prepared, set in type and mailed
to shareholders, Goldman Sachs will pay for the printing and distribution of
copies thereof used in connection with the offering to prospective investors.
Goldman Sachs will also pay for other supplementary sales literature and
advertising costs. Goldman Sachs may enter into sales agreements with certain
investment dealers and other financial service firms (the "Authorized Dealers")
to solicit subscriptions for Class A, Class B and Class C shares of the Funds.
Goldman Sachs receives a portion of the sales charge imposed on the sale, in the
case of Class A Shares, or redemption in the case of Class B and Class C Shares
(and in certain cases, Class A Shares), of such Fund shares.
B-77
Goldman Sachs retained approximately the following combined commissions
on sales of Class A, Class B and Class C Shares during the following periods:
Fiscal year ended Fiscal period ended Fiscal year ended Fiscal year ended
August 31, August 31, January 31, January 31,
2000 1999 1999 1998
================= =================== ================= =================
Balanced Fund\1\ $ 22,000 $ 45,772 $ 328,147 $ 387,000
Growth and Income Fund\1\ 102,000 161,907 1,625,895 2,405,000
CORE Large Cap Value Fund\2\ 81,000 47,033 1,035 N/A
CORE U.S. Equity Fund\1\ 258,000 247,772 516,723 566,000
CORE Large Cap Growth Fund\3\ 334,000 209,999 360,931 129,000
CORE Small Cap Equity Fund\4\ 59,000 25,650 120,911 49,000
CORE International Equity Fund\4\ 54,000 20,943 93,771 24,000
Capital Growth Fund\1\ 1,947,000 964,994 1,625,245 743,000
Strategic Growth Fund\5\ 674,000 67,647 N/A N/A
Growth Opportunities Fund\5\ 1,218,000 88,874 N/A N/A
Mid Cap Value Fund\4\ 58,000 24,203 403,632 704,000
Small Cap Value Fund\1\ 49,000 58,547 595,864 662,000
Large Cap Value Fund\6\ 46,000 N/A N/A N/A
International Equity Fund\1\ 2,891,000 818,240 1,226,623 1,091,000
European Equity Fund\7\ 579,000 217,889 433,970 N/A
Japanese Equity Fund\7\ 497,000 13,174 5,020 N/A
International Growth
Opportunities Fund\7\ 2,168,000 301,000 267,136 N/A
Emerging Markets Equity Fund\8\ 149,000 67,356 495,353 107,000
Asia Growth Fund\1\ 92,000 106,223 133,988 414,000
Research Select Fund\9\ 951,000 N/A N/A N/A
--------------------------------------------------------------------------------
1 Prior to August 15, 1997, the Balanced, Growth and Income, CORE U.S. Equity,
Capital Growth, International Equity, Small Cap Value and Asia Growth Funds had
not sold Class C Shares.
B-78
/2/ The CORE Large Cap Value Fund commenced operations on December 31, 1998.
/3/ Prior to May 1, 1997 May 1, 1997 and August 15, 1997, the CORE Large Cap
Growth Fund had not sold Class A, Class B and Class C Shares, respectively.
/4/ Prior to August 15, 1997, the CORE Small Cap Equity, CORE International
Equity and Mid Cap Value Funds had not sold Class A, Class B or Class C Shares.
/5/ The Strategic Growth and Growth Opportunities Funds commenced operations on
May 24, 1999.
/6/ The Large Cap Value Fund commenced operations on December 15, 1999. During
the fiscal period ended August 31, 1999 and the fiscal years ended January 31,
1999 and January 31, 1998, no Shares of the Fund had been offered.
/7/ Prior to October 1, 1998, May 1, 1998 and May 1, 1998, the European Equity,
Japanese Equity and International Growth Opportunities Funds had not sold Class
A, Class B or Class C Shares.
/8/ Prior to December 15, 1997, the Emerging Markets Equity Fund had not sold
Class A, Class B or Class C Shares.
/9/ The Research Select Fund commenced operations on June 19, 2000. During the
fiscal period ended August 31, 1999 and the fiscal years ended January 31, 1999
and January 31, 1998, no Shares of the Fund had been offered.
B-79
**2 Goldman Sachs, 4900 Sears Tower, Chicago, IL 60606 serves as the
Trust's transfer agent. Under its transfer agency agreement with the Trust,
Goldman Sachs has undertaken with the Trust to (i) record the issuance, transfer
and redemption of shares, (ii) provide purchase and redemption confirmations and
quarterly statements, as well as certain other statements, (iii) provide certain
information to the Trust's custodian and the relevant sub-custodian in
connection with redemptions, (iv) provide dividend crediting and certain
disbursing agent services, (v) maintain shareholder accounts, (vi) provide
certain state Blue Sky and other information, (vii) provide shareholders and
certain regulatory authorities with tax related information, (viii) respond to
shareholder inquiries, and (ix) render certain other miscellaneous services. For
its transfer agency services, Goldman Sachs is entitled to receive a transfer
agency fee equal, on an ongoing basis, to 0.04% of average daily net assets with
respect to each Fund's Institutional and Service Shares and 0.19% of average
daily net assets with respect to each Fund's Class A, Class B and Class C
Shares.
**3 As compensation for the services rendered to the Trust by Goldman
Sachs as transfer agent and the assumption by Goldman Sachs of the expenses
related thereto, Goldman Sachs received fees for the fiscal year ended August
31, 2000, the fiscal period ended August 31, 1999 and the fiscal years ended
January 31, 1999 and January 31, 1998 from each Fund then in existence as
follows under the fee schedules then in effect:
Class A, B and C Class A, B and C Class A, B and C
fiscal year ended fiscal period ended fiscal year ended
August 31, August 31, January 31,
2000 1999 1999 1998
---- ---- ---- ----
Balanced Fund/1/ $ 376,307 $ 265,040 $ 415,314 $ 240,869
Growth and Income Fund/1/ 1,712,159 1,472,797 2,847,724 1,545,495
CORE Large Cap Value Fund/2/ 220,203 79,434 478 N/A
CORE U.S. Equity Fund/1/ 1,822,544 937,880 1,026,711 483,534
CORE Large Cap Growth Fund/3/ 1,537,502 507,346 297,884 107,944
CORE Small Cap Equity Fund/4/ 145,253 85,644 169,333 62,625
CORE International Equity Fund/4/ 294,670 135,685 107,285 36,474
Capital Growth Fund/1/ 5,422,979 2,686,091 2,429,326 992,678
Strategic Growth Fund/5/ 120,349 2,712 N/A N/A
Growth Opportunities Fund/5/ 181,112 1,830 N/A N/A
MidCap Value Fund/4/ 131,918 120,585 227,387 142,558
Small Cap Value Fund/1/ 376,069 308,496 686,997 595,479
Large Cap Value Fund/6/ 6,667 N/A N/A N/A
International Equity Fund/1/ 2,468,219 1,081,759 1,276,567 860,719
European Equity/7/ 223,685 74,587 25,506 N/A
Japanese Equity Fund/7/ 129,762 25,658 23,737 N/A
International Growth
Opportunities Fund/7/ 342,784 44,408 39,575 N/A
Emerging Markets Equity Fund/8/ 151,186 68,673 131,048 1,907
Asia Growth Fund/1/ 201,343 87,224 260,032 370,233
Research Select Fund/9/ 116,520 N/A N/A N/A
----------------------------------
B-80
/1/ Prior to August 15, 1997, the Balanced, Growth and Income, CORE U.S. Equity,
Capital Growth, International Equity, Small Cap Value and Asia Growth Funds had
not sold Class C Shares.
/2/ The CORE Large Cap Value Fund commenced operations on December 31, 1998.
/3/ Prior to May 1, 1997, May 1, 1997 and August 15, 1997, the CORE Large Cap
Growth Fund had not sold Class A, Class B and Class C Shares, respectively.
/4/ Prior to August 15, 1997, the CORE Small Cap Equity, CORE International
Equity and Mid Cap Value Funds had not sold Class A, Class B or Class C Shares.
/5/ The Strategic Growth and Growth Opportunities Funds commenced operations on
May 24, 1999.
/6/ The Large Cap Value Fund commenced operation on December 15, 1999. During
the fiscal period ended August 31, 1999 and the fiscal years ended January 31,
1999 and January 31, 1998, no Shares of the Fund had been offered.
/7/ Prior to October 1, 1998, May 1, 1998 and May 1, 1998, the European Equity,
Japanese Equity and International Growth Opportunities Funds had not sold Class
A, Class B or Class C Shares.
/8/ Prior to December 15, 1997, Emerging Markets Equity Fund had not sold Class
A, Class B or Class C Shares.
/9/ The Research Select Fund commenced operations on June 19, 2000. During the
fiscal period ended August 31, 1999 and the fiscal years ended January 31, 1999
and January 31, 1998, no Shares of the Fund had been offered.
B-81
Institutional Shares
Fiscal year Fiscal period Fiscal year Fiscal year
ended ended ended Ended
August 31, August 31, January 31, January 31,
2000 1999 1999 1998
=========== ============= =========== ===========
Balanced Fund\1\ $ 991 $ 1,303 $ 10,146 $ N/A
Growth and Income Fund 12,023 9,957 65,822 2,593
CORE Large Cap Value Fund\2\ 69,901 41,227 716 N/A
CORE U.S. Equity Fund 140,635 77,800 47,585 0
CORE Large Cap Growth Fund\3\ 131,854 68,733 95,848 49
CORE Small Cap Equity Fund\4\ 31,648 14,387 99,495 0
CORE International Equity Fund\4\ 123,484 62,671 181,201 0
Capital Growth Fund\1\ 150,692 33,191 7,002 683
Strategic Growth Fund\5\ 5,633 613 N/A N/A
Growth Opportunities Fund\5\ 5,931 571 N/A N/A
Mid Cap Value Fund\4\ 61,403 45,624 189,538 74,315
Small Cap Value Fund\1\ 9,587 4,353 6,745 2,674
Large Cap Value Fund\6\ 3,253 N/A N/A N/A
International Equity Fund 104,063 30,437 15,221 0
European Equity 3,050 2,357 1,490 N/A
Service Shares
Fiscal year Fiscal period Fiscal year Fiscal year
ended ended ended ended
August 31, August 31, January 31, January 31,
2000 1999 1999 1998
=========== ============= =========== ===========
Balanced Fund\1\ $ 6 $ 36 $ 246 $ N/A
Growth and Income Fund 3,563 2,595 4,575 5,033
CORE Large Cap Value Fund\2\ 5 1 0 N/A
CORE U.S. Equity Fund 4,822 2,767 1,735 0
CORE Large Cap Growth Fund\3\ 1,224 511 490 21
CORE Small Cap Equity Fund\4\ 28 14 31 0
CORE International Equity Fund\4\ 9 2 8 0
Capital Growth Fund\1\ 3,894 1,335 612 0
Strategic Growth Fund\5\ 1 1 N/A N/A
Growth Opportunities Fund\5\ 53 1 N/A N/A
Mid Cap Value Fund\4\ 72 53 60 1
Small Cap Value Fund\4\ 21 3 8 47 0
Large Cap Value Fund\6\ 0 N/A N/A N/A
International Equity Fund 1,632 851 596 0
European Equity 1 1 0 N/A
B-82
Institutional Shares
Fiscal year Fiscal period Fiscal year Fiscal year
ended ended ended Ended
August 31, August 31, January 31, January 31,
2000 1999 1999 1998
=========== ============= =========== ===========
Japanese Equity Fund 11,878 3,738 33,786 N/A
International Growth
Opportunities Fund 45,874 10,606 40,115 N/A
Emerging Markets Equity Fund\7\ 54,038 23,830 32,313 617
Service Shares
Fiscal year Fiscal period Fiscal year Fiscal year
ended ended ended ended
August 31, August 31, January 31, January 31,
2000 1999 1999 1998
=========== ============= =========== ===========
Japanese Equity Fund 0 1 5 N/A
International Growth
Opportunities Fund 1 1 4 N/A
Emerging Markets Equity Fund\7\ 1 1 44 0
B-83
Institutional Shares
Fiscal year Fiscal period Fiscal year Fiscal year
ended ended ended Ended
August 31, August 31, January 31, January 31,
2000 1999 1999 1998
=========== ============= =========== ===========
Asia Growth Fund/1/ 4,347 1,708 406 0
Research Select Fund/8/ 411 N/A N/A N/A
Service Shares
Fiscal year Fiscal period Fiscal year Fiscal year
ended ended ended ended
August 31, August 31, January 31, January 31,
2000 1999 1999 1998
=========== ============ =========== ===========
Asia Growth Fund/1/ N/A N/A N/A N/A
Research Select Fund/8/ 1 N/A N/A N/A
--------------------------------------------------------------------------------
/1/ Prior to August 15, 1997, the Balanced Fund had not sold Institutional
Shares or Service Shares; prior to August 15, 1997 neither Capital Growth Fund
nor Small Cap Value Fund had sold Institutional or Service Shares; and Asia
Growth Fund had not sold Service Shares as of August 31, 2000.
/2/ The CORE Large Cap Value Fund commenced operations on December 31, 1998.
/3/ Prior to May 1, 1997, the CORE Large Cap Growth Fund had not sold
Institutional or Service Shares.
/4/ Prior to August 15, 1997, the CORE Small Cap Equity and the CORE
International Equity Funds had not sold Institutional or Service Shares. The Mid
Cap Value Fund had not sold Service Shares prior to July 18, 1997.
/5/ The Strategic Growth and Growth Opportunities Funds commenced operations on
May 24, 1999.
/6/ The Large Cap Value Fund commenced operations on December 15, 1999. During
the fiscal period ended August 31, 1999 and the fiscal years ended January 31,
1999 and January 31, 1998, no Shares of the Fund had been offered.
/7/ Prior to December 15, 1997, the Emerging Markets Equity Fund had not sold
Institutional or Service Shares.
/8/ The Research Select Fund commenced operations on June 19, 2000. During the
fiscal period ended August 31, 1999 and the fiscal years ended January 31, 1999
and January 31, 1998, no Shares of the Fund had been offered.
B-84
The Trust's distribution and transfer agency agreements each provide that
Goldman Sachs may render similar services to others so long as the services
Goldman Sachs provides thereunder are not impaired thereby. Such agreements also
provide that the Trust will indemnify Goldman Sachs against certain liabilities.
Expenses
The Trust, on behalf of each Fund, is responsible for the payment of each
Fund's respective expenses. The expenses include, without limitation, the fees
payable to the Investment Advisers, service fees paid to institutions that have
agreed to provide account administration and personal account maintenance
services to their customers who are the beneficial owners of Service Shares
("Service Organizations"), the fees and expenses of the Trust's custodian and
subcustodians, transfer agent fees, brokerage fees and commissions, filing fees
for the registration or qualification of the Trust's shares under federal or
state securities laws, expenses of the organization of the Trust, fees and
expenses incurred by the Trust in connection with membership in investment
company organizations, taxes, interest, costs of liability insurance, fidelity
bonds or indemnification, any costs, expenses or losses arising out of any
liability of, or claim for damages or other relief asserted against, the Trust
for violation of any law, legal and auditing fees and expenses (including the
cost of legal and certain accounting services rendered by employees of GSAM,
GSAMI and Goldman Sachs with respect to the Trust), expenses of preparing and
setting in type prospectuses, statements of additional information, proxy
material, reports and notices and the printing and distributing of the same to
the Trust's shareholders and regulatory authorities, any expenses assumed by a
Fund pursuant to its distribution and service plans, compensation and expenses
of its "non-interested" Trustees and extraordinary expenses, if any, incurred by
the Trust. Except for fees under any service plan or distribution and service
plans applicable to a particular class and transfer agency fees, all Fund
expenses are borne on a non-class specific basis.
The imposition of the Investment Adviser's fee, as well as other
operating expenses, will have the effect of reducing the total return to
investors. From time to time, the Investment Adviser may waive receipt of its
fees and/or voluntarily assume certain expenses of a Fund, which would have the
effect of lowering that Fund's overall expense ratio and increasing total return
to investors at the time such amounts are waived or assumed, as the case may be.
B-85
The Investment Advisers voluntarily have agreed to reduce or limit
certain "Other Expenses" (excluding management fees, distribution and service
fees, transfer agency fees, service share fees, taxes, interest, brokerage, and
litigation, indemnification and other extraordinary expenses) for the following
Funds to the extent such expenses exceed the following percentage of average
daily net assets:
Other
Expenses
--------
Balanced Fund 0.06%
Growth and Income Fund 0.05%
CORE Large Cap Value Fund 0.06%
CORE U.S. Equity Fund 0.00%
CORE Large Cap Growth Fund 0.02%
CORE Small Cap Equity Fund 0.04%
CORE International Equity Fund 0.12%
Capital Growth Fund 0.00%
Strategic Growth Fund 0.00%
Growth Opportunities Fund 0.11%
Mid Cap Value Fund 0.10%
Small Cap Value Fund 0.06%
Large Cap Value Fund 0.06%
International Equity Fund 0.10%
European Equity Fund 0.10%
Japanese Equity Fund 0.11%
International Growth Opportunities Fund 0.16%
Emerging Markets Equity Fund 0.35%
Asia Growth Fund 0.16%
Research Select Fund 0.06%
Such reductions or limits, if any, are calculated monthly on a cumulative
basis and may be discontinued or modified by the applicable Investment Adviser
in its discretion at any time.
Fees and expenses of legal counsel, registering shares of a Fund, holding
meetings and communicating with shareholders may include an allocable portion of
the cost of maintaining an internal legal and compliance department. Each Fund
may also bear an allocable portion of the applicable Investment Adviser's costs
of performing certain accounting services not being provided by a Fund's
Custodian.
B-86
REIMBURSEMENT
For the fiscal year ended August 31, 2000, the fiscal period ended August
31, 1999 and the fiscal years ended January 31, 1999 and January 31, 1998, the
amounts of certain "Other Expenses" of each Fund then in existence that were
reduced or otherwise limited were as follows under the expense limitations that
were then in effect:
Fiscal year ended Fiscal period ended Fiscal year ended Fiscal year ended
August 31, August 31, January 31, January 31,
2000 1999 1999 1998
==== ==== ==== ====
Balanced Fund/1/ $ 341,990 $ 307,789 $ 481,945 $ 420,659
Growth and Income Fund/1/ 0 599,598 1,033,046 0
CORE Large Cap Value Fund/2/ 308,324 239,291 137,173 N/A
CORE U.S. Equity Fund/1/ 500,448 340,568 534,447 63,253
CORE Large Cap Growth Fund/3/ 429,700 323,807 483,322 332,713
CORE Small Cap Equity Fund/4/ 336,461 275,311 415,298 202,498
CORE International Equity Fund/4/ 431,231 223,253 806,303 206,055
Capital Growth Fund/1/ 809,733 457,262 933,189 0
Strategic Growth Fund/5/ 140,479 303,839 N/A N/A
Growth Opportunities Fund/5/ 90,220 303,862 N/A N/A
Mid Cap Value Fund/4/ 115,815 134,639 459,373 264,378
Small Cap Value Fund/1/ 145,110 191,783 556,422 0
Large Cap Value Fund/6/ 239,059 N/A N/A N/A
International Equity Fund/1/ 793,656 311,046 1,803,009 0
European Equity Fund/7/ 401,453 227,469 190,277 N/A
Japanese Equity Fund/7/ 352,950 208,419 263,545 N/A
International Growth Opportunities
Fund/7/ 500,956 183,234 361,922 N/A
Emerging Markets Equity Fund/8/ 386,666 355,841 696,214 112,725
Asia Growth Fund/1/ 522,149 211,592 519,489 125,828
Research Select Fund/9/ 343,483 N/A N/A N/A
--------------------------------
/1/ Prior to August 15, 1997, Balanced, Growth and Income, CORE U.S. Equity,
Capital Growth, Small Cap Value, International Equity and Asia Growth Funds had
not sold Class C Shares. Prior to August 15, 1997, Balanced Fund had not sold
Institutional Shares or Service Shares; prior to August 15, 1997 neither Capital
Growth Fund nor Small Cap Value Fund had sold Institutional or Service Shares.
As of August 31, 2000, Asia Growth Fund had not sold Service Shares.
B-87
/2/ The CORE Large Cap Value Fund commenced operations on December 31, 1998.
/3/ Prior to May 1, 1997, May 1, 1997, August 15, 1997, May 1, 1997 and May 1,
1997 the CORE Large Cap Growth Fund had not sold Class A, Class B, Class C,
Institutional or Service Shares, respectively.
/4/ Prior to August 15, 1997, the CORE Small Cap Equity and CORE International
Equity Funds had not sold Class A, Class B, Class C, Institutional or Service
Shares. The Mid Cap Value Fund had not sold Class A, Class B or Class C Shares
prior to August 15, 1997 or Service Shares prior to July 18, 1997.
/5/ The Strategic Growth and Growth Opportunities Funds commenced operations on
May 24, 1999.
/6/ The Large Cap Value Fund commenced operations on December 15, 1999. During
the fiscal period ended August 31, 1999 and the fiscal years ended January 31,
1999 and January 31, 1998, no Shares of the Fund had been offered.
/7/ Prior to October 1, 1998, May 1, 1998 and May 1, 1998, the European Equity,
Japanese Equity and International Growth Opportunities Funds had not sold Class
A, Class B, Class C, Institutional or Service Shares
/8/ Prior to December 15, 1997, the Emerging Markets Equity Fund had not sold
Class A, Class B, Class C, Institutional or Service Shares.
/9/ The Research Select Fund commenced operations on June 19, 2000. During the
fiscal period ended August 31, 1999 and the fiscal years ended January 31, 1999
and January 31, 1998, no Shares of the Fund had been offered.
Custodian and Sub-Custodians
============================
State Street, P.O. Box 1713, Boston, Massachusetts 02105, is the
custodian of the Trust's portfolio securities and cash. State Street also
maintains the Trust's accounting records. State Street may appoint domestic and
foreign sub-custodians from time to time to hold certain securities purchased by
the Trust and to hold cash for the Trust.
Independent Public Accountants
==============================
PricewaterhouseCoopers LLP, 160 Federal Street, Boston, MA 02110,
currently serve as the independent auditors of the Funds for the fiscal year
ending August 31, 2001. In addition to audit services, PricewaterhouseCoopers
LLP prepares the Funds' federal and state tax returns, and provides consultation
and assistance on accounting, internal control and related matters. The
financial statements of the Funds for the fiscal years or periods ended on or
before August 31, 1999, and the data set forth under "Financial Highlights" in
the Prospectuses for the fiscal years or periods ended on or before August 31,
1999, were audited by Arthur Andersen LLP, the Funds' former auditors.
B-88
PORTFOLIO TRANSACTIONS AND BROKERAGE
The Investment Advisers are responsible for decisions to buy and sell
securities for the Funds, the selection of brokers and dealers to effect the
transactions and the negotiation of brokerage commissions, if any. Purchases and
sales of securities on a securities exchange are effected through brokers who
charge a commission for their services. Orders may be directed to any broker
including, to the extent and in the manner permitted by applicable law, Goldman
Sachs.
In the over-the-counter market, securities are generally traded on a
"net" basis with dealers acting as principal for their own accounts without a
stated commission, although the price of a security usually includes a profit to
the dealer. In underwritten offerings, securities are purchased at a fixed price
which includes an amount of compensation to the underwriter, generally referred
to as the underwriter's concession or discount. On occasion, certain money
market instruments may be purchased directly from an issuer, in which case no
commissions or discounts are paid.
In placing orders for portfolio securities of a Fund, the Investment
Advisers are generally required to give primary consideration to obtaining the
most favorable execution and net price available. This means that an Investment
Adviser will seek to execute each transaction at a price and commission, if any,
which provides the most favorable total cost or proceeds reasonably attainable
in the circumstances. As permitted by Section 28(e) of the Securities Exchange
Act of 1934, the Fund may pay a broker which provides brokerage and research
services to the Fund an amount of disclosed commission in excess of the
commission which another broker would have charged for effecting that
transaction. Such practice is subject to a good faith determination that such
commission is reasonable in light of the services provided and to such policies
as the Trustees may adopt from time to time. While the Investment Advisers
generally seek reasonably competitive spreads or commissions, a Fund will not
necessarily be paying the lowest spread or commission available. Within the
framework of this policy, the Investment Advisers will consider research and
investment services provided by brokers or dealers who effect or are parties to
portfolio transactions of a Fund, the Investment Advisers and their affiliates,
or their other clients. Such research and investment services are those which
brokerage houses customarily provide to institutional investors and include
research reports on particular industries and companies, economic surveys and
analyses, recommendations as to specific securities and other products or
services (e.g., quotation equipment and computer related costs and expenses),
advice concerning the value of securities, the advisability of investing in,
purchasing or selling securities, the availability of securities or the
purchasers or sellers of securities, furnishing analyses and reports concerning
issuers, industries, securities, economic factors and trends, portfolio strategy
and performance of accounts, effecting securities transactions and performing
functions incidental thereto (such as clearance and settlement) and providing
lawful and appropriate assistance to the Investment Advisers in the performance
of their decision-making responsibilities. Such services are used by the
Investment Advisers in connection with all of their investment activities, and
some of such services obtained in
B-89
connection with the execution of transactions for a Fund may be used in managing
other investment accounts. Conversely, brokers furnishing such services may be
selected for the execution of transactions of such other accounts, whose
aggregate assets are far larger than those of a Fund, and the services furnished
by such brokers may be used by the Investment Advisers in providing management
services for the Trust.
In circumstances where two or more broker-dealers offer comparable prices
and execution capability, preference may be given to a broker-dealer which has
sold shares of the Fund as well as shares of other investment companies or
accounts managed by the Investment Advisers. This policy does not imply a
commitment to execute all portfolio transactions through all broker-dealers that
sell shares of the Fund.
On occasions when an Investment Adviser deems the purchase or sale of a
security to be in the best interest of a Fund as well as its other customers
(including any other fund or other investment company or advisory account for
which such Investment Adviser acts as investment adviser or sub-investment
adviser), the Investment Adviser, to the extent permitted by applicable laws and
regulations, may aggregate the securities to be sold or purchased for the Fund
with those to be sold or purchased for such other customers in order to obtain
the best net price and most favorable execution under the circumstances. In such
event, allocation of the securities so purchased or sold, as well as the
expenses incurred in the transaction, will be made by the applicable Investment
Adviser in the manner it considers to be equitable and consistent with its
fiduciary obligations to such Fund and such other customers. In some instances,
this procedure may adversely affect the price and size of the position
obtainable for a Fund.
Commission rates in the U.S. are established pursuant to negotiations
with the broker based on the quality and quantity of execution services provided
by the broker in the light of generally prevailing rates. The allocation of
orders among brokers and the commission rates paid are reviewed periodically by
the Trustees.
Subject to the above considerations, the Investment Advisers may use
Goldman Sachs as a broker for a Fund. In order for Goldman Sachs to effect any
portfolio transactions for each Fund, the commissions, fees or other
remuneration received by Goldman Sachs must be reasonable and customary. This
standard would allow Goldman Sachs to receive no more than the remuneration
which would be expected to be received by an unaffiliated broker in a
commensurate arm's-length transaction. Furthermore, the Trustees, including a
majority of the Trustees who are not "interested" Trustees, have adopted
procedures which are reasonably designed to provide that any commissions, fees
or other remuneration paid to Goldman Sachs are consistent with the foregoing
standard. Brokerage transactions with Goldman Sachs are also subject to such
fiduciary standards as may be imposed upon Goldman Sachs by applicable law.
B-90
For the fiscal year ended August 31, 2000, the fiscal period ended August 31,
1999 and the fiscal years ended January 31, 1999 and January 31, 1998, each Fund
in existence paid brokerage commissions as follows. The amount of brokerage
commissions paid by a Fund may vary substantially from year to year because of
differences in shareholder purchase and redemption activity, portfolio turnover
rates and other factors.
Total Total Brokerage
Brokerage Amount of Commissions
Total Commissions Transaction Paid
Brokerage Paid to on which to Brokers
Commissions Affiliated Commissions Providing
Paid Persons Paid Research
Fiscal Year Ended August 31, 2000:
Balanced Fund $ 225,078 $ 22,382(10%)/1/ $ 278,759,419(2%)/2/ $ 53,129
Growth and Income Fund 2,548,828 92,167(4%)/1/ 1,928,628,857[3%)/2/ 539,897
CORE Large Cap Value Fund 220,521 2,313(1%)/1/ 367,495,734(0%)/2/ N/A
CORE U.S. Equity Fund 274,610 4,745(2%)/1/ 1,165,434,658(0%)/2/ N/A
CORE Large Cap Growth Fund 650,616 10,080(2%)/1/ 1,437,599,713[2%)/2/ N/A
CORE Small Cap Equity Fund 346,418 3,005(1%)/1/ 408,582,900(0%)/2/ N/A
CORE International Equity Fund 783,519 0(0%)/1/ 863,663,682[0%)/2/ N/A
Capital Growth Fund 2,174,111 111,902(5%)/1/ 2,389,191,388[5%)/2/ 93,525
Strategic Growth Fund 119,428 1,320(1%)/1/ 120,323,063[1%)/2/ 53,386
Growth Opportunity Fund 454,911 19,332(4%)/1/ 375,704,821[3%)/2/ 90
Mid Cap Value Fund 990,569 13,482(1%)/1/ 433,729,720[1%)/2/ 122,207
Small Cap Value Fund 1,115,498 20,301(2%)/1/ 409,760,873[1%)/2/ 118,846
Large Cap Value Fund 56,300 1,311(2%)/1/ 166,416,965[1%)/2/ 9,547
International Equity Fund 3,852,651 4,820(0%)/1/ 2,600,820,566[0%]/2/ 156,634
European Equity Fund 385,163 248(0%)/1/ 1,587,512,280(0%)/2/ 15,349
Japanese Equity Fund 223,078 8,545(4%)/1/ 148,673,088(4%)/2/ N/A
International Growth Opportunities Fund 1,450,541 8,708(1%)/1/ 1,430,844,194(0%)/2/ 0
Emerging Markets Equity Fund 1,397,600 109,044(8%)/1/ 502,044,995[10%)/2/ 27,157
Asia Growth Fund 1,665,389 85,293(5%)/1/ 448,624,714[6%)/2/ N/A
Research Select Fund 288,556 19,698(3%)/1/ 522,030,491(4%)/2/
------------------
1 Percentage of total commissions paid.
2 Percentage of total amount of transactions involving the payment of
commissions effected through affiliated persons.
3 Not operational.
B-91
Total Total
Brokerage Amount of
Total Commissions Transaction
Brokerage Paid to on which
Commissions Affiliated Commissions
Paid Persons Paid
==== ======= ====
Fiscal Period August 31, 1999:
Balanced Fund $ 199,123 $ 18,798 $ 137,175,861
Growth and Income Fund 2,361,135 139,095 1,954,788,960
CORE Large Cap Value Fund 240,567 1,839 332,291,465
CORE U.S. Equity Fund 481,746 5,296 731,549,511
CORE Large Cap Growth Fund 225,700 4,909 400,102,053
CORE Small Cap Equity Fund 83,581 693 60,482,834
CORE International Equity Fund 601,449 0 474,940,454
Capital Growth Fund 1,000,740 31,968 1,076,147,992
Strategic Growth Fund 23,988 0 21,715,180
Growth Opportunities Fund 26,193 0 18,065,858
Mid Cap Value Fund 691,991 34,185 408,033,649
Small Cap Value Fund 626,104 33,536 311,817,920
Large Cap Value Fund/1/ N/A N/A N/A
International Equity Fund 1,415,066 0 1,466,285,559
European Equity Fund 157,143 0 386,316,045
Japanese Equity Fund 83,541 3,043 193,418,576
International Growth Opportunities Fund 184,208 0 156,758,635
Emerging Markets Equity Fund 537,548 29,251 208,383,598
Asia Growth Fund 489,354 35,497 184,149,170
Research Select Fund/1/ N/A N/A N/A
---------------------
1 Not operational.
B-92
Total Total
Brokerage Amount of
Total Commissions Transaction
Brokerage Paid to on which
Commissions Affiliated Commissions
Paid Persons Paid
==== ======= ====
Fiscal Year Ended January 31, 1999:
Balanced Fund $ 278,343 $ 24,859 $ 699,638,329
Growth and Income Fund 3,210,832 315,934 4,646,698,452
CORE Large Cap Value Fund 25,776 130 60,101,321
CORE U.S. Equity Fund 339,110 250,313 1,258,046,574
CORE Large Cap Growth Fund 230,692 50,914 698,188,311
CORE Small Cap Equity Fund 167,436 34,173 211,969,412
CORE International Equity Fund 583,909 0 908,196,568
Capital Growth Fund 1,022,092 0 1,454,154,897
Strategic Growth Fund/1/ N/A N/A N/A
Growth Opportunities Fund/1/ N/A N/A N/A
Mid Cap Value Fund 577,025 49,450 649,019,064
Small Cap Value Fund 759,195 14,218 716,225,444
Large Cap Value Fund/1/ N/A N/A N/A
International Equity Fund 1,148,992 0 1,608,739,812
European Equity Fund 139,120 0 72,621,844
Japanese Equity Fund 33,379 437 34,360,336
International Growth Opportunities Fund 89,276 0 86,891,167
Emerging Markets Equity Fund 590,262 51,073 472,328,927
Asia Growth Fund 320,855 19,653 148,887,187
Research Select Fund/1/ N/A N/A N/A
---------------------
/1/ not operational.
B-93
Total Total
Brokerage Amount of
Total Commissions Transaction
Brokerage Paid to on which
Commissions Affiliated Commissions
Paid Persons Paid
==== ======= ====
Fiscal Year Ended January 31, 1998:
Balanced Fund $ 111,054 $ 13,185 $2,731,475,157
Growth and Income Fund 1,550,312 190,001 9,046,102,538
CORE Large Cap Value Fund/1/ N/A N/A N/A
CORE U.S. Equity Fund 944,895 0 1,996,000,522
CORE Large Cap Growth Fund 54,360 288 200,813,608
CORE Small Cap Equity Fund 59,517 0 159,674,227
CORE International Equity Fund 43,120 0 142,395,942
Capital Growth Fund 514,890 37,947 2,748,868,081
Strategic Growth Fund/1/ N/A N/A N/A
Growth Opportunities Fund/1/ N/A N/A N/A
Mid Cap Value Fund 480,808 76,398 2,584,258,044
Small Cap Value Fund 646,533 82,143 5,686,763,232
Large Cap Value Fund/1/ N/A N/A N/A
International Equity Fund 506,607 0 3,898,716,988
European Equity Fund N/A N/A N/A
Japanese Equity Fund/1/ N/A N/A N/A
International Growth Opportunities Fund/1/ N/A N/A N/A
Emerging Markets Equity Fund 59,999 6,230 236,915,108
Asia Growth Fund 814,656 2,885 2,160,632,195
Research Select Fund/1/ N/A N/A N/A
----------------------------
/1/ Not operational.
B-94
B-95
During the fiscal year ended August 31, 2000, the Funds acquired and sold
securities of their regular broker-dealers. As of August 31, 2000, the Funds
held the following amounts of securities of their regular broker-dealers, as
defined in Rule 10b-1 under the Act, or their parents ($ in thousands):
Fund Broker/Dealer Amount
---- ------------- ------
Balanced Fund UBS $ 859
Morgan Stanley Dean Witter 1,514
Merrill Lynch 2,121
Donaldson, Lufkin & Jenrette 1,073
JP Morgan 859
Growth and Income Donaldson, Lufkin & Jenrette $ 968
Fund Bear Stearns 291
JP Morgan 2,140
ABN AMRO 788
Chase Securities 436
Morgan Stanley Dean Witter 126,639
CORE Large Cap Value JP Morgan $ 3,912
Fund Lehman Brothers 1,421
Merrill Lynch 2,335
Morgan Stanley Dean Witter 6,291
ABN AMRO 315
Bear Stearns 116
Chase Securities 174
Donaldson, Lufkin & Jenrette 388
B-96
Fund Broker/Dealer Amount
CORE U.S. Equity Morgan Stanley Dean Witter $ 726
Fund ABN AMRO 563
Bear Stearns 208
Chase Securities 311
Donaldson, Lufkin & Jenrette 692
CORE Large Cap Lehman Brothers $ 12,224
Growth Fund Merrill Lynch 9,411
Morgan Stanley Dean Witter 6,295
Bear Stearns 1,353
ABN AMRO 3,672
Chase Securities 2,030
Donaldson, Lufkin & Jenrette 4,510
B-97
Fund Broker/Dealer Amount
CORE Small Cap Donaldson, Lufkin & Jenrette $ 647
Equity Fund Bear Stearns 183
Chase Securities 274
Morgan Stanley Dean Witter 639
ABN AMRO 496
CORE International Prudential $ 645
Equity Fund State Street Bank 3,929
Capital Growth Fund Donaldson, Lufkin & Jenrette $ 33,558
Morgan Stanley Dean Witter 35,236
Strategic Growth Bear Stearns $ 150
Fund Donaldson, Lufkin & Jenrette 499
ABN AMRO 406
Chase Securities 225
Morgan Stanley Dean Witter 524
Growth Opportunities ABN AMRO $ 4,370
Fund Bear Stearns 1,610
Chase Securities 2,416
Donaldson, Lufkin & Jenrette 5,368
Morgan Stanley Dean Witter 5,636
Mid Cap Value Fund Lehman Brothers $ 551
Donaldson, Lufkin & Jenrette 2,858
Morgan Stanley Dean Witter 3,000
B-98
Small Cap Value ABN AMRO $ 2,320
Fund Donaldson, Lufkin & Jenrette 855
Chase Securities 1,283
Bear Stearns 2,850
Morgan Stanley Dean Witter 2,992
Large Cap Value JP Morgan $ 192
Fund Merrill Lynch 305
Morgan Stanley Dean Witter 1,018
ABN AMRO 406
Bear Stearns 149
Chase Securities 224
Donaldson, Lufkin & Jenrette 498
B-99
Fund Broker/Dealer Amount
---- ------------- ------
International State Street $ 65,491
Equity Fund UBS AG 15,051
European Equity State Street Bank $ 13,243
Fund UBS AG 1,814
Japanese Equity N/A N/A
Fund
International Small State Street Bank $ 31,658
Cap Fund
Emerging Markets State Street Bank $ 1,832
Equity Fund
Research Select Fund Morgan Stanley Dean Witter $ 403
Donaldson, Lufkin & Jenrette 384
JP Morgan 307
UBS Warburg LLC 306
B-100
B-101
NET ASSET VALUE
Under the Act, the Trustees of the Trust are responsible for determining
in good faith the fair value of securities of each Fund. In accordance with
procedures adopted by the Trustees, the net value per share of each class of
each Fund is calculated by determining the value of the net assets attributed
to each class of that Fund and dividing by the number of outstanding shares of
that class. All securities are valued as of the close of regular trading on the
New York Stock Exchange (normally, but not always, 4:00 p.m. New York time) on
each Business Day. The term "Business Day" means any day the New York Stock
Exchange is open for trading, which is Monday through Friday except for
holidays. The New York Stock Exchange is closed on the following holidays: New
Year's Day, Martin Luther King, Jr. Day, Washington's Birthday (observed), Good
Friday, Memorial Day (observed), Independence Day, Labor Day, Thanksgiving Day
and Christmas Day.
In the event that the New York Stock Exchange or the national securities
exchange on which stock options are traded adopt different trading hours on
either a permanent or temporary basis, the Trustees will reconsider the time at
which net asset value is computed. In addition, each Fund may compute its net
asset value as of any time permitted pursuant to any exemption, order or
statement of the SEC or its staff.
Portfolio securities of a Fund for which accurate market quotations are
available are valued as follows: (a) securities listed on any U.S. or foreign
stock exchange or on the National Association of Securities Dealers Automated
Quotations System ("NASDAQ") will be valued at the last sale price on the
exchange or system in which they are principally traded on the valuation
B-102
date. If there is no sale on the valuation day, securities traded will be valued
at the closing bid price, or if a closing bid price is not available, at either
the exchange or system-defined close price on the exchange or system in which
such securities are principally traded. If the relevant exchange or system has
not closed by the above-mentioned time for determining the Funds net asset
value, the securities will be valued at the last sale price, or if not available
at the bid price at the time the net asset value is determined; (b)
over-the-counter securities not quoted on NASDAQ will be valued at the last sale
price on the valuation day or, if no sale occurs, at the last bid price at the
time net asset value is determined; (c) equity securities for which no prices
are obtained under section (a) or (b) including those for which a pricing
service supplies no exchange quotation or a quotation that is believed by the
portfolio manager/trader to be inaccurate, will be valued at their fair value in
accordance with procedures approved by the Board of Trustees; (d) fixed-income
securities with a remaining maturity of 60 days or more for which accurate
market quotations are readily available will normally be valued according to
dealer-supplied bid quotations or bid quotations from a recognized pricing
service (e.g., Merrill Lynch, J.J. Kenny, Muller Data Corp., Bloomberg, EJV,
Reuters or Standard & Poor's); (e) fixed-income securities for which accurate
market quotations are not readily available are valued by the Investment
Advisers based on valuation models that take into account spread and daily yield
changes on government securities in the appropriate market (i.e., matrix
pricing); (f) debt securities with a remaining maturity of 60 days or less are
valued by the Investment Adviser at amortized cost, which the Trustees have
determined to approximate fair value; and (g) all other instruments, including
those for which a pricing service supplies no exchange quotation or a quotation
that is believed by the portfolio manager/trader to be inaccurate, will be
valued at fair value in accordance with the valuation procedures approved by the
Board of Trustees.
The value of all assets and liabilities expressed in foreign currencies
will be converted into U.S. dollar values at current exchange rates of such
currencies against U.S. dollars last quoted by any major bank. If such
quotations are not available, the rate of exchange will be determined in good
faith by or under procedures established by the Board of Trustees.
Generally, trading in securities on European and Far Eastern securities
exchanges and on over-the-counter markets is substantially completed at various
times prior to the close of business on each Business Day in New York (i.e., a
day on which the New York Stock Exchange is open for trading). In addition,
European or Far Eastern securities trading generally or in a particular country
or countries may not take place on all Business Days in New York. Furthermore,
trading takes place in various foreign markets on days which are not Business
Days in New York and days on which the Funds' net asset values are not
calculated. Such calculation does not take place contemporaneously with the
determination of the prices of the majority of the portfolio securities used in
such calculation. The impact of events that occur after the publication of
market quotations used by a Fund to price its securities but before the close of
regular trading on the New York Stock Exchange will normally not be reflected in
a Fund's next determined NAV unless the Trust, in its discretion, makes an
adjustment in light of the nature and materiality of the event, its effect on
Fund operations and other relevant factors.
The proceeds received by each Fund and each other series of the Trust
from the issue or sale of its shares, and all net investment income, realized
and unrealized gain and proceeds
B-103
thereof, subject only to the rights of creditors, will be specifically allocated
to such Fund and constitute the underlying assets of that Fund or series. The
underlying assets of each Fund will be segregated on the books of account, and
will be charged with the liabilities in respect of such Fund and with a share of
the general liabilities of the Trust. Expenses of the Trust with respect to the
Funds and the other series of the Trust are generally allocated in proportion to
the net asset values of the respective Funds or series except where allocations
of expenses can otherwise be fairly made.
PERFORMANCE INFORMATION
Each Fund may from time to time quote or otherwise use yield and total
return information in advertisements, shareholder reports or sales literature.
Average annual total return and yield are computed pursuant to formulas
specified by the SEC.
Thirty-day yield is derived by dividing net investment income per share
earned during the period by the maximum public offering price per share on the
last day of such period. The results are compounded on a bond equivalent
(semi-annual) basis and then annualized. Net investment income per share is
equal to the dividends and interest earned during the period, reduced by accrued
expenses for the period. The calculation of net investment income for these
purposes may differ from the net investment income determined for accounting
purposes.
Distribution rate for a specified period is calculated by annualizing
distributions of net investment income for such period and dividing this amount
by the net asset value per share or maximum public offering price on the last
day of the period.
Average annual total return for a specified period is derived by
calculating the actual dollar amount of the investment return on a $1,000
investment made at the maximum public offering price applicable to the relevant
class at the beginning of the period, and then calculating the annual compounded
rate of return which would produce that amount, assuming a redemption at the end
of the period. This calculation assumes a complete redemption of the investment.
It also assumes that all dividends and distributions are reinvested at net asset
value on the reinvestment dates during the period.
Year-by-year total return and cumulative total return for a specified
period are each derived by calculating the percentage rate required to make a
$1,000 investment (made at the maximum public offering price with all
distributions reinvested) at the beginning of such period equal to the actual
total value of such investment at the end of such period. The table set forth
below indicates the total return (capital changes plus reinvestment of all
distributions) on a hypothetical investment of $1,000 in a Fund for the periods
indicated.
Total return calculations for Class A Shares reflect the effect of paying
the maximum initial sales charge. Investment at a lower sales charge would
result in higher performance figures. Total return calculations for Class B and
Class C Shares reflect deduction of the applicable contingent deferred sales
charge ("CDSC") imposed upon redemption of
B-104
Class B and Class C Shares held for the applicable period. Each Fund may also
from time to time advertise total return on a cumulative, average, year-by-year
or other basis for various specified periods by means of quotations, charts
graphs or schedules. In addition, each Fund may furnish total return
calculations based on investments at various sales charge levels or at NAV. Any
performance information which is based on a Fund's NAV per Share would be
reduced if any applicable sales charge were taken into account. In addition to
the above, each Fund may from time to time advertise its performance relative to
certain averages, performance rankings, indices, other information prepared by
recognized mutual fund statistical services and investments for which reliable
performance information is available. The Funds' performance quotations do not
reflect any fees charged by an Authorized Dealer, Service Organization or other
financial intermediary to its customer accounts in connection with investments
in the Funds.
Each Fund's performance will fluctuate, unlike bank deposits or other
investments which pay a fixed yield for a stated period of time. Past
performance is not necessarily indicative of future return. Actual performance
will depend on such variables as portfolio quality, the type of portfolio
instruments acquired, portfolio expenses and other factors. Performance is one
basis investors may use to analyze a Fund as compared to other funds and other
investment vehicles. However, the performance of other funds and other
investment vehicles may not be comparable because of the foregoing variables,
and differences in the methods used in valuing their portfolio instruments,
computing net asset value and determining performance.
Occasionally, statistics may be used to specify Fund volatility or risk.
Measures of volatility or risk are generally used to compare a Fund's net asset
value or performance relative to a market index. One measure of volatility is
beta. Beta is the volatility of a Fund relative to the total market. A beta of
more than 1.00 indicates volatility greater than the market, and a beta of less
than 1.00 indicates volatility less than the market. Another measure of
volatility or risk is standard deviation. Standard deviation is used to measure
variability of net asset value or total return around an average, over a
specified period of time. The premise is that greater volatility connotes
greater risk undertaken in achieving performance.
From time to time the Trust may publish an indication of a Fund's past
performance as measured by independent sources such as (but not limited to)
Lipper Analytical Services, Inc., Morningstar Mutual Funds, Weisenberger
Investment Companies Service, imoneynet.com Money Fund Report, Micropal,
Barron's, Business Week, Consumer's Digest, Consumer's Report, Investors
Business Daily, The New York Times, Kiplinger's Personal Finance Magazine,
Changing Times, Financial World, Forbes, Fortune, Money, Personal Investor,
Sylvia Porter's Personal Finance and The Wall Street Journal. The Trust may also
advertise information which has been provided to the NASD for publication in
regional and local newspapers. In addition, the Trust may from time to time
advertise a Fund's performance relative to certain indices and benchmark
investments, including: (a) the Lipper Analytical Services, Inc. Mutual Fund
Performance Analysis, Fixed-Income Analysis and Mutual Fund Indices (which
measure total return and average current yield for the mutual fund industry and
rank mutual fund performance); (b) the
B-105
CDA Mutual Fund Report published by CDA Investment Technologies, Inc. (which
analyzes price, risk and various measures of return for the mutual fund
industry); (c) the Consumer Price Index published by the U.S. Bureau of Labor
Statistics (which measures changes in the price of goods and services); (d)
Stocks, Bonds, Bills and Inflation published by Ibbotson Associates (which
provides historical performance figures for stocks, government securities and
inflation); (e) the Salomon Brothers' World Bond Index (which measures the total
return in U.S. dollar terms of government bonds, Eurobonds and foreign bonds of
ten countries, with all such bonds having a minimum maturity of five years); (f)
the Lehman Brothers Aggregate Bond Index or its component indices; (g) the
Standard & Poor's Bond Indices (which measure yield and price of corporate,
municipal and U.S. Government bonds); (h) the J.P. Morgan Global Government Bond
Index; (i) other taxable investments including certificates of deposit (CDs),
money market deposit accounts (MMDAs), checking accounts, savings accounts,
money market mutual funds and repurchase agreements; (j) imoneynet.com Money
Fund Report (which provides industry averages for 7-day annualized and
compounded yields of taxable, tax-free and U.S. Government money funds); (k) the
Hambrecht & Quist Growth Stock Index; (l) the NASDAQ OTC Composite Prime Return;
(m) the Russell Midcap Index; (n) the Russell 2000 Index - Total Return; (o) the
Russell 1000 Value Index; (p) the Russell 1000 Growth Index-Total Return; (q)
the Value-Line Composite-Price Return; (r) the Wilshire 4500 Index; (s) the FT-
Actuaries Europe and Pacific Index; (t) historical investment data supplied by
the research departments of Goldman Sachs, Lehman Brothers, First Boston
Corporation, Morgan Stanley (including the EAFE Indices, the Morgan Stanley
World Index, the Morgan Stanley Capital International Combined Asia ex Japan
Free Index and the Morgan Stanley Capital International Emerging Markets Free
Index), Salomon Brothers, Merrill Lynch, Donaldson Lufkin and Jenrette or other
providers of such data; (u) CDA/Wiesenberger Investment Companies Services or
Wiesenberger Investment Companies Service; (v) The Goldman Sachs Commodities
Index; (w) information produced by Micropal, Inc.; (x) The Tokyo Price Index and
(y) the Russell 3000 Index. The composition of the investments in such indices
and the characteristics of such benchmark investments are not identical to, and
in some cases are very different from, those of a Fund's portfolio. These
indices and averages are generally unmanaged and the items included in the
calculations of such indices and averages may not be identical to the formulas
used by a Fund to calculate its performance figures. The Goldman Sachs U.S.
Select List may also be used to compare the performance of the Research Select
Fund.
Information used in advertisements and materials furnished to present and
prospective investors may include statements or illustrations relating to the
appropriateness of certain types of securities and/or mutual funds to meet
specific financial goals. Such information may address:
cost associated with aging parents;
funding a college education (including its actual and estimated
cost);
health care expenses (including actual and projected expenses);
long-term disabilities (including the availability of, and
coverage provided by, disability insurance);
B-106
retirement (including the availability of social security
benefits, the tax treatment of such benefits and statistics and
other information relating to maintaining a particular standard of
living and outliving existing assets);
asset allocation strategies and the benefits of diversifying among
asset classes;
the benefits of international and emerging market investments;
the effects of inflation on investing and saving;
the benefits of establishing and maintaining a regular pattern of
investing and the benefits of dollar-cost averaging; and
measures of portfolio risk, including but not limited to, alpha,
beta and standard deviation.
The Trust may from time to time use comparisons, graphs or charts in
advertisements to depict the following types of information:
the benefits of focusing on after-tax returns versus pre-tax
returns for taxable investors;
the performance of various types of securities (common stocks,
small company stocks, long-term government bonds, treasury bills
and certificates of deposit) over time. However, the
characteristics of these securities are not identical to, and may
be very different from, those of a Fund's portfolio;
the dollar and non-dollar based returns of various market indices
(for example, Morgan Stanley World Index, Morgan Stanley Capital
International EAFE Index, FT-Actuaries Europe & Pacific Index and
the Standard & Poor's Index of 500 Common Stocks) over varying
periods of time;
total stock market capitalizations of specific countries and
regions on a global basis;
performance of securities markets of specific countries and
regions; and
value of a dollar amount invested in a particular market or type
of security over different periods of time.
The Trust may publish a list of the securities in the U.S. Select List
from time to time and a discussion of the attributes of these securities and the
list. In addition, the Trust may from time to time include rankings of Goldman,
Sachs & Co.'s research department by publications such as the Institutional
Investor and the Wall Street Journal in advertisements.
B-107
The CORE Large Cap Growth Fund commenced operations on May 1, 1997. The
performance information shown below for periods before that date is for a
predecessor separate account managed by the Investment Adviser which converted
into Class A Shares as of the commencement date. The performance record of the
separate account quoted by the Fund has been adjusted downward based on the
expenses applicable to Class A Shares (the class into which the separate account
transferred) to reflect the expenses that were expected to be incurred by the
Fund during its initial year of operation. These expenses include any sales
charges and asset-based charges (i.e., fees under Distribution and Service
Plans) imposed and other operating expenses. Total return quotations are
calculated pursuant to the methodology prescribed by the SEC for standardized
performance calculations. Prior to May 1, 1997, the separate account was a
separate investment advisory account under discretionary management by the
Investment Adviser and had substantially similar investment objectives, policies
and strategies as the Fund. Unlike the Fund, the separate account was not
registered as an investment company under the Act and therefore was not subject
to certain investment restrictions and operational requirements that are imposed
on investment companies by the Act. If the separate account had been registered
as an investment company under the Act, the separate account's performance may
have been adversely affected by such restrictions and requirements. On May 1,
1997, the separate account transferred a portion of its assets to the Fund in
exchange for Fund shares. The performance record of each other class has been
linked to the performance of the separate account (based on Class A expenses)
and the Class A performance for any periods prior to commencement of operations
of a class of shares.
The Service Shares of the Balanced, Capital Growth, Small Cap Value,
Growth and Income, CORE U.S. Equity, CORE Large Cap Growth and International
Equity Funds commenced operations on August 15, 1997, August 15, 1997, August
15, 1997, March 6, 1996, June 7, 1996, May 1, 1997 and March 6, 1996,
respectively. The Service Shares of these Funds had no operating or performance
history prior thereto. However, in accordance with interpretive positions
expressed by the staff of the SEC, each of these Funds has adopted the
performance records of its respective Class A Shares from that class's inception
date (October 12, 1994, April 20, 1990, October 22, 1992, February 5, 1993, May
24, 1991, November 11, 1991 and December 1, 1992 respectively) to the inception
dates of Service Shares stated above. Quotations of performance data of these
Funds relating to this period include the performance record of the applicable
Class A Shares (excluding the impact of any applicable front-end sales charge).
The performance records of the applicable Class A Shares reflect the expenses
incurred by the particular Fund's Class A Shares. These expenses include
asset-based charges (i.e., fees under Distribution and Service Plans) and other
operating expenses. Total return quotations are calculated pursuant to
SEC-approved methodology.
B-108
INTRODUCTION
VALUE OF $1,000 INVESTMENT
(AVERAGE ANNUAL TOTAL RETURN)
Assuming no voluntary
waiver of fees and no
expense reimbursements
----------------------
Assumes Assumes
Maximum maximum
Applicable Assumes Applicable Assumes
Sales no sales sales no sales
Fund Class Time Period Charge** Charge Charge** Charge
---- ----- ----------- ---------- -------- ---------- --------
Balanced Fund A 10/12/94-8/31/00 - Since inception 12.43% 13.52% 11.46% 12.54%
Balanced Fund A 9/1/95-8/31/00 - Five years 10.73% 11.99% 10.24% 11.49%
Balanced Fund A 9/1/99-8/31/00 - One year 5.82% 12.00% 5.62% 11.77%
Balanced Fund B 5/1/96-8/31/00 - Since inception 10.34% 10.76% 10.11% 10.53%
Balanced Fund B 9/1/99-8/31/00 - One year 5.87% 11.17% 5.67% 10.94%
Balanced Fund C 8/15/97-8/31/00 - Since inception 5.52% 5.52% 5.29% 5.29%
Balanced Fund C 9/1/99-8/31/00 - One year 10.17% 11.23% 9.95% 11.00%
Balanced Fund Institutional 8/15/97-8/31/00 - Since inception N/A 6.70% N/A 6.43%
Balanced Fund Institutional 9/1/99-8/31/00 - One year N/A 12.59% N/A 12.36%
Balanced Fund Service 10/12/94-8/31/00 - Since inception N/A 13.40% N/A 12.47%
Balanced Fund Service 9/1/95-8/31/00 - Five years N/A 11.85% N/A 11.41%
Balanced Fund Service 9/1/99-8/31/00 - One year N/A 11.89% N/A 11.67%
Growth and Income A 2/5/93-8/31/00 - Since inception 12.28% 13.12% 11.85% 12.69%
Growth and Income A 9/1/95-8/31/00 - Five years 10.71% 11.96% 10.60% 11.86%
Growth and Income A 9/1/99-8/31/00 - One year 0.61% 6.48% 0.61% 6.46%
B-109
INTRODUCTION
VALUE OF $1,000 INVESTMENT
(AVERAGE ANNUAL TOTAL RETURN)
Assuming no voluntary
waiver of fees and no
expense reimbursements
----------------------
Assumes Assumes
Maximum maximum
Applicable Assumes Applicable Assumes
Sales no sales sales no sales
Fund Class Time Period Charge** Charge Charge** Charge
---- ----- ----------- ---------- -------- ---------- --------
Growth and Income B 5/1/96-8/31/00 - Since inception 9.61% 10.04% 9.61% 10.04%
Growth and Income B 9/1/99-8/31/00 - One year 0.42% 5.70% 0.42% 5.69%
Growth and Income C 8/15/97-8/31/00 - Since inception 0.42% 0.42% 0.42% 0.42%
Growth and Income C 9/1/99-8/31/00 - One year 4.61% 5.67% 4.60% 5.65%
Growth and Income Institutional 6/3/96-8/31/00 - Since inception N/A 11.05% N/A 11.05%
Growth and Income Institutional 9/1/99-8/31/00 - One year N/A 7.05% N/A 7.03%
Growth and Income Service 2/5/93-8/31/00 - Since inception N/A 13.08% N/A 12.71%
Growth and Income Service 9/1/95-8/31/00 - Five years N/A 11.89% N/A 11.89%
Growth and Income Service 9/1/99-8/31/00 - One year N/A 6.40% N/A 6.38%
CORE Large Cap Value A 12/31/98-8/31/00 - Since inception 2.82% 6.35% 2.32% 5.83%
CORE Large Cap Value A 9/1/99-8/31/00 - One year (1.04)% 4.68% 1.15% 4.55%
CORE Large Cap Value B 12/31/98-8/31/00 - Since inception 3.16% 5.52% 2.65% 5.01%
B-110
INTRODUCTION
VALUE OF $1,000 INVESTMENT
(AVERAGE ANNUAL TOTAL RETURN)
Assuming no voluntary
waiver of fees and no
expense reimbursements
----------------------
Assumes Assumes
Maximum maximum
Applicable Assumes Applicable Assumes
Sales no sales sales no sales
Fund Class Time Period Charge** Charge Charge** Charge
---- ----- ----------- ---------- -------- ---------- --------
CORE Large Cap Value B 9/1/99-8/31/00 - One year (1.12)% 3.96% 1.00% 3.84%
CORE Large Cap Value C 12/31/98-8/31/00 - Since inception 5.56% 5.56% 5.05% 5.05%
CORE Large Cap Value C 9/1/99-8/31/00 - One year 2.96% 3.97% 2.84% 3.85%
CORE Large Cap Value Institutional 12/31/98-8/31/00 - Since inception* N/A 6.75% N/A 6.23%
CORE Large Cap Value Institutional 9/1/99-8/31/00 - One year N/A 5.20% N/A 5.07%
CORE Large Cap Value Service 12/31/98-8/31/00 - Since inception N/A 6.24% N/A 5.72%
CORE Large Cap Value Service 9/1/99-8/31/00 - One year N/A 4.60% N/A 4.46%
CORE U.S. Equity A 5/24/91-8/31/00 - Since inception 16.22% 16.92% 16.00% 16.70%
CORE U.S. Equity A 9/1/95-8/31/00 - Five years 20.68% 22.05% 20.51% 21.88%
CORE U.S. Equity A 9/1/99-8/31/00 - One year 12.42% 18.96% 12.29% 18.80%
CORE U.S. Equity B 5/1/96-8/31/00 - Since inception 20.43% 20.75% 20.35% 20.67%
CORE U.S. Equity B 9/1/99-8/31/00 - One year 12.49% 18.03% 12.35% 17.88%
CORE U.S. Equity C 8/15/97-8/31/00 - Since inception 16.97% 16.97% 16.82% 16.82%
CORE U.S. Equity C 9/1/99-8/31/00 - One year 16.92% 18.03% 16.77% 17.88%
B-111
INTRODUCTION
VALUE OF $1,000 INVESTMENT
(AVERAGE ANNUAL TOTAL RETURN)
Assuming no voluntary
waiver of fees and no
expense reimbursements
----------------------
Assumes Assumes
Maximum maximum
Applicable Assumes Applicable Assumes
Sales no sales sales no sales
Fund Class Time Period Charge** Charge Charge** Charge
---- ----- ----------- ---------- -------- ---------- --------
CORE U.S. Equity Institutional 6/15/95-8/31/00 - Since inception N/A 23.32% N/A 23.12%
CORE U.S. Equity Institutional 9/1/95-8/31/00 - Five years N/A 22.71% N/A 22.52%
CORE U.S. Equity Institutional 9/1/99-8/31/00 - One year N/A 19.41% N/A 19.25%
CORE U.S. Equity Service 5/24/91-8/31/00 - Since inception N/A 16.94% N/A 16.68%
CORE U.S. Equity Service 9/1/94-8/31/00 - Five years N/A 22.08% N/A 21.84%
CORE U.S. Equity Service 9/1/99-8/31/00 - One year N/A 18.83% N/A 18.67%
CORE Large Cap Growth A 11/11/91-8/31/00 - Since inception 22.23% 23.04% 21.97% 22.78%
CORE Large Cap Growth A 9/1/95-8/31/00 - Five years 26.98% 28.48% 26.50% 27.99%
CORE Large Cap Growth A 9/1/99-8/31/00 - One year 26.38% 33.73% 26.09% 33.41%
CORE Large Cap Growth B 5/1/97-8/31/00 - Since inception 27.80% 28.32% 27.20% 27.72%
CORE Large Cap Growth B 9/1/99-8/31/00 - One year 27.76% 32.78% 27.45% 32.46%
CORE Large Cap Growth C 8/15/97-8/31/00 - Since inception 24.49% 24.49% 24.13% 24.13%
B-112
INTRODUCTION
VALUE OF $1,000 INVESTMENT
(AVERAGE ANNUAL TOTAL RETURN)
Assuming no voluntary
waiver of fees and no
expense reimbursements
----------------------
Assumes Assumes
Maximum maximum
Applicable Assumes Applicable Assumes
Sales no sales sales no sales
Fund Class Time Period Charge** Charge Charge** Charge
---- ----- ----------- ---------- -------- ---------- --------
CORE Large Cap Growth C 9/1/99-8/31/00 - One year 31.84% 32.84% 31.52% 32.52%
CORE Large Cap Growth Institutional 11/11/91-8/31/00 - Since inception N/A 23.19% N/A 22.88%
CORE Large Cap Growth Institutional 9/1/95-8/31/00 - Five years N/A 28.75% N/A 28.17%
CORE Large Cap Growth Institutional 9/1/99-8/31/00 - One year N/A 34.34% N/A 34.01%
CORE Large Cap Growth Service 11/11/91-8/31/00 - Since inception N/A 22.98% N/A 22.80%
CORE Large Cap Growth Service 9/1/95-8/31/00 - Five years N/A 28.35% N/A 28.02%
CORE Large Cap Growth Service 9/1/99-8/31/00 - One year N/A 33.64% N/A 33.31%
CORE Small Cap Equity A 8/15/97-8/31/00 - Since inception 6.90% 8.90% 6.08% 8.06%
CORE Small Cap Equity A 9/1/99-8/31/00 - One year 19.11% 26.10% 18.80% 25.75%
CORE Small Cap Equity B 8/15/97-8/31/00 - Since inception 7.27% 8.11% 6.51% 7.35%
CORE Small Cap Equity B 9/1/99-8/31/00 - One year 20.17% 25.17% 19.84% 24.83%
CORE Small Cap Equity C 8/15/97-8/31/00 - Since inception 8.20% 8.20% 7.44% 7.44%
CORE Small Cap Equity C 9/1/99-8/31/00 - One year 24.35% 25.35% 24.00% 25.00%
B-113
INTRODUCTION
VALUE OF $1,000 INVESTMENT
(AVERAGE ANNUAL TOTAL RETURN)
Assuming no voluntary
waiver of fees and no
expense reimbursements
----------------------
Assumes Assumes
Maximum maximum
Applicable Assumes Applicable Assumes
Sales no sales sales no sales
Fund Class Time Period Charge** Charge Charge** Charge
---- ----- ----------- ---------- -------- ---------- --------
CORE Small Cap Equity Institutional 8/15/97-8/31/00 - Since inception N/A 9.34% N/A 8.57%
CORE Small Cap Equity Institutional 9/1/99-8/31/00 - One Year N/A 26.60% N/A 26.25%
CORE Small Cap Equity Service 8/15/97-8/31/00 - Since inception N/A 8.81% N/A 8.01%
CORE Small Cap Equity Service 9/1/99-8/31/00 - One year N/A 25.45% N/A 25.58%
CORE International Equity A 8/15/97-8/31/00 - Since inception 3.22% 5.15% 2.51% 4.43%
CORE International Equity A 9/1/99-8/31/00 - One year 1.07% 6.92% 0.98% 6.81%
B-114
INTRODUCTION
VALUE OF $1,000 INVESTMENT
(AVERAGE ANNUAL TOTAL RETURN)
Assuming no voluntary
waiver of fees and no
expense reimbursements
----------------------
Assumes Assumes
Maximum maximum
Applicable Assumes Applicable Assumes
Sales no sales sales no sales
Fund Class Time Period Charge** Charge Charge** Charge
---- ----- ----------- ---------- -------- ---------- --------
CORE International Equity B 8/15/97-8/31/00 - Since inception 3.76% 4.68% 3.10% 4.02%
CORE International Equity B 9/1/99-8/31/00 - One year 1.23% 6.36% 1.14% 6.25%
CORE International Equity C 8/15/97-8/31/00 - Since inception 4.71% 4.71% 4.05% 4.05%
CORE International Equity C 9/1/99-8/31/00 - One year 5.32% 6.34% 5.21% 6.23%
CORE International Equity Institutional 8/15/97-8/31/00 - Since inception N/A 5.85% N/A 5.18%
CORE International Equity Institutional 9/1/99-8/31/00 - One year N/A 7.62% N/A 7.51%
CORE International Equity Service 8/15/97-8/31/00 - Since inception N/A 5.34% N/A 4.65%
CORE International Equity Service 9/1/99-8/31/00 - One year N/A 7.05% N/A 6.94%
Capital Growth A 4/20/90-8/31/00 - Since inception 19.02% 19.67% 18.77% 19.42%
Capital Growth A 9/1/90-8/31/00 - Ten years 20.22% 20.91% 19.98% 20.67%
Capital Growth A 9/1/95-8/31/00 - Five years 23.06% 24.47% 22.92% 24.32%
B-115
INTRODUCTION
VALUE OF $1,000 INVESTMENT
(AVERAGE ANNUAL TOTAL RETURN)
Assuming no voluntary
waiver of fees and no
expense reimbursements
----------------------
Assumes Assumes
Maximum maximum
Applicable Assumes Applicable Assumes
Sales no sales sales no sales
Fund Class Time Period Charge** Charge Charge** Charge
---- ----- ----------- ---------- -------- ---------- --------
Capital Growth A 9/1/99-8/31/00 - One year 18.80% 25.70% 18.71% 25.59%
Capital Growth B 5/1/96-8/31/00 - Since inception 24.84% 25.16% 24.91% 25.23%
Capital Growth B 9/1/99-8/31/00 - One year 19.32% 24.75% 19.23% 24.64%
Capital Growth C 8/15/97-8/31/00 - Since inception 22.91% 22.91% 22.87% 22.87%
Capital Growth C 9/1/99-8/31/99 - One year 23.66% 24.75% 23.56% 24.64%
Capital Growth Institutional 8/15/97-8/31/00 - Since inception N/A 24.25% N/A 24.22%
Capital Growth Institutional 9/1/99-8/31/00 - One year N/A 26.18% N/A 26.07%
Capital Growth Service 4/20/90-8/31/00 - Since inception N/A 19.64% N/A 19.40%
Capital Growth Service 9/1/90-8/31/00 - Ten years N/A 20.87% N/A 20.65%
Capital Growth Service 9/1/95-8/31/00 - Five years N/A 24.39% N/A 24.28%
Capital Growth Service 9/1/99-8/31/00 - One year N/A 25.53% N/A 25.43%
Strategic Growth A 5/24/99-8/31/00 - Since inception 14.10% 19.25% 11.44% 16.48%
Strategic Growth A 9/1/99-8/31/00 - One year 17.56% 24.46% 17.30% 24.16%
Strategic Growth B 5/24/99-8/31/00 - Since inception 15.35% 18.35% 12.60% 15.60%
Strategic Growth B 9/1/99-8/31/00 - One year 18.51% 23.51% 18.23% 23.21%
Strategic Growth C 5/24/99-8/31/00 - Since inception 18.50% 18.50% 15.75% 15.75%
Strategic Growth C 9/1/99-8/31/00 - One year 22.58% 23.58% 22.28% 23.28%
B-116
INTRODUCTION
VALUE OF $1,000 INVESTMENT
(AVERAGE ANNUAL TOTAL RETURN)
Assuming no voluntary
waiver of fees and no
expense reimbursements
----------------------
Assumes Assumes
Maximum maximum
Applicable Assumes Applicable Assumes
Sales no sales sales no sales
Fund Class Time Period Charge** Charge Charge** Charge
---- ----- ----------- ---------- -------- ---------- --------
Strategic Growth Institutional 5/24/99-8/31/00 - Since inception N/A 19.71% N/A 16.93%
Strategic Growth Institutional 9/1/99-8/31/00 - One Year N/A 24.93% N/A 24.64%
Strategic Growth Service 5/24/99-8/31/00 - Since inception N/A 19.25% N/A 16.47%
Strategic Growth Service 9/1/99-8/31/00 - One year N/A 24.45% N/A 24.14%
Growth Opportunities A 5/24/99-8/31/00 - Since inception 63.56% 70.94% 58.96% 66.16%
Growth Opportunities A 9/1/99-8/31/00 - One year 84.96% 95.73% 84.41% 95.13%
Growth Opportunities B 5/24/99-8/31/00 - Since inception 67.84% 70.59% 63.09% 65.84%
Growth Opportunities B 9/1/99-8/31/00 - One year 89.18% 94.27% 88.60% 93.67%
Growth Opportunities C 5/24/99-8/31/00 - Since inception 69.66% 69.66% 64.91% 64.91%
Growth Opportunities C 9/1/99-8/31/00 - One year 93.42% 94.43% 92.82% 93.83%
Growth Opportunities Institutional 5/24/99-8/31/00 - Since inception N/A 71.58% N/A 66.78%
Growth Opportunities Institutional 9/1/99-8/31/00 - One year N/A 96.67% N/A 96.05%
Growth Opportunities Service 5/24/99-8/31/00 - Since inception N/A 70.58% N/A 65.80%
Growth Opportunities Service 9/1/99-8/31/00 - One year N/A 95.41% N/A 94.78%
Mid Cap Value A 8/15/97-8/31/00 - Since inception 1.19% 3.09% 1.12% 3.02%
B-117
INTRODUCTION
VALUE OF $1,000 INVESTMENT
(AVERAGE ANNUAL TOTAL RETURN)
Assuming no voluntary
waiver of fees and no
expense reimbursements
----------------------
Assumes Assumes
Maximum maximum
Applicable Assumes Applicable Assumes
Sales no sales sales no sales
Fund Class Time Period Charge** Charge Charge** Charge
---- ----- ----------- ---------- -------- ---------- --------
Mid Cap Value A 9/1/99-8/31/00 - One year 2.73% 8.70% 2.68% 8.63%
Mid Cap Value B 8/15/97-8/31/00 - Since inception 1.40% 2.42% 1.02% 2.34%
Mid Cap Value B 9/1/99-8/31/00 - One year 3.01% 8.01% 2.95% 7.94%
Mid Cap Value C 8/15/97-8/31/00 - Since inception 2.41% 2.41% 2.34% 2.34%
Mid Cap Value C 9/1/99-8/31/00 - One year 6.84% 7.84% 6.77% 7.77%
Mid Cap Value Institutional 8/1/95-8/31/00 - Since inception N/A 13.26% N/A 13.17%
Mid Cap Value Institutional 9/1/95-8/31/00 - Five years N/A 13.18% N/A 13.09%
Mid Cap Value Institutional 9/1/99-8/31/00 - One year N/A 9.08% N/A 9.01%
Mid Cap Value Service 7/18/97-8/31/00 - Since inception N/A 3.84% N/A 3.76%
Mid Cap Value Service 9/1/99-8/31/00 - One year N/A 8.48% N/A 8.41%
Small Cap Value A 10/22/92-8/31/00 - Since inception 10.11% 10.91% 9.88% 10.68%
Small Cap Value A 9/1/95-8/31/00 - Five years 8.00% 9.23% 7.84% 9.07%
Small Cap Value A 9/1/99-8/31/00 - One year 10.79% 17.22% 10.68% 17.09%
Small Cap Value B 5/1/96-8/31/00 - Since inception 6.52% 6.98% 6.49% 6.95%
Small Cap Value B 9/1/99-8/31/00 - One year 11.24% 16.24% 11.13% 16.12%
Small Cap Value C 8/15/97-8/31/00 - Since inception 2.32% 2.32% 2.27% 2.27%
Small Cap Value C 9/1/99-8/31/00 - One year 15.34% 16.34% 15.22% 16.22%
Small Cap Value Institutional 8/15/97-8/31/00 - Since inception N/A 3.46% N/A 3.40%
Small Cap Value Institutional 9/1/99-8/31/00 - One year N/A 17.64% N/A 17.52%
B-118
INTRODUCTION
VALUE OF $1,000 INVESTMENT
(AVERAGE ANNUAL TOTAL RETURN)
Assuming no voluntary
waiver of fees and no
expense reimbursements
----------------------
Assumes Assumes
Maximum maximum
Applicable Assumes Applicable Assumes
Sales no sales sales no sales
Fund Class Time Period Charge** Charge Charge** Charge
---- ----- ----------- ---------- -------- ---------- --------
Small Cap Value Service 10/22/92-8/31/00 - Since inception N/A 10.86% N/A 10.68%
Small Cap Value Service 9/1/95-8/31/00 - Five years N/A 9.15% N/A 9.08%
Small Cap Value Service 9/1/99-8/31/00 - One year N/A 17.05% N/A 16.93%
Large Cap Value A 12/15/99-8/31/00 - Since inception* (1.80)% 3.90% (3.21)% 2.41%
Large Cap Value B 12/15/99-8/31/00 - Since inception* (1.70)% 3.30% (3.18)% 1.82%
Large Cap Value C 12/15/99-8/31/00 - Since inception* 2.20% 3.20% 0.72% 1.72%
Large Cap Value Institutional 12/15/99-8/31/00 - Since inception* N/A 4.00% N/A 2.50%
Large Cap Value Service 12/15/99-8/31/00 - Since inception* N/A 3.80% N/A 2.27%
International Equity A 12/1/92-8/31/00 - Since inception 11.33% 12.14% 11.18% 11.99%
International Equity A 9/1/95-8/31/00 - Five years 13.08% 14.38% 13.00% 14.29%
International Equity A 9/1/99-8/31/00 - One year 8.36% 14.68% 8.28% 14.59%
International Equity B 5/1/96-8/31/00 - Since inception 10.68% 11.10% 10.69% 11.11%
International Equity B 9/1/99-8/31/00 - One year 8.59% 14.20% 8.52% 14.11%
International Equity C 8/15/97-8/31/00 - Since inception 9.18% 9.18% 9.11% 9.11%
International Equity C 9/1/99-8/31/00 - One year 13.16% 14.28% 13.07% 14.19%
B-119
INTRODUCTION
VALUE OF $1,000 INVESTMENT
(AVERAGE ANNUAL TOTAL RETURN)
Assuming no voluntary
waiver of fees and no
expense reimbursements
----------------------
Assumes Assumes
Maximum maximum
Applicable Assumes Applicable Assumes
Sales no sales sales no sales
Fund Class Time Period Charge** Charge Charge** Charge
---- ----- ----------- ---------- -------- ---------- --------
International Equity Institutional 2/7/96-8/31/00 - Since inception N/A 13.73% N/A 13.64%
International Equity Institutional 9/1/99-8/31/00 - One year N/A 15.45% N/A 15.35%
International Equity Service 12/1/92-8/31/00 - Since inception N/A 12.23% N/A 12.09%
International Equity Service 9/1/95-8/31/00 - Five years N/A 14.52% N/A 14.44%
International Equity Service 9/1/99-8/31/00 - One year N/A 15.00% N/A 14.90%
B-120
INTRODUCTION
VALUE OF $1,000 INVESTMENT
(AVERAGE ANNUAL TOTAL RETURN)
Assuming no voluntary
waiver of fees and no
expense reimbursements
----------------------
Assumes Assumes
Maximum maximum
Applicable Assumes Applicable Assumes
Sales no sales sales no sales
Fund Class Time Period Charge** Charge Charge** Charge
---- ----- ----------- ---------- -------- ---------- --------
European Equity A 10/1/98-8/31/00 - Since inception 18.15% 21.67% 17.54% 21.05%
European Equity A 9/1/99-8/31/00 - One year 17.25% 24.04% 16.77% 23.51%
European Equity B 10/1/98-8/31/00 - Since inception 19.23% 21.09% 18.61% 20.47%
European Equity B 9/1/99-8/31/00 - One year 18.05% 23.32% 17.55% 22.80%
European Equity C 10/1/98-8/31/00 - Since inception 21.22% 21.22% 20.60% 20.60%
European Equity C 9/1/99-8/31/00 - One year 22.42% 23.48% 21.91% 22.96%
European Equity Institutional 10/1/98-8/31/00 - Since inception N/A 22.46% N/A 21.84%
European Equity Institutional 9/1/99-8/31/00 - One year N/A 24.85% N/A 24.32%
European Equity Service 10/1/98-8/31/00 - Since inception N/A 21.84% N/A 21.17%
European Equity Service 9/1/99-8/31/00 - One year N/A 24.28% N/A 23.74%
Japanese Equity Fund A 5/1/98-8/31/00 - Since inception 24.35% 27.38% 22.86% 25.86%
Japanese Equity Fund A 9/1/99-8/31/00 - One year 2.48% 8.47% 2.08% 8.04%
Japanese Equity Fund B 5/1/98-8/31/00 - Since inception 25.82% 26.87% 24.30% 25.35%
Japanese Equity Fund B 9/1/99-8/31/00 - One year 2.71% 8.12% 2.29% 7.68%
Japanese Equity Fund C 5/1/98-8/31/00 - Since inception 26.80% 26.80% 25.28% 25.28%
B-121
INTRODUCTION
VALUE OF $1,000 INVESTMENT
(AVERAGE ANNUAL TOTAL RETURN)
Assuming no voluntary
waiver of fees and no
expense reimbursements
----------------------
Assumes Assumes
Maximum maximum
Applicable Assumes Applicable Assumes
Sales no sales sales no sales
Fund Class Time Period Charge** Charge Charge** Charge
---- ----- ----------- ---------- -------- ---------- --------
Japanese Equity Fund C 9/1/99-8/31/00 - One year 6.74% 7.82% 6.31% 7.39%
Japanese Equity Fund Institutional 5/1/98-8/31/00 - Since inception N/A 28.15% N/A 26.63%
Japanese Equity Fund Institutional 9/1/99-8/31/00 - One year N/A 9.14% N/A 8.70%
Japanese Equity Fund Service 5/1/98-8/31/00 - Since inception N/A 27.42% N/A 25.88%
Japanese Equity Fund Service 9/1/99-8/31/00 - One year N/A 8.65% N/A 8.20%
InternationalGrowth A 5/1/98-8/31/00 - Since inception 21.59% 24.56% 20.77% 23.72%
Oppertunities
B-122
INTRODUCTION
VALUE OF $1,000 INVESTMENT
(AVERAGE ANNUAL TOTAL RETURN)
Assuming no voluntary
waiver of fees and no
expense reimbursements
----------------------
Assumes Assumes
Maximum maximum
Applicable Assumes Applicable Assumes
Sales no sales sales no sales
Fund Class Time Period Charge** Charge Charge** Charge
---- ----- ----------- ---------- -------- ---------- --------
InternationalGrowth A 9/1/99-8/31/00 - One year 19.32% 26.26% 19.07% 25.98%
Opportunities
InternationalGrowth B 5/1/98-8/31/00 - Since inception 23.11% 24.11% 22.26% 23.26%
Opportunities
InternationalGrowth B 9/1/99-8/31/00 - One year 20.48% 25.66% 20.22% 25.38%
Opportunities
InternationalGrowth C 5/1/98-8/31/00 - Since inception 24.07% 24.07% 23.24% 23.24%
Opportunities
InternationalGrowth C 9/1/99-8/31/00 - One year 24.55% 25.58% 24.26% 25.30%
Opportunities
InternationalGrowth Institutional 5/1/98-8/31/00 - Since inception N/A 25.40% N/A 24.57%
Opportunities
InternationalGrowth Institutional 9/1/99-8/31/00 - One year N/A 27.12% N/A 26.83%
Opportunities
InternationalGrowth Service 5/1/98-8/31/00 - Since inception N/A 24.69% N/A 23.85%
Opportunities
InternationalGrowth Service 9/1/99-8/31/00 - One year N/A 26.57% N/A 26.28%
Opportunities
Emerging Markets Equity A 12/15/97-8/31/00 - Since inception 2.39% 4.54% 1.86% 4.00%
Emerging Markets Equity A 9/1/99-8/31/00 - One year 10.51% 16.95% 10.25% 16.66%
Emerging Markets Equity B 12/15/97-8/31/00 - Since inception 3.03% 4.11% 2.77% 3.85%
Emerging Markets Equity B 9/1/99-8/31/00 - One year 11.40% 16.40% 11.95% 16.94%
B-123
INTRODUCTION
VALUE OF $1,000 INVESTMENT
(AVERAGE ANNUAL TOTAL RETURN)
Assuming no voluntary
waiver of fees and no
expense reimbursements
----------------------
Assumes Assumes
Maximum maximum
Applicable Assumes Applicable Assumes
Sales no sales sales no sales
Fund Class Time Period Charge** Charge Charge** Charge
---- ----- ----------- ---------- -------- ---------- --------
Emerging Markets Equity C 12/15/97-8/31/00 - Since inception 4.19% 4.19% 3.92% 3.92%
Emerging Markets Equity C 9/1/99-8/31/00 - One year 15.34% 16.34% 15.89% 16.88%
Emerging Markets Equity Institutional 12/15/97-8/31/00 - Since inception N/A 5.31% N/A 4.77%
Emerging Markets Equity Institutional 9/1/99-8/31/00 - One year N/A 17.61% N/A 17.31%
Emerging Markets Equity Service 12/15/97-8/31/00 - Since inception N/A 3.82% N/A 3.54%
Emerging Markets Equity Service 9/1/99-8/31/00 - One year N/A 17.46% N/A 17.13%
Asia Growth A 7/8/94-8/31/00 - Since inception (4.23)% (3.34)% (4.53)% (3.65)%
Asia Growth A 9/1/95-8/31/00 - Five years (6.33)% (5.26)% (6.60)% (5.54)%
B-124
INTRODUCTION
VALUE OF $1,000 INVESTMENT
(AVERAGE ANNUAL TOTAL RETURN)
Assuming no voluntary
waiver of fees and no
expense reimbursements
----------------------
Assumes Assumes
Maximum maximum
Applicable Assumes Applicable Assumes
Sales no sales sales no sales
Fund Class Time Period Charge** Charge Charge** Charge
---- ----- ----------- ---------- -------- ---------- --------
Asia Growth A 9/1/99-8/31/00 - One year (4.78)% 0.72% (5.19)% 0.27%
Asia Growth B 5/1/96-8/31/00 - Since inception (10.44)% (10.02)% (10.66)% (10.24)%
Asia Growth B 9/1/99-8/31/00 - One year (4.82)% 0.18% (5.24)% (0.26)%
Asia Growth C 8/15/97-8/31/00 - Since inception (11.34)% (11.34)% (11.72)% (11.72)%
Asia Growth C 9/1/99-8/31/00 - One year (0.82)% 0.18% (1.25)% (0.26)%
Asia Growth Institutional 2/2/96-8/31/00 - Since inception N/A (7.64)% N/A (7.94)%
Asia Growth Institutional 9/1/99-8/31/00 - One year N/A 1.42% N/A 0.97%
Research Select A 6/19/00-8/31/00 - Since inception* 1.80% 7.70% 1.69% 7.59%
Research Select B 6/19/00-8/31/00 - Since inception* 2.60% 7.60% 2.49% 7.49%
Research Select C 6/19/00-8/31/00 - Since inception* 6.70% 7.70% 6.59% 7.59%
Research Select Institutional 6/19/00-8/31/00 - Since inception* N/A 7.80% N/A 7.67%
Research Select Service 6/19/00-8/31/00 - Since Inception* N/A 7.70% N/A 7.58%
B-125
---------------------------
All returns are average annual total returns.
* Represents an aggregate total return (not annualized) since this class has not
completed a full twelve months of operations.
** Total return reflects a maximum initial sales charge of 5.5% for Class A
Shares, the assumed deferred sales charge for Class B Shares (5% maximum
declining to 0% after six years) and the assumed deferred sales charge for Class
C Shares (1% if redeemed within 12 months of purchase).
B-126
From time to time, advertisements or information may include a discussion
of certain attributes or benefits to be derived by an investment in a Fund. Such
advertisements or information may include symbols, headlines or other material
which highlight or summarize the information discussed in more detail in the
communication.
The Trust may from time to time summarize the substance of discussions
contained in shareholder reports in advertisements and publish the Investment
Adviser's views as to markets, the rationale for a Fund's investments and
discussions of a Fund's current asset allocation.
In addition, from time to time, advertisements or information may include
a discussion of asset allocation models developed by GSAM and/or its affiliates,
certain attributes or benefits to be derived from asset allocation strategies
and the Goldman Sachs mutual funds that may be offered as investment options for
the strategic asset allocations. Such advertisements and information may also
include GSAM's current economic outlook and domestic and international market
views to suggest periodic tactical modifications to current asset allocation
strategies. Such advertisements and information may include other materials
which highlight or summarize the services provided in support of an asset
allocation program.
A Fund's performance data will be based on historical results and will
not be intended to indicate future performance. A Fund's total return and yield
will vary based on market conditions, portfolio expenses, portfolio investments
and other factors. The value of a Fund's shares will fluctuate and an investor's
shares may be worth more or less than their original cost upon redemption. The
Trust may also, at its discretion, from time to time make a list of a Fund's
holdings available to investors upon request.
Total return will be calculated separately for each class of shares in
existence. Because each class of shares is subject to different expenses, total
return with respect to each class of shares of a Fund will differ.
SHARES OF THE TRUST
The Funds, except the CORE International Equity, CORE Small Cap Equity,
CORE Large Cap Value, CORE Large Cap Growth, Strategic Growth, Growth
Opportunities, Large Cap Value, European Equity, Japanese Equity, International
Growth Opportunities, Emerging Markets Equity and Research Select Funds, were
reorganized on April 30, 1997 from series of a Maryland corporation to part of
Goldman Sachs Trust, a Delaware business trust, established by a Declaration of
Trust dated January 28, 1997.
The Trustees have authority under the Trust's Declaration of Trust to
create and classify shares of beneficial interest in separate series, without
further action by shareholders. The Trustees also have authority to classify and
reclassify any series of shares into one or more classes of shares. As of the
date of this Additional Statement, the Trustees have classified the shares of
each of the Funds into five classes: Institutional Shares, Service Shares, Class
A Shares, Class B Shares and Class C Shares.
B-127
Each Institutional Share, Service Share, Class A Share, Class B Share and
Class C Share of a Fund represents a proportionate interest in the assets
belonging to the applicable class of the Fund. All expenses of a Fund are borne
at the same rate by each class of shares, except that fees under Service Plans
are borne exclusively by Service Shares, fees under Distribution and Service
Plans are borne exclusively by Class A, Class B or Class C Shares and transfer
agency fees are borne at different rates by different share classes. The
Trustees may determine in the future that it is appropriate to allocate other
expenses differently between classes of shares and may do so to the extent
consistent with the rules of the SEC and positions of the Internal Revenue
Service. Each class of shares may have different minimum investment requirements
and be entitled to different shareholder services. With limited exceptions,
shares of a class may only be exchanged for shares of the same or an equivalent
class of another fund. See "Shareholder Guide" in the Prospectus and "Other
Information Regarding Maximum Sales Charge, Purchases, Redemption, Exchanges and
Dividends" below.
Institutional Shares may be purchased at net asset value without a sales
charge for accounts in the name of an investor or institution that is not
compensated by a Fund under a Plan for services provided to the institution's
customers.
Service Shares may be purchased at net asset value without a sales charge
for accounts held in the name of an institution that, directly or indirectly,
provides certain account administration and shareholder liaison services to its
customers, including maintenance of account records and processing orders to
purchase, redeem and exchange Service Shares. Service Shares bear the cost of
account administration fees at the annual rate of up to 0.50% of the average
daily net assets of the Fund attributable to Service Shares.
Class A Shares are sold, with an initial sales charge of up to 5.5%,
through brokers and dealers who are members of the National Association of
Securities Dealers, Inc. (the "NASD") and certain other financial service firms
that have sales agreements with Goldman Sachs. Class A Shares bear the cost of
distribution and service fees at the aggregate rate of up to 0.25% of the
average daily net assets of such Class A Shares (0.50% with respect to the CORE
International Equity, International Equity, European Equity, Japanese Equity,
International Growth Opportunities, Emerging Markets and Asia Growth Funds).
With respect to Class A Shares, the Distributor at its discretion may use
compensation for distribution services paid under the Distribution and Services
Plan for personal and account maintenance services and expenses so long as such
total compensation under the Plan does not exceed the maximum cap on "service
fees" imposed by the NASD.
Class B Shares of the Funds are sold subject to a contingent deferred
sales charge of up to 5.0% through brokers and dealers who are members of the
NASD and certain other financial services firms that have sales arrangements
with Goldman Sachs. Class B Shares bear the cost of distribution (Rule 12b-1)
fees at the aggregate rate of up to 0.75% of the average daily net assets
attributable to Class B Shares. Class B Shares also bear the cost of service
fees at an annual rate of up to 0.25% of the average daily net assets
attributable to Class B Shares.
Class C Shares of the Funds are sold subject to a contingent deferred
sales charge of up to 1.0% through brokers and dealers who are members of
the NASD
B-128
and certain other financial services firms that have sales arrangements with
Goldman Sachs. Class C Shares bear the cost of distribution (Rule 12b-1) fees at
the aggregate rate of up to 0.75% of the average daily net assets attributable
to Class C Shares. Class C Shares also bear the cost of service fees at an
annual rate of up to 0.25% of the average daily net assets attributable to Class
C Shares.
It is possible that an institution or its affiliate may offer different
classes of shares (i.e., Institutional, Service, Class A Shares, Class B Shares
and Class C Shares) to its customers and thus receive different compensation
with respect to different classes of shares of each Fund. Dividends paid by each
Fund, if any, with respect to each class of shares will be calculated in the
same manner, at the same time on the same day and will be the same amount,
except for differences caused by the differences in expenses discussed above.
Similarly, the net asset value per share may differ depending upon the class of
shares purchased.
Certain aspects of the shares may be altered after advance notice to
shareholders if it is deemed necessary in order to satisfy certain tax
regulatory requirements.
When issued, shares are fully paid and non-assessable. In the event of
liquidation, shareholders are entitled to share pro rata in the net assets of
the applicable class of the relevant Fund available for distribution to such
shareholders. All shares are freely transferable and have no preemptive,
subscription or conversion rights.
As of November 30, 2000 the following entities owned of record or
beneficially more than 5% of the outstanding shares of the Balanced Fund: Class
A Shares, Edward Jones, 201 Progress Parkway, Maryland Heights, MD 63043-3009
(48%); and Class B Shares, Edward Jones, 201 Progress Parkway, Maryland Heights,
MD 63043-3009 (6%).
As of November 30, 2000 the following entity owned of record or
beneficially more than 5% of the outstanding shares of the Growth and Income
Fund: Class A Shares, Edward Jones, 201 Progress Parkway, Maryland Heights, MD
63043-3009 (45%).
As of November 30, 2000 the following entity owned of record or
beneficially more than 5% of the outstanding shares of the CORE Large Cap Value
Fund: Institutional Class, State Street Bank & Trust Co., Goldman Sachs Growth
Strategy, Omnibus a/c - Core Large Cap Value, P.O. Box 1713, Boston, MA
02105-1713 (20%).
B-129
As of November 30, 2000 the following entities owned of record or
beneficially more than 5% of the outstanding shares of the CORE U.S. Equity
Fund: Class A Shares, Edward Jones, 201 Progress Parkway, Maryland Heights, MD
63043-3009 (21%); and Institutional Class, State Street Bank & Trust, GS Profit
Sharing Master Trust, P. O. Box 1992, Boston, MA 02105 (11%).
As of November 30, 2000 the following entity owned of record or
beneficially more than 5% of the outstanding shares of the CORE Large Cap Growth
Fund: Class A Shares, Edward Jones, 201 Progress Parkway, Maryland Heights, MD
63043-3009 (9%).
As of November 30, 2000 the following entities owned of record or
beneficially more than 5% of the outstanding shares of the CORE Small Cap Equity
Fund: Institutional Class, State Street Bank & Trust Co., Goldman Sachs Growth &
Income Strategy, P.O. Box 1713, Boston, MA 02105-1713 (7%); State Street Bank &
Trust Co., Goldman Sachs Aggressive Growth, P.O. Box 1713, Boston, MA 02105-1713
(6%); and Goldman Sachs & Co., FBO Acct. #021017538, c/o Mutual Fund Ops., 85
Broad Street, New York, NY 10004-2456 (6%).
B-130
As of November 30, 2000 the following entity owned of record or
beneficially more than 5% of the outstanding shares of the CORE International
Equity Fund: Institutional Class, State Street Bank & Trust, FBO Goldman Sachs
Growth Strategy, P.O. Box 1713, Boston, MA 02105-1713 (20%).
B-131
As of November 30, 2000 the following entity owned of record or
beneficially more than 5% of the outstanding shares of the Capital Growth Fund:
Class A Shares, Edward Jones, 201 Progress Parkway, Maryland Heights, MD
63043-3009 (14%).
As of November 30, 2000 the following entities owned of record or
beneficially more than 5% of the outstanding shares of the Mid Cap Value Fund:
Class A Shares, Edward Jones, 201 Progress Parkway, Maryland Heights, MD
63043-3009 (5%); and Institutional Class, State Street Bank & Trust, GS Profit
Sharing Master Trust, P.O. Box 1992, Boston, MA 02105 (62%).
As of November 30, 2000 the following entity owned of record or
beneficially more than 5% of the outstanding shares of the International Equity
Fund: Class A Shares, Edward Jones, 201 Progress Parkway, Maryland Heights, MD
63043-3009 (13%).
As of November 30, 2000 the following entity owned of record or
beneficially more than 5% of the outstanding shares of the Small Cap Value Fund:
Class A Shares, Edward Jones, 201 Progress Parkway, Maryland Heights, MD
63043-3009 (28%).
As of November 30, 2000 the following entities owned of record or
beneficially more than 5% of the outstanding shares of the Emerging Markets
Equity Fund: Institutional Class, State Street Bank & Trust, FBO Goldman Sachs
Growth & Income, P.O. Box 1713, Boston, MA 02105-1713 (8%); University of Texas
Systems, Permanent University Fund, P.O. Box 2033, Austin, TX 78768-2033 (15%);
and Board of Regents of the University of Texas System, P.O. Box 2033, Austin,
TX 78768-2033 (6%).
B-132
As of November 30, 2000 the following entity owned of record or
beneficially more than 5% of the outstanding shares of the Asia Growth Fund:
Class A Shares, Edward Jones, 201 Progress Parkway, Maryland Heights, MD
63043-3009 (19%).
As of November 30, 2000 the following entities owned of record or
beneficially more than 5% of the outstanding shares of the Large Cap Value Fund:
Institutional Class, Edward Jones, 201 Progress Parkway, Maryland Heights, MD
63043-3009 (41%); and The Goldman Sachs Group LP, LCVI - Large Cap Value
Institutional, Attn: Danny TSUI, 85 Broad Street, Fl. 10, New York, NY
10004-2434 (30%).
As of November 30, 2000 the following entity owned of record or
beneficially more than 5% of the outstanding shares of the Research Select Fund:
Class B Shares, Merrill Lynch Pierce Fenner & Smith, For the Sole Benefit of
It's Customers, Attn: Service Team, Sec #97PR8, Goldman Sachs Funds, 4800 Deer
Lake Drive East, 3rd Fl., Jacksonville, FL 32246-6484 (5%).
The Act requires that where more than one class or series of shares
exists, each class or series must be preferred over all other classes or series
in respect of assets specifically allocated to such class or series. In
addition, Rule 18f-2 under the Act provides that any matter required to be
submitted by the provisions of the Act or applicable state law, or otherwise, to
the holders of the outstanding voting securities of an investment company such
as the Trust shall not be deemed to have been effectively acted upon unless
approved by the holders of a majority of the outstanding shares of each class or
series affected by such matter. Rule 18f-2 further provides that a class or
series shall be deemed to be affected by a matter unless the interests of each
class or series in the matter are substantially identical or the matter does not
affect any interest of such class or series. However, Rule 18f-2 exempts the
selection of independent public accountants, the approval of principal
distribution contracts and the election of trustees from the separate voting
requirements of Rule 18f-2.
The Trust is not required to hold annual meetings of shareholders and
does not intend to hold such meetings. In the event that a meeting of
shareholders is held, each share of the Trust will be entitled, as determined by
the Trustees without the vote or consent of the shareholders, either to one vote
for each share or to one vote for each dollar of net asset value represented by
such shares on all matters presented to shareholders including the elections of
Trustees (this method of voting being referred to as "dollar based voting").
However, to the extent required by the Act or otherwise determined by the
Trustees, series and classes of the Trust will vote separately from each other.
Shareholders of the Trust do not have cumulative voting rights in the election
of Trustees. Meetings of shareholders of the Trust, or any series or class
thereof, may be called by the Trustees, certain officers or upon the written
request of holders of 10% or more of the shares entitled to vote at such
meetings. The Trustees will call a special meeting of shareholders for the
purpose of electing Trustees, if, at any time, less than a majority of Trustees
holding office at the time were elected by shareholders. The shareholders of the
Trust will have voting rights only with respect to the limited number of matters
specified in the Declaration of Trust and such other matters as the Trustees may
determine or may be required by law.
B-133
The Declaration of Trust provides for indemnification of Trustees,
officers, employees and agents of the Trust unless the recipient is adjudicated
(i) to be liable by reason of willful misfeasance, bad faith, gross negligence
or reckless disregard of the duties involved in the conduct of such person's
office or (ii) not to have acted in good faith in the reasonable belief that
such person's actions were in the best interest of the Trust. The Declaration of
Trust provides that, if any shareholder or former shareholder of any series is
held personally liable solely by reason of being or having been a shareholder
and not because of the shareholder's acts or omissions or for some other reason,
the shareholder or former shareholder (or heirs, executors, administrators,
legal representatives or general successors) shall be held harmless from and
indemnified against all loss and expense arising from such liability. The Trust,
acting on behalf of any affected series, must, upon request by such shareholder,
assume the defense of any claim made against such shareholder for any act or
obligation of the series and satisfy any judgment thereon from the assets of the
series.
The Declaration of Trust permits the termination of the Trust or of any
series or class of the Trust (i) by a majority of the affected shareholders at a
meeting of shareholders of the Trust, series or class; or (ii) by a majority of
the Trustees without shareholder approval if the Trustees determine that such
action is in the best interest of the Trust, series or its respective
shareholders. The factors and events that the Trustees may take into account in
making such determination include (i) the inability of the Trust or any
successor series or class to maintain its assets at an appropriate size; (ii)
changes in laws or regulations governing the Trust, series or class or affecting
assets of the type in which it invests; or (iii) economic developments or trends
having a significant adverse impact on their business or operations.
The Declaration of Trust authorizes the Trustees without shareholder
approval to cause the Trust, or any series thereof, to merge or consolidate with
any corporation, association, trust or their organization or sell or exchange
all or substantially all of the property belonging to the Trust or any series
thereof. In addition, the Trustees, without shareholder approval, may adopt a
master-feeder structure by investing all or a portion of the assets of a series
of the Trust in the securities of another open-end investment company.
The Declaration of Trust permits the Trustees to amend the Declaration of
Trust without a shareholder vote. However, shareholders of the Trust have the
right to vote on any amendment (i) that would adversely affect the voting rights
of shareholder; (ii) that is required by law to be approved by shareholders;
(iii) that would amend the provisions of the Declaration of Trust regarding
amendments and supplements thereto; or (iv) that the Trustees determine to
submit to shareholders.
The Trustees may appoint separate Trustees with respect to one or more
series or classes of the Trust's shares (the "Series Trustees"). Series Trustees
may, but are not required to, serve as Trustees of the Trust or any other series
or class of the Trust. The Series Trustees have, to the exclusion of any other
Trustees of the Delaware Trust, all the powers and authorities of Trustees under
the Declaration of Trust with respect to any other series or class.
B-134
Shareholder and Trustee Liability
Under Delaware Law, the shareholders of the Funds are not generally
subject to liability for the debts or obligations of the Trust. Similarly,
Delaware law provides that a series of the Trust will not be liable for the
debts or obligations of any other series of the Trust. However, no similar
statutory or other authority limiting business trust shareholder liability
exists in other states. As a result, to the extent that a Delaware business
trust or a shareholder is subject to the jurisdiction of courts of such other
states, the courts may not apply Delaware law and may thereby subject the
Delaware business trust shareholders to liability. To guard against this risk,
the Declaration of Trust contains an express disclaimer of shareholder liability
for acts or obligations of a Fund. Notice of such disclaimer will normally be
given in each agreement, obligation or instrument entered into or executed by a
series or the Trustees. The Declaration of Trust provides for indemnification by
the relevant Fund for all loss suffered by a shareholder as a result of an
obligation of the series. The Declaration of Trust also provides that a series
shall, upon request, assume the defense of any claim made against any
shareholder for any act or obligation of the series and satisfy any judgment
thereon. In view of the above, the risk of personal liability of shareholders of
a Delaware business trust is remote.
In addition to the requirements under Delaware law, the Declaration of
Trust provides that shareholders of a series may bring a derivative action on
behalf of the series only if the following conditions are met: (a) shareholders
eligible to bring such derivative action under Delaware law who hold at least
10% of the outstanding shares of the series, or 10% of the outstanding shares of
the class to which such action relates, shall join in the request for the
Trustees to commence such action; and (b) the Trustees must be afforded a
reasonable amount of time to consider such shareholder request and to
investigate the basis of such claim. The Trustees will be entitled to retain
counsel or other advisers in considering the merits of the request and may
require an undertaking by the shareholders making such request to reimburse the
series for the expense of any such advisers in the event that the Trustees
determine not to bring such action.
The Declaration of Trust further provides that the Trustees will not be
liable for error of judgment or mistakes of fact or law, but nothing in the
Declaration of Trust protects a Trustee against liability to which he or she
would otherwise be subject by reason of willful misfeasance, bad faith, gross
negligence, or reckless disregard of the duties involved in the conduct of his
or her office.
TAXATION
The following is a summary of the principal U.S. federal income, and
certain state and local, tax considerations regarding the purchase, ownership
and disposition of shares in each Fund of the Trust. This summary does not
address special tax rules applicable to certain classes of investors, such as
tax-exempt entities, insurance companies and financial institutions. Each
prospective shareholder is urged to consult his own tax adviser with respect to
the specific federal, state, local and foreign tax consequences of investing in
each Fund. The summary is based on the laws in effect on the date of this
Additional Statement, which are subject to change.
B-135
General
Each Fund is a separate taxable entity. Each Fund has elected to be
treated and intends to qualify for each taxable year as a regulated investment
company under Subchapter M of the Code.
There are certain tax requirements that all Funds must follow in order to
avoid federal taxation. In its efforts to adhere to these requirements, the
Funds may have to limit their investment activities in some types of
instruments. Qualification as a regulated investment company under the Code
requires, among other things, that (a) a Fund derive at least 90% of its gross
income for its taxable year from dividends, interest, payments with respect to
securities loans and gains from the sale or other disposition of stocks or
securities or foreign currencies, or other income (including but not limited to
gains from options, futures, and forward contracts) derived with respect to its
business of investing in such stock, securities or currencies (the "90% gross
income test"); and (b) such Fund diversify its holdings so that, at the close of
each quarter of its taxable year, (i) at least 50% of the market value of such
Fund's total (gross) assets is comprised of cash, cash items, U.S. Government
securities, securities of other regulated investment companies and other
securities limited in respect of any one issuer to an amount not greater in
value than 5% of the value of such Fund's total assets and to not more than 10%
of the outstanding voting securities of such issuer, and (ii) not more than 25%
of the value of its total (gross) assets is invested in the securities of any
one issuer (other than U.S. Government securities and securities of other
regulated investment companies) or two or more issuers controlled by the Fund
and engaged in the same, similar or related trades or businesses. For purposes
of the 90% gross income test, income that a Fund earns from equity interests in
certain entities that are not treated as corporations (e.g., partnerships or
trusts) for U.S. tax purposes will generally have the same character for such
Fund as in the hands of such an entity; consequently, a Fund may be required to
limit its equity investments in such entities that earn fee income, rental
income, or other nonqualifying income. In addition, future Treasury regulations
could provide that qualifying income under the 90% gross income test will not
include gains from foreign currency transactions that are not directly related
to a Fund's principal business of investing in stock or securities or options
and futures with respect to stock or securities. Using foreign currency
positions or entering into foreign currency options, futures and forward or swap
contracts for purposes other than hedging currency risk with respect to
securities in a Fund's portfolio or anticipated to be acquired may not qualify
as "directly-related" under these tests.
If a Fund complies with such provisions, then in any taxable year in
which such Fund distributes, in compliance with the Code's timing and other
requirements, at least 90% of its "investment company taxable income" (which
includes dividends, taxable interest, taxable accrued original issue discount
and market discount income, income from securities lending, any net short-term
capital gain in excess of net long-term capital loss, certain net realized
foreign exchange gains and any other taxable income other than "net capital
gain," as defined below, and is reduced by deductible expenses), and at least
90% of the excess of its gross tax-exempt interest income (if any) over certain
disallowed deductions, such Fund (but not its shareholders) will be relieved of
federal income tax on any income of the Fund, including long-term capital gains,
distributed to shareholders. However, if a Fund retains any investment company
taxable income or "net capital gain" (the excess of net long-term capital gain
over net short-term capital loss), it will be subject to a
B-136
tax at regular corporate rates on the amount retained. If the Fund retains any
net capital gain, the Fund may designate the retained amount as undistributed
capital gains in a notice to its shareholders who, if subject to U.S. federal
income tax on long-term capital gains, (i) will be required to include in income
for federal income tax purposes, as long-term capital gain, their shares of such
undistributed amount, and (ii) will be entitled to credit their proportionate
shares of the tax paid by the Fund against their U.S. federal income tax
liabilities, if any, and to claim refunds to the extent the credit exceeds such
liabilities. For U.S. federal income tax purposes, the tax basis of shares owned
by a shareholder of the Fund will be increased by an amount equal under current
law to 65% of the amount of undistributed net capital gain included in the
shareholder's gross income. Each Fund intends to distribute for each taxable
year to its shareholders all or substantially all of its investment company
taxable income, net capital gain and any net tax-exempt interest. Exchange
control or other foreign laws, regulations or practices may restrict
repatriation of investment income, capital or the proceeds of securities sales
by foreign investors such as the CORE International Equity, International
Equity, European Equity, Japanese Equity, International Growth Opportunities,
Emerging Markets Equity or Asia Growth Funds and may therefore make it more
difficult for such a Fund to satisfy the distribution requirements described
above, as well as the excise tax distribution requirements described below.
However, each Fund generally expects to be able to obtain sufficient cash to
satisfy such requirements from new investors, the sale of securities or other
sources. If for any taxable year a Fund does not qualify as a regulated
investment company, it will be taxed on all of its investment company taxable
income and net capital gain at corporate rates, and its distributions to
shareholders will be taxable as ordinary dividends to the extent of its current
and accumulated earnings and profits.
In order to avoid a 4% federal excise tax, each Fund must distribute (or
be deemed to have distributed) by December 31 of each calendar year at least 98%
of its taxable ordinary income for such year, at least 98% of the excess of its
capital gains over its capital losses (generally computed on the basis of the
one-year period ending on October 31 of such year), and all taxable ordinary
income and the excess of capital gains over capital losses for the previous year
that were not distributed for such year and on which the Fund paid no federal
income tax. For federal income tax purposes, dividends declared by a Fund in
October, November or December to shareholders of record on a specified date in
such a month and paid during January of the following year are taxable to such
shareholders as if received on December 31 of the year declared. Each Fund
anticipates that it will generally make timely distributions of income and
capital gains in compliance with these requirements so that they will generally
not be required to pay the excise tax. For federal income tax purposes, each
Fund is permitted to carry forward a net capital loss in any year to offset its
own capital gains, if any, during the eight years following the year of the
loss. At August 31, 2000 the following Funds had capital loss carry forwards
approximating the amount indicated for federal tax purposes, expiring in the
year indicated: Growth and Income Fund, $48,213,000 (expires 2008); Mid Cap
Value Fund, $19,761,198 (expires 2006-2008); Small Cap Value Fund, $42,959,499
(expires 2006-2008); and Asia Growth Fund, $71,481,000 (expires 2005-2007).
These amounts are available to be carried forward to offset future capital gains
to the extent permitted by the Code and applicable tax regulations.
B-137
Gains and losses on the sale, lapse, or other termination of options and
futures contracts, options thereon and certain forward contracts (except certain
foreign currency options, forward contracts and futures contracts) will
generally be treated as capital gains and losses. Certain of the futures
contracts, forward contracts and options held by a Fund will be required to be
"marked-to-market" for federal income tax purposes, that is, treated as having
been sold at their fair market value on the last day of the Fund's taxable year.
These provisions may require a Fund to recognize income or gains without a
concurrent receipt of cash. Any gain or loss recognized on actual or deemed
sales of these futures contracts, forward contracts, or options will (except for
certain foreign currency options, forward contracts, and futures contracts) be
treated as 60% long-term capital gain or loss and 40% short-term capital gain or
loss. As a result of certain hedging transactions entered into by a Fund, the
Fund may be required to defer the recognition of losses on futures contracts,
forward contracts, and options or underlying securities or foreign currencies to
the extent of any unrecognized gains on related positions held by such Fund and
the characterization of gains or losses as long-term or short-term may be
changed. The tax provisions described above applicable to options, futures and
forward contracts may affect the amount, timing and character of a Fund's
distributions to shareholders. Application of certain requirements for
qualification as a regulated investment company and/or these tax rules to
certain investment practices, such as dollar rolls, or certain derivatives such
as interest rate swaps, floors, caps and collars and currency, mortgage or index
swaps may be unclear in some respects, and a Fund may therefore be required to
limit its participation in such transactions. Certain tax elections may be
available to a Fund to mitigate some of the unfavorable consequences described
in this paragraph.
Section 988 of the Code contains special tax rules applicable to certain
foreign currency transactions and instruments that may affect the amount, timing
and character of income, gain or loss recognized by a Fund. Under these rules,
foreign exchange gain or loss realized with respect to foreign currencies and
certain futures and options thereon, foreign currency-denominated debt
instruments, foreign currency forward contracts, and foreign
currency-denominated payables and receivables will generally be treated as
ordinary income or loss, although in some cases elections may be available that
would alter this treatment. If a net foreign exchange loss treated as ordinary
loss under Section 988 of the Code were to exceed a Fund's investment company
taxable income (computed without regard to such loss) for a taxable year, the
resulting loss would not be deductible by the Fund or its shareholders in future
years. Net loss, if any, from certain foregoing currency transactions or
instruments could exceed net investment income otherwise calculated for
accounting purposes with the result being either no dividends being paid or a
portion of a Fund's dividends being treated as a return of capital for tax
purposes, nontaxable to the extent of a shareholder's tax basis in his shares
and, once such basis is exhausted, generally giving rise to capital gains.
A Fund's investment in zero coupon securities, deferred interest
securities, certain structured securities or other securities bearing original
issue discount or, if a Fund elects to include market discount in income
currently, market discount, as well as any "mark to market" gain from certain
options, futures or forward contracts, as described above, will generally cause
it to realize income or gain prior to the receipt of cash payments with respect
to these securities or contracts. In order to obtain cash to enable it to
distribute this income or gain, maintain its qualification as a regulated
B-138
investment company and avoid federal income or excise taxes, the Fund may be
required to liquidate portfolio securities that it might otherwise have
continued to hold.
Each Fund (other than the CORE Large Cap Value, CORE U.S. Equity, CORE
Large Cap Growth, CORE Small Cap Equity and Research Select Funds) anticipates
that it will be subject to foreign taxes on its income (possibly including, in
some cases, capital gains) from foreign securities. Tax conventions between
certain countries and the U.S. may reduce or eliminate such taxes in some cases.
If, as may occur for the CORE International Equity, International Equity,
European Equity, Japanese Equity, International Growth Opportunities, Emerging
Markets Equity and Asia Growth Funds, more than 50% of a Fund's total assets at
the close of any taxable year consists of stock or securities of foreign
corporations, the Fund may file an election with the Internal Revenue Service
pursuant to which shareholders of the Fund would be required to (i) include in
ordinary gross income (in addition to taxable dividends actually received) their
pro rata shares of foreign income taxes paid by the Fund that are treated as
income taxes under U.S. tax regulations (which excludes, for example, stamp
taxes, securities transaction taxes, and similar taxes) even though not actually
received by such shareholders, and (ii) treat such respective pro rata portions
as foreign income taxes paid by them.
If the CORE International Equity, International Equity, European Equity,
Japanese Equity, International Growth Opportunities, Emerging Markets Equity and
Asia Growth Funds make this election, its respective shareholders may then
deduct such pro rata portions of qualified foreign taxes in computing their
taxable incomes, or, alternatively, use them as foreign tax credits, subject to
applicable limitations, against their U.S. federal income taxes. Shareholders
who do not itemize deductions for federal income tax purposes will not, however,
be able to deduct their pro rata portion of foreign taxes paid by a Fund,
although such shareholders will be required to include their shares of such
taxes in gross income if the election is made.
If a shareholder chooses to take credit for the foreign taxes deemed paid
by such shareholder as a result of any such election by the CORE International
Equity, International Equity, European Equity, Japanese Equity, International
Growth Opportunities, Emerging Markets Equity or Asia Growth Funds, the amount
of the credit that may be claimed in any year may not exceed the same proportion
of the U.S. tax against which such credit is taken which the shareholder's
taxable income from foreign sources (but not in excess of the shareholder's
entire taxable income) bears to his entire taxable income. For this purpose,
distributions from long-term and short-term capital gains or foreign currency
gains by a Fund will generally not be treated as income from foreign sources.
This foreign tax credit limitation may also be applied separately to certain
specific categories of foreign-source income and the related foreign taxes. As a
result of these rules, which have different effects depending upon each
shareholder's particular tax situation, certain shareholders of the CORE
International Equity, International Equity, European Equity, Japanese Equity,
International Growth Opportunities, Emerging Markets Equity and Asia Growth
Funds may not be able to claim a credit for the full amount of their
proportionate share of the foreign taxes paid by such Fund even if the election
is made by such a Fund.
Shareholders who are not liable for U.S. federal income taxes, including
tax-exempt shareholders, will ordinarily not benefit from this election. Each
year, if any, that the CORE
B-139
International Equity, International Equity, European Equity, Japanese Equity,
International Growth Opportunities, Emerging Markets Equity or Asia Growth Funds
file the election described above, its shareholders will be notified of the
amount of (i) each shareholder's pro rata share of qualified foreign taxes paid
by a Fund and (ii) the portion of Fund dividends which represents income from
each foreign country. The other Funds will not be entitled to elect to pass
foreign taxes and associated credits or deductions through to their shareholders
because they will not satisfy the 50% requirement described above. If a Fund
cannot or does not make this election, it may deduct such taxes in computing the
amount it is required to distribute.
If a Fund acquires stock (including, under proposed regulations, an
option to acquire stock such as is inherent in a convertible bond) in certain
foreign corporations that receive at least 75% of their annual gross income from
passive sources (such as interest, dividends, rents, royalties or capital gain)
or hold at least 50% of their assets in investments producing such passive
income ("passive foreign investment companies"), the Fund could be subject to
federal income tax and additional interest charges on "excess distributions"
received from such companies or gain from the sale of stock in such companies,
even if all income or gain actually received by the Fund is timely distributed
to its shareholders. The Fund would not be able to pass through to its
shareholders any credit or deduction for such a tax. In some cases, elections
may be available that would ameliorate these adverse tax consequences, but such
elections would require the Fund to include each year certain amounts as income
or gain (subject to the distribution requirements described above) without a
concurrent receipt of cash. Each Fund may limit and/or manage its holdings in
passive foreign investment companies to minimize its tax liability or maximize
its return from these investments.
Investments in lower-rated securities may present special tax issues for
a Fund to the extent actual or anticipated defaults may be more likely with
respect to such securities. Tax rules are not entirely clear about issues such
as when a Fund may cease to accrue interest, original issue discount, or market
discount; when and to what extent deductions may be taken for bad debts or
worthless securities; how payments received on obligations in default should be
allocated between principal and income; and whether exchanges of debt
obligations in a workout context are taxable. These and other issues will be
addressed by a Fund, in the event it invests in such securities, in order to
seek to eliminate or minimize any adverse tax consequences.
Taxable U.S. Shareholders - Distributions
For U.S. federal income tax purposes, distributions by a Fund, whether
reinvested in additional shares or paid in cash, generally will be taxable to
shareholders who are subject to tax. Shareholders receiving a distribution in
the form of newly issued shares will be treated for U.S. federal income tax
purposes as receiving a distribution in an amount equal to the amount of cash
they would have received had they elected to receive cash and will have a cost
basis in each share received equal to such amount divided by the number of
shares received.
Distributions from investment company taxable income for the year will be
taxable as ordinary income. Distributions designated as derived from a Fund's
dividend income, if any, that would be eligible for the dividends-received
deduction if such Fund were not a regulated investment company may be
B-140
eligible, for the dividends received deduction for corporate shareholders. The
dividends-received deduction, if available, is reduced to the extent the shares
with respect to which the dividends are received are treated as debt-financed
under federal income tax law and is eliminated if the shares are deemed to have
been held for less than a minimum period, generally 46 days. Because eligible
dividends are limited to those a Fund receives from U.S. domestic corporations,
it is unlikely that a substantial portion of the distributions made by the CORE
International Equity, International Equity, European Equity, Japanese Equity,
International Growth Opportunities, Asia Growth and Emerging Markets Equity
Funds will qualify for the dividends-received deduction. The entire dividend,
including the deducted amount, is considered in determining the excess, if any,
of a corporate shareholder's adjusted current earnings over its alternative
minimum taxable income, which may increase its liability for the federal
alternative minimum tax, and the dividend may, if it is treated as an
"extraordinary dividend" under the Code, reduce such shareholder's tax basis in
its shares of a Fund. Capital gain dividends (i.e., dividends from net capital
gain) if designated as such in a written notice to shareholders mailed not later
than 60 days after a Fund's taxable year closes, will be taxed to shareholders
as long-term capital gain regardless of how long shares have been held by
shareholders, but are not eligible for the dividends-received deduction for
corporations. Such long-term capital gain will be taxed at a maximum rate of 20%
(10% for those shareholders in the 15% tax bracket). In addition, any long-term
gain distributions related to assets held for more than five years and sold
after December 31, 2000 will be taxed at a maximum rate of 8% for those
shareholders in the 15% tax bracket. For taxpayers in higher tax brackets, the
capital gains tax rate will be reduced from 20% to 18% for long-term gain
distributions related to assets acquired after December 31, 2000 and held for
more than five years. Distributions, if any, that are in excess of a Fund's
current and accumulated earnings and profits will first reduce a shareholder's
tax basis in his shares and, after such basis is reduced to zero, will generally
constitute capital gains to a shareholder who holds his shares as capital
assets.
Different tax treatment, including penalties on certain excess
contributions and deferrals, certain pre-retirement and post-retirement
distributions, and certain prohibited transactions is accorded to accounts
maintained as qualified retirement plans. Shareholders should consult their tax
advisers for more information.
Taxable U.S. Shareholders - Sale of Shares
When a shareholder's shares are sold, redeemed or otherwise disposed of
in a transaction that is treated as a sale for tax purposes, the shareholder
will generally recognize gain or loss equal to the difference between the
shareholder's adjusted tax basis in the shares and the cash, or fair market
value of any property, received. (To aid in computing its tax basis, a
shareholder should generally retain its account statement for the period that it
held shares). If the shareholder holds the shares as a capital asset at the time
of sale, the character of the gain or loss should be capital, and treated as
long-term if the shareholder's holding period is more than one year, and
short-term otherwise. In general, the maximum long-term capital gain rate will
be 20% for capital gains on assets held more than one year (10% for those
shareholders in the 15% tax bracket). In addition, gains related to the sale of
shares held for more than five years and sold after December 31, 2000 will be
taxed at a maximum rate of 8% for those
B-141
shareholders in the 15% tax bracket. For shareholders in higher tax brackets,
the capital gains tax rate will be reduced from 20% to 18% for any shares
acquired after December 31, 2000 (or marked-to-market at the beginning of 2001)
and held for more than five years. Shareholders should consult their own tax
advisers with reference to their particular circumstances to determine whether a
redemption (including an exchange) or other disposition of Fund shares is
properly treated as a sale for tax purposes, as is assumed in this discussion.
If a shareholder receives a capital gain dividend with respect to shares and
such shares have a tax holding period of six months or less at the time of a
sale or redemption of such shares, then any loss the shareholder realizes on the
sale or redemption will be treated as a long-term capital loss to the extent of
such capital gain dividend. All or a portion of any sales load paid upon the
purchase of shares of a Fund will not be taken into account in determining gain
or loss on the redemption or exchange of such shares within 90 days after their
purchase to the extent the redemption proceeds are reinvested, or the exchange
is effected, without payment of an additional sales load pursuant to the
reinvestment or exchange privilege. The load not taken into account will be
added to the tax basis of the newly-acquired shares. Additionally, any loss
realized on a sale or redemption of shares of a Fund may be disallowed under
"wash sale" rules to the extent the shares disposed of are replaced with other
shares of the same Fund within a period of 61 days beginning 30 days before and
ending 30 days after the shares are disposed of, such as pursuant to a dividend
reinvestment in shares of such Fund. If disallowed, the loss will be reflected
in an adjustment to the basis of the shares acquired.
Each Fund may be required to withhold, as "backup withholding," federal
income tax at a rate of 31% from dividends (including capital gain dividends)
and share redemption and exchange proceeds to individuals and other non-exempt
shareholders who fail to furnish such Fund with a correct taxpayer
identification number ("TIN") certified under penalties of perjury, or if the
Internal Revenue Service or a broker notifies the Fund that the payee is subject
to backup withholding as a result of failing to properly report interest or
dividend income to the Internal Revenue Service or that the TIN furnished by the
payee to the Fund is incorrect, or if (when required to do so) the payee fails
to certify under penalties of perjury that it is not subject to backup
withholding. A Fund may refuse to accept an application that does not contain
any required TIN or certification that the TIN provided is correct. If the
backup withholding provisions are applicable, any such dividends and proceeds,
whether paid in cash or reinvested in additional shares, will be reduced by the
amounts required to be withheld. Any amounts withheld may be credited against a
shareholder's U.S. federal income tax liability. If a shareholder does not have
a TIN, it should apply for one immediately by contacting its local office of the
Social Security Administration or the Internal Revenue Service (IRS). Backup
withholding could apply to payments relating to a shareholder's account while it
is waiting receipt of a TIN. Special rules apply for certain entities. For
example, for an account established under a Uniform Gifts or Transfer to Minors
Act, the TIN of the minor should be furnished.
Non-U.S. Shareholders
The discussion above relates solely to U.S. federal income tax law as it
applies to "U.S. persons" subject to tax under such law. Shareholders who, as to
the United States, are not "U.S. persons," (i.e., are nonresident aliens,
foreign corporations, fiduciaries of foreign trusts or estates, foreign
partnerships or other non-U.S. investors) generally will be subject to U.S.
federal
B-142
withholding tax at the rate of 30% on distributions treated as ordinary income
unless the tax is reduced or eliminated pursuant to a tax treaty or the
dividends are effectively connected with a U.S. trade or business of the
shareholder. In the latter case the dividends will be subject to tax on a net
income basis at the graduated rates applicable to U.S. individuals or domestic
corporations. Distributions of net capital gain, including amounts retained by a
Fund which are designated as undistributed capital gains, to a non-U.S.
shareholder will not be subject to U.S. federal income or withholding tax unless
the distributions are effectively connected with the shareholder's trade or
business in the United States or, in the case of a shareholder who is a
nonresident alien individual, the shareholder is present in the United States
for 183 days or more during the taxable year and certain other conditions are
met. Non-U.S. shareholders may also be subject to U.S. federal withholding tax
on deemed income resulting from any election by CORE International Equity,
International Equity, European Equity, Japanese Equity, International Growth
Opportunities, Emerging Markets Equity or Asia Growth Funds to treat qualified
foreign taxes it pays as passed through to shareholders (as described above),
but they may not be able to claim a U.S. tax credit or deduction with respect to
such taxes.
Any capital gain realized by a non-U.S. shareholder upon a sale or
redemption of shares of a Fund will not be subject to U.S. federal income or
withholding tax unless the gain is effectively connected with the shareholder's
trade or business in the U.S., or in the case of a shareholder who is a
nonresident alien individual, the shareholder is present in the U.S. for 183
days or more during the taxable year and certain other conditions are met.
Non-U.S. persons who fail to furnish a Fund with the proper IRS Form W-8
(i.e., W-8 BEN, W-8 ECI, W-8 IMY or W-8 EXP) or an acceptable substitute may be
subject to backup withholding at the rate of 31% on capital gain dividends and
the proceeds of redemptions and exchanges. Also, non-U.S. shareholders may be
subject to estate tax. Each shareholder who is not a U.S. person should consult
his or her tax adviser regarding the U.S. and non-U.S. tax consequences of
ownership of shares of and receipt of distributions from the Funds.
State and Local
Each Fund may be subject to state or local taxes in jurisdictions in
which such Fund may be deemed to be doing business. In addition, in those states
or localities which have income tax laws, the treatment of such Fund and its
shareholders under such laws may differ from their treatment under federal
income tax laws, and investment in such Fund may have tax consequences for
shareholders different from those of a direct investment in such Fund's
portfolio securities. Shareholders should consult their own tax advisers
concerning these matters.
FINANCIAL STATEMENTS
The audited financial statements and related reports of
PricewaterhouseCoopers LLP, independent public accountants, contained in each
Fund's 2000 Annual Report are hereby incorporated by reference. The financial
statements in each Fund's Annual Report have been incorporated by reference in
reliance upon such report
B-143
given upon the authority of such firm as experts in accounting and auditing. The
financial statements and financial highlights included in each Fund's Annual
Report for periods ending on or before August 31, 1999 were audited by Arthur
Andersen LLP, the Funds' former independent auditors. The report of Arthur
Andersen LLP dated October 8, 1999 on the Funds' financial statements included
in each Fund's Annual Report to Shareholders for the fiscal period ended August
31, 1999, is also incorporated herein by reference. No other parts of any Annual
Report are incorporated by reference herein. A copy of the Annual Reports may be
obtained without charge by writing Goldman, Sachs & Co., 4900 Sears Tower,
Chicago, Illinois 60606 or by calling Goldman, Sachs & Co., at the telephone
number on the back cover of each Fund's prospectus.
OTHER INFORMATION
Each Fund will redeem shares solely in cash up to the lesser of $250,000
or 1% of the net asset value of the Fund during any 90-day period for any one
shareholder. Each Fund, however, reserves the right to pay redemptions exceeding
$250,000 or 1% of the net asset value of the Fund at the time of redemption by a
distribution in kind of securities (instead of cash) from such Fund. The
securities distributed in kind would be readily marketable and would be valued
for this purpose using the same method employed in calculating the Fund's net
asset value per share. See "Net Asset Value." If a shareholder receives
redemption proceeds in kind, the shareholder should expect to incur transaction
costs upon the disposition of the securities received in the redemption.
The right of a shareholder to redeem shares and the date of payment by
each Fund may be suspended for more than seven days for any period during which
the New York Stock Exchange is closed, other than the customary weekends or
holidays, or when trading on such Exchange is restricted as determined by the
SEC; or during any emergency, as determined by the SEC, as a result of which it
is not reasonably practicable for such Fund to dispose of securities owned by it
or fairly to determine the value of its net assets; or for such other period as
the SEC may by order permit for the protection of shareholders of such Fund.
(The Trust may also suspend or postpone the recordation of the transfer or
shares upon the occurrence of any of the foregoing conditions).
As stated in the Prospectuses, the Trust may authorize Service
Organizations and other institutions that provide recordkeeping, reporting and
processing services to their customers to accept on the Trust's behalf purchase,
redemption and exchange orders placed by or on behalf of their customers and, if
approved by the Trust, to designate other intermediaries to accept such orders.
These institutions may receive payments from the Trust or Goldman Sachs for
their services. Certain Service Organizations or institutions may enter into
sub-transfer agency agreements with the Trust or Goldman Sachs with respect to
their services.
The Investment Adviser, Distributor and/or their affiliates may pay, out
of their own assets, compensation to Authorized Dealers, Service Organizations
and other financial
B-144
intermediaries ("Intermediaries") for the sale and distribution of Shares of the
Funds and/or for the servicing of those shares. These payments ("Additional
Payments") would be in addition to the payments by the Funds described in the
Funds' Prospectus and this Additional Statement for distribution and shareholder
servicing and processing, and would also be in addition to the sales commissions
payable to Intermediaries as set forth in the Prospectus. These Additional
Payments may take the form of "due diligence" payments for an Intermediary's
examination of the Funds and payments for providing extra employee training and
information relating to the Funds; "listing" fees for the placement of the Funds
on an Intermediary's list of mutual funds available for purchase by its
customers; "finders" or "referral" fees for directing investors to the Funds;
"marketing support" fees for providing assistance in promoting the sale of the
Funds' shares; and payments for the sale of shares and/or the maintenance of
share balances. In addition, the Investment Adviser, Distributor and/or their
affiliates may make Additional Payments for subaccounting, administrative and/or
shareholder processing services that are in addition to the shareholder
servicing and processing fees paid by the Funds. The Additional Payments made by
the Investment Adviser, Distributor and their affiliates may be a fixed dollar
amount, may be based on the number of customer accounts maintained by an
Intermediary, or may be based on a percentage of the value of shares sold to, or
held by, customers of the Intermediary involved, and may be different for
different Intermediaries. Furthermore, the Investment Adviser, Distributor
and/or their affiliates may, to the extent permitted by applicable regulations,
contribute to various non-cash and cash incentive arrangements to promote the
sale of shares, as well as sponsor various educational programs, sales contests
and/or promotions. The Investment Adviser, Distributor and their affiliates may
also pay for the travel expenses, meals, lodging and entertainment of
Intermediaries and their salespersons and guests in connection with educational,
sales and promotional programs subject to applicable NASD regulations.
In the interest of economy and convenience, the Trust does not issue
certificates representing the Funds' shares. Instead, the Transfer Agent
maintains a record of each shareholder's ownership. Each shareholder receives
confirmation of purchase and redemption orders from the Transfer Agent. Fund
shares and any dividends and distributions paid by the Funds are reflected in
account statements from the Transfer Agent.
The Prospectuses and this Additional Statement do not contain all the
information included in the Registration Statement filed with the SEC under the
1933 Act with respect to the securities offered by the Prospectuses. Certain
portions of the Registration Statement have been omitted from the Prospectuses
and this Additional Statement pursuant to the rules and regulations of the SEC.
The Registration Statement including the exhibits filed therewith may be
examined at the office of the SEC in Washington, D.C.
Statements contained in the Prospectuses or in this Additional Statement
as to the contents of any contract or other document referred to are not
necessarily complete, and, in each instance, reference is made to the copy of
such contract or other document filed as an exhibit to the Registration
Statement of which the Prospectuses and this Additional Statement form a part,
each such statement being qualified in all respects by such reference.
B-145
DISTRIBUTION AND SERVICE PLANS (Class A
Shares, Class B Shares and Class C Shares Only)
Distribution and Service Plans. As described in the Prospectuses, the
Trust has adopted, on behalf of Class A, Class B and Class C Shares of each
Fund, distribution and service plans (each a "Plan") pursuant to Rule 12b-1
under the Act. See "Shareholder Guide - Distribution and Service Fees" in the
Prospectus.
The Plans for each Fund (except the Research Select Fund) were most
recently approved on April 25, 2000 by a majority vote of the Trustees of the
Trust, including a majority of the non-interested Trustees of the Trust who have
no direct or indirect financial interest in the Plans, cast in person at a
meeting called for the purpose of approving the Plans. The Plans for the
Research Select Fund were initially approved on April 26, 2000.
The compensation for distribution services payable under a Plan may not
exceed 0.25%, 0.75% and 0.75%, per annum of a Fund's average daily net assets
attributable to Class A, Class B and Class C Shares respectively, of such Fund.
Under the Plans for Class A (CORE International Equity, International Equity,
European Equity, Japanese Equity, International Growth Opportunities, Emerging
Markets Equity and Asia Growth Funds only), Class B and Class C Shares, Goldman
Sachs is also entitled to received a separate fee for personal and account
maintenance services equal to an annual basis of 0.25% of each Fund's average
daily net assets attributable to Class A, Class B or Class C Shares. With
respect to Class A Shares, the Distributor at its discretion may use
compensation for distribution services paid under the Plan for personal and
account maintenance services and expenses so long as such total compensation
under the Plan does not exceed the maximum cap on "service fees" imposed by the
NASD.
Each Plan is a compensation plan which provides for the payment of a
specified fee without regard to the expenses actually incurred by Goldman Sachs.
If such fee exceeds Goldman Sachs' expenses, Goldman Sachs may realize a profit
from these arrangements. The distribution fees received by Goldman Sachs under
the Plans and contingent deferred sales charge on Class A, Class B and Class C
Shares may be sold by Goldman Sachs as distributor to entities which provide
financing for payments to Authorized Dealers in respect of sales of Class A,
Class B and Class C Shares. To the extent such fees are not paid to such
dealers, Goldman Sachs may retain such fee as compensation for its services and
expenses of distributing the Funds' Class A, Class B and Class C Shares.
Under each Plan, Goldman Sachs, as distributor of each Fund's Class A,
Class B and Class C Shares, will provide to the Trustees of the Trust for their
review, and the Trustees of the Trust will review at least quarterly, a written
report of the services provided and amounts expended by Goldman Sachs under the
Plans and the purposes for which such services were performed and expenditures
were made.
The Plans will remain in effect until May 1, 2001 and from year to year
thereafter, provided that such continuance is approved annually by a majority
vote of the Trustees of the Trust, including a majority of the non-interested
Trustees of the Trust who have no direct or indirect financial interest in the
Plans. The Plans may not be amended to increase materially the amount of
B-146
distribution compensation without approval of a majority of the outstanding
Class A, Class B or Class C Shares of the affected Fund and share class. All
material amendments of a Plan must also be approved by the Trustees of the Trust
in the manner described above. A Plan may be terminated at any time as to any
Fund without payment of any penalty by a vote of a majority of the
non-interested Trustees of the Trust or by vote of a majority of the Class A,
Class B or Class C Shares, respectively, of the affected Fund and share class.
If a Plan was terminated by the Trustees of the Trust and no successor plan was
adopted, the Fund would cease to make payments to Goldman Sachs under the Plan
and Goldman Sachs would be unable to recover the amount of any of its
unreimbursed expenditures. So long as a Plan is in effect, the selection and
nomination of non-interested Trustees of the Trust will be committed to the
discretion of the non-interested Trustees of the Trust. The Trustees of the
Trust have determined that in their judgment there is a reasonable likelihood
that the Plans will benefit the Funds and their Class A, Class B and Class C
Shareholders.
B-147
The following chart shows the: 1) distribution and service fees paid to Goldman
Sachs for the fiscal year ended August 31, 2000, the fiscal period ended August
31, 1999 and the fiscal year ended January 31, 1999, and 2) distribution fees
paid to Goldman Sachs for the fiscal year ended January 31, 1998 by each
applicable Fund then in existence pursuant to the Class A Plan:
Fiscal year Fiscal period Fiscal year Fiscal year
ended ended ended ended
August 31, August 31, January 31, January 31,
2000 1999 1999 1998
=========== ============= ============ ===========
Balanced Fund $ 378,767 $ 268,705 $ 466,990 $ 0
Growth and Income Fund 1,705,073 1,432,452 4,004,764 723,634
CORE Large Cap Value Fund/1/ 222,782 88,576 579 N/A
CORE U.S. Equity Fund 1,644,698 901,485 1,963,368 720,025
CORE Large Cap Growth Fund/1/ 1,073,849 366,944 270,829 0
CORE Small Cap Equity Fund/1/ 134,001 84,036 81,416 1,380
CORE International Equity Fund/1/ 687,424 321,043 208,905 2,751
Capital Growth Fund 5,843,877 2,987,611 3,953,381 0
Strategic Growth Fund/1/ 114,555 2,430 N/A N/A
Growth Opportunities Fund/1/ 171,456 2,204 N/A N/A
Mid Cap Value Fund/1/ 99,049 93,442 449,380 67,478
Small Cap Value Fund 405,682 339,961 872,585 0
Large Cap Value Fund/1/ 6,978 N/A N/A N/A
International Equity Fund 6,009,343 2,622,519 4,032,788 1,416,253
European Equity Fund/1/ 569,252 192,446 66,759 N/A
Japanese Equity Fund/1/ 286,204 55,407 19,466 N/A
International Growth Opportunities
Fund 881,543 115,648 62,146 N/A
Emerging Markets Equity Fund/1/ 381,208 176,746 226,631 3,381
Asia Growth Fund 475,309 208,976 349,621 431,390
Research Select Fund/1/ 67,271 N/A N/A N/A
--------------------------------
1. The Class A Share class of the CORE Large Cap Value, CORE Large Cap Growth,
CORE Small Cap Equity, CORE International Equity, Strategic Growth, Growth
Opportunities, Mid Cap Value, Large Cap Value, European Equity, Japanese Equity,
International Growth Opportunities, Emerging Markets Equity and Research Select
Funds commenced operations on December 31, 1998, May 1, 1997, August 15, 1997,
August 15, 1997, May 24,
B-148
1999, May 24, 1999, August 15, 1997, December 15, 1999, October 1, 1998, May 1,
1998, May 1, 1998, December 15, 1997 and June 19, 2000, respectively.
B-149
The following chart shows the: 1) distribution and service fees that
would have been paid to Goldman Sachs for the fiscal year ended August 31, 2000,
the fiscal period ended August 31, 1999 and the fiscal year ended January 31,
1999, and 2) distribution fees that would have been paid to Goldman Sachs for
the fiscal year ended January 31, 1998 by each applicable Fund then in existence
pursuant to the Class A Plan, without the voluntary limitations then in effect:
Fiscal year Fiscal period Fiscal year Fiscal year
ended ended ended ended
August 31, August 31, January 31, January 31,
2000 1999 1999 1998
=========== ============= =========== ===========
Balanced Fund $ 378,767 $ 268,705 $ 823,738 $ 301,397
Growth and Income Fund 1,705,073 1,432,452 5,307,490 2,324,970
CORE Large Cap Value Fund/1/ 222,782 88,576 579 N/A
CORE U.S. Equity Fund 1,644,698 901,485 1,963,368 771,451
CORE Large Cap Growth Fund/1/ 1,073,849 366,944 405,481 61,924
CORE Small Cap Equity Fund/1/ 134,001 84,036 102,281 6,898
CORE International Equity Fund/1/ 687,424 321,043 208,905 2,751
Capital Growth Fund 5,843,877 2,987,611 6,150,756 2,678,370
Strategic Growth Fund/1/ 114,555 2,430 N/A N/A
Growth Opportunities Fund/1/ 171,456 2,204 N/A N/A
Mid Cap Value Fund/1/ 99,049 93,442 449,380 67,478
Small Cap Value Fund 405,682 339,961 1,655,658 727,298
Large Cap Value Fund/1/ 6,978 N/A N/A N/A
International Equity Fund 6,009,343 2,622,519 4,090,492 1,632,745
European Equity Fund/1/ 569,252 192,446 66,759 N/A
Japanese Equity Fund/1/ 286,204 55,407 19,466 N/A
International Growth
Opportunities Fund/1/ 881,543 115,648 62,146 N/A
Emerging Markets Equity Fund/1/ 381,208 176,746 226,631 3,381
Asia Growth Fund 475,309 208,976 368,632 513,560
Research Select Fund/1/ 67,271 N/A N/A N/A
--------------------------------
B-150
1. The Class A Share class of the CORE Large Cap Value, CORE Large Cap Growth,
CORE Small Cap Equity, CORE International Equity, Strategic Growth, Growth
Opportunities, Mid Cap Value, Large Cap Value, European Equity, Japanese Equity,
International Growth Opportunities, Emerging Markets Equity and Research Select
Funds commenced operations on December 31, 1998, May 1, 1997, August 15, 1997,
August 15, 1997, May 24, 1999, May 24, 1999, August 15, 1997, December 15, 1999,
October 1, 1998, May 1, 1998, May 1, 1998, December 15, 1997 and June 19, 2000,
respectively.
B-151
The following chart shows the: 1) distribution and service fees paid to
Goldman Sachs for the fiscal year ended August 31, 2000, the fiscal period ended
August 31, 1999 and the fiscal year ended January 31, 1999, and 2) distribution
fees paid to Goldman Sachs for the fiscal year ended January 31, 1998 by each
applicable Fund then in existence pursuant to the Class B Plan:
Fiscal year Fiscal period Fiscal year Fiscal year
ended ended ended ended
August 31, August 31, January 31, January 31,
2000 1999 1999 1998
=========== ============= =========== ===========
Balanced Fund $ 369,057 $ 247,828 $ 372,044 $ 74,569
Growth and Income Fund 1,977,417 1,796,760 3,924,188 1,117,813
CORE Large Cap Value Fund/1/ 177,310 40,251 122 N/A
CORE U.S. Equity Fund 2,484,645 1,115,835 995,389 265,025
CORE Large Cap Growth Fund/1/ 2,642,305 858,809 449,058 34,332
CORE Small Cap Equity Fund/1/ 158,867 80,244 140,016 20,064
CORE International Equity Fund/1/ 113,403 47,034 54,688 5,700
Capital Growth Fund 4,009,512 1,739,629 1,193,755 127,395
Strategic Growth Fund/1/ 117,536 2,398 N/A N/A
Growth Opportunities Fund/1/ 164,373 598 N/A N/A
Mid Cap Value Fund/1/ 234,374 200,960 417,334 47,585
Small Cap Value Fund 285,873 220,759 494,223 160,608
Large Cap Value Fund/1/ 4,532 N/A N/A N/A
International Equity Fund 795,433 388,156 653,844 314,578
European Equity Fund/1/ 29,685 4,365 387 N/A
Japanese Equity Fund/1/ 61,667 15,230 5,736 N/A
International Growth
Opportunities Fund/1/ 17,389 1,354 1,566 N/A
Emerging Markets Equity Fund/1/ 18,920 4,255 3,075 38
Asia Growth Fund 81,059 32,196 43,192 28,550
Research Select Fund/1/ 237,495 N/A N/A N/A
-------------------------------
1. The Class B Share class of the CORE Large Cap Value, CORE Large Cap Growth,
CORE Small Cap Equity, CORE International Equity, Strategic Growth, Growth
Opportunities, Mid Cap Value, Large Cap Value, European Equity, Japanese Equity,
International Growth Opportunities, Emerging Markets Equity and Research Select
Funds commenced operations on December 31, 1998, May 1, 1997, August 15, 1997,
August 15, 1997, May 24, 1999, May 24, 1999, August 15, 1997, December 15, 1999,
October 1, 1998, May 1, 1998, May 1, 1998, December 15, 1997 and June 19, 2000,
respectively.
B-152
The following chart shows the: 1) distribution and service fees paid to
Goldman Sachs for the fiscal year ended August 31, 2000, the fiscal period ended
August 31, 1999 and the fiscal year ended January 31, 1999, and 2) distribution
fees paid to Goldman Sachs for the fiscal year ended January 31, 1998 by each
applicable Fund then in existence pursuant to the Class C Plan:
Fiscal year Fiscal period Fiscal year Fiscal year
ended ended ended ended
August 31, August 31, January 31, January 31,
2000 1999 1999 1998
=========== ============= =========== ===========
Balanced Fund/1/ $ 96,430 $ 72,293 $ 142,821 $ 13,290
Growth and Income Fund/1/ 213,661 225,003 553,531 57,542
CORE Large Cap Value Fund/1/ 90,527 23,517 82 N/A
CORE U.S. Equity Fund/1/ 528,896 214,434 152,737 14,614
CORE Large Cap Growth Fund/1/ 1,154,416 343,654 156,368 6,880
CORE Small Cap Equity Fund/1/ 69,635 34,375 44,551 4,038
CORE International Equity Fund/1/ 62,639 25,018 27,157 3,118
Capital Growth Fund 1,156,975 447,252 262,717 9,607
Strategic Growth Fund/1/ 57,666 2,161 N/A N/A
Growth Opportunities Fund/1/ 103,041 224 N/A N/A
Mid Cap Value Fund/1/ 63,738 59,930 113,272 10,495
Small Cap Value Fund 70,710 43,062 8,298 12,158
Large Cap Value Fund/1/ 2,643 N/A N/A N/A
International Equity Fund 176,506 60,274 74,197 7,485
European Equity Fund/1/ 9,104 3,312 337 N/A
Japanese Equity Fund/1/ 48,884 9,001 1,390 N/A
International Growth
Opportunities Fund/1/ 23,655 1,082 725 N/A
Emerging Markets Equity Fund/1/ 14,388 3,702 2,250 28
Asia Growth Fund 28,023 8,922 9,090 2,854
Research Select Fund/1/ 106,700 N/A N/A N/A
---------------------------
1. The Class C Share class of the Balanced, Growth and Income, CORE Large Cap
Value, CORE U.S. Equity, CORE Large Cap Growth, CORE Small Cap Equity, CORE
International Equity, Strategic Growth, Growth Opportunities, Mid Cap Value,
Large Cap Value, European Equity, Japanese Equity, International Growth
Opportunities, Emerging Markets Equity and Research Select Funds commenced
operations on August 15, 1997, August 15, 1997,
B-153
December 31, 1998, August 15, 1997, August 15, 1997, August 15, 1997, August 15,
1997, May 24, 1999, May 24, 1999, August 15, 1997, December 15, 1999, October 1,
1998, May 1, 1998, May 1, 1998, December 15, 1997 and June 19, 2000,
respectively.
B-154
During the fiscal year ended August 31, 2000, Goldman Sachs incurred
the following expenses in connection with distribution under the Class A Plan of
each applicable Fund with Class A Shares then in existence:
Compensation Printing and Preparation
and Expenses Allocable Mailing of and
of the Overhead, Prospectuses Distribution
Distributor Telephone to Other of Sales
Compensation & Its Sales and Travel Than Current Literature and
to Dealers/1/ Personnel Expenses Shareholders Advertising
----------- ----------- ---------- ------------ --------------
Fiscal Year Ended August 31, 2000:
Balanced Fund $ 395,359 $ 220,056 $ 208,374 $ 13,544 $ 75,011
Growth and Income Fund 1,712,803 277,744 201,107 12,748 70,393
CORE Large Cap Value Fund 248,369 223,884 240,802 15,278 81,957
CORE U.S. Equity Fund 1,592,169 476,649 353,527 22,742 120,895
CORE Large Cap Growth Fund 1,048,984 395,493 366,879 23,294 128,689
CORE Small Cap Equity Fund 154,877 198,387 174,827 10,999 60,872
CORE International Equity Fund 322,651 309,279 305,275 18,443 108,566
Capital Growth Fund 5,282,250 2,604,758 1,428,650 83,621 506,510
Strategic Growth Fund 243,037 283,731 224,338 13,713 80,999
Growth Opportunities Fund 284,175 421,912 322,381 20,974 120,001
Mid Cap Value 116,373 136,552 124,615 7,889 43,879
Small Cap Value Fund 367,366 284,614 201,490 12,334 71,276
Large Cap Value 23,204 127,352 119,533 8,136 46,092
International Equity Fund 3,301,457 2,588,132 1,369,574 87,977 484,940
European Equity Fund 389,261 603,492 332,522 21,692 116,977
Japanese Equity Fund 288,113 376,675 272,609 18,070 94,409
International Growth Opportunities 793,277 1,045,721 719,946 42,615 260,214
Emerging Market Equity Fund 154,009 392,813 290,638 18,138 100,625
Asia Growth Fund 370,117 405,861 339,119 21,775 115,318
Research Select 85,196 243,890 287,770 12,875 135,665
B-155
---------------------------
1 Advance commissions paid to dealers of 1% on Class A Shares are
considered deferred assets which are amortized over a period of 1 year;
amounts presented above reflect amortization expense recorded during the
period presented.
B-156
During the fiscal year ended August 31, 2000, Goldman Sachs incurred the
following expenses in connection with distribution under the Class B Plan of
each applicable Fund with Class B Shares then in existence:
Compensation Printing and Preparation
and Expenses Allocable Mailing of and
of the Overhead, Prospectuses Distribution
Distributor Telephone to Other of Sales
Compensation & Its Sales and Travel Than Current Literature and
to Dealers/1/ Personnel Expenses Shareholders Advertising
------------- --------- -------- ------------ -----------
Fiscal Year Ended August 31, 2000:
Balanced Fund $ 846,506 $ 49,517 $ 50,000 $ 3,242 $ 18,075
Growth and Income Fund 8,243,415 49,290 52,910 3,406 18,326
CORE Large Cap Value Fund 178,300 41,860 45,719 2,927 15,979
CORE U.S. Equity Fund 2,283,969 107,328 118,008 7,651 40,475
CORE Large Cap Growth Fund 2,110,932 205,443 217,539 13,799 76,205
CORE Small Cap Equity Fund 306,306 46,111 49,084 3,034 17,338
CORE International Equity Fund 164,036 23,988 24,734 1,497 8,817
Capital Growth Fund 3,561,678 168,707 178,821 10,915 63,120
Strategic Growth Fund 159,195 59,475 62,702 3,951 21,737
Growth Opportunities Fund 441,788 84,706 93,671 4,873 35,241
Mid Cap Value 1,022,312 68,059 71,369 4,535 24,820
Small Cap Value Fund 1,106,190 30,128 31,853 2,073 11,299
Large Cap Value Fund 11,709 16,663 16,369 943 6,488
International Equity Fund 1,147,354 67,635 72,662 4,713 25,281
European Equity Fund 38,753 6,403 6,524 2,194 2,413
Japanese Equity Fund 76,591 27,436 28,613 1,964 9,484
International Growth Opportunities 16,793 5,151 5,533 327 2,122
Emerging Market Equity Fund 32,177 5,854 6,227 2,154 2,283
Asia Growth Fund 204,656 25,804 27,161 1,742 9,177
Research Select 174,271 208,006 251,418 11,036 117,330
B-157
---------------------------
1 Advance commissions paid to dealers of 4% on Class B Shares are
considered deferred assets which are amortized over a period of 1 year;
amounts presented above reflect amortization expense recorded during the
period presented.
B-158
During the fiscal year ended August 31, 2000, Goldman Sachs incurred the
following expenses in connection with distribution under the Class C Plan of
each applicable Fund with Class C Shares then in existence:
Compensation Printing and Preparation
and Expenses Allocable Mailing of and
of the Overhead, Prospectuses Distribution
Distributor Telephone to Other of Sales
Compensation & Its Sales and Travel Than Current Literature and
to Dealers/1/ Personnel Expenses Shareholders Advertising
------------- ------------ ---------- ------------ --------------
Fiscal Year Ended August 31, 2000:
Balanced Fund $ 60,968 $ 10,921 $ 10,926 $ 724 $ 3,638
Growth and Income Fund 171,927 4,601 5,013 329 1,609
CORE Large Cap Value Fund 82,493 17,731 19,785 1,287 6,378
CORE U.S. Equity Fund 446,971 22,887 24,876 1,607 8,606
CORE Large Cap Growth Fund 1,031,770 79,323 83,016 5,309 27,649
CORE Small Cap Equity Fund 61,561 17,363 18,638 1,163 6,145
CORE International Equity Fund 57,545 11,361 11,680 706 3,925
Capital Growth Fund 952,905 48,083 38,735 2,382 12,377
Strategic Growth Fund 51,598 40,053 44,282 2,778 14,374
Growth Opportunities Fund 88,990 38,825 39,945 2,262 14,119
Mid Cap Value 57,927 16,293 17,051 8,459 5,453
Small Cap Value Fund 64,506 6,297 6,665 438 2,243
Large Cap Value 3,514 15,066 13,193 715 3,847
International Equity Fund 147,728 12,518 13,455 875 4,527
European Equity Fund 11,895 1,579 1,629 99 552
Japanese Equity Fund 45,471 20,189 21,106 1,493 6,556
International Growth Opportunities 20,664 6,255 6,236 370 2,163
Emerging Market Equity Fund 13,857 3,868 4,175 257 1,374
Asia Growth Fund 29,983 7,734 8,199 536 2,601
Research Select 92,639 27,892 41,610 772 15,506
1 Advance commissions paid to dealers of 1% on Class C Shares are
considered deferred assets which are amortized over a period of 1 year;
amounts presented above reflect amortization expense recorded during the
period presented.
B-159
---------------------------
B-160
B-161
B-162
The foregoing tables and the information contained in the preceding
paragraph reflect amounts expended by Goldman Sachs, which amounts are in excess
of the compensation received by Goldman Sachs under the Plans. The payments
under the plans were used by Goldman Sachs to compensate it for the expenses
shown above on a pro-rata basis.
For the fiscal year ended January 31, 1998, Goldman Sachs received
service fees from the Funds pursuant to the Plans then in existence at the rate
of 0.25% of each Fund's average daily net assets attributable to Class A, Class
B, or Class C Shares, which totaled:
B-163
Class A Class B Class C
Balanced Fund/1/ $ 268,705 $ 61,957 $ 18,073
Growth and Income Fund/1/ 1,432,452 449,190 56,251
CORE Large Cap Value Fund/2/ 88,576 10,063 5,879
CORE U.S. Equity Fund/1/ 901,485 278,959 53,608
CORE Large Cap Growth Fund/3/ 366,944 214,702 85,913
CORE Small Cap Equity Fund/4/ 84,036 20,061 8,594
CORE International Equity Fund/4/ 160,522 11,759 6,254
Capital Growth Fund/1/ 2,987,610 434,907 111,813
Strategic Growth Fund/5/ N/A N/A N/A
Growth Opportunities Fund/5/ N/A N/A N/A
Mid Cap Value Fund/4/ 93,442 50,240 14,982
Small Cap Value Fund/1/ 339,961 55,190 10,766
Large Cap Value Fund/5/ N/A N/A N/A
International Equity Fund/1/ 1,311,260 97,039 15,069
European Equity Fund/6/ 96,223 1,091 828
Japanese Equity Fund/6/ 27,703 3,808 2,250
InternationalGrowth
Opportunities Fund/6/ 57,824 338 273
Emerging Market Equity Fund/7/ 88,373 1,064 926
Asia Growth Fund/1/ 104,488 8,049 2,230
Research Select Fund/5/ N/A N/A N/A
--------------------------------------------------------------------------------
B-164
1 Prior to August 15, 1997, the Balanced, Growth and Income, CORE U.S. Equity,
Capital Growth, International Equity, Small Cap Value, and Asia Growth Funds had
not sold Class C Shares, respectively.
2 The CORE Large Cap Value Fund commenced operations on December 31, 1998.
3 Prior to May 1, 1997, May 1, 1997 and August 15, 1997, the CORE Large Cap
Growth Fund had not sold Class A, Class B and Class C Shares, respectively.
4 Prior to August 15, 1997, the CORE Small Cap Equity, CORE International Equity
and Mid Cap Value Funds had not sold Class A, Class B or Class C Shares.
5 During the periods shown, no Shares of the Strategic Growth, Growth
Opportunities, Large Cap Value or Research Select Funds were offered.
6 Prior to October 1, 1998, May 1, 1998 and May 1, 1998, European Equity,
Japanese Equity and International Growth Opportunities Funds had not sold Class
A, Class B or Class C Shares.
7 Prior to December 15, 1997, the Emerging Markets Equity Fund had not sold
Class A, Class B or Class C Shares.
OTHER INFORMATION REGARDING MAXIMUM SALES CHARGE, PURCHASES,
REDEMPTIONS, EXCHANGES AND DIVIDENDS
(Class A Shares, Class B Shares and Class C Shares Only)
Maximum Sales Charges
---------------------
Class A Shares of each Fund are sold at a maximum sales charge of 5.5%.
Using the initial offering price per share as of August 31, 2000, the maximum
offering price of each Fund's Class A shares would be as follows:
Maximum Offering
Net Asset Sales Price to
Value Charge Public
Balanced Fund $ 21.42 5.5% $ 22.67
Growth and Income Fund 24.78 5.5% 26.22
CORE U.S. Equity Fund 36.77 5.5% 38.91
CORE Large Cap Value Fund 10.81 5.5% 11.44
CORE Large Cap Growth Fund 22.66 5.5% 23.98
CORE Small Cap Equity Fund 12.90 5.5% 13.65
CORE International Equity Fund 11.32 5.5% 11.98
Capital Growth Fund 28.95 5.5% 30.63
Strategic Growth Fund 12.52 5.5% 13.25
Growth Opportunities Fund 19.50 5.5% 20.63
Mid Cap Value Fund 19.88 5.5% 21.04
International Equity Fund 23.59 5.5% 24.96
B-165
Small Cap Value Fund 23.21 5.5% 24.56
Large Cap Value Fund 10.39 5.5% 10.99
European Equity Fund 13.82 5.5% 14.62
Japanese Equity Fund 15.77 5.5% 16.69
International Growth Opportunities Fund 16.12 5.5% 17.06
Emerging Market Equity Fund 10.83 5.5% 11.46
Asia Growth Fund 11.16 5.5% 11.80
Research Select Fund 10.77 5.5% 11.40
The following information supplements the information in the Prospectus
under the captions "Shareholder Guide" and "Dividends." Please see the
Prospectus for more complete information.
B-166
Other Purchase Information
--------------------------
If shares of a Fund are held in a "street name" account with an Authorized
Dealer, all recordkeeping, transaction processing and payments of distributions
relating to the beneficial owner's account will be performed by the Authorized
Dealer, and not by the Fund and its Transfer Agent. Since the Funds will have no
record of the beneficial owner's transactions, a beneficial owner should contact
the Authorized Dealer to purchase, redeem or exchange shares, to make changes in
or give instructions concerning the account or to obtain information about the
account. The transfer of shares in a "street name" account to an account with
another dealer or to an account directly with the Fund involves special
procedures and will require the beneficial owner to obtain historical purchase
information about the shares in the account from the Authorized Dealer.
Right of Accumulation (Class A)
-------------------------------
A Class A shareholder qualifies for cumulative quantity discounts if the current
purchase price of the new investment plus the shareholder's current holdings of
existing Class A Shares (acquired by purchase or exchange) of a Fund and Class A
Shares of any other Goldman Sachs Fund (as defined in the Prospectus) total the
requisite amount for receiving a discount. For example, if a shareholder owns
shares with a current market value of $65,000 and purchases additional Class A
Shares of any Goldman Sachs Fund with a purchase price of $45,000, the sales
charge for the $45,000 purchase would be 3.75% (the rate applicable to a single
purchase of $100,000 or more). Class A Shares purchased without the imposition
of a sales charge may not be aggregated with Class A Shares purchased subject to
a sales charge. Class A Shares of the Funds and any other Goldman Sachs Fund
purchased (i) by an individual, his spouse and his children, and (ii) by a
trustee, guardian or other fiduciary of a single trust estate or a single
fiduciary account, will be combined for the purpose of determining whether a
purchase will qualify for such right of accumulation and, if qualifying, the
applicable sales charge level. For purposes of applying the right of
accumulation, (i) shares of the Funds and any other Goldman Sachs Fund purchased
by an existing client of the Private Client Services Division of Goldman Sachs
will be combined with Class A Shares held by all other Private Client Services
accounts, and (ii) shares of the Funds and any other Goldman Sachs Fund
purchased by an existing client of Goldman.com will be combined with Class A
Shares and other assets held in the client's Goldman.com account. In addition,
Class A Shares of the Funds and Class A Shares of any other Goldman Sachs Fund
purchased by partners, directors, officers or employees of the same business
organization, groups of individuals represented by and investing on the
recommendation of the same accounting firm, certain affinity groups or other
similar organizations (collectively, "eligible persons") may be combined for the
purpose of determining whether a purchase will qualify for the right of
accumulation and, if qualifying, the applicable sales charge level. This right
of accumulation is subject to the following conditions: (i) the business
organization's, group's or firm's agreement to cooperate in the offering of the
Fund's shares to eligible persons; and (ii) notification to the relevant Fund at
the time of purchase that the investor is eligible for this right of
accumulation. In addition, in connection with SIMPLE IRA accounts, cumulative
quantity discounts are available on a per plan basis if (i) your employee has
been assigned a
B-167
cumulative discount number by Goldman Sachs, and (ii) your
account, alone or in combination with the accounts of other plan participants
also invested in Class A Shares of Goldman Sachs Funds, totals the requisite
aggregate amount as described in the Prospectus.
Statement of Intention (Class A)
--------------------------------
If a shareholder anticipates purchasing at least $50,000 of Class A Shares of a
Fund alone or in combination with Class A Shares of any other Goldman Sachs Fund
within a 13-month period, the shareholder may purchase shares of the Fund at a
reduced sales charge by submitting a Statement of Intention (the "Statement").
Shares purchased pursuant to a Statement will be eligible for the same sales
charge discount that would have been available if all of the purchases had been
made at the same time. The shareholder or his Authorized Dealer must inform
Goldman Sachs that the Statement is in effect each time shares are purchased.
There is no obligation to purchase the full amount of shares indicated in the
Statement. A shareholder may include the value of all Class A Shares on which a
sales charge has previously been paid as an "accumulation credit" toward the
completion of the Statement, but a price readjustment will be made only on Class
A Shares purchased within ninety (90) days before submitting the Statement. The
Statement authorizes the Transfer Agent to hold in escrow a sufficient number of
shares which can be redeemed to make up any difference in the sales charge on
the amount actually invested. For purposes of satisfying the amount specified on
the Statement, the gross amount of each investment, exclusive of any
appreciation on shares previously purchased, will be taken into account.
The provisions applicable to the Statement, and the terms of the related escrow
agreement, are set forth in Appendix C to this Additional Statement.
Cross-Reinvestment of Dividends and Distributions
-------------------------------------------------
Shareholders may receive dividends and distributions in additional shares of the
same class of a Fund or they may elect to receive them in cash or shares of the
same class of other Goldman Sachs Funds or ILA Service Shares of the Prime
Obligations Fund or the Tax-Exempt Diversified Fund, if they hold Class A Shares
of a Fund, or ILA, Class B or Class C Shares of the Prime Obligations Fund, if
they hold Class B or Class C Shares of a Fund (the "ILA Funds").
A Fund shareholder should obtain and read the prospectus relating to any other
Goldman Sachs Fund or ILA Fund and its shares and consider its investment
objective, policies and applicable fees before electing cross-reinvestment into
that Fund. The election to cross-reinvest dividends and capital gain
distributions will not affect the tax treatment of such dividends and
distributions, which will be treated as received by the shareholder and then
used to purchase shares of the acquired fund. Such reinvestment of dividends and
distributions in shares of other Goldman Sachs Funds or ILA Funds is available
only in states where such reinvestment may legally be made.
B-168
Automatic Exchange Program
--------------------------
A Fund shareholder may elect to exchange automatically a specified dollar amount
of shares of a Fund into an identical account of another Goldman Sachs Fund or
an account registered in a different name or with a different address, social
security or other taxpayer identification number, provided that the account in
the acquired fund has been established, appropriate signatures have been
obtained and the minimum initial investment requirement has been satisfied. A
Fund shareholder should obtain and read the prospectus relating to any other
Goldman Sachs Fund and its shares and consider its investment objective,
policies and applicable fees and expenses before electing an automatic exchange
into that Goldman Sachs Fund.
Class C Exhanges
----------------
As stated in the Prospectus, Goldman Sachs normally begins paying the
annual 0.75% distribution fee on Class C Shares to Authorized Dealers after the
shares have been held for one year. When an Authorized Dealer enters into an
appropriate agreement with Goldman Sachs and stops receiving this payment on
Class C Shares that have been beneficially owned by the Authorized Dealer's
customers for at least ten years, those Class C Shares may be exchanged for
Class A Shares (which bear a lower distribution fee) of the same Fund at their
relative NAV without a sales charge in recognition of the reduced payment to the
Authorized Dealer.
Systematic Withdrawal Plan
--------------------------
A systematic withdrawal plan (the "Systematic Withdrawal Plan") is available to
shareholders of a Fund whose shares are worth at least $5,000. The Systematic
Withdrawal Plan provides for monthly payments to the participating shareholder
of any amount not less than $50.
Dividends and capital gain distributions on shares held under the Systematic
Withdrawal Plan are reinvested in additional full and fractional shares of the
applicable Fund at net asset value. The Transfer Agent acts as agent for the
shareholder in redeeming sufficient full and fractional shares to provide the
amount of the systematic withdrawal payment. The Systematic Withdrawal Plan may
be terminated at any time. Goldman Sachs reserves the right to initiate a fee of
up to $5 per withdrawal, upon thirty (30) days written notice to the
shareholder. Withdrawal payments should not be considered to be dividends, yield
or income. If periodic withdrawals continuously exceed new purchases and
reinvested dividends and capital gains distributions, the shareholder's original
investment will be correspondingly reduced and ultimately exhausted. The
maintenance of a withdrawal plan concurrently with purchases of additional Class
A, Class B or Class C Shares would be disadvantageous because of the sales
charge imposed on purchases of Class A Shares or the imposition of a CDSC on
redemptions of Class A, Class B or Class C Shares. The CDSC applicable to Class
A, Class B or Class C Shares redeemed under a systematic withdrawal plan may be
waived. See "Shareholder Guide" in the Prospectus. In addition, each withdrawal
constitutes a redemption of shares, and any gain or loss realized must be
reported for federal and state income tax purposes. A shareholder should consult
his or her own tax adviser with regard to the tax consequences of participating
in the Systematic Withdrawal Plan. For further information or to request a
Systematic Withdrawal Plan, please write or call the Transfer Agent.
B-169
SERVICE PLAN
(Service Shares Only)
The Funds have adopted a service plan (the "Plan") with respect to its Service
Shares which authorizes the Funds to compensate Service Organizations for
providing certain administration services and personal and account maintenance
services to their customers who are or may become beneficial owners of such
Shares. Pursuant to the Plan, each Fund enters into agreements with Service
Organizations which purchase Service Shares of the Fund on behalf of their
customers ("Service Agreements"). Under such Service Agreements the Service
Organizations may perform some or all of the following services: (a) act,
directly or through an agent, as the sole shareholder of record and nominee for
all customers, (b) maintain account records for each customer who beneficially
owns Service Shares of a Fund, (c) answer questions and handle correspondence
from customers regarding their accounts, (d) process customer orders to
purchase, redeem and exchange Service Shares of a Fund, and handle the
transmission of funds representing the customers' purchase price or redemption
proceeds, (e) issue confirmations for transactions in shares by customers, (f)
provide facilities to answer questions from prospective and existing investors
about Service Shares of a Fund, (g) receive and answer investor correspondence,
including requests for prospectuses and statements of additional information,
(h) display and make prospectuses available on the Service Organization's
premises, (i) assist customers in completing application forms, selecting
dividend and other account options and opening custody accounts with the Service
Organization and (j) act as liaison between customers and a Fund, including
obtaining information from the Fund, working with the Fund to correct errors and
resolve problems and providing statistical and other information to a Fund. As
compensation for such services, each Fund will pay each Service Organization a
service fee in an amount up to 0.50% (on an annualized basis) of the average
daily net assets of the Service Shares of such Fund attributable to or held in
the name of such Service Organization; provided, however, that the fee paid for
personal and account maintenance services shall not exceed .25% of such average
daily net assets.
The amount of the service fees paid by each Fund then in existence to Service
Organizations pursuant to the Plan was as follows for the fiscal year ended
August 31, 2000, the fiscal period ended August 31, 1999 and the fiscal years
ended January 31, 1999 and January 31, 1998:
Fiscal year Fiscal period Fiscal year Fiscal year
ended ended ended ended
August 31, August 31, January 31, January 31,
2000 1999 1999 1998
Balanced Fund/1/ $ 78 $ 445 $ 1,402 $ 31
Growth and Income Fund 44,543 32,442 57,187 32,418
CORE Large Cap Value Fund/2/ 59 13 1 N/A
B-170
CORE U.S. Equity Fund 60,276 34,586 49,461 27,222
CORE Large Cap Growth Fund/3/ 15,306 6,385 2,992 257
CORE Small Cap Equity Fund/3/ 315 176 74 4
CORE International Equity Fund/1/ 119 20 53 3
Capital Growth Fund/1/ 48,672 16,691 7,655 4
Strategic Growth Fund/4/ 8 2 N/A N/A
Growth Opportunities Fund/4/ 628 2 N/A N/A
Mid Cap Value Fund/5/ 904 656 685 12
Small Cap Value Fund/1/ 268 $ 471 $ 588 $ 4
Large Cap Value Fund/6/ 5 N/A N/A N/A
International Equity Fund 20,398 10,635 17,786 9,236
European Equity Fund/7/ 11 6 3 N/A
Japanese Equity Fund/7/ 14 6 6 N/A
International Growth
Opportunities Fund/7/ 11 5 6 N/A
Emerging Markets Equity Fund/8/ 2 4 7 1
Asia Growth Fund/9/ N/A N/A N/A N/A
Research Select Fund/10/ 8 N/A N/A N/A
--------------------------
1 Prior to August 15, 1997, the Balanced, CORE Small Cap Equity, CORE
International Equity, Capital Growth and Small Cap Value Funds had not sold
Service Shares.
2 Prior to December 31, 1998, the CORE Large Cap Value Fund had not sold Service
Shares.
3 Prior to May 1, 1997, the CORE Large Cap Growth Fund had not sold Service
Shares.
4 Prior to May 24, 1999, the Strategic Growth and Growth Opportunities Fund had
not sold Service Shares.
B-171
5 Prior to July 18, 1997, the Mid Cap Value Fund had not sold Service Shares.
6 Prior to December 15, 1999, the Large Cap Value Fund had not sold Service
Shares.
7 Prior to October 1, 1998, May 1, 1998 and May 1, 1998, the European Equity,
Japanese Equity and International Growth Opportunities Funds, respectively, had
not sold Service Shares.
8 Prior to December 15, 1997, the Emerging Markets Fund had not sold Service
Shares.
9 During the periods shown, Service Shares of the Asia Growth Fund were not
sold.
10 Prior to June 19, 2000, the Research Select Fund had not offered Service
Shares.
The Funds have adopted the Plan pursuant to Rule 12b-1 under the Act in order to
avoid any possibility that payments to the Service Organizations pursuant to the
Service Agreements might violate the Act. Rule 12b-1, which was adopted by the
SEC under the Act, regulates the circumstances under which an investment company
or series thereof may bear expenses associated with the distribution of its
shares. In particular, such an investment company or series thereof cannot
engage directly or indirectly in financing any activity which is primarily
intended to result in the sale of shares issued by the company unless it has
adopted a plan pursuant to, and complies with the other requirements of, such
Rule. The Trust believes that fees paid for the services provided in the Plan
and described above are not expenses incurred primarily for effecting the
distribution of Service Shares. However, should such payments be deemed by a
court or the SEC to be distribution expenses, such payments would be duly
authorized by the Plan.
Conflict of interest restrictions (including the Employee Retirement Income
Security Act of 1974) may apply to a Service Organization's receipt of
compensation paid by a Fund in connection with the investment of fiduciary
assets in Service Shares of a Fund. Service Organizations, including banks
regulated by the Comptroller of the Currency, the Federal Reserve Board or the
Federal Deposit Insurance Corporation, and investment advisers and other money
managers subject to the jurisdiction of the SEC, the Department of Labor or
state securities commissions, are urged to consult their legal advisers before
investing fiduciary assets in Service Shares of a Fund. In addition, under some
state securities laws, banks and other financial institutions purchasing Service
Shares on behalf of their customers may be required to register as dealers.
The Trustees, including a majority of the Trustees who are not interested
persons of the Trust and who have no direct or indirect financial interest in
the operation of the Plan or the related Service Agreements, most recently voted
to approve the Plan and related Service Agreements with respect to each Fund
(except the Research Select Fund) at a meeting called for the
B-172
purpose of voting on such Plan and Service Agreements on April 25, 2000. The
Plan and related Service Agreements for the Research Select Fund were initially
approved on April 26, 2000. The Plan and related Service Agreements will remain
in effect until May 1, 2001 and will continue in effect thereafter only if such
continuance is specifically approved annually by a vote of the Trustees in the
manner described above. The Plan may not be amended to increase materially the
amount to be spent for the services described therein without approval of the
Service Shareholders of the affected Fund and all material amendments of the
Plan must also be approved by the Trustees in the manner described above. The
Plan may be terminated at any time by a majority of the Trustees as described
above or by a vote of a majority of the affected Fund's outstanding Service
Shares. The Service Agreements may be terminated at any time, without payment of
any penalty, by vote of a majority of the Trustees as described above or by a
vote of a majority of the outstanding Service Shares on not more than sixty (60)
days' written notice to any other party to the Service Agreements. The Service
Agreements will terminate automatically if assigned. So long as the Plan is in
effect, the selection and nomination of those Trustees who are not interested
persons will be committed to the discretion of the non-interested Trustees. The
Trustees have determined that, in their judgment, there is a reasonable
likelihood that the Plan will benefit the Funds and the holders of Service
Shares of the Funds.
B-173
Appendix A
Commercial Paper Ratings
------------------------
A Standard & Poor's commercial paper rating is a current opinion of the
creditworthiness of an obligor with respect to financial obligations having an
original maturity of no more than 365 days. The following summarizes the rating
categories used by Standard and Poor's for commercial paper:
"A-1" - Obligations are rated in the highest category indicating that the
obligor's capacity to meet its financial commitment on the obligation is strong.
Within this category, certain obligations are designated with a plus sign (+).
This indicates that the obligor's capacity to meet its financial commitment on
these obligations is extremely strong.
"A-2" - Obligations are somewhat more susceptible to the adverse effects
of changes in circumstances and economic conditions than obligations in higher
rating categories. However, the obligor's capacity to meet its financial
commitment on the obligation is satisfactory.
"A-3" - Obligations exhibit adequate protection parameters. However,
adverse economic conditions or changing circumstances are more likely to lead to
a weakened capacity of the obligor to meet its financial commitment on the
obligation.
"B" - Obligations are regarded as having significant speculative
characteristics. The obligor currently has the capacity to meet its financial
commitment on the obligation; however, it faces major ongoing uncertainties
which could lead to the obligor's inadequate capacity to meet its financial
commitment on the obligation.
"C" - Obligations are currently vulnerable to nonpayment and are
dependent upon favorable business, financial, and economic conditions for the
obligor to meet its financial commitment on the obligation.
"D" - Obligations are in payment default. The "D" rating category is used
when payments on an obligation are not made on the date due even if the
applicable grace period has not expired, unless Standard & Poor's believes that
such payments will be made during such grace period. The "D" rating will be used
upon the filing of a bankruptcy petition or the taking of a similar action if
payments on an obligation are jeopardized.
Local Currency and Foreign Currency Risks
Country risk considerations are a standard part of Standard & Poor's analysis
for credit ratings on any issuer or issue. Currency of repayment is a key factor
in this analysis. An obligor's capacity to repay foreign obligations may be
lower than its capacity to repay obligations in its local currency due to the
sovereign government's own relatively lower capacity to repay external versus
domestic debt. These sovereign risk considerations are incorporated in the debt
ratings assigned to specific issues. Foreign currency issuer ratings
1-A
are also distinguished from local currency issuer ratings to identify those
instances where sovereign risks make them different for the same issuer.
Moody's commercial paper ratings are opinions of the ability of issuers
to honor senior financial obligations and contracts. These obligations have an
original maturity not exceeding one year, unless explicitly noted. The following
summarizes the rating categories used by Moody's for commercial paper:
"Prime-1" - Issuers (or supporting institutions) have a superior ability
for repayment of senior short-term debt obligations. Prime-1 repayment ability
will often be evidenced by many of the following characteristics: leading market
positions in well-established industries; high rates of return on funds
employed; conservative capitalization structure with moderate reliance on debt
and ample asset protection; broad margins in earnings coverage of fixed
financial charges and high internal cash generation; and well-established access
to a range of financial markets and assured sources of alternate liquidity.
"Prime-2" - Issuers (or supporting institutions) have a strong ability
for repayment of senior short-term debt obligations. This will normally be
evidenced by many of the characteristics cited above but to a lesser degree.
Earnings trends and coverage ratios, while sound, may be more subject to
variation. Capitalization characteristics, while still appropriate, may be more
affected by external conditions. Ample alternate liquidity is maintained.
"Prime-3" - Issuers (or supporting institutions) have an acceptable
ability for repayment of senior short-term debt obligations. The effect of
industry characteristics and market compositions may be more pronounced.
Variability in earnings and profitability may result in changes in the level of
debt protection measurements and may require relatively high financial leverage.
Adequate alternate liquidity is maintained.
"Not Prime" - Issuers do not fall within any of the Prime rating
categories.
2-A
Fitch, Inc. ("Fitch") short-term ratings apply to time horizons of less
than 12 months for most obligations, or up to three years for U.S. public
finance securities. The following summarizes the rating categories used by Fitch
for short-term obligations:
"F1" - Securities possess the highest credit quality. This designation
indicates the strongest capacity for timely payment of financial commitments and
may have an added "+" to denote any exceptionally strong credit feature.
"F2" - Securities possess good credit quality. This designation indicates
a satisfactory capacity for timely payment of financial commitments, but the
margin of safety is not as great as in the case of the higher ratings.
"F3" - Securities possess fair credit quality. This designation indicates
that the capacity for timely payment of financial commitments is adequate;
however, near-term adverse changes could result in a reduction to non-investment
grade.
"B" - Securities possess speculative credit quality. This designation
indicates minimal capacity for timely payment of financial commitments, plus
vulnerability to near-term adverse changes in financial and economic conditions.
"C" - Securities possess high default risk. This designation indicates a
capacity for meeting financial commitments which is solely reliant upon a
sustained, favorable business and economic environment.
"D" - Securities are in actual or imminent payment default.
3-A
Corporate and Municipal Long-Term Debt Ratings
----------------------------------------------
The following summarizes the ratings used by Standard & Poor's for
corporate and municipal debt:
"AAA" - An obligation rated "AAA" has the highest rating assigned by
Standard & Poor's. The obligor's capacity to meet its financial commitment on
the obligation is extremely strong.
"AA" - An obligation rated "AA" differs from the highest rated
obligations only in small degree. The obligor's capacity to meet its financial
commitment on the obligation is very strong.
"A" - An obligation rated "A" is somewhat more susceptible to the adverse
effects of changes in circumstances and economic conditions than obligations in
higher-rated categories. However, the obligor's capacity to meet its financial
commitment on the obligation is still strong.
"BBB" - An obligation rated "BBB" exhibits adequate protection
parameters. However, adverse economic conditions or changing circumstances are
more likely to lead to a weakened capacity of the obligor to meet its financial
commitment on the obligation.
Obligations rated "BB," "B," "CCC," "CC" and "C" are regarded as having
significant speculative characteristics. "BB" indicates the least degree of
speculation and "C" the highest. While such obligations will likely have some
quality and protective characteristics, these may be outweighed by large
uncertainties or major exposures to adverse conditions.
"BB" - An obligation rated "BB" is less vulnerable to nonpayment than
other speculative issues. However, it faces major ongoing uncertainties or
exposure to adverse business, financial or economic conditions which could lead
to the obligor's inadequate capacity to meet its financial commitment on the
obligation.
4-A
"B" - An obligation rated "B" is more vulnerable to nonpayment than
obligations rated "BB", but the obligor currently has the capacity to meet its
financial commitment on the obligation. Adverse business, financial or economic
conditions will likely impair the obligor's capacity or willingness to meet its
financial commitment on the obligation.
"CCC" - An obligation rated "CCC" is currently vulnerable to nonpayment,
and is dependent upon favorable business, financial and economic conditions for
the obligor to meet its financial commitment on the obligation. In the event of
adverse business, financial, or economic conditions, the obligor is not likely
to have the capacity to meet its financial commitment on the obligation.
"CC" - An obligation rated "CC" is currently highly vulnerable to
nonpayment.
"C" - An obligation rated "C" is currently highly vulnerable to
nonpayment. The "C" rating may be used to cover a situation where a bankruptcy
petition has been filed or similar action taken, but payments on this obligation
are being continued.
"D" - An obligation rated "D" is in payment default. The "D" rating
category is used when payments on an obligation are not made on the date due
even if the applicable grace period has not expired, unless Standard & Poor's
believes that such payments will be made during such grace period. The "D"
rating also will be used upon the filing of a bankruptcy petition or the taking
of a similar action if payments on an obligation are jeopardized.
- PLUS (+) OR MINUS (-) - The ratings from "AA" through "CCC" may be
modified by the addition of a plus or minus sign to show relative standing
within the major rating categories.
- "r" - The 'r' highlights obligations that Standard & Poor's believes
have significant noncredit risks. Examples of such obligations are securities
with principal or interest return indexed to equities, commodities, or
currencies; certain swaps and options; and interest-only and principal-only
mortgage securities. The absence of an 'r' symbol should not be taken as an
indication that an obligation will exhibit no volatility or variability in total
return.
- N.R. Indicates that no rating has been requested, that there is
insufficient information on which to base a rating, or that Standard & Poor's
does not rate a particular obligation as a matter of policy.
5-A
The following summarizes the ratings used by Moody's for corporate and
municipal long-term debt:
"Aaa" - Bonds are judged to be of the best quality. They carry the
smallest degree of investment risk and are generally referred to as "gilt
edged." Interest payments are protected by a large or by an exceptionally stable
margin and principal is secure. While the various protective elements are likely
to change, such changes as can be visualized are most unlikely to impair the
fundamentally strong position of such issues.
"Aa" - Bonds are judged to be of high quality by all standards. Together
with the "Aaa" group they comprise what are generally known as high-grade bonds.
They are rated lower than the best bonds because margins of protection may not
be as large as in "Aaa" securities or fluctuation of protective elements may be
of greater amplitude or there may be other elements present which make the
long-term risk appear somewhat larger than the "Aaa" securities.
"A" - Bonds possess many favorable investment attributes and are to be
considered as upper-medium-grade obligations. Factors giving security to
principal and interest are considered adequate, but elements may be present
which suggest a susceptibility to impairment sometime in the future.
"Baa" - Bonds are considered as medium-grade obligations, (i.e., they are
neither highly protected nor poorly secured). Interest payments and principal
security appear adequate for the present but certain protective elements may be
lacking or may be characteristically unreliable over any great length of time.
Such bonds lack outstanding investment characteristics and in fact have
speculative characteristics as well.
"Ba" - Bonds are judged to have speculative elements; their future cannot
be considered as well-assured. Often the protection of interest and principal
payments may be very moderate, and thereby not well safeguarded during both good
and bad times over the future. Uncertainty of position characterizes bonds in
this class.
"B" - Bonds generally lack characteristics of the desirable investment.
Assurance of interest and principal payments or of maintenance of other terms of
the contract over any long period of time may be small.
"Caa " - Bonds are of poor standing. Such issues may be in default or
there may be present elements of danger with respect to principal or
interest.
"Ca" - Bonds represent obligations which are speculative in a high
degree. Such issues are often in default or have other marked shortcomings.
6-A
"C" - Bonds are the lowest rated class of bonds, and issues so rated can
be regarded as having extremely poor prospects of ever attaining any real
investment standing.
Con. (...) - Bonds for which the security depends on the completion of
some act or the fulfillment of some condition are rated conditionally. These are
bonds secured by (a) earnings of projects under construction, (b) earnings of
projects unseasoned in operation experience, (c) rentals which begin when
facilities are completed, or (d) payments to which some other limiting condition
attaches. The parenthetical rating denotes probable credit stature upon
completion of construction or elimination of the basis of the condition.
Note: Moody's applies numerical modifiers 1, 2, and 3 in each generic
rating classification from "Aa" through "Caa". The modifier 1 indicates that the
obligation ranks in the higher end of its generic rating category; the modifier
2 indicates a mid-range ranking; and the modifier 3 indicates a ranking in the
lower end of its generic rating category.
The following summarizes long-term ratings used by Fitch:
7-A
"AAA" - Securities considered to be investment grade and of the highest
credit quality. These ratings denote the lowest expectation of credit risk and
are assigned only in case of exceptionally strong capacity for timely payment of
financial commitments. This capacity is highly unlikely to be adversely affected
by foreseeable events.
"AA" - Securities considered to be investment grade and of very high
credit quality. These ratings denote a very low expectation of credit risk and
indicate very strong capacity for timely payment of financial commitments. This
capacity is not significantly vulnerable to foreseeable events.
"A" - Securities considered to be investment grade and of high credit
quality. These ratings denote a low expectation of credit risk and indicate
strong capacity for timely payment of financial commitments. This capacity may,
nevertheless, be more vulnerable to changes in circumstances or in economic
conditions than is the case for higher ratings.
"BBB" - Securities considered to be investment grade and of good credit
quality. These ratings denote that there is currently a low expectation of
credit risk. The capacity for timely payment of financial commitments is
considered adequate, but adverse changes in circumstances and in economic
conditions are more likely to impair this capacity. This is the lowest
investment grade category.
"BB" - Securities considered to be speculative. These ratings indicate
that there is a possibility of credit risk developing, particularly as the
result of adverse economic change over time; however, business or financial
alternatives may be available to allow financial commitments to be met.
Securities rated in this category are not investment grade.
"B" - Securities are considered highly speculative. These ratings
indicate that significant credit risk is present, but a limited margin of safety
remains. Financial commitments are currently being met; however, capacity for
continued payment is contingent upon a sustained, favorable business and
economic environment.
"CCC", "CC" and "C" - Securities have high default risk. Default is a
real possibility, and capacity for meeting financial commitments is solely
reliant upon sustained, favorable business or economic developments. "CC"
ratings indicate that default of some kind appears probable, and "C" ratings
signal imminent default.
"DDD," "DD" and "D" - Securities are in default. The ratings of
obligations in this category are based on their prospects for achieving partial
or full recovery in a reorganization or liquidation of the obligor. While
expected recovery values are highly speculative and cannot be estimated with any
precision, the following serve as general guidelines. "DDD" obligations have the
highest potential for recovery, around 90%-100% of
8-A
outstanding amounts and accrued interest. "DD" indicates potential recoveries in
the range of 50%-90%, and "D" the lowest recovery potential, i.e., below
50%.
Entities rated in this category have defaulted on some or all of their
obligations. Entities rated "DDD" have the highest prospect for resumption of
performance or continued operation with or without a formal reorganization
process. Entities rated "DD" and "D" are generally undergoing a formal
reorganization or liquidation process; those rated "DD" are likely to satisfy a
higher portion of their outstanding obligations, while entities rated "D" have a
poor prospect for repaying all obligations.
- To provide more detailed indications of credit quality, the Fitch
ratings from and including "AA" to "CCC" and "F1" may be modified by the
addition of a plus (+) or minus (-) sign to denote relative standing within
these major rating categories.
- `NR' indicates that Fitch does not rate the issuer or issue in
question.
- `Withdrawn': A rating is withdrawn when Fitch deems the amount of
information available to be inadequate for rating purposes, or when an
obligation matures, is called, or refinanced.
- Rating Watch: Ratings are placed on Rating Watch to notify investors
that there is a reasonable probability of a rating change and the likely
direction of such change. These are designated as "Positive", indicating a
potential upgrade, "Negative", for a potential downgrade, or "Evolving", if
ratings may be raised, lowered or maintained. Rating Watch is typically resolved
over a relatively short period.
9-A
- A Rating Outlook indicates the direction a rating is likely to move
over a one to two-year period. Outlooks may be positive, stable or negative. A
positive or negative Rating Outlook does not imply a rating change is
inevitable. Similarly, companies whose outlooks are "stable" could be upgraded
or downgraded before an outlook moves to positive or negative if circumstances
warrant such an action. Occasionally, Fitch may be unable to identify the
fundamental trend. In these cases, the Rating Outlook may be described as
evolving.
Municipal Note Ratings
----------------------
A Standard and Poor's note rating reflects the liquidity factors and
market access risks unique to notes due in three years or less. The following
summarizes the ratings used by Standard & Poor's for municipal notes:
"SP-1" - The issuers of these municipal notes exhibit a strong capacity
to pay principal and interest. Those issues determined to possess a very strong
capacity to pay debt service are given a plus (+) designation.
"SP-2" - The issuers of these municipal notes exhibit satisfactory
capacity to pay principal and interest, with some vulnerability to adverse
financial and economic changes over the term of the notes.
"SP-3" - The issuers of these municipal notes exhibit speculative
capacity to pay principal and interest.
Moody's ratings for state and municipal notes and other short-term loans
are designated Moody's Investment Grade ("MIG") and variable rate demand
obligations are designated Variable Moody's Investment Grade ("VMIG"). Such
ratings recognize the differences between
10-A
short-term credit risk and long-term risk. The following summarizes the ratings
by Moody's Investors Service, Inc. for short-term notes:
"MIG-1"/"VMIG-1" - This designation denotes superior credit quality.
Excellent protection afforded by established cash flows, highly reliable
liquidity support or demonstrated broad-based access to the market for
refinancing.
"MIG-2"/"VMIG-2" - This designation denotes strong credit quality.
Margins of protection are ample although not so large as in the preceding
group.
"MIG-3"/"VMIG-3" - This designation denotes acceptable credit. Liquidity
and cash flow protection may be narrow and market access for refinancing is
likely to be less well established.
"SG" - This designation denotes speculative-grade credit quality. Debt
instruments in this category lack sufficient margins of protection.
11-A
Appendix B
BUSINESS PRINCIPLES OF GOLDMAN, SACHS & CO.
Goldman Sachs is noted for its Business Principles, which guide all of
the firm's activities and serve as the basis for its distinguished reputation
among investors worldwide.
Our client's interests always come first. Our experience shows that if we
serve our clients well, our own success will follow.
Our assets are our people, capital and reputation. If any of these is
ever diminished, the last is the most difficult to restore. We are dedicated to
complying fully with the letter and spirit of the laws, rules and ethical
principles that govern us. Our continued success depends upon unswerving
adherence to this standard.
We take great pride in the professional quality of our work. We have an
uncompromising determination to achieve excellence in everything we undertake.
Though we may be involved in a wide variety and heavy volume of activity, we
would, if it came to a choice, rather be best than biggest.
We stress creativity and imagination in everything we do. While
recognizing that the old way may still be the best way, we constantly strive to
find a better solution to a client's problems. We pride ourselves on having
pioneered many of the practices and techniques that have become standard in the
industry.
We make an unusual effort to identify and recruit the very best person
for every job. Although our activities are measured in billions of dollars, we
select our people one by one. In a service business, we know that without the
best people, we cannot be the best firm.
We offer our people the opportunity to move ahead more rapidly than is
possible at most other places. We have yet to find limits to the responsibility
that our best people are able to assume. Advancement depends solely on ability,
performance and contribution to the Firm's success, without regard to race,
color, religion, sex, age, national origin, disability, sexual orientation, or
any other impermissible criterion or circumstance.
We stress teamwork in everything we do. While individual creativity is
always encouraged, we have found that team effort often produces the best
results. We have no room for those who put their personal interests ahead of the
interests of the Firm and its clients.
The dedication of our people to the Firm and the intense effort they give
their jobs are greater than one finds in most other organizations. We think that
this is an important part of our success.
1-B
Our profits are a key to our success. They replenish our capital and
attract and keep our best people. It is our practice to share our profits
generously with all who help create them. Profitability is crucial to our
future.
We consider our size an asset that we try hard to preserve. We want to be
big enough to undertake the largest project that any of our clients could
contemplate, yet small enough to maintain the loyalty, the intimacy and the
esprit de corps that we all treasure and that contribute greatly to our success.
We constantly strive to anticipate the rapidly changing needs of our
clients and to develop new services to meet those needs. We know that the world
of finance will not stand still and that complacency can lead to extinction.
We regularly receive confidential information as part of our normal
client relationships. To breach a confidence or to use confidential information
improperly or carelessly would be unthinkable.
Our business is highly competitive, and we aggressively seek to expand
our client relationships. However, we must always be fair competitors and must
never denigrate other firms.
Integrity and honesty are the heart of our business. We expect our people
to maintain high ethical standards in everything they do, both in their work for
the firm and in their personal lives.
2-B
GOLDMAN, SACHS & CO.'S INVESTMENT BANKING AND SECURITIES ACTIVITIES
Goldman Sachs is a leading financial services firm traditionally known on
Wall Street and around the world for its institutional and private client
service.
With thirty-seven offices around the world Goldman Sachs employs over
11,000 professionals focused on opportunities in major markets.
The number one underwriter of all international equity issues from
1989-1997.
The number one lead manager of U.S. common stock offerings for the past
nine years (1989-1997).*
The number one lead manager for initial public offerings (IPOs) worldwide
(1989-1997).
-----------------------
* Source: Securities Data Corporation. Common stock ranking excludes REITs,
Investment Trusts and Rights.
3-B
GOLDMAN, SACHS & CO.'S HISTORY OF EXCELLENCE
1869 Marcus Goldman opens Goldman Sachs for business
1890 Dow Jones Industrial Average first published
1896 Goldman, Sachs & Co. joins New York Stock Exchange
1906 Goldman, Sachs & Co. takes Sears Roebuck & Co. public (at 93 years,
the firm's longest-standing client relationship)
Dow Jones Industrial Average tops 100
1925 Goldman, Sachs & Co. finances Warner Brothers, producer of the first
talking film
1956 Goldman, Sachs & Co. co-manages Ford's public offering, the largest to
date
1970 Goldman, Sachs & Co. opens London office
1972 Dow Jones Industrial Average breaks 1000
1986 Goldman, Sachs & Co. takes Microsoft public
1988 Goldman Sachs Asset Management is formally established
1991 Goldman, Sachs & Co. provides advisory services for the largest
privatization in the region of the sale of Telefonos de Mexico
1995 Goldman Sachs Asset Management introduces Global Tactical Asset
Allocation Program
Dow Jones Industrial Average breaks 5000
1996 Goldman, Sachs & Co. takes Deutsche Telekom public
Dow Jones Industrial Average breaks 6000
1997 Goldman Sachs Asset Management increases assets under management by
100% over 1996
Dow Jones Industrial Average breaks 7000
4-B
1998 Goldman Sachs Asset Management reaches $195.5 billion in assets under
management
Dow Jones Industrial Average breaks 9000
1999 Goldman Sachs becomes a public company
5-B
APPENDIX C
Statement of Intention
(applicable only to Class A shares)
If a shareholder anticipates purchasing $50,000 or more of Class A
Shares of a Fund alone or in combination with Class A Shares of another Goldman
Sachs Fund within a 13-month period, the shareholder may obtain shares of the
Fund at the same reduced sales charge as though the total quantity were invested
in one lump sum by checking and filing the Statement of Intention in the Account
Application. Income dividends and capital gain distributions taken in additional
shares will not apply toward the completion of the Statement of Intention.
To ensure that the reduced price will be received on future purchases,
the investor must inform Goldman Sachs that the Statement of Intention is in
effect each time shares are purchased. Subject to the conditions mentioned
below, each purchase will be made at the public offering price applicable to a
single transaction of the dollar amount specified on the Account Application.
The investor makes no commitment to purchase additional shares, but if the
investor's purchases within 13 months plus the value of shares credited toward
completion do not total the sum specified, the investor will pay the increased
amount of the sales charge prescribed in the Escrow Agreement.
Escrow Agreement
Out of the initial purchase (or subsequent purchases if necessary), 5%
of the dollar amount specified on the Account Application will be held in escrow
by the Transfer Agent in the form of shares registered in the investor's name.
All income dividends and capital gains distributions on escrowed shares will be
paid to the investor or to his or her order. When the minimum investment so
specified is completed (either prior to or by the end of the 13th month), the
investor will be notified and the escrowed shares will be released.
If the intended investment is not completed, the investor will be
asked to remit to Goldman Sachs any difference between the sales charge on the
amount specified and on the amount actually attained. If the investor does not
within 20 days after written request by Goldman Sachs pay such difference in the
sales charge, the Transfer Agent will redeem, pursuant to the authority given by
the investor in the Account Application, an appropriate number of the escrowed
shares in order to realize such difference. Shares remaining after any such
redemption will be released by the Transfer Agent.
1-C
|
Shares |
Description | Value | ||||
|---|---|---|---|---|---|---|
| Common Stocks – 99.7% | ||||||
| Airlines – 0.4% | ||||||
| 70,800 | Delta Air Lines, Inc. | $ 3,504,600 | ||||
| 51,000 | UAL Corp. | 2,435,250 | ||||
| 5,939,850 | ||||||
| Banks – 6.5% | ||||||
| 189,562 | Bank of America Corp. | 10,153,415 | ||||
| 669,000 | Citigroup, Inc. | 39,052,875 | ||||
| 29,250 | Fifth Third Bancorp | 1,350,984 | ||||
| 106,900 | Firstar Corp. | 2,552,237 | ||||
| 244,500 | FleetBoston Financial Corp. | 10,437,094 | ||||
| 119,100 | Mellon Financial Corp. | 5,389,275 | ||||
| 90,100 | PNC Financial Services Group | 5,310,269 | ||||
| 72,500 | SunTrust Banks, Inc. | 3,579,687 | ||||
| 200,150 | The Chase Manhattan Corp. | 11,183,381 | ||||
| 124,500 | Wells Fargo & Co. | 5,376,844 | ||||
| 94,386,061 | ||||||
| Chemicals – 1.5% | ||||||
| 43,000 | Aptargroup, Inc. | 1,002,438 | ||||
| 25,400 | Avery Dennison Corp. | 1,373,187 | ||||
| 73,400 | Minnesota Mining & Manufacturing
Co. |
6,826,200 | ||||
| 22,200 | PPG Industries, Inc. | 899,100 | ||||
| 26,400 | Praxair, Inc. | 1,168,200 | ||||
| 391,700 | The Dow Chemicals Co. | 10,257,644 | ||||
| 21,526,769 | ||||||
| Clothing – 0.3% | ||||||
| 231,800 | The Limited, Inc. | 4,636,000 | ||||
| Computer Hardware – 9.6% | ||||||
| 176,900 | Apple Computer, Inc.* | 10,779,844 | ||||
| 42,200 | Cabletron Systems, Inc.* | 1,579,863 | ||||
| 690,800 | Cisco Systems, Inc.* | 47,406,150 | ||||
| 69,500 | Dell Computer Corp.* | 3,031,937 | ||||
| 196,000 | EMC Corp.* | 19,208,000 | ||||
| 150,100 | Hewlett-Packard Co. | 18,124,575 | ||||
| 79,300 | Network Appliance, Inc.* | 9,278,100 | ||||
| 56,943 | Palm, Inc.* | 2,505,492 | ||||
| 22,500 | SanDisk Corp.* | 1,878,750 | ||||
| 80,800 | Seagate Technology, Inc.* | 4,797,500 | ||||
| 157,900 | Sun Microsystems, Inc.* | 20,043,431 | ||||
| 138,633,642 | ||||||
| Computer Software – 7.0% | ||||||
| 14,500 | Adobe Systems, Inc. | 1,885,000 | ||||
| 129,200 | International Business Machines,
Inc. |
17,054,400 | ||||
| 470,500 | Microsoft Corp.* | 32,846,781 | ||||
| 346,100 | Oracle Corp.* | 31,473,469 | ||||
| 9,100 | Sabre Holdings Corp. | 253,662 | ||||
| 14,800 | Sapient Corp.* | 777,000 | ||||
| 22,400 | Siebel Systems, Inc.* | 4,431,000 | ||||
| 101,900 | VERITAS Software Corp.* | 12,285,319 | ||||
| 101,006,631 | ||||||
| Construction – 0.1% | ||||||
| 43,700 | Fluor Corp. | 1,308,269 | ||||
|
Shares |
Description | Value | ||||
|---|---|---|---|---|---|---|
| Common Stocks – (continued) | ||||||
| Consumer Durables – 0.5% | ||||||
| 68,100 | Sherwin-Williams Co. | $ 1,566,300 | ||||
| 132,800 | Whirlpool Corp. | 5,046,400 | ||||
| 6,612,700 | ||||||
| Defense/Aerospace – 0.7% | ||||||
| 22,400 | Northrop Grumman Corp. | 1,743,000 | ||||
| 153,200 | The Boeing Co. | 8,215,350 | ||||
| 9,958,350 | ||||||
| Department Store – 2.2% | ||||||
| 234,600 | Federated Department Stores, Inc.* | 6,480,825 | ||||
| 61,700 | Sears, Roebuck & Co. | 1,924,269 | ||||
| 217,400 | Target Corp. | 5,054,550 | ||||
| 373,800 | Wal-Mart Stores, Inc. | 17,732,137 | ||||
| 31,191,781 | ||||||
| Drugs – 7.6% | ||||||
| 156,300 | Allergan, Inc. | 11,429,437 | ||||
| 141,700 | Amgen, Inc.* | 10,742,631 | ||||
| 25,100 | Bristol-Myers Squibb Co. | 1,330,300 | ||||
| 44,200 | Cardinal Health, Inc. | 3,616,113 | ||||
| 14,500 | Celera Genomics* | 1,572,344 | ||||
| 31,200 | Chiron Corp.* | 1,686,750 | ||||
| 58,600 | Eli Lilly & Co. | 4,277,800 | ||||
| 18,200 | Genentech, Inc.* | 3,467,100 | ||||
| 57,600 | MedImmune, Inc.* | 4,845,600 | ||||
| 284,100 | Merck & Co., Inc. | 19,851,487 | ||||
| 23,200 | Millennium Pharmaceuticals* | 3,320,500 | ||||
| 22,500 | PE Corp-PE Biosystems Group | 2,213,438 | ||||
| 848,750 | Pfizer, Inc. | 36,708,437 | ||||
| 87,873 | Pharmacia Corp. | 5,146,063 | ||||
| 110,208,000 | ||||||
| Electrical Equipment – 6.5% | ||||||
| 117,000 | ADC Telecommunications, Inc.* | 4,789,687 | ||||
| 17,200 | Advanced Fibre Communications, Inc.* | 909,181 | ||||
| 8,600 | CIENA Corp.* | 1,906,512 | ||||
| 67,700 | Corning, Inc. | 22,201,369 | ||||
| 188,900 | General Dynamics Corp. | 11,888,894 | ||||
| 105,600 | Lucent Technologies, Inc. | 4,415,400 | ||||
| 44,300 | Motorola, Inc. | 1,597,569 | ||||
| 413,081 | Nortel Networks Corp. | 33,691,919 | ||||
| 31,800 | QUALCOMM, Inc.* | 1,904,025 | ||||
| 50,000 | Scientific-Atlanta, Inc. | 3,896,875 | ||||
| 19,400 | Teradyne, Inc. | 1,257,363 | ||||
| 26,500 | Terayon Communication Systems, Inc. | 1,470,750 | ||||
| 91,500 | Vishay Intertechnology, Inc.* | 3,688,594 | ||||
| 93,618,138 | ||||||
| Electrical Utilities – 2.2% | ||||||
| 117,800 | Calpine Corp.* | 11,662,200 | ||||
| 42,200 | Constellation Energy Group | 1,614,150 | ||||
| 67,400 | Duke Energy Corp. | 5,042,362 | ||||
| 48,400 | Dynegy, Inc. | 2,178,000 | ||||
| 50,000 | FPL Group, Inc. | 2,668,750 | ||||
| 122,700 | Public Service Enterprise | 4,447,875 | ||||
| 78,200 | Unicom Corp. | 3,572,763 | ||||
| 31,186,100 | ||||||
|
Shares |
Description | Value | ||||
|---|---|---|---|---|---|---|
| Common Stocks – (continued) | ||||||
| Energy Resources – 5.3% | ||||||
| 39,900 | Apache Corp. | $ 2,513,700 | ||||
| 122,300 | Chevron Corp. | 10,334,350 | ||||
| 72,300 | Enron Corp. | 6,136,462 | ||||
| 408,358 | Exxon Mobil Corp. | 33,332,222 | ||||
| 39,100 | Kerr-McGee Corp. | 2,470,631 | ||||
| 24,500 | Phillips Petroleum Co. | 1,515,938 | ||||
| 339,700 | Royal Dutch Petroleum Co. ADR | 20,785,394 | ||||
| 77,088,697 | ||||||
| Entertainment – 1.2% | ||||||
| 271,600 | The Walt Disney Co. | 10,575,425 | ||||
| 93,200 | Viacom, Inc. Class B* | 6,273,525 | ||||
| 16,848,950 | ||||||
| Financial Services – 5.8% | ||||||
| 43,500 | American Express Co. | 2,571,937 | ||||
| 99,200 | Comdisco, Inc. | 2,380,800 | ||||
| 68,900 | Federal National Mortgage Assn. | 3,703,375 | ||||
| 1,120,500 | General Electric Co. | 65,759,344 | ||||
| 60,900 | Marsh & McLennan Cos., Inc. | 7,231,875 | ||||
| 18,500 | Providian Financial Corp. | 2,126,344 | ||||
| 83,773,675 | ||||||
| Food & Beverage – 3.9% | ||||||
| 243,416 | Archer-Daniels-Midland Co. | 2,145,106 | ||||
| 168,800 | ConAgra, Inc. | 3,091,150 | ||||
| 41,300 | General Mills, Inc. | 1,326,762 | ||||
| 50,800 | H.J. Heinz Co. | 1,936,750 | ||||
| 88,500 | IBP, Inc. | 1,421,531 | ||||
| 346,000 | Nabisco Group Holdings Corp. | 9,709,625 | ||||
| 192,400 | Nabisco Holdings Corp. | 10,281,375 | ||||
| 385,400 | PepsiCo., Inc. | 16,427,675 | ||||
| 58,000 | Supervalu, Inc. | 866,375 | ||||
| 94,800 | The Coca-Cola Co. | 4,988,850 | ||||
| 73,900 | The Pepsi Bottling Group, Inc. | 2,346,325 | ||||
| 22,000 | The Quaker Oats Co. | 1,494,625 | ||||
| 56,036,149 | ||||||
| Forest – 0.4% | ||||||
| 153,100 | Georgia-Pacific Group | 4,095,425 | ||||
| 28,300 | Kimberly-Clark Corp. | 1,655,550 | ||||
| 5,750,975 | ||||||
| Gold – 0.1% | ||||||
| 115,500 | Barrick Gold Corp. | 1,840,781 | ||||
| Grocery – 0.4% | ||||||
| 63,034 | Safeway, Inc.* | 3,108,364 | ||||
| 101,400 | The Kroger Co.* | 2,300,513 | ||||
| 5,408,877 | ||||||
| Heavy Electrical – 0.3% | ||||||
| 63,100 | Emerson Electric Co. | 4,176,431 | ||||
| Home Products – 0.5% | ||||||
| 70,300 | Colgate-Palmolive Co. | 3,580,906 | ||||
| 1 | Energizer Holdings, Inc.* | 20 | ||||
| 95,600 | Fortune Brands, Inc. | 2,437,800 | ||||
|
Shares |
Description | Value | ||||
|---|---|---|---|---|---|---|
| Common Stocks – (continued) | ||||||
| Home Products – (continued) | ||||||
| 46,800 | Ralston Purina Group | $ 1,058,850 | ||||
| 7,077,576 | ||||||
| Hotels – 0.2% | ||||||
| 152,000 | Park Place Entertainment Corp.* | 2,232,500 | ||||
| Industrial Parts – 1.6% | ||||||
| 72,100 | Ingersoll-Rand Co. | 3,285,056 | ||||
| 54,600 | Parker-Hannifin Corp. | 1,900,762 | ||||
| 227,186 | Tyco International Ltd. | 12,949,602 | ||||
| 89,300 | United Technologies Corp. | 5,575,669 | ||||
| 23,711,089 | ||||||
| Industrial Services – 0.4% | ||||||
| 126,400 | Hertz Corp. | 3,871,000 | ||||
| 69,600 | Robert Half International, Inc.* | 2,214,150 | ||||
| 6,085,150 | ||||||
| Information Services – 0.8% | ||||||
| 73,500 | Automatic Data Processing, Inc. | 4,382,437 | ||||
| 19,400 | Computer Sciences Corp.* | 1,533,813 | ||||
| 36,600 | Electronic Data Systems Corp. | 1,823,138 | ||||
| 83,500 | First Data Corp. | 3,981,906 | ||||
| 11,721,294 | ||||||
| Internet – 1.5% | ||||||
| 245,900 | America Online, Inc.* | 14,415,888 | ||||
| 57,700 | Yahoo!, Inc.* | 7,010,550 | ||||
| 21,426,438 | ||||||
| Leisure – 0.8% | ||||||
| 181,800 | Eastman Kodak Co. | 11,317,050 | ||||
| Life Insurance – 1.6% | ||||||
| 34,400 | AFLAC, Inc. | 1,857,600 | ||||
| 25,800 | American General Corp. | 1,878,563 | ||||
| 84,000 | Cigna Corp. | 8,169,000 | ||||
| 112,300 | UnitedHealth Group, Inc. | 10,612,350 | ||||
| 22,517,513 | ||||||
| Media – 2.1% | ||||||
| 116,800 | Fox Entertainment Group, Inc.* | 3,379,900 | ||||
| 325,200 | General Motors Corp. Class H* | 10,772,250 | ||||
| 116,500 | Infinity Broadcasting Corp.* | 4,412,437 | ||||
| 140,500 | Time Warner, Inc. | 12,012,750 | ||||
| 30,577,337 | ||||||
| Medical Products – 2.3% | ||||||
| 75,700 | Abbott Laboratories | 3,311,875 | ||||
| 18,900 | Bausch & Lomb, Inc. | 675,675 | ||||
| 63,400 | Baxter International, Inc. | 5,278,050 | ||||
| 240,400 | Johnson & Johnson | 22,101,775 | ||||
| 25,600 | Medtronic, Inc. | 1,312,000 | ||||
| 32,679,375 | ||||||
| Medical Providers – 0.2% | ||||||
| 197,300 | Beverly Enterprises, Inc.* | 1,023,494 | ||||
| 67,400 | HCA-The Healthcare Corp. | 2,325,300 | ||||
|
Shares |
Description |
Value |
||||
|---|---|---|---|---|---|---|
| Common Stocks – (continued) | ||||||
| Medical Providers – (continued) | ||||||
| 1 | Lifepoint Hospitals, Inc.* | $ 30 | ||||
| 1 | Triad Hospitals, Inc.* | 29 | ||||
| 3,348,853 | ||||||
| Mining – 0.4% | ||||||
| 160,000 | Alcan Aluminium Ltd. | 5,250,000 | ||||
| 26,300 | Nucor Corp. | 966,525 | ||||
| 6,216,525 | ||||||
| Motor Vehicle – 1.9% | ||||||
| 399,283 | Ford Motor Co. | 9,657,657 | ||||
| 220,000 | General Motors Corp. | 15,881,250 | ||||
| 45,300 | Johnson Controls, Inc. | 2,420,719 | ||||
| 27,959,626 | ||||||
| Oil Refining – 0.1% | ||||||
| 70,600 | Tosco Corp. | 2,153,300 | ||||
| Oil Services – 0.4% | ||||||
| 59,600 | BJ Services Co.* | 3,993,200 | ||||
| 36,700 | Noble Drilling Corp.* | 1,779,950 | ||||
| 5,773,150 | ||||||
| Property Insurance – 3.0% | ||||||
| 209,112 | Allstate Corp. | 6,077,317 | ||||
| 259,789 | American International Group, Inc. | 23,153,695 | ||||
| 18,500 | Jefferson-Pilot Corp. | 1,224,469 | ||||
| 26,400 | Loews Corp. | 2,136,750 | ||||
| 85,500 | MGIC Investment Corp. | 5,028,469 | ||||
| 58,100 | The Hartford Financial Services
Group, Inc. |
3,870,912 | ||||
| 33,000 | The PMI Group, Inc. | 2,046,000 | ||||
| 43,537,612 | ||||||
| Publishing – 0.2% | ||||||
| 28,300 | Dow Jones & Co., Inc. | 1,770,519 | ||||
| 25,400 | Knight-Ridder, Inc. | 1,387,475 | ||||
| 3,157,994 | ||||||
| Railroads – 0.1% | ||||||
| 91,800 | Burlington Northern Santa Fe Corp. | 2,054,025 | ||||
| Restaurants – 0.2% | ||||||
| 43,800 | Brinker International, Inc.* | 1,390,650 | ||||
| 47,000 | Tricon Global Restaurants, Inc.* | 1,368,875 | ||||
| 2,759,525 | ||||||
| Security/Asset Management – 2.1% | ||||||
| 208,300 | AXA Financial, Inc. | 10,779,525 | ||||
| 21,900 | Lehman Brothers Holdings, Inc. | 3,175,500 | ||||
| 10,300 | Merrill Lynch & Co., Inc. | 1,493,500 | ||||
| 92,500 | Morgan Stanley Dean Witter & Co. | 9,949,531 | ||||
| 143,450 | The Charles Schwab Corp. | 5,477,997 | ||||
| 30,876,053 | ||||||
| Semiconductors – 8.7% | ||||||
| 141,400 | Advanced Micro Devices, Inc.* | 5,320,175 | ||||
| 58,500 | Analog Devices, Inc.* | 5,879,250 | ||||
| 70,100 | Applied Materials, Inc.* | 6,050,506 | ||||
| 23,300 | Applied Micro Circuits Corp.* | 4,728,444 | ||||
| 22,900 | Broadcom Corp.* | 5,725,000 | ||||
| 674,400 | Intel Corp. | 50,495,700 | ||||
| 148,700 | JDS Uniphase Corp.* | 18,510,827 | ||||
|
Shares |
Description |
Value |
||||
|---|---|---|---|---|---|---|
| Common Stocks – (continued) | ||||||
| Semiconductors – (continued) | ||||||
| 18,600 | KLA-Tencor Corp.* | $ 1,220,625 | ||||
| 92,500 | Micron Technology, Inc.* | 7,561,875 | ||||
| 7,400 | PMC-Sierra, Inc.* | 1,746,400 | ||||
| 14,200 | SDL, Inc.* | 5,641,837 | ||||
| 140,100 | Texas Instruments, Inc. | 9,377,944 | ||||
| 38,400 | Xilinx, Inc.* | 3,412,800 | ||||
| 125,671,383 | ||||||
| Specialty Retail – 1.5% | ||||||
| 24,500 | Avnet, Inc. | 1,466,938 | ||||
| 93,300 | Lowes Co., Inc. | 4,181,006 | ||||
| 256,900 | The Home Depot, Inc. | 12,347,256 | ||||
| 90,400 | Tiffany & Co. | 3,762,900 | ||||
| 21,758,100 | ||||||
| Telephone – 5.1% | ||||||
| 463,475 | AT&T Corp. | 14,599,462 | ||||
| 45,200 | BCE, Inc. | 1,017,000 | ||||
| 399,500 | BellSouth Corp. | 14,906,344 | ||||
| 74,800 | Citizens Communications Co.* | 1,220,175 | ||||
| 294,222 | SBC Communications, Inc. | 12,283,768 | ||||
| 218,100 | Sprint Corp. | 7,306,350 | ||||
| 260,118 | Verizon Communications | 11,347,648 | ||||
| 304,000 | WorldCom, Inc.* | 11,096,000 | ||||
| 73,776,747 | ||||||
| Thrifts – 0.2% | ||||||
| 46,700 | Golden West Financial Corp. | 2,224,088 | ||||
| Tobacco – 0.6% | ||||||
| 247,300 | Philip Morris Cos., Inc. | 7,326,263 | ||||
| 48,800 | R.J. Reynolds Tobacco Holdings, Inc. | 1,750,700 | ||||
| 9,076,963 | ||||||
| Wireless – 0.7% | ||||||
| 53,900 | AT&T Wireless Group* | 1,411,506 | ||||
| 50,600 | Telephone & Data Systems, Inc. | 5,869,600 | ||||
| 33,900 | United States Cellular Corp.* | 2,493,769 | ||||
| 9,774,875 | ||||||
| TOTAL COMMON STOCKS | ||||||
| (Cost $1,098,258,504) | $1,440,600,967 | |||||
| Principal
Amount |
Interest
Rate |
Maturity
Date |
Value | |||||
|---|---|---|---|---|---|---|---|---|
| Repurchase Agreement – 0.2% | ||||||||
| Joint Repurchase Agreement Account II Ù | ||||||||
| $2,500,000 | 6.66 | % | 09/01/2000 | $ 2,500,000 | ||||
| TOTAL REPURCHASE AGREEMENT | ||||||||
| (Cost $2,500,000) | $ 2,500,000 | |||||||
| TOTAL INVESTMENTS | ||||||||
| (Cost $1,100,758,504) | $ 1,443,100,967 | |||||||
*
|
Non-income producing security.
|
Ù
|
Joint repurchase agreement was entered into on August 31, 2000.
|
| The percentage shown for each investment category reflects the value of investments in that category as a percentage of total net
assets.
|
| The following graph shows the value, as of August 31, 2000, of a $10,000 investment made on May 1, 1997 (commencement of
operations) in Class A shares (maximum sales charge of 5.5%) of the Goldman Sachs CORE Large Cap Growth Fund. For comparative purposes, the performance of the Fund’s benchmark (Russell 1000 Growth Index with dividends reinvested) is shown. This
performance data represents past performance and should not be considered indicative of future performance which will fluctuate with changes in market conditions. These performance fluctuations will cause an investor’s shares, when redeemed, to be
worth more or less than their original cost. Performance of Class A shares will vary from Class B, Class C, Institutional and Service shares due to differences in fees and loads.
|
| CORE Large Cap Growth Fund’s Lifetime Performance
|
| Growth of a $10,000 Investment, Distributions Reinvested May 1, 1997 to August 31, 2000.
|
 |
| Average Annual Total Return through August 31, 2000 | Since Inception | One Year | |||
|---|---|---|---|---|---|
| Class A (commenced May 1, 1997) | |||||
| Excluding sales charges | 29.22% | 33.73% | |||
| Including sales charges | 27.06% | 26.38% | |||
| |
|||||
| Class B (commenced May 1, 1997) | |||||
| Excluding contingent deferred sales charges | 28.32% | 32.78% | |||
| Including contingent deferred sales charges | 27.80% | 27.76% | |||
| |
|||||
| Class C (commenced August 15, 1997) | |||||
| Excluding contingent deferred sales charges | 24.49% | 32.84% | |||
| Including contingent deferred sales charges | 24.49% | 31.84% | |||
| |
|||||
| Institutional Class (commenced May 1, 1997) | 29.64% | 34.34% | |||
| |
|||||
| Service Class (commenced May 1, 1997) | 29.03% | 33.64% | |||
| |
|||||
| Shares | Description | Value | |||
|---|---|---|---|---|---|
| Common Stocks – 98.5% | |||||
| Apparel – 0.2% | |||||
| 55,900 | Nike, Inc. Class B | $ 2,211,544 | |||
| Chemicals – 0.6% | |||||
| 34,400 | Praxair, Inc. | 1,522,200 | |||
| 249,700 | The Dow Chemicals Co. | 6,539,019 | |||
| 8,061,219 | |||||
| Clothing – 0.8% | |||||
| 252,100 | Intimate Brands, Inc. | 4,065,112 | |||
| 243,300 | The Limited, Inc. | 4,866,000 | |||
| 25,000 | The Talbots, Inc. | 1,673,438 | |||
| 10,604,550 | |||||
| Computer Hardware – 16.6% | |||||
| 48,100 | 3Com Corp. | 799,663 | |||
| 4,500 | Alteon Websystems, Inc.* | 666,000 | |||
| 171,100 | Apple Computer, Inc.* | 10,426,406 | |||
| 20,400 | Brocade Communications Systems,
Inc.* |
4,606,575 | |||
| 1,154,900 | Cisco Systems, Inc.* | 79,255,012 | |||
| 98,400 | Dell Computer Corp.* | 4,292,700 | |||
| 13,100 | Digital Lightwave, Inc.* | 1,149,525 | |||
| 6,700 | Echelon Corp.* | 315,319 | |||
| 388,600 | EMC Corp.* | 38,082,800 | |||
| 10,200 | Extreme Networks, Inc.* | 949,237 | |||
| 161,100 | Hewlett-Packard Co. | 19,452,825 | |||
| 140,500 | Network Appliance, Inc.* | 16,438,500 | |||
| 98,909 | Palm, Inc.* | 4,351,996 | |||
| 19,300 | Redback Networks, Inc.* | 2,882,937 | |||
| 6,300 | RSA Security, Inc.* | 372,094 | |||
| 20,500 | SanDisk Corp.* | 1,711,750 | |||
| 50,000 | Seagate Technology, Inc.* | 2,968,750 | |||
| 300,100 | Sun Microsystems, Inc.* | 38,093,944 | |||
| 226,816,033 | |||||
| Computer Software – 10.9% | |||||
| 44,400 | Adobe Systems, Inc. | 5,772,000 | |||
| 2,400 | Agile Software Corp.* | 166,650 | |||
| 70,100 | BEA Systems, Inc.* | 4,771,181 | |||
| 6,100 | CheckFree Corp.* | 316,056 | |||
| 1,900 | Entrust Technologies, Inc.* | 56,525 | |||
| 18,100 | i2 Technologies, Inc.* | 3,062,294 | |||
| 132,800 | International Business Machines, Inc. | 17,529,600 | |||
| 6,600 | Internet Security Systems, Inc.* | 534,600 | |||
| 24,100 | Intuit, Inc.* | 1,442,988 | |||
| 12,100 | Mercury Interactive Corp.* | 1,478,469 | |||
| 617,600 | Microsoft Corp.* | 43,116,200 | |||
| 13,000 | Networks Associates, Inc.* | 336,375 | |||
| 443,600 | Oracle Corp.* | 40,339,875 | |||
| 12,600 | Rational Software Corp.* | 1,621,462 | |||
| 7,400 | Red Hat, Inc.* | 185,925 | |||
| 15,200 | Sapient Corp.* | 798,000 | |||
| 29,700 | Siebel Systems, Inc.* | 5,875,031 | |||
| 23,700 | TIBCO Software, Inc.* | 2,415,919 | |||
| 147,425 | VERITAS Software Corp.* | 17,773,927 | |||
| 39,300 | Vignette Corp.* | 1,498,312 | |||
| 149,091,389 | |||||
| Shares | Description | Value | |||
|---|---|---|---|---|---|
| Common Stocks – (continued) | |||||
| Defense/Aerospace – 0.8% | |||||
| 198,200 | The Boeing Co. | $ 10,628,475 | |||
| Department Store – 2.1% | |||||
| 190,100 | Federated Department Stores, Inc.* | 5,251,512 | |||
| 41,000 | Sears, Roebuck & Co. | 1,278,688 | |||
| 183,700 | Target Corp. | 4,271,025 | |||
| 368,000 | Wal-Mart Stores, Inc. | 17,457,000 | |||
| 28,258,225 | |||||
| Drugs – 11.4% | |||||
| 144,400 | Allergan, Inc. | 10,559,250 | |||
| 27,300 | Alpharma, Inc. | 1,545,863 | |||
| 245,400 | Amgen, Inc.* | 18,604,387 | |||
| 99,000 | Cardinal Health, Inc. | 8,099,437 | |||
| 33,800 | Celera Genomics* | 3,665,188 | |||
| 18,700 | Chiron Corp.* | 1,010,969 | |||
| 73,100 | Eli Lilly & Co. | 5,336,300 | |||
| 38,600 | Forest Laboratories, Inc.* | 3,777,975 | |||
| 46,200 | Genentech, Inc.* | 8,801,100 | |||
| 42,200 | IVAX Corp.* | 1,461,175 | |||
| 14,300 | Medarex, Inc.* | 1,580,150 | |||
| 61,400 | MedImmune, Inc.* | 5,165,275 | |||
| 380,300 | Merck & Co., Inc. | 26,573,462 | |||
| 39,700 | Millennium Pharmaceuticals* | 5,682,062 | |||
| 34,500 | PE Corp-PE Biosystems Group | 3,393,938 | |||
| 1,114,475 | Pfizer, Inc. | 48,201,044 | |||
| 43,700 | Schering-Plough Corp. | 1,753,463 | |||
| 155,211,038 | |||||
| Electrical Equipment – 9.4% | |||||
| 158,400 | ADC Telecommunications, Inc.* | 6,484,500 | |||
| 33,000 | Advanced Fibre Communications,
Inc.* |
1,744,359 | |||
| 22,500 | Amphenol Corp.* | 1,440,000 | |||
| 56,200 | AVX Corp. | 1,682,487 | |||
| 35,300 | CIENA Corp.* | 7,825,569 | |||
| 20,600 | Comverse Technology, Inc.* | 1,893,912 | |||
| 9,300 | Copper Mountain Networks, Inc.* | 557,419 | |||
| 99,000 | Corning, Inc. | 32,465,812 | |||
| 21,800 | Credence Systems Corp.* | 1,276,663 | |||
| 14,100 | Ditech Communications Corp.* | 831,900 | |||
| 7,000 | GlobeSpan, Inc.* | 843,063 | |||
| 4,000 | Harmonic, Inc.* | 134,000 | |||
| 194,400 | KEMET Corp.* | 5,832,000 | |||
| 36,400 | Level 3 Communications, Inc.* | 3,175,331 | |||
| 285,900 | Lucent Technologies, Inc. | 11,954,194 | |||
| 35,100 | Motorola, Inc. | 1,265,794 | |||
| 15,500 | Newport Corp. | 2,464,500 | |||
| 159,148 | Nortel Networks Corp. | 12,980,509 | |||
| 10,700 | Power-One, Inc.* | 1,695,281 | |||
| 27,300 | Powerwave Technologies, Inc.* | 1,313,812 | |||
| 91,800 | QUALCOMM, Inc.* | 5,496,525 | |||
| 114,300 | Scientific-Atlanta, Inc. | 8,908,256 | |||
| 15,000 | Sycamore Networks, Inc.* | 2,062,500 | |||
| 64,100 | Tektronix, Inc. | 4,883,619 | |||
| 37,900 | Teradyne, Inc. | 2,456,394 | |||
| Shares | Description | Value | ||||
|---|---|---|---|---|---|---|
| Common Stocks – (continued) | ||||||
| Electrical Equipment – (continued) | ||||||
| 21,800 | Terayon Communication Systems,
Inc.* |
$ 1,209,900 | ||||
| 140,550 | Vishay Intertechnology, Inc.* | 5,665,922 | ||||
| 128,544,221 | ||||||
| Electrical Utilities – 0.5% | ||||||
| 59,200 | Calpine Corp.* | 5,860,800 | ||||
| 23,964 | Dynegy, Inc. | 1,078,380 | ||||
| 6,939,180 | ||||||
| Energy Resources – 1.0% | ||||||
| 73,100 | Apache Corp. | 4,605,300 | ||||
| 54,700 | Devon Energy Corp. | 3,203,369 | ||||
| 61,300 | Kerr-McGee Corp. | 3,873,394 | ||||
| 32,500 | Murphy Oil Corp. | 2,169,375 | ||||
| 13,851,438 | ||||||
| Entertainment – 0.8% | ||||||
| 247,900 | The Walt Disney Co. | 9,652,606 | ||||
| 21,900 | Viacom, Inc. Class B* | 1,474,144 | ||||
| 11,126,750 | ||||||
| Environmental Services – 0.2% | ||||||
| 163,400 | Republic Services, Inc.* | 2,389,725 | ||||
| Financial Services – 6.1% | ||||||
| 1,429,900 | General Electric Co. | 83,917,256 | ||||
| Food & Beverage – 2.5% | ||||||
| 224,200 | ConAgra, Inc. | 4,105,662 | ||||
| 50,100 | Hormel Foods Corp. | 773,419 | ||||
| 285,100 | IBP, Inc. | 4,579,419 | ||||
| 50,800 | Keebler Foods Co. | 2,327,275 | ||||
| 289,200 | Nabisco Group Holdings Corp. | 8,115,675 | ||||
| 105,000 | PepsiCo., Inc. | 4,475,625 | ||||
| 54,900 | Supervalu, Inc. | 820,069 | ||||
| 31,300 | SYSCO Corp. | 1,324,381 | ||||
| 50,400 | The Coca-Cola Co. | 2,652,300 | ||||
| 144,000 | The Pepsi Bottling Group, Inc. | 4,572,000 | ||||
| 33,745,825 | ||||||
| Heavy Electrical – 0.1% | ||||||
| 21,700 | Molex, Inc. | 1,146,031 | ||||
| Hotels – 0.1% | ||||||
| 30,800 | Marriott International, Inc. | 1,216,600 | ||||
| Industrial Services – 0.5% | ||||||
| 169,200 | Hertz Corp. | 5,181,750 | ||||
| 58,500 | Robert Half International, Inc.* | 1,861,031 | ||||
| 7,042,781 | ||||||
| Information Services – 1.5% | ||||||
| 41,900 | Automatic Data Processing, Inc. | 2,498,287 | ||||
| 72,600 | Computer Sciences Corp.* | 5,739,937 | ||||
| 27,100 | Convergys Corp.* | 1,060,288 | ||||
| 15,900 | DST Systems, Inc.* | 1,494,600 | ||||
| 96,800 | Electronic Data Systems Corp. | 4,821,850 | ||||
| 500 | Healtheon/WebMD Corp.* | 8,813 | ||||
| Shares | Description | Value | ||||
|---|---|---|---|---|---|---|
| Common Stocks – (continued) | ||||||
| Information Services – (continued) | ||||||
| 8,000 | HomeStore.com, Inc.* | $ 433,500 | ||||
| 9,500 | Internap Network Services Corp.* | 342,000 | ||||
| 8,969 | MarchFirst, Inc.* | 173,774 | ||||
| 25,300 | Omnicom Group, Inc. | 2,110,969 | ||||
| 25,800 | The Interpublic Group of Cos., Inc. | 986,850 | ||||
| 12,800 | TMP Worldwide, Inc.* | 885,600 | ||||
| 20,556,468 | ||||||
| Internet – 5.6% | ||||||
| 6,000 | Akamai Technologies, Inc.* | 453,375 | ||||
| 29,700 | Amazon.com, Inc.* | 1,232,550 | ||||
| 415,500 | America Online, Inc.* | 24,358,687 | ||||
| 3,100 | Ameritrade Holding Corp.* | 58,319 | ||||
| 29,400 | Ariba, Inc.* | 4,626,825 | ||||
| 11,000 | Art Technology Group, Inc.* | 1,121,313 | ||||
| 9,800 | At Home Corp. Series A* | 142,713 | ||||
| 36,000 | BroadVision, Inc.* | 1,242,000 | ||||
| 600 | CacheFlow, Inc.* | 65,625 | ||||
| 34,600 | CMGI, Inc.* | 1,548,350 | ||||
| 3,100 | CNET Networks, Inc.* | 103,850 | ||||
| 31,700 | Commerce One, Inc.* | 1,982,241 | ||||
| 1,400 | Critical Path, Inc.* | 108,150 | ||||
| 5,900 | Digex, Inc.* | 499,656 | ||||
| 16,100 | DoubleClick, Inc.* | 655,069 | ||||
| 19,200 | E*TRADE Group, Inc.* | 340,800 | ||||
| 4,000 | E.piphany, Inc.* | 416,000 | ||||
| 19,400 | eBay, Inc.* | 1,202,800 | ||||
| 2,600 | Efficient Networks, Inc.* | 139,709 | ||||
| 72,300 | Exodus Communications, Inc.* | 4,948,031 | ||||
| 28,300 | InfoSpace.com, Inc.* | 1,103,700 | ||||
| 14,900 | Inktomi Corp.* | 1,942,587 | ||||
| 37,700 | Juniper Networks, Inc.* | 8,058,375 | ||||
| 11,000 | Kana Communications, Inc.* | 441,375 | ||||
| 12,200 | Liberate Technologies, Inc.* | 375,150 | ||||
| 13,400 | Lycos, Inc.* | 951,400 | ||||
| 7,900 | Macromedia, Inc.* | 545,964 | ||||
| 4,600 | Phone.com, Inc.* | 425,213 | ||||
| 14,500 | Portal Software, Inc.* | 801,125 | ||||
| 6,800 | Priceline.com, Inc.* | 184,875 | ||||
| 8,000 | Proxicom, Inc.* | 193,500 | ||||
| 18,700 | PSINet, Inc.* | 328,419 | ||||
| 14,700 | RealNetworks, Inc.* | 715,706 | ||||
| 5,600 | Scient Corp.* | 151,550 | ||||
| 6,800 | Software.com, Inc.* | 989,825 | ||||
| 35,812 | VeriSign, Inc.* | 7,122,111 | ||||
| 17,500 | VerticalNet, Inc.* | 931,875 | ||||
| 9,000 | Vitria Technology, Inc. | 423,000 | ||||
| 46,200 | Yahoo!, Inc.* | 5,613,300 | ||||
| 76,545,113 | ||||||
| Media – 1.8% | ||||||
| 31,000 | Fox Entertainment Group, Inc.* | 897,063 | ||||
| 207,700 | General Motors Corp. Class H* | 6,880,062 | ||||
| 102,500 | Infinity Broadcasting Corp.* | 3,882,188 | ||||
| 157,900 | Time Warner, Inc. | 13,500,450 | ||||
| 25,159,763 | ||||||
| Shares | Description | Value | ||||
|---|---|---|---|---|---|---|
| Common Stocks – (continued) | ||||||
| Medical Products – 2.4% | ||||||
| 142,700 | Abbott Laboratories | $ 6,243,125 | ||||
| 33,500 | Baxter International, Inc. | 2,788,875 | ||||
| 144,000 | Johnson & Johnson | 13,239,000 | ||||
| 102,800 | Medtronic, Inc. | 5,268,500 | ||||
| 19,000 | MiniMed, Inc.* | 1,364,140 | ||||
| 63,100 | Stryker Corp. | 2,827,669 | ||||
| 11,500 | Techne Corp.* | 1,098,250 | ||||
| 32,829,559 | ||||||
| Medical Providers – 0.1% | ||||||
| 17,500 | Quest Diagnostics, Inc.* | 2,165,625 | ||||
| Oil Services – 0.1% | ||||||
| 28,100 | BJ Services Co.* | 1,882,700 | ||||
| Publishing – 0.3% | ||||||
| 38,200 | Dow Jones & Co., Inc. | 2,389,887 | ||||
| 25,700 | Knight-Ridder, Inc. | 1,403,863 | ||||
| 3,793,750 | ||||||
| Security/Asset Management – 2.3% | ||||||
| 29,800 | A.G. Edwards, Inc. | 1,549,600 | ||||
| 84,300 | Lehman Brothers Holdings, Inc. | 12,223,500 | ||||
| 64,900 | Merrill Lynch & Co., Inc. | 9,410,500 | ||||
| 14,500 | Morgan Stanley Dean Witter & Co. | 1,559,656 | ||||
| 188,500 | The Charles Schwab Corp. | 7,198,344 | ||||
| 31,941,600 | ||||||
| Semiconductors – 15.1% | ||||||
| 149,000 | Advanced Micro Devices, Inc.* | 5,606,125 | ||||
| 68,800 | Analog Devices, Inc.* | 6,914,400 | ||||
| 39,700 | Applied Materials, Inc.* | 3,426,606 | ||||
| 73,700 | Applied Micro Circuits Corp.* | 14,956,494 | ||||
| 25,800 | Broadcom Corp.* | 6,450,000 | ||||
| 35,000 | Integrated Device Technology, Inc.* | 3,071,250 | ||||
| 1,233,000 | Intel Corp. | 92,320,875 | ||||
| 197,740 | JDS Uniphase Corp.* | 24,615,540 | ||||
| 113,700 | Micron Technology, Inc.* | 9,294,975 | ||||
| 23,100 | PMC-Sierra, Inc.* | 5,451,600 | ||||
| 12,000 | QLogic Corp.* | 1,362,000 | ||||
| 24,400 | RF Micro Devices, Inc.* | 1,088,850 | ||||
| 30,600 | SDL, Inc.* | 12,157,763 | ||||
| 242,600 | Texas Instruments, Inc. | 16,239,037 | ||||
| 26,700 | TriQuint Semiconductor, Inc.* | 1,476,844 | ||||
| 16,300 | Xilinx, Inc.* | 1,448,663 | ||||
| 205,881,022 | ||||||
| Shares | Description | Value | ||||
|---|---|---|---|---|---|---|
| Common Stocks – (continued) | ||||||
| Specialty Retail – 2.0% | ||||||
| 73,700 | CVS Corp. | $ 2,736,113 | ||||
| 24,000 | Lowes Co., Inc. | 1,075,500 | ||||
| 327,550 | The Home Depot, Inc. | 15,742,872 | ||||
| 154,100 | Tiffany & Co. | 6,414,412 | ||||
| 35,100 | Zale Corp.* | 1,296,506 | ||||
| 27,265,403 | ||||||
| Telephone – 1.7% | ||||||
| 108,080 | AT&T Corp. | 3,404,520 | ||||
| 344,700 | BCE, Inc. | 7,755,750 | ||||
| 27,200 | BellSouth Corp. | 1,014,900 | ||||
| 39,000 | NEXTLINK Communications, Inc.* | 1,367,437 | ||||
| 64,833 | SBC Communications, Inc. | 2,706,778 | ||||
| 200,850 | WorldCom, Inc.* | 7,331,025 | ||||
| 23,580,410 | ||||||
| Wireless – 1.0% | ||||||
| 299,100 | AT&T Wireless Group* | 7,832,682 | ||||
| 20,300 | Sprint Corp. (PCS Group)* | 1,018,806 | ||||
| 36,900 | Telephone & Data Systems, Inc. | 4,280,400 | ||||
| 13,131,888 | ||||||
| TOTAL COMMON STOCKS | ||||||
| (Cost $955,579,423) | $1,345,535,581 | |||||
| Principal
Amount |
Interest
Rate |
Maturity
Date |
Value | ||||
|---|---|---|---|---|---|---|---|
| Repurchase Agreement – 1.2% | |||||||
| Joint Repurchase Agreement Account II Ù | |||||||
| $16,300,000 | 6.66% | 09/01/2000 | $ 16,300,000 | ||||
| TOTAL REPURCHASE AGREEMENT | |||||||
| (Cost $16,300,000) | $ 16,300,000 | ||||||
| TOTAL INVESTMENTS | |||||||
| (Cost $971,879,423) | $1,361,835,581 | ||||||
*
|
Non-income producing security.
|
Ù
|
Joint repurchase agreement was entered into on August 31, 2000.
|
| The percentage shown for each investment category reflects the value of investments in that category as a percentage of total net
assets.
|
| The following graph shows the value, as of August 31, 2000, of a $10,000 investment made on August 15, 1997 (commencement of
operations) in Institutional shares at (NAV) of the Goldman Sachs CORE Small Cap Equity Fund. For comparative purposes, the performance of the Fund’s benchmark (Russell 2000 Growth Index with dividends reinvested) is shown. This performance data
represents past performance and should not be considered indicative of future performance which will fluctuate with changes in market conditions. These performance fluctuations will cause an investor’s shares, when redeemed, to be worth more or less
than their original cost. Performance of Class A, Class B, Class C and Service shares will vary from Institutional shares due to differences in fees and loads.
|
| CORE Small Cap Equity Fund’s Lifetime Performance
|
| Growth of a $10,000 Investment, Distributions Reinvested August 15, 1997 to August 31, 2000.
|
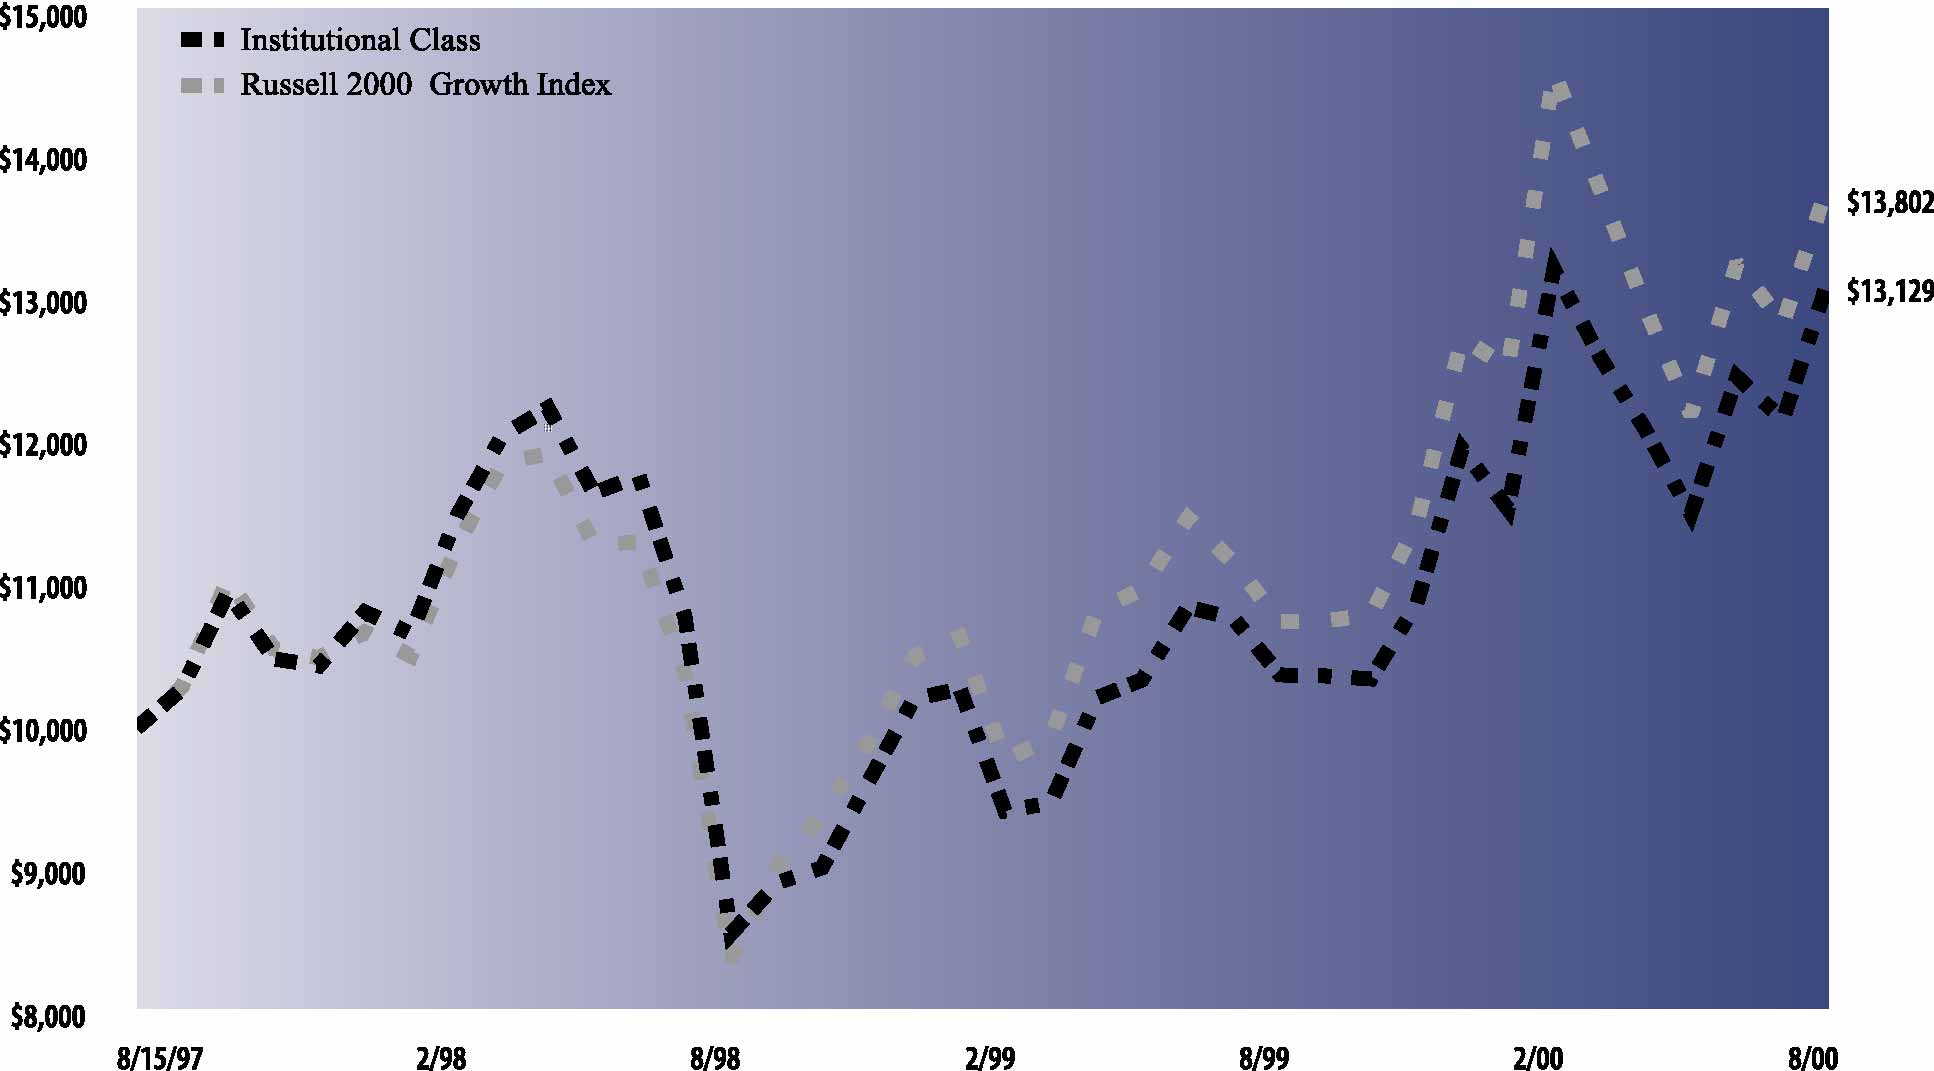 |
| Average Annual Total Return through August 31, 2000 | Since Inception | One Year | ||
|---|---|---|---|---|
| Class A (commenced August 15, 1997) | ||||
| Excluding sales charges | 8.90% | 26.10% | ||
| Including sales charges | 6.90% | 19.11% | ||
| |
||||
| Class B (commenced August 15, 1997) | ||||
| Excluding contingent deferred sales charges | 8.11% | 25.17% | ||
| Including contingent deferred sales charges | 7.27% | 20.17% | ||
| |
||||
| Class C (commenced August 15, 1997) | ||||
| Excluding contingent deferred sales charges | 8.20% | 25.35% | ||
| Including contingent deferred sales charges | 8.20% | 24.35% | ||
| |
||||
| Institutional Class (commenced August 15, 1997) | 9.34% | 26.60% | ||
| |
||||
| Service Class (commenced August 15, 1997) | 8.81% | 25.93% | ||
| |
||||
|
Shares |
Description | Value | ||||
|---|---|---|---|---|---|---|
| Common Stocks – 99.6% | ||||||
| Airlines – 0.5% | ||||||
| 17,700 | America West Holdings Corp. Class B* | $ 258,863 | ||||
| 30,200 | Frontier Airlines, Inc.* | 517,175 | ||||
| 776,038 | ||||||
| Alcohol – 0.2% | ||||||
| 9,900 | The Robert Mondavi Corp.* | 405,900 | ||||
| Apparel – 0.5% | ||||||
| 23,600 | Phillips-Van Heusen Corp. | 215,350 | ||||
| 9,500 | Skechers U.S.A., Inc.* | 169,219 | ||||
| 12,300 | Springs Industries, Inc. | 367,462 | ||||
| 13,200 | Steven Madden Ltd.* | 162,525 | ||||
| 914,556 | ||||||
| Banks – 4.0% | ||||||
| 30,300 | Brookline Bancorp, Inc. | 357,919 | ||||
| 27,100 | Cullen/Frost Bankers, Inc. | 840,100 | ||||
| 9,900 | First Charter Corp. | 159,019 | ||||
| 9,900 | GBC Bancorp | 374,962 | ||||
| 8,500 | Greater Bay Bancorp | 527,000 | ||||
| 44,491 | Imperial Bancorp | 967,679 | ||||
| 30,600 | Independence Community Bank Corp. | 415,012 | ||||
| 2,600 | Net.B@nk, Inc.* | 29,575 | ||||
| 27,300 | Silicon Valley Bancshares* | 1,573,162 | ||||
| 13,300 | Southwest Bancorp of Texas, Inc.* | 386,531 | ||||
| 12,700 | The South Financial Group, Inc. | 165,100 | ||||
| 25,300 | Trustco Bank Corp. | 325,738 | ||||
| 18,500 | United Bankshares, Inc. | 367,688 | ||||
| 25,100 | United Community Financial Corp. | 158,444 | ||||
| 6,647,929 | ||||||
| Chemicals – 3.0% | ||||||
| 30,600 | Albemarle Corp. | 759,262 | ||||
| 23,800 | Arch Chemicals, Inc. | 432,862 | ||||
| 10,200 | Brady Corp. | 295,163 | ||||
| 19,300 | Cambrex Corp. | 905,894 | ||||
| 14,500 | Cytec Industries, Inc.* | 483,937 | ||||
| 28,100 | Millennium Chemicals, Inc. | 463,650 | ||||
| 19,100 | Spartech Corp. | 472,725 | ||||
| 16,600 | The Dexter Corp. | 981,475 | ||||
| 36,200 | W.R. Grace & Co.* | 287,338 | ||||
| 5,082,306 | ||||||
| Clothing – 1.3% | ||||||
| 11,600 | AnnTaylor Stores Corp.* | 417,600 | ||||
| 6,100 | Hot Topic, Inc.* | 172,706 | ||||
| 21,900 | The Cato Corp. | 271,013 | ||||
| 22,000 | The Neiman Marcus Group, Inc.* | 738,375 | ||||
| 42,200 | Venator Group, Inc.* | 590,800 | ||||
| 2,190,494 | ||||||
| Computer Hardware – 3.3% | ||||||
| 23,200 | Advanced Digital Information Corp.* | 394,400 | ||||
| 10,250 | Avocent Corp.* | 498,406 | ||||
| 4,800 | Cylink Corp.* | 68,400 | ||||
|
Shares |
Description | Value | ||||
|---|---|---|---|---|---|---|
| Common Stocks – (continued) | ||||||
| Computer Hardware – (continued) | ||||||
| 1,100 | Globix Corp.* | $ 29,494 | ||||
| 5,700 | Identix, Inc.* | 82,650 | ||||
| 17,900 | Imation Corp.* | 398,275 | ||||
| 16,700 | InFocus Corp.* | 807,862 | ||||
| 5,700 | Interlink Electronics, Inc.* | 147,488 | ||||
| 52,500 | Iomega Corp.* | 216,562 | ||||
| 6,900 | Mercury Computer Systems, Inc.* | 195,572 | ||||
| 9,100 | MIPS Technologies, Inc.* | 520,975 | ||||
| 4,100 | MMC Networks, Inc.* | 499,431 | ||||
| 2,700 | Osicom Technologies, Inc.* | 159,300 | ||||
| 6,900 | RadiSys Corp.* | 385,969 | ||||
| 2,500 | SCM Microsystems, Inc.* | 136,094 | ||||
| 4,900 | Secure Computing Corp.* | 122,194 | ||||
| 12,000 | Take-Two Interactive Software, Inc.* | 166,312 | ||||
| 12,000 | Zebra Technologies Corp.* | 648,000 | ||||
| 5,477,384 | ||||||
| Computer Software – 5.9% | ||||||
| 18,200 | Actuate Corp.* | 472,062 | ||||
| 3,800 | Adept Technology, Inc.* | 189,762 | ||||
| 11,000 | Advent Software, Inc.* | 677,875 | ||||
| 4,200 | Allaire Corp.* | 142,538 | ||||
| 4,700 | Aspen Technology, Inc.* | 215,906 | ||||
| 24,300 | Avant! Corp.* | 353,869 | ||||
| 3,100 | Bluestone Software, Inc.* | 72,463 | ||||
| 16,200 | CACI International, Inc.* | 364,500 | ||||
| 4,900 | Cerner Corp.* | 186,506 | ||||
| 8,700 | Clarus Corp.* | 526,350 | ||||
| 2,400 | Click2learn.com, Inc.* | 36,450 | ||||
| 2,700 | Documentum, Inc.* | 193,219 | ||||
| 2,200 | Excalibur Technologies Corp.* | 104,500 | ||||
| 23,400 | eXcelon Corp.* | 188,663 | ||||
| 14,700 | FileNET Corp.* | 282,975 | ||||
| 7,300 | HNC Software, Inc.* | 397,166 | ||||
| 10,600 | Hyperion Solutions Corp.* | 335,225 | ||||
| 18,500 | IMR Global Corp.* | 219,687 | ||||
| 5,400 | Informatica Corp.* | 540,000 | ||||
| 5,900 | Information Architects Corp.* | 37,613 | ||||
| 9,800 | Intergraph Corp.* | 58,800 | ||||
| 1,100 | Manhattan Associates, Inc.* | 51,013 | ||||
| 7,600 | Manugistics Group, Inc.* | 666,900 | ||||
| 33,800 | Mentor Graphics Corp.* | 637,975 | ||||
| 7,500 | National Computer Systems, Inc. | 544,687 | ||||
| 5,600 | NetIQ Corp.* | 316,400 | ||||
| 8,500 | New Era of Networks, Inc.* | 298,031 | ||||
| 15,800 | Progress Software Corp.* | 216,262 | ||||
| 10,900 | Puma Technology, Inc.* | 265,006 | ||||
| 9,950 | Radiant Systems, Inc.* | 170,394 | ||||
| 12,900 | Remedy Corp.* | 301,537 | ||||
| 1,600 | Retek, Inc.* | 55,100 | ||||
| 5,100 | Verity, Inc.* | 233,325 | ||||
| 2,300 | WatchGuard Technologies, Inc.* | 112,988 | ||||
| 8,000 | WebTrends Corp.* | 301,375 | ||||
| 3,100 | ZixIt Corp.* | 151,125 | ||||
| 9,918,247 | ||||||
|
Shares |
Description | Value | |||
|---|---|---|---|---|---|
| Common Stocks – (continued) | |||||
| Construction – 3.4% | |||||
| 31,300 | Centex Corp. | $ 903,787 | |||
| 20,500 | D.R. Horton, Inc. | 402,312 | |||
| 14,100 | Granite Construction, Inc. | 320,775 | |||
| 12,400 | Insituform Technologies, Inc.* | 380,525 | |||
| 19,200 | M.D.C. Holdings, Inc. | 481,200 | |||
| 27,800 | Morrison Knudsen Corp.* | 333,600 | |||
| 18,900 | NCI Building Systems, Inc.* | 333,113 | |||
| 11,900 | NVR, Inc.* | 874,650 | |||
| 16,100 | Pulte Corp. | 530,294 | |||
| 28,800 | Standard Pacific Corp. | 473,400 | |||
| 19,100 | The Ryland Group, Inc. | 469,144 | |||
| 19,500 | URS Corp.* | 257,156 | |||
| 5,759,956 | |||||
| Consumer Durables – 0.7% | |||||
| 5,800 | Harman International Industries, Inc. | 445,150 | |||
| 27,800 | Pier 1 Imports, Inc. | 326,650 | |||
| 14,900 | The Toro Co. | 450,725 | |||
| 1,222,525 | |||||
| Defense/Aerospace – 0.9% | |||||
| 26,100 | Kaman Corp. | 342,563 | |||
| 16,400 | Precision Castparts Corp. | 1,246,400 | |||
| 1,588,963 | |||||
| Department Store – 0.1% | |||||
| 18,900 | Value City Department Stores, Inc.* | 170,100 | |||
| Drugs – 7.6% | |||||
| 5,900 | Allscripts, Inc.* | 172,206 | |||
| 17,100 | Alpharma, Inc. | 968,287 | |||
| 23,400 | AmeriSource Health Corp.* | 813,150 | |||
| 3,700 | Aurora Biosciences Corp.* | 252,988 | |||
| 12,250 | Barr Laboratories, Inc.* | 869,750 | |||
| 17,000 | Bergen Brunswig Corp. | 159,375 | |||
| 35,010 | Bindley Western Industries, Inc. | 1,008,726 | |||
| 8,400 | Biosite Diagnostics, Inc.* | 584,325 | |||
| 14,500 | Cell Genesys, Inc.* | 446,781 | |||
| 5,500 | Cubist Pharmaceuticals, Inc.* | 336,188 | |||
| 28,700 | Dura Pharmaceuticals, Inc.* | 791,044 | |||
| 6,400 | Emisphere Technologies, Inc.* | 211,200 | |||
| 6,700 | Enzon, Inc.* | 407,862 | |||
| 5,600 | GelTex Pharmaceuticals, Inc.* | 226,888 | |||
| 7,200 | Genome Therapeutics Corp.* | 180,900 | |||
| 25,500 | Herbalife International, Inc. | 247,031 | |||
| 10,800 | ILEX Oncology, Inc.* | 356,400 | |||
| 11,700 | Immunomedics, Inc.* | 292,500 | |||
| 1,200 | Luminex Corp.* | 48,000 | |||
| 4,900 | Maxim Pharmaceuticals, Inc.* | 299,819 | |||
| 13,300 | Medicis Pharmaceutical Corp.* | 857,019 | |||
| 2,700 | Myriad Genetics, Inc.* | 377,662 | |||
| 6,800 | Neose Technologies, Inc.* | 278,800 | |||
| 13,700 | Noven Pharmaceuticals, Inc.* | 575,400 | |||
| 8,700 | Pharmacopeia, Inc.* | 364,856 | |||
| 9,884 | Priority Healthcare Corp. Class B* | 570,801 | |||
| 13,900 | SciClone Pharmaceuticals, Inc.* | 164,194 | |||
|
Shares |
Description | Value | |||
|---|---|---|---|---|---|
| Common Stocks – (continued) | |||||
| Drugs – (continued) | |||||
| 7,200 | SuperGen, Inc.* | $ 141,750 | |||
| 16,800 | Syncor International Corp.* | 672,000 | |||
| 12,675,902 | |||||
| Electrical Equipment – 7.0% | |||||
| 6,600 | Advanced Energy Industries, Inc.* | 377,025 | |||
| 8,250 | Aeroflex, Inc.* | 303,187 | |||
| 1,700 | Anaren Microwave, Inc.* | 200,706 | |||
| 19,400 | Anixter International, Inc.* | 679,000 | |||
| 5,200 | Celeritek, Inc.* | 233,350 | |||
| 6,600 | Checkpoint Systems, Inc.* | 52,800 | |||
| 5,300 | Cobalt Networks, Inc.* | 263,013 | |||
| 7,100 | Coherent, Inc.* | 571,550 | |||
| 8,500 | DSP Group, Inc.* | 393,125 | |||
| 9,700 | FEI Co. | 292,213 | |||
| 18,300 | Glenayre Technologies, Inc.* | 199,013 | |||
| 2,300 | Keithley Instruments, Inc. | 174,656 | |||
| 13,600 | Kent Electronics Corp.* | 397,800 | |||
| 21,600 | Kimball International, Inc. Class B | 367,200 | |||
| 10,500 | Littelfuse, Inc.* | 381,281 | |||
| 10,900 | LTX Corp.* | 278,631 | |||
| 8,400 | Methode Electronics, Inc. | 505,050 | |||
| 12,900 | MRV Communications, Inc.* | 994,106 | |||
| 8,900 | Nanometrics, Inc.* | 442,775 | |||
| 10,800 | Natural MicroSystems Corp.* | 805,275 | |||
| 6,000 | Netro Corp.* | 495,750 | |||
| 5,000 | Network Equipment
Technologies, Inc.* |
60,313 | |||
| 8,200 | Park Electrochemical Corp. | 329,537 | |||
| 2,700 | PC-Tel, Inc.* | 75,600 | |||
| 5,500 | Photon Dynamics, Inc.* | 258,156 | |||
| 5,100 | Plexus Corp.* | 789,225 | |||
| 12,500 | Robotic Vision Systems, Inc.* | 158,594 | |||
| 25,700 | Sensormatic Electronics Corp.* | 427,262 | |||
| 2,500 | Tollgrade Communications, Inc.* | 277,969 | |||
| 4,200 | Trimble Navigation Ltd.* | 174,563 | |||
| 9,000 | Vicor Corp.* | 392,625 | |||
| 13,100 | Westell Technologies, Inc.* | 209,600 | |||
| 2,200 | Zygo Corp.* | 174,625 | |||
| 11,735,575 | |||||
| Electrical Utilities – 2.4% | |||||
| 42,700 | CMP Group, Inc. | 1,254,312 | |||
| 14,700 | Empire District Electric Co. | 381,281 | |||
| 35,600 | Public Service Co. of New Mexico | 760,950 | |||
| 44,900 | RGS Energy Group, Inc. | 1,116,888 | |||
| 10,500 | UIL Holdings Corp. | 528,281 | |||
| 4,041,712 | |||||
| Energy Resources – 1.6% | |||||
| 25,900 | Cross Timbers Oil Co. | 684,731 | |||
| 7,900 | Patina Oil & Gas Corp. | 167,875 | |||
| 25,200 | Southwestern Energy Co. | 195,300 | |||
| 9,500 | St. Mary Land & Exploration Co. | 393,062 | |||
| 19,100 | Tom Brown, Inc.* | 415,425 | |||
|
Shares |
Description | Value | |||
|---|---|---|---|---|---|
| Common Stocks – (continued) | |||||
| Energy Resources – (continued) | |||||
| 9,300 | Veritas DGC, Inc.* | $ 248,194 | |||
| 26,700 | Vintage Petroleum, Inc. | 560,700 | |||
| 2,665,287 | |||||
| Entertainment – 0.3% | |||||
| 34,000 | Handleman Co.* | 420,750 | |||
| Equity REIT – 5.4% | |||||
| 11,100 | Alexandria Real Estate Equities, Inc. | 388,500 | |||
| 28,500 | Bedford Property Investors, Inc. | 553,969 | |||
| 35,500 | Brandywine Realty Trust | 727,750 | |||
| 18,000 | EastGroup Properties, Inc. | 393,750 | |||
| 30,100 | Glenborough Reality Trust, Inc. | 560,612 | |||
| 36,400 | Health Care Property Investors, Inc. | 957,775 | |||
| 17,600 | LNR Property Corp. | 374,000 | |||
| 12,000 | Mid-America Apartment
Communities, Inc. |
290,250 | |||
| 17,600 | Pacific Gulf Properties, Inc. | 491,700 | |||
| 7,000 | Parkway Properties, Inc. | 222,250 | |||
| 20,600 | Prentiss Properties Trust | 500,837 | |||
| 20,700 | Realty Income Corp. | 470,925 | |||
| 13,900 | Shurgard Storage Centers, Inc. | 330,994 | |||
| 20,900 | SL Green Reality Corp. | 560,381 | |||
| 17,400 | Storage USA, Inc. | 524,175 | |||
| 27,500 | Summit Properties, Inc. | 639,375 | |||
| 15,000 | Sun Communities, Inc. | 464,063 | |||
| 13,000 | Weingarten Reality Investors | 526,500 | |||
| 8,977,806 | |||||
| Financial Services – 2.1% | |||||
| 31,500 | Advanta Corp. | 409,500 | |||
| 33,100 | AmeriCredit Corp.* | 914,387 | |||
| 10,200 | Arthur J. Gallagher & Co. | 499,800 | |||
| 26,800 | Credit Acceptance Corp.* | 160,800 | |||
| 1,500 | ePlus, Inc.* | 29,344 | |||
| 8,000 | Financial Federal Corp.* | 170,000 | |||
| 20,350 | Metris Cos., Inc. | 731,328 | |||
| 3,400 | NextCard, Inc.* | 27,944 | |||
| 34,700 | Security Capital Group, Inc. Class B* | 589,900 | |||
| 3,533,003 | |||||
| Food & Beverage – 1.8% | |||||
| 19,600 | Agribrands International, Inc.* | 779,100 | |||
| 24,600 | Corn Products International, Inc. | 618,075 | |||
| 33,200 | Fleming Cos., Inc. | 512,525 | |||
| 26,900 | Pilgrim’s Pride Corp. | 183,256 | |||
| 6,200 | Smithfield Foods, Inc.* | 164,688 | |||
| 13,700 | Suiza Foods Corp.* | 685,000 | |||
| 2,942,644 | |||||
| Forest – 0.7% | |||||
| 47,800 | Louisiana-Pacific Corp. | 504,888 | |||
| 22,300 | United Stationers, Inc.* | 723,356 | |||
| 1,228,244 | |||||
|
Shares |
Description | Value | ||||
|---|---|---|---|---|---|---|
| Common Stocks – (continued) | ||||||
| Gas Utilities – 1.1% | ||||||
| 18,900 | California Water Services Group | $ 496,125 | ||||
| 22,000 | Oneok, Inc. | 702,625 | ||||
| 11,600 | SEMCO Energy, Inc. | 174,000 | ||||
| 23,700 | UGI Corp. | 540,656 | ||||
| 1,913,406 | ||||||
| Gold – 0.2% | ||||||
| 32,800 | Freeport-McMoRan Copper & Gold,
Inc. Class B* |
321,850 | ||||
| Grocery – 0.3% | ||||||
| 8,300 | Whole Foods Market, Inc.* | 419,150 | ||||
| Heavy Electrical – 2.1% | ||||||
| 14,350 | A.O. Smith Corp. | 226,013 | ||||
| 24,500 | Belden, Inc. | 640,062 | ||||
| 19,000 | C&D Technologies, Inc. | 1,049,750 | ||||
| 21,150 | Cable Design Technologies Corp.* | 571,050 | ||||
| 17,300 | Cummins Engine Co., Inc. | 614,150 | ||||
| 14,600 | International FiberCom, Inc.* | 344,925 | ||||
| 3,445,950 | ||||||
| Heavy Machinery – 0.6% | ||||||
| 7,200 | NACCO Industries, Inc. | 337,500 | ||||
| 34,200 | Trinity Industries, Inc. | 662,625 | ||||
| 1,000,125 | ||||||
| Home Products – 0.3% | ||||||
| 20,800 | Playtex Products, Inc.* | 247,000 | ||||
| 9,700 | Zomax, Inc.* | 188,544 | ||||
| 435,544 | ||||||
| Hotels – 0.8% | ||||||
| 29,000 | Argosy Gaming Co.* | 464,000 | ||||
| 49,400 | Aztar Corp.* | 719,387 | ||||
| 33,900 | Boyd Gaming Corp.* | 156,788 | ||||
| 1,340,175 | ||||||
| Industrial Parts – 2.5% | ||||||
| 9,800 | Brooks Automation, Inc.* | 542,062 | ||||
| 25,900 | Clarcor, Inc. | 534,188 | ||||
| 3,500 | Cymer, Inc.* | 160,781 | ||||
| 18,500 | Flowserve Corp. | 342,250 | ||||
| 12,100 | Hughes Supply, Inc. | 257,730 | ||||
| 18,000 | Kennametal, Inc. | 461,250 | ||||
| 9,000 | Mattson Technology, Inc.* | 196,875 | ||||
| 46,800 | The Timken Co. | 763,425 | ||||
| 8,100 | Thomas Industries, Inc. | 163,519 | ||||
| 27,500 | Watts Industries, Inc. | 309,375 | ||||
| 20,800 | York International Corp. | 517,400 | ||||
| 4,248,855 | ||||||
| Industrial Services – 3.0% | ||||||
| 19,900 | Aaron Rents, Inc. Class B | 273,625 | ||||
| 18,000 | Avis Rent A Car, Inc.* | 553,500 | ||||
| 10,300 | Chemed Corp. | 315,437 | ||||
| 38,000 | Dollar Thrifty Automotive Group, Inc.* | 859,750 | ||||
|
Shares |
Description | Value | |||
|---|---|---|---|---|---|
| Common Stocks – (continued) | |||||
| Industrial Services – (continued) | |||||
| 4,300 | Frontline Capital Group* | $ 75,519 | |||
| 5,200 | Hall, Kinion & Associates, Inc.* | 171,600 | |||
| 4,800 | Heidrick & Struggles International,
Inc.* |
279,000 | |||
| 6,700 | Learning Tree International, Inc.* | 458,531 | |||
| 13,600 | Rent-A-Center, Inc.* | 447,950 | |||
| 10,100 | Rent-Way, Inc.* | 247,450 | |||
| 24,350 | Rollins Truck Leasing Corp. | 164,363 | |||
| 9,400 | Rollins, Inc. | 141,000 | |||
| 20,200 | The Wackenhut Corp. | 286,587 | |||
| 18,800 | United Rentals, Inc.* | 390,100 | |||
| 7,200 | XTRA Corp.* | 319,500 | |||
| 4,983,912 | |||||
| Information Services – 2.7% | |||||
| 1,700 | AGENCY.COM, Inc.* | 40,694 | |||
| 3,400 | Analysts International Corp. | 28,263 | |||
| 4,400 | BARRA, Inc.* | 253,550 | |||
| 10,200 | Braun Consulting, Inc.* | 165,750 | |||
| 4,600 | Calico Commerce, Inc.* | 46,431 | |||
| 2,700 | Cheap Tickets, Inc.* | 28,688 | |||
| 6,400 | Cognizant Technology Solutions Corp.* | 273,600 | |||
| 11,600 | Cyber-Care, Inc.* | 68,875 | |||
| 2,900 | Data Return Corp.* | 57,773 | |||
| 9,400 | Diamond Technology Partners, Inc.* | 599,837 | |||
| 3,800 | Digital Insight Corp.* | 100,700 | |||
| 13,400 | F.Y.I., Inc.* | 522,600 | |||
| 7,900 | Fair Isaac & Co., Inc. | 362,906 | |||
| 5,500 | Forrester Research, Inc.* | 336,187 | |||
| 3,700 | HotJobs.com, Ltd.* | 70,531 | |||
| 17,000 | infoUSA, Inc. | 105,188 | |||
| 9,300 | Interliant, Inc.* | 123,225 | |||
| 800 | Keynote Systems, Inc.* | 24,200 | |||
| 1,700 | McAfee.com Corp.* | 44,731 | |||
| 2,400 | Metricom, Inc.* | 97,650 | |||
| 3,200 | Modem Media, Inc.* | 33,800 | |||
| 5,400 | MP3.com, Inc.* | 44,550 | |||
| 3,400 | Multex.com, Inc.* | 73,950 | |||
| 6,000 | Nanogen, Inc.* | 144,750 | |||
| 5,500 | Netcentives, Inc.* | 52,938 | |||
| 8,000 | Network Commerce, Inc.* | 44,000 | |||
| 11,600 | Pegasus Systems, Inc.* | 230,550 | |||
| 2,200 | PurchasePro.com, Inc.* | 127,119 | |||
| 13,300 | Sylvan Learning Systems, Inc.* | 192,019 | |||
| 30,400 | Technology Solutions Co. | 94,050 | |||
| 3,800 | The TriZetto Group, Inc.* | 38,950 | |||
| 3,400 | Travelocity.com, Inc.* | 46,750 | |||
| 4,900 | U.S. Interactive, Inc.* | 38,281 | |||
| 4,513,086 | |||||
| Internet – 4.0% | |||||
| 2,000 | 24/7 Media, Inc.* | 28,875 | |||
| 2,800 | About.com, Inc.* | 122,150 | |||
| 6,100 | AppNet, Inc.* | 301,569 | |||
| 4,100 | Ask Jeeves, Inc.* | 125,050 | |||
| 5,400 | Axent Technologies, Inc.* | 128,250 | |||
|
Shares |
Description | Value | |||
|---|---|---|---|---|---|
| Common Stocks – (continued) | |||||
| Internet – (continued) | |||||
| 6,700 | Be Free, Inc.* | $ 40,619 | |||
| 5,900 | Broadbase Software, Inc.* | 123,531 | |||
| 2,400 | CareInsite, Inc.* | 53,700 | |||
| 9,700 | Digital Island* | 287,969 | |||
| 1,200 | DigitalThink, Inc.* | 40,875 | |||
| 2,600 | Digitas, Inc.* | 35,750 | |||
| 5,800 | eGain Communications Corp.* | 75,762 | |||
| 1,900 | eMerge Interactive, Inc.* | 41,919 | |||
| 3,100 | F5 Networks, Inc.* | 179,800 | |||
| 1,800 | FirePond, Inc.* | 37,575 | |||
| 2,000 | GetThere.com, Inc.* | 34,750 | |||
| 5,400 | GlobalNet Financial.com, Inc.* | 53,325 | |||
| 4,800 | Go2Net, Inc.* | 331,200 | |||
| 3,200 | GoAmerica, Inc.* | 35,000 | |||
| 5,100 | GoTo.com, Inc.* | 94,987 | |||
| 8,300 | High Speed Access Corp.* | 47,725 | |||
| 1,400 | Hotel Reservations Network, Inc.* | 49,263 | |||
| 4,400 | IDT Corp.* | 174,900 | |||
| 3,000 | IMPSAT Fiber Networks, Inc.* | 46,500 | |||
| 1,100 | Interactive Intelligence, Inc.* | 48,744 | |||
| 10,000 | Internet Pictures Corp.* | 78,125 | |||
| 2,500 | internet.com Corp.* | 78,750 | |||
| 11,100 | Intertrust Technologies Corp.* | 178,294 | |||
| 4,100 | InterWorld Corp.* | 82,512 | |||
| 6,000 | Interwoven, Inc.* | 576,000 | |||
| 3,100 | IntraNet Solutions, Inc.* | 140,469 | |||
| 8,300 | iXl Enterprises, Inc.* | 79,369 | |||
| 2,600 | LifeMinders, Inc.* | 78,000 | |||
| 7,700 | LookSmart, Ltd.* | 128,975 | |||
| 9,300 | Mail.com, Inc.* | 58,706 | |||
| 3,400 | Marimba, Inc.* | 57,375 | |||
| 1,500 | MatrixOne, Inc.* | 51,750 | |||
| 2,000 | Media Metrix, Inc.* | 49,500 | |||
| 4,200 | MyPoints.com, Inc.* | 57,225 | |||
| 1,600 | NBC Internet, Inc.* | 16,800 | |||
| 3,500 | Net Perceptions, Inc.* | 49,656 | |||
| 3,100 | Netegrity, Inc.* | 272,800 | |||
| 2,800 | Netopia, Inc.* | 102,550 | |||
| 4,400 | Network Access Solutions Corp.* | 34,925 | |||
| 900 | Nuance Communications, Inc.* | 118,462 | |||
| 1,900 | OneMain.com, Inc.* | 18,733 | |||
| 1,300 | ORATEC Interventions, Inc.* | 46,231 | |||
| 1,500 | OTG Software, Inc.* | 33,563 | |||
| 3,100 | Packeteer, Inc.* | 149,187 | |||
| 2,900 | Persistence Software, Inc.* | 49,300 | |||
| 2,600 | Primus Knowledge Solutions, Inc.* | 61,263 | |||
| 5,700 | Prodigy Communications Corp.* | 42,928 | |||
| 4,200 | Quintus Corp.* | 54,863 | |||
| 6,100 | Rare Medium Group, Inc.* | 61,000 | |||
| 9,100 | Rhythms NetConnections, Inc.* | 81,900 | |||
| 1,300 | Saba Software, Inc.* | 37,213 | |||
| 5,100 | SciQuest.com, Inc.* | 49,088 | |||
| 1,100 | Selectica, Inc.* | 52,456 | |||
| 1,200 | SmartServ Online, Inc.* | 44,175 | |||
| 2,200 | SonicWall, Inc.* | 167,475 | |||
| 1,900 | SportsLine.com, Inc.* | 33,606 | |||
|
Shares |
Description | Value | ||||
|---|---|---|---|---|---|---|
| Common Stocks – (continued) | ||||||
| Internet – (continued) | ||||||
| 300 | StarMedia, Network, Inc.* | $ 2,550 | ||||
| 4,400 | Ticketmaster Online-CitySearch, Inc.
Class B* |
105,875 | ||||
| 1,900 | Tumbleweed Communications Corp.* | 118,987 | ||||
| 2,800 | Tut Systems, Inc.* | 281,750 | ||||
| 5,000 | Ventro Corp.* | 71,250 | ||||
| 3,600 | VIA NET.WORKS, Inc.* | 46,575 | ||||
| 3,700 | Viador, Inc.* | 34,225 | ||||
| 7,300 | Viant Corp.* | 101,287 | ||||
| 3,000 | WorldGate Communications, Inc.* | 59,250 | ||||
| 6,634,761 | ||||||
| Leisure – 1.2% | ||||||
| 21,000 | Fairfield Communities, Inc.* | 168,000 | ||||
| 17,300 | Pinnacle Entertainment, Inc.* | 356,812 | ||||
| 3,700 | Quokka Sports, Inc.* | 25,438 | ||||
| 8,500 | Russ Berrie & Company, Inc. | 174,250 | ||||
| 15,750 | SCP Pool Corp.* | 461,672 | ||||
| 37,350 | Station Casinos, Inc.* | 536,906 | ||||
| 18,200 | WMS Industries, Inc.* | 291,200 | ||||
| 2,014,278 | ||||||
| Life Insurance – 0.5% | ||||||
| 14,578 | Delphi Financial Group, Inc. | 603,165 | ||||
| 12,500 | FBL Financial Group, Inc. | 184,375 | ||||
| 787,540 | ||||||
| Media – 0.7% | ||||||
| 8,200 | Gaylord Entertainment Co. | 214,225 | ||||
| 13,500 | Insight Communications, Inc.* | 240,469 | ||||
| 11,600 | Media General, Inc. | 597,400 | ||||
| 11,700 | Playboy Enterprises, Inc. Class B* | 171,844 | ||||
| 1,223,938 | ||||||
| Medical Products – 2.4% | ||||||
| 11,100 | ADAC Laboratories* | 248,362 | ||||
| 11,400 | ArthroCare Corp.* | 507,300 | ||||
| 17,600 | Henry Schein, Inc.* | 323,400 | ||||
| 6,400 | Invacare Corp. | 172,400 | ||||
| 45,500 | Owens & Minor, Inc. | 696,719 | ||||
| 7,300 | PolyMedica Corp.* | 259,150 | ||||
| 9,900 | Respironics, Inc.* | 187,481 | ||||
| 16,700 | Scott Technologies, Inc.* | 316,256 | ||||
| 21,200 | The Cooper Cos., Inc. | 696,950 | ||||
| 14,500 | Varian Medical Systems, Inc. | 666,094 | ||||
| 4,074,112 | ||||||
| Medical Providers – 2.1% | ||||||
| 37,100 | AmeriPath, Inc.* | 505,488 | ||||
| 21,200 | Apria Healthcare Group, Inc.* | 315,350 | ||||
| 24,000 | Foundation Health Systems, Inc.* | 421,500 | ||||
| 7,800 | Laboratory Corp. of America Holdings | 922,837 | ||||
| 48,700 | Omnicare, Inc. | 666,581 | ||||
| 21,600 | Triad Hospitals, Inc.* | 623,700 | ||||
| 3,455,456 | ||||||
|
Shares |
Description | Value | |||
|---|---|---|---|---|---|
| Common Stocks – (continued) | |||||
| Mining – 1.9% | |||||
| 15,500 | AK Steel Holding Corp. | $ 168,563 | |||
| 29,900 | Commercial Metals Co. | 835,331 | |||
| 24,400 | CONSOL Energy, Inc. | 507,825 | |||
| 17,000 | Mueller Industries, Inc.* | 536,562 | |||
| 37,000 | National Steel Corp. Class B | 150,313 | |||
| 23,200 | Quanex Corp. | 433,550 | |||
| 18,400 | Reliance Steel & Aluminum Corp. | 379,500 | |||
| 8,400 | U.S. Can Corp.* | 160,650 | |||
| 3,172,294 | |||||
| Motor Vehicle – 0.6% | |||||
| 33,000 | Lear Corp.* | 711,562 | |||
| 5,600 | Oshkosh Truck Corp. | 198,800 | |||
| 13,000 | Winnebago Industries, Inc. | 166,563 | |||
| 1,076,925 | |||||
| Oil Refining – 0.5% | |||||
| 10,900 | Northwestern Corp. | 237,075 | |||
| 24,000 | Western Gas Resources, Inc. | 526,500 | |||
| 763,575 | |||||
| Oil Services – 1.2% | |||||
| 8,600 | Atwood Oceanics, Inc.* | 390,225 | |||
| 85,500 | Parker Drilling Co.* | 614,531 | |||
| 15,000 | Patterson Energy, Inc.* | 470,625 | |||
| 11,000 | Seitel, Inc. | 172,563 | |||
| 8,900 | UTI Energy Corp.* | 331,525 | |||
| 1,979,469 | |||||
| Property Insurance – 1.2% | |||||
| 7,800 | Argonaut Group, Inc. | 128,700 | |||
| 21,800 | Fidelity National Financial, Inc. | 434,637 | |||
| 15,200 | First American Financial Corp. | 250,800 | |||
| 7,800 | HCC Insurance Holdings, Inc. | 164,775 | |||
| 6,900 | PMA Capital Corp. | 116,438 | |||
| 7,700 | SCPIE Holdings, Inc. | 167,475 | |||
| 11,800 | Stewart Information Services Corp. | 158,562 | |||
| 19,800 | The Commerce Group, Inc. | 514,800 | |||
| 1,936,187 | |||||
| Publishing – 1.6% | |||||
| 19,100 | ADVO, Inc.* | 781,906 | |||
| 8,300 | Penton Media, Inc. | 259,894 | |||
| 23,400 | Pulitzer, Inc. | 1,007,662 | |||
| 16,800 | The Standard Register Co. | 215,250 | |||
| 42,500 | The Topps Co., Inc.* | 334,688 | |||
| 2,599,400 | |||||
| Restaurants – 1.1% | |||||
| 26,100 | Buffets, Inc.* | 345,825 | |||
| 10,600 | CEC Entertainment, Inc.* | 306,075 | |||
| 22,200 | RARE Hospitality International, Inc.* | 624,375 | |||
| 21,400 | Ruby Tuesday, Inc. | 267,500 | |||
| 10,000 | Sonic Corp.* | 326,250 | |||
| 1,870,025 | |||||
|
Shares |
Description | Value | |||
|---|---|---|---|---|---|
| Common Stocks – (continued) | |||||
| Security/Asset Management – 2.1% | |||||
| 17,500 | Affiliated Managers Group, Inc.* | $ 975,625 | |||
| 15,300 | BlackRock, Inc.* | 627,300 | |||
| 4,800 | Donaldson, Lufkin & Jenrette, Inc-
DLJdirect* |
39,000 | |||
| 2,200 | eSPEED, Inc.* | 67,650 | |||
| 21,800 | Jefferies Group, Inc. | 663,537 | |||
| 12,200 | National Discount Brokers Group, Inc.* | 441,488 | |||
| 15,200 | The John Nuveen Co. | 689,700 | |||
| 3,504,300 | |||||
| Semiconductors – 4.1% | |||||
| 10,600 | Actel Corp.* | 466,400 | |||
| 17,700 | Alliance Semiconductor Corp.* | 465,731 | |||
| 12,150 | ANADIGICS, Inc.* | 437,400 | |||
| 6,200 | Asyst Technologies, Inc.* | 162,363 | |||
| 21,200 | Cirrus Logic, Inc.* | 641,300 | |||
| 9,200 | Cohu, Inc. | 188,600 | |||
| 2,100 | Elantec Semiconductor, Inc.* | 185,850 | |||
| 4,500 | Electro Scientific Industries, Inc.* | 185,344 | |||
| 8,150 | Exar Corp.* | 983,094 | |||
| 7,000 | General Semiconductor, Inc.* | 101,938 | |||
| 4,000 | Microsemi Corp.* | 169,000 | |||
| 7,100 | Oak Technology, Inc.* | 206,787 | |||
| 24,800 | Pioneer-Standard Electronics, Inc. | 339,450 | |||
| 5,200 | PRI Automation, Inc.* | 268,450 | |||
| 6,000 | Rainbow Technologies, Inc.* | 237,750 | |||
| 15,750 | Remec, Inc.* | 448,875 | |||
| 22,700 | Silicon Valley Group, Inc.* | 632,762 | |||
| 4,100 | SIPEX Corp.* | 176,556 | |||
| 8,300 | Varian Semiconductor Equipment
Associates, Inc.* |
474,137 | |||
| 10,300 | White Electronic Designs Corp. | 164,800 | |||
| 6,936,587 | |||||
| Specialty Retail – 2.7% | |||||
| 22,400 | Bandag, Inc. | 729,400 | |||
| 18,700 | Borders Group, Inc.* | 248,944 | |||
| 17,000 | Brown Shoe Co. | 182,750 | |||
| 5,600 | Drugstore.com, Inc.* | 34,300 | |||
| 21,900 | Genesco, Inc.* | 354,506 | |||
| 21,500 | Haverty Furniture Cos., Inc. | 248,594 | |||
| 3,200 | Hollywood Entertainment Corp.* | 22,400 | |||
| 4,100 | Hollywood.com, Inc.* | 34,338 | |||
| 4,200 | Insight Enterprises, Inc.* | 211,050 | |||
| 19,850 | InterTAN, Inc.* | 275,419 | |||
| 13,400 | Michaels Stores, Inc.* | 469,000 | |||
| 24,000 | PETCO Animal Supplies, Inc.* | 504,000 | |||
| 18,400 | School Specialty, Inc.* | 332,350 | |||
| 37,400 | Spiegel, Inc. | 254,787 | |||
| 7,300 | ValueVision International, Inc.* | 213,981 | |||
| 13,000 | Zale Corp.* | 480,187 | |||
| 4,596,006 | |||||
| Telephone – 1.0% | |||||
| 13,100 | CFW Communications Co. | 445,400 | |||
| 4,600 | Commonwealth Telephone
Enterprises, Inc.* |
$ 177,675 | |||
| 10,200 | CTC Communications Group, Inc.* | 251,175 | |||
|
Shares |
Description | Value | |||
|---|---|---|---|---|---|
| Common Stocks – (continued) | |||||
| Telephone – (continued) | |||||
| 6,900 | DSL.net, Inc.* | 42,263 | |||
| 15,900 | Electric Lightwave, Inc.* | 206,700 | |||
| 5,900 | Illuminet Holdings, Inc.* | 234,525 | |||
| 1,700 | ITXC Corp.* | 34,000 | |||
| 2,400 | Net2Phone, Inc.* | 70,950 | |||
| 3,300 | Network Plus Corp.* | 37,744 | |||
| 14,300 | Pac-West Telecomm, Inc.* | 201,987 | |||
| 6,500 | TALK.com, Inc.* | 46,719 | |||
| 1,749,138 | |||||
| Thrifts – 2.0% | |||||
| 14,200 | Bank United Corp. | 639,000 | |||
| 18,400 | Bay View Capital Corp. | 179,400 | |||
| 12,700 | Downey Financial Corp. | 425,450 | |||
| 41,200 | FirstFed Financial Corp.* | 741,600 | |||
| 40,889 | Republic Security Financial Corp. | 176,334 | |||
| 37,300 | Richmond County Financial Corp. | 750,662 | |||
| 26,600 | Staten Island Bancorp, Inc. | 490,438 | |||
| 3,402,884 | |||||
| Tobacco – 0.3% | |||||
| 20,900 | Universal Corp. | 540,788 | |||
| Truck Freight – 1.2% | |||||
| 30,800 | American Freightways Corp.* | 506,275 | |||
| 13,900 | Arkansas Best Corp. | 209,369 | |||
| 20,600 | Arnold Industries, Inc. | 320,587 | |||
| 22,000 | Overseas Shipholding Group | 647,625 | |||
| 21,700 | Yellow Corp.* | 330,925 | |||
| 2,014,781 | |||||
| Wireless – 0.9% | |||||
| 25,300 | Audiovox Corp.* | 458,563 | |||
| 10,800 | Leap Wireless International, Inc.* | 857,250 | |||
| 2,300 | Rural Celluar Corp.* | 174,800 | |||
| 1,490,613 | |||||
| TOTAL COMMON STOCKS
(Cost $145,967,007) |
$ 166,820,431 | ||||
| Principal
Amount |
Interest
Rate |
Maturity
Date |
Value | |||||
|---|---|---|---|---|---|---|---|---|
| Repurchase Agreement – 1.3% | ||||||||
| Joint Repurchase Agreement Account II Ù | ||||||||
| $2,200,000 | 6.66 | % | 09/01/2000 | $ 2,200,000 | ||||
| TOTAL REPURCHASE AGREEMENT
(Cost $2,200,000) |
$ 2,200,000 | |||||||
| TOTAL INVESTMENTS
(Cost $148,167,007) |
$169,020,431 | |||||||
*
|
Non-income producing security.
|
Ù
|
Joint repurchase agreement was entered into on August 31, 2000.
|
| The percentage shown for each investment category reflects the value of investments in that category as a percentage of total net
assets.
|
| The following graph shows the value, as of August 31, 2000, of a $10,000 investment made on December 31, 1998 (commencement of
operations) in Institutional shares at (NAV) of the Goldman Sachs CORE Large Cap Value Fund. For comparative purposes, the performance of the Fund’s benchmark (Russell 1000 Value Index with dividends reinvested) is shown. This performance data
represents past performance and should not be considered indicative of future performance which will fluctuate with changes in market conditions. These performance fluctuations will cause an investor’s shares, when redeemed, to be worth more or less
than their original cost. Performance of Class A, Class B, Class C and Service shares will vary from Institutional shares due to differences in fees and loads.
|
| CORE Large Cap Value Fund’s Lifetime Performance
|
| Growth of a $10,000 Investment, Distributions Reinvested January 1, 1999 to August 31, 2000
(a)
.
|
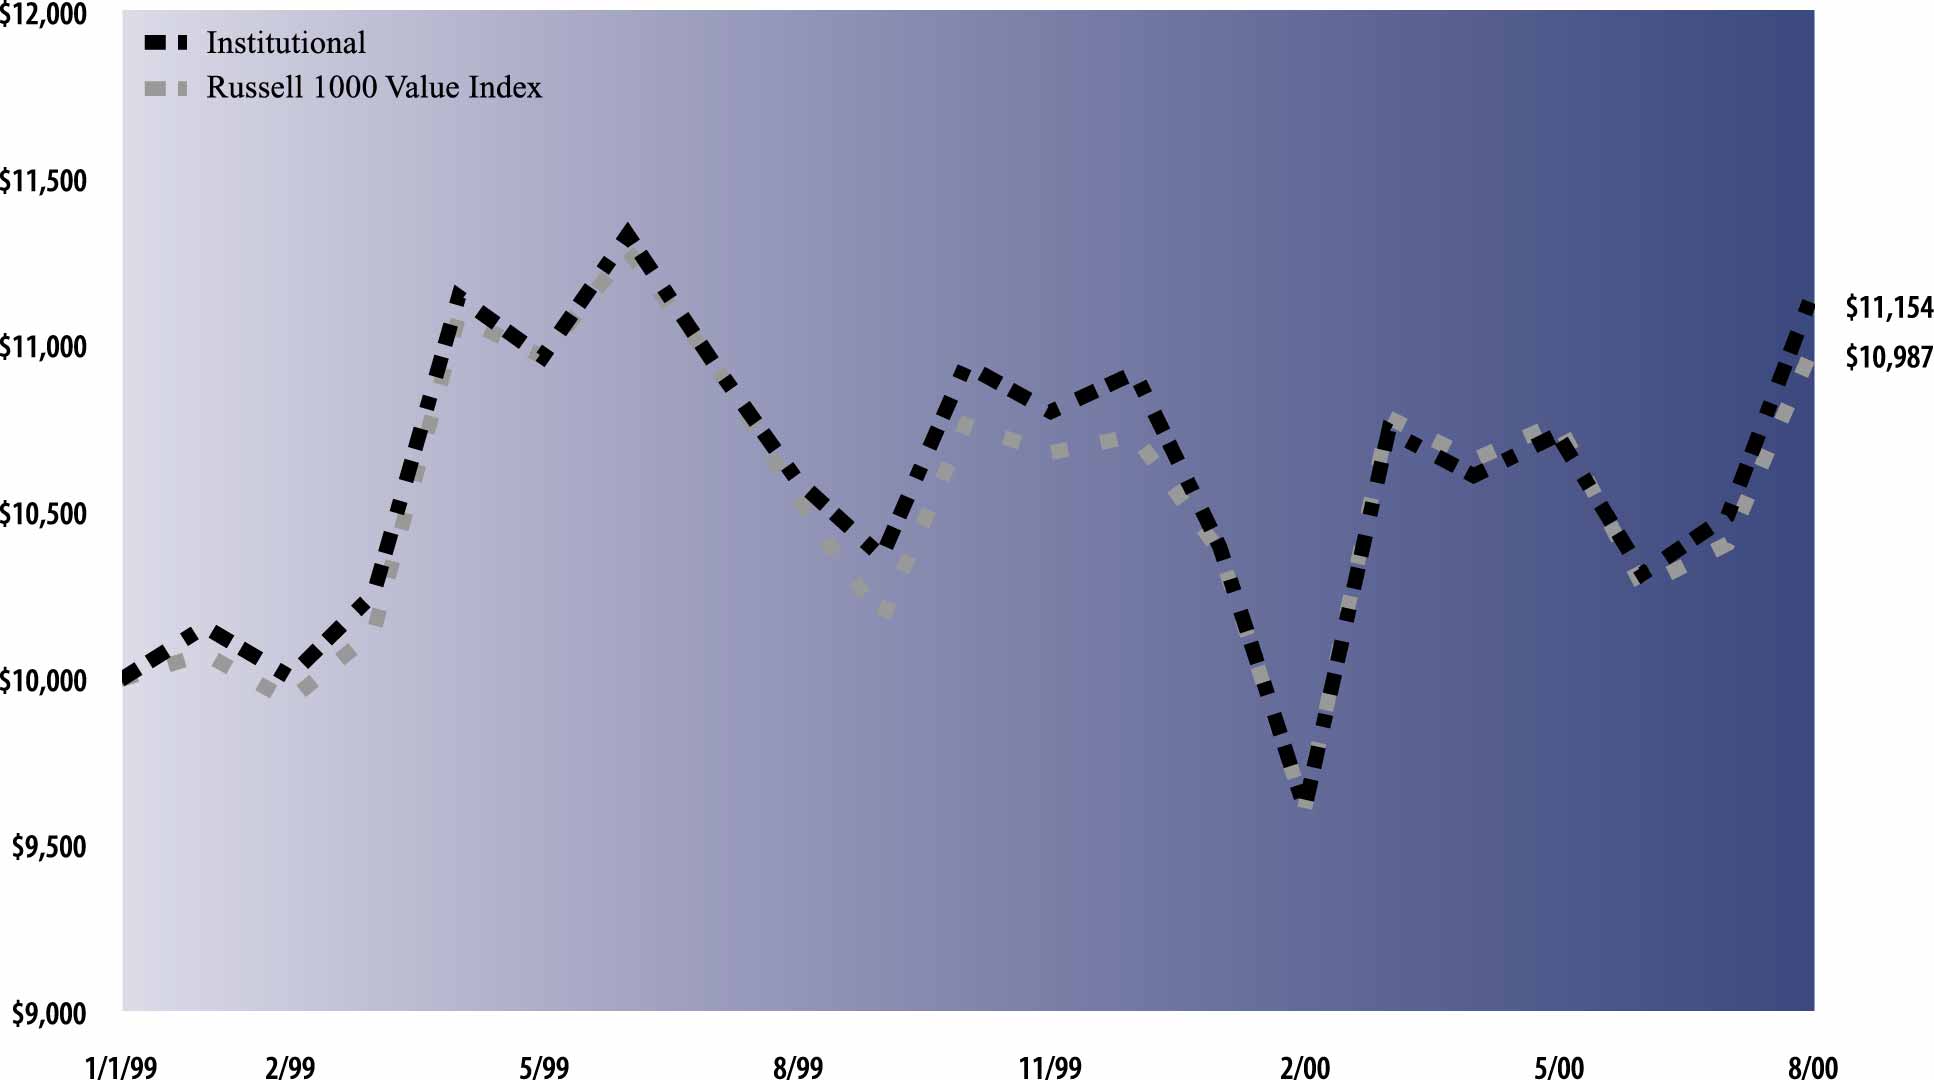 |
| Average Annual Total Return through August 31, 2000 | Since Inception | One Year | ||
|---|---|---|---|---|
| Class A (commenced December 31, 1998) | ||||
| Excluding sales charges | 6.35% | 4.68% | ||
| Including sales charges | 2.82% | -1.04% | ||
| |
||||
| Class B (commenced December 31, 1998) | ||||
| Excluding contingent deferred sales charges | 5.52% | 3.96% | ||
| Including contingent deferred sales charges | 3.16% | -1.12% | ||
| |
||||
| Class C (commenced December 31, 1998) | ||||
| Excluding contingent deferred sales charges | 5.56% | 3.97% | ||
| Including contingent deferred sales charges | 5.56% | 2.96% | ||
| |
||||
| Institutional Class (commenced December 31, 1998) | 6.95% | 5.20% | ||
| |
||||
| Service Class (commenced December 31, 1998) | 6.24% | 4.60% | ||
| |
||||
(a)
|
For comparative purposes, initial investments are assumed to be made on the first day of the month following commencement of
operations.
|
|
Shares |
Description | Value | |||
|---|---|---|---|---|---|
| Common Stocks – 99.3% | |||||
| Airlines – 0.4% | |||||
| 13,600 | AMR Corp. | $ 446,250 | |||
| 7,500 | Delta Air Lines, Inc. | 371,250 | |||
| 8,100 | UAL Corp. | 386,775 | |||
| 1,204,275 | |||||
| Alcohol – 0.4% | |||||
| 4,500 | Adolph Coors Co. Class B | 268,031 | |||
| 5,700 | Anheuser-Busch Cos., Inc. | 449,232 | |||
| 7,800 | Brown-Forman Corp. Class B | 413,400 | |||
| 1,130,663 | |||||
| Banks – 15.2% | |||||
| 97,300 | Bank of America Corp. | 5,211,631 | |||
| 26,200 | Bank One Corp. | 923,550 | |||
| 15,100 | BB&T Corp. | 408,644 | |||
| 252,200 | Citigroup, Inc. | 14,722,175 | |||
| 29,600 | Comerica, Inc. | 1,666,850 | |||
| 11,300 | Cullen/Frost Bankers, Inc. | 350,300 | |||
| 8,550 | Fifth Third Bancorp | 394,903 | |||
| 24,237 | Firstar Corp. | 578,658 | |||
| 98,200 | FleetBoston Financial Corp. | 4,191,912 | |||
| 23,400 | J.P. Morgan & Co., Inc. | 3,912,187 | |||
| 19,900 | Mellon Financial Corp. | 900,475 | |||
| 20,200 | PNC Financial Services Group | 1,190,538 | |||
| 16,600 | SouthTrust Corp. | 467,913 | |||
| 38,100 | SunTrust Banks, Inc. | 1,881,187 | |||
| 23,000 | The Bank of New York Co., Inc. | 1,206,063 | |||
| 72,000 | The Chase Manhattan Corp. | 4,023,000 | |||
| 20,600 | UnionBanCal Corp. | 511,138 | |||
| 94,800 | Wells Fargo & Co. | 4,094,175 | |||
| 46,635,299 | |||||
| Chemicals – 2.8% | |||||
| 21,600 | Air Products & Chemicals, Inc. | 784,350 | |||
| 10,000 | Cabot Corp. | 370,000 | |||
| 22,465 | E.I. du Pont de Nemours & Co. | 1,008,117 | |||
| 18,700 | Minnesota Mining &
Manufacturing Co. |
1,739,100 | |||
| 24,100 | PPG Industries, Inc. | 976,050 | |||
| 32,100 | Praxair, Inc. | 1,420,425 | |||
| 83,400 | The Dow Chemicals Co. | 2,184,037 | |||
| 8,482,079 | |||||
| Clothing – 0.2% | |||||
| 14,400 | Intimate Brands, Inc. | 232,200 | |||
| 14,400 | The Limited, Inc. | 288,000 | |||
| 520,200 | |||||
| Computer Hardware – 2.0% | |||||
| 7,000 | 3Com Corp. | 116,375 | |||
| 28,800 | Apple Computer, Inc.* | 1,755,000 | |||
| 27,500 | Hewlett-Packard Co. | 3,320,625 | |||
| 5,500 | Network Appliance, Inc.* | 643,500 | |||
| 1,100 | RSA Security, Inc.* | 64,969 | |||
| 3,100 | SanDisk Corp.* | 258,850 | |||
| 6,159,319 | |||||
|
Shares |
Description |
Value |
|||
|---|---|---|---|---|---|
| Common Stocks – (continued) | |||||
| Computer Software – 0.9% | |||||
| 3,000 | International Business Machines, Inc. | $ 396,000 | |||
| 3,200 | Intuit, Inc.* | 191,600 | |||
| 2,800 | Mercury Interactive Corp.* | 342,125 | |||
| 4,000 | Oracle Corp.* | 363,750 | |||
| 4,600 | Sabre Holdings Corp. | 128,225 | |||
| 11,500 | VERITAS Software Corp.* | 1,386,469 | |||
| 2,808,169 | |||||
| Construction – 0.6% | |||||
| 22,300 | Fluor Corp. | 667,607 | |||
| 8,100 | Quanta Services, Inc.* | 378,675 | |||
| 4,800 | Southdown, Inc. | 301,200 | |||
| 18,300 | USG Corp. | 589,031 | |||
| 1,936,513 | |||||
| Consumer Durables – 0.3% | |||||
| 14,900 | Sherwin-Williams Co. | 342,700 | |||
| 15,600 | Whirlpool Corp. | 592,800 | |||
| 935,500 | |||||
| Defense/Aerospace – 1.6% | |||||
| 31,700 | Northrop Grumman Corp. | 2,466,656 | |||
| 47,900 | The Boeing Co. | 2,568,638 | |||
| 5,035,294 | |||||
| Department Store – 1.2% | |||||
| 26,100 | Federated Department Stores, Inc.* | 721,013 | |||
| 13,400 | Kohl’s Corp.* | 750,400 | |||
| 57,500 | Sears, Roebuck & Co. | 1,793,281 | |||
| 11,400 | Target Corp. | 265,050 | |||
| 3,529,744 | |||||
| Drugs – 3.8% | |||||
| 18,800 | Allergan, Inc. | 1,374,750 | |||
| 18,900 | Alpharma, Inc. | 1,070,213 | |||
| 4,800 | American Home Products Corp. | 260,100 | |||
| 5,700 | Bristol-Myers Squibb Co. | 302,100 | |||
| 15,600 | Cardinal Health, Inc. | 1,276,275 | |||
| 8,700 | Forest Laboratories, Inc.* | 851,513 | |||
| 3,100 | Genentech, Inc.* | 590,550 | |||
| 35,100 | IVAX Corp.* | 1,215,337 | |||
| 7,500 | Jones Pharma, Inc. | 268,125 | |||
| 55,900 | Merck & Co., Inc. | 3,906,012 | |||
| 4,600 | Millennium Pharmaceuticals* | 658,375 | |||
| 11,773,350 | |||||
| Electrical Equipment – 1.4% | |||||
| 6,600 | ADC Telecommunications, Inc.* | 270,188 | |||
| 20,800 | AVX Corp. | 622,700 | |||
| 2,500 | Corning, Inc. | 819,844 | |||
| 11,600 | KEMET Corp.* | 348,000 | |||
| 5,100 | Level 3 Communications, Inc.* | 444,895 | |||
| 8,600 | Motorola, Inc. | 310,137 | |||
| 3,718 | Nortel Networks Corp. | 303,249 | |||
| 3,500 | Scientific-Atlanta, Inc. | 272,781 | |||
|
Shares |
Description | Value | ||||
|---|---|---|---|---|---|---|
| Common Stocks – (continued) | ||||||
| Electrical Equipment – (continued) | ||||||
| 5,600 | Tektronix, Inc. | $ 426,650 | ||||
| 13,650 | Vishay Intertechnology, Inc.* | 550,266 | ||||
| 4,368,710 | ||||||
| Electrical Utilities – 4.6% | ||||||
| 14,500 | Calpine Corp.* | 1,435,500 | ||||
| 28,400 | Constellation Energy Group | 1,086,300 | ||||
| 6,722 | Dominion Resources, Inc. | 356,266 | ||||
| 24,700 | DTE Energy Co. | 858,325 | ||||
| 28,000 | Dynegy, Inc. | 1,260,000 | ||||
| 26,800 | Energy East Corp. | 608,025 | ||||
| 75,300 | Entergy Corp. | 2,291,944 | ||||
| 9,100 | FPL Group, Inc. | 485,712 | ||||
| 13,500 | PG&E Corp. | 390,656 | ||||
| 45,100 | Public Service Enterprise | 1,634,875 | ||||
| 1,729 | Sempra Energy | 33,716 | ||||
| 2,200 | The Southern Co. | 65,863 | ||||
| 22,700 | TXU Corp. | 793,081 | ||||
| 59,200 | Unicom Corp. | 2,704,700 | ||||
| 14,004,963 | ||||||
| Energy Resources – 9.1% | ||||||
| 34,200 | Amerada Hess Corp. | 2,340,562 | ||||
| 23,100 | Apache Corp. | 1,455,300 | ||||
| 53,500 | Chevron Corp. | 4,520,750 | ||||
| 5,600 | Devon Energy Corp. | 327,950 | ||||
| 154,630 | Exxon Mobil Corp. | 12,621,674 | ||||
| 40,900 | Kerr-McGee Corp. | 2,584,369 | ||||
| 18,900 | Murphy Oil Corp. | 1,261,575 | ||||
| 15,700 | Noble Affiliates, Inc. | 608,375 | ||||
| 48,100 | Occidental Petroleum Corp. | 1,040,162 | ||||
| 6,300 | Phillips Petroleum Co. | 389,813 | ||||
| 29,500 | USX-Marathon Group | 809,406 | ||||
| 27,959,936 | ||||||
| Entertainment – 1.7% | ||||||
| 130,000 | The Walt Disney Co. | 5,061,875 | ||||
| Equity REIT – 0.8% | ||||||
| 52,700 | Equity Office Properties Trust | 1,521,712 | ||||
| 21,000 | Equity Residential Properties Trust | 1,008,000 | ||||
| 2,529,712 | ||||||
| Financial Services – 2.4% | ||||||
| 18,600 | American Express Co. | 1,099,725 | ||||
| 4,700 | C.I.T. Group, Inc. | 82,250 | ||||
| 27,600 | Comdisco, Inc. | 662,400 | ||||
| 37,700 | Federal National Mortgage Assn. | 2,026,375 | ||||
| 20,900 | General Electric Co. | 1,226,569 | ||||
| 7,100 | Household International, Inc. | 340,800 | ||||
| 14,700 | Marsh & McLennan Cos., Inc. | 1,745,625 | ||||
| 2,600 | Providian Financial Corp. | 298,837 | ||||
| 7,482,581 | ||||||
|
Shares |
Description | Value | |||
|---|---|---|---|---|---|
| Common Stocks – (continued) | |||||
| Food & Beverage – 4.0% | |||||
| 56,200 | ConAgra, Inc. | $ 1,029,163 | |||
| 28,000 | Hormel Foods Corp. | 432,250 | |||
| 90,700 | IBP, Inc. | 1,456,869 | |||
| 12,700 | McCormick & Co., Inc. | 370,681 | |||
| 58,800 | Nabisco Group Holdings Corp. | 1,650,075 | |||
| 26,700 | Nabisco Holdings Corp. | 1,426,781 | |||
| 78,200 | PepsiCo., Inc. | 3,333,275 | |||
| 6,900 | Suiza Foods Corp.* | 345,000 | |||
| 6,500 | Supervalu, Inc. | 97,094 | |||
| 25,000 | SYSCO Corp. | 1,057,812 | |||
| 5,000 | The Coca-Cola Co. | 263,125 | |||
| 28,600 | The Pepsi Bottling Group, Inc. | 908,050 | |||
| 12,370,175 | |||||
| Forest – 1.0% | |||||
| 33,200 | Georgia-Pacific Group | 888,100 | |||
| 8,100 | International Paper Co. | 258,187 | |||
| 31,400 | Kimberly-Clark Corp. | 1,836,900 | |||
| 2,983,187 | |||||
| Grocery – 0.2% | |||||
| 9,900 | Safeway, Inc.* | 488,194 | |||
| Heavy Electrical – 0.8% | |||||
| 8,200 | American Power Conversion Corp.* | 195,262 | |||
| 28,800 | Emerson Electric Co. | 1,906,200 | |||
| 7,300 | Rockwell International Corp. | 295,194 | |||
| 2,396,656 | |||||
| Home Products – 1.6% | |||||
| 12,300 | Alberto-Culver Co. Class B | 348,244 | |||
| 14,300 | Avon Products, Inc. | 560,381 | |||
| 12,300 | Colgate-Palmolive Co. | 626,531 | |||
| 66,500 | Ralston Purina Group | 1,504,563 | |||
| 6,700 | The Estee Lauder Cos., Inc. | 274,281 | |||
| 24,000 | The Procter & Gamble Co. | 1,483,500 | |||
| 4,797,500 | |||||
| Hotels – 0.2% | |||||
| 12,500 | Marriott International, Inc. | 493,750 | |||
| Industrial Parts – 1.9% | |||||
| 10,100 | American Standard Cos., Inc.* | 467,756 | |||
| 10,800 | Caterpillar, Inc. | 396,900 | |||
| 29,300 | Ingersoll-Rand Co. | 1,334,981 | |||
| 17,200 | Parker-Hannifin Corp. | 598,775 | |||
| 8,300 | Tecumseh Products Co. | 329,925 | |||
| 2,200 | Textron, Inc. | 123,338 | |||
| 40,200 | United Technologies Corp. | 2,509,987 | |||
| 5,761,662 | |||||
| Industrial Services – 0.6% | |||||
| 31,900 | Hertz Corp. | 976,937 | |||
| 19,200 | Robert Half International, Inc.* | 610,800 | |||
| 15,100 | Spherion Corp.* | 185,919 | |||
| 1,773,656 | |||||
|
Shares |
Description | Value | |||
|---|---|---|---|---|---|
| Common Stocks – (continued) | |||||
| Information Services – 1.2% | |||||
| 6,600 | Computer Sciences Corp.* | $ 521,812 | |||
| 10,400 | Electronic Data Systems Corp. | 518,050 | |||
| 47,400 | First Data Corp. | 2,260,387 | |||
| 900 | Healtheon/WebMD Corp.* | 15,863 | |||
| 11,200 | TeleTech Holdings, Inc.* | 365,400 | |||
| 3,681,512 | |||||
| Internet – 0.1% | |||||
| 3,900 | At Home Corp. Series A* | 56,794 | |||
| 1,600 | Critical Path, Inc.* | 123,600 | |||
| 600 | E*TRADE Group, Inc.* | 10,650 | |||
| 7,400 | Internet Capital Group, Inc.* | 258,075 | |||
| 449,119 | |||||
| Leisure – 1.2% | |||||
| 35,000 | Brunswick Corp. | 656,250 | |||
| 46,900 | Eastman Kodak Co. | 2,919,525 | |||
| 3,575,775 | |||||
| Life Insurance – 2.4% | |||||
| 7,900 | AFLAC, Inc. | 426,600 | |||
| 31,100 | American General Corp. | 2,264,469 | |||
| 29,600 | Cigna Corp. | 2,878,600 | |||
| 6,500 | Lincoln National Corp. | 351,000 | |||
| 15,400 | UnitedHealth Group, Inc. | 1,455,300 | |||
| 7,375,969 | |||||
| Media – 2.6% | |||||
| 83,200 | AT&T Corp.-Liberty Media Corp.* | 1,778,400 | |||
| 14,200 | Cox Communications, Inc.* | 504,988 | |||
| 70,700 | Fox Entertainment Group, Inc.* | 2,045,881 | |||
| 26,900 | General Motors Corp. Class H* | 891,063 | |||
| 54,900 | Infinity Broadcasting Corp.* | 2,079,337 | |||
| 1,000 | RCN Corp.* | 24,250 | |||
| 9,400 | Time Warner, Inc. | 803,700 | |||
| 8,127,619 | |||||
| Medical Products – 3.1% | |||||
| 17,800 | Abbott Laboratories | 778,750 | |||
| 7,800 | Bausch & Lomb, Inc. | 278,850 | |||
| 84,900 | Johnson & Johnson | 7,805,494 | |||
| 5,600 | Techne Corp.* | 534,800 | |||
| 9,397,894 | |||||
| Medical Providers – 0.3% | |||||
| 16,100 | HCA-The Healthcare Corp. | 555,450 | |||
| 3,200 | Quest Diagnostics, Inc.* | 396,000 | |||
| 951,450 | |||||
| Mining – 0.8% | |||||
| 23,300 | Alcan Aluminium Ltd. | 764,531 | |||
| 24,504 | Alcoa, Inc. | 814,758 | |||
| 21,300 | Nucor Corp. | 782,775 | |||
| 2,362,064 | |||||
|
Shares |
Description | Value | |||
|---|---|---|---|---|---|
| Common Stocks – (continued) | |||||
| Motor Vehicle – 2.7% | |||||
| 30,523 | Delphi Automotive Systems Corp. | $ 501,722 | |||
| 99,296 | Ford Motor Co. | 2,401,722 | |||
| 62,200 | General Motors Corp. | 4,490,062 | |||
| 12,900 | Johnson Controls, Inc. | 689,344 | |||
| 7,500 | Navistar International Corp.* | 281,250 | |||
| 8,364,100 | |||||
| Oil Refining – 0.7% | |||||
| 73,628 | Conoco, Inc. Class B | 1,923,531 | |||
| 12,100 | Ultramar Diamond Shamrock Corp. | 283,594 | |||
| 2,207,125 | |||||
| Oil Services – 0.1% | |||||
| 4,400 | BJ Services Co.* | 294,800 | |||
| Property Insurance – 5.7% | |||||
| 44,200 | Allstate Corp. | 1,284,562 | |||
| 5,500 | Ambac Financial Group, Inc. | 355,438 | |||
| 76,237 | American International Group, Inc. | 6,794,623 | |||
| 5,800 | Jefferson-Pilot Corp. | 383,888 | |||
| 32,900 | Loews Corp. | 2,662,844 | |||
| 4,600 | MBIA, Inc. | 302,450 | |||
| 34,900 | MGIC Investment Corp. | 2,052,556 | |||
| 20,300 | The Hartford Financial Services
Group, Inc. |
1,352,487 | |||
| 37,800 | The PMI Group, Inc. | 2,343,600 | |||
| 17,532,448 | |||||
| Publishing – 0.6% | |||||
| 7,700 | Dow Jones & Co., Inc. | 481,731 | |||
| 10,500 | Knight-Ridder, Inc. | 573,563 | |||
| 23,400 | The New York Times Co. | 916,987 | |||
| 1,972,281 | |||||
| Railroads – 0.9% | |||||
| 66,400 | Burlington Northern Santa Fe Corp. | 1,485,700 | |||
| 42,100 | Canadian National Railway Co. | 1,239,319 | |||
| 2,725,019 | |||||
| Restaurants – 0.8% | |||||
| 37,200 | Brinker International, Inc.* | 1,181,100 | |||
| 17,100 | Darden Restaurants, Inc. | 302,456 | |||
| 6,900 | Starbucks Corp.* | 252,713 | |||
| 24,000 | Tricon Global Restaurants, Inc.* | 699,000 | |||
| 2,435,269 | |||||
| Security/Asset Management – 3.5% | |||||
| 15,900 | A.G. Edwards, Inc. | 826,800 | |||
| 7,500 | AXA Financial, Inc. | 388,125 | |||
| 9,800 | Lehman Brothers Holdings, Inc. | 1,421,000 | |||
| 16,100 | Merrill Lynch & Co., Inc. | 2,334,500 | |||
| 54,700 | Morgan Stanley Dean Witter & Co. | 5,883,669 | |||
| 10,854,094 | |||||
|
Shares |
Description | Value | |||
|---|---|---|---|---|---|
| Common Stocks – (continued) | |||||
| Semiconductors – 0.9% | |||||
| 12,800 | Advanced Micro Devices, Inc.* | $ 481,600 | |||
| 3,100 | Applied Micro Circuits Corp.* | 629,106 | |||
| 7,100 | JDS Uniphase Corp.* | 883,839 | |||
| 3,700 | Micron Technology, Inc.* | 302,475 | |||
| 1,400 | SDL, Inc.* | 556,238 | |||
| 2,853,258 | |||||
| Specialty Retail – 0.7% | |||||
| 5,300 | Avnet, Inc. | 317,337 | |||
| 17,900 | Barnes & Noble, Inc.* | 309,894 | |||
| 6,700 | Lowes Co., Inc. | 300,244 | |||
| 14,000 | Tiffany & Co. | 582,750 | |||
| 300 | Webvan Group, Inc.* | 1,200 | |||
| 19,900 | Zale Corp.* | 735,056 | |||
| 2,246,481 | |||||
| Telephone – 9.3% | |||||
| 4,100 | Allegiance Telecom, Inc.* | 204,231 | |||
| 208,911 | AT&T Corp. | 6,580,696 | |||
| 87,900 | BCE, Inc. | 1,977,750 | |||
| 115,400 | BellSouth Corp. | 4,305,863 | |||
| 5,100 | Covad Communications Group, Inc.* | 83,194 | |||
| 7,600 | NEXTLINK Communications, Inc.* | 266,475 | |||
| 1,300 | NorthPoint Communications
Group, Inc.* |
14,869 | |||
| 139,064 | SBC Communications, Inc. | 5,805,922 | |||
| 35,400 | Sprint Corp. | 1,185,900 | |||
| 153,778 | Verizon Communications | 6,708,565 | |||
| 34,850 | WorldCom, Inc.* | 1,272,025 | |||
| 28,405,490 | |||||
|
Shares |
Description | Value | |||
|---|---|---|---|---|---|
| Common Stocks – (continued) | |||||
| Thrifts – 0.8% | |||||
| 51,800 | Golden West Financial Corp. | $ 2,466,975 | |||
| Tobacco – 1.0% | |||||
| 61,400 | Philip Morris Cos., Inc. | 1,818,975 | |||
| 23,400 | R.J. Reynolds Tobacco Holdings, Inc. | 839,475 | |||
| 17,300 | UST, Inc. | 374,112 | |||
| 3,032,562 | |||||
| Wireless – 0.2% | |||||
| 11,500 | AT&T Wireless Group* | 301,156 | |||
| 4,200 | United States Cellular Corp.* | 308,963 | |||
| 610,119 | |||||
| TOTAL COMMON STOCKS | |||||
| (Cost $294,923,304) | $ 304,544,385 | ||||
| Principal
Amount |
Interest
Rate |
Maturity
Date |
Value | |||||
|---|---|---|---|---|---|---|---|---|
| Repurchase Agreement – 0.5% | ||||||||
| Joint Repurchase Agreement Account II Ù | ||||||||
| $1,400,000 | 6.66 | % | 09/01/2000 | $ 1,400,000 | ||||
| TOTAL REPURCHASE AGREEMENT | ||||||||
| (Cost $1,400,000) | $ 1,400,000 | |||||||
| TOTAL INVESTMENTS | ||||||||
| (Cost $296,323,304) | $ 305,944,385 | |||||||
*
|
Non-income producing security.
|
Ù
|
Joint repurchase agreement was entered into on August 31, 2000.
|
| The percentage shown for each investment category reflects the value of investments in that category as a percentage of total net
assets.
|
| The following graph shows the value, as of August 31, 2000, of a $10,000 investment made on August 15, 1997 (commencement of
operations) in Institutional shares at (NAV) of the Goldman Sachs CORE International Equity Fund. For comparative purposes, the performance of the Fund’s benchmark (Morgan Stanley Capital International Gross Europe, Australia, Far East Index with
dividends reinvested (“MSCI Gross EAFE Index”)) is shown. This performance data represents past performance and should not be considered indicative of future performance which will fluctuate with changes in market conditions. These performance
fluctuations will cause an investor’s shares, when redeemed, to be worth more or less than their original cost. Performance of Class A, Class B, Class C and Service shares will vary from Institutional shares due to differences in fees and loads.
|
| CORE International Equity Fund’s Lifetime Performance
|
| Performance of a $10,000 Investment, Distributions Reinvested August 15, 1997 to August 31, 2000.
|
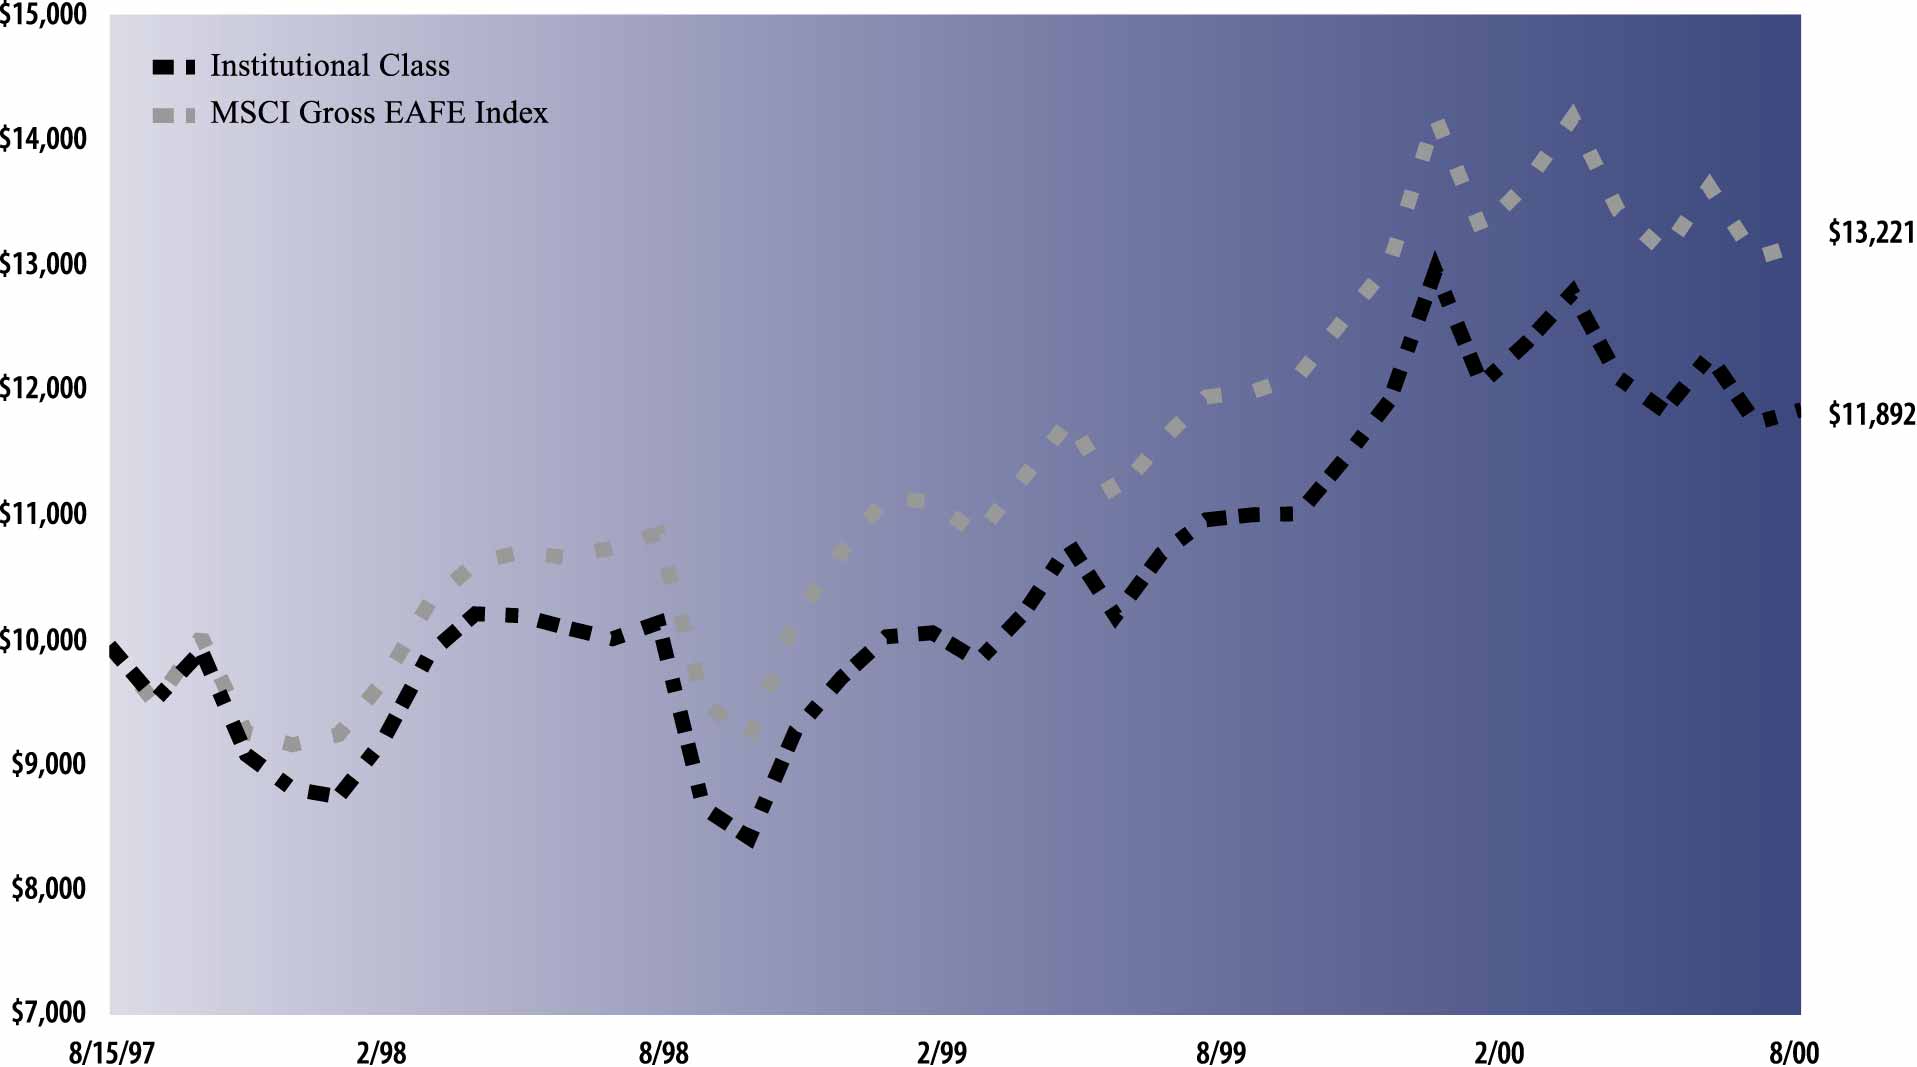 |
| Average Annual Total Return through August 31, 2000 | Since Inception | One Year | |||
|---|---|---|---|---|---|
| Class A (commenced August 15, 1997) | |||||
| Excluding sales charges | 5.15% | 6.92% | |||
| Including sales charges | 3.22% | 1.07% | |||
| |
|||||
| Class B (commenced August 15, 1997) | |||||
| Excluding contingent deferred sales charges | 4.68% | 6.36% | |||
| Including contingent deferred sales charges | 3.76% | 1.23% | |||
| |
|||||
| Class C (commenced August 15, 1997) | |||||
| Excluding contingent deferred sales charges | 4.71% | 6.34% | |||
| Including contingent deferred sales charges | 4.71% | 5.32% | |||
| |
|||||
| Institutional Class (commenced August 15, 1997) | 5.85% | 7.62% | |||
| |
|||||
| Service Class (commenced August 15, 1997) | 5.34% | 7.05% | |||
| |
|||||
|
Shares |
Description | Value | |||
|---|---|---|---|---|---|
| Common Stocks – 99.0% | |||||
| Belgium – 0.3% | |||||
| 5,900 | Groupe Bruxelles Lambert SA
(Conglomerates) |
$ 1,532,035 | |||
| Finland – 2.7% | |||||
| 61,050 | Finnair Oyj Series 1 (Airlines) | 233,048 | |||
| 235,900 | Nokia Oyj (Telecommunications) | 10,339,079 | |||
| 30,000 | Pohjola Group Insurance Corp.
Series B (Insurance) |
1,133,213 | |||
| 36,890 | Sonera Oyj (Telecommunications) | 1,231,366 | |||
| 12,936,706 | |||||
| France – 7.8% | |||||
| 39,050 | Alcatel (Telecommunications) | 3,191,065 | |||
| 27,100 | Aventis SA (Chemicals) | 2,032,904 | |||
| 28,750 | Axa (Insurance) | 4,091,308 | |||
| 39,480 | Banque Nationale de Paris (Banks) | 3,627,507 | |||
| 11,000 | Bouygues SA* (Construction) | 690,892 | |||
| 37,600 | Christian Dior SA* (Consumer
Products) |
2,062,847 | |||
| 31,800 | France Telecom SA
(Telecommunications) |
3,627,614 | |||
| 23,500 | L’Oreal SA* (Consumer Products) | 1,698,177 | |||
| 17,000 | LVMH (Louis Vuitton Moet
Hennessy)* (Conglomerates) |
1,319,019 | |||
| 5,400 | Pinault-Printemps-Redoute SA
(Merchandising) |
1,020,611 | |||
| 13,200 | PSA Peugeot Citroen (Auto) | 2,436,235 | |||
| 1,260 | Sagem SA (Electrical Equipment) | 346,867 | |||
| 33,350 | Schneider Electric SA (Electrical
Equipment) |
2,457,337 | |||
| 52,100 | Societe Generale Series A* (Banks) | 3,084,994 | |||
| 29,900 | STMicroelectronics NV
(Semiconductors) |
1,831,517 | |||
| 11,559 | Total Fina SA Class B (Energy
Resources) |
1,714,697 | |||
| 20,950 | Vivendi (Business Services) | 1,711,050 | |||
| 36,944,641 | |||||
| Germany – 11.1% | |||||
| 23,400 | Allianz AG (Insurance) | 7,883,488 | |||
| 69,900 | BASF AG (Chemicals) | 2,591,985 | |||
| 23,450 | Bayer AG (Chemicals) | 988,843 | |||
| 3,250 | Beiersdorf AG (Health) | 291,404 | |||
| 16,550 | Buderus AG (Diversified Industrial
Manufacturing) |
271,072 | |||
| 63,950 | Commerzbank AG (Banks) | 2,064,784 | |||
| 84,500 | Deutsche Bank AG (Banks) | 7,351,459 | |||
| 55,450 | Deutsche Lufthansa AG (Airlines) | 1,226,706 | |||
| 196,700 | Deutsche Telekom AG
(Telecommunications) |
7,552,335 | |||
| 31,350 | E.On AG (Energy Resources) | 1,501,759 | |||
| 20,600 | FAG Kugelfischer Georg Schaefer AG
(Industrial Services) |
138,072 | |||
| 13,950 | IWKA AG (Machinery) | 169,662 | |||
| 5,650 | Kamps AG (Food & Beverage) | 121,934 | |||
| 83,450 | MAN AG (Machinery) | 2,324,717 | |||
|
Shares |
Description | Value | |||
|---|---|---|---|---|---|
| Common Stocks – (continued) | |||||
| Germany – (continued) | |||||
| 53,400 | Merck KGAA (Health) | $ 1,716,566 | |||
| 7,400 | Muenchener Rueckversicherungs-
Gesellschaft AG (Property Insurance) |
2,029,207 | |||
| 7,950 | SAP AG (Computer Software) | 1,552,675 | |||
| 14,000 | Schering AG (Health) | 745,213 | |||
| 71,025 | Siemens AG (Electrical Equipment) | 11,380,969 | |||
| 43,700 | Thyssen AG (Steel) | 663,389 | |||
| 52,566,239 | |||||
| Hong Kong – 1.0% | |||||
| 94,900 | Cathay Pacific Airways (Airlines) | 184,349 | |||
| 56,900 | CLP Holdings Ltd. (Utilities) | 255,353 | |||
| 2,000 | Elec & Eltek International Holdings
Ltd. (Electronic Components) |
277 | |||
| 33,000 | Guoco Group Ltd. (Banks) | 84,626 | |||
| 22,500 | Hang Seng Bank Ltd. (Banks) | 241,617 | |||
| 38,000 | Henderson Land Development Co.
Ltd. (Real Estate) |
210,976 | |||
| 41,500 | Hongkong Electric Holdings Ltd.
(Electrical Utilities) |
131,434 | |||
| 91,080 | Hutchison Whampoa Ltd. (Multi-
Industrial) |
1,284,626 | |||
| 68,000 | Johnson Electric Holdings Ltd.*
(Electrical Equipment) |
141,249 | |||
| 17,000 | Li & Fung Ltd. (Wholesale) | 74,112 | |||
| 156,000 | Oriental Press Group Ltd.
(Publishing) |
21,203 | |||
| 282,203 | Pacific Century CyberWorks Ltd.*
(Computer Software) |
524,676 | |||
| 76,000 | QPL International Holdings Ltd.*
(Electronic Components) |
70,650 | |||
| 124,000 | South China Morning Post Holdings
Ltd. (Publishing) |
93,012 | |||
| 50,200 | Sun Hung Kai Properties Ltd. (Real
Estate) |
473,099 | |||
| 52,600 | Swire Pacific Ltd. (Multi-Industrial) | 360,828 | |||
| 52,000 | Wharf Holdings Co. Ltd. (Real
Estate) |
123,683 | |||
| 47,000 | Wing Lung Bank (Financial Services) | 180,491 | |||
| 53,000 | Yue Yuen Industrial Holdings
(Apparel) |
122,663 | |||
| 4,578,924 | |||||
| Italy – 6.1% | |||||
| 16,500 | Assicurazioni Generali (Insurance) | 507,549 | |||
| 431,600 | Benetton Group SpA (Apparel) | 796,958 | |||
| 457,300 | Enel SpA (Utilities) | 1,818,737 | |||
| 873,400 | ENI SpA (Energy Resources) | 5,094,122 | |||
| 53,800 | Fiat SpA (Auto) | 1,331,576 | |||
| 292,100 | Ifil (Finanziara di Partecipazioni)
SpA (Multi-Industrial) |
2,390,855 | |||
| 74,100 | Mediaset SpA (Broadcasting) | 1,324,855 | |||
| 139,000 | Milano Assicurazioni (Insurance) | 428,189 | |||
| 988,000 | Olivetti SpA (Telecommunications) | 3,096,153 | |||
| 1,391,264 | Parmalat Finanziara SpA (Food &
Beverage) |
1,895,871 | |||
|
Shares |
Description | Value | |||
|---|---|---|---|---|---|
| Common Stocks – (continued) | |||||
| Italy – (continued) | |||||
| 191,980 | Riunione Adriatica di Sicurta SpA
(Insurance) |
$ 2,244,567 | |||
| 98,700 | Telecom Italia Mobile SpA
(Telecommunications) |
490,677 | |||
| 472,300 | Telecom Italia Mobile SpA (T.I.M.)
(Telecommunications) |
4,092,216 | |||
| 287,625 | Telecom Italia SpA
(Telecommunications) |
3,177,804 | |||
| 28,690,129 | |||||
| Japan – 27.9% | |||||
| 41,000 | 77 Bank Ltd. (Banks) | 319,081 | |||
| 17,600 | Acom Co. (Financial Services) | 1,500,084 | |||
| 1,600 | Advantest Corp. (Electronics
Equipment) |
326,301 | |||
| 19,000 | Alps Electric Co. (Electrical Utilities) | 400,844 | |||
| 113,000 | Asahi Glass Co. Ltd. (Home Products) | 1,056,362 | |||
| 22,000 | Canon Sales Co., Inc. (Business
Services) |
374,402 | |||
| 72,000 | Canon, Inc. (Computer Hardware) | 3,220,253 | |||
| 289 | Central Japan Railway Co. (Railroads) | 1,674,656 | |||
| 123,000 | Cosmo Oil Co. Ltd. (Energy
Resources) |
247,961 | |||
| 136,000 | Dai Nippon Printing Co. Ltd.
(Business Services) |
2,141,060 | |||
| 372,000 | Daicel Chemical Industries
(Chemicals) |
1,049,902 | |||
| 83,000 | Daido Steel Co. Ltd. (Steel) | 218,687 | |||
| 80,000 | Daiichi Pharmaceutical Co. (Health) | 1,890,295 | |||
| 39,000 | Dainippon Ink & Chemicals, Inc.
(Chemicals) |
137,131 | |||
| 117,000 | Dainippon Pharmaceutical Co. Ltd.
(Health) |
1,535,865 | |||
| 243,000 | Daiwa Securities Group, Inc.
(Financial Services) |
3,030,380 | |||
| 201,000 | Denki Kagaku Kogyo Kabushiki
Kaisha (Chemicals) |
810,408 | |||
| 12,500 | FANUC Ltd. (Electronics Equipment) | 1,359,588 | |||
| 166,000 | Fuji Heavy Industries Ltd. (Auto) | 1,098,884 | |||
| 51 | Fuji Television Network, Inc.
(Broadcasting) |
712,731 | |||
| 46,000 | Fujitsu Ltd. (Computer Hardware) | 1,332,771 | |||
| 338,000 | Hitachi Ltd. (Electrical Equipment) | 4,002,757 | |||
| 51,000 | Honda Motor Co. Ltd. (Auto) | 1,864,979 | |||
| 157,000 | Izumiya Co. Ltd. (Merchandising) | 1,252,761 | |||
| 22,000 | Japan Radio Co. Ltd. (Electrical
Equipment) |
212,264 | |||
| 140 | Japan Tobacco, Inc. (Tobacco) | 1,073,793 | |||
| 94,000 | Kaken Pharmaceutical Co. Ltd.
(Health) |
594,937 | |||
| 148,000 | Kamigumi Co. Ltd. (Business
Services) |
700,797 | |||
| 91,000 | Kanebo Ltd.* (Consumer Products) | 267,923 | |||
| 2,300 | KDD Corp. (Telecommunications) | 195,818 | |||
| 41,000 | Koito Manufacturing Co. Ltd.
(Automotive Parts) |
199,522 | |||
|
Shares |
Description | Value | |||
|---|---|---|---|---|---|
| Common Stocks – (continued) | |||||
| Japan – (continued) | |||||
| 39,000 | Kokuyo Co. Ltd. (Specialty Retail) | $ 673,221 | |||
| 142,000 | Komatsu Ltd. (Machinery) | 917,375 | |||
| 6,000 | Konami Co. Ltd. (Computer Software) | 496,203 | |||
| 158,000 | Konica Corp. (Multi-Industrial) | 1,259,259 | |||
| 421,000 | KUBOTA Corp. (Machinery) | 1,357,937 | |||
| 21,100 | Kyocera Corp. (Electrical Utilities) | 3,766,939 | |||
| 15,000 | Makita Corp. (Electrical Equipment) | 120,956 | |||
| 17,000 | Maruichi Steel Tube Ltd. (Steel) | 244,201 | |||
| 109,000 | Matsushita Electric Industrial Co. Ltd.
(Appliance) |
2,984,341 | |||
| 212,000 | Mitsubishi Corp. (Wholesale) | 1,550,492 | |||
| 401,000 | Mitsubishi Electric (Electrical
Equipment) |
3,741,163 | |||
| 198,000 | Mitsui Co. (Wholesale) | 1,331,139 | |||
| 20,000 | Mitsumi Electric Co. Ltd.
(Electrical Equipment) |
751,993 | |||
| 16,000 | Murata Manufacturing Co. Ltd.
(Electronics Equipment) |
2,449,883 | |||
| 24,000 | NEC Corp. (Computer Hardware) | 686,357 | |||
| 250,000 | Nichirei Corp. (Food & Beverage) | 937,647 | |||
| 1,500 | Nintendo Co. Ltd. (Entertainment) | 259,353 | |||
| 336,000 | Nippon Express Co. Ltd. (Railroads) | 1,887,145 | |||
| 70,000 | Nippon Sanso Corp. (Chemicals) | 264,510 | |||
| 146,000 | Nippon Steel Corp. (Steel) | 273,793 | |||
| 321,000 | Nippon Suisan Kaisha Ltd.
(Food & Beverage) |
568,861 | |||
| 663 | Nippon Telephone & Telegraph Corp.
(Telecommunications) |
7,895,078 | |||
| 69,000 | Nippon Yusen Kabushiki Kaisha
(Transportation) |
305,373 | |||
| 169,000 | Nisshinbo Industries Inc. (Textiles) | 785,973 | |||
| 242,000 | NOF Corp. (Chemicals) | 535,509 | |||
| 45,000 | NTN Corp. (Machinery) | 189,873 | |||
| 52,000 | Oji Paper Co. Ltd. (Paper) | 345,692 | |||
| 37,000 | Olympus Optical Co. Ltd. (Specialty
Retail) |
648,758 | |||
| 3,000 | Oriental Land Co. Ltd. (Leisure) | 276,231 | |||
| 13,500 | ORIX Corp. (Financial Services) | 1,797,468 | |||
| 17,200 | Promise Co. Ltd. (Financial Services) | 1,198,275 | |||
| 117,000 | Ricoh Co. Ltd. (Computer Hardware) | 2,045,992 | |||
| 6,000 | Rohm Co. (Electronics Equipment) | 1,707,454 | |||
| 35,000 | Sankyo Co. Ltd. (Health) | 810,595 | |||
| 61,000 | Sanyo Electric Co. Ltd.
(Electrical Equipment) |
517,628 | |||
| 142,000 | Sapporo Breweries Ltd. (Food &
Beverage) |
477,993 | |||
| 12,000 | Secom Co. Ltd. (Business Services) | 874,262 | |||
| 24,900 | Shikoku Electric Power Co., Inc.
(Electrical Utilities) |
363,052 | |||
| 3,000 | Shin-Etsu Chemical Co. Ltd.
(Chemicals) |
147,398 | |||
| 9,000 | Shionogi & Co. Ltd. (Health) | 158,650 | |||
| 23,000 | Shiseido Co. Ltd. (Consumer
Products) |
271,730 | |||
| 77,000 | Showa Shell Sekiyu K.K. (Oil and
Gas) |
379,766 | |||
|
Shares |
Description | Value | |||
|---|---|---|---|---|---|
| Common Stocks – (continued) | |||||
| Japan – (continued) | |||||
| 6,000 | Skylark Co. Ltd. (Restaurants) | $ 219,409 | |||
| 234,000 | Snow Brand Milk Products Co. Ltd.
(Food & Beverage) |
886,414 | |||
| 17,300 | Softbank Corp. (Business Services) | 2,285,579 | |||
| 39,000 | Sony Corp. (Electrical Equipment) | 4,351,618 | |||
| 8,000 | Sumitomo Electric Industries Ltd.
(Electrical Equipment) |
147,773 | |||
| 62,000 | Sumitomo Metal Mining Co. Ltd.
(Metals) |
340,084 | |||
| 328,000 | Sumitomo Realty & Development Co.
Ltd. (Real Estate) |
1,423,948 | |||
| 75,000 | Suzuki Motor Corp. (Auto) | 795,359 | |||
| 15,000 | Taiyo Yuden Co. Ltd.
(Electronic Components) |
864,979 | |||
| 47,000 | Takeda Chemical Industries Ltd.
(Drugs) |
2,780,778 | |||
| 15,100 | Takefuji Corp. (Financial Services) | 1,485,223 | |||
| 20,000 | Takuma Co. Ltd. (Multi-Industrial) | 144,773 | |||
| 3,000 | TDK Corp. (Computer Hardware) | 443,319 | |||
| 140,000 | The Asahi Bank Ltd. (Banks) | 551,336 | |||
| 33,000 | The Bank of Fukuoka Ltd. (Banks) | 210,098 | |||
| 160,000 | The Bank of Tokyo-Mitsubishi Ltd.
(Banks) |
1,959,306 | |||
| 60,000 | The Bank of Yokohama Ltd.
(Commercial Banks) |
263,854 | |||
| 380,000 | The Daiwa Bank Ltd. (Banks) | 954,899 | |||
| 180,000 | The Fuji Bank Ltd. (Banks) | 1,368,776 | |||
| 20,000 | The Furukawa Electric Co. Ltd.
(Electrical Equipment) |
643,226 | |||
| 288,000 | The Industrial Bank of Japan Ltd.
(Banks) |
2,184,641 | |||
| 51,300 | The Kansai Electric Power Co., Inc.
(Electrical Utilities) |
841,772 | |||
| 39,000 | The Nomura Securities Co. Ltd.
(Financial Services) |
912,377 | |||
| 216,000 | The Sakura Bank Ltd. (Banks) | 1,608,101 | |||
| 130,000 | The Sumitomo Bank Ltd. (Banks) | 1,609,002 | |||
| 23,000 | The Sumitomo Marine & Fire
Insurance Co. Ltd. (Insurance) |
138,237 | |||
| 21,200 | Tohoku Electric Power Co., Inc.
(Electrical Utilities) |
303,141 | |||
| 86,000 | Tokai Carbon Co. Ltd. (Chemicals) | 224,979 | |||
| 9,000 | Tokyo Broadcasting System, Inc.
(Media) |
322,363 | |||
| 70,800 | Tokyo Electric Power (Electrical
Utilities) |
1,583,291 | |||
| 8,000 | Tokyo Electron Ltd. (Electrical
Equipment) |
1,123,676 | |||
| 166,000 | Toppan Printing Co. Ltd. (Business
Services) |
1,621,866 | |||
| 228,000 | Toshiba Corp. (Electrical Equipment) | 2,242,588 | |||
| 53,000 | Toyo Seikan Kaisha (Multi-Industrial) | 909,423 | |||
| 196,000 | Toyota Motor Corp. (Auto) | 8,527,333 | |||
| 75,000 | Ube Industries Ltd. (Chemicals) | 180,731 | |||
|
Shares |
Description | Value | |||
|---|---|---|---|---|---|
| Common Stocks – (continued) | |||||
| Japan – (continued) | |||||
| 328 | West Japan Railway (Railroads) | $ 1,316,306 | |||
| 149,000 | Yokogawa Electric Corp.
(Electronics Equipment) |
1,538,200 | |||
| 132,367,493 | |||||
| Netherlands – 9.1% | |||||
| 236,917 | ABN AMRO Holding NV (Banks) | 5,889,047 | |||
| 18,600 | ASM Lithography Holding NV
(Semiconductors) |
702,262 | |||
| 20,158 | Buhrmann NV (Business Services) | 571,754 | |||
| 19,771 | DSM NV (Chemicals) | 603,779 | |||
| 20,700 | Heineken NV (Food & Beverage) | 1,051,132 | |||
| 150,635 | ING Groep NV (Financial Services) | 10,082,959 | |||
| 182,260 | Koninklijke Royal Philips
Electronics NV (Appliance) |
8,866,714 | |||
| 17,726 | KPN NV (Telecommunications) | 472,245 | |||
| 248,900 | Royal Dutch Petroleum Co. (Energy
Resources) |
15,135,830 | |||
| 43,375,722 | |||||
| Norway – 0.2% | |||||
| 19,100 | Norsk Hydro ASA (Diversified
Industrial Manufacturing) |
819,959 | |||
| 6,200 | Orkla ASA (Consumer Products) | 110,219 | |||
| 7,800 | Smedvig ASA Series A (Oil and Gas) | 157,123 | |||
| 1,087,301 | |||||
| Portugal – 0.2% | |||||
| 53,790 | Banco Espirito Santo SA (Banks) | 873,386 | |||
| 23,600 | Portugal Telecom SA
(Telecommunications) |
245,544 | |||
| 1,118,930 | |||||
| Singapore – 6.7% | |||||
| 526,000 | ACMA Ltd. (Telecommunications) | 339,237 | |||
| 353,000 | Chartered Semiconductor
Manufacturing Ltd.* (Semiconductors) |
2,953,460 | |||
| 79,000 | City Developments (Real Estate) | 392,452 | |||
| 1,099,000 | Comfort Group Ltd. (Railroads) | 584,269 | |||
| 43,000 | Creative Technology Ltd. (Electrical
Equipment) |
934,402 | |||
| 91,000 | Cycle & Carriage Ltd. (Auto) | 200,918 | |||
| 391,970 | DBS Group Holdings Ltd. (Banks) | 4,737,073 | |||
| 423,000 | DBS Land Ltd. (Real Estate) | 683,249 | |||
| 275,000 | Fraser & Neave Ltd. (Tobacco) | 1,022,602 | |||
| 457,000 | Keppel Corp. Ltd. (Multi-Industrial) | 1,035,559 | |||
| 160,000 | Keppel TatLee Bank Ltd. (Financial
Services) |
293,766 | |||
| 477,000 | Marco Polo Development Ltd. (Real
Estate) |
507,181 | |||
| 51,000 | NatSteel Electronics Ltd. (Electronic
Components) |
170,385 | |||
| 45,000 | NatSteel Ltd. (Steel) | 61,705 | |||
|
Shares |
Description | Value | |||
|---|---|---|---|---|---|
| Common Stocks – (continued) | |||||
| Singapore – (continued) | |||||
| 253,250 | Oversea-Chinese Banking Corp. Ltd.
(Banks) |
$ 1,751,017 | |||
| 200,000 | Sembcorp Marine Ltd.
(Manufacturing) |
78,438 | |||
| 433,400 | Singapore Airlines Ltd. (Airlines) | 4,180,141 | |||
| 118,000 | Singapore Press Holdings Ltd.
(Publishing) |
1,899,134 | |||
| 875,000 | Singapore Technologies Engineering
Ltd. (Machinery) |
1,179,478 | |||
| 1,648,700 | Singapore Telecommunications Ltd.
(Telecommunications) |
2,720,532 | |||
| 372,400 | United Engineers (Construction) | 270,467 | |||
| 293,000 | United Industrial Corp. Ltd. (Real
Estate) |
139,597 | |||
| 588,115 | United Overseas Bank Ltd. (Banks) | 4,613,069 | |||
| 60,000 | Venture Manufacturing Ltd.
(Electrical Equipment) |
766,951 | |||
| 94,000 | WBL Corp. Ltd. (Electronics
Equipment) |
125,617 | |||
| 31,640,699 | |||||
| Spain – 7.1% | |||||
| 83,100 | Banco Bilbao Vizcaya SA (Banks) | 1,232,731 | |||
| 410,800 | Banco Santander Central Hispano
SA (Banks) |
4,412,722 | |||
| 261,600 | Endesa SA (Electrical Utilities) | 5,097,568 | |||
| 293,650 | Repsol SA (Energy Resources) | 5,813,339 | |||
| 720,513 | Telefonica de Espana SA*
(Telecommunications) |
13,816,128 | |||
| 168,600 | Union Electric Fenosa (Utilities) | 3,129,698 | |||
| 33,502,186 | |||||
| Sweden – 3.8% | |||||
| 61,000 | AstraZeneca Group PLC (Health) | 2,779,438 | |||
| 14,000 | AstraZeneca Group PLC (Health) | 628,827 | |||
| 20,000 | Granges AB (Metals) | 291,320 | |||
| 21,600 | Mo och Domsjoe AB Series B
(Paper) |
497,680 | |||
| 4,100 | OM Gruppen AB (Financial
Services) |
205,438 | |||
| 21,600 | Skandia Forsakring (Insurance) | 437,043 | |||
| 53,600 | Skanska AB Series B (Construction) | 1,834,022 | |||
| 45,800 | SKF AB Series B (Metals) | 664,696 | |||
| 187,000 | Svenska Handelsbanken AB
Series A (Banks) |
3,090,320 | |||
| 366,129 | Telefonaktiebolaget LM Ericsson
AB Series B (Telecommunications) |
7,388,671 | |||
| 17,817,455 | |||||
| Switzerland – 4.8% | |||||
| 735 | Adecco SA (Business Services) | 563,275 | |||
| 559 | Baloise Holdings Ltd. (Insurance) | 567,343 | |||
| 22,923 | Credit Suisse Group (Banks) | 4,789,881 | |||
| 2,929 | Forbo Holding AG (Building
Materials) |
1,281,227 | |||
|
Shares |
Description | Value | |||
|---|---|---|---|---|---|
| Common Stocks – (continued) | |||||
| Switzerland – (continued) | |||||
| 727 | Jelmoli Holding AG (Merchandising) | $ 917,305 | |||
| 1,637 | Nestle SA (Food & Beverage) | 3,527,726 | |||
| 2,995 | Novartis AG (Health) | 4,528,605 | |||
| 420 | Pargesa Holding AG (Financial
Services) |
1,007,807 | |||
| 129 | Roche Holding AG (Health) | 1,155,224 | |||
| 112 | Schindler Holding AG-PTG
Certificates (Machinery) |
192,110 | |||
| 2,387 | Sika Finanz AG (Chemicals) | 707,056 | |||
| 5,504 | Swisscom AG (Telecommunications) | 1,560,836 | |||
| 152 | The Swatch Group AG Series B
(Specialty Retail) |
215,959 | |||
| 7,587 | Valora Holding AG (Merchandising) | 1,885,862 | |||
| 22,900,216 | |||||
| United Kingdom – 10.2% | |||||
| 9,300 | Abbey National PLC (Financial
Services) |
112,550 | |||
| 84,200 | Allied Zurich PLC (Insurance) | 1,030,611 | |||
| 85,400 | Amvescap PLC (Financial Services) | 1,821,683 | |||
| 23,000 | ARM Holdings PLC* (Electronic
Components) |
307,053 | |||
| 22,300 | BAA PLC (Airlines) | 177,978 | |||
| 37,800 | Barclays PLC (Banks) | 943,448 | |||
| 21,700 | Bass PLC (Food & Beverage) | 211,605 | |||
| 91,600 | BG Group PLC (Utilities) | 570,230 | |||
| 568,200 | BP Amoco PLC (Energy Resources) | 5,198,570 | |||
| 64,800 | British Aerospace PLC
(Defense/Aerospace) |
403,394 | |||
| 57,800 | British Airways PLC (Airlines) | 272,799 | |||
| 56,500 | British American Tobacco PLC
(Tobacco) |
363,203 | |||
| 38,600 | British Sky Broadcasting Group PLC*
(Broadcasting) |
627,900 | |||
| 168,800 | British Telecom PLC
(Telecommunications) |
2,143,276 | |||
| 50,500 | Brixton Estate PLC (Real Estate) | 193,461 | |||
| 212,300 | Centrica PLC (Utilities) | 693,155 | |||
| 58,028 | CGNU PLC (Insurance) | 892,567 | |||
| 199,700 | Coats Viyella PLC (Textiles) | 145,530 | |||
| 31,800 | Diageo PLC (Tobacco) | 271,333 | |||
| 279,885 | FKI PLC (Electrical Equipment) | 934,125 | |||
| 96,180 | Glaxo Wellcome PLC (Health) | 2,764,820 | |||
| 54,912 | Granada Compass PLC* (Business
Services) |
676,109 | |||
| 35,300 | Great Portland Estates PLC (Real
Estate) |
115,059 | |||
| 56,800 | Halifax Group PLC (Financial
Services) |
443,433 | |||
| 43,600 | Hays PLC (Business Services) | 254,970 | |||
| 237,577 | HSBC Holdings PLC (Banks) | 3,416,454 | |||
| 128,000 | IMI PLC (Diversified Industrial
Manufacturing) |
427,204 | |||
| 211,100 | Invensys PLC (Electrical Utilities) | 824,021 | |||
|
Shares |
Description | Value | |||
|---|---|---|---|---|---|
| Common Stocks – (continued) | |||||
| United Kingdom – (continued) | |||||
| 25,200 | Johnson Matthey PLC (Diversified
Industrial Manufacturing) |
$ 376,648 | |||
| 8,600 | Land Securities PLC (Real Estate) | 102,768 | |||
| 127,300 | Lloyds TSB Group PLC (Banks) | 1,197,019 | |||
| 10,300 | Logica PLC (Business Services) | 322,094 | |||
| 16,500 | National Grid Group PLC (Utilities) | 135,039 | |||
| 31,100 | Nycomed Amersham PLC (Medical
Products) |
278,222 | |||
| 28,900 | Pearson PLC (Broadcasting) | 834,543 | |||
| 413,600 | Pilkington PLC (Multi-Industrial) | 549,160 | |||
| 116,182 | Premier Farnell PLC (Electrical
Utilities) |
893,537 | |||
| 49,300 | Prudential PLC (Financial Services) | 645,284 | |||
| 45,600 | Reed International PLC (Publishing) | 390,404 | |||
| 25,500 | Reuters Group PLC (Business
Services) |
510,642 | |||
| 39,600 | Rexam PLC (Manufacturing) | 160,898 | |||
| 54,400 | Rio Tinto PLC (Mining) | 867,549 | |||
| 88,225 | Royal Bank of Scotland Group PLC
(Banks) |
1,287,150 | |||
| 17,400 | ScottishPower PLC (Energy
Resources) |
132,558 | |||
| 42,900 | Shell Transport & Trading Co. (Oil
and Gas) |
366,043 | |||
| 199,755 | Smith & Nephew PLC (Health) | 818,868 | |||
| 141,500 | SmithKline Beecham PLC (Health) | 1,842,844 | |||
| 415,700 | Tesco PLC (Specialty Retail) | 1,307,485 | |||
| 10,308 | Thames Water (Business Services) | 124,899 | |||
| 28,458 | The Peninsular & Oriental Steam
Navigation Co. (Ship Transportation) |
254,793 | |||
| 32,600 | The Sage Group PLC (Business
Services) |
300,629 | |||
| 67,800 | United News & Media PLC
(Publishing) |
855,946 | |||
| 73,100 | United Utilities PLC (Business
Services) |
678,883 | |||
| 1,617,892 | Vodafone AirTouch PLC
(Telecommunications) |
6,532,543 | |||
| 22,700 | Williams PLC (Electrical Utilities) | 126,819 | |||
| 24,900 | WPP Group PLC (Business
Services) |
353,375 | |||
| 48,483,183 | |||||
| TOTAL COMMON STOCKS | |||||
| (Cost $431,148,325) | $469,541,859 | ||||
|
Shares |
Description | Value | |||
|---|---|---|---|---|---|
| Preferred Stocks – 0.4% | |||||
| Germany – 0.4% | |||||
| 8,250 | Dyckerhoff AG (Construction) | $ 163,324 | |||
| 23,000 | MAN AG (Machinery) | 461,453 | |||
| 5,100 | SAP AG (Computer Software) | 1,285,817 | |||
| 1,910,594 | |||||
| TOTAL PREFERRED STOCKS | |||||
| (Cost $2,024,549) | $ 1,910,594 | ||||
|
Rights |
Description | Value | |||
| Rights – 0.0% | |||||
| Singapore – 0.0% | |||||
| 18,800 | WBL Corp. Ltd. Rights exp.
09/14/2000* (Electronics Equipment) |
$ 20,536 | |||
| TOTAL RIGHTS | |||||
| (Cost $0) | $ 20,536 | ||||
| Principal
Amount |
Interest
Rate |
Maturity
Date |
Value | ||||
|---|---|---|---|---|---|---|---|
| Short-Term Obligation – 0.8% | |||||||
| State Street Bank & Trust Euro—Time Deposit | |||||||
| $3,929,000 | 6.56% | 09/01/2000 | $ 3,929,000 | ||||
| TOTAL SHORT-TERM OBLIGATION | |||||||
| (Cost $3,929,000) | $ 3,929,000 | ||||||
| U.S. Government Agency Obligation – 0.2% | ||||||
| Federal Home Loan Mortgage Corp.# | ||||||
| $1,000,000 | 6.56% | 09/14/2000 | $ 997,667 | |||
| TOTAL U.S. GOVERNMENT AGENCY OBLIGATION | ||||||
| (Cost $997,667) | $ 997,667 | |||||
| TOTAL INVESTMENTS | ||||||
| (Cost $438,099,541) | $476,399,656 | |||||
*
|
Non-income producing security.
|
#
|
A portion of this security is segregated as collateral for initial margin requirement on Futures transactions.
|
| The percentage shown for each investment category reflects the value of investments in that category as a percentage of total net
assets.
|
| As a %
of Total Net Assets |
|||||
|---|---|---|---|---|---|
| Common and Preferred Stock Industry Classifications† | |||||
| Airlines | 1.3 | % | |||
| Apparel | 0.2 | ||||
| Appliance | 2.5 | ||||
| Auto | 3.4 | ||||
| Automotive Parts | 0.0 | ||||
| Banks | 13.8 | ||||
| Broadcasting | 0.7 | ||||
| Building Materials | 0.3 | ||||
| Business Services | 3.0 | ||||
| Chemicals | 2.2 | ||||
| Commercial Banks | 0.1 | ||||
| Computer Hardware | 1.6 | ||||
| Computer Software | 0.8 | ||||
| Conglomerates | 0.6 | ||||
| Construction | 0.6 | ||||
| Consumer Products | 0.9 | ||||
| Defense/Aerospace | 0.1 | ||||
| Diversified Industrial Manufacturing | 0.4 | ||||
| Drugs | 0.6 | ||||
| Electrical Equipment | 7.3 | ||||
| Electrical Utilities | 3.0 | ||||
| Electronic Components | 0.3 | ||||
| Electronics Equipment | 1.6 | ||||
| Energy Resources | 7.3 | ||||
| Entertainment | 0.1 | ||||
| Financial Services | 5.2 | ||||
| Food & Beverage | 2.0 | ||||
| Health | 4.7 | ||||
| Home Products | 0.2 | ||||
| Industrial Services | 0.0 | ||||
| Insurance | 4.1 | ||||
| Leisure | 0.1 | ||||
| Machinery | 1.4 | ||||
| Manufacturing | 0.0 | ||||
| Media | 0.1 | ||||
| Medical Products | 0.1 | ||||
| Merchandising | 1.1 | ||||
| Metals | 0.3 | ||||
| Mining | 0.2 | ||||
| Multi-Industrial | 1.7 | ||||
| Oil and Gas | 0.2 | ||||
| Paper | 0.2 | ||||
| Property Insurance | 0.4 | ||||
| Publishing | 0.7 | ||||
| Railroads | 1.1 | ||||
| Real Estate | 0.9 | ||||
| Restaurants | 0.0 | ||||
| Semiconductors | 1.2 | ||||
| Ship Transportation | 0.1 | ||||
| Specialty Retail | 0.6 | ||||
| Steel | 0.3 | ||||
| Telecommunications | 16.9 | ||||
| Textiles | 0.2 | ||||
| Tobacco | 0.6 | ||||
| Transportation | 0.1 | ||||
| Utilities | 1.4 | ||||
| Wholesale | 0.6 | ||||
| TOTAL COMMON AND PREFERRED STOCK | 99.4 | % | |||
†
|
Industry concentrations greater than one tenth of one percent are disclosed.
|
| CORE U.S.
Equity Fund |
||
|---|---|---|
| Assets: | ||
| Investment in securities, at value (identified cost $1,100,758,504, $971,879,423, $148,167,007, $296,323,304, and
$438,099,541, respectively) |
$1,443,100,967 | |
| Cash, at value (a) | 1,762,656 | |
| Receivables: | ||
| Investment securities sold | — | |
| Dividends and interest, at value | 1,900,278 | |
| Fund shares sold | 1,611,314 | |
| Variation margin | 89,090 | |
| Reimbursement from adviser | 53,092 | |
| Other assets | 24,876 | |
| |
||
| Total assets | 1,448,542,273 | |
| |
||
| Liabilities: | ||
| Due to Bank | — | |
| Payables: | ||
| Investment securities purchased | — | |
| Fund shares repurchased | 1,672,063 | |
| Amounts owed to affiliates | 1,431,089 | |
| Accrued expenses and other liabilities, at value | 120,544 | |
| |
||
| Total liabilities | 3,223,696 | |
| |
||
| Net Assets: | ||
| Paid-in capital | 964,623,070 | |
| Accumulated undistributed net investment income (loss) | 3,253,727 | |
| Accumulated net realized gain from investment, futures and foreign currency related transactions | 135,024,537 | |
| Net unrealized gain on investments, futures and translation of assets and liabilities denominated in foreign currencies | 342,417,243 | |
| |
||
| NET ASSETS | $1,445,318,577 | |
| |
||
| Net asset value, offering and redemption price per share: (b) | ||
| Class A | $36.77 | |
| Class B | $35.71 | |
| Class C | $35.59 | |
| Institutional | $37.30 | |
| Service | $36.54 | |
| |
||
| Shares outstanding: | ||
| Class A | 19,467,362 | |
| Class B | 7,718,709 | |
| Class C | 1,765,062 | |
| Institutional | 10,166,280 | |
| Service | 325,049 | |
| |
||
| Total shares outstanding, $.001 par value (unlimited number of shares authorized) | 39,442,462 | |
| |
||
(a)
|
Includes restricted cash of $675,000, $890,000, $250,000 and $550,000, respectively for CORE U. S. Equity, CORE Large Cap Growth,
CORE Small Cap Equity and CORE Large Cap Value relating to initial margin requirements on futures transaction.
|
(b)
|
Maximum public offering price per share (NAV per share multiplied by 1.0582) for Class A shares CORE U. S. Equity, CORE Large Cap
Growth, CORE Small Cap Equity, CORE Large Cap Value and CORE International Equity Fund is $38.91, $23.98, $13.65, $11.44 and $11.98, respectively. At redemption, Class B and Class C shares may be subject to a contingent deferred sales charge, assessed on
the amount equal to the lesser of the current net asset value or the original purchase price of the shares.
|
| CORE Large Cap
Growth Fund |
CORE Small Cap
Equity Fund |
CORE Large Cap
Value Fund |
CORE International
Equity Fund |
|||||
|---|---|---|---|---|---|---|---|---|
| $1,361,835,581 | $169,020,431 | $305,944,385 | $476,399,656 | |||||
| 970,820 | 266,692 | 601,254 | — | |||||
| — | 14,666,524 | — | — | |||||
| 621,576 | 124,617 | 624,335 | 1,159,484 | |||||
| 5,236,396 | 278,804 | 373,031 | 514,030 | |||||
| 198,000 | 1,170 | 22,000 | 4,701 | |||||
| 25,199 | 106,171 | 31,272 | 200,267 | |||||
| 2,671 | 412 | 835 | 1,151 | |||||
| |
||||||||
| 1,368,890,243 | 184,464,821 | 307,597,112 | 478,279,289 | |||||
| |
||||||||
| — | — | — | 2,173,090 | |||||
| — | 16,291,082 | — | 712,731 | |||||
| 1,739,258 | 538,830 | 605,148 | 296,152 | |||||
| 1,424,163 | 162,287 | 225,535 | 458,008 | |||||
| 90,588 | 47,705 | 42,650 | 210,211 | |||||
| |
||||||||
| 3,254,009 | 17,039,904 | 873,333 | 3,850,192 | |||||
| |
||||||||
| 917,658,528 | 132,546,531 | 294,474,508 | 412,265,491 | |||||
| 1,843,333 | — | 994,281 | 1,860,540 | |||||
| 55,954,231 | 14,015,352 | 1,615,759 | 22,044,710 | |||||
| 390,180,142 | 20,863,034 | 9,639,231 | 38,258,356 | |||||
| |
||||||||
| $1,365,636,234 | $167,424,917 | $306,723,779 | $474,429,097 | |||||
| |
||||||||
| $22.66 | $12.90 | $10.81 | $11.32 | |||||
| $22.14 | $12.63 | $10.75 | $11.22 | |||||
| $22.15 | $12.66 | $10.76 | $11.23 | |||||
| $22.87 | $13.03 | $10.82 | $11.48 | |||||
| $22.55 | $12.87 | $10.81 | $11.36 | |||||
| |
||||||||
| 24,082,166 | 4,258,568 | 9,337,825 | 13,021,877 | |||||
| 15,271,402 | 1,419,190 | 1,773,980 | 1,072,221 | |||||
| 6,995,769 | 654,995 | 1,038,478 | 613,417 | |||||
| 14,117,308 | 6,612,704 | 16,225,610 | 26,839,987 | |||||
| 172,000 | 4,882 | 1,116 | 2,348 | |||||
| |
||||||||
| 60,638,645 | 12,950,339 | 28,377,009 | 41,549,850 | |||||
| |
||||||||
| CORE U.S.
Equity Fund |
|||
|---|---|---|---|
| Investment income: | |||
| Dividends (a) | $ 18,998,231 | ||
| Interest | 257,074 | ||
| |
|||
| Total income | 19,255,305 | ||
| |
|||
| Expenses: | |||
| Management fees | 9,921,575 | ||
| Distribution and service fees (b) | 4,658,239 | ||
| Transfer agent fees (b) | 1,968,001 | ||
| Custodian fees | 223,705 | ||
| Registration fees | 172,738 | ||
| Professional fees | 61,744 | ||
| Trustee fees | 8,729 | ||
| Service share fees | 60,276 | ||
| Other | 96,528 | ||
| |
|||
| Total expenses | 17,171,535 | ||
| |
|||
| Less-expense reductions | (1,171,966 | ) | |
| |
|||
| Net Expenses | 15,999,569 | ||
| |
|||
| NET INVESTMENT INCOME (LOSS) | 3,255,736 | ||
| |
|||
| Realized and unrealized gain (loss) on investment, futures and foreign currency related transactions: | |||
| Net realized gain (loss) from: | |||
| Investment transactions | 143,703,343 | ||
| Futures transactions | (1,555,326 | ) | |
| Foreign currency related transactions | — | ||
| Net change in unrealized gain (loss) on: | |||
| Investments | 83,150,865 | ||
| Futures | 101,113 | ||
| Translation of assets and liabilities denominated in foreign currencies | — | ||
| |
|||
| Net realized and unrealized gain on investment, futures and foreign currency transactions: | 225,399,995 | ||
| |
|||
| NET INCREASE IN NET ASSETS RESULTING FROM OPERATIONS | $228,655,731 | ||
| |
|||
(a)
|
For the CORE U.S. Equity, CORE Large Cap Growth, CORE Large Cap Value and CORE International Equity Funds, foreign taxes withheld
on dividends were $126,815, $40,528, $11,794 and $1,350,779, respectively.
|
(b)
|
Class specific Distribution, Service and Transfer Agent fees were as follows:
|
| Distribution and Service Fees |
Transfer Agent Fees |
|||||||||||||||
|---|---|---|---|---|---|---|---|---|---|---|---|---|---|---|---|---|
| Class A |
Class B |
Class C |
Class A |
Class B |
Class C |
Institutional |
Service |
|||||||||
| CORE U.S. Equity Fund | 1,644,698 | 2,484,645 | 528,896 | 1,249,971 | 472,083 | 100,490 | 140,635 | 4,822 | ||||||||
| CORE Large Cap Growth Fund | 1,073,849 | 2,642,305 | 1,154,416 | 816,125 | 502,038 | 219,339 | 131,854 | 1,224 | ||||||||
| CORE Small Cap Equity Fund | 134,001 | 158,867 | 69,635 | 101,837 | 30,185 | 13,231 | 31,648 | 28 | ||||||||
| CORE Large Cap Value Fund | 222,782 | 177,310 | 90,527 | 169,314 | 33,689 | 17,200 | 69,901 | 5 | ||||||||
| CORE International Equity Fund | 687,424 | 113,403 | 62,639 | 261,221 | 21,547 | 11,902 | 123,484 | 9 | ||||||||
| CORE Large Cap
Growth Fund |
CORE Small Cap
Equity Fund |
CORE Large Cap
Value Fund |
CORE International
Equity Fund |
|||||||
|---|---|---|---|---|---|---|---|---|---|---|
| $ 14,788,642 | $ 1,601,157 | $ 6,301,317 | $ 7,984,396 | |||||||
| 1,019,670 | 149,670 | 120,367 | 337,415 | |||||||
| 15,808,312 | 1,750,827 | 6,421,684 | 8,321,811 | |||||||
| 8,564,308 | 1,322,879 | 1,743,960 | 3,942,495 | |||||||
| 4,870,570 | 362,503 | 490,619 | 863,466 | |||||||
| 1,670,580 | 176,929 | 290,109 | 418,163 | |||||||
| 209,008 | 159,571 | 95,520 | 702,008 | |||||||
| 169,870 | 89,759 | 64,476 | 85,402 | |||||||
| 58,632 | 59,880 | 80,825 | 46,247 | |||||||
| 8,729 | 8,729 | 8,309 | 8,990 | |||||||
| 15,306 | — | — | — | |||||||
| 119,374 | 92,817 | 134,436 | 163,971 | |||||||
| 15,686,377 | 2,273,067 | 2,908,254 | 6,230,742 | |||||||
| (1,721,672) | (341,963 | ) | (313,827 | ) | (431,358 | ) | ||||
| 13,964,705 | 1,931,104 | 2,594,427 | 5,799,384 | |||||||
| 1,843,607 | (180,277 | ) | 3,827,257 | 2,522,427 | ||||||
| 56,604,844 | 24,138,466 | 2,034,292 | 27,776,854 | |||||||
| (772,351) | (2,740,853 | ) | (316,083 | ) | 841,952 | |||||
| 126 | — | — | (296,713 | ) | ||||||
| 261,199,851 | 13,444,703 | 8,208,812 | (3,178,332 | ) | ||||||
| 392,404 | 4,266 | 36,688 | (23,759 | ) | ||||||
| — | — | — | (53,728 | ) | ||||||
| 317,424,874 | 34,846,582 | 9,963,709 | 25,066,274 | |||||||
| $319,268,481 | $34,666,305 | $13,790,966 | $27,588,701 | |||||||
| CORE U.S.
Equity Fund |
|||
|---|---|---|---|
| From operations: | |||
| Net investment income (loss) | $ 3,255,736 | ||
| Net realized gain on investment, futures and foreign currency related transactions | 142,148,017 | ||
| Net change in unrealized gain (loss) on investments, futures and translation of assets and liabilities
denominated in foreign currencies |
83,251,978 | ||
| |
|||
| Net increase in net assets resulting from operations | 228,655,731 | ||
| |
|||
| Distributions to shareholders: | |||
| From net investment income | |||
| Class A shares | (25,013 | ) | |
| Class B shares | (1,197 | ) | |
| Class C shares | — | ||
| Institutional shares | (780,127 | ) | |
| Service shares | — | ||
| From net realized gain | |||
| Class A shares | (62,600,563 | ) | |
| Class B shares | (24,209,721 | ) | |
| Class C shares | (4,880,735 | ) | |
| Institutional shares | (33,286,059 | ) | |
| Service shares | (1,192,519 | ) | |
| |
|||
| Total distributions to shareholders | (126,975,934 | ) | |
| |
|||
| From share transactions: | |||
| Proceeds from sales of shares | 316,072,192 | ||
| Reinvestment of dividends and distributions | 119,188,185 | ||
| Cost of shares repurchased | (310,048,888 | ) | |
| |
|||
| Net increase (decrease) in net assets resulting from share transactions | 125,211,489 | ||
| |
|||
| TOTAL INCREASE | 226,891,286 | ||
| |
|||
| Net assets: | |||
| Beginning of year | 1,218,427,291 | ||
| |
|||
| End of year | $1,445,318,577 | ||
| |
|||
| Accumulated undistributed net investment income (loss) | $ 3,253,727 | ||
| |
|||
| CORE Large Cap
Growth Fund |
CORE Small Cap
Equity Fund |
CORE Large Cap
Value Fund |
CORE International
Equity Fund |
|||||||
|---|---|---|---|---|---|---|---|---|---|---|
| $ 1,843,607 | $ (180,277 | ) | $ 3,827,257 | $ 2,522,427 | ||||||
| 55,832,619 | 21,397,613 | 1,718,209 | 28,322,093 | |||||||
| 261,592,255 | 13,448,969 | 8,245,500 | (3,255,819 | ) | ||||||
| |
||||||||||
| 319,268,481 | 34,666,305 | 13,790,966 | 27,588,701 | |||||||
| |
||||||||||
| — | — | (846,877 | ) | (486,145 | ) | |||||
| — | — | (66,845 | ) | (20,223 | ) | |||||
| — | — | (37,149 | ) | (9,872 | ) | |||||
| — | — | (2,359,400 | ) | (2,508,945 | ) | |||||
| — | — | (103 | ) | (182 | ) | |||||
| (1,696,633) | — | (1,086,282 | ) | (2,715,591 | ) | |||||
| (1,073,168) | — | (203,809 | ) | (240,852 | ) | |||||
| (451,184) | — | (103,226 | ) | (124,888 | ) | |||||
| (1,514,956) | — | (2,175,304 | ) | (6,459,250 | ) | |||||
| (13,169) | — | (136 | ) | (559 | ) | |||||
| |
||||||||||
| (4,749,110) | — | (6,879,131 | ) | (12,566,507 | ) | |||||
| |
||||||||||
| 498,678,850 | 66,906,806 | 106,881,945 | 215,168,577 | |||||||
| 3,616,384 | — | 2,716,441 | 4,464,163 | |||||||
| (322,204,172) | (69,490,670 | ) | (112,907,365 | ) | (160,031,898 | ) | ||||
| |
||||||||||
| 180,091,062 | (2,583,864 | ) | (3,308,979 | ) | 59,600,842 | |||||
| |
||||||||||
| 494,610,433 | 32,082,441 | 3,602,856 | 74,623,036 | |||||||
| |
||||||||||
| 871,025,801 | 135,342,476 | 303,120,923 | 399,806,061 | |||||||
| |
||||||||||
| $1,365,636,234 | $167,424,917 | $306,723,779 | $474,429,097 | |||||||
| |
||||||||||
| $ 1,843,333 | $ — | $ 994,281 | $ 1,860,540 | |||||||
| |
||||||||||
| CORE U.S.
Equity Fund |
|||
|---|---|---|---|
| From operations: | |||
| Net investment income (loss) | $ 804,328 | ||
| Net realized gain from investment, futures and foreign currency related transactions | 107,937,721 | ||
| Net change in unrealized gain (loss) on investments, futures and translation of assets and liabilities denominated in foreign
currencies |
(67,177,513 | ) | |
| |
|||
| Net increase in net assets resulting from operations | 41,564,536 | ||
| |
|||
| Distributions to shareholders: | |||
| From net investment income | |||
| Class A shares | — | ||
| Class B shares | — | ||
| Class C shares | — | ||
| Institutional shares | — | ||
| Service shares | — | ||
| |
|||
| Total distributions to shareholders | — | ||
| |
|||
| From share transactions: | |||
| Proceeds from sales of shares | 319,448,902 | ||
| Reinvestment of dividends and distributions | — | ||
| Cost of shares repurchased | (246,210,936 | ) | |
| |
|||
| Net increase (decrease) in net assets resulting from share transactions | 73,237,966 | ||
| |
|||
| TOTAL INCREASE (DECREASE) | 114,802,502 | ||
| |
|||
| Net assets: | |||
| Beginning of period | 1,103,624,789 | ||
| |
|||
| End of period | $1,218,427,291 | ||
| |
|||
| Accumulated undistributed net investment income | $ 804,328 | ||
| |
|||
| CORE Large Cap
Growth Fund |
CORE Small Cap
Equity Fund |
CORE Large Cap
Value Fund |
CORE International
Equity Fund |
|||||||
|---|---|---|---|---|---|---|---|---|---|---|
| $ (680,556) | $ (36,586 | ) | $ 1,640,665 | $ 2,765,109 | ||||||
| 22,317,402 | 12,113,209 | 3,498,419 | 11,791,065 | |||||||
| 20,792,182 | (11,401,516 | ) | 1,503,309 | 19,565,769 | ||||||
| |
||||||||||
| 42,429,028 | 675,107 | 6,642,393 | 34,121,943 | |||||||
| |
||||||||||
| — | — | (229,621 | ) | (2,101 | ) | |||||
| — | — | (19,258 | ) | — | ||||||
| — | — | (7,228 | ) | — | ||||||
| — | — | (950,208 | ) | — | ||||||
| — | — | (5 | ) | — | ||||||
| |
||||||||||
| — | — | (1,206,320 | ) | (2,101 | ) | |||||
| |
||||||||||
| 351,963,413 | 32,163,634 | 299,579,334 | 76,300,041 | |||||||
| — | — | 301,711 | 2,066 | |||||||
| (127,065,442) | (46,364,918 | ) | (62,866,712 | ) | (112,849,452 | ) | ||||
| |
||||||||||
| 224,897,971 | (14,201,284 | ) | 237,014,333 | (36,547,345 | ) | |||||
| |
||||||||||
| 267,326,999 | (13,526,177 | ) | 242,450,406 | (2,427,503 | ) | |||||
| |
||||||||||
| 603,698,802 | 148,868,653 | 60,670,517 | 402,233,564 | |||||||
| |
||||||||||
| $871,025,801 | $135,342,476 | $303,120,923 | $399,806,061 | |||||||
| |
||||||||||
| $ — | $ — | $ 478,248 | $ 2,637,600 | |||||||
| |
||||||||||
| CORE U.S.
Equity Fund |
|||
|---|---|---|---|
| From operations: | |||
| Net investment income (loss) | $ 2,036,756 | ||
| Net realized gain (loss) from investment, futures and foreign currency related transactions | 27,478,562 | ||
| Net change in unrealized gain (loss) on investments, futures and foreign currency related transactions | 176,422,425 | ||
| |
|||
| Net increase (decrease) in net assets resulting from operations | 205,937,743 | ||
| |
|||
| Distributions to shareholders: | |||
| From net investment income | |||
| Class A shares | (627,909 | ) | |
| Institutional shares | (1,448,951 | ) | |
| Service shares | (34,929 | ) | |
| In excess of net investment income | |||
| Class A shares | (111,425 | ) | |
| Institutional shares | (257,121 | ) | |
| Service shares | (6,198 | ) | |
| From net realized gain | |||
| Class A shares | (10,973,418 | ) | |
| Class B shares | (2,631,225 | ) | |
| Class C shares | (453,366 | ) | |
| Institutional shares | (6,196,732 | ) | |
| Service shares | (222,218 | ) | |
| |
|||
| Total distributions to shareholders | (22,963,492 | ) | |
| |
|||
| From share transactions: | |||
| Proceeds from sales of shares | 472,932,540 | ||
| Reinvestment of dividends and distributions | 21,759,127 | ||
| Cost of shares repurchased | (248,643,259 | ) | |
| |
|||
| Net increase in net assets resulting from share transactions | 246,048,408 | ||
| |
|||
| TOTAL INCREASE | 429,022,659 | ||
| |
|||
| Net assets: | |||
| Beginning of year | 674,602,130 | ||
| |
|||
| End of year | $1,103,624,789 | ||
| |
|||
| Accumulated undistributed (distributions in excess of) net investment income | $ — | ||
| |
|||
(a)
|
Commencement date of operations was December 31, 1998 for all share classes.
|
| CORE Large Cap
Growth Fund |
CORE Small Cap
Equity Fund |
CORE Large Cap
Value Fund (a) |
CORE International
Equity Fund |
||||||||
|---|---|---|---|---|---|---|---|---|---|---|---|
| $ (15,644 | ) | $ 173,270 | $ 37,422 | $ 1,407,352 | |||||||
| (16,923,839 | ) | (18,927,424 | ) | (32,964 | ) | (8,586,417) | |||||
| 102,776,431 | 18,052,638 | (109,578 | ) | 21,848,298 | |||||||
| |
|||||||||||
| 85,836,948 | (701,516 | ) | (105,120 | ) | 14,669,233 | ||||||
| |
|||||||||||
| — | (47,356 | ) | — | (250,453) | |||||||
| — | (125,897 | ) | — | (808,555) | |||||||
| — | (17 | ) | — | (35) | |||||||
| — | (6,981 | ) | — | — | |||||||
| (125,793 | ) | (18,557 | ) | — | — | ||||||
| (218 | ) | (3 | ) | — | — | ||||||
| (10,120 | ) | — | — | — | |||||||
| (4,694 | ) | — | — | — | |||||||
| (1,573 | ) | — | — | — | |||||||
| (12,174 | ) | — | — | — | |||||||
| (85 | ) | — | — | — | |||||||
| |
|||||||||||
| (154,657 | ) | (198,811 | ) | — | (1,059,043) | ||||||
| |
|||||||||||
| 502,793,514 | 153,543,862 | 62,186,814 | 470,437,011 | ||||||||
| 57,232 | 80,120 | — | 288,383 | ||||||||
| (61,380,388 | ) | (36,515,377 | ) | (1,411,177 | ) | (111,237,527) | |||||
| |
|||||||||||
| 441,470,358 | 117,108,605 | 60,775,637 | 359,487,867 | ||||||||
| |
|||||||||||
| 527,152,649 | 116,208,278 | 60,670,517 | 373,098,057 | ||||||||
| |
|||||||||||
| 76,546,153 | 32,660,375 | — | 29,135,507 | ||||||||
| |
|||||||||||
| $603,698,802 | $148,868,653 | $60,670,517 | $402,233,564 | ||||||||
| |
|||||||||||
| $ (158,558 | ) | $ (61,646 | ) | $ 37,422 | $ (153,510) | ||||||
| |
|||||||||||
| 1. ORGANIZATION
|
| Goldman Sachs Trust (the “Trust”) is a Delaware business trust registered under the Investment Company Act of 1940 (as
amended) as an open-end management investment company. The Trust includes the CORE U.S. Equity Fund, CORE Large Cap Growth Fund, CORE Small Cap Equity Fund, CORE Large Cap Value Fund and the CORE International Equity Fund, collectively the “
Funds” or individually a “Fund”. Each Fund is a diversified portfolio offering five classes of shares —Class A, Class B, Class C, Institutional and Service.
|
| 2. SIGNIFICANT ACCOUNTING POLICIES
|
| The following is a summary of the significant accounting policies consistently followed by the Funds. The preparation of financial
statements in conformity with generally accepted accounting principles requires management to make estimates and assumptions that may affect the reported amounts. Actual results could differ from those estimates. Effective for fiscal year 1999, the Board
of Trustees approved a change in the fiscal year-end of the Funds from January 31 to August 31. Accordingly, the Statement of Changes in Net Assets, Summary of Share Transactions and Financial Highlights of the Funds are included for the seven-month
period ended August 31, 1999 and the year ended January 31, 1999.
|
| A. Investment Valuation — Investments in
securities traded on a U.S. or foreign securities exchange or the NASDAQ system are valued daily at their last sale price on the principal exchange on which they are traded. If no sale occurs, securities are valued at the last bid price. Debt securities
are valued at prices supplied by independent pricing services, broker / dealer-supplied valuations or matrix pricing systems. Unlisted equity and debt securities for which market quotations are available are valued at the last sale price on valuation
date, or if no sale occurs, at the last bid price. Short-term debt obligations maturing in sixty days or less are valued at amortized cost, which approximates market value. Securities for which quotations are not readily available are valued at fair value
using methods approved by the Trust’s Board of Trustees.
|
| B. Security Transactions and Investment Income — Security transactions are recorded as of the trade date. Realized gains and losses on sales of portfolio securities are calculated using the identified-cost basis. Dividend income is recorded on the ex-dividend date, net of foreign taxes where
applicable. Dividends for which the Fund has the choice to receive either cash or stock are recognized as investment income in an amount equal to the cash dividend. Interest income is recorded on the basis of interest accrued, premium amortized and
discount earned.
|
| Net investment income (other than class-specific expenses) and unrealized and realized gains or losses are allocated daily to each
class of shares of the Funds based upon the relative proportion of net assets of each class.
|
| C. Federal Taxes — It is each Fund’s
policy to comply with the requirements of the Internal Revenue Code applicable to regulated investment companies and to distribute each year substantially all of its investment company taxable income and capital gains to its shareholders. Accordingly, no
federal tax provisions are required. Income distributions, if any, are declared and paid quarterly for CORE Large Cap Value Fund and annually for all other Funds. Capital gains distributions, if any, are declared and paid annually.
|
| The characterization of distributions to shareholders for financial reporting
purposes is determined in accordance with income tax rules. Therefore, the source of each Fund’s distributions may be shown in the accompanying financial statements as either from or in excess of net investment income or net realized gain on
investment transactions, or from paid-in capital, depending on the type of book/tax differences that may exist.
|
| 2. SIGNIFICANT ACCOUNTING POLICIES (continued)
|
| At August 31, 2000, the Funds’ aggregate unrealized gains and losses based on
cost for federal income tax purposes were as follows:
|
| Fund | Tax Cost
|
|
Gross
Unrealized Gain |
Gross
Unrealized Loss |
Net Unrealized
Gain |
|||
|---|---|---|---|---|---|---|---|---|
| |
||||||||
| CORE U.S. Equity | $1,101,907,127 | $406,511,884 | $65,318,044 | $341,193,840 | ||||
| |
||||||||
| CORE Large Cap Growth | 972,847,948 | 438,202,387 | 49,214,754 | 388,987,633 | ||||
| |
||||||||
| CORE Small Cap Equity | 148,518,847 | 27,585,688 | 7,084,104 | 20,501,584 | ||||
| |
||||||||
| CORE Large Cap Value | 296,390,567 | 36,130,901 | 26,577,083 | 9,553,818 | ||||
| |
||||||||
| CORE International Equity | 438,580,837 | 62,225,912 | 24,407,093 | 37,818,819 | ||||
| |
||||||||
| D. Expenses — Expenses incurred by the
Trust that do not specifically relate to an individual fund of the Trust are allocated to the Funds on a straight-line or pro rata basis depending upon the nature of the expense.
|
| Class A, Class B and Class C shareholders of the Funds bear all expenses and fees
relating to their respective Distribution and Service plans. Shareholders of Service shares bear all expenses and fees paid to service organizations. Each class of shares of the Funds separately bears its respective class-specific transfer agency fees.
|
| E. Foreign Currency Translations — The
books and records of the Funds are maintained in U.S. dollars. Amounts denominated in foreign currencies are translated into U.S. dollars on the following basis: (i) investment valuations, foreign currency and other assets and liabilities initially
expressed in foreign currencies are converted each business day into U.S. dollars based upon current exchange rates; and (ii) purchases and sales of foreign investments, income and expenses are converted into U.S. dollars based upon currency exchange
rates prevailing on the respective dates of such transactions.
|
| Net realized and unrealized gain (loss) on foreign currency transactions will
represent: (i) foreign exchange gains and losses from the sale and holdings of foreign currencies; (ii) currency gains and losses between trade date and settlement date on investment securities transactions and forward exchange contracts; and (iii) gains
and losses from the difference between amounts of dividends, interest and foreign withholding taxes recorded and the amounts actually received.
|
| F. Segregation Transactions — The Funds
may enter into certain derivative transactions. Forward foreign currency exchange contracts, futures contracts, written options, when-issued securities and forward commitments represent examples of such transactions. As a result of entering into these
transactions, the Funds are required to segregate liquid assets on the accounting records equal to or greater than the market value of the corresponding transactions.
|
| G. Repurchase Agreements — Repurchase
agreements involve the purchase of securities subject to the seller’s agreement to repurchase them at a mutually agreed upon date and price. During the term of a repurchase agreement, the value of the underlying securities, including accrued
interest, is required to equal or exceed the value of the repurchase agreement. The underlying securities for all repurchase agreements are held in safekeeping at each Fund’s custodian.
|
| 3. AGREEMENTS
|
| Pursuant to Investment Management Agreements (the “Agreements”), Goldman Sachs Asset Management (“GSAM”), a
unit of the Investment Management Division of Goldman Sachs & Co. (“Goldman Sachs”), serves as the investment adviser to CORE Large Cap Growth, CORE Small Cap Equity, CORE Large Cap Value and CORE International Equity Funds. Goldman Sachs
Funds Management, L.P. (“GSFM”), an affiliate of Goldman, Sachs & Co., serves as the investment adviser to CORE U.S. Equity Fund. Under the Agreements, the respective adviser, subject to the general supervision of the Trust’s Board of
Trustees, manages the Funds’ portfolios. As compensation for the services rendered pursuant to the Agreements, the assumption of the expenses related thereto and administering the Funds’ business affairs, including providing facilities, the
respective adviser is entitled to a management fee, computed daily and payable monthly, at an annual rate equal to .75%, .75%, .85%, .60% and .85% of the average daily net assets of CORE U.S. Equity, CORE Large Cap Growth, CORE Small Cap Equity, CORE
Large Cap Value and CORE International Equity Funds, respectively. For the year ended August 31, 2000, the advisers for CORE U.S. Equity and CORE Large Cap Growth have voluntarily agreed to waive a portion of their management fee equal annually to .05%
and .05% (.15% prior to May 1, 2000), respectively, of each Fund’s average daily net assets. The advisers may discontinue or modify these waivers in the future at their discretion.
|
| Each adviser has voluntarily agreed to limit certain “Other Expenses”
for the CORE U.S. Equity, CORE Large Cap Growth, CORE Small Cap Equity, CORE Large Cap Value and CORE International Equity Funds (excluding management fees, distribution and service fees, transfer agent fees, taxes, interest, brokerage, litigation,
Service Share fees, indemnification costs and extraordinary expenses), to the extent such expenses exceed, on an annual basis, .00%, .02% (.00% prior to May 1, 2000), .04%, .06% (.00% prior to May 1, 2000), and .12% of the average daily net assets of the
Funds, respectively.
|
| The Trust, on behalf of each Fund, has adopted Distribution and Service Plans.
Under the Distribution and Service Plans, Goldman Sachs and/or authorized dealers are entitled to a monthly fee from each Fund for distribution and shareholder maintenance services equal, on an annual basis, to .25% (.50% for CORE International Equity
Fund), 1.00% and 1.00% of the Funds’ average daily net assets attributable to Class A, Class B and Class C Shares, respectively.
|
| Goldman Sachs serves as the distributor of shares of the Funds pursuant to
Distribution Agreements. Goldman Sachs may receive a portion of the Class A sales load and Class B and Class C contingent deferred sales charge and has advised the Funds that it retained approximately $258,000, $334,000, $59,000, $81,000 and $54,000
during the year ended August 31, 2000 for the CORE U.S. Equity, CORE Large Cap Growth, CORE Small Cap Equity, CORE Large Cap Value and CORE International Equity Funds, respectively.
|
| Goldman Sachs also serves as the transfer agent of the Funds for a fee. Fees
charged for such transfer agency services are calculated daily and payable monthly at an annual rate as follows: .19% of the average daily net assets for Class A, Class B and Class C Shares and .04% of the average daily net assets for Institutional and
Service Shares.
|
| The Trust, on behalf of each Fund, has adopted a Service Plan. This plan allows
for Service shares to compensate service organizations for providing varying levels of account administration and shareholder liaison services to their customers who are beneficial owners of such shares. The Service Plan provides for compensation to the
service organizations in an amount up to .50% (on a annualized basis) of the average daily net asset value of the Service Shares.
|
| 3. AGREEMENTS (continued)
|
| For the year ended August 31, 2000, the Funds’ advisers have voluntarily
agreed to waive certain fees and reimburse other expenses. In addition, the Funds have entered into certain offset arrangements with the custodian resulting in a reduction in the Funds’ expenses. These expense reductions were as follows (in thousands):
|
| Fund | Management Fee Waiver | Reimbursement | Custody Credit | Total Expense
Reductions |
||||
|---|---|---|---|---|---|---|---|---|
| |
||||||||
| CORE U.S. Equity | $ 661 | $501 | $10 | $1,172 | ||||
| |
||||||||
| CORE Large Cap Growth | 1,287 | 430 | 5 | 1,722 | ||||
| |
||||||||
| CORE Small Cap Equity | — | 336 | 6 | 342 | ||||
| |
||||||||
| CORE Large Cap Value | — | 308 | 6 | 314 | ||||
| |
||||||||
| CORE International Equity | — | 431 | — | 431 | ||||
| |
||||||||
| At August 31, 2000, the amounts owed to affiliates were as follows (in thousands):
|
| Fund | Management
Fees |
Distribution
and Service Fees |
Transfer
Agent Fees |
Total | ||||
|---|---|---|---|---|---|---|---|---|
| |
||||||||
| CORE U.S. Equity | $830 | $424 | $177 | $1,431 | ||||
| |
||||||||
| CORE Large Cap Growth | 758 | 499 | 167 | 1,424 | ||||
| |
||||||||
| CORE Small Cap Equity | 115 | 32 | 15 | 162 | ||||
| |
||||||||
| CORE Large Cap Value | 153 | 46 | 27 | 226 | ||||
| |
||||||||
| CORE International Equity | 342 | 79 | 37 | 458 | ||||
| |
||||||||
| 4. PORTFOLIO SECURITIES TRANSACTIONS
|
| The cost of purchases and proceeds of sales and maturities of securities (excluding short-term investments, futures
and options) for the year ended August 31, 2000, were as follows:
|
| Fund | Purchases | Sales and Maturities | |||
|---|---|---|---|---|---|
| |
|||||
| CORE U.S. Equity | $780,125,255 | $780,031,727 | |||
| |
|||||
| CORE Large Cap Growth | 984,468,553 | 811,219,403 | |||
| |
|||||
| CORE Small Cap Equity | 207,379,757 | 212,624,028 | |||
| |
|||||
| CORE Large Cap Value | 239,331,776 | 245,137,546 | |||
| |
|||||
| CORE International Equity | 467,277,939 | 417,112,631 | |||
| |
|||||
| For the year ended August 31, 2000, Goldman Sachs earned
approximately $9,100, $10,000, $4,500, $5,400 and $401,000 of brokerage commissions from portfolio transactions, including futures transactions executed on behalf of the CORE U.S. Equity, CORE Large Cap Growth, CORE Small Cap Equity, CORE Large Cap Value
and CORE International Equity Funds, respectively.
|
| Forward Foreign Currency Exchange Contracts — The CORE International Fund may enter into forward foreign currency exchange contracts for the purchase or sale of a specific foreign currency at a fixed price on a future date as a hedge or cross-hedge against either specific transactions or portfolio
positions. The CORE International Equity Fund may also purchase and sell forward contracts to seek to increase total return. All commitments are “marked-to-market” daily at the applicable translation rates and any resulting unrealized gains or
losses are recorded in the Fund’s financial statements. The Fund realizes gains or losses at the time a forward contract is offset by entry into a closing transaction or extinguished by delivery of the currency. Risks may arise upon entering into
these contracts from the potential inability of counterparties to meet the terms of their contracts and from unanticipated movements in the value of a foreign currency relative to the U.S. dollar. As of August 31, 2000, there were no open forward currency
contracts outstanding.
|
| Option Accounting Principles — When the
Funds write call or put options, an amount equal to the premium received is recorded as an asset and as an equivalent liability. The amount of the liability is subsequently marked-to-market to reflect the current market value of the option written. When a
written option expires on its stipulated expiration date or the Funds enter into a closing purchase transaction, the Funds realize a gain or loss without regard to any unrealized gain or loss on the underlying security, and the liability related to such
option is extinguished. When a written call option is exercised, the Funds realize a gain or loss from the sale of the underlying security, and the proceeds of the sale are increased by the premium originally received. When a written put option is
exercised, the amount of the premium originally received will reduce the cost of the security which the Funds purchase upon exercise. There is a risk of loss from a change in value of such options which may exceed the related premiums received.
|
| 4. PORTFOLIO SECURITIES TRANSACTIONS (continued)
|
| Upon the purchase of a call option or a protective put option by the Funds, the
premium paid is recorded as an investment and subsequently marked-to-market to reflect the current market value of the option. If an option which the Funds have purchased expires on the stipulated expiration date, the Funds will realize a loss in the
amount of the cost of the option. If the Funds enter into a closing sale transaction, the Funds will realize a gain or loss, depending on whether the sale proceeds for the closing sale transaction are greater or less than the cost of the option. If the
Funds exercise a purchased put option, the Funds will realize a gain or loss from the sale of the underlying security, and the proceeds from such sale will be decreased by the premium originally paid. If the Funds exercise a purchased call option, the
cost of the security which the Funds purchase upon exercise will be increased by the premium originally paid. As of August 31, 2000, there were no options outstanding.
|
| Futures Contracts — The Funds may enter into futures
transactions to hedge against changes in interest rates, securities prices, currency exchange rates or (for CORE International Equity Fund only) to seek to increase total return. Upon entering into a futures contract, the Funds are required to deposit
with a broker or the Fund’s custodian bank an amount of cash or securities equal to the minimum “initial margin” requirement of the associated futures exchange. Subsequent payments for futures contracts (“variation margin”) are
paid or received by the Funds, depending on the fluctuations in the value of the contracts, and are recorded for financial reporting purposes as unrealized gains or losses. When contracts are closed, the Funds realize a gain or loss which is reported in
the Statement of Operations.
|
| The use of futures contracts involve, to varying degrees, elements of market risk
which may exceed the amounts recognized in the Statements of Assets and Liabilities. Changes in the value of the futures contract may not directly correlate with changes in the value of the underlying securities. This risk may decrease the effectiveness
of the Funds’ strategies and potentially result in a loss. At August 31, 2000, open futures contracts were as follows:
|
| Fund | Type | Number of
Contracts Long |
Settlement
Month |
Market Value | Unrealized
Gain (Loss) |
||||
|---|---|---|---|---|---|---|---|---|---|
| |
|||||||||
| CORE U.S. Equity | S&P 500 Index | 11 | September 2000 | $ 4,183,300 | $ 74,780 | ||||
| |
|||||||||
| CORE Large Cap Growth | S&P 500 Index | 45 | September 2000 | $17,113,500 | $223,984 | ||||
| |
|||||||||
| CORE Small Cap Equity | Russell 2000 Index | 3 | September 2000 | $ 805,575 | $ 9,610 | ||||
| |
|||||||||
| CORE Large Cap Value | S&P 500 Index | 5 | September 2000 | $ 1,901,500 | $ 18,150 | ||||
| |
|||||||||
| CORE International Equity | FTSE 100 Index | 7 | September 2000 | $ 679,347 | $ 22,300 | ||||
| All Ordinaries Index | 3 | September 2000 | 142,418 | (2,537 | ) | ||||
| CAC-40-10EU Index | 2 | September 2000 | 117,769 | 1,110 | |||||
| IBEX 35 Index | 1 | September 2000 | 96,627 | (3,076 | ) | ||||
| Hang Seng Index | 1 | September 2000 | 110,014 | (4,244 | ) | ||||
| TOPIX Index | 6 | September 2000 | 848,383 | (1,219 | ) | ||||
| EURX EX STX Index | 19 | September 2000 | 872,712 | (2,601 | ) | ||||
| |
|||||||||
| $ 2,867,270 | $ 9,733 | ||||||||
| |
|||||||||
| 5. LINE OF CREDIT FACILITY
|
| Effective May 31, 2000, the Funds participate in a $350,000,000 committed, unsecured revolving line of credit facility. Prior
thereto, the Funds participated in a $250,000,000 uncommitted and a $250,000,000 committed, unsecured revolving line of credit facility. Under the most restrictive arrangement, each Fund must own securities having a market value in excess of 400% of the
total bank borrowings. This facility is to be used solely for temporary or emergency purposes. The interest rate on borrowings is based on the Federal Funds rate. The committed facility also requires a fee to be paid by the Funds based on the amount of
the commitment. During the year ended August 31, 2000, the Funds did not have any borrowings under any of these facilities.
|
| 6. JOINT REPURCHASE AGREEMENT ACCOUNT
|
| The Funds, together with other registered investment companies having management agreements with GSAM and GSFM or their
affiliates, transfer uninvested cash into joint accounts, the daily aggregate balance of which is invested in one or more repurchase agreements.
|
| At August 31, 2000, the CORE U.S. Equity, CORE Large Cap Growth, CORE Small Cap
Equity and CORE Large Cap Value Funds had undivided interests in the repurchase agreements in the joint account which equaled $2,500,000, $16,300,000, $2,200,000 and $1,400,000, respectively, in principal amount. At August 31, 2000, the following
repurchase agreements held in this joint account were fully collateralized by Federal Agency obligations:
|
| Repurchase Agreements | Principal
Amount |
Interest
Rate |
Maturity
Date |
Amortized
Cost |
Maturity
Value |
|||||||
|---|---|---|---|---|---|---|---|---|---|---|---|---|
| ABN/AMRO, Inc. | $814,100,000 | 6.66 | % | 09/01/2000 | $ 814,100,000 | $ 814,250,608 | ||||||
| Banc of America Securities LLC | 900,000,000 | 6.67 | 09/01/2000 | 900,000,000 | 900,166,750 | |||||||
| Barclays Capital, Inc. | 500,000,000 | 6.67 | 09/01/2000 | 500,000,000 | 500,092,639 | |||||||
| Bear Stearns Companies, Inc. | 300,000,000 | 6.67 | 09/01/2000 | 300,000,000 | 300,055,583 | |||||||
| Chase Securities, Inc. | 450,000,000 | 6.67 | 09/01/2000 | 450,000,000 | 450,083,375 | |||||||
| Donaldson, Lufkin & Jenrette, Inc. | 1,000,000,000 | 6.67 | 09/01/2000 | 1,000,000,000 | 1,000,185,278 | |||||||
| J.P. Morgan & Co., Inc. | 800,000,000 | 6.65 | 09/01/2000 | 800,000,000 | 800,147,778 | |||||||
| Morgan Stanley Dean Witter & Co. | 750,000,000 | 6.65 | 09/01/2000 | 750,000,000 | 750,138,542 | |||||||
| Morgan Stanley Dean Witter & Co. | 300,000,000 | 6.60 | 09/01/2000 | 300,000,000 | 300,055,000 | |||||||
| UBS Warburg LLC | 800,000,000 | 6.65 | 09/01/2000 | 800,000,000 | 800,147,778 | |||||||
| TOTAL JOINT REPURCHASE AGREEMENT ACCOUNT II | $6,614,100,000 | $6,615,323,331 | ||||||||||
| 7. OTHER MATTERS
|
| As of August 31, 2000, Goldman, Sachs & Co. Profit Sharing Master Trust was the beneficial owner of approximately 11% of the
outstanding shares of the CORE U.S. Equity Fund. In addition, the following Goldman Sachs Asset Allocation Portfolios were beneficial owners of the Funds (as a percentage of outstanding shares):
|
| Fund | Goldman Sachs
Growth and Income Strategy Portfolio |
Goldman Sachs
Growth Strategy Portfolio |
Goldman Sachs
Aggressive Growth Strategy Portfolio |
|||||||
|---|---|---|---|---|---|---|---|---|---|---|
| CORE Large Cap Growth | — | % | 5 | % | — | % | ||||
| CORE Small Cap Equity | 7 | 8 | 7 | |||||||
| CORE Large Cap Value | 18 | 20 | 11 | |||||||
| CORE International Equity | 22 | 21 | 11 | |||||||
| 8. CERTAIN RECLASSIFICATIONS
|
| In accordance with AICPA Statement of Position 93-2, the CORE U.S. Equity Fund reclassified $2 from paid-in capital to accumulated
net realized gain from investment, futures and foreign currency related transactions. CORE Large Cap Growth reclassified $164 from accumulated net realized gain from investment, futures and foreign currency related transactions, and $274 from accumulated
undistributed net investment income to paid-in capital. CORE Small Cap Equity reclassified $399 and $180,277 from accumulated net realized gain from investment, futures and foreign currency related transactions to paid-in capital and accumulated
undistributed net investment income, respectively. CORE Large Cap Value reclassified $850 from accumulated undistributed net investment income to accumulated net realized gain from investment, futures and foreign currency related transactions. CORE
International Equity reclassified $273,720 and $400 from accumulated undistributed net investment income to accumulated net realized gain from investment, futures and foreign currency transactions and paid-in capital, respectively. Reclassifications
result primarily from the difference in the tax treatment of foreign currency, net operating losses and organization costs.
|
| 9. CHANGE IN INDEPENDENT ACCOUNTANTS
|
| On October 26, 1999, the Board of Trustees of the Funds, upon the recommendation of the Board’s audit committee, determined
not to retain Arthur Andersen LLP and approved a change of the Funds’ independent accountants to PricewaterhouseCoopers LLP. For the period ended August 31, 1999 and year ended January 31, 1999, Arthur Andersen LLP’s audit reports contained no
adverse opinion or disclaimer of opinion; nor were their reports qualified or modified as to uncertainty, audit scope, or accounting principles. Further, there were no disagreements between the Funds and Arthur Andersen LLP on accounting principles or
practices, financial statement disclosure or audit scope or procedure, which if not resolved to the satisfaction of Arthur Andersen LLP would have caused them to make reference to the disagreement in their report.
|
| Goldman Sachs Trust — CORE Funds — Tax Information (Unaudited)
|
| For the year ended August 31, 2000, 30.74% and 73.86% of the dividends paid from net
investment company taxable income by the CORE U.S. Equity and CORE Large Cap Value Funds, respectively, qualify for the dividends received deduction available to corporations.
|
| Pursuant to Section 852 of the Internal Revenue Code, CORE U.S. Equity, CORE Large Cap
Growth and CORE Large Cap Value Funds designate $99,883,968, $4,749,110 and $354,283, respectively, as capital gains dividends for the year ended August 31, 2000.
|
| From distributions paid during the year ended August 31, 2000, the total amount of income
received by the CORE International Equity Fund from sources with foreign countries and possessions of the United States was $0.1321 per share of all of which is attributable to qualified passive income. The total amount of taxes paid by the Fund to such
countries was $0.0230 per share. A separate notice containing the country by country components of these totals has been previously mailed to the shareholders.
|
| 10. SUMMARY OF SHARE TRANSACTIONS
|
| Share activity for the year ended August 31, 2000, is as follows:
|
| CORE U.S. Equity Fund |
||||||
|---|---|---|---|---|---|---|
| Shares | Dollars | |||||
| |
||||||
| Class A Shares | ||||||
| Shares sold | 4,299,636 | $147,748,472 | ||||
| Reinvestment of dividends and distributions | 1,814,645 | 60,210,166 | ||||
| Shares repurchased | (4,601,391 | ) | (158,796,518 | ) | ||
| |
||||||
| 1,512,890 | 49,162,120 | |||||
| |
||||||
| Class B Shares | ||||||
| Shares sold | 2,022,727 | 67,970,799 | ||||
| Reinvestment of dividends and distributions | 679,601 | 22,025,886 | ||||
| Shares repurchased | (1,361,908 | ) | (45,688,038 | ) | ||
| |
||||||
| 1,340,420 | 44,308,647 | |||||
| |
||||||
| Class C Shares | ||||||
| Shares sold | 761,123 | 25,417,131 | ||||
| Reinvestment of dividends and distributions | 129,351 | 4,176,748 | ||||
| Shares repurchased | (421,409 | ) | (14,196,500 | ) | ||
| |
||||||
| 469,065 | 15,397,379 | |||||
| |
||||||
| Institutional Shares | ||||||
| Shares sold | 2,043,937 | 71,350,795 | ||||
| Reinvestment of dividends and distributions | 941,797 | 31,616,126 | ||||
| Shares repurchased | (2,511,099 | ) | (86,461,857 | ) | ||
| |
||||||
| 474,635 | 16,505,064 | |||||
| |
||||||
| Service Shares | ||||||
| Shares sold | 104,405 | 3,584,995 | ||||
| Reinvestment of dividends and distributions | 35,129 | 1,159,259 | ||||
| Shares repurchased | (143,474 | ) | (4,905,975 | ) | ||
| |
||||||
| (3,940 | ) | (161,721 | ) | |||
| |
||||||
| NET INCREASE (DECREASE) | 3,793,070 | $125,211,489 | ||||
| |
||||||
| CORE Large Cap Growth Fund | CORE Small Cap Equity Fund | CORE Large Cap Value Fund | CORE International Equity Fund | |||||||||||||||||||
|---|---|---|---|---|---|---|---|---|---|---|---|---|---|---|---|---|---|---|---|---|---|---|
| Shares | Dollars | Shares | Dollars | Shares | Dollars | Shares | Dollars | |||||||||||||||
| 13,185,194 | $264,595,168 | 2,396,202 | $28,017,254 | 5,748,276 | $59,575,667 | 10,563,804 | $122,888,676 | |||||||||||||||
| 82,214 | 1,599,043 | — | — | 181,124 | 1,877,202 | 264,086 | 3,079,248 | |||||||||||||||
| (6,856,684 | ) | (139,418,654) | (3,283,915 | ) | (38,105,187 | ) | (5,225,016 | ) | (53,546,888 | ) | (8,336,349 | ) | (97,065,965 | ) | ||||||||
| 6,410,724 | 126,775,557 | (887,713 | ) | (10,087,933 | ) | 704,384 | 7,905,981 | 2,491,541 | 28,901,959 | |||||||||||||
| 6,245,212 | 121,555,868 | 467,046 | 5,394,626 | 1,137,293 | 11,705,218 | 368,199 | 4,263,313 | |||||||||||||||
| 48,352 | 924,021 | — | — | 20,707 | 214,186 | 20,441 | 237,117 | |||||||||||||||
| (1,864,186 | ) | (36,911,091) | (406,335 | ) | (4,598,965 | ) | (761,301 | ) | (7,827,473 | ) | (164,712 | ) | (1,911,815 | ) | ||||||||
| 4,429,378 | 85,568,798 | 60,711 | 795,661 | 396,699 | 4,091,931 | 223,928 | 2,588,615 | |||||||||||||||
| 3,571,933 | 70,145,056 | 283,210 | 3,295,043 | 756,650 | 7,858,271 | 997,152 | 11,442,000 | |||||||||||||||
| 17,989 | 343,770 | — | — | 11,936 | 123,567 | 9,233 | 107,195 | |||||||||||||||
| (1,101,162 | ) | (21,663,375) | (249,135 | ) | (2,821,220 | ) | (494,316 | ) | (5,120,910 | ) | (847,176 | ) | (9,754,850 | ) | ||||||||
| 2,488,760 | 48,855,451 | 34,075 | 473,823 | 274,270 | 2,860,928 | 159,209 | 1,794,345 | |||||||||||||||
| 2,019,488 | 41,436,896 | 2,529,882 | 30,183,742 | 2,688,867 | 27,742,789 | 6,441,624 | 76,556,582 | |||||||||||||||
| 37,627 | 736,381 | — | — | 48,421 | 501,247 | 88,349 | 1,039,862 | |||||||||||||||
| (6,106,529 | ) | (123,783,480) | (1,999,404 | ) | (23,933,329 | ) | (4,477,133 | ) | (46,410,458 | ) | (4,341,229 | ) | (51,299,130 | ) | ||||||||
| (4,049,414 | ) | (81,610,203) | 530,478 | 6,250,413 | (1,739,845 | ) | (18,166,422 | ) | 2,188,744 | 26,297,314 | ||||||||||||
| 45,373 | 945,862 | 1,408 | 16,141 | — | — | 1,581 | 18,006 | |||||||||||||||
| 680 | 13,169 | — | — | 23 | 239 | 63 | 741 | |||||||||||||||
| (22,151 | ) | (457,572) | (2,769 | ) | (31,969 | ) | (160 | ) | (1,636 | ) | (11 | ) | (138 | ) | ||||||||
| 23,902 | 501,459 | (1,361 | ) | (15,828 | ) | (137 | ) | (1,397 | ) | 1,633 | 18,609 | |||||||||||
| 9,303,350 | $180,091,062 | (263,810 | ) | $ (2,583,864 | ) | (364,629 | ) | $ (3,308,979 | ) | 5,065,055 | $ 59,600,842 | |||||||||||
| 10. SUMMARY OF SHARE TRANSACTIONS (continued)
|
| Share activity for the seven-month period ended August 31, 1999, is as follows:
|
| CORE U.S. Equity Fund |
||||||
|---|---|---|---|---|---|---|
| Shares | Dollars | |||||
| |
||||||
| Class A Shares | ||||||
| Shares sold | 4,480,478 | $152,209,945 | ||||
| Reinvestment of dividends and distributions | — | — | ||||
| Shares repurchased | (4,885,988 | ) | (165,197,641 | ) | ||
| |
||||||
| (405,510 | ) | (12,987,696 | ) | |||
| |
||||||
| Class B Shares | ||||||
| Shares sold | 2,114,834 | 70,617,885 | ||||
| Reinvestment of dividends and distributions | — | — | ||||
| Shares repurchased | (424,409 | ) | (14,199,866 | ) | ||
| |
||||||
| 1,690,425 | 56,418,019 | |||||
| |
||||||
| Class C Shares | ||||||
| Shares sold | 622,703 | 20,790,097 | ||||
| Reinvestment of dividends and distributions | — | — | ||||
| Shares repurchased | (157,393 | ) | (5,321,657 | ) | ||
| |
||||||
| 465,310 | 15,468,440 | |||||
| |
||||||
| Institutional Shares | ||||||
| Shares sold | 2,156,813 | 74,023,816 | ||||
| Reinvestment of dividends and distributions | — | — | ||||
| Shares repurchased | (1,693,849 | ) | (58,817,319 | ) | ||
| |
||||||
| 462,964 | 15,206,497 | |||||
| |
||||||
| Service Shares | ||||||
| Shares sold | 53,313 | 1,807,159 | ||||
| Reinvestment of dividends and distributions | — | — | ||||
| Shares repurchased | (77,444 | ) | (2,674,453 | ) | ||
| |
||||||
| (24,131 | ) | (867,294 | ) | |||
| |
||||||
| NET INCREASE (DECREASE) | 2,189,058 | $ 73,237,966 | ||||
| |
||||||
| CORE Large Cap Growth Fund | CORE Small Cap Equity Fund | CORE Large Cap Value Fund | CORE International Equity Fund | |||||||||||||||||||
|---|---|---|---|---|---|---|---|---|---|---|---|---|---|---|---|---|---|---|---|---|---|---|
| Shares | Dollars | Shares | Dollars | Shares | Dollars | Shares | Dollars | |||||||||||||||
| 10,470,228 | $170,184,476 | 1,258,148 | $13,030,383 | 9,581,268 | $104,106,541 | 4,236,762 | $43,587,990 | |||||||||||||||
| — | — | — | — | 20,832 | 227,047 | 193 | 2,066 | |||||||||||||||
| (3,654,092 | ) | (60,336,764) | (2,417,812 | ) | (24,600,070 | ) | (1,624,984 | ) | (18,072,273 | ) | (4,760,025 | ) | (49,081,701 | ) | ||||||||
| 6,816,136 | 109,847,712 | (1,159,664 | ) | (11,569,687 | ) | 7,977,116 | 86,261,315 | (523,070 | ) | (5,491,645 | ) | |||||||||||
| 5,780,900 | 93,035,450 | 301,937 | 3,002,544 | 1,385,917 | 15,120,099 | 209,022 | 2,180,794 | |||||||||||||||
| — | — | — | — | 1,345 | 14,579 | — | — | |||||||||||||||
| (801,603 | ) | (12,987,080) | (473,346 | ) | (4,654,066 | ) | (43,481 | ) | (468,504 | ) | (104,302 | ) | (1,068,660 | ) | ||||||||
| 4,979,297 | 80,048,370 | (171,409 | ) | (1,651,522 | ) | 1,343,781 | 14,666,174 | 104,720 | 1,112,134 | |||||||||||||
| 2,791,478 | 45,140,043 | 159,684 | 1,608,796 | 751,112 | 8,221,628 | 495,659 | 5,019,291 | |||||||||||||||
| — | — | — | — | 610 | 6,613 | — | — | |||||||||||||||
| (604,096 | ) | (9,757,233) | (189,207 | ) | (1,825,005 | ) | (13,955 | ) | (152,653 | ) | (417,071 | ) | (4,248,461 | ) | ||||||||
| 2,187,382 | 35,382,810 | (29,523 | ) | (216,209 | ) | 737,767 | 8,075,588 | 78,588 | 770,830 | |||||||||||||
| 2,587,072 | 42,841,502 | 1,430,824 | 14,494,462 | 16,847,196 | 172,118,566 | 2,418,684 | 25,505,971 | |||||||||||||||
| — | — | — | — | 4,958 | 53,468 | — | — | |||||||||||||||
| (2,662,983 | ) | (43,943,062) | (1,498,950 | ) | (15,266,801 | ) | (4,143,528 | ) | (44,173,282 | ) | (5,665,112 | ) | (58,430,254 | ) | ||||||||
| (75,911 | ) | (1,101,560) | (68,126 | ) | (772,339 | ) | 12,708,626 | 127,998,752 | (3,246,428 | ) | (32,924,283 | ) | ||||||||||
| 47,403 | 761,942 | 2,880 | 27,449 | 1,092 | 12,500 | 553 | 5,995 | |||||||||||||||
| — | — | — | — | 1 | 4 | — | — | |||||||||||||||
| (2,545 | ) | (41,303) | (1,987 | ) | (18,976 | ) | — | — | (2,003 | ) | (20,376 | ) | ||||||||||
| 44,858 | 720,639 | 893 | 8,473 | 1,093 | 12,504 | (1,450 | ) | (14,381 | ) | |||||||||||||
| 13,951,762 | $224,897,971 | (1,427,829 | ) | $(14,201,284 | ) | 22,768,383 | $237,014,333 | (3,587,640 | ) | $(36,547,345 | ) | |||||||||||
| 10. SUMMARY OF SHARE TRANSACTIONS (continued)
|
| Share activity for the year ended January 31, 1999, is as follows:
|
| CORE U.S. Equity Fund |
||||||
|---|---|---|---|---|---|---|
| Shares | Dollars | |||||
| |
||||||
| Class A Shares | ||||||
| Shares sold | 8,753,952 | $ 259,032,390 | ||||
| Reinvestment of dividends and distributions | 381,760 | 11,200,848 | ||||
| Shares repurchased | (5,761,134 | ) | (166,304,148 | ) | ||
| |
||||||
| 3,374,578 | 103,929,090 | |||||
| |
||||||
| Class B Shares | ||||||
| Shares sold | 2,857,310 | 83,492,448 | ||||
| Reinvestment of dividends and distributions | 83,374 | 2,414,741 | ||||
| Shares repurchased | (501,968 | ) | (14,454,259 | ) | ||
| |
||||||
| 2,438,716 | 71,452,930 | |||||
| |
||||||
| Class C Shares | ||||||
| Shares sold | 670,600 | 19,394,950 | ||||
| Reinvestment of dividends and distributions | 13,055 | 377,761 | ||||
| Shares repurchased | (91,806 | ) | (2,614,971 | ) | ||
| |
||||||
| 591,849 | 17,157,740 | |||||
| |
||||||
| Institutional Shares | ||||||
| Shares sold | 3,495,701 | 106,922,172 | ||||
| Reinvestment of dividends and distributions | 252,278 | 7,502,432 | ||||
| Shares repurchased | (2,092,487 | ) | (62,588,379 | ) | ||
| |
||||||
| 1,655,492 | 51,836,225 | |||||
| |
||||||
| Service Shares | ||||||
| Shares sold | 138,492 | 4,090,580 | ||||
| Reinvestment of dividends and distributions | 8,981 | 263,345 | ||||
| Shares repurchased | (89,923 | ) | (2,681,502 | ) | ||
| |
||||||
| 57,550 | 1,672,423 | |||||
| |
||||||
| NET INCREASE | 8,118,185 | $ 246,048,408 | ||||
| |
||||||
(a)
|
Commencement date of operations was December 31, 1998 for all share classes.
|
| CORE Large Cap Growth Fund | CORE Small Cap Equity Fund | CORE Large Cap Value Fund (a) | CORE International Equity Fund | |||||||||||||||||||
|---|---|---|---|---|---|---|---|---|---|---|---|---|---|---|---|---|---|---|---|---|---|---|
| Shares | Dollars | Shares | Dollars | Shares | Dollars | Shares | Dollars | |||||||||||||||
| 8,392,008 | $114,907,937 | 6,683,657 | $ 62,993,476 | 659,370 | $ 6,646,109 | 16,982,750 | $159,894,304 | |||||||||||||||
| 775 | 9,734 | 5,387 | 51,508 | — | — | 25,532 | 247,660 | |||||||||||||||
| (2,029,343 | ) | (26,663,301) | (1,432,586 | ) | (14,382,982 | ) | (3,045 | ) | (30,471 | ) | (6,723,268 | ) | (65,336,060 | ) | ||||||||
| 6,363,440 | 88,254,370 | 5,256,458 | 48,662,002 | 656,325 | 6,615,638 | 10,285,014 | 94,805,904 | |||||||||||||||
| 5,276,877 | 72,837,485 | 828,354 | 8,824,797 | 33,500 | 341,048 | 515,393 | 5,051,846 | |||||||||||||||
| 1,075 | 13,374 | — | — | — | — | — | — | |||||||||||||||
| (577,338 | ) | (7,608,153) | (241,316 | ) | (2,380,103 | ) | — | — | (67,362 | ) | (640,971 | ) | ||||||||||
| 4,700,614 | 65,242,706 | 587,038 | 6,444,694 | 33,500 | 341,048 | 448,031 | 4,410,875 | |||||||||||||||
| 2,156,694 | 29,856,923 | 565,318 | 5,743,510 | 26,441 | 266,200 | 308,917 | 2,996,602 | |||||||||||||||
| 93 | 1,154 | — | — | — | — | — | — | |||||||||||||||
| (183,652 | ) | (2,472,936) | (156,900 | ) | (1,557,935 | ) | — | — | (107,735 | ) | (1,051,525 | ) | ||||||||||
| 1,973,135 | 27,385,141 | 408,418 | 4,185,575 | 26,441 | 266,200 | 201,182 | 1,945,077 | |||||||||||||||
| 19,639,867 | 283,752,115 | 7,133,876 | 75,923,060 | 5,393,552 | 54,931,857 | 30,484,309 | 302,474,224 | |||||||||||||||
| 2,288 | 32,678 | 2,982 | 28,592 | — | — | 4,168 | 40,723 | |||||||||||||||
| (1,788,450 | ) | (24,482,623) | (1,837,364 | ) | (18,190,952 | ) | (136,723 | ) | (1,380,706 | ) | (4,511,270 | ) | (44,208,971 | ) | ||||||||
| 17,853,705 | 259,302,170 | 5,299,494 | 57,760,700 | 5,256,829 | 53,551,151 | 25,977,207 | 258,305,976 | |||||||||||||||
| 105,509 | 1,439,054 | 5,527 | 59,019 | 160 | 1,600 | 2,004 | 20,035 | |||||||||||||||
| 21 | 292 | 2 | 20 | — | — | — | — | |||||||||||||||
| (11,909 | ) | (153,375) | (339 | ) | (3,405 | ) | — | — | — | — | ||||||||||||
| 93,621 | 1,285,971 | 5,190 | 55,634 | 160 | 1,600 | 2,004 | 20,035 | |||||||||||||||
| 30,984,515 | $441,470,358 | 11,556,598 | $117,108,605 | 5,973,255 | $60,775,637 | 36,913,438 | $359,487,867 | |||||||||||||||
| Income from
investment |
Distributions to shareholders |
|||||||||||||||||||||
|---|---|---|---|---|---|---|---|---|---|---|---|---|---|---|---|---|---|---|---|---|---|---|
| Net asset
value, beginning of period |
Net
investment income (loss) |
Net realized
and unrealized gain |
Total from
investment operations |
From net
investment income |
In excess
of net investment income |
From net
realized gains |
Total
distributions |
|||||||||||||||
| FOR THE YEAR ENDED AUGUST 31, | ||||||||||||||||||||||
| 2000 – Class A Shares | $34.21 | $ 0.10 | (c) | $6.00 | $6.10 | $ — | $ — | $(3.54 | ) | $(3.54 | ) | |||||||||||
| 2000 – Class B Shares | 33.56 | (0.14) | (c) | 5.83 | 5.69 | — | — | (3.54 | ) | (3.54 | ) | |||||||||||
| 2000 – Class C Shares | 33.46 | (0.13) | (c) | 5.80 | 5.67 | — | — | (3.54 | ) | (3.54 | ) | |||||||||||
| 2000 – Institutional Shares | 34.61 | 0.24 | (c) | 6.07 | 6.31 | (0.08 | ) | — | (3.54 | ) | (3.62 | ) | ||||||||||
| 2000 – Service Shares | 34.05 | 0.07 | (c) | 5.96 | 6.03 | — | — | (3.54 | ) | (3.54 | ) | |||||||||||
| FOR THE SEVEN-MONTH PERIOD ENDED AUGUST 31, | ||||||||||||||||||||||
| 1999 – Class A Shares | 32.98 | 0.03 | 1.20 | 1.23 | — | — | — | — | ||||||||||||||
| 1999 – Class B Shares | 32.50 | (0.11 | ) | 1.17 | 1.06 | — | — | — | — | |||||||||||||
| 1999 – Class C Shares | 32.40 | (0.10 | ) | 1.16 | 1.06 | — | — | — | — | |||||||||||||
| 1999 – Institutional Shares | 33.29 | 0.11 | 1.21 | 1.32 | — | — | — | — | ||||||||||||||
| 1999 – Service Shares | 32.85 | 0.01 | 1.19 | 1.20 | — | — | — | — | ||||||||||||||
| FOR THE YEARS ENDED JANUARY 31, | ||||||||||||||||||||||
| 1999 – Class A Shares | 26.59 | 0.04 | 7.02 | 7.06 | (0.03 | ) | (0.01 | ) | (0.63 | ) | (0.67 | ) | ||||||||||
| 1999 – Class B Shares | 26.32 | (0.10 | ) | 6.91 | 6.81 | — | — | (0.63 | ) | (0.63 | ) | |||||||||||
| 1999 – Class C Shares | 26.24 | (0.10 | ) | 6.89 | 6.79 | — | — | (0.63 | ) | (0.63 | ) | |||||||||||
| 1999 – Institutional Shares | 26.79 | 0.20 | 7.11 | 7.31 | (0.15 | ) | (0.03 | ) | (0.63 | ) | (0.81 | ) | ||||||||||
| 1999 – Service Shares | 26.53 | 0.06 | 7.01 | 7.07 | (0.10 | ) | (0.02 | ) | (0.63 | ) | (0.75 | ) | ||||||||||
| 1998 – Class A Shares | 23.32 | 0.11 | 5.63 | 5.74 | (0.12 | ) | — | (2.35 | ) | (2.47 | ) | |||||||||||
| 1998 – Class B Shares | 23.18 | 0.11 | 5.44 | 5.55 | — | (0.06 | ) | (2.35 | ) | (2.41 | ) | |||||||||||
| 1998 – Class C Shares (commenced August 15, 1997) | 27.48 | 0.03 | 1.22 | 1.25 | — | (0.14 | ) | (2.35 | ) | (2.49 | ) | |||||||||||
| 1998 – Institutional Shares | 23.44 | 0.30 | 5.65 | 5.95 | (0.24 | ) | (0.01 | ) | (2.35 | ) | (2.60 | ) | ||||||||||
| 1998 – Service Shares | 23.27 | 0.19 | 5.57 | 5.76 | (0.07 | ) | (0.08 | ) | (2.35 | ) | (2.50 | ) | ||||||||||
| 1997 – Class A Shares | 19.66 | 0.16 | 4.46 | 4.62 | (0.16 | ) | — | (0.80 | ) | (0.96 | ) | |||||||||||
| 1997 – Class B Shares (commenced May 1, 1996) | 20.44 | 0.04 | 3.70 | 3.74 | (0.04 | ) | (0.16 | ) | (0.80 | ) | (1.00 | ) | ||||||||||
| 1997 – Institutional Shares | 19.71 | 0.30 | 4.51 | 4.81 | (0.28 | ) | — | (0.80 | ) | (1.08 | ) | |||||||||||
| 1997 – Service Shares (commenced June 7, 1996) | 21.02 | 0.13 | 3.15 | 3.28 | (0.13 | ) | (0.10 | ) | (0.80 | ) | (1.03 | ) | ||||||||||
| 1996 – Class A Shares | 14.61 | 0.19 | 5.43 | 5.62 | (0.16 | ) | — | (0.41 | ) | (0.57 | ) | |||||||||||
| 1996 – Institutional Shares (commenced June 15, 1995) | 16.97 | 0.16 | 3.23 | 3.39 | (0.24 | ) | — | (0.41 | ) | (0.65 | ) | |||||||||||
(a)
|
Assumes investment at the net asset value at the beginning of the period, reinvestment of all dividends and distributions, a
complete redemption of the investment at the net asset value at the end of the period and no sales or redemption charges. Total return would be reduced if a sales or redemption charge were taken into account. Total returns for periods less than one full
year are not annualized.
|
(b)
|
Annualized.
|
(c)
|
Calculated based on the average shares outstanding methodology.
|
|
Ratios assuming no expense reductions |
|||||||||||||||||||||
|---|---|---|---|---|---|---|---|---|---|---|---|---|---|---|---|---|---|---|---|---|---|
| Net asset
value, end of period |
Total
return (a) |
Net assets
at end of period (in 000s) |
Ratio of
net expenses to average net assets |
Ratio of
net investment income (loss) to average net assets |
Ratio of
expenses to average net assets |
Ratio of
net investment income (loss) to average net assets |
Portfolio
turnover rate |
||||||||||||||
| $36.77 | 18.96 | % | $715,775 | 1.14 | % | 0.31 | % | 1.23 | % | 0.22 | % | 59.27 | % | ||||||||
| 35.71 | 18.03 | 275,673 | 1.89 | (0.44 | ) | 1.98 | (0.53 | ) | 59.27 | ||||||||||||
| 35.59 | 18.03 | 62,820 | 1.89 | (0.43 | ) | 1.98 | (0.52 | ) | 59.27 | ||||||||||||
| 37.30 | 19.41 | 379,172 | 0.74 | 0.71 | 0.83 | 0.62 | 59.27 | ||||||||||||||
| 36.54 | 18.83 | 11,879 | 1.24 | 0.19 | 1.33 | 0.10 | 59.27 | ||||||||||||||
| 34.21 | 3.73 | 614,310 | 1.14 | (b) | 0.15 | (b) | 1.24 | (b) | 0.05 | (b) | 41.84 | ||||||||||
| 33.56 | 3.26 | 214,087 | 1.89 | (b) | (0.60 | ) (b) | 1.99 | (b) | (0.70 | ) (b) | 41.84 | ||||||||||
| 33.46 | 3.27 | 43,361 | 1.89 | (b) | (0.61 | ) (b) | 1.99 | (b) | (0.71 | ) (b) | 41.84 | ||||||||||
| 34.61 | 3.97 | 335,465 | 0.74 | (b) | 0.54 | (b) | 0.84 | (b) | 0.44 | (b) | 41.84 | ||||||||||
| 34.05 | 3.65 | 11,204 | 1.24 | (b) | 0.06 | (b) | 1.34 | (b) | (0.04 | ) (b) | 41.84 | ||||||||||
| 32.98 | 26.89 | 605,566 | 1.23 | 0.15 | 1.36 | 0.02 | 63.79 | ||||||||||||||
| 32.50 | 26.19 | 152,347 | 1.85 | (0.50 | ) | 1.98 | (0.63 | ) | 63.79 | ||||||||||||
| 32.40 | 26.19 | 26,912 | 1.87 | (0.53 | ) | 2.00 | (0.66 | ) | 63.79 | ||||||||||||
| 33.29 | 27.65 | 307,200 | 0.69 | 0.69 | 0.82 | 0.56 | 63.79 | ||||||||||||||
| 32.85 | 27.00 | 11,600 | 1.19 | 0.19 | 1.32 | 0.06 | 63.79 | ||||||||||||||
| 26.59 | 24.96 | 398,393 | 1.28 | 0.51 | 1.47 | 0.32 | 65.89 | ||||||||||||||
| 26.32 | 24.28 | 59,208 | 1.79 | (0.05 | ) | 1.96 | (0.22 | ) | 65.89 | ||||||||||||
| 26.24 | 4.85 | 6,267 | 1.78 | (b) | (0.21 | ) (b) | 1.95 | (b) | (0.38 | ) (b) | 65.89 | ||||||||||
| 26.79 | 25.76 | 202,893 | 0.65 | 1.16 | 0.82 | 0.99 | 65.89 | ||||||||||||||
| 26.53 | 25.11 | 7,841 | 1.15 | 0.62 | 1.32 | 0.45 | 65.89 | ||||||||||||||
| 23.32 | 23.75 | 225,968 | 1.29 | 0.91 | 1.53 | 0.67 | 37.28 | ||||||||||||||
| 23.18 | 18.59 | 17,258 | 1.83 | (b) | 0.06 | (b) | 2.00 | (b) | (0.11 | ) (b) | 37.28 | ||||||||||
| 23.44 | 24.63 | 148,942 | 0.65 | 1.52 | 0.85 | 1.32 | 37.28 | ||||||||||||||
| 23.27 | 15.92 | 3,666 | 1.15 | (b) | 0.69 | (b) | 1.35 | (b) | 0.49 | (b) | 37.28 | ||||||||||
| 19.66 | 38.63 | 129,045 | 1.25 | 1.01 | 1.55 | 0.71 | 39.35 | ||||||||||||||
| 19.71 | 20.14 | 64,829 | 0.65 | (b) | 1.49 | (b) | 0.96 | (b) | 1.18 | (b) | 39.35 | ||||||||||
| Income from
investment |
Distributions to shareholders |
||||||||||||||||||||||||
|---|---|---|---|---|---|---|---|---|---|---|---|---|---|---|---|---|---|---|---|---|---|---|---|---|---|
| Net asset
value, beginning of period |
Net
investment income (loss) |
Net realized
and unrealized gain |
Total from
investment operations |
From net
investment income |
In excess
of net investment income |
From
net realized gains |
Total
distributions |
||||||||||||||||||
| FOR THE YEAR ENDED AUGUST 31, | |||||||||||||||||||||||||
| 2000 – Class A Shares | $17.02 | $ 0.06 | (c) | $5.67 | $5.73 | $ — | $ — | $(0.09 | ) | $(0.09 | ) | ||||||||||||||
| 2000 – Class B Shares | 16.75 | (0.09 | ) (c) | 5.57 | 5.48 | — | — | (0.09 | ) | (0.09 | ) | ||||||||||||||
| 2000 – Class C Shares | 16.75 | (0.08 | ) (c) | 5.57 | 5.49 | — | — | (0.09 | ) | (0.09 | ) | ||||||||||||||
| 2000 – Institutional Shares | 17.10 | 0.13 | (c) | 5.73 | 5.86 | — | — | (0.09 | ) | (0.09 | ) | ||||||||||||||
| 2000 – Service Shares | 16.95 | 0.03 | (c) | 5.66 | 5.69 | — | — | (0.09 | ) | (0.09 | ) | ||||||||||||||
| FOR THE SEVEN-MONTH PERIOD ENDED AUGUST 31, | |||||||||||||||||||||||||
| 1999 – Class A Shares | 16.17 | (0.01 | ) | 0.86 | 0.85 | — | — | — | — | ||||||||||||||||
| 1999 – Class B Shares | 15.98 | (0.07 | ) | 0.84 | 0.77 | — | — | — | — | ||||||||||||||||
| 1999 – Class C Shares | 15.99 | (0.07 | ) | 0.83 | 0.76 | — | — | — | — | ||||||||||||||||
| 1999 – Institutional Shares | 16.21 | 0.03 | 0.86 | 0.89 | — | — | — | — | |||||||||||||||||
| 1999 – Service Shares | 16.11 | (0.02 | ) | 0.86 | 0.84 | — | — | — | — | ||||||||||||||||
| FOR THE YEAR ENDED JANUARY 31, | |||||||||||||||||||||||||
| 1999 – Class A Shares | 11.97 | 0.01 | 4.19 | 4.20 | — | — | — | — | |||||||||||||||||
| 1999 – Class B Shares | 11.92 | (0.06 | ) | 4.12 | 4.06 | — | — | — | — | ||||||||||||||||
| 1999 – Class C Shares | 11.93 | (0.05 | ) | 4.11 | 4.06 | — | — | — | — | ||||||||||||||||
| 1999 – Institutional Shares | 11.97 | 0.02 | 4.23 | 4.25 | — | (0.01 | ) | — | (0.01 | ) | |||||||||||||||
| 1999 – Service Shares | 11.95 | (0.01 | ) | 4.17 | 4.16 | — | — | — | — | ||||||||||||||||
| FOR THE PERIOD ENDED JANUARY 31, | |||||||||||||||||||||||||
| 1998 – Class A Shares (commenced May 1, 1997) | 10.00 | 0.01 | 2.35 | 2.36 | (0.01 | ) | — | (0.38 | ) | (0.39 | ) | ||||||||||||||
| 1998 – Class B Shares (commenced May 1, 1997) | 10.00 | (0.03 | ) | 2.33 | 2.30 | — | — | (0.38 | ) | (0.38 | ) | ||||||||||||||
| 1998 – Class C Shares (commenced August 15, 1997) | 11.80 | (0.02 | ) | 0.54 | 0.52 | — | (0.01 | ) | (0.38 | ) | (0.39 | ) | |||||||||||||
| 1998 – Institutional Shares (commenced May 1, 1997) | 10.00 | 0.01 | 2.35 | 2.36 | (0.01 | ) | — | (0.38 | ) | (0.39 | ) | ||||||||||||||
| 1998 – Service Shares (commenced May 1, 1997) | 10.00 | (0.02 | ) | 2.35 | 2.33 | — | — | (0.38 | ) | (0.38 | ) | ||||||||||||||
(a)
|
Assumes investment at the net asset value at the beginning of the period, reinvestment of all dividends and distributions, a
complete redemption of the investment at the net asset value at the end of the period and no sales or redemption charges. Total return would be reduced if a sales or redemption charge were taken into account. Total returns for periods less than one full
year are not annualized.
|
(b)
|
Annualized.
|
(c)
|
Calculated based on the average shares outstanding methodology.
|
|
Ratios assuming no expense reductions |
|||||||||||||||||||||
|---|---|---|---|---|---|---|---|---|---|---|---|---|---|---|---|---|---|---|---|---|---|
| Net asset
value, end of period |
Total
return (a) |
Net assets
at end of period (in 000s) |
Ratio of
net expenses to average net assets |
Ratio of
net investment income (loss) to average net assets |
Ratio of
expenses to average net assets |
Ratio of
net investment income (loss) to average net assets |
Portfolio
turnover rate |
||||||||||||||
| $22.66 | 33.73 | % | $545,763 | 1.09 | % | 0.31 | % | 1.24 | % | 0.16 | % | 72.59 | % | ||||||||
| 22.14 | 32.78 | 338,128 | 1.84 | (0.44 | ) | 1.99 | (0.59 | ) | 72.59 | ||||||||||||
| 22.15 | 32.84 | 154,966 | 1.84 | (0.43 | ) | 1.99 | (0.58 | ) | 72.59 | ||||||||||||
| 22.87 | 34.34 | 322,900 | 0.69 | 0.65 | 0.84 | 0.50 | 72.59 | ||||||||||||||
| 22.55 | 33.64 | 3,879 | 1.19 | 0.15 | 1.34 | — | 72.59 | ||||||||||||||
| 17.02 | 5.26 | 300,684 | 1.04 | (b) | (0.11 | ) (b) | 1.26 | (b) | (0.33 | ) (b) | 32.74 | ||||||||||
| 16.75 | 4.82 | 181,626 | 1.79 | (b) | (0.87 | ) (b) | 2.01 | (b) | (1.09 | ) (b) | 32.74 | ||||||||||
| 16.75 | 4.75 | 75,502 | 1.79 | (b) | (0.87 | ) (b) | 2.01 | (b) | (1.09 | ) (b) | 32.74 | ||||||||||
| 17.10 | 5.49 | 310,704 | 0.64 | (b) | 0.31 | (b) | 0.86 | (b) | 0.09 | (b) | 32.74 | ||||||||||
| 16.95 | 5.21 | 2,510 | 1.14 | (b) | (0.21 | ) (b) | 1.36 | (b) | (0.43 | ) (b) | 32.74 | ||||||||||
| 16.17 | 35.10 | 175,510 | 0.97 | 0.05 | 1.46 | (0.44 | ) | 63.15 | |||||||||||||
| 15.98 | 34.07 | 93,711 | 1.74 | (0.73 | ) | 2.11 | (1.10 | ) | 63.15 | ||||||||||||
| 15.99 | 34.04 | 37,081 | 1.74 | (0.74 | ) | 2.11 | (1.11 | ) | 63.15 | ||||||||||||
| 16.21 | 35.54 | 295,734 | 0.65 | 0.35 | 1.02 | (0.02 | ) | 63.15 | |||||||||||||
| 16.11 | 34.85 | 1,663 | 1.15 | (0.16 | ) | 1.52 | (0.53 | ) | 63.15 | ||||||||||||
| 11.97 | 23.79 | 53,786 | 0.91 | (b) | 0.12 | (b) | 2.40 | (b) | (1.37 | ) (b) | 74.97 | ||||||||||
| 11.92 | 23.26 | 13,857 | 1.67 | (b) | (0.72 | ) (b) | 2.91 | (b) | (1.96 | ) (b) | 74.97 | ||||||||||
| 11.93 | 4.56 | 4,132 | 1.68 | (b) | (0.76 | ) (b) | 2.92 | (b) | (2.00 | ) (b) | 74.97 | ||||||||||
| 11.97 | 23.89 | 4,656 | 0.72 | (b) | 0.42 | (b) | 1.96 | (b) | (0.82 | ) (b) | 74.97 | ||||||||||
| 11.95 | 23.56 | 115 | 1.17 | (b) | (0.21 | ) (b) | 2.41 | (b) | (1.45 | ) (b) | 74.97 | ||||||||||
| Income from investment |
Distributions to shareholders |
|||||||||||||||||||
|---|---|---|---|---|---|---|---|---|---|---|---|---|---|---|---|---|---|---|---|---|
| Net asset
value, beginning of period |
Net
investment income (loss) |
Net realized
and unrealized gain (loss) |
Total from
investment operations |
From net
investment income |
From net
realized gains |
Total
distributions |
||||||||||||||
| FOR THE YEAR ENDED AUGUST 31, | ||||||||||||||||||||
| 2000 – Class A Shares | $10.23 | $(0.03 | ) (c) | $2.70 | $2.67 | $ — | $ — | $ — | ||||||||||||
| 2000 – Class B Shares | 10.09 | (0.11 | ) (c) | 2.65 | 2.54 | — | — | — | ||||||||||||
| 2000 – Class C Shares | 10.10 | (0.10 | ) (c) | 2.66 | 2.56 | — | — | — | ||||||||||||
| 2000 – Institutional Shares | 10.30 | 0.02 | (c) | 2.71 | 2.73 | — | — | — | ||||||||||||
| 2000 – Service Shares | 10.22 | (0.04 | ) (c) | 2.69 | 2.65 | — | — | — | ||||||||||||
| FOR THE SEVEN-MONTH PERIOD ENDED AUGUST 31, | ||||||||||||||||||||
| 1999 – Class A Shares | 10.16 | (0.01 | ) | 0.08 | 0.07 | — | — | — | ||||||||||||
| 1999 – Class B Shares | 10.07 | (0.05 | ) | 0.07 | 0.02 | — | — | — | ||||||||||||
| 1999 – Class C Shares | 10.08 | (0.05 | ) | 0.07 | 0.02 | — | — | — | ||||||||||||
| 1999 – Institutional Shares | 10.20 | 0.02 | 0.08 | 0.10 | — | — | — | |||||||||||||
| 1999 – Service Shares | 10.16 | (0.01 | ) | 0.07 | 0.06 | — | — | — | ||||||||||||
| FOR THE YEAR ENDED JANUARY 31, | ||||||||||||||||||||
| 1999 – Class A Shares | 10.59 | 0.01 | (0.43 | ) | (0.42 | ) | (0.01) | — | (0.01 | ) | ||||||||||
| 1999 – Class B Shares | 10.56 | (0.05 | ) | (0.44 | ) | (0.49 | ) | — | — | — | ||||||||||
| 1999 – Class C Shares | 10.57 | (0.04 | ) | (0.45 | ) | (0.49 | ) | — | — | — | ||||||||||
| 1999 – Institutional Shares | 10.61 | 0.04 | (0.43 | ) | (0.39 | ) | (0.02) | — | (0.02 | ) | ||||||||||
| 1999 – Service Shares | 10.60 | 0.01 | (0.44 | ) | (0.43 | ) | (0.01) | — | (0.01 | ) | ||||||||||
| FOR THE PERIOD ENDED JANUARY 31, | ||||||||||||||||||||
| 1998 – Class A Shares (commenced August 15, 1997) | 10.00 | (0.01 | ) | 0.65 | 0.64 | — | (0.05 | ) | (0.05 | ) | ||||||||||
| 1998 – Class B Shares (commenced August 15, 1997) | 10.00 | (0.03 | ) | 0.64 | 0.61 | — | (0.05 | ) | (0.05 | ) | ||||||||||
| 1998 – Class C Shares (commenced August 15, 1997) | 10.00 | (0.02 | ) | 0.64 | 0.62 | — | (0.05 | ) | (0.05 | ) | ||||||||||
| 1998 – Institutional Shares (commenced August 15, 1997) | 10.00 | 0.01 | 0.65 | 0.66 | — | (0.05 | ) | (0.05 | ) | |||||||||||
| 1998 – Service Shares (commenced August 15, 1997) | 10.00 | 0.01 | 0.64 | 0.65 | — | (0.05 | ) | (0.05 | ) | |||||||||||
| |
||||||||||||||||||||
(a)
|
Assumes investment at the net asset value at the beginning of the period, reinvestment of all dividends and distributions, a
complete redemption of the investment at the net asset value at the end of the period and no sales or redemption charges. Total return would be reduced if a sales or redemption charge were taken into account. Total returns for periods less than one full
year are not annualized.
|
(b)
|
Annualized.
|
(c)
|
Calculated based on the average shares outstanding methodology.
|
| Ratios assuming no expense reductions |
|||||||||||||||||||||
|---|---|---|---|---|---|---|---|---|---|---|---|---|---|---|---|---|---|---|---|---|---|
| Net asset
value, end of period |
Total
return (a) |
Net assets
at end of period (in 000s) |
Ratio of
net expenses to average net assets |
Ratio of
net investment income (loss) to average net assets |
Ratio of
expenses to average net assets |
Ratio of
net investment loss to average net assets |
Portfolio
turnover rate |
||||||||||||||
| $12.90 | 26.10 | % | $54,954 | 1.33 | % | (0.21 | )% | 1.55 | % | (0.43 | ) | 135.36 | % | ||||||||
| 12.63 | 25.17 | 17,923 | 2.08 | (0.96 | ) | 2.30 | (1.18 | ) | 135.36 | ||||||||||||
| 12.66 | 25.35 | 8,289 | 2.08 | (0.96 | ) | 2.30 | (1.18 | ) | 135.36 | ||||||||||||
| 13.03 | 26.60 | 86,196 | 0.93 | 0.19 | 1.15 | (0.03 | ) | 135.36 | |||||||||||||
| 12.87 | 25.93 | 63 | 1.43 | (0.30 | ) | 1.65 | (0.52 | ) | 135.36 | ||||||||||||
| 10.23 | 0.69 | 52,660 | 1.33 | (b) | (0.12 | ) (b) | 1.67 | (b) | (0.46 | ) (b) | 52.03 | ||||||||||
| 10.09 | 0.20 | 13,711 | 2.08 | (b) | (0.86 | ) (b) | 2.42 | (b) | (1.20 | ) (b) | 52.03 | ||||||||||
| 10.10 | 0.20 | 6,274 | 2.08 | (b) | (0.86 | ) (b) | 2.42 | (b) | (1.20 | ) (b) | 52.03 | ||||||||||
| 10.30 | 0.98 | 62,633 | 0.93 | (b) | 0.28 | (b) | 1.27 | (b) | (0.06 | ) (b) | 52.03 | ||||||||||
| 10.22 | 0.59 | 64 | 1.43 | (b) | (0.22 | ) (b) | 1.77 | (b) | (0.56 | ) (b) | 52.03 | ||||||||||
| 10.16 | (3.97 | ) | 64,087 | 1.31 | 0.08 | 2.00 | (0.61 | ) | 75.38 | ||||||||||||
| 10.07 | (4.64 | ) | 15,406 | 2.00 | (0.55 | ) | 2.62 | (1.17 | ) | 75.38 | |||||||||||
| 10.08 | (4.64 | ) | 6,559 | 2.01 | (0.56 | ) | 2.63 | (1.18 | ) | 75.38 | |||||||||||
| 10.20 | (3.64 | ) | 62,763 | 0.94 | 0.60 | 1.56 | (0.02 | ) | 75.38 | ||||||||||||
| 10.16 | (4.07 | ) | 54 | 1.44 | 0.01 | 2.06 | (0.61 | ) | 75.38 | ||||||||||||
| 10.59 | 6.37 | 11,118 | 1.25 | (b) | (0.36 | ) (b) | 3.92 | (b) | (3.03 | ) (b) | 37.65 | ||||||||||
| 10.56 | 6.07 | 9,957 | 1.95 | (b) | (1.04 | ) (b) | 4.37 | (b) | (3.46 | ) (b) | 37.65 | ||||||||||
| 10.57 | 6.17 | 2,557 | 1.95 | (b) | (1.07 | ) (b) | 4.37 | (b) | (3.49 | ) (b) | 37.65 | ||||||||||
| 10.61 | 6.57 | 9,026 | 0.95 | (b) | 0.15 | (b) | 3.37 | (b) | (2.27 | ) (b) | 37.65 | ||||||||||
| 10.60 | 6.47 | 2 | 1.45 | (b) | 0.40 | (b) | 3.87 | (b) | (2.02 | ) (b) | 37.65 | ||||||||||
| Income from
investment |
Distributions to
shareholders |
||||||||||||||||||
|---|---|---|---|---|---|---|---|---|---|---|---|---|---|---|---|---|---|---|---|
| Net asset
value, beginning of period |
Net
investment income |
Net realized
and unrealized gain |
Total from
investment operations |
From net
investment income |
From net
realized gains |
Total
distributions |
|||||||||||||
| FOR THE YEAR ENDED AUGUST 31, | |||||||||||||||||||
| 2000 – Class A Shares | $10.55 | $0.12 | (c) | $0.36 | $0.48 | $(0.10 | ) | $(0.12 | ) | $(0.22 | ) | ||||||||
| 2000 – Class B Shares | 10.50 | 0.05 | (c) | 0.36 | 0.41 | (0.04 | ) | (0.12 | ) | (0.16 | ) | ||||||||
| 2000 – Class C Shares | 10.51 | 0.04 | (c) | 0.37 | 0.41 | (0.04 | ) | (0.12 | ) | (0.16 | ) | ||||||||
| 2000 – Institutional Shares | 10.55 | 0.16 | (c) | 0.37 | 0.53 | (0.14 | ) | (0.12 | ) | (0.26 | ) | ||||||||
| 2000 – Service Shares | 10.55 | 0.11 | (c) | 0.36 | 0.47 | (0.09 | ) | (0.12 | ) | (0.21 | ) | ||||||||
| FOR THE SEVEN-MONTH PERIOD ENDED AUGUST 31, | |||||||||||||||||||
| 1999 – Class A Shares | 10.15 | 0.04 | 0.40 | 0.44 | (0.04 | ) | — | (0.04 | ) | ||||||||||
| 1999 – Class B Shares | 10.15 | 0.01 | 0.36 | 0.37 | (0.02 | ) | — | (0.02 | ) | ||||||||||
| 1999 – Class C Shares | 10.15 | 0.01 | 0.37 | 0.38 | (0.02 | ) | — | (0.02 | ) | ||||||||||
| 1999 – Institutional Shares | 10.16 | 0.06 | 0.38 | 0.44 | (0.05 | ) | — | (0.05 | ) | ||||||||||
| 1999 – Service Shares | 10.16 | 0.02 | 0.40 | 0.42 | (0.03 | ) | — | (0.03 | ) | ||||||||||
| FOR THE PERIOD ENDED JANUARY 31, | |||||||||||||||||||
| 1999 – Class A Shares (commenced December 31, 1998) | 10.00 | 0.01 | 0.14 | 0.15 | — | — | — | ||||||||||||
| 1999 – Class B Shares (commenced December 31, 1998) | 10.00 | — | 0.15 | 0.15 | — | — | — | ||||||||||||
| 1999 – Class C Shares (commenced December 31, 1998) | 10.00 | — | 0.15 | 0.15 | — | — | — | ||||||||||||
| 1999 – Institutional Shares (commenced December 31, 1998) | 10.00 | 0.01 | 0.15 | 0.16 | — | — | — | ||||||||||||
| 1999 – Service Shares (commenced December 31, 1998) | 10.00 | 0.02 | 0.14 | 0.16 | — | — | — | ||||||||||||
(a)
|
Assumes investment at the net asset value at the beginning of the period, reinvestment of all dividends and distributions, a
complete redemption of the investment at the net asset value at the end of the period and no sales or redemption charges. Total return would be reduced if a sales or redemption charge were taken into account. Total returns for periods less than one full
year are not annualized.
|
(b)
|
Annualized.
|
(c)
|
Calculated based on the average shares outstanding methodology.
|
|
Ratios assuming no expense reductions |
||||||||||||||||||||
|---|---|---|---|---|---|---|---|---|---|---|---|---|---|---|---|---|---|---|---|---|
| Net asset
value, end of period |
Total
return (a) |
Net assets
at end of period (in 000s) |
Ratio of
net expenses to average net assets |
Ratio of
net investment income to average net assets |
Ratio of
expenses to average net assets |
Ratio of
net investment income (loss) to average net assets |
Portfolio
turnover rate |
|||||||||||||
| $10.81 | 4.68 | % | $100,972 | 1.06% | 1.14 | % | 1.17 | % | 1.03 | % | 83.30 | % | ||||||||
| 10.75 | 3.96 | 19,069 | 1.81 | 0.44 | 1.92 | 0.33 | 83.30 | |||||||||||||
| 10.76 | 3.97 | 11,178 | 1.81 | 0.45 | 1.92 | 0.34 | 83.30 | |||||||||||||
| 10.82 | 5.20 | 175,493 | 0.66 | 1.54 | 0.77 | 1.43 | 83.30 | |||||||||||||
| 10.81 | 4.60 | 12 | 1.16 | 1.07 | 1.27 | 0.96 | 83.30 | |||||||||||||
| 10.55 | 4.31 | 91,072 | 1.04 (b) | 0.87 | (b) | 1.21 | (b) | 0.70 | (b) | 36.10 | ||||||||||
| 10.50 | 3.68 | 14,464 | 1.79 (b) | 0.05 | (b) | 1.96 | (b) | (0.12 | ) (b) | 36.10 | ||||||||||
| 10.51 | 3.73 | 8,032 | 1.79 (b) | 0.09 | (b) | 1.96 | (b) | (0.08 | ) (b) | 36.10 | ||||||||||
| 10.55 | 4.35 | 189,540 | 0.64 (b) | 1.29 | (b) | 0.81 | (b) | 1.12 | (b) | 36.10 | ||||||||||
| 10.55 | 4.11 | 13 | 1.14 (b) | 0.72 | (b) | 1.31 | (b) | 0.55 | (b) | 36.10 | ||||||||||
| 10.15 | 1.50 | 6,665 | 1.08 (b) | 1.45 | (b) | 8.03 | (b) | (5.50 | ) (b) | 0.00 | ||||||||||
| 10.15 | 1.50 | 340 | 1.82 (b) | 0.84 | (b) | 8.77 | (b) | (6.11 | ) (b) | 0.00 | ||||||||||
| 10.15 | 1.50 | 268 | 1.83 (b) | 0.70 | (b) | 8.78 | (b) | (6.25 | ) (b) | 0.00 | ||||||||||
| 10.16 | 1.60 | 53,396 | 0.66 (b) | 1.97 | (b) | 7.61 | (b) | (4.98 | ) (b) | 0.00 | ||||||||||
| 10.16 | 1.60 | 2 | 1.16 (b) | 2.17 | (b) | 8.11 | (b) | (4.78 | ) (b) | 0.00 | ||||||||||
| Income from
investment |
Distributions to
shareholders |
||||||||||||||||||||
|---|---|---|---|---|---|---|---|---|---|---|---|---|---|---|---|---|---|---|---|---|---|
| Net asset
value, beginning of period |
Net
investment income (loss) |
Net realized
and unrealized gain (loss) |
Total from
investment operations |
From net
investment income |
From net
realized gains |
Total
distributions |
|||||||||||||||
| FOR THE YEAR ENDED AUGUST 31, | |||||||||||||||||||||
| 2000 – Class A Shares | $10.87 | $ 0.02 | (c) | $ 0.74 | $ 0.76 | $(0.05 | ) | $(0.26 | ) | $(0.31 | ) | ||||||||||
| 2000 – Class B Shares | 10.81 | (0.04) | (c) | 0.73 | 0.69 | (0.02 | ) | (0.26 | ) | (0.28 | ) | ||||||||||
| 2000 – Class C Shares | 10.82 | (0.03) | (c) | 0.72 | 0.69 | (0.02 | ) | (0.26 | ) | (0.28 | ) | ||||||||||
| 2000 – Institutional Shares | 11.00 | 0.09 | (c) | 0.75 | 0.84 | (0.10 | ) | (0.26 | ) | (0.36 | ) | ||||||||||
| 2000 – Service Shares | 10.93 | 0.05 | (c) | 0.73 | 0.78 | (0.09 | ) | (0.26 | ) | (0.35 | ) | ||||||||||
| FOR THE SEVEN-MONTH PERIOD ENDED AUGUST 31, | |||||||||||||||||||||
| 1999 – Class A Shares | 9.98 | 0.05 | 0.84 | 0.89 | — | — | — | ||||||||||||||
| 1999 – Class B Shares | 9.95 | 0.01 | 0.85 | 0.86 | — | — | — | ||||||||||||||
| 1999 – Class C Shares | 9.96 | 0.01 | 0.85 | 0.86 | — | — | — | ||||||||||||||
| 1999 – Institutional Shares | 10.06 | 0.09 | 0.85 | 0.94 | — | — | — | ||||||||||||||
| 1999 – Service Shares | 10.02 | 0.01 | 0.90 | 0.91 | — | — | — | ||||||||||||||
| FOR THE YEAR ENDED JANUARY 31, | |||||||||||||||||||||
| 1999 – Class A Shares | 9.22 | (0.01 | ) | 0.79 | 0.78 | (0.02 | ) | — | ( 0.02 | ) | |||||||||||
| 1999 – Class B Shares | 9.21 | — | 0.74 | 0.74 | — | — | — | ||||||||||||||
| 1999 – Class C Shares | 9.22 | — | 0.74 | 0.74 | — | — | — | ||||||||||||||
| 1999 – Institutional Shares | 9.24 | 0.05 | 0.80 | 0.85 | (0.03 | ) | — | (0.03 | ) | ||||||||||||
| 1999 – Service Shares | 9.23 | — | 0.81 | 0.81 | (0.02 | ) | — | (0.02 | ) | ||||||||||||
| FOR THE PERIOD ENDED JANUARY 31, | |||||||||||||||||||||
| 1998 – Class A Shares (commenced August 15, 1997) | 10.00 | — | (0.78 | ) | (0.78 | ) | — | — | — | ||||||||||||
| 1998 – Class B Shares (commenced August 15, 1997) | 10.00 | (0.02 | ) | (0.77 | ) | (0.79 | ) | — | — | — | |||||||||||
| 1998 – Class C Shares (commenced August 15, 1997) | 10.00 | (0.02 | ) | (0.76 | ) | (0.78 | ) | — | — | — | |||||||||||
| 1998 – Institutional Shares (commenced August 15, 1997) | 10.00 | 0.02 | (0.76 | ) | (0.74 | ) | (0.02 | ) | — | (0.02 | ) | ||||||||||
| 1998 – Service Shares (commenced August 15, 1997) | 10.00 | 0.01 | (0.78 | ) | (0.77 | ) | — | — | — | ||||||||||||
| |
|||||||||||||||||||||
(a)
|
Assumes investment at the net asset value at the beginning of the period, reinvestment of all dividends and distributions, a
complete redemption of the investment at the net asset value at the end of the period and no sales or redemption charges. Total return would be reduced if a sales or redemption charge were taken into account. Total returns for periods less than one full
year are not annualized.
|
(b)
|
Annualized.
|
(c)
|
Calculated based on the average shares outstanding methodology.
|
|
Ratios assuming no expense redemptions |
|||||||||||||||||||||
|---|---|---|---|---|---|---|---|---|---|---|---|---|---|---|---|---|---|---|---|---|---|
| Net asset
value, end of period |
Total
return (a) |
Net assets
at end of period (in 000s) |
Ratio of
net expenses to average net assets |
Ratio of
net investment income (loss) to average net assets |
Ratio of
expenses to average net assets |
Ratio of
net investment income (loss) to average net assets |
Portfolio
turnover rate |
||||||||||||||
| $11.32 | 6.92 | % | $147,409 | 1.66 | % | 0.14 | % | 1.75 | % | 0.05 | % | 92.10 | % | ||||||||
| 11.22 | 6.36 | 12,032 | 2.16 | (0.36 | ) | 2.25 | (0.45 | ) | 92.10 | ||||||||||||
| 11.23 | 6.34 | 6,887 | 2.16 | (0.34 | ) | 2.25 | (0.43 | ) | 92.10 | ||||||||||||
| 11.48 | 7.62 | 308,074 | 1.01 | 0.78 | 1.10 | 0.69 | 92.10 | ||||||||||||||
| 11.36 | 7.05 | 27 | 1.51 | 0.33 | 1.60 | 0.24 | 92.10 | ||||||||||||||
| 10.87 | 8.92 | 114,502 | 1.66 | (b) | 0.78 | (b) | 1.76 | (b) | 0.68 | (b) | 64.97 | ||||||||||
| 10.81 | 8.64 | 9,171 | 2.16 | (b) | 0.26 | (b) | 2.26 | (b) | 0.16 | (b) | 64.97 | ||||||||||
| 10.82 | 8.63 | 4,913 | 2.16 | (b) | 0.23 | (b) | 2.26 | (b) | 0.13 | (b) | 64.97 | ||||||||||
| 11.00 | 9.34 | 271,212 | 1.01 | (b) | 1.43 | (b) | 1.11 | (b) | 1.33 | (b) | 64.97 | ||||||||||
| 10.93 | 9.08 | 8 | 1.51 | (b) | 0.07 | (b) | 1.61 | (b) | (0.03 | ) (b) | 64.97 | ||||||||||
| 9.98 | 8.37 | 110,338 | 1.63 | (0.11 | ) | 1.94 | (0.42 | ) | 194.61 | ||||||||||||
| 9.95 | 8.03 | 7,401 | 2.08 | (0.03 | ) | 2.39 | (0.34 | ) | 194.61 | ||||||||||||
| 9.96 | 8.03 | 3,742 | 2.08 | (0.04 | ) | 2.39 | (0.35 | ) | 194.61 | ||||||||||||
| 10.06 | 9.20 | 280,731 | 1.01 | 0.84 | 1.32 | 0.53 | 194.61 | ||||||||||||||
| 10.02 | 8.74 | 22 | 1.50 | 0.02 | 1.81 | (0.29 | ) | 194.61 | |||||||||||||
| 9.22 | (7.66 | ) | 7,087 | 1.50 | (b) | (0.27 | ) (b) | 4.87 | (b) | (3.90 | ) (b) | 25.16 | |||||||||
| 9.21 | (7.90 | ) | 2,721 | 2.00 | (b) | (0.72 | ) (b) | 5.12 | (b) | (3.84 | ) (b) | 25.16 | |||||||||
| 9.22 | (7.80 | ) | 1,608 | 2.00 | (b) | (0.73 | ) (b) | 5.12 | (b) | (3.85 | ) (b) | 25.16 | |||||||||
| 9.24 | (7.45 | ) | 17,719 | 1.00 | (b) | 0.59 | (b) | 4.12 | (b) | (2.53 | ) (b) | 25.16 | |||||||||
| 9.23 | (7.70 | ) | 1 | 1.50 | (b) | 0.26 | (b) | 4.62 | (b) | (2.86 | ) (b) | 25.16 | |||||||||
| To the Shareholders and Board of Trustees of
|
| Goldman Sachs Trust — CORE Equity Funds:
|
| In our opinion, the accompanying statements of assets and liabilities, including the statements of investments, and the related
statements of operations and of changes in net assets and the financial highlights present fairly, in all material respects, the financial position of Goldman Sachs CORE U.S. Equity Fund, CORE Large Cap Growth Fund, CORE Small Cap Equity Fund, CORE Large
Cap Value Fund and Core International Equity Fund (collectively, “the CORE Equity Funds”), portfolios of Goldman Sachs Trust at August 31, 2000, the results of each of their operations, the changes in each of their net assets and the financial
highlights for the year then ended, in conformity with accounting principles generally accepted in the United States of America. These financial statements and financial highlights (hereafter referred to as “financial statements”) are the
responsibility of the Core Equity Funds’ management; our responsibility is to express an opinion on these financial statements based on our audits. We conducted our audits of these financial statements in accordance with auditing standards generally
accepted in the United States of America, which require that we plan and perform the audits to obtain reasonable assurance about whether the financial statements are free of material misstatement. An audit includes examining, on a test basis, evidence
supporting the amounts and disclosures in the financial statements, assessing the accounting principles used and significant estimates made by management, and evaluating the overall financial statement presentation. We believe that our audits, which
included confirmation of securities at August 31, 2000 by correspondence with the custodian and brokers, provide a reasonable basis for our opinion. The statements of changes in net assets of the CORE Equity Funds for the periods ended August 31, 1999 and
January 31, 1999 and the financial highlights for each of the periods ended on or before August 31, 1999 were audited by other independent accountants whose report dated October 8, 1999 expressed an unqualified opinion thereon.
|
| PricewaterhouseCoopers LLP
|
| Boston, Massachusetts
|
| October 23, 2000
|
|
Shares |
Description | Value | |||
|---|---|---|---|---|---|
| Common Stocks – 94.1% | |||||
| Apparel – 1.3% | |||||
| 562,500 | Burlington Industries, Inc.* | $ 984,375 | |||
| 108,500 | Tropical Sportswear Int’l Corp.* | 1,959,781 | |||
| 2,944,156 | |||||
| Banks – 5.7% | |||||
| 159,100 | Community First Bankshares, Inc. | 2,863,800 | |||
| 20,500 | Corpus Bankshares, Inc. | 676,500 | |||
| 49,200 | Cullen/Frost Bankers, Inc. | 1,525,200 | |||
| 24,300 | Hamilton Bancorp, Inc.* | 361,463 | |||
| 260,500 | Pacific Century Financial Corp. | 3,647,000 | |||
| 78,600 | Susquehanna Bancshares, Inc. | 1,124,962 | |||
| 256,000 | The Colonial BancGroup, Inc. | 2,496,000 | |||
| 12,694,925 | |||||
| Chemicals – 6.8% | |||||
| 314,300 | Agrium, Inc. | 3,064,425 | |||
| 148,200 | IMC Global, Inc. | 2,176,687 | |||
| 980,800 | Methanex Corp.* | 5,884,800 | |||
| 178,000 | Millennium Chemicals, Inc. | 2,937,000 | |||
| 49,800 | The Lubrizol Corp. | 1,080,038 | |||
| 15,142,950 | |||||
| Clothing – 1.4% | |||||
| 128,300 | Urban Outfitters, Inc.* | 1,098,569 | |||
| 146,000 | Venator Group, Inc.* | 2,044,000 | |||
| 3,142,569 | |||||
| Computer Hardware – 2.8% | |||||
| 81,000 | Advanced Digital Information Corp.* | 1,377,000 | |||
| 127,100 | Ingram Micro, Inc.* | 1,906,500 | |||
| 57,100 | Tech Data Corp.* | 2,947,787 | |||
| 6,231,287 | |||||
| Computer Software – 1.7% | |||||
| 65,400 | Avant! Corp.* | 952,388 | |||
| 125,100 | Mentor Graphics Corp.* | 2,361,262 | |||
| 126,700 | Mobius Management Systems, Inc.* | 475,125 | |||
| 3,788,775 | |||||
| Construction – 1.6% | |||||
| 112,400 | D.R. Horton, Inc. | 2,205,850 | |||
| 113,300 | Morrison Knudsen Corp.* | 1,359,600 | |||
| 3,565,450 | |||||
| Consumer Durables – 2.0% | |||||
| 319,412 | Movado Group, Inc. | 4,471,768 | |||
| Department Store – 0.6% | |||||
| 118,500 | ShopKo Stores, Inc.* | 1,355,344 | |||
| Drugs – 0.2% | |||||
| 37,000 | Kos Pharmaceuticals, Inc.* | 518,000 | |||
| Electrical Equipment – 0.3% | |||||
| 113,200 | Brightpoint, Inc.* | 714,575 | |||
| Electrical Utilities – 6.0% | |||||
| 127,600 | Bangor Hydro-Electric Co. | 3,078,350 | |||
|
Shares |
Description | Value | |||
|---|---|---|---|---|---|
| Common Stocks – (continued) | |||||
| Electrical Utilities – continued | |||||
| 24,300 | IDACORP, Inc. | $ 958,331 | |||
| 285,100 | Public Service Co. of New Mexico | 6,094,012 | |||
| 106,500 | Sierra Pacific Resources | 1,883,719 | |||
| 59,000 | Western Resources, Inc. | 1,180,000 | |||
| 13,194,412 | |||||
| Energy Resources – 1.5% | |||||
| 35,200 | Louis Dreyfus Natural Gas Corp.* | 1,223,200 | |||
| 75,100 | Swift Energy Co.* | 2,173,206 | |||
| 3,396,406 | |||||
| Equity REIT – 10.4% | |||||
| 29,600 | Alexandria Real Estate Equities, Inc. | 1,036,000 | |||
| 18,700 | AvalonBay Communities, Inc. | 835,656 | |||
| 165,500 | Catellus Development Corp.* | 2,958,312 | |||
| 47,100 | CenterPoint Properties Corp. | 2,063,569 | |||
| 39,200 | Charles E. Smith Residential Realty,
Inc. |
1,612,100 | |||
| 49,700 | Cousins Properties, Inc. | 2,043,912 | |||
| 62,500 | Health Care Property Investors, Inc. | 1,644,531 | |||
| 77,400 | Liberty Property Trust | 2,022,075 | |||
| 75,400 | LNR Property Corp. | 1,602,250 | |||
| 126,600 | Prentiss Properties Trust | 3,077,962 | |||
| 43,100 | Reckson Associates Realty Corp. | 1,047,869 | |||
| 56,500 | Storage USA, Inc. | 1,702,063 | |||
| 98,100 | Trammell Crow Co.* | 1,361,138 | |||
| 23,007,437 | |||||
| Financial Services – 0.9% | |||||
| 58,800 | Allied Capital Corp. | 1,190,700 | |||
| 29,000 | Brown & Brown | 773,938 | |||
| 1,964,638 | |||||
| Food & Beverage – 1.6% | |||||
| 40,900 | Corn Products International, Inc. | 1,027,613 | |||
| 167,200 | Fleming Cos., Inc. | 2,581,150 | |||
| 3,608,763 | |||||
| Forest – 2.0% | |||||
| 145,200 | Caraustar Industries, Inc. | 2,241,525 | |||
| 178,800 | Packaging Corp. of America* | 2,089,725 | |||
| 4,331,250 | |||||
| Gas Utilities – 0.9% | |||||
| 46,900 | Laclede Gas Co. | 1,011,281 | |||
| 54,900 | Vectren Corp. | 1,043,100 | |||
| 2,054,381 | |||||
| Heavy Electrical – 2.6% | |||||
| 112,900 | Belden, Inc. | 2,949,512 | |||
| 130,000 | UCAR International, Inc.* | 1,771,250 | |||
| 144,300 | UNOVA, Inc.* | 1,082,250 | |||
| 5,803,012 | |||||
| Heavy Machinery – 1.9% | |||||
| 296,100 | AGCO Corp. | 3,109,050 | |||
| 218,300 | Titan International, Inc. | 1,105,144 | |||
| 4,214,194 | |||||
|
Shares |
Description | Value | |||
|---|---|---|---|---|---|
| Common Stocks – (continued) | |||||
| Hotels – 0.7% | |||||
| 91,500 | GTECH Holdings Corp.* | $ 1,635,563 | |||
| Industrial Parts – 4.4% | |||||
| 343,100 | Denison International PLC ADR* | 4,674,737 | |||
| 164,900 | Lydall, Inc.* | 1,989,106 | |||
| 205,400 | Milacron, Inc. | 3,170,863 | |||
| 9,834,706 | |||||
| Industrial Services – 2.8% | |||||
| 154,000 | ITT Educational Services, Inc.* | 3,542,000 | |||
| 173,200 | Pittston Brinks Group | 2,695,425 | |||
| 6,237,425 | |||||
| Information Services – 0.6% | |||||
| 124,100 | Modis Professional Services, Inc.* | 853,188 | |||
| 16,400 | National Data Corp. | 481,750 | |||
| 1,334,938 | |||||
| Life Insurance – 0.2% | |||||
| 18,600 | Liberty Financial Cos., Inc. | 439,425 | |||
| Media – 1.5% | |||||
| 63,300 | Media General, Inc. | 3,259,950 | |||
| Medical Products – 1.6% | |||||
| 81,900 | Haemonetics Corp.* | 2,062,856 | |||
| 34,400 | Varian Medical Systems, Inc. | 1,580,250 | |||
| 3,643,106 | |||||
| Medical Providers – 5.0% | |||||
| 1,070,700 | Beverly Enterprises, Inc.* | 5,554,256 | |||
| 178,300 | Foundation Health Systems, Inc.* | 3,131,394 | |||
| 170,600 | Manor Care, Inc.* | 2,281,775 | |||
| 10,967,425 | |||||
| Mining – 2.1% | |||||
| 38,400 | Commercial Metals Co. | 1,072,800 | |||
| 134,100 | Ispat International NV | 871,650 | |||
| 166,300 | Wolverine Tube, Inc.* | 2,764,738 | |||
| 4,709,188 | |||||
| Motor Vehicle – 1.3% | |||||
| 128,300 | Intermet Corp. | 994,325 | |||
| 156,900 | Lithia Motors, Inc.* | 1,922,025 | |||
| 2,916,350 | |||||
| Oil Refining – 0.5% | |||||
| 35,200 | Valero Energy Corp. | 1,060,400 | |||
| Oil Services – 1.7% | |||||
| 16,300 | Cal Dive International, Inc.* | 937,250 | |||
| 13,200 | Coflexip SA ADR | 784,163 | |||
| 104,300 | Stolt Offshore SA* | 1,447,162 | |||
| 51,100 | TETRA Technologies, Inc.* | 696,238 | |||
| 3,864,813 | |||||
| Property Insurance – 4.6% | |||||
| 93,500 | IPC Holdings Ltd. | 1,566,125 | |||
| 53,900 | Old Republic International Corp. | 1,290,231 | |||
| 196,400 | PXRE Group Ltd. | 2,675,950 | |||
| 196,700 | Zenith National Insurance Corp. | 4,560,981 | |||
| 10,093,287 | |||||
|
Shares |
Description | Value | ||||
|---|---|---|---|---|---|---|
| Common Stocks – (continued) | ||||||
| Publishing – 2.4% | ||||||
| 41,400 | ADVO, Inc.* | $ 1,694,812 | ||||
| 126,800 | Lee Enterprises, Inc. | 3,550,400 | ||||
| 5,245,212 | ||||||
| Restaurants – 2.8% | ||||||
| 245,500 | CBRL Group, Inc. | 2,961,344 | ||||
| 156,500 | Morton’s Restaurant Group, Inc.* | 3,286,500 | ||||
| 6,247,844 | ||||||
| Security/Asset Management – 0.7% | ||||||
| 35,400 | BlackRock, Inc.* | 1,451,400 | ||||
| Semiconductors – 3.4% | ||||||
| 292,300 | General Semiconductor, Inc.* | 4,256,619 | ||||
| 72,300 | MEMC Electronic Materials, Inc.* | 1,301,400 | ||||
| 41,000 | Pioneer-Standard Electronics, Inc. | 561,188 | ||||
| 11,900 | Siliconix, Inc.* | 664,912 | ||||
| 43,000 | Standard Microsystems Corp.* | 817,000 | ||||
| 7,601,119 | ||||||
| Specialty Retail – 1.8% | ||||||
| 138,500 | Brookstone, Inc.* | 1,809,156 | ||||
| 63,200 | The Boyds Collection Ltd.* | 560,900 | ||||
| 210,600 | The Good Guys, Inc.* | 1,632,150 | ||||
| 4,002,206 | ||||||
| Thrifts – 1.4% | ||||||
| 352,700 | Sovereign Bancorp, Inc. | 2,997,950 | ||||
| Truck Freight – 2.4% | ||||||
| 67,300 | Airborne Freight Corp. | 1,005,294 | ||||
| 35,000 | Landstar Systems, Inc.* | 1,785,000 | ||||
| 52,500 | Teekay Shipping Corp. | 2,428,125 | ||||
| 5,218,419 | ||||||
| TOTAL COMMON STOCKS | ||||||
| (Cost $190,973,518) | $208,905,018 | |||||
| Principal
Amount |
Interest
Rate |
Maturity
Date |
Value | ||||
|---|---|---|---|---|---|---|---|
| Repurchase Agreement – 4.7% | |||||||
| Joint Repurchase Agreement Account II /\ | |||||||
| $10,300,000 | 6.66% | 09/01/2000 | $ 10,300,000 | ||||
| TOTAL REPURCHASE AGREEMENT | |||||||
| (Cost $10,300,000) | $ 10,300,000 | ||||||
| TOTAL INVESTMENTS | |||||||
| (Cost $201,273,518) | $219,205,018 | ||||||
| * | Non-income producing security.
|
| /\
|
Joint repurchase agreement was entered into on August 31, 2000.
|
| The percentage shown for each investment category reflects the value of investments in that category as a percentage of total net
assets.
|
| |
| Investment Abbreviations:
|
| ADR —American Depositary Receipt
|
| |
August 31, 2000
| Assets:
|
| Investment in securities, at value (identified cost $201,273,518) | $219,205,018 | ||||||
| Cash | 54,991 | ||||||
| Receivables: | |||||||
| Investment securities sold | 2,865,775 | ||||||
| Fund shares sold | 888,208 | ||||||
| Dividends and interest | 194,755 | ||||||
| Reimbursement from adviser | 44,045 | ||||||
| Other assets | 5,308 | ||||||
| Total assets | 223,258,100 | ||||||
| Liabilities: | |||||||
| Payables: | |||||||
| Investment securities purchased | 579,757 | ||||||
| Fund shares repurchased | 429,342 | ||||||
| Amounts owed to affiliates | 279,287 | ||||||
| Accrued expenses and other liabilities | 23,779 | ||||||
| Total liabilities | 1,312,165 | ||||||
| Net Assets: | |||||||
| Paid-in capital | 258,062,378 | ||||||
| Accumulated net realized loss from investment and options transactions | (54,047,943 | ) | |||||
| Net unrealized gain on investments | 17,931,500 | ||||||
| NET ASSETS | $221,945,935 | ||||||
| Net asset value, offering and redemption price per share: (a) | |||||||
| Class A | $23.21 | ||||||
| Class B | $22.40 | ||||||
| Class C | $22.42 | ||||||
| Institutional | $23.47 | ||||||
| Service | $23.13 | ||||||
| Shares outstanding: | |||||||
| Class A | 6,798,488 | ||||||
| Class B | 1,303,543 | ||||||
| Class C | 375,860 | ||||||
| Institutional | 1,126,925 | ||||||
| Service | 3,580 | ||||||
| Total shares outstanding, $.001 par value (unlimited number of shares authorized) | 9,608,396 | ||||||
(a)
|
Maximum public offering price per share (NAV per share multiplied by 1.0582) for Class A shares is $24.56. At redemption, Class B
and Class C Shares may be subject to a contingent deferred sales charge, assessed on the amount equal to the lesser of the current net asset value or the original purchase price of the shares.
|
| |
| |
| |
| |
| |
| |
| |
| |
| |
| |
(a)
|
Foreign taxes withheld on dividends were $15,892.
|
(b)
|
Class A, Class B and Class C had Distribution and Service fees of $405,682, $285,873 and $70,710, respectively.
|
(c)
|
Class A, Class B, Class C, Institutional Class and Service Class had Transfer Agent fees of $308,318, $54,316, $13,435, $9,587 and
$21, respectively.
|
| For the
Year Ended August 31, 2000 |
For the
Seven-Months Ended August 31, 1999 |
For the
Year Ended January 31, 1999 |
||||||||
|---|---|---|---|---|---|---|---|---|---|---|
| From operations: | ||||||||||
| Net investment loss | $ (13,530 | ) | $ (764,389 | ) | $ (1,430,151 | ) | ||||
| Net realized loss on investment and options transactions | (8,307,106 | ) | (24,597,058 | ) | (21,053,205 | ) | ||||
| Net change in unrealized gain (loss) on investments | 36,005,585 | 42,816,511 | (75,425,946 | ) | ||||||
| Net increase (decrease) in net assets resulting from operations | 27,684,949 | 17,455,064 | (97,909,302 | ) | ||||||
| Distributions to shareholders: | ||||||||||
| From net realized gain on investment transactions | ||||||||||
| Class A Shares | — | — | (20,135,069 | ) | ||||||
| Class B Shares | — | — | (2,897,126 | ) | ||||||
| Class C Shares | — | — | (512,006 | ) | ||||||
| Institutional Shares | — | — | (946,473 | ) | ||||||
| Service Shares | — | — | (16,422 | ) | ||||||
| Total distributions to shareholders | — | — | (24,507,096 | ) | ||||||
| From share transactions: | ||||||||||
| Proceeds from sales of shares | 34,453,997 | 96,142,667 | 285,768,961 | |||||||
| Reinvestment of dividends and distributions | — | — | 22,881,335 | |||||||
| Cost of shares repurchased | (123,238,056 | ) | (158,916,521 | ) | (291,025,366 | ) | ||||
| Net increase (decrease) in net assets resulting from share transactions | (88,784,059 | ) | (62,773,854 | ) | 17,624,930 | |||||
| TOTAL DECREASE | (61,099,110 | ) | (45,318,790 | ) | (104,791,468 | ) | ||||
| Net assets: | ||||||||||
| Beginning of period | 283,045,045 | 328,363,835 | 433,155,303 | |||||||
| End of period | $221,945,935 | $283,045,045 | $328,363,835 | |||||||
| Accumulated net investment loss | — | — | — | |||||||
| 1. ORGANIZATION
|
| Goldman Sachs Trust (the “Trust”) is a Delaware business trust registered under the Investment Company Act of 1940 (as
amended) as an open-end management investment company. The Trust includes the Goldman Sachs Small Cap Value Fund (the “Fund”). The Fund is a diversified portfolio offering five classes of shares — Class A, Class B, Class C,
Institutional and Service.
|
| 2. SIGNIFICANT ACCOUNTING POLICIES
|
| The following is a summary of the significant accounting policies consistently followed by the Fund. The preparation of financial
statements in conformity with generally accepted accounting principles requires management to make estimates and assumptions that may affect the reported amounts. Actual results could differ from those estimates. Effective for fiscal year 1999, the Board
of Trustees approved a change in the fiscal year-end of the Fund from January 31 to August 31. Accordingly, the Statements of Changes in Net Assets, Summary of Share Transactions and the Financial Highlights of the Fund are included for the seven-month
period ended August 31, 1999 and the year ended January 31, 1999.
|
| A. Investment Valuation — Investments in
securities traded on a U.S. or foreign securities exchange or the NASDAQ system are valued daily at their last sale price on the principal exchange on which they are traded. If no sale occurs, securities are valued at the last bid price. Debt securities
are valued at prices supplied by independent pricing services, broker/dealer-supplied valuations or matrix pricing systems. Unlisted equity and debt securities for which market quotations are available are valued at the last sale price on valuation date,
or if no sale occurs, at the last bid price. Short-term debt obligations maturing in sixty days or less are valued at amortized cost, which approximates market value. Securities for which quotations are not readily available are valued at fair value using
methods approved by the Trust’s Board of Trustees.
|
| B. Security Transactions and Investment Income — Security transactions are recorded as of the trade date. Realized gains and losses on sales of portfolio securities are calculated using the identified-cost basis. Dividend income is recorded on the ex-dividend date, net of foreign withholding taxes
where applicable. Dividends for which the Fund has the choice to receive either cash or stock are recognized as investment income in an amount equal to the cash dividend. Interest income is recorded on the basis of interest accrued, premium amortized and
discount earned.
|
| Net investment income (other than class specific expenses) and unrealized and
realized gains or losses are allocated daily to each class of shares of the Fund based upon the relative proportion of net assets of each class.
|
| C. Federal Taxes — It is the Fund’s
policy to comply with the requirements of the Internal Revenue Code applicable to regulated investment companies and to distribute each year substantially all of its investment company taxable income and capital gains to its shareholders. Accordingly, no
federal tax provision is required. Income and capital gain distributions, if any, are declared and paid annually.
|
| The characterization of distributions to shareholders for financial reporting
purposes is determined in accordance with income tax rules. Therefore, the source of the Fund’s distributions may be shown in the accompanying financial statements as either from or in excess of net investment income or net realized gain on
investment transactions, or from paid-in-capital, depending on the type of book/tax differences that may exist.
|
| The Fund had approximately $42,959,499 at August 31, 2000 (the Fund’s tax
year-end) of capital loss carryforward expiring in 2006-2008 for federal tax purposes. This amount is available to be carried forward to offset future capital gains to the extent permitted by applicable laws or regulations.
|
| At August 31, 2000 the aggregate cost of portfolio securities for federal income
tax purposes is $203,053,683. Accordingly, the gross unrealized gain on investments was $34,834,050 and the gross unrealized loss on investments was $18,682,715 resulting in a net unrealized gain of $16,151,335.
|
| 2. SIGNIFICANT ACCOUNTING POLICIES (continued)
|
| D. Expenses — Expenses incurred by the
Trust that do not specifically relate to an individual fund of the Trust are allocated to the funds on a straight-line or pro rata basis depending upon the nature of the expense.
|
| Class A, Class B and Class C shareholders of the Fund bear all expenses and fees
relating to their respective Distribution and Service plans. Shareholders of Service shares bear all expenses and fees paid to service organizations. Each class of Shares of the Fund separately bears its respective class-specific Transfer Agency fees.
|
| E. Foreign Currency Translations — The
books and records of the Fund are maintained in U.S. dollars. Amounts denominated in foreign currencies are translated into U.S. dollars on the following basis: (i) investment valuations, foreign currency and other assets and liabilities initially
expressed in foreign currencies are converted each business day into U.S. dollars based upon current exchange rates; and (ii) purchases and sales of foreign investments, income and expenses are converted into U.S. dollars based upon currency exchange
rates prevailing on the respective dates of such transactions.
|
| Net realized and unrealized gain (loss) on foreign currency transactions will
represent: (i) foreign exchange gains and losses from the sale and holdings of foreign currencies; (ii) currency gains and losses between trade date and settlement date on investment securities transactions and forward exchange contracts; and (iii) gains
and losses from the difference between amounts of dividends and interest recorded and the amounts actually received.
|
| F. Segregation Transactions — The Fund may
enter into certain derivative transactions to seek to increase total return. Forward foreign currency exchange contracts, futures contracts, written options, when-issued securities and forward commitments represent examples of such transactions. As a
result of entering into these transactions, the Fund is required to segregate liquid assets on the accounting records equal to or greater than the market value of the corresponding transactions.
|
| G. Repurchase Agreements — Repurchase
agreements involve the purchase of securities subject to the seller’s agreement to repurchase them at a mutually agreed upon date and price. During the term of a repurchase agreement, the value of the underlying securities, including accrued
interest, is required to equal or exceed the value of the repurchase agreement. The underlying securities for all repurchase agreements are held in safekeeping at the Fund’s custodian.
|
| 3. AGREEMENTS
|
| Pursuant to the Investment Management Agreement (“the Agreement”), Goldman Sachs Asset Management (“GSAM”), a
unit of the Investment Management Division of Goldman, Sachs & Co. (“Goldman Sachs”), serves as the investment adviser to the Fund. Under the Agreement, the adviser, subject to the general supervision of the Trust’s Board of Trustees,
manages the Fund’s portfolio. As compensation for the services rendered pursuant to the Agreement, the assumption of the expenses related thereto and administering the Fund’s business affairs, including providing facilities, the adviser is
entitled to a fee, computed daily and payable monthly, at an annual rate equal to 1.00% of the average daily net assets of the Fund.
|
| The investment adviser has voluntarily agreed to limit certain “Other
Expenses” of the Fund (excluding Management fees, Distribution and Service fees, Transfer Agent fees, taxes, interest, brokerage, litigation, Service Share fees, indemnification costs and other extraordinary expenses) to the extent such expenses
exceed, on an annual basis, 0.06% of the average daily net assets of the Fund. For the year ended August 31, 2000, Goldman Sachs reimbursed approximately $145,000. In addition, the Fund has entered into certain offset arrangements with the custodian
resulting in a reduction in the Fund’s expenses. For the year ended August 31, 2000, custody fees were reduced by approximately $5,000.
|
| The Trust, on behalf of the Fund, has adopted Distribution and Service Plans.
Under the Distribution and Service Plans, Goldman Sachs and/or authorized dealers are entitled to a monthly fee from the Fund for distribution and shareholder maintenance services equal, on an annual basis, to 0.25%, 1.00% and 1.00% of the Fund’s
average daily net assets attributable to Class A, Class B and Class C Shares, respectively.
|
| 3. AGREEMENTS (continued)
|
| Goldman Sachs serves as the distributor of shares of the Fund pursuant to a
Distribution Agreement. Goldman Sachs may receive a portion of the Class A sales load and Class B and Class C contingent deferred sales charges and has advised the Fund that it retained approximately $49,000 during the year ended August 31, 2000.
|
| Goldman Sachs also serves as the Transfer Agent of the Fund for a fee. The fees
charged for such transfer agency services are calculated daily and payable monthly at an annual rate as follows: 0.19% of the average daily net assets for Class A, Class B and Class C Shares and .04% of the average daily net assets for Institutional and
Service shares.
|
| The Trust, on behalf of the Fund, has adopted a Service Plan. This plan allows for
Service shares to compensate service organizations for providing varying levels of account administration and shareholder liaison services to their customers who are beneficial owners of such shares. The Service Plan provides for compensation to the
service organizations in an amount up to .50% (on an annualized basis), of the average daily net asset value of the Service shares.
|
| As of August 31, 2000, the amounts owed to affiliates were approximately $184,000,
$63,000, and $32,000 for Management, Distribution and Service and Transfer Agent fees, respectively.
|
| 4. PORTFOLIO SECURITIES TRANSACTIONS
|
| The cost of purchases and proceeds of sales and maturities of securities (excluding short-term investments) for the year ended
August 31, 2000 were $162,861,797 and $260,542,665 respectively.
|
| For the year ended August 31, 2000, Goldman Sachs earned approximately $20,000 of
brokerage commissions from portfolio transactions.
|
| Option Accounting Principles — When the Fund writes
call or put options, an amount equal to the premium received is recorded as an asset and as an equivalent liability. The amount of the liability is subsequently marked-to-market to reflect the current market value of the option written. When a written
option expires on its stipulated expiration date or the Fund enters into a closing purchase transaction, the Fund realizes a gain or loss without regard to any unrealized gain or loss on the underlying security, and the liability related to such option is
extinguished. When a written call option is exercised, the Fund realizes a gain or loss from the sale of the underlying security, and the proceeds of the sale are increased by the premium originally received. When a written put option is exercised, the
amount of the premium originally received will reduce the cost of the security which the Fund purchases upon exercise. There is a risk of loss from a change in value of such options which may exceed the related premiums received.
|
| Upon the purchase of a call option or a protective put option by the Fund, the
premium paid is recorded as an investment and subsequently marked-to-market to reflect the current market value of the option. If an option which the Fund has purchased expires on the stipulated expiration date, the Fund will realize a loss in the amount
of the cost of the option. If the Fund enters into a closing sale transaction, the Fund will realize a gain or loss, depending on whether the sale proceeds for the closing sale transaction are greater or less than the cost of the option. If the Fund
exercises a purchased put option, the Fund will realize a gain or loss from the sale of the underlying security, and the proceeds from such sale will be decreased by the premium originally paid. If the Fund exercises a purchased call option, the cost of
the security which the Fund purchases upon exercise will be increased by the premium originally paid. At August 31, 2000, there were no open written option contracts.
|
| 5. LINE OF CREDIT FACILITY
|
| Effective May 31, 2000, the Fund participates in a $350,000,000 committed, unsecured revolving line of credit facility. Prior
thereto, the Fund participated in a $250,000,000 uncommitted and a $250,000,000 committed, unsecured revolving line of
credit facility. Under the most restrictive arrangement, the Fund must own securities having a market value in excess of 400% of the total bank borrowings. This facility is to be used solely for temporary or emergency purposes. The interest rate on
borrowings is based on the Federal Funds rate. The committed facility also requires a fee to be paid by the Fund based on the amount of the commitment which has not been utilized. During the year ended August 31, 2000, the Fund did not have any borrowings
under any of these facilities.
|
| 6. JOINT REPURCHASE AGREEMENT ACCOUNT
|
| The Fund, together with other registered investment companies having management agreements with GSAM or its affiliates, transfers
uninvested cash into joint accounts, the daily aggregate balance of which is invested in one or more repurchase agreements.
|
| At August 31, 2000, the Fund had an undivided interest in the repurchase
agreements in the joint account which equaled $10,300,000 in principal amount. At August 31, 2000, the following repurchase agreements held in this joint account were fully collateralized by Federal Agency obligations:
|
| Repurchase Agreements | Principal
Amount |
Interest
Rate |
Maturity
Date |
Amortized
Cost |
Maturity
Value |
|||||||
|---|---|---|---|---|---|---|---|---|---|---|---|---|
| ABN/AMRO, Inc. | $ 814,100,000 | 6.66 | % | 09/01/2000 | $ 814,100,000 | $ 814,250,608 | ||||||
| Banc of America Securities LLC | 900,000,000 | 6.67 | 09/01/2000 | 900,000,000 | 900,166,750 | |||||||
| Barclays Capital, Inc. | 500,000,000 | 6.67 | 09/01/2000 | 500,000,000 | 500,092,639 | |||||||
| Bear Stearns Companies, Inc. | 300,000,000 | 6.67 | 09/01/2000 | 300,000,000 | 300,055,583 | |||||||
| Chase Securities, Inc. | 450,000,000 | 6.67 | 09/01/2000 | 450,000,000 | 450,083,375 | |||||||
| Donaldson, Lufkin & Jenrette, Inc. | 1,000,000,000 | 6.67 | 09/01/2000 | 1,000,000,000 | 1,000,185,278 | |||||||
| J.P. Morgan & Co., Inc. | 800,000,000 | 6.65 | 09/01/2000 | 800,000,000 | 800,147,778 | |||||||
| Morgan Stanley Dean Witter & Co. | 750,000,000 | 6.65 | 09/01/2000 | 750,000,000 | 750,138,542 | |||||||
| Morgan Stanley Dean Witter & Co. | 300,000,000 | 6.60 | 09/01/2000 | 300,000,000 | 300,055,000 | |||||||
| UBS Warburg LLC | 800,000,000 | 6.65 | 09/01/2000 | 800,000,000 | 800,147,778 | |||||||
| TOTAL JOINT REPURCHASE AGREEMENT ACCOUNT II | $6,614,100,000 | $6,615,323,331 | ||||||||||
| 7. CHANGE IN INDEPENDENT ACCOUNTANTS
|
| On October 26, 1999 the Board of Trustees of the Fund upon the recommendation of the Board’s audit committee, determined not
to retain Arthur Andersen LLP and approved a change of the Fund’s independent accountants to PricewaterhouseCoopers LLP. For the period ended August 31, 1999 and the year ended January 31, 1999, Arthur Andersen LLP’s audit reports contained no
adverse opinion or disclaimer of opinion; nor were their reports qualified or modified as to uncertainty, audit scope, or accounting principles. Further, there were no disagreements between the Fund and Arthur Andersen LLP on accounting principles or
practices, financial statement disclosure or audit scope or procedure, which if not resolved to the satisfaction of Arthur Andersen LLP would have caused them to make reference to the disagreement in their reports.
|
| 8. CERTAIN RECLASSIFICATIONS
|
| In accordance with statement of Position 93-2, the Fund has reclassified $13,530 from paid-in capital to accumulated net
investment loss. This reclassification has no impact on the net asset value of the Fund and is designed to present the Fund’s capital accounts on a tax basis. Reclassifications result primarily from the difference in the tax treatment of foreign
currency, net operating losses and organization costs.
|
| 9. SUMMARY OF SHARE TRANSACTIONS
|
| Share activity is as follows:
|
| For the Year Ended
August 31, 2000 |
|||||||||||||||
|---|---|---|---|---|---|---|---|---|---|---|---|---|---|---|---|
| Shares | Dollars | ||||||||||||||
| Class A Shares | |||||||||||||||
| Shares sold | 1,375,654 | $27,265,326 | |||||||||||||
| Shares repurchased | (5,211,119 | ) | (99,633,194 | ) | |||||||||||
| (3,835,465 | ) | (72,367,868 | ) | ||||||||||||
| Class B Shares | |||||||||||||||
| Shares sold | 183,134 | 3,555,201 | |||||||||||||
| Shares repurchased | (819,879 | ) | (15,030,277 | ) | |||||||||||
| (636,745 | ) | (11,475,076 | ) | ||||||||||||
| Class C Shares | |||||||||||||||
| Shares sold | 137,123 | 2,640,911 | |||||||||||||
| Shares repurchased | (180,209 | ) | (3,309,647 | ) | |||||||||||
| (43,086 | ) | (668,736 | ) | ||||||||||||
| Institutional Shares | |||||||||||||||
| Shares sold | 47,653 | 945,353 | |||||||||||||
| Shares repurchased | (275,006 | ) | (5,233,437 | ) | |||||||||||
| (227,353 | ) | (4,288,084 | ) | ||||||||||||
| Service Shares | |||||||||||||||
| Shares sold | 2,401 | 47,206 | |||||||||||||
| Shares repurchased | (1,714 | ) | (31,501 | ) | |||||||||||
| 687 | 15,705 | ||||||||||||||
| NET DECREASE | (4,741,962 | ) | $(88,784,059 | ) | |||||||||||
| 9. SUMMARY OF SHARE TRANSACTIONS (continued)
|
| Share activity is as follows:
|
| For the Seven-Months Ended
August 31, 1999 |
|||||||
|---|---|---|---|---|---|---|---|
| Shares | Dollars | ||||||
| Class A Shares | |||||||
| Shares sold | 3,974,603 | $ 75,211,330 | |||||
| Shares repurchased | (7,479,721 | ) | (141,251,011 | ) | |||
| (3,505,118 | ) | (66,039,681 | ) | ||||
| Class B Shares | |||||||
| Shares sold | 223,866 | 4,216,615 | |||||
| Shares repurchased | (652,859 | ) | (11,537,114 | ) | |||
| (428,993 | ) | (7,320,499 | ) | ||||
| Class C Shares | |||||||
| Shares sold | 121,721 | 2,343,776 | |||||
| Shares repurchased | (156,184 | ) | (2,743,702 | ) | |||
| (34,463 | ) | (399,926 | ) | ||||
| Institutional Shares | |||||||
| Shares sold | 693,113 | 14,235,041 | |||||
| Shares repurchased | (163,344 | ) | (3,050,873 | ) | |||
| 529,769 | 11,184,168 | ||||||
| Service Shares | |||||||
| Shares sold | 7,750 | 135,905 | |||||
| Shares repurchased | (18,993 | ) | (333,821 | ) | |||
| (11,243 | ) | (197,916 | ) | ||||
| NET DECREASE | (3,450,048 | ) | $ (62,773,854 | ) | |||
| 9. SUMMARY OF SHARE TRANSACTIONS (continued)
|
| Share activity is as follows:
|
| For the Year Ended
January 31, 1999 |
|||||||
|---|---|---|---|---|---|---|---|
| Shares | Dollars | ||||||
| Class A Shares | |||||||
| Shares sold | 11,250,168 | $248,147,068 | |||||
| Reinvestments of dividends and distributions | 1,120,125 | 18,887,752 | |||||
| Shares repurchased | (13,625,605 | ) | (275,189,998 | ) | |||
| (1,255,312 | ) | (8,155,178 | ) | ||||
| Class B Shares | |||||||
| Shares sold | 1,020,790 | 24,298,444 | |||||
| Reinvestments of dividends and distributions | 159,248 | 2,632,705 | |||||
| Shares repurchased | (609,437 | ) | (12,177,880 | ) | |||
| 570,601 | 14,753,269 | ||||||
| Class C Shares | |||||||
| Shares sold | 348,913 | 8,014,845 | |||||
| Reinvestments of dividends and distributions | 24,492 | 404,852 | |||||
| Shares repurchased | (156,144 | ) | (3,072,836 | ) | |||
| 217,261 | 5,346,861 | ||||||
| Institutional Shares | |||||||
| Shares sold | 191,950 | 5,013,154 | |||||
| Reinvestments of dividends and distributions | 55,467 | 939,606 | |||||
| Shares repurchased | (30,030 | ) | (583,311 | ) | |||
| 217,387 | 5,369,449 | ||||||
| Service Shares | |||||||
| Shares sold | 13,163 | 295,450 | |||||
| Reinvestments of dividends and distributions | 974 | 16,420 | |||||
| Shares repurchased | (71 | ) | (1,341 | ) | |||
| 14,066 | 310,529 | ||||||
| NET INCREASE (DECREASE) | (235,997 | ) | $ 17,624,930 | ||||
| Income (loss) from
investment operations |
Distributions to shareholders |
||||||||||||||||||||||||
|---|---|---|---|---|---|---|---|---|---|---|---|---|---|---|---|---|---|---|---|---|---|---|---|---|---|
| Net asset
value, beginning of period |
Net
investment income (loss) |
Net realized and unrealized gain (loss) |
Total
income (loss) from investment operations |
In excess
of net investment income |
From net
realized gains |
Total
distributions |
|||||||||||||||||||
| FOR THE YEAR ENDED AUGUST 31, | |||||||||||||||||||||||||
| 2000 - Class A Shares | $19.80 | $ 0.01 | (c) | $ 3.40 | $ 3.41 | $ — | $ — | $ — | |||||||||||||||||
| 2000 - Class B Shares | 19.27 | (0.13 | ) (c) | 3.26 | 3.13 | — | — | — | |||||||||||||||||
| 2000 - Class C Shares | 19.28 | (0.12 | ) (c) | 3.26 | 3.14 | — | — | — | |||||||||||||||||
| 2000 - Institutional Shares | 19.95 | 0.10 | (c) | 3.42 | 3.52 | — | — | — | |||||||||||||||||
| 2000 - Service Shares | 19.76 | 0.01 | (c) | 3.36 | 3.37 | — | — | — | |||||||||||||||||
| FOR THE SEVEN-MONTH PERIOD ENDED AUGUST 31, | |||||||||||||||||||||||||
| 1999 - Class A Shares | 18.51 | (0.05 | ) | 1.34 | 1.29 | — | — | — | |||||||||||||||||
| 1999 - Class B Shares | 18.10 | (0.12 | ) | 1.29 | 1.17 | — | — | — | |||||||||||||||||
| 1999 - Class C Shares | 18.12 | (0.11 | ) | 1.27 | 1.16 | — | — | — | |||||||||||||||||
| 1999 - Institutional Shares | 18.62 | — | 1.33 | 1.33 | — | — | — | ||||||||||||||||||
| 1999 - Service Shares | 18.50 | (0.13 | ) | 1.39 | 1.26 | — | — | — | |||||||||||||||||
| FOR THE YEARS ENDED JANUARY
31, |
|||||||||||||||||||||||||
| 1999 - Class A Shares | 24.05 | (0.06 | ) | (4.48 | ) | (4.54 | ) | — | (1.00 | ) | (1.00 | ) | |||||||||||||
| 1999 - Class B Shares | 23.73 | (0.21 | ) | (4.42 | ) | (4.63 | ) | — | (1.00 | ) | (1.00 | ) | |||||||||||||
| 1999 - Class C Shares | 23.73 | (0.18 | ) | (4.43 | ) | (4.61 | ) | — | (1.00 | ) | (1.00 | ) | |||||||||||||
| 1999 - Institutional Shares | 24.09 | 0.03 | (4.50 | ) | (4.47 | ) | — | (1.00 | ) | (1.00 | ) | ||||||||||||||
| 1999 - Service Shares | 24.05 | (0.04 | ) | (4.51 | ) | (4.55 | ) | — | (1.00 | ) | (1.00 | ) | |||||||||||||
| 1998 - Class A Shares | 20.91 | 0.14 | 5.33 | 5.47 | — | (2.33 | ) | (2.33 | ) | ||||||||||||||||
| 1998 - Class B Shares | 20.80 | (0.01 | ) | 5.27 | 5.26 | — | (2.33 | ) | (2.33 | ) | |||||||||||||||
| 1998 - Class C Shares (commenced August 15, 1997) | 24.69 | (0.06 | ) | 1.43 | 1.37 | (0.34 | ) | (1.99 | ) | (2.33 | ) | ||||||||||||||
| 1998 - Institutional Shares (commenced August 15,
1997) |
24.91 | 0.03 | 1.48 | 1.51 | (0.28 | ) | (2.05 | ) | (2.33 | ) | |||||||||||||||
| 1998 - Service Shares (commenced August 15, 1997) | 24.91 | (0.01 | ) | 1.48 | 1.47 | (0.31 | ) | (2.02 | ) | (2.33 | ) | ||||||||||||||
| 1997 - Class A Shares | 17.29 | (0.21 | ) | 4.92 | 4.71 | — | (1.09 | ) | (1.09 | ) | |||||||||||||||
| 1997 - Class B Shares (commenced May 1, 1996) | 20.79 | (0.11 | ) | 1.21 | 1.10 | — | (1.09 | ) | (1.09 | ) | |||||||||||||||
| 1996 - Class A Shares | 16.14 | (0.23 | ) | 1.39 | 1.16 | — | (0.01 | ) | (0.01 | ) | |||||||||||||||
| |
(a)
|
Assumes investment at the net asset value at the beginning of the period, reinvestment of all dividends and distributions, a
complete redemption of the investment at the net asset value at the end of the period and no sales or redemption charges. Total return would be reduced if a sales or redemption charge were taken into account. Total returns for periods less than one full
year are not annualized.
|
(b)
|
Annualized.
|
(c)
|
Calculated based on the average shares outstanding methodology.
|
|
Ratios assuming no expense reductions |
|||||||||||||||||||||
|---|---|---|---|---|---|---|---|---|---|---|---|---|---|---|---|---|---|---|---|---|---|
| Net asset
value, end of period |
Total
return (a) |
Net assets at end of period (in 000s) |
Ratio of
net expenses to average net assets |
Ratio of
net investment income (loss) to average net assets |
Ratio of
expenses to average net assets |
Ratio of
net investment income (loss) to average net assets |
Portfolio
turnover rate |
||||||||||||||
| $23.21 | 17.22 | % | $157,791 | 1.50 | % | 0.07 | % | 1.57 | % | — | % | 75.31 | % | ||||||||
| 22.40 | 16.24 | 29,199 | 2.25 | (0.68 | ) | 2.32 | (0.75 | ) | 75.31 | ||||||||||||
| 22.42 | 16.34 | 8,428 | 2.25 | (0.65 | ) | 2.32 | (0.72 | ) | 75.31 | ||||||||||||
| 23.47 | 17.64 | 26,445 | 1.10 | 0.49 | 1.17 | 0.42 | 75.31 | ||||||||||||||
| 23.13 | 17.05 | 83 | 1.60 | 0.03 | 1.67 | (0.04 | ) | 75.31 | |||||||||||||
| 19.80 | 6.97 | 210,500 | 1.50 | (b) | (0.35 | ) (b) | 1.61 | (b) | (0.46 | ) (b) | 46.95 | ||||||||||
| 19.27 | 6.46 | 37,386 | 2.25 | (b) | (1.10 | ) (b) | 2.36 | (b) | (1.21 | ) (b) | 46.95 | ||||||||||
| 19.28 | 6.40 | 8,079 | 2.25 | (b) | (1.10 | ) (b) | 2.36 | (b) | (1.21 | ) (b) | 46.95 | ||||||||||
| 19.95 | 7.14 | 27,023 | 1.10 | (b) | 0.05 | (b) | 1.21 | (b) | (0.06 | ) (b) | 46.95 | ||||||||||
| 19.76 | 6.81 | 57 | 1.60 | (b) | (0.41 | ) (b) | 1.71 | (b) | (0.52 | ) (b) | 46.95 | ||||||||||
| 18.51 | (17.37 | ) | 261,661 | 1.50 | (0.24 | ) | 1.74 | (0.48 | ) | 98.46 | |||||||||||
| 18.10 | (18.00 | ) | 42,879 | 2.25 | (0.99 | ) | 2.29 | (1.03 | ) | 98.46 | |||||||||||
| 18.12 | (17.91 | ) | 8,212 | 2.25 | (0.99 | ) | 2.29 | (1.03 | ) | 98.46 | |||||||||||
| 18.62 | (17.04 | ) | 15,351 | 1.13 | 0.13 | 1.17 | 0.09 | 98.46 | |||||||||||||
| 18.50 | (17.41 | ) | 261 | 1.62 | (0.47 | ) | 1.66 | (0.51 | ) | 98.46 | |||||||||||
| 24.05 | 26.17 | 370,246 | 1.54 | (0.28 | ) | 1.76 | (0.50 | ) | 84.81 | ||||||||||||
| 23.73 | 25.29 | 42,677 | 2.29 | (0.92 | ) | 2.29 | (0.92 | ) | 84.81 | ||||||||||||
| 23.73 | 5.51 | 5,604 | 2.09 | (b) | (0.79 | ) (b) | 2.09 | (b) | (0.79 | ) (b) | 84.81 | ||||||||||
| 24.09 | 6.08 | 14,626 | 1.16 | (b) | 0.27 | (b) | 1.16 | (b) | 0.27 | (b) | 84.81 | ||||||||||
| 24.05 | 5.91 | 2 | 1.45 | (b) | (0.07 | ) (b) | 1.45 | (b) | (0.07 | ) (b) | 84.81 | ||||||||||
| 20.91 | 27.28 | 212,061 | 1.60 | (0.72 | ) | 1.85 | (0.97 | ) | 99.46 | ||||||||||||
| 20.80 | 5.39 | 3,674 | 2.35 | (b) | (1.63 | ) (b) | 2.35 | (b) | (1.63 | ) (b) | 99.46 | ||||||||||
| 17.29 | 7.20 | 204,994 | 1.41 | (0.59 | ) | 1.66 | (0.84 | ) | 57.58 | ||||||||||||
| To the Shareholders and Board of Trustees of
|
| Goldman Sachs Trust — Small Cap Value Fund:
|
| In our opinion, the accompanying statement of assets and liabilities, including the statement of investments, and the related
statements of operations and of changes in net assets and the financial highlights present fairly, in all material respects, the financial position of Goldman Sachs Small Cap Value Fund (“the Fund”), one of the portfolios constituting Goldman
Sachs Trust, at August 31, 2000, the results of its operations, the changes in its net assets and the financial highlights for the year then ended, in conformity with accounting principles generally accepted in the United States of America. These
financial statements and financial highlights (hereafter referred to as “financial statements”) are the responsibility of the Fund’s management; our responsibility is to express an opinion on these financial statements based on our audit.
We conducted our audit of these financial statements in accordance with auditing standards generally accepted in the United States of America, which require that we plan and perform the audit to obtain reasonable assurance about whether the financial
statements are free of material misstatement. An audit includes examining, on a test basis, evidence supporting the amounts and disclosures in the financial statements, assessing the accounting principles used and significant estimates made by management,
and evaluating the overall financial statement presentation. We believe that our audit, which included confirmation of securities at August 31, 2000 by correspondence with the custodian and brokers, provides a reasonable basis for our opinion. The
statements of changes in net assets of the Fund for the period ended August 31, 1999 and the year ended January 31, 1999 and the financial highlights for each of the periods ended on or before August 31, 1999 were audited by other independent accountants
whose report dated October 8, 1999 expressed an unqualified opinion thereon.
|
| PricewaterhouseCoopers LLP
|
| Boston, Massachusetts
|
| October 23, 2000
|
| Shares | Description | Value | |||
|---|---|---|---|---|---|
| Common Stocks – 94.5% | |||||
| Banks – 5.1% | |||||
| 60,467 | Citigroup, Inc. | $ 3,529,742 | |||
| 26,300 | State Street Corp. | 3,096,825 | |||
| 11,200 | Wells Fargo & Co. | 483,700 | |||
| 7,110,267 | |||||
| Chemicals – 0.7% | |||||
| 8,192 | E.I. du Pont de Nemours & Co. | 367,616 | |||
| 6,800 | Minnesota Mining & Manufacturing
Co. |
632,400 | |||
| 1,000,016 | |||||
| Computer Hardware – 7.5% | |||||
| 70,000 | Cisco Systems, Inc.* | 4,803,750 | |||
| 27,600 | EMC Corp.* | 2,704,800 | |||
| 23,200 | Sun Microsystems, Inc.* | 2,944,950 | |||
| 10,453,500 | |||||
| Computer Software – 6.6% | |||||
| 10,500 | CheckFree Corp.* | 544,031 | |||
| 15,000 | International Business Machines, Inc. | 1,980,000 | |||
| 56,300 | Microsoft Corp.* | 3,930,444 | |||
| 29,800 | Oracle Corp.* | 2,709,937 | |||
| 9,164,412 | |||||
| Department Store – 1.5% | |||||
| 45,400 | Wal-Mart Stores, Inc. | 2,153,663 | |||
| Drugs – 8.6% | |||||
| 19,300 | American Home Products Corp. | 1,045,819 | |||
| 5,700 | Amgen, Inc.* | 432,131 | |||
| 58,600 | Bristol-Myers Squibb Co. | 3,105,800 | |||
| 11,500 | Eli Lilly & Co. | 839,500 | |||
| 7,500 | Merck & Co., Inc. | 524,063 | |||
| 113,050 | Pfizer, Inc. | 4,889,412 | |||
| 28,000 | Schering-Plough Corp. | 1,123,500 | |||
| 11,960,225 | |||||
| Electrical Equipment – 5.2% | |||||
| 6,800 | Corning, Inc. | 2,229,975 | |||
| 29,500 | Lucent Technologies, Inc. | 1,233,469 | |||
| 37,700 | Nortel Networks Corp. | 3,074,906 | |||
| 11,500 | QUALCOMM, Inc.* | 688,562 | |||
| 7,226,912 | |||||
| Electrical Utilities – 2.9% | |||||
| 62,400 | The AES Corp.* | 3,978,000 | |||
| Energy Resources – 0.7% | |||||
| 11,000 | Exxon Mobil Corp. | 897,875 | |||
| Entertainment – 2.6% | |||||
| 17,800 | The Walt Disney Co. | 693,087 | |||
| 43,650 | Viacom, Inc. Class B* | 2,938,191 | |||
| 3,631,278 | |||||
| Shares | Description | Value | |||
|---|---|---|---|---|---|
| Common Stocks – (continued) | |||||
| Financial Services – 8.5% | |||||
| 48,400 | Federal Home Loan Mortgage Corp. | $ 2,038,850 | |||
| 38,700 | Federal National Mortgage Assn. | 2,080,125 | |||
| 99,200 | General Electric Co. | 5,821,800 | |||
| 55,300 | MBNA Corp. | 1,952,781 | |||
| 11,893,556 | |||||
| Food & Beverage – 3.5% | |||||
| 26,000 | Nabisco Group Holdings Corp. | 729,625 | |||
| 29,000 | PepsiCo., Inc. | 1,236,125 | |||
| 30,800 | The Coca-Cola Co. | 1,620,850 | |||
| 17,300 | Wm. Wrigley Jr. Co. | 1,281,281 | |||
| 4,867,881 | |||||
| Home Products – 3.5% | |||||
| 26,400 | Avon Products, Inc. | 1,034,550 | |||
| 40,200 | Colgate-Palmolive Co. | 2,047,687 | |||
| 28,766 | Energizer Holdings, Inc.* | 568,129 | |||
| 11,000 | The Gillette Co. | 330,000 | |||
| 14,200 | The Procter & Gamble Co. | 877,737 | |||
| 4,858,103 | |||||
| Hotels – 2.0% | |||||
| 38,100 | Harrah’s Entertainment, Inc.* | 1,081,088 | |||
| 17,400 | Marriott International, Inc. | 687,300 | |||
| 31,800 | Starwood Hotels & Resorts
Worldwide, Inc. Class B |
1,017,600 | |||
| 2,785,988 | |||||
| Information Services – 2.4% | |||||
| 47,400 | Cendant Corp.* | 625,088 | |||
| 39,800 | First Data Corp. | 1,897,962 | |||
| 30,100 | Valassis Communications, Inc.* | 869,138 | |||
| 3,392,188 | |||||
| Internet – 1.7% | |||||
| 4,500 | DoubleClick, Inc.* | 183,094 | |||
| 5,000 | S1 Corp.* | 87,188 | |||
| 7,437 | VeriSign, Inc.* | 1,479,033 | |||
| 5,300 | Yahoo!, Inc.* | 643,950 | |||
| 2,393,265 | |||||
| Life Insurance – 0.6% | |||||
| 36,900 | MetLife, Inc.* | 897,131 | |||
| Media – 9.2% | |||||
| 38,000 | A.H. Belo Corp. | 726,750 | |||
| 151,600 | AT&T Corp.-Liberty Media Corp.* | 3,240,450 | |||
| 7,520 | Clear Channel Communications, Inc.* | 544,260 | |||
| 8,900 | Comcast Corp. | 331,525 | |||
| 29,300 | EchoStar Communications Corp.* | 1,428,375 | |||
| 13,900 | Gannett Co., Inc. | 787,087 | |||
| 24,100 | General Motors Corp. Class H* | 798,312 | |||
| 35,625 | Infinity Broadcasting Corp.* | 1,349,297 | |||
| 37,700 | Time Warner, Inc. | 3,223,350 | |||
| 11,000 | Tribune Co. | 392,563 | |||
| 12,821,969 | |||||
|
Shares |
Description | Value | |||
|---|---|---|---|---|---|
| Common Stocks – (continued) | |||||
| Medical Products – 0.9% | |||||
| 14,300 | Johnson & Johnson | $ 1,314,706 | |||
| Oil Refining – 0.0% | |||||
| 3 | Conoco, Inc. Class B | 78 | |||
| Oil Services – 1.4% | |||||
| 23,300 | Schlumberger Ltd. | 1,987,781 | |||
| Property Insurance – 3.0% | |||||
| 33,100 | Ambac Financial Group, Inc. | 2,139,087 | |||
| 22,700 | American International Group, Inc. | 2,023,138 | |||
| 4,162,225 | |||||
| Publishing – 0.6% | |||||
| 22,600 | The New York Times Co. | 885,638 | |||
| Restaurants – 0.7% | |||||
| 32,500 | McDonald’s Corp. | 970,938 | |||
| Security/Asset Management – 0.5% | |||||
| 19,600 | The Charles Schwab Corp. | 748,475 | |||
| Semiconductors – 5.5% | |||||
| 67,800 | Intel Corp. | 5,076,525 | |||
| 8,100 | JDS Uniphase Corp.* | 1,008,323 | |||
| 2,000 | PMC-Sierra, Inc.* | 472,000 | |||
| 16,000 | Texas Instruments, Inc. | 1,071,000 | |||
| 7,627,848 | |||||
| Specialty Retail – 3.7% | |||||
| 24,800 | CVS Corp. | 920,700 | |||
| 8,300 | RadioShack Corp. | 489,700 | |||
| 28,450 | The Home Depot, Inc. | 1,367,378 | |||
| 73,800 | Walgreen Co. | 2,426,175 | |||
| 5,203,953 | |||||
| Telephone – 3.1% | |||||
| 22,431 | AT&T Corp. | 706,577 | |||
| 28,400 | SBC Communications, Inc. | 1,185,700 | |||
| 8,900 | Sprint Corp. | 298,150 | |||
| 23,352 | Verizon Communications | 1,018,731 | |||
| 29,850 | WorldCom, Inc.* | 1,089,525 | |||
| 4,298,683 | |||||
| Tobacco – 0.6% | |||||
| 28,300 | Philip Morris Cos., Inc. | 838,388 | |||
| Wireless – 1.7% | |||||
| 36,000 | Crown Castle International Corp.* | 1,248,750 | |||
| 14,900 | Sprint Corp. (PCS Group)* | 747,794 | |||
| 10,400 | Vodafone Group PLC ADR | 425,750 | |||
| 2,422,294 | |||||
| TOTAL COMMON STOCKS | |||||
| (Cost $117,056,949) | $131,947,236 | ||||
| Principal
Amount |
Interest
Rate |
Maturity
Date |
Value | ||||
|---|---|---|---|---|---|---|---|
| Repurchase Agreement – 2.4% | |||||||
| Joint Repurchase Agreement Account II Ù | |||||||
| $3,300,000 | 6.66% | 09/01/2000 | $ 3,300,000 | ||||
| TOTAL REPURCHASE AGREEMENT | |||||||
| (Cost $3,300,000) | $ 3,300,000 | ||||||
| TOTAL INVESTMENTS | |||||||
| (Cost $120,356,949) | $135,247,236 | ||||||
*
|
Non-income producing security.
|
Ù
|
Joint repurchase agreement was entered into on August 31, 2000.
|
| The percentage shown for each investment category reflects the value of investments in that category as a percentage of total net
assets.
|
| |
| Investment Abbreviations:
|
| ADR—American Depositary Receipt
|
| |
| Assets: | ||||
| Investment in securities, at value (identified cost $120,356,949) | $135,247,236 | |||
| Cash | 18,801 | |||
| Receivables: | ||||
| Fund shares sold | 4,172,805 | |||
| Investment securities sold | 359,592 | |||
| Dividends and interest | 65,873 | |||
| Reimbursement from adviser | 57,672 | |||
| Other assets | 149 | |||
| Total assets | 139,922,128 | |||
| Liabilities: | ||||
| Payables: | ||||
| Amounts owed to affiliates | 168,162 | |||
| Fund shares repurchased | 85,895 | |||
| Accrued expenses and other liabilities | 48,763 | |||
| Total liabilities | 302,820 | |||
| Net Assets: | ||||
| Paid-in capital | 125,351,314 | |||
| Accumulated net realized loss from investment transactions | (622,293 | ) | ||
| Net unrealized gain on investments | 14,890,287 | |||
| NET ASSETS | $139,619,308 | |||
| Net asset value, offering and redemption price per share: (a) | ||||
| Class A | $12.52 | |||
| Class B | $12.40 | |||
| Class C | $12.42 | |||
| Institutional | $12.58 | |||
| Service | $12.52 | |||
| Shares outstanding: | ||||
| Class A | 7,368,679 | |||
| Class B | 1,382,482 | |||
| Class C | 586,685 | |||
| Institutional | 1,821,463 | |||
| Service | 150 | |||
| Total shares outstanding, $.001 par value (unlimited number of shares authorized) | 11,159,459 | |||
(a)
|
Maximum public offering price per share (NAV per share multiplied by 1.0582) for Class A Shares is $13.25. At redemption, Class B
and Class C Shares may be subject to a contingent deferred sales charge, assessed on the amount equal to the lesser of the current net asset value or the original purchase price of the shares.
|
| Investment income: | |||
| Dividends (a) | $ 506,392 | ||
| Interest | 227,020 | ||
| Total income | 733,412 | ||
| Expenses: | |||
| Management fees | 774,259 | ||
| Distribution and Service fees (b) | 289,757 | ||
| Transfer Agent fees (c) | 125,983 | ||
| Professional fees | 48,433 | ||
| Custodian fees | 22,363 | ||
| Registration fees | 7,623 | ||
| Trustee fees | 7,508 | ||
| Other | 61,613 | ||
| Total expenses | 1,337,539 | ||
| Less — expense reductions | (144,435 | ) | |
| Net expenses | 1,193,104 | ||
| NET INVESTMENT LOSS | (459,692 | ) | |
| Realized and unrealized gain (loss) on investment transactions: | |||
| Net realized loss from investment transactions | (548,651 | ) | |
| Net change in unrealized loss on investments | 15,194,104 | ||
| Net realized and unrealized gain on investment transactions | 14,645,453 | ||
| NET INCREASE IN NET ASSETS RESULTING FROM OPERATIONS | $14,185,761 | ||
(a)
|
Foreign taxes withheld on dividends were $360.
|
(b)
|
Class A, Class B and Class C had Distribution and Service fees of $114,555, $117,536 and $57,666, respectively.
|
(c)
|
Class A, Class B, Class C, Institutional Class and Service Class had Transfer Agent fees of $87,060, $22,332, $10,957, $5,633 and
$1, respectively.
|
|
For the
|
For the
|
||||||
|---|---|---|---|---|---|---|---|
| YearEnded | Period Ended | ||||||
| August 31, 2000 | August 31, 1999 (a) | ||||||
| From operations: | |||||||
| Net investment loss | $ (459,692 | ) | $ (2,481 | ) | |||
| Net realized loss from investment transactions | (548,651 | ) | (73,642 | ) | |||
| Net change in unrealized loss on investments | 15,194,104 | (303,817 | ) | ||||
| |
|||||||
| Net increase (decrease) in net assets resulting from operations | 14,185,761 | (379,940 | ) | ||||
| |
|||||||
| Distributions to shareholders: | |||||||
| From net investment income | |||||||
| Class A Shares | (1,011 | ) | — | ||||
| Institutional Shares | (1,164 | ) | — | ||||
| |
|||||||
| Total distributions to shareholders | (2,175 | ) | — | ||||
| |
|||||||
| From share transactions: | |||||||
| Proceeds from sales of shares | 120,078,710 | 22,791,501 | |||||
| Reinvestment of dividends and distributions | 1,911 | — | |||||
| Cost of shares repurchased | (16,779,719 | ) | (276,741 | ) | |||
| |
|||||||
| Net increase in net assets resulting from share transactions | 103,300,902 | 22,514,760 | |||||
| |
|||||||
| TOTAL INCREASE | 117,484,488 | 22,134,820 | |||||
| |
|||||||
| Net assets: | |||||||
| Beginning of year | 22,134,820 | — | |||||
| |
|||||||
| End of year | $139,619,308 | $22,134,820 | |||||
| |
|||||||
| Accumulated undistributed net investment income | $ — | $ 2,182 | |||||
| |
|||||||
(a)
|
Commencement date of operations was May 24, 1999 for all share classes.
|
| 1. ORGANIZATION
|
| Goldman Sachs Trust (the “Trust”) is a Delaware business trust registered under the Investment Company Act of 1940 (as
amended) as an open-end management investment company. The Trust includes the Goldman Sachs Strategic Growth Fund (the “Fund”). The Fund is a diversified portfolio offering five classes of shares — Class A, Class B, Class C,
Institutional and Service.
|
| 2. SIGNIFICANT ACCOUNTING POLICIES
|
| The following is a summary of the significant accounting policies consistently followed by the Fund. The preparation of financial
statements in conformity with generally accepted accounting principles requires management to make estimates and assumptions that may affect the reported amounts. Actual results could differ from those estimates.
|
| A. Investment Valuation — Investments in
securities traded on a U.S. or foreign securities exchange or the NASDAQ system are valued daily at their last sale price on the principal exchange on which they are traded. If no sale occurs, securities are valued at the last bid price. Debt securities
are valued at prices supplied by independent pricing services, broker/dealer-supplied valuations or matrix pricing systems. Unlisted equity and debt securities for which market quotations are available are valued at the last sale price on valuation date,
or if no sale occurs, at the last bid price. Short-term debt obligations maturing in sixty days or less are valued at amortized cost, which approximates market value. Securities for which quotations are not readily available are valued at fair value using
methods approved by the Trust’s Board of Trustees.
|
| B. Security Transactions and Investment Income — Security transactions are recorded as of the trade date. Realized gains and losses on sales of portfolio securities are calculated using the identified-cost basis. Dividend income is recorded on the ex-dividend date net of foreign withholding taxes where
applicable. Dividends for which the Fund has the choice to receive either cash or stock are recognized as investment income in an amount equal to the cash dividend. Interest income is recorded on the basis of interest accrued, premium amortized and
discount earned.
|
| Net investment income (other than class specific expenses) and unrealized and
realized gains or losses are allocated daily to each class of shares of the Fund based upon the relative proportion of net assets of each class.
|
| C. Federal Taxes — It is the Fund’s
policy to comply with the requirements of the Internal Revenue Code applicable to regulated investment companies and to distribute each year substantially all of its investment company taxable income and capital gains to its shareholders. Accordingly, no
federal tax provision is required. Income and capital gain distributions, if any, are declared and paid annually.
|
| The characterization of distributions to shareholders for financial reporting
purposes is determined in accordance with income tax rules. Therefore, the source of the Fund’s distributions may be shown in the accompanying financial statements as either from or in excess of net investment income or net realized gain on
investment transactions, or from paid-in capital, depending on the type of book/tax differences that may exist.
|
| At August 31, 2000, the aggregate cost of portfolio securities for federal income
tax purposes is $120,992,776. Accordingly, the gross unrealized gain on investments was $21,234,665 and the gross unrealized loss on investments was $6,980,205 resulting in a net unrealized gain of $14,254,460.
|
| 2. SIGNIFICANT ACCOUNTING POLICIES (continued)
|
| D. Expenses — Expenses incurred by the
Trust that do not specifically relate to an individual Fund of the Trust are allocated to the Funds on a straight-line or pro rata basis depending upon the nature of the expense.
|
| Class A, Class B and Class C shareholders of the Fund bear all expenses and fees
relating to their respective Distribution and Service plans. Shareholders of Service shares bear all expenses and fees paid to service organizations. Each class of shares separately bears its respective class-specific Transfer Agency fees.
|
| E. Foreign Currency Translations — The
books and records of the Fund are maintained in U.S. dollars. Amounts denominated in foreign currencies are translated into U.S. dollars on the following basis: (i) investment valuations, foreign currency and other assets and liabilities initially
expressed in foreign currencies are converted each business day into U.S. dollars based upon current exchange rates; and (ii) purchases and sales of foreign investments, income and expenses are converted into U.S. dollars based upon currency exchange
rates prevailing on the respective dates of such transactions.
|
| Net realized and unrealized gain (loss) on foreign currency transactions will
represent: (i) foreign exchange gains and losses from the sale and holdings of foreign currencies; (ii) currency gains and losses between trade date and settlement date on investment securities transactions and forward exchange contracts; and (iii) gains
and losses from the difference between amounts of dividends and interest recorded and the amounts actually received.
|
| F. Segregation Transactions — The Fund may
enter into certain derivative transactions to seek to increase total return. Forward foreign currency exchange contracts, futures contracts, written options, when-issued securities and forward commitments represent examples of such transactions. As a
result of entering into these transactions, the Fund is required to segregate liquid assets on the accounting records equal to or greater than the market value of the corresponding transactions.
|
| G. Repurchase Agreements — Repurchase
agreements involve the purchase of securities subject to the seller’s agreement to repurchase them at a mutually agreed upon date and price. During the term of a repurchase agreement, the value of the underlying securities, including accrued
interest, is required to equal or exceed the value of the repurchase agreement. The underlying securities for all repurchase agreements are held in safekeeping at the Fund’s custodian.
|
| 3. AGREEMENTS
|
| Pursuant to the Investment Management Agreement (the “Agreement”), Goldman Sachs Asset Management (“GSAM”), a
unit of the Investment Management Division of Goldman, Sachs & Co. (“Goldman Sachs”), serves as the investment adviser to the Fund. Under the Agreement, the adviser, subject to the general supervision of the Trust’s Board of Trustees,
manages the Fund’s portfolio. As compensation for the services rendered pursuant to the Agreement, the assumption of the expenses related thereto and administering the Fund’s business affairs, including providing facilities, the adviser is
entitled to a fee, computed daily and payable monthly, at an annual rate equal to 1.00% of the average daily net assets of the Fund.
|
| The investment adviser has voluntarily agreed to limit certain “Other
Expenses” of the Fund (excluding Management fees, Distribution and Service fees, Transfer Agent fees, taxes, interest, brokerage, litigation, Service Share fees, indemnification costs and other extraordinary expenses) to the extent such expenses
exceed, on an annual basis, 0.00% of the average daily net assets of the Fund. For the year ended August 31, 2000, the adviser reimbursed approximately $140,000. In addition, the Fund has entered into certain expense offset arrangements with the custodian
resulting in a reduction of the Fund’s expenses. For the year ended August 31, 2000, Custody fee reductions amounted to approximately $4,000.
|
| The Trust, on behalf of the Fund, has adopted Distribution and Service Plans.
Under the Distribution and Service Plans, Goldman Sachs and/or authorized dealers are entitled to a monthly fee from the Fund for distribution and shareholder maintenance services equal, on an annual basis, to 0.25%, 1.00% and 1.00% of the Fund’s
average daily net assets attributable to Class A, Class B and Class C Shares, respectively.
|
| 3. AGREEMENTS (continued)
|
| Goldman Sachs serves as the distributor of shares of the Fund pursuant to
Distribution Agreements. Goldman Sachs may receive a portion of the Class A sales load and Class B and Class C contingent deferred sales charges and has advised the Fund that it retained approximately $674,000 for the year ended August 31, 2000.
|
| Goldman Sachs also serves as the Transfer Agent of the Fund for a fee. The fees
charged for such transfer agency services are calculated daily and payable monthly at an annual rate as follows: 0.19% of the average daily net assets for Class A, Class B and Class C Shares and 0.04% of the average daily net assets for Institutional and
Service Shares.
|
| The Trust, on behalf of the Fund, has adopted a Service Plan. This Plan allows for
Service Shares to compensate service organizations for providing varying levels of account administration and shareholder liaison services to their customers who are beneficial owners of such shares. The Service Plan provides for compensation to the
service organizations in an amount up to 0.50% (on an annualized basis), of the average daily net asset value of the Service Shares.
|
| As of August 31, 2000, the amounts owed to affiliates were approximately $111,000,
$39,000 and $18,000 for Management, Distribution and Service and Transfer Agent fees, respectively.
|
| 4. PORTFOLIO SECURITIES TRANSACTIONS
|
| The cost of purchases and proceeds of sales or maturities of securities (excluding short-term investments) for the year ended
August 31, 2000, were $112,547,871 and $14,265,061, respectively.
|
| For the year ended August 31, 2000, Goldman Sachs earned approximately $1,000 of
brokerage commissions for portfolio transactions.
|
| Option Accounting Principles — When the Fund writes
call or put options, an amount equal to the premium received is recorded as an asset and as an equivalent liability. The amount of the liability is subsequently marked-to-market to reflect the current market value of the option written. When a written
option expires on its stipulated expiration date or the Fund enters into a closing purchase transaction, the Fund realizes a gain or loss without regard to any unrealized gain or loss on the underlying security, and the liability related to such option is
extinguished. When a written call option is exercised, the Fund realizes a gain or loss from the sale of the underlying security, and the proceeds of the sale are increased by the premium originally received. When a written put option is exercised, the
amount of the premium originally received will reduce the cost of the security which the Fund purchases upon exercise. There is a risk of loss from a change in value of such options which may exceed the related premiums received.
|
| Upon the purchase of a call option or a protective put option by the Fund, the
premium paid is recorded as an investment and subsequently marked-to-market to reflect the current market value of the option. If an option which the Fund has purchased expires on the stipulated expiration date, the Fund will realize a loss in the amount
of the cost of the option. If the Fund enters into a closing sale transaction, the Fund will realize a gain or loss, depending on whether the sale proceeds for the closing sale transaction are greater or less than the cost of the option. If the Fund
exercises a purchased put option, the Fund will realize a gain or loss from the sale of the underlying security, and the proceeds from such sale will be decreased by the premium originally paid. If the Fund exercises a purchased call option, the cost of
the security which the Fund purchases upon exercise will be increased by the premium originally paid. At August 31, 2000, there were no open written option contracts.
|
| Futures Contracts — The Fund may enter into futures
transactions to hedge against changes in interest rates, securities prices, currency exchange rates or to seek to increase total return. Upon entering into a futures contract, the Fund is required to deposit with a broker or the Fund’s custodian bank
an amount of cash or securities equal to the minimum “initial margin” requirement of the associated futures exchange. Subsequent payments for futures contracts (“variation margin”) are paid or received by the Fund daily, depending on
the daily fluctuations in the value of the contracts, and are recorded for financial
4. PORTFOLIO SECURITIES TRANSACTIONS (continued)
|
| reporting purposes as unrealized gains or losses. When contracts are closed, the Fund realizes a gain or loss which is reported in
the Statement of Operations.
|
| The use of futures contracts involve, to varying degrees, elements of market risk
which may exceed the amounts recognized in the Statement of Assets and Liabilities. Changes in the value of the futures contract may not directly correlate with changes in the value of the underlying securities. This risk may decrease the effectiveness of
the Fund’s hedging strategies and potentially result in a loss. At August 31, 2000, there were no open futures contracts.
|
| 5. LINE OF CREDIT FACILITY
|
| Effective May 31, 2000, the Fund participates in a $350,000,000 committed, unsecured revolving line of credit facility. Prior
thereto, the Fund participated in a $250,000,000 uncommitted and a $250,000,000 committed, unsecured revolving line of credit facility. Under the most restrictive arrangement, the Fund must own securities having a market value in excess of 400% of the
total bank borrowings. These facilities are to be used solely for temporary or emergency purposes. The interest rate on borrowings is based on the Federal Funds rate. The committed facility also requires a fee to be paid by the Fund based on the amount of
the commitment which has not been utilized. During the year ended August 31, 2000, the Fund did not have any borrowings under any of these facilities.
|
| 6. JOINT REPURCHASE AGREEMENT ACCOUNT
|
| The Fund, together with other registered investment companies having management agreements with GSAM or its affiliates, transfers
uninvested cash into joint accounts, the daily aggregate balance of which is invested in one or more repurchase agreements.
|
| At August 31, 2000, the Fund had an undivided interest in the repurchase
agreements in the joint account which equaled $3,300,000 in principal amount. At August 31, 2000, the following repurchase agreements held in this joint account were fully collateralized by Federal Agency obligations:
|
| Repurchase Agreements | Principal
Amount |
Interest
Rate |
Maturity
Date |
Amortized
Cost |
Maturity Value | |||||||
|---|---|---|---|---|---|---|---|---|---|---|---|---|
| ABN/AMRO, Inc. | $ 814,100,000 | 6.66 | % | 09/01/2000 | $ 814,100,000 | $ 814,250,608 | ||||||
| Banc of America Securities LLC | 900,000,000 | 6.67 | 09/01/2000 | 900,000,000 | 900,166,750 | |||||||
| Barclays Capital Inc. | 500,000,000 | 6.67 | 09/01/2000 | 500,000,000 | 500,092,639 | |||||||
| Bear Stearns Companies, Inc. | 300,000,000 | 6.67 | 09/01/2000 | 300,000,000 | 300,055,583 | |||||||
| Chase Securities, Inc. | 450,000,000 | 6.67 | 09/01/2000 | 450,000,000 | 450,083,375 | |||||||
| Donaldson, Lufkin & Jenrette, Inc. | 1,000,000,000 | 6.67 | 09/01/2000 | 1,000,000,000 | 1,000,185,278 | |||||||
| J.P. Morgan & Co., Inc. | 800,000,000 | 6.65 | 09/01/2000 | 800,000,000 | 800,147,778 | |||||||
| Morgan Stanley Dean Witter & Co. | 750,000,000 | 6.65 | 09/01/2000 | 750,000,000 | 750,138,542 | |||||||
| Morgan Stanley Dean Witter & Co. | 300,000,000 | 6.60 | 09/01/2000 | 300,000,000 | 300,055,000 | |||||||
| UBS Warburg LLC | 800,000,000 | 6.65 | 09/01/2000 | 800,000,000 | 800,147,778 | |||||||
| TOTAL JOINT REPURCHASE AGREEMENT ACCOUNT II | $6,614,100,000 | $6,615,323,331 | ||||||||||
| 7. CHANGE IN ACCOUNTANTS
|
| On October 26, 1999, the Board of Trustees of the Fund, upon the recommendation of the Board’s audit committee, determined
not to retain Arthur Andersen LLP and approved a change of the Fund’s independent accountants to PricewaterhouseCoopers LLP. For the period ended August 31, 1999, Arthur Andersen LLP audit reports contained no adverse opinion or disclaimer of opinion;
nor were their reports qualified or modified as to uncertainty, audit scope, or accounting principles. Further, there were no disagreements between the Fund and Arthur Andersen LLP on accounting principles or practices, financial statement disclosure or
audit scope or procedure, which if not resolved to the satisfaction of Arthur Andersen LLP would have caused them to make reference to the disagreement in their reports.
|
| 8. CERTAIN RECLASSIFICATIONS
|
| In accordance with AICPA Statement of Position 93-2, the Fund has reclassified $459,685 from paid-in capital to accumulated net
investment loss. This reclassification has no impact on the net asset value of the Fund and is designed to present the Fund’s capital accounts on a tax basis. Reclassifications result primarily from the difference in the tax treatment of foreign
currency, net operating losses and organization costs.
|
| 9. SUMMARY OF SHARE TRANSACTIONS
|
| Share activity is as follows:
|
| For the Year
Ended August 31, 2000 |
|||||||||||
|---|---|---|---|---|---|---|---|---|---|---|---|
| Shares | Dollars | ||||||||||
| Class A Shares | |||||||||||
| Shares sold | 6,980,953 | $ 81,208,797 | |||||||||
| Reinvestments of dividends and distributions | 65 | 749 | |||||||||
| Shares repurchased | (643,589 | ) | (7,592,195 | ) | |||||||
| 6,337,429 | 73,617,351 | ||||||||||
| Class B Shares | |||||||||||
| Shares sold | 1,151,624 | 12,874,188 | |||||||||
| Reinvestments of dividends and distributions | — | — | |||||||||
| Shares repurchased | (107,170 | ) | (1,253,024 | ) | |||||||
| 1,044,454 | 11,621,164 | ||||||||||
| Class C Shares | |||||||||||
| Shares sold | 458,422 | 5,048,001 | |||||||||
| Reinvestments of dividends and distributions | — | — | |||||||||
| Shares repurchased | (109,451 | ) | (1,260,537 | ) | |||||||
| 348,971 | 3,787,464 | ||||||||||
| Institutional Shares | |||||||||||
| Shares sold | 1,779,701 | 20,947,724 | |||||||||
| Reinvestments of dividends and distributions | 101 | 1,162 | |||||||||
| Shares repurchased | (552,466 | ) | (6,673,963 | ) | |||||||
| 1,227,336 | 14,274,923 | ||||||||||
| Service Shares | |||||||||||
| Shares sold | — | — | |||||||||
| Reinvestments of dividends and distributions | — | — | |||||||||
| Shares repurchased | — | — | |||||||||
| — | — | ||||||||||
| NET INCREASE | 8,958,190 | $ 103,300,902 | |||||||||
| 9. SUMMARY OF SHARE TRANSACTIONS (continued)
|
| Share activity is as follows:
|
| For the period
ended August 31, 1999 (a) |
|||||||||||
|---|---|---|---|---|---|---|---|---|---|---|---|
| Shares | Dollars | ||||||||||
| Class A Shares | |||||||||||
| Shares sold | 1,045,628 | $10,768,656 | |||||||||
| Shares repurchased | (14,378 | ) | (145,441 | ) | |||||||
| 1,031,250 | 10,623,215 | ||||||||||
| Class B Shares | |||||||||||
| Shares sold | 351,153 | 3,596,720 | |||||||||
| Shares repurchased | (13,125 | ) | (131,280 | ) | |||||||
| 338,028 | 3,465,440 | ||||||||||
| Class C Shares | |||||||||||
| Shares sold | 237,714 | 2,435,565 | |||||||||
| Shares repurchased | — | — | |||||||||
| 237,714 | 2,435,565 | ||||||||||
| Institutional Shares | |||||||||||
| Shares sold | 594,129 | 5,989,060 | |||||||||
| Shares repurchased | (2 | ) | (20 | ) | |||||||
| 594,127 | 5,989,040 | ||||||||||
| Service Shares | |||||||||||
| Shares sold | 150 | 1,500 | |||||||||
| Shares repurchased | — | — | |||||||||
| 150 | 1,500 | ||||||||||
| NET INCREASE | 2,201,269 | $22,514,760 | |||||||||
(a)
|
Commencement date of operations was May 24, 1999 for all share classes.
|
| Income from
investment operations |
||||||||||||
|---|---|---|---|---|---|---|---|---|---|---|---|---|
| Net asset
value, beginning of period |
Net
investment income (loss) |
Net
realized and unrealized gain |
Total
income from investment operations |
|||||||||
| FOR THE YEAR ENDED AUGUST 31, | ||||||||||||
| 2000 - Class A Shares | $10.06
|
$(0.06
|
)
(c)
|
$2.52
|
$2.46
|
|||||||
| 2000 - Class B Shares | 10.04
|
(0.14
|
)
(c)
|
2.50
|
2.36
|
|||||||
| 2000 - Class C Shares | 10.05
|
(0.14
|
)
(c)
|
2.51
|
2.37
|
|||||||
| 2000 - Institutional Shares | 10.07
|
(0.01
|
)
(c)
|
2.52
|
2.51
|
|||||||
| 2000 - Service Shares | 10.06
|
(0.04
|
)
(c)
|
2.50
|
2.46
|
|||||||
| FOR THE PERIOD ENDED AUGUST 31, | ||||||||||||
| 1999 - Class A Shares (commenced May 24) | 10.00
|
—
|
|
0.06
|
0.06
|
|||||||
| 1999 - Class B Shares (commenced May 24) | 10.00
|
(0.03
|
)
(c)
|
0.07
|
0.04
|
|||||||
| 1999 - Class C Shares (commenced May 24) | 10.00
|
(0.03
|
)
(c)
|
0.08
|
0.05
|
|||||||
| 1999 - Institutional Shares (commenced May 24) | 10.00
|
0.01
|
|
0.06
|
0.07
|
|||||||
| 1999 - Service Shares (commenced May 24) | 10.00
|
(0.01
|
)
|
0.07
|
0.06
|
|||||||
| |
||||||||||||
(a)
|
Assumes investment at the net asset value at the beginning of the period, reinvestment of all dividends and distributions, a
complete redemption of the investment at the net asset value at the end of the period and no sales or redemption charges. Total return would be reduced if a sales or redemption charge were taken into account. Total returns for periods less than one full
year are not annualized.
|
(b)
|
Annualized.
|
(c)
|
Calculated based on the average shares outstanding methodology.
|
|
Ratios assuming no expense reductions |
|||||||||||||||||||||
|---|---|---|---|---|---|---|---|---|---|---|---|---|---|---|---|---|---|---|---|---|---|
| Net asset
value, end of period |
Total
return (a) |
Net assets
at end of period (in 000s) |
Ratio of
net expenses to average net assets |
Ratio of
net investment income (loss) to average net assets |
Ratio of
expenses to average net assets |
Ratio of
net investment loss to average net assets |
Portfolio
turnover rate |
||||||||||||||
| $12.52
|
24.46 | % | $92,271 | 1.44 | % | (0.50)
|
%
|
1.63
|
%
|
(0.69)%
|
19.28 | % | |||||||||
| 12.40
|
23.51 | 17,149 | 2.19 | (1.24)
|
2.38 | (1.43)
|
19.28 | ||||||||||||||
| 12.42
|
23.58 | 7,287 | 2.19 | (1.24)
|
2.38 | (1.43)
|
19.28 | ||||||||||||||
| 12.58
|
24.93 | 22,910 | 1.04 | (0.09)
|
1.23 | (0.28)
|
19.28 | ||||||||||||||
| 12.52
|
24.45 | 2 | 1.54 | (0.35)
|
1.73 | (0.54)
|
19.28 | ||||||||||||||
| |
|||||||||||||||||||||
| |
|||||||||||||||||||||
| |
|||||||||||||||||||||
| 10.06
|
0.60 | 10,371 | 1.44 | (b) | (0.17) |
(b)
|
11.70 | (b) | (10.43)
(b)
|
6.98 | |||||||||||
| 10.04
|
0.40 | 3,393 | 2.19 | (b) | (0.97) |
(b)
|
12.45 | (b) | (11.23)(b)
|
6.98 | |||||||||||
| 10.05
|
0.50 | 2,388 | 2.19 | (b) | (0.99) |
(b)
|
12.45 | (b) | (11.25)(b)
|
6.98 | |||||||||||
| 10.07
|
0.70 | 5,981 | 1.04 | (b) | 0.24) |
(b)
|
11.30 | (b) | (10.02)(b)
|
6.98 | |||||||||||
| 10.06
|
0.60 | 2 | 1.54 | (b) | (0.24) |
(b)
|
11.80 | (b) | (10.50)(b)
|
6.98 | |||||||||||
| |
|||||||||||||||||||||
| Goldman Sachs Trust — Strategic Growth Fund — Tax Information (unaudited)
|
| For the tax year ended August 31, 2000, 100% of the dividends paid from net investment
company taxable income by the Strategic Growth Fund qualify for the dividends received deduction available to corporations.
|
| To the Shareholders and Board of Trustees of
|
| Goldman Sachs Trust — Strategic Growth Fund:
|
| In our opinion, the accompanying statement of assets and liabilities, including the statement of investments, and the related
statements of operations and of changes in net assets and the financial highlights present fairly, in all material respects, the financial position of Goldman Sachs Strategic Growth Fund (“the Fund”), one of the portfolios constituting Goldman
Sachs Trust, at August 31, 2000, the results of its operations, the changes in its net assets and the financial highlights for the year then ended, in conformity with accounting principles generally accepted in the United States of America. These
financial statements and financial highlights (hereafter referred to as “financial statements”) are the responsibility of the Fund’s management; our responsibility is to express an opinion on these financial statements based on our audit.
We conducted our audit of these financial statements in accordance with auditing standards generally accepted in the United States of America, which require that we plan and perform the audit to obtain reasonable assurance about whether the financial
statements are free of material misstatement. An audit includes examining, on a test basis, evidence supporting the amounts and disclosures in the financial statements, assessing the accounting principles used and significant estimates made by management,
and evaluating the overall financial statement presentation. We believe that our audit, which included confirmation of securities at August 31, 2000 by correspondence with the custodian and brokers, provides a reasonable basis for our opinion. The
statement of changes in net assets and the financial highlights of the Fund for the period ended August 31, 1999 were audited by other independent accountants whose report dated October 8, 1999 expressed an unqualified opinion thereon.
|
| PricewaterhouseCoopers LLP
|
| Boston, Massachusetts
|
| October 23, 2000
|
|
Shares |
Description | Value | |||
|---|---|---|---|---|---|
| Common Stocks – 94.0% | |||||
| Banks – 4.9% | |||||
| 457,049 | Bank of America Corp. | $ 24,480,687 | |||
| 1,298,000 | Citigroup, Inc. | 75,770,750 | |||
| 398,490 | State Street Corp. | 46,922,197 | |||
| 272,900 | The Bank of New York Co., Inc. | 14,310,194 | |||
| 128,950 | The Chase Manhattan Corp. | 7,205,081 | |||
| 442,900 | Wells Fargo & Co. | 19,127,744 | |||
| 187,816,653 | |||||
| Chemicals – 1.5% | |||||
| 468,429 | E.I. du Pont de Nemours & Co. | 21,020,752 | |||
| 296,000 | Minnesota Mining & Manufacturing
Co. |
27,528,000 | |||
| 346,300 | The Dow Chemicals Co. | 9,068,731 | |||
| 57,617,483 | |||||
| Computer Hardware – 8.4% | |||||
| 2,003,780 | Cisco Systems, Inc.* | 137,509,402 | |||
| 703,690 | Dell Computer Corp.* | 30,698,476 | |||
| 670,500 | EMC Corp.* | 65,709,000 | |||
| 197,660 | Hewlett-Packard Co. | 23,867,445 | |||
| 489,400 | Sun Microsystems, Inc.* | 62,123,213 | |||
| 154,100 | Xerox Corp. | 2,475,231 | |||
| 322,382,767 | |||||
| Computer Software – 6.8% | |||||
| 136,830 | CheckFree Corp.* | 7,089,504 | |||
| 86,700 | Gemstar-TV Guide International,
Inc.* |
7,824,675 | |||
| 424,700 | International Business Machines,
Inc. |
56,060,400 | |||
| 1,569,600 | Microsoft Corp.* | 109,577,700 | |||
| 833,600 | Oracle Corp.* | 75,805,500 | |||
| 49,760 | VERITAS Software Corp.* | 5,999,190 | |||
| 262,356,969 | |||||
| Defense/Aerospace – 0.1% | |||||
| 105,300 | Honeywell International, Inc. | 4,060,631 | |||
| Department Store – 1.6% | |||||
| 1,286,400 | Wal-Mart Stores, Inc. | 61,023,600 | |||
| Drugs – 7.9% | |||||
| 361,100 | American Home Products Corp. | 19,567,106 | |||
| 297,300 | Amgen, Inc.* | 22,539,056 | |||
| 1,319,210 | Bristol-Myers Squibb Co. | 69,918,130 | |||
| 326,300 | Eli Lilly & Co. | 23,819,900 | |||
| 497,600 | Merck & Co., Inc. | 34,769,800 | |||
| 2,611,510 | Pfizer, Inc. | 112,947,807 | |||
| 482,100 | Schering-Plough Corp. | 19,344,263 | |||
| 302,906,062 | |||||
|
Shares |
Description | Value | |||
|---|---|---|---|---|---|
| Common Stocks – continued | |||||
| Electrical Equipment – 5.7% | |||||
| 186,700 | Corning, Inc. | $ 61,225,931 | |||
| 907,050 | Lucent Technologies, Inc. | 37,926,028 | |||
| 430,887 | Motorola, Inc. | 15,538,863 | |||
| 1,041,100 | Nortel Networks Corp. | 84,914,719 | |||
| 311,440 | QUALCOMM, Inc.* | 18,647,470 | |||
| 218,253,011 | |||||
| Electrical Utilities – 1.9% | |||||
| 103,500 | Duke Energy Corp. | 7,743,094 | |||
| 901,900 | The AES Corp.* | 57,496,125 | |||
| 218,160 | The Southern Co. | 6,531,165 | |||
| 71,770,384 | |||||
| Energy Resources – 4.1% | |||||
| 209,700 | Chevron Corp. | 17,719,650 | |||
| 189,300 | Enron Corp. | 16,066,838 | |||
| 994,406 | Exxon Mobil Corp. | 81,168,390 | |||
| 635,000 | Royal Dutch Petroleum Co. | 38,854,062 | |||
| 148,400 | Unocal Corp. | 4,952,850 | |||
| 158,761,790 | |||||
| Entertainment – 1.5% | |||||
| 351,600 | The Walt Disney Co. | 13,690,425 | |||
| 623,545 | Viacom, Inc. Class B* | 41,972,373 | |||
| 55,662,798 | |||||
| Environmental Services – 0.1% | |||||
| 210,500 | Waste Management, Inc. | 3,986,344 | |||
| Financial Services – 7.2% | |||||
| 900,200 | Federal Home Loan Mortgage
Corp. |
37,920,925 | |||
| 729,800 | Federal National Mortgage Assn. | 39,226,750 | |||
| 2,688,000 | General Electric Co. | 157,752,000 | |||
| 1,177,680 | MBNA Corp. | 41,586,825 | |||
| 276,486,500 | |||||
| Food & Beverage – 3.0% | |||||
| 726,260 | Nabisco Group Holdings Corp. | 20,380,671 | |||
| 818,000 | PepsiCo., Inc. | 34,867,250 | |||
| 800,300 | The Coca-Cola Co. | 42,115,787 | |||
| 224,780 | Wm. Wrigley Jr. Co. | 16,647,769 | |||
| 114,011,477 | |||||
| Forest – 0.6% | |||||
| 247,900 | International Paper Co. | 7,901,812 | |||
| 127,200 | Kimberly-Clark Corp. | 7,441,200 | |||
| 174,300 | Weyerhaeuser Co. | 8,072,269 | |||
| 23,415,281 | |||||
| Heavy Electrical – 0.1% | |||||
| 59,200 | Emerson Electric Co. | 3,918,300 | |||
|
Shares |
Description | Value | |||
|---|---|---|---|---|---|
| Common Stocks – continued | |||||
| Home Products – 2.5% | |||||
| 358,800 | Avon Products, Inc. | $ 14,060,475 | |||
| 777,860 | Colgate-Palmolive Co. | 39,622,243 | |||
| 681,800 | Energizer Holdings, Inc.* | 13,465,550 | |||
| 266,800 | The Gillette Co. | 8,004,000 | |||
| 328,780 | The Procter & Gamble Co. | 20,322,714 | |||
| 95,474,982 | |||||
| Hotels – 2.0% | |||||
| 1,077,000 | Harrah’s Entertainment, Inc.* | 30,559,875 | |||
| 592,940 | Marriott International, Inc. | 23,421,130 | |||
| 725,380 | Starwood Hotels & Resorts
Worldwide, Inc. Class B |
23,212,160 | |||
| 77,193,165 | |||||
| Industrial Parts – 0.7% | |||||
| 293,250 | Tyco International Ltd. | 16,715,250 | |||
| 130,540 | United Technologies Corp. | 8,150,591 | |||
| 24,865,841 | |||||
| Information Services – 2.1% | |||||
| 314,500 | Automatic Data Processing, Inc. | 18,752,063 | |||
| 905,500 | Cendant Corp.* | 11,941,281 | |||
| 686,060 | First Data Corp. | 32,716,486 | |||
| 559,430 | Valassis Communications, Inc.* | 16,153,541 | |||
| 79,563,371 | |||||
| Internet – 2.1% | |||||
| 416,790 | America Online, Inc.* | 24,434,314 | |||
| 125,300 | DoubleClick, Inc.* | 5,098,144 | |||
| 52,390 | E.piphany, Inc.* | 5,448,560 | |||
| 158,160 | S1 Corp.* | 2,757,915 | |||
| 126,765 | VeriSign, Inc.* | 25,210,389 | |||
| 147,600 | Yahoo!, Inc.* | 17,933,400 | |||
| 80,882,722 | |||||
| Life Insurance – 1.2% | |||||
| 1,503,320 | MetLife, Inc.* | 36,549,468 | |||
| 269,800 | Nationwide Financial Services, Inc. | 10,758,275 | |||
| 47,307,743 | |||||
| Media – 6.0% | |||||
| 1,102,000 | A.H. Belo Corp. | 21,075,750 | |||
| 1,483,100 | AT&T Corp.-Liberty Media Corp.* | 31,701,262 | |||
| 162,100 | Cablevision Systems Corp.* | 10,901,225 | |||
| 182,830 | Clear Channel Communications,
Inc.* |
13,232,321 | |||
| 244,420 | Comcast Corp. | 9,104,645 | |||
| 256,190 | EchoStar Communications Corp.* | 12,489,262 | |||
| 185,300 | Gannett Co., Inc. | 10,492,613 | |||
| 780,277 | General Motors Corp. Class H* | 25,846,676 | |||
|
Shares |
Description | Value | |||
|---|---|---|---|---|---|
| Common Stocks – continued | |||||
| Media – (continued) | |||||
| 729,320 | Infinity Broadcasting Corp.* | $ 27,622,995 | |||
| 713,300 | Time Warner, Inc. | 60,987,150 | |||
| 189,800 | Tribune Co. | 6,773,488 | |||
| 230,227,387 | |||||
| Medical Products – 0.7% | |||||
| 305,000 | Johnson & Johnson | 28,040,938 | |||
| Mining – 0.2% | |||||
| 285,200 | Alcoa, Inc. | 9,482,900 | |||
| Motor Vehicle – 0.7% | |||||
| 542,242 | Ford Motor Co. | 13,115,478 | |||
| 193,048 | General Motors Corp. | 13,935,653 | |||
| 27,051,131 | |||||
| Oil Refining – 0.2% | |||||
| 184,100 | Texaco, Inc. | 9,481,150 | |||
| Oil Services – 1.3% | |||||
| 569,900 | Schlumberger Ltd. | 48,619,594 | |||
| Property Insurance – 2.1% | |||||
| 397,930 | Ambac Financial Group, Inc. | 25,716,226 | |||
| 621,031 | American International Group, Inc. | 55,349,388 | |||
| 81,065,614 | |||||
| Publishing – 0.4% | |||||
| 392,800 | The New York Times Co. | 15,392,850 | |||
| Restaurants – 0.7% | |||||
| 934,600 | McDonald’s Corp. | 27,921,175 | |||
| Security/Asset Management – 1.1% | |||||
| 99,600 | Merrill Lynch & Co., Inc. | 14,442,000 | |||
| 721,300 | The Charles Schwab Corp. | 27,544,644 | |||
| 41,986,644 | |||||
| Semiconductors – 6.8% | |||||
| 92,500 | Analog Devices, Inc.* | 9,296,250 | |||
| 152,200 | Applied Materials, Inc.* | 13,136,763 | |||
| 1,923,200 | Intel Corp. | 143,999,600 | |||
| 316,840 | JDS Uniphase Corp.* | 39,441,629 | |||
| 82,500 | Maxim Integrated Products, Inc.* | 7,234,219 | |||
| 33,800 | PMC-Sierra, Inc.* | 7,976,800 | |||
| 492,300 | Texas Instruments, Inc. | 32,953,331 | |||
| 93,800 | Xilinx, Inc.* | 8,336,475 | |||
| 262,375,067 | |||||
| Specialty Retail – 2.3% | |||||
| 236,900 | CVS Corp. | 8,794,913 | |||
| 201,600 | RadioShack Corp. | 11,894,400 | |||
|
Shares |
Description | Value | |||
|---|---|---|---|---|---|
| Common Stocks – (continued) | |||||
| Specialty Retail – (continued) | |||||
| 666,150 | The Home Depot, Inc. | $ 32,016,834 | |||
| 1,059,420 | Walgreen Co. | 34,828,432 | |||
| 87,534,579 | |||||
| Telephone – 3.2% | |||||
| 590,298 | AT&T Corp. | 18,594,387 | |||
| 1,007,600 | SBC Communications, Inc. | 42,067,300 | |||
| 763,718 | Verizon Communications | 33,317,198 | |||
| 831,750 | WorldCom, Inc. * | 30,358,875 | |||
| 124,337,760 | |||||
| Tobacco – 0.8% | |||||
| 998,190 | Philip Morris Cos., Inc. | 29,571,379 | |||
| Wireless – 1.5% | |||||
| 855,800 | Crown Castle International Corp. * | 29,685,563 | |||
| 339,900 | Sprint Corp. (PCS Group) * | 17,058,731 | |||
| 297,200 | Vodafone Group PLC ADR | 12,166,625 | |||
| 58,910,919 | |||||
| TOTAL COMMON STOCKS | |||||
| (Cost $2,480,410,243) | $ 3,611,716,961 | ||||
| Principal
Amount |
Interest
Rate |
Maturity
Date |
Value | |||||
|---|---|---|---|---|---|---|---|---|
| Repurchase Agreement – 5.8% | ||||||||
| Joint Repurchase Agreement Account II Ù | ||||||||
| $222,000,000 | 6.66 | % | 09/01/2000 | $ 222,000,000 | ||||
| TOTAL REPURCHASE AGREEMENT | ||||||||
| (Cost $222,000,000) | $ 222,000,000 | |||||||
| TOTAL INVESTMENTS | ||||||||
| (Cost $2,702,410,243) | $ 3,833,716,961 | |||||||
*
|
Non-income producing security.
|
Ù
|
Joint repurchase agreement was entered into on August 31, 2000.
|
| The percentage shown for each investment category reflects the value of investments in that category as a percentage of total net
assets.
|
| |
| Investment Abbreviations:
|
| ADR—American Depositary Receipt
|
| |
| Assets: | |||
| Investment in securities, at value (identified cost $2,702,410,243) | $3,833,716,961 | ||
| Cash (a) | 4,013,696 | ||
| Receivables: | |||
| Fund shares sold | 9,481,995 | ||
| Dividends and interest | 3,511,394 | ||
| Variation margin | 836,000 | ||
| Reimbursement from investment adviser | 121,601 | ||
| Other assets | 45,898 | ||
| Total assets | 3,851,727,545 | ||
| Liabilities: | |||
| Payables: | |||
| Amounts owed to affiliates | 4,771,543 | ||
| Fund shares repurchased | 3,735,605 | ||
| Accrued expenses and other liabilities | 290,584 | ||
| Total liabilities | 8,797,732 | ||
| Net Assets: | |||
| Paid-in capital | 2,456,264,852 | ||
| Accumulated net realized gain from investment and futures transactions | 252,884,068 | ||
| Net unrealized gain on investments and futures | 1,133,780,893 | ||
| NET ASSETS | $3,842,929,813 | ||
| Net asset value, offering and redemption price per share: (b) | |||
| Class A | $28.95 | ||
| Class B | $27.99 | ||
| Class C | $27.94 | ||
| Institutional | $29.19 | ||
| Service | $28.81 | ||
| Shares outstanding: | |||
| Class A | 94,525,771 | ||
| Class B | 16,137,213 | ||
| Class C | 5,121,908 | ||
| Institutional | 17,059,630 | ||
| Service | 474,444 | ||
| Total shares outstanding, $.001 par value (unlimited number of shares authorized) | 133,318,966 | ||
(a)
|
Includes restricted cash of $4,000,000 relating to initial margin requirements and collateral for futures transactions.
|
(b)
|
Maximum public offering price per share (NAV per share multiplied by 1.0582) for Class A Shares is $30.63. At redemption, Class B
and Class C Shares may be subject to a contingent deferred sales charge, assessed on the amount equal to the lesser of the current net asset value or the original purchase price of the shares.
|
| Investment income: | |||
| Dividend (a) | $ 27,242,338 | ||
| Interest | 6,268,033 | ||
| Total income | 33,510,371 | ||
| Expenses: | |||
| Management fees | 32,406,631 | ||
| Distribution and Service fees (b) | 11,010,364 | ||
| Transfer Agent fees (c) | 5,577,565 | ||
| Registration fees | 352,348 | ||
| Custodian fees | 318,438 | ||
| Professional fees | 64,244 | ||
| Service Share fees | 48,672 | ||
| Trustee fees | 8,729 | ||
| Other | 239,388 | ||
| Total expenses | 50,026,379 | ||
| Less — expense reductions | (853,521 | ) | |
| Net expenses | 49,172,858 | ||
| NET INVESTMENT LOSS | (15,662,487 | ) | |
| Realized and unrealized gain on investment and futures transactions: | |||
| Net realized gain from: | |||
| Investment transactions | 326,037,782 | ||
| Futures transactions | 7,257,241 | ||
| Net change in unrealized gain on: | |||
| Investments | 394,881,460 | ||
| Futures | 2,474,175 | ||
| Net realized and unrealized gain on investment and futures transactions | 730,650,658 | ||
| NET INCREASE IN NET ASSETS RESULTING FROM OPERATIONS | $714,988,171 | ||
(a)
|
Foreign taxes withheld on dividends were $138,007.
|
(b)
|
Class A, Class B and Class C had Distribution and Service fees of $5,843,877, $4,009,512 and $1,156,975, respectively.
|
(c)
|
Class A, Class B, Class C, Institutional Class and Service Class had Transfer Agent fees of $4,441,347, $761,807, $219,825,
$150,692 and $3,894,
respectively. |
| For the
Year Ended August 31, 2000 |
For the
Seven Months Ended August 31, 1999 |
For the
Year Ended January 31, 1999 |
|||||||||||||||||||||||||
|---|---|---|---|---|---|---|---|---|---|---|---|---|---|---|---|---|---|---|---|---|---|---|---|---|---|---|---|
| From operations: | |||||||||||||||||||||||||||
| Net investment loss | $ (15,662,487 | ) | $ (9,313,696 | ) | $ (4,273,950 | ) | |||||||||||||||||||||
| Net realized gain from investment and futures transactions | 333,295,023 | 120,162,134 | 133,916,314 | ||||||||||||||||||||||||
| Net change in unrealized gain on investments | 397,355,635 | (19,552,612 | ) | 392,953,579 | |||||||||||||||||||||||
| Net increase in net assets resulting from operations | 714,988,171 | 91,295,826 | 522,595,943 | ||||||||||||||||||||||||
| Distributions to shareholders: | |||||||||||||||||||||||||||
| From net realized gain on investment transactions | |||||||||||||||||||||||||||
| Class A Shares | (175,959,949 | ) | — | (59,433,653 | ) | ||||||||||||||||||||||
| Class B Shares | (31,007,673 | ) | — | (6,254,745 | ) | ||||||||||||||||||||||
| Class C Shares | (8,484,987 | ) | — | (1,535,180 | ) | ||||||||||||||||||||||
| Institutional Shares | (24,209,541 | ) | — | (949,782 | ) | ||||||||||||||||||||||
| Service Shares | (570,727 | ) | — | (97,173 | ) | ||||||||||||||||||||||
| Total distributions to shareholders | (240,232,877 | ) | — | (68,270,533 | ) | ||||||||||||||||||||||
| From share transactions: | |||||||||||||||||||||||||||
| Proceeds from sales of shares | 1,067,676,367 | 705,992,404 | 958,527,625 | ||||||||||||||||||||||||
| Reinvestment of dividends and distributions | 220,662,950 | — | 63,389,050 | ||||||||||||||||||||||||
| Cost of shares repurchased | (570,091,770 | ) | (481,582,281 | ) | (452,101,755 | ) | |||||||||||||||||||||
| Net increase in net assets resulting from share transactions | 718,247,547 | 224,410,123 | 569,814,920 | ||||||||||||||||||||||||
| TOTAL INCREASE | 1,193,002,841 | 315,705,949 | 1,024,140,330 | ||||||||||||||||||||||||
| Net assets: | |||||||||||||||||||||||||||
| Beginning of period | 2,649,926,972 | 2,334,221,023 | 1,310,080,693 | ||||||||||||||||||||||||
| End of period | $3,842,929,813 | $2,649,926,972 | $2,334,221,023 | ||||||||||||||||||||||||
| Accumulated net investment loss | $ — | — | — | ||||||||||||||||||||||||
| 1. ORGANIZATION
|
| Goldman Sachs Trust (the “Trust”) is a Delaware business trust registered under the Investment Company Act of 1940 (as
amended) as an open-end management investment company. The Trust includes the Goldman Sachs Capital Growth Fund (the “Fund”). The Fund is a diversified portfolio offering five classes of shares — Class A, Class B, Class C,
Institutional and Service.
|
| 2. SIGNIFICANT ACCOUNTING POLICIES
|
| The following is a summary of the significant accounting policies consistently followed by the Fund. The preparation of financial
statements in conformity with generally accepted accounting principles requires management to make estimates and assumptions that may affect the reported amounts. Actual results could differ from those estimates. Effective for fiscal year 1999, the Board
of Trustees approved a change in the fiscal year-end of the Fund from January 31 to August 31. Accordingly, the Statements of Changes in Net Assets, Summary of Share Transactions and Financial Highlights of the Fund include the seven months ended August
31, 1999 and for the year ended January 31, 1999.
|
| A. Investment Valuation — Investments in
securities traded on a U.S. or foreign securities exchange or the NASDAQ system are valued daily at their last sale price on the principal exchange on which they are traded. If no sale occurs, securities are valued at the last bid price. Debt securities
are valued at prices supplied by independent pricing services, broker/dealer-supplied valuations or matrix pricing systems. Unlisted equity and debt securities for which market quotations are available are valued at the last sale price on valuation date,
or if no sale occurs, at the last bid price. Short-term debt obligations maturing in sixty days or less are valued at amortized cost, which approximates market value. Securities for which quotations are not readily available are valued at fair value using
methods approved by the Board of Trustees of the Trust.
|
| B. Security Transactions and Investment Income — Security transactions are recorded as of the trade date. Realized gains and losses on sales of portfolio securities are calculated using the identified-cost basis. Dividend income is recorded on the ex-dividend date net of foreign withholding taxes where
applicable. Dividends for which the Fund has the choice to receive either cash or stock are recognized as investment income in an amount equal to the cash dividend. Interest income is recorded on the basis of interest accrued, premium amortized and
discount earned.
|
| Net investment income (other than class specific expenses) and unrealized and
realized gains or losses are allocated daily to each class of shares of the Fund based upon the relative proportion of net assets of each class.
|
| C. Federal Taxes — It is the Fund’s
policy to comply with the requirements of the Internal Revenue Code applicable to regulated investment companies and to distribute each year substantially all of its investment company taxable income and capital gains to its shareholders. Accordingly, no
federal tax provision is required. Income and capital gain distributions, if any, are declared and paid annually.
|
| The characterization of distributions to shareholders for financial reporting
purposes is determined in accordance with income tax rules. Therefore, the source of the Fund’s distributions may be shown in the accompanying financial statements as either from or in excess of net investment income or net realized gain on
investment transactions, or from paid-in capital, depending on the type of book/tax differences that may exist.
|
| At August 31, 2000, the aggregate cost of portfolio securities for federal income
tax purposes is $2,702,579,305. Accordingly, the gross unrealized gain on investments was $1,275,440,219 and the gross unrealized loss on investments was $144,302,563 resulting in a net unrealized gain of $1,131,137,656.
|
| 2. SIGNIFICANT ACCOUNTING POLICIES (continued)
|
| D. Expenses — Expenses incurred by the
Trust that do not specifically relate to an individual fund of the Trust are allocated to the funds on a straight-line or pro rata basis depending upon the nature of the expense.
|
| Class A, Class B and Class C Shares bear all expenses and fees relating to their
respective Distribution and Service Plans. Shareholders of Service Shares bear all expenses and fees paid to service organizations. Each class of shares separately bears its respective class-specific Transfer Agency fees.
|
| E. Foreign Currency Translations — The
books and records of the Fund are maintained in U.S. dollars. Amounts denominated in foreign currencies are translated into U.S. dollars on the following basis: (i) investment valuations, foreign currency and other assets and liabilities initially
expressed in foreign currencies are converted each business day into U.S. dollars based upon current exchange rates; and (ii) purchases and sales of foreign investments, income and expenses are converted into U.S. dollars based upon currency exchange
rates prevailing on the respective dates of such transactions.
|
| Net realized and unrealized gain (loss) on foreign currency transactions will
represent: (i) foreign exchange gains and losses from the sale and holdings of foreign currencies; (ii) currency gains and losses between trade date and settlement date on investment securities transactions and forward exchange contracts; and (iii) gains
and losses from the difference between amounts of dividends and interest recorded and the amounts actually received.
|
| F. Segregation Transactions — The Fund may
enter into certain derivative transactions to seek to increase total return. Forward foreign currency exchange contracts, futures contracts, written options, when-issued securities and forward commitments represent examples of such transactions. As a
result of entering into these transactions, the Fund is required to segregate liquid assets on the accounting records equal to or greater than the market value of the corresponding transactions.
|
| G. Repurchase Agreements — Repurchase
agreements involve the purchase of securities subject to the sellers agreement to repurchase them at a mutually agreed upon date and price.
|
| During the term of a repurchase agreement, the value of the underlying securities,
including accrued interest, is required to equal or exceed the value of the repurchase agreement. The underlying securities for all repurchase agreements are held in safekeeping at the Fund’s custodian.
|
| 3. AGREEMENTS
|
| Pursuant to the Investment Management Agreement (the “Agreement”), Goldman Sachs Funds Management, L.P. (“GSFM”
), a unit of the Investment Management Division of Goldman, Sachs & Co. (“Goldman Sachs”), serves as the investment adviser to the Fund. Under the Agreement, the adviser, subject to the general supervision of the Trust’s Board of
Trustees, manages the Fund’s portfolio. As compensation for the services rendered pursuant to the Agreement, the assumption of the expenses related thereto and administering the Fund’s business affairs, including providing facilities, the
adviser is entitled to a fee, computed daily and payable monthly, at an annual rate equal to 1.00% of the average daily net assets of the Fund.
|
| The adviser has voluntarily agreed to limit certain “Other Expenses” of
the Fund (excluding Management fees, Distribution and Service fees, Transfer Agent fees, taxes, interest, brokerage, litigation, Service Share fees, indemnification costs and other extraordinary expenses) to the extent such expenses exceed, on an annual
basis, 0.00% of the average daily net assets of the Fund. For the year ended August 31, 2000, Goldman Sachs has agreed to reimburse approximately $810,000.
|
| In addition, the Fund has entered into certain offset arrangements with the
custodian resulting in a reduction in the Fund’s expenses. For the year ended August 31, 2000, custody fees were reduced by approximately $44,000.
|
| The Trust, on behalf of the Fund, has adopted Distribution and Service Plans.
Under the Distribution and Service Plans, Goldman Sachs and/or authorized dealers are entitled to a monthly fee from the Fund for distribution and shareholder mainte
3. AGREEMENTS (continued)
|
| nance services equal, on an annual basis, to 0.25%, 1.00% and 1.00% of the Fund’s average daily net assets attributable to
Class A, Class B and Class C Shares, respectively.
|
| Goldman Sachs serves as the distributor of shares of the Fund pursuant to
Distribution Agreements. Goldman Sachs may receive a portion of the Class A sales load and Class B and Class C contingent deferred sales charges and has advised the Fund that it retained approximately $1,947,000 for the year ended August 31, 2000.
|
| Goldman Sachs also serves as the transfer agent of the Fund for a fee. The fees
charged for such transfer agency services are calculated daily and payable monthly at an annual rate as follows: 0.19% of the average daily net assets for Class A, Class B and Class C Shares and 0.04% of the average daily net assets for Institutional and
Service Shares.
|
| The Trust, on behalf of the Fund, has adopted a Service Plan. This Plan allows for
Service Shares to compensate service organizations for providing varying levels of account administration and shareholder liaison services to their customers who are beneficial owners of such shares. The Service Plan provides for compensation to the
service organizations in an amount up to 0.50% (on an annualized basis), of the average daily net asset value of the Service shares.
|
| As of August 31, 2000, the amounts owed to affiliates were approximately
$3,174,000, $1,057,000, and $541,000 for Management, Distribution and Service and Transfer Agent fees, respectively.
|
| 4. PORTFOLIO SECURITIES TRANSACTIONS
|
| The cost of purchases and proceeds of sales or maturities of securities (excluding short-term investments and futures) for the
year ended August 31, 2000, were $1,377,035,017 and $1,063,546,227, respectively. For the year ended August 31, 2000, Goldman Sachs earned approximately $106,000 of brokerage commissions from portfolio transactions including futures transactions executed
on behalf of the Fund.
|
| Futures Contracts — The Fund may enter into futures
transactions to hedge against changes in interest rates, securities prices, currency exchange rates or to seek to increase total return. Upon entering into a futures contract, the Fund is required to deposit with a broker or the Fund’s custodian bank
an amount of cash or securities equal to the minimum “initial margin” requirement of the associated futures exchange. Subsequent payments for futures contracts (“variation margin”) are paid or received by the Fund daily, depending on
the daily fluctuations in the value of the contracts, and are recorded for financial reporting purposes as unrealized gains or losses. When contracts are closed, the Fund realizes a gain or loss which is reported in the Statement of Operations.
|
| The use of futures contracts involve, to varying degrees, elements of market risk
which may exceed the amounts recognized in the Statement of Assets and Liabilities. Changes in the value of the futures contract may not directly correlate with changes in the value of the underlying securities. This risk may decrease the effectiveness of
the Fund’s hedging strategies and potentially result in a loss.
|
| As of August 31, 2000, open futures contracts were as follows:
|
| Type | Number of
Contracts Long |
Settlement
Month |
Market Value | Unrealized Gain | |||||
|---|---|---|---|---|---|---|---|---|---|
| S&P 500 Index Futures | 190 | September 2000 | $72,257,000 | $2,474,175 | |||||
| Option Accounting Principles — When the Fund writes
call or put options, an amount equal to the premium received is recorded as an asset and as an equivalent liability. The amount of the liability is subsequently marked-to-market to reflect the current market value of the option written. When a written
option expires on its stipulated expiration date or the Fund enters into a closing purchase transaction, the Fund realizes a gain or loss without regard to any unrealized gain or loss on the underlying security, and the liability related to such option is
extinguished. When a written call option is exercised, the Fund realizes a gain or loss from the sale of the underlying security, and the proceeds of the sale are increased by the premium
4. PORTFOLIO SECURITIES TRANSACTIONS (continued)
|
| originally received. When a written put option is exercised, the amount of the premium originally received will reduce the cost of
the security which the Fund purchases upon exercise. There is a risk of loss from a change in value of such options which may exceed the related premiums received.
|
| Upon the purchase of a call option or a protective put option by the Fund, the
premium paid is recorded as an investment and subsequently marked-to-market to reflect the current market value of the option. If an option which the Fund has purchased expires on the stipulated expiration date, the Fund will realize a loss in the amount
of the cost of the option. If the Fund enters into a closing sale transaction, the Fund will realize a gain or loss, depending on whether the sale proceeds for the closing sale transaction are greater or less than the cost of the option. If the Fund
exercises a purchased put option, the Fund will realize a gain or loss from the sale of the underlying security, and the proceeds from such sale will be decreased by the premium originally paid. If the Fund exercises a purchased call option, the cost of
the security which the Fund purchases upon exercise will be increased by the premium originally paid. At August 31, 2000, there were no open written option contracts.
|
| 5. LINE OF CREDIT FACILITY
|
| Effective May 31, 2000, the Fund participates in a $350,000,000 committed, unsecured revolving line of credit facility. Prior
thereto, the Fund participated in a $250,000,000 uncommitted and a $250,000,000 committed, unsecured revolving line of credit facility. Under the most restrictive arrangement, the Fund must own securities having a market value in excess of 400% of the
total bank borrowings. These facilities are to be used solely for temporary or emergency purposes. The interest rate on borrowings is based on the Federal Funds rate. The committed facilities also require a fee to be paid by the Fund based on the amount
of the commitment. During the year ended August 31, 2000, the Fund did not have any borrowings under any of these facilities.
|
| Goldman Sachs Capital Growth Fund — Tax Information (unaudited)
|
| For the year ended August 31, 2000, 79.23% of the dividends paid from net investment
company taxable income by the Capital Growth Fund, qualify for the dividends received deduction available to corporations.
|
| Goldman Sachs Capital Growth Fund — Tax Information (unaudited)
|
| Pursuant to Section 852 of the Internal Revenue Code, the Fund designated $207,043,137 as
capital gain dividends paid during its year ended August 31, 2000.
|
| 6. JOINT REPURCHASE AGREEMENT ACCOUNT
|
| The Fund, together with other registered investment companies having management agreements with GSFM or its affiliates, transfers
uninvested cash into joint accounts, the daily aggregate balance of which is invested in one or more repurchase agreements.
|
| At August 31, 2000, the Fund had an undivided interest in the repurchase
agreements in the joint account which equaled $222,000,000 in principal amount. At August 31, 2000, the following repurchase agreements held in this joint account were fully collateralized by Federal Agency obligations:
|
| Repurchase Agreements | Principal
Amount |
Interest
Rate |
Maturity
Date |
Amortized
Cost |
Maturity
Value |
|||||||
|---|---|---|---|---|---|---|---|---|---|---|---|---|
| ABN/AMRO, Inc. | $ 814,100,000 | 6.66 | % | 09/01/2000 | $ 814,100,000 | $ 814,250,608 | ||||||
| Banc of America Securities LLC | 900,000,000 | 6.67 | 09/01/2000 | 900,000,000 | 900,166,750 | |||||||
| Barclays Capital, Inc. | 500,000,000 | 6.67 | 09/01/2000 | 500,000,000 | 500,092,639 | |||||||
| Bear Stearns Companies, Inc. | 300,000,000 | 6.67 | 09/01/2000 | 300,000,000 | 300,055,583 | |||||||
| Chase Securities, Inc. | 450,000,000 | 6.67 | 09/01/2000 | 450,000,000 | 450,083,375 | |||||||
| Donaldson, Lufkin & Jenrette, Inc. | 1,000,000,000 | 6.67 | 09/01/2000 | 1,000,000,000 | 1,000,185,278 | |||||||
| J.P. Morgan & Co., Inc. | 800,000,000 | 6.65 | 09/01/2000 | 800,000,000 | 800,147,778 | |||||||
| Morgan Stanley Dean Witter & Co. | 750,000,000 | 6.65 | 09/01/2000 | 750,000,000 | 750,138,542 | |||||||
| Morgan Stanley Dean Witter & Co. | 300,000,000 | 6.60 | 09/01/2000 | 300,000,000 | 300,055,000 | |||||||
| UBS Warburg LLC | 800,000,000 | 6.65 | 09/01/2000 | 800,000,000 | 800,147,778 | |||||||
| TOTAL JOINT REPURCHASE AGREEMENT ACCOUNT II | $6,614,100,000 | $6,615,323,331 | ||||||||||
| 7. CERTAIN RECLASSIFICATIONS
|
| In accordance with AICPA Statement of Position 93-2, the Fund has reclassified $15,662,487 from accumulated net realized gain from
investment transactions to accumulated net investment loss. These reclassifications have no impact on the net asset value of the Fund and are designed to present the Fund’s capital accounts on a tax basis.
|
| 8. CHANGE IN INDEPENDENT ACCOUNTANTS
|
| On October 26, 1999 the Board of Trustees of the Fund, upon the recommendation of the Board’s audit committee, determined not
to retain Arthur Andersen LLP and approved a change of the Fund’s independent accountants to PricewaterhouseCoopers LLP. For the period ended August 31, 1999 and the fiscal year ended January 31, 1999, Arthur Andersen LLP’s audit reports
contained no adverse opinion or disclaimer of opinion; nor were their reports qualified or modified as to uncertainty, audit scope, or accounting principles. Further, there were no disagreements between the Fund and Arthur Andersen LLP on accounting
principles or practices, financial statement disclosure or audit scope or procedure, which if not resolved to the satisfaction of Arthur Andersen LLP would have caused them to make reference to the disagreement in their reports.
|
| 9. SUMMARY OF SHARE TRANSACTIONS
|
| Share activity is as follows:
|
| For the Year Ended
August 31, 2000 |
For the Seven Months Ended
August 31, 1999 |
For the Year Ended
January 31, 1999 |
|||||||||||||||||
|---|---|---|---|---|---|---|---|---|---|---|---|---|---|---|---|---|---|---|---|
| Shares | Dollars | Shares | Dollars | Shares | Dollars | ||||||||||||||
| Class A Shares | |||||||||||||||||||
| Shares sold | 24,015,612 | $652,956,057 | 12,642,498 | $314,261,490 | 32,045,496 | $679,898,165 | |||||||||||||
| Reinvestments of dividends and distributions | 6,216,899 | 162,385,895 | — | — | 2,523,862 | 55,320,129 | |||||||||||||
| Shares repurchased | (14,669,534 | ) | (395,793,370 | ) | (16,595,373 | ) | (416,956,361 | ) | (19,634,822 | ) | (411,065,361 | ) | |||||||
| 15,562,977 | 419,548,582 | (3,952,875 | ) | (102,694,871 | ) | 14,934,536 | 324,152,933 | ||||||||||||
| Class B Shares | |||||||||||||||||||
| Shares sold | 4,183,831 | 108,757,719 | 4,426,589 | 107,188,155 | 8,217,516 | 174,195,041 | |||||||||||||
| Reinvestments of dividends and distributions | 1,113,074 | 28,260,990 | — | — | 269,890 | 5,814,080 | |||||||||||||
| Shares repurchased | (2,693,312 | ) | (70,581,776 | ) | (922,539 | ) | (22,536,793 | ) | (692,115 | ) | (14,198,964 | ) | |||||||
| 2,603,593 | 66,436,933 | 3,504,050 | 84,651,362 | 7,795,291 | 165,810,157 | ||||||||||||||
| Class C Shares | |||||||||||||||||||
| Shares sold | 2,244,635 | 58,635,987 | 1,430,606 | 34,761,116 | 2,456,617 | 52,140,496 | |||||||||||||
| Reinvestments of dividends and distributions | 290,772 | 7,371,075 | — | — | 62,802 | 1,350,138 | |||||||||||||
| Shares repurchased | (1,000,329 | ) | (26,074,413 | ) | (404,991 | ) | (9,881,726 | ) | (254,033 | ) | (5,309,819 | ) | |||||||
| 1,535,078 | 39,932,649 | 1,025,615 | 24,879,390 | 2,265,386 | 48,180,815 | ||||||||||||||
| Institutional Shares | |||||||||||||||||||
| Shares sold | 8,732,980 | 236,966,132 | 9,692,869 | 245,837,614 | 2,253,646 | 49,347,338 | |||||||||||||
| Reinvestments of dividends and distributions | 845,809 | 22,210,942 | — | — | 36,717 | 807,532 | |||||||||||||
| Shares repurchased | (2,701,667 | ) | (72,457,337 | ) | (1,248,315 | ) | (31,382,873 | ) | (946,047 | ) | (21,160,240 | ) | |||||||
| 6,877,122 | 186,719,737 | 8,444,554 | 214,454,741 | 1,344,316 | 28,994,630 | ||||||||||||||
| Service Shares | |||||||||||||||||||
| Shares sold | 386,213 | 10,360,472 | 164,617 | 3,944,029 | 140,100 | 2,946,585 | |||||||||||||
| Reinvestments of dividends and distributions | 16,688 | 434,048 | — | — | 4,439 | 97,171 | |||||||||||||
| Shares repurchased | (188,392 | ) | (5,184,874 | ) | (33,428 | ) | (824,528 | ) | (15,887 | ) | (367,371 | ) | |||||||
| 214,509 | 5,609,646 | 131,189 | 3,119,501 | 128,652 | 2,676,385 | ||||||||||||||
| NET INCREASE | 26,793,279 | $718,247,547 | 9,152,533 | $224,410,123 | 26,468,181 | $569,814,920 | |||||||||||||
| Income from investment operations |
Distributions to shareholders |
||||||||||||||||
|---|---|---|---|---|---|---|---|---|---|---|---|---|---|---|---|---|---|
| Net asset
value, beginning of period |
Net
investment income (loss) |
Net
realized and unrealized gains |
Total
income from investment operations |
From net
investment income |
In excess
of net investment income |
From net
realized gains |
Total
distributions |
||||||||||
| FOR THE YEAR ENDED AUGUST 31, | |||||||||||||||||
| 2000 - Class A Shares | $24.96 | $(0.11)(c) | $6.29 | $6.18 | $ — | $ — | $(2.19) | $(2.19) | |||||||||
| 2000 - Class B Shares | 24.37 | (0.30) (c) | 6.11 | 5.81 | — | — | (2.19) | (2.19) | |||||||||
| 2000 - Class C Shares | 24.33 | (0.30) (c) | 6.10 | 5.80 | — | — | (2.19) | (2.19) | |||||||||
| 2000 - Institutional Shares | 25.06 | — | 6.32 | 6.32 | — | — | (2.19) | (2.19) | |||||||||
| 2000 - Service Shares | 24.88 | (0.13) (c) | 6.25 | 6.12 | — | — | (2.19) | (2.19) | |||||||||
| FOR THE SEVEN MONTHS ENDED AUGUST 31, | |||||||||||||||||
| 1999 - Class A Shares | 24.03 | (0.08) | 1.01 | 0.93 | — | — | — | — | |||||||||
| 1999 - Class B Shares | 23.57 | (0.17) | 0.97 | 0.80 | — | — | — | — | |||||||||
| 1999 - Class C Shares | 23.52 | (0.16) | 0.97 | 0.81 | — | — | — | — | |||||||||
| 1999 - Institutional Shares | 24.07 | (0.02) | 1.01 | 0.99 | — | — | — | — | |||||||||
| 1999 - Service Shares | 23.96 | (0.08) | 1.00 | 0.92 | — | — | — | — | |||||||||
| FOR THE YEARS ENDED JANUARY 31, | |||||||||||||||||
| 1999 - Class A Shares | 18.48 | (0.03) | 6.35 | 6.32 | — | — | (0.77) | (0.77) | |||||||||
| 1999 - Class B Shares | 18.27 | (0.12) | 6.19 | 6.07 | — | — | (0.77) | (0.77) | |||||||||
| 1999 - Class C Shares | 18.24 | (0.10) | 6.15 | 6.05 | — | — | (0.77) | (0.77) | |||||||||
| 1999 - Institutional Shares | 18.45 | 0.01 | 6.38 | 6.39 | — | — | (0.77) | (0.77) | |||||||||
| 1999 - Service Shares | 18.46 | (0.04) | 6.31 | 6.27 | — | — | (0.77) | (0.77) | |||||||||
| |
|||||||||||||||||
| 1998 - Class A Shares | 16.73 | 0.02 | 4.78 | 4.80 | (0.01) | (0.01) | (3.03) | (3.05) | |||||||||
| 1998 - Class B Shares | 16.67 | 0.02 | 4.61 | 4.63 | — | — | (3.03) | (3.03) | |||||||||
| 1998 - Class C Shares (commenced August 15, 1997) | 19.73 | (0.02) | 1.60 | 1.58 | — | (0.04) | (3.03) | (3.07) | |||||||||
| 1998 - Institutional Shares (commenced August 15, 1997) | 19.88 | 0.02 | 1.66 | 1.68 | (0.01) | (0.07) | (3.03) | (3.11) | |||||||||
| 1998 - Service Shares (commenced August 15, 1997) | 19.88 | (0.01) | 1.66 | 1.65 | — | (0.04) | (3.03) | (3.07) | |||||||||
| |
|||||||||||||||||
| 1997 - Class A Shares | 14.91 | 0.10 | 3.56 | 3.66 | (0.10) | (0.02) | (1.72) | (1.84) | |||||||||
| 1997 - Class B Shares (commenced May 1, 1996) | 15.67 | 0.01 | 2.81 | 2.82 | (0.01) | (0.09) | (1.72) | (1.82) | |||||||||
| |
|||||||||||||||||
| 1996 - Class A Shares | 13.67 | 0.12 | 3.93 | 4.05 | (0.12) | — | (2.69) | (2.81) | |||||||||
| |
|||||||||||||||||
(a)
|
Assumes investment at the net asset value at the beginning of the period, reinvestment of all dividends and distributions, a
complete redemption of the investment at the net asset value at the end of the period and no sales or redemption charges. Total return would be reduced if a sales or redemption charge were taken into account. Total returns for periods less than one full
year are not annualized.
|
(b)
|
Annualized.
|
(c)
|
Calculated based on the average shares outstanding methodology.
|
|
Ratios assuming no expense reductions |
|||||||||||||||||||||
|---|---|---|---|---|---|---|---|---|---|---|---|---|---|---|---|---|---|---|---|---|---|
| Net asset
value, end of period |
Total
return (a) |
Net assets
at end of period (in 000s) |
Ratio of
net expenses to average net assets |
Ratio of
net investment income (loss) to average net assets |
Ratio of
expenses to average net assets |
Ratio of
net investment income (loss) to average net assets |
Portfolio
turnover rate |
||||||||||||||
| $28.95 | 25.70 | % | $2,736,484 | 1.45 | % | (0.41 | )% | 1.47 | % | (0.44 | )% | 34.03 | % | ||||||||
| 27.99 | 24.75 | 451,666 | 2.20 | (1.16 | ) | 2.22 | (1.19 | ) | 34.03 | ||||||||||||
| 27.94 | 24.75 | 143,126 | 2.20 | (1.16 | ) | 2.22 | (1.19 | ) | 34.03 | ||||||||||||
| 29.19 | 26.18 | 497,986 | 1.05 | — | 1.07 | (0.03 | ) | 34.03 | |||||||||||||
| 28.81 | 25.53 | 13,668 | 1.55 | (0.49 | ) | 1.57 | (0.52 | ) | 34.03 | ||||||||||||
| 24.96 | 3.87 | 1,971,097 | 1.44 | (b) | (0.53 | ) (b) | 1.47 | (b) | (0.56 | ) (b) | 18.16 | ||||||||||
| 24.37 | 3.39 | 329,870 | 2.19 | (b) | (1.29 | ) (b) | 2.22 | (b) | (1.32 | ) (b) | 18.16 | ||||||||||
| 24.33 | 3.44 | 87,284 | 2.19 | (b) | (1.29 | ) (b) | 2.22 | (b) | (1.32 | ) (b) | 18.16 | ||||||||||
| 25.06 | 4.11 | 255,210 | 1.04 | (b) | (0.20 | ) (b) | 1.07 | (b) | (0.23 | ) (b) | 18.16 | ||||||||||
| 24.88 | 3.84 | 6,466 | 1.54 | (b) | (0.65 | ) (b) | 1.57 | (b) | (0.68 | ) (b) | 18.16 | ||||||||||
| 24.03 | 34.58 | 1,992,716 | 1.42 | (0.18 | ) | 1.58 | (0.34 | ) | 30.17 | ||||||||||||
| 23.57 | 33.60 | 236,369 | 2.19 | (0.98 | ) | 2.21 | (1.00 | ) | 30.17 | ||||||||||||
| 23.52 | 33.55 | 60,234 | 2.19 | (1.00 | ) | 2.21 | (1.02 | ) | 30.17 | ||||||||||||
| 24.07 | 35.02 | 41,817 | 1.07 | 0.11 | 1.09 | 0.09 | 30.17 | ||||||||||||||
| 23.96 | 34.34 | 3,085 | 1.57 | (0.37 | ) | 1.59 | (0.39 | ) | 30.17 | ||||||||||||
| 18.48 | 29.71 | 1,256,595 | 1.40 | 0.08 | 1.65 | (0.17 | ) | 61.50 | |||||||||||||
| 18.27 | 28.73 | 40,827 | 2.18 | (0.77 | ) | 2.18 | (0.77 | ) | 61.50 | ||||||||||||
| 18.24 | 8.83 | 5,395 | 2.21 | (b) | (0.86 | ) (b) | 2.21 | (b) | (0.86 | ) (b) | 61.50 | ||||||||||
| 18.45 | 9.31 | 7,262 | 1.16 | (b) | 0.18 | (b) | 1.16 | (b) | 0.18 | (b) | 61.50 | ||||||||||
| 18.46 | 9.18 | 2 | 1.50 | (b) | (0.16 | ) (b) | 1.50 | (b) | (0.16 | ) (b) | 61.50 | ||||||||||
| 16.73 | 25.97 | 920,646 | 1.40 | 0.62 | 1.65 | 0.37 | 52.92 | ||||||||||||||
| 16.67 | 19.39 | 3,221 | 2.15 | (b) | (0.39 | ) (b) | 2.15 | (b) | (0.39 | ) (b) | 52.92 | ||||||||||
| 14.91 | 30.45 | 881,056 | 1.36 | 0.65 | 1.61 | 0.40 | 63.90 | ||||||||||||||
| To the Shareholders and Board of Trustees of
|
| Goldman Sachs Trust — Capital Growth Fund:
|
| In our opinion, the accompanying statement of assets and liabilities, including the statement of investments, and the related
statements of operations and of changes in net assets and the financial highlights present fairly, in all material respects, the financial position of Goldman Sachs Capital Growth Fund (“the Fund”), one of the portfolios constituting Goldman
Sachs Trust, at August 31, 2000, the results of its operations, the changes in its net assets and the financial highlights for the year then ended, in conformity with accounting principles generally accepted in the United States of America. These
financial statements and financial highlights (hereafter referred to as “financial statements”) are the responsibility of the Fund’s management; our responsibility is to express an opinion on these financial statements based on our audit.
We conducted our audit of these financial statements in accordance with auditing standards generally accepted in the United States of America, which require that we plan and perform the audit to obtain reasonable assurance about whether the financial
statements are free of material misstatement. An audit includes examining, on a test basis, evidence supporting the amounts and disclosures in the financial statements, assessing the accounting principles used and significant estimates made by management,
and evaluating the overall financial statement presentation. We believe that our audit, which included confirmation of securities at August 31, 2000 by correspondence with the custodian and brokers, provides a reasonable basis for our opinion. The
statements of changes in net assets of the Fund for the period ended August 31, 1999 and the year ended January 31, 1999 and the financial highlights for each of the periods ended on or before August 31, 1999 were audited by other independent accountants
whose report dated October 8, 1999 expressed an unqualified opinion thereon.
|
| PricewaterhouseCoopers LLP
|
| Boston, Massachusetts
|
| October 23, 2000
|
|
Shares |
Description | Value | |||
|---|---|---|---|---|---|
| Common Stocks – 94.2% | |||||
| Banks – 1.9% | |||||
| 118,215 | Charter One Financial, Inc. | $ 2,807,606 | |||
| 157,600 | National Commerce Bancorp | 3,043,650 | |||
| 5,851,256 | |||||
| Chemicals – 2.5% | |||||
| 65,000 | Cambrex Corp. | 3,050,938 | |||
| 204,100 | Sybron International Corp.* | 4,643,275 | |||
| 7,694,213 | |||||
| Clothing – 2.0% | |||||
| 46,700 | Payless ShoeSource, Inc.* | 2,492,613 | |||
| 178,900 | The Limited, Inc. | 3,578,000 | |||
| 6,070,613 | |||||
| Computer Hardware – 2.1% | |||||
| 52,100 | Pitney Bowes, Inc. | 1,904,906 | |||
| 109,200 | Symbol Technologies, Inc. | 4,518,150 | |||
| 6,423,056 | |||||
| Computer Software – 5.6% | |||||
| 100,400 | Caminus Corp.* | 1,694,250 | |||
| 36,600 | CheckFree Corp.* | 1,896,338 | |||
| 90,500 | Intuit, Inc.* | 5,418,687 | |||
| 78,100 | PeopleSoft, Inc.* | 2,518,725 | |||
| 49,600 | Sabre Holdings Corp. | 1,382,600 | |||
| 54,300 | Symantec Corp.* | 2,650,519 | |||
| 81,600 | Witness Systems, Inc.* | 1,621,800 | |||
| 17,182,919 | |||||
| Construction – 1.6% | |||||
| 69,900 | Martin Marietta Materials | 2,796,000 | |||
| 103,700 | Masco Corp. | 2,022,150 | |||
| 4,818,150 | |||||
| Consumer Durables – 2.6% | |||||
| 107,800 | Ethan Allen Interiors, Inc. | 2,903,862 | |||
| 65,800 | Harman International Industries,
Inc. |
5,050,150 | |||
| 7,954,012 | |||||
| Drugs – 1.6% | |||||
| 22,600 | Forest Laboratories, Inc.* | 2,211,975 | |||
| 13,500 | MedImmune, Inc.* | 1,135,688 | |||
| 11,100 | Millennium Pharmaceuticals* | 1,588,687 | |||
| 4,936,350 | |||||
| Electrical Equipment – 10.7% | |||||
| 27,200 | American Tower Corp.* | 987,700 | |||
| 85,500 | Amphenol Corp.* | 5,472,000 | |||
| 12,700 | Corvis Corp.* | 1,318,419 | |||
| 124,300 | Harris Corp. | 3,736,769 | |||
| 69,200 | Jabil Circuit, Inc.* | 4,415,825 | |||
| 79,800 | Manufacturers’ Services Ltd.* | 2,034,900 | |||
| 29,600 | McDATA Corp. Class B* | 3,183,850 | |||
| 70,000 | Millipore Corp. | 4,261,250 | |||
| 42,700 | Sanmina Corp.* | 5,038,600 | |||
|
Shares |
Description | Value | |||
|---|---|---|---|---|---|
| Common Stocks – (continued) | |||||
| Electrical Equipment – (continued) | |||||
| 115,500 | Western Multiplex Corp.* | $ 2,302,781 | |||
| 32,752,094 | |||||
| Electrical Utilities – 1.8% | |||||
| 74,576 | Dynegy, Inc. | 3,355,920 | |||
| 88,200 | NRG Energy, Inc.* | 2,315,250 | |||
| 5,671,170 | |||||
| Energy Resources – 3.7% | |||||
| 24,400 | Apache Corp. | 1,537,200 | |||
| 64,000 | Burlington Resources, Inc. | 2,516,000 | |||
| 58,500 | Devon Energy Corp. | 3,425,906 | |||
| 110,000 | Louis Dreyfus Natural Gas Corp.* | 3,822,500 | |||
| 11,301,606 | |||||
| Fiber Optics – 0.3% | |||||
| 5,200 | Avici Systems, Inc.* | 779,025 | |||
| Financial Services – 2.0% | |||||
| 209,200 | Allied Capital Corp. | 4,236,300 | |||
| 78,600 | Comdisco, Inc. | 1,886,400 | |||
| 6,122,700 | |||||
| Food & Beverage – 1.1% | |||||
| 76,200 | Keebler Foods Co. | 3,490,913 | |||
| Heavy Electrical – 0.8% | |||||
| 49,625 | Molex, Inc. | 2,620,820 | |||
| Home Products – 2.3% | |||||
| 223,833 | Energizer Holdings, Inc.* | 4,420,702 | |||
| 110,500 | Ralston Purina Group | 2,500,062 | |||
| 6,920,764 | |||||
| Hotels – 2.3% | |||||
| 186,100 | Harrah’s Entertainment, Inc.* | 5,280,588 | |||
| 50,000 | MGM Mirage, Inc. | 1,718,750 | |||
| 6,999,338 | |||||
| Industrial Parts – 1.4% | |||||
| 93,200 | American Standard Cos., Inc.* | 4,316,325 | |||
| Industrial Services – 3.6% | |||||
| 85,550 | Cintas Corp. | 3,555,672 | |||
| 146,500 | ITT Educational Services, Inc.* | 3,369,500 | |||
| 161,764 | Pittston Brinks Group | 2,517,452 | |||
| 53,600 | Robert Half International, Inc.* | 1,705,150 | |||
| 11,147,774 | |||||
| Information Services – 9.6% | |||||
| 268,800 | Cendant Corp.* | 3,544,800 | |||
| 191,000 | Ceridian Corp.* | 4,619,812 | |||
| 90,700 | Convergys Corp.* | 3,548,638 | |||
| 82,800 | Dyax Corp.* | 2,898,000 | |||
| 83,200 | Fiserv, Inc.* | 4,508,400 | |||
| 165,700 | SunGard Data Systems, Inc.* | 5,965,200 | |||
| 153,400 | Valassis Communications, Inc.* | 4,429,425 | |||
| 29,514,275 | |||||
|
Shares |
Description | Value | |||
|---|---|---|---|---|---|
| Common Stocks – (continued) | |||||
| Internet – 3.8% | |||||
| 37,000 | DoubleClick, Inc.* | $ 1,505,437 | |||
| 23,480 | E.piphany, Inc.* | 2,441,920 | |||
| 140,800 | Intertrust Technologies Corp.* | 2,261,600 | |||
| 37,000 | Interwoven, Inc.* | 3,552,000 | |||
| 9,600 | VeriSign, Inc.* | 1,909,200 | |||
| 11,670,157 | |||||
| Life Insurance – 2.4% | |||||
| 132,600 | MetLife, Inc.* | 3,223,838 | |||
| 106,400 | Nationwide Financial Services, Inc. | 4,242,700 | |||
| 7,466,538 | |||||
| Media – 5.5% | |||||
| 32,100 | Cablevision Systems Corp.* | 2,158,725 | |||
| 94,700 | Emmis Communications Corp.* | 3,107,344 | |||
| 85,300 | Entravision Communications
Corp.* |
1,690,006 | |||
| 281,500 | Insight Communications, Inc.* | 5,014,219 | |||
| 59,300 | Univision Communications, Inc.* | 2,616,612 | |||
| 82,000 | Westwood One, Inc.* | 2,280,625 | |||
| 16,867,531 | |||||
| Medical Products – 1.6% | |||||
| 53,400 | Bausch & Lomb, Inc. | 1,909,050 | |||
| 56,100 | deCODE GENETICS, Inc.* | 1,549,763 | |||
| 100,000 | Owens & Minor, Inc. | 1,531,250 | |||
| 4,990,063 | |||||
| Medical Providers – 1.4% | |||||
| 374,000 | Hooper Holmes, Inc. | 4,371,125 | |||
| Oil Services – 2.3% | |||||
| 80,200 | Nabors Industries, Inc.* | 3,814,513 | |||
| 67,200 | Weatherford International | 3,154,200 | |||
| 6,968,713 | |||||
| Property Insurance – 3.1% | |||||
| 88,500 | Ambac Financial Group, Inc. | 5,719,312 | |||
| 48,100 | Loews Corp. | 3,893,094 | |||
| 9,612,406 | |||||
| Security/Asset Management – 1.4% | |||||
| 27,600 | Legg Mason, Inc. | 1,455,900 | |||
| 135,800 | TD Waterhouse Group, Inc.* | 2,749,950 | |||
| 4,205,850 | |||||
| Semiconductors – 1.7% | |||||
| 38,600 | Microchip Technology, Inc.* | 2,627,212 | |||
| 30,300 | Vitesse Semiconductor Corp.* | 2,691,019 | |||
| 5,318,231 | |||||
| Specialty Retail – 3.1% | |||||
| 61,800 | 99 Cents Only Stores* | 2,777,137 | |||
| 57,900 | Avnet, Inc. | 3,466,762 | |||
| 65,500 | Grainger W.W., Inc. | 1,891,313 | |||
|
Shares |
Description | Value | |||
|---|---|---|---|---|---|
| Common Stocks – (continued) | |||||
| Specialty Retail – (continued) | |||||
| 21,300 | RadioShack Corp. | $ 1,256,700 | |||
| 9,391,912 | |||||
| Telephone – 3.5% | |||||
| 144,700 | Broadwing, Inc. | 4,042,556 | |||
| 145,600 | CenturyTel, Inc. | 4,195,100 | |||
| 145,900 | Citizens Communications Co.* | 2,379,994 | |||
| 10,617,650 | |||||
| Wireless – 4.9% | |||||
| 167,100 | Crown Castle International Corp.* | 5,796,281 | |||
| 199,500 | Dobson Communications Corp.* | 4,301,719 | |||
| 88,900 | Triton PCS Holdings, Inc.* | 4,922,837 | |||
| 15,020,837 | |||||
| TOTAL COMMON STOCKS | |||||
| (Cost $248,471,799) | $289,068,386 | ||||
| Principal
Amount |
Interest
Rate |
Maturity
Date |
Value | |||||
|---|---|---|---|---|---|---|---|---|
| Repurchase Agreement – 6.3% | ||||||||
| Joint Repurchase Agreement Account II Ù | ||||||||
| $19,400,000 | 6.66 | % | 09/01/2000 | $ 19,400,000 | ||||
| TOTAL REPURCHASE AGREEMENT | ||||||||
| (Cost $19,400,000) | $ 19,400,000 | |||||||
| TOTAL INVESTMENTS | ||||||||
| (Cost $267,871,799) | $308,468,386 | |||||||
*
|
Non-income producing security.
|
Ù
|
Joint repurchase agreement was entered into on August 31, 2000.
|
| The percentage shown for each investment category reflects the value of investments in that category as a percentage of total net
assets.
|
| Assets: | |||
| Investment in securities, at value (identified cost $267,871,799) | $308,468,386 | ||
| Cash | 17,249 | ||
| Receivables: | |||
| Fund shares sold | 9,068,660 | ||
| Dividends and interest | 117,368 | ||
| Reimbursement from adviser | 35,571 | ||
| Other assets | 96 | ||
| Total assets | 317,707,330 | ||
| Liabilities: | |||
| Payables: | |||
| Investment securities purchased | 10,073,030 | ||
| Amounts owed to affiliates | 359,252 | ||
| Fund shares repurchased | 185,320 | ||
| Accrued expenses and other liabilities | 79,621 | ||
| Total liabilities | 10,697,223 | ||
| Net Assets: | |||
| Paid-in capital | 258,972,261 | ||
| Accumulated net realized gain on investment transactions | 7,441,259 | ||
| Net unrealized gain on investments | 40,596,587 | ||
| NET ASSETS | $307,010,107 | ||
| Net asset value, offering and redemption price per share: (a) | |||
| Class A | $19.50 | ||
| Class B | $19.45 | ||
| Class C | $19.31 | ||
| Institutional | $19.59 | ||
| Service | $19.45 | ||
| Shares outstanding: | |||
| Class A | 9,651,763 | ||
| Class B | 2,162,947 | ||
| Class C | 1,389,118 | ||
| Institutional | 2,548,325 | ||
| Service | 153 | ||
| Total shares outstanding, $.001 par value (unlimited number of shares authorized) | 15,752,306 | ||
(a)
|
Maximum public offering price per share (NAV per share multiplied by 1.0582) for Class A shares is $20.63. At redemption, Class B
and Class C shares may be subject to a contingent deferred sales charge, assessed on the amount equal to the lesser of the current net asset value or the original purchase price of the shares.
|
| Investment income: | |||
| Dividends | $ 504,212 | ||
| Interest | 465,831 | ||
| Total income | 970,043 | ||
| Expenses: | |||
| Management fees | 1,102,761 | ||
| Distribution and Service fees (a) | 438,870 | ||
| Transfer Agent fees (b) | 187,096 | ||
| Professional fees | 48,433 | ||
| Registration fees | 46,759 | ||
| Custodian fees | 17,248 | ||
| Trustee fees | 7,508 | ||
| Other | 65,561 | ||
| Total expenses | 1,914,236 | ||
| Less — expense reductions | (97,907 | ) | |
| Net expenses | 1,816,329 | ||
| NET INVESTMENT LOSS | (846,286 | ) | |
| Realized and unrealized gain on investment transactions: | |||
| Net realized gain from investment transactions | 8,337,861 | ||
| Net change in unrealized loss on investments | 41,373,281 | ||
| Net realized and unrealized gain on investments | 49,711,142 | ||
| NET INCREASE IN NET ASSETS RESULTING FROM OPERATIONS | $48,864,856 | ||
(a)
|
Class A, Class B and Class C had Distribution and Service fees of $171,456, $164,373 and $103,041, respectively.
|
(b)
|
Class A, Class B, Class C, Institutional Class and Service Class had Transfer Agent fees of $130,303, $31,231, $19,578, $5,931 and
$53, respectively.
|
| From operations: | ||||
| Net investment loss | $ (846,286 | ) | ||
| Net realized gain on investment transactions | 8,337,861 | |||
| Net change in unrealized loss on investments | 41,373,281 | |||
| Net increase in net assets resulting from operations | 48,864,856 | |||
| Distributions to shareholders: | ||||
| From net investment income | ||||
| Class A Shares | (1,699 | ) | ||
| Class B Shares | (381 | ) | ||
| Class C Shares | (280 | ) | ||
| Institutional Shares | (2,161 | ) | ||
| From net realized gain on investment transactions | ||||
| Class A Shares | (264,562 | ) | ||
| Class B Shares | (52,339 | ) | ||
| Class C Shares | (26,174 | ) | ||
| Institutional Shares | (129,481 | ) | ||
| Service Shares | (35 | ) | ||
| Total distributions to shareholders | (477,112 | ) | ||
| From share transactions: | ||||
| Proceeds from sales of shares | 269,642,227 | |||
| Reinvestment of dividends and distributions | 470,028 | |||
| Cost of shares repurchased | (25,694,467 | ) | ||
| Net increase in net assets resulting from share transactions | 244,417,788 | |||
| TOTAL INCREASE | 292,805,532 | |||
| Net assets: | ||||
| Beginning of year | $ 14,204,575 | |||
| End of year | $307,010,107 | |||
| Accumulated net investment loss | $ — | |||
| From operations: | ||||
| Net investment income | $ 2,304 | |||
| Net realized gain from investment transactions | 422,322 | |||
| Net change in unrealized loss on investments | (776,694 | ) | ||
| Net decrease in net assets resulting from operations | (352,068 | ) | ||
| From share transactions: | ||||
| Proceeds from sales of shares | 14,846,644 | |||
| Cost of shares repurchased | (290,001 | ) | ||
| Net increase in net assets resulting from share transactions | 14,556,643 | |||
| TOTAL INCREASE | 14,204,575 | |||
| Net assets: | ||||
| Beginning of period | — | |||
| End of period | $14,204,575 | |||
| Accumulated undistributed net investment income | $ 4,476 | |||
(a)
|
Commencement date of operations was May 24, 1999 for all share classes.
|
| 1. ORGANIZATION
|
| Goldman Sachs Trust (the “Trust”) is a Delaware business trust registered under the Investment Company Act of 1940 (as
amended) as an open-end management investment company. The Trust includes the Goldman Sachs Growth Opportunities Fund (the “Fund”). The Fund is a diversified portfolio offering five classes of shares — Class A, Class B, Class C,
Institutional and Service.
|
| 2. SIGNIFICANT ACCOUNTING POLICIES
|
| The following is a summary of the significant accounting policies consistently followed by the Fund. The preparation of financial
statements in conformity with generally accepted accounting principles requires management to make estimates and assumptions that may affect the reported amounts. Actual results could differ from those estimates.
|
| A. Investment Valuation — Investments in
securities traded on a U.S. or foreign securities exchange or the NASDAQ system are valued daily at their last sale price on the principal exchange on which they are traded. If no sale occurs, securities are valued at the last bid price. Debt securities
are valued at prices supplied by independent pricing services, broker/dealer-supplied valuations or matrix pricing systems. Unlisted equity and debt securities for which market quotations are available are valued at the last sale price on valuation date,
or if no sale occurs, at the last bid price. Short-term debt obligations maturing in sixty days or less are valued at amortized cost, which approximates market value. Securities for which quotations are not readily available are valued at fair value using
methods approved by the Board of Trustees of the Trust.
|
| B. Security Transactions and Investment Income — Security transactions are recorded as of the trade date. Realized gains and losses on sales of portfolio securities are calculated using the identified-cost basis. Dividend income is recorded on the ex-dividend date net of foreign withholding taxes where
applicable. Dividends for which the Fund has the choice to receive either cash or stock are recognized as investment income in an amount equal to the cash dividend. Interest income is recorded on the basis of interest accrued, premium amortized and
discount earned.
|
| Net investment income (other than class-specific expenses) and unrealized and
realized gains or losses are allocated daily to each class of shares of the Fund based upon the relative proportion of net assets of each class.
|
| C. Foreign Currency Translations — The
books and records of the Fund are maintained in U.S. dollars. Amounts denominated in foreign currencies are translated into U.S. dollars on the following basis: (i) investment valuations, foreign currency and other assets and liabilities initially
expressed in foreign currencies are converted each business day into U.S. dollars based upon current exchange rates; and (ii) purchases and sales of foreign investments, income and expenses are converted into U.S. dollars based upon currency exchange
rates prevailing on the respective dates of such transactions.
|
| Net realized and unrealized gain (loss) on foreign currency transactions will
represent: (i) foreign exchange gains and losses from the sale and holdings of foreign currencies; (ii) currency gains and losses between trade date and settlement date on investment securities transactions and forward exchange contracts; and (iii) gains
and losses from the difference between amounts of dividends and interest recorded and the amounts actually received.
|
| D. Segregation Transactions — The Fund may
enter into certain derivative transactions to seek to increase total return. Forward foreign currency exchange contracts, futures contracts, written options, when-issued securities and forward commitments represent examples of such transactions. As a
result of entering into these transactions, the Fund is required to segregate liquid assets on the accounting records equal to or greater than the market value of the corresponding transactions.
|
| E. Federal Taxes — It is the Fund’s
policy to comply with the requirements of the Internal Revenue Code applicable to regulated investment companies and to distribute each year substantially all of its investment company taxable income and
2. SIGNIFICANT ACCOUNTING POLICIES (continued)
|
| capital gains to its shareholders. Accordingly, no federal tax provision is required. Income and capital gains distributions, if
any, are declared and paid annually.
|
| The characterization of distributions to shareholders for financial reporting
purposes is determined in accordance with income tax rules. Therefore, the source of the Fund’s distributions may be shown in the accompanying financial statements as either from or in excess of net investment income or net realized gain on
investment transactions, or from paid-in capital, depending on the type of book/tax differences that may exist.
|
| At August 31, 2000, the aggregate cost of portfolio securities for federal income
tax purposes is $268,041,676. Accordingly, the gross unrealized gain on investments was $47,622,180 and the gross unrealized loss on investments was $7,195,470 resulting in a net unrealized gain of $40,426,710.
|
| F. Expenses — Expenses incurred by the
Trust that do not specifically relate to an individual Fund of the Trust are allocated to the Funds on a straight-line or pro rata basis depending upon the nature of the expense.
|
| Class A, Class B and Class C Shares bear all expenses and fees relating to their
respective Distribution and Service Plans. Shareholders of Service Shares bear all expenses and fees paid to service organizations. Each class of shares of the Fund separately bears its respective class-specific Transfer Agency fees.
|
| G. Repurchase Agreements — Repurchase
agreements involve the purchase of securities subject to the seller’s agreement to repurchase them at a mutually agreed upon date and place. During the term of a repurchase agreement, the value of the underlying securities, including accrued
interest, is required to equal or exceed the value of the repurchase agreement. The underlying securities for all repurchase agreements are held in safekeeping at the Fund’s custodian.
|
| 3. AGREEMENTS
|
| Pursuant to the Investment Management Agreement (the “Agreement”), Goldman Sachs Asset Management (“GSAM”), a
unit of the Investment Management Division of Goldman, Sachs & Co. (“Goldman Sachs”), serves as the investment adviser to the Fund. Under the Agreement, the adviser, subject to the general supervision of the Trust’s Board of Trustees,
manages the Fund’s portfolio. As compensation for the services rendered pursuant to the Agreement, the assumption of the expenses related thereto and administering the Fund’s business affairs, including providing facilities, the adviser is
entitled to a fee, computed daily and payable monthly, at an annual rate equal to 1.00% of the average daily net assets of the Fund.
|
| The adviser has voluntarily agreed to limit certain “Other Expenses” of
the Fund (excluding Management fees, Distribution and Service fees, Transfer Agent fees, taxes, interest, brokerage, litigation, Service Share fees, indemnification costs and other extraordinary expenses) to the extent such expenses exceed, on an annual
basis, 0.11% (0.00% prior to May 1, 2000) of the average daily net assets of the Fund. For the year ended August 31, 2000, the adviser reimbursed approximately $90,000. In addition, the Fund has entered into certain offset arrangements with the custodian
resulting in a reduction in the Fund’s expenses. For the year ended August 31, 2000, custody fees were reduced by approximately $8,000.
|
| The Trust, on behalf of the Fund, has adopted Distribution and Service Plans.
Under the Distribution and Service Plans, Goldman Sachs and/or authorized dealers are entitled to a monthly fee from the Fund for distribution and shareholder maintenance services equal, on an annual basis, to 0.25%, 1.00% and 1.00% of the Fund’s
average daily net assets attributable to Class A, Class B and Class C Shares, respectively.
|
| Goldman Sachs serves as the distributor of shares of the Fund pursuant to
Distribution Agreements. Goldman Sachs may receive a portion of the Class A sales load and Class B and Class C contingent deferred sales charges and has advised the Fund that it retained approximately $1,218,000 for the year ended August 31, 2000.
|
| 3. AGREEMENTS (continued)
|
| Goldman Sachs also serves as the Transfer Agent of the Fund for a fee. The fees
charged for such transfer agency services are calculated daily and payable monthly at an annual rate as follows: 0.19% of the average daily net assets for Class A, Class B and Class C Shares and 0.04% of the average daily net assets for Institutional and
Service Shares.
|
| The Trust, on behalf of the Fund, has adopted a Service Plan. This Plan allows for
Service Shares to compensate service organizations for providing varying levels of account administration and shareholder liaison services to their customers who are beneficial owners of such shares. The Service Plan provides for compensation to the
service organizations in an amount up to 0.50% (on an annualized basis), of the average daily net asset value of the Service Shares.
|
| As of August 31, 2000, the amounts owed to affiliates were approximately $232,000,
$88,000, and $39,000 for Management, Distribution and Service, and Transfer Agent fees, respectively.
|
| 4. PORTFOLIO SECURITIES TRANSACTIONS
|
| The cost of purchases and proceeds of sales and maturities of securities (excluding short-term investments) for the year ended
August 31, 2000, were $304,416,103 and $78,181,199, respectively.
|
| For the year ended August 31, 2000, Goldman Sachs earned approximately $19,000 of
brokerage commissions for portfolio transactions.
|
| Futures Contracts — The Fund may enter into futures transactions to hedge against changes in interest rates, securities prices, currency exchange rates or to seek to increase total return. Upon entering into a futures contract, the Fund is required to deposit with a broker
or the Fund’s custodian bank an amount of cash or securities equal to the minimum “initial margin” requirement of the associated futures exchange. Subsequent payments for futures contracts (“variation margin”) are paid or received
by the Fund daily, depending on the daily fluctuations in the value of the contracts, and are recorded for financial reporting purposes as unrealized gains or losses. When contracts are closed, the Fund realizes a gain or loss which is reported in the
Statement of Operations.
|
| The use of futures contracts involve, to varying degrees, elements of market risk
which may exceed the amounts recognized in the Statement of Assets and Liabilities. Changes in the value of the futures contract may not directly correlate with changes in the value of the underlying securities. This risk may decrease the effectiveness of
the Fund’s hedging strategies and potentially result in a loss. At August 31, 2000, there were no open futures contracts.
|
| Option Accounting Principles — When the Fund writes call or put options, an amount equal to the premium received is recorded as an asset and as an equivalent liability. The amount of the liability is subsequently marked-to-market to reflect the current market value of the option
written. When a written option expires on its stipulated expiration date or the Fund enters into a closing purchase transaction, the Fund realizes a gain or loss without regard to any unrealized gain or loss on the underlying security, and the liability
related to such option is extinguished. When a written call option is exercised, the Fund realizes a gain or loss from the sale of the underlying security, and the proceeds of the sale are increased by the premium originally received. When a written put
option is exercised, the amount of the premium originally received will reduce the cost of the security which the Fund purchases upon exercise. There is a risk of loss from a change in value of such options which may exceed the related premiums received.
|
| Upon the purchase of a call option or a protective put option by the Fund, the
premium paid is recorded as an investment and subsequently marked-to-market to reflect the current market value of the option. If an option which the Fund has purchased expires on the stipulated expiration date, the Fund will realize a loss in the amount
of the cost of the option. If the Fund enters into a closing sale transaction, the Fund will realize a gain or loss, depending on whether the sale proceeds for the closing sale transaction are greater or less than the cost of the option. If the Fund
exercises a purchased put option, the Fund will realize a gain or loss from the sale of the underlying security, and the proceeds from such sale will be decreased by the premium originally paid. If the Fund exercises a purchased call option, the cost of
the security which the Fund purchases
|
| upon exercise will be increased by the premium originally paid. At August 31, 2000, there were no open written option contracts.
|
| 5. LINE OF CREDIT FACILITY
|
| Effective May 31, 2000, the Fund participates in a $350,000,000 committed, unsecured revolving line of credit facility.
|
| Prior thereto, the Fund participated in a $250,000,000 uncommitted and a $250,000,000 committed, unsecured revolving line of
credit facility. Under the most restrictive arrangement, the Fund must own securities having a market value in excess of 400% of the total bank borrowings. This facility is to be used solely for temporary or emergency purposes. The interest rate on
borrowings is based on the Federal Funds rate. The committed facility also requires a fee to be paid by the Fund based on the amount of the commitment. During the year ended August 31, 2000, the Fund did not have any borrowings under any of these facilities
.
|
| 6. JOINT REPURCHASE AGREEMENT ACCOUNT
|
| The Fund, together with other registered investment companies having management agreements with GSAM or its affiliates, transfers
uninvested cash into joint accounts, the daily aggregate balance of which is invested in one or more repurchase agreements.
|
| At August 31, 2000, the Fund had an undivided interest in the repurchase
agreements in the joint account which equaled $19,400,000 in principal amount. At August 31, 2000, the following repurchase agreements held in this joint account were fully collateralized by Federal Agency obligations:
|
| Repurchase Agreements | Principal
Amount |
Interest
Rate |
Maturity
Date |
Amortized
Cost |
Maturity
Value |
|||||||
|---|---|---|---|---|---|---|---|---|---|---|---|---|
| ABN/AMRO, Inc. | $ 814,100,000 | 6.66 | % | 09/01/2000 | $ 814,100,000 | $ 814,250,608 | ||||||
| Banc of America Securities LLC | 900,000,000 | 6.67 | 09/01/2000 | 900,000,000 | 900,166,750 | |||||||
| Barclays Capital, Inc. | 500,000,000 | 6.67 | 09/01/2000 | 500,000,000 | 500,092,639 | |||||||
| Bear Stearns Companies, Inc. | 300,000,000 | 6.67 | 09/01/2000 | 300,000,000 | 300,055,583 | |||||||
| Chase Securities, Inc. | 450,000,000 | 6.67 | 09/01/2000 | 450,000,000 | 450,083,375 | |||||||
| Donaldson, Lufkin & Jenrette, Inc. | 1,000,000,000 | 6.67 | 09/01/2000 | 1,000,000,000 | 1,000,185,278 | |||||||
| J.P. Morgan & Co., Inc. | 800,000,000 | 6.65 | 09/01/2000 | 800,000,000 | 800,147,778 | |||||||
| Morgan Stanley Dean Witter & Co. | 750,000,000 | 6.65 | 09/01/2000 | 750,000,000 | 750,138,542 | |||||||
| Morgan Stanley Dean Witter & Co. | 300,000,000 | 6.60 | 09/01/2000 | 300,000,000 | 300,055,000 | |||||||
| UBS Warburg LLC | 800,000,000 | 6.65 | 09/01/2000 | 800,000,000 | 800,147,778 | |||||||
| TOTAL JOINT REPURCHASE AGREEMENT ACCOUNT II | $6,614,100,000 | $6,615,323,331 | ||||||||||
| 7. CHANGE IN INDEPENDENT ACCOUNTANTS
|
| On October 26, 1999, the Board of Trustees of the Fund upon the recommendation of the Board’s audit committee, determined not
to retain Arthur Andersen LLP and approved a change of the Fund’s independent accountants to PricewaterhouseCoopers LLP. For the period ended August 31, 1999, Arthur Andersen LLP’s audit reports contained no adverse opinion or disclaimer of
opinion; nor were their reports qualified or modified as to uncertainty, audit scope, or accounting principles. Further, there were no disagreements between the Fund and Arthur Andersen LLP on accounting principles or practices, financial statement
disclosure or audit scope or procedure, which if not resolved to the satisfaction of Arthur Andersen LLP would have caused them to make reference to the disagreement in their report.
|
| 8. CERTAIN RECLASSIFICATIONS
|
| In accordance with AICPA Statement of Position 93-2, the Fund has reclassified $846,331 and $2 from accumulated net realized gain
on investment transactions to accumulated net investment loss and paid-in capital, respectively. These reclassifications have no impact on the net asset value of the Fund and are designed to present the Fund’s capital accounts on a tax basis.
Reclassifications result primarily from the difference in the tax treatment of foreign currency, net operating losses and organization costs.
|
| Goldman Sachs Trust — Growth Opportunities Fund — Tax Information (unaudited)
|
| For the year ended August 31, 2000, 2.47% of the dividends paid from net investment
company taxable income by the Growth Opportunities Fund, qualify for the dividends received deduction available for corporations.
|
| 9. SUMMARY OF SHARE TRANSACTIONS
|
| Share activity is as follows:
|
| For the Year Ended
August 31, 2000 |
For the Period
Ended August 31, 1999 (a) |
||||||||||||
|---|---|---|---|---|---|---|---|---|---|---|---|---|---|
| Shares | Dollars | Shares | Dollars | ||||||||||
| Class A Shares | |||||||||||||
| Shares sold | 9,546,230 | $163,309,769 | 837,654 | $ 8,891,707 | |||||||||
| Reinvestment of dividends and distributions | 18,793 | 263,625 | — | — | |||||||||
| Shares repurchased | (723,140 | ) | (12,932,520 | ) | (27,774 | ) | (289,978 | ) | |||||
| 8,841,883 | 150,640,874 | 809,880 | 8,601,729 | ||||||||||
| Class B Shares | |||||||||||||
| Shares sold | 2,216,674 | 36,648,725 | 51,071 | 529,423 | |||||||||
| Reinvestment of dividends and distributions | 3,548 | 49,742 | — | — | |||||||||
| Shares repurchased | (108,346 | ) | (1,884,792 | ) | — | (2 | ) | ||||||
| 2,111,876 | 34,813,675 | 51,071 | 529,421 | ||||||||||
| Class C Shares | |||||||||||||
| Shares sold | 1,499,042 | 24,849,781 | 25,390 | 263,994 | |||||||||
| Reinvestment of dividends and distributions | 1,796 | 24,984 | — | — | |||||||||
| Shares repurchased | (137,110 | ) | (2,322,043 | ) | — | (1 | ) | ||||||
| 1,363,728 | 22,552,722 | 25,390 | 263,993 | ||||||||||
| Institutional Shares | |||||||||||||
| Shares sold | 2,559,976 | 44,573,678 | 515,358 | 5,160,020 | |||||||||
| Reinvestment of dividends and distributions | 9,403 | 131,642 | — | — | |||||||||
| Shares repurchased | (536,410 | ) | (8,258,792 | ) | (2 | ) | (20 | ) | |||||
| 2,032,969 | 36,446,528 | 515,356 | 5,160,000 | ||||||||||
| Service Shares | |||||||||||||
| Shares sold | 16,250 | 260,274 | 150 | 1,500 | |||||||||
| Reinvestment of dividends and distributions | 3 | 35 | — | — | |||||||||
| Shares repurchased | (16,250 | ) | (296,320 | ) | — | — | |||||||
| 3 | (36,011 | ) | 150 | 1,500 | |||||||||
| NET INCREASE | 14,350,459 | $244,417,788 | 1,401,847 | $14,556,643 | |||||||||
(a)
|
Commencement date of operations was May 24, 1999 for all share classes.
|
| Net asset
value, beginning of period |
Income from
investment operations |
Total
from investment operations |
Distributions
to shareholders |
|||||||||
|---|---|---|---|---|---|---|---|---|---|---|---|---|
| Net
investment income (loss) |
Net realized
and unrealized gain |
From net
realized gains |
||||||||||
| FOR THE YEAR ENDED AUGUST 31, | ||||||||||||
| 2000 - Class A Shares | $10.13 | $(0.11 | ) (c) | $9.71 | $9.60 | $(0.23 | ) | |||||
| 2000 - Class B Shares | 10.18 | (0.24 | ) (c) | 9.74 | 9.50 | (0.23 | ) | |||||
| 2000 - Class C Shares | 10.10 | (0.24 | ) (c) | 9.68 | 9.44 | (0.23 | ) | |||||
| 2000 - Institutional Shares | 10.13 | (0.04 | ) (c) | 9.73 | 9.69 | (0.23 | ) | |||||
| 2000 - Service Shares | 10.12 | (0.12 | ) (c) | 9.68 | 9.56 | (0.23 | ) | |||||
| FOR THE PERIOD ENDED AUGUST 31, | ||||||||||||
| 1999 - Class A Shares (commenced May 24) | 10.00 | (0.01 | ) (c) | 0.14 | 0.13 | — | ||||||
| 1999 - Class B Shares (commenced May 24) | 10.00 | (0.03 | ) (c) | 0.21 | 0.18 | — | ||||||
| 1999 - Class C Shares (commenced May 24) | 10.00 | (0.03 | ) (c) | 0.13 | 0.10 | — | ||||||
| 1999 - Institutional Shares (commenced May 24) | 10.00 | 0.01 | 0.12 | 0.13 | — | |||||||
| 1999 - Service Shares (commenced May 24) | 10.00 | — | 0.12 | 0.12 | — | |||||||
(a)
|
Assumes investment at the net asset value at the beginning of the period, reinvestment of all dividends and distributions, a
complete redemption of the investment at the net asset value at the end of the period and no sales or redemption charges. Total return would be reduced if a sales or redemption charge were taken into account. Total returns for periods less than one full
year are not annualized.
|
(b)
|
Annualized.
|
(c)
|
Calculated based on the average shares outstanding methodology.
|
|
Ratios assuming no expense reductions |
||||||||||||||||||||
|---|---|---|---|---|---|---|---|---|---|---|---|---|---|---|---|---|---|---|---|---|
| Net asset
value, end of period |
Total
return (a) |
Net assets
at end of period (in 000s) |
Ratio of
net expenses to average net assets |
Ratio of
net investment income (loss) to average net assets |
Ratio of expenses to
average net assets |
Ratio of
net investment loss to average net assets |
Portfolio
turnover rate |
|||||||||||||
| $19.50 | 95.73 | % | $188,199 | 1.52 | % | (0.64 | )% | 1.61 | % | (0.73 | )% | 73.35 | % | |||||||
| 19.45 | 94.27 | 42,061 | 2.27 | (1.38 | ) | 2.36 | (1.47 | ) | 73.35 | |||||||||||
| 19.31 | 94.43 | 26,826 | 2.27 | (1.38 | ) | 2.36 | (1.47 | ) | 73.35 | |||||||||||
| 19.59 | 96.67 | 49,921 | 1.12 | (0.23 | ) | 1.21 | (0.32 | ) | 73.35 | |||||||||||
| 19.45 | 95.41 | 3 | 1.62 | (0.69 | ) | 1.71 | (0.78 | ) | 73.35 | |||||||||||
| 10.13 | 1.30 | 8,204 | 1.44 | (b) | (0.27 | ) (b) | 14.15 | (b) | (12.98 | ) (b) | 26.53 | |||||||||
| 10.18 | 1.80 | 520 | 2.19 | (b) | (1.04 | ) (b) | 14.90 | (b) | (13.75 | ) (b) | 26.53 | |||||||||
| 10.10 | 1.00 | 256 | 2.19 | (b) | (1.12 | ) (b) | 14.90 | (b) | (13.83 | ) (b) | 26.53 | |||||||||
| 10.13 | 1.30 | 5,223 | 1.04 | (b) | 0.39 | (b) | 13.75 | (b) | (12.32 | ) (b) | 26.53 | |||||||||
| 10.12 | 1.20 | 2 | 1.54 | (b) | 0.03 | (b) | 14.25 | (b) | (12.68 | ) (b) | 26.53 | |||||||||
| To the Shareholders and Board of Trustees of
|
| Goldman Sachs Trust — Growth Opportunities Fund:
|
| In our opinion, the accompanying statement of assets and liabilities, including the statement of investments, and the related
statements of operations and of changes in net assets and the financial highlights present fairly, in all material respects, the financial position of Goldman Sachs Growth Opportunities Fund (“the Fund”), one of the portfolios constituting
Goldman Sachs Trust, at August 31, 2000, the results of its operations, the changes in its net assets and the financial highlights for the year then ended, in conformity with accounting principles generally accepted in the United States of America. These
financial statements and financial highlights (hereafter referred to as “financial statements”) are the responsibility of the Fund’s management; our responsibility is to express an opinion on these financial statements based on our audit.
We conducted our audit of these financial statements in accordance with auditing standards generally accepted in the United States of America, which require that we plan and perform the audit to obtain reasonable assurance about whether the financial
statements are free of material misstatement. An audit includes examining, on a test basis, evidence supporting the amounts and disclosures in the financial statements, assessing the accounting principles used and significant estimates made by management,
and evaluating the overall financial statement presentation. We believe that our audit, which included confirmation of securities at August 31, 2000 by correspondence with the custodian and brokers, provides a reasonable basis for our opinion. The
statement of changes in net assets and the financial highlights of the Fund for the period ended August 31, 1999, were audited by other independent accountants whose report dated October 8, 1999 expressed an unqualified opinion thereon.
|
| PricewaterhouseCoopers LLP
|
| Boston, Massachusetts
|
| October 23, 2000
|
| Shares | Description | Value | |||
|---|---|---|---|---|---|
| Common Stocks – 91.1% | |||||
| Airlines – 0.4% | |||||
| 18,800 | Delta Air Lines, Inc. | $ 930,600 | |||
| Apparel – 1.0% | |||||
| 56,300 | Nike, Inc. Class B | 2,227,369 | |||
| Banks – 4.4% | |||||
| 25,300 | AmSouth Bancorp | 461,725 | |||
| 34,700 | Comerica, Inc. | 1,954,044 | |||
| 264,800 | Pacific Century Financial Corp. | 3,707,200 | |||
| 84,600 | The Colonial BancGroup, Inc. | 824,850 | |||
| 88,750 | UnionBanCal Corp. | 2,202,109 | |||
| 13,100 | Wilmington Trust Corp. | 659,913 | |||
| 9,809,841 | |||||
| Chemicals – 3.9% | |||||
| 189,000 | IMC Global, Inc. | 2,775,938 | |||
| 151,500 | Millennium Chemicals, Inc. | 2,499,750 | |||
| 65,700 | Potash Corp. of Saskatchewan, Inc. | 3,490,312 | |||
| 8,766,000 | |||||
| Clothing – 1.6% | |||||
| 236,400 | Ross Stores, Inc. | 3,575,550 | |||
| Computer Hardware – 3.1% | |||||
| 38,600 | Diebold, Inc. | 1,090,450 | |||
| 231,500 | Ingram Micro, Inc.* | 3,472,500 | |||
| 46,100 | Tech Data Corp.* | 2,379,912 | |||
| 6,942,862 | |||||
| Computer Software – 2.8% | |||||
| 83,800 | Mentor Graphics Corp.* | 1,581,725 | |||
| 129,442 | Synopsys, Inc.* | 4,797,444 | |||
| 6,379,169 | |||||
| Construction – 0.5% | |||||
| 57,800 | D.R. Horton, Inc. | 1,134,325 | |||
| Consumer Durables – 1.0% | |||||
| 37,850 | Herman Miller, Inc. | 1,208,834 | |||
| 49,100 | Sherwin-Williams Co. | 1,129,300 | |||
| 2,338,134 | |||||
| Defense/Aerospace – 1.4% | |||||
| 39,500 | Northrop Grumman Corp. | 3,073,594 | |||
| Department Store – 0.3% | |||||
| 26,200 | Federated Department Stores, Inc.* | 723,775 | |||
| Electrical Equipment – 0.3% | |||||
| 9,000 | Eaton Corp. | 597,375 | |||
| Electrical Utilities – 12.7% | |||||
| 91,600 | DTE Energy Co. | 3,183,100 | |||
| 124,200 | Energy East Corp. | 2,817,788 | |||
| 103,000 | Entergy Corp. | 3,135,062 | |||
| 65,000 | FPL Group, Inc. | 3,469,375 | |||
| 171,500 | Northeast Utilities | 3,901,625 | |||
| 215,100 | Public Service Co. of New Mexico | 4,597,762 | |||
| 39,200 | Reliant Energy, Inc. | 1,455,300 | |||
| Shares | Description | Value | |||
|---|---|---|---|---|---|
| Common Stocks – (continued) | |||||
| Electrical Utilities – (continued) | |||||
| 102,100 | SCANA Corp. | $ 2,794,988 | |||
| 70,600 | Unicom Corp. | 3,225,537 | |||
| 28,580,537 | |||||
| Energy Resources – 3.5% | |||||
| 45,694 | Anadarko Petroleum Corp. | 3,005,294 | |||
| 58,100 | Burlington Resources, Inc. | 2,284,056 | |||
| 129,600 | Ocean Energy, Inc.* | 1,968,300 | |||
| 48,300 | Pioneer Natural Resources Co.* | 670,163 | |||
| 7,927,813 | |||||
| Environmental Services – 1.5% | |||||
| 238,400 | Republic Services, Inc.* | 3,486,600 | |||
| Equity REIT – 7.0% | |||||
| 28,100 | AvalonBay Communities, Inc. | 1,255,719 | |||
| 39,900 | Boston Properties, Inc. | 1,613,456 | |||
| 95,900 | Duke-Weeks Realty Corp. | 2,277,625 | |||
| 33,100 | Equity Residential Properties Trust | 1,588,800 | |||
| 55,700 | Health Care Property Investors, Inc. | 1,465,606 | |||
| 116,000 | Public Storage, Inc. | 2,827,500 | |||
| 30,100 | Spieker Properties, Inc. | 1,644,213 | |||
| 200,000 | Trizec Hahn Corp. | 3,162,500 | |||
| 15,835,419 | |||||
| Food & Beverage – 2.9% | |||||
| 294,494 | Archer-Daniels-Midland Co. | 2,595,224 | |||
| 35,495 | ConAgra, Inc. | 650,004 | |||
| 140,000 | Fleming Cos., Inc. | 2,161,250 | |||
| 43,100 | Nabisco Group Holdings Corp. | 1,209,494 | |||
| 6,615,972 | |||||
| Forest – 3.3% | |||||
| 32,300 | Fort James Corp. | 1,021,487 | |||
| 146,100 | Georgia-Pacific Corp. (Timber Group) | 4,282,556 | |||
| 19,600 | Georgia-Pacific Group | 524,300 | |||
| 65,700 | Smurfit-Stone Container Corp.* | 862,313 | |||
| 39,900 | Sonoco Products Co. | 770,569 | |||
| 7,461,225 | |||||
| Gas Utilities – 1.0% | |||||
| 93,050 | LG&E Energy Corp. | 2,279,725 | |||
| Heavy Electrical – 1.0% | |||||
| 97,800 | UCAR International, Inc.* | 1,332,525 | |||
| 131,600 | UNOVA, Inc.* | 987,000 | |||
| 2,319,525 | |||||
| Heavy Machinery – 1.3% | |||||
| 88,700 | Deere & Co. | 2,921,556 | |||
| Industrial Parts – 1.1% | |||||
| 72,350 | Parker-Hannifin Corp. | 2,518,684 | |||
| Information Services – 1.5% | |||||
| 11,400 | Convergys Corp.* | 446,025 | |||
| 160,900 | Modis Professional Services, Inc.* | 1,106,187 | |||
| 56,500 | The Dun & Bradstreet Corp. | 1,864,500 | |||
| 3,416,712 | |||||
| Shares | Description | Value | |||
|---|---|---|---|---|---|
| Common Stocks – (continued) | |||||
| Media – 2.7% | |||||
| 136,800 | A.H. Belo Corp. | $ 2,616,300 | |||
| 65,600 | Media General, Inc. | 3,378,400 | |||
| 5,994,700 | |||||
| Medical Providers – 5.0% | |||||
| 45,500 | Aetna, Inc. | 2,545,156 | |||
| 89,200 | Health Management Associates, Inc.* | 1,455,075 | |||
| 301,200 | Manor Care, Inc.* | 4,028,550 | |||
| 106,600 | Tenet Healthcare Corp. | 3,304,600 | |||
| 11,333,381 | |||||
| Mining – 1.5% | |||||
| 111,700 | Ispat International NV | 726,050 | |||
| 28,200 | Nucor Corp. | 1,036,350 | |||
| 35,800 | Phelps Dodge Corp. | 1,593,100 | |||
| 3,355,500 | |||||
| Oil Refining – 1.2% | |||||
| 44,200 | Tosco Corp. | 1,348,100 | |||
| 41,900 | Valero Energy Corp. | 1,262,238 | |||
| 2,610,338 | |||||
| Oil Services – 2.3% | |||||
| 21,500 | Cal Dive International, Inc.* | 1,236,250 | |||
| 25,000 | Coflexip SA ADR | 1,485,156 | |||
| 23,000 | Diamond Offshore Drilling, Inc. | 1,030,688 | |||
| 106,600 | Stolt Offshore SA * | 1,479,075 | |||
| 5,231,169 | |||||
| Property Insurance – 9.3% | |||||
| 56,500 | Ambac Financial Group, Inc. | 3,651,313 | |||
| 101,500 | Everest Re Group, Ltd. | 4,085,375 | |||
| 33,100 | Loews Corp. | 2,679,031 | |||
| 33,300 | MBIA, Inc. | 2,189,475 | |||
| 222,800 | Old Republic International Corp. | 5,333,275 | |||
| 43,600 | XL Capital Ltd. | 3,005,675 | |||
| 20,944,144 | |||||
| Publishing – 0.9% | |||||
| 77,200 | R.R. Donnelley & Sons Co. | 1,987,900 | |||
| Railroads – 0.5% | |||||
| 43,500 | CSX Corp. | 1,038,563 | |||
| Restaurants – 1.2% | |||||
| 231,450 | CBRL Group, Inc. | 2,791,866 | |||
| Security/Asset Management – 1.5% | |||||
| 3,800 | Lehman Brothers Holdings, Inc. | 551,000 | |||
| 42,765 | The Bear Stearns Cos., Inc. | 2,867,928 | |||
| 3,418,928 | |||||
| Semiconductors – 1.6% | |||||
| 89,700 | MEMC Electronic Materials, Inc.* | 1,614,600 | |||
| 35,700 | Siliconix, Inc. * | 1,994,737 | |||
| 3,609,337 | |||||
| Shares | Description | Value | |||
|---|---|---|---|---|---|
| Common Stocks – (continued) | |||||
| Specialty Retail – 1.3% | |||||
| 20,400 | AutoZone, Inc.* | $ 459,000 | |||
| 24,800 | Avnet, Inc. | 1,484,900 | |||
| 49,700 | Toys “R” Us, Inc.* | 903,919 | |||
| 2,847,819 | |||||
| Telephone – 0.2% | |||||
| 19,700 | CenturyTel, Inc. | 561,401 | |||
| Thrifts – 2.4% | |||||
| 87,900 | GreenPoint Financial Corp. | 2,296,387 | |||
| 359,300 | Sovereign Bancorp, Inc. | 3,054,050 | |||
| 5,350,437 | |||||
| Tobacco – 1.4% | |||||
| 35,166 | R.J. Reynolds Tobacco Holdings, Inc. | 1,261,580 | |||
| 92,500 | UST, Inc. | 2,000,313 | |||
| 3,261,893 | |||||
| Truck Freight – 0.6% | |||||
| 54,200 | CNF Transportation, Inc. | 1,327,900 | |||
| TOTAL COMMON STOCKS | |||||
| (Cost $192,696,287) | $ 205,527,638 | ||||
| Principal
Amount |
Interest
Rate |
Maturity
Date |
Value | ||||
|---|---|---|---|---|---|---|---|
| Repurchase Agreement – 8.4% | |||||||
| Joint Repurchase Agreement Account II Ù | |||||||
| $18,900,000 | 6.66% | 09/01/2000 | $ 18,900,000 | ||||
| TOTAL REPURCHASE AGREEMENT | |||||||
| (Cost $18,900,000) | $ 18,900,000 | ||||||
| TOTAL INVESTMENTS | |||||||
| (Cost $211,596,287) | $ 224,427,638 | ||||||
*
|
Non-income producing security.
|
Ù
|
Joint repurchase agreement was entered into on August 31, 2000.
|
| The percentage shown for each investment category reflects the value of investments in that category as a percentage of total net
assets.
|
| |
| Investment Abbreviations:
|
| ADR—American Depositary Receipt
|
| |
| Assets:
|
| Investment in securities, at value (identified cost $211,596,287) | $224,427,638 | |||
| Cash | 19,329 | |||
| Receivables: | ||||
| Investment securities sold | 1,741,221 | |||
| Dividends and interest | 480,586 | |||
| Fund shares sold | 208,499 | |||
| Reimbursement from investment adviser | 38,632 | |||
| Other assets | 2,569 | |||
| Total assets | 226,918,474 | |||
| Liabilities: | ||||
| Payables: | ||||
| Fund shares repurchased | 594,097 | |||
| Investment securities purchased | 561,401 | |||
| Amounts owed to affiliates | 187,527 | |||
| Accrued expenses and other liabilities | 35,675 | |||
| Total liabilities | 1,378,700 | |||
| Net Assets: | ||||
| Paid-in capital | 232,617,463 | |||
| Accumulated undistributed net investment income | 2,001,174 | |||
| Accumulated net realized loss from investment, options and foreign currency related transactions | (21,910,214 | ) | ||
| Net unrealized gain on investments | 12,831,351 | |||
| NET ASSETS | $225,539,774 | |||
| Net asset value, offering and redemption price per share: (a) | ||||
| Class A | $19.88 | |||
| Class B | $19.69 | |||
| Class C | $19.67 | |||
| Institutional | $19.86 | |||
| Service | $19.73 | |||
| Shares outstanding: | ||||
| Class A | 1,968,707 | |||
| Class B | 1,131,753 | |||
| Class C | 290,769 | |||
| Institutional | 7,965,367 | |||
| Service | 10,448 | |||
| Total shares outstanding, $.001 par value (unlimited number of shares authorized) | 11,367,044 | |||
(a)
|
Maximum public offering price per share (NAV per share multiplied by 1.0582) for Class A shares is $21.04. At redemption, Class B
and Class C Shares may be subject to a deferred contingent sales charge, assessed on the amount equal to the lesser of the current net asset value or the original purchase price of the shares.
|
| Investment income: | ||||
| Dividends (a) | $ 4,843,040 | |||
| Interest | 520,165 | |||
| Total income | 5,363,205 | |||
| Expenses: | ||||
| Management fees | 1,673,380 | |||
| Distribution and Service fees (b) | 397,161 | |||
| Transfer Agent fees (c) | 193,393 | |||
| Registration fees | 85,833 | |||
| Custodian fees | 75,164 | |||
| Professional fees | 66,992 | |||
| Amortization of deferred organization expenses | 15,801 | |||
| Trustee fees | 8,729 | |||
| Other | 99,802 | |||
| Total expenses | 2,616,255 | |||
| Less — expense reductions | (119,374 | ) | ||
| Net expenses | 2,496,881 | |||
| NET INVESTMENT INCOME | 2,866,324 | |||
| Realized and unrealized gain (loss) on investment transactions: | ||||
| Net realized loss from investment transactions | (16,933,957 | ) | ||
| Net change in unrealized gain on investments | 27,143,384 | |||
| Net realized and unrealized gain on investment transactions | 10,209,427 | |||
| NET INCREASE IN NET ASSETS RESULTING FROM OPERATIONS | $13,075,751 | |||
(a)
|
Foreign taxes withheld on dividends were $40,254.
|
(b)
|
Class A, Class B and Class C had Distribution and Service fees of $99,049, $234,374 and $63,738, respectively.
|
(c)
|
Class A, Class B, Class C, Institutional Class and Service Class had Transfer Agent fees of $75,277, $44,531, $12,110, $61,403 and
$72, respectively.
|
| For the
Year Ended August 31, 2000 |
For the
Seven Months Ended August 31, 1999 |
For the
Year Ended January 31, 1999 |
||||||||||||
|---|---|---|---|---|---|---|---|---|---|---|---|---|---|---|
| From operations: | ||||||||||||||
| Net investment income | $ 2,866,324 | $ 980,264 | $ 2,221,134 | |||||||||||
| Net realized gain (loss) from investment, options and foreign currency related
transactions |
(16,933,957 | ) | 13,695,867 | 6,435,290 | ||||||||||
| Net change in unrealized gain (loss) on investments and translation of assets and
liabilities denominated in foreign currencies |
27,143,384 | 11,157,599 | (58,648,058 | ) | ||||||||||
| Net increase (decrease) in net assets resulting from operations | 13,075,751 | 25,833,730 | (49,991,634 | ) | ||||||||||
| Distributions to shareholders: | ||||||||||||||
| From net investment income | ||||||||||||||
| Class A Shares | (279,844 | ) | — | (280,574 | ) | |||||||||
| Class B Shares | — | — | (3,078 | ) | ||||||||||
| Class C Shares | — | — | (9,612 | ) | ||||||||||
| Institutional Shares | (1,995,272 | ) | — | (2,055,325 | ) | |||||||||
| Service Shares | (1,120 | ) | — | (2,638 | ) | |||||||||
| In excess of net investment income | ||||||||||||||
| Class A Shares | — | — | (6,261 | ) | ||||||||||
| Class B Shares | — | — | (69 | ) | ||||||||||
| Class C Shares | — | — | (214 | ) | ||||||||||
| Institutional Shares | — | — | (45,868 | ) | ||||||||||
| Service Shares | — | — | (59 | ) | ||||||||||
| From net realized gain on investment and options transactions | ||||||||||||||
| Class A Shares | — | (4,331,730 | ) | (3,498,210 | ) | |||||||||
| Class B Shares | — | (2,778,438 | ) | (1,854,834 | ) | |||||||||
| Class C Shares | — | (868,578 | ) | (536,322 | ) | |||||||||
| Institutional Shares | — | (16,406,543 | ) | (9,058,413 | ) | |||||||||
| Service Shares | — | (16,471 | ) | (14,028 | ) | |||||||||
| Total distributions to shareholders | (2,276,236 | ) | (24,401,760 | ) | (17,365,505 | ) | ||||||||
| From share transactions: | ||||||||||||||
| Proceeds from sales of shares | 29,205,968 | 40,482,737 | 203,854,529 | |||||||||||
| Reinvestment of dividends and distributions | 2,225,142 | 23,418,266 | 16,585,994 | |||||||||||
| Cost of shares repurchased | (98,141,541 | ) | (99,881,814 | ) | (199,307,468 | ) | ||||||||
| Net increase (decrease) in net assets resulting from share transactions | (66,710,431 | ) | (35,980,811 | ) | 21,133,055 | |||||||||
| TOTAL DECREASE | (55,910,916 | ) | (34,548,841 | ) | (46,224,084 | ) | ||||||||
| Net assets: | ||||||||||||||
| Beginning of period | 281,450,690 | 315,999,531 | 362,223,615 | |||||||||||
| End of period | $225,539,774 | $281,450,690 | $315,999,531 | |||||||||||
| Accumulated undistributed (distributions in excess of) net investment income | $ 2,001,174 | $ 1,394,240 | $ (31,716 | ) | ||||||||||
| 1. ORGANIZATION
|
| Goldman Sachs Trust (the “Trust”) is a Delaware business trust registered under the Investment Company Act of 1940 (as
amended) as an open-end management investment company. The Trust includes the Goldman Sachs Mid Cap Value Fund (the “Fund”). Effective May 1, 1999, the name of Goldman Sachs Mid Cap Equity Fund was changed to Goldman Sachs Mid Cap Value Fund.
The Fund is a diversified portfolio offering five classes of shares — Class A, Class B, Class C, Institutional and Service.
|
| 2. SIGNIFICANT ACCOUNTING POLICIES
|
| The following is a summary of the significant accounting policies consistently followed by the Fund. The preparation of financial
statements in conformity with generally accepted accounting principles requires management to make estimates and assumptions that may affect the reported amounts. Actual results could differ from those estimates. Effective for fiscal year 1999, the Board
of Trustees approved a change in the fiscal year-end of the Fund from January 31 to August 31. Accordingly, the Statements of Changes in Net Assets, Summary of Share Transactions and Financial Highlights of the Fund include the seven months ended August
31, 1999 and the year ended January 31, 1999.
|
| A. Investment Valuation — Investments in
securities traded on a U.S. or foreign securities exchange or the NASDAQ system are valued daily at their last sale price on the principal exchange on which they are traded. If no sale occurs, securities are valued at the last bid price. Debt securities
are valued at prices supplied by independent pricing services, broker/dealer-supplied valuations or matrix pricing systems. Unlisted equity and debt securities for which market quotations are available are valued at the last sale price on valuation date,
or if no sale occurs, at the last bid price. Short-term debt obligations maturing in sixty days or less are valued at amortized cost, which approximates market value. Securities for which quotations are not readily available are valued at fair value using
methods approved by the Board of Trustees of the Trust.
|
| B. Security Transactions and Investment Income — Security transactions are recorded as of the trade date. Realized gains and losses on sales of portfolio securities are calculated on the identified-cost basis. Dividend income is recorded on the ex-dividend date net of foreign withholding taxes where
applicable. Dividends for which the Fund has the choice to receive either cash or stock are recognized as investment income in an amount equal to the cash dividend. Interest income is recorded on the basis of interest accrued, premium amortized and
discount earned.
|
| Net investment income (other than class specific expenses) and unrealized and
realized gains or losses are allocated daily to each class of shares of the Fund based upon the relative proportion of net assets of each class.
|
| C. Federal Taxes — It is the Fund’s
policy to comply with the requirements of the Internal Revenue Code applicable to regulated investment companies and to distribute each year substantially all of its investment company taxable income and capital gains to its shareholders. Accordingly, no
federal tax provision is required. Income and capital gain distributions, if any, are declared and paid annually.
|
| The characterization of distributions to shareholders for financial reporting
purposes is determined in accordance with income tax rules. Therefore, the source of the Fund’s distributions may be shown in the accompanying financial statements as either from or in excess of net investment income or net realized gain on
investment transactions, or from paid-in capital, depending on the type of book/tax differences that may exist.
|
| At August 31, 2000, the Fund had approximately $19,761,198 of capital loss
carryforward expiring in the period of 2006 through 2008 for federal tax purposes. This amount is available to be carried forward to offset future capital gains to the extent permitted by applicable laws or regulations.
|
| 2. SIGNIFICANT ACCOUNTING POLICIES (continued)
|
| At August 31, 2000, the aggregate cost of portfolio securities for federal income
tax purposes is $213,221,822. Accordingly, the gross unrealized gain on investments was $28,373,761 and the gross unrealized loss on investments was $17,167,945 resulting in a net unrealized gain of $11,205,816.
|
| D. Expenses — Expenses incurred by the
Trust that do not specifically relate to an individual fund of the Trust are allocated to the funds based on a straight-line or pro rata basis depending upon the nature of the expense.
|
| Class A, Class B and Class C Shares bear all expenses and fees relating to their
respective Distribution and Service Plans. Shareholders of Service Shares bear all expenses and fees paid to service organizations. Each class of shares separately bears its respective class-specific Transfer Agency fees.
|
| E. Deferred Organization Expenses —
Organization-related costs are being amortized on a straight-line basis over a period of five years.
|
| F. Foreign Currency Translations — The
books and records of the Fund are maintained in U.S. dollars. Amounts denominated in foreign currencies are translated into U.S. dollars on the following basis: (i) investment valuations, foreign currency and other assets and liabilities initially
expressed in foreign currencies are converted each business day into U.S. dollars based upon current exchange rates; and (ii) purchases and sales of foreign investments, income and expenses are converted into U.S. dollars based upon currency exchange
rates prevailing on the respective dates of such transactions.
|
| Net realized and unrealized gain (loss) on foreign currency transactions will
represent: (i) foreign exchange gains and losses from the sale and holdings of foreign currencies; (ii) currency gains and losses between trade date and settlement date on investment securities transactions and forward exchange contracts; and (iii) gains
and losses from the difference between amounts of dividends and interest recorded and the amounts actually received.
|
| G. Segregation Transactions — The Fund may
enter into certain derivative transactions to seek to increase total return. Forward foreign currency exchange contracts, futures contracts, written options, when-issued securities and forward commitments represent examples of such transactions. As a
result of entering into these transactions, the Fund is required to segregate liquid assets on the accounting records equal to or greater than the market value of the corresponding transactions.
|
| H. Repurchase Agreements — Repurchase
agreements involve the purchase of securities subject to the seller’s agreement to repurchase them at a mutually agreed upon date and price. During the term of a repurchase agreement, the value of the underlying securities, including accrued
interest, is required to equal or exceed the value of the repurchase agreement. The underlying securities for all repurchase agreements are held in safekeeping at the Fund’s custodian.
|
| 3. AGREEMENTS
|
| Pursuant to the Investment Management Agreement (the “Agreement”), Goldman Sachs Asset Management (“GSAM”), a
unit of the Investment Management Division of Goldman, Sachs & Co. (“Goldman Sachs”), serves as the investment adviser to the Fund. Under the Agreement, the adviser, subject to the general supervision of the Trust’s Board of Trustees,
manages the Fund’s portfolio. As compensation for the services rendered pursuant to the Agreement, the assumption of the expenses related thereto and administering the Fund’s business affairs, including providing facilities, the adviser is
entitled to a fee, computed daily and payable monthly, at an annual rate equal to 0.75% of the average daily net assets of the Fund.
|
| The adviser has voluntarily agreed to limit certain “Other Expenses” of
the Fund (excluding Management fees, Distribution and Service fees, Transfer Agent fees, taxes, interest, brokerage, litigation, Service Share fees, indemnification costs and
|
| 3. AGREEMENTS (continued)
|
| other extraordinary expenses) to the extent such expenses exceed, on an annual basis, 0.10% of the average daily net assets of the
Fund. For the year ended August 31, 2000, Goldman Sachs has agreed to reimburse approximately $116,000. In addition, the Fund has entered into certain offset arrangements with the custodian resulting in a reduction in the Fund’s expenses. For the
year ended August 31, 2000 custodian fees were reduced by approximately $3,000.
|
| The Trust, on behalf of the Fund, has adopted Distribution and Service Plans.
Under the Distribution and Service Plans, Goldman Sachs and/or authorized dealers are entitled to a monthly fee from the Fund for distribution and shareholder maintenance services equal, on an annual basis, to 0.25%, 1.00% and 1.00% of the Fund’s
average daily net assets attributable to Class A, Class B and Class C Shares, respectively.
|
| Goldman Sachs serves as the distributor of shares of the Fund pursuant to a
Distribution Agreement. Goldman Sachs may receive a portion of the Class A sales load and Class B and Class C contingent deferred sales charges and has advised the Fund that it retained approximately $58,000 during the year ended August 31, 2000.
|
| Goldman Sachs also serves as the Transfer Agent of the Fund for a fee. The fees
charged for such transfer agency services are calculated daily and payable monthly at an annual rate as follows: 0.19% of the average daily net assets for Class A, Class B and Class C Shares and 0.04% of the average daily net assets for Institutional and
Service Shares.
|
| The Trust, on behalf of the Fund, has adopted a Service Plan. This Plan allows for
Service Shares to compensate service organizations for providing varying levels of account administration and shareholder liaison services to their customers who are beneficial owners of such shares. The Service Plan provides for compensation to the
service organizations in an amount up to 0.50% (on a annualized basis), of the average daily net asset value of the Service Shares.
|
| As of August 31, 2000, the amounts owed to affiliates were approximately $140,000,
$31,000 and $17,000 for Management, Distribution and Service and Transfer Agent fees, respectively.
|
| 4. PORTFOLIO SECURITIES TRANSACTIONS
|
| The cost of purchases and proceeds of sales and maturities of securities (excluding short-term investments) for the year ended
August 31, 2000, were $179,253,315 and $255,650,399, respectively. For the year ended August 31, 2000, Goldman Sachs earned approximately $13,000 of brokerage commissions from portfolio transactions.
|
| Option Accounting Principles — When the Fund writes
call or put options, an amount equal to the premium received is recorded as an asset and as an equivalent liability. The amount of the liability is subsequently marked-to-market to reflect the current market value of the options written. When a written
option expires on its stipulated expiration date or the Fund enters into a closing purchase transaction, the Fund realizes a gain or loss without regard to any unrealized gain or loss on the underlying security, and the liability related to such option is
extinguished. When a written call option is exercised, the Fund realizes a gain or loss from the sale of the underlying security, and the proceeds of the sale are increased by the premium originally received. When a written put option is exercised, the
amount of the premium originally received will reduce the cost of the security which the Fund purchases upon exercise. There is a risk of loss from a change in value of such options which may exceed the related premiums received.
|
| Upon the purchase of a call option or a protective put option by the Fund, the
premium paid is recorded as an investment and subsequently marked-to-market to reflect the current market value of the option. If an option which the Fund has purchased expires on the stipulated expiration date, the Fund will realize a loss in the amount
of the cost of the option. If the Fund enters into a closing sale transaction, the Fund will realize a gain or loss, depending on whether the sale proceeds for the closing sale transaction are greater or less than the cost of the option. If the Fund
exercises a purchased put option, the Fund will realize a gain or loss from the sale of the underlying security, and the proceeds from such sale will be decreased by the premium originally paid. If the Fund exercises a purchased call option, the cost of
the security which the Fund purchases
4. PORTFOLIO SECURITIES TRANSACTIONS (continued)
|
| upon exercise will be increased by the premium originally paid. At August 31, 2000, there were no open written options contracts.
|
| Futures Contracts — The Fund may enter into futures
transactions to hedge against changes in interest rates, securities prices or to seek to increase total return. Upon entering into a futures contract, the Fund is required to deposit with a broker or the Fund’s custodian bank an amount of cash or
securities equal to the minimum “initial margin” requirement of the associated futures exchange. Subsequent payments for futures contracts (“variation margin”) are paid or received by the Fund daily, depending on the daily fluctuations
in the value of the contracts, and are recorded for financial reporting purposes as unrealized gains or losses. When contracts are closed, the Fund realizes a gain or loss which is reported in the Statement of Operations.
|
| The use of futures contracts involve, to varying degrees, elements of market risk
which may exceed the amounts recognized in the Statement of Assets and Liabilities. Changes in the value of the futures contract may not directly correlate with changes in the value of the underlying securities. This risk may decrease the effectiveness of
the Fund’s hedging strategies and potentially result in a loss. At August 31, 2000, there were no open futures contracts.
|
| 5. LINE OF CREDIT FACILITY
|
| Effective May 31, 2000, the Fund participates in a $350,000,000 committed, unsecured revolving line of credit facility. Prior
thereto, the Fund participated in a $250,000,000 uncommitted and a $250,000,000 committed, unsecured revolving line of credit facility. Under the most restrictive arrangement, the Fund must own securities having a market value in excess of 400% of the
total bank borrowings. This facility is to be used solely for temporary or emergency purposes. The interest rate on borrowings is based on the Federal Funds rate. The committed facility also requires a fee to be paid by the Fund based on the amount of the
commitment. During the year ended August 31, 2000, the Fund did not have any borrowings under any of these facilities.
|
| 6. JOINT REPURCHASE AGREEMENT ACCOUNT
|
| The Fund, together with other registered investment companies having management agreements with GSAM or its affiliates, transfers
uninvested cash into joint accounts, the daily aggregate balance of which is invested in one or more repurchase agreements.
|
| At August 31, 2000, the Fund had an undivided interest in the repurchase
agreements in the joint account which equaled $18,900,000 in principal amount. At August 31, 2000, the following repurchase agreements held in this joint account were fully collateralized by Federal Agency obligations:
|
| Repurchase Agreements | Principal
Amount |
Interest
Rate |
Maturity
Date |
Amortized
Cost |
Maturity
Value |
|||||||
|---|---|---|---|---|---|---|---|---|---|---|---|---|
| ABN/AMRO, Inc. | $ 814,100,000 | 6.66 | % | 09/01/2000 | $ 814,100,000 | $ 814,250,608 | ||||||
| Banc of America Securities LLC | 900,000,000 | 6.67 | 09/01/2000 | 900,000,000 | 900,166,750 | |||||||
| Barclays Capital, Inc. | 500,000,000 | 6.67 | 09/01/2000 | 500,000,000 | 500,092,639 | |||||||
| Bear Stearns Companies, Inc. | 300,000,000 | 6.67 | 09/01/2000 | 300,000,000 | 300,055,583 | |||||||
| Chase Securities, Inc. | 450,000,000 | 6.67 | 09/01/2000 | 450,000,000 | 450,083,375 | |||||||
| Donaldson, Lufkin & Jenrette, Inc. | 1,000,000,000 | 6.67 | 09/01/2000 | 1,000,000,000 | 1,000,185,278 | |||||||
| J.P. Morgan & Co., Inc. | 800,000,000 | 6.65 | 09/01/2000 | 800,000,000 | 800,147,778 | |||||||
| Morgan Stanley Dean Witter & Co. | 750,000,000 | 6.65 | 09/01/2000 | 750,000,000 | 750,138,542 | |||||||
| Morgan Stanley Dean Witter & Co. | 300,000,000 | 6.60 | 09/01/2000 | 300,000,000 | 300,055,000 | |||||||
| UBS Warburg LLC | 800,000,000 | 6.65 | 09/01/2000 | 800,000,000 | 800,147,778 | |||||||
| TOTAL JOINT REPURCHASE AGREEMENT ACCOUNT II | $6,614,100,000 | $6,615,323,331 | ||||||||||
| 7. OTHER MATTERS
|
| As of August 31, 2000, Goldman, Sachs & Co. Employees Profit Sharing Master Trust was the beneficial owner of approximately
66% of the outstanding shares of the Fund.
|
| 8. CERTAIN RECLASSIFICATIONS
|
| In accordance with AICPA Statement of Position 93-2, the Fund has reclassified $16,846 from paid-in capital to accumulated net
investment loss. This reclassification has no impact on the net asset value of the Fund and is designed to present the Fund’s capital accounts on a tax basis. Reclassifications result primarily from the difference in the tax treatment of foreign
currency, net operating losses and organization costs.
|
| 9. CHANGE IN INDEPENDENT ACCOUNTANTS
|
| On October 26, 1999, the Board of Trustees of the Fund, upon the recommendation of the Board’s audit committee, determined
not to retain Arthur Andersen LLP and approved a change of the Fund’s independent accountants to PricewaterhouseCoopers LLP. For the period ended August 31, 1999 and the year ended January 31, 1999, Arthur Andersen LLP’s audit reports contained
no adverse opinion or disclaimer of opinion; nor were their reports qualified or modified as to uncertainty, audit scope, or accounting principles. Further, there were no disagreements between the Fund and Arthur Andersen LLP on accounting principles or
practices, financial statement disclosure or audit scope or procedure, which if not resolved to the satisfaction of Arthur Andersen LLP would have caused them to make reference to the disagreement in their reports.
|
| 10. SUMMARY OF SHARE TRANSACTIONS
|
| Share activity is as follows:
|
| For the Year Ended
August 31, 2000 |
For the Seven Months Ended
August 31, 1999 |
For the Year Ended
January 31, 1999 |
|||||||||||||||||
|---|---|---|---|---|---|---|---|---|---|---|---|---|---|---|---|---|---|---|---|
| Shares | Dollars | Shares | Dollars | Shares | Dollars | ||||||||||||||
| Class A Shares | |||||||||||||||||||
| Shares sold | 815,181 | $14,319,663 | 1,367,506 | $26,553,720 | 6,897,312 | $143,833,096 | |||||||||||||
| Reinvestments of dividends and distributions | 16,254 | 270,462 | 214,436 | 4,213,683 | 198,815 | 3,620,601 | |||||||||||||
| Shares repurchased | (1,527,747 | ) | (26,456,142 | ) | (2,756,189 | ) | (54,358,686 | ) | (7,448,798 | ) | (147,546,061 | ) | |||||||
| (696,312 | ) | (11,866,017 | ) | (1,174,247 | ) | (23,591,283 | ) | (352,671 | ) | (92,364 | ) | ||||||||
| Class B Shares | |||||||||||||||||||
| Shares sold | 203,697 | 3,662,014 | 232,886 | 4,652,883 | 1,238,560 | 27,854,158 | |||||||||||||
| Reinvestments of dividends and distributions | 2 | 31 | 121,303 | 2,361,741 | 82,866 | 1,503,199 | |||||||||||||
| Shares repurchased | (817,446 | ) | (13,980,108 | ) | (675,993 | ) | (12,921,155 | ) | (586,417 | ) | (11,387,076 | ) | |||||||
| (613,747 | ) | (10,318,063 | ) | (321,804 | ) | (5,906,531 | ) | 735,009 | 17,970,281 | ||||||||||
| Class C Shares | |||||||||||||||||||
| Shares sold | 75,788 | 1,333,632 | 98,072 | 2,005,005 | 499,586 | 10,988,153 | |||||||||||||
| Reinvestments of dividends and distributions | — | — | 33,722 | 656,882 | 22,110 | 401,070 | |||||||||||||
| Shares repurchased | (322,641 | ) | (5,484,036 | ) | (184,318 | ) | (3,524,952 | ) | (230,071 | ) | (4,500,505 | ) | |||||||
| (246,853 | ) | (4,150,404 | ) | (52,524 | ) | (863,065 | ) | 291,625 | 6,888,718 | ||||||||||
| Institutional Shares | |||||||||||||||||||
| Shares sold | 541,972 | 9,884,659 | 348,804 | 7,246,129 | 967,052 | 20,867,072 | |||||||||||||
| Reinvestments of dividends and distributions | 117,753 | 1,953,524 | 821,203 | 16,169,493 | 607,168 | 11,044,402 | |||||||||||||
| Shares repurchased | (3,020,832 | ) | (52,215,710 | ) | (1,537,957 | ) | (28,938,741 | ) | (1,801,025 | ) | (35,855,143 | ) | |||||||
| (2,361,107 | ) | (40,377,527 | ) | (367,950 | ) | (5,523,119 | ) | (226,805 | ) | (3,943,669 | ) | ||||||||
| Service Shares | |||||||||||||||||||
| Shares sold | 350 | 6,000 | 1,188 | 25,000 | 15,505 | 312,050 | |||||||||||||
| Reinvestments of dividends and distributions | 68 | 1,125 | 843 | 16,467 | 923 | 16,722 | |||||||||||||
| Shares repurchased | (334 | ) | (5,545 | ) | (7,477 | ) | (138,280 | ) | (978 | ) | (18,683 | ) | |||||||
| 84 | 1,580 | (5,446 | ) | (96,813 | ) | 15,450 | 310,089 | ||||||||||||
| NET INCREASE (DECREASE) | (3,917,935 | ) | $(66,710,431 | ) | (1,921,971 | ) | $(35,980,811 | ) | 462,608 | $ 21,133,055 | |||||||||
| Goldman Sachs Mid Cap Value Fund — Tax Information (unaudited)
|
| For the year ended August 31, 2000, 57.01% of the dividends paid from net investment
company taxable income by the Mid Cap Value Fund qualify for the dividends received deduction available to corporations.
|
| Income from
investment operations |
Distributions to shareholders |
||||||||||||||||||||||
|---|---|---|---|---|---|---|---|---|---|---|---|---|---|---|---|---|---|---|---|---|---|---|---|
| Net asset
value, beginning of period |
Net
investment income (loss) |
Net realized
and unrealized gain (loss) |
Total income
from investment operations |
From net
investment income |
In excess
of net investment income |
From net
realized gains |
Total
Distributions |
||||||||||||||||
| FOR THE YEAR ENDED AUGUST 31, | |||||||||||||||||||||||
| 2000 - Class A Shares | $18.42 | $0.20 | (c) | $1.38 | $1.58 | $(0.12 | ) | $ — | $ — | $(0.12) | |||||||||||||
| 2000 - Class B Shares | 18.23 | 0.06 | (c) | 1.40 | 1.46 | — | — | — | — | ||||||||||||||
| 2000 - Class C Shares | 18.24 | 0.06 | (c) | 1.37 | 1.43 | — | — | — | — | ||||||||||||||
| 2000 - Institutional Shares | 18.45 | 0.27 | (c) | 1.36 | 1.63 | (0.22 | ) | — | — | (0.22) | |||||||||||||
| 2000 - Service Shares | 18.31 | 0.18 | (c) | 1.35 | 1.53 | (0.11 | ) | — | — | (0.11) | |||||||||||||
| FOR THE SEVEN MONTHS ENDED AUGUST 31, | |||||||||||||||||||||||
| 1999 - Class A Shares | 18.38 | 0.06 | 1.71 | 1.77 | — | — | (1.73 | ) | (1.73) | ||||||||||||||
| 1999 - Class B Shares | 18.29 | (0.04 | ) | 1.71 | 1.67 | — | — | (1.73 | ) | (1.73) | |||||||||||||
| 1999 - Class C Shares | 18.30 | (0.04 | ) | 1.71 | 1.67 | — | — | (1.73 | ) | (1.73) | |||||||||||||
| 1999 - Institutional Shares | 18.37 | 0.09 | 1.72 | 1.81 | — | — | (1.73 | ) | (1.73) | ||||||||||||||
| 1999 - Service Shares | 18.29 | 0.05 | 1.70 | 1.75 | — | — | (1.73 | ) | (1.73) | ||||||||||||||
| FOR THE YEARS ENDED JANUARY 31, | |||||||||||||||||||||||
| 1999 - Class A Shares | 21.61 | 0.10 | (2.38 | ) | (2.28 | ) | (0.07 | ) | — | (0.88 | ) | (0.95) | |||||||||||
| 1999 - Class B Shares | 21.57 | (0.05 | ) | (2.35 | ) | (2.40 | ) | — | — | (0.88 | ) | (0.88) | |||||||||||
| 1999 - Class C Shares | 21.59 | (0.05 | ) | (2.34 | ) | (2.39 | ) | (0.02 | ) | — | (0.88 | ) | (0.90) | ||||||||||
| 1999 - Institutional Shares | 21.65 | 0.19 | (2.38 | ) | (2.19 | ) | (0.21 | ) | — | (0.88 | ) | (1.09) | |||||||||||
| 1999 - Service Shares | 21.62 | 0.03 | (2.31 | ) | (2.28 | ) | (0.17 | ) | — | (0.88 | ) | (1.05) | |||||||||||
| 1998 - Class A Shares
(commenced August 15, 1997) |
23.63 | 0.09 | 0.76 | 0.85 | (0.06 | ) | (0.04 | ) | (2.77 | ) | (2.87) | ||||||||||||
| 1998 - Class B Shares
(commenced August 15, 1997) |
23.63 | 0.06 | 0.74 | 0.80 | (0.09 | ) | — | (2.77 | ) | (2.86) | |||||||||||||
| 1998 - Class C Shares
(commenced August 15, 1997) |
23.63 | 0.06 | 0.76 | 0.82 | (0.09 | ) | — | (2.77 | ) | (2.86) | |||||||||||||
| 1998 - Institutional Shares | 18.73 | 0.16 | 5.66 | 5.82 | (0.13 | ) | — | (2.77 | ) | (2.90) | |||||||||||||
| 1998 - Service Shares
(commenced July 18, 1997) |
23.01 | 0.09 | 1.40 | 1.49 | (0.11 | ) | — | (2.77 | ) | (2.88) | |||||||||||||
| 1997 - Institutional Shares | 15.91 | 0.24 | 3.77 | 4.01 | (0.24 | ) | (0.93 | ) | (0.02 | ) | (1.19) | ||||||||||||
| FOR THE PERIOD ENDED JANUARY 31, | |||||||||||||||||||||||
| 1996 - Institutional Shares (commenced
August 1, 1995) |
15.00 | 0.13 | 0.90 | 1.03 | (0.12 | ) | — | — | (0.12) | ||||||||||||||
(a)
|
Assumes investment at the net asset value at the beginning of the period, reinvestment of all dividends and distributions, a
complete redemption of the investment at the net asset value at the end of the period and no sales or redemption charges. Total return would be reduced if a sales or redemption charge were taken into account. Total returns for periods less than one full
year are not annualized.
|
(b)
|
Annualized.
|
(c)
|
Calculated based on average shares outstanding methodology.
|
| Ratios assuming no
expense reductions |
|||||||||||||||||||||
|---|---|---|---|---|---|---|---|---|---|---|---|---|---|---|---|---|---|---|---|---|---|
| Net asset
value, end of period |
Total
return (a) |
Net assets
at end of period (in 000s) |
Ratio of
net expenses to average net assets |
Ratio of
net investment income (loss) to average net assets |
Ratio of
expenses to average net assets |
Ratio of
net investment income (loss) to average net assets |
Portfolio
turnover rate |
||||||||||||||
| $19.88 | 8.70 | % | $ 39,142 | 1.29 | % | 1.11 | % | 1.34 | % | 1.06 | % | 82.92 | % | ||||||||
| 19.69 | 8.01 | 22,284 | 2.04 | 0.35 | 2.09 | 0.30 | 82.92 | ||||||||||||||
| 19.67 | 7.84 | 5,720 | 2.04 | 0.32 | 2.09 | 0.27 | 82.92 | ||||||||||||||
| 19.86 | 9.08 | 158,188 | 0.89 | 1.51 | 0.94 | 1.46 | 82.92 | ||||||||||||||
| 19.73 | 8.48 | 206 | 1.39 | 1.03 | 1.44 | 0.98 | 82.92 | ||||||||||||||
| 18.42 | 9.04 | 49,081 | 1.29 | (b) | 0.43 | (b) | 1.37 | (b) | 0.35 | (b) | 68.84 | ||||||||||
| 18.23 | 8.53 | 31,824 | 2.04 | (b) | (0.33 | ) (b) | 2.12 | (b) | (0.41 | ) (b) | 68.84 | ||||||||||
| 18.24 | 8.52 | 9,807 | 2.04 | (b) | (0.34 | ) (b) | 2.12 | (b) | (0.42 | ) (b) | 68.84 | ||||||||||
| 18.45 | 9.26 | 190,549 | 0.89 | (b) | 0.79 | (b) | 0.97 | (b) | 0.71 | (b) | 68.84 | ||||||||||
| 18.31 | 8.97 | 190 | 1.39 | (b) | 0.38 | (b) | 1.47 | (b) | 0.30 | (b) | 68.84 | ||||||||||
| 18.38 | (10.48 | ) | 70,578 | 1.33 | 0.38 | 1.41 | 0.30 | 92.18 | |||||||||||||
| 18.29 | (11.07 | ) | 37,821 | 1.93 | (0.22 | ) | 2.01 | (0.30 | ) | 92.18 | |||||||||||
| 18.30 | (11.03 | ) | 10,800 | 1.93 | (0.22 | ) | 2.01 | (0.30 | ) | 92.18 | |||||||||||
| 18.37 | (10.07 | ) | 196,512 | 0.87 | 0.83 | 0.95 | 0.75 | 92.18 | |||||||||||||
| 18.29 | (10.48 | ) | 289 | 1.37 | 0.32 | 1.45 | 0.24 | 92.18 | |||||||||||||
| 21.61 | 3.42 | 90,588 | 1.35 | (b) | 0.33 | (b) | 1.47 | (b) | 0.21 | (b) | 62.60 | ||||||||||
| 21.57 | 3.17 | 28,743 | 1.85 | (b) | (0.20 | ) (b) | 1.97 | (b) | (0.32 | ) (b) | 62.60 | ||||||||||
| 21.59 | 3.27 | 6,445 | 1.85 | (b) | (0.23 | ) (b) | 1.97 | (b) | (0.35 | ) (b) | 62.60 | ||||||||||
| 21.65 | 30.86 | 236,440 | 0.85 | 0.78 | 0.97 | 0.66 | 62.60 | ||||||||||||||
| 21.62 | 6.30 | 8 | 1.35 | (b) | 0.63 | (b) | 1.43 | (b) | 0.51 | (b) | 62.60 | ||||||||||
| 18.73 | 25.63 | 145,253 | 0.85 | 1.35 | 0.91 | 1.29 | 74.03 | ||||||||||||||
| 15.91 | 6.89 | 135,671 | 0.85 | (b) | 1.67 | (b) | 0.98 | (b) | 1.54 | (b) | 58.77 | ||||||||||
| To the Shareholders and Board of Trustees of
|
| Goldman Sachs Trust — Mid Cap Value Fund:
|
| In our opinion, the accompanying statement of assets and liabilities, including the statement of investments, and the related
statements of operations and of changes in net assets and the financial highlights present fairly, in all material respects, the financial position of Goldman Sachs Mid Cap Value Fund (“the Fund”), one of the portfolios constituting Goldman
Sachs Trust, at August 31, 2000, the results of its operations, the changes in its net assets and the financial highlights for the year then ended, in conformity with accounting principles generally accepted in the United States of America. These
financial statements and financial highlights (hereafter referred to as “financial statements”) are the responsibility of the Fund’s management; our responsibility is to express an opinion on these financial statements based on our audit.
We conducted our audit of these financial statements in accordance with auditing standards generally accepted in the United States of America, which require that we plan and perform the audit to obtain reasonable assurance about whether the financial
statements are free of material misstatement. An audit includes examining, on a test basis, evidence supporting the amounts and disclosures in the financial statements, assessing the accounting principles used and significant estimates made by management,
and evaluating the overall financial statement presentation. We believe that our audit, which included confirmation of securities at August 31, 2000 by correspondence with the custodian and brokers, provides a reasonable basis for our opinion. The
statements of changes in net assets of the Fund for the period ended August 31, 1999 and the year ended January 31, 1999, and the financial highlights for each of the periods ended on or before August 31, 1999, were audited by other independent
accountants whose report dated October 8, 1999 expressed an unqualified opinion thereon.
|
| PricewaterhouseCoopers LLP
|
| Boston, Massachusetts
|
| October 23, 2000
|
|
Shares |
Description | Value | ||||
|---|---|---|---|---|---|---|
| Common Stocks – 92.9% | ||||||
| Airlines – 0.7% | ||||||
| 8,200 | Southwest Airlines Co. | $ 185,525 | ||||
| Alcohol – 0.6% | ||||||
| 2,100 | Anheuser-Busch Cos., Inc. | 165,506 | ||||
| Apparel – 0.4% | ||||||
| 2,300 | Nike, Inc. Class B | 90,994 | ||||
| Banks – 12.7% | ||||||
| 4,900 | Bank of America Corp. | 262,456 | ||||
| 4,600 | Bank One Corp. | 162,150 | ||||
| 20,633 | Citigroup, Inc. | 1,204,471 | ||||
| 3,200 | FleetBoston Financial Corp. | 136,600 | ||||
| 1,150 | J.P. Morgan & Co., Inc. | 192,266 | ||||
| 7,300 | Mellon Financial Corp. | 330,325 | ||||
| 1,400 | PNC Financial Services Group | 82,512 | ||||
| 4,850 | The Bank of New York Co., Inc. | 254,322 | ||||
| 5,350 | The Chase Manhattan Corp. | 298,931 | ||||
| 8,000 | Wells Fargo & Co. | 345,500 | ||||
| 3,269,533 | ||||||
| Chemicals – 3.4% | ||||||
| 8,500 | E.I. du Pont de Nemours & Co. | 381,438 | ||||
| 3,250 | Minnesota Mining & Manufacturing
Co. |
302,250 | ||||
| 7,100 | The Dow Chemicals Co. | 185,931 | ||||
| 869,619 | ||||||
| Computer Hardware – 2.5% | ||||||
| 2,900 | Apple Computer, Inc.* | 176,719 | ||||
| 6,600 | Compaq Computer Corp. | 224,812 | ||||
| 1,400 | Dell Computer Corp.* | 61,075 | ||||
| 1,400 | Hewlett-Packard Co. | 169,050 | ||||
| 631,656 | ||||||
| Computer Software – 0.9% | ||||||
| 1,850 | International Business Machines, Inc. | 244,200 | ||||
| Defense/Aerospace – 1.5% | ||||||
| 3,500 | Honeywell International, Inc. | 134,969 | ||||
| 3,200 | Northrop Grumman Corp. | 249,000 | ||||
| 383,969 | ||||||
| Department Store – 0.8% | ||||||
| 1,000 | Costco Wholesale Corp.* | 34,438 | ||||
| 4,900 | The May Department Stores Co. | 112,394 | ||||
| 1,400 | Wal-Mart Stores, Inc. | 66,412 | ||||
| 213,244 | ||||||
| Drugs – 3.3% | ||||||
| 700 | Amgen, Inc.* | 53,069 | ||||
| 2,300 | Bristol-Myers Squibb Co. | 121,900 | ||||
| 3,200 | Merck & Co., Inc. | 223,600 | ||||
| 4,775 | Pfizer, Inc. | 206,519 | ||||
| 1,866 | Pharmacia Corp. | 109,278 | ||||
| 3,500 | Schering-Plough Corp. | 140,437 | ||||
| 854,803 | ||||||
| Electrical Equipment – 1.1% | ||||||
| 7,800 | Motorola, Inc. | 281,288 | ||||
|
Shares |
Description | Value | ||||
|---|---|---|---|---|---|---|
| Common Stocks – (continued) | ||||||
| Electrical Utilities – 5.3% | ||||||
| 6,000 | DTE Energy Co. | $ 208,500 | ||||
| 3,200 | Duke Energy Corp. | 239,400 | ||||
| 10,300 | Entergy Corp. | 313,506 | ||||
| 5,300 | FPL Group, Inc. | 282,887 | ||||
| 13,100 | Niagara Mohawk Holdings, Inc.* | 168,663 | ||||
| 3,200 | Unicom Corp. | 146,200 | ||||
| 1,359,156 | ||||||
| Energy Resources – 8.6% | ||||||
| 6,860 | Anadarko Petroleum Corp. | 451,182 | ||||
| 13,600 | Exxon Mobil Corp. | 1,110,100 | ||||
| 4,000 | Royal Dutch Petroleum Co. ADR | 244,750 | ||||
| 4,400 | Unocal Corp. | 146,850 | ||||
| 9,800 | USX-Marathon Group | 268,888 | ||||
| 2,221,770 | ||||||
| Entertainment – 3.2% | ||||||
| 10,800 | Carnival Corp. | 215,325 | ||||
| 9,600 | The Walt Disney Co. | 373,800 | ||||
| 3,572 | Viacom, Inc. Class B* | 240,440 | ||||
| 829,565 | ||||||
| Equity REIT – 0.3% | ||||||
| 1,600 | Cousins Properties, Inc. | 65,800 | ||||
| Financial Services – 3.0% | ||||||
| 2,800 | American Express Co. | 165,550 | ||||
| 8,500 | Federal Home Loan Mortgage Corp. | 358,063 | ||||
| 2,300 | General Electric Co. | 134,981 | ||||
| 2,500 | Household International, Inc. | 120,000 | ||||
| 778,594 | ||||||
| Food & Beverage – 1.2% | ||||||
| 1,400 | The Coca-Cola Co. | 73,675 | ||||
| 3,500 | The Quaker Oats Co. | 237,781 | ||||
| 311,456 | ||||||
| Forest – 2.0% | ||||||
| 4,200 | Bowater, Inc. | 215,775 | ||||
| 9,496 | International Paper Co. | 302,685 | ||||
| 518,460 | ||||||
| Grocery – 1.5% | ||||||
| 3,700 | Safeway, Inc.* | 182,456 | ||||
| 8,500 | The Kroger Co.* | 192,844 | ||||
| 375,300 | ||||||
| Heavy Electrical – 0.8% | ||||||
| 3,000 | Emerson Electric Co. | 198,563 | ||||
| Heavy Machinery – 1.3% | ||||||
| 5,400 | Crane Co. | 135,675 | ||||
| 6,000 | Deere & Co. | 197,625 | ||||
| 333,300 | ||||||
| Home Products – 0.3% | ||||||
| 3,700 | Ralston Purina Group | 83,713 | ||||
|
Shares |
Description | Value | ||||
|---|---|---|---|---|---|---|
| Common Stocks – (continued) | ||||||
| Industrial Parts – 2.2% | ||||||
| 4,000 | Caterpillar, Inc. | $ 147,000 | ||||
| 3,500 | Parker-Hannifin Corp. | 121,844 | ||||
| 1,900 | Tyco International Ltd. | 108,300 | ||||
| 3,200 | United Technologies Corp. | 199,800 | ||||
| 576,944 | ||||||
| Information Services – 0.5% | ||||||
| 950 | Electronic Data Systems Corp. | 47,322 | ||||
| 1,900 | First Data Corp. | 90,606 | ||||
| 137,928 | ||||||
| Life Insurance – 0.8% | ||||||
| 3,650 | AFLAC, Inc. | 197,100 | ||||
| Media – 3.0% | ||||||
| 15,400 | AT&T Corp.-Liberty Media Corp.* | 329,175 | ||||
| 5,200 | Comcast Corp.* | 193,700 | ||||
| 1,400 | EchoStar Communications Corp.* | 68,250 | ||||
| 900 | The News Corp. Ltd. ADR | 47,362 | ||||
| 1,500 | Time Warner, Inc. | 128,250 | ||||
| 766,737 | ||||||
| Medical Products – 3.5% | ||||||
| 5,800 | Abbott Laboratories | 253,750 | ||||
| 2,100 | Baxter International, Inc. | 174,825 | ||||
| 5,100 | Johnson & Johnson | 468,881 | ||||
| 897,456 | ||||||
| Mining – 0.9% | ||||||
| 7,100 | Alcoa, Inc. | 236,075 | ||||
| Oil Refining – 0.4% | ||||||
| 1,900 | Texaco, Inc. | 97,850 | ||||
| Oil Services – 2.6% | ||||||
| 1,400 | Baker Hughes, Inc. | 51,187 | ||||
| 1,400 | Diamond Offshore Drilling, Inc. | 62,737 | ||||
| 4,300 | Halliburton Co. | 227,900 | ||||
| 2,000 | Santa Fe International Corp. | 78,625 | ||||
| 600 | Schlumberger Ltd. | 51,188 | ||||
| 3,500 | Transocean Sedco Forex, Inc. | 209,125 | ||||
| 680,762 | ||||||
| Property Insurance – 9.1% | ||||||
| 5,700 | Ambac Financial Group, Inc. | 368,362 | ||||
| 8,850 | American International Group, Inc. | 788,756 | ||||
| 4,600 | The Hartford Financial Services
Group, Inc. |
306,475 | ||||
| 5,600 | The St. Paul Cos., Inc.* | 266,700 | ||||
| 8,900 | XL Capital Ltd. | 613,544 | ||||
| 2,343,837 | ||||||
| Railroads – 0.5% | ||||||
| 4,200 | Canadian National Railway Co. | 123,638 | ||||
| Restaurants – 0.6% | ||||||
| 5,600 | McDonald’s Corp. | 167,300 | ||||
|
Shares |
Description | Value | ||||
|---|---|---|---|---|---|---|
| Common Stocks – (continued) | ||||||
| Security/Asset Management – 3.1% | ||||||
| 2,100 | Merrill Lynch & Co., Inc. | $ 304,500 | ||||
| 4,600 | Morgan Stanley Dean Witter & Co. | 494,787 | ||||
| 799,287 | ||||||
| Semiconductors – 0.2% | ||||||
| 700 | Intel Corp. | 52,413 | ||||
| Specialty Retail – 0.6% | ||||||
| 3,200 | CVS Corp. | 118,800 | ||||
| 500 | RadioShack Corp. | 29,500 | ||||
| 148,300 | ||||||
| Telephone – 6.8% | ||||||
| 4,200 | BellSouth Corp. | 156,713 | ||||
| 900 | NEXTLINK Communications, Inc.* | 31,556 | ||||
| 2,791 | Qwest Communications
International, Inc.* |
144,085 | ||||
| 11,700 | SBC Communications, Inc. | 488,475 | ||||
| 3,900 | Sprint Corp. | 130,650 | ||||
| 12,802 | Verizon Communications | 558,487 | ||||
| 6,550 | WorldCom, Inc.* | 239,075 | ||||
| 1,749,041 | ||||||
| Thrifts – 0.6% | ||||||
| 4,600 | Washington Mutual, Inc. | 161,000 | ||||
| Tobacco – 1.1% | ||||||
| 9,400 | Philip Morris Cos., Inc. | 278,474 | ||||
| Wireless – 1.0% | ||||||
| 900 | ALLTEL Corp. | 45,506 | ||||
| 3,200 | Sprint Corp. (PCS Group)* | 160,600 | ||||
| 1,300 | Vodafone Group PLC ADR | 53,219 | ||||
| 259,325 | ||||||
| TOTAL COMMON STOCKS | ||||||
| (Cost $22,588,162) | $ 23,939,481 | |||||
| Principal
Amount |
Interest
Rate |
Maturity
Date |
Value | |||||
|---|---|---|---|---|---|---|---|---|
| Repurchase Agreements – 7.0% | ||||||||
| Joint Repurchase Agreement Account II _ | ||||||||
| $1,800,000
|
6.66 | % | 09/01/2000 | $ 1,800,000 | ||||
| TOTAL REPURCHASE AGREEMENTS | ||||||||
| (Cost $1,800,000) | $ 1,800,000 | |||||||
| TOTAL INVESTMENTS | ||||||||
| (Cost $24,388,162) | $25,739,481 | |||||||
*
|
Non-income producing security.
|
_
|
Joint repurchase agreement was entered into on August 31, 2000.
|
| The percentage shown for each investment category reflects the value of investments in that category as a percentage of total net
assets.
|
| |
| Investment Abbreviations:
|
| ADR—American Depositary Receipt
|
| |
| Assets: | ||||
| Investment in securities, at value (identified cost $24,388,162) | $25,739,481 | |||
| Cash | 95,012 | |||
| Receivables: | ||||
| Investment securities sold | 368,928 | |||
| Fund shares sold | 141,578 | |||
| Dividends and interest | 47,957 | |||
| Reimbursement from investment adviser | 39,983 | |||
| Other assets | 252 | |||
| Total assets | 26,433,191 | |||
| Liabilities: | ||||
| Payables: | ||||
| Investment securities purchased | 520,412 | |||
| Fund shares repurchased | 83,895 | |||
| Amounts owed to affiliates | 20,523 | |||
| Accrued expenses and other liabilities | 38,368 | |||
| Total liabilities | 663,198 | |||
| Net Assets: | ||||
| Paid-in capital | 24,705,481 | |||
| Accumulated undistributed net investment income | 131,769 | |||
| Accumulated net realized loss on investment and futures transactions | (418,576 | ) | ||
| Net unrealized gain on investments | 1,351,319 | |||
| NET ASSETS | $25,769,993 | |||
| Net asset value, offering and redemption price per share: (a) | ||||
| Class A | $10.39 | |||
| Class B | $10.33 | |||
| Class C | $10.32 | |||
| Institutional | $10.40 | |||
| Service | $10.38 | |||
| Shares outstanding: | ||||
| Class A | 690,929 | |||
| Class B | 153,219 | |||
| Class C | 82,372 | |||
| Institutional | 1,552,809 | |||
| Service | 150 | |||
| Total shares outstanding, $.001 par value (unlimited number of shares authorized) | 2,479,479 | |||
(a)
|
Maximum public offering price per share (NAV per share multiplied by 1.0582) for Class A Shares is $10.99. At redemption, Class B
and Class C Shares may be subject to a contingent deferred sales charge, assessed on the amount equal to the lesser of the current net asset value or the original purchase price of the shares.
|
| Investment income: | ||||
| Dividends (b) | $ 198,686 | |||
| Interest | 50,998 | |||
| Total income | 249,684 | |||
| Expenses: | ||||
| Registration fees | 95,897 | |||
| Management fees | 87,323 | |||
| Printing | 60,402 | |||
| Custodian fees | 52,543 | |||
| Professional fees | 22,930 | |||
| Distribution and Service fees (c) | 14,153 | |||
| Transfer Agent fees (d) | 9,920 | |||
| Trustee fees | 6,431 | |||
| Other | 10,278 | |||
| Total expenses | 359,877 | |||
| Less — expense reductions | (241,023 | ) | ||
| Net expenses | 118,854 | |||
| NET INVESTMENT INCOME | 130,830 | |||
| Realized and unrealized gain (loss) on investment and futures transactions: | ||||
| Net realized loss from: | ||||
| Investment transactions | (411,802 | ) | ||
| Futures transactions | (6,774 | ) | ||
| Net unrealized gain on investments | 1,351,319 | |||
| Net realized and unrealized gain on investment and futures transactions | 932,743 | |||
| NET INCREASE IN NET ASSETS RESULTING FROM OPERATIONS | $1,063,573 | |||
(a)
|
Commencement of operations was December 15, 1999.
|
(b)
|
Foreign taxes withheld on dividends were $902.
|
(c)
|
Class A, Class B and Class C had Distribution and Service fees of $6,978, $4,532 and $2,643, respectively.
|
(d)
|
Class A, Class B, Class C, Institutional Class and Service Class had Transfer Agent fees of $5,304, $861, $502, $3,253 and $0,
respectively.
|
| From operations: | |||
| Net investment income | $ 130,830 | ||
| Net realized loss on investment and futures transactions | (418,576 | ) | |
| Net unrealized gain on investments | 1,351,319 | ||
| Net increase in net assets resulting from operations | 1,063,573 | ||
| From share transactions: | |||
| Proceeds from sales of shares | 27,589,665 | ||
| Cost of shares repurchased | (2,883,245 | ) | |
| Net increase in net assets resulting from share transactions | 24,706,420 | ||
| TOTAL INCREASE | 25,769,993 | ||
| Net assets: | |||
| Beginning of period | — | ||
| End of period | $25,769,993 | ||
| Accumulated undistributed net investment income | $ 131,769 | ||
(a)
|
Commencement date of operations was December 15, 1999 for all share classes.
|
| 1. ORGANIZATION
|
| Goldman Sachs Trust (the “Trust”) is a Delaware business trust registered under the Investment Company Act of 1940 (as
amended) as an open-end management investment company. The Trust includes the Goldman Sachs Large Cap Value Fund (the “Fund”). The Fund is a diversified portfolio offering five classes of shares — Class A, Class B, Class C,
Institutional and Service.
|
| 2. SIGNIFICANT ACCOUNTING POLICIES
|
| The following is a summary of the significant accounting policies consistently followed by the Fund. The preparation of financial
statements in conformity with generally accepted accounting principles requires management to make estimates and assumptions that may affect the reported amounts. Actual results could differ from those estimates.
|
| A. Investment Valuation — Investments in
securities traded on a U.S. or foreign securities exchange or the NASDAQ system are valued daily at their last sale price on the principal exchange on which they are traded. If no sale occurs, securities are valued at the last bid price. Debt securities
are valued at prices supplied by independent pricing services, broker/dealer-supplied valuations or matrix pricing systems. Unlisted equity and debt securities for which market quotations are available are valued at the last sale price on valuation date
or, if no sale occurs, at the last bid price. Short-term debt obligations maturing in sixty days or less are valued at amortized cost, which approximates market value. Securities for which quotations are not readily available are valued at fair value
using methods approved by the Board of Trustees of the Trust.
|
| B. Security Transactions and Investment Income — Security transactions are recorded as of the trade date. Realized gains and losses on sales of portfolio securities are calculated using the identified-cost basis. Dividend income is recorded on the ex-dividend date, net of foreign withholding taxes
where applicable. Dividends for which the Fund has the choice to receive either cash or stock are recognized as investment income in an amount equal to the cash dividend. Interest income is recorded on the basis of interest accrued, premium amortized and
discount earned.
|
| Net investment income (other than class-specific expenses) and unrealized and
realized gains or losses are allocated daily to each class of shares of the Fund based upon the relative proportion of net assets.
|
| C. Federal Taxes — It is the Fund’s
policy to comply with the requirements of the Internal Revenue Code applicable to regulated investment companies and to distribute each year substantially all of its investment company taxable income and capital gains to its shareholders. Accordingly, no
federal tax provision is required. Income and capital gains distributions, if any, are declared and paid annually.
|
| The characterization of distributions to shareholders for financial reporting
purposes is determined in accordance with income tax rules. Therefore, the source of the Fund’s distributions may be shown in the accompanying financial statements as either from or in excess of net investment income or net realized gain on
investment transactions, or from paid-in capital, depending on the type of book/tax differences that may exist.
|
| At August 31, 2000, the aggregate cost of portfolio securities for federal income
tax purposes is $24,611,396. Accordingly, the gross unrealized gain on investments was $2,366,093 and the gross unrealized loss on investments was $1,238,008 resulting in a net unrealized gain of $1,128,085.
|
| D. Expenses — Expenses incurred by the
Trust which do not specifically relate to an individual Fund of the Trust are allocated to the Funds on a straight-line or pro rata basis depending upon the nature of the expense.
|
| Class A, Class B and Class C Shares bear all expenses and fees relating to their
respective Distribution and Service Plans. Shareholders of Service Shares bear all expenses and fees paid to service organizations. Each class of shares separately bears its respective class-specific Transfer Agency fees.
|
| E. Segregation Transactions — The Fund may
enter into certain derivative transactions to seek to increase total return. Forward foreign currency exchange contracts, futures contracts, written options, when-issued securities and forward commit
ments represent examples of such transactions. As a result of entering into these transactions, the Fund is required to segregate liquid assets on the accounting records equal to or greater than the market value of the corresponding transactions.
|
| F. Repurchase Agreements — Repurchase
agreements involve the purchase of securities subject to the seller’s agreement to repurchase them at a mutually agreed upon date and price. During the term of a repurchase agreement, the value of the underlying securities, including accrued
interest, is required to equal or exceed the value of the repurchase agreement. The underlying securities for all repurchase agreements are held in safekeeping at the Fund’s custodian.
|
| 3. AGREEMENTS
|
| Pursuant to the Investment Management Agreement (the “Agreement”), Goldman Sachs Asset Management (“GSAM”), a
unit of the Investment Management Division of Goldman, Sachs & Co. (“Goldman Sachs”), serves as the investment adviser to the Fund. Under the Agreement, GSAM, subject to the general supervision of the Trust’s Board of Trustees, manages
the Fund’s portfolio. As compensation for the services rendered under the Agreement, the assumption of the expenses related thereto and administering the Fund’s business affairs, including providing facilities, GSAM is entitled to a fee,
computed daily and payable monthly, at an annual rate equal to 0.75% of the average daily net assets of the Fund.
|
| The investment adviser has voluntarily agreed to limit certain “Other
Expenses” of the Fund (excluding Management fees, Distribution and Service fees, Transfer Agent fees, taxes, interest, brokerage, litigation, Service Share fees, indemnification costs and other extraordinary expenses) to the extent such expenses
exceed, on an annual basis, 0.06% of the average daily net assets of the Fund. For the period ended August 31, 2000, the adviser reimbursed approximately $239,000. In addition, the Fund has entered into certain offset arrangements with the custodian
resulting in a reduction in the Fund’s expenses. For the period ended August 31, 2000, custody fees were reduced by approximately $2,000.
|
| The Trust, on behalf of the Fund, has adopted Distribution and Service Plans.
Under the Distribution and Service Plans, Goldman Sachs and/or authorized dealers are entitled to a monthly fee from the Fund for distribution and shareholder maintenance services equal, on an annual basis, to 0.25%, 1.00% and 1.00% of the Fund’s
average daily net assets attributable to Class A, Class B and Class C Shares, respectively.
|
| Goldman Sachs serves as the distributor of shares of the Fund pursuant to
Distribution Agreements. Goldman Sachs may receive a portion of the Class A sales load and Class B and Class C contingent deferred sales charges and has advised the Fund that it retained approximately $46,000 for the period ended August 31, 2000.
|
| Goldman Sachs also serves as the transfer agent of the Fund for a fee. The fees
charged for such transfer agency services are calculated daily and payable monthly at an annual rate as follows: 0.19% of the average daily net assets for Class A, Class B and Class C shares and 0.04% of the average daily net assets for Institutional and
Service Shares.
|
| The Trust, on behalf of the Fund, has adopted a Service Plan. This plan allows for
Service shares to compensate service organizations for providing varying levels of account administration and shareholder liaison services to their customers who are beneficial owners of such shares. The Service Plan provides for compensation to the
service organizations in an amount up to 0.50% (on an annualized basis), of the average daily net asset value of the Service Shares.
|
| As of August 31, 2000, the amounts owed to affiliates were approximately $15,000,
$4,000 and $2,000 for Management, Distribution and Service and Transfer Agent fees, respectively.
|
| 4. PORTFOLIO SECURITIES TRANSACTIONS
|
| The cost of purchases and proceeds of sales and maturities of securities (excluding short-term investments and futures) for the
period ended August 31, 2000 were $33,457,986 and $10,458,022, respectively. For the period ended August 31, 2000, Goldman Sachs earned approximately $1,300 of brokerage commissions from portfolio transactions, including futures transactions executed on
behalf of the Fund.
|
| Futures Contracts — The Fund may enter into futures
transactions to hedge against changes in interest rates, securities prices, currency exchange rates or to seek to increase total return. Upon entering into a futures contract, the Fund is required to deposit with a broker or the Fund’s custodian
bank, an amount of cash or securities equal to the minimum “initial margin” requirement of the associated futures exchange. Subsequent payments for futures contracts (“variation margin”) are paid or received by the Fund, depending on
the daily fluctuations in the value of the contracts, and are recorded for financial reporting purposes as unrealized gains or losses. When contracts are closed, the Fund realizes a gain or loss which is reported in the Statement of Operations.
|
| The use of futures contracts involve, to varying degrees, elements of market risk
which may exceed the amounts recognized in the Statement of Assets and Liabilities. Changes in the value of the futures contracts may not directly correlate with changes in the value of the underlying securities. This risk may decrease the effectiveness
of the Fund’s hedging strategies and potentially result in a loss. At August 31, 2000, there were no open futures contracts.
|
| Option Accounting Principles — When the Fund writes
call or put options, an amount equal to the premium received is recorded as an asset and as an equivalent liability. The amount of the liability is subsequently marked-to-market to reflect the current market value of the option written. When a written
option expires on its stipulated expiration date or the Fund enters into a closing purchase transaction, the Fund realizes a gain or loss without regard to any unrealized gain or loss on the underlying security, and the liability related to such option is
extinguished. When a written call option is exercised, the Fund realizes a gain or loss from the sale of the underlying security, and the proceeds of the sale are increased by the premium originally received. When a written put option is exercised, the
amount of the premium originally received will reduce the cost of the security which the Fund purchases upon exercise. There is a risk of loss from a change in value of such options which may exceed the related premiums received.
|
| Upon the purchase of a call option or a protective put option by the Fund, the
premium paid is recorded as an investment and subsequently marked-to-market to reflect the current market value of the option. If an option which the Fund has purchased expires on the stipulated expiration date, the Fund will realize a loss in the amount
of the cost of the option. If the Fund enters into a closing sale transaction, the Fund will realize a gain or loss, depending on whether the sale proceeds for the closing sale transaction are greater or less than the cost of the option. If the Fund
exercises a purchased put option, the Fund will realize a gain or loss from the sale of the underlying security, and the proceeds from such sale will be decreased by the premium originally paid. If the Fund exercises a purchased call option, the cost of
the security which the Fund purchases upon exercise will be increased by the premium originally paid. At August 31, 2000, there were no open written option contracts.
|
| 5. JOINT REPURCHASE AGREEMENT ACCOUNT
|
| The Fund, together with other registered investment companies having management agreements with GSAM or its affiliates, transfers
uninvested cash into joint accounts, the daily aggregate balance of which is invested in one or more repurchase agreements.
|
| At August 31, 2000, the Fund had an undivided interest in the repurchase
agreements in the joint account which equaled $1,800,000 in principal amount. At August 31, 2000, the following repurchase agreements held in this joint account were fully collateralized by federal agency obligations:
|
| Repurchase Agreements | Principal
Amount |
Interest
Rate |
Maturity
Date |
Amortized
Cost |
Maturity
Value |
|||||||
|---|---|---|---|---|---|---|---|---|---|---|---|---|
| ABN/AMRO, Inc. | $ 814,100,000 | 6.66 | % | 09/01/2000 | $ 814,100,000 | $ 814,250,608 | ||||||
| Banc of America Securities LLC | 900,000,000 | 6.67 | 09/01/2000 | 900,000,000 | 900,166,750 | |||||||
| Barclays Capital, Inc. | 500,000,000 | 6.67 | 09/01/2000 | 500,000,000 | 500,092,639 | |||||||
| Bear Stearns Companies, Inc. | 300,000,000 | 6.67 | 09/01/2000 | 300,000,000 | 300,055,583 | |||||||
| Chase Securities, Inc. | 450,000,000 | 6.67 | 09/01/2000 | 450,000,000 | 450,083,375 | |||||||
| Donaldson, Lufkin & Jenrette, Inc. | 1,000,000,000 | 6.67 | 09/01/2000 | 1,000,000,000 | 1,000,185,278 | |||||||
| J.P. Morgan & Co., Inc. | 800,000,000 | 6.65 | 09/01/2000 | 800,000,000 | 800,147,778 | |||||||
| Morgan Stanley Dean Witter & Co. | 750,000,000 | 6.65 | 09/01/2000 | 750,000,000 | 750,138,542 | |||||||
| Morgan Stanley Dean Witter & Co. | 300,000,000 | 6.60 | 09/01/2000 | 300,000,000 | 300,055,000 | |||||||
| UBS Warburg LLC | 800,000,000 | 6.65 | 09/01/2000 | 800,000,000 | 800,147,778 | |||||||
| TOTAL JOINT REPURCHASE AGREEMENT ACCOUNT II | $6,614,100,000 | $6,615,323,331 | ||||||||||
| 6. LINE OF CREDIT FACILITY
|
| The Fund participates in a $350,000,000 committed, unsecured revolving line of credit facility. Under the most restrictive
arrangement, the Fund must own securities having a market value in excess of 400% of the total bank borrowings. This facility is to be used solely for temporary or emergency purposes. The interest rate on borrowings is based on the Federal Funds rate. The
committed facility also requires a fee to be paid by the Fund based on the amount of the commitment. During the period ended August 31, 2000, the Fund did not have any borrowings under this facility.
|
| 7. SUMMARY OF SHARE TRANSACTIONS
|
| Share activity is as follows:
|
| For the Period Ended
August 31, 2000(a) |
|||||||
|---|---|---|---|---|---|---|---|
| Shares | Dollars | ||||||
| Class A Shares | |||||||
| Shares sold | 923,249 | $ 9,131,437 | |||||
| Shares repurchased | (232,320 | ) | (2,326,070 | ) | |||
| 690,929 | 6,805,367 | ||||||
| Class B Shares | |||||||
| Shares sold | 162,981 | 1,619,970 | |||||
| Shares repurchased | (9,762 | ) | (97,213 | ) | |||
| 153,219 | 1,522,757 | ||||||
| Class C Shares | |||||||
| Shares sold | 108,974 | 1,083,827 | |||||
| Shares repurchased | (26,602 | ) | (248,355 | ) | |||
| 82,372 | 835,472 | ||||||
| Institutional Shares | |||||||
| Shares sold | 1,573,915 | 15,752,931 | |||||
| Shares repurchased | (21,106 | ) | (211,607 | ) | |||
| 1,552,809 | 15,541,324 | ||||||
| Service Shares | |||||||
| Shares sold | 150 | 1,500 | |||||
| 150 | 1,500 | ||||||
| NET INCREASE | 2,479,479 | $24,706,420 | |||||
(a)
|
Commencement date of operations was December 15, 1999 for all share classes.
|
| 8. CERTAIN RECLASSIFICATIONS
|
| In accordance with AICPA Statement of Position 93-2 the Fund has reclassified $939 from paid-in capital to accumulated
undistributed net investment income. This reclassification has no impact on the net asset value of the Fund and is designed to present the Fund’s capital accounts on a tax basis. Reclassifications result primarily from the difference in the tax
treatment of foreign currency, net operating losses and organization costs.
|
| Income from
investment operations |
|||||||||
|---|---|---|---|---|---|---|---|---|---|
|
Net asset value at beginning of period |
Net
investment income (c) |
Net realized
and unrealized gain |
Total
from investment operations |
||||||
| FOR THE PERIOD ENDED AUGUST 31, | |||||||||
| 2000 - Class A Shares (commenced Dec. 15, 1999) | $10.00 | $0.06 | $0.33 | $0.39 | |||||
| 2000 - Class B Shares (commenced Dec. 15, 1999) | 10.00 | — | 0.33 | 0.33 | |||||
| 2000 - Class C Shares (commenced Dec. 15, 1999) | 10.00 | 0.01 | 0.31 | 0.32 | |||||
| 2000 - Institutional Shares (commenced Dec. 15, 1999) | 10.00 | 0.09 | 0.31 | 0.40 | |||||
| 2000 - Service Shares (commenced Dec. 15, 1999) | 10.00 | 0.07 | 0.31 | 0.38 | |||||
(a)
|
Assumes investment at the NAV at the beginning of the period, reinvestment of all dividends and distributions, a complete
redemption of the investment at the NAV at the end of the period and no sales or redemption charges. Total return would be reduced if a sales or redemption charge were taken into account. Total returns for periods less than one full year are not annualized.
|
(b)
|
Annualized.
|
(c)
|
Calculated based on the average shares outstanding methodology.
|
|
Ratios assuming no expense reductions |
||||||||||||||||||
|---|---|---|---|---|---|---|---|---|---|---|---|---|---|---|---|---|---|---|
| Net asset
value, end of period |
Total
return (a) |
Net assets
at end of period (in 000s) |
Ratio of net
expenses to average net assets (b) |
Ratio of net
investment income to average net assets (b) |
Ratio of
expenses to average net assets (b) |
Ratio of net
investment income to average net assets (b) |
Portfolio
turnover rate |
|||||||||||
| $10.39 | 3.90% | $7,181 | 1.25% | 0.84 | % | 3.30 | % | (1.21 | )% | 66.79 | % | |||||||
| 10.33 | 3.30 | 1,582 | 2.00 | 0.06 | 4.05 | (1.99 | ) | 66.79 | ||||||||||
| 10.32 | 3.20 | 850 | 2.00 | 0.15 | 4.05 | (1.90 | ) | 66.79 | ||||||||||
| 10.40 | 4.00 | 16,155 | 0.85 | 1.31 | 2.90 | (0.74 | ) | 66.79 | ||||||||||
| 10.38 | 3.80 | 2 | 1.35 | 0.95 | 3.40 | (1.10 | ) | 66.79 | ||||||||||
| To the Shareholders and Board of Trustees of
|
| Goldman Sachs Trust — Large Cap Value Fund:
|
| In our opinion, the accompanying statement of assets and liabilities, including the statement of investments, and the related
statement of operations and of changes in net assets and the financial highlights present fairly, in all material respects, the financial position of Goldman Sachs Large Cap Value Fund (“the Fund”), one of the portfolios constituting Goldman
Sachs Trust, at August 31, 2000, the results of its operations, the changes in its net assets and the financial highlights for the period then ended, in conformity with accounting principles generally accepted in the United States of America. These
financial statements and financial highlights (hereafter referred to as “financial statements”) are the responsibility of the Fund’s management; our responsibility is to express an opinion on these financial statements based on our audit.
We conducted our audit of these financial statements in accordance with auditing standards generally accepted in the United States of America, which require that we plan and perform the audit to obtain reasonable assurance about whether the financial
statements are free of material misstatement. An audit includes examining, on a test basis, evidence supporting the amounts and disclosures in the financial statements, assessing the accounting principles used and significant estimates made by management,
and evaluating the overall financial statement presentation. We believe that our audit, which included confirmation of securities at August 31, 2000 by correspondence with the custodian and brokers, provides a reasonable basis for our opinion.
|
| PricewaterhouseCoopers LLP
|
| Boston, Massachusetts
|
| October 23, 2000
|
|
Shares |
Description | Value | |||
|---|---|---|---|---|---|
| Common Stocks – 100.0% | |||||
| Airlines – 0.6% | |||||
| 224,200 | Southwest Airlines Co. | $ 5,072,525 | |||
| Alcohol – 0.7% | |||||
| 66,400 | Anheuser-Busch Cos., Inc. | 5,233,150 | |||
| Apparel – 0.5% | |||||
| 90,700 | Nike, Inc. Class B | 3,588,319 | |||
| Banks – 6.0% | |||||
| 78,200 | Bank One Corp. | 2,756,550 | |||
| 391,200 | Citigroup, Inc. | 22,836,300 | |||
| 12,800 | J.P. Morgan & Co., Inc. | 2,140,000 | |||
| 146,000 | Mellon Financial Corp. | 6,606,500 | |||
| 27,100 | PNC Financial Services Group | 1,597,206 | |||
| 73,800 | The Bank of New York Co., Inc. | 3,869,888 | |||
| 48,150 | The Chase Manhattan Corp. | 2,690,381 | |||
| 108,100 | Wells Fargo & Co. | 4,668,569 | |||
| 47,165,394 | |||||
| Chemicals – 2.3% | |||||
| 143,400 | E.I. du Pont de Nemours & Co. | 6,435,075 | |||
| 92,400 | Minnesota Mining & Manufacturing
Co. |
8,593,200 | |||
| 105,300 | The Dow Chemicals Co. | 2,757,544 | |||
| 17,785,819 | |||||
| Clothing – 0.1% | |||||
| 50,300 | The Gap, Inc. | 1,128,606 | |||
| Computer Hardware – 9.3% | |||||
| 24,000 | Apple Computer, Inc.* | 1,462,500 | |||
| 424,100 | Cisco Systems, Inc.* | 29,103,862 | |||
| 180,900 | Compaq Computer Corp. | 6,161,906 | |||
| 191,100 | Dell Computer Corp.* | 8,336,738 | |||
| 136,400 | EMC Corp.* | 13,367,200 | |||
| 26,800 | Hewlett-Packard Co. | 3,236,100 | |||
| 17,900 | Network Appliance, Inc.* | 2,094,300 | |||
| 73,900 | Sun Microsystems, Inc.* | 9,380,681 | |||
| 73,143,287 | |||||
| Computer Software – 7.2% | |||||
| 133,200 | International Business Machines, Inc. | 17,582,400 | |||
| 319,100 | Microsoft Corp.* | 22,277,169 | |||
| 152,500 | Oracle Corp.* | 13,867,969 | |||
| 25,650 | VERITAS Software Corp.* | 3,092,428 | |||
| 56,819,966 | |||||
| Defense/Aerospace – 0.3% | |||||
| 68,600 | Honeywell International, Inc. | 2,645,388 | |||
| Department Store – 2.3% | |||||
| 65,600 | The May Department Stores Co. | 1,504,700 | |||
| 352,500 | Wal-Mart Stores, Inc. | 16,721,719 | |||
| 18,226,419 | |||||
| Drugs – 7.8% | |||||
| 64,100 | Amgen, Inc.* | 4,859,581 | |||
| 131,900 | Bristol-Myers Squibb Co. | 6,990,700 | |||
| 30,600 | Eli Lilly & Co. | 2,233,800 | |||
|
Shares |
Description | Value | |||
|---|---|---|---|---|---|
| Common Stocks – (continued) | |||||
| Drugs – (continued) | |||||
| 103,400 | Merck & Co., Inc. | $ 7,225,075 | |||
| 551,100 | Pfizer, Inc. | 23,835,075 | |||
| 82,598 | Pharmacia Corp. | 4,837,146 | |||
| 180,800 | Schering-Plough Corp. | 7,254,600 | |||
| 64,800 | SmithKline Beecham PLC ADR | 4,232,250 | |||
| 61,468,227 | |||||
| Electrical Equipment – 4.3% | |||||
| 9,200 | Corning, Inc. | 3,017,025 | |||
| 22,100 | Corvis Corp.* | 2,294,256 | |||
| 134,800 | Lucent Technologies, Inc. | 5,636,325 | |||
| 196,200 | Motorola, Inc. | 7,075,462 | |||
| 162,500 | Nortel Networks Corp. | 13,253,906 | |||
| 44,700 | QUALCOMM, Inc.* | 2,676,413 | |||
| 33,953,387 | |||||
| Electrical Utilities – 2.4% | |||||
| 36,700 | Duke Energy Corp. | 2,745,619 | |||
| 142,700 | Entergy Corp. | 4,343,431 | |||
| 97,300 | FPL Group, Inc. | 5,193,387 | |||
| 345,200 | Niagara Mohawk Holdings, Inc.* | 4,444,450 | |||
| 40,800 | Unicom Corp. | 1,864,050 | |||
| 18,590,937 | |||||
| Energy Resources – 5.3% | |||||
| 157,066 | Anadarko Petroleum Corp. | 10,330,231 | |||
| 202,136 | Exxon Mobil Corp. | 16,499,351 | |||
| 117,300 | Royal Dutch Petroleum Co. | 7,177,294 | |||
| 124,300 | Unocal Corp. | 4,148,512 | |||
| 135,900 | USX-Marathon Group | 3,728,756 | |||
| 41,884,144 | |||||
| Entertainment – 3.2% | |||||
| 370,100 | Carnival Corp. | 7,378,869 | |||
| 175,000 | The Walt Disney Co. | 6,814,062 | |||
| 166,963 | Viacom, Inc. Class B* | 11,238,697 | |||
| 25,431,628 | |||||
| Financial Services – 5.5% | |||||
| 166,100 | Federal Home Loan Mortgage Corp. | 6,996,962 | |||
| 589,200 | General Electric Co. | 34,578,675 | |||
| 38,000 | Household International, Inc. | 1,824,000 | |||
| 43,399,637 | |||||
| Food & Beverage – 2.0% | |||||
| 75,800 | PepsiCo., Inc. | 3,230,975 | |||
| 102,100 | The Coca-Cola Co. | 5,373,013 | |||
| 106,700 | The Quaker Oats Co. | 7,248,931 | |||
| 15,852,919 | |||||
| Forest – 1.9% | |||||
| 123,100 | Bowater, Inc. | 6,324,262 | |||
| 36,700 | Fort James Corp. | 1,160,638 | |||
| 225,600 | International Paper Co. | 7,191,000 | |||
| 14,675,900 | |||||
|
Shares |
Description | Value | |||
|---|---|---|---|---|---|
| Common Stocks – (continued) | |||||
| Grocery – 1.4% | |||||
| 78,700 | Safeway, Inc.* | $ 3,880,894 | |||
| 297,500 | The Kroger Co.* | 6,749,531 | |||
| 10,630,425 | |||||
| Heavy Electrical – 0.2% | |||||
| 18,900 | Emerson Electric Co. | 1,250,944 | |||
| Heavy Machinery – 0.7% | |||||
| 145,000 | Crane Co. | 3,643,125 | |||
| 63,800 | Deere & Co. | 2,101,413 | |||
| 5,744,538 | |||||
| Home Products – 0.6% | |||||
| 72,100 | The Procter & Gamble Co. | 4,456,681 | |||
| Industrial Parts – 2.1% | |||||
| 83,700 | Caterpillar, Inc. | 3,075,975 | |||
| 100,600 | Parker-Hannifin Corp. | 3,502,138 | |||
| 104,400 | Tyco International Ltd. | 5,950,800 | |||
| 57,100 | United Technologies Corp. | 3,565,181 | |||
| 16,094,094 | |||||
| Information Services – 0.6% | |||||
| 53,900 | Automatic Data Processing, Inc. | 3,213,787 | |||
| 36,600 | Electronic Data Systems Corp. | 1,823,138 | |||
| 5,036,925 | |||||
| Internet – 1.1% | |||||
| 132,400 | America Online, Inc.* | 7,761,950 | |||
| 5,700 | Juniper Networks, Inc.* | 1,218,375 | |||
| 8,980,325 | |||||
| Life Insurance – 0.8% | |||||
| 112,400 | AFLAC, Inc. | 6,069,600 | |||
| Media – 3.1% | |||||
| 151,000 | AT&T Corp.-Liberty Media Corp.* | 3,227,625 | |||
| 31,100 | Clear Channel Communications, Inc.* | 2,250,862 | |||
| 162,700 | Comcast Corp.* | 6,060,575 | |||
| 30,800 | The News Corp. Ltd. ADR | 1,620,850 | |||
| 128,300 | Time Warner, Inc. | 10,969,650 | |||
| 24,129,562 | |||||
| Medical Products – 2.0% | |||||
| 75,400 | Abbott Laboratories | 3,298,750 | |||
| 49,000 | Baxter International, Inc. | 4,079,250 | |||
| 89,600 | Johnson & Johnson | 8,237,600 | |||
| 15,615,600 | |||||
| Mining – 0.5% | |||||
| 110,600 | Alcoa, Inc. | 3,677,450 | |||
| Oil Refining – 0.2% | |||||
| 36,300 | Texaco, Inc. | 1,869,450 | |||
| Oil Services – 2.5% | |||||
| 33,100 | Baker Hughes, Inc. | 1,210,219 | |||
| 37,200 | Diamond Offshore Drilling, Inc. | 1,667,025 | |||
|
Shares |
Description | Value | ||||||||||||||
|---|---|---|---|---|---|---|---|---|---|---|---|---|---|---|---|---|
| Common Stocks – (continued) | ||||||||||||||||
| Oil Services – (continued) | ||||||||||||||||
| 123,000 | Halliburton Co. | $ 6,519,000 | ||||||||||||||
| 66,800 | Santa Fe International Corp. | 2,626,075 | ||||||||||||||
| 45,500 | Schlumberger Ltd. | 3,881,718 | ||||||||||||||
| 59,100 | Transocean Sedco Forex, Inc. | 3,531,225 | ||||||||||||||
| 19,435,262 | ||||||||||||||||
| Property Insurance – 5.8% | ||||||||||||||||
| 164,850 | American International Group, Inc. | 14,692,256 | ||||||||||||||
| 114,600 | The Hartford Financial Services
Group, Inc.* |
7,635,225 | ||||||||||||||
| 49,700 | The St. Paul Cos., Inc.* | 2,366,962 | ||||||||||||||
| 296,100 | XL Capital Ltd. | 20,412,394 | ||||||||||||||
| 45,106,837 | ||||||||||||||||
| Railroads – 0.5% | ||||||||||||||||
| 123,900 | Canadian National Railway Co. | 3,647,306 | ||||||||||||||
| Restaurants – 0.4% | ||||||||||||||||
| 104,000 | McDonald’s Corp. | 3,107,000 | ||||||||||||||
| Security/Asset Management – 1.3% | ||||||||||||||||
| 94,300 | Morgan Stanley Dean Witter & Co. | 10,143,144 | ||||||||||||||
| Semiconductors – 7.2% | ||||||||||||||||
| 45,100 | Advanced Micro Devices, Inc.* | 1,696,888 | ||||||||||||||
| 38,800 | Altera Corp.* | 2,478,691 | ||||||||||||||
| 20,300 | Analog Devices, Inc.* | 2,015,506 | ||||||||||||||
| 34,000 | Applied Materials, Inc.* | 2,934,625 | ||||||||||||||
| 4,700 | Broadcom Corp.* | 1,175,000 | ||||||||||||||
| 458,000 | Intel Corp. | 34,292,750 | ||||||||||||||
| 13,100 | KLA-Tencor Corp.* | 859,688 | ||||||||||||||
| 16,400 | Novellus Systems, Inc.* | 1,009,625 | ||||||||||||||
| 97,600 | Texas Instruments, Inc. | 6,533,100 | ||||||||||||||
| 35,700 | Xilinx, Inc.* | 3,172,837 | ||||||||||||||
| 56,168,710 | ||||||||||||||||
| Specialty Retail – 1.9% | ||||||||||||||||
| 21,300 | Best Buy Co., Inc.* | 1,315,275 | ||||||||||||||
| 115,200 | CVS Corp. | 4,276,800 | ||||||||||||||
| 20,300 | RadioShack Corp. | 1,197,700 | ||||||||||||||
| 160,800 | The Home Depot, Inc. | 7,728,450 | ||||||||||||||
| 14,518,225 | ||||||||||||||||
| Telephone – 3.8% | ||||||||||||||||
| 25,100 | NEXTLINK Communications, Inc.* | 880,069 | ||||||||||||||
| 107,700 | Qwest Communications International, Inc.* | 5,560,012 | ||||||||||||||
| 136,669 | SBC Communications, Inc. | 5,705,931 | ||||||||||||||
| 60,900 | Sprint Corp. | 2,040,150 | ||||||||||||||
| 194,176 | Verizon Communications | 8,470,928 | ||||||||||||||
| 191,000 | WorldCom, Inc.* | 6,971,500 | ||||||||||||||
| 29,628,590 | ||||||||||||||||
| Tobacco – 0.5% | ||||||||||||||||
| 140,300 | Philip Morris Cos., Inc. | 4,156,388 | ||||||||||||||
|
Shares |
Description | Value | ||||||||||||||
|---|---|---|---|---|---|---|---|---|---|---|---|---|---|---|---|---|
| Common Stocks – (continued) | ||||||||||||||||
| Wireless – 1.1% | ||||||||||||||||
| 18,800 | ALLTEL Corp. | $ 950,575 | ||||||||||||||
| 106,100 | Sprint Corp. (PCS Group)* | 5,324,894 | ||||||||||||||
| 48,100 | Vodafone Group PLC ADR | 1,969,094 | ||||||||||||||
| 8,244,563 | ||||||||||||||||
| TOTAL COMMON STOCKS | ||||||||||||||||
| (Cost $683,919,954) | $ 783,777,271 | |||||||||||||||
| Principal
Amount |
Interest
Rate |
Maturity
Date |
Value | |||||
|---|---|---|---|---|---|---|---|---|
| Repurchase Agreement – 0.4% | ||||||||
| Joint Repurchase Agreement Account II Ù | ||||||||
| $3,500,000 | 6.66 | % | 09/01/2000 | $ 3,500,000 | ||||
| TOTAL REPURCHASE AGREEMENT | ||||||||
| (Cost $3,500,000) | $ 3,500,000 | |||||||
| TOTAL INVESTMENTS | ||||||||
| (Cost $687,419,954) | $ 787,277,271 | |||||||
*
|
Non-income producing security.
|
Ù
|
Joint repurchase agreement was entered into on August 31, 2000.
|
| The percentage shown for each investment category reflects the value of investments in that category as a percentage of total net
assets.
|
| |
| Investment Abbreviations:
|
| ADR—American Depositary Receipt
|
| |
| Assets: | ||||||||||
| Investment in securities, at value (identified cost $687,419,954) | $787,277,271 | |||||||||
| Cash | 87,480 | |||||||||
| Receivables: | ||||||||||
| Investment securities sold | 8,498,022 | |||||||||
| Dividends and interest | 1,066,121 | |||||||||
| Fund shares sold | 219,901 | |||||||||
| Other assets | 2,827 | |||||||||
| Total assets | 797,151,622 | |||||||||
| Liabilities: | ||||||||||
| Payables: | ||||||||||
| Investment securities purchased | 9,766,761 | |||||||||
| Fund shares repurchased | 2,379,786 | |||||||||
| Amounts owed to affiliates | 853,052 | |||||||||
| Accrued expenses and other liabilities | 56,370 | |||||||||
| Total liabilities | 13,055,969 | |||||||||
| Net Assets: | ||||||||||
| Paid-in capital | 740,492,952 | |||||||||
| Accumulated net realized loss from investment, futures and options transactions | (56,254,616 | ) | ||||||||
| Net unrealized gain on investments, futures and options | 99,857,317 | |||||||||
| NET ASSETS | $784,095,653 | |||||||||
| Net asset value, offering and redemption price per share: (a) | ||||||||||
| Class A | $24.78 | |||||||||
| Class B | $24.42 | |||||||||
| Class C | $24.37 | |||||||||
| Institutional | $24.91 | |||||||||
| Service | $24.77 | |||||||||
| Shares outstanding: | ||||||||||
| Class A | 23,257,196 | |||||||||
| Class B | 6,368,469 | |||||||||
| Class C | 646,203 | |||||||||
| Institutional | 1,146,056 | |||||||||
| Service | 319,928 | |||||||||
| Total shares outstanding, $.001 par value (unlimited number of shares authorized) | 31,737,852 | |||||||||
(a)
|
Maximum public offering price per share (NAV per share multiplied by 1.0582) for Class A Shares is $26.22. At redemption, Class B
and Class C Shares may be subject to a contingent deferred sales charge, assessed on the amount equal to the lesser of the current net asset value or the original purchase price of the shares.
|
| Investment income: | ||||
| Dividends (a) | $12,021,226 | |||
| Interest | 2,070,812 | |||
| Total income | 14,092,038 | |||
| Expenses: | ||||
| Management fees | 6,580,727 | |||
| Distribution and Service fees (b) | 3,896,151 | |||
| Transfer Agent fees (c) | 1,727,745 | |||
| Custodian fees | 145,173 | |||
| Registration fees | 68,745 | |||
| Professional fees | 60,522 | |||
| Service share fees | 44,543 | |||
| Trustee fees | 8,729 | |||
| Other | 124,004 | |||
| Total expenses | 12,656,339 | |||
| Less — expense reductions | (18,726 | ) | ||
| Net expenses | 12,637,613 | |||
| NET INVESTMENT INCOME | 1,454,425 | |||
| Realized and unrealized gain (loss) on investment, futures and options transactions: | ||||
| Net realized gain (loss) from: | ||||
| Investment transactions | (60,356,960 | ) | ||
| Options written | 572,270 | |||
| Futures transactions | 5,268,671 | |||
| Net change in unrealized gain (loss) on: | ||||
| Investments | 98,915,933 | |||
| Options written | (202,732 | ) | ||
| Futures | 1,429 | |||
| Net realized and unrealized gain (loss) on investment, futures and options transactions | 44,198,611 | |||
| NET INCREASE IN NET ASSETS RESULTING FROM OPERATIONS | $45,653,036 | |||
(a)
|
Foreign taxes withheld on dividends were $44,796.
|
(b)
|
Class A, Class B and Class C had Distribution and Service fees of $1,705,073, $1,977,417 and $213,661, respectively.
|
(c)
|
Class A, Class B, Class C, Institutional Class and Service Class had Transfer Agent fees of $1,295,854, $375,709, $40,596, $12,023
and $3,563, respectively.
|
| For the
Year Ended August 31, 2000 |
For the
Seven Months Ended August 31, 1999 |
For the
Year Ended January 31, 1999 |
||||||||
|---|---|---|---|---|---|---|---|---|---|---|
| From operations: | ||||||||||
| Net investment income | $ 1,454,425 | $ 8,748,029 | $ 12,713,525 | |||||||
| Net realized gain (loss) from investment, futures and options transactions | (54,516,019 | ) | 74,409,026 | (79,720,615 | ) | |||||
| Net change in unrealized gain (loss) on investment, futures and options transactions | 98,714,630 | (52,594,995 | ) | (91,067,228 | ) | |||||
| Net increase (decrease) in net assets resulting from operations | 45,653,036 | 30,562,060 | (158,074,318 | ) | ||||||
| Distributions to shareholders: | ||||||||||
| From net investment income | ||||||||||
| Class A Shares | (1,750,861 | ) | (5,816,651 | ) | (9,893,876 | ) | ||||
| Class B Shares | (187,991 | ) | (690,509 | ) | (555,085 | ) | ||||
| Class C Shares | (20,602 | ) | (77,463 | ) | (98,749 | ) | ||||
| Institutional Shares | (114,748 | ) | (244,239 | ) | (2,084,974 | ) | ||||
| Service Shares | (18,316 | ) | (63,039 | ) | (80,841 | ) | ||||
| In excess of net investment income | ||||||||||
| Class A Shares | (865,614 | ) | — | (473,558 | ) | |||||
| Class B Shares | (92,941 | ) | — | (26,568 | ) | |||||
| Class C Shares | (10,186 | ) | — | (4,727 | ) | |||||
| Institutional Shares | (56,731 | ) | — | (99,795 | ) | |||||
| Service Shares | (9,056 | ) | — | (3,869 | ) | |||||
| From net realized gains | ||||||||||
| Class A Shares | (40,865,392 | ) | — | — | ||||||
| Class B Shares | (12,294,241 | ) | — | — | ||||||
| Class C Shares | (1,338,227 | ) | — | — | ||||||
| Institutional Shares | (1,708,729 | ) | — | — | ||||||
| Service Shares | (523,645 | ) | — | — | ||||||
| Total distributions to shareholders | (59,857,280 | ) | (6,891,901 | ) | (13,322,042 | ) | ||||
| From share transactions: | ||||||||||
| Proceeds from sales of shares | 47,866,453 | 114,124,273 | 1,026,751,116 | |||||||
| Reinvestment of dividends and distributions | 56,587,452 | 6,538,450 | 10,754,319 | |||||||
| Cost of shares repurchased | (506,756,739 | ) | (649,333,927 | ) | (761,706,430 | ) | ||||
| Net increase (decrease) in net assets resulting from share transactions | (402,302,834 | ) | (528,671,204 | ) | 275,799,005 | |||||
| TOTAL INCREASE (DECREASE) | (416,507,078 | ) | (505,001,045 | ) | 104,402,645 | |||||
| Net assets: | ||||||||||
| Beginning of period | 1,200,602,731 | 1,705,603,776 | 1,601,201,131 | |||||||
| End of period | $ 784,095,653 | $1,200,602,731 | $1,705,603,776 | |||||||
| Accumulated undistributed (distributions in excess of) net investment income | $ — | $ 634,990 | $ (1,221,249 | ) | ||||||
| 1. ORGANIZATION
|
| Goldman Sachs Trust (the “Trust”) is a Delaware business trust registered under the Investment Company Act of 1940 (as
amended) as an open-end, management investment company. The Trust includes the Goldman Sachs Growth and Income Fund (the “Fund”). The Fund is a diversified portfolio offering five classes of shares — Class A, Class B, Class C,
Institutional and Service.
|
| 2. SIGNIFICANT ACCOUNTING POLICIES
|
| The following is a summary of the significant accounting policies consistently followed by the Fund. The preparation of financial
statements in conformity with generally accepted accounting principles requires management to make estimates and assumptions that may affect the reported amounts. Actual results could differ from those estimates. Effective for fiscal year 1999, the Board
of Trustees approved a change in the fiscal year-end of the Fund from January 31 to August 31. Accordingly, the Statements of Changes in Net Assets, Summary of Share Transactions and Financial Highlights of the Fund are included for the seven months ended
August 31, 1999 and the year ended January 31, 1999.
|
| A. Investment Valuation — Investments in
securities traded on a U.S. or foreign securities exchange or the NASDAQ system are valued daily at their last sale price on the principal exchange on which they are traded. If no sale occurs, securities are valued at the last bid price. Debt securities
are valued at prices supplied by independent pricing services, broker/dealer-supplied valuations or matrix pricing systems. Unlisted equity and debt securities for which market quotations are available are valued at the last sale price on valuation date,
or if no sale occurs, at the last bid price. Short-term debt obligations maturing in sixty days or less are valued at amortized cost, which approximates market value. Securities for which quotations are not readily available are valued at fair value using
methods approved by the Board of Trustees of the Trust.
|
| B. Security Transactions and Investment Income — Security transactions are recorded as of the trade date. Realized gains and losses on sales of portfolio securities are calculated using the identified-cost basis. Dividend income is recorded on the ex-dividend date, net of foreign taxes where
applicable. Dividends for which the Fund has the choice to receive either cash or stock are recognized as investment income in an amount equal to the cash dividend. Interest income is recorded on the basis of interest accrued, premium amortized and
discount earned.
|
| Net investment income (other than class-specific expenses) and unrealized and
realized gains or losses are allocated daily to each class of shares of the Fund based upon the relative proportion of net assets of each class.
|
| C. Federal Taxes — It is the Fund’s
policy to comply with the requirements of the Internal Revenue Code applicable to regulated investment companies and to distribute each year substantially all of its investment company taxable income and capital gains to its shareholders. Accordingly, no
federal tax provision is required. Income distributions, if any, are declared and paid quarterly. Capital gains distributions, if any, are declared and paid annually.
|
| The characterization of distributions to shareholders for financial reporting
purposes is determined in accordance with income tax rules. Therefore, the source of the Fund’s distributions may be shown in the accompanying financial statements as either from or in excess of net investment income or net realized gain on
investment transactions, or from paid-in capital, depending on the type of book/tax differences that may exist.
|
| The Fund had approximately $48,213,000 at August 31, 2000, (the Fund’s tax
year-end) of capital loss carryforward expiring in 2008 for federal tax purposes. This amount is available to be carried forward to offset future capital gains to the extent permitted by applicable laws or regulations.
|
| At August 31, 2000, the aggregate cost of portfolio securities for federal income
tax purposes is $690,086,222. Accordingly, the gross unrealized gain on investments was $157,315,148 and the gross unrealized loss on investments was $60,124,099 resulting in a net unrealized gain of $97,191,049.
|
| 2. SIGNIFICANT ACCOUNTING POLICIES (continued)
|
| D. Expenses — Expenses incurred by the
Trust that do not specifically relate to an individual Fund of the Trust are allocated to the Funds on a straight-line or pro rata basis depending upon the nature of the expense.
|
| Class A, Class B and Class C Shares bear all expenses and fees relating to their
respective Distribution and Service Plans. Shareholders of Service Shares bear all expenses and fees paid to service organizations for their services with respect to such shares. Each class of shares separately bears its respective class-specific Transfer
Agency fees.
|
| E. Foreign Currency Translations — The
books and records of the Fund are maintained in U.S. dollars. Amounts denominated in foreign currencies are translated into U.S. dollars on the following basis: (i) investment valuations, foreign currency and other assets and liabilities initially
expressed in foreign currencies are converted each business day into U.S. dollars based upon current exchange rates; and (ii) purchases and sales of foreign investments, income and expenses are converted into U.S. dollars based upon currency exchange
rates prevailing on the respective dates of such transactions.
|
| Net realized and unrealized gain (loss) on foreign currency transactions will
represent: (i) foreign exchange gains and losses from the sale and holdings of foreign currencies; (ii) currency gains and losses between trade date and settlement date on investment securities transactions and forward exchange contracts; and (iii) gains
and losses from the difference between amounts of dividends and interest recorded and the amounts actually received.
|
| F. Repurchase Agreements — Repurchase
agreements involve the purchase of securities subject to the seller’s agreement to repurchase them at a mutually agreed upon date and price. During the term of a repurchase agreement, the value of the underlying securities, including accrued
interest, is required to equal or exceed the value of the repurchase agreement. The underlying securities for all repurchase agreements are held in safekeeping at the Fund’s custodian.
|
| G. Segregation Transactions — The Fund may
enter into certain derivative transactions to seek to increase total return. Forward foreign currency exchange contracts, futures contracts, written options, when-issued securities and forward commitments represent examples of such transactions. As a
result of entering into these transactions, the Fund is required to segregate liquid assets on the accounting records equal to or greater than the market value of the corresponding transactions.
|
| Goldman Sachs Growth and Income Fund — Tax Information (unaudited)
|
| For the year ended August 31, 2000, 45.31% of the dividends paid from net investment
company taxable income by the Growth and Income Fund qualify for the dividends received deduction available to corporations.
|
| Pursuant to Section 852 of the Internal Revenue Code, the Fund designated $13,430,900 as
capital gains dividends paid during its year ended August 31, 2000.
|
| 3. AGREEMENTS
|
| Pursuant to the Investment Management Agreement (the “Agreement”), Goldman Sachs Asset Management (“GSAM”), a
unit of the Investment Management Division of Goldman, Sachs & Co. (“Goldman Sachs”), serves as the investment adviser to the Fund. Under the Agreement, the adviser, subject to the general supervision of the Trust’s Board of Trustees,
manages the Fund’s portfolio. As compensation for the services rendered pursuant to the Agreement, the assumption of the expenses related thereto and administering the Fund’s business affairs, including providing facilities, the adviser is
entitled to a fee, computed daily and payable monthly, at an annual rate equal to 0.70% of the average daily net assets of the Fund.
|
| The investment adviser has voluntarily agreed to limit certain “Other
Expenses” of the Fund (excluding Management fees, Distribution and Service fees, Transfer Agent fees, taxes, interest, brokerage commissions, litigation, Service Share fees, indemnification costs and other extraordinary expenses) to the extent such
expenses exceed, on an annual basis, 0.05% of the average daily net assets of the Fund. For the year ended August 31, 2000, there was no expense reimbursement. In addition, the Fund has entered into certain offset arrangements with the custodian resulting
in a reduction in the Fund’s expenses. For the year ended August 31, 2000, custody fees were reduced by approximately $19,000.
|
| The Trust, on behalf of the Fund, has adopted Distribution and Service Plans.
Under the Distribution and Service Plans, Goldman Sachs and/or authorized dealers are entitled to a monthly fee from the Fund for distribution and shareholder maintenance services equal, on an annual basis, to 0.25%, 1.00% and 1.00% of the Fund’s
average daily net assets attributable to Class A, Class B and Class C Shares, respectively.
|
| Goldman Sachs serves as the distributor of shares of the Fund pursuant to a
Distribution Agreement. Goldman Sachs may receive a portion of the Class A sales load and Class B and Class C contingent deferred sales charges and has advised the Fund that it retained approximately $102,000 during the year ended August 31, 2000.
|
| Goldman Sachs also serves as the Transfer Agent of the Fund for a fee. The fees
charged for such transfer agency services are calculated daily and payable monthly at an annual rate as follows: 0.19% of the average daily net assets for Class A, Class B and Class C Shares and 0.04% of the average daily net assets for Institutional and
Service Shares.
|
| The Trust, on behalf of the Fund, has adopted a Service Plan. This plan allows for
Service Shares to compensate service organizations for providing varying levels of account administration and shareholder liaison services to their customers who are beneficial owners of such shares. The Service Plan provides for compensation to the
service organizations in an amount up to 0.50% (on a annualized basis), of the average daily net asset value of the Service Shares.
|
| As of August 31, 2000, the amounts owed to affiliates were approximately $465,000,
$267,000 and $121,000 for Management, Distribution and Service and Transfer Agent fees, respectively.
|
| 4. PORTFOLIO SECURITIES TRANSACTIONS
|
| The cost of purchases and proceeds of sales and maturities of securities (excluding short-term investments, futures and options
transactions) for the year ended August 31, 2000, were $783,581,050 and $1,157,676,958, respectively. For the year ended August 31, 2000, Goldman Sachs earned approximately $95,000 of brokerage commissions from portfolio transactions, including futures
transactions executed on behalf of the Fund.
|
| Futures Contracts — The Fund may enter into futures
transactions to hedge against changes in interest rates, securities prices, currency exchange rates or to seek to increase total return. Upon entering into a futures contract, the Fund is required to deposit with a broker or the Fund’s custodian bank
an amount of cash or securities equal to the minimum “initial margin” requirement of the associated futures exchange. Subsequent payments for futures contracts (“variation margin”) are paid or received by the Fund daily, depending on
the daily fluctuations in the value of the contracts, and are recorded for financial reporting purposes as unrealized gains or losses. When contracts are closed, the Fund realizes a gain or loss which is reported in the Statement of Operations.
|
| 4. PORTFOLIO SECURITIES TRANSACTIONS (continued)
|
| The use of futures contracts involve, to varying degrees, elements of market risk
which may exceed the amounts recognized in the Statement of Assets and Liabilities. Changes in the value of the futures contract may not directly correlate with changes in the value of the underlying securities. This risk may decrease the effectiveness of
the Fund’s hedging strategies and potentially result in a loss. At August 31, 2000, the Fund had no open futures contracts.
|
| Option Accounting Principles — When the Fund writes
call or put options, an amount equal to the premium received is recorded as an asset and as an equivalent liability. The amount of the liability is subsequently marked-to-market to reflect the current market value of the option written. When a written
option expires on its stipulated expiration date or the Fund enters into a closing purchase transaction, the Fund realizes a gain or loss without regard to any unrealized gain or loss on the underlying security, and the liability related to such option is
extinguished. When a written call option is exercised, the Fund realizes a gain or loss from the sale of the underlying security, and the proceeds of the sale are increased by the premium originally received. When a written put option is exercised, the
amount of the premium originally received will reduce the cost of the security which the Fund purchases upon exercise. There is a risk of loss from a change in value of such options which may exceed the related premiums received.
|
| Upon the purchase of a call option or a protective put option by the Fund, the
premium paid is recorded as an investment and subsequently marked-to-market to reflect the current market value of the option. If an option which the Fund has purchased expires on the stipulated expiration date, the Fund will realize a loss in the amount
of the cost of the option. If the Fund enters into a closing sale transaction, the Fund will realize a gain or loss, depending on whether the sale proceeds for the closing sale transaction are greater or less than the cost of the option. If the Fund
exercises a purchased put option, the Fund will realize a gain or loss from the sale of the underlying security, and the proceeds from such sale will be decreased by the premium originally paid. If the Fund exercises a purchased call option, the cost of
the security which the Fund purchases upon exercise will be increased by the premium originally paid. At August 31, 2000, there were no open written option contracts.
|
| For the year ended August 31, 2000, written call option transactions in the Fund
were as follows:
|
| Written Options | Number of Contracts | Premium Received | |||||
|---|---|---|---|---|---|---|---|
| |
|||||||
| Balance outstanding, beginning of year | 2,795
|
$ 572,270
|
|||||
| Options assigned | (1,442
|
) | (217,937
|
) | |||
| Options expired | (1,353
|
) | (354,333
|
) | |||
| |
|||||||
| Balance outstanding, end of year | —
|
$ —
|
|||||
| |
|||||||
| 5. LINE OF CREDIT FACILITY
|
| Effective May 31, 2000, the Fund participates in a $350,000,000 committed, unsecured revolving line of credit facility. Prior
thereto, the Fund participated in a $250,000,000 uncommitted and a $250,000,000 committed unsecured revolving line of credit facility. Under the most restrictive arrangement the Fund must own securities having a market value in excess of 400% of the total
bank borrowings. This facility is to be used solely for temporary or emergency purposes. The interest rate on borrowings is based on the Federal Funds rate. The committed facility also requires a fee to be paid by the Fund based on the amount of the
commitment. During the year ended August 31, 2000, the Fund did not have any borrowings under any of these facilities.
|
| 6. JOINT REPURCHASE AGREEMENT ACCOUNT
|
| The Fund, together with other registered investment companies having management agreements with GSAM or its affiliates, transfers
uninvested cash into joint accounts, the daily aggregate balance of which is invested in one or more repurchase agreements.
|
| At August 31, 2000, the Fund had an undivided interest in the repurchase
agreements in the joint account which equaled $3,500,000 in principal amount. At August 31, 2000, the following repurchase agreements held in this joint account were fully collateralized by Federal Agency obligations:
|
| Repurchase Agreements | Principal Amount | Interest
Rate |
Maturity
Date |
Amortized
Cost |
Maturity
Value |
|||||||
|---|---|---|---|---|---|---|---|---|---|---|---|---|
| ABN/AMRO, Inc. | $ 814,100,000 | 6.66 | % | 09/01/2000 | $ 814,100,000 | $ 814,250,608 | ||||||
| Banc of America Securities LLC | 900,000,000 | 6.67 | 09/01/2000 | 900,000,000 | 900,166,750 | |||||||
| Barclays Capital, Inc. | 500,000,000 | 6.67 | 09/01/2000 | 500,000,000 | 500,092,639 | |||||||
| Bear Stearns Companies, Inc. | 300,000,000 | 6.67 | 09/01/2000 | 300,000,000 | 300,055,583 | |||||||
| Chase Securities, Inc. | 450,000,000 | 6.67 | 09/01/2000 | 450,000,000 | 450,083,375 | |||||||
| Donaldson, Lufkin & Jenrette, Inc. | 1,000,000,000 | 6.67 | 09/01/2000 | 1,000,000,000 | 1,000,185,278 | |||||||
| J.P. Morgan & Co., Inc. | 800,000,000 | 6.65 | 09/01/2000 | 800,000,000 | 800,147,778 | |||||||
| Morgan Stanley Dean Witter & Co. | 750,000,000 | 6.65 | 09/01/2000 | 750,000,000 | 750,138,542 | |||||||
| Morgan Stanley Dean Witter & Co. | 300,000,000 | 6.60 | 09/01/2000 | 300,000,000 | 300,055,000 | |||||||
| UBS Warburg LLC | 800,000,000 | 6.65 | 09/01/2000 | 800,000,000 | 800,147,778 | |||||||
| TOTAL JOINT REPURCHASE AGREEMENT ACCOUNT II | $6,614,100,000 | $6,615,323,331 | ||||||||||
| 7. CHANGE IN INDEPENDENT ACCOUNTANTS
|
| On October 26, 1999, the Board of Trustees of the Fund, upon the recommendation of the Board’s audit committee, determined
not to retain Arthur Andersen LLP and approved a change of the Fund’s independent accountants to PricewaterhouseCoopers LLP. For the period ended August 31, 1999 and the year ended January 31, 1999, Arthur Andersen LLP’s audit reports contained
no adverse opinion or disclaimer of opinion; nor were their reports qualified or modified as to uncertainty, audit scope, or account principles. Further, there were no disagreements between the Fund and Arthur Andersen LLP on accounting principles or
practices, financial statement disclosure or audit scope or procedure, which if not resolved to the satisfaction of Arthur Andersen LLP would have caused them to make reference to the disagreement in their reports.
|
| 8. CERTAIN RECLASSIFICATIONS
|
| In accordance with AICPA Statement of Position 93-2, the Fund reclassified $1,040,735 from accumulated distributions in excess of
net investment income to paid-in capital and $3,104 from undistributed net investment income to accumulated net realized loss from investment, futures and options transactions. These reclassifications have no impact on the net asset value of the Fund and
are designed to present the Fund’s capital accounts on a tax basis. Reclassifications result primarily from the difference in the tax treatment of foreign currency, net operating losses and organization costs.
|
| 9. SUMMARY OF SHARE TRANSACTIONS
|
| Share activity is as follows:
|
| For the Year
Ended August 31, 2000 |
For the Seven Months
Ended August 31, 1999 |
For the Year Ended
January 31, 1999 |
|||||||||||||||||
|---|---|---|---|---|---|---|---|---|---|---|---|---|---|---|---|---|---|---|---|
| Shares | Dollars | Shares | Dollars | Shares | Dollars | ||||||||||||||
| Class A Shares | |||||||||||||||||||
| Shares sold | 1,336,043 | $ 31,836,651 | 2,693,500 | $ 68,994,627 | 19,137,910 | $508,921,386 | |||||||||||||
| Reinvestments of dividends and
distributions |
1,808,369 | 42,287,423 | 222,190 | 5,612,552 | 390,593 | 9,715,068 | |||||||||||||
| Shares repurchased | (14,540,480 | ) | (344,395,625 | ) | (14,386,320 | ) | (361,520,290 | ) | (20,323,258 | ) | (510,471,024 | ) | |||||||
| (11,396,068 | ) | (270,271,551 | ) | (11,470,630 | ) | (286,913,111 | ) | (794,755 | ) | 8,165,430 | |||||||||
| Class B Shares | |||||||||||||||||||
| Shares sold | 354,447 | 8,333,880 | 532,909 | 13,448,149 | 7,059,564 | 191,017,805 | |||||||||||||
| Reinvestments of dividends and
distributions |
467,551 | 10,834,187 | 23,841 | 604,660 | 21,979 | 509,810 | |||||||||||||
| Shares repurchased | (5,569,557 | ) | (130,534,853 | ) | (3,930,139 | ) | (97,151,929 | ) | (4,555,733 | ) | (111,930,613 | ) | |||||||
| (4,747,559 | ) | (111,366,786 | ) | (3,373,389 | ) | (83,099,120 | ) | 2,525,810 | 79,597,002 | ||||||||||
| Class C Shares | |||||||||||||||||||
| Shares sold | 82,360 | 1,922,744 | 104,662 | 2,636,497 | 1,937,045 | 52,029,313 | |||||||||||||
| Reinvestments of dividends and
distributions |
51,899 | 1,200,022 | 2,859 | 72,208 | 4,364 | 105,648 | |||||||||||||
| Shares repurchased | (771,431 | ) | (18,113,626 | ) | (823,868 | ) | (20,529,279 | ) | (1,174,701 | ) | (28,489,276 | ) | |||||||
| (637,172 | ) | (14,990,860 | ) | (716,347 | ) | (17,820,574 | ) | 766,708 | 23,645,685 | ||||||||||
| Institutional Shares | |||||||||||||||||||
| Shares sold | 181,437 | 4,379,832 | 1,012,105 | 26,839,595 | 10,119,858 | 268,940,951 | |||||||||||||
| Reinvestments of dividends and
distributions |
74,291 | 1,738,712 | 7,373 | 189,388 | 14,004 | 346,705 | |||||||||||||
| Shares repurchased | (411,654 | ) | (9,765,648 | ) | (6,850,928 | ) | (165,722,925 | ) | (4,396,583 | ) | (108,988,620 | ) | |||||||
| (155,926 | ) | (3,647,104 | ) | (5,831,450 | ) | (138,693,942 | ) | 5,737,279 | 160,299,036 | ||||||||||
| Service Shares | |||||||||||||||||||
| Shares sold | 58,518 | 1,393,346 | 85,566 | 2,205,405 | 218,320 | 5,841,661 | |||||||||||||
| Reinvestments of dividends and
distributions |
22,542 | 527,108 | 2,354 | 59,642 | 3,132 | 77,088 | |||||||||||||
| Shares repurchased | (166,719 | ) | (3,946,987 | ) | (173,088 | ) | (4,409,504 | ) | (73,792 | ) | (1,826,897 | ) | |||||||
| (85,659 | ) | (2,026,533 | ) | (85,168 | ) | (2,144,457 | ) | 147,660 | 4,091,852 | ||||||||||
| NET INCREASE (DECREASE) | (17,022,384 | ) | $(402,302,834 | ) | (21,476,984 | ) | $(528,671,204 | ) | 8,382,702 | $275,799,005 | |||||||||
| Income from
investment operations |
Distributions to shareholders |
||||||||||||||||||||||||
|---|---|---|---|---|---|---|---|---|---|---|---|---|---|---|---|---|---|---|---|---|---|---|---|---|---|
| Net asset
value, beginning of period |
Net
investment income (loss) |
Net realized
and unrealized gain (loss) |
Total from
investment operations |
From net
investment income |
In excess
of net investment income |
From net
realized gains |
|||||||||||||||||||
| FOR THE YEAR ENDED AUGUST 31, | |||||||||||||||||||||||||
| 2000 - Class A Shares | $24.68 | $ 0.07 | (c) | $1.44 | $1.51 | $(0.05 | ) | $(0.03 | ) | $(1.33 | ) | ||||||||||||||
| 2000 - Class B Shares | 24.46 | (0.10 | ) (c) | 1.42 | 1.32 | (0.02 | ) | (0.01 | ) | (1.33 | ) | ||||||||||||||
| 2000 - Class C Shares | 24.41 | (0.09 | ) (c) | 1.40 | 1.31 | (0.01 | ) | (0.01 | ) | (1.33 | ) | ||||||||||||||
| 2000 - Institutional Shares | 24.72 | 0.16 | (c) | 1.49 | 1.65 | (0.09 | ) | (0.04 | ) | (1.33 | ) | ||||||||||||||
| 2000 - Service Shares | 24.68 | 0.05 | (c) | 1.44 | 1.49 | (0.05 | ) | (0.02 | ) | (1.33 | ) | ||||||||||||||
| FOR THE SEVEN MONTHS ENDED AUGUST 31, | |||||||||||||||||||||||||
| 1999 - Class A Shares | 24.33 | 0.19 | 0.31 | 0.50 | (0.15 | ) | — | — | |||||||||||||||||
| 1999 - Class B Shares | 24.13 | 0.08 | 0.31 | 0.39 | (0.06 | ) | — | — | |||||||||||||||||
| 1999 - Class C Shares | 24.08 | 0.08 | 0.30 | 0.38 | (0.05 | ) | — | — | |||||||||||||||||
| 1999 - Institutional Shares | 24.35 | 0.34 | 0.23 | 0.57 | (0.20 | ) | — | — | |||||||||||||||||
| 1999 - Service Shares | 24.33 | 0.17 | 0.32 | 0.49 | (0.14 | ) | — | — | |||||||||||||||||
| FOR THE YEARS ENDED JANUARY 31, | |||||||||||||||||||||||||
| 1999 - Class A Shares | 25.93 | 0.20 | (1.60 | ) | (1.40 | ) | (0.19 | ) | (0.01 | ) | — | ||||||||||||||
| 1999 - Class B Shares | 25.73 | 0.02 | (1.58 | ) | (1.56 | ) | (0.04 | ) | — | — | |||||||||||||||
| 1999 - Class C Shares | 25.70 | 0.02 | (1.59 | ) | (1.57 | ) | (0.05 | ) | — | — | |||||||||||||||
| 1999 - Institutional Shares | 25.95 | 0.29 | (1.58 | ) | (1.29 | ) | (0.30 | ) | (0.01 | ) | — | ||||||||||||||
| 1999 - Service Shares | 25.92 | 0.17 | (1.58 | ) | (1.41 | ) | (0.17 | ) | (0.01 | ) | — | ||||||||||||||
| 1998 - Class A Shares | 23.18 | 0.11 | 5.27 | 5.38 | (0.11 | ) | — | (2.52 | ) | ||||||||||||||||
| 1998 - Class B Shares | 23.10 | 0.04 | 5.14 | 5.18 | — | (0.03 | ) | (2.52 | ) | ||||||||||||||||
| 1998 - Class C Shares (commenced August 15, 1997) | 28.20 | (0.01 | ) | 0.06 | 0.05 | — | (0.03 | ) | (2.52 | ) | |||||||||||||||
| 1998 - Institutional Shares | 23.19 | 0.27 | 5.23 | 5.50 | (0.22 | ) | — | (2.52 | ) | ||||||||||||||||
| 1998 - Service Shares | 23.17 | 0.14 | 5.23 | 5.37 | (0.06 | ) | (0.04 | ) | (2.52 | ) | |||||||||||||||
| 1997 - Class A Shares | 19.98 | 0.35 | 5.18 | 5.53 | (0.35 | ) | (0.01 | ) | (1.97 | ) | |||||||||||||||
| 1997 - Class B Shares (commenced May 1, 1996) | 20.82 | 0.17 | 4.31 | 4.48 | (0.17 | ) | (0.06 | ) | (1.97 | ) | |||||||||||||||
| 1997 - Institutional Shares (commenced June 3, 1996) | 21.25 | 0.29 | 3.96 | 4.25 | (0.30 | ) | (0.04 | ) | (1.97 | ) | |||||||||||||||
| 1997 - Service Shares (commenced March 6, 1996) | 20.71 | 0.28 | 4.50 | 4.78 | (0.28 | ) | (0.07 | ) | (1.97 | ) | |||||||||||||||
| 1996 - Class A Shares | 15.80 | 0.33 | 4.75 | 5.08 | (0.30 | ) | — | (0.60 | ) | ||||||||||||||||
(a)
|
Assumes investment at the net asset value at the beginning of the period, reinvestment of all dividends and distributions, a
complete redemption of the investment at the net asset value at the end of the period and no sales or redemption charges. Total return would be reduced if a sales or redemption charge were taken into account. Total returns for periods less than one full
year are not annualized.
|
(b)
|
Annualized.
|
(c)
|
Calculated based on the average shares outstanding methodology.
|
|
Ratios assuming no expense reductions |
||||||||||||||||||||||||
|---|---|---|---|---|---|---|---|---|---|---|---|---|---|---|---|---|---|---|---|---|---|---|---|---|
| Total
distributions |
Net asset
value, end of period |
Total
return (a) |
Net assets
at end of period (in 000s) |
Ratio of
net expenses to average net assets |
Ratio of
net investment income (loss) to average net assets |
Ratio of
expenses to average net assets |
Ratio of
net investment income (loss) to average net assets |
Portfolio
turnover rate |
||||||||||||||||
| $(1.41 | ) | $24.78 | 6.48 | % | $ 576,354 | 1.18 | % | 0.31 | % | 1.18 | % | 0.31 | % | 86.84 | % | |||||||||
| (1.36 | ) | 24.42 | 5.70 | 155,527 | 1.93 | (0.41 | ) | 1.93 | (0.41 | ) | 86.84 | |||||||||||||
| (1.35 | ) | 24.37 | 5.67 | 15,746 | 1.93 | (0.40 | ) | 1.93 | (0.40 | ) | 86.84 | |||||||||||||
| (1.46 | ) | 24.91 | 7.05 | 28,543 | 0.78 | 0.69 | 0.78 | 0.69 | 86.84 | |||||||||||||||
| (1.40 | ) | 24.77 | 6.40 | 7,926 | 1.28 | 0.20 | 1.28 | 0.20 | 86.84 | |||||||||||||||
| (0.15 | ) | 24.68 | 2.05 | 855,174 | 1.19 | (b) | 1.26 | (b) | 1.20 | (b) | 1.25 | (b) | 55.43 | |||||||||||
| (0.06 | ) | 24.46 | 1.60 | 271,912 | 1.94 | (b) | 0.51 | (b) | 1.95 | (b) | 0.50 | (b) | 55.43 | |||||||||||
| (0.05 | ) | 24.41 | 1.58 | 31,328 | 1.94 | (b) | 0.51 | (b) | 1.95 | (b) | 0.50 | (b) | 55.43 | |||||||||||
| (0.20 | ) | 24.72 | 2.32 | 32,181 | 0.79 | (b) | 1.72 | (b) | 0.80 | (b) | 1.71 | (b) | 55.43 | |||||||||||
| (0.14 | ) | 24.68 | 2.01 | 10,008 | 1.29 | (b) | 1.16 | (b) | 1.30 | (b) | 1.15 | (b) | 55.43 | |||||||||||
| (0.20 | ) | 24.33 | (5.40 | )
|
1,122,157 | 1.22 | 0.78 | 1.32 | 0.68 | 125.79 | ||||||||||||||
| (0.04 | ) | 24.13 | (6.07 | )
|
349,662 | 1.92 | 0.09 | 1.92 | 0.09 | 125.79 | ||||||||||||||
| (0.05 | ) | 24.08 | (6.12 | )
|
48,146 | 1.92 | 0.10 | 1.92 | 0.10 | 125.79 | ||||||||||||||
| (0.31 | ) | 24.35 | (5.00 | )
|
173,696 | 0.80 | 1.25 | 0.80 | 1.25 | 125.79 | ||||||||||||||
| (0.18 | ) | 24.33 | (5.44 | )
|
11,943 | 1.30 | 0.72 | 1.30 | 0.72 | 125.79 | ||||||||||||||
| |
||||||||||||||||||||||||
| (2.63 | ) | 25.93 | 23.71 | 1,216,582 | 1.25 | 0.43 | 1.42 | 0.26 | 61.95 | |||||||||||||||
| (2.55 | ) | 25.73 | 22.87 | 307,815 | 1.94 | (0.35 | ) | 1.94 | (0.35 | ) | 61.95 | |||||||||||||
| (2.55 | ) | 25.70 | 0.51 | 31,686 | 1.99 | (b) | (0.48 | ) (b) | 1.99 | (b) | (0.48 | ) (b) | 61.95 | |||||||||||
| (2.74 | ) | 25.95 | 24.24 | 36,225 | 0.83 | 0.76 | 0.83 | 0.76 | 61.95 | |||||||||||||||
| (2.62 | ) | 25.92 | 23.63 | 8,893 | 1.32 | 0.32 | 1.32 | 0.32 | 61.95 | |||||||||||||||
| |
||||||||||||||||||||||||
| (2.33 | ) | 23.18 | 28.42 | 615,103 | 1.22 | 1.60 | 1.43 | 1.39 | 53.03 | |||||||||||||||
| (2.20 | ) | 23.10 | 22.23 | 17,346 | 1.93 | (b) | 0.15 | (b) | 1.93 | (b) | 0.15 | (b) | 53.03 | |||||||||||
| (2.31 | ) | 23.19 | 20.77 | 193 | 0.82 | (b) | 1.36 | (b) | 0.82 | (b) | 1.36 | (b) | 53.03 | |||||||||||
| (2.32 | ) | 23.17 | 23.87 | 3,174 | 1.32 | (b) | 0.94 | (b) | 1.32 | (b) | 0.94 | (b) | 53.03 | |||||||||||
| |
||||||||||||||||||||||||
| (0.90 | ) | 19.98 | 32.45 | 436,757 | 1.20 | 1.67 | 1.45 | 1.42 | 57.93 | |||||||||||||||
| |
||||||||||||||||||||||||
| To the Shareholders and Board of Trustees of
Goldman Sachs Trust—Growth and Income Fund: |
| In our opinion, the accompanying statement of assets and liabilities, including the statement of investments, and the related
statements of operations and of changes in net assets and the financial highlights present fairly, in all material respects, the financial position of Goldman Sachs Growth and Income Fund (“the Fund”), one of the portfolios constituting Goldman
Sachs Trust, at August 31, 2000, the results of its operations, the changes in its net assets and the financial highlights for the year then ended, in conformity with accounting principles generally accepted in the United States of America. These
financial statements and financial highlights (hereafter referred to as “financial statements”) are the responsibility of the Fund’s management; our responsibility is to express an opinion on these financial statements based on our audit.
We conducted our audit of these financial statements in accordance with auditing standards generally accepted in the United States of America, which require that we plan and perform the audit to obtain reasonable assurance about whether the financial
statements are free of material misstatement. An audit includes examining, on a test basis, evidence supporting the amounts and disclosures in the financial statements, assessing the accounting principles used and significant estimates made by management,
and evaluating the overall financial statement presentation. We believe that our audit, which included confirmation of securities at August 31, 2000 by correspondence with the custodian and brokers, provides a reasonable basis for our opinion. The
statements of changes in net assets of the Fund for the period ended August 31, 1999 and the year ended January 31, 1999 and the financial highlights for each of the periods ended on or before August 31, 1999 were audited by other independent accountants
whose report dated October 8, 1999 expressed an unqualified opinion thereon.
|
| PricewaterhouseCoopers LLP
|
| Boston, Massachusetts
|
| October 23, 2000
|
|
Shares |
Description | Value | |||
|---|---|---|---|---|---|
| Common Stocks – 94.6% | |||||
| Australia – 2.4% | |||||
| 480,889 | Broken Hill Proprietary Co. Ltd.
(Nonferrous Metals) |
$ 5,259,638 | |||
| 758,410 | News Corp. Ltd. (Media) | 9,894,754 | |||
| 1,384,297 | Tab Corp. Holdings Ltd.
(Entertainment) |
7,862,811 | |||
| 2,998,836 | Telstra Corp. (Utilities) | 10,911,750 | |||
| 2,168,232 | Woolworths Ltd. (Specialty Retail) | 8,564,631 | |||
| 42,493,584 | |||||
| Canada – 0.4% | |||||
| 125,200 | The Seagram Co. Ltd.
(Entertainment) |
7,535,475 | |||
| China – 0.1% | |||||
| 325,000 | China Mobile Ltd. *
(Telecommunications) |
2,500,321 | |||
| Finland – 2.8% | |||||
| 1,009,156 | Nokia Oyj (Telecommunications) | 44,229,519 | |||
| 143,648 | Sonera Oyj (Telecommunications) | 4,794,885 | |||
| 49,024,404 | |||||
| France – 10.8% | |||||
| 151,889 | Accor SA (Hotels) | 6,539,715 | |||
| 84,862 | Air Liquide SA (Chemicals) | 10,810,753 | |||
| 272,279 | Alcatel (Telecommunications) | 22,249,933 | |||
| 297,297 | Alstom (Electrical Equipment) | 6,664,118 | |||
| 145,786 | Aventis SA (Drugs) | 10,936,121 | |||
| 118,711 | Axa (Insurance) | 16,893,330 | |||
| 116,828 | Banque Nationale de Paris (Banks) | 10,734,407 | |||
| 31,131 | Cap Gemini SA (Business
Services) |
6,494,590 | |||
| 136,388 | Carrefour SA (Specialty Retail) | 9,940,543 | |||
| 131,506 | France Telecom SA
(Telecommunications) |
15,001,665 | |||
| 91,189 | Lafarge SA (Construction) | 6,751,485 | |||
| 77,405 | LVMH (Louis Vuitton Moet
Hennessy) * (Conglomerates) |
6,005,805 | |||
| 139,061 | Renault SA (Auto) | 6,044,182 | |||
| 97,547 | STMicroelectronics NV
(Semiconductors) |
5,975,218 | |||
| 173,923 | Total Fina SA Class B (Energy
Resources) |
25,800,270 | |||
| 135,006 | Valeo SA (Auto) | 7,239,037 | |||
| 125,525 | Vivendi (Business Services) | 10,252,006 | |||
| 208,271 | Vivendi Environnement * (Utilities) | 7,146,100 | |||
| 191,479,278 | |||||
| Germany – 5.3% | |||||
| 38,617 | Allianz AG (Insurance) | 13,010,114 | |||
| 74,499 | DaimlerChrysler AG (Auto) | 3,829,303 | |||
| 233,894 | Deutsche Bank AG (Banks) | 20,348,666 | |||
| 343,534 | Deutsche Lufthansa AG (Airlines) | 7,599,912 | |||
| 373,212 | Deutsche Telekom AG
(Telecommunications) |
14,329,548 | |||
| 162,406 | E.On AG (Energy Resources) | 7,779,725 | |||
|
Shares |
Description | Value | |||
|---|---|---|---|---|---|
| Common Stocks – (continued) | |||||
| Germany – (continued) | |||||
| 25,792 | Muenchener Rueckversicherungs-
Gesellschaft AG (Property Insurance) |
$ 7,072,609 | |||
| 128,622 | Siemens AG (Electrical Equipment) | 20,610,249 | |||
| 94,580,126 | |||||
| Hong Kong – 2.1% | |||||
| 5,174,000 | Giordano International Ltd.
(Specialty Retail) |
2,902,455 | |||
| 1,086,700 | Hang Seng Bank Ltd. (Banks) | 11,669,589 | |||
| 1,108,600 | Hutchison Whampoa Ltd.
(Multi-Industrial) |
15,636,107 | |||
| 778,000 | Li & Fung Ltd. (Wholesale) | 3,391,717 | |||
| 1,680,657 | Pacific Century CyberWorks Ltd. *
(Computer Software) |
3,124,699 | |||
| 36,724,567 | |||||
| Ireland – 0.6% | |||||
| 1,767,646 | Bank of Ireland (Banks) | 10,487,043 | |||
| Italy – 3.3% | |||||
| 1,659,582 | Banca Nazionale del Lavoro
(Financial Services) |
6,158,370 | |||
| 1,384,556 | San Paolo-IMI SpA (Banks) | 24,558,215 | |||
| 1,844,500 | Telecom Italia Mobile SpA
(T.I.M.) (Telecommunications) |
15,981,563 | |||
| 1,009,563 | Telecom Italia SpA
(Telecommunications) |
12,403,958 | |||
| 59,102,106 | |||||
| Japan – 24.7% | |||||
| 247,959 | Aderans Co. Ltd. (Specialty Retail) | 9,834,661 | |||
| 76,300 | Advantest Corp. (Electronics
Equipment) |
15,560,479 | |||
| 928,000 | Asahi Chemical Industry Co. Ltd.
(Chemicals) |
5,803,807 | |||
| 1,343,000 | Asahi Glass Co. Ltd. (Home
Products) |
12,554,816 | |||
| 476,000 | Bridgestone Corp. (Auto) | 6,159,213 | |||
| 448,265 | Canon, Inc. (Computer Hardware) | 20,048,984 | |||
| 1,299,000 | Chiba Bank Ltd. (Banks) | 5,310,493 | |||
| 251,700 | Circle K Japan Co. (Specialty
Retail) |
9,039,016 | |||
| 394,000 | Daiwa Securities Group, Inc.
(Financial Services) |
4,913,456 | |||
| 180,600 | FANUC Ltd. (Electronics
Equipment) |
19,643,320 | |||
| 339,000 | Fuji Photo Film Ltd. (Leisure) | 12,142,335 | |||
| 281,000 | Fujitsu Ltd. (Computer Hardware) | 8,141,491 | |||
| 172,000 | Honda Motor Co. Ltd. (Auto) | 6,289,733 | |||
| 252 | Hoya Corp. (Electrical Equipment) | 24,101 | |||
| 506,000 | Kao Corp. (Chemicals) | 13,901,360 | |||
| 960,000 | Kirin Brewery Ltd. (Food &
Beverage) |
10,531,646 | |||
| 2,542,790 | Mitsui Marine & Fire (Insurance) | 12,660,305 | |||
| 452,000 | NEC Corp. (Computer Hardware) | 12,926,396 | |||
|
Shares |
Description | Value | |||
|---|---|---|---|---|---|
| Common Stocks – (continued) | |||||
| Japan – (continued) | |||||
| 450,000 | NGK Insulators Ltd.
(Multi-Industrial) |
$ 6,181,435 | |||
| 28,242 | Nintendo Co. Ltd. (Entertainment) | 4,883,099 | |||
| 2,429 | Nippon Telephone & Telegraph
Corp. (Telecommunications) |
28,924,802 | |||
| 751,000 | Ricoh Co. Ltd. (Computer
Hardware) |
13,132,818 | |||
| 56,000 | Rohm Co. (Electronics Equipment) | 15,936,241 | |||
| 27,500 | Ryohin Keikaku Co. Ltd.
(Specialty Retail) |
2,655,884 | |||
| 936,000 | Sanyo Electric Co. Ltd. (Electrical
Equipment) |
7,942,617 | |||
| 924,000 | Sharp Corp. (Electrical Equipment) | 14,719,888 | |||
| 282,000 | Shin-Etsu Chemical Co. Ltd.
(Chemicals) |
13,855,416 | |||
| 392,000 | Skylark Co. Ltd. (Restaurants) | 14,334,741 | |||
| 23,811 | SMC Corp. (Machinery) | 4,219,671 | |||
| 127,100 | Sony Corp. (Electrical Equipment) | 14,181,810 | |||
| 1,178,000 | Sumitomo Corp. (Wholesale) | 10,272,293 | |||
| 161,000 | Takeda Chemical Industries Ltd.
(Drugs) |
9,525,645 | |||
| 100,600 | Takefuji Corp. (Financial Services) | 9,894,928 | |||
| 169,000 | Terumo Corp. (Medical Products) | 4,674,637 | |||
| 1,438,000 | The Fuji Bank Ltd. (Banks) | 10,935,003 | |||
| 361,000 | The Nomura Securities Co. Ltd.
(Financial Services) |
8,445,336 | |||
| 562,800 | Tokyo Electric Power (Electrical
Utilities) |
12,585,824 | |||
| 453,200 | Toppan Forms Co. Ltd.
(Publishing) |
9,582,429 | |||
| 443,000 | Toyota Motor Corp. (Auto) | 19,273,513 | |||
| 339,000 | Yamanouchi Pharmaceutical Co.
Ltd. (Drugs) |
16,783,123 | |||
| 438,426,765 | |||||
| Netherlands – 7.4% | |||||
| 355,258 | ASM Lithography Holding NV
(Semiconductors) |
13,413,127 | |||
| 250,765 | Fortis Netherlands NV (Financial
Services) |
7,718,120 | |||
| 514,675 | Getronics NV (Business Services) | 6,451,468 | |||
| 393,958 | ING Groep NV (Financial
Services) |
26,370,116 | |||
| 368,171 | Koninklijke Royal Philips
Electronics NV (Appliance) |
17,911,045 | |||
| 423,776 | KPN NV (Telecommunications) | 11,289,979 | |||
| 473,741 | Royal Dutch Petroleum Co.
(Energy Resources) |
28,808,611 | |||
| 367,455 | United Pan-Europe
Communications NV * (Telecommunications) |
8,973,989 | |||
| 195,824 | VNU NV (Media) | 10,430,568 | |||
| 131,367,023 | |||||
|
Shares |
Description | Value | |||
|---|---|---|---|---|---|
| Common Stocks – (continued) | |||||
| Singapore – 1.0% | |||||
| 851,300 | Chartered Semiconductor
Manufacturing Ltd. * (Semiconductors) |
$ 7,122,608 | |||
| 451,847 | DBS Group Holdings Ltd. (Banks) | 5,460,704 | |||
| 280,000 | Singapore Press Holdings Ltd.
(Publishing) |
4,506,420 | |||
| 17,089,732 | |||||
| Spain – 2.6% | |||||
| 214,815 | Acerinox SA (Steel) | 6,293,168 | |||
| 422,243 | Endesa SA (Electrical Utilities) | 8,227,876 | |||
| 257,210 | Repsol SA (Energy Resources) | 5,091,943 | |||
| 1,397,430 | Telefonica de Espana SA *
(Telecommunications) |
26,796,285 | |||
| 46,409,272 | |||||
| Sweden – 5.0% | |||||
| 798,360 | Investor AB (Financial Services) | 11,332,893 | |||
| 1,974,131 | Nordbanken Holding AB (Banks) | 13,697,915 | |||
| 45,607 | Sandvik AB (Machinery) | 995,259 | |||
| 548,311 | Securitas AB Series B (Business
Services) |
12,197,855 | |||
| 569,477 | Skandia Forsakring (Insurance) | 11,522,501 | |||
| 1,901,168 | Telefonaktiebolaget LM Ericsson
AB Series B (Telecommunications) |
38,366,544 | |||
| 88,112,967 | |||||
| Switzerland – 6.9% | |||||
| 133,657 | ABB Ltd. (Business Services) | 14,961,605 | |||
| 10,594 | Adecco SA (Business Services) | 8,118,823 | |||
| 52,442 | Credit Suisse Group (Banks) | 10,958,030 | |||
| 12,334 | Nestle SA (Food & Beverage) | 26,579,699 | |||
| 9,690 | Novartis AG (Health) | 14,651,814 | |||
| 2,227 | Roche Holding AG (Health) | 19,943,284 | |||
| 5,957 | Swiss Re (Property Insurance) | 12,228,606 | |||
| 103,424 | UBS AG (Banks) | 15,050,507 | |||
| 122,492,368 | |||||
| United Kingdom – 19.2% | |||||
| 1,306,185 | Allied Zurich PLC (Insurance) | 15,987,750 | |||
| 556,153 | Amvescap PLC (Financial
Services) |
11,863,401 | |||
| 234,385 | AstraZeneca Group PLC (Health) | 10,679,651 | |||
| 2,937,538 | BP Amoco PLC (Energy
Resources) |
26,876,095 | |||
| 861,731 | British Aerospace PLC
(Defense/Aerospace) |
5,364,467 | |||
| 761,849 | British American Tobacco PLC
(Tobacco) |
4,897,452 | |||
| 1,340,651 | British Telecom PLC
(Telecommunications) |
17,022,423 | |||
| 218,669 | Cable & Wireless PLC
(Telecommunications) |
4,039,366 | |||
| 433,691 | CGNU PLC (Insurance) | 6,670,891 | |||
| 1,586,248 | Diageo PLC (Tobacco) | 13,534,618 | |||
| 951,088 | Glaxo Wellcome PLC (Health) | 27,340,268 | |||
| (continued)
|
|
Shares |
Description | Value | |||
|---|---|---|---|---|---|
| Common Stocks – (continued) | |||||
| United Kingdom – (continued) | |||||
| 1,310,889 | HSBC Holdings PLC (Banks) | $ 18,851,120 | |||
| 725,059 | Imperial Chemical Industries
PLC (Chemicals) |
4,892,422 | |||
| 803,100 | Lloyds TSB Group PLC (Banks) | 7,551,656 | |||
| 449,164 | Marconi PLC
(Telecommunications) |
7,964,779 | |||
| 514,707 | Reuters Group PLC (Business
Services) |
10,307,106 | |||
| 726,149 | Royal Bank of Scotland Group
PLC * (Banks) |
853,509 | |||
| 726,149 | Royal Bank of Scotland Group
PLC (Banks) |
13,108,220 | |||
| 1,055,355 | ScottishPower PLC (Energy
Resources) |
8,039,989 | |||
| 1,794,244 | SmithKline Beecham PLC
(Health) |
23,367,569 | |||
| 3,516,715 | Tesco PLC (Specialty Retail) | 11,060,986 | |||
| 2,914,076 | Unilever PLC (Food & Beverage) | 18,246,487 | |||
| 315,479 | United News & Media PLC
(Publishing) |
3,982,789 | |||
| 15,205,430 | Vodafone AirTouch PLC
(Telecommunications) |
61,394,782 | |||
| 477,868 | WPP Group PLC (Business
Services) |
6,781,791 | |||
| 340,679,587 | |||||
| TOTAL COMMON STOCKS | |||||
| (Cost $1,542,578,392) | $ 1,678,504,618 | ||||
|
Shares |
Description | Value | |||
|---|---|---|---|---|---|
| Preferred Stocks – 0.7% | |||||
| Germany – 0.7% | |||||
| 49,154 | SAP AG (Computer Software) | $ 12,392,759 | |||
| TOTAL PREFERRED STOCKS | |||||
| (Cost $6,915,138) | $ 12,392,759 | ||||
| Principal
Amount |
Interest
Rate |
Maturity
Date |
Value | ||||
|---|---|---|---|---|---|---|---|
| Short-Term Obligation – 3.7% | |||||||
| State Street Bank & Trust Euro-Time Deposit | |||||||
| $65,491,000 | 6.56% | 09/01/2000 | $ 65,491,000 | ||||
| TOTAL SHORT-TERM OBLIGATION | |||||||
| (Cost $65,491,000) | $ 65,491,000 | ||||||
| TOTAL INVESTMENTS | |||||||
| (Cost $1,614,984,530) | $1,756,388,377 | ||||||
*
|
Non-income producing security.
|
| The percentage shown for each investment category reflects the value of investments in that category as a percentage of total net
assets.
|
| Percentage
of Total Net Assets |
||||
|---|---|---|---|---|
| Common and Preferred Stock Industry Classifications | ||||
| Airlines | 0.4 | % | ||
| Appliance | 1.0 | |||
| Auto | 2.8 | |||
| Banks | 10.1 | |||
| Business Services | 4.3 | |||
| Chemicals | 3.4 | |||
| Computer Hardware | 3.1 | |||
| Computer Software | 0.9 | |||
| Conglomerates | 0.3 | |||
| Construction | 0.4 | |||
| Defense/Aerospace | 0.3 | |||
| Drugs | 1.5 | |||
| Electrical Equipment | 3.6 | |||
| Electrical Utilities | 1.2 | |||
| Electronics Equipment | 2.9 | |||
| Energy Resources | 5.8 | |||
| Entertainment | 1.1 | |||
| Financial Services | 4.9 | |||
| Food & Beverage | 3.1 | |||
| Health | 5.4 | |||
| Home Products | 0.7 | |||
| Hotels | 0.4 | |||
| Insurance | 4.3 | |||
| Leisure | 0.7 | |||
| Machinery | 0.3 | |||
| Media | 1.1 | |||
| Medical Products | 0.3 | |||
| Multi-Industrial | 1.2 | |||
| Nonferrous Metals | 0.3 | |||
| Property Insurance | 1.1 | |||
| Publishing | 1.0 | |||
| Restaurants | 0.8 | |||
| Semiconductors | 1.5 | |||
| Specialty Retail | 3.0 | |||
| Steel | 0.4 | |||
| Telecommunications | 18.9 | |||
| Tobacco | 1.0 | |||
| Utilities | 1.0 | |||
| Wholesale | 0.8 | |||
| TOTAL COMMON AND PREFERRED STOCK | 95.3 | % | ||
| Assets: | ||||
| Investment in securities, at value (identified cost $1,614,984,530) | $1,756,388,377 | |||
| Cash, at value | 3,296,292 | |||
| Receivables: | ||||
| Fund shares sold | 14,582,133 | |||
| Dividends and interest, at value | 3,888,191 | |||
| Investment securities sold, at value | 2,948,543 | |||
| Variation margin (a) | 2,892,385 | |||
| Forward foreign currency exchange contracts, at value | 1,677,801 | |||
| Reimbursement from investment adviser | 545,848 | |||
| Other assets | 6,736 | |||
| Total assets | 1,786,226,306 | |||
| Liabilities: | ||||
| Payables: | ||||
| Investment securities purchased, at value | 3,357,057 | |||
| Forward foreign currency exchange contracts, at value | 2,593,826 | |||
| Amounts owed to affiliates | 2,378,429 | |||
| Fund shares repurchased | 2,141,506 | |||
| Accrued expenses and other liabilities | 631,698 | |||
| Total liabilities | 11,102,516 | |||
| Net Assets: | ||||
| Paid-in capital | 1,501,445,561 | |||
| Accumulated distributions in excess of net investment loss | (8,940,186 | ) | ||
| Accumulated net realized gain on investment, futures and foreign currency related transactions | 141,971,105 | |||
| Net unrealized gain on investments, futures and translation of assets and liabilities denominated in foreign currencies | 140,647,310 | |||
| NET ASSETS | $1,775,123,790 | |||
| Net asset value, offering and redemption price per share: (b) | ||||
| Class A | $23.59 | |||
| Class B | $23.14 | |||
| Class C | $22.89 | |||
| Institutional | $24.06 | |||
| Service | $23.65 | |||
| Shares outstanding: | ||||
| Class A | 56,958,617 | |||
| Class B | 3,469,803 | |||
| Class C | 962,518 | |||
| Institutional | 13,512,467 | |||
| Service | 160,182 | |||
| Total shares outstanding, $.001 par value (unlimited number of shares authorized) | 75,063,587 | |||
(a)
|
Includes approximately $2,056,000 relating to initial margin requirements for futures transactions.
|
(b)
|
Maximum public offering price per share (NAV per share multiplied by 1.0582) for Class A Shares is $24.96. At redemption, Class B
and Class C Shares may be subject to a contingent deferred sales charge, assessed on the amount equal to the lesser of the current net asset value or the original purchase price of the shares.
|
| Investment income: | ||||
| Dividends (a) | $ 21,033,572 | |||
| Interest | 5,147,523 | |||
| Total income | 26,181,095 | |||
| Expenses: | ||||
| Management fees | 15,633,003 | |||
| Distribution and Service fees (b) | 6,981,282 | |||
| Transfer Agent fees (c) | 2,573,914 | |||
| Custodian fees | 1,918,064 | |||
| Registration fees | 199,961 | |||
| Professional fees | 67,010 | |||
| Service share fees | 20,398 | |||
| Trustee fees | 8,901 | |||
| Other | 226,450 | |||
| Total expenses | 27,628,983 | |||
| Less — expense reductions | (794,554 | ) | ||
| Net expenses | 26,834,429 | |||
| NET INVESTMENT LOSS | (653,334 | ) | ||
| Realized and unrealized gain (loss) on investment, futures and foreign currency related transactions: | ||||
| Net realized gain (loss) from: | ||||
| Investment transactions | 152,167,182 | |||
| Futures transactions | 17,526,583 | |||
| Foreign currency related transactions | (2,733,931 | ) | ||
| Net change in unrealized gain (loss) on: | ||||
| Investments | 2,670,982 | |||
| Futures | (367,621 | ) | ||
| Translation of assets and liabilities denominated in foreign currencies | (338,987 | ) | ||
| Net realized and unrealized gain on investment, futures and foreign currency related transactions | 168,924,208 | |||
| NET INCREASE IN NET ASSETS RESULTING FROM OPERATIONS | $168,270,874 | |||
(a)
|
Foreign taxes withheld on dividends were $3,097,226.
|
(b)
|
Class A, Class B and Class C had Distribution and Service fees of $6,009,343, $795,433 and $176,506, respectively.
|
(c)
|
Class A, Class B, Class C, Institutional Class and Service Class had Transfer Agent fees of $2,283,550, $151,133, $33,536,
$104,063 and $1,632, respectively.
|
| For the
Year Ended August 31, 2000 |
||||
|---|---|---|---|---|
| From operations: | ||||
| Net investment loss | $ (653,334 | ) | ||
| Net realized gain from investment, futures and foreign currency related transactions | 166,959,834 | |||
| Net change in unrealized gain on investments, futures and translation of assets and liabilities denominated in foreign
currencies |
1,964,374 | |||
| Net increase in net assets resulting from operations | 168,270,874 | |||
| Distributions to shareholders: | ||||
| From net investment income | ||||
| Class A Shares | (4,137,059 | ) | ||
| Class B Shares | (213,456 | ) | ||
| Class C Shares | (50,889 | ) | ||
| Institutional Shares | (1,171,372 | ) | ||
| Service Shares | (16,685 | ) | ||
| In excess of net investment income | ||||
| Class A Shares | (9,786,740 | ) | ||
| Class B Shares | (504,956 | ) | ||
| Class C Shares | (120,385 | ) | ||
| Institutional Shares | (2,771,030 | ) | ||
| Service Shares | (39,469 | ) | ||
| From net realized gains | ||||
| Class A Shares | (105,741,385 | ) | ||
| Class B Shares | (7,678,106 | ) | ||
| Class C Shares | (1,511,693 | ) | ||
| Institutional Shares | (22,154,888 | ) | ||
| Service Shares | (403,458 | ) | ||
| Total distributions to shareholders | (156,301,571 | ) | ||
| From share transactions: | ||||
| Proceeds from sales of shares | 962,871,083 | |||
| Reinvestment of dividends and distributions | 121,561,009 | |||
| Cost of shares repurchased | (529,098,512 | ) | ||
| Net increase in net assets resulting from share transactions | 555,333,580 | |||
| TOTAL INCREASE | 567,302,883 | |||
| Net assets: | ||||
| Beginning of year | $1,207,820,907 | |||
| End of year | $1,775,123,790 | |||
| Accumulated distributions in excess of net investment loss | $ (8,940,186 | ) | ||
| For the
Seven Months Ended August 31, 1999 |
|||||||||||
|---|---|---|---|---|---|---|---|---|---|---|---|
| From operations: | |||||||||||
| Net investment income | $ 2,238,774 | ||||||||||
| Net realized gain on investment, futures and foreign currency related transactions | 98,723,169 | ||||||||||
| Net change in unrealized loss on investments, futures and translation of assets and liabilities denominated in foreign
currencies |
(33,406,060 | ) | |||||||||
| Net increase in net assets resulting from operations | 67,555,883 | ||||||||||
| From share transactions: | |||||||||||
| Proceeds from sales of shares | 1,029,391,946 | ||||||||||
| Cost of shares repurchased | (1,032,832,481 | ) | |||||||||
| Net decrease in net assets resulting from share transactions | (3,440,535 | ) | |||||||||
| TOTAL INCREASE | 64,115,348 | ||||||||||
| Net assets: | |||||||||||
| Beginning of period | 1,143,705,559 | ||||||||||
| End of period | $ 1,207,820,907 | ||||||||||
| Accumulated undistributed net investment income | $ 6,242,794 | ||||||||||
| For the
Year Ended January 31, 1999 |
|||||||||||
|---|---|---|---|---|---|---|---|---|---|---|---|
| From operations: | |||||||||||
| Net investment loss | $ (2,714,406 | ) | |||||||||
| Net realized gain on investment, futures and foreign currency related transactions | 96,004,014 | ||||||||||
| Net change in unrealized gain on investments, futures and translation of assets and liabilities denominated in foreign
currencies |
55,278,283 | ||||||||||
| Net increase in net assets resulting from operations | 148,567,891 | ||||||||||
| Distributions to shareholders: | |||||||||||
| From net realized gains | |||||||||||
| Class A Shares | (41,132,351 | ) | |||||||||
| Class B Shares | (3,418,683 | ) | |||||||||
| Class C Shares | (556,864 | ) | |||||||||
| Institutional Shares | (4,927,209 | ) | |||||||||
| Service Shares | (179,258 | ) | |||||||||
| Total distributions to shareholders | (50,214,365 | ) | |||||||||
| From share transactions: | |||||||||||
| Proceeds from sales of shares | 2,171,378,743 | ||||||||||
| Reinvestment of dividends and distributions | 40,976,198 | ||||||||||
| Cost of shares repurchased | (1,982,583,097 | ) | |||||||||
| Net increase in net assets resulting from share transactions | 229,771,844 | ||||||||||
| TOTAL INCREASE | 328,125,370 | ||||||||||
| Net assets: | |||||||||||
| Beginning of year | 815,580,189 | ||||||||||
| End of year | $ 1,143,705,559 | ||||||||||
| Accumulated undistributed net investment income | $ 1,040,126 | ||||||||||
| 1. ORGANIZATION
|
| Goldman Sachs Trust (the “Trust”) is a Delaware business trust registered under the Investment Company Act of 1940 (as
amended) as an open-end, management investment company. The Trust includes the Goldman Sachs International Equity Fund (the “Fund”). The Fund is a diversified portfolio offering five classes of shares — Class A, Class B, Class C,
Institutional and Service.
|
| 2. SIGNIFICANT ACCOUNTING POLICIES
|
| The following is a summary of the significant accounting policies consistently followed by the Fund. The preparation of financial
statements in conformity with generally accepted accounting principles requires management to make estimates and assumptions that may affect the reported amounts. Actual results could differ from those estimates. Effective for fiscal year 1999, the Board
of Trustees approved a change in the fiscal year end of the Fund from January 31 to August 31. Accordingly, the Statements of Changes in Net Assets, Summary of Share Transactions, and Financial Highlights of the Fund are included for the seven months
ended August 31, 1999 and the year ended January 31, 1999.
|
| A. Investment Valuation — Investments in
securities traded on a U.S. or foreign securities exchange or the NASDAQ system are valued daily at their last sale price on the principal exchange on which they are traded. If no sale occurs, securities are valued at the last bid price. Debt securities
are valued at prices supplied by independent pricing services, broker/dealer-supplied valuations or matrix pricing systems. Unlisted equity and debt securities for which market quotations are available are valued at the last sale price on valuation date,
or if no sale occurs at the last bid price. Short-term debt obligations maturing in sixty days or less are valued at amortized cost, which approximates market value. Securities for which quotations are not readily available are valued at fair value using
methods approved by the Board of Trustees of the Trust.
|
| B. Security Transactions And Investment Income — Security transactions are recorded as of the trade date. Realized gains and losses on sales of portfolio securities are calculated using the identified-cost basis. Dividend income is recorded on the ex-dividend date, net of foreign withholding taxes
where applicable. Dividends for which the Fund has the choice to receive either cash or stock are recognized as investment income in an amount equal to the cash dividend. Interest income is recorded on the basis of interest accrued, premium amortized and
discount earned.
|
| Net investment income (other than class specific expenses) and unrealized and
realized gains or losses are allocated daily to each class of share of the Fund based upon the relative proportion of net assets of each class.
|
| C. Federal Taxes — It is the Fund’s
policy to comply with the requirements of the Internal Revenue Code applicable to regulated investment companies and to distribute each year substantially all of its investment company taxable income and capital gains to its shareholders. Accordingly, no
federal tax provision is required. Income and capital gains distributions, if any, are declared and paid annually.
|
| The characterization of distributions to shareholders for financial reporting
purposes is determined in accordance with income tax rules. Therefore, the source of the Fund’s distributions may be shown in the accompanying financial statements as either from or in excess of net investment income or net realized gain on
investment transactions, or from paid-in capital, depending on the type of book/tax differences that may exist.
|
| At August 31, 2000, the aggregate cost of portfolio securities for federal income
tax purposes is $1,624,611,545. Accordingly gross unrealized gain on investments was $223,254,070 and the gross unrealized loss on investments was $91,477,238 resulting in a net unrealized gain of $131,776,832.
|
| 2. SIGNIFICANT ACCOUNTING POLICIES (continued)
|
| D. Expenses — Expenses incurred by the
Trust which do not specifically relate to an individual Fund of the Trust are allocated to the Funds based on a straight-line or pro rata basis depending upon the nature of the expense.
|
| Class A, Class B and Class C Shares bear all expenses and fees relating to the
Distribution and Service Plans. Shareholders of Service Shares bear all expenses and fees paid to service organizations. Each class of shares separately bears its respective class-specific Transfer Agency fees.
|
| E. Foreign Currency Translations — The
books and records of the Fund are maintained in U.S. dollars. Amounts denominated in foreign currencies are translated into U.S. dollars on the following basis: (i) investment valuations, foreign currency and other assets and liabilities initially
expressed in foreign currencies are converted each business day into U.S. dollars based on current exchange rates; (ii) purchases and sales of foreign investments, income and expenses are converted into U.S. dollars based on currency exchange rates
prevailing on the respective dates of such transactions.
|
| Net realized and unrealized gain (loss) on foreign currency transactions will
represent: (i) foreign exchange gains and losses from the sale and holdings of foreign currencies; and (ii) currency gains and losses between trade date and settlement date on investment securities transactions and forward exchange contracts; and (iii)
gains and losses from the difference between amounts of dividends, interest and foreign withholding taxes recorded and the amounts actually received.
|
| F. Segregation Transactions — The Fund may
enter into certain derivative transactions to seek to increase total return. Forward foreign currency exchange contracts, futures contracts, written options, mortgage dollar rolls, when-issued and forward commitments represent examples of such
transactions. As a result of entering into those transactions the Fund is required to segregate liquid assets on the accounting records equal to or greater than the market value of the corresponding transactions.
|
| 3. AGREEMENTS
|
| Pursuant to the Investment Management Agreement (the “Agreement”), Goldman Sachs Asset Management International (“
GSAMI”), an affiliate of Goldman, Sachs & Co. (“Goldman Sachs”), serves as the investment adviser to the Fund. Under the Agreement, GSAMI, subject to the general supervision of the Trust’s Board of Trustees, manages the Fund’s
portfolio. As compensation for the services rendered under the Agreement, the assumption of the expenses related thereto and administering the Fund’s business affairs, including providing facilities, GSAMI is entitled to a fee, computed daily and
payable monthly, at an annual rate equal to 1.00% of the average daily net assets of the Fund.
|
| The investment adviser has voluntarily agreed to limit certain “Other
Expenses” (excluding Management fees, Distribution and Service fees, Transfer Agent fees, taxes, interest, brokerage, litigation, Service Share fees, indemnification costs and other extraordinary expenses) to the extent such expenses exceed, on an
annual basis, 0.10% of the average daily net assets of the Fund. Goldman Sachs reimbursed approximately $794,000 for the year ended August 31, 2000. In addition, the Fund has entered into certain offset arrangements with the custodian resulting in a
reduction in the Fund’s expenses. For the year ended August 31, 2000, custody fees were reduced by approximately $1,000.
|
| The Trust, on behalf of the Fund, has adopted Distribution and Service Plans.
Under the Distribution and Service Plans, Goldman Sachs and/or authorized dealers are entitled to a monthly fee from the Fund for distribution and shareholder maintenance services equal, on an annual basis, to 0.50%, 1.00% and 1.00% of the Fund’s
average daily net assets attributable to Class A, Class B and Class C Shares, respectively.
|
| Goldman Sachs serves as the distributor of shares of the Fund pursuant to a
Distribution Agreement. Goldman Sachs may receive a portion of the Class A sales load and Class B and Class C contingent deferred sales charges and has advised the Fund that it retained approximately $2,891,000 for the year ended August 31, 2000.
|
| 3. AGREEMENTS (continued)
|
| Goldman Sachs also serves as the Transfer Agent of the Fund for a fee. The fees
charged for such transfer agency services are calculated daily and payable monthly at an annual rate as follows: 0.19% of average daily net assets for Class A, Class B and Class C Shares and 0.04% of average daily net assets for Institutional and Service
shares.
|
| The Trust, on behalf of the Fund, has adopted a Service Plan. This Plan allows for
Service Shares to compensate service organizations for providing varying levels of account administration and shareholder liaison services to their customers who are beneficial owners of such shares. The Service Plan provides for compensation to the
service organizations in an amount up to 0.50% (on an annualized basis), of the average daily net asset value of the Service Shares.
|
| As of August 31, 2000, the amounts owed to affiliates were approximately
$1,483,000, $653,000 and $242,000 for Management, Distribution and Service and Transfer Agent fees, respectively.
|
| 4. PORTFOLIO SECURITIES TRANSACTIONS
|
| The cost of purchases and proceeds of sales and maturities of securities (excluding short-term investments and futures) for the
year ended August 31, 2000, were $1,555,116,959 and $1,170,979,843, respectively. For the year ended August 31, 2000, Goldman Sachs earned approximately $101,000 of brokerage commissions from futures transactions executed on behalf of the Fund.
|
| Forward Foreign Currency Exchange Contracts — The
Fund may enter into forward foreign currency exchange contracts for the purchase or sale of a specific foreign currency at a fixed price on a future date as a hedge or cross-hedge against either specific transactions or portfolio positions. The Fund may
also purchase and sell such contracts to seek to increase total return. All commitments are “marked-to-market” daily at the applicable translation rates and any resulting unrealized gains or losses are recorded in the Fund’s financial
statements. The Fund realizes gains or losses at the time a forward contract is offset by entry into a closing transaction or extinguished by delivery of the currency. Risks may arise upon entering these contracts from the potential inability of
counterparties to meet the terms of their contracts and from unanticipated movements in the value of a foreign currency relative to the U.S. dollar.
|
| At August 31, 2000, the Fund had the following outstanding forward foreign
currency exchange contracts:
|
| Open Foreign Currency | Value on
Settlement Date |
Current Value | Unrealized |
||||||
|---|---|---|---|---|---|---|---|---|---|
| Purchase Contracts | Gain | Loss | |||||||
| Australian Dollar | |||||||||
| expiring 10/13/2000 | $ 3,521,620 | $ 3,443,050 | $ — | $ 78,570 | |||||
| Danish Krone | |||||||||
| expiring 10/19/2000 | 14,605,000 | 14,220,417 | — | 384,583 | |||||
| Euro | |||||||||
| expiring 10/13/2000 | 19,453,483 | 19,129,311 | — | 324,172 | |||||
| Great British Pound | |||||||||
| expiring 9/14/2000 | 504,164 | 482,458 | — | 21,706 | |||||
| expiring 9/14/2000 | 13,028,098 | 12,599,983 | — | 428,115 | |||||
| expiring 9/14/2000 | 5,283,974 | 5,290,512 | 6,538 | — | |||||
| Norwegian Krone | |||||||||
| expiring 9/21/2000 | 6,686,000 | 6,524,793 | — | 161,207 | |||||
| New Zealand Dollar | |||||||||
| expiring 11/15/2000 | 2,465,889 | 2,335,514 | — | 130,375 | |||||
| TOTAL OPEN FOREIGN CURRENCY PURCHASE
CONTRACTS |
$65,548,228 | $64,026,038 | $6,538 | $1,528,728 | |||||
| 4. PORTFOLIO SECURITIES TRANSACTIONS (continued)
|
| Open Forward Foreign Currency | Value on
Settlement Date |
Current Value | Unrealized |
||||||
|---|---|---|---|---|---|---|---|---|---|
| Sale Contracts | Gain | Loss | |||||||
| Euro | |||||||||
| expiring 9/14/2000 | $ 547,073 | $ 509,121 | $ 37,952 | $ — | |||||
| Hong Kong Dollar | |||||||||
| expiring 12/8/2000 | 25,903,974 | 25,912,802 | — | 8,828 | |||||
| Japanese Yen | |||||||||
| expiring 11/17/2000 | 2,714,365 | 2,744,178 | — | 29,813 | |||||
| Swedish Krona | |||||||||
| expiring 10/13/2000 | 27,351,540 | 26,711,268 | 640,272 | — | |||||
| Swiss Franc | |||||||||
| expiring 11/20/2000 | 18,552,168 | 18,232,414 | 319,754 | — | |||||
| TOTAL OPEN FORWARD FOREIGN CURRENCY
SALE CONTRACTS |
$ 75,069,120 | $ 74,109,783 | $997,978 | $ 38,641 | |||||
| Closed but Unsettled | Purchase
Value |
Sale Value | Realized |
||||||
| Forward Foreign Currency Contracts | Gain | Loss | |||||||
| Euro | |||||||||
| expiring 9/14/2000 | $ 11,355,176 | $ 11,292,566 | $ — | $ 62,610 | |||||
| expiring 9/14/2000 | 10,883,308 | 10,811,422 | — | 71,886 | |||||
| expiring 9/14/2000 | 523,596 | 528,388 | 4,792 | — | |||||
| expiring 9/14/2000 | 10,713,362 | 10,832,611 | 119,249 | — | |||||
| expiring 10/13/2000 | 7,467,657 | 7,288,874 | — | 178,783 | |||||
| expiring 10/13/2000 | 642,005 | 637,046 | — | 4,959 | |||||
| expiring 10/13/2000 | 19,324,411 | 19,181,671 | — | 142,740 | |||||
| expiring 10/13/2000 | 14,013,271 | 13,971,080 | — | 42,191 | |||||
| expiring 10/13/2000 | 2,688,391 | 2,715,329 | 26,938 | — | |||||
| expiring 10/13/2000 | 2,766,811 | 2,895,863 | 129,052 | — | |||||
| Great British Pound | |||||||||
| expiring 9/14/2000 | 11,292,566 | 11,215,363 | — | 77,203 | |||||
| expiring 9/14/2000 | 11,267,987 | 11,215,362 | — | 52,625 | |||||
| expiring 9/14/2000 | 71,823 | 71,428 | — | 395 | |||||
| expiring 9/14/2000 | 11,248,496 | 11,165,530 | — | 82,966 | |||||
| expiring 9/14/2000 | 256,886 | 253,017 | — | 3,869 | |||||
| expiring 9/14/2000 | 11,379,685 | 11,240,972 | — | 138,713 | |||||
| expiring 9/14/2000 | 10,910,859 | 10,744,495 | — | 166,364 | |||||
| Japanese Yen | |||||||||
| expiring 10/20/2000 | 22,450,461 | 22,716,000 | 265,539 | — | |||||
| expiring 11/17/2000 | 7,742,000 | 7,869,715 | 127,715 | — | |||||
| Hong Kong Dollar | |||||||||
| expiring 12/8/2000 | 2,192,214 | 2,191,061 | — | 1,153 | |||||
| TOTAL CLOSED BUT UNSETTLED FORWARD
FOREIGN CURRENCY CONTRACTS |
$169,190,965 | $168,837,793 | $673,285 | $1,026,457 | |||||
| 4. PORTFOLIO SECURITIES TRANSACTIONS (continued)
|
| The contractual amounts of forward foreign currency exchange contracts do not necessarily represent the amounts potentially
subject to risk. The measurement of the risks associated with these instruments is meaningful only when all related and offsetting transactions are considered. At August 31, 2000, the Fund had sufficient cash and securities to cover any commitments under
these contracts.
|
| Futures Contracts — The Fund may enter into futures
transactions to hedge against changes in interest rates, securities prices, currency exchange rates or to seek to increase total return. Upon entering into a futures contract, the Fund is required to deposit with a broker or the Fund’s custodian
bank, an amount of cash or securities equal to the minimum “initial margin” requirement of the associated futures exchange. Subsequent payments for futures contracts (“variation margin”) are paid or received by the Fund, depending on
the fluctuations in the value of the contracts, and are recorded for financial reporting purposes as unrealized gains or losses. When contracts are closed, the Fund realizes a gain or loss which is reported in the Statement of Operations.
|
| The use of futures contracts involve, to varying degrees, elements of market and
counterparty risk which may exceed the amounts recognized in the Statement of Assets and Liabilities. Changes in the value of the futures contracts may not directly correlate with changes in the value of the underlying securities. This risk may decrease
the effectiveness of the Fund’s hedging strategies and potentially result in a loss.
|
| At August 31, 2000, open futures contracts were as follows:
|
| Type | Number of Contracts
Long |
Settlement
Month |
Market Value | Unrealized
Loss |
|||||
|---|---|---|---|---|---|---|---|---|---|
| Dow Jones Euro Stoxx 50 | 925 | September 2000 | $42,487,281 | $32,891 | |||||
| Option Accounting Principles — When the Fund writes
call or put options, an amount equal to the premium received is recorded as an asset and as an equivalent liability. The amount of the liability is subsequently marked-to-market to reflect the current market value of the option written. When a written
option expires on its stipulated expiration date or the Fund enters into a closing purchase transaction, the Fund realizes a gain or loss without regard to any unrealized gain or loss on the underlying security, and the liability related to such option is
extinguished. When a written call option is exercised, the Fund realizes a gain or loss from the sale of the underlying security, and the proceeds of the sale are increased by the premium originally received. When a written put option is exercised, the
amount of the premium originally received will reduce the cost of the security which the Fund purchases upon exercise. There is a risk of loss from a change in value of such options which may exceed the related premiums received.
|
| Upon the purchase of a call option or a protective put option by the Fund, the
premium paid is recorded as an investment and subsequently marked-to-market to reflect the current market value of the option. If an option which the Fund has purchased expires on the stipulated expiration date, the Fund will realize a loss in the amount
of the cost of the option. If the Fund enters into a closing sale transaction, the Fund will realize a gain or loss, depending on whether the sale proceeds for the closing sale transaction are greater or less than the cost of the option. If the Fund
exercises a purchased put option, the Fund will realize a gain or loss from the sale of the underlying security, and the proceeds from such sale will be decreased by the premium originally paid. If the Fund exercises a purchased call option, the cost of
the security which the Fund purchases upon exercise will be increased by the premium originally paid. At August 31, 2000, there were no open written option contracts.
|
| 5. LINE OF CREDIT FACILITY
|
| Effective May 31, 2000, the Fund participates in a $350,000,000 committed, unsecured revolving line of credit facility. Prior
thereto, the Fund participated in a $250,000,000 uncommitted and a $250,000,000 committed, unsecured revolving line of credit facility. Under the most restrictive arrangement, the Fund must own securities having a market value in excess of 400% of the
total bank borrowings. This facility is to be used solely for temporary or emergency purposes. The interest rate on borrowings is based on the Federal Funds rate. The committed facility also requires a fee to be paid by the Fund based on the amount of the
commitment. During the year ended August 31, 2000, the Fund did not have any borrowings under any of these facilities.
|
| 6. CHANGE IN INDEPENDENT ACCOUNTANTS
|
| On October 26, 1999 the Board of Trustees of the Fund, upon the recommendation of the Board’s audit committee, determined not
to retain Arthur Andersen LLP and approved a change of the Fund’s independent accountants to PricewaterhouseCoopers LLP. For the period ended August 31, 1999 and the year ended January 31, 1999, Arthur Andersen LLP’s audit reports contained no
adverse opinion or disclaimer of opinion; nor were their reports qualified or modified as to uncertainty, audit scope, or accounting principles. Further, there were no disagreements between the Fund and Arthur Andersen LLP on accounting principles or
practices, financial statement disclosure or audit scope or procedure, which if not resolved to the satisfaction of Arthur Andersen LLP would have caused them to make reference to the disagreement in their report.
|
| 7. CERTAIN RECLASSIFICATIONS
|
| In accordance with AICPA Statement of Position 93-2, the Fund reclassified $4,193,340 from accumulated net realized gain on
investment, futures and foreign currency related transactions to accumulated distributions in excess of net investment loss and $89,055 from paid-in capital to accumulated distributions in excess of net investment loss. These reclassifications have no
impact on the net asset value of the Fund and are designed to present the Fund’s capital accounts on a tax basis. Reclassifications result primarily from the difference in the tax treatment of foreign currency, net operating losses and organization
costs.
|
| Goldman Sachs International Equity Fund — Tax Information (unaudited)
|
| For the distribution
paid during the year ended August 31, 2000, the total amount of income received by the International Equity Fund from sources within foreign countries and possessions of the United States was $0.2593 per share all of which is attributable to qualified
passive income. The total amount of taxes paid by the Fund to such countries was $0.0311 per share. A separate notice containing the country by country components of these totals has been previously mailed to the shareholders.
|
| Pursuant to Section
852 of the Internal Revenue Code, the Fund designated $116,956,804 as capital gains dividends paid during its year ended August 31, 2000.
|
| 8. SUMMARY OF SHARE TRANSACTIONS
|
| Share activity for:
|
| For the Year
Ended August 31, 2000 |
For the Seven Months
Ended August 31, 1999 |
For the Year Ended
January 31, 1999 |
|||||||||||||||||||||||
|---|---|---|---|---|---|---|---|---|---|---|---|---|---|---|---|---|---|---|---|---|---|---|---|---|---|
| Shares | Dollars | Shares | Dollars | Shares | Dollars | ||||||||||||||||||||
| Class A Shares | |||||||||||||||||||||||||
| Shares sold | 29,637,438 | $727,913,986 | 40,503,629 | $878,896,664 | 90,785,418 | $ 1,949,815,404 | |||||||||||||||||||
| Reinvestments of
dividends and distributions |
4,008,202 | 93,992,338 | — | — | 1,669,818 | 34,480,481 | |||||||||||||||||||
| Shares repurchased | (17,502,173 | ) | (431,597,850 | ) | (42,925,516 | ) | (937,796,470 | ) | (84,367,795 | ) | (1,819,683,956) | ||||||||||||||
| 16,143,467 | 390,308,474 | (2,421,887 | ) | (58,899,806 | ) | 8,087,441 | 164,611,929 | ||||||||||||||||||
| Class B Shares | |||||||||||||||||||||||||
| Shares sold | 596,787 | 14,423,566 | 231,545 | 5,004,374 | 794,593 | 17,488,784 | |||||||||||||||||||
| Reinvestments of dividends and
distributions |
335,760 | 7,745,988 | — | — | 156,073 | 3,180,373 | |||||||||||||||||||
| Shares repurchased | (484,425 | ) | (11,699,142 | ) | (410,880 | ) | (8,878,625 | ) | (557,697 | ) | (11,834,003) | ||||||||||||||
| 448,122 | 10,470,412 | (179,335 | ) | (3,874,251 | ) | 392,969 | 8,835,154 | ||||||||||||||||||
| Class C Shares | |||||||||||||||||||||||||
| Shares sold | 1,503,847 | 35,487,591 | 3,386,747 | 71,812,024 | 6,644,608 | 139,922,460 | |||||||||||||||||||
| Reinvestments of dividends and
distributions |
52,340 | 1,194,420 | — | — | 19,517 | 394,623 | |||||||||||||||||||
| Shares repurchased | (1,092,313 | ) | (25,780,443 | ) | (3,429,722 | ) | (73,325,070 | ) | (6,294,716 | ) | (133,220,855) | ||||||||||||||
| 463,874 | 10,901,568 | (42,975 | ) | (1,513,046 | ) | 369,409 | 7,096,228 | ||||||||||||||||||
| Institutional Shares | |||||||||||||||||||||||||
| Shares sold | 7,389,250 | 183,681,326 | 3,229,820 | 73,161,867 | 2,805,737 | 62,386,145 | |||||||||||||||||||
| Reinvestments of dividends and
distributions |
763,388 | 18,168,651 | — | — | 131,238 | 2,741,464 | |||||||||||||||||||
| Shares repurchased | (2,327,895 | ) | (58,028,723 | ) | (556,938 | ) | (12,395,514 | ) | (740,110 | ) | (16,145,728) | ||||||||||||||
| 5,824,743 | 143,821,254 | 2,672,882 | 60,766,353 | 2,196,865 | 48,981,881 | ||||||||||||||||||||
| Service Shares | |||||||||||||||||||||||||
| Shares sold | 55,114 | 1,364,614 | 23,838 | 517,017 | 78,227 | 1,765,950 | |||||||||||||||||||
| Reinvestments of dividends and
distributions |
19,583 | 459,612 | — | — | 8,677 | 179,257 | |||||||||||||||||||
| Shares repurchased | (80,974 | ) | (1,992,354 | ) | (20,037 | ) | (436,802 | ) | (77,199 | ) | (1,698,555) | ||||||||||||||
| (6,277 | ) | (168,128 | ) | 3,801 | 80,215 | 9,705 | 246,652 | ||||||||||||||||||
| NET INCREASE (DECREASE) | 22,873,929 | $555,333,580 | 32,486 | $ (3,440,535 | ) | 11,056,389 | $ 229,771,844 | ||||||||||||||||||
| Income from
investment operations |
Distributions to shareholders |
||||||||||||||||||||||
|---|---|---|---|---|---|---|---|---|---|---|---|---|---|---|---|---|---|---|---|---|---|---|---|
|
Net asset value, beginning of period |
Net
investment income (loss) |
Net realized
and unrealized gain (loss) |
Total from
Investment Operations |
From net
investment income |
In excess
of net investment income |
From net
realized gains |
Total
Distributions |
||||||||||||||||
| FOR THE YEAR ENDED AUGUST 31, | |||||||||||||||||||||||
| 2000 - Class A Shares | $23.12 | $(0.03 | ) (c) | $3.41 | $3.38 | $(0.10 | ) | $(0.24) | $(2.57 | ) | $(2.91 | ) | |||||||||||
| 2000 - Class B Shares | 22.73 | (0.16 | ) (c) | 3.38 | 3.22 | (0.07 | ) | (0.17) | (2.57 | ) | (2.81 | ) | |||||||||||
| 2000 - Class C Shares | 22.54 | (0.14 | ) (c) | 3.35 | 3.21 | (0.09 | ) | (0.20) | (2.57 | ) | (2.86 | ) | |||||||||||
| 2000 - Institutional Shares | 23.49 | 0.14 | (c) | 3.46 | 3.60 | (0.14 | ) | (0.32) | (2.57 | ) | (3.03 | ) | |||||||||||
| 2000 - Service Shares | 23.14 | (0.01 | ) (c) | 3.45 | 3.44 | (0.11 | ) | (0.25) | (2.57 | ) | (2.93 | ) | |||||||||||
| FOR THE SEVEN MONTHS ENDED AUGUST 31, | |||||||||||||||||||||||
| 1999 - Class A Shares | 21.92 | 0.04 | 1.16 | 1.20 | — | — | — | — | |||||||||||||||
| 1999 - Class B Shares | 21.63 | (0.02 | ) | 1.12 | 1.10 | — | — | — | — | ||||||||||||||
| 1999 - Class C Shares | 21.45 | (0.03 | ) | 1.12 | 1.09 | — | — | — | — | ||||||||||||||
| 1999 - Institutional Shares | 22.20 | 0.12 | (c) | 1.17 | (c) | 1.29 | — | — | — | — | |||||||||||||
| 1999 - Service Shares | 21.93 | 0.06 | 1.15 | 1.21 | — | — | — | — | |||||||||||||||
| FOR THE YEARS ENDED JANUARY 31, | |||||||||||||||||||||||
| 1999 - Class A Shares | 19.85 | (0.06 | ) | 3.24 | 3.18 | — | — | (1.11 | ) | (1.11 | ) | ||||||||||||
| 1999 - Class B Shares | 19.70 | (0.17 | ) | 3.21 | 3.04 | — | — | (1.11 | ) | (1.11 | ) | ||||||||||||
| 1999 - Class C Shares | 19.56 | (0.15 | ) | 3.15 | 3.00 | — | — | (1.11 | ) | (1.11 | ) | ||||||||||||
| 1999 - Institutional Shares | 19.97 | 0.03 | 3.31 | 3.34 | — | — | (1.11 | ) | (1.11 | ) | |||||||||||||
| 1999 - Service Shares | 19.84 | (0.04 | ) | 3.24 | 3.20 | — | — | (1.11 | ) | (1.11 | ) | ||||||||||||
| |
|||||||||||||||||||||||
| 1998 - Class A Shares | 19.32 | 0.03 | 2.04 | 2.07 | — | (0.30 | ) | (1.24 | ) | (1.54 | ) | ||||||||||||
| 1998 - Class B Shares | 19.24 | (0.08 | ) | 2.02 | 1.94 | — | (0.25 | ) | (1.23 | ) | (1.48 | ) | |||||||||||
| 1998 - Class C Shares (commenced August 15,
1997) |
22.60 | (0.04 | ) | (1.38 | ) | (1.42 | ) | — | (0.38 | ) | (1.24 | ) | (1.62 | ) | |||||||||
| 1998 - Institutional Shares | 19.40 | 0.10 | 2.11 | 2.21 | (0.07 | ) | (0.33 | ) | (1.24 | ) | (1.64 | ) | |||||||||||
| 1998 - Service Shares | 19.34 | 0.02 | 2.06 | 2.08 | — | (0.35 | ) | (1.23 | ) | (1.58 | ) | ||||||||||||
| |
|||||||||||||||||||||||
| 1997 - Class A Shares | 17.20 | 0.10 | 2.23 | 2.33 | — | — | (0.21 | ) | (0.21 | ) | |||||||||||||
| 1997 - Class B Shares (commenced May 1, 1996) | 18.91 | (0.06 | ) | 0.60 | 0.54 | — | — | (0.21 | ) | (0.21 | ) | ||||||||||||
| 1997 - Institutional Shares (commenced February 7,
1996) |
17.45 | 0.04 | 2.15 | 2.19 | (0.03 | ) | — | (0.21 | ) | (0.24 | ) | ||||||||||||
| 1997 - Service Shares (commenced March 6, 1996) | 17.70 | (0.02 | ) | 1.87 | 1.85 | — | — | (0.21 | ) | (0.21 | ) | ||||||||||||
| |
|||||||||||||||||||||||
| 1996 - Class A Shares | 14.52 | 0.13 | 4.00 | 4.13 | (0.58 | ) | — | (0.87 | ) | (1.45 | ) | ||||||||||||
| |
|||||||||||||||||||||||
(a)
|
Assumes investment at the net asset value at the beginning of the period, reinvestment of all dividends and distributions, a
complete redemption of the investment at the net asset value at the end of the period and no sales or redemption charges. Total return would be reduced if a sales or redemption charge were taken into account. Total returns for periods less than one full
year are not annualized.
|
(b)
|
Annualized.
|
(c)
|
Calculated based on the average shares outstanding methodology.
|
| Ratios assuming no expense
reductions |
|||||||||||||||||||||||
|---|---|---|---|---|---|---|---|---|---|---|---|---|---|---|---|---|---|---|---|---|---|---|---|
| Net asset
value, end of period |
Total
return (a) |
Net assets
at end of period (in 000s) |
Ratio of
net expenses to average net assets |
Ratio of
net investment income (loss) to average net assets |
Ratio of
expenses to average net assets |
Ratio of
net investment income (loss) to average net assets |
Portfolio
turnover rate |
||||||||||||||||
| $23.59 | 14.68 | % | $1,343,869 | 1.79 | % | (0.12 | )% | 1.84 | % | (0.17 | )% | 79.79 | % | ||||||||||
| 23.14 | 14.20 | 80,274 | 2.29 | (0.65 | ) | 2.34 | (0.70 | ) | 79.79 | ||||||||||||||
| 22.89 | 14.28 | 22,031 | 2.29 | (0.59 | ) | 2.34 | (0.64 | ) | 79.79 | ||||||||||||||
| 24.06 | 15.45 | 325,161 | 1.14 | 0.54 | 1.19 | 0.49 | 79.79 | ||||||||||||||||
| 23.65 | 15.00 | 3,789 | 1.64 | (0.02 | ) | 1.69 | (0.07 | ) | 79.79 | ||||||||||||||
| 23.12 | 5.47 | 943,473 | 1.79 | (b) | 0.31 | (b) | 1.84 | (b) | 0.26 | (b) | 61.10 | ||||||||||||
| 22.73 | 5.09 | 68,691 | 2.29 | (b) | (0.19 | ) (b) | 2.34 | (b) | (0.24 | ) (b) | 61.10 | ||||||||||||
| 22.54 | 5.08 | 11,241 | 2.29 | (b) | (0.26 | ) (b) | 2.34 | (b) | (0.31 | ) (b) | 61.10 | ||||||||||||
| 23.49 | 5.81 | 180,564 | 1.14 | (b) | 0.89 | (b) | 1.19 | (b) | 0.84 | (b) | 61.10 | ||||||||||||
| 23.14 | 5.52 | 3,852 | 1.64 | (b) | 0.47 | (b) | 1.69 | (b) | 0.42 | (b) | 61.10 | ||||||||||||
| 21.92 | 16.39 | 947,973 | 1.73 | (0.28 | ) | 1.82 | (0.37 | ) | 113.79 | ||||||||||||||
| 21.63 | 15.80 | 69,231 | 2.24 | (0.79 | ) | 2.32 | (0.87 | ) | 113.79 | ||||||||||||||
| 21.45 | 15.70 | 11,619 | 2.24 | (0.98 | ) | 2.32 | (1.06 | ) | 113.79 | ||||||||||||||
| 22.20 | 17.09 | 111,315 | 1.13 | 0.23 | 1.21 | 0.15 | 113.79 | ||||||||||||||||
| 21.93 | 16.49 | 3,568 | 1.63 | (0.18 | ) | 1.71 | (0.26 | ) | 113.79 | ||||||||||||||
| 19.85 | 11.12 | 697,590 | 1.67 | (0.27 | ) | 1.80 | (0.40 | ) | 40.82 | ||||||||||||||
| 19.70 | 10.51 | 55,324 | 2.20 | (0.90 | ) | 2.30 | (1.00 | ) | 40.82 | ||||||||||||||
| 19.56 | (5.92 | ) | 3,369 | 2.27 | (b) | (1.43 | ) (b) | 2.37 | (b) | (1.53 | ) (b) | 40.82 | |||||||||||
| 19.97 | 11.82 | 56,263 | 1.08 | 0.30 | 1.18 | 0.20 | 40.82 | ||||||||||||||||
| 19.84 | 11.25 | 3,035 | 1.55 | (0.36 | ) | 1.65 | (0.46 | ) | 40.82 | ||||||||||||||
| 19.32 | 13.48 | 536,283 | 1.69 | (0.07 | ) | 1.88 | (0.26 | ) | 38.01 | ||||||||||||||
| 19.24 | 2.83 | 19,198 | 2.23 | (b) | (0.97 | ) (b) | 2.38 | (b) | (1.12 | ) (b) | 38.01 | ||||||||||||
| 19.40 | 12.53 | 68,374 | 1.10 | (b) | 0.43 | (b) | 1.25 | (b) | 0.28 | (b) | 38.01 | ||||||||||||
| 19.34 | 10.42 | 674 | 1.60 | (b) | (0.40 | ) (b) | 1.75 | (b) | (0.55 | ) (b) | 38.01 | ||||||||||||
| 17.20 | 28.68 | 330,860 | 1.52 | 0.26 | 1.77 | 0.01 | 68.48 | ||||||||||||||||
| To the Shareholders and Board of Trustees of
|
| Goldman Sachs Trust — International Equity Fund:
|
| In our opinion, the accompanying statement of assets and liabilities, including the statement of investments, and the related
statements of operations and of changes in net assets and the financial highlights present fairly, in all material respects, the financial position of Goldman Sachs International Equity Fund (“the Fund”), one of the portfolios constituting
Goldman Sachs Trust, at August 31, 2000, the results of its operations, the changes in its net assets and the financial highlights for the year then ended, in conformity with accounting principles generally accepted in the United States of America. These
financial statements and financial highlights (hereafter referred to as “financial statements”) are the responsibility of the Fund’s management; our responsibility is to express an opinion on these financial statements based on our audit.
We conducted our audit of these financial statements in accordance with auditing standards generally accepted in the United States of America, which require that we plan and perform the audit to obtain reasonable assurance about whether the financial
statements are free of material misstatement. An audit includes examining, on a test basis, evidence supporting the amounts and disclosures in the financial statements, assessing the accounting principles used and significant estimates made by management,
and evaluating the overall financial statement presentation. We believe that our audit, which included confirmation of securities at August 31, 2000 by correspondence with the custodian and brokers, provides a reasonable basis for our opinion. The
statements of changes in net assets of the Fund for the period ended August 31, 1999 and the year ended January 31, 1999 and the financial highlights for each of the periods ended on or before August 31, 1999 were audited by other independent accountants
whose report dated October 8, 1999 expressed an unqualified opinion thereon.
|
| PricewaterhouseCoopers LLP
|
| Boston, Massachusetts
|
| October 23, 2000
|
|
Shares |
Description | Value | |||
|---|---|---|---|---|---|
| Common Stocks – 92.1% | |||||
| Canada – 0.3% | |||||
| 8,000 | The Seagram Co. Ltd. (Entertainment) | $ 481,500 | |||
| Denmark – 0.5% | |||||
| 5,114 | Group 4 Falck A/S (Electrical
Equipment) |
800,880 | |||
| Finland – 4.2% | |||||
| 139,794 | Nokia Oyj (Telecommunications) | 6,126,923 | |||
| 17,406 | Sonera Oyj (Telecommunications) | 581,002 | |||
| 6,707,925 | |||||
| France – 13.7% | |||||
| 17,161 | Accor SA (Hotels) | 738,882 | |||
| 10,021 | Air Liquide SA (Chemicals) | 1,276,597 | |||
| 33,973 | Alcatel (Telecommunications) | 2,776,185 | |||
| 30,817 | Alstom (Electrical Equipment) | 690,784 | |||
| 13,066 | Axa (Insurance) | 1,859,375 | |||
| 10,174 | Banque Nationale de Paris (Banks) | 934,809 | |||
| 2,044 | Cap Gemini SA (Business Services) | 426,422 | |||
| 20,845 | Carrefour SA (Specialty Retail) | 1,519,273 | |||
| 17,887 | France Telecom SA
(Telecommunications) |
2,040,476 | |||
| 18,844 | Lafarge SA (Construction) | 1,395,179 | |||
| 9,552 | LVMH (Louis Vuitton Moet
Hennessy)* (Conglomerates) |
741,134 | |||
| 12,080 | Rhone-Poulenc SA (Chemicals) | 906,180 | |||
| 13,367 | STMicroelectronics NV
(Semiconductors) |
818,792 | |||
| 18,185 | Total Fina SA Class B (Energy
Resources) |
2,697,619 | |||
| 16,577 | Valeo SA (Auto) | 888,861 | |||
| 16,612 | Vivendi (Business Services) | 1,356,752 | |||
| 25,422 | Vivendi Environnement* (Utilities) | 872,268 | |||
| 21,939,588 | |||||
| Germany – 7.3% | |||||
| 4,483 | Allianz AG (Insurance) | 1,510,328 | |||
| 28,812 | Deutsche Bank AG (Banks) | 2,506,630 | |||
| 56,593 | Deutsche Telekom AG
(Telecommunications) |
2,172,899 | |||
| 29,684 | E.On AG (Energy Resources) | 1,421,943 | |||
| 6,464 | Muenchener Rueckversicherungs-
Gesellschaft AG (Property Insurance) |
1,772,540 | |||
| 14,339 | Siemens AG (Electrical Equipment) | 2,297,666 | |||
| 11,682,006 | |||||
| Ireland – 0.6% | |||||
| 168,413 | Bank of Ireland (Banks) | 994,918 | |||
| Italy – 5.1% | |||||
| 346,802 | Banca Nazionale del Lavoro
(Financial Services) |
1,286,911 | |||
| 137,500 | ENI SpA (Energy Resources) | 801,971 | |||
| 146,532 | San Paolo-IMI SpA (Banks) | 2,599,075 | |||
| 90,000 | Telecom Italia Mobile SpA (T.I.M.)
(Telecommunications) |
779,800 | |||
|
Shares |
Description | Value | |||
|---|---|---|---|---|---|
| Common Stocks – (continued) | |||||
| Italy – (continued) | |||||
| 124,796 | Telecom Italia SpA
(Telecommunications) |
$ 1,533,301 | |||
| 218,000 | Unicredito Italiano SpA (Banks) | 1,126,342 | |||
| 8,127,400 | |||||
| Netherlands – 9.9% | |||||
| 31,254 | ASM Lithography Holding NV
(Semiconductors) |
1,180,027 | |||
| 3,542 | Equant NV* (Computer Software) | 137,096 | |||
| 588 | Equant NV* (Computer Software) | 22,707 | |||
| 17,133 | Fortis Netherlands NV (Financial
Services) |
527,325 | |||
| 35,885 | Getronics NV (Business Services) | 449,820 | |||
| 45,879 | ING Groep NV (Financial Services) | 3,070,973 | |||
| 63,518 | Koninklijke Royal Philips Electronics
NV (Appliance) |
3,090,069 | |||
| 48,352 | KPN NV (Telecommunications) | 1,288,164 | |||
| 63,789 | Royal Dutch Petroleum Co. (Energy
Resources) |
3,879,066 | |||
| 38,363 | United Pan-Europe Communications
NV* (Telecommunications) |
936,901 | |||
| 26,475 | VNU NV (Media) | 1,410,191 | |||
| 15,992,339 | |||||
| Spain – 4.8% | |||||
| 17,825 | Acerinox SA (Steel) | 522,197 | |||
| 19,278 | Altadis SA Series A (Consumer
Goods) |
276,392 | |||
| 89,307 | Banco Santander Central Hispano SA
(Banks) |
959,316 | |||
| 75,808 | Endesa SA (Electrical Utilities) | 1,477,203 | |||
| 51,958 | Repsol SA (Energy Resources) | 1,028,604 | |||
| 178,357 | Telefonica de Espana SA*
(Telecommunications) |
3,420,067 | |||
| 7,683,779 | |||||
| Sweden – 6.9% | |||||
| 107,504 | Investor AB (Financial Services) | 1,526,043 | |||
| 134,793 | Nordbanken Holding AB (Banks) | 935,289 | |||
| 32,269 | Sandvik AB (Machinery) | 704,190 | |||
| 67,971 | Securitas AB Series B (Business
Services) |
1,512,099 | |||
| 71,627 | Skandia Forsakring (Insurance) | 1,449,263 | |||
| 246,220 | Telefonaktiebolaget LM Ericsson AB
Series B (Telecommunications) |
4,968,846 | |||
| 11,095,730 | |||||
| Switzerland – 9.3% | |||||
| 16,041 | ABB Ltd. (Business Services) | 1,795,634 | |||
| 878 | Adecco SA (Business Services) | 672,864 | |||
| 5,814 | Credit Suisse Group (Banks) | 1,214,866 | |||
| 1,370 | Nestle SA (Food & Beverage) | 2,952,342 | |||
| 1,699 | Novartis AG (Health) | 2,568,982 | |||
| 268 | Roche Holding AG (Health) | 2,400,000 | |||
|
Shares |
Description | Value | |||
|---|---|---|---|---|---|
| Common Stocks – (continued) | |||||
| Switzerland – (continued) | |||||
| 759 | Swiss Re (Property Insurance) | $ 1,558,085 | |||
| 12,467 | UBS AG (Banks) | 1,814,228 | |||
| 14,977,001 | |||||
| United Kingdom – 29.5% | |||||
| 139,689 | Allied Zurich PLC (Insurance) | 1,709,798 | |||
| 82,668 | Amvescap PLC (Financial Services) | 1,763,406 | |||
| 53,269 | AstraZeneca Group PLC (Health) | 2,427,179 | |||
| 383,048 | BP Amoco PLC (Energy Resources) | 3,504,579 | |||
| 99,414 | British Aerospace PLC
(Defense/Aerospace) |
618,874 | |||
| 174,096 | British American Tobacco PLC
(Tobacco) |
1,119,155 | |||
| 168,183 | British Telecom PLC
(Telecommunications) |
2,135,442 | |||
| 24,506 | Cable & Wireless PLC
(Telecommunications) |
452,687 | |||
| 87,944 | CGNU PLC (Insurance) | 1,352,725 | |||
| 216,039 | Diageo PLC (Tobacco) | 1,843,347 | |||
| 107,019 | Glaxo Wellcome PLC (Health) | 3,076,401 | |||
| 153,195 | HSBC Holdings PLC (Banks) | 2,203,007 | |||
| 103,149 | Imperial Chemical Industries PLC
(Chemicals) |
696,010 | |||
| 192,003 | Lloyds TSB Group PLC (Banks) | 1,805,430 | |||
| 62,190 | Marconi PLC (Telecommunications) | 1,102,781 | |||
| 75,469 | PowerGen PLC (Electrical Utilities) | 639,557 | |||
| 51,334 | Reckitt Benckiser PLC (Food &
Beverage) |
612,314 | |||
| 64,447 | Reuters Group PLC (Business
Services) |
1,290,564 | |||
| 129,288 | Royal Bank of Scotland Group
PLC* (Banks) |
151,964 | |||
| 123,373 | Royal Bank of Scotland Group PLC
(Banks) |
2,227,092 | |||
| 106,037 | Scottish and Southern Energy PLC
(Electrical Utilities) |
858,597 | |||
| 57,141 | ScottishPower PLC (Energy
Resources) |
435,316 | |||
| 243,669 | SmithKline Beecham PLC (Health) | 3,173,455 | |||
| 407,713 | Tesco PLC (Specialty Retail) | 1,282,364 | |||
| 391,558 | Unilever PLC (Food & Beverage) | 2,451,740 | |||
| 43,988 | United News & Media PLC
(Publishing) |
555,330 | |||
| 1,758,218 | Vodafone AirTouch PLC
(Telecommunications) |
7,099,136 | |||
| 53,989 | WPP Group PLC (Business
Services) |
766,199 | |||
| 47,354,449 | |||||
| TOTAL COMMON STOCKS | |||||
| (Cost $139,593,901) | $147,837,515 | ||||
|
Shares |
Description | Value | |||
|---|---|---|---|---|---|
| Preferred Stocks – 0.7% | |||||
| Germany – 0.7% | |||||
| 4,274 | SAP AG (Computer Software) | $ 1,077,566 | |||
| TOTAL PREFERRED STOCKS | |||||
| (Cost $575,529) | $ 1,077,566 | ||||
| Principal Amount | Interest
Rate |
Maturity
Date |
Value | |||||
|---|---|---|---|---|---|---|---|---|
| Short-Term Obligations – 8.2% | ||||||||
| State Street Bank & Trust Euro-Time Deposits€ | ||||||||
| EUR7,150,000 | 4.70 | % | 09/01/2000 | $ 6,381,017 | ||||
| 7,730,000 | 4.60 | 09/05/2000 | 6,862,309 | |||||
| TOTAL SHORT-TERM OBLIGATIONS | ||||||||
| (Cost $13,243,326) | $ 13,243,326 | |||||||
| TOTAL INVESTMENTS | ||||||||
| (Cost $153,412,756) | $ 162,158,407 | |||||||
€
|
The principal amount of each security is stated in the currency in which the bond is denominated. See below.
|
| EUR=Euro Currency
|
*
|
Non-income producing security.
|
| The percentage shown for each investment category reflects the value of investments in that category as a percentage of total net
assets.
|
| As a % of
total net assets |
||||
|---|---|---|---|---|
| Common and Preferred Stock Industry Classifications† | ||||
| Appliance | 1.9 | % | ||
| Auto | 0.6 | |||
| Banks | 12.1 | |||
| Business Services | 5.2 | |||
| Chemicals | 1.8 | |||
| Computer Software | 0.8 | |||
| Conglomerates | 0.5 | |||
| Construction | 0.9 | |||
| Consumer Goods | 0.2 | |||
| Defense/Aerospace | 0.4 | |||
| Electrical Equipment | 2.4 | |||
| Electrical Utilities | 1.9 | |||
| Energy Resources | 8.6 | |||
| Entertainment | 0.3 | |||
| Financial Services | 5.1 | |||
| Food & Beverage | 3.7 | |||
| Health | 8.5 | |||
| Hotels | 0.5 | |||
| Insurance | 4.9 | |||
| Machinery | 0.4 | |||
| Media | 0.9 | |||
| Property Insurance | 2.1 | |||
| Publishing | 0.3 | |||
| Semiconductors | 1.2 | |||
| Specialty Retail | 1.7 | |||
| Steel | 0.3 | |||
| Telecommunications | 23.3 | |||
| Tobacco | 1.8 | |||
| Utilities | 0.5 | |||
| TOTAL COMMON AND PREFERRED STOCK | 92.8 | % | ||
†
|
Industry concentrations greater than one tenth of one percent are disclosed.
|
| Assets: | ||||
| Investment in securities, at value (identified cost $153,412,756) | $162,158,407 | |||
| Cash, at value | 1,075,035 | |||
| Receivables: | ||||
| Fund shares sold | 2,686,708 | |||
| Investment securities sold | 900,283 | |||
| Variation margin, at value (a) | 885,229 | |||
| Dividends and interest, at value | 479,965 | |||
| Forward foreign currency exchange contracts, at value | 430,055 | |||
| Reimbursement from investment adviser | 155,402 | |||
| Other assets | 263 | |||
| Total assets | 168,771,347 | |||
| Liabilities: | ||||
| Payables: | ||||
| Investment securities purchased, at value | 7,296,106 | |||
| Forward foreign currency exchange contracts, at value | 428,639 | |||
| Amounts owed to affiliates | 221,635 | |||
| Fund shares repurchased | 93,700 | |||
| Accrued expenses and other liabilities | 112,815 | |||
| Total liabilities | 8,152,895 | |||
| Net Assets: | ||||
| Paid-in capital | 139,349,829 | |||
| Accumulated net investment loss | (1,170,986 | ) | ||
| Accumulated net realized gain from investment, futures and foreign currency related transactions | 13,747,696 | |||
| Net unrealized gain on investments and translation of assets and liabilities denominated in foreign currencies | 8,691,913 | |||
| NET ASSETS | $160,618,452 | |||
| Net asset value, offering and redemption price per share: (b) | ||||
| Class A | $13.82 | |||
| Class B | $13.69 | |||
| Class C | $13.72 | |||
| Institutional | $14.00 | |||
| Service | $13.86 | |||
| Shares outstanding: | ||||
| Class A | 10,131,218 | |||
| Class B | 331,379 | |||
| Class C | 107,992 | |||
| Institutional | 1,045,348 | |||
| Service | 156 | |||
| Total shares outstanding, $.001 par value (unlimited number of shares authorized) | 11,616,093 | |||
(a)
|
Includes approximately $262,300 relating to initial margin requirements for futures transactions.
|
(b)
|
Maximum public offering price per share (NAV per share multiplied by 1.0582) for Class A Shares is $14.62. At redemption, Class B
and Class C Shares may be subject to a contingent deferred sales charge, assessed on the amount equal to the lesser of the current net asset value or the original purchase price of the shares.
|
| Investment income: | ||||
| Dividends (a) | $ 2,063,666 | |||
| Interest | 223,695 | |||
| Total income | 2,287,361 | |||
| Expenses: | ||||
| Management fees | 1,253,575 | |||
| Distribution and Service fees (b) | 608,041 | |||
| Custodian fees | 341,018 | |||
| Transfer Agent fees (c) | 226,736 | |||
| Registration fees | 67,145 | |||
| Professional fees | 55,650 | |||
| Trustee fees | 6,615 | |||
| Other | 135,577 | |||
| Total expenses | 2,694,357 | |||
| Less — expense reductions | (475,621 | ) | ||
| Net expenses | 2,218,736 | |||
| NET INVESTMENT INCOME | 68,625 | |||
| Realized and unrealized gain (loss) on investment, futures and foreign currency related transactions: | ||||
| Net realized gain from: | ||||
| Investment transactions | 11,010,376 | |||
| Futures transactions | 573,892 | |||
| Foreign currency related transactions | 1,925,508 | |||
| Net change in unrealized gain (loss) on: | ||||
| Investments | 4,497,839 | |||
| Futures | 10,514 | |||
| Translation of assets and liabilities denominated in foreign currencies | (18,838 | ) | ||
| Net realized and unrealized gain on investment, futures and foreign currency related transactions | 17,999,291 | |||
| NET INCREASE IN NET ASSETS RESULTING FROM OPERATIONS | $18,067,916 | |||
(a)
|
Foreign taxes withheld on dividends were $331,236.
|
(b)
|
Class A, Class B and Class C had Distribution and Service fees of $569,252, $29,685 and $9,104, respectively.
|
(c)
|
Class A, Class B, Class C, Institutional Class and Service Class had Transfer Agent fees of $216,315, $5,640, $1,730, $3,050 and
$1, respectively.
|
| For the
Year Ended August 31, 2000 |
For the
Seven Months Ended August 31, 1999 |
For the
Period Ended January 31, 1999 (a) |
||||||||
|---|---|---|---|---|---|---|---|---|---|---|
| From operations: | ||||||||||
| Net investment income (loss) | $ 68,625 | $ 400,829 | $ (172,676 | ) | ||||||
| Net realized gain from investment, futures and foreign currency related transactions | 13,509,776 | 1,981,969 | 1,555,106 | |||||||
| Net change in unrealized gain (loss) on investments, futures and translation of assets
and liabilities denominated in foreign currencies |
4,489,515 | (5,072,876 | ) | 9,275,274 | ||||||
| Net increase (decrease) in net assets resulting from operations | 18,067,916 | (2,690,078 | ) | 10,657,704 | ||||||
| Distributions to shareholders: | ||||||||||
| From net realized gains | ||||||||||
| Class A Shares | (4,552,387 | ) | — | — | ||||||
| Class B Shares | (85,427 | ) | — | — | ||||||
| Class C Shares | (18,441 | ) | — | — | ||||||
| Institutional Shares | (214,659 | ) | — | — | ||||||
| Service Shares | (105 | ) | — | — | ||||||
| Total distributions to shareholders | (4,871,019 | ) | — | — | ||||||
| From share transactions: | ||||||||||
| Proceeds from sales of shares | 92,017,420 | 30,108,519 | 65,352,139 | |||||||
| Reinvestment of dividends and distributions | 4,698,363 | — | — | |||||||
| Cost of shares repurchased | (31,390,674 | ) | (20,233,820 | ) | (1,098,018 | ) | ||||
| Net increase in net assets resulting from share transactions | 65,325,109 | 9,874,699 | 64,254,121 | |||||||
| TOTAL INCREASE | 78,522,006 | 7,184,621 | 74,911,825 | |||||||
| Net assets: | ||||||||||
| Beginning of period | $ 82,096,446 | 74,911,825 | — | |||||||
| End of period | $160,618,452 | $82,096,446 | $74,911,825 | |||||||
| Accumulated undistributed (distribution in excess of) net investment income | $ (1,170,986 | ) | $ — | $ (175,403 | ) | |||||
(a)
|
Commencement date of operations was October 1, 1998 for all share classes.
|
| 1. ORGANIZATION
|
| Goldman Sachs Trust (the “Trust”) is a Delaware business trust registered under the Investment Company Act of 1940 (as
amended) as an open-end, management investment company. The Trust includes the Goldman Sachs European Equity Fund (the “Fund”). The Fund is a diversified portfolio offering five classes of shares — Class A, Class B, Class C,
Institutional and Service.
|
| 2. SIGNIFICANT ACCOUNTING POLICIES
|
| The following is a summary of the significant accounting policies consistently followed by the Fund. The preparation of financial
statements in conformity with generally accepted accounting principles requires management to make estimates and assumptions that may affect the reported amounts. Actual results could differ from those estimates. Effective for fiscal year 1999, the Board
of Trustees approved a change in the fiscal year end of the Fund from January 31 to August 31. Accordingly, the Statements of Changes in Net Assets, Summary of Share Transactions, and Financial Highlights of the Fund are included for the seven months
ended August 31, 1999 and the year ended January 31, 1999.
|
| A. Investment Valuation — Investments in
securities traded on a U.S. or foreign securities exchange or the NASDAQ system are valued daily at their last sale price on the principal exchange on which they are traded. If no sale occurs, securities are valued at the last bid price. Debt securities
are valued at prices supplied by independent pricing services, broker/dealer-supplied valuations or matrix pricing systems. Unlisted equity and debt securities for which market quotations are available are valued at the last sale price on valuation date
or, if no sale occurs, at the last bid price. Short-term debt obligations maturing in sixty days or less are valued at amortized cost, which approximates market value. Securities for which quotations are not readily available are valued at fair value
using methods approved by the Board of Trustees of the Trust.
|
| B. Security Transactions and Investment Income — Security transactions are recorded as of the trade date. Realized gains and losses on sales of portfolio securities are calculated using the identified-cost basis. Dividend income is recorded on the ex-dividend date, net of foreign withholding taxes
where applicable. Dividends for which the Fund has the choice to receive either cash or stock are recognized as investment income in an amount equal to the cash dividend. Interest income is recorded on the basis of interest accrued, premium amortized and
discount earned.
|
| Net investment income (other than class specific expenses) and unrealized and
realized gains or losses are allocated daily to each class of shares of the Fund based upon the relative proportion of net assets of each class.
|
| C. Federal Taxes — It is the Fund’s
policy to comply with the requirements of the Internal Revenue Code applicable to regulated investment companies and to distribute each year substantially all of its investment company taxable income and capital gains to its shareholders. Accordingly, no
federal tax provision is required. Income and capital gains distributions, if any, are declared and paid annually.
|
| The characterization of distributions to shareholders for financial reporting
purposes is determined in accordance with income tax rules. Therefore, the source of the Fund’s distributions may be shown in the accompanying financial statements as either from or in excess of net investment income or net realized gain on
investment transactions, or from paid-in capital, depending on the type of book/tax differences that may exist.
|
| At August 31, 2000, the aggregate cost of portfolio securities for federal income
tax purposes is $153,412,756. Accordingly, the gross unrealized gain on investments was $16,786,328 and the gross unrealized loss on investments was $8,040,677 resulting in a net unrealized gain of $8,745,651.
|
| 2. SIGNIFICANT ACCOUNTING POLICIES (continued)
|
| D. Expenses — Expenses incurred by the
Trust which do not specifically relate to an individual Fund of the Trust are allocated to the Funds based on a straight-line or pro rata basis depending upon the nature of the expense.
|
| Class A, Class B and Class C Shares bear all expenses and fees relating to their
respective Distribution and Service Plans. Shareholders of Service Shares bear all expenses and fees paid to service organizations. Each class of shares separately bears its respective class-specific Transfer Agency fees.
|
| E. Foreign Currency Translations — The
books and records of the Fund are maintained in U.S. dollars. Amounts denominated in foreign currencies are translated into U.S. dollars on the following basis: (i) investment valuations, foreign currency and other assets and liabilities initially
expressed in foreign currencies are converted each business day into U.S. dollars based on current exchange rates; (ii) purchases and sales of foreign investments, income and expenses are converted into U.S. dollars based on currency exchange rates
prevailing on the respective dates of such transactions.
|
| Net realized and unrealized gain (loss) on foreign currency transactions will
represent: (i) foreign exchange gains and losses from the sale and holdings of foreign currencies; (ii) currency gains and losses between trade date and settlement date on investment securities transactions and forward exchange contracts; and (iii) gains
and losses from the difference between amounts of dividends, interest and foreign withholding taxes recorded and the amounts actually received.
|
| F. Segregation Transactions — The Fund may
enter into certain derivative transactions to seek to increase total return. Forward foreign currency exchange contracts, futures contracts, written options, when-issued securities and forward commitments represent examples of such transactions. As a
result of entering into these transactions, the Fund is required to segregate liquid assets on the accounting records equal to or greater than the market value of the corresponding transactions.
|
| 3. AGREEMENTS
|
| Pursuant to the Investment Management Agreement (the “Agreement”), Goldman Sachs Asset Management International (“
GSAMI”), an affiliate of Goldman, Sachs & Co. (“Goldman Sachs”), serves as the investment adviser to the Fund. Under the Agreement, GSAMI, subject to the general supervision of the Trust’s Board of Trustees, manages the Fund’s
portfolio. As compensation for the services rendered under the Agreement, the assumption of the expenses related thereto and administering the Fund’s business affairs, including providing facilities, GSAMI is entitled to a fee, computed daily and
payable monthly, at an annual rate equal to 1.00% of the average daily net assets of the Fund.
|
| The investment adviser has voluntarily agreed to limit certain “Other
Expenses” (excluding Management fees, Distribution and Service fees, Transfer Agent fees, taxes, interest, brokerage, litigation, Service Share fees, indemnification costs and other extraordinary expenses) to the extent such expenses exceed, on an
annual basis, 0.10% of the average daily net assets of the Fund. Goldman Sachs reimbursed approximately $401,000 for the year ended August 31, 2000. In addition, the Fund has entered into certain offset arrangements with the custodian resulting in a
reduction in the Fund’s expenses. For the year ended August 31, 2000, custody fees were reduced by approximately $75,000.
|
| The Trust on behalf of the Fund, has adopted Distribution and Service Plans. Under
the Distribution and Service Plans, Goldman Sachs and/or authorized dealers are entitled to a monthly fee from the Fund for distribution and shareholder maintenance services equal, on an annual basis, to 0.50%, 1.00%, and 1.00% of the Fund’s average
daily net assets attributable to Class A, Class B and Class C Shares, respectively.
|
| Goldman Sachs serves as the distributor of shares of the Fund pursuant to a
Distribution Agreement. Goldman Sachs may receive a portion of the Class A sales load and Class B and Class C contingent deferred sales charges and has advised the Fund that it retained approximately $579,000 for the year ended August 31, 2000.
|
| Goldman Sachs also serves as the Transfer Agent of the Fund for a fee. The fees
charged for such transfer agency services are calculated daily and payable monthly at an annual rate as follows: 0.19% of average daily net assets for Class A, Class B and Class C Shares and 0.04% of average daily net assets for Institutional and Service
Shares.
|
| 3. AGREEMENTS (continued)
|
| The Trust, on behalf of the Fund, has adopted a Service Plan. This Plan allows for
Service Shares to compensate service organizations for providing varying levels of account administration and shareholder liaison services to their customers who are beneficial owners of such shares. The Service Plan provides for compensation to the
service organizations in an amount up to 0.50% (on an annualized basis), of the average daily net asset value of the Service Shares.
|
| As of August 31, 2000, the amounts owed to affiliates were approximately $134,000,
$64,000 and $24,000 for Management, Distribution and Service, and Transfer Agent fees, respectively.
|
| 4. PORTFOLIO SECURITIES TRANSACTIONS
|
| The cost of purchases and proceeds of sales and maturities of securities (excluding short-term investments and futures) for the
year ended August 31, 2000, were $164,598,174 and $114,086,346, respectively. For the year ended August 31, 2000, Goldman Sachs earned approximately $12,000 of brokerage commissions from futures transactions executed on behalf of the Fund.
|
| Forward Foreign Currency Exchange Contracts — The
Fund may enter into forward foreign currency exchange contracts for the purchase or sale of a specific foreign currency at a fixed price on a future date as a hedge or cross-hedge against either specific transactions or portfolio positions. The Fund may
also purchase and sell such contracts to seek to increase total return. All commitments are “marked-to-market” daily at the applicable translation rates and any resulting unrealized gains or losses are recorded in the Fund’s financial
statements. The Fund realizes gains or losses at the time a forward contract is offset by entry into a closing transaction or extinguished by the delivery of the currency. Risks may arise upon entering these contracts from the potential inability of
counterparties to meet the terms of their contracts and from unanticipated movements in the value of a foreign currency relative to the U.S. dollar.
|
| At August 31, 2000, forward foreign currency exchange contracts were as follows:
|
| Value on
Settlement Date |
Current Value | Unrealized |
|||||||
|---|---|---|---|---|---|---|---|---|---|
| Open Forward Foreign Currency
Purchase Contracts |
Gain | Loss | |||||||
| British Pounds | |||||||||
| expiring 9/14/2000 | $1,049,390 | $1,004,399 | $ — | $44,991 | |||||
| expiring 9/14/2000 | 1,042,004 | 997,142 | — | 44,862 | |||||
| TOTAL OPEN FORWARD FOREIGN CURRENCY
PURCHASE CONTRACTS |
$2,091,394 | $2,001,541 | $ — | $89,853 | |||||
| Value on
Settlement Date |
Current Value | Unrealized |
|||||||
| Open Forward Foreign Currency
Sale Contracts |
Gain | Loss | |||||||
| Euro | |||||||||
| expiring 10/31/2000 | $1,978,000 | $1,968,466 | $ 9,534 | $ — | |||||
| expiring 10/31/2000 | 1,978,000 | 1,939,022 | 38,978 | — | |||||
| British Pounds | |||||||||
| expiring 9/14/2000 | 2,056,413 | 1,981,220 | 75,193 | — | |||||
| TOTAL OPEN FORWARD FOREIGN CURRENCY
SALE CONTRACTS |
$6,012,413 | $5,888,708 | $123,705 | $ — | |||||
| 4. PORTFOLIO SECURITIES TRANSACTIONS (continued)
|
| Foreign Currency
Cross Contracts (Purchase/Sale) |
Purchase
Current Value |
Sale
Current Value |
Realized |
||||||
|---|---|---|---|---|---|---|---|---|---|
| Gain | Loss | ||||||||
| Euro/British Pounds | |||||||||
| expiring 9/14/2000 | $ 2,038,789 | $ 1,888,513 | $ — | $150,276 | |||||
| expiring 9/14/2000 | 964,292 | 1,035,284 | 70,992 | — | |||||
| expiring 9/14/2000 | 1,015,177 | 955,037 | — | 60,140 | |||||
| expiring 9/14/2000 | 955,037 | 1,024,223 | 69,186 | — | |||||
| expiring 9/14/2000 | 966,714 | 1,038,778 | 72,064 | — | |||||
| British Pounds/Euro | |||||||||
| expiring 9/14/2000 | 1,981,221 | 2,038,789 | 57,568 | — | |||||
| expiring 9/14/2000 | 1,035,285 | 990,610 | — | 44,675 | |||||
| expiring 9/14/2000 | 978,637 | 1,015,177 | 36,540 | — | |||||
| expiring 9/14/2000 | 1,024,222 | 982,163 | — | 42,059 | |||||
| expiring 9/14/2000 | 1,038,778 | 997,142 | — | 41,636 | |||||
| TOTAL FOREIGN CURRENCY CROSS CONTRACTS | $11,998,152 | $11,965,716 | $306,350 | $338,786 | |||||
| The contractual amounts of forward foreign currency exchange contracts do not
necessarily represent the amounts potentially subject to risk. The measurement of the risks associated with these instruments is meaningful only when all related and offsetting transactions are considered. At August 31, 2000, the Fund had sufficient cash
and securities to cover any commitments under these contracts.
|
| Futures Contracts — The Fund may enter into futures
transactions to hedge against changes in interest rates, securities prices, currency exchange rates or to seek to increase total return. Upon entering into a futures contract, the Fund is required to deposit with a broker or the Fund’s custodian
bank, an amount of cash or securities equal to the minimum “initial margin” requirement of the associated futures exchange. Subsequent payments for futures contracts (“variation margin”) are paid or received by the Fund, depending on
the fluctuations in the value of the contracts, and are recorded for financial reporting purposes as unrealized gains or losses. When contracts are closed, the Fund realizes a gain or loss which is reported in the Statement of Operations.
|
| The use of futures contracts involve, to varying degrees, elements of market risk
which may exceed the amounts recognized in the Statement of Assets and Liabilities. Changes in the value of the futures contracts may not directly correlate with changes in the value of the underlying securities. This risk may decrease the effectiveness
of the Fund’s hedging strategies and potentially result in a loss.
|
| At August 31, 2000, open futures contracts were as follows:
|
| Type | Number of
Contracts Long |
Settlement Month | Market Value | Unrealized loss | |||||
|---|---|---|---|---|---|---|---|---|---|
| Dow Jones Euro Stoxx 50 | 118 | September 2000 | $5,419,998 | $27,908 | |||||
| 5. LINE OF CREDIT FACILITY
|
| Effective May 31, 2000, the Fund participates in a $350,000,000 committed, unsecured revolving line of credit facility. Prior
thereto, the Fund participated in a $250,000,000 uncommitted and a $250,000,000 committed, unsecured revolving line of credit facility. Under the most restrictive arrangement, the Fund must own securities having a market value in excess of 400% of the
total bank borrowings. This facility is to be used solely for temporary or emergency purposes. The interest rate on borrowings is based on the Federal Funds rate. The committed facility also requires a fee to be paid by the Fund based on the amount of the
commitment which has not been utilized. During the year ended August 31, 2000, the Fund did not have any borrowings under any of these facilities.
|
| 6. CHANGE IN INDEPENDENT ACCOUNTANTS
|
| On October 26, 1999 the Board of Trustees of the Fund upon the recommendation of the Board’s audit committee, determined not
to retain Arthur Andersen LLP and approved a change of the Fund’s independent accountants to PricewaterhouseCoopers LLP. For the periods ended August 31, 1999 and January 31, 1999, Arthur Andersen LLP’s audit reports contained no adverse opinion
or disclaimer of opinion; nor were their reports qualified or modified as to uncertainty, audit scope, or accounting principles. Further, there were no disagreements between the Fund and Arthur Andersen LLP on accounting principles or practices, financial
statement disclosure or audit scope or procedure, which if not resolved to the satisfaction of Arthur Andersen LLP would have caused them to make reference to the disagreement in their reports.
|
| 7. CERTAIN RECLASSIFICATIONS
|
| In accordance with AICPA Statement of Position 93-2, the Fund reclassified $1,239,611 from accumulated undistributed net
investment income to accumulated net realized gain from investment and foreign currency related transactions and $375 from paid-in capital to accumulated net realized gain from investment, futures and foreign currency related transactions. These
reclassifications have no impact on the net asset value of the Fund and are designed to present the Fund’s capital accounts on a tax basis. Reclassifications result primarily from the difference in the tax treatment of foreign currency, net operating
losses and organization costs.
|
| 8. SUMMARY OF SHARE TRANSACTIONS
|
| Share activity is as follows:
|
| For the Year Ended
August 31, 2000 |
For the Seven Months Ended
August 31, 1999 |
For the Period Ended
January 31, 1999 (a) |
|||||||||||||||||
|---|---|---|---|---|---|---|---|---|---|---|---|---|---|---|---|---|---|---|---|
| Shares | Dollars | Shares | Dollars | Shares | Dollars | ||||||||||||||
| Class A Shares | |||||||||||||||||||
| Shares sold | 5,326,777 | $ 74,566,934 | 2,119,807 | $24,745,494 | 5,087,352 | $53,619,415 | |||||||||||||
| Reinvestment of dividends and distributions | 337,798 | 4,394,755 | — | — | — | — | |||||||||||||
| Shares repurchased | (1,904,482 | ) | (26,514,624 | ) | (759,657 | ) | (8,753,714 | ) | (76,377 | ) | (844,311 | ) | |||||||
| 3,760,093 | 52,447,065 | 1,360,150 | 15,991,780 | 5,010,975 | 52,775,104 | ||||||||||||||
| Class B Shares | |||||||||||||||||||
| Shares sold | 312,710 | 4,322,812 | 53,116 | 627,367 | 35,445 | 410,945 | |||||||||||||
| Reinvestment of dividends and distributions | 6,038 | 78,135 | — | — | — | — | |||||||||||||
| Shares repurchased | (62,406 | ) | (846,347 | ) | (13,524 | ) | (156,078 | ) | — | — | |||||||||
| 256,342 | 3,554,600 | 39,592 | 471,289 | 35,445 | 410,945 | ||||||||||||||
| Class C Shares | |||||||||||||||||||
| Shares sold | 96,303 | 1,362,429 | 148,372 | 1,718,395 | 48,110 | 570,630 | |||||||||||||
| Reinvestment of dividends and distributions | 924 | 11,976 | — | — | — | — | |||||||||||||
| Shares repurchased | (22,323 | ) | (291,955 | ) | (163,394 | ) | (1,909,241 | ) | — | — | |||||||||
| 74,904 | 1,082,450 | (15,022 | ) | (190,846 | ) | 48,110 | 570,630 | ||||||||||||
| Institutional Shares | |||||||||||||||||||
| Shares sold | 824,255 | 11,763,455 | 254,200 | 3,017,263 | 1,062,367 | 10,749,551 | |||||||||||||
| Reinvestment of dividends and distributions | 16,264 | 213,392 | — | — | — | — | |||||||||||||
| Shares repurchased | (299,728 | ) | (3,735,818 | ) | (791,417 | ) | (9,414,787 | ) | (20,593 | ) | (253,707 | ) | |||||||
| 540,791 | 8,241,029 | (537,217 | ) | (6,397,524 | ) | 1,041,774 | 10,495,844 | ||||||||||||
| Service Shares | |||||||||||||||||||
| Shares sold | 148 | 1,790 | — | — | 160 | 1,598 | |||||||||||||
| Reinvestment of dividends and distributions | 8 | 105 | — | — | — | — | |||||||||||||
| Shares repurchased | (160 | ) | (1,930 | ) | — | — | — | — | |||||||||||
| (4 | ) | (35 | ) | — | — | 160 | 1,598 | ||||||||||||
| NET INCREASE | 4,632,126 | $ 65,325,109 | 847,503 | $ 9,874,699 | 6,136,464 | $64,254,121 | |||||||||||||
(a)
|
Commencement date of operations was October 1, 1998 for all share classes.
|
| Income from
investment operations |
Distributions to
shareholders |
|||||||||||||||||
|---|---|---|---|---|---|---|---|---|---|---|---|---|---|---|---|---|---|---|
| Net asset
value, beginning of period |
Net
investment income (loss) |
Net realized
and unrealized gain (loss) |
Total from
investment operations |
From net
realized gains |
Total
distributions |
|||||||||||||
| FOR THE YEAR ENDED AUGUST 31, | ||||||||||||||||||
| 2000 - Class A Shares | $11.75 | $ — | (c) | $ 2.78 | $ 2.78 | $(0.71 | ) | $(0.71 | ) | |||||||||
| 2000 - Class B Shares | 11.71 | (0.04 | ) (c) | 2.73 | 2.69 | (0.71 | ) | (0.71 | ) | |||||||||
| 2000 - Class C Shares | 11.72 | (0.04 | ) (c) | 2.75 | 2.71 | (0.71 | ) | (0.71 | ) | |||||||||
| 2000 - Institutional Shares | 11.82 | 0.10 | (c) | 2.79 | 2.89 | (0.71 | ) | (0.71 | ) | |||||||||
| 2000 - Service Shares | 11.76 | 0.01 | (c) | 2.80 | 2.81 | (0.71 | ) | (0.71 | ) | |||||||||
| FOR THE SEVEN MONTHS ENDED AUGUST 31, | ||||||||||||||||||
| 1999 - Class A Shares | 12.20 | 0.05 | (0.50 | ) | (0.45 | ) | — | — | ||||||||||
| 1999 - Class B Shares | 12.19 | 0.03 | (0.51 | ) | (0.48 | ) | — | — | ||||||||||
| 1999 - Class C Shares | 12.20 | 0.04 | (0.52 | ) | (0.48 | ) | — | — | ||||||||||
| 1999 - Institutional Shares | 12.23 | 0.18 | (0.59 | ) | (0.41 | ) | — | — | ||||||||||
| 1999 - Service Shares | 12.20 | 0.08 | (0.52 | ) | (0.44 | ) | — | — | ||||||||||
| FOR THE PERIOD ENDED JANUARY 31, | ||||||||||||||||||
| 1999 - Class A Shares (commenced October 1, 1998) | 10.00 | (0.03 | ) | 2.23 | 2.20 | — | — | |||||||||||
| 1999 - Class B Shares (commenced October 1, 1998) | 10.00 | (0.02 | ) | 2.21 | 2.19 | — | — | |||||||||||
| 1999 - Class C Shares (commenced October 1, 1998) | 10.00 | (0.01 | ) | 2.21 | 2.20 | — | — | |||||||||||
| 1999 - Institutional Shares (commenced October 1, 1998) | 10.00 | (0.01 | ) | 2.24 | 2.23 | — | — | |||||||||||
| 1999 - Service Shares (commenced October 1, 1998) | 10.00 | (0.03 | ) | 2.23 | 2.20 | — | — | |||||||||||
(a)
|
Assumes investment at the net asset value at the beginning of the period, reinvestment of all dividends and distributions, a
complete redemption of the investment at the net asset value at the end of the period and no sales or redemption charges. Total return would be reduced if a sales or redemption charge were taken into account. Total returns for periods less than one full
year are not annualized.
|
(b)
|
Annualized.
|
(c)
|
Calculated based on the average shares outstanding methodology.
|
| Goldman Sachs European Equity Fund — Tax Information (unaudited)
|
| For the distribution paid during the year ended August 31, 2000, the total amount of
income received by the European Equity Fund from sources within foreign countries and possessions of the United States was $0.1615 per share all of which is attributable to qualified passive income. The total amount of taxes paid by the Fund to such
countries was $0.0203 per share. A separate notice containing the country by country components of these totals has been previously mailed to the shareholders.
|
| Pursuant to Section 852 of the Internal Revenue Code, the Fund designated $416,379 as
capital gains dividends paid during its year ended August 31, 2000.
|
|
Ratios assuming no expense reductions |
|||||||||||||||||||||
|---|---|---|---|---|---|---|---|---|---|---|---|---|---|---|---|---|---|---|---|---|---|
| Net asset
value, end of period |
Total
return (a) |
Net assets
at end of period (in 000s) |
Ratio of
net expenses to average net assets |
Ratio of
net investment income (loss) to average net assets |
Ratio of
expenses to average net assets |
Ratio of
net investment income (loss) to average net assets |
Portfolio
turnover rate |
||||||||||||||
| $13.82 | 24.04 | % | $139,966 | 1.79 | % | 0.02 | % | 2.17 | % | (0.36 | )% | 98.10 | % | ||||||||
| 13.69 | 23.32 | 4,538 | 2.29 | (0.27 | ) | 2.67 | (0.65 | ) | 98.10 | ||||||||||||
| 13.72 | 23.48 | 1,482 | 2.29 | (0.26 | ) | 2.67 | (0.64 | ) | 98.10 | ||||||||||||
| 14.00 | 24.85 | 14,630 | 1.14 | 0.70 | 1.52 | 0.32 | 98.10 | ||||||||||||||
| 13.86 | 24.28 | 2 | 1.64 | 0.09 | 2.02 | (0.29 | ) | 98.10 | |||||||||||||
| 11.75 | (3.69 | ) | 74,862 | 1.79 | (b) | 0.80 | (b) | 2.29 | (b) | 0.30 | (b) | 54.98 | |||||||||
| 11.71 | (3.94 | ) | 879 | 2.29 | (b) | 0.43 | (b) | 2.79 | (b) | (0.07 | ) (b) | 54.98 | |||||||||
| 11.72 | (3.93 | ) | 388 | 2.29 | (b) | 0.42 | (b) | 2.79 | (b) | (0.08 | ) (b) | 54.98 | |||||||||
| 11.82 | (3.35 | ) | 5,965 | 1.14 | (b) | 1.53 | (b) | 1.64 | (b) | 1.03 | (b) | 54.98 | |||||||||
| 11.76 | (3.61 | ) | 2 | 1.64 | (b) | 1.10 | (b) | 2.14 | (b) | 0.60 | (b) | 54.98 | |||||||||
| 12.20 | 22.00 | 61,151 | 1.79 | (b) | (1.19 | ) (b) | 2.80 | (b) | (2.20 | ) (b) | 70.77 | ||||||||||
| 12.19 | 21.90 | 432 | 2.29 | (b) | (1.78 | ) (b) | 3.30 | (b) | (2.79 | ) (b) | 70.77 | ||||||||||
| 12.20 | 22.00 | 587 | 2.29 | (b) | (1.83 | ) (b) | 3.30 | (b) | (2.84 | ) (b) | 70.77 | ||||||||||
| 12.23 | 22.30 | 12,740 | 1.14 | (b) | (0.33 | ) (b) | 2.15 | (b) | (1.34 | ) (b) | 70.77 | ||||||||||
| 12.20 | 22.00 | 2 | 1.64 | (b) | (0.69 | ) (b) | 2.65 | (b) | (1.70 | ) (b) | 70.77 | ||||||||||
| To the Shareholders and Board of Trustees of
|
| Goldman Sachs Trust — European Equity Fund:
|
| In our opinion, the accompanying statement of assets and liabilities, including the statement of investments, and the related
statements of operations and of changes in net assets and the financial highlights present fairly, in all material respects, the financial position of Goldman Sachs European Equity Fund (“the Fund”), one of the portfolios constituting Goldman
Sachs Trust, at August 31, 2000, the results of its operations, the changes in its net assets and the financial highlights for the year then ended, in conformity with accounting principles generally accepted in the United States of America. These
financial statements and financial highlights (hereafter referred to as “financial statements”) are the responsibility of the Fund’s management; our responsibility is to express an opinion on these financial statements based on our audit.
We conducted our audit of these financial statements in accordance with auditing standards generally accepted in the United States of America, which require that we plan and perform the audit to obtain reasonable assurance about whether the financial
statements are free of material misstatement. An audit includes examining, on a test basis, evidence supporting the amounts and disclosures in the financial statements, assessing the accounting principles used and significant estimates made by management,
and evaluating the overall financial statement presentation. We believe that our audit, which included confirmation of securities at August 31, 2000 by correspondence with the custodian and brokers, provides a reasonable basis for our opinion. The
statements of changes in net assets and the financial highlights of the Fund for the periods ended August 31, 1999 and January 31, 1999 were audited by other independent accountants whose report dated October 8, 1999 expressed an unqualified opinion thereon
.
|
| PricewaterhouseCoopers LLP
|
| Boston, Massachusetts
|
| October 23, 2000
|
| Shares | Description | Value | ||
|---|---|---|---|---|
| Common Stocks – 96.3% | ||||
| Japan – 96.3% | ||||
| 91,000 | 77 Bank Ltd. (Banks) | $ 708,204 | ||
| 8,000 | ABLE, Inc. (Real Estate) | 135,021 | ||
| 13,000 | Advantest Corp. (Electronics
Equipment) |
2,651,196 | ||
| 8,700 | Aiful Corp. (Financial Services) | 750,492 | ||
| 303,000 | Asahi Chemical Industry Co. Ltd.
(Chemicals) |
1,894,993 | ||
| 213,000 | Asahi Glass Co. Ltd. (Building
Materials) |
1,991,196 | ||
| 51,000 | Bridgestone Corp. (Auto) | 659,916 | ||
| 62,000 | Canon, Inc. (Computer Hardware) | 2,772,996 | ||
| 176,000 | Chiba Bank Ltd. (Banks) | 719,512 | ||
| 135,000 | Dai-Ichi Kangyo Bank Ltd. (Banks) | 1,024,051 | ||
| 132,000 | Daiwa Securities Group, Inc.
(Financial Services) |
1,646,132 | ||
| 147 | DDI Corp. (Telecommunications) | 1,157,806 | ||
| 172 | East Japan Railway Co. (Railroads) | 935,396 | ||
| 18,000 | Eisai Co. Ltd. (Drugs) | 543,460 | ||
| 12,600 | FANUC Ltd. (Machinery) | 1,370,464 | ||
| 48,000 | Fuji Photo Film Ltd. (Leisure) | 1,719,269 | ||
| 114,000 | Fujitec Co. Ltd. (Construction) | 1,047,539 | ||
| 51,000 | Fujitsu Ltd. (Computer Hardware) | 1,477,637 | ||
| 16,000 | Honda Motor Co. Ltd. (Auto) | 585,091 | ||
| 800 | Ito En Ltd. (Food & Beverage) | 59,259 | ||
| 174,000 | Kanebo Ltd. * (Consumer Products) | 512,293 | ||
| 128,000 | Kaneka Corp. (Chemicals) | 1,411,421 | ||
| 69,000 | Kao Corp. (Consumer Products) | 1,895,640 | ||
| 4,500 | Keyence Corp. (Industrial Parts) | 1,493,671 | ||
| 129,000 | Kirin Brewery Ltd. (Food &
Beverage) |
1,415,190 | ||
| 85,000 | Kokuyo Co. Ltd. (Specialty Retail) | 1,467,276 | ||
| 9,200 | Kyocera Corp. (Electronics
Equipment) |
1,642,457 | ||
| 13,900 | Matsumotokyoshi (Specialty Retail) | 1,251,196 | ||
| 127,000 | Matsushita Electric Works Ltd.
(Construction) |
1,548,054 | ||
| 30,300 | Meitec Corp. (Business Services) | 1,400,647 | ||
| 176,000 | Minebea Co. (Electronics Equipment) | 2,277,356 | ||
| 53,600 | Ministop Co. Ltd. (Specialty Retail) | 1,191,111 | ||
| 67,000 | Mitsui Marine & Fire (Insurance) | 333,587 | ||
| 288,000 | Mitsui Mining & Smelting (Mining) | 2,281,857 | ||
| 11,000 | Murata Manufacturing Co. Ltd.
(Electronics Equipment) |
1,684,295 | ||
| 82,000 | NEC Corp. (Computer Hardware) | 2,345,054 | ||
| 75,000 | NGK Insulators Ltd. (Multi-Industrial) | 1,030,239 | ||
| 18,000 | Nihon Unisys Ltd. (Computer
Hardware) |
322,194 | ||
| 7,100 | Nintendo Co. Ltd. (Entertainment) | 1,227,604 | ||
| 103,000 | Nippon Mining & Metals Co. Ltd.
(Mining) |
577,534 | ||
| 200 | Nippon Telephone & Telegraph Corp.
(Telecommunications) |
2,381,622 | ||
| 259 | NTT Mobile Communications
Network, Inc. (Telecommunications) |
6,848,383 | ||
| 111,000 | Ricoh Co. Ltd. (Computer Hardware) | 1,941,069 | ||
| 9,200 | Rohm Co. (Electronics Equipment) | 2,618,097 | ||
| Shares | Description | Value | |||
|---|---|---|---|---|---|
| Common Stocks – (continued) | |||||
| Japan – (continued) | |||||
| 9,500 | Ryohin Keikaku Co. Ltd. (Specialty
Retail) |
$ 917,487 | |||
| 130,000 | Sanwa Bank (Banks) | 1,229,911 | |||
| 161,000 | Sanyo Electric Co. Ltd. (Electrical
Equipment) |
1,366,198 | |||
| 18,500 | Sato Corp. (Electronics Equipment) | 464,885 | |||
| 126,000 | Sharp Corp. (Electrical Equipment) | 2,007,257 | |||
| 34,000 | Shin-Etsu Chemical Co. Ltd.
(Chemicals) |
1,670,511 | |||
| 41,000 | Skylark Co. Ltd. (Restaurants) | 1,499,297 | |||
| 6,600 | SMC Corp. (Machinery) | 1,169,620 | |||
| 19,600 | Sony Corp. (Electrical Equipment) | 2,186,967 | |||
| 106,000 | Sumitomo Bakelite (Chemicals) | 1,401,407 | |||
| 234,000 | Sumitomo Corp. (Wholesale) | 2,040,506 | |||
| 10,400 | Sumitomo Real Estate Sales Co. Ltd.
(Real Estate) |
408,589 | |||
| 4,800 | Taiyo Ink Manufacturing Co. Ltd.
(Chemicals) |
280,844 | |||
| 37,000 | Takeda Chemical Industries Ltd.
(Drugs) |
2,189,123 | |||
| 14,800 | Takefuji Corp. (Financial Services) | 1,455,715 | |||
| 43,600 | Terumo Corp. (Medical Products) | 1,206,001 | |||
| 252,000 | The Daiwa Bank Ltd. (Banks) | 633,249 | |||
| 71,000 | The Fuji Bank Ltd. (Banks) | 539,906 | |||
| 75,000 | The Nomura Securities Co. Ltd.
(Financial Services) |
1,754,571 | |||
| 97,000 | The Sumitomo Marine & Fire
Insurance Co. Ltd. (Insurance) |
583,000 | |||
| 126,000 | The Sumitomo Trust & Banking Co.
Ltd. (Banks) |
888,439 | |||
| 25,700 | THK Co. Ltd. (Machinery) | 1,214,515 | |||
| 6,500 | Toho Co. (Leisure) | 1,039,147 | |||
| 17,000 | Tokyo Broadcasting System, Inc.
(Media) |
608,908 | |||
| 69,000 | Tokyo Electric Power (Electrical
Utilities) |
1,543,038 | |||
| 61,500 | Toppan Forms Co. Ltd. (Publishing) | 1,300,352 | |||
| 38,000 | Toyoda Machine Works Ltd.
(Machinery) |
344,547 | |||
| 49,000 | Toyota Motor Corp. (Auto) | 2,131,833 | |||
| 128,000 | Tsubakimoto Chain Co. (Machinery) | 516,081 | |||
| 31,000 | Yamanouchi Pharmaceutical Co. Ltd.
(Drugs) |
1,534,740 | |||
| 60,000 | York-Benimaru Co. Ltd. (Specialty
Retail) |
1,409,284 | |||
| 630 | Yoshinoya D&C Co. Ltd.
(Restaurants) |
1,045,570 | |||
| TOTAL COMMON STOCKS | |||||
| (Cost $94,881,731) | $ 103,528,975 | ||||
| TOTAL INVESTMENTS | |||||
| (Cost $94,881,731) | $ 103,528,975 | ||||
*
|
Non-income producing security.
|
| The percentage shown for each investment category reflects the value of investments in that category as a percentage of total net
assets.
|
| As a % of
total net assets |
||||
|---|---|---|---|---|
| Common Stock Industry Classifications† | ||||
| Auto | 3.1 | % | ||
| Banks | 5.3 | |||
| Building Materials | 1.8 | |||
| Business Services | 1.3 | |||
| Chemicals | 6.2 | |||
| Computer Hardware | 8.2 | |||
| Construction | 2.4 | |||
| Consumer Products | 2.2 | |||
| Drugs | 4.0 | |||
| Electrical Equipment | 5.2 | |||
| Electrical Utilities | 1.4 | |||
| Electronics Equipment | 10.5 | |||
| Entertainment | 1.1 | |||
| Financial Services | 5.2 | |||
| Food & Beverage | 1.4 | |||
| Industrial Parts | 1.4 | |||
| Insurance | 0.9 | |||
| Leisure | 2.6 | |||
| Machinery | 4.3 | |||
| Media | 0.6 | |||
| Medical Products | 1.1 | |||
| Mining | 2.7 | |||
| Multi-Industrial | 1.0 | |||
| Publishing | 1.2 | |||
| Railroads | 0.9 | |||
| Real Estate | 0.5 | |||
| Restaurants | 2.4 | |||
| Specialty Retail | 5.8 | |||
| Telecommunications | 9.7 | |||
| Wholesale | 1.9 | |||
| TOTAL COMMON STOCK | 96.3 | % | ||
†
|
Industry concentrations greater than one tenth of one percent are disclosed.
|
| Assets: | ||||||||
| Investment in securities, at value (identified cost $94,881,731) | $103,528,975 | |||||||
| Cash, at value | 2,068,527 | |||||||
| Receivables: | ||||||||
| Fund shares sold | 1,716,008 | |||||||
| Investment securities sold, at value | 845,913 | |||||||
| Reimbursement from investment adviser | 98,440 | |||||||
| Dividends and interest, at value | 41,737 | |||||||
| Forward foreign currency exchange contracts, at value | 17,180 | |||||||
| Deferred organization expenses, net | 8,334 | |||||||
| Other assets | 245 | |||||||
| Total assets | 108,325,359 | |||||||
| Liabilities: | ||||||||
| Payables: | ||||||||
| Investment securities purchased, at value | 511,018 | |||||||
| Amounts owed to affiliates | 138,153 | |||||||
| Fund shares repurchased | 74,498 | |||||||
| Accrued expenses and other liabilities, at value | 58,498 | |||||||
| Total liabilities | 782,167 | |||||||
| Net Assets: | ||||||||
| Paid-in capital | 94,465,512 | |||||||
| Accumulated net investment loss | (1,052,384 | ) | ||||||
| Accumulated net realized gain on investment and foreign currency related transactions | 5,471,371 | |||||||
| Net unrealized gain on investments and translation of assets and liabilities denominated in foreign currencies | 8,658,693 | |||||||
| NET ASSETS | $107,543,192 | |||||||
| Net asset value, offering and redemption price per share: (a) | ||||||||
| Class A | $15.77 | |||||||
| Class B | $15.63 | |||||||
| Class C | $15.58 | |||||||
| Institutional | $15.96 | |||||||
| Service | $15.83 | |||||||
| Shares outstanding: | ||||||||
| Class A | 4,423,243 | |||||||
| Class B | 370,078 | |||||||
| Class C | 272,645 | |||||||
| Institutional | 1,739,909 | |||||||
| Service | 167 | |||||||
| Total shares outstanding, $.001 par value (unlimited number of shares authorized) | 6,806,042 | |||||||
(a)
|
Maximum public offering price per share (NAV per share multiplied by 1.0582) for Class A Shares is $16.69. At redemption, Class B
and Class C Shares may be subject to a contingent deferred sales charge, assessed on the amount equal to the lesser of the current net asset value or the original purchase price of the shares.
|
| Investment income: | ||||||||
| Dividends (a) | $ 426,376 | |||||||
| Interest | 113,496 | |||||||
| Total income | 539,872 | |||||||
| Expenses: | ||||||||
| Management fees | 979,938 | |||||||
| Distribution and Service fees (b) | 396,755 | |||||||
| Custodian fees | 173,141 | |||||||
| Transfer Agent fees (c) | 141,640 | |||||||
| Registration fees | 73,024 | |||||||
| Professional fees | 43,905 | |||||||
| Trustee fees | 8,900 | |||||||
| Amortization of deferred organization expenses | 3,030 | |||||||
| Other | 105,419 | |||||||
| Total expenses | 1,925,752 | |||||||
| Less — expense reductions | (356,497 | ) | ||||||
| Net expenses | 1,569,255 | |||||||
| NET INVESTMENT LOSS | (1,029,383 | ) | ||||||
| Realized and unrealized gain (loss) on Investments, Futures and Foreign currency related transactions: | ||||||||
| Net realized gain (loss) from: | ||||||||
| Investment transactions | 9,773,012 | |||||||
| Futures transactions | 418,165 | |||||||
| Foreign currency related transactions | (18,530 | ) | ||||||
| Net change in unrealized gain (loss) on: | ||||||||
| Investments | (5,490,559 | ) | ||||||
| Futures | (20,305 | ) | ||||||
| Translation of assets and liabilities denominated in foreign currencies | (14,848 | ) | ||||||
| Net realized and unrealized gain on Investments, Futures and Foreign currency related transactions: | 4,646,935 | |||||||
| NET INCREASE IN NET ASSETS RESULTING FROM OPERATIONS | $3,617,552 | |||||||
(a)
|
Foreign taxes withheld on dividends were $74,254.
|
(b)
|
Class A, Class B and Class C had Distribution and Service fees of $286,204, $61,667 and $48,884, respectively.
|
(c)
|
Class A, Class B, Class C, Institutional Class and Service Class had Transfer Agent fees of $108,757, $11,717, $9,288, $11,878 and
$0, respectively.
|
| For the
Year Ended August 31, 2000 |
For the
Seven Months Ended August 31, 1999 |
For the
Period Ended January 31, 1999 (a) |
||||||||||||||||||||
|---|---|---|---|---|---|---|---|---|---|---|---|---|---|---|---|---|---|---|---|---|---|---|
| From operations: | ||||||||||||||||||||||
| Net investment loss | $ (1,029,383 | ) | $ (203,143 | ) | $ (86,973 | ) | ||||||||||||||||
| Net realized gain from investment, futures and foreign currency related transactions | 10,172,647 | 4,330,190 | 140,585 | |||||||||||||||||||
| Net change in unrealized gain (loss) on investments, futures and translation of assets
and liabilities denominated in foreign currencies |
(5,525,712 | ) | 12,242,725 | 1,941,680 | ||||||||||||||||||
| Net increase in net assets resulting from operations | 3,617,552 | 16,369,772 | 1,995,292 | |||||||||||||||||||
| Distributions to shareholders: | ||||||||||||||||||||||
| In excess of net investment income | ||||||||||||||||||||||
| Class A Shares | (473,037 | ) | (1,121 | ) | — | |||||||||||||||||
| Class B Shares | (63,355 | ) | — | — | ||||||||||||||||||
| Class C Shares | (65,248 | ) | (715 | ) | — | |||||||||||||||||
| Institutional Shares | (411,232 | ) | (1,768 | ) | (6,204 | ) | ||||||||||||||||
| Service Shares | (23 | ) | — | — | ||||||||||||||||||
| From net realized gain on investment, futures and foreign currency transactions | ||||||||||||||||||||||
| Class A Shares | (3,934,010 | ) | — | — | ||||||||||||||||||
| Class B Shares | (595,331 | ) | — | — | ||||||||||||||||||
| Class C Shares | (521,995 | ) | — | — | ||||||||||||||||||
| Institutional Shares | (2,840,673 | ) | — | — | ||||||||||||||||||
| Service Shares | (259 | ) | — | — | ||||||||||||||||||
| Total distributions to shareholders | (8,905,163 | ) | (3,604 | ) | (6,204 | ) | ||||||||||||||||
| From share transactions: | ||||||||||||||||||||||
| Proceeds from sales of shares | 103,614,398 | 29,653,297 | 23,719,687 | |||||||||||||||||||
| Reinvestment of dividends and distributions | 8,358,222 | 3,181 | — | |||||||||||||||||||
| Cost of shares repurchased | (63,935,353 | ) | (2,751,373 | ) | (4,186,512 | ) | ||||||||||||||||
| Net increase in net assets resulting from share transactions | 48,037,267 | 26,905,105 | 19,533,175 | |||||||||||||||||||
| TOTAL INCREASE | 42,749,656 | 43,271,273 | 21,522,263 | |||||||||||||||||||
| Net assets: | ||||||||||||||||||||||
| Beginning of period | 64,793,536 | 21,522,263 | — | |||||||||||||||||||
| End of period | $107,543,192 | $64,793,536 | $21,522,263 | |||||||||||||||||||
| Accumulated net investment income (loss) | $ (1,052,384 | ) | $ 270,409 | $ (34,385 | ) | |||||||||||||||||
(a)
|
Commencement date of operations was May 1, 1998 for all share classes.
|
| 1. ORGANIZATION
|
| Goldman Sachs Trust (the “Trust”) is a Delaware business trust registered under the Investment Company Act of 1940 (as
amended) as an open-end management investment company. The Trust includes the Goldman Sachs Japanese Equity Fund (the “Fund”). The Fund is a diversified portfolio offering five classes of shares — Class A, Class B, Class C,
Institutional and Service.
|
| 2. SIGNIFICANT ACCOUNTING POLICIES
|
| The following is a summary of the significant accounting policies consistently followed by the Fund. The preparation of financial
statements in conformity with generally accepted accounting principles requires management to make estimates and assumptions that may affect the reported amounts. Actual results could differ from those estimates. Effective for fiscal year 1999, the Board
of Trustees approved a change in the fiscal year end of the Fund from January 31 to August 31. Accordingly, the Statements of Changes in Net Assets, Summary of Share Transactions and Financial Highlights of the Fund include the seven months ended August
31, 1999 and the year ended January 31, 1999.
|
| A. Investment Valuation — Investments in
securities traded on a U.S. or foreign securities exchange or the NASDAQ system are valued daily at their last sale price on the principal exchange on which they are traded. If no sale occurs, securities are valued at the last bid price. Debt securities
are valued at prices supplied by independent pricing services, broker/dealer-supplied valuations or matrix pricing system. Unlisted equity and debt securities for which market quotations are available are valued at the last sale price on the valuation
date or, if no sale occurs the last bid price. Short-term debt obligations maturing in sixty days or less are valued at amortized cost, which approximates market value. Securities for which quotations are not readily available are valued at fair value
using methods approved by the Board of Trustees of the Trust.
|
| B. Security Transactions and Investment Income — Security transactions are recorded as of the trade date. Realized gains and losses on sales of portfolio securities are calculated using the identified-cost basis. Dividend income is recorded on the ex-dividend date net of foreign withholding taxes where
applicable. Dividends for which the Fund has the choice to receive either cash or stock are recognized as investment income in an amount equal to the cash dividend. Interest income is recorded on the basis of interest accrued, premium amortized and
discount earned.
|
| Net investment income (other than class specific expenses) and unrealized and
realized gains or losses are allocated daily to each class of shares of the Fund based upon the relative proportion of net assets of each class.
|
| C. Federal Taxes — It is the Fund’s
policy to comply with the requirements of the Internal Revenue Code applicable to regulated investment companies and to distribute each year substantially all of its investment company taxable income and capital gains to its shareholders. Accordingly, no
federal tax provision is required. Income and capital gain distributions, if any, are declared and paid annually.
|
| The characterization of distributions to shareholders for financial reporting
purposes is determined in accordance with income tax rules. Therefore, the source of the Fund’s distributions may be shown in the accompanying financial statements as either from or in excess of net investment income or net realized gain on
investment transactions, or from paid-in capital, depending on the type of book/tax differences that may exist.
|
| At August 31, 2000, the aggregate cost of portfolio securities for federal income
tax purposes is $95,541,798. Accordingly, the gross unrealized gain on investments was $10,179,863 and the gross unrealized loss on investments was $2,192,686 resulting in a net unrealized gain of $7,987,177.
|
| D. Expenses — Expenses incurred by the
Trust which do not specifically relate to an individual Fund of the Trust are allocated to the Funds based on a straight-line or prorata basis depending upon the nature of the expense.
|
| Class A, Class B and Class C Shares bear all expenses and fees relating to their
respective Distribution and Service Plans. Shareholders of Service Shares bear all expenses and fees paid to service organizations. Each class of shares separately bears its respective class-specific Transfer Agency fees.
|
| 2. SIGNIFICANT ACCOUNTING POLICIES (continued)
|
| E. Deferred Organization Expenses —
Organization-related costs are amortized on a straight-line basis over a period of five years.
|
| F. Foreign Currency Translations — The
books and records of the Fund are maintained in U.S. dollars. Amounts denominated in foreign currencies are translated into U.S. dollars on the following basis: (i) investment valuations, foreign currency and other assets and liabilities initially
expressed in foreign currencies are converted each business day into U.S. dollars based on current exchange rates; (ii) purchases and sales of foreign investments, income and expenses are converted into U.S. dollars based on currency exchange rates
prevailing on the respective dates of such transactions.
|
| Net realized and unrealized gain (loss) on foreign currency transactions will
represent: (i) foreign exchange gains and losses from the sale and holdings of foreign currencies; (ii) currency gains and losses between trade date and settlement date on investment securities transactions and forward exchange contracts; and (iii) gains
and losses from the difference between amounts of dividends, interest and foreign withholding taxes recorded and the amounts actually received.
|
| G. Segregation Transactions — The Fund may
enter into certain derivative transactions to seek to increase total return. Forward foreign currency exchange contracts, futures contracts, written options, mortgage dollar rolls, when-issued securities and forward commitments represent examples of such
transactions. As a result of entering into these transactions, the Fund is required to segregate liquid assets on the accounting records equal to or greater than the market value of the corresponding transactions.
|
| 3. AGREEMENTS
|
| Pursuant to the Investment Management Agreement (the “Agreement”), Goldman Sachs Asset Management International (“
GSAMI”), an affiliate of Goldman Sachs & Co. (“Goldman Sachs”) serves as the investment adviser to the Fund. Under the Agreement, GSAMI, subject to the general supervision of the Trust’s Board of Trustees, manages the Fund’s
portfolio. As compensation for the services rendered under the Agreement, the assumption of the expenses related thereto and administering the Fund’s business affairs, including providing facilities, GSAMI is entitled to a fee, computed daily and
payable monthly, at an annual rate equal to 1.00% of the average daily net assets of the Fund.
|
| The adviser has voluntarily agreed to limit certain “Other Expenses”
(excluding Management fees, Distribution and Service fees, Transfer Agent fees, Service Share fees, taxes, interest, brokerage, litigation, indemnification costs and other extraordinary expenses) to the extent such expenses exceed, on an annual basis,
0.11% (0.01% prior to May 1, 2000) of the average daily net assets of the Fund. For the year ended August 31, 2000, Goldman Sachs reimbursed approximately $353,000. In addition, the Fund has entered into certain offset arrangements with the custodian
resulting in a reduction in the Fund’s expenses. For the year ended August 31, 2000, custody fees were reduced by approximately $3,000.
|
| The Trust, on behalf of the Fund, had adopted Distribution and Service Plans.
Under the Distribution and Service Plans, Goldman Sachs and/or Authorized Dealers are entitled to a monthly fee from the Fund for distribution and shareholder maintenance services equal, on an annual basis, to 0.50%, 1.00% and 1.00% of the Fund’s
average daily net assets attributable to Class A, Class B and Class C Shares, respectively.
|
| Goldman Sachs serves as the distributor of shares of the Fund pursuant to a
Distribution Agreement. Goldman Sachs may receive a portion of the Class A sales load and Class B and Class C contingent deferred sales charges and has advised the Fund that it retained approximately $497,000 for the year ended August 31, 2000.
|
| Goldman Sachs also serves as the transfer agent of the Fund for a fee. The fees
charged for such transfer agent services are calculated daily and payable monthly at an annual rate as follows: 0.19% of average daily net assets for Class A, Class B and Class C Shares and 0.04% of average daily net assets for Institutional and Service
Shares.
|
| 3. AGREEMENTS (continued)
|
| The Trust, on behalf of the Fund, has adopted a Service Plan. This Plan allows for Service Shares to compensate service
organizations for providing varying levels of account administration and shareholder liaison services to their customers who are beneficial owners of such shares. The Service Plan provides for compensation to the service organizations in an amount up to
0.50% (on an annualized basis), of the average daily net asset value of the Service Shares.
|
| As of August 31, 2000, the amounts owed to affiliates were approximately $88,000, $37,000 and $13,000 for Management, Distribution
and Service and Transfer Agent fees, respectively.
|
| 4. PORTFOLIO SECURITIES TRANSACTIONS
|
| The cost of purchases and proceeds of sales or maturities of securities (excluding short-term investments and futures) for the
year ended August 31, 2000, were $95,360,487 and $54,626,277, respectively. For the year ended August 31, 2000, Goldman Sachs earned approximately $8,000 of brokerage commissions from portfolio transactions including futures transactions executed on
behalf of the Fund.
|
| Forward Foreign Currency Exchange Contracts — The
Fund may enter into forward foreign currency exchange contracts for the purchase or sale of a specific foreign currency at a fixed price on a future date as a hedge or cross-hedge against either specific transactions or portfolio positions. The Fund may
also purchase and sell such contracts to seek to increase total return. All commitments are “marked-to-market” daily at the applicable translation rates and any resulting unrealized gains or losses are recorded in the Fund’s financial
statements. The Fund records realized gains or losses at the time a forward contract is offset by entry into a closing transaction or extinguished by delivery of the currency. Risks may arise upon entering these contracts from the potential inability of
counterparties to meet the terms of their contracts and from unanticipated movements in the value of a foreign currency relative to the U.S. dollar.
|
| At August 31, 2000, the Fund had the following outstanding forward foreign currency exchange contracts:
|
| Unrealized |
|||||||||
|---|---|---|---|---|---|---|---|---|---|
| Open Forward Foreign Currency
Purchase Contracts |
Value on
Settlement Date |
Current
Value |
Gain | Loss | |||||
| Japanese Yen | |||||||||
| expiring 10/20/2000 | $ 16,801 | $ 17,180 | $ 379 | $— | |||||
| TOTAL OPEN FORWARD FOREIGN CURRENCY
PURCHASE CONTRACTS |
$ 16,801 | $ 17,180 | $ 379 | $— | |||||
| Closed but Unsettled | Purchase | Sale | Realized |
||||||
| Forward Foreign Currency Contracts | Value | Value | Gain | Loss | |||||
| Japanese Yen | |||||||||
| expiring 10/20/2000 | $1,456,199 | $1,473,000 | $16,801 | $— | |||||
| TOTAL CLOSED BUT UNSETTLED FORWARD
FOREIGN CURRENCY CONTRACTS |
$1,456,199 | $1,473,000 | $16,801 | $— | |||||
| 4. PORTFOLIO SECURITIES TRANSACTIONS (continued)
|
| The contractual amounts of forward foreign currency exchange contracts do not necessarily represent the amounts potentially
subject to risk. The measurement of the risks associated with these instruments is meaningful only when all related and offsetting transactions are considered. At August 31, 2000, the Fund had sufficient cash and securities to cover any commitments under
these contracts.
|
| Futures Contracts — The Fund may enter into futures
transactions to hedge against changes in interest rates, securities prices, currency exchange rates or to seek to increase total return. Upon entering into a futures contract, the Fund is required to deposit with a broker or the Fund’s custodian
bank, an amount of cash or securities equal to the minimum “initial margin” requirement of the associated futures exchange. Subsequent payments for futures contracts (“variation margin”) are paid or received by the Fund, depending on
the fluctuations in the value of the contracts, and are recorded as unrealized gains or losses. When contracts are closed, the Fund realizes a gain or loss which is reported in the Statement of Operations.
|
| The use of futures contracts involve, to varying degrees, elements of market risk
which may exceed the amounts recognized in the Statement of Assets and Liabilities. Changes in the value of the futures contracts may not directly correlate with changes in the value of the underlying securities. This risk may decrease the effectiveness
of the Fund’s hedging strategies and potentially result in a loss. At August 31, 2000, there were no open futures contracts.
|
| 5. LINE OF CREDIT FACILITY
|
| Effective May 31, 2000, the Fund participates in a $350,000,000 committed, unsecured revolving line of credit facility. Prior
thereto, the Fund participated in a $250,000,000 uncommitted and a $250,000,000 committed, unsecured revolving line of credit facility. Under the most restrictive arrangement, the Fund must own securities having a market value in excess of 400% of the
total bank borrowings. These facilities are to be used solely for temporary or emergency proposes. The interest rate on borrowings is based on the Federal Funds rate. The committed facility also requires a fee to be paid by the Fund based on the amount of
the commitment. During the year ended August 31, 2000, the Fund did not have any borrowings under any of these facilities.
|
| 6. CERTAIN RECLASSIFICATIONS
|
| In accordance with AICPA Statement of Position 93-2, the Fund reclassified $716,455 from accumulated net realized gain from
investment and foreign currency related transactions to accumulated net investment loss and $3,030 from paid-in capital to accumulated undistributed net investment loss. These reclassifications have no impact on the net asset value of the Fund and are
designed to present the Fund’s capital accounts on a tax basis. Reclassifications results primarily from the difference in the tax treatment of foreign currency, net operating losses and organization costs.
|
| 7. OTHER MATTERS
|
| As of August 31, 2000, the Goldman Sachs Group was the beneficial owner of approximately 12% of the outstanding shares of the Fund.
|
| 8. CHANGE IN INDEPENDENT ACCOUNTANTS
|
| On October 26, 1999 the Board of Trustees of the Fund upon the recommendation of the Board’s audit committee, determined not
to retain Arthur Andersen LLP and approved a change of the Fund’s independent accountants to PricewaterhouseCoopers LLP. For the fiscal years ended August 31, 1999 and January 31, 1999, Arthur Andersen LLP’s audit reports contained no adverse
opinion or disclaimer of opinion; nor were their reports qualified or modified as to uncertainty, audit scope, or accounting principles. Further, there were no disagreements between the Fund and Arthur Andersen LLP on accounting principles or practices,
financial statement disclosure or audit scope or procedure, which if not resolved to the satisfaction of Arthur Andersen LLP would have caused them to make reference to the disagreement in their report.
|
| 9. SUMMARY OF SHARE TRANSACTIONS
|
| Share activity is as follows:
|
| For the Year Ended
August 31, 2000 |
For the Seven Months
Ended August 31, 1999 |
For the Period Ended
January 31, 1999(a) |
|||||||||||||||||
|---|---|---|---|---|---|---|---|---|---|---|---|---|---|---|---|---|---|---|---|
| Shares | Dollars | Shares | Dollars | Shares | Dollars | ||||||||||||||
| Class A Shares | |||||||||||||||||||
| Shares sold | 4,738,629 | $79,542,711 | 1,490,616 | $19,567,798 | 974,018 | $ 9,912,925 | |||||||||||||
| Reinvestment of dividends and distributions | 251,265 | 4,158,443 | 61 | 921 | — | — | |||||||||||||
| Shares repurchased | (2,677,761 | ) | (44,672,392 | ) | (138,512 | ) | (1,823,081 | ) | (215,073 | ) | (2,211,327 | ) | |||||||
| 2,312,133 | 39,028,762 | 1,352,165 | 17,745,638 | 758,945 | 7,701,598 | ||||||||||||||
| Class B Shares | |||||||||||||||||||
| Shares sold | 256,898 | 4,363,660 | 156,293 | 2,037,345 | 143,378 | 1,452,502 | |||||||||||||
| Reinvestment of dividends and distributions | 37,057 | 608,848 | — | — | — | — | |||||||||||||
| Shares repurchased | (185,312 | ) | (3,068,196 | ) | (24,231 | ) | (344,034 | ) | (14,005 | ) | (144,559 | ) | |||||||
| 108,643 | 1,904,312 | 132,062 | 1,693,311 | 129,373 | 1,307,943 | ||||||||||||||
| Class C Shares | |||||||||||||||||||
| Shares sold | 184,775 | 3,116,549 | 209,165 | 2,748,964 | 197,598 | 2,047,960 | |||||||||||||
| Reinvestment of dividends and distributions | 32,401 | 532,028 | 44 | 665 | — | — | |||||||||||||
| Shares repurchased | (166,325 | ) | (2,745,926 | ) | (13,133 | ) | (201,949 | ) | (171,880 | ) | (1,830,626 | ) | |||||||
| 50,851 | 902,651 | 196,076 | 2,547,680 | 25,718 | 217,334 | ||||||||||||||
| Institutional Shares | |||||||||||||||||||
| Shares sold | 984,742 | 16,591,478 | 384,318 | 5,299,190 | 1,028,740 | 10,304,702 | |||||||||||||
| Reinvestment of dividends and distributions | 183,481 | 3,058,621 | 104 | 1,595 | — | — | |||||||||||||
| Shares repurchased | (816,713 | ) | (13,448,640 | ) | (24,763 | ) | (382,309 | ) | — | — | |||||||||
| 351,510 | 6,201,459 | 359,659 | 4,918,476 | 1,028,740 | 10,304,702 | ||||||||||||||
| Service Shares | |||||||||||||||||||
| Shares sold | — | — | — | — | 161 | 1,598 | |||||||||||||
| Reinvestment of dividends and distributions | 17 | 282 | — | — | — | — | |||||||||||||
| Shares repurchased | (11 | ) | (199 | ) | — | — | — | — | |||||||||||
| 6 | 83 | — | — | 161 | 1,598 | ||||||||||||||
| NET INCREASE | 2,823,143 | $48,037,267 | 2,039,962 | $26,905,105 | 1,942,937 | $19,533,175 | |||||||||||||
(a)
|
Commencement date of operations was May 1, 1998 for all share classes.
|
| Goldman Sachs Japanese Fund — Tax Information (unaudited)
|
| Pursuant to Section 852 of the Internal Revenue Code, the Fund designated $3,591,461 as
capital gain dividends paid during its year ended August 31, 2000. For the distribution paid during the year ended August 31, 2000, the total amount of income received by the Japanese Equity Fund from sources within foreign countries and possessions of
the United States was $0.0270 per share all of which is attributable to qualified passive income. The total amount of taxes paid by the Fund to such countries was $0.0044 per share. A separate notice containing the country by country components of these
totals has been previously mailed to the shareholders.
|
| Income from
investment operations |
Distributions to shareholders |
||||||||||||||||||||
|---|---|---|---|---|---|---|---|---|---|---|---|---|---|---|---|---|---|---|---|---|---|
| Net asset
value, beginning of period |
Net
investment loss |
Net realized
and unrealized gains |
Total income
from investment operations |
From net
investment income |
In excess
of net investment income |
From net
realized gains |
Total
distributions |
||||||||||||||
| FOR THE YEAR ENDED AUGUST 31, | |||||||||||||||||||||
| 2000 - Class A Shares | $16.24 | $(0.20 | ) (c) | $1.67 | $1.47 | $ — | $(0.21 | ) | $(1.73 | ) | $(1.94) | ||||||||||
| 2000 - Class B Shares | 16.14 | (0.28 | ) (c) | 1.68 | 1.40 | — | (0.18 | ) | (1.73 | ) | (1.91) | ||||||||||
| 2000 - Class C Shares | 16.16 | (0.28 | ) (c) | 1.64 | 1.36 | — | (0.21 | ) | (1.73 | ) | (1.94) | ||||||||||
| 2000 - Institutional Shares | 16.36 | (0.09 | ) (c) | 1.67 | 1.58 | — | (0.25 | ) | (1.73 | ) | (1.98) | ||||||||||
| 2000 - Service Shares | 16.22 | (0.16 | ) (c) | 1.65 | 1.49 | — | (0.15 | ) | (1.73 | ) | (1.88) | ||||||||||
| FOR THE SEVEN MONTHS ENDED AUGUST 31, | |||||||||||||||||||||
| 1999 - Class A Shares | 11.06 | (0.06 | ) | 5.24 | 5.18 | — | — | — | — | ||||||||||||
| 1999 - Class B Shares | 11.03 | (0.09 | ) | 5.20 | 5.11 | — | — | — | — | ||||||||||||
| 1999 - Class C Shares | 11.04 | (0.08 | ) | 5.20 | 5.12 | — | — | — | — | ||||||||||||
| 1999 - Institutional Shares | 11.10 | (0.03 | ) | 5.29 | 5.26 | — | — | — | — | ||||||||||||
| 1999 - Service Shares | 11.04 | (0.06 | ) | 5.24 | 5.18 | — | — | — | — | ||||||||||||
| FOR THE PERIOD ENDED JANUARY 31, | |||||||||||||||||||||
| 1999 - Class A Shares (commenced May 1, 1998) | 10.00 | (0.06 | ) | 1.12 | 1.06 | — | — | — | — | ||||||||||||
| 1999 - Class B Shares (commenced May 1, 1998) | 10.00 | (0.08 | ) | 1.11 | 1.03 | — | — | — | — | ||||||||||||
| 1999 - Class C Shares (commenced May 1, 1998) | 10.00 | (0.09 | ) | 1.13 | 1.04 | — | — | — | — | ||||||||||||
| 1999 - Institutional Shares (commenced May 1, 1998) | 10.00 | (0.02 | ) | 1.13 | 1.11 | (0.01 | ) | — | — | (0.01) | |||||||||||
| 1999 - Service Shares (commenced May 1, 1998) | 10.00 | (0.05 | ) | 1.09 | 1.04 | — | — | — | — | ||||||||||||
(a)
|
Assumes investment at the net asset value at the beginning of the period, reinvestment of all dividends and distributions, a
complete redemption of the investment at the net asset value at the end of the period and no sales or redemption charges. Total return would be reduced if a sales or redemption charge were taken into account. Total returns for periods less than one full
year are not annualized.
|
(b)
|
Annualized.
|
| (c) Calculated based on the average shares outstanding methodology.
|
|
Ratios assuming no expense reductions |
||||||||||||||||||||||
|---|---|---|---|---|---|---|---|---|---|---|---|---|---|---|---|---|---|---|---|---|---|---|
| Net asset
value, end of period |
Total
return (b) |
Net assets
at end of period (in 000s) |
Ratio of
net expenses to average net assets |
Ratio of
net investment loss to average net assets |
Ratio of
expenses to average net assets |
Ratio of
net investment loss to average net assets |
Portfolio
turnover rate |
|||||||||||||||
| $15.77 | 8.47 | % | $69,741 | 1.74 | % | (1.20 | )% | 2.10 | % | (1.56 | )% | 60.76 | % | |||||||||
| 15.63 | 8.12 | 5,783 | 2.24 | (1.67 | ) | 2.60 | (2.03 | ) | 60.76 | |||||||||||||
| 15.58 | 7.82 | 4,248 | 2.24 | (1.66 | ) | 2.60 | (2.02 | ) | 60.76 | |||||||||||||
| 15.96 | 9.14 | 27,768 | 1.09 | (0.53 | ) | 1.45 | (0.89 | ) | 60.76 | |||||||||||||
| 15.83 | 8.65 | 3 | 1.59 | (0.94 | ) | 1.95 | (1.30 | ) | 60.76 | |||||||||||||
| 16.24 | 46.84 | 34,279 | 1.70 | (b) | (1.17 | ) (b) | 2.62 | (b) | (2.09 | ) (b) | 44.83 | |||||||||||
| 16.14 | 46.33 | 4,219 | 2.20 | (b) | (1.57 | ) (b) | 3.12 | (b) | (2.49 | ) (b) | 44.83 | |||||||||||
| 16.16 | 46.41 | 3,584 | 2.20 | (b) | (1.81 | ) (b) | 3.12 | (b) | (2.73 | ) (b) | 44.83 | |||||||||||
| 16.36 | 47.40 | 22,709 | 1.05 | (b) | (0.37 | ) (b) | 1.97 | (b) | (1.29 | ) (b) | 44.83 | |||||||||||
| 16.22 | 46.92 | 3 | 1.55 | (b) | (0.74 | ) (b) | 2.47 | (b) | (1.66 | ) (b) | 44.83 | |||||||||||
| 11.06 | 10.60 | 8,391 | 1.64 | (b) | (1.20 | ) (b) | 4.18 | (b) | (3.74 | ) (b) | 53.29 | |||||||||||
| 11.03 | 10.30 | 1,427 | 2.15 | (b) | (1.76 | ) (b) | 4.69 | (b) | (4.30 | ) (b) | 53.29 | |||||||||||
| 11.04 | 10.40 | 284 | 2.15 | (b) | (1.69 | ) (b) | 4.69 | (b) | (4.23 | ) (b) | 53.29 | |||||||||||
| 11.10 | 11.06 | 11,418 | 1.03 | (b) | (0.36 | ) (b) | 3.57 | (b) | (2.90 | ) (b) | 53.29 | |||||||||||
| 11.04 | 10.43 | 2 | 1.53 | (b) | (0.68 | ) (b) | 4.07 | (b) | (3.22 | ) (b) | 53.29 | |||||||||||
| To the Shareholders and Board of Trustees of
Goldman Sachs Trust — Japanese Equity Fund: |
| In our opinion, the accompanying statement of assets and liabilities, including the statement of investments, and the related
statements of operations and of changes in net assets and the financial highlights present fairly, in all material respects, the financial position of Goldman Sachs Japanese Equity Fund (“the Fund”), one of the portfolios constituting Goldman
Sachs Trust, at August 31, 2000, the results of its operations, the changes in its net assets and the financial highlights for the year then ended, in conformity with accounting principles generally accepted in the United States of America. These
financial statements and financial highlights (hereafter referred to as “financial statements”) are the responsibility of the Fund’s management; our responsibility is to express an opinion on these financial statements based on our audit.
We conducted our audit of these financial statements in accordance with auditing standards generally accepted in the United States of America, which require that we plan and perform the audit to obtain reasonable assurance about whether the financial
statements are free of material misstatement. An audit includes examining, on a test basis, evidence supporting the amounts and disclosures in the financial statements, assessing the accounting principles used and significant estimates made by management,
and evaluating the overall financial statement presentation. We believe that our audit, which included confirmation of securities at August 31, 2000 by correspondence with the custodian and brokers, provides a reasonable basis for our opinion. The
statements of changes in net assets and financial highlights of the Fund for the periods ended August 31, 1999 and January 31, 1999 were audited by other independent accountants whose report dated October 8, 1999 expressed an unqualified opinion thereon.
|
| PricewaterhouseCoopers LLP
|
| Boston, Massachusetts
|
| October 23, 2000
|
|
Shares |
Description | Value | |||
|---|---|---|---|---|---|
| Common Stock – 90.0% | |||||
| Australia – 1.8% | |||||
| 735,000 | APN News & Media Ltd.
(Publishing) |
$ 2,034,421 | |||
| 609,900 | Fairfax (John) Holdings Ltd.
(Publishing) |
1,790,147 | |||
| 250,000 | Primary Health Care Ltd. (Health) | 834,701 | |||
| 389,400 | QBE Insurance Group Ltd.
(Insurance) |
1,942,336 | |||
| 89,762 | Tab Corp. Holdings Ltd.
(Entertainment) |
509,849 | |||
| 282,177 | Westfield Holdings Ltd. (Real Estate) | 2,017,696 | |||
| 9,129,150 | |||||
| Austria – 0.2% | |||||
| 48,251 | Cybertron Telekom AG
(Telecomunications) |
856,697 | |||
| Denmark – 4.0% | |||||
| 146,193 | DSV, De Sammensluttede
Vognmaend af Series B* (Transportation) |
3,516,892 | |||
| 52,237 | Group 4 Falck A/S (Electrical
Equipment) |
8,180,597 | |||
| 202,104 | Vestas Wind Systems A/S (Energy
Resources) |
8,977,693 | |||
| 20,675,182 | |||||
| Finland – 2.0% | |||||
| 161,480 | Elisa Communications Oyj Series A
(Telecommunications) |
6,135,547 | |||
| 451,886 | JOT Automation Group Oyj
(Industrial Equipment) |
3,092,958 | |||
| 44,674 | Nokian Renkaat Oyj (Auto) | 1,249,270 | |||
| 1,025 | Talentum (Publishing) | 11,556 | |||
| 10,489,331 | |||||
| France – 8.2% | |||||
| 27,581 | Altran Technologies (Business
Services) |
6,527,711 | |||
| 47,017 | Coface (Insurance) | 4,424,371 | |||
| 50,100 | Compagnie Generale de Geophysique
SA* (Energy Resources) |
3,736,008 | |||
| 24,676 | Diosos* (Diversified Industrial
Manufacturing) |
920,057 | |||
| 350,275 | Elior* (Food & Beverage) | 3,793,672 | |||
| 35,585 | FI System* (Business Services) | 2,132,365 | |||
| 27,379 | IPSOS (Media) | 3,660,440 | |||
| 2,666 | Jet Multimedia (Information Services) | 148,868 | |||
| 142,291 | Kalisto Entertainment*
(Entertainment) |
2,475,850 | |||
| 47,747 | Royal Canin SA (Grocery) | 4,611,750 | |||
| 75,560 | SR Teleperformance (Multi-Industry) | 2,951,450 | |||
| 48,457 | Unibail (Real Estate) | 7,356,029 | |||
| 42,738,571 | |||||
|
Shares |
Description | Value | |||
|---|---|---|---|---|---|
| Common Stock – (continued) | |||||
| Germany – 3.3% | |||||
| 40,565 | Allbecon AG (Business Services) | $ 1,206,388 | |||
| 2,480 | Concept! AG* (Internet) | 80,359 | |||
| 40,860 | D. Logistics AG* (Business Services) | 3,888,517 | |||
| 71,075 | Dis Deutscher Industrie (Business
Services) |
2,997,100 | |||
| 37,290 | Intershop Communication AG*
(Computer Software) |
3,393,181 | |||
| 29,280 | Rhoen-Klinikum AG (Health) | 1,258,077 | |||
| 70,482 | Wedeco AG* (Business Services) | 2,408,961 | |||
| 35,667 | Zapf Creaton AG (Entertainment) | 1,899,803 | |||
| 17,132,386 | |||||
| Hong Kong – 2.2% | |||||
| 560,200 | Dah Sing Financial Holdings (Banks) | 2,614,602 | |||
| 903,000 | Dickson Concepts International Ltd.
(Specialty Retail) |
804,699 | |||
| 5,656,000 | Giordano International Ltd. (Specialty
Retail) |
3,172,842 | |||
| 1,520,000 | Hang Lung Development Co. Ltd.
(Real Estate) |
1,413,002 | |||
| 1,254,000 | Legend Holding Ltd. (Electronic
Components) |
1,334,556 | |||
| 542,000 | Li & Fung Ltd. (Wholesale) | 2,362,867 | |||
| 11,702,568 | |||||
| Ireland – 3.0% | |||||
| 1,215,800 | Independent News & Media PLC
(Publishing) |
4,145,983 | |||
| 1,036,092 | Kingspan Group PLC (Construction) | 2,759,373 | |||
| 167,900 | SmartForce PLC ADR* (Information
Services) |
8,730,800 | |||
| 15,636,156 | |||||
| Italy – 5.5% | |||||
| 258,902 | Banca Popolare Commercio e
Industria Ordinary Shares (Banks) |
6,042,502 | |||
| 922,203 | Banca Popolare di Milano BPM
(Banks) |
6,467,619 | |||
| 503,318 | Brembo SpA (Auto) | 4,736,299 | |||
| 375,191 | Gruppo Coin SpA* (Department
Store) |
4,329,986 | |||
| 1,242,041 | Saipem SpA (Energy Resources) | 7,189,096 | |||
| 28,765,502 | |||||
| Japan – 31.8% | |||||
| 67,000 | ABLE, Inc. (Real Estate) | 1,130,802 | |||
| 102,700 | Aderans Co. Ltd. (Specialty Retail) | 4,073,334 | |||
| 205,000 | Alpine Electronics Inc. (Electronics
Equipment) |
3,171,589 | |||
| 150,000 | Amatsuji Steel Ball Manufacturing
Co. Ltd. (Industrial Parts) |
1,378,340 | |||
| 44,000 | ARRK Corp. (Manufacturing) | 2,227,848 | |||
| 6,800 | Bellsystem24, Inc. (Business
Services) |
3,270,886 | |||
| Shares | Description | Value | ||
|---|---|---|---|---|
| Common Stocks – (continued) | ||||
| Japan – (continued) | ||||
| 43,000 | Citizen Electronic (Electrical
Equipment) |
$ 4,475,387 | ||
| 73,000 | Culture Convenience Club Co. Ltd.*
(Specialty Retail) |
1,218,378 | ||
| 257,000 | Daiwa Electronics (Consumer
Durables) |
869,920 | ||
| 85,000 | Eneserve Corp. (Energy Resources) | 3,984,998 | ||
| 52,500 | Enplas Corp. (Electrical Equipment) | 3,312,940 | ||
| 336,000 | Foster Electric Co. Ltd. (Electrical
Equipment) |
2,457,384 | ||
| 45,000 | Fuji Electronics Co. Ltd. (Wholesale) | 898,734 | ||
| 33,700 | Fuji Seal (Heavy Machinery) | 1,722,128 | ||
| 74,800 | Fujimi, Inc. (Diversified Industrial
Manufacturing) |
3,373,540 | ||
| 328,000 | Fujitec Co. Ltd. (Construction) | 3,013,971 | ||
| 204,000 | Fukuda Denshi Co. Ltd. (Health) | 4,016,878 | ||
| 18,000 | Funai Electric Co. Ltd. (Electrical
Equipment) |
2,236,287 | ||
| 15,000 | Funai Electric Co. Ltd. New Shares*
(Electrical Equipment) |
1,863,573 | ||
| 204,700 | Hakuto Co. (Electrical Equipment) | 6,353,090 | ||
| 435,000 | Hitachi Powdered Metals (Mining) | 4,731,364 | ||
| 55 | Intelligence Ltd. (Business Services) | 1,180,966 | ||
| 231,500 | Iuchi Seieido Co. (Electrical
Equipment) |
3,603,282 | ||
| 119,900 | Japan Business Computer Co. Ltd.
(Computer Software) |
3,822,410 | ||
| 171,100 | Japan CBM Corp. (Electrical
Equipment) |
2,406,470 | ||
| 435,000 | Kato Sangyo Co. Ltd. (Food &
Beverage) |
2,651,196 | ||
| 294,000 | Kawasumi Labs, Inc. (Chemicals) | 2,759,438 | ||
| 111,100 | Koekisha Co. Ltd. (Medical
Providers) |
4,791,936 | ||
| 196,900 | Komeri Co. Ltd. (Home Products) | 5,815,612 | ||
| 85,300 | Kuroda Electric Co. Ltd. (Electronics
Equipment) |
2,879,325 | ||
| 288 | Kyoto Kimono Yuzen Co. Ltd.
(Specialty Retail) |
1,755,274 | ||
| 81,000 | Medical Support Co. (Food &
Beverage) |
1,594,937 | ||
| 121,100 | Meitec Corp. (Business Services) | 5,597,966 | ||
| 40,800 | Milbon Co. Ltd. (Consumer Non-
Durables) |
2,677,919 | ||
| 209,500 | Ministop Co. Ltd. (Specialty Retail) | 4,655,556 | ||
| 117,000 | Mirai Industry Co. Ltd. (Multi-
Industry) |
1,481,013 | ||
| 96,000 | Mitta Co. Ltd* (Specialty Retail) | 1,989,311 | ||
| 211,000 | MKC-STAT Corp. (Business
Services) |
5,203,282 | ||
| 76,600 | Nagaileben Co. Ltd. (Apparel) | 1,537,028 | ||
| 266,000 | Nippon Kanzai Co. (Business
Services) |
4,240,038 | ||
| 284,000 | Ogura Clutch Co. Ltd. (Auto) | 2,290,108 | ||
| 30,000 | Otsuka Shokai Co. Ltd. (Computer
Software) |
2,030,942 | ||
| Shares | Description | Value | |||
|---|---|---|---|---|---|
| Common Stocks – (continued) | |||||
| Japan – (continued) | |||||
| 39,000 | OZEKI Co. Ltd. (Grocery) | $ 2,066,104 | |||
| 92,000 | PA Co. Ltd.* (Business Services) | 1,096,409 | |||
| 23,200 | People Co. Ltd. (Health) | 1,651,083 | |||
| 28 | Rakuten Inc. (Specialty Retail) | 774,496 | |||
| 47,400 | Relocation Services Corp. (Real
Estate) |
3,466,667 | |||
| 80,900 | Rock Field Co. Ltd. (Grocery) | 4,172,058 | |||
| 199,900 | Sato Corp. (Electronics Equipment) | 5,023,273 | |||
| 100 | Seikoh Giken Co. Ltd. (Electronics
Equipment) |
64,229 | |||
| 48,100 | Sogo Medical Co. Ltd. (Business
Services) |
771,224 | |||
| 140,600 | Sumitomo Real Estate Sales Co. Ltd.
(Real Estate) |
5,523,807 | |||
| 71,000 | Suruga Co. Ltd. (Consumer Durables) | 3,361,932 | |||
| 77,900 | Taiyo Ink Manufacturing Co. Ltd.
(Chemicals) |
4,557,862 | |||
| 227,700 | Trusco Nakayama (Wholesale) | 3,219,612 | |||
| 306,000 | Uchida Yoko Co. Ltd. (Wholesale) | 1,721,519 | |||
| 2,226 | Yoshinoya D&C Co. Ltd.
(Restaurants) |
3,694,346 | |||
| 165,910,001 | |||||
| Luxembourg – 1.7% | |||||
| 48,347 | Thiel Logistik AG* (Computer
Software) |
9,004,628 | |||
| Netherlands – 2.1% | |||||
| 62,505 | Beter Bed holding NV (Specialty
Retail) |
1,459,356 | |||
| 242,523 | IFCO Systems NV* (Packaging) | 5,081,076 | |||
| 98,831 | Samas Groep NV (Business Services) | 1,337,993 | |||
| 111,689 | Versatel Telecom International NV*
(Telecommunications) |
3,182,777 | |||
| 11,061,202 | |||||
| Norway – 1.2% | |||||
| 48,551 | EDB Business Partner ASA (Business
Services) |
566,498 | |||
| 186,204 | Tomra Systems ASA (Machinery) | 5,534,099 | |||
| 6,100,597 | |||||
| Portugal – 0.4% | |||||
| 469,578 | ParaRede, SGPS* (Information
Services) |
2,251,087 | |||
| Singapore – 3.1% | |||||
| 392,440 | Datacraft Asia Ltd.
(Telecommunications) |
3,296,496 | |||
| 738,000 | DBS Land Ltd. (Real Estate) | 1,192,052 | |||
| 1,506,000 | First Capital Corp. Ltd. (Real Estate) | 1,461,286 | |||
| 390,000 | Overseas Union Bank Ltd. (Banks) | 1,971,414 | |||
| 305,000 | Sembcorp Logistics Ltd.
(Transportation) |
1,913,892 | |||
| 1,375,000 | SIA Engineering Co.* (Airlines) | 1,398,089 | |||
| Shares | Description | Value | |||
|---|---|---|---|---|---|
| Common Stocks – (continued) | |||||
| Singapore – (continued) | |||||
| 84,000 | Singapore Press Holdings Ltd.
(Publishing) |
$ 1,351,926 | |||
| 297,000 | Venture Manufacturing Ltd.
(Electrical Equipment) |
3,796,409 | |||
| 16,381,564 | |||||
| Spain – 3.7% | |||||
| 67,895 | Aldeasa SA (Specialty Retail) | 1,310,955 | |||
| 453,363 | Centros Comerciales Pryca SA
(Grocery) |
6,016,973 | |||
| 153,201 | Promotora de Informaciones SA*
(Media) |
3,665,314 | |||
| 338,790 | Sociedad General de Aguas de
Barcelona SA (Multi-Industry) |
4,240,728 | |||
| 108,413 | Sogecable SA* (Broadcasting) | 3,897,868 | |||
| 19,131,838 | |||||
| Sweden – 2.5% | |||||
| 348,642 | Europolitan Holdings AB
(Telecommunications) |
3,711,786 | |||
| 220,207 | HiQ International AB (Business
Services) |
2,496,043 | |||
| 10,158 | Proffice AB Series B (Business
Services) |
362,640 | |||
| 251,803 | Sifo Group AB Series B (Business
Services) |
3,387,676 | |||
| 906,656 | Swedish Match AB (Tobacco) | 2,929,406 | |||
| 12,887,551 | |||||
| Switzerland – 3.6% | |||||
| 4,017 | Belimo Holding AG (Construction) | 1,729,478 | |||
| 20,382 | Komax Group* (Machinery) | 1,813,553 | |||
| 2,890 | Kudelski SA* (Electrical
Equipment) |
3,865,499 | |||
| 5,145 | Lindt & Spruengli AG (Food &
Beverage) |
2,495,709 | |||
| 14,820 | Logitech International SA*
(Computer Hardware) |
5,010,896 | |||
| 5,662 | Societe Generale wD’Affichage
(Media) |
2,600,230 | |||
| 2,003 | Think Tools AG* (Computer
Software) |
1,067,040 | |||
| 18,582,405 | |||||
| United Kingdom – 9.3% | |||||
| 1,098,056 | Cannons Group PLC (Leisure) | 2,309,141 | |||
| 1,909,244 | Countrywide Assured Group PLC
(Real Estate) |
2,798,211 | |||
| 479,769 | Future Network PLC* (Media) | 5,172,715 | |||
| 322,265 | Guardian IT PLC (Business
Services) |
7,665,071 | |||
| 343,889 | ITNET PLC (Business Services) | 4,588,666 | |||
| 1,113,216 | London Merchant Securities PLC
(Real Estate) |
3,255,008 | |||
| 714,949 | Matalan PLC (Real Estate) | 6,385,585 | |||
| 1,070,367 | N Brown Group PLC (Specialty
Retail) |
4,224,732 | |||
| Shares | Description | Value | |||
|---|---|---|---|---|---|
| Common Stocks – (continued) | |||||
| United Kingdom – (continued) | |||||
| 30,300 | NDS Group PLC ADR* (Internet
Software) |
$ 2,370,975 | |||
| 506,769 | Sero Group (Business Services) | 4,081,320 | |||
| 719,467 | The Berkeley Group PLC
(Construction) |
5,877,828 | |||
| 48,729,252 | |||||
| United States – 0.4% | |||||
| 55,000 | MIH Ltd.* (Media) | 2,055,625 | |||
| TOTAL COMMON STOCKS | |||||
| (Cost $435,446,947) | $ 469,221,293 | ||||
| Preferred Stocks – 1.9% | |||||
| Germany – 1.9% | |||||
| 1,643 | Porsche AG (Auto) | $ 5,659,266 | |||
| 91,260 | Rhoen-Klinikum AG Non-Voting
(Health) |
4,001,384 | |||
| 9,660,650 | |||||
| TOTAL PREFERRED STOCKS | |||||
| (Cost $7,890,480) | $ 9,660,650 | ||||
| Units | Description | Value | |||
| Rights – 0.1% | |||||
| Switzerland – 0.1% | |||||
| 578 | Kudelski SA Rights exp. 09/09/00*
(Electrical Equipment) |
$ 572,359 | |||
| TOTAL RIGHTS | |||||
| (Cost $0) | $ 572,359 | ||||
| Warrants – 0.0% | |||||
| France – 0.0% | |||||
| 3,600 | IPSOS exp. 06/21/03* (Media) | $ 51,135 | |||
| 1,054 | Jet Multimedia exp. 12/31/01*
(Information Services) |
53,334 | |||
| 104,469 | |||||
| TOTAL WARRANTS | |||||
| (Cost $0) | $ 104,469 | ||||
| Principal
Amount |
Interest
Rate |
Maturity
Date |
Value | ||||
|---|---|---|---|---|---|---|---|
| Short-Term Obligation – 6.1% | |||||||
| State Street Bank & Trust Euro – Time Deposit | |||||||
| $31,658,000 | 6.56% | 09/01/2000 | $ 31,658,000 | ||||
| TOTAL SHORT-TERM OBLIGATION | |||||||
| (Cost $31,658,000) | $ 31,658,000 | ||||||
| TOTAL INVESTMENTS | |||||||
| (Cost $474,995,427) | $511,216,771 | ||||||
*
|
Non-income producing security.
|
| The percentage shown for each investment category reflects the value of investments in that category as a percentage of total net
assets.
|
| |
| Investment Abbreviations:
|
| ADR—American Depositary Receipt
|
| |
| As a %
of total net assets |
||||
|---|---|---|---|---|
| Common and Preferred Stock Industry Classifications† | ||||
| Airlines | 0.3 | % | ||
| Apparel | 0.3 | |||
| Auto | 2.7 | |||
| Banks | 3.3 | |||
| Broadcasting | 0.7 | |||
| Business Services | 12.5 | |||
| Chemicals | 1.4 | |||
| Computer Hardware | 1.0 | |||
| Computer Software | 3.7 | |||
| Construction | 2.6 | |||
| Consumer Durables | 0.8 | |||
| Consumer Non-Durables | 0.5 | |||
| Department Store | 0.8 | |||
| Diversified Industrial Manufacturing | 0.8 | |||
| Electrical Equipment | 8.2 | |||
| Electronic Components | 0.3 | |||
| Electronics Equipment | 2.1 | |||
| Energy Resources | 4.6 | |||
| Entertainment | 0.9 | |||
| Food & Beverage | 2.0 | |||
| Grocery | 3.2 | |||
| Health | 2.3 | |||
| Heavy Machinery | 0.3 | |||
| Home Products | 1.1 | |||
| Industrial Equipment | 0.6 | |||
| Industrial Parts | 0.3 | |||
| Information Services | 2.1 | |||
| Insurance | 1.2 | |||
| Internet Software | 0.5 | |||
| Leisure | 0.4 | |||
| Machinery | 1.4 | |||
| Manufacturing | 0.4 | |||
| Media | 3.3 | |||
| Medical Providers | 0.9 | |||
| Mining | 0.9 | |||
| Multi-Industry | 1.7 | |||
| Packaging | 1.0 | |||
| Publishing | 1.8 | |||
| Real Estate | 6.9 | |||
| Restaurants | 0.7 | |||
| Specialty Retail | 4.9 | |||
| Telecommunications | 3.3 | |||
| Tobacco | 0.6 | |||
| Transportation | 1.0 | |||
| Wholesale | 1.6 | |||
| TOTAL COMMON AND PREFERRED STOCK | 91.9 | % | ||
†
|
Industry concentrations greater than one tenth of one percent are disclosed.
|
| Assets: | |||
| Investment in securities, at value (identified cost $474,995,427) | $511,216,771 | ||
| Cash, at value | 249,855 | ||
| Receivables: | |||
| Fund shares sold | 9,055,359 | ||
| Variation margin (a) | 2,212,513 | ||
| Investment securities sold, at value | 1,032,274 | ||
| Reimbursement from investment adviser | 308,889 | ||
| Dividends and interest, at value | 284,897 | ||
| Deferred organization expenses, net | 9,110 | ||
| Other assets, at value | 109,272 | ||
| Total assets | 524,478,940 | ||
| Liabilities: | |||
| Payables: | |||
| Investment securities purchased, at value | 2,336,896 | ||
| Amounts owed to affiliates | 675,138 | ||
| Accrued expenses and other liabilities, at value | 193,012 | ||
| Total liabilities | 3,205,046 | ||
| Net Assets: | |||
| Paid-in capital | 455,064,418 | ||
| Accumulated net realized gain from investment, futures and foreign currency related transactions | 29,485,884 | ||
| Net unrealized gain on investments, futures and translation of assets and liabilities denominated in foreign currencies | 36,723,592 | ||
| NET ASSETS | $521,273,894 | ||
| Net asset value, offering and redemption price per share: (b) | |||
| Class A | $16.12 | ||
| Class B | $15.98 | ||
| Class C | $15.97 | ||
| Institutional | $16.37 | ||
| Service | $16.16 | ||
| Shares outstanding: | |||
| Class A | 20,331,035 | ||
| Class B | 176,944 | ||
| Class C | 229,926 | ||
| Institutional | 11,429,500 | ||
| Service | 156 | ||
| Total shares of beneficial interest outstanding, $.001 par value (unlimited number of shares authorized) | 32,167,561 | ||
(a)
|
Includes approximately $1,013,000 relating to initial margin requirements for futures transactions.
|
(b)
|
Maximum public offering price per share (NAV per share multiplied by 1.0582) for Class A Shares is $17.06. At redemption, Class B
and Class C Shares may be subject to a contingent deferred sales charge, assessed on the amount equal to the lesser of the current net asset value or the original purchase price of the shares.
|
| Investment income: | |||||||||||
| Dividends (a) | $ 2,382,282 | ||||||||||
| Interest | 1,300,982 | ||||||||||
| Total income | 3,683,264 | ||||||||||
| Expenses: | |||||||||||
| Management fees | 3,541,196 | ||||||||||
| Distribution and Service fees (b) | 922,587 | ||||||||||
| Custodian fees | 685,097 | ||||||||||
| Transfer Agent fees (c) | 388,659 | ||||||||||
| Registration fees | 135,615 | ||||||||||
| Professional fees | 45,155 | ||||||||||
| Trustee fees | 8,900 | ||||||||||
| Amortization of deferred organization expenses | 2,284 | ||||||||||
| Other | 112,627 | ||||||||||
| Total expenses | 5,842,120 | ||||||||||
| Less — expense reductions | (505,703 | ) | |||||||||
| Net expenses | 5,336,417 | ||||||||||
| NET INVESTMENT LOSS | (1,653,153 | ) | |||||||||
| Realized and unrealized gain (loss) on investment, futures and foreign currency related transactions: | |||||||||||
| Net realized gain (loss) from: | |||||||||||
| Investment transactions | 34,584,583 | ||||||||||
| Futures transactions | (245,020 | ) | |||||||||
| Foreign currency related transactions | 337,440 | ||||||||||
| Net change in unrealized gain (loss) on: | |||||||||||
| Investments | 16,371,022 | ||||||||||
| Futures | 477,017 | ||||||||||
| Translation of assets and liabilities denominated in foreign currencies | 1,124 | ||||||||||
| Net realized and unrealized gain on investment, futures and foreign currency related transactions | 51,526,166 | ||||||||||
| NET INCREASE IN NET ASSETS RESULTING FROM OPERATIONS | $49,873,013 | ||||||||||
(a)
|
Foreign taxes withheld on dividends were $357,765.
|
(b)
|
Class A, Class B and Class C had Distribution and Service fees of $881,543, $17,389 and $23,655, respectively.
|
(c)
|
Class A, Class B, Class C, Institutional Class and Service Class had Transfer Agent fees of $334,985, $3,304, $4,495, $45,874 and
$1, respectively.
|
| For the
Year Ended August 31, 2000 |
For the
Seven Months Ended August 31, 1999 |
For the
Period Ended January 31, 1999 (a) |
||||||||
|---|---|---|---|---|---|---|---|---|---|---|
| From operations: | ||||||||||
| Net investment loss | $ (1,653,153 | ) | $ (173,328 | ) | $ (147,894 | ) | ||||
| Net realized gain from investment, futures and foreign currency related
transactions |
34,677,003 | 3,660,821 | 232,160 | |||||||
| Net change in unrealized gain on investments, futures and translation of assets and
liabilities denominated in foreign currencies |
16,849,163 | 17,316,915 | 2,557,514 | |||||||
| Net increase in net assets resulting from operations | 49,873,013 | 20,804,408 | 2,641,780 | |||||||
| Distributions to shareholders: | ||||||||||
| In excess of net investment income | ||||||||||
| Class A Shares | — | — | — | |||||||
| Class B Shares | — | — | — | |||||||
| Class C Shares | — | — | — | |||||||
| Institutional Shares | — | (3,921 | ) | (21,659 | ) | |||||
| Service Shares | — | — | — | |||||||
| From net realized gains | ||||||||||
| Class A Shares | (3,818,699 | ) | — | — | ||||||
| Class B Shares | (23,470 | ) | — | — | ||||||
| Class C Shares | (31,640 | ) | — | — | ||||||
| Institutional Shares | (3,219,751 | ) | — | — | ||||||
| Service Shares | (79 | ) | — | — | ||||||
| Total distributions to shareholders | (7,093,639 | ) | (3,921 | ) | (21,659 | ) | ||||
| From share transactions: | ||||||||||
| Proceeds from sales of shares | 421,373,628 | 58,890,454 | 81,743,079 | |||||||
| Reinvestment of dividends and distributions | 4,607,275 | 2,349 | 8,522 | |||||||
| Cost of shares repurchased | (83,439,939 | ) | (14,124,187 | ) | (13,987,269 | ) | ||||
| Net increase in net assets resulting from share transactions | 342,540,964 | 44,768,616 | 67,764,332 | |||||||
| TOTAL INCREASE | 385,320,338 | 65,569,103 | 70,384,453 | |||||||
| Net assets: | ||||||||||
| Beginning of period | 135,953,556 | 70,384,453 | — | |||||||
| End of period | $521,273,894 | $135,953,556 | $70,384,453 | |||||||
| Accumulated net investment loss | $ — | $ — | $ (106,697 | ) | ||||||
(a)
|
Commencement date of operations was May 1, 1998 for all share classes.
|
| 1. ORGANIZATION
|
| Goldman Sachs Trust (the “Trust”) is a Delaware business trust registered under the Investment Company Act of 1940 (as
amended) as an open-end, management investment company. The Trust includes the Goldman Sachs International Small Cap Fund (the “Fund”). The Fund is a diversified portfolio offering five classes of shares — Class A, Class B, Class
C, Institutional and Service.
|
| 2. SIGNIFICANT ACCOUNTING POLICIES
|
| The following is a summary of the significant accounting policies consistently followed by the Fund. The preparation of financial
statements in conformity with generally accepted accounting principles requires management to make estimates and assumptions that may affect the reported amounts. Actual results could differ from those estimates. Effective for fiscal year 1999, the Board
of Trustees approved a change in the fiscal year end of the Fund from January 31 to August 31. Accordingly, the Statements of Changes in Net Assets, Summary of Share Transactions, and Financial Highlights of the Fund are included for the seven months
ended August 31, 1999 and the year ended January 31, 1999.
|
| A. Investment Valuation — Investments in
securities traded on a U.S. or foreign securities exchange or the NASDAQ system are valued daily at their last sale price on the principal exchange on which they are traded. If no sale occurs, securities are valued at the last bid price. Debt securities
are valued at prices supplied by independent pricing services, broker/dealer-supplied valuations or matrix pricing systems. Unlisted equity and debt securities for which market quotations are available are valued at the last sale price on valuation date,
or if no sale occurs at the last bid price. Short-term debt obligations maturing in sixty days or less are valued at amortized cost, which approximates market value. Securities for which quotations are not readily available are valued at fair value using
methods approved by the Board of Trustees of the Trust.
|
| B. Security Transactions and Investment Income — Security transactions are recorded as of the trade date. Realized gains and losses on sales of portfolio securities are calculated using the identified-cost basis. Dividend income is recorded on the ex-dividend date, net of foreign withholding taxes
where applicable. Dividends for which the Fund has the choice to receive either cash or stock are recognized as investment income in an amount equal to the cash dividend. Interest income is recorded on the basis of interest accrued, premium amortized and
discount earned.
|
| Net investment income (other than class specific expenses) and unrealized and
realized gains or losses are allocated daily to each class of the Fund based upon the relative proportion of net assets.
|
| C. Federal Taxes — It is the Fund’s
policy to comply with the requirements of the Internal Revenue Code applicable to regulated investment companies and to distribute each year substantially all of its investment company taxable income and capital gains to its shareholders. Accordingly, no
federal tax provision is required. Income and capital gains distributions, if any, are declared and paid annually.
|
| The characterization of distributions to shareholders for financial reporting
purposes is determined in accordance with income tax rules. Therefore, the source of the Fund’s distributions may be shown in the accompanying financial statements as either from or in excess of net investment income or net realized gain on
investment transactions, or from paid-in capital, depending on the type of book/tax differences that may exist.
|
| At August 31, 2000, the aggregate cost of portfolio securities for federal income
tax purposes is $476,252,872. Accordingly, the gross unrealized gain on investments was $63,977,182 and the gross unrealized loss on investments was $29,013,283 resulting in a net unrealized gain of $34,963,899.
|
| D. Expenses — Expenses incurred by the
Trust which do not specifically relate to an individual Fund of the Trust are allocated to the Funds based on a straight-line or pro rata basis depending upon the nature of the expense.
|
| 2. SIGNIFICANT ACCOUNTING POLICIES (continued)
|
| Class A, Class B and Class C Shares bear all expenses and fees relating to their
respective Distribution and Service Plans. Shareholders of Service Shares bear all expenses and fees paid to service organizations. Each class of shares separately bears its respective class-specific Transfer Agency fees.
|
| E. Deferred Organization Expenses —
Organization-related costs are amortized on a straight-line basis over a period of five years.
|
| F. Foreign Currency Translations — The
books and records of the Fund are maintained in U.S. dollars. Amounts denominated in foreign currencies are translated into U.S. dollars on the following basis: (i) investment valuations, foreign currency and other assets and liabilities initially
expressed in foreign currencies are converted each business day into U.S. dollars based on current exchange rates; (ii) purchases and sales of foreign investments, income and expenses are converted into U.S. dollars based on currency exchange rates
prevailing on the respective dates of such transactions.
|
| Net realized and unrealized gain (loss) on foreign currency transactions will
represent: (i) foreign exchange gains and losses from the sale and holdings of foreign currencies; (ii) currency gains and losses between trade date and settlement date on investment securities transactions and forward exchange contracts; and (iii) gains
and losses from the difference between amounts of dividends, interest and foreign withholding taxes recorded and the amounts actually received.
|
| G. Segregation Transactions — The Fund may
enter into certain derivative transactions to seek to increase total return. Forward foreign currency exchange contracts, futures contracts, written options, when-issued securities and forward commitments represent examples of such transactions. As a
result of entering into those transactions, the Fund is required to segregate liquid assets on the accounting records equal to or greater than the market value of the corresponding transactions.
|
| 3. AGREEMENTS
|
| Pursuant to the Investment Management Agreement (the “Agreement”), Goldman Sachs Asset Management International (“
GSAMI”), an affiliate of Goldman, Sachs & Co. (“Goldman Sachs”), serves as the investment adviser to the Fund. Under the Agreement, GSAMI, subject to the general supervision of the Trust’s Board of Trustees, manages the Fund’s
portfolio. As compensation for the services rendered under the Agreement, the assumption of the expenses related thereto and administering the Fund’s business affairs, including providing facilities, GSAMI is entitled to a fee, computed daily and
payable monthly, at an annual rate equal to 1.20% of the average daily net assets of the Fund.
|
| The investment adviser has voluntarily agreed to limit certain “Other
Expenses” (excluding Management fees, Distribution and Service fees, Transfer Agent fees, taxes, interest, brokerage, litigation, Service Share fees, indemnification costs and other extraordinary expenses) to the extent such expenses exceed, on an
annual basis, 0.16% of the average daily net assets of the Fund. For the year ended August 31, 2000, the adviser reimbursed approximately $501,000. In addition, the Fund has entered into certain offset arrangements with the custodian resulting in a
reduction in the Fund’s expenses. For the year ended August 31, 2000, Custody fees were reduced by approximately $5,000.
|
| The Trust, on behalf of the Fund, has adopted Distribution and Service Plans.
Under the Distribution and Service Plans, Goldman Sachs and/or authorized dealers are entitled to a monthly fee from the Fund for distribution and shareholder maintenance services equal, on an annual basis, to 0.50%, 1.00% and 1.00% of the Fund’s
average daily net assets attributable to Class A, Class B and Class C Shares, respectively.
|
| Goldman Sachs serves as the distributor of shares of the Fund pursuant to a
Distribution Agreement. Goldman Sachs may receive a portion of the Class A sales load and Class B and Class C contingent deferred sales charges and has advised the Fund that it retained approximately $2,168,000 for the year ended August 31, 2000.
|
| 3. AGREEMENTS (continued)
|
| Goldman Sachs also serves as the transfer agent of the Fund for a fee. The fees
charged for such transfer agency services are calculated daily and payable monthly at an annual rate as follows: 0.19% of average daily net assets for Class A, Class B and Class C Shares and 0.04% of average daily net assets for Institutional and Service
Shares.
|
| The Trust, on behalf of the Fund, has adopted a Service Plan. This Plan allows for
Service Shares to compensate service organizations for providing varying levels of account administration and shareholder liaison services to their customers who are beneficial owners of such shares. The Service Plan provides for compensation to the
service organizations in an amount up to 0.50% (on an annualized basis), of the average daily net asset value of the Service Shares.
|
| As of August 31, 2000, the amounts owed to affiliates were approximately $487,000,
$133,000 and $55,000 for Management, Distribution and Service, and Transfer Agent fees, respectively.
|
| 4. PORTFOLIO SECURITIES TRANSACTIONS
|
| Purchases and proceeds of sales or maturities of securities (excluding short-term
investments and futures) for the year ended August 31, 2000, were $513,837,934 and $202,918,134, respectively. For the year ended August 31, 2000, Goldman Sachs earned approximately $3,000 of brokerage commissions from portfolio transactions, including
futures transactions executed on behalf of the Fund.
|
| Forward Foreign Currency Exchange Contracts — The
Fund may enter into forward foreign currency exchange contracts for the purchase or sale of a specific foreign currency at a fixed price on a future date as a hedge or cross-hedge against either specific transactions or portfolio positions. The Fund may
also purchase and sell such contracts to seek to increase total return. All commitments are “marked-to-market” daily at the applicable translation rates and any resulting unrealized gains or losses are recorded in the Fund’s financial
statements. The Fund realizes gains or losses at the time a forward contract is offset by entry into a closing transaction or extinguished by delivery of the currency. Risks may arise upon entering these contracts from the potential inability of
counterparties to meet the terms of their contracts and from unanticipated movements in the value of a foreign currency relative to the U.S. dollar. At August 31, 2000, the Fund had no open forward foreign exchange contracts.
|
| Futures Contracts — The Fund may enter into futures
transactions to hedge against changes in interest rates, securities prices, currency exchange rates or to seek to increase total return. Upon entering into a futures contract, the Fund is required to deposit with a broker or the Fund’s custodian
bank, an amount of cash or securities equal to the minimum “initial margin” requirement of the associated futures exchange. Subsequent payments for futures contracts (“variation margin”) are paid or received by the Fund, depending on
the fluctuations in the value of the contracts, and are recorded for financial reporting purposes as unrealized gains or losses. When contracts are closed, the Fund realizes a gain or loss which is reported in the Statement of Operations.
|
| The use of futures contracts involve, to varying degrees, elements of market risk
which may exceed the amounts recognized in the Statement of Assets and Liabilities. Changes in the value of the futures contract may not directly correlate with changes in the value of the underlying securities. This risk may decrease the effectiveness of
the Fund’s hedging strategies and potentially result in a loss.
|
| At August 31, 2000 the following futures contracts were open as follows:
|
| Type | Number of
Contracts Long |
Settlement
Month |
Market
Value |
Unrealized
Gain |
|||||
|---|---|---|---|---|---|---|---|---|---|
| FTSE 100 | 199 | Sep-00 | $19,312,875 | $504,809 | |||||
| $504,809 | |||||||||
| 5. LINE OF CREDIT FACILITY
|
| Effective May 31, 2000, the Fund participates in a $350,000,000 committed, unsecured revolving line of credit facility. Prior
thereto, the Fund participated in a $250,000,000 uncommitted and a $250,000,000 committed, unsecured revolving line of credit facility. Under the most restrictive arrangement, the Fund must own securities having a market value in excess of 400% of the
total bank borrowings. This facility is to be used solely for temporary or emergency purposes. The interest rate on borrowings is based on the Federal Funds rate. The committed facility also requires a fee to be paid by the Fund based on the amount of the
commitment which has not been utilized. During the year ended August 31, 2000, the Fund did not have any borrowings under any of these facilities.
|
| 6. CHANGE IN INDEPENDENT ACCOUNTANTS
|
| On October 26, 1999 the Board of Trustees of the Fund, upon the recommendation of the Board’s audit committee, determined not
to retain Arthur Andersen LLP and approved a change of the Fund’s independent accountants to PricewaterhouseCoopers LLP. For the period ended August 31, 1999 and the fiscal year ended January 31, 1999, Arthur Andersen LLP’s audit reports
contained no adverse opinion or disclaimer of opinion; nor were their reports qualified or modified as to uncertainty, audit scope, or accounting principles. Further, there were no disagreements between the Fund and Arthur Andersen LLP on accounting
principles or practices, financial statement disclosure or audit scope or procedure, which if not resolved to the satisfaction of Arthur Andersen LLP would have caused them to make reference to the disagreement in their report.
|
| 7. CERTAIN RECLASSIFICATIONS
|
| In accordance with statement of position 93-2, the Fund has reclassified $1,650,869 and $2,284 from accumulated net investment
gain and paid-in capital, respectively to accumulated net investment loss. This reclassification has no impact on the net asset value of the Fund and is designed to present the Fund’s capital accounts on a tax basis. Reclassifications result
primarily from the difference in the tax treatment of foreign currency, net operating losses and organization costs.
|
| 8. SUMMARY OF SHARE TRANSACTIONS
|
| Share activity for the:
|
| For the
Year Ended August 31, 2000 |
For the
Seven Months Ended August 31, 1999 |
For the
Period Ended January 31, 1999 (a) |
|||||||||||||||||
|---|---|---|---|---|---|---|---|---|---|---|---|---|---|---|---|---|---|---|---|
| Shares | Dollars | Shares | Dollars | Shares | Dollars | ||||||||||||||
| Class A Shares | |||||||||||||||||||
| Shares sold | 19,003,047 | $297,708,611 | 2,607,810 | $32,403,673 | 3,789,828 | $39,461,070 | |||||||||||||
| Reinvestment of dividends and
distributions |
157,580 | 2,229,751 | — | — | — | — | |||||||||||||
| Shares repurchased | (4,075,523 | ) | (64,277,773 | ) | (470,755 | ) | (5,480,465 | ) | (680,952 | ) | (6,496,553 | ) | |||||||
| 15,085,104 | 235,660,589 | 2,137,055 | 26,923,208 | 3,108,876 | 32,964,517 | ||||||||||||||
| Class B Shares | |||||||||||||||||||
| Shares sold | 204,200 | 3,281,798 | 6,837 | 79,235 | 24,738 | 250,752 | |||||||||||||
| Reinvestment of dividends and
distributions |
1,259 | 17,723 | — | — | — | — | |||||||||||||
| Shares repurchased | (51,476 | ) | (813,483 | ) | (3,975 | ) | (41,451 | ) | (4,639 | ) | (43,306 | ) | |||||||
| 153,983 | 2,486,038 | 2,862 | 37,784 | 20,099 | 207,446 | ||||||||||||||
| Class C Shares | |||||||||||||||||||
| Shares sold | 654,778 | 10,258,693 | 21,336 | 268,279 | 19,740 | 196,453 | |||||||||||||
| Reinvestment of dividends and
distributions |
2,170 | 30,550 | — | — | — | — | |||||||||||||
| Shares repurchased | (458,758 | ) | (7,319,550 | ) | (6,059 | ) | (68,915 | ) | (3,281 | ) | (32,610 | ) | |||||||
| 198,190 | 2,969,693 | 15,277 | 199,364 | 16,459 | 163,843 | ||||||||||||||
| Institutional Shares | |||||||||||||||||||
| Shares sold | 7,042,187 | 110,124,526 | 2,231,140 | 26,139,267 | 4,172,165 | 41,833,210 | |||||||||||||
| Reinvestment of dividends and
distributions |
162,879 | 2,329,172 | 183 | 2,349 | 851 | 8,522 | |||||||||||||
| Shares repurchased | (703,368 | ) | (11,028,965 | ) | (773,017 | ) | (8,533,356 | ) | (703,520 | ) | (7,414,800 | ) | |||||||
| 6,501,698 | 101,424,733 | 1,458,306 | 17,608,260 | 3,469,496 | 34,426,932 | ||||||||||||||
| Service Shares | |||||||||||||||||||
| Shares sold | — | — | — | — | 161 | 1,594 | |||||||||||||
| Reinvestment of dividends and
distributions |
6 | 79 | — | — | — | — | |||||||||||||
| Shares repurchased | (11 | ) | (168 | ) | — | — | — | — | |||||||||||
| (5 | ) | (89 | ) | — | — | 161 | 1,594 | ||||||||||||
| NET INCREASE | 21,938,970 | $342,540,964 | 3,613,500 | $44,768,616 | 6,615,091 | $67,764,332 | |||||||||||||
(a)
|
The Fund commenced operations on May 1, 1998 for all share classes.
|
| Goldman Sachs International Small Cap Fund — Tax Information (unaudited)
|
| For the distribution paid during the year ended August 31, 2000, the total amount of
income received by the International Small Cap Equity Fund from sources within foreign countries and possessions of the United States was $0.0403 per share all of which is attributable to qualified passive income. The total amount of taxes paid by the
Fund to such countries was $0.0060 per share. A separate notice containing the country by country components of these totals has been previously mailed to the shareholders.
|
| Income from
investment operations |
Distributions to shareholders |
|||||||||||||||||||
|---|---|---|---|---|---|---|---|---|---|---|---|---|---|---|---|---|---|---|---|---|
| Net asset
value, beginning of period |
Net
investment loss |
Net realized
and unrealized gain |
Total
income from investment operations |
In excess
of net investment income |
From net
realized gains |
Total
distributions |
||||||||||||||
| FOR THE YEAR ENDED AUGUST 31, | ||||||||||||||||||||
| 2000 - Class A Shares | $13.24 | $(0.12 | ) (c) | $3.52 | $3.40 | $ — | $(0.52 | ) | $(0.52 | ) | ||||||||||
| 2000 - Class B Shares | 13.19 | (0.18 | ) (c) | 3.49 | 3.31 | — | (0.52 | ) | (0.52 | ) | ||||||||||
| 2000 - Class C Shares | 13.19 | (0.19 | ) (c) | 3.49 | 3.30 | — | (0.52 | ) | (0.52 | ) | ||||||||||
| 2000 - Institutional Shares | 13.35 | (0.03 | ) (c) | 3.57 | 3.54 | — | (0.52 | ) | (0.52 | ) | ||||||||||
| 2000 - Service Shares | 13.24 | (0.10 | ) (c) | 3.54 | 3.44 | — | (0.52 | ) | (0.52 | ) | ||||||||||
| FOR THE SEVEN-MONTH PERIOD ENDED AUGUST 31, | ||||||||||||||||||||
| 1999 - Class A Shares | 10.62 | (0.03 | ) | 2.65 | 2.62 | — | — | — | ||||||||||||
| 1999 - Class B Shares | 10.61 | (0.08 | ) (c) | 2.66 | 2.58 | — | — | — | ||||||||||||
| 1999 - Class C Shares | 10.61 | (0.08 | ) (c) | 2.66 | 2.58 | — | — | — | ||||||||||||
| 1999 - Institutional Shares | 10.66 | — | 2.69 | 2.69 | — | — | — | |||||||||||||
| 1999 - Service Shares | 10.61 | (0.02 | ) | 2.65 | 2.63 | — | — | — | ||||||||||||
| FOR THE PERIOD ENDED JANUARY 31, | ||||||||||||||||||||
| 1999 - Class A Shares (commenced May 1, 1998) | 10.00 | (0.04 | ) | 0.66 | 0.62 | — | — | — | ||||||||||||
| 1999 - Class B Shares (commenced May 1, 1998) | 10.00 | (0.10 | ) | 0.71 | 0.61 | — | — | — | ||||||||||||
| 1999 - Class C Shares (commenced May 1, 1998) | 10.00 | (0.06 | ) | 0.67 | 0.61 | — | — | — | ||||||||||||
| 1999 - Institutional Shares (commenced May 1, 1998) | 10.00 | — | 0.67 | 0.67 | (0.01 | ) | — | (0.01 | ) | |||||||||||
| 1999 - Service Shares (commenced May 1, 1998) | 10.00 | (0.02 | ) | 0.63 | 0.61 | — | — | — | ||||||||||||
(a)
|
Assumes investment at the net asset value at the beginning of the period, reinvestment of all dividends and distributions, a
complete redemption of the investment at the net asset value at the end of the period and no sales or redemption charges. Total return would be reduced if a sales or redemption charge were taken into account. Total returns for periods less than one full
year are not annualized.
|
(b)
|
Annualized.
|
(c)
|
Calculated based on the average shares outstanding methodology.
|
|
Ratios assuming no expense reductions |
|||||||||||||||||||||
|---|---|---|---|---|---|---|---|---|---|---|---|---|---|---|---|---|---|---|---|---|---|
| Net asset
value, end of period |
Total
return (a) |
Net assets
at end of period (in 000s) |
Ratio of net expenses to
average net assets |
Ratio of
net investment loss to average net assets |
Ratio of
expenses to average net assets |
Ratio of
net investment loss to average net assets |
Portfolio
turnover rate |
||||||||||||||
| $16.12 | 26.26 | % | $327,697 | 2.05 | % | (0.79 | )% | 2.22 | % | (0.96 | )% | 73.43 | % | ||||||||
| 15.98 | 25.66 | 2,827 | 2.55 | (1.16 | ) | 2.72 | (1.33 | ) | 73.43 | ||||||||||||
| 15.97 | 25.58 | 3,672 | 2.55 | (1.23 | ) | 2.72 | (1.40 | ) | 73.43 | ||||||||||||
| 16.37 | 27.12 | 187,075 | 1.40 | (0.19 | ) | 1.57 | (0.36 | ) | 73.43 | ||||||||||||
| 16.16 | 26.57 | 3 | 1.90 | (0.63 | ) | 2.07 | (0.80 | ) | 73.43 | ||||||||||||
| 13.24 | 24.67 | 69,458 | 2.05 | (b) | (0.68 | ) (b) | 2.42 | (b) | (1.05 | ) (b) | 58.81 | ||||||||||
| 13.19 | 24.32 | 303 | 2.55 | (b) | (1.16 | ) (b) | 2.92 | (b) | (1.53 | ) (b) | 58.81 | ||||||||||
| 13.19 | 24.32 | 419 | 2.55 | (b) | (1.21 | ) (b) | 2.92 | (b) | (1.58 | ) (b) | 58.81 | ||||||||||
| 13.35 | 25.24 | 65,772 | 1.40 | (b) | (0.05 | ) (b) | 1.77 | (b) | (0.42 | ) (b) | 58.81 | ||||||||||
| 13.24 | 24.79 | 2 | 1.90 | (b) | (0.35 | ) (b) | 2.27 | (b) | (0.72 | ) (b) | 58.81 | ||||||||||
| 10.62 | 6.20 | 33,002 | 2.02 | (b) | (1.03 | ) (b) | 3.60 | (b) | (2.61 | ) (b) | 96.11 | ||||||||||
| 10.61 | 6.10 | 213 | 2.51 | (b) | (1.30 | ) (b) | 4.09 | (b) | (2.88 | ) (b) | 96.11 | ||||||||||
| 10.61 | 6.10 | 175 | 2.51 | (b) | (1.45 | ) (b) | 4.09 | (b) | (3.03 | ) (b) | 96.11 | ||||||||||
| 10.66 | 6.67 | 36,992 | 1.40 | (b) | (0.19 | ) (b) | 2.98 | (b) | (1.77 | ) (b) | 96.11 | ||||||||||
| 10.61 | 6.10 | 2 | 1.90 | (b) | (0.26 | ) (b) | 3.48 | (b) | (1.84 | ) (b) | 96.11 | ||||||||||
| To the Shareholders and Board of Trustees of
Goldman Sachs Trust — International Small Cap Fund: |
| In our opinion, the accompanying statement of assets and liabilities, including the statement of investments, and the related
statements of operations and of changes in net assets and the financial highlights present fairly, in all material respects, the financial position of Goldman Sachs International Small Cap Fund (“the Fund”), one of the portfolios constituting
Goldman Sachs Trust, at August 31, 2000, the results of its operations, the changes in its net assets and the financial highlights for the year then ended, in conformity with accounting principles generally accepted in the United States of America. These
financial statements and financial highlights (hereafter referred to as “financial statements”) are the responsibility of the Fund’s management; our responsibility is to express an opinion on these financial statements based on our audit.
We conducted our audit of these financial statements in accordance with auditing standards generally accepted in the United States of America, which require that we plan and perform the audit to obtain reasonable assurance about whether the financial
statements are free of material misstatement. An audit includes examining, on a test basis, evidence supporting the amounts and disclosures in the financial statements, assessing the accounting principles used and significant estimates made by management,
and evaluating the overall financial statement presentation. We believe that our audit, which included confirmation of securities at August 31, 2000 by correspondence with the custodian and brokers, provides a reasonable basis for our opinion. The
statements of changes in net assets and financial highlights of the Fund for the periods ended August 31, 1999 and January 31, 1999 were audited by other independent accountants whose report dated October 8, 1999 expressed an unqualified opinion thereon.
|
| PricewaterhouseCoopers LLP
|
| Boston, Massachusetts
|
| October 23, 2000
|
|
Shares |
Description | Value | |||
|---|---|---|---|---|---|
| Common Stocks – 88.3% | |||||
| Brazil – 5.3% | |||||
| 143,006 | Companhia Cervejaria Brahma
ADR (Food & Beverage) |
$ 2,967,374 | |||
| 43,000 | IdeiasNet* (Information Services) | 200,407 | |||
| 207,000 | Petroleo Brasileiro SA ADR*
(Energy Resources) |
6,585,187 | |||
| 79,100 | Votorantim Celulose e Papel SA
ADR (Paper) |
1,591,888 | |||
| 11,344,856 | |||||
| Chile – 4.0% | |||||
| 6,000 | Banco Santander Chile Series A
ADR (Financial Services) |
90,750 | |||
| 40,500 | Banco Santiago ADR (Banks) | 794,813 | |||
| 27,200 | BBV Banco BHIF ADR
(Financial Services) |
397,800 | |||
| 121,800 | Cia de Telecomunicaciones de
Chile SA ADR (Telecommunications) |
2,146,725 | |||
| 20,400 | Compania Cervecerias Unidas SA
ADR (Food & Beverage) |
471,750 | |||
| 96,600 | Distribucion y Servicio D&S SA
ADR (Merchandising) |
1,666,350 | |||
| 108,100 | Embotelladora Andina SA
Series B ADR (Food & Beverage) |
1,114,781 | |||
| 62,346 | Empresa Nacional de Electricidad
SA Endesa ADR (Electrical Utilities) |
666,323 | |||
| 70,204 | Enersis SA ADR (Electrical
Utilities) |
1,211,019 | |||
| 8,560,311 | |||||
| China – 4.7% | |||||
| 735,000 | China Mobile Ltd.*
(Telecommunications) |
5,654,571 | |||
| 2,112,000 | Huaneng Power International, Inc.
Class H (Utilities) |
880,113 | |||
| 5,699,000 | Jiangxi Copper Co. Ltd. Class H*
(Nonferrous Metals) |
730,734 | |||
| 8,339,000 | PetroChina Co. Ltd. Class H*†
(Energy Resources) |
1,988,786 | |||
| 2,846,000 | Yanzhou Coal Mining Co. Ltd.
Class H (Mining) |
821,067 | |||
| 10,075,271 | |||||
| Colombia – 0.6% | |||||
| 32,600 | Banco Ganadero SA Class B
ADR (Banks) |
118,175 | |||
| 353,400 | Bavaria SA (Food & Beverage) | 1,164,967 | |||
| 1,283,142 | |||||
| Czech Republic – 0.6% | |||||
| 3,300 | Ceske Radiokomunikace GDR*
(Telecommunications) |
146,685 | |||
| 182,600 | CEZ* (Electrical Utilities) | 496,871 | |||
| 49,215 | SPT Telecom AS*
(Telecommunications) |
742,615 | |||
| 1,386,171 | |||||
|
Shares |
Description | Value | |||
|---|---|---|---|---|---|
| Common Stocks – (continued) | |||||
| Greece – 1.4% | |||||
| 5,652 | Alpha Bank SA (Banks) | $ 172,399 | |||
| 5,561 | Attica Enterprises Holding SA
(Ship Transportation) |
38,531 | |||
| 4,120 | Commercial Bank of Greece
(Banks) |
166,782 | |||
| 3,320 | EFG Eurobank Ergasias (Banks) | 75,077 | |||
| 6,720 | Ergo Bank SA (Banks) | 109,556 | |||
| 49,015 | Hellenic Telecommunications
Organization SA (OTE) (Telecommunications) |
911,218 | |||
| 26,966 | Intracom (Electrical Equipment) | 836,705 | |||
| 20,597 | National Bank of Greece (Banks) | 695,954 | |||
| 2,910 | Titan Cement Co. (Mining) | 101,004 | |||
| 3,107,226 | |||||
| Hong Kong – 1.2% | |||||
| 2,814,000 | China Resources Beijing Land
Ltd. (Energy Resources) |
602,562 | |||
| 238,400 | China Unicom Ltd.*
(Telecommunications) |
553,281 | |||
| 194,000 | Citic Pacific Ltd. (Multi-Industry) | 925,350 | |||
| 2,478,000 | Denway Motors Ltd.* (Auto) | 406,698 | |||
| 2,487,891 | |||||
| Hungary – 0.8% | |||||
| 6,600 | Graphisoft NV* (Computer
Software) |
96,676 | |||
| 36,072 | Magyar Travkozlesi Rt ADR
(Telecommunications) |
1,019,034 | |||
| 8,680 | Mol Magyar Olaj-es Gazipari Rt
Class S GDR (Energy Resources) |
117,614 | |||
| 4,845 | OTP Bank Rt. GDR (Financial
Services) |
257,996 | |||
| 9,300 | Pannonplast Rt. (Multi-Industry) | 156,741 | |||
| 1,648,061 | |||||
| India – 6.6% | |||||
| 15,070 | Cadbury India Ltd. (Food &
Beverage) |
197,534 | |||
| 32,149 | Dr. Reddy’s Laboratories Ltd.
(Medical Products) |
930,289 | |||
| 21,711 | Hindalco Industries Ltd.
(Nonferrous Metals) |
380,802 | |||
| 430,300 | Hindustan Lever Ltd. (Consumer
Cyclicals) |
2,240,979 | |||
| 96,770 | Housing Development Finance
Corp. Ltd. (Banks) |
1,113,262 | |||
| 3,000 | Infosys Technologies Ltd.
(Computer Software) |
527,890 | |||
| 7,940 | Infosys Technologies Ltd.
(Computer Software) |
1,397,149 | |||
| 95,326 | ITC Ltd. (Tobacco) | 1,618,804 | |||
| 42,000 | Nestle India Ltd. (Food &
Beverage) |
418,808 | |||
| 52,440 | Ranbaxy Laboratories Ltd.
(Medical Products) |
789,949 | |||
|
Shares |
Description | Value | |||
|---|---|---|---|---|---|
| Common Stocks – (continued) | |||||
| India – (continued) | |||||
| 171,271 | Reliance Industries Ltd. (Energy
Resources) |
$ 1,264,762 | |||
| 59,150 | Satyam Computer Services Ltd.
(Business Services) |
742,523 | |||
| 100,000 | State Bank of India (Banks) | 431,721 | |||
| 10,000 | State Bank of India GDR (Banks) | 99,000 | |||
| 44,870 | Videsh Sanchar Nigam Ltd.
(Telecommunications) |
794,886 | |||
| 21,000 | VisualSoft Technologies Ltd.
(Computer Software) |
834,017 | |||
| 28,000 | Zee Telefilms Ltd.
(Entertainment) |
313,498 | |||
| 14,095,873 | |||||
| Indonesia – 1.6% | |||||
| 1,030,000 | PT Astra International Tbk*
(Auto) |
325,198 | |||
| 2,978,600 | PT Bank Pan Indonesia Tbk-
Alien Market* (Banks) |
103,697 | |||
| 297,000 | PT Gudang Garam Tbk (Tobacco) | 444,965 | |||
| 244,300 | PT Hanjaya Mandala Sampoerna
Tbk (Multi-Industry) |
362,198 | |||
| 1,359,500 | PT Indah Kiat Pulp & Paper
Corp.* (Paper) |
237,464 | |||
| 273,000 | PT Indofood Sukses* (Food &
Beverage) |
122,244 | |||
| 161,000 | PT Indosat (Persero) Tbk
(Telecommunications) |
143,992 | |||
| 2,480,000 | PT Matahari Putra Prima Tbk
(Specialty Retail) |
190,540 | |||
| 402,000 | PT Ramayana Lestari Sentosa
Tbk (Specialty Retail) |
248,535 | |||
| 3,120,200 | PT Telekomunikasi Indonesia
Series B (Telecommunications) |
1,082,518 | |||
| 554,000 | PT Tempo Scan Pacific Tbk
(Health) |
223,462 | |||
| 3,484,813 | |||||
| Israel – 5.7% | |||||
| 352,830 | Bank Hapoalim (Banks) | 1,123,439 | |||
| 232,907 | Bank Leumi (Banks) | 536,497 | |||
| 138,952 | Bezeq Israel Telecomm
(Telecommunications) |
862,055 | |||
| 33,100 | Check Point Software
Technologies Ltd.* (Computer Software) |
4,826,394 | |||
| 13,900 | ECI Telecom Ltd. (Electrical
Equipment) |
436,113 | |||
| 22,284 | First International Bank of Israel
Ltd. (Financial Services) |
163,582 | |||
| 4,100 | Gilat Satellite Networks Ltd.*
(Electrical Equipment) |
329,025 | |||
| 281,642 | ICL Israel Chemical (Chemicals) | 352,403 | |||
| 12,106 | IDB Holding Corp. Ltd.
(Multi-Industry) |
510,741 | |||
|
Shares |
Description | Value | |||
|---|---|---|---|---|---|
| Common Stocks – (continued) | |||||
| Israel – (continued) | |||||
| 17,513 | Koors Industries Ltd. ADR
(Multi-Industry) |
$ 369,962 | |||
| 7,900 | Matav-Cable Systems Media Ltd.
(Broadcasting) |
171,756 | |||
| 7,100 | Orbotech Ltd.* (Computer
Software) |
687,369 | |||
| 37,518 | Super Sol (Merchandising) | 140,739 | |||
| 28,920 | Teva Pharmaceutical Industries
Ltd. ADR (Medical Products) |
1,753,275 | |||
| 12,263,350 | |||||
| Malaysia – 2.3% | |||||
| 358,000 | Arab-Malaysian Finance Berhad-
Alien Market (Banks) |
373,074 | |||
| 81,000 | British American Tobacco
(Malaysia) Berhad (Tobacco) |
756,710 | |||
| 158,000 | Malayan Banking Berhad (Banks) | 607,053 | |||
| 363,000 | Malayan Cement Berhad (Mining) | 126,095 | |||
| 33,000 | Malaysian Pacific Industries
Berhad (Electrical Equipment) |
286,579 | |||
| 297,000 | Public Bank Berhad (Banks) | 254,795 | |||
| 87,000 | Resorts World Berhad (Leisure) | 179,724 | |||
| 269,000 | RHB Capital Berhad (Banks) | 291,653 | |||
| 234,000 | Sime Darby Berhad (Electrical
Equipment) |
259,863 | |||
| 117,000 | Star Publications (Malaysia)
Berhad (Publishing) |
431,053 | |||
| 65,000 | Tanjong PLC (Leisure) | 141,118 | |||
| 91,000 | Telekom Malaysia Berhad
(Telecommunications) |
258,631 | |||
| 143,000 | Tenaga Nasional Berhad
(Electrical Utilities) |
477,921 | |||
| 88,000 | Unisem (M) Berhad (Electrical
Equipment) |
458,526 | |||
| 4,902,795 | |||||
| Mexico – 11.8% | |||||
| 146,400 | Apasco SA de CV (Construction) | 905,354 | |||
| 101,061 | Cemex SA de CV ADR (Mining) | 2,368,617 | |||
| 434,700 | Grupo Carso SA Series A*
(Multi-Industry) |
1,544,907 | |||
| 4,307,600 | Grupo Financiero BBVA
Bancomer, SA de CV* (Banks) |
2,584,279 | |||
| 1,026,200 | Grupo Modelo SA Series C
(Tobacco) |
2,559,645 | |||
| 21,100 | Grupo Televisa SA ADR*
(Broadcasting) |
1,366,225 | |||
| 186,440 | Organizacion Soriana SA de CV
Series B (Merchandising) |
804,442 | |||
| 49,700 | Panamerican Beverages, Inc.
(Food & Beverage) |
922,556 | |||
| 173,339 | Telefonos de Mexico SA ADR
(Telecommunications) |
9,436,142 | |||
| 130,000 | Wal-Mart de Mexico SA de CV
Series V* (Specialty Retail) |
324,964 | |||
|
Shares |
Description | Value | |||
|---|---|---|---|---|---|
| Common Stocks – (continued) | |||||
| Mexico – (continued) | |||||
| 1,018,600 | Wal-Mart de Mexico SA de CV
Series C* (Specialty Retail) |
$ 2,391,236 | |||
| 25,208,367 | |||||
| Pakistan – 0.3% | |||||
| 79,000 | Fauji Fertilizer Co. Ltd.
(Chemicals) |
59,277 | |||
| 352,000 | Hub Power Co. Ltd.* (Electrical
Utilities) |
111,582 | |||
| 44,400 | Pakistan State Oil Co. Ltd.
(Energy Resources) |
143,105 | |||
| 610,000 | Pakistan Telecommunications Co.
Ltd. (Telecommunications) |
286,139 | |||
| 600,103 | |||||
| Peru – 0.5% | |||||
| 18,200 | Compania de Minas
Buenaventura SA Series B ADR (Mining) |
300,300 | |||
| 85,500 | Credicorp Ltd. (Financial
Services) |
716,062 | |||
| 1,016,362 | |||||
| Philippines – 0.8% | |||||
| 396,900 | ABS-CBN Broadcasting Corp.
PDR (Broadcasting) |
422,375 | |||
| 1,271,900 | Ayala Corp. (Multi-Industry) | 203,030 | |||
| 964,800 | Benpres Holdings Corp.*
(Multi-Industry) |
85,560 | |||
| 112,600 | Manila Electric Co. Class B
(Electrical Utilities) |
163,514 | |||
| 16,750 | Philippine Long Distance
Telephone Co. (Telecommunications) |
284,087 | |||
| 7,350 | Philippine Long Distance
Telephone Co. ADR (Telecommunications) |
124,031 | |||
| 106,240 | San Miguel Corp. “B” Class B
(Tobacco) |
124,836 | |||
| 1,858,400 | SM Prime (Construction) | 218,369 | |||
| 1,625,802 | |||||
| Poland – 0.5% | |||||
| 2,000 | BRE Bank SA (Financial
Services) |
64,332 | |||
| 5,330 | Elektrim Spolka Akcyjna SA
(Multi-Industry) |
60,310 | |||
| 24,500 | KGHM Polska Miedz SA
(Nonferrous Metals) |
176,617 | |||
| 4,800 | Netia Holdings SA ADR*
(Telecommunications) |
105,600 | |||
| 7,780 | Polski Koncern Naftowy Orlen
SA GDR† (Energy Resources) |
71,965 | |||
| 17,600 | Polski Koncern Naftowy SA
GDR (Energy Resources) |
162,800 | |||
|
Shares |
Description | Value | |||
|---|---|---|---|---|---|
| Common Stocks – (continued) | |||||
| Poland – (continued) | |||||
| 2,900 | Prokom Software SA (Computer
Software) |
$ 143,561 | |||
| 35,100 | Telekomunikacja Polska SA
(Telecommunications) |
208,190 | |||
| 993,375 | |||||
| Russia – 2.9% | |||||
| 33,500 | AO Tatneft ADR (Energy
Resources) |
441,781 | |||
| 3,730 | Gedeon Richter Ltd. Class S GDR
(Medical Products) |
207,948 | |||
| 2,873 | LUKoil Holding ADR (Energy
Resources) |
185,309 | |||
| 14,800 | Mobile Telesystems ADR*
(Telecommunications) |
431,050 | |||
| 38,182 | Norilsk Nickel (Mining) | 381,820 | |||
| 111,097 | RAO Unified Energy Systems
GDR (Electrical Utilities) |
1,926,977 | |||
| 132,002 | Surgutneftegaz ADR* (Energy
Resources) |
2,574,039 | |||
| 6,148,924 | |||||
| South Africa – 7.0% | |||||
| 103,300 | ABSA Group Ltd. (Financial
Services) |
426,608 | |||
| 28,800 | Anglo American Platinum Corp.
(Nonferrous Metals) |
1,125,784 | |||
| 18,429 | Angloglold (Mining) | 718,799 | |||
| 34,400 | Barlow Ltd. (Conglomerates) | 224,690 | |||
| 49,248 | Bidvest Group Ltd. (Multi-
Industry) |
356,629 | |||
| 513,400 | BOE Ltd. (Financial Services) | 321,717 | |||
| 86,000 | Comparex Holdings Ltd.
(Business Services) |
133,186 | |||
| 13,300 | Coronation Holdings Ltd.
(Financial Services) |
213,602 | |||
| 76,753 | De Beers Centenary (Agriculture) | 2,135,177 | |||
| 828,598 | FirstRand Ltd. (Financial
Services) |
908,954 | |||
| 107,598 | Gold Fields Ltd. (Mining) | 396,528 | |||
| 8,700 | Impala Platinum Holdings Ltd.
(Nonferrous Metals) |
411,690 | |||
| 28,100 | Imperial Holdings Ltd.
(Conglomerates) |
269,971 | |||
| 13,120 | Investec Group Ltd. (Banks) | 470,339 | |||
| 40,319 | Liberty Group Ltd. (Insurance) | 375,803 | |||
| 193,800 | M-Cell Ltd.
(Telecommunications) |
836,483 | |||
| 21,308 | Mobile Industries Ltd. Class N
(Financial Services) |
1,008 | |||
| 10,528 | Mobile Industries Ltd. (Financial
Services) |
498 | |||
| 88,600 | Nampak Ltd. (Consumer
Durables) |
170,881 | |||
| 40,971 | Nedcor Ltd. (Banks) | 928,262 | |||
|
Shares |
Description | Value | |||
|---|---|---|---|---|---|
| Common Stocks – (continued) | |||||
| South Africa – (continued) | |||||
| 13,676 | Omni Media Corp. Ltd.
(Publishing) |
$ 276,513 | |||
| 70,902 | Rembrandt Group (Tobacco) | 701,527 | |||
| 35,346 | RMB Holdings Ltd. (Financial
Services) |
55,753 | |||
| 441,400 | Sanlam Ltd. (Information
Services) |
531,678 | |||
| 79,300 | Sappi Ltd. (Pulp and Paper) | 693,649 | |||
| 162,125 | Sasol (Chemicals) | 1,325,139 | |||
| 116,679 | South African Brewery (Alcohol) | 854,969 | |||
| 25,628 | Tiger Oats (Food & Beverage) | 204,327 | |||
| 15,070,164 | |||||
| South Korea – 11.4% | |||||
| 13,140 | Cheil Jedang Corp. (Food &
Beverage) |
551,080 | |||
| 59,263 | Housing & Commercial Bank
(Banks) |
1,266,772 | |||
| 134,940 | Hyundai Electronics Industries
Co.* (Electrical Equipment) |
2,470,604 | |||
| 68,125 | Hyundai Motor Co. Ltd. (Auto) | 1,032,244 | |||
| 60,400 | Korea Electric Power Corp. ADR
(Electrical Utilities) |
1,019,250 | |||
| 79,570 | Korea Electric Power Corp.
(Electrical Utilities) |
2,339,555 | |||
| 3,980 | Korea Telecom Corp.
(Telecommunications) |
272,453 | |||
| 16,570 | LG Chemical Ltd. (Chemicals) | 279,467 | |||
| 10,148 | Pohang Iron & Steel Co. Ltd.
(Steel) |
761,775 | |||
| 17,110 | Samsung Electro-Mechanics Co.*
(Computer Hardware) |
726,837 | |||
| 36,216 | Samsung Electronics
(Semiconductors) |
8,933,552 | |||
| 289 | Samsung Fire & Marine Insurance
(Insurance) |
7,715 | |||
| 93,590 | Shinhan Bank (Banks) | 1,021,365 | |||
| 14,940 | SK Telecom Co. Ltd.
(Telecommunications) |
3,287,811 | |||
| 14,101 | SK Telecom Co. Ltd. ADR
(Telecommunications) |
361,338 | |||
| 1,504 | Trigem Computer, Inc.*
(Computer Hardware) |
26,384 | |||
| 24,358,202 | |||||
| Taiwan – 11.4% | |||||
| 36,400 | Acer Peripherals, Inc. (Computer
Hardware) |
84,433 | |||
| 208,152 | Ambit Microsystems Corp.
(Electrical Equipment) |
1,522,245 | |||
| 95,360 | Asustek Computer, Inc.
(Appliance) |
586,783 | |||
| 947,735 | Bank Sinopac (Financial Services) | 540,429 | |||
| 587,288 | Cathay Life Insurance Co.
(Insurance) |
1,352,806 | |||
|
Shares |
Description | Value | |||
|---|---|---|---|---|---|
| Common Stocks – (continued) | |||||
| Taiwan – (continued) | |||||
| 236,600 | China Development Industrial
Bank (Multi-Industry) |
$ 244,680 | |||
| 307,400 | Chinatrust Commercial Bank
(Banks) |
242,632 | |||
| 458,900 | Compal Electronics, Inc.
(Electronic Components) |
879,657 | |||
| 203,200 | Compeq Manufacturing Co. Ltd.
(Electrical Equipment) |
1,171,804 | |||
| 131,250 | Delta Electronics, Inc. (Electrical
Equipment) |
503,181 | |||
| 394,697 | Formosa Chemicals & Fibre Corp.
(Chemicals) |
443,780 | |||
| 242,392 | Hon Hai Precision (Electrical
Equipment) |
1,850,738 | |||
| 399,267 | Nan Ya Plastic Corp. (Chemicals) | 662,444 | |||
| 218,416 | President Chain Store Corp.
(Merchandising) |
647,367 | |||
| 18,700 | Procomp Informatics Co. Ltd.
(Semiconductors) |
103,019 | |||
| 41,000 | Siliconware Precision Industries
Co. ADR (Multi-Industry) |
297,250 | |||
| 1,250,957 | Taiwan Semiconductor
(Semiconductors) |
5,420,545 | |||
| 1,588,000 | United Microelectronics Corp.
Ltd. (Semiconductors) |
4,220,683 | |||
| 147,000 | Via Technologies, Inc. (Electrical
Equipment) |
1,960,631 | |||
| 410,000 | Winbond Electronics Corp.
(Electrical Equipment) |
1,017,075 | |||
| 107,900 | Zinwell Corp. (Electronic
Components) |
528,376 | |||
| 24,280,558 | |||||
| Thailand – 2.2% | |||||
| 82,000 | Advanced Info Service Public-
Alien Market* (Telecommunications) |
991,143 | |||
| 289,850 | Bangkok Bank Public-Alien
Market* (Banks) |
299,637 | |||
| 86,800 | BEC World PLC-Alien Market
(Entertainment) |
475,733 | |||
| 73,200 | Delta Electronics (Thailand)
Public Co. Ltd.-Alien Market (Electrical Equipment) |
537,313 | |||
| 382,700 | Land & House Public Co. Ltd.-
Alien Market* (Real Estate) |
128,753 | |||
| 139,600 | Loxley Public Co. Ltd.-Alien
Market FDR* (Telecommunications) |
119,550 | |||
| 88,700 | PTT Exploration & Production
Public-Alien Market (Energy Resources) |
529,552 | |||
| 165,400 | Shin Corp. Public Co. Ltd.-Alien
Market* (Computer Hardware) |
756,785 | |||
| 16,800 | Siam Cement Public-Alien
Market* (Construction) |
215,395 | |||
|
Shares |
Description | Value | |||
|---|---|---|---|---|---|
| Common Stocks – (continued) | |||||
| Thailand – (continued) | |||||
| 133,100 | Siam Commercial Bank Public
Co. Ltd.-Alien Market* (Banks) |
$ 61,062 | |||
| 288,800 | TelecomAsia Corp. Public-Alien
Market* (Telecommunications) |
233,188 | |||
| 516,500 | Thai Farmers Bank Public Co.
Ltd.-Alien Market* (Banks) |
315,941 | |||
| 4,664,052 | |||||
| Turkey – 3.0% | |||||
| 8,946,000 | Akcansa Cimento AS
(Construction) |
114,727 | |||
| 9,250,741 | Anadolu Efes Biracilik ve Malt
Sanayii AS* (Food & Beverage) |
494,314 | |||
| 11,045,400 | Arcelik AS (Consumer Durables) | 349,912 | |||
| 2,847,400 | Aygaz AS (Electrical Utilities) | 123,894 | |||
| 5,088,500 | Dogan Sirketler Grubu Holding
AS (Publishing) |
118,473 | |||
| 13,304,357 | Eregli Demir ve Celik Fabrikalari
TAS Erdemir (Steel) |
441,786 | |||
| 4,876,400 | Ford Otomotiv Sanayi AS (Motor
Vehicle) |
279,183 | |||
| 1,056,390 | Migros (Merchandising) | 143,540 | |||
| 11,866,000 | Tofas Turk Otomobil Fabrikasi
AS (Motor Vehicle) |
163,044 | |||
| 8,017,600 | Tupras-Turkiye Petrol Rafinerileri
AS (Energy Resources) |
361,098 | |||
| 25,000 | Turkcell Iletisim Hizmetleri AS
ADR * (Telecommunications) |
335,937 | |||
| 39,969,740 | Turkiye Garanti Bankasi AS
(Banks) |
408,851 | |||
| 93,887,246 | Turkiye Is Bankasi Isbank
Class C (Banks) |
1,899,246 | |||
| 706,300 | Vestel Elektronik Sanayi ve
Ticaret AS* (Appliance) |
134,790 | |||
| 120,151,476 | Yapi Kredi Bankesi (Banks) | 1,008,906 | |||
| 6,377,701 | |||||
| United Kingdom – 0.8% | |||||
| 177,006 | Dimension Data Holdings PLC*
(Computer Software) |
1,725,971 | |||
| United States – 0.4% | |||||
| 53,100 | Ampal-American Israel Corp.*
(Multi-Industry) |
826,369 | |||
| Venezuela – 0.5% | |||||
| 42,200 | Compania Anonima Nacional
Telefonos de Venezuela Class D ADR (Telecommunications) |
1,039,175 | |||
| TOTAL COMMON STOCKS | |||||
| (Cost $176,322,803) | $ 188,574,885 | ||||
|
Shares |
Description | Value | |||
|---|---|---|---|---|---|
| Preferred Stocks – 10.0% | |||||
| Brazil – 8.3% | |||||
| 286,426,530 | Banco Bradesco SA (Banks) | $ 2,408,533 | |||
| 46,149 | Brasil Telecom Participacoes SA
ADR (Telecommunications) |
3,250,620 | |||
| 2,000 | Companhia Vale do Rio Doce
ADR (Mining) |
54,375 | |||
| 112,700 | Companhia Vale do Rio Doce
(Mining) |
3,047,453 | |||
| 94,912 | Embratel Participacoes SA ADR
(Telecommunications) |
2,076,200 | |||
| 1,000 | Tele Centro Sul Participacoes SA
(Telecommunications) |
14 | |||
| 179,156 | Tele Norte Leste Participacoes SA
ADR (Telecommunications) |
4,568,478 | |||
| 78,515,678 | Telesp Celular Participacoes SA
(Telecommunications) |
1,160,798 | |||
| 101,100 | Ultrapar Participacoes SA ADR
(Multi-Industry) |
1,118,419 | |||
| 17,684,890 | |||||
| Russia – 1.7% | |||||
| 110,226 | LUKoil Holding ADR (Energy
Resources) |
2,755,650 | |||
| 56,000 | Surgutneftegaz ADR (Energy
Resources) |
910,000 | |||
| 3,665,650 | |||||
| TOTAL PREFERRED STOCKS | |||||
| (Cost $16,670,534) | $ 21,350,540 | ||||
| Units | Description | Value | |||
| Rights – 0.0% | |||||
| Brazil – 0.0% | |||||
| 7,851,567 | Telesp Celular Participacoes SA-
Rights exp. 10/02/00* (Telecommunications) |
$ 4,747 | |||
| TOTAL RIGHTS | |||||
| (Cost $0) | $ 4,747 | ||||
| Warrants – 0.0% | |||||
| Indonesia – 0.0% | |||||
| 277,200 | PT Bank Pan Indonesia Tbk-Alien
Market exp. 07/08/2002* (Banks) |
$ 1,897 | |||
| Thailand – 0.0% | |||||
| 276,100 | Siam Commercial Bank Public
Co. Ltd.-Alien Market exp. 05/10/2002* (Banks) |
23,644 | |||
| TOTAL WARRANTS | |||||
| (Cost $0) | $ 25,541 | ||||
| Units | Description |
Value |
|||
|---|---|---|---|---|---|
| Structured Note – 0.1% | |||||
| Switzerland – 0.1% | |||||
| Korea Tobacco & Ginseng Equity Link Note* | |||||
| 7,850 | exp 10/09/2000 | $ 133,921 | |||
| TOTAL STRUCTURED NOTE | |||||
| (Cost $252,349) | $ 133,921 | ||||
| Principal
Amount |
Interest
Rate |
Maturity
Date |
Value | |||||
|---|---|---|---|---|---|---|---|---|
| Convertible Bond – 0.0% | ||||||||
| South Africa – 0.0% | ||||||||
| Mobile Industries Ltd. E | ||||||||
| ZAR 2,011 | 6.00 | % | 12/31/2049 | $ 303 | ||||
| TOTAL CONVERTIBLE BOND | ||||||||
| (Cost $252) | $ 303 | |||||||
| Short-Term Obligation – 0.8% | ||||||||
| State Street Bank & Trust Euro-Time Deposit | ||||||||
| $1,832,000 | 6.56 | % | 09/01/2000 | $ 1,832,000 | ||||
| TOTAL SHORT-TERM OBLIGATION | ||||||||
| (Cost $1,832,000) | $ 1,832,000 | |||||||
| TOTAL INVESTMENTS | ||||||||
| (Cost $195,077,938) | $ 211,921,937 | |||||||
*
|
Non-income producing security
|
†
|
Security is exempt from registration under Rule 144A of the Securities Act of 1933. Such security may be resold, normally to
qualified institutional buyers in transactions exempt from registration. The market value of 144A Securities amounts to $2,060,751 as of August 31, 2000.
|
E
|
The principal amount of each security is stated in the currency in which the bond is denominated. See Below.
|
| The percentage shown for each investment category reflects the value of investments in that category as a percentage of total net
assets.
|
| |
| Investment Abbreviations:
|
| ADR—American Depository Receipt
|
| GDR—Global Depository Receipt
|
| PDR—Philippines Depository Receipt
|
| ZAR—South African Rand
|
| |
| As a % of
total net assets |
||||
|---|---|---|---|---|
| Common and Preferred Stock Industry Classifications† | ||||
| Agriculture | 1.0 | % | ||
| Alcohol | 0.4 | |||
| Appliance | 0.3 | |||
| Auto | 0.8 | |||
| Banks | 9.3 | |||
| Broadcasting | 0.9 | |||
| Business Services | 0.4 | |||
| Chemicals | 1.5 | |||
| Computer Hardware | 0.8 | |||
| Computer Software | 4.8 | |||
| Conglomerates | 0.2 | |||
| Constuction | 0.7 | |||
| Consumer Cyclicals | 1.1 | |||
| Consumer Durables | 0.2 | |||
| Electrical Equipment | 6.4 | |||
| Electrical Utilities | 4.0 | |||
| Electronic Components | 0.7 | |||
| Energy Resources | 8.7 | |||
| Entertainment | 0.4 | |||
| Financial Services | 2.0 | |||
| Food & Beverage | 4.0 | |||
| Health | 0.1 | |||
| Information Services | 0.3 | |||
| Insurance | 0.8 | |||
| Leisure | 0.2 | |||
| Medical Products | 1.7 | |||
| Merchandising | 1.6 | |||
| Mining | 3.9 | |||
| Motor Vehicle | 0.2 | |||
| Multi-Industry | 3.3 | |||
| Nonferrous Metals | 1.3 | |||
| Paper | 0.9 | |||
| Publishing | 0.4 | |||
| Pulp and Paper | 0.3 | |||
| Real Estate | 0.1 | |||
| Semiconductors | 8.7 | |||
| Ship Transportation | 0.0 | |||
| Specialty Retail | 1.5 | |||
| Steel | 0.6 | |||
| Telecommunications | 20.5 | |||
| Tobacco | 2.9 | |||
| Utilities | 0.4 | |||
| TOTAL COMMON AND PREFERRED STOCK | 98.3 | % | ||
†
|
Industry concentrations greater than one tenth of one percent are disclosed.
|
| Assets: | ||||
| Investment in securities, at value (identified cost $195,077,938) | $211,921,937 | |||
| Cash, at value | 1,081,659 | |||
| Receivables: | ||||
| Investment securities sold, at value | 1,217,935 | |||
| Fund shares sold | 644,184 | |||
| Dividends and interest, at value | 452,998 | |||
| Reimbursement from investment adviser | 137,060 | |||
| Deferred organization expenses, net | 6,736 | |||
| Other assets, at value | 537 | |||
| Total assets | 215,463,046 | |||
| Liabilities: | ||||
| Payables: | ||||
| Investment securities purchased, at value | 1,291,680 | |||
| Amounts owed to affiliates | 262,707 | |||
| Capital gains tax | 171,814 | |||
| Fund shares repurchased | 47,234 | |||
| Accrued expenses and other liabilities, at value | 143,501 | |||
| Total liabilities | 1,916,936 | |||
| Net Assets: | ||||
| Paid-in capital | 194,114,839 | |||
| Accumulated net investment loss | (321,626 | ) | ||
| Accumulated net realized gain from investment and foreign currency related transactions | 3,084,511 | |||
| Net unrealized gain on investments and translation of assets and liabilities denominated in foreign currencies | 16,668,386 | |||
| NET ASSETS | $213,546,110 | |||
| Net asset value, offering and redemption price per share: (a) | ||||
| Class A | $10.83 | |||
| Class B | $10.72 | |||
| Class C | $10.75 | |||
| Institutional | $11.02 | |||
| Service | $10.63 | |||
| Shares outstanding: | ||||
| Class A | 5,936,636 | |||
| Class B | 203,998 | |||
| Class C | 121,362 | |||
| Institutional | 13,232,591 | |||
| Service | 163 | |||
| Total shares outstanding, $.001 par value (unlimited number of shares authorized) | 19,494,750 | |||
(a)
|
Maximum public offering price per share (NAV per share multiplied by 1.0582) for Class A shares is $11.46. At redemption, Class B
and Class C shares may be subject to a contingent deferred sales charge, assessed on the amount equal to the lesser of the current net asset value or the original purchase price of the shares.
|
| Investment income: | ||||
| Dividends (a) | $ 3,197,954 | |||
| Interest | 235,518 | |||
| Total income | 3,433,472 | |||
| Expenses: | ||||
| Management fees | 2,576,018 | |||
| Custodian fees | 674,366 | |||
| Distribution and Service fees (b) | 414,516 | |||
| Transfer Agent fees (c) | 205,225 | |||
| Professional fees | 45,159 | |||
| Registration fees | 36,718 | |||
| Trustee fees | 8,900 | |||
| Amortization of deferred organization expenses | 2,950 | |||
| Other | 118,071 | |||
| Total expenses | 4,081,923 | |||
| Less — expense reductions | (408,592 | ) | ||
| Net expenses | 3,673,331 | |||
| NET INVESTMENT LOSS | (239,859 | ) | ||
| Realized and unrealized gain (loss) on investments and foreign currency related transactions: | ||||
| Net realized gain (loss) from: | ||||
| Investment transactions | 36,103,747 | |||
| Foreign currency related transactions | (1,755,322 | ) | ||
| Net change in unrealized gain on: | ||||
| Investments | (4,714,633 | ) | ||
| Translation of assets and liabilities denominated in foreign currencies | (13,769 | ) | ||
| Net realized and unrealized gain on investment and foreign currency related transactions | 29,620,023 | |||
| NET INCREASE IN NET ASSETS RESULTING FROM OPERATIONS | $29,380,164 | |||
(a)
|
Foreign taxes withheld on dividends were $416,710.
|
(b)
|
Class A, Class B and Class C had Distribution and Service fees of $381,208, $18,920 and $14,388, respectively.
|
(c)
|
Class A, Class B, Class C, Institutional Class and Service Class had Transfer Agent fees of $144,857, $3,595, $2,734, $54,038 and
$1, respectively.
|
| For the
Year Ended August 31, 2000 |
For the Seven
Months Ended August 31, 1999 |
For the
Year Ended January 31, 1999 |
||||||||
|---|---|---|---|---|---|---|---|---|---|---|
| From operations: | ||||||||||
| Net investment income (loss) | $ (239,859 | ) | $ 238,988 | $ 1,649,430 | ||||||
| Net realized gain (loss) on investment and foreign currency related transactions | 34,348,425 | 12,150,716 | (41,326,432 | ) | ||||||
| Net change in unrealized gain (loss) on investments and translation of assets and liabilities
denominated in foreign currencies |
(4,728,402 | ) | 31,170,452 | (8,910,101 | ) | |||||
| Net increase (decrease) in net assets resulting from operations | 29,380,164 | 43,560,156 | (48,587,103 | ) | ||||||
| Distributions to shareholders: | ||||||||||
| From net investment income | ||||||||||
| Class A Shares | — | — | (569,869 | ) | ||||||
| Class B Shares | — | — | (4,352 | ) | ||||||
| Class C Shares | — | — | (2,737 | ) | ||||||
| Institutional Shares | — | — | (1,092,333 | ) | ||||||
| Service Shares | — | — | (11 | ) | ||||||
| In excess of net investment income | ||||||||||
| Class A Shares | — | — | (1,680,766 | ) | ||||||
| Class B Shares | — | — | (12,834 | ) | ||||||
| Class C Shares | — | — | (8,074 | ) | ||||||
| Institutional Shares | — | — | (3,221,713 | ) | ||||||
| Service Shares | — | — | (33 | ) | ||||||
| Total distributions to shareholders | — | — | (6,592,722 | ) | ||||||
| From share transactions: | ||||||||||
| Proceeds from sales of shares | 106,627,300 | 32,173,466 | 220,344,538 | |||||||
| Reinvestment of dividends and distributions | — | — | 4,301,531 | |||||||
| Cost of shares repurchased | (98,802,301 | ) | (43,018,256 | ) | (62,779,701 | ) | ||||
| Net increase (decrease) in net assets resulting from share transactions | 7,824,999 | (10,844,790 | ) | 161,866,368 | ||||||
| TOTAL INCREASE | 37,205,163 | 32,715,366 | 106,686,543 | |||||||
| Net assets: | ||||||||||
| Beginning of period | 176,340,947 | 143,625,581 | 36,939,038 | |||||||
| End of period | $213,546,110 | $176,340,947 | $143,625,581 | |||||||
| Accumulated undistributed net investment income (loss) | $ (321,626 | ) | $ (45,928 | ) | $ 26,133 | |||||
| 1. ORGANIZATION
|
| Goldman Sachs Trust (the “Trust”) is a Delaware business trust registered under the Investment Company Act of 1940 (as
amended) as an open-end management investment company. The Trust includes the Goldman Sachs Emerging Markets Equity Fund (the “Fund”). The Fund is a diversified portfolio offering five classes of shares — Class A, Class B, Class
C, Institutional and Service.
|
| 2. SIGNIFICANT ACCOUNTING POLICIES
|
| The following is a summary of the significant accounting policies consistently followed by the Fund. The preparation of financial
statements in conformity with generally accepted accounting principles requires management to make estimates and assumptions that may affect the reported amounts. Actual results could differ from those estimates. Effective for fiscal year 1999, the Board
of Trustees approved a change in the fiscal year end of the Fund from January 31 to August 31. Accordingly, the Statements of Changes in Net Assets, Summary of Share Transactions and Financial Highlights of the Fund are included for the seven months ended
August 31, 1999 and the year ended January 31, 1999.
|
| A. Investment Valuation — Investments in
securities traded on a U.S. or foreign securities exchange or the NASDAQ system are valued daily at their last sale price on the principal exchange on which they are traded. If no sale occurs, securities are valued at the last bid price. Debt securities
are valued at prices supplied by independent pricing services, broker/dealer-supplied valuations or matrix pricing systems. Unlisted equity and debt securities for which market quotations are available are valued at the last sale price on valuation date
or, if no sale occurs, at the last bid price. Short-term debt obligations maturing in sixty days or less are valued at amortized cost, which approximates market value. Securities for which quotations are not readily available are valued at fair value
using methods approved by the Board of Trustees of the Trust.
|
| Investing in emerging markets may involve special risks and considerations not
typically associated with investing in the United States. These risks include revaluation of currencies, high rates of inflation, repatriation restrictions on income and capital, and adverse political and economic developments. Moreover, securities issued
in these markets may be less liquid, subject to government ownership controls, delayed settlements, and their prices more volatile than those of comparable securities in the United States.
|
| B. Security Transactions and Investment Income — Security transactions are recorded as of the trade date. Realized gains and losses on sales of portfolio securities are calculated using the identified-cost basis. Dividend income is recorded on the ex-dividend date, net of foreign withholding taxes
where applicable. Dividends for which the Fund has the choice to receive either cash or stock are recognized as investment income in an amount equal to the cash dividend. Interest income is recorded on the basis of interest accrued, premium amortized and
discount earned. It is the Fund’s policy, where necessary, to accrue for estimated capital gains taxes on appreciated foreign securities.
|
| Net investment income (other than class specific expenses) and unrealized and
realized gains or losses are allocated daily, to each class of shares of the Fund based upon the relative proportion of net assets of each class.
|
| C. Federal Taxes — It is the Fund’s
policy to comply with the requirements of the Internal Revenue Code applicable to regulated investment companies and to distribute each year substantially all of its investment company taxable income and capital gains to its shareholders. Accordingly, no
federal tax provision is required. Income and capital gains distributions, if any, are declared and paid annually.
|
| The characterization of distributions to shareholders for financial reporting
purposes is determined in accordance with income tax rules. Therefore, the source of the Fund’s distributions may be shown in the accompanying financial statements as either from or in excess of net investment income or net realized gain on
investment transactions, or from paid-in capital, depending on the type of book/tax differences that may exist.
|
| 2. SIGNIFICANT ACCOUNTING POLICIES (continued)
|
| At August 31, 2000, the aggregate cost of portfolio securities for federal income
tax purposes is $199,160,616. Accordingly, the gross unrealized gain on investments was $26,836,354 and the gross unrealized loss on investments was $14,075,033 resulting in a net unrealized gain of $12,761,321.
|
| D. Expenses — Expenses incurred by the
Trust which do not specifically relate to an individual Fund of the Trust are allocated to the Funds based on a straight-line or pro rata basis depending upon the nature of the expense.
|
| Class A, Class B and Class C Shares bear all expenses and fees relating to their
respective Distribution and Service Plans. Shareholders of Service Shares bear all expenses and fees paid to service organizations. Each class of shares separately bears its respective class-specific Transfer Agency fees.
|
| E. Deferred Organization Expenses —
Organization-related costs are amortized on a straight-line basis over a period of five years.
|
| F. Foreign Currency Translations — The
books and records of the Fund are maintained in U.S. dollars. Amounts denominated in foreign currencies are translated into U.S. dollars on the following basis: (i) investment valuations, foreign currency and other assets and liabilities initially
expressed in foreign currencies are converted each business day into U.S. dollars based on current exchange rates; and (ii) purchases and sales of foreign investments, income and expenses are converted into U.S. dollars based on currency exchange rates
prevailing on the respective dates of such transactions.
|
| Net realized and unrealized gain (loss) on foreign currency transactions will
represent: (i) foreign exchange gains and losses from the sale and holdings of foreign currencies; (ii) currency gains and losses between trade date and settlement date on investment securities transactions and forward exchange contracts; and (iii) gains
and losses from the difference between amounts of dividends, interest and foreign withholding taxes recorded and the amounts actually received.
|
| G. Derivative Financial Instruments — The
Fund may utilize derivative financial instruments such as structured notes and equity swaps. Such instruments are used by the Fund as a means of investing in a particular market or increasing the return on the Fund’s investments or both. The value of
the principal of and/or interest on such securities is determined by reference to changes in the value of the financial indicators including, but not limited to indices, currencies or interest rates. These financial instruments may subject the Fund to a
greater degree of market or counterparty risk and loss than other types of securities.
|
| H. Segregation Transactions — The Fund may
enter into certain derivative transactions to seek to increase total return. Forward foreign currency exchange contracts, futures contracts, written options, mortgage dollar rolls, when-issued securities and forward commitments represent examples of such
transactions. As a result of entering into these transactions, the Fund is required to segregate liquid assets on the accounting records equal to or greater than the market value of the corresponding transactions.
|
| 3. AGREEMENTS
|
| Pursuant to the Investment Management Agreement (the “Agreement”), Goldman Sachs Asset Management International (“
GSAMI”), an affiliate of Goldman, Sachs & Co. (“Goldman Sachs”), serves as the investment adviser to the Fund. Under the Agreement, GSAMI, subject to the general supervision of the Trust’s Board of Trustees, manages the Fund’s
portfolio. As compensation for the services rendered under the Agreement, the assumption of the expenses related thereto and administering the Fund’s business affairs, including providing facilities, GSAMI is entitled to a fee, computed daily and
payable monthly, at an annual rate equal to 1.20% of the average daily net assets of the Fund.
|
| The investment adviser has voluntarily agreed to limit certain “Other
Expenses” (excluding management fees, distribution and service fees, transfer agent fees, taxes, interest, brokerage, litigation, Service share fees, indemnification costs and other extraordinary expenses) to the extent such expenses exceed, on an
annual basis, 0.35% (0.15% prior to May 1, 2000) of the average daily net assets of the Fund. Goldman Sachs reimbursed approximately $387,000 for the year ended August 31, 2000. In addition, the Fund has entered into certain offset arrangements with the
custodian resulting in a reduction in the Fund’s expenses. For the year ended August 31, 2000, Custody fees were reduced by approximately $22,000.
|
| The Trust, on behalf of the Fund, has adopted Distribution and Service Plans.
Under the Distribution and Service Plans, Goldman Sachs and/or authorized dealers are entitled to a monthly fee from the Fund for distribution and shareholder maintenance services equal, on an annual basis, to 0.50%, 1.00% and 1.00% of the Fund’s
average daily net assets attributable to Class A, Class B and Class C Shares, respectively.
|
| Goldman Sachs serves as the distributor of shares of the Fund pursuant to a
Distribution Agreement. Goldman Sachs may receive a portion of the Class A sales load and Class B and Class C contingent deferred sales charges and has advised the Fund that it has retained approximately $149,000 for the year ended August 31, 2000.
|
| Goldman Sachs also serves as the Transfer Agent of the Fund for a fee. Fees
charged for such transfer agency services are calculated daily and payable monthly at an annual rate as follows: 0.19% of average daily net assets for Class A, Class B and Class C Shares and 0.04% of average daily net assets for Institutional and Service
Shares.
|
| The Trust, on behalf of the Fund, has adopted a Service Plan. This Plan allows for
Service Shares to compensate service organizations for providing varying levels of account administration and shareholder liaison services to their customers who are beneficial owners of such shares. The Service Plan provides for compensation to the
service organizations in an amount up to 0.50% (on an annualized basis), of the average daily net asset value of the Service Shares.
|
| As of August 31, 2000, the amounts owed to affiliates were approximately $217,000,
$30,000 and $16,000 for Management, Distribution and Service and Transfer Agent fees, respectively.
|
| 4. PORTFOLIO SECURITIES TRANSACTIONS
|
| The cost of purchases and proceeds of sales and maturities of securities (excluding short-term investments) for the year ended
August 31, 2000 were $269,545,752 and $257,071,810, respectively. For the year ended August 31, 2000, Goldman Sachs earned approximately $63,000 of brokerage commissions from portfolio transactions.
|
| Forward Foreign Currency Exchange Contracts — The
Fund may enter into forward foreign currency exchange contracts for the purchase or sale of a specific foreign currency at a fixed price on a future date as a hedge or cross-hedge against either specific transactions or portfolio positions. The Fund may
also purchase and sell such contracts to seek to increase total return. All commitments are “marked-to-market” daily at the applicable translation rates and any resulting unrealized gains or losses are recorded in the Fund’s financial
statements. The Fund realizes gains or losses at the time a forward contract is offset by entry into a closing transaction or extinguished by delivery of the currency. Risks may arise upon entering these contracts from the potential inability of
counterparties to meet the terms of their contracts and from unanticipated movements in the value of a foreign currency relative to the U.S. dollar. At August 31, 2000 the Fund had no outstanding forward foreign currency exchange contracts.
|
| Futures Contracts — The Fund may enter into futures
transactions to hedge against changes in interest rates, securities prices, currency exchange rates or to seek to increase total return. Upon entering into a futures contract, the Fund is required to deposit with a broker or the Fund’s custodian
bank, an amount of cash or securities equal to the minimum “initial margin” requirement of the associated futures exchange. Subsequent payments for futures contracts (“variation margin”) are paid or received by the Fund, depending on
the fluctuations in the value of the contracts, and are recorded for financial reporting purposes as unrealized gains or losses. When contracts are closed, the Fund realizes a gain or loss which is reported in the Statement of Operations.
|
| The use of futures contracts involve, to varying degrees, elements of market risk
which may exceed the amounts recognized in the Statement of Assets and Liabilities. Changes in the value of the futures contract may not directly correlate with changes in the value of the underlying securities. This risk may decrease the effectiveness of
the Fund’s hedging strategies and potentially result in a loss. At August 31, 2000, the Fund had no open futures contracts.
|
| 4. PORTFOLIO SECURITIES TRANSACTIONS (continued)
|
| Option Accounting Principles — When the Fund writes
call or put options, an amount equal to the premium received is recorded as an asset and as an equivalent liability. The amount of the liability is subsequently marked-to-market to reflect the current market value of the option written. When a written
option expires on its stipulated expiration date or the Fund enters into a closing purchase transaction, the Fund realizes a gain or loss without regard to any unrealized gain or loss on the underlying security, and the liability related to such option is
extinguished. When a written call option is exercised, the Fund realizes a gain or loss from the sale of the underlying security, and the proceeds of the sale are increased by the premium originally received. When a written put option is exercised, the
amount of the premium originally received will reduce the cost of the security which the Fund purchases upon exercise. There is a risk of loss from a change in value of such options which may exceed the related premiums received.
|
| Upon the purchase of a call option or a protective put option by the Fund, the
premium paid is recorded as an investment and subsequently marked-to-market to reflect the current market value of the option. If an option which the Fund has purchased expires on the stipulated expiration date, the Fund will realize a loss in the amount
of the cost of the option. If the Fund enters into a closing sale transaction, the Fund will realize a gain or loss, depending on whether the sale proceeds for the closing sale transaction are greater or less than the cost of the option. If the Fund
exercises a purchased put option, the Fund will realize a gain or loss from the sale of the underlying security, and the proceeds from such sale will be decreased by the premium originally paid. If the Fund exercises a purchased call option, the cost of
the security which the Fund purchases upon exercise will be increased by the premium originally paid. At August 31, 2000, there were no open written option contracts.
|
| 5. LINE OF CREDIT FACILITY
|
| Effective May 31, 2000, the Fund participates in a $350,000,000 committed, unsecured revolving line of credit facility. Prior
thereto, the Fund participated in a $250,000,000 uncommitted and a $250,000,000 committed, unsecured revolving line of credit facility. Under the most restrictive arrangement, the Fund must own securities having a market value in excess of 400% of the
total bank borrowings. This facility is to be used solely for temporary or emergency purposes. The interest rate on borrowings is based on the Federal Funds rate. The committed facility also requires a fee to be paid by the Fund based on the amount of the
commitment which has not been utilized. During the year ended August 31, 2000, the Fund did not have any borrowings under any of these facilities.
|
| 6. OTHER MATTERS
|
| As of August 31, 2000, the Goldman Sachs Growth and Income Strategy Portfolio, the Goldman Sachs Growth Strategy Portfolio and the
Goldman Sachs Aggressive Growth Strategy Portfolio were beneficial owners of approximately 9%, 8% and 5% of the outstanding shares of the Fund, respectively.
|
| 7. CERTAIN RECLASSIFICATIONS
|
| In accordance with AICPA Statement of Position 93-2, the Fund has reclassified $1,813,367 from paid-in-capital to accumulated net
realized gain from investment and foreign currency related transactions and $35,839 from accumulated net investment loss to accumulated net realized gain from investment and foreign currency related transactions. These reclassifications have no impact on
the net asset value of the Fund and are designed to present the Fund’s capital accounts on a tax basis. Reclassifications result primarily from the difference in the tax treatment of net operating losses and organizations costs.
|
| 8. CHANGE IN INDEPENDENT ACCOUNTANTS
|
| On October 26, 1999 the Board of Trustees of the Fund, upon the recommendation of the Board’s audit committee, determined not
to retain Arthur Andersen LLP and approved a change of the Fund’s independent accountants to PricewaterhouseCoopers LLP. For the period ended August 31, 1999 and the year ended January 31, 1999, Arthur Andersen LLP’s audit reports contained no
adverse opinion or disclaimer of opinion; nor were their reports qualified or modified as to uncertainty, audit scope, or accounting principles. Further, there were no disagreements between the Fund and Arthur Andersen LLP on accounting principles or
practices, financial statement disclosure or audit scope or procedure, which if not resolved to the satisfaction of Arthur Andersen LLP would have caused them to make reference to the disagreement in their report.
|
| 9. SUMMARY OF SHARE TRANSACTIONS
|
| Share activity is as follows:
|
| For the Year
Ended August 31, 2000 |
For the Seven Months
Ended August 31, 1999 |
For the Year
Ended January 31, 1999 |
|||||||||||||||||
|---|---|---|---|---|---|---|---|---|---|---|---|---|---|---|---|---|---|---|---|
| Shares | Dollars | Shares | Dollars | Shares | Dollars | ||||||||||||||
| Class A Shares | |||||||||||||||||||
| Shares sold | 5,026,648 | $54,984,525 | 2,397,786 | $20,583,469 | 10,357,445 | $ 89,405,582 | |||||||||||||
| Reinvestment of dividends and distributions | — | — | — | — | 318,269 | 2,176,957 | |||||||||||||
| Shares repurchased | (6,183,012 | ) | (67,304,757 | ) | (2,788,776 | ) | (23,870,559 | ) | (5,015,931 | ) | (38,121,169 | ) | |||||||
| (1,156,364 | ) | (12,320,232 | ) | (390,990 | ) | (3,287,090 | ) | 5,659,783 | 53,461,370 | ||||||||||
| Class B Shares | |||||||||||||||||||
| Shares sold | 177,799 | 2,059,925 | 54,000 | 468,026 | 73,263 | 638,031 | |||||||||||||
| Reinvestment of dividends and distributions | — | — | — | — | 1,969 | 13,468 | |||||||||||||
| Shares repurchased | (79,346 | ) | (873,521 | ) | (13,777 | ) | (120,123 | ) | (16,489 | ) | (112,961 | ) | |||||||
| 98,453 | 1,186,404 | 40,223 | 347,903 | 58,743 | 538,538 | ||||||||||||||
| Class C Shares | |||||||||||||||||||
| Shares sold | 83,030 | 978,614 | 92,068 | 838,996 | 44,699 | 387,030 | |||||||||||||
| Reinvestment of dividends and distributions | — | — | — | — | 1,550 | 10,621 | |||||||||||||
| Shares repurchased | (80,149 | ) | (857,557 | ) | (12,341 | ) | (114,463 | ) | (15,015 | ) | (115,705 | ) | |||||||
| 2,881 | 121,057 | 79,727 | 724,533 | 31,234 | 281,946 | ||||||||||||||
| Institutional Shares | |||||||||||||||||||
| Shares sold | 4,246,307 | 48,602,783 | 1,216,533 | 10,282,975 | 13,487,704 | 129,913,895 | |||||||||||||
| Reinvestment of dividends and distributions | — | — | — | — | 304,854 | 2,100,442 | |||||||||||||
| Shares repurchased | (2,606,818 | ) | (29,764,998 | ) | (2,338,484 | ) | (18,913,111 | ) | (3,049,355 | ) | (24,429,866 | ) | |||||||
| 1,639,489 | 18,837,785 | (1,121,951 | ) | (8,630,136 | ) | 10,743,203 | 107,584,471 | ||||||||||||
| Service Shares | |||||||||||||||||||
| Shares sold | 163 | 1,453 | — | — | — | — | |||||||||||||
| Reinvestment of dividends and distributions | — | — | — | — | 6 | 43 | |||||||||||||
| Share repurchased | (166 | ) | (1,468 | ) | — | — | — | — | |||||||||||
| (3 | ) | (15 | ) | — | — | 6 | 43 | ||||||||||||
| NET INCREASE (DECREASE) | 584,456 | $ 7,824,999 | (1,392,991 | ) | $(10,844,790 | ) | 16,492,969 | $161,866,368 | |||||||||||
| Income from
investment operations |
Distributions to shareholders |
||||||||||||||||||||||
|---|---|---|---|---|---|---|---|---|---|---|---|---|---|---|---|---|---|---|---|---|---|---|---|
| Net asset
value, beginning of period |
Net
investment income (loss) |
Net realized
and unrealized gain (loss) |
Total
income from investment operations |
From net
investment income |
In excess
of net investment income |
Total
distributions |
|||||||||||||||||
| FOR THE YEAR ENDED AUGUST 31, | |||||||||||||||||||||||
| 2000 - Class A Shares | $ 9.26 | $(0.05 | ) (c) | $ 1.62 | $ 1.57 | $ — | $ — | $ — | |||||||||||||||
| 2000 - Class B Shares | 9.21 | (0.11 | ) (c) | 1.62 | 1.51 | — | — | — | |||||||||||||||
| 2000 - Class C Shares | 9.24 | (0.10 | ) (c) | 1.61 | 1.51 | — | — | — | |||||||||||||||
| 2000 - Institutional Shares | 9.37 | 0.01 | (c) | 1.64 | 1.65 | — | — | — | |||||||||||||||
| 2000 - Service Shares | 9.05 | 0.01 | (c) | 1.57 | 1.58 | — | — | — | |||||||||||||||
| FOR THE SEVEN MONTHS ENDED AUGUST 31, | |||||||||||||||||||||||
| 1999 - Class A Shares | 7.04 | (0.01 | ) | 2.23 | 2.22 | — | — | — | |||||||||||||||
| 1999 - Class B Shares | 7.03 | (0.03 | ) | 2.21 | 2.18 | — | — | — | |||||||||||||||
| 1999 - Class C Shares | 7.05 | (0.03 | ) | 2.22 | 2.19 | — | — | — | |||||||||||||||
| 1999 - Institutional Shares | 7.09 | 0.02 | 2.26 | 2.28 | — | — | — | ||||||||||||||||
| 1999 - Service Shares | 6.87 | 0.01 | 2.17 | 2.18 | — | — | — | ||||||||||||||||
| FOR THE YEAR ENDED JANUARY 31, | |||||||||||||||||||||||
| 1999 - Class A Shares | 9.69 | 0.04 | (2.40 | ) | (2.36 | ) | (0.07 | ) | (0.22 | ) | (0.29 | ) | |||||||||||
| 1999 - Class B Shares | 9.69 | 0.03 | (2.41 | ) | (2.38 | ) | (0.07 | ) | (0.21 | ) | (0.28 | ) | |||||||||||
| 1999 - Class C Shares | 9.70 | 0.01 | (2.39 | ) | (2.38 | ) | (0.07 | ) | (0.20 | ) | (0.27 | ) | |||||||||||
| 1999 - Institutional Shares | 9.70 | 0.06 | (2.36 | ) | (2.30 | ) | (0.08 | ) | (0.23 | ) | (0.31 | ) | |||||||||||
| 1999 - Service Shares | 9.69 | (0.13 | ) | (2.41 | ) | (2.28 | ) | (0.07 | ) | (0.21 | ) | (0.28 | ) | ||||||||||
| FOR THE PERIOD ENDED JANUARY 31, | |||||||||||||||||||||||
| 1998 - Class A Shares (commenced December 15, 1997) | 10.00 | — | (0.31 | ) | (0.31 | ) | — | — | — | ||||||||||||||
| 1998 - Class B Shares (commenced December 15, 1997) | 10.00 | — | (0.31 | ) | (0.31 | ) | — | — | — | ||||||||||||||
| 1998 - Class C Shares (commenced December 15, 1997) | 10.00 | — | (0.30 | ) | (0.30 | ) | — | — | — | ||||||||||||||
| 1998 - Institutional Shares (commenced December 15, 1997) | 10.00 | 0.01 | (0.31 | ) | (0.30 | ) | — | — | — | ||||||||||||||
| 1998 - Service Shares (commenced December 15, 1997) | 10.00 | — | (0.31 | ) | (0.31 | ) | — | — | — | ||||||||||||||
(a)
|
Assumes investment at the net asset value at the beginning of the period, reinvestment of all dividends and distributions, a
complete redemption of the investment at the net asset value at the end of the period and no sales or redemption charges. Total return would be reduced if a sales or redemption charge were taken into account. Total returns for periods less than one full
year are not annualized.
|
(b)
|
Annualized.
|
(c)
|
Calculated based on the average shares outstanding methodology.
|
|
Ratios assuming no expense reductions |
||||||||||||||||||||
|---|---|---|---|---|---|---|---|---|---|---|---|---|---|---|---|---|---|---|---|---|
| Net asset
value, end of period |
Total
return (a) |
Net assets
at end of period (in 000s) |
Ratio of
net expenses to average net assets |
Ratio of
net investment income (loss) to average net assets |
Ratio of
expenses to average net assets |
Ratio of
net investment income (loss) to average net assets |
Portfolio
turnover rate |
|||||||||||||
| $10.83 | 16.95 | % | $64,279 | 2.11 | % | (0.49 | )% | 2.30 | % | (0.68 | )% | 125.35% | ||||||||
| 10.72 | 16.40 | 2,187 | 2.61 | (1.00 | ) | 2.80 | (1.19 | ) | 125.35 | |||||||||||
| 10.75 | 16.34 | 1,304 | 2.61 | (0.96 | ) | 2.80 | (1.15 | ) | 125.35 | |||||||||||
| 11.02 | 17.61 | 145,774 | 1.46 | 0.13 | 1.65 | (0.06 | ) | 125.35 | ||||||||||||
| 10.63 | 17.46 | 2 | 1.96 | 0.14 | 2.15 | (0.05 | ) | 125.35 | ||||||||||||
| 9.26 | 31.53 | 65,698 | 2.04 | (b) | (0.15 | ) (b) | 2.41 | (b) | (0.52 | ) (b) | 63.24 | |||||||||
| 9.21 | 31.01 | 972 | 2.54 | (b) | (0.71 | ) (b) | 2.91 | (b) | (281.08 | ) (b) | 63.24 | |||||||||
| 9.24 | 31.06 | 1,095 | 2.54 | (b) | (0.85 | ) (b) | 2.91 | (b) | (1.22 | ) (b) | 63.24 | |||||||||
| 9.37 | 32.16 | 108,574 | 1.39 | (b) | 0.50 | (b) | 1.76 | (b) | 0.13 | (b) | 63.24 | |||||||||
| 9.05 | 31.73 | 2 | 1.89 | (b) | 0.12 | (b) | 2.26 | (b) | (0.25 | ) (b) | 63.24 | |||||||||
| 7.04 | (24.32 | ) | 52,704 | 2.09 | 0.80 | 2.53 | 0.36 | 153.67 | ||||||||||||
| 7.03 | (24.51 | ) | 459 | 2.59 | 0.19 | 3.03 | (0.25 | ) | 153.67 | |||||||||||
| 7.05 | (24.43 | ) | 273 | 2.59 | 0.28 | 3.03 | (0.16 | ) | 153.67 | |||||||||||
| 7.09 | (23.66 | ) | 90,189 | 1.35 | 1.59 | 1.79 | 1.15 | 153.67 | ||||||||||||
| 6.87 | (26.17 | ) | 1 | 1.85 | (1.84 | ) | 2.29 | (2.28 | ) | 153.67 | ||||||||||
| 9.69 | (3.10 | ) | 17,681 | 1.90 | (b) | 0.55 | (b) | 5.88 | (b) | (3.43 | ) (b) | 3.35 | ||||||||
| 9.69 | (3.10 | ) | 64 | 2.41 | (b) | 0.05 | (b) | 6.39 | (b) | (3.93 | ) (b) | 3.35 | ||||||||
| 9.70 | (3.00 | ) | 73 | 2.48 | (b) | (0.27 | ) (b) | 6.46 | (b) | (4.25 | ) (b) | 3.35 | ||||||||
| 9.70 | (3.00 | ) | 19,120 | 1.30 | (b) | 0.80 | (b) | 5.28 | (b) | (3.18 | ) (b) | 3.35 | ||||||||
| 9.69 | (3.10 | ) | 2 | 2.72 | (b) | (0.05 | ) (b) | 6.70 | (b) | (4.03 | ) (b) | 3.35 | ||||||||
| To the Shareholders and Board of Trustees of
|
| Goldman Sachs Trust — Emerging Markets Equity Fund:
|
| In our opinion, the accompanying statement of assets and liabilities, including the statement of investments, and the related
statements of operations and of changes in net assets and the financial highlights present fairly, in all material respects, the financial position of Goldman Sachs Emerging Markets Equity Fund (“the Fund”), one of the portfolios constituting
Goldman Sachs Trust, at August 31, 2000, the results of its operations, the changes in its net assets and the financial highlights for the year then ended, in conformity with accounting principles generally accepted in the United States of America. These
financial statements and financial highlights (hereafter referred to as “financial statements”) are the responsibility of the Fund’s management; our responsibility is to express an opinion on these financial statements based on our audit.
We conducted our audit of these financial statements in accordance with auditing standards generally accepted in the United States of America, which require that we plan and perform the audit to obtain reasonable assurance about whether the financial
statements are free of material misstatement. An audit includes examining, on a test basis, evidence supporting the amounts and disclosures in the financial statements, assessing the accounting principles used and significant estimates made by management,
and evaluating the overall financial statement presentation. We believe that our audit, which included confirmation of securities at August 31, 2000 by correspondence with the custodian and brokers, provides a reasonable basis of our opinion. The
statements of changes in net assets of the Fund for the period ended August 31, 1999 and the year ended January 31, 1999 and the financial highlights for each of the periods ended on or before August 31, 1999 were audited by other independent accountants
whose report dated October 8, 1999 expressed an unqualified opinion thereon.
|
| PricewaterhouseCoopers LLP
|
| Boston, Massachusetts
|
| October 23, 2000
|
|
Shares |
Description | Value | |||
|---|---|---|---|---|---|
| Common Stocks – 92.2% | |||||
| China – 6.8% | |||||
| 532,000 | China Mobile Ltd.*
(Telecommunications) |
$ 4,092,832 | |||
| 354,000 | Guangdong Kelon Electrical Holdings
Co. Ltd. Class H (Appliance) |
116,880 | |||
| 9,327,000 | PetroChina Co. Ltd. Class H*†
(Energy Resources) |
2,224,416 | |||
| 1,490,000 | Yanzhou Coal Mining Co. Ltd.
Class H (Mining) |
429,863 | |||
| 6,863,991 | |||||
| Hong Kong – 26.0% | |||||
| 420,000 | Amoy Properties (Real Estate) | 393,127 | |||
| 103,000 | Cheung Kong Holdings Ltd. (Real
Estate) |
1,347,096 | |||
| 202,400 | Dah Sing Financial Holdings (Banks) | 944,655 | |||
| 712,000 | Dickson Concepts International Ltd.
(Specialty Retail) |
634,492 | |||
| 1,840,000 | Giordano International Ltd. (Specialty
Retail) |
1,032,184 | |||
| 261,900 | Hang Seng Bank Ltd. (Banks) | 2,812,428 | |||
| 505,500 | Hutchison Whampoa Ltd. (Multi-
Industrial) |
7,129,760 | |||
| 1,052,000 | Johnson Electric Holdings Ltd.
(Electrical Equipment) |
2,185,203 | |||
| 552,000 | Li & Fung Ltd. (Wholesale) | 2,406,462 | |||
| 1,091,267 | Pacific Century CyberWorks Ltd.*
(Telecommunications) |
2,028,898 | |||
| 399,000 | South China Morning Post Holdings
Ltd. (Publishing) |
299,288 | |||
| 303,000 | Sun Hung Kai Properties Ltd. (Real
Estate) |
2,855,558 | |||
| 257,000 | Swire Pacific Ltd. (Multi-Industrial) | 1,762,983 | |||
| 388,000 | TCL International Holdings Ltd.*
(Electronics Equipment) |
110,694 | |||
| 55,000 | Television Broadcasts Ltd. (Media) | 311,001 | |||
| 26,253,829 | |||||
| India – 8.4% | |||||
| 850 | HCL Technologies Ltd. (Business
Services) |
24,148 | |||
| 11,800 | Hindustan Lever Ltd. (Consumer
Cyclicals) |
61,454 | |||
| 242,021 | Hindustan Lever Ltd. (Consumer
Cyclicals) |
1,260,432 | |||
| 16,800 | Infosys Technologies Ltd. (Computer
Software) |
2,956,184 | |||
| 865 | ITC Ltd. (Tobacco) | 14,689 | |||
| 64,810 | Satyam Computer Services Ltd.
(Business Services) |
813,574 | |||
| 91,700 | Satyam Computer Services Ltd.
(Computer Software) |
1,151,130 | |||
| 92,339 | Videsh Sanchar Nigam Ltd.
(Telecommunications) |
1,635,815 | |||
| 7,700 | Wipro Ltd. (Computer Software) | 552,776 | |||
| 8,470,202 | |||||
|
Shares |
Description | Value | |||
|---|---|---|---|---|---|
| Common Stocks – (continued) | |||||
| Indonesia – 1.4% | |||||
| 145,000 | Gulf Indonesia Resources Ltd.*
(Energy Resources) |
$ 1,450,000 | |||
| Malaysia – 4.9% | |||||
| 159,000 | Arab-Malaysian Finance Berhad-Alien
Market (Banks) |
165,695 | |||
| 148,400 | British American Tobacco
Berhad (Tobacco) |
1,386,368 | |||
| 187,000 | Hong Leong Bank Berhad (Banks) | 337,092 | |||
| 742,000 | IOI Corp. Berhad (Agriculture) | 632,653 | |||
| 106,800 | Malayan Banking Berhad (Banks) | 410,337 | |||
| 451,000 | Road Builder (M) Holdings Berhad
(Construction) |
503,221 | |||
| 153,000 | Star Publications Berhad (Publishing) | 563,684 | |||
| 269,000 | Tenaga Nasional Berhad (Electrical
Utilities) |
899,026 | |||
| 4,898,076 | |||||
| Singapore – 11.3% | |||||
| 194,000 | Chartered Semiconductor
Manufacturing Ltd.* (Semiconductors) |
1,623,148 | |||
| 129,000 | City Developments (Real Estate) | 640,840 | |||
| 40,000 | Datacraft Asia Ltd.
(Telecommunications) |
336,000 | |||
| 179,150 | DBS Group Holdings Ltd. (Banks) | 2,165,081 | |||
| 239,000 | Keppel Land Ltd. (Real Estate) | 370,769 | |||
| 62,000 | SIA Engineering Co.* (Airlines) | 63,041 | |||
| 102,000 | Singapore Airlines Ltd. (Airlines) | 983,789 | |||
| 59,664 | Singapore Press Holdings Ltd.
(Publishing) |
960,254 | |||
| 452,000 | Singapore Technologies Engineering
Ltd. (Machinery) |
609,285 | |||
| 587,000 | Singapore Telecommunications Ltd.
(Telecommunications) |
968,613 | |||
| 235,512 | United Overseas Bank Ltd. (Banks) | 1,847,314 | |||
| 64,000 | Venture Manufacturing Ltd. (Electrical
Equipment) |
818,081 | |||
| 11,386,215 | |||||
| South Korea – 14.4% | |||||
| 16,560 | Hite Brewery Co. (Food & Beverage) | 709,448 | |||
| 38,053 | Housing & Commercial Bank (Banks) | 813,399 | |||
| 72,190 | Hyundai Electronics Industries Co.*
(Electrical Equipment) |
1,321,720 | |||
| 80,780 | Korea Electric Power Corp. (Electrical
Utilities) |
2,375,132 | |||
| 3,900 | Korea Telecom Corp.
(Telecommunications) |
266,976 | |||
| 32,500 | LG Chemical Ltd. (Chemicals) | 548,140 | |||
| 5,577 | Pohang Iron & Steel Co. Ltd. (Steel) | 418,646 | |||
| 23,779 | Samsung Electronics (Semiconductors) | 5,865,665 | |||
| 4,580 | SK Telecom Co. Ltd.
(Telecommunications) |
1,007,910 | |||
|
Shares |
Description | Value | |||
|---|---|---|---|---|---|
| Common Stocks – (continued) | |||||
| South Korea – (continued) | |||||
| 45,248 | SK Telecom Co. Ltd. ADR
(Telecommunications) |
$ 1,159,480 | |||
| 14,486,516 | |||||
| Taiwan – 18.2% | |||||
| 510 | Acer Laboratories, Inc.
(Semiconductors) |
1,577 | |||
| 259,200 | Acer Communications, Inc.
(Computer Hardware) |
601,237 | |||
| 26,000 | Ambit Microsystems Corp. | ||||
| (Electrical Equipment) | 190,142 | ||||
| 1,105,091 | Bank Sinopac (Financial Services) | 630,158 | |||
| 191,352 | Cathay Life Insurance Co. (Insurance) | 440,775 | |||
| 985,488 | Chinatrust Commercial Bank (Banks) | 777,850 | |||
| 193,500 | Compal Electronics, Inc. (Electronic
Components) |
370,917 | |||
| 172,800 | Compeq Manufacturing Co. Ltd.
(Electrical Equipment) |
996,495 | |||
| 136,250 | Delta Electronics, Inc. (Electrical
Equipment) |
522,350 | |||
| 44 | Far Eastern Textile Ltd. (Apparel) | 49 | |||
| 201,820 | Hon Hai Precision (Electrical
Equipment) |
1,540,958 | |||
| 14,500 | Nan Ya Plastic Corp. (Chemicals) | 24,058 | |||
| 389,224 | President Chain Store Corp.
(Merchandising) |
1,153,628 | |||
| 71,000 | Procomp Informatics Co. Ltd.
(Semiconductors) |
391,140 | |||
| 36,481 | Siliconware Precis (Electrical
Equipment) |
56,414 | |||
| 90,700 | Siliconware Precision Industries Co.
ADR (Electrical Equipment) |
657,575 | |||
| 1,171,519 | Taiwan Semiconductor
(Semiconductors) |
5,076,331 | |||
| 1,387,400 | United Microelectronics Corp. Ltd.
(Semiconductors) |
3,687,516 | |||
| 423,800 | Universal Scientific Industrial Co.
Ltd. (Electrical Equipment) |
649,899 | |||
| 216,450 | Winbond Electronics Corp. (Electrical
Equipment) |
536,941 | |||
| 18,306,010 | |||||
| Thailand – 0.8% | |||||
| 138,200 | PTT Exploration & Production
Public-Alien Market (Energy Resources) |
825,075 | |||
| TOTAL COMMON STOCKS | |||||
| (Cost $88,821,757) | $ 92,939,914 | ||||
|
Units |
Description | Value | |||
|---|---|---|---|---|---|
| Warrants – 0.2% | |||||
| South Korea – 0.2% | |||||
| 9,850 | Korea Tobacco & Ginseng Corp.
exp.10/09/00* (Tobacco) |
$ 168,041 | |||
| TOTAL WARRANTS | |||||
| (Cost $316,642) | $ 168,041 | ||||
| Principal
Amount |
Interest
Rate |
Maturity
Date |
Value | |||||
|---|---|---|---|---|---|---|---|---|
| Short-Term Obligation – 2.9% | ||||||||
| State Street Bank & Trust Euro-Time Deposit | ||||||||
| $2,978,000 | 6.56 | % | 09/01/2000 | $ 2,978,000 | ||||
| TOTAL SHORT-TERM OBLIGATION | ||||||||
| (Cost $2,978,000) | $ 2,978,000 | |||||||
| TOTAL INVESTMENTS | ||||||||
| (Cost $92,116,399) | $96,085,955 | |||||||
*
|
Non-income producing security.
|
†
|
Security is exempt from registration under rule 144A of the Securities Act of 1933. Such a security may be resold, normally to
qualified institutional buyers in transactions exempt from registration. The market value of 144A securities amounts to $2,224,416 as of August 31, 2000.
|
| The percentage shown for each investment category reflects the value of investments in that category as a percentage of total net
assets.
|
| |
| Investment Abbreviations:
|
| ADR—American Depositary Receipt
|
| |
| As a % of
Total Net Assets |
|||||
|---|---|---|---|---|---|
| Common Stock Industry Classifications† | |||||
| Agriculture | 0.6 | % | |||
| Airlines | 1.0 | ||||
| Appliance | 0.1 | ||||
| Banks | 10.2 | ||||
| Business Services | 0.8 | ||||
| Chemicals | 0.6 | ||||
| Computer Hardware | 0.6 | ||||
| Computer Software | 4.6 | ||||
| Construction | 0.5 | ||||
| Consumer Cyclicals | 1.3 | ||||
| Electrical Equipment | 9.5 | ||||
| Electrical Utilities | 3.3 | ||||
| Electronic Components | 0.4 | ||||
| Electronics Equipment | 0.1 | ||||
| Energy Resources | 4.5 | ||||
| Financial Services | 0.6 | ||||
| Food & Beverage | 0.7 | ||||
| Insurance | 0.4 | ||||
| Machinery | 0.6 | ||||
| Media | 0.3 | ||||
| Merchandising | 1.2 | ||||
| Mining | 0.4 | ||||
| Multi-Industrial | 8.8 | ||||
| Publishing | 1.8 | ||||
| Real Estate | 5.6 | ||||
| Semiconductors | 16.4 | ||||
| Specialty Retail | 1.7 | ||||
| Steel | 0.4 | ||||
| Telecommunications | 11.4 | ||||
| Tobacco | 1.4 | ||||
| Wholesale | 2.4 | ||||
| TOTAL COMMON STOCK | 92.2 | % | |||
†
|
Industry concentrations greater than one tenth of one percent are disclosed.
|
| Assets: | ||||
| Investment in securities, at value (identified cost $92,116,399) | $ 96,085,955 | |||
| Cash, at value | 5,054,404 | |||
| Receivables: | ||||
| Investment securities sold, at value | 4,083,726 | |||
| Fund shares sold | 876,584 | |||
| Reimbursement from adviser | 225,340 | |||
| Dividends and interest, at value | 114,112 | |||
| Other assets | 40,330 | |||
| Total assets | 106,480,451 | |||
| Liabilities: | ||||
| Payables: | ||||
| Investment securities purchased, at value | 5,152,178 | |||
| Amounts owed to affiliates | 149,965 | |||
| Fund shares repurchased | 276,190 | |||
| Capital gains tax, at value | 8,098 | |||
| Accrued expenses and other liabilities | 85,825 | |||
| Total liabilities | 5,672,256 | |||
| Net Assets: | ||||
| Paid-in capital | 169,933,410 | |||
| Accumulated net investment loss | (372,165 | ) | ||
| Accumulated net realized loss on investment, futures and foreign currency related transactions | (72,751,513 | ) | ||
| Net unrealized gain on investments, futures and translation of assets and liabilities denominated in foreign currencies | 3,998,463 | |||
| NET ASSETS | $100,808,195 | |||
| Net asset value, offering and redemption price per share:(a) | ||||
| Class A | $11.16 | |||
| Class B | $10.91 | |||
| Class C | $10.88 | |||
| Institutional | $11.41 | |||
| Shares outstanding: | ||||
| Class A | 7,746,375 | |||
| Class B | 627,533 | |||
| Class C | 208,108 | |||
| Institutional | 458,932 | |||
| Total shares outstanding, $.001 par value (unlimited number of shares authorized) | 9,040,948 | |||
(a)
|
Maximum public offering price per share (NAV per share multiplied by 1.0582) for Class A shares is $11.80. At redemption, Class B
and Class C shares may be subject to a deferred contingent sales charge, assessed on the amount equal to the lesser of the current net asset value or the original purchase price of the shares.
|
| Investment income: | ||||
| Dividends (a) | $ 1,416,316 | |||
| Interest | 271,907 | |||
| Total income | 1,688,223 | |||
| Expenses: | ||||
| Management fees | 1,168,382 | |||
| Distribution and Service fees (b) | 584,391 | |||
| Custodian fees | 466,832 | |||
| Transfer Agent fees (c) | 205,690 | |||
| Registration fees | 68,501 | |||
| Professional fees | 49,306 | |||
| Trustee fees | 8,901 | |||
| Other | 125,617 | |||
| Total expenses | 2,677,620 | |||
| Less — expense reductions | (527,542 | ) | ||
| Net expenses | 2,150,078 | |||
| NET INVESTMENT LOSS | (461,855 | ) | ||
| Realized and unrealized gain (loss) on investment, futures and foreign currency transactions: | ||||
| Net realized gain (loss) from: | ||||
| Investment transactions | 21,929,849 | |||
| Futures transactions | 24,408 | |||
| Foreign currency related transactions | (457,786 | ) | ||
| Net change in unrealized gain (loss) on: | ||||
| Investments | (17,712,839 | ) | ||
| Translation of assets and liabilities denominated in foreign currencies | (1,827 | ) | ||
| Net realized and unrealized gain on investment, futures and foreign currency transactions | 3,781,805 | |||
| NET INCREASE IN NET ASSETS RESULTING FROM OPERATIONS | $ 3,319,950 | |||
(a)
|
Foreign taxes withheld on dividends were $170,962.
|
(b)
|
Class A, Class B and Class C had Distribution and Service fees of $475,309, $81,059 and $28,023, respectively.
|
(c)
|
Class A, Class B, Class C, Institutional Class and Service Class had Transfer Agent fees of $180,618, $15,401, $5,324, $4,347 and
$0, respectively.
|
| For the
Year Ended August 31, 2000 |
For the
Seven Months Ended August 31, 1999 |
For the
Year Ended January 31, 1999 |
||||||||
|---|---|---|---|---|---|---|---|---|---|---|
| From operations: | ||||||||||
| Net investment income (loss) | $ (461,855 | ) | $ (189,728 | ) | $ 492,262 | |||||
| Net realized gain (loss) from investment, futures and foreign currency related transactions | 21,496,471 | 3,213,321 | (27,883,885 | ) | ||||||
| Net change in unrealized gain (loss) on investments and translation of assets and
liabilities denominated in foreign currencies |
(17,714,666 | ) | 26,462,083 | 21,285,501 | ||||||
| Net increase (decrease) in net assets resulting from operations | 3,319,950 | 29,485,676 | (6,106,122 | ) | ||||||
| Distributions to shareholders: | ||||||||||
| In excess of net investment income | ||||||||||
| Institutional Shares | — | (43,226 | ) | — | ||||||
| Total distributions to shareholders | — | (43,226 | ) | — | ||||||
| From share transactions: | ||||||||||
| Proceeds from sales of shares | 144,806,450 | 97,742,029 | 138,273,446 | |||||||
| Reinvestment of dividends and distributions | — | 40,413 | — | |||||||
| Cost of shares repurchased | (153,488,825 | ) | (90,383,194 | ) | (154,943,929 | ) | ||||
| Net increase (decrease) in net assets resulting from share transactions | (8,682,375 | ) | 7,399,248 | (16,670,483 | ) | |||||
| TOTAL INCREASE (DECREASE) | (5,362,425 | ) | 36,841,698 | (22,776,605 | ) | |||||
| Net assets: | ||||||||||
| Beginning of period | 106,170,620 | 69,328,922 | 92,105,527 | |||||||
| End of period | $100,808,195 | $106,170,620 | $ 69,328,922 | |||||||
| Accumulated net investment loss | $ (372,165 | ) | $ — | $ (105,797 | ) | |||||
| 1. ORGANIZATION
|
| Goldman Sachs Trust (the “Trust”) is a Delaware business trust registered under the Investment Company Act of 1940 (as
amended) as an open-end management investment company. The Trust includes the Goldman Sachs Asia Growth Fund (the “Fund”). The Fund is a diversified portfolio offering five classes of shares — Class A, Class B, Class C,
Institutional and Service (Service shares have not commenced operations).
|
| 2. SIGNIFICANT ACCOUNTING POLICIES
|
| The following is a summary of the significant accounting policies consistently followed by the Fund. The preparation of financial
statements in conformity with generally accepted accounting principles requires management to make estimates and assumptions that may affect the reported amounts. Actual results could differ from those estimates. Effective for fiscal year 1999, the Board
of Trustees approved a change in the fiscal year end of the Fund from January 31 to August 31. Accordingly, the Statements of Changes in Net Assets, Summary of Share Transactions and Financial Highlights of the Fund are included for the seven months ended
August 31, 1999 and the year ended January 31, 1999.
|
| A. Investment Valuation — Investments in
securities traded on a U.S. or foreign securities exchange or the NASDAQ system are valued daily at their last sale price on the principal exchange on which they are traded. If no sale occurs, securities are valued at the last bid price. Debt securities
are valued at prices supplied by independent pricing services, broker/dealer-supplied valuations or matrix pricing systems. Unlisted equity and debt securities for which market quotations are available are valued at the last sale price on the valuation
date or, if no sale occurs, at the last bid price. Short-term debt obligations maturing in sixty days or less are valued at amortized cost, which approximates market value. Securities for which quotations are not readily available are valued at fair value
using methods approved by the Board of Trustees of the Trust.
|
| Investing in emerging markets may involve special risks and considerations not
typically associated with investing in the United States. These risks include revaluation of currencies, high rates of inflation, repatriation restrictions on income and capital and future adverse political and economic developments. Moreover, securities
issued in these markets may be less liquid, subject to government ownership controls, delayed settlements, and their prices may be more volatile than those of comparable securities in the United States.
|
| B. Security Transactions and Investment Income — Security transactions are recorded as of the trade date. Realized gains and losses on sales of portfolio securities are calculated using the identified-cost basis. Dividend income is recorded on the ex-dividend date, net of foreign withholding taxes
where applicable. Dividends for which the Fund has the choice to receive either cash or stock are recognized as investment income in an amount equal to the cash dividend. Interest income is recorded on the basis of interest accrued, premium amortized and
discount earned. In addition, it is the Fund’s policy to accrue for estimated capital gains taxes on appreciated foreign securities held.
|
| Net investment income (other than class specific expenses) and unrealized and
realized gains or losses are allocated daily to each class of shares of the Fund based upon the relative proportion of net assets of each class.
|
| 2. SIGNIFICANT ACCOUNTING POLICIES (continued)
|
| C. Federal Taxes — It is the Fund’s
policy to comply with the requirements of the Internal Revenue Code applicable to regulated investment companies and to distribute each year substantially all of its investment company taxable income and capital gains to its shareholders. Accordingly, no
federal tax provision is required. Income and capital gain distributions, if any, are declared and paid annually.
|
| The Fund had approximately $71,481,000 at August 31, 2000 (the Fund’s tax
year end) of capital loss carryforwards expiring 2005 through 2007 for federal tax purposes. These amounts are available to be carried forward to offset future capital gains to the extent permitted by applicable laws or regulations.
|
| The characterization of distributions to shareholders for financial reporting
purposes is determined in accordance with income tax rules. Therefore, the source of the Fund’s distributions may be shown in the accompanying financial statements as either from or in excess of net investment income or net realized gain on
investment transactions, or from paid-in capital, depending on the type of book / tax differences that may exist. At August 31, 2000, the aggregate cost of portfolio securities for federal income tax purposes is $93,387,029. Accordingly, the gross
unrealized gain on investments was $8,383,096 and the gross unrealized loss on investments was $5,684,170 resulting in a net unrealized gain of $2,698,926.
|
| D. Expenses — Expenses incurred by the
Trust which do not specifically relate to an individual Fund of the Trust are allocated to the Funds based on a straight-line or pro rata basis depending on the nature of the expense.
|
| Class A, Class B and Class C shares bear all expenses and fees relating to their
respective Distribution and Service plans. Each class of shares of the Fund separately bears its respective class-specific transfer agency fees.
|
| E. Foreign Currency Translations — The
books and records of the Fund are maintained in U.S. dollars. Amounts denominated in foreign currencies are translated into U.S. dollars on the following basis: (i) investment valuations, foreign currency and other assets and liabilities initially
expressed in foreign currencies are converted each business day into U.S. dollars based on current exchange rates; (ii) purchases and sales of foreign investments, income and expenses are converted into U.S. dollars based on currency exchange rates
prevailing on the respective dates of such transactions.
|
| Net realized and unrealized gain (loss) on foreign currency transactions will
represent: (i) foreign exchange gains and losses from the sale and holdings of foreign currencies; (ii) currency gains and losses between trade date and settlement date on investment securities transactions and forward exchange contracts; and (iii) gains
and losses from the difference between amounts of dividends, interest and foreign withholding taxes recorded and the amounts actually received.
|
| F. Derivative Financial Instruments — The
Fund may utilize derivative financial instruments such as structured notes and equity swaps. Such instruments are used by the Fund as a means of investing in a particular market or increasing the return on the Fund’s investments or both. The value of
the principal and/or interest on such securities is determined by reference to changes in the value of the financial indicators including, but not limited to indices, currencies or interest rates. These financial instruments may subject the Fund to a
greater degree of market or counterparty risk and loss than other types of securities.
|
| G. Segregation Transactions — The Fund may
enter into certain derivative transactions to seek to increase total return. Forward foreign currency exchange contracts, futures contracts, written options, mortgage dollar rolls, when-issued securities and forward commitments represent examples of such
transactions. As a result of entering into these transactions, the Fund is required to segregate liquid assets on the accounting records equal to or greater than the market value of the corresponding transactions.
|
| 3. AGREEMENTS
|
| Pursuant to the Investment Management Agreement (the “Agreement”), Goldman Sachs Asset Management International (“
GSAMI”), an affiliate of Goldman Sachs, Sachs & Co. (“Goldman Sachs”), serves as the investment adviser to the Fund. Under the Agreement, GSAMI, subject to the general supervision of the Trust’s Board of Trustees, manages the
Fund’s portfolio. As compensation for the services rendered under the Agreement, the assumption of the expenses related thereto and administering the Fund’s business affairs, including providing facilities, GSAMI is entitled to a fee, computed
daily and payable monthly, at an annual rate equal to 1.00% of the average daily net assets of the Fund.
|
| The investment adviser has voluntarily agreed to limit certain “Other
Expenses” (excluding Management fees, Distribution and Service fees, Transfer agent fees, taxes, interest, brokerage, litigation, indemnification costs and other extraordinary expenses) to the extent such expenses exceed, on an annual basis, 0.16% of
the average daily net assets of the Fund. Goldman Sachs reimbursed approximately $523,000 for the year ended August 31, 2000. In addition, the Fund has entered into certain offset arrangements with the custodian resulting in a reduction in the Fund’s
expenses. For the year ended August 31, 2000, Custody fees were reduced by approximately $5,000.
|
| The Trust, on behalf of the Fund, has adopted Distribution and Service Plans.
Under the Distribution and Service Plans, Goldman Sachs and/or authorized dealers are entitled to a monthly fee from the Fund for distribution and shareholder maintenance services equal, on an annual basis, to 0.50%, 1.00% and 1.00% of the Fund’s
average daily net assets attributable to Class A, Class B and Class C Shares, respectively.
|
| Goldman Sachs serves as the distributor of shares of the Fund pursuant to a
Distribution Agreement. Goldman Sachs may receive a portion of the Class A sales load and Class B and Class C contingent deferred sales charges and has advised the Fund that it retained approximately $92,000 for the year ended August 31, 2000.
|
| Goldman Sachs also serves as the Transfer Agent of the Fund for a fee. The fees
charged for such transfer agency services are calculated daily and payable monthly at an annual rate as follows: 0.19% of average daily net assets for Class A, Class B and Class C Shares and 0.04% of average daily net assets for Institutional Shares.
|
| As of August 31, 2000, the amounts owed to affiliates were approximately $88,000,
$46,000 and $16,000 for Management, Distribution and Service and Transfer Agent fees, respectively.
|
| 4. PORTFOLIO SECURITIES TRANSACTIONS
|
| The cost of purchases and proceeds of sales and maturities of securities (excluding short-term investments and futures
transactions) for the year ended August 31, 2000, were $223,287,721 and $239,283,135 respectively.
|
| For the year ended August 31, 2000, Goldman Sachs earned approximately $92,000 of
brokerage commissions from portfolio transactions, including futures transactions executed on behalf of the Fund.
|
| Futures Contracts — The Fund may enter into futures
transactions to hedge against changes in interest rates, securities prices, currency exchange rates or to seek to increase total return. Upon entering into a futures contract, the Fund is required to deposit with a broker or the Fund’s custodian
bank, an amount of cash or securities equal to the minimum “initial margin” requirement of the associated futures exchange. Subsequent payments for futures contracts (“variation margin”) are paid or received by the Fund, depending on
the fluctuations in the value of the contracts, and are recorded as unrealized gains or losses. When contracts are closed, the Fund realizes a gain or loss which is reported in the Statement of Operations.
|
| The use of futures contracts involve, to varying degrees, elements of market risk
which may exceed the amounts recognized in the Statement of Assets and Liabilities. Changes in the value of the futures contracts may not directly correlate with changes in the value of the underlying securities. This risk may decrease the effectiveness
of the Fund’s hedging strategies and potentially result in a loss. At August 31, 2000, the Fund had no open futures contracts.
|
| 4. PORTFOLIO SECURITIES TRANSACTIONS (continued)
|
| Forward Foreign Currency Exchange Contracts — The
Fund may enter into forward foreign currency exchange contracts for the purchase or sale of a specific foreign currency at a fixed price on a future date as a hedge or cross-hedge against either specific transactions or portfolio positions. The Fund may
also purchase and sell such contracts to seek to increase total return. All commitments are “marked-to-market” daily at the applicable translation rates and any resulting gains or losses are recorded in the Fund’s financial statements. The
Fund realizes gains or losses at the time a forward contract is offset by entry into a closing transaction or extinguished by delivery of the currency. Risks may arise upon entering these contracts from the potential inability of counterparties to meet
the terms of their contracts and from unanticipated movements in the value of a foreign currency relative to the U.S. dollar. At August 31, 2000, the Fund had no open forward foreign currency exchange contracts.
|
| Option Accounting Principles — When the Fund writes
call or put options, an amount equal to the premium received is recorded as an asset and as an equivalent liability. The amount of the liability is subsequently marked-to-market to reflect the current market value of the option written. When a written
option expires on its stipulated expiration date or the Fund enters into a closing purchase transaction, the Fund realizes a gain or loss without regard to any unrealized gain or loss on the underlying security, and the liability related to such option is
extinguished. When a written call option is exercised, the Fund realizes a gain or loss from the sale of the underlying security, and the proceeds of the sale are increased by the premium originally received. When a written put option is exercised, the
amount of the premium originally received will reduce the cost of the security which the Fund purchases upon exercise. There is a risk of loss from a change in value of such options which may exceed the related premiums received.
|
| Upon the purchase of a call option or a protective put option by the Fund, the
premium paid is recorded as an investment and subsequently marked-to-market to reflect the current market value of the option. If an option which the Fund has purchased expires on the stipulated expiration date, the Fund will realize a loss in the amount
of the cost of the option. If the Fund enters into a closing sale transaction, the Fund will realize a gain or loss, depending on whether the sale proceeds for the closing sale transaction are greater or less than the cost of the option. If the Fund
exercises a purchased put option, the Fund will realize a gain or loss from the sale of the underlying security, and the proceeds from such sale will be decreased by the premium originally paid. If the Fund exercises a purchased call option, the cost of
the security which the Fund purchases upon exercise will be increased by the premium originally paid. At August 31, 2000, there were no open written option contracts.
|
| 5. LINE OF CREDIT FACILITY
|
| Effective May 31, 2000, the Fund participates in a $350,000,000 committed, unsecured revolving line of credit facility. Prior
thereto, the Fund participated in a $250,000,000 uncommitted and a $250,000,000 committed, unsecured revolving line of credit facility. Under the most restrictive arrangement, the Fund must own securities having a market value in excess of 400% of the
total bank borrowings. These facilities are to be used solely for temporary or emergency purposes. The interest rate on borrowings is based on the Federal Funds rate. The committed facility also requires a fee to be paid by the Fund based on the amount of
the commitment which has not been utilized. During the year ended August 31, 2000, the Fund did not have any borrowings under any of these facilities.
|
| 6. CHANGE IN INDEPENDENT ACCOUNTANTS
|
| On October 26, 1999, the Board of Trustees of the Portfolios, upon the recommendation of the Board’s audit committee,
determined not to retain Arthur Andersen LLP and approved a change of the Fund’s independent accountants to PricewaterhouseCoopers LLP. For the period ended August 31, 1999 and the year ended January 31, 1999, Arthur Andersen LLP audit reports
contained no adverse opinion or disclaimer of opinion; nor were their reports qualified as to uncertainty, audit scope, or accounting principles. Further, there were no disagreements between the Fund and Arthur Andersen LLP on accounting principles or
practices, financial statement disclosure or audit scope or procedure, which if not resolved to the satisfaction of Arthur Andersen LLP would have caused them to make reference to the disagreement in their reports.
|
| 7. CERTAIN RECLASSIFICATIONS
|
| In accordance with Statement of Position 93-2, the Fund reclassified $89,690 from paid-in capital to accumulated net investment
loss and $2,643,953 from paid-in capital to accumulated net realized loss from investment, futures and foreign currency related transactions. These reclassifications have no impact on the net asset value of the Fund and are designed to present the
Fund’s capital accounts on a tax basis. Reclassifications result primarily from the difference in the tax treatment of foreign currency and net operating losses.
|
| 8. SUMMARY OF SHARE TRANSACTIONS
|
| Share activity is as follows:
|
| For the Year
Ended August 31, 2000 |
For the Seven Months Ended August 31, 1999 |
For the Year Ended January 31, 1999 |
|||||||||||||||||
|---|---|---|---|---|---|---|---|---|---|---|---|---|---|---|---|---|---|---|---|
| Shares | Dollars | Shares | Dollars | Shares | Dollars | ||||||||||||||
| Class A Shares | |||||||||||||||||||
| Shares sold | 11,913,197 | $138,502,220 | 7,428,461 | $68,519,866 | 15,227,587 | $114,095,624 | |||||||||||||
| Shares repurchased | (11,775,948 | ) | (138,970,536 | ) | (7,511,626 | ) | (69,221,284 | ) | (17,965,578 | ) | (136,028,026 | ) | |||||||
| 137,249 | (468,316 | ) | (83,165 | ) | (701,418 | ) | (2,737,991 | ) | (21,932,402 | ) | |||||||||
| Class B Shares | |||||||||||||||||||
| Shares sold | 202,864 | 2,476,344 | 201,786 | 2,022,897 | 345,699 | 2,823,123 | |||||||||||||
| Shares repurchased | (242,422 | ) | (2,884,327 | ) | (80,372 | ) | (733,280 | ) | (204,359 | ) | (1,519,808 | ) | |||||||
| (39,558 | ) | (407,983 | ) | 121,414 | 1,289,617 | 141,340 | 1,303,315 | ||||||||||||
| Class C Shares | |||||||||||||||||||
| Shares sold | 231,312 | 2,696,102 | 2,420,991 | 19,122,822 | 2,148,809 | 16,213,829 | |||||||||||||
| Shares repurchased | (233,490 | ) | (2,757,642 | ) | (2,340,851 | ) | (18,439,726 | ) | (2,071,174 | ) | (15,859,777 | ) | |||||||
| (2,178 | ) | (61,540 | ) | 80,140 | 683,096 | 77,635 | 354,052 | ||||||||||||
| Institutional Shares | |||||||||||||||||||
| Shares sold | 88,366 | 1,131,784 | 753,741 | 8,076,444 | 636,785 | 5,140,870 | |||||||||||||
| Reinvestment of dividends
and distributions |
— | — | 3,661 | 40,413 | — | — | |||||||||||||
| Shares repurchased | (729,131 | ) | (8,876,320 | ) | (188,772 | ) | (1,988,904 | ) | (209,306 | ) | (1,536,318 | ) | |||||||
| (640,765 | ) | (7,744,536 | ) | 568,630 | 6,127,953 | 427,479 | 3,604,552 | ||||||||||||
| NET INCREASE
(DECREASE) |
(545,252 | ) | $ (8,682,375 | ) | 687,019 | $ 7,399,248 | (2,091,537 | ) | $ (16,670,483 | ) | |||||||||
| Income from
investment operations |
Distributions to shareholders |
||||||||||||||||||||||
|---|---|---|---|---|---|---|---|---|---|---|---|---|---|---|---|---|---|---|---|---|---|---|---|
|
Net asset value, beginning of period |
Net
investment income (loss) |
Net realized
and unrealized gain (loss) |
Total income
from investment operations |
From net
investment income |
In excess
of net investment income |
From net
realized gains |
Total
distributions |
||||||||||||||||
| FOR THE YEAR ENDED AUGUST 31, | |||||||||||||||||||||||
| 2000 - Class A Shares | $11.07 | $(0.05) (c) | $0.14 | $0.09 | $ — | $ — | $ — | $ — | |||||||||||||||
| 2000 - Class B Shares | 10.88 | (0.11) (c) | 0.14 | 0.03 | — | — | — | — | |||||||||||||||
| 2000 - Class C Shares | 10.85 | (0.11) (c) | 0.14 | 0.03 | — | — | — | — | |||||||||||||||
| 2000 - Institutional Shares | 11.24 | 0.01 (c) | 0.16 | 0.17 | — | — | — | — | |||||||||||||||
| FOR THE SEVEN-MONTH PERIOD ENDED AUGUST 31, | |||||||||||||||||||||||
| 1999 - Class A Shares | 7.79 | (0.02) | 3.30 | 3.28 | — | — | — | — | |||||||||||||||
| 1999 - Class B Shares | 7.68 | (0.04) | 3.24 | 3.20 | — | — | — | — | |||||||||||||||
| 1999 - Class C Shares | 7.68 | (0.04) | 3.21 | 3.17 | — | — | — | — | |||||||||||||||
| 1999 - Institutional Shares | 7.91 | 0.01 | 3.36 | 3.37 | — | (0.04 | ) | — | — | ||||||||||||||
| FOR THE YEARS ENDED JANUARY 31, | |||||||||||||||||||||||
| 1999 - Class A Shares | 8.38 | 0.07 | (0.66 | ) | (0.59 | ) | — | — | — | — | |||||||||||||
| 1999 - Class B Shares | 8.31 | 0.01 | (0.64 | ) | (0.63 | ) | — | — | — | — | |||||||||||||
| 1999 - Class C Shares | 8.29 | — | (0.61 | ) | (0.61 | ) | — | — | — | — | |||||||||||||
| 1999 - Institutional Shares | 8.44 | 0.03 | (0.56 | ) | (0.53 | ) | — | — | — | — | |||||||||||||
| 1998 - Class A Shares | 16.31 | — | (7.90 | ) | (7.90 | ) | — | (0.03 | ) | — | (0.03 | ) | |||||||||||
| 1998 - Class B Shares | 16.24 | 0.01 | (7.91 | ) | (7.90 | ) | — | (0.03 | ) | — | (0.03 | ) | |||||||||||
| 1998 - Class C Shares (commenced
August 15, 1997) |
15.73 | 0.01 | (7.42 | ) | (7.41 | ) | — | (0.03 | ) | — | (0.03 | ) | |||||||||||
| 1998 - Institutional Shares | 16.33 | 0.10 | (7.96 | ) | (7.86 | ) | (0.03 | ) | — | — | (0.03 | ) | |||||||||||
| 1997 - Class A Shares | 16.49 | 0.06 | (0.11 | ) | (0.05 | ) | (0.12 | ) | — | (0.01 | ) | (0.13 | ) | ||||||||||
| 1997 - Class B Shares (commenced
May 1, 1996) |
17.31 | (0.05) | (0.48 | ) | (0.53 | ) | (0.51 | ) | (0.03 | ) | — | (0.54 | ) | ||||||||||
| 1997 - Institutional Shares (commenced
February 2, 1996) |
16.61 | 0.04 | (0.11 | ) | (0.07 | ) | (0.11 | ) | (0.06 | ) | (0.04 | ) | (0.21 | ) | |||||||||
| 1996 - Class A Shares | 13.31 | 0.17 | 3.44 | 3.61 | (0.12 | ) | (0.14 | ) | (0.17 | ) | (0.43 | ) | |||||||||||
(a)
|
Assumes investment at the net asset value at the beginning of the period, reinvestment of all dividends and distributions, a
complete redemption of the investment at the net asset value at the end of the period and no sales or redemption charges. Total return would be reduced if a sales or redemption charge were taken into account. Total returns for periods less than one full
year are not annualized.
|
(b)
|
Annualized.
|
(c)
|
Calculated based on the average shares outstanding methodology.
|
|
Ratios assuming no expense reductions |
|||||||||||||||||||||
|---|---|---|---|---|---|---|---|---|---|---|---|---|---|---|---|---|---|---|---|---|---|
| Net asset
value, end of period |
Total
return (a) |
Net assets
at end of period (in 000s) |
Ratio of
net expenses to average net assets |
Ratio of
net investment income (loss) to average net assets |
Ratio of
expenses to average net assets |
Ratio of
net investment income (loss) to average net assets |
Portfolio
turnover rate |
||||||||||||||
| $11.16 | 0.72 | % | $ 86,458 | 1.85 | % | (0.39 | )% | 2.30 | % | (0.84 | )% | 207.22 | % | ||||||||
| 10.91 | 0.18 | 6,849 | 2.35 | (0.91 | ) | 2.80 | (1.36 | ) | 207.22 | ||||||||||||
| 10.88 | 0.18 | 2,265 | 2.35 | (0.91 | ) | 2.80 | (1.36 | ) | 207.22 | ||||||||||||
| 11.41 | 1.42 | 5,236 | 1.20 | 0.12 | 1.65 | (0.33 | ) | 207.22 | |||||||||||||
| 11.07 | 42.11 | 84,269 | 1.85 | (b) | (0.38 | ) (b) | 2.27 | (b) | (0.80 | ) (b) | 96.58 | ||||||||||
| 10.88 | 41.67 | 7,258 | 2.35 | (b) | (0.90 | ) (b) | 2.77 | (b) | (1.32 | ) (b) | 96.58 | ||||||||||
| 10.85 | 41.28 | 2,281 | 2.35 | (b) | (0.89 | ) (b) | 2.77 | (b) | (1.31 | ) (b) | 96.58 | ||||||||||
| 11.24 | 42.61 | 12,363 | 1.20 | (b) | (0.14 | ) (b) | 1.62 | (b) | (0.28 | ) (b) | 96.58 | ||||||||||
| 7.79 | (7.04 | ) | 59,940 | 1.93 | 0.63 | 2.48 | 0.08 | 106.00 | |||||||||||||
| 7.68 | (7.58 | ) | 4,190 | 2.45 | 0.10 | 2.97 | (0.42 | ) | 106.00 | ||||||||||||
| 7.68 | (7.36 | ) | 999 | 2.45 | 0.10 | 2.97 | (0.42 | ) | 106.00 | ||||||||||||
| 7.91 | (6.28 | ) | 4,200 | 1.16 | 1.10 | 1.68 | 0.58 | 106.00 | |||||||||||||
| 8.38 | (48.49 | ) | 87,437 | 1.75 | 0.31 | 1.99 | 0.07 | 105.16 | |||||||||||||
| 8.31 | (48.70 | ) | 3,359 | 2.30 | (0.29 | ) | 2.50 | (0.49 | ) | 105.16 | |||||||||||
| 8.29 | (47.17 | ) | 436 | 2.35 | (b) | (0.26 | ) (b) | 2.55 | (b) | (0.46 | ) (b) | 105.16 | |||||||||
| 8.44 | (48.19 | ) | 874 | 1.11 | 0.87 | 1.31 | 0.67 | 105.16 | |||||||||||||
| 16.31 | (1.01 | ) | 263,014 | 1.67 | 0.20 | 1.87 | — | 48.40 | |||||||||||||
| 16.24 | (6.02 | ) | 3,354 | 2.21 | (b) | (0.56 | ) (b) | 2.37 | (b) | (0.72 | ) (b) | 48.40 | |||||||||
| 16.33 | (1.09 | ) | 13,322 | 1.10 | (b) | 0.54 | (b) | 1.26 | (b) | 0.38 | (b) | 48.40 | |||||||||
| 16.49 | 26.49 | 205,539 | 1.77 | 1.05 | 2.02 | 0.80 | 88.80 | ||||||||||||||
| To the Shareholders and Board of Trustees of
Goldman Sachs Trust — Asia Growth Fund: |
| In our opinion, the accompanying statement of assets and liabilities, including the statement of investments, and the related
statements of operations and of changes in net assets and the financial highlights present fairly, in all material respects, the financial position of Goldman Sachs Asia Growth Fund (“the Fund”), one of the portfolios constituting Goldman Sachs
Trust at August 31, 2000, the results of its operations, the changes in its net assets and the financial highlights for the year then ended, in conformity with accounting principles generally accepted in the United States of America. These financial
statements and financial highlights (hereafter referred to as “financial statements”) are the responsibility of the Fund’s management; our responsibility is to express an opinion on these financial statements based on our audit. We
conducted our audit of these financial statements in accordance with auditing standards generally accepted in the United States of America, which require that we plan and perform the audit to obtain reasonable assurance about whether the financial
statements are free of material misstatement. An audit includes examining, on a test basis, evidence supporting the amounts and disclosures in the financial statements, assessing the accounting principles used and significant estimates made by management,
and evaluating the overall financial statement presentation. We believe that our audit, which included confirmation of securities at August 31, 2000 by correspondence with the custodian and brokers, provides a reasonable basis for our opinion. The
statements of changes in net assets of the Fund for the period ended August 31, 1999 and the year ended January 31, 1999 and the financial highlights for each of the periods ended on or before August 31, 1999 were audited by other independent accountants
whose report dated October 8, 1999 expressed an unqualified opinion thereon.
|
| PricewaterhouseCoopers LLP
|
| Boston, Massachusetts
|
| October 23, 2000
|
|
Shares |
Description | Value | |||
|---|---|---|---|---|---|
| Common Stocks – 47.6% | |||||
| Airlines – 0.1% | |||||
| 10,300 | Southwest Airlines Co. | $ 233,038 | |||
| Alcohol – 0.1% | |||||
| 2,400 | Anheuser-Busch Cos., Inc. | 189,150 | |||
| Apparel – 0.1% | |||||
| 3,900 | Nike, Inc. Class B | 154,294 | |||
| Banks – 2.6% | |||||
| 6,500 | Bank of America Corp. | 348,156 | |||
| 3,500 | Bank One Corp. | 123,375 | |||
| 36,133 | Citigroup, Inc. | 2,109,283 | |||
| 600 | J.P. Morgan & Co., Inc. | 100,313 | |||
| 6,700 | Mellon Financial Corp. | 303,175 | |||
| 1,200 | PNC Financial Services Group | 70,725 | |||
| 5,900 | State Street Corp. | 694,725 | |||
| 6,000 | The Bank of New York Co., Inc. | 314,625 | |||
| 3,950 | The Chase Manhattan Corp. | 220,706 | |||
| 11,300 | Wells Fargo & Co. | 488,019 | |||
| 4,773,102 | |||||
| Chemicals – 0.9% | |||||
| 12,877 | E.I. du Pont de Nemours & Co. | 577,855 | |||
| 8,400 | Minnesota Mining & Manufacturing
Co. |
781,200 | |||
| 10,000 | The Dow Chemicals Co. | 261,875 | |||
| 1,620,930 | |||||
| Clothing – 0.0% | |||||
| 2,300 | The Gap, Inc. | 51,606 | |||
| Computer Hardware – 4.4% | |||||
| 900 | Apple Computer, Inc.* | 54,844 | |||
| 47,400 | Cisco Systems, Inc.* | 3,252,825 | |||
| 8,000 | Compaq Computer Corp. | 272,500 | |||
| 19,100 | Dell Computer Corp.* | 833,237 | |||
| 15,700 | EMC Corp.* | 1,538,600 | |||
| 4,200 | Hewlett-Packard Co. | 507,150 | |||
| 800 | Network Appliance, Inc.* | 93,600 | |||
| 10,400 | Sun Microsystems, Inc.* | 1,320,150 | |||
| 2,500 | Xerox Corp. | 40,156 | |||
| 7,913,062 | |||||
| Computer Software – 3.4% | |||||
| 1,400 | Gemstar-TV Guide International, Inc.* | 126,350 | |||
| 11,900 | International Business Machines, Inc. | 1,570,800 | |||
| 35,400 | Microsoft Corp.* | 2,471,362 | |||
| 18,800 | Oracle Corp.* | 1,709,625 | |||
| 1,900 | VERITAS Software Corp.* | 229,069 | |||
| 6,107,206 | |||||
| Consumer Services – 0.2% | |||||
| 14,300 | Cendant Corp.* | 188,581 | |||
| 8,250 | Valassis Communications, Inc.* | 238,219 | |||
| 426,800 | |||||
| Defense/Aerospace – 0.1% | |||||
| 4,700 | Honeywell International, Inc. | 181,244 | |||
|
Shares |
Description | Value | |||
|---|---|---|---|---|---|
| Common Stocks – (continued) | |||||
| Department Store – 0.0% | |||||
| 3,000 | The May Department Stores Co. | $ 68,813 | |||
| Drugs – 3.9% | |||||
| 5,500 | American Home Products Corp. | 298,031 | |||
| 7,200 | Amgen, Inc.* | 545,850 | |||
| 24,800 | Bristol-Myers Squibb Co. | 1,314,400 | |||
| 6,000 | Eli Lilly & Co. | 438,000 | |||
| 11,600 | Merck & Co., Inc. | 810,550 | |||
| 59,925 | Pfizer, Inc. | 2,591,756 | |||
| 3,717 | Pharmacia Corp. | 217,677 | |||
| 15,600 | Schering-Plough Corp. | 625,950 | |||
| 2,800 | SmithKline Beecham PLC ADR | 182,875 | |||
| 7,025,089 | |||||
| Electronics Equipment – 2.4% | |||||
| 2,400 | Corning, Inc. | 787,050 | |||
| 1,000 | Corvis Corp.* | 103,813 | |||
| 19,200 | Lucent Technologies, Inc. | 802,800 | |||
| 14,626 | Motorola, Inc. | 527,450 | |||
| 21,000 | Nortel Networks Corp. | 1,712,812 | |||
| 6,700 | QUALCOMM, Inc.* | 401,163 | |||
| 4,335,088 | |||||
| Electrical Utilities – 1.0% | |||||
| 3,200 | Duke Energy Corp. | 239,400 | |||
| 6,000 | Entergy Corp. | 182,625 | |||
| 4,400 | FPL Group, Inc. | 234,850 | |||
| 15,400 | Niagara Mohawk Holdings, Inc.* | 198,275 | |||
| 11,700 | The AES Corp.* | 745,875 | |||
| 3,400 | The Southern Co. | 101,787 | |||
| 1,700 | Unicom Corp. | 77,669 | |||
| 1,780,481 | |||||
| Energy Resources – 2.3% | |||||
| 7,098 | Anadarko Petroleum Corp. | 466,835 | |||
| 3,200 | Chevron Corp. | 270,400 | |||
| 2,900 | Enron Corp. | 246,138 | |||
| 23,445 | Exxon Mobil Corp. | 1,913,698 | |||
| 14,400 | Royal Dutch Petroleum Co. | 881,100 | |||
| 7,400 | Unocal Corp. | 246,975 | |||
| 6,000 | USX-Marathon Group | 164,625 | |||
| 4,189,771 | |||||
| Entertainment – 1.1% | |||||
| 15,500 | Carnival Corp. | 309,031 | |||
| 13,500 | The Walt Disney Co. | 525,656 | |||
| 16,277 | Viacom, Inc. Class B * | 1,095,646 | |||
| 1,930,333 | |||||
| Environmental Services – 0.0% | |||||
| 3,400 | Waste Management, Inc. | 64,388 | |||
| Financial Services – 1.1% | |||||
| 19,600 | Federal Home Loan Mortgage Corp. | 825,650 | |||
| 9,900 | Federal National Mortgage Assn. | 532,125 | |||
|
Shares |
Description | Value | |||||||||||||
|---|---|---|---|---|---|---|---|---|---|---|---|---|---|---|---|
| Common Stocks – (continued) | |||||||||||||||
| Financial Services – (continued) | |||||||||||||||
| 1,700 | Household International, Inc. | $ 81,600 | |||||||||||||
| 16,800 | MBNA Corp. | 593,250 | |||||||||||||
| 2,032,625 | |||||||||||||||
| Food & Beverage – 1.3% | |||||||||||||||
| 11,000 | Nabisco Group Holdings Corp. | 308,687 | |||||||||||||
| 15,000 | PepsiCo., Inc. | 639,375 | |||||||||||||
| 14,600 | The Coca-Cola Co. | 768,325 | |||||||||||||
| 4,800 | The Quaker Oats Co. | 326,100 | |||||||||||||
| 3,200 | Wm. Wrigley Jr. Co. | 237,000 | |||||||||||||
| 2,279,487 | |||||||||||||||
| Forest – 0.6% | |||||||||||||||
| 5,700 | Bowater, Inc. | 292,837 | |||||||||||||
| 1,700 | Fort James Corp. | 53,763 | |||||||||||||
| 14,400 | International Paper Co. | 459,000 | |||||||||||||
| 1,900 | Kimberly-Clark Corp. | 111,150 | |||||||||||||
| 2,700 | Weyerhaeuser Co. | 125,044 | |||||||||||||
| 1,041,794 | |||||||||||||||
| Grocery – 0.3% | |||||||||||||||
| 3,500 | Safeway, Inc.* | 172,594 | |||||||||||||
| 13,300 | The Kroger Co.* | 301,744 | |||||||||||||
| 474,338 | |||||||||||||||
| Heavy Electrical – 0.1% | |||||||||||||||
| 1,800 | Emerson Electric Co. | 119,138 | |||||||||||||
| Heavy Machinery – 0.1% | |||||||||||||||
| 6,600 | Crane Co. | 165,825 | |||||||||||||
| 2,700 | Deere & Co. | 88,931 | |||||||||||||
| 254,756 | |||||||||||||||
| Home Products – 0.9% | |||||||||||||||
| 5,600 | Avon Products, Inc. | 219,450 | |||||||||||||
| 11,100 | Colgate-Palmolive Co. | 565,406 | |||||||||||||
| 10,400 | Energizer Holdings, Inc.* | 205,400 | |||||||||||||
| 4,200 | The Gillette Co. | 126,000 | |||||||||||||
| 8,000 | The Procter & Gamble Co. | 494,500 | |||||||||||||
| 1,610,756 | |||||||||||||||
| Hotels – 0.6% | |||||||||||||||
| 16,300 | Harrah’s Entertainment, Inc.* | 462,512 | |||||||||||||
| 8,400 | Marriott International, Inc. | 331,800 | |||||||||||||
| 10,300 | Starwood Hotels & Resorts Worldwide,
Inc. Class B |
329,600 | |||||||||||||
| 1,123,912 | |||||||||||||||
| Industrial Parts – 0.6% | |||||||||||||||
| 3,800 | Caterpillar, Inc. | 139,650 | |||||||||||||
| 4,400 | Parker-Hannifin Corp. | 153,175 | |||||||||||||
| 9,000 | Tyco International Ltd. | 513,000 | |||||||||||||
| 4,500 | United Technologies Corp. | 280,969 | |||||||||||||
| 1,086,794 | |||||||||||||||
|
Shares |
Description | Value | |||||||||||||
|---|---|---|---|---|---|---|---|---|---|---|---|---|---|---|---|
| Common Stocks – (continued) | |||||||||||||||
| Information Services – 0.5% | |||||||||||||||
| 6,000 | Automatic Data Processing, Inc. | $ 357,750 | |||||||||||||
| 1,600 | Electronic Data Systems Corp. | 79,700 | |||||||||||||
| 9,200 | First Data Corp. | 438,725 | |||||||||||||
| 876,175 | |||||||||||||||
| Internet – 0.9% | |||||||||||||||
| 11,800 | America Online, Inc.* | 691,775 | |||||||||||||
| 2,200 | CheckFree Corp.* | 113,988 | |||||||||||||
| 1,800 | DoubleClick, Inc.* | 73,237 | |||||||||||||
| 600 | E.piphany, Inc.* | 62,400 | |||||||||||||
| 300 | Juniper Networks, Inc.* | 63,063 | |||||||||||||
| 2,500 | S1 Corp.* | 43,594 | |||||||||||||
| 1,935 | VeriSign, Inc.* | 384,823 | |||||||||||||
| 2,200 | Yahoo!, Inc.* | 267,300 | |||||||||||||
| 1,700,180 | |||||||||||||||
| Life Insurance – 0.5% | |||||||||||||||
| 5,200 | AFLAC, Inc. | 280,800 | |||||||||||||
| 15,900 | MetLife, Inc.* | 386,569 | |||||||||||||
| 4,300 | Nationwide Financial Services, Inc. | 171,462 | |||||||||||||
| 838,831 | |||||||||||||||
| Media – 2.0% | |||||||||||||||
| 15,700 | A.H. Belo Corp. | 300,263 | |||||||||||||
| 28,660 | AT&T Corp.-Liberty Media Corp.* | 612,607 | |||||||||||||
| 2,500 | Cablevision Systems Corp.* | 168,125 | |||||||||||||
| 4,026 | Clear Channel Communications, Inc.* | 291,382 | |||||||||||||
| 11,300 | Comcast Corp. | 420,925 | |||||||||||||
| 3,400 | EchoStar Communications Corp.* | 165,750 | |||||||||||||
| 8,000 | Infinity Broadcasting Corp.* | 303,000 | |||||||||||||
| 1,400 | The News Corp. Ltd. ADR | 73,675 | |||||||||||||
| 15,900 | Time Warner, Inc. | 1,359,450 | |||||||||||||
| 3,695,177 | |||||||||||||||
| Medical Products – 0.6% | |||||||||||||||
| 3,500 | Abbott Laboratories | 153,125 | |||||||||||||
| 2,100 | Baxter International, Inc. | 174,825 | |||||||||||||
| 7,900 | Johnson & Johnson | 726,306 | |||||||||||||
| 1,054,256 | |||||||||||||||
| Mining – 0.2% | |||||||||||||||
| 8,900 | Alcoa, Inc. | 295,925 | |||||||||||||
| Motor Vehicle – 0.2% | |||||||||||||||
| 8,239 | Ford Motor Co. | 199,281 | |||||||||||||
| 3,008 | General Motors Corp. | 217,140 | |||||||||||||
| 416,421 | |||||||||||||||
| Multi-Industry – 2.1% | |||||||||||||||
| 64,200 | General Electric Co. | 3,767,737 | |||||||||||||
| Oil Refining – 0.1% | |||||||||||||||
| 3 | Conoco, Inc. Class B | 78 | |||||||||||||
| 4,600 | Texaco, Inc. | 236,900 | |||||||||||||
| 236,978 | |||||||||||||||
|
Shares |
Description | Value | |||||||||||||
|---|---|---|---|---|---|---|---|---|---|---|---|---|---|---|---|
| Common Stocks – (continued) | |||||||||||||||
| Oil Services – 0.9% | |||||||||||||||
| 1,500 | Baker Hughes, Inc. | $ 54,844 | |||||||||||||
| 1,900 | Diamond Offshore Drilling, Inc. | 85,144 | |||||||||||||
| 6,300 | Halliburton Co. | 333,900 | |||||||||||||
| 2,700 | Santa Fe International Corp. | 106,144 | |||||||||||||
| 10,300 | Schlumberger Ltd. | 878,718 | |||||||||||||
| 3,000 | Transocean Sedco Forex, Inc. | 179,250 | |||||||||||||
| 1,638,000 | |||||||||||||||
| Property Insurance – 1.7% | |||||||||||||||
| 5,700 | Ambac Financial Group, Inc. | 368,362 | |||||||||||||
| 15,847 | American International Group, Inc. | 1,412,364 | |||||||||||||
| 5,100 | The Hartford Financial Services Group,
Inc. |
339,788 | |||||||||||||
| 2,300 | The St. Paul Cos., Inc.* | 109,538 | |||||||||||||
| 12,600 | XL Capital Ltd. | 868,612 | |||||||||||||
| 3,098,664 | |||||||||||||||
| Publishing – 0.3% | |||||||||||||||
| 2,800 | Gannett Co., Inc. | 158,550 | |||||||||||||
| 6,200 | The New York Times Co. | 242,963 | |||||||||||||
| 3,200 | Tribune Co. | 114,200 | |||||||||||||
| 515,713 | |||||||||||||||
| Railroads – 0.1% | |||||||||||||||
| 5,700 | Canadian National Railway Co. | 167,794 | |||||||||||||
| Restaurants – 0.3% | |||||||||||||||
| 17,400 | McDonald’s Corp. | 519,825 | |||||||||||||
| Security/Asset Management – 0.6% | |||||||||||||||
| 1,500 | Merrill Lynch & Co., Inc. | 217,500 | |||||||||||||
| 3,600 | Morgan Stanley Dean Witter & Co. | 387,225 | |||||||||||||
| 10,250 | The Charles Schwab Corp. | 391,422 | |||||||||||||
| 996,147 | |||||||||||||||
| Semiconductors – 3.5% | |||||||||||||||
| 2,100 | Advanced Micro Devices, Inc.* | 79,013 | |||||||||||||
| 1,800 | Altera Corp.* | 114,991 | |||||||||||||
| 2,300 | Analog Devices, Inc.* | 231,150 | |||||||||||||
| 3,800 | Applied Materials, Inc.* | 327,987 | |||||||||||||
| 200 | Broadcom Corp.* | 50,000 | |||||||||||||
| 47,200 | Intel Corp. | 3,534,100 | |||||||||||||
| 4,420 | JDS Uniphase Corp.* | 550,221 | |||||||||||||
| 600 | KLA-Tencor Corp.* | 39,375 | |||||||||||||
| 1,200 | Maxim Integrated Products, Inc.* | 105,225 | |||||||||||||
| 700 | Novellus Systems, Inc.* | 43,094 | |||||||||||||
| 500 | PMC-Sierra, Inc.* | 118,000 | |||||||||||||
| 11,600 | Texas Instruments, Inc. | 776,475 | |||||||||||||
| 3,000 | Xilinx, Inc.* | 266,625 | |||||||||||||
| 6,236,256 | |||||||||||||||
| Specialty Retail – 1.9% | |||||||||||||||
| 1,000 | Best Buy Co., Inc.* | 61,750 | |||||||||||||
| 8,000 | CVS Corp. | 297,000 | |||||||||||||
| 4,000 | RadioShack Corp. | 236,000 | |||||||||||||
| 16,750 | The Home Depot, Inc. | 805,047 | |||||||||||||
|
Shares |
Description | Value | |||
|---|---|---|---|---|---|
| Common Stocks – (continued) | |||||
| Specialty Retail – (continued) | |||||
| 15,100 | Walgreen Co. | $ 496,412 | |||
| 33,500 | Wal-Mart Stores, Inc. | 1,589,156 | |||
| 3,485,365 | |||||
| Telephone – 1.8% | |||||
| 9,572 | AT&T Corp. | 301,518 | |||
| 1,200 | NEXTLINK Communications, Inc.* | 42,075 | |||
| 5,000 | Qwest Communications International,
Inc.* |
258,125 | |||
| 20,565 | SBC Communications, Inc. | 858,589 | |||
| 2,800 | Sprint Corp. | 93,800 | |||
| 19,842 | Verizon Communications | 865,607 | |||
| 20,550 | WorldCom, Inc.* | 750,075 | |||
| 3,169,789 | |||||
| Tobacco – 0.3% | |||||
| 21,100 | Philip Morris Cos., Inc. | 625,088 | |||
| Wireless – 0.9% | |||||
| 900 | ALLTEL Corp. | 45,506 | |||
| 12,300 | Crown Castle International Corp.* | 426,656 | |||
| 11,868 | General Motors Corp. Class H* | 393,127 | |||
| 9,800 | Sprint Corp. (PCS Group)* | 491,838 | |||
| 6,700 | Vodafone Group PLC ADR | 274,281 | |||
| 1,631,408 | |||||
| TOTAL COMMON STOCKS | |||||
| (Cost $62,725,091) | $ 86,033,724 | ||||
| Principal
Amount |
Interest
Rate |
Maturity
Date |
Value | |||||
|---|---|---|---|---|---|---|---|---|
| Asset-Backed Securities – 4.3% | ||||||||
| Auto – 0.0% | ||||||||
| Fasco Auto Trust Series 1996-1, Class A | ||||||||
| $ 16,249 | 6.65
|
%
|
11/15/2001 | $ 16,199 | ||||
| |
||||||||
| Credit Card – 1.0% | ||||||||
| Capital One Master Trust Series 2000-1, Class A | ||||||||
| 1,500,000 | 7.10 | 04/17/2006 | 1,508,760 | |||||
| Standard Credit Card Master Trust I Series 1995-9, Class A | ||||||||
| 360,000 | 6.55 | 10/07/2007 | 352,818 | |||||
| |
||||||||
| 1,861,578 | ||||||||
| |
||||||||
| Home Equity – 2.2% | ||||||||
| Contimortgage Home Equity Loan Series 1998-1, Class A5 | ||||||||
| 3,000,000 | 6.43 | 04/15/2016 | 2,953,200 | |||||
| IMC Home Equity Loan Series 1996-3, Class A7 | ||||||||
| 1,000,000 | 8.05 | 08/25/2026 | 1,008,390 | |||||
| |
||||||||
| 3,961,590 | ||||||||
| |
||||||||
| Lease – 0.7% | ||||||||
| First Sierra Receivables Series 1998-1, Class A4 | ||||||||
| 1,350,000 | 5.63 | 08/12/2004 | 1,323,972 | |||||
| |
||||||||
| Principal
Amount |
Interest
Rate |
Maturity
Date |
Value | |||||
|---|---|---|---|---|---|---|---|---|
| Asset-Backed Securities – (continued) | ||||||||
| Manufactured Housing – 0.4% | ||||||||
| Mid-State Trust Series 4, Class A | ||||||||
| $ 599,945 | 8.33 | % | 04/01/2030 | $ 605,296 | ||||
| TOTAL ASSET-BACKED SECURITIES | ||||||||
| (Cost $7,937,393) | $ 7,768,635 | |||||||
| Corporate Bonds – 18.9% | ||||||||
| Aerospace/Defense – 0.3% | ||||||||
| Raytheon Co. | ||||||||
| $ 605,000 | 6.45 | % | 08/15/2002 | $ 594,963 | ||||
| Airlines – 0.6% | ||||||||
| Continental Airlines, Inc. | ||||||||
| 332,733 | 6.54 | 09/15/2009 | 315,191 | |||||
| Northwest Airlines, Inc. Class A | ||||||||
| 187,078 | 7.67 | 01/02/2015 | 181,832 | |||||
| Northwest Airlines, Inc. Class C | ||||||||
| 201,599 | 8.97 | 01/02/2015 | 203,706 | |||||
| NWA Trust Series A | ||||||||
| 52,725 | 8.26 | 03/10/2006 | 52,771 | |||||
| US Airways, Inc. Class C | ||||||||
| 306,820 | 8.93 | 04/15/2008 | 291,443 | |||||
| 1,044,943 | ||||||||
| Automotive – 0.9% | ||||||||
| Chrysler Corp. | ||||||||
| 90,000 | 7.45 | 03/01/2027 | 86,399 | |||||
| Ford Motor Co. | ||||||||
| 390,000 | 6.63 | 10/01/2028 | 333,106 | |||||
| Ford Motor Credit Co. | ||||||||
| 170,000 | 5.75 | 02/23/2004 | 161,529 | |||||
| The Hertz Corp. | ||||||||
| 1,055,000 | 6.00 | 01/15/2003 | 1,026,762 | |||||
| 1,607,796 | ||||||||
| Automotive Parts – 0.5% | ||||||||
| Federal-Mogul Corp. | ||||||||
| 250,000 | 7.50 | 01/15/2009 | 186,250 | |||||
| Hayes Lemmerz International, Inc. Series B | ||||||||
| 250,000 | 8.25 | 12/15/2008 | 218,125 | |||||
| TRW, Inc. | ||||||||
| 460,000 | 6.63 | 06/01/2004 | 442,454 | |||||
| 846,829 | ||||||||
| Building Materials – 0.1% | ||||||||
| Owens Corning | ||||||||
| 520,000 | 7.50 | 05/01/2005 | 273,000 | |||||
| Chemicals – 0.3% | ||||||||
| Lyondell Chemical Co. Series B | ||||||||
| 250,000 | 9.88 | 05/01/2007 | 255,000 | |||||
| NL Industries, Inc. | ||||||||
| 250,000 | 11.75 | 10/15/2003 | 253,750 | |||||
| 508,750 | ||||||||
| Principal
Amount |
Interest
Rate |
Maturity
Date |
Value | |||||
|---|---|---|---|---|---|---|---|---|
| Corporate Bonds – (continued) | ||||||||
| Commercial Banks – 1.6% | ||||||||
| Bank of America Corp. | ||||||||
| $ 355,000 | 7.75 | % | 07/15/2002 | $ 358,702 | ||||
| 480,000 | 7.25 | 10/15/2025 | 448,949 | |||||
| Citicorp | ||||||||
| 315,000 | 8.00 | 02/01/2003 | 319,867 | |||||
| Continental Bank NA | ||||||||
| 100,000 | 12.50 | 04/01/2001 | 102,966 | |||||
| First Union Corp. | ||||||||
| 290,000 | 7.10 | 08/15/2004 | 286,132 | |||||
| Golden West Financial Corp. | ||||||||
| 200,000 | 10.25 | 12/01/2000 | 201,388 | |||||
| Long Island Savings Bank | ||||||||
| 620,000 | 6.20 | 04/02/2001 | 617,066 | |||||
| Wells Fargo & Co. | ||||||||
| 485,000 | 6.63 | 07/15/2004 | 475,848 | |||||
| Wells Fargo Bank NA # | ||||||||
| 140,000 | 7.80 | 06/15/2010 | 141,842 | |||||
| 2,952,760 | ||||||||
| Conglomerates – 0.5% | ||||||||
| Tyco International Group SA | ||||||||
| 875,000 | 5.88 | 11/01/2004 | 828,651 | |||||
| Consumer Cyclicals – 0.3% | ||||||||
| United Rentals, Inc. Series B | ||||||||
| 500,000 | 8.80 | 08/15/2008 | 460,000 | |||||
| Credit Card Banks – 0.9% | ||||||||
| Capital One Bank | ||||||||
| 500,000 | 6.39 | 03/05/2001 | 498,125 | |||||
| 150,000 | 6.15 | 06/01/2001 | 148,706 | |||||
| 300,000 | 6.76 | 07/23/2002 | 295,705 | |||||
| 500,000 | 6.38 | 02/15/2003 | 484,227 | |||||
| Providian National Bank | ||||||||
| 250,000 | 6.65 | 02/01/2004 | 239,393 | |||||
| 1,666,156 | ||||||||
| Electric – 0.5% | ||||||||
| CMS Energy Corp. Series B | ||||||||
| 150,000 | 7.38 | 11/15/2000 | 149,505 | |||||
| Edison Mission Energy Funding† | ||||||||
| 57,642 | 6.77 | 09/15/2003 | 55,761 | |||||
| MidAmerican Energy Holdings Co. | ||||||||
| 250,000 | 7.23 | 09/15/2005 | 245,977 | |||||
| Niagara Mohawk Power Co. | ||||||||
| 450,000 | 6.88 | 04/01/2003 | 445,878 | |||||
| 897,121 | ||||||||
| Energy – 1.1% | ||||||||
| Gulf Canada Resources Ltd. | ||||||||
| 90,000 | 9.25 | 01/15/2004 | 91,238 | |||||
| Occidental Petroleum Corp. | ||||||||
| 525,000 | 7.65 | 02/15/2006 | 527,390 | |||||
| Principal
Amount |
Interest
Rate |
Maturity
Date |
Value | |||||
|---|---|---|---|---|---|---|---|---|
| Corporate Bonds – (continued) | ||||||||
| Energy – (continued) | ||||||||
| Petroleum Geo-Services ASA | ||||||||
| $ 110,000 | 7.13 | % | 03/30/2028 | $ 94,349 | ||||
| Phillips Petroleum Co. | ||||||||
| 160,000 | 8.50 | 05/25/2005 | 167,465 | |||||
| The Williams Cos., Inc. | ||||||||
| 1,125,000 | 6.13 | 02/15/2002 | 1,103,642 | |||||
| 1,984,084 | ||||||||
| Environmental – 0.4% | ||||||||
| Allied Waste North America, Inc. Series B | ||||||||
| 250,000 | 7.63 | 01/01/2006 | 229,688 | |||||
| Waste Management, Inc.# | ||||||||
| 500,000 | 6.13 | 07/15/2001 | 488,701 | |||||
| 718,389 | ||||||||
| Finance Companies – 1.5% | ||||||||
| Beneficial Corp. | ||||||||
| 1,350,000 | 6.43 | 04/10/2002 | 1,332,381 | |||||
| Comdisco, Inc. | ||||||||
| 965,000 | 6.13 | 01/15/2003 | 900,160 | |||||
| 400,000 | 9.50 | 08/15/2003 | 401,272 | |||||
| 2,633,813 | ||||||||
| Food – 0.1% | ||||||||
| International Home Foods, Inc. | ||||||||
| 250,000 | 10.38 | 11/01/2006 | 267,500 | |||||
| Health Care – 0.1% | ||||||||
| Tenet Healthcare Corp. | ||||||||
| 175,000 | 8.63 | 12/01/2003 | 174,781 | |||||
| Insurance Companies – 0.1% | ||||||||
| Conseco, Inc. | ||||||||
| 260,000 | 8.50 | 10/15/2002 | 166,400 | |||||
| Lodging – 0.3% | ||||||||
| ITT Corp. | ||||||||
| 50,000 | 6.25 | 11/15/2000 | 49,834 | |||||
| 465,000 | 6.75 | 11/15/2003 | 444,932 | |||||
| 494,766 | ||||||||
| Media-Cable – 1.6% | ||||||||
| Adelphia Communications Corp. | ||||||||
| 125,000 | 7.88 | 05/01/2009 | 105,937 | |||||
| 125,000 | 9.38 | 11/15/2009 | 116,094 | |||||
| Charter Communications Holdings LLC | ||||||||
| 250,000 | 8.25 | 04/01/2007 | 230,000 | |||||
| Comcast UK Cable Partners Ltd.+ | ||||||||
| 125,000 | 0.00/11.20 | 11/15/2007 | 116,562 | |||||
| Cox Communications, Inc. | ||||||||
| 145,000 | 7.50 | 08/15/2004 | 145,293 | |||||
| 60,000 | 6.40 | 08/01/2008 | 55,894 | |||||
| 50,000 | 6.80 | 08/01/2028 | 43,054 | |||||
| Lenfest Communications, Inc. | ||||||||
| 300,000 | 8.38 | 11/01/2005 | 311,317 | |||||
| Principal
Amount |
Interest
Rate |
Maturity
Date |
Value | |||||
|---|---|---|---|---|---|---|---|---|
| Corporate Bonds – (continued) | ||||||||
| Media-Cable – (continued) | ||||||||
| Rogers Cablesystems Ltd. | ||||||||
| $ 115,000 | 9.63 | % | 08/01/2002 | $ 117,300 | ||||
| Telewest Communications PLC+ | ||||||||
| 250,000 | 0.00/11.00 | 10/01/2007 | 238,437 | |||||
| 250,000 | 0.00/9.25 | † | 04/15/2009 | 138,750 | ||||
| Time Warner Entertainment Co. | ||||||||
| 445,000 | 9.63 | 05/01/2002 | 460,663 | |||||
| Time Warner, Inc. | ||||||||
| 250,000 | 7.98 | 08/15/2004 | 256,350 | |||||
| 565,000 | 7.75 | 06/15/2005 | 575,031 | |||||
| 2,910,682 | ||||||||
| Media-Non Cable – 1.5% | ||||||||
| Clear Channel Communications, Inc. | ||||||||
| 250,000 | 8.00 | 11/01/2008 | 252,500 | |||||
| Crown Castle International Corp.+ | ||||||||
| 250,000 | 0.00/10.38 | 05/15/2011 | 162,500 | |||||
| J. Seagram & Sons, Inc. | ||||||||
| 275,000 | 6.25 | 12/15/2001 | 271,542 | |||||
| News America Holdings, Inc. | ||||||||
| 245,000 | 8.50 | 02/15/2005 | 254,398 | |||||
| 135,000 | 8.00 | 10/17/2016 | 131,362 | |||||
| 225,000 | 7.25 | 05/18/2018 | 202,962 | |||||
| PanAmSat Corp. | ||||||||
| 205,000 | 6.13 | 01/15/2005 | 191,185 | |||||
| Viacom, Inc. | ||||||||
| 205,000 | 8.88 | 06/01/2001 | 206,905 | |||||
| 900,000 | 6.75 | 01/15/2003 | 890,487 | |||||
| 120,000 | 7.70 | 07/30/2010 | 121,633 | |||||
| 2,685,474 | ||||||||
| Mortgage Banks – 0.6% | ||||||||
| Countrywide Capital III Series B | ||||||||
| 330,000 | 8.05 | 06/15/2027 | 298,852 | |||||
| Countrywide Home Loans, Inc. | ||||||||
| 850,000 | 6.45 | 02/27/2003 | 830,851 | |||||
| 1,129,703 | ||||||||
| Paper – 0.3% | ||||||||
| Packaging Corp. of America | ||||||||
| 250,000 | 9.63 | 04/01/2009 | 256,250 | |||||
| Riverwood International Corp. | ||||||||
| 250,000 | 10.63 | 08/01/2007 | 255,000 | |||||
| 511,250 | ||||||||
| REIT – 0.9% | ||||||||
| Chelsea GCA Realty, Inc. | ||||||||
| 656,000 | 7.75 | 01/26/2001 | 655,707 | |||||
| Liberty Property LP | ||||||||
| 205,000 | 7.10 | 08/15/2004 | 198,362 | |||||
| Meditrust Cos. | ||||||||
| 215,000 | 7.82 | 09/10/2026 | 165,550 | |||||
| Principal
Amount |
Interest
Rate |
Maturity
Date |
Value | |||||
|---|---|---|---|---|---|---|---|---|
| Corporate Bonds – (continued) | ||||||||
| REIT – (continued) | ||||||||
| Simon Property Group LP | ||||||||
| $ 675,000 | 6.63 | % | 06/15/2003 | $ 649,364 | ||||
| 1,668,983 | ||||||||
| Retailers – 0.1% | ||||||||
| Kmart Corp. | ||||||||
| 165,000 | 8.38 | 12/01/2004 | 155,994 | |||||
| Supermarkets – 0.3% | ||||||||
| Ahold Finance USA, Inc. | ||||||||
| 115,000 | 8.25 | 07/15/2010 | 115,809 | |||||
| Fred Meyer, Inc. | ||||||||
| 260,000 | 7.45 | 03/01/2008 | 250,881 | |||||
| Safeway, Inc. | ||||||||
| 265,000 | 6.05 | 11/15/2003 | 254,539 | |||||
| 621,229 | ||||||||
| Technology – 0.1% | ||||||||
| Flextronics International Ltd. | ||||||||
| 125,000 | 9.88 | 07/01/2010 | 129,687 | |||||
| Telecommunications – 2.1% | ||||||||
| 360 Communications Co. | ||||||||
| 575,000 | 7.13 | 03/01/2003 | 575,062 | |||||
| Alaska Communications Holdings, Inc. | ||||||||
| 125,000 | 9.38 | 05/15/2009 | 115,000 | |||||
| AT&T Canada, Inc.+ | ||||||||
| 345,000 | 0.00/9.95 | 06/15/2008 | 280,313 | |||||
| Deutsche Telekom AG | ||||||||
| 305,000 | 7.75 | 06/15/2005 | 308,756 | |||||
| Global Crossing Holdings Ltd.† | ||||||||
| 125,000 | 9.13 | 11/15/2006 | 124,063 | |||||
| Intermedia Communications, Inc. Series B | ||||||||
| 250,000 | 8.60 | 06/01/2008 | 205,000 | |||||
| MCI WorldCom, Inc. | ||||||||
| 275,000 | 6.40 | 08/15/2005 | 264,041 | |||||
| Metromedia Fiber Network, Inc. | ||||||||
| 125,000 | 10.00 | 12/15/2009 | 123,125 | |||||
| Nextel Communications, Inc. | ||||||||
| 250,000 | 9.38 | 11/15/2009 | 245,000 | |||||
| Price Communications Wireless, Inc. Series B | ||||||||
| 250,000 | 9.13 | 12/15/2006 | 255,000 | |||||
| Qwest Corp.† | ||||||||
| 425,000 | 7.63 | 06/09/2003 | 427,905 | |||||
| Sprint Capital Corp. | ||||||||
| 565,000 | 5.88 | 05/01/2004 | 537,389 | |||||
| 130,000 | 6.88 | 11/15/2028 | 111,125 | |||||
| Tele-Communications, Inc. | ||||||||
| 100,000 | 9.65 | 10/01/2003 | 103,325 | |||||
| US West Capital Funding, Inc. | ||||||||
| 200,000 | 6.88 | 07/15/2028 | 171,504 | |||||
| 3,846,608 | ||||||||
| Principal
Amount |
Interest
Rate |
Maturity
Date |
Value | |||||
|---|---|---|---|---|---|---|---|---|
| Corporate Bonds – (continued) | ||||||||
| Tobacco – 0.6% | ||||||||
| Philip Morris Cos., Inc. | ||||||||
| $ 400,000 | 9.00 | % | 01/01/2001 | $ 401,492 | ||||
| 150,000 | 7.00 | 07/15/2005 | 143,157 | |||||
| 195,000 | 6.95 | 06/01/2006 | 192,652 | |||||
| R.J. Reynolds Tobacco Holdings, Inc. | ||||||||
| 355,000 | 7.38 | 05/15/2003 | 335,475 | |||||
| 1,072,776 | ||||||||
| Yankee Bonds – 0.7% | ||||||||
| HSBC Holdings PLC | ||||||||
| 110,000 | 7.50 | 07/15/2009 | 109,907 | |||||
| National Westminster Bank PLC | ||||||||
| 260,000 | 7.38 | 10/01/2009 | 257,192 | |||||
| Province of Quebec | ||||||||
| 730,000 | 7.50 | 07/15/2023 | 733,478 | |||||
| 105,000 | 5.74 | 03/02/2026 | 104,354 | |||||
| Province of Saskatchewan | ||||||||
| 90,000 | 8.50 | 07/15/2022 | 101,427 | |||||
| 1,306,358 | ||||||||
| TOTAL CORPORATE BONDS | ||||||||
| (Cost $35,694,101) | $ 34,159,446 | |||||||
| Emerging Market Debt – 3.9% | ||||||||
| Federal Republic of Brazil | ||||||||
| $ 100,000 | 12.25 | % | 03/06/2030 | $ 98,438 | ||||
| 60,000 | 11.00 | 08/17/2040 | 49,125 | |||||
| Federal Republic of Brazil C-Bonds | ||||||||
| 149,000 | 8.00 | 04/15/2014 | 115,196 | |||||
| Federal Republic of Germany | ||||||||
| 2,000,000 | 5.25 | 07/04/2010 | 1,769,817 | |||||
| Grupo Industrial Durango SA | ||||||||
| 100,000 | 12.63 | 08/01/2003 | 101,486 | |||||
| Hanvit Bank† | ||||||||
| 170,000 | 11.75 | 03/01/2010 | 170,650 | |||||
| MRS Logistica SA | ||||||||
| 100,000 | 10.63 | 08/15/2005 | 88,392 | |||||
| National Power Corp. | ||||||||
| 240,000 | 7.63 | 11/15/2000 | 239,564 | |||||
| National Republic of Bulgaria# | ||||||||
| 490,000 | 2.75 | 07/28/2012 | 372,706 | |||||
| Petroleos Mexicanos#† | ||||||||
| 160,000 | 9.50 | 09/15/2027 | 166,400 | |||||
| PTC International Finance BV+ | ||||||||
| 210,000 | 0.00/10.75 | 07/01/2007 | 155,400 | |||||
| Republic of France | ||||||||
| 2,050,000 | 5.00 | 07/12/2005 | 1,796,229 | |||||
| Republic of Panama | ||||||||
| 70,000 | 7.88 | 02/13/2002 | 69,256 | |||||
| 390,793 | 7.93 | # | 05/14/2002 | 386,641 | ||||
| 140,000 | 10.75 | 05/15/2020 | 142,371 | |||||
| 160,000 | 9.38 | 04/01/2029 | 157,700 | |||||
| Principal
Amount |
Interest
Rate |
Maturity
Date |
Value | |||||
|---|---|---|---|---|---|---|---|---|
| Emerging Market Debt – (continued) | ||||||||
| Republic of Peru# | ||||||||
| $ 460,000 | 3.75 | % | 03/07/2017 | $ 298,713 | ||||
| Republic of Philippines | ||||||||
| 130,000 | 9.50 | 10/21/2024 | 124,069 | |||||
| 270,000 | 10.63 | 03/16/2025 | 238,194 | |||||
| Republic of Poland+ | ||||||||
| 150,000 | 0.00/4.00 | 10/27/2024 | 95,625 | |||||
| Republic of Turkey | ||||||||
| 80,000 | 11.75 | 06/15/2010 | 84,000 | |||||
| State of Qatar | ||||||||
| 130,000 | 9.50 | 05/21/2009 | 136,500 | |||||
| 70,000 | 9.75 | † | 06/15/2030 | 72,581 | ||||
| TFM, SA de CV+ | ||||||||
| 140,000 | 0.00/11.75 | 06/15/2009 | 109,200 | |||||
| United Mexican States | ||||||||
| 60,000 | 9.88 | 02/01/2010 | 64,275 | |||||
| TOTAL EMERGING MARKET DEBT | ||||||||
| (Cost $7,035,101) | $ 7,102,528 | |||||||
| Mortgage Backed Obligations – 21.4% | ||||||||
| Federal Home Loan Mortgage Corp. (FHLMC) – 5.7% | ||||||||
| $ 973,411 | 7.00 | % | 11/01/2025 | $ 953,602 | ||||
| 746,675 | 6.00 | 11/01/2028 | 694,766 | |||||
| 1,946,115 | 6.00 | 01/01/2029 | 1,810,821 | |||||
| 7,000,000 | 7.50 | TBA-30 yrD | 6,962,250 | |||||
| 10,421,439 | ||||||||
| Federal National Mortgage Association (FNMA) – 5.8% | ||||||||
| $ 189,939 | 6.50 | % | 09/01/2025 | $ 182,271 | ||||
| 205,973 | 6.50 | 10/01/2025 | 197,658 | |||||
| 262,255 | 6.50 | 11/01/2025 | 252,150 | |||||
| 171,010 | 6.50 | 02/01/2028 | 163,724 | |||||
| 876,781 | 6.50 | 03/01/2028 | 838,220 | |||||
| 389,572 | 6.50 | 07/01/2028 | 372,438 | |||||
| 55,800 | 6.50 | 08/01/2028 | 53,346 | |||||
| 877,098 | 6.00 | 09/01/2028 | 815,754 | |||||
| 415,988 | 6.50 | 11/01/2028 | 397,693 | |||||
| 2,716,227 | 6.00 | 12/01/2028 | 2,526,255 | |||||
| 497,654 | 6.50 | 12/01/2028 | 475,767 | |||||
| 60,186 | 6.00 | 01/01/2029 | 55,977 | |||||
| 37,479 | 6.50 | 01/01/2029 | 35,831 | |||||
| 121,930 | 6.00 | 02/01/2029 | 113,402 | |||||
| 629,502 | 6.00 | 03/01/2029 | 585,474 | |||||
| 127,619 | 6.50 | 04/01/2029 | 121,957 | |||||
| 136,655 | 6.50 | 05/01/2029 | 130,592 | |||||
| 156,760 | 6.50 | 10/01/2029 | 149,805 | |||||
| 1,000,000 | 7.00 | 11/01/2029 | 975,310 | |||||
| 1,000,100 | 8.00 | 08/01/2030 | 1,009,631 | |||||
| 1,000,000 | 8.50 | TBA-30 yrD | 1,019,062 | |||||
| 10,472,317 | ||||||||
| Principal
Amount |
Interest
Rate |
Maturity
Date |
Value | |||||
|---|---|---|---|---|---|---|---|---|
| Mortgage Backed Obligations – (continued) | ||||||||
| Government National Mortgage Association (GNMA) – 6.6% | ||||||||
| $ 150,729 | 6.50 | % | 06/15/2023 | $ 145,456 | ||||
| 647,739 | 6.50 | 08/15/2023 | 625,081 | |||||
| 1,171,091 | 6.50 | 09/15/2023 | 1,130,126 | |||||
| 198,047 | 6.50 | 10/15/2023 | 191,119 | |||||
| 1,782,164 | 6.50 | 11/15/2023 | 1,719,824 | |||||
| 387,944 | 6.50 | 12/15/2023 | 374,374 | |||||
| 665,175 | 6.50 | 01/15/2024 | 641,741 | |||||
| 106,640 | 6.50 | 03/15/2024 | 102,883 | |||||
| 1,357,353 | 6.50 | 04/15/2024 | 1,309,534 | |||||
| 1,904,626 | 6.50 | 03/15/2026 | 1,834,173 | |||||
| 941,807 | 6.50 | 05/15/2026 | 906,970 | |||||
| 901,083 | 6.50 | 01/15/2029 | 864,760 | |||||
| 245,518 | 8.00 | 10/15/2029 | 249,294 | |||||
| 480,845 | 8.00 | 07/15/2030 | 488,044 | |||||
| 1,273,816 | 8.00 | 08/15/2030 | 1,292,885 | |||||
| 11,876,264 | ||||||||
| Collateralized Mortgage Obligations (CMOs) – 3.3% | ||||||||
| Inverse Floater# – 0.9% | ||||||||
| FHLMC-GNMA Series 14, Class SB | ||||||||
| $ 914,509 | 3.71 | % | 06/25/2023 | $ 718,109 | ||||
| FNMA Series 1993-248, Class SA | ||||||||
| 1,000,000 | 3.96 | 08/25/2023 | 869,945 | |||||
| $ 1,588,054 | ||||||||
| Non-Agency CMOs – 2.4% | ||||||||
| Asset Securitization Corp. Series 1997-D4, Class A 1D | ||||||||
| $ 450,000 | 7.49 | % | 04/14/2029 | $ 454,302 | ||||
| CS First Boston Mortgage Securities Corp. Series 1997-C2,
Class A2 |
||||||||
| 700,000 | 6.52 | 07/17/2007 | 680,596 | |||||
| CS First Boston Mortgage Securities Corp. Series 1999-C1,
Class A1 |
||||||||
| 954,634 | 6.91 | 01/15/2008 | 945,063 | |||||
| First Union-Lehman Brothers Commercial Mortgage Services
Series 1997-C1, Class A2 |
||||||||
| 300,000 | 7.30 | 12/18/2006 | 301,853 | |||||
| Merrill Lynch Mortgage Investors, Inc. Series 1998-C2,
Class A2 |
||||||||
| 2,000,000 | 6.39 | 02/15/2030 | 1,902,940 | |||||
| $ 4,284,754 | ||||||||
| TOTAL COLLATERALIZED
MORTGAGE OBLIGATIONS (CMOS) |
$ 5,872,808 | |||||||
| TOTAL MORTGAGE BACKED OBLIGATIONS | ||||||||
| (Cost $38,418,279) | $ 38,642,828 | |||||||
| Principal
Amount |
Interest
Rate |
Maturity
Date |
Value | ||||||
|---|---|---|---|---|---|---|---|---|---|
| U.S. Treasury Obligations – 2.9% | |||||||||
| U.S. Treasury Note | |||||||||
| $ | 1,800,000 | 5.75 | % | 11/30/2002 | $ 1,783,688 | ||||
| U.S. Treasury Principal-Only Stripped Securities @ | |||||||||
| 2,000,000 | 6.10 | 11/15/2018 | 686,638 | ||||||
| 4,650,000 | 6.08 | 05/15/2020 | 1,464,606 | ||||||
| 1,290,000 | 5.99 | 11/15/2024 | 319,506 | ||||||
| 1,000,000 | 5.96 | 08/15/2025 | 238,349 | ||||||
| 3,310,000 | 5.92 | 08/15/2026 | 750,539 | ||||||
| |
|||||||||
| TOTAL U.S. TREASURY OBLIGATIONS | |||||||||
| (Cost $5,009,370) | $ 5,243,326 | ||||||||
| |
|||||||||
| Repurchase Agreement – 3.9% | |||||||||
| Joint Repurchase Agreement Account IIÙ | |||||||||
| $ | 7,100,000 | 6.66 | % | 09/01/2000 | $ 7,100,000 | ||||
| |
|||||||||
| TOTAL REPURCHASE AGREEMENT | |||||||||
| (Cost $7,100,000) | $ 7,100,000 | ||||||||
| |
|||||||||
| TOTAL INVESTMENTS | |||||||||
| (Cost $163,919,335) | $ 186,050,487 | ||||||||
| |
|||||||||
*
|
Non-income producing security.
|
Ù
|
Joint repurchase agreement was entered into on August 31, 2000.
|
#
|
Variable rate security. Coupon rate disclosed is that which is in effect at August 31, 2000.
|
D
|
TBA (To Be Assigned) securities are purchased on a forward commitment basis with an approximate (generally ± 2.5%)
principal amount and maturity date. The actual principal amount and maturity date will be determined upon settlement when the specific mortgage pools are assigned.
|
†
|
Securities are exempt from registration under Rule 144A of the Securities Act of 1933. Such securities may be resold, normally to
qualified institutional buyers in transactions exempt from registration. Total market value of Rule 144A securities amounted to $1,156,110 at August 31, 2000.
|
+
|
These securities are issued with a zero coupon which increases to the stated rate at a set date in the future.
|
@
|
Security is issued with a zero coupon. The interest rate disclosed for this security represents effective yield to maturity.
|
| The percentage shown for each investment category reflects the value of investments in that category as a percentage of total net
assets.
|
| |
| Investment Abbreviations:
|
| ADR—American Depositary Receipt
|
| |
| Assets: | |||
| Investment in securities, at value (identified cost $163,919,335) | $186,050,487 | ||
| Cash (a) | 900,000 | ||
| Receivables: | |||
| Investment securities sold | 9,421,378 | ||
| Interest and dividends, at value | 1,052,930 | ||
| Variation margin | 160,771 | ||
| Forward foreign currency exchange contracts, at value | 93,216 | ||
| Reimbursement from investment adviser | 78,839 | ||
| Fund shares sold | 77,176 | ||
| Other assets | 10,223 | ||
| Total assets | 197,845,020 | ||
| Liabilities: | |||
| Due to custodian | 599,135 | ||
| Payables: | |||
| Investment securities purchased | 14,954,212 | ||
| Fund shares repurchased | 535,001 | ||
| Amounts owed to affiliates | 192,295 | ||
| Forward sale contract, at value | 929,062 | ||
| Accrued expenses and other liabilities | 60,696 | ||
| Total liabilities | 17,270,401 | ||
| Net Assets: | |||
| Paid-in capital | 155,500,515 | ||
| Accumulated undistributed net investment income | 2,189,502 | ||
| Accumulated net realized gain from investment, futures, options and foreign currency related transactions | 254,867 | ||
| Net unrealized gain on investments, futures and translation of assets and liabilities denominated in foreign currency | 22,629,735 | ||
| NET ASSETS | $180,574,619 | ||
| Net asset value, offering and redemption price per share: (b) | |||
| Class A | $21.42 | ||
| Class B | $21.27 | ||
| Class C | $21.25 | ||
| Institutional | $21.46 | ||
| Service | $21.41 | ||
| Shares outstanding: | |||
| Class A | 6,332,281 | ||
| Class B | 1,587,217 | ||
| Class C | 407,509 | ||
| Institutional | 116,883 | ||
| Service | 794 | ||
| Total shares outstanding, $.001 par value (unlimited number of shares authorized) | 8,444,684 | ||
(a)
|
Restricted cash relating to initial margin requirements and collateral on futures transactions.
|
(b)
|
Maximum public offering price per share (NAV per share multiplied by 1.0582) for Class A Shares is $22.67. At redemption, Class B
and Class C Shares may be subject to a contingent deferred sales charge, assessed on the amount equal to the lesser of the current net asset value or the original purchase price of the shares.
|
| Investment income: | ||||||||||
| Interest | $ 7,062,157 | |||||||||
| Dividends (a) | 1,080,922 | |||||||||
| Total income | 8,143,079 | |||||||||
| Expenses: | ||||||||||
| Management fees | 1,303,563 | |||||||||
| Distribution and Service fees (b) | 844,254 | |||||||||
| Transfer Agent fees (c) | 377,304 | |||||||||
| Custodian fees | 189,959 | |||||||||
| Registration fees | 59,552 | |||||||||
| Professional fees | 47,686 | |||||||||
| Trustee fees | 8,729 | |||||||||
| Amortization of deferred organization expenses | 1,507 | |||||||||
| Other | 102,056 | |||||||||
| Total expenses | 2,934,610 | |||||||||
| Less — expense reductions | (350,424 | ) | ||||||||
| Net expenses | 2,584,186 | |||||||||
| NET INVESTMENT INCOME | 5,558,893 | |||||||||
| Realized and unrealized gain (loss) on investment, futures, options and foreign currency related transactions: | ||||||||||
| Net realized gain (loss) from: | ||||||||||
| Investment transactions | 638,987 | |||||||||
| Options written | 35,020 | |||||||||
| Futures transactions | 731,379 | |||||||||
| Foreign currency related transactions | (6,765 | ) | ||||||||
| Net change in unrealized gain (loss) on: | ||||||||||
| Investments | 14,367,213 | |||||||||
| Options written | (11,670 | ) | ||||||||
| Futures | 695,504 | |||||||||
| Translation of assets and liabilities denominated in foreign currencies | 130,383 | |||||||||
| Net realized and unrealized gain on investment, futures, options and foreign currency related transactions | 16,580,051 | |||||||||
| NET INCREASE IN NET ASSETS RESULTING FROM OPERATIONS | $22,138,944 | |||||||||
(a)
|
Foreign taxes withheld on dividends were $4,197.
|
(b)
|
Class A, Class B and Class C had Distribution and Service fees of $378,767, $369,057 and $96,430, respectively.
|
(c)
|
Class A, Class B, Class C, Institutional Class and Service Class had Transfer Agent fees of $287,864, $70,121, $18,322, $991 and
$6, respectively.
|
| For the
Year Ended August 31, 2000 |
For the
Seven Months Ended August 31, 1999 |
For the
Year Ended January 31, 1999 |
||||||||
|---|---|---|---|---|---|---|---|---|---|---|
| From operations: | ||||||||||
| Net investment income | $ 5,558,893 | $ 3,460,485 | $ 6,835,375 | |||||||
| Net realized gain (loss) from investment, futures, options and foreign currency related
transactions |
1,398,621 | 6,012,842 | (3,394,596 | ) | ||||||
| Net change in unrealized gain (loss) on investments, futures, options and translation of
assets and liabilities denominated in foreign currencies |
15,181,430 | (7,516,307 | ) | 4,114,362 | ||||||
| Net increase in net assets resulting from operations | 22,138,944 | 1,957,020 | 7,555,141 | |||||||
| Distributions to shareholders: | ||||||||||
| From net investment income | ||||||||||
| Class A Shares | (3,728,709 | ) | (2,035,907 | ) | (5,454,393 | ) | ||||
| Class B Shares | (664,618 | ) | (312,410 | ) | (858,147 | ) | ||||
| Class C Shares | (176,298 | ) | (88,561 | ) | (325,754 | ) | ||||
| Institutional Shares | (68,550 | ) | (66,533 | ) | (294,710 | ) | ||||
| Service Shares | (353 | ) | (2,011 | ) | (7,267 | ) | ||||
| From net realized gains | ||||||||||
| Class A Shares | (6,165,905 | ) | — | — | ||||||
| Class B Shares | (1,496,998 | ) | — | — | ||||||
| Class C Shares | (399,802 | ) | — | — | ||||||
| Institutional Shares | (97,914 | ) | — | — | ||||||
| Service Shares | (569 | ) | — | — | ||||||
| Total distributions to shareholders | (12,799,716 | ) | (2,505,422 | ) | (6,940,271 | ) | ||||
| From share transactions: | ||||||||||
| Proceeds from sales of shares | 14,022,180 | 22,988,417 | 116,979,156 | |||||||
| Reinvestment of dividends and distributions | 12,298,235 | 2,398,095 | 6,132,572 | |||||||
| Cost of shares repurchased | (78,654,543 | ) | (60,433,602 | ) | (69,069,832 | ) | ||||
| Net increase (decrease) in net assets resulting from share transactions | (52,334,128 | ) | (35,047,090 | ) | 54,041,896 | |||||
| TOTAL INCREASE (DECREASE) | (42,994,900 | ) | (35,595,492 | ) | 54,656,766 | |||||
| Net assets: | ||||||||||
| Beginning of period | 223,569,519 | 259,165,011 | 204,508,245 | |||||||
| End of period | $180,574,619 | $223,569,519 | $259,165,011 | |||||||
| Accumulated undistributed net investment income | $ 2,189,502 | $ 1,302,040 | $ 375,856 | |||||||
| 1. ORGANIZATION
|
| Goldman Sachs Trust (the “Trust”) is a Delaware business trust registered under the Investment Company Act of 1940 (as
amended) as an open-end management investment company. The Trust includes the Goldman Sachs Balanced Fund (the “Fund”). The Fund is a diversified portfolio offering five classes of shares — Class A, Class B, Class C, Institutional
and Service.
|
| 2. SIGNIFICANT ACCOUNTING POLICIES
|
| The following is a summary of the significant accounting policies consistently followed by the Fund. The preparation of financial
statements in conformity with generally accepted accounting principles requires management to make estimates and assumptions that may affect the reported amounts. Actual results could differ from those estimates. Effective for fiscal year 1999, the Board
of Trustees approved a change in the fiscal year-end of the Fund from January 31 to August 31. Accordingly, the Statements of Changes in Net Assets, Summary of Share Transactions and Financial Highlights of the Fund are included for the seven months ended
August 31, 1999 and the year ended January 31, 1999.
|
| A. Investment Valuation — Investments in
securities traded on a U.S. or foreign securities exchange or the NASDAQ system are valued daily at their last sale on the principal exchange on which they are traded. If no sale occurs, securities are valued at the last bid price. Debt securities are
valued at prices supplied by independent pricing services, broker/dealer-supplied valuations or matrix pricing systems. Unlisted equity and debt securities for which market quotations are available are valued at the last sale price on valuation date, or
if no sale occurs, at the last bid price. Short-term debt obligations maturing in sixty days or less are valued at amortized cost, which approximates market value. Securities for which quotations are not readily available are valued at fair value using
methods approved by the Board of Trustees of the Trust.
|
| Investing in emerging markets may involve special risks and considerations not
typically associated with investing in the United States. These risks include revaluation of currencies, high rates of inflation, repatriation restrictions on income and capital, and adverse political and economic developments. Moreover, securities issued
in these markets may be less liquid, subject to government ownership controls, delayed settlements, and their prices more volatile than those of comparable securities in the United States.
|
| B. Security Transactions and Investment Income — Security transactions are recorded as of the trade date. Realized gains and losses on sales of portfolio securities are calculated using the identified-cost basis. Dividend income is recorded on the ex-dividend date, net of foreign withholding taxes
where applicable. Dividends for which the Fund has the choice to receive either cash or stock are recognized as investment income in an amount equal to the cash dividend. Interest income is recorded on the basis of interest accrued, premium amortized and
discount earned. However, the Fund does not amortize premiums on U.S. Government and corporate bonds.
|
| Net investment income (other than class specific expenses) and unrealized and
realized gains or losses are allocated daily to each class of shares of the Fund based upon the relative proportion of net assets of each class.
|
| C. Federal Taxes — It is the Fund’s
policy to comply with the requirements of the Internal Revenue Code applicable to regulated investment companies and to distribute each year substantially all of its investment company taxable income and capital gains to its shareholders. Accordingly, no
federal tax provision is required. Income distributions, if any, are declared and paid quarterly. Capital gains distributions, if any, are declared and paid annually.
|
| The characterization of distributions to shareholders for financial reporting
purposes is determined in accordance with income tax rules. Therefore, the source of the Fund’s distributions may be shown in the accompanying financial statements as either from or in excess of net investment income or net realized gain on
investment transactions, or from paid-in capital, depending on the type of book/tax differences that may exist.
|
| 2. SIGNIFICANT ACCOUNTING POLICIES (continued)
|
| At August 31, 2000, the aggregate cost of portfolio securities for federal income
tax purposes is $165,174,184. Accordingly, the gross unrealized gain on investments was $26,179,794 and the gross unrealized loss on investments was $5,303,491 resulting in a net unrealized gain of $20,876,303.
|
| D. Expenses — Expenses incurred by the
Trust that do not specifically relate to an individual Fund of the Trust are allocated to the Funds on a straight-line or pro rata basis depending upon the nature of the expense.
|
| Class A, Class B and Class C Shares bear all expenses and fees relating to their
respective Distribution and Service plans. Shareholders of Service Shares bear all expenses and fees paid to service organizations. Each class of shares separately bears its respective class-specific Transfer Agency fees.
|
| E. Mortgage Dollar Rolls — The Fund may
enter into mortgage “dollar rolls” in which the Fund sells securities in the current month for delivery and simultaneously contracts with the same counterparty to repurchase similar (same type, coupon and maturity) but not identical securities
on a specified future date. For financial reporting and tax reporting purposes, the Fund treats mortgage dollar rolls as two separate transactions; one involving the purchase of a security and a separate transaction involving a sale.
|
| F. Foreign Currency Translations — The
books and records of the Fund are maintained in U.S. dollars. Amounts denominated in foreign currencies are translated into U.S. dollars on the following basis: (i) investment valuations, foreign currency and other assets and liabilities initially
expressed in foreign currencies are converted each business day into U.S. dollars based upon current exchange rates; and (ii) purchases and sales of foreign investments, income and expenses are converted into U.S. dollars based upon currency exchange
rates prevailing on the respective dates of such transactions.
|
| Net realized and unrealized gain (loss) on foreign currency transactions will
represent: (i) foreign exchange gains and losses from the sale and holdings of foreign currencies; (ii) gains and losses from the sale of investments (applicable to fixed income securities); (iii) currency gains and losses between trade date and
settlement date on investment securities transactions and forward exchange contracts; and (iv) gains and losses from the difference between amounts of dividends and interest recorded and the amounts actually received.
|
| G. Segregation Transactions — The Fund may
enter into certain derivative transactions to seek to increase total return. Forward foreign currency exchange contracts, futures contracts, written options, mortgage dollar rolls, when-issued securities and forward commitments represent examples of such
transactions. As a result of entering into these transactions, the Fund is required to segregate liquid assets on the accounting records equal to or greater than the market value of the corresponding transactions.
|
| H. Forward Sales Contracts — The Fund may
enter into forward security sales of mortgage backed securities in which the Fund sells securities in the current month for delivery of securities defined by pool stipulated characteristics on a specified future date. The value of the contract is recorded
as a liability on the Fund’s records with the difference between its market value and cash proceeds received being recorded as an unrealized gain or loss. Gains or losses are realized upon delivery of the security.
|
| I. Deferred Organization Expenses —
Organization-related costs are being amortized on a straight-line basis over a period of five years.
|
| J. Repurchase Agreements — Repurchase
agreements involve the purchase of securities subject to the seller’s agreement to repurchase them at a mutually agreed upon date and price. During the term of a repurchase agreement, the value of the underlying securities, including accrued
interest, is required to equal or exceed the value of the repurchase agreement. The underlying securities for all repurchase agreements are held in safekeeping at the Fund’s custodian.
|
| 3. AGREEMENTS
|
| Pursuant to the Investment Management Agreement (the “Agreement”), Goldman Sachs Asset Management, (“GSAM”), a
unit of the Investment Management Division of Goldman, Sachs & Co. (“Goldman Sachs”), serves as the investment adviser to the Fund. Under the Agreement, the adviser, subject to the general supervision of the Trust’s Board of Trustees,
manages the Fund’s portfolio. As compensation for the services rendered pursuant to the Agreement, the assumption of the expenses related thereto and administering the Fund’s business affairs, including providing facilities, the adviser is
entitled to a fee, computed daily and payable monthly, at an annual rate equal to 0.65% of the average daily net assets of the Fund.
|
| The adviser has voluntarily agreed to limit certain “Other Expenses” of
the Fund (excluding Management fees, Distribution and Service fees, Transfer Agent fees, taxes, interest, brokerage, litigation, Service Share fees, indemnification costs and other extraordinary expenses), to the extent that such expenses exceed, on an
annual basis, 0.06% (.01% prior to May 1, 2000) of the average daily net assets of the Fund. For the year ended August 31, 2000, Goldman Sachs has agreed to reimburse approximately $342,000. In addition, the Fund has entered into certain offset
arrangements with the custodian resulting in a reduction in the Fund’s expenses. For the year ended August 31, 2000, custody fees were reduced by approximately $8,000.
|
| The Trust, on behalf of the Fund, has adopted Distribution and Service Plans.
Under the Distribution and Service Plans, Goldman Sachs and/or authorized dealers are entitled to a monthly fee from the Fund for distribution and shareholder maintenance services equal, on an annual basis, to 0.25%, 1.00% and 1.00% of the Fund’s
average daily net assets attributable to Class A, Class B and Class C Shares, respectively.
|
| Goldman Sachs serves as the distributor of shares of the Fund pursuant to a
Distribution Agreement. Goldman Sachs may receive a portion of the Class A sales load and Class B and Class C contingent deferred sales charges and has advised the Fund that it retained approximately $22,000 during the year ended August 31, 2000.
|
| Goldman Sachs also serves as the transfer agent of the Fund for a fee. The fees
charged for such transfer agency services are calculated daily and payable monthly at an annual rate as follows: 0.19% of the average daily net assets for Class A, Class B and Class C Shares and 0.04% of the average daily net assets for Institutional and
Service Shares.
|
| The Trust, on behalf of the Fund, has adopted a Service Plan. This plan allows for
Service Shares to compensate service organizations for providing varying levels of account administration and shareholder liaison services to their customers who are beneficial owners of such shares. The Service Plan provides for compensation to the
service organizations in an amount up to 0.50% (on a annualized basis) of the average daily net asset value of the Service Shares.
|
| As of August 31, 2000, the amounts owed to affiliates were approximately $99,000,
$64,000 and $29,000 for Management, Distribution and Service, and Transfer Agent fees, respectively.
|
| 4. PORTFOLIO SECURITIES TRANSACTIONS
|
| The cost of purchases and proceeds of sales and maturities of securities (excluding short-term investments, futures and options)
for the year ended August 31, 2000, were $300,414,813 and $351,951,681, respectively. Included in these amounts are purchases and proceeds of sales and maturities of U.S. Government and agency obligations in the amounts of $205,615,990 and $201,945,316,
respectively. For the year ended August 31, 2000, Goldman Sachs earned approximately $26,000 of brokerage commissions from portfolio transactions, including futures transactions executed on behalf of the Fund.
|
| Forward Foreign Currency Exchange Contracts — The
Fund may enter into forward foreign currency exchange contracts for the purchase or sale of a specific foreign currency at a fixed price on a future date as a hedge or cross-hedge against either specific transactions or portfolio positions. The Fund may
also purchase and sell forward contracts to seek to increase total return. All commitments are “marked-to-market” daily at the applicable translation rates. The Fund realizes gains or losses at the time a forward contract is offset by entry into
a closing transaction or extinguished by delivery of the currency. Risks may arise upon entering into these contracts from the potential inability of counterparties to meet the terms of their contracts and from unanticipated movements in the value of a
foreign currency relative to the U.S. dollar.
|
| 4. PORTFOLIO SECURITIES TRANSACTIONS (continued)
|
| At August 31, 2000, forward foreign currency exchange contracts were as follows:
|
| Open Forward Foreign
Currency Sale Contracts |
Value on
Settlement Date |
Current Value | Unrealized Gain | ||||
|---|---|---|---|---|---|---|---|
| Euro
expiring 10/13/2000 |
$3,726,992 | $3,633,776 | $93,216 | ||||
| The contractual amounts of forward foreign currency contracts do not necessarily
represent the amounts potentially subject to risk. The measurement of the risks associated with these instruments is meaningful only when all related and offsetting transactions are considered. At August 31, 2000, the Fund had sufficient cash and
securities to cover any commitments under these contracts.
|
| Option Accounting Principles — When the Fund writes
call or put options, an amount equal to the premium received is recorded as an asset and as an equivalent liability. The amount of the liability is subsequently marked-to-market to reflect the current market value of the option written. When a written
option expires on its stipulated expiration date or the Fund enters into a closing purchase transaction, the Fund realizes a gain or loss without regard to any unrealized gain or loss on the underlying security, and the liability related to such option is
extinguished. When a written call option is exercised, the Fund realizes a gain or loss from the sale of the underlying security, and the proceeds of the sale are increased by the premium originally received. When a written put option is exercised, the
amount of the premium originally received will reduce the cost of the security which the Fund purchases upon exercise. There is a risk of loss from a change in value of such options which may exceed the related premiums received.
|
| Upon the purchase of a call option or a protective put option by the Fund, the
premium paid is recorded as an investment and subsequently marked-to-market to reflect the current market value of the option. If an option which the Fund has purchased expires on the stipulated expiration date, the Fund will realize a loss in the amount
of the cost of the option. If the Fund enters into a closing sale transaction, the Fund will realize a gain or loss, depending on whether the sale proceeds for the closing sale transaction are greater or less than the cost of the option. If the Fund
exercises a purchased put option, the Fund will realize a gain or loss from the sale of the underlying security, and the proceeds from such sale will be decreased by the premium originally paid. If the Fund exercises a purchased call option, the cost of
the security which the Fund purchases upon exercise will be increased by the premium originally paid.
|
| For the year ended August 31, 2000, written call option transactions in the Fund
were as follows:
|
| Written Options | Number of Contracts | Premium Received | |||||
|---|---|---|---|---|---|---|---|
| Balance outstanding, beginning of year | 172 | $ 35,020 | |||||
| Options assigned | (94 | ) | (14,207 | ) | |||
| Options expired | (78 | ) | (20,813 | ) | |||
| Balance outstanding, end of year | — | $ — | |||||
| 4. PORTFOLIO SECURITIES TRANSACTIONS (continued)
|
| Futures Contracts — The Fund may enter into futures
transactions to hedge against changes in interest rates, securities prices, currency exchange rates or to seek to increase total return. Upon entering into a futures contract, the Fund is required to deposit with a broker or the Fund’s custodian bank
an amount of cash or securities equal to the minimum “initial margin” requirement of the associated futures exchange. Subsequent payments for futures contracts (“variation margin”) are paid or received by the Fund, depending on the
fluctuations in the value of the contracts, and are recorded for financial reporting purposes as unrealized gains or losses. When contracts are closed, the Fund realizes a gain or loss which is reported in the Statement of Operations.
|
| The use of futures contracts involve, to varying degrees, elements of market risk
which may exceed the amounts recognized in the Statement of Assets and Liabilities. Changes in the value of the futures contract may not directly correlate with changes in the value of the underlying securities. This risk may decrease the effectiveness of
the Fund’s hedging strategies and potentially result in a loss. At August 31, 2000, open futures contracts were as follows:
|
| Type | Number of Contracts
Long/(Short) |
Settlement Month | Market Value | Unrealized
Gain(Loss) |
||||||||
|---|---|---|---|---|---|---|---|---|---|---|---|---|
| Euro Dollars | 12 | March 2003 | $ 2,795,700 | $ 9,677 | ||||||||
| Euro Dollars | 12 | March 2004 | 2,794,200 | 8,577 | ||||||||
| Euro Dollars | 12 | June 2003 | 2,795,250 | 9,227 | ||||||||
| Euro Dollars | 12 | June 2004 | 2,793,300 | 8,577 | ||||||||
| Euro Dollars | 12 | September 2002 | 2,795,850 | 10,902 | ||||||||
| Euro Dollars | 12 | September 2003 | 2,795,100 | 9,177 | ||||||||
| Euro Dollars | 12 | December 2002 | 2,794,050 | 10,152 | ||||||||
| Euro Dollars | 12 | December 2003 | 2,793,000 | 8,727 | ||||||||
| S&P 500 Index | 39 | September 2000 | 14,831,700 | 333,412 | ||||||||
| 2 Year U.S. Treasury Note | 10 | December 2000 | 1,994,844 | 1,981 | ||||||||
| 5 Year U.S. Treasury Note | (167 | ) | December 2000 | (16,710,438 | ) | (42,033 | ) | |||||
| 10 Year U.S. Treasury Note | 32 | December 2000 | 3,202,500 | 590 | ||||||||
| 20 Year U.S. Treasury Bond | 5 | September 2000 | 501,875 | 35,639 | ||||||||
| 20 Year U.S. Treasury Bond | 3 | December 2000 | 301,313 | 2,001 | ||||||||
| $26,478,244 | $406,606 | |||||||||||
| 5. LINE OF CREDIT FACILITY
|
| Effective May 31, 2000, the Fund participates in a $350,000,000 committed, unsecured revolving line of credit facility. Prior
thereto, the Fund participated in a $250,000,000 uncommitted and a $250,000,000 committed, unsecured revolving line of credit facility. Under the most restrictive arrangement, the Fund must own securities having a market value in excess of 400% of the
total bank borrowings. This facility is to be used solely for temporary or emergency purposes. The interest rate on borrowings is based on the Federal Funds rate. The committed facility also requires a fee to be paid by the Fund based on the amount of the
commitment which has been utilized. During the year ended August 31, 2000, the Fund did not have any borrowings under any of these facilities.
|
| 6. JOINT REPURCHASE AGREEMENT ACCOUNT
|
| The Fund, together with other registered investment companies having management agreements with GSAM or its affiliates, transfers
uninvested cash into joint accounts, the daily aggregate balance of which is invested in one or more repurchase agreements.
|
| At August 31, 2000, the Fund had an undivided interest in the repurchase
agreements in the joint account which equaled $7,100,000 in principal amount. At August 31, 2000, the following repurchase agreements held in this joint account were fully collateralized by Federal Agency obligations:
|
| Repurchase Agreements | Principal
Amount |
Interest
Rate |
Maturity
Date |
Amortized
Cost |
Maturity
Value |
|||||||
|---|---|---|---|---|---|---|---|---|---|---|---|---|
| ABN/AMRO, Inc. | $ 814,100,000 | 6.66 | % | 09/01/2000 | $ 814,100,000 | $ 814,250,608 | ||||||
| Banc of America Securities LLC | 900,000,000 | 6.67 | 09/01/2000 | 900,000,000 | 900,166,750 | |||||||
| Barclays Capital, Inc. | 500,000,000 | 6.67 | 09/01/2000 | 500,000,000 | 500,092,639 | |||||||
| Bear Stearns Companies, Inc. | 300,000,000 | 6.67 | 09/01/2000 | 300,000,000 | 300,055,583 | |||||||
| Chase Securities, Inc. | 450,000,000 | 6.67 | 09/01/2000 | 450,000,000 | 450,083,375 | |||||||
| Donaldson, Lufkin & Jenrette, Inc. | 1,000,000,000 | 6.67 | 09/01/2000 | 1,000,000,000 | 1,000,185,278 | |||||||
| J.P. Morgan & Co., Inc. | 800,000,000 | 6.65 | 09/01/2000 | 800,000,000 | 800,147,778 | |||||||
| Morgan Stanley Dean Witter & Co. | 750,000,000 | 6.65 | 09/01/2000 | 750,000,000 | 750,138,542 | |||||||
| Morgan Stanley Dean Witter & Co. | 300,000,000 | 6.60 | 09/01/2000 | 300,000,000 | 300,055,000 | |||||||
| UBS Warburg LLC | 800,000,000 | 6.65 | 09/01/2000 | 800,000,000 | 800,147,778 | |||||||
| TOTAL JOINT REPURCHASE AGREEMENT ACCOUNT II | $6,614,100,000 | $6,615,323,331 | ||||||||||
| 7. CERTAIN RECLASSIFICATIONS
|
| In accordance with AICPA Statement of Position 93-2, the Fund reclassified $32,903 from accumulated undistributed net investment
income to accumulated net realized gain from investment, futures, options and foreign currency related transactions and $2,640 from paid-in capital to accumulated net realized gain from investment, futures, options and foreign currency related
transactions. These reclassifications have no impact on the net asset value of the Fund and are designed to present the Fund’s capital accounts on a tax basis. Reclassifications result primarily from the difference in the tax treatment of foreign
currency, net operating losses and organization costs.
|
| 8. CHANGE IN INDEPENDENT ACCOUNTANTS
|
| On October 26, 1999, the Board of Trustees of the Fund upon the recommendation of the Board’s audit committee, determined not
to retain Arthur Andersen LLP and approved a change of the Fund’s independent accountants to PricewaterhouseCoopers LLP. For the period ended August 31, 1999 and the fiscal year ended January 31, 1999, Arthur Andersen LLP’s audit reports
contained no adverse opinion or disclaimer of opinion; nor were their reports qualified or modified as to uncertainty, audit scope, or accounting principles. Further, there were no disagreements between the Fund and Arthur Andersen LLP on accounting
principles or practices, financial statement disclosure or audit scope or procedure, which if not resolved to the satisfaction of Arthur Andersen LLP would have caused them to make reference to the disagreement in their reports.
|
| Goldman Sachs Balanced Fund — Tax Information (unaudited)
|
| For the year ended August 31, 2000, 17.77% of the dividends paid from net investment
company taxable income by the Balanced Fund qualify for the dividends received deduction available to corporations.
|
| Pursuant to Section 852 of the Internal Revenue Code, the Fund designated $2,481,606 as
capital gains dividends paid during its year ended August 31, 2000.
|
| 9. SUMMARY OF SHARE TRANSACTIONS
|
| Share activity is as follows:
|
| For the Year Ended August 31, 2000 |
||||||
|---|---|---|---|---|---|---|
| Shares | Dollars | |||||
| |
||||||
| Class A Shares | ||||||
| Shares sold | 472,085 | $ 9,684,221 | ||||
| Reinvestments of dividends and distributions | 478,974 | 9,686,061 | ||||
| Shares repurchased | (2,930,304) | (60,263,205) | ||||
| |
||||||
| (1,979,245) | (40,892,923) | |||||
| |
||||||
| Class B Shares | ||||||
| Shares sold | 153,476 | 3,127,574 | ||||
| Reinvestments of dividends and distributions | 97,539 | 1,962,412 | ||||
| Shares repurchased | (663,521) | (13,518,116) | ||||
| |
||||||
| (412,506) | (8,428,130) | |||||
| |
||||||
| Class C Shares | ||||||
| Shares sold | 47,375 | 974,400 | ||||
| Reinvestments of dividends and distributions | 25,220 | 506,596 | ||||
| Shares repurchased | (222,853) | (4,520,537) | ||||
| |
||||||
| (150,258) | (3,039,541) | |||||
| |
||||||
| Institutional Shares | ||||||
| Shares sold | 11,157 | 233,723 | ||||
| Reinvestments of dividends and distributions | 7,030 | 142,244 | ||||
| Shares repurchased | (17,090) | (350,812) | ||||
| |
||||||
| 1,097 | 25,155 | |||||
| |
||||||
| Service Shares | ||||||
| Shares sold | 112 | 2,262 | ||||
| Reinvestments of dividends and distributions | 46 | 922 | ||||
| Shares repurchased | (91) | (1,873) | ||||
| |
||||||
| 67 | 1,311 | |||||
| |
||||||
| NET DECREASE | (2,540,845) | $(52,334,128) | ||||
| |
||||||
| 9. SUMMARY OF SHARE TRANSACTIONS (continued)
|
| Share activity is as follows:
|
| For the Seven Months
Ended August 31, 1999 |
For the Year Ended
January 31, 1999 |
||||||||||||
|---|---|---|---|---|---|---|---|---|---|---|---|---|---|
| Shares | Dollars | Shares | Dollars | ||||||||||
| Class A Shares | |||||||||||||
| Shares sold | 690,947 | $14,334,527 | 3,748,039 | $76,506,479 | |||||||||
| Reinvestments of dividends and distributions | 96,208 | 1,976,640 | 241,188 | 4,838,697 | |||||||||
| Shares repurchased | (1,873,693 | ) | (38,906,818 | ) | (2,655,783 | ) | (53,412,703 | ) | |||||
| (1,086,538 | ) | (22,595,651 | ) | 1,333,444 | 27,932,473 | ||||||||
| Class B Shares | |||||||||||||
| Shares sold | 222,544 | 4,589,209 | 1,305,421 | 26,769,887 | |||||||||
| Reinvestments of dividends and distributions | 13,623 | 279,018 | 37,761 | 751,177 | |||||||||
| Shares repurchased | (392,771 | ) | (8,099,668 | ) | (357,101 | ) | (7,118,524 | ) | |||||
| (156,604 | ) | (3,231,441 | ) | 986,081 | 20,402,540 | ||||||||
| Class C Shares | |||||||||||||
| Shares sold | 109,915 | 2,268,065 | 532,005 | 10,982,657 | |||||||||
| Reinvestments of dividends and distributions | 3,746 | 76,630 | 13,484 | 268,120 | |||||||||
| Shares repurchased | (258,346 | ) | (5,306,034 | ) | (281,904 | ) | (5,604,206 | ) | |||||
| (144,685 | ) | (2,961,339 | ) | 263,585 | 5,646,571 | ||||||||
| Institutional Shares | |||||||||||||
| Shares sold | 86,577 | 1,782,979 | 108,930 | 2,247,577 | |||||||||
| Reinvestments of dividends and distributions | 3,129 | 63,796 | 13,275 | 267,312 | |||||||||
| Shares repurchased | (365,015 | ) | (7,628,710 | ) | (143,532 | ) | (2,931,934 | ) | |||||
| (275,309 | ) | (5,781,935 | ) | (21,327 | ) | (417,045 | ) | ||||||
| Service Shares | |||||||||||||
| Shares sold | 682 | 13,637 | 22,926 | 472,556 | |||||||||
| Reinvestments of dividends and distributions | 99 | 2,011 | 375 | 7,266 | |||||||||
| Shares repurchased | (24,012 | ) | (492,372 | ) | (123 | ) | (2,465 | ) | |||||
| (23,231 | ) | (476,724 | ) | 23,178 | 477,357 | ||||||||
| NET INCREASE (DECREASE) | (1,686,367 | ) | $(35,047,090 | ) | 2,584,961 | $54,041,896 | |||||||
| Income from
investment operations |
Distributions to shareholders |
|||||||||||||||||||||||
|---|---|---|---|---|---|---|---|---|---|---|---|---|---|---|---|---|---|---|---|---|---|---|---|---|
| Net asset
value, beginning of period |
Net
investment Income |
Net realized
and unrealized gain(loss) |
Total from
investment operations |
From net
investment income |
In excess
of net investment income |
From net
realized gains |
Total
distributions |
|||||||||||||||||
| FOR THE YEAR ENDED AUGUST 31, | ||||||||||||||||||||||||
| 2000 - Class A Shares | $20.38 | $0.60 | (c) | $ 1.75 | $2.35 | $(0.50 | ) | $ — | $(0.81 | ) | $(1.31 | ) | ||||||||||||
| 2000 - Class B Shares | 20.26 | 0.45 | (c) | 1.73 | 2.18 | (0.36 | ) | — | (0.81 | ) | (1.17 | ) | ||||||||||||
| 2000 - Class C Shares | 20.23 | 0.45 | (c) | 1.74 | 2.19 | (0.36 | ) | — | (0.81 | ) | (1.17 | ) | ||||||||||||
| 2000 - Institutional Shares | 20.39 | 0.71 | (c) | 1.75 | 2.46 | (0.58 | ) | — | (0.81 | ) | (1.39 | ) | ||||||||||||
| 2000 - Service Shares | 20.37 | 0.59 | (c) | 1.74 | 2.33 | (0.48 | ) | — | (0.81 | ) | (1.29 | ) | ||||||||||||
| FOR THE SEVEN MONTHS ENDED AUGUST 31, | ||||||||||||||||||||||||
| 1999 - Class A Shares | 20.48 | 0.32 | (0.19 | ) | 0.13 | (0.23 | ) | — | — | (0.23 | ) | |||||||||||||
| 1999 - Class B Shares | 20.37 | 0.22 | (0.18 | ) | 0.04 | (0.15 | ) | — | — | (0.15 | ) | |||||||||||||
| 1999 - Class C Shares | 20.34 | 0.23 | (0.19 | ) | 0.04 | (0.15 | ) | — | — | (0.15 | ) | |||||||||||||
| 1999 - Institutional Shares | 20.48 | 0.53 | (0.35 | ) | 0.18 | (0.27 | ) | — | — | (0.27 | ) | |||||||||||||
| 1999 - Service Shares | 20.47 | 1.22 | (1.14 | ) | 0.08 | (0.18 | ) | — | — | (0.18 | ) | |||||||||||||
| FOR THE YEARS ENDED JANUARY 31, | ||||||||||||||||||||||||
| 1999 - Class A Shares | 20.29 | 0.58 | 0.20 | 0.78 | (0.59 | ) | — | — | (0.59 | ) | ||||||||||||||
| 1999 - Class B Shares | 20.20 | 0.41 | 0.21 | 0.62 | (0.45 | ) | — | — | (0.45 | ) | ||||||||||||||
| 1999 - Class C Shares | 20.17 | 0.41 | 0.21 | 0.62 | (0.45 | ) | — | — | (0.45 | ) | ||||||||||||||
| 1999 - Institutional Shares | 20.29 | 0.64 | 0.20 | 0.84 | (0.65 | ) | — | — | (0.65 | ) | ||||||||||||||
| 1999 - Service Shares | 20.28 | 0.53 | 0.21 | 0.74 | (0.55 | ) | — | — | (0.55 | ) | ||||||||||||||
| 1998 - Class A Shares | 18.78 | 0.57 | 2.66 | 3.23 | (0.56 | ) | — | (1.16 | ) | (1.72 | ) | |||||||||||||
| 1998 - Class B Shares | 18.73 | 0.50 | 2.57 | 3.07 | (0.42 | ) | (0.02 | ) | (1.16 | ) | (1.60 | ) | ||||||||||||
| 1998 - Class C Shares (commenced August 15, 1997) | 21.10 | 0.25 | 0.24 | 0.49 | (0.22 | ) | (0.04 | ) | (1.16 | ) | (1.42 | ) | ||||||||||||
| 1998 - Institutional Shares (commenced August 15, 1997) | 21.18 | 0.26 | 0.32 | 0.58 | (0.23 | ) | (0.08 | ) | (1.16 | ) | (1.47 | ) | ||||||||||||
| 1998 - Service Shares (commenced August 15, 1997) | 21.18 | 0.22 | 0.32 | 0.54 | (0.22 | ) | (0.06 | ) | (1.16 | ) | (1.44 | ) | ||||||||||||
| 1997 - Class A Shares | 17.31 | 0.66 | 2.47 | 3.13 | (0.66 | ) | — | (1.00 | ) | (1.66 | ) | |||||||||||||
| 1997 - Class B Shares (commenced May 1, 1996) | 17.46 | 0.42 | 2.34 | 2.76 | (0.42 | ) | (0.07 | ) | (1.00 | ) | (1.49 | ) | ||||||||||||
| 1996 - Class A Shares | 14.22 | 0.51 | 3.43 | 3.94 | (0.50 | ) | — | (0.35 | ) | (0.85 | ) | |||||||||||||
(a)
|
Assumes investment at the net asset value at the beginning of the period, reinvestment of all dividends and distributions, a
complete redemption of the investment at the net asset value at the end of the period and no sales or redemption charges. Total return would be reduced if a sales or redemption charge were taken into account. Total returns for periods less than one full
year are not annualized.
|
(b)
|
Annualized.
|
(c)
|
Calculated based on average shares outstanding methodology.
|
(d)
|
Includes the effect of mortgage dollar roll transactions.
|
| Ratios assuming no expense reductions |
|||||||||||||||||||||
|---|---|---|---|---|---|---|---|---|---|---|---|---|---|---|---|---|---|---|---|---|---|
| Net asset
value, end of period |
Total
return (a) |
Net assets
at end of period (in 000s) |
Ratio of
net expenses to average net assets |
Ratio of
net investment income to average net assets |
Ratio of
expenses to average net assets |
Ratio of
net investment income to average net assets |
Portfolio
turnover rate (d) |
||||||||||||||
| $21.42 | 12.00 | % | $135,632 | 1.12 | % | 2.94 | % | 1.29 | % | 2.77 | % | 153.69 | % | ||||||||
| 21.27 | 11.17 | 33,759 | 1.87 | 2.19 | 2.04 | 2.02 | 153.69 | ||||||||||||||
| 21.25 | 11.23 | 8,658 | 1.87 | 2.19 | 2.04 | 2.02 | 153.69 | ||||||||||||||
| 21.46 | 12.59 | 2,509 | 0.72 | 3.46 | 0.89 | 3.29 | 153.69 | ||||||||||||||
| 21.41 | 11.89 | 17 | 1.22 | 2.86 | 1.39 | 2.69 | 153.69 | ||||||||||||||
| 20.38 | 0.62 | 169,395 | 1.10 | (b) | 2.58 | (b) | 1.32 | (b) | 2.36 | (b) | 90.41 | ||||||||||
| 20.26 | 0.20 | 40,515 | 1.85 | (b) | 1.83 | (b) | 2.07 | (b) | 1.61 | (b) | 90.41 | ||||||||||
| 20.23 | 0.18 | 11,284 | 1.85 | (b) | 1.84 | (b) | 2.07 | (b) | 1.62 | (b) | 90.41 | ||||||||||
| 20.39 | 0.86 | 2,361 | 0.70 | (b) | 2.96 | (b) | 0.92 | (b) | 2.74 | (b) | 90.41 | ||||||||||
| 20.37 | 0.39 | 15 | 1.20 | (b) | 2.46 | (b) | 1.42 | (b) | 2.24 | (b) | 90.41 | ||||||||||
| 20.48 | 3.94 | 192,453 | 1.04 | 2.90 | 1.45 | 2.49 | 175.06 | ||||||||||||||
| 20.37 | 3.15 | 43,926 | 1.80 | 2.16 | 2.02 | 1.94 | 175.06 | ||||||||||||||
| 20.34 | 3.14 | 14,286 | 1.80 | 2.17 | 2.02 | 1.95 | 175.06 | ||||||||||||||
| 20.48 | 4.25 | 8,010 | 0.73 | 3.22 | 0.95 | 3.00 | 175.06 | ||||||||||||||
| 20.47 | 3.80 | 490 | 1.23 | 2.77 | 1.45 | 2.55 | 175.06 | ||||||||||||||
| 20.29 | 17.54 | 163,636 | 1.00 | 2.94 | 1.57 | 2.37 | 190.43 | ||||||||||||||
| 20.20 | 16.71 | 23,639 | 1.76 | 2.14 | 2.07 | 1.83 | 190.43 | ||||||||||||||
| 20.17 | 2.49 | 8,850 | 1.77 | (b) | 2.13 | (b) | 2.08 | (b) | 1.82 | (b) | 190.43 | ||||||||||
| 20.29 | 2.93 | 8,367 | 0.76 | (b) | 3.13 | (b) | 1.07 | (b) | 2.82 | (b) | 190.43 | ||||||||||
| 20.28 | 2.66 | 16 | 1.26 | (b) | 2.58 | (b) | 1.57 | (b) | 2.27 | (b) | 190.43 | ||||||||||
| 18.78 | 18.59 | 81,410 | 1.00 | 3.76 | 1.77 | 2.99 | 208.11 | ||||||||||||||
| 18.73 | 16.22 | 2,110 | 1.75 | (b) | 2.59 | (b) | 2.27 | (b) | 2.07 | (b) | 208.11 | ||||||||||
| 17.31 | 28.10 | 50,928 | 1.00 | 3.65 | 1.90 | 2.75 | 197.10 | ||||||||||||||
| To the Shareholders and Board of Trustees of
|
| Goldman Sachs Trust — Balanced Fund:
|
| In our opinion, the accompanying statement of assets and liabilities, including the statement of investments, and the related
statements of operations and of changes in net assets and the financial highlights present fairly, in all material respects, the financial position of Goldman Sachs Balanced Fund (“the Fund”), one of the portfolios constituting Goldman Sachs
Trust, at August 31, 2000, the results of its operations, the changes in its net assets and the financial highlights for the year then ended, in conformity with accounting principles generally accepted in the United States of America. These financial
statements and financial highlights (hereafter referred to as “financial statements”) are the responsibility of the Fund’s management; our responsibility is to express an opinion on these financial statements based on our audit. We
conducted our audit of these financial statements in accordance with auditing standards generally accepted in the United States of America, which require that we plan and perform the audit to obtain reasonable assurance about whether the financial
statements are free of material misstatement. An audit includes examining, on a test basis, evidence supporting the amounts and disclosures in the financial statements, assessing the accounting principles used and significant estimates made by management,
and evaluating the overall financial statement presentation. We believe that our audit, which included confirmation of securities at August 31, 2000 by correspondence with the custodian and brokers, provides a reasonable basis for our opinion. The
statements of changes in net assets of the Fund for the period ended August 31, 1999 and the year ended January 31, 1999 and the financial highlights for each of the periods ended on or before August 31, 1999 were audited by other independent accountants
whose report dated October 8, 1999 expressed an unqualified opinion thereon.
|
| PricewaterhouseCoopers LLP
|
| Boston, Massachusetts
|
| October 23, 2000
|
| Shares | Description | Value | ||||
|---|---|---|---|---|---|---|
| Common Stocks – 98.8% | ||||||
| Banks – 6.4% | ||||||
| 290,233 | Citigroup, Inc. | $ 16,942,371 | ||||
| 709,300 | Firstar Corp. | 16,934,537 | ||||
| 33,876,908 | ||||||
| Computer Hardware – 3.2% | ||||||
| 247,100 | Cisco Systems, Inc.* | 16,957,237 | ||||
| Computer Software – 10.0% | ||||||
| 246,000 | Amdocs Ltd.* | 17,573,625 | ||||
| 125,000 | International Business Machines,
Inc. |
16,500,000 | ||||
| 145,000 | Rational Software Corp.* | 18,659,687 | ||||
| 52,733,312 | ||||||
| Drugs – 3.1% | ||||||
| 233,100 | Merck & Co., Inc. | 16,287,863 | ||||
| Electrical Equipment – 6.4% | ||||||
| 186,500 | Comverse Technology, Inc.* | 17,146,344 | ||||
| 254,500 | Teradyne, Inc. ~ | 16,494,781 | ||||
| 33,641,125 | ||||||
| Electrical Utilities – 3.3% | ||||||
| 175,800 | Calpine Corp.* | 17,404,200 | ||||
| Energy Resources – 9.6% | ||||||
| 267,700 | Anadarko Petroleum Corp. | 17,606,629 | ||||
| 191,900 | Enron Corp. | 16,287,512 | ||||
| 362,300 | The Williams Cos., Inc. | 16,688,444 | ||||
| 50,582,585 | ||||||
| Entertainment – 3.1% | ||||||
| 246,300 | Viacom, Inc. Class B* | 16,579,069 | ||||
| Financial Services – 9.5% | ||||||
| 288,900 | General Electric Co. | 16,954,819 | ||||
| 345,400 | Household International, Inc. | 16,579,200 | ||||
| 476,600 | MBNA Corp. | 16,829,937 | ||||
| 50,363,956 | ||||||
| Industrial Parts – 6.4% | ||||||
| 298,400 | Tyco International Ltd. | 17,008,800 | ||||
| 271,800 | United Technologies Corp. | 16,970,512 | ||||
| 33,979,312 | ||||||
| Information Services – 3.2% | ||||||
| 350,400 | First Data Corp. | 16,709,700 | ||||
| Media – 9.0% | ||||||
| 749,800 | AT&T Corp.-Liberty Media Corp.* | 16,026,975 | ||||
| 241,800 | Cablevision Systems Corp.* | 16,261,050 | ||||
| 210,200 | Clear Channel Communications,
Inc.* |
15,213,225 | ||||
| 47,501,250 | ||||||
| Medical Products – 3.3% | ||||||
| 255,000 | Guidant Corp.* | 17,164,687 | ||||
| Shares | Description | Value | |||
|---|---|---|---|---|---|
| Common Stocks – (continued) | |||||
| Oil Services – 3.1% | |||||
| 192,200 | Schlumberger Ltd. | $ 16,397,063 | |||
| Property Insurance – 3.2% | |||||
| 189,450 | American International Group, Inc. | 16,884,731 | |||
| Security/Asset Management – 3.2% | |||||
| 442,200 | The Charles Schwab Corp. | 16,886,513 | |||
| Semiconductors – 3.2% | |||||
| 238,500 | Linear Technology Corp. | 17,157,094 | |||
| Telephone – 3.0% | |||||
| 458,200 | NEXTLINK Communications, Inc.* | 16,065,638 | |||
| Tobacco – 3.1% | |||||
| 550,300 | Philip Morris Cos., Inc. | 16,302,638 | |||
| Wireless – 3.5% | |||||
| 335,500 | Nextel Communications, Inc.* | 18,599,281 | |||
| TOTAL COMMON STOCKS | |||||
| (Cost $485,166,741) | $ 522,074,162 | ||||
| Principal
Amount |
Interest
Rate |
Maturity
Date |
Value | |||||
|---|---|---|---|---|---|---|---|---|
| Repurchase Agreement – 0.3% | ||||||||
| Joint Repurchase Agreement Account II Ù | ||||||||
| $1,400,000 | 6.66 | % | 09/01/2000 | $ 1,400,000 | ||||
| TOTAL REPURCHASE AGREEMENT | ||||||||
| (Cost $1,400,000) | $ 1,400,000 | |||||||
| TOTAL INVESTMENTS | ||||||||
| (Cost $486,566,741) | $523,474,162 | |||||||
*
|
Non-income producing security.
|
|
~
|
Common stock rights attached to this security.
|
Ù
|
Joint repurchase agreement was entered into on August 31, 2000.
|
| The percentage shown for each investment category reflects the value of investments in that category as a percentage of total net
assets.
|
| Assets: | |||||
| Investment in securities, at value (identified cost $486,566,741) | $523,474,162 | ||||
| Cash | 143,252 | ||||
| Receivables: | |||||
| Fund shares sold | 30,897,499 | ||||
| Reimbursement from adviser | 225,383 | ||||
| Dividends and interest | 192,966 | ||||
| Total assets | 554,933,262 | ||||
| Liabilities: | |||||
| Payables: | |||||
| Investment securities purchased | 25,288,101 | ||||
| Amounts owed to affiliates | 651,715 | ||||
| Fund shares repurchased | 299,149 | ||||
| Accrued expenses and other liabilities | 313,880 | ||||
| Total liabilities | 26,552,845 | ||||
| Net Assets: | |||||
| Paid-in capital | 492,745,518 | ||||
| Accumulated net realized loss on investment transactions | (1,272,522 | ) | |||
| Net unrealized gain on investments | 36,907,421 | ||||
| NET ASSETS | $528,380,417 | ||||
| Net asset value, offering and redemption price per share: (a) | |||||
| Class A | $10.77 | ||||
| Class B | $10.76 | ||||
| Class C | $10.77 | ||||
| Institutional | $10.78 | ||||
| Service | $10.78 | ||||
| Shares outstanding: | |||||
| Class A | 20,219,850 | ||||
| Class B | 18,717,945 | ||||
| Class C | 8,952,835 | ||||
| Institutional | 1,175,807 | ||||
| Service | 1,120 | ||||
| Total shares outstanding, $.001 par value (unlimited number of shares authorized) | 49,067,557 | ||||
(a)
|
Maximum public offering price per share (NAV per share multiplied by 1.0582) for Class A shares is $11.40. At redemption, Class B
and Class C shares may be subject to a contingent deferred sales charge, assessed on the amount equal to the lesser of the current net asset value or the original purchase price of the shares.
|
| Investment income: | ||||
| Dividends | $ 281,053 | |||
| Interest | 9,836 | |||
| Total income | 290,889 | |||
| Expenses: | ||||
| Management fees | 623,564 | |||
| Distribution and Service fees (b) | 411,466 | |||
| Registration fees | 235,877 | |||
| Transfer Agent fees (c) | 116,932 | |||
| Printing fees | 97,136 | |||
| Custodian fees | 27,025 | |||
| Professional fees | 18,000 | |||
| Other | 7,582 | |||
| Total expenses | 1,537,582 | |||
| Less — expense reductions | (345,712 | ) | ||
| Net expenses | 1,191,870 | |||
| NET INVESTMENT LOSS | (900,981 | ) | ||
| Realized and unrealized gain (loss) on investment transactions: | ||||
| Net realized loss from investment transactions | (1,272,522 | ) | ||
| Net unrealized gain on investments | 36,907,421 | |||
| Net realized and unrealized gain on investment transactions | 35,634,899 | |||
| NET INCREASE IN NET ASSETS RESULTING FROM OPERATIONS | $34,733,918 | |||
(a)
|
Commencement date of operations was June 19, 2000 for all share classes.
|
(b)
|
Class A, Class B and Class C had Distribution and Service fees of $67,271, $237,495 and $106,700, respectively.
|
(c)
|
Class A, Class B, Class C, Institutional Class and Service Class had Transfer Agent fees of $51,124, $45,123, $20,273, $411 and
$1, respectively.
|
| From operations: | ||||
| Net investment loss | $ (900,981 | ) | ||
| Net realized loss on investment transactions | (1,272,522 | ) | ||
| Unrealized gain on investments | 36,907,421 | |||
| Net increase in net assets resulting from operations | 34,733,918 | |||
| From share transactions: | ||||
| Proceeds from sales of shares | 503,337,356 | |||
| Cost of shares repurchased | (9,690,857 | ) | ||
| Net increase in net assets resulting from share transactions | 493,646,499 | |||
| TOTAL INCREASE | 528,380,417 | |||
| Net assets: | ||||
| Beginning of period | — | |||
| End of period | $528,380,417 | |||
| Accumulated net investment loss | — | |||
(a)
|
Commencement date of operations was June 19, 2000 for all share classes.
|
| 1. ORGANIZATION
|
| Goldman Sachs Trust (the “Trust”) is a Delaware business trust registered under the Investment Company Act of 1940 (as
amended) as an open-end management investment company. The Trust includes the Goldman Sachs Research Select Fund (the “Fund”). The Fund is a diversified portfolio offering five classes of shares — Class A, Class B, Class C,
Institutional and Service.
|
| 2. SIGNIFICANT ACCOUNTING POLICIES
|
| The following is a summary of the significant accounting policies consistently followed by the Fund. The preparation of financial
statements in conformity with generally accepted accounting principles requires management to make estimates and assumptions that may affect the reported amounts. Actual results could differ from those estimates.
|
| A. Investment Valuation — Investments in
securities traded on a U.S. or foreign securities exchange or the NASDAQ system are valued daily at their last sale price on the principal exchange on which they are traded. If no sale occurs, securities are valued at the last bid price. Debt securities
are valued at prices supplied by independent pricing services, broker/dealer-supplied valuations or matrix pricing systems. Unlisted equity and debt securities for which market quotations are available are valued at the last sale price on valuation date,
or if no sale occurs, at the last bid price. Short-term debt obligations maturing in sixty days or less are valued at amortized cost, which approximates market value. Securities for which quotations are not readily available are valued at fair value using
methods approved by the Board of Trustees of the Trust.
|
| B. Security Transactions and Investment Income — Security transactions are recorded as of the trade date. Realized gains and losses on sales of portfolio securities are calculated using the identified-cost basis. Dividend income is recorded on the ex-dividend date, net of foreign withholding taxes
where applicable. Dividends for which the Fund has the choice to receive either cash or stock are recognized as investment income in an amount equal to the cash dividend. Interest income is recorded on the basis of interest accrued, premium amortized and
discount earned.
|
| Net investment income (other than class specific-expenses) and unrealized and
realized gains or losses are allocated daily to each class of shares of the Fund based upon the relative proportion of net assets of each class.
|
| C. Segregation Transactions — The Fund may
enter into certain derivative transactions to seek to increase total return. Forward foreign currency exchange contracts, futures contracts, written options, when-issued securities and forward commitments represent examples of such transactions. As a
result of entering into these transactions, the Fund is required to segregate liquid assets on the accounting records equal to or greater than the market value of the corresponding transactions.
|
| D. Federal Taxes — It is the Fund’s
policy to comply with the requirements of the Internal Revenue Code applicable to regulated investment companies and to distribute each year substantially all of its investment company taxable income and capital gains to its shareholders. Accordingly, no
federal tax provision is required. Income and capital gains distributions, if any, are declared and paid annually.
|
| The characterization of distributions to shareholders for financial reporting
purposes is determined in accordance with income tax rules. Therefore, the source of the Fund’s distributions may be shown in the accompanying financial statements as either from or in excess of net investment income or net realized gain on
investment transactions, or from paid-in capital, depending on the type of book/tax differences that may exist.
|
| At August 31, 2000, the aggregate cost of portfolio securities for federal income
tax purposes is $487,502,094. Accordingly, the gross unrealized gain on investments was $43,743,330 and the gross unrealized loss on investments was $7,771,262 resulting in a net unrealized gain of $35,972,068.
|
| 2. SIGNIFICANT ACCOUNTING POLICIES (continued)
|
| E. Expenses — Expenses incurred by the
Trust that do not specifically relate to an individual Fund of the Trust are allocated to the Funds on a straight-line or pro rata basis depending upon the nature of the expense.
|
| Class A, Class B and Class C Shares bear all expenses and fees relating to their
respective Distribution and Service Plans. Shareholders of Service Shares bear all expenses and fees paid to service organizations. Each class of shares of the Fund separately bears its respective class-specific Transfer Agency fees.
|
| F. Repurchase Agreements — Repurchase
agreements involve the purchase of securities subject to the seller’s agreement to repurchase them at a mutually agreed upon date and price.
|
| During the term of a repurchase agreement, the value of
the underlying securities, including accrued interest, is required to equal or exceed the value of the repurchase agreement. The underlying securities for all repurchase agreements are held in safekeeping at the Fund’s custodian.
|
| 3. AGREEMENTS
|
| Pursuant to the Investment Management Agreement (the “Agreement”), Goldman Sachs Asset Management (“GSAM”), a
unit of the Investment Management Division of Goldman, Sachs & Co. (“Goldman Sachs”), serves as the investment adviser to the Fund. Under the Agreement, the adviser, subject to the general supervision of the Trust’s Board of Trustees,
manages the Fund’s portfolio. As compensation for the services rendered pursuant to the Agreement, the assumption of the expenses related thereto and administering the Fund’s business affairs, including providing facilities, the adviser is
entitled to a fee, computed daily and payable monthly, at an annual rate equal to 1.00% of the average daily net assets of the Fund.
|
| The adviser has voluntarily agreed to limit certain “Other Expenses” of
the Fund (excluding Management fees, Distribution and Service fees, Transfer Agent fees, taxes, interest, brokerage, litigation, Service Share fees, indemnification costs and other extraordinary expenses) to the extent such expenses exceed, on an annual
basis, 0.06% of the average daily net assets of the Fund.
|
| For the period ended August 31, 2000, the adviser reimbursed approximately
$344,000. In addition, the Fund has entered into certain offset arrangements with the custodian resulting in a reduction in the Fund’s expenses. For the period ended August 31, 2000, custody fees were reduced by approximately $2,000.
|
| The Trust, on behalf of the Fund, has adopted Distribution and Service Plans.
Under the Distribution and Service Plans, Goldman Sachs and/or authorized dealers are entitled to a monthly fee from the Fund for distribution and shareholder maintenance services equal, on an annual basis, to 0.25%, 1.00% and 1.00% of the Fund’s
average daily net assets attributable to Class A, Class B and Class C Shares, respectively.
|
| Goldman Sachs serves as the distributor of shares of the Fund pursuant to
Distribution Agreements. Goldman Sachs may receive a portion of the Class A sales load and Class B and Class C contingent deferred sales charges and has advised the Fund that it retained approximately $951,000 for the period ended August 31, 2000.
|
| Goldman Sachs also serves as the Transfer Agent of the Fund for a fee. The fees
charged for such transfer agency services are calculated daily and payable monthly at an annual rate as follows: 0.19% of the average daily net assets for Class A, Class B and Class C Shares and 0.04% of the average daily net assets for Institutional and
Service Shares.
|
| The Trust, on behalf of the Fund, has adopted a Service Plan. This Plan allows for
Service Shares to compensate service organizations for providing varying levels of account administration and shareholder liaison services to their customers who are beneficial owners of such shares. The Service Plan provides for compensation to the
service organizations in an amount up to 0.50% (on an annualized basis), of the average daily net asset value of the Service Shares.
|
| As of August 31, 2000, the amounts owed to affiliates were approximately $352,000,
$234,000, and $66,000 for Management, Distribution and Service, and Transfer Agent fees, respectively.
|
| 4. PORTFOLIO SECURITIES TRANSACTIONS
|
| The cost of purchases and proceeds of sales and maturities of securities (excluding short-term investments) for the period ended
August 31, 2000, were $504,234,877 and $17,795,614, respectively.
|
| For the period ended August 31, 2000, Goldman Sachs earned approximately $20,000
of brokerage commissions from portfolio transactions.
|
| 5. LINE OF CREDIT FACILITY
|
| The Fund participates in a $350,000,000 committed, unsecured revolving line of credit facility. Under the most restrictive
arrangement, the Fund must own securities having a market value in excess of 400% of the total bank borrowings. This facility is to be used solely for temporary or emergency purposes. The interest rate on borrowings is based on the Federal Funds rate. The
committed facility also requires a fee to be paid by the Fund based on the amount of the commitment. During the period ended August 31, 2000, the Fund did not have any borrowings under this facility.
|
| 6. JOINT REPURCHASE AGREEMENT ACCOUNT
|
| The Fund, together with other registered investment companies having management agreements with GSAM or its affiliates, transfers
uninvested cash into joint accounts, the daily aggregate balance of which is invested in one or more repurchase agreements.
|
| At August 31, 2000, the Fund had an undivided interest in the repurchase
agreements in the joint account which equaled $1,400,000 in principal amount. At August 31, 2000, the following repurchase agreements held in this joint account were fully collateralized by Federal Agency obligations:
|
| Repurchase Agreements | Principal
Amount |
Interest
Rate |
Maturity
Date |
Amortized
Cost |
Maturity
Value |
|||||||
|---|---|---|---|---|---|---|---|---|---|---|---|---|
| ABN/AMRO, Inc. | $ 814,100,000 | 6.66 | % | 09/01/2000 | $ 814,100,000 | $ 814,250,608 | ||||||
| Banc of America Securities LLC | 900,000,000 | 6.67 | 09/01/2000 | 900,000,000 | 900,166,750 | |||||||
| Barclays Capital, Inc. | 500,000,000 | 6.67 | 09/01/2000 | 500,000,000 | 500,092,639 | |||||||
| Bear Stearns Companies, Inc. | 300,000,000 | 6.67 | 09/01/2000 | 300,000,000 | 300,055,583 | |||||||
| Chase Securities, Inc. | 450,000,000 | 6.67 | 09/01/2000 | 450,000,000 | 450,083,375 | |||||||
| Donaldson, Lufkin & Jenrette, Inc. | 1,000,000,000 | 6.67 | 09/01/2000 | 1,000,000,000 | 1,000,185,278 | |||||||
| J.P. Morgan & Co., Inc. | 800,000,000 | 6.65 | 09/01/2000 | 800,000,000 | 800,147,778 | |||||||
| Morgan Stanley Dean Witter & Co. | 750,000,000 | 6.65 | 09/01/2000 | 750,000,000 | 750,138,542 | |||||||
| Morgan Stanley Dean Witter & Co. | 300,000,000 | 6.60 | 09/01/2000 | 300,000,000 | 300,055,000 | |||||||
| UBS Warburg LLC | 800,000,000 | 6.65 | 09/01/2000 | 800,000,000 | 800,147,778 | |||||||
| TOTAL JOINT REPURCHASE AGREEMENT ACCOUNT II | $6,614,100,000 | $6,615,323,331 | ||||||||||
| 7. SUMMARY OF SHARE TRANSACTIONS
|
| Share activity is as follows:
|
| For the Period
Ended August 31, 2000 (a) |
|||||||
|---|---|---|---|---|---|---|---|
| Shares | Dollars | ||||||
| |
|||||||
| Class A Shares | |||||||
| Shares sold | 20,575,834 | $206,719,550 | |||||
| Shares repurchased | (355,984 | ) | (3,608,374 | ) | |||
| |
|||||||
| 20,219,850 | 203,111,176 | ||||||
| |
|||||||
| Class B Shares | |||||||
| Shares sold | 18,789,070 | 188,934,348 | |||||
| Shares repurchased | (71,125 | ) | (724,005 | ) | |||
| |
|||||||
| 18,717,945 | 188,210,343 | ||||||
| |
|||||||
| Class C Shares | |||||||
| Shares sold | 8,987,442 | 90,662,633 | |||||
| Shares repurchased | (34,607 | ) | (356,002 | ) | |||
| |
|||||||
| 8,952,835 | 90,306,631 | ||||||
| |
|||||||
| Institutional Shares | |||||||
| Shares sold | 1,676,491 | 17,008,949 | |||||
| Shares repurchased | (500,684 | ) | (5,002,476 | ) | |||
| |
|||||||
| 1,175,807 | 12,006,473 | ||||||
| |
|||||||
| Service Shares | |||||||
| Shares sold | 1,120 | 11,876 | |||||
| |
|||||||
| 1,120 | 11,876 | ||||||
| |
|||||||
| NET INCREASE | 49,067,557 | $493,646,499 | |||||
| |
|||||||
(a)
|
Commencement date of operations was June 19, 2000 for all share classes.
|
| 8. CERTAIN RECLASSIFICATIONS
|
| In accordance with AICPA Statement of Position 93-2, the Fund has reclassified $900,981 from paid-in capital to accumulated net
investment loss. This reclassification has no impact on the net asset value of the Fund and is designed to present the Fund’s capital accounts on a tax basis. Reclassifications result primarily from the difference in the tax treatment of foreign
currency, net operating losses and organization costs.
|
| Income from
investment operations |
|||||||||||||
|---|---|---|---|---|---|---|---|---|---|---|---|---|---|
| Net asset
value, beginning of period |
Net
investment loss (c) |
Net realized
and unrealized gain |
Total
from investment operations |
||||||||||
| FOR THE PERIOD ENDED AUGUST 31, | |||||||||||||
| 2000 - Class A Shares (commenced June 19, 2000) | $10.00
|
$(0.02 | ) | $0.79
|
$0.77
|
||||||||
| 2000 - Class B Shares (commenced June 19, 2000) | 10.00
|
(0.04 | ) | 0.80
|
0.76
|
||||||||
| 2000 - Class C Shares (commenced June 19, 2000) | 10.00
|
(0.04 | ) | 0.81
|
0.77
|
||||||||
| 2000 - Institutional Shares (commenced June 19, 2000) | 10.00
|
(0.01 | ) | 0.79
|
0.78
|
||||||||
| 2000 - Service Shares (commenced June 19, 2000) | 10.00
|
(0.02 | ) | 0.80
|
0.78
|
||||||||
| |
|||||||||||||
(a)
|
Assumes investment at the net asset value at the beginning of the period, reinvestment of all dividends and distributions, a
complete redemption of the investment at the net asset value at the end of the period and no sales or redemption charges. Total return would be reduced if a sales or redemption charge were taken into account. Total returns for periods less than one full
year are not annualized.
|
(b)
|
Annualized.
|
(c)
|
Calculated based on the average shares outstanding methodology.
|
|
Ratios assuming no expense reductions |
||||||||||||||||||||
|---|---|---|---|---|---|---|---|---|---|---|---|---|---|---|---|---|---|---|---|---|
| Net asset
value, end of period |
Total
return (a) |
Net assets
at end of period (in 000s) |
Ratio of
net expenses to average net assets (b) |
Ratio of
net investment loss to average net assets (b) |
Ratio of
expenses to average net assets (b) |
Ratio of
net investment loss to average net assets (b) |
Portfolio
turnover rate |
|||||||||||||
| $10.77 | 7.70 | % | $217,861 | 1.50 | % | (1.04 | )% | 2.05 | % | (1.59 | )% | 5.04% | ||||||||
| 10.76 | 7.60 | 201,437 | 2.25 | (1.79 | ) | 2.80 | (2.34 | ) | 5.04 | |||||||||||
| 10.77 | 7.70 | 96,393 | 2.25 | (1.78 | ) | 2.80 | (2.33 | ) | 5.04 | |||||||||||
| 10.78 | 7.80 | 12,677 | 1.10 | (0.50 | ) | 1.65 | (1.05 | ) | 5.04 | |||||||||||
| 10.78 | 7.70 | 12 | 1.60 | (1.13 | ) | 2.15 | (1.68 | ) | 5.04 | |||||||||||
| To the Shareholders and Board of Trustees of
Goldman Sachs Trust — Research Select Fund: |
| In our opinion, the accompanying statement of assets and liabilities, including the statement of investments, and the related
statement of operations and of changes in net assets and the financial highlights present fairly, in all material respects, the financial position of Goldman Sachs Research Select Fund (“the Fund”), one of the portfolios constituting Goldman
Sachs Trust, at August 31, 2000, the results of its operations, the changes in its net assets and the financial highlights for the period then ended, in conformity with accounting principles generally accepted in the United States of America. These
financial statements and financial highlights (hereafter referred to as “financial statements”) are the responsibility of the Fund’s management; our responsibility is to express an opinion on these financial statements based on our audit.
We conducted our audit of these financial statements in accordance with auditing standards generally accepted in the United States of America, which require that we plan and perform the audit to obtain reasonable assurance about whether the financial
statements are free of material misstatement. An audit includes examining, on a test basis, evidence supporting the amounts and disclosures in the financial statements, assessing the accounting principles used and significant estimates made by management,
and evaluating the overall financial statement presentation. We believe that our audit, which included confirmation of securities at August 31, 2000 by correspondence with the custodian and brokers, provides a reasonable basis for our opinion.
|
| PricewaterhouseCoopers LLP
|
| Boston, Massachusetts
|
| October 23, 2000
|
PART C
OTHER INFORMATION
Item 23. Exhibits
--------
The following exhibits relating to Goldman Sachs Trust are
incorporated herein by reference to Post-Effective Amendment No. 26 to Goldman
Sachs Trust's Registration Statement on Form N-1A (Accession No.
000950130-95-002856); to Post-Effective Amendment No. 27 to such Registration
Statement (Accession No. 0000950130-96-004931); to Post-Effective Amendment No.
29 to such Registration Statement (Accession No. 0000950130-97-000573); to
Post-Effective Amendment No. 31 to such Registration Statement (Accession No.
0000950130-97-000805); to Post-Effective Amendment No. 32 to such Registration
Statement (Accession No. 0000950130-97-0001846); to Post-Effective Amendment No.
40 to such Registration Statement (Accession No. 0000950130-97-004495); to
Post-Effective Amendment No. 41 to such Registration Statement (Accession No
0000950130-98-000676); to Post-Effective Amendment No. 43 to such Registration
Statement (Accession No. 0000950130-98-000965); to Post-Effective Amendment No.
44 to such Registration Statement (Accession No. 0000950130-98-002160); to
Post-Effective Amendment No. 46 to such Registration Statement (Accession No.
0000950130-98-003563); to Post-Effective Amendment No. 47 to such Registration
Statement (Accession No. 0000950130-98-004845); to Post-Effective Amendment No.
48 to such Registration Statement (Accession No. 0000950109-98-005275); to
Post-Effective Amendment No. 50 to such Registration Statement (Accession No.
0000950130-98-006081); to Post-Effective Amendment No. 51 to such Registration
Statement (Accession No. 0000950130-99-000178); to Post-Effective Amendment No.
52 to such Registration Statement (Accession No. 0000950130-99-000742); to
Post-Effective Amendment No. 53 to such Registration Statement (Accession No.
0000950130-99-001069); to Post-Effective Amendment No. 54 to such Registration
Statement (Accession No. 0000950130-99-002212); to Post-Effective Amendment No.
55 to such Registration Statement (Accession No. 0000950109-99-002544); to
Post-Effective Amendment No. 56 to such Registration Statement (Accession No.
0000950130-99-005294); to Post-Effective Amendment No. 57 to such Registration
Statement (Accession No. 0000950109-99-003474); to Post-Effective Amendment No.
58 to such Registration Statement (Accession No. 0000950109-99-004208); to
Post-Effective Amendment No. 59 to such Registration Statement (Accession No.
0000950130-99-006810); to Post-Effective Amendment No. 60 to such Registration
Statement (Accession No. 0000950109-99-004538) (no exhibits filed as part of
this Amendment); to Post-Effective Amendment No. 61 to such Registration
Statement (Accession No. 0000950130-00-000099) (no exhibits filed as part of
this Amendment); to Post-Effective Amendment No. 62 to such Registration
Statement (Accession No. 0000950109-00-000585); to Post-Effective Amendment No.
63 to such Registration Statement (Accession No. 0000950109-00-001365); to
Post-Effective Amendment No. 64 to such Registration Statement (Accession No.
0000950130-00-002072); to Post-Effective Amendment No. 65 to such Registration
Statement (Accession No. 0000950130-00-002509); to Post-Effective Amendment No.
66 to such Registration Statement (Accession No. 0000950130-00-003033); to
Post-Effective Amendment No. 67 to such Registration Statement (Accession No.
0000950130-00-003405) and to Post-
-1-
Effective Amendment No. 68 to such Registration Statement (Accession No.
0000950109-00-500123).
(a)(1). Agreement and Declaration of Trust dated January 28, 1997.
(Accession No. 0000950130-97-000573.)
(a)(2). Amendment No. 1 dated April 24, 1997 to Agreement and
Declaration of Trust January 28, 1997. (Accession No.
0000950130-97-004495.)
(a)(3). Amendment No. 2 dated July 21, 1997 to Agreement and
Declaration of Trust as amended, dated January 28, 1997.
(Accession No. 0000950130-97-004495.)
(a)(4). Amendment No. 3 dated October 21, 1997 to the Agreement and
Declaration of Trust as amended, dated January 28, 1997.
(Accession No. 0000950130-98-000676.)
(a)(5) Amendment No. 4 dated January 28, 1998 to the Agreement and
Declaration of Trust as amended, dated January 28, 1997.
(Accession No. 0000950130-98-000676.)
(a)(6). Amendment No. 5 dated April 23, 1998 to Agreement and
Declaration of Trust as amended, dated January 28, 1997.
(Accession No. 0000950130-98-004845.)
(a)(7). Amendment No. 6 dated July 22, 1998 to Agreement and
Declaration of Trust as amended, dated January 28, 1997.
(Accession No. 0000950130-98-004845.)
(a)(8). Amendment No. 7 dated November 3, 1998 to Agreement and
Declaration of Trust as amended, dated January 28, 1997.
(Accession No. 0000950130-98-006081.)
(a)(9). Amendment No. 8 dated January 22, 1999 to Agreement and
Declaration of Trust as amended, dated January 28, 1997.
(Accession No. 0000950130-99-000742.)
(a)(10). Amendment No. 9 dated April 28, 1999 to Agreement and
Declaration of Trust as amended, dated January 28, 1997.
(Accession No. 0000950109-99-002544.)
(a)(11). Amendment No. 10 dated July 27, 1999 to Agreement and
Declaration of Trust as amended, dated January 28, 1997.
(Accession No. 0000950130-99-005294.)
-2-
(a)(12). Amendment No. 11 dated July 27, 1999 to Agreement and
Declaration of Trust as amended, dated January 28, 1997.
(Accession No. 0000950130-99-005294.)
(a)(13). Amendment No. 12 dated October 26, 1999 to Agreement and
Declaration of Trust as amended, dated January 28, 1997.
(Accession No. 0000950130-99-004208.)
(a)(14). Amendment No. 13 dated February 3, 2000 to Agreement and
Declaration of Trust as amended, dated January 28, 1997.
(Accession No. 0000950109-00-000585.)
(a)(15). Amendment No. 14 dated April 26, 2000 to Agreement and
Declaration of Trust as amended, dated January 28, 1997.
(Accession No. 0000950130-00-002509.)
(a)(16). Amendment No. 15 dated August 1, 2000 to Agreement and
Declaration of Trust, as amended, dated January 28, 1997.
(Accession No. 0000950109-00-500123).
(b). Amended and Restated By-laws of the Delaware business trust
dated January 28, 1997. (Accession No.
0000950130-97-000573.)
(b)(2). Amended and Restated By-laws of the Delaware business trust
dated January 28, 1997 as amended and restated July 27,
1999. (Accession No. 0000950130-99-005294.)
(c). Not applicable.
(d)(1). Management Agreement dated April 30, 1997 between
Registrant, on behalf of Goldman Sachs Short Duration
Government Fund, and Goldman Sachs Funds Management, L.P.
(Accession No. 0000950130-98-000676.)
(d)(2). Management Agreement dated April 30, 1997 between
Registrant, on behalf of Goldman Sachs Adjustable Rate
Government Fund, and Goldman Sachs Funds Management, L.P.
(Accession No. 0000950130-98-000676.)
(d)(3). Management Agreement dated April 30, 1997 between
Registrant, on behalf of Goldman Sachs Short Duration
Tax-Free Fund, and Goldman Sachs Asset Management.
(Accession No. 0000950130-98-000676.)
-3-
(d)(4). Management Agreement dated April 30, 1997 between
Registrant, on behalf of Goldman Sachs Core Fixed Income
Fund, and Goldman Sachs Asset Management. (Accession No.
0000950130-98-000676.)
(d)(5). Management Agreement dated April 30, 1997 between the
Registrant, on behalf of Goldman Sachs - Institutional
Liquid Assets, and Goldman Sachs Asset Management.
(Accession No. 0000950130-98-000676.)
(d)(6). Management Agreement dated April 30, 1997 between
Registrant, Goldman Sachs Asset Management, Goldman Sachs
Fund Management L.P. and Goldman, Sachs Asset Management
International. (Accession No. 0000950109-98-005275.)
(d)(7). Management Agreement dated January 1, 1998 on behalf of the
Goldman Sachs Asset Allocation Portfolios and Goldman Sachs
Asset Management. (Accession No. 0000950130-98-000676.)
(d)(8). Amended Annex A to Management Agreement dated January 1,
1998 on behalf of the Goldman Sachs Asset Allocation
Portfolios and Goldman Sachs Asset Management (Conservative
Strategy Portfolio) (Accession No. 0000950130-99-000742.)
(d)(9). Amended Annex A dated April 28, 1999 to Management Agreement
dated April 30, 1997. (Accession No. 0000950109-99-002544.)
(d)(10). Amended Annex A dated July 27, 1999 to Management Agreement
dated April 30, 1997. (Accession No. 0000950130-99-005294.)
(d)(11). Amended Annex A dated October 26, 1999 to Management
Agreement dated April 30, 1997. (Accession No.
0000950130-99-004208.)
(d)(12). Amended Annex A dated February 3, 2000 to Management
Agreement dated April 30, 1997 (Accession No.
0000950109-00-001365.)
(d)(13). Amended Annex A dated April 26, 2000 to Management Agreement
dated April 30, 1997 (Accession No. 0000950130-00-002509).
-4-
(e). Distribution Agreement dated April 30, 1997 as amended April
26, 2000 between Registrant and Goldman Sachs & Co.
(Accession No. 0000950130-00-003405).
(f). Not applicable.
(g)(1). Custodian Agreement dated July 15, 1991, between Registrant
and State Street Bank and Trust Company. (Accession No.
0000950130-95-002856.)
(g)(2). Custodian Agreement dated December 27, 1978 between
Registrant and State Street Bank and Trust Company, on
behalf of Goldman Sachs - Institutional Liquid Assets, filed
as Exhibit 8(a). (Accession No. 0000950130-98-000965.)
(g)(3). Letter Agreement dated December 27, 1978 between Registrant
and State Street Bank and Trust Company, on behalf of
Goldman Sachs - Institutional Liquid Assets, pertaining to
the fees payable by Registrant pursuant to the Custodian
Agreement, filed as Exhibit 8(b). (Accession No.
0000950130-98-000965.)
(g)(4). Amendment dated May 28, 1981 to the Custodian Agreement
referred to above as Exhibit (g)(2) (Accession No.
0000950130-98-000965.)
(g)(5). Fee schedule relating to the Custodian Agreement between
Registrant on behalf of the Goldman Sachs Asset Allocation
Portfolios and State Street Bank and Trust Company.
(Accession No. 0000950130-97-004495.)
(g)(6). Letter Agreement dated June 14, 1984 between Registrant and
State Street Bank and Trust Company, on behalf of Goldman
Sachs - Institutional Liquid Assets, pertaining to a change
in wire charges under the Custodian Agreement, filed as
Exhibit 8(d). (Accession No. 0000950130-98-000965.)
(g)(7). Letter Agreement dated March 29, 1983 between Registrant and
State Street Bank and Trust Company, on behalf of Goldman
Sachs - Institutional Liquid Assets, pertaining to the
latter's designation of Bank of America, N.T. and S.A. as
its subcustodian and certain other matters, filed as Exhibit
8(f). (Accession No. 0000950130-98-000965.)
(g)(8). Letter Agreement dated March 21, 1985 between Registrant and
State Street Bank and Trust Company, on behalf of Goldman
Sachs - Institutional Liquid Assets, pertaining to the
creation of a
-5-
joint repurchase agreement account, filed as Exhibit 8(g).
(Accession No. 0000950130-98-000965.)
(g)(9). Letter Agreement dated November 7, 1985, with attachments,
between Registrant and State Street Bank and Trust Company,
on behalf of Goldman Sachs - Institutional Liquid Assets,
authorizing State Street Bank and Trust Company to permit
redemption of units by check, filed as Exhibit 8(h).
(Accession No. 0000950130-98-000965.)
(g)(10). Money Transfer Services Agreement dated November 14, 1985,
including attachment, between Registrant and State Street
Bank and Trust Company, on behalf of Goldman Sachs -
Institutional Liquid Assets, pertaining to transfers of
funds on deposit with State Street Bank and Trust Company,
filed as Exhibit 8(i). (Accession No. 0000950130-98-000965.)
(g)(11). Letter Agreement dated November 27, 1985 between Registrant
and State Street Bank and Trust Company, on behalf of
Goldman Sachs - Institutional Liquid Assets, amending the
Custodian Agreement. (Accession No. 0000950130-98-000965.)
(g)(12). Letter Agreement dated July 22, 1986 between Registrant and
State Street Bank and Trust Company, on behalf of Goldman
Sachs - Institutional Liquid Assets, pertaining to a change
in wire charges. (Accession No. 0000950130-98-000965.)
(g)(13). Letter Agreement dated June 20, 1987 between Registrant and
State Street Bank and Trust Company, on behalf of Goldman
Sachs - Institutional Liquid Assets, amending the Custodian
Agreement. (Accession No. 0000950130-98-000965.)
(g)(14). Letter Agreement between Registrant and State Street Bank
and Trust Company, on behalf of Goldman Sachs -
Institutional Liquid Assets, pertaining to the latter's
designation of Security Pacific National Bank as its
subcustodian and certain other matters. (Accession No.
0000950130-98-000965.)
(g)(15). Amendment dated July 19, 1988 to the Custodian Agreement
between Registrant and State Street Bank and Trust Company,
on behalf of Goldman Sachs - Institutional Liquid Assets.
Accession No. 0000950130-98-000965.)
(g)(16). Amendment dated December 19, 1988 to the Custodian Agreement
between Registrant and State Street Bank and Trust Company,
on
-6-
behalf of Goldman Sachs - Institutional Liquid Assets.
Accession No. 0000950130-98-000965.)
(g)(17). Custodian Agreement dated April 6, 1990 between Registrant
and State Street Bank and Trust Company on behalf of Goldman
Sachs Capital Growth Fund. (Accession No.
0000950130-98-006081.)
(g)(18). Sub-Custodian Agreement dated March 29, 1983 between State
Street Bank and Trust Company and Bank of America, National
Trust and Savings Association on behalf of Goldman Sachs
Institutional Liquid Assets. (Accession No.
0000950130-98-006081.)
(g)(19). Fee schedule dated January 8, 1999 relating to Custodian
Agreement dated April 6, 1990 between Registrant and State
Street Bank and Trust Company (Conservative Strategy
Portfolio). (Accession No. 0000950130-99-000742.)
(g)(20). Fee schedule dated April 12, 1999 relating to Custodian
Agreement dated April 6, 1990 between Registrant and State
Street Bank and Trust Company (Strategic Growth and Growth
Opportunities Portfolios). (Accession No.
0000950109-99-002544.)
(g)(21). Fee schedule dated July 19, 1999 relating to Custodian
Agreement dated April 6, 1990 between Registrant and State
Street Bank and Trust Company (Internet Tollkeeper Fund).
(Accession No. 0000950130-99-005294.)
(g)(22). Fee schedule dated October 1, 1999 relating to the Custodian
Agreement dated April 6, 1990 between Registrant and State
Street Bank and Trust Company (Large Cap Value Fund).
(Accession No. 0000950130-99-006810.)
(g)(23). Fee schedule dated January 12, 2000 relating to Custodian
Agreement dated April 6, 1990 between Registrant and State
Street Bank and Trust Company (CORE Tax-Managed Equity
Fund). (Accession No. 0000950109-00-000585.)
(g)(24). Fee schedule dated January 6, 2000 relating to Custodian
Agreement dated July 15, 1991 between Registrant and State
Street Bank and Trust Company (High Yield Municipal Fund).
(Accession No. 0000950109-00-000585.)
(g)(25). Fee schedule dated April 14, 2000 relating to Custodian
Agreement dated April 6, 1990 to between Registrant and
State
-7-
Street Bank and Trust Company (Research Select Fund).
(Accession No. 0000950130-00-002509.)
(g)(26). Fee schedule dated April 14, 2000 relating to Custodian
Agreement dated July 15, 1991 between Registrant and State
Street Bank and Trust Company (Enhanced Income Fund).
(Accession No. 0000950130-00-002509.)
(g)(27). Additional Portfolio Agreement dated September 27, 1999
between Registrant and State Street Bank and Trust Company.
(Accession No. 0000950109-00-000585.)
(g)(28). Letter Agreement dated September 27, 1999 between Registrant
and State Street Bank and Trust Company relating to
Custodian Agreement dated December 27, 1978. (Accession No.
0000950109-00-000585.)
(g)(29). Letter Agreement dated September 27, 1999 between Registrant
and State Street Bank and Trust Company relating to
Custodian Agreement dated April 6, 1990. (Accession No.
0000950109-00-000585.)
(g)(30). Letter Agreement dated September 27, 1999 between Registrant
and State Street Bank and Trust Company relating to
Custodian Agreement dated July 15, 1991. (Accession No.
0000950109-00-000585.)
(h)(1). Wiring Agreement dated June 20, 1987 among Goldman, Sachs &
Co., State Street Bank and Trust Company and The Northern
Trust Company. (Accession No. 0000950130-98-000965.)
(h)(2). Letter Agreement dated June 20, 1987 regarding use of
checking account between Registrant and The Northern Trust
Company. (Accession No. 0000950130-98-000965.)
(h)(3). Transfer Agency Agreement dated July 15, 1991 between
Registrant and Goldman, Sachs & Co. (Accession No.
0000950130-95-002856.)
(h)(4). Fee schedule relating to Transfer Agency Agreement between
Registrant on behalf of the Goldman Sachs Asset Allocation
Portfolios and Goldman, Sachs & Co. (Accession No.
0000950130-97-004495.)
(h)(5). Fee Schedule dated July 31, 1998 relating to Transfer Agency
Agreement between Registrant and Goldman, Sachs & Co. on
-8-
behalf of ILA Money Market Funds. (Accession No.
0000950130-98-006081.)
(h)(6). Transfer Agency Agreement dated May 1, 1988 between Goldman
Sachs Institutional Liquid Assets and Goldman, Sachs & Co.
(Accession No. 0000950130-98-006081.)
(h)(7). Transfer Agency Agreement dated April 30, 1997 between
Registrant and Goldman, Sachs & Co. on behalf of the
Financial Square Funds. (Accession No.
0000950130-98-006081.)
(h)(8). Transfer Agency Agreement dated April 6, 1990 between
GS-Capital Growth Fund, Inc. and Goldman Sachs & Co.
(Accession No. 0000950130-98-006081.)
(h)(9). Goldman Sachs - Institutional Liquid Assets Administration
Class Administration Plan dated April 22, 1998. (Accession
No. 0000950130-98-006081.)
(h)(10). Goldman Sachs - Institutional Liquid Assets Service Class
Service Plan dated April 22, 1998. (Accession No.
0000950130-98-006081.)
(h)(11). Cash Management Shares Service Plan dated May 1, 1998.
(Accession No. 0000950130-98-006081.)
(h)(12). Form of Retail Service Agreement on behalf of Goldman Sachs
Trust relating to Class A Shares of Goldman Sachs Asset
Allocation Portfolios, Goldman Sachs Fixed Income Funds,
Goldman Sachs Domestic Equity Funds and Goldman Sachs
International Equity Funds. (Accession No.
0000950130-98-006081.)
(h)(13). Form of Supplemental Service Agreement on behalf of Goldman
Sachs Trust relating to the Administrative Class, Service
Class and Cash Management Class of Goldman Sachs -
Institutional Liquid Assets Portfolios. (Accession No.
0000950130-98-006081.)
(h)(14). Form of Supplemental Service Agreement on behalf of Goldman
Sachs Trust relating to the FST Shares, FST Preferred
Shares, FST Administration Shares and FST Service Shares of
Goldman Sachs Financial Square Funds. (Accession No.
0000950130-98-006081.)
(h)(15). Form of Service Agreement on behalf of Goldman Sachs Trust
relating to the Select Class, the Preferred Class, the
Administration Class, the Service Class and the Cash
Management Class, as
-9-
applicable, of Goldman Sachs Financial Square Funds, Goldman
Sachs - Institutional Liquid Assets Portfolios, Goldman
Sachs Fixed Income Funds, Goldman Sachs Domestic Equity
Funds, Goldman Sachs International Equity Funds and Goldman
Sachs Asset Allocation Portfolios. (Accession No.
0000950130-00-002509.)
(h)(16). FST Select Shares Plan dated October 26, 1999. (Accession
No. 0000950130-99-006810.)
(h)(17). FST Administration Class Administration Plan dated April 25,
2000. (Accession No. 0000950130-00-002509.)
(h)(18). FST Service Class Service Plan dated April 25, 2000.
(Accession No. 0000950130-00-002509.)
(h)(19). FST Preferred Class Preferred Administration Plan dated
April 25, 2000. (Accession No. 0000950130-00-002509.)
(h)(20). Service Class Service Plan dated April 25, 2000. (Accession
No. 0000950130-00-002509.)
(h)(21). Administration Class Administration Plan dated April 26,
2000. (Accession No. 0000950130-00-002509.)
(i)(1). Opinion of Drinker, Biddle & Reath LLP. (With respect to the
Asset Allocation Portfolios). (Accession No.
0000950130-97-004495.)
(i)(2). Opinion of Morris, Nichols, Arsht & Tunnell. (Accession No.
0000950130-97-001846.)
(i)(3). Opinion of Drinker Biddle & Reath LLP. (With respect to
Japanese Equity and International Small Cap). (Accession No.
0000950130-98-003563.)
(i)(4). Opinion of Drinker Biddle & Reath LLP. (With respect to Cash
Management Shares). (Accession No. 0000950130-98-003563.)
(i)(5). Opinion of Drinker Biddle & Reath LLP. (With respect to the
European Equity Fund). (Accession No. 0000950130-98-006081.)
(i)(6). Opinion of Drinker Biddle & Reath LLP. (With respect to the
CORE Large Cap Value Fund). (Accession No.
0000950130-98-006081.)
-10-
(i)(7). Opinion of Drinker Biddle & Reath LLP (with respect to the
Conservative Strategy Portfolio). (Accession No.
0000950130-99-001069.)
(i)(8). Opinion of Drinker Biddle & Reath LLP (with respect to the
Strategic Growth and Growth Opportunities Portfolios).
(Accession No. 0000950109-99-002544.)
(i)(9). Opinion of Drinker Biddle & Reath LLP (with respect to the
Internet Tollkeeper Fund). Accession No.
0000950109-99-004208.)
(i)(10). Opinion of Drinker Biddle & Reath LLP (with respect to the
Large Cap Value Fund). (Accession No. 0000950130-99-006810.)
(i)(11). Opinion of Drinker Biddle & Reath LLP (with respect to FST
Select Shares). (Accession No. 0000950109-00-000585.)
(i)(12). Opinion of Drinker Biddle & Reath LLP (with respect to the
High Yield Municipal Fund). (Accession No.
0000950109-00-001365.)
(i)(13). Opinion of Drinker Biddle & Reath LLP (with respect to the
CORE Tax-Managed Equity Fund). (Accession No.
0000950109-00-001365.)
(i)(14). Opinion of Drinker Biddle & Reath LLP (with respect to the
Research Select Fund). (Accession No.
0000950109-00-500123).
(i)(15). Opinion of Drinker Biddle & Reath LLP (with respect to the
Enhanced Income Fund). (Accession No.
0000950109-00-500123).
(i)(16) Opinion of Drinker Biddle & Reath LLP (with respect to Cash
Management Shares of certain ILA Portfolios). (Accession No.
0000950109-00-500123).
(j). None.
(k). Not applicable.
(l). Not applicable.
(m)(1). Class A Distribution and Service Plan amended and restated
as of September 1, 1998. (Accession No.
0000950130-98-004845.)
-11-
(m)(2). Class B Distribution and Service Plan amended and restated
as of September 1, 1998. (Accession No.
0000950130-98-004845.)
(m)(3). Class C Distribution and Service Plan amended and restated
as of September 1, 1998. (Accession No.
0000950130-98-004845.)
(m)(4). Cash Management Shares Plan of Distribution pursuant to Rule
12b-1 dated May 1, 1998. (Accession No.
0000950130-98-006081.)
(n). None.
(o). Plan dated October 26, 1999 entered into by Registrant
pursuant to Rule 18f-3. (Accession No.
0000950130-99-006810.)
(p)(1). Code of Ethics - Goldman Sachs Trust and Goldman Sachs
Variable Insurance Trust, dated April 23, 1997, as amended
October 21, 1997 and April 25, 2000. (Accession No.
0000950130-00-002509.)
(p)(2). Code of Ethics - Goldman Sachs Asset Management, Goldman
Sachs Funds Management L.P. and Goldman Sachs Asset
Management International, effective January 23, 1991 (as
revised April 1, 2000). (Accession No.
0000950130-00-002509.)
(q)(1). Powers of Attorney of Messrs. Bakhru, Ford, Grip, Shuch,
Smart, Springer, Strubel, McNulty, Mosior, Gilman,
Perlowski, Richman, Surloff, Mmes. McPherson, Mucker and
Taylor. (Accession No. 0000950130-97-000805.)
(q)(2). Powers of Attorney dated October 21, 1997 on behalf of James
A. Fitzpatrick and Valerie A. Zondorak. (Accession No.
0000950130-98-000676.)
(q)(3). Power of Attorney dated November 15, 2000 on behalf of
Patrick T. Harker (Accession No. 0000950109-00-500123).
The following exhibits relating to Goldman Sachs Trust are filed herewith
electronically pursuant to EDGAR rules:
(j)(1) Consent of PricewaterhouseCoopers LLP.
(j)(2) Consent of Arthur Andersen LLP.
-12-
Item 24. Persons Controlled by or Under Common Control with Registrant.
-------------------------------------------------------------
Not Applicable.
Item 25. Indemnification
---------------
Article IV of the Declaration of Trust of Goldman Sachs Trust, Delaware business
trust, provides for indemnification of the Trustees, officers and agents of the
Trust, subject to certain limitations. The Declaration of Trust is incorporated
by reference to Exhibit (a)(1).
The Management Agreement with each of the Funds (other than the ILA Portfolios)
provides that the applicable Investment Adviser will not be liable for any error
of judgment or mistake of law or for any loss suffered by a Fund, except a loss
resulting from willful misfeasance, bad faith or gross negligence on the part of
the Investment Adviser or from reckless disregard by the Investment Adviser of
its obligations or duties under the Management Agreement. Section 7 of the
Management Agreement with respect to the ILA Portfolios provides that the ILA
Portfolios will indemnify the Adviser against certain liabilities; provided,
however, that such indemnification does not apply to any loss by reason of its
willful misfeasance, bad faith or gross negligence or the Adviser's reckless
disregard of its obligation under the Management Agreement. The Management
Agreements are incorporated by reference to Exhibits (d)(1) through (d)(7).
Section 9 of the Distribution Agreement between the Registrant and Goldman Sachs
dated April 30, 1997, as amended April 26, 2000 and Section 7 of the Transfer
Agency Agreements between the Registrant and Goldman, Sachs & Co. dated July 15,
1991, May 1, 1988, April 30, 1997 and April 6, 1990 each provide that the
Registrant will indemnify Goldman, Sachs & Co. against certain liabilities. A
copy of the Distribution Agreement is incorporated by reference as Exhibit (e).
The Transfer Agency Agreements are incorporated by reference as Exhibits (h)(3),
(h)(6), (h)(7) and (h)(8), respectively, to the Registrant's Registration
Statement.
Mutual fund and Trustees and officers liability policies purchased jointly by
the Registrant, Trust for Credit Unions, Goldman Sachs Variable Insurance Trust
and The Commerce Funds insure such persons and their respective trustees,
partners, officers and employees, subject to the policies' coverage limits and
exclusions and varying deductibles, against loss resulting from claims by reason
of any act, error, omission, misstatement, misleading statement, neglect or
breach of duty.
Item 26. Business and Other Connections of Investment Adviser.
-----------------------------------------------------
The business and other connections of the officers and Managing Directors of
Goldman, Sachs & Co., Goldman Sachs Funds Management, L.P., and Goldman Sachs
Asset Management International are listed on their respective Forms ADV as
currently filed
-13-
with the Commission (File Nos. 801-16048, 801-37591 and 801-38157, respectively)
the texts of which are hereby incorporated by reference.
Item 27. Principal Underwriters.
-----------------------
(a) Goldman, Sachs & Co. or an affiliate or a division thereof currently serves
as investment adviser and distributor of the units of Trust for Credit Unions,
for shares of Goldman Sachs Trust and for shares of Goldman Sachs Variable
Insurance Trust. Goldman, Sachs & Co., or a division thereof currently serves as
administrator and distributor of the units or shares of The Commerce Funds.
(b) Set forth below is certain information pertaining to the Managing Directors
of Goldman, Sachs & Co., the Registrant's principal underwriter, who are members
of Goldman, Sachs & Co.'s Management Committee. None of the members of the
management committee holds a position or office with the Registrant, except John
P. McNulty who is a Trustee of the Registrant.
GOLDMAN SACHS MANAGEMENT COMMITTEE
Name and Principal
Business Address Position with Goldman Sachs & Co.
----------------- ---------------------------------
Henry M. Paulson, Jr. (1) Chairman and Chief Executive Officer
Robert J. Hurst (1) Vice Chairman
John A. Thain (1)(3) President and Co-Chief Operating Officer
John L. Thornton (3) President and Co-Chief Operating Officer
Lloyd C. Blankfein (1) Managing Director
Richard A. Friedman (1) Managing Director
Steven M. Heller (1) Managing Director
Robert S. Kaplan (1) Managing Director
Robert J. Katz (1) Senior Counsel and Managing Director
John P. McNulty (2) Managing Director
-14-
Name and Principal
Business Address Position with Goldman Sachs & Co.
----------------- ---------------------------------
Philip D. Murphy (2) Managing Director
Daniel M. Neidich (1) Managing Director
Robin Neustein (2) Managing Director
Mark Schwartz (4) Managing Director
Robert K. Steel (2) Managing Director
Leslie C. Tortora (2) Managing Director
David A. Viniar (5) Managing Director
Patrick J. Ward (3) Managing Director
Peter A. Weinberg (3) Managing Director
Gregory K. Palm (1) Counsel and Managing Director
Tom Winkelried (3) Managing Director
John F.W. Rogers (1) Managing Director'
-----------------------
(1) 85 Broad Street, New York, NY 10004
(2) One New York Plaza, New York, NY 10004
(3) Peterborough Court, 133 Fleet Street, London EC4A 2BB, England
(4) ARK Mori Building, 12-32 Akasaka I-Chome Minato-KY,
Tokyo 107-6019, Japan
(5) 10 Hanover Square, New York, NY 10005
(c) Not Applicable.
Item 28. Location of Accounts and Records.
---------------------------------
The Declaration of Trust, By-laws and minute books of the Registrant and certain
investment adviser records are in the physical possession of Goldman Sachs Asset
Management, 32 Old Slip, New York, New York 10005. All other accounts, books and
other documents required to be maintained under Section 31(a) of the Investment
Company Act of 1940 and the Rules promulgated thereunder are in the physical
possession of State Street Bank and Trust Company, P.O. Box 1713, Boston,
Massachusetts 02105 except for certain transfer agency records which are
maintained by Goldman, Sachs & Co., 4900 Sears Tower, Chicago, Illinois 60606.
-15-
Item 29. Management Services
-------------------
Not applicable.
Item 30. Undertakings
------------
Not applicable.
-16-
SIGNATURES
Pursuant to the requirements of the Securities Act of 1933 and the Investment
Company Act of 1940, the Registrant certifies that it meets all of the
requirements for effectiveness of this Post-Effective Amendment No. 69 under
Rule 485(b) under the Securities Act of 1933 and has duly caused this
Post-Effective Amendment No. 69 to its Registration Statement to be signed on
its behalf by the undersigned, duly authorized, in the City and State of New
York on the 15th day of December, 2000.
GOLDMAN SACHS TRUST
(A Delaware business trust)
By: /s/ Howard B. Surloff
---------------------
Howard B. Surloff
Assistant Secretary
Pursuant to the requirements of the Securities Act of 1933, this Post-Effective
Amendment to said Registration Statement has been signed below by the following
persons in the capacities and on the date indicated.
Name Title Date
---- ----- ----
C>
*Douglas C. Grip President and
----------------
Douglas C. Grip Trustee December 15, 2000
*John M. Perlowski Principal Accounting Officer
------------------
John M. Perlowski and Principal Financial Officer December 15, 2000
*David B. Ford Trustee December 15, 2000
--------------
David B. Ford
*Mary Patterson McPherson Trustee December 15, 2000
------------------------
Mary Patterson McPherson
*Ashok N. Bakhru Chairman and Trustee December 15, 2000
----------------
Ashok N. Bakhru
*Alan A. Shuch Trustee December 15, 2000
--------------
Alan A. Shuch
*John P. McNulty Trustee December 15, 2000
----------------
John P. McNulty
*William H. Springer Trustee December 15, 2000
--------------------
William H. Springer
*Richard P. Strubel Trustee December 15, 2000
--------------------
Richard P. Strubel
*Patrick T. Harker Trustee December 15, 2000
-------------------
Patrick T. Harker
*By:/s/ Howard B. Surloff
---------------------
Howard B. Surloff,
Attorney-In-Fact
* Pursuant to a power of attorney previously filed.
-17-
CERTIFICATE
-----------
The undersigned Assistant Secretary for Goldman Sachs Trust (the
"Trust") hereby certifies that the Board of Trustees of the Trust duly adopted
the following resolution at a meeting of the Board held on April 25, 2000.
RESOLVED, that the Trustees and Officers of the Trusts who may
be required to execute any amendments to the Trust's Registration Statement be,
and each hereby is, authorized to execute a power of attorney appointing James
A. Fitzpatrick, Douglas C. Grip, Nancy L. Mucker, John W. Perlowski, Michael J.
Richman, Howard B. Surloff and Valerie A. Zondorak, jointly and severally, their
attorneys-in-fact, each with power of substitution, for said Trustees and
Officers in any and all capacities to sign the Registration Statement under the
Securities Act of 1933 and the Investment Company Act of 1940 of the Trusts and
any and all amendments to such Registration Statement, and to file the same,
with exhibits thereto, and other documents in connection therewith, with the
Securities and Exchange Commission, the Trustees and Officers hereby ratifying
and confirming all that each of said attorneys-in-fact, or his or her substitute
or substitutes, may do or caused to be done by virtue hereof.
Dated: December 15, 2000
/s/ Howard B. Surloff
---------------------------------------
Howard B. Surloff,
Assistant Secretary
-18-
EXHIBIT INDEX
(j)(1) Consent of PricewaterhouseCoopers LLP.
(j)(2) Consent of Arthur Andersen LLP.
-19-
|
|