|
|
|
|
|
|
|
|
|
GOLDMAN SACHS RESEARCH SELECT FUND
Market Overview
Dear Shareholder:
We are pleased to provide an overview of the U.S. Equity Market from the Fund’s inception on June 19, 2000 through August 31, 2000.
This Fund capitalizes on the significant resources of Goldman Sachs by combining some of the best ideas of Goldman Sachs Equity Research with the Investment Management Division’s portfolio management expertise.
Because the Fund’s portfolio consists of approximately 25-35 stocks that the Goldman Sachs U.S. Stock Selection Committee believes will perform the best over the next 12-18 months within the context of a focused, well-structured equity portfolio, the market overview below reflects the current views of Goldman Sachs Equity Research.
During the period under review, the financial markets were extremely volatile. However, by the end of the period, the S&P 500 Index had generated positive results.
However, stocks reversed course in July, as the S&P 500 and Nasdaq fell 1.6% and 5.0%, respectively. Several technology companies announced strong earnings during the month, which led to many mid-month market rallies. However, at the end of July the Department of Commerce reported that GDP growth surged by 5.2% in the second quarter, more than the 3.8% that economists were forecasting. As a result, investors who had been anticipating a cooling economy were disappointed, and fears arose that further interest rate hikes may be forthcoming.
The market then reversed course yet again in August, as the S&P 500 climbed 6.2%, while the Nasdaq rose a sharp 11.7%. Favorable economic data, in particular a decrease in factory orders, bolstered confidence that interest rates had reached a near-term peak. In addition, with the presidential election nearing, it became increasingly unlikely that the Fed would raise rates again before year-end.
As always, we appreciate your support and we look forward to serving your investment needs in the years to come.
| Sincerely, | |||
 |
 |
||
| David B. Ford | David W. Blood | ||
| Co-Head, Goldman Sachs Asset Management | Co-Head, Goldman Sachs Asset Management | ||
| September 15, 2000 |
GOLDMAN SACHS RESEARCH SELECT FUND
Fund Basics
as of August 31, 2000
| PERFORMANCE REVIEW | ||||
| June 19, 2000–August 31, 2000 | Fund Total Return (without sales charge)1 | S&P 500 Index2
|
||
| |
||||
| Class A | 7.70 | % | 2.38 | % |
| Class B | 7.60 | 2.38 | ||
| Class C | 7.70 | 2.38 | ||
| Institutional | 7.80 | 2.38 | ||
| Service | 7.70 | 2.38 | ||
| |
||||
1 The net asset value represents the net assets of the Fund (ex-dividend) divided by the total number of shares. The Fund’s performance assumes the reinvestment of dividends and other distributions.
2 The unmanaged S&P 500 Index (with dividends reinvested) figures do not reflect any fees or expenses. In addition, investors cannot invest directly in the Index.
| STANDARDIZED TOTAL RETURNS | |||||||||||
| For the period ended 6/30/00 | Class A
|
Class B
|
Class C
|
Institutional
|
Service
|
||||||
| |
|||||||||||
| Since Inception3 | –7.75 | % | –7.28 | % | –3.38 | % | –2.40 | % | –2.40 | % | |
| (6/19/00) | |||||||||||
| |
|||||||||||
3 The Standardized Total Returns are average annual total returns (only if the performance period is one year or less) as of the most recent calendar quarter-end. They assume reinvestment of all distributions at net asset value. These returns reflect a maximum initial sales charge of 5.5% for Class A shares, the assumed deferred sales charge for Class B shares (5% maximum declining to 0% after six years) and the assumed deferred sales charge for Class C shares (1% if redeemed within 12 months of purchase). Because Institutional and Service shares do not involve a sales charge, such a charge is not applied to their Standardized Total Returns.
Total return figures represent past performance and do not indicate future results, which will vary. The investment return and principal value of an investment will fluctuate and, therefore, an investor’s shares, when redeemed, may be worth more or less than their original cost. Performance reflects expense limitations in effect. In their absence, performance would be reduced.
| TOP 10 HOLDINGS AS OF 8/31/00 | |||
| Holding | % of Total Net Assets | Line of Business | |
| |
|||
| Rational Software Comp. | 3.5 | % | Computer Software |
| Nextel Communications | 3.5 | Wireless | |
| Anadarko Petroleum Corp. | 3.3 | Energy Resources | |
| Amdocs Ltd. | 3.3 | Computer Software | |
| Calpine Corp. | 3.3 | Electrical Services | |
| Guidant Corp. | 3.2 | Medical Products | |
| Linear Technology Corp. | 3.2 | Semiconductors | |
| Comverse Technology, Inc. | 3.2 | Electrical Equipment | |
| Tyco International Ltd. | 3.2 | Industrial Parts | |
| United Technologies Corp. | 3.2 | Industrial Parts | |
| |
|||
The top 10 holdings may not be representative of the Fund’s future investments.
The performance of the Fund may differ from that of the published U.S. Select List due to fees and expenses, transaction costs, the timing of portfolio transactions, modifications in stock weights in order to control trading costs, and the Fund’s holdings in securities other than equities. The Fund will be more volatile due to its concentration in a smaller number of stocks. Goldman Sachs Research Select Fund SM is a service mark of Goldman, Sachs & Co.
1
GOLDMAN SACHS RESEARCH SELECT FUND
Performance Overview
Dear Shareholder,
We are pleased to report on the performance of the Goldman Sachs Research Select Fund for the short period from its inception on June 19, 2000 through August 31, 2000.
Performance Review
During the Fund’s reporting period its Class A, B, C, Institutional and Service shares generated total cumulative returns, without sales charges, of 7.70%, 7.60%, 7.70%, 7.80%, and 7.70%, respectively. These figures compare very favorably to the 2.38% total cumulative return of the Fund’s benchmark, the S&P 500 Index.
The Fund’s performance was enhanced by its medium-capitalization bias, and having a relatively smaller exposure to underperforming larger-capitalization issues. In addition, our stock selection among large cap issues enhanced returns. On a sector basis, the Fund was helped by an overweight position relative to the S&P 500 in Financial and Industrial stocks, and underweights in Health Care and Consumer Cyclicals. The only major sector differential that hurt returns was our overweight in Consumer Services.
Investment Process
Goldman Sachs Research Select Fund seeks long-term growth of capital through a focused portfolio of U.S. equity securities. The Fund will generally consist of the 25-35 stocks that make up the Goldman Sachs’ “U.S. Select List.” This list represents the stocks that the firm’s U.S. Stock Selection Committee believes will perform the best over the next 12 to 18 months, within the context of a well-structured equity portfolio.
Portfolio Positioning
The Fund emphasizes economic sectors that the U.S. Stock Selection Committee believes will perform best, while de-emphasizing or avoiding sectors they do not expect to perform well. For example, as of August 31, 2000, the Fund was overweight Financials and underweight Technology versus the S&P 500 Index.
Portfolio Highlights
The stocks that contributed the most to the Fund’s returns since its inception were Calpine Corp. and Rational Software (which are not contained in the S&P 500), and overweight positions in Guidant Corp., Anadarko Petroleum Corp. and MBNA Corp. While no holdings proved overly detrimental to performance, AT&T Corp. Liberty Media, NextLink Communications, Nextel Communications Inc. and Teradyne did not meet our expectations.
2
GOLDMAN SACHS RESEARCH SELECT FUND
Portfolio Outlook
Using any number of measures, the market we’ve experienced this year has been highly unusual. While the high level of volatility was difficult for novice and experienced investors alike, we believe it could serve to be a positive for the long-term health of the financial markets, as it created a number of investment opportunities. To a great extent, the very speculative nature of the market that was driving returns has diminished. And we’re already beginning to see a return to more “normal” levels of volatility.
Looking ahead, we anticipate remaining fully invested as we actively manage the Fund’s portfolio in the sectors and stocks that we believe hold the most promise.
We thank you for your investment and look forward to your continued confidence.
Goldman Sachs Quantitative Equity Investment Team
New York
September 15, 2000
3
GOLDMAN SACHS RESEARCH SELECT FUND
The Goldman Sachs Advantage
Founded in 1869, Goldman, Sachs & Co. is a premier financial services firm traditionally known on Wall Street and around the world for its institutional expertise.
Today, the firm’s Investment Management Division provides individual investors the opportunity to tap the resources of a global institutional powerhouse — and put this expertise to work in their individual portfolios.
What Sets Goldman Sachs Funds Apart?
Our portfolio management teams are located on-site, around the world, in New York, London, Tokyo and Singapore. Their understanding of local economies, markets, industries and cultures helps deliver what many investors want: access to global investment opportunities and consistent, risk-adjusted performance.

Our portfolio management teams make on-site visits to hundreds of companies each month, then construct selective portfolios with an emphasis on their best ideas. Our teams also have access to Goldman, Sachs & Co.’s Global Investment Research Department.

In this, our institutional heritage is clear. Institutions, as well as many individual investors, often look to us to manage the risks of global investing over time in different market environments.
To learn more about the Goldman Sachs Funds, call your investment professional today.
4
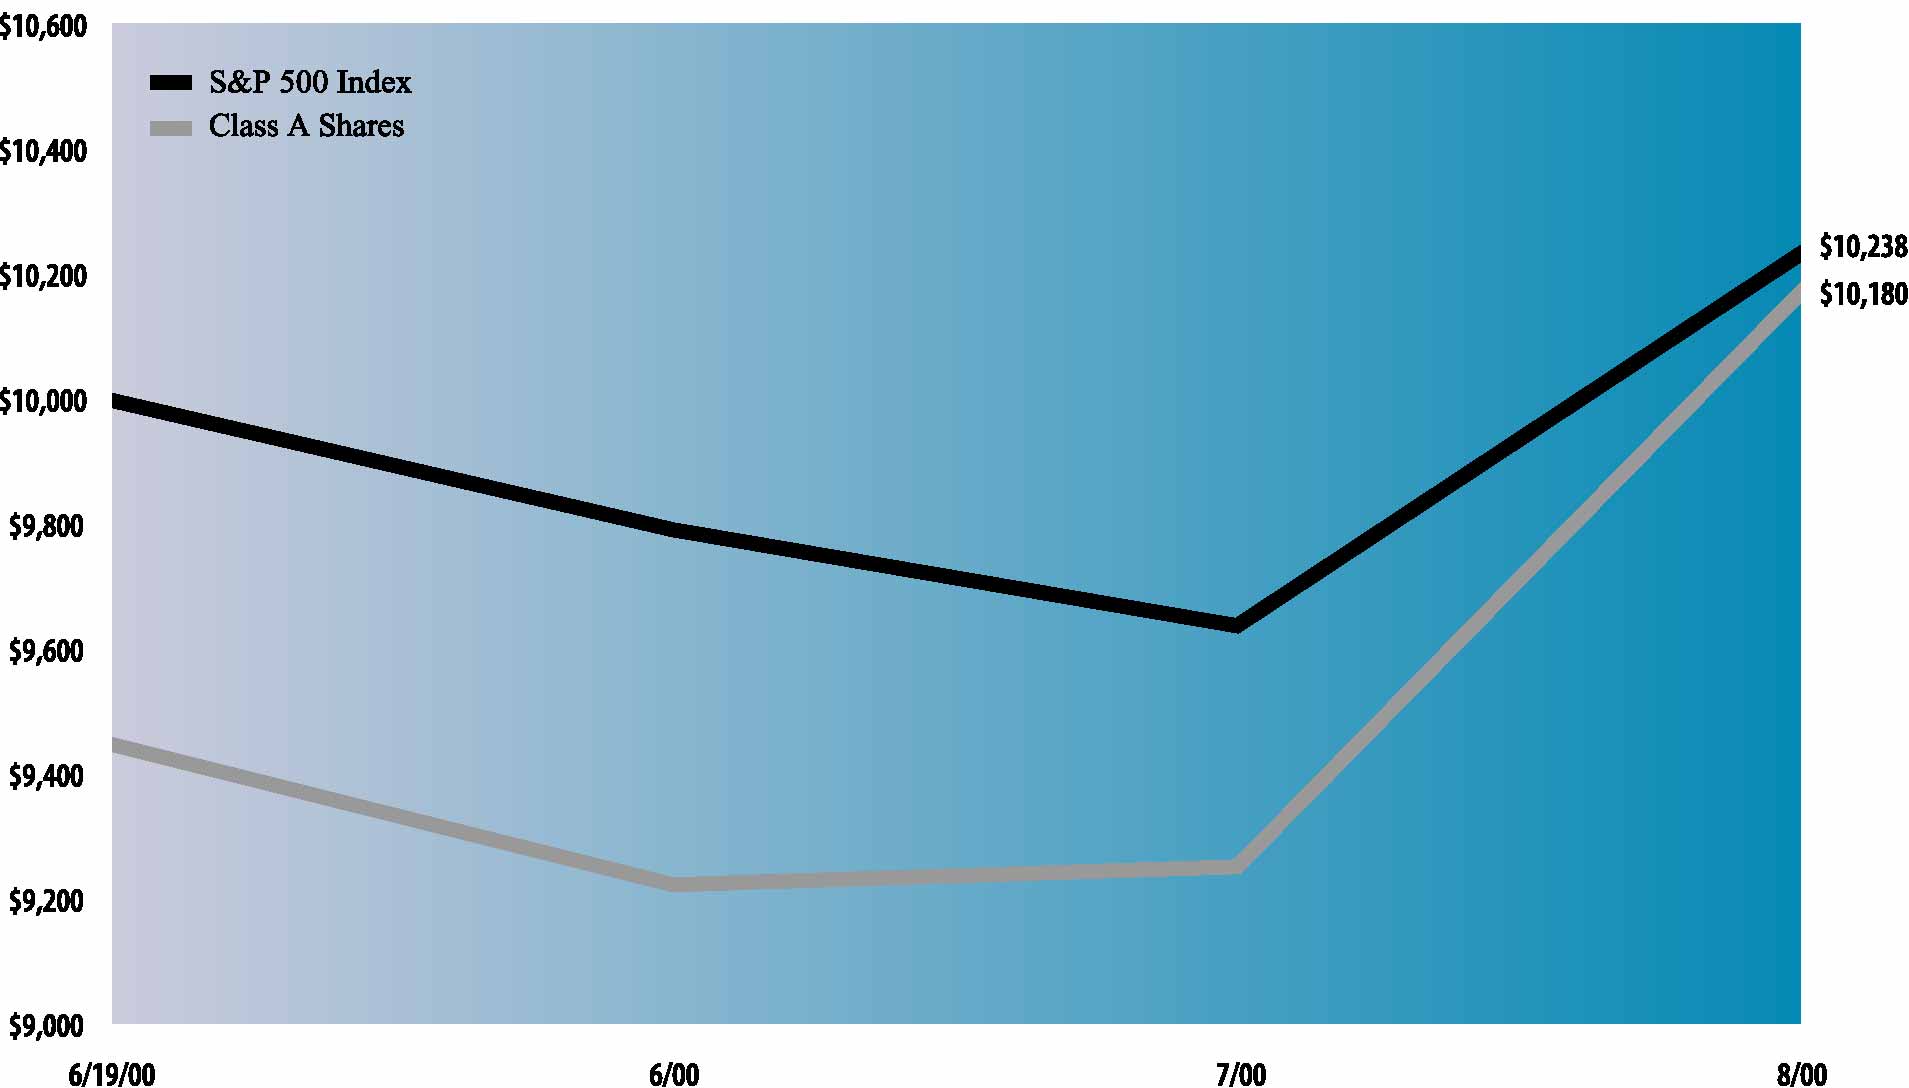
| The following graph shows the value, as of August 31, 2000, of a $10,000 investment made on June 19, 2000 (commencement of
operations) in Class A Shares (maximum sales charge of 5.5%) of the Goldman Sachs Research Select Fund. For comparative purposes, the performance of the Fund’s benchmark, the Standard and Poor’s 500 Index with dividend reinvestment (“S&
P 500 Index”), is shown. This performance data represents past performance and should not be considered indicative of future performance which will fluctuate with changes in market conditions. These performance fluctuations will cause an
investor’s shares, when redeemed, to be worth more or less than their original cost. Performance of Class B, Class C, Institutional and Service shares will vary from Class A due to differences in fees and loads.
|
| Research Select Fund’s Lifetime Performance
|
| Growth of a $10,000 Investment, Distributions reinvested June 19, 2000 to August 31, 2000
|
 |
| Aggregate Total Return through August 31, 2000 | Since Inception (a) | ||
|---|---|---|---|
| Class A (commenced June 19, 2000) | |||
| Excluding sales charges | 7.70% | ||
| Including sales charges | 1.80% | ||
| Class B (commenced June 19, 2000) | |||
| Excluding contingent deferred sales charges | 7.60% | ||
| Including contingent deferred sales charges | 2.60% | ||
| Class C (commenced June 19, 2000) | |||
| Excluding contingent deferred sales charges | 7.70% | ||
| Including contingent deferred sales charges | 6.70% | ||
| Institutional Class (commenced June 19, 2000) | 7.80% | ||
| Service Class (commenced June 19, 2000) | 7.70% | ||
(a)
|
Not annualized.
|
| Shares | Description | Value | ||||
|---|---|---|---|---|---|---|
| Common Stocks – 98.8% | ||||||
| Banks – 6.4% | ||||||
| 290,233 | Citigroup, Inc. | $ 16,942,371 | ||||
| 709,300 | Firstar Corp. | 16,934,537 | ||||
| 33,876,908 | ||||||
| Computer Hardware – 3.2% | ||||||
| 247,100 | Cisco Systems, Inc.* | 16,957,237 | ||||
| Computer Software – 10.0% | ||||||
| 246,000 | Amdocs Ltd.* | 17,573,625 | ||||
| 125,000 | International Business Machines,
Inc. |
16,500,000 | ||||
| 145,000 | Rational Software Corp.* | 18,659,687 | ||||
| 52,733,312 | ||||||
| Drugs – 3.1% | ||||||
| 233,100 | Merck & Co., Inc. | 16,287,863 | ||||
| Electrical Equipment – 6.4% | ||||||
| 186,500 | Comverse Technology, Inc.* | 17,146,344 | ||||
| 254,500 | Teradyne, Inc. ~ | 16,494,781 | ||||
| 33,641,125 | ||||||
| Electrical Utilities – 3.3% | ||||||
| 175,800 | Calpine Corp.* | 17,404,200 | ||||
| Energy Resources – 9.6% | ||||||
| 267,700 | Anadarko Petroleum Corp. | 17,606,629 | ||||
| 191,900 | Enron Corp. | 16,287,512 | ||||
| 362,300 | The Williams Cos., Inc. | 16,688,444 | ||||
| 50,582,585 | ||||||
| Entertainment – 3.1% | ||||||
| 246,300 | Viacom, Inc. Class B* | 16,579,069 | ||||
| Financial Services – 9.5% | ||||||
| 288,900 | General Electric Co. | 16,954,819 | ||||
| 345,400 | Household International, Inc. | 16,579,200 | ||||
| 476,600 | MBNA Corp. | 16,829,937 | ||||
| 50,363,956 | ||||||
| Industrial Parts – 6.4% | ||||||
| 298,400 | Tyco International Ltd. | 17,008,800 | ||||
| 271,800 | United Technologies Corp. | 16,970,512 | ||||
| 33,979,312 | ||||||
| Information Services – 3.2% | ||||||
| 350,400 | First Data Corp. | 16,709,700 | ||||
| Media – 9.0% | ||||||
| 749,800 | AT&T Corp.-Liberty Media Corp.* | 16,026,975 | ||||
| 241,800 | Cablevision Systems Corp.* | 16,261,050 | ||||
| 210,200 | Clear Channel Communications,
Inc.* |
15,213,225 | ||||
| 47,501,250 | ||||||
| Medical Products – 3.3% | ||||||
| 255,000 | Guidant Corp.* | 17,164,687 | ||||
| Shares | Description | Value | |||
|---|---|---|---|---|---|
| Common Stocks – (continued) | |||||
| Oil Services – 3.1% | |||||
| 192,200 | Schlumberger Ltd. | $ 16,397,063 | |||
| Property Insurance – 3.2% | |||||
| 189,450 | American International Group, Inc. | 16,884,731 | |||
| Security/Asset Management – 3.2% | |||||
| 442,200 | The Charles Schwab Corp. | 16,886,513 | |||
| Semiconductors – 3.2% | |||||
| 238,500 | Linear Technology Corp. | 17,157,094 | |||
| Telephone – 3.0% | |||||
| 458,200 | NEXTLINK Communications, Inc.* | 16,065,638 | |||
| Tobacco – 3.1% | |||||
| 550,300 | Philip Morris Cos., Inc. | 16,302,638 | |||
| Wireless – 3.5% | |||||
| 335,500 | Nextel Communications, Inc.* | 18,599,281 | |||
| TOTAL COMMON STOCKS | |||||
| (Cost $485,166,741) | $ 522,074,162 | ||||
| Principal
Amount |
Interest
Rate |
Maturity
Date |
Value | |||||
|---|---|---|---|---|---|---|---|---|
| Repurchase Agreement – 0.3% | ||||||||
| Joint Repurchase Agreement Account II Ù | ||||||||
| $1,400,000 | 6.66 | % | 09/01/2000 | $ 1,400,000 | ||||
| TOTAL REPURCHASE AGREEMENT | ||||||||
| (Cost $1,400,000) | $ 1,400,000 | |||||||
| TOTAL INVESTMENTS | ||||||||
| (Cost $486,566,741) | $523,474,162 | |||||||
*
|
Non-income producing security.
|
|
~
|
Common stock rights attached to this security.
|
Ù
|
Joint repurchase agreement was entered into on August 31, 2000.
|
| The percentage shown for each investment category reflects the value of investments in that category as a percentage of total net
assets.
|
| Assets: | |||||
| Investment in securities, at value (identified cost $486,566,741) | $523,474,162 | ||||
| Cash | 143,252 | ||||
| Receivables: | |||||
| Fund shares sold | 30,897,499 | ||||
| Reimbursement from adviser | 225,383 | ||||
| Dividends and interest | 192,966 | ||||
| Total assets | 554,933,262 | ||||
| Liabilities: | |||||
| Payables: | |||||
| Investment securities purchased | 25,288,101 | ||||
| Amounts owed to affiliates | 651,715 | ||||
| Fund shares repurchased | 299,149 | ||||
| Accrued expenses and other liabilities | 313,880 | ||||
| Total liabilities | 26,552,845 | ||||
| Net Assets: | |||||
| Paid-in capital | 492,745,518 | ||||
| Accumulated net realized loss on investment transactions | (1,272,522 | ) | |||
| Net unrealized gain on investments | 36,907,421 | ||||
| NET ASSETS | $528,380,417 | ||||
| Net asset value, offering and redemption price per share: (a) | |||||
| Class A | $10.77 | ||||
| Class B | $10.76 | ||||
| Class C | $10.77 | ||||
| Institutional | $10.78 | ||||
| Service | $10.78 | ||||
| Shares outstanding: | |||||
| Class A | 20,219,850 | ||||
| Class B | 18,717,945 | ||||
| Class C | 8,952,835 | ||||
| Institutional | 1,175,807 | ||||
| Service | 1,120 | ||||
| Total shares outstanding, $.001 par value (unlimited number of shares authorized) | 49,067,557 | ||||
(a)
|
Maximum public offering price per share (NAV per share multiplied by 1.0582) for Class A shares is $11.40. At redemption, Class B
and Class C shares may be subject to a contingent deferred sales charge, assessed on the amount equal to the lesser of the current net asset value or the original purchase price of the shares.
|
| Investment income: | ||||
| Dividends | $ 281,053 | |||
| Interest | 9,836 | |||
| Total income | 290,889 | |||
| Expenses: | ||||
| Management fees | 623,564 | |||
| Distribution and Service fees (b) | 411,466 | |||
| Registration fees | 235,877 | |||
| Transfer Agent fees (c) | 116,932 | |||
| Printing fees | 97,136 | |||
| Custodian fees | 27,025 | |||
| Professional fees | 18,000 | |||
| Other | 7,582 | |||
| Total expenses | 1,537,582 | |||
| Less — expense reductions | (345,712 | ) | ||
| Net expenses | 1,191,870 | |||
| NET INVESTMENT LOSS | (900,981 | ) | ||
| Realized and unrealized gain (loss) on investment transactions: | ||||
| Net realized loss from investment transactions | (1,272,522 | ) | ||
| Net unrealized gain on investments | 36,907,421 | |||
| Net realized and unrealized gain on investment transactions | 35,634,899 | |||
| NET INCREASE IN NET ASSETS RESULTING FROM OPERATIONS | $34,733,918 | |||
(a)
|
Commencement date of operations was June 19, 2000 for all share classes.
|
(b)
|
Class A, Class B and Class C had Distribution and Service fees of $67,271, $237,495 and $106,700, respectively.
|
(c)
|
Class A, Class B, Class C, Institutional Class and Service Class had Transfer Agent fees of $51,124, $45,123, $20,273, $411 and
$1, respectively.
|
| From operations: | ||||
| Net investment loss | $ (900,981 | ) | ||
| Net realized loss on investment transactions | (1,272,522 | ) | ||
| Unrealized gain on investments | 36,907,421 | |||
| Net increase in net assets resulting from operations | 34,733,918 | |||
| From share transactions: | ||||
| Proceeds from sales of shares | 503,337,356 | |||
| Cost of shares repurchased | (9,690,857 | ) | ||
| Net increase in net assets resulting from share transactions | 493,646,499 | |||
| TOTAL INCREASE | 528,380,417 | |||
| Net assets: | ||||
| Beginning of period | — | |||
| End of period | $528,380,417 | |||
| Accumulated net investment loss | — | |||
(a)
|
Commencement date of operations was June 19, 2000 for all share classes.
|
| 1. ORGANIZATION
|
| Goldman Sachs Trust (the “Trust”) is a Delaware business trust registered under the Investment Company Act of 1940 (as
amended) as an open-end management investment company. The Trust includes the Goldman Sachs Research Select Fund (the “Fund”). The Fund is a diversified portfolio offering five classes of shares — Class A, Class B, Class C,
Institutional and Service.
|
| 2. SIGNIFICANT ACCOUNTING POLICIES
|
| The following is a summary of the significant accounting policies consistently followed by the Fund. The preparation of financial
statements in conformity with generally accepted accounting principles requires management to make estimates and assumptions that may affect the reported amounts. Actual results could differ from those estimates.
|
| A. Investment Valuation — Investments in
securities traded on a U.S. or foreign securities exchange or the NASDAQ system are valued daily at their last sale price on the principal exchange on which they are traded. If no sale occurs, securities are valued at the last bid price. Debt securities
are valued at prices supplied by independent pricing services, broker/dealer-supplied valuations or matrix pricing systems. Unlisted equity and debt securities for which market quotations are available are valued at the last sale price on valuation date,
or if no sale occurs, at the last bid price. Short-term debt obligations maturing in sixty days or less are valued at amortized cost, which approximates market value. Securities for which quotations are not readily available are valued at fair value using
methods approved by the Board of Trustees of the Trust.
|
| B. Security Transactions and Investment Income — Security transactions are recorded as of the trade date. Realized gains and losses on sales of portfolio securities are calculated using the identified-cost basis. Dividend income is recorded on the ex-dividend date, net of foreign withholding taxes
where applicable. Dividends for which the Fund has the choice to receive either cash or stock are recognized as investment income in an amount equal to the cash dividend. Interest income is recorded on the basis of interest accrued, premium amortized and
discount earned.
|
| Net investment income (other than class specific-expenses) and unrealized and
realized gains or losses are allocated daily to each class of shares of the Fund based upon the relative proportion of net assets of each class.
|
| C. Segregation Transactions — The Fund may
enter into certain derivative transactions to seek to increase total return. Forward foreign currency exchange contracts, futures contracts, written options, when-issued securities and forward commitments represent examples of such transactions. As a
result of entering into these transactions, the Fund is required to segregate liquid assets on the accounting records equal to or greater than the market value of the corresponding transactions.
|
| D. Federal Taxes — It is the Fund’s
policy to comply with the requirements of the Internal Revenue Code applicable to regulated investment companies and to distribute each year substantially all of its investment company taxable income and capital gains to its shareholders. Accordingly, no
federal tax provision is required. Income and capital gains distributions, if any, are declared and paid annually.
|
| The characterization of distributions to shareholders for financial reporting
purposes is determined in accordance with income tax rules. Therefore, the source of the Fund’s distributions may be shown in the accompanying financial statements as either from or in excess of net investment income or net realized gain on
investment transactions, or from paid-in capital, depending on the type of book/tax differences that may exist.
|
| At August 31, 2000, the aggregate cost of portfolio securities for federal income
tax purposes is $487,502,094. Accordingly, the gross unrealized gain on investments was $43,743,330 and the gross unrealized loss on investments was $7,771,262 resulting in a net unrealized gain of $35,972,068.
|
| 2. SIGNIFICANT ACCOUNTING POLICIES (continued)
|
| E. Expenses — Expenses incurred by the
Trust that do not specifically relate to an individual Fund of the Trust are allocated to the Funds on a straight-line or pro rata basis depending upon the nature of the expense.
|
| Class A, Class B and Class C Shares bear all expenses and fees relating to their
respective Distribution and Service Plans. Shareholders of Service Shares bear all expenses and fees paid to service organizations. Each class of shares of the Fund separately bears its respective class-specific Transfer Agency fees.
|
| F. Repurchase Agreements — Repurchase
agreements involve the purchase of securities subject to the seller’s agreement to repurchase them at a mutually agreed upon date and price.
|
| During the term of a repurchase agreement, the value of
the underlying securities, including accrued interest, is required to equal or exceed the value of the repurchase agreement. The underlying securities for all repurchase agreements are held in safekeeping at the Fund’s custodian.
|
| 3. AGREEMENTS
|
| Pursuant to the Investment Management Agreement (the “Agreement”), Goldman Sachs Asset Management (“GSAM”), a
unit of the Investment Management Division of Goldman, Sachs & Co. (“Goldman Sachs”), serves as the investment adviser to the Fund. Under the Agreement, the adviser, subject to the general supervision of the Trust’s Board of Trustees,
manages the Fund’s portfolio. As compensation for the services rendered pursuant to the Agreement, the assumption of the expenses related thereto and administering the Fund’s business affairs, including providing facilities, the adviser is
entitled to a fee, computed daily and payable monthly, at an annual rate equal to 1.00% of the average daily net assets of the Fund.
|
| The adviser has voluntarily agreed to limit certain “Other Expenses” of
the Fund (excluding Management fees, Distribution and Service fees, Transfer Agent fees, taxes, interest, brokerage, litigation, Service Share fees, indemnification costs and other extraordinary expenses) to the extent such expenses exceed, on an annual
basis, 0.06% of the average daily net assets of the Fund.
|
| For the period ended August 31, 2000, the adviser reimbursed approximately
$344,000. In addition, the Fund has entered into certain offset arrangements with the custodian resulting in a reduction in the Fund’s expenses. For the period ended August 31, 2000, custody fees were reduced by approximately $2,000.
|
| The Trust, on behalf of the Fund, has adopted Distribution and Service Plans.
Under the Distribution and Service Plans, Goldman Sachs and/or authorized dealers are entitled to a monthly fee from the Fund for distribution and shareholder maintenance services equal, on an annual basis, to 0.25%, 1.00% and 1.00% of the Fund’s
average daily net assets attributable to Class A, Class B and Class C Shares, respectively.
|
| Goldman Sachs serves as the distributor of shares of the Fund pursuant to
Distribution Agreements. Goldman Sachs may receive a portion of the Class A sales load and Class B and Class C contingent deferred sales charges and has advised the Fund that it retained approximately $951,000 for the period ended August 31, 2000.
|
| Goldman Sachs also serves as the Transfer Agent of the Fund for a fee. The fees
charged for such transfer agency services are calculated daily and payable monthly at an annual rate as follows: 0.19% of the average daily net assets for Class A, Class B and Class C Shares and 0.04% of the average daily net assets for Institutional and
Service Shares.
|
| The Trust, on behalf of the Fund, has adopted a Service Plan. This Plan allows for
Service Shares to compensate service organizations for providing varying levels of account administration and shareholder liaison services to their customers who are beneficial owners of such shares. The Service Plan provides for compensation to the
service organizations in an amount up to 0.50% (on an annualized basis), of the average daily net asset value of the Service Shares.
|
| As of August 31, 2000, the amounts owed to affiliates were approximately $352,000,
$234,000, and $66,000 for Management, Distribution and Service, and Transfer Agent fees, respectively.
|
| 4. PORTFOLIO SECURITIES TRANSACTIONS
|
| The cost of purchases and proceeds of sales and maturities of securities (excluding short-term investments) for the period ended
August 31, 2000, were $504,234,877 and $17,795,614, respectively.
|
| For the period ended August 31, 2000, Goldman Sachs earned approximately $20,000
of brokerage commissions from portfolio transactions.
|
| 5. LINE OF CREDIT FACILITY
|
| The Fund participates in a $350,000,000 committed, unsecured revolving line of credit facility. Under the most restrictive
arrangement, the Fund must own securities having a market value in excess of 400% of the total bank borrowings. This facility is to be used solely for temporary or emergency purposes. The interest rate on borrowings is based on the Federal Funds rate. The
committed facility also requires a fee to be paid by the Fund based on the amount of the commitment. During the period ended August 31, 2000, the Fund did not have any borrowings under this facility.
|
| 6. JOINT REPURCHASE AGREEMENT ACCOUNT
|
| The Fund, together with other registered investment companies having management agreements with GSAM or its affiliates, transfers
uninvested cash into joint accounts, the daily aggregate balance of which is invested in one or more repurchase agreements.
|
| At August 31, 2000, the Fund had an undivided interest in the repurchase
agreements in the joint account which equaled $1,400,000 in principal amount. At August 31, 2000, the following repurchase agreements held in this joint account were fully collateralized by Federal Agency obligations:
|
| Repurchase Agreements | Principal
Amount |
Interest
Rate |
Maturity
Date |
Amortized
Cost |
Maturity
Value |
|||||||
|---|---|---|---|---|---|---|---|---|---|---|---|---|
| ABN/AMRO, Inc. | $ 814,100,000 | 6.66 | % | 09/01/2000 | $ 814,100,000 | $ 814,250,608 | ||||||
| Banc of America Securities LLC | 900,000,000 | 6.67 | 09/01/2000 | 900,000,000 | 900,166,750 | |||||||
| Barclays Capital, Inc. | 500,000,000 | 6.67 | 09/01/2000 | 500,000,000 | 500,092,639 | |||||||
| Bear Stearns Companies, Inc. | 300,000,000 | 6.67 | 09/01/2000 | 300,000,000 | 300,055,583 | |||||||
| Chase Securities, Inc. | 450,000,000 | 6.67 | 09/01/2000 | 450,000,000 | 450,083,375 | |||||||
| Donaldson, Lufkin & Jenrette, Inc. | 1,000,000,000 | 6.67 | 09/01/2000 | 1,000,000,000 | 1,000,185,278 | |||||||
| J.P. Morgan & Co., Inc. | 800,000,000 | 6.65 | 09/01/2000 | 800,000,000 | 800,147,778 | |||||||
| Morgan Stanley Dean Witter & Co. | 750,000,000 | 6.65 | 09/01/2000 | 750,000,000 | 750,138,542 | |||||||
| Morgan Stanley Dean Witter & Co. | 300,000,000 | 6.60 | 09/01/2000 | 300,000,000 | 300,055,000 | |||||||
| UBS Warburg LLC | 800,000,000 | 6.65 | 09/01/2000 | 800,000,000 | 800,147,778 | |||||||
| TOTAL JOINT REPURCHASE AGREEMENT ACCOUNT II | $6,614,100,000 | $6,615,323,331 | ||||||||||
| 7. SUMMARY OF SHARE TRANSACTIONS
|
| Share activity is as follows:
|
| For the Period
Ended August 31, 2000 (a) |
|||||||
|---|---|---|---|---|---|---|---|
| Shares | Dollars | ||||||
| |
|||||||
| Class A Shares | |||||||
| Shares sold | 20,575,834 | $206,719,550 | |||||
| Shares repurchased | (355,984 | ) | (3,608,374 | ) | |||
| |
|||||||
| 20,219,850 | 203,111,176 | ||||||
| |
|||||||
| Class B Shares | |||||||
| Shares sold | 18,789,070 | 188,934,348 | |||||
| Shares repurchased | (71,125 | ) | (724,005 | ) | |||
| |
|||||||
| 18,717,945 | 188,210,343 | ||||||
| |
|||||||
| Class C Shares | |||||||
| Shares sold | 8,987,442 | 90,662,633 | |||||
| Shares repurchased | (34,607 | ) | (356,002 | ) | |||
| |
|||||||
| 8,952,835 | 90,306,631 | ||||||
| |
|||||||
| Institutional Shares | |||||||
| Shares sold | 1,676,491 | 17,008,949 | |||||
| Shares repurchased | (500,684 | ) | (5,002,476 | ) | |||
| |
|||||||
| 1,175,807 | 12,006,473 | ||||||
| |
|||||||
| Service Shares | |||||||
| Shares sold | 1,120 | 11,876 | |||||
| |
|||||||
| 1,120 | 11,876 | ||||||
| |
|||||||
| NET INCREASE | 49,067,557 | $493,646,499 | |||||
| |
|||||||
(a)
|
Commencement date of operations was June 19, 2000 for all share classes.
|
| 8. CERTAIN RECLASSIFICATIONS
|
| In accordance with AICPA Statement of Position 93-2, the Fund has reclassified $900,981 from paid-in capital to accumulated net
investment loss. This reclassification has no impact on the net asset value of the Fund and is designed to present the Fund’s capital accounts on a tax basis. Reclassifications result primarily from the difference in the tax treatment of foreign
currency, net operating losses and organization costs.
|
| Income from
investment operations |
|||||||||||||
|---|---|---|---|---|---|---|---|---|---|---|---|---|---|
| Net asset
value, beginning of period |
Net
investment loss (c) |
Net realized
and unrealized gain |
Total
from investment operations |
||||||||||
| FOR THE PERIOD ENDED AUGUST 31, | |||||||||||||
| 2000 - Class A Shares (commenced June 19, 2000) | $10.00
|
$(0.02 | ) | $0.79
|
$0.77
|
||||||||
| 2000 - Class B Shares (commenced June 19, 2000) | 10.00
|
(0.04 | ) | 0.80
|
0.76
|
||||||||
| 2000 - Class C Shares (commenced June 19, 2000) | 10.00
|
(0.04 | ) | 0.81
|
0.77
|
||||||||
| 2000 - Institutional Shares (commenced June 19, 2000) | 10.00
|
(0.01 | ) | 0.79
|
0.78
|
||||||||
| 2000 - Service Shares (commenced June 19, 2000) | 10.00
|
(0.02 | ) | 0.80
|
0.78
|
||||||||
| |
|||||||||||||
(a)
|
Assumes investment at the net asset value at the beginning of the period, reinvestment of all dividends and distributions, a
complete redemption of the investment at the net asset value at the end of the period and no sales or redemption charges. Total return would be reduced if a sales or redemption charge were taken into account. Total returns for periods less than one full
year are not annualized.
|
(b)
|
Annualized.
|
(c)
|
Calculated based on the average shares outstanding methodology.
|
|
Ratios assuming no expense reductions |
||||||||||||||||||||
|---|---|---|---|---|---|---|---|---|---|---|---|---|---|---|---|---|---|---|---|---|
| Net asset
value, end of period |
Total
return (a) |
Net assets
at end of period (in 000s) |
Ratio of
net expenses to average net assets (b) |
Ratio of
net investment loss to average net assets (b) |
Ratio of
expenses to average net assets (b) |
Ratio of
net investment loss to average net assets (b) |
Portfolio
turnover rate |
|||||||||||||
| $10.77 | 7.70 | % | $217,861 | 1.50 | % | (1.04 | )% | 2.05 | % | (1.59 | )% | 5.04% | ||||||||
| 10.76 | 7.60 | 201,437 | 2.25 | (1.79 | ) | 2.80 | (2.34 | ) | 5.04 | |||||||||||
| 10.77 | 7.70 | 96,393 | 2.25 | (1.78 | ) | 2.80 | (2.33 | ) | 5.04 | |||||||||||
| 10.78 | 7.80 | 12,677 | 1.10 | (0.50 | ) | 1.65 | (1.05 | ) | 5.04 | |||||||||||
| 10.78 | 7.70 | 12 | 1.60 | (1.13 | ) | 2.15 | (1.68 | ) | 5.04 | |||||||||||
| To the Shareholders and Board of Trustees of
Goldman Sachs Trust — Research Select Fund: |
| In our opinion, the accompanying statement of assets and liabilities, including the statement of investments, and the related
statement of operations and of changes in net assets and the financial highlights present fairly, in all material respects, the financial position of Goldman Sachs Research Select Fund (“the Fund”), one of the portfolios constituting Goldman
Sachs Trust, at August 31, 2000, the results of its operations, the changes in its net assets and the financial highlights for the period then ended, in conformity with accounting principles generally accepted in the United States of America. These
financial statements and financial highlights (hereafter referred to as “financial statements”) are the responsibility of the Fund’s management; our responsibility is to express an opinion on these financial statements based on our audit.
We conducted our audit of these financial statements in accordance with auditing standards generally accepted in the United States of America, which require that we plan and perform the audit to obtain reasonable assurance about whether the financial
statements are free of material misstatement. An audit includes examining, on a test basis, evidence supporting the amounts and disclosures in the financial statements, assessing the accounting principles used and significant estimates made by management,
and evaluating the overall financial statement presentation. We believe that our audit, which included confirmation of securities at August 31, 2000 by correspondence with the custodian and brokers, provides a reasonable basis for our opinion.
|
| PricewaterhouseCoopers LLP
|
| Boston, Massachusetts
|
| October 23, 2000
|
GOLDMAN SACHS FUND PROFILE
Goldman Sachs Research Select Fund
An Investment Idea for the Long Term
The Goldman Sachs Research Select Fund capitalizes on the significant resources of Goldman Sachs by combining some of the best ideas of Goldman Sachs Equity Research with the Investment Management Division’s portfolio management expertise.
The Fund consists of 25–35 stocks that the Goldman Sachs U.S. Stock Selection Committee believes will perform the best over the next 12–18 months within the context of a focused, well-structured equity portfolio.
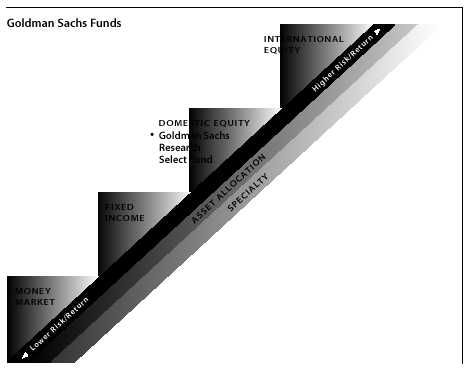
Target Your Needs
The Goldman Sachs Research Select Fund has a distinct investment objective and a defined place on the risk/return spectrum. As your investment objectives change, you can exchange shares within the Goldman Sachs Funds without an additional charge.* (Please note: in general, greater returns are associated with greater risk.)
For More Information
To learn more about the Goldman Sachs Research Select Fund and other Goldman Sachs Funds, please call your investment professional today.
*The exchange privilege is subject to termination and its terms are subject to change.
Goldman Sachs Research Select Fund is a service mark of Goldman, Sachs & Co.

|
|