
|
|
|
|
|
|
|
|
|
|
Previous: TREASURERS FUND INC /MD/, N-30D, 2001-01-04 |
Next: SOTHEBYS HOLDINGS INC, SC 13D/A, 2001-01-04 |
| Prospectus
|
December 29, 2000
GOLDMAN SACHS INTERNATIONAL EQUITY FUNDS

THE SECURITIES AND EXCHANGE COMMISSION HAS NOT APPROVED OR DISAPPROVED THESE SECURITIES OR PASSED UPON THE ADEQUACY OF THIS PROSPECTUS. ANY REPRESENTATION TO THE CONTRARY IS A CRIMINAL OFFENSE.
| AN INVESTMENT IN A FUND IS NOT A BANK DEPOSIT AND IS NOT INSURED BY THE FEDERAL DEPOSIT INSURANCE CORPORATION OR ANY OTHER
GOVERNMENT AGENCY. AN INVESTMENT IN A FUND INVOLVES INVESTMENT RISKS, INCLUDING POSSIBLE LOSS OF PRINCIPAL.
|
n
|
Goldman Sachs
CORE
SM
International Equity Fund
|
n
|
Goldman Sachs
International Equity Fund
|
n
|
Goldman Sachs
European Equity Fund
|
n
|
Goldman Sachs
Japanese Equity Fund
|
n
|
Goldman Sachs
International Growth Opportunities Fund (formerly International Small Cap Fund)
|
n
|
Goldman Sachs
Emerging Markets Equity Fund
|
n
|
Goldman Sachs
Asia Growth Fund |

| NOT FDIC-INSURED
|
May Lose Value
|
No Bank Guarantee
|
| Goldman Sachs Asset Management, a unit of the Investment Management Division of Goldman, Sachs & Co. (“Goldman
Sachs”), serves as investment adviser to the CORE International Equity Fund. Goldman Sachs Asset Management International serves as investment adviser to International Equity, European Equity, Japanese Equity, International Growth Opportunities,
Emerging Markets Equity and Asia Growth Funds. Goldman Sachs Asset Management and Goldman Sachs Asset Management International are each referred to in this Prospectus as the “Investment Adviser.”
|
| ACTIVE INTERNATIONAL STYLE FUNDS
|
| Goldman Sachs’ Active International Investment Philosophy:
|
| Belief | How the Investment Adviser Acts on Belief | ||
|---|---|---|---|
| n Equity markets are inefficient | Seeks excess return through team driven, research
intensive and bottom-up stock selection. |
||
| n Returns are variable | Seeks to capitalize on variability of market and regional
returns through asset allocation decisions. |
||
| n
Corporate fundamentals
ultimately drive share price |
Seeks to conduct rigorous, first-hand research of business
and company management. |
||
| n A
business’ intrinsic value will be
achieved over time |
Seeks to realize value through a long-term investment
horizon. |
||
| n
Portfolio risk must be carefully
analyzed and monitored |
Seeks to systematically monitor and manage risk through
diversification, multifactor risk models and currency management. |
||
| The Investment Adviser attempts to manage risk in these Funds through disciplined portfolio construction and continual portfolio
review and analysis. As a result, bottom-up stock selection, driven by fundamental research, should be a main driver of returns.
|
| QUANTITATIVE (“CORE”) STYLE FUNDS
|
| Goldman Sachs’ CORE Investment Philosophy:
|
| Goldman Sachs’ quantitative style of funds—CORE—emphasizes the two building blocks of active management: stock
selection and portfolio construction.
|
| I. CORE STOCK SELECTION
|
| The CORE Fund uses the Goldman Sachs proprietary multifactor model (“Multifactor Model”), a rigorous computerized rating
system, to forecast the returns of securities held in the Fund’s portfolio. The Multifactor Model incorporates common variables covering measures of:
|
n
|
Value (How is the company priced relative to fundamental accounting measures?)
|
n
|
Price Momentum (What are medium-term price trends?)
|
n
|
Earnings Momentum (Are company profit expectations growing?)
|
n
|
Stability (How likely is the risk of earnings disappointment?)
|
| All of the above factors are carefully evaluated within the Multifactor Model since each has demonstrated a significant
impact on the performance of the securities and markets they were designed to forecast. Stock selection in this process combines both our quantitative and qualitative analysis.
|
| II. CORE PORTFOLIO CONSTRUCTION
|
| Portfolio risk is monitored with the use of a sophisticated risk model, which measures the portfolio’s exposure to a variety
of risk factors and estimates the associated volatility. In this process, the Investment Adviser manages risk by attempting to limit deviations from the benchmark and by attempting to run a size and sector neutral portfolio. A computer optimizer evaluates many different security combinations (considering many possible weightings) in an effort to construct the most efficient risk/return portfolio given each CORE Fund benchmark. In addition, the CORE International
Equity Fund utilizes proprietary quantitative models to allocate assets across countries.
|
| Goldman Sachs CORE Funds are fully invested, broadly diversified and offer consistent overall portfolio characteristics. They may
serve as good foundations on which to build a portfolio.
|
| FUND FACTS
|
|
| Objective:
|
Long-term growth of capital
|
| Benchmark:
|
MSCI® Europe, Australasia, Far East (“EAFE®”) Index (unhedged)
|
| Investment Focus:
|
Large-capitalization equity securities of companies that are organized outside the United States or whose securities are primarily traded outside
the United States
|
| Investment Style:
|
Quantitative
|
| INVESTMENT OBJECTIVE
|
| The Fund seeks long-term growth of capital. The Fund seeks this objective through a broadly diversified portfolio of equity
securities of large-cap companies that are organized outside the United States or whose securities are principally traded outside the United States.
|
| PRINCIPAL INVESTMENT STRATEGIES
|
| Equity Securities. The Fund invests, under normal circumstances, at least 90% of its total assets in equity securities of companies that are organized outside the United States or whose securities are principally traded outside the United States.
|
| The Fund may allocate its assets among countries as determined by the Investment Adviser from time to time, provided the Fund’
s assets are invested in at least three foreign countries. The Fund may invest in the securities of issuers in countries with emerging markets or economies (“emerging countries”).
|
| The Fund seeks broad representation of large-cap issuers across major countries and sectors of the international economy. The
Fund’s investments are selected using both a variety of quantitative techniques and fundamental research in seeking to maximize the Fund’s expected return, while maintaining risk, style, capitalization and industry characteristics similar to the
EAFE® Index. In addition, the Fund seeks a portfolio composed of companies with attractive valuations and stronger momentum characteristics than the EAFE® Index.
|
| Other.
The Fund’s investments in fixed-income securities are limited to securities that are considered to be cash equivalents.
|
| FUND FACTS
|
|
| Objective:
|
Long-term capital appreciation
|
| Benchmark:
|
MSCI® EAFE® Index (unhedged)
|
| Investment Focus:
|
Equity securities of companies organized outside the United States or whose securities are principally traded outside the United States
|
| Investment Style:
|
Active International
|
| INVESTMENT OBJECTIVE
|
| The Fund seeks long-term capital appreciation.
|
| PRINCIPAL INVESTMENT STRATEGIES
|
| Equity Securities. The Fund invests, under normal circumstances, substantially all, and at least 65% of its total assets in equity securities of companies that are organized outside the United States or whose securities are principally traded outside the United States. The
Fund intends to invest in companies with public stock market capitalizations that are larger than $1 billion at the time of investment.
|
| The Fund may allocate its assets among countries as determined by the Investment Adviser from time to time provided that the
Fund’s assets are invested in at least three foreign countries.
|
| The Fund expects to invest a substantial portion of its assets in the securities of issuers located in the developed countries of
Western Europe and in Japan. However, the Fund may also invest in the securities of issuers located in Australia, Canada, New Zealand and in emerging countries. Currently, emerging countries include, among others, most Latin American, African, Asian and
Eastern European nations.
|
| Other.
The Fund may also invest up to 35% of its total assets in fixed-income securities, such as government, corporate and bank debt obligations.
|
| FUND FACTS
|
|
| Objective:
|
Long-term capital appreciation
|
| Benchmark:
|
MSCI® Europe Index (unhedged)
|
| Investment Focus:
|
Equity securities of European companies
|
| Investment Style:
|
Active International
|
| INVESTMENT OBJECTIVE
|
| The Fund seeks long-term capital appreciation.
|
| PRINCIPAL INVESTMENT STRATEGIES
|
| Equity Securities. The Fund invests, under normal circumstances, substantially all, and at least 65% of its total assets in equity securities of European companies. Because of its focus, the Fund will be more susceptible to European economic, market, political and local
risks than a fund that is more geographically diversified.
|
| A European issuer is a company that either:
|
n
|
Has a class of its securities whose principal securities markets are in European countries;
|
n
|
Is organized under the laws of, or has a principal office in, a European country;
|
n
|
Derives 50% or more of its total revenue from goods produced, sales made or services provided in one or more of the European
countries; or
|
n
|
Maintains 50% or more of its assets in one or more of the European countries.
|
| The Fund may allocate its assets among different countries as determined by the Investment Adviser from time to time, provided
that the Fund’s assets are invested in at least three European countries. It is currently anticipated that a majority of the Fund’s assets will be invested in the equity securities of large cap companies located in the developed countries of
Western Europe. However, the Fund may also invest, without limit, in mid cap companies and small cap companies, as well as companies located in emerging countries. Currently, emerging countries include among others, most Latin and South American, African,
Asian and Eastern European nations, including the states that formerly comprised the Soviet Union and Yugoslavia.
|
| Other.
The Fund may invest in the aggregate up to 35% of its total assets in equity securities of non-European countries and in fixed-income securities, such as government, corporate and bank debt obligations.
|
| FUND FACTS
|
|
| Objective:
|
Long-term capital appreciation
|
| Benchmark:
|
Tokyo Price Index (“TOPIX”) (unhedged)
|
| Investment Focus:
|
Equity securities of Japanese companies
|
| Investment Style:
|
Active International
|
| INVESTMENT OBJECTIVE
|
| The Fund seeks long-term capital appreciation.
|
| PRINCIPAL INVESTMENT STRATEGIES
|
| Equity Securities. The Fund invests, under normal circumstances, substantially all, and at least 65% of its total assets in equity securities of Japanese companies. A Japanese issuer is a company that either:
|
n
|
Has a class of its securities whose principal securities markets is in Japan;
|
n
|
Is organized under the laws of, or has a principal office in, Japan;
|
n
|
Derives 50% or more of its total revenue from goods produced, sales made or services provided in Japan; or
|
n
|
Maintains 50% or more of its assets in Japan.
|
| The Fund’s concentration in Japanese companies will expose it to the risk of adverse social, political and economic events
which occur in Japan or affect the Japanese markets.
|
| Japan’s economy, the second largest in the world, has grown substantially over the last three decades. Japan’s economic
growth in the 1990’s, however, was substantially below the level of earlier decades, and its economy drifted between modest growth and recession. In calendar year 1998, Japan’s gross national product contracted by 2.8% — its worst
performance in the post-war period. To address this economic downturn, Japan has attempted to implement changes related to high wages and taxes, currency valuations, structural rigidities, political reform and the deregulation of its economy. These
initiatives have, however, resulted in notable uncertainty and loss of public confidence. These conditions present risks to the Japanese Equity Fund and its ability to attain its investment objective.
|
| Japan’s economy is heavily dependent upon international trade, and is especially sensitive to trade barriers and disputes.
In particular, Japan relies on large imports of agricultural products, raw materials and fuels. A substantial rise in world oil or commodity prices, or a fall-off in Japan’s manufactured exports, could be expected to adversely affect Japan’s
economy. In addition, Japan is vulnerable to earthquakes, volcanoes and other natural disasters. Japan’s banking industry has recently suffered from non-performing loans, lower real estate values and lower valuations of securities holdings.
|
| The Japanese securities markets are less regulated than the U.S. markets. Evidence has emerged from time to time of distortion of
market prices to serve political or other purposes. Shareholders’ rights are also not always equally enforced.
|
| For most of the 1990’s, Japanese securities markets experienced significant declines. Although the stock markets exhibited
strength in 1999, they have again generally declined through the first three quarters of 2000.
|
| The common stocks of many Japanese companies have historically traded at high price-earnings ratios. Differences in accounting
methods have made it difficult to compare the earnings of Japanese companies with those of companies in other countries, especially the United States. Reported net income in Japan has been generally understated relative to U.S. accounting standards and
this has been one reason price-earnings ratios of the stocks of Japanese companies have tended historically to be higher than those of U.S. stocks. In addition, Japanese companies have tended to have higher growth rates than U.S. companies, and Japanese
interest rates have generally been lower than U.S. interest rates. These factors have contributed to lower discount rates and higher price-earnings ratios in Japan than in the United States.
|
| Other.
The Fund may invest in the aggregate up to 35% of its total assets in equity securities of non-Japanese companies and in fixed-income securities, such as government, corporate and bank debt obligations.
|
| FUND FACTS
|
|
| Objective:
|
Long-term capital appreciation
|
| Benchmark:
|
MSCI® EAFE® Small Cap Index (unhedged)
|
| Investment Focus:
|
Small-capitalization foreign equity securities
|
| Investment Style:
|
Active International
|
| INVESTMENT OBJECTIVE
|
| The Fund seeks long-term capital appreciation.
|
| PRINCIPAL INVESTMENT STRATEGIES
|
| Equity Securities. The Fund invests, under normal circumstances, substantially all, and at least 65% of its total assets in equity securities of companies:
|
n
|
With public stock market capitalizations (based upon shares available for trading on an unrestricted basis) within $100 million
and $3 billion, at the time of investment; and
|
n
|
That are organized outside the United States or whose securities are principally traded outside the United States.
|
| The Fund seeks to achieve its investment objective by investing in a diversified portfolio of equity securities that are
considered by the Investment Adviser to be strategically positioned for long-term growth.
|
| The Fund may allocate its assets among countries as determined by the Investment Adviser from time to time provided that the
Fund’s assets are invested in at least three foreign countries. The Fund expects to invest a substantial portion of its assets in securities of companies in the developed countries of Western Europe, Japan and Asia. However, the Fund may also invest
in the securities of issuers located in Australia, Canada, New Zealand and in emerging countries. Currently, emerging countries include, among others, most Latin American, African, Asian and Eastern European nations.
|
| Other.
The Fund may invest in the aggregate up to 35% of its total assets in equity securities of companies with public stock market capitalizations outside the range of the market capitalization range stated above at the time of investment and in fixed-income
securities, such as government, corporate and bank debt obligations. If the market capitalization of a company held by the Fund moves outside the range stated above, the Fund may, consistent with its investment objective, continue to hold the security.
|
| FUND FACTS
|
|
| Objective:
|
Long-term capital appreciation
|
| Benchmark:
|
MSCI® Emerging Markets Free Index
|
| Investment Focus:
|
Equity securities of emerging country issuers
|
| Investment Style:
|
Active International
|
| INVESTMENT OBJECTIVE
|
| The Fund seeks long-term capital appreciation.
|
| PRINCIPAL INVESTMENT STRATEGIES
|
| Equity Securities. The Fund invests, under normal circumstances, substantially all, and at least 65% of its total assets in equity securities of emerging country issuers. The Investment Adviser may consider classifications by the World Bank, the International Finance
Corporation or the United Nations and its agencies in determining whether a country is emerging or developed. Currently, emerging countries include, among others, most Latin and South American, African, Asian and Eastern European nations. The Investment
Adviser currently intends that the Fund’s investment focus will be in the following emerging countries as well as any other emerging country to the extent that foreign investors are permitted by applicable law to make such investments:
|
| n Argentina | n Egypt | n Jordan | n Philippines | n Taiwan | ||||
| n Botswana | n Greece | n Kenya | n Poland | n Thailand | ||||
| n Brazil | n Hong Kong | n Malaysia | n Russia | n Turkey | ||||
| n Chile | n Hungary | n Mexico | n Singapore | n Venezuela | ||||
| n China | n India | n Morocco | n South Africa | n Zimbabwe | ||||
| n Colombia | n Indonesia | n Pakistan | n South Korea | |||||
| n Czech Republic | n Israel | n Peru | n Sri Lanka |
| An emerging country issuer is any company that either:
|
n
|
Has a class of its securities whose principal securities market is in an emerging country;
|
n
|
Is organized under the laws of, or has a principal office in, an emerging country;
|
n
|
Derives 50% or more of its total revenue from goods produced, sales made or services provided in one or more emerging countries; or
|
n
|
Maintains 50% or more of its assets in one or more of the emerging countries.
|
| Under normal circumstances, the Fund maintains investments in at least six emerging countries, and will not invest more than 35%
of its total assets in securities of issuers in any one emerging country. Allocation of the Fund’s investments will depend upon the relative attractiveness of the emerging country markets and particular issuers. In addition, macro-economic factors
and the portfolio managers’ and Goldman Sachs economists’ views of the relative attractiveness of emerging countries and currencies are considered in allocating the Fund’s assets among emerging countries.
|
| Other.
The Fund may invest in the aggregate up to 35% of its total assets in (i) fixed-income securities of private and government emerging country issuers; and (ii) equity and fixed-income securities, such as government, corporate and bank debt obligations, of
issuers in developed countries.
|
| FUND FACTS
|
|
| Objective:
|
Long-term capital appreciation
|
| Benchmark:
|
MSCI® All Country Asia Free
ex-Japan Index (unhedged) |
| Investment Focus:
|
Equity securities of companies in Asian countries
|
| Investment Process:
|
Active International
|
| INVESTMENT OBJECTIVE
|
| The Fund seeks long-term capital appreciation.
|
| PRINCIPAL INVESTMENT STRATEGIES
|
| Equity Securities. The Fund invests, under normal circumstances, substantially all, and at least 65% of its total assets in equity securities of Asian issuers.
|
| An Asian issuer is any company that either:
|
n
|
Has a class of its securities whose principal securities markets is in one or more Asian countries;
|
n
|
Is organized under the laws of, or has a principal office in, an Asian country;
|
n
|
Derives 50% or more of its total revenue from goods produced, sales made or services provided in one or more Asian countries; or
|
n
|
Maintains 50% or more of its assets in one or more Asian countries.
|
| The Fund may allocate its assets among the Asian countries as determined from time to time by the Investment Adviser. For purposes
of the Fund’s investment policies, Asian countries are:
|
| n China
n
Hong Kong
n
India
n
Indonesia
|
n Malaysia
n
Pakistan
n
Philippines
n
Singapore
|
n South Korea
n
Sri Lanka
n
Taiwan
n
Thailand
|
| as well as any other country in Asia (other than Japan) to the extent that foreign investors are permitted by applicable law to
make such investments.
|
| Allocation of the Fund’s investments will depend upon the Investment Adviser’s views of the relative attractiveness of
the Asian markets and particular issuers.
|
| Concentration of the Fund’s assets in one or a few of the Asian countries and Asian currencies will subject the Fund to
greater risks than if the Fund’s assets were not so concentrated. For example, on August 31, 2000 (the end of the Fund’s last fiscal year), more than 25% of the Fund’s assets were invested in securities that traded in Hong Kong.
|
| Starting in mid-1997 some Pacific region countries began to experience currency devaluations that resulted in high interest rate
levels and sharp reductions in economic activity. This situation resulted in a significant drop in the securities prices of companies located in the region. Some countries have recently experienced government intervention, have sought assistance from the
International Monetary Fund and have experienced substantial domestic unrest. Although some restructuring has been undertaken, there can be no assurance that these efforts will be successful or that their recent problems will not persist. At the end of
its last fiscal year, a substantial portion of the Asia Growth Fund was invested in securities traded in the Hong Kong market. In 1997, the sovereignty of Hong Kong reverted from the United Kingdom to China. Although Hong Kong is, by law, to maintain a
high degree of autonomy, there can be no assurance that Hong Kong will not be adversely affected by Chinese sovereignty or political developments. Furthermore, the reversion of Hong Kong to China has created additional uncertainty as to future currency
valuations relative to the U.S. dollar. Because the Hong Kong stock market has significant exposure to the property market in Hong Kong, the Fund’s investments could be adversely affected by a decline in that market.
|
| Other.
The Fund may invest in the aggregate up to 35% of its total assets in equity securities of issuers in non-Asian countries and Japan, and in fixed-income securities, such as government, corporate and bank debt obligations.
|
| CORE
International Equity Fund |
International
Equity Fund |
European
Equity Fund |
|||||
|---|---|---|---|---|---|---|---|
| Investment Practices | |||||||
| Borrowings | 33 1
/3
|
33 1
/3
|
33 1
/3
|
||||
| Cross Hedging of Currencies | Ÿ | Ÿ | Ÿ | ||||
| Currency Swaps* | 15 | 15 | 15 | ||||
| Custodial Receipts | Ÿ | Ÿ | Ÿ | ||||
| Equity Swaps* | 15 | 15 | 15 | ||||
| Foreign Currency Transactions | Ÿ | Ÿ | Ÿ | ||||
| Futures Contracts and Options on Futures Contracts | Ÿ | Ÿ | Ÿ | ||||
| Investment Company Securities (including iShares
SM
and Standard & Poor’s Depositary Receipts TM ) |
10 | 10 | 10 | ||||
| Options on Foreign Currencies 1 | Ÿ | Ÿ | Ÿ | ||||
| Options on Securities and Securities Indices 2 | Ÿ | Ÿ | Ÿ | ||||
| Unseasoned Companies | Ÿ | Ÿ | Ÿ | ||||
| Warrants and Stock Purchase Rights | Ÿ | Ÿ | Ÿ | ||||
| Repurchase Agreements | Ÿ | Ÿ | Ÿ | ||||
| Securities Lending | 33 1
/3
|
33 1
/3
|
33 1
/3
|
||||
| Short Sales Against the Box | — | 25 | 25 | ||||
| When-Issued Securities and Forward Commitments | Ÿ | Ÿ | Ÿ | ||||
|
Japanese Equity Fund |
International
Growth Opportunities Fund |
Emerging Markets Equity Fund |
Asia Growth Fund |
||||
|---|---|---|---|---|---|---|---|
| 33 1
/3
|
33 1
/3
|
33 1
/3
|
33 1
/3
|
||||
| Ÿ | Ÿ | Ÿ | Ÿ | ||||
| 15 | 15 | 15 | 15 | ||||
| Ÿ | Ÿ | Ÿ | Ÿ | ||||
| 15 | 15 | 15 | 15 | ||||
| Ÿ | Ÿ | Ÿ | Ÿ | ||||
| Ÿ | Ÿ | Ÿ | Ÿ | ||||
| 10 | 10 | 10 | 10 | ||||
| Ÿ | Ÿ | Ÿ | Ÿ | ||||
| Ÿ | Ÿ | Ÿ | Ÿ | ||||
| Ÿ | Ÿ | Ÿ | Ÿ | ||||
| Ÿ | Ÿ | Ÿ | Ÿ | ||||
| Ÿ | Ÿ | Ÿ | Ÿ | ||||
| 33 1
/3
|
33 1
/3
|
33 1
/3
|
33 1
/3
|
||||
| 25 | 25 | 25 | 25 | ||||
| Ÿ | Ÿ | Ÿ | Ÿ | ||||
Ÿ
|
No specific percentage limitation on usage;
limited only by the objectives and strategies of the Fund |
| CORE
International Equity Fund |
International
Equity Fund |
European
Equity Fund |
|||||
|---|---|---|---|---|---|---|---|
| Investment Securities | |||||||
| American, European and Global Depositary Receipts | Ÿ | Ÿ | Ÿ | ||||
| Asset-Backed and Mortgage-Backed Securities 2 | — | Ÿ | Ÿ | ||||
| Bank Obligations 1 , 2 | Ÿ | Ÿ | Ÿ | ||||
| Convertible Securities | Ÿ | Ÿ | Ÿ | ||||
| Corporate Debt Obligations 2 | Ÿ 4 | Ÿ | Ÿ | ||||
| Equity Securities | 90+ | 65+ | 65+ | ||||
| Emerging Country Securities | 25 | Ÿ | Ÿ | ||||
| Fixed Income Securities 3 | 10 4 | 35 | 35 5 | ||||
| Foreign Securities | Ÿ | Ÿ | Ÿ | ||||
| Foreign Government Securities 2 | Ÿ | Ÿ | Ÿ | ||||
| Non-Investment Grade Fixed Income Securities 2 | — | Ÿ 6 | Ÿ 6 | ||||
| Real Estate Investment Trusts | Ÿ | Ÿ | Ÿ | ||||
| Structured Securities * | Ÿ | Ÿ | Ÿ | ||||
| Temporary Investments | 35 | 100 | 100 | ||||
| U.S. Government Securities 2 | Ÿ | Ÿ | Ÿ | ||||
*
|
Limited to 15% of net assets (together with other illiquid securities) for all structured securities which are not
deemed to be liquid and all swap transactions.
|
1
|
Issued by U.S. or foreign banks.
|
2
|
Limited by the amount the Fund invests in fixed-income securities.
|
3
|
Except as noted under “Non-Investment Grade Fixed Income Securities,” fixed-income securities are investment
grade (e.g., BBB or higher by Standard & Poor’s Rating Group (“Standard & Poor’s”) or Baa or higher by Moody’s Investor’s Service, Inc. (“Moody’s”)).
|
4
|
Cash equivalents only.
|
5
|
The European Equity Fund may invest in the aggregate up to 35% of its total assets in: (1) equity securities of
non-European countries; and (2) fixed-income securities.
|
6
|
May be BB or lower by Standard & Poor’s or Ba or lower by Moody’s.
|
| Japanese
Equity Fund |
International
Growth Opportunities Fund |
Emerging
Markets Equity Fund |
Asia Growth
Fund |
|||||||
|---|---|---|---|---|---|---|---|---|---|---|
| Ÿ | Ÿ | Ÿ | Ÿ | |||||||
| Ÿ | Ÿ | Ÿ | Ÿ | |||||||
| Ÿ | Ÿ | Ÿ | Ÿ | |||||||
| Ÿ | Ÿ | Ÿ | Ÿ | |||||||
| Ÿ | Ÿ | Ÿ | Ÿ | |||||||
| 65 | + | 65+ | 65 | + | 65 | + | ||||
| Ÿ | Ÿ | Ÿ | Ÿ | |||||||
| 35 | 7 | 35 8 | 35 | 9 | 35 | 10 | ||||
| Ÿ | Ÿ | Ÿ | Ÿ | |||||||
| Ÿ | Ÿ | Ÿ | Ÿ | |||||||
| Ÿ | 6 | Ÿ |
Ÿ | 6 | Ÿ | 6 | ||||
| Ÿ | Ÿ | Ÿ | Ÿ | |||||||
| Ÿ | Ÿ | Ÿ | Ÿ | |||||||
| 100 | 100 | 35 | 100 | |||||||
| Ÿ | Ÿ | Ÿ | Ÿ | |||||||
7
|
The Japanese Equity Fund may invest in the aggregate up to 35% of its total assets in: (1) fixed-income securities; and
(2) equity securities of non-Japanese companies.
|
8
|
The International Growth Opportunities Fund may invest in the aggregate up to 35% of its total assets in (1) fixed-income
securities; and (2) equity securities of companies with public stock market capitalizations of less than $100 million or more than $3 billion at the time of investment.
|
9
|
The Emerging Markets Equity Fund may invest in the aggregate up to 35% of its total assets in: (1) fixed-income
securities of private and government emerging country issuers; and (2) equity and fixed-income securities of issuers in developed countries.
|
10
|
The Asia Growth Fund may invest in the aggregate up to 35% of its total assets in: (1) fixed-income securities; and (2)
equity securities of issuers in non-Asian countries and Japan.
|
| CORE
International Equity |
International
Equity |
European
Equity |
Japanese
Equity |
International
Growth Opportunities |
Emerging
Markets Equity |
Asia
Growth |
|||||||||
|---|---|---|---|---|---|---|---|---|---|---|---|---|---|---|---|
| Credit/Default | Ÿ | Ÿ | Ÿ | Ÿ | Ÿ | Ÿ | Ÿ | ||||||||
| Emerging Countries | Ÿ | Ÿ | Ÿ | Ÿ | Ÿ | Ÿ | Ÿ | ||||||||
| Interest Rate | Ÿ | Ÿ | Ÿ | Ÿ | Ÿ | Ÿ | Ÿ | ||||||||
| Small Cap | — | — | Ÿ | — | Ÿ | — | — | ||||||||
| Foreign | Ÿ | Ÿ | Ÿ | Ÿ | Ÿ | Ÿ | Ÿ | ||||||||
| Derivatives | Ÿ | Ÿ | Ÿ | Ÿ | Ÿ | Ÿ | Ÿ | ||||||||
| Management | Ÿ | Ÿ | Ÿ | Ÿ | Ÿ | Ÿ | Ÿ | ||||||||
| Market | Ÿ | Ÿ | Ÿ | Ÿ | Ÿ | Ÿ | Ÿ | ||||||||
| Liquidity | Ÿ | Ÿ | Ÿ | Ÿ | Ÿ | Ÿ | Ÿ | ||||||||
| Stock | Ÿ | Ÿ | Ÿ | Ÿ | Ÿ | Ÿ | Ÿ | ||||||||
| Geographic | — | — | Ÿ | Ÿ | — | Ÿ | — | ||||||||
| Initial Public
Offering (“IPO”) |
— | — | Ÿ | Ÿ | Ÿ | Ÿ | Ÿ | ||||||||
n
|
Credit/Default Risk—The risk that an issuer or guarantor of fixed-income securities held by a Fund may default
on its obligation to pay interest and repay principal.
|
n
|
Emerging Countries Risk—The securities markets of Asian, Latin and South American, Eastern European,
African and other emerging countries are less liquid, are especially subject to greater price volatility, have smaller market capitalizations, have less government regulation and are not subject to as extensive and frequent accounting, financial and other
reporting requirements as the securities markets of more developed countries. Further, investment in equity securities of issuers located in Russia and certain other emerging countries involves risk of loss result
ing from problems in share registration and custody and substantial economic and political disruptions. These risks are not normally associated with investment in more developed countries.
|
n
|
Interest Rate Risk—The risk that when interest rates increase, securities held by a Fund will decline in value.
Long-term fixed-income securities will normally have more price volatility because of this risk than short-term fixed-income securities.
|
n
|
Foreign Risk—The risk that when a Fund invests in foreign securities, it will be subject to risk of loss not
typically associated with domestic issuers. Loss may result because of less foreign government regulation, less public information and less economic, political and social stability. Loss may also result from the imposition of exchange controls,
confiscations and other government restrictions. A Fund will also be subject to the risk of negative foreign currency rate fluctuations. Foreign risks will normally be greatest when a Fund invests in issuers located in emerging countries.
|
n
|
Derivatives Risk—The risk that loss may result from a Fund’s investments in options, futures, swaps,
structured securities and other derivative instruments. These instruments may be leveraged so that small changes may produce disproportionate losses to a Fund.
|
n
|
Management Risk—The risk that a strategy used by the Investment Adviser may fail to produce the intended results.
|
n
|
Market Risk—The risk that the value of the securities in which a Fund invests may go up or down in response to
the prospects of individual companies, particular industry sectors and/or general economic conditions. Price changes may be temporary or last for extended periods. A Fund’s investments may be overweighted from time to time in one or more industry
sectors, which will increase the Fund’s exposure to risk of loss from adverse developments affecting those sectors.
|
n
|
Liquidity Risk—The risk that a Fund will not be able to pay redemption proceeds within the time period stated
in this Prospectus because of unusual market conditions, an unusually high volume of redemption requests, or other reasons. Funds that invest in non-investment grade fixed-income securities, small capitalization stocks, REITs or emerging country issuers
will be especially subject to the risk that during certain periods the liquidity of particular issuers or industries, or all securities within particular investment categories, will shrink or disappear suddenly and without warning as a result of adverse
economic, market or political events, or adverse investor perceptions whether or not accurate. The Goldman Sachs Asset Allocation Portfolios (the “Asset Allocation Portfolios”) expect to invest a significant percentage of their assets in the
Funds and other funds for which Goldman Sachs now or in the future acts as investment adviser or underwriter. Redemptions by an Asset Allocation Portfolio of its position in a Fund may further increase liquidity risk and may impact a Fund’s net asset
value (“NAV”).
|
n
|
Stock Risk—The risk that stock prices have historically risen and fallen in periodic cycles. Recently, U.S.
stock markets and certain foreign stock markets have experienced substantial price volatility and, at times, have traded at or close to record high levels. There is no guarantee that such levels will be reached or maintained in the future.
|
n
|
Geographic Risk—The European Equity Fund invests primarily in equity securities of European companies. The
Japanese Equity Fund invests primarily in equity securities of Japanese equity companies. The Asia Growth Fund invests primarily in equity securities of Asian issuers. Concentration of the investments of these or other Funds in issuers located in a
particular country or region will subject a Fund, to a greater extent than if investments were less concentrated, to the risks of adverse securities markets, exchange rates and social, political, regulatory or economic events which may occur in that
country or region.
|
n
|
Small Cap Risk—The securities of small capitalization stocks involve greater risks than those associated with
larger, more established companies and may be subject to more abrupt or erratic price movements. Securities of such issuers may lack sufficient market liquidity to enable a Fund to effect sales at an advantageous time or without a substantial drop in price.
|
n
|
IPO Risk—The risk that the market value of IPO shares will fluctuate considerably due to factors such as the
absence of a prior public market, unseasoned trading, the small number of shares available for trading and limited information about the issuer. The purchase of IPO shares may involve high transaction costs. IPO shares are subject to market risk and
liquidity risk. When a Fund’s asset base is small, a significant portion of the Fund’s performance could be attributable to investments in IPOs, because such investments would have a magnified impact on the Fund. As the Fund’s assets grow,
the effect of the Fund’s investments in IPOs on the Fund’s performance probably will decline, which could reduce the Fund’s performance.
|
| HOW THE FUNDS HAVE PERFORMED
|
| The bar chart and table below provide an indication of the risks of investing in a Fund by showing: (a) changes in the performance
of a Fund’s Institutional Shares from year to year; and (b) how the average annual returns of a Fund’s Institutional Shares compare to those of broad-based securities market indices. The bar chart and table assume reinvestment of dividends and
distributions. A Fund’s past performance is not necessarily an indication of how the Fund will perform in the future. Performance reflects expense limitations in effect. If expense limitations were not in place, a Fund’s performance would have
been reduced.
|
| TOTAL RETURN
|
CALENDAR YEAR
|
| The total return for Institutional Shares for the 9-month period ended September 30, 2000 was -13.15%.
Best Quarter
Q4 ’98 +19.05%
Worst Quarter
Q3 ’98 -15.84%
|
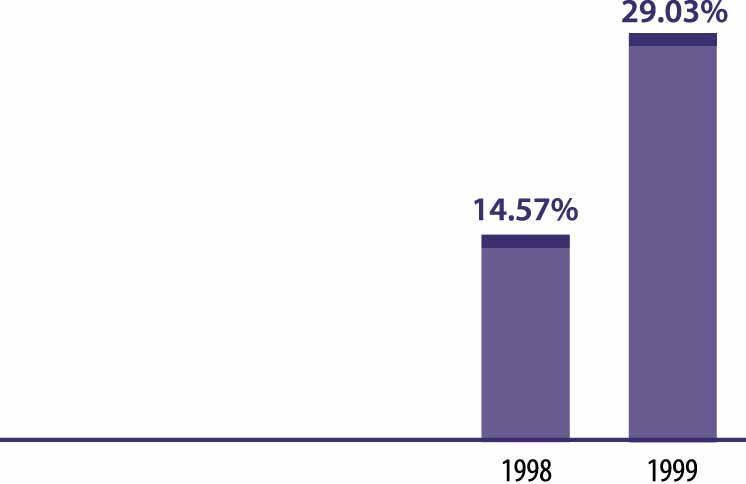 |
| AVERAGE ANNUAL TOTAL RETURN
|
| For the period ended December 31, 1999 | 1 Year | Since Inception | |||
|---|---|---|---|---|---|
| Institutional Shares (Inception 8/15/97) | 29.03% | 11.65% | |||
| Morgan Stanley Capital International (MSCI®) Europe,
Australasia, Far East (EAFE®) Index (unhedged)* |
27.29% | 15.99% | |||
*
|
The unmanaged MSCI® EAFE® Index (unhedged) is a market capitalization-weighted composite of securities in 20 developed
markets. The Index figures do not reflect any fees or expenses.
|
| TOTAL RETURN
|
CALENDAR YEAR
|
| The total return for Institutional Shares for the 9-month period ended September 30, 2000 was -10.15%.
Best Quarter
Q4 ’99 +21.89%
Worst Quarter
Q3 ’98 -14.25%
|
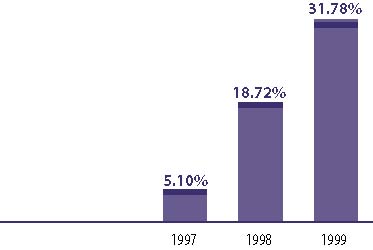 |
| AVERAGE ANNUAL TOTAL RETURN
|
| For the period ended December 31, 1999 | 1 Year | Since Inception | |||
|---|---|---|---|---|---|
| Institutional Shares (Inception 2/7/96) | 31.78% | 18.02% | |||
| MSCI® EAFE® (unhedged)* | 27.29% | 13.60% | |||
*
|
The MSCI® EAFE® Index (unhedged) is an unmanaged index of common stock prices. The Index figures do not reflect any
fees or expenses.
|
| TOTAL RETURN
|
CALENDAR YEAR
|
| The total return for Institutional Shares for the 9-month period ended September 30, 2000 was -5.40%.
Best Quarter
Q4 ’99 +24.93%
Worst Quarter
Q2 ’99 -2.86%
|
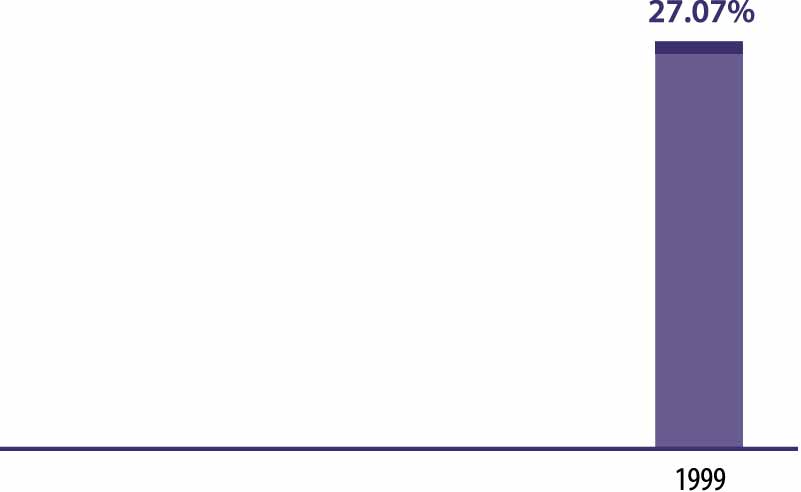 |
| AVERAGE ANNUAL TOTAL RETURN
|
| For the period ended December 31, 1999 | 1 Year | Since Inception | |||
|---|---|---|---|---|---|
| Institutional Shares (Inception 10/1/98) | 27.07% | 37.08% | |||
| MSCI® Europe Index (unhedged)* | 16.21% | 29.39% | |||
| FT/S&P Actuaries Europe Index (unhedged)** | 16.14% | 29.20% | |||
*
|
The MSCI® Europe Index (unhedged), an unmanaged index of common stock prices, replaced the FT/S&P Actuaries Europe
Index (unhedged) as the European Equity Fund’s performance benchmark. The MSCI® Europe Index is widely used throughout the investment management industry to represent the investment opportunities available to a large cap, developed country
European equity strategy and, in the Investment Adviser’s opinion, is a more appropriate benchmark against which to measure the performance of the European Equity Fund. The Index figures do not reflect any fees or expenses.
|
**
|
The unmanaged FT/S&P Actuaries Europe Index (unhedged) is a market capitalization-weighted composite of approximately 750
stocks from 16 countries in Europe. The Index figures do not reflect any fees or expenses.
|
| TOTAL RETURN
|
CALENDAR YEAR
|
| The total return for Institutional Shares for the 9-month period ended September 30, 2000 was -12.12%.
Best Quarter*
Q3 ’99 +23.29%
Worst Quarter*
Q1 ’99 +9.64%
|
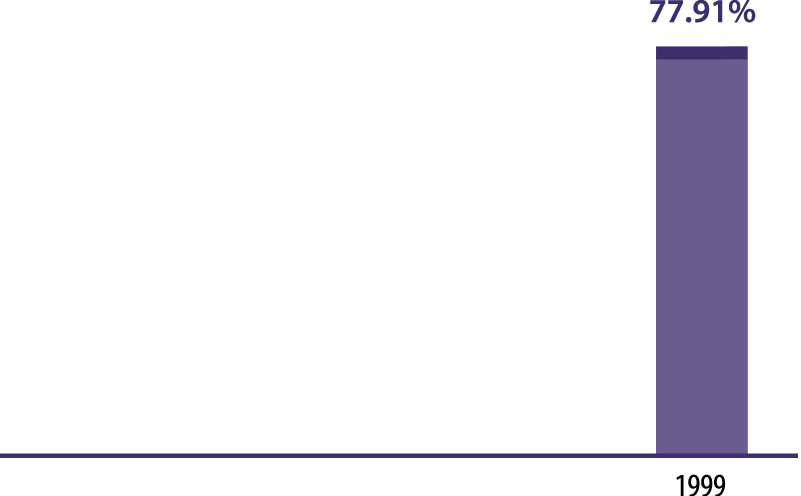 |
| AVERAGE ANNUAL TOTAL RETURN
|
| For the period ended December 31, 1999 | 1 Year | Since Inception | |||
|---|---|---|---|---|---|
| Institutional Shares (Inception 5/1/98) | 77.91% | 50.30% | |||
| Tokyo Price Index (“TOPIX”) (unhedged)** | 75.32% | 43.28% | |||
*
|
Please note that “Best Quarter” and “Worst Quarter” figures are applicable only to the time period covered
by the bar chart.
|
**
|
The TOPIX (unhedged) is an unmanaged composite of all stocks on the first section of the Tokyo Stock Exchange. The Index
figures do not reflect any fees or expenses.
|
| TOTAL RETURN
|
CALENDAR YEAR
|
| The total return for Institutional Shares for the 9-month period ended September 30, 2000 was 2.54%.
Best Quarter*
Q4 ’99 +12.79%
Worst Quarter*
Q1 ’99 +4.98%
|
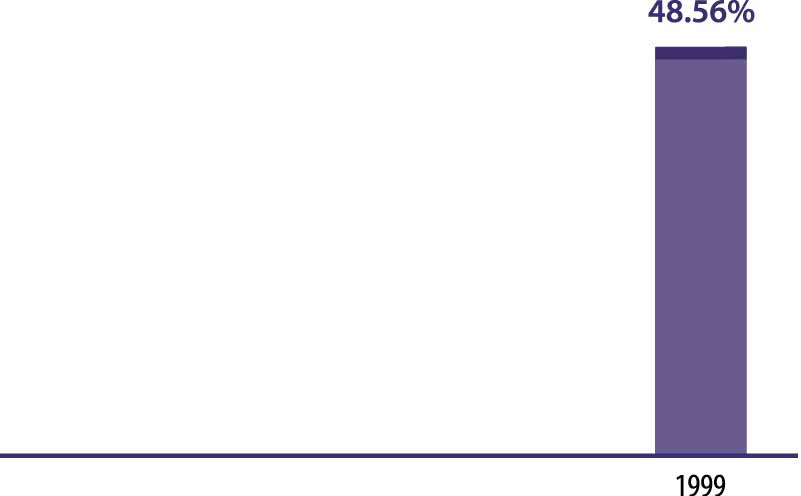 |
| AVERAGE ANNUAL TOTAL RETURN
|
| For the period ended December 31, 1999 | 1 Year | Since Inception | |||
|---|---|---|---|---|---|
| Institutional Shares (Inception 5/1/98) | 48.56% | 30.08% | |||
| MSCI® EAFE® Small Cap Index (unhedged)** | 17.67% | 3.00%
|
|||
*
|
Please note that “Best Quarter” and “Worst Quarter” figures are applicable only to the time period covered
by the bar chart.
|
**
|
The MSCI® EAFE® Small Cap Index (unhedged), inception date 1/15/98, includes 1,502 securities from 23 developed markets
with a capitalization range of $200-800 million and a general regional allocation of 60% Europe, 30% Japan and 10% Asia. The Index figures do not reflect any fees or expenses.
|
| TOTAL RETURN
|
CALENDAR YEAR
|
| The total return for Institutional Shares for the 9-month period ended September 30, 2000 was -15.40%.
Best Quarter
Q4 ’99
+30.18%
Worst Quarter
Q3 ’98
-22.78%
|
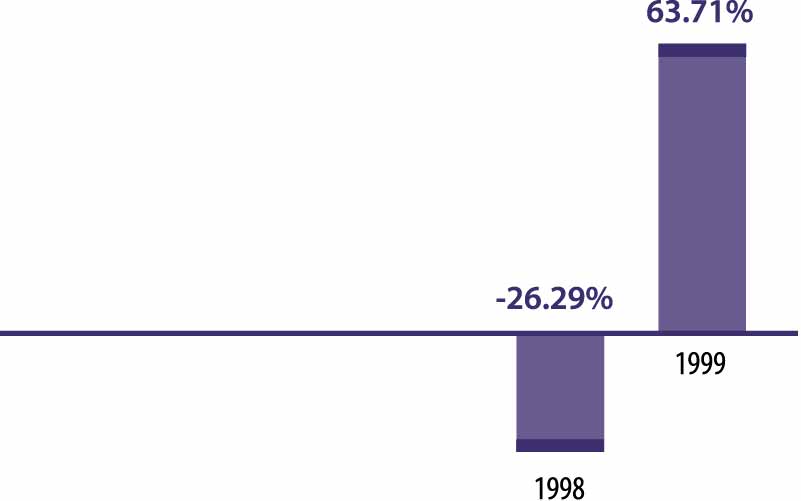 |
| AVERAGE ANNUAL TOTAL RETURN
|
| For the period ended December 31, 1999 | 1 Year | Since Inception | |||
|---|---|---|---|---|---|
| Institutional Shares (Inception 12/15/97) | 63.71% | 10.84% | |||
| MSCI® Emerging Markets Free (EMF) Index* | 66.42% | 14.52% | |||
*
|
The unmanaged MSCI® EMF Index is a market capitalization-weighted composite of securities in over 30 emerging market
countries. “Free” indicates an index that excludes shares in otherwise free markets that are not purchasable by foreigners. The Index figures do not reflect any fees or expenses.
|
| TOTAL RETURN
|
CALENDAR YEAR
|
| The total return for Institutional Shares for the 9-month period ended September 30, 2000 was -21.29%.
Best Quarter
Q2 ’99 +31.32%
Worst Quarter
Q4 ’97 -27.19%
|
 |
| AVERAGE ANNUAL TOTAL RETURN
|
| For the period ended December 31, 1999 | 1 Year | Since Inception | |||
|---|---|---|---|---|---|
| Institutional Shares (Inception 2/2/96) | 60.55% | (5.50)% | |||
| MSCI® All Country Asia Free ex-Japan Index (unhedged)* | 61.95% | (4.05)% | |||
*
|
The unmanaged MSCI® All Country Asia Free ex-Japan Index (unhedged) is a market capitalization-weighted composite of
securities in ten Asian countries. “Free” indicates an index that excludes shares in otherwise free markets that are not purchasable by foreigners. The Index figures do not reflect any fees or expenses.
|
| CORE
International Equity Fund |
International
Equity Fund |
European
Equity Fund |
|||||
|---|---|---|---|---|---|---|---|
| Shareholder Fees | |||||||
| (fees paid directly from your investment): | |||||||
| Maximum Sales Charge (Load) Imposed on
Purchases |
None | None | None | ||||
| Maximum Sales Charge (Load) Imposed on
Reinvested Dividends |
None | None | None | ||||
| Redemption Fees | None | None | None | ||||
| Exchange Fees | None | None | None | ||||
| Annual Fund Operating Expenses | |||||||
| (expenses that are deducted from Fund assets):1 | |||||||
| Management Fees | 0.85% | 1.00% | 1.00% | ||||
| Distribution and Service (12b-1) Fees | None | None | None | ||||
| Other Expenses 2 | 0.25% | 0.19% | 0.52% | ||||
| Total Fund Operating Expenses * | 1.10% | 1.19% | 1.52% | ||||
*
|
As a result of the current expense limitations, “Other Expenses” and “Total Fund Operating Expenses” of the
Funds which are actually incurred as of the date of this Prospectus are as set forth below. The expense limitations may be terminated at any time at the option of the Investment Adviser. If this occurs, “Other Expenses” and “Total Fund
Operating Expenses” may increase without shareholder approval.
|
| CORE
International Equity Fund |
International
Equity Fund |
European
Equity Fund |
|||||
|---|---|---|---|---|---|---|---|
| Annual Fund Operating Expenses | |||||||
| (expenses that are deducted from Fund assets): 1 | |||||||
| Management Fees | 0.85% | 1.00% | 1.00% | ||||
| Distribution and Service (12b-1) Fees | None | None | None | ||||
| Other Expenses 2 | 0.16% | 0.14% | 0.14% | ||||
| Total Fund Operating Expenses (after
current expense limitations) |
1.01% | 1.14% | 1.14% | ||||
| Japanese
Equity Fund |
International
Growth Opportunities Fund |
Emerging
Markets Equity Fund |
Asia
Growth Fund |
||||
|---|---|---|---|---|---|---|---|
| None | None | None | None | ||||
| None | None | None | None | ||||
| None | None | None | None | ||||
| None | None | None | None | ||||
| 1.00% | 1.20% | 1.20% | 1.00% | ||||
| None | None | None | None | ||||
| 0.45% | 0.37% | 0.45% | 0.65% | ||||
| 1.45% | 1.57% | 1.65% | 1.65% | ||||
| Japanese
Equity Fund |
International
Growth Opportunities Fund |
Emerging
Markets Equity Fund |
Asia
Growth Fund |
||||
|---|---|---|---|---|---|---|---|
| 1.00% | 1.20% | 1.20% | 1.00% | ||||
| None | None | None | None | ||||
| 0.15% | 0.20% | 0.39% | 0.20% | ||||
| 1.15% | 1.40% | 1.59% | 1.20% | ||||
1
|
The Funds’ annual operating expenses are based on actual expenses.
|
2
|
“Other Expenses” include transfer agency fees equal to 0.04% of the average daily net assets of each Fund’
s Institutional Shares plus all other ordinary expenses of the Funds not detailed above. The Investment Adviser has voluntarily agreed to reduce or limit “Other Expenses” (excluding management fees, transfer agency fees, taxes, interest and
brokerage fees and litigation, indemnification and other extraordinary expenses) to the following percentages of each Fund’s average daily net assets:
|
| Fund | Other
Expenses |
||
|---|---|---|---|
| CORE International Equity | 0.12% | ||
| International Equity | 0.10% | ||
| European Equity | 0.10% | ||
| Japanese Equity | 0.11% | ||
| International Growth
Opportunities |
0.16% | ||
| Emerging Markets Equity | 0.35% | ||
| Asia Growth | 0.16% | ||
| Fund | 1 Year | 3 Years | 5 Years | 10 Years | |||||
|---|---|---|---|---|---|---|---|---|---|
| CORE International Equity | $112 | $350 | $606 | $1,340 | |||||
| International Equity | $121 | $378 | $654 | $1,443 | |||||
| European Equity | $155 | $480 | $829 | $1,813 | |||||
| Japanese Equity | $148 | $459 | $792 | $1,735 | |||||
| International Growth Opportunities | $160 | $496 | $855 | $1,867 | |||||
| Emerging Markets Equity | $168 | $520 | $897 | $1,955 | |||||
| Asia Growth | $168 | $520 | $897 | $1,955 | |||||
| INVESTMENT ADVISERS
|
| Investment Adviser | Fund | ||
|---|---|---|---|
| Goldman Sachs Asset Management (“GSAM”) | CORE International Equity | ||
| 32 Old Slip | |||
| New York, New York 10005 | |||
| Goldman Sachs Asset Management International (“GSAMI”) | International Equity | ||
| Procession House | European Equity | ||
| 55 Ludgate Hill | Japanese Equity | ||
| London, England EC4M 7JW | International Growth Opportunities | ||
| Emerging Markets Equity | |||
| Asia Growth | |||
| GSAM and GSAMI are separate business units of the Investment Management Division (“IMD”) of Goldman Sachs. Goldman Sachs
registered as an investment adviser in 1981. GSAMI, a member of the Investment Management Regulatory Organization Limited since 1990 and a registered investment adviser since 1991, is an affiliate of Goldman Sachs. As of September 30, 2000, GSAM and
GSAMI, along with other units of IMD, had assets under management of $281.3 billion.
|
| The Investment Adviser provides day-to-day advice regarding the Funds’ portfolio transactions. The Investment Adviser makes
the investment decisions for the Funds and places purchase and sale orders for the Funds’ portfolio transactions in U.S. and foreign markets. As permitted by applicable law, these orders may be directed to any brokers, including Goldman Sachs and its
affiliates. While the Investment Adviser is ultimately responsible for the management of the Funds, it is able to draw upon the research and expertise of its asset management affiliates for portfolio decisions and management with respect to certain
portfolio securities. In addition, the Investment Adviser has access to the research and certain proprietary technical models developed by Goldman Sachs, and will apply quantitative and qualitative analysis in determining the appropriate allocations among
categories of issuers and types of securities.
|
| The Investment Adviser also performs the following additional services for the Funds:
|
n
|
Supervises all non-advisory operations of the Funds
|
n
|
Provides personnel to perform necessary executive, administrative and clerical services to the Funds
|
n
|
Arranges for the preparation of all required tax returns, reports to shareholders, prospectuses and statements of additional
information and other reports filed with the Securities and Exchange Commission (the “SEC”) and other regulatory authorities
|
n
|
Maintains the records of each Fund
|
n
|
Provides office space and all necessary office equipment and services
|
| MANAGEMENT FEES
|
| As compensation for its services and its assumption of certain expenses, the Investment Adviser is entitled to the following fees,
computed daily and payable monthly, at the annual rates (as a percentage of each respective portfolio’s average daily net assets) listed below:
|
| Contractual Rate | Actual Rate
For the Fiscal Year Ended August 31, 2000 |
||||||
|---|---|---|---|---|---|---|---|
| GSAM: | |||||||
| CORE International Equity | 0.85 | % | 0.85 | % | |||
| GSAMI: | |||||||
| International Equity | 1.00 | % | 1.00 | % | |||
| European Equity | 1.00 | % | 1.00 | % | |||
| Japanese Equity | 1.00 | % | 1.00 | % | |||
| International Growth Opportunities | 1.20 | % | 1.20 | % | |||
| Emerging Markets Equity | 1.20 | % | 1.20 | % | |||
| Asia Growth | 1.00 | % | 1.00 | % | |||
| The difference, if any, between the stated fees and the actual fees paid by the Funds reflects that the Investment Adviser did not
charge the full amount of the fees to which it would have been entitled. The Investment Adviser may discontinue or modify any such voluntary limitations in the future at its discretion.
|
| FUND MANAGERS
|
| M. Roch Hillenbrand, a Managing Director of Goldman Sachs since 1997, is the Head of Global Equities for GSAM, overseeing the
United States, Europe, Japan, and non-Japan Asia. In this capacity, he is responsible for managing the group as it defines and implements global portfolio management processes that are consistent, reliable and predictable. Mr. Hillenbrand joined Goldman
Sachs in 1997
upon its acquisition of Commodities Corporation, LLC where he was and continues as President. Over the course of his 20-year career at Commodities Corporation, Mr. Hillenbrand has had extensive experience in dealing with internal and external investment
managers who have managed a range of futures and equities strategies across multiple markets, using a variety of styles.
|
| International Equity Portfolio Management Team
|
n
|
Global portfolio teams based in London, Singapore, Tokyo and New York. Local presence is a key to the Investment Adviser’s
fundamental research capabilities
|
n
|
Team manages over $45.9 billion in international equities for retail, institutional and high net worth clients
|
n
|
Focus on bottom-up stock selection as main driver of returns, though the team leverages the asset allocation, currency and risk
management capabilities of GSAM
|
| Name and Title | Fund Responsibility | Years Primarily
Responsible |
Five Year Employment History | ||||
| David Dick
Executive Director |
Senior Portfolio Manager—
European Equity Fund |
Since
1998 |
Mr. Dick joined the Investment
Adviser as a senior portfolio manager on the European Equity team in 1998. From 1990 to 1998, he was with Mercury Asset Management, where he was a portfolio manager for European equity and was head of Mercury’s European sector strategy. |
||||
| Gary Greenberg
Vice President Co-Head of Emerging Markets Equity |
Senior Portfolio Manager—
Emerging Markets Equity Fund |
Since
1999 |
Mr. Greenberg joined the
Investment Adviser as a portfolio manager in 1999. From 1998 to 1999, he was a Managing Director and the lead international portfolio manager at Van Eck Global Asset Management. Prior to that, he was Chief Investment Officer for Peregrine Asset Management in Hong Kong from 1994 to 1998. |
||||
| Name and Title | Fund Responsibility | Years Primarily
Responsible |
Five Year Employment History | ||||
| James P. Hordern
Executive Director |
Senior Portfolio Manager—
International Growth Opportunities Fund |
Since
1998 |
Mr. Hordern joined the
Investment Adviser as a portfolio manager in 1997. From 1991 to 1997, he was an Assistant Director and portfolio manager at Mercury Asset Management on the European Specialist Team. |
||||
| Ralf Laier
Vice President |
Portfolio Manager—
Emerging Markets Equity Fund |
Since
1998 |
Mr. Laier joined the Investment
Adviser as a portfolio manager with a focus on Central/Eastern European (CEE) and the Commonwealth of Independent States (CIS) in 1997. Prior to joining the Investment Adviser, from 1995 to 1997, he was Vice President of Soros Global Research, where he analyzed investment opportunities in CEE/CIS. |
||||
| Susan Noble
Managing Director |
Senior Portfolio Manager—
European Equity Fund International Equity Fund |
Since
1998 1998 |
Ms. Noble joined the Investment
Adviser as a senior portfolio manager and head of the European Equity Team in October 1997. From 1986 to 1997, she worked at Fleming Investment Management in London, where she most recently was Portfolio Management Director for the European equity investment strategy and process. |
||||
| Andrew Orchard
Executive Director |
Senior Portfolio Manager—
European Equity Fund International Equity Fund |
Since
1999 1999 |
Mr. Orchard joined the
Investment Adviser as a portfolio manager in 1999. From 1994 to 1999 he was a portfolio manager at Morgan Grenfell Asset Management where he managed global equity portfolios and chaired Morgan Grenfell’s Global Sector Committee. |
||||
| Name and Title | Fund Responsibility | Years Primarily
Responsible |
Five Year Employment History | ||||
| |
|||||||
| Robert Stewart
Executive Director |
Senior Portfolio Manager—
European Equity Fund International Equity Fund |
Since
1999 1999 |
Mr. Stewart joined the
Investment Adviser as a portfolio manager in 1996. He is a member of the European Equity Team. From 1996 to 1998 he was a portfolio manager in Japan where he managed Japanese Equity Institutional Portfolios. Prior to that Mr. Stewart was a portfolio manager at CINMan from 1989 to 1996 where he managed international equities. |
||||
| |
|||||||
| Danny Truell
Managing Director |
Senior Portfolio Manager—
European Equity Fund International Equity |
Since
1998 2000 |
Mr. Truell joined the Investment
Adviser as a senior portfolio manager and head of UK equities in 1998. From 1992 to 1996, he was Investment Banking Executive Director for SBC Warburg and Chief Asian Equity Strategist. |
||||
| |
|||||||
| Gabriella Antici
Vice President Co-Head of Emerging Markets Equity |
Senior Portfolio Manager—
Emerging Markets Equity Fund |
Since
1998 |
Ms. Antici joined the Investment
Adviser as a portfolio manager in 1997. From 1994 to 1997, she was a Vice President for HSBC Asset Management, where she was a portfolio manager for emerging markets and head of the Latin American Department. |
||||
| |
|||||||
| Rory Bateman
Executive Director |
Portfolio Manager—
European Equity Fund |
Since
2000 |
Mr. Bateman joined the
Investment Adviser as an equity analyst in 1996. Prior to that he was an analyst at CINMan covering European equities. |
||||
| |
|||||||
| Name and Title | Fund Responsibility | Years Primarily
Responsible |
Five Year Employment History | ||||
| |
|||||||
| Melissa Brown
Managing Director |
Senior Portfolio Manager—
CORE International Equity Fund |
Since
1998 |
Ms. Brown joined the Investment
Adviser as a portfolio manager in 1998. From 1984 to 1998, she was the director of Quantitative Equity Research and served on the Investment Policy Committee at Prudential Securities. |
||||
| |
|||||||
| Mark M. Carhart
Managing Director |
Portfolio Manager—
CORE International Equity Fund |
Since
1998 |
Mr. Carhart joined the
Investment Adviser as a member of the Quantitative Research and Risk Management team in 1997. From August 1995 to September 1997, he was Assistant Professor of Finance at the Marshall School of Business at USC and a Senior Fellow of the Wharton Financial Institutions Center. |
||||
| |
|||||||
| Raymond J.
Iwanowski Managing Director |
Portfolio Manager—
CORE International Equity Fund |
Since
1998 |
Mr. Iwanowski joined the
Investment Adviser as an associate and portfolio manager in 1997. From 1993 to 1997, he was a Vice President and head of the Fixed Derivatives Client Research group at Salomon Brothers. |
||||
| |
|||||||
| Robert C. Jones
Managing Director |
Senior Portfolio Manager—
CORE International Equity Fund |
Since
1997 |
Mr. Jones joined the
Investment Adviser as a portfolio manager in 1989. |
||||
| |
|||||||
| Name and Title | Fund Responsibility | Years Primarily
Responsible |
Five Year Employment History | ||||
| |
|||||||
| Alice Lui
Vice President |
Portfolio Manager—
Asia Growth Fund Emerging Markets Equity Fund International Equity Fund International Growth Opportunities Fund |
Since
1994 1999 1999 1999 |
Ms. Lui joined the Investment
Adviser as a portfolio manager in 1990. |
||||
| |
|||||||
| Ravi Shanker
Vice President |
Senior Portfolio Manager—
Asia Growth Fund Emerging Markets Equity Fund International Equity Fund International Growth Opportunities Fund |
Since
1997 1998 1999 1999 |
Mr. Shanker joined the
Investment Adviser as an operations manager in 1997. From July 1996 to 1997, he worked for Goldman Sachs in Singapore as a strategic advisor for transactions involving infrastructure industries in Asia. From 1988 to 1996, he worked for Goldman Sachs as an investment banker in the Investment Banking Division. |
||||
| |
|||||||
| Siew-Hua Thio
Vice President |
Portfolio Manager—
Asia Growth Fund Emerging Markets Equity Fund International Equity Fund International Growth Opportunities Fund |
Since
1998 1998 1998 1998 |
Ms. Thio joined the Investment
Adviser as a portfolio manager in 1998. From 1997 to 1998, she was Head of Research for Indosuez WI Carr in Singapore. From 1993 to 1997, she was a research analyst at the same firm. |
||||
| |
|||||||
| Name and Title | Fund Responsibility | Years Primarily
Responsible |
Five Year Employment History | ||||
| Toshiyuki Ejima
Vice President |
Portfolio Manager—
Japanese Equity Fund |
Since
1999 |
Mr. Ejima joined the Investment
Adviser as a portfolio manager in April 1999. Prior to that he was a portfolio manager at Daiichi Mutual Life from 1993 to 1999 where he managed Japanese equities. |
||||
| Shigeka Kouda
Vice President |
Portfolio Manager—
International Growth Opportunities Fund |
Since
1998 |
Mr. Kouda joined the
Investment Adviser as a portfolio manager in 1997. From 1992 to 1997, he was at the Fixed Income Division of Goldman Sachs (Japan) Limited, where he was extensively involved in emerging markets trading as well as International Fixed Income institutional sales. |
||||
| Shogo Maeda
Managing Director |
Senior Portfolio Manager—
Japanese Equity Fund International Equity Fund International Growth Opportunities Fund |
Since
1994 1994 1998 |
Mr. Maeda joined the
Investment Adviser as a portfolio manager in 1994. |
||||
| Miyako Shibamoto
Vice President |
Portfolio Manager—
Japanese Equity Fund |
Since
1998 |
Ms. Shibamoto joined the
Investment Adviser as a member of the Japanese Equity team in March 1998. From 1993 to 1998, she was a Vice President at Scudder Stevens and Clark (Japan). |
||||
| Takeya Suzuki
Vice President |
Portfolio Manager—
Japanese Equity Fund |
Since
1998 |
Mr. Suzuki joined the
Investment Adviser as a portfolio manager in 1996. From 1990 to 1996, he was a Japanese equity portfolio manager at Nomura Investment Management where he actively managed assets for U.S. pension funds. |
||||
| DISTRIBUTOR AND TRANSFER AGENT
|
| Goldman Sachs, 85 Broad Street, New York, New York 10004, serves as the exclusive distributor (the “Distributor”) of
each Fund’s shares. Goldman Sachs, 4900 Sears Tower, Chicago, Illinois 60606-6372, also serves as the Funds’ transfer agent (the “Transfer Agent”) and, as such, performs various shareholder servicing functions.
|
| From time to time, Goldman Sachs or any of its affiliates may purchase and hold shares of the Funds. Goldman Sachs reserves the
right to redeem at any time some or all of the shares acquired for its own account.
|
| ACTIVITIES OF GOLDMAN SACHS AND ITS AFFILIATES AND OTHER ACCOUNTS MANAGED BY GOLDMAN SACHS
|
| The involvement of the Investment Adviser, Goldman Sachs and their affiliates in the management of, or their interest in, other
accounts and other activities of Goldman Sachs may present conflicts of interest with respect to a Fund or limit a Fund’s investment activities. Goldman Sachs and its affiliates engage in proprietary trading and advise accounts and funds which have
investment objectives similar to those of the Funds and/or which engage in and compete for transactions in the same types of securities, currencies and instruments as the Funds. Goldman Sachs and its affiliates will not have any obligation to make
available any information regarding their proprietary activities or strategies, or the activities or strategies used for other accounts managed by them, for the benefit of the management of the Funds. The results of a Fund’s investment activities,
therefore, may differ from those of Goldman Sachs and its affiliates, and it is possible that a Fund could sustain losses during periods in which Goldman Sachs and its affiliates and other accounts achieve significant profits on their trading for
proprietary or other accounts. In addition, the Funds may, from time to time, enter into transactions in which other clients of Goldman Sachs have an adverse interest. A Fund’s activities may be limited because of regulatory restrictions applicable
to Goldman Sachs and its affiliates, and/or their internal policies designed to comply with such restrictions.
|
| Each Fund pays dividends from its investment company taxable income and distributions from net realized capital gains. You may
choose to have dividends and distributions paid in:
|
n
|
Cash
|
n
|
Additional shares of the same class of the same Fund
|
n
|
Shares of the same or an equivalent class of another Goldman Sachs Fund. Special restrictions may apply for certain ILA
Portfolios. See the Additional Statement.
|
| You may indicate your election on your Account Application. Any changes may be submitted in writing to Goldman Sachs at any time
before the record date for a particular dividend or distribution. If you do not indicate any choice, dividends and distributions will be reinvested automatically in the applicable Fund.
|
| The election to reinvest dividends and distributions in additional shares will not affect the tax treatment of such dividends and
distributions, which will be treated as received by you and then used to purchase the shares.
|
| The Funds’ investments in foreign securities may be subject to foreign withholding taxes. Under certain circumstances, the
Funds may elect to pass-through these taxes to you. If this election is made, a proportionate amount of such taxes will constitute a distribution to you, which would allow you either (1) to credit such proportionate amount of foreign taxes against your
U.S. federal income tax liability or (2) to take such amount as an itemized deduction.
|
| Dividends from investment company taxable income and distributions from net capital gains are declared and paid annually.
|
| From time to time a portion of a Fund’s dividends may constitute a return of capital.
|
| At the time of an investor’s purchase of shares of a Fund, a portion of the NAV per share may be represented by undistributed
income or undistributed realized appreciation of the Fund’s portfolio securities. Therefore, subsequent distributions on such shares from such income or realized appreciation may be taxable to you even if the NAV of the shares is, as a result of the
distributions, reduced below the cost of such shares and the distributions (or portions thereof) represent a return of a portion of the purchase price.
|
| The following section will provide you with answers to some of the most often asked questions regarding buying and selling the
Funds’ Institutional Shares.
|
| How Can I Purchase Institutional Shares Of The Funds?
|
| You may purchase Institutional Shares on any business day at their NAV next determined after receipt of an order. No sales load is
charged. You should place an order with Goldman Sachs at 1-800-621-2550 and either:
|
n
|
Wire federal funds to The Northern Trust Company (“Northern”), as subcustodian for State Street Bank and Trust Company
(“State Street”) (each Fund’s custodian) on the next business day; or
|
n
|
Send a check or Federal Reserve draft payable to Goldman Sachs Funds—(Name of Fund and Class of Shares), 4900 Sears Tower,
Chicago, IL 60606-6372. The Fund will not accept a check drawn on a foreign bank or a third-party check.
|
| In order to make an initial investment in a Fund, you must furnish to the Fund or Goldman Sachs the Account Application attached
to this Prospectus. Purchases of Institutional Shares must be settled within three business days of receipt of a complete purchase order.
|
| In certain instances, the Trust may require a signature guarantee in order to effect purchase, redemption or exchange
transactions. Signature guarantees must be obtained from a bank, brokerage firm or other financial intermediary that is a member of an approved Medallion Guarantee Program or that is otherwise approved by Goldman Sachs. A notary public cannot provide a
signature guarantee.
|
| How Do I Purchase Shares Through A Financial Institution?
|
| Certain institutions (including banks, trust companies, brokers and investment advisers) that provide recordkeeping, reporting and
processing services to their customers may be authorized to accept, on behalf of Goldman Sachs Trust (the “Trust”), purchase, redemption and exchange orders placed by or on behalf of their customers, and may designate other intermediaries to
accept such orders, if approved by the Trust. In these cases:
|
n
|
A Fund will be deemed to have received an order in proper form when the order is accepted by the authorized institution or
intermediary on a business day, and the order will be priced at the Fund’s NAV next determined after such acceptance.
|
n
|
Authorized institutions and intermediaries will be responsible for transmitting accepted orders and payments to the Trust within
the time period agreed upon by them.
|
| You should contact your institution or intermediary to learn whether it is authorized to accept orders for the Trust.
|
| These institutions may receive payments from the Funds or Goldman Sachs for the services provided by them with respect to the
Funds’ Institutional Shares. These payments may be in addition to other payments borne by the Funds.
|
| The Investment Adviser, Distributor and/or their affiliates may pay additional compensation from time to time, out of their assets
and not as an additional charge to the Funds, to certain institutions and other persons in connection with the sale, distribution and/or servicing of shares of the Funds and other Goldman Sachs Funds. Additional compensation based on sales may, but is
currently not expected to, exceed 0.50% (annualized) of the amount invested.
|
| In addition to Institutional Shares, each Fund also offers other classes of shares to investors. These other share classes are
subject to different fees and expenses (which affect performance), have different minimum investment requirements and are entitled to different services than Institutional Shares. Information regarding these other share classes may be obtained from your
sales representative or from Goldman Sachs by calling the number on the back cover of this Prospectus.
|
| What Is My Minimum Investment In The Funds?
|
| Type of Investor | Minimum Investment | ||
|---|---|---|---|
| n
Banks, trust companies or other
depository institutions investing for their own account or on behalf of clients |
$1,000,000 in Institutional Shares of a Fund
alone or in combination with other assets under the management of GSAM and its affiliates |
||
| n
Section 401(k), profit sharing,
money purchase pension, tax- sheltered annuity, defined benefit pension, or other employee benefit plans that are sponsored by one or more employers (including governmental or church employers) or employee organizations |
|||
| n
State, county, city or any
instrumentality, department, authority or agency thereof |
|||
| n
Corporations with at least $100
million in assets or in outstanding publicly traded securities |
|||
| n
“Wrap” account sponsors (provided
they have an agreement covering the arrangement with GSAM) |
|||
| n
Registered investment advisers
investing for accounts for which they receive asset-based fees |
|||
| n Individual investors | $10,000,000 | ||
| n
Qualified non-profit organizations,
charitable trusts, foundations and endowments |
|||
| n
Accounts over which GSAM or its
advisory affiliates have investment discretion |
|||
| The minimum investment requirement may be waived for current and former officers, partners, directors or employees of Goldman
Sachs or any of its affiliates or for other investors at the discretion of the Trust’s officers. No minimum amount is required for subsequent investments.
|
| What Else Should I Know About Share Purchases?
|
| The Trust reserves the right to:
|
n
|
Modify or waive the minimum investment amounts.
|
n
|
Reject or restrict any purchase or exchange orders by a particular purchaser (or group of related purchasers). This may occur, for
example, when a pattern of frequent purchases, sales or exchanges of Institutional Shares of a Fund is evident, or if purchases, sales or exchanges are, or a subsequent abrupt redemption might be, of a size that would disrupt the management of a Fund.
|
n
|
Close a Fund to new investors from time to time and reopen a Fund whenever it is deemed appropriate by a Fund’s Investment
Adviser.
|
| The Funds may allow you to purchase shares with securities instead of cash if consistent with a Fund’s investment policies
and operations and if approved by the Fund’s Investment Adviser.
|
| How Are Shares Priced?
|
| The price you pay or receive when you buy, sell or exchange Institutional Shares is determined by a Fund’s NAV. The Funds
calculate NAV as follows:
|
| (Value of Assets of the Class) | ||
| – (Liabilities of the Class) | ||
| NAV = | ||
| Number of Outstanding Shares of the Class |
| The Funds’ investments are valued based on market quotations or, if accurate quotations are not readily available, the fair
value of the Fund’s investments may be determined in good faith under procedures established by the Trustees.
|
n
|
NAV per share of each class is calculated by State Street on each business day as of the close of regular trading on the New York
Stock Exchange (normally 4:00 p.m. New York time). Fund shares will not be priced on any day the New York Stock Exchange is closed.
|
n
|
When you buy shares, you pay the NAV next calculated after the Funds receive your order in proper form.
|
n
|
When you sell shares, you receive the NAV next calculated after the Funds receive your order in proper form.
|
| Note: The time at which transactions and shares are priced and the time by which orders must be received may be changed in
case of an emergency or if regular trading on the New York Stock Exchange is stopped at a time other than 4:00 p.m. New York time.
|
| Foreign securities may trade in their local markets on days a Fund is closed. As a result, the NAV of a Fund that holds foreign
securities may be impacted on days when investors may not purchase or redeem Fund shares.
|
| In addition, the impact of events that occur after the publication of market quotations used by a Fund to price its securities but
before the close of regular trading on the New York Stock Exchange will normally not be reflected in a Fund’s next determined NAV unless the Trust, in its discretion, makes an adjustment in light of the nature and materiality of the event, its effect
on Fund operations and other relevant factors.
|
| How Can I Sell Institutional Shares Of The Funds?
|
| You may arrange to take money out of your account by selling (redeeming) some or all of your shares. Generally, each Fund will
redeem its Institutional Shares upon request on any business day at their NAV next determined after receipt of such request in proper form. You may request that redemption proceeds be sent to you by check or by wire (if the wire instructions are on record). Redemptions may be requested in writing or by telephone.
|
| Instructions For Redemptions: | |||||
|---|---|---|---|---|---|
| By Writing: | n Write a letter of instruction that includes: | ||||
| n Your name(s) and signature(s) | |||||
| n Your account number | |||||
| n The Fund name and Class of Shares | |||||
| n The dollar amount you want to sell | |||||
| n How and where to send the proceeds | |||||
| n Mail your request to: | |||||
| Goldman Sachs Funds | |||||
| 4900 Sears Tower | |||||
| Chicago, IL 60606-6372 | |||||
| By Telephone: | If you have elected the telephone | ||||
| redemption privilege on your Account Application: | |||||
| n 1-800-621-2550 | |||||
| (8:00 a.m. to 4:00 p.m. New York time) | |||||
| Certain institutions and intermediaries are authorized to accept redemption requests on behalf of the Funds as described under
“How Do I Purchase Shares Through A Financial Institution?”
|
| What Do I Need To Know About Telephone Redemption Requests?
|
| The Trust, the Distributor and the Transfer Agent will not be liable for any loss you may incur in the event that the Trust
accepts unauthorized telephone redemption requests that the Trust reasonably believes to be genuine. In an effort to prevent unauthorized or fraudulent redemption and exchange requests by telephone, Goldman Sachs employs reasonable procedures specified by
the Trust to confirm that such instructions are genuine. If reasonable procedures are not employed, the Trust may be liable for any loss due to unauthorized or fraudulent transactions. The following general policies are currently in effect:
|
n
|
All telephone requests are recorded.
|
n
|
Any redemption request that requires money to go to an account or address other than that designated on the Account Application
must be in writing and signed by an authorized person designated on the Account Application. The
written request may be confirmed by telephone with both the requesting party and the designated bank account to verify instructions.
|
n
|
The telephone redemption option may be modified or terminated at any time.
|
| Note: It may be difficult to make telephone redemptions in times of drastic economic or market conditions.
|
| How Are Redemption Proceeds Paid?
|
| By Wire: You may arrange for your redemption proceeds to be wired as federal funds to the bank account designated in
your Account Application. The following general policies govern wiring redemption proceeds:
|
n
|
Redemption proceeds will normally be wired on the next business day in federal funds (for a total of one business day delay), but
may be paid up to three business days following receipt of a properly executed wire transfer redemption request. If you are selling shares you recently paid for by check, the Fund will pay you when your check has cleared, which may take up to 15 days. If
the Federal Reserve Bank is closed on the day that the redemption proceeds would ordinarily be wired, wiring the redemption proceeds may be delayed one additional business day.
|
n
|
To change the bank designated on your Account Application, you must send written instructions signed by an authorized person
designated on the account application to the Transfer Agent.
|
n
|
Neither the Trust, Goldman Sachs nor any other institution assumes any responsibility for the performance of your bank or any
intermediaries in the transfer process. If a problem with such performance arises, you should deal directly with your bank or any such intermediaries.
|
| By Check: You may elect in writing to receive your redemption proceeds by check. Redemption proceeds paid by check
will normally be mailed to the address of record within three business days of a properly executed redemption request. If you are selling shares you recently paid for by check, the Fund will pay you when your check has cleared, which may take up to 15 days.
|
| What Else Do I Need To Know About Redemptions?
|
| The following generally applies to redemption requests:
|
n
|
Additional documentation may be required when deemed appropriate by the Transfer Agent. A redemption request will not be in proper
form until such additional documentation has been received.
|
n
|
Institutions (including banks, trust companies, brokers and investment advisers) are responsible for the timely transmittal of
redemption requests by their customers to the Transfer Agent. In order to facilitate the timely transmittal of redemption requests, these institutions may set times by which they must receive
redemption requests. These institutions may also require additional documentation from you.
|
| The Trust reserves the right to:
|
n
|
Redeem your shares if your account balance falls below $50 as a result of earlier redemptions. The Funds will not redeem your
shares on this basis if the value of your account falls below the minimum account balance solely as a result of market conditions. The Fund will give you 60 days’ prior written notice to allow you to purchase sufficient additional shares of the Fund
in order to avoid such redemption.
|
n
|
Redeem your shares in other circumstances determined by the Board of Trustees to be in the best interest of the Trust.
|
n
|
Pay redemptions by a distribution in-kind of securities (instead of cash). If you receive redemption proceeds in-kind, you should
expect to incur transaction costs upon the disposition of those securities.
|
n
|
Reinvest any dividends or other distributions which you have elected to receive in cash should your check for such dividends or
other distributions be returned to the Fund as undeliverable or remain uncashed for six months. In addition, that distribution and all future distributions payable to you will be reinvested at NAV in additional Institutional Shares of the Fund that pays
the distributions. No interest will accrue on amounts represented by uncashed distribution or redemption checks.
|
| Can I Exchange My Investment From One Fund To Another?
|
| You may exchange Institutional Shares of a Fund at NAV for Institutional Shares of any other Goldman Sachs Fund. The exchange
privilege may be materially modified or withdrawn at any time upon 60 days’ written notice to you.
|
| Instructions For Exchanging Shares: | |||||
|---|---|---|---|---|---|
| By Writing: | n Write a letter of instruction that includes: | ||||
| n Your name(s) and signature(s) | |||||
| n Your account number | |||||
| n The Fund names and Class of Shares | |||||
| n The dollar amount to be exchanged | |||||
| n
Mail the request to:
Goldman Sachs Funds 4900 Sears Tower Chicago, IL 60606-6372 |
|||||
| By Telephone: | If you have elected the telephone exchange
privilege on your Account Application: |
||||
| n
1-800-621-2550
(8:00 a.m. to 4:00 p.m. New York time) |
|||||
| You should keep in mind the following factors when making or considering an exchange:
|
n
|
You should obtain and carefully read the prospectus of the Fund you are acquiring before making an exchange.
|
n
|
All exchanges which represent an initial investment in a Fund must satisfy the minimum initial investment requirements of that
Fund, except that this requirement may be waived at the discretion of the Trust.
|
n
|
Telephone exchanges normally will be made only to an identically registered account.
|
n
|
Shares may be exchanged among accounts with different names, addresses and social security or other taxpayer identification
numbers only if the exchange instructions are in writing and are signed by an authorized person designated on the Account Application.
|
n
|
Exchanges are available only in states where exchanges may be legally made.
|
n
|
It may be difficult to make telephone exchanges in times of drastic economic or market conditions.
|
n
|
Goldman Sachs may use reasonable procedures described under “What Do I Need To Know About Telephone Redemption Requests?”
in an effort to prevent unauthorized or fraudulent telephone exchange requests.
|
n
|
Exchanges into Funds that are closed to new investors may be restricted.
|
| For federal income tax purposes, an exchange from one Fund to another is treated as a redemption of the shares surrendered in the
exchange, on which you may be subject to tax, followed by a purchase of shares received in the exchange. You should consult your tax adviser concerning the tax consequences of an exchange.
|
| Restrictions on Excessive Trading Practices. The Trust does not permit market-timing or other excessive trading
practices. Purchases and exchanges should be made for long-term investment purposes only. The Trust and Goldman Sachs reserve the right to reject or restrict purchase or exchange requests for any investor. Excessive, short-term (market-timing) trading
practices may disrupt portfolio management strategies, harm Fund performance and negatively impact long-term shareholders. The Trust and Goldman Sachs will not be held liable for any loss resulting from rejected purchase or exchange orders. To minimize
harm to the Trust (or Goldman Sachs) and its shareholders, the Trust (or Goldman Sachs) will exercise these rights if, in the Trust’s (or Goldman Sachs’) judgment, an investor has a history of excessive trading or if an investor’s trading,
in the judgment of the Trust (or Goldman Sachs) has been or may be disruptive to a Fund. In making this judgment, trades executed in multiple accounts under common ownership or control may be considered together.
|
| What Types of Reports Will I Be Sent Regarding Investments In Institutional Shares?
|
| You will receive an annual report containing audited financial statements and a semi-annual report. To eliminate unnecessary
duplication, only one copy of such reports will be sent to shareholders with the same mailing address. If you would like a duplicate copy to be mailed to you, please contact Goldman Sachs Funds at 1-800-621-2550. You will also be provided with a printed
confirmation for each transaction in your account and a monthly account statement. The Funds do not generally provide sub-accounting services.
|
| As with any investment, you should consider how your investment in the Funds will be taxed. The tax information below is provided
as general information. More tax information is available in the Additional Statement. You should consult your tax adviser about the federal, state, local or foreign tax consequences of your investment in the Funds.
|
| Unless your investment is an IRA or other tax-advantaged account, you should consider the possible tax consequences of Fund
distributions and the sale of your Fund shares.
|
| DISTRIBUTIONS
|
| Distributions you receive from the Funds are generally subject to federal income tax, and may also be subject to state or local
taxes. This is true whether you reinvest your distributions in additional Fund shares or receive them in cash. For federal tax purposes, the Funds’ income dividend distributions and short-term capital gain distributions are taxable to you as ordinary
income. Any long-term capital gain distributions are taxable as long-term capital gains, no matter how long you have owned your Fund shares.
|
| Although distributions are generally treated as taxable to you in the year they are paid, distributions declared in October,
November or December but paid in January are taxable as if they were paid in December. A percentage of the Funds’ dividends paid to corporate shareholders may be eligible for the corporate dividends-received deduction. The Funds will inform
shareholders of the source and tax status of all distributions promptly after the close of each calendar year.
|
| Each Fund may be subject to foreign withholding or other foreign taxes on income or gain from certain foreign securities. In
general, the Funds may deduct these taxes in computing their taxable income.
|
| If you buy shares of a Fund before it makes a distribution, the distribution will be taxable to you even though it may actually be
a return of a portion of your investment. This is known as “buying a dividend.”
|
| SALES AND EXCHANGES
|
| Your sale of Fund shares is a taxable transaction for federal income tax purposes, and may also be subject to state and local
taxes. For tax purposes, the exchange of your Fund shares for shares of a different Goldman Sachs Fund is the same as a sale. When you sell your shares, you will generally recognize a capital gain or loss in an amount equal to the difference between your
adjusted tax basis in the shares and the amount received. Generally, this gain or loss is long-term or short-term depending on whether your holding period exceeds twelve months, except that any loss realized on shares held for six months or less will be
treated as a long-term capital loss to the extent of any capital gain dividends that were received on the shares.
|
| OTHER INFORMATION
|
| When you open your account, you should provide your social security or tax identification number on your Account Application. By
law, each Fund must withhold 31% of your taxable distributions and any redemption proceeds if you do not provide your correct taxpayer identification number, or certify that it is correct, or if the IRS instructs the Fund to do so. Non-U.S. investors may
be subject to U.S. withholding and estate tax.
|
| A. General Portfolio Risks
|
| The Funds will be subject to the risks associated with equity securities. “Equity securities” include common stocks,
preferred stocks, interests in real estate investment trusts, convertible debt obligations, convertible preferred stocks, equity interests in trusts, partnerships, joint ventures, limited liability companies and similar enterprises, warrants and stock
purchase rights. In general, stock values fluctuate in response to the activities of individual companies and in response to general market and economic conditions. Accordingly, the value of the stocks that a Fund holds may decline over short or extended
periods. The stock markets tend to be cyclical, with periods when stock prices generally rise and periods when prices generally decline. The volatility of equity securities means that the value of your investment in the Funds may increase or decrease.
Recently, certain stock markets have experienced substantial price volatility and, at times, have traded at or close to record high levels. There can be no guarantee that such levels will be reached or maintained in the future.
|
| To the extent that a Fund invests in fixed-income securities, that Fund will also be subject to the risks associated with its
fixed-income securities. These risks include interest rate risk, credit risk and call/extension risk. In general, interest rate risk involves the risk that when interest rates decline, the market value of fixed-income securities tends to increase
(although many mortgage related securities will have less potential than other debt securities for capital appreciation during periods of declining rates). Conversely, when interest rates increase, the market value of fixed-income securities tends to
decline. Credit risk involves the risk that an issuer or guarantor could default on its obligations, and a Fund will not recover its investment. Call risk and extension risk are normally present in mortgage-backed securities and asset-backed securities.
For example, homeowners have the option to prepay their mortgages. Therefore, the duration of a security backed by home mortgages can either shorten (call risk) or lengthen (extension risk). In general, if interest rates on new mortgage loans fall
sufficiently below the interest rates on existing outstanding mortgage loans, the rate of prepayment would be expected to increase. Conversely, if mortgage loan interest rates rise above the interest rates on existing outstanding mortgage loans, the rate
of prepayment would be expected to decrease. In either case, a change in the prepayment rate can result in losses to investors.
|
| The Investment Adviser will not consider the portfolio turnover rate a limiting factor in making investment decisions for a Fund.
A high rate of portfolio turnover (100% or more) involves correspondingly greater expenses which must be borne by a Fund and its shareholders, and is also likely to result in higher short-term capital gains taxable to shareholders. The portfolio turnover
rate is calculated by dividing the lesser of the dollar amount of sales or purchases of portfolio securities by the average monthly value of a Fund’s portfolio securities, excluding securities having a maturity at the date of purchase of one year or
less. See “Financial Highlights” in Appendix B for a statement of the Funds’ historical portfolio turnover rates.
|
| The following sections provide further information on certain types of securities and investment techniques that may be used by
the Funds, including their associated risks. Additional information is provided in the Additional Statement, which is available upon request. Among other things, the Additional Statement describes certain fundamental investment restrictions that cannot be
changed without shareholder approval. You should note, however, that all investment objectives, and all investment policies not specifically designated as fundamental are non-fundamental and may be changed without shareholder approval. If there is a
change in a Fund’s investment objective, you should consider whether that Fund remains an appropriate investment in light of your then current financial position and needs.
|
| B. Other Portfolio Risks
|
| Risks of Investing in Small Capitalization Companies. Each Fund may invest in small capitalization companies.
Investments in small capitalization companies involve greater risk and portfolio price volatility than investments in larger capitalization stocks. Among the reasons for the greater price volatility of these investments are the less certain growth
prospects of smaller firms and the lower degree of liquidity in the markets for such securities. Small capitalization companies may be thinly traded and may have to be sold at a discount from current market prices or in small lots over an extended period
of time. In addition, these securities are subject to the risk that during certain periods the liquidity of particular issuers or industries, or all securities in these investment categories, will shrink or disappear suddenly and without warning as a
result of adverse economic or market conditions, or adverse investor perceptions whether or not accurate. Because of the lack of sufficient market liquidity, a Fund may incur losses because it will be required to effect sales at a disadvantageous time and
only then at a substantial drop in price. Small capitalization companies include “unseasoned” issuers that do not have an established financial history; often have limited product lines, markets or financial
resources; may depend on or use a few key personnel for management; and may be susceptible to losses and risks of bankruptcy. Transaction costs for these investments are often higher than those of larger capitalization companies. Investments in small
capitalization companies may be more difficult to price precisely than other types of securities because of their characteristics and lower trading volumes.
|
| Risks of Foreign Investments. The Funds may make foreign investments. Foreign investments involve special risks that
are not typically associated with U.S. dollar denominated or quoted securities of U.S. issuers. Foreign investments may be affected by changes in currency rates, changes in foreign or U.S. laws or restrictions applicable to such investments and changes in
exchange control regulations (e.g., currency blockage). A decline in the exchange rate of the currency (i.e., weakening of the currency against the U.S. dollar) in which a portfolio security is quoted or denominated relative to the U.S. dollar would reduce the value of
the portfolio security. In addition, if the currency in which a Fund receives dividends, interest or other payments declines in value against the U.S. dollar before such income is distributed as dividends to shareholders or converted to U.S. dollars, the
Fund may have to sell portfolio securities to obtain sufficient cash to pay such dividends.
|
| The introduction of a single currency, the euro, on January 1, 1999 for participating nations in the European Economic and
Monetary Union has presented unique uncertainties, including the fluctuation of the euro relative to non-euro currencies during the transition period from January 1, 1999 to December 31, 2001 and beyond; whether the interest rate, tax and labor regimes of
European countries participating in the euro will converge over time; and whether the conversion of the currencies of other countries that now are or may in the future become members of the European Union (“EU”), may have an impact on the euro.
Also, it is possible that the euro could be abandoned in the future by countries that have already adopted its use. These or other events, including political and economic developments, could cause market disruptions, and could adversely affect the value
of securities held by the Funds. Because of the number of countries using this single currency, a significant portion of the assets held by the Funds may be denominated in the euro.
|
| Brokerage commissions, custodial services and other costs relating to investment in international securities markets generally are
more expensive than in the United States. In addition, clearance and settlement procedures may be different in foreign countries and, in certain markets, such procedures have been unable to keep pace with the volume of securities transactions, thus making
it difficult to conduct such transactions.
|
| Foreign issuers are not generally subject to uniform accounting, auditing and financial reporting standards comparable to those
applicable to U.S. issuers. There may be less publicly available information about a foreign issuer than about a U.S. issuer. In addition, there is generally less government regulation of foreign markets, companies and securities dealers than in the
United States. Foreign securities markets may have substantially less volume than U.S. securities markets and secu-
|
| rities of many foreign issuers are less liquid and more volatile than securities of comparable domestic issuers. Furthermore, with
respect to certain foreign countries, there is a possibility of nationalization, expropriation or confiscatory taxation, imposition of withholding or other taxes on dividend or interest payments (or, in some cases, capital gains distributions),
limitations on the removal of funds or other assets from such countries, and risks of political or social instability or diplomatic developments which could adversely affect investments in those countries.
|
| Concentration of a Fund’s assets in one or a few countries and currencies will subject a Fund to greater risks than if a
Fund’s assets were not geographically concentrated.
|
| Investment in sovereign debt obligations by certain Funds involves risks not present in debt obligations of corporate issuers. The
issuer of the debt or the governmental authorities that control the repayment of the debt may be unable or unwilling to repay principal or interest when due in accordance with the terms of such debt, and a Fund may have limited recourse to compel payment
in the event of a default. Periods of economic uncertainty may result in the volatility of market prices of sovereign debt, and in turn a Fund’s NAV, to a greater extent than the volatility inherent in debt obligations of U.S. issuers.
|
| A sovereign debtor’s willingness or ability to repay principal and pay interest in a timely manner may be affected by, among
other factors, its cash flow situation, the extent of its foreign currency reserves, the availability of sufficient foreign exchange on the date a payment
is due, the relative size of the debt service burden to the economy as a whole, the sovereign debtor’s policy toward international lenders, and the political constraints to which a sovereign debtor may be subject.
|
| Investments in foreign securities may take the form of sponsored and unsponsored American Depositary Receipts (“ADRs”)
and Global Depositary Receipts (“GDRs”). Certain Funds may also invest in European Depositary Receipts (“EDRs”) or other similar instruments representing securities of foreign issuers. ADRs represent the right to receive securities of
foreign issuers deposited in a domestic bank or a correspondent bank. Prices of ADRs are quoted in U.S. dollars, and ADRs are traded in the United States. EDRs and GDRs are receipts evidencing an arrangement with a non-U.S. bank. EDRs and GDRs are not
necessarily quoted in the same currency as the underlying security.
|
| Risks of Emerging Countries. Certain Funds may invest in securities of issuers located in emerging countries. The
risks of foreign investment are heightened when the issuer is located in an emerging country. Emerging countries are generally located in the Asia-Pacific region, Eastern Europe, Latin and South America and Africa. A Fund’s purchase and sale of
portfolio securities in certain emerging countries may be constrained by limitations relating to daily changes in the prices of listed securities, periodic trading or settlement volume and/or limitations on aggregate holdings of foreign investors. Such
limitations may be computed based on the aggregate trading volume by or holdings of a Fund, the Investment Adviser, its affiliates and their respective clients and other service providers. A Fund may not be able to sell securities in circumstances where
price, trading or settlement volume limitations have been reached.
|
| Foreign investment in the securities markets of certain emerging countries is restricted or controlled to varying degrees which
may limit investment in such countries or increase the administrative costs of such investments. For example, certain Asian countries require governmental approval prior to investments by foreign persons or limit investment by foreign persons to only a
specified percentage of an issuer’s outstanding securities or a specific class of securities which may have less advantageous terms (including price) than securities of the issuer available for purchase by nationals. In addition, certain countries
may restrict or prohibit investment opportunities in issuers or industries deemed important to national interests. Such restrictions may affect the market price, liquidity and rights of securities that may be purchased by a Fund. The repatriation of both
investment income and capital from certain emerging countries is subject to restrictions such as the need for governmental consents. Due to restrictions on direct investment in equity securities in certain Asian and other countries, it is anticipated that
a Fund may invest in such countries through other investment funds in such countries.
|
| Many emerging countries have recently experienced currency devaluations and substantial (and, in some cases, extremely high) rates
of inflation. Other emerging countries have experienced economic recessions. These circumstances have had a negative effect on the economies and securities markets of such emerging countries. Economies in emerging countries generally are dependent heavily
upon commodity prices and international trade and, accordingly, have been and may continue to be affected adversely by the economies of their trading partners, trade barriers, exchange controls, managed adjustments in relative currency values and other
protectionist measures imposed or negotiated by the countries with which they trade.
|
| Many emerging countries are subject to a substantial degree of economic, political and social instability. Governments of some
emerging countries are authoritarian in nature or have been installed or removed as a result of military coups, while governments in other emerging countries have periodically used force to suppress
civil dissent. Disparities of wealth, the pace and success of democratization, and ethnic, religious and racial disaffection, among other factors, have also led to social unrest, violence and/or labor unrest in some emerging countries. Unanticipated
political or social developments may result in sudden and significant investment losses. Investing in emerging countries involves greater risk of loss due to expropriation, nationalization, confiscation of assets and property or the imposition of
restrictions on foreign investments and on repatriation of capital invested. As an example, in the past some Eastern European governments have expropriated substantial amounts of private property, and many claims of the property owners have never been
fully settled. There is no assurance that similar expropriations will not recur in Eastern Europe or other countries.
|
| A Fund’s investment in emerging countries may also be subject to withholding or other taxes, which may be significant and may
reduce the return from an investment in such countries to the Fund.
|
| Settlement procedures in emerging countries are frequently less developed and reliable than those in the United States and often
may involve a Fund’s delivery of securities before receipt of payment for their sale. In addition, significant delays are common in certain markets in registering the transfer of securities. Settlement or registration problems may make it more
difficult for a Fund to value its portfolio securities and could cause the Fund to miss attractive investment opportunities, to have a portion of its assets uninvested or to incur losses due to the failure of a counterparty to pay for securities the Fund
has delivered or the Fund’s inability to complete its contractual obligations because of theft or other reasons. The creditworthiness of the local securities firms used by the Fund in emerging countries may not be as sound as the creditworthiness of
firms used in more developed countries. As a result, the Fund may be subject to a greater risk of loss if a securities firm defaults in the performance of its responsibilities.
|
| The small size and inexperience of the securities markets in certain emerging countries and the limited volume of trading in
securities in those countries may make a Fund’s investments in such countries less liquid and more volatile than investments in countries with more developed securities markets (such as the United States, Japan and most Western European countries). A
Fund’s investments in emerging countries are subject to the risk that the liquidity of a particular investment, or investments generally, in such countries will shrink or disappear suddenly and without warning as a result of adverse economic, market
or political conditions or adverse investor perceptions, whether or not accurate. Because of the lack of sufficient market liquidity, a Fund may incur losses because it will be required to effect sales at a disadvantageous time and only then at a
substantial drop in price. Investments in emerging countries may be more difficult to price precisely because of the characteristics discussed above and lower trading volumes.
|
| A Fund’s use of foreign currency management techniques in emerging countries may be limited. Due to the limited market for
these instruments in emerging countries, the Investment Adviser does not currently anticipate that a significant portion of the Funds’ currency exposure in emerging countries, if any, will be covered by such instruments.
|
| Risks of Derivative Investments. A Fund’s transactions, if any, in options, futures, options on futures, swaps,
interest rate caps, floors and collars, structured securities and currency transactions involve additional risk of loss. Loss can result from a lack of correlation between changes in the value of derivative instruments and the portfolio assets (if any)
being hedged, the potential illiquidity of the markets for derivative instruments, or the risks arising from margin requirements and related leverage factors associated with such transactions. The use of these management techniques also involves the risk
of loss if the Investment Adviser is incorrect in its expectation of fluctuations in securities prices, interest rates or currency prices. Each Fund may also invest in derivative investments for non-hedging purposes (that is, to seek to increase total
return). Investing for non-hedging purposes is considered a speculative practice and presents even greater risk of loss.
|
| Risks of Illiquid Securities. Each Fund may invest up to 15% of its net assets in illiquid securities which cannot
be disposed of in seven days in the ordinary course of business at fair value. Illiquid securities include:
|
n
|
Both domestic and foreign securities that are not readily marketable
|
n
|
Certain stripped mortgage-backed securities
|
n
|
Repurchase agreements and time deposits with a notice or demand period of more than seven days
|
n
|
Certain over-the-counter options
|
n
|
Certain structured securities and all swap transactions
|
n
|
Certain restricted securities, unless it is determined, based upon a review of the trading markets for a specific restricted
security, that such restricted security is eligible for resale pursuant to Rule 144A under the Securities Act of 1933 (“144A Securities”) and, therefore, is liquid.
|
| Investing in 144A Securities may decrease the liquidity of a Fund’s portfolio to the extent that qualified institutional
buyers become for a time uninterested in purchasing these restricted securities. The purchase price and subsequent valuation of restricted and illiquid securities normally reflect a discount, which may be significant, from the market price of comparable
securities for which a liquid market exists.
|
| Credit Risks. Debt securities purchased by the Funds may include securities (including zero coupon bonds) issued by
the U.S. government (and its agencies, instrumentalities and sponsored enterprises), foreign governments, domestic and foreign corporations, banks and other issuers. Further information is provided in the Additional Statement.
|
| Debt securities rated BBB or higher by Standard & Poor’s or Baa or higher by Moody’s are considered “investment
grade.” Securities rated BBB or Baa are considered medium-grade obligations with speculative characteristics, and adverse economic conditions or changing circumstances may weaken their issuers’ capacity to pay interest and repay principal. A
security will be deemed to have met a rating requirement if it receives the minimum required rating from at least one such rating organization even though it has been rated below the minimum rating by one or more other rating organizations, or if unrated
by such rating organizations, determined by the Investment Adviser to be of comparable credit quality.
|
| Certain Funds may invest in fixed-income securities rated BB or Ba or below (or comparable unrated securities) which are commonly
referred to as “junk bonds.” Junk bonds are considered predominantly speculative and may be questionable as to principal and interest payments.
|
| In some cases, junk bonds may be highly speculative, have poor prospects for reaching investment grade standing and be in default.
As a result, investment in such bonds will present greater speculative risks than those associated with investment in investment grade bonds. Also, to the extent that the rating assigned to a security in a Fund’s portfolio is downgraded by a rating
organization, the market price and liquidity of such security may be adversely affected.
|
| Risks of Initial Public Offerings. The Funds may invest in IPOs. An IPO is a company’s first offering of stock
to the public. IPO risk is the risk that the market value of IPO shares will fluctuate considerably due to factors such as the absence of a prior public market, unseasoned trading, the small number of shares available for trading and limited information
about the issuer. The purchase of IPO shares may involve high transaction costs. IPO shares are subject to market risk and liquidity risk. When a Fund’s asset base is small, a significant portion of the Fund’s performance could be attributable
to investments in IPOs, because such investments would have a magnified impact on the Fund. As the Fund’s assets grow, the effect of the Fund’s investments in IPOs on the Fund’s performance probably will decline, which could reduce the
Fund’s performance. Because of the price volatility of IPO shares, a Fund may choose to hold IPO shares for a very short period of time. This may increase the turnover of the Fund’s portfolio and may lead to increased expenses to the Fund, such
as commissions and transaction costs. By selling IPO shares, the Fund may realize taxable gains it will subse
quently distribute to shareholders. In addition, the market for IPO shares can be speculative and/or inactive for extended periods of time. There is no assurance that a Fund will be able to obtain allocable portions of IPO shares. The limited number of
shares available for trading in some IPOs may make it more difficult for a Fund to buy or sell significant amounts of shares without an unfavorable impact on prevailing prices. Investors in IPO shares can be affected by substantial dilution in the value
of their shares, by sales of additional shares and by concentration of control in existing management and principal shareholders.
|
| Temporary Investment Risks. Each Fund may, for temporary defensive purposes, invest a certain percentage of its
total assets in:
|
n
|
U.S. government securities
|
n
|
Commercial paper rated at least A-2 by Standard & Poor’s or P-2 by Moody’s
|
n
|
Certificates of deposit
|
n
|
Bankers’ acceptances
|
n
|
Repurchase agreements
|
n
|
Non-convertible preferred stocks and non-convertible corporate bonds with a remaining maturity of less than one year
|
| When a Fund’s assets are invested in such instruments, the Fund may not be achieving its investment objective.
|
| C. Portfolio Securities and Techniques
|
| This section provides further information on certain types of securities and investment techniques that may be used by the Funds,
including their associated risks. Further information is provided in the Additional Statement, which is available upon request.
|
| Convertible Securities. Each Fund may invest in convertible securities. Convertible securities are preferred stock
or debt obligations that are convertible into common stock. Convertible securities generally offer lower interest or dividend yields than non-convertible securities of similar quality. Convertible securities in which a Fund invests are subject to the same
rating criteria as its other investments in fixed-income securities. Convertible securities have both equity and fixed-income risk characteristics. Like all fixed-income securities, the value of convertible securities is susceptible to the risk of market
losses attributable to changes in interest rates. Generally, the market value of convertible securities tends to decline as interest rates increase and, conversely, to increase as interest rates decline. However, when the market price of the common stock
underlying a convertible security exceeds the conversion price of the convertible security, the convertible security tends to reflect the market price of the underlying common stock. As the market
price of the underlying common stock declines, the convertible security, like a fixed-income security, tends to trade increasingly on a yield basis, and thus may not decline in price to the same extent as the underlying common stock.
|
| Foreign Currency Transactions. A Fund may, to the extent consistent with its investment policies, purchase or sell
foreign currencies on a cash basis or through forward contracts. A forward contract involves an obligation to purchase or sell a specific currency at a future date at a price set at the time of the contract. A Fund may engage in foreign currency
transactions for hedging purposes and to seek to protect against anticipated changes in future foreign currency exchange rates. In addition, certain Funds may also enter into such transactions to seek to increase total return, which is considered a
speculative practice.
|
| Some Funds may also engage in cross-hedging by using forward contracts in a currency different from that in which the hedged
security is denominated or quoted. A Fund may hold foreign currency received in connection with investments in foreign securities when, in the judgment of the Investment Adviser, it would be beneficial to convert such currency into U.S. dollars at a later
date (e.g., the Investment Adviser may anticipate the foreign currency to appreciate against the U.S. dollar).
|
| Currency exchange rates may fluctuate significantly over short periods of time, causing, along with other factors, a Fund’s
NAV to fluctuate (when the Fund’s NAV fluctuates, the value of your shares may go up or down). Currency exchange rates also can be affected unpredictably by the intervention of U.S. or foreign governments or central banks, or the failure to
intervene, or by currency controls or political developments in the United States or abroad.
|
| The market in forward foreign currency exchange contracts, currency swaps and other privately negotiated currency instruments
offers less protection against defaults by the other party to such instruments than is available for currency instruments traded on an exchange. Such contracts are subject to the risk that the counterparty to the contract will default on its obligations.
Since these contracts are not guaranteed by an exchange or clearinghouse, a default on a contract would deprive a Fund of unrealized profits, transaction costs or the benefits of a currency hedge or could force the Fund to cover its purchase or sale
commitments, if any, at the current market price.
|
| Structured Securities. Each Fund may invest in structured securities. Structured securities are securities whose
value is determined by reference to changes in the value of specific currencies, interest rates, commodities, indices or other financial indicators (the “Reference”) or the relative change in two or more References.
The interest rate or the principal amount payable upon maturity or redemption may be increased or decreased depending upon changes in the applicable Reference. Structured securities may be positively or negatively indexed, so that appreciation of the
Reference may produce an increase or decrease in the interest rate or value of the security at maturity. In addition, changes in the interest rates or the value of the security at maturity may be a multiple of changes in the value of the Reference.
Consequently, structured securities may present a greater degree of market risk than other types of fixed-income securities and may be more volatile, less liquid and more difficult to price accurately than less complex securities.
|
| REITs. Each Fund may invest in REITs. REITs are pooled investment vehicles that invest primarily in either real
estate or real estate related loans. The value of a REIT is affected by changes in the value of the properties owned by the REIT or securing mortgage loans held by the REIT. REITs are dependent upon the ability of the REITs’ managers, and are subject
to heavy cash flow dependency, default by borrowers and the qualification of the REITs under applicable regulatory requirements for favorable income tax treatment. REITs are also subject to risks generally associated with investments in real estate
including possible declines in the value of real estate, general and local economic conditions, environmental problems and changes in interest rates. To the extent that assets underlying a REIT are concentrated geographically, by property type or in
certain other respects, these risks may be heightened. A Fund will indirectly bear its proportionate share of any expenses, including management fees, paid by a REIT in which it invests.
|
| Options on Securities, Securities Indices and Foreign Currencies. A put option gives the purchaser of the option the
right to sell, and the writer (seller) of the option the obligation to buy, the underlying instrument during the option period. A call option gives the purchaser of the option the right to buy, and the writer (seller) of the option the obligation to sell,
the underlying instrument during the option period. Each Fund may write (sell) covered call and put options and purchase put and call options on any securities in which they may invest or on any securities index consisting of securities in which they may
invest. A Fund may also, to the extent that it invests in foreign securities, purchase and sell (write) put and call options on foreign currencies.
|
| The writing and purchase of options is a highly specialized activity which involves special investment risks. Options may be used
for either hedging or cross-hedging purposes, or to seek to increase total return (which is considered a speculative activity). The successful use of options depends in part on the ability of the Investment Adviser to manage future price fluctuations and
the degree of correlation between the options and securities (or currency) markets. If the Invest
ment Adviser is incorrect in its expectation of changes in market prices or determination of the correlation between the instruments or indices on which options are written and purchased and the instruments in a Fund’s investment portfolio, the Fund
may incur losses that it would not otherwise incur. The use of options can also increase a Fund’s transaction costs. Options written or purchased by the Funds may be traded on either U.S. or foreign exchanges or over-the-counter. Foreign and
over-the-counter options will present greater possibility of loss because of their greater illiquidity and credit risks.
|
| Futures Contracts and Options on Futures Contracts. Futures contracts are standardized, exchange-traded contracts
that provide for the sale or purchase of a specified financial instrument or currency at a future time at a specified price. An option on a futures contract gives the purchaser the right (and the writer of the option the obligation) to assume a position
in a futures contract at a specified exercise price within a specified period of time. A futures contract may be based on various securities (such as U.S. government securities), foreign currencies, securities indices and other financial instruments and
indices. The Funds may engage in futures transactions on both U.S. and foreign exchanges.
|
| Each Fund may purchase and sell futures contracts, and purchase and write call and put options on futures contracts, in order to
seek to increase total return or to hedge against changes in interest rates, securities prices or, to the extent a Fund invests in foreign securities, currency exchange rates, or to otherwise manage their term structures, sector selection and durations in
accordance with their investment objectives and policies. Each Fund may also enter into closing purchase and sale transactions with respect to such contracts and options. A Fund will engage in futures and related options transactions for bona fide hedging
purposes as defined in regulations of the Commodity Futures Trading Commission or to seek to increase total return to the extent permitted by such regulations. A Fund may not purchase or sell futures contracts or purchase or sell related options to seek
to increase total return, except for closing purchase or sale transactions, if immediately thereafter the sum of the amount of initial margin deposits and premiums paid on the Fund’s outstanding positions in futures and related options entered into
for the purpose of seeking to increase total return would exceed 5% of the market value of the Fund’s net assets.
|
| Futures contracts and related options present the following risks:
|
n
|
While a Fund may benefit from the use of futures and options on futures, unanticipated changes in interest rates, securities
prices or currency exchange rates may result in poorer overall performance than if the Fund had not entered into any futures contracts or options transactions.
|
n
|
Because perfect correlation between a futures position and portfolio position that is intended to be protected is impossible to
achieve, the desired protection may not be obtained and a Fund may be exposed to additional risk of loss.
|
n
|
The loss incurred by a Fund in entering into futures contracts and in writing call options on futures is potentially unlimited and
may exceed the amount of the premium received.
|
n
|
Futures markets are highly volatile and the use of futures may increase the volatility of a Fund’s NAV.
|
n
|
As a result of the low margin deposits normally required in futures trading, a relatively small price movement in a futures
contract may result in substantial losses to a Fund.
|
n
|
Futures contracts and options on futures may be illiquid, and exchanges may limit fluctuations in futures contract prices during a
single day.
|
n
|
Foreign exchanges may not provide the same protection as U.S. exchanges.
|
| Equity Swaps. Each Fund may invest in equity swaps. Equity swaps allow the parties to a swap agreement to exchange
the dividend income or other components of return on an equity investment (for example, a group of equity securities or an index) for a component of return on another non-equity or equity investment.
|
| An equity swap may be used by a Fund to invest in a market without owning or taking physical custody of securities in
circumstances in which direct investment may be restricted for legal reasons or is otherwise impractical. Equity swaps are derivatives and their value can be very volatile. To the extent that the Investment Adviser does not accurately analyze and predict
the potential relative fluctuation of the components swapped with another party, a Fund may suffer a loss, which may be substantial. The value of some components of an equity swap (such as the dividends on a common stock) may also be sensitive to changes
in interest rates. Furthermore, a Fund may suffer a loss if the counterparty defaults. Because equity swaps are normally illiquid, a Fund may be unable to terminate its obligations when desired.
|
| When-Issued Securities and Forward Commitments. Each Fund may purchase when-issued securities and make contracts to
purchase or sell securities for a fixed price at a future date beyond customary settlement time. When-issued securities are securities that have been authorized, but not yet issued. When-issued securities are purchased in order to secure what is
considered to be an advantageous price and yield to the Fund at the time of entering into the transaction. A forward commitment involves the entering into a contract to purchase or sell securities for a fixed price at a future date beyond the customary
settlement period.
|
| The purchase of securities on a when-issued or forward commitment basis involves a risk of loss if the value of the security to be
purchased declines before the settlement date. Conversely, the sale of securities on a forward commitment basis involves the risk that the value of the securities sold may increase before the
settlement date. Although a Fund will generally purchase securities on a when-issued or forward commitment basis with the intention of acquiring the securities for its portfolio, a Fund may dispose of when-issued securities or forward commitments prior
to settlement if the Investment Adviser deems it appropriate.
|
| Repurchase Agreements. Repurchase agreements involve the purchase of securities subject to the seller’s
agreement to repurchase them at a mutually agreed upon date and price. Each Fund may enter into repurchase agreements with dealers in U.S. government securities and member banks of the Federal Reserve System which furnish collateral at least equal in
value or market price to the amount of their repurchase obligation.
|
| If the other party or “seller” defaults, a Fund might suffer a loss to the extent that the proceeds from the sale of the
underlying securities and other collateral held by the Fund are less than the repurchase price and the Fund’s costs associated with delay and enforcement of the repurchase agreement. In addition, in the event of bankruptcy of the seller, a Fund could
suffer additional losses if a court determines that the Fund’s interest in the collateral is not enforceable.
|
| In evaluating whether to enter into a repurchase agreement, the Investment Adviser will carefully consider the creditworthiness of
the seller. Certain Funds, together with other registered investment companies having advisory agreements with the Investment Adviser or any of its affiliates, may transfer uninvested cash balances into a single joint account, the daily aggregate balance
of which will be invested in one or more repurchase agreements.
|
| Lending of Portfolio Securities. Each Fund may engage in securities lending. Securities lending involves the lending
of securities owned by a Fund to financial institutions such as certain broker-dealers. The borrowers are required to secure their loan continuously with cash, cash equivalents, U.S. government securities or letters of credit in an amount at least equal
to the market value of the securities loaned. Cash collateral may be invested in cash equivalents. To the extent that cash collateral is invested in other investment securities, such collateral will be subject to market depreciation or appreciation, and a
Fund will be responsible for any loss that might result from its investment of the borrowers’ collateral. If the Investment Adviser determines to make securities loans, the value of the securities loaned may not exceed 33 1
/3% of the value of the total assets of a
Fund (including the loan collateral).
|
| A Fund may lend its securities to increase its income. A Fund may, however, experience delay in the recovery of its securities if
the institution with which it has engaged in a portfolio loan transaction breaches its agreement with the Fund.
|
| Short Sales Against-the-Box. Certain Funds may make short sales against-the-box. A short sale against-the-box means
that at all times when a short position is open the Fund will own an equal amount of securities sold short, or securities convertible into or exchangeable for, without payment of any further consideration, an equal amount of the securities of the same
issuer as the securities sold short.
|
| Preferred Stock, Warrants and Rights. Each Fund may invest in preferred stock, warrants and rights. Preferred stocks
are securities that represent an ownership interest providing the holder with claims on the issuer’s earnings and assets before common stock owners but after bond owners. Unlike debt securities, the obligations of an issuer of preferred stock,
including dividend and other payment obligations, may not typically be accelerated by the holders of such preferred stock on the occurrence of an event of default or other non-compliance by the issuer of the preferred stock.
|
| Warrants and other rights are options to buy a stated number of shares of common stock at a specified price at any time during the
life of the warrant or right. The holders of warrants and rights have no voting rights, receive no dividends and have no rights with respect to the assets of the issuer.
|
| Other Investment Companies. Each Fund may invest in securities of other investment companies (including
exchange-traded funds such as SPDRs and iShares
SM
, as defined below) subject to statutory limitations prescribed by the Act. These limitations include a
prohibition on any Fund acquiring more than 3% of the voting shares of any other investment company, and a prohibition on investing more than 5% of a Fund’s total assets in securities of any one investment company or more than 10% of its total assets
in securities of all investment companies. A Fund will indirectly bear its proportionate share of any management fees and other expenses paid by such other investment companies. Exchange-traded funds such as SPDRs and iShares
SM
are shares of unaffiliated investment companies which are traded like traditional equity securities on a national
securities exchange or the NASDAQ® National Market System.
|
n
|
Standard & Poor’s Depositary Receipts™.
The Funds may, consistent with their investment policies, purchase Standard & Poor’s Depositary Receipts™ (“SPDRs”). SPDRs are securities traded on the American Stock Exchange (“AMEX”) that represent
ownership in the SPDR Trust, a trust which has been established to accumulate and hold a portfolio of common stocks that is intended to track the price performance and dividend yield of the S&P 500®. The SPDR Trust is sponsored by a subsidiary of
the AMEX. SPDRs may be used for several reasons, including, but not limited to, facilitating the handling
of cash flows or trading, or reducing transaction costs. The price movement of SPDRs may not perfectly parallel the price action of the S&P 500®.
|
n
|
iShares
SM
(formerly World Equity Benchmark Shares or WEBs). iShares are shares of an investment company that invests substantially all of its assets in securities included
in the MSCI indices for specified countries. iShares are listed on the AMEX and were initially offered to the public in 1996. The market prices of iShares are expected to fluctuate in accordance with both changes in the NAVs of their underlying indices
and supply and demand of iShares on the AMEX. To date, iShares have traded at relatively modest discounts and premiums to their NAVs. However, iShares have a limited operating history and information is lacking regarding the actual performance and trading
liquidity of iShares for extended periods or over complete market cycles. In addition, there is no assurance that the requirements of the AMEX necessary to maintain the listing of iShares will continue to be met or will remain unchanged. In the event
substantial market or other disruptions affecting iShares should occur in the future, the liquidity and value of a Fund’s shares could also be substantially and adversely affected. If such disruptions were to occur, a Fund could be required to
reconsider the use of iShares as part of its investment strategy.
|
| Unseasoned Companies. Each Fund may invest in companies (including predecessors) which have operated less than three
years. The securities of such companies may have limited liquidity, which can result in their being priced higher or lower than might otherwise be the case. In addition, investments in unseasoned companies are more speculative and entail greater risk than
do investments in companies with an established operating record.
|
| Corporate Debt Obligations. Corporate debt obligations include bonds, notes, debentures, commercial paper and other
obligations of corporations to pay interest and repay principal, and include securities issued by banks and other financial institutions. Each Fund may invest in corporate debt obligations issued by U.S. and certain non-U.S. issuers which issue securities
denominated in the U.S. dollar (including Yankee and Euro obligations). In addition to obligations of corporations, corporate debt obligations include securities issued by banks and other financial institutions and supranational entities (i.e., the World Bank, the International Monetary Fund, etc.).
|
| Bank Obligations. Each Fund may invest in obligations issued or guaranteed by U.S. or foreign banks. Bank
obligations, including without limitations, time deposits, bankers’ acceptances and certificates of deposit, may be general obligations of the parent bank or may be limited to the issuing branch by the terms of the specific obligations or by
government regulations. Banks are subject to extensive but different governmental regulations which may limit both the amount and types of
loans which may be made and interest rates which may be charged. In addition, the profitability of the banking industry is largely dependent upon the availability and cost of funds for the purpose of financing lending operations under prevailing money
market conditions. General economic conditions as well as exposure to credit losses arising from possible financial difficulties of borrowers play an important part in the operation of this industry.
|
| U.S. Government Securities. Each Fund may invest in U.S. government securities. U.S. government securities include
U.S. Treasury obligations and obligations issued or guaranteed by U.S. government agencies, instrumentalities or sponsored enterprises. U.S. government securities may be supported by (a) the full faith and credit of the U.S. Treasury (such as the
Government National Mortgage Association (“Ginnie Mae”)); (b) the right of the issuer to borrow from the U.S. Treasury (such as securities of the Student Loan Marketing Association); (c) the discretionary authority of the U.S. government to
purchase certain obligations of the issuer; or (d) only the credit of the issuer. U.S. government securities also include Treasury receipts, zero coupon bonds and other stripped U.S. government securities, where the interest and principal components of
stripped U.S. government securities are traded independently.
|
| Custodial Receipts. Interests in U.S. government securities may be purchased in the form of custodial receipts that
evidence ownership of future interest payments, principal payments or both on certain notes or bonds issued or guaranteed as to principal and interest by the U.S. government, its agencies, instrumentalities, political subdivisions or authorities. For
certain securities law purposes, custodial receipts are not considered obligations of the U.S. government.
|
| Mortgage-Backed Securities. Certain Funds may invest in mortgage-backed securities. Mortgage-backed securities
represent direct or indirect participations in, or are collateralized by and payable from, mortgage loans secured by real property. Mortgage-backed securities can be backed by either fixed rate mortgage loans or adjustable rate mortgage loans, and may be
issued by either a governmental or non-governmental entity. Privately issued mortgage-backed securities are normally structured with one or more types of “credit enhancement.” However, these mortgage-backed securities typically do not have the
same credit standing as U.S. government guaranteed mortgage-backed securities.
|
| Mortgage-backed securities may include multiple class securities, including collateralized mortgage obligations (“CMOs”)
and Real Estate Mortgage Investment Conduit (“REMIC”) pass-through or participation certificates. CMOs provide an investor with a specified interest in the cash flow from a pool of underlying mortgages or of other mortgage-backed securities.
CMOs are issued in multiple classes. In many cases, payments of principal are applied to the CMO classes in the
order of their respective stated maturities, so that no principal payments will be made on a CMO class until all other classes having an earlier stated maturity date are paid in full. A REMIC is a CMO that qualifies for special tax treatment and invests
in certain mortgages principally secured by interests in real property and other permitted investments.
|
| Mortgaged-backed securities also include stripped mortgage-backed securities (“SMBS”), which are derivative multiple
class mortgage-backed securities. SMBS are usually structured with two different classes: one that receives substantially all of the interest payments and the other that receives substantially all of the principal payments from a pool of mortgage loans.
The market value of SMBS consisting entirely of principal payments generally is unusually volatile in response to changes in interest rates. The yields on SMBS that receive all or most of the interest from mortgage loans are generally higher than
prevailing market yields on other mortgage-backed securities because their cash flow patterns are more volatile and there is a greater risk that the initial investment will not be fully recouped.
|
| Asset-Backed Securities. Certain Funds may invest in asset-backed securities. Asset-backed securities are securities
whose principal and interest payments are collateralized by pools of assets such as auto loans, credit card receivables, leases, installment contracts and personal property. Asset-backed securities are often subject to more rapid repayment than their
stated maturity date would indicate as a result of the pass-through of prepayments of principal on the underlying loans. During periods of declining interest rates, prepayment of loans underlying asset-backed securities can be expected to accelerate.
Accordingly, a Fund’s ability to maintain positions in such securities will be affected by reductions in the principal amount of such securities resulting from prepayments, and its ability to reinvest the returns of principal at comparable yields is
subject to generally prevailing interest rates at that time. Asset-backed securities present credit risks that are not presented by mortgage-backed securities. This is because asset-backed securities generally do not have the benefit of a security
interest in collateral that is comparable to mortgage assets. If the issuer of an asset-backed security defaults on its payment obligations, there is the possibility that, in some cases, the Fund will be unable to possess and sell the underlying
collateral and that the Fund’s recoveries on repossessed collateral may not be available to support payments on the securities. In the event of a default, a Fund may suffer a loss if it cannot sell collateral quickly and receive the amount it is owed.
|
| Borrowings. Each Fund can borrow money from banks and other financial institutions in amounts not exceeding
one-third of its total assets for temporary or emergency purposes. A Fund may not make additional investments if borrowings exceed 5% of its total assets.
|
| The financial highlights tables are intended to help you understand a Fund’s financial performance for the past five years
(or less if the Fund has been in operation for less than five years). Certain information reflects financial results for a single Fund share. The total returns in the table represent the rate that an investor would have earned or lost on an investment in
a Fund (assuming reinvestment of all dividends and distributions). This information for the periods ended August 31, 2000 has been audited by PricewaterhouseCoopers LLP, whose report, along with the Funds’ financial statements, is included in the
Funds’ annual reports (available upon request without charge). The information for all periods prior to the periods ended August 31, 2000, has been audited by the Funds’ previous independent accountants.
|
| CORE INTERNATIONAL EQUITY FUND
|
| Income from
investment operations |
|||||||||
|---|---|---|---|---|---|---|---|---|---|
|
Net asset value, beginning of period |
Net
investment income (loss) |
Net realized
and unrealized gain (loss) |
|||||||
| For the Year Ended August 31, | |||||||||
| 2000 - Class A Shares | $10.87 | $ 0.02 | c | $ 0.74 | |||||
| 2000 - Class B Shares | 10.81 | (0.04 | ) c | 0.73 | |||||
| 2000 - Class C Shares | 10.82 | (0.03 | ) c | 0.72 | |||||
| 2000 - Institutional Shares | 11.00 | 0.09 | c | 0.75 | |||||
| 2000 - Service Shares | 10.93 | 0.05 | c | 0.73 | |||||
| For the Seven-month Period Ended August 31, | |||||||||
| 1999 - Class A Shares | 9.98 | 0.05 | 0.84 | ||||||
| 1999 - Class B Shares | 9.95 | 0.01 | 0.85 | ||||||
| 1999 - Class C Shares | 9.96 | 0.01 | 0.85 | ||||||
| 1999 - Institutional Shares | 10.06 | 0.09 | 0.85 | ||||||
| 1999 - Service Shares | 10.02 | 0.01 | 0.90 | ||||||
| For the Year Ended January 31, | |||||||||
| 1999 - Class A Shares | 9.22 | (0.01 | ) | 0.79 | |||||
| 1999 - Class B Shares | 9.21 | — | 0.74 | ||||||
| 1999 - Class C Shares | 9.22 | — | 0.74 | ||||||
| 1999 - Institutional Shares | 9.24 | 0.05 | 0.80 | ||||||
| 1999 - Service Shares | 9.23 | — | 0.81 | ||||||
| For the Period Ended January 31, | |||||||||
| 1998 - Class A Shares (commenced August 15, 1997) | 10.00 | — | (0.78 | ) | |||||
| 1998 - Class B Shares (commenced August 15, 1997) | 10.00 | (0.02 | ) | (0.77 | ) | ||||
| 1998 - Class C Shares (commenced August 15, 1997) | 10.00 | (0.02 | ) | (0.76 | ) | ||||
| 1998 - Institutional Shares (commenced August 15, 1997) | 10.00 | 0.02 | (0.76 | ) | |||||
| 1998 - Service Shares (commenced August 15, 1997) | 10.00 | 0.01 | (0.78 | ) | |||||
|
Distributions to shareholders |
|||||||||||||||||||||
|---|---|---|---|---|---|---|---|---|---|---|---|---|---|---|---|---|---|---|---|---|---|
| Total from
investment operations |
From net
investment income |
From net
realized gains |
Total
distributions |
Net asset
value, end of period |
Total
returna |
Net assets at end of period (in 000s) |
Ratio of net
expenses to average net assets |
||||||||||||||
| $ 0.76 | $(0.05 | ) | $(0.26 | ) | $(0.31 | ) | $11.32 | 6.92 | % | $147,409 | 1.66 | % | |||||||||
| 0.69 | (0.02 | ) | (0.26 | ) | (0.28 | ) | 11.22 | 6.36 | 12,032 | 2.16 | |||||||||||
| 0.69 | (0.02 | ) | (0.26 | ) | (0.28 | ) | 11.23 | 6.34 | 6,887 | 2.16 | |||||||||||
| 0.84 | (0.10 | ) | (0.26 | ) | (0.36 | ) | 11.48 | 7.62 | 308,074 | 1.01 | |||||||||||
| 0.78 | (0.09 | ) | (0.26 | ) | (0.35 | ) | 11.36 | 7.05 | 27 | 1.51 | |||||||||||
| 0.89 | — | — | — | 10.87 | 8.92 | 114,502 | 1.66 | b | |||||||||||||
| 0.86 | — | — | — | 10.81 | 8.64 | 9,171 | 2.16 | b | |||||||||||||
| 0.86 | — | — | — | 10.82 | 8.63 | 4,913 | 2.16 | b | |||||||||||||
| 0.94 | — | — | — | 11.00 | 9.34 | 271,212 | 1.01 | b | |||||||||||||
| 0.91 | — | — | — | 10.93 | 9.08 | 8 | 1.51 | b | |||||||||||||
| 0.78 | (0.02 | ) | — | (0.02 | ) | 9.98 | 8.37 | 110,338 | 1.63 | ||||||||||||
| 0.74 | — | — | — | 9.95 | 8.03 | 7,401 | 2.08 | ||||||||||||||
| 0.74 | — | — | — | 9.96 | 8.03 | 3,742 | 2.08 | ||||||||||||||
| 0.85 | (0.03 | ) | — | (0.03 | ) | 10.06 | 9.20 | 280,731 | 1.01 | ||||||||||||
| 0.81 | (0.02 | ) | — | (0.02 | ) | 10.02 | 8.74 | 22 | 1.50 | ||||||||||||
| (0.78 | ) | — | — | — | 9.22 | (7.66 | ) | 7,087 | 1.50 | b | |||||||||||
| (0.79 | ) | — | — | — | 9.21 | (7.90 | ) | 2,721 | 2.00 | b | |||||||||||
| (0.78 | ) | — | — | — | 9.22 | (7.80 | ) | 1,608 | 2.00 | b | |||||||||||
| (0.74 | ) | (0.02 | ) | — | (0.02 | ) | 9.24 | (7.45 | ) | 17,719 | 1.00 | b | |||||||||
| (0.77 | ) | — | — | — | 9.23 | (7.70 | ) | 1 | 1.50 | b | |||||||||||
| CORE INTERNATIONAL EQUITY FUND (continued)
|
| Ratios assuming no
expense reductions |
|||||||||||||
|---|---|---|---|---|---|---|---|---|---|---|---|---|---|
| Ratio of
net investment income (loss) to average net assets |
Ratio of
expenses to average net assets |
Ratio of
net investment income (loss) to average net assets |
Portfolio
turnover rate |
||||||||||
| For the Year Ended August 31, | |||||||||||||
| 2000 - Class A Shares | 0.14 | % | 1.75 | % | 0.05 | % | 92.10 | % | |||||
| 2000 - Class B Shares | (0.36 | ) | 2.25 | (0.45 | ) | 92.10 | |||||||
| 2000 - Class C Shares | (0.34 | ) | 2.25 | (0.43 | ) | 92.10 | |||||||
| 2000 - Institutional Shares | 0.78 | 1.10 | 0.69 | 92.10 | |||||||||
| 2000 - Service Shares | 0.33 | 1.60 | 0.24 | 92.10 | |||||||||
| For the Seven-month Period Ended August 31, | |||||||||||||
| 1999 - Class A Shares | 0.78 | b | 1.76 | b | 0.68 | b | 64.97 | ||||||
| 1999 - Class B Shares | 0.26 | b | 2.26 | b | 0.16 | b | 64.97 | ||||||
| 1999 - Class C Shares | 0.23 | b | 2.26 | b | 0.13 | b | 64.97 | ||||||
| 1999 - Institutional Shares | 1.43 | b | 1.11 | b | 1.33 | b | 64.97 | ||||||
| 1999 - Service Shares | 0.07 | b | 1.61 | b | (0.03 | ) b | 64.97 | ||||||
| For the Year Ended January 31, | |||||||||||||
| 1999 - Class A Shares | (0.11 | ) | 1.94 | (0.42 | ) | 194.61 | |||||||
| 1999 - Class B Shares | (0.03 | ) | 2.39 | (0.34 | ) | 194.61 | |||||||
| 1999 - Class C Shares | (0.04 | ) | 2.39 | (0.35 | ) | 194.61 | |||||||
| 1999 - Institutional Shares | 0.84 | 1.32 | 0.53 | 194.61 | |||||||||
| 1999 - Service Shares | 0.02 | 1.81 | (0.29 | ) | 194.61 | ||||||||
| For the Period Ended January 31, | |||||||||||||
| 1998 - Class A Shares (commenced August 15, 1997) | (0.27 | ) b | 4.87 | b | (3.90 | ) b | 25.16 | ||||||
| 1998 - Class B Shares (commenced August 15, 1997) | (0.72 | ) b | 5.12 | b | (3.84 | ) b | 25.16 | ||||||
| 1998 - Class C Shares (commenced August 15, 1997) | (0.73 | ) b | 5.12 | b | (3.85 | ) b | 25.16 | ||||||
| 1998 - Institutional Shares (commenced August 15, 1997) | 0.59 | b | 4.12 | b | (2.53 | ) b | 25.16 | ||||||
| 1998 - Service Shares (commenced August 15, 1997) | 0.26 | b | 4.62 | b | (2.86 | ) b | 25.16 | ||||||
| INTERNATIONAL EQUITY FUND
|
| Income from
investment operations |
||||||||||||
|---|---|---|---|---|---|---|---|---|---|---|---|---|
|
Net asset value, beginning of period |
Net
investment income (loss) |
Net realized
and unrealized gain (loss) |
Total from
investment operations |
|||||||||
| For the Year Ended August 31, | ||||||||||||
| 2000 - Class A Shares | $23.12 | $(0.03 | ) c | $3.41 | $3.38 | |||||||
| 2000 - Class B Shares | 22.73 | (0.16 | ) c | 3.38 | 3.22 | |||||||
| 2000 - Class C Shares | 22.54 | (0.14 | ) c | 3.35 | 3.21 | |||||||
| 2000 - Institutional Shares | 23.49 | 0.14 | c | 3.46 | 3.60 | |||||||
| 2000 - Service Shares | 23.14 | (0.01 | ) c | 3.45 | 3.44 | |||||||
| For the Seven Months Ended August 31, | ||||||||||||
| 1999 - Class A Shares | 21.92 | 0.04 | 1.16 | 1.20 | ||||||||
| 1999 - Class B Shares | 21.63 | (0.02 | ) | 1.12 | 1.10 | |||||||
| 1999 - Class C Shares | 21.45 | (0.03 | ) | 1.12 | 1.09 | |||||||
| 1999 - Institutional Shares | 22.20 | 0.12 | c | 1.17 | c | 1.29 | ||||||
| 1999 - Service Shares | 21.93 | 0.06 | 1.15 | 1.21 | ||||||||
| For the Years Ended January 31, | ||||||||||||
| 1999 - Class A Shares | 19.85 | (0.06 | ) | 3.24 | 3.18 | |||||||
| 1999 - Class B Shares | 19.70 | (0.17 | ) | 3.21 | 3.04 | |||||||
| 1999 - Class C Shares | 19.56 | (0.15 | ) | 3.15 | 3.00 | |||||||
| 1999 - Institutional Shares | 19.97 | 0.03 | 3.31 | 3.34 | ||||||||
| 1999 - Service Shares | 19.84 | (0.04 | ) | 3.24 | 3.20 | |||||||
| 1998 - Class A Shares | 19.32 | 0.03 | 2.04 | 2.07 | ||||||||
| 1998 - Class B Shares | 19.24 | (0.08 | ) | 2.02 | 1.94 | |||||||
| 1998 - Class C Shares (commenced August 15, 1997) | 22.60 | (0.04 | ) | (1.38 | ) | (1.42 | ) | |||||
| 1998 - Institutional Shares | 19.40 | 0.10 | 2.11 | 2.21 | ||||||||
| 1998 - Service Shares | 19.34 | 0.02 | 2.06 | 2.08 | ||||||||
| 1997 - Class A Shares | 17.20 | 0.10 | 2.23 | 2.33 | ||||||||
| 1997 - Class B Shares (commenced May 1, 1996) | 18.91 | (0.06 | ) | 0.60 | 0.54 | |||||||
| 1997 - Institutional Shares (commenced February 7, 1996) | 17.45 | 0.04 | 2.15 | 2.19 | ||||||||
| 1997 - Service Shares (commenced March 6, 1996) | 17.70 | (0.02 | ) | 1.87 | 1.85 | |||||||
| 1996 - Class A Shares | 14.52 | 0.13 | 4.00 | 4.13 | ||||||||
| Distributions to shareholders |
|||||||||||||||||||||
|---|---|---|---|---|---|---|---|---|---|---|---|---|---|---|---|---|---|---|---|---|---|
| From net
investment income |
In excess of net investment income |
From net
realized gains |
Total
distributions |
Net asset
value, end of period |
Total
returna |
Net assets
at end of period (in 000s) |
Ratio of
net expenses to average net assets |
||||||||||||||
| $(0.10 | ) | $(0.24) | $(2.57 | ) | $(2.91 | ) | $23.59 | 14.68 | % | $1,343,869 | 1.79 | % | |||||||||
| (0.07 | ) | (0.17) | (2.57 | ) | (2.81 | ) | 23.14 | 14.20 | 80,274 | 2.29 | |||||||||||
| (0.09 | ) | (0.20) | (2.57 | ) | (2.86 | ) | 22.89 | 14.28 | 22,031 | 2.29 | |||||||||||
| (0.14 | ) | (0.32) | (2.57 | ) | (3.03 | ) | 24.06 | 15.45 | 325,161 | 1.14 | |||||||||||
| (0.11 | ) | (0.25) | (2.57 | ) | (2.93 | ) | 23.65 | 15.00 | 3,789 | 1.64 | |||||||||||
| — | — | — | — | 23.12 | 5.47 | 943,473 | 1.79 | b | |||||||||||||
| — | — | — | — | 22.73 | 5.09 | 68,691 | 2.29 | b | |||||||||||||
| — | — | — | — | 22.54 | 5.08 | 11,241 | 2.29 | b | |||||||||||||
| — | — | — | — | 23.49 | 5.81 | 180,564 | 1.14 | b | |||||||||||||
| — | — | — | — | 23.14 | 5.52 | 3,852 | 1.64 | b | |||||||||||||
| — | — | (1.11 | ) | (1.11 | ) | 21.92 | 16.39 | 947,973 | 1.73 | ||||||||||||
| — | — | (1.11 | ) | (1.11 | ) | 21.63 | 15.80 | 69,231 | 2.24 | ||||||||||||
| — | — | (1.11 | ) | (1.11 | ) | 21.45 | 15.70 | 11,619 | 2.24 | ||||||||||||
| — | — | (1.11 | ) | (1.11 | ) | 22.20 | 17.09 | 111,315 | 1.13 | ||||||||||||
| — | — | (1.11 | ) | (1.11 | ) | 21.93 | 16.49 | 3,568 | 1.63 | ||||||||||||
| — | (0.30 | ) | (1.24 | ) | (1.54 | ) | 19.85 | 11.12 | 697,590 | 1.67 | |||||||||||
| — | (0.25 | ) | (1.23 | ) | (1.48 | ) | 19.70 | 10.51 | 55,324 | 2.20 | |||||||||||
| — | (0.38 | ) | (1.24 | ) | (1.62 | ) | 19.56 | (5.92 | ) | 3,369 | 2.27 | b | |||||||||
| (0.07 | ) | (0.33 | ) | (1.24 | ) | (1.64 | ) | 19.97 | 11.82 | 56,263 | 1.08 | ||||||||||
| — | (0.35 | ) | (1.23 | ) | (1.58 | ) | 19.84 | 11.25 | 3,035 | 1.55 | |||||||||||
| — | — | (0.21 | ) | (0.21 | ) | 19.32 | 13.48 | 536,283 | 1.69 | ||||||||||||
| — | — | (0.21 | ) | (0.21 | ) | 19.24 | 2.83 | 19,198 | 2.23 | b | |||||||||||
| (0.03 | ) | — | (0.21 | ) | (0.24 | ) | 19.40 | 12.53 | 68,374 | 1.10 | b | ||||||||||
| — | — | (0.21 | ) | (0.21 | ) | 19.34 | 10.42 | 674 | 1.60 | b | |||||||||||
| (0.58 | ) | — | (0.87 | ) | (1.45 | ) | 17.20 | 28.68 | 330,860 | 1.52 | |||||||||||
| INTERNATIONAL EQUITY FUND (continued)
|
| Ratios assuming no
expense reductions |
|||||||||||||
|---|---|---|---|---|---|---|---|---|---|---|---|---|---|
| Ratio of
net investment income (loss) to average net assets |
Ratio of
expenses to average net assets |
Ratio of
net investment income (loss) to average net assets |
Portfolio
turnover rate |
||||||||||
| For the Year Ended August 31, | |||||||||||||
| 2000 - Class A Shares | (0.12 | )% | 1.84 | % | (0.17 | )% | 79.79 | % | |||||
| 2000 - Class B Shares | (0.65 | ) | 2.34 | (0.70 | ) | 79.79 | |||||||
| 2000 - Class C Shares | (0.59 | ) | 2.34 | (0.64 | ) | 79.79 | |||||||
| 2000 - Institutional Shares | 0.54 | 1.19 | 0.49 | 79.79 | |||||||||
| 2000 - Service Shares | (0.02 | ) | 1.69 | (0.07 | ) | 79.79 | |||||||
| For the Seven Months Ended August 31, | |||||||||||||
| 1999 - Class A Shares | 0.31 | b | 1.84 | b | 0.26 | b | 61.10 | ||||||
| 1999 - Class B Shares | (0.19 | ) b | 2.34 | b | (0.24 | ) b | 61.10 | ||||||
| 1999 - Class C Shares | (0.26 | ) b | 2.34 | b | (0.31 | ) b | 61.10 | ||||||
| 1999 - Institutional Shares | 0.89 | b | 1.19 | b | 0.84 | b | 61.10 | ||||||
| 1999 - Service Shares | 0.47 | b | 1.69 | b | 0.42 | b | 61.10 | ||||||
| For the Years Ended January 31, | |||||||||||||
| 1999 - Class A Shares | (0.28 | ) | 1.82 | (0.37 | ) | 113.79 | |||||||
| 1999 - Class B Shares | (0.79 | ) | 2.32 | (0.87 | ) | 113.79 | |||||||
| 1999 - Class C Shares | (0.98 | ) | 2.32 | (1.06 | ) | 113.79 | |||||||
| 1999 - Institutional Shares | 0.23 | 1.21 | 0.15 | 113.79 | |||||||||
| 1999 - Service Shares | (0.18 | ) | 1.71 | (0.26 | ) | 113.79 | |||||||
| 1998 - Class A Shares | (0.27 | ) | 1.80 | (0.40 | ) | 40.82 | |||||||
| 1998 - Class B Shares | (0.90 | ) | 2.30 | (1.00 | ) | 40.82 | |||||||
| 1998 - Class C Shares (commenced August 15, 1997) | (1.43 | ) b | 2.37 | b | (1.53 | ) b | 40.82 | ||||||
| 1998 - Institutional Shares | 0.30 | 1.18 | 0.20 | 40.82 | |||||||||
| 1998 - Service Shares | (0.36 | ) | 1.65 | (0.46 | ) | 40.82 | |||||||
| 1997 - Class A Shares | (0.07 | ) | 1.88 | (0.26 | ) | 38.01 | |||||||
| 1997 - Class B Shares (commenced May 1, 1996) | (0.97 | ) b | 2.38 | b | (1.12 | ) b | 38.01 | ||||||
| 1997 - Institutional Shares (commenced February 7, 1996) | 0.43 | b | 1.25 | b | 0.28 | b | 38.01 | ||||||
| 1997 - Service Shares (commenced March 6, 1996) | (0.40 | ) b | 1.75 | b | (0.55 | ) b | 38.01 | ||||||
| 1996 - Class A Shares | 0.26 | 1.77 | 0.01 | 68.48 | |||||||||
| EUROPEAN EQUITY FUND
|
| Income from
investment operations |
|||||||||
|---|---|---|---|---|---|---|---|---|---|
| Net asset
value, beginning of period |
Net investment income (loss) |
Net realized
and unrealized gain (loss) |
|||||||
| For the Year Ended August 31, | |||||||||
| 2000 - Class A Shares | $11.75 | $ — | c | $ 2.78 | |||||
| 2000 - Class B Shares | 11.71 | (0.04 | ) c | 2.73 | |||||
| 2000 - Class C Shares | 11.72 | (0.04 | ) c | 2.75 | |||||
| 2000 - Institutional Shares | 11.82 | 0.10 | c | 2.79 | |||||
| 2000 - Service Shares | 11.76 | 0.01 | c | 2.80 | |||||
| For the Seven Months Ended August 31, | |||||||||
| 1999 - Class A Shares | 12.20 | 0.05 | (0.50 | ) | |||||
| 1999 - Class B Shares | 12.19 | 0.03 | (0.51 | ) | |||||
| 1999 - Class C Shares | 12.20 | 0.04 | (0.52 | ) | |||||
| 1999 - Institutional Shares | 12.23 | 0.18 | (0.59 | ) | |||||
| 1999 - Service Shares | 12.20 | 0.08 | (0.52 | ) | |||||
| For the Period Ended January 31, | |||||||||
| 1999 - Class A Shares (commenced October 1, 1998) | 10.00 | (0.03 | ) | 2.23 | |||||
| 1999 - Class B Shares (commenced October 1, 1998) | 10.00 | (0.02 | ) | 2.21 | |||||
| 1999 - Class C Shares (commenced October 1, 1998) | 10.00 | (0.01 | ) | 2.21 | |||||
| 1999 - Institutional Shares (commenced October 1, 1998) | 10.00 | (0.01 | ) | 2.24 | |||||
| 1999 - Service Shares (commenced October 1, 1998) | 10.00 | (0.03 | ) | 2.23 | |||||
| Distributions to
shareholders |
||||||||||||||||||
|---|---|---|---|---|---|---|---|---|---|---|---|---|---|---|---|---|---|---|
| Total from
investment operations |
From net
realized gains |
Total
distributions |
Net asset
value, end of period |
Total
returna |
Net assets at end of period (in 000s) |
Ratio of
net expenses to average net assets |
||||||||||||
| $ 2.78 | $(0.71 | ) | $(0.71 | ) | $13.82 | 24.04 | % | $139,966 | 1.79 | % | ||||||||
| 2.69 | (0.71 | ) | (0.71 | ) | 13.69 | 23.32 | 4,538 | 2.29 | ||||||||||
| 2.71 | (0.71 | ) | (0.71 | ) | 13.72 | 23.48 | 1,482 | 2.29 | ||||||||||
| 2.89 | (0.71 | ) | (0.71 | ) | 14.00 | 24.85 | 14,630 | 1.14 | ||||||||||
| 2.81 | (0.71 | ) | (0.71 | ) | 13.86 | 24.28 | 2 | 1.64 | ||||||||||
| (0.45 | ) | — | — | 11.75 | (3.69 | ) | 74,862 | 1.79 | b | |||||||||
| (0.48 | ) | — | — | 11.71 | (3.94 | ) | 879 | 2.29 | b | |||||||||
| (0.48 | ) | — | — | 11.72 | (3.93 | ) | 388 | 2.29 | b | |||||||||
| (0.41 | ) | — | — | 11.82 | (3.35 | ) | 5,965 | 1.14 | b | |||||||||
| (0.44 | ) | — | — | 11.76 | (3.61 | ) | 2 | 1.64 | b | |||||||||
| 2.20 | — | — | 12.20 | 22.00 | 61,151 | 1.79 | b | |||||||||||
| 2.19 | — | — | 12.19 | 21.90 | 432 | 2.29 | b | |||||||||||
| 2.20 | — | — | 12.20 | 22.00 | 587 | 2.29 | b | |||||||||||
| 2.23 | — | — | 12.23 | 22.30 | 12,740 | 1.14 | b | |||||||||||
| 2.20 | — | — | 12.20 | 22.00 | 2 | 1.64 | b | |||||||||||
| EUROPEAN EQUITY FUND (continued)
|
| Ratios assuming no
expense reductions |
|||||||||||||
|---|---|---|---|---|---|---|---|---|---|---|---|---|---|
| Ratio of
net investment income (loss) to average net assets |
Ratio of
expenses to average net assets |
Ratio of
net investment income (loss) to average net assets |
Portfolio
turnover rate |
||||||||||
| For the Year Ended August 31, | |||||||||||||
| 2000 - Class A Shares | 0.02 | % | 2.17 | % | (0.36 | )% | 98.10 | % | |||||
| 2000 - Class B Shares | (0.27 | ) | 2.67 | (0.65 | ) | 98.10 | |||||||
| 2000 - Class C Shares | (0.26 | ) | 2.67 | (0.64 | ) | 98.10 | |||||||
| 2000 - Institutional Shares | 0.70 | 1.52 | 0.32 | 98.10 | |||||||||
| 2000 - Service Shares | 0.09 | 2.02 | (0.29 | ) | 98.10 | ||||||||
| For the Seven Months Ended August 31, | |||||||||||||
| 1999 - Class A Shares | 0.80 | b | 2.29 | b | 0.30 | b | 54.98 | ||||||
| 1999 - Class B Shares | 0.43 | b | 2.79 | b | (0.07 | ) b | 54.98 | ||||||
| 1999 - Class C Shares | 0.42 | b | 2.79 | b | (0.08 | ) b | 54.98 | ||||||
| 1999 - Institutional Shares | 1.53 | b | 1.64 | b | 1.03 | b | 54.98 | ||||||
| 1999 - Service Shares | 1.10 | b | 2.14 | b | 0.60 | b | 54.98 | ||||||
| For the Period Ended January 31, | |||||||||||||
| 1999 - Class A Shares (commenced October 1, 1998) | (1.19 | ) b | 2.80 | b | (2.20 | ) b | 70.77 | ||||||
| 1999 - Class B Shares (commenced October 1, 1998) | (1.78 | ) b | 3.30 | b | (2.79 | ) b | 70.77 | ||||||
| 1999 - Class C Shares (commenced October 1, 1998) | (1.83 | ) b | 3.30 | b | (2.84 | ) b | 70.77 | ||||||
| 1999 - Institutional Shares (commenced October 1, 1998) | (0.33 | ) b | 2.15 | b | (1.34 | ) b | 70.77 | ||||||
| 1999 - Service Shares (commenced October 1, 1998) | (0.69 | ) b | 2.65 | b | (1.70 | ) b | 70.77 | ||||||
| JAPANESE EQUITY FUND
|
| Income from
investment operations |
||||||||||
|---|---|---|---|---|---|---|---|---|---|---|
|
Net asset value, beginning of period |
Net
investment loss |
Net realized
and unrealized gains |
Total from
investment operations |
|||||||
| For the Year Ended August 31, | ||||||||||
| 2000 - Class A Shares | $16.24 | $(0.20 | ) c | $1.67 | $1.47 | |||||
| 2000 - Class B Shares | 16.14 | (0.28 | ) c | 1.68 | 1.40 | |||||
| 2000 - Class C Shares | 16.16 | (0.28 | ) c | 1.64 | 1.36 | |||||
| 2000 - Institutional Shares | 16.36 | (0.09 | ) c | 1.67 | 1.58 | |||||
| 2000 - Service Shares | 16.22 | (0.16 | ) c | 1.65 | 1.49 | |||||
| For the Seven Months Ended August 31, | ||||||||||
| 1999 - Class A Shares | 11.06 | (0.06 | ) | 5.24 | 5.18 | |||||
| 1999 - Class B Shares | 11.03 | (0.09 | ) | 5.20 | 5.11 | |||||
| 1999 - Class C Shares | 11.04 | (0.08 | ) | 5.20 | 5.12 | |||||
| 1999 - Institutional Shares | 11.10 | (0.03 | ) | 5.29 | 5.26 | |||||
| 1999 - Service Shares | 11.04 | (0.06 | ) | 5.24 | 5.18 | |||||
| For the Period Ended January 31, | ||||||||||
| 1999 - Class A Shares (commenced May 1, 1998) | 10.00 | (0.06 | ) | 1.12 | 1.06 | |||||
| 1999 - Class B Shares (commenced May 1, 1998) | 10.00 | (0.08 | ) | 1.11 | 1.03 | |||||
| 1999 - Class C Shares (commenced May 1, 1998) | 10.00 | (0.09 | ) | 1.13 | 1.04 | |||||
| 1999 - Institutional Shares (commenced May 1, 1998) | 10.00 | (0.02 | ) | 1.13 | 1.11 | |||||
| 1999 - Service Shares (commenced May 1, 1998) | 10.00 | (0.05 | ) | 1.09 | 1.04 | |||||
|
Distributions to shareholders |
|||||||||||||||||||||
|---|---|---|---|---|---|---|---|---|---|---|---|---|---|---|---|---|---|---|---|---|---|
| From net
investment income |
In excess of net investment income |
From net
realized gains |
Total
distributions |
Net asset
value, end of period |
Total
returnb |
Net assets
at end of period (in 000s) |
Ratio of
net expenses to average net assets |
||||||||||||||
| $ — | $(0.21 | ) | $(1.73 | ) | $(1.94 | ) | $15.77 | 8.47 | % | $69,741 | 1.74 | % | |||||||||
| — | (0.18 | ) | (1.73 | ) | (1.91 | ) | 15.63 | 8.12 | 5,783 | 2.24 | |||||||||||
| — | (0.21 | ) | (1.73 | ) | (1.94 | ) | 15.58 | 7.82 | 4,248 | 2.24 | |||||||||||
| — | (0.25 | ) | (1.73 | ) | (1.98 | ) | 15.96 | 9.14 | 27,768 | 1.09 | |||||||||||
| — | (0.15 | ) | (1.73 | ) | (1.88 | ) | 15.83 | 8.65 | 3 | 1.59 | |||||||||||
| — | — | — | — | 16.24 | 46.84 | 34,279 | 1.70 | b | |||||||||||||
| — | — | — | — | 16.14 | 46.33 | 4,219 | 2.20 | b | |||||||||||||
| — | — | — | — | 16.16 | 46.41 | 3,584 | 2.20 | b | |||||||||||||
| — | — | — | — | 16.36 | 47.40 | 22,709 | 1.05 | b | |||||||||||||
| — | — | — | — | 16.22 | 46.92 | 3 | 1.55 | b | |||||||||||||
| — | — | — | — | 11.06 | 10.60 | 8,391 | 1.64 | b | |||||||||||||
| — | — | — | — | 11.03 | 10.30 | 1,427 | 2.15 | b | |||||||||||||
| — | — | — | — | 11.04 | 10.40 | 284 | 2.15 | b | |||||||||||||
| (0.01 | ) | — | — | (0.01 | ) | 11.10 | 11.06 | 11,418 | 1.03 | b | |||||||||||
| — | — | — | — | 11.04 | 10.43 | 2 | 1.53 | b | |||||||||||||
| JAPANESE EQUITY FUND (continued)
|
| Ratios assuming no
expense reductions |
|||||||||||||
|---|---|---|---|---|---|---|---|---|---|---|---|---|---|
| Ratio of
net investment loss to average net assets |
Ratio of
expenses to average net assets |
Ratio of
net investment loss to average net assets |
Portfolio
turnover rate |
||||||||||
| For the Year Ended August 31, | |||||||||||||
| 2000 - Class A Shares | (1.20 | )% | 2.10 | % | (1.56 | )% | 60.76 | % | |||||
| 2000 - Class B Shares | (1.67 | ) | 2.60 | (2.03 | ) | 60.76 | |||||||
| 2000 - Class C Shares | (1.66 | ) | 2.60 | (2.02 | ) | 60.76 | |||||||
| 2000 - Institutional Shares | (0.53 | ) | 1.45 | (0.89 | ) | 60.76 | |||||||
| 2000 - Service Shares | (0.94 | ) | 1.95 | (1.30 | ) | 60.76 | |||||||
| For the Seven Months Ended August 31, | |||||||||||||
| 1999 - Class A Shares | (1.17 | ) b | 2.62 | b | (2.09 | ) b | 44.83 | ||||||
| 1999 - Class B Shares | (1.57 | ) b | 3.12 | b | (2.49 | ) b | 44.83 | ||||||
| 1999 - Class C Shares | (1.81 | ) b | 3.12 | b | (2.73 | ) b | 44.83 | ||||||
| 1999 - Institutional Shares | (0.37 | ) b | 1.97 | b | (1.29 | ) b | 44.83 | ||||||
| 1999 - Service Shares | (0.74 | ) b | 2.47 | b | (1.66 | ) b | 44.83 | ||||||
| For the Period Ended January 31, | |||||||||||||
| 1999 - Class A Shares (commenced May 1, 1998) | (1.20 | ) b | 4.18 | b | (3.74 | ) b | 53.29 | ||||||
| 1999 - Class B Shares (commenced May 1, 1998) | (1.76 | ) b | 4.69 | b | (4.30 | ) b | 53.29 | ||||||
| 1999 - Class C Shares (commenced May 1, 1998) | (1.69 | ) b | 4.69 | b | (4.23 | ) b | 53.29 | ||||||
| 1999 - Institutional Shares (commenced May 1, 1998) | (0.36 | ) b | 3.57 | b | (2.90 | ) b | 53.29 | ||||||
| 1999 - Service Shares (commenced May 1, 1998) | (0.68 | ) b | 4.07 | b | (3.22 | ) b | 53.29 | ||||||
| INTERNATIONAL GROWTH OPPORTUNITIES FUND
|
| (formerly International Small Cap Fund)
|
| Income from
investment operations |
||||||||||
|---|---|---|---|---|---|---|---|---|---|---|
|
Net asset value, beginning of period |
Net
investment loss |
Net realized
and unrealized gain |
Total from investment operations |
|||||||
| For the Year Ended August 31, | ||||||||||
| 2000 - Class A Shares ; | $13.24 | $(0.12 | ) c | $3.52 | $3.40 | |||||
| 2000 - Class B Shares | 13.19 | (0.18 | ) c | 3.49 | 3.31 | |||||
| 2000 - Class C Shares | 13.19 | (0.19 | ) c | 3.49 | 3.30 | |||||
| 2000 - Institutional Shares | 13.35 | (0.03 | ) c | 3.57 | 3.54 | |||||
| 2000 - Service Shares | 13.24 | (0.10 | ) c | 3.54 | 3.44 | |||||
| For the Seven-month Period Ended August 31, | ||||||||||
| 1999 - Class A Shares | 10.62 | (0.03 | ) | 2.65 | 2.62 | |||||
| 1999 - Class B Shares | 10.61 | (0.08 | ) c | 2.66 | 2.58 | |||||
| 1999 - Class C Shares | 10.61 | (0.08 | ) c | 2.66 | 2.58 | |||||
| 1999 - Institutional Shares | 10.66 | — | 2.69 | 2.69 | ||||||
| 1999 - Service Shares | 10.61 | (0.02 | ) | 2.65 | 2.63 | |||||
| For the Period Ended January 31, | ||||||||||
| 1999 - Class A Shares (commenced May 1, 1998) | 10.00 | (0.04 | ) | 0.66 | 0.62 | |||||
| 1999 - Class B Shares (commenced May 1, 1998) | 10.00 | (0.10 | ) | 0.71 | 0.61 | |||||
| 1999 - Class C Shares (commenced May 1, 1998) | 10.00 | (0.06 | ) | 0.67 | 0.61 | |||||
| 1999 - Institutional Shares (commenced May 1, 1998) | 10.00 | — | 0.67 | 0.67 | ||||||
| 1999 - Service Shares (commenced May 1, 1998) | 10.00 | (0.02 | ) | 0.63 | 0.61 | |||||
|
Distributions to shareholders |
||||||||||||||||||
|---|---|---|---|---|---|---|---|---|---|---|---|---|---|---|---|---|---|---|
| In excess
of net investment income |
From net
realized gains |
Total
distributions |
Net asset
value, end of period |
Total
returna |
Net assets
at end of period (in 000s) |
Ratio of
net expenses to average net assets |
||||||||||||
| $ — | $(0.52 | ) | $(0.52 | ) | $16.12 | 26.26 | % | $327,697 | 2.05 | % | ||||||||
| — | (0.52 | ) | (0.52 | ) | 15.98 | 25.66 | 2,827 | 2.55 | ||||||||||
| — | (0.52 | ) | (0.52 | ) | 15.97 | 25.58 | 3,672 | 2.55 | ||||||||||
| — | (0.52 | ) | (0.52 | ) | 16.37 | 27.12 | 187,075 | 1.40 | ||||||||||
| — | (0.52 | ) | (0.52 | ) | 16.16 | 26.57 | 3 | 1.90 | ||||||||||
| — | — | — | 13.24 | 24.67 | 69,458 | 2.05 | b | |||||||||||
| — | — | — | 13.19 | 24.32 | 303 | 2.55 | b | |||||||||||
| — | — | — | 13.19 | 24.32 | 419 | 2.55 | b | |||||||||||
| — | — | — | 13.35 | 25.24 | 65,772 | 1.40 | b | |||||||||||
| — | — | — | 13.24 | 24.79 | 2 | 1.90 | b | |||||||||||
| — | — | — | 10.62 | 6.20 | 33,002 | 2.02 | b | |||||||||||
| — | — | — | 10.61 | 6.10 | 213 | 2.51 | b | |||||||||||
| — | — | — | 10.61 | 6.10 | 175 | 2.51 | b | |||||||||||
| (0.01 | ) | — | (0.01 | ) | 10.66 | 6.67 | 36,992 | 1.40 | b | |||||||||
| — | — | — | 10.61 | 6.10 | 2 | 1.90 | b | |||||||||||
| INTERNATIONAL GROWTH OPPORTUNITIES FUND
|
| (formerly International Small Cap Fund) (continued)
|
| Ratios assuming no
expense reductions |
|||||||||||||
|---|---|---|---|---|---|---|---|---|---|---|---|---|---|
| Ratio of
net investment loss to average net assets |
Ratio of
expenses to average net assets |
Ratio of
net investment loss to average net assets |
Portfolio
turnover rate |
||||||||||
| For the Year Ended August 31, | |||||||||||||
| 2000 - Class A Shares ; | (0.79 | )% | 2.22 | % | (0.96 | )% | 73.43 | % | |||||
| 2000 - Class B Shares | (1.16 | ) | 2.72 | (1.33 | ) | 73.43 | |||||||
| 2000 - Class C Shares | (1.23 | ) | 2.72 | (1.40 | ) | 73.43 | |||||||
| 2000 - Institutional Shares | (0.19 | ) | 1.57 | (0.36 | ) | 73.43 | |||||||
| 2000 - Service Shares | (0.63 | ) | 2.07 | (0.80 | ) | 73.43 | |||||||
| For the Seven-month Period Ended August 31, | |||||||||||||
| 1999 - Class A Shares | (0.68 | ) b | 2.42 | b | (1.05 | ) b | 58.81 | ||||||
| 1999 - Class B Shares | (1.16 | ) b | 2.92 | b | (1.53 | ) b | 58.81 | ||||||
| 1999 - Class C Shares | (1.21 | ) b | 2.92 | b | (1.58 | ) b | 58.81 | ||||||
| 1999 - Institutional Shares | (0.05 | ) b | 1.77 | b | (0.42 | ) b | 58.81 | ||||||
| 1999 - Service Shares | (0.35 | ) b | 2.27 | b | (0.72 | ) b | 58.81 | ||||||
| For the Period Ended January 31, | |||||||||||||
| 1999 - Class A Shares (commenced May 1, 1998) | (1.03 | ) b | 3.60 | b | (2.61 | ) b | 96.11 | ||||||
| 1999 - Class B Shares (commenced May 1, 1998) | (1.30 | ) b | 4.09 | b | (2.88 | ) b | 96.11 | ||||||
| 1999 - Class C Shares (commenced May 1, 1998) | (1.45 | ) b | 4.09 | b | (3.03 | ) b | 96.11 | ||||||
| 1999 - Institutional Shares (commenced May 1, 1998) | (0.19 | ) b | 2.98 | b | (1.77 | ) b | 96.11 | ||||||
| 1999 - Service Shares (commenced May 1, 1998) | (0.26 | ) b | 3.48 | b | (1.84 | ) b | 96.11 | ||||||
| EMERGING MARKETS EQUITY FUND
|
| Income from
investment operations |
||||||||||||
|---|---|---|---|---|---|---|---|---|---|---|---|---|
| Net asset
value, beginning of period |
Net
investment income (loss) |
Net
realized and unrealized gain (loss) |
Total from
investment operations |
|||||||||
| For the Year Ended August 31, | ||||||||||||
| 2000 - Class A Shares | $ 9.26 | $(0.05 | ) c | $ 1.62 | $ 1.57 | |||||||
| 2000 - Class B Shares | 9.21 | (0.11 | ) c | 1.62 | 1.51 | |||||||
| 2000 - Class C Shares | 9.24 | (0.10 | ) c | 1.61 | 1.51 | |||||||
| 2000 - Institutional Shares | 9.37 | 0.01 | c | 1.64 | 1.65 | |||||||
| 2000 - Service Shares | 9.05 | 0.01 | c | 1.57 | 1.58 | |||||||
| For the Seven Months Ended August 31, | ||||||||||||
| 1999 - Class A Shares | 7.04 | (0.01 | ) | 2.23 | 2.22 | |||||||
| 1999 - Class B Shares | 7.03 | (0.03 | ) | 2.21 | 2.18 | |||||||
| 1999 - Class C Shares | 7.05 | (0.03 | ) | 2.22 | 2.19 | |||||||
| 1999 - Institutional Shares | 7.09 | 0.02 | 2.26 | 2.28 | ||||||||
| 1999 - Service Shares | 6.87 | 0.01 | 2.17 | 2.18 | ||||||||
| For the Year Ended January 31, | ||||||||||||
| 1999 - Class A Shares | 9.69 | 0.04 | (2.40 | ) | (2.36 | ) | ||||||
| 1999 - Class B Shares | 9.69 | 0.03 | (2.41 | ) | (2.38 | ) | ||||||
| 1999 - Class C Shares | 9.70 | 0.01 | (2.39 | ) | (2.38 | ) | ||||||
| 1999 - Institutional Shares | 9.70 | 0.06 | (2.36 | ) | (2.30 | ) | ||||||
| 1999 - Service Shares | 9.69 | (0.13 | ) | (2.41 | ) | (2.28 | ) | |||||
| For the Period Ended January 31, | ||||||||||||
| 1998 - Class A Shares (commenced December 15, 1997) | 10.00 | — | (0.31 | ) | (0.31 | ) | ||||||
| 1998 - Class B Shares (commenced December 15, 1997) | 10.00 | — | (0.31 | ) | (0.31 | ) | ||||||
| 1998 - Class C Shares (commenced December 15, 1997) | 10.00 | — | (0.30 | ) | (0.30 | ) | ||||||
| 1998 - Institutional Shares (commenced December 15, 1997) | 10.00 | 0.01 | (0.31 | ) | (0.30 | ) | ||||||
| 1998 - Service Shares (commenced December 15, 1997) | 10.00 | — | (0.31 | ) | (0.31 | ) | ||||||
|
Distributions to shareholders |
|||||||||||||||||
|---|---|---|---|---|---|---|---|---|---|---|---|---|---|---|---|---|---|
| From net
investment income |
In excess of net investment income |
Total
distributions |
Net asset
value, end of period |
Total
returna |
Net assets
at end of period (in 000s) |
Ratio of
net expenses to average net assets |
|||||||||||
| $ — | $ — | $ — | $10.83 | 16.95 | % | $64,279 | 2.11 | % | |||||||||
| — | — | — | 10.72 | 16.40 | 2,187 | 2.61 | |||||||||||
| — | — | — | 10.75 | 16.34 | 1,304 | 2.61 | |||||||||||
| — | — | — | 11.02 | 17.61 | 145,774 | 1.46 | |||||||||||
| — | — | — | 10.63 | 17.46 | 2 | 1.96 | |||||||||||
| — | — | — | 9.26 | 31.53 | 65,698 | 2.04 | b | ||||||||||
| — | — | — | 9.21 | 31.01 | 972 | 2.54 | b | ||||||||||
| — | — | — | 9.24 | 31.06 | 1,095 | 2.54 | b | ||||||||||
| — | — | — | 9.37 | 32.16 | 108,574 | 1.39 | b | ||||||||||
| — | — | — | 9.05 | 31.73 | 2 | 1.89 | b | ||||||||||
| (0.07 | ) | (0.22) | (0.29 | ) | 7.04 | (24.32 | ) | 52,704 | 2.09 | ||||||||
| (0.07 | ) | (0.21) | (0.28 | ) | 7.03 | (24.51 | ) | 459 | 2.59 | ||||||||
| (0.07 | ) | (0.20) | (0.27 | ) | 7.05 | (24.43 | ) | 273 | 2.59 | ||||||||
| (0.08 | ) | (0.23) | (0.31 | ) | 7.09 | (23.66 | ) | 90,189 | 1.35 | ||||||||
| (0.07 | ) | (0.21) | (0.28 | ) | 6.87 | (26.17 | ) | 1 | 1.85 | ||||||||
| — | — | — | 9.69 | (3.10 | ) | 17,681 | 1.90 | b | |||||||||
| — | — | — | 9.69 | (3.10 | ) | 64 | 2.41 | b | |||||||||
| — | — | — | 9.70 | (3.00 | ) | 73 | 2.48 | b | |||||||||
| — | — | — | 9.70 | (3.00 | ) | 19,120 | 1.30 | b | |||||||||
| — | — | — | 9.69 | (3.10 | ) | 2 | 2.72 | b | |||||||||
| EMERGING MARKETS EQUITY FUND (continued)
|
| Ratios assuming no
expense reductions |
|||||||||||||
|---|---|---|---|---|---|---|---|---|---|---|---|---|---|
| Ratio of net
investment income (loss) to average net assets |
Ratio of
expenses to average net assets |
Ratio of net
investment income (loss) to average net assets |
Portfolio
turnover rate |
||||||||||
| For the Year Ended August 31, | |||||||||||||
| 2000 - Class A Shares | (0.49 | )% | 2.30 | % | (0.68 | )% | 125.35 | % | |||||
| 2000 - Class B Shares | (1.00 | ) | 2.80 | (1.19 | ) | 125.35 | |||||||
| 2000 - Class C Shares | (0.96 | ) | 2.80 | (1.15 | ) | 125.35 | |||||||
| 2000 - Institutional Shares | 0.13 | 1.65 | (0.06 | ) | 125.35 | ||||||||
| 2000 - Service Shares | 0.14 | 2.15 | (0.05 | ) | 125.35 | ||||||||
| For the Seven Months Ended August 31, | |||||||||||||
| 1999 - Class A Shares | (0.15 | ) b | 2.41 | b | (0.52 | ) b | 63.24 | ||||||
| 1999 - Class B Shares | (0.71 | ) b | 2.91 | b | (281.08 | ) b | 63.24 | ||||||
| 1999 - Class C Shares | (0.85 | ) b | 2.91 | b | (1.22 | ) b | 63.24 | ||||||
| 1999 - Institutional Shares | 0.50 | b | 1.76 | b | 0.13 | b | 63.24 | ||||||
| 1999 - Service Shares | 0.12 | b | 2.26 | b | (0.25 | ) b | 63.24 | ||||||
| For the Year Ended January 31, | |||||||||||||
| 1999 - Class A Shares | 0.80 | 2.53 | 0.36 | 153.67 | |||||||||
| 1999 - Class B Shares | 0.19 | 3.03 | (0.25 | ) | 153.67 | ||||||||
| 1999 - Class C Shares | 0.28 | 3.03 | (0.16 | ) | 153.67 | ||||||||
| 1999 - Institutional Shares | 1.59 | 1.79 | 1.15 | 153.67 | |||||||||
| 1999 - Service Shares | (1.84 | ) | 2.29 | (2.28 | ) | 153.67 | |||||||
| For the Period Ended January 31, | |||||||||||||
| 1998 - Class A Shares (commenced December 15, 1997) | 0.55 | b | 5.88 | b | (3.43 | ) b | 3.35 | ||||||
| 1998 - Class B Shares (commenced December 15, 1997) | 0.05 | b | 6.39 | b | (3.93 | ) b | 3.35 | ||||||
| 1998 - Class C Shares (commenced December 15, 1997) | (0.27 | ) b | 6.46 | b | (4.25 | ) b | 3.35 | ||||||
| 1998 - Institutional Shares (commenced December 15, 1997) | 0.80 | b | 5.28 | b | (3.18 | ) b | 3.35 | ||||||
| 1998 - Service Shares (commenced December 15, 1997) | (0.05 | ) b | 6.70 | b | (4.03 | ) b | 3.35 | ||||||
| ASIA GROWTH FUND
|
| Income from
investment operations |
||||||||||||
|---|---|---|---|---|---|---|---|---|---|---|---|---|
|
Net asset value, beginning of period |
Net
investment income (loss) |
Net realized
and unrealized gain (loss) |
Total
from investment operations |
|||||||||
| For the Year Ended August 31, | ||||||||||||
| 2000 - Class A Shares | $11.07 | $(0.05 | ) c | $0.14 | $ 0.09 | |||||||
| 2000 - Class B Shares | 10.88 | (0.11 | ) c | 0.14 | 0.03 | |||||||
| 2000 - Class C Shares | 10.85 | (0.11 | ) c | 0.14 | 0.03 | |||||||
| 2000 - Institutional Shares | 11.24 | 0.01 | c | 0.16 | 0.17 | |||||||
| For the Seven-Month Period Ended August 31, | ||||||||||||
| 1999 - Class A Shares | 7.79 | (0.02 | ) | 3.30 | 3.28 | |||||||
| 1999 - Class B Shares | 7.68 | (0.04 | ) | 3.24 | 3.20 | |||||||
| 1999 - Class C Shares | 7.68 | (0.04 | ) | 3.21 | 3.17 | |||||||
| 1999 - Institutional Shares | 7.91 | 0.01 | 3.36 | 3.37 | ||||||||
| For the Years Ended January 31, | ||||||||||||
| 1999 - Class A Shares | 8.38 | 0.07 | (0.66 | ) | (0.59 | ) | ||||||
| 1999 - Class B Shares | 8.31 | 0.01 | (0.64 | ) | (0.63 | ) | ||||||
| 1999 - Class C Shares | 8.29 | — | (0.61 | ) | (0.61 | ) | ||||||
| 1999 - Institutional Shares | 8.44 | 0.03 | (0.56 | ) | (0.53 | ) | ||||||
| 1998 - Class A Shares | 16.31 | — | (7.90 | ) | (7.90 | ) | ||||||
| 1998 - Class B Shares | 16.24 | 0.01 | (7.91 | ) | (7.90 | ) | ||||||
| 1998 - Class C Shares (commenced August 15, 1997) | 15.73 | 0.01 | (7.42 | ) | (7.41 | ) | ||||||
| 1998 - Institutional Shares | 16.33 | 0.10 | (7.96 | ) | (7.86 | ) | ||||||
| 1997 - Class A Shares | 16.49 | 0.06 | (0.11 | ) | (0.05 | ) | ||||||
| 1997 - Class B Shares (commenced May 1, 1996) | 17.31 | (0.05 | ) | (0.48 | ) | (0.53 | ) | |||||
| 1997 - Institutional Shares (commenced February 2, 1996) | 16.61 | 0.04 | (0.11 | ) | (0.07 | ) | ||||||
| 1996 - Class A Shares | 13.31 | 0.17 | 3.44 | 3.61 | ||||||||
|
Distributions to shareholders |
|||||||||||||||||||||
|---|---|---|---|---|---|---|---|---|---|---|---|---|---|---|---|---|---|---|---|---|---|
| From net
investment income |
In excess
of net investment income |
From net
realized gains |
Total
distributions |
Net asset
value, end of period |
Total
returna |
Net assets
at end of period (in 000s) |
Ratio of
net expenses to average net assets |
||||||||||||||
| $ — | $ — | $ — | $ — | $11.16 | 0.72 | % | $ 86,458 | 1.85 | % | ||||||||||||
| — | — | — | — | 10.91 | 0.18 | 6,849 | 2.35 | ||||||||||||||
| — | — | — | — | 10.88 | 0.18 | 2,265 | 2.35 | ||||||||||||||
| — | — | — | — | 11.41 | 1.42 | 5,236 | 1.20 | ||||||||||||||
| — | |||||||||||||||||||||
| — | — | — | — | 11.07 | 42.11 | 84,269 | 1.85 | b | |||||||||||||
| — | — | — | — | 10.88 | 41.67 | 7,258 | 2.35 | b | |||||||||||||
| — | — | — | — | 10.85 | 41.28 | 2,281 | 2.35 | b | |||||||||||||
| — | (0.04 | ) | — | (0.04 | ) | 11.24 | 42.61 | 12,363 | 1.20 | b | |||||||||||
| — | |||||||||||||||||||||
| — | — | — | — | 7.79 | (7.04 | ) | 59,940 | 1.93 | |||||||||||||
| — | — | — | — | 7.68 | (7.58 | ) | 4,190 | 2.45 | |||||||||||||
| — | — | — | — | 7.68 | (7.36 | ) | 999 | 2.45 | |||||||||||||
| — | — | — | — | 7.91 | (6.28 | ) | 4,200 | 1.16 | |||||||||||||
| — | (0.03 | ) | — | (0.03 | ) | 8.38 | (48.49 | ) | 87,437 | 1.75 | |||||||||||
| — | (0.03 | ) | — | (0.03 | ) | 8.31 | (48.70 | ) | 3,359 | 2.30 | |||||||||||
| — | (0.03 | ) | — | (0.03 | ) | 8.29 | (47.17 | ) | 436 | 2.35 | b | ||||||||||
| (0.03 | ) | — | — | (0.03 | ) | 8.44 | (48.19 | ) | 874 | 1.11 | |||||||||||
| (0.12 | ) | — | (0.01 | ) | (0.13 | ) | 16.31 | (1.01 | ) | 263,014 | 1.67 | ||||||||||
| (0.51 | ) | (0.03 | ) | — | (0.54 | ) | 16.24 | (6.02 | ) | 3,354 | 2.21 | b | |||||||||
| (0.11 | ) | (0.06 | ) | (0.04 | ) | (0.21 | ) | 16.33 | (1.09 | ) | 13,322 | 1.10 | b | ||||||||
| (0.12 | ) | (0.14 | ) | (0.17 | ) | (0.43 | ) | 16.49 | 26.49 | 205,539 | 1.77 | ||||||||||
| ASIA GROWTH FUND (continued)
|
| Ratios assuming no
expense reductions |
|||||||||||||
|---|---|---|---|---|---|---|---|---|---|---|---|---|---|
| Ratio of net
investment income (loss) to average net assets |
Ratio of
expenses to average net assets |
Ratio of net
investment income (loss) to average net assets |
Portfolio
turnover rate |
||||||||||
| For the Year Ended August 31, | |||||||||||||
| 2000 - Class A Shares | (0.39 | )% | 2.30 | % | (0.84 | )% | 207.22 | % | |||||
| 2000 - Class B Shares | (0.91 | ) | 2.80 | (1.36 | ) | 207.22 | |||||||
| 2000 - Class C Shares | (0.91 | ) | 2.80 | (1.36 | ) | 207.22 | |||||||
| 2000 - Institutional Shares | 0.12 | 1.65 | (0.33 | ) | 207.22 | ||||||||
| For the Seven-Month Period Ended August 31, | |||||||||||||
| 1999 - Class A Shares | (0.38 | ) b | 2.27 | b | (0.80 | ) b | 96.58 | ||||||
| 1999 - Class B Shares | (0.90 | ) b | 2.77 | b | (1.32 | ) b | 96.58 | ||||||
| 1999 - Class C Shares | (0.89 | ) b | 2.77 | b | (1.31 | ) b | 96.58 | ||||||
| 1999 - Institutional Shares | (0.14 | ) b | 1.62 | b | (0.28 | ) b | 96.58 | ||||||
| For the Years Ended January 31, | |||||||||||||
| 1999 - Class A Shares | 0.63 | 2.48 | 0.08 | 106.00 | |||||||||
| 1999 - Class B Shares | 0.10 | 2.97 | (0.42 | ) | 106.00 | ||||||||
| 1999 - Class C Shares | 0.10 | 2.97 | (0.42 | ) | 106.00 | ||||||||
| 1999 - Institutional Shares | 1.10 | 1.68 | 0.58 | 106.00 | |||||||||
| 1998 - Class A Shares | 0.31 | 1.99 | 0.07 | 105.16 | |||||||||
| 1998 - Class B Shares | (0.29 | ) | 2.50 | (0.49 | ) | 105.16 | |||||||
| 1998 - Class C Shares (commenced August 15, 1997) | (0.26 | ) b | 2.55 | b | (0.46 | ) b | 105.16 | ||||||
| 1998 - Institutional Shares | 0.87 | 1.31 | 0.67 | 105.16 | |||||||||
| 1997 - Class A Shares | 0.20 | 1.87 | — | 48.40 | |||||||||
| 1997 - Class B Shares (commenced May 1, 1996) | (0.56 | ) b | 2.37 | b | (0.72 | ) b | 48.40 | ||||||
| 1997 - Institutional Shares (commenced February 2, 1996) | 0.54 | b | 1.26 | b | 0.38 | b | 48.40 | ||||||
| 1996 - Class A Shares | 1.05 | 2.02 | 0.80 | 88.80 | |||||||||
a
|
Assumes investment at the net asset value at the beginning of the period, reinvestment of all dividends and
distributions, a complete redemption of the investment at the net asset value at the end of the period and no sales or redemption charges. Total return would be reduced if a sales or redemption charge were taken into account. Total returns for periods
less than one full year are not annualized.
|
b
|
Annualized.
|
c
|
Calculated based on the average shares outstanding methodology.
|
| FOR MORE INFORMATION
|
| Annual/Semi-annual Report
|
| Additional information about the Funds’ investments is available in the Funds’ annual and semi-annual reports to
shareholders. In the Funds’ annual reports, you will find a discussion of the market conditions and investment strategies that significantly affected the Funds’ performance during the last fiscal year.
|
| Statement of Additional Information
|
| Additional information about the Funds and their policies is also available in the Funds’ Statement of Additional Information
(“Additional Statement”). The Additional Statement is incorporated by reference into this Prospectus (is legally considered part of this Prospectus).
|
| The Funds’ annual and semi-annual reports, and the Additional Statement, are available free upon request by calling Goldman
Sachs at 1-800-621-2550.
|
| To obtain other information and for shareholder inquiries:
|
| By telephone – Call 1-800-621-2550
|
| By mail – Goldman Sachs Funds, 4900 Sears Tower, Chicago, IL 60606-6372
|
| By e-mail – [email protected]
|
| On the Internet – Text-only versions of the Funds’ documents are located online and may be downloaded from:
|
| SEC EDGAR database – http://www.sec.gov
|
| You may review and obtain copies of Fund documents by visiting the SEC’s Public Reference Room in Washington, D.C. You may
also obtain copies of Fund documents, after paying a duplicating fee, by writing to the SEC’s Public Reference Section, Washington, D.C. 20549-0102 or by electronic request to: [email protected]. Information on the operation of the public reference
room may be obtained by calling the SEC at (202) 942-8090.
|
| The Funds’ investment company registration number is 811-5349.
|
| CORE
SM
is a service mark of Goldman, Sachs & Co.
|
| Prospectus
|
| GOLDMAN SACHS INTERNATIONAL EQUITY FUNDS
|

| THE SECURITIES AND EXCHANGE COMMISSION HAS NOT APPROVED OR DISAPPROVED THESE SECURITIES OR PASSED UPON THE ADEQUACY OF THIS PROSPECTUS.
ANY REPRESENTATION TO THE CONTRARY IS A CRIMINAL OFFENSE.
|
| AN INVESTMENT IN A FUND IS NOT A BANK DEPOSIT AND IS NOT INSURED BY THE FEDERAL DEPOSIT INSURANCE CORPORATION OR ANY OTHER
GOVERNMENT AGENCY. AN INVESTMENT IN A FUND INVOLVES INVESTMENT RISKS, INCLUDING POSSIBLE LOSS OF PRINCIPAL.
|
n
|
Goldman Sachs CORE
SM
International Equity Fund
|
n
|
Goldman Sachs International Equity Fund
|
n
|
Goldman Sachs European Equity Fund
|
n
|
Goldman Sachs Japanese Equity Fund
|
n
|
Goldman Sachs International Growth Opportunities Fund (formerly
International Small Cap Fund)
|
n
|
Goldman Sachs Emerging Markets Equity Fund
|
n
|
Goldman Sachs Asia Growth Fund
|

| NOT FDIC-INSURED
|
May Lose Value
|
No Bank Guarantee
|
| Goldman Sachs Asset Management, a unit of the Investment Management Division of Goldman, Sachs & Co. (“Goldman
Sachs”), serves as investment adviser to the CORE International Equity Fund. Goldman Sachs Asset Management International serves as investment adviser to International Equity, European Equity, Japanese Equity, International Growth Opportunities,
Emerging Markets Equity and Asia Growth Funds. Goldman Sachs Asset Management and Goldman Sachs Asset Management International are each referred to in this Prospectus as the “Investment Adviser.”
|
| ACTIVE INTERNATIONAL STYLE FUNDS
|
| Goldman Sachs’ Active International Investment Philosophy:
|
| Belief | How the Investment Adviser Acts on Belief | ||
|---|---|---|---|
| n Equity markets are inefficient | Seeks excess return through team driven, research
intensive and bottom-up stock selection. |
||
| n Returns are variable | Seeks to capitalize on variability of market and regional
returns through asset allocation decisions. |
||
| n
Corporate fundamentals
ultimately drive share price |
Seeks to conduct rigorous, first-hand research of business
and company management. |
||
| n A
business’ intrinsic value will be
achieved over time |
Seeks to realize value through a long-term investment
horizon. |
||
| n
Portfolio risk must be carefully
analyzed and monitored |
Seeks to systematically monitor and manage risk through
diversification, multifactor risk models and currency management. |
||
| The Investment Adviser attempts to manage risk in these Funds through disciplined portfolio construction and continual portfolio
review and analysis. As a result, bottom-up stock selection, driven by fundamental research, should be a main driver of returns.
|
| QUANTITATIVE (“CORE”) STYLE FUNDS
|
| Goldman Sachs’ CORE Investment Philosophy:
|
| Goldman Sachs’ quantitative style of funds—CORE—emphasizes the two building blocks of active management: stock
selection and portfolio construction.
|
| I. CORE STOCK SELECTION
|
| The CORE Fund uses the Goldman Sachs proprietary multifactor model (“Multifactor Model”), a rigorous computerized rating
system, to forecast the returns of securities held in the Fund’s portfolio. The Multifactor Model incorporates common variables covering measures of:
|
n
|
Value (How is the company priced relative to fundamental accounting measures?)
|
n
|
Price Momentum (What are medium-term price trends?)
|
n
|
Earnings Momentum (Are company profit expectations growing?)
|
n
|
Stability (How likely is the risk of earnings disappointment?)
|
| All of the above factors are carefully evaluated within the Multifactor Model since each has demonstrated a significant
impact on the performance of the securities and markets they were designed to forecast. Stock selection in this process combines both our quantitative and qualitative analysis.
|
| II. CORE PORTFOLIO CONSTRUCTION
|
| Portfolio risk is monitored with the use of a sophisticated risk model, which measures the portfolio’s exposure to a variety
of risk factors and estimates the associated volatility. In this process, the Investment Adviser manages risk by attempting to limit deviations from the benchmark and by attempting to run a size and sector neutral portfolio. A computer optimizer evaluates many different security combinations (considering many possible weightings) in an effort to construct the most efficient risk/return portfolio given each CORE Fund benchmark. In addition, the CORE International
Equity Fund utilizes proprietary quantitative models to allocate assets across countries.
|
| Goldman Sachs CORE Funds are fully invested, broadly diversified and offer consistent overall portfolio characteristics. They may
serve as good foundations on which to build a portfolio.
|
| FUND FACTS
|
|
| Objective:
|
Long-term growth of capital
|
| Benchmark:
|
MSCI® Europe, Australasia, Far East (“EAFE®”) Index (unhedged)
|
| Investment Focus:
|
Large-capitalization equity securities of companies that are organized outside the United States or whose securities are primarily traded outside
the United States
|
| Investment Style:
|
Quantitative
|
| INVESTMENT OBJECTIVE
|
| The Fund seeks long-term growth of capital. The Fund seeks this objective through a broadly diversified portfolio of equity
securities of large-cap companies that are organized outside the United States or whose securities are principally traded outside the United States.
|
| PRINCIPAL INVESTMENT STRATEGIES
|
| Equity Securities. The Fund invests, under normal circumstances, at least 90% of its total assets in equity securities of companies that are organized outside the United States or whose securities are principally traded outside the United States.
|
| The Fund may allocate its assets among countries as determined by the Investment Adviser from time to time, provided the Fund’
s assets are invested in at least three foreign countries. The Fund may invest in the securities of issuers in countries with emerging markets or economies (“emerging countries”).
|
| The Fund seeks broad representation of large-cap issuers across major countries and sectors of the international economy. The
Fund’s investments are selected using both a variety of quantitative techniques and fundamental research in seeking to maximize the Fund’s expected return, while maintaining risk, style, capitalization and industry characteristics similar to the
EAFE® Index. In addition, the Fund seeks a portfolio composed of companies with attractive valuations and stronger momentum characteristics than the EAFE® Index.
|
| Other.
The Fund’s investments in fixed-income securities are limited to securities that are considered to be cash equivalents.
|
| FUND FACTS
|
|
| Objective:
|
Long-term capital appreciation
|
| Benchmark:
|
MSCI® EAFE® Index (unhedged)
|
| Investment Focus:
|
Equity securities of companies organized outside the United States or whose securities are principally traded outside the United States
|
| Investment Style:
|
Active International
|
| INVESTMENT OBJECTIVE
|
| The Fund seeks long-term capital appreciation.
|
| PRINCIPAL INVESTMENT STRATEGIES
|
| Equity Securities. The Fund invests, under normal circumstances, substantially all, and at least 65% of its total assets in equity securities of companies that are organized outside the United States or whose securities are principally traded outside the United States. The
Fund intends to invest in companies with public stock market capitalizations that are larger than $1 billion at the time of investment.
|
| The Fund may allocate its assets among countries as determined by the Investment Adviser from time to time provided that the
Fund’s assets are invested in at least three foreign countries.
|
| The Fund expects to invest a substantial portion of its assets in the securities of issuers located in the developed countries of
Western Europe and in Japan. However, the Fund may also invest in the securities of issuers located in Australia, Canada, New Zealand and in emerging countries. Currently, emerging countries include, among others, most Latin American, African, Asian and
Eastern European nations.
|
| Other.
The Fund may also invest up to 35% of its total assets in fixed-income securities, such as government, corporate and bank debt obligations.
|
| FUND FACTS
|
|
| Objective:
|
Long-term capital appreciation
|
| Benchmark:
|
MSCI® Europe Index (unhedged)
|
| Investment Focus:
|
Equity securities of European companies
|
| Investment Style:
|
Active International
|
| INVESTMENT OBJECTIVE
|
| The Fund seeks long-term capital appreciation.
|
| PRINCIPAL INVESTMENT STRATEGIES
|
| Equity Securities. The Fund invests, under normal circumstances, substantially all, and at least 65% of its total assets in equity securities of European companies. Because of its focus, the Fund will be more susceptible to European economic, market, political and local
risks than a fund that is more geographically diversified.
|
| A European issuer is a company that either:
|
n
|
Has a class of its securities whose principal securities markets are in European countries;
|
n
|
Is organized under the laws of, or has a principal office in, a European country;
|
n
|
Derives 50% or more of its total revenue from goods produced, sales made or services provided in one or more of the European
countries; or
|
n
|
Maintains 50% or more of its assets in one or more of the European countries.
|
| The Fund may allocate its assets among different countries as determined by the Investment Adviser from time to time, provided
that the Fund’s assets are invested in at least three European countries. It is currently anticipated that a majority of the Fund’s assets will be invested in the equity securities of large cap companies located in the developed countries of
Western Europe. However, the Fund may also invest, without limit, in mid cap companies and small cap companies, as well as companies located in emerging countries. Currently, emerging countries include among others, most Latin and South American, African,
Asian and Eastern European nations, including the states that formerly comprised the Soviet Union and Yugoslavia.
|
| Other.
The Fund may invest in the aggregate up to 35% of its total assets in equity securities of non-European countries and in fixed-income securities, such as government, corporate and bank debt obligations.
|
| FUND FACTS
|
|
| Objective:
|
Long-term capital appreciation
|
| Benchmark:
|
Tokyo Price Index (“TOPIX”) (unhedged)
|
| Investment Focus:
|
Equity securities of Japanese companies
|
| Investment Style:
|
Active International
|
| INVESTMENT OBJECTIVE
|
| The Fund seeks long-term capital appreciation.
|
| PRINCIPAL INVESTMENT STRATEGIES
|
| Equity Securities. The Fund invests, under normal circumstances, substantially all, and at least 65% of its total assets in equity securities of Japanese companies. A Japanese issuer is a company that either:
|
n
|
Has a class of its securities whose principal securities markets is in Japan;
|
n
|
Is organized under the laws of, or has a principal office in, Japan;
|
n
|
Derives 50% or more of its total revenue from goods produced, sales made or services provided in Japan; or
|
n
|
Maintains 50% or more of its assets in Japan.
|
| The Fund’s concentration in Japanese companies will expose it to the risk of adverse social, political and economic events
which occur in Japan or affect the Japanese markets.
|
| Japan’s economy, the second largest in the world, has grown substantially over the last three decades. Japan’s economic
growth in the 1990’s, however, was substantially below the level of earlier decades, and its economy drifted between modest growth and recession. In calendar year 1998, Japan’s gross national product contracted by 2.8% — its worst
performance in the post-war period. To address this economic downturn, Japan has attempted to implement changes related to high wages and taxes, currency valuations, structural rigidities, political reform and the deregulation of its economy. These
initiatives have, however, resulted in
notable uncertainty and loss of public confidence. These conditions present risks to the Japanese Equity Fund and its ability to attain its investment objective.
|
| Japan’s economy is heavily dependent upon international trade, and is especially sensitive to trade barriers and disputes. In
particular, Japan relies on large imports of agricultural products, raw materials and fuels. A substantial rise in world oil or commodity prices, or a fall-off in Japan’s manufactured exports, could be expected to adversely affect Japan’s
economy. In addition, Japan is vulnerable to earthquakes, volcanoes and other natural disasters. Japan’s banking industry has recently suffered from non-performing loans, lower real estate values and lower valuations of securities holdings.
|
| The Japanese securities markets are less regulated than the U.S. markets. Evidence has emerged from time to time of distortion of
market prices to serve political or other purposes. Shareholders’ rights are also not always equally enforced.
|
| For most of the 1990’s, Japanese securities markets experienced significant declines. Although the stock markets exhibited
strength in 1999, they have again generally declined through the first three quarters of 2000.
|
| The common stocks of many Japanese companies have historically traded at high price-earnings ratios. Differences in accounting
methods have made it difficult to compare the earnings of Japanese companies with those of companies in other countries, especially the United States. Reported net income in Japan has been generally understated relative to U.S. accounting standards and
this has been one reason price-earnings ratios of the stocks of Japanese companies have tended historically to be higher than those of U.S. stocks. In addition, Japanese companies have tended to have higher growth rates than U.S. companies, and Japanese
interest rates have generally been lower than U.S. interest rates. These factors have contributed to lower discount rates and higher price-earnings ratios in Japan than in the United States.
|
| Other.
The Fund may invest in the aggregate up to 35% of its total assets in equity securities of non-Japanese companies and in fixed-income securities, such as government, corporate and bank debt obligations.
|
| FUND FACTS
|
|
| Objective:
|
Long-term capital appreciation
|
| Benchmark:
|
MSCI® EAFE® Small Cap Index (unhedged)
|
| Investment Focus:
|
Small-capitalization foreign equity securities
|
| Investment Style:
|
Active International
|
| INVESTMENT OBJECTIVE
|
| The Fund seeks long-term capital appreciation.
|
| PRINCIPAL INVESTMENT STRATEGIES
|
| Equity Securities. The Fund invests, under normal circumstances, substantially all, and at least 65% of its total assets in equity securities of companies:
|
n
|
With public stock market capitalizations (based upon shares available for trading on an unrestricted basis) within $100 million
and $3 billion, at the time of investment; and
|
n
|
That are organized outside the United States or whose securities are principally traded outside the United States.
|
| The Fund seeks to achieve its investment objective by investing in a diversified portfolio of equity securities that are
considered by the Investment Adviser to be strategically positioned for long-term growth.
|
| The Fund may allocate its assets among countries as determined by the Investment Adviser from time to time provided that the
Fund’s assets are invested in at least three foreign countries. The Fund expects to invest a substantial portion of its assets in securities of companies in the developed countries of Western Europe, Japan and Asia. However, the Fund may also invest
in the securities of issuers located in Australia, Canada, New Zealand and in emerging countries. Currently, emerging countries include, among others, most Latin American, African, Asian and Eastern European nations.
|
| Other.
The Fund may invest in the aggregate up to 35% of its total assets in equity securities of companies with public stock market capitalizations outside the range of the market capitalization range stated above at the time of investment and in fixed-income
securities, such as government, corporate and bank debt obligations. If the market capitalization of a company held by the Fund moves outside the range stated above, the Fund may, consistent with its investment objective, continue to hold the security.
|
| FUND FACTS
|
|
| Objective:
|
Long-term capital appreciation
|
| Benchmark:
|
MSCI® Emerging Markets Free Index
|
| Investment Focus:
|
Equity securities of emerging country issuers
|
| Investment Style:
|
Active International
|
| INVESTMENT OBJECTIVE
|
| The Fund seeks long-term capital appreciation.
|
| PRINCIPAL INVESTMENT STRATEGIES
|
| Equity Securities. The Fund invests, under normal circumstances, substantially all, and at least 65% of its total assets in equity securities of emerging country issuers. The Investment Adviser may consider classifications by the World Bank, the International Finance
Corporation or the United Nations and its agencies in determining whether a country is emerging or developed. Currently, emerging countries include, among others, most Latin and South American, African, Asian and Eastern European nations. The Investment
Adviser currently intends that the Fund’s investment focus will be in the following emerging countries as well as any other emerging country to the extent that foreign investors are permitted by applicable law to make such investments:
|
| n Argentina | n Egypt | n Jordan | n Philippines | n Taiwan | ||||
| n Botswana | n Greece | n Kenya | n Poland | n Thailand | ||||
| n Brazil | n Hong Kong | n Malaysia | n Russia | n Turkey | ||||
| n Chile | n Hungary | n Mexico | n Singapore | n Venezuela | ||||
| n China | n India | n Morocco | n South Africa | n Zimbabwe | ||||
| n Colombia | n Indonesia | n Pakistan | n South Korea | |||||
| n Czech Republic | n Israel | n Peru | n Sri Lanka |
| An emerging country issuer is any company that either:
|
n
|
Has a class of its securities whose principal securities market is in an emerging country;
|
n
|
Is organized under the laws of, or has a principal office in, an emerging country;
|
n
|
Derives 50% or more of its total revenue from goods produced, sales made or services provided in one or more emerging countries; or
|
n
|
Maintains 50% or more of its assets in one or more of the emerging countries.
|
| Under normal circumstances, the Fund maintains investments in at least six emerging countries, and will not invest more than 35%
of its total assets in securities of issuers in any one emerging country. Allocation of the Fund’s investments will depend upon the relative attractiveness of the emerging country markets and particular issuers. In addition, macro-economic factors
and the portfolio managers’ and Goldman Sachs economists’ views of the relative attractiveness of emerging countries and currencies are considered in allocating the Fund’s assets among emerging countries.
|
| Other.
The Fund may invest in the aggregate up to 35% of its total assets in (i) fixed-income securities of private and government emerging country issuers; and (ii) equity and fixed-income securities, such as government, corporate and bank debt obligations, of
issuers in developed countries.
|
| FUND FACTS
|
|
| Objective:
|
Long-term capital appreciation
|
| Benchmark:
|
MSCI® All Country Asia Free
ex-Japan Index (unhedged) |
| Investment Focus:
|
Equity securities of companies in Asian countries
|
| Investment Process:
|
Active International
|
| INVESTMENT OBJECTIVE
|
| The Fund seeks long-term capital appreciation.
|
| PRINCIPAL INVESTMENT STRATEGIES
|
| Equity Securities. The Fund invests, under normal circumstances, substantially all, and at least 65% of its total assets in equity securities of Asian issuers.
|
| An Asian issuer is any company that either:
|
n
|
Has a class of its securities whose principal securities markets is in one or more Asian countries;
|
n
|
Is organized under the laws of, or has a principal office in, an Asian country;
|
n
|
Derives 50% or more of its total revenue from goods produced, sales made or services provided in one or more Asian countries; or
|
n
|
Maintains 50% or more of its assets in one or more Asian countries.
|
| The Fund may allocate its assets among the Asian countries as determined from time to time by the Investment Adviser. For purposes
of the Fund’s investment policies, Asian countries are:
|
| n China
n
Hong Kong
n
India
n
Indonesia
|
n Malaysia
n
Pakistan
n
Philippines
n
Singapore
|
n South Korea
n
Sri Lanka
n
Taiwan
n
Thailand
|
| as well as any other country in Asia (other than Japan) to the extent that foreign investors are permitted by applicable law to
make such investments.
|
| Allocation of the Fund’s investments will depend upon the Investment Adviser’s views of the relative attractiveness of
the Asian markets and particular issuers.
|
| Concentration of the Fund’s assets in one or a few of the Asian countries and Asian currencies will subject the Fund to
greater risks than if the Fund’s assets were not so concentrated. For example, on August 31, 2000 (the end of the Fund’s last fiscal year), more than 25% of the Fund’s assets were invested in securities that traded in Hong Kong.
|
| Starting in mid-1997 some Pacific region countries began to experience currency devaluations that resulted in high interest rate
levels and sharp reductions in economic activity. This situation resulted in a significant drop in the securities prices of companies located in the region. Some countries have recently experienced government intervention, have sought assistance from the
International Monetary Fund and have experienced substantial domestic unrest. Although some restructuring has been undertaken, there can be no assurance that these efforts will be successful or that their recent problems will not persist. At the end of
its last fiscal year, a substantial portion of the Asia Growth Fund was invested in securities traded in the Hong Kong market. In 1997, the sovereignty of Hong Kong reverted from the United Kingdom to China. Although Hong Kong is, by law, to maintain a
high degree of autonomy, there can be no assurance that Hong Kong will not be adversely affected by Chinese sovereignty or political developments. Furthermore, the reversion of Hong Kong to China has created additional uncertainty as to future currency
valuations relative to the U.S. dollar. Because the Hong Kong stock market has significant exposure to the property market in Hong Kong, the Fund’s investments could be adversely affected by a decline in that market.
|
| Other.
The Fund may invest in the aggregate up to 35% of its total assets in equity securities of issuers in non-Asian countries and Japan, and in fixed-income securities, such as government, corporate and bank debt obligations.
|
| CORE
International Equity Fund |
International
Equity Fund |
European
Equity Fund |
|||||
|---|---|---|---|---|---|---|---|
| Investment Practices | |||||||
| Borrowings | 33 1
/3
|
33 1
/3
|
33 1
/3
|
||||
| Cross Hedging of Currencies | Ÿ | Ÿ | Ÿ | ||||
| Currency Swaps* | 15 | 15 | 15 | ||||
| Custodial Receipts | Ÿ | Ÿ | Ÿ | ||||
| Equity Swaps* | 15 | 15 | 15 | ||||
| Foreign Currency Transactions | Ÿ | Ÿ | Ÿ | ||||
| Futures Contracts and Options on Futures Contracts | Ÿ | Ÿ | Ÿ | ||||
| Investment Company Securities (including iShares
SM
and Standard & Poor’s Depositary Receipts TM ) |
10 | 10 | 10 | ||||
| Options on Foreign Currencies 1 | Ÿ | Ÿ | Ÿ | ||||
| Options on Securities and Securities Indices 2 | Ÿ | Ÿ | Ÿ | ||||
| Unseasoned Companies | Ÿ | Ÿ | Ÿ | ||||
| Warrants and Stock Purchase Rights | Ÿ | Ÿ | Ÿ | ||||
| Repurchase Agreements | Ÿ | Ÿ | Ÿ | ||||
| Securities Lending | 33 1
/3
|
33 1
/3
|
33 1
/3
|
||||
| Short Sales Against the Box | — | 25 | 25 | ||||
| When-Issued Securities and Forward Commitments | Ÿ | Ÿ | Ÿ | ||||
|
Japanese Equity Fund |
International
Growth Opportunities Fund |
Emerging Markets Equity Fund |
Asia Growth Fund |
||||
|---|---|---|---|---|---|---|---|
| 33 1
/3
|
33 1
/3
|
33 1
/3
|
33 1
/3
|
||||
| Ÿ | Ÿ | Ÿ | Ÿ | ||||
| 15 | 15 | 15 | 15 | ||||
| Ÿ | Ÿ | Ÿ | Ÿ | ||||
| 15 | 15 | 15 | 15 | ||||
| Ÿ | Ÿ | Ÿ | Ÿ | ||||
| Ÿ | Ÿ | Ÿ | Ÿ | ||||
| 10 | 10 | 10 | 10 | ||||
| Ÿ | Ÿ | Ÿ | Ÿ | ||||
| Ÿ | Ÿ | Ÿ | Ÿ | ||||
| Ÿ | Ÿ | Ÿ | Ÿ | ||||
| Ÿ | Ÿ | Ÿ | Ÿ | ||||
| Ÿ | Ÿ | Ÿ | Ÿ | ||||
| 33 1
/3
|
33 1
/3
|
33 1
/3
|
33 1
/3
|
||||
| 25 | 25 | 25 | 25 | ||||
| Ÿ | Ÿ | Ÿ | Ÿ | ||||
Ÿ
|
No specific percentage limitation on usage;
limited only by the objectives and strategies of the Fund |
| CORE
International Equity Fund |
International
Equity Fund |
European
Equity Fund |
|||||
|---|---|---|---|---|---|---|---|
| Investment Securities | |||||||
| American, European and Global Depositary Receipts | Ÿ | Ÿ | Ÿ | ||||
| Asset-Backed and Mortgage-Backed Securities 2 | — | Ÿ | Ÿ | ||||
| Bank Obligations 1 , 2 | Ÿ | Ÿ | Ÿ | ||||
| Convertible Securities | Ÿ | Ÿ | Ÿ | ||||
| Corporate Debt Obligations 2 | Ÿ 4 | Ÿ | Ÿ | ||||
| Equity Securities | 90+ | 65+ | 65+ | ||||
| Emerging Country Securities | 25 | Ÿ | Ÿ | ||||
| Fixed Income Securities 3 | 10 4 | 35 | 35 5 | ||||
| Foreign Securities | Ÿ | Ÿ | Ÿ | ||||
| Foreign Government Securities 2 | Ÿ | Ÿ | Ÿ | ||||
| Non-Investment Grade Fixed Income Securities 2 | — | Ÿ 6 | Ÿ 6 | ||||
| Real Estate Investment Trusts | Ÿ | Ÿ | Ÿ | ||||
| Structured Securities * | Ÿ | Ÿ | Ÿ | ||||
| Temporary Investments | 35 | 100 | 100 | ||||
| U.S. Government Securities 2 | Ÿ | Ÿ | Ÿ | ||||
*
|
Limited to 15% of net assets (together with other illiquid securities) for all structured securities which are not
deemed to be liquid and all swap transactions.
|
1
|
Issued by U.S. or foreign banks.
|
2
|
Limited by the amount the Fund invests in fixed-income securities.
|
3
|
Except as noted under “Non-Investment Grade Fixed Income Securities,” fixed-income securities are investment
grade (e.g., BBB or higher by Standard & Poor’s Rating Group (“Standard & Poor’s”) or Baa or higher by Moody’s Investor’s Service, Inc. (“Moody’s”)).
|
4
|
Cash equivalents only.
|
5
|
The European Equity Fund may invest in the aggregate up to 35% of its total assets in: (1) equity securities of
non-European countries; and (2) fixed-income securities.
|
6
|
May be BB or lower by Standard & Poor’s or Ba or lower by Moody’s.
|
| Japanese
Equity Fund |
International
Growth Opportunities Fund |
Emerging
Markets Equity Fund |
Asia Growth
Fund |
|||||||
|---|---|---|---|---|---|---|---|---|---|---|
| Ÿ | Ÿ | Ÿ | Ÿ | |||||||
| Ÿ | Ÿ | Ÿ | Ÿ | |||||||
| Ÿ | Ÿ | Ÿ | Ÿ | |||||||
| Ÿ | Ÿ | Ÿ | Ÿ | |||||||
| Ÿ | Ÿ | Ÿ | Ÿ | |||||||
| 65 | + | 65+ | 65 | + | 65 | + | ||||
| Ÿ | Ÿ | Ÿ | Ÿ | |||||||
| 35 | 7 | 35 8 | 35 | 9 | 35 | 10 | ||||
| Ÿ | Ÿ | Ÿ | Ÿ | |||||||
| Ÿ | Ÿ | Ÿ | Ÿ | |||||||
| Ÿ | 6 | Ÿ |
Ÿ | 6 | Ÿ | 6 | ||||
| Ÿ | Ÿ | Ÿ | Ÿ | |||||||
| Ÿ | Ÿ | Ÿ | Ÿ | |||||||
| 100 | 100 | 35 | 100 | |||||||
| Ÿ | Ÿ | Ÿ | Ÿ | |||||||
7
|
The Japanese Equity Fund may invest in the aggregate up to 35% of its total assets in: (1) fixed-income securities; and
(2) equity securities of non-Japanese companies.
|
8
|
The International Growth Opportunities Fund may invest in the aggregate up to 35% of its total assets in (1) fixed-income
securities; and (2) equity securities of companies with public stock market capitalizations of less than $100 million or more than $3 billion at the time of investment.
|
9
|
The Emerging Markets Equity Fund may invest in the aggregate up to 35% of its total assets in: (1) fixed-income
securities of private and government emerging country issuers; and (2) equity and fixed-income securities of issuers in developed countries.
|
10
|
The Asia Growth Fund may invest in the aggregate up to 35% of its total assets in: (1) fixed-income securities; and (2)
equity securities of issuers in non-Asian countries and Japan.
|
| CORE
International Equity |
International
Equity |
European
Equity |
Japanese
Equity |
International
Growth Opportunities |
Emerging
Markets Equity |
Asia
Growth |
|||||||||
|---|---|---|---|---|---|---|---|---|---|---|---|---|---|---|---|
| Credit/Default | Ÿ | Ÿ | Ÿ | Ÿ | Ÿ | Ÿ | Ÿ | ||||||||
| Emerging Countries | Ÿ | Ÿ | Ÿ | Ÿ | Ÿ | Ÿ | Ÿ | ||||||||
| Interest Rate | Ÿ | Ÿ | Ÿ | Ÿ | Ÿ | Ÿ | Ÿ | ||||||||
| Small Cap | — | — | Ÿ | — | Ÿ | — | — | ||||||||
| Foreign | Ÿ | Ÿ | Ÿ | Ÿ | Ÿ | Ÿ | Ÿ | ||||||||
| Derivatives | Ÿ | Ÿ | Ÿ | Ÿ | Ÿ | Ÿ | Ÿ | ||||||||
| Management | Ÿ | Ÿ | Ÿ | Ÿ | Ÿ | Ÿ | Ÿ | ||||||||
| Market | Ÿ | Ÿ | Ÿ | Ÿ | Ÿ | Ÿ | Ÿ | ||||||||
| Liquidity | Ÿ | Ÿ | Ÿ | Ÿ | Ÿ | Ÿ | Ÿ | ||||||||
| Stock | Ÿ | Ÿ | Ÿ | Ÿ | Ÿ | Ÿ | Ÿ | ||||||||
| Geographic | — | — | Ÿ | Ÿ | — | Ÿ | — | ||||||||
| Initial Public
Offering (“IPO”) |
— | — | Ÿ | Ÿ | Ÿ | Ÿ | Ÿ | ||||||||
n
|
Credit/Default Risk—The risk that an issuer or guarantor of fixed-income securities held by a Fund may default
on its obligation to pay interest and repay principal.
|
n
|
Emerging Countries Risk—The securities markets of Asian, Latin and South American, Eastern European,
African and other emerging countries are less liquid, are especially subject to greater price volatility, have smaller market capitalizations, have less government regulation and are not subject to as extensive and frequent accounting, financial and other
reporting requirements as the securities markets of more developed countries. Further, investment in equity securities of issuers located in Russia and certain other emerging countries involves risk of loss result
ing from problems in share registration and custody and substantial economic and political disruptions. These risks are not normally associated with investment in more developed countries.
|
n
|
Interest Rate Risk—The risk that when interest rates increase, securities held by a Fund will decline in value.
Long-term fixed-income securities will normally have more price volatility because of this risk than short-term fixed-income securities.
|
n
|
Foreign Risk—The risk that when a Fund invests in foreign securities, it will be subject to risk of loss not
typically associated with domestic issuers. Loss may result because of less foreign government regulation, less public information and less economic, political and social stability. Loss may also result from the imposition of exchange controls,
confiscations and other government restrictions. A Fund will also be subject to the risk of negative foreign currency rate fluctuations. Foreign risks will normally be greatest when a Fund invests in issuers located in emerging countries.
|
n
|
Derivatives Risk—The risk that loss may result from a Fund’s investments in options, futures, swaps,
structured securities and other derivative instruments. These instruments may be leveraged so that small changes may produce disproportionate losses to a Fund.
|
n
|
Management Risk—The risk that a strategy used by the Investment Adviser may fail to produce the intended results.
|
n
|
Market Risk—The risk that the value of the securities in which a Fund invests may go up or down in response to
the prospects of individual companies, particular industry sectors and/or general economic conditions. Price changes may be temporary or last for extended periods. A Fund’s investments may be overweighted from time to time in one or more industry
sectors, which will increase the Fund’s exposure to risk of loss from adverse developments affecting those sectors.
|
n
|
Liquidity Risk—The risk that a Fund will not be able to pay redemption proceeds within the time period stated
in this Prospectus because of unusual market conditions, an unusually high volume of redemption requests, or other reasons. Funds that invest in non-investment grade fixed-income securities, small capitalization stocks, REITs or emerging country issuers
will be especially subject to the risk that during certain periods the liquidity of particular issuers or industries, or all securities within particular investment categories, will shrink or disappear suddenly and without warning as a result of adverse
economic, market or political events, or adverse investor perceptions whether or not accurate. The Goldman Sachs Asset Allocation Portfolios (the “Asset Allocation Portfolios”) expect to invest a significant percentage of their assets in the
Funds and other funds for which Goldman Sachs now or in the future acts as investment adviser or underwriter. Redemptions by an Asset Allocation Portfolio of its position in a Fund may further increase liquidity risk and may impact a Fund’s net asset
value (“NAV”).
|
n
|
Stock Risk—The risk that stock prices have historically risen and fallen in periodic cycles. Recently, U.S.
stock markets and certain foreign stock markets have experienced substantial price volatility and, at times, have traded at or close to record high levels. There is no guarantee that such levels will be reached or maintained in the future.
|
n
|
Geographic Risk—The European Equity Fund invests primarily in equity securities of European companies. The
Japanese Equity Fund invests primarily in equity securities of Japanese equity companies. The Asia Growth Fund invests primarily in equity securities of Asian issuers. Concentration of the investments of these or other Funds in issuers located in a
particular country or region will subject a Fund, to a greater extent than if investments were less concentrated, to the risks of adverse securities markets, exchange rates and social, political, regulatory or economic events which may occur in that
country or region.
|
n
|
Small Cap Risk—The securities of small capitalization stocks involve greater risks than those associated with
larger, more established companies and may be subject to more abrupt or erratic price movements. Securities of such issuers may lack sufficient market liquidity to enable a Fund to effect sales at an advantageous time or without a substantial drop in price.
|
n
|
IPO Risk—The risk that the market value of IPO shares will fluctuate considerably due to factors such as the
absence of a prior public market, unseasoned trading, the small number of shares available for trading and limited information about the issuer. The purchase of IPO shares may involve high transaction costs. IPO shares are subject to market risk and
liquidity risk. When a Fund’s asset base is small, a significant portion of the Fund’s performance could be attributable to investments in IPOs, because such investments would have a magnified impact on the Fund. As the Fund’s assets grow,
the effect of the Fund’s investments in IPOs on the Fund’s performance probably will decline, which could reduce the Fund’s performance.
|
| HOW THE FUNDS HAVE PERFORMED
|
| The bar chart and table below provide an indication of the risks of investing in a Fund by showing: (a) changes in the performance
of a Fund’s Class A Shares from year to year; and (b) how the average annual returns of a Fund’s Class A, B and C Shares compare to those of broad-based securities market indices. The bar chart and table assume reinvestment of dividends and
distributions. A Fund’s past performance is not necessarily an indication of how the Fund will perform in the future. The average annual total return calculation reflects a maximum initial sales charge of 5.5% for Class A Shares, the assumed
contingent deferred sales charge (“CDSC”) for Class B Shares (5% maximum declining to 0% after six years), and the assumed CDSC for Class C Shares (1% if redeemed within 12 months of purchase). The bar chart does not reflect the sales loads
applicable to Class A Shares. If the sales loads were reflected, returns would be less. Performance reflects expense limitations in effect. If expense limitations were not in place, a Fund’s performance would have been reduced.
|
| TOTAL RETURN
|
| The total return for Class A Shares for the 9-month period ended September 30, 2000 was -13.52%.
Best Quarter
Q4 ’98 +18.84%
Worst Quarter
Q3 ’98 -16.00%
|
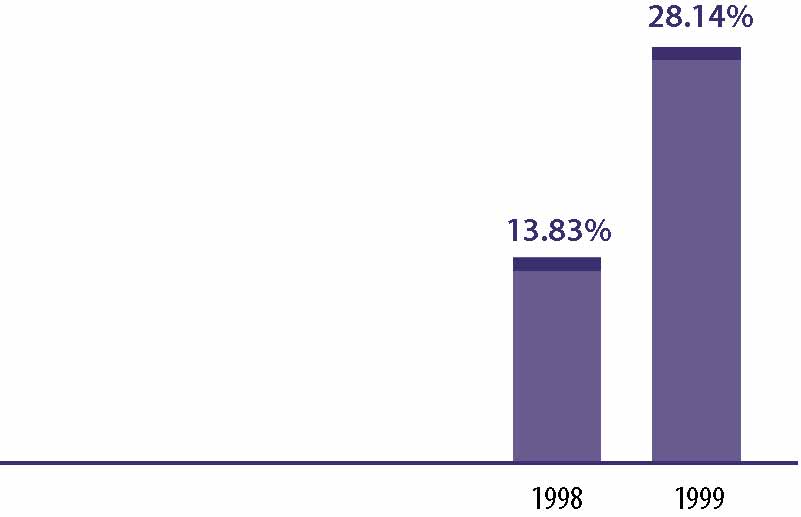 |
| AVERAGE ANNUAL TOTAL RETURN
|
| For the period ended December 31, 1999 | 1 Year | Since Inception | |||
|---|---|---|---|---|---|
| Class A (Inception 8/15/97) | |||||
| Including Sales Charges | 21.09% | 8.32% | |||
| Morgan Stanley Capital International (MSCI®) Europe, Australasia,
Far East (EAFE®) Index (unhedged)* |
27.29% | 15.99% | |||
| Class B (Inception 8/15/97) | |||||
| Including CDSC | 22.42% | 9.30% | |||
| MSCI® EAFE® Index (unhedged)* | 27.29% | 15.99% | |||
| Class C (Inception 8/15/97) | |||||
| Including CDSC | 26.48% | 10.47% | |||
| MSCI® EAFE® Index (unhedged)* | 27.29% | 15.99% | |||
*
|
The unmanaged MSCI® EAFE® Index (unhedged) is a market capitalization-weighted composite of securities in 20 developed
markets. The Index figures do not reflect any fees or expenses.
|
| TOTAL RETURN
|
CALENDAR YEAR (CLASS A)
|
| The total return for Class A Shares for the 9-month period ended September 30, 2000 was -10.59%.
Best Quarter
Q4 ’99 +21.70%
Worst Quarter
Q3 ’98 -14.37%
|
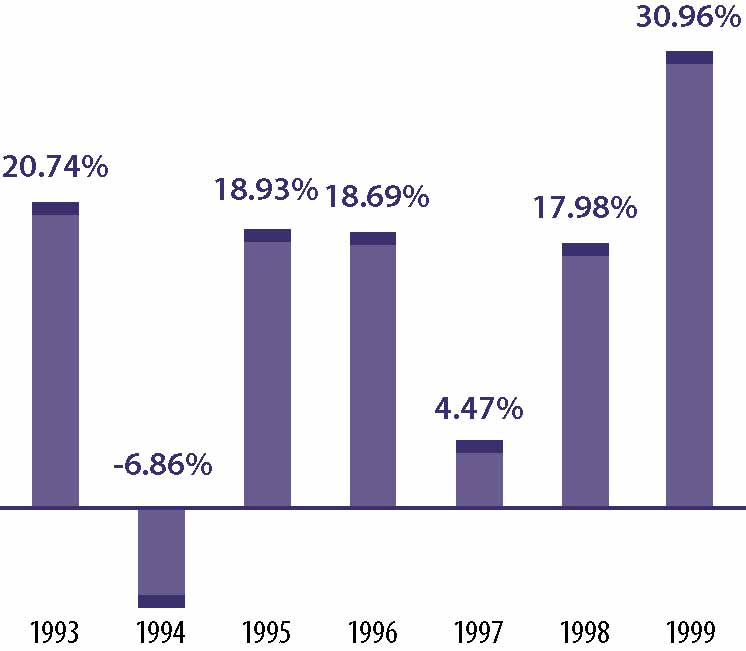 |
| AVERAGE ANNUAL TOTAL RETURN
|
| For the period ended December 31, 1999 | 1 Year | 5 Years | Since Inception | ||||
|---|---|---|---|---|---|---|---|
| Class A (Inception 12/1/92) | |||||||
| Including Sales Charges | 23.78% | 16.58% | 13.46% | ||||
| MSCI® EAFE® Index (unhedged)* | 27.29% | 13.14% | 14.91% | ||||
| Class B (Inception 5/1/96) | |||||||
| Including CDSC | 24.65% | N/A | 14.57% | ||||
| MSCI® EAFE® Index (unhedged)* | 27.29% | N/A | 13.04% | ||||
| Class C (Inception 8/15/97) | |||||||
| Including CDSC | 29.16% | N/A | 15.03% | ||||
| MSCI® EAFE® Index (unhedged)* | 27.29% | N/A | 15.99% | ||||
*
|
The MSCI® EAFE® Index (unhedged) is an unmanaged index of common stock prices. The Index figures do not reflect any
fees or expenses.
|
| TOTAL RETURN
|
| The total return for Class A Shares for the 9-month period ended September 30, 2000 was -5.87%.
Best Quarter
Q4 ’99 +24.66%
Worst Quarter
Q2 ’99 -3.04%
|
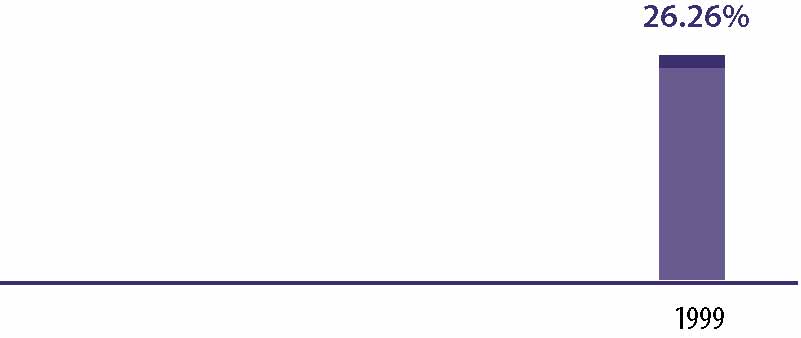 |
| AVERAGE ANNUAL TOTAL RETURN
|
| For the period ended December 31, 1999 | 1 Year | Since Inception | |||
|---|---|---|---|---|---|
| Class A (Inception 10/1/98) | |||||
| Including Sales Charges | 19.30% | 30.20% | |||
| MSCI® Europe Index (unhedged)* | 16.21% | 29.39% | |||
| FT/S&P Actuaries Europe Index (unhedged)** | 16.14% | 29.20% | |||
| Class B (Inception 10/1/98) | |||||
| Including CDSC | 20.30% | 32.47% | |||
| MSCI® Europe Index (unhedged)* | 16.21% | 29.39% | |||
| FT/S&P Actuaries Europe Index (unhedged)** | 16.14% | 29.20% | |||
| Class C (Inception 10/1/98) | |||||
| Including CDSC | 24.69% | 35.75% | |||
| MSCI® Europe Index (unhedged)* | 16.21% | 29.39% | |||
| FT/S&P Actuaries Europe Index (unhedged)** | 16.14% | 29.20% | |||
*
|
The MSCI® Europe Index (unhedged), an unmanaged index of common stock prices, replaced the FT/S&P Actuaries Europe
Index (unhedged) as the European Equity Fund’s performance benchmark. The MSCI® Europe Index is widely used throughout the investment management industry to represent the investment opportunities available to a large cap, developed country
European equity strategy and, in the Investment Adviser’s opinion, is a more appropriate benchmark against which to measure the performance of the European Equity Fund. The Index figures do not reflect any fees or expenses.
|
**
|
The unmanaged FT/S&P Actuaries Europe Index (unhedged) is a market capitalization-weighted composite of approximately 750
stocks from 16 countries in Europe. The Index figures do not reflect any fees or expenses.
|
| TOTAL RETURN
|
CALENDAR YEAR (CLASS A)
|
| The total return for Class A Shares for the 9-month period ended September 30, 2000 was -12.61%.
Best Quarter*
Q3 ’99 +23.08%
Worst Quarter*
Q1 ’99 +9.49%
|
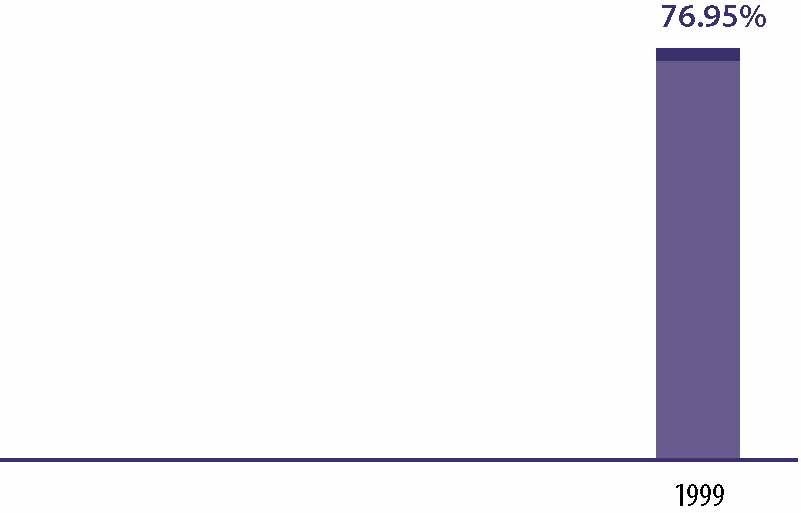 |
| AVERAGE ANNUAL TOTAL RETURN
|
| For the period ended December 31, 1999 | 1 Year | Since Inception | |||
|---|---|---|---|---|---|
| Class A (Inception 5/1/98) | |||||
| Including Sales Charges | 67.28% | 44.49% | |||
| Tokyo Price Index (“TOPIX”) (unhedged)** | 75.32% | 43.28% | |||
| Class B (Inception 5/1/98) | |||||
| Including CDSC | 70.28% | 46.68% | |||
| Tokyo Price Index (“TOPIX”) (unhedged)** | 75.32% | 43.28% | |||
| Class C (Inception 5/1/98) | |||||
| Including CDSC | 74.82% | 48.85% | |||
| Tokyo Price Index (“TOPIX”) (unhedged)** | 75.32% | 43.28% | |||
*
|
Please note that “Best Quarter” and “Worst Quarter” figures are applicable only to the time period covered
by the bar chart.
|
**
|
The TOPIX (unhedged) is an unmanaged composite of all stocks on the first section of the Tokyo Stock Exchange. The Index
figures do not reflect any fees or expenses.
|
| TOTAL RETURN
|
| The total return for Class A Shares for the
9-month period ended September 30, 2000 was 2.03%. Best Quarter*
Q4 ’99 +12.52%
Worst Quarter*
Q1 ’99 +4.81%
|
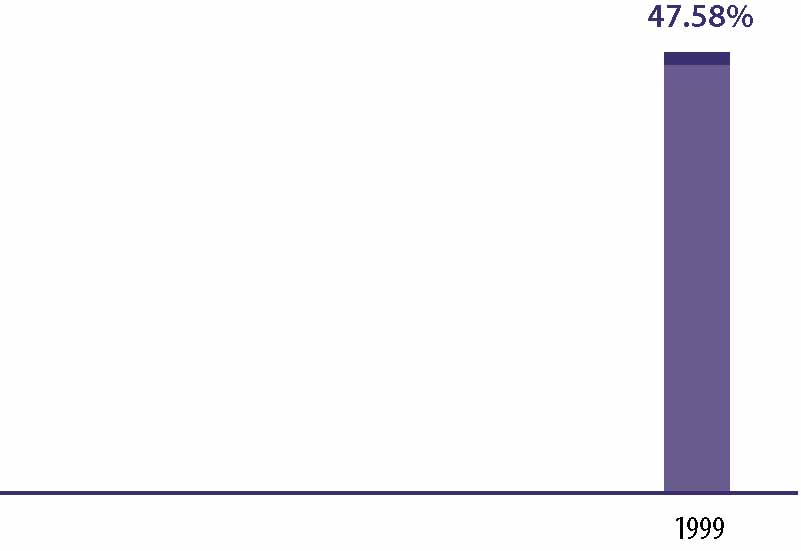 |
| AVERAGE ANNUAL TOTAL RETURN
|
| For the period ended December 31, 1999 | 1 Year | Since Inception | |||
|---|---|---|---|---|---|
| Class A (Inception 5/1/98) | |||||
| Including Sales Charges | 39.40% | 24.93% | |||
| MSCI® EAFE® Small Cap Index (unhedged)** | 17.67% | 3.00% | |||
| Class B (Inception 5/1/98) | |||||
| Including CDSC | 41.62% | 26.71% | |||
| MSCI® EAFE® Small Cap Index (unhedged)** | 17.67% | 3.00% | |||
| Class C (Inception 5/1/98) | |||||
| Including CDSC | 45.67% | 28.76% | |||
| MSCI® EAFE® Small Cap Index (unhedged)** | 17.67% | 3.00% | |||
*
|
Please note that “Best Quarter” and “Worst Quarter” figures are applicable only to the time period covered
by the bar chart.
|
**
|
The MSCI® EAFE® Small Cap Index (unhedged), inception date 1/15/98, includes 1,502 securities from 23 developed markets
with a capitalization range of $200-800 million and a general regional allocation of 60% Europe, 30% Japan and 10% Asia. The Index figures do not reflect any fees or expenses.
|
| TOTAL RETURN
|
| The total return for Class A Shares for the
9-month period ended September 30, 2000 was -15.78%. Best Quarter
Q4 ’99 +29.84%
Worst Quarter
Q3 ’98 -22.94%
|
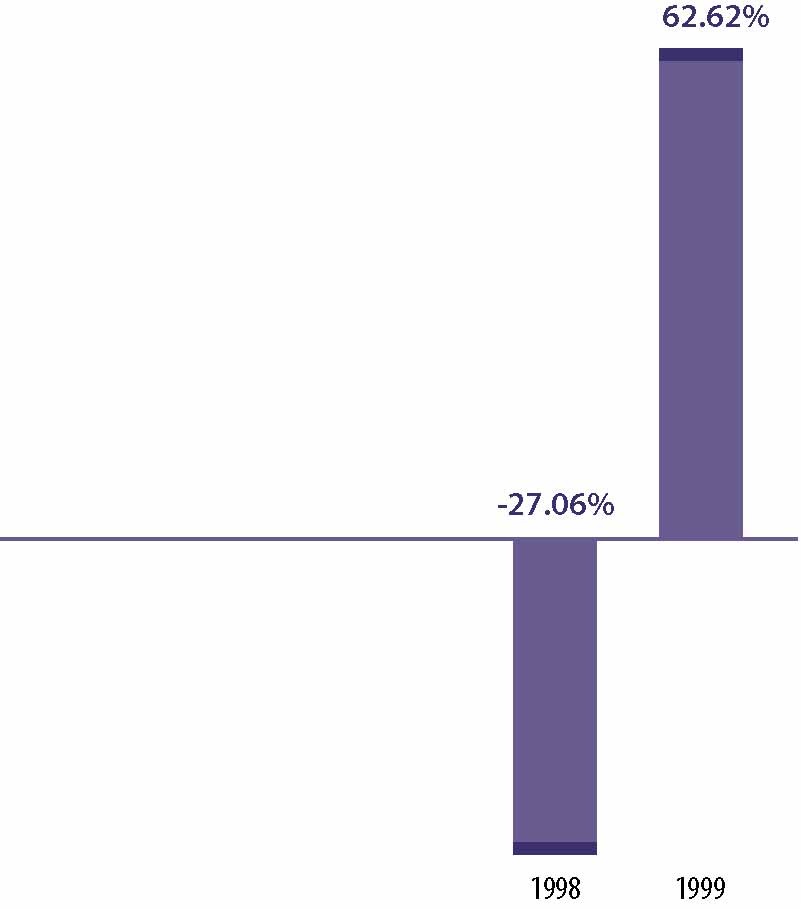 |
| AVERAGE ANNUAL TOTAL RETURN
|
| For the period ended December 31, 1999 | 1 Year | Since Inception | |||
|---|---|---|---|---|---|
| Class A (Inception 12/15/97) | |||||
| Including Sales Charges | 53.62% | 6.98% | |||
| MSCI® Emerging Markets Free (EMF) Index* | 66.42% | 14.52% | |||
| Class B (Inception 12/15/97) | |||||
| Including CDSC | 56.59% | 8.10% | |||
| MSCI® EMF Index* | 66.42% | 14.52% | |||
| Class C (Inception 12/15/97) | |||||
| Including CDSC | 60.84% | 9.69% | |||
| MSCI® EMF Index* | 66.42% | 14.52% | |||
*
|
The unmanaged MSCI® EMF Index is a market capitalization-weighted composite of securities in over 30 emerging markets
countries. “Free” indicates an index that excludes shares in otherwise free markets that are not purchasable by foreigners. The Index figures do not reflect any fees or expenses.
|
| TOTAL RETURN
|
| The total return for Class A Shares for the 9-month period ended September 30, 2000 was -21.73%.
Best Quarter
Q2 ’99 +30.97%
Worst Quarter
Q4 ‘97 -27.33%
|
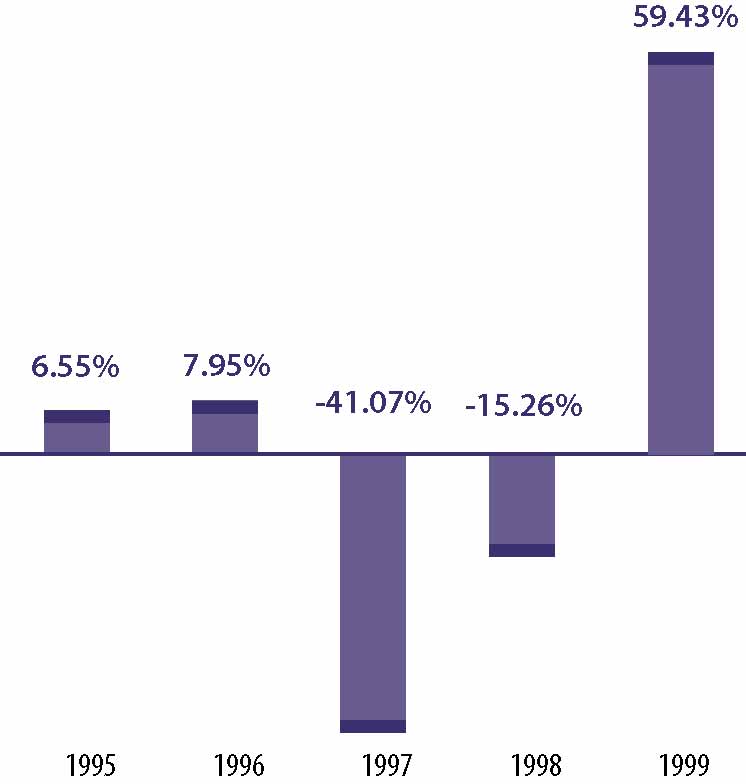 |
| AVERAGE ANNUAL TOTAL RETURN
|
| For the period ended December 31, 1999 | 1 Year | 5 Years | Since Inception | ||||
|---|---|---|---|---|---|---|---|
| Class A (Inception 7/8/94) | |||||||
| Including Sales Charges | 50.70% | (2.84)% | (2.12)% | ||||
| MSCI® All Country Asia Free ex-Japan (unhedged)* | 61.95% | (1.28)% | (0.94)% | ||||
| Class B (Inception 5/1/96) | |||||||
| Including CDSC | 53.70% | N/A | (8.78)% | ||||
| MSCI® All Country Asia Free ex-Japan (unhedged)* | 61.95% | N/A | (5.50)% | ||||
| Class C (Inception 8/15/97) | |||||||
| Including CDSC | 57.52% | N/A | (8.65)% | ||||
| MSCI® All Country Asia Free ex-Japan (unhedged)* | 61.95% | N/A | (5.65)% | ||||
*
|
The unmanaged MSCI® All Country Asia Free ex-Japan Index (unhedged) is a market
capitalization-weighted composite of securities in ten Asian countries. “Free” indicates an index that excludes shares in otherwise free markets that are not purchasable by foreigners. The Index figures do not reflect any fees or expenses. |
| CORE International Equity Fund |
||||||||||
|---|---|---|---|---|---|---|---|---|---|---|
| Class A | Class B | Class C | ||||||||
| Shareholder Fees | ||||||||||
| (fees paid directly from your investment): | ||||||||||
| Maximum Sales Charge (Load) Imposed on
Purchases |
5.5% | 1 | None | None | ||||||
| Maximum Deferred Sales Charge (Load) 2 | None | 1 | 5.0% | 3 | 1.0% | 4 | ||||
| Maximum Sales Charge (Load) Imposed on
Reinvested Dividends |
None | None | None | |||||||
| Redemption Fees 5 | None | None | None | |||||||
| Exchange Fees | None | None | None | |||||||
| Annual Fund Operating Expenses | ||||||||||
| (expenses that are deducted from Fund assets):6 | ||||||||||
| Management Fees | 0.85% | 0.85% | 0.85% | |||||||
| Distribution and Service (12b-1) Fees | 0.50% | 1.00% | 1.00% | |||||||
| Other Expenses 7 | 0.40% | 0.40% | 0.40% | |||||||
| Total Fund Operating Expenses* | 1.75% | 2.25% | 2.25% | |||||||
| See page 37 for all other footnotes.
|
*
|
As a result of the current expense limitations, “Other Expenses” and “Total Fund Operating Expenses” of the
Fund which are actually incurred as of the date of this Prospectus are as set forth below. The expense limitations may be terminated at any time at the option of the Investment Adviser. If this occurs, “Other Expenses” and “Total Fund
Operating Expenses” may increase without shareholder approval.
|
| CORE International Equity Fund |
|||||||
|---|---|---|---|---|---|---|---|
| Class A | Class B | Class C | |||||
| Annual Fund Operating Expenses | |||||||
| (expenses that are deducted from Fund assets): 6 | |||||||
| Management Fees | 0.85% | 0.85% | 0.85% | ||||
| Distribution and Service (12b-1) Fees | 0.50% | 1.00% | 1.00% | ||||
| Other Expenses 7 | 0.31% | 0.31% | 0.31% | ||||
| Total Fund Operating Expenses (after
current expense limitations) |
1.66% | 2.16% | 2.16% | ||||
| International Equity Fund |
||||||||||
|---|---|---|---|---|---|---|---|---|---|---|
| Class A | Class B | Class C | ||||||||
| Shareholder Fees | ||||||||||
| (fees paid directly from your investment): | ||||||||||
| Maximum Sales Charge (Load) Imposed on
Purchases |
5.5% | 1 | None | None | ||||||
| Maximum Deferred Sales Charge (Load) 2 | None | 1 | 5.0% | 3 | 1.0% | 4 | ||||
| Maximum Sales Charge (Load) Imposed on
Reinvested Dividends |
None | None | None | |||||||
| Redemption Fees 5 | None | None | None | |||||||
| Exchange Fees | None | None | None | |||||||
| Annual Fund Operating Expenses | ||||||||||
| (expenses that are deducted from Fund assets):6 | ||||||||||
| Management Fees | 1.00% | 1.00% | 1.00% | |||||||
| Distribution and Service (12b-1) Fees | 0.50% | 1.00% | 1.00% | |||||||
| Other Expenses 7 | 0.34% | 0.34% | 0.34% | |||||||
| Total Fund Operating Expenses* | 1.84% | 2.34% | 2.34% | |||||||
| See page 37 for all other footnotes.
|
*
|
As a result of the current expense limitations, “Other Expenses” and “Total Fund Operating Expenses” of the
Fund which are actually incurred as of the date of this Prospectus are as set forth below. The expense limitations may be terminated at any time at the option of the Investment Adviser. If this occurs, “Other Expenses” and “Total Fund
Operating Expenses” may increase without shareholder approval.
|
| International Equity Fund |
|||||||
|---|---|---|---|---|---|---|---|
| Class A | Class B | Class C | |||||
| Annual Fund Operating Expenses | |||||||
| (expenses that are deducted from Fund assets): 6 | |||||||
| Management Fees | 1.00% | 1.00% | 1.00% | ||||
| Distribution and Service (12b-1) Fees | 0.50% | 1.00% | 1.00% | ||||
| Other Expenses 7 | 0.29% | 0.29% | 0.29% | ||||
| Total Fund Operating Expenses (after
current expense limitations) |
1.79% | 2.29% | 2.29% | ||||
| European Equity Fund |
||||||||||
|---|---|---|---|---|---|---|---|---|---|---|
| Class A | Class B | Class C | ||||||||
| Shareholder Fees | ||||||||||
| (fees paid directly from your investment): | ||||||||||
| Maximum Sales Charge (Load) Imposed on
Purchases |
5.5% | 1 | None | None | ||||||
| Maximum Deferred Sales Charge (Load) 2 | None | 1 | 5.0% | 3 | 1.0% | 4 | ||||
| Maximum Sales Charge (Load) Imposed on
Reinvested Dividends |
None | None | None | |||||||
| Redemption Fees 5 | None | None | None | |||||||
| Exchange Fees | None | None | None | |||||||
| Annual Fund Operating Expenses | ||||||||||
| (expenses that are deducted from Fund assets):6 | ||||||||||
| Management Fees | 1.00% | 1.00% | 1.00% | |||||||
| Distribution and Service (12b-1) Fees | 0.50% | 1.00% | 1.00% | |||||||
| Other Expenses 7 | 0.67% | 0.67% | 0.67% | |||||||
| Total Fund Operating Expenses* | 2.17% | 2.67% | 2.67% | |||||||
| See page 37 for all other footnotes.
|
*
|
As a result of the current expense limitations, “Other Expenses” and “Total Fund Operating Expenses” of the
Fund which are actually incurred as of the date of this Prospectus are as set forth below. The expense limitations may be terminated at any time at the option of the Investment Adviser. If this occurs, “Other Expenses” and “Total Fund
Operating Expenses” may increase without shareholder approval.
|
| European Equity Fund |
|||||||
|---|---|---|---|---|---|---|---|
| Class A | Class B | Class C | |||||
| Annual Fund Operating Expenses | |||||||
| (expenses that are deducted from Fund assets): 6 | |||||||
| Management Fees | 1.00% | 1.00% | 1.00% | ||||
| Distribution and Service (12b-1) Fees | 0.50% | 1.00% | 1.00% | ||||
| Other Expenses 7 | 0.29% | 0.29% | 0.29% | ||||
| Total Fund Operating Expenses (after
current expense limitations) |
1.79% | 2.29% | 2.29% | ||||
| Japanese Equity Fund |
||||||||||
|---|---|---|---|---|---|---|---|---|---|---|
| Class A | Class B | Class C | ||||||||
| Shareholder Fees | ||||||||||
| (fees paid directly from your investment): | ||||||||||
| Maximum Sales Charge (Load) Imposed on
Purchases |
5.5% | 1 | None | None | ||||||
| Maximum Deferred Sales Charge (Load) 2 | None | 1 | 5.0% | 3 | 1.0% | 4 | ||||
| Maximum Sales Charge (Load) Imposed on
Reinvested Dividends |
None | None | None | |||||||
| Redemption Fees 5 | None | None | None | |||||||
| Exchange Fees | None | None | None | |||||||
| Annual Fund Operating Expenses | ||||||||||
| (expenses that are deducted from Fund assets):6 | ||||||||||
| Management Fees | 1.00% | 1.00% | 1.00% | |||||||
| Distribution and Service (12b-1) Fees | 0.50% | 1.00% | 1.00% | |||||||
| Other Expenses 7 | 0.60% | 0.60% | 0.60% | |||||||
| Total Fund Operating Expenses* | 2.10% | 2.60% | 2.60% | |||||||
| See page 37 for all other footnotes.
|
*
|
As a result of the current expense limitations, “Other Expenses” and “Total Fund Operating Expenses” of the
Fund which are actually incurred as of the date of this Prospectus are as set forth below. The expense limitations may be terminated at any time at the option of the Investment Adviser. If this occurs, “Other Expenses” and “Total Fund
Operating Expenses” may increase without shareholder approval.
|
| Japanese Equity Fund |
|||||||
|---|---|---|---|---|---|---|---|
| Class A | Class B | Class C | |||||
| Annual Fund Operating Expenses | |||||||
| (expenses that are deducted from Fund assets): 6 | |||||||
| Management Fees | 1.00% | 1.00% | 1.00% | ||||
| Distribution and Service (12b-1) Fees | 0.50% | 1.00% | 1.00% | ||||
| Other Expenses 7 | 0.30% | 0.30% | 0.30% | ||||
| Total Fund Operating Expenses (after
current expense limitations) |
1.80% | 2.30% | 2.30% | ||||
| International Growth Opportunities Fund |
||||||||||
|---|---|---|---|---|---|---|---|---|---|---|
| Class A | Class B | Class C | ||||||||
| Shareholder Fees | ||||||||||
| (fees paid directly from your investment): | ||||||||||
| Maximum Sales Charge (Load) Imposed on
Purchases |
5.5% | 1 | None | None | ||||||
| Maximum Deferred Sales Charge (Load) 2 | None | 1 | 5.0% | 3 | 1.0% | 4 | ||||
| Maximum Sales Charge (Load) Imposed on
Reinvested Dividends |
None | None | None | |||||||
| Redemption Fees 5 | None | None | None | |||||||
| Exchange Fees | None | None | None | |||||||
| Annual Fund Operating Expenses | ||||||||||
| (expenses that are deducted from Fund assets):6 | ||||||||||
| Management Fees | 1.20% | 1.20% | 1.20% | |||||||
| Distribution and Service (12b-1) Fees | 0.50% | 1.00% | 1.00% | |||||||
| Other Expenses 7 | 0.52% | 0.52% | 0.52% | |||||||
| Total Fund Operating Expenses* | 2.22% | 2.72% | 2.72% | |||||||
| See page 37 for all other footnotes.
|
*
|
As a result of the current expense limitations, “Other Expenses” and “Total Fund Operating Expenses” of the
Fund which are actually incurred as of the date of this Prospectus are as set forth below. The expense limitations may be terminated at any time at the option of the Investment Adviser. If this occurs, “Other Expenses” and “Total Fund
Operating Expenses” may increase without shareholder approval.
|
| International Growth Opportunities Fund |
|||||||
|---|---|---|---|---|---|---|---|
| Class A | Class B | Class C | |||||
| Annual Fund Operating Expenses | |||||||
| (expenses that are deducted from Fund assets): 6 | |||||||
| Management Fees | 1.20% | 1.20% | 1.20% | ||||
| Distribution and Service (12b-1) Fees | 0.50% | 1.00% | 1.00% | ||||
| Other Expenses 7 | 0.35% | 0.35% | 0.35% | ||||
| Total Fund Operating Expenses (after
current expense limitations) |
2.05% | 2.55% | 2.55% | ||||
| Emerging Markets Equity Fund |
||||||||||
|---|---|---|---|---|---|---|---|---|---|---|
| Class A | Class B | Class C | ||||||||
| Shareholder Fees | ||||||||||
| (fees paid directly from your investment): | ||||||||||
| Maximum Sales Charge (Load) Imposed on
Purchases |
5.5% | 1 | None | None | ||||||
| Maximum Deferred Sales Charge (Load) 2 | None | 1 | 5.0% | 3 | 1.0% | 4 | ||||
| Maximum Sales Charge (Load) Imposed on
Reinvested Dividends |
None | None | None | |||||||
| Redemption Fees 5 | None | None | None | |||||||
| Exchange Fees | None | None | None | |||||||
| Annual Fund Operating Expenses | ||||||||||
| (expenses that are deducted from Fund assets):6 | ||||||||||
| Management Fees | 1.20% | 1.20% | 1.20% | |||||||
| Distribution and Service (12b-1) Fees | 0.50% | 1.00% | 1.00% | |||||||
| Other Expenses 7 | 0.60% | 0.60% | 0.60% | |||||||
| Total Fund Operating Expenses* | 2.30% | 2.80% | 2.80% | |||||||
| See page 37 for all other footnotes.
|
*
|
As a result of the current expense limitations, “Other Expenses” and “Total Fund Operating Expenses” of the
Fund which are actually incurred as of the date of this Prospectus are as set forth below. The expense limitations may be terminated at any time at the option of the Investment Adviser. If this occurs, “Other Expenses” and “Total Fund
Operating Expenses” may increase without shareholder approval.
|
| Emerging Markets Equity Fund |
|||||||
|---|---|---|---|---|---|---|---|
| Class A | Class B | Class C | |||||
| Annual Fund Operating Expenses | |||||||
| (expenses that are deducted from Fund assets): 6 | |||||||
| Management Fees | 1.20% | 1.20% | 1.20% | ||||
| Distribution and Service (12b-1) Fees | 0.50% | 1.00% | 1.00% | ||||
| Other Expenses 7 | 0.54% | 0.54% | 0.54% | ||||
| Total Fund Operating Expenses (after
current expense limitations) |
2.24% | 2.74% | 2.74% | ||||
| Asia Growth Fund |
||||||||||
|---|---|---|---|---|---|---|---|---|---|---|
| Class A | Class B | Class C | ||||||||
| Shareholder Fees | ||||||||||
| (fees paid directly from your investment): | ||||||||||
| Maximum Sales Charge (Load) Imposed on
Purchases |
5.5% | 1 | None | None | ||||||
| Maximum Deferred Sales Charge (Load) 2 | None | 1 | 5.0% | 3 | 1.0% | 4 | ||||
| Maximum Sales Charge (Load) Imposed on
Reinvested Dividends |
None | None | None | |||||||
| Redemption Fees 5 | None | None | None | |||||||
| Exchange Fees | None | None | None | |||||||
| Annual Fund Operating Expenses | ||||||||||
| (expenses that are deducted from Fund assets):6 | ||||||||||
| Management Fees | 1.00% | 1.00% | 1.00% | |||||||
| Distribution and Service (12b-1) Fees | 0.50% | 1.00% | 1.00% | |||||||
| Other Expenses 7 | 0.80% | 0.80% | 0.80% | |||||||
| Total Fund Operating Expenses* | 2.30% | 2.80% | 2.80% | |||||||
| See page 37 for all other footnotes.
|
*
|
As a result of the current expense limitations, “Other Expenses” and “Total Fund Operating Expenses” of the
Fund which are actually incurred as of the date of this Prospectus are as set forth below. The expense limitations may be terminated at any time at the option of the Investment Adviser. If this occurs, “Other Expenses” and “Total Fund
Operating Expenses” may increase without shareholder approval.
|
| Asia Growth Fund |
|||||||
|---|---|---|---|---|---|---|---|
| Class A | Class B | Class C | |||||
| Annual Fund Operating Expenses | |||||||
| (expenses that are deducted from Fund assets): 6 | |||||||
| Management Fees | 1.00% | 1.00% | 1.00% | ||||
| Distribution and Service (12b-1) Fees | 0.50% | 1.00% | 1.00% | ||||
| Other Expenses 7 | 0.35% | 0.35% | 0.35% | ||||
| Total Fund Operating Expenses (after
current expense limitations) |
1.85% | 2.35% | 2.35% | ||||
1
|
The maximum sales charge is a percentage of the offering price. A CDSC of 1% is imposed on certain redemptions (within
18 months of purchase) of Class A Shares sold without an initial sales charge as part of an investment of $1 million or more.
|
2
|
The maximum CDSC is a percentage of the lesser of the NAV at the time of the redemption or the NAV when the shares were
originally purchased.
|
3
|
A CDSC is imposed upon Class B Shares redeemed within six years of purchase at a rate of 5% in the first year, declining
to 1% in the sixth year, and eliminated thereafter.
|
4
|
A CDSC of 1% is imposed on Class C Shares redeemed within 12 months of purchase.
|
5
|
A transaction fee of $7.50 may be charged for redemption proceeds paid by wire.
|
6
|
The Funds’ annual operating expenses are based on actual expenses.
|
7
|
“Other Expenses” include transfer agency fees equal to 0.19% of the average daily net assets of each Fund’
s Class A, B and C Shares, plus all other ordinary expenses not detailed above. The Investment Adviser has voluntarily agreed to reduce or limit certain “Other Expenses” (excluding management fees, distribution and service fees, transfer agency
fees, taxes, interest and brokerage fees and litigation, indemnification and other extraordinary expenses) to the following percentages of each Fund’s average daily net assets:
|
| Fund | Other
Expenses |
||
|---|---|---|---|
| CORE International Equity | 0.12% | ||
| International Equity | 0.10% | ||
| European Equity | 0.10% | ||
| Japanese Equity | 0.11% | ||
| International Growth
Opportunities |
0.16% | ||
| Emerging Markets Equity | 0.35% | ||
| Asia Growth | 0.16% | ||
| Fund | 1 Year | 3 Years | 5 Years | 10 Years | |||||
|---|---|---|---|---|---|---|---|---|---|
| CORE International Equity | |||||||||
| Class A Shares | $718 | $1,071 | $1,447 | $2,499 | |||||
| Class B Shares | |||||||||
| – Assuming complete redemption at end of period | $728 | $1,003 | $1,405 | $2,459 | |||||
| – Assuming no redemption | $228 | $ 703 | $1,205 | $2,459 | |||||
| Class C Shares | |||||||||
| – Assuming complete redemption at end of period | $328 | $ 703 | $1,205 | $2,585 | |||||
| – Assuming no redemption | $228 | $ 703 | $1,205 | $2,585 | |||||
| International Equity | |||||||||
| Class A Shares | $727 | $1,097 | $1,491 | $2,590 | |||||
| Class B Shares | |||||||||
| – Assuming complete redemption at end of period | $737 | $1,030 | $1,450 | $2,552 | |||||
| – Assuming no redemption | $237 | $ 730 | $1,250 | $2,552 | |||||
| Class C Shares | |||||||||
| – Assuming complete redemption at end of period | $337 | $ 730 | $1,250 | $2,676 | |||||
| – Assuming no redemption | $237 | $ 730 | $1,250 | $2,676 | |||||
| European Equity | |||||||||
| Class A Shares | $758 | $1,192 | $1,650 | $2,916 | |||||
| Class B Shares | |||||||||
| – Assuming complete redemption at end of period | $770 | $1,129 | $1,615 | $2,882 | |||||
| – Assuming no redemption | $270 | $ 829 | $1,415 | $2,882 | |||||
| Class C Shares | |||||||||
| – Assuming complete redemption at end of period | $370 | $ 829 | $1,415 | $3,003 | |||||
| – Assuming no redemption | $270 | $ 829 | $1,415 | $3,003 | |||||
| Fund | 1 Year | 3 Years | 5 Years | 10 Years | |||||
|---|---|---|---|---|---|---|---|---|---|
| Japanese Equity | |||||||||
| Class A Shares | $751 | $1,172 | $1,617 | $2,847 | |||||
| Class B Shares | |||||||||
| – Assuming complete redemption at end of period | $763 | $1,108 | $1,580 | $2,813 | |||||
| – Assuming no redemption | $263 | $ 808 | $1,380 | $2,813 | |||||
| Class C Shares | |||||||||
| – Assuming complete redemption at end of period | $363 | $ 808 | $1,380 | $2,934 | |||||
| – Assuming no redemption | $263 | $ 808 | $1,380 | $2,934 | |||||
| International Growth Opportunities | |||||||||
| Class A Shares | $763 | $1,206 | $1,674 | $2,964 | |||||
| Class B Shares | |||||||||
| – Assuming complete redemption at end of period | $775 | $1,144 | $1,640 | $2,931 | |||||
| – Assuming no redemption | $275 | $ 844 | $1,440 | $2,931 | |||||
| Class C Shares | |||||||||
| – Assuming complete redemption at end of period | $375 | $ 844 | $1,440 | $3,051 | |||||
| – Assuming no redemption | $275 | $ 844 | $1,440 | $3,051 | |||||
| Emerging Markets Equity | |||||||||
| Class A Shares | $770 | $1,229 | $1,713 | $3,041 | |||||
| Class B Shares | |||||||||
| – Assuming complete redemption at end of period | $783 | $1,168 | $1,679 | $3,009 | |||||
| – Assuming no redemption | $283 | $ 868 | $1,479 | $3,009 | |||||
| Class C Shares | |||||||||
| – Assuming complete redemption at end of period | $383 | $ 868 | $1,479 | $3,128 | |||||
| – Assuming no redemption | $283 | $ 868 | $1,479 | $3,128 | |||||
| Asia Growth | |||||||||
| Class A Shares | $770 | $1,229 | $1,713 | $3,041 | |||||
| Class B Shares | |||||||||
| – Assuming complete redemption at end of period | $783 | $1,168 | $1,679 | $3,009 | |||||
| – Assuming no redemption | $283 | $ 868 | $1,479 | $3,009 | |||||
| Class C Shares | |||||||||
| – Assuming complete redemption at end of period | $383 | $ 868 | $1,479 | $3,128 | |||||
| – Assuming no redemption | $283 | $ 868 | $1,479 | $3,128 | |||||
| INVESTMENT ADVISERS
|
| Investment Adviser | Fund | ||
|---|---|---|---|
| Goldman Sachs Asset Management (“GSAM”) | CORE International Equity | ||
| 32 Old Slip | |||
| New York, New York 10005 | |||
| Goldman Sachs Asset Management International (“GSAMI”) | International Equity | ||
| Procession House | European Equity | ||
| 55 Ludgate Hill | Japanese Equity | ||
| London, England EC4M 7JW | International Growth Opportunities | ||
| Emerging Markets Equity | |||
| Asia Growth | |||
| GSAM and GSAMI are separate business units of the Investment Management Division (“IMD”) of Goldman Sachs. Goldman Sachs
registered as an investment adviser in 1981. GSAMI, a member of the Investment Management Regulatory Organization Limited since 1990 and a registered investment adviser since 1991, is an affiliate of Goldman Sachs. As of September 30, 2000, GSAM and
GSAMI, along with other units of IMD, had assets under management of $281.3 billion.
|
| The Investment Adviser provides day-to-day advice regarding the Funds’ portfolio transactions. The Investment Adviser makes
the investment decisions for the Funds and places purchase and sale orders for the Funds’ portfolio transactions in U.S. and foreign markets. As permitted by applicable law, these orders may be directed to any brokers, including Goldman Sachs and its
affiliates. While the Investment Adviser is ultimately responsible for the management of the Funds, it is able to draw upon the research and expertise of its asset management affiliates for portfolio decisions and management with respect to certain
portfolio securities. In addition, the Investment Adviser has access to the research and certain proprietary technical models developed by Goldman Sachs, and will apply quantitative and qualitative analysis in determining the appropriate allocations among
categories of issuers and types of securities.
|
| The Investment Adviser also performs the following additional services for the Funds:
|
n
|
Supervises all non-advisory operations of the Funds
|
n
|
Provides personnel to perform necessary executive, administrative and clerical services to the Funds
|
n
|
Arranges for the preparation of all required tax returns, reports to shareholders, prospectuses and statements of additional
information and other reports filed with the Securities and Exchange Commission (the “SEC”) and other regulatory authorities
|
n
|
Maintains the records of each Fund
|
n
|
Provides office space and all necessary office equipment and services
|
| MANAGEMENT FEES
|
| As compensation for its services and its assumption of certain expenses, the Investment Adviser is entitled to the following fees,
computed daily and payable monthly, at the annual rates (as a percentage of each respective portfolio’s average daily net assets) listed below:
|
| Contractual Rate | Actual Rate
For the Fiscal Year Ended August 31, 2000 |
||||
|---|---|---|---|---|---|
| GSAM: | |||||
| CORE International Equity | 0.85% | 0.85% | |||
| GSAMI: | |||||
| International Equity | 1.00% | 1.00% | |||
| European Equity | 1.00% | 1.00% | |||
| Japanese Equity | 1.00% | 1.00% | |||
| International Growth Opportunities | 1.20% | 1.20% | |||
| Emerging Markets Equity | 1.20% | 1.20% | |||
| Asia Growth | 1.00% | 1.00% | |||
| The difference, if any, between the stated fees and the actual fees paid by the Funds reflects that the Investment Adviser did not
charge the full amount of the fees to which it would have been entitled. The Investment Adviser may discontinue or modify any such voluntary limitations in the future at its discretion.
|
| FUND MANAGERS
|
| M. Roch Hillenbrand, a Managing Director of Goldman Sachs since 1997, is the Head of Global Equities for GSAM, overseeing the
United States, Europe, Japan, and non-Japan Asia. In this capacity, he is responsible for managing the group as it defines and implements global portfolio management processes that are consistent, reliable and predictable. Mr. Hillenbrand joined Goldman
Sachs in 1997
upon its acquisition of Commodities Corporation, LLC where he was and continues as President. Over the course of his 20-year career at Commodities Corporation, Mr. Hillenbrand has had extensive experience in dealing with internal and external investment
managers who have managed a range of futures and equities strategies across multiple markets, using a variety of styles.
|
| International Equity Portfolio Management Team
|
n
|
Global portfolio teams based in London, Singapore, Tokyo and New York. Local presence is a key to the Investment Adviser’s
fundamental research capabilities
|
n
|
Team manages over $45.9 billion in international equities for retail, institutional and high net worth clients
|
n
|
Focus on bottom-up stock selection as main driver of returns, though the team leverages the asset allocation, currency and risk
management capabilities of GSAM
|
| Name and Title | Fund Responsibility | Years Primarily
Responsible |
Five Year Employment History | ||||
| |
|||||||
| David Dick
Executive Director |
Senior Portfolio Manager—
European Equity Fund |
Since
1998 |
Mr. Dick joined the Investment
Adviser as a senior portfolio manager on the European Equity team in 1998. From 1990 to 1998, he was with Mercury Asset Management, where he was a portfolio manager for European equity and was head of Mercury’s European sector strategy. |
||||
| |
|||||||
| Gary Greenberg
Vice President Co-Head of Emerging Markets Equity |
Senior Portfolio Manager—
Emerging Markets Equity Fund |
Since
1999 |
Mr. Greenberg joined the
Investment Adviser as a portfolio manager in 1999. From 1998 to 1999, he was a Managing Director and the lead international portfolio manager at Van Eck Global Asset Management. Prior to that, he was Chief Investment Officer for Peregrine Asset Management in Hong Kong from 1994 to 1998. |
||||
| |
|||||||
| Name and Title | Fund Responsibility | Years Primarily
Responsible |
Five Year Employment History | ||||
| |
|||||||
| James P. Hordern
Executive Director |
Senior Portfolio Manager—
International Growth Opportunities Fund |
Since
1998 |
Mr. Hordern joined the
Investment Adviser as a portfolio manager in 1997. From 1991 to 1997, he was an Assistant Director and portfolio manager at Mercury Asset Management on the European Specialist Team. |
||||
| |
|||||||
| Ralf Laier
Vice President |
Portfolio Manager—
Emerging Markets Equity Fund |
Since
1998 |
Mr. Laier joined the Investment
Adviser as a portfolio manager with a focus on Central/Eastern European (CEE) and the Commonwealth of Independent States (CIS) in 1997. Prior to joining the Investment Adviser, from 1995 to 1997, he was Vice President of Soros Global Research, where he analyzed investment opportunities in CEE/CIS. |
||||
| |
|||||||
| Susan Noble
Managing Director |
Senior Portfolio Manager—
European Equity Fund International Equity Fund |
Since
1998 1998 |
Ms. Noble joined the Investment
Adviser as a senior portfolio manager and head of the European Equity Team in October 1997. From 1986 to 1997, she worked at Fleming Investment Management in London, where she most recently was Portfolio Management Director for the European equity investment strategy and process. |
||||
| |
|||||||
| Andrew Orchard
Executive Director |
Senior Portfolio Manager—
European Equity Fund International Equity Fund |
Since
1999 1999 |
Mr. Orchard joined the
Investment Adviser as a portfolio manager in 1999. From 1994 to 1999 he was a portfolio manager at Morgan Grenfell Asset Management where he managed global equity portfolios and chaired Morgan Grenfell’s Global Sector Committee. |
||||
| |
|||||||
| Name and Title | Fund Responsibility | Years Primarily
Responsible |
Five Year Employment History | ||||
| |
|||||||
| Robert Stewart
Executive Director |
Senior Portfolio Manager—
European Equity Fund International Equity Fund |
Since
1999 1999 |
Mr. Stewart joined the
Investment Adviser as a portfolio manager in 1996. He is a member of the European Equity Team. From 1996 to 1998 he was a portfolio manager in Japan where he managed Japanese Equity Institutional Portfolios. Prior to that Mr. Stewart was a portfolio manager at CINMan from 1989 to 1996 where he managed international equities. |
||||
| |
|||||||
| Danny Truell
Managing Director |
Senior Portfolio Manager—
European Equity Fund International Equity |
Since
1998 2000 |
Mr. Truell joined the Investment
Adviser as a senior portfolio manager and head of UK equities in 1998. From 1992 to 1996, he was Investment Banking Executive Director for SBC Warburg and Chief Asian Equity Strategist. |
||||
| |
|||||||
| Gabriella Antici
Vice President Co-Head of Emerging Markets Equity |
Senior Portfolio Manager—
Emerging Markets Equity Fund |
Since
1998 |
Ms. Antici joined the Investment
Adviser as a portfolio manager in 1997. From 1994 to 1997, she was a Vice President for HSBC Asset Management, where she was a portfolio manager for emerging markets and head of the Latin American Department. |
||||
| |
|||||||
| Rory Bateman
Executive Director |
Portfolio Manager—
European Equity Fund |
Since
2000 |
Mr. Bateman joined the
Investment Adviser as an equity analyst in 1996. Prior to that he was an analyst at CINMan covering European equities. |
||||
| |
|||||||
| Name and Title | Fund Responsibility | Years Primarily
Responsible |
Five Year Employment History | ||||
| |
|||||||
| Melissa Brown
Managing Director |
Senior Portfolio Manager—
CORE International Equity Fund |
Since
1998 |
Ms. Brown joined the Investment
Adviser as a portfolio manager in 1998. From 1984 to 1998, she was the director of Quantitative Equity Research and served on the Investment Policy Committee at Prudential Securities. |
||||
| |
|||||||
| Mark M. Carhart
Managing Director |
Portfolio Manager—
CORE International Equity Fund |
Since
1998 |
Mr. Carhart joined the
Investment Adviser as a member of the Quantitative Research and Risk Management team in 1997. From August 1995 to September 1997, he was Assistant Professor of Finance at the Marshall School of Business at USC and a Senior Fellow of the Wharton Financial Institutions Center. |
||||
| |
|||||||
| Raymond J.
Iwanowski Managing Director |
Portfolio Manager—
CORE International Equity Fund |
Since
1998 |
Mr. Iwanowski joined the
Investment Adviser as an associate and portfolio manager in 1997. From 1993 to 1997, he was a Vice President and head of the Fixed Derivatives Client Research group at Salomon Brothers. |
||||
| |
|||||||
| Robert C. Jones
Managing Director |
Senior Portfolio Manager—
CORE International Equity Fund |
Since
1997 |
Mr. Jones joined the
Investment Adviser as a portfolio manager in 1989. |
||||
| |
|||||||
| Name and Title | Fund Responsibility | Years Primarily
Responsible |
Five Year Employment History | ||||
| |
|||||||
| Alice Lui
Vice President |
Portfolio Manager—
Asia Growth Fund Emerging Markets Equity Fund International Equity Fund International Growth Opportunities Fund |
Since
1994 1999 1999 1999 |
Ms. Lui joined the Investment
Adviser as a portfolio manager in 1990. |
||||
| |
|||||||
| Ravi Shanker
Vice President |
Senior Portfolio Manager—
Asia Growth Fund Emerging Markets Equity Fund International Equity Fund International Growth Opportunities Fund |
Since
1997 1998 1999 1999 |
Mr. Shanker joined the
Investment Adviser as an operations manager in 1997. From July 1996 to 1997, he worked for Goldman Sachs in Singapore as a strategic advisor for transactions involving infrastructure industries in Asia. From 1988 to 1996, he worked for Goldman Sachs as an investment banker in the Investment Banking Division. |
||||
| |
|||||||
| Siew-Hua Thio
Vice President |
Portfolio Manager—
Asia Growth Fund Emerging Markets Equity Fund International Equity Fund International Growth Opportunities Fund |
Since
1998 1998 1998 1998 |
Ms. Thio joined the Investment
Adviser as a portfolio manager in 1998. From 1997 to 1998, she was Head of Research for Indosuez WI Carr in Singapore. From 1993 to 1997, she was a research analyst at the same firm. |
||||
| |
|||||||
| Name and Title | Fund Responsibility | Years Primarily
Responsible |
Five Year Employment History | ||||
| Toshiyuki Ejima
Vice President |
Portfolio Manager—
Japanese Equity Fund |
Since
1999 |
Mr. Ejima joined the Investment
Adviser as a portfolio manager in April 1999. Prior to that he was a portfolio manager at Daiichi Mutual Life from 1993 to 1999 where he managed Japanese equities. |
||||
| Shigeka Kouda
Vice President |
Portfolio Manager—
International Growth Opportunities Fund |
Since
1998 |
Mr. Kouda joined the
Investment Adviser as a portfolio manager in 1997. From 1992 to 1997, he was at the Fixed Income Division of Goldman Sachs (Japan) Limited, where he was extensively involved in emerging markets trading as well as International Fixed Income institutional sales. |
||||
| Shogo Maeda
Managing Director |
Senior Portfolio Manager—
Japanese Equity Fund International Equity Fund International Growth Opportunities Fund |
Since
1994 1994 1998 |
Mr. Maeda joined the
Investment Adviser as a portfolio manager in 1994. |
||||
| Miyako Shibamoto
Vice President |
Portfolio Manager—
Japanese Equity Fund |
Since
1998 |
Ms. Shibamoto joined the
Investment Adviser as a member of the Japanese Equity team in March 1998. From 1993 to 1998, she was a Vice President at Scudder Stevens and Clark (Japan). |
||||
| Takeya Suzuki
Vice President |
Portfolio Manager—
Japanese Equity Fund |
Since
1998 |
Mr. Suzuki joined the
Investment Adviser as a portfolio manager in 1996. From 1990 to 1996, he was a Japanese equity portfolio manager at Nomura Investment Management where he actively managed assets for U.S. pension funds. |
||||
| DISTRIBUTOR AND TRANSFER AGENT
|
| Goldman Sachs, 85 Broad Street, New York, New York 10004, serves as the exclusive distributor (the “Distributor”) of
each Fund’s shares. Goldman Sachs, 4900 Sears Tower, Chicago, Illinois 60606-6372, also serves as the Funds’ transfer agent (the “Transfer Agent”) and, as such, performs various shareholder servicing functions.
|
| From time to time, Goldman Sachs or any of its affiliates may purchase and hold shares of the Funds. Goldman Sachs reserves the
right to redeem at any time some or all of the shares acquired for its own account.
|
| ACTIVITIES OF GOLDMAN SACHS AND ITS AFFILIATES AND OTHER ACCOUNTS MANAGED BY GOLDMAN SACHS
|
| The involvement of the Investment Adviser, Goldman Sachs and their affiliates in the management of, or their interest in, other
accounts and other activities of Goldman Sachs may present conflicts of interest with respect to a Fund or limit a Fund’s investment activities. Goldman Sachs and its affiliates engage in proprietary trading and advise accounts and funds which have
investment objectives similar to those of the Funds and/or which engage in and compete for transactions in the same types of securities, currencies and instruments as the Funds. Goldman Sachs and its affiliates will not have any obligation to make
available any information regarding their proprietary activities or strategies, or the activities or strategies used for other accounts managed by them, for the benefit of the management of the Funds. The results of a Fund’s investment activities,
therefore, may differ from those of Goldman Sachs and its affiliates, and it is possible that a Fund could sustain losses during periods in which Goldman Sachs and its affiliates and other accounts achieve significant profits on their trading for
proprietary or other accounts. In addition, the Funds may, from time to time, enter into transactions in which other clients of Goldman Sachs have an adverse interest. A Fund’s activities may be limited because of regulatory restrictions applicable
to Goldman Sachs and its affiliates, and/or their internal policies designed to comply with such restrictions.
|
| Each Fund pays dividends from its investment company taxable income and distributions from net realized capital gains. You may
choose to have dividends and distributions paid in:
|
n
|
Cash
|
n
|
Additional shares of the same class of the same Fund
|
n
|
Shares of the same or an equivalent class of another Goldman Sachs Fund. Special restrictions may apply for certain ILA
Portfolios. See the Additional Statement.
|
| You may indicate your election on your Account Application. Any changes may be submitted in writing to Goldman Sachs at any time
before the record date for a particular dividend or distribution. If you do not indicate any choice, dividends and distributions will be reinvested automatically in the applicable Fund.
|
| The election to reinvest dividends and distributions in additional shares will not affect the tax treatment of such dividends and
distributions, which will be treated as received by you and then used to purchase the shares.
|
| The Funds’ investments in foreign securities may be subject to foreign withholding taxes. Under certain circumstances, the
Funds may elect to pass-through these taxes to you. If this election is made, a proportionate amount of such taxes will constitute a distribution to you, which would allow you either (1) to credit such proportionate amount of foreign taxes against your
U.S. federal income tax liability or (2) to take such amount as an itemized deduction.
|
| Dividends from investment company taxable income and distributions from net capital gains are declared and paid annually.
|
| From time to time a portion of a Fund’s dividends may constitute a return of capital.
|
| At the time of an investor’s purchase of shares of a Fund, a portion of the NAV per share may be represented by undistributed
income or undistributed realized appreciation of the Fund’s portfolio securities. Therefore, subsequent distributions on such shares from such income or realized appreciation may be taxable to you even if the NAV of the shares is, as a result of the
distributions, reduced below the cost of such shares and the distributions (or portions thereof) represent a return of a portion of the purchase price.
|
| The following section will provide you with answers to some of the most often asked questions regarding buying and selling the
Funds’ shares.
|
| How Can I Purchase Class A, Class B And Class C Shares Of The Funds?
|
| You may purchase shares of the Funds through:
|
n
|
Goldman Sachs;
|
n
|
Authorized Dealers; or
|
n
|
Directly from Goldman Sachs Trust (the “Trust”).
|
| In order to make an initial investment in a Fund, you must furnish to the Fund, Goldman Sachs or your Authorized Dealer the
information in the Account Application attached to this Prospectus.
|
| To Open an Account:
|
n
|
Complete the enclosed Account Application
|
n
|
Mail your payment and Account Application to:
|
| Your Authorized Dealer
|
–
|
Purchases by check or Federal Reserve draft should be made payable to your Authorized Dealer
|
–
|
Your Authorized Dealer is responsible for forwarding payment promptly (within three business days) to the Fund
|
| or
|
| Goldman Sachs Funds c/o National Financial Data Services, Inc. (“NFDS”), P.O. Box 219711, Kansas
City, MO 64121-9711
|
–
|
Purchases by check or Federal Reserve draft should be made payable to Goldman Sachs Funds – (Name of Fund and
Class of Shares)
|
–
|
NFDS will not accept a check drawn on a foreign bank, a third-party check, cash, money orders, travelers cheques or credit card
checks
|
–
|
Federal funds wire, Automated Clearing House Network (“ACH”) transfer or bank wires should be sent to State Street Bank
and Trust Company (“State Street”) (each Fund’s custodian). Please call the Funds at 1-800-526-7384 to get detailed instructions on how to wire your money.
|
| What Is My Minimum Investment In The Funds?
|
| Initial | Additional | ||||
|---|---|---|---|---|---|
| Regular Accounts | $1,000 | $50 | |||
| Tax-Sheltered Retirement Plans (excluding SIMPLE IRAs and
Education IRAs) |
$250 | $50 | |||
| Uniform Gift to Minors Act Accounts/Uniform Transfer to
Minors Act Accounts |
$250 | $50 | |||
| 403(b) Plan Accounts | $200 | $50 | |||
| SIMPLE IRAs and Education IRAs | $50 | $50 | |||
| Automatic Investment Plan Accounts | $50 | $50 | |||
| What Alternative Sales Arrangements Are Available?
|
| The Funds offer three classes of shares through this Prospectus.
|
| Maximum Amount You Can
Buy In The Aggregate Across Funds |
Class A | No limit | |||
| Class B | $250,000 | ||||
| Class C | $1,000,000 | ||||
| Initial Sales Charge | Class A | Applies to purchases of less than $1 million—
varies by size of investment with a maximum of 5.5% |
|||
| Class B | None | ||||
| Class C | None | ||||
| CDSC | Class A | 1.00% on certain investments of $1 million or
more if you sell within 18 months |
|||
| Class B | 6 year declining CDSC with a maximum of 5% | ||||
| Class C | 1% if shares are redeemed within 12 months
of purchase |
||||
| Conversion Feature | Class A | None | |||
| Class B | Class B Shares convert to Class A Shares after
8 years |
||||
| Class C | None | ||||
| What Else Should I Know About Share Purchases?
|
| The Trust reserves the right to:
|
n
|
Refuse to open an account if you fail to (i) provide a social security number or other taxpayer identification number; or (ii)
certify that such number is correct (if required to do so under applicable law).
|
n
|
Reject or restrict any purchase or exchange order by a particular purchaser (or group of related purchasers). This may occur, for
example, when a pattern of
frequent purchases, sales or exchanges of shares of a Fund is evident, or if purchases, sales or exchanges are, or a subsequent abrupt redemption might be, of a size that would disrupt management of a Fund.
|
n
|
Close a Fund to new investors from time to time and reopen a
Fund whenever it is deemed appropriate by a Fund’s Investment Adviser.
|
n
|
Modify or waive the minimum investment amounts.
|
n
|
Modify the manner in which shares are offered.
|
n
|
Modify the sales charge rates applicable to future purchases of shares.
|
| The Funds may allow you to purchase shares with securities instead of cash if consistent with a Fund’s investment policies
and operations and if approved by the Fund’s Investment Adviser.
|
| How Are Shares Priced?
|
| The price you pay or receive when you buy, sell or exchange shares is determined by a Fund’s NAV and share class. Each class
calculates its NAV as follows:
|
| |
(Value of Assets of the Class)
|
|
| NAV =
|
– (Liabilities of the Class)
|
|
| |
Number of Outstanding Shares of the Class
|
|
| The Funds’ investments are valued based on market quotations or if accurate quotations are not readily available, the fair
value of the Fund’s investments may be determined in good faith under procedures established by the Trustees.
|
n
|
NAV per share of each share class is calculated by the Fund’s custodian on each business day as of the close of regular
trading on the New York Stock Exchange (normally 4:00 p.m. New York time). Fund shares will not be priced on any day the New York Stock Exchange is closed.
|
n
|
When you buy shares, you pay the NAV next calculated after the Funds receive your order in proper form, plus any applicable
sales charge.
|
n
|
When you sell shares, you receive the NAV next calculated after the Funds receive your order in proper form, less any
applicable CDSC.
|
| Note: The time at which transactions and shares are priced and the time by which orders must be received may be changed in
case of an emergency or if regular trading on the New York Stock Exchange is stopped at a time other than 4:00 p.m. New York time.
|
| Foreign securities may trade in their local markets on days a Fund is closed. As a result, the NAV of a Fund that holds foreign
securities may be impacted on days when investors may not purchase or redeem Fund shares.
|
| In addition, the impact of events that occur after the publication of market quotations used by a Fund to price its securities but
before the close of regular trading
on the New York Stock Exchange will normally not be reflected in a Fund’s next determined NAV unless the Trust, in its discretion, makes an adjustment in light of the nature and materiality of the event, its effect on Fund operations and other
relevant factors.
|
| COMMON QUESTIONS ABOUT THE PURCHASE OF CLASS A SHARES
|
| What Is The Offering Price Of Class A Shares?
|
| The offering price of Class A Shares of each Fund is the next determined NAV per share plus an initial sales charge paid to
Goldman Sachs at the time of purchase of shares. The sales charge varies depending upon the amount you purchase. In some cases, described below, the initial sales charge may be eliminated altogether, and the offering price will be the NAV per share. The current sales charges and commissions paid
to Authorized Dealers are as follows:
|
| Amount of Purchase
(including sales charge, if any) |
Sales Charge as
Percentage of Offering Price |
Sales Charge
as Percentage of Net Amount Invested |
Maximum Dealer
Allowance as Percentage of Offering Price* |
|||||||
|---|---|---|---|---|---|---|---|---|---|---|
| Less than $50,000 | 5.50 | % | 5.82 | % | 5.00 | % | ||||
| $50,000 up to (but less than) $100,000 | 4.75 | 4.99 | 4.00 | |||||||
| $100,000 up to (but less than) $250,000 | 3.75 | 3.90 | 3.00 | |||||||
| $250,000 up to (but less than) $500,000 | 2.75 | 2.83 | 2.25 | |||||||
| $500,000 up to (but less than) $1 million | 2.00 | 2.04 | 1.75 | |||||||
| $1 million or more | 0.00 | ** | 0.00 | ** | *** | |||||
*
|
Dealer’s allowance may be changed periodically. During special promotions, the entire sales charge may be allowed
to Authorized Dealers. Authorized Dealers to whom substantially the entire sales charge is allowed may be deemed to be “underwriters” under the Securities Act of 1933.
|
**
|
No sales charge is payable at the time of purchase of Class A Shares of $1 million or more, but a CDSC of 1% may be
imposed in the event of certain redemptions within 18 months of purchase.
|
***
|
The Distributor may pay a one-time commission to Authorized Dealers who initiate or are responsible for purchases of $1
million or more of shares of the Funds equal to 1.00% of the amount under $3 million, 0.50% of the next $2 million, and 0.25% thereafter. The Distributor may also pay, with respect to all or a portion of the amount purchased, a commission in accordance
with the foregoing schedule to Authorized Dealers who initiate or are responsible for purchases of $500,000 or more by certain Section 401(k), profit sharing, money purchase pension, tax-sheltered annuity, defined benefit pension, or other employee
benefit plans that are sponsored by one or more employers (including governmental or church employers) or employee organizations investing in the Funds which satisfy the criteria set forth below in “When Are Class A Shares Not Subject To A Sales
Load?” or $1 million or more by certain “wrap” accounts. Purchases by such plans will be made at NAV with no initial sales charge, but if all of the shares held are redeemed within 18 months after the end of the calendar month in which such
purchase was made, a CDSC of 1% may be imposed upon the plan sponsor or the third party administrator. In addition, Authorized Dealers will remit to the Distributor such payments received in connection with “wrap” accounts in the event that
shares are redeemed within 18 months after the end of the calendar month in which the purchase was made.
|
| What Else Do I Need To Know About Class A Shares’ CDSC?
|
| Purchases of $1 million or more of Class A Shares will be made at NAV with no initial sales charge. However, if you redeem shares
within 18 months after the end of the calendar month in which the purchase was made, excluding any period of time in which the shares were exchanged into and remained invested in an equivalent class of an ILA Portfolio, a CDSC of 1% may be imposed. The
CDSC may not be imposed if your Authorized Dealer enters into an agreement with the Distributor to return all or an applicable prorated portion of its commission to the Distributor. The CDSC is waived on redemptions in certain circumstances. See “In
What Situations May The CDSC On Class A, B Or C Shares Be Waived Or Reduced?” below.
|
| When Are Class A Shares Not Subject To A Sales Load?
|
| Class A Shares of the Funds may be sold at NAV without payment of any sales charge to the following individuals and entities:
|
n
|
Goldman Sachs, its affiliates or their respective officers, partners, directors or employees (including retired employees and
former partners), any partnership of which Goldman Sachs is a general partner, any Trustee or officer of the Trust and designated family members of any of these individuals;
|
n
|
Qualified retirement plans of Goldman Sachs;
|
n
|
Trustees or directors of investment companies for which Goldman Sachs or an affiliate acts as sponsor;
|
n
|
Any employee or registered representative of any Authorized Dealer or their respective spouses, children and parents;
|
n
|
Banks, trust companies or other types of depository institutions investing for their own account or investing for discretionary or
non-discretionary accounts;
|
n
|
Any state, county or city, or any instrumentality, department, authority or agency thereof, which is prohibited by applicable
investment laws from paying a sales charge or commission in connection with the purchase of shares of a Fund;
|
n
|
Section 401(k), profit sharing, money purchase pension, tax-sheltered annuity, defined benefit pension, or other employee benefit
plans that are sponsored by one or more employers (including governmental or church employers) or employee organizations (“Retirement Plans”) that:
|
n
|
Buy shares of Goldman Sachs Funds worth $500,000 or more; or
|
n
|
Have 100 or more eligible employees at the time of purchase; or
|
n
|
Certify that they expect to have annual plan purchases of shares of Goldman Sachs Funds of $200,000 or more; or
|
n
|
Are provided administrative services by certain third-party administrators that have entered into a special service arrangement
with Goldman Sachs relating to such plans; or
|
n
|
Have at the time of purchase aggregate assets of at least $2,000,000;
|
n
|
“Wrap” accounts for the benefit of clients of broker-dealers, financial institutions or financial planners, provided
they have entered into an agreement with GSAM specifying aggregate minimums and certain operating policies and standards;
|
n
|
Registered investment advisers investing for accounts for which they receive asset-based fees;
|
n
|
Accounts over which GSAM or its advisory affiliates have investment discretion;
|
n
|
Shareholders receiving distributions from a qualified retirement plan invested in the Goldman Sachs Funds and reinvesting such
proceeds in a Goldman Sachs IRA;
|
n
|
Shareholders who roll over distributions from any tax-qualified retirement plan or tax-sheltered annuity to an IRA which invests
in the Goldman Sachs Funds if the tax-qualified retirement plan or tax-sheltered annuity receives administrative services provided by certain third-party administrators that have entered into a special service arrangement with Goldman Sachs relating to
such plan or annuity; or
|
n
|
Other exemptions may be stated from time to time in the Additional Statement.
|
| You must certify eligibility for any of the above exemptions on your Account Application and notify the Fund if you no longer
are eligible for the exemption. The Fund will grant you an exemption subject to confirmation of your entitlement. You may be charged a fee if you effect your transactions through a broker or agent.
|
| How Can The Sales Charge On Class A Shares Be Reduced?
|
n
|
Right of Accumulation: When buying Class A Shares in Goldman Sachs Funds, your current aggregate
investment determines the initial sales load you pay. You may qualify for reduced sales charges when the current market value of holdings (shares at current offering price), plus new purchases, reaches $50,000 or more. Class A Shares of any of the Goldman
Sachs Funds may be combined under the Right of Accumulation. To qualify for a reduced sales load, you or your Authorized Dealer must notify the Funds’ Transfer Agent at the time of investment that a quantity discount is applicable. Use of this
service is subject to a check of appropriate records. The Additional Statement has more information about the Right of Accumulation.
|
n
|
Statement of Intention: You may obtain a reduced sales charge by means of a written Statement of
Intention which expresses your non-binding commitment to invest in the aggregate $50,000 or more (not counting reinvestments of dividends and distributions) within a period of 13 months in Class A Shares of one or more Goldman Sachs Fund. Any investments
you make during the period
will receive the discounted sales load based on the full amount of your investment commitment. If the investment commitment of the Statement of Intention is not met prior to the expiration of the 13-month period, the entire amount will be subject to the
higher applicable sales charge. By signing the Statement of Intention, you authorize the Transfer Agent to escrow and redeem Class A Shares in your account to pay this additional charge. The Additional Statement has more information about the Statement of
Intention, which you should read carefully.
|
| COMMON QUESTIONS ABOUT THE PURCHASE OF CLASS B SHARES
|
| What Is The Offering Price Of Class B Shares?
|
| You may purchase Class B Shares of the Funds at the next determined NAV without an initial sales charge. However, Class B
Shares redeemed within six years of purchase will be subject to a CDSC at the rates shown in the table below based on how long you held your shares.
|
| The CDSC schedule is as follows:
|
| Year Since Purchase | CDSC as a
Percentage of Dollar Amount Subject to CDSC |
||
|---|---|---|---|
| First | 5% | ||
| Second | 4% | ||
| Third | 3% | ||
| Fourth | 3% | ||
| Fifth | 2% | ||
| Sixth | 1% | ||
| Seventh and thereafter | None | ||
| Proceeds from the CDSC are payable to the Distributor and may be used in whole or in part to defray the Distributor’s
expenses related to providing distribution-related services to the Funds in connection with the sale of Class B Shares, including the payment of compensation to Authorized Dealers. A commission equal to 4% of the amount invested is paid to Authorized
Dealers.
|
| What Should I Know About The Automatic Conversion Of Class B Shares?
|
| Class B Shares of a Fund will automatically convert into Class A Shares of the same Fund at the end of the calendar quarter that
is eight years after the purchase date.
|
| If you acquire Class B Shares of a Fund by exchange from Class B Shares of another Goldman Sachs Fund, your Class B Shares will
convert into Class A Shares of such Fund based on the date of the initial purchase and the CDSC schedule of that purchase.
|
| If you acquire Class B Shares through reinvestment of distributions, your Class B Shares will convert into Class A Shares based on
the date of the initial purchase of the shares on which the distribution was paid.
|
| The conversion of Class B Shares to Class A Shares will not occur at any time the Funds are advised that such conversions may
constitute taxable events for federal tax purposes, which the Funds believe is unlikely. If conversions do not occur as a result of possible taxability, Class B Shares would continue to be subject to higher expenses than Class A Shares for an
indeterminate period.
|
| A COMMON QUESTION ABOUT THE PURCHASE OF CLASS C SHARES
|
| What Is The Offering Price Of Class C Shares?
|
| You may purchase Class C Shares of the Funds at the next determined NAV without paying an initial sales charge. However, if you
redeem Class C Shares within 12 months of purchase, a CDSC of 1% will normally be deducted from the redemption proceeds; provided that in connection with purchases by Retirement Plans, where all of the Class C Shares are redeemed within 12 months of
purchase, a CDSC of 1% may be imposed upon the plan sponsor or third-party administrator.
|
| Proceeds from the CDSC are payable to the Distributor and may be used in whole or in part to defray the Distributor’s
expenses related to providing distribution-related services to the Funds in connection with the sale of Class C Shares, including the payment of compensation to Authorized Dealers. An amount equal to 1% of the amount invested is normally paid by the
Distributor to Authorized Dealers.
|
| COMMON QUESTIONS APPLICABLE TO THE PURCHASE OF CLASS A, B AND C SHARES
|
| What Else Do I Need To Know About The CDSC On Class A, B Or C Shares?
|
n
|
The CDSC is based on the lesser of the NAV of the shares at the time of redemption or the original offering price (which is the
original NAV).
|
n
|
No CDSC is charged on shares acquired from reinvested dividends or capital gains distributions.
|
n
|
No CDSC is charged on the per share appreciation of your account over the initial purchase price.
|
n
|
When counting the number of months since a purchase of Class B or Class C Shares was made, all payments made during a month will
be combined and considered to have been made on the first day of that month.
|
n
|
To keep your CDSC as low as possible, each time you place a request to sell shares, the Funds will first sell any shares in your
account that do not carry a CDSC and then the shares in your account that have been held the longest.
|
| In What Situations May The CDSC On Class A, B Or C Shares Be Waived Or Reduced?
|
| The CDSC on Class A, Class B and Class C Shares that are subject to a CDSC may be waived or reduced if the redemption relates to:
|
n
|
Retirement distributions or loans to participants or beneficiaries from Retirement Plans;
|
n
|
The death or disability (as defined in Section 72(m)(7) of the Internal Revenue Code of 1986, as amended (the “Code”))
of a participant or beneficiary in a Retirement Plan;
|
n
|
Hardship withdrawals by a participant or beneficiary in a Retirement Plan;
|
n
|
Satisfying the minimum distribution requirements of the Code;
|
n
|
Establishing “substantially equal periodic payments” as described under Section 72(t)(2) of the Code;
|
n
|
The separation from service by a participant or beneficiary in a Retirement Plan;
|
n
|
The death or disability (as defined in Section 72(m)(7) of the Code) of a shareholder if the redemption is made within one year of
the event;
|
n
|
Excess contributions distributed from a Retirement Plan;
|
n
|
Distributions from a qualified Retirement Plan invested in the Goldman Sachs Funds which are being rolled over to a Goldman Sachs
IRA; or
|
n
|
Redemption proceeds which are to be reinvested in accounts or non-registered products over which GSAM or its advisory affiliates
have investment discretion.
|
| In addition, Class A, B and C Shares subject to a systematic withdrawal plan may be redeemed without a CDSC. The Funds reserve the
right to limit such redemptions, on an annual basis, to 12% each of the value of your Class B and C Shares and 10% of the value of your Class A Shares.
|
| How Do I Decide Whether To Buy Class A, B Or C Shares?
|
| The decision as to which Class to purchase depends on the amount you invest, the intended length of the investment and your
personal situation.
|
n
|
Class A Shares. If you are making an investment of $50,000 or more that qualifies for a reduced sales
charge, you should consider purchasing Class A Shares.
|
n
|
Class B Shares. If you plan to hold your investment for at least six years and would prefer not to pay
an initial sales charge, you might consider purchasing Class B Shares. By not paying a front-end sales charge, your entire investment in Class B Shares is available to work for you from the time you make your initial investment. However, the distribution
and service fee paid by Class B Shares will cause your Class B Shares (until conversion to Class A Shares) to have a higher expense ratio, and thus lower performance and lower dividend payments (to the extent dividends are paid) than Class A Shares. A
maximum purchase limitation of $250,000 in the aggregate normally applies to Class B Shares. Individual purchases exceeding $250,000 will be rejected.
|
n
|
Class C Shares. If you are unsure of the length of your investment or plan to hold your investment for
less than six years and would prefer not to pay an initial sales charge, you may prefer Class C Shares. By not paying a front-end sales charge, your entire investment in Class C Shares is available to work for you from the time you make your initial
investment. However, the distribution and service fee paid by Class C Shares will cause your Class C Shares to have a higher expense ratio, and thus lower performance and lower dividend payments (to the extent dividends are paid) than Class A Shares (or
Class B Shares after conversion to Class A Shares).
|
| Although Class C Shares are subject to a CDSC for only 12 months, Class C Shares do not have the automatic eight year conversion
feature applicable to Class B Shares and your investment may pay higher distribution fees indefinitely.
|
| A maximum purchase limitation of $1,000,000 in the aggregate normally applies to purchases of Class C Shares. Individual purchases
exceeding $1,000,000 will be rejected.
|
| Note: Authorized Dealers may receive different compensation for selling Class A, Class B or Class C Shares.
|
| In addition to Class A, Class B and Class C Shares, each Fund also offers other classes of shares to investors. These other share
classes are subject to different fees and expenses (which affect performance), have different minimum investment requirements and are entitled to different services. Information regarding these other share classes may be obtained from your sales
representative or from Goldman Sachs by calling the number on the back cover of this Prospectus.
|
| How Can I Sell Class A, Class B And Class C Shares Of The Funds?
|
| You may arrange to take money out of your account by selling (redeeming) some or all of your shares. Each Fund will redeem its
shares upon request on any business day at the NAV next determined after receipt of such request in proper form, subject to any applicable CDSC. You may request that redemption proceeds be sent to you by check or by wire (if the wire instructions are on record). Redemptions may be requested in writing or by telephone.
|
| Instructions For Redemptions: | |||
|---|---|---|---|
| By Writing: | n Write a letter of instruction that includes: | ||
| n Your name(s) and signature(s) | |||
| n Your account number | |||
| n The Fund name and Class of Shares | |||
| n The dollar amount you want to sell | |||
| n How and where to send the proceeds | |||
| n Obtain a signature guarantee (see details below) | |||
| n
Mail your request to:
Goldman Sachs Funds c/o NFDS P.O. Box 219711 Kansas City, MO 64121-9711 |
|||
| By Telephone: | If you have not declined the telephone redemption
privilege on your Account Application: |
||
| n
1-800-526-7384
(8:00 a.m. to 4:00 p.m. New York time) |
|||
| n
You may redeem up to $50,000 of your shares
within any 7 calendar day period |
|||
| n
Proceeds which are sent directly to a Goldman
Sachs brokerage account are not subject to the $50,000 limit |
|||
| When Do I Need A Signature Guarantee To Redeem Shares?
|
| A signature guarantee is required if:
|
n
|
You are requesting in writing to redeem shares in an amount over $50,000;
|
n
|
You would like the redemption proceeds sent to an address that is not your address of record; or
|
n
|
You would like to change the bank designated on your Account Application.
|
| A signature guarantee must be obtained from a bank, brokerage firm or other financial intermediary that is a member of an approved
Medallion Guarantee Program or that is otherwise approved by Goldman Sachs. A notary public cannot provide a signature guarantee. Additional documentation may be required for executors, trustees or corporations or when deemed appropriate by the Transfer
Agent.
|
| What Do I Need To Know About Telephone Redemption Requests?
|
| The Trust, the Distributor and the Transfer Agent will not be liable for any loss you may incur in the event that the Trust
accepts unauthorized telephone redemption requests that the Trust reasonably believes to be genuine. The Trust may accept telephone redemption instructions from any person identifying himself or herself as the owner of an account or the owner’s
registered representative where the owner has not declined in writing to use this service. Thus, you risk possible losses if a telephone redemption is not authorized by you.
|
| In an effort to prevent unauthorized or fraudulent redemption and exchange requests by telephone, Goldman Sachs and NFDS each
employ reasonable procedures specified by the Trust to confirm that such instructions are genuine. If reasonable procedures are not employed, the Trust may be liable for any loss due to unauthorized or fraudulent transactions. The following general
policies are currently in effect:
|
n
|
All telephone requests are recorded.
|
n
|
Proceeds of telephone redemption requests will be sent only to your address of record or authorized bank account designated in the
Account Application (unless you provide written instructions and a signature guarantee, indicating another address or account) and exchanges of shares normally will be made only to an identically registered account.
|
n
|
Telephone redemptions will not be accepted during the 30-day period following any change in your address of record.
|
n
|
The telephone redemption option does not apply to shares held in a “street name” account. “Street name”
accounts are accounts maintained and serviced by your Authorized Dealer. If your account is held in “street name,” you should contact your registered representative of record, who may make telephone redemptions on your behalf.
|
n
|
The telephone redemption option may be modified or terminated at any time.
|
| Note: It may be difficult to make telephone redemptions in times of drastic economic or market conditions.
|
| How Are Redemption Proceeds Paid?
|
| By Wire: You may arrange for your redemption proceeds to be wired as federal funds to the bank account designated in
your Account Application. The following general policies govern wiring redemption proceeds:
|
n
|
Redemption proceeds will normally be wired on the next business day in federal funds (for a total of one business day delay), but
may be paid up to three business days following receipt of a properly executed wire transfer redemption request. If you are selling shares you recently paid for by check, the Fund will pay you when your check has cleared, which may take up to 15 days. If th
e
Federal Reserve Bank is closed on the day that the redemption proceeds would ordinarily be wired, wiring the redemption proceeds may be delayed one additional business day.
|
n
|
A transaction fee of $7.50 may be charged for payments of redemption proceeds by wire. Your bank may also charge wiring fees. You
should contact your bank directly to learn whether it charges such fees.
|
n
|
To change the bank designated on your Account Application, you must send written instructions (with your signature guaranteed) to
the Transfer Agent.
|
n
|
Neither the Trust, Goldman Sachs nor any Authorized Dealer assumes any responsibility for the performance of your bank or any
intermediaries in the transfer process. If a problem with such performance arises, you should deal directly with your bank or any such intermediaries.
|
| By Check: You may elect to receive your redemption proceeds by check. Redemption proceeds paid by check will
normally be mailed to the address of record within three business days of a properly executed redemption request. If you are selling shares you recently paid for by check, the Fund will pay you when your check has cleared, which may take up to 15 days.
|
| What Else Do I Need To Know About Redemptions?
|
| The following generally applies to redemption requests:
|
n
|
Additional documentation may be required when deemed appropriate by the Transfer Agent. A redemption request will not be in proper
form until such additional documentation has been received.
|
| The Trust reserves the right to:
|
n
|
Redeem your shares if your account balance is less than $50 as a result of a redemption. The Funds will not redeem your shares on
this basis if the value of your account falls below the minimum account balance solely as a result of market conditions. The Funds will give you 60 days’ prior written notice to allow you to purchase sufficient additional shares of the Fund in order
to avoid such redemption.
|
n
|
Redeem your shares in other circumstances determined by the Board of Trustees to be in the best interests of the Trust.
|
n
|
Pay redemptions by a distribution in-kind of securities (instead of cash). If you receive redemption proceeds in-kind, you should
expect to incur transaction costs upon the disposition of those securities.
|
n
|
Reinvest any dividends or other distributions which you have elected to receive in cash should your check for such dividends or
other distributions be returned to the Fund as undeliverable or remain uncashed for six months. In addition, that distribution and all future distributions payable to you will be reinvested at NAV in additional shares of the same class of the Fund on
which the distribu
tions are paid. No interest will accrue on amounts represented by uncashed distribution or redemption checks.
|
| Can I Reinvest Redemption Proceeds In The Same Or Another Goldman Sachs Fund?
|
| You may redeem shares of a Fund and reinvest a portion or all of the redemption proceeds (plus any additional amounts needed to
round off purchases to the nearest full share) at NAV. To be eligible for this privilege, you must hold the shares you want to redeem for at least 30 days and you must reinvest the share proceeds within 90 days after you redeem. You may reinvest as follows:
|
n
|
Class A or B Shares—Class A Shares of the same Fund or any other Goldman Sachs Fund
|
n
|
Class C Shares—Class C Shares of the same Fund or any other Goldman Sachs Fund
|
n
|
You should obtain and read the applicable prospectuses before investing in any other Funds.
|
n
|
If you pay a CDSC upon redemption of Class A or Class C Shares and then reinvest in Class A or Class C Shares as described above,
your account will be credited with the amount of the CDSC you paid. The reinvested shares will, however, continue to be subject to a CDSC. The holding period of the shares acquired through reinvestment will include the holding period of the redeemed
shares for purposes of computing the CDSC payable upon a subsequent redemption. For Class B Shares, you may reinvest the redemption proceeds in Class A Shares at NAV but the amount of the CDSC paid upon redemption of the Class B Shares will not be
credited to your account.
|
n
|
The reinvestment privilege may be exercised at any time in connection with transactions in which the proceeds are reinvested at
NAV in a tax-sheltered retirement plan. In other cases, the reinvestment privilege may be exercised once per year upon receipt of a written request.
|
n
|
You may be subject to tax as a result of a redemption. You should consult your tax adviser concerning the tax consequences of a
redemption and reinvestment.
|
| Can I Exchange My Investment From One Fund To Another?
|
| You may exchange shares of a Fund at NAV without the imposition of an initial sales charge or CDSC at the time of exchange for
shares of the same class or an equivalent class of any other Goldman Sachs Fund. The exchange privilege may be materially modified or withdrawn at any time upon 60 days’ written notice to you.
|
| Instructions For Exchanging Shares: | |||
|---|---|---|---|
| By Writing: | n Write a letter of instruction that includes: | ||
| n Your name(s) and signature(s) | |||
| n Your account number | |||
| n The Fund names and Class of Shares | |||
| n The dollar amount you want to exchange | |||
| n Obtain a signature guarantee (see details above) | |||
| n Mail the request to: | |||
| Goldman Sachs Funds | |||
| c/o NFDS | |||
| P.O. Box 219711 | |||
| Kansas City, MO 64121-9711 | |||
| or for overnight delivery - | |||
| Goldman Sachs Funds | |||
| c/o NFDS | |||
| 330 West 9th St. | |||
| Poindexter Bldg., 1st Floor | |||
| Kansas City, MO 64105 | |||
| By Telephone: | If you have not declined the telephone exchange
privilege on your Account Application: |
||
| n
1-800-526-7384 (8:00 a.m. to 4:00 p.m.
New York time) |
|||
| You should keep in mind the following factors when making or considering an exchange:
|
n
|
You should obtain and carefully read the prospectus of the Fund you are acquiring before making an exchange.
|
n
|
Currently, there is no charge for exchanges, although the Funds may impose a charge in the future.
|
n
|
The exchanged shares may later be exchanged for shares of the same class (or an equivalent class) of the original Fund at the next
determined NAV without the imposition of an initial sales charge or CDSC if the amount in the Fund resulting from such exchanges is less than the largest amount on which you have previously paid the applicable sales charge.
|
n
|
When you exchange shares subject to a CDSC, no CDSC will be charged at that time. The exchanged shares will be subject to the CDSC
of the shares originally held. For purposes of determining the amount of the applicable CDSC, the length of time you have owned the shares will be measured from the date you acquired the original shares subject to a CDSC and will not be affected by a
subsequent exchange.
|
n
|
Eligible investors may exchange certain classes of shares for another class of shares of the same Fund. For further information,
call Goldman Sachs Funds at 1-800-526-7384 and see the Additional Statement.
|
n
|
All exchanges which represent an initial investment in a Fund must satisfy the minimum initial investment requirements of that Fund.
|
n
|
Exchanges are available only in states where exchanges may be legally made.
|
n
|
It may be difficult to make telephone exchanges in times of drastic economic or market conditions.
|
n
|
Goldman Sachs and NFDS may use reasonable procedures described under “What Do I Need to Know About Telephone Redemption
Requests?” in an effort to prevent unauthorized or fraudulent telephone exchange requests.
|
n
|
Telephone exchanges normally will be made only to an identically registered account. Shares may be exchanged among accounts with
different names, addresses and social security or other taxpayer identification numbers only if the exchange instructions are in writing and accompanied by a signature guarantee.
|
n
|
Exchanges into Funds that are closed to new investors may be restricted.
|
| For federal income tax purposes, an exchange from one Fund to another is treated as a redemption of the shares surrendered in the
exchange, on which you may be subject to tax, followed by a purchase of shares received in the exchange. You should consult your tax adviser concerning the tax consequences of an exchange.
|
| Restrictions on Excessive Trading Practices. The Trust does not permit market-timing or other excessive trading
practices. Purchases and exchanges should be made for long-term investment purposes only. The Trust and Goldman Sachs reserve the right to reject or restrict purchase or exchange requests from any investor. Excessive, short-term (market-timing) trading
practices may disrupt portfolio management strategies, harm Fund performance and negatively impact long-term shareholders. The Trust and Goldman Sachs will not be held liable for any loss resulting from rejected purchase or exchange orders. To minimize
harm to the Trust (or Goldman Sachs) and its shareholders, the Trust (or Goldman Sachs) will exercise these rights if, in the Trust’s (or Goldman Sachs’) judgment, an investor has a history of excessive trading or if an investor’s trading,
in the judgment of the Trust (or Goldman Sachs) has been or may be disruptive to a Fund. In making this judgment, trades executed in multiple accounts under common ownership or control may be considered together.
|
| SHAREHOLDER SERVICES
|
| Can I Arrange To Have Automatic Investments Made On A Regular Basis?
|
| You may be able to make systematic cash investments through your bank via ACH transfer or your checking account via bank draft
each month. Forms for this option are available from Goldman Sachs, your Authorized Dealer or you may check the appropriate box on the Account Application.
|
| Can My Dividends And Distributions From A Fund Be Invested In Other Funds?
|
| You may elect to cross-reinvest dividends and capital gain distributions paid by a Fund in shares of the same class or an
equivalent class of any other Goldman Sachs Fund.
|
n
|
Shares will be purchased at NAV.
|
n
|
No initial sales charge or CDSC will be imposed.
|
n
|
You may elect cross-reinvestment into an identically registered account or an account registered in a different name or with a
different address, social security number or taxpayer identification number provided that the account has been properly established, appropriate signature guarantees obtained and the minimum initial investment has been satisfied.
|
| Can I Arrange To Have Automatic Exchanges Made On A Regular Basis?
|
| You may elect to exchange automatically a specified dollar amount of shares of a Fund for shares of the same class or an
equivalent class of any other Goldman Sachs Fund.
|
n
|
Shares will be purchased at NAV.
|
n
|
No initial sales charge is imposed.
|
n
|
Shares subject to a CDSC acquired under this program may be subject to a CDSC at the time of redemption from the Fund into which
the exchange is made depending upon the date and value of your original purchase.
|
n
|
Automatic exchanges are made monthly on the 15th day of each month or the first business day thereafter.
|
n
|
Minimum dollar amount: $50 per month.
|
| What Else Should I Know About Cross-Reinvestments And Automatic Exchanges?
|
| Cross-reinvestments and automatic exchanges are subject to the following conditions:
|
n
|
You must hold $5,000 or more in the Fund which is paying the dividend or from which the exchange is being made.
|
n
|
You must invest an amount in the Fund into which cross-reinvestments or automatic exchanges are being made that is equal to that
Fund’s minimum initial investment or continue to cross-reinvest or to make automatic exchanges until such minimum initial investment is met.
|
n
|
You should obtain and read the prospectus of the Fund into which dividends are invested or automatic exchanges are made.
|
| Can I Have Automatic Withdrawals Made On A Regular Basis?
|
| You may draw on your account systematically via check or ACH transfer in any amount of $50 or more.
|
n
|
It is normally undesirable to maintain a systematic withdrawal plan at the same time that you are purchasing additional Class A,
Class B or Class C Shares because of the sales charge imposed on your purchases of Class A Shares or the imposition of a CDSC on your redemptions of Class A, Class B or Class C Shares.
|
n
|
You must have a minimum balance of $5,000 in a Fund.
|
n
|
Checks are mailed on or about the 25th day of each month.
|
n
|
Each systematic withdrawal is a redemption and therefore a taxable transaction.
|
n
|
The CDSC applicable to Class A, Class B or Class C Shares redeemed under the systematic withdrawal plan may be waived.
|
| What Types of Reports Will I Be Sent Regarding My Investment?
|
| You will be provided with a printed confirmation of each transaction in your account and an individual quarterly account
statement. A year-to-date statement for your account will be provided upon request made to Goldman Sachs. If your account is held in “street name” you may receive your statements and confirmations on a different schedule.
|
| You will also receive an annual shareholder report containing audited financial statements and a semi-annual shareholder report.
If you have consented to the delivery of a single copy of shareholder reports, prospectuses and other information to all shareholders who share the same mailing address with your account, you may revoke your consent at any time by contacting Goldman Sachs
Funds by phone at 1-800-526-7384 or by mail at Goldman Sachs Funds, 4900 Sears Tower, Chicago, IL 60606-6372. The Funds will begin sending individual copies to you within 30 days after receipt of your revocation.
|
| The Funds do not generally provide sub-accounting services.
|
| What Should I Know When I Purchase Shares Through An Authorized Dealer?
|
| Authorized Dealers and other financial intermediaries may provide varying arrangements for their clients to purchase and redeem
Fund shares. They may charge additional fees not described in this Prospectus to their customers for such services.
|
| If shares of a Fund are held in a “street name” account with an Authorized Dealer, all recordkeeping, transaction
processing and payments of distributions relating to your account will be performed by the Authorized Dealer, and not by the Fund and its Transfer Agent. Since the Funds will have no record of your transactions, you should contact the Authorized Dealer to
purchase, redeem or exchange shares, to make changes in or give instructions concerning the account or to obtain information about your account. The transfer of shares in a “street name” account to an account with another dealer or to an account
directly with the Fund involves special procedures and will require you to obtain historical purchase information about the shares in the account from the Authorized Dealer.
|
| Authorized Dealers and other financial intermediaries may be authorized to accept, on behalf of the Trust, purchase, redemption
and exchange orders placed by or on behalf of their customers, and if approved by the Trust, to designate other intermediaries to accept such orders. In these cases:
|
n
|
A Fund will be deemed to have received an order that is in proper form when the order is accepted by an Authorized Dealer or
intermediary on a business day, and the order will be priced at the Fund’s NAV per share (adjusted for any applicable sales charge) next determined after such acceptance.
|
n
|
Authorized Dealers and intermediaries are responsible for transmitting accepted orders to the Funds within the time period agreed
upon by them.
|
| You should contact your Authorized Dealer or intermediary to learn whether it is authorized to accept orders for the Trust.
|
| The Investment Adviser, Distributor and/or their affiliates may pay additional compensation from time to time, out of their assets
and not as an additional charge to the Funds, to selected Authorized Dealers and other persons in connection with the sale, distribution and/or servicing of shares of the Funds and other Goldman Sachs Funds. Additional compensation based on sales may, but
is currently not expected to, exceed 0.50% (annualized) of the amount invested.
|
| DISTRIBUTION SERVICES AND FEES
|
| What Are The Different Distribution And Service Fees Paid By Class A, B and C Shares?
|
| The Trust has adopted distribution and service plans (each a “Plan”) under which Class A, Class B and Class C Shares
bear distribution and service fees paid to Authorized Dealers and Goldman Sachs. If the fees received by Goldman Sachs pursuant to the Plans exceed its expenses, Goldman Sachs may realize a profit from these arrangements. Goldman Sachs pays the
distribution and service fees on a quarterly basis.
|
| Under the Plans, Goldman Sachs is entitled to a monthly fee from each Fund for distribution services equal, on an annual basis,
to 0.25%, 0.75% and 0.75%, respectively, of a Fund’s average daily net assets attributed to Class A, Class B and Class C Shares. Because these fees are paid out of the Fund’s assets on an ongoing basis, over time, these fees will increase the
cost of your investment and may cost you more than paying other types of such charges.
|
| The distribution fees are subject to the requirements of Rule 12b-1 under the Act, and may be used (among other things) for:
|
n
|
Compensation paid to and expenses incurred by Authorized Dealers, Goldman Sachs and their respective officers, employees and sales
representatives;
|
n
|
Commissions paid to Authorized Dealers;
|
n
|
Allocable overhead;
|
n
|
Telephone and travel expenses;
|
n
|
Interest and other costs associated with the financing of such compensation and expenses;
|
n
|
Printing of prospectuses for prospective shareholders;
|
n
|
Preparation and distribution of sales literature or advertising of any type; and
|
n
|
All other expenses incurred in connection with activities primarily intended to result in the sale of Class A, Class B and Class C
Shares.
|
| In connection with the sale of Class C Shares, Goldman Sachs normally begins paying the 0.75% distribution fee as an ongoing
commission to Authorized Dealers after the shares have been held for one year.
|
| PERSONAL ACCOUNT MAINTENANCE SERVICES AND FEES
|
| Under the Plans, Goldman Sachs is also entitled to receive a separate fee equal on an annual basis to 0.25% of each Fund’s
average daily net assets attributed to Class A (applicable to Goldman Sachs International Equity Funds), Class B or Class C Shares. This fee is for personal and account maintenance services, and may be used to make payments to Goldman Sachs, Authorized
Dealers and their officers, sales representatives and employees for responding to inquiries of, and furnishing assistance to, shareholders regarding ownership of their shares or their accounts or similar services not otherwise provided on behalf of the
Funds. If the fees received by Goldman Sachs pursuant to the Plans exceed its expenses, Goldman Sachs may realize a profit from this arrangement.
|
| In connection with the sale of Class C Shares, Goldman Sachs normally begins paying the 0.25% ongoing service fee to Authorized
Dealers after the shares have been held for one year.
|
| As with any investment, you should consider how your investment in the Funds will be taxed. The tax information below is provided
as general information. More tax information is available in the Additional Statement. You should consult your tax adviser about the federal, state, local or foreign tax consequences of your investment in the Funds.
|
| Unless your investment is an IRA or other tax-advantaged account, you should consider the possible tax consequences of Fund
distributions and the sale of your Fund shares.
|
| DISTRIBUTIONS
|
| Distributions you receive from the Funds are generally subject to federal income tax, and may also be subject to state or local
taxes. This is true whether you reinvest your distributions in additional Fund shares or receive them in cash. For federal tax purposes, the Funds’ income dividend distributions and short-term capital gain distributions are taxable to you as ordinary
income. Any long-term capital gain distributions are taxable as long-term capital gains, no matter how long you have owned your Fund shares.
|
| Although distributions are generally treated as taxable to you in the year they are paid, distributions declared in October,
November or December but paid in January are taxable as if they were paid in December. A percentage of the Funds’ dividends paid to corporate shareholders may be eligible for the corporate dividends-received deduction. The Funds will inform
shareholders of the source and tax status of all distributions promptly after the close of each calendar year.
|
| Each Fund may be subject to foreign withholding or other foreign taxes on income or gain from certain foreign securities. In
general, the Funds may deduct these taxes in computing their taxable income.
|
| If you buy shares of a Fund before it makes a distribution, the distribution will be taxable to you even though it may actually be
a return of a portion of your investment. This is known as “buying a dividend.”
|
| SALES AND EXCHANGES
|
| Your sale of Fund shares is a taxable transaction for federal income tax purposes, and may also be subject to state and local
taxes. For tax purposes, the exchange of your Fund shares for shares of a different Goldman Sachs Fund is the same as a sale. When you sell your shares, you will generally recognize a capital gain or loss in an amount equal to the difference between your
adjusted tax basis in the shares and the amount received. Generally, this gain or loss is long-term or short-term depending on whether your holding period exceeds twelve months, except that any loss realized on shares held for six months or less will be
treated as a long-term capital loss to the extent of any capital gain dividends that were received on the shares.
|
| OTHER INFORMATION
|
| When you open your account, you should provide your social security or tax identification number on your Account Application. By
law, each Fund must withhold 31% of your taxable distributions and any redemption proceeds if you do not provide your correct taxpayer identification number, or certify that it is correct, or if the IRS instructs the Fund to do so. Non-U.S. investors may
be subject to U.S. withholding and estate tax.
|
| A. General Portfolio Risks
|
| The Funds will be subject to the risks associated with equity securities. “Equity securities” include common stocks,
preferred stocks, interests in real estate investment trusts, convertible debt obligations, convertible preferred stocks, equity interests in trusts, partnerships, joint ventures, limited liability companies and similar enterprises, warrants and stock
purchase rights. In general, stock values fluctuate in response to the activities of individual companies and in response to general market and economic conditions. Accordingly, the value of the stocks that a Fund holds may decline over short or extended
periods. The stock markets tend to be cyclical, with periods when stock prices generally rise and periods when prices generally decline. The volatility of equity securities means that the value of your investment in the Funds may increase or decrease.
Recently, certain stock markets have experienced substantial price volatility and, at times, have traded at or close to record high levels. There can be no guarantee that such levels will be reached or maintained in the future.
|
| To the extent that a Fund invests in fixed-income securities, that Fund will also be subject to the risks associated with its
fixed-income securities. These risks include interest rate risk, credit risk and call/extension risk. In general, interest rate risk involves the risk that when interest rates decline, the market value of fixed-income securities tends to increase
(although many mortgage related securities will have less potential than other debt securities for capital appreciation during periods of declining rates). Conversely, when interest rates increase, the market value of fixed-income securities tends to
decline. Credit risk involves the risk that an issuer or guarantor could default on its obligations, and a Fund will not recover its investment. Call risk and extension risk are normally present in mortgage-backed securities and asset-backed securities.
For example, homeowners have the option to prepay their mortgages. Therefore, the duration of a security backed by home mortgages can either shorten (call risk) or lengthen (extension risk). In general, if interest rates on new mortgage loans fall
sufficiently below the interest rates on existing outstanding mortgage loans, the rate of prepayment would be expected to increase. Conversely, if mortgage loan interest rates rise above the interest rates on existing outstanding mortgage loans, the rate
of prepayment would be expected to decrease. In either case, a change in the prepayment rate can result in losses to investors.
|
| The Investment Adviser will not consider the portfolio turnover rate a limiting factor in making investment decisions for a Fund.
A high rate of portfolio turnover (100% or more) involves correspondingly greater expenses which must be borne by a Fund and its shareholders, and is also likely to result in higher short-term capital gains taxable to shareholders. The portfolio turnover
rate is calculated by dividing the lesser of the dollar amount of sales or purchases of portfolio securities by the average monthly value of a Fund’s portfolio securities, excluding securities having a maturity at the date of purchase of one year or
less. See “Financial Highlights” in Appendix B for a statement of the Funds’ historical portfolio turnover rates.
|
| The following sections provide further information on certain types of securities and investment techniques that may be used by
the Funds, including their associated risks. Additional information is provided in the Additional Statement, which is available upon request. Among other things, the Additional Statement describes certain fundamental investment restrictions that cannot be
changed without shareholder approval. You should note, however, that all investment objectives, and all investment policies not specifically designated as fundamental are non-fundamental and may be changed without shareholder approval. If there is a
change in a Fund’s investment objective, you should consider whether that Fund remains an appropriate investment in light of your then current financial position and needs.
|
| B. Other Portfolio Risks
|
| Risks of Investing in Small Capitalization Companies. Each Fund may invest in small capitalization companies.
Investments in small capitalization companies involve greater risk and portfolio price volatility than investments in larger capitalization stocks. Among the reasons for the greater price volatility of these investments are the less certain growth
prospects of smaller firms and the lower degree of liquidity in the markets for such securities. Small capitalization companies may be thinly traded and may have to be sold at a discount from current market prices or in small lots over an extended period
of time. In addition, these securities are subject to the risk that during certain periods the liquidity of particular issuers or industries, or all securities in these investment categories, will shrink or disappear suddenly and without warning as a
result of adverse economic or market conditions, or adverse investor perceptions whether or not accurate. Because of the lack of sufficient market liquidity, a Fund may incur losses because it will be required to effect sales at a disadvantageous time and
only then at a substantial drop in price. Small capitalization companies include “unseasoned” issuers that do not have an established financial history; often have limited product lines, markets or financial
resources; may depend on or use a few key personnel for management; and may be susceptible to losses and risks of bankruptcy. Transaction costs for these investments are often higher than those of larger capitalization companies. Investments in small
capitalization companies may be more difficult to price precisely than other types of securities because of their characteristics and lower trading volumes.
|
| Risks of Foreign Investments. The Funds may make foreign investments. Foreign investments involve special risks that
are not typically associated with U.S. dollar denominated or quoted securities of U.S. issuers. Foreign investments may be affected by changes in currency rates, changes in foreign or U.S. laws or restrictions applicable to such investments and changes in
exchange control regulations (e.g., currency blockage). A decline in the exchange rate of the currency (i.e., weakening of the currency against the U.S. dollar) in which a portfolio security is quoted or denominated relative to the U.S. dollar would reduce the value of
the portfolio security. In addition, if the currency in which a Fund receives dividends, interest or other payments declines in value against the U.S. dollar before such income is distributed as dividends to shareholders or converted to U.S. dollars, the
Fund may have to sell portfolio securities to obtain sufficient cash to pay such dividends.
|
| The introduction of a single currency, the euro, on January 1, 1999 for participating nations in the European Economic and
Monetary Union has presented unique uncertainties, including the fluctuation of the euro relative to non-euro currencies during the transition period from January 1, 1999 to December 31, 2001 and beyond; whether the interest rate, tax and labor regimes of
European countries participating in the euro will converge over time; and whether the conversion of the currencies of other countries that now are or may in the future become members of the European Union (“EU”), may have an impact on the euro.
Also, it is possible that the euro could be abandoned in the future by countries that have already adopted its use. These or other events, including political and economic developments, could cause market disruptions, and could adversely affect the value
of securities held by the Funds. Because of the number of countries using this single currency, a significant portion of the assets held by the Funds may be denominated in the euro.
|
| Brokerage commissions, custodial services and other costs relating to investment in international securities markets generally are
more expensive than in the United States. In addition, clearance and settlement procedures may be different in foreign countries and, in certain markets, such procedures have been unable to keep pace with the volume of securities transactions, thus making
it difficult to conduct such transactions.
|
| Foreign issuers are not generally subject to uniform accounting, auditing and financial reporting standards comparable to those
applicable to U.S. issuers. There may be less publicly available information about a foreign issuer than about a U.S. issuer. In addition, there is generally less government regulation of foreign markets, companies and securities dealers than in the
United States. Foreign securities markets may have substantially less volume than U.S. securities markets and secu-
|
| rities of many foreign issuers are less liquid and more volatile than securities of comparable domestic issuers. Furthermore, with
respect to certain foreign countries, there is a possibility of nationalization, expropriation or confiscatory taxation, imposition of withholding or other taxes on dividend or interest payments (or, in some cases, capital gains distributions),
limitations on the removal of funds or other assets from such countries, and risks of political or social instability or diplomatic developments which could adversely affect investments in those countries.
|
| Concentration of a Fund’s assets in one or a few countries and currencies will subject a Fund to greater risks than if a
Fund’s assets were not geographically concentrated.
|
| Investment in sovereign debt obligations by certain Funds involves risks not present in debt obligations of corporate issuers. The
issuer of the debt or the governmental authorities that control the repayment of the debt may be unable or unwilling to repay principal or interest when due in accordance with the terms of such debt, and a Fund may have limited recourse to compel payment
in the event of a default. Periods of economic uncertainty may result in the volatility of market prices of sovereign debt, and in turn a Fund’s NAV, to a greater extent than the volatility inherent in debt obligations of U.S. issuers.
|
| A sovereign debtor’s willingness or ability to repay principal and pay interest in a timely manner may be affected by, among
other factors, its cash flow situation, the extent of its foreign currency reserves, the availability of sufficient foreign exchange on the date a payment
is due, the relative size of the debt service burden to the economy as a whole, the sovereign debtor’s policy toward international lenders, and the political constraints to which a sovereign debtor may be subject.
|
| Investments in foreign securities may take the form of sponsored and unsponsored American Depositary Receipts (“ADRs”)
and Global Depositary Receipts (“GDRs”). Certain Funds may also invest in European Depositary Receipts (“EDRs”) or other similar instruments representing securities of foreign issuers. ADRs represent the right to receive securities of
foreign issuers deposited in a domestic bank or a correspondent bank. Prices of ADRs are quoted in U.S. dollars, and ADRs are traded in the United States. EDRs and GDRs are receipts evidencing an arrangement with a non-U.S. bank. EDRs and GDRs are not
necessarily quoted in the same currency as the underlying security.
|
| Risks of Emerging Countries. Certain Funds may invest in securities of issuers located in emerging countries. The
risks of foreign investment are heightened when the issuer is located in an emerging country. Emerging countries are generally located in the Asia-Pacific region, Eastern Europe, Latin and South America and Africa. A Fund’s purchase and sale of
portfolio securities in certain emerging countries may be constrained by limitations relating to daily changes in the prices of listed securities, periodic trading or settlement volume and/or limitations on aggregate holdings of foreign investors. Such
limitations may be computed based on the aggregate trading volume by or holdings of a Fund, the Investment Adviser, its affiliates and their respective clients and other service providers. A Fund may not be able to sell securities in circumstances where
price, trading or settlement volume limitations have been reached.
|
| Foreign investment in the securities markets of certain emerging countries is restricted or controlled to varying degrees which
may limit investment in such countries or increase the administrative costs of such investments. For example, certain Asian countries require governmental approval prior to investments by foreign persons or limit investment by foreign persons to only a
specified percentage of an issuer’s outstanding securities or a specific class of securities which may have less advantageous terms (including price) than securities of the issuer available for purchase by nationals. In addition, certain countries
may restrict or prohibit investment opportunities in issuers or industries deemed important to national interests. Such restrictions may affect the market price, liquidity and rights of securities that may be purchased by a Fund. The repatriation of both
investment income and capital from certain emerging countries is subject to restrictions such as the need for governmental consents. Due to restrictions on direct investment in equity securities in certain Asian and other countries, it is anticipated that
a Fund may invest in such countries through other investment funds in such countries.
|
| Many emerging countries have recently experienced currency devaluations and substantial (and, in some cases, extremely high) rates
of inflation. Other emerging countries have experienced economic recessions. These circumstances have had a negative effect on the economies and securities markets of such emerging countries. Economies in emerging countries generally are dependent heavily
upon commodity prices and international trade and, accordingly, have been and may continue to be affected adversely by the economies of their trading partners, trade barriers, exchange controls, managed adjustments in relative currency values and other
protectionist measures imposed or negotiated by the countries with which they trade.
|
| Many emerging countries are subject to a substantial degree of economic, political and social instability. Governments of some
emerging countries are authoritarian in nature or have been installed or removed as a result of military coups, while
governments in other emerging countries have periodically used force to suppress civil dissent. Disparities of wealth, the pace and success of democratization, and ethnic, religious and racial disaffection, among other factors, have also led to social
unrest, violence and/or labor unrest in some emerging countries. Unanticipated political or social developments may result in sudden and significant investment losses. Investing in emerging countries involves greater risk of loss due to expropriation,
nationalization, confiscation of assets and property or the imposition of restrictions on foreign investments and on repatriation of capital invested. As an example, in the past some Eastern European governments have expropriated substantial amounts of
private property, and many claims of the property owners have never been fully settled. There is no assurance that similar expropriations will not recur in Eastern Europe or other countries.
|
| A Fund’s investment in emerging countries may also be subject to withholding or other taxes, which may be significant and may
reduce the return from an investment in such countries to the Fund.
|
| Settlement procedures in emerging countries are frequently less developed and reliable than those in the United States and often
may involve a Fund’s delivery of securities before receipt of payment for their sale. In addition, significant delays are common in certain markets in registering the transfer of securities. Settlement or registration problems may make it more
difficult for a Fund to value its portfolio securities and could cause the Fund to miss attractive investment opportunities, to have a portion of its assets uninvested or to incur losses due to the failure of a counterparty to pay for securities the Fund
has delivered or the Fund’s inability to complete its contractual obligations because of theft or other reasons. The creditworthiness of the local securities firms used by the Fund in emerging countries may not be as sound as the creditworthiness of
firms used in more developed countries. As a result, the Fund may be subject to a greater risk of loss if a securities firm defaults in the performance of its responsibilities.
|
| The small size and inexperience of the securities markets in certain emerging countries and the limited volume of trading in
securities in those countries may make a Fund’s investments in such countries less liquid and more volatile than investments in countries with more developed securities markets (such as the United States, Japan and most Western European countries). A
Fund’s investments in emerging countries are subject to the risk that the liquidity of a particular investment, or investments generally, in such countries will shrink or disappear suddenly and without warning as a result of adverse economic, market
or political conditions or adverse investor perceptions, whether or not accurate. Because of the lack of sufficient market liquidity, a Fund may incur losses because it will be required to effect sales at a disadvantageous time and only then at a
substantial drop in price. Invest
ments in emerging countries may be more difficult to price precisely because of the characteristics discussed above and lower trading volumes.
|
| A Fund’s use of foreign currency management techniques in emerging countries may be limited. Due to the limited market for
these instruments in emerging countries, the Investment Adviser does not currently anticipate that a significant portion of the Funds’ currency exposure in emerging countries, if any, will be covered by such instruments.
|
| Risks of Derivative Investments. A Fund’s transactions, if any, in options, futures, options on futures, swaps,
interest rate caps, floors and collars, structured securities and currency transactions involve additional risk of loss. Loss can result from a lack of correlation between changes in the value of derivative instruments and the portfolio assets (if any)
being hedged, the potential illiquidity of the markets for derivative instruments, or the risks arising from margin requirements and related leverage factors associated with such transactions. The use of these management techniques also involves the risk
of loss if the Investment Adviser is incorrect in its expectation of fluctuations in securities prices, interest rates or currency prices. Each Fund may also invest in derivative investments for non-hedging purposes (that is, to seek to increase total
return). Investing for non-hedging purposes is considered a speculative practice and presents even greater risk of loss.
|
| Risks of Illiquid Securities. Each Fund may invest up to 15% of its net assets in illiquid securities which cannot
be disposed of in seven days in the ordinary course of business at fair value. Illiquid securities include:
|
n
|
Both domestic and foreign securities that are not readily marketable
|
n
|
Certain stripped mortgage-backed securities
|
n
|
Repurchase agreements and time deposits with a notice or demand period of more than seven days
|
n
|
Certain over-the-counter options
|
n
|
Certain structured securities and all swap transactions
|
n
|
Certain restricted securities, unless it is determined, based upon a review of the trading markets for a specific restricted
security, that such restricted security is eligible for resale pursuant to Rule 144A under the Securities Act of 1933 (“144A Securities”) and, therefore, is liquid.
|
| Investing in 144A Securities may decrease the liquidity of a Fund’s portfolio to the extent that qualified institutional
buyers become for a time uninterested in purchasing these restricted securities. The purchase price and subsequent valuation of restricted and illiquid securities normally reflect a discount, which may be significant, from the market price of comparable
securities for which a liquid market exists.
|
| Credit Risks. Debt securities purchased by the Funds may include securities (including zero coupon bonds) issued by
the U.S. government (and its agencies, instrumentalities and sponsored enterprises), foreign governments, domestic and foreign corporations, banks and other issuers. Further information is provided in the Additional Statement.
|
| Debt securities rated BBB or higher by Standard & Poor’s or Baa or higher by Moody’s are considered “investment
grade.” Securities rated BBB or Baa are considered medium-grade obligations with speculative characteristics, and adverse economic conditions or changing circumstances may weaken their issuers’ capacity to pay interest and repay principal. A
security will be deemed to have met a rating requirement if it receives the minimum required rating from at least one such rating organization even though it has been rated below the minimum rating by one or more other rating organizations, or if unrated
by such rating organizations, determined by the Investment Adviser to be of comparable credit quality.
|
| Certain Funds may invest in fixed-income securities rated BB or Ba or below (or comparable unrated securities) which are commonly
referred to as “junk bonds.” Junk bonds are considered predominantly speculative and may be questionable as to principal and interest payments.
|
| In some cases, junk bonds may be highly speculative, have poor prospects for reaching investment grade standing and be in default.
As a result, investment in such bonds will present greater speculative risks than those associated with investment in investment grade bonds. Also, to the extent that the rating assigned to a security in a Fund’s portfolio is downgraded by a rating
organization, the market price and liquidity of such security may be adversely affected.
|
| Risks of Initial Public Offerings. The Funds may invest in IPOs. An IPO is a company’s first offering of stock
to the public. IPO risk is the risk that the market value of IPO shares will fluctuate considerably due to factors such as the absence of a prior public market, unseasoned trading, the small number of shares available for trading and limited information
about the issuer. The purchase of IPO shares may involve high transaction costs. IPO shares are subject to market risk and liquidity risk. When a Fund’s asset base is small, a significant portion of the Fund’s performance could be attributable
to investments in IPOs, because such investments would have a magnified impact on the Fund. As the Fund’s assets grow, the effect of the Fund’s investments in IPOs on the Fund’s performance probably will decline, which could reduce the
Fund’s performance. Because of the price volatility of IPO shares, a Fund may choose to hold IPO shares for a very short period of time. This may increase the turnover of the Fund’s portfolio and may lead to increased expenses to the Fund, such
as commissions and transaction costs. By selling IPO shares, the Fund may realize taxable gains it will subse
quently distribute to shareholders. In addition, the market for IPO shares can be speculative and/or inactive for extended periods of time. There is no assurance that a Fund will be able to obtain allocable portions of IPO shares. The limited number of
shares available for trading in some IPOs may make it more difficult for a Fund to buy or sell significant amounts of shares without an unfavorable impact on prevailing prices. Investors in IPO shares can be affected by substantial dilution in the value
of their shares, by sales of additional shares and by concentration of control in existing management and principal shareholders.
|
| Temporary Investment Risks. Each Fund may, for temporary defensive purposes, invest a certain percentage of its
total assets in:
|
n
|
U.S. government securities
|
n
|
Commercial paper rated at least A-2 by Standard & Poor’s or P-2 by Moody’s
|
n
|
Certificates of deposit
|
n
|
Bankers’ acceptances
|
n
|
Repurchase agreements
|
n
|
Non-convertible preferred stocks and non-convertible corporate bonds with a remaining maturity of less than one year
|
| When a Fund’s assets are invested in such instruments, the Fund may not be achieving its investment objective.
|
| C. Portfolio Securities and Techniques
|
| This section provides further information on certain types of securities and investment techniques that may be used by the Funds,
including their associated risks. Further information is provided in the Additional Statement, which is available upon request.
|
| Convertible Securities. Each Fund may invest in convertible securities. Convertible securities are preferred stock
or debt obligations that are convertible into common stock. Convertible securities generally offer lower interest or dividend yields than non-convertible securities of similar quality. Convertible securities in which a Fund invests are subject to the same
rating criteria as its other investments in fixed-income securities. Convertible securities have both equity and fixed-income risk characteristics. Like all fixed-income securities, the value of convertible securities is susceptible to the risk of market
losses attributable to changes in interest rates. Generally, the market value of convertible securities tends to decline as interest rates increase and, conversely, to increase as interest rates decline. However, when the market price of the common stock
underlying a convertible security exceeds the conversion price of the convertible security, the convertible security tends to reflect the market price of the underlying common stock. As the market
price of the underlying common stock declines, the convertible security, like a fixed-income security, tends to trade increasingly on a yield basis, and thus may not decline in price to the same extent as the underlying common stock.
|
| Foreign Currency Transactions. A Fund may, to the extent consistent with its investment policies, purchase or sell
foreign currencies on a cash basis or through forward contracts. A forward contract involves an obligation to purchase or sell a specific currency at a future date at a price set at the time of the contract. A Fund may engage in foreign currency
transactions for hedging purposes and to seek to protect against anticipated changes in future foreign currency exchange rates. In addition, certain Funds may also enter into such transactions to seek to increase total return, which is considered a
speculative practice.
|
| Some Funds may also engage in cross-hedging by using forward contracts in a currency different from that in which the hedged
security is denominated or quoted. A Fund may hold foreign currency received in connection with investments in foreign securities when, in the judgment of the Investment Adviser, it would be beneficial to convert such currency into U.S. dollars at a later
date (e.g., the Investment Adviser may anticipate the foreign currency to appreciate against the U.S. dollar).
|
| Currency exchange rates may fluctuate significantly over short periods of time, causing, along with other factors, a Fund’s
NAV to fluctuate (when the Fund’s NAV fluctuates, the value of your shares may go up or down). Currency exchange rates also can be affected unpredictably by the intervention of U.S. or foreign governments or central banks, or the failure to
intervene, or by currency controls or political developments in the United States or abroad.
|
| The market in forward foreign currency exchange contracts, currency swaps and other privately negotiated currency instruments
offers less protection against defaults by the other party to such instruments than is available for currency instruments traded on an exchange. Such contracts are subject to the risk that the counterparty to the contract will default on its obligations.
Since these contracts are not guaranteed by an exchange or clearinghouse, a default on a contract would deprive a Fund of unrealized profits, transaction costs or the benefits of a currency hedge or could force the Fund to cover its purchase or sale
commitments, if any, at the current market price.
|
| Structured Securities. Each Fund may invest in structured securities. Structured securities are securities whose
value is determined by reference to changes in the value of specific currencies, interest rates, commodities, indices or other financial indicators (the “Reference”) or the relative change in two or more References.
The interest rate or the principal amount payable upon maturity or redemption may be increased or decreased depending upon changes in the applicable Reference. Structured securities may be positively or negatively indexed, so that appreciation of the
Reference may produce an increase or decrease in the interest rate or value of the security at maturity. In addition, changes in the interest rates or the value of the security at maturity may be a multiple of changes in the value of the Reference.
Consequently, structured securities may present a greater degree of market risk than other types of fixed-income securities and may be more volatile, less liquid and more difficult to price accurately than less complex securities.
|
| REITs. Each Fund may invest in REITs. REITs are pooled investment vehicles that invest primarily in either real
estate or real estate related loans. The value of a REIT is affected by changes in the value of the properties owned by the REIT or securing mortgage loans held by the REIT. REITs are dependent upon the ability of the REITs’ managers, and are subject
to heavy cash flow dependency, default by borrowers and the qualification of the REITs under applicable regulatory requirements for favorable income tax treatment. REITs are also subject to risks generally associated with investments in real estate
including possible declines in the value of real estate, general and local economic conditions, environmental problems and changes in interest rates. To the extent that assets underlying a REIT are concentrated geographically, by property type or in
certain other respects, these risks may be heightened. A Fund will indirectly bear its proportionate share of any expenses, including management fees, paid by a REIT in which it invests.
|
| Options on Securities, Securities Indices and Foreign Currencies. A put option gives the purchaser of the option the
right to sell, and the writer (seller) of the option the obligation to buy, the underlying instrument during the option period. A call option gives the purchaser of the option the right to buy, and the writer (seller) of the option the obligation to sell,
the underlying instrument during the option period. Each Fund may write (sell) covered call and put options and purchase put and call options on any securities in which they may invest or on any securities index consisting of securities in which they may
invest. A Fund may also, to the extent that it invests in foreign securities, purchase and sell (write) put and call options on foreign currencies.
|
| The writing and purchase of options is a highly specialized activity which involves special investment risks. Options may be used
for either hedging or cross-hedging purposes, or to seek to increase total return (which is considered a speculative activity). The successful use of options depends in part on the ability of the Investment Adviser to manage future price fluctuations and
the degree of correlation between the options and securities (or currency) markets. If the Invest
ment Adviser is incorrect in its expectation of changes in market prices or determination of the correlation between the instruments or indices on which options are written and purchased and the instruments in a Fund’s investment portfolio, the Fund
may incur losses that it would not otherwise incur. The use of options can also increase a Fund’s transaction costs. Options written or purchased by the Funds may be traded on either U.S. or foreign exchanges or over-the-counter. Foreign and
over-the-counter options will present greater possibility of loss because of their greater illiquidity and credit risks.
|
| Futures Contracts and Options on Futures Contracts. Futures contracts are standardized, exchange-traded contracts
that provide for the sale or purchase of a specified financial instrument or currency at a future time at a specified price. An option on a futures contract gives the purchaser the right (and the writer of the option the obligation) to assume a position
in a futures contract at a specified exercise price within a specified period of time. A futures contract may be based on various securities (such as U.S. government securities), foreign currencies, securities indices and other financial instruments and
indices. The Funds may engage in futures transactions on both U.S. and foreign exchanges.
|
| Each Fund may purchase and sell futures contracts, and purchase and write call and put options on futures contracts, in order to
seek to increase total return or to hedge against changes in interest rates, securities prices or, to the extent a Fund invests in foreign securities, currency exchange rates, or to otherwise manage their term structures, sector selection and durations in
accordance with their investment objectives and policies. Each Fund may also enter into closing purchase and sale transactions with respect to such contracts and options. A Fund will engage in futures and related options transactions for bona fide hedging
purposes as defined in regulations of the Commodity Futures Trading Commission or to seek to increase total return to the extent permitted by such regulations. A Fund may not purchase or sell futures contracts or purchase or sell related options to seek
to increase total return, except for closing purchase or sale transactions, if immediately thereafter the sum of the amount of initial margin deposits and premiums paid on the Fund’s outstanding positions in futures and related options entered into
for the purpose of seeking to increase total return would exceed 5% of the market value of the Fund’s net assets.
|
| Futures contracts and related options present the following risks:
|
n
|
While a Fund may benefit from the use of futures and options on futures, unanticipated changes in interest rates, securities
prices or currency exchange rates may result in poorer overall performance than if the Fund had not entered into any futures contracts or options transactions.
|
n
|
Because perfect correlation between a futures position and portfolio position that is intended to be protected is impossible to
achieve, the desired protection may not be obtained and a Fund may be exposed to additional risk of loss.
|
n
|
The loss incurred by a Fund in entering into futures contracts and in writing call options on futures is potentially unlimited and
may exceed the amount of the premium received.
|
n
|
Futures markets are highly volatile and the use of futures may increase the volatility of a Fund’s NAV.
|
n
|
As a result of the low margin deposits normally required in futures trading, a relatively small price movement in a futures
contract may result in substantial losses to a Fund.
|
n
|
Futures contracts and options on futures may be illiquid, and exchanges may limit fluctuations in futures contract prices during a
single day.
|
n
|
Foreign exchanges may not provide the same protection as U.S. exchanges.
|
| Equity Swaps. Each Fund may invest in equity swaps. Equity swaps allow the parties to a swap agreement to exchange
the dividend income or other components of return on an equity investment (for example, a group of equity securities or an index) for a component of return on another non-equity or equity investment.
|
| An equity swap may be used by a Fund to invest in a market without owning or taking physical custody of securities in
circumstances in which direct investment may be restricted for legal reasons or is otherwise impractical. Equity swaps are derivatives and their value can be very volatile. To the extent that the Investment Adviser does not accurately analyze and predict
the potential relative fluctuation of the components swapped with another party, a Fund may suffer a loss, which may be substantial. The value of some components of an equity swap (such as the dividends on a common stock) may also be sensitive to changes
in interest rates. Furthermore, a Fund may suffer a loss if the counterparty defaults. Because equity swaps are normally illiquid, a Fund may be unable to terminate its obligations when desired.
|
| When-Issued Securities and Forward Commitments. Each Fund may purchase when-issued securities and make contracts to
purchase or sell securities for a fixed price at a future date beyond customary settlement time. When-issued securities are securities that have been authorized, but not yet issued. When-issued securities are purchased in order to secure what is
considered to be an advantageous price and yield to the Fund at the time of entering into the transaction. A forward commitment involves the entering into a contract to purchase or sell securities for a fixed price at a future date beyond the customary
settlement period.
|
| The purchase of securities on a when-issued or forward commitment basis involves a risk of loss if the value of the security to be
purchased declines before the settlement date. Conversely, the sale of securities on a forward commitment
basis involves the risk that the value of the securities sold may increase before the settlement date. Although a Fund will generally purchase securities on a when-issued or forward commitment basis with the intention of acquiring the securities for its
portfolio, a Fund may dispose of when-issued securities or forward commitments prior to settlement if the Investment Adviser deems it appropriate.
|
| Repurchase Agreements. Repurchase agreements involve the purchase of securities subject to the seller’s
agreement to repurchase them at a mutually agreed upon date and price. Each Fund may enter into repurchase agreements with dealers in U.S. government securities and member banks of the Federal Reserve System which furnish collateral at least equal in
value or market price to the amount of their repurchase obligation.
|
| If the other party or “seller” defaults, a Fund might suffer a loss to the extent that the proceeds from the sale of the
underlying securities and other collateral held by the Fund are less than the repurchase price and the Fund’s costs associated with delay and enforcement of the repurchase agreement. In addition, in the event of bankruptcy of the seller, a Fund could
suffer additional losses if a court determines that the Fund’s interest in the collateral is not enforceable.
|
| In evaluating whether to enter into a repurchase agreement, the Investment Adviser will carefully consider the creditworthiness of
the seller. Certain Funds, together with other registered investment companies having advisory agreements with the Investment Adviser or any of its affiliates, may transfer uninvested cash balances into a single joint account, the daily aggregate balance
of which will be invested in one or more repurchase agreements.
|
| Lending of Portfolio Securities. Each Fund may engage in securities lending. Securities lending involves the lending
of securities owned by a Fund to financial institutions such as certain broker-dealers. The borrowers are required to secure their loan continuously with cash, cash equivalents, U.S. government securities or letters of credit in an amount at least equal
to the market value of the securities loaned. Cash collateral may be invested in cash equivalents. To the extent that cash collateral is invested in other investment securities, such collateral will be subject to market depreciation or appreciation, and a
Fund will be responsible for any loss that might result from its investment of the borrowers’ collateral. If the Investment Adviser determines to make securities loans, the value of the securities loaned may not exceed 33 1
/3% of the value of the total assets of a
Fund (including the loan collateral).
|
| A Fund may lend its securities to increase its income. A Fund may, however, experience delay in the recovery of its securities if
the institution with which it has engaged in a portfolio loan transaction breaches its agreement with the Fund.
|
| Short Sales Against-the-Box. Certain Funds may make short sales against-the-box. A short sale against-the-box means
that at all times when a short position is open the Fund will own an equal amount of securities sold short, or securities convertible into or exchangeable for, without payment of any further consideration, an equal amount of the securities of the same
issuer as the securities sold short.
|
| Preferred Stock, Warrants and Rights. Each Fund may invest in preferred stock, warrants and rights. Preferred stocks
are securities that represent an ownership interest providing the holder with claims on the issuer’s earnings and assets before common stock owners but after bond owners. Unlike debt securities, the obligations of an issuer of preferred stock,
including dividend and other payment obligations, may not typically be accelerated by the holders of such preferred stock on the occurrence of an event of default or other non-compliance by the issuer of the preferred stock.
|
| Warrants and other rights are options to buy a stated number of shares of common stock at a specified price at any time during the
life of the warrant or right. The holders of warrants and rights have no voting rights, receive no dividends and have no rights with respect to the assets of the issuer.
|
| Other Investment Companies. Each Fund may invest in securities of other investment companies (including
exchange-traded funds such as SPDRs and iShares
SM
, as defined below) subject to statutory limitations prescribed by the Act. These limitations include a
prohibition on any Fund acquiring more than 3% of the voting shares of any other investment company, and a prohibition on investing more than 5% of a Fund’s total assets in securities of any one investment company or more than 10% of its total assets
in securities of all investment companies. A Fund will indirectly bear its proportionate share of any management fees and other expenses paid by such other investment companies. Exchange-traded funds such as SPDRs and iShares
SM
are shares of unaffiliated investment companies which are traded like traditional equity securities on a national
securities exchange or the NASDAQ® National Market System.
|
n
|
Standard & Poor’s Depositary Receipts™.
The Funds may, consistent with their investment policies, purchase Standard & Poor’s Depositary Receipts™ (“SPDRs”). SPDRs are securities traded on the American Stock Exchange (“AMEX”) that represent
ownership in the SPDR Trust, a trust which has been established to accumulate and hold a portfolio of common stocks that is intended to track the price performance and dividend yield of the S&P 500®. The SPDR Trust is sponsored by a subsidiary of
the AMEX. SPDRs may be used for several reasons, including, but not limited to, facilitating the handling
of cash flows or trading, or reducing transaction costs. The price movement of SPDRs may not perfectly parallel the price action of the S&P 500®.
|
n
|
iShares
SM
(formerly World Equity Benchmark Shares or WEBs). iShares are shares of an investment company that invests substantially all of its assets in securities included
in the MSCI indices for specified countries. iShares are listed on the AMEX and were initially offered to the public in 1996. The market prices of iShares are expected to fluctuate in accordance with both changes in the NAVs of their underlying indices
and supply and demand of iShares on the AMEX. To date, iShares have traded at relatively modest discounts and premiums to their NAVs. However, iShares have a limited operating history and information is lacking regarding the actual performance and trading
liquidity of iShares for extended periods or over complete market cycles. In addition, there is no assurance that the requirements of the AMEX necessary to maintain the listing of iShares will continue to be met or will remain unchanged. In the event
substantial market or other disruptions affecting iShares should occur in the future, the liquidity and value of a Fund’s shares could also be substantially and adversely affected. If such disruptions were to occur, a Fund could be required to
reconsider the use of iShares as part of its investment strategy.
|
| Unseasoned Companies. Each Fund may invest in companies (including predecessors) which have operated less than three
years. The securities of such companies may have limited liquidity, which can result in their being priced higher or lower than might otherwise be the case. In addition, investments in unseasoned companies are more speculative and entail greater risk than
do investments in companies with an established operating record.
|
| Corporate Debt Obligations. Corporate debt obligations include bonds, notes, debentures, commercial paper and other
obligations of corporations to pay interest and repay principal, and include securities issued by banks and other financial institutions. Each Fund may invest in corporate debt obligations issued by U.S. and certain non-U.S. issuers which issue securities
denominated in the U.S. dollar (including Yankee and Euro obligations). In addition to obligations of corporations, corporate debt obligations include securities issued by banks and other financial institutions and supranational entities (i.e., the World Bank, the International Monetary Fund, etc.).
|
| Bank Obligations. Each Fund may invest in obligations issued or guaranteed by U.S. or foreign banks. Bank
obligations, including without limitations, time deposits, bankers’ acceptances and certificates of deposit, may be general obligations of the parent bank or may be limited to the issuing branch by the terms of the specific obligations or by
government regulations. Banks are subject to extensive but different governmental regulations which may limit both the amount and types of
loans which may be made and interest rates which may be charged. In addition, the profitability of the banking industry is largely dependent upon the availability and cost of funds for the purpose of financing lending operations under prevailing money
market conditions. General economic conditions as well as exposure to credit losses arising from possible financial difficulties of borrowers play an important part in the operation of this industry.
|
| U.S. Government Securities. Each Fund may invest in U.S. government securities. U.S. government securities include
U.S. Treasury obligations and obligations issued or guaranteed by U.S. government agencies, instrumentalities or sponsored enterprises. U.S. government securities may be supported by (a) the full faith and credit of the U.S. Treasury (such as the
Government National Mortgage Association (“Ginnie Mae”)); (b) the right of the issuer to borrow from the U.S. Treasury (such as securities of the Student Loan Marketing Association); (c) the discretionary authority of the U.S. government to
purchase certain obligations of the issuer; or (d) only the credit of the issuer. U.S. government securities also include Treasury receipts, zero coupon bonds and other stripped U.S. government securities, where the interest and principal components of
stripped U.S. government securities are traded independently.
|
| Custodial Receipts. Interests in U.S. government securities may be purchased in the form of custodial receipts that
evidence ownership of future interest payments, principal payments or both on certain notes or bonds issued or guaranteed as to principal and interest by the U.S. government, its agencies, instrumentalities, political subdivisions or authorities. For
certain securities law purposes, custodial receipts are not considered obligations of the U.S. government.
|
| Mortgage-Backed Securities. Certain Funds may invest in mortgage-backed securities. Mortgage-backed securities
represent direct or indirect participations in, or are collateralized by and payable from, mortgage loans secured by real property. Mortgage-backed securities can be backed by either fixed rate mortgage loans or adjustable rate mortgage loans, and may be
issued by either a governmental or non-governmental entity. Privately issued mortgage-backed securities are normally structured with one or more types of “credit enhancement.” However, these mortgage-backed securities typically do not have the
same credit standing as U.S. government guaranteed mortgage-backed securities.
|
| Mortgage-backed securities may include multiple class securities, including collateralized mortgage obligations (“CMOs”)
and Real Estate Mortgage Investment Conduit (“REMIC”) pass-through or participation certificates. CMOs provide an investor with a specified interest in the cash flow from a pool of underlying mortgages or of other mortgage-backed securities.
CMOs are issued in multiple classes. In many cases, payments of principal are applied to the CMO classes in the
order of their respective stated maturities, so that no principal payments will be made on a CMO class until all other classes having an earlier stated maturity date are paid in full. A REMIC is a CMO that qualifies for special tax treatment and invests
in certain mortgages principally secured by interests in real property and other permitted investments.
|
| Mortgaged-backed securities also include stripped mortgage-backed securities (“SMBS”), which are derivative multiple
class mortgage-backed securities. SMBS are usually structured with two different classes: one that receives substantially all of the interest payments and the other that receives substantially all of the principal payments from a pool of mortgage loans.
The market value of SMBS consisting entirely of principal payments generally is unusually volatile in response to changes in interest rates. The yields on SMBS that receive all or most of the interest from mortgage loans are generally higher than
prevailing market yields on other mortgage-backed securities because their cash flow patterns are more volatile and there is a greater risk that the initial investment will not be fully recouped.
|
| Asset-Backed Securities. Certain Funds may invest in asset-backed securities. Asset-backed securities are securities
whose principal and interest payments are collateralized by pools of assets such as auto loans, credit card receivables, leases, installment contracts and personal property. Asset-backed securities are often subject to more rapid repayment than their
stated maturity date would indicate as a result of the pass-through of prepayments of principal on the underlying loans. During periods of declining interest rates, prepayment of loans underlying asset-backed securities can be expected to accelerate.
Accordingly, a Fund’s ability to maintain positions in such securities will be affected by reductions in the principal amount of such securities resulting from prepayments, and its ability to reinvest the returns of principal at comparable yields is
subject to generally prevailing interest rates at that time. Asset-backed securities present credit risks that are not presented by mortgage-backed securities. This is because asset-backed securities generally do not have the benefit of a security
interest in collateral that is comparable to mortgage assets. If the issuer of an asset-backed security defaults on its payment obligations, there is the possibility that, in some cases, the Fund will be unable to possess and sell the underlying
collateral and that the Fund’s recoveries on repossessed collateral may not be available to support payments on the securities. In the event of a default, a Fund may suffer a loss if it cannot sell collateral quickly and receive the amount it is owed.
|
| Borrowings. Each Fund can borrow money from banks and other financial institutions in amounts not exceeding
one-third of its total assets for temporary or emergency purposes. A Fund may not make additional investments if borrowings exceed 5% of its total assets.
|
| The financial highlights tables are intended to help you understand a Fund’s financial performance for the past five years
(or less if the Fund has been in operation for less than five years). Certain information reflects financial results for a single Fund share. The total returns in the table represent the rate that an investor would have earned or lost on an investment in
a Fund (assuming reinvestment of all dividends and distributions). This information for the periods ended August 31, 2000 has been audited by PriceWaterhouseCoopers LLP, whose report, along with the Funds’ financial statements, is included in the
Funds’ annual reports (available upon request without charge). The information for all periods prior to the periods ended August 31, 2000, has been audited by the Funds’ previous independent accountants.
|
| CORE INTERNATIONAL EQUITY FUND
|
| Income from
investment operations |
|||||||||
|---|---|---|---|---|---|---|---|---|---|
|
Net asset value, beginning of period |
Net
investment income (loss) |
Net realized
and unrealized gain (loss) |
|||||||
| For the Year Ended August 31, | |||||||||
| 2000 - Class A Shares | $10.87 | $ 0.02 | c | $ 0.74 | |||||
| 2000 - Class B Shares | 10.81 | (0.04 | ) c | 0.73 | |||||
| 2000 - Class C Shares | 10.82 | (0.03 | ) c | 0.72 | |||||
| 2000 - Institutional Shares | 11.00 | 0.09 | c | 0.75 | |||||
| 2000 - Service Shares | 10.93 | 0.05 | c | 0.73 | |||||
| For the Seven-month Period Ended August 31, | |||||||||
| 1999 - Class A Shares | 9.98 | 0.05 | 0.84 | ||||||
| 1999 - Class B Shares | 9.95 | 0.01 | 0.85 | ||||||
| 1999 - Class C Shares | 9.96 | 0.01 | 0.85 | ||||||
| 1999 - Institutional Shares | 10.06 | 0.09 | 0.85 | ||||||
| 1999 - Service Shares | 10.02 | 0.01 | 0.90 | ||||||
| For the Year Ended January 31, | |||||||||
| 1999 - Class A Shares | 9.22 | (0.01 | ) | 0.79 | |||||
| 1999 - Class B Shares | 9.21 | — | 0.74 | ||||||
| 1999 - Class C Shares | 9.22 | — | 0.74 | ||||||
| 1999 - Institutional Shares | 9.24 | 0.05 | 0.80 | ||||||
| 1999 - Service Shares | 9.23 | — | 0.81 | ||||||
| For the Period Ended January 31, | |||||||||
| 1998 - Class A Shares (commenced August 15, 1997) | 10.00 | — | (0.78 | ) | |||||
| 1998 - Class B Shares (commenced August 15, 1997) | 10.00 | (0.02 | ) | (0.77 | ) | ||||
| 1998 - Class C Shares (commenced August 15, 1997) | 10.00 | (0.02 | ) | (0.76 | ) | ||||
| 1998 - Institutional Shares (commenced August 15, 1997) | 10.00 | 0.02 | (0.76 | ) | |||||
| 1998 - Service Shares (commenced August 15, 1997) | 10.00 | 0.01 | (0.78 | ) | |||||
|
Distributions to shareholders |
|||||||||||||||||||||
|---|---|---|---|---|---|---|---|---|---|---|---|---|---|---|---|---|---|---|---|---|---|
| Total from
investment operations |
From net
investment income |
From net
realized gains |
Total
distributions |
Net asset
value, end of period |
Total
returna |
Net assets at end of period (in 000s) |
Ratio of net
expenses to average net assets |
||||||||||||||
| $ 0.76 | $(0.05 | ) | $(0.26 | ) | $(0.31 | ) | $11.32 | 6.92 | % | $147,409 | 1.66 | % | |||||||||
| 0.69 | (0.02 | ) | (0.26 | ) | (0.28 | ) | 11.22 | 6.36 | 12,032 | 2.16 | |||||||||||
| 0.69 | (0.02 | ) | (0.26 | ) | (0.28 | ) | 11.23 | 6.34 | 6,887 | 2.16 | |||||||||||
| 0.84 | (0.10 | ) | (0.26 | ) | (0.36 | ) | 11.48 | 7.62 | 308,074 | 1.01 | |||||||||||
| 0.78 | (0.09 | ) | (0.26 | ) | (0.35 | ) | 11.36 | 7.05 | 27 | 1.51 | |||||||||||
| 0.89 | — | — | — | 10.87 | 8.92 | 114,502 | 1.66 | b | |||||||||||||
| 0.86 | — | — | — | 10.81 | 8.64 | 9,171 | 2.16 | b | |||||||||||||
| 0.86 | — | — | — | 10.82 | 8.63 | 4,913 | 2.16 | b | |||||||||||||
| 0.94 | — | — | — | 11.00 | 9.34 | 271,212 | 1.01 | b | |||||||||||||
| 0.91 | — | — | — | 10.93 | 9.08 | 8 | 1.51 | b | |||||||||||||
| 0.78 | (0.02 | ) | — | (0.02 | ) | 9.98 | 8.37 | 110,338 | 1.63 | ||||||||||||
| 0.74 | — | — | — | 9.95 | 8.03 | 7,401 | 2.08 | ||||||||||||||
| 0.74 | — | — | — | 9.96 | 8.03 | 3,742 | 2.08 | ||||||||||||||
| 0.85 | (0.03 | ) | — | (0.03 | ) | 10.06 | 9.20 | 280,731 | 1.01 | ||||||||||||
| 0.81 | (0.02 | ) | — | (0.02 | ) | 10.02 | 8.74 | 22 | 1.50 | ||||||||||||
| (0.78 | ) | — | — | — | 9.22 | (7.66 | ) | 7,087 | 1.50 | b | |||||||||||
| (0.79 | ) | — | — | — | 9.21 | (7.90 | ) | 2,721 | 2.00 | b | |||||||||||
| (0.78 | ) | — | — | — | 9.22 | (7.80 | ) | 1,608 | 2.00 | b | |||||||||||
| (0.74 | ) | (0.02 | ) | — | (0.02 | ) | 9.24 | (7.45 | ) | 17,719 | 1.00 | b | |||||||||
| (0.77 | ) | — | — | — | 9.23 | (7.70 | ) | 1 | 1.50 | b | |||||||||||
| CORE INTERNATIONAL EQUITY FUND (continued)
|
| Ratios assuming no
expense reductions |
|||||||||||||
|---|---|---|---|---|---|---|---|---|---|---|---|---|---|
| Ratio of
net investment income (loss) to average net assets |
Ratio of
expenses to average net assets |
Ratio of
net investment income (loss) to average net assets |
Portfolio
turnover rate |
||||||||||
| For the Year Ended August 31, | |||||||||||||
| 2000 - Class A Shares | 0.14 | % | 1.75 | % | 0.05 | % | 92.10 | % | |||||
| 2000 - Class B Shares | (0.36 | ) | 2.25 | (0.45 | ) | 92.10 | |||||||
| 2000 - Class C Shares | (0.34 | ) | 2.25 | (0.43 | ) | 92.10 | |||||||
| 2000 - Institutional Shares | 0.78 | 1.10 | 0.69 | 92.10 | |||||||||
| 2000 - Service Shares | 0.33 | 1.60 | 0.24 | 92.10 | |||||||||
| For the Seven-month Period Ended August 31, | |||||||||||||
| 1999 - Class A Shares | 0.78 | b | 1.76 | b | 0.68 | b | 64.97 | ||||||
| 1999 - Class B Shares | 0.26 | b | 2.26 | b | 0.16 | b | 64.97 | ||||||
| 1999 - Class C Shares | 0.23 | b | 2.26 | b | 0.13 | b | 64.97 | ||||||
| 1999 - Institutional Shares | 1.43 | b | 1.11 | b | 1.33 | b | 64.97 | ||||||
| 1999 - Service Shares | 0.07 | b | 1.61 | b | (0.03 | ) b | 64.97 | ||||||
| For the Year Ended January 31, | |||||||||||||
| 1999 - Class A Shares | (0.11 | ) | 1.94 | (0.42 | ) | 194.61 | |||||||
| 1999 - Class B Shares | (0.03 | ) | 2.39 | (0.34 | ) | 194.61 | |||||||
| 1999 - Class C Shares | (0.04 | ) | 2.39 | (0.35 | ) | 194.61 | |||||||
| 1999 - Institutional Shares | 0.84 | 1.32 | 0.53 | 194.61 | |||||||||
| 1999 - Service Shares | 0.02 | 1.81 | (0.29 | ) | 194.61 | ||||||||
| For the Period Ended January 31, | |||||||||||||
| 1998 - Class A Shares (commenced August 15, 1997) | (0.27 | ) b | 4.87 | b | (3.90 | ) b | 25.16 | ||||||
| 1998 - Class B Shares (commenced August 15, 1997) | (0.72 | ) b | 5.12 | b | (3.84 | ) b | 25.16 | ||||||
| 1998 - Class C Shares (commenced August 15, 1997) | (0.73 | ) b | 5.12 | b | (3.85 | ) b | 25.16 | ||||||
| 1998 - Institutional Shares (commenced August 15, 1997) | 0.59 | b | 4.12 | b | (2.53 | ) b | 25.16 | ||||||
| 1998 - Service Shares (commenced August 15, 1997) | 0.26 | b | 4.62 | b | (2.86 | ) b | 25.16 | ||||||
| INTERNATIONAL EQUITY FUND
|
| Income from
investment operations |
||||||||||||
|---|---|---|---|---|---|---|---|---|---|---|---|---|
|
Net asset value, beginning of period |
Net
investment income (loss) |
Net realized
and unrealized gain (loss) |
Total from
investment operations |
|||||||||
| For the Year Ended August 31, | ||||||||||||
| 2000 - Class A Shares | $23.12 | $(0.03 | ) c | $3.41 | $3.38 | |||||||
| 2000 - Class B Shares | 22.73 | (0.16 | ) c | 3.38 | 3.22 | |||||||
| 2000 - Class C Shares | 22.54 | (0.14 | ) c | 3.35 | 3.21 | |||||||
| 2000 - Institutional Shares | 23.49 | 0.14 | c | 3.46 | 3.60 | |||||||
| 2000 - Service Shares | 23.14 | (0.01 | ) c | 3.45 | 3.44 | |||||||
| For the Seven Months Ended August 31, | ||||||||||||
| 1999 - Class A Shares | 21.92 | 0.04 | 1.16 | 1.20 | ||||||||
| 1999 - Class B Shares | 21.63 | (0.02 | ) | 1.12 | 1.10 | |||||||
| 1999 - Class C Shares | 21.45 | (0.03 | ) | 1.12 | 1.09 | |||||||
| 1999 - Institutional Shares | 22.20 | 0.12 | c | 1.17 | c | 1.29 | ||||||
| 1999 - Service Shares | 21.93 | 0.06 | 1.15 | 1.21 | ||||||||
| For the Years Ended January 31, | ||||||||||||
| 1999 - Class A Shares | 19.85 | (0.06 | ) | 3.24 | 3.18 | |||||||
| 1999 - Class B Shares | 19.70 | (0.17 | ) | 3.21 | 3.04 | |||||||
| 1999 - Class C Shares | 19.56 | (0.15 | ) | 3.15 | 3.00 | |||||||
| 1999 - Institutional Shares | 19.97 | 0.03 | 3.31 | 3.34 | ||||||||
| 1999 - Service Shares | 19.84 | (0.04 | ) | 3.24 | 3.20 | |||||||
| 1998 - Class A Shares | 19.32 | 0.03 | 2.04 | 2.07 | ||||||||
| 1998 - Class B Shares | 19.24 | (0.08 | ) | 2.02 | 1.94 | |||||||
| 1998 - Class C Shares (commenced August 15, 1997) | 22.60 | (0.04 | ) | (1.38 | ) | (1.42 | ) | |||||
| 1998 - Institutional Shares | 19.40 | 0.10 | 2.11 | 2.21 | ||||||||
| 1998 - Service Shares | 19.34 | 0.02 | 2.06 | 2.08 | ||||||||
| 1997 - Class A Shares | 17.20 | 0.10 | 2.23 | 2.33 | ||||||||
| 1997 - Class B Shares (commenced May 1, 1996) | 18.91 | (0.06 | ) | 0.60 | 0.54 | |||||||
| 1997 - Institutional Shares (commenced February 7, 1996) | 17.45 | 0.04 | 2.15 | 2.19 | ||||||||
| 1997 - Service Shares (commenced March 6, 1996) | 17.70 | (0.02 | ) | 1.87 | 1.85 | |||||||
| 1996 - Class A Shares | 14.52 | 0.13 | 4.00 | 4.13 | ||||||||
| Distributions to shareholders |
|||||||||||||||||||||
|---|---|---|---|---|---|---|---|---|---|---|---|---|---|---|---|---|---|---|---|---|---|
| From net
investment income |
In excess of net investment income |
From net
realized gains |
Total
distributions |
Net asset
value, end of period |
Total
returna |
Net assets
at end of period (in 000s) |
Ratio of
net expenses to average net assets |
||||||||||||||
| $(0.10 | ) | $(0.24) | $(2.57 | ) | $(2.91 | ) | $23.59 | 14.68 | % | $1,343,869 | 1.79 | % | |||||||||
| (0.07 | ) | (0.17) | (2.57 | ) | (2.81 | ) | 23.14 | 14.20 | 80,274 | 2.29 | |||||||||||
| (0.09 | ) | (0.20) | (2.57 | ) | (2.86 | ) | 22.89 | 14.28 | 22,031 | 2.29 | |||||||||||
| (0.14 | ) | (0.32) | (2.57 | ) | (3.03 | ) | 24.06 | 15.45 | 325,161 | 1.14 | |||||||||||
| (0.11 | ) | (0.25) | (2.57 | ) | (2.93 | ) | 23.65 | 15.00 | 3,789 | 1.64 | |||||||||||
| — | — | — | — | 23.12 | 5.47 | 943,473 | 1.79 | b | |||||||||||||
| — | — | — | — | 22.73 | 5.09 | 68,691 | 2.29 | b | |||||||||||||
| — | — | — | — | 22.54 | 5.08 | 11,241 | 2.29 | b | |||||||||||||
| — | — | — | — | 23.49 | 5.81 | 180,564 | 1.14 | b | |||||||||||||
| — | — | — | — | 23.14 | 5.52 | 3,852 | 1.64 | b | |||||||||||||
| — | — | (1.11 | ) | (1.11 | ) | 21.92 | 16.39 | 947,973 | 1.73 | ||||||||||||
| — | — | (1.11 | ) | (1.11 | ) | 21.63 | 15.80 | 69,231 | 2.24 | ||||||||||||
| — | — | (1.11 | ) | (1.11 | ) | 21.45 | 15.70 | 11,619 | 2.24 | ||||||||||||
| — | — | (1.11 | ) | (1.11 | ) | 22.20 | 17.09 | 111,315 | 1.13 | ||||||||||||
| — | — | (1.11 | ) | (1.11 | ) | 21.93 | 16.49 | 3,568 | 1.63 | ||||||||||||
| — | (0.30 | ) | (1.24 | ) | (1.54 | ) | 19.85 | 11.12 | 697,590 | 1.67 | |||||||||||
| — | (0.25 | ) | (1.23 | ) | (1.48 | ) | 19.70 | 10.51 | 55,324 | 2.20 | |||||||||||
| — | (0.38 | ) | (1.24 | ) | (1.62 | ) | 19.56 | (5.92 | ) | 3,369 | 2.27 | b | |||||||||
| (0.07 | ) | (0.33 | ) | (1.24 | ) | (1.64 | ) | 19.97 | 11.82 | 56,263 | 1.08 | ||||||||||
| — | (0.35 | ) | (1.23 | ) | (1.58 | ) | 19.84 | 11.25 | 3,035 | 1.55 | |||||||||||
| — | — | (0.21 | ) | (0.21 | ) | 19.32 | 13.48 | 536,283 | 1.69 | ||||||||||||
| — | — | (0.21 | ) | (0.21 | ) | 19.24 | 2.83 | 19,198 | 2.23 | b | |||||||||||
| (0.03 | ) | — | (0.21 | ) | (0.24 | ) | 19.40 | 12.53 | 68,374 | 1.10 | b | ||||||||||
| — | — | (0.21 | ) | (0.21 | ) | 19.34 | 10.42 | 674 | 1.60 | b | |||||||||||
| (0.58 | ) | — | (0.87 | ) | (1.45 | ) | 17.20 | 28.68 | 330,860 | 1.52 | |||||||||||
| INTERNATIONAL EQUITY FUND (continued)
|
| Ratios assuming no
expense reductions |
|||||||||||||
|---|---|---|---|---|---|---|---|---|---|---|---|---|---|
| Ratio of
net investment income (loss) to average net assets |
Ratio of
expenses to average net assets |
Ratio of
net investment income (loss) to average net assets |
Portfolio
turnover rate |
||||||||||
| For the Year Ended August 31, | |||||||||||||
| 2000 - Class A Shares | (0.12 | )% | 1.84 | % | (0.17 | )% | 79.79 | % | |||||
| 2000 - Class B Shares | (0.65 | ) | 2.34 | (0.70 | ) | 79.79 | |||||||
| 2000 - Class C Shares | (0.59 | ) | 2.34 | (0.64 | ) | 79.79 | |||||||
| 2000 - Institutional Shares | 0.54 | 1.19 | 0.49 | 79.79 | |||||||||
| 2000 - Service Shares | (0.02 | ) | 1.69 | (0.07 | ) | 79.79 | |||||||
| For the Seven Months Ended August 31, | |||||||||||||
| 1999 - Class A Shares | 0.31 | b | 1.84 | b | 0.26 | b | 61.10 | ||||||
| 1999 - Class B Shares | (0.19 | ) b | 2.34 | b | (0.24 | ) b | 61.10 | ||||||
| 1999 - Class C Shares | (0.26 | ) b | 2.34 | b | (0.31 | ) b | 61.10 | ||||||
| 1999 - Institutional Shares | 0.89 | b | 1.19 | b | 0.84 | b | 61.10 | ||||||
| 1999 - Service Shares | 0.47 | b | 1.69 | b | 0.42 | b | 61.10 | ||||||
| For the Years Ended January 31, | |||||||||||||
| 1999 - Class A Shares | (0.28 | ) | 1.82 | (0.37 | ) | 113.79 | |||||||
| 1999 - Class B Shares | (0.79 | ) | 2.32 | (0.87 | ) | 113.79 | |||||||
| 1999 - Class C Shares | (0.98 | ) | 2.32 | (1.06 | ) | 113.79 | |||||||
| 1999 - Institutional Shares | 0.23 | 1.21 | 0.15 | 113.79 | |||||||||
| 1999 - Service Shares | (0.18 | ) | 1.71 | (0.26 | ) | 113.79 | |||||||
| 1998 - Class A Shares | (0.27 | ) | 1.80 | (0.40 | ) | 40.82 | |||||||
| 1998 - Class B Shares | (0.90 | ) | 2.30 | (1.00 | ) | 40.82 | |||||||
| 1998 - Class C Shares (commenced August 15, 1997) | (1.43 | ) b | 2.37 | b | (1.53 | ) b | 40.82 | ||||||
| 1998 - Institutional Shares | 0.30 | 1.18 | 0.20 | 40.82 | |||||||||
| 1998 - Service Shares | (0.36 | ) | 1.65 | (0.46 | ) | 40.82 | |||||||
| 1997 - Class A Shares | (0.07 | ) | 1.88 | (0.26 | ) | 38.01 | |||||||
| 1997 - Class B Shares (commenced May 1, 1996) | (0.97 | ) b | 2.38 | b | (1.12 | ) b | 38.01 | ||||||
| 1997 - Institutional Shares (commenced February 7, 1996) | 0.43 | b | 1.25 | b | 0.28 | b | 38.01 | ||||||
| 1997 - Service Shares (commenced March 6, 1996) | (0.40 | ) b | 1.75 | b | (0.55 | ) b | 38.01 | ||||||
| 1996 - Class A Shares | 0.26 | 1.77 | 0.01 | 68.48 | |||||||||
| EUROPEAN EQUITY FUND
|
| Income from
investment operations |
|||||||||
|---|---|---|---|---|---|---|---|---|---|
| Net asset
value, beginning of period |
Net investment income (loss) |
Net realized
and unrealized gain (loss) |
|||||||
| For the Year Ended August 31, | |||||||||
| 2000 - Class A Shares | $11.75 | $ — | c | $ 2.78 | |||||
| 2000 - Class B Shares | 11.71 | (0.04 | ) c | 2.73 | |||||
| 2000 - Class C Shares | 11.72 | (0.04 | ) c | 2.75 | |||||
| 2000 - Institutional Shares | 11.82 | 0.10 | c | 2.79 | |||||
| 2000 - Service Shares | 11.76 | 0.01 | c | 2.80 | |||||
| For the Seven Months Ended August 31, | |||||||||
| 1999 - Class A Shares | 12.20 | 0.05 | (0.50 | ) | |||||
| 1999 - Class B Shares | 12.19 | 0.03 | (0.51 | ) | |||||
| 1999 - Class C Shares | 12.20 | 0.04 | (0.52 | ) | |||||
| 1999 - Institutional Shares | 12.23 | 0.18 | (0.59 | ) | |||||
| 1999 - Service Shares | 12.20 | 0.08 | (0.52 | ) | |||||
| For the Period Ended January 31, | |||||||||
| 1999 - Class A Shares (commenced October 1, 1998) | 10.00 | (0.03 | ) | 2.23 | |||||
| 1999 - Class B Shares (commenced October 1, 1998) | 10.00 | (0.02 | ) | 2.21 | |||||
| 1999 - Class C Shares (commenced October 1, 1998) | 10.00 | (0.01 | ) | 2.21 | |||||
| 1999 - Institutional Shares (commenced October 1, 1998) | 10.00 | (0.01 | ) | 2.24 | |||||
| 1999 - Service Shares (commenced October 1, 1998) | 10.00 | (0.03 | ) | 2.23 | |||||
| Distributions to
shareholders |
||||||||||||||||||
|---|---|---|---|---|---|---|---|---|---|---|---|---|---|---|---|---|---|---|
| Total from
investment operations |
From net
realized gains |
Total
distributions |
Net asset
value, end of period |
Total
returna |
Net assets at end of period (in 000s) |
Ratio of
net expenses to average net assets |
||||||||||||
| $ 2.78 | $(0.71 | ) | $(0.71 | ) | $13.82 | 24.04 | % | $139,966 | 1.79 | % | ||||||||
| 2.69 | (0.71 | ) | (0.71 | ) | 13.69 | 23.32 | 4,538 | 2.29 | ||||||||||
| 2.71 | (0.71 | ) | (0.71 | ) | 13.72 | 23.48 | 1,482 | 2.29 | ||||||||||
| 2.89 | (0.71 | ) | (0.71 | ) | 14.00 | 24.85 | 14,630 | 1.14 | ||||||||||
| 2.81 | (0.71 | ) | (0.71 | ) | 13.86 | 24.28 | 2 | 1.64 | ||||||||||
| (0.45 | ) | — | — | 11.75 | (3.69 | ) | 74,862 | 1.79 | b | |||||||||
| (0.48 | ) | — | — | 11.71 | (3.94 | ) | 879 | 2.29 | b | |||||||||
| (0.48 | ) | — | — | 11.72 | (3.93 | ) | 388 | 2.29 | b | |||||||||
| (0.41 | ) | — | — | 11.82 | (3.35 | ) | 5,965 | 1.14 | b | |||||||||
| (0.44 | ) | — | — | 11.76 | (3.61 | ) | 2 | 1.64 | b | |||||||||
| 2.20 | — | — | 12.20 | 22.00 | 61,151 | 1.79 | b | |||||||||||
| 2.19 | — | — | 12.19 | 21.90 | 432 | 2.29 | b | |||||||||||
| 2.20 | — | — | 12.20 | 22.00 | 587 | 2.29 | b | |||||||||||
| 2.23 | — | — | 12.23 | 22.30 | 12,740 | 1.14 | b | |||||||||||
| 2.20 | — | — | 12.20 | 22.00 | 2 | 1.64 | b | |||||||||||
| EUROPEAN EQUITY FUND (continued)
|
| Ratios assuming no
expense reductions |
|||||||||||||
|---|---|---|---|---|---|---|---|---|---|---|---|---|---|
| Ratio of
net investment income (loss) to average net assets |
Ratio of
expenses to average net assets |
Ratio of
net investment income (loss) to average net assets |
Portfolio
turnover rate |
||||||||||
| For the Year Ended August 31, | |||||||||||||
| 2000 - Class A Shares | 0.02 | % | 2.17 | % | (0.36 | )% | 98.10 | % | |||||
| 2000 - Class B Shares | (0.27 | ) | 2.67 | (0.65 | ) | 98.10 | |||||||
| 2000 - Class C Shares | (0.26 | ) | 2.67 | (0.64 | ) | 98.10 | |||||||
| 2000 - Institutional Shares | 0.70 | 1.52 | 0.32 | 98.10 | |||||||||
| 2000 - Service Shares | 0.09 | 2.02 | (0.29 | ) | 98.10 | ||||||||
| For the Seven Months Ended August 31, | |||||||||||||
| 1999 - Class A Shares | 0.80 | b | 2.29 | b | 0.30 | b | 54.98 | ||||||
| 1999 - Class B Shares | 0.43 | b | 2.79 | b | (0.07 | ) b | 54.98 | ||||||
| 1999 - Class C Shares | 0.42 | b | 2.79 | b | (0.08 | ) b | 54.98 | ||||||
| 1999 - Institutional Shares | 1.53 | b | 1.64 | b | 1.03 | b | 54.98 | ||||||
| 1999 - Service Shares | 1.10 | b | 2.14 | b | 0.60 | b | 54.98 | ||||||
| For the Period Ended January 31, | |||||||||||||
| 1999 - Class A Shares (commenced October 1, 1998) | (1.19 | ) b | 2.80 | b | (2.20 | ) b | 70.77 | ||||||
| 1999 - Class B Shares (commenced October 1, 1998) | (1.78 | ) b | 3.30 | b | (2.79 | ) b | 70.77 | ||||||
| 1999 - Class C Shares (commenced October 1, 1998) | (1.83 | ) b | 3.30 | b | (2.84 | ) b | 70.77 | ||||||
| 1999 - Institutional Shares (commenced October 1, 1998) | (0.33 | ) b | 2.15 | b | (1.34 | ) b | 70.77 | ||||||
| 1999 - Service Shares (commenced October 1, 1998) | (0.69 | ) b | 2.65 | b | (1.70 | ) b | 70.77 | ||||||
| JAPANESE EQUITY FUND
|
| Income from
investment operations |
||||||||||
|---|---|---|---|---|---|---|---|---|---|---|
|
Net asset value, beginning of period |
Net
investment loss |
Net realized
and unrealized gains |
Total
from investment operations |
|||||||
| For the Year Ended August 31, | ||||||||||
| 2000 - Class A Shares | $16.24 | $(0.20 | ) c | $1.67 | $1.47 | |||||
| 2000 - Class B Shares | 16.14 | (0.28 | ) c | 1.68 | 1.40 | |||||
| 2000 - Class C Shares | 16.16 | (0.28 | ) c | 1.64 | 1.36 | |||||
| 2000 - Institutional Shares | 16.36 | (0.09 | ) c | 1.67 | 1.58 | |||||
| 2000 - Service Shares | 16.22 | (0.16 | ) c | 1.65 | 1.49 | |||||
| For the Seven Months Ended August 31, | ||||||||||
| 1999 - Class A Shares | 11.06 | (0.06 | ) | 5.24 | 5.18 | |||||
| 1999 - Class B Shares | 11.03 | (0.09 | ) | 5.20 | 5.11 | |||||
| 1999 - Class C Shares | 11.04 | (0.08 | ) | 5.20 | 5.12 | |||||
| 1999 - Institutional Shares | 11.10 | (0.03 | ) | 5.29 | 5.26 | |||||
| 1999 - Service Shares | 11.04 | (0.06 | ) | 5.24 | 5.18 | |||||
| For the Period Ended January 31, | ||||||||||
| 1999 - Class A Shares (commenced May 1, 1998) | 10.00 | (0.06 | ) | 1.12 | 1.06 | |||||
| 1999 - Class B Shares (commenced May 1, 1998) | 10.00 | (0.08 | ) | 1.11 | 1.03 | |||||
| 1999 - Class C Shares (commenced May 1, 1998) | 10.00 | (0.09 | ) | 1.13 | 1.04 | |||||
| 1999 - Institutional Shares (commenced May 1, 1998) | 10.00 | (0.02 | ) | 1.13 | 1.11 | |||||
| 1999 - Service Shares (commenced May 1, 1998) | 10.00 | (0.05 | ) | 1.09 | 1.04 | |||||
|
Distributions to shareholders |
|||||||||||||||||||||
|---|---|---|---|---|---|---|---|---|---|---|---|---|---|---|---|---|---|---|---|---|---|
| From net
investment income |
In excess of net investment income |
From net
realized gains |
Total
distributions |
Net asset
value, end of period |
Total
returnb |
Net assets
at end of period (in 000s) |
Ratio of
net expenses to average net assets |
||||||||||||||
| $ — | $(0.21 | ) | $(1.73 | ) | $(1.94 | ) | $15.77 | 8.47 | % | $69,741 | 1.74 | % | |||||||||
| — | (0.18 | ) | (1.73 | ) | (1.91 | ) | 15.63 | 8.12 | 5,783 | 2.24 | |||||||||||
| — | (0.21 | ) | (1.73 | ) | (1.94 | ) | 15.58 | 7.82 | 4,248 | 2.24 | |||||||||||
| — | (0.25 | ) | (1.73 | ) | (1.98 | ) | 15.96 | 9.14 | 27,768 | 1.09 | |||||||||||
| — | (0.15 | ) | (1.73 | ) | (1.88 | ) | 15.83 | 8.65 | 3 | 1.59 | |||||||||||
| — | — | — | — | 16.24 | 46.84 | 34,279 | 1.70 | b | |||||||||||||
| — | — | — | — | 16.14 | 46.33 | 4,219 | 2.20 | b | |||||||||||||
| — | — | — | — | 16.16 | 46.41 | 3,584 | 2.20 | b | |||||||||||||
| — | — | — | — | 16.36 | 47.40 | 22,709 | 1.05 | b | |||||||||||||
| — | — | — | — | 16.22 | 46.92 | 3 | 1.55 | b | |||||||||||||
| — | — | — | — | 11.06 | 10.60 | 8,391 | 1.64 | b | |||||||||||||
| — | — | — | — | 11.03 | 10.30 | 1,427 | 2.15 | b | |||||||||||||
| — | — | — | — | 11.04 | 10.40 | 284 | 2.15 | b | |||||||||||||
| (0.01 | ) | — | — | (0.01 | ) | 11.10 | 11.06 | 11,418 | 1.03 | b | |||||||||||
| — | — | — | — | 11.04 | 10.43 | 2 | 1.53 | b | |||||||||||||
| JAPANESE EQUITY FUND (continued)
|
| Ratios assuming no
expense reductions |
|||||||||||||
|---|---|---|---|---|---|---|---|---|---|---|---|---|---|
| Ratio of
net investment loss to average net assets |
Ratio of
expenses to average net assets |
Ratio of
net investment loss to average net assets |
Portfolio
turnover rate |
||||||||||
| For the Year Ended August 31, | |||||||||||||
| 2000 - Class A Shares | (1.20 | )% | 2.10 | % | (1.56 | )% | 60.76 | % | |||||
| 2000 - Class B Shares | (1.67 | ) | 2.60 | (2.03 | ) | 60.76 | |||||||
| 2000 - Class C Shares | (1.66 | ) | 2.60 | (2.02 | ) | 60.76 | |||||||
| 2000 - Institutional Shares | (0.53 | ) | 1.45 | (0.89 | ) | 60.76 | |||||||
| 2000 - Service Shares | (0.94 | ) | 1.95 | (1.30 | ) | 60.76 | |||||||
| For the Seven Months Ended August 31, | |||||||||||||
| 1999 - Class A Shares | (1.17 | ) b | 2.62 | b | (2.09 | ) b | 44.83 | ||||||
| 1999 - Class B Shares | (1.57 | ) b | 3.12 | b | (2.49 | ) b | 44.83 | ||||||
| 1999 - Class C Shares | (1.81 | ) b | 3.12 | b | (2.73 | ) b | 44.83 | ||||||
| 1999 - Institutional Shares | (0.37 | ) b | 1.97 | b | (1.29 | ) b | 44.83 | ||||||
| 1999 - Service Shares | (0.74 | ) b | 2.47 | b | (1.66 | ) b | 44.83 | ||||||
| For the Period Ended January 31, | |||||||||||||
| 1999 - Class A Shares (commenced May 1, 1998) | (1.20 | ) b | 4.18 | b | (3.74 | ) b | 53.29 | ||||||
| 1999 - Class B Shares (commenced May 1, 1998) | (1.76 | ) b | 4.69 | b | (4.30 | ) b | 53.29 | ||||||
| 1999 - Class C Shares (commenced May 1, 1998) | (1.69 | ) b | 4.69 | b | (4.23 | ) b | 53.29 | ||||||
| 1999 - Institutional Shares (commenced May 1, 1998) | (0.36 | ) b | 3.57 | b | (2.90 | ) b | 53.29 | ||||||
| 1999 - Service Shares (commenced May 1, 1998) | (0.68 | ) b | 4.07 | b | (3.22 | ) b | 53.29 | ||||||
| INTERNATIONAL GROWTH OPPORTUNITIES FUND
|
| (formerly International Small Cap Fund)
|
| Income from
investment operations |
||||||||||
|---|---|---|---|---|---|---|---|---|---|---|
| Net asset
value, beginning of period |
Net
investment loss |
Net realized
and unrealized gain |
Total from investment operations |
|||||||
| For the Year Ended August 31, | ||||||||||
| 2000 - Class A Shares ; | $13.24 | $(0.12 | ) c | $3.52 | $3.40 | |||||
| 2000 - Class B Shares | 13.19 | (0.18 | ) c | 3.49 | 3.31 | |||||
| 2000 - Class C Shares | 13.19 | (0.19 | ) c | 3.49 | 3.30 | |||||
| 2000 - Institutional Shares | 13.35 | (0.03 | ) c | 3.57 | 3.54 | |||||
| 2000 - Service Shares | 13.24 | (0.10 | ) c | 3.54 | 3.44 | |||||
| For the Seven-month Period Ended August 31, | ||||||||||
| 1999 - Class A Shares | 10.62 | (0.03 | ) | 2.65 | 2.62 | |||||
| 1999 - Class B Shares | 10.61 | (0.08 | ) c | 2.66 | 2.58 | |||||
| 1999 - Class C Shares | 10.61 | (0.08 | ) c | 2.66 | 2.58 | |||||
| 1999 - Institutional Shares | 10.66 | — | 2.69 | 2.69 | ||||||
| 1999 - Service Shares | 10.61 | (0.02 | ) | 2.65 | 2.63 | |||||
| For the Period Ended January 31, | ||||||||||
| 1999 - Class A Shares (commenced May 1, 1998) | 10.00 | (0.04 | ) | 0.66 | 0.62 | |||||
| 1999 - Class B Shares (commenced May 1, 1998) | 10.00 | (0.10 | ) | 0.71 | 0.61 | |||||
| 1999 - Class C Shares (commenced May 1, 1998) | 10.00 | (0.06 | ) | 0.67 | 0.61 | |||||
| 1999 - Institutional Shares (commenced May 1, 1998) | 10.00 | — | 0.67 | 0.67 | ||||||
| 1999 - Service Shares (commenced May 1, 1998) | 10.00 | (0.02 | ) | 0.63 | 0.61 | |||||
|
Distributions to shareholders |
||||||||||||||||||
|---|---|---|---|---|---|---|---|---|---|---|---|---|---|---|---|---|---|---|
| In excess
of net investment income |
From net
realized gains |
Total
distributions |
Net asset
value, end of period |
Total
returna |
Net assets
at end of period (in 000s) |
Ratio of net expenses to average net assets |
||||||||||||
| $ — | $(0.52 | ) | $(0.52 | ) | $16.12 | 26.26 | % | $327,697 | 2.05 | % | ||||||||
| — | (0.52 | ) | (0.52 | ) | 15.98 | 25.66 | 2,827 | 2.55 | ||||||||||
| — | (0.52 | ) | (0.52 | ) | 15.97 | 25.58 | 3,672 | 2.55 | ||||||||||
| — | (0.52 | ) | (0.52 | ) | 16.37 | 27.12 | 187,075 | 1.40 | ||||||||||
| — | (0.52 | ) | (0.52 | ) | 16.16 | 26.57 | 3 | 1.90 | ||||||||||
| — | — | — | 13.24 | 24.67 | 69,458 | 2.05 | b | |||||||||||
| — | — | — | 13.19 | 24.32 | 303 | 2.55 | b | |||||||||||
| — | — | — | 13.19 | 24.32 | 419 | 2.55 | b | |||||||||||
| — | — | — | 13.35 | 25.24 | 65,772 | 1.40 | b | |||||||||||
| — | — | — | 13.24 | 24.79 | 2 | 1.90 | b | |||||||||||
| — | — | — | 10.62 | 6.20 | 33,002 | 2.02 | b | |||||||||||
| — | — | — | 10.61 | 6.10 | 213 | 2.51 | b | |||||||||||
| — | — | — | 10.61 | 6.10 | 175 | 2.51 | b | |||||||||||
| (0.01 | ) | — | (0.01 | ) | 10.66 | 6.67 | 36,992 | 1.40 | b | |||||||||
| — | — | — | 10.61 | 6.10 | 2 | 1.90 | b | |||||||||||
| INTERNATIONAL GROWTH OPPORTUNITIES FUND
|
| (formerly International Small Cap Fund) (continued)
|
| Ratios assuming no
expense reductions |
|||||||||||||
|---|---|---|---|---|---|---|---|---|---|---|---|---|---|
| Ratio of
net investment loss to average net assets |
Ratio of
expenses to average net assets |
Ratio of
net investment loss to average net assets |
Portfolio
turnover rate |
||||||||||
| For the Year Ended August 31, | |||||||||||||
| 2000 - Class A Shares ; | (0.79 | )% | 2.22 | % | (0.96 | )% | 73.43 | % | |||||
| 2000 - Class B Shares | (1.16 | ) | 2.72 | (1.33 | ) | 73.43 | |||||||
| 2000 - Class C Shares | (1.23 | ) | 2.72 | (1.40 | ) | 73.43 | |||||||
| 2000 - Institutional Shares | (0.19 | ) | 1.57 | (0.36 | ) | 73.43 | |||||||
| 2000 - Service Shares | (0.63 | ) | 2.07 | (0.80 | ) | 73.43 | |||||||
| For the Seven-month Period Ended August 31, | |||||||||||||
| 1999 - Class A Shares | (0.68 | ) b | 2.42 | b | (1.05 | ) b | 58.81 | ||||||
| 1999 - Class B Shares | (1.16 | ) b | 2.92 | b | (1.53 | ) b | 58.81 | ||||||
| 1999 - Class C Shares | (1.21 | ) b | 2.92 | b | (1.58 | ) b | 58.81 | ||||||
| 1999 - Institutional Shares | (0.05 | ) b | 1.77 | b | (0.42 | ) b | 58.81 | ||||||
| 1999 - Service Shares | (0.35 | ) b | 2.27 | b | (0.72 | ) b | 58.81 | ||||||
| For the Period Ended January 31, | |||||||||||||
| 1999 - Class A Shares (commenced May 1, 1998) | (1.03 | ) b | 3.60 | b | (2.61 | ) b | 96.11 | ||||||
| 1999 - Class B Shares (commenced May 1, 1998) | (1.30 | ) b | 4.09 | b | (2.88 | ) b | 96.11 | ||||||
| 1999 - Class C Shares (commenced May 1, 1998) | (1.45 | ) b | 4.09 | b | (3.03 | ) b | 96.11 | ||||||
| 1999 - Institutional Shares (commenced May 1, 1998) | (0.19 | ) b | 2.98 | b | (1.77 | ) b | 96.11 | ||||||
| 1999 - Service Shares (commenced May 1, 1998) | (0.26 | ) b | 3.48 | b | (1.84 | ) b | 96.11 | ||||||
| EMERGING MARKETS EQUITY FUND
|
| Income from
investment operations |
||||||||||||
|---|---|---|---|---|---|---|---|---|---|---|---|---|
| Net asset
value, beginning of period |
Net
investment income (loss) |
Net
realized and unrealized gain (loss) |
Total
from investment operations |
|||||||||
| For the Year Ended August 31, | ||||||||||||
| 2000 - Class A Shares | $ 9.26 | $(0.05 | ) c | $ 1.62 | $ 1.57 | |||||||
| 2000 - Class B Shares | 9.21 | (0.11 | ) c | 1.62 | 1.51 | |||||||
| 2000 - Class C Shares | 9.24 | (0.10 | ) c | 1.61 | 1.51 | |||||||
| 2000 - Institutional Shares | 9.37 | 0.01 | c | 1.64 | 1.65 | |||||||
| 2000 - Service Shares | 9.05 | 0.01 | c | 1.57 | 1.58 | |||||||
| For the Seven Months Ended August 31, | ||||||||||||
| 1999 - Class A Shares | 7.04 | (0.01 | ) | 2.23 | 2.22 | |||||||
| 1999 - Class B Shares | 7.03 | (0.03 | ) | 2.21 | 2.18 | |||||||
| 1999 - Class C Shares | 7.05 | (0.03 | ) | 2.22 | 2.19 | |||||||
| 1999 - Institutional Shares | 7.09 | 0.02 | 2.26 | 2.28 | ||||||||
| 1999 - Service Shares | 6.87 | 0.01 | 2.17 | 2.18 | ||||||||
| For the Year Ended January 31, | ||||||||||||
| 1999 - Class A Shares | 9.69 | 0.04 | (2.40 | ) | (2.36 | ) | ||||||
| 1999 - Class B Shares | 9.69 | 0.03 | (2.41 | ) | (2.38 | ) | ||||||
| 1999 - Class C Shares | 9.70 | 0.01 | (2.39 | ) | (2.38 | ) | ||||||
| 1999 - Institutional Shares | 9.70 | 0.06 | (2.36 | ) | (2.30 | ) | ||||||
| 1999 - Service Shares | 9.69 | (0.13 | ) | (2.41 | ) | (2.28 | ) | |||||
| For the Period Ended January 31, | ||||||||||||
| 1998 - Class A Shares (commenced December 15, 1997) | 10.00 | — | (0.31 | ) | (0.31 | ) | ||||||
| 1998 - Class B Shares (commenced December 15, 1997) | 10.00 | — | (0.31 | ) | (0.31 | ) | ||||||
| 1998 - Class C Shares (commenced December 15, 1997) | 10.00 | — | (0.30 | ) | (0.30 | ) | ||||||
| 1998 - Institutional Shares (commenced December 15, 1997) | 10.00 | 0.01 | (0.31 | ) | (0.30 | ) | ||||||
| 1998 - Service Shares (commenced December 15, 1997) | 10.00 | — | (0.31 | ) | (0.31 | ) | ||||||
|
Distributions to shareholders |
|||||||||||||||||
|---|---|---|---|---|---|---|---|---|---|---|---|---|---|---|---|---|---|
| From net
investment income |
In excess of net investment income |
Total
distributions |
Net asset
value, end of period |
Total
returna |
Net assets
at end of period (in 000s) |
Ratio of
net expenses to average net assets |
|||||||||||
| $ — | $ — | $ — | $10.83 | 16.95 | % | $64,279 | 2.11 | % | |||||||||
| — | — | — | 10.72 | 16.40 | 2,187 | 2.61 | |||||||||||
| — | — | — | 10.75 | 16.34 | 1,304 | 2.61 | |||||||||||
| — | — | — | 11.02 | 17.61 | 145,774 | 1.46 | |||||||||||
| — | — | — | 10.63 | 17.46 | 2 | 1.96 | |||||||||||
| — | — | — | 9.26 | 31.53 | 65,698 | 2.04 | b | ||||||||||
| — | — | — | 9.21 | 31.01 | 972 | 2.54 | b | ||||||||||
| — | — | — | 9.24 | 31.06 | 1,095 | 2.54 | b | ||||||||||
| — | — | — | 9.37 | 32.16 | 108,574 | 1.39 | b | ||||||||||
| — | — | — | 9.05 | 31.73 | 2 | 1.89 | b | ||||||||||
| (0.07 | ) | (0.22) | (0.29 | ) | 7.04 | (24.32 | ) | 52,704 | 2.09 | ||||||||
| (0.07 | ) | (0.21) | (0.28 | ) | 7.03 | (24.51 | ) | 459 | 2.59 | ||||||||
| (0.07 | ) | (0.20) | (0.27 | ) | 7.05 | (24.43 | ) | 273 | 2.59 | ||||||||
| (0.08 | ) | (0.23) | (0.31 | ) | 7.09 | (23.66 | ) | 90,189 | 1.35 | ||||||||
| (0.07 | ) | (0.21) | (0.28 | ) | 6.87 | (26.17 | ) | 1 | 1.85 | ||||||||
| — | — | — | 9.69 | (3.10 | ) | 17,681 | 1.90 | b | |||||||||
| — | — | — | 9.69 | (3.10 | ) | 64 | 2.41 | b | |||||||||
| — | — | — | 9.70 | (3.00 | ) | 73 | 2.48 | b | |||||||||
| — | — | — | 9.70 | (3.00 | ) | 19,120 | 1.30 | b | |||||||||
| — | — | — | 9.69 | (3.10 | ) | 2 | 2.72 | b | |||||||||
| EMERGING MARKETS EQUITY FUND (continued)
|
| Ratios assuming no
expense reductions |
|||||||||||||
|---|---|---|---|---|---|---|---|---|---|---|---|---|---|
| Ratio of net
investment income (loss) to average net assets |
Ratio of
expenses to average net assets |
Ratio of net
investment income (loss) to average net assets |
Portfolio
turnover rate |
||||||||||
| For the Year Ended August 31, | |||||||||||||
| 2000 - Class A Shares | (0.49 | )% | 2.30 | % | (0.68 | )% | 125.35 | % | |||||
| 2000 - Class B Shares | (1.00 | ) | 2.80 | (1.19 | ) | 125.35 | |||||||
| 2000 - Class C Shares | (0.96 | ) | 2.80 | (1.15 | ) | 125.35 | |||||||
| 2000 - Institutional Shares | 0.13 | 1.65 | (0.06 | ) | 125.35 | ||||||||
| 2000 - Service Shares | 0.14 | 2.15 | (0.05 | ) | 125.35 | ||||||||
| For the Seven Months Ended August 31, | |||||||||||||
| 1999 - Class A Shares | (0.15 | ) b | 2.41 | b | (0.52 | ) b | 63.24 | ||||||
| 1999 - Class B Shares | (0.71 | ) b | 2.91 | b | (281.08 | ) b | 63.24 | ||||||
| 1999 - Class C Shares | (0.85 | ) b | 2.91 | b | (1.22 | ) b | 63.24 | ||||||
| 1999 - Institutional Shares | 0.50 | b | 1.76 | b | 0.13 | b | 63.24 | ||||||
| 1999 - Service Shares | 0.12 | b | 2.26 | b | (0.25 | ) b | 63.24 | ||||||
| For the Year Ended January 31, | |||||||||||||
| 1999 - Class A Shares | 0.80 | 2.53 | 0.36 | 153.67 | |||||||||
| 1999 - Class B Shares | 0.19 | 3.03 | (0.25 | ) | 153.67 | ||||||||
| 1999 - Class C Shares | 0.28 | 3.03 | (0.16 | ) | 153.67 | ||||||||
| 1999 - Institutional Shares | 1.59 | 1.79 | 1.15 | 153.67 | |||||||||
| 1999 - Service Shares | (1.84 | ) | 2.29 | (2.28 | ) | 153.67 | |||||||
| For the Period Ended January 31, | |||||||||||||
| 1998 - Class A Shares (commenced December 15, 1997) | 0.55 | b | 5.88 | b | (3.43 | ) b | 3.35 | ||||||
| 1998 - Class B Shares (commenced December 15, 1997) | 0.05 | b | 6.39 | b | (3.93 | ) b | 3.35 | ||||||
| 1998 - Class C Shares (commenced December 15, 1997) | (0.27 | ) b | 6.46 | b | (4.25 | ) b | 3.35 | ||||||
| 1998 - Institutional Shares (commenced December 15, 1997) | 0.80 | b | 5.28 | b | (3.18 | ) b | 3.35 | ||||||
| 1998 - Service Shares (commenced December 15, 1997) | (0.05 | ) b | 6.70 | b | (4.03 | ) b | 3.35 | ||||||
| ASIA GROWTH FUND
|
| Income from
investment operations |
||||||||||||
|---|---|---|---|---|---|---|---|---|---|---|---|---|
|
Net asset value, beginning of period |
Net
investment income (loss) |
Net realized
and unrealized gain (loss) |
Total from
investment operations |
|||||||||
| For the Year Ended August 31, | ||||||||||||
| 2000 - Class A Shares | $11.07 | $(0.05 | ) c | $0.14 | $ 0.09 | |||||||
| 2000 - Class B Shares | 10.88 | (0.11 | ) c | 0.14 | 0.03 | |||||||
| 2000 - Class C Shares | 10.85 | (0.11 | ) c | 0.14 | 0.03 | |||||||
| 2000 - Institutional Shares | 11.24 | 0.01 | c | 0.16 | 0.17 | |||||||
| For the Seven-Month Period Ended August 31, | ||||||||||||
| 1999 - Class A Shares | 7.79 | (0.02 | ) | 3.30 | 3.28 | |||||||
| 1999 - Class B Shares | 7.68 | (0.04 | ) | 3.24 | 3.20 | |||||||
| 1999 - Class C Shares | 7.68 | (0.04 | ) | 3.21 | 3.17 | |||||||
| 1999 - Institutional Shares | 7.91 | 0.01 | 3.36 | 3.37 | ||||||||
| For the Years Ended January 31, | ||||||||||||
| 1999 - Class A Shares | 8.38 | 0.07 | (0.66 | ) | (0.59 | ) | ||||||
| 1999 - Class B Shares | 8.31 | 0.01 | (0.64 | ) | (0.63 | ) | ||||||
| 1999 - Class C Shares | 8.29 | — | (0.61 | ) | (0.61 | ) | ||||||
| 1999 - Institutional Shares | 8.44 | 0.03 | (0.56 | ) | (0.53 | ) | ||||||
| 1998 - Class A Shares | 16.31 | — | (7.90 | ) | (7.90 | ) | ||||||
| 1998 - Class B Shares | 16.24 | 0.01 | (7.91 | ) | (7.90 | ) | ||||||
| 1998 - Class C Shares (commenced August 15, 1997) | 15.73 | 0.01 | (7.42 | ) | (7.41 | ) | ||||||
| 1998 - Institutional Shares | 16.33 | 0.10 | (7.96 | ) | (7.86 | ) | ||||||
| 1997 - Class A Shares | 16.49 | 0.06 | (0.11 | ) | (0.05 | ) | ||||||
| 1997 - Class B Shares (commenced May 1, 1996) | 17.31 | (0.05 | ) | (0.48 | ) | (0.53 | ) | |||||
| 1997 - Institutional Shares (commenced February 2, 1996) | 16.61 | 0.04 | (0.11 | ) | (0.07 | ) | ||||||
| 1996 - Class A Shares | 13.31 | 0.17 | 3.44 | 3.61 | ||||||||
|
Distributions to shareholders |
|||||||||||||||||||||
|---|---|---|---|---|---|---|---|---|---|---|---|---|---|---|---|---|---|---|---|---|---|
| From net
investment income |
In excess
of net investment income |
From net
realized gains |
Total
distributions |
Net asset
value, end of period |
Total
returna |
Net assets
at end of period (in 000s) |
Ratio of
net expenses to average net assets |
||||||||||||||
| $ — | $ — | $ — | $ — | $11.16 | 0.72 | % | $ 86,458 | 1.85 | % | ||||||||||||
| — | — | — | — | 10.91 | 0.18 | 6,849 | 2.35 | ||||||||||||||
| — | — | — | — | 10.88 | 0.18 | 2,265 | 2.35 | ||||||||||||||
| — | — | — | — | 11.41 | 1.42 | 5,236 | 1.20 | ||||||||||||||
| — | |||||||||||||||||||||
| — | — | — | — | 11.07 | 42.11 | 84,269 | 1.85 | b | |||||||||||||
| — | — | — | — | 10.88 | 41.67 | 7,258 | 2.35 | b | |||||||||||||
| — | — | — | — | 10.85 | 41.28 | 2,281 | 2.35 | b | |||||||||||||
| — | (0.04 | ) | — | (0.04 | ) | 11.24 | 42.61 | 12,363 | 1.20 | b | |||||||||||
| — | — | — | — | 7.79 | (7.04 | ) | 59,940 | 1.93 | |||||||||||||
| — | — | — | — | 7.68 | (7.58 | ) | 4,190 | 2.45 | |||||||||||||
| — | — | — | — | 7.68 | (7.36 | ) | 999 | 2.45 | |||||||||||||
| — | — | — | — | 7.91 | (6.28 | ) | 4,200 | 1.16 | |||||||||||||
| — | (0.03 | ) | — | (0.03 | ) | 8.38 | (48.49 | ) | 87,437 | 1.75 | |||||||||||
| — | (0.03 | ) | — | (0.03 | ) | 8.31 | (48.70 | ) | 3,359 | 2.30 | |||||||||||
| — | (0.03 | ) | — | (0.03 | ) | 8.29 | (47.17 | ) | 436 | 2.35 | b | ||||||||||
| (0.03 | ) | — | — | (0.03 | ) | 8.44 | (48.19 | ) | 874 | 1.11 | |||||||||||
| (0.12 | ) | — | (0.01 | ) | (0.13 | ) | 16.31 | (1.01 | ) | 263,014 | 1.67 | ||||||||||
| (0.51 | ) | (0.03 | ) | — | (0.54 | ) | 16.24 | (6.02 | ) | 3,354 | 2.21 | b | |||||||||
| (0.11 | ) | (0.06 | ) | (0.04 | ) | (0.21 | ) | 16.33 | (1.09 | ) | 13,322 | 1.10 | b | ||||||||
| (0.12 | ) | (0.14 | ) | (0.17 | ) | (0.43 | ) | 16.49 | 26.49 | 205,539 | 1.77 | ||||||||||
| ASIA GROWTH FUND (continued)
|
| Ratios assuming no
expense reductions |
|||||||||||||
|---|---|---|---|---|---|---|---|---|---|---|---|---|---|
| Ratio of net
investment income (loss) to average net assets |
Ratio of
expenses to average net assets |
Ratio of net
investment income (loss) to average net assets |
Portfolio
turnover rate |
||||||||||
| For the Year Ended August 31, | |||||||||||||
| 2000 - Class A Shares | (0.39 | )% | 2.30 | % | (0.84 | )% | 207.22 | % | |||||
| 2000 - Class B Shares | (0.91 | ) | 2.80 | (1.36 | ) | 207.22 | |||||||
| 2000 - Class C Shares | (0.91 | ) | 2.80 | (1.36 | ) | 207.22 | |||||||
| 2000 - Institutional Shares | 0.12 | 1.65 | (0.33 | ) | 207.22 | ||||||||
| For the Seven-Month Period Ended August 31, | |||||||||||||
| 1999 - Class A Shares | (0.38 | ) b | 2.27 | b | (0.80 | ) b | 96.58 | ||||||
| 1999 - Class B Shares | (0.90 | ) b | 2.77 | b | (1.32 | ) b | 96.58 | ||||||
| 1999 - Class C Shares | (0.89 | ) b | 2.77 | b | (1.31 | ) b | 96.58 | ||||||
| 1999 - Institutional Shares | (0.14 | ) b | 1.62 | b | (0.28 | ) b | 96.58 | ||||||
| For the Years Ended January 31, | |||||||||||||
| 1999 - Class A Shares | 0.63 | 2.48 | 0.08 | 106.00 | |||||||||
| 1999 - Class B Shares | 0.10 | 2.97 | (0.42 | ) | 106.00 | ||||||||
| 1999 - Class C Shares | 0.10 | 2.97 | (0.42 | ) | 106.00 | ||||||||
| 1999 - Institutional Shares | 1.10 | 1.68 | 0.58 | 106.00 | |||||||||
| 1998 - Class A Shares | 0.31 | 1.99 | 0.07 | 105.16 | |||||||||
| 1998 - Class B Shares | (0.29 | ) | 2.50 | (0.49 | ) | 105.16 | |||||||
| 1998 - Class C Shares (commenced August 15, 1997) | (0.26 | ) b | 2.55 | b | (0.46 | ) b | 105.16 | ||||||
| 1998 - Institutional Shares | 0.87 | 1.31 | 0.67 | 105.16 | |||||||||
| 1997 - Class A Shares | 0.20 | 1.87 | — | 48.40 | |||||||||
| 1997 - Class B Shares (commenced May 1, 1996) | (0.56 | ) b | 2.37 | b | (0.72 | ) b | 48.40 | ||||||
| 1997 - Institutional Shares (commenced February 2, 1996) | 0.54 | b | 1.26 | b | 0.38 | b | 48.40 | ||||||
| 1996 - Class A Shares | 1.05 | 2.02 | 0.80 | 88.80 | |||||||||
a
|
Assumes investment at the net asset value at the beginning of the period, reinvestment of all dividends and
distributions, a complete redemption of the investment at the net asset value at the end of the period and no sales or redemption charges. Total return would be reduced if a sales or redemption charge were taken into account. Total returns for periods
less than one full year are not annualized.
|
b
|
Annualized.
|
c
|
Calculated based on the average shares outstanding methodology.
|
| FOR MORE INFORMATION
|
| Annual/Semi-annual Report
|
| Additional information about the Funds’ investments is available in the Funds’ annual and semi-annual reports to
shareholders. In the Funds’ annual reports, you will find a discussion of the market conditions and investment strategies that significantly affected the Funds’ performance during the last fiscal year.
|
| Statement of Additional Information
|
| Additional information about the Funds and their policies is also available in the Funds’ Statement of Additional Information
(“Additional Statement”). The Additional Statement is incorporated by reference into this Prospectus (is legally considered part of this Prospectus).
|
| The Funds’ annual and semi-annual reports, and the Additional Statement, are available free upon request by calling Goldman
Sachs at 1-800-526-7384.
|
| To obtain other information and for shareholder inquiries:
|
| By telephone – Call 1-800-526-7384
|
| By mail – Goldman Sachs Funds, 4900 Sears Tower, Chicago, IL 60606-6372
|
| By e-mail – [email protected]
|
| On the Internet – Text-only versions of the Funds’ documents are located online and may be downloaded from:
|
| SEC EDGAR database – http://www.sec.gov
|
| Goldman Sachs – http://www.gs.com (Prospectus Only)
|
| You may review and obtain copies of Fund documents by visiting the SEC’s Public Reference Room in Washington, D.C. You may
also obtain copies of Fund documents, after paying a duplicating fee, by writing to the SEC’s Public Reference Section, Washington, D.C. 20549-0102 or by electronic request to: [email protected]. Information on the operation of the public reference
room may be obtained by calling the SEC at (202) 942-8090.
|
| The Funds’ investment company registration number is 811-5349.
|
| CORE
SM
is a service mark of Goldman, Sachs & Co.
|
| Prospectus
|
| GOLDMAN SACHS INTERNATIONAL EQUITY FUNDS
|
| THE SECURITIES AND EXCHANGE COMMISSION HAS NOT APPROVED OR DISAPPROVED THESE SECURITIES OR PASSED UPON THE ADEQUACY OF THIS PROSPECTUS.
ANY REPRESENTATION TO THE CONTRARY IS A CRIMINAL OFFENSE.
|
| AN INVESTMENT IN A FUND IS NOT A BANK DEPOSIT AND IS NOT INSURED BY THE FEDERAL DEPOSIT INSURANCE CORPORATION OR ANY OTHER GOVERNMENT
AGENCY. AN INVESTMENT IN A FUND INVOLVES INVESTMENT RISKS, INCLUDING POSSIBLE LOSS OF PRINCIPAL.
|
| n
|
Goldman Sachs CORE SM
International Equity Fund
|
n
|
Goldman Sachs International Equity Fund
|
n
|
Goldman Sachs European Equity Fund
|
n
|
Goldman Sachs Japanese Equity Fund
|
n
|
Goldman Sachs International Growth Opportunities Fund (formerly International Small Cap Fund)
|
n
|
Goldman Sachs Emerging Markets Equity Fund
|
| n | Goldman Sachs Asia Growth Fund
|

| NOT FDIC-INSURED
|
May Lose Value
|
No Bank Guarantee |
| Goldman Sachs Asset Management, a unit of the Investment Management Division of Goldman, Sachs & Co. (“Goldman
Sachs”), serves as investment adviser to the CORE International Equity Fund. Goldman Sachs Asset Management International serves as investment adviser to International Equity, European Equity, Japanese Equity, International Growth Opportunities,
Emerging Markets Equity and Asia Growth Funds. Goldman Sachs Asset Management and Goldman Sachs Asset Management International are each referred to in this Prospectus as the “Investment Adviser.”
|
| ACTIVE INTERNATIONAL STYLE FUNDS
|
| Goldman Sachs’ Active International Investment Philosophy:
|
| Belief | How the Investment Adviser Acts on Belief | ||
|---|---|---|---|
| n Equity markets are inefficient | Seeks excess return through team driven, research
intensive and bottom-up stock selection. |
||
| n Returns are variable | Seeks to capitalize on variability of market and regional
returns through asset allocation decisions. |
||
| n
Corporate fundamentals
ultimately drive share price |
Seeks to conduct rigorous, first-hand research of business
and company management. |
||
| n A
business’ intrinsic value will be
achieved over time |
Seeks to realize value through a long-term investment
horizon. |
||
| n
Portfolio risk must be carefully
analyzed and monitored |
Seeks to systematically monitor and manage risk through
diversification, multifactor risk models and currency management. |
||
| The Investment Adviser attempts to manage risk in these Funds through disciplined portfolio construction and continual portfolio
review and analysis. As a result, bottom-up stock selection, driven by fundamental research, should be a main driver of returns.
|
| QUANTITATIVE (“CORE”) STYLE FUNDS
|
| Goldman Sachs’ CORE Investment Philosophy:
|
| Goldman Sachs’ quantitative style of funds—CORE—emphasizes the two building blocks of active management: stock
selection and portfolio construction.
|
| I. CORE STOCK SELECTION
|
| The CORE Fund uses the Goldman Sachs proprietary multifactor model (“Multifactor Model”), a rigorous computerized rating
system, to forecast the returns of securities held in the Fund’s portfolio. The Multifactor Model incorporates common variables covering measures of:
|
n
|
Value (How is the company priced relative to fundamental accounting measures?)
|
n
|
Price Momentum (What are medium-term price trends?)
|
n
|
Earnings Momentum (Are company profit expectations growing?)
|
n
|
Stability (How likely is the risk of earnings disappointment?)
|
| All of the above factors are carefully evaluated within the Multifactor Model since each has demonstrated a significant
impact on the performance of the securities and markets they were designed to forecast. Stock selection in this process combines both our quantitative and qualitative analysis.
|
| II. CORE PORTFOLIO CONSTRUCTION
|
| Portfolio risk is monitored with the use of a sophisticated risk model, which measures the portfolio’s exposure to a variety
of risk factors and estimates the associated volatility. In this process, the Investment Adviser manages risk by attempting to limit deviations from the benchmark and by attempting to run a size and sector neutral portfolio. A computer optimizer evaluates many different security combinations (considering many possible weightings) in an effort to construct the most efficient risk/return portfolio given each CORE Fund benchmark. In addition, the CORE International
Equity Fund utilizes proprietary quantitative models to allocate assets across countries.
|
| Goldman Sachs CORE Funds are fully invested, broadly diversified and offer consistent overall portfolio characteristics. They may
serve as good foundations on which to build a portfolio.
|
| FUND FACTS
|
|
| Objective:
|
Long-term growth of capital
|
| Benchmark:
|
MSCI® Europe, Australasia, Far East (“EAFE®”) Index (unhedged)
|
| Investment Focus:
|
Large-capitalization equity securities of companies that are organized outside the United States or whose securities are primarily traded outside
the United States
|
| Investment Style:
|
Quantitative
|
| INVESTMENT OBJECTIVE
|
| The Fund seeks long-term growth of capital. The Fund seeks this objective through a broadly diversified portfolio of equity
securities of large-cap companies that are organized outside the United States or whose securities are principally traded outside the United States.
|
| PRINCIPAL INVESTMENT STRATEGIES
|
| Equity Securities. The Fund invests, under normal circumstances, at least 90% of its total assets in equity securities of companies that are organized outside the United States or whose securities are principally traded outside the United States.
|
| The Fund may allocate its assets among countries as determined by the Investment Adviser from time to time, provided the Fund’
s assets are invested in at least three foreign countries. The Fund may invest in the securities of issuers in countries with emerging markets or economies (“emerging countries”).
|
| The Fund seeks broad representation of large-cap issuers across major countries and sectors of the international economy. The
Fund’s investments are selected using both a variety of quantitative techniques and fundamental research in seeking to maximize the Fund’s expected return, while maintaining risk, style, capitalization and industry characteristics similar to the
EAFE® Index. In addition, the Fund seeks a portfolio composed of companies with attractive valuations and stronger momentum characteristics than the EAFE® Index.
|
| Other.
The Fund’s investments in fixed-income securities are limited to securities that are considered to be cash equivalents.
|
| FUND FACTS
|
|
| Objective:
|
Long-term capital appreciation
|
| Benchmark:
|
MSCI® EAFE® Index (unhedged)
|
| Investment Focus:
|
Equity securities of companies organized outside the United States or whose securities are principally traded outside the United States
|
| Investment Style:
|
Active International
|
| INVESTMENT OBJECTIVE
|
| The Fund seeks long-term capital appreciation.
|
| PRINCIPAL INVESTMENT STRATEGIES
|
| Equity Securities. The Fund invests, under normal circumstances, substantially all, and at least 65% of its total assets in equity securities of companies that are organized outside the United States or whose securities are principally traded outside the United States. The
Fund intends to invest in companies with public stock market capitalizations that are larger than $1 billion at the time of investment.
|
| The Fund may allocate its assets among countries as determined by the Investment Adviser from time to time provided that the
Fund’s assets are invested in at least three foreign countries.
|
| The Fund expects to invest a substantial portion of its assets in the securities of issuers located in the developed countries of
Western Europe and in Japan. However, the Fund may also invest in the securities of issuers located in Australia, Canada, New Zealand and in emerging countries. Currently, emerging countries include, among others, most Latin American, African, Asian and
Eastern European nations.
|
| Other.
The Fund may also invest up to 35% of its total assets in fixed-income securities, such as government, corporate and bank debt obligations.
|
| FUND FACTS
|
|
| Objective:
|
Long-term capital appreciation
|
| Benchmark:
|
MSCI® Europe Index (unhedged)
|
| Investment Focus:
|
Equity securities of European companies
|
| Investment Style:
|
Active International
|
| INVESTMENT OBJECTIVE
|
| The Fund seeks long-term capital appreciation.
|
| PRINCIPAL INVESTMENT STRATEGIES
|
| Equity Securities. The Fund invests, under normal circumstances, substantially all, and at least 65% of its total assets in equity securities of European companies. Because of its focus, the Fund will be more susceptible to European economic, market, political and local
risks than a fund that is more geographically diversified.
|
| A European issuer is a company that either:
|
n
|
Has a class of its securities whose principal securities markets are in European countries;
|
n
|
Is organized under the laws of, or has a principal office in, a European country;
|
n
|
Derives 50% or more of its total revenue from goods produced, sales made or services provided in one or more of the European
countries; or
|
n
|
Maintains 50% or more of its assets in one or more of the European countries.
|
| The Fund may allocate its assets among different countries as determined by the Investment Adviser from time to time, provided
that the Fund’s assets are invested in at least three European countries. It is currently anticipated that a majority of the Fund’s assets will be invested in the equity securities of large cap companies located in the developed countries of
Western Europe. However, the Fund may also invest, without limit, in mid cap companies and small cap companies, as well as companies located in emerging countries. Currently, emerging countries include among others, most Latin and South American, African,
Asian and Eastern European nations, including the states that formerly comprised the Soviet Union and Yugoslavia.
|
| Other.
The Fund may invest in the aggregate up to 35% of its total assets in equity securities of non-European countries and in fixed-income securities, such as government, corporate and bank debt obligations.
|
| FUND FACTS
|
|
| Objective:
|
Long-term capital appreciation
|
| Benchmark:
|
Tokyo Price Index (“TOPIX”) (unhedged)
|
| Investment Focus:
|
Equity securities of Japanese companies
|
| Investment Style:
|
Active International
|
| INVESTMENT OBJECTIVE
|
| The Fund seeks long-term capital appreciation.
|
| PRINCIPAL INVESTMENT STRATEGIES
|
| Equity Securities. The Fund invests, under normal circumstances, substantially all, and at least 65% of its total assets in equity securities of Japanese companies. A Japanese issuer is a company that either:
|
n
|
Has a class of its securities whose principal securities markets is in Japan;
|
n
|
Is organized under the laws of, or has a principal office in, Japan;
|
n
|
Derives 50% or more of its total revenue from goods produced, sales made or services provided in Japan; or
|
n
|
Maintains 50% or more of its assets in Japan.
|
| The Fund’s concentration in Japanese companies will expose it to the risk of adverse social, political and economic events
which occur in Japan or affect the Japanese markets.
|
| Japan’s economy, the second largest in the world, has grown substantially over the last three decades. Japan’s economic
growth in the 1990’s, however, was substantially below the level of earlier decades, and its economy drifted between modest growth and recession. In calendar year 1998, Japan’s gross national product contracted by 2.8% — its worst
performance in the post-war period. To address this economic downturn, Japan has attempted to implement changes related to high wages and taxes, currency valuations, structural rigidities, political reform and the deregulation of its economy. These
initiatives have, however, resulted in notable uncertainty and loss of public confidence. These conditions pres
ent risks to the Japanese Equity Fund and its ability to attain its investment objective.
|
| Japan’s economy is heavily dependent upon international trade, and is especially sensitive to trade barriers and disputes. In
particular, Japan relies on large imports of agricultural products, raw materials and fuels. A substantial rise in world oil or commodity prices, or a fall-off in Japan’s manufactured exports, could be expected to adversely affect Japan’s
economy. In addition, Japan is vulnerable to earthquakes, volcanoes and other natural disasters. Japan’s banking industry has recently suffered from non-performing loans, lower real estate values and lower valuations of securities holdings.
|
| The Japanese securities markets are less regulated than the U.S. markets. Evidence has emerged from time to time of distortion of
market prices to serve political or other purposes. Shareholders’ rights are also not always equally enforced.
|
| For most of the 1990’s, Japanese securities markets experienced significant declines. Although the stock markets exhibited
strength in 1999, they have again generally declined through the first three quarters of 2000.
|
| The common stocks of many Japanese companies have historically traded at high price-earnings ratios. Differences in accounting
methods have made it difficult to compare the earnings of Japanese companies with those of companies in other countries, especially the United States. Reported net income in Japan has been generally understated relative to U.S. accounting standards and
this has been one reason price-earnings ratios of the stocks of Japanese companies have tended historically to be higher than those of U.S. stocks. In addition, Japanese companies have tended to have higher growth rates than U.S. companies, and Japanese
interest rates have generally been lower than U.S. interest rates. These factors have contributed to lower discount rates and higher price-earnings ratios in Japan than in the United States.
|
| Other.
The Fund may invest in the aggregate up to 35% of its total assets in equity securities of non-Japanese companies and in fixed-income securities, such as government, corporate and bank debt obligations.
|
| FUND FACTS
|
|
| Objective:
|
Long-term capital appreciation
|
| Benchmark:
|
MSCI® EAFE® Small Cap Index (unhedged)
|
| Investment Focus:
|
Small-capitalization foreign equity securities
|
| Investment Style:
|
Active International
|
| INVESTMENT OBJECTIVE
|
| The Fund seeks long-term capital appreciation.
|
| PRINCIPAL INVESTMENT STRATEGIES
|
| Equity Securities. The Fund invests, under normal circumstances, substantially all, and at least 65% of its total assets in equity securities of companies:
|
n
|
With public stock market capitalizations (based upon shares available for trading on an unrestricted basis) within $100 million
and $3 billion, at the time of investment; and
|
n
|
That are organized outside the United States or whose securities are principally traded outside the United States.
|
| The Fund seeks to achieve its investment objective by investing in a diversified portfolio of equity securities that are
considered by the Investment Adviser to be strategically positioned for long-term growth.
|
| The Fund may allocate its assets among countries as determined by the Investment Adviser from time to time provided that the
Fund’s assets are invested in at least three foreign countries. The Fund expects to invest a substantial portion of its assets in securities of companies in the developed countries of Western Europe, Japan and Asia. However, the Fund may also invest
in the securities of issuers located in Australia, Canada, New Zealand and in emerging countries. Currently, emerging countries include, among others, most Latin American, African, Asian and Eastern European nations.
|
| Other.
The Fund may invest in the aggregate up to 35% of its total assets in equity securities of companies with public stock market capitalizations outside the range of the market capitalization range stated above at the time of investment and in fixed-income
securities, such as government, corporate and bank debt obligations. If the market capitalization of a company held by the Fund moves outside the range stated above, the Fund may, consistent with its investment objective, continue to hold the security.
|
| FUND FACTS
|
|
| Objective:
|
Long-term capital appreciation
|
| Benchmark:
|
MSCI® Emerging Markets Free Index
|
| Investment Focus:
|
Equity securities of emerging country issuers
|
| Investment Style:
|
Active International
|
| INVESTMENT OBJECTIVE
|
| The Fund seeks long-term capital appreciation.
|
| PRINCIPAL INVESTMENT STRATEGIES
|
| Equity Securities. The Fund invests, under normal circumstances, substantially all, and at least 65% of its total assets in equity securities of emerging country issuers. The Investment Adviser may consider classifications by the World Bank, the International Finance
Corporation or the United Nations and its agencies in determining whether a country is emerging or developed. Currently, emerging countries include, among others, most Latin and South American, African, Asian and Eastern European nations. The Investment
Adviser currently intends that the Fund’s investment focus will be in the following emerging countries as well as any other emerging country to the extent that foreign investors are permitted by applicable law to make such investments:
|
| n Argentina | n Egypt | n Jordan | n Philippines | n Taiwan | ||||
| n Botswana | n Greece | n Kenya | n Poland | n Thailand | ||||
| n Brazil | n Hong Kong | n Malaysia | n Russia | n Turkey | ||||
| n Chile | n Hungary | n Mexico | n Singapore | n Venezuela | ||||
| n China | n India | n Morocco | n South Africa | n Zimbabwe | ||||
| n Colombia | n Indonesia | n Pakistan | n South Korea | |||||
| n Czech Republic | n Israel | n Peru | n Sri Lanka |
| An emerging country issuer is any company that either:
|
n
|
Has a class of its securities whose principal securities market is in an emerging country;
|
n
|
Is organized under the laws of, or has a principal office in, an emerging country;
|
n
|
Derives 50% or more of its total revenue from goods produced, sales made or services provided in one or more emerging countries; or
|
n
|
Maintains 50% or more of its assets in one or more of the emerging countries.
|
| Under normal circumstances, the Fund maintains investments in at least six emerging countries, and will not invest more than 35%
of its total assets in securities of issuers in any one emerging country. Allocation of the Fund’s investments will depend upon the relative attractiveness of the emerging country markets and particular issuers. In addition, macro-economic factors
and the portfolio managers’ and Goldman Sachs economists’ views of the relative attractiveness of emerging countries and currencies are considered in allocating the Fund’s assets among emerging countries.
|
| Other.
The Fund may invest in the aggregate up to 35% of its total assets in (i) fixed-income securities of private and government emerging country issuers; and (ii) equity and fixed-income securities, such as government, corporate and bank debt obligations, of
issuers in developed countries.
|
| FUND FACTS
|
|
| Objective:
|
Long-term capital appreciation
|
| Benchmark:
|
MSCI® All Country Asia Free
ex-Japan Index (unhedged) |
| Investment Focus:
|
Equity securities of companies in Asian countries
|
| Investment Process:
|
Active International
|
| INVESTMENT OBJECTIVE
|
| The Fund seeks long-term capital appreciation.
|
| PRINCIPAL INVESTMENT STRATEGIES
|
| Equity Securities. The Fund invests, under normal circumstances, substantially all, and at least 65% of its total assets in equity securities of Asian issuers.
|
| An Asian issuer is any company that either:
|
n
|
Has a class of its securities whose principal securities markets is in one or more Asian countries;
|
n
|
Is organized under the laws of, or has a principal office in, an Asian country;
|
n
|
Derives 50% or more of its total revenue from goods produced, sales made or services provided in one or more Asian countries; or
|
n
|
Maintains 50% or more of its assets in one or more Asian countries.
|
| The Fund may allocate its assets among the Asian countries as determined from time to time by the Investment Adviser. For purposes
of the Fund’s investment policies, Asian countries are:
|
| n China
n
Hong Kong
n
India
n
Indonesia
|
n Malaysia
n
Pakistan
n
Philippines
n
Singapore
|
n South Korea
n
Sri Lanka
n
Taiwan
n
Thailand
|
| as well as any other country in Asia (other than Japan) to the extent that foreign investors are permitted by applicable law to
make such investments.
|
| Allocation of the Fund’s investments will depend upon the Investment Adviser’s views of the relative attractiveness of
the Asian markets and particular issuers.
|
| Concentration of the Fund’s assets in one or a few of the Asian countries and Asian currencies will subject the Fund to
greater risks than if the Fund’s assets were not so concentrated. For example, on August 31, 2000 (the end of the Fund’s last fiscal year), more than 25% of the Fund’s assets were invested in securities that traded in Hong Kong.
|
| Starting in mid-1997 some Pacific region countries began to experience currency devaluations that resulted in high interest rate
levels and sharp reductions in economic activity. This situation resulted in a significant drop in the securities prices of companies located in the region. Some countries have recently experienced government intervention, have sought assistance from the
International Monetary Fund and have experienced substantial domestic unrest. Although some restructuring has been undertaken, there can be no assurance that these efforts will be successful or that their recent problems will not persist. At the end of
its last fiscal year, a substantial portion of the Asia Growth Fund was invested in securities traded in the Hong Kong market. In 1997, the sovereignty of Hong Kong reverted from the United Kingdom to China. Although Hong Kong is, by law, to maintain a
high degree of autonomy, there can be no assurance that Hong Kong will not be adversely affected by Chinese sovereignty or political developments. Furthermore, the reversion of Hong Kong to China has created additional uncertainty as to future currency
valuations relative to the U.S. dollar. Because the Hong Kong stock market has significant exposure to the property market in Hong Kong, the Fund’s investments could be adversely affected by a decline in the market.
|
| Other.
The Fund may invest in the aggregate up to 35% of its total assets in equity securities of issuers in non-Asian countries and Japan, and in fixed-income securities, such as government, corporate and bank debt obligations.
|
| CORE
International Equity Fund |
International
Equity Fund |
European
Equity Fund |
|||||
|---|---|---|---|---|---|---|---|
| Investment Practices | |||||||
| Borrowings | 33 1
/3
|
33 1
/3
|
33 1
/3
|
||||
| Cross Hedging of Currencies | Ÿ | Ÿ | Ÿ | ||||
| Currency Swaps* | 15 | 15 | 15 | ||||
| Custodial Receipts | Ÿ | Ÿ | Ÿ | ||||
| Equity Swaps* | 15 | 15 | 15 | ||||
| Foreign Currency Transactions | Ÿ | Ÿ | Ÿ | ||||
| Futures Contracts and Options on Futures Contracts | Ÿ | Ÿ | Ÿ | ||||
| Investment Company Securities (including iShares
SM
and Standard & Poor’s Depositary Receipts TM ) |
10 | 10 | 10 | ||||
| Options on Foreign Currencies 1 | Ÿ | Ÿ | Ÿ | ||||
| Options on Securities and Securities Indices 2 | Ÿ | Ÿ | Ÿ | ||||
| Unseasoned Companies | Ÿ | Ÿ | Ÿ | ||||
| Warrants and Stock Purchase Rights | Ÿ | Ÿ | Ÿ | ||||
| Repurchase Agreements | Ÿ | Ÿ | Ÿ | ||||
| Securities Lending | 33 1
/3
|
33 1
/3
|
33 1
/3
|
||||
| Short Sales Against the Box | — | 25 | 25 | ||||
| When-Issued Securities and Forward Commitments | Ÿ | Ÿ | Ÿ | ||||
|
Japanese Equity Fund |
International
Growth Opportunities Fund |
Emerging Markets Equity Fund |
Asia Growth Fund |
||||
|---|---|---|---|---|---|---|---|
| 33 1
/3
|
33 1
/3
|
33 1
/3
|
33 1
/3
|
||||
| Ÿ | Ÿ | Ÿ | Ÿ | ||||
| 15 | 15 | 15 | 15 | ||||
| Ÿ | Ÿ | Ÿ | Ÿ | ||||
| 15 | 15 | 15 | 15 | ||||
| Ÿ | Ÿ | Ÿ | Ÿ | ||||
| Ÿ | Ÿ | Ÿ | Ÿ | ||||
| 10 | 10 | 10 | 10 | ||||
| Ÿ | Ÿ | Ÿ | Ÿ | ||||
| Ÿ | Ÿ | Ÿ | Ÿ | ||||
| Ÿ | Ÿ | Ÿ | Ÿ | ||||
| Ÿ | Ÿ | Ÿ | Ÿ | ||||
| Ÿ | Ÿ | Ÿ | Ÿ | ||||
| 33 1
/3
|
33 1
/3
|
33 1
/3
|
33 1
/3
|
||||
| 25 | 25 | 25 | 25 | ||||
| Ÿ | Ÿ | Ÿ | Ÿ | ||||
Ÿ
|
No specific percentage limitation on usage;
limited only by the objectives and strategies of the Fund |
| CORE
International Equity Fund |
International
Equity Fund |
European
Equity Fund |
|||||
|---|---|---|---|---|---|---|---|
| Investment Securities | |||||||
| American, European and Global Depositary Receipts | Ÿ | Ÿ | Ÿ | ||||
| Asset-Backed and Mortgage-Backed Securities 2 | — | Ÿ | Ÿ | ||||
| Bank Obligations 1 , 2 | Ÿ | Ÿ | Ÿ | ||||
| Convertible Securities | Ÿ | Ÿ | Ÿ | ||||
| Corporate Debt Obligations 2 | Ÿ 4 | Ÿ | Ÿ | ||||
| Equity Securities | 90+ | 65+ | 65+ | ||||
| Emerging Country Securities | 25 | Ÿ | Ÿ | ||||
| Fixed Income Securities 3 | 10 4 | 35 | 35 5 | ||||
| Foreign Securities | Ÿ | Ÿ | Ÿ | ||||
| Foreign Government Securities 2 | Ÿ | Ÿ | Ÿ | ||||
| Non-Investment Grade Fixed Income Securities 2 | — | Ÿ 6 | Ÿ 6 | ||||
| Real Estate Investment Trusts | Ÿ | Ÿ | Ÿ | ||||
| Structured Securities * | Ÿ | Ÿ | Ÿ | ||||
| Temporary Investments | 35 | 100 | 100 | ||||
| U.S. Government Securities 2 | Ÿ | Ÿ | Ÿ | ||||
*
|
Limited to 15% of net assets (together with other illiquid securities) for all structured securities which are not
deemed to be liquid and all swap transactions.
|
1
|
Issued by U.S. or foreign banks.
|
2
|
Limited by the amount the Fund invests in fixed-income securities.
|
3
|
Except as noted under “Non-Investment Grade Fixed Income Securities,” fixed-income securities are investment
grade (e.g., BBB or higher by Standard & Poor’s Rating Group (“Standard & Poor’s”) or Baa or higher by Moody’s Investor’s Service, Inc. (“Moody’s”)).
|
4
|
Cash equivalents only.
|
5
|
The European Equity Fund may invest in the aggregate up to 35% of its total assets in: (1) equity securities of
non-European countries; and (2) fixed-income securities.
|
6
|
May be BB or lower by Standard & Poor’s or Ba or lower by Moody’s.
|
| Japanese
Equity Fund |
International
Growth Opportunities Fund |
Emerging
Markets Equity Fund |
Asia Growth
Fund |
|||||||
|---|---|---|---|---|---|---|---|---|---|---|
| Ÿ | Ÿ | Ÿ | Ÿ | |||||||
| Ÿ | Ÿ | Ÿ | Ÿ | |||||||
| Ÿ | Ÿ | Ÿ | Ÿ | |||||||
| Ÿ | Ÿ | Ÿ | Ÿ | |||||||
| Ÿ | Ÿ | Ÿ | Ÿ | |||||||
| 65 | + | 65+ | 65 | + | 65 | + | ||||
| Ÿ | Ÿ | Ÿ | Ÿ | |||||||
| 35 | 7 | 35 8 | 35 | 9 | 35 | 10 | ||||
| Ÿ | Ÿ | Ÿ | Ÿ | |||||||
| Ÿ | Ÿ | Ÿ | Ÿ | |||||||
| Ÿ | 6 | Ÿ |
Ÿ | 6 | Ÿ | 6 | ||||
| Ÿ | Ÿ | Ÿ | Ÿ | |||||||
| Ÿ | Ÿ | Ÿ | Ÿ | |||||||
| 100 | 100 | 35 | 100 | |||||||
| Ÿ | Ÿ | Ÿ | Ÿ | |||||||
7
|
The Japanese Equity Fund may invest in the aggregate up to 35% of its total assets in: (1) fixed-income securities; and
(2) equity securities of non-Japanese companies.
|
8
|
The International Growth Opportunities Fund may invest in the aggregate up to 35% of its total assets in (1) fixed-income
securities; and (2) equity securities of companies with public stock market capitalizations of less than $100 million or more than $3 billion at the time of investment.
|
9
|
The Emerging Markets Equity Fund may invest in the aggregate up to 35% of its total assets in: (1) fixed-income
securities of private and government emerging country issuers; and (2) equity and fixed-income securities of issuers in developed countries.
|
10
|
The Asia Growth Fund may invest in the aggregate up to 35% of its total assets in: (1) fixed-income securities; and (2)
equity securities of issuers in non-Asian countries and Japan.
|
| CORE
International Equity |
International
Equity |
European
Equity |
Japanese
Equity |
International
Growth Opportunities |
Emerging
Markets Equity |
Asia
Growth |
|||||||||
|---|---|---|---|---|---|---|---|---|---|---|---|---|---|---|---|
| Credit/Default | Ÿ | Ÿ | Ÿ | Ÿ | Ÿ | Ÿ | Ÿ | ||||||||
| Emerging Countries | Ÿ | Ÿ | Ÿ | Ÿ | Ÿ | Ÿ | Ÿ | ||||||||
| Interest Rate | Ÿ | Ÿ | Ÿ | Ÿ | Ÿ | Ÿ | Ÿ | ||||||||
| Small Cap | — | — | Ÿ | — | Ÿ | — | — | ||||||||
| Foreign | Ÿ | Ÿ | Ÿ | Ÿ | Ÿ | Ÿ | Ÿ | ||||||||
| Derivatives | Ÿ | Ÿ | Ÿ | Ÿ | Ÿ | Ÿ | Ÿ | ||||||||
| Management | Ÿ | Ÿ | Ÿ | Ÿ | Ÿ | Ÿ | Ÿ | ||||||||
| Market | Ÿ | Ÿ | Ÿ | Ÿ | Ÿ | Ÿ | Ÿ | ||||||||
| Liquidity | Ÿ | Ÿ | Ÿ | Ÿ | Ÿ | Ÿ | Ÿ | ||||||||
| Stock | Ÿ | Ÿ | Ÿ | Ÿ | Ÿ | Ÿ | Ÿ | ||||||||
| Geographic | — | — | Ÿ | Ÿ | — | Ÿ | — | ||||||||
| Initial Public
Offering (“IPO”) |
— | — | Ÿ | Ÿ | Ÿ | Ÿ | Ÿ | ||||||||
n
|
Credit/Default Risk—The risk that an issuer or guarantor of fixed-income securities held by a Fund may default
on its obligation to pay interest and repay principal.
|
n
|
Emerging Countries Risk—The securities markets of Asian, Latin and South American, Eastern European,
African and other emerging countries are less liquid, are especially subject to greater price volatility, have smaller market capitalizations, have less government regulation and are not subject to as extensive and frequent accounting, financial and other
reporting requirements as the securities markets of more developed countries. Further, investment in equity securities of issuers located in Russia and certain other emerging countries involves risk of loss result
ing from problems in share registration and custody and substantial economic and political disruptions. These risks are not normally associated with investment in more developed countries.
|
n
|
Interest Rate Risk—The risk that when interest rates increase, securities held by a Fund will decline in value.
Long-term fixed-income securities will normally have more price volatility because of this risk than short-term fixed-income securities.
|
n
|
Foreign Risk—The risk that when a Fund invests in foreign securities, it will be subject to risk of loss not
typically associated with domestic issuers. Loss may result because of less foreign government regulation, less public information and less economic, political and social stability. Loss may also result from the imposition of exchange controls,
confiscations and other government restrictions. A Fund will also be subject to the risk of negative foreign currency rate fluctuations. Foreign risks will normally be greatest when a Fund invests in issuers located in emerging countries.
|
n
|
Derivatives Risk—The risk that loss may result from a Fund’s investments in options, futures, swaps,
structured securities and other derivative instruments. These instruments may be leveraged so that small changes may produce disproportionate losses to a Fund.
|
n
|
Management Risk—The risk that a strategy used by the Investment Adviser may fail to produce the intended results.
|
n
|
Market Risk—The risk that the value of the securities in which a Fund invests may go up or down in response to
the prospects of individual companies, particular industry sectors and/or general economic conditions. Price changes may be temporary or last for extended periods. A Fund’s investments may be overweighted from time to time in one or more industry
sectors, which will increase the Fund’s exposure to risk of loss from adverse developments affecting those sectors.
|
n
|
Liquidity Risk—The risk that a Fund will not be able to pay redemption proceeds within the time period stated
in this Prospectus because of unusual market conditions, an unusually high volume of redemption requests, or other reasons. Funds that invest in non-investment grade fixed-income securities, small capitalization stocks, REITs or emerging country issuers
will be especially subject to the risk that during certain periods the liquidity of particular issuers or industries, or all securities within particular investment categories, will shrink or disappear suddenly and without warning as a result of adverse
economic, market or political events, or adverse investor perceptions whether or not accurate. The Goldman Sachs Asset Allocation Portfolios (the “Asset Allocation Portfolios”) expect to invest a significant percentage of their assets in the
Funds and other funds for which Goldman Sachs now or in the future acts as investment adviser or underwriter. Redemptions by an Asset Allocation Portfolio of its position in a Fund may further increase liquidity risk and may impact a Fund’s net asset
value (“NAV”).
|
n
|
Stock Risk—The risk that stock prices have historically risen and fallen in periodic cycles. Recently, U.S.
stock markets and certain foreign stock markets have experienced substantial price volatility and, at times, have traded at or close to record high levels. There is no guarantee that such levels will be reached or maintained in the future.
|
n
|
Geographic Risk—The European Equity Fund invests primarily in equity securities of European companies. The
Japanese Equity Fund invests primarily in equity securities of Japanese equity companies. The Asia Growth Fund invests primarily in equity securities of Asian issuers. Concentration of the investments of these or other Funds in issuers located in a
particular country or region will subject a Fund, to a greater extent than if investments were less concentrated, to the risks of adverse securities markets, exchange rates and social, political, regulatory or economic events which may occur in that
country or region.
|
n
|
Small Cap Risk—The securities of small capitalization stocks involve greater risks than those associated with
larger, more established companies and may be subject to more abrupt or erratic price movements. Securities of such issuers may lack sufficient market liquidity to enable a Fund to effect sales at an advantageous time or without a substantial drop in price.
|
n
|
IPO Risk—The risk that the market value of IPO shares will fluctuate considerably due to factors such as the
absence of a prior public market, unseasoned trading, the small number of shares available for trading and limited information about the issuer. The purchase of IPO shares may involve high transaction costs. IPO shares are subject to market risk and
liquidity risk. When a Fund’s asset base is small, a significant portion of the Fund’s performance could be attributable to investments in IPOs, because such investments would have a magnified impact on the Fund. As the Fund’s assets grow,
the effect of the Fund’s investments in IPOs on the Fund’s performance probably will decline, which could reduce the Fund’s performance.
|
| HOW THE FUNDS HAVE PERFORMED
|
| The bar chart and table below provide an indication of the risks of investing in a Fund by showing: (a) changes in the performance
of a Fund’s Service Shares from year to year; and (b) how the average annual returns of a Fund’s Service Shares compare to those of broad-based securities market indices. The bar chart and table assume reinvestment of dividends and
distributions. A Fund’s past performance is not necessarily an indication of how the Fund will perform in the future. Performance reflects expense limitations in effect. If expense limitations were not in place, a Fund’s performance would have
been reduced. As of the date of this Prospectus, Service Shares of the Asia Growth Fund had not commenced operations. Performance of the Asia Growth Fund is represented by the Fund’s Class A Shares. Class A Shares are not offered in this Prospectus
but have substantially similar annual returns because the shares are invested in the same investment portfolio of securities. Annual returns differ only to the extent that Class A Shares have a 0.50% distribution and service fee and a 0.19% transfer
agency fee while Service Shares have a 0.50% service fee and a 0.04% transfer agency fee. In addition, Class A Shares, unlike Service Shares, are subject to a maximum sales charge of 5.5%.
|
| TOTAL RETURN
|
| The total return for Service Shares for the 9-month period ended September 30, 2000 was -13.40%.
Best Quarter
Q4 ’98
+18.97%
Worst Quarter
Q3 ’98
-15.97%
|
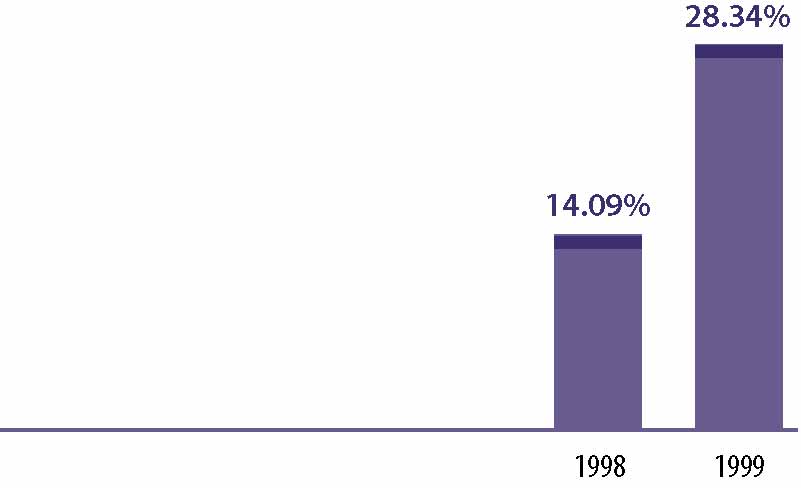 |
| AVERAGE ANNUAL TOTAL RETURN
|
| For the period ended December 31, 1999 | 1 Year | Since Inception | |||||
|---|---|---|---|---|---|---|---|
| Service Shares (Inception 8/15/97) | 28.34 | % | 11.13 | % | |||
| Morgan Stanley Capital International (MSCI®) Europe,
Australasia, Far East (EAFE®) Index (unhedged)* |
27.29 | % | 15.99 | % | |||
*
|
The unmanaged MSCI® EAFE® Index is a market capitalization-weighted composite of securities in 20 developed markets.
The Index figures do not reflect any fees or expenses.
|
| TOTAL RETURN
|
| The total return for Service Shares for the 9-month period ended September 30, 2000 was -10.46%.
Best Quarter
Q4 ’99
+21.77%
Worst Quarter
Q3 ’98
-14.37%
|
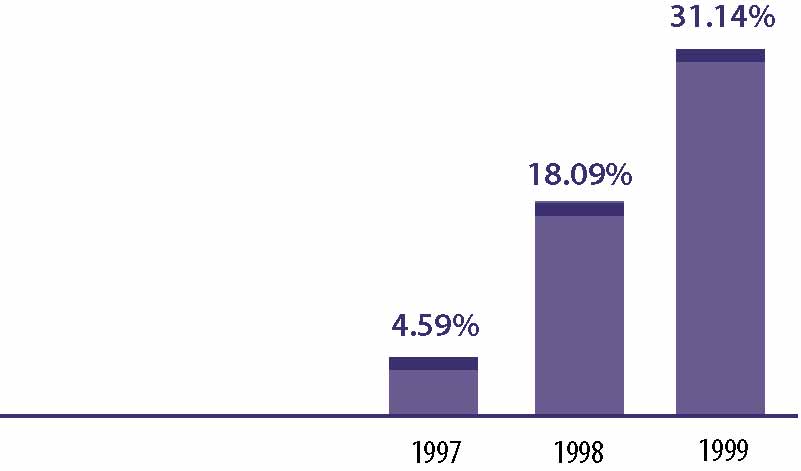 |
| AVERAGE ANNUAL TOTAL RETURN
|
| For the period ended December 31, 1999 | 1 Year | Since Inception | |||||
|---|---|---|---|---|---|---|---|
| Service Shares (Inception 3/6/96) | 31.14 | % | 17.23 | % | |||
| MSCI® EAFE® (unhedged)* | 27.29 | % | 13.96 | % | |||
*
|
The MSCI® EAFE® Index (unhedged) is an unmanaged index of common stock prices. The Index figures do not reflect any
fees or expenses.
|
| TOTAL RETURN
|
| The total return for Service Shares for the 9-month period ended September 30, 2000 was -5.72%.
Best Quarter
Q4 ’99
+24.91%
Worst Quarter
Q2 ’99
-3.04%
|
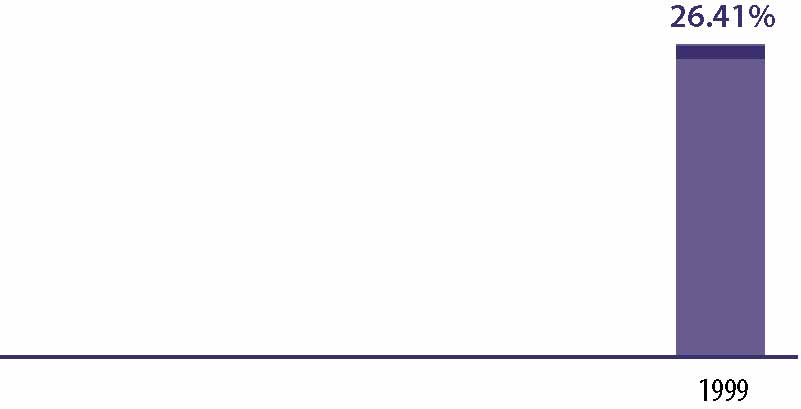 |
| AVERAGE ANNUAL TOTAL RETURN
|
| For the period ended December 31, 1999 | 1 Year | Since Inception | |||||
|---|---|---|---|---|---|---|---|
| Service Shares (Inception 10/1/98) | 26.41 | % | 36.41 | % | |||
| MSCI® Europe Index (unhedged)* | 16.21 | % | 29.39 | % | |||
| FT/S&P Actuaries Europe Index (unhedged)** | 16.14 | % | 29.20 | % | |||
*
|
The MSCI® Europe Index (unhedged), an unmanaged index of common stock prices, replaced the FT/S&P Actuaries Europe
Index (unhedged) as the European Equity Fund’s performance benchmark. The MSCI® Europe Index is widely used throughout the investment management industry to represent the investment opportunities available to a large cap, developed country
European equity strategy and, in the Investment Adviser’s opinion, is a more appropriate benchmark against which to increase the performance of the European Equity Fund. The Index figures do not reflect any fees or expenses.
|
**
|
The unmanaged FT/S&P Actuaries Europe Index (unhedged) is a market capitalization-weighted composite of approximately 750
stocks from 16 countries in Europe. The Index figures do not reflect any fees or expenses.
|
| TOTAL RETURN
|
| The total return for Service Shares for the 9-month period ended September 30, 2000 was -12.41%.
Best Quarter*
Q3 ’99
+23.18%
Worst Quarter*
Q1 ’99
+9.31%
|
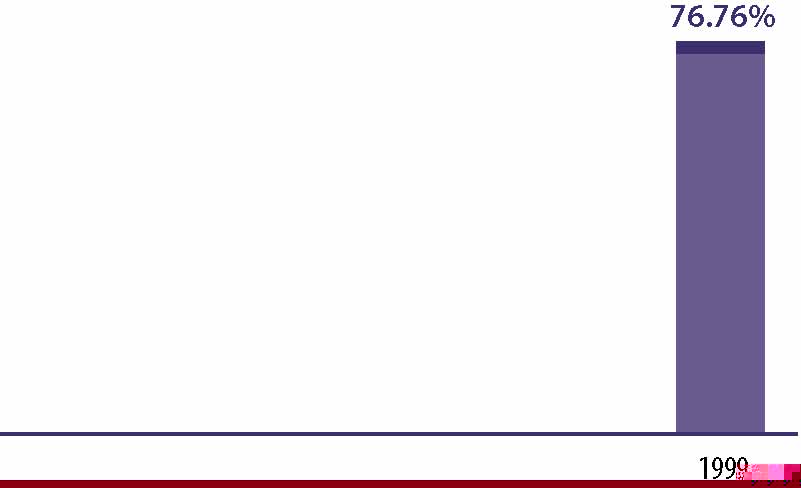 |
| AVERAGE ANNUAL TOTAL RETURN
|
| For the period ended December 31, 1999 | 1 Year | Since Inception | |||||
|---|---|---|---|---|---|---|---|
| Service Shares (Inception 5/1/98) | 76.76 | % | 49.37 | % | |||
| Tokyo Price Index (“TOPIX”) (unhedged)** | 75.32 | % | 43.28 | % | |||
*
|
Please note that “Best Quarter” and “Worst Quarter” figures are applicable only to the time period covered
by the bar chart.
|
**
|
The TOPIX (unhedged) is an unmanaged composite of all stocks on the first section of the Tokyo Stock Exchange. The Index
figures do not reflect any fees or expenses.
|
| TOTAL RETURN
|
| The total return for the Service Shares for the 9-month period ended September 30, 2000 was 2.23%.
Best Quarter*
Q4 ’99
+12.60%
Worst Quarter*
Q1 ’99
+4.71%
|
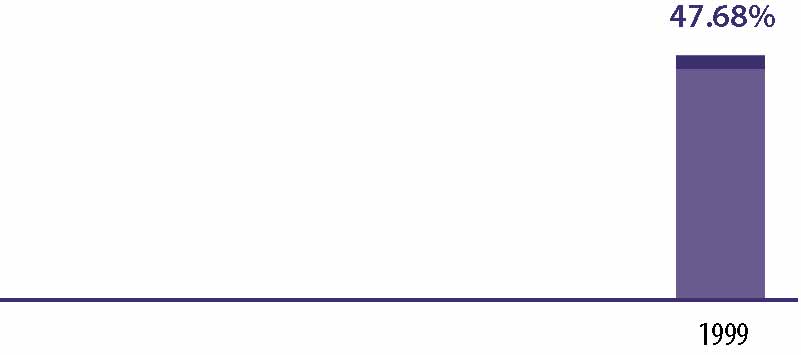 |
| AVERAGE ANNUAL TOTAL RETURN
|
| For the period ended December 31, 1999 | 1 Year | Since Inception | |||||
|---|---|---|---|---|---|---|---|
| Service Shares (Inception 5/1/98) | 47.68 | % | 29.27 | % | |||
| MSCI® EAFE® Small Cap Index (unhedged)** | 17.67 | % | 3.00 | % | |||
*
|
Please note that “Best Quarter” and “Worst Quarter” figures are applicable only to the time period covered
by the bar chart.
|
**
|
The MSCI® EAFE® Small Cap Index (unhedged), inception date 1/15/98, includes 1,502 securities from 23 developed markets
with a capitalization range of $200-800 million and a general regional allocation of 60% Europe, 30% Japan and 10% Asia. The Index figures do not reflect any fees or expenses.
|
| TOTAL RETURN
|
| The total return for Service Shares for the 9-month period ended September 30, 2000 was -15.43%.
Best Quarter
Q4 ’99
+30.10%
Worst Quarter
Q3 ’98
-23.84 %
|
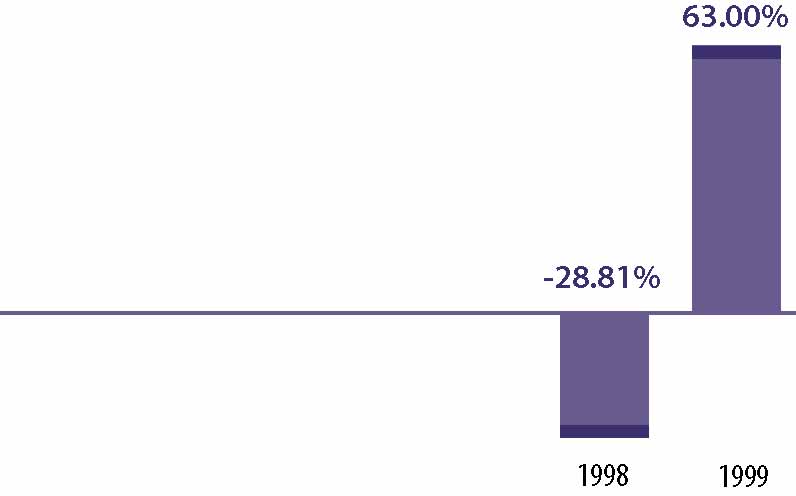 |
| AVERAGE ANNUAL TOTAL RETURN
|
| For the period ended December 31, 1999 | 1 Year | Since Inception | |||
|---|---|---|---|---|---|
| Service Shares (Inception 12/15/97) | 63.00% | 8.79% | |||
| MSCI® Emerging Markets Free (EMF) Index* | 66.42% | 14.52% | |||
*
|
The unmanaged MSCI® EMF Index is a market capitalization-weighted composite of securities in over 30 emerging market
countries. “Free” indicates an index that excludes shares in otherwise free markets that are not purchasable by foreigners. The Index figures do not reflect any fees or expenses.
|
| TOTAL RETURN
|
| The total return for Class A Shares for the 9-month period ended September 30, 2000 was -21.73%.
Best Quarter
Q2 ’99
+30.97%
Worst Quarter
Q4 ‘97
-27.33%
|
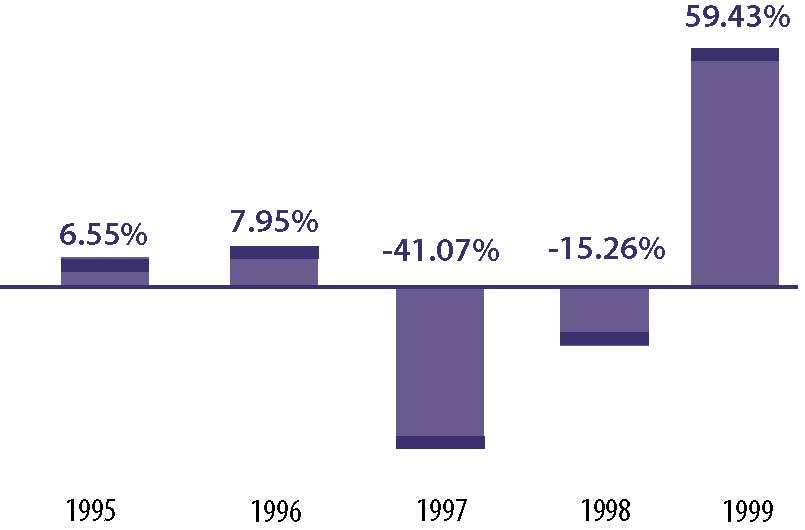 |
| AVERAGE ANNUAL TOTAL RETURN
|
| For the period ended December 31, 1999 | 1 Year | 5 Years | Since Inception | ||||
|---|---|---|---|---|---|---|---|
| Class A (Inception 7/8/94) | |||||||
| Including 5.5% Sales Charge | 50.70% | (2.84) | (2.12)% | ||||
| MSCI® All Country Asia Free ex-Japan (unhedged)* | 61.95% | (1.28) | (.94)% | ||||
*
|
The unmanaged MSCI® All Country Asia Free ex-Japan Index (unhedged) is a market capitalization-weighted composite of
securities in ten Asian countries. “Free” indicates an index that excludes shares in otherwise free markets that are not purchasable by foreigners. The Index figures do not reflect any fees or expenses.
|
| CORE
International Equity Fund |
International
Equity Fund |
European
Equity Fund |
|||||
|---|---|---|---|---|---|---|---|
| Shareholder Fees | |||||||
| (fees paid directly from your investment): | |||||||
| Maximum Sales Charge (Load) Imposed on
Purchases |
None | None | None | ||||
| Maximum Sales Charge (Load) Imposed on
Reinvested Dividends |
None | None | None | ||||
| Redemption Fees | None | None | None | ||||
| Exchange Fees | None | None | None | ||||
| Annual Fund Operating Expenses | |||||||
| (expenses that are deducted from Fund assets):2 | |||||||
| Management Fees | 0.85% | 1.00% | 1.00% | ||||
| Service Fees 3 | 0.50% | 0.50% | 0.50% | ||||
| Other Expenses 4 | 0.25% | 0.19% | 0.52% | ||||
| Total Fund Operating Expenses* | 1.60% | 1.69% | 2.02% | ||||
| See page 32 for all other footnotes.
|
*
|
As a result of the current expense limitations, “Other Expenses” and “Total Fund Operating Expenses” of the
Funds which are actually incurred as of the date of this Prospectus are as set forth below. The expense limitations may be terminated at any time at the option of the Investment Adviser. If this occurs, “Other Expenses” and “Total Fund
Operating Expenses” may increase without shareholder approval.
|
| CORE
International Equity Fund |
International
Equity Fund |
European
Equity Fund |
|||||
|---|---|---|---|---|---|---|---|
| Annual Fund Operating Expenses | |||||||
| (expenses that are deducted from
Fund assets): 2 |
|||||||
| Management Fees | 0.85% | 1.00% | 1.00% | ||||
| Service Fees 3 | 0.50% | 0.50% | 0.50% | ||||
| Other Expenses 4 | 0.16% | 0.14% | 0.14% | ||||
| Total Fund Operating Expenses
(after current expense limitations) |
1.51% | 1.64% | 1.64% | ||||
| Japanese
Equity Fund |
International Growth
Opportunities Fund |
Emerging
Markets Equity Fund |
Asia
Growth Fund 1 |
||||
|---|---|---|---|---|---|---|---|
| None | None | None | None | ||||
| None | None | None | None | ||||
| None | None | None | None | ||||
| None | None | None | None | ||||
| 1.00% | 1.20% | 1.20% | 1.00% | ||||
| 0.50% | 0.50% | 0.50% | 0.50% | ||||
| 0.45% | 0.37% | 0.45% | 0.65% | ||||
| 1.95% | 2.07% | 2.15% | 2.15% | ||||
| Japanese
Equity Fund |
International Growth
Opportunities Fund |
Emerging
Markets Equity Fund |
Asia
Growth Fund 1 |
||||
|---|---|---|---|---|---|---|---|
| 1.00% | 1.20% | 1.20% | 1.00% | ||||
| 0.50% | 0.50% | 0.50% | 0.50% | ||||
| 0.15% | 0.20% | 0.39% | 0.20% | ||||
| 1.65% | 1.90% | 2.09% | 1.70% | ||||
1
|
Service Shares had not commenced operations as of the date of this Prospectus.
|
2
|
The Funds’ annual operating expenses are based on actual expenses.
|
3
|
Service Organizations may charge other fees to their customers who are beneficial owners of Service Shares in connection
with their customers’ accounts. Such fees may affect the return customers realize with respect to their investments.
|
4
|
“Other Expenses” include transfer agency fees equal to 0.04% of the average daily net assets of each Fund’
s Service Shares, plus all other ordinary expenses not detailed above. The Investment Adviser has voluntarily agreed to reduce or limit “Other Expenses” (excluding management fees, transfer agency fees, service fees, taxes, interest and
brokerage fees and litigation, indemnification and other extraordinary expenses) to the following percentages of each Fund’s average daily net assets:
|
| Fund | Other
Expenses |
||
|---|---|---|---|
| CORE International Equity | 0.12% | ||
| International Equity | 0.10% | ||
| European Equity | 0.10% | ||
| Japanese Equity | 0.11% | ||
| International Growth
Opportunities |
0.16% | ||
| Emerging Markets Equity | 0.35% | ||
| Asia Growth | 0.16% | ||
| Fund | 1 Year | 3 Years | 5 Years | 10 Years | |||||
|---|---|---|---|---|---|---|---|---|---|
| CORE International Equity | $163 | $505 | $ 871 | $1,900 | |||||
| International Equity | $172 | $533 | $ 918 | $1,998 | |||||
| European Equity | $205 | $634 | $1,088 | $2,348 | |||||
| Japanese Equity | $198 | $612 | $1,052 | $2,275 | |||||
| International Growth Opportunities | $210 | $649 | $1,114 | $2,400 | |||||
| Emerging Markets Equity | $218 | $673 | $1,154 | $2,483 | |||||
| Asia Growth | $218 | $673 | $1,154 | $2,483 | |||||
| INVESTMENT ADVISERS
|
| Investment Adviser | Fund | ||
|---|---|---|---|
| Goldman Sachs Asset Management (“GSAM”) | CORE International Equity | ||
| 32 Old Slip | |||
| New York, New York 10005 | |||
| Goldman Sachs Asset Management International (“GSAMI”) | International Equity | ||
| Procession House | European Equity | ||
| 55 Ludgate Hill | Japanese Equity | ||
| London, England EC4M 7JW | International Growth Opportunities | ||
| Emerging Markets Equity | |||
| Asia Growth | |||
| GSAM and GSAMI are separate business units of the Investment Management Division (“IMD”) of Goldman Sachs. Goldman Sachs
registered as an investment adviser in 1981. GSAMI, a member of the Investment Management Regulatory Organization Limited since 1990 and a registered investment adviser since 1991, is an affiliate of Goldman Sachs. As of September 30, 2000, GSAM and
GSAMI, along with other units of IMD, had assets under management of $281.3 billion.
|
| The Investment Adviser provides day-to-day advice regarding the Funds’ portfolio transactions. The Investment Adviser makes
the investment decisions for the Funds and places purchase and sale orders for the Funds’ portfolio transactions in U.S. and foreign markets. As permitted by applicable law, these orders may be directed to any brokers, including Goldman Sachs and its
affiliates. While the Investment Adviser is ultimately responsible for the management of the Funds, it is able to draw upon the research and expertise of its asset management affiliates for portfolio decisions and management with respect to certain
portfolio securities. In addition, the Investment Adviser has access to the research and certain proprietary technical models developed by Goldman Sachs, and will apply quantitative and qualitative analysis in determining the appropriate allocations among
categories of issuers and types of securities.
|
| The Investment Adviser also performs the following additional services for the Funds:
|
n
|
Supervises all non-advisory operations of the Funds
|
n
|
Provides personnel to perform necessary executive, administrative and clerical services to the Funds
|
n
|
Arranges for the preparation of all required tax returns, reports to shareholders, prospectuses and statements of additional
information and other reports filed with the Securities and Exchange Commission (the “SEC”) and other regulatory authorities
|
n
|
Maintains the records of each Fund
|
n
|
Provides office space and all necessary office equipment and services
|
| MANAGEMENT FEES
|
| As compensation for its services and its assumption of certain expenses, the Investment Adviser is entitled to the following fees,
computed daily and payable monthly, at the annual rates (as a percentage of each respective portfolio’s average daily net assets) listed below:
|
| Contractual Rate | Actual Rate
For the Fiscal Year Ended August 31, 2000 |
||||||
|---|---|---|---|---|---|---|---|
| GSAM: | |||||||
| CORE International Equity | 0.85 | % | 0.85 | % | |||
| GSAMI: | |||||||
| International Equity | 1.00 | % | 1.00 | % | |||
| European Equity | 1.00 | % | 1.00 | % | |||
| Japanese Equity | 1.00 | % | 1.00 | % | |||
| International Growth Opportunities | 1.20 | % | 1.20 | % | |||
| Emerging Markets Equity | 1.20 | % | 1.20 | % | |||
| Asia Growth | 1.00 | % | 1.00 | % | |||
| The difference, if any, between the stated fees and the actual fees paid by the Funds reflects that the Investment Adviser did not
charge the full amount of the fees to which it would have been entitled. The Investment Adviser may discontinue or modify any such voluntary limitations in the future at its discretion.
|
| FUND MANAGERS
|
| M. Roch Hillenbrand, a Managing Director of Goldman Sachs since 1997, is the Head of Global Equities for GSAM, overseeing the
United States, Europe, Japan, and non-Japan Asia. In this capacity, he is responsible for managing the group as it defines and implements global portfolio management processes that are consistent, reliable and predictable. Mr. Hillenbrand joined Goldman
Sachs in 1997
upon its acquisition of Commodities Corporation, LLC where he was and continues as President. Over the course of his 20-year career at Commodities Corporation, Mr. Hillenbrand has had extensive experience in dealing with internal and external investment
managers who have managed a range of futures and equities strategies across multiple markets, using a variety of styles.
|
| International Equity Portfolio Management Team
|
n
|
Global portfolio teams based in London, Singapore, Tokyo and New York. Local presence is a key to the Investment Adviser’s
fundamental research capabilities
|
n
|
Team manages over $45.9 billion in international equities for retail, institutional and high net worth clients
|
n
|
Focus on bottom-up stock selection as main driver of returns, though the team leverages the asset allocation, currency and risk
management capabilities of GSAM
|
| Name and Title | Fund Responsibility | Years Primarily
Responsible |
Five Year Employment History | ||||
|---|---|---|---|---|---|---|---|
| David Dick
Executive Director |
Senior Portfolio Manager—
European Equity Fund |
Since
1998 |
Mr. Dick joined the Investment
Adviser as a senior portfolio manager on the European Equity team in 1998. From 1990 to 1998, he was with Mercury Asset Management, where he was a portfolio manager for European equity and was head of Mercury’s European sector strategy. |
||||
| Gary Greenberg
Vice President Co-Head of Emerging Markets Equity |
Senior Portfolio Manager—
Emerging Markets Equity Fund |
Since
1999 |
Mr. Greenberg joined the
Investment Adviser as a portfolio manager in 1999. From 1998 to 1999, he was a Managing Director and the lead international portfolio manager at Van Eck Global Asset Management. Prior to that, he was Chief Investment Officer for Peregrine Asset Management in Hong Kong from 1994 to 1998. |
||||
| Name and Title | Fund Responsibility | Years Primarily
Responsible |
Five Year Employment History | ||||
|---|---|---|---|---|---|---|---|
| James P. Hordern
Executive Director |
Senior Portfolio Manager—
International Growth Opportunities Fund |
Since
1998 |
Mr. Hordern joined the
Investment Adviser as a portfolio manager in 1997. From 1991 to 1997, he was an Assistant Director and portfolio manager at Mercury Asset Management on the European Specialist Team. |
||||
| Ralf Laier
Vice President |
Portfolio Manager—
Emerging Markets Equity Fund |
Since
1998 |
Mr. Laier joined the Investment
Adviser as a portfolio manager with a focus on Central/Eastern European (CEE) and the Commonwealth of Independent States (CIS) in 1997. Prior to joining the Investment Adviser, from 1995 to 1997, he was Vice President of Soros Global Research, where he analyzed investment opportunities in CEE/CIS. |
||||
| Susan Noble
Managing Director |
Senior Portfolio Manager—
European Equity Fund International Equity Fund |
Since
1998 1998 |
Ms. Noble joined the Investment
Adviser as a senior portfolio manager and head of the European Equity Team in October 1997. From 1986 to 1997, she worked at Fleming Investment Management in London, where she most recently was Portfolio Management Director for the European equity investment strategy and process. |
||||
| Andrew Orchard
Executive Director |
Senior Portfolio Manager—
European Equity Fund International Equity Fund |
Since
1999 1999 |
Mr. Orchard joined the
Investment Adviser as a portfolio manager in 1999. From 1994 to 1999 he was a portfolio manager at Morgan Grenfell Asset Management where he managed global equity portfolios and chaired Morgan Grenfell’s Global Sector Committee. |
||||
| Name and Title | Fund Responsibility | Years Primarily
Responsible |
Five Year Employment History | ||||
|---|---|---|---|---|---|---|---|
| Robert Stewart
Executive Director |
Senior Portfolio Manager—
European Equity Fund International Equity Fund |
Since
1999 1999 |
Mr. Stewart joined the
Investment Adviser as a portfolio manager in 1996. He is a member of the European Equity Team. From 1996 to 1998 he was a portfolio manager in Japan where he managed Japanese Equity Institutional Portfolios. Prior to that Mr. Stewart was a portfolio manager at CINMan from 1989 to 1996 where he managed international equities. |
||||
| Danny Truell
Managing Director |
Senior Portfolio Manager—
European Equity Fund International Equity |
Since
1998 2000 |
Mr. Truell joined the Investment
Adviser as a senior portfolio manager and head of UK equities in 1998. From 1992 to 1996, he was Investment Banking Executive Director for SBC Warburg and Chief Asian Equity Strategist. |
||||
| Gabriella Antici
Vice President Co-Head of Emerging Markets Equity |
Senior Portfolio Manager—
Emerging Markets Equity Fund |
Since
1998 |
Ms. Antici joined the Investment
Adviser as a portfolio manager in 1997. From 1994 to 1997, she was a Vice President for HSBC Asset Management, where she was a portfolio manager for emerging markets and head of the Latin American Department. |
||||
| Rory Bateman
Executive Director |
Portfolio Manager—
European Equity Fund |
Since
2000 |
Mr. Bateman joined the
Investment Adviser as an equity analyst in 1996. Prior to that he was an analyst at CINMan covering European equities. |
||||
| Name and Title | Fund Responsibility | Years Primarily
Responsible |
Five Year Employment History | ||||
| |
|||||||
| Melissa Brown
Managing Director |
Senior Portfolio Manager—
CORE International Equity Fund |
Since
1998 |
Ms. Brown joined the Investment
Adviser as a portfolio manager in 1998. From 1984 to 1998, she was the director of Quantitative Equity Research and served on the Investment Policy Committee at Prudential Securities. |
||||
| |
|||||||
| Mark M. Carhart
Managing Director |
Portfolio Manager—
CORE International Equity Fund |
Since
1998 |
Mr. Carhart joined the
Investment Adviser as a member of the Quantitative Research and Risk Management team in 1997. From August 1995 to September 1997, he was Assistant Professor of Finance at the Marshall School of Business at USC and a Senior Fellow of the Wharton Financial Institutions Center. |
||||
| |
|||||||
| Raymond J.
Iwanowski Managing Director |
Portfolio Manager—
CORE International Equity Fund |
Since
1998 |
Mr. Iwanowski joined the
Investment Adviser as an associate and portfolio manager in 1997. From 1993 to 1997, he was a Vice President and head of the Fixed Derivatives Client Research group at Salomon Brothers. |
||||
| |
|||||||
| Robert C. Jones
Managing Director |
Senior Portfolio Manager—
CORE International Equity Fund |
Since
1997 |
Mr. Jones joined the
Investment Adviser as a portfolio manager in 1989. |
||||
| |
|||||||
| Name and Title | Fund Responsibility | Years Primarily
Responsible |
Five Year Employment History | ||||
| |
|||||||
| Alice Lui
Vice President |
Portfolio Manager—
Asia Growth Fund Emerging Markets Equity Fund International Equity Fund International Growth Opportunities Fund |
Since
1994 1999 1999 1999 |
Ms. Lui joined the Investment
Adviser as a portfolio manager in 1990. |
||||
| |
|||||||
| Ravi Shanker
Vice President |
Senior Portfolio Manager—
Asia Growth Fund Emerging Markets Equity Fund International Equity Fund International Growth Opportunities Fund |
Since
1997 1998 1999 1999 |
Mr. Shanker joined the
Investment Adviser as an operations manager in 1997. From July 1996 to 1997, he worked for Goldman Sachs in Singapore as a strategic advisor for transactions involving infrastructure industries in Asia. From 1988 to 1996, he worked for Goldman Sachs as an investment banker in the Investment Banking Division. |
||||
| |
|||||||
| Siew-Hua Thio
Vice President |
Portfolio Manager—
Asia Growth Fund Emerging Markets Equity Fund International Equity Fund International Growth Opportunities Fund |
Since
1998 1998 1998 1998 |
Ms. Thio joined the Investment
Adviser as a portfolio manager in 1998. From 1997 to 1998, she was Head of Research for Indosuez WI Carr in Singapore. From 1993 to 1997, she was a research analyst at the same firm. |
||||
| |
|||||||
| Name and Title | Fund Responsibility | Years Primarily
Responsible |
Five Year Employment History | ||||
| |
|||||||
| Toshiyuki Ejima
Vice President |
Portfolio Manager—
Japanese Equity Fund |
Since
1999 |
Mr. Ejima joined the Investment
Adviser as a portfolio manager in April 1999. Prior to that he was a portfolio manager at Daiichi Mutual Life from 1993 to 1999 where he managed Japanese equities. |
||||
| |
|||||||
| Shigeka Kouda
Vice President |
Portfolio Manager—
International Growth Opportunities Fund |
Since
1998 |
Mr. Kouda joined the
Investment Adviser as a portfolio manager in 1997. From 1992 to 1997, he was at the Fixed Income Division of Goldman Sachs (Japan) Limited, where he was extensively involved in emerging markets trading as well as International Fixed Income institutional sales. |
||||
| |
|||||||
| Shogo Maeda
Managing Director |
Senior Portfolio Manager—
Japanese Equity Fund International Equity Fund International Growth Opportunities Fund |
Since
1994 1994 1998 |
Mr. Maeda joined the
Investment Adviser as a portfolio manager in 1994. |
||||
| |
|||||||
| Miyako Shibamoto
Vice President |
Portfolio Manager—
Japanese Equity Fund |
Since
1998 |
Ms. Shibamoto joined the
Investment Adviser as a member of the Japanese Equity team in March 1998. From 1993 to 1998, she was a Vice President at Scudder Stevens and Clark (Japan). |
||||
| |
|||||||
| Takeya Suzuki
Vice President |
Portfolio Manager—
Japanese Equity Fund |
Since
1998 |
Mr. Suzuki joined the
Investment Adviser as a portfolio manager in 1996. From 1990 to 1996, he was a Japanese equity portfolio manager at Nomura Investment Management where he actively managed assets for U.S. pension funds. |
||||
| |
|||||||
| DISTRIBUTOR AND TRANSFER AGENT
|
| Goldman Sachs, 85 Broad Street, New York, New York 10004, serves as the exclusive distributor (the “Distributor”) of
each Fund’s shares. Goldman Sachs, 4900 Sears Tower, Chicago, Illinois 60606-6372, also serves as the Funds’ transfer agent (the “Transfer Agent”) and, as such, performs various shareholder servicing functions.
|
| From time to time, Goldman Sachs or any of its affiliates may purchase and hold shares of the Funds. Goldman Sachs reserves the
right to redeem at any time some or all of the shares acquired for its own account.
|
| ACTIVITIES OF GOLDMAN SACHS AND ITS AFFILIATES AND OTHER ACCOUNTS MANAGED BY GOLDMAN SACHS
|
| The involvement of the Investment Adviser, Goldman Sachs and their affiliates in the management of, or their interest in, other
accounts and other activities of Goldman Sachs may present conflicts of interest with respect to a Fund or limit a Fund’s investment activities. Goldman Sachs and its affiliates engage in proprietary trading and advise accounts and funds which have
investment objectives similar to those of the Funds and/or which engage in and compete for transactions in the same types of securities, currencies and instruments as the Funds. Goldman Sachs and its affiliates will not have any obligation to make
available any information regarding their proprietary activities or strategies, or the activities or strategies used for other accounts managed by them, for the benefit of the management of the Funds. The results of a Fund’s investment activities,
therefore, may differ from those of Goldman Sachs and its affiliates, and it is possible that a Fund could sustain losses during periods in which Goldman Sachs and its affiliates and other accounts achieve significant profits on their trading for
proprietary or other accounts. In addition, the Funds may, from time to time, enter into transactions in which other clients of Goldman Sachs have an adverse interest. A Fund’s activities may be limited because of regulatory restrictions applicable
to Goldman Sachs and its affiliates, and/or their internal policies designed to comply with such restrictions.
|
| Each Fund pays dividends from its investment company taxable income and distributions from net realized capital gains. You may
choose to have dividends and distributions paid in:
|
n
|
Cash
|
n
|
Additional shares of the same class of the same Fund
|
n
|
Shares of the same or an equivalent class of another Goldman Sachs Fund. Special restrictions may apply for certain ILA
Portfolios. See the Additional Statement.
|
| You may indicate your election on your Account Application. Any changes may be submitted in writing to Goldman Sachs at any time
before the record date for a particular dividend or distribution. If you do not indicate any choice, dividends and distributions will be reinvested automatically in the applicable Fund.
|
| The election to reinvest dividends and distributions in additional shares will not affect the tax treatment of such dividends and
distributions, which will be treated as received by you and then used to purchase the shares.
|
| The Funds’ investments in foreign securities may be subject to foreign withholding taxes. Under certain circumstances, the
Funds may elect to pass-through these taxes to you. If this election is made, a proportionate amount of such taxes will constitute a distribution to you, which would allow you either (1) to credit such proportionate amount of foreign taxes against your
U.S. federal income tax liability or (2) to take such amount as an itemized deduction.
|
| Dividends from investment company taxable income and distributions from net capital gains are declared and paid annually.
|
| From time to time a portion of a Fund’s dividends may constitute a return of capital.
|
| At the time of an investor’s purchase of shares of a Fund, a portion of the NAV per share may be represented by undistributed
income or undistributed realized appreciation of the Fund’s portfolio securities. Therefore, subsequent distributions on such shares from such income or realized appreciation may be taxable to you even if the NAV of the shares is, as a result of the
distributions, reduced below the cost of such shares and the distributions (or portions thereof) represent a return of a portion of the purchase price.
|
| The following section will provide you with answers to some of the most often asked questions regarding buying and selling the
Funds’ Service Shares.
|
| How Can I Purchase Service Shares Of The Funds?
|
| Generally, Service Shares may be purchased only through institutions that have agreed to provide account administration and
personal and account maintenance services to their customers who are the beneficial owners of Service Shares. These institutions are called “Service Organizations.” Customers of a Service Organization will normally give their purchase
instructions to the Service Organization, and the Service Organization will, in turn, place purchase orders with Goldman Sachs. Service Organizations will set times by which purchase orders and payments must be received by them from their customers.
Generally, Service Shares may be purchased from the Funds on any business day at their NAV next determined after receipt of an order by Goldman Sachs from a Service Organization. No sales load is charged. Purchases of Service Shares must be settled within
three business days of receipt of a complete purchase order.
|
| Service Organizations are responsible for transmitting purchase orders and payments to Goldman Sachs in a timely fashion. Service
Organizations should place an order with Goldman Sachs at 1-800-621-2550 and either:
|
n
|
Wire federal funds to The Northern Trust Company (“Northern”), as subcustodian for State Street Bank and Trust Company
(“State Street”) (each Fund’s custodian) on the next business day; or
|
n
|
Send a check or Federal Reserve draft payable to Goldman Sachs Funds—(Name of Fund and Class of Shares), 4900 Sears Tower,
Chicago, IL 60606-6372. The Fund will not accept a check drawn on a foreign bank or a third-party check.
|
| In certain instances, the Trust may require a signature guarantee in order to effect purchase, redemption or exchange
transactions. Signature guarantees must be obtained from a bank, brokerage firm or other financial intermediary that is a member of an approved Medallion Guarantee Program or that is otherwise approved by Goldman Sachs. A notary public cannot provide a
signature guarantee.
|
| What Do I Need To Know About Service Organizations?
|
| Service Organizations may provide the following services in connection with their customers’ investments in Service Shares:
|
n
|
Acting, directly or through an agent, as the sole shareholder of record
|
n
|
Maintaining account records for customers
|
n
|
Processing orders to purchase, redeem or exchange shares for customers
|
n
|
Responding to inquiries from prospective and existing shareholders
|
n
|
Assisting customers with investment procedures
|
| In addition, some (but not all) Service Organizations are authorized to accept, on behalf of Goldman Sachs Trust (the “
Trust”), purchase, redemption and exchange orders placed by or on behalf of their customers, and may designate other intermediaries to accept such orders, if approved by the Trust. In these cases:
|
n
|
A Fund will be deemed to have received an order in proper form when the order is accepted by the authorized Service Organization
or intermediary on a business day, and the order will be priced at the Fund’s NAV next determined after such acceptance.
|
n
|
Service Organizations or intermediaries will be responsible for transmitting accepted orders and payments to the Trust within the
time period agreed upon by them.
|
| You should contact your Service Organization directly to learn whether it is authorized to accept orders for the Trust.
|
| Pursuant to a service plan adopted by the Trust’s Board of Trustees, Service Organizations are entitled to receive payment
for their services from the Trust of up to 0.50% (on an annualized basis) of the average daily net assets of the Service Shares of the Funds, which are attributable to or held in the name of the Service Organization for its customers.
|
| The Investment Adviser, Distributor and/or their affiliates may pay additional compensation from time to time, out of their assets
and not as an additional charge to the Funds, to selected Service Organizations and other persons in connection with the sale, distribution and/or servicing of shares of the Funds and other Goldman Sachs Funds. Additional compensation based on sales may,
but is currently not expected to, exceed 0.50% (annualized) of the amount invested.
|
| In addition to Service Shares, each Fund also offers other classes of shares to investors. These other share classes are subject
to different fees and expenses (which affect performance), have different minimum investment requirements and
|
| are entitled to different services than Service Shares. Information regarding these other share classes may be obtained from your
sales representative or from Goldman Sachs by calling the number on the back cover of this Prospectus.
|
| What Is My Minimum Investment In The Funds?
|
| The Funds do not have any minimum purchase or account requirements with respect to Service Shares. A Service Organization may,
however, impose a minimum amount for initial and subsequent investments in Service Shares, and may establish other requirements such as a minimum account balance. A Service Organization may redeem Service Shares held by non-complying accounts, and may
impose a charge for any special services.
|
| What Else Should I Know About Share Purchases?
|
| The Trust reserves the right to:
|
n
|
Reject or restrict any purchase or exchange orders by a particular purchaser (or group of related purchasers). This may occur, for
example, when a pattern of frequent purchases, sales or exchanges of Service Shares of a Fund is evident, or if purchases, sales or exchanges are, or a subsequent abrupt redemption might be, of a size that would disrupt the management of a Fund.
|
n
|
Close a Fund to new investors from time to time and reopen a
Fund whenever it is deemed appropriate by a Fund’s Investment Adviser.
|
| The Funds may allow Service Organizations to purchase shares with securities instead of cash if consistent with a Fund’s
investment policies and operations and if approved by the Fund’s Investment Adviser.
|
| How Are Shares Priced?
|
| The price you pay or receive when you buy, sell or exchange Service Shares is determined by a Fund’s NAV. The Funds calculate
NAV as follows:
|
| |
(Value of Assets of the Class)
|
|
| NAV =
|
– (Liabilities of the Class)
|
|
| |
Number of Outstanding Shares of the Class
|
|
| The Funds’ investments are valued based on market quotations or, if accurate quotations are not readily available, the fair
value of the Fund’s investments may be determined in good faith under procedures established by the Trustees.
|
n
|
NAV per share of each class is calculated by State Street on each business day as of the close of regular trading on the New York
Stock Exchange (normally 4:00 p.m. New York time). Fund shares will not be priced on any day the New York Stock Exchange is closed.
|
n
|
When you buy shares, you pay the NAV next calculated after the Funds receive your order in proper form.
|
n
|
When you sell shares, you receive the NAV next calculated after the Funds receive your order in proper form.
|
| Note: The time at which transactions and shares are priced and the time by which orders must be received may be
changed in case of an emergency or if regular trading on the New York Stock Exchange is stopped at a time other than 4:00 p.m. New York time.
|
| Foreign securities may trade in their local markets on days a Fund is closed. As a result, the NAV of a Fund that holds foreign
securities may be impacted on days when investors may not purchase or redeem Fund shares.
|
| In addition, the impact of events that occur after the publication of market quotations used by a Fund to price its securities but
before the close of regular trading on the New York Stock Exchange will normally not be reflected in a Fund’s next determined NAV unless the Trust, in its discretion, makes an adjustment in light of the nature and materiality of the event, its effect
on Fund operations and other relevant factors.
|
| How Can I Sell Service Shares Of The Funds?
|
| Generally, Service Shares may be sold (redeemed) only through Service Organizations. Customers of a Service Organization will
normally give their redemption instructions to the Service Organization, and the Service Organization will, in turn, place redemption orders with the Funds. Generally, each Fund will redeem its Service Shares upon request on any business day at their NAV next determined after receipt of such request in proper form. Redemption proceeds may be sent to recordholders by check or by wire (if the wire
instructions are on record).
|
| A Service Organization may request redemptions in writing or by telephone if the optional telephone redemption privilege is
elected on the Account Application.
|
| By Writing: | Goldman Sachs Funds
4900 Sears Tower Chicago, IL 60606-6372 |
||
| By Telephone: | 1-800-621-2550
(8:00 a.m. to 4:00 p.m. New York time) |
||
| What Do I Need To Know About Telephone Redemption Requests?
|
| The Trust, the Distributor and the Transfer Agent will not be liable for any loss you may incur in the event that the Trust
accepts unauthorized telephone redemption requests that the Trust reasonably believes to be genuine. In an effort to prevent unauthorized or fraudulent redemption and exchange requests by tele
phone, Goldman Sachs employs reasonable procedures specified by the Trust to confirm that such instructions are genuine. If reasonable procedures are not employed, the Trust may be liable for any loss due to unauthorized or fraudulent transactions. The
following general policies are currently in effect:
|
n
|
All telephone requests are recorded.
|
n
|
Any redemption request that requires money to go to an account or address other than that designated on the Account Application
must be in writing and signed by an authorized person designated on the Account Application. The written request may be confirmed by telephone with both the requesting party and the designated bank account to verify instructions.
|
n
|
The telephone redemption option may be modified or terminated at any time.
|
| Note: It may be difficult to make telephone redemptions in times of drastic economic or market conditions.
|
| How Are Redemption Proceeds Paid?
|
| By Wire: The Funds will arrange for redemption proceeds to be wired as federal funds to the bank account
designated in the recordholder’s Account Application. The following general policies govern wiring redemption proceeds:
|
n
|
Redemption proceeds will normally be wired on the next business day in federal funds (for a total of one business day delay), but
may be paid up to three business days following receipt of a properly executed wire transfer redemption request. If the shares to be sold were recently paid for by check, the Fund will pay the redemption proceeds when the check has cleared, which may take
up to 15 days. If the Federal Reserve Bank is closed on the day that the redemption proceeds would ordinarily be wired, wiring the redemption proceeds may be delayed one additional business day.
|
n
|
To change the bank designated on your Account Application, you must send written instructions signed by an authorized person
designated on the Account Application to the Service Organization.
|
n
|
Neither the Trust nor Goldman Sachs assumes any responsibility for the performance of intermediaries or your Service Organization
in the transfer process. If a problem with such performance arises, you should deal directly with such intermediaries or Service Organization.
|
| By Check: A recordholder may elect in writing to receive redemption proceeds by check. Redemption
proceeds paid by check will normally be mailed to the address of record within three business days of receipt of a properly executed redemption request. If the shares to be sold were recently paid for by check, the Fund will pay the redemption proceeds
when the check has cleared, which may take up to 15 days.
|
| What Else Do I Need To Know About Redemptions?
|
| The following generally applies to redemption requests:
|
n
|
Additional documentation may be required when deemed appropriate by the Transfer Agent. A redemption request will not be in proper
form until such additional documentation has been received.
|
n
|
Service Organizations are responsible for the timely transmittal of redemption requests by their customers to the Transfer Agent.
In order to facilitate the timely transmittal of redemption requests, Service Organizations may set times by which they must receive redemption requests. Service Organizations may also require additional documentation from you.
|
| The Trust reserves the right to:
|
n
|
Redeem the Service Shares of any Service Organization whose account balance falls below $50 as a result of a redemption. The Funds
will not redeem Service Shares on this basis if the value of the account falls below the minimum account balance solely as a result of market conditions. The Fund will give 60 days’ prior written notice to allow a Service Organization to purchase
sufficient additional shares of the Fund in order to avoid such redemption.
|
n
|
Redeem your shares in other circumstances determined by the Board of Trustees to be in the best interest of the Trust.
|
n
|
Pay redemptions by a distribution in-kind of securities (instead of cash). If you receive redemption proceeds in-kind, you should
expect to incur transaction costs upon the disposition of those securities.
|
n
|
Reinvest any dividends or other distributions which you have elected to receive in cash should your check for such dividends or
other distributions be returned to the Fund as undeliverable or remain uncashed for six months. In addition, that distribution and all future distributions payable to you will be reinvested at NAV in additional Service shares of the Fund that pays the
distributions. No interest will accrue on amounts represented by uncashed distribution or redemption checks.
|
| Can I Exchange My Investment From One Fund To Another?
|
| A Service Organization may exchange Service Shares of a Fund at NAV for Service Shares of any other Goldman Sachs Fund. The
exchange privilege may be materially modified or withdrawn at any time upon 60 days’ written notice.
|
| Instructions For Exchanging Shares: | |||||
|---|---|---|---|---|---|
| By Writing: | n Write a letter of instruction that includes: | ||||
| n The recordholder name(s) and signature(s) | |||||
| n The account number | |||||
| n The Fund names and Class of Shares | |||||
| n The dollar amount to be exchanged | |||||
| n
Mail the request to:
Goldman Sachs Funds 4900 Sears Tower Chicago, IL 60606-6372 |
|||||
| By Telephone: | If you have elected the telephone exchange
privilege on your Account Application: |
||||
| n
1-800-621-2550
(8:00 a.m. to 4:00 p.m. New York time) |
|||||
| You should keep in mind the following factors when making or considering an exchange:
|
n
|
You should obtain and carefully read the prospectus of the Fund you are acquiring before making an exchange.
|
n
|
All exchanges which represent an initial investment in a Fund must satisfy the minimum initial investment requirement of that
Fund, except that this requirement may be waived at the discretion of the Trust.
|
n
|
Telephone exchanges normally will be made only to an identically registered account.
|
n
|
Shares may be exchanged among accounts with different names, addresses and social security or other taxpayer identification
numbers only if the exchange instructions are in writing and are signed by an authorized person designated on the Account Application.
|
n
|
Exchanges are available only in states where exchanges may be legally made.
|
n
|
It may be difficult to make telephone exchanges in times of drastic economic or market conditions.
|
n
|
Goldman Sachs may use reasonable procedures described under “What Do I Need To Know About Telephone Redemption Requests?”
in an effort to prevent unauthorized or fraudulent telephone exchange requests.
|
n
|
Exchanges into Funds that are closed to new investors may be restricted.
|
| For federal income tax purposes, an exchange from one Fund to another is treated as a redemption of the shares surrendered in the
exchange, on which you may be subject to tax, followed by a purchase of shares received in the exchange. You should consult your tax adviser concerning the tax consequences of an exchange.
|
| Restrictions on Excessive Trading Practices. The Trust does not permit market-timing or other excessive trading
practices. Purchases and exchanges should be made for long-term investment purposes only. The Trust and Goldman Sachs reserve the right to reject or restrict purchase or exchange requests from any investor. Excessive, short-term (market-timing) trading
practices may disrupt portfolio management strategies, harm Fund performance and negatively impact long-term shareholders. The Trust and Goldman Sachs will not be held liable for any loss resulting from rejected purchase or exchange orders. To minimize
harm to the Trust (or Goldman Sachs) and its shareholders, the Trust (or Goldman Sachs) will exercise these rights if, in the Trust’s (or Goldman Sachs’) judgment, an investor has a history of excessive trading or if an investor’s trading,
in the judgment of the Trust (or Goldman Sachs) has been or may be disruptive to a Fund. In making this judgment, trades executed in multiple accounts under common ownership or control may be considered together.
|
| What Types Of Reports Will Be Sent Regarding Investments In Service Shares?
|
| Service Organizations will receive from the Funds annual reports containing audited financial statements and semi-annual reports.
Service Organizations will also be provided with a printed confirmation for each transaction in their account and a monthly account statement. Service Organizations are responsible for providing these or other reports to their customers who are the
beneficial owners of Service Shares in accordance with the rules that apply to their accounts with the Service Organizations.
|
| As with any investment, you should consider how your investment in the Funds will be taxed. The tax information below is provided
as general information. More tax information is available in the Additional Statement. You should consult your tax adviser about the federal, state, local or foreign tax consequences of your investment in the Funds.
|
| Unless your investment is an IRA or other tax-advantaged account, you should consider the possible tax consequences of Fund
distributions and the sale of your Fund shares.
|
| DISTRIBUTIONS
|
| Distributions you receive from the Funds are generally subject to federal income tax, and may also be subject to state or local
taxes. This is true whether you reinvest your distributions in additional Fund shares or receive them in cash. For federal tax purposes, the Funds’ income dividend distributions and short-term capital gain distributions are taxable to you as ordinary
income. Any long-term capital gain distributions are taxable as long-term capital gains, no matter how long you have owned your Fund shares.
|
| Although distributions are generally treated as taxable to you in the year they are paid, distributions declared in October,
November or December but paid in January are taxable as if they were paid in December. A percentage of the Funds’ dividends paid to corporate shareholders may be eligible for the corporate dividends-received deduction. The Funds will inform
shareholders of the source and tax status of all distributions promptly after the close of each calendar year.
|
| Each Fund may be subject to foreign withholding or other foreign taxes on income or gain from certain foreign securities. In
general, the Funds may deduct these taxes in computing their taxable income.
|
| If you buy shares of a Fund before it makes a distribution, the distribution will be taxable to you even though it may actually be
a return of a portion of your investment. This is known as “buying a dividend.”
|
| SALES AND EXCHANGES
|
| Your sale of Fund shares is a taxable transaction for federal income tax purposes, and may also be subject to state and local
taxes. For tax purposes, the exchange of your Fund shares for shares of a different Goldman Sachs Fund is the same as a sale. When you sell your shares, you will generally recognize a capital gain or loss in an amount equal to the difference between your
adjusted tax basis in the shares and the amount received. Generally, this gain or loss is long-term or short-term depending on whether your holding period exceeds twelve months, except that any loss realized on shares held for six months or less will be
treated as a long-term capital loss to the extent of any capital gain dividends that were received on the shares.
|
| OTHER INFORMATION
|
| When you open your account, you should provide your social security or tax identification number on your Account Application. By
law, each Fund must withhold 31% of your taxable distributions and any redemption proceeds if you do not provide your correct taxpayer identification number, or certify that it is correct, or if the IRS instructs the Fund to do so. Non-U.S. investors may
be subject to U.S. withholding and estate tax.
|
| A. General Portfolio Risks
|
| The Funds will be subject to the risks associated with equity securities. “Equity securities” include common stocks,
preferred stocks, interests in real estate investment trusts, convertible debt obligations, convertible preferred stocks, equity interests in trusts, partnerships, joint ventures, limited liability companies and similar enterprises, warrants and stock
purchase rights. In general, stock values fluctuate in response to the activities of individual companies and in response to general market and economic conditions. Accordingly, the value of the stocks that a Fund holds may decline over short or extended
periods. The stock markets tend to be cyclical, with periods when stock prices generally rise and periods when prices generally decline. The volatility of equity securities means that the value of your investment in the Funds may increase or decrease.
Recently, certain stock markets have experienced substantial price volatility and, at times, have traded at or close to record high levels. There can be no guarantee that such levels will be reached or maintained in the future.
|
| To the extent that a Fund invests in fixed-income securities, that Fund will also be subject to the risks associated with its
fixed-income securities. These risks include interest rate risk, credit risk and call/extension risk. In general, interest rate risk involves the risk that when interest rates decline, the market value of fixed-income securities tends to increase
(although many mortgage related securities will have less potential than other debt securities for capital appreciation during periods of declining rates). Conversely, when interest rates increase, the market value of fixed-income securities tends to
decline. Credit risk involves the risk that an issuer or guarantor could default on its obligations, and a Fund will not recover its investment. Call risk and extension risk are normally present in mortgage-backed securities and asset-backed securities.
For example, homeowners have the option to prepay their mortgages. Therefore, the duration of a security backed by home mortgages can either shorten (call risk) or lengthen (extension risk). In general, if interest rates on new mortgage loans fall
sufficiently below the interest rates on existing outstanding mortgage loans, the rate of prepayment would be expected to increase. Conversely, if mortgage loan interest rates rise above the interest rates on existing outstanding mortgage loans, the rate
of prepayment would be expected to decrease. In either case, a change in the prepayment rate can result in losses to investors.
|
| The Investment Adviser will not consider the portfolio turnover rate a limiting factor in making investment decisions for a Fund.
A high rate of portfolio turnover (100% or more) involves correspondingly greater expenses which must be borne by a Fund and its shareholders, and is also likely to result in higher short-term capital gains taxable to shareholders. The portfolio turnover
rate is calculated by dividing the lesser of the dollar amount of sales or purchases of portfolio securities by the average monthly value of a Fund’s portfolio securities, excluding securities having a maturity at the date of purchase of one year or
less. See “Financial Highlights” in Appendix B for a statement of the Funds’ historical portfolio turnover rates.
|
| The following sections provide further information on certain types of securities and investment techniques that may be used by
the Funds, including their associated risks. Additional information is provided in the Additional Statement, which is available upon request. Among other things, the Additional Statement describes certain fundamental investment restrictions that cannot be
changed without shareholder approval. You should note, however, that all investment objectives, and all investment policies not specifically designated as fundamental are non-fundamental and may be changed without shareholder approval. If there is a
change in a Fund’s investment objective, you should consider whether that Fund remains an appropriate investment in light of your then current financial position and needs.
|
| B. Other Portfolio Risks
|
| Risks of Investing in Small Capitalization Companies. Each Fund may invest in small capitalization companies.
Investments in small capitalization companies involve greater risk and portfolio price volatility than investments in larger capitalization stocks. Among the reasons for the greater price volatility of these investments are the less certain growth
prospects of smaller firms and the lower degree of liquidity in the markets for such securities. Small capitalization companies may be thinly traded and may have to be sold at a discount from current market prices or in small lots over an extended period
of time. In addition, these securities are subject to the risk that during certain periods the liquidity of particular issuers or industries, or all securities in these investment categories, will shrink or disappear suddenly and without warning as a
result of adverse economic or market conditions, or adverse investor perceptions whether or not accurate. Because of the lack of sufficient market liquidity, a Fund may incur losses because it will be required to effect sales at a disadvantageous time and
only then at a substantial drop in price. Small capitalization companies include “unseasoned” issuers that do not have an established financial history; often have limited product lines, markets or financial
resources; may depend on or use a few key personnel for management; and may be susceptible to losses and risks of bankruptcy. Transaction costs for these investments are often higher than those of larger capitalization companies. Investments in small
capitalization companies may be more difficult to price precisely than other types of securities because of their characteristics and lower trading volumes.
|
| Risks of Foreign Investments. The Funds may make foreign investments. Foreign investments involve special risks that
are not typically associated with U.S. dollar denominated or quoted securities of U.S. issuers. Foreign investments may be affected by changes in currency rates, changes in foreign or U.S. laws or restrictions applicable to such investments and changes in
exchange control regulations (e.g., currency blockage). A decline in the exchange rate of the currency (i.e., weakening of the currency against the U.S. dollar) in which a portfolio security is quoted or denominated relative to the U.S. dollar would reduce the value of
the portfolio security. In addition, if the currency in which a Fund receives dividends, interest or other payments declines in value against the U.S. dollar before such income is distributed as dividends to shareholders or converted to U.S. dollars, the
Fund may have to sell portfolio securities to obtain sufficient cash to pay such dividends.
|
| The introduction of a single currency, the euro, on January 1, 1999 for participating nations in the European Economic and
Monetary Union has presented unique uncertainties, including the fluctuation of the euro relative to non-euro currencies during the transition period from January 1, 1999 to December 31, 2001 and beyond; whether the interest rate, tax and labor regimes of
European countries participating in the euro will converge over time; and whether the conversion of the currencies of other countries that now are or may in the future become members of the European Union (“EU”), may have an impact on the euro.
Also, it is possible that the euro could be abandoned in the future by countries that have already adopted its use. These or other events, including political and economic developments, could cause market disruptions, and could adversely affect the value
of securities held by the Funds. Because of the number of countries using this single currency, a significant portion of the assets held by the Funds may be denominated in the euro.
|
| Brokerage commissions, custodial services and other costs relating to investment in international securities markets generally are
more expensive than in the United States. In addition, clearance and settlement procedures may be different in foreign countries and, in certain markets, such procedures have been unable to keep pace with the volume of securities transactions, thus making
it difficult to conduct such transactions.
|
| Foreign issuers are not generally subject to uniform accounting, auditing and financial reporting standards comparable to those
applicable to U.S. issuers. There may be less publicly available information about a foreign issuer than about a U.S. issuer. In addition, there is generally less government regulation of foreign markets, companies and securities dealers than in the
United States. Foreign securities markets may have substantially less volume than U.S. securities markets and secu-
|
| rities of many foreign issuers are less liquid and more volatile than securities of comparable domestic issuers. Furthermore, with
respect to certain foreign countries, there is a possibility of nationalization, expropriation or confiscatory taxation, imposition of withholding or other taxes on dividend or interest payments (or, in some cases, capital gains distributions),
limitations on the removal of funds or other assets from such countries, and risks of political or social instability or diplomatic developments which could adversely affect investments in those countries.
|
| Concentration of a Fund’s assets in one or a few countries and currencies will subject a Fund to greater risks than if a
Fund’s assets were not geographically concentrated.
|
| Investment in sovereign debt obligations by certain Funds involves risks not present in debt obligations of corporate issuers. The
issuer of the debt or the governmental authorities that control the repayment of the debt may be unable or unwilling to repay principal or interest when due in accordance with the terms of such debt, and a Fund may have limited recourse to compel payment
in the event of a default. Periods of economic uncertainty may result in the volatility of market prices of sovereign debt, and in turn a Fund’s NAV, to a greater extent than the volatility inherent in debt obligations of U.S. issuers.
|
| A sovereign debtor’s willingness or ability to repay principal and pay interest in a timely manner may be affected by, among
other factors, its cash flow situation, the extent of its foreign currency reserves, the availability of sufficient foreign exchange on the date a payment
is due, the relative size of the debt service burden to the economy as a whole, the sovereign debtor’s policy toward international lenders, and the political constraints to which a sovereign debtor may be subject.
|
| Investments in foreign securities may take the form of sponsored and unsponsored American Depositary Receipts (“ADRs”)
and Global Depositary Receipts (“GDRs”). Certain Funds may also invest in European Depositary Receipts (“EDRs”) or other similar instruments representing securities of foreign issuers. ADRs represent the right to receive securities of
foreign issuers deposited in a domestic bank or a correspondent bank. Prices of ADRs are quoted in U.S. dollars, and ADRs are traded in the United States. EDRs and GDRs are receipts evidencing an arrangement with a non-U.S. bank. EDRs and GDRs are not
necessarily quoted in the same currency as the underlying security.
|
| Risks of Emerging Countries. Certain Funds may invest in securities of issuers located in emerging countries. The
risks of foreign investment are heightened when the issuer is located in an emerging country. Emerging countries are generally located in the Asia-Pacific region, Eastern Europe, Latin and South America and Africa. A Fund’s purchase and sale of
portfolio securities in certain emerging countries may be constrained by limitations relating to daily changes in the prices of listed securities, periodic trading or settlement volume and/or limitations on aggregate holdings of foreign investors. Such
limitations may be computed based on the aggregate trading volume by or holdings of a Fund, the Investment Adviser, its affiliates and their respective clients and other service providers. A Fund may not be able to sell securities in circumstances where
price, trading or settlement volume limitations have been reached.
|
| Foreign investment in the securities markets of certain emerging countries is restricted or controlled to varying degrees which
may limit investment in such countries or increase the administrative costs of such investments. For example, certain Asian countries require governmental approval prior to investments by foreign persons or limit investment by foreign persons to only a
specified percentage of an issuer’s outstanding securities or a specific class of securities which may have less advantageous terms (including price) than securities of the issuer available for purchase by nationals. In addition, certain countries
may restrict or prohibit investment opportunities in issuers or industries deemed important to national interests. Such restrictions may affect the market price, liquidity and rights of securities that may be purchased by a Fund. The repatriation of both
investment income and capital from certain emerging countries is subject to restrictions such as the need for governmental consents. Due to restrictions on direct investment in equity securities in certain Asian and other countries, it is anticipated that
a Fund may invest in such countries through other investment funds in such countries.
|
| Many emerging countries have recently experienced currency devaluations and substantial (and, in some cases, extremely high) rates
of inflation. Other emerging countries have experienced economic recessions. These circumstances have had a negative effect on the economies and securities markets of such emerging countries. Economies in emerging countries generally are dependent heavily
upon commodity prices and international trade and, accordingly, have been and may continue to be affected adversely by the economies of their trading partners, trade barriers, exchange controls, managed adjustments in relative currency values and other
protectionist measures imposed or negotiated by the countries with which they trade.
|
| Many emerging countries are subject to a substantial degree of economic, political and social instability. Governments of some
emerging countries are authoritarian in nature or have been installed or removed as a result of military coups, while governments in other emerging countries have periodically used force to suppress
civil dissent. Disparities of wealth, the pace and success of democratization, and ethnic, religious and racial disaffection, among other factors, have also led to social unrest, violence and/or labor unrest in some emerging countries. Unanticipated
political or social developments may result in sudden and significant investment losses. Investing in emerging countries involves greater risk of loss due to expropriation, nationalization, confiscation of assets and property or the imposition of
restrictions on foreign investments and on repatriation of capital invested. As an example, in the past some Eastern European governments have expropriated substantial amounts of private property, and many claims of the property owners have never been
fully settled. There is no assurance that similar expropriations will not recur in Eastern Europe or other countries.
|
| A Fund’s investment in emerging countries may also be subject to withholding or other taxes, which may be significant and may
reduce the return from an investment in such countries to the Fund.
|
| Settlement procedures in emerging countries are frequently less developed and reliable than those in the United States and often
may involve a Fund’s delivery of securities before receipt of payment for their sale. In addition, significant delays are common in certain markets in registering the transfer of securities. Settlement or registration problems may make it more
difficult for a Fund to value its portfolio securities and could cause the Fund to miss attractive investment opportunities, to have a portion of its assets uninvested or to incur losses due to the failure of a counterparty to pay for securities the Fund
has delivered or the Fund’s inability to complete its contractual obligations because of theft or other reasons. The creditworthiness of the local securities firms used by the Fund in emerging countries may not be as sound as the creditworthiness of
firms used in more developed countries. As a result, the Fund may be subject to a greater risk of loss if a securities firm defaults in the performance of its responsibilities.
|
| The small size and inexperience of the securities markets in certain emerging countries and the limited volume of trading in
securities in those countries may make a Fund’s investments in such countries less liquid and more volatile than investments in countries with more developed securities markets (such as the United States, Japan and most Western European countries). A
Fund’s investments in emerging countries are subject to the risk that the liquidity of a particular investment, or investments generally, in such countries will shrink or disappear suddenly and without warning as a result of adverse economic, market
or political conditions or adverse investor perceptions, whether or not accurate. Because of the lack of sufficient market liquidity, a Fund may incur losses because it will be required to effect sales at a disadvantageous time and only then at a
substantial drop in price. Investments in emerging countries may be more difficult to price precisely because of the characteristics discussed above and lower trading volumes.
|
| A Fund’s use of foreign currency management techniques in emerging countries may be limited. Due to the limited market for
these instruments in emerging countries, the Investment Adviser does not currently anticipate that a significant portion of the Funds’ currency exposure in emerging countries, if any, will be covered by such instruments.
|
| Risks of Derivative Investments. A Fund’s transactions, if any, in options, futures, options on futures, swaps,
interest rate caps, floors and collars, structured securities and currency transactions involve additional risk of loss. Loss can result from a lack of correlation between changes in the value of derivative instruments and the portfolio assets (if any)
being hedged, the potential illiquidity of the markets for derivative instruments, or the risks arising from margin requirements and related leverage factors associated with such transactions. The use of these management techniques also involves the risk
of loss if the Investment Adviser is incorrect in its expectation of fluctuations in securities prices, interest rates or currency prices. Each Fund may also invest in derivative investments for non-hedging purposes (that is, to seek to increase total
return). Investing for non-hedging purposes is considered a speculative practice and presents even greater risk of loss.
|
| Risks of Illiquid Securities. Each Fund may invest up to 15% of its net assets in illiquid securities which cannot
be disposed of in seven days in the ordinary course of business at fair value. Illiquid securities include:
|
n
|
Both domestic and foreign securities that are not readily marketable
|
n
|
Certain stripped mortgage-backed securities
|
n
|
Repurchase agreements and time deposits with a notice or demand period of more than seven days
|
n
|
Certain over-the-counter options
|
n
|
Certain structured securities and all swap transactions
|
n
|
Certain restricted securities, unless it is determined, based upon a review of the trading markets for a specific restricted
security, that such restricted security is eligible for resale pursuant to Rule 144A under the Securities Act of 1933 (“144A Securities”) and, therefore, is liquid.
|
| Investing in 144A Securities may decrease the liquidity of a Fund’s portfolio to the extent that qualified institutional
buyers become for a time uninterested in purchasing these restricted securities. The purchase price and subsequent valuation of restricted and illiquid securities normally reflect a discount, which may be significant, from the market price of comparable
securities for which a liquid market exists.
|
| Credit Risks. Debt securities purchased by the Funds may include securities (including zero coupon bonds) issued by
the U.S. government (and its agencies, instrumentalities and sponsored enterprises), foreign governments, domestic and foreign corporations, banks and other issuers. Further information is provided in the Additional Statement.
|
| Debt securities rated BBB or higher by Standard & Poor’s or Baa or higher by Moody’s are considered “investment
grade.” Securities rated BBB or Baa are considered medium-grade obligations with speculative characteristics, and adverse economic conditions or changing circumstances may weaken their issuers’ capacity to pay interest and repay principal. A
security will be deemed to have met a rating requirement if it receives the minimum required rating from at least one such rating organization even though it has been rated below the minimum rating by one or more other rating organizations, or if unrated
by such rating organizations, determined by the Investment Adviser to be of comparable credit quality.
|
| Certain Funds may invest in fixed-income securities rated BB or Ba or below (or comparable unrated securities) which are commonly
referred to as “junk bonds.” Junk bonds are considered predominantly speculative and may be questionable as to principal and interest payments.
|
| In some cases, junk bonds may be highly speculative, have poor prospects for reaching investment grade standing and be in default.
As a result, investment in such bonds will present greater speculative risks than those associated with investment in investment grade bonds. Also, to the extent that the rating assigned to a security in a Fund’s portfolio is downgraded by a rating
organization, the market price and liquidity of such security may be adversely affected.
|
| Risks of Initial Public Offerings. The Funds may invest in IPOs. An IPO is a company’s first offering of stock
to the public. IPO risk is the risk that the market value of IPO shares will fluctuate considerably due to factors such as the absence of a prior public market, unseasoned trading, the small number of shares available for trading and limited information
about the issuer. The purchase of IPO shares may involve high transaction costs. IPO shares are subject to market risk and liquidity risk. When a Fund’s asset base is small, a significant portion of the Fund’s performance could be attributable
to investments in IPOs, because such investments would have a magnified impact on the Fund. As the Fund’s assets grow, the effect of the Fund’s investments in IPOs on the Fund’s performance probably will decline, which could reduce the
Fund’s performance. Because of the price volatility of IPO shares, a Fund may choose to hold IPO shares for a very short period of time. This may increase the turnover of the Fund’s portfolio and may lead to increased expenses to the Fund, such
as commissions and transaction costs. By selling IPO shares, the Fund may realize taxable gains it will subse
quently distribute to shareholders. In addition, the market for IPO shares can be speculative and/or inactive for extended periods of time. There is no assurance that a Fund will be able to obtain allocable portions of IPO shares. The limited number of
shares available for trading in some IPOs may make it more difficult for a Fund to buy or sell significant amounts of shares without an unfavorable impact on prevailing prices. Investors in IPO shares can be affected by substantial dilution in the value
of their shares, by sales of additional shares and by concentration of control in existing management and principal shareholders.
|
| Temporary Investment Risks. Each Fund may, for temporary defensive purposes, invest a certain percentage of its
total assets in:
|
n
|
U.S. government securities
|
n
|
Commercial paper rated at least A-2 by Standard & Poor’s or P-2 by Moody’s
|
n
|
Certificates of deposit
|
n
|
Bankers’ acceptances
|
n
|
Repurchase agreements
|
n
|
Non-convertible preferred stocks and non-convertible corporate bonds with a remaining maturity of less than one year
|
| When a Fund’s assets are invested in such instruments, the Fund may not be achieving its investment objective.
|
| C. Portfolio Securities and Techniques
|
| This section provides further information on certain types of securities and investment techniques that may be used by the Funds,
including their associated risks. Further information is provided in the Additional Statement, which is available upon request.
|
| Convertible Securities. Each Fund may invest in convertible securities. Convertible securities are preferred stock
or debt obligations that are convertible into common stock. Convertible securities generally offer lower interest or dividend yields than non-convertible securities of similar quality. Convertible securities in which a Fund invests are subject to the same
rating criteria as its other investments in fixed-income securities. Convertible securities have both equity and fixed-income risk characteristics. Like all fixed-income securities, the value of convertible securities is susceptible to the risk of market
losses attributable to changes in interest rates. Generally, the market value of convertible securities tends to decline as interest rates increase and, conversely, to increase as interest rates decline. However, when the market price of the common stock
underlying a convertible security exceeds the conversion price of the convertible security, the convertible security tends to reflect the market price of the underlying common stock. As the market
price of the underlying common stock declines, the convertible security, like a fixed-income security, tends to trade increasingly on a yield basis, and thus may not decline in price to the same extent as the underlying common stock.
|
| Foreign Currency Transactions. A Fund may, to the extent consistent with its investment policies, purchase or sell
foreign currencies on a cash basis or through forward contracts. A forward contract involves an obligation to purchase or sell a specific currency at a future date at a price set at the time of the contract. A Fund may engage in foreign currency
transactions for hedging purposes and to seek to protect against anticipated changes in future foreign currency exchange rates. In addition, certain Funds may also enter into such transactions to seek to increase total return, which is considered a
speculative practice.
|
| Some Funds may also engage in cross-hedging by using forward contracts in a currency different from that in which the hedged
security is denominated or quoted. A Fund may hold foreign currency received in connection with investments in foreign securities when, in the judgment of the Investment Adviser, it would be beneficial to convert such currency into U.S. dollars at a later
date (e.g., the Investment Adviser may anticipate the foreign currency to appreciate against the U.S. dollar).
|
| Currency exchange rates may fluctuate significantly over short periods of time, causing, along with other factors, a Fund’s
NAV to fluctuate (when the Fund’s NAV fluctuates, the value of your shares may go up or down). Currency exchange rates also can be affected unpredictably by the intervention of U.S. or foreign governments or central banks, or the failure to
intervene, or by currency controls or political developments in the United States or abroad.
|
| The market in forward foreign currency exchange contracts, currency swaps and other privately negotiated currency instruments
offers less protection against defaults by the other party to such instruments than is available for currency instruments traded on an exchange. Such contracts are subject to the risk that the counterparty to the contract will default on its obligations.
Since these contracts are not guaranteed by an exchange or clearinghouse, a default on a contract would deprive a Fund of unrealized profits, transaction costs or the benefits of a currency hedge or could force the Fund to cover its purchase or sale
commitments, if any, at the current market price.
|
| Structured Securities. Each Fund may invest in structured securities. Structured securities are securities whose
value is determined by reference to changes in the value of specific currencies, interest rates, commodities, indices or other financial indicators (the “Reference”) or the relative change in two or more References.
The interest rate or the principal amount payable upon maturity or redemption may be increased or decreased depending upon changes in the applicable Reference. Structured securities may be positively or negatively indexed, so that appreciation of the
Reference may produce an increase or decrease in the interest rate or value of the security at maturity. In addition, changes in the interest rates or the value of the security at maturity may be a multiple of changes in the value of the Reference.
Consequently, structured securities may present a greater degree of market risk than other types of fixed-income securities and may be more volatile, less liquid and more difficult to price accurately than less complex securities.
|
| REITs. Each Fund may invest in REITs. REITs are pooled investment vehicles that invest primarily in either real
estate or real estate related loans. The value of a REIT is affected by changes in the value of the properties owned by the REIT or securing mortgage loans held by the REIT. REITs are dependent upon the ability of the REITs’ managers, and are subject
to heavy cash flow dependency, default by borrowers and the qualification of the REITs under applicable regulatory requirements for favorable income tax treatment. REITs are also subject to risks generally associated with investments in real estate
including possible declines in the value of real estate, general and local economic conditions, environmental problems and changes in interest rates. To the extent that assets underlying a REIT are concentrated geographically, by property type or in
certain other respects, these risks may be heightened. A Fund will indirectly bear its proportionate share of any expenses, including management fees, paid by a REIT in which it invests.
|
| Options on Securities, Securities Indices and Foreign Currencies. A put option gives the purchaser of the option the
right to sell, and the writer (seller) of the option the obligation to buy, the underlying instrument during the option period. A call option gives the purchaser of the option the right to buy, and the writer (seller) of the option the obligation to sell,
the underlying instrument during the option period. Each Fund may write (sell) covered call and put options and purchase put and call options on any securities in which they may invest or on any securities index consisting of securities in which they may
invest. A Fund may also, to the extent that it invests in foreign securities, purchase and sell (write) put and call options on foreign currencies.
|
| The writing and purchase of options is a highly specialized activity which involves special investment risks. Options may be used
for either hedging or cross-hedging purposes, or to seek to increase total return (which is considered a speculative activity). The successful use of options depends in part on the ability of the Investment Adviser to manage future price fluctuations and
the degree of correlation between the options and securities (or currency) markets. If the Invest
ment Adviser is incorrect in its expectation of changes in market prices or determination of the correlation between the instruments or indices on which options are written and purchased and the instruments in a Fund’s investment portfolio, the Fund
may incur losses that it would not otherwise incur. The use of options can also increase a Fund’s transaction costs. Options written or purchased by the Funds may be traded on either U.S. or foreign exchanges or over-the-counter. Foreign and
over-the-counter options will present greater possibility of loss because of their greater illiquidity and credit risks.
|
| Futures Contracts and Options on Futures Contracts. Futures contracts are standardized, exchange-traded contracts
that provide for the sale or purchase of a specified financial instrument or currency at a future time at a specified price. An option on a futures contract gives the purchaser the right (and the writer of the option the obligation) to assume a position
in a futures contract at a specified exercise price within a specified period of time. A futures contract may be based on various securities (such as U.S. government securities), foreign currencies, securities indices and other financial instruments and
indices. The Funds may engage in futures transactions on both U.S. and foreign exchanges.
|
| Each Fund may purchase and sell futures contracts, and purchase and write call and put options on futures contracts, in order to
seek to increase total return or to hedge against changes in interest rates, securities prices or, to the extent a Fund invests in foreign securities, currency exchange rates, or to otherwise manage their term structures, sector selection and durations in
accordance with their investment objectives and policies. Each Fund may also enter into closing purchase and sale transactions with respect to such contracts and options. A Fund will engage in futures and related options transactions for bona fide hedging
purposes as defined in regulations of the Commodity Futures Trading Commission or to seek to increase total return to the extent permitted by such regulations. A Fund may not purchase or sell futures contracts or purchase or sell related options to seek
to increase total return, except for closing purchase or sale transactions, if immediately thereafter the sum of the amount of initial margin deposits and premiums paid on the Fund’s outstanding positions in futures and related options entered into
for the purpose of seeking to increase total return would exceed 5% of the market value of the Fund’s net assets.
|
| Futures contracts and related options present the following risks:
|
n
|
While a Fund may benefit from the use of futures and options on futures, unanticipated changes in interest rates, securities
prices or currency exchange rates may result in poorer overall performance than if the Fund had not entered into any futures contracts or options transactions.
|
n
|
Because perfect correlation between a futures position and portfolio position that is intended to be protected is impossible to
achieve, the desired protection may not be obtained and a Fund may be exposed to additional risk of loss.
|
n
|
The loss incurred by a Fund in entering into futures contracts and in writing call options on futures is potentially unlimited and
may exceed the amount of the premium received.
|
n
|
Futures markets are highly volatile and the use of futures may increase the volatility of a Fund’s NAV.
|
n
|
As a result of the low margin deposits normally required in futures trading, a relatively small price movement in a futures
contract may result in substantial losses to a Fund.
|
n
|
Futures contracts and options on futures may be illiquid, and exchanges may limit fluctuations in futures contract prices during a
single day.
|
n
|
Foreign exchanges may not provide the same protection as U.S. exchanges.
|
| Equity Swaps. Each Fund may invest in equity swaps. Equity swaps allow the parties to a swap agreement to exchange
the dividend income or other components of return on an equity investment (for example, a group of equity securities or an index) for a component of return on another non-equity or equity investment.
|
| An equity swap may be used by a Fund to invest in a market without owning or taking physical custody of securities in
circumstances in which direct investment may be restricted for legal reasons or is otherwise impractical. Equity swaps are derivatives and their value can be very volatile. To the extent that the Investment Adviser does not accurately analyze and predict
the potential relative fluctuation of the components swapped with another party, a Fund may suffer a loss, which may be substantial. The value of some components of an equity swap (such as the dividends on a common stock) may also be sensitive to changes
in interest rates. Furthermore, a Fund may suffer a loss if the counterparty defaults. Because equity swaps are normally illiquid, a Fund may be unable to terminate its obligations when desired.
|
| When-Issued Securities and Forward Commitments. Each Fund may purchase when-issued securities and make contracts to
purchase or sell securities for a fixed price at a future date beyond customary settlement time. When-issued securities are securities that have been authorized, but not yet issued. When-issued securities are purchased in order to secure what is
considered to be an advantageous price and yield to the Fund at the time of entering into the transaction. A forward commitment involves the entering into a contract to purchase or sell securities for a fixed price at a future date beyond the customary
settlement period.
|
| The purchase of securities on a when-issued or forward commitment basis involves a risk of loss if the value of the security to be
purchased declines before
the settlement date. Conversely, the sale of securities on a forward commitment basis involves the risk that the value of the securities sold may increase before the settlement date. Although a Fund will generally purchase securities on a when-issued or
forward commitment basis with the intention of acquiring the securities for its portfolio, a Fund may dispose of when-issued securities or forward commitments prior to settlement if the Investment Adviser deems it appropriate.
|
| Repurchase Agreements. Repurchase agreements involve the purchase of securities subject to the seller’s
agreement to repurchase them at a mutually agreed upon date and price. Each Fund may enter into repurchase agreements with dealers in U.S. government securities and member banks of the Federal Reserve System which furnish collateral at least equal in
value or market price to the amount of their repurchase obligation.
|
| If the other party or “seller” defaults, a Fund might suffer a loss to the extent that the proceeds from the sale of the
underlying securities and other collateral held by the Fund are less than the repurchase price and the Fund’s costs associated with delay and enforcement of the repurchase agreement. In addition, in the event of bankruptcy of the seller, a Fund could
suffer additional losses if a court determines that the Fund’s interest in the collateral is not enforceable.
|
| In evaluating whether to enter into a repurchase agreement, the Investment Adviser will carefully consider the creditworthiness of
the seller. Certain Funds, together with other registered investment companies having advisory agreements with the Investment Adviser or any of its affiliates, may transfer uninvested cash balances into a single joint account, the daily aggregate balance
of which will be invested in one or more repurchase agreements.
|
| Lending of Portfolio Securities. Each Fund may engage in securities lending. Securities lending involves the lending
of securities owned by a Fund to financial institutions such as certain broker-dealers. The borrowers are required to secure their loan continuously with cash, cash equivalents, U.S. government securities or letters of credit in an amount at least equal
to the market value of the securities loaned. Cash collateral may be invested in cash equivalents. To the extent that cash collateral is invested in other investment securities, such collateral will be subject to market depreciation or appreciation, and a
Fund will be responsible for any loss that might result from its investment of the borrowers’ collateral. If the Investment Adviser determines to make securities loans, the value of the securities loaned may not exceed 33 1
/3% of the value of the total assets of a
Fund (including the loan collateral).
|
| A Fund may lend its securities to increase its income. A Fund may, however, experience delay in the recovery of its securities if
the institution with which it has engaged in a portfolio loan transaction breaches its agreement with the Fund.
|
| Short Sales Against-the-Box. Certain Funds may make short sales against-the-box. A short sale against-the-box means
that at all times when a short position is open the Fund will own an equal amount of securities sold short, or securities convertible into or exchangeable for, without payment of any further consideration, an equal amount of the securities of the same
issuer as the securities sold short.
|
| Preferred Stock, Warrants and Rights. Each Fund may invest in preferred stock, warrants and rights. Preferred stocks
are securities that represent an ownership interest providing the holder with claims on the issuer’s earnings and assets before common stock owners but after bond owners. Unlike debt securities, the obligations of an issuer of preferred stock,
including dividend and other payment obligations, may not typically be accelerated by the holders of such preferred stock on the occurrence of an event of default or other non-compliance by the issuer of the preferred stock.
|
| Warrants and other rights are options to buy a stated number of shares of common stock at a specified price at any time during the
life of the warrant or right. The holders of warrants and rights have no voting rights, receive no dividends and have no rights with respect to the assets of the issuer.
|
| Other Investment Companies. Each Fund may invest in securities of other investment companies (including
exchange-traded funds such as SPDRs and iShares
SM
, as defined below) subject to statutory limitations prescribed by the Act. These limitations include a
prohibition on any Fund acquiring more than 3% of the voting shares of any other investment company, and a prohibition on investing more than 5% of a Fund’s total assets in securities of any one investment company or more than 10% of its total assets
in securities of all investment companies. A Fund will indirectly bear its proportionate share of any management fees and other expenses paid by such other investment companies. Exchange-traded funds such as SPDRs and iShares
SM
are shares of unaffiliated investment companies which are traded like traditional equity securities on a national
securities exchange or the NASDAQ® National Market System.
|
n
|
Standard & Poor’s Depositary Receipts™.
The Funds may, consistent with their investment policies, purchase Standard & Poor’s Depositary Receipts™ (“SPDRs”). SPDRs are securities traded on the American Stock Exchange (“AMEX”) that represent
ownership in the SPDR Trust, a trust which has been established to accumulate and hold a portfolio of common stocks that is intended to track the price performance and dividend yield of the S&P 500®. The SPDR Trust is sponsored by a subsidiary of
the AMEX. SPDRs may be used for several reasons, including, but not limited to, facilitating the handling
of cash flows or trading, or reducing transaction costs. The price movement of SPDRs may not perfectly parallel the price action of the S&P 500®.
|
n
|
iShares
SM
(formerly World Equity Benchmark Shares or WEBs). iShares are shares of an investment company that invests substantially all of its assets in securities included
in the MSCI indices for specified countries. iShares are listed on the AMEX and were initially offered to the public in 1996. The market prices of iShares are expected to fluctuate in accordance with both changes in the NAVs of their underlying indices
and supply and demand of iShares on the AMEX. To date, iShares have traded at relatively modest discounts and premiums to their NAVs. However, iShares have a limited operating history and information is lacking regarding the actual performance and trading
liquidity of iShares for extended periods or over complete market cycles. In addition, there is no assurance that the requirements of the AMEX necessary to maintain the listing of iShares will continue to be met or will remain unchanged. In the event
substantial market or other disruptions affecting iShares should occur in the future, the liquidity and value of a Fund’s shares could also be substantially and adversely affected. If such disruptions were to occur, a Fund could be required to
reconsider the use of iShares as part of its investment strategy.
|
| Unseasoned Companies. Each Fund may invest in companies (including predecessors) which have operated less than three
years. The securities of such companies may have limited liquidity, which can result in their being priced higher or lower than might otherwise be the case. In addition, investments in unseasoned companies are more speculative and entail greater risk than
do investments in companies with an established operating record.
|
| Corporate Debt Obligations. Corporate debt obligations include bonds, notes, debentures, commercial paper and other
obligations of corporations to pay interest and repay principal, and include securities issued by banks and other financial institutions. Each Fund may invest in corporate debt obligations issued by U.S. and certain non-U.S. issuers which issue securities
denominated in the U.S. dollar (including Yankee and Euro obligations). In addition to obligations of corporations, corporate debt obligations include securities issued by banks and other financial institutions and supranational entities (i.e., the World Bank, the International Monetary Fund, etc.).
|
| Bank Obligations. Each Fund may invest in obligations issued or guaranteed by U.S. or foreign banks. Bank
obligations, including without limitations, time deposits, bankers’ acceptances and certificates of deposit, may be general obligations of the parent bank or may be limited to the issuing branch by the terms of the specific obligations or by
government regulations. Banks are subject to extensive but different governmental regulations which may limit both the amount and types of
loans which may be made and interest rates which may be charged. In addition, the profitability of the banking industry is largely dependent upon the availability and cost of funds for the purpose of financing lending operations under prevailing money
market conditions. General economic conditions as well as exposure to credit losses arising from possible financial difficulties of borrowers play an important part in the operation of this industry.
|
| U.S. Government Securities. Each Fund may invest in U.S. government securities. U.S. government securities include
U.S. Treasury obligations and obligations issued or guaranteed by U.S. government agencies, instrumentalities or sponsored enterprises. U.S. government securities may be supported by (a) the full faith and credit of the U.S. Treasury (such as the
Government National Mortgage Association (“Ginnie Mae”)); (b) the right of the issuer to borrow from the U.S. Treasury (such as securities of the Student Loan Marketing Association); (c) the discretionary authority of the U.S. government to
purchase certain obligations of the issuer; or (d) only the credit of the issuer. U.S. government securities also include Treasury receipts, zero coupon bonds and other stripped U.S. government securities, where the interest and principal components of
stripped U.S. government securities are traded independently.
|
| Custodial Receipts. Interests in U.S. government securities may be purchased in the form of custodial receipts that
evidence ownership of future interest payments, principal payments or both on certain notes or bonds issued or guaranteed as to principal and interest by the U.S. government, its agencies, instrumentalities, political subdivisions or authorities. For
certain securities law purposes, custodial receipts are not considered obligations of the U.S. government.
|
| Mortgage-Backed Securities. Certain Funds may invest in mortgage-backed securities. Mortgage-backed securities
represent direct or indirect participations in, or are collateralized by and payable from, mortgage loans secured by real property. Mortgage-backed securities can be backed by either fixed rate mortgage loans or adjustable rate mortgage loans, and may be
issued by either a governmental or non-governmental entity. Privately issued mortgage-backed securities are normally structured with one or more types of “credit enhancement.” However, these mortgage-backed securities typically do not have the
same credit standing as U.S. government guaranteed mortgage-backed securities.
|
| Mortgage-backed securities may include multiple class securities, including collateralized mortgage obligations (“CMOs”)
and Real Estate Mortgage Investment Conduit (“REMIC”) pass-through or participation certificates. CMOs provide an investor with a specified interest in the cash flow from a pool of underlying mortgages or of other mortgage-backed securities.
CMOs are issued in multiple classes. In many cases, payments of principal are applied to the CMO classes in the
order of their respective stated maturities, so that no principal payments will be made on a CMO class until all other classes having an earlier stated maturity date are paid in full. A REMIC is a CMO that qualifies for special tax treatment and invests
in certain mortgages principally secured by interests in real property and other permitted investments.
|
| Mortgaged-backed securities also include stripped mortgage-backed securities (“SMBS”), which are derivative multiple
class mortgage-backed securities. SMBS are usually structured with two different classes: one that receives substantially all of the interest payments and the other that receives substantially all of the principal payments from a pool of mortgage loans.
The market value of SMBS consisting entirely of principal payments generally is unusually volatile in response to changes in interest rates. The yields on SMBS that receive all or most of the interest from mortgage loans are generally higher than
prevailing market yields on other mortgage-backed securities because their cash flow patterns are more volatile and there is a greater risk that the initial investment will not be fully recouped.
|
| Asset-Backed Securities. Certain Funds may invest in asset-backed securities. Asset-backed securities are securities
whose principal and interest payments are collateralized by pools of assets such as auto loans, credit card receivables, leases, installment contracts and personal property. Asset-backed securities are often subject to more rapid repayment than their
stated maturity date would indicate as a result of the pass-through of prepayments of principal on the underlying loans. During periods of declining interest rates, prepayment of loans underlying asset-backed securities can be expected to accelerate.
Accordingly, a Fund’s ability to maintain positions in such securities will be affected by reductions in the principal amount of such securities resulting from prepayments, and its ability to reinvest the returns of principal at comparable yields is
subject to generally prevailing interest rates at that time. Asset-backed securities present credit risks that are not presented by mortgage-backed securities. This is because asset-backed securities generally do not have the benefit of a security
interest in collateral that is comparable to mortgage assets. If the issuer of an asset-backed security defaults on its payment obligations, there is the possibility that, in some cases, the Fund will be unable to possess and sell the underlying
collateral and that the Fund’s recoveries on repossessed collateral may not be available to support payments on the securities. In the event of a default, a Fund may suffer a loss if it cannot sell collateral quickly and receive the amount it is owed.
|
| Borrowings. Each Fund can borrow money from banks and other financial institutions in amounts not exceeding
one-third of its total assets for temporary or emergency purposes. A Fund may not make additional investments if borrowings exceed 5% of its total assets.
|
| The financial highlights tables are intended to help you understand a Fund’s financial performance for the past five years
(or less if the Fund has been in operation for less than five years). Certain information reflects financial results for a single Fund share. The total returns in the table represent the rate that an investor would have earned or lost on an investment in
a Fund (assuming reinvestment of all dividends and distributions). This information for the periods ended August 31, 2000 has been audited by PriceWaterhouseCoopers LLP whose report, along with the Funds’ financial statements, is included in the
Funds’ annual reports (available upon request without charge). The information for all periods prior to the periods ended August 31, 2000, has been audited by the Funds’ previous independent accountants.
|
| CORE INTERNATIONAL EQUITY FUND
|
| Income from
investment operations |
|||||||||
|---|---|---|---|---|---|---|---|---|---|
| Net asset
value, beginning of period |
Net
investment income (loss) |
Net realized
and unrealized gain (loss) |
|||||||
| For the Year Ended August 31, | |||||||||
| 2000 - Class A Shares | $10.87 | $ 0.02 | c | $ 0.74 | |||||
| 2000 - Class B Shares | 10.81 | (0.04 | ) c | 0.73 | |||||
| 2000 - Class C Shares | 10.82 | (0.03 | ) c | 0.72 | |||||
| 2000 - Institutional Shares | 11.00 | 0.09 | c | 0.75 | |||||
| 2000 - Service Shares | 10.93 | 0.05 | c | 0.73 | |||||
| For the Seven-month Period Ended August 31, | |||||||||
| 1999 - Class A Shares | 9.98 | 0.05 | 0.84 | ||||||
| 1999 - Class B Shares | 9.95 | 0.01 | 0.85 | ||||||
| 1999 - Class C Shares | 9.96 | 0.01 | 0.85 | ||||||
| 1999 - Institutional Shares | 10.06 | 0.09 | 0.85 | ||||||
| 1999 - Service Shares | 10.02 | 0.01 | 0.90 | ||||||
| For the Year Ended January 31, | |||||||||
| 1999 - Class A Shares | 9.22 | (0.01 | ) | 0.79 | |||||
| 1999 - Class B Shares | 9.21 | — | 0.74 | ||||||
| 1999 - Class C Shares | 9.22 | — | 0.74 | ||||||
| 1999 - Institutional Shares | 9.24 | 0.05 | 0.80 | ||||||
| 1999 - Service Shares | 9.23 | — | 0.81 | ||||||
| For the Period Ended January 31, | |||||||||
| 1998 - Class A Shares (commenced August 15, 1997) | 10.00 | — | (0.78 | ) | |||||
| 1998 - Class B Shares (commenced August 15, 1997) | 10.00 | (0.02 | ) | (0.77 | ) | ||||
| 1998 - Class C Shares (commenced August 15, 1997) | 10.00 | (0.02 | ) | (0.76 | ) | ||||
| 1998 - Institutional Shares (commenced August 15, 1997) | 10.00 | 0.02 | (0.76 | ) | |||||
| 1998 - Service Shares (commenced August 15, 1997) | 10.00 | 0.01 | (0.78 | ) | |||||
|
Distributions to shareholders |
|||||||||||||||||||||
|---|---|---|---|---|---|---|---|---|---|---|---|---|---|---|---|---|---|---|---|---|---|
| Total from
investment operations |
From net
investment income |
From net
realized gains |
Total
distributions |
Net asset
value, end of period |
Total
returna |
Net assets
at end of period (in 000s) |
Ratio of net
expenses to average net assets |
||||||||||||||
| $ 0.76 | $(0.05 | ) | $(0.26 | ) | $(0.31 | ) | $11.32 | 6.92 | % | $147,409 | 1.66 | % | |||||||||
| 0.69 | (0.02 | ) | (0.26 | ) | (0.28 | ) | 11.22 | 6.36 | 12,032 | 2.16 | |||||||||||
| 0.69 | (0.02 | ) | (0.26 | ) | (0.28 | ) | 11.23 | 6.34 | 6,887 | 2.16 | |||||||||||
| 0.84 | (0.10 | ) | (0.26 | ) | (0.36 | ) | 11.48 | 7.62 | 308,074 | 1.01 | |||||||||||
| 0.78 | (0.09 | ) | (0.26 | ) | (0.35 | ) | 11.36 | 7.05 | 27 | 1.51 | |||||||||||
| 0.89 | — | — | — | 10.87 | 8.92 | 114,502 | 1.66 | b | |||||||||||||
| 0.86 | — | — | — | 10.81 | 8.64 | 9,171 | 2.16 | b | |||||||||||||
| 0.86 | — | — | — | 10.82 | 8.63 | 4,913 | 2.16 | b | |||||||||||||
| 0.94 | — | — | — | 11.00 | 9.34 | 271,212 | 1.01 | b | |||||||||||||
| 0.91 | — | — | — | 10.93 | 9.08 | 8 | 1.51 | b | |||||||||||||
| 0.78 | (0.02 | ) | — | (0.02 | ) | 9.98 | 8.37 | 110,338 | 1.63 | ||||||||||||
| 0.74 | — | — | — | 9.95 | 8.03 | 7,401 | 2.08 | ||||||||||||||
| 0.74 | — | — | — | 9.96 | 8.03 | 3,742 | 2.08 | ||||||||||||||
| 0.85 | (0.03 | ) | — | (0.03 | ) | 10.06 | 9.20 | 280,731 | 1.01 | ||||||||||||
| 0.81 | (0.02 | ) | — | (0.02 | ) | 10.02 | 8.74 | 22 | 1.50 | ||||||||||||
| (0.78 | ) | — | — | — | 9.22 | (7.66 | ) | 7,087 | 1.50 | b | |||||||||||
| (0.79 | ) | — | — | — | 9.21 | (7.90 | ) | 2,721 | 2.00 | b | |||||||||||
| (0.78 | ) | — | — | — | 9.22 | (7.80 | ) | 1,608 | 2.00 | b | |||||||||||
| (0.74 | ) | (0.02 | ) | — | (0.02 | ) | 9.24 | (7.45 | ) | 17,719 | 1.00 | b | |||||||||
| (0.77 | ) | — | — | — | 9.23 | (7.70 | ) | 1 | 1.50 | b | |||||||||||
| CORE INTERNATIONAL EQUITY FUND (continued)
|
| Ratios assuming no
expense reductions |
|||||||||||||
|---|---|---|---|---|---|---|---|---|---|---|---|---|---|
| Ratio of
net investment income (loss) to average net assets |
Ratio of
expenses to average net assets |
Ratio of
net investment income (loss) to average net assets |
Portfolio
turnover rate |
||||||||||
| For the Year Ended August 31, | |||||||||||||
| 2000 - Class A Shares | 0.14 | % | 1.75 | % | 0.05 | % | 92.10 | % | |||||
| 2000 - Class B Shares | (0.36 | ) | 2.25 | (0.45 | ) | 92.10 | |||||||
| 2000 - Class C Shares | (0.34 | ) | 2.25 | (0.43 | ) | 92.10 | |||||||
| 2000 - Institutional Shares | 0.78 | 1.10 | 0.69 | 92.10 | |||||||||
| 2000 - Service Shares | 0.33 | 1.60 | 0.24 | 92.10 | |||||||||
| For the Seven-month Period Ended August 31, | |||||||||||||
| 1999 - Class A Shares | 0.78 | b | 1.76 | b | 0.68 | b | 64.97 | ||||||
| 1999 - Class B Shares | 0.26 | b | 2.26 | b | 0.16 | b | 64.97 | ||||||
| 1999 - Class C Shares | 0.23 | b | 2.26 | b | 0.13 | b | 64.97 | ||||||
| 1999 - Institutional Shares | 1.43 | b | 1.11 | b | 1.33 | b | 64.97 | ||||||
| 1999 - Service Shares | 0.07 | b | 1.61 | b | (0.03 | ) b | 64.97 | ||||||
| For the Year Ended January 31, | |||||||||||||
| 1999 - Class A Shares | (0.11 | ) | 1.94 | (0.42 | ) | 194.61 | |||||||
| 1999 - Class B Shares | (0.03 | ) | 2.39 | (0.34 | ) | 194.61 | |||||||
| 1999 - Class C Shares | (0.04 | ) | 2.39 | (0.35 | ) | 194.61 | |||||||
| 1999 - Institutional Shares | 0.84 | 1.32 | 0.53 | 194.61 | |||||||||
| 1999 - Service Shares | 0.02 | 1.81 | (0.29 | ) | 194.61 | ||||||||
| For the Period Ended January 31, | |||||||||||||
| 1998 - Class A Shares (commenced August 15, 1997) | (0.27 | ) b | 4.87 | b | (3.90 | ) b | 25.16 | ||||||
| 1998 - Class B Shares (commenced August 15, 1997) | (0.72 | ) b | 5.12 | b | (3.84 | ) b | 25.16 | ||||||
| 1998 - Class C Shares (commenced August 15, 1997) | (0.73 | ) b | 5.12 | b | (3.85 | ) b | 25.16 | ||||||
| 1998 - Institutional Shares (commenced August 15, 1997) | 0.59 | b | 4.12 | b | (2.53 | ) b | 25.16 | ||||||
| 1998 - Service Shares (commenced August 15, 1997) | 0.26 | b | 4.62 | b | (2.86 | ) b | 25.16 | ||||||
| INTERNATIONAL EQUITY FUND
|
|
Income from investment operations |
||||||||||||
|---|---|---|---|---|---|---|---|---|---|---|---|---|
|
Net asset value, beginning of period |
Net
investment income (loss) |
Net realized
and unrealized gain (loss) |
Total from
investment operations |
|||||||||
| For the Year Ended August 31, | ||||||||||||
| 2000 - Class A Shares | $23.12 | $(0.03 | ) c | $3.41 | $3.38 | |||||||
| 2000 - Class B Shares | 22.73 | (0.16 | ) c | 3.38 | 3.22 | |||||||
| 2000 - Class C Shares | 22.54 | (0.14 | ) c | 3.35 | 3.21 | |||||||
| 2000 - Institutional Shares | 23.49 | 0.14 | c | 3.46 | 3.60 | |||||||
| 2000 - Service Shares | 23.14 | (0.01 | ) c | 3.45 | 3.44 | |||||||
| For the Seven Months Ended August 31, | ||||||||||||
| 1999 - Class A Shares | 21.92 | 0.04 | 1.16 | 1.20 | ||||||||
| 1999 - Class B Shares | 21.63 | (0.02 | ) | 1.12 | 1.10 | |||||||
| 1999 - Class C Shares | 21.45 | (0.03 | ) | 1.12 | 1.09 | |||||||
| 1999 - Institutional Shares | 22.20 | 0.12 | c | 1.17 | c | 1.29 | ||||||
| 1999 - Service Shares | 21.93 | 0.06 | 1.15 | 1.21 | ||||||||
| For the Years Ended January 31, | ||||||||||||
| 1999 - Class A Shares | 19.85 | (0.06 | ) | 3.24 | 3.18 | |||||||
| 1999 - Class B Shares | 19.70 | (0.17 | ) | 3.21 | 3.04 | |||||||
| 1999 - Class C Shares | 19.56 | (0.15 | ) | 3.15 | 3.00 | |||||||
| 1999 - Institutional Shares | 19.97 | 0.03 | 3.31 | 3.34 | ||||||||
| 1999 - Service Shares | 19.84 | (0.04 | ) | 3.24 | 3.20 | |||||||
| 1998 - Class A Shares | 19.32 | 0.03 | 2.04 | 2.07 | ||||||||
| 1998 - Class B Shares | 19.24 | (0.08 | ) | 2.02 | 1.94 | |||||||
| 1998 - Class C Shares (commenced August 15, 1997) | 22.60 | (0.04 | ) | (1.38 | ) | (1.42 | ) | |||||
| 1998 - Institutional Shares | 19.40 | 0.10 | 2.11 | 2.21 | ||||||||
| 1998 - Service Shares | 19.34 | 0.02 | 2.06 | 2.08 | ||||||||
| 1997 - Class A Shares | 17.20 | 0.10 | 2.23 | 2.33 | ||||||||
| 1997 - Class B Shares (commenced May 1, 1996) | 18.91 | (0.06 | ) | 0.60 | 0.54 | |||||||
| 1997 - Institutional Shares (commenced February 7, 1996) | 17.45 | 0.04 | 2.15 | 2.19 | ||||||||
| 1997 - Service Shares (commenced March 6, 1996) | 17.70 | (0.02 | ) | 1.87 | 1.85 | |||||||
| 1996 - Class A Shares | 14.52 | 0.13 | 4.00 | 4.13 | ||||||||
|
Distributions to shareholders |
|||||||||||||||||||||
|---|---|---|---|---|---|---|---|---|---|---|---|---|---|---|---|---|---|---|---|---|---|
| From net
investment income |
In excess of net investment income |
From net
realized gains |
Total
distributions |
Net asset
value, end of period |
Total
returna |
Net assets
at end of period (in 000s) |
Ratio of
net expenses to average net assets |
||||||||||||||
| $(0.10 | ) | $(0.24) | $(2.57 | ) | $(2.91 | ) | $23.59 | 14.68 | % | $1,343,869 | 1.79 | % | |||||||||
| (0.07 | ) | (0.17) | (2.57 | ) | (2.81 | ) | 23.14 | 14.20 | 80,274 | 2.29 | |||||||||||
| (0.09 | ) | (0.20) | (2.57 | ) | (2.86 | ) | 22.89 | 14.28 | 22,031 | 2.29 | |||||||||||
| (0.14 | ) | (0.32) | (2.57 | ) | (3.03 | ) | 24.06 | 15.45 | 325,161 | 1.14 | |||||||||||
| (0.11 | ) | (0.25) | (2.57 | ) | (2.93 | ) | 23.65 | 15.00 | 3,789 | 1.64 | |||||||||||
| — | — | — | — | 23.12 | 5.47 | 943,473 | 1.79 | b | |||||||||||||
| — | — | — | — | 22.73 | 5.09 | 68,691 | 2.29 | b | |||||||||||||
| — | — | — | — | 22.54 | 5.08 | 11,241 | 2.29 | b | |||||||||||||
| — | — | — | — | 23.49 | 5.81 | 180,564 | 1.14 | b | |||||||||||||
| — | — | — | — | 23.14 | 5.52 | 3,852 | 1.64 | b | |||||||||||||
| — | — | (1.11 | ) | (1.11 | ) | 21.92 | 16.39 | 947,973 | 1.73 | ||||||||||||
| — | — | (1.11 | ) | (1.11 | ) | 21.63 | 15.80 | 69,231 | 2.24 | ||||||||||||
| — | — | (1.11 | ) | (1.11 | ) | 21.45 | 15.70 | 11,619 | 2.24 | ||||||||||||
| — | — | (1.11 | ) | (1.11 | ) | 22.20 | 17.09 | 111,315 | 1.13 | ||||||||||||
| — | — | (1.11 | ) | (1.11 | ) | 21.93 | 16.49 | 3,568 | 1.63 | ||||||||||||
| — | (0.30 | ) | (1.24 | ) | (1.54 | ) | 19.85 | 11.12 | 697,590 | 1.67 | |||||||||||
| — | (0.25 | ) | (1.23 | ) | (1.48 | ) | 19.70 | 10.51 | 55,324 | 2.20 | |||||||||||
| — | (0.38 | ) | (1.24 | ) | (1.62 | ) | 19.56 | (5.92 | ) | 3,369 | 2.27 | b | |||||||||
| (0.07 | ) | (0.33 | ) | (1.24 | ) | (1.64 | ) | 19.97 | 11.82 | 56,263 | 1.08 | ||||||||||
| — | (0.35 | ) | (1.23 | ) | (1.58 | ) | 19.84 | 11.25 | 3,035 | 1.55 | |||||||||||
| — | — | (0.21 | ) | (0.21 | ) | 19.32 | 13.48 | 536,283 | 1.69 | ||||||||||||
| — | — | (0.21 | ) | (0.21 | ) | 19.24 | 2.83 | 19,198 | 2.23 | b | |||||||||||
| (0.03 | ) | — | (0.21 | ) | (0.24 | ) | 19.40 | 12.53 | 68,374 | 1.10 | b | ||||||||||
| — | — | (0.21 | ) | (0.21 | ) | 19.34 | 10.42 | 674 | 1.60 | b | |||||||||||
| (0.58 | ) | — | (0.87 | ) | (1.45 | ) | 17.20 | 28.68 | 330,860 | 1.52 | |||||||||||
| INTERNATIONAL EQUITY FUND (continued)
|
|
Ratios assuming no expense reductions |
|||||||||||||
|---|---|---|---|---|---|---|---|---|---|---|---|---|---|
| Ratio of
net investment income (loss) to average net assets |
Ratio of
expenses to average net assets |
Ratio of
net investment income (loss) to average net assets |
Portfolio
turnover rate |
||||||||||
| For the Year Ended August 31, | |||||||||||||
| 2000 - Class A Shares | (0.12 | )% | 1.84 | % | (0.17 | )% | 79.79 | % | |||||
| 2000 - Class B Shares | (0.65 | ) | 2.34 | (0.70 | ) | 79.79 | |||||||
| 2000 - Class C Shares | (0.59 | ) | 2.34 | (0.64 | ) | 79.79 | |||||||
| 2000 - Institutional Shares | 0.54 | 1.19 | 0.49 | 79.79 | |||||||||
| 2000 - Service Shares | (0.02 | ) | 1.69 | (0.07 | ) | 79.79 | |||||||
| For the Seven Months Ended August 31, | |||||||||||||
| 1999 - Class A Shares | 0.31 | b | 1.84 | b | 0.26 | b | 61.10 | ||||||
| 1999 - Class B Shares | (0.19 | ) b | 2.34 | b | (0.24 | ) b | 61.10 | ||||||
| 1999 - Class C Shares | (0.26 | ) b | 2.34 | b | (0.31 | ) b | 61.10 | ||||||
| 1999 - Institutional Shares | 0.89 | b | 1.19 | b | 0.84 | b | 61.10 | ||||||
| 1999 - Service Shares | 0.47 | b | 1.69 | b | 0.42 | b | 61.10 | ||||||
| For the Years Ended January 31, | |||||||||||||
| 1999 - Class A Shares | (0.28 | ) | 1.82 | (0.37 | ) | 113.79 | |||||||
| 1999 - Class B Shares | (0.79 | ) | 2.32 | (0.87 | ) | 113.79 | |||||||
| 1999 - Class C Shares | (0.98 | ) | 2.32 | (1.06 | ) | 113.79 | |||||||
| 1999 - Institutional Shares | 0.23 | 1.21 | 0.15 | 113.79 | |||||||||
| 1999 - Service Shares | (0.18 | ) | 1.71 | (0.26 | ) | 113.79 | |||||||
| 1998 - Class A Shares | (0.27 | ) | 1.80 | (0.40 | ) | 40.82 | |||||||
| 1998 - Class B Shares | (0.90 | ) | 2.30 | (1.00 | ) | 40.82 | |||||||
| 1998 - Class C Shares (commenced August 15, 1997) | (1.43 | ) b | 2.37 | b | (1.53 | ) b | 40.82 | ||||||
| 1998 - Institutional Shares | 0.30 | 1.18 | 0.20 | 40.82 | |||||||||
| 1998 - Service Shares | (0.36 | ) | 1.65 | (0.46 | ) | 40.82 | |||||||
| 1997 - Class A Shares | (0.07 | ) | 1.88 | (0.26 | ) | 38.01 | |||||||
| 1997 - Class B Shares (commenced May 1, 1996) | (0.97 | ) b | 2.38 | b | (1.12 | ) b | 38.01 | ||||||
| 1997 - Institutional Shares (commenced February 7, 1996) | 0.43 | b | 1.25 | b | 0.28 | b | 38.01 | ||||||
| 1997 - Service Shares (commenced March 6, 1996) | (0.40 | ) b | 1.75 | b | (0.55 | ) b | 38.01 | ||||||
| 1996 - Class A Shares | 0.26 | 1.77 | 0.01 | 68.48 | |||||||||
| EUROPEAN EQUITY FUND
|
| Income from
investment operations |
|||||||||
|---|---|---|---|---|---|---|---|---|---|
| Net asset
value, beginning of period |
Net investment income (loss) |
Net realized
and unrealized gain (loss) |
|||||||
| For the Year Ended August 31, | |||||||||
| 2000 - Class A Shares | $11.75 | $ — | c | $ 2.78 | |||||
| 2000 - Class B Shares | 11.71 | (0.04 | ) c | 2.73 | |||||
| 2000 - Class C Shares | 11.72 | (0.04 | ) c | 2.75 | |||||
| 2000 - Institutional Shares | 11.82 | 0.10 | c | 2.79 | |||||
| 2000 - Service Shares | 11.76 | 0.01 | c | 2.80 | |||||
| For the Seven Months Ended August 31, | |||||||||
| 1999 - Class A Shares | 12.20 | 0.05 | (0.50 | ) | |||||
| 1999 - Class B Shares | 12.19 | 0.03 | (0.51 | ) | |||||
| 1999 - Class C Shares | 12.20 | 0.04 | (0.52 | ) | |||||
| 1999 - Institutional Shares | 12.23 | 0.18 | (0.59 | ) | |||||
| 1999 - Service Shares | 12.20 | 0.08 | (0.52 | ) | |||||
| For the Period Ended January 31, | |||||||||
| 1999 - Class A Shares (commenced October 1, 1998) | 10.00 | (0.03 | ) | 2.23 | |||||
| 1999 - Class B Shares (commenced October 1, 1998) | 10.00 | (0.02 | ) | 2.21 | |||||
| 1999 - Class C Shares (commenced October 1, 1998) | 10.00 | (0.01 | ) | 2.21 | |||||
| 1999 - Institutional Shares (commenced October 1, 1998) | 10.00 | (0.01 | ) | 2.24 | |||||
| 1999 - Service Shares (commenced October 1, 1998) | 10.00 | (0.03 | ) | 2.23 | |||||
| Distributions to
shareholders |
||||||||||||||||||
|---|---|---|---|---|---|---|---|---|---|---|---|---|---|---|---|---|---|---|
| Total from
investment operations |
From net
realized gains |
Total
distributions |
Net asset
value, end of period |
Total
returna |
Net assets at end of period (in 000s) |
Ratio of
net expenses to average net assets |
||||||||||||
| $ 2.78 | $(0.71 | ) | $(0.71 | ) | $13.82 | 24.04 | % | $139,966 | 1.79 | % | ||||||||
| 2.69 | (0.71 | ) | (0.71 | ) | 13.69 | 23.32 | 4,538 | 2.29 | ||||||||||
| 2.71 | (0.71 | ) | (0.71 | ) | 13.72 | 23.48 | 1,482 | 2.29 | ||||||||||
| 2.89 | (0.71 | ) | (0.71 | ) | 14.00 | 24.85 | 14,630 | 1.14 | ||||||||||
| 2.81 | (0.71 | ) | (0.71 | ) | 13.86 | 24.28 | 2 | 1.64 | ||||||||||
| (0.45 | ) | — | — | 11.75 | (3.69 | ) | 74,862 | 1.79 | b | |||||||||
| (0.48 | ) | — | — | 11.71 | (3.94 | ) | 879 | 2.29 | b | |||||||||
| (0.48 | ) | — | — | 11.72 | (3.93 | ) | 388 | 2.29 | b | |||||||||
| (0.41 | ) | — | — | 11.82 | (3.35 | ) | 5,965 | 1.14 | b | |||||||||
| (0.44 | ) | — | — | 11.76 | (3.61 | ) | 2 | 1.64 | b | |||||||||
| 2.20 | — | — | 12.20 | 22.00 | 61,151 | 1.79 | b | |||||||||||
| 2.19 | — | — | 12.19 | 21.90 | 432 | 2.29 | b | |||||||||||
| 2.20 | — | — | 12.20 | 22.00 | 587 | 2.29 | b | |||||||||||
| 2.23 | — | — | 12.23 | 22.30 | 12,740 | 1.14 | b | |||||||||||
| 2.20 | — | — | 12.20 | 22.00 | 2 | 1.64 | b | |||||||||||
| EUROPEAN EQUITY FUND (continued)
|
| Ratios assuming no
expense reductions |
|||||||||||||
|---|---|---|---|---|---|---|---|---|---|---|---|---|---|
| Ratio of
net investment income (loss) to average net assets |
Ratio of
expenses to average net assets |
Ratio of
net investment income (loss) to average net assets |
Portfolio
turnover rate |
||||||||||
| For the Year Ended August 31, | |||||||||||||
| 2000 - Class A Shares | 0.02 | % | 2.17 | % | (0.36 | )% | 98.10 | % | |||||
| 2000 - Class B Shares | (0.27 | ) | 2.67 | (0.65 | ) | 98.10 | |||||||
| 2000 - Class C Shares | (0.26 | ) | 2.67 | (0.64 | ) | 98.10 | |||||||
| 2000 - Institutional Shares | 0.70 | 1.52 | 0.32 | 98.10 | |||||||||
| 2000 - Service Shares | 0.09 | 2.02 | (0.29 | ) | 98.10 | ||||||||
| For the Seven Months Ended August 31, | |||||||||||||
| 1999 - Class A Shares | 0.80 | b | 2.29 | b | 0.30 | b | 54.98 | ||||||
| 1999 - Class B Shares | 0.43 | b | 2.79 | b | (0.07 | ) b | 54.98 | ||||||
| 1999 - Class C Shares | 0.42 | b | 2.79 | b | (0.08 | ) b | 54.98 | ||||||
| 1999 - Institutional Shares | 1.53 | b | 1.64 | b | 1.03 | b | 54.98 | ||||||
| 1999 - Service Shares | 1.10 | b | 2.14 | b | 0.60 | b | 54.98 | ||||||
| For the Period Ended January 31, | |||||||||||||
| 1999 - Class A Shares (commenced October 1, 1998) | (1.19 | ) b | 2.80 | b | (2.20 | ) b | 70.77 | ||||||
| 1999 - Class B Shares (commenced October 1, 1998) | (1.78 | ) b | 3.30 | b | (2.79 | ) b | 70.77 | ||||||
| 1999 - Class C Shares (commenced October 1, 1998) | (1.83 | ) b | 3.30 | b | (2.84 | ) b | 70.77 | ||||||
| 1999 - Institutional Shares (commenced October 1, 1998) | (0.33 | ) b | 2.15 | b | (1.34 | ) b | 70.77 | ||||||
| 1999 - Service Shares (commenced October 1, 1998) | (0.69 | ) b | 2.65 | b | (1.70 | ) b | 70.77 | ||||||
| JAPANESE EQUITY FUND
|
| Income from
investment operations |
||||||||||
|---|---|---|---|---|---|---|---|---|---|---|
|
Net asset value, beginning of period |
Net
investment loss |
Net realized
and unrealized gains |
Total from
investment operations |
|||||||
| For the Year Ended August 31, | ||||||||||
| 2000 - Class A Shares | $16.24 | $(0.20 | ) c | $1.67 | $1.47 | |||||
| 2000 - Class B Shares | 16.14 | (0.28 | ) c | 1.68 | 1.40 | |||||
| 2000 - Class C Shares | 16.16 | (0.28 | ) c | 1.64 | 1.36 | |||||
| 2000 - Institutional Shares | 16.36 | (0.09 | ) c | 1.67 | 1.58 | |||||
| 2000 - Service Shares | 16.22 | (0.16 | ) c | 1.65 | 1.49 | |||||
| For the Seven Months Ended August 31, | ||||||||||
| 1999 - Class A Shares | 11.06 | (0.06 | ) | 5.24 | 5.18 | |||||
| 1999 - Class B Shares | 11.03 | (0.09 | ) | 5.20 | 5.11 | |||||
| 1999 - Class C Shares | 11.04 | (0.08 | ) | 5.20 | 5.12 | |||||
| 1999 - Institutional Shares | 11.10 | (0.03 | ) | 5.29 | 5.26 | |||||
| 1999 - Service Shares | 11.04 | (0.06 | ) | 5.24 | 5.18 | |||||
| For the Period Ended January 31, | ||||||||||
| 1999 - Class A Shares (commenced May 1, 1998) | 10.00 | (0.06 | ) | 1.12 | 1.06 | |||||
| 1999 - Class B Shares (commenced May 1, 1998) | 10.00 | (0.08 | ) | 1.11 | 1.03 | |||||
| 1999 - Class C Shares (commenced May 1, 1998) | 10.00 | (0.09 | ) | 1.13 | 1.04 | |||||
| 1999 - Institutional Shares (commenced May 1, 1998) | 10.00 | (0.02 | ) | 1.13 | 1.11 | |||||
| 1999 - Service Shares (commenced May 1, 1998) | 10.00 | (0.05 | ) | 1.09 | 1.04 | |||||
|
Distributions to shareholders |
|||||||||||||||||||||
|---|---|---|---|---|---|---|---|---|---|---|---|---|---|---|---|---|---|---|---|---|---|
| From net
investment income |
In excess of net investment income |
From net
realized gains |
Total
distributions |
Net asset
value, end of period |
Total
returnb |
Net assets
at end of period (in 000s) |
Ratio of
net expenses to average net assets |
||||||||||||||
| $ — | $(0.21 | ) | $(1.73 | ) | $(1.94 | ) | $15.77 | 8.47 | % | $69,741 | 1.74 | % | |||||||||
| — | (0.18 | ) | (1.73 | ) | (1.91 | ) | 15.63 | 8.12 | 5,783 | 2.24 | |||||||||||
| — | (0.21 | ) | (1.73 | ) | (1.94 | ) | 15.58 | 7.82 | 4,248 | 2.24 | |||||||||||
| — | (0.25 | ) | (1.73 | ) | (1.98 | ) | 15.96 | 9.14 | 27,768 | 1.09 | |||||||||||
| — | (0.15 | ) | (1.73 | ) | (1.88 | ) | 15.83 | 8.65 | 3 | 1.59 | |||||||||||
| — | — | — | — | 16.24 | 46.84 | 34,279 | 1.70 | b | |||||||||||||
| — | — | — | — | 16.14 | 46.33 | 4,219 | 2.20 | b | |||||||||||||
| — | — | — | — | 16.16 | 46.41 | 3,584 | 2.20 | b | |||||||||||||
| — | — | — | — | 16.36 | 47.40 | 22,709 | 1.05 | b | |||||||||||||
| — | — | — | — | 16.22 | 46.92 | 3 | 1.55 | b | |||||||||||||
| — | — | — | — | 11.06 | 10.60 | 8,391 | 1.64 | b | |||||||||||||
| — | — | — | — | 11.03 | 10.30 | 1,427 | 2.15 | b | |||||||||||||
| — | — | — | — | 11.04 | 10.40 | 284 | 2.15 | b | |||||||||||||
| (0.01 | ) | — | — | (0.01 | ) | 11.10 | 11.06 | 11,418 | 1.03 | b | |||||||||||
| — | — | — | — | 11.04 | 10.43 | 2 | 1.53 | b | |||||||||||||
| JAPANESE EQUITY FUND (continued)
|
| Ratios assuming no
expense reductions |
|||||||||||||
|---|---|---|---|---|---|---|---|---|---|---|---|---|---|
| Ratio of
net investment loss to average net assets |
Ratio of
expenses to average net assets |
Ratio of
net investment loss to average net assets |
Portfolio
turnover rate |
||||||||||
| For the Year Ended August 31, | |||||||||||||
| 2000 - Class A Shares | (1.20 | )% | 2.10 | % | (1.56 | )% | 60.76 | % | |||||
| 2000 - Class B Shares | (1.67 | ) | 2.60 | (2.03 | ) | 60.76 | |||||||
| 2000 - Class C Shares | (1.66 | ) | 2.60 | (2.02 | ) | 60.76 | |||||||
| 2000 - Institutional Shares | (0.53 | ) | 1.45 | (0.89 | ) | 60.76 | |||||||
| 2000 - Service Shares | (0.94 | ) | 1.95 | (1.30 | ) | 60.76 | |||||||
| For the Seven Months Ended August 31, | |||||||||||||
| 1999 - Class A Shares | (1.17 | ) b | 2.62 | b | (2.09 | ) b | 44.83 | ||||||
| 1999 - Class B Shares | (1.57 | ) b | 3.12 | b | (2.49 | ) b | 44.83 | ||||||
| 1999 - Class C Shares | (1.81 | ) b | 3.12 | b | (2.73 | ) b | 44.83 | ||||||
| 1999 - Institutional Shares | (0.37 | ) b | 1.97 | b | (1.29 | ) b | 44.83 | ||||||
| 1999 - Service Shares | (0.74 | ) b | 2.47 | b | (1.66 | ) b | 44.83 | ||||||
| For the Period Ended January 31, | |||||||||||||
| 1999 - Class A Shares (commenced May 1, 1998) | (1.20 | ) b | 4.18 | b | (3.74 | ) b | 53.29 | ||||||
| 1999 - Class B Shares (commenced May 1, 1998) | (1.76 | ) b | 4.69 | b | (4.30 | ) b | 53.29 | ||||||
| 1999 - Class C Shares (commenced May 1, 1998) | (1.69 | ) b | 4.69 | b | (4.23 | ) b | 53.29 | ||||||
| 1999 - Institutional Shares (commenced May 1, 1998) | (0.36 | ) b | 3.57 | b | (2.90 | ) b | 53.29 | ||||||
| 1999 - Service Shares (commenced May 1, 1998) | (0.68 | ) b | 4.07 | b | (3.22 | ) b | 53.29 | ||||||
| INTERNATIONAL GROWTH OPPORTUNITIES FUND
|
| (formerly International Small Cap Fund)
|
| Income from
investment operations |
||||||||||
|---|---|---|---|---|---|---|---|---|---|---|
| Net asset
value, beginning of period |
Net
investment loss |
Net realized
and unrealized gain |
Total from investment operations |
|||||||
| For the Year Ended August 31, | ||||||||||
| 2000 - Class A Shares ; | $13.24 | $(0.12 | ) c | $3.52 | $3.40 | |||||
| 2000 - Class B Shares | 13.19 | (0.18 | ) c | 3.49 | 3.31 | |||||
| 2000 - Class C Shares | 13.19 | (0.19 | ) c | 3.49 | 3.30 | |||||
| 2000 - Institutional Shares | 13.35 | (0.03 | ) c | 3.57 | 3.54 | |||||
| 2000 - Service Shares | 13.24 | (0.10 | ) c | 3.54 | 3.44 | |||||
| For the Seven-month Period Ended August 31, | ||||||||||
| 1999 - Class A Shares | 10.62 | (0.03 | ) | 2.65 | 2.62 | |||||
| 1999 - Class B Shares | 10.61 | (0.08 | ) c | 2.66 | 2.58 | |||||
| 1999 - Class C Shares | 10.61 | (0.08 | ) c | 2.66 | 2.58 | |||||
| 1999 - Institutional Shares | 10.66 | — | 2.69 | 2.69 | ||||||
| 1999 - Service Shares | 10.61 | (0.02 | ) | 2.65 | 2.63 | |||||
| For the Period Ended January 31, | ||||||||||
| 1999 - Class A Shares (commenced May 1, 1998) | 10.00 | (0.04 | ) | 0.66 | 0.62 | |||||
| 1999 - Class B Shares (commenced May 1, 1998) | 10.00 | (0.10 | ) | 0.71 | 0.61 | |||||
| 1999 - Class C Shares (commenced May 1, 1998) | 10.00 | (0.06 | ) | 0.67 | 0.61 | |||||
| 1999 - Institutional Shares (commenced May 1, 1998) | 10.00 | — | 0.67 | 0.67 | ||||||
| 1999 - Service Shares (commenced May 1, 1998) | 10.00 | (0.02 | ) | 0.63 | 0.61 | |||||
|
Distributions to shareholders |
||||||||||||||||||
|---|---|---|---|---|---|---|---|---|---|---|---|---|---|---|---|---|---|---|
| In excess
of net investment income |
From net
realized gains |
Total
distributions |
Net asset
value, end of period |
Total
returna |
Net assets
at end of period (in 000s) |
Ratio of
net expenses to average net assets |
||||||||||||
| $ — | $(0.52 | ) | $(0.52 | ) | $16.12 | 26.26 | % | $327,697 | 2.05 | % | ||||||||
| — | (0.52 | ) | (0.52 | ) | 15.98 | 25.66 | 2,827 | 2.55 | ||||||||||
| — | (0.52 | ) | (0.52 | ) | 15.97 | 25.58 | 3,672 | 2.55 | ||||||||||
| — | (0.52 | ) | (0.52 | ) | 16.37 | 27.12 | 187,075 | 1.40 | ||||||||||
| — | (0.52 | ) | (0.52 | ) | 16.16 | 26.57 | 3 | 1.90 | ||||||||||
| — | — | — | 13.24 | 24.67 | 69,458 | 2.05 | b | |||||||||||
| — | — | — | 13.19 | 24.32 | 303 | 2.55 | b | |||||||||||
| — | — | — | 13.19 | 24.32 | 419 | 2.55 | b | |||||||||||
| — | — | — | 13.35 | 25.24 | 65,772 | 1.40 | b | |||||||||||
| — | — | — | 13.24 | 24.79 | 2 | 1.90 | b | |||||||||||
| — | — | — | 10.62 | 6.20 | 33,002 | 2.02 | b | |||||||||||
| — | — | — | 10.61 | 6.10 | 213 | 2.51 | b | |||||||||||
| — | — | — | 10.61 | 6.10 | 175 | 2.51 | b | |||||||||||
| (0.01 | ) | — | (0.01 | ) | 10.66 | 6.67 | 36,992 | 1.40 | b | |||||||||
| — | — | — | 10.61 | 6.10 | 2 | 1.90 | b | |||||||||||
| INTERNATIONAL GROWTH OPPORTUNITIES FUND
|
| (formerly International Small Cap Fund) (continued)
|
| Ratios assuming no
expense reductions |
|||||||||||||
|---|---|---|---|---|---|---|---|---|---|---|---|---|---|
| Ratio of
net investment loss to average net assets |
Ratio of
expenses to average net assets |
Ratio of
net investment loss to average net assets |
Portfolio
turnover rate |
||||||||||
| For the Year Ended August 31, | |||||||||||||
| 2000 - Class A Shares ; | (0.79 | )% | 2.22 | % | (0.96 | )% | 73.43 | % | |||||
| 2000 - Class B Shares | (1.16 | ) | 2.72 | (1.33 | ) | 73.43 | |||||||
| 2000 - Class C Shares | (1.23 | ) | 2.72 | (1.40 | ) | 73.43 | |||||||
| 2000 - Institutional Shares | (0.19 | ) | 1.57 | (0.36 | ) | 73.43 | |||||||
| 2000 - Service Shares | (0.63 | ) | 2.07 | (0.80 | ) | 73.43 | |||||||
| For the Seven-month Period Ended August 31, | |||||||||||||
| 1999 - Class A Shares | (0.68 | ) b | 2.42 | b | (1.05 | ) b | 58.81 | ||||||
| 1999 - Class B Shares | (1.16 | ) b | 2.92 | b | (1.53 | ) b | 58.81 | ||||||
| 1999 - Class C Shares | (1.21 | ) b | 2.92 | b | (1.58 | ) b | 58.81 | ||||||
| 1999 - Institutional Shares | (0.05 | ) b | 1.77 | b | (0.42 | ) b | 58.81 | ||||||
| 1999 - Service Shares | (0.35 | ) b | 2.27 | b | (0.72 | ) b | 58.81 | ||||||
| For the Period Ended January 31, | |||||||||||||
| 1999 - Class A Shares (commenced May 1, 1998) | (1.03 | ) b | 3.60 | b | (2.61 | ) b | 96.11 | ||||||
| 1999 - Class B Shares (commenced May 1, 1998) | (1.30 | ) b | 4.09 | b | (2.88 | ) b | 96.11 | ||||||
| 1999 - Class C Shares (commenced May 1, 1998) | (1.45 | ) b | 4.09 | b | (3.03 | ) b | 96.11 | ||||||
| 1999 - Institutional Shares (commenced May 1, 1998) | (0.19 | ) b | 2.98 | b | (1.77 | ) b | 96.11 | ||||||
| 1999 - Service Shares (commenced May 1, 1998) | (0.26 | ) b | 3.48 | b | (1.84 | ) b | 96.11 | ||||||
| EMERGING MARKETS EQUITY FUND
|
| Income from
investment operations |
||||||||||||
|---|---|---|---|---|---|---|---|---|---|---|---|---|
| Net asset
value, beginning of period |
Net
investment income (loss) |
Net
realized and unrealized gain (loss) |
Total from
investment operations |
|||||||||
| For the Year Ended August 31, | ||||||||||||
| 2000 - Class A Shares | $ 9.26 | $(0.05 | ) c | $ 1.62 | $ 1.57 | |||||||
| 2000 - Class B Shares | 9.21 | (0.11 | ) c | 1.62 | 1.51 | |||||||
| 2000 - Class C Shares | 9.24 | (0.10 | ) c | 1.61 | 1.51 | |||||||
| 2000 - Institutional Shares | 9.37 | 0.01 | c | 1.64 | 1.65 | |||||||
| 2000 - Service Shares | 9.05 | 0.01 | c | 1.57 | 1.58 | |||||||
| For the Seven Months Ended August 31, | ||||||||||||
| 1999 - Class A Shares | 7.04 | (0.01 | ) | 2.23 | 2.22 | |||||||
| 1999 - Class B Shares | 7.03 | (0.03 | ) | 2.21 | 2.18 | |||||||
| 1999 - Class C Shares | 7.05 | (0.03 | ) | 2.22 | 2.19 | |||||||
| 1999 - Institutional Shares | 7.09 | 0.02 | 2.26 | 2.28 | ||||||||
| 1999 - Service Shares | 6.87 | 0.01 | 2.17 | 2.18 | ||||||||
| For the Year Ended January 31, | ||||||||||||
| 1999 - Class A Shares | 9.69 | 0.04 | (2.40 | ) | (2.36 | ) | ||||||
| 1999 - Class B Shares | 9.69 | 0.03 | (2.41 | ) | (2.38 | ) | ||||||
| 1999 - Class C Shares | 9.70 | 0.01 | (2.39 | ) | (2.38 | ) | ||||||
| 1999 - Institutional Shares | 9.70 | 0.06 | (2.36 | ) | (2.30 | ) | ||||||
| 1999 - Service Shares | 9.69 | (0.13 | ) | (2.41 | ) | (2.28 | ) | |||||
| For the Period Ended January 31, | ||||||||||||
| 1998 - Class A Shares (commenced December 15, 1997) | 10.00 | — | (0.31 | ) | (0.31 | ) | ||||||
| 1998 - Class B Shares (commenced December 15, 1997) | 10.00 | — | (0.31 | ) | (0.31 | ) | ||||||
| 1998 - Class C Shares (commenced December 15, 1997) | 10.00 | — | (0.30 | ) | (0.30 | ) | ||||||
| 1998 - Institutional Shares (commenced December 15, 1997) | 10.00 | 0.01 | (0.31 | ) | (0.30 | ) | ||||||
| 1998 - Service Shares (commenced December 15, 1997) | 10.00 | — | (0.31 | ) | (0.31 | ) | ||||||
|
Distributions to shareholders |
||||||||||||||||||
|---|---|---|---|---|---|---|---|---|---|---|---|---|---|---|---|---|---|---|
| From net
investment income |
In excess of net investment income |
Total
distributions |
Net asset
value, end of period |
Total
returna |
Net assets
at end of period (in 000s) |
Ratio of
net expenses to average net assets |
||||||||||||
| $ — | $ — | $ — | $10.83 | 16.95 | % | $64,279 | 2.11 | % | ||||||||||
| — | — | — | 10.72 | 16.40 | 2,187 | 2.61 | ||||||||||||
| — | — | — | 10.75 | 16.34 | 1,304 | 2.61 | ||||||||||||
| — | — | — | 11.02 | 17.61 | 145,774 | 1.46 | ||||||||||||
| — | — | — | 10.63 | 17.46 | 2 | 1.96 | ||||||||||||
| — | — | — | 9.26 | 31.53 | 65,698 | 2.04 | b | |||||||||||
| — | — | — | 9.21 | 31.01 | 972 | 2.54 | b | |||||||||||
| — | — | — | 9.24 | 31.06 | 1,095 | 2.54 | b | |||||||||||
| — | — | — | 9.37 | 32.16 | 108,574 | 1.39 | b | |||||||||||
| — | — | — | 9.05 | 31.73 | 2 | 1.89 | b | |||||||||||
| (0.07 | ) | (0.22 | ) | (0.29 | ) | 7.04 | (24.32 | ) | 52,704 | 2.09 | ||||||||
| (0.07 | ) | (0.21 | ) | (0.28 | ) | 7.03 | (24.51 | ) | 459 | 2.59 | ||||||||
| (0.07 | ) | (0.20 | ) | (0.27 | ) | 7.05 | (24.43 | ) | 273 | 2.59 | ||||||||
| (0.08 | ) | (0.23 | ) | (0.31 | ) | 7.09 | (23.66 | ) | 90,189 | 1.35 | ||||||||
| (0.07 | ) | (0.21 | ) | (0.28 | ) | 6.87 | (26.17 | ) | 1 | 1.85 | ||||||||
| — | — | — | 9.69 | (3.10 | ) | 17,681 | 1.90 | b | ||||||||||
| — | — | — | 9.69 | (3.10 | ) | 64 | 2.41 | b | ||||||||||
| — | — | — | 9.70 | (3.00 | ) | 73 | 2.48 | b | ||||||||||
| — | — | — | 9.70 | (3.00 | ) | 19,120 | 1.30 | b | ||||||||||
| — | — | — | 9.69 | (3.10 | ) | 2 | 2.72 | b | ||||||||||
| EMERGING MARKETS EQUITY FUND (continued)
|
| Ratios assuming no
expense reductions |
|||||||||||||
|---|---|---|---|---|---|---|---|---|---|---|---|---|---|
| Ratio of net
investment income (loss) to average net assets |
Ratio of
expenses to average net assets |
Ratio of net
investment income (loss) to average net assets |
Portfolio
turnover rate |
||||||||||
| For the Year Ended August 31, | |||||||||||||
| 2000 - Class A Shares | (0.49 | )% | 2.30 | % | (0.68 | )% | 125.35 | % | |||||
| 2000 - Class B Shares | (1.00 | ) | 2.80 | (1.19 | ) | 125.35 | |||||||
| 2000 - Class C Shares | (0.96 | ) | 2.80 | (1.15 | ) | 125.35 | |||||||
| 2000 - Institutional Shares | 0.13 | 1.65 | (0.06 | ) | 125.35 | ||||||||
| 2000 - Service Shares | 0.14 | 2.15 | (0.05 | ) | 125.35 | ||||||||
| For the Seven Months Ended August 31, | |||||||||||||
| 1999 - Class A Shares | (0.15 | ) b | 2.41 | b | (0.52 | ) b | 63.24 | ||||||
| 1999 - Class B Shares | (0.71 | ) b | 2.91 | b | (281.08 | ) b | 63.24 | ||||||
| 1999 - Class C Shares | (0.85 | ) b | 2.91 | b | (1.22 | ) b | 63.24 | ||||||
| 1999 - Institutional Shares | 0.50 | b | 1.76 | b | 0.13 | b | 63.24 | ||||||
| 1999 - Service Shares | 0.12 | b | 2.26 | b | (0.25 | ) b | 63.24 | ||||||
| For the Year Ended January 31, | |||||||||||||
| 1999 - Class A Shares | 0.80 | 2.53 | 0.36 | 153.67 | |||||||||
| 1999 - Class B Shares | 0.19 | 3.03 | (0.25 | ) | 153.67 | ||||||||
| 1999 - Class C Shares | 0.28 | 3.03 | (0.16 | ) | 153.67 | ||||||||
| 1999 - Institutional Shares | 1.59 | 1.79 | 1.15 | 153.67 | |||||||||
| 1999 - Service Shares | (1.84 | ) | 2.29 | (2.28 | ) | 153.67 | |||||||
| For the Period Ended January 31, | |||||||||||||
| 1998 - Class A Shares (commenced December 15, 1997) | 0.55 | b | 5.88 | b | (3.43 | ) b | 3.35 | ||||||
| 1998 - Class B Shares (commenced December 15, 1997) | 0.05 | b | 6.39 | b | (3.93 | ) b | 3.35 | ||||||
| 1998 - Class C Shares (commenced December 15, 1997) | (0.27 | ) b | 6.46 | b | (4.25 | ) b | 3.35 | ||||||
| 1998 - Institutional Shares (commenced December 15, 1997) | 0.80 | b | 5.28 | b | (3.18 | ) b | 3.35 | ||||||
| 1998 - Service Shares (commenced December 15, 1997) | (0.05 | ) b | 6.70 | b | (4.03 | ) b | 3.35 | ||||||
| ASIA GROWTH FUND
|
|
Income from investment operations |
||||||||||||
|---|---|---|---|---|---|---|---|---|---|---|---|---|
|
Net asset value, beginning of period |
Net
investment income (loss) |
Net realized
and unrealized gain (loss) |
Total from
investment operations |
|||||||||
| For the Year Ended August 31, | ||||||||||||
| 2000 - Class A Shares | $11.07 | $(0.05 | ) c | $ 0.14 | $ 0.09 | |||||||
| 2000 - Class B Shares | 10.88 | (0.11 | ) c | 0.14 | 0.03 | |||||||
| 2000 - Class C Shares | 10.85 | (0.11 | ) c | 0.14 | 0.03 | |||||||
| 2000 - Institutional Shares | 11.24 | 0.01 | c | 0.16 | 0.17 | |||||||
| For the Seven-Month Period Ended August 31, | ||||||||||||
| 1999 - Class A Shares | 7.79 | (0.02 | ) | 3.30 | 3.28 | |||||||
| 1999 - Class B Shares | 7.68 | (0.04 | ) | 3.24 | 3.20 | |||||||
| 1999 - Class C Shares | 7.68 | (0.04 | ) | 3.21 | 3.17 | |||||||
| 1999 - Institutional Shares | 7.91 | 0.01 | 3.36 | 3.37 | ||||||||
| For the Years Ended January 31, | ||||||||||||
| 1999 - Class A Shares | 8.38 | 0.07 | (0.66 | ) | (0.59 | ) | ||||||
| 1999 - Class B Shares | 8.31 | 0.01 | (0.64 | ) | (0.63 | ) | ||||||
| 1999 - Class C Shares | 8.29 | — | (0.61 | ) | (0.61 | ) | ||||||
| 1999 - Institutional Shares | 8.44 | 0.03 | (0.56 | ) | (0.53 | ) | ||||||
| 1998 - Class A Shares | 16.31 | — | (7.90 | ) | (7.90 | ) | ||||||
| 1998 - Class B Shares | 16.24 | 0.01 | (7.91 | ) | (7.90 | ) | ||||||
| 1998 - Class C Shares (commenced August 15, 1997) | 15.73 | 0.01 | (7.42 | ) | (7.41 | ) | ||||||
| 1998 - Institutional Shares | 16.33 | 0.10 | (7.96 | ) | (7.86 | ) | ||||||
| 1997 - Class A Shares | 16.49 | 0.06 | (0.11 | ) | (0.05 | ) | ||||||
| 1997 - Class B Shares (commenced May 1, 1996) | 17.31 | (0.05 | ) | (0.48 | ) | (0.53 | ) | |||||
| 1997 - Institutional Shares (commenced February 2, 1996) | 16.61 | 0.04 | (0.11 | ) | (0.07 | ) | ||||||
| 1996 - Class A Shares | 13.31 | 0.17 | 3.44 | 3.61 | ||||||||
|
Distributions to shareholders |
|||||||||||||||||||||
|---|---|---|---|---|---|---|---|---|---|---|---|---|---|---|---|---|---|---|---|---|---|
| From net
investment income |
In excess
of net investment income |
From net
realized gains |
Total
distributions |
Net asset
value, end of period |
Total
returna |
Net assets
at end of period (in 000s) |
Ratio of
net expenses to average net assets |
||||||||||||||
| $ — | $ — | $ — | $ — | $11.16 | 0.72 | % | $ 86,458 | 1.85 | % | ||||||||||||
| — | — | — | — | 10.91 | 0.18 | 6,849 | 2.35 | ||||||||||||||
| — | — | — | — | 10.88 | 0.18 | 2,265 | 2.35 | ||||||||||||||
| — | — | — | — | 11.41 | 1.42 | 5,236 | 1.20 | ||||||||||||||
| — | |||||||||||||||||||||
| — | — | — | — | 11.07 | 42.11 | 84,269 | 1.85 | b | |||||||||||||
| — | — | — | — | 10.88 | 41.67 | 7,258 | 2.35 | b | |||||||||||||
| — | — | — | — | 10.85 | 41.28 | 2,281 | 2.35 | b | |||||||||||||
| — | (0.04 | ) | — | (0.04 | ) | 11.24 | 42.61 | 12,363 | 1.20 | b | |||||||||||
| — | |||||||||||||||||||||
| — | — | — | — | 7.79 | (7.04 | ) | 59,940 | 1.93 | |||||||||||||
| — | — | — | — | 7.68 | (7.58 | ) | 4,190 | 2.45 | |||||||||||||
| — | — | — | — | 7.68 | (7.36 | ) | 999 | 2.45 | |||||||||||||
| — | — | — | — | 7.91 | (6.28 | ) | 4,200 | 1.16 | |||||||||||||
| — | (0.03 | ) | — | (0.03 | ) | 8.38 | (48.49 | ) | 87,437 | 1.75 | |||||||||||
| — | (0.03 | ) | — | (0.03 | ) | 8.31 | (48.70 | ) | 3,359 | 2.30 | |||||||||||
| — | (0.03 | ) | — | (0.03 | ) | 8.29 | (47.17 | ) | 436 | 2.35 | b | ||||||||||
| (0.03 | ) | — | — | (0.03 | ) | 8.44 | (48.19 | ) | 874 | 1.11 | |||||||||||
| (0.12 | ) | — | (0.01 | ) | (0.13 | ) | 16.31 | (1.01 | ) | 263,014 | 1.67 | ||||||||||
| (0.51 | ) | (0.03 | ) | — | (0.54 | ) | 16.24 | (6.02 | ) | 3,354 | 2.21 | b | |||||||||
| (0.11 | ) | (0.06 | ) | (0.04 | ) | (0.21 | ) | 16.33 | (1.09 | ) | 13,322 | 1.10 | b | ||||||||
| (0.12 | ) | (0.14 | ) | (0.17 | ) | (0.43 | ) | 16.49 | 26.49 | 205,539 | 1.77 | ||||||||||
| ASIA GROWTH FUND (continued)
|
|
Ratios assuming no expense reductions |
|||||||||||||
|---|---|---|---|---|---|---|---|---|---|---|---|---|---|
| Ratio of net
investment income (loss) to average net assets |
Ratio of
expenses to average net assets |
Ratio of net
investment income (loss) to average net assets |
Portfolio
turnover rate |
||||||||||
| For the Year Ended August 31, | |||||||||||||
| 2000 - Class A Shares | (0.39 | )% | 2.30 | % | (0.84 | )% | 207.22 | % | |||||
| 2000 - Class B Shares | (0.91 | ) | 2.80 | (1.36 | ) | 207.22 | |||||||
| 2000 - Class C Shares | (0.91 | ) | 2.80 | (1.36 | ) | 207.22 | |||||||
| 2000 - Institutional Shares | 0.12 | 1.65 | (0.33 | ) | 207.22 | ||||||||
| For the Seven-Month Period Ended August 31, | |||||||||||||
| 1999 - Class A Shares | (0.38 | ) b | 2.27 | b | (0.80 | ) b | 96.58 | ||||||
| 1999 - Class B Shares | (0.90 | ) b | 2.77 | b | (1.32 | ) b | 96.58 | ||||||
| 1999 - Class C Shares | (0.89 | ) b | 2.77 | b | (1.31 | ) b | 96.58 | ||||||
| 1999 - Institutional Shares | (0.14 | ) b | 1.62 | b | (0.28 | ) b | 96.58 | ||||||
| For the Years Ended January 31, | |||||||||||||
| 1999 - Class A Shares | 0.63 | 2.48 | 0.08 | 106.00 | |||||||||
| 1999 - Class B Shares | 0.10 | 2.97 | (0.42 | ) | 106.00 | ||||||||
| 1999 - Class C Shares | 0.10 | 2.97 | (0.42 | ) | 106.00 | ||||||||
| 1999 - Institutional Shares | 1.10 | 1.68 | 0.58 | 106.00 | |||||||||
| 1998 - Class A Shares | 0.31 | 1.99 | 0.07 | 105.16 | |||||||||
| 1998 - Class B Shares | (0.29 | ) | 2.50 | (0.49 | ) | 105.16 | |||||||
| 1998 - Class C Shares (commenced August 15, 1997) | (0.26 | ) b | 2.55 | b | (0.46 | ) b | 105.16 | ||||||
| 1998 - Institutional Shares | 0.87 | 1.31 | 0.67 | 105.16 | |||||||||
| 1997 - Class A Shares | 0.20 | 1.87 | — | 48.40 | |||||||||
| 1997 - Class B Shares (commenced May 1, 1996) | (0.56 | ) b | 2.37 | b | (0.72 | ) b | 48.40 | ||||||
| 1997 - Institutional Shares (commenced February 2, 1996) | 0.54 | b | 1.26 | b | 0.38 | b | 48.40 | ||||||
| 1996 - Class A Shares | 1.05 | 2.02 | 0.80 | 88.80 | |||||||||
a
|
Assumes investment at the net asset value at the beginning of the period, reinvestment of all dividends and
distributions, a complete redemption of the investment at the net asset value at the end of the period and no sales or redemption charges. Total return would be reduced if a sales or redemption charge were taken into account. Total returns for periods
less than one full year are not annualized.
|
b
|
Annualized.
|
c
|
Calculated based on the average shares outstanding methodology.
|
| FOR MORE INFORMATION
|
| Annual/Semi-annual Report
|
| Additional information about the Funds’ investments is available in the Funds’ annual and semi-annual reports to
shareholders. In the Funds’ annual reports, you will find a discussion of the market conditions and investment strategies that significantly affected the Funds’ performance during the last fiscal year.
|
| Statement of Additional Information
|
| Additional information about the Funds and their policies is also available in the Funds’ Statement of Additional Information
(“Additional Statement”). The Additional Statement is incorporated by reference into this Prospectus (is legally considered part of this Prospectus).
|
| The Funds’ annual and semi-annual reports, and the Additional Statement, are available free upon request by calling Goldman
Sachs at 1-800-621-2550.
|
| To obtain other information and for shareholder inquiries:
|
| By telephone – Call 1-800-621-2550
|
| By mail – Goldman Sachs Funds, 4900 Sears Tower, Chicago, IL 60606-6372
|
| By e-mail – [email protected]
|
| On the Internet – Text-only versions of the Funds’ documents are located online and may be downloaded from:
|
| SEC EDGAR database – http://www.sec.gov
|
| You may review and obtain copies of Fund documents by visiting the SEC’s Public Reference Room in Washington, D.C. You may
also obtain copies of Fund documents, after paying a duplicating fee, by writing to the SEC’s Public Reference Section, Washington, D.C. 20549-0102 or by electronic request to: [email protected]. Information on the operation of the public reference
room may be obtained by calling the SEC at (202) 942-8090.
|
| The Funds’ investment company registration number is 811-5349.
|
| CORE
SM
is a service mark of Goldman, Sachs & Co.
|
| Prospectus
|
| GOLDMAN SACHS DOMESTIC EQUITY FUNDS
|

| THE SECURITIES AND EXCHANGE COMMISSION HAS NOT APPROVED OR DISAPPROVED THESE SECURITIES OR PASSED UPON THE ADEQUACY OF THIS PROSPECTUS.
ANY REPRESENTATION TO THE CONTRARY IS A CRIMINAL OFFENSE.
|
| AN INVESTMENT IN A FUND IS NOT A BANK DEPOSIT AND IS NOT INSURED BY THE FEDERAL DEPOSIT INSURANCE CORPORATION OR ANY OTHER GOVERNMENT
AGENCY. AN INVESTMENT IN A FUND INVOLVES INVESTMENT RISKS, INCLUDING POSSIBLE LOSS OF PRINCIPAL.
|
| n
|
Goldman Sachs Balanced Fund
|
| n
|
Goldman Sachs Growth and Income Fund
|
| n
|
Goldman Sachs CORE
SM
Large Cap Value Fund
|
| n
|
Goldman Sachs CORE
SM
U.S. Equity Fund
|
| n
|
Goldman Sachs CORE
SM
Large Cap Growth Fund
|
| n
|
Goldman Sachs CORE
SM
Small Cap Equity Fund
|
| n
|
Goldman Sachs Capital Growth Fund
|
| n
|
Goldman Sachs Strategic Growth Fund
|
| n
|
Goldman Sachs Growth Opportunities Fund
|
| n
|
Goldman Sachs Mid Cap Value Fund (formerly Mid Cap Equity)
|
| n
|
Goldman Sachs Small Cap Value Fund
|
| n
|
Goldman Sachs Large Cap Value Fund
|

| NOT FDIC-INSURED
|
May Lose Value
|
No Bank Guarantee
|
| Goldman Sachs Asset Management, a unit of the Investment Management Division of Goldman, Sachs & Co. (“Goldman
Sachs”), serves as investment adviser to the Balanced, Growth and Income, CORE Large Cap Value, CORE Large Cap Growth, CORE Small Cap Equity, Strategic Growth, Growth Opportunities, Mid Cap Value, Small Cap Value and Large Cap Value Funds. Goldman
Sachs Funds Management, L.P. serves as investment adviser to the CORE U.S. Equity and Capital Growth Funds. Goldman Sachs Asset Management and Goldman Sachs Funds Management, L.P. are each referred to in this Prospectus as the “Investment Adviser.”
;
|
| VALUE STYLE FUNDS
|
| Goldman Sachs’ Value Investment Philosophy:
|
| Through intensive, hands-on research our portfolio team seeks to identify:
|
1.
|
Well-positioned businesses that have:
|
n
|
Attractive returns on capital.
|
n
|
Sustainable earnings and cash flow.
|
n
|
Strong company management focused on long-term returns to shareholders.
|
2.
|
Attractive valuation opportunities where:
|
n
|
The intrinsic value of the business is not reflected in the stock price.
|
| Business quality, conservative valuation, and thoughtful portfolio construction are the key elements of our value approach.
|
| GROWTH STYLE FUNDS
|
| Goldman Sachs’ Growth Investment Philosophy:
|
1.
|
Invest as if buying the company/business, not simply trading its stock:
|
n
|
Understand the business, management, products and competition.
|
n
|
Perform intensive, hands-on fundamental research.
|
n
|
Seek businesses with strategic competitive advantages.
|
n
|
Over the long-term, expect each company’s stock price ultimately to track the growth in the value of the business.
|
2.
|
Buy high-quality growth businesses that possess strong business franchises, favorable long-term prospects and
excellent management.
|
3.
|
Purchase superior long-term growth companies at a favorable price—seek to purchase at a fair valuation,
giving the investor the potential to fully capture returns from above-average growth rates.
|
| Growth companies have earnings expectations that exceed those of the stock market as a whole.
|
| QUANTITATIVE (“CORE”) STYLE FUNDS
|
| Goldman Sachs’ CORE Investment Philosophy:
|
| Goldman Sachs’ quantitative style of funds—CORE—emphasizes the two building blocks of active management: stock
selection and portfolio construction.
|
| I. CORE Stock Selection
|
| The CORE Funds use the Goldman Sachs’ proprietary multifactor model (“Multifactor Model”), a rigorous computerized
rating system, to forecast the returns of securities held in each Fund’s portfolio. The Multifactor Model incorporates common variables covering measures of:
|
n
|
Research (What do fundamental analysts think about the company and its prospects?)
|
n
|
Value (How is the company priced relative to fundamental accounting measures?)
|
n
|
Momentum (What are medium-term price trends? How has the price responded to new information?)
|
n
|
Profitability (What is the company’s margin on sales? How efficient are its operations?)
|
n
|
Earnings Quality (Were earnings derived from sustainable (cash-based) sources?)
|
| All of the above factors are carefully evaluated within the Multifactor Model since each has demonstrated a significant
impact on the performance of the securities and markets they were designed to forecast. Stock selection in this process combines both our quantitative and qualitative analysis.
|
| II. CORE Portfolio Construction
|
| A proprietary risk model, which is intended to identify and measure risk as accurately as possible, includes all the above factors
used in the return model to select stocks, as well as several other factors associated with risk but not return. In this process, the Investment Adviser manages risk by attempting to limit deviations from the benchmark, and by attempting to run a size and
sector neutral portfolio. A computer optimizer evaluates many different security combinations (considering many possible weightings) in an effort to construct the most efficient risk/return portfolio given each CORE Fund benchmark.
|
| Goldman Sachs CORE Funds are fully invested, broadly diversified and offer consistent overall portfolio characteristics. They may
serve as good foundations on which to build a portfolio.
|
| Balanced Fund
|
|
Objective:
|
Long-term growth of capital and current income
|
|
Benchmarks:
|
S&P 500® Index and Lehman Brothers Aggregate Bond Index
|
|
Investment Focus:
|
Large capitalization U.S. stocks and fixed-income securities
|
|
Investment Style:
|
Asset Allocation, with growth and value (blend) equity components
|
| INVESTMENT OBJECTIVE
|
| The Fund seeks to provide long-term growth of capital and current income. The Fund seeks growth of capital primarily through
investments in equity securities (stocks). The Fund seeks to provide current income through investment in fixed-income securities (bonds).
|
| PRINCIPAL INVESTMENT STRATEGIES
|
| Historically, stock and bond markets have often had different cycles, with one asset class rising when the other is falling. A
balanced objective seeks to reduce the volatility associated with investing in a single market. There is no guarantee, however, that market cycles will move in opposition to one another or that a balanced investment program will successfully reduce
volatility.
|
| The percentage of the portfolio invested in equity and fixed-income securities will vary from time to time as the Investment
Adviser evaluates such securities’ relative attractiveness based on market valuations, economic growth and inflation prospects. The allocation between equity and fixed-income securities is subject to the Fund’s intention to pay regular quarterly
dividends. The amount of quarterly dividends can also be expected to fluctuate in accordance with factors such as prevailing interest rates and the percentage of the Fund’s assets invested in fixed-income securities.
|
| Equity Securities. The Fund invests, under normal circumstances, between 45% and 65% of its total assets in equity securities. Although the Fund’s equity investments consist primarily of publicly traded U.S. securities, the Fund may invest up to 10% of its total
assets in the equity securities of foreign issuers, including issuers in countries with emerging markets or economies (“emerging countries”) and equity securities quoted in foreign currencies. A portion of the Fund’s portfolio of equity
securities may be selected primarily to provide current income (including interests in real estate investment trusts (“REITs”), convertible securities, preferred stocks, utility stocks, and interests in limited partnerships).
|
| Fixed Income Securities. The Fund invests at least 25% of its total assets in fixed-income senior securities. The remainder of the Fund’s assets are invested in other fixed-income securities and cash.
|
| The Fund’s fixed-income securities primarily include:
|
n
|
Securities issued by the U.S. government, its agencies, instrumentalities or sponsored enterprises
|
n
|
Securities issued by corporations, banks and other issuers
|
n
|
Mortgage-backed and asset-backed securities
|
| The Fund may also invest up to 10% of its total assets in debt obligations (U.S. dollar and non-U.S.-dollar denominated) issued or
guaranteed by one or more foreign governments or any of their political subdivisions, agencies or instrumentalities and foreign corporations or other entities. The issuers of these securities may be located in emerging countries.
|
|
Objective:
|
Long-term growth of capital and growth of income
|
|
Benchmark:
|
S&P 500® Index
|
|
Investment Focus:
|
Large capitalization U.S. equity securities with an emphasis on undervalued stocks
|
|
Investment Style:
|
Value
|
| INVESTMENT OBJECTIVE
|
| The Fund seeks long-term growth of capital and growth of income.
|
| PRINCIPAL INVESTMENT STRATEGIES
|
| Equity Securities. The Fund invests, under normal circumstances, at least 65% of its total assets in equity securities that the Investment Adviser considers to have favorable prospects for capital appreciation and/or dividend-paying ability. Although the Fund will invest
primarily in publicly traded U.S. securities, it may invest up to 25% of its total assets in foreign securities, including securities of issuers in emerging countries and securities quoted in foreign currencies.
|
| Other.
The Fund may also invest up to 35% of its total assets in fixed-income securities, such as government, corporate and bank debt obligations, that offer the potential to further the Fund’s investment objective.
|
|
Objective:
|
Long-term growth of capital and dividend income
|
|
Benchmark:
|
Russell 1000® Value Index
|
|
Investment Focus:
|
Diversified portfolio of equity securities of large-cap U.S. issuers selling at low to modest valuations
|
|
Investment Style:
|
Quantitative, applied to large-cap value stocks
|
| INVESTMENT OBJECTIVE
|
| The Fund seeks long-term growth of capital and dividend income. The Fund seeks this objective through a broadly diversified
portfolio of equity securities of large-cap U.S. issuers that are selling at low to modest valuations relative to general market measures, such as earnings, book value and other fundamental accounting measures, and that are expected to have favorable
prospects for capital appreciation and/or dividend-paying ability.
|
| PRINCIPAL INVESTMENT STRATEGIES
|
| Equity Securities. The Fund invests, under normal circumstances, at least 90% of its total assets in equity securities of U.S. issuers, including foreign issuers that are traded in the United States.
|
| The Fund’s investments are selected using both a variety of quantitative techniques and fundamental research in seeking to
maximize the Fund’s expected return, while maintaining risk, style, capitalization and industry characteristics similar to the Russell 1000® Value Index. The Fund seeks a portfolio consisting of companies with above average capitalizations and
low to moderate valuations as measured by price/earnings ratios, book value and other fundamental accounting measures.
|
| Other.
The Fund’s investments in fixed-income securities are limited to securities that are considered cash equivalents.
|
|
Objective:
|
Long-term growth of capital and dividend income
|
|
Benchmark:
|
S&P 500® Index
|
|
Investment Focus:
|
Large-cap U.S. equity securities
|
|
Investment Style:
|
Quantitative, applied to large-cap growth and value (blend) stocks
|
| INVESTMENT OBJECTIVE
|
| The Fund seeks long-term growth of capital and dividend income. The Fund seeks this objective through a broadly diversified
portfolio of large-cap and blue chip equity securities representing all major sectors of the U.S. economy.
|
| PRINCIPAL INVESTMENT STRATEGIES
|
| Equity Securities. The Fund invests, under normal circumstances, at least 90% of its total assets in equity securities of U.S. issuers, including foreign issuers that are traded in the United States.
|
| The Fund’s investments are selected using both a variety of quantitative techniques and fundamental research in seeking to
maximize the Fund’s expected return, while maintaining risk, style, capitalization and industry characteristics similar to the S&P 500® Index. The Fund seeks a broad representation in most major sectors of the U.S. economy and a portfolio
consisting of companies with average long-term earnings growth expectations and dividend yields.
|
| Other.
The Fund’s investments in fixed-income securities are limited to securities that are considered cash equivalents.
|
|
Objective:
|
Long-term growth of capital; dividend income is a secondary consideration
|
|
Benchmark:
|
Russell 1000® Growth Index
|
|
Investment Focus:
|
Large-cap, growth-oriented U.S. stocks
|
|
Investment Style:
|
Quantitative, applied to large-cap growth stocks
|
| INVESTMENT OBJECTIVE
|
| The Fund seeks long-term growth of capital. The Fund seeks this objective through a broadly diversified portfolio of equity
securities of large-cap U.S. issuers that are expected to have better prospects for earnings growth than the growth rate of the general domestic economy. Dividend income is a secondary consideration.
|
| PRINCIPAL INVESTMENT STRATEGIES
|
| Equity Securities. The Fund invests, under normal circumstances, at least 90% of its total assets in equity securities of U.S. issuers, including foreign issuers that are traded in the United States.
|
| The Investment Adviser emphasizes a company’s growth prospects in analyzing equity securities to be purchased by the Fund.
The Fund’s investments are selected using both a variety of quantitative techniques and fundamental research in seeking to maximize the Fund’s expected return, while maintaining risk, style, capitalization and industry characteristics similar to
the Russell 1000® Growth Index. The Fund seeks a portfolio consisting of companies with above average capitalizations and earnings growth expectations and below average dividend yields.
|
| Other.
The Fund’s investments in fixed-income securities are limited to securities that are considered cash equivalents.
|
|
Objective:
|
Long-term growth of capital
|
|
Benchmark:
|
Russell 2000® Index
|
|
Investment Focus:
|
Stocks of small capitalization U.S. companies
|
|
Investment Style:
|
Quantitative, applied to small-cap growth and value (blend) stocks
|
| INVESTMENT OBJECTIVE
|
| The Fund seeks long-term growth of capital. The Fund seeks this objective through a broadly diversified portfolio of equity
securities of U.S. issuers which are included in the Russell 2000® Index at the time of investment.
|
| PRINCIPAL INVESTMENT STRATEGIES
|
| Equity Securities. The Fund invests, under normal circumstances, at least 90% of its total assets in equity securities of U.S. issuers, including foreign issuers that are traded in the United States.
|
| The Fund’s investments are selected using both a variety of quantitative techniques and fundamental research in seeking to
maximize the Fund’s expected return, while maintaining risk, style, capitalization and industry characteristics similar to the Russell 2000® Index. The Fund seeks a portfolio consisting of companies with small market capitalizations, strong
expected earnings growth and momentum, and better valuation and risk characteristics than the Russell 2000® Index. If the issuer of a portfolio security held by the Fund is no longer included in the Russell 2000® Index, the Fund may, but is not
required to, sell the security.
|
| Other.
The Fund’s investments in fixed-income securities are limited to securities that are considered cash equivalents.
|
|
Objective:
|
Long-term growth of capital
|
|
Benchmark:
|
S&P 500® Index
|
|
Investment Focus:
|
Large-cap U.S. equity securities that offer long-term capital appreciation potential
|
|
Investment Style:
|
Growth
|
| INVESTMENT OBJECTIVE
|
| The Fund seeks long-term growth of capital.
|
| PRINCIPAL INVESTMENT STRATEGIES
|
| Equity Securities. The Fund invests, under normal circumstances, at least 90% of its total assets in equity securities. The Fund seeks to achieve its investment objective by investing in a diversified portfolio of equity securities that are considered by the Investment
Adviser to have long-term capital appreciation potential. Although the Fund invests primarily in publicly traded U.S. securities, it may invest up to 10% of its total assets in foreign securities, including securities of issuers in emerging countries and
securities quoted in foreign currencies.
|
|
Objective:
|
Long-term growth of capital
|
|
Benchmark:
|
S&P 500® Index
|
|
Investment Focus:
|
Large-cap U.S. equity securities that are considered to be strategically positioned for consistent long-term growth
|
|
Investment Style:
|
Growth
|
| INVESTMENT OBJECTIVE
|
| The Fund seeks long-term growth of capital.
|
| PRINCIPAL INVESTMENT STRATEGIES
|
| Equity Securities. The Fund invests, under normal circumstances, at least 90% of its total assets in equity securities. The Fund seeks to achieve its investment objective by investing in a diversified portfolio of equity securities that are considered by the Investment
Adviser to be strategically positioned for consistent long-term growth. Although the Fund invests primarily in publicly traded U.S. securities, it may invest up to 10% of its total assets in foreign securities, including securities of issuers in emerging
countries and securities quoted in foreign currencies.
|
|
Objective:
|
Long-term growth of capital
|
|
Benchmark:
|
S&P Midcap 400 Index
|
|
Investment Focus:
|
U.S. equity securities that offer long-term capital appreciation
with a primary focus on mid-capitalization companies |
|
Investment Style:
|
Growth
|
| INVESTMENT OBJECTIVE
|
| The Fund seeks long-term growth of capital.
|
| PRINCIPAL INVESTMENT STRATEGIES
|
| Equity Securities. The Fund invests, under normal circumstances, at least 90% of its total assets in equity securities with a primary focus on mid-cap companies. The Fund seeks to achieve its investment objective by investing in a diversified portfolio of equity securities
that are considered by the Investment Adviser to be strategically positioned for long-term growth. Although the Fund invests primarily in publicly traded U.S. securities, it may invest up to 10% of its total assets in foreign securities, including
securities of issuers in emerging countries and securities quoted in foreign currencies.
|
|
Objective:
|
Long-term capital appreciation
|
|
Benchmark:
|
Russell Midcap Value Index
|
|
Investment Focus:
|
Mid-capitalization U.S. stocks that are believed to be undervalued or undiscovered by the marketplace
|
|
Investment Style:
|
Value
|
| INVESTMENT OBJECTIVE
|
| The Fund seeks long-term capital appreciation.
|
| PRINCIPAL INVESTMENT STRATEGIES
|
| Equity Securities. The Fund invests, under normal circumstances, substantially all of its assets in equity securities and at least 65% of its total assets in equity securities of mid-cap companies with public stock market capitalizations (based upon shares available for
trading on an unrestricted basis) within the range of the market capitalization of companies constituting the Russell Midcap Value Index at the time of investment (currently between $300 million and $15 billion). If the market capitalization of a company
held by the Fund moves outside this range, the Fund may, but is not required to, sell the securities. Although the Fund will invest primarily in publicly traded U.S. securities, it may invest up to 25% of its total assets in foreign securities, including
securities of issuers in emerging countries and securities quoted in foreign currencies.
|
| Other.
The Fund may invest in the aggregate up to 35% of its total assets in companies with public stock market capitalizations outside the range of companies constituting the Russell Midcap Value Index at the time of investment and in fixed-income securities,
such as government, corporate and bank debt obligations.
|
|
Objective:
|
Long-term growth of capital
|
|
Benchmark:
|
Russell 2000® Value Index
|
|
Investment Focus:
|
Small-capitalization U.S. stocks that are believed to be undervalued or undiscovered by the marketplace
|
|
Investment Style:
|
Value
|
| INVESTMENT OBJECTIVE
|
| The Fund seeks long-term growth of capital.
|
| PRINCIPAL INVESTMENT STRATEGIES
|
| Equity Securities. The Fund invests, under normal circumstances, at least 65% of its total assets in equity securities of companies with public stock market capitalizations (based upon shares available for trading on an unrestricted basis) within the range of the market
capitalization of companies constituting the Russell 2000® Value Index at the time of investment (currently between $20 million and $3 billion). If the market capitalization of a company held by the Fund moves outside this range, the Fund may, but is
not required to, sell the securities. Under normal circumstances, the Fund’s investment horizon for ownership of stocks will be two to three years. Although the Fund will invest primarily in publicly traded U.S. securities, it may invest up to 25% of
its total assets in foreign securities, including securities of issuers in emerging countries and securities quoted in foreign currencies.
|
| Other.
The Fund may invest in the aggregate up to 35% of its total assets in companies with public stock market capitalizations outside the range of companies constituting the Russell 2000® Value Index at the time of investment and in fixed-income
securities, such as government, corporate and bank debt obligations.
|
|
Objective:
|
Long-term capital appreciation
|
|
Benchmark:
|
Russell 1000® Value Index
|
|
Investment Focus:
|
Large capitalization U.S. equity securities that are believed to be undervalued
|
|
Investment Style:
|
Value
|
| INVESTMENT OBJECTIVE
|
| The Fund seeks long-term capital appreciation.
|
| PRINCIPAL INVESTMENT STRATEGIES
|
| Equity Securities. The Fund invests, under normal circumstances, at least 90% of its total assets in equity securities. The Fund seeks its investment objective by investing in value opportunities that the Investment Adviser defines as companies with identifiable
competitive advantages whose intrinsic value is not reflected in the stock price. Although the Fund will invest primarily in publicly traded U.S. securities, it may invest up to 25% of its total assets in foreign securities, including securities quoted in
foreign currencies.
|
| Other.
The Fund may invest up to 10% of its total assets in fixed-income securities, such as government, corporate and bank debt obligations.
|
Ÿ
|
No specific percentage limitation on usage;
limited only by the objectives and strategies of the Fund |
| Balanced
Fund |
Growth
and Income Fund |
CORE
Large Cap Value Fund |
CORE
U.S. Equity Fund |
||||||
|---|---|---|---|---|---|---|---|---|---|
| Investment Practices | |||||||||
| Borrowings | 33 1
/3
|
33 1
/3
|
33 1
/3
|
33 1
/3
|
|||||
| Credit, Currency, Index, Interest Rate and
Mortgage Swaps* |
15 | — | — | — | |||||
| Cross Hedging of Currencies | Ÿ | Ÿ | Ÿ | Ÿ | |||||
| Custodial Receipts | Ÿ | Ÿ | Ÿ | Ÿ | |||||
| Equity Swaps* | 15 | 15 | 15 | 15 | |||||
| Foreign Currency Transactions** | Ÿ 1 | Ÿ | Ÿ | Ÿ | |||||
| Futures Contracts and Options on Futures
Contracts |
Ÿ | Ÿ | Ÿ 2 | Ÿ 3 | |||||
| Interest Rate Caps, Floors and Collars | Ÿ | — | — | — | |||||
| Investment Company Securities (including
iShares SM and Standard & Poor’s Depositary Receipts TM ) |
10 | 10 | 10 | 10 | |||||
| Loan Participations | Ÿ | — | — | — | |||||
| Mortgage Dollar Rolls | Ÿ | — | — | — | |||||
| Options on Foreign Currencies 4 | Ÿ | Ÿ | Ÿ | Ÿ | |||||
| Options on Securities and Securities Indices 5 | Ÿ | Ÿ | Ÿ | Ÿ | |||||
| Repurchase Agreements | Ÿ | Ÿ | Ÿ | Ÿ | |||||
| Reverse Repurchase Agreements (for investment
purposes) |
Ÿ | — | — | — | |||||
| Securities Lending | 33 1
/3
|
33 1
/3
|
33 1
/3
|
33 1
/3
|
|||||
| Short Sales Against the Box | 25 | 25 | — | — | |||||
| Unseasoned Companies | Ÿ | Ÿ | Ÿ | Ÿ | |||||
| Warrants and Stock Purchase Rights | Ÿ | Ÿ | Ÿ | Ÿ | |||||
| When-Issued Securities and Forward
Commitments |
Ÿ | Ÿ | Ÿ | Ÿ | |||||
*
|
Limited to 15% of net assets (together with other illiquid securities) for all structured securities which are not
deemed to be liquid and all swap transactions.
|
**
|
Limited by the amount the Fund invests in foreign securities.
|
1
|
The Balanced Fund may also enter into forward foreign currency exchange contracts to seek to increase total return.
|
2
|
The CORE Large Cap Value, CORE Large Cap Growth and CORE Small Cap Equity Funds may enter into futures transactions only
with respect to a representative index.
|
3
|
The CORE U.S. Equity Fund may enter into futures transactions only with respect to the S&P 500 Index.
|
4
|
The Funds may purchase and sell call and put options.
|
5
|
The Funds may sell covered call and put options and purchase call and put options.
|
| CORE
Large Cap Growth Fund |
CORE
Small Cap Equity Fund |
Capital
Growth Fund |
Strategic
Growth Fund |
Growth
Opportunities Fund |
Mid Cap
Value Fund |
Small Cap
Value Fund |
Large Cap
Value Fund |
||||||||
|---|---|---|---|---|---|---|---|---|---|---|---|---|---|---|---|
| 33 1
/3
|
33 1
/3
|
33 1
/3
|
33 1
/3
|
33 1
/3
|
33 1
/3
|
33 1
/3
|
33 1
/3
|
||||||||
| — | — | — | — | — | — | — | — | ||||||||
| Ÿ | Ÿ | Ÿ | Ÿ | Ÿ | Ÿ | Ÿ | Ÿ | ||||||||
| Ÿ | Ÿ | Ÿ | Ÿ | Ÿ | Ÿ | Ÿ | Ÿ | ||||||||
| 15 | 15 | 15 | 15 | 15 | 15 | 15 | 15 | ||||||||
| Ÿ | Ÿ | Ÿ | Ÿ | Ÿ | Ÿ | Ÿ | Ÿ | ||||||||
| Ÿ 2 | Ÿ 2 | Ÿ | Ÿ | Ÿ | Ÿ | Ÿ | Ÿ | ||||||||
| — | — | — | — | — | — | — | — | ||||||||
| 10 | 10 | 10 | 10 | 10 | 10 | 10 | 10 | ||||||||
| — | — | — | — | — | — | — | — | ||||||||
| — | — | — | — | — | — | — | — | ||||||||
| Ÿ | Ÿ | Ÿ | Ÿ | Ÿ | Ÿ | Ÿ | Ÿ | ||||||||
| Ÿ | Ÿ | Ÿ | Ÿ | Ÿ | Ÿ | Ÿ | Ÿ | ||||||||
| Ÿ | Ÿ | Ÿ | Ÿ | Ÿ | Ÿ | Ÿ | Ÿ | ||||||||
| — | — | — | — | — | — | — | — | ||||||||
| 33 1
/3
|
33 1
/3
|
33 1
/3
|
33 1
/3
|
33 1
/3
|
33 1
/3
|
33 1
/3
|
33 1
/3
|
||||||||
| — | — | 25 | 25 | 25 | 25 | 25 | 25 | ||||||||
| Ÿ | Ÿ | Ÿ | Ÿ | Ÿ | Ÿ | Ÿ | Ÿ | ||||||||
| Ÿ | Ÿ | Ÿ | Ÿ | Ÿ | Ÿ | Ÿ | Ÿ | ||||||||
| Ÿ | Ÿ | Ÿ | Ÿ | Ÿ | Ÿ | Ÿ | Ÿ | ||||||||
Ÿ
|
No specific percentage limitation on usage;
limited only by the objectives and strategies of the Fund |
| Balanced
Fund |
Growth
and Income Fund |
CORE
Large Cap Value Fund |
CORE
U.S. Equity Fund |
||||||||||
|---|---|---|---|---|---|---|---|---|---|---|---|---|---|
| Investment Securities | |||||||||||||
| American, European and Global Depositary
Receipts |
Ÿ | Ÿ | Ÿ 6 | Ÿ 6 | |||||||||
| Asset-Backed and Mortgage-Backed Securities 7 | Ÿ | Ÿ | — | — | |||||||||
| Bank Obligations 7 | Ÿ | Ÿ | Ÿ | Ÿ | |||||||||
| Convertible Securities 8 | Ÿ | Ÿ | Ÿ | Ÿ | |||||||||
| Corporate Debt Obligations 7 | Ÿ | Ÿ | Ÿ 9 | Ÿ 9 | |||||||||
| Equity Securities | 45-65 | 65 | + | 90 | + | 90 | + | ||||||
| Emerging Country Securities | 10 10 | 25 | 10 | — | — | ||||||||
| Fixed Income Securities 11 | 35-45 | 18 | 35 | 10 | 9 | 10 | 9 | ||||||
| Foreign Securities | 10 10 | 25 | 10 | Ÿ 14 | Ÿ 14 | ||||||||
| Foreign Government Securities 7 | Ÿ | — | — | — | |||||||||
| Municipal Securities | Ÿ | — | — | — | |||||||||
| Non-Investment Grade Fixed Income Securities | 10 15 | 10 | 16 | — | — | ||||||||
| Real Estate Investment Trusts | Ÿ | Ÿ | Ÿ | Ÿ | |||||||||
| Stripped Mortgage Backed Securities 7 | Ÿ | — | — | — | |||||||||
| Structured Securities* | Ÿ | Ÿ | Ÿ | Ÿ | |||||||||
| Temporary Investments | 100 | 100 | 35 | 35 | |||||||||
| U.S. Government Securities 7 | Ÿ | Ÿ | Ÿ | Ÿ | |||||||||
| Yield Curve Options and Inverse Floating Rate
Securities |
Ÿ | — | — | — | |||||||||
*
|
Limited to 15% of net assets (together with other illiquid securities) for all structured securities which are not
deemed to be liquid and all swap transactions.
|
6
|
The CORE Funds may not invest in European Depositary Receipts.
|
7
|
Limited by the amount the Fund invests in fixed-income securities.
|
8
|
Convertible securities purchased by the Balanced Fund must be B or higher by Standard & Poor’s Rating Group
(“Standard & Poor’s”) or Moody’s Investor’s Service, Inc. (“Moody’s”). The CORE Funds have no minimum rating criteria and all other Funds use the same rating criteria for convertible and non-convertible debt
securities.
|
9
|
Cash equivalents only.
|
10
|
The Balanced, Growth and Income, Capital Growth, Strategic Growth, Growth Opportunities, Mid Cap Value and Small Cap
Value Funds may invest in the aggregate up to 10%, 25%, 10%, 10%, 10%, 25% and 25%, respectively, of their total assets in foreign securities, including emerging country securities.
|
11
|
Except as noted under “Non-Investment Grade Fixed Income Securities,” fixed-income securities must be
investment grade (i.e., BBB or higher by Standard & Poor’s or Baa or higher by Moody’s).
|
12
|
The Mid Cap Value Fund may invest in the aggregate up to 35% of its total assets is (1) securities of companies with
public stock market capitalizations outside the range of companies constituting the Russell Midcap Value Index at the time of investment and (2) fixed-income securities.
|
13
|
The Small Cap Value Fund may invest in the aggregate up to 35% of its total assets in: (1) securities of companies with
public stock market capitalizations outside the range of companies constituting the Russell 2000® Value Index at the time of investment and (2) fixed-income securities.
|
| CORE
Large Cap Growth Fund |
CORE
Small Cap Equity Fund |
Capital
Growth Fund |
Strategic
Growth Fund |
Growth
Opportunities Fund |
Mid Cap
Value Fund |
Small Cap
Value Fund |
Large Cap
Value Fund |
|||||||||
|---|---|---|---|---|---|---|---|---|---|---|---|---|---|---|---|---|
| Ÿ 6 | Ÿ 6 | Ÿ | Ÿ | Ÿ | Ÿ | Ÿ | Ÿ | |||||||||
| — | — | Ÿ | Ÿ | Ÿ | Ÿ | Ÿ | Ÿ | |||||||||
| Ÿ | Ÿ | Ÿ | Ÿ | Ÿ | Ÿ | Ÿ | Ÿ | |||||||||
| Ÿ | Ÿ | Ÿ | Ÿ | Ÿ | Ÿ | Ÿ | Ÿ | |||||||||
| Ÿ 9 | Ÿ 9 | Ÿ | Ÿ | Ÿ | Ÿ | Ÿ | Ÿ | |||||||||
| 90+ | 90+ | 90 | + | 90+ | 90+ | 65+ | 65+ | 90+ | ||||||||
| — | — | 10 | 10 | 10 10 | 10 10 | 25 10 | 25 10 | — | ||||||||
| 10 9 | 10 9 | Ÿ | Ÿ | Ÿ | 35 12 | 35 13 | 10 | |||||||||
| Ÿ |
Ÿ 14 | 10 | 10 | 10 10 | 10 10 | 25 10 | 25 10 | 25 | ||||||||
| — | — | — | — | — | — | — | — | |||||||||
| — | — | — | — | — | — | — | — | |||||||||
| — | — | 10 | 16 | 10 16 | 10 16 | 10 17 | 35 16 | 10 16 | ||||||||
| Ÿ | Ÿ | Ÿ | Ÿ | Ÿ | Ÿ | Ÿ | Ÿ | |||||||||
| — | — | — | — | — | — | — | — | |||||||||
| Ÿ | Ÿ | Ÿ | Ÿ | Ÿ | Ÿ | Ÿ | Ÿ | |||||||||
| 35 | 35 | 100 | 100 | 100 | 100 | 100 | 100 | |||||||||
| Ÿ | Ÿ | Ÿ | Ÿ | Ÿ | Ÿ | Ÿ | Ÿ | |||||||||
| — | — | — | — | — | — | — | — | |||||||||
14
|
Equity securities of foreign issuers must be traded in the United States.
|
15
|
Must be at least BB or B by Standard & Poor’s or Ba or B by Moody’s.
|
16
|
May be BB or lower by Standard & Poor’s or Ba or lower by Moody’s.
|
17
|
Must be B or higher by Standard & Poor’s or B or higher by Moody’s.
|
18
|
The Balanced Fund invests at least 25% of its total assets in fixed-income senior securities; the remainder may be
invested in other fixed-income securities and cash.
|
| Ÿ
Applicable
— Not applicable |
Balanced
Fund |
Growth
and Income Fund |
CORE
Large Cap Value Fund |
CORE
U.S. Equity Fund |
CORE
Large Cap Growth Fund |
CORE
Small Cap Equity Fund |
|||||||
|---|---|---|---|---|---|---|---|---|---|---|---|---|---|
| Credit/Default | Ÿ | Ÿ | Ÿ | Ÿ | Ÿ | Ÿ | |||||||
| Foreign | Ÿ | Ÿ | Ÿ | Ÿ | Ÿ | Ÿ | |||||||
| Emerging Countries | Ÿ | Ÿ | Ÿ | Ÿ | Ÿ | Ÿ | |||||||
| Small Cap | — | — | — | — | — | Ÿ | |||||||
| Stock | Ÿ | Ÿ | Ÿ | Ÿ | Ÿ | Ÿ | |||||||
| Derivatives | Ÿ | Ÿ | Ÿ | Ÿ | Ÿ | Ÿ | |||||||
| Interest Rate | Ÿ | Ÿ | Ÿ | Ÿ | Ÿ | Ÿ | |||||||
| Management | Ÿ | Ÿ | Ÿ | Ÿ | Ÿ | Ÿ | |||||||
| Market | Ÿ | Ÿ | Ÿ | Ÿ | Ÿ | Ÿ | |||||||
| Liquidity | Ÿ | Ÿ | Ÿ | Ÿ | Ÿ | Ÿ | |||||||
| Initial Public Offering (“IPO”) | — | — | — | — | — | — | |||||||
| Capital
Growth Fund |
Strategic
Growth Fund |
Growth
Opportunities Fund |
Mid
Cap Value Fund |
Small Cap Value Fund |
Large
Cap Value Fund |
||||||
|---|---|---|---|---|---|---|---|---|---|---|---|
| Ÿ | Ÿ | Ÿ | Ÿ | Ÿ | Ÿ | ||||||
| Ÿ | Ÿ | Ÿ | Ÿ | Ÿ | Ÿ | ||||||
| Ÿ | Ÿ | Ÿ | Ÿ | Ÿ | Ÿ | ||||||
| — | — | — | Ÿ | Ÿ | — | ||||||
| Ÿ | Ÿ | Ÿ | Ÿ | Ÿ | Ÿ | ||||||
| Ÿ | Ÿ | Ÿ | Ÿ | Ÿ | Ÿ | ||||||
| Ÿ | Ÿ | Ÿ | Ÿ | Ÿ | Ÿ | ||||||
| Ÿ | Ÿ | Ÿ | Ÿ | Ÿ | Ÿ | ||||||
| Ÿ | Ÿ | Ÿ | Ÿ | Ÿ | Ÿ | ||||||
| Ÿ | Ÿ | Ÿ | Ÿ | Ÿ | Ÿ | ||||||
| — | Ÿ | Ÿ | Ÿ | Ÿ | — | ||||||
n
|
Credit/Default Risk—The risk that an issuer or guarantor of fixed-income securities held by a Fund may default
on its obligation to pay interest and repay principal.
|
n
|
Foreign Risk—The risk that when a Fund invests in foreign securities, it will be subject to risk of loss not
typically associated with domestic issuers. Loss may result because of less foreign government regulation, less public information and less economic, political and social stability. Loss may also result from the imposition of exchange controls,
confiscations and other government restrictions. A
Fund will also be subject to the risk of negative foreign currency rate fluctuations. Foreign risks will normally be greatest when a Fund invests in issuers located in emerging countries. |
n
|
Emerging Countries Risk—The securities markets of Asian, Latin and South American, Eastern European, African
and other emerging countries are less liquid, are especially subject to greater price volatility, have smaller market capitalizations, have less government regulation and are not subject to as extensive and frequent accounting, financial and other
reporting requirements as the securities markets of more developed countries. Further, investment in equity securities of issuers located in Russia and certain other emerging countries involves risk of loss resulting from problems in share registration
and custody and substantial economic and political disruptions. These risks are not normally associated with investments in more developed countries.
|
n
|
Stock Risk—The risk that stock prices
have historically risen and fallen in periodic cycles. Recently, U.S. stock markets and certain foreign stock markets have experienced substantial price volatility and, at times, have traded at or close to record high levels. There is no guarantee that
such levels will be reached or maintained in the future.
|
n
|
Derivatives Risk—The risk that loss may result from a Fund’s investments in options, futures, swaps,
structured securities and other derivative instruments. These instruments may be leveraged so that small changes may produce disproportionate losses to a Fund.
|
n
|
Interest Rate Risk—The risk that when interest rates increase, securities held by a Fund will decline in value.
Long-term fixed-income securities will normally have more price volatility because of this risk than short-term fixed-income securities.
|
n
|
Management Risk—The risk that a strategy used by the Investment Adviser may fail to produce the intended results.
|
n
|
Market Risk—The risk that the value of the securities in which a Fund invests may go up or down in response to
the prospects of individual companies, particular industry sectors and/or general economic conditions. Price changes may be temporary or last for extended periods. A Fund’s investments may be overweighted
from time to time in one or more industry sectors, which will increase the Fund’s exposure to risk of loss from adverse developments affecting those sectors.
|
n
|
Liquidity Risk—The risk that a Fund will not be able to pay redemption proceeds within the time period stated
in this Prospectus because of unusual market conditions, an unusually high volume of redemption requests, or other reasons. Funds that invest in non-investment grade fixed-income securities, small capitalization stocks, REITs and emerging country issuers
will be especially subject to the risk that during certain periods the liquidity of particular issuers or industries, or all securities within particular investment categories, will shrink or disappear suddenly and without warning as a result of adverse
economic, market or political events, or adverse investor perceptions whether or not accurate. The Goldman Sachs Asset Allocation Portfolios (the “Asset Allocation Portfolios”) expect to invest a significant percentage of their assets in the
Funds and other funds for which Goldman Sachs now or in the future acts as investment adviser or underwriter. Redemptions by an Asset Allocation Portfolio of its position in a Fund may further increase liquidity risk and may impact a Fund’s net asset
value (“NAV”).
|
n
|
Small Cap Risk—The securities of small capitalization stocks involve greater risks than those associated with
larger, more established companies and may be subject to more abrupt or erratic price movements. Securities of such issuers may lack sufficient market liquidity to enable a Fund to effect sales at an advantageous time or without a substantial drop in price.
|
n
|
IPO Risk—The risk that the market value of IPO shares will fluctuate considerably due to factors such as the
absence of a prior public market, unseasoned trading, the small number of shares available for trading and limited information about the issuer. The purchase of IPO shares may involve high transaction costs. IPO shares are subject to market risk and
liquidity risk. When a Fund’s asset base is small, a significant portion of the Fund’s performance could be attributable to investments in IPOs, because such investments would have a magnified impact on the Fund. As the Fund’s assets grow,
the effect of the Fund’s investments in IPOs on the Fund’s performance probably will decline, which could reduce the Fund’s performance.
|
| HOW THE FUNDS HAVE PERFORMED
|
| The bar chart and table below provide an indication of the risks of investing in a Fund by showing: (a) changes in the performance
of a Fund’s Class A Shares from year to year; and (b) how the average annual returns of a Fund’s Class A, B and C Shares compare to those of broad-based securities market indices. The bar chart and table assume reinvestment of dividends and
distributions. A Fund’s past performance is not necessarily an indication of how the Fund will perform in the future. The average annual total return calculation reflects a maximum initial sales charge of 5.5% for Class A Shares, the assumed
contingent deferred sales charge (“CDSC”) for Class B Shares (5% maximum declining to 0% after six years), and the assumed CDSC for Class C Shares (1% if redeemed within 12 months of purchase). The bar chart does not reflect the sales loads
applicable to Class A Shares. If the sales loads were reflected, returns would be less. Performance reflects expense limitations in effect. If expense limitations were not in place, a Fund’s performance would have been reduced. The Strategic Growth,
Growth Opportunities and Large Cap Value Funds commenced operations on May 24, 1999, May 24, 1999 and December 15, 1999, respectively. Since these Funds have less than one calendar year’s performance, no performance information is provided in this
section.
|
| TOTAL RETURN
|
| The total return for Class A Shares for the 9-month period ended September 30, 2000 was 2.16%.
Best Quarter
Q2 ’97 +9.92%
Worst Quarter
Q3 ’98 -8.71%
|
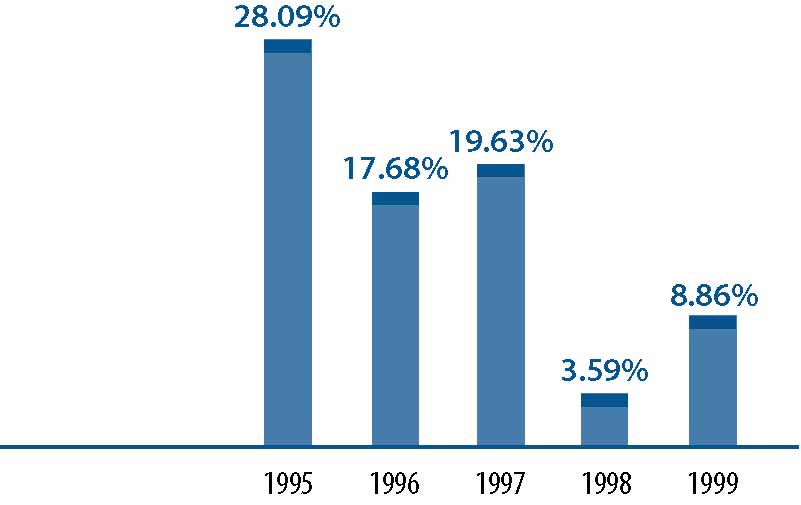 |
| AVERAGE ANNUAL TOTAL RETURN
|
| For the period ended December 31, 1999 | 1 Year | 5 Years | Since Inception | ||||
|---|---|---|---|---|---|---|---|
| Class A (Inception 10/12/94) | |||||||
| Including Sales Charges | 2.86% | 13.96% | 13.10% | ||||
| S&P 500® Index* | 21.04% | 28.54% | 27.00% | ||||
| Lehman Brothers Aggregate Bond Index** | (0.82)% | 7.73% | 7.46% | ||||
| Class B (Inception 5/1/96) | |||||||
| Including CDSC | 2.78% | N/A | 10.76% | ||||
| S&P 500® Index* | 21.04% | N/A | 26.74% | ||||
| Lehman Brothers Aggregate Bond Index** | (0.82)% | N/A | 6.36% | ||||
| Class C (Inception 8/15/97) | |||||||
| Including CDSC | 7.01% | N/A | 5.20% | ||||
| S&P 500® Index* | 21.04% | N/A | 23.21% | ||||
| Lehman Brothers Aggregate Bond Index** | (0.82)% | N/A | 5.14% | ||||
*
|
The S&P 500® Index is the Standard & Poor’s Composite Index of 500 stocks, an unmanaged index of common stock
prices. The Index figures do not reflect any fees or expenses.
|
**
|
The Lehman Brothers Aggregate Bond Index is an unmanaged index of bond prices. The Index figures do not reflect any fees or
expenses.
|
| TOTAL RETURN
|
| The total return for Class A Shares for the
9-month period ended September 30, 2000 was -.92%.
Best Quarter
Q2 ’97 +15.18%
Worst Quarter
Q3 ’98 -16.97%
|
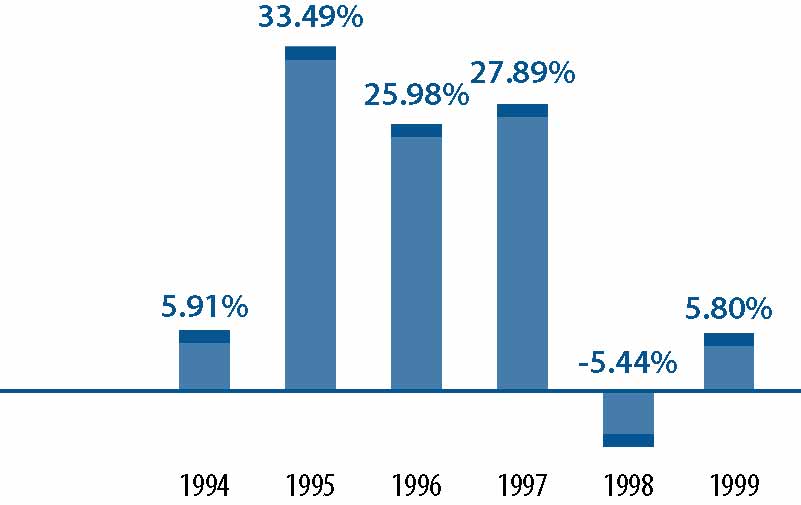 |
| AVERAGE ANNUAL TOTAL RETURN
|
| For the period ended December 31, 1999 | 1 Year | 5 Years | Since Inception | ||||
|---|---|---|---|---|---|---|---|
| Class A (Inception 2/5/93) | |||||||
| Including Sales Charges | 0.00% | 15.26% | 12.98% | ||||
| S&P 500® Index* | 21.04% | 28.54% | 21.37% | ||||
| Class B (Inception 5/1/96) | |||||||
| Including CDSC | (0.29)% | N/A | 10.26% | ||||
| S&P 500® Index* | 21.04% | N/A | 26.74% | ||||
| Class C (Inception 8/15/97) | |||||||
| Including CDSC | 3.94% | N/A | (0.71)% | ||||
| S&P 500® Index* | 21.04% | N/A | 23.21% | ||||
*
|
The S&P 500® Index is the Standard & Poor’s Composite Index of 500 stocks, an unmanaged index of common stock
prices. The Index figures do not reflect any fees or expenses.
|
| TOTAL RETURN
|
| The total return for Class A Shares for the 9-month period ended September 30, 2000 was 2.48%.
Best Quarter
Q2 ’99 +10.41%
Worst Quarter
Q3 ’99 -8.52%
|
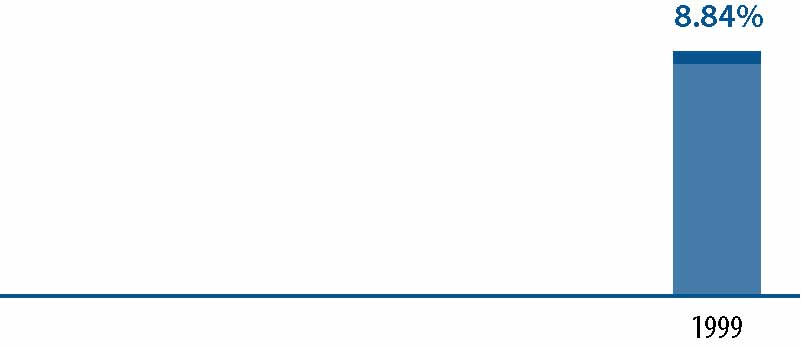 |
| AVERAGE ANNUAL TOTAL RETURN
|
| For the period ended December 31, 1999 | 1 Year | Since Inception | |||
|---|---|---|---|---|---|
| Class A (Inception 12/31/98) | |||||
| Including Sales Charges | 2.87% | 2.86% | |||
| Russell 1000® Value Index* | 7.34% | 7.34% | |||
| Class B (Inception 12/31/98) | |||||
| Including CDSC | 2.95% | 3.95% | |||
| Russell 1000® Value Index* | 7.34% | 7.34% | |||
| Class C (Inception 12/31/98) | |||||
| Including CDSC | 7.06% | 8.05% | |||
| Russell 1000® Value Index* | 7.34% | 7.34% | |||
*
|
The Russell 1000® Value Index (inception date 1/1/99) is a market capitalization weighted index of the 1,000 highest
ranking U.S. stocks with below-average growth orientation. The Index figures do not reflect any fees or expenses.
|
| TOTAL RETURN
|
| The total return for Class A Shares for the 9-month period ended September 30, 2000 was -0.40%.
Best Quarter
Q4 ’98 +21.44%
Worst Quarter
Q3 ’98 -14.69%
|
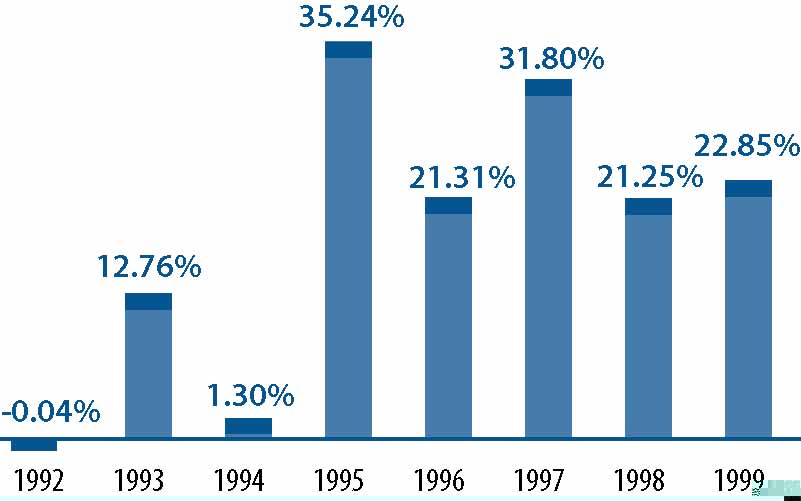 |
| AVERAGE ANNUAL TOTAL RETURN
|
| For the period ended December 31, 1999 | 1 Year | 5 Years | Since Inception | ||||
|---|---|---|---|---|---|---|---|
| Class A (Inception 5/24/91) | |||||||
| Including Sales Charges | 16.08% | 24.93% | 16.84% | ||||
| S&P 500® Index* | 21.04% | 28.54% | 19.87% | ||||
| Class B (Inception 5/1/96) | |||||||
| Including CDSC | 16.39% | N/A | 22.70% | ||||
| S&P 500® Index* | 21.04% | N/A | 26.74% | ||||
| Class C (Inception 8/15/97) | |||||||
| Including CDSC | 20.84% | N/A | 19.73% | ||||
| S&P 500® Index* | 21.04% | N/A | 23.21% | ||||
*
|
The S&P 500® Index is the Standard & Poor’s Composite Index of 500 stocks, an unmanaged index of common stock
prices. The Index figures do not reflect any fees or expenses.
|
| TOTAL RETURN
|
| The total return for Class A Shares for the 9-month period ended September 30, 2000 was -0.87%.
Best Quarter
Q4 ’98 +25.47%
Worst Quarter
Q3 ’98 -13.95%
|
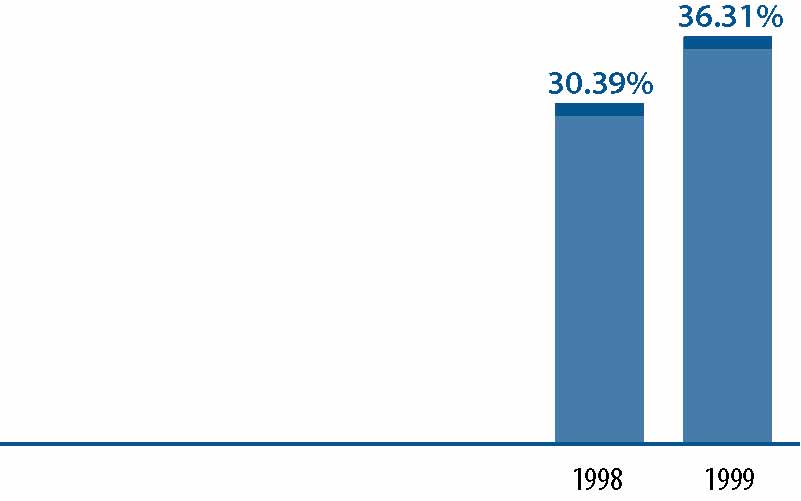 |
| AVERAGE ANNUAL TOTAL RETURN
|
| For the period ended December 31, 1999 | 1 Year | Since Inception | |||
|---|---|---|---|---|---|
| Class A (Inception 5/1/97) | |||||
| Including Sales Charges | 28.83% | 30.63% | |||
| Russell 1000® Growth Index* | 33.15% | 35.42% | |||
| Class B (Inception 5/1/97) | |||||
| Including CDSC | 30.31% | 31.76% | |||
| Russell 1000® Growth Index* | 33.15% | 35.42% | |||
| Class C (Inception 8/15/97) | |||||
| Including CDSC | 34.40% | 27.94% | |||
| Russell 1000® Growth Index* | 33.15% | 31.26% | |||
*
|
The Russell 1000® Growth Index is an unmanaged index of common stock prices. The Index figures do not reflect any fees or
expenses.
|
| TOTAL RETURN
|
| The total return for Class A Shares for the 9-month period ended September 30, 2000 was 6.96%.
Best Quarter
Q4 ’99 +15.26%
Worst Quarter
Q3 ’98 -24.34%
|
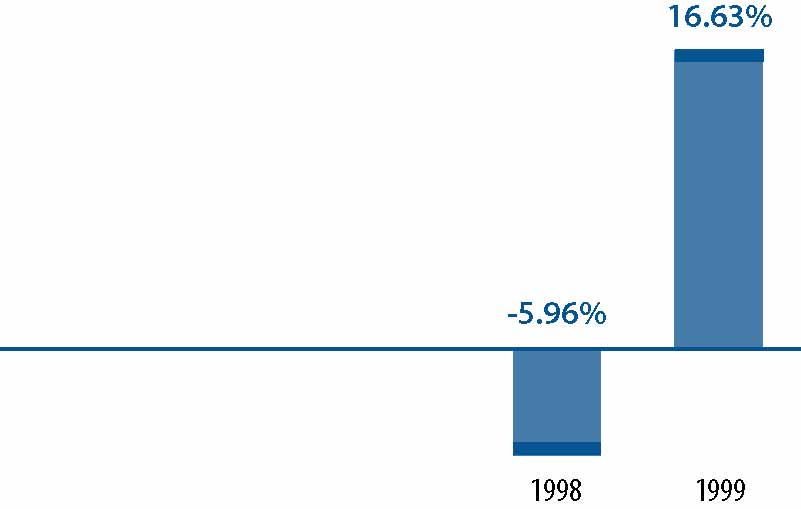 |
| AVERAGE ANNUAL TOTAL RETURN
|
| For the period ended December 31, 1999 | 1 Year | Since Inception | |||
|---|---|---|---|---|---|
| Class A (Inception 8/15/97) | |||||
| Including Sales Charges | 10.20% | 4.85% | |||
| Russell 2000® Index* | 21.26% | 10.21% | |||
| Class B (Inception 8/15/97) | |||||
| Including CDSC | 10.78% | 5.42% | |||
| Russell 2000® Index* | 21.26% | 10.21% | |||
| Class C (Inception 8/15/97) | |||||
| Including CDSC | 14.97% | 6.71% | |||
| Russell 2000® Index* | 21.26% | 10.21% | |||
*
|
The Russell 2000® Index is an unmanaged index of common stock prices. The Index figures do not reflect any fees or expenses.
|
| TOTAL RETURN
|
| The total return for Class A Shares for the 9-month period ended September 30, 2000 was 0.29%.
Best Quarter
Q4 ’98 +24.31%
Worst Quarter
Q3 ’98 -11.44%
|
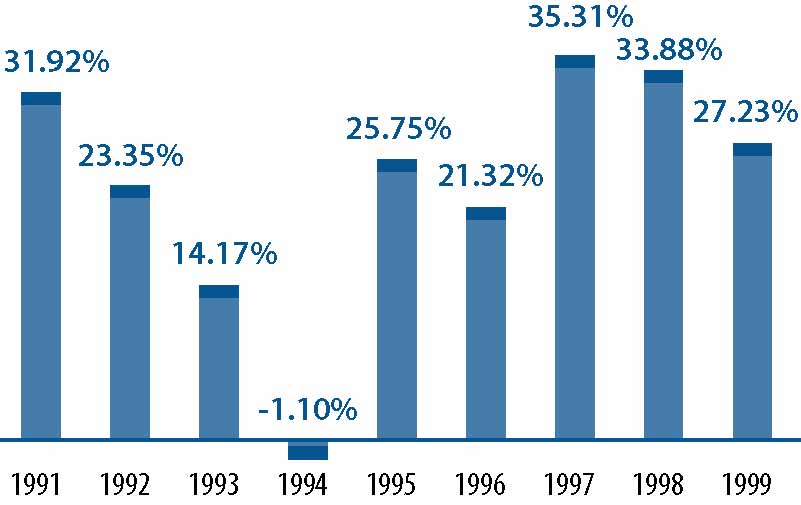 |
| AVERAGE ANNUAL TOTAL RETURN
|
| For the period ended December 31, 1999 | 1 Year | 5 Years | Since Inception | ||||
|---|---|---|---|---|---|---|---|
| Class A (Inception 4/20/90) | |||||||
| Including Sales Charges | 20.24% | 27.15% | 19.81% | ||||
| S&P 500® Index* | 21.04% | 28.54% | 19.33% | ||||
| Class B (Inception 5/1/96) | |||||||
| Including CDSC | 20.78% | N/A | 28.09% | ||||
| S&P 500® Index* | 21.04% | N/A | 26.74% | ||||
| Class C (Inception 8/15/97) | |||||||
| Including CDSC | 25.22% | N/A | 27.67% | ||||
| S&P 500® Index* | 21.04% | N/A | 23.21% | ||||
*
|
The S&P 500® Index is the Standard & Poor’s Composite Index of 500 stocks, an unmanaged index of common stock
prices. The Index figures do not reflect any fees or expenses.
|
| TOTAL RETURN
|
| The total return for Class A Shares for the 9-month period ended September 30, 2000 was 17.88%.
Best Quarter
Q2 ’99 +21.13%
Worst Quarter
Q3 ’98 -20.87%
|
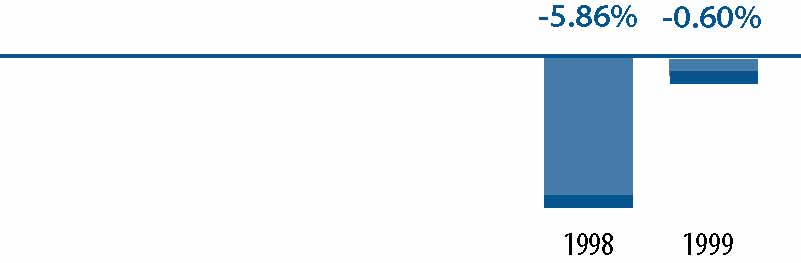 |
| AVERAGE ANNUAL TOTAL RETURN
|
| For the period ended December 31, 1999 | 1 Year | Since Inception | |||
|---|---|---|---|---|---|
| Class A (Inception 8/15/97) | |||||
| Including Sales Charges | (6.07)% | (4.27)% | |||
| Russell Midcap Value Index* | (0.10)% | 6.38% | |||
| Class B (Inception 8/15/97) | |||||
| Including CDSC | (6.32)% | (3.87)% | |||
| Russell Midcap Value Index* | (0.10)% | 6.38% | |||
| Class C (Inception 8/15/97) | |||||
| Including CDSC | (2.37)% | (2.58)% | |||
| Russell Midcap Value Index* | (0.10)% | 6.38% | |||
| *The Russell Midcap Value Index is an unmanaged index of common stock prices. The Index figures do not reflect any fees or expenses.
|
| TOTAL RETURN
|
| The total return for Class A Shares for the 9-month period ended September 30, 2000 was 26.61%.
Best Quarter
Q2 ’99 +30.13%
Worst Quarter
Q3 ’98 -32.23%
|
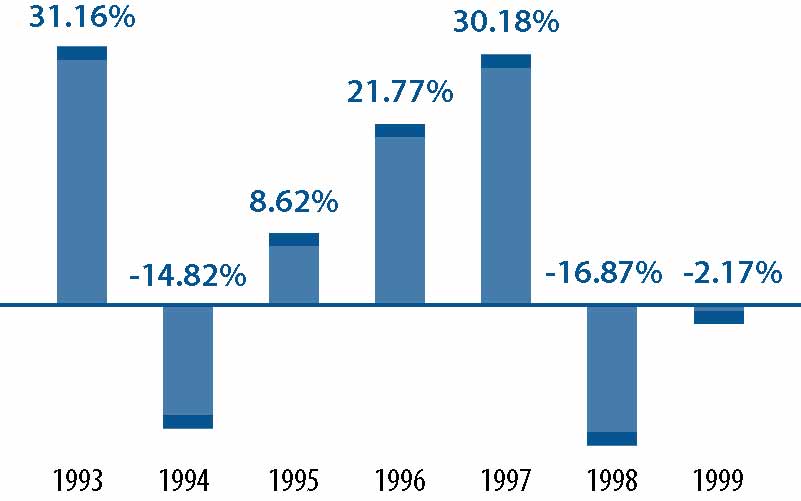 |
| AVERAGE ANNUAL TOTAL RETURN
|
| For the period ended December 31, 1999 | 1 Year | 5 Years | Since Inception | ||||
|---|---|---|---|---|---|---|---|
| Class A (Inception 10/22/92) | |||||||
| Including Sales Charges | (7.55)% | 5.77% | 7.65% | ||||
| Russell 2000® Value Index* | (1.49)% | 13.13% | 13.94% | ||||
| Class B (Inception 5/1/96) | |||||||
| Including CDSC | (7.72)% | N/A | 1.13% | ||||
| Russell 2000® Value Index* | (1.49)% | N/A | 9.06% | ||||
| Class C (Inception 8/15/97) | |||||||
| Including CDSC | (3.84)% | N/A | (6.15)% | ||||
| Russell 2000® Value Index* | (1.49)% | N/A | 0.81% | ||||
| *The Russell 2000® Value Index is an unmanaged index of common stock prices. The Index figures do not reflect any
fees or expenses.
|
| Balanced Fund |
||||||||||
|---|---|---|---|---|---|---|---|---|---|---|
| Class A | Class B | Class C | ||||||||
| Shareholder Fees | ||||||||||
| (fees paid directly from your investment): | ||||||||||
| Maximum Sales Charge (Load) Imposed on
Purchases |
5.5% | 1 | None | None | ||||||
| Maximum Deferred Sales Charge (Load) 2 | None | 1 | 5.0% | 3 | 1.0% | 4 | ||||
| Maximum Sales Charge (Load) Imposed on
Reinvested Dividends |
None | None | None | |||||||
| Redemption Fees 5 | None | None | None | |||||||
| Exchange Fees | None | None | None | |||||||
| Annual Fund Operating Expenses | ||||||||||
| (expenses that are deducted from Fund assets):6 | ||||||||||
| Management Fees | 0.65% | 0.65% | 0.65% | |||||||
| Distribution and Service (12b-1) Fees | 0.25% | 1.00% | 1.00% | |||||||
| Other Expenses 8 | 0.39% | 0.39% | 0.39% | |||||||
| Total Fund Operating Expenses* | 1.29% | 2.04% | 2.04% | |||||||
| See page 48 for all other footnotes.
|
*
|
As a result of the current expense limitations, “Other Expenses” and “Total Fund Operating Expenses” of the
Fund which are actually incurred as of the date of this Prospectus are as set forth below. The expense limitations may be terminated at any time at the option of the Investment Adviser. If this occurs, “Other Expenses” and “Total Fund
Operating Expenses” may increase without shareholder approval.
|
| Balanced Fund |
|||||||
|---|---|---|---|---|---|---|---|
| Class A | Class B | Class C | |||||
| Annual Fund Operating Expenses | |||||||
| (expenses that are deducted from Fund assets): 6 | |||||||
| Management Fees | 0.65% | 0.65% | 0.65% | ||||
| Distribution and Service (12b-1) Fees | 0.25% | 1.00% | 1.00% | ||||
| Other Expenses 8 | 0.25% | 0.25% | 0.25% | ||||
| Total Fund Operating Expenses (after
current expense limitations) |
1.15% | 1.90% | 1.90% | ||||
| Growth and Income Fund |
||||||||||
|---|---|---|---|---|---|---|---|---|---|---|
| Class A | Class B | Class C | ||||||||
| Shareholder Fees | ||||||||||
| (fees paid directly from your investment): | ||||||||||
| Maximum Sales Charge (Load) Imposed on
Purchases |
5.5% | 1 | None | None | ||||||
| Maximum Deferred Sales Charge (Load) 2 | None | 1 | 5.0% | 3 | 1.0% | 4 | ||||
| Maximum Sales Charge (Load) Imposed on
Reinvested Dividends |
None | None | None | |||||||
| Redemption Fees 5 | None | None | None | |||||||
| Exchange Fees | None | None | None | |||||||
| Annual Fund Operating Expenses | ||||||||||
| (expenses that are deducted from Fund assets):6 | ||||||||||
| Management Fees | 0.70% | 0.70% | 0.70% | |||||||
| Distribution and Service (12b-1) Fees | 0.25% | 1.00% | 1.00% | |||||||
| Other Expenses 8 | 0.23% | 0.23% | 0.23% | |||||||
| Total Fund Operating Expenses* | 1.18% | 1.93% | 1.93% | |||||||
| See page 48 for all other footnotes.
|
*
|
As a result of the current expense limitations, “Other Expenses” and “Total Fund Operating Expenses” of the
Fund which are actually incurred as of the date of this Prospectus are as set forth below. The expense limitations may be terminated at any time at the option of the Investment Adviser. If this occurs, “Other Expenses” and “Total Fund
Operating Expenses” may increase without shareholder approval.
|
| Growth and Income Fund |
|||||||
|---|---|---|---|---|---|---|---|
| Class A | Class B | Class C | |||||
| Annual Fund Operating Expenses | |||||||
| (expenses that are deducted from Fund assets): 6 | |||||||
| Management Fees | 0.70% | 0.70% | 0.70% | ||||
| Distribution and Service (12b-1) Fees | 0.25% | 1.00% | 1.00% | ||||
| Other Expenses 8 | 0.23% | 0.23% | 0.23% | ||||
| Total Fund Operating Expenses (after
current expense limitations) |
1.18% | 1.93% | 1.93% | ||||
| CORE Large Cap Value Fund |
||||||||||
|---|---|---|---|---|---|---|---|---|---|---|
| Class A | Class B | Class C | ||||||||
| Shareholder Fees | ||||||||||
| (fees paid directly from your investment): | ||||||||||
| Maximum Sales Charge (Load) Imposed on
Purchases |
5.5% | 1 | None | None | ||||||
| Maximum Deferred Sales Charge (Load) 2 | None | 1 | 5.0% | 3 | 1.0% | 4 | ||||
| Maximum Sales Charge (Load) Imposed on
Reinvested Dividends |
None | None | None | |||||||
| Redemption Fees 5 | None | None | None | |||||||
| Exchange Fees | None | None | None | |||||||
| Annual Fund Operating Expenses | ||||||||||
| (expenses that are deducted from Fund assets):6 | ||||||||||
| Management Fees | 0.60% | 0.60% | 0.60% | |||||||
| Distribution and Service (12b-1) Fees | 0.25% | 1.00% | 1.00% | |||||||
| Other Expenses 8 | 0.32% | 0.32% | 0.32% | |||||||
| Total Fund Operating Expenses* | 1.17% | 1.92% | 1.92% | |||||||
| See page 48 for all other footnotes.
|
*
|
As a result of the current expense limitations, “Other Expenses” and “Total Fund Operating Expenses” of the
Fund which are actually incurred as of the date of this Prospectus are as set forth below. The expense limitations may be terminated at any time at the option of the Investment Adviser. If this occurs, “Other Expenses” and “Total Fund
Operating Expenses” may increase without shareholder approval.
|
| CORE Large Cap Value Fund |
|||||||
|---|---|---|---|---|---|---|---|
| Class A | Class B | Class C | |||||
| Annual Fund Operating Expenses | |||||||
| (expenses that are deducted from Fund assets): 6 | |||||||
| Management Fees | 0.60% | 0.60% | 0.60% | ||||
| Distribution and Service (12b-1) Fees | 0.25% | 1.00% | 1.00% | ||||
| Other Expenses 8 | 0.25% | 0.25% | 0.25% | ||||
| Total Fund Operating Expenses (after
current expense limitations) |
1.10% | 1.85% | 1.85% | ||||
| CORE U.S. Equity Fund |
||||||||||
|---|---|---|---|---|---|---|---|---|---|---|
| Class A | Class B | Class C | ||||||||
| Shareholder Fees | ||||||||||
| (fees paid directly from your investment): | ||||||||||
| Maximum Sales Charge (Load) Imposed on
Purchases |
5.5% | 1 | None | None | ||||||
| Maximum Deferred Sales Charge (Load) 2 | None | 1 | 5.0% | 3 | 1.0% | 4 | ||||
| Maximum Sales Charge (Load) Imposed on
Reinvested Dividends |
None | None | None | |||||||
| Redemption Fees 5 | None | None | None | |||||||
| Exchange Fees | None | None | None | |||||||
| Annual Fund Operating Expenses | ||||||||||
| (expenses that are deducted from Fund assets):6 | ||||||||||
| Management Fees 7 | 0.75% | 0.75% | 0.75% | |||||||
| Distribution and Service (12b-1) Fees | 0.25% | 1.00% | 1.00% | |||||||
| Other Expenses 8 | 0.23% | 0.23% | 0.23% | |||||||
| Total Fund Operating Expenses* | 1.23% | 1.98% | 1.98% | |||||||
| See page 48 for all other footnotes.
|
*
|
As a result of the current waivers and expense limitations, “Other Expenses” and “Total Fund Operating
Expenses” of the Fund which are actually incurred as of the date of this Prospectus are as set forth below. The waivers and expense limitations may be terminated at any time at the option of the Investment Adviser. If this occurs, “Other
Expenses” and “Total Fund Operating Expenses” may increase without shareholder approval.
|
| CORE U.S. Equity Fund |
|||||||
|---|---|---|---|---|---|---|---|
| Class A | Class B | Class C | |||||
| Annual Fund Operating Expenses | |||||||
| (expenses that are deducted from Fund assets): 6 | |||||||
| Management Fees 7 | 0.70% | 0.70% | 0.70% | ||||
| Distribution and Service (12b-1) Fees | 0.25% | 1.00% | 1.00% | ||||
| Other Expenses 8 | 0.19% | 0.19% | 0.19% | ||||
| Total Fund Operating Expenses (after current
waivers and expense limitations) |
1.14% | 1.89% | 1.89% | ||||
| CORE Large Cap Growth Fund |
||||||||||
|---|---|---|---|---|---|---|---|---|---|---|
| Class A | Class B | Class C | ||||||||
| Shareholder Fees | ||||||||||
| (fees paid directly from your investment): | ||||||||||
| Maximum Sales Charge (Load) Imposed on
Purchases |
5.5% | 1 | None | None | ||||||
| Maximum Deferred Sales Charge (Load) 2 | None | 1 | 5.0% | 3 | 1.0% | 4 | ||||
| Maximum Sales Charge (Load) Imposed on
Reinvested Dividends |
None | None | None | |||||||
| Redemption Fees 5 | None | None | None | |||||||
| Exchange Fees | None | None | None | |||||||
| Annual Fund Operating Expenses | ||||||||||
| (expenses that are deducted from Fund assets):6 | ||||||||||
| Management Fees 7 | 0.75% | 0.75% | 0.75% | |||||||
| Distribution and Service (12b-1) Fees | 0.25% | 1.00% | 1.00% | |||||||
| Other Expenses 8 | 0.24% | 0.24% | 0.24% | |||||||
| Total Fund Operating Expenses* | 1. 24% | 1.99% | 1.99% | |||||||
| See page 48 for all other footnotes.
|
*
|
As a result of the current waivers and expense limitations, “Other Expenses” and “Total Fund Operating
Expenses” of the Fund which are actually incurred as of the date of this Prospectus are as set forth below. The waivers and expense limitations may be terminated at any time at the option of the Investment Adviser. If this occurs, “Other
Expenses” and “Total Fund Operating Expenses” may increase without shareholder approval.
|
| CORE Large Cap Growth Fund |
|||||||
|---|---|---|---|---|---|---|---|
| Class A | Class B | Class C | |||||
| Annual Fund Operating Expenses | |||||||
| (expenses that are deducted from Fund assets): 6 | |||||||
| Management Fees 7 | 0.70% | 0.70% | 0.70% | ||||
| Distribution and Service (12b-1) Fees | 0.25% | 1.00% | 1.00% | ||||
| Other Expenses 8 | 0.21% | 0.21% | 0.21% | ||||
| Total Fund Operating Expenses (after current
waivers and expense limitations) |
1.16% | 1.91% | 1.91% | ||||
| CORE Small Cap Equity Fund |
||||||||||
|---|---|---|---|---|---|---|---|---|---|---|
| Class A | Class B | Class C | ||||||||
| Shareholder Fees | ||||||||||
| (fees paid directly from your investment): | ||||||||||
| Maximum Sales Charge (Load) Imposed on
Purchases |
5.5% | 1 | None | None | ||||||
| Maximum Deferred Sales Charge (Load) 2 | None | 1 | 5.0% | 3 | 1.0% | 4 | ||||
| Maximum Sales Charge (Load) Imposed on
Reinvested Dividends |
None | None | None | |||||||
| Redemption Fees 5 | None | None | None | |||||||
| Exchange Fees | None | None | None | |||||||
| Annual Fund Operating Expenses | ||||||||||
| (expenses that are deducted from Fund assets):6 | ||||||||||
| Management Fees | 0.85% | 0.85% | 0.85% | |||||||
| Distribution and Service (12b-1) Fees | 0.25% | 1.00% | 1.00% | |||||||
| Other Expenses 8 | 0.45% | 0.45% | 0.45% | |||||||
| Total Fund Operating Expenses* | 1.55% | 2.30% | 2.30% | |||||||
| See page 48 for all other footnotes.
|
*
|
As a result of the current expense limitations, “Other Expenses” and “Total Fund Operating Expenses” of the
Fund which are actually incurred as of the date of this Prospectus are as set forth below. The expense limitations may be terminated at any time at the option of the Investment Adviser. If this occurs, “Other Expenses” and “Total Fund
Operating Expenses” may increase without shareholder approval.
|
| CORE Small Cap Equity Fund |
|||||||
|---|---|---|---|---|---|---|---|
| Class A | Class B | Class C | |||||
| Annual Fund Operating Expenses | |||||||
| (expenses that are deducted from Fund assets): 6 | |||||||
| Management Fees | 0.85% | 0.85% | 0.85% | ||||
| Distribution and Service (12b-1) Fees | 0.25% | 1.00% | 1.00% | ||||
| Other Expenses 8 | 0.23% | 0.23% | 0.23% | ||||
| Total Fund Operating Expenses (after current
expense limitations) |
1.33% | 2.08% | 2.08% | ||||
| Capital Growth Fund |
||||||||||
|---|---|---|---|---|---|---|---|---|---|---|
| Class A | Class B | Class C | ||||||||
| Shareholder Fees | ||||||||||
| (fees paid directly from your investment): | ||||||||||
| Maximum Sales Charge (Load) Imposed on
Purchases |
5.5% | 1 | None | None | ||||||
| Maximum Deferred Sales Charge (Load) 2 | None | 1 | 5.0% | 3 | 1.0% | 4 | ||||
| Maximum Sales Charge (Load) Imposed on
Reinvested Dividends |
None | None | None | |||||||
| Redemption Fees 5 | None | None | None | |||||||
| Exchange Fees | None | None | None | |||||||
| Annual Fund Operating Expenses | ||||||||||
| (expenses that are deducted from Fund assets):6 | ||||||||||
| Management Fees | 1.00% | 1.00% | 1.00% | |||||||
| Distribution and Service (12b-1) Fees | 0.25% | 1.00% | 1.00% | |||||||
| Other Expenses 8 | 0.22% | 0.22% | 0.22% | |||||||
| Total Fund Operating Expenses* | 1.47% | 2.22% | 2.22% | |||||||
| See page 48 for all other footnotes.
|
*
|
As a result of the current expense limitations, “Other Expenses” and “Total Fund Operating Expenses” of the
Fund which are actually incurred as of the date of this Prospectus are as set forth below. The expense limitations may be terminated at any time at the option of the Investment Adviser. If this occurs, “Other Expenses” and “Total Fund
Operating Expenses” may increase without shareholder approval.
|
| Capital Growth Fund |
|||||||
|---|---|---|---|---|---|---|---|
| Class A | Class B | Class C | |||||
| Annual Fund Operating Expenses | |||||||
| (expenses that are deducted from Fund assets): 6 | |||||||
| Management Fees | 1.00% | 1.00% | 1.00% | ||||
| Distribution and Service (12b-1) Fees | 0.25% | 1.00% | 1.00% | ||||
| Other Expenses 8 | 0.19% | 0.19% | 0.19% | ||||
| Total Fund Operating Expenses (after
current expense limitations) |
1.44% | 2.19% | 2.19% | ||||
| Strategic Growth Fund |
||||||||||
|---|---|---|---|---|---|---|---|---|---|---|
| Class A | Class B | Class C | ||||||||
| Shareholder Fees | ||||||||||
| (fees paid directly from your investment): | ||||||||||
| Maximum Sales Charge (Load) Imposed on
Purchases |
5.5% | 1 | None | None | ||||||
| Maximum Deferred Sales Charge (Load) 2 | None | 1 | 5.0% | 3 | 1.0% | 4 | ||||
| Maximum Sales Charge (Load) Imposed on
Reinvested Dividends |
None | None | None | |||||||
| Redemption Fees 5 | None | None | None | |||||||
| Exchange Fees | None | None | None | |||||||
| Annual Fund Operating Expenses | ||||||||||
| (expenses that are deducted from Fund assets):6 | ||||||||||
| Management Fees | 1.00% | 1.00% | 1.00% | |||||||
| Distribution and Service (12b-1) Fees | 0.25% | 1.00% | 1.00% | |||||||
| Other Expenses 8 | 0.38% | 0.38% | 0.38% | |||||||
| Total Fund Operating Expenses* | 1.63% | 2.38% | 2.38% | |||||||
| See page 48 for all other footnotes.
|
*
|
As a result of the current expense limitations, “Other Expenses” and “Total Fund Operating Expenses” of the
Fund which are actually incurred as of the date of this Prospectus are as set forth below. The expense limitations may be terminated at any time at the option of the Investment Adviser. If this occurs, “Other Expenses” and “Total Fund
Operating Expenses” may increase without shareholder approval.
|
| Strategic Growth Fund |
|||||||
|---|---|---|---|---|---|---|---|
| Class A | Class B | Class C | |||||
| Annual Fund Operating Expenses | |||||||
| (expenses that are deducted from Fund assets): 6 | |||||||
| Management Fees | 1.00% | 1.00% | 1.00% | ||||
| Distribution and Service (12b-1) Fees | 0.25% | 1.00% | 1.00% | ||||
| Other Expenses 8 | 0.19% | 0.19% | 0.19% | ||||
| Total Fund Operating Expenses (after
current expense limitations) |
1.44% | 2.19% | 2.19% | ||||
| Growth Opportunities Fund |
||||||||||
|---|---|---|---|---|---|---|---|---|---|---|
| Class A | Class B | Class C | ||||||||
| Shareholder Fees | ||||||||||
| (fees paid directly from your investment): | ||||||||||
| Maximum Sales Charge (Load) Imposed on
Purchases |
5.5% | 1 | None | None | ||||||
| Maximum Deferred Sales Charge (Load) 2 | None | 1 | 5.0% | 3 | 1.0% | 4 | ||||
| Maximum Sales Charge (Load) Imposed on
Reinvested Dividends |
None | None | None | |||||||
| Redemption Fees 5 | None | None | None | |||||||
| Exchange Fees | None | None | None | |||||||
| Annual Fund Operating Expenses | ||||||||||
| (expenses that are deducted from Fund assets):6 | ||||||||||
| Management Fees | 1.00% | 1.00% | 1.00% | |||||||
| Distribution and Service (12b-1) Fees | 0.25% | 1.00% | 1.00% | |||||||
| Other Expenses 8 | 0.36% | 0.36% | 0.36% | |||||||
| Total Fund Operating Expenses* | 1.61% | 2.36% | 2.36% | |||||||
| See page 48 for all other footnotes.
|
*
|
As a result of the current expense limitations, “Other Expenses” and “Total Fund Operating Expenses” of the
Fund which are actually incurred as of the date of this Prospectus are as set forth below. The expense limitations may be terminated at any time at the option of the Investment Adviser. If this occurs, “Other Expenses” and “Total Fund
Operating Expenses” may increase without shareholder approval.
|
| Growth Opportunities Fund |
|||||||
|---|---|---|---|---|---|---|---|
| Class A | Class B | Class C | |||||
| Annual Fund Operating Expenses | |||||||
| (expenses that are deducted from Fund assets): 6 | |||||||
| Management Fees | 1.00% | 1.00% | 1.00% | ||||
| Distribution and Service (12b-1) Fees | 0.25% | 1.00% | 1.00% | ||||
| Other Expenses 8 | 0.30% | 0.30% | 0.30% | ||||
| Total Fund Operating Expenses (after
current expense limitations) |
1.55% | 2.30% | 2.30% | ||||
| Mid Cap Value Fund |
||||||||||
|---|---|---|---|---|---|---|---|---|---|---|
| Class A | Class B | Class C | ||||||||
| Shareholder Fees | ||||||||||
| (fees paid directly from your investment): | ||||||||||
| Maximum Sales Charge (Load) Imposed on
Purchases |
5.5% | 1 | None | None | ||||||
| Maximum Deferred Sales Charge (Load) 2 | None | 1 | 5.0% | 3 | 1.0% | 4 | ||||
| Maximum Sales Charge (Load) Imposed on
Reinvested Dividends |
None | None | None | |||||||
| Redemption Fees 5 | None | None | None | |||||||
| Exchange Fees | None | None | None | |||||||
| Annual Fund Operating Expenses | ||||||||||
| (expenses that are deducted from Fund assets):6 | ||||||||||
| Management Fees | 0.75% | 0.75% | 0.75% | |||||||
| Distribution and Service (12b-1) Fees | 0.25% | 1.00% | 1.00% | |||||||
| Other Expenses 8 | 0.34% | 0.34% | 0.34% | |||||||
| Total Fund Operating Expenses* | 1.34% | 2.09% | 2.09% | |||||||
| See page 48 for all other footnotes.
|
*
|
As a result of the current expense limitations, “Other Expenses” and “Total Fund Operating Expenses” of the
Fund which are actually incurred as of the date of this Prospectus are as set forth below. The expense limitations may be terminated at any time at the option of the Investment Adviser. If this occurs, “Other Expenses” and “Total Fund
Operating Expenses” may increase without shareholder approval.
|
| Mid Cap Value Fund |
|||||||
|---|---|---|---|---|---|---|---|
| Class A | Class B | Class C | |||||
| Annual Fund Operating Expenses | |||||||
| (expenses that are deducted from Fund assets): 6 | |||||||
| Management Fees | 0.75% | 0.75% | 0.75% | ||||
| Distribution and Service (12b-1) Fees | 0.25% | 1.00% | 1.00% | ||||
| Other Expenses 8 | 0.29% | 0.29% | 0.29% | ||||
| Total Fund Operating Expenses (after
current expense limitations) |
1.29% | 2.04% | 2.04% | ||||
| Small Cap Value Fund |
||||||||||
|---|---|---|---|---|---|---|---|---|---|---|
| Class A | Class B | Class C | ||||||||
| Shareholder Fees | ||||||||||
| (fees paid directly from your investment): | ||||||||||
| Maximum Sales Charge (Load) Imposed on
Purchases |
5.5% | 1 | None | None | ||||||
| Maximum Deferred Sales Charge (Load) 2 | None | 1 | 5.0% | 3 | 1.0% | 4 | ||||
| Maximum Sales Charge (Load) Imposed on
Reinvested Dividends |
None | None | None | |||||||
| Redemption Fees 5 | None | None | None | |||||||
| Exchange Fees | None | None | None | |||||||
| Annual Fund Operating Expenses | ||||||||||
| (expenses that are deducted from Fund assets):6 | ||||||||||
| Management Fees | 1.00% | 1.00% | 1.00% | |||||||
| Distribution and Service (12b-1) Fees | 0.25% | 1.00% | 1.00% | |||||||
| Other Expenses 8 | 0.32% | 0.32% | 0.32% | |||||||
| Total Fund Operating Expenses* | 1.57% | 2.32% | 2.32% | |||||||
| See page 48 for all other footnotes.
|
*
|
As a result of the current expense limitations, “Other Expenses” and “Total Fund Operating Expenses” of the
Fund which are actually incurred as of the date of this Prospectus are as set forth below. The expense limitations may be terminated at any time at the option of the Investment Adviser. If this occurs, “Other Expenses” and “Total Fund
Operating Expenses” may increase without shareholder approval.
|
| Small Cap Value Fund |
|||||||
|---|---|---|---|---|---|---|---|
| Class A | Class B | Class C | |||||
| Annual Fund Operating Expenses | |||||||
| (expenses that are deducted from Fund assets): 6 | |||||||
| Management Fees | 1.00% | 1.00% | 1.00% | ||||
| Distribution and Service (12b-1) Fees | 0.25% | 1.00% | 1.00% | ||||
| Other Expenses 8 | 0.25% | 0.25% | 0.25% | ||||
| Total Fund Operating Expenses (after
current expense limitations) |
1.50% | 2.25% | 2.25% | ||||
| Large Cap Value Fund |
||||||||||
|---|---|---|---|---|---|---|---|---|---|---|
| Class A | Class B | Class C | ||||||||
| Shareholder Fees | ||||||||||
| (fees paid directly from your investment): | ||||||||||
| Maximum Sales Charge (Load) Imposed on
Purchases |
5.5% | 1 | None | None | ||||||
| Maximum Deferred Sales Charge (Load) 2 | None | 1 | 5.0% | 3 | 1.0% | 4 | ||||
| Maximum Sales Charge (Load) Imposed on
Reinvested Dividends |
None | None | None | |||||||
| Redemption Fees 5 | None | None | None | |||||||
| Exchange Fees | None | None | None | |||||||
| Annual Fund Operating Expenses | ||||||||||
| (expenses that are deducted from Fund assets):6 | ||||||||||
| Management Fees | 0.75% | 0.75% | 0.75% | |||||||
| Distribution and Service (12b-1) Fees | 0.25% | 1.00% | 1.00% | |||||||
| Other Expenses 8 | 2.30% | 2.30% | 2.30% | |||||||
| Total Fund Operating Expenses* | 3.30% | 4.05% | 4.05% | |||||||
| See page 48 for all other footnotes.
|
*
|
As a result of the current waivers and expense limitations, “Other Expenses” and “Total Fund Operating
Expenses” of the Fund which are actually incurred as of the date of this Prospectus are as set forth below. The waivers and expense limitations may be terminated at any time at the option of the Investment Adviser. If this occurs, “Other
Expenses” and “Total Fund Operating Expenses” may increase without shareholder approval.
|
| Large Cap Value Fund |
|||||||
|---|---|---|---|---|---|---|---|
| Class A | Class B | Class C | |||||
| Annual Fund Operating Expenses | |||||||
| (expenses that are deducted from Fund assets): 6 | |||||||
| Management Fees | 0.75% | 0.75% | 0.75% | ||||
| Distribution and Service (12b-1) Fees | 0.25% | 1.00% | 1.00% | ||||
| Other Expenses 8 | 0.25% | 0.25% | 0.25% | ||||
| Total Fund Operating Expenses (after
current waivers and expense limitations) |
1.25% | 2.00% | 2.00% | ||||
1
|
The maximum sales charge is a percentage of the offering price. A CDSC of 1% is imposed on certain redemptions (within
18 months of purchase) of Class A Shares sold without an initial sales charge as part of an investment of $1 million or more.
|
2
|
The maximum CDSC is a percentage of the lesser of the NAV at the time of the redemption or the NAV when the shares were
originally purchased.
|
3
|
A CDSC is imposed upon Class B Shares redeemed within six years of purchase at a rate of 5% in the first year, declining
to 1% in the sixth year, and eliminated thereafter.
|
4
|
A CDSC of 1% is imposed on Class C Shares redeemed within 12 months of purchase.
|
5
|
A transaction fee of $7.50 may be charged for redemption proceeds paid by wire.
|
6
|
The Funds’ annual operating expenses are based on actual expenses.
|
7
|
The Investment Adviser has voluntarily agreed not to impose a portion of the management fee on the CORE U.S. Equity Fund
and the CORE Large Cap Growth Fund equal to 0.05% and 0.05%, respectively, of such Funds’ average daily net assets. As a result of fee waivers, the current management fees of the CORE U.S. Equity Fund and CORE Large Cap Growth Fund are 0.70% and 0.70%, respectively, of such Fund’s average daily net assets. The waivers may be terminated at any time at the option
of the Investment Adviser.
|
8
|
“Other Expenses” include transfer agency fees equal to 0.19% of the average daily net assets of each Fund’
s Class A, B and C Shares, plus all other ordinary expenses not detailed above. The Investment Adviser has voluntarily agreed to reduce or limit “Other Expenses” (excluding management fees, distribution and service fees, transfer agency fees,
taxes, interest and brokerage fees and litigation, indemnification and other extraordinary expenses) to the following percentages of each Fund’s average daily net assets:
|
| Fund | Other
Expenses |
||
|---|---|---|---|
| Balanced | 0.06% | ||
| Growth and Income | 0.05% | ||
| CORE Large Cap Value | 0.06% | ||
| CORE U.S. Equity | 0.00% | ||
| CORE Large Cap Growth | 0.02% | ||
| CORE Small Cap Equity | 0.04% | ||
| Capital Growth | 0.00% | ||
| Strategic Growth | 0.00% | ||
| Growth Opportunities | 0.11% | ||
| Mid Cap Value | 0.10% | ||
| Small Cap Value | 0.06% | ||
| Large Cap Value | 0.06% | ||
| Fund | 1 Year | 3 Years | 5 Years | 10 Years | |||||
|---|---|---|---|---|---|---|---|---|---|
| Balanced | |||||||||
| Class A Shares | $674 | $936 | $1,219 | $2,021 | |||||
| Class B Shares | |||||||||
| – Assuming complete redemption at end of period | $707 | $940 | $1,298 | $2,176 | |||||
| – Assuming no redemption | $207 | $640 | $1,098 | $2,176 | |||||
| Class C Shares | |||||||||
| – Assuming complete redemption at end of period | $307 | $640 | $1,098 | $2,369 | |||||
| – Assuming no redemption | $207 | $640 | $1,098 | $2,369 | |||||
| Growth and Income | |||||||||
| Class A Shares | $664 | $904 | $1,163 | $1,903 | |||||
| Class B Shares | |||||||||
| – Assuming complete redemption at end of period | $696 | $906 | $1,242 | $2,059 | |||||
| – Assuming no redemption | $196 | $606 | $1,042 | $2,059 | |||||
| Class C Shares | |||||||||
| – Assuming complete redemption at end of period | $296 | $606 | $1,042 | $2,254 | |||||
| – Assuming no redemption | $196 | $606 | $1,042 | $2,254 | |||||
| CORE Large Cap Value | |||||||||
| Class A Shares | $663 | $901 | $1,158 | $1,892 | |||||
| Class B Shares | |||||||||
| – Assuming complete redemption at end of period | $695 | $903 | $1,237 | $2,048 | |||||
| – Assuming no redemption | $195 | $603 | $1,037 | $2,048 | |||||
| Class C Shares | |||||||||
| – Assuming complete redemption at end of period | $295 | $603 | $1,037 | $2,243 | |||||
| – Assuming no redemption | $195 | $603 | $1,037 | $2,243 | |||||
| Fund | 1 Year | 3 Years | 5 Years | 10 Years | |||||
|---|---|---|---|---|---|---|---|---|---|
| CORE U.S. Equity | |||||||||
| Class A Shares | $668 | $ 919 | $1,188 | $1,957 | |||||
| Class B Shares | |||||||||
| – Assuming complete redemption at end of period | $701 | $ 921 | $1,268 | $2,113 | |||||
| – Assuming no redemption | $201 | $ 621 | $1,068 | $2,113 | |||||
| Class C Shares | |||||||||
| – Assuming complete redemption at end of period | $301 | $ 621 | $1,068 | $2,306 | |||||
| – Assuming no redemption | $201 | $ 621 | $1,068 | $2,306 | |||||
| CORE Large Cap Growth | |||||||||
| Class A Shares | $669 | $ 922 | $1,194 | $1,967 | |||||
| Class B Shares | |||||||||
| – Assuming complete redemption at end of period | $702 | $ 924 | $1,273 | $2,123 | |||||
| – Assuming no redemption | $202 | $ 624 | $1,073 | $2,123 | |||||
| Class C Shares | |||||||||
| – Assuming complete redemption at end of period | $302 | $ 624 | $1,073 | $2,317 | |||||
| – Assuming no redemption | $202 | $ 624 | $1,073 | $2,317 | |||||
| CORE Small Cap Equity | |||||||||
| Class A Shares | $699 | $1,013 | $1,348 | $2,294 | |||||
| Class B Shares | |||||||||
| – Assuming complete redemption at end of period | $733 | $1,118 | $1,430 | $2,448 | |||||
| – Assuming no redemption | $233 | $ 718 | $1,230 | $2,448 | |||||
| Class C Shares | |||||||||
| – Assuming complete redemption at end of period | $333 | $ 718 | $1,230 | $2,636 | |||||
| – Assuming no redemption | $233 | $ 718 | $1,230 | $2,636 | |||||
| Capital Growth | |||||||||
| Class A Shares | $691 | $ 989 | $1,309 | $2,211 | |||||
| Class B Shares | |||||||||
| – Assuming complete redemption at end of period | $725 | $1,094 | $1,390 | $2,365 | |||||
| – Assuming no redemption | $225 | $ 694 | $1,190 | $2,365 | |||||
| Class C Shares | |||||||||
| – Assuming complete redemption at end of period | $325 | $ 694 | $1,190 | $2,554 | |||||
| – Assuming no redemption | $225 | $ 694 | $1,190 | $2,554 | |||||
| Strategic Growth | |||||||||
| Class A Shares | $707 | $1,036 | $1,388 | $2,376 | |||||
| Class B Shares | |||||||||
| – Assuming complete redemption at end of period | $741 | $1,042 | $1,470 | $2,530 | |||||
| – Assuming no redemption | $241 | $ 742 | $1,270 | $2,530 | |||||
| Class C Shares | |||||||||
| – Assuming complete redemption at end of period | $341 | $ 742 | $1,270 | $2,716 | |||||
| – Assuming no redemption | $241 | $ 742 | $1,270 | $2,716 | |||||
| Fund | 1 Year | 3 Years | 5 Years | 10 Years | |||||
|---|---|---|---|---|---|---|---|---|---|
| Growth Opportunities | |||||||||
| Class A Shares | $ 705 | $ 1,030 | $ 1,378 | $ 2,356 | |||||
| Class B Shares | |||||||||
| – Assuming complete redemption at end of period | $ 739 | $ 1,036 | $ 1,460 | $ 2,510 | |||||
| – Assuming no redemption | $ 239 | $ 736 | $ 1,260 | $ 2,510 | |||||
| Class C Shares | |||||||||
| – Assuming complete redemption at end of period | $ 339 | $ 736 | $ 1,260 | $ 2,696 | |||||
| – Assuming no redemption | $ 239 | $ 736 | $ 1,260 | $ 2,696 | |||||
| Mid Cap Value | |||||||||
| Class A Shares | $ 679 | $ 951 | $ 1,244 | $ 2,074 | |||||
| Class B Shares | |||||||||
| – Assuming complete redemption at end of period | $ 712 | $ 955 | $ 1,344 | $ 2,229 | |||||
| – Assuming no redemption | $ 212 | $ 655 | $ 1,124 | $ 2,229 | |||||
| Class C Shares | |||||||||
| – Assuming complete redemption at end of period | $ 312 | $ 655 | $ 1,124 | $ 2,421 | |||||
| – Assuming no redemption | $ 212 | $ 655 | $ 1,124 | $ 2,421 | |||||
| Small Cap Value | |||||||||
| Class A Shares | $ 701 | $ 1,018 | $ 1,358 | $ 2,315 | |||||
| Class B Shares | |||||||||
| – Assuming complete redemption at end of period | $ 735 | $ 1,024 | $ 1,440 | $ 2,468 | |||||
| – Assuming no redemption | $ 235 | $ 724 | $ 1,240 | $ 2,468 | |||||
| Class C Shares | |||||||||
| – Assuming complete redemption at end of period | $ 335 | $ 724 | $ 1,240 | $ 2,656 | |||||
| – Assuming no redemption | $ 235 | $ 724 | $ 1,240 | $ 2,656 | |||||
| Large Cap Value | |||||||||
| Class A Shares | $ 865 | $ 1,510 | $ 2,177 | $ 3,947 | |||||
| Class B Shares | |||||||||
| – Assuming complete redemption at end of period | $ 907 | $ 1,532 | $ 2,274 | $ 4,090 | |||||
| – Assuming no redemption | $ 407 | $ 1,232 | $ 2,074 | $ 4,090 | |||||
| Class C Shares | |||||||||
| – Assuming complete redemption at end of period | $ 507 | $ 1,232 | $ 2,074 | $ 4,248 | |||||
| – Assuming no redemption | $ 407 | $ 1,232 | $ 2,074 | $ 4,248 | |||||
| The hypothetical example assumes that a CDSC will not apply to redemptions of Class A Shares within the first 18 months. Class B
Shares convert to Class A Shares eight years after purchase; therefore, Class A expenses are used in the hypothetical example after year eight.
|
| Certain institutions that sell Fund shares and/or their salespersons may receive other compensation in connection with the sale
and distribution of Class A, Class B and Class C Shares for services to their customers’ accounts and/or the Funds. For additional information regarding such compensation, see “What Should I Know When I Purchase Shares Through An Authorized
Dealer?”
|
| INVESTMENT ADVISERS
|
| Investment Adviser | Fund | ||
|---|---|---|---|
| Goldman Sachs Asset Management (“GSAM”) | Balanced | ||
| 32 Old Slip | Growth and Income | ||
| New York, New York 10005 | CORE Large Cap Value | ||
| CORE Large Cap Growth | |||
| CORE Small Cap Equity | |||
| Strategic Growth | |||
| Growth Opportunities | |||
| Mid Cap Value | |||
| Small Cap Value | |||
| Large Cap Value | |||
| Goldman Sachs Funds Management, L.P. (“GSFM”) | CORE U.S. Equity | ||
| 32 Old Slip | Capital Growth | ||
| New York, New York 10005 | |||
| GSAM and GSFM are separate business units of the Investment Management Division (“IMD”) of Goldman Sachs. Goldman Sachs
registered as an investment adviser in 1981. GSFM, a registered investment adviser since 1990, is a Delaware limited partnership which is an affiliate of Goldman Sachs. As of September 30, 2000, GSAM and GSFM, along with other units of IMD, had assets
under management of $281.3 billion.
|
| The Investment Adviser provides day-to-day advice regarding the Funds’ portfolio transactions. The Investment Adviser makes
the investment decisions for the Funds and places purchase and sale orders for the Funds’ portfolio transactions in U.S. and foreign markets. As permitted by applicable law, these orders may be directed to any brokers, including Goldman Sachs and its
affiliates. While the Investment Adviser is ultimately responsible for the management of the Funds, it is able to draw upon the research and expertise of its asset management affiliates for portfolio decisions and management with respect to certain
portfolio securities. In addition, the Investment Adviser has access to the research and certain proprietary technical models developed by Goldman Sachs, and will apply quantitative and qualitative analysis in determining the appropriate allocations among
categories of issuers and types of securities.
|
| The Investment Adviser also performs the following additional services for the Funds:
|
n
|
Supervises all non-advisory operations of the Funds
|
n
|
Provides personnel to perform necessary executive, administrative and clerical services to the Funds
|
n
|
Arranges for the preparation of all required tax returns,
reports to shareholders, prospectuses and statements of additional information and other reports filed with the Securities and Exchange Commission (the “SEC”) and other regulatory authorities
|
n
|
Maintains the records of each Fund
|
n
|
Provides office space and all necessary office equipment and services
|
| MANAGEMENT FEES
|
| As compensation for its services and its assumption of certain expenses, the Investment Adviser is entitled to the following fees,
computed daily and payable monthly, at the annual rates listed below (as a percentage of each respective Fund’s average daily net assets):
|
| Contractual Rate | Actual Rate
For the Fiscal Year Ended August 31, 2000 |
||||
|---|---|---|---|---|---|
| GSAM: | |||||
| Balanced | 0.65% | 0.65% | |||
| Growth and Income | 0.70% | 0.70% | |||
| CORE Large Cap Value | 0.60% | 0.60% | |||
| CORE Large Cap Growth | 0.75% | 0.64% | |||
| CORE Small Cap Equity | 0.85% | 0.85% | |||
| Strategic Growth | 1.00% | 1.00% | |||
| Growth Opportunities | 1.00% | 1.00% | |||
| Mid Cap Value | 0.75% | 0.75% | |||
| Small Cap Value | 1.00% | 1.00% | |||
| Large Cap Value | 0.75% | 0.75% | |||
| GSFM: | |||||
| CORE U.S. Equity | 0.75% | 0.70% | |||
| Capital Growth | 1.00% | 1.00% | |||
| The difference, if any, between the stated fees and the actual fees paid by the Funds reflects that the Investment Adviser did not
charge the full amount of the fees to which it would have been entitled. The Investment Adviser may discontinue or modify any such voluntary limitations in the future at its discretion.
|
| FUND MANAGERS
|
| M. Roch Hillenbrand, a Managing Director of Goldman Sachs since 1997, is the Head of Global Equities for GSAM, overseeing the
United States, Europe, Japan, and non-Japan Asia. In this capacity, he is responsible for managing the group as it defines and implements global portfolio management processes that are consistent, reliable and predictable. Mr. Hillenbrand joined Goldman
Sachs in 1997 upon its acquisition of Commodities Corporation, LLC where he was and continues as President. Over the course of his 19-year career at Commodities Corporation, Mr. Hillenbrand has had extensive experience in dealing with internal and
external investment managers who have managed a range of futures and equities strategies across multiple markets, using a variety of styles.
|
| Value Team
|
n
|
Twelve portfolio managers/analysts with over 100 years of combined financial experience comprise the Investment Adviser’s
value investment team
|
n
|
Multi-sector focus provides a balanced perspective and in-depth industry
knowledge |
n
|
Across all value products, the Investment Adviser leverages the industry research expertise of its small, mid and large cap
investment teams
|
| Name and Title | Fund Responsibility | Years
Primarily Responsible |
Five Year Employment History | ||||
|---|---|---|---|---|---|---|---|
| Eileen A. Aptman
Vice President |
Senior Portfolio Manager—
Mid Cap Value Small Cap Value |
Since
1996 1997 |
Ms. Aptman joined the Investment
Adviser as a research analyst in 1993. She became a portfolio manager in 1996. |
||||
| Matthew B.
McLennan Vice President |
Senior Portfolio Manager—
Small Cap Value Mid Cap Value |
Since
1996 1998 |
Mr. McLennan joined the
Investment Adviser as a research analyst in 1995 and became a portfolio manager in 1996. From 1994 to 1995, he worked in the Investment Banking Division of Goldman Sachs in Australia. |
||||
| Meera Mayer
Vice President |
Senior Portfolio Manager—
Growth and Income Large Cap Value Balanced (Equity) |
Since
1999 1999 1999 |
Ms. Mayer joined the Investment
Adviser as a senior portfolio manager in November 1999. From July 1999 to November 1999, she worked at Oppenheimer Funds as a senior equity analyst. From 1995 to March 1999, she worked at Spears, Benzak, Salomon and Farrell as a managing director and portfolio manager. |
||||
| Name and Title | Fund Responsibility | Years
Primarily Responsible |
Five Year Employment History | ||||
|---|---|---|---|---|---|---|---|
| Chip Otness
Vice President |
Senior Portfolio Manager—
Small Cap Value Mid Cap Value |
Since
2000 2000 |
Mr. Otness joined the Investment
Adviser as a senior portfolio manager in 2000. From 1998 to 2000, he headed Dolphin Asset Management. From 1970 to 1998, he worked at J.P. Morgan, most recently as a managing director and senior portfolio manager responsible for small-cap institutional equity investments. |
||||
| Eileen Rominger
Managing Director |
Senior Portfolio Manager—
Growth and Income Large Cap Value Balanced (Equity) |
Since
1999 1999 1999 |
Ms. Rominger joined the
Investment Adviser as a senior portfolio manager and Chief Investment Officer of the Value Equity team in 1999. From 1981 to 1999, she worked at Oppenheimer Capital, most recently as a senior portfolio manager. |
||||
| Quantitative Equity Team
|
n
|
A stable and growing team supported by an extensive internal staff
|
n
|
Access to the research ideas of Goldman Sachs’ renowned Global Investment Research Department
|
n
|
More than $34 billion in equities currently under management
|
| Name and Title | Fund Responsibility | Years
Primarily Responsible |
Five Year Employment History | ||||
|---|---|---|---|---|---|---|---|
| Melissa Brown
Managing Director |
Senior Portfolio Manager—
CORE Large Cap Value CORE U.S. Equity CORE Large Cap Growth CORE Small Cap Equity |
Since
1998 1998 1998 1998 |
Ms. Brown joined the
Investment Adviser as a portfolio manager in 1998. From 1984 to 1998, she was the director of Quantitative Equity Research and served on the Investment Policy Committee at Prudential Securities. |
||||
| Robert C. Jones
Managing Director |
Senior Portfolio Manager—
CORE U.S. Equity CORE Large Cap Growth CORE Small Cap Equity CORE Large Cap Value |
Since
1991 1997 1997 1998 |
Mr. Jones joined the
Investment Adviser as a portfolio manager in 1989. |
||||
| Victor H. Pinter
Vice President |
Senior Portfolio Manager—
CORE U.S. Equity CORE Large Cap Growth CORE Small Cap Equity CORE Large Cap Value |
Since
1996 1997 1997 1998 |
Mr. Pinter joined the
Investment Adviser as a research analyst in 1989. He became a portfolio manager in 1992. |
||||
| Growth Equity Investment Team
|
n
|
18 year consistent investment style applied through diverse and complete market cycles
|
n
|
More than $22 billion in equities currently under management
|
n
|
More than 300 client account relationships
|
n
|
A portfolio management and analytical team with more than 150 years combined investment experience
|
| Name and Title | Fund Responsibility | Years
Primarily Responsible |
Five Year Employment History | ||||
|---|---|---|---|---|---|---|---|
| George D. Adler
Vice President |
Senior Portfolio Manager—
Balanced (Equity) Capital Growth Strategic Growth Growth Opportunities |
Since
1997 1997 1999 1999 |
Mr. Adler joined the
Investment Adviser as a portfolio manager in 1997. From 1990 to 1997, he was a portfolio manager at Liberty Investment Management, Inc. (“Liberty”). |
||||
| Steve Barry
Vice President |
Senior Portfolio Manager—
Growth Opportunities Capital Growth Balanced (Equity) Strategic Growth |
Since
1999 2000 2000 2000 |
Mr. Barry joined the Investment
Adviser as a portfolio manager in 1999. From 1988 to 1999, he was a portfolio manager at Alliance Capital Management. |
||||
| Kenneth T. Berents
Managing Director |
Senior Portfolio Manager—
Capital Growth Balanced (Equity) Strategic Growth Growth Opportunities |
Since
2000 2000 2000 2000 |
Mr. Berents joined the Investment
Adviser as a portfolio manager in 2000. From 1992 to 1999, he was Director of Research and head of the Investment Committee at Wheat First Union. |
||||
| Robert G. Collins
Managing Director |
Senior Portfolio Manager—
Capital Growth Balanced (Equity) Strategic Growth Growth Opportunities |
Since
1997 1998 1999 1999 |
Mr. Collins joined the Investment
Adviser as portfolio manager and Co-Chair of the Growth Equity Investment Committee in 1997. From 1991 to 1997, he was a portfolio manager at Liberty. |
||||
| Herbert E. Ehlers
Managing Director |
Senior Portfolio Manager—
Capital Growth Balanced (Equity) Strategic Growth Growth Opportunities |
Since
1997 1998 1999 1999 |
Mr. Ehlers joined the Investment
Adviser as a senior portfolio manager and Chief Investment Officer of the Growth Equity team in 1997. From 1994 to 1997, he was the Chief Investment Officer and Chairman of Liberty. |
||||
| Name and Title | Fund Responsibility | Years
Primarily Responsible |
Five Year Employment History | ||||
|---|---|---|---|---|---|---|---|
| Gregory H. Ekizian
Managing Director |
Senior Portfolio Manager—
Capital Growth Balanced (Equity) Strategic Growth Growth Opportunities |
Since
1997 1998 1999 1999 |
Mr. Ekizian joined the Investment
Adviser as portfolio manager and Co-Chair of the Growth Equity Investment Committee in 1997. From 1990 to 1997, he was a portfolio manager at Liberty and its predecessor firm, Eagle. |
||||
| Scott Kolar
Vice President |
Portfolio Manager—
Growth Opportunities Capital Growth Balanced (Equity) Strategic Growth |
Since
1999 2000 2000 2000 |
Mr. Kolar joined the Investment
Adviser as an equity analyst in 1997 and became a portfolio manager in 1999. From 1994 to 1997, he was an equity analyst and information systems specialist at Liberty. |
||||
| David G. Shell
Managing Director |
Senior Portfolio Manager—
Capital Growth Balanced (Equity) Strategic Growth Growth Opportunities |
Since
1997 1998 1999 1999 |
Mr. Shell joined the Investment
Adviser as a portfolio manager in 1997. From 1987 to 1997, he was a portfolio manager at Liberty and its predecessor firm, Eagle. |
||||
| Ernest C. Segundo, Jr.
Vice President |
Senior Portfolio Manager—
Capital Growth Balanced (Equity) Strategic Growth Growth Opportunities |
Since
1997 1998 1999 1999 |
Mr. Segundo joined the Investment
Adviser as a portfolio manager in 1997. From 1992 to 1997, he was a portfolio manager at Liberty. |
||||
| Fixed-Income Portfolio Management Team
|
n
|
Fixed-income portfolio management is comprised of a deep team of sector specialists
|
n
|
The team strives to maximize risk-adjusted returns by de-emphasizing interest rate anticipation and focusing on security selection
and sector allocation
|
n
|
The team manages approximately $49 billion in fixed-income assets for retail, institutional and high net worth clients
|
| Name and Title | Fund Responsibility | Years
Primarily Responsible |
Five Year Employment History | ||||
|---|---|---|---|---|---|---|---|
| Jonathan A. Beinner
Managing Director and Co-Head U.S. Fixed Income |
Senior Portfolio Manager—
Balanced (Fixed-Income) |
Since
1994 |
Mr. Beinner joined the Investment
Adviser as a portfolio manager in 1990. |
||||
| C. Richard Lucy
Managing Director and Co-Head U.S. Fixed Income |
Senior Portfolio Manager—
Balanced (Fixed-Income) |
Since
1994 |
Mr. Lucy joined the Investment
Adviser as a portfolio manager in 1992. |
||||
| DISTRIBUTOR AND TRANSFER AGENT
|
| Goldman Sachs, 85 Broad Street, New York, New York 10004, serves as the exclusive distributor (the “Distributor”) of
each Fund’s shares. Goldman Sachs, 4900 Sears Tower, Chicago, Illinois 60606-6372, also serves as the Funds’ transfer agent (the “Transfer Agent”) and, as such, performs various shareholder servicing functions.
|
| From time to time, Goldman Sachs or any of its affiliates may purchase and hold shares of the Funds. Goldman Sachs reserves the
right to redeem at any time some or all of the shares acquired for its own account.
|
| ACTIVITIES OF GOLDMAN SACHS AND ITS AFFILIATES AND OTHER ACCOUNTS MANAGED BY GOLDMAN SACHS
|
| The involvement of the Investment Adviser, Goldman Sachs and their affiliates in the management of, or their interest in, other
accounts and other activities of Goldman Sachs may present conflicts of interest with respect to a Fund or limit a Fund’s investment activities. Goldman Sachs and its affiliates engage in proprietary trading and advise accounts and funds which have
investment objectives similar to those of the Funds and/or which engage in and compete for transactions in the same types of securities, currencies and instruments as the Funds. Goldman Sachs and its affiliates will not have any obligation to make
available any information regarding their proprietary activities or strategies, or the activities or strategies used for other accounts managed by them, for the benefit of the management of the Funds. The results of a Fund’s investment activities,
therefore, may differ from those of Goldman Sachs and its affiliates, and it is possible that a Fund could sustain losses during periods in which Goldman Sachs and its affiliates and other accounts achieve significant profits on their trading for
proprietary or other
accounts. In addition, the Funds may, from time to time, enter into transactions in which other clients of Goldman Sachs have an adverse interest. A Fund’s activities may be limited because of regulatory restrictions applicable to Goldman Sachs and its affiliates, and/or their internal policies designed to comply with such restrictions. |
n
|
Cash
|
n
|
Additional shares of the same class of the same Fund
|
n
|
Shares of the same or an equivalent class of another Goldman Sachs Fund. Special restrictions may apply for certain ILA
Portfolios. See the Additional Statement.
|
| Fund | Investment
Income Dividends |
Capital Gains
Distributions |
|||
|---|---|---|---|---|---|
| Balanced | Quarterly | Annually | |||
| Growth and Income | Quarterly | Annually | |||
| CORE Large Cap Value | Quarterly | Annually | |||
| CORE U.S. Equity | Annually | Annually | |||
| CORE Large Cap Growth | Annually | Annually | |||
| CORE Small Cap Equity | Annually | Annually | |||
| Capital Growth | Annually | Annually | |||
| Strategic Growth | Annually | Annually | |||
| Growth Opportunities | Annually | Annually | |||
| Mid Cap Value | Annually | Annually | |||
| Small Cap Value | Annually | Annually | |||
| Large Cap Value | Annually | Annually | |||
| The following section will provide you with answers to some of the most often asked questions regarding buying and selling the
Funds’ shares.
|
| How Can I Purchase Class A, Class B And Class C Shares Of The Funds?
|
| You may purchase shares of the Funds through:
|
n
|
Goldman Sachs;
|
n
|
Authorized Dealers; or
|
n
|
Directly from Goldman Sachs Trust (the “Trust”).
|
| In order to make an initial investment in a Fund, you must furnish to the Fund, Goldman Sachs or your Authorized Dealer the
information in the Account Application attached to this Prospectus.
|
| To Open an Account:
|
n
|
Complete the enclosed Account Application
|
n
|
Mail your payment and Account Application to:
|
| Your Authorized Dealer
|
–
|
Purchases by check or Federal Reserve draft should be made payable to your Authorized Dealer
|
–
|
Your Authorized Dealer is responsible for forwarding payment promptly (within three business days) to the Fund
|
| or
|
| Goldman Sachs Funds c/o National Financial Data Services, Inc. (“NFDS”), P.O. Box 219711, Kansas
City, MO 64121-9711
|
–
|
Purchases by check or Federal Reserve draft should be made payable to Goldman Sachs Funds – (Name of Fund and
Class of Shares)
|
–
|
NFDS will not accept a check drawn on a foreign bank, a third-party check, cash, money orders, travelers cheques or credit card
checks
|
–
|
Federal funds wire, Automated Clearing House Network (“ACH”) transfer or bank wires should be sent to State Street Bank
and Trust Company (“State Street”) (each Fund’s custodian). Please call the Funds at 1-800-526-7384 to get detailed instructions on how to wire your money.
|
| What Is My Minimum Investment In The Funds?
|
| Initial | Additional | ||||
|---|---|---|---|---|---|
| Regular Accounts | $1,000 | $50 | |||
| Tax-Sheltered Retirement Plans (excluding SIMPLE IRAs and
Education IRAs) |
$250 | $50 | |||
| Uniform Gift to Minors Act Accounts/Uniform Transfer to
Minors Act Accounts |
$250 | $50 | |||
| 403(b) Plan Accounts | $200 | $50 | |||
| SIMPLE IRAs and Education IRAs | $50 | $50 | |||
| Automatic Investment Plan Accounts | $50 | $50 | |||
| What Alternative Sales Arrangements Are Available?
|
| The Funds offer three classes of shares through this Prospectus.
|
| Maximum Amount You Can
Buy In The Aggregate Across Funds |
Class A | No limit | |||
| Class B | $250,000 | ||||
| Class C | $1,000,000 | ||||
| Initial Sales Charge | Class A | Applies to purchases of less than $1 million—
varies by size of investment with a maximum of 5.5% |
|||
| Class B | None | ||||
| Class C | None | ||||
| CDSC | Class A | 1.00% on certain investments of $1 million or
more if you sell within 18 months |
|||
| Class B | 6 year declining CDSC with a maximum of 5% | ||||
| Class C | 1% if shares are redeemed within 12 months
of purchase |
||||
| Conversion Feature | Class A | None | |||
| Class B | Class B Shares convert to Class A Shares after
8 years |
||||
| Class C | None | ||||
| What Else Should I Know About Share Purchases?
|
| The Trust reserves the right to:
|
n
|
Refuse to open an account if you fail to (i) provide a social security number or other taxpayer identification number; or (ii)
certify that such number is correct (if required to do so under applicable law).
|
n
|
Reject or restrict any purchase or exchange order by a particular purchaser (or group of related purchasers). This may occur, for
example, when a pattern of
frequent purchases, sales or exchanges of shares of a Fund is evident, or if purchases, sales or exchanges are, or a subsequent abrupt redemption might be, of a size that would disrupt management of a Fund.
|
n
|
Close a Fund to new investors from time to time and reopen a
Fund whenever it is deemed appropriate by a Fund’s Investment Adviser.
|
n
|
Modify or waive the minimum investment amounts.
|
n
|
Modify the manner in which shares are offered.
|
n
|
Modify the sales charge rates applicable to future purchases of shares.
|
| The Funds may allow you to purchase shares with securities instead of cash if consistent with a Fund’s investment policies
and operations and if approved by the Fund’s Investment Adviser.
|
| How Are Shares Priced?
|
| The price you pay or receive when you buy, sell or exchange shares is determined by a Fund’s NAV and share class. Each class
calculates its NAV as follows:
|
| (Value of Assets of the Class) | ||
| – (Liabilities of the Class) | ||
| NAV = | ||
| Number of Outstanding Shares of the Class |
| The Funds’ investments are valued based on market quotations or if accurate quotations are not readily available, the fair
value of the Fund’s investments may be determined in good faith under procedures established by the Trustees.
|
n
|
NAV per share of each share class is calculated by the Fund’s custodian on each business day as of the close of regular
trading on the New York Stock Exchange (normally 4:00 p.m. New York time). Fund shares will not be priced on any day the New York Stock Exchange is closed.
|
n
|
When you buy shares, you pay the NAV next calculated after the Funds receive your order in proper form, plus any applicable
sales charge.
|
n
|
When you sell shares, you receive the NAV next calculated after the Funds receive your order in proper form, less any
applicable CDSC.
|
| Note: The time at which transactions and shares are priced and the time by which orders must be received may be changed in
case of an emergency or if regular trading on the New York Stock Exchange is stopped at a time other than 4:00 p.m. New York time.
|
| Foreign securities may trade in their local markets on days a Fund is closed. As a result, the NAV of a Fund that holds foreign
securities may be impacted on days when investors may not purchase or redeem Fund shares.
|
| In addition, the impact of events that occur after the publication of market quotations used by a Fund to price its securities but
before the close of regular trading
on the New York Stock Exchange will normally not be reflected in a Fund’s next determined NAV unless the Trust, in its discretion, makes an adjustment in light of the nature and materiality of the event, its effect on Fund operations and other
relevant factors.
|
| COMMON QUESTIONS ABOUT THE PURCHASE OF CLASS A SHARES
|
| What Is The Offering Price Of Class A Shares?
|
| The offering price of Class A Shares of each Fund is the next determined NAV per share plus an initial sales charge paid to
Goldman Sachs at the time of purchase of shares. The sales charge varies depending upon the amount you purchase. In some cases, described below, the initial sales charge may be eliminated altogether, and the offering price will be the NAV per share. The current sales charges and commissions paid
to Authorized Dealers are as follows:
|
| Amount of Purchase
(including sales charge, if any) |
Sales Charge as
Percentage of Offering Price |
Sales Charge
as Percentage of Net Amount Invested |
Maximum Dealer
Allowance as Percentage of Offering Price* |
|||||||
|---|---|---|---|---|---|---|---|---|---|---|
| Less than $50,000 | 5.50 | % | 5.82 | % | 5.00 | % | ||||
| $50,000 up to (but less than) $100,000 | 4.75 | 4.99 | 4.00 | |||||||
| $100,000 up to (but less than) $250,000 | 3.75 | 3.90 | 3.00 | |||||||
| $250,000 up to (but less than) $500,000 | 2.75 | 2.83 | 2.25 | |||||||
| $500,000 up to (but less than) $1 million | 2.00 | 2.04 | 1.75 | |||||||
| $1 million or more | 0.00 | ** | 0.00 | ** | *** | |||||
*
|
Dealer’s allowance may be changed periodically. During special promotions, the entire sales charge may be allowed
to Authorized Dealers. Authorized Dealers to whom substantially the entire sales charge is allowed may be deemed to be “underwriters” under the Securities Act of 1933.
|
**
|
No sales charge is payable at the time of purchase of Class A Shares of $1 million or more, but a CDSC of 1% may be
imposed in the event of certain redemptions within 18 months of purchase.
|
***
|
The Distributor may pay a one-time commission to Authorized Dealers who initiate or are responsible for purchases of $1
million or more of shares of the Funds equal to 1.00% of the amount under $3 million, 0.50% of the next $2 million, and 0.25% thereafter. The Distributor may also pay, with respect to all or a portion of the amount purchased, a commission in accordance
with the foregoing schedule to Authorized Dealers who initiate or are responsible for purchases of $500,000 or more by certain Section 401(k), profit sharing, money purchase pension, tax-sheltered annuity, defined benefit pension, or other employee
benefit plans that are sponsored by one or more employers (including governmental or church employers) or employee organizations investing in the Funds which satisfy the criteria set forth below in “When Are Class A Shares Not Subject To A Sales
Load?” or $1 million or more by certain “wrap” accounts. Purchases by such plans will be made at NAV with no initial sales charge, but if all of the shares held are redeemed within 18 months after the end of the calendar month in which such
purchase was made, a CDSC of 1% may be imposed upon the plan sponsor or the third party administrator. In addition, Authorized Dealers will remit to the Distributor such payments received in connection with “wrap” accounts in the event that
shares are redeemed within 18 months after the end of the calendar month in which the purchase was made.
|
| What Else Do I Need To Know About Class A Shares’ CDSC?
|
| Purchases of $1 million or more of Class A Shares will be made at NAV with no initial sales charge. However, if you redeem shares
within 18 months after the end of the calendar month in which the purchase was made, excluding any period of time in which the shares were exchanged into and remained invested in an equivalent class of an ILA Portfolio, a CDSC of 1% may be imposed. The
CDSC may not be imposed if your Authorized Dealer enters into an agreement with the Distributor to return all or an applicable prorated portion of its commission to the Distributor. The CDSC is waived on redemptions in certain circumstances. See “In
What Situations May The CDSC On Class A, B Or C Shares Be Waived Or Reduced?” below.
|
| When Are Class A Shares Not Subject To A Sales Load?
|
| Class A Shares of the Funds may be sold at NAV without payment of any sales charge to the following individuals and entities:
|
n
|
Goldman Sachs, its affiliates or their respective officers, partners, directors or employees (including retired employees and
former partners), any partnership of which Goldman Sachs is a general partner, any Trustee or officer of the Trust and designated family members of any of these individuals;
|
n
|
Qualified retirement plans of Goldman Sachs;
|
n
|
Trustees or directors of investment companies for which Goldman Sachs or an affiliate acts as sponsor;
|
n
|
Any employee or registered representative of any Authorized Dealer or their respective spouses, children and parents;
|
n
|
Banks, trust companies or other types of depository institutions investing for their own account or investing for discretionary or
non-discretionary accounts;
|
n
|
Any state, county or city, or any instrumentality, department, authority or agency thereof, which is prohibited by applicable
investment laws from paying a sales charge or commission in connection with the purchase of shares of a Fund;
|
n
|
Section 401(k), profit sharing, money purchase pension, tax-sheltered annuity, defined benefit pension, or other employee benefit
plans that are sponsored by one or more employers (including governmental or church employers) or employee organizations (“Retirement Plans”) that:
|
n
|
Buy shares of Goldman Sachs Funds worth $500,000 or more; or
|
n
|
Have 100 or more eligible employees at the time of purchase; or
|
n
|
Certify that they expect to have annual plan purchases of shares of Goldman Sachs Funds of $200,000 or more; or
|
n
|
Are provided administrative services by certain third-party administrators that have entered into a special service arrangement
with Goldman Sachs relating to such plans; or
|
n
|
Have at the time of purchase aggregate assets of at least $2,000,000;
|
n
|
“Wrap” accounts for the benefit of clients of broker-dealers, financial institutions or financial planners, provided
they have entered into an agreement with GSAM specifying aggregate minimums and certain operating policies and standards;
|
n
|
Registered investment advisers investing for accounts for which they receive asset-based fees;
|
n
|
Accounts over which GSAM or its advisory affiliates have investment discretion;
|
n
|
Shareholders receiving distributions from a qualified retirement plan invested in the Goldman Sachs Funds and reinvesting such
proceeds in a Goldman Sachs IRA;
|
n
|
Shareholders who roll over distributions from any tax-qualified retirement plan or tax-sheltered annuity to an IRA which invests
in the Goldman Sachs Funds if the tax-qualified retirement plan or tax-sheltered annuity receives administrative services provided by certain third-party administrators that have entered into a special service arrangement with Goldman Sachs relating to
such plan or annuity; or
|
n
|
Other exemptions may be stated from time to time in the Additional Statement.
|
| You must certify eligibility for any of the above exemptions on your Account Application and notify the Fund if you no longer
are eligible for the exemption. The Fund will grant you an exemption subject to confirmation of your entitlement. You may be charged a fee if you effect your transactions through a broker or agent.
|
| How Can The Sales Charge On Class A Shares Be Reduced?
|
n
|
Right of Accumulation: When buying Class A Shares in Goldman Sachs Funds, your current aggregate
investment determines the initial sales load you pay. You may qualify for reduced sales charges when the current market value of holdings (shares at current offering price), plus new purchases, reaches $50,000 or more. Class A Shares of any of the Goldman
Sachs Funds may be combined under the Right of Accumulation. To qualify for a reduced sales load, you or your Authorized Dealer must notify the Funds’ Transfer Agent at the time of investment that a quantity discount is applicable. Use of this
service is subject to a check of appropriate records. The Additional Statement has more information about the Right of Accumulation.
|
n
|
Statement of Intention: You may obtain a reduced sales charge by means of a written Statement of
Intention which expresses your non-binding commitment to invest in the aggregate $50,000 or more (not counting reinvestments of dividends and distributions) within a period of 13 months in Class A Shares of one or more Goldman Sachs Fund. Any investments
you make during the period will receive the discounted sales load based on the full amount of your invest
ment commitment. If the investment commitment of the Statement of Intention is not met prior to the expiration of the 13-month period, the entire amount will be subject to the higher applicable sales charge. By signing the Statement of Intention, you
authorize the Transfer Agent to escrow and redeem Class A Shares in your account to pay this additional charge. The Additional Statement has more information about the Statement of Intention, which you should read carefully.
|
| COMMON QUESTIONS ABOUT THE PURCHASE OF CLASS B SHARES
|
| What Is The Offering Price Of Class B Shares?
|
| You may purchase Class B Shares of the Funds at the next determined NAV without an initial sales charge. However, Class B
Shares redeemed within six years of purchase will be subject to a CDSC at the rates shown in the table below based on how long you held your shares.
|
| The CDSC schedule is as follows:
|
| Year Since Purchase | CDSC as a
Percentage of Dollar Amount Subject to CDSC |
||
|---|---|---|---|
| First | 5% | ||
| Second | 4% | ||
| Third | 3% | ||
| Fourth | 3% | ||
| Fifth | 2% | ||
| Sixth | 1% | ||
| Seventh and thereafter | None | ||
| Proceeds from the CDSC are payable to the Distributor and may be used in whole or in part to defray the Distributor’s
expenses related to providing distribution-related services to the Funds in connection with the sale of Class B Shares, including the payment of compensation to Authorized Dealers. A commission equal to 4% of the amount invested is paid to Authorized
Dealers.
|
| What Should I Know About The Automatic Conversion Of Class B Shares?
|
| Class B Shares of a Fund will automatically convert into Class A Shares of the same Fund at the end of the calendar quarter that
is eight years after the purchase date.
|
| If you acquire Class B Shares of a Fund by exchange from Class B Shares of another Goldman Sachs Fund, your Class B Shares will
convert into Class A Shares of such Fund based on the date of the initial purchase and the CDSC schedule of that purchase.
|
| If you acquire Class B Shares through reinvestment of distributions, your Class B Shares will convert into Class A Shares based
on the date of the initial purchase of the shares on which the distribution was paid.
|
| The conversion of Class B Shares to Class A Shares will not occur at any time the Funds are advised that such conversions may
constitute taxable events for federal tax purposes, which the Funds believe is unlikely. If conversions do not occur as a result of possible taxability, Class B Shares would continue to be subject to higher expenses than Class A Shares for an
indeterminate period.
|
| A COMMON QUESTION ABOUT THE PURCHASE OF CLASS C SHARES
|
| What Is The Offering Price Of Class C Shares?
|
| You may purchase Class C Shares of the Funds at the next determined NAV without paying an initial sales charge. However, if you
redeem Class C Shares within 12 months of purchase, a CDSC of 1% will normally be deducted from the redemption proceeds; provided that in connection with purchases by Retirement Plans, where all of the Class C Shares are redeemed within 12 months of
purchase, a CDSC of 1% may be imposed upon the plan sponsor or third-party administrator.
|
| Proceeds from the CDSC are payable to the Distributor and may be used in whole or in part to defray the Distributor’s
expenses related to providing distribution-related services to the Funds in connection with the sale of Class C Shares, including the payment of compensation to Authorized Dealers. An amount equal to 1% of the amount invested is normally paid by the
Distributor to Authorized Dealers.
|
| COMMON QUESTIONS APPLICABLE TO THE PURCHASE OF CLASS A, B AND C SHARES
|
| What Else Do I Need To Know About The CDSC On Class A, B Or C Shares?
|
n
|
The CDSC is based on the lesser of the NAV of the shares at the time of redemption or the original offering price (which is the
original NAV).
|
n
|
No CDSC is charged on shares acquired from reinvested dividends or capital gains distributions.
|
n
|
No CDSC is charged on the per share appreciation of your account over the initial purchase price.
|
n
|
When counting the number of months since a purchase of Class B or Class C Shares was made, all payments made during a month will
be combined and considered to have been made on the first day of that month.
|
n
|
To keep your CDSC as low as possible, each time you place a request to sell shares, the Funds will first sell any shares in your
account that do not carry a CDSC and then the shares in your account that have been held the longest.
|
| In What Situations May The CDSC On Class A, B Or C Shares Be Waived Or Reduced?
|
| The CDSC on Class A, Class B and Class C Shares that are subject to a CDSC may be waived or reduced if the redemption relates to:
|
n
|
Retirement distributions or loans to participants or beneficiaries from Retirement Plans;
|
n
|
The death or disability (as defined in Section 72(m)(7) of the Internal Revenue Code of 1986, as amended (the “Code”))
of a participant or beneficiary in a Retirement Plan;
|
n
|
Hardship withdrawals by a participant or beneficiary in a Retirement Plan;
|
n
|
Satisfying the minimum distribution requirements of the Code;
|
n
|
Establishing “substantially equal periodic payments” as described under Section 72(t)(2) of the Code;
|
n
|
The separation from service by a participant or beneficiary in a Retirement Plan;
|
n
|
The death or disability (as defined in Section 72(m)(7) of the Code) of a shareholder if the redemption is made within one year of
the event;
|
n
|
Excess contributions distributed from a Retirement Plan;
|
n
|
Distributions from a qualified Retirement Plan invested in the Goldman Sachs Funds which are being rolled over to a Goldman Sachs
IRA; or
|
n
|
Redemption proceeds which are to be reinvested in accounts or non-registered products over which GSAM or its advisory affiliates
have investment discretion.
|
| In addition, Class A, B and C Shares subject to a systematic withdrawal plan may be redeemed without a CDSC. The Funds reserve the
right to limit such redemptions, on an annual basis, to 12% each of the value of your Class B and C Shares and 10% of the value of your Class A Shares.
|
| How Do I Decide Whether To Buy Class A, B Or C Shares?
|
| The decision as to which Class to purchase depends on the amount you invest, the intended length of the investment and your
personal situation.
|
n
|
Class A Shares. If you are making an investment of $50,000 or more that qualifies for a reduced sales
charge, you should consider purchasing Class A Shares.
|
n
|
Class B Shares. If you plan to hold your investment for at least six years and would prefer not to pay
an initial sales charge, you might consider purchasing Class B Shares. By not paying a front-end sales charge, your entire investment
in Class B Shares is available to work for you from the time you make your initial investment. However, the distribution and service fee paid by Class B Shares will cause your Class B Shares (until conversion to Class A Shares) to have a higher expense
ratio, and thus lower performance and lower dividend payments (to the extent dividends are paid) than Class A Shares. A maximum purchase limitation of $250,000 in the aggregate normally applies to Class B Shares. Individual purchases exceeding $250,000
will be rejected.
|
n
|
Class C Shares. If you are unsure of the length of your investment or plan to hold your investment for
less than six years and would prefer not to pay an initial sales charge, you may prefer Class C Shares. By not paying a front-end sales charge, your entire investment in Class C Shares is available to work for you from the time you make your initial
investment. However, the distribution and service fee paid by Class C Shares will cause your Class C Shares to have a higher expense ratio, and thus lower performance and lower dividend payments (to the extent dividends are paid) than Class A Shares (or
Class B Shares after conversion to Class A Shares).
|
| Although Class C Shares are subject to a CDSC for only 12 months, Class C Shares do not have the automatic eight year conversion
feature applicable to Class B Shares and your investment may pay higher distribution fees indefinitely.
|
| A maximum purchase limitation of $1,000,000 in the aggregate normally applies to purchases of Class C Shares. Individual purchases
exceeding $1,000,000 will be rejected.
|
| Note: Authorized Dealers may receive different compensation for selling Class A, Class B or Class C Shares.
|
| In addition to Class A, Class B and Class C Shares, each Fund also offers other classes of shares to investors. These other share
classes are subject to different fees and expenses (which affect performance), have different minimum investment requirements and are entitled to different services. Information regarding these other share classes may be obtained from your sales
representative or from Goldman Sachs by calling the number on the back cover of this Prospectus.
|
| How Can I Sell Class A, Class B And Class C Shares Of The Funds?
|
| You may arrange to take money out of your account by selling (redeeming) some or all of your shares. Each Fund will redeem its
shares upon request on any business day at the NAV next determined after receipt of such request in proper form, subject to any applicable CDSC. You may request that redemption proceeds be sent to you by check or by wire (if the wire instructions are on record). Redemptions may be requested in writing or by telephone.
|
| Instructions For Redemptions: | |||
|---|---|---|---|
| By Writing: | n Write a letter of instruction that includes: | ||
| n Your name(s) and signature(s) | |||
| n Your account number | |||
| n The Fund name and Class of Shares | |||
| n The dollar amount you want to sell | |||
| n How and where to send the proceeds | |||
| n Obtain a signature guarantee (see details below) | |||
| n
Mail your request to:
Goldman Sachs Funds c/o NFDS P.O. Box 219711 Kansas City, MO 64121-9711 |
|||
| By Telephone: | If you have not declined the telephone redemption
privilege on your Account Application: |
||
| n
1-800-526-7384
(8:00 a.m. to 4:00 p.m. New York time) |
|||
| n
You may redeem up to $50,000 of your shares
within any 7 calendar day period |
|||
| n
Proceeds which are sent directly to a Goldman
Sachs brokerage account are not subject to the $50,000 limit |
|||
| When Do I Need A Signature Guarantee To Redeem Shares?
|
| A signature guarantee is required if:
|
n
|
You are requesting in writing to redeem shares in an amount over $50,000;
|
n
|
You would like the redemption proceeds sent to an address that is not your address of record; or
|
n
|
You would like to change the bank designated on your Account Application.
|
| A signature guarantee must be obtained from a bank, brokerage firm or other financial intermediary that is a member of an approved
Medallion Guarantee Program or that is otherwise approved by Goldman Sachs. A notary public cannot provide a signature guarantee. Additional documentation may be required for executors, trustees or corporations or when deemed appropriate by the Transfer
Agent.
|
| What Do I Need To Know About Telephone Redemption Requests?
|
| The Trust, the Distributor and the Transfer Agent will not be liable for any loss you may incur in the event that the Trust
accepts unauthorized telephone redemption requests that the Trust reasonably believes to be genuine. The Trust may accept telephone redemption instructions from any person identifying himself or herself as the owner of an account or the owner’s
registered representative where the owner has not declined in writing to use this service. Thus, you risk possible losses if a telephone redemption is not authorized by you.
|
| In an effort to prevent unauthorized or fraudulent redemption and exchange requests by telephone, Goldman Sachs and NFDS each
employ reasonable procedures specified by the Trust to confirm that such instructions are genuine. If reasonable procedures are not employed, the Trust may be liable for any loss due to unauthorized or fraudulent transactions. The following general
policies are currently in effect:
|
n
|
All telephone requests are recorded.
|
n
|
Proceeds of telephone redemption requests will be sent only to your address of record or authorized bank account designated in the
Account Application (unless you provide written instructions and a signature guarantee, indicating another address or account) and exchanges of shares normally will be made only to an identically registered account.
|
n
|
Telephone redemptions will not be accepted during the 30-day period following any change in your address of record.
|
n
|
The telephone redemption option does not apply to shares held in a “street name” account. “Street name”
accounts are accounts maintained and serviced by your Authorized Dealer. If your account is held in “street name,” you should contact your registered representative of record, who may make telephone redemptions on your behalf.
|
n
|
The telephone redemption option may be modified or terminated at any time.
|
| Note: It may be difficult to make telephone redemptions in times of drastic economic or market conditions.
|
| How Are Redemption Proceeds Paid?
|
| By Wire: You may arrange for your redemption proceeds to be wired as federal funds to the bank account designated in
your Account Application. The following general policies govern wiring redemption proceeds:
|
n
|
Redemption proceeds will normally be wired on the next business day in federal funds (for a total of one business day delay), but
may be paid up to three business days following receipt of a properly executed wire transfer redemption request. If you are selling shares you recently paid for by check, the Fund will pay you when your check has cleared, which may take up to 15 days. If
the Federal Reserve Bank is closed on the day that the redemption proceeds would ordinarily be wired, wiring the redemption proceeds may be delayed one additional business day.
|
n
|
A transaction fee of $7.50 may be charged for payments of redemption proceeds by wire. Your bank may also charge wiring fees. You
should contact your bank directly to learn whether it charges such fees.
|
n
|
To change the bank designated on your Account Application, you must send written instructions (with your signature guaranteed) to
the Transfer Agent.
|
n
|
Neither the Trust, Goldman Sachs nor any Authorized Dealer assumes any responsibility for the performance of your bank or any
intermediaries in the transfer process. If a problem with such performance arises, you should deal directly with your bank or any such intermediaries.
|
| By Check: You may elect to receive your redemption proceeds by check. Redemption proceeds paid by check will
normally be mailed to the address of record within three business days of a properly executed redemption request. If you are selling shares you recently paid for by check, the Fund will pay you when your check has cleared, which may take up to 15 days.
|
| What Else Do I Need To Know About Redemptions?
|
| The following generally applies to redemption requests:
|
n
|
Additional documentation may be required when deemed appropriate by the Transfer Agent. A redemption request will not be in proper
form until such additional documentation has been received.
|
| The Trust reserves the right to:
|
n
|
Redeem your shares if your account balance is less than $50 as a result of a redemption. The Funds will not redeem your shares on
this basis if the value of your account falls below the minimum account balance solely as a result of market conditions. The Funds will give you 60 days’ prior written notice to allow you to purchase sufficient additional shares of the Fund in order
to avoid such redemption.
|
n
|
Redeem your shares in other circumstances determined by the Board of Trustees to be in the best interests of the Trust.
|
n
|
Pay redemptions by a distribution in-kind of securities (instead of cash). If you receive redemption proceeds in-kind, you should
expect to incur transaction costs upon the disposition of those securities.
|
n
|
Reinvest any dividends or other distributions which you have elected to receive in cash should your check for such dividends or
other distributions be returned to the Fund as undeliverable or remain uncashed for six months. In addition, that distribution and all future distributions payable to you will be reinvested at NAV in additional shares of the same class of the Fund on
which the distributions are paid. No interest will accrue on amounts represented by uncashed distribution or redemption checks.
|
| Can I Reinvest Redemption Proceeds In The Same Or Another Goldman Sachs Fund?
|
| You may redeem shares of a Fund and reinvest a portion or all of the redemption proceeds (plus any additional amounts needed to
round off purchases to the nearest full share) at NAV. To be eligible for this privilege, you must hold the shares
you want to redeem for at least 30 days and you must reinvest the share proceeds within 90 days after you redeem. You may reinvest as follows:
|
n
|
Class A or B Shares—Class A Shares of the same Fund or any other Goldman Sachs Fund
|
n
|
Class C Shares—Class C Shares of the same Fund or any other Goldman Sachs Fund
|
n
|
You should obtain and read the applicable prospectuses before investing in any other Funds.
|
n
|
If you pay a CDSC upon redemption of Class A or Class C Shares and then reinvest in Class A or Class C Shares as described above,
your account will be credited with the amount of the CDSC you paid. The reinvested shares will, however, continue to be subject to a CDSC. The holding period of the shares acquired through reinvestment will include the holding period of the redeemed
shares for purposes of computing the CDSC payable upon a subsequent redemption. For Class B Shares, you may reinvest the redemption proceeds in Class A Shares at NAV but the amount of the CDSC paid upon redemption of the Class B Shares will not be
credited to your account.
|
n
|
The reinvestment privilege may be exercised at any time in connection with transactions in which the proceeds are reinvested at
NAV in a tax-sheltered retirement plan. In other cases, the reinvestment privilege may be exercised once per year upon receipt of a written request.
|
n
|
You may be subject to tax as a result of a redemption. You should consult your tax adviser concerning the tax consequences of a
redemption and reinvestment.
|
| Can I Exchange My Investment From One Fund To Another?
|
| You may exchange shares of a Fund at NAV without the imposition of an initial sales charge or CDSC at the time of exchange for
shares of the same class or an equivalent class of any other Goldman Sachs Fund. The exchange privilege may be materially modified or withdrawn at any time upon 60 days’ written notice to you.
|
| Instructions For Exchanging Shares: | |||
|---|---|---|---|
| By Writing: | n Write a letter of instruction that includes: | ||
| n Your name(s) and signature(s) | |||
| n Your account number | |||
| n The Fund names and Class of Shares | |||
| n The dollar amount you want to exchange | |||
| n Obtain a signature guarantee (see details above) | |||
| n Mail the request to: | |||
| Goldman Sachs Funds | |||
| c/o NFDS | |||
| P.O. Box 219711 | |||
| Kansas City, MO 64121-9711 | |||
| or for overnight delivery - | |||
| Goldman Sachs Funds | |||
| c/o NFDS | |||
| 330 West 9th St. | |||
| Poindexter Bldg., 1st Floor | |||
| Kansas City, MO 64105 | |||
| By Telephone: | If you have not declined the telephone exchange
privilege on your Account Application: |
||
| n
1-800-526-7384 (8:00 a.m. to 4:00 p.m.
New York time) |
|||
| You should keep in mind the following factors when making or considering an exchange:
|
n
|
You should obtain and carefully read the prospectus of the Fund you are acquiring before making an exchange.
|
n
|
Currently, there is no charge for exchanges, although the Funds may impose a charge in the future.
|
n
|
The exchanged shares may later be exchanged for shares of the same class (or an equivalent class) of the original Fund at the next
determined NAV without the imposition of an initial sales charge or CDSC if the amount in the Fund resulting from such exchanges is less than the largest amount on which you have previously paid the applicable sales charge.
|
n
|
When you exchange shares subject to a CDSC, no CDSC will be charged at that time. The exchanged shares will be subject to the CDSC
of the shares originally held. For purposes of determining the amount of the applicable CDSC, the length of time you have owned the shares will be measured from the date you acquired the original shares subject to a CDSC and will not be affected by a
subsequent exchange.
|
n
|
Eligible investors may exchange certain classes of shares for another class of shares of the same Fund. For further information,
call Goldman Sachs Funds at 1-800-526-7384 and see the Additional Statement.
|
n
|
All exchanges which represent an initial investment in a Fund must satisfy the minimum initial investment requirements of that Fund.
|
n
|
Exchanges are available only in states where exchanges may be legally made.
|
n
|
It may be difficult to make telephone exchanges in times of drastic economic or market conditions.
|
n
|
Goldman Sachs and NFDS may use reasonable procedures described under “What Do I Need to Know About Telephone Redemption
Requests?” in an effort to prevent unauthorized or fraudulent telephone exchange requests.
|
n
|
Telephone exchanges normally will be made only to an identically registered account. Shares may be exchanged among accounts with
different names, addresses and social security or other taxpayer identification numbers only if the exchange instructions are in writing and accompanied by a signature guarantee.
|
n
|
Exchanges into Funds that are closed to new investors may be
restricted.
|
| For federal income tax purposes, an exchange from one Fund to another is treated as a redemption of the shares surrendered in the
exchange, on which you may be subject to tax, followed by a purchase of shares received in the exchange. You should consult your tax adviser concerning the tax consequences of an exchange.
|
| Restrictions on Excessive Trading Practices. The Trust does not permit market-timing or other excessive trading
practices. Purchases and exchanges should be made for long-term investment purposes only. The Trust and Goldman Sachs reserve the right to reject or restrict purchase or exchange requests from any investor. Excessive, short-term (market-timing) trading
practices may disrupt portfolio management strategies, harm Fund performance and negatively impact long-term shareholders. The Trust and Goldman Sachs will not be held liable for any loss resulting from rejected purchase or exchange orders. To minimize
harm to the Trust (or Goldman Sachs) and its shareholders, the Trust (or Goldman Sachs) will exercise these rights if, in the Trust’s (or Goldman Sachs’) judgment, an investor has a history of excessive trading or if an investor’s trading,
in the judgment of the Trust (or Goldman Sachs) has been or may be disruptive to a Fund. In making this judgment, trades executed in multiple accounts under common ownership or control may be considered together.
|
| SHAREHOLDER SERVICES
|
| Can I Arrange To Have Automatic Investments Made On A Regular Basis?
|
| You may be able to make systematic cash investments through your bank via ACH transfer or your checking account via bank draft
each month. Forms for this option are available from Goldman Sachs, your Authorized Dealer or you may check the appropriate box on the Account Application.
|
| Can My Dividends And Distributions From A Fund Be Invested In Other Funds?
|
| You may elect to cross-reinvest dividends and capital gain distributions paid by a Fund in shares of the same class or an
equivalent class of any other Goldman Sachs Fund.
|
n
|
Shares will be purchased at NAV.
|
n
|
No initial sales charge or CDSC will be imposed.
|
n
|
You may elect cross-reinvestment into an identically registered account or an account registered in a different name or with a
different address, social security number or taxpayer identification number provided that the account has been properly established, appropriate signature guarantees obtained and the minimum initial investment has been satisfied.
|
| Can I Arrange To Have Automatic Exchanges Made On A Regular Basis?
|
| You may elect to exchange automatically a specified dollar amount of shares of a Fund for shares of the same class or an
equivalent class of any other Goldman Sachs Fund.
|
n
|
Shares will be purchased at NAV.
|
n
|
No initial sales charge is imposed.
|
n
|
Shares subject to a CDSC acquired under this program may be subject to a CDSC at the time of redemption from the Fund into which
the exchange is made depending upon the date and value of your original purchase.
|
n
|
Automatic exchanges are made monthly on the 15th day of each month or the first business day thereafter.
|
n
|
Minimum dollar amount: $50 per month.
|
| What Else Should I Know About Cross-Reinvestments And Automatic Exchanges?
|
| Cross-reinvestments and automatic exchanges are subject to the following conditions:
|
n
|
You must hold $5,000 or more in the Fund which is paying the dividend or from which the exchange is being made.
|
n
|
You must invest an amount in the Fund into which cross-reinvestments or automatic exchanges are being made that is equal to that
Fund’s minimum initial investment or continue to cross-reinvest or to make automatic exchanges until such minimum initial investment is met.
|
n
|
You should obtain and read the prospectus of the Fund into which dividends are invested or automatic exchanges are made.
|
| Can I Have Automatic Withdrawals Made On A Regular Basis?
|
| You may draw on your account systematically via check or ACH transfer in any amount of $50 or more.
|
n
|
It is normally undesirable to maintain a systematic withdrawal plan at the same time that you are purchasing additional Class A,
Class B or Class C Shares because of the sales charge imposed on your purchases of Class A Shares or the imposition of a CDSC on your redemptions of Class A, Class B or Class C Shares.
|
n
|
You must have a minimum balance of $5,000 in a Fund.
|
n
|
Checks are mailed on or about the 25th day of each month.
|
n
|
Each systematic withdrawal is a redemption and therefore a taxable transaction.
|
n
|
The CDSC applicable to Class A, Class B or Class C Shares redeemed under the systematic withdrawal plan may be waived.
|
| What Types of Reports Will I Be Sent Regarding My Investment?
|
| You will be provided with a printed confirmation of each transaction in your account and an individual quarterly account
statement. A year-to-date statement for your account will be provided upon request made to Goldman Sachs. If your account is held in “street name” you may receive your statements and confirmations on a different schedule.
|
| You will also receive an annual shareholder report containing audited financial statements and a semi-annual shareholder report.
If you have consented to the delivery of a single copy of shareholder reports, prospectuses and other information to all shareholders who share the same mailing address with your account, you may revoke your consent at any time by contacting Goldman Sachs
Funds by phone at 1-800-526-7384 or by mail at Goldman Sachs Funds, 4900 Sears Tower, Chicago, IL 60606-6372. The Funds will begin sending individual copies to you within 30 days after receipt of your revocation.
|
| The Funds do not generally provide sub-accounting services.
|
| What Should I Know When I Purchase Shares Through An Authorized Dealer?
|
| Authorized Dealers and other financial intermediaries may provide varying arrangements for their clients to purchase and redeem
Fund shares. They may charge additional fees not described in this Prospectus to their customers for such services.
|
| If shares of a Fund are held in a “street name” account with an Authorized Dealer, all recordkeeping, transaction
processing and payments of distributions relating to your account will be performed by the Authorized Dealer, and not by the Fund and its Transfer Agent. Since the Funds will have no record of your transactions, you should contact the Authorized Dealer to
purchase, redeem or exchange shares, to make changes in or give instructions concerning the account or to obtain information about your account. The transfer of shares in a “street name” account to an account with another dealer or to an account
directly with the Fund involves special procedures and will require you to obtain historical purchase information about the shares in the account from the Authorized Dealer.
|
| Authorized Dealers and other financial intermediaries may be authorized to accept, on behalf of the Trust, purchase, redemption
and exchange orders placed by or on behalf of their customers, and if approved by the Trust, to designate other intermediaries to accept such orders. In these cases:
|
n
|
A Fund will be deemed to have received an order that is in proper form when the order is accepted by an Authorized Dealer or
intermediary on a business day, and the order will be priced at the Fund’s NAV per share (adjusted for any applicable sales charge) next determined after such acceptance.
|
n
|
Authorized Dealers and intermediaries are responsible for transmitting accepted orders to the Funds within the time period agreed
upon by them.
|
| You should contact your Authorized Dealer or intermediary to learn whether it is authorized to accept orders for the Trust.
|
| The Investment Adviser, Distributor and/or their affiliates may pay additional compensation from time to time, out of their assets
and not as an additional charge to the Funds, to selected Authorized Dealers and other persons in connection with the sale, distribution and/or servicing of shares of the Funds and other Goldman Sachs Funds. Additional compensation based on sales may, but
is currently not expected to, exceed 0.50% (annualized) of the amount invested.
|
| DISTRIBUTION SERVICES AND FEES
|
| What Are The Different Distribution And Service Fees Paid By Class A, B and C Shares?
|
| The Trust has adopted distribution and service plans (each a “Plan”) under which Class A, Class B and Class C Shares
bear distribution and service fees paid to Authorized Dealers and Goldman Sachs. If the fees received by Goldman Sachs pursuant to the Plans exceed its expenses, Goldman Sachs may realize a profit from these arrangements. Goldman Sachs pays the
distribution and service fees on a quarterly basis.
|
| Under the Plans, Goldman Sachs is entitled to a monthly fee from each Fund for distribution services equal, on an annual basis,
to 0.25%, 0.75% and 0.75%, respectively, of a Fund’s average daily net assets attributed to Class A, Class B and Class C Shares. Because these fees are paid out of the Fund’s assets on an ongoing basis, over time, these fees will increase the
cost of your investment and may cost you more than paying other types of such charges.
|
| The distribution fees are subject to the requirements of Rule 12b-1 under the Act, and may be used (among other things) for:
|
n
|
Compensation paid to and expenses incurred by Authorized Dealers, Goldman Sachs and their respective officers, employees and sales
representatives;
|
n
|
Commissions paid to Authorized Dealers;
|
n
|
Allocable overhead;
|
n
|
Telephone and travel expenses;
|
n
|
Interest and other costs associated with the financing of such compensation and expenses;
|
n
|
Printing of prospectuses for prospective shareholders;
|
n
|
Preparation and distribution of sales literature or advertising of any type; and
|
n
|
All other expenses incurred in connection with activities primarily intended to result in the sale of Class A, Class B and Class C
Shares.
|
| In connection with the sale of Class C Shares, Goldman Sachs normally begins paying the 0.75% distribution fee as an ongoing
commission to Authorized Dealers after the shares have been held for one year.
|
| PERSONAL ACCOUNT MAINTENANCE SERVICES AND FEES
|
| Under the Plans, Goldman Sachs is also entitled to receive a separate fee equal on an annual basis to 0.25% of each Fund’s
average daily net assets attributed to Class A (applicable to Goldman Sachs International Equity Funds), Class B or Class C Shares. This fee is for personal and account maintenance services, and may be used to make payments to Goldman Sachs, Authorized
Dealers and their officers, sales representatives and employees for responding to inquiries of, and furnishing assistance to, shareholders regarding ownership of their shares or their accounts or similar services not otherwise provided on behalf of the
Funds. If the fees received by Goldman Sachs pursuant to the Plans exceed its expenses, Goldman Sachs may realize a profit from this arrangement.
|
| In connection with the sale of Class C Shares, Goldman Sachs normally begins paying the 0.25% ongoing service fee to Authorized
Dealers after the shares have been held for one year.
|
| As with any investment, you should consider how your investment in the Funds will be taxed. The tax information below is provided
as general information. More tax information is available in the Additional Statement. You should consult your tax adviser about the federal, state, local or foreign tax consequences of your investment in the Funds.
|
| Unless your investment is an IRA or other tax-advantaged account, you should consider the possible tax consequences of Fund
distributions and the sale of your Fund shares.
|
| DISTRIBUTIONS
|
| Distributions you receive from the Funds are generally subject to federal income tax, and may also be subject to state or local
taxes. This is true whether you reinvest your distributions in additional Fund shares or receive them in cash. For federal tax purposes, the Funds’ income dividend distributions and short-term capital gain distributions are taxable to you as ordinary
income. Any long-term capital gain distributions are taxable as long-term capital gains, no matter how long you have owned your Fund shares.
|
| Although distributions are generally treated as taxable to you in the year they are paid, distributions declared in October,
November or December but paid in January are taxable as if they were paid in December. A percentage of the Funds’ dividends paid to corporate shareholders may be eligible for the corporate dividends-received deduction. The Funds will inform
shareholders of the source and tax status of all distributions promptly after the close of each calendar year.
|
| Each Fund may be subject to foreign withholding or other foreign taxes on income or gain from certain foreign securities. In
general, the Funds may deduct these taxes in computing their taxable income.
|
| If you buy shares of a Fund before it makes a distribution, the distribution will be taxable to you even though it may actually be
a return of a portion of your investment. This is known as “buying a dividend.”
|
| SALES AND EXCHANGES
|
| Your sale of Fund shares is a taxable transaction for federal income tax purposes, and may also be subject to state and local
taxes. For tax purposes, the exchange of your Fund shares for shares of a different Goldman Sachs Fund is the same as a sale. When you sell your shares, you will generally recognize a capital gain or loss in an amount equal to the difference between your
adjusted tax basis in the shares and the amount received. Generally, this gain or loss is long-term or short-term depending on whether your holding period exceeds twelve months, except that any loss realized on shares held for six months or less will be
treated as a long-term capital loss to the extent of any capital gain dividends that were received on the shares.
|
| OTHER INFORMATION
|
| When you open your account, you should provide your social security or tax identification number on your Account Application. By
law, each Fund must withhold 31% of your taxable distributions and any redemption proceeds if you do not provide your correct taxpayer identification number, or certify that it is correct, or if the IRS instructs the Fund to do so. Non-U.S. investors may
be subject to U.S. withholding and estate tax.
|
| A. General Portfolio Risks
|
| The Funds will be subject to the risks associated with equity securities. “Equity securities” include common stocks,
preferred stocks, interests in real estate investment trusts, convertible debt obligations, convertible preferred stocks, equity interests in trusts, partnerships, joint ventures, limited liability companies and similar enterprises, warrants and stock
purchase rights. In general, stock values fluctuate in response to the activities of individual companies and in response to general market and economic conditions. Accordingly, the value of the stocks that a Fund holds may decline over short or extended
periods. The stock markets tend to be cyclical, with periods when stock prices generally rise and periods when prices generally decline. The volatility of equity securities means that the value of your investment in the Funds may increase or decrease.
Recently, certain stock markets have experienced substantial price volatility and, at times, have traded at or close to record high levels. There can be no guarantee that such levels will be reached or maintained in the future.
|
| To the extent that a Fund invests in fixed-income securities, that Fund will also be subject to the risks associated with its
fixed-income securities. These risks include interest rate risk, credit risk and call/extension risk. In general, interest rate risk involves the risk that when interest rates decline, the market value of fixed-income securities tends to increase
(although many mortgage related securities will have less potential than other debt securities for capital appreciation during periods of declining rates). Conversely, when interest rates increase, the market value of fixed-income securities tends to
decline. Credit risk involves the risk that an issuer or guarantor could default on its obligations, and a Fund will not recover its investment. Call risk and extension risk are normally present in mortgage-backed securities and asset-backed securities.
For example, homeowners have the option to prepay their mortgages. Therefore, the duration of a security backed by home mortgages can either shorten (call risk) or lengthen (extension risk). In general, if interest rates on new mortgage loans fall
sufficiently below the interest rates on existing outstanding mortgage loans, the rate of prepayment would be expected to increase. Conversely, if mortgage loan interest rates rise above the interest rates on existing outstanding mortgage loans, the rate
of prepayment would be expected to decrease. In either case, a change in the prepayment rate can result in losses to investors.
|
| The Investment Adviser will not consider the portfolio turnover rate a limiting factor in making investment decisions for a Fund.
A high rate of portfolio turnover (100% or more) involves correspondingly greater expenses which must be borne by a Fund and its shareholders, and is also likely to result in higher short-term capital gains taxable to shareholders. The portfolio turnover
rate is calculated by dividing the lesser of the dollar amount of sales or purchases of portfolio securities by the average monthly value of a Fund’s portfolio securities, excluding securities having a maturity at the date of purchase of one year or
less. See “Financial Highlights” in Appendix B for a statement of the Funds’ historical portfolio turnover rates.
|
| The following sections provide further information on certain types of securities and investment techniques that may be used by
the Funds, including their associated risks. Additional information is provided in the Additional Statement, which is available upon request. Among other things, the Additional Statement describes certain fundamental investment restrictions that cannot be
changed without shareholder approval. You should note, however, that all investment objectives, and all investment policies not specifically designated as fundamental are non-fundamental and may be changed without shareholder approval. If there is a
change in a Fund’s investment objective, you should consider whether that Fund remains an appropriate investment in light of your then current financial position and needs.
|
| B. Other Portfolio Risks
|
| Risks of Investing in Small Capitalization Companies. Each Fund may invest in small capitalization companies.
Investments in small capitalization companies involve greater risk and portfolio price volatility than investments in larger capitalization stocks. Among the reasons for the greater price volatility of these investments are the less certain growth
prospects of smaller firms and the lower degree of liquidity in the markets for such securities. Small capitalization companies may be thinly traded and may have to be sold at a discount from current market prices or in small lots over an extended period
of time. In addition, these securities are subject to the risk that during certain periods the liquidity of particular issuers or industries, or all securities in these investment categories, will shrink or disappear suddenly and without warning as a
result of adverse economic or market conditions, or adverse investor perceptions whether or not accurate. Because of the lack of sufficient market liquidity, a Fund may incur losses because it will be required to effect sales at a disadvantageous time and
only then at a substantial drop in price. Small capitalization companies include “unseasoned” issuers that do not have an established financial history; often have limited product lines, markets or financial
resources; may depend on or use a few key personnel for management; and may be susceptible to losses and risks of bankruptcy. Transaction costs for these investments are often higher than those of larger capitalization companies. Investments in small
capitalization companies may be more difficult to price precisely than other types of securities because of their characteristics and lower trading volumes.
|
| Risks of Foreign Investments. The Funds may make foreign investments. Foreign investments involve special risks that
are not typically associated with U.S. dollar denominated or quoted securities of U.S. issuers. Foreign investments may be affected by changes in currency rates, changes in foreign or U.S. laws or restrictions applicable to such investments and changes in
exchange control regulations (e.g., currency blockage). A decline in the exchange rate of the currency (i.e., weakening of the currency against the U.S. dollar) in which a portfolio security is quoted or denominated relative to the U.S. dollar would reduce the value of
the portfolio security. In addition, if the currency in which a Fund receives dividends, interest or other payments declines in value against the U.S. dollar before such income is distributed as dividends to shareholders or converted to U.S. dollars, the
Fund may have to sell portfolio securities to obtain sufficient cash to pay such dividends.
|
| The introduction of a single currency, the euro, on January 1, 1999 for participating nations in the European Economic and
Monetary Union has presented unique uncertainties, including the fluctuation of the euro relative to non-euro currencies during the transition period from January 1, 1999 to December 31, 2001 and beyond; whether the interest rate, tax and labor regimes of
European countries participating in the euro will converge over time; and whether the conversion of the currencies of other countries that now are or may in the future become members of the European Union (“EU”), may have an impact on the euro.
Also, it is possible that the euro could be abandoned in the future by countries that have already adopted its use. These or other events, including political and economic developments, could cause market disruptions, and could adversely affect the value
of securities held by the Funds. Because of the number of countries using this single currency, a significant portion of the assets held by the Funds may be denominated in the euro.
|
| Brokerage commissions, custodial services and other costs relating to investment in international securities markets generally are
more expensive than in the United States. In addition, clearance and settlement procedures may be different in foreign countries and, in certain markets, such procedures have been unable to keep pace with the volume of securities transactions, thus making
it difficult to conduct such transactions.
|
| Foreign issuers are not generally subject to uniform accounting, auditing and financial reporting standards comparable to those
applicable to U.S. issuers. There may be less publicly available information about a foreign issuer than about a U.S. issuer. In addition, there is generally less government regulation of foreign markets, companies and securities dealers than in the
United States. Foreign securities markets may have substantially less volume than U.S. securities markets and secu-
|
| rities of many foreign issuers are less liquid and more volatile than securities of comparable domestic issuers. Furthermore, with
respect to certain foreign countries, there is a possibility of nationalization, expropriation or confiscatory taxation, imposition of withholding or other taxes on dividend or interest payments (or, in some cases, capital gains distributions),
limitations on the removal of funds or other assets from such countries, and risks of political or social instability or diplomatic developments which could adversely affect investments in those countries.
|
| Concentration of a Fund’s assets in one or a few countries and currencies will subject a Fund to greater risks than if a
Fund’s assets were not geographically concentrated.
|
| Investment in sovereign debt obligations by certain Funds involves risks not present in debt obligations of corporate issuers. The
issuer of the debt or the governmental authorities that control the repayment of the debt may be unable or unwilling to repay principal or interest when due in accordance with the terms of such debt, and a Fund may have limited recourse to compel payment
in the event of a default. Periods of economic uncertainty may result in the volatility of market prices of sovereign debt, and in turn a Fund’s NAV, to a greater extent than the volatility inherent in debt obligations of U.S. issuers.
|
| A sovereign debtor’s willingness or ability to repay principal and pay interest in a timely manner may be affected by, among
other factors, its cash flow situation, the extent of its foreign currency reserves, the availability of sufficient foreign exchange on the date a payment
is due, the relative size of the debt service burden to the economy as a whole, the sovereign debtor’s policy toward international lenders, and the political constraints to which a sovereign debtor may be subject.
|
| Investments in foreign securities may take the form of sponsored and unsponsored American Depositary Receipts (“ADRs”)
and Global Depositary Receipts (“GDRs”). Certain Funds may also invest in European Depositary Receipts (“EDRs”) or other similar instruments representing securities of foreign issuers. ADRs represent the right to receive securities of
foreign issuers deposited in a domestic bank or a correspondent bank. Prices of ADRs are quoted in U.S. dollars, and ADRs are traded in the United States. EDRs and GDRs are receipts evidencing an arrangement with a non-U.S. bank. EDRs and GDRs are not
necessarily quoted in the same currency as the underlying security.
|
| Risks of Emerging Countries. Certain Funds may invest in securities of issuers located in emerging countries. The
risks of foreign investment are heightened when the issuer is located in an emerging country. Emerging countries are generally located in the Asia-Pacific region, Eastern Europe, Latin and South America and Africa. A Fund’s purchase and sale of
portfolio securities in certain emerging countries may be constrained by limitations relating to daily changes in the prices of listed securities, periodic trading or settlement volume and/or limitations on aggregate holdings of foreign investors. Such
limitations may be computed based on the aggregate trading volume by or holdings of a Fund, the Investment Adviser, its affiliates and their respective clients and other service providers. A Fund may not be able to sell securities in circumstances where
price, trading or settlement volume limitations have been reached.
|
| Foreign investment in the securities markets of certain emerging countries is restricted or controlled to varying degrees which
may limit investment in such countries or increase the administrative costs of such investments. For example, certain Asian countries require governmental approval prior to investments by foreign persons or limit investment by foreign persons to only a
specified percentage of an issuer’s outstanding securities or a specific class of securities which may have less advantageous terms (including price) than securities of the issuer available for purchase by nationals. In addition, certain countries
may restrict or prohibit investment opportunities in issuers or industries deemed important to national interests. Such restrictions may affect the market price, liquidity and rights of securities that may be purchased by a Fund. The repatriation of both
investment income and capital from certain emerging countries is subject to restrictions such as the need for governmental consents. Due to restrictions on direct investment in equity securities in certain Asian and other countries, it is anticipated that
a Fund may invest in such countries through other investment funds in such countries.
|
| Many emerging countries have recently experienced currency devaluations and substantial (and, in some cases, extremely high) rates
of inflation. Other emerging countries have experienced economic recessions. These circumstances have had a negative effect on the economies and securities markets of such emerging countries. Economies in emerging countries generally are dependent heavily
upon commodity prices and international trade and, accordingly, have been and may continue to be affected adversely by the economies of their trading partners, trade barriers, exchange controls, managed adjustments in relative currency values and other
protectionist measures imposed or negotiated by the countries with which they trade.
|
| Many emerging countries are subject to a substantial degree of economic, political and social instability. Governments of some
emerging countries are authoritarian
in nature or have been installed or removed as a result of military coups, while governments in other emerging countries have periodically used force to suppress civil dissent. Disparities of wealth, the pace and success of democratization, and ethnic,
religious and racial disaffection, among other factors, have also led to social unrest, violence and/or labor unrest in some emerging countries. Unanticipated political or social developments may result in sudden and significant investment losses.
Investing in emerging countries involves greater risk of loss due to expropriation, nationalization, confiscation of assets and property or the imposition of restrictions on foreign investments and on repatriation of capital invested. As an example, in
the past some Eastern European governments have expropriated substantial amounts of private property, and many claims of the property owners have never been fully settled. There is no assurance that similar expropriations will not recur in Eastern Europe
or other countries.
|
| A Fund’s investment in emerging countries may also be subject to withholding or other taxes, which may be significant and may
reduce the return from an investment in such countries to the Fund.
|
| Settlement procedures in emerging countries are frequently less developed and reliable than those in the United States and often
may involve a Fund’s delivery of securities before receipt of payment for their sale. In addition, significant delays are common in certain markets in registering the transfer of securities. Settlement or registration problems may make it more
difficult for a Fund to value its portfolio securities and could cause the Fund to miss attractive investment opportunities, to have a portion of its assets uninvested or to incur losses due to the failure of a counterparty to pay for securities the Fund
has delivered or the Fund’s inability to complete its contractual obligations because of theft or other reasons. The creditworthiness of the local securities firms used by the Fund in emerging countries may not be as sound as the creditworthiness of
firms used in more developed countries. As a result, the Fund may be subject to a greater risk of loss if a securities firm defaults in the performance of its responsibilities.
|
| The small size and inexperience of the securities markets in certain emerging countries and the limited volume of trading in
securities in those countries may make a Fund’s investments in such countries less liquid and more volatile than investments in countries with more developed securities markets (such as the United States, Japan and most Western European countries). A
Fund’s investments in emerging countries are subject to the risk that the liquidity of a particular investment, or investments generally, in such countries will shrink or disappear suddenly and without warning as a result of adverse economic, market
or political conditions or adverse investor perceptions, whether or not accurate. Because of the lack of sufficient market liquidity, a Fund may incur losses because it will be required to effect
sales at a disadvantageous time and only then at a substantial drop in price. Investments in emerging countries may be more difficult to price precisely because of the characteristics discussed above and lower trading volumes.
|
| A Fund’s use of foreign currency management techniques in emerging countries may be limited. Due to the limited market for
these instruments in emerging countries, the Investment Adviser does not currently anticipate that a significant portion of the Funds’ currency exposure in emerging countries, if any, will be covered by such instruments.
|
| Risks of Derivative Investments. A Fund’s transactions, if any, in options, futures, options on futures, swaps,
interest rate caps, floors and collars, structured securities and currency transactions involve additional risk of loss. Loss can result from a lack of correlation between changes in the value of derivative instruments and the portfolio assets (if any)
being hedged, the potential illiquidity of the markets for derivative instruments, or the risks arising from margin requirements and related leverage factors associated with such transactions. The use of these management techniques also involves the risk
of loss if the Investment Adviser is incorrect in its expectation of fluctuations in securities prices, interest rates or currency prices. Each Fund may also invest in derivative investments for non-hedging purposes (that is, to seek to increase total
return). Investing for non-hedging purposes is considered a speculative practice and presents even greater risk of loss.
|
| Risks of Illiquid Securities. Each Fund may invest up to 15% of its net assets in illiquid securities which cannot
be disposed of in seven days in the ordinary course of business at fair value. Illiquid securities include:
|
n
|
Both domestic and foreign securities that are not readily marketable
|
n
|
Certain stripped mortgage-backed securities
|
n
|
Repurchase agreements and time deposits with a notice or demand period of more than seven days
|
n
|
Certain over-the-counter options
|
n
|
Certain structured securities and all swap transactions
|
n
|
Certain restricted securities, unless it is determined, based upon a review of the trading markets for a specific restricted
security, that such restricted security is eligible for resale pursuant to Rule 144A under the Securities Act of 1933 (“144A Securities”) and, therefore, is liquid.
|
| Investing in 144A Securities may decrease the liquidity of a Fund’s portfolio to the extent that qualified institutional
buyers become for a time uninterested in purchasing these restricted securities. The purchase price and subsequent valuation of restricted and illiquid securities normally reflect a discount, which may be significant, from the market price of comparable
securities for which a liquid market exists.
|
| Credit Risks. Debt securities purchased by the Funds may include securities (including zero coupon bonds) issued by
the U.S. government (and its agencies, instrumentalities and sponsored enterprises), foreign governments, domestic and foreign corporations, banks and other issuers. Further information is provided in the Additional Statement.
|
| Debt securities rated BBB or higher by Standard & Poor’s or Baa or higher by Moody’s are considered “investment
grade.” Securities rated BBB or Baa are considered medium-grade obligations with speculative characteristics, and adverse economic conditions or changing circumstances may weaken their issuers’ capacity to pay interest and repay principal. A
security will be deemed to have met a rating requirement if it receives the minimum required rating from at least one such rating organization even though it has been rated below the minimum rating by one or more other rating organizations, or if unrated
by such rating organizations, determined by the Investment Adviser to be of comparable credit quality.
|
| Certain Funds may invest in fixed-income securities rated BB or Ba or below (or comparable unrated securities) which are commonly
referred to as “junk bonds.” Junk bonds are considered predominantly speculative and may be questionable as to principal and interest payments.
|
| In some cases, junk bonds may be highly speculative, have poor prospects for reaching investment grade standing and be in default.
As a result, investment in such bonds will present greater speculative risks than those associated with investment in investment grade bonds. Also, to the extent that the rating assigned to a security in a Fund’s portfolio is downgraded by a rating
organization, the market price and liquidity of such security may be adversely affected.
|
| Risks of Initial Public Offerings. The Funds may invest in IPOs. An IPO is a company’s first offering of stock
to the public. IPO risk is the risk that the market value of IPO shares will fluctuate considerably due to factors such as the absence of a prior public market, unseasoned trading, the small number of shares available for trading and limited information
about the issuer. The purchase of IPO shares may involve high transaction costs. IPO shares are subject to market risk and liquidity risk. When a Fund’s asset base is small, a significant portion of the Fund’s performance could be attributable
to investments in IPOs, because such investments would have a magnified impact on the Fund. As the Fund’s assets grow, the effect of the Fund’s investments in IPOs on the Fund’s performance probably will decline, which could reduce the
Fund’s performance. Because of the price volatility of IPO shares, a Fund may choose to hold IPO shares for a very short period of time. This may increase the turnover of the Fund’s portfolio and may lead to increased expenses to the Fund, such
as commissions and transaction costs. By selling IPO shares, the Fund may realize taxable gains it will subse
quently distribute to shareholders. In addition, the market for IPO shares can be speculative and/or inactive for extended periods of time. There is no assurance that a Fund will be able to obtain allocable portions of IPO shares. The limited number of
shares available for trading in some IPOs may make it more difficult for a Fund to buy or sell significant amounts of shares without an unfavorable impact on prevailing prices. Investors in IPO shares can be affected by substantial dilution in the value
of their shares, by sales of additional shares and by concentration of control in existing management and principal shareholders.
|
| Temporary Investment Risks. Each Fund may, for temporary defensive purposes, invest a certain percentage of its
total assets in:
|
n
|
U.S. government securities
|
n
|
Commercial paper rated at least A-2 by Standard & Poor’s or P-2 by Moody’s
|
n
|
Certificates of deposit
|
n
|
Bankers’ acceptances
|
n
|
Repurchase agreements
|
n
|
Non-convertible preferred stocks and non-convertible corporate bonds with a remaining maturity of less than one year
|
| When a Fund’s assets are invested in such instruments, the Fund may not be achieving its investment objective.
|
| C. Portfolio Securities and Techniques
|
| This section provides further information on certain types of securities and investment techniques that may be used by the Funds,
including their associated risks. Further information is provided in the Additional Statement, which is available upon request.
|
| Convertible Securities. Each Fund may invest in convertible securities. Convertible securities are preferred stock
or debt obligations that are convertible into common stock. Convertible securities generally offer lower interest or dividend yields than non-convertible securities of similar quality. Convertible securities in which a Fund invests are subject to the same
rating criteria as its other investments in fixed-income securities. Convertible securities have both equity and fixed-income risk characteristics. Like all fixed-income securities, the value of convertible securities is susceptible to the risk of market
losses attributable to changes in interest rates. Generally, the market value of convertible securities tends to decline as interest rates increase and, conversely, to increase as interest rates decline. However, when the market price of the common stock
underlying a convertible security exceeds the conversion price of the convertible security, the convertible security tends to reflect the market price of the underlying common stock. As the market
price of the underlying common stock declines, the convertible security, like a fixed-income security, tends to trade increasingly on a yield basis, and thus may not decline in price to the same extent as the underlying common stock.
|
| Foreign Currency Transactions. A Fund may, to the extent consistent with its investment policies, purchase or sell
foreign currencies on a cash basis or through forward contracts. A forward contract involves an obligation to purchase or sell a specific currency at a future date at a price set at the time of the contract. A Fund may engage in foreign currency
transactions for hedging purposes and to seek to protect against anticipated changes in future foreign currency exchange rates. In addition, certain Funds may also enter into such transactions to seek to increase total return, which is considered a
speculative practice.
|
| Some Funds may also engage in cross-hedging by using forward contracts in a currency different from that in which the hedged
security is denominated or quoted. A Fund may hold foreign currency received in connection with investments in foreign securities when, in the judgment of the Investment Adviser, it would be beneficial to convert such currency into U.S. dollars at a later
date (e.g., the Investment Adviser may anticipate the foreign currency to appreciate against the U.S. dollar).
|
| Currency exchange rates may fluctuate significantly over short periods of time, causing, along with other factors, a Fund’s
NAV to fluctuate (when the Fund’s NAV fluctuates, the value of your shares may go up or down). Currency exchange rates also can be affected unpredictably by the intervention of U.S. or foreign governments or central banks, or the failure to
intervene, or by currency controls or political developments in the United States or abroad.
|
| The market in forward foreign currency exchange contracts, currency swaps and other privately negotiated currency instruments
offers less protection against defaults by the other party to such instruments than is available for currency instruments traded on an exchange. Such contracts are subject to the risk that the counterparty to the contract will default on its obligations.
Since these contracts are not guaranteed by an exchange or clearinghouse, a default on a contract would deprive a Fund of unrealized profits, transaction costs or the benefits of a currency hedge or could force the Fund to cover its purchase or sale
commitments, if any, at the current market price.
|
| Structured Securities. Each Fund may invest in structured securities. Structured securities are securities whose
value is determined by reference to changes in the value of specific currencies, interest rates, commodities, indices or other financial indicators (the “Reference”) or the relative change in two or more References.
The interest rate or the principal amount payable upon maturity or redemption may be increased or decreased depending upon changes in the applicable Reference. Structured securities may be positively or negatively indexed, so that appreciation of the
Reference may produce an increase or decrease in the interest rate or value of the security at maturity. In addition, changes in the interest rates or the value of the security at maturity may be a multiple of changes in the value of the Reference.
Consequently, structured securities may present a greater degree of market risk than other types of fixed-income securities and may be more volatile, less liquid and more difficult to price accurately than less complex securities.
|
| REITs. Each Fund may invest in REITs. REITs are pooled investment vehicles that invest primarily in either real
estate or real estate related loans. The value of a REIT is affected by changes in the value of the properties owned by the REIT or securing mortgage loans held by the REIT. REITs are dependent upon the ability of the REITs’ managers, and are subject
to heavy cash flow dependency, default by borrowers and the qualification of the REITs under applicable regulatory requirements for favorable income tax treatment. REITs are also subject to risks generally associated with investments in real estate
including possible declines in the value of real estate, general and local economic conditions, environmental problems and changes in interest rates. To the extent that assets underlying a REIT are concentrated geographically, by property type or in
certain other respects, these risks may be heightened. A Fund will indirectly bear its proportionate share of any expenses, including management fees, paid by a REIT in which it invests.
|
| Options on Securities, Securities Indices and Foreign Currencies. A put option gives the purchaser of the option the
right to sell, and the writer (seller) of the option the obligation to buy, the underlying instrument during the option period. A call option gives the purchaser of the option the right to buy, and the writer (seller) of the option the obligation to sell,
the underlying instrument during the option period. Each Fund may write (sell) covered call and put options and purchase put and call options on any securities in which they may invest or on any securities index consisting of securities in which they may
invest. A Fund may also, to the extent that it invests in foreign securities, purchase and sell (write) put and call options on foreign currencies.
|
| The writing and purchase of options is a highly specialized activity which involves special investment risks. Options may be used
for either hedging or cross-hedging purposes, or to seek to increase total return (which is considered a speculative activity). The successful use of options depends in part on the ability of the Investment Adviser to manage future price fluctuations and
the degree of correlation between the options and securities (or currency) markets. If the Invest
ment Adviser is incorrect in its expectation of changes in market prices or determination of the correlation between the instruments or indices on which options are written and purchased and the instruments in a Fund’s investment portfolio, the Fund
may incur losses that it would not otherwise incur. The use of options can also increase a Fund’s transaction costs. Options written or purchased by the Funds may be traded on either U.S. or foreign exchanges or over-the-counter. Foreign and
over-the-counter options will present greater possibility of loss because of their greater illiquidity and credit risks.
|
| Futures Contracts and Options on Futures Contracts. Futures contracts are standardized, exchange-traded contracts
that provide for the sale or purchase of a specified financial instrument or currency at a future time at a specified price. An option on a futures contract gives the purchaser the right (and the writer of the option the obligation) to assume a position
in a futures contract at a specified exercise price within a specified period of time. A futures contract may be based on various securities (such as U.S. government securities), foreign currencies, securities indices and other financial instruments and
indices. The Funds may engage in futures transactions on both U.S. and foreign exchanges.
|
| Each Fund may purchase and sell futures contracts, and purchase and write call and put options on futures contracts, in order to
seek to increase total return or to hedge against changes in interest rates, securities prices or, to the extent a Fund invests in foreign securities, currency exchange rates, or to otherwise manage their term structures, sector selection and durations in
accordance with their investment objectives and policies. Each Fund may also enter into closing purchase and sale transactions with respect to such contracts and options. A Fund will engage in futures and related options transactions for bona fide hedging
purposes as defined in regulations of the Commodity Futures Trading Commission or to seek to increase total return to the extent permitted by such regulations. A Fund may not purchase or sell futures contracts or purchase or sell related options to seek
to increase total return, except for closing purchase or sale transactions, if immediately thereafter the sum of the amount of initial margin deposits and premiums paid on the Fund’s outstanding positions in futures and related options entered into
for the purpose of seeking to increase total return would exceed 5% of the market value of the Fund’s net assets.
|
| Futures contracts and related options present the following risks:
|
n
|
While a Fund may benefit from the use of futures and options on futures, unanticipated changes in interest rates, securities
prices or currency exchange rates may result in poorer overall performance than if the Fund had not entered into any futures contracts or options transactions.
|
n
|
Because perfect correlation between a futures position and portfolio position that is intended to be protected is impossible to
achieve, the desired protection may not be obtained and a Fund may be exposed to additional risk of loss.
|
n
|
The loss incurred by a Fund in entering into futures contracts and in writing call options on futures is potentially unlimited and
may exceed the amount of the premium received.
|
n
|
Futures markets are highly volatile and the use of futures may increase the volatility of a Fund’s NAV.
|
n
|
As a result of the low margin deposits normally required in futures trading, a relatively small price movement in a futures
contract may result in substantial losses to a Fund.
|
n
|
Futures contracts and options on futures may be illiquid, and exchanges may limit fluctuations in futures contract prices during a
single day.
|
n
|
Foreign exchanges may not provide the same protection as U.S. exchanges.
|
| Equity Swaps. Each Fund may invest in equity swaps. Equity swaps allow the parties to a swap agreement to exchange
the dividend income or other components of return on an equity investment (for example, a group of equity securities or an index) for a component of return on another non-equity or equity investment.
|
| An equity swap may be used by a Fund to invest in a market without owning or taking physical custody of securities in
circumstances in which direct investment may be restricted for legal reasons or is otherwise impractical. Equity swaps are derivatives and their value can be very volatile. To the extent that the Investment Adviser does not accurately analyze and predict
the potential relative fluctuation of the components swapped with another party, a Fund may suffer a loss, which may be substantial. The value of some components of an equity swap (such as the dividends on a common stock) may also be sensitive to changes
in interest rates. Furthermore, a Fund may suffer a loss if the counterparty defaults. Because equity swaps are normally illiquid, a Fund may be unable to terminate its obligations when desired.
|
| When-Issued Securities and Forward Commitments. Each Fund may purchase when-issued securities and make contracts to
purchase or sell securities for a fixed price at a future date beyond customary settlement time. When-issued securities are securities that have been authorized, but not yet issued. When-issued securities are purchased in order to secure what is
considered to be an advantageous price and yield to the Fund at the time of entering into the transaction. A forward commitment involves the entering into a contract to purchase or sell securities for a fixed price at a future date beyond the customary
settlement period.
|
| The purchase of securities on a when-issued or forward commitment basis involves a risk of loss if the value of the security to be
purchased declines before
the settlement date. Conversely, the sale of securities on a forward commitment basis involves the risk that the value of the securities sold may increase before the settlement date. Although a Fund will generally purchase securities on a when-issued or
forward commitment basis with the intention of acquiring the securities for its portfolio, a Fund may dispose of when-issued securities or forward commitments prior to settlement if the Investment Adviser deems it appropriate.
|
| Repurchase Agreements. Repurchase agreements involve the purchase of securities subject to the seller’s
agreement to repurchase them at a mutually agreed upon date and price. Each Fund may enter into repurchase agreements with dealers in U.S. government securities and member banks of the Federal Reserve System which furnish collateral at least equal in
value or market price to the amount of their repurchase obligation.
|
| If the other party or “seller” defaults, a Fund might suffer a loss to the extent that the proceeds from the sale of the
underlying securities and other collateral held by the Fund are less than the repurchase price and the Fund’s costs associated with delay and enforcement of the repurchase agreement. In addition, in the event of bankruptcy of the seller, a Fund could
suffer additional losses if a court determines that the Fund’s interest in the collateral is not enforceable.
|
| In evaluating whether to enter into a repurchase agreement, the Investment Adviser will carefully consider the creditworthiness of
the seller. Certain Funds, together with other registered investment companies having advisory agreements with the Investment Adviser or any of its affiliates, may transfer uninvested cash balances into a single joint account, the daily aggregate balance
of which will be invested in one or more repurchase agreements.
|
| Lending of Portfolio Securities. Each Fund may engage in securities lending. Securities lending involves the lending
of securities owned by a Fund to financial institutions such as certain broker-dealers. The borrowers are required to secure their loan continuously with cash, cash equivalents, U.S. government securities or letters of credit in an amount at least equal
to the market value of the securities loaned. Cash collateral may be invested in cash equivalents. To the extent that cash collateral is invested in other investment securities, such collateral will be subject to market depreciation or appreciation, and a
Fund will be responsible for any loss that might result from its investment of the borrowers’ collateral. If the Investment Adviser determines to make securities loans, the value of the securities loaned may not exceed 33 1
/3% of the value of the total assets of a
Fund (including the loan collateral).
|
| A Fund may lend its securities to increase its income. A Fund may, however, experience delay in the recovery of its securities if
the institution with which it has engaged in a portfolio loan transaction breaches its agreement with the Fund.
|
| Short Sales Against-the-Box. Certain Funds may make short sales against-the-box. A short sale against-the-box means
that at all times when a short position is open the Fund will own an equal amount of securities sold short, or securities convertible into or exchangeable for, without payment of any further consideration, an equal amount of the securities of the same
issuer as the securities sold short.
|
| Preferred Stock, Warrants and Rights. Each Fund may invest in preferred stock, warrants and rights. Preferred stocks
are securities that represent an ownership interest providing the holder with claims on the issuer’s earnings and assets before common stock owners but after bond owners. Unlike debt securities, the obligations of an issuer of preferred stock,
including dividend and other payment obligations, may not typically be accelerated by the holders of such preferred stock on the occurrence of an event of default or other non-compliance by the issuer of the preferred stock.
|
| Warrants and other rights are options to buy a stated number of shares of common stock at a specified price at any time during the
life of the warrant or right. The holders of warrants and rights have no voting rights, receive no dividends and have no rights with respect to the assets of the issuer.
|
| Other Investment Companies. Each Fund may invest in securities of other investment companies (including
exchange-traded funds such as SPDRs and iShares
SM
, as defined below) subject to statutory limitations prescribed by the Act. These limitations include a
prohibition on any Fund acquiring more than 3% of the voting shares of any other investment company, and a prohibition on investing more than 5% of a Fund’s total assets in securities of any one investment company or more than 10% of its total assets
in securities of all investment companies. A Fund will indirectly bear its proportionate share of any management fees and other expenses paid by such other investment companies. Exchange-traded funds such as SPDRs and iShares
SM
are shares of unaffiliated investment companies which are traded like traditional equity securities on a national
securities exchange or the NASDAQ® National Market System.
|
n
|
Standard & Poor’s Depositary Receipts™.
The Funds may, consistent with their investment policies, purchase Standard & Poor’s Depositary Receipts™ (“SPDRs”). SPDRs are securities traded on the American Stock Exchange (“AMEX”) that represent
ownership in the SPDR Trust, a trust which has been established to accumulate and hold a portfolio of common stocks that is intended to track the price performance and dividend yield of the S&P 500®. The SPDR Trust is sponsored by a subsidiary of
the AMEX. SPDRs may be used for several reasons, including, but not limited to, facilitating the handling
of cash flows or trading, or reducing transaction costs. The price movement of SPDRs may not perfectly parallel the price action of the S&P 500®.
|
n
|
iShares
SM
(formerly World Equity Benchmark Shares or WEBs). iShares are shares of an investment company that invests substantially all of its assets in securities included
in the MSCI indices for specified countries. iShares are listed on the AMEX and were initially offered to the public in 1996. The market prices of iShares are expected to fluctuate in accordance with both changes in the NAVs of their underlying indices
and supply and demand of iShares on the AMEX. To date, iShares have traded at relatively modest discounts and premiums to their NAVs. However, iShares have a limited operating history and information is lacking regarding the actual performance and trading
liquidity of iShares for extended periods or over complete market cycles. In addition, there is no assurance that the requirements of the AMEX necessary to maintain the listing of iShares will continue to be met or will remain unchanged. In the event
substantial market or other disruptions affecting iShares should occur in the future, the liquidity and value of a Fund’s shares could also be substantially and adversely affected. If such disruptions were to occur, a Fund could be required to
reconsider the use of iShares as part of its investment strategy.
|
| Unseasoned Companies. Each Fund may invest in companies (including predecessors) which have operated less than three
years. The securities of such companies may have limited liquidity, which can result in their being priced higher or lower than might otherwise be the case. In addition, investments in unseasoned companies are more speculative and entail greater risk than
do investments in companies with an established operating record.
|
| Corporate Debt Obligations. Corporate debt obligations include bonds, notes, debentures, commercial paper and other
obligations of corporations to pay interest and repay principal, and include securities issued by banks and other financial institutions. Each Fund may invest in corporate debt obligations issued by U.S. and certain non-U.S. issuers which issue securities
denominated in the U.S. dollar (including Yankee and Euro obligations). In addition to obligations of corporations, corporate debt obligations include securities issued by banks and other financial institutions and supranational entities (i.e., the World Bank, the International Monetary Fund, etc.).
|
| Bank Obligations. Each Fund may invest in obligations issued or guaranteed by U.S. or foreign banks. Bank
obligations, including without limitations, time deposits, bankers’ acceptances and certificates of deposit, may be general obligations of the parent bank or may be limited to the issuing branch by the terms of the specific obligations or by
government regulations. Banks are subject to extensive but different governmental regulations which may limit both the amount and types of
loans which may be made and interest rates which may be charged. In addition, the profitability of the banking industry is largely dependent upon the availability and cost of funds for the purpose of financing lending operations under prevailing money
market conditions. General economic conditions as well as exposure to credit losses arising from possible financial difficulties of borrowers play an important part in the operation of this industry.
|
| U.S. Government Securities. Each Fund may invest in U.S. government securities. U.S. government securities include
U.S. Treasury obligations and obligations issued or guaranteed by U.S. government agencies, instrumentalities or sponsored enterprises. U.S. government securities may be supported by (a) the full faith and credit of the U.S. Treasury (such as the
Government National Mortgage Association (“Ginnie Mae”)); (b) the right of the issuer to borrow from the U.S. Treasury (such as securities of the Student Loan Marketing Association); (c) the discretionary authority of the U.S. government to
purchase certain obligations of the issuer; or (d) only the credit of the issuer. U.S. government securities also include Treasury receipts, zero coupon bonds and other stripped U.S. government securities, where the interest and principal components of
stripped U.S. government securities are traded independently.
|
| Custodial Receipts. Interests in U.S. government securities may be purchased in the form of custodial receipts that
evidence ownership of future interest payments, principal payments or both on certain notes or bonds issued or guaranteed as to principal and interest by the U.S. government, its agencies, instrumentalities, political subdivisions or authorities. For
certain securities law purposes, custodial receipts are not considered obligations of the U.S. government.
|
| Mortgage-Backed Securities. Certain Funds may invest in mortgage-backed securities. Mortgage-backed securities
represent direct or indirect participations in, or are collateralized by and payable from, mortgage loans secured by real property. Mortgage-backed securities can be backed by either fixed rate mortgage loans or adjustable rate mortgage loans, and may be
issued by either a governmental or non-governmental entity. Privately issued mortgage-backed securities are normally structured with one or more types of “credit enhancement.” However, these mortgage-backed securities typically do not have the
same credit standing as U.S. government guaranteed mortgage-backed securities.
|
| Mortgage-backed securities may include multiple class securities, including collateralized mortgage obligations (“CMOs”)
and Real Estate Mortgage Investment Conduit (“REMIC”) pass-through or participation certificates. CMOs provide an investor with a specified interest in the cash flow from a pool of underlying mortgages or of other mortgage-backed securities.
CMOs are issued in multiple classes. In many cases, payments of principal are applied to the CMO classes in the
order of their respective stated maturities, so that no principal payments will be made on a CMO class until all other classes having an earlier stated maturity date are paid in full. A REMIC is a CMO that qualifies for special tax treatment and invests
in certain mortgages principally secured by interests in real property and other permitted investments.
|
| Mortgaged-backed securities also include stripped mortgage-backed securities (“SMBS”), which are derivative multiple
class mortgage-backed securities. SMBS are usually structured with two different classes: one that receives substantially all of the interest payments and the other that receives substantially all of the principal payments from a pool of mortgage loans.
The market value of SMBS consisting entirely of principal payments generally is unusually volatile in response to changes in interest rates. The yields on SMBS that receive all or most of the interest from mortgage loans are generally higher than
prevailing market yields on other mortgage-backed securities because their cash flow patterns are more volatile and there is a greater risk that the initial investment will not be fully recouped.
|
| Asset-Backed Securities. Certain Funds may invest in asset-backed securities. Asset-backed securities are securities
whose principal and interest payments are collateralized by pools of assets such as auto loans, credit card receivables, leases, installment contracts and personal property. Asset-backed securities are often subject to more rapid repayment than their
stated maturity date would indicate as a result of the pass-through of prepayments of principal on the underlying loans. During periods of declining interest rates, prepayment of loans underlying asset-backed securities can be expected to accelerate.
Accordingly, a Fund’s ability to maintain positions in such securities will be affected by reductions in the principal amount of such securities resulting from prepayments, and its ability to reinvest the returns of principal at comparable yields is
subject to generally prevailing interest rates at that time. Asset-backed securities present credit risks that are not presented by mortgage-backed securities. This is because asset-backed securities generally do not have the benefit of a security
interest in collateral that is comparable to mortgage assets. If the issuer of an asset-backed security defaults on its payment obligations, there is the possibility that, in some cases, the Fund will be unable to possess and sell the underlying
collateral and that the Fund’s recoveries on repossessed collateral may not be available to support payments on the securities. In the event of a default, a Fund may suffer a loss if it cannot sell collateral quickly and receive the amount it is owed.
|
| Borrowings. Each Fund can borrow money from banks and other financial institutions in amounts not exceeding
one-third of its total assets for temporary or emergency purposes. A Fund may not make additional investments if borrowings exceed 5% of its total assets.
|
| Mortgage Dollar Rolls. Certain Funds may enter into mortgage dollar rolls. A mortgage dollar roll involves the sale
by a Fund of securities for delivery in the current month. The Fund simultaneously contracts with the same counterparty to repurchase substantially similar (same type, coupon and maturity) but not identical securities on a specified future date. During
the roll period, the Fund loses the right to receive principal and interest paid on the securities sold. However, the Fund benefits to the extent of any difference between (a) the price received for the securities sold and (b) the lower forward price for
the future purchase and/or fee income plus the interest earned on the cash proceeds of the securities sold. Unless the benefits of a mortgage dollar roll exceed the income, capital appreciation and gain or loss due to mortgage prepayments that would have
been realized on the securities sold as part of the roll, the use of this technique will diminish the Fund’s performance.
|
| Successful use of mortgage dollar rolls depends upon the Investment Adviser’s ability to predict correctly interest rates and
mortgage prepayments. If the Investment Adviser is incorrect in its prediction, a Fund may experience a loss. For financial reporting and tax purposes, the Funds treat mortgage dollar rolls as two separate transactions: one involving the purchase of a
security and a separate transaction involving a sale. The Funds do not currently intend to enter into mortgage dollar rolls that are accounted for as a financing and do not treat them as borrowings.
|
| Yield Curve Options. Certain Funds may enter into options on the yield “spread” or differential between
two securities. Such transactions are referred to as “yield curve” options. In contrast to other types of options, a yield curve option is based on the difference between the yields of designated securities, rather than the prices of the
individual securities, and is settled through cash payments. Accordingly, a yield curve option is profitable to the holder if this differential widens (in the case of a call) or narrows (in the case of a put), regardless of whether the yields of the
underlying securities increase or decrease.
|
| The trading of yield curve options is subject to all of the risks associated with the trading of other types of options. In
addition, such options present a risk of loss even if the yield of one of the underlying securities remains constant, or if the spread moves in a direction or to an extent which was not anticipated.
|
| Reverse Repurchase Agreements. Certain Funds may enter into reverse repurchase agreements. Reverse repurchase
agreements involve the sale of securities held by a Fund subject to the Fund’s agreement to repurchase them at a mutually agreed upon date and price (including interest). These transactions may be entered into as a temporary measure for emergency
purposes or to meet redemption requests. Reverse repurchase agreements may also be entered into when the Invest
ment Adviser expects that the interest income to be earned from the investment of the transaction proceeds will be greater than the related interest expense. Reverse repurchase agreements involve leveraging. If the securities held by a Fund decline in
value while these transactions are outstanding, the NAV of the Fund’s outstanding shares will decline in value by proportionately more than the decline in value of the securities. In addition, reverse repurchase agreements involve the risk that the
interest income earned by a Fund (from the investment of the proceeds) will be less than the interest expense of the transaction, that the market value of the securities sold by a Fund will decline below the price the Fund is obligated to pay to
repurchase the securities, and that the securities may not be returned to the Fund.
|
| Municipal Securities. Certain Funds may invest in securities and instruments issued by state and local government
issuers. Municipal securities in which a Fund may invest consist of bonds, notes, commercial paper and other instruments (including participating interests in such securities) issued by or on behalf of states, territories and possessions of the United
States (including the District of Columbia) and their political subdivisions, agencies or instrumentalities. Such securities may pay fixed, variable or floating rates of interest. Municipal securities are often issued to obtain funds for various public
purposes, including the construction of a wide range of public facilities such as bridges, highways, housing, hospitals, mass transportation, schools, streets and water and sewer works. Other public purposes for which municipal securities may be issued
include refunding outstanding obligations, obtaining funds for general operating expenses, and obtaining funds to lend to other public institutions and facilities. Municipal securities in which a Fund may invest include private activity bonds, municipal
leases, certificates of participation, pre-funded municipal securities and auction rate securities.
|
| Interest Rate Swaps, Mortgage Swaps, Credit Swaps, Currency Swaps and Interest Rate Caps, Floors and Collars.
Interest rate swaps involve the exchange by a Fund with another party of their respective commitments to pay or receive interest, such as an exchange of fixed-rate payments for floating rate payments. Mortgage swaps are similar to interest rate swaps in
that they represent commitments to pay and receive interest. The notional principal amount, however, is tied to a reference pool or pools of mortgages. Credit swaps involve the receipt of floating or fixed rate payments in exchange for assuming potential
credit losses of an underlying security. Credit swaps give one party to a transaction the right to dispose of or acquire an asset (or group of assets), or the right to receive or make a payment from the other party, upon the occurrence of specified credit
events. Currency swaps involve the exchange of the parties’ respective rights to make or receive payments in specified currencies. The purchase of an interest rate cap entitles the purchaser, to the extent that a specified index exceeds a
predetermined interest
rate, to receive payment of interest on a notional principal amount from the party selling such interest rate cap. The purchase of an interest rate floor entitles the purchaser, to the extent that a specified index falls below a predetermined interest
rate, to receive payments of interest on a notional principal amount from the party selling the interest rate floor. An interest rate collar is the combination of a cap and a floor that preserves a certain return within a predetermined range of interest
rates.
|
| Certain Funds may enter into swap transactions for hedging purposes or to seek to increase total return. The use of interest rate,
mortgage, credit and currency swaps, as well as interest rate caps, floors and collars, is a highly specialized activity which involves investment techniques and risks different from those associated with ordinary portfolio securities transactions. If the
Investment Adviser is incorrect in its forecasts of market value, interest rates and currency exchange rates, the investment performance of a Fund would be less favorable than it would have been if these investment techniques were not used.
|
| Loan Participations. Certain Funds may invest in loan participations. A loan participation is an interest in a loan
to a U.S. or foreign company or other borrower which is administered and sold by a financial intermediary. A Fund may only invest in loans to issuers in whose obligations it may otherwise invest. Loan participation interests may take the form of a direct
or co-lending relationship with the corporate borrower, an assignment of an interest in the loan by a co-lender or another participant, or a participation in the seller’s share of the loan. When a Fund acts as co-lender in connection with a
participation interest or when it acquires certain participation interests, the Fund will have direct recourse against the borrower if the borrower fails to pay scheduled principal and interest. In cases where the Fund lacks direct recourse, it will look
to the agent bank to enforce appropriate credit remedies against the borrower. In these cases, the Fund may be subject to delays, expenses and risks that are greater than those that would have been involved if the Fund had purchased a direct obligation
(such as commercial paper) of such borrower. Moreover, under the terms of the loan participation, the Fund may be regarded as a creditor of the agent bank (rather than of the underlying corporate borrower), so that the Fund may also be subject to the risk
that the agent bank may become insolvent.
|
| Inverse Floaters. Certain Funds may invest in inverse floating rate debt securities (“inverse floaters”).
The interest rate on inverse floaters resets in the opposite direction from the market rate of interest to which the inverse floater is indexed. An inverse floater may be considered to be leveraged to the extent that its interest rate varies by a
magnitude that exceeds the magnitude of the change in the index rate of interest. The higher the degree of leverage of an inverse floater, the greater the volatility of its market value.
|
| The financial highlights tables are intended to help you understand a Fund’s financial performance for the past five years
(or less if the Fund has not been in operation for less than five years). Certain information reflects financial results for a single Fund share. The total returns in the table represent the rate that an investor would have earned or lost on an investment
in a Fund (assuming reinvestment of all dividends and distributions). This information for the periods ended August 31, 2000 has been audited by PricewaterhouseCoopers LLP, whose report, along with a Fund’s financial statements, is included in the
Fund’s annual report (available upon request). The information for all periods prior to the periods ended August 31, 2000 has been audited by the Funds’ previous independent accountants.
|
| BALANCED FUND
|
|
Income from investment operations |
|||||||||||
|---|---|---|---|---|---|---|---|---|---|---|---|
|
Net asset value, beginning of period |
Net
investment Income |
Net realized
and unrealized gain (loss) |
Total from
investment operations |
||||||||
| For The Year Ended August 31, | |||||||||||
| 2000 - Class A Shares | $20.38 | $0.60 | c | $ 1.75 | $2.35 | ||||||
| 2000 - Class B Shares | 20.26 | 0.45 | c | 1.73 | 2.18 | ||||||
| 2000 - Class C Shares | 20.23 | 0.45 | c | 1.74 | 2.19 | ||||||
| 2000 - Institutional Shares | 20.39 | 0.71 | c | 1.75 | 2.46 | ||||||
| 2000 - Service Shares | 20.37 | 0.59 | c | 1.74 | 2.33 | ||||||
| For The Seven Months Ended August 31, | |||||||||||
| 1999 - Class A Shares | 20.48 | 0.32 | (0.19 | ) | 0.13 | ||||||
| 1999 - Class B Shares | 20.37 | 0.22 | (0.18 | ) | 0.04 | ||||||
| 1999 - Class C Shares | 20.34 | 0.23 | (0.19 | ) | 0.04 | ||||||
| 1999 - Institutional Shares | 20.48 | 0.53 | (0.35 | ) | 0.18 | ||||||
| 1999 - Service Shares | 20.47 | 1.22 | (1.14 | ) | 0.08 | ||||||
| For The Years Ended January 31, | |||||||||||
| 1999 - Class A Shares | 20.29 | 0.58 | 0.20 | 0.78 | |||||||
| 1999 - Class B Shares | 20.20 | 0.41 | 0.21 | 0.62 | |||||||
| 1999 - Class C Shares | 20.17 | 0.41 | 0.21 | 0.62 | |||||||
| 1999 - Institutional Shares | 20.29 | 0.64 | 0.20 | 0.84 | |||||||
| 1999 - Service Shares | 20.28 | 0.53 | 0.21 | 0.74 | |||||||
| 1998 - Class A Shares | 18.78 | 0.57 | 2.66 | 3.23 | |||||||
| 1998 - Class B Shares | 18.73 | 0.50 | 2.57 | 3.07 | |||||||
| 1998 - Class C Shares (commenced August 15, 1997) | 21.10 | 0.25 | 0.24 | 0.49 | |||||||
| 1998 - Institutional Shares (commenced August 15, 1997) | 21.18 | 0.26 | 0.32 | 0.58 | |||||||
| 1998 - Service Shares (commenced August 15, 1997) | 21.18 | 0.22 | 0.32 | 0.54 | |||||||
| 1997 - Class A Shares | 17.31 | 0.66 | 2.47 | 3.13 | |||||||
| 1997 - Class B Shares (commenced May 1, 1996) | 17.46 | 0.42 | 2.34 | 2.76 | |||||||
| 1996 - Class A Shares | 14.22 | 0.51 | 3.43 | 3.94 | |||||||
|
Distributions to shareholders |
|||||||||||||||||||||
|---|---|---|---|---|---|---|---|---|---|---|---|---|---|---|---|---|---|---|---|---|---|
| From net
investment income |
In excess of net investment income |
From net
realized gains |
Total
distributions |
Net asset
value, end of period |
Total
return a |
Net assets
at end of period (in 000s) |
Ratio of
net expenses to average net assets |
||||||||||||||
| $(0.50 | ) | $ — | $(0.81 | ) | $(1.31 | ) | $21.42 | 12.00 | % | $135,632 | 1.12 | % | |||||||||
| (0.36 | ) | — | (0.81 | ) | (1.17 | ) | 21.27 | 11.17 | 33,759 | 1.87 | |||||||||||
| (0.36 | ) | — | (0.81 | ) | (1.17 | ) | 21.25 | 11.23 | 8,658 | 1.87 | |||||||||||
| (0.58 | ) | — | (0.81 | ) | (1.39 | ) | 21.46 | 12.59 | 2,509 | 0.72 | |||||||||||
| (0.48 | ) | — | (0.81 | ) | (1.29 | ) | 21.41 | 11.89 | 17 | 1.22 | |||||||||||
| (0.23 | ) | — | — | (0.23 | ) | 20.38 | 0.62 | 169,395 | 1.10 | b | |||||||||||
| (0.15 | ) | — | — | (0.15 | ) | 20.26 | 0.20 | 40,515 | 1.85 | b | |||||||||||
| (0.15 | ) | — | — | (0.15 | ) | 20.23 | 0.18 | 11,284 | 1.85 | b | |||||||||||
| (0.27 | ) | — | — | (0.27 | ) | 20.39 | 0.86 | 2,361 | 0.70 | b | |||||||||||
| (0.18 | ) | — | — | (0.18 | ) | 20.37 | 0.39 | 15 | 1.20 | b | |||||||||||
| (0.59 | ) | — | — | (0.59 | ) | 20.48 | 3.94 | 192,453 | 1.04 | ||||||||||||
| (0.45 | ) | — | — | (0.45 | ) | 20.37 | 3.15 | 43,926 | 1.80 | ||||||||||||
| (0.45 | ) | — | — | (0.45 | ) | 20.34 | 3.14 | 14,286 | 1.80 | ||||||||||||
| (0.65 | ) | — | — | (0.65 | ) | 20.48 | 4.25 | 8,010 | 0.73 | ||||||||||||
| (0.55 | ) | — | — | (0.55 | ) | 20.47 | 3.80 | 490 | 1.23 | ||||||||||||
| (0.56 | ) | — | (1.16 | ) | (1.72 | ) | 20.29 | 17.54 | 163,636 | 1.00 | |||||||||||
| (0.42 | ) | (0.02 | ) | (1.16 | ) | (1.60 | ) | 20.20 | 16.71 | 23,639 | 1.76 | ||||||||||
| (0.22 | ) | (0.04 | ) | (1.16 | ) | (1.42 | ) | 20.17 | 2.49 | 8,850 | 1.77 | b | |||||||||
| (0.23 | ) | (0.08 | ) | (1.16 | ) | (1.47 | ) | 20.29 | 2.93 | 8,367 | 0.76 | b | |||||||||
| (0.22 | ) | (0.06 | ) | (1.16 | ) | (1.44 | ) | 20.28 | 2.66 | 16 | 1.26 | b | |||||||||
| (0.66 | ) | — | (1.00 | ) | (1.66 | ) | 18.78 | 18.59 | 81,410 | 1.00 | |||||||||||
| (0.42 | ) | (0.07 | ) | (1.00 | ) | (1.49 | ) | 18.73 | 16.22 | 2,110 | 1.75 | b | |||||||||
| (0.50 | ) | — | (0.35 | ) | (0.85 | ) | 17.31 | 28.10 | 50,928 | 1.00 | |||||||||||
| BALANCED FUND (continued)
|
|
Ratios assuming no expense reductions |
|||||||||||||
|---|---|---|---|---|---|---|---|---|---|---|---|---|---|
| Ratio of
net investment income to average net assets |
Ratio of
expenses to average net assets |
Ratio of
net investment income to average net assets |
Portfolio
turnover rated |
||||||||||
| For The Year Ended August 31, | |||||||||||||
| 2000 - Class A Shares | 2.94 | % | 1.29 | % | 2.77 | % | 153.69 | % | |||||
| 2000 - Class B Shares | 2.19 | 2.04 | 2.02 | 153.69 | |||||||||
| 2000 - Class C Shares | 2.19 | 2.04 | 2.02 | 153.69 | |||||||||
| 2000 - Institutional Shares | 3.46 | 0.89 | 3.29 | 153.69 | |||||||||
| 2000 - Service Shares | 2.86 | 1.39 | 2.69 | 153.69 | |||||||||
| For The Seven Months Ended August 31, | |||||||||||||
| 1999 - Class A Shares | 2.58 | b | 1.32 | b | 2.36 | b | 90.41 | ||||||
| 1999 - Class B Shares | 1.83 | b | 2.07 | b | 1.61 | b | 90.41 | ||||||
| 1999 - Class C Shares | 1.84 | b | 62.07 | b | 1.62 | b | 90.41 | ||||||
| 1999 - Institutional Shares | 2.96 | b | 60.92 | b | 2.74 | b | 90.41 | ||||||
| 1999 - Service Shares | 2.46 | b | 1.42 | b | 2.24 | b | 90.41 | ||||||
| For The Years Ended January 31, | |||||||||||||
| 1999 - Class A Shares | 2.90 | 1.45 | 2.49 | 175.06 | |||||||||
| 1999 - Class B Shares | 2.16 | 2.02 | 1.94 | 175.06 | |||||||||
| 1999 - Class C Shares | 2.17 | 2.02 | 1.95 | 175.06 | |||||||||
| 1999 - Institutional Shares | 3.22 | 0.95 | 3.00 | 175.06 | |||||||||
| 1999 - Service Shares | 2.77 | 1.45 | 2.55 | 175.06 | |||||||||
| 1998 - Class A Shares | 2.94 | 1.57 | 2.37 | 190.43 | |||||||||
| 1998 - Class B Shares | 2.14 | 2.07 | 1.83 | 190.43 | |||||||||
| 1998 - Class C Shares (commenced August 15, 1997) | 2.13 | b | 2.08 | b | 1.82 | b | 190.43 | ||||||
| 1998 - Institutional Shares (commenced August 15, 1997) | 3.13 | b | 1.07 | b | 2.82 | b | 190.43 | ||||||
| 1998 - Service Shares (commenced August 15, 1997) | 2.58 | b | 1.57 | b | 2.27 | b | 190.43 | ||||||
| 1997 - Class A Shares | 3.76 | 1.77 | 2.99 | 208.11 | |||||||||
| 1997 - Class B Shares (commenced May 1, 1996) | 2.59 | b | 2.27 | b | 2.07 | b | 208.11 | ||||||
| 1996 - Class A Shares | 3.65 | 1.90 | 2.75 | 197.10 | |||||||||
| GROWTH AND INCOME FUND
|
|
Income from investment operations |
||||||||||||
|---|---|---|---|---|---|---|---|---|---|---|---|---|
|
Net asset value, beginning of period |
Net
investment income (loss) |
Net realized
and unrealized gain (loss) |
Total from
investment operations |
|||||||||
| For The Year Ended August 31, | ||||||||||||
| 2000 - Class A Shares | $24.68 | $ 0.07 | c | $1.44 | $1.51 | |||||||
| 2000 - Class B Shares | 24.46 | (0.10 | ) c | 1.42 | 1.32 | |||||||
| 2000 - Class C Shares | 24.41 | (0.09 | ) c | 1.40 | 1.31 | |||||||
| 2000 - Institutional Shares | 24.72 | 0.16 | c | 1.49 | 1.65 | |||||||
| 2000 - Service Shares | 24.68 | 0.05 | c | 1.44 | 1.49 | |||||||
| For The Seven Months Ended August 31, | ||||||||||||
| 1999 - Class A Shares | 24.33 | 0.19 | 0.31 | 0.50 | ||||||||
| 1999 - Class B Shares | 24.13 | 0.08 | 0.31 | 0.39 | ||||||||
| 1999 - Class C Shares | 24.08 | 0.08 | 0.30 | 0.38 | ||||||||
| 1999 - Institutional Shares | 24.35 | 0.34 | 0.23 | 0.57 | ||||||||
| 1999 - Service Shares | 24.33 | 0.17 | 0.32 | 0.49 | ||||||||
| For The Years Ended January 31, | ||||||||||||
| 1999 - Class A Shares | 25.93 | 0.20 | (1.60 | ) | (1.40 | ) | ||||||
| 1999 - Class B Shares | 25.73 | 0.02 | (1.58 | ) | (1.56 | ) | ||||||
| 1999 - Class C Shares | 25.70 | 0.02 | (1.59 | ) | (1.57 | ) | ||||||
| 1999 - Institutional Shares | 25.95 | 0.29 | (1.58 | ) | (1.29 | ) | ||||||
| 1999 - Service Shares | 25.92 | 0.17 | (1.58 | ) | (1.41 | ) | ||||||
| 1998 - Class A Shares | 23.18 | 0.11 | 5.27 | 5.38 | ||||||||
| 1998 - Class B Shares | 23.10 | 0.04 | 5.14 | 5.18 | ||||||||
| 1998 - Class C Shares (commenced August 15, 1997) | 28.20 | (0.01 | ) | 0.06 | 0.05 | |||||||
| 1998 - Institutional Shares | 23.19 | 0.27 | 5.23 | 5.50 | ||||||||
| 1998 - Service Shares | 23.17 | 0.14 | 5.23 | 5.37 | ||||||||
| 1997 - Class A Shares | 19.98 | 0.35 | 5.18 | 5.53 | ||||||||
| 1997 - Class B Shares (commenced May 1, 1996) | 20.82 | 0.17 | 4.31 | 4.48 | ||||||||
| 1997 - Institutional Shares (commenced June 3, 1996) | 21.25 | 0.29 | 3.96 | 4.25 | ||||||||
| 1997 - Service Shares (commenced March 6, 1996) | 20.71 | 0.28 | 4.50 | 4.78 | ||||||||
| 1996 - Class A Shares | 15.80 | 0.33 | 4.75 | 5.08 | ||||||||
|
Distributions to shareholders |
|||||||||||||||||||||
|---|---|---|---|---|---|---|---|---|---|---|---|---|---|---|---|---|---|---|---|---|---|
| From net
investment income |
In excess of net investment income |
From net
realized gains |
Total
distributions |
Net asset
value, end of period |
Total
returna |
Net assets
at end of period (in 000s) |
Ratio of
net expenses to average net assets |
||||||||||||||
| $(0.05 | ) | $(0.03 | ) | $(1.33 | ) | $(1.41 | ) | $24.78 | 6.48 | % | $ 576,354 | 1.18 | % | ||||||||
| (0.02 | ) | (0.01 | ) | (1.33 | ) | (1.36 | ) | 24.42 | 5.70 | 155,527 | 1.93 | ||||||||||
| (0.01 | ) | (0.01 | ) | (1.33 | ) | (1.35 | ) | 24.37 | 5.67 | 15,746 | 1.93 | ||||||||||
| (0.09 | ) | (0.04 | ) | (1.33 | ) | (1.46 | ) | 24.91 | 7.05 | 28,543 | 0.78 | ||||||||||
| (0.05 | ) | (0.02 | ) | (1.33 | ) | (1.40 | ) | 24.77 | 6.40 | 7,926 | 1.28 | ||||||||||
| (0.15 | ) | — | — | (0.15 | ) | 24.68 | 2.05 | 855,174 | 1.19 | b | |||||||||||
| (0.06 | ) | — | — | (0.06 | ) | 24.46 | 1.60 | 271,912 | 1.94 | b | |||||||||||
| (0.05 | ) | — | — | (0.05 | ) | 24.41 | 1.58 | 31,328 | 1.94 | b | |||||||||||
| (0.20 | ) | — | — | (0.20 | ) | 24.72 | 2.32 | 32,181 | 0.79 | b | |||||||||||
| (0.14 | ) | — | — | (0.14 | ) | 24.68 | 2.01 | 10,008 | 1.29 | b | |||||||||||
| (0.19 | ) | (0.01 | ) | — | (0.20 | ) | 24.33 | (5.40 | ) | 1,122,157 | 1.22 | ||||||||||
| (0.04 | ) | — | — | (0.04 | ) | 24.13 | (6.07 | ) | 349,662 | 1.92 | |||||||||||
| (0.05 | ) | — | — | (0.05 | ) | 24.08 | (6.12 | ) | 48,146 | 1.92 | |||||||||||
| (0.30 | ) | (0.01 | ) | — | (0.31 | ) | 24.35 | (5.00 | ) | 173,696 | 0.80 | ||||||||||
| (0.17 | ) | (0.01 | ) | — | (0.18 | ) | 24.33 | (5.44 | ) | 11,943 | 1.30 | ||||||||||
| (0.11 | ) | — | (2.52 | ) | (2.63 | ) | 25.93 | 23.71 | 1,216,582 | 1.25 | |||||||||||
| — | (0.03 | ) | (2.52 | ) | (2.55 | ) | 25.73 | 22.87 | 307,815 | 1.94 | |||||||||||
| — | (0.03 | ) | (2.52 | ) | (2.55 | ) | 25.70 | 0.51 | 31,686 | 1.99 | b | ||||||||||
| (0.22 | ) | — | (2.52 | ) | (2.74 | ) | 25.95 | 24.24 | 36,225 | 0.83 | |||||||||||
| (0.06 | ) | (0.04 | ) | (2.52 | ) | (2.62 | ) | 25.92 | 23.63 | 8,893 | 1.32 | ||||||||||
| (0.35 | ) | (0.01 | ) | (1.97 | ) | (2.33 | ) | 23.18 | 28.42 | 615,103 | 1.22 | ||||||||||
| (0.17 | ) | (0.06 | ) | (1.97 | ) | (2.20 | ) | 23.10 | 22.23 | 17,346 | 1.93 | b | |||||||||
| (0.30 | ) | (0.04 | ) | (1.97 | ) | (2.31 | ) | 23.19 | 20.77 | 193 | 0.82 | b | |||||||||
| (0.28 | ) | (0.07 | ) | (1.97 | ) | (2.32 | ) | 23.17 | 23.87 | 3,174 | 1.32 | b | |||||||||
| (0.30 | ) | — | (0.60 | ) | (0.90 | ) | 19.98 | 32.45 | 436,757 | 1.20 | |||||||||||
| GROWTH AND INCOME FUND (continued)
|
|
Ratios assuming no expense reductions |
|||||||||||||
|---|---|---|---|---|---|---|---|---|---|---|---|---|---|
| Ratio of
net investment income (loss) to average net assets |
Ratio of
expenses to average net assets |
Ratio of
net investment income (loss) to average net assets |
Portfolio
turnover rate |
||||||||||
| For The Year Ended August 31, | |||||||||||||
| 2000 - Class A Shares | 0.31 | % | 1.18 | % | 0.31 | % | 86.84 | % | |||||
| 2000 - Class B Shares | (0.41 | ) | 1.93 | (0.41 | ) | 86.84 | |||||||
| 2000 - Class C Shares | (0.40 | ) | 1.93 | (0.40 | ) | 86.84 | |||||||
| 2000 - Institutional Shares | 0.69 | 0.78 | 0.69 | 86.84 | |||||||||
| 2000 - Service Shares | 0.20 | 1.28 | 0.20 | 86.84 | |||||||||
| For The Seven Months Ended August 31, | |||||||||||||
| 1999 - Class A Shares | 1.26 | b | 1.20 | b | 1.25 | b | 55.43 | ||||||
| 1999 - Class B Shares | 0.51 | b | 1.95 | b | 0.50 | b | 55.43 | ||||||
| 1999 - Class C Shares | 0.51 | b | 1.95 | b | 0.50 | b | 55.43 | ||||||
| 1999 - Institutional Shares | 1.72 | b | 0.80 | b | 1.71 | b | 55.43 | ||||||
| 1999 - Service Shares | 1.16 | b | 1.30 | b | 1.15 | b | 55.43 | ||||||
| For The Years Ended January 31, | |||||||||||||
| 1999 - Class A Shares | 0.78 | 1.32 | 0.68 | 125.79 | |||||||||
| 1999 - Class B Shares | 0.09 | 1.92 | 0.09 | 125.79 | |||||||||
| 1999 - Class C Shares | 0.10 | 1.92 | 0.10 | 125.79 | |||||||||
| 1999 - Institutional Shares | 1.25 | 0.80 | 1.25 | 125.79 | |||||||||
| 1999 - Service Shares | 0.72 | 1.30 | 0.72 | 125.79 | |||||||||
| 1998 - Class A Shares | 0.43 | 1.42 | 0.26 | 61.95 | |||||||||
| 1998 - Class B Shares | (0.35 | ) | 1.94 | (0.35 | ) | 61.95 | |||||||
| 1998 - Class C Shares (commenced August 15, 1997) | (0.48 | ) b | 1.99 | b | (0.48 | ) b | 61.95 | ||||||
| 1998 - Institutional Shares | 0.76 | 0.83 | 0.76 | 61.95 | |||||||||
| 1998 - Service Shares | 0.32 | 1.32 | 0.32 | 61.95 | |||||||||
| 1997 - Class A Shares | 1.60 | 1.43 | 1.39 | 53.03 | |||||||||
| 1997 - Class B Shares (commenced May 1, 1996) | 0.15 | b | 1.93 | b | 0.15 | b | 53.03 | ||||||
| 1997 - Institutional Shares (commenced June 3, 1996) | 1.36 | b | 0.82 | b | 1.36 | b | 53.03 | ||||||
| 1997 - Service Shares (commenced March 6, 1996) | 0.94 | b | 1.32 | b | 0.94 | b | 53.03 | ||||||
| 1996 - Class A Shares | 1.67 | 1.45 | 1.42 | 57.93 | |||||||||
| CORE LARGE CAP VALUE FUND
|
|
Income from investment operations |
||||||||||||
|---|---|---|---|---|---|---|---|---|---|---|---|---|
| Net asset
value, beginning of period |
Net
investment income |
Net realized
and unrealized gain |
Total from
investment operations |
|||||||||
| For the Year Ended August 31, | ||||||||||||
| 2000 - Class A Shares | $10.55 | $0.12 | c | $0.36 | $0.48 | |||||||
| 2000 - Class B Shares | 10.50 | 0.05 | c | 0.36 | 0.41 | |||||||
| 2000 - Class C Shares | 10.51 | 0.04 | c | 0.37 | 0.41 | |||||||
| 2000 - Institutional Shares | 10.55 | 0.16 | c | 0.37 | 0.53 | |||||||
| 2000 - Service Shares | 10.55 | 0.11 | c | 0.36 | 0.47 | |||||||
| For the Seven-Month Period Ended August 31, | ||||||||||||
| 1999 - Class A Shares | 10.15 | 0.04 | 0.40 | 0.44 | ||||||||
| 1999 - Class B Shares | 10.15 | 0.01 | 0.36 | 0.37 | ||||||||
| 1999 - Class C Shares | 10.15 | 0.01 | 0.37 | 0.38 | ||||||||
| 1999 - Institutional Shares | 10.16 | 0.06 | 0.38 | 0.44 | ||||||||
| 1999 - Service Shares | 10.16 | 0.02 | 0.40 | 0.42 | ||||||||
| For the Period Ended January 31, | ||||||||||||
| 1999 - Class A Shares (commenced December 31, 1998) | 10.00 | 0.01 | 0.14 | 0.15 | ||||||||
| 1999 - Class B Shares (commenced December 31, 1998) | 10.00 | — | 0.15 | 0.15 | ||||||||
| 1999 - Class C Shares (commenced December 31, 1998) | 10.00 | — | 0.15 | 0.15 | ||||||||
| 1999 - Institutional Shares (commenced December 31, 1998) | 10.00 | 0.01 | 0.15 | 0.16 | ||||||||
| 1999 - Service Shares (commenced December 31, 1998) | 10.00 | 0.02 | 0.14 | 0.16 | ||||||||
|
Distributions to shareholders |
|||||||||||||||||||||
|---|---|---|---|---|---|---|---|---|---|---|---|---|---|---|---|---|---|---|---|---|---|
| From net
investment income |
From net
realized gains |
Total
distributions |
Net asset
value, end of period |
Total
returna |
Net assets
at end of period (in 000s) |
Ratio of
net expenses to average net assets |
Ratio of
net investment income to average net assets |
||||||||||||||
| $(0.10 | ) | $(0.12 | ) | $(0.22 | ) | $10.81 | 4.68 | % | $100,972 | 1.06 | % | 1.14 | % | ||||||||
| (0.04 | ) | (0.12 | ) | (0.16 | ) | 10.75 | 3.96 | 19,069 | 1.81 | 0.44 | |||||||||||
| (0.04 | ) | (0.12 | ) | (0.16 | ) | 10.76 | 3.97 | 11,178 | 1.81 | 0.45 | |||||||||||
| (0.14 | ) | (0.12 | ) | (0.26 | ) | 10.82 | 5.20 | 175,493 | 0.66 | 1.54 | |||||||||||
| (0.09 | ) | (0.12 | ) | (0.21 | ) | 10.81 | 4.60 | 12 | 1.16 | 1.07 | |||||||||||
| (0.04 | ) | — | (0.04 | ) | 10.55 | 4.31 | 91,072 | 1.04 | b | 0.87 | b | ||||||||||
| (0.02 | ) | — | (0.02 | ) | 10.50 | 3.68 | 14,464 | 1.79 | b | 0.05 | b | ||||||||||
| (0.02 | ) | — | (0.02 | ) | 10.51 | 3.73 | 8,032 | 1.79 | b | 0.09 | b | ||||||||||
| (0.05 | ) | — | (0.05 | ) | 10.55 | 4.35 | 189,540 | 0.64 | b | 1.29 | b | ||||||||||
| (0.03 | ) | — | (0.03 | ) | 10.55 | 4.11 | 13 | 1.14 | b | 0.72 | b | ||||||||||
| — | — | — | 10.15 | 1.50 | 6,665 | 1.08 | b | 1.45 | b | ||||||||||||
| — | — | — | 10.15 | 1.50 | 340 | 1.82 | b | 0.84 | b | ||||||||||||
| — | — | — | 10.15 | 1.50 | 268 | 1.83 | b | 0.70 | b | ||||||||||||
| — | — | — | 10.16 | 1.60 | 53,396 | 0.66 | b | 1.97 | b | ||||||||||||
| — | — | — | 10.16 | 1.60 | 2 | 1.16 | b | 2.17 | b | ||||||||||||
| CORE LARGE CAP VALUE FUND (continued)
|
|
Ratios assuming no expense reductions |
||||||||||
|---|---|---|---|---|---|---|---|---|---|---|
| Ratio of
expenses to average net assets |
Ratio of
net investment income (loss) to average net assets |
Portfolio
turnover rate |
||||||||
| For the Year Ended August 31, | ||||||||||
| 2000 - Class A Shares | 1.17 | % | 1.03 | % | 83.30 | % | ||||
| 2000 - Class B Shares | 1.92 | 0.33 | 83.30 | |||||||
| 2000 - Class C Shares | 1.92 | 0.34 | 83.30 | |||||||
| 2000 - Institutional Shares | 0.77 | 1.43 | 83.30 | |||||||
| 2000 - Service Shares | 1.27 | 0.96 | 83.30 | |||||||
| For the Seven-Month Period Ended August 31, | ||||||||||
| 1999 - Class A Shares | 1.21 | b | 0.70 | b | 36.10 | |||||
| 1999 - Class B Shares | 1.96 | b | (0.12 | ) b | 36.10 | |||||
| 1999 - Class C Shares | 1.96 | b | (0.08 | ) b | 36.10 | |||||
| 1999 - Institutional Shares | 0.81 | b | 1.12 | b | 36.10 | |||||
| 1999 - Service Shares | 1.31 | b | 0.55 | b | 36.10 | |||||
| For the Period Ended January 31, | ||||||||||
| 1999 - Class A Shares (commenced December 31, 1998) | 8.03 | b | (5.50 | ) b | 0.00 | |||||
| 1999 - Class B Shares (commenced December 31, 1998) | 8.77 | b | (6.11 | ) b | 0.00 | |||||
| 1999 - Class C Shares (commenced December 31, 1998) | 8.78 | b | (6.25 | ) b | 0.00 | |||||
| 1999 - Institutional Shares (commenced December 31, 1998) | 7.61 | b | (4.98 | ) b | 0.00 | |||||
| 1999 - Service Shares (commenced December 31, 1998) | 8.11 | b | (4.78 | ) b | 0.00 | |||||
| CORE U.S. EQUITY FUND
|
|
Income from investment operations |
||||||||||
|---|---|---|---|---|---|---|---|---|---|---|
|
Net asset value, beginning of period |
Net
investment income (loss) |
Net realized
and unrealized gain |
Total from
investment operations |
|||||||
| For The Year Ended August 31, | ||||||||||
| 2000 - Class A Shares | $34.21 | $ 0.10 | c | $6.00 | $6.10 | |||||
| 2000 - Class B Shares | 33.56 | (0.14 | ) c | 5.83 | 5.69 | |||||
| 2000 - Class C Shares | 33.46 | (0.13 | ) c | 5.80 | 5.67 | |||||
| 2000 - Institutional Shares | 34.61 | 0.24 | c | 6.07 | 6.31 | |||||
| 2000 - Service Shares | 34.05 | 0.07 | c | 5.96 | 6.03 | |||||
| For The Seven-Month Period Ended August 31, | ||||||||||
| 1999 - Class A Shares | 32.98 | 0.03 | 1.20 | 1.23 | ||||||
| 1999 - Class B Shares | 32.50 | (0.11 | ) | 1.17 | 1.06 | |||||
| 1999 - Class C Shares | 32.40 | (0.10 | ) | 1.16 | 1.06 | |||||
| 1999 - Institutional Shares | 33.29 | 0.11 | 1.21 | 1.32 | ||||||
| 1999 - Service Shares | 32.85 | 0.01 | 1.19 | 1.20 | ||||||
| For The Years Ended January 31, | ||||||||||
| 1999 - Class A Shares | 26.59 | 0.04 | 7.02 | 7.06 | ||||||
| 1999 - Class B Shares | 26.32 | (0.10 | ) | 6.91 | 6.81 | |||||
| 1999 - Class C Shares | 26.24 | (0.10 | ) | 6.89 | 6.79 | |||||
| 1999 - Institutional Shares | 26.79 | 0.20 | 7.11 | 7.31 | ||||||
| 1999 - Service Shares | 26.53 | 0.06 | 7.01 | 7.07 | ||||||
| 1998 - Class A Shares | 23.32 | 0.11 | 5.63 | 5.74 | ||||||
| 1998 - Class B Shares | 23.18 | 0.11 | 5.44 | 5.55 | ||||||
| 1998 - Class C Shares (commenced August 15, 1997) | 27.48 | 0.03 | 1.22 | 1.25 | ||||||
| 1998 - Institutional Shares | 23.44 | 0.30 | 5.65 | 5.95 | ||||||
| 1998 - Service Shares | 23.27 | 0.19 | 5.57 | 5.76 | ||||||
| 1997 - Class A Shares | 19.66 | 0.16 | 4.46 | 4.62 | ||||||
| 1997 - Class B Shares (commenced May 1, 1996) | 20.44 | 0.04 | 3.70 | 3.74 | ||||||
| 1997 - Institutional Shares | 19.71 | 0.30 | 4.51 | 4.81 | ||||||
| 1997 - Service Shares (commenced June 7, 1996) | 21.02 | 0.13 | 3.15 | 3.28 | ||||||
| 1996 - Class A Shares | 14.61 | 0.19 | 5.43 | 5.62 | ||||||
| 1996 - Institutional Shares (commenced June 15, 1995) | 16.97 | 0.16 | 3.23 | 3.39 | ||||||
|
Distributions to shareholders |
||||||||||||||||||||||||
|---|---|---|---|---|---|---|---|---|---|---|---|---|---|---|---|---|---|---|---|---|---|---|---|---|
| From net
investment income |
In excess
of net investment income |
From net
realized gains |
Total
distributions |
Net asset
value, end of period |
Total
returna |
Net assets
at end of period (in 000s) |
Ratio of
net expenses to average net assets |
Ratio of
net investment income (loss) to average net assets |
||||||||||||||||
| $ — | $ — | $(3.54 | ) | $(3.54 | ) | $36.77 | 18.96 | % | $715,775 | 1.14 | % | 0.31 | % | |||||||||||
| — | — | (3.54 | ) | (3.54 | ) | 35.71 | 18.03 | 275,673 | 1.89 | (0.44 | ) | |||||||||||||
| — | — | (3.54 | ) | (3.54 | ) | 35.59 | 18.03 | 62,820 | 1.89 | (0.43 | ) | |||||||||||||
| (0.08 | ) | — | (3.54 | ) | (3.62 | ) | 37.30 | 19.41 | 379,172 | 0.74 | 0.71 | |||||||||||||
| — | — | (3.54 | ) | (3.54 | ) | 36.54 | 18.83 | 11,879 | 1.24 | 0.19 | ||||||||||||||
| — | — | — | — | 34.21 | 3.73 | 614,310 | 1.14 | b | 0.15 | b | ||||||||||||||
| — | — | — | — | 33.56 | 3.26 | 214,087 | 1.89 | b | (0.60 | ) b | ||||||||||||||
| — | — | — | — | 33.46 | 3.27 | 43,361 | 1.89 | b | (0.61 | ) b | ||||||||||||||
| — | — | — | — | 34.61 | 3.97 | 335,465 | 0.74 | b | 0.54 | b | ||||||||||||||
| — | — | — | — | 34.05 | 3.65 | 11,204 | 1.24 | b | 0.06 | b | ||||||||||||||
| (0.03 | ) | (0.01 | ) | (0.63 | ) | (0.67 | ) | 32.98 | 26.89 | 605,566 | 1.23 | 0.15 | ||||||||||||
| — | — | (0.63 | ) | (0.63 | ) | 32.50 | 26.19 | 152,347 | 1.85 | (0.50 | ) | |||||||||||||
| — | — | (0.63 | ) | (0.63 | ) | 32.40 | 26.19 | 26,912 | 1.87 | (0.53 | ) | |||||||||||||
| (0.15 | ) | (0.03 | ) | (0.63 | ) | (0.81 | ) | 33.29 | 27.65 | 307,200 | 0.69 | 0.69 | ||||||||||||
| (0.10 | ) | (0.02 | ) | (0.63 | ) | (0.75 | ) | 32.85 | 27.00 | 11,600 | 1.19 | 0.19 | ||||||||||||
| (0.12 | ) | — | (2.35 | ) | (2.47 | ) | 26.59 | 24.96 | 398,393 | 1.28 | 0.51 | |||||||||||||
| — | (0.06 | ) | (2.35 | ) | (2.41 | ) | 26.32 | 24.28 | 59,208 | 1.79 | (0.05 | ) | ||||||||||||
| — | (0.14 | ) | (2.35 | ) | (2.49 | ) | 26.24 | 4.85 | 6,267 | 1.78 | b | (0.21 | ) b | |||||||||||
| (0.24 | ) | (0.01 | ) | (2.35 | ) | (2.60 | ) | 26.79 | 25.76 | 202,893 | 0.65 | 1.16 | ||||||||||||
| (0.07 | ) | (0.08 | ) | (2.35 | ) | (2.50 | ) | 26.53 | 25.11 | 7,841 | 1.15 | 0.62 | ||||||||||||
| (0.16 | ) | — | (0.80 | ) | (0.96 | ) | 23.32 | 23.75 | 225,968 | 1.29 | 0.91 | |||||||||||||
| (0.04 | ) | (0.16 | ) | (0.80 | ) | (1.00 | ) | 23.18 | 18.59 | 17,258 | 1.83 | b | 0.06 | b | ||||||||||
| (0.28 | ) | — | (0.80 | ) | (1.08 | ) | 23.44 | 24.63 | 148,942 | 0.65 | 1.52 | |||||||||||||
| (0.13 | ) | (0.10 | ) | (0.80 | ) | (1.03 | ) | 23.27 | 15.92 | 3,666 | 1.15 | b | 0.69 | b | ||||||||||
| (0.16 | ) | — | (0.41 | ) | (0.57 | ) | 19.66 | 38.63 | 129,045 | 1.25 | 1.01 | |||||||||||||
| (0.24 | ) | — | (0.41 | ) | (0.65 | ) | 19.71 | 20.14 | 64,829 | 0.65 | b | 1.49 | b | |||||||||||
| CORE U.S. EQUITY FUND (continued)
|
|
Ratios assuming no expense reductions |
||||||||||
|---|---|---|---|---|---|---|---|---|---|---|
| Ratio of
expenses to average net assets |
Ratio of
net investment income (loss) to average net assets |
Portfolio
turnover rate |
||||||||
| For The Year Ended August 31, | ||||||||||
| 2000 - Class A Shares | 1.23 | % | 0.22 | % | 59.27 | % | ||||
| 2000 - Class B Shares | 1.98 | (0.53 | ) | 59.27 | ||||||
| 2000 - Class C Shares | 1.98 | (0.52 | ) | 59.27 | ||||||
| 2000 - Institutional Shares | 0.83 | 0.62 | 59.27 | |||||||
| 2000 - Service Shares | 1.33 | 0.10 | 59.27 | |||||||
| For The Seven-Month Period Ended August 31, | ||||||||||
| 1999 - Class A Shares | 1.24 | b | 0.05 | b | 41.84 | |||||
| 1999 - Class B Shares | 1.99 | b | (0.70 | ) b | 41.84 | |||||
| 1999 - Class C Shares | 1.99 | b | (0.71 | ) b | 41.84 | |||||
| 1999 - Institutional Shares | 0.84 | b | 0.44 | b | 41.84 | |||||
| 1999 - Service Shares | 1.34 | b | (0.04 | ) b | 41.84 | |||||
| For The Years Ended January 31, | ||||||||||
| 1999 - Class A Shares | 1.36 | 0.02 | 63.79 | |||||||
| 1999 - Class B Shares | 1.98 | (0.63 | ) | 63.79 | ||||||
| 1999 - Class C Shares | 2.00 | (0.66 | ) | 63.79 | ||||||
| 1999 - Institutional Shares | 0.82 | 0.56 | 63.79 | |||||||
| 1999 - Service Shares | 1.32 | 0.06 | 63.79 | |||||||
| 1998 - Class A Shares | 1.47 | 0.32 | 65.89 | |||||||
| 1998 - Class B Shares | 1.96 | (0.22 | ) | 65.89 | ||||||
| 1998 - Class C Shares (commenced August 15, 1997) | 1.95 | b | (0.38 | ) b | 65.89 | |||||
| 1998 - Institutional Shares | 0.82 | 0.99 | 65.89 | |||||||
| 1998 - Service Shares | 1.32 | 0.45 | 65.89 | |||||||
| 1997 - Class A Shares | 1.53 | 0.67 | 37.28 | |||||||
| 1997 - Class B Shares (commenced May 1, 1996) | 2.00 | b | (0.11 | ) b | 37.28 | |||||
| 1997 - Institutional Shares | 0.85 | 1.32 | 37.28 | |||||||
| 1997 - Service Shares (commenced June 7, 1996) | 1.35 | b | 0.49 | b | 37.28 | |||||
| 1996 - Class A Shares | 1.55 | 0.71 | 39.35 | |||||||
| 1996 - Institutional Shares (commenced June 15, 1995) | 0.96 | b | 1.18 | b | 39.35 | |||||
| CORE LARGE CAP GROWTH FUND
|
|
Income from investment operations |
||||||||||
|---|---|---|---|---|---|---|---|---|---|---|
|
Net asset value, beginning of period |
Net
investment income (loss) |
Net realized
and unrealized gain |
Total from
investment operations |
|||||||
| For the Year Ended August 31, | ||||||||||
| 2000 - Class A Shares | $17.02 | $ 0.06 | c | $5.67 | $5.73 | |||||
| 2000 - Class B Shares | 16.75 | (0.09 | ) c | 5.57 | 5.48 | |||||
| 2000 - Class C Shares | 16.75 | (0.08 | ) c | 5.57 | 5.49 | |||||
| 2000 - Institutional Shares | 17.10 | 0.13 | c | 5.73 | 5.86 | |||||
| 2000 - Service Shares | 16.95 | 0.03 | c | 5.66 | 5.69 | |||||
| For the Seven-Month Period Ended August 31, | ||||||||||
| 1999 - Class A Shares | 16.17 | (0.01 | ) | 0.86 | 0.85 | |||||
| 1999 - Class B Shares | 15.98 | (0.07 | ) | 0.84 | 0.77 | |||||
| 1999 - Class C Shares | 15.99 | (0.07 | ) | 0.83 | 0.76 | |||||
| 1999 - Institutional Shares | 16.21 | 0.03 | 0.86 | 0.89 | ||||||
| 1999 - Service Shares | 16.11 | (0.02 | ) | 0.86 | 0.84 | |||||
| For the Year Ended January 31, | ||||||||||
| 1999 - Class A Shares | 11.97 | 0.01 | 4.19 | 4.20 | ||||||
| 1999 - Class B Shares | 11.92 | (0.06 | ) | 4.12 | 4.06 | |||||
| 1999 - Class C Shares | 11.93 | (0.05 | ) | 4.11 | 4.06 | |||||
| 1999 - Institutional Shares | 11.97 | 0.02 | 4.23 | 4.25 | ||||||
| 1999 - Service Shares | 11.95 | (0.01 | ) | 4.17 | 4.16 | |||||
| For the Period Ended January 31, | ||||||||||
| 1998 - Class A Shares (commenced May 1, 1997) | 10.00 | 0.01 | 2.35 | 2.36 | ||||||
| 1998 - Class B Shares (commenced May 1, 1997) | 10.00 | (0.03 | ) | 2.33 | 2.30 | |||||
| 1998 - Class C Shares (commenced August 15, 1997) | 11.80 | (0.02 | ) | 0.54 | 0.52 | |||||
| 1998 - Institutional Shares (commenced May 1, 1997) | 10.00 | 0.01 | 2.35 | 2.36 | ||||||
| 1998 - Service Shares (commenced May 1, 1997) | 10.00 | (0.02 | ) | 2.35 | 2.33 | |||||
|
Distributions to Shareholders |
|||||||||||||||||||||
|---|---|---|---|---|---|---|---|---|---|---|---|---|---|---|---|---|---|---|---|---|---|
|
From Net Investment Income |
In excess
of net investment income |
From net
realized gains |
Total
distributions |
Net asset
value, end of period |
Total
returna |
Net assets
at end of period (in 000s) |
Ratio of
net expenses to average net assets |
||||||||||||||
| $ — | $ — | $(0.09 | ) | $(0.09 | ) | $22.66 | 33.73 | % | $545,763 | 1.09 | % | ||||||||||
| — | — | (0.09 | ) | (0.09 | ) | 22.14 | 32.78 | 338,128 | 1.84 | ||||||||||||
| — | — | (0.09 | ) | (0.09 | ) | 22.15 | 32.84 | 154,966 | 1.84 | ||||||||||||
| — | — | (0.09 | ) | (0.09 | ) | 22.87 | 34.34 | 322,900 | 0.69 | ||||||||||||
| — | — | (0.09 | ) | (0.09 | ) | 22.55 | 33.64 | 3,879 | 1.19 | ||||||||||||
| — | — | — | — | 17.02 | 5.26 | 300,684 | 1.04 | b | |||||||||||||
| — | — | — | — | 16.75 | 4.82 | 181,626 | 1.79 | b | |||||||||||||
| — | — | — | — | 16.75 | 4.75 | 75,502 | 1.79 | b | |||||||||||||
| — | — | — | — | 17.10 | 5.49 | 310,704 | 0.64 | b | |||||||||||||
| — | — | — | — | 16.95 | 5.21 | 2,510 | 1.14 | b | |||||||||||||
| — | — | — | — | 16.17 | 35.10 | 175,510 | 0.97 | ||||||||||||||
| — | — | — | — | 15.98 | 34.07 | 93,711 | 1.74 | ||||||||||||||
| — | — | — | — | 15.99 | 34.04 | 37,081 | 1.74 | ||||||||||||||
| — | (0.01 | ) | — | (0.01 | ) | 16.21 | 35.54 | 295,734 | 0.65 | ||||||||||||
| — | — | — | — | 16.11 | 34.85 | 1,663 | 1.15 | ||||||||||||||
| (0.01 | ) | — | (0.38 | ) | (0.39 | ) | 11.97 | 23.79 | 53,786 | 0.91 | b | ||||||||||
| — | — | (0.38 | ) | (0.38 | ) | 11.92 | 23.26 | 13,857 | 1.67 | b | |||||||||||
| — | (0.01 | ) | (0.38 | ) | (0.39 | ) | 11.93 | 4.56 | 4,132 | 1.68 | b | ||||||||||
| (0.01 | ) | — | (0.38 | ) | (0.39 | ) | 11.97 | 23.89 | 4,656 | 0.72 | b | ||||||||||
| — | — | (0.38 | ) | (0.38 | ) | 11.95 | 23.56 | 115 | 1.17 | b | |||||||||||
| CORE LARGE CAP GROWTH FUND (continued)
|
|
Ratios assuming no expense reductions |
|||||||||||||
|---|---|---|---|---|---|---|---|---|---|---|---|---|---|
| Ratio of
net investment income (loss) to average net assets |
Ratio of
expenses to average net assets |
Ratio of net
investment income (loss) to average net assets |
Portfolio
turnover rate |
||||||||||
| For the Year Ended August 31, | |||||||||||||
| 2000 - Class A Shares | 0.31 | % | 1.24 | % | 0.16 | % | 72.59 | % | |||||
| 2000 - Class B Shares | (0.44 | ) | 1.99 | (0.59 | ) | 72.59 | |||||||
| 2000 - Class C Shares | (0.43 | ) | 1.99 | (0.58 | ) | 72.59 | |||||||
| 2000 - Institutional Shares | 0.65 | 0.84 | 0.50 | 72.59 | |||||||||
| 2000 - Service Shares | 0.15 | 1.34 | — | 72.59 | |||||||||
| For the Seven-Month Period Ended August 31, | |||||||||||||
| 1999 - Class A Shares | (0.11 | ) b | 1.26 | b | (0.33 | ) b | 32.74 | ||||||
| 1999 - Class B Shares | (0.87 | ) b | 2.01 | b | (1.09 | ) b | 32.74 | ||||||
| 1999 - Class C Shares | (0.87 | ) b | 2.01 | b | (1.09 | ) b | 32.74 | ||||||
| 1999 - Institutional Shares | 0.31 | b | 0.86 | b | 0.09 | b | 32.74 | ||||||
| 1999 - Service Shares | (0.21 | ) b | 1.36 | b | (0.43 | ) b | 32.74 | ||||||
| For the Year Ended January 31, | |||||||||||||
| 1999 - Class A Shares | 0.05 | 1.46 | (0.44 | ) | 63.15 | ||||||||
| 1999 - Class B Shares | (0.73 | ) | 2.11 | (1.10 | ) | 63.15 | |||||||
| 1999 - Class C Shares | (0.74 | ) | 2.11 | (1.11 | ) | 63.15 | |||||||
| 1999 - Institutional Shares | 0.35 | 1.02 | (0.02 | ) | 63.15 | ||||||||
| 1999 - Service Shares | (0.16 | ) | 1.52 | (0.53 | ) | 63.15 | |||||||
| For the Period Ended January 31, | |||||||||||||
| 1998 - Class A Shares (commenced May 1, 1997) | 0.12 | b | 2.40 | b | (1.37 | ) b | 74.97 | ||||||
| 1998 - Class B Shares (commenced May 1, 1997) | (0.72 | ) b | 2.91 | b | (1.96 | ) b | 74.97 | ||||||
| 1998 - Class C Shares (commenced August 15, 1997) | (0.76 | ) b | 2.92 | b | (2.00 | ) b | 74.97 | ||||||
| 1998 - Institutional Shares (commenced May 1, 1997) | 0.42 | b | 1.96 | b | (0.82 | ) b | 74.97 | ||||||
| 1998 - Service Shares (commenced May 1, 1997) | (0.21 | ) b | 2.41 | b | (1.45 | ) b | 74.97 | ||||||
| CORE SMALL CAP EQUITY FUND
|
|
Income from investment operations |
||||||||||||
|---|---|---|---|---|---|---|---|---|---|---|---|---|
|
Net asset value, beginning of period |
Net
investment income (loss) |
Net
realized and unrealized gain (loss) |
Total from
investment operations |
|||||||||
| For the Year Ended August 31, | ||||||||||||
| 2000 - Class A Shares | $10.23 | $(0.03 | ) c | $2.70 | $2.67 | |||||||
| 2000 - Class B Shares | 10.09 | (0.11 | ) c | 2.65 | 2.54 | |||||||
| 2000 - Class C Shares | 10.10 | (0.10 | ) c | 2.66 | 2.56 | |||||||
| 2000 - Institutional Shares | 10.30 | 0.02 | c | 2.71 | 2.73 | |||||||
| 2000 - Service Shares | 10.22 | (0.04 | ) c | 2.69 | 2.65 | |||||||
| For the Seven-Month Period Ended August 31, | ||||||||||||
| 1999 - Class A Shares | 10.16 | (0.01 | ) | 0.08 | 0.07 | |||||||
| 1999 - Class B Shares | 10.07 | (0.05 | ) | 0.07 | 0.02 | |||||||
| 1999 - Class C Shares | 10.08 | (0.05 | ) | 0.07 | 0.02 | |||||||
| 1999 - Institutional Shares | 10.20 | 0.02 | 0.08 | 0.10 | ||||||||
| 1999 - Service Shares | 10.16 | (0.01 | ) | 0.07 | 0.06 | |||||||
| For the Year Ended January 31, | ||||||||||||
| 1999 - Class A Shares | 10.59 | 0.01 | (0.43 | ) | (0.42 | ) | ||||||
| 1999 - Class B Shares | 10.56 | (0.05 | ) | (0.44 | ) | (0.49 | ) | |||||
| 1999 - Class C Shares | 10.57 | (0.04 | ) | (0.45 | ) | (0.49 | ) | |||||
| 1999 - Institutional Shares | 10.61 | 0.04 | (0.43 | ) | (0.39 | ) | ||||||
| 1999 - Service Shares | 10.60 | 0.01 | (0.44 | ) | (0.43 | ) | ||||||
| For the Period Ended January 31, | ||||||||||||
| 1998 - Class A Shares (commenced August 15, 1997) | 10.00 | (0.01 | ) | 0.65 | 0.64 | |||||||
| 1998 - Class B Shares (commenced August 15, 1997) | 10.00 | (0.03 | ) | 0.64 | 0.61 | |||||||
| 1998 - Class C Shares (commenced August 15, 1997) | 10.00 | (0.02 | ) | 0.64 | 0.62 | |||||||
| 1998 - Institutional Shares (commenced August 15, 1997) | 10.00 | 0.01 | 0.65 | 0.66 | ||||||||
| 1998 - Service Shares (commenced August 15, 1997) | 10.00 | 0.01 | 0.64 | 0.65 | ||||||||
|
Distributions to Shareholders |
||||||||||||||||||
|---|---|---|---|---|---|---|---|---|---|---|---|---|---|---|---|---|---|---|
|
From net investment income |
From net realized gains |
Total
distributions |
Net asset
value, end of period |
Total
returna |
Net assets
at end of period (in 000s) |
Ratio of
net expenses to average net assets |
||||||||||||
| $ — | $ — | $ — | $12.90 | 26.10 | % | $54,954 | 1.33 | % | ||||||||||
| — | — | — | 12.63 | 25.17 | 17,923 | 2.08 | ||||||||||||
| — | — | — | 12.66 | 25.35 | 8,289 | 2.08 | ||||||||||||
| — | — | — | 13.03 | 26.60 | 86,196 | 0.93 | ||||||||||||
| — | — | — | 12.87 | 25.93 | 63 | 1.43 | ||||||||||||
| — | — | — | 10.23 | 0.69 | 52,660 | 1.33 | b | |||||||||||
| — | — | — | 10.09 | 0.20 | 13,711 | 2.08 | b | |||||||||||
| — | — | — | 10.10 | 0.20 | 6,274 | 2.08 | b | |||||||||||
| — | — | — | 10.30 | 0.98 | 62,633 | 0.93 | b | |||||||||||
| — | — | — | 10.22 | 0.59 | 64 | 1.43 | b | |||||||||||
| (0.01 | ) | — | (0.01 | ) | 10.16 | (3.97 | ) | 64,087 | 1.31 | |||||||||
| — | — | — | 10.07 | (4.64 | ) | 15,406 | 2.00 | |||||||||||
| — | — | — | 10.08 | (4.64 | ) | 6,559 | 2.01 | |||||||||||
| (0.02 | ) | — | (0.02 | ) | 10.20 | (3.64 | ) | 62,763 | 0.94 | |||||||||
| (0.01 | ) | — | (0.01 | ) | 10.16 | (4.07 | ) | 54 | 1.44 | |||||||||
| — | (0.05 | ) | (0.05 | ) | 10.59 | 6.37 | 11,118 | 1.25 | b | |||||||||
| — | (0.05 | ) | (0.05 | ) | 10.56 | 6.07 | 9,957 | 1.95 | b | |||||||||
| — | (0.05 | ) | (0.05 | ) | 10.57 | 6.17 | 2,557 | 1.95 | b | |||||||||
| — | (0.05 | ) | (0.05 | ) | 10.61 | 6.57 | 9,026 | 0.95 | b | |||||||||
| — | (0.05 | ) | (0.05 | ) | 10.60 | 6.47 | 2 | 1.45 | b | |||||||||
| CORE SMALL CAP EQUITY FUND (continued)
|
|
Ratios assuming no expense reductions |
|||||||||||||
|---|---|---|---|---|---|---|---|---|---|---|---|---|---|
| Ratio of net
investment income (loss) to average net assets |
Ratio of
expenses to average net assets |
Ratio of net
investment loss to average net assets |
Portfolio
turnover rate |
||||||||||
| For the Year Ended August 31, | |||||||||||||
| 2000 - Class A Shares | (0.21 | )% | 1.55 | % | (0.43 | ) | 135.36 | % | |||||
| 2000 - Class B Shares | (0.96 | ) | 2.30 | (1.18 | ) | 135.36 | |||||||
| 2000 - Class C Shares | (0.96 | ) | 2.30 | (1.18 | ) | 135.36 | |||||||
| 2000 - Institutional Shares | 0.19 | 1.15 | (0.03 | ) | 135.36 | ||||||||
| 2000 - Service Shares | (0.30 | ) | 1.65 | (0.52 | ) | 135.36 | |||||||
| For the Seven-Month Period Ended August 31, | |||||||||||||
| 1999 - Class A Shares | (0.12 | ) b | 1.67 | b | (0.46 | ) b | 52.03 | ||||||
| 1999 - Class B Shares | (0.86 | ) b | 2.42 | b | (1.20 | ) b | 52.03 | ||||||
| 1999 - Class C Shares | (0.86 | ) b | 2.42 | b | (1.20 | ) b | 52.03 | ||||||
| 1999 - Institutional Shares | 0.28 | b | 1.27 | b | (0.06 | ) b | 52.03 | ||||||
| 1999 - Service Shares | (0.22 | ) b | 1.77 | b | (0.56 | ) b | 52.03 | ||||||
| For the Year Ended January 31, | |||||||||||||
| 1999 - Class A Shares | 0.08 | 2.00 | (0.61 | ) | 75.38 | ||||||||
| 1999 - Class B Shares | (0.55 | ) | 2.62 | (1.17 | ) | 75.38 | |||||||
| 1999 - Class C Shares | (0.56 | ) | 2.63 | (1.18 | ) | 75.38 | |||||||
| 1999 - Institutional Shares | 0.60 | 1.56 | (0.02 | ) | 75.38 | ||||||||
| 1999 - Service Shares | 0.01 | 2.06 | (0.61 | ) | 75.38 | ||||||||
| For the Period Ended January 31, | |||||||||||||
| 1998 - Class A Shares (commenced August 15, 1997) | (0.36 | ) b | 3.92 | b | (3.03 | ) b | 37.65 | ||||||
| 1998 - Class B Shares (commenced August 15, 1997) | (1.04 | ) b | 4.37 | b | (3.46 | ) b | 37.65 | ||||||
| 1998 - Class C Shares (commenced August 15, 1997) | (1.07 | ) b | 4.37 | b | (3.49 | ) b | 37.65 | ||||||
| 1998 - Institutional Shares (commenced August 15, 1997) | 0.15 | b | 3.37 | b | (2.27 | ) b | 37.65 | ||||||
| 1998 - Service Shares (commenced August 15, 1997) | 0.40 | b | 3.87 | b | (2.02 | ) b | 37.65 | ||||||
| CAPITAL GROWTH FUND
|
|
Income from investment operations |
||||||||||
|---|---|---|---|---|---|---|---|---|---|---|
|
Net asset value, beginning of period |
Net
investment income (loss) |
Net realized
and unrealized gains |
Total
income from investment operations |
|||||||
| For the Year Ended August 31, | ||||||||||
| 2000 - Class A Shares | $24.96 | $(0.11 | ) c | $6.29 | $6.18 | |||||
| 2000 - Class B Shares | 24.37 | (0.30 | ) c | 6.11 | 5.81 | |||||
| 2000 - Class C Shares | 24.33 | (0.30 | ) c | 6.10 | 5.80 | |||||
| 2000 - Institutional Shares | 25.06 | — | 6.32 | 6.32 | ||||||
| 2000 - Service Shares | 24.88 | (0.13 | ) c | 6.25 | 6.12 | |||||
| For the Seven Months Ended August 31, | ||||||||||
| 1999 - Class A Shares | 24.03 | (0.08 | ) | 1.01 | 0.93 | |||||
| 1999 - Class B Shares | 23.57 | (0.17 | ) | 0.97 | 0.80 | |||||
| 1999 - Class C Shares | 23.52 | (0.16 | ) | 0.97 | 0.81 | |||||
| 1999 - Institutional Shares | 24.07 | (0.02 | ) | 1.01 | 0.99 | |||||
| 1999 - Service Shares | 23.96 | (0.08 | ) | 1.00 | 0.92 | |||||
| For the Years Ended January 31, | ||||||||||
| 1999 - Class A Shares | 18.48 | (0.03 | ) | 6.35 | 6.32 | |||||
| 1999 - Class B Shares | 18.27 | (0.12 | ) | 6.19 | 6.07 | |||||
| 1999 - Class C Shares | 18.24 | (0.10 | ) | 6.15 | 6.05 | |||||
| 1999 - Institutional Shares | 18.45 | 0.01 | 6.38 | 6.39 | ||||||
| 1999 - Service Shares | 18.46 | (0.04 | ) | 6.31 | 6.27 | |||||
| 1998 - Class A Shares | 16.73 | 0.02 | 4.78 | 4.80 | ||||||
| 1998 - Class B Shares | 16.67 | 0.02 | 4.61 | 4.63 | ||||||
| 1998 - Class C Shares (commenced August 15, 1997) | 19.73 | (0.02 | ) | 1.60 | 1.58 | |||||
| 1998 - Institutional Shares (commenced August 15, 1997) | 19.88 | 0.02 | 1.66 | 1.68 | ||||||
| 1998 - Service Shares (commenced August 15, 1997) | 19.88 | (0.01 | ) | 1.66 | 1.65 | |||||
| 1997 - Class A Shares | 14.91 | 0.10 | 3.56 | 3.66 | ||||||
| 1997 - Class B Shares (commenced May 1, 1996) | 15.67 | 0.01 | 2.81 | 2.82 | ||||||
| 1996 - Class A Shares | 13.67 | 0.12 | 3.93 | 4.05 | ||||||
|
Distributions to shareholders |
|||||||||||||||||||||
|---|---|---|---|---|---|---|---|---|---|---|---|---|---|---|---|---|---|---|---|---|---|
| From net
investment income |
In excess of net investment income |
From net
realized gain |
Total
distributions |
Net asset
value, end of period |
Total
returna |
Net assets
at end of period (in 000s) |
Ratio of
net expenses to average net assets |
||||||||||||||
| $ — | $ — | $(2.19 | ) | $(2.19 | ) | $28.95 | 25.70 | % | $2,736,484 | 1.45 | % | ||||||||||
| — | — | (2.19 | ) | (2.19 | ) | 27.99 | 24.75 | 451,666 | 2.20 | ||||||||||||
| — | — | (2.19 | ) | (2.19 | ) | 27.94 | 24.75 | 143,126 | 2.20 | ||||||||||||
| — | — | (2.19 | ) | (2.19 | ) | 29.19 | 26.18 | 497,986 | 1.05 | ||||||||||||
| — | — | (2.19 | ) | (2.19 | ) | 28.81 | 25.53 | 13,668 | 1.55 | ||||||||||||
| — | — | — | — | 24.96 | 3.87 | 1,971,097 | 1.44 | b | |||||||||||||
| — | — | — | — | 24.37 | 3.39 | 329,870 | 2.19 | b | |||||||||||||
| — | — | — | — | 24.33 | 3.44 | 87,284 | 2.19 | b | |||||||||||||
| — | — | — | — | 25.06 | 4.11 | 255,210 | 1.04 | b | |||||||||||||
| — | — | — | — | 24.88 | 3.84 | 6,466 | 1.54 | b | |||||||||||||
| — | — | (0.77 | ) | (0.77 | ) | 24.03 | 34.58 | 1,992,716 | 1.42 | ||||||||||||
| — | — | (0.77 | ) | (0.77 | ) | 23.57 | 33.60 | 236,369 | 2.19 | ||||||||||||
| — | — | (0.77 | ) | (0.77 | ) | 23.52 | 33.55 | 60,234 | 2.19 | ||||||||||||
| — | — | (0.77 | ) | (0.77 | ) | 24.07 | 35.02 | 41,817 | 1.07 | ||||||||||||
| — | — | (0.77 | ) | (0.77 | ) | 23.96 | 34.34 | 3,085 | 1.57 | ||||||||||||
| (0.01 | ) | (0.01 | ) | (3.03 | ) | (3.05 | ) | 18.48 | 29.71 | 1,256,595 | 1.40 | ||||||||||
| — | — | (3.03 | ) | (3.03 | ) | 18.27 | 28.73 | 40,827 | 2.18 | ||||||||||||
| — | (0.04 | ) | (3.03 | ) | (3.07 | ) | 18.24 | 8.83 | 5,395 | 2.21 | b | ||||||||||
| (0.01 | ) | (0.07 | ) | (3.03 | ) | (3.11 | ) | 18.45 | 9.31 | 7,262 | 1.16 | b | |||||||||
| — | (0.04 | ) | (3.03 | ) | (3.07 | ) | 18.46 | 9.18 | 2 | 1.50 | b | ||||||||||
| (0.10 | ) | (0.02 | ) | (1.72 | ) | (1.84 | ) | 16.73 | 25.97 | 920,646 | 1.40 | ||||||||||
| (0.01 | ) | (0.09 | ) | (1.72 | ) | (1.82 | ) | 16.67 | 19.39 | 3,221 | 2.15 | b | |||||||||
| (0.12 | ) | — | (2.69 | ) | (2.81 | ) | 14.91 | 30.45 | 881,056 | 1.36 | |||||||||||
| CAPITAL GROWTH FUND (continued)
|
|
Ratios assuming no expense reductions |
|||||||||||||
|---|---|---|---|---|---|---|---|---|---|---|---|---|---|
| Ratio of
net investment income (loss) to average net assets |
Ratio of
expenses to average net assets |
Ratio of
net investment income (loss) to average net assets |
Portfolio
turnover rate |
||||||||||
| For the Year Ended August 31, | |||||||||||||
| 2000 - Class A Shares | (0.41 | )% | 1.47 | % | (0.44 | )% | 34.03 | % | |||||
| 2000 - Class B Shares | (1.16 | ) | 2.22 | (1.19 | ) | 34.03 | |||||||
| 2000 - Class C Shares | (1.16 | ) | 2.22 | (1.19 | ) | 34.03 | |||||||
| 2000 - Institutional Shares | — | 1.07 | (0.03 | ) | 34.03 | ||||||||
| 2000 - Service Shares | (0.49 | ) | 1.57 | (0.52 | ) | 34.03 | |||||||
| For the Seven Months Ended August 31, | |||||||||||||
| 1999 - Class A Shares | (0.53 | ) b | 1.47 | b | (0.56 | ) b | 18.16 | ||||||
| 1999 - Class B Shares | (1.29 | ) b | 2.22 | b | (1.32 | ) b | 18.16 | ||||||
| 1999 - Class C Shares | (1.29 | ) b | 2.22 | b | (1.32 | ) b | 18.16 | ||||||
| 1999 - Institutional Shares | (0.20 | ) b | 1.07 | b | (0.23 | ) b | 18.16 | ||||||
| 1999 - Service Shares | (0.65 | ) b | 1.57 | b | (0.68 | ) b | 18.16 | ||||||
| For the Years Ended January 31, | |||||||||||||
| 1999 - Class A Shares | (0.18 | ) | 1.58 | (0.34 | ) | 30.17 | |||||||
| 1999 - Class B Shares | (0.98 | ) | 2.21 | (1.00 | ) | 30.17 | |||||||
| 1999 - Class C Shares | (1.00 | ) | 2.21 | (1.02 | ) | 30.17 | |||||||
| 1999 - Institutional Shares | 0.11 | 1.09 | 0.09 | 30.17 | |||||||||
| 1999 - Service Shares | (0.37 | ) | 1.59 | (0.39 | ) | 30.17 | |||||||
| 1998 - Class A Shares | 0.08 | 1.65 | (0.17 | ) | 61.50 | ||||||||
| 1998 - Class B Shares | (0.77 | ) | 2.18 | (0.77 | ) | 61.50 | |||||||
| 1998 - Class C Shares (commenced August 15, 1997) | (0.86 | ) b | 2.21 | b | (0.86 | ) b | 61.50 | ||||||
| 1998 - Institutional Shares (commenced August 15, 1997) | 0.18 | b | 1.16 | b | 0.18 | b | 61.50 | ||||||
| 1998 - Service Shares (commenced August 15, 1997) | (0.16 | ) b | 1.50 | b | (0.16 | ) b | 61.50 | ||||||
| 1997 - Class A Shares | 0.62 | 1.65 | 0.37 | 52.92 | |||||||||
| 1997 - Class B Shares (commenced May 1, 1996) | (0.39 | ) b | 2.15 | b | (0.39 | ) b | 52.92 | ||||||
| 1996 - Class A Shares | 0.65 | 1.61 | 0.40 | 63.90 | |||||||||
| STRATEGIC GROWTH FUND
|
|
Income from investment operations |
||||||||||
|---|---|---|---|---|---|---|---|---|---|---|
| Net asset
value, beginning of period |
Net
investment income (loss) |
Net
realized and unrealized gain |
Total
income from investment operations |
|||||||
| For The Year Ended August 31, | ||||||||||
| 2000 - Class A Shares | $10.06 | $(0.06 | ) c | $2.52 | $2.46 | |||||
| 2000 - Class B Shares | 10.04 | (0.14 | ) c | 2.50 | 2.36 | |||||
| 2000 - Class C Shares | 10.05 | (0.14 | ) c | 2.51 | 2.37 | |||||
| 2000 - Institutional Shares | 10.07 | (0.01 | ) c | 2.52 | 2.51 | |||||
| 2000 - Service Shares | 10.06 | (0.04 | ) c | 2.50 | 2.46 | |||||
| For The Period Ended August 31, | ||||||||||
| 1999 - Class A Shares (commenced May 24) | 10.00 | — | 0.06 | 0.06 | ||||||
| 1999 - Class B Shares (commenced May 24) | 10.00 | (0.03 | ) c | 0.07 | 0.04 | |||||
| 1999 - Class C Shares (commenced May 24) | 10.00 | (0.03 | ) c | 0.08 | 0.05 | |||||
| 1999 - Institutional Shares (commenced May 24) | 10.00 | 0.01 | 0.06 | 0.07 | ||||||
| 1999 - Service Shares (commenced May 24) | 10.00 | (0.01 | ) | 0.07 | 0.06 | |||||
|
|
||||||||||||
|---|---|---|---|---|---|---|---|---|---|---|---|---|
| Net asset
value, end of period |
Total
returna |
Net assets
at end of period (in 000s) |
Ratio of
net expenses to average net assets |
Ratio of
net investment income (loss) to average net assets |
||||||||
| $12.52 | 24.46 | % | $92,271 | 1.44 | % | (0.50 | )% | |||||
| 12.40 | 23.51 | 17,149 | 2.19 | (1.24 | ) | |||||||
| 12.42 | 23.58 | 7,287 | 2.19 | (1.24 | ) | |||||||
| 12.58 | 24.93 | 22,910 | 1.04 | (0.09 | ) | |||||||
| 12.52 | 24.45 | 2 | 1.54 | (0.35 | ) | |||||||
| 10.06 | 0.60 | 10,371 | 1.44 | b | (0.17 | ) b | ||||||
| 10.04 | 0.40 | 3,393 | 2.19 | b | (0.97 | ) b | ||||||
| 10.05 | 0.50 | 2,388 | 2.19 | b | (0.99 | ) b | ||||||
| 10.07 | 0.70 | 5,981 | 1.04 | b | 0.24 | b | ||||||
| 10.06 | 0.60 | 2 | 1.54 | b | (0.24 | ) b | ||||||
| STRATEGIC GROWTH FUND (continued)
|
|
Ratios assuming no expense reductions |
||||||||||
|---|---|---|---|---|---|---|---|---|---|---|
|
Ratio of expenses to average net assets |
Ratio of
net investment loss to average net assets |
Portfolio
turnover rate |
||||||||
| For The Year Ended August 31, | ||||||||||
| 2000 - Class A Shares | 1.63 | % | (0.69 | )% | 19.28 | % | ||||
| 2000 - Class B Shares | 2.38 | (1.43 | ) | 19.28 | ||||||
| 2000 - Class C Shares | 2.38 | (1.43 | ) | 19.28 | ||||||
| 2000 - Institutional Shares | 1.23 | (0.28 | ) | 19.28 | ||||||
| 2000 - Service Shares | 1.73 | (0.54 | ) | 19.28 | ||||||
| For The Period Ended August 31, | ||||||||||
| 1999 - Class A Shares (commenced May 24) | 11.70 | b | (10.43 | ) b | 6.98 | |||||
| 1999 - Class B Shares (commenced May 24) | 12.45 | b | (11.23 | ) b | 6.98 | |||||
| 1999 - Class C Shares (commenced May 24) | 12.45 | b | (11.25 | ) b | 6.98 | |||||
| 1999 - Institutional Shares (commenced May 24) | 11.30 | b | (10.02 | ) b | 6.98 | |||||
| 1999 - Service Shares (commenced May 24) | 11.80 | b | (10.50 | ) b | 6.98 | |||||
| GROWTH OPPORTUNITIES FUND
|
|
Income from investment operations |
||||||||
|---|---|---|---|---|---|---|---|---|
|
Net asset value, beginning of period |
Net
investment income (loss) |
Net realized
and unrealized gain |
||||||
| For the Year Ended August 31, | ||||||||
| 2000 - Class A Shares | $10.13 | $(0.11 | ) c | $9.71 | ||||
| 2000 - Class B Shares | 10.18 | (0.24 | ) c | 9.74 | ||||
| 2000 - Class C Shares | 10.10 | (0.24 | ) c | 9.68 | ||||
| 2000 - Institutional Shares | 10.13 | (0.04 | ) c | 9.73 | ||||
| 2000 - Service Shares | 10.12 | (0.12 | ) c | 9.68 | ||||
| For the Period Ended August 31, | ||||||||
| 1999 - Class A Shares (commenced May 24) | 10.00 | (0.01 | ) c | 0.14 | ||||
| 1999 - Class B Shares (commenced May 24) | 10.00 | (0.03 | ) c | 0.21 | ||||
| 1999 - Class C Shares (commenced May 24) | 10.00 | (0.03 | ) c | 0.13 | ||||
| 1999 - Institutional Shares (commenced May 24) | 10.00 | 0.01 | 0.12 | |||||
| 1999 - Service Shares (commenced May 24) | 10.00 | — | 0.12 | |||||
|
Distributions to shareholders |
||||||||||||||
|---|---|---|---|---|---|---|---|---|---|---|---|---|---|---|
| Total from
investment operations |
From net
realized gains |
Net asset
value, end of period |
Total
returna |
Net assets at end of period (in 000s) |
Ratio of
net expenses to average net assets |
|||||||||
| $9.60 | $(0.23 | ) | $19.50 | 95.73 | % | $188,199 | 1.52 | % | ||||||
| 9.50 | (0.23 | ) | 19.45 | 94.27 | 42,061 | 2.27 | ||||||||
| 9.44 | (0.23 | ) | 19.31 | 94.43 | 26,826 | 2.27 | ||||||||
| 9.69 | (0.23 | ) | 19.59 | 96.67 | 49,921 | 1.12 | ||||||||
| 9.56 | (0.23 | ) | 19.45 | 95.41 | 3 | 1.62 | ||||||||
| 0.13 | — | 10.13 | 1.30 | 8,204 | 1.44 | b | ||||||||
| 0.18 | — | 10.18 | 1.80 | 520 | 2.19 | b | ||||||||
| 0.10 | — | 10.10 | 1.00 | 256 | 2.19 | b | ||||||||
| 0.13 | — | 10.13 | 1.30 | 5,223 | 1.04 | b | ||||||||
| 0.12 | — | 10.12 | 1.20 | 2 | 1.54 | b | ||||||||
| GROWTH OPPORTUNITIES FUND (continued)
|
|
Ratios assuming no expense reductions |
|||||||||||||
|---|---|---|---|---|---|---|---|---|---|---|---|---|---|
| Ratio
of net investment income (loss) to average net assets |
Ratio of
expenses to average net assets |
Ratio
of net investment loss to average net assets |
Portfolio
turnover rate |
||||||||||
| For the Year Ended August 31, | |||||||||||||
| 2000 - Class A Shares | (0.64 | )% | 1.61 | % | (0.73 | )% | 73.35 | % | |||||
| 2000 - Class B Shares | (1.38 | ) | 2.36 | (1.47 | ) | 73.35 | |||||||
| 2000 - Class C Shares | (1.38 | ) | 2.36 | (1.47 | ) | 73.35 | |||||||
| 2000 - Institutional Shares | (0.23 | ) | 1.21 | (0.32 | ) | 73.35 | |||||||
| 2000 - Service Shares | (0.69 | ) | 1.71 | (0.78 | ) | 73.35 | |||||||
| For the Period Ended August 31, | |||||||||||||
| 1999 - Class A Shares (commenced May 24) | (0.27 | ) b | 14.15 | b | (12.98 | ) b | 26.53 | ||||||
| 1999 - Class B Shares (commenced May 24) | (1.04 | ) b | 14.90 | b | (13.75 | ) b | 26.53 | ||||||
| 1999 - Class C Shares (commenced May 24) | (1.12 | ) b | 14.90 | b | (13.83 | ) b | 26.53 | ||||||
| 1999 - Institutional Shares (commenced May 24) | 0.39 | b | 13.75 | b | (12.32 | ) b | 26.53 | ||||||
| 1999 - Service Shares (commenced May 24) | 0.03 | b | 14.25 | b | (12.68 | ) b | 26.53 | ||||||
| MID CAP VALUE FUND
|
|
Income from investment operations |
|||||||||||
|---|---|---|---|---|---|---|---|---|---|---|---|
|
Net asset value, beginning of period |
Net
investment income (loss) |
Net realized
and unrealized gain (loss) |
Total income
from investment operations |
||||||||
| For the Year Ended August 31, | |||||||||||
| 2000 - Class A Shares | $18.42 | $0.20 | c | $1.38 | $1.58 | ||||||
| 2000 - Class B Shares | 18.23 | 0.06 | c | 1.40 | 1.46 | ||||||
| 2000 - Class C Shares | 18.24 | 0.06 | c | 1.37 | 1.43 | ||||||
| 2000 - Institutional Shares | 18.45 | 0.27 | c | 1.36 | 1.63 | ||||||
| 2000 - Service Shares | 18.31 | 0.18 | c | 1.35 | 1.53 | ||||||
| For the Seven Months Ended August 31, | |||||||||||
| 1999 - Class A Shares | 18.38 | 0.06 | 1.71 | 1.77 | |||||||
| 1999 - Class B Shares | 18.29 | (0.04 | ) | 1.71 | 1.67 | ||||||
| 1999 - Class C Shares | 18.30 | (0.04 | ) | 1.71 | 1.67 | ||||||
| 1999 - Institutional Shares | 18.37 | 0.09 | 1.72 | 1.81 | |||||||
| 1999 - Service Shares | 18.29 | 0.05 | 1.70 | 1.75 | |||||||
| For the Years Ended January 31, | |||||||||||
| 1999 - Class A Shares | 21.61 | 0.10 | (2.38 | ) | (2.28 | ) | |||||
| 1999 - Class B Shares | 21.57 | (0.05 | ) | (2.35 | ) | (2.40 | ) | ||||
| 1999 - Class C Shares | 21.59 | (0.05 | ) | (2.34 | ) | (2.39 | ) | ||||
| 1999 - Institutional Shares | 21.65 | 0.19 | (2.38 | ) | (2.19 | ) | |||||
| 1999 - Service Shares | 21.62 | 0.03 | (2.31 | ) | (2.28 | ) | |||||
| 1998 - Class A Shares (commenced August 15, 1997) | 23.63 | 0.09 | 0.76 | 0.85 | |||||||
| 1998 - Class B Shares (commenced August 15, 1997) | 23.63 | 0.06 | 0.74 | 0.80 | |||||||
| 1998 - Class C Shares (commenced August 15, 1997) | 23.63 | 0.06 | 0.76 | 0.82 | |||||||
| 1998 - Institutional Shares | 18.73 | 0.16 | 5.66 | 5.82 | |||||||
| 1998 - Service Shares (commenced July 18, 1997) | 23.01 | 0.09 | 1.40 | 1.49 | |||||||
| 1997 - Institutional Shares | 15.91 | 0.24 | 3.77 | 4.01 | |||||||
| For the Period Ended January 31, | |||||||||||
| 1996 - Institutional Shares (commenced August 1, 1995) | 15.00 | 0.13 | 0.90 | 1.03 | |||||||
|
Distributions to shareholders |
|||||||||||||||||||||
|---|---|---|---|---|---|---|---|---|---|---|---|---|---|---|---|---|---|---|---|---|---|
| From net
investment income |
In excess of net investment income |
From net
realized gains |
Total
Distributions |
Net asset
value, end of period |
Total
returna |
Net assets
at end of period (in 000s) |
Ratio of
net expenses to average net assets |
||||||||||||||
| $(0.12 | ) | $ — | $ — | $(0.12 | ) | $19.88 | 8.70 | % | $ 39,142 | 1.29 | % | ||||||||||
| — | — | — | — | 19.69 | 8.01 | 22,284 | 2.04 | ||||||||||||||
| — | — | — | — | 19.67 | 7.84 | 5,720 | 2.04 | ||||||||||||||
| (0.22 | ) | — | — | (0.22 | ) | 19.86 | 9.08 | 158,188 | 0.89 | ||||||||||||
| (0.11 | ) | — | — | (0.11 | ) | 19.73 | 8.48 | 206 | 1.39 | ||||||||||||
| — | — | (1.73 | ) | (1.73 | ) | 18.42 | 9.04 | 49,081 | 1.29 | b | |||||||||||
| — | — | (1.73 | ) | (1.73 | ) | 18.23 | 8.53 | 31,824 | 2.04 | b | |||||||||||
| — | — | (1.73 | ) | (1.73 | ) | 18.24 | 8.52 | 9,807 | 2.04 | b | |||||||||||
| — | — | (1.73 | ) | (1.73 | ) | 18.45 | 9.26 | 190,549 | 0.89 | b | |||||||||||
| — | — | (1.73 | ) | (1.73 | ) | 18.31 | 8.97 | 190 | 1.39 | b | |||||||||||
| (0.07 | ) | — | (0.88 | ) | (0.95 | ) | 18.38 | (10.48 | ) | 70,578 | 1.33 | ||||||||||
| — | — | (0.88 | ) | (0.88 | ) | 18.29 | (11.07 | ) | 37,821 | 1.93 | |||||||||||
| (0.02 | ) | — | (0.88 | ) | (0.90 | ) | 18.30 | (11.03 | ) | 10,800 | 1.93 | ||||||||||
| (0.21 | ) | — | (0.88 | ) | (1.09 | ) | 18.37 | (10.07 | ) | 196,512 | 0.87 | ||||||||||
| (0.17 | ) | — | (0.88 | ) | (1.05 | ) | 18.29 | (10.48 | ) | 289 | 1.37 | ||||||||||
| (0.06 | ) | (0.04 | ) | (2.77 | ) | (2.87 | ) | 21.61 | 3.42 | 90,588 | 1.35 | b | |||||||||
| (0.09 | ) | — | (2.77 | ) | (2.86 | ) | 21.57 | 3.17 | 28,743 | 1.85 | b | ||||||||||
| (0.09 | ) | — | (2.77 | ) | (2.86 | ) | 21.59 | 3.27 | 6,445 | 1.85 | b | ||||||||||
| (0.13 | ) | — | (2.77 | ) | (2.90 | ) | 21.65 | 30.86 | 236,440 | 0.85 | |||||||||||
| (0.11 | ) | — | (2.77 | ) | (2.88 | ) | 21.62 | 6.30 | 8 | 1.35 | b | ||||||||||
| (0.24 | ) | (0.93 | ) | (0.02 | ) | (1.19 | ) | 18.73 | 25.63 | 145,253 | 0.85 | ||||||||||
| (0.12 | ) | — | — | (0.12 | ) | 15.91 | 6.89 | 135,671 | 0.85 | b | |||||||||||
| MID CAP VALUE FUND (continued)
|
|
Ratios assuming no expense reductions |
||||||||||||
|---|---|---|---|---|---|---|---|---|---|---|---|---|
| Ratio of
net investment income (loss) to average net assets |
Ratio of
expenses to average net assets |
Ratio of
net investment income (loss) to average net assets |
Portfolio
turnover rate |
|||||||||
| For the Year Ended August 31, | ||||||||||||
| 2000 - Class A Shares | 1.11 | % | 1.34 | % | 1.06 | % | 82.92 | % | ||||
| 2000 - Class B Shares | 0.35 | 2.09 | 0.30 | 82.92 | ||||||||
| 2000 - Class C Shares | 0.32 | 2.09 | 0.27 | 82.92 | ||||||||
| 2000 - Institutional Shares | 1.51 | 0.94 | 1.46 | 82.92 | ||||||||
| 2000 - Service Shares | 1.03 | 1.44 | 0.98 | 82.92 | ||||||||
| For the Seven-Months Ended August 31, | ||||||||||||
| 1999 - Class A Shares | 0.43 | b | 1.37 | b | 0.35 | b | 68.84 | |||||
| 1999 - Class B Shares | (0.33 | ) b | 2.12 | b | (0.41 | ) b | 68.84 | |||||
| 1999 - Class C Shares | (0.34 | ) b | 2.12 | b | (0.42 | ) b | 68.84 | |||||
| 1999 - Institutional Shares | 0.79 | b | 0.97 | b | 0.71 | b | 68.84 | |||||
| 1999 - Service Shares | 0.38 | b | 1.47 | b | 0.30 | b | 68.84 | |||||
| For the Years Ended January 31, | ||||||||||||
| 1999 - Class A Shares | 0.38 | 1.41 | 0.30 | 92.18 | ||||||||
| 1999 - Class B Shares | (0.22 | ) | 2.01 | (0.30 | ) | 92.18 | ||||||
| 1999 - Class C Shares | (0.22 | ) | 2.01 | (0.30 | ) | 92.18 | ||||||
| 1999 - Institutional Shares | 0.83 | 0.95 | 0.75 | 92.18 | ||||||||
| 1999 - Service Shares | 0.32 | 1.45 | 0.24 | 92.18 | ||||||||
| 1998 - Class A Shares (commenced August 15, 1997) | 0.33 | b | 1.47 | b | 0.21 | b | 62.60 | |||||
| 1998 - Class B Shares (commenced August 15, 1997) | (0.20 | ) b | 1.97 | b | (0.32 | ) b | 62.60 | |||||
| 1998 - Class C Shares (commenced August 15, 1997) | (0.23 | ) b | 1.97 | b | (0.35 | ) b | 62.60 | |||||
| 1998 - Institutional Shares | 0.78 | 0.97 | 0.66 | 62.60 | ||||||||
| 1998 - Service Shares (commenced July 18, 1997) | 0.63 | b | 1.43 | b | 0.51 | b | 62.60 | |||||
| 1997 - Institutional Shares | 1.35 | 0.91 | 1.29 | 74.03 | ||||||||
| For the Period Ended January 31, | ||||||||||||
| 1996 - Institutional Shares (commenced August 1, 1995) | 1.67 | b | 0.98 | b | 1.54 | b | 58.77 | |||||
| SMALL CAP VALUE FUND
|
|
Income (loss) from investment operations |
||||||||||||
|---|---|---|---|---|---|---|---|---|---|---|---|---|
| Net asset
value, beginning of period |
Net
investment income (loss) |
Net realized and unrealized gain (loss) |
Total
income (loss) from investment operations |
|||||||||
| For the Year Ended August 31, | ||||||||||||
| 2000 - Class A Shares | $19.80 | $ 0.01 | c | $ 3.40 | $ 3.41 | |||||||
| 2000 - Class B Shares | 19.27 | (0.13 | ) c | 3.26 | 3.13 | |||||||
| 2000 - Class C Shares | 19.28 | (0.12 | ) c | 3.26 | 3.14 | |||||||
| 2000 - Institutional Shares | 19.95 | 0.10 | c | 3.42 | 3.52 | |||||||
| 2000 - Service Shares | 19.76 | 0.01 | c | 3.36 | 3.37 | |||||||
| For the Seven-Month Period Ended August 31, | ||||||||||||
| 1999 - Class A Shares | 18.51 | (0.05 | ) | 1.34 | 1.29 | |||||||
| 1999 - Class B Shares | 18.10 | (0.12 | ) | 1.29 | 1.17 | |||||||
| 1999 - Class C Shares | 18.12 | (0.11 | ) | 1.27 | 1.16 | |||||||
| 1999 - Institutional Shares | 18.62 | — | 1.33 | 1.33 | ||||||||
| 1999 - Service Shares | 18.50 | (0.13 | ) | 1.39 | 1.26 | |||||||
| For the Years Ended January 31, | ||||||||||||
| 1999 - Class A Shares | 24.05 | (0.06 | ) | (4.48 | ) | (4.54 | ) | |||||
| 1999 - Class B Shares | 23.73 | (0.21 | ) | (4.42 | ) | (4.63 | ) | |||||
| 1999 - Class C Shares | 23.73 | (0.18 | ) | (4.43 | ) | (4.61 | ) | |||||
| 1999 - Institutional Shares | 24.09 | 0.03 | (4.50 | ) | (4.47 | ) | ||||||
| 1999 - Service Shares | 24.05 | (0.04 | ) | (4.51 | ) | (4.55 | ) | |||||
| 1998 - Class A Shares | 20.91 | 0.14 | 5.33 | 5.47 | ||||||||
| 1998 - Class B Shares | 20.80 | (0.01 | ) | 5.27 | 5.26 | |||||||
| 1998 - Class C Shares (commenced August 15, 1997) | 24.69 | (0.06 | ) | 1.43 | 1.37 | |||||||
| 1998 - Institutional Shares (commenced August 15, 1997) | 24.91 | 0.03 | 1.48 | 1.51 | ||||||||
| 1998 - Service Shares (commenced August 15, 1997) | 24.91 | (0.01 | ) | 1.48 | 1.47 | |||||||
| 1997 - Class A Shares | 17.29 | (0.21 | ) | 4.92 | 4.71 | |||||||
| 1997 - Class B Shares (commenced May 1, 1996) | 20.79 | (0.11 | ) | 1.21 | 1.10 | |||||||
| 1996 - Class A Shares | 16.14 | (0.23 | ) | 1.39 | 1.16 | |||||||
|
Distributions to shareholders |
|||||||||||||||||
|---|---|---|---|---|---|---|---|---|---|---|---|---|---|---|---|---|---|
| In excess
of net investment income |
From net
realized gains |
Total
distributions |
Net asset value, end of period |
Total
returna |
Net assets
at end of period (in 000s) |
Ratio of
net expenses to average net assets |
|||||||||||
| $ — | $ — | $ — | $23.21 | 17.22 | % | $157,791 | 1.50 | % | |||||||||
| — | — | — | 22.40 | 16.24 | 29,199 | 2.25 | |||||||||||
| — | — | — | 22.42 | 16.34 | 8,428 | 2.25 | |||||||||||
| — | — | — | 23.47 | 17.64 | 26,445 | 1.10 | |||||||||||
| — | — | — | 23.13 | 17.05 | 83 | 1.60 | |||||||||||
| — | — | — | 19.80 | 6.97 | 210,500 | 1.50 | b | ||||||||||
| — | — | — | 19.27 | 6.46 | 37,386 | 2.25 | b | ||||||||||
| — | — | — | 19.28 | 6.40 | 8,079 | 2.25 | b | ||||||||||
| — | — | — | 19.95 | 7.14 | 27,023 | 1.10 | b | ||||||||||
| — | — | — | 19.76 | 6.81 | 57 | 1.60 | b | ||||||||||
| — | (1.00 | ) | (1.00 | ) | 18.51 | (17.37 | ) | 261,661 | 1.50 | ||||||||
| — | (1.00 | ) | (1.00 | ) | 18.10 | (18.00 | ) | 42,879 | 2.25 | ||||||||
| — | (1.00 | ) | (1.00 | ) | 18.12 | (17.91 | ) | 8,212 | 2.25 | ||||||||
| — | (1.00 | ) | (1.00 | ) | 18.62 | (17.04 | ) | 15,351 | 1.13 | ||||||||
| — | (1.00 | ) | (1.00 | ) | 18.50 | (17.41 | ) | 261 | 1.62 | ||||||||
| — | (2.33 | ) | (2.33 | ) | 24.05 | 26.17 | 370,246 | 1.54 | |||||||||
| — | (2.33 | ) | (2.33 | ) | 23.73 | 25.29 | 42,677 | 2.29 | |||||||||
| — | (2.33 | ) | (2.33 | ) | 23.73 | 5.51 | 5,604 | 2.09 | b | ||||||||
| — | (2.33 | ) | (2.33 | ) | 24.09 | 6.08 | 14,626 | 1.16 | b | ||||||||
| — | (2.33 | ) | (2.33 | ) | 24.05 | 5.91 | 2 | 1.45 | b | ||||||||
| — | (1.09 | ) | (1.09 | ) | 20.91 | 27.28 | 212,061 | 1.60 | |||||||||
| — | (1.09 | ) | (1.09 | ) | 20.80 | 5.39 | 3,674 | 2.35 | b | ||||||||
| — | (0.01 | ) | (0.01 | ) | 17.29 | 7.20 | 204,994 | 1.41 | |||||||||
| SMALL CAP VALUE FUND (continued)
|
|
Ratios assuming no expense reductions |
|||||||||||||
|---|---|---|---|---|---|---|---|---|---|---|---|---|---|
| Ratio of
net investment income (loss) to average net assets |
Ratio of
expenses to average net assets |
Ratio of
net investment income (loss) to average net assets |
Portfolio
turnover rate |
||||||||||
| For the Year Ended August 31, | |||||||||||||
| 2000 - Class A Shares | 0.07 | % | 1.57 | % | — | % | 75.31 | % | |||||
| 2000 - Class B Shares | (0.68 | ) | 2.32 | (0.75 | ) | 75.31 | |||||||
| 2000 - Class C Shares | (0.65 | ) | 2.32 | (0.72 | ) | 75.31 | |||||||
| 2000 - Institutional Shares | 0.49 | 1.17 | 0.42 | 75.31 | |||||||||
| 2000 - Service Shares | 0.03 | 1.67 | (0.04 | ) | 75.31 | ||||||||
| For the Seven-Month Period Ended August 31, | |||||||||||||
| 1999 - Class A Shares | (0.35 | ) b | 1.61 | b | (0.46 | ) b | 46.95 | ||||||
| 1999 - Class B Shares | (1.10 | ) b | 2.36 | b | (1.21 | ) b | 46.95 | ||||||
| 1999 - Class C Shares | (1.10 | ) b | 2.36 | b | (1.21 | ) b | 46.95 | ||||||
| 1999 - Institutional Shares | 0.05 | b | 1.21 | b | (0.06 | ) b | 46.95 | ||||||
| 1999 - Service Shares | (0.41 | ) b | 1.71 | b | (0.52 | ) b | 46.95 | ||||||
| For the Years Ended January 31, | |||||||||||||
| 1999 - Class A Shares | (0.24 | ) | 1.74 | (0.48 | ) | 98.46 | |||||||
| 1999 - Class B Shares | (0.99 | ) | 2.29 | (1.03 | ) | 98.46 | |||||||
| 1999 - Class C Shares | (0.99 | ) | 2.29 | (1.03 | ) | 98.46 | |||||||
| 1999 - Institutional Shares | 0.13 | 1.17 | 0.09 | 98.46 | |||||||||
| 1999 - Service Shares | (0.47 | ) | 1.66 | (0.51 | ) | 98.46 | |||||||
| 1998 - Class A Shares | (0.28 | ) | 1.76 | (0.50 | ) | 84.81 | |||||||
| 1998 - Class B Shares | (0.92 | ) | 2.29 | (0.92 | ) | 84.81 | |||||||
| 1998 - Class C Shares (commenced August 15, 1997) | (0.79 | ) b | 2.09 | b | (0.79 | ) b | 84.81 | ||||||
| 1998 - Institutional Shares (commenced August 15, 1997) | 0.27 | b | 1.16 | b | 0.27 | b | 84.81 | ||||||
| 1998 - Service Shares (commenced August 15, 1997) | (0.07 | ) b | 1.45 | b | (0.07 | ) b | 84.81 | ||||||
| 1997 - Class A Shares | (0.72 | ) | 1.85 | (0.97 | ) | 99.46 | |||||||
| 1997 - Class B Shares (commenced May 1, 1996) | (1.63 | ) b | 2.35 | b | (1.63 | ) b | 99.46 | ||||||
| 1996 - Class A Shares | (0.59 | ) | 1.66 | (0.84 | ) | 57.58 | |||||||
| LARGE CAP VALUE FUND
|
|
Income from investment operations |
|||||||||||
|---|---|---|---|---|---|---|---|---|---|---|---|
|
Net asset value, beginning of period |
Net
investment incomec |
Net
realized and unrealized gain |
Total from
investment operations |
Net asset
value, end of period |
|||||||
| For the Period Ended August 31, | |||||||||||
| 2000 - Class A Shares (commenced Dec. 15, 1999) | $10.00 | $0.06 | $0.33 | $0.39 | $10.39 | ||||||
| 2000 - Class B Shares (commenced Dec. 15, 1999) | 10.00 | — | 0.33 | 0.33 | 10.33 | ||||||
| 2000 - Class C Shares (commenced Dec. 15, 1999) | 10.00 | 0.01 | 0.31 | 0.32 | 10.32 | ||||||
| 2000 - Institutional Shares (commenced Dec. 15, 1999) | 10.00 | 0.09 | 0.31 | 0.40 | 10.40 | ||||||
| 2000 - Service Shares (commenced Dec. 15, 1999) | 10.00 | 0.07 | 0.31 | 0.38 | 10.38 | ||||||
a
|
Assumes investment at the net asset value at the beginning of the period, reinvestment of all dividends and
distributions, a complete redemption of the investment at the net asset value at the end of the period and no sales or redemption charges. Total return would be reduced if a sales or redemption charge were taken into account. Total returns for periods
less than one full year are not annualized.
|
b
|
Annualized.
|
c
|
Calculated based on average shares outstanding methodology.
|
d
|
Includes the effect of mortgage dollar roll transactions.
|
|
Ratios assuming no expense reductions |
||||||||||||||||||
|---|---|---|---|---|---|---|---|---|---|---|---|---|---|---|---|---|---|---|
| Total
returna |
Net assets
at end of period (in 000s) |
Ratio of net
expenses to average net assetsb |
Ratio of net
investment income to average net assetsb |
Ratio of
expenses to average net assetsb |
Ratio of net
investment income to average net assetsb |
Portfolio
turnover rate |
||||||||||||
| 3.90 | % | $7,181 | 1.25 | % | 0.84 | % | 3.30 | % | (1.21 | )% | 66.79 | % | ||||||
| 3.30 | 1,582 | 2.00 | 0.06 | 4.05 | (1.99 | ) | 66.79 | |||||||||||
| 3.20 | 850 | 2.00 | 0.15 | 4.05 | (1.90 | ) | 66.79 | |||||||||||
| 4.00 | 16,155 | 0.85 | 1.31 | 2.90 | (0.74 | ) | 66.79 | |||||||||||
| 3.80 | 2 | 1.35 | 0.95 | 3.40 | (1.10 | ) | 66.79 | |||||||||||
| FOR MORE INFORMATION
|
| Annual/Semi-annual Report
|
| Additional information about the Funds’ investments is available in the Funds’ annual and semi-annual reports to
shareholders. In the Funds’ annual reports, you will find a discussion of the market conditions and investment strategies that significantly affected the Funds’ performance during the last fiscal year.
|
| Statement of Additional Information
|
| Additional information about the Funds and their policies is also available in the Funds’ Additional Statement. The
Additional Statement is incorporated by reference into this Prospectus (is legally considered part of this Prospectus).
|
| The Funds’ annual and semi-annual reports, and the Additional Statement, are available free upon request by calling Goldman
Sachs at 1-800-526-7384.
|
| To obtain other information and for shareholder inquiries:
|
| By telephone – Call 1-800-526-7384
|
| By mail – Goldman Sachs Funds, 4900 Sears Tower, Chicago, IL 60606-6372
|
| By e-mail – [email protected]
|
| On the Internet – Text-only versions of the Funds’ documents are located online and may be downloaded from:
|
| SEC EDGAR database – http://www.sec.gov
|
| Goldman Sachs – http://www.gs.com (Prospectus Only)
|
| You may review and obtain copies of Fund documents by visiting the SEC’s Public Reference Room in Washington, D.C. You may
also obtain copies of Fund documents, after paying a duplicating fee, by writing to the SEC’s Public Reference Section, Washington, D.C. 20549-0102 or by electronic request to: [email protected]. Information on the operation of the public reference
room may be obtained by calling the SEC at (202) 942-8090.
|

| The Funds’ investment company registration number is 811-5349.
|
| Prospectus
|
| GOLDMAN SACHS DOMESTIC EQUITY FUNDS
|
| THE SECURITIES AND EXCHANGE COMMISSION HAS NOT APPROVED OR DISAPPROVED THESE SECURITIES OR PASSED UPON THE ADEQUACY OF THIS PROSPECTUS.
ANY REPRESENTATION TO THE CONTRARY IS A CRIMINAL OFFENSE.
|
| AN INVESTMENT IN A FUND IS NOT A BANK DEPOSIT AND IS NOT INSURED BY THE FEDERAL DEPOSIT INSURANCE CORPORATION OR ANY OTHER GOVERNMENT
AGENCY. AN INVESTMENT IN A FUND INVOLVES INVESTMENT RISKS, INCLUDING POSSIBLE LOSS OF PRINCIPAL.
|
| n
|
Goldman Sachs Balanced Fund
|
| n
|
Goldman Sachs Growth and Income Fund
|
| n
|
Goldman Sachs CORE
SM
|
| Large Cap Value Fund
|
| n
|
Goldman Sachs CORE
SM
U.S. Equity Fund
|
| n
|
Goldman Sachs CORE
SM
Large Cap Growth Fund
|
| n
|
Goldman Sachs CORE
SM
Small Cap Equity Fund
|
| n
|
Goldman Sachs Capital Growth Fund
|
| n
|
Goldman Sachs Strategic Growth Fund
|
| n
|
Goldman Sachs Growth Opportunities Fund
|
| n
|
Goldman Sachs Mid Cap Value Fund (formerly Mid Cap Equity)
|
| n
|
Goldman Sachs Small Cap Value Fund
|
| n
|
Goldman Sachs Large Cap Value Fund
|
| NOT FDIC-INSURED
|
May Lose Value
|
No Bank Guarantee
|
| Goldman Sachs Asset Management, a unit of the Investment Management Division of Goldman, Sachs & Co. (“Goldman
Sachs”), serves as investment adviser to the Balanced, Growth and Income, CORE Large Cap Value, CORE Large Cap Growth, CORE Small Cap Equity, Strategic Growth, Growth Opportunities, Mid Cap Value, Small Cap Value and Large Cap Value Funds. Goldman
Sachs Funds Management, L.P. serves as investment adviser to the CORE U.S. Equity and Capital Growth Funds. Goldman Sachs Asset Management and Goldman Sachs Funds Management, L.P. are each referred to in this Prospectus as the “Investment Adviser.”
;
|
| VALUE STYLE FUNDS
|
| Goldman Sachs’ Value Investment Philosophy:
|
| Through intensive, hands-on research our portfolio team seeks to identify:
|
1.
|
Well-positioned businesses that have:
|
n
|
Attractive returns on capital.
|
n
|
Sustainable earnings and cash flow.
|
n
|
Strong company management focused on long-term returns to shareholders.
|
2.
|
Attractive valuation opportunities where:
|
n
|
The intrinsic value of the business is not reflected in the stock price.
|
| Business quality, conservative valuation, and thoughtful portfolio construction are the key elements of our value approach.
|
| GROWTH STYLE FUNDS
|
| Goldman Sachs’ Growth Investment Philosophy:
|
1.
|
Invest as if buying the company/business, not simply trading its stock:
|
n
|
Understand the business, management, products and competition.
|
n
|
Perform intensive, hands-on fundamental research.
|
n
|
Seek businesses with strategic competitive advantages.
|
n
|
Over the long-term, expect each company’s stock price ultimately to track the growth in the value of the business.
|
2.
|
Buy high-quality growth businesses that possess strong business franchises, favorable long-term prospects and
excellent management.
|
3.
|
Purchase superior long-term growth companies at a favorable price—seek to purchase at a fair valuation,
giving the investor the potential to fully capture returns from above-average growth rates.
|
| Growth companies have earnings expectations that exceed those of the stock market as a whole.
|
| QUANTITATIVE (“CORE”) STYLE FUNDS
|
| Goldman Sachs’ CORE Investment Philosophy:
|
| Goldman Sachs’ quantitative style of funds—CORE—emphasizes the two building blocks of active management: stock
selection and portfolio construction.
|
| I. CORE Stock Selection
|
| The CORE Funds use the Goldman Sachs’ proprietary multifactor model (“Multifactor Model”), a rigorous computerized
rating system, to forecast the returns of securities held in each Fund’s portfolio. The Multifactor Model incorporates common variables covering measures of:
|
n
|
Research (What do fundamental analysts think about the company and its prospects?)
|
n
|
Value (How is the company priced relative to fundamental accounting measures?)
|
n
|
Momentum (What are medium-term price trends? How has the price responded to new information?)
|
n
|
Profitability (What is the company’s margin on sales? How efficient are its operations?)
|
n
|
Earnings Quality (Were earnings derived from sustainable (cash-based) sources?)
|
| All of the above factors are carefully evaluated within the Multifactor Model since each has demonstrated a significant
impact on the performance of the securities and markets they were designed to forecast. Stock selection in this process combines both our quantitative and qualitative analysis.
|
| II. CORE Portfolio Construction
|
| A proprietary risk model, which is intended to identify and measure risk as accurately as possible, includes all the above factors
used in the return model to select stocks, as well as several other factors associated with risk but not return. In this process, the Investment Adviser manages risk by attempting to limit deviations from the benchmark, and by attempting to run a size and
sector neutral portfolio. A computer optimizer evaluates many different security combinations (considering many possible weightings) in an effort to construct the most efficient risk/return portfolio given each CORE Fund benchmark.
|
| Goldman Sachs CORE Funds are fully invested, broadly diversified and offer consistent overall portfolio characteristics. They may
serve as good foundations on which to build a portfolio.
|
| Balanced Fund
|
|
Objective:
|
Long-term growth of capital and current income
|
|
Benchmarks:
|
S&P 500® Index and Lehman Brothers Aggregate Bond Index
|
|
Investment Focus:
|
Large capitalization U.S. stocks and fixed-income securities
|
|
Investment Style:
|
Asset Allocation, with growth and value (blend) equity components
|
| INVESTMENT OBJECTIVE
|
| The Fund seeks to provide long-term growth of capital and current income. The Fund seeks growth of capital primarily through
investments in equity securities (stocks). The Fund seeks to provide current income through investment in fixed-income securities (bonds).
|
| PRINCIPAL INVESTMENT STRATEGIES
|
| Historically, stock and bond markets have often had different cycles, with one asset class rising when the other is falling. A
balanced objective seeks to reduce the volatility associated with investing in a single market. There is no guarantee, however, that market cycles will move in opposition to one another or that a balanced investment program will successfully reduce
volatility.
|
| The percentage of the portfolio invested in equity and fixed-income securities will vary from time to time as the Investment
Adviser evaluates such securities’ relative attractiveness based on market valuations, economic growth and inflation prospects. The allocation between equity and fixed-income securities is subject to the Fund’s intention to pay regular quarterly
dividends. The amount of quarterly dividends can also be expected to fluctuate in accordance with factors such as prevailing interest rates and the percentage of the Fund’s assets invested in fixed-income securities.
|
| Equity Securities. The Fund invests, under normal circumstances, between 45% and 65% of its total assets in equity securities. Although the Fund’s equity investments consist primarily of publicly traded U.S. securities, the Fund may invest up to 10% of its total
assets in the equity securities of foreign issuers, including issuers in countries with emerging markets or economies (“emerging countries”) and equity securities quoted in foreign currencies. A portion of the Fund’s portfolio of equity
securities may be selected primarily to provide current income (including interests in real estate investment trusts (“REITs”), convertible securities, preferred stocks, utility stocks, and interests in limited partnerships).
|
| Fixed Income Securities. The Fund invests at least 25% of its total assets in fixed-income senior securities. The remainder of the Fund’s assets are invested in other fixed-income securities and cash.
|
| The Fund’s fixed-income securities primarily include:
|
n
|
Securities issued by the U.S. government, its agencies, instrumentalities or sponsored enterprises
|
n
|
Securities issued by corporations, banks and other issuers
|
n
|
Mortgage-backed and asset-backed securities
|
| The Fund may also invest up to 10% of its total assets in debt obligations (U.S. dollar and non-U.S.-dollar denominated) issued or
guaranteed by one or more foreign governments or any of their political subdivisions, agencies or instrumentalities and foreign corporations or other entities. The issuers of these securities may be located in emerging countries.
|
|
Objective:
|
Long-term growth of capital and growth of income
|
|
Benchmark:
|
S&P 500® Index
|
|
Investment Focus:
|
Large capitalization U.S. equity securities with an emphasis on undervalued stocks
|
|
Investment Style:
|
Value
|
| INVESTMENT OBJECTIVE
|
| The Fund seeks long-term growth of capital and growth of income.
|
| PRINCIPAL INVESTMENT STRATEGIES
|
| Equity Securities. The Fund invests, under normal circumstances, at least 65% of its total assets in equity securities that the Investment Adviser considers to have favorable prospects for capital appreciation and/or dividend-paying ability. Although the Fund will invest
primarily in publicly traded U.S. securities, it may invest up to 25% of its total assets in foreign securities, including securities of issuers in emerging countries and securities quoted in foreign currencies.
|
| Other.
The Fund may also invest up to 35% of its total assets in fixed-income securities, such as government, corporate and bank debt obligations, that offer the potential to further the Fund’s investment objective.
|
|
Objective:
|
Long-term growth of capital and dividend income
|
|
Benchmark:
|
Russell 1000® Value Index
|
|
Investment Focus:
|
Diversified portfolio of equity securities of large-cap U.S. issuers selling at low to modest valuations
|
|
Investment Style:
|
Quantitative, applied to large-cap value stocks
|
| INVESTMENT OBJECTIVE
|
| The Fund seeks long-term growth of capital and dividend income. The Fund seeks this objective through a broadly diversified
portfolio of equity securities of large-cap U.S. issuers that are selling at low to modest valuations relative to general market measures, such as earnings, book value and other fundamental accounting measures, and that are expected to have favorable
prospects for capital appreciation and/or dividend-paying ability.
|
| PRINCIPAL INVESTMENT STRATEGIES
|
| Equity Securities. The Fund invests, under normal circumstances, at least 90% of its total assets in equity securities of U.S. issuers, including foreign issuers that are traded in the United States.
|
| The Fund’s investments are selected using both a variety of quantitative techniques and fundamental research in seeking to
maximize the Fund’s expected return, while maintaining risk, style, capitalization and industry characteristics similar to the Russell 1000® Value Index. The Fund seeks a portfolio consisting of companies with above average capitalizations and
low to moderate valuations as measured by price/earnings ratios, book value and other fundamental accounting measures.
|
| Other.
The Fund’s investments in fixed-income securities are limited to securities that are considered cash equivalents.
|
|
Objective:
|
Long-term growth of capital and dividend income
|
|
Benchmark:
|
S&P 500® Index
|
|
Investment Focus:
|
Large-cap U.S. equity securities
|
|
Investment Style:
|
Quantitative, applied to large-cap growth and value (blend) stocks
|
| INVESTMENT OBJECTIVE
|
| The Fund seeks long-term growth of capital and dividend income. The Fund seeks this objective through a broadly diversified
portfolio of large-cap and blue chip equity securities representing all major sectors of the U.S. economy.
|
| PRINCIPAL INVESTMENT STRATEGIES
|
| Equity Securities. The Fund invests, under normal circumstances, at least 90% of its total assets in equity securities of U.S. issuers, including foreign issuers that are traded in the United States.
|
| The Fund’s investments are selected using both a variety of quantitative techniques and fundamental research in seeking to
maximize the Fund’s expected return, while maintaining risk, style, capitalization and industry characteristics similar to the S&P 500® Index. The Fund seeks a broad representation in most major sectors of the U.S. economy and a portfolio
consisting of companies with average long-term earnings growth expectations and dividend yields.
|
| Other.
The Fund’s investments in fixed-income securities are limited to securities that are considered cash equivalents.
|
|
Objective:
|
Long-term growth of capital; dividend income is a secondary consideration
|
|
Benchmark:
|
Russell 1000® Growth Index
|
|
Investment Focus:
|
Large-cap, growth-oriented U.S. stocks
|
|
Investment Style:
|
Quantitative, applied to large-cap growth stocks
|
| INVESTMENT OBJECTIVE
|
| The Fund seeks long-term growth of capital. The Fund seeks this objective through a broadly diversified portfolio of equity
securities of large-cap U.S. issuers that are expected to have better prospects for earnings growth than the growth rate of the general domestic economy. Dividend income is a secondary consideration.
|
| PRINCIPAL INVESTMENT STRATEGIES
|
| Equity Securities. The Fund invests, under normal circumstances, at least 90% of its total assets in equity securities of U.S. issuers, including foreign issuers that are traded in the United States.
|
| The Investment Adviser emphasizes a company’s growth prospects in analyzing equity securities to be purchased by the Fund.
The Fund’s investments are selected using both a variety of quantitative techniques and fundamental research in seeking to maximize the Fund’s expected return, while maintaining risk, style, capitalization and industry characteristics similar to
the Russell 1000® Growth Index. The Fund seeks a portfolio consisting of companies with above average capitalizations and earnings growth expectations and below average dividend yields.
|
| Other.
The Fund’s investments in fixed-income securities are limited to securities that are considered cash equivalents.
|
|
Objective:
|
Long-term growth of capital
|
|
Benchmark:
|
Russell 2000® Index
|
|
Investment Focus:
|
Stocks of small capitalization U.S. companies
|
|
Investment Style:
|
Quantitative, applied to small-cap growth and value (blend) stocks
|
| INVESTMENT OBJECTIVE
|
| The Fund seeks long-term growth of capital. The Fund seeks this objective through a broadly diversified portfolio of equity
securities of U.S. issuers which are included in the Russell 2000® Index at the time of investment.
|
| PRINCIPAL INVESTMENT STRATEGIES
|
| Equity Securities. The Fund invests, under normal circumstances, at least 90% of its total assets in equity securities of U.S. issuers, including foreign issuers that are traded in the United States.
|
| The Fund’s investments are selected using both a variety of quantitative techniques and fundamental research in seeking to
maximize the Fund’s expected return, while maintaining risk, style, capitalization and industry characteristics similar to the Russell 2000® Index. The Fund seeks a portfolio consisting of companies with small market capitalizations, strong
expected earnings growth and momentum, and better valuation and risk characteristics than the Russell 2000® Index. If the issuer of a portfolio security held by the Fund is no longer included in the Russell 2000® Index, the Fund may, but is not
required to, sell the security.
|
| Other.
The Fund’s investments in fixed-income securities are limited to securities that are considered cash equivalents.
|
|
Objective:
|
Long-term growth of capital
|
|
Benchmark:
|
S&P 500® Index
|
|
Investment Focus:
|
Large-cap U.S. equity securities that offer long-term capital appreciation potential
|
|
Investment Style:
|
Growth
|
| INVESTMENT OBJECTIVE
|
| The Fund seeks long-term growth of capital.
|
| PRINCIPAL INVESTMENT STRATEGIES
|
| Equity Securities. The Fund invests, under normal circumstances, at least 90% of its total assets in equity securities. The Fund seeks to achieve its investment objective by investing in a diversified portfolio of equity securities that are considered by the Investment
Adviser to have long-term capital appreciation potential. Although the Fund invests primarily in publicly traded U.S. securities, it may invest up to 10% of its total assets in foreign securities, including securities of issuers in emerging countries and
securities quoted in foreign currencies.
|
|
Objective:
|
Long-term growth of capital
|
|
Benchmark:
|
S&P 500® Index
|
|
Investment Focus:
|
Large-cap U.S. equity securities that are considered to be strategically positioned for consistent long-term growth
|
|
Investment Style:
|
Growth
|
| INVESTMENT OBJECTIVE
|
| The Fund seeks long-term growth of capital.
|
| PRINCIPAL INVESTMENT STRATEGIES
|
| Equity Securities. The Fund invests, under normal circumstances, at least 90% of its total assets in equity securities. The Fund seeks to achieve its investment objective by investing in a diversified portfolio of equity securities that are considered by the Investment
Adviser to be strategically positioned for consistent long-term growth. Although the Fund invests primarily in publicly traded U.S. securities, it may invest up to 10% of its total assets in foreign securities, including securities of issuers in emerging
countries and securities quoted in foreign currencies.
|
|
Objective:
|
Long-term growth of capital
|
|
Benchmark:
|
S&P Midcap 400 Index
|
|
Investment Focus:
|
U.S. equity securities that offer long-term capital appreciation
with a primary focus on mid-capitalization companies |
|
Investment Style:
|
Growth
|
| INVESTMENT OBJECTIVE
|
| The Fund seeks long-term growth of capital.
|
| PRINCIPAL INVESTMENT STRATEGIES
|
| Equity Securities. The Fund invests, under normal circumstances, at least 90% of its total assets in equity securities with a primary focus on mid-cap companies. The Fund seeks to achieve its investment objective by investing in a diversified portfolio of equity securities
that are considered by the Investment Adviser to be strategically positioned for long-term growth. Although the Fund invests primarily in publicly traded U.S. securities, it may invest up to 10% of its total assets in foreign securities, including
securities of issuers in emerging countries and securities quoted in foreign currencies.
|
|
Objective:
|
Long-term capital appreciation
|
|
Benchmark:
|
Russell Midcap Value Index
|
|
Investment Focus:
|
Mid-capitalization U.S. stocks that are believed to be undervalued or undiscovered by the marketplace
|
|
Investment Style:
|
Value
|
| INVESTMENT OBJECTIVE
|
| The Fund seeks long-term capital appreciation.
|
| PRINCIPAL INVESTMENT STRATEGIES
|
| Equity Securities. The Fund invests, under normal circumstances, substantially all of its assets in equity securities and at least 65% of its total assets in equity securities of mid-cap companies with public stock market capitalizations (based upon shares available for
trading on an unrestricted basis) within the range of the market capitalization of companies constituting the Russell Midcap Value Index at the time of investment (currently between $300 million and $15 billion). If the market capitalization of a company
held by the Fund moves outside this range, the Fund may, but is not required to, sell the securities. Although the Fund will invest primarily in publicly traded U.S. securities, it may invest up to 25% of its total assets in foreign securities, including
securities of issuers in emerging countries and securities quoted in foreign currencies.
|
| Other.
The Fund may invest in the aggregate up to 35% of its total assets in companies with public stock market capitalizations outside the range of companies constituting the Russell Midcap Value Index at the time of investment and in fixed-income securities,
such as government, corporate and bank debt obligations.
|
|
Objective:
|
Long-term growth of capital
|
|
Benchmark:
|
Russell 2000® Value Index
|
|
Investment Focus:
|
Small-capitalization U.S. stocks that are believed to be undervalued or undiscovered by the marketplace
|
|
Investment Style:
|
Value
|
| INVESTMENT OBJECTIVE
|
| The Fund seeks long-term growth of capital.
|
| PRINCIPAL INVESTMENT STRATEGIES
|
| Equity Securities. The Fund invests, under normal circumstances, at least 65% of its total assets in equity securities of companies with public stock market capitalizations (based upon shares available for trading on an unrestricted basis) within the range of the market
capitalization of companies constituting the Russell 2000® Value Index at the time of investment (currently between $20 million and $3 billion). If the market capitalization of a company held by the Fund moves outside this range, the Fund may, but is
not required to, sell the securities. Under normal circumstances, the Fund’s investment horizon for ownership of stocks will be two to three years. Although the Fund will invest primarily in publicly traded U.S. securities, it may invest up to 25% of
its total assets in foreign securities, including securities of issuers in emerging countries and securities quoted in foreign currencies.
|
| Other.
The Fund may invest in the aggregate up to 35% of its total assets in companies with public stock market capitalizations outside the range of companies constituting the Russell 2000® Value Index at the time of investment and in fixed-income
securities, such as government, corporate and bank debt obligations.
|
|
Objective:
|
Long-term capital appreciation
|
|
Benchmark:
|
Russell 1000® Value Index
|
|
Investment Focus:
|
Large capitalization U.S. equity securities that are believed to be undervalued
|
|
Investment Style:
|
Value
|
| INVESTMENT OBJECTIVE
|
| The Fund seeks long-term capital appreciation.
|
| PRINCIPAL INVESTMENT STRATEGIES
|
| Equity Securities. The Fund invests, under normal circumstances, at least 90% of its total assets in equity securities. The Fund seeks its investment objective by investing in value opportunities that the Investment Adviser defines as companies with identifiable
competitive advantages whose intrinsic value is not reflected in the stock price. Although the Fund will invest primarily in publicly traded U.S. securities, it may invest up to 25% of its total assets in foreign securities, including securities quoted in
foreign currencies.
|
| Other.
The Fund may invest up to 10% of its total assets in fixed-income securities, such as government, corporate and bank debt obligations.
|
Ÿ
|
No specific percentage limitation on usage;
limited only by the objectives and strategies of the Fund |
| Balanced
Fund |
Growth
and Income Fund |
CORE
Large Cap Value Fund |
CORE
U.S. Equity Fund |
||||||
|---|---|---|---|---|---|---|---|---|---|
| Investment Practices | |||||||||
| Borrowings | 33 1
/3
|
33 1
/3
|
33 1
/3
|
33 1
/3
|
|||||
| Credit, Currency, Index, Interest Rate and
Mortgage Swaps* |
15 | — | — | — | |||||
| Cross Hedging of Currencies | Ÿ | Ÿ | Ÿ | Ÿ | |||||
| Custodial Receipts | Ÿ | Ÿ | Ÿ | Ÿ | |||||
| Equity Swaps* | 15 | 15 | 15 | 15 | |||||
| Foreign Currency Transactions** | Ÿ 1 | Ÿ | Ÿ | Ÿ | |||||
| Futures Contracts and Options on Futures
Contracts |
Ÿ | Ÿ | Ÿ 2 | Ÿ 3 | |||||
| Interest Rate Caps, Floors and Collars | Ÿ | — | — | — | |||||
| Investment Company Securities (including
iShares SM and Standard & Poor’s Depositary Receipts TM ) |
10 | 10 | 10 | 10 | |||||
| Loan Participations | Ÿ | — | — | — | |||||
| Mortgage Dollar Rolls | Ÿ | — | — | — | |||||
| Options on Foreign Currencies 4 | Ÿ | Ÿ | Ÿ | Ÿ | |||||
| Options on Securities and Securities Indices 5 | Ÿ | Ÿ | Ÿ | Ÿ | |||||
| Repurchase Agreements | Ÿ | Ÿ | Ÿ | Ÿ | |||||
| Reverse Repurchase Agreements (for investment
purposes) |
Ÿ | — | — | — | |||||
| Securities Lending | 33 1
/3
|
33 1
/3
|
33 1
/3
|
33 1
/3
|
|||||
| Short Sales Against the Box | 25 | 25 | — | — | |||||
| Unseasoned Companies | Ÿ | Ÿ | Ÿ | Ÿ | |||||
| Warrants and Stock Purchase Rights | Ÿ | Ÿ | Ÿ | Ÿ | |||||
| When-Issued Securities and Forward
Commitments |
Ÿ | Ÿ | Ÿ | Ÿ | |||||
*
|
Limited to 15% of net assets (together with other illiquid securities) for all structured securities which are not
deemed to be liquid and all swap transactions.
|
**
|
Limited by the amount the Fund invests in foreign securities.
|
1
|
The Balanced Fund may also enter into forward foreign currency exchange contracts to seek to increase total return.
|
2
|
The CORE Large Cap Value, CORE Large Cap Growth and CORE Small Cap Equity Funds may enter into futures transactions only
with respect to a representative index.
|
3
|
The CORE U.S. Equity Fund may enter into futures transactions only with respect to the S&P 500 Index.
|
4
|
The Funds may purchase and sell call and put options.
|
5
|
The Funds may sell covered call and put options and purchase call and put options.
|
| CORE
Large Cap Growth Fund |
CORE
Small Cap Equity Fund |
Capital
Growth Fund |
Strategic
Growth Fund |
Growth
Opportunities Fund |
Mid Cap
Value Fund |
Small Cap
Value Fund |
Large Cap
Value Fund |
||||||||
|---|---|---|---|---|---|---|---|---|---|---|---|---|---|---|---|
| 33 1
/3
|
33 1
/3
|
33 1
/3
|
33 1
/3
|
33 1
/3
|
33 1
/3
|
33 1
/3
|
33 1
/3
|
||||||||
| — | — | — | — | — | — | — | — | ||||||||
| Ÿ | Ÿ | Ÿ | Ÿ | Ÿ | Ÿ | Ÿ | Ÿ | ||||||||
| Ÿ | Ÿ | Ÿ | Ÿ | Ÿ | Ÿ | Ÿ | Ÿ | ||||||||
| 15 | 15 | 15 | 15 | 15 | 15 | 15 | 15 | ||||||||
| Ÿ | Ÿ | Ÿ | Ÿ | Ÿ | Ÿ | Ÿ | Ÿ | ||||||||
| Ÿ 2 | Ÿ 2 | Ÿ | Ÿ | Ÿ | Ÿ | Ÿ | Ÿ | ||||||||
| — | — | — | — | — | — | — | — | ||||||||
| 10 | 10 | 10 | 10 | 10 | 10 | 10 | 10 | ||||||||
| — | — | — | — | — | — | — | — | ||||||||
| — | — | — | — | — | — | — | — | ||||||||
| Ÿ | Ÿ | Ÿ | Ÿ | Ÿ | Ÿ | Ÿ | Ÿ | ||||||||
| Ÿ | Ÿ | Ÿ | Ÿ | Ÿ | Ÿ | Ÿ | Ÿ | ||||||||
| Ÿ | Ÿ | Ÿ | Ÿ | Ÿ | Ÿ | Ÿ | Ÿ | ||||||||
| — | — | — | — | — | — | — | — | ||||||||
| 33 1
/3
|
33 1
/3
|
33 1
/3
|
33 1
/3
|
33 1
/3
|
33 1
/3
|
33 1
/3
|
33 1
/3
|
||||||||
| — | — | 25 | 25 | 25 | 25 | 25 | 25 | ||||||||
| Ÿ | Ÿ | Ÿ | Ÿ | Ÿ | Ÿ | Ÿ | Ÿ | ||||||||
| Ÿ | Ÿ | Ÿ | Ÿ | Ÿ | Ÿ | Ÿ | Ÿ | ||||||||
| Ÿ | Ÿ | Ÿ | Ÿ | Ÿ | Ÿ | Ÿ | Ÿ | ||||||||
Ÿ
|
No specific percentage limitation on usage;
limited only by the objectives and strategies of the Fund |
| Balanced
Fund |
Growth
and Income Fund |
CORE
Large Cap Value Fund |
CORE
U.S. Equity Fund |
||||||||||
|---|---|---|---|---|---|---|---|---|---|---|---|---|---|
| Investment Securities | |||||||||||||
| American, European and Global Depositary
Receipts |
Ÿ | Ÿ | Ÿ 6 | Ÿ 6 | |||||||||
| Asset-Backed and Mortgage-Backed Securities 7 | Ÿ | Ÿ | — | — | |||||||||
| Bank Obligations 7 | Ÿ | Ÿ | Ÿ | Ÿ | |||||||||
| Convertible Securities 8 | Ÿ | Ÿ | Ÿ | Ÿ | |||||||||
| Corporate Debt Obligations 7 | Ÿ | Ÿ | Ÿ 9 | Ÿ 9 | |||||||||
| Equity Securities | 45-65 | 65 | + | 90 | + | 90 | + | ||||||
| Emerging Country Securities | 10 10 | 25 | 10 | — | — | ||||||||
| Fixed Income Securities 11 | 35-45 | 18 | 35 | 10 | 9 | 10 | 9 | ||||||
| Foreign Securities | 10 10 | 25 | 10 | Ÿ 14 | Ÿ 14 | ||||||||
| Foreign Government Securities 7 | Ÿ | — | — | — | |||||||||
| Municipal Securities | Ÿ | — | — | — | |||||||||
| Non-Investment Grade Fixed Income Securities | 10 15 | 10 | 16 | — | — | ||||||||
| Real Estate Investment Trusts | Ÿ | Ÿ | Ÿ | Ÿ | |||||||||
| Stripped Mortgage Backed Securities 7 | Ÿ | — | — | — | |||||||||
| Structured Securities* | Ÿ | Ÿ | Ÿ | Ÿ | |||||||||
| Temporary Investments | 100 | 100 | 35 | 35 | |||||||||
| U.S. Government Securities 7 | Ÿ | Ÿ | Ÿ | Ÿ | |||||||||
| Yield Curve Options and Inverse Floating Rate
Securities |
Ÿ | — | — | — | |||||||||
*
|
Limited to 15% of net assets (together with other illiquid securities) for all structured securities which are not
deemed to be liquid and all swap transactions.
|
6
|
The CORE Funds may not invest in European Depositary Receipts.
|
7
|
Limited by the amount the Fund invests in fixed-income securities.
|
8
|
Convertible securities purchased by the Balanced Fund must be B or higher by Standard & Poor’s Rating Group
(“Standard & Poor’s”) or Moody’s Investor’s Service, Inc. (“Moody’s”). The CORE Funds have no minimum rating criteria and all other Funds use the same rating criteria for convertible and non-convertible debt
securities.
|
9
|
Cash equivalents only.
|
10
|
The Balanced, Growth and Income, Capital Growth, Strategic Growth, Growth Opportunities, Mid Cap Value and Small Cap
Value Funds may invest in the aggregate up to 10%, 25%, 10%, 10%, 10%, 25% and 25%, respectively, of their total assets in foreign securities, including emerging country securities.
|
11
|
Except as noted under “Non-Investment Grade Fixed Income Securities,” fixed-income securities must be
investment grade (i.e., BBB or higher by Standard & Poor’s or Baa or higher by Moody’s).
|
12
|
The Mid Cap Value Fund may invest in the aggregate up to 35% of its total assets in: (1) securities of companies with
public stock market capitalizations outside the range of companies constituting the Russell Midcap Value Index at the time of investment; and (2) fixed-income securities.
|
13
|
The Small Cap Value Fund may invest in the aggregate up to 35% of its total assets in: (1) securities of companies with
public stock market capitalizations outside the range of companies constituting the Russell 2000® Value Index at the time of investment; and (2) fixed-income securities.
|
| CORE
Large Cap Growth Fund |
CORE
Small Cap Equity Fund |
Capital
Growth Fund |
Strategic
Growth Fund |
Growth
Opportunities Fund |
Mid Cap
Value Fund |
Small Cap
Value Fund |
Large Cap
Value Fund |
|||||||||
|---|---|---|---|---|---|---|---|---|---|---|---|---|---|---|---|---|
| Ÿ 6 | Ÿ 6 | Ÿ | Ÿ | Ÿ | Ÿ | Ÿ | Ÿ | |||||||||
| — | — | Ÿ | Ÿ | Ÿ | Ÿ | Ÿ | Ÿ | |||||||||
| Ÿ | Ÿ | Ÿ | Ÿ | Ÿ | Ÿ | Ÿ | Ÿ | |||||||||
| Ÿ | Ÿ | Ÿ | Ÿ | Ÿ | Ÿ | Ÿ | Ÿ | |||||||||
| Ÿ 9 | Ÿ 9 | Ÿ | Ÿ | Ÿ | Ÿ | Ÿ | Ÿ | |||||||||
| 90+ | 90+ | 90 | + | 90+ | 90+ | 65+ | 65+ | 90+ | ||||||||
| — | — | 10 | 10 | 10 10 | 10 10 | 25 10 | 25 10 | — | ||||||||
| 10 9 | 10 9 | Ÿ | Ÿ | Ÿ | 35 12 | 35 13 | 10 | |||||||||
| Ÿ |
Ÿ 14 | 10 | 10 | 10 10 | 10 10 | 25 10 | 25 10 | 25 | ||||||||
| — | — | — | — | — | — | — | — | |||||||||
| — | — | — | — | — | — | — | — | |||||||||
| — | — | 10 | 16 | 10 16 | 10 16 | 10 17 | 35 16 | 10 16 | ||||||||
| Ÿ | Ÿ | Ÿ | Ÿ | Ÿ | Ÿ | Ÿ | Ÿ | |||||||||
| — | — | — | — | — | — | — | — | |||||||||
| Ÿ | Ÿ | Ÿ | Ÿ | Ÿ | Ÿ | Ÿ | Ÿ | |||||||||
| 35 | 35 | 100 | 100 | 100 | 100 | 100 | 100 | |||||||||
| Ÿ | Ÿ | Ÿ | Ÿ | Ÿ | Ÿ | Ÿ | Ÿ | |||||||||
| — | — | — | — | — | — | — | — | |||||||||
14
|
Equity securities of foreign issuers must be traded in the United States.
|
15
|
Must be at least BB or B by Standard & Poor’s or Ba or B by Moody’s.
|
16
|
May be BB or lower by Standard & Poor’s or Ba or lower by Moody’s.
|
17
|
Must be B or higher by Standard & Poor’s or B or higher by Moody’s.
|
18
|
The Balanced Fund invests at least 25% of its total assets in fixed-income senior securities; the remainder may be
invested in other fixed-income securities and cash.
|
| Ÿ
Applicable
— Not applicable |
Balanced
Fund |
Growth
and Income Fund |
CORE
Large Cap Value Fund |
CORE
U.S. Equity Fund |
CORE
Large Cap Growth Fund |
CORE
Small Cap Equity Fund |
|||||||
|---|---|---|---|---|---|---|---|---|---|---|---|---|---|
| Credit/Default | Ÿ | Ÿ | Ÿ | Ÿ | Ÿ | Ÿ | |||||||
| Foreign | Ÿ | Ÿ | Ÿ | Ÿ | Ÿ | Ÿ | |||||||
| Emerging Countries | Ÿ | Ÿ | Ÿ | Ÿ | Ÿ | Ÿ | |||||||
| Small Cap | — | — | — | — | — | Ÿ | |||||||
| Stock | Ÿ | Ÿ | Ÿ | Ÿ | Ÿ | Ÿ | |||||||
| Derivatives | Ÿ | Ÿ | Ÿ | Ÿ | Ÿ | Ÿ | |||||||
| Interest Rate | Ÿ | Ÿ | Ÿ | Ÿ | Ÿ | Ÿ | |||||||
| Management | Ÿ | Ÿ | Ÿ | Ÿ | Ÿ | Ÿ | |||||||
| Market | Ÿ | Ÿ | Ÿ | Ÿ | Ÿ | Ÿ | |||||||
| Liquidity | Ÿ | Ÿ | Ÿ | Ÿ | Ÿ | Ÿ | |||||||
| Initial Public Offering (“IPO”) | — | — | — | — | — | — | |||||||
| Capital
Growth Fund |
Strategic
Growth Fund |
Growth
Opportunities Fund |
Mid
Cap Value Fund |
Small Cap Value Fund |
Large
Cap Value Fund |
||||||
|---|---|---|---|---|---|---|---|---|---|---|---|
| Ÿ | Ÿ | Ÿ | Ÿ | Ÿ | Ÿ | ||||||
| Ÿ | Ÿ | Ÿ | Ÿ | Ÿ | Ÿ | ||||||
| Ÿ | Ÿ | Ÿ | Ÿ | Ÿ | Ÿ | ||||||
| — | — | — | Ÿ | Ÿ | — | ||||||
| Ÿ | Ÿ | Ÿ | Ÿ | Ÿ | Ÿ | ||||||
| Ÿ | Ÿ | Ÿ | Ÿ | Ÿ | Ÿ | ||||||
| Ÿ | Ÿ | Ÿ | Ÿ | Ÿ | Ÿ | ||||||
| Ÿ | Ÿ | Ÿ | Ÿ | Ÿ | Ÿ | ||||||
| Ÿ | Ÿ | Ÿ | Ÿ | Ÿ | Ÿ | ||||||
| Ÿ | Ÿ | Ÿ | Ÿ | Ÿ | Ÿ | ||||||
| — | Ÿ | Ÿ | Ÿ | Ÿ | — | ||||||
n
|
Credit/Default Risk—The risk that an issuer or guarantor of fixed-income securities held by a Fund may default
on its obligation to pay interest and repay principal.
|
n
|
Foreign Risk—The risk that when a Fund invests in foreign securities, it will be subject to risk of loss not
typically associated with domestic issuers. Loss may result because of less foreign government regulation, less public information and less economic, political and social stability. Loss may also result from the imposition of exchange controls,
confiscations and other government restrictions. A
Fund will also be subject to the risk of negative foreign currency rate fluctuations. Foreign risks will normally be greatest when a Fund invests in issuers located in emerging countries. |
n
|
Emerging Countries Risk—The securities markets of Asian, Latin and South American, Eastern European, African
and other emerging countries are less liquid, are especially subject to greater price volatility, have smaller market capitalizations, have less government regulation and are not subject to as extensive and frequent accounting, financial and other
reporting requirements as the securities markets of more developed countries. Further, investment in equity securities of issuers located in Russia and certain other emerging countries involves risk of loss resulting from problems in share registration
and custody and substantial economic and political disruptions. These risks are not normally associated with investments in more developed countries.
|
n
|
Stock Risk—The risk that stock prices
have historically risen and fallen in periodic cycles. Recently, U.S. stock markets and certain foreign stock markets have experienced substantial price volatility and, at times, have traded at or close to record high levels. There is no guarantee that
such levels will be reached or maintained in the future.
|
n
|
Derivatives Risk—The risk that loss may result from a Fund’s investments in options, futures, swaps,
structured securities and other derivative instruments. These instruments may be leveraged so that small changes may produce disproportionate losses to a Fund.
|
n
|
Interest Rate Risk—The risk that when interest rates increase, securities held by a Fund will decline in value.
Long-term fixed-income securities will normally have more price volatility because of this risk than short-term fixed income securities.
|
n
|
Management Risk—The risk that a strategy used by the Investment Adviser may fail to produce the intended results.
|
n
|
Market Risk—The risk that the value of the securities in which a Fund invests may go up or down in response to
the prospects of individual companies, particular industry sectors and/or general economic conditions. Price changes may be temporary or last for extended periods. A Fund’s investments may be overweighted
from time to time in one or more industry sectors, which will increase the Fund’s exposure to risk of loss from adverse developments affecting those sectors.
|
n
|
Liquidity Risk—The risk that a Fund will not be able to pay redemption proceeds within the time period stated
in this Prospectus because of unusual market conditions, an unusually high volume of redemption requests, or other reasons. Funds that invest in non-investment grade fixed-income securities, small capitalization stocks, REITs and emerging country issuers
will be especially subject to the risk that during certain periods the liquidity of particular issuers or industries, or all securities within particular investment categories, will shrink or disappear suddenly and without warning as a result of adverse
economic, market or political events, or adverse investor perceptions whether or not accurate. The Goldman Sachs Asset Allocation Portfolios (the “Asset Allocation Portfolios”) expect to invest a significant percentage of their assets in the
Funds and other funds for which Goldman Sachs now or in the future acts as investment adviser or underwriter. Redemptions by an Asset Allocation Portfolio of its position in a Fund may further increase liquidity risk and may impact a Fund’s net asset
value (“NAV”).
|
n
|
Small Cap Risk—The securities of small capitalization stocks involve greater risks than those associated with
larger, more established companies and may be subject to more abrupt or erratic price movements. Securities of such issuers may lack sufficient market liquidity to enable a Fund to effect sales at an advantageous time or without a substantial drop in price.
|
n
|
IPO Risk—The risk that the market value of IPO shares will fluctuate considerably due to factors such as the
absence of a prior public market, unseasoned trading, the small number of shares available for trading and limited information about the issuer. The purchase of IPO shares may involve high transaction costs. IPO shares are subject to market risk and
liquidity risk. When a Fund’s asset base is small, a significant portion of the Fund’s performance could be attributanble to investments in IPOs, because such investments would have a magnified impact on the Fund. As the Fund’s assets grow,
the effect of the Fund’s investments in IPOs on the Fund’s performance probably will decline, which could reduce the Fund’s performance.
|
| HOW THE FUNDS HAVE PERFORMED
|
| The bar chart and table below provide an indication of the risks of investing in a Fund by showing: (a) changes in the performance
of a Fund’s Institutional Shares from year to year; and (b) how the average annual returns of a Fund’s Institutional Shares compare to those of broad-based securities market indices. The bar chart and table assume reinvestment of dividends and
distributions. A Fund’s past performance is not necessarily an indication of how the Fund will perform in the future. Performance reflects expense limitations in effect. If expense limitations were not in place, a Fund’s performance would have
been reduced. The Strategic Growth, Growth Opportunities and Large Cap Value Funds commenced operations on May 24, 1999, May 24, 1999 and December 15, 1999, respectively. Since these Funds have less than one calendar year’s performance, no
performance information is provided in this section.
|
| TOTAL RETURN
|
| The total return for Institutional Shares for the 9-month period ended September 30, 2000 was 2.65%.
Best Quarter
Q4 ’99 +8.29%
Worst Quarter
Q3 ’98 -8.69%
|
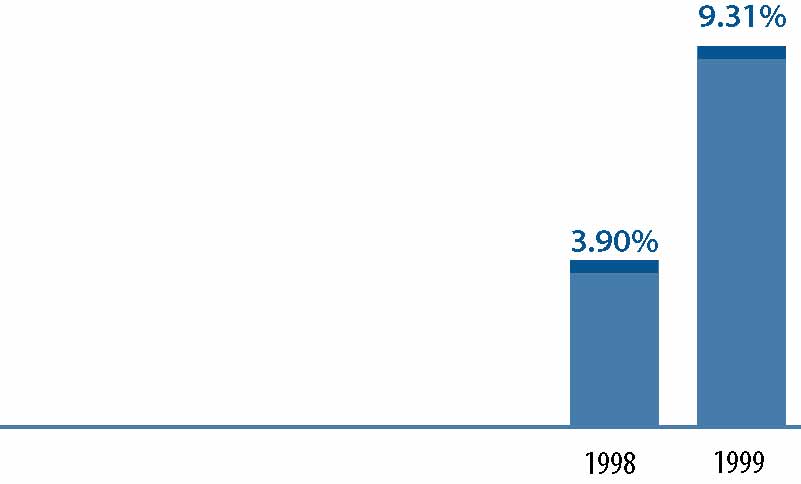 |
| AVERAGE ANNUAL TOTAL RETURN
|
| For the period ended December 31, 1999 | 1 Year | Since Inception | |||
|---|---|---|---|---|---|
| Institutional Shares (Inception 8/15/97) | 9.31% | 6.33% | |||
| S&P 500® Index* | 21.04% | 23.21% | |||
| Lehman Brothers Aggregate Bond Index** | (0.82)% | 5.14% | |||
*
|
The S&P 500® Index is the Standard & Poor’s Composite Index of 500 stocks, an unmanaged index of common stock
prices. The Index figures do not reflect any fees or expenses.
|
**
|
The Lehman Brothers Aggregate Bond Index is an unmanaged index of bond prices. The Index figures do not reflect any fees or
expenses.
|
| TOTAL RETURN
|
| The total return for Institutional Shares for the
9-month period ended September 30, 2000 was -0.46%.
Best Quarter
Q2 ’97
+15.24%
Worst Quarter
Q3 ’98
-16.86%
|
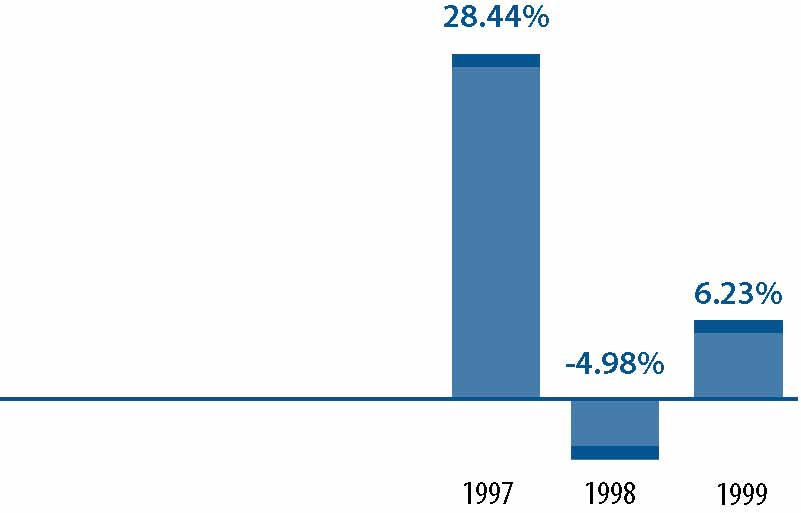 |
| AVERAGE ANNUAL TOTAL RETURN
|
| For the period ended December 31, 1999 | 1 Year | Since Inception | |||
|---|---|---|---|---|---|
| Institutional Shares (Inception 6/3/96) | 6.23% | 12.03% | |||
| S&P 500® Index* | 21.04% | 26.60% | |||
*
|
The S&P 500® Index is the Standard & Poor’s Composite Index of 500 stocks, an unmanaged index of common stock
prices. The Index figures do not reflect any fees or expenses.
|
| TOTAL RETURN
|
| The total return for Institutional Shares for the 9-month period ended September 30, 2000 was 2.68%.
Best Quarter
Q2 ’99 +10.50%
Worst Quarter
Q3 ’99 -8.52%
|
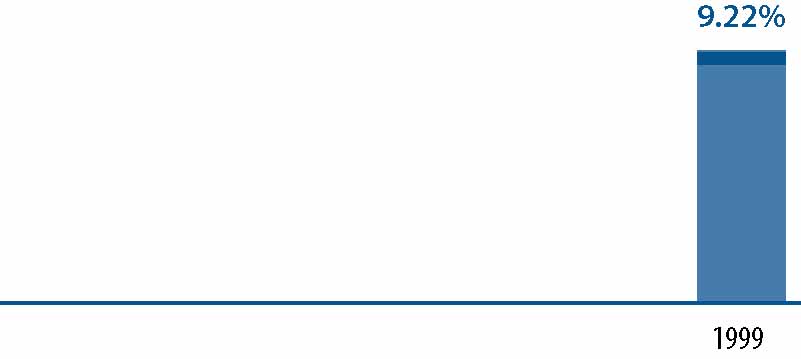 |
| AVERAGE ANNUAL TOTAL RETURN
|
| For the period ended December 31, 1999 | 1 Year | Since Inception | |||
|---|---|---|---|---|---|
| Institutional Shares (Inception 12/31/98) | 9.22% | 9.19% | |||
| Russell 1000 Value Index | 7.34% | 7.34% | |||
*
|
The Russell 1000® Value Index (inception date 1/1/99) is a market capitalization weighted index of the 1000 highest ranking
U.S. stocks with below-average growth orientation. The Index figures do not reflect any fees or expenses.
|
| TOTAL RETURN
|
| The total return for Institutional Shares for the 9-month period ended September 30, 2000 was -0.09%.
Best Quarter
Q4 ’98 +21.60%
Worst Quarter
Q3 ’98 -14.57%
|
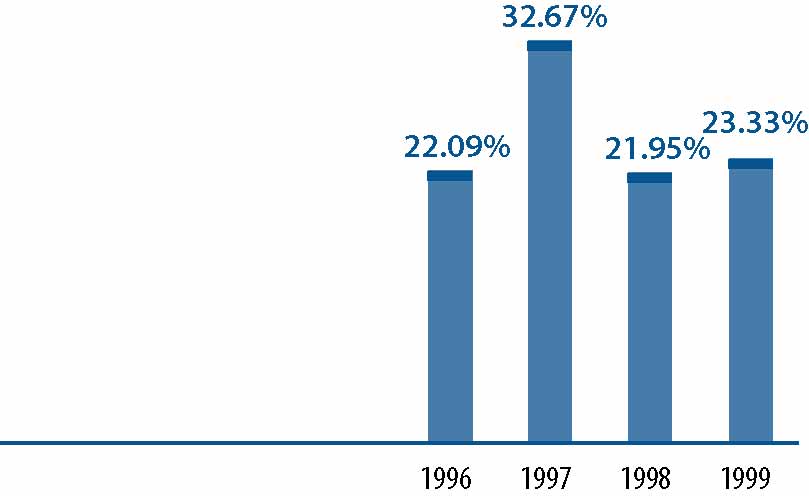 |
| AVERAGE ANNUAL TOTAL RETURN
|
| For the period ended December 31, 1999 | 1 Year | Since Inception | |||
|---|---|---|---|---|---|
| Institutional Shares (Inception 6/15/95) | 23.33% | 25.59% | |||
| S&P 500® Index* | 21.04% | 27.01% | |||
*
|
The S&P 500® Index is the Standard & Poor’s Composite Index of 500 stocks, an unmanaged index of common stock
prices. The Index figures do not reflect any fees or expenses.
|
| TOTAL RETURN
|
| The total return for Institutional Shares for the 9-month period ended September 30, 2000 was -0.53%.
Best Quarter
Q4 ’98 +25.61%
Worst Quarter
Q3 ’98 -13.87%
|
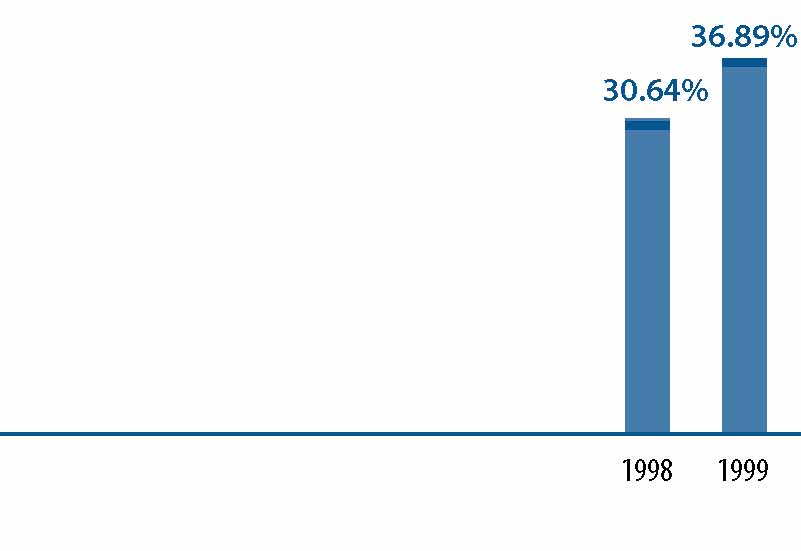 |
| AVERAGE ANNUAL TOTAL RETURN
|
| For the period ended December 31, 1999 | 1 Year | Since Inception | |||
|---|---|---|---|---|---|
| Institutional Shares (Inception 5/1/97) | 36.89% | 33.80% | |||
| Russell 1000® Growth Index* | 33.15% | 35.42% | |||
*
|
The Russell 1000® Growth Index is an unmanaged index of common stock prices. The Index figures do not reflect any fees or
expenses.
|
| TOTAL RETURN
|
| The total return for Institutional Shares for the 9-month period ended September 30, 2000 was 7.25%.
Best Quarter
Q4 ’99 +15.35%
Worst Quarter
Q3 ’98 -24.25%
|
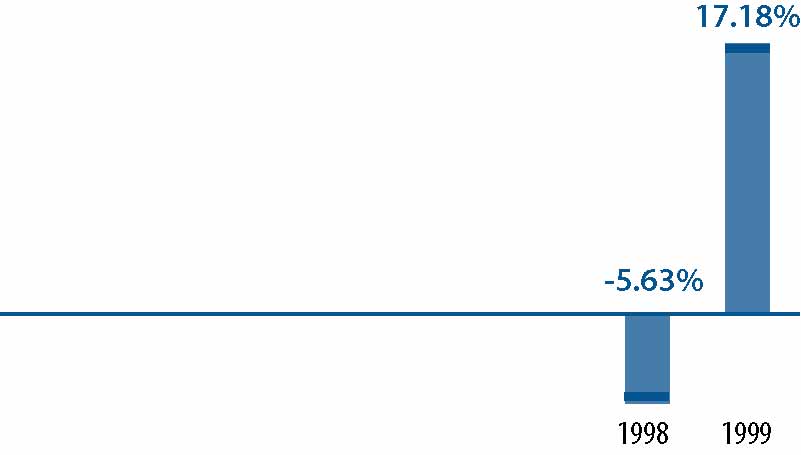 |
| AVERAGE ANNUAL TOTAL RETURN
|
| For the period ended December 31, 1999 | 1 Year | Since Inception | |||
|---|---|---|---|---|---|
| Institutional Shares (Inception 8/15/97) | 17.18% | 7.77% | |||
| Russell 2000® Index* | 21.26% | 10.21% | |||
*
|
The Russell 2000® Index is an unmanaged index of common stock prices. The Index figures do not reflect any fees or expenses.
|
| TOTAL RETURN
|
| The total return for Institutional Shares for the 9-month period ended September 30, 2000 was 0.58%
Best Quarter
Q4 ’98 +24.46%
Worst Quarter
Q3 ’98 -11.40%
|
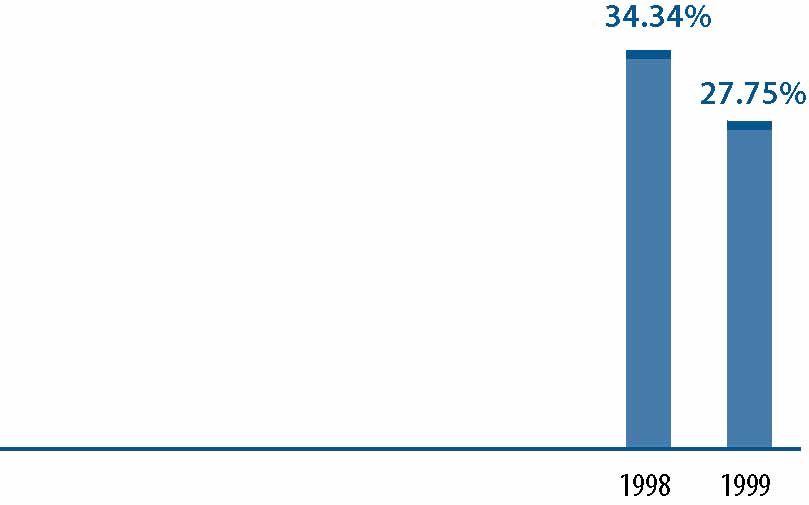 |
| AVERAGE ANNUAL TOTAL RETURN
|
| For the period ended December 31, 1999 | 1 Year | Since Inception | |||
|---|---|---|---|---|---|
| Institutional Shares (Inception 8/15/97) | 27.75% | 29.05% | |||
| S&P 500® Index* | 21.04% | 23.21% | |||
*
|
The S&P 500® Index is the Standard & Poor’s Composite Index of 500 stocks, an unmanaged index of common stock
prices. The Index figures do not reflect any fees or expenses.
|
| TOTAL RETURN
|
| The total return for Institutional Shares for the 9-month period ended September 30, 2000 was 18.17%.
Best Quarter
Q2 ’99 +21.23%
Worst Quarter
Q3 ’98 -20.78%
|
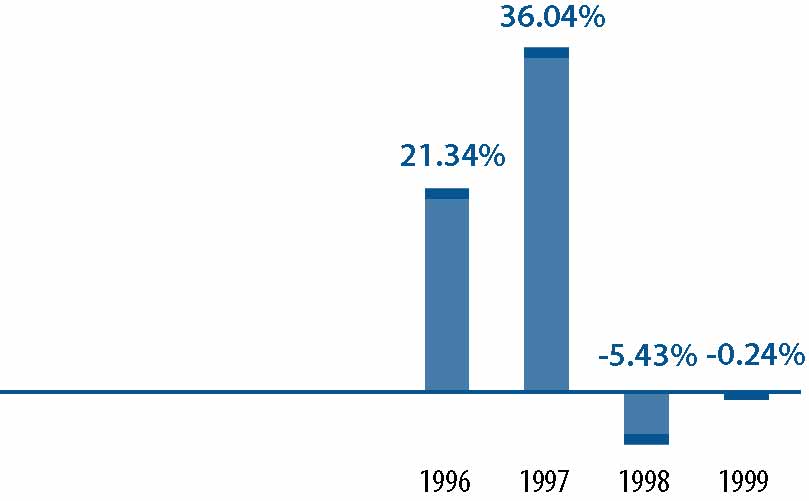 |
| AVERAGE ANNUAL TOTAL RETURN
|
| For the period ended December 31, 1999 | 1 Year | Since Inception | |||
|---|---|---|---|---|---|
| Institutional Shares (Inception 8/1/95) | (0.24)% | 11.76% | |||
| Russell Midcap Value Index* | (0.10)% | 14.92% | |||
*
|
The Russell Midcap Value Index is an unmanaged index of common stock prices. The Index figures do not reflect any fees or
expenses.
|
| TOTAL RETURN
|
| The total return for Institutional Shares for the 9-month period ended September 30, 2000 was 26.83%.
Best Quarter
Q2 ’99 +30.23%
Worst Quarter
Q3 ’98 -32.16%
|
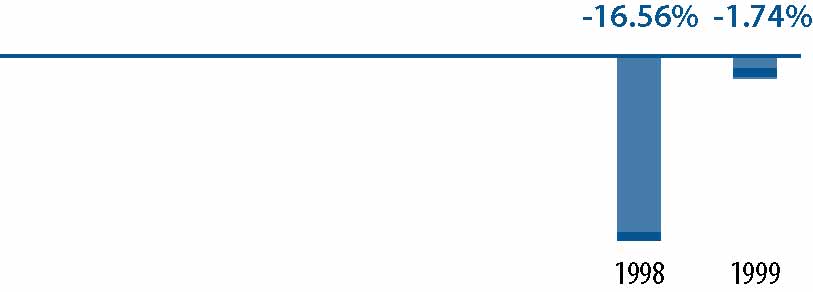 |
| AVERAGE ANNUAL TOTAL RETURN
|
| For the period ended December 31, 1999 | 1 Year | Since Inception | |||
|---|---|---|---|---|---|
| Institutional Shares (Inception 8/15/97) | (1.74)% | (5.12)% | |||
| Russell 2000® Value Index * | (1.49)% | 0.81% | |||
*
|
The Russell 2000® Value Index is an unmanaged index of common stock prices. The Index figures do not reflect any fees or
expenses.
|
| Balanced
Fund |
Growth and
Income Fund |
CORE
Large Cap Value Fund |
CORE
U.S. Equity Fund |
||||||
|---|---|---|---|---|---|---|---|---|---|
| Shareholder Fees | |||||||||
| (fees paid directly from your investment): | |||||||||
| Maximum Sales Charge (Load) Imposed on
Purchases |
None | None | None | None | |||||
| Maximum Sales Charge (Load) Imposed on
Reinvested Dividends |
None | None | None | None | |||||
| Redemption Fees | None | None | None | None | |||||
| Exchange Fees | None | None | None | None | |||||
| Annual Fund Operating Expenses | |||||||||
| (expenses that are deducted from Fund assets):1 | |||||||||
| Management Fees 2 | 0.65% | 0.70% | 0.60% | 0.75% | |||||
| Distribution and Service (12b-1) Fees | None | None | None | None | |||||
| Other Expenses 3 | 0.24% | 0.08% | 0.17% | 0.08% | |||||
| Total Fund Operating Expenses* | 0.89% | 0.78% | 0.77% | 0.83% | |||||
| See page 38 for all other footnotes.
|
*
|
As a result of current waivers and expense limitations, “Other Expenses” and “Total Fund Operating Expenses”
of the Funds which are actually incurred as of the date of this Prospectus are as set forth below. The waivers and expense limitations may be terminated at any time at the option of the Investment Adviser. If this occurs, “Other Expenses” and
“Total Fund Operating Expenses” may increase without shareholder approval.
|
| Balanced
Fund |
Growth and
Income Fund |
CORE
Large Cap Value Fund |
CORE
U.S. Equity Fund |
||||||
|---|---|---|---|---|---|---|---|---|---|
| Annual Fund Operating Expenses | |||||||||
| (expenses that are deducted from Fund assets): 1 | |||||||||
| Management Fees 2 | 0.65% | 0.70% | 0.60% | 0.70% | |||||
| Distribution and Service (12b-1) Fees | None | None | None | None | |||||
| Other Expenses 3 | 0.10% | 0.08% | 0.10% | 0.04% | |||||
| Total Fund Operating Expenses (after current
waivers and expense limitations) |
0.75% | 0.78% | 0.70% | 0.74% | |||||
| CORE
Large Cap Growth Fund |
CORE
Small Cap Equity Fund |
Capital
Growth Fund |
Strategic
Growth Fund |
Growth
Opportunities Fund |
Mid Cap
Value Fund |
Small Cap
Value Fund |
Large Cap
Value Fund |
||||||||
|---|---|---|---|---|---|---|---|---|---|---|---|---|---|---|---|
| None | None | None | None | None | None | None | None | ||||||||
| None | None | None | None | None | None | None | None | ||||||||
| None | None | None | None | None | None | None | None | ||||||||
| None | None | None | None | None | None | None | None | ||||||||
| 0.75% | 0.85% | 1.00% | 1.00% | 1.00% | 0.75% | 1.00% | 0.75% | ||||||||
| None | None | None | None | None | None | None | None | ||||||||
| 0.09% | 0.30% | 0.07% | 0.23% | 0.21% | 0.19% | 0.17% | 2.15% | ||||||||
| 0.84% | 1.15% | 1.07% | 1.23% | 1.21% | 0.94% | 1.17% | 2.90% | ||||||||
| CORE
Large Cap Growth Fund |
CORE
Small Cap Equity Fund |
Capital
Growth Fund |
Strategic
Growth Fund |
Growth
Opportunities Fund |
Mid Cap
Value Fund |
Small Cap
Value Fund |
Large Cap
Value Fund |
||||||||
|---|---|---|---|---|---|---|---|---|---|---|---|---|---|---|---|
| 0.70% | 0.85% | 1.00% | 1.00% | 1.00% | 0.75% | 1.00% | 0.75% | ||||||||
| None | None | None | None | None | None | None | None | ||||||||
| 0.06% | 0.08% | 0.04% | 0.04% | 0.15% | 0.14% | 0.10% | 0.10% | ||||||||
| 0.76% | 0.93% | 1.04% | 1.04% | 1.15% | 0.89% | 1.10% | 0.85% | ||||||||
1
|
The Funds’ annual operating expenses are based on actual expenses.
|
2
|
The Investment Adviser has voluntarily agreed not to impose a portion of the management fee on the CORE U.S. Equity Fund
and the CORE Large Cap Growth Fund equal to 0.05% and 0.05%, respectively, of such Funds’ average daily net assets. As a result of fee waivers, the current management fees of the CORE U.S. Equity Fund and CORE Large Cap Growth Fund are 0.70% and 0.70%, respectively, of such Funds’ average daily net assets. The waivers may be terminated at any time at the option
of the Investment Adviser.
|
3
|
“Other Expenses” include transfer agency fees equal to 0.04% of the average daily net assets of each Fund’
s Institutional Shares plus all other ordinary expenses not detailed above. The Investment Adviser has voluntarily agreed to reduce or limit “Other Expenses”(excluding management fees, transfer agency fees, taxes, interest and brokerage fees and
litigation, indemnification and other extraordinary expenses) to the following percentages of each Fund’s average daily net assets:
|
| Fund | Other
Expenses |
||
|---|---|---|---|
| Balanced | 0.06% | ||
| Growth and Income | 0.05% | ||
| CORE Large Cap Value | 0.06% | ||
| CORE U.S. Equity | 0.00% | ||
| CORE Large Cap Growth | 0.02% | ||
| CORE Small Cap Equity | 0.04% | ||
| Capital Growth | 0.00% | ||
| Strategic Growth | 0.00% | ||
| Growth Opportunities | 0.11% | ||
| Mid Cap Value | 0.10% | ||
| Small Cap Value | 0.06% | ||
| Large Cap Value | 0.06% | ||
| Fund | 1 Year | 3 Years | 5 Years | 10 Years | |||||
|---|---|---|---|---|---|---|---|---|---|
| Balanced | $ 91 | $284 | $ 493 | $1,096 | |||||
| Growth and Income | $ 80 | $249 | $ 433 | $ 966 | |||||
| CORE Large Cap Value | $ 79 | $246 | $ 428 | $ 954 | |||||
| CORE U.S. Equity | $ 85 | $265 | $ 460 | $1,025 | |||||
| CORE Large Cap Growth | $ 86 | $268 | $ 466 | $1,037 | |||||
| CORE Small Cap Equity | $117 | $365 | $ 633 | $1,398 | |||||
| Capital Growth | $109 | $340 | $ 590 | $1,306 | |||||
| Strategic Growth | $125 | $390 | $ 676 | $1,489 | |||||
| Growth Opportunities | $123 | $384 | $ 665 | $1,466 | |||||
| Mid Cap Value | $ 96 | $300 | $ 520 | $1,155 | |||||
| Small Cap Value | $119 | $372 | $ 644 | $1,420 | |||||
| Large Cap Value | $293 | $898 | $1,528 | $3,223 | |||||
| INVESTMENT ADVISERS
|
| Investment Adviser | Fund | ||
|---|---|---|---|
| Goldman Sachs Asset Management (“GSAM”) | Balanced | ||
| 32 Old Slip | Growth and Income | ||
| New York, New York 10005 | CORE Large Cap Value | ||
| CORE Large Cap Growth | |||
| CORE Small Cap Equity | |||
| Strategic Growth | |||
| Growth Opportunities | |||
| Mid Cap Value | |||
| Small Cap Value | |||
| Large Cap Value | |||
| Goldman Sachs Funds Management, L.P. (“GSFM”) | CORE U.S. Equity | ||
| 32 Old Slip | Capital Growth | ||
| New York, New York 10005 | |||
| GSAM and GSFM are separate business units of the Investment Management Division (“IMD”) of Goldman Sachs. Goldman Sachs
registered as an investment adviser in 1981. GSFM, a registered investment adviser since 1990, is a Delaware limited partnership which is an affiliate of Goldman Sachs. As of September 30, 2000, GSAM and GSFM, along with other units of IMD, had assets
under management of $281.3 billion.
|
| The Investment Adviser provides day-to-day advice regarding the Funds’ portfolio transactions. The Investment Adviser makes
the investment decisions for the Funds and places purchase and sale orders for the Funds’ portfolio transactions in U.S. and foreign markets. As permitted by applicable law, these orders may be directed to any brokers, including Goldman Sachs and its
affiliates. While the Investment Adviser is ultimately responsible for the management of the Funds, it is able to draw upon the research and expertise of its asset management affiliates for portfolio decisions and management with respect to certain
portfolio securities. In addition, the Investment Adviser has access to the research and certain proprietary technical models developed by Goldman Sachs, and will apply quantitative and qualitative analysis in determining the appropriate allocations among
categories of issuers and types of securities.
|
| The Investment Adviser also performs the following additional services for the Funds:
|
n
|
Supervises all non-advisory operations of the Funds
|
n
|
Provides personnel to perform necessary executive, administrative and clerical services to the Funds
|
n
|
Arranges for the preparation of all required tax returns,
reports to shareholders, prospectuses and statements of additional information and other reports filed with the Securities and Exchange Commission (the “SEC”) and other regulatory authorities
|
n
|
Maintains the records of each Fund
|
n
|
Provides office space and all necessary office equipment and services
|
| MANAGEMENT FEES
|
| As compensation for its services and its assumption of certain expenses, the Investment Adviser is entitled to the following fees,
computed daily and payable monthly, at the annual rates listed below (as a percentage of each respective Fund’s average daily net assets):
|
| Contractual Rate | Actual Rate
For the Fiscal Year Ended August 31, 2000 |
||||
|---|---|---|---|---|---|
| GSAM: | |||||
| Balanced | 0.65% | 0.65% | |||
| Growth and Income | 0.70% | 0.70% | |||
| CORE Large Cap Value | 0.60% | 0.60% | |||
| CORE Large Cap Growth | 0.75% | 0.64% | |||
| CORE Small Cap Equity | 0.85% | 0.85% | |||
| Strategic Growth | 1.00% | 1.00% | |||
| Growth Opportunities | 1.00% | 1.00% | |||
| Mid Cap Value | 0.75% | 0.75% | |||
| Small Cap Value | 1.00% | 1.00% | |||
| Large Cap Value | 0.75% | 0.75% | |||
| GSFM: | |||||
| CORE U.S. Equity | 0.75% | 0.70% | |||
| Capital Growth | 1.00% | 1.00% | |||
| The difference, if any, between the stated fees and the actual fees paid by the Funds reflects that the Investment Adviser did not
charge the full amount of the fees to which it would have been entitled. The Investment Adviser may discontinue or modify any such voluntary limitations in the future at its discretion.
|
| FUND MANAGERS
|
| M. Roch Hillenbrand, a Managing Director of Goldman Sachs since 1997, is the Head of Global Equities for GSAM, overseeing the
United States, Europe, Japan, and non-Japan Asia. In this capacity, he is responsible for managing the group as it defines and implements global portfolio management processes that are consistent, reliable and predictable. Mr. Hillenbrand joined Goldman
Sachs in 1997 upon its acquisition of Commodities Corporation, LLC where he was and continues as President. Over the course of his 19-year career at Commodities Corporation, Mr. Hillenbrand has had extensive experience in dealing with internal and
external investment managers who have managed a range of futures and equities strategies across multiple markets, using a variety of styles.
|
| Value Team
|
n
|
Twelve portfolio managers/analysts with over 100 years of combined financial experience comprise the Investment Adviser’s
value investment team
|
n
|
Multi-sector focus provides a balanced perspective and in-depth industry
knowledge |
n
|
Across all value products, the Investment Adviser leverages the industry research expertise of its small, mid and large cap
investment teams
|
| Name and Title | Fund Responsibility | Years
Primarily Responsible |
Five Year Employment History | ||||
|---|---|---|---|---|---|---|---|
| Eileen A. Aptman
Vice President |
Senior Portfolio Manager—
Mid Cap Value Small Cap Value |
Since
1996 1997 |
Ms. Aptman joined the Investment
Adviser as a research analyst in 1993. She became a portfolio manager in 1996. |
||||
| Matthew B.
McLennan Vice President |
Senior Portfolio Manager—
Small Cap Value Mid Cap Value |
Since
1996 1998 |
Mr. McLennan joined the
Investment Adviser as a research analyst in 1995 and became a portfolio manager in 1996. From 1994 to 1995, he worked in the Investment Banking Division of Goldman Sachs in Australia. |
||||
| Meera Mayer
Vice President |
Senior Portfolio Manager—
Growth and Income Large Cap Value Balanced (Equity) |
Since
1999 1999 1999 |
Ms. Mayer joined the Investment
Adviser as a senior portfolio manager in November 1999. From July 1999 to November 1999, she worked at Oppenheimer Funds as a senior equity analyst. From 1995 to March 1999, she worked at Spears, Benzak, Salomon and Farrell as a managing director and portfolio manager. |
||||
| Name and Title | Fund Responsibility | Years
Primarily Responsible |
Five Year Employment History | ||||
|---|---|---|---|---|---|---|---|
| Chip Otness
Vice President |
Senior Portfolio Manager—
Small Cap Value Mid Cap Value |
Since
2000 2000 |
Mr. Otness joined the Investment
Adviser as a senior portfolio manager in 2000. From 1998 to 2000, he headed Dolphin Asset Management. From 1970 to 1998, he worked at J.P. Morgan, most recently as a managing director and senior portfolio manager responsible for small-cap institutional equity investments. |
||||
| Eileen Rominger
Managing Director |
Senior Portfolio Manager—
Growth and Income Large Cap Value Balanced (Equity) |
Since
1999 1999 1999 |
Ms. Rominger joined the
Investment Adviser as a senior portfolio manager and Chief Investment Officer of the Value Equity team in 1999. From 1981 to 1999, she worked at Oppenheimer Capital, most recently as a senior portfolio manager. |
||||
| Quantitative Equity Team
|
n
|
A stable and growing team supported by an extensive internal staff
|
n
|
Access to the research ideas of Goldman Sachs’ renowned Global Investment Research Department
|
n
|
More than $34 billion in equities currently under management
|
| Name and Title | Fund Responsibility | Years
Primarily Responsible |
Five Year Employment History | ||||
|---|---|---|---|---|---|---|---|
| Melissa Brown
Managing Director |
Senior Portfolio Manager—
CORE Large Cap Value CORE U.S. Equity CORE Large Cap Growth CORE Small Cap Equity |
Since
1998 1998 1998 1998 |
Ms. Brown joined the
Investment Adviser as a portfolio manager in 1998. From 1984 to 1998, she was the director of Quantitative Equity Research and served on the Investment Policy Committee at Prudential Securities. |
||||
| Robert C. Jones
Managing Director |
Senior Portfolio Manager—
CORE U.S. Equity CORE Large Cap Growth CORE Small Cap Equity CORE Large Cap Value |
Since
1991 1997 1997 1998 |
Mr. Jones joined the
Investment Adviser as a portfolio manager in 1989. |
||||
| Victor H. Pinter
Vice President |
Senior Portfolio Manager—
CORE U.S. Equity CORE Large Cap Growth CORE Small Cap Equity CORE Large Cap Value |
Since
1996 1997 1997 1998 |
Mr. Pinter joined the
Investment Adviser as a research analyst in 1989. He became a portfolio manager in 1992. |
||||
| Growth Equity Investment Team
|
n
|
18 year consistent investment style applied through diverse and complete market cycles
|
n
|
More than $22 billion in equities currently under management
|
n
|
More than 300 client account relationships
|
n
|
A portfolio management and analytical team with more than 150 years combined investment experience
|
| Name and Title | Fund Responsibility | Years
Primarily Responsible |
Five Year Employment History | ||||
|---|---|---|---|---|---|---|---|
| George D. Adler
Vice President |
Senior Portfolio Manager—
Balanced (Equity) Capital Growth Strategic Growth Growth Opportunities |
Since
1997 1997 1999 1999 |
Mr. Adler joined the
Investment Adviser as a portfolio manager in 1997. From 1990 to 1997, he was a portfolio manager at Liberty Investment Management, Inc. (“Liberty”). |
||||
| Steve Barry
Vice President |
Senior Portfolio Manager—
Growth Opportunities Capital Growth Balanced (Equity) Strategic Growth |
Since
1999 2000 2000 2000 |
Mr. Barry joined the Investment
Adviser as a portfolio manager in 1999. From 1988 to 1999, he was a portfolio manager at Alliance Capital Management. |
||||
| Kenneth T. Berents
Managing Director |
Senior Portfolio Manager—
Capital Growth Balanced (Equity) Strategic Growth Growth Opportunities |
Since
2000 2000 2000 2000 |
Mr. Berents joined the Investment
Adviser as a portfolio manager in 2000. From 1992 to 1999, he was Director of Research and head of the Investment Committee at Wheat First Union. |
||||
| Robert G. Collins
Managing Director |
Senior Portfolio Manager—
Capital Growth Balanced (Equity) Strategic Growth Growth Opportunities |
Since
1997 1998 1999 1999 |
Mr. Collins joined the Investment
Adviser as portfolio manager and Co-Chair of the Growth Equity Investment Committee in 1997. From 1991 to 1997, he was a portfolio manager at Liberty. |
||||
| Herbert E. Ehlers
Managing Director |
Senior Portfolio Manager—
Capital Growth Balanced (Equity) Strategic Growth Growth Opportunities |
Since
1997 1998 1999 1999 |
Mr. Ehlers joined the Investment
Adviser as a senior portfolio manager and Chief Investment Officer of the Growth Equity team in 1997. From 1994 to 1997, he was the Chief Investment Officer and Chairman of Liberty. |
||||
| Name and Title | Fund Responsibility | Years
Primarily Responsible |
Five Year Employment History | ||||
|---|---|---|---|---|---|---|---|
| Gregory H. Ekizian
Managing Director |
Senior Portfolio Manager—
Capital Growth Balanced (Equity) Strategic Growth Growth Opportunities |
Since
1997 1998 1999 1999 |
Mr. Ekizian joined the Investment
Adviser as portfolio manager and Co-Chair of the Growth Equity Investment Committee in 1997. From 1990 to 1997, he was a portfolio manager at Liberty and its predecessor firm, Eagle. |
||||
| Scott Kolar
Vice President |
Portfolio Manager—
Growth Opportunities Capital Growth Balanced (Equity) Strategic Growth |
Since
1999 2000 2000 2000 |
Mr. Kolar joined the Investment
Adviser as an equity analyst in 1997 and became a portfolio manager in 1999. From 1994 to 1997, he was an equity analyst and information systems specialist at Liberty. |
||||
| David G. Shell
Managing Director |
Senior Portfolio Manager—
Capital Growth Balanced (Equity) Strategic Growth Growth Opportunities |
Since
1997 1998 1999 1999 |
Mr. Shell joined the Investment
Adviser as a portfolio manager in 1997. From 1987 to 1997, he was a portfolio manager at Liberty and its predecessor firm, Eagle. |
||||
| Ernest C. Segundo, Jr.
Vice President |
Senior Portfolio Manager—
Capital Growth Balanced (Equity) Strategic Growth Growth Opportunities |
Since
1997 1998 1999 1999 |
Mr. Segundo joined the Investment
Adviser as a portfolio manager in 1997. From 1992 to 1997, he was a portfolio manager at Liberty. |
||||
| Fixed-Income Portfolio Management Team
|
n
|
Fixed-income portfolio management is comprised of a deep team of sector specialists
|
n
|
The team strives to maximize risk-adjusted returns by de-emphasizing interest rate anticipation and focusing on security selection
and sector allocation
|
n
|
The team manages approximately $49 billion in fixed-income assets for retail, institutional and high net worth clients
|
| Name and Title | Fund Responsibility | Years
Primarily Responsible |
Five Year Employment History | ||||
|---|---|---|---|---|---|---|---|
| Jonathan A. Beinner
Managing Director and Co-Head U.S. Fixed Income |
Senior Portfolio Manager—
Balanced (Fixed-Income) |
Since
1994 |
Mr. Beinner joined the Investment
Adviser as a portfolio manager in 1990. |
||||
| C. Richard Lucy
Managing Director and Co-Head U.S. Fixed Income |
Senior Portfolio Manager—
Balanced (Fixed-Income) |
Since
1994 |
Mr. Lucy joined the Investment
Adviser as a portfolio manager in 1992. |
||||
| DISTRIBUTOR AND TRANSFER AGENT
|
| Goldman Sachs, 85 Broad Street, New York, New York 10004, serves as the exclusive distributor (the “Distributor”) of
each Fund’s shares. Goldman Sachs, 4900 Sears Tower, Chicago, Illinois 60606-6372, also serves as the Funds’ transfer agent (the “Transfer Agent”) and, as such, performs various shareholder servicing functions.
|
| From time to time, Goldman Sachs or any of its affiliates may purchase and hold shares of the Funds. Goldman Sachs reserves the
right to redeem at any time some or all of the shares acquired for its own account.
|
| ACTIVITIES OF GOLDMAN SACHS AND ITS AFFILIATES AND OTHER ACCOUNTS MANAGED BY GOLDMAN SACHS
|
| The involvement of the Investment Adviser, Goldman Sachs and their affiliates in the management of, or their interest in, other
accounts and other activities of Goldman Sachs may present conflicts of interest with respect to a Fund or limit a Fund’s investment activities. Goldman Sachs and its affiliates engage in proprietary trading and advise accounts and funds which have
investment objectives similar to those of the Funds and/or which engage in and compete for transactions in the same types of securities, currencies and instruments as the Funds. Goldman Sachs and its affiliates will not have any obligation to make
available any information regarding their proprietary activities or strategies, or the activities or strategies used for other accounts managed by them, for the benefit of the management of the Funds. The results of a Fund’s investment activities,
therefore, may differ from those of Goldman Sachs and its affiliates, and it is possible that a Fund could sustain losses during periods in which Goldman Sachs and its affiliates and other accounts achieve significant profits on their trading for
proprietary or other accounts. In addition, the Funds may, from time to time, enter into transactions in which other clients of Goldman Sachs have an adverse interest. A Fund’s activities may be limited because of regulatory restrictions applicable
to Goldman Sachs and its affiliates, and/or their internal policies designed to comply with such restrictions.
|
n
|
Cash
|
n
|
Additional shares of the same class of the same Fund
|
n
|
Shares of the same or an equivalent class of another Goldman Sachs Fund. Special restrictions may apply for certain ILA
Portfolios. See the Additional Statement.
|
| Fund | Investment
Income Dividends |
Capital Gains
Distributions |
|||
|---|---|---|---|---|---|
| Balanced | Quarterly | Annually | |||
| Growth and Income | Quarterly | Annually | |||
| CORE Large Cap Value | Quarterly | Annually | |||
| CORE U.S. Equity | Annually | Annually | |||
| CORE Large Cap Growth | Annually | Annually | |||
| CORE Small Cap Equity | Annually | Annually | |||
| Capital Growth | Annually | Annually | |||
| Strategic Growth | Annually | Annually | |||
| Growth Opportunities | Annually | Annually | |||
| Mid Cap Value | Annually | Annually | |||
| Small Cap Value | Annually | Annually | |||
| Large Cap Value | Annually | Annually | |||
| The following section will provide you with answers to some of the most often asked questions regarding buying and selling the
Funds’ Institutional Shares.
|
| How Can I Purchase Institutional Shares Of The Funds?
|
| You may purchase Institutional Shares on any business day at their NAV next determined after receipt of an order. No sales load is
charged. You should place an order with Goldman Sachs at 1-800-621-2550 and either:
|
n
|
Wire federal funds to The Northern Trust Company (“Northern”), as subcustodian for State Street Bank and Trust Company
(“State Street”) (each Fund’s custodian) on the next business day; or
|
n
|
Send a check or Federal Reserve draft payable to Goldman Sachs Funds—(Name of Fund and Class of Shares), 4900 Sears Tower,
Chicago, IL 60606-6372. The Fund will not accept a check drawn on a foreign bank or a third-party check.
|
| In order to make an initial investment in a Fund, you must furnish to the Fund or Goldman Sachs the Account Application attached
to this Prospectus. Purchases of Institutional Shares must be settled within three business days of receipt of a complete purchase order.
|
| In certain instances, the Trust may require a signature guarantee in order to effect purchase, redemption or exchange
transactions. Signature guarantees must be obtained from a bank, brokerage firm or other financial intermediary that is a member of an approved Medallion Guarantee Program or that is otherwise approved by Goldman Sachs. A notary public cannot provide a
signature guarantee.
|
| How Do I Purchase Shares Through A Financial Institution?
|
| Certain institutions (including banks, trust companies, brokers and investment advisers) that provide recordkeeping, reporting and
processing services to their customers may be authorized to accept, on behalf of Goldman Sachs Trust (the “Trust”), purchase, redemption and exchange orders placed by or on behalf of their customers, and may designate other intermediaries to
accept such orders, if approved by the Trust. In these cases:
|
n
|
A Fund will be deemed to have received an order in proper form when the order is accepted by the authorized institution or
intermediary on a business day, and the order will be priced at the Fund’s NAV next determined after such acceptance.
|
n
|
Authorized institutions and intermediaries will be responsible for transmitting accepted orders and payments to the Trust within
the time period agreed upon by them.
|
| You should contact your institution or intermediary to learn whether it is authorized to accept orders for the Trust.
|
| These institutions may receive payments from the Funds or Goldman Sachs for the services provided by them with respect to the
Funds’ Institutional Shares. These payments may be in addition to other payments borne by the Funds.
|
| The Investment Adviser, Distributor and/or their affiliates may pay additional compensation from time to time, out of their assets
and not as an additional charge to the Funds, to certain institutions and other persons in connection with the sale, distribution and/or servicing of shares of the Funds and other Goldman Sachs Funds. Additional compensation based on sales may, but is
currently not expected to, exceed 0.50% (annualized) of the amount invested.
|
| In addition to Institutional Shares, each Fund also offers other classes of shares to investors. These other share classes are
subject to different fees and expenses (which affect performance), have different minimum investment requirements and are entitled to different services than Institutional Shares. Information regarding these other share classes may be obtained from your
sales representative or from Goldman Sachs by calling the number on the back cover of this Prospectus.
|
| What Is My Minimum Investment In The Funds?
|
| Type of Investor | Minimum Investment | ||
|---|---|---|---|
| n
Banks, trust companies or other
depository institutions investing for their own account or on behalf of clients |
$1,000,000 in Institutional Shares of a Fund
alone or in combination with other assets under the management of GSAM and its affiliates |
||
| n
Section 401(k), profit sharing,
money purchase pension, tax- sheltered annuity, defined benefit pension, or other employee benefit plans that are sponsored by one or more employers (including governmental or church employers) or employee organizations |
|||
| n
State, county, city or any
instrumentality, department, authority or agency thereof |
|||
| n
Corporations with at least $100
million in assets or in outstanding publicly traded securities |
|||
| n
“Wrap” account sponsors (provided
they have an agreement covering the arrangement with GSAM) |
|||
| n
Registered investment advisers
investing for accounts for which they receive asset-based fees |
|||
| n Individual investors | $10,000,000 | ||
| n
Qualified non-profit organizations,
charitable trusts, foundations and endowments |
|||
| n
Accounts over which GSAM or its
advisory affiliates have investment discretion |
|||
| The minimum investment requirement may be waived for current and former officers, partners, directors or employees of Goldman
Sachs or any of its affiliates or for other investors at the discretion of the Trust’s officers. No minimum amount is required for subsequent investments.
|
| What Else Should I Know About Share Purchases?
|
| The Trust reserves the right to:
|
n
|
Modify or waive the minimum investment amounts.
|
n
|
Reject or restrict any purchase or exchange orders by a particular purchaser (or group of related purchasers). This may occur, for
example, when a pattern of
frequent purchases, sales or exchanges of Institutional Shares of a Fund is evident, or if purchases, sales or exchanges are, or a subsequent abrupt redemption might be, of a size that would disrupt the management of a Fund.
|
n
|
Close a Fund to new investors from time to time and reopen a Fund whenever it is deemed appropriate by a Fund’s Investment
Adviser.
|
| The Funds may allow you to purchase shares with securities instead of cash if consistent with a Fund’s investment policies
and operations and if approved by the Fund’s Investment Adviser.
|
| How Are Shares Priced?
|
| The price you pay or receive when you buy, sell or exchange Institutional Shares is determined by a Fund’s NAV. The Funds
calculate NAV as follows:
|
| |
(Value of Assets of the Class)
|
|
| NAV =
|
– (Liabilities of the Class)
|
|
| |
Number of Outstanding Shares of the Class
|
|
| The Funds’ investments are valued based on market quotations or, if accurate quotations are not readily available, the fair
value of the Fund’s investments may be determined in good faith under procedures established by the Trustees.
|
n
|
NAV per share of each class is calculated by State Street on each business day as of the close of regular trading on the New York
Stock Exchange (normally 4:00 p.m. New York time). Fund shares will not be priced on any day the New York Stock Exchange is closed.
|
n
|
When you buy shares, you pay the NAV next calculated after the Funds receive your order in proper form.
|
n
|
When you sell shares, you receive the NAV next calculated after the Funds receive your order in proper form.
|
| Note: The time at which transactions and shares are priced and the time by which orders must be received may be changed in
case of an emergency or if regular trading on the New York Stock Exchange is stopped at a time other than 4:00 p.m. New York time.
|
| Foreign securities may trade in their local markets on days a Fund is closed. As a result, the NAV of a Fund that holds foreign
securities may be impacted on days when investors may not purchase or redeem Fund shares.
|
| In addition, the impact of events that occur after the publication of market quotations used by a Fund to price its securities but
before the close of regular trading on the New York Stock Exchange will normally not be reflected in a Fund’s next determined NAV unless the Trust, in its discretion, makes an adjustment in light of the nature and materiality of the event, its effect
on Fund operations and other relevant factors.
|
| How Can I Sell Institutional Shares Of The Funds?
|
| You may arrange to take money out of your account by selling (redeeming) some or all of your shares. Generally, each Fund will
redeem its Institutional Shares upon request on any business day at their NAV next determined after receipt of such request in proper form. You may request that redemption proceeds be sent to you by check or by wire (if the wire instructions are on record). Redemptions may be requested in writing or by telephone.
|
| Instructions For Redemptions: | |||||
|---|---|---|---|---|---|
| By Writing: | n Write a letter of instruction that includes: | ||||
| n Your name(s) and signature(s) | |||||
| n Your account number | |||||
| n The Fund name and Class of Shares | |||||
| n The dollar amount you want to sell | |||||
| n How and where to send the proceeds | |||||
| n Mail your request to: | |||||
| Goldman Sachs Funds | |||||
| 4900 Sears Tower | |||||
| Chicago, IL 60606-6372 | |||||
| By Telephone: | If you have elected the telephone | ||||
| redemption privilege on your Account Application: | |||||
| n 1-800-621-2550 | |||||
| (8:00 a.m. to 4:00 p.m. New York time) | |||||
| Certain institutions and intermediaries are authorized to accept redemption requests on behalf of the Funds as described under
“How Do I Purchase Shares Through A Financial Institution?”
|
| What Do I Need To Know About Telephone Redemption Requests?
|
| The Trust, the Distributor and the Transfer Agent will not be liable for any loss you may incur in the event that the Trust
accepts unauthorized telephone redemption requests that the Trust reasonably believes to be genuine. In an effort to prevent unauthorized or fraudulent redemption and exchange requests by telephone, Goldman Sachs employs reasonable procedures specified by
the Trust to confirm that such instructions are genuine. If reasonable procedures are not employed, the Trust may be liable for any loss due to unauthorized or fraudulent transactions. The following general policies are currently in effect:
|
n
|
All telephone requests are recorded.
|
n
|
Any redemption request that requires money to go to an account or address other than that designated on the Account Application
must be in writing and signed by an authorized person designated on the Account Application. The
written request may be confirmed by telephone with both the requesting party and the designated bank account to verify instructions.
|
n
|
The telephone redemption option may be modified or terminated at any time.
|
| Note: It may be difficult to make telephone redemptions in times of drastic economic or market conditions.
|
| How Are Redemption Proceeds Paid?
|
| By Wire: You may arrange for your redemption proceeds to be wired as federal funds to the bank account designated in
your Account Application. The following general policies govern wiring redemption proceeds:
|
n
|
Redemption proceeds will normally be wired on the next business day in federal funds (for a total of one business day delay), but
may be paid up to three business days following receipt of a properly executed wire transfer redemption request. If you are selling shares you recently paid for by check, the Fund will pay you when your check has cleared, which may take up to 15 days. If
the Federal Reserve Bank is closed on the day that the redemption proceeds would ordinarily be wired, wiring the redemption proceeds may be delayed one additional business day.
|
n
|
To change the bank designated on your Account Application, you must send written instructions signed by an authorized person
designated on the account application to the Transfer Agent.
|
n
|
Neither the Trust, Goldman Sachs nor any other institution assumes any responsibility for the performance of your bank or any
intermediaries in the transfer process. If a problem with such performance arises, you should deal directly with your bank or any such intermediaries.
|
| By Check: You may elect in writing to receive your redemption proceeds by check. Redemption proceeds paid by check
will normally be mailed to the address of record within three business days of a properly executed redemption request. If you are selling shares you recently paid for by check, the Fund will pay you when your check has cleared, which may take up to 15 days.
|
| What Else Do I Need To Know About Redemptions?
|
| The following generally applies to redemption requests:
|
n
|
Additional documentation may be required when deemed appropriate by the Transfer Agent. A redemption request will not be in proper
form until such additional documentation has been received.
|
n
|
Institutions (including banks, trust companies, brokers and investment advisers) are responsible for the timely transmittal of
redemption requests by their customers to the Transfer Agent. In order to facilitate the timely transmittal of redemption requests, these institutions may set times by which they must receive
redemption requests. These institutions may also require additional documentation from you.
|
| The Trust reserves the right to:
|
n
|
Redeem your shares if your account balance falls below $50 as a result of earlier redemptions. The Funds will not redeem your
shares on this basis if the value of your account falls below the minimum account balance solely as a result of market conditions. The Fund will give you 60 days’ prior written notice to allow you to purchase sufficient additional shares of the Fund
in order to avoid such redemption.
|
n
|
Redeem your shares in other circumstances determined by the Board of Trustees to be in the best interest of the Trust.
|
n
|
Pay redemptions by a distribution in-kind of securities (instead of cash). If you receive redemption proceeds in-kind, you should
expect to incur transaction costs upon the disposition of those securities.
|
n
|
Reinvest any dividends or other distributions which you have elected to receive in cash should your check for such dividends or
other distributions be returned to the Fund as undeliverable or remain uncashed for six months. In addition, that distribution and all future distributions payable to you will be reinvested at NAV in additional Institutional shares of the Fund that pays
the distributions. No interest will accrue on amounts represented by uncashed distribution or redemption checks.
|
| Can I Exchange My Investment From One Fund To Another?
|
| You may exchange Institutional Shares of a Fund at NAV for Institutional Shares of any other Goldman Sachs Fund. The exchange
privilege may be materially modified or withdrawn at any time upon 60 days’ written notice to you.
|
| Instructions For Exchanging Shares: | |||||
|---|---|---|---|---|---|
| By Writing: | n Write a letter of instruction that includes: | ||||
| n Your name(s) and signature(s) | |||||
| n Your account number | |||||
| n The Fund names and Class of Shares | |||||
| n The dollar amount to be exchanged | |||||
| n
Mail the request to:
Goldman Sachs Funds 4900 Sears Tower Chicago, IL 60606-6372 |
|||||
| By Telephone: | If you have elected the telephone exchange
privilege on your Account Application: |
||||
| n
1-800-621-2550
(8:00 a.m. to 4:00 p.m. New York time) |
|||||
| You should keep in mind the following factors when making or considering an exchange:
|
n
|
You should obtain and carefully read the prospectus of the Fund you are acquiring before making an exchange.
|
n
|
All exchanges which represent an initial investment in a Fund must satisfy the minimum initial investment requirements of that
Fund, except that this requirement may be waived at the discretion of the Trust.
|
n
|
Telephone exchanges normally will be made only to an identically registered account.
|
n
|
Shares may be exchanged among accounts with different names, addresses and social security or other taxpayer identification
numbers only if the exchange instructions are in writing and are signed by an authorized person designated on the Account Application.
|
n
|
Exchanges are available only in states where exchanges may be legally made.
|
n
|
It may be difficult to make telephone exchanges in times of drastic economic or market conditions.
|
n
|
Goldman Sachs may use reasonable procedures described under “What Do I Need To Know About Telephone Redemption Requests?”
in an effort to prevent unauthorized or fraudulent telephone exchange requests.
|
n
|
Exchanges into Funds that are closed to new investors may be restricted.
|
| For federal income tax purposes, an exchange from one Fund to another is treated as a redemption of the shares surrendered in the
exchange, on which you may be subject to tax, followed by a purchase of shares received in the exchange. You should consult your tax adviser concerning the tax consequences of an exchange.
|
| Restrictions on Excessive Trading Practices. The Trust does not permit market-timing or other excessive trading
practices. Purchases and exchanges should be made for long-term investment purposes only. The Trust and Goldman Sachs reserve the right to reject or restrict purchase or exchange requests from any investor. Excessive, short-term (market-timing) trading
practices may disrupt portfolio management strategies, harm Fund performance and negatively impact long-term shareholders. The Trust and Goldman Sachs will not be held liable for any loss resulting from rejected purchase or exchange orders. To minimize
harm to the Trust (or Goldman Sachs) and its shareholders, the Trust (or Goldman Sachs) will exercise these rights if, in the Trust’s (or Goldman Sachs’) judgment, an investor has a history of excessive trading or if an investor’s trading,
in the judgment of the Trust (or Goldman Sachs) has been or may be disruptive to a Fund. In making this judgment, trades executed in multiple accounts under common ownership or control may be considered together.
|
| What Types of Reports Will I Be Sent Regarding Investments In Institutional Shares?
|
| You will receive an annual report containing audited financial statements and a semi-annual report. To eliminate unnecessary
duplication, only one copy of such reports will be sent to shareholders with the same mailing address. If you would like a duplicate copy to be mailed to you, please contact Goldman Sachs Funds at 1-800-621-2550. You will also be provided with a printed
confirmation for each transaction in your account and a monthly account statement. The Funds do not generally provide sub-accounting services.
|
| As with any investment, you should consider how your investment in the Funds will be taxed. The tax information below is provided
as general information. More tax information is available in the Additional Statement. You should consult your tax adviser about the federal, state, local or foreign tax consequences of your investment in the Funds.
|
| Unless your investment is an IRA or other tax-advantaged account, you should consider the possible tax consequences of Fund
distributions and the sale of your Fund shares.
|
| DISTRIBUTIONS
|
| Distributions you receive from the Funds are generally subject to federal income tax, and may also be subject to state or local
taxes. This is true whether you reinvest your distributions in additional Fund shares or receive them in cash. For federal tax purposes, the Funds’ income dividend distributions and short-term capital gain distributions are taxable to you as ordinary
income. Any long-term capital gain distributions are taxable as long-term capital gains, no matter how long you have owned your Fund shares.
|
| Although distributions are generally treated as taxable to you in the year they are paid, distributions declared in October,
November or December but paid in January are taxable as if they were paid in December. A percentage of the Funds’ dividends paid to corporate shareholders may be eligible for the corporate dividends-received deduction. The Funds will inform
shareholders of the source and tax status of all distributions promptly after the close of each calendar year.
|
| Each Fund may be subject to foreign withholding or other foreign taxes on income or gain from certain foreign securities. In
general, the Funds may deduct these taxes in computing their taxable income.
|
| If you buy shares of a Fund before it makes a distribution, the distribution will be taxable to you even though it may actually be
a return of a portion of your investment. This is known as “buying a dividend.”
|
| SALES AND EXCHANGES
|
| Your sale of Fund shares is a taxable transaction for federal income tax purposes, and may also be subject to state and local
taxes. For tax purposes, the exchange of your Fund shares for shares of a different Goldman Sachs Fund is the same as a sale. When you sell your shares, you will generally recognize a capital gain or loss in an amount equal to the difference between your
adjusted tax basis in the shares and the amount received. Generally, this gain or loss is long-term or short-term depending on whether your holding period exceeds twelve months, except that any loss realized on shares held for six months or less will be
treated as a long-term capital loss to the extent of any capital gain dividends that were received on the shares.
|
| OTHER INFORMATION
|
| When you open your account, you should provide your social security or tax identification number on your Account Application. By
law, each Fund must withhold 31% of your taxable distributions and any redemption proceeds if you do not provide your correct taxpayer identification number, or certify that it is correct, or if the IRS instructs the Fund to do so. Non-U.S. investors may
be subject to U.S. withholding and estate tax.
|
| A. General Portfolio Risks
|
| The Funds will be subject to the risks associated with equity securities. “Equity securities” include common stocks,
preferred stocks, interests in real estate investment trusts, convertible debt obligations, convertible preferred stocks, equity interests in trusts, partnerships, joint ventures, limited liability companies and similar enterprises, warrants and stock
purchase rights. In general, stock values fluctuate in response to the activities of individual companies and in response to general market and economic conditions. Accordingly, the value of the stocks that a Fund holds may decline over short or extended
periods. The stock markets tend to be cyclical, with periods when stock prices generally rise and periods when prices generally decline. The volatility of equity securities means that the value of your investment in the Funds may increase or decrease.
Recently, certain stock markets have experienced substantial price volatility and, at times, have traded at or close to record high levels. There can be no guarantee that such levels will be reached or maintained in the future.
|
| To the extent that a Fund invests in fixed-income securities, that Fund will also be subject to the risks associated with its
fixed-income securities. These risks include interest rate risk, credit risk and call/extension risk. In general, interest rate risk involves the risk that when interest rates decline, the market value of fixed-income securities tends to increase
(although many mortgage related securities will have less potential than other debt securities for capital appreciation during periods of declining rates). Conversely, when interest rates increase, the market value of fixed-income securities tends to
decline. Credit risk involves the risk that an issuer or guarantor could default on its obligations, and a Fund will not recover its investment. Call risk and extension risk are normally present in mortgage-backed securities and asset-backed securities.
For example, homeowners have the option to prepay their mortgages. Therefore, the duration of a security backed by home mortgages can either shorten (call risk) or lengthen (extension risk). In general, if interest rates on new mortgage loans fall
sufficiently below the interest rates on existing outstanding mortgage loans, the rate of prepayment would be expected to increase. Conversely, if mortgage loan interest rates rise above the interest rates on existing outstanding mortgage loans, the rate
of prepayment would be expected to decrease. In either case, a change in the prepayment rate can result in losses to investors.
|
| The Investment Adviser will not consider the portfolio turnover rate a limiting factor in making investment decisions for a Fund.
A high rate of portfolio turnover (100% or more) involves correspondingly greater expenses which must be borne by a Fund and its shareholders, and is also likely to result in higher short-term capital gains taxable to shareholders. The portfolio turnover
rate is calculated by dividing the lesser of the dollar amount of sales or purchases of portfolio securities by the average monthly value of a Fund’s portfolio securities, excluding securities having a maturity at the date of purchase of one year or
less. See “Financial Highlights” in Appendix B for a statement of the Funds’ historical portfolio turnover rates.
|
| The following sections provide further information on certain types of securities and investment techniques that may be used by
the Funds, including their associated risks. Additional information is provided in the Additional Statement, which is available upon request. Among other things, the Additional Statement describes certain fundamental investment restrictions that cannot be
changed without shareholder approval. You should note, however, that all investment objectives, and all investment policies not specifically designated as fundamental are non-fundamental and may be changed without shareholder approval. If there is a
change in a Fund’s investment objective, you should consider whether that Fund remains an appropriate investment in light of your then current financial position and needs.
|
| B. Other Portfolio Risks
|
| Risks of Investing in Small Capitalization Companies. Each Fund may invest in small capitalization companies.
Investments in small capitalization companies involve greater risk and portfolio price volatility than investments in larger capitalization stocks. Among the reasons for the greater price volatility of these investments are the less certain growth
prospects of smaller firms and the lower degree of liquidity in the markets for such securities. Small capitalization companies may be thinly traded and may have to be sold at a discount from current market prices or in small lots over an extended period
of time. In addition, these securities are subject to the risk that during certain periods the liquidity of particular issuers or industries, or all securities in these investment categories, will shrink or disappear suddenly and without warning as a
result of adverse economic or market conditions, or adverse investor perceptions whether or not accurate. Because of the lack of sufficient market liquidity, a Fund may incur losses because it will be required to effect sales at a disadvantageous time and
only then at a substantial drop in price. Small capitalization companies include “unseasoned” issuers that do not have an established financial history; often have limited product lines, markets or financial
resources; may depend on or use a few key personnel for management; and may be susceptible to losses and risks of bankruptcy. Transaction costs for these investments are often higher than those of larger capitalization companies. Investments in small
capitalization companies may be more difficult to price precisely than other types of securities because of their characteristics and lower trading volumes.
|
| Risks of Foreign Investments. The Funds may make foreign investments. Foreign investments involve special risks that
are not typically associated with U.S. dollar denominated or quoted securities of U.S. issuers. Foreign investments may be affected by changes in currency rates, changes in foreign or U.S. laws or restrictions applicable to such investments and changes in
exchange control regulations (e.g., currency blockage). A decline in the exchange rate of the currency (i.e., weakening of the currency against the U.S. dollar) in which a portfolio security is quoted or denominated relative to the U.S. dollar would reduce the value of
the portfolio security. In addition, if the currency in which a Fund receives dividends, interest or other payments declines in value against the U.S. dollar before such income is distributed as dividends to shareholders or converted to U.S. dollars, the
Fund may have to sell portfolio securities to obtain sufficient cash to pay such dividends.
|
| The introduction of a single currency, the euro, on January 1, 1999 for participating nations in the European Economic and
Monetary Union has presented unique uncertainties, including the fluctuation of the euro relative to non-euro currencies during the transition period from January 1, 1999 to December 31, 2001 and beyond; whether the interest rate, tax and labor regimes of
European countries participating in the euro will converge over time; and whether the conversion of the currencies of other countries that now are or may in the future become members of the European Union (“EU”), may have an impact on the euro.
Also, it is possible that the euro could be abandoned in the future by countries that have already adopted its use. These or other events, including political and economic developments, could cause market disruptions, and could adversely affect the value
of securities held by the Funds. Because of the number of countries using this single currency, a significant portion of the assets held by the Funds may be denominated in the euro.
|
| Brokerage commissions, custodial services and other costs relating to investment in international securities markets generally are
more expensive than in the United States. In addition, clearance and settlement procedures may be different in foreign countries and, in certain markets, such procedures have been unable to keep pace with the volume of securities transactions, thus making
it difficult to conduct such transactions.
|
| Foreign issuers are not generally subject to uniform accounting, auditing and financial reporting standards comparable to those
applicable to U.S. issuers. There may be less publicly available information about a foreign issuer than about a U.S. issuer. In addition, there is generally less government regulation of foreign markets, companies and securities dealers than in the
United States. Foreign securities markets may have substantially less volume than U.S. securities markets and secu-
|
| rities of many foreign issuers are less liquid and more volatile than securities of comparable domestic issuers. Furthermore, with
respect to certain foreign countries, there is a possibility of nationalization, expropriation or confiscatory taxation, imposition of withholding or other taxes on dividend or interest payments (or, in some cases, capital gains distributions),
limitations on the removal of funds or other assets from such countries, and risks of political or social instability or diplomatic developments which could adversely affect investments in those countries.
|
| Concentration of a Fund’s assets in one or a few countries and currencies will subject a Fund to greater risks than if a
Fund’s assets were not geographically concentrated.
|
| Investment in sovereign debt obligations by certain Funds involves risks not present in debt obligations of corporate issuers. The
issuer of the debt or the governmental authorities that control the repayment of the debt may be unable or unwilling to repay principal or interest when due in accordance with the terms of such debt, and a Fund may have limited recourse to compel payment
in the event of a default. Periods of economic uncertainty may result in the volatility of market prices of sovereign debt, and in turn a Fund’s NAV, to a greater extent than the volatility inherent in debt obligations of U.S. issuers.
|
| A sovereign debtor’s willingness or ability to repay principal and pay interest in a timely manner may be affected by, among
other factors, its cash flow situation, the extent of its foreign currency reserves, the availability of sufficient foreign exchange on the date a payment
is due, the relative size of the debt service burden to the economy as a whole, the sovereign debtor’s policy toward international lenders, and the political constraints to which a sovereign debtor may be subject.
|
| Investments in foreign securities may take the form of sponsored and unsponsored American Depositary Receipts (“ADRs”)
and Global Depositary Receipts (“GDRs”). Certain Funds may also invest in European Depositary Receipts (“EDRs”) or other similar instruments representing securities of foreign issuers. ADRs represent the right to receive securities of
foreign issuers deposited in a domestic bank or a correspondent bank. Prices of ADRs are quoted in U.S. dollars, and ADRs are traded in the United States. EDRs and GDRs are receipts evidencing an arrangement with a non-U.S. bank. EDRs and GDRs are not
necessarily quoted in the same currency as the underlying security.
|
| Risks of Emerging Countries. Certain Funds may invest in securities of issuers located in emerging countries. The
risks of foreign investment are heightened when the issuer is located in an emerging country. Emerging countries are generally located in the Asia-Pacific region, Eastern Europe, Latin and South America and Africa. A Fund’s purchase and sale of
portfolio securities in certain emerging countries may be constrained by limitations relating to daily changes in the prices of listed securities, periodic trading or settlement volume and/or limitations on aggregate holdings of foreign investors. Such
limitations may be computed based on the aggregate trading volume by or holdings of a Fund, the Investment Adviser, its affiliates and their respective clients and other service providers. A Fund may not be able to sell securities in circumstances where
price, trading or settlement volume limitations have been reached.
|
| Foreign investment in the securities markets of certain emerging countries is restricted or controlled to varying degrees which
may limit investment in such countries or increase the administrative costs of such investments. For example, certain Asian countries require governmental approval prior to investments by foreign persons or limit investment by foreign persons to only a
specified percentage of an issuer’s outstanding securities or a specific class of securities which may have less advantageous terms (including price) than securities of the issuer available for purchase by nationals. In addition, certain countries
may restrict or prohibit investment opportunities in issuers or industries deemed important to national interests. Such restrictions may affect the market price, liquidity and rights of securities that may be purchased by a Fund. The repatriation of both
investment income and capital from certain emerging countries is subject to restrictions such as the need for governmental consents. Due to restrictions on direct investment in equity securities in certain Asian and other countries, it is anticipated that
a Fund may invest in such countries through other investment funds in such countries.
|
| Many emerging countries have recently experienced currency devaluations and substantial (and, in some cases, extremely high) rates
of inflation. Other emerging countries have experienced economic recessions. These circumstances have had a negative effect on the economies and securities markets of such emerging countries. Economies in emerging countries generally are dependent heavily
upon commodity prices and international trade and, accordingly, have been and may continue to be affected adversely by the economies of their trading partners, trade barriers, exchange controls, managed adjustments in relative currency values and other
protectionist measures imposed or negotiated by the countries with which they trade.
|
| Many emerging countries are subject to a substantial degree of economic, political and social instability. Governments of some
emerging countries are authoritarian in nature or have been installed or removed as a result of military coups, while
governments in other emerging countries have periodically used force to suppress civil dissent. Disparities of wealth, the pace and success of democratization, and ethnic, religious and racial disaffection, among other factors, have also led to social
unrest, violence and/or labor unrest in some emerging countries. Unanticipated political or social developments may result in sudden and significant investment losses. Investing in emerging countries involves greater risk of loss due to expropriation,
nationalization, confiscation of assets and property or the imposition of restrictions on foreign investments and on repatriation of capital invested. As an example, in the past some Eastern European governments have expropriated substantial amounts of
private property, and many claims of the property owners have never been fully settled. There is no assurance that similar expropriations will not recur in Eastern Europe or other countries.
|
| A Fund’s investment in emerging countries may also be subject to withholding or other taxes, which may be significant and may
reduce the return from an investment in such countries to the Fund.
|
| Settlement procedures in emerging countries are frequently less developed and reliable than those in the United States and often
may involve a Fund’s delivery of securities before receipt of payment for their sale. In addition, significant delays are common in certain markets in registering the transfer of securities. Settlement or registration problems may make it more
difficult for a Fund to value its portfolio securities and could cause the Fund to miss attractive investment opportunities, to have a portion of its assets uninvested or to incur losses due to the failure of a counterparty to pay for securities the Fund
has delivered or the Fund’s inability to complete its contractual obligations because of theft or other reasons. The creditworthiness of the local securities firms used by the Fund in emerging countries may not be as sound as the creditworthiness of
firms used in more developed countries. As a result, the Fund may be subject to a greater risk of loss if a securities firm defaults in the performance of its responsibilities.
|
| The small size and inexperience of the securities markets in certain emerging countries and the limited volume of trading in
securities in those countries may make a Fund’s investments in such countries less liquid and more volatile than investments in countries with more developed securities markets (such as the United States, Japan and most Western European countries). A
Fund’s investments in emerging countries are subject to the risk that the liquidity of a particular investment, or investments generally, in such countries will shrink or disappear suddenly and without warning as a result of adverse economic, market
or political conditions or adverse investor perceptions, whether or not accurate. Because of the lack of sufficient market liquidity, a Fund may incur losses because it will be required to effect sales at a disadvantageous time and only then at a
substantial drop in price. Invest
ments in emerging countries may be more difficult to price precisely because of the characteristics discussed above and lower trading volumes.
|
| A Fund’s use of foreign currency management techniques in emerging countries may be limited. Due to the limited market for
these instruments in emerging countries, the Investment Adviser does not currently anticipate that a significant portion of the Funds’ currency exposure in emerging countries, if any, will be covered by such instruments.
|
| Risks of Derivative Investments. A Fund’s transactions, if any, in options, futures, options on futures, swaps,
interest rate caps, floors and collars, structured securities and currency transactions involve additional risk of loss. Loss can result from a lack of correlation between changes in the value of derivative instruments and the portfolio assets (if any)
being hedged, the potential illiquidity of the markets for derivative instruments, or the risks arising from margin requirements and related leverage factors associated with such transactions. The use of these management techniques also involves the risk
of loss if the Investment Adviser is incorrect in its expectation of fluctuations in securities prices, interest rates or currency prices. Each Fund may also invest in derivative investments for non-hedging purposes (that is, to seek to increase total
return). Investing for non-hedging purposes is considered a speculative practice and presents even greater risk of loss.
|
| Risks of Illiquid Securities. Each Fund may invest up to 15% of its net assets in illiquid securities which cannot
be disposed of in seven days in the ordinary course of business at fair value. Illiquid securities include:
|
n
|
Both domestic and foreign securities that are not readily marketable
|
n
|
Certain stripped mortgage-backed securities
|
n
|
Repurchase agreements and time deposits with a notice or demand period of more than seven days
|
n
|
Certain over-the-counter options
|
n
|
Certain structured securities and all swap transactions
|
n
|
Certain restricted securities, unless it is determined, based upon a review of the trading markets for a specific restricted
security, that such restricted security is eligible for resale pursuant to Rule 144A under the Securities Act of 1933 (“144A Securities”) and, therefore, is liquid.
|
| Investing in 144A Securities may decrease the liquidity of a Fund’s portfolio to the extent that qualified institutional
buyers become for a time uninterested in purchasing these restricted securities. The purchase price and subsequent valuation of restricted and illiquid securities normally reflect a discount, which may be significant, from the market price of comparable
securities for which a liquid market exists.
|
| Credit Risks. Debt securities purchased by the Funds may include securities (including zero coupon bonds) issued by
the U.S. government (and its agencies, instrumentalities and sponsored enterprises), foreign governments, domestic and foreign corporations, banks and other issuers. Further information is provided in the Additional Statement.
|
| Debt securities rated BBB or higher by Standard & Poor’s or Baa or higher by Moody’s are considered “investment
grade.” Securities rated BBB or Baa are considered medium-grade obligations with speculative characteristics, and adverse economic conditions or changing circumstances may weaken their issuers’ capacity to pay interest and repay principal. A
security will be deemed to have met a rating requirement if it receives the minimum required rating from at least one such rating organization even though it has been rated below the minimum rating by one or more other rating organizations, or if unrated
by such rating organizations, determined by the Investment Adviser to be of comparable credit quality.
|
| Certain Funds may invest in fixed-income securities rated BB or Ba or below (or comparable unrated securities) which are commonly
referred to as “junk bonds.” Junk bonds are considered predominantly speculative and may be questionable as to principal and interest payments.
|
| In some cases, junk bonds may be highly speculative, have poor prospects for reaching investment grade standing and be in default.
As a result, investment in such bonds will present greater speculative risks than those associated with investment in investment grade bonds. Also, to the extent that the rating assigned to a security in a Fund’s portfolio is downgraded by a rating
organization, the market price and liquidity of such security may be adversely affected.
|
| Risks of Initial Public Offerings. The Funds may invest in IPOs. An IPO is a company’s first offering of stock
to the public. IPO risk is the risk that the market value of IPO shares will fluctuate considerably due to factors such as the absence of a prior public market, unseasoned trading, the small number of shares available for trading and limited information
about the issuer. The purchase of IPO shares may involve high transaction costs. IPO shares are subject to market risk and liquidity risk. When a Fund’s asset base is small, a significant portion of the Fund’s performance could be attributable
to investments in IPOs, because such investments would have a magnified impact on the Fund. As the Fund’s assets grow, the effect of the Fund’s investments in IPOs on the Fund’s performance probably will decline, which could reduce the
Fund’s performance. Because of the price volatility of IPO shares, a Fund may choose to hold IPO shares for a very short period of time. This may increase the turnover of the Fund’s portfolio and may lead to increased expenses to the Fund, such
as commissions and transaction costs. By selling IPO shares, the Fund may realize taxable gains it will subse
quently distribute to shareholders. In addition, the market for IPO shares can be speculative and/or inactive for extended periods of time. There is no assurance that a Fund will be able to obtain allocable portions of IPO shares. The limited number of
shares available for trading in some IPOs may make it more difficult for a Fund to buy or sell significant amounts of shares without an unfavorable impact on prevailing prices. Investors in IPO shares can be affected by substantial dilution in the value
of their shares, by sales of additional shares and by concentration of control in existing management and principal shareholders.
|
| Temporary Investment Risks. Each Fund may, for temporary defensive purposes, invest a certain percentage of its
total assets in:
|
n
|
U.S. government securities
|
n
|
Commercial paper rated at least A-2 by Standard & Poor’s or P-2 by Moody’s
|
n
|
Certificates of deposit
|
n
|
Bankers’ acceptances
|
n
|
Repurchase agreements
|
n
|
Non-convertible preferred stocks and non-convertible corporate bonds with a remaining maturity of less than one year
|
| When a Fund’s assets are invested in such instruments, the Fund may not be achieving its investment objective.
|
| C. Portfolio Securities and Techniques
|
| This section provides further information on certain types of securities and investment techniques that may be used by the Funds,
including their associated risks. Further information is provided in the Additional Statement, which is available upon request.
|
| Convertible Securities. Each Fund may invest in convertible securities. Convertible securities are preferred stock
or debt obligations that are convertible into common stock. Convertible securities generally offer lower interest or dividend yields than non-convertible securities of similar quality. Convertible securities in which a Fund invests are subject to the same
rating criteria as its other investments in fixed-income securities. Convertible securities have both equity and fixed-income risk characteristics. Like all fixed-income securities, the value of convertible securities is susceptible to the risk of market
losses attributable to changes in interest rates. Generally, the market value of convertible securities tends to decline as interest rates increase and, conversely, to increase as interest rates decline. However, when the market price of the common stock
underlying a convertible security exceeds the conversion price of the convertible security, the convertible security tends to reflect the market price of the underlying common stock. As the market
price of the underlying common stock declines, the convertible security, like a fixed-income security, tends to trade increasingly on a yield basis, and thus may not decline in price to the same extent as the underlying common stock.
|
| Foreign Currency Transactions. A Fund may, to the extent consistent with its investment policies, purchase or sell
foreign currencies on a cash basis or through forward contracts. A forward contract involves an obligation to purchase or sell a specific currency at a future date at a price set at the time of the contract. A Fund may engage in foreign currency
transactions for hedging purposes and to seek to protect against anticipated changes in future foreign currency exchange rates. In addition, certain Funds may also enter into such transactions to seek to increase total return, which is considered a
speculative practice.
|
| Some Funds may also engage in cross-hedging by using forward contracts in a currency different from that in which the hedged
security is denominated or quoted. A Fund may hold foreign currency received in connection with investments in foreign securities when, in the judgment of the Investment Adviser, it would be beneficial to convert such currency into U.S. dollars at a later
date (e.g., the Investment Adviser may anticipate the foreign currency to appreciate against the U.S. dollar).
|
| Currency exchange rates may fluctuate significantly over short periods of time, causing, along with other factors, a Fund’s
NAV to fluctuate (when the Fund’s NAV fluctuates, the value of your shares may go up or down). Currency exchange rates also can be affected unpredictably by the intervention of U.S. or foreign governments or central banks, or the failure to
intervene, or by currency controls or political developments in the United States or abroad.
|
| The market in forward foreign currency exchange contracts, currency swaps and other privately negotiated currency instruments
offers less protection against defaults by the other party to such instruments than is available for currency instruments traded on an exchange. Such contracts are subject to the risk that the counterparty to the contract will default on its obligations.
Since these contracts are not guaranteed by an exchange or clearinghouse, a default on a contract would deprive a Fund of unrealized profits, transaction costs or the benefits of a currency hedge or could force the Fund to cover its purchase or sale
commitments, if any, at the current market price.
|
| Structured Securities. Each Fund may invest in structured securities. Structured securities are securities whose
value is determined by reference to changes in the value of specific currencies, interest rates, commodities, indices or other financial indicators (the “Reference”) or the relative change in two or more References.
The interest rate or the principal amount payable upon maturity or redemption may be increased or decreased depending upon changes in the applicable Reference. Structured securities may be positively or negatively indexed, so that appreciation of the
Reference may produce an increase or decrease in the interest rate or value of the security at maturity. In addition, changes in the interest rates or the value of the security at maturity may be a multiple of changes in the value of the Reference.
Consequently, structured securities may present a greater degree of market risk than other types of fixed-income securities and may be more volatile, less liquid and more difficult to price accurately than less complex securities.
|
| REITs. Each Fund may invest in REITs. REITs are pooled investment vehicles that invest primarily in either real
estate or real estate related loans. The value of a REIT is affected by changes in the value of the properties owned by the REIT or securing mortgage loans held by the REIT. REITs are dependent upon the ability of the REITs’ managers, and are subject
to heavy cash flow dependency, default by borrowers and the qualification of the REITs under applicable regulatory requirements for favorable income tax treatment. REITs are also subject to risks generally associated with investments in real estate
including possible declines in the value of real estate, general and local economic conditions, environmental problems and changes in interest rates. To the extent that assets underlying a REIT are concentrated geographically, by property type or in
certain other respects, these risks may be heightened. A Fund will indirectly bear its proportionate share of any expenses, including management fees, paid by a REIT in which it invests.
|
| Options on Securities, Securities Indices and Foreign Currencies. A put option gives the purchaser of the option the
right to sell, and the writer (seller) of the option the obligation to buy, the underlying instrument during the option period. A call option gives the purchaser of the option the right to buy, and the writer (seller) of the option the obligation to sell,
the underlying instrument during the option period. Each Fund may write (sell) covered call and put options and purchase put and call options on any securities in which they may invest or on any securities index consisting of securities in which they may
invest. A Fund may also, to the extent that it invests in foreign securities, purchase and sell (write) put and call options on foreign currencies.
|
| The writing and purchase of options is a highly specialized activity which involves special investment risks. Options may be used
for either hedging or cross-hedging purposes, or to seek to increase total return (which is considered a speculative activity). The successful use of options depends in part on the ability of the Investment Adviser to manage future price fluctuations and
the degree of correlation between the options and securities (or currency) markets. If the Invest
ment Adviser is incorrect in its expectation of changes in market prices or determination of the correlation between the instruments or indices on which options are written and purchased and the instruments in a Fund’s investment portfolio, the Fund
may incur losses that it would not otherwise incur. The use of options can also increase a Fund’s transaction costs. Options written or purchased by the Funds may be traded on either U.S. or foreign exchanges or over-the-counter. Foreign and
over-the-counter options will present greater possibility of loss because of their greater illiquidity and credit risks.
|
| Futures Contracts and Options on Futures Contracts. Futures contracts are standardized, exchange-traded contracts
that provide for the sale or purchase of a specified financial instrument or currency at a future time at a specified price. An option on a futures contract gives the purchaser the right (and the writer of the option the obligation) to assume a position
in a futures contract at a specified exercise price within a specified period of time. A futures contract may be based on various securities (such as U.S. government securities), foreign currencies, securities indices and other financial instruments and
indices. The Funds may engage in futures transactions on both U.S. and foreign exchanges.
|
| Each Fund may purchase and sell futures contracts, and purchase and write call and put options on futures contracts, in order to
seek to increase total return or to hedge against changes in interest rates, securities prices or, to the extent a Fund invests in foreign securities, currency exchange rates, or to otherwise manage their term structures, sector selection and durations in
accordance with their investment objectives and policies. Each Fund may also enter into closing purchase and sale transactions with respect to such contracts and options. A Fund will engage in futures and related options transactions for bona fide hedging
purposes as defined in regulations of the Commodity Futures Trading Commission or to seek to increase total return to the extent permitted by such regulations. A Fund may not purchase or sell futures contracts or purchase or sell related options to seek
to increase total return, except for closing purchase or sale transactions, if immediately thereafter the sum of the amount of initial margin deposits and premiums paid on the Fund’s outstanding positions in futures and related options entered into
for the purpose of seeking to increase total return would exceed 5% of the market value of the Fund’s net assets.
|
| Futures contracts and related options present the following risks:
|
n
|
While a Fund may benefit from the use of futures and options on futures, unanticipated changes in interest rates, securities
prices or currency exchange rates may result in poorer overall performance than if the Fund had not entered into any futures contracts or options transactions.
|
n
|
Because perfect correlation between a futures position and portfolio position that is intended to be protected is impossible to
achieve, the desired protection may not be obtained and a Fund may be exposed to additional risk of loss.
|
n
|
The loss incurred by a Fund in entering into futures contracts and in writing call options on futures is potentially unlimited and
may exceed the amount of the premium received.
|
n
|
Futures markets are highly volatile and the use of futures may increase the volatility of a Fund’s NAV.
|
n
|
As a result of the low margin deposits normally required in futures trading, a relatively small price movement in a futures
contract may result in substantial losses to a Fund.
|
n
|
Futures contracts and options on futures may be illiquid, and exchanges may limit fluctuations in futures contract prices during a
single day.
|
n
|
Foreign exchanges may not provide the same protection as U.S. exchanges.
|
| Equity Swaps. Each Fund may invest in equity swaps. Equity swaps allow the parties to a swap agreement to exchange
the dividend income or other components of return on an equity investment (for example, a group of equity securities or an index) for a component of return on another non-equity or equity investment.
|
| An equity swap may be used by a Fund to invest in a market without owning or taking physical custody of securities in
circumstances in which direct investment may be restricted for legal reasons or is otherwise impractical. Equity swaps are derivatives and their value can be very volatile. To the extent that the Investment Adviser does not accurately analyze and predict
the potential relative fluctuation of the components swapped with another party, a Fund may suffer a loss, which may be substantial. The value of some components of an equity swap (such as the dividends on a common stock) may also be sensitive to changes
in interest rates. Furthermore, a Fund may suffer a loss if the counterparty defaults. Because equity swaps are normally illiquid, a Fund may be unable to terminate its obligations when desired.
|
| When-Issued Securities and Forward Commitments. Each Fund may purchase when-issued securities and make contracts to
purchase or sell securities for a fixed price at a future date beyond customary settlement time. When-issued securities are securities that have been authorized, but not yet issued. When-issued securities are purchased in order to secure what is
considered to be an advantageous price and yield to the Fund at the time of entering into the transaction. A forward commitment involves the entering into a contract to purchase or sell securities for a fixed price at a future date beyond the customary
settlement period.
|
| The purchase of securities on a when-issued or forward commitment basis involves a risk of loss if the value of the security to be
purchased declines before
the settlement date. Conversely, the sale of securities on a forward commitment basis involves the risk that the value of the securities sold may increase before the settlement date. Although a Fund will generally purchase securities on a when-issued or
forward commitment basis with the intention of acquiring the securities for its portfolio, a Fund may dispose of when-issued securities or forward commitments prior to settlement if the Investment Adviser deems it appropriate.
|
| Repurchase Agreements. Repurchase agreements involve the purchase of securities subject to the seller’s
agreement to repurchase them at a mutually agreed upon date and price. Each Fund may enter into repurchase agreements with dealers in U.S. government securities and member banks of the Federal Reserve System which furnish collateral at least equal in
value or market price to the amount of their repurchase obligation.
|
| If the other party or “seller” defaults, a Fund might suffer a loss to the extent that the proceeds from the sale of the
underlying securities and other collateral held by the Fund are less than the repurchase price and the Fund’s costs associated with delay and enforcement of the repurchase agreement. In addition, in the event of bankruptcy of the seller, a Fund could
suffer additional losses if a court determines that the Fund’s interest in the collateral is not enforceable.
|
| In evaluating whether to enter into a repurchase agreement, the Investment Adviser will carefully consider the creditworthiness of
the seller. Certain Funds, together with other registered investment companies having advisory agreements with the Investment Adviser or any of its affiliates, may transfer uninvested cash balances into a single joint account, the daily aggregate balance
of which will be invested in one or more repurchase agreements.
|
| Lending of Portfolio Securities. Each Fund may engage in securities lending. Securities lending involves the lending
of securities owned by a Fund to financial institutions such as certain broker-dealers. The borrowers are required to secure their loan continuously with cash, cash equivalents, U.S. government securities or letters of credit in an amount at least equal
to the market value of the securities loaned. Cash collateral may be invested in cash equivalents. To the extent that cash collateral is invested in other investment securities, such collateral will be subject to market depreciation or appreciation, and a
Fund will be responsible for any loss that might result from its investment of the borrowers’ collateral. If the Investment Adviser determines to make securities loans, the value of the securities loaned may not exceed 33 1
/3% of the value of the total assets of a
Fund (including the loan collateral).
|
| A Fund may lend its securities to increase its income. A Fund may, however, experience delay in the recovery of its securities if
the institution with which it has engaged in a portfolio loan transaction breaches its agreement with the Fund.
|
| Short Sales Against-the-Box. Certain Funds may make short sales against-the-box. A short sale against-the-box means
that at all times when a short position is open the Fund will own an equal amount of securities sold short, or securities convertible into or exchangeable for, without payment of any further consideration, an equal amount of the securities of the same
issuer as the securities sold short.
|
| Preferred Stock, Warrants and Rights. Each Fund may invest in preferred stock, warrants and rights. Preferred stocks
are securities that represent an ownership interest providing the holder with claims on the issuer’s earnings and assets before common stock owners but after bond owners. Unlike debt securities, the obligations of an issuer of preferred stock,
including dividend and other payment obligations, may not typically be accelerated by the holders of such preferred stock on the occurrence of an event of default or other non-compliance by the issuer of the preferred stock.
|
| Warrants and other rights are options to buy a stated number of shares of common stock at a specified price at any time during the
life of the warrant or right. The holders of warrants and rights have no voting rights, receive no dividends and have no rights with respect to the assets of the issuer.
|
| Other Investment Companies. Each Fund may invest in securities of other investment companies (including
exchange-traded funds such as SPDRs and iShares
SM
, as defined below) subject to statutory limitations prescribed by the Act. These limitations include a
prohibition on any Fund acquiring more than 3% of the voting shares of any other investment company, and a prohibition on investing more than 5% of a Fund’s total assets in securities of any one investment company or more than 10% of its total assets
in securities of all investment companies. A Fund will indirectly bear its proportionate share of any management fees and other expenses paid by such other investment companies. Exchange-traded funds such as SPDRs and iShares
SM
are shares of unaffiliated investment companies which are traded like traditional equity securities on a national
securities exchange or the NASDAQ® National Market System.
|
n
|
Standard & Poor’s Depositary Receipts™.
The Funds may, consistent with their investment policies, purchase Standard & Poor’s Depositary Receipts™ (“SPDRs”). SPDRs are securities traded on the American Stock Exchange (“AMEX”) that represent
ownership in the SPDR Trust, a trust which has been established to accumulate and hold a portfolio of common stocks that is intended to track the price performance and dividend yield of the S&P 500®. The SPDR Trust is sponsored by a subsidiary of
the AMEX. SPDRs may be used for several reasons, including, but not limited to, facilitating the handling
of cash flows or trading, or reducing transaction costs. The price movement of SPDRs may not perfectly parallel the price action of the S&P 500®.
|
n
|
iShares
SM
(formerly World Equity Benchmark Shares or WEBs). iShares are shares of an investment company that invests substantially all of its assets in securities included
in the MSCI indices for specified countries. iShares are listed on the AMEX and were initially offered to the public in 1996. The market prices of iShares are expected to fluctuate in accordance with both changes in the NAVs of their underlying indices
and supply and demand of iShares on the AMEX. To date, iShares have traded at relatively modest discounts and premiums to their NAVs. However, iShares have a limited operating history and information is lacking regarding the actual performance and trading
liquidity of iShares for extended periods or over complete market cycles. In addition, there is no assurance that the requirements of the AMEX necessary to maintain the listing of iShares will continue to be met or will remain unchanged. In the event
substantial market or other disruptions affecting iShares should occur in the future, the liquidity and value of a Fund’s shares could also be substantially and adversely affected. If such disruptions were to occur, a Fund could be required to
reconsider the use of iShares as part of its investment strategy.
|
| Unseasoned Companies. Each Fund may invest in companies (including predecessors) which have operated less than three
years. The securities of such companies may have limited liquidity, which can result in their being priced higher or lower than might otherwise be the case. In addition, investments in unseasoned companies are more speculative and entail greater risk than
do investments in companies with an established operating record.
|
| Corporate Debt Obligations. Corporate debt obligations include bonds, notes, debentures, commercial paper and other
obligations of corporations to pay interest and repay principal, and include securities issued by banks and other financial institutions. Each Fund may invest in corporate debt obligations issued by U.S. and certain non-U.S. issuers which issue securities
denominated in the U.S. dollar (including Yankee and Euro obligations). In addition to obligations of corporations, corporate debt obligations include securities issued by banks and other financial institutions and supranational entities (i.e., the World Bank, the International Monetary Fund, etc.).
|
| Bank Obligations. Each Fund may invest in obligations issued or guaranteed by U.S. or foreign banks. Bank
obligations, including without limitations, time deposits, bankers’ acceptances and certificates of deposit, may be general obligations of the parent bank or may be limited to the issuing branch by the terms of the specific obligations or by
government regulations. Banks are subject to extensive but different governmental regulations which may limit both the amount and types of
loans which may be made and interest rates which may be charged. In addition, the profitability of the banking industry is largely dependent upon the availability and cost of funds for the purpose of financing lending operations under prevailing money
market conditions. General economic conditions as well as exposure to credit losses arising from possible financial difficulties of borrowers play an important part in the operation of this industry.
|
| U.S. Government Securities. Each Fund may invest in U.S. government securities. U.S. government securities include
U.S. Treasury obligations and obligations issued or guaranteed by U.S. government agencies, instrumentalities or sponsored enterprises. U.S. government securities may be supported by (a) the full faith and credit of the U.S. Treasury (such as the
Government National Mortgage Association (“Ginnie Mae”)); (b) the right of the issuer to borrow from the U.S. Treasury (such as securities of the Student Loan Marketing Association); (c) the discretionary authority of the U.S. government to
purchase certain obligations of the issuer; or (d) only the credit of the issuer. U.S. government securities also include Treasury receipts, zero coupon bonds and other stripped U.S. government securities, where the interest and principal components of
stripped U.S. government securities are traded independently.
|
| Custodial Receipts. Interests in U.S. government securities may be purchased in the form of custodial receipts that
evidence ownership of future interest payments, principal payments or both on certain notes or bonds issued or guaranteed as to principal and interest by the U.S. government, its agencies, instrumentalities, political subdivisions or authorities. For
certain securities law purposes, custodial receipts are not considered obligations of the U.S. government.
|
| Mortgage-Backed Securities. Certain Funds may invest in mortgage-backed securities. Mortgage-backed securities
represent direct or indirect participations in, or are collateralized by and payable from, mortgage loans secured by real property. Mortgage-backed securities can be backed by either fixed rate mortgage loans or adjustable rate mortgage loans, and may be
issued by either a governmental or non-governmental entity. Privately issued mortgage-backed securities are normally structured with one or more types of “credit enhancement.” However, these mortgage-backed securities typically do not have the
same credit standing as U.S. government guaranteed mortgage-backed securities.
|
| Mortgage-backed securities may include multiple class securities, including collateralized mortgage obligations (“CMOs”)
and Real Estate Mortgage Investment Conduit (“REMIC”) pass-through or participation certificates. CMOs provide an investor with a specified interest in the cash flow from a pool of underlying mortgages or of other mortgage-backed securities.
CMOs are issued in multiple classes. In many cases, payments of principal are applied to the CMO classes in the
order of their respective stated maturities, so that no principal payments will be made on a CMO class until all other classes having an earlier stated maturity date are paid in full. A REMIC is a CMO that qualifies for special tax treatment and invests
in certain mortgages principally secured by interests in real property and other permitted investments.
|
| Mortgaged-backed securities also include stripped mortgage-backed securities (“SMBS”), which are derivative multiple
class mortgage-backed securities. SMBS are usually structured with two different classes: one that receives substantially all of the interest payments and the other that receives substantially all of the principal payments from a pool of mortgage loans.
The market value of SMBS consisting entirely of principal payments generally is unusually volatile in response to changes in interest rates. The yields on SMBS that receive all or most of the interest from mortgage loans are generally higher than
prevailing market yields on other mortgage-backed securities because their cash flow patterns are more volatile and there is a greater risk that the initial investment will not be fully recouped.
|
| Asset-Backed Securities. Certain Funds may invest in asset-backed securities. Asset-backed securities are securities
whose principal and interest payments are collateralized by pools of assets such as auto loans, credit card receivables, leases, installment contracts and personal property. Asset-backed securities are often subject to more rapid repayment than their
stated maturity date would indicate as a result of the pass-through of prepayments of principal on the underlying loans. During periods of declining interest rates, prepayment of loans underlying asset-backed securities can be expected to accelerate.
Accordingly, a Fund’s ability to maintain positions in such securities will be affected by reductions in the principal amount of such securities resulting from prepayments, and its ability to reinvest the returns of principal at comparable yields is
subject to generally prevailing interest rates at that time. Asset-backed securities present credit risks that are not presented by mortgage-backed securities. This is because asset-backed securities generally do not have the benefit of a security
interest in collateral that is comparable to mortgage assets. If the issuer of an asset-backed security defaults on its payment obligations, there is the possibility that, in some cases, the Fund will be unable to possess and sell the underlying
collateral and that the Fund’s recoveries on repossessed collateral may not be available to support payments on the securities. In the event of a default, a Fund may suffer a loss if it cannot sell collateral quickly and receive the amount it is owed.
|
| Borrowings. Each Fund can borrow money from banks and other financial institutions in amounts not exceeding
one-third of its total assets for temporary or emergency purposes. A Fund may not make additional investments if borrowings exceed 5% of its total assets.
|
| Mortgage Dollar Rolls. Certain Funds may enter into mortgage dollar rolls. A mortgage dollar roll involves the sale
by a Fund of securities for delivery in the current month. The Fund simultaneously contracts with the same counterparty to repurchase substantially similar (same type, coupon and maturity) but not identical securities on a specified future date. During
the roll period, the Fund loses the right to receive principal and interest paid on the securities sold. However, the Fund benefits to the extent of any difference between (a) the price received for the securities sold and (b) the lower forward price for
the future purchase and/or fee income plus the interest earned on the cash proceeds of the securities sold. Unless the benefits of a mortgage dollar roll exceed the income, capital appreciation and gain or loss due to mortgage prepayments that would have
been realized on the securities sold as part of the roll, the use of this technique will diminish the Fund’s performance.
|
| Successful use of mortgage dollar rolls depends upon the Investment Adviser’s ability to predict correctly interest rates and
mortgage prepayments. If the Investment Adviser is incorrect in its prediction, a Fund may experience a loss. For financial reporting and tax purposes, the Funds treat mortgage dollar rolls as two separate transactions: one involving the purchase of a
security and a separate transaction involving a sale. The Funds do not currently intend to enter into mortgage dollar rolls that are accounted for as a financing and do not treat them as borrowings.
|
| Yield Curve Options. Certain Funds may enter into options on the yield “spread” or differential between
two securities. Such transactions are referred to as “yield curve” options. In contrast to other types of options, a yield curve option is based on the difference between the yields of designated securities, rather than the prices of the
individual securities, and is settled through cash payments. Accordingly, a yield curve option is profitable to the holder if this differential widens (in the case of a call) or narrows (in the case of a put), regardless of whether the yields of the
underlying securities increase or decrease.
|
| The trading of yield curve options is subject to all of the risks associated with the trading of other types of options. In
addition, such options present a risk of loss even if the yield of one of the underlying securities remains constant, or if the spread moves in a direction or to an extent which was not anticipated.
|
| Reverse Repurchase Agreements. Certain Funds may enter into reverse repurchase agreements. Reverse repurchase
agreements involve the sale of securities held by a Fund subject to the Fund’s agreement to repurchase them at a mutually agreed upon date and price (including interest). These transactions may be entered into as a temporary measure for emergency
purposes or to meet redemption requests. Reverse repurchase agreements may also be entered into when the Invest
ment Adviser expects that the interest income to be earned from the investment of the transaction proceeds will be greater than the related interest expense. Reverse repurchase agreements involve leveraging. If the securities held by a Fund decline in
value while these transactions are outstanding, the NAV of the Fund’s outstanding shares will decline in value by proportionately more than the decline in value of the securities. In addition, reverse repurchase agreements involve the risk that the
interest income earned by a Fund (from the investment of the proceeds) will be less than the interest expense of the transaction, that the market value of the securities sold by a Fund will decline below the price the Fund is obligated to pay to
repurchase the securities, and that the securities may not be returned to the Fund.
|
| Municipal Securities. Certain Funds may invest in securities and instruments issued by state and local government
issuers. Municipal securities in which a Fund may invest consist of bonds, notes, commercial paper and other instruments (including participating interests in such securities) issued by or on behalf of states, territories and possessions of the United
States (including the District of Columbia) and their political subdivisions, agencies or instrumentalities. Such securities may pay fixed, variable or floating rates of interest. Municipal securities are often issued to obtain funds for various public
purposes, including the construction of a wide range of public facilities such as bridges, highways, housing, hospitals, mass transportation, schools, streets and water and sewer works. Other public purposes for which municipal securities may be issued
include refunding outstanding obligations, obtaining funds for general operating expenses, and obtaining funds to lend to other public institutions and facilities. Municipal securities in which a Fund may invest include private activity bonds, municipal
leases, certificates of participation, pre-funded municipal securities and auction rate securities.
|
| Interest Rate Swaps, Mortgage Swaps, Credit Swaps, Currency Swaps and Interest Rate Caps, Floors and Collars.
Interest rate swaps involve the exchange by a Fund with another party of their respective commitments to pay or receive interest, such as an exchange of fixed-rate payments for floating rate payments. Mortgage swaps are similar to interest rate swaps in
that they represent commitments to pay and receive interest. The notional principal amount, however, is tied to a reference pool or pools of mortgages. Credit swaps involve the receipt of floating or fixed rate payments in exchange for assuming potential
credit losses of an underlying security. Credit swaps give one party to a transaction the right to dispose of or acquire an asset (or group of assets), or the right to receive or make a payment from the other party, upon the occurrence of specified credit
events. Currency swaps involve the exchange of the parties’ respective rights to make or receive payments in specified currencies. The purchase of an interest rate cap entitles the purchaser, to the extent that a specified index exceeds a
predetermined interest
rate, to receive payment of interest on a notional principal amount from the party selling such interest rate cap. The purchase of an interest rate floor entitles the purchaser, to the extent that a specified index falls below a predetermined interest
rate, to receive payments of interest on a notional principal amount from the party selling the interest rate floor. An interest rate collar is the combination of a cap and a floor that preserves a certain return within a predetermined range of interest
rates.
|
| Certain Funds may enter into swap transactions for hedging purposes or to seek to increase total return. The use of interest rate,
mortgage, credit and currency swaps, as well as interest rate caps, floors and collars, is a highly specialized activity which involves investment techniques and risks different from those associated with ordinary portfolio securities transactions. If the
Investment Adviser is incorrect in its forecasts of market value, interest rates and currency exchange rates, the investment performance of a Fund would be less favorable than it would have been if these investment techniques were not used.
|
| Loan Participations. Certain Funds may invest in loan participations. A loan participation is an interest in a loan
to a U.S. or foreign company or other borrower which is administered and sold by a financial intermediary. A Fund may only invest in loans to issuers in whose obligations it may otherwise invest. Loan participation interests may take the form of a direct
or co-lending relationship with the corporate borrower, an assignment of an interest in the loan by a co-lender or another participant, or a participation in the seller’s share of the loan. When a Fund acts as co-lender in connection with a
participation interest or when it acquires certain participation interests, the Fund will have direct recourse against the borrower if the borrower fails to pay scheduled principal and interest. In cases where the Fund lacks direct recourse, it will look
to the agent bank to enforce appropriate credit remedies against the borrower. In these cases, the Fund may be subject to delays, expenses and risks that are greater than those that would have been involved if the Fund had purchased a direct obligation
(such as commercial paper) of such borrower. Moreover, under the terms of the loan participation, the Fund may be regarded as a creditor of the agent bank (rather than of the underlying corporate borrower), so that the Fund may also be subject to the risk
that the agent bank may become insolvent.
|
| Inverse Floaters. Certain Funds may invest in inverse floating rate debt securities (“inverse floaters”).
The interest rate on inverse floaters resets in the opposite direction from the market rate of interest to which the inverse floater is indexed. An inverse floater may be considered to be leveraged to the extent that its interest rate varies by a
magnitude that exceeds the magnitude of the change in the index rate of interest. The higher the degree of leverage of an inverse floater, the greater the volatility of its market value.
|
| The financial highlights tables are intended to help you understand a Fund’s financial performance for the past five years
(or less if the Fund has not been in operation for less than five years). Certain information reflects financial results for a single Fund share. The total returns in the table represent the rate that an investor would have earned or lost on an investment
in a Fund (assuming reinvestment of all dividends and distributions). This information for the periods ended August 30, 2000 has been audited by PricewaterhouseCoopers LLP, whose report, along with a Fund’s financial statements, is included in the
Fund’s annual report (available upon request). The information for all periods prior to the periods ended August 31, 2000 has been audited by the Funds’ previous independent accountants.
|
| BALANCED FUND
|
|
Income from investment operations |
|||||||||||
|---|---|---|---|---|---|---|---|---|---|---|---|
|
Net asset value, beginning of period |
Net
investment Income |
Net realized
and unrealized gain(loss) |
Total from
investment operations |
||||||||
| For The Year Ended August 31, | |||||||||||
| 2000 - Class A Shares | $20.38 | $0.60 | c | $ 1.75 | $2.35 | ||||||
| 2000 - Class B Shares | 20.26 | 0.45 | c | 1.73 | 2.18 | ||||||
| 2000 - Class C Shares | 20.23 | 0.45 | c | 1.74 | 2.19 | ||||||
| 2000 - Institutional Shares | 20.39 | 0.71 | c | 1.75 | 2.46 | ||||||
| 2000 - Service Shares | 20.37 | 0.59 | c | 1.74 | 2.33 | ||||||
| For The Seven Months Ended August 31, | |||||||||||
| 1999 - Class A Shares | 20.48 | 0.32 | (0.19 | ) | 0.13 | ||||||
| 1999 - Class B Shares | 20.37 | 0.22 | (0.18 | ) | 0.04 | ||||||
| 1999 - Class C Shares | 20.34 | 0.23 | (0.19 | ) | 0.04 | ||||||
| 1999 - Institutional Shares | 20.48 | 0.53 | (0.35 | ) | 0.18 | ||||||
| 1999 - Service Shares | 20.47 | 1.22 | (1.14 | ) | 0.08 | ||||||
| For The Years Ended January 31, | |||||||||||
| 1999 - Class A Shares | 20.29 | 0.58 | 0.20 | 0.78 | |||||||
| 1999 - Class B Shares | 20.20 | 0.41 | 0.21 | 0.62 | |||||||
| 1999 - Class C Shares | 20.17 | 0.41 | 0.21 | 0.62 | |||||||
| 1999 - Institutional Shares | 20.29 | 0.64 | 0.20 | 0.84 | |||||||
| 1999 - Service Shares | 20.28 | 0.53 | 0.21 | 0.74 | |||||||
| 1998 - Class A Shares | 18.78 | 0.57 | 2.66 | 3.23 | |||||||
| 1998 - Class B Shares | 18.73 | 0.50 | 2.57 | 3.07 | |||||||
| 1998 - Class C Shares (commenced August 15, 1997) | 21.10 | 0.25 | 0.24 | 0.49 | |||||||
| 1998 - Institutional Shares (commenced August 15, 1997) | 21.18 | 0.26 | 0.32 | 0.58 | |||||||
| 1998 - Service Shares (commenced August 15, 1997) | 21.18 | 0.22 | 0.32 | 0.54 | |||||||
| 1997 - Class A Shares | 17.31 | 0.66 | 2.47 | 3.13 | |||||||
| 1997 - Class B Shares (commenced May 1, 1996) | 17.46 | 0.42 | 2.34 | 2.76 | |||||||
| 1996 - Class A Shares | 14.22 | 0.51 | 3.43 | 3.94 | |||||||
|
Distributions to shareholders |
|||||||||||||||||||||
|---|---|---|---|---|---|---|---|---|---|---|---|---|---|---|---|---|---|---|---|---|---|
| From net
investment income |
In excess of net investment income |
From net
realized gains |
Total
distributions |
Net asset
value, end of period |
Total
return a |
Net assets
at end of period (in 000s) |
Ratio of
net expenses to average net assets |
||||||||||||||
| $(0.50 | ) | $ — | $(0.81 | ) | $(1.31 | ) | $21.42 | 12.00 | % | $135,632 | 1.12 | % | |||||||||
| (0.36 | ) | — | (0.81 | ) | (1.17 | ) | 21.27 | 11.17 | 33,759 | 1.87 | |||||||||||
| (0.36 | ) | — | (0.81 | ) | (1.17 | ) | 21.25 | 11.23 | 8,658 | 1.87 | |||||||||||
| (0.58 | ) | — | (0.81 | ) | (1.39 | ) | 21.46 | 12.59 | 2,509 | 0.72 | |||||||||||
| (0.48 | ) | — | (0.81 | ) | (1.29 | ) | 21.41 | 11.89 | 17 | 1.22 | |||||||||||
| (0.23 | ) | — | — | (0.23 | ) | 20.38 | 0.62 | 169,395 | 1.10 | b | |||||||||||
| (0.15 | ) | — | — | (0.15 | ) | 20.26 | 0.20 | 40,515 | 1.85 | b | |||||||||||
| (0.15 | ) | — | — | (0.15 | ) | 20.23 | 0.18 | 11,284 | 1.85 | b | |||||||||||
| (0.27 | ) | — | — | (0.27 | ) | 20.39 | 0.86 | 2,361 | 0.70 | b | |||||||||||
| (0.18 | ) | — | — | (0.18 | ) | 20.37 | 0.39 | 15 | 1.20 | b | |||||||||||
| (0.59 | ) | — | — | (0.59 | ) | 20.48 | 3.94 | 192,453 | 1.04 | ||||||||||||
| (0.45 | ) | — | — | (0.45 | ) | 20.37 | 3.15 | 43,926 | 1.80 | ||||||||||||
| (0.45 | ) | — | — | (0.45 | ) | 20.34 | 3.14 | 14,286 | 1.80 | ||||||||||||
| (0.65 | ) | — | — | (0.65 | ) | 20.48 | 4.25 | 8,010 | 0.73 | ||||||||||||
| (0.55 | ) | — | — | (0.55 | ) | 20.47 | 3.80 | 490 | 1.23 | ||||||||||||
| (0.56 | ) | — | (1.16 | ) | (1.72 | ) | 20.29 | 17.54 | 163,636 | 1.00 | |||||||||||
| (0.42 | ) | (0.02 | ) | (1.16 | ) | (1.60 | ) | 20.20 | 16.71 | 23,639 | 1.76 | ||||||||||
| (0.22 | ) | (0.04 | ) | (1.16 | ) | (1.42 | ) | 20.17 | 2.49 | 8,850 | 1.77 | b | |||||||||
| (0.23 | ) | (0.08 | ) | (1.16 | ) | (1.47 | ) | 20.29 | 2.93 | 8,367 | 0.76 | b | |||||||||
| (0.22 | ) | (0.06 | ) | (1.16 | ) | (1.44 | ) | 20.28 | 2.66 | 16 | 1.26 | b | |||||||||
| (0.66 | ) | — | (1.00 | ) | (1.66 | ) | 18.78 | 18.59 | 81,410 | 1.00 | |||||||||||
| (0.42 | ) | (0.07 | ) | (1.00 | ) | (1.49 | ) | 18.73 | 16.22 | 2,110 | 1.75 | b | |||||||||
| (0.50 | ) | — | (0.35 | ) | (0.85 | ) | 17.31 | 28.10 | 50,928 | 1.00 | |||||||||||
| BALANCED FUND (continued)
|
|
Ratios assuming no expense reductions |
|||||||||||||
|---|---|---|---|---|---|---|---|---|---|---|---|---|---|
| Ratio of
net investment income to average net assets |
Ratio of
expenses to average net assets |
Ratio of
net investment income to average net assets |
Portfolio
turnover rate d |
||||||||||
| For The Year Ended August 31, | |||||||||||||
| 2000 - Class A Shares | 2.94 | % | 1.29 | % | 2.77 | % | 153.69 | % | |||||
| 2000 - Class B Shares | 2.19 | 2.04 | 2.02 | 153.69 | |||||||||
| 2000 - Class C Shares | 2.19 | 2.04 | 2.02 | 153.69 | |||||||||
| 2000 - Institutional Shares | 3.46 | 0.89 | 3.29 | 153.69 | |||||||||
| 2000 - Service Shares | 2.86 | 1.39 | 2.69 | 153.69 | |||||||||
| For The Seven Months Ended August 31, | |||||||||||||
| 1999 - Class A Shares | 2.58 | b | 1.32 | b | 2.36 | b | 90.41 | ||||||
| 1999 - Class B Shares | 1.83 | b | 2.07 | b | 1.61 | b | 90.41 | ||||||
| 1999 - Class C Shares | 1.84 | b | 2.07 | b | 1.62 | b | 90.41 | ||||||
| 1999 - Institutional Shares | 2.96 | b | 0.92 | b | 2.74 | b | 90.41 | ||||||
| 1999 - Service Shares | 2.46 | b | 1.42 | b | 2.24 | b | 90.41 | ||||||
| For The Years Ended January 31, | |||||||||||||
| 1999 - Class A Shares | 2.90 | 1.45 | 2.49 | 175.06 | |||||||||
| 1999 - Class B Shares | 2.16 | 2.02 | 1.94 | 175.06 | |||||||||
| 1999 - Class C Shares | 2.17 | 2.02 | 1.95 | 175.06 | |||||||||
| 1999 - Institutional Shares | 3.22 | 0.95 | 3.00 | 175.06 | |||||||||
| 1999 - Service Shares | 2.77 | 1.45 | 2.55 | 175.06 | |||||||||
| 1998 - Class A Shares | 2.94 | 1.57 | 2.37 | 190.43 | |||||||||
| 1998 - Class B Shares | 2.14 | 2.07 | 1.83 | 190.43 | |||||||||
| 1998 - Class C Shares (commenced August 15, 1997) | 2.13 | b | 2.08 | b | 1.82 | b | 190.43 | ||||||
| 1998 - Institutional Shares (commenced August 15, 1997) | 3.13 | b | 1.07 | b | 2.82 | b | 190.43 | ||||||
| 1998 - Service Shares (commenced August 15, 1997) | 2.58 | b | 1.57 | b | 2.27 | b | 190.43 | ||||||
| 1997 - Class A Shares | 3.76 | 1.77 | 2.99 | 208.11 | |||||||||
| 1997 - Class B Shares (commenced May 1, 1996) | 2.59 | b | 2.27 | b | 2.07 | b | 208.11 | ||||||
| 1996 - Class A Shares | 3.65 | 1.90 | 2.75 | 197.10 | |||||||||
| GROWTH AND INCOME FUND
|
|
Income from investment operations |
||||||||||||
|---|---|---|---|---|---|---|---|---|---|---|---|---|
|
Net asset value, beginning of period |
Net
investment income (loss) |
Net realized
and unrealized gain (loss) |
Total from
investment operations |
|||||||||
| For The Year Ended August 31, | ||||||||||||
| 2000 - Class A Shares | $24.68 | $ 0.07 | c | $1.44 | $1.51 | |||||||
| 2000 - Class B Shares | 24.46 | (0.10 | ) c | 1.42 | 1.32 | |||||||
| 2000 - Class C Shares | 24.41 | (0.09 | ) c | 1.40 | 1.31 | |||||||
| 2000 - Institutional Shares | 24.72 | 0.16 | c | 1.49 | 1.65 | |||||||
| 2000 - Service Shares | 24.68 | 0.05 | c | 1.44 | 1.49 | |||||||
| For The Seven Months Ended August 31, | ||||||||||||
| 1999 - Class A Shares | 24.33 | 0.19 | 0.31 | 0.50 | ||||||||
| 1999 - Class B Shares | 24.13 | 0.08 | 0.31 | 0.39 | ||||||||
| 1999 - Class C Shares | 24.08 | 0.08 | 0.30 | 0.38 | ||||||||
| 1999 - Institutional Shares | 24.35 | 0.34 | 0.23 | 0.57 | ||||||||
| 1999 - Service Shares | 24.33 | 0.17 | 0.32 | 0.49 | ||||||||
| For The Years Ended January 31, | ||||||||||||
| 1999 - Class A Shares | 25.93 | 0.20 | (1.60 | ) | (1.40 | ) | ||||||
| 1999 - Class B Shares | 25.73 | 0.02 | (1.58 | ) | (1.56 | ) | ||||||
| 1999 - Class C Shares | 25.70 | 0.02 | (1.59 | ) | (1.57 | ) | ||||||
| 1999 - Institutional Shares | 25.95 | 0.29 | (1.58 | ) | (1.29 | ) | ||||||
| 1999 - Service Shares | 25.92 | 0.17 | (1.58 | ) | (1.41 | ) | ||||||
| 1998 - Class A Shares | 23.18 | 0.11 | 5.27 | 5.38 | ||||||||
| 1998 - Class B Shares | 23.10 | 0.04 | 5.14 | 5.18 | ||||||||
| 1998 - Class C Shares (commenced August 15, 1997) | 28.20 | (0.01 | ) | 0.06 | 0.05 | |||||||
| 1998 - Institutional Shares | 23.19 | 0.27 | 5.23 | 5.50 | ||||||||
| 1998 - Service Shares | 23.17 | 0.14 | 5.23 | 5.37 | ||||||||
| 1997 - Class A Shares | 19.98 | 0.35 | 5.18 | 5.53 | ||||||||
| 1997 - Class B Shares (commenced May 1, 1996) | 20.82 | 0.17 | 4.31 | 4.48 | ||||||||
| 1997 - Institutional Shares (commenced June 3, 1996) | 21.25 | 0.29 | 3.96 | 4.25 | ||||||||
| 1997 - Service Shares (commenced March 6, 1996) | 20.71 | 0.28 | 4.50 | 4.78 | ||||||||
| 1996 - Class A Shares | 15.80 | 0.33 | 4.75 | 5.08 | ||||||||
|
Distributions to shareholders |
|||||||||||||||||||||||
|---|---|---|---|---|---|---|---|---|---|---|---|---|---|---|---|---|---|---|---|---|---|---|---|
| From net
investment income |
In excess of net investment income |
From net
realized gains |
Total
distributions |
Net asset
value, end of period |
Total
returna |
Net assets
at end of period (in 000s) |
Ratio of
net expenses to average net assets |
||||||||||||||||
| $(0.05 | ) | $(0.03 | ) | $(1.33 | ) | $(1.41 | ) | $24.78 | 6.48 | % | $ 576,354 | 1.18 | % | ||||||||||
| (0.02 | ) | (0.01 | ) | (1.33 | ) | (1.36 | ) | 24.42 | 5.70 | 155,527 | 1.93 | ||||||||||||
| (0.01 | ) | (0.01 | ) | (1.33 | ) | (1.35 | ) | 24.37 | 5.67 | 15,746 | 1.93 | ||||||||||||
| (0.09 | ) | (0.04 | ) | (1.33 | ) | (1.46 | ) | 24.91 | 7.05 | 28,543 | 0.78 | ||||||||||||
| (0.05 | ) | (0.02 | ) | (1.33 | ) | (1.40 | ) | 24.77 | 6.40 | 7,926 | 1.28 | ||||||||||||
| (0.15 | ) | — | — | (0.15 | ) | 24.68 | 2.05 | 855,174 | 1.19 | b | |||||||||||||
| (0.06 | ) | — | — | (0.06 | ) | 24.46 | 1.60 | 271,912 | 1.94 | b | |||||||||||||
| (0.05 | ) | — | — | (0.05 | ) | 24.41 | 1.58 | 31,328 | 1.94 | b | |||||||||||||
| (0.20 | ) | — | — | (0.20 | ) | 24.72 | 2.32 | 32,181 | 0.79 | b | |||||||||||||
| (0.14 | ) | — | — | (0.14 | ) | 24.68 | 2.01 | 10,008 | 1.29 | b | |||||||||||||
| (0.19 | ) | (0.01 | ) | — | (0.20 | ) | 24.33 | (5.40 | ) | 1,122,157 | 1.22 | ||||||||||||
| (0.04 | ) | — | — | (0.04 | ) | 24.13 | (6.07 | ) | 349,662 | 1.92 | |||||||||||||
| (0.05 | ) | — | — | (0.05 | ) | 24.08 | (6.12 | ) | 48,146 | 1.92 | |||||||||||||
| (0.30 | ) | (0.01 | ) | — | (0.31 | ) | 24.35 | (5.00 | ) | 173,696 | 0.80 | ||||||||||||
| (0.17 | ) | (0.01 | ) | — | (0.18 | ) | 24.33 | (5.44 | ) | 11,943 | 1.30 | ||||||||||||
| (0.11 | ) | — | (2.52 | ) | (2.63 | ) | 25.93 | 23.71 | 1,216,582 | 1.25 | |||||||||||||
| — | (0.03 | ) | (2.52 | ) | (2.55 | ) | 25.73 | 22.87 | 307,815 | 1.94 | |||||||||||||
| — | (0.03 | ) | (2.52 | ) | (2.55 | ) | 25.70 | 0.51 | 31,686 | 1.99 | b | ||||||||||||
| (0.22 | ) | — | (2.52 | ) | (2.74 | ) | 25.95 | 24.24 | 36,225 | 0.83 | |||||||||||||
| (0.06 | ) | (0.04 | ) | (2.52 | ) | (2.62 | ) | 25.92 | 23.63 | 8,893 | 1.32 | ||||||||||||
| |
|||||||||||||||||||||||
| (0.35 | ) | (0.01 | ) | (1.97 | ) | (2.33 | ) | 23.18 | 28.42 | 615,103 | 1.22 | ||||||||||||
| (0.17 | ) | (0.06 | ) | (1.97 | ) | (2.20 | ) | 23.10 | 22.23 | 17,346 | 1.93 | b | |||||||||||
| (0.30 | ) | (0.04 | ) | (1.97 | ) | (2.31 | ) | 23.19 | 20.77 | 193 | 0.82 | b | |||||||||||
| (0.28 | ) | (0.07 | ) | (1.97 | ) | (2.32 | ) | 23.17 | 23.87 | 3,174 | 1.32 | b | |||||||||||
| (0.30 | ) | — | (0.60 | ) | (0.90 | ) | 19.98 | 32.45 | 436,757 | 1.20 | |||||||||||||
| |
|||||||||||||||||||||||
| GROWTH AND INCOME FUND (continued)
|
|
Ratios assuming no expense reductions |
|||||||||||||
|---|---|---|---|---|---|---|---|---|---|---|---|---|---|
| Ratio of
net investment income (loss) to average net assets |
Ratio of
expenses to average net assets |
Ratio of
net investment income (loss) to average net assets |
Portfolio
turnover rate |
||||||||||
| |
|||||||||||||
| For The Year Ended August 31, | |||||||||||||
| 2000 - Class A Shares | 0.31 | % | 1.18 | % | 0.31 | % | 86.84 | % | |||||
| 2000 - Class B Shares | (0.41 | ) | 1.93 | (0.41 | ) | 86.84 | |||||||
| 2000 - Class C Shares | (0.40 | ) | 1.93 | (0.40 | ) | 86.84 | |||||||
| 2000 - Institutional Shares | 0.69 | 0.78 | 0.69 | 86.84 | |||||||||
| 2000 - Service Shares | 0.20 | 1.28 | 0.20 | 86.84 | |||||||||
| For The Seven Months Ended August 31, | |||||||||||||
| 1999 - Class A Shares | 1.26 | b | 1.20 | b | 1.25 | b | 55.43 | ||||||
| 1999 - Class B Shares | 0.51 | b | 1.95 | b | 0.50 | b | 55.43 | ||||||
| 1999 - Class C Shares | 0.51 | b | 1.95 | b | 0.50 | b | 55.43 | ||||||
| 1999 - Institutional Shares | 1.72 | b | 0.80 | b | 1.71 | b | 55.43 | ||||||
| 1999 - Service Shares | 1.16 | b | 1.30 | b | 1.15 | b | 55.43 | ||||||
| For The Years Ended January 31, | |||||||||||||
| 1999 - Class A Shares | 0.78 | 1.32 | 0.68 | 125.79 | |||||||||
| 1999 - Class B Shares | 0.09 | 1.92 | 0.09 | 125.79 | |||||||||
| 1999 - Class C Shares | 0.10 | 1.92 | 0.10 | 125.79 | |||||||||
| 1999 - Institutional Shares | 1.25 | 0.80 | 1.25 | 125.79 | |||||||||
| 1999 - Service Shares | 0.72 | 1.30 | 0.72 | 125.79 | |||||||||
| 1998 - Class A Shares | 0.43 | 1.42 | 0.26 | 61.95 | |||||||||
| 1998 - Class B Shares | (0.35 | ) | 1.94 | (0.35 | ) | 61.95 | |||||||
| 1998 - Class C Shares (commenced August 15, 1997) | (0.48 | ) b | 1.99 | b | (0.48 | ) b | 61.95 | ||||||
| 1998 - Institutional Shares | 0.76 | 0.83 | 0.76 | 61.95 | |||||||||
| 1998 - Service Shares | 0.32 | 1.32 | 0.32 | 61.95 | |||||||||
| 1997 - Class A Shares | 1.60 | 1.43 | 1.39 | 53.03 | |||||||||
| 1997 - Class B Shares (commenced May 1, 1996) | 0.15 | b | 1.93 | b | 0.15 | b | 53.03 | ||||||
| 1997 - Institutional Shares (commenced June 3, 1996) | 1.36 | b | 0.82 | b | 1.36 | b | 53.03 | ||||||
| 1997 - Service Shares (commenced March 6, 1996) | 0.94 | b | 1.32 | b | 0.94 | b | 53.03 | ||||||
| 1996 - Class A Shares | 1.67 | 1.45 | 1.42 | 57.93 | |||||||||
| CORE LARGE CAP VALUE FUND
|
|
Income from investment operations |
||||||||||||
|---|---|---|---|---|---|---|---|---|---|---|---|---|
| Net asset
value, beginning of period |
Net
investment income |
Net realized
and unrealized gain |
Total from
investment operations |
|||||||||
| For the Year Ended August 31, | ||||||||||||
| 2000 - Class A Shares | $10.55 | $0.12 | c | $0.36 | $0.48 | |||||||
| 2000 - Class B Shares | 10.50 | 0.05 | c | 0.36 | 0.41 | |||||||
| 2000 - Class C Shares | 10.51 | 0.04 | c | 0.37 | 0.41 | |||||||
| 2000 - Institutional Shares | 10.55 | 0.16 | c | 0.37 | 0.53 | |||||||
| 2000 - Service Shares | 10.55 | 0.11 | c | 0.36 | 0.47 | |||||||
| For the Seven-Month Period Ended August 31, | ||||||||||||
| 1999 - Class A Shares | 10.15 | 0.04 | 0.40 | 0.44 | ||||||||
| 1999 - Class B Shares | 10.15 | 0.01 | 0.36 | 0.37 | ||||||||
| 1999 - Class C Shares | 10.15 | 0.01 | 0.37 | 0.38 | ||||||||
| 1999 - Institutional Shares | 10.16 | 0.06 | 0.38 | 0.44 | ||||||||
| 1999 - Service Shares | 10.16 | 0.02 | 0.40 | 0.42 | ||||||||
| For the Period Ended January 31, | ||||||||||||
| 1999 - Class A Shares (commenced December 31, 1998) | 10.00 | 0.01 | 0.14 | 0.15 | ||||||||
| 1999 - Class B Shares (commenced December 31, 1998) | 10.00 | — | 0.15 | 0.15 | ||||||||
| 1999 - Class C Shares (commenced December 31, 1998) | 10.00 | — | 0.15 | 0.15 | ||||||||
| 1999 - Institutional Shares (commenced December 31, 1998) | 10.00 | 0.01 | 0.15 | 0.16 | ||||||||
| 1999 - Service Shares (commenced December 31, 1998) | 10.00 | 0.02 | 0.14 | 0.16 | ||||||||
|
Distributions to shareholders |
|||||||||||||||||||||
|---|---|---|---|---|---|---|---|---|---|---|---|---|---|---|---|---|---|---|---|---|---|
| From net
investment income |
From net
realized gains |
Total
distributions |
Net asset
value, end of period |
Total
returna |
Net assets
at end of period (in 000s) |
Ratio of
net expenses to average net assets |
Ratio of
net investment income to average net assets |
||||||||||||||
| $(0.10 | ) | $(0.12 | ) | $(0.22 | ) | $10.81 | 4.68 | % | $100,972 | 1.06 | % | 1.14 | % | ||||||||
| (0.04 | ) | (0.12 | ) | (0.16 | ) | 10.75 | 3.96 | 19,069 | 1.81 | 0.44 | |||||||||||
| (0.04 | ) | (0.12 | ) | (0.16 | ) | 10.76 | 3.97 | 11,178 | 1.81 | 0.45 | |||||||||||
| (0.14 | ) | (0.12 | ) | (0.26 | ) | 10.82 | 5.20 | 175,493 | 0.66 | 1.54 | |||||||||||
| (0.09 | ) | (0.12 | ) | (0.21 | ) | 10.81 | 4.60 | 12 | 1.16 | 1.07 | |||||||||||
| (0.04 | ) | — | (0.04 | ) | 10.55 | 4.31 | 91,072 | 1.04 | b | 0.87 | b | ||||||||||
| (0.02 | ) | — | (0.02 | ) | 10.50 | 3.68 | 14,464 | 1.79 | b | 0.05 | b | ||||||||||
| (0.02 | ) | — | (0.02 | ) | 10.51 | 3.73 | 8,032 | 1.79 | b | 0.09 | b | ||||||||||
| (0.05 | ) | — | (0.05 | ) | 10.55 | 4.35 | 189,540 | 0.64 | b | 1.29 | b | ||||||||||
| (0.03 | ) | — | (0.03 | ) | 10.55 | 4.11 | 13 | 1.14 | b | 0.72 | b | ||||||||||
| — | — | — | 10.15 | 1.50 | 6,665 | 1.08 | b | 1.45 | b | ||||||||||||
| — | — | — | 10.15 | 1.50 | 340 | 1.82 | b | 0.84 | b | ||||||||||||
| — | — | — | 10.15 | 1.50 | 268 | 1.83 | b | 0.70 | b | ||||||||||||
| — | — | — | 10.16 | 1.60 | 53,396 | 0.66 | b | 1.97 | b | ||||||||||||
| — | — | — | 10.16 | 1.60 | 2 | 1.16 | b | 2.17 | b | ||||||||||||
| CORE LARGE CAP VALUE FUND (continued)
|
|
Ratios assuming no expense reductions |
||||||||||
|---|---|---|---|---|---|---|---|---|---|---|
| Ratio of
expenses to average net assets |
Ratio of
net investment income (loss) to average net assets |
Portfolio
turnover rate |
||||||||
| For the Year Ended August 31, | ||||||||||
| 2000 - Class A Shares | 1.17 | % | 1.03 | % | 83.30 | % | ||||
| 2000 - Class B Shares | 1.92 | 0.33 | 83.30 | |||||||
| 2000 - Class C Shares | 1.92 | 0.34 | 83.30 | |||||||
| 2000 - Institutional Shares | 0.77 | 1.43 | 83.30 | |||||||
| 2000 - Service Shares | 1.27 | 0.96 | 83.30 | |||||||
| For the Seven-Month Period Ended August 31, | ||||||||||
| 1999 - Class A Shares | 1.21 | b | 0.70 | b | 36.10 | |||||
| 1999 - Class B Shares | 1.96 | b | (0.12 | ) b | 36.10 | |||||
| 1999 - Class C Shares | 1.96 | b | (0.08 | ) b | 36.10 | |||||
| 1999 - Institutional Shares | 0.81 | b | 1.12 | b | 36.10 | |||||
| 1999 - Service Shares | 1.31 | b | 0.55 | b | 36.10 | |||||
| For the Period Ended January 31, | ||||||||||
| 1999 - Class A Shares (commenced December 31, 1998) | 8.03 | b | (5.50 | ) b | 0.00 | |||||
| 1999 - Class B Shares (commenced December 31, 1998) | 8.77 | b | (6.11 | ) b | 0.00 | |||||
| 1999 - Class C Shares (commenced December 31, 1998) | 8.78 | b | (6.25 | ) b | 0.00 | |||||
| 1999 - Institutional Shares (commenced December 31, 1998) | 7.61 | b | (4.98 | ) b | 0.00 | |||||
| 1999 - Service Shares (commenced December 31, 1998) | 8.11 | b | (4.78 | ) b | 0.00 | |||||
| CORE U.S. EQUITY FUND
|
|
Income from investment operations |
||||||||||
|---|---|---|---|---|---|---|---|---|---|---|
|
Net asset value, beginning of period |
Net
investment income (loss) |
Net realized
and unrealized gain |
Total from
investment operations |
|||||||
| For The Year Ended August 31, | ||||||||||
| 2000 - Class A Shares | $34.21 | $ 0.10 | c | $6.00 | $6.10 | |||||
| 2000 - Class B Shares | 33.56 | (0.14 | ) c | 5.83 | 5.69 | |||||
| 2000 - Class C Shares | 33.46 | (0.13 | ) c | 5.80 | 5.67 | |||||
| 2000 - Institutional Shares | 34.61 | 0.24 | c | 6.07 | 6.31 | |||||
| 2000 - Service Shares | 34.05 | 0.07 | c | 5.96 | 6.03 | |||||
| For The Seven-Month Period Ended August 31, | ||||||||||
| 1999 - Class A Shares | 32.98 | 0.03 | 1.20 | 1.23 | ||||||
| 1999 - Class B Shares | 32.50 | (0.11 | ) | 1.17 | 1.06 | |||||
| 1999 - Class C Shares | 32.40 | (0.10 | ) | 1.16 | 1.06 | |||||
| 1999 - Institutional Shares | 33.29 | 0.11 | 1.21 | 1.32 | ||||||
| 1999 - Service Shares | 32.85 | 0.01 | 1.19 | 1.20 | ||||||
| For The Years Ended January 31, | ||||||||||
| 1999 - Class A Shares | 26.59 | 0.04 | 7.02 | 7.06 | ||||||
| 1999 - Class B Shares | 26.32 | (0.10 | ) | 6.91 | 6.81 | |||||
| 1999 - Class C Shares | 26.24 | (0.10 | ) | 6.89 | 6.79 | |||||
| 1999 - Institutional Shares | 26.79 | 0.20 | 7.11 | 7.31 | ||||||
| 1999 - Service Shares | 26.53 | 0.06 | 7.01 | 7.07 | ||||||
| 1998 - Class A Shares | 23.32 | 0.11 | 5.63 | 5.74 | ||||||
| 1998 - Class B Shares | 23.18 | 0.11 | 5.44 | 5.55 | ||||||
| 1998 - Class C Shares (commenced August 15, 1997) | 27.48 | 0.03 | 1.22 | 1.25 | ||||||
| 1998 - Institutional Shares | 23.44 | 0.30 | 5.65 | 5.95 | ||||||
| 1998 - Service Shares | 23.27 | 0.19 | 5.57 | 5.76 | ||||||
| 1997 - Class A Shares | 19.66 | 0.16 | 4.46 | 4.62 | ||||||
| 1997 - Class B Shares (commenced May 1, 1996) | 20.44 | 0.04 | 3.70 | 3.74 | ||||||
| 1997 - Institutional Shares | 19.71 | 0.30 | 4.51 | 4.81 | ||||||
| 1997 - Service Shares (commenced June 7, 1996) | 21.02 | 0.13 | 3.15 | 3.28 | ||||||
| 1996 - Class A Shares | 14.61 | 0.19 | 5.43 | 5.62 | ||||||
| 1996 - Institutional Shares (commenced June 15, 1995) | 16.97 | 0.16 | 3.23 | 3.39 | ||||||
|
Distributions to shareholders |
||||||||||||||||||||||||
|---|---|---|---|---|---|---|---|---|---|---|---|---|---|---|---|---|---|---|---|---|---|---|---|---|
| From net
investment income |
In excess
of net investment income |
From net
realized gains |
Total
distributions |
Net asset
value, end of period |
Total
returna |
Net assets
at end of period (in 000s) |
Ratio of
net expenses to average net assets |
Ratio of
net investment income (loss) to average net assets |
||||||||||||||||
| $ — | $ — | $(3.54 | ) | $(3.54 | ) | $36.77 | 18.96 | % | $715,775 | 1.14 | % | 0.31 | % | |||||||||||
| — | — | (3.54 | ) | (3.54 | ) | 35.71 | 18.03 | 275,673 | 1.89 | (0.44 | ) | |||||||||||||
| — | — | (3.54 | ) | (3.54 | ) | 35.59 | 18.03 | 62,820 | 1.89 | (0.43 | ) | |||||||||||||
| (0.08 | ) | — | (3.54 | ) | (3.62 | ) | 37.30 | 19.41 | 379,172 | 0.74 | 0.71 | |||||||||||||
| — | — | (3.54 | ) | (3.54 | ) | 36.54 | 18.83 | 11,879 | 1.24 | 0.19 | ||||||||||||||
| — | — | — | — | 34.21 | 3.73 | 614,310 | 1.14 | b | 0.15 | b | ||||||||||||||
| — | — | — | — | 33.56 | 3.26 | 214,087 | 1.89 | b | (0.60 | ) b | ||||||||||||||
| — | — | — | — | 33.46 | 3.27 | 43,361 | 1.89 | b | (0.61 | ) b | ||||||||||||||
| — | — | — | — | 34.61 | 3.97 | 335,465 | 0.74 | b | 0.54 | b | ||||||||||||||
| — | — | — | — | 34.05 | 3.65 | 11,204 | 1.24 | b | 0.06 | b | ||||||||||||||
| (0.03 | ) | (0.01 | ) | (0.63 | ) | (0.67 | ) | 32.98 | 26.89 | 605,566 | 1.23 | 0.15 | ||||||||||||
| — | — | (0.63 | ) | (0.63 | ) | 32.50 | 26.19 | 152,347 | 1.85 | (0.50 | ) | |||||||||||||
| — | — | (0.63 | ) | (0.63 | ) | 32.40 | 26.19 | 26,912 | 1.87 | (0.53 | ) | |||||||||||||
| (0.15 | ) | (0.03 | ) | (0.63 | ) | (0.81 | ) | 33.29 | 27.65 | 307,200 | 0.69 | 0.69 | ||||||||||||
| (0.10 | ) | (0.02 | ) | (0.63 | ) | (0.75 | ) | 32.85 | 27.00 | 11,600 | 1.19 | 0.19 | ||||||||||||
| (0.12 | ) | — | (2.35 | ) | (2.47 | ) | 26.59 | 24.96 | 398,393 | 1.28 | 0.51 | |||||||||||||
| — | (0.06 | ) | (2.35 | ) | (2.41 | ) | 26.32 | 24.28 | 59,208 | 1.79 | (0.05 | ) | ||||||||||||
| — | (0.14 | ) | (2.35 | ) | (2.49 | ) | 26.24 | 4.85 | 6,267 | 1.78 | b | (0.21 | ) b | |||||||||||
| (0.24 | ) | (0.01 | ) | (2.35 | ) | (2.60 | ) | 26.79 | 25.76 | 202,893 | 0.65 | 1.16 | ||||||||||||
| (0.07 | ) | (0.08 | ) | (2.35 | ) | (2.50 | ) | 26.53 | 25.11 | 7,841 | 1.15 | 0.62 | ||||||||||||
| (0.16 | ) | — | (0.80 | ) | (0.96 | ) | 23.32 | 23.75 | 225,968 | 1.29 | 0.91 | |||||||||||||
| (0.04 | ) | (0.16 | ) | (0.80 | ) | (1.00 | ) | 23.18 | 18.59 | 17,258 | 1.83 | b | 0.06 | b | ||||||||||
| (0.28 | ) | — | (0.80 | ) | (1.08 | ) | 23.44 | 24.63 | 148,942 | 0.65 | 1.52 | |||||||||||||
| (0.13 | ) | (0.10 | ) | (0.80 | ) | (1.03 | ) | 23.27 | 15.92 | 3,666 | 1.15 | b | 0.69 | b | ||||||||||
| (0.16 | ) | — | (0.41 | ) | (0.57 | ) | 19.66 | 38.63 | 129,045 | 1.25 | 1.01 | |||||||||||||
| (0.24 | ) | — | (0.41 | ) | (0.65 | ) | 19.71 | 20.14 | 64,829 | 0.65 | b | 1.49 | b | |||||||||||
| CORE U.S. EQUITY FUND (continued)
|
|
Ratios assuming no expense reductions |
||||||||||
|---|---|---|---|---|---|---|---|---|---|---|
| Ratio of
expenses to average net assets |
Ratio of
net investment income (loss) to average net assets |
Portfolio
turnover rate |
||||||||
| For The Year Ended August 31, | ||||||||||
| 2000 - Class A Shares | 1.23 | % | 0.22 | % | 59.27 | % | ||||
| 2000 - Class B Shares | 1.98 | (0.53 | ) | 59.27 | ||||||
| 2000 - Class C Shares | 1.98 | (0.52 | ) | 59.27 | ||||||
| 2000 - Institutional Shares | 0.83 | 0.62 | 59.27 | |||||||
| 2000 - Service Shares | 1.33 | 0.10 | 59.27 | |||||||
| For The Seven-Month Period Ended August 31, | ||||||||||
| 1999 - Class A Shares | 1.24 | b | 0.05 | b | 41.84 | |||||
| 1999 - Class B Shares | 1.99 | b | (0.70 | ) b | 41.84 | |||||
| 1999 - Class C Shares | 1.99 | b | (0.71 | ) b | 41.84 | |||||
| 1999 - Institutional Shares | 0.84 | b | 0.44 | b | 41.84 | |||||
| 1999 - Service Shares | 1.34 | b | (0.04 | ) b | 41.84 | |||||
| For The Years Ended January 31, | ||||||||||
| 1999 - Class A Shares | 1.36 | 0.02 | 63.79 | |||||||
| 1999 - Class B Shares | 1.98 | (0.63 | ) | 63.79 | ||||||
| 1999 - Class C Shares | 2.00 | (0.66 | ) | 63.79 | ||||||
| 1999 - Institutional Shares | 0.82 | 0.56 | 63.79 | |||||||
| 1999 - Service Shares | 1.32 | 0.06 | 63.79 | |||||||
| 1998 - Class A Shares | 1.47 | 0.32 | 65.89 | |||||||
| 1998 - Class B Shares | 1.96 | (0.22 | ) | 65.89 | ||||||
| 1998 - Class C Shares (commenced August 15, 1997) | 1.95 | b | (0.38 | ) b | 65.89 | |||||
| 1998 - Institutional Shares | 0.82 | 0.99 | 65.89 | |||||||
| 1998 - Service Shares | 1.32 | 0.45 | 65.89 | |||||||
| 1997 - Class A Shares | 1.53 | 0.67 | 37.28 | |||||||
| 1997 - Class B Shares (commenced May 1, 1996) | 2.00 | b | (0.11 | ) b | 37.28 | |||||
| 1997 - Institutional Shares | 0.85 | 1.32 | 37.28 | |||||||
| 1997 - Service Shares (commenced June 7, 1996) | 1.35 | b | 0.49 | b | 37.28 | |||||
| 1996 - Class A Shares | 1.55 | 0.71 | 39.35 | |||||||
| 1996 - Institutional Shares (commenced June 15, 1995) | 0.96 | b | 1.18 | b | 39.35 | |||||
| CORE LARGE CAP GROWTH FUND
|
|
Income from investment operations |
||||||||||
|---|---|---|---|---|---|---|---|---|---|---|
|
Net asset value, beginning of period |
Net
investment income (loss) |
Net realized
and unrealized gain |
Total from
investment operations |
|||||||
| For the Year Ended August 31, | ||||||||||
| 2000 - Class A Shares | $17.02 | $ 0.06 | c | $5.67 | $5.73 | |||||
| 2000 - Class B Shares | 16.75 | (0.09 | ) c | 5.57 | 5.48 | |||||
| 2000 - Class C Shares | 16.75 | (0.08 | ) c | 5.57 | 5.49 | |||||
| 2000 - Institutional Shares | 17.10 | 0.13 | c | 5.73 | 5.86 | |||||
| 2000 - Service Shares | 16.95 | 0.03 | c | 5.66 | 5.69 | |||||
| For the Seven-Month Period Ended August 31, | ||||||||||
| 1999 - Class A Shares | 16.17 | (0.01 | ) | 0.86 | 0.85 | |||||
| 1999 - Class B Shares | 15.98 | (0.07 | ) | 0.84 | 0.77 | |||||
| 1999 - Class C Shares | 15.99 | (0.07 | ) | 0.83 | 0.76 | |||||
| 1999 - Institutional Shares | 16.21 | 0.03 | 0.86 | 0.89 | ||||||
| 1999 - Service Shares | 16.11 | (0.02 | ) | 0.86 | 0.84 | |||||
| For the Year Ended January 31, | ||||||||||
| 1999 - Class A Shares | 11.97 | 0.01 | 4.19 | 4.20 | ||||||
| 1999 - Class B Shares | 11.92 | (0.06 | ) | 4.12 | 4.06 | |||||
| 1999 - Class C Shares | 11.93 | (0.05 | ) | 4.11 | 4.06 | |||||
| 1999 - Institutional Shares | 11.97 | 0.02 | 4.23 | 4.25 | ||||||
| 1999 - Service Shares | 11.95 | (0.01 | ) | 4.17 | 4.16 | |||||
| For the Period Ended January 31, | ||||||||||
| 1998 - Class A Shares (commenced May 1, 1997) | 10.00 | 0.01 | 2.35 | 2.36 | ||||||
| 1998 - Class B Shares (commenced May 1, 1997) | 10.00 | (0.03 | ) | 2.33 | 2.30 | |||||
| 1998 - Class C Shares (commenced August 15, 1997) | 11.80 | (0.02 | ) | 0.54 | 0.52 | |||||
| 1998 - Institutional Shares (commenced May 1, 1997) | 10.00 | 0.01 | 2.35 | 2.36 | ||||||
| 1998 - Service Shares (commenced May 1, 1997) | 10.00 | (0.02 | ) | 2.35 | 2.33 | |||||
|
Distributions to Shareholders |
|||||||||||||||||||||
|---|---|---|---|---|---|---|---|---|---|---|---|---|---|---|---|---|---|---|---|---|---|
|
From Net Investment Income |
In excess
of net investment income |
From net
realized gains |
Total
distributions |
Net asset
value, end of period |
Total
returna |
Net assets
at end of period (in 000s) |
Ratio of
net expenses to average net assets |
||||||||||||||
| $ — | $ — | $(0.09 | ) | $(0.09 | ) | $22.66 | 33.73 | % | $545,763 | 1.09 | % | ||||||||||
| — | — | (0.09 | ) | (0.09 | ) | 22.14 | 32.78 | 338,128 | 1.84 | ||||||||||||
| — | — | (0.09 | ) | (0.09 | ) | 22.15 | 32.84 | 154,966 | 1.84 | ||||||||||||
| — | — | (0.09 | ) | (0.09 | ) | 22.87 | 34.34 | 322,900 | 0.69 | ||||||||||||
| — | — | (0.09 | ) | (0.09 | ) | 22.55 | 33.64 | 3,879 | 1.19 | ||||||||||||
| — | — | — | — | 17.02 | 5.26 | 300,684 | 1.04 | b | |||||||||||||
| — | — | — | — | 16.75 | 4.82 | 181,626 | 1.79 | b | |||||||||||||
| — | — | — | — | 16.75 | 4.75 | 75,502 | 1.79 | b | |||||||||||||
| — | — | — | — | 17.10 | 5.49 | 310,704 | 0.64 | b | |||||||||||||
| — | — | — | — | 16.95 | 5.21 | 2,510 | 1.14 | b | |||||||||||||
| — | — | — | — | 16.17 | 35.10 | 175,510 | 0.97 | ||||||||||||||
| — | — | — | — | 15.98 | 34.07 | 93,711 | 1.74 | ||||||||||||||
| — | — | — | — | 15.99 | 34.04 | 37,081 | 1.74 | ||||||||||||||
| — | (0.01 | ) | — | (0.01 | ) | 16.21 | 35.54 | 295,734 | 0.65 | ||||||||||||
| — | — | — | — | 16.11 | 34.85 | 1,663 | 1.15 | ||||||||||||||
| (0.01 | ) | — | (0.38 | ) | (0.39 | ) | 11.97 | 23.79 | 53,786 | 0.91 | b | ||||||||||
| — | — | (0.38 | ) | (0.38 | ) | 11.92 | 23.26 | 13,857 | 1.67 | b | |||||||||||
| — | (0.01 | ) | (0.38 | ) | (0.39 | ) | 11.93 | 4.56 | 4,132 | 1.68 | b | ||||||||||
| (0.01 | ) | — | (0.38 | ) | (0.39 | ) | 11.97 | 23.89 | 4,656 | 0.72 | b | ||||||||||
| — | — | (0.38 | ) | (0.38 | ) | 11.95 | 23.56 | 115 | 1.17 | b | |||||||||||
| CORE LARGE CAP GROWTH FUND (continued)
|
|
Ratios assuming no expense reductions |
|||||||||||||
|---|---|---|---|---|---|---|---|---|---|---|---|---|---|
| Ratio of
net investment income (loss) to average net assets |
Ratio of
expenses to average net assets |
Ratio of net
investment income (loss) to average net assets |
Portfolio
turnover rate |
||||||||||
| For the Year Ended August 31, | |||||||||||||
| 2000 - Class A Shares | 0.31 | % | 1.24 | % | 0.16 | % | 72.59 | % | |||||
| 2000 - Class B Shares | (0.44 | ) | 1.99 | (0.59 | ) | 72.59 | |||||||
| 2000 - Class C Shares | (0.43 | ) | 1.99 | (0.58 | ) | 72.59 | |||||||
| 2000 - Institutional Shares | 0.65 | 0.84 | 0.50 | 72.59 | |||||||||
| 2000 - Service Shares | 0.15 | 1.34 | — | 72.59 | |||||||||
| For the Seven-Month Period Ended August 31, | |||||||||||||
| 1999 - Class A Shares | (0.11 | ) b | 1.26 | b | (0.33 | ) b | 32.74 | ||||||
| 1999 - Class B Shares | (0.87 | ) b | 2.01 | b | (1.09 | ) b | 32.74 | ||||||
| 1999 - Class C Shares | (0.87 | ) b | 2.01 | b | (1.09 | ) b | 32.74 | ||||||
| 1999 - Institutional Shares | 0.31 | b | 0.86 | b | 0.09 | b | 32.74 | ||||||
| 1999 - Service Shares | (0.21 | ) b | 1.36 | b | (0.43 | ) b | 32.74 | ||||||
| For the Year Ended January 31, | |||||||||||||
| 1999 - Class A Shares | 0.05 | 1.46 | (0.44 | ) | 63.15 | ||||||||
| 1999 - Class B Shares | (0.73 | ) | 2.11 | (1.10 | ) | 63.15 | |||||||
| 1999 - Class C Shares | (0.74 | ) | 2.11 | (1.11 | ) | 63.15 | |||||||
| 1999 - Institutional Shares | 0.35 | 1.02 | (0.02 | ) | 63.15 | ||||||||
| 1999 - Service Shares | (0.16 | ) | 1.52 | (0.53 | ) | 63.15 | |||||||
| For the Period Ended January 31, | |||||||||||||
| 1998 - Class A Shares (commenced May 1, 1997) | 0.12 | b | 2.40 | b | (1.37 | ) b | 74.97 | ||||||
| 1998 - Class B Shares (commenced May 1, 1997) | (0.72 | ) b | 2.91 | b | (1.96 | ) b | 74.97 | ||||||
| 1998 - Class C Shares (commenced August 15, 1997) | (0.76 | ) b | 2.92 | b | (2.00 | ) b | 74.97 | ||||||
| 1998 - Institutional Shares (commenced May 1, 1997) | 0.42 | b | 1.96 | b | (0.82 | ) b | 74.97 | ||||||
| 1998 - Service Shares (commenced May 1, 1997) | (0.21 | ) b | 2.41 | b | (1.45 | ) b | 74.97 | ||||||
| CORE SMALL CAP EQUITY FUND
|
|
Income from investment operations |
||||||||||||
|---|---|---|---|---|---|---|---|---|---|---|---|---|
|
Net asset value, beginning of period |
Net
investment income (loss) |
Net
realized and unrealized gain (loss) |
Total from
investment operations |
|||||||||
| For the Year Ended August 31, | ||||||||||||
| 2000 - Class A Shares | $10.23 | $(0.03 | ) c | $2.70 | $2.67 | |||||||
| 2000 - Class B Shares | 10.09 | (0.11 | ) c | 2.65 | 2.54 | |||||||
| 2000 - Class C Shares | 10.10 | (0.10 | ) c | 2.66 | 2.56 | |||||||
| 2000 - Institutional Shares | 10.30 | 0.02 | c | 2.71 | 2.73 | |||||||
| 2000 - Service Shares | 10.22 | (0.04 | ) c | 2.69 | 2.65 | |||||||
| For the Seven-Month Period Ended August 31, | ||||||||||||
| 1999 - Class A Shares | 10.16 | (0.01 | ) | 0.08 | 0.07 | |||||||
| 1999 - Class B Shares | 10.07 | (0.05 | ) | 0.07 | 0.02 | |||||||
| 1999 - Class C Shares | 10.08 | (0.05 | ) | 0.07 | 0.02 | |||||||
| 1999 - Institutional Shares | 10.20 | 0.02 | 0.08 | 0.10 | ||||||||
| 1999 - Service Shares | 10.16 | (0.01 | ) | 0.07 | 0.06 | |||||||
| For the Year Ended January 31, | ||||||||||||
| 1999 - Class A Shares | 10.59 | 0.01 | (0.43 | ) | (0.42 | ) | ||||||
| 1999 - Class B Shares | 10.56 | (0.05 | ) | (0.44 | ) | (0.49 | ) | |||||
| 1999 - Class C Shares | 10.57 | (0.04 | ) | (0.45 | ) | (0.49 | ) | |||||
| 1999 - Institutional Shares | 10.61 | 0.04 | (0.43 | ) | (0.39 | ) | ||||||
| 1999 - Service Shares | 10.60 | 0.01 | (0.44 | ) | (0.43 | ) | ||||||
| For the Period Ended January 31, | ||||||||||||
| 1998 - Class A Shares (commenced August 15, 1997) | 10.00 | (0.01 | ) | 0.65 | 0.64 | |||||||
| 1998 - Class B Shares (commenced August 15, 1997) | 10.00 | (0.03 | ) | 0.64 | 0.61 | |||||||
| 1998 - Class C Shares (commenced August 15, 1997) | 10.00 | (0.02 | ) | 0.64 | 0.62 | |||||||
| 1998 - Institutional Shares (commenced August 15, 1997) | 10.00 | 0.01 | 0.65 | 0.66 | ||||||||
| 1998 - Service Shares (commenced August 15, 1997) | 10.00 | 0.01 | 0.64 | 0.65 | ||||||||
|
Distributions to Shareholders |
||||||||||||||||||
|---|---|---|---|---|---|---|---|---|---|---|---|---|---|---|---|---|---|---|
|
From net investment income |
From net realized gains |
Total
distributions |
Net asset
value, end of period |
Total
returna |
Net assets
at end of period (in 000s) |
Ratio of
net expenses to average net assets |
||||||||||||
| $ — | $ — | $ — | $12.90 | 26.10 | % | $54,954 | 1.33 | % | ||||||||||
| — | — | — | 12.63 | 25.17 | 17,923 | 2.08 | ||||||||||||
| — | — | — | 12.66 | 25.35 | 8,289 | 2.08 | ||||||||||||
| — | — | — | 13.03 | 26.60 | 86,196 | 0.93 | ||||||||||||
| — | — | — | 12.87 | 25.93 | 63 | 1.43 | ||||||||||||
| — | — | — | 10.23 | 0.69 | 52,660 | 1.33 | b | |||||||||||
| — | — | — | 10.09 | 0.20 | 13,711 | 2.08 | b | |||||||||||
| — | — | — | 10.10 | 0.20 | 6,274 | 2.08 | b | |||||||||||
| — | — | — | 10.30 | 0.98 | 62,633 | 0.93 | b | |||||||||||
| — | — | — | 10.22 | 0.59 | 64 | 1.43 | b | |||||||||||
| (0.01 | ) | — | (0.01 | ) | 10.16 | (3.97 | ) | 64,087 | 1.31 | |||||||||
| — | — | — | 10.07 | (4.64 | ) | 15,406 | 2.00 | |||||||||||
| — | — | — | 10.08 | (4.64 | ) | 6,559 | 2.01 | |||||||||||
| (0.02 | ) | — | (0.02 | ) | 10.20 | (3.64 | ) | 62,763 | 0.94 | |||||||||
| (0.01 | ) | — | (0.01 | ) | 10.16 | (4.07 | ) | 54 | 1.44 | |||||||||
| — | (0.05 | ) | (0.05 | ) | 10.59 | 6.37 | 11,118 | 1.25 | b | |||||||||
| — | (0.05 | ) | (0.05 | ) | 10.56 | 6.07 | 9,957 | 1.95 | b | |||||||||
| — | (0.05 | ) | (0.05 | ) | 10.57 | 6.17 | 2,557 | 1.95 | b | |||||||||
| — | (0.05 | ) | (0.05 | ) | 10.61 | 6.57 | 9,026 | 0.95 | b | |||||||||
| — | (0.05 | ) | (0.05 | ) | 10.60 | 6.47 | 2 | 1.45 | b | |||||||||
| CORE SMALL CAP EQUITY FUND (continued)
|
|
Ratios assuming no expense reductions |
|||||||||||||
|---|---|---|---|---|---|---|---|---|---|---|---|---|---|
| Ratio of net
investment income (loss) to average net assets |
Ratio of
expenses to average net assets |
Ratio of net
investment loss to average net assets |
Portfolio
turnover rate |
||||||||||
| For the Year Ended August 31, | |||||||||||||
| 2000 - Class A Shares | (0.21 | )% | 1.55 | % | (0.43 | ) | 135.36 | % | |||||
| 2000 - Class B Shares | (0.96 | ) | 2.30 | (1.18 | ) | 135.36 | |||||||
| 2000 - Class C Shares | (0.96 | ) | 2.30 | (1.18 | ) | 135.36 | |||||||
| 2000 - Institutional Shares | 0.19 | 1.15 | (0.03 | ) | 135.36 | ||||||||
| 2000 - Service Shares | (0.30 | ) | 1.65 | (0.52 | ) | 135.36 | |||||||
| For the Seven-Month Period Ended August 31, | |||||||||||||
| 1999 - Class A Shares | (0.12 | ) b | 1.67 | b | (0.46 | ) b | 52.03 | ||||||
| 1999 - Class B Shares | (0.86 | ) b | 2.42 | b | (1.20 | ) b | 52.03 | ||||||
| 1999 - Class C Shares | (0.86 | ) b | 2.42 | b | (1.20 | ) b | 52.03 | ||||||
| 1999 - Institutional Shares | 0.28 | b | 1.27 | b | (0.06 | ) b | 52.03 | ||||||
| 1999 - Service Shares | (0.22 | ) b | 1.77 | b | (0.56 | ) b | 52.03 | ||||||
| For the Year Ended January 31, | |||||||||||||
| 1999 - Class A Shares | 0.08 | 2.00 | (0.61 | ) | 75.38 | ||||||||
| 1999 - Class B Shares | (0.55 | ) | 2.62 | (1.17 | ) | 75.38 | |||||||
| 1999 - Class C Shares | (0.56 | ) | 2.63 | (1.18 | ) | 75.38 | |||||||
| 1999 - Institutional Shares | 0.60 | 1.56 | (0.02 | ) | 75.38 | ||||||||
| 1999 - Service Shares | 0.01 | 2.06 | (0.61 | ) | 75.38 | ||||||||
| For the Period Ended January 31, | |||||||||||||
| 1998 - Class A Shares (commenced August 15, 1997) | (0.36 | ) b | 3.92 | b | (3.03 | ) b | 37.65 | ||||||
| 1998 - Class B Shares (commenced August 15, 1997) | (1.04 | ) b | 4.37 | b | (3.46 | ) b | 37.65 | ||||||
| 1998 - Class C Shares (commenced August 15, 1997) | (1.07 | ) b | 4.37 | b | (3.49 | ) b | 37.65 | ||||||
| 1998 - Institutional Shares (commenced August 15, 1997) | 0.15 | b | 3.37 | b | (2.27 | ) b | 37.65 | ||||||
| 1998 - Service Shares (commenced August 15, 1997) | 0.40 | b | 3.87 | b | (2.02 | ) b | 37.65 | ||||||
| CAPITAL GROWTH FUND
|
|
Income from investment operations |
|||||||||||
|---|---|---|---|---|---|---|---|---|---|---|---|
|
Net asset value, beginning of period |
Net
investment income (loss) |
Net realized
and unrealized gains |
Total
income from investment operations |
||||||||
| For the Year Ended August 31, | |||||||||||
| 2000 - Class A Shares | $24.96 | $(0.11 | ) c | $6.29 | $6.18 | ||||||
| 2000 - Class B Shares | 24.37 | (0.30 | ) c | 6.11 | 5.81 | ||||||
| 2000 - Class C Shares | 24.33 | (0.30 | ) c | 6.10 | 5.80 | ||||||
| 2000 - Institutional Shares | 25.06 | — | 6.32 | 6.32 | |||||||
| 2000 - Service Shares | 24.88 | (0.13 | ) c | 6.25 | 6.12 | ||||||
| For the Seven Months Ended August 31, | |||||||||||
| 1999 - Class A Shares | 24.03 | (0.08 | ) | 1.01 | 0.93 | ||||||
| 1999 - Class B Shares | 23.57 | (0.17 | ) | 0.97 | 0.80 | ||||||
| 1999 - Class C Shares | 23.52 | (0.16 | ) | 0.97 | 0.81 | ||||||
| 1999 - Institutional Shares | 24.07 | (0.02 | ) | 1.01 | 0.99 | ||||||
| 1999 - Service Shares | 23.96 | (0.08 | ) | 1.00 | 0.92 | ||||||
| For the Years Ended January 31, | |||||||||||
| 1999 - Class A Shares | 18.48 | (0.03 | ) | 6.35 | 6.32 | ||||||
| 1999 - Class B Shares | 18.27 | (0.12 | ) | 6.19 | 6.07 | ||||||
| 1999 - Class C Shares | 18.24 | (0.10 | ) | 6.15 | 6.05 | ||||||
| 1999 - Institutional Shares | 18.45 | 0.01 | 6.38 | 6.39 | |||||||
| 1999 - Service Shares | 18.46 | (0.04 | ) | 6.31 | 6.27 | ||||||
| 1998 - Class A Shares | 16.73 | 0.02 | 4.78 | 4.80 | |||||||
| 1998 - Class B Shares | 16.67 | 0.02 | 4.61 | 4.63 | |||||||
| 1998 - Class C Shares (commenced August 15, 1997) | 19.73 | (0.02 | ) | 1.60 | 1.58 | ||||||
| 1998 - Institutional Shares (commenced August 15, 1997) | 19.88 | 0.02 | 1.66 | 1.68 | |||||||
| 1998 - Service Shares (commenced August 15, 1997) | 19.88 | (0.01 | ) | 1.66 | 1.65 | ||||||
| 1997 - Class A Shares | 14.91 | 0.10 | 3.56 | 3.66 | |||||||
| 1997 - Class B Shares (commenced May 1, 1996) | 15.67 | 0.01 | 2.81 | 2.82 | |||||||
| |
|||||||||||
| 1996 - Class A Shares | 13.67 | 0.12 | 3.93 | 4.05 | |||||||
|
Distributions to shareholders |
|||||||||||||||||||||
|---|---|---|---|---|---|---|---|---|---|---|---|---|---|---|---|---|---|---|---|---|---|
| From net
investment income |
In excess of net investment income |
From net
realized gain |
Total
distributions |
Net asset
value, end of period |
Total
returna |
Net assets
at end of period (in 000s) |
Ratio of
net expenses to average net assets |
||||||||||||||
| $ — | $ — | $(2.19 | ) | $(2.19 | ) | $28.95 | 25.70 | % | $2,736,484 | 1.45 | % | ||||||||||
| — | — | (2.19 | ) | (2.19 | ) | 27.99 | 24.75 | 451,666 | 2.20 | ||||||||||||
| — | — | (2.19 | ) | (2.19 | ) | 27.94 | 24.75 | 143,126 | 2.20 | ||||||||||||
| — | — | (2.19 | ) | (2.19 | ) | 29.19 | 26.18 | 497,986 | 1.05 | ||||||||||||
| — | — | (2.19 | ) | (2.19 | ) | 28.81 | 25.53 | 13,668 | 1.55 | ||||||||||||
| — | — | — | — | 24.96 | 3.87 | 1,971,097 | 1.44 | b | |||||||||||||
| — | — | — | — | 24.37 | 3.39 | 329,870 | 2.19 | b | |||||||||||||
| — | — | — | — | 24.33 | 3.44 | 87,284 | 2.19 | b | |||||||||||||
| — | — | — | — | 25.06 | 4.11 | 255,210 | 1.04 | b | |||||||||||||
| — | — | — | — | 24.88 | 3.84 | 6,466 | 1.54 | b | |||||||||||||
| — | — | (0.77 | ) | (0.77 | ) | 24.03 | 34.58 | 1,992,716 | 1.42 | ||||||||||||
| — | — | (0.77 | ) | (0.77 | ) | 23.57 | 33.60 | 236,369 | 2.19 | ||||||||||||
| — | — | (0.77 | ) | (0.77 | ) | 23.52 | 33.55 | 60,234 | 2.19 | ||||||||||||
| — | — | (0.77 | ) | (0.77 | ) | 24.07 | 35.02 | 41,817 | 1.07 | ||||||||||||
| — | — | (0.77 | ) | (0.77 | ) | 23.96 | 34.34 | 3,085 | 1.57 | ||||||||||||
| (0.01 | ) | (0.01 | ) | (3.03 | ) | (3.05 | ) | 18.48 | 29.71 | 1,256,595 | 1.40 | ||||||||||
| — | — | (3.03 | ) | (3.03 | ) | 18.27 | 28.73 | 40,827 | 2.18 | ||||||||||||
| — | (0.04 | ) | (3.03 | ) | (3.07 | ) | 18.24 | 8.83 | 5,395 | 2.21 | b | ||||||||||
| (0.01 | ) | (0.07 | ) | (3.03 | ) | (3.11 | ) | 18.45 | 9.31 | 7,262 | 1.16 | b | |||||||||
| — | (0.04 | ) | (3.03 | ) | (3.07 | ) | 18.46 | 9.18 | 2 | 1.50 | b | ||||||||||
| (0.10 | ) | (0.02 | ) | (1.72 | ) | (1.84 | ) | 16.73 | 25.97 | 920,646 | 1.40 | ||||||||||
| (0.01 | ) | (0.09 | ) | (1.72 | ) | (1.82 | ) | 16.67 | 19.39 | 3,221 | 2.15 | b | |||||||||
| (0.12 | ) | — | (2.69 | ) | (2.81 | ) | 14.91 | 30.45 | 881,056 | 1.36 | |||||||||||
| CAPITAL GROWTH FUND (continued)
|
|
Ratios assuming no expense reductions |
|||||||||||||
|---|---|---|---|---|---|---|---|---|---|---|---|---|---|
| Ratio of
net investment income (loss) to average net assets |
Ratio of
expenses to average net assets |
Ratio of
net investment income (loss) to average net assets |
Portfolio
turnover rate |
||||||||||
| For the Year Ended August 31, | |||||||||||||
| 2000 - Class A Shares | (0.41 | )% | 1.47 | % | (0.44 | )% | 34.03 | % | |||||
| 2000 - Class B Shares | (1.16 | ) | 2.22 | (1.19 | ) | 34.03 | |||||||
| 2000 - Class C Shares | (1.16 | ) | 2.22 | (1.19 | ) | 34.03 | |||||||
| 2000 - Institutional Shares | — | 1.07 | (0.03 | ) | 34.03 | ||||||||
| 2000 - Service Shares | (0.49 | ) | 1.57 | (0.52 | ) | 34.03 | |||||||
| For the Seven Months Ended August 31, | |||||||||||||
| 1999 - Class A Shares | (0.53 | ) b | 1.47 | b | (0.56 | ) b | 18.16 | ||||||
| 1999 - Class B Shares | (1.29 | ) b | 2.22 | b | (1.32 | ) b | 18.16 | ||||||
| 1999 - Class C Shares | (1.29 | ) b | 2.22 | b | (1.32 | ) b | 18.16 | ||||||
| 1999 - Institutional Shares | (0.20 | ) b | 1.07 | b | (0.23 | ) b | 18.16 | ||||||
| 1999 - Service Shares | (0.65 | ) b | 1.57 | b | (0.68 | ) b | 18.16 | ||||||
| For the Years Ended January 31, | |||||||||||||
| 1999 - Class A Shares | (0.18 | ) | 1.58 | (0.34 | ) | 30.17 | |||||||
| 1999 - Class B Shares | (0.98 | ) | 2.21 | (1.00 | ) | 30.17 | |||||||
| 1999 - Class C Shares | (1.00 | ) | 2.21 | (1.02 | ) | 30.17 | |||||||
| 1999 - Institutional Shares | 0.11 | 1.09 | 0.09 | 30.17 | |||||||||
| 1999 - Service Shares | (0.37 | ) | 1.59 | (0.39 | ) | 30.17 | |||||||
| 1998 - Class A Shares | 0.08 | 1.65 | (0.17 | ) | 61.50 | ||||||||
| 1998 - Class B Shares | (0.77 | ) | 2.18 | (0.77 | ) | 61.50 | |||||||
| 1998 - Class C Shares (commenced August 15, 1997) | (0.86 | ) b | 2.21 | b | (0.86 | ) b | 61.50 | ||||||
| 1998 - Institutional Shares (commenced August 15, 1997) | 0.18 | b | 1.16 | b | 0.18 | b | 61.50 | ||||||
| 1998 - Service Shares (commenced August 15, 1997) | (0.16 | ) b | 1.50 | b | (0.16 | ) b | 61.50 | ||||||
| 1997 - Class A Shares | 0.62 | 1.65 | 0.37 | 52.92 | |||||||||
| 1997 - Class B Shares (commenced May 1, 1996) | (0.39 | ) b | 2.15 | b | (0.39 | ) b | 52.92 | ||||||
| 1996 - Class A Shares | 0.65 | 1.61 | 0.40 | 63.90 | |||||||||
| STRATEGIC GROWTH FUND
|
|
Income from investment operations |
|||||||||
|---|---|---|---|---|---|---|---|---|---|
| Net asset
value, beginning of period |
Net
investment income (loss) |
Net
realized and unrealized gain |
Total
income from investment operations |
||||||
| For The Year Ended August 31, | |||||||||
| 2000 - Class A Shares | $10.06 | $(0.06 | ) c | $2.52 | $2.46 | ||||
| 2000 - Class B Shares | 10.04 | (0.14 | ) c | 2.50 | 2.36 | ||||
| 2000 - Class C Shares | 10.05 | (0.14 | ) c | 2.51 | 2.37 | ||||
| 2000 - Institutional Shares | 10.07 | (0.01 | ) c | 2.52 | 2.51 | ||||
| 2000 - Service Shares | 10.06 | (0.04 | ) c | 2.50 | 2.46 | ||||
| For The Period Ended August 31, | |||||||||
| 1999 - Class A Shares (commenced May 24) | 10.00 | — | 0.06 | 0.06 | |||||
| 1999 - Class B Shares (commenced May 24) | 10.00 | (0.03 | ) c | 0.07 | 0.04 | ||||
| 1999 - Class C Shares (commenced May 24) | 10.00 | (0.03 | ) c | 0.08 | 0.05 | ||||
| 1999 - Institutional Shares (commenced May 24) | 10.00 | 0.01 | 0.06 | 0.07 | |||||
| 1999 - Service Shares (commenced May 24) | 10.00 | (0.01 | ) | 0.07 | 0.06 | ||||
|
|
||||||||||||
|---|---|---|---|---|---|---|---|---|---|---|---|---|
| Net asset
value, end of period |
Total
returna |
Net assets
at end of period (in 000s) |
Ratio of
net expenses to average net assets |
Ratio of
net investment income (loss) to average net assets |
||||||||
| $12.52 | 24.46 | % | $92,271 | 1.44 | % | (0.50 | )% | |||||
| 12.40 | 23.51 | 17,149 | 2.19 | (1.24 | ) | |||||||
| 12.42 | 23.58 | 7,287 | 2.19 | (1.24 | ) | |||||||
| 12.58 | 24.93 | 22,910 | 1.04 | (0.09 | ) | |||||||
| 12.52 | 24.45 | 2 | 1.54 | (0.35 | ) | |||||||
| 10.06 | 0.60 | 10,371 | 1.44 | b | (0.17 | ) b | ||||||
| 10.04 | 0.40 | 3,393 | 2.19 | b | (0.97 | ) b | ||||||
| 10.05 | 0.50 | 2,388 | 2.19 | b | (0.99 | ) b | ||||||
| 10.07 | 0.70 | 5,981 | 1.04 | b | 0.24 | b | ||||||
| 10.06 | 0.60 | 2 | 1.54 | b | (0.24 | ) b | ||||||
| STRATEGIC GROWTH FUND (continued)
|
|
Ratios assuming no expense reductions |
||||||||||
|---|---|---|---|---|---|---|---|---|---|---|
|
Ratio of expenses to average net assets |
Ratio of
net investment loss to average net assets |
Portfolio
turnover rate |
||||||||
| For The Year Ended August 31, | ||||||||||
| 2000 - Class A Shares | 1.63 | % | (0.69 | )% | 19.28 | % | ||||
| 2000 - Class B Shares | 2.38 | (1.43 | ) | 19.28 | ||||||
| 2000 - Class C Shares | 2.38 | (1.43 | ) | 19.28 | ||||||
| 2000 - Institutional Shares | 1.23 | (0.28 | ) | 19.28 | ||||||
| 2000 - Service Shares | 1.73 | (0.54 | ) | 19.28 | ||||||
| For The Period Ended August 31, | ||||||||||
| 1999 - Class A Shares (commenced May 24) | 11.70 | b | (10.43 | ) b | 6.98 | |||||
| 1999 - Class B Shares (commenced May 24) | 12.45 | b | (11.23 | ) b | 6.98 | |||||
| 1999 - Class C Shares (commenced May 24) | 12.45 | b | (11.25 | ) b | 6.98 | |||||
| 1999 - Institutional Shares (commenced May 24) | 11.30 | b | (10.02 | ) b | 6.98 | |||||
| 1999 - Service Shares (commenced May 24) | 11.80 | b | (10.50 | ) b | 6.98 | |||||
| GROWTH OPPORTUNITIES FUND
|
|
Income from investment operations |
||||||||
|---|---|---|---|---|---|---|---|---|
|
Net asset value, beginning of period |
Net
investment income (loss) |
Net realized
and unrealized gain |
||||||
| For the Year Ended August 31, | ||||||||
| 2000 - Class A Shares | $10.13 | $(0.11 | ) c | $9.71 | ||||
| 2000 - Class B Shares | 10.18 | (0.24 | ) c | 9.74 | ||||
| 2000 - Class C Shares | 10.10 | (0.24 | ) c | 9.68 | ||||
| 2000 - Institutional Shares | 10.13 | (0.04 | ) c | 9.73 | ||||
| 2000 - Service Shares | 10.12 | (0.12 | ) c | 9.68 | ||||
| For the Period Ended August 31, | ||||||||
| 1999 - Class A Shares (commenced May 24) | 10.00 | (0.01 | ) c | 0.14 | ||||
| 1999 - Class B Shares (commenced May 24) | 10.00 | (0.03 | ) c | 0.21 | ||||
| 1999 - Class C Shares (commenced May 24) | 10.00 | (0.03 | ) c | 0.13 | ||||
| 1999 - Institutional Shares (commenced May 24) | 10.00 | 0.01 | 0.12 | |||||
| 1999 - Service Shares (commenced May 24) | 10.00 | — | 0.12 | |||||
|
Distributions to shareholders |
||||||||||||||
|---|---|---|---|---|---|---|---|---|---|---|---|---|---|---|
| Total from
investment operations |
From net
realized gains |
Net asset
value, end of period |
Total
returna |
Net assets at end of period (in 000s) |
Ratio of
net expenses to average net assets |
|||||||||
| $9.60 | $(0.23 | ) | $19.50 | 95.73 | % | $188,199 | 1.52 | % | ||||||
| 9.50 | (0.23 | ) | 19.45 | 94.27 | 42,061 | 2.27 | ||||||||
| 9.44 | (0.23 | ) | 19.31 | 94.43 | 26,826 | 2.27 | ||||||||
| 9.69 | (0.23 | ) | 19.59 | 96.67 | 49,921 | 1.12 | ||||||||
| 9.56 | (0.23 | ) | 19.45 | 95.41 | 3 | 1.62 | ||||||||
| 0.13 | — | 10.13 | 1.30 | 8,204 | 1.44 | b | ||||||||
| 0.18 | — | 10.18 | 1.80 | 520 | 2.19 | b | ||||||||
| 0.10 | — | 10.10 | 1.00 | 256 | 2.19 | b | ||||||||
| 0.13 | — | 10.13 | 1.30 | 5,223 | 1.04 | b | ||||||||
| 0.12 | — | 10.12 | 1.20 | 2 | 1.54 | b | ||||||||
| GROWTH OPPORTUNITIES FUND (continued)
|
|
Ratios assuming no expense reductions |
|||||||||||||
|---|---|---|---|---|---|---|---|---|---|---|---|---|---|
| Ratio
of net investment income (loss) to average net assets |
Ratio of
expenses to average net assets |
Ratio
of net investment loss to average net assets |
Portfolio
turnover rate |
||||||||||
| For the Year Ended August 31, | |||||||||||||
| 2000 - Class A Shares | (0.64 | )% | 1.61 | % | (0.73 | )% | 73.35 | % | |||||
| 2000 - Class B Shares | (1.38 | ) | 2.36 | (1.47 | ) | 73.35 | |||||||
| 2000 - Class C Shares | (1.38 | ) | 2.36 | (1.47 | ) | 73.35 | |||||||
| 2000 - Institutional Shares | (0.23 | ) | 1.21 | (0.32 | ) | 73.35 | |||||||
| 2000 - Service Shares | (0.69 | ) | 1.71 | (0.78 | ) | 73.35 | |||||||
| For the Period Ended August 31, | |||||||||||||
| 1999 - Class A Shares (commenced May 24) | (0.27 | ) b | 14.15 | b | (12.98 | ) b | 26.53 | ||||||
| 1999 - Class B Shares (commenced May 24) | (1.04 | ) b | 14.90 | b | (13.75 | ) b | 26.53 | ||||||
| 1999 - Class C Shares (commenced May 24) | (1.12 | ) b | 14.90 | b | (13.83 | ) b | 26.53 | ||||||
| 1999 - Institutional Shares (commenced May 24) | 0.39 | b | 13.75 | b | (12.32 | ) b | 26.53 | ||||||
| 1999 - Service Shares (commenced May 24) | 0.03 | b | 14.25 | b | (12.68 | ) b | 26.53 | ||||||
| MID CAP VALUE FUND
|
|
Income from investment operations |
|||||||||||
|---|---|---|---|---|---|---|---|---|---|---|---|
|
Net asset value, beginning of period |
Net
investment income (loss) |
Net realized
and unrealized gain (loss) |
Total income
from investment operations |
||||||||
| For the Year Ended August 31, | |||||||||||
| 2000 - Class A Shares | $18.42 | $0.20 | c | $1.38 | $1.58 | ||||||
| 2000 - Class B Shares | 18.23 | 0.06 | c | 1.40 | 1.46 | ||||||
| 2000 - Class C Shares | 18.24 | 0.06 | c | 1.37 | 1.43 | ||||||
| 2000 - Institutional Shares | 18.45 | 0.27 | c | 1.36 | 1.63 | ||||||
| 2000 - Service Shares | 18.31 | 0.18 | c | 1.35 | 1.53 | ||||||
| For the Seven Months Ended August 31, | |||||||||||
| 1999 - Class A Shares | 18.38 | 0.06 | 1.71 | 1.77 | |||||||
| 1999 - Class B Shares | 18.29 | (0.04 | ) | 1.71 | 1.67 | ||||||
| 1999 - Class C Shares | 18.30 | (0.04 | ) | 1.71 | 1.67 | ||||||
| 1999 - Institutional Shares | 18.37 | 0.09 | 1.72 | 1.81 | |||||||
| 1999 - Service Shares | 18.29 | 0.05 | 1.70 | 1.75 | |||||||
| For the Years Ended January 31, | |||||||||||
| 1999 - Class A Shares | 21.61 | 0.10 | (2.38 | ) | (2.28 | ) | |||||
| 1999 - Class B Shares | 21.57 | (0.05 | ) | (2.35 | ) | (2.40 | ) | ||||
| 1999 - Class C Shares | 21.59 | (0.05 | ) | (2.34 | ) | (2.39 | ) | ||||
| 1999 - Institutional Shares | 21.65 | 0.19 | (2.38 | ) | (2.19 | ) | |||||
| 1999 - Service Shares | 21.62 | 0.03 | (2.31 | ) | (2.28 | ) | |||||
| 1998 - Class A Shares (commenced August 15, 1997) | 23.63 | 0.09 | 0.76 | 0.85 | |||||||
| 1998 - Class B Shares (commenced August 15, 1997) | 23.63 | 0.06 | 0.74 | 0.80 | |||||||
| 1998 - Class C Shares (commenced August 15, 1997) | 23.63 | 0.06 | 0.76 | 0.82 | |||||||
| 1998 - Institutional Shares | 18.73 | 0.16 | 5.66 | 5.82 | |||||||
| 1998 - Service Shares (commenced July 18, 1997) | 23.01 | 0.09 | 1.40 | 1.49 | |||||||
| 1997 - Institutional Shares | 15.91 | 0.24 | 3.77 | 4.01 | |||||||
| For the Period Ended January 31, | |||||||||||
| 1996 - Institutional Shares (commenced August 1, 1995) | 15.00 | 0.13 | 0.90 | 1.03 | |||||||
|
Distributions to shareholders |
|||||||||||||||||||||
|---|---|---|---|---|---|---|---|---|---|---|---|---|---|---|---|---|---|---|---|---|---|
| From net
investment income |
In excess of net investment income |
From net
realized gains |
Total
Distributions |
Net asset
value, end of period |
Total
returna |
Net assets
at end of period (in 000s) |
Ratio of
net expenses to average net assets |
||||||||||||||
| $(0.12 | ) | $ — | $ — | $(0.12 | ) | $19.88 | 8.70 | % | $ 39,142 | 1.29 | % | ||||||||||
| — | — | — | — | 19.69 | 8.01 | 22,284 | 2.04 | ||||||||||||||
| — | — | — | — | 19.67 | 7.84 | 5,720 | 2.04 | ||||||||||||||
| (0.22 | ) | — | — | (0.22 | ) | 19.86 | 9.08 | 158,188 | 0.89 | ||||||||||||
| (0.11 | ) | — | — | (0.11 | ) | 19.73 | 8.48 | 206 | 1.39 | ||||||||||||
| — | — | (1.73 | ) | (1.73 | ) | 18.42 | 9.04 | 49,081 | 1.29 | b | |||||||||||
| — | — | (1.73 | ) | (1.73 | ) | 18.23 | 8.53 | 31,824 | 2.04 | b | |||||||||||
| — | — | (1.73 | ) | (1.73 | ) | 18.24 | 8.52 | 9,807 | 2.04 | b | |||||||||||
| — | — | (1.73 | ) | (1.73 | ) | 18.45 | 9.26 | 190,549 | 0.89 | b | |||||||||||
| — | — | (1.73 | ) | (1.73 | ) | 18.31 | 8.97 | 190 | 1.39 | b | |||||||||||
| (0.07 | ) | — | (0.88 | ) | (0.95 | ) | 18.38 | (10.48 | ) | 70,578 | 1.33 | ||||||||||
| — | — | (0.88 | ) | (0.88 | ) | 18.29 | (11.07 | ) | 37,821 | 1.93 | |||||||||||
| (0.02 | ) | — | (0.88 | ) | (0.90 | ) | 18.30 | (11.03 | ) | 10,800 | 1.93 | ||||||||||
| (0.21 | ) | — | (0.88 | ) | (1.09 | ) | 18.37 | (10.07 | ) | 196,512 | 0.87 | ||||||||||
| (0.17 | ) | — | (0.88 | ) | (1.05 | ) | 18.29 | (10.48 | ) | 289 | 1.37 | ||||||||||
| (0.06 | ) | (0.04 | ) | (2.77 | ) | (2.87 | ) | 21.61 | 3.42 | 90,588 | 1.35 | b | |||||||||
| (0.09 | ) | — | (2.77 | ) | (2.86 | ) | 21.57 | 3.17 | 28,743 | 1.85 | b | ||||||||||
| (0.09 | ) | — | (2.77 | ) | (2.86 | ) | 21.59 | 3.27 | 6,445 | 1.85 | b | ||||||||||
| (0.13 | ) | — | (2.77 | ) | (2.90 | ) | 21.65 | 30.86 | 236,440 | 0.85 | |||||||||||
| (0.11 | ) | — | (2.77 | ) | (2.88 | ) | 21.62 | 6.30 | 8 | 1.35 | b | ||||||||||
| (0.24 | ) | (0.93 | ) | (0.02 | ) | (1.19 | ) | 18.73 | 25.63 | 145,253 | 0.85 | ||||||||||
| (0.12 | ) | — | — | (0.12 | ) | 15.91 | 6.89 | 135,671 | 0.85 | b | |||||||||||
| MID CAP VALUE FUND (continued)
|
|
Ratios assuming no expense reductions |
||||||||||||
|---|---|---|---|---|---|---|---|---|---|---|---|---|
| Ratio of
net investment income (loss) to average net assets |
Ratio of
expenses to average net assets |
Ratio of
net investment income (loss) to average net assets |
Portfolio
turnover rate |
|||||||||
| For the Year Ended August 31, | ||||||||||||
| 2000 - Class A Shares | 1.11 | % | 1.34 | % | 1.06 | % | 82.92 | % | ||||
| 2000 - Class B Shares | 0.35 | 2.09 | 0.30 | 82.92 | ||||||||
| 2000 - Class C Shares | 0.32 | 2.09 | 0.27 | 82.92 | ||||||||
| 2000 - Institutional Shares | 1.51 | 0.94 | 1.46 | 82.92 | ||||||||
| 2000 - Service Shares | 1.03 | 1.44 | 0.98 | 82.92 | ||||||||
| For the Seven-Months Ended August 31, | ||||||||||||
| 1999 - Class A Shares | 0.43 | b | 1.37 | b | 0.35 | b | 68.84 | |||||
| 1999 - Class B Shares | (0.33 | ) b | 2.12 | b | (0.41 | ) b | 68.84 | |||||
| 1999 - Class C Shares | (0.34 | ) b | 2.12 | b | (0.42 | ) b | 68.84 | |||||
| 1999 - Institutional Shares | 0.79 | b | 0.97 | b | 0.71 | b | 68.84 | |||||
| 1999 - Service Shares | 0.38 | b | 1.47 | b | 0.30 | b | 68.84 | |||||
| For the Years Ended January 31, | ||||||||||||
| 1999 - Class A Shares | 0.38 | 1.41 | 0.30 | 92.18 | ||||||||
| 1999 - Class B Shares | (0.22 | ) | 2.01 | (0.30 | ) | 92.18 | ||||||
| 1999 - Class C Shares | (0.22 | ) | 2.01 | (0.30 | ) | 92.18 | ||||||
| 1999 - Institutional Shares | 0.83 | 0.95 | 0.75 | 92.18 | ||||||||
| 1999 - Service Shares | 0.32 | 1.45 | 0.24 | 92.18 | ||||||||
| 1998 - Class A Shares (commenced August 15, 1997) | 0.33 | b | 1.47 | b | 0.21 | b | 62.60 | |||||
| 1998 - Class B Shares (commenced August 15, 1997) | (0.20 | ) b | 1.97 | b | (0.32 | ) b | 62.60 | |||||
| 1998 - Class C Shares (commenced August 15, 1997) | (0.23 | ) b | 1.97 | b | (0.35 | ) b | 62.60 | |||||
| 1998 - Institutional Shares | 0.78 | 0.97 | 0.66 | 62.60 | ||||||||
| 1998 - Service Shares (commenced July 18, 1997) | 0.63 | b | 1.43 | b | 0.51 | b | 62.60 | |||||
| 1997 - Institutional Shares | 1.35 | 0.91 | 1.29 | 74.03 | ||||||||
| For the Period Ended January 31, | ||||||||||||
| 1996 - Institutional Shares (commenced August 1, 1995) | 1.67 | b | 0.98 | b | 1.54 | b | 58.77 | |||||
| SMALL CAP VALUE FUND
|
|
Income (loss) from investment operations |
|||||||||||
|---|---|---|---|---|---|---|---|---|---|---|---|
| Net asset
value, beginning of period |
Net
investment income (loss) |
Net realized and unrealized gain (loss) |
Total
income (loss) from investment operations |
||||||||
| For the Year Ended August 31, | |||||||||||
| 2000 - Class A Shares | $19.80 | $ 0.01 | c | $ 3.40 | $ 3.41 | ||||||
| 2000 - Class B Shares | 19.27 | (0.13 | ) c | 3.26 | 3.13 | ||||||
| 2000 - Class C Shares | 19.28 | (0.12 | ) c | 3.26 | 3.14 | ||||||
| 2000 - Institutional Shares | 19.95 | 0.10 | c | 3.42 | 3.52 | ||||||
| 2000 - Service Shares | 19.76 | 0.01 | c | 3.36 | 3.37 | ||||||
| For the Seven-Month Period Ended August 31, | |||||||||||
| 1999 - Class A Shares | 18.51 | (0.05 | ) | 1.34 | 1.29 | ||||||
| 1999 - Class B Shares | 18.10 | (0.12 | ) | 1.29 | 1.17 | ||||||
| 1999 - Class C Shares | 18.12 | (0.11 | ) | 1.27 | 1.16 | ||||||
| 1999 - Institutional Shares | 18.62 | — | 1.33 | 1.33 | |||||||
| 1999 - Service Shares | 18.50 | (0.13 | ) | 1.39 | 1.26 | ||||||
| For the Years Ended January 31, | |||||||||||
| 1999 - Class A Shares | 24.05 | (0.06 | ) | (4.48 | ) | (4.54 | ) | ||||
| 1999 - Class B Shares | 23.73 | (0.21 | ) | (4.42 | ) | (4.63 | ) | ||||
| 1999 - Class C Shares | 23.73 | (0.18 | ) | (4.43 | ) | (4.61 | ) | ||||
| 1999 - Institutional Shares | 24.09 | 0.03 | (4.50 | ) | (4.47 | ) | |||||
| 1999 - Service Shares | 24.05 | (0.04 | ) | (4.51 | ) | (4.55 | ) | ||||
| 1998 - Class A Shares | 20.91 | 0.14 | 5.33 | 5.47 | |||||||
| 1998 - Class B Shares | 20.80 | (0.01 | ) | 5.27 | 5.26 | ||||||
| 1998 - Class C Shares (commenced August 15, 1997) | 24.69 | (0.06 | ) | 1.43 | 1.37 | ||||||
| 1998 - Institutional Shares (commenced August 15, 1997) | 24.91 | 0.03 | 1.48 | 1.51 | |||||||
| 1998 - Service Shares (commenced August 15, 1997) | 24.91 | (0.01 | ) | 1.48 | 1.47 | ||||||
| 1997 - Class A Shares | 17.29 | (0.21 | ) | 4.92 | 4.71 | ||||||
| 1997 - Class B Shares (commenced May 1, 1996) | 20.79 | (0.11 | ) | 1.21 | 1.10 | ||||||
| 1996 - Class A Shares | 16.14 | (0.23 | ) | 1.39 | 1.16 | ||||||
|
Distributions to shareholders |
||||||||||||||||
|---|---|---|---|---|---|---|---|---|---|---|---|---|---|---|---|---|
| In excess
of net investment income |
From net
realized gains |
Total
distributions |
Net asset value, end of period |
Total
returna |
Net assets
at end of period (in 000s) |
Ratio of
net expenses to average net assets |
||||||||||
| $— | $ — | $ — | $23.21 | 17.22 | % | $157,791 | 1.50 | % | ||||||||
| — | — | — | 22.40 | 16.24 | 29,199 | 2.25 | ||||||||||
| — | — | — | 22.42 | 16.34 | 8,428 | 2.25 | ||||||||||
| — | — | — | 23.47 | 17.64 | 26,445 | 1.10 | ||||||||||
| — | — | — | 23.13 | 17.05 | 83 | 1.60 | ||||||||||
| — | — | — | 19.80 | 6.97 | 210,500 | 1.50 | b | |||||||||
| — | — | — | 19.27 | 6.46 | 37,386 | 2.25 | b | |||||||||
| — | — | — | 19.28 | 6.40 | 8,079 | 2.25 | b | |||||||||
| — | — | — | 19.95 | 7.14 | 27,023 | 1.10 | b | |||||||||
| — | — | — | 19.76 | 6.81 | 57 | 1.60 | b | |||||||||
| — | (1.00 | ) | (1.00 | ) | 18.51 | (17.37 | ) | 261,661 | 1.50 | |||||||
| — | (1.00 | ) | (1.00 | ) | 18.10 | (18.00 | ) | 42,879 | 2.25 | |||||||
| — | (1.00 | ) | (1.00 | ) | 18.12 | (17.91 | ) | 8,212 | 2.25 | |||||||
| — | (1.00 | ) | (1.00 | ) | 18.62 | (17.04 | ) | 15,351 | 1.13 | |||||||
| — | (1.00 | ) | (1.00 | ) | 18.50 | (17.41 | ) | 261 | 1.62 | |||||||
| — | (2.33 | ) | (2.33 | ) | 24.05 | 26.17 | 370,246 | 1.54 | ||||||||
| — | (2.33 | ) | (2.33 | ) | 23.73 | 25.29 | 42,677 | 2.29 | ||||||||
| — | 2.33 | (2.33 | ) | 23.73 | 5.51 | 5,604 | 2.09 | b | ||||||||
| — | 2.33 | (2.33 | ) | 24.09 | 6.08 | 14,626 | 1.16 | b | ||||||||
| — | 2.33 | (2.33 | ) | 24.05 | 5.91 | 2 | 1.45 | b | ||||||||
| — | (1.09 | ) | (1.09 | ) | 20.91 | 27.28 | 212,061 | 1.60 | ||||||||
| — | (1.09 | ) | (1.09 | ) | 20.80 | 5.39 | 3,674 | 2.35 | b | |||||||
| |
||||||||||||||||
| — | (0.01 | ) | (0.01 | ) | 17.29 | 7.20 | 204,994 | 1.41 | ||||||||
| |
||||||||||||||||
| SMALL CAP VALUE FUND (continued)
|
|
Ratios assuming no expense reductions |
|||||||||||||
|---|---|---|---|---|---|---|---|---|---|---|---|---|---|
| Ratio of
net investment income (loss) to average net assets |
Ratio of
expenses to average net assets |
Ratio of
net investment income (loss) to average net assets |
Portfolio
turnover rate |
||||||||||
| For the Year Ended August 31, | |||||||||||||
| 2000 - Class A Shares | 0.07 | % | 1.57 | % | — | % | 75.31 | % | |||||
| 2000 - Class B Shares | (0.68 | ) | 2.32 | (0.75 | ) | 75.31 | |||||||
| 2000 - Class C Shares | (0.65 | ) | 2.32 | (0.72 | ) | 75.31 | |||||||
| 2000 - Institutional Shares | 0.49 | 1.17 | 0.42 | 75.31 | |||||||||
| 2000 - Service Shares | 0.03 | 1.67 | (0.04 | ) | 75.31 | ||||||||
| For the Seven-Month Period Ended August 31, | |||||||||||||
| 1999 - Class A Shares | (0.35 | ) b | 1.61 | b | (0.46 | ) b | 46.95 | ||||||
| 1999 - Class B Shares | (1.10 | ) b | 2.36 | b | (1.21 | ) b | 46.95 | ||||||
| 1999 - Class C Shares | (1.10 | ) b | 2.36 | b | (1.21 | ) b | 46.95 | ||||||
| 1999 - Institutional Shares | 0.05 | b | 1.21 | b | (0.06 | ) b | 46.95 | ||||||
| 1999 - Service Shares | (0.41 | ) b | 1.71 | b | (0.52 | ) b | 46.95 | ||||||
| For the Years Ended January 31, | |||||||||||||
| 1999 - Class A Shares | (0.24 | ) | 1.74 | (0.48 | ) | 98.46 | |||||||
| 1999 - Class B Shares | (0.99 | ) | 2.29 | (1.03 | ) | 98.46 | |||||||
| 1999 - Class C Shares | (0.99 | ) | 2.29 | (1.03 | ) | 98.46 | |||||||
| 1999 - Institutional Shares | 0.13 | 1.17 | 0.09 | 98.46 | |||||||||
| 1999 - Service Shares | (0.47 | ) | 1.66 | (0.51 | ) | 98.46 | |||||||
| 1998 - Class A Shares | (0.28 | ) | 1.76 | (0.50 | ) | 84.81 | |||||||
| 1998 - Class B Shares | (0.92 | ) | 2.29 | (0.92 | ) | 84.81 | |||||||
| 1998 - Class C Shares (commenced August 15, 1997) | (0.79 | ) b | 2.09 | b | (0.79 | ) b | 84.81 | ||||||
| 1998 - Institutional Shares (commenced August 15, 1997) | 0.27 | b | 1.16 | b | 0.27 | b | 84.81 | ||||||
| 1998 - Service Shares (commenced August 15, 1997) | (0.07 | ) b | 1.45 | b | (0.07 | ) b | 84.81 | ||||||
| 1997 - Class A Shares | (0.72 | ) | 1.85 | (0.97 | ) | 99.46 | |||||||
| 1997 - Class B Shares (commenced May 1, 1996) | (1.63 | ) b | 2.35 | b | (1.63 | ) b | 99.46 | ||||||
| 1996 - Class A Shares | (0.59 | ) | 1.66 | (0.84 | ) | 57.58 | |||||||
| LARGE CAP VALUE FUND
|
|
Income from investment operations |
|||||||||||
|---|---|---|---|---|---|---|---|---|---|---|---|
|
Net asset value, beginning of period |
Net
investment incomec |
Net
realized and unrealized gain |
Total from
investment operations |
Net asset
value, end of period |
|||||||
| For the Period Ended August 31, | |||||||||||
| 2000 - Class A Shares (commenced Dec. 15, 1999) | $10.00 | $0.06 | $0.33 | $0.39 | $10.39 | ||||||
| 2000 - Class B Shares (commenced Dec. 15, 1999) | 10.00 | — | 0.33 | 0.33 | 10.33 | ||||||
| 2000 - Class C Shares (commenced Dec. 15, 1999) | 10.00 | 0.01 | 0.31 | 0.32 | 10.32 | ||||||
| 2000 - Institutional Shares (commenced Dec. 15, 1999) | 10.00 | 0.09 | 0.31 | 0.40 | 10.40 | ||||||
| 2000 - Service Shares (commenced Dec. 15, 1999) | 10.00 | 0.07 | 0.31 | 0.38 | 10.38 | ||||||
a
|
Assumes investment at the net asset value at the beginning of the period, reinvestment of all dividends and
distributions, a complete redemption of the investment at the net asset value at the end of the period and no sales or redemption charges. Total return would be reduced if a sales or redemption charge were taken into account. Total returns for periods
less than one full year are not annualized.
|
b
|
Annualized.
|
c
|
Calculated based on average shares outstanding methodology.
|
d
|
Includes the effect of mortgage dollar roll transactions.
|
|
Ratios assuming no expense reductions |
||||||||||||||||||
|---|---|---|---|---|---|---|---|---|---|---|---|---|---|---|---|---|---|---|
| Total
returna |
Net assets
at end of period (in 000s) |
Ratio of net
expenses to average net assetsb |
Ratio of net
investment income to average net assetsb |
Ratio of
expenses to average net assetsb |
Ratio of net
investment income to average net assetsb |
Portfolio
turnover rate |
||||||||||||
| 3.90 | % | $7,181 | 1.25 | % | 0.84 | % | 3.30 | % | (1.21 | )% | 66.79 | % | ||||||
| 3.30 | 1,582 | 2.00 | 0.06 | 4.05 | (1.99 | ) | 66.79 | |||||||||||
| 3.20 | 850 | 2.00 | 0.15 | 4.05 | (1.90 | ) | 66.79 | |||||||||||
| 4.00 | 16,155 | 0.85 | 1.31 | 2.90 | (0.74 | ) | 66.79 | |||||||||||
| 3.80 | 2 | 1.35 | 0.95 | 3.40 | (1.10 | ) | 66.79 | |||||||||||
| FOR MORE INFORMATION
|
| Annual/Semi-annual Report
|
| Additional information about the Funds’ investments is available in the Funds’ annual and semi-annual reports to
shareholders. In the Funds’ annual reports, you will find a discussion of the market conditions and investment strategies that significantly affected the Funds’ performance during the last fiscal year.
|
| Statement of Additional Information
|
| Additional information about the Funds and their policies is also available in the Funds’ Additional Statement. The
Additional Statement is incorporated by reference into this Prospectus (is legally considered part of this Prospectus).
|
| The Funds’ annual and semi-annual reports, and the Additional Statement, are available free upon request by calling Goldman
Sachs at 1-800-621-2550.
|
| To obtain other information and for shareholder inquiries:
|
| By telephone – Call 1-800-621-2550
|
| By mail – Goldman Sachs Funds, 4900 Sears Tower, Chicago, IL 60606-6372
|
| By e-mail – [email protected]
|
| On the Internet – Text-only versions of the Funds’ documents are located online and may be downloaded from:
|
| SEC EDGAR database – http://www.sec.gov
|
| You may review and obtain copies of Fund documents by visiting the SEC’s Public Reference Room in Washington, D.C. You may
also obtain copies of Fund documents, after paying a duplicating fee, by writing to the SEC’s Public Reference Section, Washington, D.C. 20549-0102 or by electronic request to: [email protected]. Information on the operation of the public reference
room may be obtained by calling the SEC at (202) 942-8090.
|
| Prospectus
|
| GOLDMAN SACHS DOMESTIC EQUITY FUNDS
|
| THE SECURITIES AND EXCHANGE COMMISSION HAS NOT APPROVED OR DISAPPROVED THESE SECURITIES OR PASSED UPON THE ADEQUACY OF THIS PROSPECTUS.
ANY REPRESENTATION TO THE CONTRARY IS A CRIMINAL OFFENSE.
|
| AN INVESTMENT IN A FUND IS NOT A BANK DEPOSIT AND IS NOT INSURED BY THE FEDERAL DEPOSIT INSURANCE CORPORATION OR ANY OTHER GOVERNMENT
AGENCY. AN INVESTMENT IN A FUND INVOLVES INVESTMENT RISKS, INCLUDING POSSIBLE LOSS OF PRINCIPAL.
|
| n
|
Goldman Sachs
Balanced Fund
|
| n
|
Goldman Sachs
Growth and Income Fund
|
| n
|
Goldman Sachs
CORE
SM
Large Cap Value Fund
|
| n
|
Goldman Sachs
CORE
SM
U.S. Equity Fund
|
| n
|
Goldman Sachs
CORE
SM
Large Cap Growth Fund
|
| n
|
Goldman Sachs
CORE
SM
Small Cap Equity Fund
|
| n
|
Goldman Sachs
Capital Growth Fund
|
| n
|
Goldman Sachs
Strategic Growth Fund
|
| n
|
Goldman Sachs
Growth Opportunities Fund
|
| n
|
Goldman Sachs
Mid Cap Value Fund (formerly Mid Cap Equity)
|
| n
|
Goldman Sachs
Small Cap Value Fund
|
| n
|
Goldman Sachs
Large Cap Value Fund
|

| NOT FDIC-INSURED
|
May Lose Value
|
No Bank Guarantee
|
| Goldman Sachs Asset Management, a unit of the Investment Management Division of Goldman, Sachs & Co. (“Goldman
Sachs”), serves as investment adviser to the Balanced, Growth and Income, CORE Large Cap Value, CORE Large Cap Growth, CORE Small Cap Equity, Strategic Growth, Growth Opportunities, Mid Cap Value, Small Cap Value and Large Cap Value Funds. Goldman
Sachs Funds Management, L.P. serves as investment adviser to the CORE U.S. Equity and Capital Growth Funds. Goldman Sachs Asset Management and Goldman Sachs Funds Management, L.P. are each referred to in this Prospectus as the “Investment Adviser.”
;
|
| VALUE STYLE FUNDS
|
| Goldman Sachs’ Value Investment Philosophy:
|
| Through intensive, hands-on research our portfolio team seeks to identify:
|
1.
|
Well-positioned businesses that have:
|
n
|
Attractive returns on capital.
|
n
|
Sustainable earnings and cash flow.
|
n
|
Strong company management focused on long-term returns to shareholders.
|
2.
|
Attractive valuation opportunities where:
|
n
|
The intrinsic value of the business is not reflected in the stock price.
|
| Business quality, conservative valuation, and thoughtful portfolio construction are the key elements of our value approach.
|
| GROWTH STYLE FUNDS
|
| Goldman Sachs’ Growth Investment Philosophy:
|
1.
|
Invest as if buying the company/business, not simply trading its stock:
|
n
|
Understand the business, management, products and competition.
|
n
|
Perform intensive, hands-on fundamental research.
|
n
|
Seek businesses with strategic competitive advantages.
|
n
|
Over the long-term, expect each company’s stock price ultimately to track the growth in the value of the business.
|
2.
|
Buy high-quality growth businesses that possess strong business franchises, favorable long-term prospects and
excellent management.
|
3.
|
Purchase superior long-term growth companies at a favorable price—seek to purchase at a fair valuation,
giving the investor the potential to fully capture returns from above-average growth rates.
|
| Growth companies have earnings expectations that exceed those of the stock market as a whole.
|
| QUANTITATIVE (“CORE”) STYLE FUNDS
|
| Goldman Sachs’ CORE Investment Philosophy:
|
| Goldman Sachs’ quantitative style of funds—CORE—emphasizes the two building blocks of active management: stock
selection and portfolio construction.
|
| I. CORE Stock Selection
|
| The CORE Funds use the Goldman Sachs’ proprietary multifactor model (“Multifactor Model”), a rigorous computerized
rating system, to forecast the returns of securities held in each Fund’s portfolio. The Multifactor Model incorporates common variables covering measures of:
|
n
|
Research (What do fundamental analysts think about the company and its prospects?)
|
n
|
Value (How is the company priced relative to fundamental accounting measures?)
|
n
|
Momentum (What are medium-term price trends? How has the price responded to new information?)
|
n
|
Profitability (What is the company’s margin on sales? How efficient are its operations?)
|
n
|
Earnings Quality (Were earnings derived from sustainable (cash-based) sources?)
|
| All of the above factors are carefully evaluated within the Multifactor Model since each has demonstrated a significant
impact on the performance of the securities and markets they were designed to forecast. Stock selection in this process combines both our quantitative and qualitative analysis.
|
| II. CORE Portfolio Construction
|
| A proprietary risk model, which is intended to identify and measure risk as accurately as possible, includes all the above factors
used in the return model to select stocks, as well as several other factors associated with risk but not return. In this process, the Investment Adviser manages risk by attempting to limit deviations from the benchmark, and by attempting to run a size and
sector neutral portfolio. A computer optimizer evaluates many different security combinations (considering many possible weightings) in an effort to construct the most efficient risk/return portfolio given each CORE Fund benchmark.
|
| Goldman Sachs CORE Funds are fully invested, broadly diversified and offer consistent overall portfolio characteristics. They may
serve as good foundations on which to build a portfolio.
|
| Balanced Fund
|
|
Objective:
|
Long-term growth of capital and current income
|
|
Benchmarks:
|
S&P 500® Index and Lehman Brothers Aggregate Bond Index
|
|
Investment Focus:
|
Large capitalization U.S. stocks and fixed-income securities
|
|
Investment Style:
|
Asset Allocation, with growth and value (blend) equity components
|
| INVESTMENT OBJECTIVE
|
| The Fund seeks to provide long-term growth of capital and current income. The Fund seeks growth of capital primarily through
investments in equity securities (stocks). The Fund seeks to provide current income through investment in fixed-income securities (bonds).
|
| PRINCIPAL INVESTMENT STRATEGIES
|
| Historically, stock and bond markets have often had different cycles, with one asset class rising when the other is falling. A
balanced objective seeks to reduce the volatility associated with investing in a single market. There is no guarantee, however, that market cycles will move in opposition to one another or that a balanced investment program will successfully reduce
volatility.
|
| The percentage of the portfolio invested in equity and fixed-income securities will vary from time to time as the Investment
Adviser evaluates such securities’ relative attractiveness based on market valuations, economic growth and inflation prospects. The allocation between equity and fixed-income securities is subject to the Fund’s intention to pay regular quarterly
dividends. The amount of quarterly dividends can also be expected to fluctuate in accordance with factors such as prevailing interest rates and the percentage of the Fund’s assets invested in fixed-income securities.
|
| Equity Securities. The Fund invests, under normal circumstances, between 45% and 65% of its total assets in equity securities. Although the Fund’s equity investments consist primarily of publicly traded U.S. securities, the Fund may invest up to 10% of its total
assets in the equity securities of foreign issuers, including issuers in countries with emerging markets or economies (“emerging countries”) and equity securities quoted in foreign currencies. A portion of the Fund’s portfolio of equity
securities may be selected primarily to provide current income (including interests in real estate investment trusts (“REITs”), convertible securities, preferred stocks, utility stocks, and interests in limited partnerships).
|
| Fixed Income Securities. The Fund invests at least 25% of its total assets in fixed-income senior securities. The remainder of the Fund’s assets are invested in other fixed-income securities and cash.
|
| The Fund’s fixed-income securities primarily include:
|
n
|
Securities issued by the U.S. government, its agencies, instrumentalities or sponsored enterprises
|
n
|
Securities issued by corporations, banks and other issuers
|
n
|
Mortgage-backed and asset-backed securities
|
| The Fund may also invest up to 10% of its total assets in debt obligations (U.S. dollar and non-U.S.-dollar denominated) issued or
guaranteed by one or more foreign governments or any of their political subdivisions, agencies or instrumentalities and foreign corporations or other entities. The issuers of these securities may be located in emerging countries.
|
|
Objective:
|
Long-term growth of capital and growth of income
|
|
Benchmark:
|
S&P 500® Index
|
|
Investment Focus:
|
Large capitalization U.S. equity securities with an emphasis on undervalued stocks
|
|
Investment Style:
|
Value
|
| INVESTMENT OBJECTIVE
|
| The Fund seeks long-term growth of capital and growth of income.
|
| PRINCIPAL INVESTMENT STRATEGIES
|
| Equity Securities. The Fund invests, under normal circumstances, at least 65% of its total assets in equity securities that the Investment Adviser considers to have favorable prospects for capital appreciation and/or dividend-paying ability. Although the Fund will invest
primarily in publicly traded U.S. securities, it may invest up to 25% of its total assets in foreign securities, including securities of issuers in emerging countries and securities quoted in foreign currencies.
|
| Other.
The Fund may also invest up to 35% of its total assets in fixed-income securities, such as government, corporate and bank debt obligations, that offer the potential to further the Fund’s investment objective.
|
|
Objective:
|
Long-term growth of capital and dividend income
|
|
Benchmark:
|
Russell 1000® Value Index
|
|
Investment Focus:
|
Diversified portfolio of equity securities of large-cap U.S. issuers selling at low to modest valuations
|
|
Investment Style:
|
Quantitative, applied to large-cap value stocks
|
| INVESTMENT OBJECTIVE
|
| The Fund seeks long-term growth of capital and dividend income. The Fund seeks this objective through a broadly diversified
portfolio of equity securities of large-cap U.S. issuers that are selling at low to modest valuations relative to general market measures, such as earnings, book value and other fundamental accounting measures, and that are expected to have favorable
prospects for capital appreciation and/or dividend-paying ability.
|
| PRINCIPAL INVESTMENT STRATEGIES
|
| Equity Securities. The Fund invests, under normal circumstances, at least 90% of its total assets in equity securities of U.S. issuers, including foreign issuers that are traded in the United States.
|
| The Fund’s investments are selected using both a variety of quantitative techniques and fundamental research in seeking to
maximize the Fund’s expected return, while maintaining risk, style, capitalization and industry characteristics similar to the Russell 1000® Value Index. The Fund seeks a portfolio consisting of companies with above average capitalizations and
low to moderate valuations as measured by price/earnings ratios, book value and other fundamental accounting measures.
|
| Other.
The Fund’s investments in fixed-income securities are limited to securities that are considered cash equivalents.
|
|
Objective:
|
Long-term growth of capital and dividend income
|
|
Benchmark:
|
S&P 500® Index
|
|
Investment Focus:
|
Large-cap U.S. equity securities
|
|
Investment Style:
|
Quantitative, applied to large-cap growth and value (blend) stocks
|
| INVESTMENT OBJECTIVE
|
| The Fund seeks long-term growth of capital and dividend income. The Fund seeks this objective through a broadly diversified
portfolio of large-cap and blue chip equity securities representing all major sectors of the U.S. economy.
|
| PRINCIPAL INVESTMENT STRATEGIES
|
| Equity Securities. The Fund invests, under normal circumstances, at least 90% of its total assets in equity securities of U.S. issuers, including foreign issuers that are traded in the United States.
|
| The Fund’s investments are selected using both a variety of quantitative techniques and fundamental research in seeking to
maximize the Fund’s expected return, while maintaining risk, style, capitalization and industry characteristics similar to the S&P 500® Index. The Fund seeks a broad representation in most major sectors of the U.S. economy and a portfolio
consisting of companies with average long-term earnings growth expectations and dividend yields.
|
| Other.
The Fund’s investments in fixed-income securities are limited to securities that are considered cash equivalents.
|
|
Objective:
|
Long-term growth of capital; dividend income is a secondary consideration
|
|
Benchmark:
|
Russell 1000® Growth Index
|
|
Investment Focus:
|
Large-cap, growth-oriented U.S. stocks
|
|
Investment Style:
|
Quantitative, applied to large-cap growth stocks
|
| INVESTMENT OBJECTIVE
|
| The Fund seeks long-term growth of capital. The Fund seeks this objective through a broadly diversified portfolio of equity
securities of large-cap U.S. issuers that are expected to have better prospects for earnings growth than the growth rate of the general domestic economy. Dividend income is a secondary consideration.
|
| PRINCIPAL INVESTMENT STRATEGIES
|
| Equity Securities. The Fund invests, under normal circumstances, at least 90% of its total assets in equity securities of U.S. issuers, including foreign issuers that are traded in the United States.
|
| The Investment Adviser emphasizes a company’s growth prospects in analyzing equity securities to be purchased by the Fund.
The Fund’s investments are selected using both a variety of quantitative techniques and fundamental research in seeking to maximize the Fund’s expected return, while maintaining risk, style, capitalization and industry characteristics similar to
the Russell 1000® Growth Index. The Fund seeks a portfolio consisting of companies with above average capitalizations and earnings growth expectations and below average dividend yields.
|
| Other.
The Fund’s investments in fixed-income securities are limited to securities that are considered cash equivalents.
|
|
Objective:
|
Long-term growth of capital
|
|
Benchmark:
|
Russell 2000® Index
|
|
Investment Focus:
|
Stocks of small capitalization U.S. companies
|
|
Investment Style:
|
Quantitative, applied to small-cap growth and value (blend) stocks
|
| INVESTMENT OBJECTIVE
|
| The Fund seeks long-term growth of capital. The Fund seeks this objective through a broadly diversified portfolio of equity
securities of U.S. issuers which are included in the Russell 2000® Index at the time of investment.
|
| PRINCIPAL INVESTMENT STRATEGIES
|
| Equity Securities. The Fund invests, under normal circumstances, at least 90% of its total assets in equity securities of U.S. issuers, including foreign issuers that are traded in the United States.
|
| The Fund’s investments are selected using both a variety of quantitative techniques and fundamental research in seeking to
maximize the Fund’s expected return, while maintaining risk, style, capitalization and industry characteristics similar to the Russell 2000® Index. The Fund seeks a portfolio consisting of companies with small market capitalizations, strong
expected earnings growth and momentum, and better valuation and risk characteristics than the Russell 2000® Index. If the issuer of a portfolio security held by the Fund is no longer included in the Russell 2000® Index, the Fund may, but is not
required to, sell the security.
|
| Other.
The Fund’s investments in fixed-income securities are limited to securities that are considered cash equivalents.
|
|
Objective:
|
Long-term growth of capital
|
|
Benchmark:
|
S&P 500® Index
|
|
Investment Focus:
|
Large-cap U.S. equity securities that offer long-term capital appreciation potential
|
|
Investment Style:
|
Growth
|
| INVESTMENT OBJECTIVE
|
| The Fund seeks long-term growth of capital.
|
| PRINCIPAL INVESTMENT STRATEGIES
|
| Equity Securities. The Fund invests, under normal circumstances, at least 90% of its total assets in equity securities. The Fund seeks to achieve its investment objective by investing in a diversified portfolio of equity securities that are considered by the Investment
Adviser to have long-term capital appreciation potential. Although the Fund invests primarily in publicly traded U.S. securities, it may invest up to 10% of its total assets in foreign securities, including securities of issuers in emerging countries and
securities quoted in foreign currencies.
|
|
Objective:
|
Long-term growth of capital
|
|
Benchmark:
|
S&P 500® Index
|
|
Investment Focus:
|
Large-cap U.S. equity securities that are considered to be strategically positioned for consistent long-term growth
|
|
Investment Style:
|
Growth
|
| INVESTMENT OBJECTIVE
|
| The Fund seeks long-term growth of capital.
|
| PRINCIPAL INVESTMENT STRATEGIES
|
| Equity Securities. The Fund invests, under normal circumstances, at least 90% of its total assets in equity securities. The Fund seeks to achieve its investment objective by investing in a diversified portfolio of equity securities that are considered by the Investment
Adviser to be strategically positioned for consistent long-term growth. Although the Fund invests primarily in publicly traded U.S. securities, it may invest up to 10% of its total assets in foreign securities, including securities of issuers in emerging
countries and securities quoted in foreign currencies.
|
|
Objective:
|
Long-term growth of capital
|
|
Benchmark:
|
S&P Midcap 400 Index
|
|
Investment Focus:
|
U.S. equity securities that offer long-term capital appreciation
with a primary focus on mid-capitalization companies |
|
Investment Style:
|
Growth
|
| INVESTMENT OBJECTIVE
|
| The Fund seeks long-term growth of capital.
|
| PRINCIPAL INVESTMENT STRATEGIES
|
| Equity Securities. The Fund invests, under normal circumstances, at least 90% of its total assets in equity securities with a primary focus on mid-cap companies. The Fund seeks to achieve its investment objective by investing in a diversified portfolio of equity securities
that are considered by the Investment Adviser to be strategically positioned for long-term growth. Although the Fund invests primarily in publicly traded U.S. securities, it may invest up to 10% of its total assets in foreign securities, including
securities of issuers in emerging countries and securities quoted in foreign currencies.
|
|
Objective:
|
Long-term capital appreciation
|
|
Benchmark:
|
Russell Midcap Value Index
|
|
Investment Focus:
|
Mid-capitalization U.S. stocks that are believed to be undervalued or undiscovered by the marketplace
|
|
Investment Style:
|
Value
|
| INVESTMENT OBJECTIVE
|
| The Fund seeks long-term capital appreciation.
|
| PRINCIPAL INVESTMENT STRATEGIES
|
| Equity Securities. The Fund invests, under normal circumstances, substantially all of its assets in equity securities and at least 65% of its total assets in equity securities of mid-cap companies with public stock market capitalizations (based upon shares available for
trading on an unrestricted basis) within the range of the market capitalization of companies constituting the Russell Midcap Value Index at the time of investment (currently between $300 million and $15 billion). If the market capitalization of a company
held by the Fund moves outside this range, the Fund may, but is not required to, sell the securities. Although the Fund will invest primarily in publicly traded U.S. securities, it may invest up to 25% of its total assets in foreign securities, including
securities of issuers in emerging countries and securities quoted in foreign currencies.
|
| Other.
The Fund may invest in the aggregate up to 35% of its total assets in companies with public stock market capitalizations outside the range of companies constituting the Russell Midcap Value Index at the time of investment and in fixed-income securities,
such as government, corporate and bank debt obligations.
|
|
Objective:
|
Long-term growth of capital
|
|
Benchmark:
|
Russell 2000® Value Index
|
|
Investment Focus:
|
Small-capitalization U.S. stocks that are believed to be undervalued or undiscovered by the marketplace
|
|
Investment Style:
|
Value
|
| INVESTMENT OBJECTIVE
|
| The Fund seeks long-term growth of capital.
|
| PRINCIPAL INVESTMENT STRATEGIES
|
| Equity Securities. The Fund invests, under normal circumstances, at least 65% of its total assets in equity securities of companies with public stock market capitalizations (based upon shares available for trading on an unrestricted basis) within the range of the market
capitalization of companies constituting the Russell 2000® Value Index at the time of investment (currently between $20 million and $3 billion). If the market capitalization of a company held by the Fund moves outside this range, the Fund may, but is
not required to sell the securities. Under normal circumstances, the Fund’s investment horizon for ownership of stocks will be two to three years. Although the Fund will invest primarily in publicly traded U.S. securities, it may invest up to 25% of
its total assets in foreign securities, including securities of issuers in emerging countries and securities quoted in foreign currencies.
|
| Other.
The Fund may invest in the aggregate up to 35% of its total assets in companies with public stock market capitalizations outside the range of companies constituting the Russell 2000® Value Index at the time of investment and in fixed-income
securities, such as government, corporate and bank debt obligations.
|
|
Objective:
|
Long-term capital appreciation
|
|
Benchmark:
|
Russell 1000® Value Index
|
|
Investment Focus:
|
Large capitalization U.S. equity securities that are believed to be undervalued
|
|
Investment Style:
|
Value
|
| INVESTMENT OBJECTIVE
|
| The Fund seeks long-term capital appreciation.
|
| PRINCIPAL INVESTMENT STRATEGIES
|
| Equity Securities. The Fund invests, under normal circumstances, at least 90% of its total assets in equity securities. The Fund seeks its investment objective by investing in value opportunities that the Investment Adviser defines as companies with identifiable
competitive advantages whose intrinsic value is not reflected in the stock price. Although the Fund will invest primarily in publicly traded U.S. securities, it may invest up to 25% of its total assets in foreign securities, including securities quoted in
foreign currencies.
|
| Other.
The Fund may invest up to 10% of its total assets in fixed-income securities, such as government, corporate and bank debt obligations.
|
Ÿ
|
No specific percentage limitation on usage;
limited only by the objectives and strategies of the Fund |
| Balanced
Fund |
Growth
and Income Fund |
CORE
Large Cap Value Fund |
CORE
U.S. Equity Fund |
||||||
|---|---|---|---|---|---|---|---|---|---|
| Investment Practices | |||||||||
| Borrowings | 33 1
/3
|
33 1
/3
|
33 1
/3
|
33 1
/3
|
|||||
| Credit, Currency, Index, Interest Rate and
Mortgage Swaps* |
15 | — | — | — | |||||
| Cross Hedging of Currencies | Ÿ | Ÿ | Ÿ | Ÿ | |||||
| Custodial Receipts | Ÿ | Ÿ | Ÿ | Ÿ | |||||
| Equity Swaps* | 15 | 15 | 15 | 15 | |||||
| Foreign Currency Transactions** | Ÿ 1 | Ÿ | Ÿ | Ÿ | |||||
| Futures Contracts and Options on Futures
Contracts |
Ÿ | Ÿ | Ÿ 2 | Ÿ 3 | |||||
| Interest Rate Caps, Floors and Collars | Ÿ | — | — | — | |||||
| Investment Company Securities (including
iShares SM and Standard & Poor’s Depositary Receipts TM ) |
10 | 10 | 10 | 10 | |||||
| Loan Participations | Ÿ | — | — | — | |||||
| Mortgage Dollar Rolls | Ÿ | — | — | — | |||||
| Options on Foreign Currencies 4 | Ÿ | Ÿ | Ÿ | Ÿ | |||||
| Options on Securities and Securities Indices 5 | Ÿ | Ÿ | Ÿ | Ÿ | |||||
| Repurchase Agreements | Ÿ | Ÿ | Ÿ | Ÿ | |||||
| Reverse Repurchase Agreements (for investment
purposes) |
Ÿ | — | — | — | |||||
| Securities Lending | 33 1
/3
|
33 1
/3
|
33 1
/3
|
33 1
/3
|
|||||
| Short Sales Against the Box | 25 | 25 | — | — | |||||
| Unseasoned Companies | Ÿ | Ÿ | Ÿ | Ÿ | |||||
| Warrants and Stock Purchase Rights | Ÿ | Ÿ | Ÿ | Ÿ | |||||
| When-Issued Securities and Forward
Commitments |
Ÿ | Ÿ | Ÿ | Ÿ | |||||
*
|
Limited to 15% of net assets (together with other illiquid securities) for all structured securities which are not
deemed to be liquid and all swap transactions.
|
**
|
Limited by the amount the Fund invests in foreign securities.
|
1
|
The Balanced Fund may also enter into forward foreign currency exchange contracts to seek to increase total return.
|
2
|
The CORE Large Cap Value, CORE Large Cap Growth and CORE Small Cap Equity Funds may enter into futures transactions only
with respect to a representative index.
|
3
|
The CORE U.S. Equity Fund may enter into futures transactions only with respect to the S&P 500 Index.
|
4
|
The Funds may purchase and sell call and put options.
|
5
|
The Funds may sell covered call and put options and purchase call and put options.
|
| CORE
Large Cap Growth Fund |
CORE
Small Cap Equity Fund |
Capital
Growth Fund |
Strategic
Growth Fund |
Growth
Opportunities Fund |
Mid Cap
Value Fund |
Small Cap
Value Fund |
Large Cap
Value Fund |
||||||||
|---|---|---|---|---|---|---|---|---|---|---|---|---|---|---|---|
| 33 1
/3
|
33 1
/3
|
33 1
/3
|
33 1
/3
|
33 1
/3
|
33 1
/3
|
33 1
/3
|
33 1
/3
|
||||||||
| — | — | — | — | — | — | — | — | ||||||||
| Ÿ | Ÿ | Ÿ | Ÿ | Ÿ | Ÿ | Ÿ | Ÿ | ||||||||
| Ÿ | Ÿ | Ÿ | Ÿ | Ÿ | Ÿ | Ÿ | Ÿ | ||||||||
| 15 | 15 | 15 | 15 | 15 | 15 | 15 | 15 | ||||||||
| Ÿ | Ÿ | Ÿ | Ÿ | Ÿ | Ÿ | Ÿ | Ÿ | ||||||||
| Ÿ 2 | Ÿ 2 | Ÿ | Ÿ | Ÿ | Ÿ | Ÿ | Ÿ | ||||||||
| — | — | — | — | — | — | — | — | ||||||||
| 10 | 10 | 10 | 10 | 10 | 10 | 10 | 10 | ||||||||
| — | — | — | — | — | — | — | — | ||||||||
| — | — | — | — | — | — | — | — | ||||||||
| Ÿ | Ÿ | Ÿ | Ÿ | Ÿ | Ÿ | Ÿ | Ÿ | ||||||||
| Ÿ | Ÿ | Ÿ | Ÿ | Ÿ | Ÿ | Ÿ | Ÿ | ||||||||
| Ÿ | Ÿ | Ÿ | Ÿ | Ÿ | Ÿ | Ÿ | Ÿ | ||||||||
| — | — | — | — | — | — | — | — | ||||||||
| 33 1
/3
|
33 1
/3
|
33 1
/3
|
33 1
/3
|
33 1
/3
|
33 1
/3
|
33 1
/3
|
33 1
/3
|
||||||||
| — | — | 25 | 25 | 25 | 25 | 25 | 25 | ||||||||
| Ÿ | Ÿ | Ÿ | Ÿ | Ÿ | Ÿ | Ÿ | Ÿ | ||||||||
| Ÿ | Ÿ | Ÿ | Ÿ | Ÿ | Ÿ | Ÿ | Ÿ | ||||||||
| Ÿ | Ÿ | Ÿ | Ÿ | Ÿ | Ÿ | Ÿ | Ÿ | ||||||||
Ÿ
|
No specific percentage limitation on usage;
limited only by the objectives and strategies of the Fund |
| Balanced
Fund |
Growth
and Income Fund |
CORE
Large Cap Value Fund |
CORE
U.S. Equity Fund |
||||||||||
|---|---|---|---|---|---|---|---|---|---|---|---|---|---|
| Investment Securities | |||||||||||||
| American, European and Global Depositary
Receipts |
Ÿ | Ÿ | Ÿ 6 | Ÿ 6 | |||||||||
| Asset-Backed and Mortgage-Backed Securities 7 | Ÿ | Ÿ | — | — | |||||||||
| Bank Obligations 7 | Ÿ | Ÿ | Ÿ | Ÿ | |||||||||
| Convertible Securities 8 | Ÿ | Ÿ | Ÿ | Ÿ | |||||||||
| Corporate Debt Obligations 7 | Ÿ | Ÿ | Ÿ 9 | Ÿ 9 | |||||||||
| Equity Securities | 45-65 | 65 | + | 90 | + | 90 | + | ||||||
| Emerging Country Securities | 10 10 | 25 | 10 | — | — | ||||||||
| Fixed Income Securities 11 | 35-45 | 18 | 35 | 10 | 9 | 10 | 9 | ||||||
| Foreign Securities | 10 10 | 25 | 10 | Ÿ 14 | Ÿ 14 | ||||||||
| Foreign Government Securities 7 | Ÿ | — | — | — | |||||||||
| Municipal Securities | Ÿ | — | — | — | |||||||||
| Non-Investment Grade Fixed Income Securities | 10 15 | 10 | 16 | — | — | ||||||||
| Real Estate Investment Trusts | Ÿ | Ÿ | Ÿ | Ÿ | |||||||||
| Stripped Mortgage Backed Securities 7 | Ÿ | — | — | — | |||||||||
| Structured Securities* | Ÿ | Ÿ | Ÿ | Ÿ | |||||||||
| Temporary Investments | 100 | 100 | 35 | 35 | |||||||||
| U.S. Government Securities 7 | Ÿ | Ÿ | Ÿ | Ÿ | |||||||||
| Yield Curve Options and Inverse Floating Rate
Securities |
Ÿ | — | — | — | |||||||||
*
|
Limited to 15% of net assets (together with other illiquid securities) for all structured securities which are not
deemed to be liquid and all swap transactions.
|
6
|
The CORE Funds may not invest in European Depositary Receipts.
|
7
|
Limited by the amount the Fund invests in fixed-income securities.
|
8
|
Convertible securities purchased by the Balanced Fund must be B or higher by Standard & Poor’s Rating Group
(“Standard & Poor’s”) or Moody’s Investor’s Service, Inc. (“Moody’s”). The CORE Funds have no minimum rating criteria and all other Funds use the same rating criteria for convertible and non-convertible debt
securities.
|
9
|
Cash equivalents only.
|
10
|
The Balanced, Growth and Income, Capital Growth, Strategic Growth, Growth Opportunities, Mid Cap Value and Small Cap
Value Funds may invest in the aggregate up to 10%, 25%, 10%, 10%, 10%, 25% and 25%, respectively, of their total assets in foreign securities, including emerging country securities.
|
11
|
Except as noted under “Non-Investment Grade Fixed Income Securities,” fixed-income securities must be
investment grade (i.e., BBB or higher by Standard & Poor’s or Baa or higher by Moody’s).
|
12
|
The Mid Cap Value Fund may invest in the aggregate up to 35% of its total assets in: (1) securities of companies with
public stock market capitalizations outside the range of companies constituting the Russell Midcap Value Index at the time of investment and (2) fixed-income securities.
|
| CORE
Large Cap Growth Fund |
CORE
Small Cap Equity Fund |
Capital
Growth Fund |
Strategic
Growth Fund |
Growth
Opportunities Fund |
Mid Cap
Value Fund |
Small Cap
Value Fund |
Large Cap
Value Fund |
|||||||||
|---|---|---|---|---|---|---|---|---|---|---|---|---|---|---|---|---|
| Ÿ 6 | Ÿ 6 | Ÿ | Ÿ | Ÿ | Ÿ | Ÿ | Ÿ | |||||||||
| — | — | Ÿ | Ÿ | Ÿ | Ÿ | Ÿ | Ÿ | |||||||||
| Ÿ | Ÿ | Ÿ | Ÿ | Ÿ | Ÿ | Ÿ | Ÿ | |||||||||
| Ÿ | Ÿ | Ÿ | Ÿ | Ÿ | Ÿ | Ÿ | Ÿ | |||||||||
| Ÿ 9 | Ÿ 9 | Ÿ | Ÿ | Ÿ | Ÿ | Ÿ | Ÿ | |||||||||
| 90+ | 90+ | 90 | + | 90+ | 90+ | 65+ | 65+ | 90+ | ||||||||
| — | — | 10 | 10 | 10 10 | 10 10 | 25 10 | 25 10 | — | ||||||||
| 10 9 | 10 9 | Ÿ | Ÿ | Ÿ | 35 12 | 35 13 | 10 | |||||||||
| Ÿ |
Ÿ 14 | 10 | 10 | 10 10 | 10 10 | 25 10 | 25 10 | 25 | ||||||||
| — | — | — | — | — | — | — | — | |||||||||
| — | — | — | — | — | — | — | — | |||||||||
| — | — | 10 | 16 | 10 16 | 10 16 | 10 17 | 35 16 | 10 16 | ||||||||
| Ÿ | Ÿ | Ÿ | Ÿ | Ÿ | Ÿ | Ÿ | Ÿ | |||||||||
| — | — | — | — | — | — | — | — | |||||||||
| Ÿ | Ÿ | Ÿ | Ÿ | Ÿ | Ÿ | Ÿ | Ÿ | |||||||||
| 35 | 35 | 100 | 100 | 100 | 100 | 100 | 100 | |||||||||
| Ÿ | Ÿ | Ÿ | Ÿ | Ÿ | Ÿ | Ÿ | Ÿ | |||||||||
| — | — | — | — | — | — | — | — | |||||||||
13
|
The Small Cap Value Fund may invest in the aggregate up to 35% of its total assets in:
(1) securities of companies with public stock market capitalizations outside the range of companies constituting the Russell 2000® Value Index at the time of investment; and (2) fixed-income securities. |
14
|
Equity securities of foreign issuers must be traded in the United States.
|
15
|
Must be at least BB or B by Standard & Poor’s or Ba or B by Moody’s.
|
16
|
May be BB or lower by Standard & Poor’s or Ba or lower by Moody’s.
|
17
|
Must be B or higher by Standard & Poor’s or B or higher by Moody’s.
|
18
|
The Balanced Fund invests at least 25% of its total assets in fixed-income senior securities; the remainder may be
invested in other fixed-income securities and cash.
|
| Ÿ
Applicable
— Not applicable |
Balanced
Fund |
Growth
and Income Fund |
CORE
Large Cap Value Fund |
CORE
U.S. Equity Fund |
CORE
Large Cap Growth Fund |
CORE
Small Cap Equity Fund |
|||||||
|---|---|---|---|---|---|---|---|---|---|---|---|---|---|
| Credit/Default | Ÿ | Ÿ | Ÿ | Ÿ | Ÿ | Ÿ | |||||||
| Foreign | Ÿ | Ÿ | Ÿ | Ÿ | Ÿ | Ÿ | |||||||
| Emerging Countries | Ÿ | Ÿ | Ÿ | Ÿ | Ÿ | Ÿ | |||||||
| Small Cap | — | — | — | — | — | Ÿ | |||||||
| Stock | Ÿ | Ÿ | Ÿ | Ÿ | Ÿ | Ÿ | |||||||
| Derivatives | Ÿ | Ÿ | Ÿ | Ÿ | Ÿ | Ÿ | |||||||
| Interest Rate | Ÿ | Ÿ | Ÿ | Ÿ | Ÿ | Ÿ | |||||||
| Management | Ÿ | Ÿ | Ÿ | Ÿ | Ÿ | Ÿ | |||||||
| Market | Ÿ | Ÿ | Ÿ | Ÿ | Ÿ | Ÿ | |||||||
| Liquidity | Ÿ | Ÿ | Ÿ | Ÿ | Ÿ | Ÿ | |||||||
| Initial Public Offering (“IPO”) | — | — | — | — | — | — | |||||||
| Capital
Growth Fund |
Strategic
Growth Fund |
Growth
Opportunities Fund |
Mid
Cap Value Fund |
Small Cap Value Fund |
Large
Cap Value Fund |
||||||
|---|---|---|---|---|---|---|---|---|---|---|---|
| Ÿ | Ÿ | Ÿ | Ÿ | Ÿ | Ÿ | ||||||
| Ÿ | Ÿ | Ÿ | Ÿ | Ÿ | Ÿ | ||||||
| Ÿ | Ÿ | Ÿ | Ÿ | Ÿ | Ÿ | ||||||
| — | — | — | Ÿ | Ÿ | — | ||||||
| Ÿ | Ÿ | Ÿ | Ÿ | Ÿ | Ÿ | ||||||
| Ÿ | Ÿ | Ÿ | Ÿ | Ÿ | Ÿ | ||||||
| Ÿ | Ÿ | Ÿ | Ÿ | Ÿ | Ÿ | ||||||
| Ÿ | Ÿ | Ÿ | Ÿ | Ÿ | Ÿ | ||||||
| Ÿ | Ÿ | Ÿ | Ÿ | Ÿ | Ÿ | ||||||
| Ÿ | Ÿ | Ÿ | Ÿ | Ÿ | Ÿ | ||||||
| — | Ÿ | Ÿ | Ÿ | Ÿ | — | ||||||
n
|
Credit/Default Risk—The risk that an issuer or guarantor of fixed-income securities held by a Fund may default
on its obligation to pay interest and repay principal.
|
n
|
Foreign Risk—The risk that when a Fund invests in foreign securities, it will be subject to risk of loss not
typically associated with domestic issuers. Loss may result because of less foreign government regulation, less public information and less economic, political and social stability. Loss may also result from the imposition of exchange controls,
confiscations and other government restrictions. A
Fund will also be subject to the risk of negative foreign currency rate fluctuations. Foreign risks will normally be greatest when a Fund invests in issuers located in emerging countries. |
n
|
Emerging Countries Risk—The securities markets of Asian, Latin and South American, Eastern European, African
and other emerging countries are less liquid, are especially subject to greater price volatility, have smaller market capitalizations, have less government regulation and are not subject to as extensive and frequent accounting, financial and other
reporting requirements as the securities markets of more developed countries. Further, investment in equity securities of issuers located in Russia and certain other emerging countries involves risk of loss resulting from problems in share registration
and custody and substantial economic and political disruptions. These risks are not normally associated with investments in more developed countries.
|
n
|
Stock Risk—The risk that stock prices
have historically risen and fallen in periodic cycles. Recently, U.S. stock markets and certain foreign stock markets have experienced substantial price volatility and, at times, have traded at or close to record high levels. There is no guarantee that
such levels will be reached or maintained in the future.
|
n
|
Derivatives Risk—The risk that loss may result from a Fund’s investments in options, futures, swaps,
structured securities and other derivative instruments. These instruments may be leveraged so that small changes may produce disproportionate losses to a Fund.
|
n
|
Interest Rate Risk—The risk that when interest rates increase, securities held by a Fund will decline in value.
Long-term fixed-income securities will normally have more price volatility because of this risk than short-term fixed-income securities.
|
n
|
Management Risk—The risk that a strategy used by the Investment Adviser may fail to produce the intended results.
|
n
|
Market Risk—The risk that the value of the securities in which a Fund invests may go up or down in response to
the prospects of individual companies, particular industry sectors and/or general economic conditions. Price changes may be temporary or last for extended periods. A Fund’s investments may be overweighted
from time to time in one or more industry sectors, which will increase the Fund’s exposure to risk of loss from adverse developements affecting those sectors.
|
n
|
Liquidity Risk—The risk that a Fund will not be able to pay redemption proceeds within the time period stated
in this Prospectus because of unusual market conditions, an unusually high volume of redemption requests, or other reasons. Funds that invest in non-investment grade fixed-income securities, small capitalization stocks, REITs and emerging country issuers
will be especially subject to the risk that during certain periods the liquidity of particular issuers or industries, or all securities within particular investment categories, will shrink or disappear suddenly and without warning as a result of adverse
economic, market or political events, or adverse investor perceptions whether or not accurate. The Goldman Sachs Asset Allocation Portfolios (the “Asset Allocation Portfolios”) expect to invest a significant percentage of their assets in the
Funds and other funds for which Goldman Sachs now or in the future acts as investment adviser or underwriter. Redemptions by an Asset Allocation Portfolio of its position in a Fund may further increase liquidity risk and may impact a Fund’s net asset
value (“NAV”).
|
n
|
Small Cap Risk—The securities of small capitalization stocks involve greater risks than those associated with
larger, more established companies and may be subject to more abrupt or erratic price movements. Securities of such issuers may lack sufficient market liquidity to enable a Fund to effect sales at an advantageous time or without a substantial drop in price.
|
n
|
IPO Risk—The risk that the market value of IPO shares will fluctuate considerably due to factors such as the
absence of a prior public market, unseasoned trading, the small number of shares available for trading and limited information about the issuer. The purchase of IPO shares may involve high transaction costs. IPO shares are subject to market risk and
liquidity risk. When a Fund’s asset base is small, a significant portion of the Fund’s performance could be attributable to investments in IPOs, because such investments would have a magnified impact on the Fund. As the Fund’s assets grow,
the effect of the Fund’s investments in IPOs on the Fund’s performance probably will decline, which could reduce the Fund’s performance.
|
| HOW THE FUNDS HAVE PERFORMED
|
| The bar chart and table below provide an indication of the risks of investing in a Fund by showing: (a) changes in the performance
of a Fund’s Service Shares from year to year; and (b) how the average annual returns of a Fund’s Service Shares compare to those of broad-based securities market indices. The bar chart and table assume reinvestment of dividends and
distributions. A Fund’s past performance is not necessarily an indication of how the Fund will perform in the future. Performance reflects expense limitations in effect. If expense limitations were not in place, a Fund’s performance would have
been reduced. The Strategic Growth, Growth Opportunities and Large Cap Value Funds commenced operations on May 24, 1999, May 24, 1999 and December 15, 1999, respectively. Since these Funds have less than one calendar year’s performance, no
performance information is provided in this section.
|
| TOTAL RETURN
|
| The total return for Service Shares for the 9-month period ended September 30, 2000 was
2.10%.
Best Quarter
Q4 ’99 +8.14%
Worst Quarter
Q3 ’98 -8.76%
|
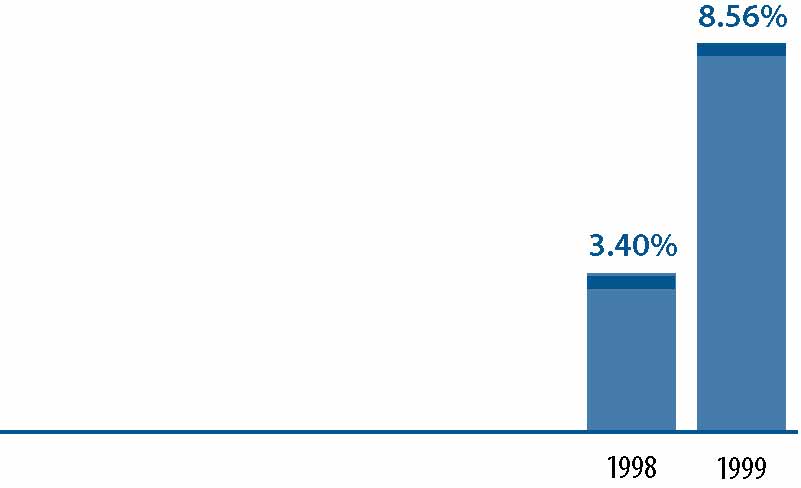 |
| AVERAGE ANNUAL TOTAL RETURN
|
| For the period ended December 31, 1999 | 1 Year | Since Inception | ||||
|---|---|---|---|---|---|---|
| Service Shares (Inception 8/15/97) | 8.56 | % | 5.74% | |||
| S&P 500® Index* | 21.04 | % | 23.21% | |||
| Lehman Brothers Aggregate Bond Index** | (0.82 | )% | 5.14% | |||
*
|
The S&P 500® Index is the Standard & Poor’s Composite Index of 500 stocks, an unmanaged index of common stock
prices. The Index figures do not reflect any fees or expenses.
|
**
|
The Lehman Brothers Aggregate Bond Index is an unmanaged index of bond prices. The Index figures do not reflect any fees or
expenses.
|
| TOTAL RETURN
|
| The total return for Service Shares for the 9-month period ended September 30, 2000 was
-0.92%.
Best Quarter
Q2 ’97 +15.16%
Worst Quarter
Q3 ’98 -16.98%
|
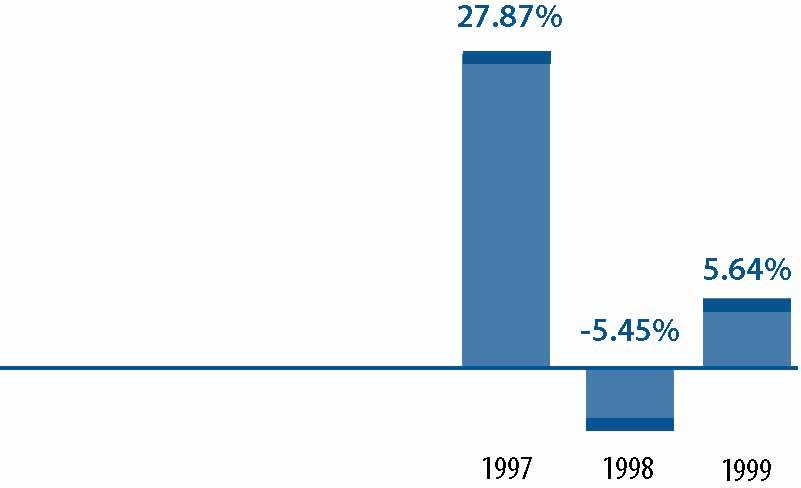 |
| AVERAGE ANNUAL TOTAL RETURN
|
| For the period ended December 31, 1999 | 1 Year | Since Inception | |||
|---|---|---|---|---|---|
| Service Shares (Inception 3/6/96) | 5.64% | 11.53% | |||
| S&P 500® Index* | 21.04% | 25.79% | |||
*
|
The S&P 500® Index is the Standard & Poor’s Composite Index of 500 stocks, an unmanaged index of common stock
prices. The Index figures do not reflect any fees or expenses.
|
| TOTAL RETURN
|
| The total return for Service Shares for the
9-month period ended September 30, 2000 was 2.41%. Best Quarter
Q2 ’99 +10.38%
Worst Quarter
Q3 ’99 -8.53%
|
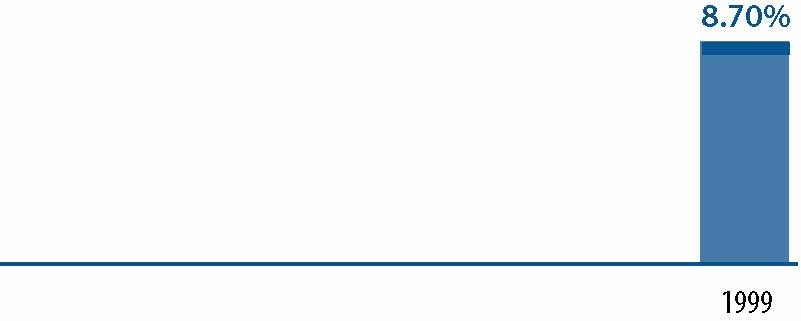 |
| AVERAGE ANNUAL TOTAL RETURN
|
| For the period ended December 31, 1999 | 1 Year | Since Inception | |||
|---|---|---|---|---|---|
| Service Shares (Inception 12/31/98) | 8.70% | 8.68% | |||
| Russell 1000® Value Index* | 7.34% | 7.34% | |||
*
|
The Russell 1000® Value Index, (inception date 1/1/99), is a market capitalization weighted index of the 1,000 highest
ranking U.S. stocks with below-average growth orientation. The Index figures do not reflect any fees or expenses.
|
| TOTAL RETURN
|
| The total return for Service Shares for the
9-month period ended September 30, 2000 was -0.46%. Best Quarter
Q4 ’98 +21.46%
Worst Quarter
Q3 ’98 -14.68%
|
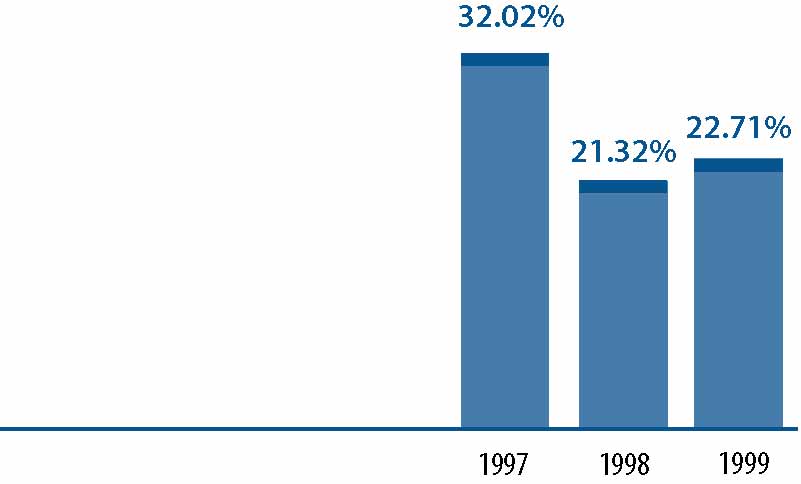 |
| AVERAGE ANNUAL TOTAL RETURN
|
| For the period ended December 31, 1999 | 1 Year | Since Inception | |||
|---|---|---|---|---|---|
| Service Shares (Inception 6/7/96) | 22.71% | 23.91% | |||
| S&P 500® Index* | 21.04% | 26.47% | |||
*
|
The S&P 500® Index is the Standard & Poor’s Composite Index of 500 stocks, an unmanaged index of common stock
prices. The Index figures do not reflect any fees or expenses.
|
| TOTAL RETURN
|
| The total return for Service Shares for the
9-month period ended September 30, 2000 was -0.92%.
Best Quarter
Q4 ’98 +25.52%
Worst Quarter
Q3 ’98 -14.00%
|
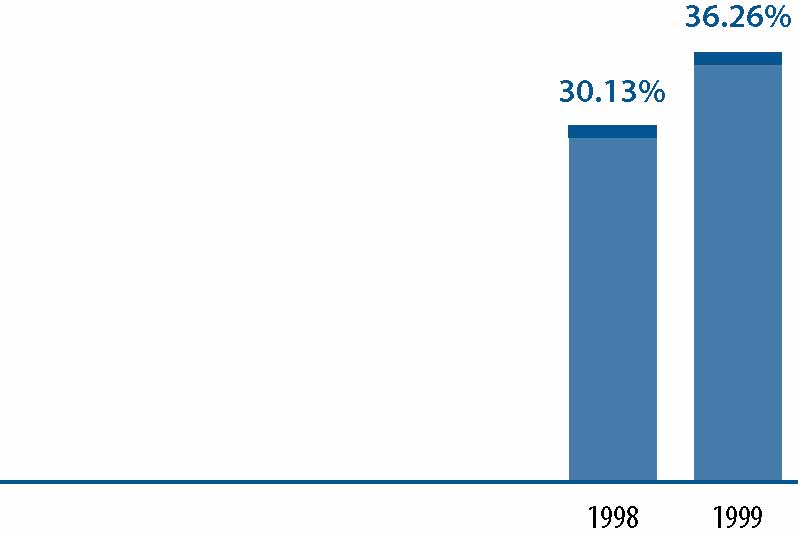 |
| AVERAGE ANNUAL TOTAL RETURN
|
| For the period ended December 31, 1999 | 1 Year | Since Inception | |||
|---|---|---|---|---|---|
| Service Shares (Inception 5/1/97) | 36.26% | 33.20% | |||
| Russell 1000® Growth Index* | 33.15% | 35.42% | |||
*
|
The Russell 1000® Growth Index is an unmanaged index of common stock prices. The Index figures do not reflect any fees or
expenses.
|
| TOTAL RETURN
|
| The total return for Service Shares the
9-month period ended September 30, 2000 was 6.80%.
Best Quarter
Q4 ’99 +15.28%
Worst Quarter
Q3 ’98 -24.34%
|
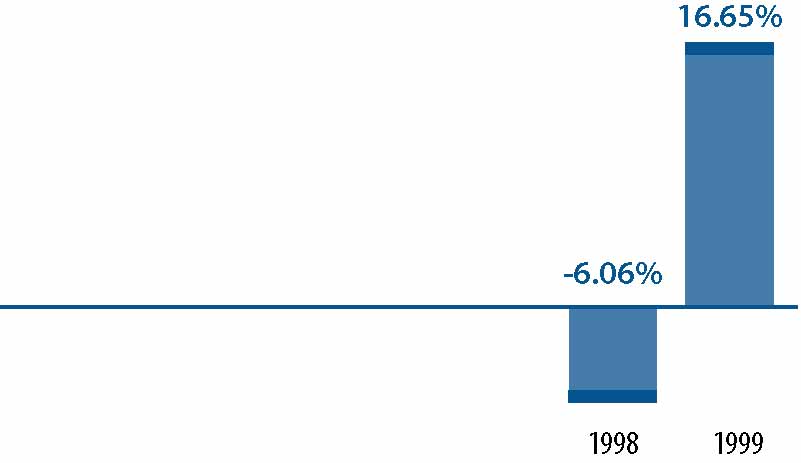 |
| AVERAGE ANNUAL TOTAL RETURN
|
| For the period ended December 31, 1999 | 1 Year | Since Inception | |||
|---|---|---|---|---|---|
| Service Shares (Inception 8/15/97) | 16.65% | 7.32% | |||
| Russell 2000® Index* | 21.26% | 10.21% | |||
*
|
The Russell 2000® Index is an unmanaged index of common stock prices. The Index figures do not reflect any fees or expenses.
|
| TOTAL RETURN
|
| The total return for Service Shares for the 9-month period ended September 30, 2000 was
0.22%.
Best Quarter
Q4 ’98 +24.32%
Worst Quarter
Q3 ’98 -11.51%
|
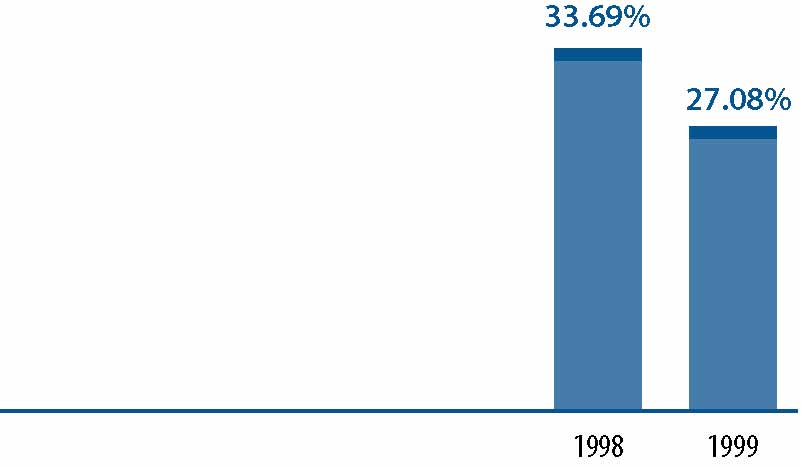 |
| AVERAGE ANNUAL TOTAL RETURN
|
| For the period ended December 31, 1999 | 1 Year | Since Inception | |||
|---|---|---|---|---|---|
| Service Shares (Inception 8/15/97) | 27.08% | 28.47% | |||
| S&P 500® Index* | 21.04% | 23.21% | |||
*
|
The S&P 500® Index is the Standard & Poor’s Composite Index of 500 stocks, an unmanaged index of common stock
prices. The Index figures do not reflect any fees or expenses.
|
| TOTAL RETURN
|
| The total return for Service Shares for the 9-month period ended September 30, 2000 was 17.69%.
Best Quarter
Q2 ’99 +21.13%
Worst Quarter
Q3 ’98 -20.81%
|
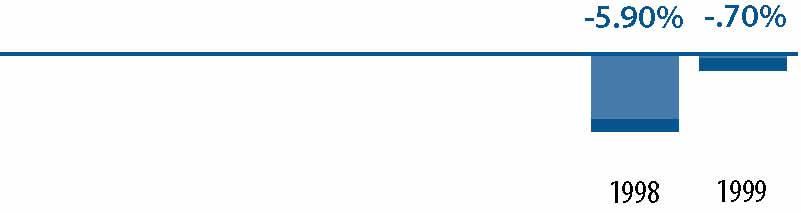 |
| AVERAGE ANNUAL TOTAL RETURN
|
| For the period ended December 31, 1999 | 1 Year | Since Inception | |||||
|---|---|---|---|---|---|---|---|
| Service Shares (Inception 7/18/97) | (0.70 | )% | (0.84 | )% | |||
| Russell Midcap Value Index* | (0.10 | )% | 7.04 | % | |||
*
|
The Russell Midcap Value Index is an unmanaged index of common stock prices. The Index figures do not reflect any fees or
expenses.
|
| TOTAL RETURN
|
| The total return for Service Shares for the 9-month period ended September 30, 2000 was
26.33%.
Best Quarter
Q2 ’99 +30.02%
Worst Quarter
Q3 ’98 -32.23%
|
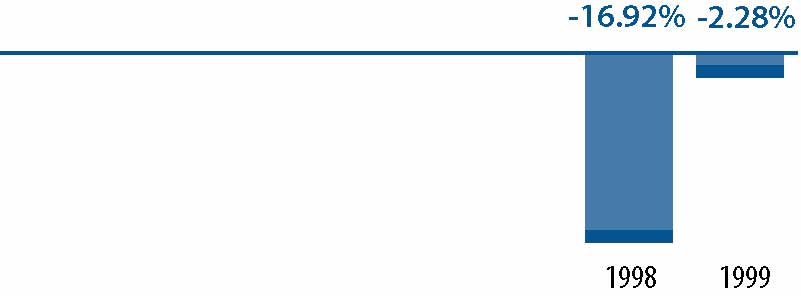 |
| AVERAGE ANNUAL TOTAL RETURN
|
| For the period ended December 31, 1999 | 1 Year | Since Inception | |||
|---|---|---|---|---|---|
| Service Shares (Inception 8/15/97) | (2.28)% | (5.56)% | |||
| Russell 2000® Value Index* | (1.49)% | 0.81% | |||
*
|
The Russell 2000® Value Index is an unmanaged index of common stock prices. The Index figures do not reflect any fees or
expenses.
|
| Balanced
Fund |
Growth
and Income Fund |
CORE
Large Cap Value Fund |
CORE
U.S. Equity Fund |
||||||
|---|---|---|---|---|---|---|---|---|---|
| Shareholder Fees | |||||||||
| (fees paid directly from your investment): | |||||||||
| Maximum Sales Charge (Load) Imposed
on Purchases |
None | None | None | None | |||||
| Maximum Sales Charge (Load) Imposed on
Reinvested Dividends |
None | None | None | None | |||||
| Redemption Fees | None | None | None | None | |||||
| Exchange Fees | None | None | None | None | |||||
| Annual Fund Operating Expenses | |||||||||
| (expenses that are deducted from Fund assets):1 | |||||||||
| Management Fees 2 | 0.65% | 0.70% | 0.60% | 0.75% | |||||
| Service Fees 3 | 0.50% | 0.50% | 0.50% | 0.50% | |||||
| Other Expenses 4 | 0.24% | 0.08% | 0.17% | 0.08% | |||||
| Total Fund Operating Expenses* | 1.39% | 1.28% | 1.27% | 1.33% | |||||
| See page 38 for all other footnotes.
|
*
|
As a result of current waivers and expense limitations, “Other Expenses” and “Total Fund Operating Expenses”
of the Funds which are actually incurred as of the date of this Prospectus are as set forth below. The waivers and expense limitations may be terminated at any time at the option of the Investment Adviser. If this occurs, “Other Expenses” and
“Total Fund Operating Expenses” may increase without shareholder approval.
|
| Balanced
Fund |
Growth
and Income Fund |
CORE
Large Cap Value Fund |
CORE
U.S. Equity Fund |
||||||
|---|---|---|---|---|---|---|---|---|---|
| Annual Fund Operating Expenses | |||||||||
| (expenses that are deducted from Fund assets): 1 | |||||||||
| Management Fees 2 | 0.65% | 0.70% | 0.60% | 0.70% | |||||
| Service Fees 3 | 0.50% | 0.50% | 0.50% | 0.50% | |||||
| Other Expenses 4 | 0.10% | 0.08% | 0.10% | 0.04% | |||||
| Total Fund Operating Expenses (after current
waivers and expense limitations) |
1.25% | 1.28% | 1.20% | 1.24% | |||||
| CORE
Large Cap Growth Fund |
CORE
Small Cap Equity Fund |
Capital
Growth Fund |
Strategic
Growth Fund |
Growth
Opportunities Fund |
Mid Cap
Value Fund |
Small Cap
Value Fund |
Large Cap
Value Fund |
||||||||
|---|---|---|---|---|---|---|---|---|---|---|---|---|---|---|---|
| None | None | None | None | None | None | None | None | ||||||||
| None | None | None | None | None | None | None | None | ||||||||
| None | None | None | None | None | None | None | None | ||||||||
| None | None | None | None | None | None | None | None | ||||||||
| 0.75% | 0.85% | 1.00% | 1.00% | 1.00% | 0.75% | 1.00% | 0.75% | ||||||||
| 0.50% | 0.50% | 0.50% | 0.50% | 0.50% | 0.50% | 0.50% | 0.50% | ||||||||
| 0.09% | 0.30% | 0.07% | 0.23% | 0.21% | 0.19% | 0.17% | 2.15% | ||||||||
| 1.34% | 1.65% | 1.57% | 1.73% | 1.71% | 1.44% | 1.67% | 3.40% | ||||||||
| CORE
Large Cap Growth Fund |
CORE
Small Cap Equity Fund |
Capital
Growth Fund |
Strategic
Growth Fund |
Growth
Opportunities Fund |
Mid Cap
Value Fund |
Small Cap
Value Fund |
Large Cap
Value Fund |
||||||||
|---|---|---|---|---|---|---|---|---|---|---|---|---|---|---|---|
| 0.70% | 0.85% | 1.00% | 1.00% | 1.00% | 0.75% | 1.00% | 0.75% | ||||||||
| 0.50% | 0.50% | 0.50% | 0.50% | 0.50% | 0.50% | 0.50% | 0.50% | ||||||||
| 0.06% | 0.08% | 0.04% | 0.04% | 0.15% | 0.14% | 0.10% | 0.10% | ||||||||
| 1.26% | 1.43% | 1.54% | 1.54% | 1.65% | 1.39% | 1.60% | 1.35% | ||||||||
1
|
The Funds’ annual operating expenses are based on actual expenses.
|
2
|
The Investment Adviser has voluntarily agreed not to impose a portion of the management fee on the CORE U.S. Equity Fund
and the CORE Large Cap Growth Fund equal to 0.05% and 0.05%, respectively, of such Funds’ average daily net assets. As a result of fee waivers, the current management fees of the CORE U.S. Equity Fund and CORE Large Cap Growth Fund are 0.70% and 0.70%, respectively, of such Funds’ average daily net assets. The waivers may be terminated at any time at the option
of the Investment Adviser.
|
3
|
Service Organizations may charge other fees to their customers who are beneficial owners of Service Shares in connection
with their customers’ accounts. Such fees may affect the return customers realize with respect to their investments.
|
4
|
“Other Expenses” include transfer agency fees equal to 0.04% of the average daily net assets of each Fund’
s Service Shares, plus all other ordinary expenses not detailed above. The Investment Adviser has voluntarily agreed to reduce or limit “Other Expenses” (excluding management fees, transfer agency fees, service fees, taxes, interest and
brokerage fees and litigation, indemnification and other extraordinary expenses) to the following percentages of each Fund’s average daily net assets:
|
| Fund | Other
Expenses |
|
|---|---|---|
| Balanced | 0.06% | |
| Growth and Income | 0.05% | |
| CORE Large Cap Value | 0.06% | |
| CORE U.S. Equity | 0.00% | |
| CORE Large Cap Growth | 0.02% | |
| CORE Small Cap Equity | 0.04% | |
| Capital Growth | 0.00% | |
| Strategic Growth | 0.00% | |
| Growth Opportunities | 0.11% | |
| Mid Cap Value | 0.10% | |
| Small Cap Value | 0.06% | |
| Large Cap Value | 0.06% | |
| Fund | 1 Year | 3 Years | 5 Years | 10 Years | |||||
|---|---|---|---|---|---|---|---|---|---|
| Balanced | $142 | $ 440 | $ 761 | $1,669 | |||||
| Growth and Income | $130 | $ 406 | $ 702 | $1,545 | |||||
| CORE Large Cap Value | $129 | $ 403 | $ 697 | $1,534 | |||||
| CORE U.S. Equity | $135 | $ 421 | $ 729 | $1,601 | |||||
| CORE Large Cap Growth | $136 | $ 425 | $ 734 | $1,613 | |||||
| CORE Small Cap Equity | $168 | $ 520 | $ 897 | $1,955 | |||||
| Capital Growth | $160 | $ 496 | $ 855 | $1,867 | |||||
| Strategic Growth | $176 | $ 545 | $ 939 | $2,041 | |||||
| Growth Opportunities | $174 | $ 539 | $ 928 | $2,019 | |||||
| Mid Cap Value | $147 | $ 456 | $ 787 | $1,724 | |||||
| Small Cap Value | $170 | $ 526 | $ 907 | $1,976 | |||||
| Large Cap Value | $343 | $1,045 | $1,769 | $3,685 | |||||
| INVESTMENT ADVISERS
|
| Investment Adviser | Fund | ||
|---|---|---|---|
| Goldman Sachs Asset Management (“GSAM”) | Balanced | ||
| 32 Old Slip | Growth and Income | ||
| New York, New York 10005 | CORE Large Cap Value | ||
| CORE Large Cap Growth | |||
| CORE Small Cap Equity | |||
| Strategic Growth | |||
| Growth Opportunities | |||
| Mid Cap Value | |||
| Small Cap Value | |||
| Large Cap Value | |||
| Goldman Sachs Funds Management, L.P. (“GSFM”) | CORE U.S. Equity | ||
| 32 Old Slip | Capital Growth | ||
| New York, New York 10005 | |||
| GSAM and GSFM are separate business units of the Investment Management Division (“IMD”) of Goldman Sachs. Goldman Sachs
registered as an investment adviser in 1981. GSFM, a registered investment adviser since 1990, is a Delaware limited partnership which is an affiliate of Goldman Sachs. As of September 30, 2000, GSAM and GSFM, along with other units of IMD, had assets
under management of $281.3 billion.
|
| The Investment Adviser provides day-to-day advice regarding the Funds’ portfolio transactions. The Investment Adviser makes
the investment decisions for the Funds and places purchase and sale orders for the Funds’ portfolio transactions in U.S. and foreign markets. As permitted by applicable law, these orders may be directed to any brokers, including Goldman Sachs and its
affiliates. While the Investment Adviser is ultimately responsible for the management of the Funds, it is able to draw upon the research and expertise of its asset management affiliates for portfolio decisions and management with respect to certain
portfolio securities. In addition, the Investment Adviser has access to the research and certain proprietary technical models developed by Goldman Sachs, and will apply quantitative and qualitative analysis in determining the appropriate allocations among
categories of issuers and types of securities.
|
| The Investment Adviser also performs the following additional services for the Funds:
|
n
|
Supervises all non-advisory operations of the Funds
|
n
|
Provides personnel to perform necessary executive, administrative and clerical services to the Funds
|
n
|
Arranges for the preparation of all required tax returns,
reports to shareholders, prospectuses and statements of additional information and other reports filed with the Securities and Exchange Commission (the “SEC”) and other regulatory authorities
|
n
|
Maintains the records of each Fund
|
n
|
Provides office space and all necessary office equipment and services
|
| MANAGEMENT FEES
|
| As compensation for its services and its assumption of certain expenses, the Investment Adviser is entitled to the following fees,
computed daily and payable monthly, at the annual rates listed below (as a percentage of each respective Fund’s average daily net assets):
|
| Contractual Rate | Actual Rate
For the Fiscal Year Ended August 31, 2000 |
||||
|---|---|---|---|---|---|
| GSAM: | |||||
| Balanced | 0.65% | 0.65% | |||
| Growth and Income | 0.70% | 0.70% | |||
| CORE Large Cap Value | 0.60% | 0.60% | |||
| CORE Large Cap Growth | 0.75% | 0.64% | |||
| CORE Small Cap Equity | 0.85% | 0.85% | |||
| Strategic Growth | 1.00% | 1.00% | |||
| Growth Opportunities | 1.00% | 1.00% | |||
| Mid Cap Value | 0.75% | 0.75% | |||
| Small Cap Value | 1.00% | 1.00% | |||
| Large Cap Value | 0.75% | 0.75% | |||
| GSFM: | |||||
| CORE U.S. Equity | 0.75% | 0.70% | |||
| Capital Growth | 1.00% | 1.00% | |||
| The difference, if any, between the stated fees and the actual fees paid by the Funds reflects that the Investment Adviser did not
charge the full amount of the fees to which it would have been entitled. The Investment Adviser may discontinue or modify any such voluntary limitations in the future at its discretion.
|
| FUND MANAGERS
|
| M. Roch Hillenbrand, a Managing Director of Goldman Sachs since 1997, is the Head of Global Equities for GSAM, overseeing the
United States, Europe, Japan, and non-Japan Asia. In this capacity, he is responsible for managing the group as it defines and implements global portfolio management processes that are consistent, reliable and predictable. Mr. Hillenbrand joined Goldman
Sachs in 1997 upon its acquisition of Commodities Corporation, LLC where he was and continues as President. Over the course of his 19-year career at Commodities Corporation, Mr. Hillenbrand has had extensive experience in dealing with internal and
external investment managers who have managed a range of futures and equities strategies across multiple markets, using a variety of styles.
|
| Value Team
|
n
|
Twelve portfolio managers/analysts with over 100 years of combined financial experience comprise the Investment Adviser’s
value investment team
|
n
|
Multi-sector focus provides a balanced perspective and in-depth industry
knowledge |
n
|
Across all value products, the Investment Adviser leverages the industry research expertise of its small, mid and large cap
investment teams
|
| Name and Title | Fund Responsibility | Years
Primarily Responsible |
Five Year Employment History | ||||
|---|---|---|---|---|---|---|---|
| Eileen A. Aptman
Vice President |
Senior Portfolio Manager—
Mid Cap Value Small Cap Value |
Since
1996 1997 |
Ms. Aptman joined the Investment
Adviser as a research analyst in 1993. She became a portfolio manager in 1996. |
||||
| Matthew B.
McLennan Vice President |
Senior Portfolio Manager—
Small Cap Value Mid Cap Value |
Since
1996 1998 |
Mr. McLennan joined the
Investment Adviser as a research analyst in 1995 and became a portfolio manager in 1996. From 1994 to 1995, he worked in the Investment Banking Division of Goldman Sachs in Australia. |
||||
| Meera Mayer
Vice President |
Senior Portfolio Manager—
Growth and Income Large Cap Value Balanced (Equity) |
Since
1999 1999 1999 |
Ms. Mayer joined the Investment
Adviser as a senior portfolio manager in November 1999. From July 1999 to November 1999, she worked at Oppenheimer Funds as a senior equity analyst. From 1995 to March 1999, she worked at Spears, Benzak, Salomon and Farrell as a managing director and portfolio manager. |
||||
| Name and Title | Fund Responsibility | Years
Primarily Responsible |
Five Year Employment History | ||||
|---|---|---|---|---|---|---|---|
| Chip Otness
Vice President |
Senior Portfolio Manager—
Small Cap Value Mid Cap Value |
Since
2000 2000 |
Mr. Otness joined the Investment
Adviser as a senior portfolio manager in 2000. From 1998 to 2000, he headed Dolphin Asset Management. From 1970 to 1998, he worked at J.P. Morgan, most recently as a managing director and senior portfolio manager responsible for small-cap institutional equity investments. |
||||
| Eileen Rominger
Managing Director |
Senior Portfolio Manager—
Growth and Income Large Cap Value Balanced (Equity) |
Since
1999 1999 1999 |
Ms. Rominger joined the
Investment Adviser as a senior portfolio manager and Chief Investment Officer of the Value Equity team in 1999. From 1981 to 1999, she worked at Oppenheimer Capital, most recently as a senior portfolio manager. |
||||
| Quantitative Equity Team
|
n
|
A stable and growing team supported by an extensive internal staff
|
n
|
Access to the research ideas of Goldman Sachs’ renowned Global Investment Research Department
|
n
|
More than $34 billion in equities currently under management
|
| Name and Title | Fund Responsibility | Years
Primarily Responsible |
Five Year Employment History | ||||
|---|---|---|---|---|---|---|---|
| Melissa Brown
Managing Director |
Senior Portfolio Manager—
CORE Large Cap Value CORE U.S. Equity CORE Large Cap Growth CORE Small Cap Equity |
Since
1998 1998 1998 1998 |
Ms. Brown joined the
Investment Adviser as a portfolio manager in 1998. From 1984 to 1998, she was the director of Quantitative Equity Research and served on the Investment Policy Committee at Prudential Securities. |
||||
| Robert C. Jones
Managing Director |
Senior Portfolio Manager—
CORE U.S. Equity CORE Large Cap Growth CORE Small Cap Equity CORE Large Cap Value |
Since
1991 1997 1997 1998 |
Mr. Jones joined the
Investment Adviser as a portfolio manager in 1989. |
||||
| Victor H. Pinter
Vice President |
Senior Portfolio Manager—
CORE U.S. Equity CORE Large Cap Growth CORE Small Cap Equity CORE Large Cap Value |
Since
1996 1997 1997 1998 |
Mr. Pinter joined the
Investment Adviser as a research analyst in 1989. He became a portfolio manager in 1992. |
||||
| Growth Equity Investment Team
|
n
|
18 year consistent investment style applied through diverse and complete market cycles
|
n
|
More than $22 billion in equities currently under management
|
n
|
More than 300 client account relationships
|
n
|
A portfolio management and analytical team with more than 150 years combined investment experience
|
| Name and Title | Fund Responsibility | Years
Primarily Responsible |
Five Year Employment History | ||||
|---|---|---|---|---|---|---|---|
| George D. Adler
Vice President |
Senior Portfolio Manager—
Balanced (Equity) Capital Growth Strategic Growth Growth Opportunities |
Since
1997 1997 1999 1999 |
Mr. Adler joined the
Investment Adviser as a portfolio manager in 1997. From 1990 to 1997, he was a portfolio manager at Liberty Investment Management, Inc. (“Liberty”). |
||||
| Steve Barry
Vice President |
Senior Portfolio Manager—
Growth Opportunities Capital Growth Balanced (Equity) Strategic Growth |
Since
1999 2000 2000 2000 |
Mr. Barry joined the Investment
Adviser as a portfolio manager in 1999. From 1988 to 1999, he was a portfolio manager at Alliance Capital Management. |
||||
| Kenneth T. Berents
Managing Director |
Senior Portfolio Manager—
Capital Growth Balanced (Equity) Strategic Growth Growth Opportunities |
Since
2000 2000 2000 2000 |
Mr. Berents joined the Investment
Adviser as a portfolio manager in 2000. From 1992 to 1999, he was Director of Research and head of the Investment Committee at Wheat First Union. |
||||
| Robert G. Collins
Managing Director |
Senior Portfolio Manager—
Capital Growth Balanced (Equity) Strategic Growth Growth Opportunities |
Since
1997 1998 1999 1999 |
Mr. Collins joined the Investment
Adviser as portfolio manager and Co-Chair of the Growth Equity Investment Committee in 1997. From 1991 to 1997, he was a portfolio manager at Liberty. |
||||
| Herbert E. Ehlers
Managing Director |
Senior Portfolio Manager—
Capital Growth Balanced (Equity) Strategic Growth Growth Opportunities |
Since
1997 1998 1999 1999 |
Mr. Ehlers joined the Investment
Adviser as a senior portfolio manager and Chief Investment Officer of the Growth Equity team in 1997. From 1994 to 1997, he was the Chief Investment Officer and Chairman of Liberty. |
||||
| Name and Title | Fund Responsibility | Years
Primarily Responsible |
Five Year Employment History | ||||
|---|---|---|---|---|---|---|---|
| Gregory H. Ekizian
Managing Director |
Senior Portfolio Manager—
Capital Growth Balanced (Equity) Strategic Growth Growth Opportunities |
Since
1997 1998 1999 1999 |
Mr. Ekizian joined the Investment
Adviser as portfolio manager and Co-Chair of the Growth Equity Investment Committee in 1997. From 1990 to 1997, he was a portfolio manager at Liberty and its predecessor firm, Eagle. |
||||
| Scott Kolar
Vice President |
Portfolio Manager—
Growth Opportunities Capital Growth Balanced (Equity) Strategic Growth |
Since
1999 2000 2000 2000 |
Mr. Kolar joined the Investment
Adviser as an equity analyst in 1997 and became a portfolio manager in 1999. From 1994 to 1997, he was an equity analyst and information systems specialist at Liberty. |
||||
| David G. Shell
Managing Director |
Senior Portfolio Manager—
Capital Growth Balanced (Equity) Strategic Growth Growth Opportunities |
Since
1997 1998 1999 1999 |
Mr. Shell joined the Investment
Adviser as a portfolio manager in 1997. From 1987 to 1997, he was a portfolio manager at Liberty and its predecessor firm, Eagle. |
||||
| Ernest C. Segundo, Jr.
Vice President |
Senior Portfolio Manager—
Capital Growth Balanced (Equity) Strategic Growth Growth Opportunities |
Since
1997 1998 1999 1999 |
Mr. Segundo joined the Investment
Adviser as a portfolio manager in 1997. From 1992 to 1997, he was a portfolio manager at Liberty. |
||||
| Fixed-Income Portfolio Management Team
|
n
|
Fixed-income portfolio management is comprised of a deep team of sector specialists
|
n
|
The team strives to maximize risk-adjusted returns by de-emphasizing interest rate anticipation and focusing on security selection
and sector allocation
|
n
|
The team manages approximately $49 billion in fixed-income assets for retail, institutional and high net worth clients
|
| Name and Title | Fund Responsibility | Years
Primarily Responsible |
Five Year Employment History | ||||
|---|---|---|---|---|---|---|---|
| Jonathan A. Beinner
Managing Director and Co-Head U.S. Fixed Income |
Senior Portfolio Manager—
Balanced (Fixed-Income) |
Since
1994 |
Mr. Beinner joined the Investment
Adviser as a portfolio manager in 1990. |
||||
| C. Richard Lucy
Managing Director and Co-Head U.S. Fixed Income |
Senior Portfolio Manager—
Balanced (Fixed-Income) |
Since
1994 |
Mr. Lucy joined the Investment
Adviser as a portfolio manager in 1992. |
||||
| DISTRIBUTOR AND TRANSFER AGENT
|
| Goldman Sachs, 85 Broad Street, New York, New York 10004, serves as the exclusive distributor (the “Distributor”) of
each Fund’s shares. Goldman Sachs, 4900 Sears Tower, Chicago, Illinois 60606-6372, also serves as the Funds’ transfer agent (the “Transfer Agent”) and, as such, performs various shareholder servicing functions.
|
| From time to time, Goldman Sachs or any of its affiliates may purchase and hold shares of the Funds. Goldman Sachs reserves the
right to redeem at any time some or all of the shares acquired for its own account.
|
| ACTIVITIES OF GOLDMAN SACHS AND ITS AFFILIATES AND OTHER ACCOUNTS MANAGED BY GOLDMAN SACHS
|
| The involvement of the Investment Adviser, Goldman Sachs and their affiliates in the management of, or their interest in, other
accounts and other activities of Goldman Sachs may present conflicts of interest with respect to a Fund or limit a Fund’s investment activities. Goldman Sachs and its affiliates engage in proprietary trading and advise accounts and funds which have
investment objectives similar to those of the Funds and/or which engage in and compete for transactions in the same types of securities, currencies and instruments as the Funds. Goldman Sachs and its affiliates will not have any obligation to make
available any information regarding their proprietary activities or strategies, or the activities or strategies used for other accounts managed by them, for the benefit of the management of the Funds. The results of a Fund’s investment activities,
therefore, may differ from those of Goldman Sachs and its affiliates, and it is possible that a Fund could sustain losses during periods in which Goldman Sachs and its affiliates and other accounts achieve significant profits on their trading for
proprietary or other
accounts. In addition, the Funds may, from time to time, enter into transactions in which other clients of Goldman Sachs have an adverse interest. A Fund’s activities may be limited because of regulatory restrictions applicable to Goldman Sachs and
its affiliates, and/or their internal policies designed to comply with such restrictions.
|
n
|
Cash
|
n
|
Additional shares of the same class of the same Fund
|
n
|
Shares of the same or an equivalent class of another Goldman Sachs Fund. Special restrictions may apply for certain ILA
Portfolios. See the Additional Statement.
|
| Fund | Investment
Income Dividends |
Capital Gains
Distributions |
|||
|---|---|---|---|---|---|
| Balanced | Quarterly | Annually | |||
| Growth and Income | Quarterly | Annually | |||
| CORE Large Cap Value | Quarterly | Annually | |||
| CORE U.S. Equity | Annually | Annually | |||
| CORE Large Cap Growth | Annually | Annually | |||
| CORE Small Cap Equity | Annually | Annually | |||
| Capital Growth | Annually | Annually | |||
| Strategic Growth | Annually | Annually | |||
| Growth Opportunities | Annually | Annually | |||
| Mid Cap Value | Annually | Annually | |||
| Small Cap Value | Annually | Annually | |||
| Large Cap Value | Annually | Annually | |||
| The following section will provide you with answers to some of the most often asked questions regarding buying and selling the
Funds’ Service Shares.
|
| How Can I Purchase Service Shares Of The Funds?
|
| Generally, Service Shares may be purchased only through institutions that have agreed to provide account administration and
personal and account maintenance services to their customers who are the beneficial owners of Service Shares. These institutions are called “Service Organizations.” Customers of a Service Organization will normally give their purchase
instructions to the Service Organization, and the Service Organization will, in turn, place purchase orders with Goldman Sachs. Service Organizations will set times by which purchase orders and payments must be received by them from their customers.
Generally, Service Shares may be purchased from the Funds on any business day at their NAV next determined after receipt of an order by Goldman Sachs from a Service Organization. No sales load is charged. Purchases of Service Shares must be settled within
three business days of receipt of a complete purchase order.
|
| Service Organizations are responsible for transmitting purchase orders and payments to Goldman Sachs in a timely fashion. Service
Organizations should place an order with Goldman Sachs at 1-800-621-2550 and either:
|
n
|
Wire federal funds to The Northern Trust Company (“Northern”), as subcustodian for State Street Bank and Trust Company
(“State Street”) (each Fund’s custodian) on the next business day; or
|
n
|
Send a check or Federal Reserve draft payable to Goldman Sachs Funds—(Name of Fund and Class of Shares), 4900 Sears Tower,
Chicago, IL 60606-6372. The Fund will not accept a check drawn on a foreign bank or a third-party check.
|
| In certain instances, the Trust may require a signature guarantee in order to effect purchase, redemption or exchange
transactions. Signature guarantees must be obtained from a bank, brokerage firm or other financial intermediary that is a member of an approved Medallion Guarantee Program or that is otherwise approved by Goldman Sachs. A notary public cannot provide a
signature guarantee.
|
| What Do I Need To Know About Service Organizations?
|
| Service Organizations may provide the following services in connection with their customers’ investments in Service Shares:
|
n
|
Acting, directly or through an agent, as the sole shareholder of record
|
n
|
Maintaining account records for customers
|
n
|
Processing orders to purchase, redeem or exchange shares for customers
|
n
|
Responding to inquiries from prospective and existing shareholders
|
n
|
Assisting customers with investment procedures
|
| In addition, some (but not all) Service Organizations are authorized to accept, on behalf of Goldman Sachs Trust (the “
Trust”), purchase, redemption and exchange orders placed by or on behalf of their customers, and may designate other intermediaries to accept such orders, if approved by the Trust. In these cases:
|
n
|
A Fund will be deemed to have received an order in proper form when the order is accepted by the authorized Service Organization
or intermediary on a business day, and the order will be priced at the Fund’s NAV next determined after such acceptance.
|
n
|
Service Organizations or intermediaries will be responsible for transmitting accepted orders and payments to the Trust within the
time period agreed upon by them.
|
| You should contact your Service Organization directly to learn whether it is authorized to accept orders for the Trust.
|
| Pursuant to a service plan adopted by the Trust’s Board of Trustees, Service Organizations are entitled to receive payment
for their services from the Trust of up to 0.50% (on an annualized basis) of the average daily net assets of the Service Shares of the Funds, which are attributable to or held in the name of the Service Organization for its customers.
|
| The Investment Adviser, Distributor and/or their affiliates may pay additional compensation from time to time, out of their assets
and not as an additional charge to the Funds, to selected Service Organizations and other persons in connection with the sale, distribution and/or servicing of shares of the Funds and other Goldman Sachs Funds. Additional compensation based on sales may,
but is currently not expected to, exceed 0.50% (annualized) of the amount invested.
|
| In addition to Service Shares, each Fund also offers other classes of shares to investors. These other share classes are subject
to different fees and expenses (which affect performance), have different minimum investment requirements and
|
| are entitled to different services than Service Shares. Information regarding these other share classes may be obtained from your
sales representative or from Goldman Sachs by calling the number on the back cover of this Prospectus.
|
| What Is My Minimum Investment In The Funds?
|
| The Funds do not have any minimum purchase or account requirements with respect to Service Shares. A Service Organization may,
however, impose a minimum amount for initial and subsequent investments in Service Shares, and may establish other requirements such as a minimum account balance. A Service Organization may redeem Service Shares held by non-complying accounts, and may
impose a charge for any special services.
|
| What Else Should I Know About Share Purchases?
|
| The Trust reserves the right to:
|
n
|
Reject or restrict any purchase or exchange orders by a particular purchaser (or group of related purchasers). This may occur, for
example, when a pattern of frequent purchases, sales or exchanges of Service Shares of a Fund is evident, or if purchases, sales or exchanges are, or a subsequent abrupt redemption might be, of a size that would disrupt the management of a Fund.
|
n
|
Close a Fund to new investors from time to time and reopen a
Fund whenever it is deemed appropriate by a Fund’s Investment Adviser.
|
| The Funds may allow Service Organizations to purchase shares with securities instead of cash if consistent with a Fund’s
investment policies and operations and if approved by the Fund’s Investment Adviser.
|
| How Are Shares Priced?
|
| The price you pay or receive when you buy, sell or exchange Service Shares is determined by a Fund’s NAV. The Funds calculate
NAV as follows:
|
| |
(Value of Assets of the Class)
|
|
| NAV =
|
– (Liabilities of the Class)
|
|
| |
Number of Outstanding Shares of the Class
|
|
| The Funds’ investments are valued based on market quotations or, if accurate quotations are not readily available, the fair
value of the Fund’s investments may be determined in good faith under procedures established by the Trustees.
|
n
|
NAV per share of each class is calculated by State Street on each business day as of the close of regular trading on the New York
Stock Exchange (normally 4:00 p.m. New York time). Fund shares will not be priced on any day the New York Stock Exchange is closed.
|
n
|
When you buy shares, you pay the NAV next calculated after the Funds receive your order in proper form.
|
n
|
When you sell shares, you receive the NAV next calculated after the Funds receive your order in proper form.
|
| Note: The time at which transactions and shares are priced and the time by which orders must be received may be
changed in case of an emergency or if regular trading on the New York Stock Exchange is stopped at a time other than 4:00 p.m. New York time.
|
| Foreign securities may trade in their local markets on days a Fund is closed. As a result, if a Fund holds foriegn securities, its
NAV may be impacted on days when investors may not purchase or redeem Fund shares.
|
| In addition, the impact of events that occur after the publication of market quotations used by a Fund to price its securities but
before the close of regular trading on the New York Stock Exchange will normally not be reflected in a Fund’s next determined NAV unless the Trust, in its discretion, makes an adjustment in light of the nature and materiality of the event, its effect
on Fund operations and other relevant factors.
|
| How Can I Sell Service Shares Of The Funds?
|
| Generally, Service Shares may be sold (redeemed) only through Service Organizations. Customers of a Service Organization will
normally give their redemption instructions to the Service Organization, and the Service Organization will, in turn, place redemption orders with the Funds. Generally, each Fund will redeem its Service Shares upon request on any business day at their NAV next determined after receipt of such request in proper form. Redemption proceeds may be sent to recordholders by check or by wire (if the wire
instructions are on record).
|
| A Service Organization may request redemptions in writing or by telephone if the optional telephone redemption privilege is
elected on the Account Application.
|
| By Writing: | Goldman Sachs Funds
4900 Sears Tower Chicago, IL 60606-6372 |
||
| By Telephone: | 1-800-621-2550
(8:00 a.m. to 4:00 p.m. New York time) |
||
| What Do I Need To Know About Telephone Redemption Requests?
|
| The Trust, the Distributor and the Transfer Agent will not be liable for any loss you may incur in the event that the Trust
accepts unauthorized telephone redemption requests that the Trust reasonably believes to be genuine. In an effort to prevent unauthorized or fraudulent redemption and exchange requests by tele
phone, Goldman Sachs employs reasonable procedures specified by the Trust to confirm that such instructions are genuine. If reasonable procedures are not employed, the Trust may be liable for any loss due to unauthorized or fraudulent transactions. The
following general policies are currently in effect:
|
n
|
All telephone requests are recorded.
|
n
|
Any redemption request that requires money to go to an account or address other than that designated on the Account Application
must be in writing and signed by an authorized person designated on the Account Application. The written request may be confirmed by telephone with both the requesting party and the designated bank account to verify instructions.
|
n
|
The telephone redemption option may be modified or terminated at any time.
|
| Note: It may be difficult to make telephone redemptions in times of drastic economic or market conditions.
|
| How Are Redemption Proceeds Paid?
|
| By Wire: The Funds will arrange for redemption proceeds to be wired as federal funds to the bank account
designated in the recordholder’s Account Application. The following general policies govern wiring redemption proceeds:
|
n
|
Redemption proceeds will normally be wired on the next business day in federal funds (for a total of one business day delay), but
may be paid up to three business days following receipt of a properly executed wire transfer redemption request. If the shares to be sold were recently paid for by check, the Fund will pay the redemption proceeds when the check has cleared, which may take
up to 15 days. If the Federal Reserve Bank is closed on the day that the redemption proceeds would ordinarily be wired, wiring the redemption proceeds may be delayed one additional business day.
|
n
|
To change the bank designated on your Account Application, you must send written instructions signed by an authorized person
designated on the Account Application to the Service Organization.
|
n
|
Neither the Trust nor Goldman Sachs assumes any responsibility for the performance of intermediaries or your Service Organization
in the transfer process. If a problem with such performance arises, you should deal directly with such intermediaries or Service Organization.
|
| By Check: A recordholder may elect in writing to receive redemption proceeds by check. Redemption
proceeds paid by check will normally be mailed to the address of record within three business days of receipt of a properly executed redemption request. If the shares to be sold were recently paid for by check, the Fund will pay the redemption proceeds
when the check has cleared, which may take up to 15 days.
|
| What Else Do I Need To Know About Redemptions?
|
| The following generally applies to redemption requests:
|
n
|
Additional documentation may be required when deemed appropriate by the Transfer Agent. A redemption request will not be in proper
form until such additional documentation has been received.
|
n
|
Service Organizations are responsible for the timely transmittal of redemption requests by their customers to the Transfer Agent.
In order to facilitate the timely transmittal of redemption requests, Service Organizations may set times by which they must receive redemption requests. Service Organizations may also require additional documentation from you.
|
| The Trust reserves the right to:
|
n
|
Redeem the Service Shares of any Service Organization whose account balance falls below $50 as a result of a redemption. The Funds
will not redeem Service Shares on this basis if the value of the account falls below the minimum account balance solely as a result of market conditions. The Fund will give 60 days’ prior written notice to allow a Service Organization to purchase
sufficient additional shares of the Fund in order to avoid such redemption.
|
n
|
Redeem your shares in other circumstances determined by the Board of Trustees to be in the best interest of the Trust.
|
n
|
Pay redemptions by a distribution in-kind of securities (instead of cash). If you receive redemption proceeds in-kind, you should
expect to incur transaction costs upon the disposition of those securities.
|
n
|
Reinvest any dividends or other distributions which you have elected to receive in cash should your check for such dividends or
other distributions be returned to the Fund as undeliverable or remain uncashed for six months. In addition, that distribution and all future distributions payable to you will be reinvested at NAV in additional Service shares of the Fund that pays the
distributions. No interest will accrue on amounts represented by uncashed distribution or redemption checks.
|
| Can I Exchange My Investment From One Fund To Another?
|
| A Service Organization may exchange Service Shares of a Fund at NAV for Service Shares of any other Goldman Sachs Fund. The
exchange privilege may be materially modified or withdrawn at any time upon 60 days’ written notice.
|
| Instructions For Exchanging Shares: | |||||
|---|---|---|---|---|---|
| By Writing: | n Write a letter of instruction that includes: | ||||
| n The recordholder name(s) and signature(s) | |||||
| n The account number | |||||
| n The Fund names and Class of Shares | |||||
| n The dollar amount to be exchanged | |||||
| n
Mail the request to:
Goldman Sachs Funds 4900 Sears Tower Chicago, IL 60606-6372 |
|||||
| By Telephone: | If you have elected the telephone exchange
privilege on your Account Application: |
||||
| n
1-800-621-2550
(8:00 a.m. to 4:00 p.m. New York time) |
|||||
| You should keep in mind the following factors when making or considering an exchange:
|
n
|
You should obtain and carefully read the prospectus of the Fund you are acquiring before making an exchange.
|
n
|
All exchanges which represent an initial investment in a Fund must satisfy the minimum initial investment requirement of that
Fund, except that this requirement may be waived at the discretion of the Trust.
|
n
|
Telephone exchanges normally will be made only to an identically registered account.
|
n
|
Shares may be exchanged among accounts with different names, addresses and social security or other taxpayer identification
numbers only if the exchange instructions are in writing and are signed by an authorized person designated on the Account Application.
|
n
|
Exchanges are available only in states where exchanges may be legally made.
|
n
|
It may be difficult to make telephone exchanges in times of drastic economic or market conditions.
|
n
|
Goldman Sachs may use reasonable procedures described under “What Do I Need To Know About Telephone Redemption Requests?”
in an effort to prevent unauthorized or fraudulent telephone exchange requests.
|
n
|
Exchanges into Funds that are closed to new investors may be restricted.
|
| For federal income tax purposes, an exchange from one Fund to another is treated as a redemption of the shares surrendered in the
exchange, on which you may be subject to tax, followed by a purchase of shares received in the exchange. You should consult your tax adviser concerning the tax consequences of an exchange.
|
| Restrictions on Excessive Trading Practices. The Trust does not permit market-timing or other excessive trading
practices. Purchases and exchanges should be made for long-term investment purposes only. The Trust and Goldman Sachs reserve the right to reject or restrict purchase or exchange requests from any investor. Excessive, short-term (market-timing) trading
practices may disrupt portfolio management strategies, harm Fund performance and negatively impact long-term shareholders. The Trust and Goldman Sachs will not be held liable for any loss resulting from rejected purchase or exchange orders. To minimize
harm to the Trust (or Goldman Sachs) and its shareholders, the Trust (or Goldman Sachs) will exercise these rights if, in the Trust’s (or Goldman Sachs’) judgment, an investor has a history of excessive trading or if an investor’s trading,
in the judgment of the Trust (or Goldman Sachs) has been or may be disruptive to a Fund. In making this judgment, trades executed in multiple accounts under common ownership or control may be considered together.
|
| What Types Of Reports Will Be Sent Regarding Investments In Service Shares?
|
| Service Organizations will receive from the Funds annual reports containing audited financial statements and semi-annual reports.
Service Organizations will also be provided with a printed confirmation for each transaction in their account and a monthly account statement. Service Organizations are responsible for providing these or other reports to their customers who are the
beneficial owners of Service Shares in accordance with the rules that apply to their accounts with the Service Organizations.
|
| As with any investment, you should consider how your investment in the Funds will be taxed. The tax information below is provided
as general information. More tax information is available in the Additional Statement. You should consult your tax adviser about the federal, state, local or foreign tax consequences of your investment in the Funds.
|
| Unless your investment is an IRA or other tax-advantaged account, you should consider the possible tax consequences of Fund
distributions and the sale of your Fund shares.
|
| DISTRIBUTIONS
|
| Distributions you receive from the Funds are generally subject to federal income tax, and may also be subject to state or local
taxes. This is true whether you reinvest your distributions in additional Fund shares or receive them in cash. For federal tax purposes, the Funds’ income dividend distributions and short-term capital gain distributions are taxable to you as ordinary
income. Any long-term capital gain distributions are taxable as long-term capital gains, no matter how long you have owned your Fund shares.
|
| Although distributions are generally treated as taxable to you in the year they are paid, distributions declared in October,
November or December but paid in January are taxable as if they were paid in December. A percentage of the Funds’ dividends paid to corporate shareholders may be eligible for the corporate dividends-received deduction. The Funds will inform
shareholders of the source and tax status of all distributions promptly after the close of each calendar year.
|
| Each Fund may be subject to foreign withholding or other foreign taxes on income or gain from certain foreign securities. In
general, the Funds may deduct these taxes in computing their taxable income.
|
| If you buy shares of a Fund before it makes a distribution, the distribution will be taxable to you even though it may actually be
a return of a portion of your investment. This is known as “buying a dividend.”
|
| SALES AND EXCHANGES
|
| Your sale of Fund shares is a taxable transaction for federal income tax purposes, and may also be subject to state and local
taxes. For tax purposes, the exchange of your Fund shares for shares of a different Goldman Sachs Fund is the same as a sale. When you sell your shares, you will generally recognize a capital gain or loss in an amount equal to the difference between your
adjusted tax basis in the shares and the amount received. Generally, this gain or loss is long-term or short-term depending on whether your holding period exceeds twelve months, except that any loss realized on shares held for six months or less will be
treated as a long-term capital loss to the extent of any capital gain dividends that were received on the shares.
|
| OTHER INFORMATION
|
| When you open your account, you should provide your social security or tax identification number on your Account Application. By
law, each Fund must withhold 31% of your taxable distributions and any redemption proceeds if you do not provide your correct taxpayer identification number, or certify that it is correct, or if the IRS instructs the Fund to do so. Non-U.S. investors may
be subject to U.S. withholding and estate tax.
|
| A. General Portfolio Risks
|
| The Funds will be subject to the risks associated with equity securities. “Equity securities” include common stocks,
preferred stocks, interests in real estate investment trusts, convertible debt obligations, convertible preferred stocks, equity interests in trusts, partnerships, joint ventures, limited liability companies and similar enterprises, warrants and stock
purchase rights. In general, stock values fluctuate in response to the activities of individual companies and in response to general market and economic conditions. Accordingly, the value of the stocks that a Fund holds may decline over short or extended
periods. The stock markets tend to be cyclical, with periods when stock prices generally rise and periods when prices generally decline. The volatility of equity securities means that the value of your investment in the Funds may increase or decrease.
Recently, certain stock markets have experienced substantial price volatility and, at times, have traded at or close to record high levels. There can be no guarantee that such levels will be reached or maintained in the future.
|
| To the extent that a Fund invests in fixed-income securities, that Fund will also be subject to the risks associated with its
fixed-income securities. These risks include interest rate risk, credit risk and call/extension risk. In general, interest rate risk involves the risk that when interest rates decline, the market value of fixed-income securities tends to increase
(although many mortgage related securities will have less potential than other debt securities for capital appreciation during periods of declining rates). Conversely, when interest rates increase, the market value of fixed-income securities tends to
decline. Credit risk involves the risk that an issuer or guarantor could default on its obligations, and a Fund will not recover its investment. Call risk and extension risk are normally present in mortgage-backed securities and asset-backed securities.
For example, homeowners have the option to prepay their mortgages. Therefore, the duration of a security backed by home mortgages can either shorten (call risk) or lengthen (extension risk). In general, if interest rates on new mortgage loans fall
sufficiently below the interest rates on existing outstanding mortgage loans, the rate of prepayment would be expected to increase. Conversely, if mortgage loan interest rates rise above the interest rates on existing outstanding mortgage loans, the rate
of prepayment would be expected to decrease. In either case, a change in the prepayment rate can result in losses to investors.
|
| The Investment Adviser will not consider the portfolio turnover rate a limiting factor in making investment decisions for a Fund.
A high rate of portfolio turnover (100% or more) involves correspondingly greater expenses which must be borne by a Fund and its shareholders, and is also likely to result in higher short-term capital gains taxable to shareholders. The portfolio turnover
rate is calculated by dividing the lesser of the dollar amount of sales or purchases of portfolio securities by the average monthly value of a Fund’s portfolio securities, excluding securities having a maturity at the date of purchase of one year or
less. See “Financial Highlights” in Appendix B for a statement of the Funds’ historical portfolio turnover rates.
|
| The following sections provide further information on certain types of securities and investment techniques that may be used by
the Funds, including their associated risks. Additional information is provided in the Additional Statement, which is available upon request. Among other things, the Additional Statement describes certain fundamental investment restrictions that cannot be
changed without shareholder approval. You should note, however, that all investment objectives, and all investment policies not specifically designated as fundamental are non-fundamental and may be changed without shareholder approval. If there is a
change in a Fund’s investment objective, you should consider whether that Fund remains an appropriate investment in light of your then current financial position and needs.
|
| B. Other Portfolio Risks
|
| Risks of Investing in Small Capitalization Companies. Each Fund may invest in small capitalization companies.
Investments in small capitalization companies involve greater risk and portfolio price volatility than investments in larger capitalization stocks. Among the reasons for the greater price volatility of these investments are the less certain growth
prospects of smaller firms and the lower degree of liquidity in the markets for such securities. Small capitalization companies may be thinly traded and may have to be sold at a discount from current market prices or in small lots over an extended period
of time. In addition, these securities are subject to the risk that during certain periods the liquidity of particular issuers or industries, or all securities in these investment categories, will shrink or disappear suddenly and without warning as a
result of adverse economic or market conditions, or adverse investor perceptions whether or not accurate. Because of the lack of sufficient market liquidity, a Fund may incur losses because it will be required to effect sales at a disadvantageous time and
only then at a substantial drop in price. Small capitalization companies include “unseasoned” issuers that do not have an established financial history; often have limited product lines, markets or financial
resources; may depend on or use a few key personnel for management; and may be susceptible to losses and risks of bankruptcy. Transaction costs for these investments are often higher than those of larger capitalization companies. Investments in small
capitalization companies may be more difficult to price precisely than other types of securities because of their characteristics and lower trading volumes.
|
| Risks of Foreign Investments. The Funds may make foreign investments. Foreign investments involve special risks that
are not typically associated with U.S. dollar denominated or quoted securities of U.S. issuers. Foreign investments may be affected by changes in currency rates, changes in foreign or U.S. laws or restrictions applicable to such investments and changes in
exchange control regulations (e.g., currency blockage). A decline in the exchange rate of the currency (i.e., weakening of the currency against the U.S. dollar) in which a portfolio security is quoted or denominated relative to the U.S. dollar would reduce the value of
the portfolio security. In addition, if the currency in which a Fund receives dividends, interest or other payments declines in value against the U.S. dollar before such income is distributed as dividends to shareholders or converted to U.S. dollars, the
Fund may have to sell portfolio securities to obtain sufficient cash to pay such dividends.
|
| The introduction of a single currency, the euro, on January 1, 1999 for participating nations in the European Economic and
Monetary Union has presented unique uncertainties, including the fluctuation of the euro relative to non-euro currencies during the transition period from January 1, 1999 to December 31, 2001 and beyond; whether the interest rate, tax and labor regimes of
European countries participating in the euro will converge over time; and whether the conversion of the currencies of other countries that now are or may in the future become members of the European Union (“EU”), may have an impact on the euro.
Also, it is possible that the euro could be abandoned in the future by countries that have already adopted its use. These or other events, including political and economic developments, could cause market disruptions, and could adversely affect the value
of securities held by the Funds. Because of the number of countries using this single currency, a significant portion of the assets held by the Funds may be denominated in the euro.
|
| Brokerage commissions, custodial services and other costs relating to investment in international securities markets generally are
more expensive than in the United States. In addition, clearance and settlement procedures may be different in foreign countries and, in certain markets, such procedures have been unable to keep pace with the volume of securities transactions, thus making
it difficult to conduct such transactions.
|
| Foreign issuers are not generally subject to uniform accounting, auditing and financial reporting standards comparable to those
applicable to U.S. issuers. There may be less publicly available information about a foreign issuer than about a U.S. issuer. In addition, there is generally less government regulation of foreign markets, companies and securities dealers than in the
United States. Foreign securities markets may have substantially less volume than U.S. securities markets and secu-
|
| rities of many foreign issuers are less liquid and more volatile than securities of comparable domestic issuers. Furthermore, with
respect to certain foreign countries, there is a possibility of nationalization, expropriation or confiscatory taxation, imposition of withholding or other taxes on dividend or interest payments (or, in some cases, capital gains distributions),
limitations on the removal of funds or other assets from such countries, and risks of political or social instability or diplomatic developments which could adversely affect investments in those countries.
|
| Concentration of a Fund’s assets in one or a few countries and currencies will subject a Fund to greater risks than if a
Fund’s assets were not geographically concentrated.
|
| Investment in sovereign debt obligations by certain Funds involves risks not present in debt obligations of corporate issuers. The
issuer of the debt or the governmental authorities that control the repayment of the debt may be unable or unwilling to repay principal or interest when due in accordance with the terms of such debt, and a Fund may have limited recourse to compel payment
in the event of a default. Periods of economic uncertainty may result in the volatility of market prices of sovereign debt, and in turn a Fund’s NAV, to a greater extent than the volatility inherent in debt obligations of U.S. issuers.
|
| A sovereign debtor’s willingness or ability to repay principal and pay interest in a timely manner may be affected by, among
other factors, its cash flow situation, the extent of its foreign currency reserves, the availability of sufficient foreign exchange on the date a payment
is due, the relative size of the debt service burden to the economy as a whole, the sovereign debtor’s policy toward international lenders, and the political constraints to which a sovereign debtor may be subject.
|
| Investments in foreign securities may take the form of sponsored and unsponsored American Depositary Receipts (“ADRs”)
and Global Depositary Receipts (“GDRs”). Certain Funds may also invest in European Depositary Receipts (“EDRs”) or other similar instruments representing securities of foreign issuers. ADRs represent the right to receive securities of
foreign issuers deposited in a domestic bank or a correspondent bank. Prices of ADRs are quoted in U.S. dollars, and ADRs are traded in the United States. EDRs and GDRs are receipts evidencing an arrangement with a non-U.S. bank. EDRs and GDRs are not
necessarily quoted in the same currency as the underlying security.
|
| Risks of Emerging Countries. Certain Funds may invest in securities of issuers located in emerging countries. The
risks of foreign investment are heightened when the issuer is located in an emerging country. Emerging countries are generally located in the Asia-Pacific region, Eastern Europe, Latin and South America and Africa. A Fund’s purchase and sale of
portfolio securities in certain emerging countries may be constrained by limitations relating to daily changes in the prices of listed securities, periodic trading or settlement volume and/or limitations on aggregate holdings of foreign investors. Such
limitations may be computed based on the aggregate trading volume by or holdings of a Fund, the Investment Adviser, its affiliates and their respective clients and other service providers. A Fund may not be able to sell securities in circumstances where
price, trading or settlement volume limitations have been reached.
|
| Foreign investment in the securities markets of certain emerging countries is restricted or controlled to varying degrees which
may limit investment in such countries or increase the administrative costs of such investments. For example, certain Asian countries require governmental approval prior to investments by foreign persons or limit investment by foreign persons to only a
specified percentage of an issuer’s outstanding securities or a specific class of securities which may have less advantageous terms (including price) than securities of the issuer available for purchase by nationals. In addition, certain countries
may restrict or prohibit investment opportunities in issuers or industries deemed important to national interests. Such restrictions may affect the market price, liquidity and rights of securities that may be purchased by a Fund. The repatriation of both
investment income and capital from certain emerging countries is subject to restrictions such as the need for governmental consents. Due to restrictions on direct investment in equity securities in certain Asian and other countries, it is anticipated that
a Fund may invest in such countries through other investment funds in such countries.
|
| Many emerging countries have recently experienced currency devaluations and substantial (and, in some cases, extremely high) rates
of inflation. Other emerging countries have experienced economic recessions. These circumstances have had a negative effect on the economies and securities markets of such emerging countries. Economies in emerging countries generally are dependent heavily
upon commodity prices and international trade and, accordingly, have been and may continue to be affected adversely by the economies of their trading partners, trade barriers, exchange controls, managed adjustments in relative currency values and other
protectionist measures imposed or negotiated by the countries with which they trade.
|
| Many emerging countries are subject to a substantial degree of economic, political and social instability. Governments of some
emerging countries are authoritarian in nature or have been installed or removed as a result of military coups, while
governments in other emerging countries have periodically used force to suppress civil dissent. Disparities of wealth, the pace and success of democratization, and ethnic, religious and racial disaffection, among other factors, have also led to social
unrest, violence and/or labor unrest in some emerging countries. Unanticipated political or social developments may result in sudden and significant investment losses. Investing in emerging countries involves greater risk of loss due to expropriation,
nationalization, confiscation of assets and property or the imposition of restrictions on foreign investments and on repatriation of capital invested. As an example, in the past some Eastern European governments have expropriated substantial amounts of
private property, and many claims of the property owners have never been fully settled. There is no assurance that similar expropriations will not recur in Eastern Europe or other countries.
|
| A Fund’s investment in emerging countries may also be subject to withholding or other taxes, which may be significant and may
reduce the return from an investment in such countries to the Fund.
|
| Settlement procedures in emerging countries are frequently less developed and reliable than those in the United States and often
may involve a Fund’s delivery of securities before receipt of payment for their sale. In addition, significant delays are common in certain markets in registering the transfer of securities. Settlement or registration problems may make it more
difficult for a Fund to value its portfolio securities and could cause the Fund to miss attractive investment opportunities, to have a portion of its assets uninvested or to incur losses due to the failure of a counterparty to pay for securities the Fund
has delivered or the Fund’s inability to complete its contractual obligations because of theft or other reasons. The creditworthiness of the local securities firms used by the Fund in emerging countries may not be as sound as the creditworthiness of
firms used in more developed countries. As a result, the Fund may be subject to a greater risk of loss if a securities firm defaults in the performance of its responsibilities.
|
| The small size and inexperience of the securities markets in certain emerging countries and the limited volume of trading in
securities in those countries may make a Fund’s investments in such countries less liquid and more volatile than investments in countries with more developed securities markets (such as the United States, Japan and most Western European countries). A
Fund’s investments in emerging countries are subject to the risk that the liquidity of a particular investment, or investments generally, in such countries will shrink or disappear suddenly and without warning as a result of adverse economic, market
or political conditions or adverse investor perceptions, whether or not accurate. Because of the lack of sufficient market liquidity, a Fund may incur losses because it will be required to effect sales at a disadvantageous time and only then at a
substantial drop in price. Invest
ments in emerging countries may be more difficult to price precisely because of the characteristics discussed above and lower trading volumes.
|
| A Fund’s use of foreign currency management techniques in emerging countries may be limited. Due to the limited market for
these instruments in emerging countries, the Investment Adviser does not currently anticipate that a significant portion of the Funds’ currency exposure in emerging countries, if any, will be covered by such instruments.
|
| Risks of Derivative Investments. A Fund’s transactions, if any, in options, futures, options on futures, swaps,
interest rate caps, floors and collars, structured securities and currency transactions involve additional risk of loss. Loss can result from a lack of correlation between changes in the value of derivative instruments and the portfolio assets (if any)
being hedged, the potential illiquidity of the markets for derivative instruments, or the risks arising from margin requirements and related leverage factors associated with such transactions. The use of these management techniques also involves the risk
of loss if the Investment Adviser is incorrect in its expectation of fluctuations in securities prices, interest rates or currency prices. Each Fund may also invest in derivative investments for non-hedging purposes (that is, to seek to increase total
return). Investing for non-hedging purposes is considered a speculative practice and presents even greater risk of loss.
|
| Risks of Illiquid Securities. Each Fund may invest up to 15% of its net assets in illiquid securities which cannot
be disposed of in seven days in the ordinary course of business at fair value. Illiquid securities include:
|
n
|
Both domestic and foreign securities that are not readily marketable
|
n
|
Certain stripped mortgage-backed securities
|
n
|
Repurchase agreements and time deposits with a notice or demand period of more than seven days
|
n
|
Certain over-the-counter options
|
n
|
Certain structured securities and all swap transactions
|
n
|
Certain restricted securities, unless it is determined, based upon a review of the trading markets for a specific restricted
security, that such restricted security is eligible for resale pursuant to Rule 144A under the Securities Act of 1933 (“144A Securities”) and, therefore, is liquid.
|
| Investing in 144A Securities may decrease the liquidity of a Fund’s portfolio to the extent that qualified institutional
buyers become for a time uninterested in purchasing these restricted securities. The purchase price and subsequent valuation of restricted and illiquid securities normally reflect a discount, which may be significant, from the market price of comparable
securities for which a liquid market exists.
|
| Credit Risks. Debt securities purchased by the Funds may include securities (including zero coupon bonds) issued by
the U.S. government (and its agencies, instrumentalities and sponsored enterprises), foreign governments, domestic and foreign corporations, banks and other issuers. Further information is provided in the Additional Statement.
|
| Debt securities rated BBB or higher by Standard & Poor’s or Baa or higher by Moody’s are considered “investment
grade.” Securities rated BBB or Baa are considered medium-grade obligations with speculative characteristics, and adverse economic conditions or changing circumstances may weaken their issuers’ capacity to pay interest and repay principal. A
security will be deemed to have met a rating requirement if it receives the minimum required rating from at least one such rating organization even though it has been rated below the minimum rating by one or more other rating organizations, or if unrated
by such rating organizations, determined by the Investment Adviser to be of comparable credit quality.
|
| Certain Funds may invest in fixed-income securities rated BB or Ba or below (or comparable unrated securities) which are commonly
referred to as “junk bonds.” Junk bonds are considered predominantly speculative and may be questionable as to principal and interest payments.
|
| In some cases, junk bonds may be highly speculative, have poor prospects for reaching investment grade standing and be in default.
As a result, investment in such bonds will present greater speculative risks than those associated with investment in investment grade bonds. Also, to the extent that the rating assigned to a security in a Fund’s portfolio is downgraded by a rating
organization, the market price and liquidity of such security may be adversely affected.
|
| Risks of Initial Public Offerings. The Funds may invest in IPOs. An IPO is a company’s first offering of stock
to the public. IPO risk is the risk that the market value of IPO shares will fluctuate considerably due to factors such as the absence of a prior public market, unseasoned trading, the small number of shares available for trading and limited information
about the issuer. The purchase of IPO shares may involve high transaction costs. IPO shares are subject to market risk and liquidity risk. When a Fund’s asset base is small, a significant portion of the Fund’s performance could be attributable
to investments in IPOs, because such investments would have a magnified impact on the Fund. As the Fund’s assets grow, the effect of the Fund’s investments in IPOs on the Fund’s performance probably will decline, which could reduce the
Fund’s performance. Because of the price volatility of IPO shares, a Fund may choose to hold IPO shares for a very short period of time. This may increase the turnover of the Fund’s portfolio and may lead to increased expenses to the Fund, such
as commissions and transaction costs. By selling IPO shares, the Fund may realize taxable gains it will subse
quently distribute to shareholders. In addition, the market for IPO shares can be speculative and/or inactive for extended periods of time. There is no assurance that a Fund will be able to obtain allocable portions of IPO shares. The limited number of
shares available for trading in some IPOs may make it more difficult for a Fund to buy or sell significant amounts of shares without an unfavorable impact on prevailing prices. Investors in IPO shares can be affected by substantial dilution in the value
of their shares, by sales of additional shares and by concentration of control in existing management and principal shareholders.
|
| Temporary Investment Risks. Each Fund may, for temporary defensive purposes, invest a certain percentage of its
total assets in:
|
n
|
U.S. government securities
|
n
|
Commercial paper rated at least A-2 by Standard & Poor’s or P-2 by Moody’s
|
n
|
Certificates of deposit
|
n
|
Bankers’ acceptances
|
n
|
Repurchase agreements
|
n
|
Non-convertible preferred stocks and non-convertible corporate bonds with a remaining maturity of less than one year
|
| When a Fund’s assets are invested in such instruments, the Fund may not be achieving its investment objective.
|
| C. Portfolio Securities and Techniques
|
| This section provides further information on certain types of securities and investment techniques that may be used by the Funds,
including their associated risks. Further information is provided in the Additional Statement, which is available upon request.
|
| Convertible Securities. Each Fund may invest in convertible securities. Convertible securities are preferred stock
or debt obligations that are convertible into common stock. Convertible securities generally offer lower interest or dividend yields than non-convertible securities of similar quality. Convertible securities in which a Fund invests are subject to the same
rating criteria as its other investments in fixed-income securities. Convertible securities have both equity and fixed-income risk characteristics. Like all fixed-income securities, the value of convertible securities is susceptible to the risk of market
losses attributable to changes in interest rates. Generally, the market value of convertible securities tends to decline as interest rates increase and, conversely, to increase as interest rates decline. However, when the market price of the common stock
underlying a convertible security exceeds the conversion price of the convertible security, the convertible security tends to reflect the market price of the underlying common stock. As the market
price of the underlying common stock declines, the convertible security, like a fixed-income security, tends to trade increasingly on a yield basis, and thus may not decline in price to the same extent as the underlying common stock.
|
| Foreign Currency Transactions. A Fund may, to the extent consistent with its investment policies, purchase or sell
foreign currencies on a cash basis or through forward contracts. A forward contract involves an obligation to purchase or sell a specific currency at a future date at a price set at the time of the contract. A Fund may engage in foreign currency
transactions for hedging purposes and to seek to protect against anticipated changes in future foreign currency exchange rates. In addition, certain Funds may also enter into such transactions to seek to increase total return, which is considered a
speculative practice.
|
| Some Funds may also engage in cross-hedging by using forward contracts in a currency different from that in which the hedged
security is denominated or quoted. A Fund may hold foreign currency received in connection with investments in foreign securities when, in the judgment of the Investment Adviser, it would be beneficial to convert such currency into U.S. dollars at a later
date (e.g., the Investment Adviser may anticipate the foreign currency to appreciate against the U.S. dollar).
|
| Currency exchange rates may fluctuate significantly over short periods of time, causing, along with other factors, a Fund’s
NAV to fluctuate (when the Fund’s NAV fluctuates, the value of your shares may go up or down). Currency exchange rates also can be affected unpredictably by the intervention of U.S. or foreign governments or central banks, or the failure to
intervene, or by currency controls or political developments in the United States or abroad.
|
| The market in forward foreign currency exchange contracts, currency swaps and other privately negotiated currency instruments
offers less protection against defaults by the other party to such instruments than is available for currency instruments traded on an exchange. Such contracts are subject to the risk that the counterparty to the contract will default on its obligations.
Since these contracts are not guaranteed by an exchange or clearinghouse, a default on a contract would deprive a Fund of unrealized profits, transaction costs or the benefits of a currency hedge or could force the Fund to cover its purchase or sale
commitments, if any, at the current market price.
|
| Structured Securities. Each Fund may invest in structured securities. Structured securities are securities whose
value is determined by reference to changes in the value of specific currencies, interest rates, commodities, indices or other financial indicators (the “Reference”) or the relative change in two or more References.
The interest rate or the principal amount payable upon maturity or redemption may be increased or decreased depending upon changes in the applicable Reference. Structured securities may be positively or negatively indexed, so that appreciation of the
Reference may produce an increase or decrease in the interest rate or value of the security at maturity. In addition, changes in the interest rates or the value of the security at maturity may be a multiple of changes in the value of the Reference.
Consequently, structured securities may present a greater degree of market risk than other types of fixed-income securities and may be more volatile, less liquid and more difficult to price accurately than less complex securities.
|
| REITs. Each Fund may invest in REITs. REITs are pooled investment vehicles that invest primarily in either real
estate or real estate related loans. The value of a REIT is affected by changes in the value of the properties owned by the REIT or securing mortgage loans held by the REIT. REITs are dependent upon the ability of the REITs’ managers, and are subject
to heavy cash flow dependency, default by borrowers and the qualification of the REITs under applicable regulatory requirements for favorable income tax treatment. REITs are also subject to risks generally associated with investments in real estate
including possible declines in the value of real estate, general and local economic conditions, environmental problems and changes in interest rates. To the extent that assets underlying a REIT are concentrated geographically, by property type or in
certain other respects, these risks may be heightened. A Fund will indirectly bear its proportionate share of any expenses, including management fees, paid by a REIT in which it invests.
|
| Options on Securities, Securities Indices and Foreign Currencies. A put option gives the purchaser of the option the
right to sell, and the writer (seller) of the option the obligation to buy, the underlying instrument during the option period. A call option gives the purchaser of the option the right to buy, and the writer (seller) of the option the obligation to sell,
the underlying instrument during the option period. Each Fund may write (sell) covered call and put options and purchase put and call options on any securities in which they may invest or on any securities index consisting of securities in which they may
invest. A Fund may also, to the extent that it invests in foreign securities, purchase and sell (write) put and call options on foreign currencies.
|
| The writing and purchase of options is a highly specialized activity which involves special investment risks. Options may be used
for either hedging or cross-hedging purposes, or to seek to increase total return (which is considered a speculative activity). The successful use of options depends in part on the ability of the Investment Adviser to manage future price fluctuations and
the degree of correlation between the options and securities (or currency) markets. If the Invest
ment Adviser is incorrect in its expectation of changes in market prices or determination of the correlation between the instruments or indices on which options are written and purchased and the instruments in a Fund’s investment portfolio, the Fund
may incur losses that it would not otherwise incur. The use of options can also increase a Fund’s transaction costs. Options written or purchased by the Funds may be traded on either U.S. or foreign exchanges or over-the-counter. Foreign and
over-the-counter options will present greater possibility of loss because of their greater illiquidity and credit risks.
|
| Futures Contracts and Options on Futures Contracts. Futures contracts are standardized, exchange-traded contracts
that provide for the sale or purchase of a specified financial instrument or currency at a future time at a specified price. An option on a futures contract gives the purchaser the right (and the writer of the option the obligation) to assume a position
in a futures contract at a specified exercise price within a specified period of time. A futures contract may be based on various securities (such as U.S. government securities), foreign currencies, securities indices and other financial instruments and
indices. The Funds may engage in futures transactions on both U.S. and foreign exchanges.
|
| Each Fund may purchase and sell futures contracts, and purchase and write call and put options on futures contracts, in order to
seek to increase total return or to hedge against changes in interest rates, securities prices or, to the extent a Fund invests in foreign securities, currency exchange rates, or to otherwise manage their term structures, sector selection and durations in
accordance with their investment objectives and policies. Each Fund may also enter into closing purchase and sale transactions with respect to such contracts and options. A Fund will engage in futures and related options transactions for bona fide hedging
purposes as defined in regulations of the Commodity Futures Trading Commission or to seek to increase total return to the extent permitted by such regulations. A Fund may not purchase or sell futures contracts or purchase or sell related options to seek
to increase total return, except for closing purchase or sale transactions, if immediately thereafter the sum of the amount of initial margin deposits and premiums paid on the Fund’s outstanding positions in futures and related options entered into
for the purpose of seeking to increase total return would exceed 5% of the market value of the Fund’s net assets.
|
| Futures contracts and related options present the following risks:
|
n
|
While a Fund may benefit from the use of futures and options on futures, unanticipated changes in interest rates, securities
prices or currency exchange rates may result in poorer overall performance than if the Fund had not entered into any futures contracts or options transactions.
|
n
|
Because perfect correlation between a futures position and portfolio position that is intended to be protected is impossible to
achieve, the desired protection may not be obtained and a Fund may be exposed to additional risk of loss.
|
n
|
The loss incurred by a Fund in entering into futures contracts and in writing call options on futures is potentially unlimited and
may exceed the amount of the premium received.
|
n
|
Futures markets are highly volatile and the use of futures may increase the volatility of a Fund’s NAV.
|
n
|
As a result of the low margin deposits normally required in futures trading, a relatively small price movement in a futures
contract may result in substantial losses to a Fund.
|
n
|
Futures contracts and options on futures may be illiquid, and exchanges may limit fluctuations in futures contract prices during a
single day.
|
n
|
Foreign exchanges may not provide the same protection as U.S. exchanges.
|
| Equity Swaps. Each Fund may invest in equity swaps. Equity swaps allow the parties to a swap agreement to exchange
the dividend income or other components of return on an equity investment (for example, a group of equity securities or an index) for a component of return on another non-equity or equity investment.
|
| An equity swap may be used by a Fund to invest in a market without owning or taking physical custody of securities in
circumstances in which direct investment may be restricted for legal reasons or is otherwise impractical. Equity swaps are derivatives and their value can be very volatile. To the extent that the Investment Adviser does not accurately analyze and predict
the potential relative fluctuation of the components swapped with another party, a Fund may suffer a loss, which may be substantial. The value of some components of an equity swap (such as the dividends on a common stock) may also be sensitive to changes
in interest rates. Furthermore, a Fund may suffer a loss if the counterparty defaults. Because equity swaps are normally illiquid, a Fund may be unable to terminate its obligations when desired.
|
| When-Issued Securities and Forward Commitments. Each Fund may purchase when-issued securities and make contracts to
purchase or sell securities for a fixed price at a future date beyond customary settlement time. When-issued securities are securities that have been authorized, but not yet issued. When-issued securities are purchased in order to secure what is
considered to be an advantageous price and yield to the Fund at the time of entering into the transaction. A forward commitment involves the entering into a contract to purchase or sell securities for a fixed price at a future date beyond the customary
settlement period.
|
| The purchase of securities on a when-issued or forward commitment basis involves a risk of loss if the value of the security to be
purchased declines before the settlement date. Conversely, the sale of securities on a forward commitment
basis involves the risk that the value of the securities sold may increase before the settlement date. Although a Fund will generally purchase securities on a when-issued or forward commitment basis with the intention of acquiring the securities for its
portfolio, a Fund may dispose of when-issued securities or forward commitments prior to settlement if the Investment Adviser deems it appropriate.
|
| Repurchase Agreements. Repurchase agreements involve the purchase of securities subject to the seller’s
agreement to repurchase them at a mutually agreed upon date and price. Each Fund may enter into repurchase agreements with dealers in U.S. government securities and member banks of the Federal Reserve System which furnish collateral at least equal in
value or market price to the amount of their repurchase obligation.
|
| If the other party or “seller” defaults, a Fund might suffer a loss to the extent that the proceeds from the sale of the
underlying securities and other collateral held by the Fund are less than the repurchase price and the Fund’s costs associated with delay and enforcement of the repurchase agreement. In addition, in the event of bankruptcy of the seller, a Fund could
suffer additional losses if a court determines that the Fund’s interest in the collateral is not enforceable.
|
| In evaluating whether to enter into a repurchase agreement, the Investment Adviser will carefully consider the creditworthiness of
the seller. Certain Funds, together with other registered investment companies having advisory agreements with the Investment Adviser or any of its affiliates, may transfer uninvested cash balances into a single joint account, the daily aggregate balance
of which will be invested in one or more repurchase agreements.
|
| Lending of Portfolio Securities. Each Fund may engage in securities lending. Securities lending involves the lending
of securities owned by a Fund to financial institutions such as certain broker-dealers. The borrowers are required to secure their loan continuously with cash, cash equivalents, U.S. government securities or letters of credit in an amount at least equal
to the market value of the securities loaned. Cash collateral may be invested in cash equivalents. To the extent that cash collateral is invested in other investment securities, such collateral will be subject to market depreciation or appreciation, and a
Fund will be responsible for any loss that might result from its investment of the borrowers’ collateral. If the Investment Adviser determines to make securities loans, the value of the securities loaned may not exceed 33 1
/3% of the value of the total assets of a
Fund (including the loan collateral).
|
| A Fund may lend its securities to increase its income. A Fund may, however, experience delay in the recovery of its securities if
the institution with which it has engaged in a portfolio loan transaction breaches its agreement with the Fund.
|
| Short Sales Against-the-Box. Certain Funds may make short sales against-the-box. A short sale against-the-box means
that at all times when a short position is open the Fund will own an equal amount of securities sold short, or securities convertible into or exchangeable for, without payment of any further consideration, an equal amount of the securities of the same
issuer as the securities sold short.
|
| Preferred Stock, Warrants and Rights. Each Fund may invest in preferred stock, warrants and rights. Preferred stocks
are securities that represent an ownership interest providing the holder with claims on the issuer’s earnings and assets before common stock owners but after bond owners. Unlike debt securities, the obligations of an issuer of preferred stock,
including dividend and other payment obligations, may not typically be accelerated by the holders of such preferred stock on the occurrence of an event of default or other non-compliance by the issuer of the preferred stock.
|
| Warrants and other rights are options to buy a stated number of shares of common stock at a specified price at any time during the
life of the warrant or right. The holders of warrants and rights have no voting rights, receive no dividends and have no rights with respect to the assets of the issuer.
|
| Other Investment Companies. Each Fund may invest in securities of other investment companies (including
exchange-traded funds such as SPDRs and iShares
SM
, as defined below) subject to statutory limitations prescribed by the Act. These limitations include a prohibition on any Fund acquiring more than 3% of the voting shares of any other
investment company, and a prohibition on investing more than 5% of a Fund’s total assets in securities of any one investment company or more than 10% of its total assets in securities of all investment companies. A Fund will indirectly bear its
proportionate share of any management fees and other expenses paid by such other investment companies. Exchange-traded funds such as SPDRs and iShares
SM
are shares of unaffiliated investment companies which are traded like traditional equity securities on a national securities exchange or the NASDAQ® National Market System.
|
n
|
Standard & Poor’s Depositary Receipts™.
The Funds may, consistent with their investment policies, purchase Standard & Poor’s Depositary Receipts™ (“SPDRs”). SPDRs are securities traded on the American Stock Exchange (“AMEX”) that represent
ownership in the SPDR Trust, a trust which has been established to accumulate and hold a portfolio of common stocks that is intended to track the price performance and dividend yield of the S&P 500®. The SPDR Trust is sponsored by a subsidiary of
the AMEX. SPDRs may be used for several reasons, including, but not limited to, facilitating the handling
of cash flows or trading, or reducing transaction costs. The price movement of SPDRs may not perfectly parallel the price action of the S&P 500®.
|
n
|
iShares
SM
(formerly World Equity Benchmark Shares or WEBs). iShares are shares of an investment company that invests substantially all of its assets in securities included
in the MSCI indices for specified countries. iShares are listed on the AMEX and were initially offered to the public in 1996. The market prices of iShares are expected to fluctuate in accordance with both changes in the NAVs of their underlying indices
and supply and demand of iShares on the AMEX. To date, iShares have traded at relatively modest discounts and premiums to their NAVs. However, iShares have a limited operating history and information is lacking regarding the actual performance and trading
liquidity of iShares for extended periods or over complete market cycles. In addition, there is no assurance that the requirements of the AMEX necessary to maintain the listing of iShares will continue to be met or will remain unchanged. In the event
substantial market or other disruptions affecting iShares should occur in the future, the liquidity and value of a Fund’s shares could also be substantially and adversely affected. If such disruptions were to occur, a Fund could be required to
reconsider the use of iShares as part of its investment strategy.
|
| Unseasoned Companies. Each Fund may invest in companies (including predecessors) which have operated less than three
years. The securities of such companies may have limited liquidity, which can result in their being priced higher or lower than might otherwise be the case. In addition, investments in unseasoned companies are more speculative and entail greater risk than
do investments in companies with an established operating record.
|
| Corporate Debt Obligations. Corporate debt obligations include bonds, notes, debentures, commercial paper and other
obligations of corporations to pay interest and repay principal, and include securities issued by banks and other financial institutions. Each Fund may invest in corporate debt obligations issued by U.S. and certain non-U.S. issuers which issue securities
denominated in the U.S. dollar (including Yankee and Euro obligations). In addition to obligations of corporations, corporate debt obligations include securities issued by banks and other financial institutions and supranational entities (i.e., the World Bank, the International Monetary Fund, etc.).
|
| Bank Obligations. Each Fund may invest in obligations issued or guaranteed by U.S. or foreign banks. Bank
obligations, including without limitations, time deposits, bankers’ acceptances and certificates of deposit, may be general obligations of the parent bank or may be limited to the issuing branch by the terms of the specific obligations or by
government regulations. Banks are subject to extensive but different governmental regulations which may limit both the amount and types of
loans which may be made and interest rates which may be charged. In addition, the profitability of the banking industry is largely dependent upon the availability and cost of funds for the purpose of financing lending operations under prevailing money
market conditions. General economic conditions as well as exposure to credit losses arising from possible financial difficulties of borrowers play an important part in the operation of this industry.
|
| U.S. Government Securities. Each Fund may invest in U.S. government securities. U.S. government securities include
U.S. Treasury obligations and obligations issued or guaranteed by U.S. government agencies, instrumentalities or sponsored enterprises. U.S. government securities may be supported by (a) the full faith and credit of the U.S. Treasury (such as the
Government National Mortgage Association (“Ginnie Mae”)); (b) the right of the issuer to borrow from the U.S. Treasury (such as securities of the Student Loan Marketing Association); (c) the discretionary authority of the U.S. government to
purchase certain obligations of the issuer; or (d) only the credit of the issuer. U.S. government securities also include Treasury receipts, zero coupon bonds and other stripped U.S. government securities, where the interest and principal components of
stripped U.S. government securities are traded independently.
|
| Custodial Receipts. Interests in U.S. government securities may be purchased in the form of custodial receipts that
evidence ownership of future interest payments, principal payments or both on certain notes or bonds issued or guaranteed as to principal and interest by the U.S. government, its agencies, instrumentalities, political subdivisions or authorities. For
certain securities law purposes, custodial receipts are not considered obligations of the U.S. government.
|
| Mortgage-Backed Securities. Certain Funds may invest in mortgage-backed securities. Mortgage-backed securities
represent direct or indirect participations in, or are collateralized by and payable from, mortgage loans secured by real property. Mortgage-backed securities can be backed by either fixed rate mortgage loans or adjustable rate mortgage loans, and may be
issued by either a governmental or non-governmental entity. Privately issued mortgage-backed securities are normally structured with one or more types of “credit enhancement.” However, these mortgage-backed securities typically do not have the
same credit standing as U.S. government guaranteed mortgage-backed securities.
|
| Mortgage-backed securities may include multiple class securities, including collateralized mortgage obligations (“CMOs”)
and Real Estate Mortgage Investment Conduit (“REMIC”) pass-through or participation certificates. CMOs provide an investor with a specified interest in the cash flow from a pool of underlying mortgages or of other mortgage-backed securities.
CMOs are issued in multiple classes. In many cases, payments of principal are applied to the CMO classes in the
order of their respective stated maturities, so that no principal payments will be made on a CMO class until all other classes having an earlier stated maturity date are paid in full. A REMIC is a CMO that qualifies for special tax treatment and invests
in certain mortgages principally secured by interests in real property and other permitted investments.
|
| Mortgaged-backed securities also include stripped mortgage-backed securities (“SMBS”), which are derivative multiple
class mortgage-backed securities. SMBS are usually structured with two different classes: one that receives substantially all of the interest payments and the other that receives substantially all of the principal payments from a pool of mortgage loans.
The market value of SMBS consisting entirely of principal payments generally is unusually volatile in response to changes in interest rates. The yields on SMBS that receive all or most of the interest from mortgage loans are generally higher than
prevailing market yields on other mortgage-backed securities because their cash flow patterns are more volatile and there is a greater risk that the initial investment will not be fully recouped.
|
| Asset-Backed Securities. Certain Funds may invest in asset-backed securities. Asset-backed securities are securities
whose principal and interest payments are collateralized by pools of assets such as auto loans, credit card receivables, leases, installment contracts and personal property. Asset-backed securities are often subject to more rapid repayment than their
stated maturity date would indicate as a result of the pass-through of prepayments of principal on the underlying loans. During periods of declining interest rates, prepayment of loans underlying asset-backed securities can be expected to accelerate.
Accordingly, a Fund’s ability to maintain positions in such securities will be affected by reductions in the principal amount of such securities resulting from prepayments, and its ability to reinvest the returns of principal at comparable yields is
subject to generally prevailing interest rates at that time. Asset-backed securities present credit risks that are not presented by mortgage-backed securities. This is because asset-backed securities generally do not have the benefit of a security
interest in collateral that is comparable to mortgage assets. If the issuer of an asset-backed security defaults on its payment obligations, there is the possibility that, in some cases, the Fund will be unable to possess and sell the underlying
collateral and that the Fund’s recoveries on repossessed collateral may not be available to support payments on the securities. In the event of a default, a Fund may suffer a loss if it cannot sell collateral quickly and receive the amount it is owed.
|
| Borrowings. Each Fund can borrow money from banks and other financial institutions in amounts not exceeding
one-third of its total assets for temporary or emergency purposes. A Fund may not make additional investments if borrowings exceed 5% of its total assets.
|
| Mortgage Dollar Rolls. Certain Funds may enter into mortgage dollar rolls. A mortgage dollar roll involves the sale
by a Fund of securities for delivery in the current month. The Fund simultaneously contracts with the same counterparty to repurchase substantially similar (same type, coupon and maturity) but not identical securities on a specified future date. During
the roll period, the Fund loses the right to receive principal and interest paid on the securities sold. However, the Fund benefits to the extent of any difference between (a) the price received for the securities sold and (b) the lower forward price for
the future purchase and/or fee income plus the interest earned on the cash proceeds of the securities sold. Unless the benefits of a mortgage dollar roll exceed the income, capital appreciation and gain or loss due to mortgage prepayments that would have
been realized on the securities sold as part of the roll, the use of this technique will diminish the Fund’s performance.
|
| Successful use of mortgage dollar rolls depends upon the Investment Adviser’s ability to predict correctly interest rates and
mortgage prepayments. If the Investment Adviser is incorrect in its prediction, a Fund may experience a loss. For financial reporting and tax purposes, the Funds treat mortgage dollar rolls as two separate transactions: one involving the purchase of a
security and a separate transaction involving a sale. The Funds do not currently intend to enter into mortgage dollar rolls that are accounted for as a financing and do not treat them as borrowings.
|
| Yield Curve Options. Certain Funds may enter into options on the yield “spread” or differential between
two securities. Such transactions are referred to as “yield curve” options. In contrast to other types of options, a yield curve option is based on the difference between the yields of designated securities, rather than the prices of the
individual securities, and is settled through cash payments. Accordingly, a yield curve option is profitable to the holder if this differential widens (in the case of a call) or narrows (in the case of a put), regardless of whether the yields of the
underlying securities increase or decrease.
|
| The trading of yield curve options is subject to all of the risks associated with the trading of other types of options. In
addition, such options present a risk of loss even if the yield of one of the underlying securities remains constant, or if the spread moves in a direction or to an extent which was not anticipated.
|
| Reverse Repurchase Agreements. Certain Funds may enter into reverse repurchase agreements. Reverse repurchase
agreements involve the sale of securities held by a Fund subject to the Fund’s agreement to repurchase them at a mutually agreed upon date and price (including interest). These transactions may be entered into as a temporary measure for emergency
purposes or to meet redemption requests. Reverse repurchase agreements may also be entered into when the Invest
ment Adviser expects that the interest income to be earned from the investment of the transaction proceeds will be greater than the related interest expense. Reverse repurchase agreements involve leveraging. If the securities held by a Fund decline in
value while these transactions are outstanding, the NAV of the Fund’s outstanding shares will decline in value by proportionately more than the decline in value of the securities. In addition, reverse repurchase agreements involve the risk that the
interest income earned by a Fund (from the investment of the proceeds) will be less than the interest expense of the transaction, that the market value of the securities sold by a Fund will decline below the price the Fund is obligated to pay to
repurchase the securities, and that the securities may not be returned to the Fund.
|
| Municipal Securities. Certain Funds may invest in securities and instruments issued by state and local government
issuers. Municipal securities in which a Fund may invest consist of bonds, notes, commercial paper and other instruments (including participating interests in such securities) issued by or on behalf of states, territories and possessions of the United
States (including the District of Columbia) and their political subdivisions, agencies or instrumentalities. Such securities may pay fixed, variable or floating rates of interest. Municipal securities are often issued to obtain funds for various public
purposes, including the construction of a wide range of public facilities such as bridges, highways, housing, hospitals, mass transportation, schools, streets and water and sewer works. Other public purposes for which municipal securities may be issued
include refunding outstanding obligations, obtaining funds for general operating expenses, and obtaining funds to lend to other public institutions and facilities. Municipal securities in which a Fund may invest include private activity bonds, municipal
leases, certificates of participation, pre-funded municipal securities and auction rate securities.
|
| Interest Rate Swaps, Mortgage Swaps, Credit Swaps, Currency Swaps and Interest Rate Caps, Floors and Collars.
Interest rate swaps involve the exchange by a Fund with another party of their respective commitments to pay or receive interest, such as an exchange of fixed-rate payments for floating rate payments. Mortgage swaps are similar to interest rate swaps in
that they represent commitments to pay and receive interest. The notional principal amount, however, is tied to a reference pool or pools of mortgages. Credit swaps involve the receipt of floating or fixed rate payments in exchange for assuming potential
credit losses of an underlying security. Credit swaps give one party to a transaction the right to dispose of or acquire an asset (or group of assets), or the right to receive or make a payment from the other party, upon the occurrence of specified credit
events. Currency swaps involve the exchange of the parties’ respective rights to make or receive payments in specified currencies. The purchase of an interest rate cap entitles the purchaser, to the extent that a specified index exceeds a
predetermined interest
rate, to receive payment of interest on a notional principal amount from the party selling such interest rate cap. The purchase of an interest rate floor entitles the purchaser, to the extent that a specified index falls below a predetermined interest
rate, to receive payments of interest on a notional principal amount from the party selling the interest rate floor. An interest rate collar is the combination of a cap and a floor that preserves a certain return within a predetermined range of interest
rates.
|
| Certain Funds may enter into swap transactions for hedging purposes or to seek to increase total return. The use of interest rate,
mortgage, credit and currency swaps, as well as interest rate caps, floors and collars, is a highly specialized activity which involves investment techniques and risks different from those associated with ordinary portfolio securities transactions. If the
Investment Adviser is incorrect in its forecasts of market value, interest rates and currency exchange rates, the investment performance of a Fund would be less favorable than it would have been if these investment techniques were not used.
|
| Loan Participations. Certain Funds may invest in loan participations. A loan participation is an interest in a loan
to a U.S. or foreign company or other borrower which is administered and sold by a financial intermediary. A Fund may only invest in loans to issuers in whose obligations it may otherwise invest. Loan participation interests may take the form of a direct
or co-lending relationship with the corporate borrower, an assignment of an interest in the loan by a co-lender or another participant, or a participation in the seller’s share of the loan. When a Fund acts as co-lender in connection with a
participation interest or when it acquires certain participation interests, the Fund will have direct recourse against the borrower if the borrower fails to pay scheduled principal and interest. In cases where the Fund lacks direct recourse, it will look
to the agent bank to enforce appropriate credit remedies against the borrower. In these cases, the Fund may be subject to delays, expenses and risks that are greater than those that would have been involved if the Fund had purchased a direct obligation
(such as commercial paper) of such borrower. Moreover, under the terms of the loan participation, the Fund may be regarded as a creditor of the agent bank (rather than of the underlying corporate borrower), so that the Fund may also be subject to the risk
that the agent bank may become insolvent.
|
| Inverse Floaters. Certain Funds may invest in inverse floating rate debt securities (“inverse floaters”).
The interest rate on inverse floaters resets in the opposite direction from the market rate of interest to which the inverse floater is indexed. An inverse floater may be considered to be leveraged to the extent that its interest rate varies by a
magnitude that exceeds the magnitude of the change in the index rate of interest. The higher the degree of leverage of an inverse floater, the greater the volatility of its market value.
|
| The financial highlights tables are intended to help you understand a Fund’s financial performance for the past five years
(or less if the Fund has not been in operation for less than five years). Certain information reflects financial results for a single Fund share. The total returns in the table represent the rate that an investor would have earned or lost on an investment
in a Fund (assuming reinvestment of all dividends and distributions). This information for the periods ended August 31, 2000 has been audited by PricewaterhouseCoopers LLP, whose report, along with a Fund’s financial statements, is included in the
Fund’s annual report (available upon request). The information for all periods prior to the periods ended August 31, 2000 has been audited by the Funds’ previous independent accountants.
|
| BALANCED FUND
|
|
Income from investment operations |
|||||||||||
|---|---|---|---|---|---|---|---|---|---|---|---|
|
Net asset value, beginning of period |
Net
investment Income |
Net realized
and unrealized gain(loss) |
Total from
investment operations |
||||||||
| For The Year Ended August 31, | |||||||||||
| 2000 - Class A Shares | $20.38 | $0.60 | c | $ 1.75 | $2.35 | ||||||
| 2000 - Class B Shares | 20.26 | 0.45 | c | 1.73 | 2.18 | ||||||
| 2000 - Class C Shares | 20.23 | 0.45 | c | 1.74 | 2.19 | ||||||
| 2000 - Institutional Shares | 20.39 | 0.71 | c | 1.75 | 2.46 | ||||||
| 2000 - Service Shares | 20.37 | 0.59 | c | 1.74 | 2.33 | ||||||
| For The Seven Months Ended August 31, | |||||||||||
| 1999 - Class A Shares | 20.48 | 0.32 | (0.19 | ) | 0.13 | ||||||
| 1999 - Class B Shares | 20.37 | 0.22 | (0.18 | ) | 0.04 | ||||||
| 1999 - Class C Shares | 20.34 | 0.23 | (0.19 | ) | 0.04 | ||||||
| 1999 - Institutional Shares | 20.48 | 0.53 | (0.35 | ) | 0.18 | ||||||
| 1999 - Service Shares | 20.47 | 1.22 | (1.14 | ) | 0.08 | ||||||
| For The Years Ended January 31, | |||||||||||
| 1999 - Class A Shares | 20.29 | 0.58 | 0.20 | 0.78 | |||||||
| 1999 - Class B Shares | 20.20 | 0.41 | 0.21 | 0.62 | |||||||
| 1999 - Class C Shares | 20.17 | 0.41 | 0.21 | 0.62 | |||||||
| 1999 - Institutional Shares | 20.29 | 0.64 | 0.20 | 0.84 | |||||||
| 1999 - Service Shares | 20.28 | 0.53 | 0.21 | 0.74 | |||||||
| 1998 - Class A Shares | 18.78 | 0.57 | 2.66 | 3.23 | |||||||
| 1998 - Class B Shares | 18.73 | 0.50 | 2.57 | 3.07 | |||||||
| 1998 - Class C Shares (commenced August 15, 1997) | 21.10 | 0.25 | 0.24 | 0.49 | |||||||
| 1998 - Institutional Shares (commenced August 15, 1997) | 21.18 | 0.26 | 0.32 | 0.58 | |||||||
| 1998 - Service Shares (commenced August 15, 1997) | 21.18 | 0.22 | 0.32 | 0.54 | |||||||
| 1997 - Class A Shares | 17.31 | 0.66 | 2.47 | 3.13 | |||||||
| 1997 - Class B Shares (commenced May 1, 1996) | 17.46 | 0.42 | 2.34 | 2.76 | |||||||
| 1996 - Class A Shares | 14.22 | 0.51 | 3.43 | 3.94 | |||||||
|
Distributions to shareholders |
|||||||||||||||||||||
|---|---|---|---|---|---|---|---|---|---|---|---|---|---|---|---|---|---|---|---|---|---|
| From net
investment income |
In excess of net investment income |
From net
realized gains |
Total
distributions |
Net asset
value, end of period |
Total
return a |
Net assets
at end of period (in 000s) |
Ratio of
net expenses to average net assets |
||||||||||||||
| $(0.50 | ) | $ — | $(0.81 | ) | $(1.31 | ) | $21.42 | 12.00 | % | $135,632 | 1.12 | % | |||||||||
| (0.36 | ) | — | (0.81 | ) | (1.17 | ) | 21.27 | 11.17 | 33,759 | 1.87 | |||||||||||
| (0.36 | ) | — | (0.81 | ) | (1.17 | ) | 21.25 | 11.23 | 8,658 | 1.87 | |||||||||||
| (0.58 | ) | — | (0.81 | ) | (1.39 | ) | 21.46 | 12.59 | 2,509 | 0.72 | |||||||||||
| (0.48 | ) | — | (0.81 | ) | (1.29 | ) | 21.41 | 11.89 | 17 | 1.22 | |||||||||||
| (0.23 | ) | — | — | (0.23 | ) | 20.38 | 0.62 | 169,395 | 1.10 | b | |||||||||||
| (0.15 | ) | — | — | (0.15 | ) | 20.26 | 0.20 | 40,515 | 1.85 | b | |||||||||||
| (0.15 | ) | — | — | (0.15 | ) | 20.23 | 0.18 | 11,284 | 1.85 | b | |||||||||||
| (0.27 | ) | — | — | (0.27 | ) | 20.39 | 0.86 | 2,361 | 0.70 | b | |||||||||||
| (0.18 | ) | — | — | (0.18 | ) | 20.37 | 0.39 | 15 | 1.20 | b | |||||||||||
| (0.59 | ) | — | — | (0.59 | ) | 20.48 | 3.94 | 192,453 | 1.04 | ||||||||||||
| (0.45 | ) | — | — | (0.45 | ) | 20.37 | 3.15 | 43,926 | 1.80 | ||||||||||||
| (0.45 | ) | — | — | (0.45 | ) | 20.34 | 3.14 | 14,286 | 1.80 | ||||||||||||
| (0.65 | ) | — | — | (0.65 | ) | 20.48 | 4.25 | 8,010 | 0.73 | ||||||||||||
| (0.55 | ) | — | — | (0.55 | ) | 20.47 | 3.80 | 490 | 1.23 | ||||||||||||
| (0.56 | ) | — | (1.16 | ) | (1.72 | ) | 20.29 | 17.54 | 163,636 | 1.00 | |||||||||||
| (0.42 | ) | (0.02 | ) | (1.16 | ) | (1.60 | ) | 20.20 | 16.71 | 23,639 | 1.76 | ||||||||||
| (0.22 | ) | (0.04 | ) | (1.16 | ) | (1.42 | ) | 20.17 | 2.49 | 8,850 | 1.77 | b | |||||||||
| (0.23 | ) | (0.08 | ) | (1.16 | ) | (1.47 | ) | 20.29 | 2.93 | 8,367 | 0.76 | b | |||||||||
| (0.22 | ) | (0.06 | ) | (1.16 | ) | (1.44 | ) | 20.28 | 2.66 | 16 | 1.26 | b | |||||||||
| (0.66 | ) | — | (1.00 | ) | (1.66 | ) | 18.78 | 18.59 | 81,410 | 1.00 | |||||||||||
| (0.42 | ) | (0.07 | ) | (1.00 | ) | (1.49 | ) | 18.73 | 16.22 | 2,110 | 1.75 | b | |||||||||
| (0.50 | ) | — | (0.35 | ) | (0.85 | ) | 17.31 | 28.10 | 50,928 | 1.00 | |||||||||||
| BALANCED FUND (continued)
|
|
Ratios assuming no expense reductions |
|||||||||||||
|---|---|---|---|---|---|---|---|---|---|---|---|---|---|
| Ratio of
net investment income to average net assets |
Ratio of
expenses to average net assets |
Ratio of
net investment income to average net assets |
Portfolio
turnover rate d |
||||||||||
| For The Year Ended August 31, | |||||||||||||
| 2000 - Class A Shares | 2.94 | % | 1.29 | % | 2.77 | % | 153.69 | % | |||||
| 2000 - Class B Shares | 2.19 | 2.04 | 2.02 | 153.69 | |||||||||
| 2000 - Class C Shares | 2.19 | 2.04 | 2.02 | 153.69 | |||||||||
| 2000 - Institutional Shares | 3.46 | 0.89 | 3.29 | 153.69 | |||||||||
| 2000 - Service Shares | 2.86 | 1.39 | 2.69 | 153.69 | |||||||||
| For The Seven Months Ended August 31, | |||||||||||||
| 1999 - Class A Shares | 2.58 | b | 1.32 | b | 2.36 | b | 90.41 | ||||||
| 1999 - Class B Shares | 1.83 | b | 2.07 | b | 1.61 | b | 90.41 | ||||||
| 1999 - Class C Shares | 1.84 | b | 2.07 | b | 1.62 | b | 90.41 | ||||||
| 1999 - Institutional Shares | 2.96 | b | 0.92 | b | 2.74 | b | 90.41 | ||||||
| 1999 - Service Shares | 2.46 | b | 1.42 | b | 2.24 | b | 90.41 | ||||||
| For The Years Ended January 31, | |||||||||||||
| 1999 - Class A Shares | 2.90 | 1.45 | 2.49 | 175.06 | |||||||||
| 1999 - Class B Shares | 2.16 | 2.02 | 1.94 | 175.06 | |||||||||
| 1999 - Class C Shares | 2.17 | 2.02 | 1.95 | 175.06 | |||||||||
| 1999 - Institutional Shares | 3.22 | 0.95 | 3.00 | 175.06 | |||||||||
| 1999 - Service Shares | 2.77 | 1.45 | 2.55 | 175.06 | |||||||||
| 1998 - Class A Shares | 2.94 | 1.57 | 2.37 | 190.43 | |||||||||
| 1998 - Class B Shares | 2.14 | 2.07 | 1.83 | 190.43 | |||||||||
| 1998 - Class C Shares (commenced August 15, 1997) | 2.13 | b | 2.08 | b | 1.82 | b | 190.43 | ||||||
| 1998 - Institutional Shares (commenced August 15, 1997) | 3.13 | b | 1.07 | b | 2.82 | b | 190.43 | ||||||
| 1998 - Service Shares (commenced August 15, 1997) | 2.58 | b | 1.57 | b | 2.27 | b | 190.43 | ||||||
| 1997 - Class A Shares | 3.76 | 1.77 | 2.99 | 208.11 | |||||||||
| 1997 - Class B Shares (commenced May 1, 1996) | 2.59 | b | 2.27 | b | 2.07 | b | 208.11 | ||||||
| 1996 - Class A Shares | 3.65 | 1.90 | 2.75 | 197.10 | |||||||||
| GROWTH AND INCOME FUND
|
|
Income from investment operations |
||||||||||||
|---|---|---|---|---|---|---|---|---|---|---|---|---|
|
Net asset value, beginning of period |
Net
investment income (loss) |
Net realized
and unrealized gain (loss) |
Total from
investment operations |
|||||||||
| For The Year Ended August 31, | ||||||||||||
| 2000 - Class A Shares | $24.68 | $ 0.07 | c | $1.44 | $1.51 | |||||||
| 2000 - Class B Shares | 24.46 | (0.10 | ) c | 1.42 | 1.32 | |||||||
| 2000 - Class C Shares | 24.41 | (0.09 | ) c | 1.40 | 1.31 | |||||||
| 2000 - Institutional Shares | 24.72 | 0.16 | c | 1.49 | 1.65 | |||||||
| 2000 - Service Shares | 24.68 | 0.05 | c | 1.44 | 1.49 | |||||||
| For The Seven Months Ended August 31, | ||||||||||||
| 1999 - Class A Shares | 24.33 | 0.19 | 0.31 | 0.50 | ||||||||
| 1999 - Class B Shares | 24.13 | 0.08 | 0.31 | 0.39 | ||||||||
| 1999 - Class C Shares | 24.08 | 0.08 | 0.30 | 0.38 | ||||||||
| 1999 - Institutional Shares | 24.35 | 0.34 | 0.23 | 0.57 | ||||||||
| 1999 - Service Shares | 24.33 | 0.17 | 0.32 | 0.49 | ||||||||
| For The Years Ended January 31, | ||||||||||||
| 1999 - Class A Shares | 25.93 | 0.20 | (1.60 | ) | (1.40 | ) | ||||||
| 1999 - Class B Shares | 25.73 | 0.02 | (1.58 | ) | (1.56 | ) | ||||||
| 1999 - Class C Shares | 25.70 | 0.02 | (1.59 | ) | (1.57 | ) | ||||||
| 1999 - Institutional Shares | 25.95 | 0.29 | (1.58 | ) | (1.29 | ) | ||||||
| 1999 - Service Shares | 25.92 | 0.17 | (1.58 | ) | (1.41 | ) | ||||||
| 1998 - Class A Shares | 23.18 | 0.11 | 5.27 | 5.38 | ||||||||
| 1998 - Class B Shares | 23.10 | 0.04 | 5.14 | 5.18 | ||||||||
| 1998 - Class C Shares (commenced August 15, 1997) | 28.20 | (0.01 | ) | 0.06 | 0.05 | |||||||
| 1998 - Institutional Shares | 23.19 | 0.27 | 5.23 | 5.50 | ||||||||
| 1998 - Service Shares | 23.17 | 0.14 | 5.23 | 5.37 | ||||||||
| 1997 - Class A Shares | 19.98 | 0.35 | 5.18 | 5.53 | ||||||||
| 1997 - Class B Shares (commenced May 1, 1996) | 20.82 | 0.17 | 4.31 | 4.48 | ||||||||
| 1997 - Institutional Shares (commenced June 3, 1996) | 21.25 | 0.29 | 3.96 | 4.25 | ||||||||
| 1997 - Service Shares (commenced March 6, 1996) | 20.71 | 0.28 | 4.50 | 4.78 | ||||||||
| 1996 - Class A Shares | 15.80 | 0.33 | 4.75 | 5.08 | ||||||||
|
Distributions to shareholders |
|||||||||||||||||||||
|---|---|---|---|---|---|---|---|---|---|---|---|---|---|---|---|---|---|---|---|---|---|
| From net
investment income |
In excess of net investment income |
From net
realized gains |
Total
distributions |
Net asset
value, end of period |
Total
returna |
Net assets
at end of period (in 000s) |
Ratio of
net expenses to average net assets |
||||||||||||||
| $(0.05 | ) | $(0.03 | ) | $(1.33 | ) | $(1.41 | ) | $24.78 | 6.48 | % | $ 576,354 | 1.18 | % | ||||||||
| (0.02 | ) | (0.01 | ) | (1.33 | ) | (1.36 | ) | 24.42 | 5.70 | 155,527 | 1.93 | ||||||||||
| (0.01 | ) | (0.01 | ) | (1.33 | ) | (1.35 | ) | 24.37 | 5.67 | 15,746 | 1.93 | ||||||||||
| (0.09 | ) | (0.04 | ) | (1.33 | ) | (1.46 | ) | 24.91 | 7.05 | 28,543 | 0.78 | ||||||||||
| (0.05 | ) | (0.02 | ) | (1.33 | ) | (1.40 | ) | 24.77 | 6.40 | 7,926 | 1.28 | ||||||||||
| (0.15 | ) | — | — | (0.15 | ) | 24.68 | 2.05 | 855,174 | 1.19 | b | |||||||||||
| (0.06 | ) | — | — | (0.06 | ) | 24.46 | 1.60 | 271,912 | 1.94 | b | |||||||||||
| (0.05 | ) | — | — | (0.05 | ) | 24.41 | 1.58 | 31,328 | 1.94 | b | |||||||||||
| (0.20 | ) | — | — | (0.20 | ) | 24.72 | 2.32 | 32,181 | 0.79 | b | |||||||||||
| (0.14 | ) | — | — | (0.14 | ) | 24.68 | 2.01 | 10,008 | 1.29 | b | |||||||||||
| (0.19 | ) | (0.01 | ) | — | (0.20 | ) | 24.33 | (5.40 | ) | 1,122,157 | 1.22 | ||||||||||
| (0.04 | ) | — | — | (0.04 | ) | 24.13 | (6.07 | ) | 349,662 | 1.92 | |||||||||||
| (0.05 | ) | — | — | (0.05 | ) | 24.08 | (6.12 | ) | 48,146 | 1.92 | |||||||||||
| (0.30 | ) | (0.01 | ) | — | (0.31 | ) | 24.35 | (5.00 | ) | 173,696 | 0.80 | ||||||||||
| (0.17 | ) | (0.01 | ) | — | (0.18 | ) | 24.33 | (5.44 | ) | 11,943 | 1.30 | ||||||||||
| (0.11 | ) | — | (2.52 | ) | (2.63 | ) | 25.93 | 23.71 | 1,216,582 | 1.25 | |||||||||||
| — | (0.03 | ) | (2.52 | ) | (2.55 | ) | 25.73 | 22.87 | 307,815 | 1.94 | |||||||||||
| — | (0.03 | ) | (2.52 | ) | (2.55 | ) | 25.70 | 0.51 | 31,686 | 1.99 | b | ||||||||||
| (0.22 | ) | — | (2.52 | ) | (2.74 | ) | 25.95 | 24.24 | 36,225 | 0.83 | |||||||||||
| (0.06 | ) | (0.04 | ) | (2.52 | ) | (2.62 | ) | 25.92 | 23.63 | 8,893 | 1.32 | ||||||||||
| (0.35 | ) | (0.01 | ) | (1.97 | ) | (2.33 | ) | 23.18 | 28.42 | 615,103 | 1.22 | ||||||||||
| (0.17 | ) | (0.06 | ) | (1.97 | ) | (2.20 | ) | 23.10 | 22.23 | 17,346 | 1.93 | b | |||||||||
| (0.30 | ) | (0.04 | ) | (1.97 | ) | (2.31 | ) | 23.19 | 20.77 | 193 | 0.82 | b | |||||||||
| (0.28 | ) | (0.07 | ) | (1.97 | ) | (2.32 | ) | 23.17 | 23.87 | 3,174 | 1.32 | b | |||||||||
| (0.30 | ) | — | (0.60 | ) | (0.90 | ) | 19.98 | 32.45 | 436,757 | 1.20 | |||||||||||
| GROWTH AND INCOME FUND (continued)
|
|
Ratios assuming no expense reductions |
|||||||||||||
|---|---|---|---|---|---|---|---|---|---|---|---|---|---|
| Ratio of
net investment income (loss) to average net assets |
Ratio of
expenses to average net assets |
Ratio of
net investment income (loss) to average net assets |
Portfolio
turnover rate |
||||||||||
| For The Year Ended August 31, | |||||||||||||
| 2000 - Class A Shares | 0.31 | % | 1.18 | % | 0.31 | % | 86.84 | % | |||||
| 2000 - Class B Shares | (0.41 | ) | 1.93 | (0.41 | ) | 86.84 | |||||||
| 2000 - Class C Shares | (0.40 | ) | 1.93 | (0.40 | ) | 86.84 | |||||||
| 2000 - Institutional Shares | 0.69 | 0.78 | 0.69 | 86.84 | |||||||||
| 2000 - Service Shares | 0.20 | 1.28 | 0.20 | 86.84 | |||||||||
| For The Seven Months Ended August 31, | |||||||||||||
| 1999 - Class A Shares | 1.26 | b | 1.20 | b | 1.25 | b | 55.43 | ||||||
| 1999 - Class B Shares | 0.51 | b | 1.95 | b | 0.50 | b | 55.43 | ||||||
| 1999 - Class C Shares | 0.51 | b | 1.95 | b | 0.50 | b | 55.43 | ||||||
| 1999 - Institutional Shares | 1.72 | b | 0.80 | b | 1.71 | b | 55.43 | ||||||
| 1999 - Service Shares | 1.16 | b | 1.30 | b | 1.15 | b | 55.43 | ||||||
| For The Years Ended January 31, | |||||||||||||
| 1999 - Class A Shares | 0.78 | 1.32 | 0.68 | 125.79 | |||||||||
| 1999 - Class B Shares | 0.09 | 1.92 | 0.09 | 125.79 | |||||||||
| 1999 - Class C Shares | 0.10 | 1.92 | 0.10 | 125.79 | |||||||||
| 1999 - Institutional Shares | 1.25 | 0.80 | 1.25 | 125.79 | |||||||||
| 1999 - Service Shares | 0.72 | 1.30 | 0.72 | 125.79 | |||||||||
| 1998 - Class A Shares | 0.43 | 1.42 | 0.26 | 61.95 | |||||||||
| 1998 - Class B Shares | (0.35 | ) | 1.94 | (0.35 | ) | 61.95 | |||||||
| 1998 - Class C Shares (commenced August 15, 1997) | (0.48 | ) b | 1.99 | b | (0.48 | ) b | 61.95 | ||||||
| 1998 - Institutional Shares | 0.76 | 0.83 | 0.76 | 61.95 | |||||||||
| 1998 - Service Shares | 0.32 | 1.32 | 0.32 | 61.95 | |||||||||
| 1997 - Class A Shares | 1.60 | 1.43 | 1.39 | 53.03 | |||||||||
| 1997 - Class B Shares (commenced May 1, 1996) | 0.15 | b | 1.93 | b | 0.15 | b | 53.03 | ||||||
| 1997 - Institutional Shares (commenced June 3, 1996) | 1.36 | b | 0.82 | b | 1.36 | b | 53.03 | ||||||
| 1997 - Service Shares (commenced March 6, 1996) | 0.94 | b | 1.32 | b | 0.94 | b | 53.03 | ||||||
| 1996 - Class A Shares | 1.67 | 1.45 | 1.42 | 57.93 | |||||||||
| CORE LARGE CAP VALUE FUND
|
|
Income from investment operations |
||||||||||||
|---|---|---|---|---|---|---|---|---|---|---|---|---|
| Net asset
value, beginning of period |
Net
investment income |
Net realized
and unrealized gain |
Total from
investment operations |
|||||||||
| For the Year Ended August 31, | ||||||||||||
| 2000 - Class A Shares | $10.55 | $0.12 | c | $0.36 | $0.48 | |||||||
| 2000 - Class B Shares | 10.50 | 0.05 | c | 0.36 | 0.41 | |||||||
| 2000 - Class C Shares | 10.51 | 0.04 | c | 0.37 | 0.41 | |||||||
| 2000 - Institutional Shares | 10.55 | 0.16 | c | 0.37 | 0.53 | |||||||
| 2000 - Service Shares | 10.55 | 0.11 | c | 0.36 | 0.47 | |||||||
| For the Seven-Month Period Ended August 31, | ||||||||||||
| 1999 - Class A Shares | 10.15 | 0.04 | 0.40 | 0.44 | ||||||||
| 1999 - Class B Shares | 10.15 | 0.01 | 0.36 | 0.37 | ||||||||
| 1999 - Class C Shares | 10.15 | 0.01 | 0.37 | 0.38 | ||||||||
| 1999 - Institutional Shares | 10.16 | 0.06 | 0.38 | 0.44 | ||||||||
| 1999 - Service Shares | 10.16 | 0.02 | 0.40 | 0.42 | ||||||||
| For the Period Ended January 31, | ||||||||||||
| 1999 - Class A Shares (commenced December 31, 1998) | 10.00 | 0.01 | 0.14 | 0.15 | ||||||||
| 1999 - Class B Shares (commenced December 31, 1998) | 10.00 | — | 0.15 | 0.15 | ||||||||
| 1999 - Class C Shares (commenced December 31, 1998) | 10.00 | — | 0.15 | 0.15 | ||||||||
| 1999 - Institutional Shares (commenced December 31, 1998) | 10.00 | 0.01 | 0.15 | 0.16 | ||||||||
| 1999 - Service Shares (commenced December 31, 1998) | 10.00 | 0.02 | 0.14 | 0.16 | ||||||||
|
Distributions to shareholders |
|||||||||||||||||||||
|---|---|---|---|---|---|---|---|---|---|---|---|---|---|---|---|---|---|---|---|---|---|
| From net
investment income |
From net
realized gains |
Total
distributions |
Net asset
value, end of period |
Total
returna |
Net assets
at end of period (in 000s) |
Ratio of
net expenses to average net assets |
Ratio of
net investment income to average net assets |
||||||||||||||
| $(0.10 | ) | $(0.12 | ) | $(0.22 | ) | $10.81 | 4.68 | % | $100,972 | 1.06 | % | 1.14 | % | ||||||||
| (0.04 | ) | (0.12 | ) | (0.16 | ) | 10.75 | 3.96 | 19,069 | 1.81 | 0.44 | |||||||||||
| (0.04 | ) | (0.12 | ) | (0.16 | ) | 10.76 | 3.97 | 11,178 | 1.81 | 0.45 | |||||||||||
| (0.14 | ) | (0.12 | ) | (0.26 | ) | 10.82 | 5.20 | 175,493 | 0.66 | 1.54 | |||||||||||
| (0.09 | ) | (0.12 | ) | (0.21 | ) | 10.81 | 4.60 | 12 | 1.16 | 1.07 | |||||||||||
| (0.04 | ) | — | (0.04 | ) | 10.55 | 4.31 | 91,072 | 1.04 | b | 0.87 | b | ||||||||||
| (0.02 | ) | — | (0.02 | ) | 10.50 | 3.68 | 14,464 | 1.79 | b | 0.05 | b | ||||||||||
| (0.02 | ) | — | (0.02 | ) | 10.51 | 3.73 | 8,032 | 1.79 | b | 0.09 | b | ||||||||||
| (0.05 | ) | — | (0.05 | ) | 10.55 | 4.35 | 189,540 | 0.64 | b | 1.29 | b | ||||||||||
| (0.03 | ) | — | (0.03 | ) | 10.55 | 4.11 | 13 | 1.14 | b | 0.72 | b | ||||||||||
| — | — | — | 10.15 | 1.50 | 6,665 | 1.08 | b | 1.45 | b | ||||||||||||
| — | — | — | 10.15 | 1.50 | 340 | 1.82 | b | 0.84 | b | ||||||||||||
| — | — | — | 10.15 | 1.50 | 268 | 1.83 | b | 0.70 | b | ||||||||||||
| — | — | — | 10.16 | 1.60 | 53,396 | 0.66 | b | 1.97 | b | ||||||||||||
| — | — | — | 10.16 | 1.60 | 2 | 1.16 | b | 2.17 | b | ||||||||||||
| CORE LARGE CAP VALUE FUND (continued)
|
|
Ratios assuming no expense reductions |
||||||||||
|---|---|---|---|---|---|---|---|---|---|---|
| Ratio of
expenses to average net assets |
Ratio of
net investment income (loss) to average net assets |
Portfolio
turnover rate |
||||||||
| For the Year Ended August 31, | ||||||||||
| 2000 - Class A Shares | 1.17 | % | 1.03 | % | 83.30 | % | ||||
| 2000 - Class B Shares | 1.92 | 0.33 | 83.30 | |||||||
| 2000 - Class C Shares | 1.92 | 0.34 | 83.30 | |||||||
| 2000 - Institutional Shares | 0.77 | 1.43 | 83.30 | |||||||
| 2000 - Service Shares | 1.27 | 0.96 | 83.30 | |||||||
| For the Seven-Month Period Ended August 31, | ||||||||||
| 1999 - Class A Shares | 1.21 | b | 0.70 | b | 36.10 | |||||
| 1999 - Class B Shares | 1.96 | b | (0.12 | ) b | 36.10 | |||||
| 1999 - Class C Shares | 1.96 | b | (0.08 | ) b | 36.10 | |||||
| 1999 - Institutional Shares | 0.81 | b | 1.12 | b | 36.10 | |||||
| 1999 - Service Shares | 1.31 | b | 0.55 | b | 36.10 | |||||
| For the Period Ended January 31, | ||||||||||
| 1999 - Class A Shares (commenced December 31, 1998) | 8.03 | b | (5.50 | ) b | 0.00 | |||||
| 1999 - Class B Shares (commenced December 31, 1998) | 8.77 | b | (6.11 | ) b | 0.00 | |||||
| 1999 - Class C Shares (commenced December 31, 1998) | 8.78 | b | (6.25 | ) b | 0.00 | |||||
| 1999 - Institutional Shares (commenced December 31, 1998) | 7.61 | b | (4.98 | ) b | 0.00 | |||||
| 1999 - Service Shares (commenced December 31, 1998) | 8.11 | b | (4.78 | ) b | 0.00 | |||||
| CORE U.S. EQUITY FUND
|
|
Income from investment operations |
||||||||||
|---|---|---|---|---|---|---|---|---|---|---|
|
Net asset value, beginning of period |
Net
investment income (loss) |
Net realized
and unrealized gain |
Total from
investment operations |
|||||||
| For The Year Ended August 31, | ||||||||||
| 2000 - Class A Shares | $34.21 | $ 0.10 | c | $6.00 | $6.10 | |||||
| 2000 - Class B Shares | 33.56 | (0.14 | ) c | 5.83 | 5.69 | |||||
| 2000 - Class C Shares | 33.46 | (0.13 | ) c | 5.80 | 5.67 | |||||
| 2000 - Institutional Shares | 34.61 | 0.24 | c | 6.07 | 6.31 | |||||
| 2000 - Service Shares | 34.05 | 0.07 | c | 5.96 | 6.03 | |||||
| For The Seven-Month Period Ended August 31, | ||||||||||
| 1999 - Class A Shares | 32.98 | 0.03 | 1.20 | 1.23 | ||||||
| 1999 - Class B Shares | 32.50 | (0.11 | ) | 1.17 | 1.06 | |||||
| 1999 - Class C Shares | 32.40 | (0.10 | ) | 1.16 | 1.06 | |||||
| 1999 - Institutional Shares | 33.29 | 0.11 | 1.21 | 1.32 | ||||||
| 1999 - Service Shares | 32.85 | 0.01 | 1.19 | 1.20 | ||||||
| For The Years Ended January 31, | ||||||||||
| 1999 - Class A Shares | 26.59 | 0.04 | 7.02 | 7.06 | ||||||
| 1999 - Class B Shares | 26.32 | (0.10 | ) | 6.91 | 6.81 | |||||
| 1999 - Class C Shares | 26.24 | (0.10 | ) | 6.89 | 6.79 | |||||
| 1999 - Institutional Shares | 26.79 | 0.20 | 7.11 | 7.31 | ||||||
| 1999 - Service Shares | 26.53 | 0.06 | 7.01 | 7.07 | ||||||
| 1998 - Class A Shares | 23.32 | 0.11 | 5.63 | 5.74 | ||||||
| 1998 - Class B Shares | 23.18 | 0.11 | 5.44 | 5.55 | ||||||
| 1998 - Class C Shares (commenced August 15, 1997) | 27.48 | 0.03 | 1.22 | 1.25 | ||||||
| 1998 - Institutional Shares | 23.44 | 0.30 | 5.65 | 5.95 | ||||||
| 1998 - Service Shares | 23.27 | 0.19 | 5.57 | 5.76 | ||||||
| 1997 - Class A Shares | 19.66 | 0.16 | 4.46 | 4.62 | ||||||
| 1997 - Class B Shares (commenced May 1, 1996) | 20.44 | 0.04 | 3.70 | 3.74 | ||||||
| 1997 - Institutional Shares | 19.71 | 0.30 | 4.51 | 4.81 | ||||||
| 1997 - Service Shares (commenced June 7, 1996) | 21.02 | 0.13 | 3.15 | 3.28 | ||||||
| 1996 - Class A Shares | 14.61 | 0.19 | 5.43 | 5.62 | ||||||
| 1996 - Institutional Shares (commenced June 15, 1995) | 16.97 | 0.16 | 3.23 | 3.39 | ||||||
|
Distributions to shareholders |
||||||||||||||||||||||||
|---|---|---|---|---|---|---|---|---|---|---|---|---|---|---|---|---|---|---|---|---|---|---|---|---|
| From net
investment income |
In excess
of net investment income |
From net
realized gains |
Total
distributions |
Net asset
value, end of period |
Total
returna |
Net assets
at end of period (in 000s) |
Ratio of
net expenses to average net assets |
Ratio of
net investment income (loss) to average net assets |
||||||||||||||||
| $ — | $ — | $(3.54 | ) | $(3.54 | ) | $36.77 | 18.96 | % | $715,775 | 1.14 | % | 0.31 | % | |||||||||||
| — | — | (3.54 | ) | (3.54 | ) | 35.71 | 18.03 | 275,673 | 1.89 | (0.44 | ) | |||||||||||||
| — | — | (3.54 | ) | (3.54 | ) | 35.59 | 18.03 | 62,820 | 1.89 | (0.43 | ) | |||||||||||||
| (0.08 | ) | — | (3.54 | ) | (3.62 | ) | 37.30 | 19.41 | 379,172 | 0.74 | 0.71 | |||||||||||||
| — | — | (3.54 | ) | (3.54 | ) | 36.54 | 18.83 | 11,879 | 1.24 | 0.19 | ||||||||||||||
| — | — | — | — | 34.21 | 3.73 | 614,310 | 1.14 | b | 0.15 | b | ||||||||||||||
| — | — | — | — | 33.56 | 3.26 | 214,087 | 1.89 | b | (0.60 | ) b | ||||||||||||||
| — | — | — | — | 33.46 | 3.27 | 43,361 | 1.89 | b | (0.61 | ) b | ||||||||||||||
| — | — | — | — | 34.61 | 3.97 | 335,465 | 0.74 | b | 0.54 | b | ||||||||||||||
| — | — | — | — | 34.05 | 3.65 | 11,204 | 1.24 | b | 0.06 | b | ||||||||||||||
| (0.03 | ) | (0.01 | ) | (0.63 | ) | (0.67 | ) | 32.98 | 26.89 | 605,566 | 1.23 | 0.15 | ||||||||||||
| — | — | (0.63 | ) | (0.63 | ) | 32.50 | 26.19 | 152,347 | 1.85 | (0.50 | ) | |||||||||||||
| — | — | (0.63 | ) | (0.63 | ) | 32.40 | 26.19 | 26,912 | 1.87 | (0.53 | ) | |||||||||||||
| (0.15 | ) | (0.03 | ) | (0.63 | ) | (0.81 | ) | 33.29 | 27.65 | 307,200 | 0.69 | 0.69 | ||||||||||||
| (0.10 | ) | (0.02 | ) | (0.63 | ) | (0.75 | ) | 32.85 | 27.00 | 11,600 | 1.19 | 0.19 | ||||||||||||
| (0.12 | ) | — | (2.35 | ) | (2.47 | ) | 26.59 | 24.96 | 398,393 | 1.28 | 0.51 | |||||||||||||
| — | (0.06 | ) | (2.35 | ) | (2.41 | ) | 26.32 | 24.28 | 59,208 | 1.79 | (0.05 | ) | ||||||||||||
| — | (0.14 | ) | (2.35 | ) | (2.49 | ) | 26.24 | 4.85 | 6,267 | 1.78 | b | (0.21 | ) b | |||||||||||
| (0.24 | ) | (0.01 | ) | (2.35 | ) | (2.60 | ) | 26.79 | 25.76 | 202,893 | 0.65 | 1.16 | ||||||||||||
| (0.07 | ) | (0.08 | ) | (2.35 | ) | (2.50 | ) | 26.53 | 25.11 | 7,841 | 1.15 | 0.62 | ||||||||||||
| (0.16 | ) | — | (0.80 | ) | (0.96 | ) | 23.32 | 23.75 | 225,968 | 1.29 | 0.91 | |||||||||||||
| (0.04 | ) | (0.16 | ) | (0.80 | ) | (1.00 | ) | 23.18 | 18.59 | 17,258 | 1.83 | b | 0.06 | b | ||||||||||
| (0.28 | ) | — | (0.80 | ) | (1.08 | ) | 23.44 | 24.63 | 148,942 | 0.65 | 1.52 | |||||||||||||
| (0.13 | ) | (0.10 | ) | (0.80 | ) | (1.03 | ) | 23.27 | 15.92 | 3,666 | 1.15 | b | 0.69 | b | ||||||||||
| (0.16 | ) | — | (0.41 | ) | (0.57 | ) | 19.66 | 38.63 | 129,045 | 1.25 | 1.01 | |||||||||||||
| (0.24 | ) | — | (0.41 | ) | (0.65 | ) | 19.71 | 20.14 | 64,829 | 0.65 | b | 1.49 | b | |||||||||||
| CORE U.S. EQUITY FUND (continued)
|
|
Ratios assuming no expense reductions |
||||||||||
|---|---|---|---|---|---|---|---|---|---|---|
| Ratio of
expenses to average net assets |
Ratio of
net investment income (loss) to average net assets |
Portfolio
turnover rate |
||||||||
| For The Year Ended August 31, | ||||||||||
| 2000 - Class A Shares | 1.23 | % | 0.22 | % | 59.27 | % | ||||
| 2000 - Class B Shares | 1.98 | (0.53 | ) | 59.27 | ||||||
| 2000 - Class C Shares | 1.98 | (0.52 | ) | 59.27 | ||||||
| 2000 - Institutional Shares | 0.83 | 0.62 | 59.27 | |||||||
| 2000 - Service Shares | 1.33 | 0.10 | 59.27 | |||||||
| For The Seven-Month Period Ended August 31, | ||||||||||
| 1999 - Class A Shares | 1.24 | b | 0.05 | b | 41.84 | |||||
| 1999 - Class B Shares | 1.99 | b | (0.70 | ) b | 41.84 | |||||
| 1999 - Class C Shares | 1.99 | b | (0.71 | ) b | 41.84 | |||||
| 1999 - Institutional Shares | 0.84 | b | 0.44 | b | 41.84 | |||||
| 1999 - Service Shares | 1.34 | b | (0.04 | ) b | 41.84 | |||||
| For The Years Ended January 31, | ||||||||||
| 1999 - Class A Shares | 1.36 | 0.02 | 63.79 | |||||||
| 1999 - Class B Shares | 1.98 | (0.63 | ) | 63.79 | ||||||
| 1999 - Class C Shares | 2.00 | (0.66 | ) | 63.79 | ||||||
| 1999 - Institutional Shares | 0.82 | 0.56 | 63.79 | |||||||
| 1999 - Service Shares | 1.32 | 0.06 | 63.79 | |||||||
| 1998 - Class A Shares | 1.47 | 0.32 | 65.89 | |||||||
| 1998 - Class B Shares | 1.96 | (0.22 | ) | 65.89 | ||||||
| 1998 - Class C Shares (commenced August 15, 1997) | 1.95 | b | (0.38 | ) b | 65.89 | |||||
| 1998 - Institutional Shares | 0.82 | 0.99 | 65.89 | |||||||
| 1998 - Service Shares | 1.32 | 0.45 | 65.89 | |||||||
| 1997 - Class A Shares | 1.53 | 0.67 | 37.28 | |||||||
| 1997 - Class B Shares (commenced May 1, 1996) | 2.00 | b | (0.11 | ) b | 37.28 | |||||
| 1997 - Institutional Shares | 0.85 | 1.32 | 37.28 | |||||||
| 1997 - Service Shares (commenced June 7, 1996) | 1.35 | b | 0.49 | b | 37.28 | |||||
| 1996 - Class A Shares | 1.55 | 0.71 | 39.35 | |||||||
| 1996 - Institutional Shares (commenced June 15, 1995) | 0.96 | b | 1.18 | b | 39.35 | |||||
| CORE LARGE CAP GROWTH FUND
|
|
Income from investment operations |
||||||||||
|---|---|---|---|---|---|---|---|---|---|---|
|
Net asset value, beginning of period |
Net
investment income (loss) |
Net realized
and unrealized gain |
Total from
investment operations |
|||||||
| For the Year Ended August 31, | ||||||||||
| 2000 - Class A Shares | $17.02 | $ 0.06 | c | $5.67 | $5.73 | |||||
| 2000 - Class B Shares | 16.75 | (0.09 | ) c | 5.57 | 5.48 | |||||
| 2000 - Class C Shares | 16.75 | (0.08 | ) c | 5.57 | 5.49 | |||||
| 2000 - Institutional Shares | 17.10 | 0.13 | c | 5.73 | 5.86 | |||||
| 2000 - Service Shares | 16.95 | 0.03 | c | 5.66 | 5.69 | |||||
| For the Seven-Month Period Ended August 31, | ||||||||||
| 1999 - Class A Shares | 16.17 | (0.01 | ) | 0.86 | 0.85 | |||||
| 1999 - Class B Shares | 15.98 | (0.07 | ) | 0.84 | 0.77 | |||||
| 1999 - Class C Shares | 15.99 | (0.07 | ) | 0.83 | 0.76 | |||||
| 1999 - Institutional Shares | 16.21 | 0.03 | 0.86 | 0.89 | ||||||
| 1999 - Service Shares | 16.11 | (0.02 | ) | 0.86 | 0.84 | |||||
| For the Year Ended January 31, | ||||||||||
| 1999 - Class A Shares | 11.97 | 0.01 | 4.19 | 4.20 | ||||||
| 1999 - Class B Shares | 11.92 | (0.06 | ) | 4.12 | 4.06 | |||||
| 1999 - Class C Shares | 11.93 | (0.05 | ) | 4.11 | 4.06 | |||||
| 1999 - Institutional Shares | 11.97 | 0.02 | 4.23 | 4.25 | ||||||
| 1999 - Service Shares | 11.95 | (0.01 | ) | 4.17 | 4.16 | |||||
| For the Period Ended January 31, | ||||||||||
| 1998 - Class A Shares (commenced May 1, 1997) | 10.00 | 0.01 | 2.35 | 2.36 | ||||||
| 1998 - Class B Shares (commenced May 1, 1997) | 10.00 | (0.03 | ) | 2.33 | 2.30 | |||||
| 1998 - Class C Shares (commenced August 15, 1997) | 11.80 | (0.02 | ) | 0.54 | 0.52 | |||||
| 1998 - Institutional Shares (commenced May 1, 1997) | 10.00 | 0.01 | 2.35 | 2.36 | ||||||
| 1998 - Service Shares (commenced May 1, 1997) | 10.00 | (0.02 | ) | 2.35 | 2.33 | |||||
|
Distributions to Shareholders |
|||||||||||||||||||||
|---|---|---|---|---|---|---|---|---|---|---|---|---|---|---|---|---|---|---|---|---|---|
|
From Net Investment Income |
In excess
of net investment income |
From net
realized gains |
Total
distributions |
Net asset
value, end of period |
Total
returna |
Net assets
at end of period (in 000s) |
Ratio of
net expenses to average net assets |
||||||||||||||
| $ — | $ — | $(0.09 | ) | $(0.09 | ) | $22.66 | 33.73 | % | $545,763 | 1.09 | % | ||||||||||
| — | — | (0.09 | ) | (0.09 | ) | 22.14 | 32.78 | 338,128 | 1.84 | ||||||||||||
| — | — | (0.09 | ) | (0.09 | ) | 22.15 | 32.84 | 154,966 | 1.84 | ||||||||||||
| — | — | (0.09 | ) | (0.09 | ) | 22.87 | 34.34 | 322,900 | 0.69 | ||||||||||||
| — | — | (0.09 | ) | (0.09 | ) | 22.55 | 33.64 | 3,879 | 1.19 | ||||||||||||
| — | — | — | — | 17.02 | 5.26 | 300,684 | 1.04 | b | |||||||||||||
| — | — | — | — | 16.75 | 4.82 | 181,626 | 1.79 | b | |||||||||||||
| — | — | — | — | 16.75 | 4.75 | 75,502 | 1.79 | b | |||||||||||||
| — | — | — | — | 17.10 | 5.49 | 310,704 | 0.64 | b | |||||||||||||
| — | — | — | — | 16.95 | 5.21 | 2,510 | 1.14 | b | |||||||||||||
| — | — | — | — | 16.17 | 35.10 | 175,510 | 0.97 | ||||||||||||||
| — | — | — | — | 15.98 | 34.07 | 93,711 | 1.74 | ||||||||||||||
| — | — | — | — | 15.99 | 34.04 | 37,081 | 1.74 | ||||||||||||||
| — | (0.01 | ) | — | (0.01 | ) | 16.21 | 35.54 | 295,734 | 0.65 | ||||||||||||
| — | — | — | — | 16.11 | 34.85 | 1,663 | 1.15 | ||||||||||||||
| (0.01 | ) | — | (0.38 | ) | (0.39 | ) | 11.97 | 23.79 | 53,786 | 0.91 | b | ||||||||||
| — | — | (0.38 | ) | (0.38 | ) | 11.92 | 23.26 | 13,857 | 1.67 | b | |||||||||||
| — | (0.01 | ) | (0.38 | ) | (0.39 | ) | 11.93 | 4.56 | 4,132 | 1.68 | b | ||||||||||
| (0.01 | ) | — | (0.38 | ) | (0.39 | ) | 11.97 | 23.89 | 4,656 | 0.72 | b | ||||||||||
| — | — | (0.38 | ) | (0.38 | ) | 11.95 | 23.56 | 115 | 1.17 | b | |||||||||||
| CORE LARGE CAP GROWTH FUND (continued)
|
|
Ratios assuming no expense reductions |
|||||||||||||
|---|---|---|---|---|---|---|---|---|---|---|---|---|---|
| Ratio of
net investment income (loss) to average net assets |
Ratio of
expenses to average net assets |
Ratio of net
investment income (loss) to average net assets |
Portfolio
turnover rate |
||||||||||
| For the Year Ended August 31, | |||||||||||||
| 2000 - Class A Shares | 0.31 | % | 1.24 | % | 0.16 | % | 72.59 | % | |||||
| 2000 - Class B Shares | (0.44 | ) | 1.99 | (0.59 | ) | 72.59 | |||||||
| 2000 - Class C Shares | (0.43 | ) | 1.99 | (0.58 | ) | 72.59 | |||||||
| 2000 - Institutional Shares | 0.65 | 0.84 | 0.50 | 72.59 | |||||||||
| 2000 - Service Shares | 0.15 | 1.34 | — | 72.59 | |||||||||
| For the Seven-Month Period Ended August 31, | |||||||||||||
| 1999 - Class A Shares | (0.11 | ) b | 1.26 | b | (0.33 | ) b | 32.74 | ||||||
| 1999 - Class B Shares | (0.87 | ) b | 2.01 | b | (1.09 | ) b | 32.74 | ||||||
| 1999 - Class C Shares | (0.87 | ) b | 2.01 | b | (1.09 | ) b | 32.74 | ||||||
| 1999 - Institutional Shares | 0.31 | b | 0.86 | b | 0.09 | b | 32.74 | ||||||
| 1999 - Service Shares | (0.21 | ) b | 1.36 | b | (0.43 | ) b | 32.74 | ||||||
| For the Year Ended January 31, | |||||||||||||
| 1999 - Class A Shares | 0.05 | 1.46 | (0.44 | ) | 63.15 | ||||||||
| 1999 - Class B Shares | (0.73 | ) | 2.11 | (1.10 | ) | 63.15 | |||||||
| 1999 - Class C Shares | (0.74 | ) | 2.11 | (1.11 | ) | 63.15 | |||||||
| 1999 - Institutional Shares | 0.35 | 1.02 | (0.02 | ) | 63.15 | ||||||||
| 1999 - Service Shares | (0.16 | ) | 1.52 | (0.53 | ) | 63.15 | |||||||
| For the Period Ended January 31, | |||||||||||||
| 1998 - Class A Shares (commenced May 1, 1997) | 0.12 | b | 2.40 | b | (1.37 | ) b | 74.97 | ||||||
| 1998 - Class B Shares (commenced May 1, 1997) | (0.72 | ) b | 2.91 | b | (1.96 | ) b | 74.97 | ||||||
| 1998 - Class C Shares (commenced August 15, 1997) | (0.76 | ) b | 2.92 | b | (2.00 | ) b | 74.97 | ||||||
| 1998 - Institutional Shares (commenced May 1, 1997) | 0.42 | b | 1.96 | b | (0.82 | ) b | 74.97 | ||||||
| 1998 - Service Shares (commenced May 1, 1997) | (0.21 | ) b | 2.41 | b | (1.45 | ) b | 74.97 | ||||||
| CORE SMALL CAP EQUITY FUND
|
|
Income from investment operations |
||||||||||||
|---|---|---|---|---|---|---|---|---|---|---|---|---|
|
Net asset value, beginning of period |
Net
investment income (loss) |
Net
realized and unrealized gain (loss) |
Total from
investment operations |
|||||||||
| For the Year Ended August 31, | ||||||||||||
| 2000 - Class A Shares | $10.23 | $(0.03 | ) c | $2.70 | $2.67 | |||||||
| 2000 - Class B Shares | 10.09 | (0.11 | ) c | 2.65 | 2.54 | |||||||
| 2000 - Class C Shares | 10.10 | (0.10 | ) c | 2.66 | 2.56 | |||||||
| 2000 - Institutional Shares | 10.30 | 0.02 | c | 2.71 | 2.73 | |||||||
| 2000 - Service Shares | 10.22 | (0.04 | ) c | 2.69 | 2.65 | |||||||
| For the Seven-Month Period Ended August 31, | ||||||||||||
| 1999 - Class A Shares | 10.16 | (0.01 | ) | 0.08 | 0.07 | |||||||
| 1999 - Class B Shares | 10.07 | (0.05 | ) | 0.07 | 0.02 | |||||||
| 1999 - Class C Shares | 10.08 | (0.05 | ) | 0.07 | 0.02 | |||||||
| 1999 - Institutional Shares | 10.20 | 0.02 | 0.08 | 0.10 | ||||||||
| 1999 - Service Shares | 10.16 | (0.01 | ) | 0.07 | 0.06 | |||||||
| For the Year Ended January 31, | ||||||||||||
| 1999 - Class A Shares | 10.59 | 0.01 | (0.43 | ) | (0.42 | ) | ||||||
| 1999 - Class B Shares | 10.56 | (0.05 | ) | (0.44 | ) | (0.49 | ) | |||||
| 1999 - Class C Shares | 10.57 | (0.04 | ) | (0.45 | ) | (0.49 | ) | |||||
| 1999 - Institutional Shares | 10.61 | 0.04 | (0.43 | ) | (0.39 | ) | ||||||
| 1999 - Service Shares | 10.60 | 0.01 | (0.44 | ) | (0.43 | ) | ||||||
| For the Period Ended January 31, | ||||||||||||
| 1998 - Class A Shares (commenced August 15, 1997) | 10.00 | (0.01 | ) | 0.65 | 0.64 | |||||||
| 1998 - Class B Shares (commenced August 15, 1997) | 10.00 | (0.03 | ) | 0.64 | 0.61 | |||||||
| 1998 - Class C Shares (commenced August 15, 1997) | 10.00 | (0.02 | ) | 0.64 | 0.62 | |||||||
| 1998 - Institutional Shares (commenced August 15, 1997) | 10.00 | 0.01 | 0.65 | 0.66 | ||||||||
| 1998 - Service Shares (commenced August 15, 1997) | 10.00 | 0.01 | 0.64 | 0.65 | ||||||||
|
Distributions to Shareholders |
||||||||||||||||||
|---|---|---|---|---|---|---|---|---|---|---|---|---|---|---|---|---|---|---|
|
From net investment income |
From net realized gains |
Total
distributions |
Net asset
value, end of period |
Total
returna |
Net assets
at end of period (in 000s) |
Ratio of
net expenses to average net assets |
||||||||||||
| $ — | $ — | $ — | $12.90 | 26.10 | % | $54,954 | 1.33 | % | ||||||||||
| — | — | — | 12.63 | 25.17 | 17,923 | 2.08 | ||||||||||||
| — | — | — | 12.66 | 25.35 | 8,289 | 2.08 | ||||||||||||
| — | — | — | 13.03 | 26.60 | 86,196 | 0.93 | ||||||||||||
| — | — | — | 12.87 | 25.93 | 63 | 1.43 | ||||||||||||
| — | — | — | 10.23 | 0.69 | 52,660 | 1.33 | b | |||||||||||
| — | — | — | 10.09 | 0.20 | 13,711 | 2.08 | b | |||||||||||
| — | — | — | 10.10 | 0.20 | 6,274 | 2.08 | b | |||||||||||
| — | — | — | 10.30 | 0.98 | 62,633 | 0.93 | b | |||||||||||
| — | — | — | 10.22 | 0.59 | 64 | 1.43 | b | |||||||||||
| (0.01 | ) | — | (0.01 | ) | 10.16 | (3.97 | ) | 64,087 | 1.31 | |||||||||
| — | — | — | 10.07 | (4.64 | ) | 15,406 | 2.00 | |||||||||||
| — | — | — | 10.08 | (4.64 | ) | 6,559 | 2.01 | |||||||||||
| (0.02 | ) | — | (0.02 | ) | 10.20 | (3.64 | ) | 62,763 | 0.94 | |||||||||
| (0.01 | ) | — | (0.01 | ) | 10.16 | (4.07 | ) | 54 | 1.44 | |||||||||
| — | (0.05 | ) | (0.05 | ) | 10.59 | 6.37 | 11,118 | 1.25 | b | |||||||||
| — | (0.05 | ) | (0.05 | ) | 10.56 | 6.07 | 9,957 | 1.95 | b | |||||||||
| — | (0.05 | ) | (0.05 | ) | 10.57 | 6.17 | 2,557 | 1.95 | b | |||||||||
| — | (0.05 | ) | (0.05 | ) | 10.61 | 6.57 | 9,026 | 0.95 | b | |||||||||
| — | (0.05 | ) | (0.05 | ) | 10.60 | 6.47 | 2 | 1.45 | b | |||||||||
| CORE SMALL CAP EQUITY FUND (continued)
|
|
Ratios assuming no expense reductions |
|||||||||||||
|---|---|---|---|---|---|---|---|---|---|---|---|---|---|
| Ratio of net
investment income (loss) to average net assets |
Ratio of
expenses to average net assets |
Ratio of net
investment loss to average net assets |
Portfolio
turnover rate |
||||||||||
| For the Year Ended August 31, | |||||||||||||
| 2000 - Class A Shares | (0.21 | )% | 1.55 | % | (0.43 | ) | 135.36 | % | |||||
| 2000 - Class B Shares | (0.96 | ) | 2.30 | (1.18 | ) | 135.36 | |||||||
| 2000 - Class C Shares | (0.96 | ) | 2.30 | (1.18 | ) | 135.36 | |||||||
| 2000 - Institutional Shares | 0.19 | 1.15 | (0.03 | ) | 135.36 | ||||||||
| 2000 - Service Shares | (0.30 | ) | 1.65 | (0.52 | ) | 135.36 | |||||||
| For the Seven-Month Period Ended August 31, | |||||||||||||
| 1999 - Class A Shares | (0.12 | ) b | 1.67 | b | (0.46 | ) b | 52.03 | ||||||
| 1999 - Class B Shares | (0.86 | ) b | 2.42 | b | (1.20 | ) b | 52.03 | ||||||
| 1999 - Class C Shares | (0.86 | ) b | 2.42 | b | (1.20 | ) b | 52.03 | ||||||
| 1999 - Institutional Shares | 0.28 | b | 1.27 | b | (0.06 | ) b | 52.03 | ||||||
| 1999 - Service Shares | (0.22 | ) b | 1.77 | b | (0.56 | ) b | 52.03 | ||||||
| For the Year Ended January 31, | |||||||||||||
| 1999 - Class A Shares | 0.08 | 2.00 | (0.61 | ) | 75.38 | ||||||||
| 1999 - Class B Shares | (0.55 | ) | 2.62 | (1.17 | ) | 75.38 | |||||||
| 1999 - Class C Shares | (0.56 | ) | 2.63 | (1.18 | ) | 75.38 | |||||||
| 1999 - Institutional Shares | 0.60 | 1.56 | (0.02 | ) | 75.38 | ||||||||
| 1999 - Service Shares | 0.01 | 2.06 | (0.61 | ) | 75.38 | ||||||||
| For the Period Ended January 31, | |||||||||||||
| 1998 - Class A Shares (commenced August 15, 1997) | (0.36 | ) b | 3.92 | b | (3.03 | ) b | 37.65 | ||||||
| 1998 - Class B Shares (commenced August 15, 1997) | (1.04 | ) b | 4.37 | b | (3.46 | ) b | 37.65 | ||||||
| 1998 - Class C Shares (commenced August 15, 1997) | (1.07 | ) b | 4.37 | b | (3.49 | ) b | 37.65 | ||||||
| 1998 - Institutional Shares (commenced August 15, 1997) | 0.15 | b | 3.37 | b | (2.27 | ) b | 37.65 | ||||||
| 1998 - Service Shares (commenced August 15, 1997) | 0.40 | b | 3.87 | b | (2.02 | ) b | 37.65 | ||||||
| CAPITAL GROWTH FUND
|
|
Income from investment operations |
||||||||||
|---|---|---|---|---|---|---|---|---|---|---|
|
Net asset value, beginning of period |
Net
investment income (loss) |
Net realized
and unrealized gains |
Total
income from investment operations |
|||||||
| For the Year Ended August 31, | ||||||||||
| 2000 - Class A Shares | $24.96 | $(0.11 | ) c | $6.29 | $6.18 | |||||
| 2000 - Class B Shares | 24.37 | (0.30 | ) c | 6.11 | 5.81 | |||||
| 2000 - Class C Shares | 24.33 | (0.30 | ) c | 6.10 | 5.80 | |||||
| 2000 - Institutional Shares | 25.06 | — | 6.32 | 6.32 | ||||||
| 2000 - Service Shares | 24.88 | (0.13 | ) c | 6.25 | 6.12 | |||||
| For the Seven Months Ended August 31, | ||||||||||
| 1999 - Class A Shares | 24.03 | (0.08 | ) | 1.01 | 0.93 | |||||
| 1999 - Class B Shares | 23.57 | (0.17 | ) | 0.97 | 0.80 | |||||
| 1999 - Class C Shares | 23.52 | (0.16 | ) | 0.97 | 0.81 | |||||
| 1999 - Institutional Shares | 24.07 | (0.02 | ) | 1.01 | 0.99 | |||||
| 1999 - Service Shares | 23.96 | (0.08 | ) | 1.00 | 0.92 | |||||
| For the Years Ended January 31, | ||||||||||
| 1999 - Class A Shares | 18.48 | (0.03 | ) | 6.35 | 6.32 | |||||
| 1999 - Class B Shares | 18.27 | (0.12 | ) | 6.19 | 6.07 | |||||
| 1999 - Class C Shares | 18.24 | (0.10 | ) | 6.15 | 6.05 | |||||
| 1999 - Institutional Shares | 18.45 | 0.01 | 6.38 | 6.39 | ||||||
| 1999 - Service Shares | 18.46 | (0.04 | ) | 6.31 | 6.27 | |||||
| 1998 - Class A Shares | 16.73 | 0.02 | 4.78 | 4.80 | ||||||
| 1998 - Class B Shares | 16.67 | 0.02 | 4.61 | 4.63 | ||||||
| 1998 - Class C Shares (commenced August 15, 1997) | 19.73 | (0.02 | ) | 1.60 | 1.58 | |||||
| 1998 - Institutional Shares (commenced August 15, 1997) | 19.88 | 0.02 | 1.66 | 1.68 | ||||||
| 1998 - Service Shares (commenced August 15, 1997) | 19.88 | (0.01 | ) | 1.66 | 1.65 | |||||
| 1997 - Class A Shares | 14.91 | 0.10 | 3.56 | 3.66 | ||||||
| 1997 - Class B Shares (commenced May 1, 1996) | 15.67 | 0.01 | 2.81 | 2.82 | ||||||
| 1996 - Class A Shares | 13.67 | 0.12 | 3.93 | 4.05 | ||||||
|
Distributions to shareholders |
|||||||||||||||||||||
|---|---|---|---|---|---|---|---|---|---|---|---|---|---|---|---|---|---|---|---|---|---|
| From net
investment income |
In excess of net investment income |
From net
realized gain |
Total
distributions |
Net asset
value, end of period |
Total
returna |
Net assets
at end of period (in 000s) |
Ratio of
net expenses to average net assets |
||||||||||||||
| $ — | $ — | $(2.19 | ) | $(2.19 | ) | $28.95 | 25.70 | % | $2,736,484 | 1.45 | % | ||||||||||
| — | — | (2.19 | ) | (2.19 | ) | 27.99 | 24.75 | 451,666 | 2.20 | ||||||||||||
| — | — | (2.19 | ) | (2.19 | ) | 27.94 | 24.75 | 143,126 | 2.20 | ||||||||||||
| — | — | (2.19 | ) | (2.19 | ) | 29.19 | 26.18 | 497,986 | 1.05 | ||||||||||||
| — | — | (2.19 | ) | (2.19 | ) | 28.81 | 25.53 | 13,668 | 1.55 | ||||||||||||
| — | — | — | — | 24.96 | 3.87 | 1,971,097 | 1.44 | b | |||||||||||||
| — | — | — | — | 24.37 | 3.39 | 329,870 | 2.19 | b | |||||||||||||
| — | — | — | — | 24.33 | 3.44 | 87,284 | 2.19 | b | |||||||||||||
| — | — | — | — | 25.06 | 4.11 | 255,210 | 1.04 | b | |||||||||||||
| — | — | — | — | 24.88 | 3.84 | 6,466 | 1.54 | b | |||||||||||||
| — | — | (0.77 | ) | (0.77 | ) | 24.03 | 34.58 | 1,992,716 | 1.42 | ||||||||||||
| — | — | (0.77 | ) | (0.77 | ) | 23.57 | 33.60 | 236,369 | 2.19 | ||||||||||||
| — | — | (0.77 | ) | (0.77 | ) | 23.52 | 33.55 | 60,234 | 2.19 | ||||||||||||
| — | — | (0.77 | ) | (0.77 | ) | 24.07 | 35.02 | 41,817 | 1.07 | ||||||||||||
| — | — | (0.77 | ) | (0.77 | ) | 23.96 | 34.34 | 3,085 | 1.57 | ||||||||||||
| (0.01 | ) | (0.01 | ) | (3.03 | ) | (3.05 | ) | 18.48 | 29.71 | 1,256,595 | 1.40 | ||||||||||
| — | — | (3.03 | ) | (3.03 | ) | 18.27 | 28.73 | 40,827 | 2.18 | ||||||||||||
| — | (0.04 | ) | (3.03 | ) | (3.07 | ) | 18.24 | 8.83 | 5,395 | 2.21 | b | ||||||||||
| (0.01 | ) | (0.07 | ) | (3.03 | ) | (3.11 | ) | 18.45 | 9.31 | 7,262 | 1.16 | b | |||||||||
| — | (0.04 | ) | (3.03 | ) | (3.07 | ) | 18.46 | 9.18 | 2 | 1.50 | b | ||||||||||
| (0.10 | ) | (0.02 | ) | (1.72 | ) | (1.84 | ) | 16.73 | 25.97 | 920,646 | 1.40 | ||||||||||
| (0.01 | ) | (0.09 | ) | (1.72 | ) | (1.82 | ) | 16.67 | 19.39 | 3,221 | 2.15 | b | |||||||||
| (0.12 | ) | — | (2.69 | ) | (2.81 | ) | 14.91 | 30.45 | 881,056 | 1.36 | |||||||||||
| CAPITAL GROWTH FUND (continued)
|
|
Ratios assuming no expense reductions |
|||||||||||||
|---|---|---|---|---|---|---|---|---|---|---|---|---|---|
| Ratio of
net investment income (loss) to average net assets |
Ratio of
expenses to average net assets |
Ratio of
net investment income (loss) to average net assets |
Portfolio
turnover rate |
||||||||||
| For the Year Ended August 31, | |||||||||||||
| 2000 - Class A Shares | (0.41 | )% | 1.47 | % | (0.44 | )% | 34.03 | % | |||||
| 2000 - Class B Shares | (1.16 | ) | 2.22 | (1.19 | ) | 34.03 | |||||||
| 2000 - Class C Shares | (1.16 | ) | 2.22 | (1.19 | ) | 34.03 | |||||||
| 2000 - Institutional Shares | — | 1.07 | (0.03 | ) | 34.03 | ||||||||
| 2000 - Service Shares | (0.49 | ) | 1.57 | (0.52 | ) | 34.03 | |||||||
| For the Seven Months Ended August 31, | |||||||||||||
| 1999 - Class A Shares | (0.53 | ) b | 1.47 | b | (0.56 | ) b | 18.16 | ||||||
| 1999 - Class B Shares | (1.29 | ) b | 2.22 | b | (1.32 | ) b | 18.16 | ||||||
| 1999 - Class C Shares | (1.29 | ) b | 2.22 | b | (1.32 | ) b | 18.16 | ||||||
| 1999 - Institutional Shares | (0.20 | ) b | 1.07 | b | (0.23 | ) b | 18.16 | ||||||
| 1999 - Service Shares | (0.65 | ) b | 1.57 | b | (0.68 | ) b | 18.16 | ||||||
| For the Years Ended January 31, | |||||||||||||
| 1999 - Class A Shares | (0.18 | ) | 1.58 | (0.34 | ) | 30.17 | |||||||
| 1999 - Class B Shares | (0.98 | ) | 2.21 | (1.00 | ) | 30.17 | |||||||
| 1999 - Class C Shares | (1.00 | ) | 2.21 | (1.02 | ) | 30.17 | |||||||
| 1999 - Institutional Shares | 0.11 | 1.09 | 0.09 | 30.17 | |||||||||
| 1999 - Service Shares | (0.37 | ) | 1.59 | (0.39 | ) | 30.17 | |||||||
| 1998 - Class A Shares | 0.08 | 1.65 | (0.17 | ) | 61.50 | ||||||||
| 1998 - Class B Shares | (0.77 | ) | 2.18 | (0.77 | ) | 61.50 | |||||||
| 1998 - Class C Shares (commenced August 15, 1997) | (0.86 | ) b | 2.21 | b | (0.86 | ) b | 61.50 | ||||||
| 1998 - Institutional Shares (commenced August 15, 1997) | 0.18 | b | 1.16 | b | 0.18 | b | 61.50 | ||||||
| 1998 - Service Shares (commenced August 15, 1997) | (0.16 | ) b | 1.50 | b | (0.16 | ) b | 61.50 | ||||||
| 1997 - Class A Shares | 0.62 | 1.65 | 0.37 | 52.92 | |||||||||
| 1997 - Class B Shares (commenced May 1, 1996) | (0.39 | ) b | 2.15 | b | (0.39 | ) b | 52.92 | ||||||
| 1996 - Class A Shares | 0.65 | 1.61 | 0.40 | 63.90 | |||||||||
| STRATEGIC GROWTH FUND
|
|
Income from investment operations |
||||||||||
|---|---|---|---|---|---|---|---|---|---|---|
| Net asset
value, beginning of period |
Net
investment income (loss) |
Net
realized and unrealized gain |
Total
income from investment operations |
|||||||
| For The Year Ended August 31, | ||||||||||
| 2000 - Class A Shares | $10.06 | $(0.06 | ) c | $2.52 | $2.46 | |||||
| 2000 - Class B Shares | 10.04 | (0.14 | ) c | 2.50 | 2.36 | |||||
| 2000 - Class C Shares | 10.05 | (0.14 | ) c | 2.51 | 2.37 | |||||
| 2000 - Institutional Shares | 10.07 | (0.01 | ) c | 2.52 | 2.51 | |||||
| 2000 - Service Shares | 10.06 | (0.04 | ) c | 2.50 | 2.46 | |||||
| For The Period Ended August 31, | ||||||||||
| 1999 - Class A Shares (commenced May 24) | 10.00 | — | 0.06 | 0.06 | ||||||
| 1999 - Class B Shares (commenced May 24) | 10.00 | (0.03 | ) c | 0.07 | 0.04 | |||||
| 1999 - Class C Shares (commenced May 24) | 10.00 | (0.03 | ) c | 0.08 | 0.05 | |||||
| 1999 - Institutional Shares (commenced May 24) | 10.00 | 0.01 | 0.06 | 0.07 | ||||||
| 1999 - Service Shares (commenced May 24) | 10.00 | (0.01 | ) | 0.07 | 0.06 | |||||
|
|
||||||||||||
|---|---|---|---|---|---|---|---|---|---|---|---|---|
| Net asset
value, end of period |
Total
returna |
Net assets
at end of period (in 000s) |
Ratio of
net expenses to average net assets |
Ratio of
net investment income (loss) to average net assets |
||||||||
| $12.52 | 24.46 | % | $92,271 | 1.44 | % | (0.50 | )% | |||||
| 12.40 | 23.51 | 17,149 | 2.19 | (1.24 | ) | |||||||
| 12.42 | 23.58 | 7,287 | 2.19 | (1.24 | ) | |||||||
| 12.58 | 24.93 | 22,910 | 1.04 | (0.09 | ) | |||||||
| 12.52 | 24.45 | 2 | 1.54 | (0.35 | ) | |||||||
| 10.06 | 0.60 | 10,371 | 1.44 | b | (0.17 | ) b | ||||||
| 10.04 | 0.40 | 3,393 | 2.19 | b | (0.97 | ) b | ||||||
| 10.05 | 0.50 | 2,388 | 2.19 | b | (0.99 | ) b | ||||||
| 10.07 | 0.70 | 5,981 | 1.04 | b | 0.24 | b | ||||||
| 10.06 | 0.60 | 2 | 1.54 | b | (0.24 | ) b | ||||||
| STRATEGIC GROWTH FUND (continued)
|
|
Ratios assuming no expense reductions |
||||||||||
|---|---|---|---|---|---|---|---|---|---|---|
|
Ratio of expenses to average net assets |
Ratio of
net investment loss to average net assets |
Portfolio
turnover rate |
||||||||
| For The Year Ended August 31, | ||||||||||
| 2000 - Class A Shares | 1.63 | % | (0.69 | )% | 19.28 | % | ||||
| 2000 - Class B Shares | 2.38 | (1.43 | ) | 19.28 | ||||||
| 2000 - Class C Shares | 2.38 | (1.43 | ) | 19.28 | ||||||
| 2000 - Institutional Shares | 1.23 | (0.28 | ) | 19.28 | ||||||
| 2000 - Service Shares | 1.73 | (0.54 | ) | 19.28 | ||||||
| For The Period Ended August 31, | ||||||||||
| 1999 - Class A Shares (commenced May 24) | 11.70 | b | (10.43 | ) b | 6.98 | |||||
| 1999 - Class B Shares (commenced May 24) | 12.45 | b | (11.23 | ) b | 6.98 | |||||
| 1999 - Class C Shares (commenced May 24) | 12.45 | b | (11.25 | ) b | 6.98 | |||||
| 1999 - Institutional Shares (commenced May 24) | 11.30 | b | (10.02 | ) b | 6.98 | |||||
| 1999 - Service Shares (commenced May 24) | 11.80 | b | (10.50 | ) b | 6.98 | |||||
| GROWTH OPPORTUNITIES FUND
|
|
Income from investment operations |
||||||||
|---|---|---|---|---|---|---|---|---|
|
Net asset value, beginning of period |
Net
investment income (loss) |
Net realized
and unrealized gain |
||||||
| For the Year Ended August 31, | ||||||||
| 2000 - Class A Shares | $10.13 | $(0.11 | ) c | $9.71 | ||||
| 2000 - Class B Shares | 10.18 | (0.24 | ) c | 9.74 | ||||
| 2000 - Class C Shares | 10.10 | (0.24 | ) c | 9.68 | ||||
| 2000 - Institutional Shares | 10.13 | (0.04 | ) c | 9.73 | ||||
| 2000 - Service Shares | 10.12 | (0.12 | ) c | 9.68 | ||||
| For the Period Ended August 31, | ||||||||
| 1999 - Class A Shares (commenced May 24) | 10.00 | (0.01 | ) c | 0.14 | ||||
| 1999 - Class B Shares (commenced May 24) | 10.00 | (0.03 | ) c | 0.21 | ||||
| 1999 - Class C Shares (commenced May 24) | 10.00 | (0.03 | ) c | 0.13 | ||||
| 1999 - Institutional Shares (commenced May 24) | 10.00 | 0.01 | 0.12 | |||||
| 1999 - Service Shares (commenced May 24) | 10.00 | — | 0.12 | |||||
|
Distributions to shareholders |
||||||||||||||
|---|---|---|---|---|---|---|---|---|---|---|---|---|---|---|
| Total from
investment operations |
From net
realized gains |
Net asset
value, end of period |
Total
returna |
Net assets at end of period (in 000s) |
Ratio of
net expenses to average net assets |
|||||||||
| $9.60 | $(0.23 | ) | $19.50 | 95.73 | % | $188,199 | 1.52 | % | ||||||
| 9.50 | (0.23 | ) | 19.45 | 94.27 | 42,061 | 2.27 | ||||||||
| 9.44 | (0.23 | ) | 19.31 | 94.43 | 26,826 | 2.27 | ||||||||
| 9.69 | (0.23 | ) | 19.59 | 96.67 | 49,921 | 1.12 | ||||||||
| 9.56 | (0.23 | ) | 19.45 | 95.41 | 3 | 1.62 | ||||||||
| 0.13 | — | 10.13 | 1.30 | 8,204 | 1.44 | b | ||||||||
| 0.18 | — | 10.18 | 1.80 | 520 | 2.19 | b | ||||||||
| 0.10 | — | 10.10 | 1.00 | 256 | 2.19 | b | ||||||||
| 0.13 | — | 10.13 | 1.30 | 5,223 | 1.04 | b | ||||||||
| 0.12 | — | 10.12 | 1.20 | 2 | 1.54 | b | ||||||||
| GROWTH OPPORTUNITIES FUND (continued)
|
|
Ratios assuming no expense reductions |
|||||||||||||
|---|---|---|---|---|---|---|---|---|---|---|---|---|---|
| Ratio
of net investment income (loss) to average net assets |
Ratio of
expenses to average net assets |
Ratio
of net investment loss to average net assets |
Portfolio
turnover rate |
||||||||||
| For the Year Ended August 31, | |||||||||||||
| 2000 - Class A Shares | (0.64 | )% | 1.61 | % | (0.73 | )% | 73.35 | % | |||||
| 2000 - Class B Shares | (1.38 | ) | 2.36 | (1.47 | ) | 73.35 | |||||||
| 2000 - Class C Shares | (1.38 | ) | 2.36 | (1.47 | ) | 73.35 | |||||||
| 2000 - Institutional Shares | (0.23 | ) | 1.21 | (0.32 | ) | 73.35 | |||||||
| 2000 - Service Shares | (0.69 | ) | 1.71 | (0.78 | ) | 73.35 | |||||||
| For the Period Ended August 31, | |||||||||||||
| 1999 - Class A Shares (commenced May 24) | (0.27 | ) b | 14.15 | b | (12.98 | ) b | 26.53 | ||||||
| 1999 - Class B Shares (commenced May 24) | (1.04 | ) b | 14.90 | b | (13.75 | ) b | 26.53 | ||||||
| 1999 - Class C Shares (commenced May 24) | (1.12 | ) b | 14.90 | b | (13.83 | ) b | 26.53 | ||||||
| 1999 - Institutional Shares (commenced May 24) | 0.39 | b | 13.75 | b | (12.32 | ) b | 26.53 | ||||||
| 1999 - Service Shares (commenced May 24) | 0.03 | b | 14.25 | b | (12.68 | ) b | 26.53 | ||||||
| MID CAP VALUE FUND
|
|
Income from investment operations |
|||||||||||
|---|---|---|---|---|---|---|---|---|---|---|---|
|
Net asset value, beginning of period |
Net
investment income (loss) |
Net realized
and unrealized gain (loss) |
Total income
from investment operations |
||||||||
| For the Year Ended August 31, | |||||||||||
| 2000 - Class A Shares | $18.42 | $0.20 | c | $1.38 | $1.58 | ||||||
| 2000 - Class B Shares | 18.23 | 0.06 | c | 1.40 | 1.46 | ||||||
| 2000 - Class C Shares | 18.24 | 0.06 | c | 1.37 | 1.43 | ||||||
| 2000 - Institutional Shares | 18.45 | 0.27 | c | 1.36 | 1.63 | ||||||
| 2000 - Service Shares | 18.31 | 0.18 | c | 1.35 | 1.53 | ||||||
| For the Seven Months Ended August 31, | |||||||||||
| 1999 - Class A Shares | 18.38 | 0.06 | 1.71 | 1.77 | |||||||
| 1999 - Class B Shares | 18.29 | (0.04 | ) | 1.71 | 1.67 | ||||||
| 1999 - Class C Shares | 18.30 | (0.04 | ) | 1.71 | 1.67 | ||||||
| 1999 - Institutional Shares | 18.37 | 0.09 | 1.72 | 1.81 | |||||||
| 1999 - Service Shares | 18.29 | 0.05 | 1.70 | 1.75 | |||||||
| For the Years Ended January 31, | |||||||||||
| 1999 - Class A Shares | 21.61 | 0.10 | (2.38 | ) | (2.28 | ) | |||||
| 1999 - Class B Shares | 21.57 | (0.05 | ) | (2.35 | ) | (2.40 | ) | ||||
| 1999 - Class C Shares | 21.59 | (0.05 | ) | (2.34 | ) | (2.39 | ) | ||||
| 1999 - Institutional Shares | 21.65 | 0.19 | (2.38 | ) | (2.19 | ) | |||||
| 1999 - Service Shares | 21.62 | 0.03 | (2.31 | ) | (2.28 | ) | |||||
| 1998 - Class A Shares (commenced August 15, 1997) | 23.63 | 0.09 | 0.76 | 0.85 | |||||||
| 1998 - Class B Shares (commenced August 15, 1997) | 23.63 | 0.06 | 0.74 | 0.80 | |||||||
| 1998 - Class C Shares (commenced August 15, 1997) | 23.63 | 0.06 | 0.76 | 0.82 | |||||||
| 1998 - Institutional Shares | 18.73 | 0.16 | 5.66 | 5.82 | |||||||
| 1998 - Service Shares (commenced July 18, 1997) | 23.01 | 0.09 | 1.40 | 1.49 | |||||||
| 1997 - Institutional Shares | 15.91 | 0.24 | 3.77 | 4.01 | |||||||
| For the Period Ended January 31, | |||||||||||
| 1996 - Institutional Shares (commenced August 1, 1995) | 15.00 | 0.13 | 0.90 | 1.03 | |||||||
|
Distributions to shareholders |
|||||||||||||||||||||
|---|---|---|---|---|---|---|---|---|---|---|---|---|---|---|---|---|---|---|---|---|---|
| From net
investment income |
In excess of net investment income |
From net
realized gains |
Total
Distributions |
Net asset
value, end of period |
Total
returna |
Net assets
at end of period (in 000s) |
Ratio of
net expenses to average net assets |
||||||||||||||
| $(0.12 | ) | $ — | $ — | $(0.12 | ) | $19.88 | 8.70 | % | $ 39,142 | 1.29 | % | ||||||||||
| — | — | — | — | 19.69 | 8.01 | 22,284 | 2.04 | ||||||||||||||
| — | — | — | — | 19.67 | 7.84 | 5,720 | 2.04 | ||||||||||||||
| (0.22 | ) | — | — | (0.22 | ) | 19.86 | 9.08 | 158,188 | 0.89 | ||||||||||||
| (0.11 | ) | — | — | (0.11 | ) | 19.73 | 8.48 | 206 | 1.39 | ||||||||||||
| — | — | (1.73 | ) | (1.73 | ) | 18.42 | 9.04 | 49,081 | 1.29 | b | |||||||||||
| — | — | (1.73 | ) | (1.73 | ) | 18.23 | 8.53 | 31,824 | 2.04 | b | |||||||||||
| — | — | (1.73 | ) | (1.73 | ) | 18.24 | 8.52 | 9,807 | 2.04 | b | |||||||||||
| — | — | (1.73 | ) | (1.73 | ) | 18.45 | 9.26 | 190,549 | 0.89 | b | |||||||||||
| — | — | (1.73 | ) | (1.73 | ) | 18.31 | 8.97 | 190 | 1.39 | b | |||||||||||
| (0.07 | ) | — | (0.88 | ) | (0.95 | ) | 18.38 | (10.48 | ) | 70,578 | 1.33 | ||||||||||
| — | — | (0.88 | ) | (0.88 | ) | 18.29 | (11.07 | ) | 37,821 | 1.93 | |||||||||||
| (0.02 | ) | — | (0.88 | ) | (0.90 | ) | 18.30 | (11.03 | ) | 10,800 | 1.93 | ||||||||||
| (0.21 | ) | — | (0.88 | ) | (1.09 | ) | 18.37 | (10.07 | ) | 196,512 | 0.87 | ||||||||||
| (0.17 | ) | — | (0.88 | ) | (1.05 | ) | 18.29 | (10.48 | ) | 289 | 1.37 | ||||||||||
| (0.06 | ) | (0.04 | ) | (2.77 | ) | (2.87 | ) | 21.61 | 3.42 | 90,588 | 1.35 | b | |||||||||
| (0.09 | ) | — | (2.77 | ) | (2.86 | ) | 21.57 | 3.17 | 28,743 | 1.85 | b | ||||||||||
| (0.09 | ) | — | (2.77 | ) | (2.86 | ) | 21.59 | 3.27 | 6,445 | 1.85 | b | ||||||||||
| (0.13 | ) | — | (2.77 | ) | (2.90 | ) | 21.65 | 30.86 | 236,440 | 0.85 | |||||||||||
| (0.11 | ) | — | (2.77 | ) | (2.88 | ) | 21.62 | 6.30 | 8 | 1.35 | b | ||||||||||
| (0.24 | ) | (0.93 | ) | (0.02 | ) | (1.19 | ) | 18.73 | 25.63 | 145,253 | 0.85 | ||||||||||
| (0.12 | ) | — | — | (0.12 | ) | 15.91 | 6.89 | 135,671 | 0.85 | b | |||||||||||
| MID CAP VALUE FUND (continued)
|
|
Ratios assuming no expense reductions |
||||||||||||
|---|---|---|---|---|---|---|---|---|---|---|---|---|
| Ratio of
net investment income (loss) to average net assets |
Ratio of
expenses to average net assets |
Ratio of
net investment income (loss) to average net assets |
Portfolio
turnover rate |
|||||||||
| For the Year Ended August 31, | ||||||||||||
| 2000 - Class A Shares | 1.11 | % | 1.34 | % | 1.06 | % | 82.92 | % | ||||
| 2000 - Class B Shares | 0.35 | 2.09 | 0.30 | 82.92 | ||||||||
| 2000 - Class C Shares | 0.32 | 2.09 | 0.27 | 82.92 | ||||||||
| 2000 - Institutional Shares | 1.51 | 0.94 | 1.46 | 82.92 | ||||||||
| 2000 - Service Shares | 1.03 | 1.44 | 0.98 | 82.92 | ||||||||
| For the Seven-Months Ended August 31, | ||||||||||||
| 1999 - Class A Shares | 0.43 | b | 1.37 | b | 0.35 | b | 68.84 | |||||
| 1999 - Class B Shares | (0.33 | ) b | 2.12 | b | (0.41 | ) b | 68.84 | |||||
| 1999 - Class C Shares | (0.34 | ) b | 2.12 | b | (0.42 | ) b | 68.84 | |||||
| 1999 - Institutional Shares | 0.79 | b | 0.97 | b | 0.71 | b | 68.84 | |||||
| 1999 - Service Shares | 0.38 | b | 1.47 | b | 0.30 | b | 68.84 | |||||
| For the Years Ended January 31, | ||||||||||||
| 1999 - Class A Shares | 0.38 | 1.41 | 0.30 | 92.18 | ||||||||
| 1999 - Class B Shares | (0.22 | ) | 2.01 | (0.30 | ) | 92.18 | ||||||
| 1999 - Class C Shares | (0.22 | ) | 2.01 | (0.30 | ) | 92.18 | ||||||
| 1999 - Institutional Shares | 0.83 | 0.95 | 0.75 | 92.18 | ||||||||
| 1999 - Service Shares | 0.32 | 1.45 | 0.24 | 92.18 | ||||||||
| 1998 - Class A Shares (commenced August 15, 1997) | 0.33 | b | 1.47 | b | 0.21 | b | 62.60 | |||||
| 1998 - Class B Shares (commenced August 15, 1997) | (0.20 | ) b | 1.97 | b | (0.32 | ) b | 62.60 | |||||
| 1998 - Class C Shares (commenced August 15, 1997) | (0.23 | ) b | 1.97 | b | (0.35 | ) b | 62.60 | |||||
| 1998 - Institutional Shares | 0.78 | 0.97 | 0.66 | 62.60 | ||||||||
| 1998 - Service Shares (commenced July 18, 1997) | 0.63 | b | 1.43 | b | 0.51 | b | 62.60 | |||||
| 1997 - Institutional Shares | 1.35 | 0.91 | 1.29 | 74.03 | ||||||||
| For the Period Ended January 31, | ||||||||||||
| 1996 - Institutional Shares (commenced August 1, 1995) | 1.67 | b | 0.98 | b | 1.54 | b | 58.77 | |||||
| SMALL CAP VALUE FUND
|
|
Income (loss) from investment operations |
|||||||||||
|---|---|---|---|---|---|---|---|---|---|---|---|
| Net asset
value, beginning of period |
Net
investment income (loss) |
Net realized and unrealized gain (loss) |
Total
income (loss) from investment operations |
||||||||
| For the Year Ended August 31, | |||||||||||
| 2000 - Class A Shares | $19.80 | $ 0.01 | c | $ 3.40 | $ 3.41 | ||||||
| 2000 - Class B Shares | 19.27 | (0.13 | ) c | 3.26 | 3.13 | ||||||
| 2000 - Class C Shares | 19.28 | (0.12 | ) c | 3.26 | 3.14 | ||||||
| 2000 - Institutional Shares | 19.95 | 0.10 | c | 3.42 | 3.52 | ||||||
| 2000 - Service Shares | 19.76 | 0.01 | c | 3.36 | 3.37 | ||||||
| For the Seven-Month Period Ended August 31, | |||||||||||
| 1999 - Class A Shares | 18.51 | (0.05 | ) | 1.34 | 1.29 | ||||||
| 1999 - Class B Shares | 18.10 | (0.12 | ) | 1.29 | 1.17 | ||||||
| 1999 - Class C Shares | 18.12 | (0.11 | ) | 1.27 | 1.16 | ||||||
| 1999 - Institutional Shares | 18.62 | — | 1.33 | 1.33 | |||||||
| 1999 - Service Shares | 18.50 | (0.13 | ) | 1.39 | 1.26 | ||||||
| For the Years Ended January 31, | |||||||||||
| 1999 - Class A Shares | 24.05 | (0.06 | ) | (4.48 | ) | (4.54 | ) | ||||
| 1999 - Class B Shares | 23.73 | (0.21 | ) | (4.42 | ) | (4.63 | ) | ||||
| 1999 - Class C Shares | 23.73 | (0.18 | ) | (4.43 | ) | (4.61 | ) | ||||
| 1999 - Institutional Shares | 24.09 | 0.03 | (4.50 | ) | (4.47 | ) | |||||
| 1999 - Service Shares | 24.05 | (0.04 | ) | (4.51 | ) | (4.55 | ) | ||||
| 1998 - Class A Shares | 20.91 | 0.14 | 5.33 | 5.47 | |||||||
| 1998 - Class B Shares | 20.80 | (0.01 | ) | 5.27 | 5.26 | ||||||
| 1998 - Class C Shares (commenced August 15, 1997) | 24.69 | (0.06 | ) | 1.43 | 1.37 | ||||||
| 1998 - Institutional Shares (commenced August 15, 1997) | 24.91 | 0.03 | 1.48 | 1.51 | |||||||
| 1998 - Service Shares (commenced August 15, 1997) | 24.91 | (0.01 | ) | 1.48 | 1.47 | ||||||
| 1997 - Class A Shares | 17.29 | (0.21 | ) | 4.92 | 4.71 | ||||||
| 1997 - Class B Shares (commenced May 1, 1996) | 20.79 | (0.11 | ) | 1.21 | 1.10 | ||||||
| 1996 - Class A Shares | 16.14 | (0.23 | ) | 1.39 | 1.16 | ||||||
|
Distributions to shareholders |
|||||||||||||||||
|---|---|---|---|---|---|---|---|---|---|---|---|---|---|---|---|---|---|
| In excess
of net investment income |
From net
realized gains |
Total
distributions |
Net asset value, end of period |
Total
returna |
Net assets
at end of period (in 000s) |
Ratio of
net expenses to average net assets |
|||||||||||
| $— | $ — | $ — | $23.21 | 17.22 | % | $157,791 | 1.50 | % | |||||||||
| — | — | — | 22.40 | 16.24 | 29,199 | 2.25 | |||||||||||
| — | — | — | 22.42 | 16.34 | 8,428 | 2.25 | |||||||||||
| — | — | — | 23.47 | 17.64 | 26,445 | 1.10 | |||||||||||
| — | — | — | 23.13 | 17.05 | 83 | 1.60 | |||||||||||
| — | — | — | 19.80 | 6.97 | 210,500 | 1.50 | b | ||||||||||
| — | — | — | 19.27 | 6.46 | 37,386 | 2.25 | b | ||||||||||
| — | — | — | 19.28 | 6.40 | 8,079 | 2.25 | b | ||||||||||
| — | — | — | 19.95 | 7.14 | 27,023 | 1.10 | b | ||||||||||
| — | — | — | 19.76 | 6.81 | 57 | 1.60 | b | ||||||||||
| — | (1.00 | ) | (1.00 | ) | 18.51 | (17.37 | ) | 261,661 | 1.50 | ||||||||
| — | (1.00 | ) | (1.00 | ) | 18.10 | (18.00 | ) | 42,879 | 2.25 | ||||||||
| — | (1.00 | ) | (1.00 | ) | 18.12 | (17.91 | ) | 8,212 | 2.25 | ||||||||
| — | (1.00 | ) | (1.00 | ) | 18.62 | (17.04 | ) | 15,351 | 1.13 | ||||||||
| — | (1.00 | ) | (1.00 | ) | 18.50 | (17.41 | ) | 261 | 1.62 | ||||||||
| — | (2.33 | ) | (2.33 | ) | 24.05 | 26.17 | 370,246 | 1.54 | |||||||||
| — | (2.33 | ) | (2.33 | ) | 23.73 | 25.29 | 42,677 | 2.29 | |||||||||
| — | 2.33 | (2.33 | ) | 23.73 | 5.51 | 5,604 | 2.09 | b | |||||||||
| — | 2.33 | (2.33 | ) | 24.09 | 6.08 | 14,626 | 1.16 | b | |||||||||
| — | 2.33 | (2.33 | ) | 24.05 | 5.91 | 2 | 1.45 | b | |||||||||
| — | (1.09 | ) | (1.09 | ) | 20.91 | 27.28 | 212,061 | 1.60 | |||||||||
| — | (1.09 | ) | (1.09 | ) | 20.80 | 5.39 | 3,674 | 2.35 | b | ||||||||
| — | (0.01 | ) | (0.01 | ) | 17.29 | 7.20 | 204,994 | 1.41 | |||||||||
| SMALL CAP VALUE FUND (continued)
|
|
Ratios assuming no expense reductions |
|||||||||||||
|---|---|---|---|---|---|---|---|---|---|---|---|---|---|
| Ratio of
net investment income (loss) to average net assets |
Ratio of
expenses to average net assets |
Ratio of
net investment income (loss) to average net assets |
Portfolio
turnover rate |
||||||||||
| For the Year Ended August 31, | |||||||||||||
| 2000 - Class A Shares | 0.07 | % | 1.57 | % | — | % | 75.31 | % | |||||
| 2000 - Class B Shares | (0.68 | ) | 2.32 | (0.75 | ) | 75.31 | |||||||
| 2000 - Class C Shares | (0.65 | ) | 2.32 | (0.72 | ) | 75.31 | |||||||
| 2000 - Institutional Shares | 0.49 | 1.17 | 0.42 | 75.31 | |||||||||
| 2000 - Service Shares | 0.03 | 1.67 | (0.04 | ) | 75.31 | ||||||||
| For the Seven-Month Period Ended August 31, | |||||||||||||
| 1999 - Class A Shares | (0.35 | ) b | 1.61 | b | (0.46 | ) b | 46.95 | ||||||
| 1999 - Class B Shares | (1.10 | ) b | 2.36 | b | (1.21 | ) b | 46.95 | ||||||
| 1999 - Class C Shares | (1.10 | ) b | 2.36 | b | (1.21 | ) b | 46.95 | ||||||
| 1999 - Institutional Shares | 0.05 | b | 1.21 | b | (0.06 | ) b | 46.95 | ||||||
| 1999 - Service Shares | (0.41 | ) b | 1.71 | b | (0.52 | ) b | 46.95 | ||||||
| For the Years Ended January 31, | |||||||||||||
| 1999 - Class A Shares | (0.24 | ) | 1.74 | (0.48 | ) | 98.46 | |||||||
| 1999 - Class B Shares | (0.99 | ) | 2.29 | (1.03 | ) | 98.46 | |||||||
| 1999 - Class C Shares | (0.99 | ) | 2.29 | (1.03 | ) | 98.46 | |||||||
| 1999 - Institutional Shares | 0.13 | 1.17 | 0.09 | 98.46 | |||||||||
| 1999 - Service Shares | (0.47 | ) | 1.66 | (0.51 | ) | 98.46 | |||||||
| 1998 - Class A Shares | (0.28 | ) | 1.76 | (0.50 | ) | 84.81 | |||||||
| 1998 - Class B Shares | (0.92 | ) | 2.29 | (0.92 | ) | 84.81 | |||||||
| 1998 - Class C Shares (commenced August 15, 1997) | (0.79 | ) b | 2.09 | b | (0.79 | ) b | 84.81 | ||||||
| 1998 - Institutional Shares (commenced August 15, 1997) | 0.27 | b | 1.16 | b | 0.27 | b | 84.81 | ||||||
| 1998 - Service Shares (commenced August 15, 1997) | (0.07 | ) b | 1.45 | b | (0.07 | ) b | 84.81 | ||||||
| 1997 - Class A Shares | (0.72 | ) | 1.85 | (0.97 | ) | 99.46 | |||||||
| 1997 - Class B Shares (commenced May 1, 1996) | (1.63 | ) b | 2.35 | b | (1.63 | ) b | 99.46 | ||||||
| 1996 - Class A Shares | (0.59 | ) | 1.66 | (0.84 | ) | 57.58 | |||||||
| LARGE CAP VALUE FUND
|
|
Income from investment operations |
|||||||||||
|---|---|---|---|---|---|---|---|---|---|---|---|
|
Net asset value, beginning of period |
Net
investment incomec |
Net
realized and unrealized gain |
Total from
investment operations |
Net asset
value, end of period |
|||||||
| For the Period Ended August 31, | |||||||||||
| 2000 - Class A Shares (commenced Dec. 15, 1999) | $10.00 | $0.06 | $0.33 | $0.39 | $10.39 | ||||||
| 2000 - Class B Shares (commenced Dec. 15, 1999) | 10.00 | — | 0.33 | 0.33 | 10.33 | ||||||
| 2000 - Class C Shares (commenced Dec. 15, 1999) | 10.00 | 0.01 | 0.31 | 0.32 | 10.32 | ||||||
| 2000 - Institutional Shares (commenced Dec. 15, 1999) | 10.00 | 0.09 | 0.31 | 0.40 | 10.40 | ||||||
| 2000 - Service Shares (commenced Dec. 15, 1999) | 10.00 | 0.07 | 0.31 | 0.38 | 10.38 | ||||||
a
|
Assumes investment at the net asset value at the beginning of the period, reinvestment of all dividends and
distributions, a complete redemption of the investment at the net asset value at the end of the period and no sales or redemption charges. Total return would be reduced if a sales or redemption charge were taken into account. Total returns for periods
less than one full year are not annualized.
|
b
|
Annualized.
|
c
|
Calculated based on average shares outstanding methodology.
|
d
|
Includes the effect of mortgage dollar roll transactions.
|
|
Ratios assuming no expense reductions |
||||||||||||||||||
|---|---|---|---|---|---|---|---|---|---|---|---|---|---|---|---|---|---|---|
| Total
returna |
Net assets
at end of period (in 000s) |
Ratio of net
expenses to average net assetsb |
Ratio of net
investment income to average net assetsb |
Ratio of
expenses to average net assetsb |
Ratio of net
investment income to average net assetsb |
Portfolio
turnover rate |
||||||||||||
| 3.90 | % | $7,181 | 1.25 | % | 0.84 | % | 3.30 | % | (1.21 | )% | 66.79 | % | ||||||
| 3.30 | 1,582 | 2.00 | 0.06 | 4.05 | (1.99 | ) | 66.79 | |||||||||||
| 3.20 | 850 | 2.00 | 0.15 | 4.05 | (1.90 | ) | 66.79 | |||||||||||
| 4.00 | 16,155 | 0.85 | 1.31 | 2.90 | (0.74 | ) | 66.79 | |||||||||||
| 3.80 | 2 | 1.35 | 0.95 | 3.40 | (1.10 | ) | 66.79 | |||||||||||
| FOR MORE INFORMATION
|
| Annual/Semi-annual Report
|
| Additional information about the Funds’ investments is available in the Funds’ annual and semi-annual reports to
shareholders. In the Funds’ annual reports, you will find a discussion of the market conditions and investment strategies that significantly affected the Funds’ performance during the last fiscal year.
|
| Statement of Additional Information
|
| Additional information about the Funds and their policies is also available in the Funds’ Additional Statement. The
Additional Statement is incorporated by reference into this Prospectus (is legally considered part of this Prospectus).
|
| The Funds’ annual and semi-annual reports, and the Additional Statement, are available free upon request by calling Goldman
Sachs at 1-800-621-2550.
|
| To obtain other information and for shareholder inquiries:
|
| By telephone – Call 1-800-621-2550
|
| By mail – Goldman Sachs Funds, 4900 Sears Tower, Chicago, IL 60606-6372
|
| By e-mail – [email protected]
|
| On the Internet – Text-only versions of the Funds’ documents are located online and may be downloaded from:
|
| SEC EDGAR database – http://www.sec.gov
|
| You may review and obtain copies of Fund documents by visiting the SEC’s Public Reference Room in Washington, D.C. You may
also obtain copies of Fund documents, after paying a duplicating fee, by writing to the SEC’s Public Reference Section, Washington, D.C. 20549-0102 or by electronic request to: [email protected]. Information on the operation of the public reference
room may be obtained by calling the SEC at (202) 942-8090.
|
| The Funds’ investment company registration number is 811-5349.
|
|
EQDOMPROSVC
|
| Prospectus
|
| Service Shares
|
| December 29, 2000
|
|
| GOLDMAN SACHS RESEARCH SELECT FUND
SM
|

| THE SECURITIES AND EXCHANGE COMMISSION HAS NOT APPROVED OR DISAPPROVED THESE SECURITIES OR PASSED UPON THE ADEQUACY OF THIS PROSPECTUS.
ANY REPRESENTATION TO THE CONTRARY IS A CRIMINAL OFFENSE.
|
| AN INVESTMENT IN THE FUND IS NOT A BANK DEPOSIT AND IS NOT INSURED BY THE FEDERAL DEPOSIT INSURANCE CORPORATION OR ANY OTHER GOVERNMENT
AGENCY. AN INVESTMENT IN THE FUND INVOLVES INVESTMENT RISKS, INCLUDING POSSIBLE LOSS OF PRINCIPAL.
|
| NOT FDIC-INSURED
|
May Lose Value
|
No Bank Guarantee
|
| Goldman Sachs Asset Management, a unit of the Investment Management Division of Goldman, Sachs & Co. (“Goldman
Sachs”), serves as investment adviser to the Research Select Fund (the “Fund”). Goldman Sachs Asset Management is referred to in this Prospectus as the “Investment Adviser.”
|
| RESEARCH STYLE FUNDS—RESEARCH SELECT FUND
|
| The Goldman Sachs Research Select Fund selects substantially all of its securities from the U.S. Select List developed by
the Goldman Sachs Investment Research Division. The Fund leverages the resources of Goldman Sachs by applying the Investment Management Division’s portfolio management expertise to the equity securities included in the U.S. Select List.
|
|
|
| Research Select Fund
|
|
Objective:
|
Long-term growth of capital
|
|
Benchmark:
|
S&P 500® Index
|
|
Investment Focus:
|
A focused portfolio of U.S. equity securities that offer the potential for long-term capital appreciation
|
| INVESTMENT OBJECTIVE
|
| The Fund seeks to provide long-term growth of capital by investing in a focused portfolio of U.S. equity securities.
|
| PRINCIPAL INVESTMENT STRATEGIES
|
| Equity Securities. The Fund invests, under normal circumstances, at least 90% of its total assets in U.S. equity securities, including securities of foreign issuers that are traded in the United States. Under normal circumstances, the Fund will only
purchase equity securities that are included in the Goldman Sachs Global Investment Research Division’s U.S. Select List and will sell securities that have been removed from the U.S. Select List. Notification of changes to the U.S. Select List is made to clients of Goldman Sachs and to the Fund’s portfolio management team at the
same time. The Fund will purchase a security that has been added to, or sell a security that has been removed from, the list after publication of that change. In addition, the Investment Adviser may apply the techniques described below in managing the
Fund and in purchasing and selling securities that are included in the U.S. Select List.
|
| The Goldman Sachs Global Investment Research Division’s U.S. Select List.
The U.S. Select List was introduced on September 9, 1998 and comprises approximately 25 to 35 equity securities that the Goldman Sachs U.S. Stock Selection
Committee expects, as a portfolio, to outperform its benchmark, the S&P 500® Index over the next 12 to 18 months. The list is consistent with overall investment policy and emphasizes strategically favored economic sectors. The U.S. Select List is updated on a regular basis. Historically, the U.S. Select List has consisted primarily of common stocks of relatively large U.S. companies, although the list is not restricted to those types of companies.
|
| The U.S. Select List is used primarily by institutional clients.
|
| Our Approach to Portfolio Management.
To the extent practicable, the Fund will seek to deliver returns that are comparable to the price returns of the U.S. Select List. Generally, the Fund will seek to maintain approximate equal weightings of its assets among the securities included
in the list. Any remaining assets may be invested by the Investment Adviser in the other instruments described in this Prospectus, including short-term debt obligations, options and futures contracts.
|
| Investors should be aware, however, that the performance of the Fund will differ from the price returns of the U.S. Select List
for a variety of reasons, including the change in securities prices that may occur between the time when a security is added to or removed from the list and when it is bought or sold for the Fund; the Fund’s investment of cash flow from purchases
and sales of Fund shares, which can occur daily and will result in portfolio purchases and sales; modifications in the Fund’s stock weights in order to control trading costs; the timing and amount of dividend and distribution payments; and the
Fund’s use of investment techniques and instruments that are not included in the U.S. Select List. In addition, unlike the U.S. Select List, the Fund will incur transactional costs (such as brokerage commissions) and operational expenses (such as investment advisory fees).
|
| While the Fund intends to track the composition of the U.S. Select List, the Fund’s purchases and sales of securities
that are added to and deleted from the list may not be completed on the first trading day after changes to the list are announced, and in certain cases may take several days or weeks to complete. Moreover, purchases and sales of the Fund and other
investors following the U.S. Select List could create a temporary imbalance between the supply and demand of the securities on the list. The imbalance could affect the time it takes the Fund to complete its transactions, as well as the price the Fund pays or receives. In
order to reduce impact of these trading costs, the Investment Adviser may decide for a period of time not to buy a security that is included in the U.S. Select List or to continue to hold a security that has been removed from the list.
|
| The Fund will periodically rebalance its portfolio in an effort to maintain approximate equal weightings of its assets among the
securities on the U.S. Select List.
|
| Other. The Fund’s investments in fixed-income securities are limited to securities that are considered cash equivalents.
|
Ÿ
|
No specific percentage limitation on usage;
limited only by the objective and strategies of the Fund |
| Research
Select Fund |
|||
|---|---|---|---|
| Investment Practices | |||
| Borrowings | 33 1
/3
|
||
| Custodial Receipts | — | ||
| Equity Swaps* | 15 | ||
| Futures Contracts and Options on Futures Contracts | Ÿ | ||
| Investment Company Securities (including exchange-traded funds) | 10 | ||
| Options on Securities and Securities Indices 1 | Ÿ | ||
| Repurchase Agreements | Ÿ | ||
| Securities Lending | 33 1
/3
|
||
| Short Sales Against the Box | 25 | ||
| Unseasoned Companies | Ÿ | ||
| Warrants and Stock Purchase Rights | Ÿ | ||
| When-Issued Securities and Forward Commitments | Ÿ | ||
*
|
Limited to 15% of net assets (together with other illiquid securities) for all structured securities which are not
deemed to be liquid and all swap transactions.
|
1
|
The Fund may sell covered call and put options and purchase call and put options.
|
Ÿ
|
No specific percentage limitation on usage;
limited only by the objective and strategies of the Fund |
| Research
Select Fund |
||||
|---|---|---|---|---|
| Investment Securities | ||||
| American and Global Depositary Receipts | — | |||
| Asset-Backed and Mortgage-Backed Securities | — | |||
| Bank Obligations 2 | Ÿ | |||
| Convertible Securities 3 | Ÿ | |||
| Corporate Debt Obligations 2 | Ÿ | |||
| Equity Securities | 90 | + | ||
| Emerging Country Securities | — | |||
| Fixed Income Securities | Ÿ | |||
| Foreign Issuers | Ÿ | |||
| Non-Investment Grade Fixed Income Securities | — | |||
| Real Estate Investment Trusts (“REITs”) | Ÿ | |||
| Structured Securities * | Ÿ | |||
| Temporary Investments | 100 | |||
| U.S. Government Securities 2 | Ÿ | |||
*
|
Limited to 15% of net assets (together with other illiquid securities) for all structured securities which are not
deemed to be liquid and all swap transactions.
|
2
|
Limited by the amount the Fund invests in fixed-income securities. Cash equivalents only.
|
3
|
The Fund has no minimum rating criteria.
|
| Loss of money is a risk of investing in the Fund. An investment in the Fund is not a deposit of any bank and is not insured or
guaranteed by the Federal Deposit Insurance Corporation or any other governmental agency. The following summarizes important risks that apply to the Fund and may result in a loss of your investment. The Fund should not be relied upon as a complete
investment program. There can be no assurance that the Fund will achieve its investment objective.
|
| Research
Select Fund |
|||
|---|---|---|---|
| Ÿ Applicable | |||
| U.S. Select List | Ÿ | ||
| Stock | Ÿ | ||
| Credit/Default | Ÿ | ||
| Foreign | Ÿ | ||
| Derivatives | Ÿ | ||
| Interest Rate | Ÿ | ||
| Management | Ÿ | ||
| Market | Ÿ | ||
| Liquidity | Ÿ | ||
| Small Cap | Ÿ | ||
n
|
U.S. Select List Risk—The Fund invests
principally in securities included in the U.S. Select List, which comprises approximately 25 to 35 stocks. As a result of the small universe of stocks in which the Fund generally invests, it may be subject to greater risks than would a more diversified fund.
|
| Price returns reported for the U.S. Select List do not predict or reflect the future results of the U.S. Select List
or the Fund. In addition, unlike the Fund, the securities included in the U.S. Select List constitute only a “paper portfolio” that does not reflect actual trading and does not have an actual performance record.
|
| Although the Goldman Sachs U.S. Stock Selection Committee periodically makes subjective decisions to add or delete companies for the
U.S. Select List, the list is not compiled with any particular client or product in mind and is not (and will not be) compiled with the Fund in mind. The Global Investment Research Division could at any time cease publishing the U.S. Select List
. In that event, the Board of Trustees will make a determination on how to proceed
in the best interest of shareholders of the Fund, consistent with the Fund’s investment objective. Goldman Sachs publishes similar lists of recommended securities that may be appropriate for shareholders of the Fund but which will not be used by the
Investment Adviser for the Fund at this time.
|
| The Fund’s purchases and sales for its portfolio will be affected by market conditions following the publication of changes
to the U.S. Select List and will be subject to competing orders by Goldman Sachs clients who invest in the securities included on the list.
|
| The activities of Goldman Sachs and its affiliates may occasionally limit the Fund’s ability to purchase or sell securities
included in the U.S. Select List. The U.S. Select List is also subject to restrictions related to Goldman Sachs’ other businesses. In addition, certain securities may or may not appear on the U.S. Select List or may or may not be removed from
the list due to legal restrictions applicable to, or other business concerns of, Goldman Sachs. An investor should understand that these concerns will generally not be related to whether a particular security on the list or a security not on the list is
an attractive investment opportunity.
|
| As a global financial services firm, Goldman Sachs provides a wide range of financial services to issuers of securities and
investors in securities. Goldman Sachs, its affiliates and others associated with it may create markets or specialize in, have positions in and affect transactions in, securities of companies included in the U.S. Select List and may also perform or seek to perform financial services for those companies. Within the last three years, Goldman Sachs or its affiliates may have managed or co-managed public security offerings for companies included in the
U.S. Select List, and they or their employees may have a long or short position on holdings in the securities, or options on securities, or other related investments of companies included in the U.S. Select List.
|
| The Fund’s ability to invest in particular securities included in the U.S. Select List may be limited by the
diversification and other restrictions imposed on it as a registered mutual fund under the Investment Company Act of 1940 (the “Act”).
|
n
|
Stock Risk—The risk that stock prices
have historically risen and fallen in periodic cycles. Recently, U.S. stock markets and certain foreign stock markets have experienced substantial price volatility and, at times, have traded at or close to record high levels. There is no guarantee that
such levels will be reached or maintained in the future.
|
n
|
Credit/Default Risk—The risk that an issuer or guarantor of fixed-income securities held by the Fund may
default on its obligation to pay interest and repay principal.
|
n
|
Foreign Risk—The risk that when the Fund invests in foreign issuers, it will be subject to risk of loss not
typically associated with domestic issuers. Loss may result because of less foreign government regulation, less public information and
less economic, political and social stability. Loss may also result from the imposition of exchange controls, confiscations and other government restrictions.
|
n
|
Derivatives Risk—The risk that loss may result from the Fund’s investments in options, futures, swaps,
structured securities and other derivative instruments. These instruments may be leveraged so that small changes may produce disproportionate losses to the Fund.
|
n
|
Interest Rate Risk—The risk that when interest rates increase, fixed-income securities held by the Fund will
decline in value.
|
n
|
Management Risk—The risk that a strategy used by the Investment Adviser may fail to produce the intended results.
|
n
|
Market Risk—The risk that the value of the securities in which the Fund invests may go up or down in response
to the prospects of individual companies, particular industry sectors and/or general economic conditions. Price changes may be temporary or last for extended periods. The Fund’s investments may be overweighted from time to time in one or more
industry sectors, which will increase the Fund’s exposure to risk of loss from adverse developments affecting those sectors.
|
n
|
Liquidity Risk—The risk that the Fund will not be able to pay redemption proceeds within the time period stated
in this Prospectus because of unusual market conditions, an unusually high volume of redemption requests, or other reasons. Because the Fund may invest in small capitalization stocks and REITs, the Fund will be especially subject to the risk that during
certain periods the liquidity of particular issuers or industries, or all securities within particular investment categories, will shrink or disappear suddenly and without warning as a result of adverse economic, market or political events, or adverse
investor perceptions whether or not accurate.
|
n
|
Small Cap Stock Risk—The securities of small capitalization stocks involve greater risks than those associated
with larger, more established companies and may be subject to more abrupt or erratic price movements. Securities of such issuers may lack sufficient market liquidity to enable the Fund to effect sales at an advantageous time or without a substantial drop
in price.
|
| More information about the Fund’s portfolio securities and investment techniques, and their associated risks, is provided in
Appendix A. You should consider the investment risks discussed in this section and in Appendix A. Both are important to your investment choice.
|
| HOW THE FUND HAS PERFORMED
|
| The Fund commenced operations on June 19, 2000. Since the Fund has less than one calendar year’s performance, no performance
information is provided in this section.
|
| Research
Select Fund |
|||
|---|---|---|---|
| Shareholder Fees | |||
| (fees paid directly from your investment): | |||
| Maximum Sales Charge (Load) Imposed
on Purchases |
None | ||
| Maximum Sales Charge (Load) Imposed on Reinvested Dividends | None | ||
| Redemption Fees | None | ||
| Exchange Fees | None | ||
| Annual Fund Operating Expenses | |||
| (expenses that are deducted from Fund assets):1 | |||
| Management Fees | 1.00% | ||
| Service Fees 2 | 0.50% | ||
| Other Expenses 3 | 0.65% | ||
| Total Fund Operating Expenses* | 2.15% | ||
| See page 11 for all other footnotes.
|
*
|
As a result of current expense limitations, the estimated “Other Expenses” and “Total Fund Operating Expenses”
of the Fund which are actually incurred as of the date of this Prospectus are as set forth below. The expense limitations may be terminated at any time at the option of the Investment Adviser. If this occurs, “Other Expenses” and “Total
Fund Operating Expenses” may increase without shareholder approval.
|
| Research
Select Fund |
|||
|---|---|---|---|
| Annual Fund Operating Expenses | |||
| (expenses that are deducted from Fund assets): 1 | |||
| Management Fees | 1.00% | ||
| Service Fees 2 | 0.50% | ||
| Other Expenses 3 | 0.10% | ||
| Total Fund Operating Expenses (after current expense limitations) | 1.60% | ||
1
|
The operating expenses for the Fund are estimated for the current year.
|
2
|
Service Organizations may charge other fees to their customers who are beneficial owners of Service Shares in connection
with their customers’ accounts. Such fees may affect the return customers realize with respect to their investments.
|
3
|
Estimated “Other Expenses” include transfer agency fees equal to 0.04% of the average daily net assets of the
Fund’s Service Shares, plus all other ordinary expenses not detailed above. The Investment Adviser has voluntarily agreed to reduce or limit “Other Expenses” (excluding management fees, transfer agency fees, service fees, taxes, interest
and brokerage fees and litigation, indemnification and other extraordinary expenses) to the following percentage of the Fund’s average daily net assets:
|
| Fund | Other
Expenses |
||
|---|---|---|---|
| Research Select | 0.06% | ||
| Fund | 1 Year | 3 Years | 5 Years | 10 Years | |||||
|---|---|---|---|---|---|---|---|---|---|
| Research Select | $218 | $673 | N/A | N/A | |||||
| INVESTMENT ADVISER
|
| Investment Adviser | Fund | ||
|---|---|---|---|
| Goldman Sachs Asset Management (“GSAM”) | Research Select | ||
| 32 Old Slip | |||
| New York, New York 10005 | |||
| GSAM is a business unit of the Investment Management Division (“IMD”) of Goldman Sachs. Goldman Sachs registered as an
investment adviser in 1981. As of September 30, 2000, GSAM, along with other units of IMD, had assets under management of $281.3 billion.
|
| The Investment Adviser provides day-to-day investment management services regarding the Fund’s portfolio transactions. The
Investment Adviser makes the investment decisions for the Fund and places purchase and sale orders for the Fund’s portfolio transactions in U.S. markets. As permitted by applicable law, these orders may be directed to any brokers, including Goldman
Sachs and its affiliates. In addition, the Investment Adviser has access to the research and certain proprietary technical models developed by Goldman Sachs.
|
| The Investment Adviser also performs the following additional services for the Fund:
|
n
|
Supervises all non-advisory operations of the Fund
|
n
|
Provides personnel to perform necessary executive, administrative and clerical services to the Fund
|
n
|
Arranges for the preparation of all required tax returns,
reports to shareholders, prospectuses and statements of additional information and other reports filed with the Securities and Exchange Commission (the “SEC”) and other regulatory authorities
|
n
|
Maintains the records of the Fund
|
n
|
Provides office space and all necessary office equipment and services
|
| MANAGEMENT FEES
|
| As compensation for its services and its assumption of certain expenses, the Investment Adviser is entitled to the following fee,
computed daily and payable monthly, at the annual rate listed below (as a percentage of the Fund’s average daily net assets):
|
| Contractual Rate | Actual Rate for the
Fiscal Period Ended August 31, 2000 |
||||
|---|---|---|---|---|---|
| Research Select | 1.00% | 1.00% | |||
| The Investment Adviser may voluntarily waive a portion of its advisory fee from time to time, and may discontinue any voluntary
waiver at any time at its discretion.
|
| FUND MANAGERS
|
| Robert B. Litterman, Ph.D., a Managing Director of Goldman Sachs, is the co-developer, along with the late Fischer Black, of the
Black-Litterman Global Asset Allocation Model, a key tool in IMD’s asset allocation process. As Director of Quantitative Resources, Dr. Litterman oversees Quantitative Equities, the Quantitative Strategies Group, the Investment Performance &
Valuation Oversight Group, and the Client Research Groups. In total, these groups include over 120 professionals. Prior to moving to IMD, Dr. Litterman was the head of the Firmwide Risk department of Goldman Sachs since becoming a Partner in 1994.
Preceding his time in the Operations, Technology & Finance Division, Dr. Litterman spent eight years in the Fixed Income Division’s research department where he was co-director of the research and model development group.
|
| Quantitative Equity Team
|
n
|
A stable and growing team supported by an extensive internal staff
|
n
|
Access to the research ideas of Goldman Sachs’ renowned Global Investment Research Department
|
n
|
More than $34 billion in equities currently under management
|
n
|
Proprietary research on quantitative models and tax-advantaged strategies
|
| Name and Title | Fund Responsibility | Years
Primarily Responsible |
Five Year Employment History | ||||
|---|---|---|---|---|---|---|---|
| Melissa Brown
Managing Director Product Manager for Quantitative Equities |
Senior Portfolio Manager —
Research Select |
Since
2000 |
Ms. Brown joined the
Investment Adviser as a portfolio manager in 1998. From 1984 to 1998, she was the director of Quantitative Equity Research and served on the Investment Policy Committee at Prudential Securities. |
||||
| Robert C. Jones
Managing Director Head of Quantitative Equities |
Senior Portfolio Manager—
Research Select |
Since
2000 |
Mr. Jones joined the
Investment Adviser as a portfolio manager in 1989. |
||||
| Victor H. Pinter
Vice President Head of Portfolio Construction |
Senior Portfolio Manager—
Research Select |
Since
2000 |
Mr. Pinter joined the
Investment Adviser as a research analyst in 1989. He became a portfolio manager in 1992. |
||||
| DISTRIBUTOR AND TRANSFER AGENT
|
| Goldman Sachs, 85 Broad Street, New York, New York 10004, serves as the exclusive distributor (the “Distributor”) of the
Fund’s shares. Goldman Sachs, 4900 Sears Tower, Chicago, Illinois 60606-6372, also serves as the Fund’s transfer agent (the “Transfer Agent”) and, as such, performs various shareholder servicing functions.
|
| From time to time, Goldman Sachs or any of its affiliates may purchase and hold shares of the Fund. Goldman Sachs reserves the
right to redeem at any time some or all of the shares acquired for its own account.
|
| ACTIVITIES OF GOLDMAN SACHS AND ITS AFFILIATES AND OTHER ACCOUNTS MANAGED BY GOLDMAN SACHS
|
| The involvement of the Investment Adviser, Goldman Sachs and their affiliates in the management of, or their interest in, other
accounts and other activities of Goldman Sachs may present conflicts of interest with respect to the Fund or limit the Fund’s investment activities. Goldman Sachs and its affiliates engage in proprietary trading and advise accounts and funds which
have investment objectives similar to those of the Fund and/or which engage in and compete for transactions in the same types of securities, currencies and instruments as the Fund. Goldman Sachs and its affiliates will not have any obligation to make
available any information regarding their proprietary activities or strategies, or the activities or strategies used for other accounts managed by them, for the benefit of the management of the Fund. The results of the Fund’s investment activities,
therefore, may differ from those of Goldman Sachs and its affiliates, and it is possible that the Fund could sustain losses during periods in which Goldman Sachs and its affiliates and other accounts achieve significant profits on their trading for
proprietary or other accounts. In addition, the Fund may, from time to time, enter into transactions in which other clients of Goldman Sachs have an adverse interest. The Fund’s activities may be limited because of regulatory restrictions applicable
to Goldman Sachs and its affiliates, and/or their internal policies designed to comply with such restrictions.
|
| In
providing its investment management services for the Fund, the Investment Adviser invests in equity securities that are included in the Goldman Sachs Global Investment Research Division’s U.S. Select List. Goldman Sachs is a leading, full service global investment banking and securities firm. The firm’s Global Investment Research Division provides far-reaching and comprehensive analysis and commentary on portfolio strategy,
economics, industries and companies. For over two decades, Goldman Sachs has committed the resources on a global scale to develop an industry-leading position for the firm’s investment research products.
|
| Goldman Sachs has achieved worldwide recognition for its value-added research products. The Global Investment Research Division
has a well-regarded staff of approximately 900 professionals including more than 300 equity analysts, 25 global research teams, and 12 portfolio strategists, covering approximately 2400 companies, over 50 economies and over 25 stock markets.
|
| The U.S. Stock Selection Committee comprises approximately twelve senior professionals, including the head of Global Investment
Research and the Director of U.S. Investment Research, as well as a senior market strategist, an economist, and sector specialists.
|
n
|
Cash
|
n
|
Additional shares of the same class of the Fund
|
n
|
Shares of the same or an equivalent class of another Goldman Sachs Fund. Special restrictions may apply for certain ILA
Portfolios. See the Additional Statement.
|
| Fund | Investment
Income Dividends |
Capital Gains
Distributions |
|||
|---|---|---|---|---|---|
| Research Select | Annually | Annually | |||
| The following section will provide you with answers to some of the most often asked questions regarding buying and selling the
Fund’s Service Shares.
|
| How Can I Purchase Service Shares Of The Fund?
|
| Generally, Service Shares may be purchased only through institutions that have agreed to provide account administration and
personal and account maintenance services to their customers who are the beneficial owners of Service Shares. These institutions are called “Service Organizations.” Customers of a Service Organization will normally give their purchase
instructions to the Service Organization, and the Service Organization will, in turn, place purchase orders with Goldman Sachs. Service Organizations will set times by which purchase orders and payments must be received by them from their customers.
Generally, Service Shares may be purchased from the Fund on any business day at their NAV next determined after receipt of an order by Goldman Sachs from a Service Organization. No sales load is charged. Purchases of Service Shares must be settled within
three business days of receipt of a complete purchase order.
|
| Service Organizations are responsible for transmitting purchase orders and payments to Goldman Sachs in a timely fashion. Service
Organizations should place an order with Goldman Sachs at 1-800-621-2550 and either:
|
n
|
Wire federal funds to The Northern Trust Company (“Northern”), as subcustodian for State Street Bank and Trust Company
(“State Street”) (the Fund’s custodian) on the next business day; or
|
n
|
Send a check or Federal Reserve draft payable to Goldman Sachs Funds—(Name of Fund and Class of Shares), 4900 Sears Tower,
Chicago, IL 60606-6372. The Fund will not accept a check drawn on a foreign bank or a third-party check.
|
| In certain instances, the Trust may require a signature guarantee in order to effect purchase, redemption or exchange
transactions. Signature guarantees must be obtained from a bank, brokerage firm or other financial intermediary that is a member of an approved Medallion Guarantee Program or that is otherwise approved by Goldman Sachs. A notary public cannot provide a
signature guarantee.
|
| What Do I Need To Know About Service Organizations?
|
| Service Organizations may provide the following services in connection with their customers’ investments in Service Shares:
|
n
|
Acting, directly or through an agent, as the sole shareholder of record
|
n
|
Maintaining account records for customers
|
n
|
Processing orders to purchase, redeem or exchange shares for customers
|
n
|
Responding to inquiries from prospective and existing shareholders
|
n
|
Assisting customers with investment procedures
|
| In addition, some (but not all) Service Organizations are authorized to accept, on behalf of Goldman Sachs Trust (the “
Trust”), purchase, redemption and exchange orders placed by or on behalf of their customers, and may designate other intermediaries to accept such orders, if approved by the Trust. In these cases:
|
n
|
The Fund will be deemed to have received an order in proper form when the order is accepted by the authorized Service Organization
or intermediary on a business day, and the order will be priced at the Fund’s NAV next determined after such acceptance.
|
n
|
Service Organizations or intermediaries will be responsible for transmitting accepted orders and payments to the Trust within the
time period agreed upon by them.
|
| You should contact your Service Organization directly to learn whether it is authorized to accept orders for the Trust.
|
| Pursuant to a service plan adopted by the Trust’s Board of Trustees, Service Organizations are entitled to receive payment
for their services from the Trust of up to 0.50% (on an annualized basis) of the average daily net assets of the Service Shares of the Fund, which are attributable to or held in the name of the Service Organization for its customers.
|
| The Investment Adviser, Distributor and/or their affiliates may pay additional compensation from time to time, out of their assets
and not as an additional charge to the Fund, to selected Service Organizations and other persons in connection with the sale, distribution and/or servicing of shares of the Fund and other Goldman Sachs Funds. Additional compensation based on sales may,
but is currently not expected to, exceed 0.50% (annualized) of the amount invested.
|
| In addition to Service Shares, the Fund also offers other classes of shares to investors. These other share classes are subject to
different fees and expenses (which affect performance), have different minimum investment requirements and
|
| are entitled to different services than Service Shares. Information regarding these other share classes may be obtained from your
sales representative or from Goldman Sachs by calling the number on the back cover of this Prospectus.
|
| What Is My Minimum Investment In The Fund?
|
| The Fund does not have any minimum purchase or account requirements with respect to Service Shares. A Service Organization may,
however, impose a mini
mum amount for initial and subsequent investments in Service Shares, and may establish other requirements such as a minimum account balance. A Service Organization may redeem Service Shares held by non-complying accounts, and may impose a charge for any
special services.
|
| What Else Should I Know About Share Purchases?
|
| The Trust reserves the right to:
|
n
|
Reject or restrict any purchase or exchange orders by a particular purchaser (or group of related purchasers). This may occur, for
example, when a pattern of frequent purchases, sales or exchanges of Service Shares of the Fund is evident, or if purchases, sales or exchanges are, or a subsequent abrupt redemption might be, of a size that would disrupt the management of the Fund.
|
n
|
Close the Fund to new investors from time to time and reopen
the Fund whenever it is deemed appropriate by the Fund’s Investment Adviser.
|
| The Fund may allow Service Organizations to purchase shares with securities instead of cash if consistent with the Fund’s
investment policies and operations and if approved by the Fund’s Investment Adviser.
|
| How Are Shares Priced?
|
| The price you pay or receive when you buy, sell or exchange Service Shares is determined by the Fund’s NAV. The Fund
calculates NAV as follows:
|
| |
(Value of Assets of the Class)
|
|
|||
| NAV =
|
– (Liabilities of the Class)
|
|
|||
| |
Number of Outstanding Shares of the Class
|
|
|||
| The Fund’s investments are valued based on market quotations or, if accurate quotations are not readily available, the fair
value of the Fund’s investments may be determined in good faith under procedures established by the Trustees.
|
n
|
NAV per share of each class is calculated by State Street on each business day as of the close of regular trading on the New York
Stock Exchange (normally 4:00 p.m. New York time). Fund shares will not be priced on any day the New York Stock Exchange is closed.
|
n
|
When you buy shares, you pay the NAV next calculated after the Fund receives your order in proper form.
|
n
|
When you sell shares, you receive the NAV next calculated after the Fund receives your order in proper form.
|
| Note: The time at which transactions and shares are priced and the time by which orders must be received may be
changed in case of an emergency or if regular trading on the New York Stock Exchange is stopped at a time other than 4:00 p.m. New York time.
|
| In addition, the impact of events that occur after the publication of market quotations used by the Fund to price its securities
(for example, in foreign markets), but before the close of regular trading on the New York Stock Exchange will normally not be reflected in the Fund’s next determined NAV unless the Trust, in its discretion, makes an adjustment in light of the nature
and materiality of the event, its effect on Fund operations and other relevant factors.
|
| How Can I Sell Service Shares Of The Fund?
|
| Generally, Service Shares may be sold (redeemed) only through Service Organizations. Customers of a Service Organization will
normally give their redemption instructions to the Service Organization, and the Service Organization will, in turn, place redemption orders with the Fund. Generally, the Fund will redeem its Service Shares upon request on any business day at their NAV next determined after receipt of such request in proper form. Redemption proceeds may be sent to recordholders by check or by wire (if the wire
instructions are on record).
|
| A Service Organization may request redemptions in writing or by telephone if the optional telephone redemption privilege is
elected on the Account Application.
|
| |
| By Writing: | Goldman Sachs Funds
4900 Sears Tower Chicago, IL 60606-6372 |
||
| By Telephone: | If you have elected the telephone redemption
privilege on your Account Application: 1-800-621-2550 (8:00 a.m. to 4:00 p.m. New York time) |
||
| What Do I Need To Know About Telephone Redemption Requests?
|
| The Trust, the Distributor and the Transfer Agent will not be liable for any loss you may incur in the event that the Trust
accepts unauthorized telephone redemption requests that the Trust reasonably believes to be genuine. In an effort to prevent unauthorized or fraudulent redemption and exchange requests by telephone, Goldman Sachs employs reasonable procedures specified by
the Trust to confirm that such instructions are genuine. If reasonable procedures are not employed, the Trust may be liable for any loss due to unauthorized or fraudulent transactions. The following general policies are currently in effect:
|
n
|
All telephone requests are recorded.
|
n
|
Any redemption request that requires money to go to an account or address other than that designated on the Account Application
must be in writing and
signed by an authorized person designated on the Account Application. The written request may be confirmed by telephone with both the requesting party and the designated bank account to verify instructions.
|
n
|
The telephone redemption option may be modified or terminated at any time.
|
| Note: It may be difficult to make telephone redemptions in times of drastic economic or market conditions.
|
| How Are Redemption Proceeds Paid?
|
| By Wire: The Fund will arrange for redemption proceeds to be wired as federal funds to the bank account
designated in the recordholder’s Account Application. The following general policies govern wiring redemption proceeds:
|
n
|
Redemption proceeds will normally be wired on the next business day in federal funds (for a total of one business day delay), but
may be paid up to three business days following receipt of a properly executed wire transfer redemption request. If the shares to be sold were recently paid for by check, the Fund will pay the redemption proceeds when the check has cleared, which may take
up to 15 days. If the Federal Reserve Bank is closed on the day that the redemption proceeds would ordinarily be wired, wiring the redemption proceeds may be delayed one additional business day.
|
n
|
To change the bank designated on your Account Application, you must send written instructions signed by an authorized person
designated on the Account Application to the Service Organization.
|
n
|
Neither the Trust, Goldman Sachs nor any other institution assumes any responsibility for the performance of intermediaries or
your Service Organization in the transfer process. If a problem with such performance arises, you should deal directly with such intermediaries or Service Organization.
|
| By Check: A recordholder may elect in writing to receive redemption proceeds by check. Redemption
proceeds paid by check will normally be mailed to the address of record within three business days of receipt of a properly executed redemption request. If the shares to be sold were recently paid for by check, the Fund will pay the redemption proceeds
when the check has cleared, which may take up to 15 days.
|
| What Else Do I Need To Know About Redemptions?
|
| The following generally applies to redemption requests:
|
n
|
Additional documentation may be required when deemed appropriate by the Transfer Agent. A redemption request will not be in proper
form until such additional documentation has been received.
|
n
|
Service Organizations are responsible for the timely transmittal of redemption requests by their customers to the Transfer Agent.
In order to facilitate the timely transmittal of redemption requests, Service Organizations may set times by which they must receive redemption requests. Service Organizations may also require additional documentation from you.
|
| The Trust reserves the right to:
|
n
|
Redeem the Service Shares of any Service Organization whose account balance falls below $50 as a result of earlier redemptions.
The Fund will not redeem Service Shares on this basis if the value of the account falls below the minimum account balance solely as a result of market conditions. The Fund will give 60 days’ prior written notice to allow a Service Organization to
purchase sufficient additional shares of the Fund in order to avoid such redemption.
|
n
|
Redeem your shares in other circumstances determined by the Board of Trustees to be in the best interest of the Trust.
|
n
|
Pay redemptions by a distribution in-kind of securities (instead of cash). If you receive redemption proceeds in-kind, you should
expect to incur transaction costs upon the disposition of those securities.
|
n
|
Reinvest any dividends or other distributions which you have elected to receive in cash should your check for such dividends or
other distributions be returned to the Fund as undeliverable or remain uncashed for six months. In addition, that distribution and all future distributions payable to you will be reinvested at NAV in additional Fund Service Shares of the Fund. No interest
will accrue on amounts represented by uncashed distribution or redemption checks.
|
| Can I Exchange My Investment From One Fund To Another?
|
| A Service Organization may exchange Service Shares of the Fund at NAV for Service Shares of any other Goldman Sachs Fund. The
exchange privilege may be materially modified or withdrawn at any time upon 60 days’ written notice.
|
| Instructions For Exchanging Shares: | |||||
|---|---|---|---|---|---|
| By Writing: | n Write a letter of instruction that includes: | ||||
| n The recordholder name(s) and signature(s) | |||||
| n The account number | |||||
| n The Fund names and Class of Shares | |||||
| n The dollar amount to be exchanged | |||||
| n
Mail the request to:
Goldman Sachs Funds 4900 Sears Tower Chicago, IL 60606-6372 |
|||||
| By Telephone: | If you have elected the telephone exchange
privilege on your Account Application: |
||||
| n
1-800-621-2550
(8:00 a.m. to 4:00 p.m. New York time) |
|||||
| You should keep in mind the following factors when making or considering an exchange:
|
n
|
You should obtain and carefully read the prospectus of the Fund you are acquiring before making an exchange.
|
n
|
All exchanges which represent an initial investment in a Fund must satisfy the minimum initial investment requirement of that
Fund, except that this requirement may be waived at the discretion of the Trust.
|
n
|
Telephone exchanges normally will be made only to an identically registered account.
|
n
|
Shares may be exchanged among accounts with different names, addresses and social security or other taxpayer identification
numbers only if the exchange instructions are in writing and are signed by an authorized person designated on the Account Application.
|
n
|
Exchanges are available only in states where exchanges may be legally made.
|
n
|
It may be difficult to make telephone exchanges in times of drastic economic or market conditions.
|
n
|
Goldman Sachs may use reasonable procedures described under “What Do I Need To Know About Telephone Redemption Requests?”
in an effort to prevent unauthorized or fraudulent telephone exchange requests.
|
n
|
Exchanges into Funds that are closed to new investors may be restricted.
|
| For federal income tax purposes, an exchange from one fund to another, is treated as a redemption of the shares surrendered in the
exchange, on which you may be
subject to tax, followed by a purchase of shares received in the exchange. You should consult your tax adviser concerning the tax consequences of an exchange.
|
| Restrictions on Excessive Trading Practices. The Trust does not permit market-timing or other excessive trading
practices. Purchases and exchanges should be made for long-term investment purposes only. The Trust and Goldman Sachs reserve the right to reject or restrict purchase or exchange requests from any investor. Excessive, short-term (market-timing) trading
practices may disrupt portfolio management strategies, harm Fund performance and negatively impact long-term shareholders. The Trust and Goldman Sachs will not be held liable for any loss resulting from rejected purchase or exchange orders. To minimize
harm to the Trust (or Goldman Sachs) and its shareholders, the Trust (or Goldman Sachs) will exercise these rights if, in the Trust’s (or Goldman Sachs’) judgment, an investor has a history of excessive trading or if an investor’s trading,
in the judgment of the Trust (or Goldman Sachs), has been or may be disruptive to the Fund. In making this judgment, trades executed in multiple accounts under common ownership or control may be considered together.
|
| What Types Of Reports Will Be Sent Regarding Investments In Service Shares?
|
| Service Organizations will receive from the Fund annual reports containing audited financial statements and semi-annual reports.
Service Organizations will also be provided with a printed confirmation for each transaction in their account and a monthly account statement. Service Organizations are responsible for providing these or other reports to their customers who are the
beneficial owners of Service Shares in accordance with the rules that apply to their accounts with the Service Organizations.
|
| As with any investment, you should consider how your investment in the Fund will be taxed. The tax information below is provided
as general information. More tax information is available in the Additional Statement. You should consult your tax adviser about the federal, state, local or foreign tax consequences of your investment in the Fund.
|
| Unless your investment is in an IRA or other tax-advantaged account, you should consider the possible tax consequences of Fund
distributions and the sale of your Fund shares.
|
| DISTRIBUTIONS
|
| Distributions you receive from the Fund are generally subject to federal income tax, and may also be subject to state or local
taxes. This is true whether you reinvest your distributions in additional Fund shares or receive them in cash. For federal tax purposes, the Fund’s income dividend distributions and short-term capital gain distributions are taxable to you as ordinary
income. Any long-term capital gain distributions are taxable as long-term capital gains, no matter how long you have owned your Fund shares.
|
| Although distributions are generally treated as taxable to you in the year they are paid, distributions declared in October,
November or December but paid in January are taxable as if they were paid in December. A percentage of the Fund’s dividends paid to corporate shareholders may be eligible for the corporate dividends-received deduction. The Fund will inform
shareholders of the character and tax status of all distributions promptly after the close of each calendar year.
|
| The Fund may be subject to foreign withholding or other foreign taxes on income or gain from certain foreign securities. In
general, the Fund may deduct these taxes in computing its taxable income.
|
| If you buy shares of the Fund before it makes a distribution, the distribution will be taxable to you even though it may actually
be a return of a portion of your investment. This is known as “buying a dividend.”
|
| SALES AND EXCHANGES
|
| Your sale of Fund shares is a taxable transaction for federal income tax purposes, and may also be subject to state and local
taxes. For tax purposes, the exchange of your Fund shares for shares of a different Goldman Sachs Fund is the same as a sale. When you sell your shares, you will generally recognize a capital gain or loss in an amount equal to the difference between your
adjusted tax basis in the shares and the amount received. Generally, this gain or loss is long-term or short-term depending on whether your holding period exceeds twelve months, except that any loss realized on shares held for six months or less will be
treated as a long-term capital loss to the extent of any long-term capital gain dividends that were received on the shares.
|
| RETIREMENT PLANS
|
| The one major exception to these tax principles is that distributions on, and sales, exchanges and redemptions of, shares held in
an IRA (or other tax-qualified plan) will not be currently taxable.
|
| OTHER INFORMATION
|
| When you open your account, you should provide your social security or tax identification number on your Account Application. By
law, the Fund must withhold 31% of your taxable distributions and any redemption proceeds if you do not provide your correct taxpayer identification number, or certify that it is correct, or if the IRS instructs the Fund to do so. Non-U.S. investors may
be subject to U.S. withholding and estate tax.
|
| A. General Portfolio Risks
|
| The Fund will be subject to the risks associated with equity securities. “Equity securities” may include common stocks,
preferred stocks, interests in real estate investment trusts, convertible debt obligations, convertible preferred stocks, equity interests in trusts, partnerships, joint ventures, limited liability companies and similar enterprises, warrants, and stock
purchase rights. In general, stock values fluctuate in response to the activities of individual companies and in response to general market and economic conditions. Accordingly, the value of the stocks that the Fund holds may decline over short or
extended periods. The stock markets tend to be cyclical, with periods when stock prices generally rise and periods when prices generally decline. The volatility of equity securities means that the value of your investment in the Fund may increase or
decrease. Recently, certain stock markets have experienced substantial price volatility and, at times, have traded at or close to record high levels. There can be no guarantee that such levels will be reached or maintained in the future.
|
| To the extent that the Fund invests in fixed-income securities, the Fund will also be subject to the risks associated with its
fixed-income securities. These risks include interest rate risk and credit risk. In general, interest rate risk involves the risk that when interest rates decline, the market value of fixed-income securities tends to increase. Conversely, when interest
rates increase, the market value of fixed-income securities tends to decline. Credit risk involves the risk that an issuer or guarantor could default on its obligations, and the Fund will not recover its investment.
|
| The Investment Adviser will not consider the portfolio turnover rate a limiting factor in making investment decisions for the
Fund. Trading to keep the Fund’s portfolio holdings consistent with, and equally weighted among, the securities in the U.S. Select List may increase the Fund’s portfolio turnover rate. A high rate of portfolio turnover (100% or more) involves correspondingly greater expenses which must be borne by the Fund and its shareholders, and is also likely to result in
higher short-term capital gains taxable to shareholders. The portfolio turnover rate is calculated by dividing the lesser of the dollar amount of sales or purchases of portfolio securities by the average monthly value of the Fund’s portfolio
securities, excluding securities having a maturity at the date of purchase of one year or less.
|
| The following sections provide further information on certain types of securities and investment techniques that may be used by
the Fund, including their associated risks. Additional information is provided in the Additional Statement, which is available upon request. Among other things, the Additional Statement describes certain fundamental investment restrictions that cannot be
changed without shareholder approval. You should note, however, that the investment objective, and all investment policies not specifically designated as fundamental, are non-fundamental and may be changed without shareholder approval. If there is a
change in the Fund’s investment objective, you should consider whether the Fund remains an appropriate investment in light of your then current financial position and needs.
|
| B. Other Portfolio Risks
|
| Risks of Investing in Small Capitalization Companies. The Fund may invest in small capitalization companies.
Investments in small capitalization companies involve greater risk and portfolio price volatility than investments in larger capitalization stocks. Among the reasons for the greater price volatility of these investments are the less certain growth
prospects of smaller firms and the lower degree of liquidity in the markets for such securities. Small capitalization companies may be thinly traded and may have to be sold at a discount from current market prices or in small lots over an extended period
of time. In addition, these securities are subject to the risk that during certain periods the liquidity of particular issuers or industries, or all securities in particular investment categories, will shrink or disappear suddenly and without warning as a
result of adverse economic or market conditions, or adverse investor perceptions whether or not accurate. Because of the lack of sufficient market liquidity, the Fund may incur losses because it will be required to effect sales at a disadvantageous time
and only then at a substantial drop in price. Small capitalization companies include “unseasoned” issuers that do not have an established financial history; often have limited product lines, markets or financial resources; may depend on or use a
few key personnel for management; and may be susceptible to losses and risks of bankruptcy. Transaction costs for these investments are often higher than those of larger capitalization companies. Investments in small capitalization companies may be more
difficult to price precisely than other types of securities because of their characteristics and lower trading volumes.
|
| Risks of Foreign Issuers. The Fund may invest in foreign issuers. Foreign issuers involve special risks that are not
typically associated with U.S. issuers. There may be less publicly available information about a foreign issuer than about a U.S. issuer. In addition, there is generally less government regulation of foreign compa
nies than in the United States. The securities of many foreign issuers are less liquid and more volatile than securities of comparable domestic issuers. Furthermore, with respect to certain foreign countries, there is a possibility of nationalization,
expropriation or confiscatory taxation, imposition of withholding or other taxes on dividend or interest payments (or, in some cases, capital gains), limitations on the removal of funds or other assets, and political or social instability or diplomatic
developments which could affect the Fund’s investments.
|
| Risks of Derivative Investments. The Fund’s transactions in options, futures, options on futures, swaps and
structured securities involve additional risk of loss. Loss can result from a lack of correlation between changes in the value of derivative instruments and the portfolio assets (if any) being hedged, the potential illiquidity of the markets for
derivative instruments, or the risks arising from margin requirements and related leverage factors associated with such transactions. The use of these management techniques also involves the risk of loss if the Investment Adviser is incorrect in its
expectation of fluctuations in securities prices or interest rates. The Fund may also invest in derivative investments for non-hedging purposes (that is, to seek to increase total return). Investing for non-hedging purposes is considered a speculative
practice and presents even greater risk of loss.
|
| Risks of Illiquid Securities. The Fund may invest up to 15% of its net assets in illiquid securities which cannot be
disposed of in seven days in the ordinary course of business at fair value. Illiquid securities include:
|
n
|
Securities that are not readily marketable
|
n
|
Repurchase agreements and time deposits with a notice or demand period of more than seven days
|
n
|
Certain over-the-counter options
|
n
|
Certain structured securities and all swap transactions
|
n
|
Certain restricted securities, unless it is determined, based upon a review of the trading markets for a specific restricted
security, that such restricted security is eligible for resale pursuant to Rule 144A under the Securities Act of 1933 (“144A Securities”) and, therefore, is liquid.
|
| Investing in 144A Securities may decrease the liquidity of the Fund’s portfolio to the extent that qualified institutional
buyers become for a time uninterested in purchasing these restricted securities. The purchase price and subsequent valuation of restricted and illiquid securities normally reflect a discount, which may be significant, from the market price of comparable
securities for which a liquid market exists.
|
| Credit Risks. Debt securities purchased by the Fund may include securities (including zero coupon bonds) issued by
the U.S. government (and its agencies, instru
mentalities and sponsored enterprises), domestic and foreign corporations, banks and other issuers. Further information is provided in the Additional Statement.
|
| Temporary Investment Risks. The Fund may, for temporary defensive purposes, invest a certain percentage of its total
assets in:
|
n
|
U.S. government securities
|
n
|
Commercial paper rated at least A-2 by Standard & Poor’s or P-2 by Moody’s
|
n
|
Certificates of deposit
|
n
|
Bankers’ acceptances
|
n
|
Repurchase agreements
|
n
|
Non-convertible preferred stocks and non-convertible corporate bonds with a remaining maturity of less than one year
|
| When the Fund’s assets are invested in such instruments, the Fund may not be achieving its investment objective.
|
| C. Portfolio Securities and Techniques
|
| This section provides further information on certain types of securities and investment techniques that may be used by the Fund,
including their associated risks. Further information is provided in the Additional Statement, which is available upon request.
|
| Structured Securities. The Fund may invest in structured securities. Structured securities are securities whose
value is determined by reference to changes in the value of specific currencies, interest rates, commodities, indices or other financial indicators (the “Reference”) or the relative change in two or more References. The interest rate or the
principal amount payable upon maturity or redemption may be increased or decreased depending upon changes in the applicable Reference. Structured securities may be positively or negatively indexed, so that appreciation of the Reference may produce an
increase or decrease in the interest rate or value of the security at maturity. In addition, changes in the interest rates or the value of the security at maturity may be a multiple of changes in the value of the Reference. Consequently, structured
securities may present a greater degree of market risk than other types of securities and may be more volatile, less liquid and more difficult to price accurately than less complex securities.
|
| REITs. The Fund may invest in REITs. REITs are pooled investment vehicles that invest primarily in either real
estate or real estate related loans. The value of a REIT is affected by changes in the value of the properties owned by the REIT or securing mortgage loans held by the REIT. REITs are dependent upon the ability of the REITs’ managers, and are subject
to heavy cash flow dependency,
default by borrowers and the qualification of the REITs under applicable regulatory requirements for favorable income tax treatment. REITs are also subject to risks generally associated with investments in real estate including possible declines in the
value of real estate, general and local economic conditions, environmental problems and changes in interest rates. To the extent that assets underlying a REIT are concentrated geographically, by property type or in certain other respects, these risks may
be heightened. The Fund will indirectly bear its proportionate share of any expenses, including management fees, paid by a REIT in which it invests.
|
| Options on Securities and Securities Indices. A put option gives the purchaser of the option the right to sell, and
the writer (seller) of the option the obligation to buy, the underlying instrument during the option period. A call option gives the purchaser of the option the right to buy, and the writer (seller) of the option the obligation to sell, the underlying
instrument during the option period. The Fund may write (sell) covered call and put options and purchase put and call options on any securities in which it may invest or on any securities index consisting of securities in which it may invest.
|
| The writing and purchase of options is a highly specialized activity which involves special investment risks. Options may be used
for either hedging or cross-hedging purposes, or to seek to increase total return (which is considered a speculative activity). The successful use of options depends in part on the ability of the Investment Adviser to manage future price fluctuations and
the degree of correlation between the options and securities markets. If the Investment Adviser is incorrect in its expectation of changes in market prices or determination of the correlation between the instruments or indices on which options are written
and purchased and the instruments in the Fund’s investment portfolio, the Fund may incur losses that it would not otherwise incur. The use of options can also increase the Fund’s transaction costs. Options written or purchased by the Fund may be
traded on U.S. exchanges or over-the-counter. Over-the-counter options will present greater possibility of loss because of their greater illiquidity and credit risks.
|
| Futures Contracts and Options on Futures Contracts. Futures contracts are standardized, exchange-traded contracts
that provide for the sale or purchase of a specified financial instrument at a future time at a specified price. An option on a futures contract gives the purchaser the right (and the writer of the option the obligation) to assume a position in a futures
contract at a specified exercise price within a specified period of time. A futures contract may be based on various securities (such as U.S. government securities), securities indices, and other financial instruments and indices. The Fund may engage in
futures transactions on U.S. exchanges.
|
| The Fund may purchase and sell futures contracts, and purchase and write call and put options on futures contracts, in order to
seek to increase total return or to hedge against changes in interest rates or securities prices. The Fund may also enter into closing purchase and sale transactions with respect to such contracts and options. The Fund will engage in futures and related
options transactions for bona fide hedging purposes as defined in regulations of the Commodity Futures Trading Commission or to seek to increase total return to the extent permitted by such regulations. The Fund may not purchase or sell futures contracts
or purchase or sell related options to seek to increase total return, except for closing purchase or sale transactions, if immediately thereafter the sum of the amount of initial margin deposits and premiums paid on the Fund’s outstanding positions
in futures and related options entered into for the purpose of seeking to increase total return would exceed 5% of the market value of the Fund’s net assets.
|
| Futures contracts and related options present the following risks:
|
n
|
While the Fund may benefit from the use of futures and options on futures, unanticipated changes in interest rates or securities
prices may result in poorer overall performance than if the Fund had not entered into any futures contracts or options transactions.
|
n
|
Because perfect correlation between a futures position and portfolio position that is intended to be protected is impossible to
achieve, the desired protection may not be obtained and the Fund may be exposed to additional risk of loss.
|
n
|
The loss incurred by the Fund in entering into futures contracts and in writing call options on futures is potentially unlimited
and may exceed the amount of the premium received.
|
n
|
Futures markets are highly volatile and the use of futures may increase the volatility of the Fund’s NAV.
|
n
|
As a result of the low margin deposits normally required in futures trading, a relatively small price movement in a futures
contract may result in substantial losses to the Fund.
|
n
|
Futures contracts and options on futures may be illiquid, and exchanges may limit fluctuations in futures contract prices during a
single day.
|
| Equity Swaps. The Fund may invest in equity swaps. Equity swaps allow the parties to a swap agreement to exchange
the dividend income or other components of return on an equity investment (for example, a group of equity securities or an index) for a component of return on another non-equity or equity investment.
|
| An equity swap may be used by the Fund to invest in a market without owning or taking physical custody of securities in
circumstances in which direct investment may be restricted for legal reasons or is otherwise impractical. Equity swaps are derivatives and their value can be very volatile. To the extent that the Investment
Adviser does not accurately analyze and predict the potential relative fluctuation of the components swapped with another party, the Fund may suffer a loss, which may be substantial. The value of some components of an equity swap (such as the dividends
on a common stock) may also be sensitive to changes in interest rates. Furthermore, the Fund may suffer a loss if the counterparty defaults. Because equity swaps are normally illiquid, the Fund may be unable to terminate its obligations when desired.
|
| When-Issued Securities and Forward Commitments. The Fund may purchase when-issued securities and enter into forward
commitments. When-issued securities are securities that have been authorized, but not yet issued. When-issued securities are purchased in order to secure what is considered to be an advantageous price or yield to the Fund at the time of entering into the
transaction. A forward commitment involves the entering into a contract to purchase or sell securities for a fixed price at a future date beyond the customary settlement period.
|
| The purchase of securities on a when-issued or forward commitment basis involves a risk of loss if the value of the security to be
purchased declines before the settlement date. Conversely, the sale of securities on a forward commitment basis involves the risk that the value of the securities sold may increase before the settlement date. Although the Fund will generally purchase
securities on a when-issued or forward commitment basis with the intention of acquiring the securities for its portfolio, the Fund may dispose of when-issued securities or forward commitments prior to settlement if the Investment Adviser deems it
appropriate.
|
| Repurchase Agreements. Repurchase agreements involve the purchase of securities subject to the seller’s
agreement to repurchase them at a mutually agreed upon date and price. The Fund may enter into repurchase agreements with dealers in U.S. government securities and member banks of the Federal Reserve System which furnish collateral at least equal in value
or market price to the amount of their repurchase obligation.
|
| If the other party or “seller” defaults, the Fund might suffer a loss to the extent that the proceeds from the sale of
the underlying securities and other collateral held by the Fund are less than the repurchase price and the Fund’s costs associated with delay and enforcement of the repurchase agreement. In addition, in the event of bankruptcy of the seller, the Fund
could suffer additional losses if a court determines that the Fund’s interest in the collateral is not enforceable.
|
| In evaluating whether to enter into a repurchase agreement, the Investment Adviser will carefully consider the creditworthiness of
the seller. The Fund, together with other registered investment companies having advisory agreements with the Investment Adviser or any of its affiliates, may transfer uninvested cash balances into a single joint account, the daily aggregate balance of
which will be invested in one or more repurchase agreements.
|
| Lending of Portfolio Securities. The Fund may engage in securities lending. Securities lending involves the lending
of securities owned by the Fund to financial institutions such as certain broker-dealers. The borrowers are required to secure their loan continuously with cash, cash equivalents, U.S. government securities or letters of credit in an amount at least equal
to the market value of the securities loaned. Cash collateral may be invested in cash equivalents. To the extent that cash collateral is invested in other investment securities, such collateral will be subject to market depreciation or appreciation, and
the Fund will be responsible for any loss that might result from its investment of the borrowers’ collateral. If the Investment Adviser determines to make securities loans, the value of the securities loaned may not exceed 33 1
/3% of the value of the total assets of the
Fund (including the loan collateral).
|
| The Fund may lend its securities to increase its income. The Fund may, however, experience delay in the recovery of its securities
or a capital loss if the institution with which it has engaged in a portfolio loan transaction breaches its agreement with the Fund.
|
| Preferred Stock, Warrants and Rights. The Fund may invest in preferred stock, warrants and rights. Preferred stocks
are securities that represent an ownership interest providing the holder with claims on the issuer’s earnings and assets before common stock owners but after bond owners. Unlike debt securities, the obligations of an issuer of preferred stock,
including dividend and other payment obligations, may not typically be accelerated by the holders of such preferred stock on the occurrence of an event of default or other non-compliance by the issuer of the preferred stock.
|
| Warrants and other rights are options to buy a stated number of shares of common stock at a specified price at any time during the
life of the warrant or right. The holders of warrants and rights have no voting rights, receive no dividends and have no rights with respect to the assets of the issuer.
|
| Other Investment Companies. The Fund may invest in securities of other investment companies (including
exchange-traded funds such as SPDRs as defined below) subject to statutory limitations prescribed by the Act. These limitations include a prohibition on the Fund acquiring more than 3% of the voting shares of any other investment company, and a
prohibition on investing more than 5% of the Fund’s total assets in securities of any one investment company or more than 10% of its total assets in securities of all investment companies. The Fund will indirectly bear its proportionate share of any
management fees and other expenses paid by such other investment companies. Exchange-traded funds such as SPDRs are shares of unaffiliated investment companies which are traded like traditional equity securities on a national securities exchange or the
NASDAQ® National Market System.
|
| n
|
Standard & Poor’s Depositary Receipts
TM
. The Fund may, consistent with its investment policies, purchase Standard & Poor’s
Depositary Receipts™ (“SPDRs”). SPDRs are securities traded on the American Stock Exchange (“AMEX”) that represent ownership in the SPDR Trust, a trust which has been established to accumulate and hold a portfolio of common stocks
that is intended to track the price performance and dividend yield of the S&P 500®. The SPDR Trust is sponsored by a subsidiary of the AMEX. SPDRs may be used for several reasons, including, but not limited to, facilitating the handling of cash
flows or trading, or reducing transaction costs. The price movement of SPDRs may not perfectly parallel the price action of the S&P 500®.
|
| Unseasoned Companies. The Fund may invest in companies (including predecessors) which have operated less than three
years. The securities of such companies may have limited liquidity, which can result in their being priced higher or lower than might otherwise be the case. In addition, investments in unseasoned companies are more speculative and entail greater risk than
do investments in companies with an established operating record.
|
| Corporate Debt Obligations. Corporate debt obligations include bonds, notes, debentures, commercial paper and other
obligations of corporations to pay interest and repay principal, and include securities issued by banks and other financial institutions. The Fund may invest in corporate debt obligations issued by U.S. and certain non-U.S. issuers which issue securities
denominated in the U.S. dollar (including Yankee and Euro obligations). In addition to obligations of corporations, corporate debt obligations include securities issued by banks and other financial institutions and supranational entities (i.e., the World Bank, the International Monetary Fund, etc.).
|
| Bank Obligations. The Fund may invest in obligations issued or guaranteed by U.S. or foreign banks. Bank
obligations, including without limitations, time deposits, bankers’ acceptances and certificates of deposit, may be general obligations of the parent bank or may be limited to the issuing branch by the terms of the specific obligations or by
government regulations. Banks are subject to extensive but different governmental regulations which may limit both the amount and types of loans which may be made and interest rates which may be charged. In addition, the profitability of the banking
industry is largely dependent upon the availability and cost of funds for the purpose of financing lending operations under prevailing money market conditions. General economic conditions as well as exposure to credit losses arising from possible
financial difficulties of borrowers play an important part in the operation of this industry.
|
| U.S. Government Securities. The Fund may invest in U.S. government securities. U.S. government securities include
U.S. Treasury obligations and obligations
issued or guaranteed by U.S. government agencies, instrumentalities or sponsored enterprises. U.S. government securities may be supported by (a) the full faith and credit of the U.S. Treasury (such as the Government National Mortgage Association (“
Ginnie Mae”)); (b) the right of the issuer to borrow from the U.S. Treasury (such as securities of the Student Loan Marketing Association); (c) the discretionary authority of the U.S. government to purchase certain obligations of the issuer (such as
the Federal National Mortgage Association (“Fannie Mae”) and Federal Home Loan Mortgage Corporation (“Freddie Mac”)); or (d) only the credit of the issuer.
|
| Borrowings. The Fund can borrow money from banks and other financial institutions in amounts not exceeding one-third
of its total assets for temporary or emergency purposes. The Fund may not make additional investments if borrowings exceed 5% of its total assets.
|
| Short Sales Against-the-Box. The Fund may make short sales against-the-box. A short sale against-the-box means that
at all times when a short position is open the Fund will own an equal amount of securities sold short, or securities convertible into or exchangeable for, without payment of any further consideration, an equal amount of the securities of the same issuer
as the securities sold short.
|
| The financial highlights table is intended to help you understand the Fund’s financial performance from its commencement
(June 19, 2000) to August 31, 2000. Certain information reflects financial results for a single Fund share. The total returns in the table represent the rate that an investor would have earned or lost on an investment in the Fund (assuming reinvestment of
all dividends and distributions). This information for the period ended August 31, 2000 has been audited by PricewaterhouseCoopers LLP, whose report, along with the Fund’s financial statements, is included in the Fund’s annual report (available
upon request).
|
| RESEARCH SELECT FUND
|
| Income from
investment operations |
|||||||||||||||||||
|---|---|---|---|---|---|---|---|---|---|---|---|---|---|---|---|---|---|---|---|
| Net asset
value, beginning of period |
Net
investment loss(c) |
Net realized
and unrealized gain |
Total from
investment operations |
||||||||||||||||
| For the Period Ended August 31, | |||||||||||||||||||
| 2000 - Class A Shares (commenced June 19, 2000) | $10.00 | $(0.02 | ) | $0.79 | $0.77 | ||||||||||||||
| 2000 - Class B Shares (commenced June 19, 2000) | 10.00 | (0.04 | ) | 0.80 | 0.76 | ||||||||||||||
| 2000 - Class C Shares (commenced June 19, 2000) | 10.00 | (0.04 | ) | 0.81 | 0.77 | ||||||||||||||
| 2000 - Institutional Shares (commenced June 19, 2000) | 10.00 | (0.01 | ) | 0.79 | 0.78 | ||||||||||||||
| 2000 - Service Shares (commenced June 19, 2000) | 10.00 | (0.02 | ) | 0.80 | 0.78 | ||||||||||||||
(a)
|
Assumes investment at the net asset value at the beginning of the period, reinvestment of all dividends and
distributions, a complete redemption of the investment at the net asset value at the end of the period and no sales or redemption charges. Total return would be reduced if a sales or redemption charge were taken into account. Total returns for periods
less than one full year are not annualized.
|
(b)
|
Annualized.
|
(c)
|
Calculated based on the average shares outstanding methodology.
|
| Ratios assuming
no expense reductions |
|||||||||||||||||||||
|---|---|---|---|---|---|---|---|---|---|---|---|---|---|---|---|---|---|---|---|---|---|
| Net asset
value, end of period |
Total
return(a) |
Net assets
at end of period (in 000s) |
Ratio of
net expenses to average net assets(b) |
Ratio of
net investment loss to average net assets(b) |
Ratio of
expenses to average net assets(b) |
Ratio of
net investment loss to average net assets(b) |
Portfolio
turnover rate |
||||||||||||||
| $10.77 | 7.70 | % | $217,861 | 1.50 | % | (1.04 | )% | 2.05 | % | (1.59 | )% | 5.04 | % | ||||||||
| 10.76 | 7.60 | 201,437 | 2.25 | (1.79 | ) | 2.80 | (2.34 | ) | 5.04 | ||||||||||||
| 10.77 | 7.70 | 96,393 | 2.25 | (1.78 | ) | 2.80 | (2.33 | ) | 5.04 | ||||||||||||
| 10.78 | 7.80 | 12,677 | 1.10 | (0.50 | ) | 1.65 | (1.05 | ) | 5.04 | ||||||||||||
| 10.78 | 7.70 | 12 | 1.60 | (1.13 | ) | 2.15 | (1.68 | ) | 5.04 | ||||||||||||
| U.S. Select List
|
| As mentioned in “Fund Investment Objective and Strategies,” the U.S. Select List was introduced on September 9,
1998 and comprises approximately 25 to 35 stocks that the Goldman Sachs U.S. Stock Selection Committee expects, as a portfolio, to outperform its benchmark, the S&P 500® Index, over the next twelve to eighteen months. The U.S. Select List changes regularly. While the companies on the list generally have been relatively large U.S. companies, the list is not restricted to those types of companies. It is expected that, under normal market conditions, the quarterly
performance of the Fund, before expenses, will track the price return of the U.S. Select List within a .90 correlation coefficient.
|
| The Fund’s portfolio management team does not have access to information regarding additions or deletions for the U.S.
Select List prior to their publication. Goldman Sachs publishes other lists of recommended securities that could be appropriate for Fund investors but that are not used by the Fund’s portfolio management team.
|
| The chart below reflects historical information regarding the U.S. Select List. The U.S. Select List is not
maintained for the purpose of managing any account or investment company such as the Fund. The number of stocks on the U.S. Select List and the frequency of additions to and deletions from the U.S. Select List change from time to time. The stocks included in the U.S. Select List constitute only a “paper portfolio” that does not reflect
actual trading and does not have an actual performance record. The U.S. Select List’s price return does not represent the return on any fund or any other account that involves actual trading. The price returns are not indicative of the returns on any fund or account because, among other things, they do not
reflect actual prices when stocks are purchased or sold, transaction costs and account fees. In addition, because the U.S. Select List does not include a cash component, price returns are based on a constant 100% investment in the stocks on the U.S. Select List. Also, the information below does not reflect the impact that the Investment Adviser’s
portfolio management decisions and techniques may have on performance. Further, the actual performance of the Fund may differ from that of the U.S. Select List because of time delays between when a stock is added to or removed from the list and when it is bought or sold for the Fund. Investors should not consider this price return information as a substitute for, or an indication of,
future performance of the Research Select Fund or
the Investment Adviser. Finally, past price returns of the U.S. Select List are not representative of future price returns of the list.
|
| 9/9/98
(inception) to 12/31/98 |
1/1/99
to 12/31/99 |
1/1/00
to 10/31/00 |
9/9/98
(inception) to 10/31/00 |
||||||
|---|---|---|---|---|---|---|---|---|---|
| U.S. Select List Stock Price Return* | 37.57% | 33.81% | 18.1% | 117.5% | |||||
| S&P 500® Index Price Return** | 22.73% | 21.06% | -1.8% | 45.9% | |||||
*
|
The results for the U.S. Select List portfolio represent an equal-weighted arithmetic average of the stocks held at any
point during the month. The results are calculated monthly using each stock’s capital appreciation or depreciation during the period that it is on the U.S. Select List and dividing that by the highest number of stocks that were on the U.S. Select
List at any point during the month. Prior to June 1999, the divisor was the time-weighted number of stocks on the list for the specified period. The results are calculated using the prices of the stocks at the close of trading of the stock market one full
day after the stock was added to the U.S. Select List (e.g., if the stock was added on the afternoon of 5/5, the recorded price is at the close on 5/6). The results do not reflect the execution of actual purchases or sales, and there is no guarantee that
a mutual fund following the U.S. Select List would be able to execute purchases and sales at the prices used to calculate the price returns. Because the U.S. Select List is a paper portfolio that is not managed to a target number of stocks, no “
re-balancing” of actual investments is done when stocks are added to or deleted from the U.S. Select List. Price returns are based on 100% investment in the stocks on the U.S. Select List.
|
| Price returns are calculated to include the price return plus dividends for the stock during the month in which they are
paid without being reinvested into the security. They do not reflect the market impact on the stock prices that may occur between the time the publication is made of additions to and deletions from the U.S. Select List and the time a mutual fund following
the U.S. Select List would be able to execute purchases and sales. They also do not reflect transaction fees, such as commissions, fees and interest charges, or the costs of running a mutual fund, such as management fees, distribution fees and other
expenses. They do not reflect the impact that an investment adviser’s portfolio management decisions and techniques may have on a mutual fund’s returns. Actual transactions and the effect of dividends, fees and costs will result in returns that
differ from those of the U.S. Select List.
|
**
|
The S&P 500® Index is an unmanaged index containing common stocks of 500 industrial, transportation, utility and
financial companies, regarded as generally representative of the U.S. stock market. The S&P 500® Index performance numbers shown are price returns reflecting the reinvestment of dividends. They do not reflect fees, brokerage commissions or other
costs of investing that are not incurred by an index.
|
| FOR MORE INFORMATION
|
| Annual/Semi-annual Report
|
| Additional information about the Fund’s investments is available in the Fund’s annual and semi-annual reports to
shareholders. In the Fund’s annual report, you will find a discussion of the market conditions and investment strategies that significantly affected the Fund’s performance during the last fiscal year.
|
| Statement of Additional Information
|
| Additional information about the Fund and its policies is also available in the Fund’s Additional Statement. The Additional
Statement is incorporated by reference into this Prospectus (is legally considered part of this Prospectus).
|
| The Fund’s annual and semi-annual reports, and the Additional Statement, are available free upon request by calling Goldman
Sachs at 1-800-621-2550.
|
| To obtain other information and for shareholder inquiries:
|
| By telephone – Call 1-800-621-2550
|
| By mail – Goldman Sachs Funds, 4900 Sears Tower, Chicago, IL 60606-6372
|
| By e-mail – [email protected]
|
| On the Internet – Text-only versions of the Fund’s documents are located online and may be downloaded from:
|
| SEC EDGAR database – http://www.sec.gov
|
| You may review and obtain copies of Fund documents by visiting the SEC’s Public Reference Room in Washington, D.C. You may
also obtain copies of Fund documents, after paying a duplicating fee, by writing to the SEC’s Public Reference Section, Washington, D.C. 20549-0102 or by electronic request to: [email protected]. Information on the operation of the public reference
room may be obtained by calling the SEC at (202) 942-8090.
|
| The Goldman Sachs Research Select Fund
SM
is a service mark of Goldman Sachs & Co.
|
| The Fund’s investment company registration number is 811-5349.
|
| Prospectus
|
| GOLDMAN SACHS RESEARCH SELECT FUND
SM
|
| THE SECURITIES AND EXCHANGE COMMISSION HAS NOT APPROVED OR DISAPPROVED THESE SECURITIES OR PASSED UPON THE ADEQUACY OF THIS PROSPECTUS.
ANY REPRESENTATION TO THE CONTRARY IS A CRIMINAL OFFENSE.
|
| AN INVESTMENT IN THE FUND IS NOT A BANK DEPOSIT AND IS NOT INSURED BY THE FEDERAL DEPOSIT INSURANCE CORPORATION OR ANY OTHER GOVERNMENT
AGENCY. AN INVESTMENT IN THE FUND INVOLVES INVESTMENT RISKS, INCLUDING POSSIBLE LOSS OF PRINCIPAL.
|
| NOT FDIC-INSURED
|
May Lose Value
|
No Bank Guarantee
|
| Goldman Sachs Asset Management, a unit of the Investment Management Division of Goldman, Sachs & Co. (“Goldman
Sachs”), serves as investment adviser to the Research Select Fund (the “Fund”). Goldman Sachs Asset Management is referred to in this Prospectus as the “Investment Adviser.”
|
| RESEARCH STYLE FUNDS—RESEARCH SELECT FUND
|
| The Goldman Sachs Research Select Fund selects substantially all of its securities from the U.S. Select List developed by
the Goldman Sachs Investment Research Division. The Fund leverages the resources of Goldman Sachs by applying the Investment Management Division’s portfolio management expertise to the equity securities included in the U.S. Select List.
|
|
|
Objective:
|
Long-term growth of capital
|
|
Benchmark:
|
S&P 500® Index
|
|
Investment Focus:
|
A focused portfolio of U.S. equity securities that offer the potential for long-term capital appreciation
|
| INVESTMENT OBJECTIVE
|
| The Fund seeks to provide long-term growth of capital by investing in a focused portfolio of U.S. equity securities.
|
| PRINCIPAL INVESTMENT STRATEGIES
|
| Equity Securities. The Fund invests, under normal circumstances, at least 90% of its total assets in U.S. equity securities, including securities of foreign issuers that are traded in the United States. Under normal circumstances, the Fund will only
purchase equity securities that are included in the Goldman Sachs Global Investment Research Division’s U.S. Select List and will sell securities that have been removed from the U.S. Select List. Notification of changes to the U.S. Select List is made to clients of Goldman Sachs and to the Fund’s portfolio management team at the
same time. The Fund will purchase a security that has been added to, or sell a security that has been removed from, the list after publication of that change. In addition, the Investment Adviser may apply the techniques described below in managing the
Fund and in purchasing and selling securities that are included in the U.S. Select List.
|
| The Goldman Sachs Global Investment Research Division’s U.S. Select List.
The U.S. Select List was introduced on September 9, 1998 and comprises approximately 25 to 35 equity securities that the Goldman Sachs U.S. Stock Selection
Committee expects, as a portfolio, to outperform its benchmark, the S&Ps 500® Index over the next 12 to 18 months. The list is consistent with overall investment policy and emphasizes strategically favored economic sectors. The U.S. Select List is updated on a regular basis. Historically, the U.S. Select List has consisted primarily of common stocks of relatively large U.S. companies, although the list is not restricted to those types of companies.
|
| The U.S. Select List is used primarily by institutional clients.
|
| Our Approach to Portfolio Management.
To the extent practicable, the Fund will seek to deliver returns that are comparable to the price returns of the U.S. Select List. Generally, the Fund will seek to maintain approximate equal weightings of its assets among the securities included
in the list. Any remaining assets may be invested by the Investment Adviser in the other instruments described in this Prospectus, including short-term debt obligations, options and futures contracts.
|
| Investors should be aware, however, that the performance of the Fund will differ from the price returns of the U.S. Select List
for a variety of reasons, including the change in securities prices that may occur between the time when a security is added to or removed from the list and when it is bought or sold for the Fund; the Fund’s investment of cash flow from purchases
and sales of Fund shares, which can occur daily and will result in portfolio purchases and sales; modifications in the Fund’s stock weights in order to control trading costs; the timing and amount of dividend and distribution payments; and the
Fund’s use of investment techniques and instruments that are not included in the U.S. Select List. In addition, unlike the U.S. Select List, the Fund will incur transactional costs (such as brokerage commissions) and operational expenses (such as investment advisory fees).
|
| While the Fund intends to track the composition of the U.S. Select List, the Fund’s purchases and sales of securities
that are added to and deleted from the list may not be completed on the first trading day after changes to the list are announced, and in certain cases may take several days or weeks to complete. Moreover, purchases and sales of the Fund and other
investors following the U.S. Select List could create a temporary imbalance between the supply and demand of the securities on the list. The imbalance could affect the time it takes the Fund to complete its transactions, as well as the price the Fund pays or receives. In
order to reduce impact of these trading costs, the Investment Adviser may decide for a period of time not to buy a security that is included in the U.S. Select List or to continue to hold a security that has been removed from the list.
|
| The Fund will periodically rebalance its portfolio in an effort to maintain approximate equal weightings of its assets among the
securities on the U.S. Select List.
|
| Other. The Fund’s investments in fixed-income securities are limited to securities that are considered cash equivalents.
|
Ÿ
|
No specific percentage limitation on usage;
limited only by the objective and strategies of the Fund |
| Research
Select Fund |
|||
|---|---|---|---|
| Investment Practices | |||
| Borrowings | 33 1
/3
|
||
| Custodial Receipts | — | ||
| Equity Swaps* | 15 | ||
| Futures Contracts and Options on Futures Contracts | Ÿ | ||
| Investment Company Securities (including exchange-traded funds) | 10 | ||
| Options on Securities and Securities Indices 1 | Ÿ | ||
| Repurchase Agreements | Ÿ | ||
| Securities Lending | 33 1
/3
|
||
| Short Sales Against the Box | 25 | ||
| Unseasoned Companies | Ÿ | ||
| Warrants and Stock Purchase Rights | Ÿ | ||
| When-Issued Securities and Forward Commitments | Ÿ | ||
*
|
Limited to 15% of net assets (together with other illiquid securities) for all structured securities which are not
deemed to be liquid and all swap transactions.
|
1
|
The Fund may sell covered call and put options and purchase call and put options.
|
Ÿ
|
No specific percentage limitation on usage;
limited only by the objective and strategies of the Fund |
| Research
Select Fund |
||||
|---|---|---|---|---|
| Investment Securities | ||||
| American and Global Depositary Receipts | — | |||
| Asset-Backed and Mortgage-Backed Securities | — | |||
| Bank Obligations 2 | Ÿ | |||
| Convertible Securities 3 | Ÿ | |||
| Corporate Debt Obligations 2 | Ÿ | |||
| Equity Securities | 90 | + | ||
| Emerging Country Securities | — | |||
| Fixed Income Securities | Ÿ | |||
| Foreign Issuers | Ÿ | |||
| Non-Investment Grade Fixed Income Securities | — | |||
| Real Estate Investment Trusts (“REITs”) | Ÿ | |||
| Structured Securities * | Ÿ | |||
| Temporary Investments | 100 | |||
| U.S. Government Securities 2 | Ÿ | |||
*
|
Limited to 15% of net assets (together with other illiquid securities) for all structured securities which are not
deemed to be liquid and all swap transactions.
|
2
|
Limited by the amount the Fund invests in fixed-income securities. Cash equivalents only.
|
3
|
The Fund has no minimum rating criteria.
|
| Loss of money is a risk of investing in the Fund. An investment in the Fund is not a deposit of any bank and is not insured or
guaranteed by the Federal Deposit Insurance Corporation or any other governmental agency. The following summarizes important risks that apply to the Fund and may result in a loss of your investment. The Fund should not be relied upon as a complete
investment program. There can be no assurance that the Fund will achieve its investment objective.
|
| Research
Select Fund |
|||
|---|---|---|---|
| Ÿ Applicable | |||
| U.S. Select List | Ÿ | ||
| Stock | Ÿ | ||
| Credit/Default | Ÿ | ||
| Foreign | Ÿ | ||
| Derivatives | Ÿ | ||
| Interest Rate | Ÿ | ||
| Management | Ÿ | ||
| Market | Ÿ | ||
| Liquidity | Ÿ | ||
| Small Cap | Ÿ | ||
n
|
U.S. Select List Risk—The Fund invests
principally in securities included in the U.S. Select List, which comprises approximately 25 to 35 stocks. As a result of the small universe of stocks in which the Fund generally invests, it may be subject to greater risks than would a more diversified fund.
|
| Price returns reported for the U.S. Select List do not predict or reflect the future results of the U.S. Select List
or the Fund. In addition, unlike the Fund, the securities included in the U.S. Select List constitute only a “paper portfolio” that does not reflect actual trading and does not have an actual performance record.
|
| Although the Goldman Sachs U.S. Stock Selection Committee periodically makes subjective decisions to add or delete companies for the
U.S. Select List, the list is not compiled with any particular client or product in mind and is not (and will not be) compiled with the Fund in mind. The Global Investment Research Division could at any time cease publishing the U.S. Select List
. In that event, the Board of Trustees will make a determination on how to proceed
in the best interest of shareholders of the Fund, consistent with the Fund’s investment objective. Goldman Sachs publishes similar lists of recommended securities that may be appropriate for shareholders of the Fund but which will not be used by the
Investment Adviser for the Fund at this time.
|
| The Fund’s purchases and sales for its portfolio will be affected by market conditions following the publication of changes
to the U.S. Select List and will be subject to competing orders by Goldman Sachs clients who invest in the securities included on the list.
|
| The activities of Goldman Sachs and its affiliates may occasionally limit the Fund’s ability to purchase or sell securities
included in the U.S. Select List. The U.S. Select List is also subject to restrictions related to Goldman Sachs’ other businesses. In addition, certain securities may or may not appear on the U.S. Select List or may or may not be removed from
the list due to legal restrictions applicable to, or other business concerns of, Goldman Sachs. An investor should understand that these concerns will generally not be related to whether a particular security on the list or a security not on the list is
an attractive investment opportunity.
|
| As a global financial services firm, Goldman Sachs provides a wide range of financial services to issuers of securities and
investors in securities. Goldman Sachs, its affiliates and others associated with it may create markets or specialize in, have positions in and affect transactions in, securities of companies included in the U.S. Select List and may also perform or seek to perform financial services for those companies. Within the last three years, Goldman Sachs or its affiliates may have managed or co-managed public security offerings for companies included in the
U.S. Select List, and they or their employees may have a long or short position on holdings in the securities, or options on securities, or other related investments of companies included in the U.S. Select List.
|
| The Fund’s ability to invest in particular securities included in the U.S. Select List may be limited by the
diversification and other restrictions imposed on it as a registered mutual fund under the Investment Company Act of 1940 (the “Act”).
|
n
|
Stock Risk—The risk that stock prices
have historically risen and fallen in periodic cycles. Recently, U.S. stock markets and certain foreign stock markets have experienced substantial price volatility and, at times, have traded at or close to record high levels. There is no guarantee that
such levels will be reached or maintained in the future.
|
n
|
Credit/Default Risk—The risk that an issuer or guarantor of fixed-income securities held by the Fund may
default on its obligation to pay interest and repay principal.
|
n
|
Foreign Risk—The risk that when the Fund invests in foreign issuers, it will be subject to risk of loss not
typically associated with domestic issuers. Loss may result because of less foreign government regulation, less public information and
less economic, political and social stability. Loss may also result from the imposition of exchange controls, confiscations and other government restrictions.
|
n
|
Derivatives Risk—The risk that loss may result from the Fund’s investments in options, futures, swaps,
structured securities and other derivative instruments. These instruments may be leveraged so that small changes may produce disproportionate losses to the Fund.
|
n
|
Interest Rate Risk—The risk that when interest rates increase, fixed-income securities held by the Fund will
decline in value.
|
n
|
Management Risk—The risk that a strategy used by the Investment Adviser may fail to produce the intended results.
|
n
|
Market Risk—The risk that the value of the securities in which the Fund invests may go up or down in response
to the prospects of individual companies particular industry sectors and/or general economic conditions. Price changes may be temporary or last for extended periods. The Fund’s investments may be overweighted from time to time in one or more industry
sectors, which will increase the Fund’s exposure to risk of loss from adverse developments affecting those sectors.
|
n
|
Liquidity Risk—The risk that the Fund will not be able to pay redemption proceeds within the time period stated
in this Prospectus because of unusual market conditions, an unusually high volume of redemption requests, or other reasons. Because the Fund may invest in small capitalization stocks and REITs, the Fund will be especially subject to the risk that during
certain periods the liquidity of particular issuers or industries, or all securities within particular investment categories, will shrink or disappear suddenly and without warning as a result of adverse economic, market or political events, or adverse
investor perceptions whether or not accurate.
|
n
|
Small Cap Stock Risk—The securities of small capitalization stocks involve greater risks than those associated
with larger, more established companies and may be subject to more abrupt or erratic price movements. Securities of such issuers may lack sufficient market liquidity to enable the Fund to effect sales at an advantageous time or without a substantial drop
in price.
|
| More information about the Fund’s portfolio securities and investment techniques, and their associated risks, is provided in
Appendix A. You should consider the investment risks discussed in this section and in Appendix A. Both are important to your investment choice.
|
| HOW THE FUND HAS PERFORMED
|
| The Fund commenced operations on June 19, 2000. Since the Fund has less than one calendar year’s performance, no performance
information is provided in this section.
|
| Research
Select Fund |
|||
|---|---|---|---|
| Shareholder Fees | |||
| (fees paid directly from your investment): | |||
| Maximum Sales Charge (Load) Imposed on Purchases | None | ||
| Maximum Sales Charge (Load) Imposed on Reinvested Dividends | None | ||
| Redemption Fees | None | ||
| Exchange Fees | None | ||
| Annual Fund Operating Expenses | |||
| (expenses that are deducted from Fund assets):1 | |||
| Management Fees | 1.00% | ||
| Distribution and Service (12b-1) Fees | None | ||
| Other Expenses 2 | 0.65% | ||
| Total Fund Operating Expenses* | 1.65% | ||
| See page 11 for all other footnotes.
|
*
|
As a result of current expense limitations, the estimated “Other Expenses” and “Total Fund Operating Expenses”
of the Fund which are actually incurred as of the date of this Prospectus are as set forth below. The expense limitations may be terminated at any time at the option of the Investment Adviser. If this occurs, “Other Expenses” and “Total
Fund Operating Expenses” may increase without shareholder approval.
|
| Research
Select Fund |
|||
|---|---|---|---|
| Annual Fund Operating Expenses | |||
| (expenses that are deducted from Fund assets):1 | |||
| Management Fees | 1.00% | ||
| Distribution and Service (12b-1) Fees | None | ||
| Other Expenses 2 | 0.10% | ||
| Total Fund Operating Expenses (after current expense limitations) | 1.10% | ||
1
|
The operating expenses for the Fund are estimated for the current year.
|
2
|
Estimated “Other Expenses” include transfer agency fees equal to 0.04% of the average daily net assets of the
Fund’s Institutional Shares plus all other ordinary expenses not detailed above. The Investment Adviser has voluntarily agreed to reduce or limit “Other Expenses” (excluding management fees, transfer agency fees, taxes, interest and
brokerage fees and litigation, indemnification and other extraordinary expenses) to the following percentage of the Fund’s average daily net assets:
|
| Fund | Other
Expenses |
||
|---|---|---|---|
| Research Select | 0.06% | ||
| Fund | 1 Year | 3 Years | 5 Years | 10 Years | |||||
|---|---|---|---|---|---|---|---|---|---|
| Research Select | $168 | $520 | N/A | N/A | |||||
| INVESTMENT ADVISER
|
| Investment Adviser | Fund | ||
|---|---|---|---|
| Goldman Sachs Asset Management (“GSAM”) | Research Select | ||
| 32 Old Slip | |||
| New York, New York 10005 | |||
| GSAM is a business unit of the Investment Management Division (“IMD”) of Goldman Sachs. Goldman Sachs registered as an
investment adviser in 1981. As of September 30, 2000, GSAM, along with other units of IMD, had assets under management of $281.3 billion.
|
| The Investment Adviser provides day-to-day investment management services regarding the Fund’s portfolio transactions. The
Investment Adviser makes the investment decisions for the Fund and places purchase and sale orders for the Fund’s portfolio transactions in U.S. markets. As permitted by applicable law, these orders may be directed to any brokers, including Goldman
Sachs and its affiliates. In addition, the Investment Adviser has access to the research and certain proprietary technical models developed by Goldman Sachs.
|
| The Investment Adviser also performs the following additional services for the Fund:
|
n
|
Supervises all non-advisory operations of the Fund
|
n
|
Provides personnel to perform necessary executive, administrative and clerical services to the Fund
|
n
|
Arranges for the preparation of all required tax returns,
reports to shareholders, prospectuses and statements of additional information and other reports filed with the Securities and Exchange Commission (the “SEC”) and other regulatory authorities
|
n
|
Maintains the records of the Fund
|
n
|
Provides office space and all necessary office equipment and services
|
| MANAGEMENT FEES
|
| As compensation for its services and its assumption of certain expenses, the Investment Adviser is entitled to the following fee,
computed daily and payable monthly, at the annual rate listed below (as a percentage of the Fund’s average daily net assets):
|
| Contractual Rate | Actual Rate for the
Fiscal Period Ended August 31, 2000 |
||||
|---|---|---|---|---|---|
| Research Select | 1.00% | 1.00% | |||
| The Investment Adviser may voluntarily waive a portion of its advisory fee from time to time, and may discontinue any voluntary
waiver at any time at its discretion.
|
| FUND MANAGERS
|
| Robert B. Litterman, Ph.D., a Managing Director of Goldman Sachs, is the co-developer, along with the late Fischer Black, of the
Black-Litterman Global Asset Allocation Model, a key tool in IMD’s asset allocation process. As Director of Quantitative Resources, Dr. Litterman oversees Quantitative Equities, the Quantitative Strategies Group, the Investment Performance &
Valuation Oversight Group, and the Client Research Groups. In total, these groups include over 120 professionals. Prior to moving to IMD, Dr. Litterman was the head of the Firmwide Risk department of Goldman Sachs since becoming a Partner in 1994.
Preceding his time in the Operations, Technology & Finance Division, Dr. Litterman spent eight years in the Fixed Income Division’s research department where he was co-director of the research and model development group.
|
| Quantitative Equity Team
|
n
|
A stable and growing team supported by an extensive internal staff
|
n
|
Access to the research ideas of Goldman Sachs’ renowned Global Investment Research Department
|
n
|
More than $34 billion in equities currently under management
|
n
|
Proprietary research on quantitative models and tax-advantaged strategies
|
| Name and Title | Fund Responsibility | Years
Primarily Responsible |
Five Year Employment History | ||||
|---|---|---|---|---|---|---|---|
| Melissa Brown
Managing Director Product Manager for Quantitative Equities |
Senior Portfolio Manager—
Research Select |
Since
2000 |
Ms. Brown joined the
Investment Adviser as a portfolio manager in 1998. From 1984 to 1998, she was the director of Quantitative Equity Research and served on the Investment Policy Committee at Prudential Securities. |
||||
| Robert C. Jones
Managing Director Head of Quantitative Equities |
Senior Portfolio Manager—
Research Select |
Since
2000 |
Mr. Jones joined the
Investment Adviser as a portfolio manager in 1989. |
||||
| Victor H. Pinter
Vice President Head of Portfolio Construction |
Senior Portfolio Manager—
Research Select |
Since
2000 |
Mr. Pinter joined the
Investment Adviser as a research analyst in 1989. He became a portfolio manager in 1992. |
||||
| DISTRIBUTOR AND TRANSFER AGENT
|
| Goldman Sachs, 85 Broad Street, New York, New York 10004, serves as the exclusive distributor (the “Distributor”) of the
Fund’s shares. Goldman Sachs, 4900 Sears Tower, Chicago, Illinois 60606-6372, also serves as the Fund’s transfer agent (the “Transfer Agent”) and, as such, performs various shareholder servicing functions.
|
| From time to time, Goldman Sachs or any of its affiliates may purchase and hold shares of the Fund. Goldman Sachs reserves the
right to redeem at any time some or all of the shares acquired for its own account.
|
| ACTIVITIES OF GOLDMAN SACHS AND ITS AFFILIATES AND OTHER ACCOUNTS MANAGED BY GOLDMAN SACHS
|
| The involvement of the Investment Adviser, Goldman Sachs and their affiliates in the management of, or their interest in, other
accounts and other activities of Goldman Sachs may present conflicts of interest with respect to the Fund or limit the Fund’s investment activities. Goldman Sachs and its affiliates engage in proprietary trading and advise accounts and funds which
have investment objectives similar to those of the Fund and/or which engage in and compete for transactions in the same types of securities, currencies and instruments as the Fund. Goldman Sachs and its affiliates will not have any obligation to make
available any information regarding their proprietary activities or strategies, or the activities or strategies used for other accounts managed by them, for the benefit of the management of the Fund. The results of the Fund’s investment activities,
therefore, may differ from those of Goldman Sachs and its affiliates, and it is possible that the Fund could sustain losses during periods in which Goldman Sachs and its affiliates and other accounts achieve significant profits on their trading for
proprietary or other accounts. In addition, the Fund may, from time to time, enter into transactions in which other clients of Goldman Sachs have an adverse interest. The Fund’s activities may be limited because of regulatory restrictions applicable
to Goldman Sachs and its affiliates, and/or their internal policies designed to comply with such restrictions.
|
| In
providing its investment management services for the Fund, the Investment Adviser invests in equity securities that are included in the Goldman Sachs Global Investment Research Division’s U.S. Select List. Goldman Sachs is a leading, full service global investment banking and securities firm. The firm’s Global Investment Research Division provides far-reaching and comprehensive analysis and commentary on portfolio strategy,
economics, industries and companies. For over two decades, Goldman Sachs has committed the resources on a global scale to develop an industry-leading position for the firm’s investment research products.
|
| Goldman Sachs has achieved worldwide recognition for its value-added research products. The Global Investment Research Division
has a well-regarded staff of approximately 900 professionals including more than 300 equity analysts, 25 global research teams, and 12 portfolio strategists, covering approximately 2400 companies, over 50 economies and over 25 stock markets.
|
| The U.S. Stock Selection Committee comprises approximately twelve senior professionals, including the head of Global Investment
Research and the Director of U.S. Investment Research, as well as a senior market strategist, an economist, and sector specialists.
|
n
|
Cash
|
n
|
Additional shares of the same class of the Fund
|
n
|
Shares of the same or an equivalent class of another Goldman Sachs Fund. Special restrictions may apply for certain ILA
Portfolios. See the Additional Statement.
|
| Fund | Investment
Income Dividends |
Capital Gains
Distributions |
|||
|---|---|---|---|---|---|
| Research Select | Annually | Annually | |||
| The following section will provide you with answers to some of the most often asked questions regarding buying and selling the
Fund’s Institutional Shares.
|
| How Can I Purchase Institutional Shares Of The Fund?
|
| You may purchase Institutional Shares on any business day at their NAV next determined after receipt of an order. No sales load is
charged. You should place an order with Goldman Sachs at 1-800-621-2550 and either:
|
n
|
Wire federal funds to The Northern Trust Company (“Northern”), as subcustodian for State Street Bank and Trust Company
(“State Street”) (the Fund’s custodian) on the next business day; or
|
n
|
Send a check or Federal Reserve draft payable to Goldman Sachs Funds—(Name of Fund and Class of Shares), 4900 Sears Tower,
Chicago, IL 60606-6372. The Fund will not accept a check drawn on a foreign bank or a third-party check.
|
| In order to make an initial investment in the Fund, you must furnish to the Fund or Goldman Sachs the Account Application attached
to this Prospectus. Purchases of Institutional Shares must be settled within three business days of receipt of a complete purchase order.
|
| In certain instances, the Trust may require a signature guarantee in order to effect purchase, redemption or exchange
transactions. Signature guarantees must be obtained from a bank, brokerage firm or other financial intermediary that is a member of an approved Medallion Guarantee Program or that is otherwise approved by Goldman Sachs. A notary public cannot provide a
signature guarantee.
|
| How Do I Purchase Shares Through A Financial Institution?
|
| Certain institutions (including banks, trust companies, brokers and investment advisers) that provide recordkeeping, reporting and
processing services to their customers may be authorized to accept, on behalf of Goldman Sachs Trust (the “Trust”), purchase, redemption and exchange orders placed by or on behalf of their customers, and may designate other intermediaries to
accept such orders, if approved by the Trust. In these cases:
|
n
|
The Fund will be deemed to have received an order in proper form when the order is accepted by the authorized institution or
intermediary on a business day, and the order will be priced at the Fund’s NAV next determined after such acceptance.
|
n
|
Authorized institutions and intermediaries will be responsible for transmitting accepted orders and payments to the Trust within
the time period agreed upon by them.
|
| You should contact your institution or intermediary to learn whether it is authorized to accept orders for the Trust.
|
| These institutions may receive payments from the Fund or Goldman Sachs for the services provided by them with respect to the
Fund’s Institutional Shares. These payments may be in addition to other payments borne by the Fund.
|
| The Investment Adviser, Distributor and/or their affiliates may pay additional compensation from time to time, out of their assets
and not as an additional charge to the Fund, to certain institutions and other persons in connection with the sale, distribution and/or servicing of shares of the Fund and other Goldman Sachs Funds. Additional compensation based on sales may, but is
currently not expected to, exceed 0.50% (annualized) of the amount invested.
|
| In addition to Institutional Shares, the Fund also offers other classes of shares to investors. These other share classes are
subject to different fees and expenses (which affect performance), have different minimum investment requirements and are entitled to different services than Institutional Shares. Information regarding these other share classes may be obtained from your
sales representative or from Goldman Sachs by calling the number on the back cover of this Prospectus.
|
| What Is My Minimum Investment In The Fund?
|
| Type of Investor | Minimum Investment | ||
|---|---|---|---|
| n
Banks, trust companies or other
depository institutions investing for their own account or on behalf of clients |
$1,000,000 in Institutional Shares of the Fund
alone or in combination with other assets under the management of GSAM and its affiliates |
||
| n
Section 401(k), profit sharing,
money purchase pension, tax- sheltered annuity, defined benefit pension, or other employee benefit plans that are sponsored by one or more employers (including governmental or church employers) or employee organizations |
|||
| n
State, county, city or any
instrumentality, department, authority or agency thereof |
|||
| n
Corporations with at least $100
million in assets or in outstanding publicly traded securities |
|||
| n
“Wrap” account sponsors (provided
they have an agreement covering the arrangement with GSAM) |
|||
| n
Registered investment advisers
investing for accounts for which they receive asset-based fees |
|||
| n Individual investors | $10,000,000 | ||
| n
Qualified non-profit organizations,
charitable trusts, foundations and endowments |
|||
| n
Accounts over which GSAM or its
advisory affiliates have investment discretion |
|||
| The minimum investment requirement may be waived for current and former officers, partners, directors or employees of Goldman
Sachs or any of its affiliates or for other investors at the discretion of the Trust’s officers. No minimum amount is required for subsequent investments.
|
| What Else Should I Know About Share Purchases?
|
| The Trust reserves the right to:
|
n
|
Modify or waive the minimum investment amounts.
|
n
|
Reject or restrict any purchase or exchange orders by a particular purchaser (or group of related purchasers). This may occur, for
example, when a pattern of frequent purchases, sales or exchanges of Institutional Shares of the Fund is evident, or if purchases, sales or exchanges are, or a subsequent abrupt redemption might be, of a size that would disrupt the management of the Fund.
|
n
|
Close the Fund to new investors from time to time and reopen the Fund whenever it is deemed appropriate by the Fund’s
Investment Adviser.
|
| The Fund may allow you to purchase shares with securities instead of cash if consistent with the Fund’s investment policies
and operations and if approved by the Fund’s Investment Adviser.
|
| How Are Shares Priced?
|
| The price you pay or receive when you buy, sell or exchange Institutional Shares is determined by the Fund’s NAV. The Fund
calculates NAV as follows:
|
| (Value of Assets of the Class) | ||
| NAV = | – (Liabilities of the Class) | |
| Number of Outstanding Shares of the Class |
| The Fund’s investments are valued based on market quotations or, if accurate quotations are not readily available, the fair
value of the Fund’s investments may be determined in good faith under procedures established by the Trustees.
|
n
|
NAV per share of each class is calculated by State Street on each business day as of the close of regular trading on the New York
Stock Exchange (normally 4:00 p.m. New York time). Fund shares will not be priced on any day the New York Stock Exchange is closed.
|
n
|
When you buy shares, you pay the NAV next calculated after the Fund receives your order in proper form.
|
n
|
When you sell shares, you receive the NAV next calculated after the Fund receives your order in proper form.
|
| Note: The time at which transactions and shares are priced and the time by which orders must be received may be changed in
case of an emergency or if regular trading on the New York Stock Exchange is stopped at a time other than 4:00 p.m. New York time.
|
| In addition, the impact of events that occur after the publication of market quotations used by the Fund to price its securities
(for example, in foreign markets), but before the close of regular trading on the New York Stock Exchange will normally not be reflected in the Fund’s next determined NAV unless the Trust, in its discretion, makes an adjustment in light of the nature
and materiality of the event, its effect on Fund operations and other relevant factors.
|
| How Can I Sell Institutional Shares Of The Fund?
|
| You may arrange to take money out of your account by selling (redeeming) some or all of your shares. Generally, the Fund will
redeem its Institutional Shares upon request on any business day at their NAV next determined after receipt of such request in proper form. You may request that redemption proceeds be sent to you by check or by wire (if the wire instructions are on record). Redemptions may be requested in writing or by telephone.
|
| Instructions For Redemptions: | |||
|---|---|---|---|
| By Writing: | n Write a letter of instruction that includes: | ||
| n Your name(s) and signature(s) | |||
| n Your account number | |||
| n The Fund name and Class of Shares | |||
| n The dollar amount you want to sell | |||
| n How and where to send the proceeds | |||
| n Mail your request to: | |||
| Goldman Sachs Funds | |||
| 4900 Sears Tower | |||
| Chicago, IL 60606-6372 | |||
| By Telephone: | If you have elected the telephone | ||
| redemption privilege on your Account Application: | |||
| n 1-800-621-2550 | |||
| (8:00 a.m. to 4:00 p.m. New York time) | |||
| Certain institutions and intermediaries are authorized to accept redemption requests on behalf of the Fund as described under
“How Do I Purchase Shares Through A Financial Institution?”
|
| What Do I Need To Know About Telephone Redemption Requests?
|
| The Trust, the Distributor and the Transfer Agent will not be liable for any loss you may incur in the event that the Trust
accepts unauthorized telephone redemption requests that the Trust reasonably believes to be genuine. In an effort to prevent unauthorized or fraudulent redemption and exchange requests by telephone, Goldman Sachs employs reasonable procedures specified by
the Trust to confirm that such instructions are genuine. If reasonable procedures are not employed, the Trust may be liable for any loss due to unauthorized or fraudulent transactions. The following general policies are currently in effect:
|
n
|
All telephone requests are recorded.
|
n
|
Any redemption request that requires money to go to an account or address other than that designated on the Account Application
must be in writing and signed by an authorized person designated on the Account Application. The
written request may be confirmed by telephone with both the requesting party and the designated bank account to verify instructions.
|
n
|
The telephone redemption option may be modified or terminated at any time.
|
| Note: It may be difficult to make telephone redemptions in times of drastic economic or market conditions.
|
| How Are Redemption Proceeds Paid?
|
| By Wire: You may arrange for your redemption proceeds to be wired as federal funds to the bank account designated in
your Account Application. The following general policies govern wiring redemption proceeds:
|
n
|
Redemption proceeds will normally be wired on the next business day in federal funds (for a total of one business day delay), but
may be paid up to three business days following receipt of a properly executed wire transfer redemption request. If you are selling shares you recently paid for by check, the Fund will pay you when your check has cleared, which may take up to 15 days. If
the Federal Reserve Bank is closed on the day that the redemption proceeds would ordinarily be wired, wiring the redemption proceeds may be delayed one additional business day.
|
n
|
To change the bank designated on your Account Application, you must send written instructions signed by an authorized person
designated on the account application to the Transfer Agent.
|
n
|
Neither the Trust, Goldman Sachs nor any other institution assumes any responsibility for the performance of your bank or any
intermediaries in the transfer process. If a problem with such performance arises, you should deal directly with your bank or any such intermediaries.
|
| By Check: You may elect in writing to receive your redemption proceeds by check. Redemption proceeds paid by check
will normally be mailed to the address of record within three business days of a properly executed redemption request. If you are selling shares you recently paid for by check, the Fund will pay you when your check has cleared, which may take up to 15 days.
|
| What Else Do I Need To Know About Redemptions?
|
| The following generally applies to redemption requests:
|
n
|
Additional documentation may be required when deemed appropriate by the Transfer Agent. A redemption request will not be in proper
form until such additional documentation has been received.
|
n
|
Institutions (including banks, trust companies, brokers and investment advisers) are responsible for the timely transmittal of
redemption requests by their customers to the Transfer Agent. In order to facilitate the timely transmittal of redemption requests, these institutions may set times by which they must receive redemption requests. These institutions may also require
additional documentation from you.
|
| The Trust reserves the right to:
|
n
|
Redeem your shares if your account balance falls below $50 as a result of earlier redemptions. The Fund will not redeem your
shares on this basis if the value of your account falls below the minimum account balance solely as a result of market conditions. The Fund will give you 60 days’ prior written notice to allow you to purchase sufficient additional shares of the Fund
in order to avoid such redemption.
|
n
|
Redeem your shares in other circumstances determined by the Board of Trustees to be in the best interest of the Trust.
|
n
|
Pay redemptions by a distribution in-kind of securities (instead of cash). If you receive redemption proceeds in-kind, you should
expect to incur transaction costs upon the disposition of those securities.
|
n
|
Reinvest any dividends or other distributions which you have elected to receive in cash should your check for such dividends or
other distributions be returned to the Fund as undeliverable or remain uncashed for six months. In addition, that distribution and all future distributions payable to you will be reinvested at NAV in additional Institutional Shares of the Fund. No
interest will accrue on amounts represented by uncashed distribution or redemption checks.
|
| Can I Exchange My Investment From One Fund To Another?
|
| You may exchange Institutional Shares of the Fund at NAV for Institutional Shares of any other Goldman Sachs Fund. The exchange
privilege may be materially modified or withdrawn at any time upon 60 days’ written notice to you.
|
| Instructions For Exchanging Shares: | |||
|---|---|---|---|
| By Writing: | n Write a letter of instruction that includes: | ||
| n Your name(s) and signature(s) | |||
| n Your account number | |||
| n The Fund names and Class of Shares | |||
| n The dollar amount to be exchanged | |||
| n
Mail the request to:
Goldman Sachs Funds 4900 Sears Tower Chicago, IL 60606-6372 |
|||
| By Telephone: | If you have elected the telephone exchange
privilege on your Account Application: |
||
| n
1-800-621-2550
(8:00 a.m. to 4:00 p.m. New York time) |
|||
| You should keep in mind the following factors when making or considering an exchange:
|
n
|
You should obtain and carefully read the prospectus of the Fund you are acquiring before making an exchange.
|
n
|
All exchanges which represent an initial investment in a Fund must satisfy the minimum initial investment requirements of that
Fund, except that this requirement may be waived at the discretion of the Trust.
|
n
|
Telephone exchanges normally will be made only to an identically registered account.
|
n
|
Shares may be exchanged among accounts with different names, addresses and social security or other taxpayer identification
numbers only if the exchange instructions are in writing and are signed by an authorized person designated on the Account Application.
|
n
|
Exchanges are available only in states where exchanges may be legally made.
|
n
|
It may be difficult to make telephone exchanges in times of drastic economic or market conditions.
|
n
|
Goldman Sachs may use reasonable procedures described under “What Do I Need To Know About Telephone Redemption Requests?”
in an effort to prevent unauthorized or fraudulent telephone exchange requests.
|
n
|
Exchanges into Funds that are closed to new investors may be restricted.
|
| For federal income tax purposes, an exchange from one Fund to another is treated as a redemption of the shares surrendered in the
exchange, on which you may be subject to tax, followed by a purchase of shares received in the exchange. You should consult your tax adviser concerning the tax consequences of an exchange.
|
| Restrictions on Excessive Trading Practices. The Trust does not permit market-timing or other excessive trading
practices. Purchases and exchanges should be made for long-term investment purposes only. The Trust and Goldman Sachs reserve the right to reject or restrict purchase or exchange requests from any investor. Excessive, short-term (market-timing) trading
practices may disrupt portfolio management strategies, harm Fund performance and negatively impact long-term shareholders. The Trust and Goldman Sachs will not be held liable for any loss resulting from rejected purchase or exchange orders. To minimize
harm to the Trust (or Goldman Sachs) and its shareholders, the Trust (or Goldman Sachs) will exercise these rights if, in the Trust’s (or Goldman Sachs’) judgment, an investor has a history of excessive trading or if an investor’s trading,
in the judgment of the Trust (or Goldman Sachs), has been or may be disruptive to the Fund. In making this judgment, trades executed in multiple accounts under common ownership or control may be considered together.
|
| What Types Of Reports Will I Be Sent Regarding Investments In Institutional Shares?
|
| You will receive an annual report containing audited financial statements and a semi-annual report. To eliminate unnecessary
duplication, only one copy of such reports will be sent to shareholders with the same mailing address. If you would like a duplicate copy to be mailed to you, please contact Goldman Sachs Funds at 1-800-621-2550. You will also be provided with a printed
confirmation for each transaction in your account and a monthly account statement. The Fund does not generally provide sub-accounting services.
|
| As with any investment, you should consider how your investment in the Fund will be taxed. The tax information below is provided
as general information. More tax information is available in the Additional Statement. You should consult your tax adviser about the federal, state, local or foreign tax consequences of your investment in the Fund.
|
| Unless your investment is in an IRA or other tax-advantaged account, you should consider the possible tax consequences of Fund
distributions and the sale of your Fund shares.
|
| DISTRIBUTIONS
|
| Distributions you receive from the Fund are generally subject to federal income tax, and may also be subject to state or local
taxes. This is true whether you reinvest your distributions in additional Fund shares or receive them in cash. For federal tax purposes, the Fund’s income dividend distributions and short-term capital gain distributions are taxable to you as ordinary
income. Any long-term capital gain distributions are taxable as long-term capital gains, no matter how long you have owned your Fund shares.
|
| Although distributions are generally treated as taxable to you in the year they are paid, distributions declared in October,
November or December but paid in January are taxable as if they were paid in December. A percentage of the Fund’s dividends paid to corporate shareholders may be eligible for the corporate dividends-received deduction. The Fund will inform
shareholders of the character and tax status of all distributions promptly after the close of each calendar year.
|
| The Fund may be subject to foreign withholding or other foreign taxes on income or gain from certain foreign securities. In
general, the Fund may deduct these taxes in computing its taxable income.
|
| If you buy shares of the Fund before it makes a distribution, the distribution will be taxable to you even though it may actually
be a return of a portion of your investment. This is known as “buying a dividend.”
|
| SALES AND EXCHANGES
|
| Your sale of Fund shares is a taxable transaction for federal income tax purposes, and may also be subject to state and local
taxes. For tax purposes, the exchange of your Fund shares for shares of a different Goldman Sachs Fund is the same as a sale. When you sell your shares, you will generally recognize a capital gain or loss in an amount equal to the difference between your
adjusted tax basis in the shares and the amount received. Generally, this gain or loss is long-term or short-term depending on whether your holding period exceeds twelve months, except that any loss realized on shares held for six months or less will be
treated as a long-term capital loss to the extent of any long-term capital gain dividends that were received on the shares.
|
| RETIREMENT PLANS
|
| The one major exception to these tax principles is that distributions on, and sales, exchanges and redemptions of, shares held in
an IRA (or other tax-qualified plan) will not be currently taxable.
|
| OTHER INFORMATION
|
| When you open your account, you should provide your social security or tax identification number on your Account Application. By
law, the Fund must withhold 31% of your taxable distributions and any redemption proceeds if you do not provide your correct taxpayer identification number, or certify that it is correct, or if the IRS instructs the Fund to do so. Non-U.S. investors may
be subject to U.S. withholding and estate tax.
|
| A. General Portfolio Risks
|
| The Fund will be subject to the risks associated with equity securities. “Equity securities” may include common stocks,
preferred stocks, interests in real estate investment trusts, convertible debt obligations, convertible preferred stocks, equity interests in trusts, partnerships, joint ventures, limited liability companies and similar enterprises, warrants, and stock
purchase rights. In general, stock values fluctuate in response to the activities of individual companies and in response to general market and economic conditions. Accordingly, the value of the stocks that the Fund holds may decline over short or
extended periods. The stock markets tend to be cyclical, with periods when stock prices generally rise and periods when prices generally decline. The volatility of equity securities means that the value of your investment in the Fund may increase or
decrease. Recently, certain stock markets have experienced substantial price volatility and, at times, have traded at or close to record high levels. There can be no guarantee that such levels will be reached or maintained in the future.
|
| To the extent that the Fund invests in fixed-income securities, the Fund will also be subject to the risks associated with its
fixed-income securities. These risks include interest rate risk and credit risk. In general, interest rate risk involves the risk that when interest rates decline, the market value of fixed-income securities tends to increase. Conversely, when interest
rates increase, the market value of fixed-income securities tends to decline. Credit risk involves the risk that an issuer or guarantor could default on its obligations, and the Fund will not recover its investment.
|
| The Investment Adviser will not consider the portfolio turnover rate a limiting factor in making investment decisions for the
Fund. Trading to keep the Fund’s portfolio holdings consistent with, and equally weighted among, the securities in the U.S. Select List may increase the Fund’s portfolio turnover rate. A high rate of portfolio turnover (100% or more) involves correspondingly greater expenses which must be borne by the Fund and its shareholders, and is also likely to result in
higher short-term capital gains taxable to shareholders. The portfolio turnover rate is calculated by dividing the lesser of the dollar amount of sales or purchases of portfolio securities by the average monthly value of the Fund’s portfolio
securities, excluding securities having a maturity at the date of purchase of one year or less.
|
| The following sections provide further information on certain types of securities and investment techniques that may be used by
the Fund, including their associated risks. Additional information is provided in the Additional Statement, which is available upon request. Among other things, the Additional Statement describes certain fundamental investment restrictions that cannot be
changed without shareholder approval. You should note, however, that the investment objective, and all investment policies not specifically designated as fundamental, are non-fundamental and may be changed without shareholder approval. If there is a
change in the Fund’s investment objective, you should consider whether the Fund remains an appropriate investment in light of your then current financial position and needs.
|
| B. Other Portfolio Risks
|
| Risks of Investing in Small Capitalization Companies. The Fund may invest in small capitalization companies.
Investments in small capitalization companies involve greater risk and portfolio price volatility than investments in larger capitalization stocks. Among the reasons for the greater price volatility of these investments are the less certain growth
prospects of smaller firms and the lower degree of liquidity in the markets for such securities. Small capitalization companies may be thinly traded and may have to be sold at a discount from current market prices or in small lots over an extended period
of time. In addition, these securities are subject to the risk that during certain periods the liquidity of particular issuers or industries, or all securities in particular investment categories, will shrink or disappear suddenly and without warning as a
result of adverse economic or market conditions, or adverse investor perceptions whether or not accurate. Because of the lack of sufficient market liquidity, the Fund may incur losses because it will be required to effect sales at a disadvantageous time
and only then at a substantial drop in price. Small capitalization companies include “unseasoned” issuers that do not have an established financial history; often have limited product lines, markets or financial resources; may depend on or use a
few key personnel for management; and may be susceptible to losses and risks of bankruptcy. Transaction costs for these investments are often higher than those of larger capitalization companies. Investments in small capitalization companies may be more
difficult to price precisely than other types of securities because of their characteristics and lower trading volumes.
|
| Risks of Foreign Issuers. The Fund may invest in foreign issuers. Foreign issuers involve special risks that are not
typically associated with U.S. issuers. There may be less publicly available information about a foreign issuer than about a U.S. issuer. In addition, there is generally less government regulation of foreign compa
nies than in the United States. The securities of many foreign issuers are less liquid and more volatile than securities of comparable domestic issuers. Furthermore, with respect to certain foreign countries, there is a possibility of nationalization,
expropriation or confiscatory taxation, imposition of withholding or other taxes on dividend or interest payments (or, in some cases, capital gains), limitations on the removal of funds or other assets, and political or social instability or diplomatic
developments which could affect the Fund’s investments.
|
| Risks of Derivative Investments. The Fund’s transactions in options, futures, options on futures, swaps and
structured securities involve additional risk of loss. Loss can result from a lack of correlation between changes in the value of derivative instruments and the portfolio assets (if any) being hedged, the potential illiquidity of the markets for
derivative instruments, or the risks arising from margin requirements and related leverage factors associated with such transactions. The use of these management techniques also involves the risk of loss if the Investment Adviser is incorrect in its
expectation of fluctuations in securities prices or interest rates. The Fund may also invest in derivative investments for non-hedging purposes (that is, to seek to increase total return). Investing for non-hedging purposes is considered a speculative
practice and presents even greater risk of loss.
|
| Risks of Illiquid Securities. The Fund may invest up to 15% of its net assets in illiquid securities which cannot be
disposed of in seven days in the ordinary course of business at fair value. Illiquid securities include:
|
n
|
Securities that are not readily marketable
|
n
|
Repurchase agreements and time deposits with a notice or demand period of more than seven days
|
n
|
Certain over-the-counter options
|
n
|
Certain structured securities and all swap transactions
|
n
|
Certain restricted securities, unless it is determined, based upon a review of the trading markets for a specific restricted
security, that such restricted security is eligible for resale pursuant to Rule 144A under the Securities Act of 1933 (“144A Securities”) and, therefore, is liquid.
|
| Investing in 144A Securities may decrease the liquidity of the Fund’s portfolio to the extent that qualified institutional
buyers become for a time uninterested in purchasing these restricted securities. The purchase price and subsequent valuation of restricted and illiquid securities normally reflect a discount, which may be significant, from the market price of comparable
securities for which a liquid market exists.
|
| Credit Risks. Debt securities purchased by the Fund may include securities (including zero coupon bonds) issued by
the U.S. government (and its agencies, instru
mentalities and sponsored enterprises), domestic and foreign corporations, banks and other issuers. Further information is provided in the Additional Statement.
|
| Temporary Investment Risks. The Fund may, for temporary defensive purposes, invest a certain percentage of its total
assets in:
|
n
|
U.S. government securities
|
n
|
Commercial paper rated at least A-2 by Standard & Poor’s or P-2 by Moody’s
|
n
|
Certificates of deposit
|
n
|
Bankers’ acceptances
|
n
|
Repurchase agreements
|
n
|
Non-convertible preferred stocks and non-convertible corporate bonds with a remaining maturity of less than one year
|
| When the Fund’s assets are invested in such instruments, the Fund may not be achieving its investment objective.
|
| C. Portfolio Securities and Techniques
|
| This section provides further information on certain types of securities and investment techniques that may be used by the Fund,
including their associated risks. Further information is provided in the Additional Statement, which is available upon request.
|
| Structured Securities. The Fund may invest in structured securities. Structured securities are securities whose
value is determined by reference to changes in the value of specific currencies, interest rates, commodities, indices or other financial indicators (the “Reference”) or the relative change in two or more References. The interest rate or the
principal amount payable upon maturity or redemption may be increased or decreased depending upon changes in the applicable Reference. Structured securities may be positively or negatively indexed, so that appreciation of the Reference may produce an
increase or decrease in the interest rate or value of the security at maturity. In addition, changes in the interest rates or the value of the security at maturity may be a multiple of changes in the value of the Reference. Consequently, structured
securities may present a greater degree of market risk than other types of securities and may be more volatile, less liquid and more difficult to price accurately than less complex securities.
|
| REITs. The Fund may invest in REITs. REITs are pooled investment vehicles that invest primarily in either real
estate or real estate related loans. The value of a REIT is affected by changes in the value of the properties owned by the REIT or securing mortgage loans held by the REIT. REITs are dependent upon the ability of the REITs’ managers, and are subject
to heavy cash flow dependency,
default by borrowers and the qualification of the REITs under applicable regulatory requirements for favorable income tax treatment. REITs are also subject to risks generally associated with investments in real estate including possible declines in the
value of real estate, general and local economic conditions, environmental problems and changes in interest rates. To the extent that assets underlying a REIT are concentrated geographically, by property type or in certain other respects, these risks may
be heightened. The Fund will indirectly bear its proportionate share of any expenses, including management fees, paid by a REIT in which it invests.
|
| Options on Securities and Securities Indices. A put option gives the purchaser of the option the right to sell, and
the writer (seller) of the option the obligation to buy, the underlying instrument during the option period. A call option gives the purchaser of the option the right to buy, and the writer (seller) of the option the obligation to sell, the underlying
instrument during the option period. The Fund may write (sell) covered call and put options and purchase put and call options on any securities in which it may invest or on any securities index consisting of securities in which it may invest.
|
| The writing and purchase of options is a highly specialized activity which involves special investment risks. Options may be used
for either hedging or cross-hedging purposes, or to seek to increase total return (which is considered a speculative activity). The successful use of options depends in part on the ability of the Investment Adviser to manage future price fluctuations and
the degree of correlation between the options and securities markets. If the Investment Adviser is incorrect in its expectation of changes in market prices or determination of the correlation between the instruments or indices on which options are written
and purchased and the instruments in the Fund’s investment portfolio, the Fund may incur losses that it would not otherwise incur. The use of options can also increase the Fund’s transaction costs. Options written or purchased by the Fund may be
traded on U.S. exchanges or over-the-counter. Over-the-counter options will present greater possibility of loss because of their greater illiquidity and credit risks.
|
| Futures Contracts and Options on Futures Contracts. Futures contracts are standardized, exchange-traded contracts
that provide for the sale or purchase of a specified financial instrument at a future time at a specified price. An option on a futures contract gives the purchaser the right (and the writer of the option the obligation) to assume a position in a futures
contract at a specified exercise price within a specified period of time. A futures contract may be based on various securities (such as U.S. government securities), securities indices, and other financial instruments and indices. The Fund may engage in
futures transactions on U.S. exchanges.
|
| The Fund may purchase and sell futures contracts, and purchase and write call and put options on futures contracts, in order to
seek to increase total return or to hedge against changes in interest rates or securities prices. The Fund may also enter into closing purchase and sale transactions with respect to such contracts and options. The Fund will engage in futures and related
options transactions for bona fide hedging purposes as defined in regulations of the Commodity Futures Trading Commission or to seek to increase total return to the extent permitted by such regulations. The Fund may not purchase or sell futures contracts
or purchase or sell related options to seek to increase total return, except for closing purchase or sale transactions, if immediately thereafter the sum of the amount of initial margin deposits and premiums paid on the Fund’s outstanding positions
in futures and related options entered into for the purpose of seeking to increase total return would exceed 5% of the market value of the Fund’s net assets.
|
| Futures contracts and related options present the following risks:
|
n
|
While the Fund may benefit from the use of futures and options on futures, unanticipated changes in interest rates or securities
prices may result in poorer overall performance than if the Fund had not entered into any futures contracts or options transactions.
|
n
|
Because perfect correlation between a futures position and portfolio position that is intended to be protected is impossible to
achieve, the desired protection may not be obtained and the Fund may be exposed to additional risk of loss.
|
n
|
The loss incurred by the Fund in entering into futures contracts and in writing call options on futures is potentially unlimited
and may exceed the amount of the premium received.
|
n
|
Futures markets are highly volatile and the use of futures may increase the volatility of the Fund’s NAV.
|
n
|
As a result of the low margin deposits normally required in futures trading, a relatively small price movement in a futures
contract may result in substantial losses to the Fund.
|
n
|
Futures contracts and options on futures may be illiquid, and exchanges may limit fluctuations in futures contract prices during a
single day.
|
| Equity Swaps. The Fund may invest in equity swaps. Equity swaps allow the parties to a swap agreement to exchange
the dividend income or other components of return on an equity investment (for example, a group of equity securities or an index) for a component of return on another non-equity or equity investment.
|
| An equity swap may be used by the Fund to invest in a market without owning or taking physical custody of securities in
circumstances in which direct investment may be restricted for legal reasons or is otherwise impractical. Equity swaps are derivatives and their value can be very volatile. To the extent that the Investment
Adviser does not accurately analyze and predict the potential relative fluctuation of the components swapped with another party, the Fund may suffer a loss, which may be substantial. The value of some components of an equity swap (such as the dividends
on a common stock) may also be sensitive to changes in interest rates. Furthermore, the Fund may suffer a loss if the counterparty defaults. Because equity swaps are normally illiquid, the Fund may be unable to terminate its obligations when desired.
|
| When-Issued Securities and Forward Commitments. The Fund may purchase when-issued securities and enter into forward
commitments. When-issued securities are securities that have been authorized, but not yet issued. When-issued securities are purchased in order to secure what is considered to be an advantageous price or yield to the Fund at the time of entering into the
transaction. A forward commitment involves the entering into a contract to purchase or sell securities for a fixed price at a future date beyond the customary settlement period.
|
| The purchase of securities on a when-issued or forward commitment basis involves a risk of loss if the value of the security to be
purchased declines before the settlement date. Conversely, the sale of securities on a forward commitment basis involves the risk that the value of the securities sold may increase before the settlement date. Although the Fund will generally purchase
securities on a when-issued or forward commitment basis with the intention of acquiring the securities for its portfolio, the Fund may dispose of when-issued securities or forward commitments prior to settlement if the Investment Adviser deems it
appropriate.
|
| Repurchase Agreements. Repurchase agreements involve the purchase of securities subject to the seller’s
agreement to repurchase them at a mutually agreed upon date and price. The Fund may enter into repurchase agreements with dealers in U.S. government securities and member banks of the Federal Reserve System which furnish collateral at least equal in value
or market price to the amount of their repurchase obligation.
|
| If the other party or “seller” defaults, the Fund might suffer a loss to the extent that the proceeds from the sale of
the underlying securities and other collateral held by the Fund are less than the repurchase price and the Fund’s costs associated with delay and enforcement of the repurchase agreement. In addition, in the event of bankruptcy of the seller, the Fund
could suffer additional losses if a court determines that the Fund’s interest in the collateral is not enforceable.
|
| In evaluating whether to enter into a repurchase agreement, the Investment Adviser will carefully consider the creditworthiness of
the seller. The Fund, together with other registered investment companies having advisory agreements with the Investment Adviser or any of its affiliates, may transfer uninvested cash balances into a single joint account, the daily aggregate balance of
which will be invested in one or more repurchase agreements.
|
| Lending of Portfolio Securities. The Fund may engage in securities lending. Securities lending involves the lending
of securities owned by the Fund to financial institutions such as certain broker-dealers. The borrowers are required to secure their loan continuously with cash, cash equivalents, U.S. government securities or letters of credit in an amount at least equal
to the market value of the securities loaned. Cash collateral may be invested in cash equivalents. To the extent that cash collateral is invested in other investment securities, such collateral will be subject to market depreciation or appreciation, and
the Fund will be responsible for any loss that might result from its investment of the borrowers’ collateral. If the Investment Adviser determines to make securities loans, the value of the securities loaned may not exceed 33 1
/3% of the value of the total assets of the
Fund (including the loan collateral).
|
| The Fund may lend its securities to increase its income. The Fund may, however, experience delay in the recovery of its securities
or a capital loss if the institution with which it has engaged in a portfolio loan transaction breaches its agreement with the Fund.
|
| Preferred Stock, Warrants and Rights. The Fund may invest in preferred stock, warrants and rights. Preferred stocks
are securities that represent an ownership interest providing the holder with claims on the issuer’s earnings and assets before common stock owners but after bond owners. Unlike debt securities, the obligations of an issuer of preferred stock,
including dividend and other payment obligations, may not typically be accelerated by the holders of such preferred stock on the occurrence of an event of default or other non-compliance by the issuer of the preferred stock.
|
| Warrants and other rights are options to buy a stated number of shares of common stock at a specified price at any time during the
life of the warrant or right. The holders of warrants and rights have no voting rights, receive no dividends and have no rights with respect to the assets of the issuer.
|
| Other Investment Companies. The Fund may invest in securities of other investment companies (including
exchange-traded funds such as SPDRs as defined below) subject to statutory limitations prescribed by the Act. These limitations include a prohibition on the Fund acquiring more than 3% of the voting shares of any other investment company, and a
prohibition on investing more than 5% of the Fund’s total assets in securities of any one investment company or more than 10% of its total assets in securities of all investment companies. The Fund will indirectly bear its proportionate share of any
management fees and other expenses paid by such other investment companies. Exchange-traded funds such as SPDRs are shares of unaffiliated investment companies which are traded like traditional equity securities on a national securities exchange or the
NASDAQ® National Market System.
|
n
|
Standard & Poor’s Depositary Receipts
TM
. The Fund may, consistent with its investment policies, purchase Standard
& Poor’s Depositary Receipts™ (“SPDRs”). SPDRs are securities traded on the American Stock Exchange (“AMEX”) that represent ownership in the SPDR Trust, a trust which has been established to accumulate and hold a
portfolio of common stocks that is intended to track the price performance and dividend yield of the S&P 500®. The SPDR Trust is sponsored by a subsidiary of the AMEX. SPDRs may be used for several reasons, including, but not limited to,
facilitating the handling of cash flows or trading, or reducing transaction costs. The price movement of SPDRs may not perfectly parallel the price action of the S&P 500®.
|
| Unseasoned Companies. The Fund may invest in companies (including predecessors) which have operated less than three
years. The securities of such companies may have limited liquidity, which can result in their being priced higher or lower than might otherwise be the case. In addition, investments in unseasoned companies are more speculative and entail greater risk than
do investments in companies with an established operating record.
|
| Corporate Debt Obligations. Corporate debt obligations include bonds, notes, debentures, commercial paper and other
obligations of corporations to pay interest and repay principal, and include securities issued by banks and other financial institutions. The Fund may invest in corporate debt obligations issued by U.S. and certain non-U.S. issuers which issue securities
denominated in the U.S. dollar (including Yankee and Euro obligations). In addition to obligations of corporations, corporate debt obligations include securities issued by banks and other financial institutions and supranational entities (i.e., the World Bank, the International Monetary Fund, etc.).
|
| Bank Obligations. The Fund may invest in obligations issued or guaranteed by U.S. or foreign banks. Bank
obligations, including without limitations, time deposits, bankers’ acceptances and certificates of deposit, may be general obligations of the parent bank or may be limited to the issuing branch by the terms of the specific obligations or by
government regulations. Banks are subject to extensive but different governmental regulations which may limit both the amount and types of loans which may be made and interest rates which may be charged. In addition, the profitability of the banking
industry is largely dependent upon the availability and cost of funds for the purpose of financing lending operations under prevailing money market conditions. General economic conditions as well as exposure to credit losses arising from possible
financial difficulties of borrowers play an important part in the operation of this industry.
|
| U.S. Government Securities. The Fund may invest in U.S. government securities. U.S. government securities include
U.S. Treasury obligations and obligations
issued or guaranteed by U.S. government agencies, instrumentalities or sponsored enterprises. U.S. government securities may be supported by (a) the full faith and credit of the U.S. Treasury (such as the Government National Mortgage Association (“
Ginnie Mae”)); (b) the right of the issuer to borrow from the U.S. Treasury (such as securities of the Student Loan Marketing Association); (c) the discretionary authority of the U.S. government to purchase certain obligations of the issuer (such as
the Federal National Mortgage Association (“Fannie Mae”) and Federal Home Loan Mortgage Corporation (“Freddie Mac”)); or (d) only the credit of the issuer.
|
| Borrowings. The Fund can borrow money from banks and other financial institutions in amounts not exceeding one-third
of its total assets for temporary or emergency purposes. The Fund may not make additional investments if borrowings exceed 5% of its total assets.
|
| Short Sales Against-the-Box. The Fund may make short sales against-the-box. A short sale against-the-box means that
at all times when a short position is open the Fund will own an equal amount of securities sold short, or securities convertible into or exchangeable for, without payment of any further consideration, an equal amount of the securities of the same issuer
as the securities sold short.
|
| The financial highlights table is intended to help you understand the Fund’s financial performance from its commencement
(June 19, 2000) to August 31, 2000. Certain information reflects financial results for a single Fund share. The total returns in the table represent the rate that an investor would have earned or lost on an investment in the Fund (assuming reinvestment of
all dividends and distributions). This information for the period ended August 31, 2000 has been audited by PricewaterhouseCoopers LLP, whose report, along with the Fund’s financial statements, is included in the Fund’s annual report (available
upon request).
|
| RESEARCH SELECT FUND
|
| Income from
investment operations |
|||||||||||||||||||
|---|---|---|---|---|---|---|---|---|---|---|---|---|---|---|---|---|---|---|---|
| Net asset
value, beginning of period |
Net
investment loss(c) |
Net realized
and unrealized gain |
Total from
investment operations |
||||||||||||||||
| For the Period Ended August 31, | |||||||||||||||||||
| 2000 - Class A Shares (commenced June 19, 2000) | $10.00 | $(0.02 | ) | $0.79 | $0.77 | ||||||||||||||
| 2000 - Class B Shares (commenced June 19, 2000) | 10.00 | (0.04 | ) | 0.80 | 0.76 | ||||||||||||||
| 2000 - Class C Shares (commenced June 19, 2000) | 10.00 | (0.04 | ) | 0.81 | 0.77 | ||||||||||||||
| 2000 - Institutional Shares (commenced June 19, 2000) | 10.00 | (0.01 | ) | 0.79 | 0.78 | ||||||||||||||
| 2000 - Service Shares (commenced June 19, 2000) | 10.00 | (0.02 | ) | 0.80 | 0.78 | ||||||||||||||
(a)
|
Assumes investment at the net asset value at the beginning of the period, reinvestment of all dividends and
distributions, a complete redemption of the investment at the net asset value at the end of the period and no sales or redemption charges. Total return would be reduced if a sales or redemption charge were taken into account. Total returns for periods
less than one full year are not annualized.
|
(b)
|
Annualized.
|
(c)
|
Calculated based on the average shares outstanding methodology.
|
| Ratios assuming
no expense reductions |
|||||||||||||||||||||
|---|---|---|---|---|---|---|---|---|---|---|---|---|---|---|---|---|---|---|---|---|---|
| Net asset
value, end of period |
Total
return(a) |
Net assets
at end of period (in 000s) |
Ratio of
net expenses to average net assets(b) |
Ratio of
net investment loss to average net assets(b) |
Ratio of
expenses to average net assets(b) |
Ratio of
net investment loss to average net assets(b) |
Portfolio
turnover rate |
||||||||||||||
| $10.77 | 7.70 | % | $217,861 | 1.50 | % | (1.04 | )% | 2.05 | % | (1.59 | )% | 5.04 | % | ||||||||
| 10.76 | 7.60 | 201,437 | 2.25 | (1.79 | ) | 2.80 | (2.34 | ) | 5.04 | ||||||||||||
| 10.77 | 7.70 | 96,393 | 2.25 | (1.78 | ) | 2.80 | (2.33 | ) | 5.04 | ||||||||||||
| 10.78 | 7.80 | 12,677 | 1.10 | (0.50 | ) | 1.65 | (1.05 | ) | 5.04 | ||||||||||||
| 10.78 | 7.70 | 12 | 1.60 | (1.13 | ) | 2.15 | (1.68 | ) | 5.04 | ||||||||||||
| U.S. Select List
|
| As mentioned in “Fund Investment Objective and Strategies,” the U.S. Select List was introduced on September 9,
1998 and comprises approximately 25 to 35 stocks that the Goldman Sachs U.S. Stock Selection Committee expects, as a portfolio, to outperform its benchmark, the S&P 500® Index, over the next twelve to eighteen months. The U.S. Select List changes regularly. While the companies on the list generally have been relatively large U.S. companies, the list is not restricted to those types of companies. It is expected that, under normal market conditions, the quarterly
performance of the Fund, before expenses, will track the price return of the U.S. Select List within a .90 correlation coefficient.
|
| The Fund’s portfolio management team does not have access to information regarding additions or deletions for the U.S.
Select List prior to their publication. Goldman Sachs publishes other lists of recommended securities that could be appropriate for Fund investors but that are not used by the Fund’s portfolio management team.
|
| The chart below reflects historical information regarding the U.S. Select List. The U.S. Select List is not
maintained for the purpose of managing any account or investment company such as the Fund. The number of stocks on the U.S. Select List and the frequency of additions to and deletions from the U.S. Select List change from time to time. The stocks included in the U.S. Select List constitute only a “paper portfolio” that does not reflect
actual trading and does not have an actual performance record. The U.S. Select List’s price return does not represent the return on any fund or any other account that involves actual trading. The price returns are not indicative of the returns on any fund or account because, among other things, they do not
reflect actual prices when stocks are purchased or sold, transaction costs and account fees. In addition, because the U.S. Select List does not include a cash component, price returns are based on a constant 100% investment in the stocks on the U.S. Select List. Also, the information below does not reflect the impact that the Investment Adviser’s
portfolio management decisions and techniques may have on performance. Further, the actual performance of the Fund may differ from that of the U.S. Select List because of time delays between when a stock is added to or removed from the list and when it is bought or sold for the Fund. Investors should not consider this price return information as a substitute for, or an indication of,
future performance of the Research Select Fund or
the Investment Adviser. Finally, past price returns of the U.S. Select List are not representative of future price returns of the list.
|
| 9/9/98
(inception) to 12/31/98 |
1/1/99
to 12/31/99 |
1/1/00
to 10/31/00 |
9/9/98
(inception) to 10/31/00 |
||||||
|---|---|---|---|---|---|---|---|---|---|
| U.S. Select List Stock Price Return* | 37.57% | 33.81% | 18.1% | 117.5% | |||||
| S&P 500® Index Price Return** | 22.73% | 21.06% | -1.8% | 45.9% | |||||
*
|
The results for the U.S. Select List portfolio represent an equal-weighted arithmetic average of the stocks held at any
point during the month. The results are calculated monthly using each stock’s capital appreciation or depreciation during the period that it is on the U.S. Select List and dividing that by the highest number of stocks that were on the U.S. Select
List at any point during the month. Prior to June 1999, the divisor was the time-weighted number of stocks on the list for the specified period. The results are calculated using the prices of the stocks at the close of trading of the stock market one full
day after the stock was added to the U.S. Select List (e.g., if the stock was added on the afternoon of 5/5, the recorded price is at the close on 5/6). The results do not reflect the execution of actual purchases or sales, and there is no guarantee that
a mutual fund following the U.S. Select List would be able to execute purchases and sales at the prices used to calculate the price returns. Because the U.S. Select List is a paper portfolio that is not managed to a target number of stocks, no “
re-balancing” of actual investments is done when stocks are added to or deleted from the U.S. Select List. Price returns are based on 100% investment in the stocks on the U.S. Select List.
|
| Price returns are calculated to include the price return plus dividends for the stock during the month in which they are
paid without being reinvested into the security. They do not reflect the market impact on the stock prices that may occur between the time the publication is made of additions to and deletions from the U.S. Select List and the time a mutual fund following
the U.S. Select List would be able to execute purchases and sales. They also do not reflect transaction fees, such as commissions, fees and interest charges, or the costs of running a mutual fund, such as management fees, distribution fees and other
expenses. They do not reflect the impact that an investment adviser’s portfolio management decisions and techniques may have on a mutual fund’s returns. Actual transactions and the effect of dividends, fees and costs will result in returns that
differ from those of the U.S. Select List.
|
**
|
The S&P 500® Index is an unmanaged index containing common stocks of 500 industrial, transportation, utility and
financial companies, regarded as generally representative of the U.S. stock market. The S&P 500® Index performance numbers shown are price returns reflecting the reinvestment of dividends. They do not reflect fees, brokerage commissions or other
costs of investing that are not incurred by an index.
|
| FOR MORE INFORMATION
|
| Annual/Semi-annual Report
|
| Additional information about the Fund’s investments is available in the Fund’s annual and semi-annual reports to
shareholders. In the Fund’s annual report, you will find a discussion of the market conditions and investment strategies that significantly affected the Fund’s performance during the last fiscal year.
|
| Statement of Additional Information
|
| Additional information about the Fund and its policies is also available in the Fund’s Additional Statement. The Additional
Statement is incorporated by reference into this Prospectus (is legally considered part of this Prospectus).
|
| The Fund’s annual and semi-annual reports, and the Additional Statement, are available free upon request by calling Goldman
Sachs at 1-800-621-2550.
|
| To obtain other information and for shareholder inquiries:
|
| By telephone – Call 1-800-621-2550
|
| By mail – Goldman Sachs Funds, 4900 Sears Tower, Chicago, IL 60606-6372
|
| By e-mail – [email protected]
|
| On the Internet – Text-only versions of the Fund’s documents are located online and may be downloaded from:
|
| SEC EDGAR database – http://www.sec.gov
|
| You may review and obtain copies of Fund documents by visiting the SEC’s Public Reference Room in Washington, D.C. You may
also obtain copies of Fund documents, after paying a duplicating fee, by writing to the SEC’s Public Reference Section, Washington, D.C. 20549-0102 or by electronic request to: [email protected]. Information on the operation of the public reference
room may be obtained by calling the SEC at (202) 942-8090.
|
| Prospectus
|
| GOLDMAN SACHS RESEARCH SELECT FUND
SM
|
| Class A, B
and C Shares |
| December 29, 2000
|
|
| THE SECURITIES AND EXCHANGE COMMISSION HAS NOT APPROVED OR DISAPPROVED THESE SECURITIES OR PASSED UPON THE ADEQUACY OF THIS PROSPECTUS.
ANY REPRESENTATION TO THE CONTRARY IS A CRIMINAL OFFENSE.
|
| AN INVESTMENT IN THE FUND IS NOT A BANK DEPOSIT AND IS NOT INSURED BY THE FEDERAL DEPOSIT INSURANCE CORPORATION OR ANY OTHER GOVERNMENT
AGENCY. AN INVESTMENT IN THE FUND INVOLVES INVESTMENT RISKS, INCLUDING POSSIBLE LOSS OF PRINCIPAL.
|
|
| NOT FDIC-INSURED
|
May Lose Value
|
No Bank Guarantee
|
| Goldman Sachs Asset Management, a unit of the Investment Management Division of Goldman, Sachs & Co. (“Goldman
Sachs”), serves as investment adviser to the Research Select Fund (the “Fund”). Goldman Sachs Asset Management is referred to in this Prospectus as the “Investment Adviser.”
|
| RESEARCH STYLE FUNDS—RESEARCH SELECT FUND
|
| The Goldman Sachs Research Select Fund selects substantially all of its securities from the U.S. Select List developed by
the Goldman Sachs Investment Research Division. The Fund leverages the resources of Goldman Sachs by applying the Investment Management Division’s portfolio management expertise to the equity securities included in the U.S. Select List.
|
|
| Research Select Fund
|
|
Objective:
|
Long-term growth of capital
|
|
Benchmark:
|
S&P 500® Index
|
|
Investment Focus:
|
A focused portfolio of U.S. equity securities that offer the potential for long-term capital appreciation
|
| INVESTMENT OBJECTIVE
|
| The Fund seeks to provide long-term growth of capital by investing in a focused portfolio of U.S. equity securities.
|
| PRINCIPAL INVESTMENT STRATEGIES
|
| Equity Securities. The Fund invests, under normal circumstances, at least 90% of its total assets in U.S. equity securities, including securities of foreign issuers that are traded in the United States. Under normal circumstances, the Fund will only
purchase equity securities that are included in the Goldman Sachs Global Investment Research Division’s U.S. Select List and will sell securities that have been removed from the U.S. Select List. Notification of changes to the U.S. Select List is made to clients of Goldman Sachs and to the Fund’s portfolio management team at the
same time. The Fund will purchase a security that has been added to, or sell a security that has been removed from, the list after publication of that change. In addition, the Investment Adviser may apply the techniques described below in managing the
Fund and in purchasing and selling securities that are included in the U.S. Select List.
|
| The Goldman Sachs Global Investment Research Division’s U.S. Select List.
The U.S. Select List was introduced on September 9, 1998 and comprises approximately 25 to 35 equity securities that the Goldman Sachs U.S. Stock Selection
Committee expects, as a portfolio, to outperform its benchmark, the S&P 500® Index over the next 12 to 18 months. The list is consistent with overall investment policy and emphasizes strategically favored economic sectors. The U.S. Select List is updated on a regular basis. Historically, the U.S. Select List has consisted primarily of common stocks of relatively large U.S. companies, although the list is not restricted to those types of companies.
|
| The U.S. Select List is used primarily by institutional clients.
|
| Our Approach to Portfolio Management.
To the extent practicable, the Fund will seek to deliver returns that are comparable to the price returns of the U.S. Select List. Generally, the Fund will seek to maintain approximate equal weightings of its assets among the securities included
in the list. Any remaining assets may be invested by the Investment Adviser in the other instruments described in this Prospectus, including short-term debt obligations, options and futures contracts.
|
| Investors should be aware, however, that the performance of the Fund will differ from the price returns of the U.S. Select List
for a variety of reasons, including the change in securities prices that may occur between the time when a security is added to or removed from the list and when it is bought or sold for the Fund; the Fund’s investment of cash flow from purchases
and sales of Fund shares, which can occur daily and will result in portfolio purchases and sales; modifications in the Fund’s stock weights in order to control trading costs; the timing and amount of dividend and distribution payments; and the
Fund’s use of investment techniques and instruments that are not included in the U.S. Select List. In addition, unlike the U.S. Select List, the Fund will incur transactional costs (such as brokerage commissions) and operational expenses (such as investment advisory fees).
|
| While the Fund intends to track the composition of the U.S. Select List, the Fund’s purchases and sales of securities
that are added to and deleted from the list may not be completed on the first trading day after changes to the list are announced, and in certain cases may take several days or weeks to complete. Moreover, purchases and sales of the Fund and other
investors following the U.S. Select List could create a temporary imbalance between the supply and demand of the securities on the list. The imbalance could affect the time it takes the Fund to complete its transactions, as well as the price the Fund pays or receives. In
order to reduce impact of these trading costs, the Investment Adviser may decide for a period of time not to buy a security that is included in the U.S. Select List or to continue to hold a security that has been removed from the list.
|
| The Fund will periodically rebalance its portfolio in an effort to maintain approximate equal weightings of its assets among the
securities on the U.S. Select List.
|
| Other. The Fund’s investments in fixed-income securities are limited to securities that are considered cash equivalents.
|
Ÿ
|
No specific percentage limitation on usage;
limited only by the objective and strategies of the Fund |
| Research
Select Fund |
|||
|---|---|---|---|
| Investment Practices | |||
| Borrowings | 33 1
/3
|
||
| Custodial Receipts | — | ||
| Equity Swaps* | 15 | ||
| Futures Contracts and Options on Futures Contracts | Ÿ | ||
| Investment Company Securities (including exchange-traded funds) | 10 | ||
| Options on Securities and Securities Indices 1 | Ÿ | ||
| Repurchase Agreements | Ÿ | ||
| Securities Lending | 33 1
/3
|
||
| Short Sales Against the Box | 25 | ||
| Unseasoned Companies | Ÿ | ||
| Warrants and Stock Purchase Rights | Ÿ | ||
| When-Issued Securities and Forward Commitments | Ÿ | ||
*
|
Limited to 15% of net assets (together with other illiquid securities) for all structured securities which are not
deemed to be liquid and all swap transactions.
|
1
|
The Fund may sell covered call and put options and purchase call and put options.
|
Ÿ
|
No specific percentage limitation on usage;
limited only by the objective and strategies of the Fund |
| Research
Select Fund |
||||
|---|---|---|---|---|
| Investment Securities | ||||
| American and Global Depositary Receipts | — | |||
| Asset-Backed and Mortgage-Backed Securities | — | |||
| Bank Obligations 2 | Ÿ | |||
| Convertible Securities 3 | Ÿ | |||
| Corporate Debt Obligations 2 | Ÿ | |||
| Equity Securities | 90 | + | ||
| Emerging Country Securities | — | |||
| Fixed Income Securities | Ÿ | |||
| Foreign Issuers | Ÿ | |||
| Non-Investment Grade Fixed Income Securities | — | |||
| Real Estate Investment Trusts (“REITs”) | Ÿ | |||
| Structured Securities * | Ÿ | |||
| Temporary Investments | 100 | |||
| U.S. Government Securities 2 | Ÿ | |||
*
|
Limited to 15% of net assets (together with other illiquid securities) for all structured securities which are not
deemed to be liquid and all swap transactions.
|
2
|
Limited by the amount the Fund invests in fixed-income securities. Cash equivalents only.
|
3
|
The Fund has no minimum rating criteria.
|
| Loss of money is a risk of investing in the Fund. An investment in the Fund is not a deposit of any bank and is not insured or
guaranteed by the Federal Deposit Insurance Corporation or any other governmental agency. The following summarizes important risks that apply to the Fund and may result in a loss of your investment. The Fund should not be relied upon as a complete
investment program. There can be no assurance that the Fund will achieve its investment objective.
|
| Research
Select Fund |
|||
|---|---|---|---|
| Ÿ Applicable | |||
| U.S. Select List | Ÿ | ||
| Stock | Ÿ | ||
| Credit/Default | Ÿ | ||
| Foreign | Ÿ | ||
| Derivatives | Ÿ | ||
| Interest Rate | Ÿ | ||
| Management | Ÿ | ||
| Market | Ÿ | ||
| Liquidity | Ÿ | ||
| Small Cap | Ÿ | ||
n
|
U.S. Select List Risk—The Fund invests
principally in securities included in the U.S. Select List, which comprises approximately 25 to 35 stocks. As a result of the small universe of stocks in which the Fund generally invests, it may be subject to greater risks than would a more diversified fund.
|
| Price returns reported for the U.S. Select List do not predict or reflect the future results of the U.S. Select List
or the Fund. In addition, unlike the Fund, the securities included in the U.S. Select List constitute only a “paper portfolio” that does not reflect actual trading and does not have an actual performance record.
|
| Although the Goldman Sachs U.S. Stock Selection Committee periodically makes subjective decisions to add or delete companies for the
U.S. Select List, the list is not compiled with any particular client or product in mind and is not (and will not be) compiled with the Fund in mind. The Global Investment Research Division could at any time cease publishing the U.S. Select List
. In that event, the Board of Trustees will make a determination on how to proceed
in the best interest of shareholders of the Fund, consistent with the Fund’s investment objective. Goldman Sachs publishes similar lists of recommended securities that may be appropriate for shareholders of the Fund but which will not be used by the
Investment Adviser for the Fund at this time.
|
| The Fund’s purchases and sales for its portfolio will be affected by market conditions following the publication of changes
to the U.S. Select List and will be subject to competing orders by Goldman Sachs clients who invest in the securities included on the list.
|
| The activities of Goldman Sachs and its affiliates may occasionally limit the Fund’s ability to purchase or sell securities
included in the U.S. Select List. The U.S. Select List is also subject to restrictions related to Goldman Sachs’ other businesses. In addition, certain securities may or may not appear on the U.S. Select List or may or may not be removed from
the list due to legal restrictions applicable to, or other business concerns of, Goldman Sachs. An investor should understand that these concerns will generally not be related to whether a particular security on the list or a security not on the list is
an attractive investment opportunity.
|
| As a global financial services firm, Goldman Sachs provides a wide range of financial services to issuers of securities and
investors in securities. Goldman Sachs, its affiliates and others associated with it may create markets or specialize in, have positions in and affect transactions in, securities of companies included in the U.S. Select List and may also perform or seek to perform financial services for those companies. Within the last three years, Goldman Sachs or its affiliates may have managed or co-managed public security offerings for companies included in the
U.S. Select List, and they or their employees may have a long or short position on holdings in the securities, or options on securities, or other related investments of companies included in the U.S. Select List.
|
| The Fund’s ability to invest in particular securities included in the U.S. Select List may be limited by the
diversification and other restrictions imposed on it as a registered mutual fund under the Investment Company Act of 1940 (the “Act”).
|
n
|
Stock Risk—The risk that stock prices
have historically risen and fallen in periodic cycles. Recently, U.S. stock markets and certain foreign stock markets have experienced substantial price volatility and, at times, have traded at or close to record high levels. There is no guarantee that
such levels will be reached or maintained in the future.
|
n
|
Credit/Default Risk—The risk that an issuer or guarantor of fixed-income securities held by the Fund may
default on its obligation to pay interest and repay principal.
|
n
|
Foreign Risk—The risk that when the Fund invests in foreign issuers, it will be subject to risk of loss not
typically associated with domestic issuers. Loss may result because of less foreign government regulation, less public information and
less economic, political and social stability. Loss may also result from the imposition of exchange controls, confiscations and other government restrictions.
|
n
|
Derivatives Risk—The risk that loss may result from the Fund’s investments in options, futures, swaps,
structured securities and other derivative instruments. These instruments may be leveraged so that small changes may produce disproportionate losses to the Fund.
|
n
|
Interest Rate Risk—The risk that when interest rates increase, fixed-income securities held by the Fund will
decline in value.
|
n
|
Management Risk—The risk that a strategy used by the Investment Adviser may fail to produce the intended results.
|
n
|
Market Risk—The risk that the value of the securities in which the Fund invests may go up or down in response
to the prospects of individual
companies, particular industry sectors and/or general economic conditions. Price changes may be temporary or last for extended periods. The Fund’s investments may be overweighted from time to time in one or more industry sectors, which will increase the Fund’s exposure to risk of loss from adverse developments affecting those sectors. |
n
|
Liquidity Risk—The risk that the Fund will not be able to pay redemption proceeds within the time period stated
in this Prospectus because of unusual market conditions, an unusually high volume of redemption requests, or other reasons. Because the Fund may invest in small capitalization stocks and REITs, the Fund will be especially subject to the risk that during
certain periods the liquidity of particular issuers or industries, or all securities within particular investment categories, will shrink or disappear suddenly and without warning as a result of adverse economic, market or political events, or adverse
investor perceptions whether or not accurate.
|
n
|
Small Cap Stock Risk—The securities of small capitalization stocks involve greater risks than those associated
with larger, more established companies and may be subject to more abrupt or erratic price movements. Securities of such issuers may lack sufficient market liquidity to enable the Fund to effect sales at an advantageous time or without a substantial drop
in price.
|
| More information about the Fund’s portfolio securities and investment techniques, and their associated risks, is provided in
Appendix A. You should consider the investment risks discussed in this section and in Appendix A. Both are important to your investment choice.
|
| HOW THE FUND HAS PERFORMED
|
| The Fund commenced operations on June 19, 2000. Since the Fund has less than one calendar year’s performance, no performance
information is provided in this section.
|
| Research Select Fund |
||||||||||
|---|---|---|---|---|---|---|---|---|---|---|
| Class A | Class B | Class C | ||||||||
| Shareholder Fees | ||||||||||
| (fees paid directly from your investment): | ||||||||||
| Maximum Sales Charge (Load) Imposed on
Purchases |
5.5% | 1 | None | None | ||||||
| Maximum Deferred Sales Charge (Load) 2 | None | 1 | 5.0% | 3 | 1.0% | 4 | ||||
| Maximum Sales Charge (Load) Imposed on
Reinvested Dividends |
None | None | None | |||||||
| Redemption Fees 5 | None | None | None | |||||||
| Exchange Fees | None | None | None | |||||||
| Annual Fund Operating Expenses | ||||||||||
| (expenses that are deducted from Fund assets):6 | ||||||||||
| Management Fees | 1.00% | 1.00% | 1.00% | |||||||
| Distribution and Service (12b-1) Fees | 0.25% | 1.00% | 1.00% | |||||||
| Other Expenses 7 | 0.80% | 0.80% | 0.80% | |||||||
| Total Fund Operating Expenses* | 2.05% | 2.80% | 2.80% | |||||||
| See page 11 for all other footnotes.
|
*
|
As a result of current expense limitations, the estimated “Other Expenses” and “Total Fund Operating Expenses”
of the Fund which are actually incurred as of the date of this Prospectus are as set forth below. The expense limitations may be terminated at any time at the option of the Investment Adviser. If this occurs, “Other Expenses” and “Total
Fund Operating Expenses” may increase without shareholder approval.
|
| Research Select Fund |
|||||||
|---|---|---|---|---|---|---|---|
| Class A | Class B | Class C | |||||
| Annual Fund Operating Expenses | |||||||
| (expenses that are deducted from Fund assets): 6 | |||||||
| Management Fees | 1.00% | 1.00% | 1.00% | ||||
| Distribution and Service (12b-1) Fees | 0.25% | 1.00% | 1.00% | ||||
| Other Expenses 7 | 0.25% | 0.25% | 0.25% | ||||
| Total Fund Operating Expenses (after current
expense limitations) |
1.50% | 2.25% | 2.25% | ||||
1
|
The maximum sales charge is a percentage of the offering price. A contingent deferred sales charge (“CDSC”) of
1% is imposed on certain redemptions (within 18 months of purchase) of Class A Shares sold without an initial sales charge as part of an investment of $1 million or more.
|
2
|
The maximum CDSC is a percentage of the lesser of the NAV at the time of the redemption or the NAV when the shares were
originally purchased.
|
3
|
A CDSC is imposed upon Class B Shares redeemed within six years of purchase at a rate of 5% in the first year, declining
to 1% in the sixth year, and eliminated thereafter.
|
4
|
A CDSC of 1% is imposed on Class C Shares redeemed within 12 months of purchase.
|
5
|
A transaction fee of $7.50 may be charged for redemption proceeds paid by wire.
|
6
|
The Fund’s operating expenses for the current fiscal year have been estimated.
|
7
|
Estimated “Other Expenses” include transfer agency fees equal to 0.19% of the average daily net assets of the
Fund’s Class A, B and C Shares, plus all other ordinary expenses not detailed above. The Investment Adviser has voluntarily agreed to reduce or limit “Other Expenses” (excluding management fees, distribution and service fees, transfer
agency fees, taxes, interest and brokerage fees and litigation, indemnification and other extraordinary expenses) to the following percentage of the Fund’s average daily net assets:
|
| Fund | Other
Expenses |
||
|---|---|---|---|
| Research Select | 0.06% | ||
| Fund | 1 Year | 3 Years | 5 Years | 10 Years | |||||
|---|---|---|---|---|---|---|---|---|---|
| Research Select | |||||||||
| Class A Shares | $747 | $1,157 | N/A | N/A | |||||
| Class B Shares | |||||||||
| – Assuming complete redemption at end of period | $783 | $1,168 | N/A | N/A | |||||
| – Assuming no redemption | $283 | $ 868 | N/A | N/A | |||||
| Class C Shares | |||||||||
| – Assuming complete redemption at end of period | $383 | $ 868 | N/A | N/A | |||||
| – Assuming no redemption | $283 | $ 868 | N/A | N/A | |||||
| INVESTMENT ADVISER
|
| Investment Adviser | Fund | ||
|---|---|---|---|
| Goldman Sachs Asset Management (“GSAM”) | Research Select | ||
| 32 Old Slip | |||
| New York, New York 10005 | |||
| GSAM is a business unit of the Investment Management Division (“IMD”) of Goldman Sachs. Goldman Sachs registered as an
investment adviser in 1981. As of September 30, 2000, GSAM, along with other units of IMD, had assets under management of $281.3 billion.
|
| The Investment Adviser provides day-to-day investment management services regarding the Fund’s portfolio transactions. The
Investment Adviser makes the investment decisions for the Fund and places purchase and sale orders for the Fund’s portfolio transactions in U.S. markets. As permitted by applicable law, these orders may be directed to any brokers, including Goldman
Sachs and its affiliates. In addition, the Investment Adviser has access to the research and certain proprietary technical models developed by Goldman Sachs.
|
| The Investment Adviser also performs the following additional services for the Fund:
|
n
|
Supervises all non-advisory operations of the Fund
|
n
|
Provides personnel to perform necessary executive, administrative and clerical services to the Fund
|
n
|
Arranges for the preparation of all required tax returns,
reports to shareholders, prospectuses and statements of additional information and other reports filed with the Securities and Exchange Commission (the “SEC”) and other regulatory authorities
|
n
|
Maintains the records of the Fund
|
n
|
Provides office space and all necessary office equipment and services
|
| MANAGEMENT FEES
|
| As compensation for its services and its assumption of certain expenses, the Investment Adviser is entitled to the following fee,
computed daily and payable monthly, at the annual rate listed below (as a percentage of the Fund’s average daily net assets):
|
| Contractual Rate | Actual Rate for the
Fiscal Period Ended August 31, 2000 |
||||
|---|---|---|---|---|---|
| Research Select | 1.00% | 1.00% | |||
| The Investment Adviser may voluntarily waive a portion of its advisory fee from time to time, and may discontinue any voluntary
waiver at any time at its discretion.
|
| FUND MANAGERS
|
| Robert B. Litterman, Ph.D., a Managing Director of Goldman Sachs, is the co-developer, along with the late Fischer Black, of the
Black-Litterman Global Asset Allocation Model, a key tool in IMD’s asset allocation process. As Director of Quantitative Resources, Dr. Litterman oversees Quantitative Equities, the Quantitative Strategies Group, the Investment Performance &
Valuation Oversight Group, and the Client Research Groups. In total, these groups include over 120 professionals. Prior to moving to IMD, Dr. Litterman was the head of the Firmwide Risk department of Goldman Sachs since becoming a Partner in 1994.
Preceding his time in the Operations, Technology & Finance Division, Dr. Litterman spent eight years in the Fixed Income Division’s research department where he was co-director of the research and model development group.
|
| Quantitative Equity Team
|
n
|
A stable and growing team supported by an extensive internal staff
|
n
|
Access to the research ideas of Goldman Sachs’ renowned Global Investment Research Department
|
n
|
More than $34 billion in equities currently under management
|
n
|
Proprietary research on quantitative models and tax-advantaged strategies
|
| Name and Title | Fund Responsibility | Years
Primarily Responsible |
Five Year Employment History | ||||
|---|---|---|---|---|---|---|---|
| Melissa Brown
Managing Director Product Manager for Quantitative Equities |
Senior Portfolio Manager —
Research Select |
Since
2000 |
Ms. Brown joined the
Investment Adviser as a portfolio manager in 1998. From 1984 to 1998, she was the director of Quantitative Equity Research and served on the Investment Policy Committee at Prudential Securities. |
||||
| Robert C. Jones
Managing Director Head of Quantitative Equities |
Senior Portfolio Manager—
Research Select |
Since
2000 |
Mr. Jones joined the
Investment Adviser as a portfolio manager in 1989. |
||||
| Victor H. Pinter
Vice President Head of Portfolio Construction |
Senior Portfolio Manager—
Research Select |
Since
2000 |
Mr. Pinter joined the
Investment Adviser as a research analyst in 1989. He became a portfolio manager in 1992. |
||||
| DISTRIBUTOR AND TRANSFER AGENT
|
| Goldman Sachs, 85 Broad Street, New York, New York 10004, serves as the exclusive distributor (the “Distributor”) of the
Fund’s shares. Goldman Sachs, 4900 Sears Tower, Chicago, Illinois 60606-6372, also serves as the Fund’s transfer agent (the “Transfer Agent”) and, as such, performs various shareholder servicing functions.
|
| From time to time, Goldman Sachs or any of its affiliates may purchase and hold shares of the Fund. Goldman Sachs reserves the
right to redeem at any time some or all of the shares acquired for its own account.
|
| ACTIVITIES OF GOLDMAN SACHS AND ITS AFFILIATES AND OTHER ACCOUNTS MANAGED BY GOLDMAN SACHS
|
| The involvement of the Investment Adviser, Goldman Sachs and their affiliates in the management of, or their interest in, other
accounts and other activities of Goldman Sachs may present conflicts of interest with respect to the Fund or limit the Fund’s investment activities. Goldman Sachs and its affiliates engage in proprietary trading and advise accounts and funds which
have investment objectives similar to those of the Fund and/or which engage in and compete for transactions in the same types of securities, currencies and instruments as the Fund. Goldman Sachs and its affiliates will not have any obligation to make
available any information regarding their proprietary activities or strategies, or the activities or strategies used for other accounts managed by them, for the benefit of the management of the Fund. The results of the Fund’s investment activities,
therefore, may differ from those of Goldman Sachs and its affiliates, and it is possible that the Fund could sustain losses during periods in which Goldman Sachs and its affiliates and other accounts achieve significant profits on their trading for
proprietary or other accounts. In addition, the Fund may, from time to time, enter into transactions in which other clients of Goldman Sachs have an adverse interest. The Fund’s activities may be limited because of regulatory restrictions applicable
to Goldman Sachs and its affiliates, and/or their internal policies designed to comply with such restrictions.
|
| In
providing its investment management services for the Fund, the Investment Adviser invests in equity securities that are included in the Goldman Sachs Global Investment Research Division’s U.S. Select List. Goldman Sachs is a leading, full service global investment banking and securities firm. The firm’s Global Investment Research Division provides far-reaching and comprehensive analysis and commentary on portfolio strategy,
economics, industries and companies. For over two decades, Goldman Sachs has committed the resources on a global scale to develop an industry-leading position for the firm’s investment research products.
|
| Goldman Sachs has achieved worldwide recognition for its value-added research products. The Global Investment Research Division
has a well-regarded staff of approximately 900 professionals including more than 300 equity analysts, 25 global research teams, and 12 portfolio strategists, covering approximately 2400 companies, over 50 economies and over 25 stock markets.
|
| The U.S. Stock Selection Committee comprises approximately twelve senior professionals, including the head of Global Investment
Research and the Director of U.S. Investment Research, as well as a senior market strategist, an economist, and sector specialists.
|
n
|
Cash
|
n
|
Additional shares of the same class of the Fund
|
n
|
Shares of the same or an equivalent class of another Goldman Sachs Fund. Special restrictions may apply for certain ILA
Portfolios. See the Additional Statement.
|
| Fund | Investment
Income Dividends |
Capital Gains
Distributions |
|||
|---|---|---|---|---|---|
| Research Select | Annually | Annually | |||
| The following section will provide you with answers to some of the most often asked questions regarding buying and selling the
Fund’s shares.
|
| How Can I Purchase Class A, Class B And Class C Shares Of The Fund?
|
| You may purchase shares of the Fund through:
|
n
|
Goldman Sachs;
|
n
|
Authorized Dealers; or
|
n
|
Directly from Goldman Sachs Trust (the “Trust”).
|
| In order to make an initial investment in the Fund, you must furnish to the Fund, Goldman Sachs or your Authorized Dealer the
information in the Account Application attached to this Prospectus.
|
| To Open an Account:
|
n
|
Complete the enclosed Account Application
|
n
|
Mail your payment and Account Application to:
|
| Your Authorized Dealer
|
–
|
Purchases by check or Federal Reserve draft should be made payable to your Authorized Dealer
|
–
|
Your Authorized Dealer is responsible for forwarding payment promptly (within three business days) to the Fund
|
| or
|
| Goldman Sachs Funds c/o National Financial Data Services, Inc. (“NFDS”), P.O. Box 219711, Kansas
City, MO 64121-9711
|
–
|
Purchases by check or Federal Reserve draft should be made payable to Goldman Sachs Funds – (Name of Fund and
Class of Shares)
|
–
|
NFDS will not accept a check drawn on a foreign bank, a third-party check, cash, money orders, travelers cheques or credit card
checks
|
–
|
Federal funds wire, Automated Clearing House Network (“ACH”) transfer or bank wires should be sent to State Street Bank
and Trust Company (“State Street”) (the Fund’s custodian). Please call the Fund at 1-800-526-7384 to get detailed instructions on how to wire your money.
|
| What Is My Minimum Investment In The Fund?
|
| Initial | Additional | ||||
|---|---|---|---|---|---|
| Regular Accounts | $1,000 | $50 | |||
| Tax-Sheltered Retirement Plans (excluding SIMPLE IRAs and
Education IRAs) |
$250 | $50 | |||
| Uniform Gift to Minors Act Accounts/Uniform Transfer to
Minors Act Accounts |
$250 | $50 | |||
| 403(b) Plan Accounts | $200 | $50 | |||
| SIMPLE IRAs and Education IRAs | $50 | $50 | |||
| Automatic Investment Plan Accounts | $50 | $50 | |||
| What Alternative Sales Arrangements Are Available?
|
| The Fund offers three classes of shares through this Prospectus.
|
| Maximum Amount You Can | Class A | No limit | |||
| Buy In The Aggregate | Class B | $250,000 | |||
| Class C | $1,000,000 | ||||
| Initial Sales Charge | Class A | Applies to purchases of less than $1 million—
varies by size of investment with a maximum of 5.5% |
|||
| Class B | None | ||||
| Class C | None | ||||
| CDSC | Class A | 1.00% on certain investments of $1 million or
more if you sell within 18 months |
|||
| Class B | 6 year declining CDSC with a maximum of 5% | ||||
| Class C | 1% if shares are redeemed within 12 months
of purchase |
||||
| Conversion Feature | Class A | None | |||
| Class B | Class B Shares convert to Class A Shares after
8 years |
||||
| Class C | None | ||||
| What Else Should I Know About Share Purchases?
|
| The Trust reserves the right to:
|
| n
|
Refuse to open an account if you fail to (i) provide a social security number or other taxpayer identification number; or (ii)
certify that such number is correct (if required to do so under applicable law).
|
| n |
Reject or restrict any purchase or exchange order by a particular purchaser (or group of related purchasers). This may occur, for example, when a pattern of frequent purchases, sales or exchanges of shares of the Fund is evident, or if purchases, sales or exchanges are, or a subsequent abrupt redemption might be, of a size that would disrupt management of the Fund. |
|
| n
|
Close the Fund to new investors from time to time and reopen
the Fund whenever it is deemed appropriate by the Fund’s Investment Adviser.
|
n
|
Modify or waive the minimum investment amounts.
|
n
|
Modify the manner in which shares are offered.
|
n
|
Modify the sales charge rates applicable to future purchases of shares.
|
| The Fund may allow you to purchase shares with securities instead of cash if consistent with the Fund’s investment policies
and operations and if approved by the Fund’s Investment Adviser.
|
| How Are Shares Priced?
|
| The price you pay or receive when you buy, sell or exchange shares is determined by the Fund’s NAV and share class. Each
class calculates its NAV as follows:
|
| |
(Value of Assets of the Class)
|
||||
| |
NAV =
|
– (Liabilities of the Class)
|
|||
| |
Number of Outstanding Shares of the Class
|
||||
| The Fund’s investments are valued based on market quotations or, if accurate quotations are not readily available, the fair
value of the Fund’s investments may be determined in good faith under procedures established by the Trustees.
|
n
|
NAV per share of each share class is calculated by the Fund’s custodian on each business day as of the close of regular
trading on the New York Stock Exchange (normally 4:00 p.m. New York time). Fund shares will not be priced on any day the New York Stock Exchange is closed.
|
n
|
When you buy shares, you pay the NAV next calculated after the Fund receives your order in proper form, plus any applicable
sales charge.
|
n
|
When you sell shares, you receive the NAV next calculated after the Fund receives your order in proper form, less any
applicable CDSC.
|
| Note: The time at which transactions and shares are priced and the time by which orders must be received may be changed in
case of an emergency or if regular trading on the New York Stock Exchange is stopped at a time other than 4:00 p.m. New York time.
|
| In addition, the impact of events that occur after the publication of market quotations used by the Fund to price its securities
(for example, in foreign markets), but before the close of regular trading on the New York Stock Exchange will nor
mally not be reflected in the Fund’s next determined NAV unless the Trust, in its discretion, makes an adjustment in light of the nature and materiality of the event, its effect on Fund operations and other relevant factors.
|
| COMMON QUESTIONS ABOUT THE PURCHASE OF CLASS A SHARES
|
| What Is The Offering Price Of Class A Shares?
|
| The offering price of Class A Shares of the Fund is the next determined NAV per share plus an initial sales charge paid to
Goldman Sachs at the time of purchase of shares. The sales charge varies depending upon the amount you purchase. In some cases, described below, the initial sales charge may be eliminated altogether, and the offering price will be the NAV per share. The current sales charges and commissions paid
to Authorized Dealers are as follows:
|
| Amount of Purchase
(including sales charge, if any) |
Sales Charge as
Percentage of Offering Price |
Sales Charge
as Percentage of Net Amount Invested |
Maximum Dealer
Allowance as Percentage of Offering Price* |
|||||||
|---|---|---|---|---|---|---|---|---|---|---|
| Less than $50,000 | 5.50 | % | 5.82 | % | 5.00 | % | ||||
| $50,000 up to (but less than) $100,000 | 4.75 | 4.99 | 4.00 | |||||||
| $100,000 up to (but less than) $250,000 | 3.75 | 3.90 | 3.00 | |||||||
| $250,000 up to (but less than) $500,000 | 2.75 | 2.83 | 2.25 | |||||||
| $500,000 up to (but less than) $1 million | 2.00 | 2.04 | 1.75 | |||||||
| $1 million or more | 0.00 | ** | 0.00 | ** | *** | |||||
*
|
Dealer’s allowance may be changed periodically. During special promotions, the entire sales charge may be allowed
to Authorized Dealers. Authorized Dealers to whom substantially the entire sales charge is allowed may be deemed to be “underwriters” under the Securities Act of 1933.
|
**
|
No sales charge is payable at the time of purchase of Class A Shares of $1 million or more, but a CDSC of 1% may be
imposed in the event of certain redemptions within 18 months of purchase.
|
***
|
The Distributor may pay a one-time commission to Authorized Dealers who initiate or are responsible for purchases of $1
million or more of shares of the Fund equal to 1.00% of the amount under $3 million, 0.50% of the next $2 million, and 0.25% thereafter. The Distributor may also pay, with respect to all or a portion of the amount purchased, a commission in accordance
with the foregoing schedule to Authorized Dealers who initiate or are responsible for purchases of $500,000 or more by certain Section 401(k), profit sharing, money purchase pension, tax-sheltered annuity, defined benefit pension, or other employee
benefit plans that are sponsored by one or more employers (including governmental or church employers) or employee organizations investing in the Fund which satisfy the criteria set forth below in “When Are Class A Shares Not Subject To A Sales
Load?” or $1 million or more by certain “wrap” accounts. Purchases by such plans will be made at NAV with no initial sales charge, but if all of the shares held are redeemed within 18 months after the end of the calendar month in which such
purchase was made, a CDSC of 1% may be imposed upon the plan sponsor or the third party administrator. In addition, Authorized Dealers will remit to the Distributor such payments received in connection with “wrap” accounts in the event that
shares are redeemed within 18 months after the end of the calendar month in which the purchase was made.
|
| What Else Do I Need To Know About Class A Shares’ CDSC?
|
| Purchases of $1 million or more of Class A Shares will be made at NAV with no initial sales charge. However, if you redeem shares
within 18 months after the end of the calendar month in which the purchase was made, excluding any period of time in which the shares were exchanged into and remained invested in an equivalent class of an ILA Portfolio, a CDSC of 1% may be imposed. The
CDSC may not be imposed if your Authorized Dealer enters into an agreement with the Distributor to return all or an applicable prorated portion of its commission to the Distributor. The CDSC is waived on redemptions in certain circumstances. See “In
What Situations May The CDSC On Class A, B Or C Shares Be Waived Or Reduced?” below.
|
| When Are Class A Shares Not Subject To A Sales Load?
|
| Class A Shares of the Fund may be sold at NAV without payment of any sales charge to the following individuals and entities:
|
n
|
Goldman Sachs, its affiliates or their respective officers, partners, directors or employees (including retired employees and
former partners), any partnership of which Goldman Sachs is a general partner, any Trustee or officer of the Trust and designated family members of any of these individuals;
|
n
|
Qualified retirement plans of Goldman Sachs;
|
n
|
Trustees or directors of investment companies for which Goldman Sachs or an affiliate acts as sponsor;
|
n
|
Any employee or registered representative of any Authorized Dealer or their respective spouses, children and parents;
|
n
|
Banks, trust companies or other types of depository institutions investing for their own account or investing for discretionary or
non-discretionary accounts;
|
n
|
Any state, county or city, or any instrumentality, department, authority or agency thereof, which is prohibited by applicable
investment laws from paying a sales charge or commission in connection with the purchase of shares of a Fund;
|
n
|
Section 401(k), profit sharing, money purchase pension, tax-sheltered annuity, defined benefit pension, or other employee benefit
plans that are sponsored by one or more employers (including governmental or church employers) or employee organizations (“Retirement Plans”) that:
|
n
|
Buy shares of Goldman Sachs Funds worth $500,000 or more; or
|
n
|
Have 100 or more eligible employees at the time of purchase; or
|
n
|
Certify that they expect to have annual plan purchases of shares of Goldman Sachs Funds of $200,000 or more; or
|
n
|
Are provided administrative services by certain third-party administrators that have entered into a special service arrangement
with Goldman Sachs relating to such plans; or
|
n
|
Have at the time of purchase aggregate assets of at least $2,000,000;
|
n
|
“Wrap” accounts for the benefit of clients of broker-dealers, financial institutions or financial planners, provided
they have entered into an agreement with GSAM specifying aggregate minimums and certain operating policies and standards;
|
n
|
Registered investment advisers investing for accounts for which they receive asset-based fees;
|
n
|
Accounts over which GSAM or its advisory affiliates have investment discretion;
|
n
|
Shareholders receiving distributions from a qualified retirement plan invested in the Goldman Sachs Funds and reinvesting such
proceeds in a Goldman Sachs IRA;
|
n
|
Shareholders who roll over distributions from any tax-qualified retirement plan or tax-sheltered annuity to an IRA which invests
in the Goldman Sachs Funds if the tax-qualified retirement plan or tax-sheltered annuity receives administrative services provided by certain third-party administrators that have entered into a special service arrangement with Goldman Sachs relating to
such plan or annuity; or
|
n
|
Other exemptions may be stated from time to time in the Additional Statement.
|
| You must certify eligibility for any of the above exemptions on your Account Application and notify the Fund if you no longer
are eligible for the exemption. The Fund will grant you an exemption subject to confirmation of your entitlement. You may be charged a fee if you effect your transactions through a broker or agent.
|
| How Can The Sales Charge On Class A Shares Be Reduced?
|
n
|
Right of Accumulation: When buying Class A Shares in Goldman Sachs Funds, your current aggregate
investment determines the initial sales load you pay. You may qualify for reduced sales charges when the current market value of holdings (shares at current offering price), plus new purchases, reaches $50,000 or more. Class A Shares of any of the Goldman
Sachs Funds may be combined under the Right of Accumulation. To qualify for a reduced sales load, you or your Authorized Dealer must notify the Fund’s Transfer Agent at the time of investment that a quantity discount is applicable. Use of this
service is subject to a check of appropriate records. The Additional Statement has more information about the Right of Accumulation.
|
n
|
Statement of Intention: You may obtain a reduced sales charge by means of a written Statement of
Intention which expresses your non-binding commitment to invest in the aggregate $50,000 or more (not counting reinvestments of dividends and distributions) within a period of 13 months in Class A Shares of one or more Goldman Sachs Funds. Any investments
you make during the period will receive the discounted sales load based on the full amount of your investment commitment. If the investment commitment of the Statement of Intention is not met prior to the expiration of the 13-month period, the entire
amount will be subject to the
higher applicable sales charge. By signing the Statement of Intention, you authorize the Transfer Agent to escrow and redeem Class A Shares in your account to pay this additional charge. The Additional Statement has more information about the Statement
of Intention, which you should read carefully.
|
| COMMON QUESTIONS ABOUT THE PURCHASE OF CLASS B SHARES
|
| What Is The Offering Price Of Class B Shares?
|
| You may purchase Class B Shares of the Fund at the next determined NAV without an initial sales charge. However, Class B Shares
redeemed within six years of purchase will be subject to a CDSC at the rates shown in the table below based on how long you held your shares.
|
| The CDSC schedule is as follows:
|
| Year Since Purchase | CDSC as a
Percentage of Dollar Amount Subject to CDSC |
||
|---|---|---|---|
| First | 5% | ||
| Second | 4% | ||
| Third | 3% | ||
| Fourth | 3% | ||
| Fifth | 2% | ||
| Sixth | 1% | ||
| Seventh and thereafter | None | ||
| Proceeds from the CDSC are payable to the Distributor and may be used in whole or in part to defray the Distributor’s
expenses related to providing distribution-related services to the Fund in connection with the sale of Class B Shares, including the payment of compensation to Authorized Dealers. A commission equal to 4% of the amount invested is paid to Authorized Dealers
.
|
| What Should I Know About The Automatic Conversion Of Class B Shares?
|
| Class B Shares of the Fund will automatically convert into Class A Shares of the Fund at the end of the calendar quarter that is
eight years after the purchase date.
|
| If you acquire Class B Shares of the Fund by exchange from Class B Shares of another Goldman Sachs Fund, your Class B Shares will
convert into Class A Shares of such Fund based on the date of the initial purchase and the CDSC schedule of that purchase.
|
| If you acquire Class B Shares through reinvestment of distributions, your Class B Shares will convert into Class A Shares based on
the date of the initial purchase of the shares on which the distribution was paid.
|
| The conversion of Class B Shares to Class A Shares will not occur at any time the Fund is advised that such conversions may
constitute taxable events for federal tax purposes, which the Fund believes is unlikely. If conversions do not occur as a result of possible taxability, Class B Shares would continue to be subject to higher expenses than Class A Shares for an
indeterminate period.
|
| A COMMON QUESTION ABOUT THE PURCHASE OF CLASS C SHARES
|
| What Is The Offering Price Of Class C Shares?
|
| You may purchase Class C Shares of the Fund at the next determined NAV without paying an initial sales charge. However, if you
redeem Class C Shares within 12 months of purchase, a CDSC of 1% will normally be deducted from the redemption proceeds; provided that in connection with purchases by Retirement Plans, where all of the Class C Shares are redeemed within 12 months of
purchase, a CDSC of 1% may be imposed upon the plan sponsor or third-party administrator.
|
| Proceeds from the CDSC are payable to the Distributor and may be used in whole or in part to defray the Distributor’s
expenses related to providing distribution-related services to the Fund in connection with the sale of Class C Shares, including the payment of compensation to Authorized Dealers. An amount equal to 1% of the amount invested is normally paid by the
Distributor to Authorized Dealers.
|
| COMMON QUESTIONS APPLICABLE TO THE PURCHASE OF CLASS A, B AND C SHARES
|
| What Else Do I Need To Know About The CDSC On Class A, B Or C Shares?
|
n
|
The CDSC is based on the lesser of the NAV of the shares at the time of redemption or the original offering price (which is the
original NAV).
|
n
|
No CDSC is charged on shares acquired from reinvested dividends or capital gains distributions.
|
n
|
No CDSC is charged on the per share appreciation of your account over the initial purchase price.
|
n
|
When counting the number of months since a purchase of Class B or Class C Shares was made, all payments made during a month will
be combined and considered to have been made on the first day of that month.
|
n
|
To keep your CDSC as low as possible, each time you place a request to sell shares, the Fund will first sell any shares in your
account that do not carry a CDSC and then the shares in your account that have been held the longest.
|
| In What Situations May The CDSC On Class A, B Or C Shares Be Waived Or Reduced?
|
| The CDSC on Class A, Class B and Class C Shares that are subject to a CDSC may be waived or reduced if the redemption relates to:
|
n
|
Retirement distributions or loans to participants or beneficiaries from Retirement Plans;
|
n
|
The death or disability (as defined in Section 72(m)(7) of the Internal Revenue Code of 1986, as amended (the “Code”))
of a participant or beneficiary in a Retirement Plan;
|
n
|
Hardship withdrawals by a participant or beneficiary in a Retirement Plan;
|
n
|
Satisfying the minimum distribution requirements of the Code;
|
n
|
Establishing “substantially equal periodic payments” as described under Section 72(t)(2) of the Code;
|
n
|
The separation from service by a participant or beneficiary in a Retirement Plan;
|
n
|
The death or disability (as defined in Section 72(m)(7) of the Code) of a shareholder if the redemption is made within one year of
the event;
|
n
|
Excess contributions distributed from a Retirement Plan;
|
n
|
Distributions from a qualified Retirement Plan invested in the Goldman Sachs Funds which are being rolled over to a Goldman Sachs
IRA; or
|
n
|
Redemption proceeds which are to be reinvested in accounts or non-registered products over which GSAM or its advisory affiliates
have investment discretion.
|
| In addition, Class A, B and C Shares subject to a systematic withdrawal plan may be redeemed without a CDSC. The Fund reserves the
right to limit such redemptions, on an annual basis, to 12% each of the value of your Class B and C Shares and 10% of the value of your Class A Shares.
|
| How Do I Decide Whether To Buy Class A, B Or C Shares?
|
| The decision as to which Class to purchase depends on the amount you invest, the intended length of the investment and your
personal situation.
|
n
|
Class A Shares. If you are making an investment of $50,000 or more that qualifies for a reduced sales
charge, you should consider purchasing Class A Shares.
|
n
|
Class B Shares. If you plan to hold your investment for at least six years and would prefer not to pay
an initial sales charge, you might consider purchasing Class B Shares. By not paying a front-end sales charge, your entire investment in Class B Shares is available to work for you from the time you make your initial investment. However, the distribution
and service fee paid by Class B
Shares will cause your Class B Shares (until conversion to Class A Shares) to have a higher expense ratio, and thus lower performance and lower dividend payments (to the extent dividends are paid) than Class A Shares. A maximum purchase limitation of
$250,000 in the aggregate normally applies to Class B Shares. Individual purchases exceeding $250,000 will be rejected.
|
| n
|
Class C Shares. If you are unsure of the length of your investment or plan to hold your investment for
less than six years and would prefer not to pay an initial sales charge, you may prefer Class C Shares. By not paying a front-end sales charge, your entire investment in Class C Shares is available to work for you from the time you make your initial
investment. However, the distribution and service fee paid by Class C Shares will cause your Class C Shares to have a higher expense ratio, and thus lower performance and lower dividend payments (to the extent dividends are paid) than Class A Shares (or
Class B Shares after conversion to Class A Shares).
|
| Although Class C Shares are subject to a CDSC for only 12 months, Class C Shares do not have the automatic eight year conversion
feature applicable to Class B Shares and your investment may pay higher distribution fees indefinitely.
|
| A maximum purchase limitation of $1,000,000 in the aggregate normally applies to purchases of Class C Shares. Individual purchases
exceeding $1,000,000 will be rejected.
|
| Note: Authorized Dealers may receive different compensation for selling Class A, Class B or Class C Shares.
|
| In addition to Class A, Class B and Class C Shares, the Fund also offers other classes of shares to investors. These other share
classes are subject to different fees and expenses (which affect performance), have different minimum investment requirements and are entitled to different services. Information regarding these other share classes may be obtained from your sales
representative or from Goldman Sachs by calling the number on the back cover of this Prospectus.
|
| How Can I Sell Class A, Class B And Class C Shares Of The Fund?
|
| You may arrange to take money out of your account by selling (redeeming) some or all of your shares. The Fund will redeem its
shares upon request on any business day at the NAV next determined after receipt of such request in proper form, subject to any applicable CDSC. You may request that redemption proceeds be sent to you by check or by wire (if the wire instructions are on record). Redemptions may be requested in writing or by telephone.
|
| Instructions For Redemptions: | |||
|---|---|---|---|
| By Writing: | n Write a letter of instruction that includes: | ||
| n Your name(s) and signature(s) | |||
| n Your account number | |||
| n The Fund name and Class of Shares | |||
| n The dollar amount you want to sell | |||
| n How and where to send the proceeds | |||
| n Obtain a signature guarantee (see details below) | |||
| n
Mail your request to:
Goldman Sachs Funds c/o NFDS P.O. Box 219711 Kansas City, MO 64121-9711 |
|||
| By Telephone: | If you have not declined the telephone redemption
privilege on your Account Application: |
||
| n
1-800-526-7384
(8:00 a.m. to 4:00 p.m. New York time) |
|||
| n
You may redeem up to $50,000 of your shares
within any 7 calendar day period |
|||
| n
Proceeds which are sent directly to a Goldman
Sachs brokerage account are not subject to the $50,000 limit |
|||
| When Do I Need A Signature Guarantee To Redeem Shares?
|
| A signature guarantee is required if:
|
n
|
You are requesting in writing to redeem shares in an amount over $50,000;
|
n
|
You would like the redemption proceeds sent to an address that is not your address of record; or
|
n
|
You would like to change the bank designated on your Account Application.
|
| A signature guarantee must be obtained from a bank, brokerage firm or other financial intermediary that is a member of an approved
Medallion Guarantee Program or that is otherwise approved by Goldman Sachs. A notary public cannot provide a signature guarantee. Additional documentation may be required for executors, trustees or corporations or when deemed appropriate by the Transfer
Agent.
|
| What Do I Need To Know About Telephone Redemption Requests?
|
| The Trust, the Distributor and the Transfer Agent will not be liable for any loss you may incur in the event that the Trust
accepts unauthorized telephone redemption requests that the Trust reasonably believes to be genuine. The Trust may accept telephone redemption instructions from any person identifying himself or herself as the owner of an account or the owner’s
registered representative where
the owner has not declined in writing to use this service. Thus, you risk possible losses if a telephone redemption is not authorized by you.
|
| In an effort to prevent unauthorized or fraudulent redemption and exchange requests by telephone, Goldman Sachs and NFDS each
employ reasonable procedures specified by the Trust to confirm that such instructions are genuine. If reasonable procedures are not employed, the Trust may be liable for any loss due to unauthorized or fraudulent transactions. The following general
policies are currently in effect:
|
n
|
All telephone requests are recorded.
|
n
|
Proceeds of telephone redemption requests will be sent only to your address of record or authorized bank account designated in the
Account Application (unless you provide written instructions and a signature guarantee, indicating another address or account) and exchanges of shares normally will be made only to an identically registered account.
|
n
|
Telephone redemptions by check to your address of record will not be accepted during the 30-day period following any change in
your address of record.
|
n
|
The telephone redemption option does not apply to shares held in a “street name” account. “Street name”
accounts are accounts maintained and serviced by your Authorized Dealer. If your account is held in “street name,” you should contact your registered representative of record, who may make telephone redemptions on your behalf.
|
n
|
The telephone redemption option may be modified or terminated at any time.
|
| Note: It may be difficult to make telephone redemptions in times of drastic economic or market conditions.
|
| How Are Redemption Proceeds Paid?
|
| By Wire: You may arrange for your redemption proceeds to be wired as federal funds to the bank account designated in
your Account Application. The following general policies govern wiring redemption proceeds:
|
n
|
Redemption proceeds will normally be wired on the next business day in federal funds (for a total of one business day delay), but
may be paid up to three business days following receipt of a properly executed wire transfer redemption request. If you are selling shares you recently paid for by check, the Fund will pay you when your check has cleared, which may take up to 15 days. If
the Federal Reserve Bank is closed on the day that the redemption proceeds would ordinarily be wired, wiring the redemption proceeds may be delayed one additional business day.
|
n
|
A transaction fee of $7.50 may be charged for payments of redemption proceeds by wire. Your bank may also charge wiring fees. You
should contact your bank directly to learn whether it charges such fees.
|
n
|
To change the bank designated on your Account Application, you must send written instructions (with your signature guaranteed) to
the Transfer Agent.
|
n
|
Neither the Trust, Goldman Sachs nor any Authorized Dealer assumes any responsibility for the performance of your bank or any
intermediaries in the transfer process. If a problem with such performance arises, you should deal directly with your bank or any such intermediaries.
|
| By Check: You may elect to receive your redemption proceeds by check. Redemption proceeds paid by check will
normally be mailed to the address of record within three business days of a properly executed redemption request. If you are selling shares you recently paid for by check, the Fund will pay you when your check has cleared, which may take up to 15 days.
|
| What Else Do I Need To Know About Redemptions?
|
| The following generally applies to redemption requests:
|
n
|
Additional documentation may be required when deemed appropriate by the Transfer Agent. A redemption request will not be in proper
form until such additional documentation has been received.
|
| The Trust reserves the right to:
|
n
|
Redeem your shares if your account balance is less than $50 as a result of earlier redemptions. The Fund will not redeem your
shares on this basis if the value of your account falls below the minimum account balance solely as a result of market conditions. The Fund will give you 60 days’ prior written notice to allow you to purchase sufficient additional shares of the Fund
in order to avoid such redemption.
|
n
|
Redeem your shares in other circumstances determined by the Board of Trustees to be in the best interests of the Trust.
|
n
|
Pay redemptions by a distribution in-kind of securities (instead of cash). If you receive redemption proceeds in-kind, you should
expect to incur transaction costs upon the disposition of those securities.
|
n
|
Reinvest any dividends or other distributions which you have elected to receive in cash should your check for such dividends or
other distributions be returned to the Fund as undeliverable or remain uncashed for six months. In addition, that distribution and all future distributions payable to you will be reinvested at NAV in additional shares of the same class of the Fund. No
interest will accrue on amounts represented by uncashed distribution or redemption checks.
|
| Can I Reinvest Redemption Proceeds In The Same Or Another Goldman Sachs Fund?
|
| You may redeem shares of the Fund and reinvest a portion or all of the redemption proceeds (plus any additional amounts needed to
round off purchases to the nearest full share) at NAV. To be eligible for this privilege, you must hold the shares you want to redeem for at least 30 days and you must reinvest the share proceeds within 90 days after you redeem. You may reinvest as follows:
|
n
|
Class A or B Shares—Class A Shares of the Fund or any other Goldman Sachs Fund
|
n
|
Class C Shares—Class C Shares of the Fund or any other Goldman Sachs Fund
|
n
|
You should obtain and read the applicable prospectuses before investing in any other Funds.
|
n
|
If you pay a CDSC upon redemption of Class A or Class C Shares and then reinvest in Class A or Class C Shares as described above,
your account will be credited with the amount of the CDSC you paid. The reinvested shares will, however, continue to be subject to a CDSC. The holding period of the shares acquired through reinvestment will include the holding period of the redeemed
shares for purposes of computing the CDSC payable upon a subsequent redemption. For Class B Shares, you may reinvest the redemption proceeds in Class A Shares at NAV but the amount of the CDSC paid upon redemption of the Class B Shares will not be
credited to your account.
|
n
|
The reinvestment privilege may be exercised at any time in connection with transactions in which the proceeds are reinvested at
NAV in a tax-sheltered retirement plan. In other cases, the reinvestment privilege may be exercised once per year upon receipt of a written request.
|
n
|
You may be subject to capital gains tax as a result of a redemption. You should consult your tax adviser concerning the tax
consequences of a redemption and reinvestment.
|
| Can I Exchange My Investment From One Fund To Another?
|
| You may exchange shares of the Fund at NAV without the imposition of an initial sales charge or CDSC at the time of exchange for
shares of the same class or an equivalent class of any other Goldman Sachs Fund. The exchange privilege may be materially modified or withdrawn at any time upon 60 days’ written notice to you.
|
| Instructions For Exchanging Shares: | |||
| |
|||
| By Writing: | n Write a letter of instruction that includes: | ||
n Your name(s) and signature(s) |
|||
| n Obtain a signature guarantee (see details above) | |||
| n Mail the request to: | |||
Goldman Sachs Funds |
|||
| or for overnight delivery - | |||
Goldman Sachs Funds |
|||
| |
|||
| By Telephone: | If you have not declined the telephone exchange
privilege on your Account Application: |
||
| n
1-800-526-7384 (8:00 a.m. to 4:00 p.m.
New York time) |
|||
| |
|||
| You should keep in mind the following factors when making or considering an exchange:
|
n
|
You should obtain and carefully read the prospectus of the Fund you are acquiring before making an exchange.
|
n
|
Currently, there is no charge for exchanges, although the Fund may impose a charge in the future.
|
n
|
The exchanged shares may later be exchanged for shares of the same class (or an equivalent class) of the original Fund at the next
determined NAV without the imposition of an initial sales charge or CDSC if the amount in the Fund resulting from such exchanges is less than the largest amount on which you have previously paid the applicable sales charge.
|
n
|
When you exchange shares subject to a CDSC, no CDSC will be charged at that time. The exchanged shares will be subject to the CDSC
of the shares
originally held. For purposes of determining the amount of the applicable CDSC, the length of time you have owned the shares will be measured from the date you acquired the original shares subject to a CDSC and will not be affected by a subsequent exchange
.
|
n
|
Eligible investors may exchange certain classes of shares for another class of shares of the Fund. For further information, call
Goldman Sachs Funds at 1-800-526-7384 and see the Additional Statement.
|
n
|
All exchanges which represent an initial investment in a Fund must satisfy the minimum initial investment requirements of that Fund.
|
n
|
Exchanges are available only in states where exchanges may be legally made.
|
n
|
It may be difficult to make telephone exchanges in times of drastic economic or market conditions.
|
n
|
Goldman Sachs and NFDS may use reasonable procedures described under “What Do I Need to Know About Telephone Redemption
Requests?” in an effort to prevent unauthorized or fraudulent telephone exchange requests.
|
n
|
Telephone exchanges normally will be made only to an identically registered account. Shares may be exchanged among accounts with
different names, addresses and social security or other taxpayer identification numbers only if the exchange instructions are in writing and accompanied by a signature guarantee.
|
n
|
Exchanges into Funds that are closed to new investors may be restricted.
|
| For federal income tax purposes, an exchange from one Fund to another is treated as a redemption of the shares surrendered in the
exchange, on which you may be subject to tax, followed by a purchase of shares received in the exchange. You should consult your tax adviser concerning the tax consequences of an exchange.
|
| Restrictions on Excessive Trading Practices. The Trust does not permit market-timing or other excessive trading
practices. Purchases and exchanges should be made for long-term investment purposes only. The Trust and Goldman Sachs reserve the right to reject or restrict purchase or exchange requests from any investor. Excessive, short-term (market-timing) trading
practices may disrupt portfolio management strategies, harm Fund performance and negatively impact long-term shareholders. The Trust and Goldman Sachs will not be held liable for any loss resulting from rejected purchase or exchange orders. To minimize
harm to the Trust (or Goldman Sachs) and its shareholders, the Trust (or Goldman Sachs) will exercise these rights if, in the Trust’s (or Goldman Sachs’) judgment, an investor has a history of excessive trading or if an investor’s trading,
in the judgment of the Trust (or Goldman Sachs), has been or may be disruptive to the Fund. In making this judgment, trades executed in multiple accounts under common ownership or control may be considered together.
|
| SHAREHOLDER SERVICES
|
| Can I Arrange To Have Automatic Investments Made On A Regular Basis?
|
| You may be able to make systematic cash investments through your bank via ACH transfer or your checking account via bank draft
each month. Forms for this option are available from Goldman Sachs, your Authorized Dealer or you may check the appropriate box on the Account Application.
|
| Can My Dividends From The Fund Be Invested In Other Funds?
|
| You may elect to cross-reinvest dividends paid by the Fund in shares of the same class or an equivalent class of any other Goldman
Sachs Fund.
|
n
|
Shares will be purchased at NAV.
|
n
|
No initial sales charge or CDSC will be imposed.
|
n
|
You may elect cross-reinvestment into an identically registered account or an account registered in a different name or with a
different address, social security number or taxpayer identification number provided that the account has been properly established, appropriate signature guarantees obtained and the minimum initial investment has been satisfied.
|
| Can I Arrange To Have Automatic Exchanges Made On A Regular Basis?
|
| You may elect to exchange automatically a specified dollar amount of shares of the Fund for shares of the same class or an
equivalent class of any other Goldman Sachs Fund.
|
n
|
Shares will be purchased at NAV.
|
n
|
No initial sales charge is imposed.
|
n
|
Shares subject to a CDSC acquired under this program may be subject to a CDSC at the time of redemption from the Fund into which
the exchange is made depending upon the date and value of your original purchase.
|
n
|
Automatic exchanges are made monthly on the 15th day of each month or the first business day thereafter.
|
n
|
Minimum dollar amount: $50 per month.
|
| What Else Should I Know About Cross-Reinvestments And Automatic Exchanges?
|
| Cross-reinvestments and automatic exchanges are subject to the following conditions:
|
n
|
You must hold $5,000 or more in the Fund which is paying the dividend or from which the exchange is being made.
|
n
|
You must invest an amount in the Fund into which cross-reinvestments or automatic exchanges are being made that is equal to that
Fund’s minimum initial investment or continue to cross-reinvest or to make automatic exchanges until such minimum initial investment is met.
|
n
|
You should obtain and read the prospectus of the Fund into which dividends are invested or automatic exchanges are made.
|
| Can I Have Automatic Withdrawals Made On A Regular Basis?
|
| You may draw on your account systematically via check or ACH transfer in any amount of $50 or more.
|
n
|
It is normally undesirable to maintain a systematic withdrawal plan at the same time that you are purchasing additional Class A,
Class B or Class C Shares because of the sales charge imposed on your purchases of Class A Shares or the imposition of a CDSC on your redemptions of Class A, Class B or Class C Shares.
|
n
|
You must have a minimum balance of $5,000 in the Fund.
|
n
|
Checks are mailed on or about the 25th day of each month.
|
n
|
Each systematic withdrawal is a redemption and therefore a taxable transaction.
|
n
|
The CDSC applicable to Class A, Class B or Class C Shares redeemed under the systematic withdrawal plan may be waived.
|
| What Types Of Reports Will I Be Sent Regarding My Investment?
|
| You will be provided with a printed confirmation of each transaction in your account and an individual quarterly account
statement. A year-to-date statement for your account will be provided upon request made to Goldman Sachs. If your account is held in “street name” you may receive your statements and confirmations on a different schedule.
|
| You will also receive an annual shareholder report containing audited financial statements and a semi-annual shareholder report.
If you have consented to the delivery of a single copy of shareholder reports, prospectuses and other information to all shareholders who share the same mailing address with your account, you may revoke your consent at any time by contacting Goldman Sachs
Funds by phone at 1-800-526-7384 or by mail at Goldman Sachs Funds, 4900 Sears Tower, Chicago, IL 60606-6372. The Fund will begin sending individual copies to you within 30 days after receipt of your revocation.
|
| The Fund does not generally provide sub-accounting services.
|
| What Should I Know When I Purchase Shares Through An Authorized Dealer?
|
| Authorized Dealers and other financial intermediaries may provide varying arrangements for their clients to purchase and redeem
Fund shares. They may charge additional fees not described in this Prospectus to their customers for such services.
|
| If shares of the Fund are held in a “street name” account with an Authorized Dealer, all recordkeeping, transaction
processing and payments of distributions relating to your account will be performed by the Authorized Dealer, and not by the Fund and its Transfer Agent. Since the Fund will have no record of your transactions, you should contact the Authorized Dealer to
purchase, redeem or exchange shares, to make changes in or give instructions concerning the account or to obtain information about your account. The transfer of shares in a “street name” account to an account with another dealer or to an account
directly with the Fund involves special procedures and will require you to obtain historical purchase information about the shares in the account from the Authorized Dealer.
|
| Authorized Dealers and other financial intermediaries may be authorized to accept, on behalf of the Trust, purchase, redemption
and exchange orders placed by or on behalf of their customers, and if approved by the Trust, to designate other intermediaries to accept such orders. In these cases:
|
n
|
The Fund will be deemed to have received an order that is in proper form when the order is accepted by an Authorized Dealer or
intermediary on a business day, and the order will be priced at the Fund’s NAV per share (adjusted for any applicable sales charge) next determined after such acceptance.
|
n
|
Authorized Dealers and intermediaries are responsible for transmitting accepted orders to the Fund within the time period agreed
upon by them.
|
| You should contact your Authorized Dealer or intermediary to learn whether it is authorized to accept orders for the Trust.
|
| The Investment Adviser, Distributor and/or their affiliates may pay additional compensation from time to time, out of their assets
and not as an additional charge to the Fund, to selected Authorized Dealers and other persons in connection with the sale, distribution and/or servicing of shares of the Fund and other Goldman Sachs Funds. Additional compensation based on sales may, but
is currently not expected to, exceed 0.50% (annualized) of the amount invested.
|
| DISTRIBUTION SERVICES AND FEES
|
| What Are The Different Distribution And Service Fees Paid By Class A, B and C Shares?
|
| The Trust has adopted distribution and service plans (each a “Plan”) under which Class A, Class B and Class C Shares
bear distribution and service fees paid to Authorized Dealers and Goldman Sachs. If the fees received by Goldman Sachs pursuant to the Plans exceed its expenses, Goldman Sachs may realize a profit from these arrangements. Goldman Sachs pays the
distribution and service fees on a quarterly basis.
|
| Under the Plans, Goldman Sachs is entitled to a monthly fee from the Fund for distribution services equal, on an annual basis, to
0.25%, 0.75% and 0.75%, respectively, of the Fund’s average daily net assets attributed to Class A, Class B and Class C Shares. Because these fees are paid out of the Fund’s assets on an ongoing basis, over time, these fees will increase the
cost of your investment and may cost you more than paying other types of such charges.
|
| The distribution fees are subject to the requirements of Rule 12b-1 under the Act, and may be used (among other things) for:
|
n
|
Compensation paid to and expenses incurred by Authorized Dealers, Goldman Sachs and their respective officers, employees and sales
representatives;
|
n
|
Commissions paid to Authorized Dealers;
|
n
|
Allocable overhead;
|
n
|
Telephone and travel expenses;
|
n
|
Interest and other costs associated with the financing of such compensation and expenses;
|
n
|
Printing of prospectuses for prospective shareholders;
|
n
|
Preparation and distribution of sales literature or advertising of any type; and
|
n
|
All other expenses incurred in connection with activities primarily intended to result in the sale of Class A, Class B and Class C
Shares.
|
| In connection with the sale of Class C Shares, Goldman Sachs normally begins paying the 0.75% distribution fee as an ongoing
commission to Authorized Dealers after the shares have been held for one year.
|
| PERSONAL ACCOUNT MAINTENANCE SERVICES AND FEES
|
| Under the Plans, Goldman Sachs is also entitled to receive a separate fee equal on an annual basis to 0.25% of the Fund’s
average daily net assets attributed to
|
| Class B or Class C Shares. This fee is for personal and account maintenance services, and may be used to make payments to Goldman
Sachs, Authorized Dealers and their officers, sales representatives and employees for responding to inquiries of, and furnishing assistance to, shareholders regarding ownership of their shares or their accounts or similar services not otherwise provided
on behalf of the Fund. If the fees received by Goldman Sachs pursuant to the Plans exceed its expenses, Goldman Sachs may realize a profit from this arrangement.
|
| In connection with the sale of Class C Shares, Goldman Sachs normally begins paying the 0.25% ongoing service fee to Authorized
Dealers after the shares have been held for one year.
|
| As with any investment, you should consider how your investment in the Fund will be taxed. The tax information below is provided
as general information. More tax information is available in the Additional Statement. You should consult your tax adviser about the federal, state, local or foreign tax consequences of your investment in the Fund.
|
| Unless your investment is in an IRA or other tax-advantaged account, you should consider the possible tax consequences of Fund
distributions and the sale of your Fund shares.
|
| DISTRIBUTIONS
|
| Distributions you receive from the Fund are generally subject to federal income tax, and may also be subject to state or local
taxes. This is true whether you reinvest your distributions in additional Fund shares or receive them in cash. For federal tax purposes, the Fund’s income dividend distributions and short-term capital gain distributions are taxable to you as ordinary
income. Any long-term capital gain distributions are taxable as long-term capital gains, no matter how long you have owned your Fund shares.
|
| Although distributions are generally treated as taxable to you in the year they are paid, distributions declared in October,
November or December but paid in January are taxable as if they were paid in December. A percentage of the Fund’s dividends paid to corporate shareholders may be eligible for the corporate dividends-received deduction. The Fund will inform
shareholders of the character and tax status of all distributions promptly after the close of each calendar year.
|
| The Fund may be subject to foreign withholding or other foreign taxes on income or gain from certain foreign securities. In
general, the Fund may deduct these taxes in computing its taxable income.
|
| If you buy shares of the Fund before it makes a distribution, the distribution will be taxable to you even though it may actually
be a return of a portion of your investment. This is known as “buying a dividend.”
|
| SALES AND EXCHANGES
|
| Your sale of Fund shares is a taxable transaction for federal income tax purposes, and may also be subject to state and local
taxes. For tax purposes, the exchange of your Fund shares for shares of a different Goldman Sachs Fund is the same as a sale. When you sell your shares, you will generally recognize a capital gain or loss in an amount equal to the difference between your
adjusted tax basis in the shares and the amount received. Generally, this gain or loss is long-term or short-term depending on whether your holding period exceeds twelve months, except that any loss realized on shares held for six months or less will be
treated as a long-term capital loss to the extent of any long-term capital gain dividends that were received on the shares.
|
| RETIREMENT PLANS
|
| The one major exception to these tax principles is that distributions on, and sales, exchanges and redemptions of, shares held in
an IRA (or other tax-qualified plan) will not be currently taxable.
|
| OTHER INFORMATION
|
| When you open your account, you should provide your social security or tax identification number on your Account Application. By
law, the Fund must withhold 31% of your taxable distributions and any redemption proceeds if you do not provide your correct taxpayer identification number, or certify that it is correct, or if the IRS instructs the Fund to do so. Non-U.S. investors may
be subject to U.S. withholding and estate tax.
|
| A. General Portfolio Risks
|
| The Fund will be subject to the risks associated with equity securities. “Equity securities” may include common stocks,
preferred stocks, interests in real estate investment trusts, convertible debt obligations, convertible preferred stocks, equity interests in trusts, partnerships, joint ventures, limited liability companies and similar enterprises, warrants, and stock
purchase rights. In general, stock values fluctuate in response to the activities of individual companies and in response to general market and economic conditions. Accordingly, the value of the stocks that the Fund holds may decline over short or
extended periods. The stock markets tend to be cyclical, with periods when stock prices generally rise and periods when prices generally decline. The volatility of equity securities means that the value of your investment in the Fund may increase or
decrease. Recently, certain stock markets have experienced substantial price volatility and, at times, have traded at or close to record high levels. There can be no guarantee that such levels will be reached or maintained in the future.
|
| To the extent that the Fund invests in fixed-income securities, the Fund will also be subject to the risks associated with its
fixed-income securities. These risks include interest rate risk and credit risk. In general, interest rate risk involves the risk that when interest rates decline, the market value of fixed-income securities tends to increase. Conversely, when interest
rates increase, the market value of fixed-income securities tends to decline. Credit risk involves the risk that an issuer or guarantor could default on its obligations, and the Fund will not recover its investment.
|
| The Investment Adviser will not consider the portfolio turnover rate a limiting factor in making investment decisions for the
Fund. Trading to keep the Fund’s portfolio holdings consistent with, and equally weighted among, the securities in the U.S. Select List may increase the Fund’s portfolio turnover rate. A high rate of portfolio turnover (100% or more) involves correspondingly greater expenses which must be borne by the Fund and its shareholders, and is also likely to result in
higher short-term capital gains taxable to shareholders. The portfolio turnover rate is calculated by dividing the lesser of the dollar amount of sales or purchases of portfolio securities by the average monthly value of the Fund’s portfolio
securities, excluding securities having a maturity at the date of purchase of one year or less.
|
| The following sections provide further information on certain types of securities and investment techniques that may be used by
the Fund, including their associated risks. Additional information is provided in the Additional Statement, which is available upon request. Among other things, the Additional Statement describes certain fundamental investment restrictions that cannot be
changed without shareholder approval. You should note, however, that the investment objective, and all investment policies not specifically designated as fundamental, are non-fundamental and may be changed without shareholder approval. If there is a
change in the Fund’s investment objective, you should consider whether the Fund remains an appropriate investment in light of your then current financial position and needs.
|
| B. Other Portfolio Risks
|
| Risks of Investing in Small Capitalization Companies. The Fund may invest in small capitalization companies.
Investments in small capitalization companies involve greater risk and portfolio price volatility than investments in larger capitalization stocks. Among the reasons for the greater price volatility of these investments are the less certain growth
prospects of smaller firms and the lower degree of liquidity in the markets for such securities. Small capitalization companies may be thinly traded and may have to be sold at a discount from current market prices or in small lots over an extended period
of time. In addition, these securities are subject to the risk that during certain periods the liquidity of particular issuers or industries, or all securities in particular investment categories, will shrink or disappear suddenly and without warning as a
result of adverse economic or market conditions, or adverse investor perceptions whether or not accurate. Because of the lack of sufficient market liquidity, the Fund may incur losses because it will be required to effect sales at a disadvantageous time
and only then at a substantial drop in price. Small capitalization companies include “unseasoned” issuers that do not have an established financial history; often have limited product lines, markets or financial resources; may depend on or use a
few key personnel for management; and may be susceptible to losses and risks of bankruptcy. Transaction costs for these investments are often higher than those of larger capitalization companies. Investments in small capitalization companies may be more
difficult to price precisely than other types of securities because of their characteristics and lower trading volumes.
|
| Risks of Foreign Issuers. The Fund may invest in foreign issuers. Foreign issuers involve special risks that are not
typically associated with U.S. issuers. There may be less publicly available information about a foreign issuer than about a U.S. issuer. In addition, there is generally less government regulation of foreign compa
nies than in the United States. The securities of many foreign issuers are less liquid and more volatile than securities of comparable domestic issuers. Furthermore, with respect to certain foreign countries, there is a possibility of nationalization,
expropriation or confiscatory taxation, imposition of withholding or other taxes on dividend or interest payments (or, in some cases, capital gains), limitations on the removal of funds or other assets, and political or social instability or diplomatic
developments which could affect the Fund’s investments.
|
| Risks of Derivative Investments. The Fund’s transactions in options, futures, options on futures, swaps and
structured securities involve additional risk of loss. Loss can result from a lack of correlation between changes in the value of derivative instruments and the portfolio assets (if any) being hedged, the potential illiquidity of the markets for
derivative instruments, or the risks arising from margin requirements and related leverage factors associated with such transactions. The use of these management techniques also involves the risk of loss if the Investment Adviser is incorrect in its
expectation of fluctuations in securities prices or interest rates. The Fund may also invest in derivative investments for non-hedging purposes (that is, to seek to increase total return). Investing for non-hedging purposes is considered a speculative
practice and presents even greater risk of loss.
|
| Risks of Illiquid Securities. The Fund may invest up to 15% of its net assets in illiquid securities which cannot be
disposed of in seven days in the ordinary course of business at fair value. Illiquid securities include:
|
n
|
Securities that are not readily marketable
|
n
|
Repurchase agreements and time deposits with a notice or demand period of more than seven days
|
n
|
Certain over-the-counter options
|
n
|
Certain structured securities and all swap transactions
|
n
|
Certain restricted securities, unless it is determined, based upon a review of the trading markets for a specific restricted
security, that such restricted security is eligible for resale pursuant to Rule 144A under the Securities Act of 1933 (“144A Securities”) and, therefore, is liquid.
|
| Investing in 144A Securities may decrease the liquidity of the Fund’s portfolio to the extent that qualified institutional
buyers become for a time uninterested in purchasing these restricted securities. The purchase price and subsequent valuation of restricted and illiquid securities normally reflect a discount, which may be significant, from the market price of comparable
securities for which a liquid market exists.
|
| Credit Risks. Debt securities purchased by the Fund may include securities (including zero coupon bonds) issued by
the U.S. government (and its agencies, instru
mentalities and sponsored enterprises), domestic and foreign corporations, banks and other issuers. Further information is provided in the Additional Statement.
|
| Temporary Investment Risks. The Fund may, for temporary defensive purposes, invest a certain percentage of its total
assets in:
|
n
|
U.S. government securities
|
n
|
Commercial paper rated at least A-2 by Standard & Poor’s or P-2 by Moody’s
|
n
|
Certificates of deposit
|
n
|
Bankers’ acceptances
|
n
|
Repurchase agreements
|
n
|
Non-convertible preferred stocks and non-convertible corporate bonds with a remaining maturity of less than one year
|
| When the Fund’s assets are invested in such instruments, the Fund may not be achieving its investment objective.
|
| C. Portfolio Securities and Techniques
|
| This section provides further information on certain types of securities and investment techniques that may be used by the Fund,
including their associated risks. Further information is provided in the Additional Statement, which is available upon request.
|
| Structured Securities. The Fund may invest in structured securities. Structured securities are securities whose
value is determined by reference to changes in the value of specific currencies, interest rates, commodities, indices or other financial indicators (the “Reference”) or the relative change in two or more References. The interest rate or the
principal amount payable upon maturity or redemption may be increased or decreased depending upon changes in the applicable Reference. Structured securities may be positively or negatively indexed, so that appreciation of the Reference may produce an
increase or decrease in the interest rate or value of the security at maturity. In addition, changes in the interest rates or the value of the security at maturity may be a multiple of changes in the value of the Reference. Consequently, structured
securities may present a greater degree of market risk than other types of securities and may be more volatile, less liquid and more difficult to price accurately than less complex securities.
|
| REITs. The Fund may invest in REITs. REITs are pooled investment vehicles that invest primarily in either real
estate or real estate related loans. The value of a REIT is affected by changes in the value of the properties owned by the REIT or securing mortgage loans held by the REIT. REITs are dependent upon the ability of the REITs’ managers, and are subject
to heavy cash flow dependency,
default by borrowers and the qualification of the REITs under applicable regulatory requirements for favorable income tax treatment. REITs are also subject to risks generally associated with investments in real estate including possible declines in the
value of real estate, general and local economic conditions, environmental problems and changes in interest rates. To the extent that assets underlying a REIT are concentrated geographically, by property type or in certain other respects, these risks may
be heightened. The Fund will indirectly bear its proportionate share of any expenses, including management fees, paid by a REIT in which it invests.
|
| Options on Securities and Securities Indices. A put option gives the purchaser of the option the right to sell, and
the writer (seller) of the option the obligation to buy, the underlying instrument during the option period. A call option gives the purchaser of the option the right to buy, and the writer (seller) of the option the obligation to sell, the underlying
instrument during the option period. The Fund may write (sell) covered call and put options and purchase put and call options on any securities in which it may invest or on any securities index consisting of securities in which it may invest.
|
| The writing and purchase of options is a highly specialized activity which involves special investment risks. Options may be used
for either hedging or cross-hedging purposes, or to seek to increase total return (which is considered a speculative activity). The successful use of options depends in part on the ability of the Investment Adviser to manage future price fluctuations and
the degree of correlation between the options and securities markets. If the Investment Adviser is incorrect in its expectation of changes in market prices or determination of the correlation between the instruments or indices on which options are written
and purchased and the instruments in the Fund’s investment portfolio, the Fund may incur losses that it would not otherwise incur. The use of options can also increase the Fund’s transaction costs. Options written or purchased by the Fund may be
traded on U.S. exchanges or over-the-counter. Over-the-counter options will present greater possibility of loss because of their greater illiquidity and credit risks.
|
| Futures Contracts and Options on Futures Contracts. Futures contracts are standardized, exchange-traded contracts
that provide for the sale or purchase of a specified financial instrument at a future time at a specified price. An option on a futures contract gives the purchaser the right (and the writer of the option the obligation) to assume a position in a futures
contract at a specified exercise price within a specified period of time. A futures contract may be based on various securities (such as U.S. government securities), securities indices, and other financial instruments and indices. The Fund may engage in
futures transactions on U.S. exchanges.
|
| The Fund may purchase and sell futures contracts, and purchase and write call and put options on futures contracts, in order to
seek to increase total return or to hedge against changes in interest rates or securities prices. The Fund may also enter into closing purchase and sale transactions with respect to such contracts and options. The Fund will engage in futures and related
options transactions for bona fide hedging purposes as defined in regulations of the Commodity Futures Trading Commission or to seek to increase total return to the extent permitted by such regulations. The Fund may not purchase or sell futures contracts
or purchase or sell related options to seek to increase total return, except for closing purchase or sale transactions, if immediately thereafter the sum of the amount of initial margin deposits and premiums paid on the Fund’s outstanding positions
in futures and related options entered into for the purpose of seeking to increase total return would exceed 5% of the market value of the Fund’s net assets.
|
| Futures contracts and related options present the following risks:
|
n
|
While the Fund may benefit from the use of futures and options on futures, unanticipated changes in interest rates or securities
prices may result in poorer overall performance than if the Fund had not entered into any futures contracts or options transactions.
|
n
|
Because perfect correlation between a futures position and portfolio position that is intended to be protected is impossible to
achieve, the desired protection may not be obtained and the Fund may be exposed to additional risk of loss.
|
n
|
The loss incurred by the Fund in entering into futures contracts and in writing call options on futures is potentially unlimited
and may exceed the amount of the premium received.
|
n
|
Futures markets are highly volatile and the use of futures may increase the volatility of the Fund’s NAV.
|
n
|
As a result of the low margin deposits normally required in futures trading, a relatively small price movement in a futures
contract may result in substantial losses to the Fund.
|
n
|
Futures contracts and options on futures may be illiquid, and exchanges may limit fluctuations in futures contract prices during a
single day.
|
| Equity Swaps. The Fund may invest in equity swaps. Equity swaps allow the parties to a swap agreement to exchange
the dividend income or other components of return on an equity investment (for example, a group of equity securities or an index) for a component of return on another non-equity or equity investment.
|
| An equity swap may be used by the Fund to invest in a market without owning or taking physical custody of securities in
circumstances in which direct investment may be restricted for legal reasons or is otherwise impractical. Equity swaps are derivatives and their value can be very volatile. To the extent that the Investment
Adviser does not accurately analyze and predict the potential relative fluctuation of the components swapped with another party, the Fund may suffer a loss, which may be substantial. The value of some components of an equity swap (such as the dividends
on a common stock) may also be sensitive to changes in interest rates. Furthermore, the Fund may suffer a loss if the counterparty defaults. Because equity swaps are normally illiquid, the Fund may be unable to terminate its obligations when desired.
|
| When-Issued Securities and Forward Commitments. The Fund may purchase when-issued securities and enter into forward
commitments. When-issued securities are securities that have been authorized, but not yet issued. When-issued securities are purchased in order to secure what is considered to be an advantageous price or yield to the Fund at the time of entering into the
transaction. A forward commitment involves the entering into a contract to purchase or sell securities for a fixed price at a future date beyond the customary settlement period.
|
| The purchase of securities on a when-issued or forward commitment basis involves a risk of loss if the value of the security to be
purchased declines before the settlement date. Conversely, the sale of securities on a forward commitment basis involves the risk that the value of the securities sold may increase before the settlement date. Although the Fund will generally purchase
securities on a when-issued or forward commitment basis with the intention of acquiring the securities for its portfolio, the Fund may dispose of when-issued securities or forward commitments prior to settlement if the Investment Adviser deems it
appropriate.
|
| Repurchase Agreements. Repurchase agreements involve the purchase of securities subject to the seller’s
agreement to repurchase them at a mutually agreed upon date and price. The Fund may enter into repurchase agreements with dealers in U.S. government securities and member banks of the Federal Reserve System which furnish collateral at least equal in value
or market price to the amount of their repurchase obligation.
|
| If the other party or “seller” defaults, the Fund might suffer a loss to the extent that the proceeds from the sale of
the underlying securities and other collateral held by the Fund are less than the repurchase price and the Fund’s costs associated with delay and enforcement of the repurchase agreement. In addition, in the event of bankruptcy of the seller, the Fund
could suffer additional losses if a court determines that the Fund’s interest in the collateral is not enforceable.
|
| In evaluating whether to enter into a repurchase agreement, the Investment Adviser will carefully consider the creditworthiness of
the seller. The Fund, together with other registered investment companies having advisory agreements with the Investment Adviser or any of its affiliates, may transfer uninvested cash balances into a single joint account, the daily aggregate balance of
which will be invested in one or more repurchase agreements.
|
| Lending of Portfolio Securities. The Fund may engage in securities lending. Securities lending involves the lending
of securities owned by the Fund to financial institutions such as certain broker-dealers. The borrowers are required to secure their loan continuously with cash, cash equivalents, U.S. government securities or letters of credit in an amount at least equal
to the market value of the securities loaned. Cash collateral may be invested in cash equivalents. To the extent that cash collateral is invested in other investment securities, such collateral will be subject to market depreciation or appreciation, and
the Fund will be responsible for any loss that might result from its investment of the borrowers’ collateral. If the Investment Adviser determines to make securities loans, the value of the securities loaned may not exceed 33 1
/3% of the value of the total assets of the
Fund (including the loan collateral).
|
| The Fund may lend its securities to increase its income. The Fund may, however, experience delay in the recovery of its securities
or a capital loss if the institution with which it has engaged in a portfolio loan transaction breaches its agreement with the Fund.
|
| Preferred Stock, Warrants and Rights. The Fund may invest in preferred stock, warrants and rights. Preferred stocks
are securities that represent an ownership interest providing the holder with claims on the issuer’s earnings and assets before common stock owners but after bond owners. Unlike debt securities, the obligations of an issuer of preferred stock,
including dividend and other payment obligations, may not typically be accelerated by the holders of such preferred stock on the occurrence of an event of default or other non-compliance by the issuer of the preferred stock.
|
| Warrants and other rights are options to buy a stated number of shares of common stock at a specified price at any time during the
life of the warrant or right. The holders of warrants and rights have no voting rights, receive no dividends and have no rights with respect to the assets of the issuer.
|
| Other Investment Companies. The Fund may invest in securities of other investment companies (including
exchange-traded funds such as SPDRs as defined below) subject to statutory limitations prescribed by the Act. These limitations include a prohibition on the Fund acquiring more than 3% of the voting shares of any other investment company, and a
prohibition on investing more than 5% of the Fund’s total assets in securities of any one investment company or more than 10% of its total assets in securities of all investment companies. The Fund will indirectly bear its proportionate share of any
management fees and other expenses paid by such other investment companies. Exchange-traded funds such as SPDRs are shares of unaffiliated investment companies which are traded like traditional equity securities on a national securities exchange or the
NASDAQ® National Market System.
|
n
|
Standard & Poor’s Depositary Receipts
TM
. The Fund may, consistent with its investment policies, purchase Standard
& Poor’s Depositary Receipts™ (“SPDRs”). SPDRs are securities traded on the American Stock Exchange (“AMEX”) that represent ownership in the SPDR Trust, a trust which has been established to accumulate and hold a
portfolio of common stocks that is intended to track the price performance and dividend yield of the S&P 500®. The SPDR Trust is sponsored by a subsidiary of the AMEX. SPDRs may be used for several reasons, including, but not limited to,
facilitating the handling of cash flows or trading, or reducing transaction costs. The price movement of SPDRs may not perfectly parallel the price action of the S&P 500®.
|
| Unseasoned Companies. The Fund may invest in companies (including predecessors) which have operated less than three
years. The securities of such companies may have limited liquidity, which can result in their being priced higher or lower than might otherwise be the case. In addition, investments in unseasoned companies are more speculative and entail greater risk than
do investments in companies with an established operating record.
|
| Corporate Debt Obligations. Corporate debt obligations include bonds, notes, debentures, commercial paper and other
obligations of corporations to pay interest and repay principal, and include securities issued by banks and other financial institutions. The Fund may invest in corporate debt obligations issued by U.S. and certain non-U.S. issuers which issue securities
denominated in the U.S. dollar (including Yankee and Euro obligations). In addition to obligations of corporations, corporate debt obligations include securities issued by banks and other financial institutions and supranational entities (i.e., the World Bank, the International Monetary Fund, etc.).
|
| Bank Obligations. The Fund may invest in obligations issued or guaranteed by U.S. or foreign banks. Bank
obligations, including without limitations, time deposits, bankers’ acceptances and certificates of deposit, may be general obligations of the parent bank or may be limited to the issuing branch by the terms of the specific obligations or by
government regulations. Banks are subject to extensive but different governmental regulations which may limit both the amount and types of loans which may be made and interest rates which may be charged. In addition, the profitability of the banking
industry is largely dependent upon the availability and cost of funds for the purpose of financing lending operations under prevailing money market conditions. General economic conditions as well as exposure to credit losses arising from possible
financial difficulties of borrowers play an important part in the operation of this industry.
|
| U.S. Government Securities. The Fund may invest in U.S. government securities. U.S. government securities include
U.S. Treasury obligations and obligations
issued or guaranteed by U.S. government agencies, instrumentalities or sponsored enterprises. U.S. government securities may be supported by (a) the full faith and credit of the U.S. Treasury (such as the Government National Mortgage Association (“
Ginnie Mae”)); (b) the right of the issuer to borrow from the U.S. Treasury (such as securities of the Student Loan Marketing Association); (c) the discretionary authority of the U.S. government to purchase certain obligations of the issuer (such as
the Federal National Mortgage Association (“Fannie Mae”) and Federal Home Loan Mortgage Corporation (“Freddie Mac”)); or (d) only the credit of the issuer.
|
| Borrowings. The Fund can borrow money from banks and other financial institutions in amounts not exceeding one-third
of its total assets for temporary or emergency purposes. The Fund may not make additional investments if borrowings exceed 5% of its total assets.
|
| Short Sales Against-the-Box. The Fund may make short sales against-the-box. A short sale against-the-box means that
at all times when a short position is open the Fund will own an equal amount of securities sold short, or securities convertible into or exchangeable for, without payment of any further consideration, an equal amount of the securities of the same issuer
as the securities sold short.
|
| The financial highlights table is intended to help you understand the Fund’s financial performance from its commencement
(June 19, 2000) to August 31, 2000. Certain information reflects financial results for a single Fund share. The total returns in the table represent the rate that an investor would have earned or lost on an investment in the Fund (assuming reinvestment of
all dividends and distributions). This information for the period ended August 31, 2000 has been audited by PricewaterhouseCoopers LLP, whose report, along with the Fund’s financial statements, is included in the Fund’s annual report (available
upon request).
|
| RESEARCH SELECT FUND
|
| Income from
investment operations |
|||||||||||||||||||
|---|---|---|---|---|---|---|---|---|---|---|---|---|---|---|---|---|---|---|---|
| Net asset
value, beginning of period |
Net
investment loss(c) |
Net realized
and unrealized gain |
Total from
investment operations |
||||||||||||||||
| For the Period Ended August 31, | |||||||||||||||||||
| 2000 - Class A Shares (commenced June 19, 2000) | $10.00 | $(0.02 | ) | $0.79 | $0.77 | ||||||||||||||
| 2000 - Class B Shares (commenced June 19, 2000) | 10.00 | (0.04 | ) | 0.80 | 0.76 | ||||||||||||||
| 2000 - Class C Shares (commenced June 19, 2000) | 10.00 | (0.04 | ) | 0.81 | 0.77 | ||||||||||||||
| 2000 - Institutional Shares (commenced June 19, 2000) | 10.00 | (0.01 | ) | 0.79 | 0.78 | ||||||||||||||
| 2000 - Service Shares (commenced June 19, 2000) | 10.00 | (0.02 | ) | 0.80 | 0.78 | ||||||||||||||
(a)
|
Assumes investment at the net asset value at the beginning of the period, reinvestment of all dividends and
distributions, a complete redemption of the investment at the net asset value at the end of the period and no sales or redemption charges. Total return would be reduced if a sales or redemption charge were taken into account. Total returns for periods
less than one full year are not annualized.
|
(b)
|
Annualized.
|
(c)
|
Calculated based on the average shares outstanding methodology.
|
| Ratios assuming
no expense reductions |
|||||||||||||||||||||
|---|---|---|---|---|---|---|---|---|---|---|---|---|---|---|---|---|---|---|---|---|---|
| Net asset
value, end of period |
Total
return(a) |
Net assets
at end of period (in 000s) |
Ratio of
net expenses to average net assets(b) |
Ratio of
net investment loss to average net assets(b) |
Ratio of
expenses to average net assets(b) |
Ratio of
net investment loss to average net assets(b) |
Portfolio
turnover rate |
||||||||||||||
| $10.77 | 7.70 | % | $217,861 | 1.50 | % | (1.04 | )% | 2.05 | % | (1.59 | )% | 5.04 | % | ||||||||
| 10.76 | 7.60 | 201,437 | 2.25 | (1.79 | ) | 2.80 | (2.34 | ) | 5.04 | ||||||||||||
| 10.77 | 7.70 | 96,393 | 2.25 | (1.78 | ) | 2.80 | (2.33 | ) | 5.04 | ||||||||||||
| 10.78 | 7.80 | 12,677 | 1.10 | (0.50 | ) | 1.65 | (1.05 | ) | 5.04 | ||||||||||||
| 10.78 | 7.70 | 12 | 1.60 | (1.13 | ) | 2.15 | (1.68 | ) | 5.04 | ||||||||||||
| U.S. Select List
|
| As mentioned in “Fund Investment Objective and Strategies,” the U.S. Select List was introduced on September 9,
1998 and comprises approximately 25 to 35 stocks that the Goldman Sachs U.S. Stock Selection Committee expects, as a portfolio, to outperform its benchmark, the S&P 500® Index, over the next twelve to eighteen months. The U.S. Select List changes regularly. While the companies on the list generally have been relatively large U.S. companies, the list is not restricted to those types of companies. It is expected that, under normal market conditions, the quarterly
performance of the Fund, before expenses, will track the price return of the U.S. Select List within a .90 correlation coefficient.
|
| The Fund’s portfolio management team does not have access to information regarding additions or deletions for the U.S.
Select List prior to their publication. Goldman Sachs publishes other lists of recommended securities that could be appropriate for Fund investors but that are not used by the Fund’s portfolio management team.
|
| The chart below reflects historical information regarding the U.S. Select List. The U.S. Select List is not
maintained for the purpose of managing any account or investment company such as the Fund. The number of stocks on the U.S. Select List and the frequency of additions to and deletions from the U.S. Select List change from time to time. The stocks included in the U.S. Select List constitute only a “paper portfolio” that does not reflect
actual trading and does not have an actual performance record. The U.S. Select List’s price return does not represent the return on any fund or any other account that involves actual trading. The price returns are not indicative of the returns on any fund or account because, among other things, they do not
reflect actual prices when stocks are purchased or sold, transaction costs and account fees. In addition, because the U.S. Select List does not include a cash component, price returns are based on a constant 100% investment in the stocks on the U.S. Select List. Also, the information below does not reflect the impact that the Investment Adviser’s
portfolio management decisions and techniques may have on performance. Further, the actual performance of the Fund may differ from that of the U.S. Select List because of time delays between when a stock is added to or removed from the list and when it is bought or sold for the Fund. Investors should not consider this price return information as a substitute for, or an indication of,
future performance of the Research Select Fund or
the Investment Adviser. Finally, past price returns of the U.S. Select List are not representative of future price returns of the list.
|
| 9/9/98
(inception) to 12/31/98 |
1/1/99
to 12/31/99 |
1/1/00
to 10/31/00 |
9/9/98
(inception) to 10/31/00 |
||||||
|---|---|---|---|---|---|---|---|---|---|
| U.S. Select List Stock Price Return* | 37.57% | 33.81% | 18.1% | 117.5% | |||||
| S&P 500® Index Price Return** | 22.73% | 21.06% | -1.8% | 45.9% | |||||
*
|
The results for the U.S. Select List portfolio represent an equal-weighted arithmetic average of the stocks held at any
point during the month. The results are calculated monthly using each stock’s capital appreciation or depreciation during the period that it is on the U.S. Select List and dividing that by the highest number of stocks that were on the U.S. Select
List at any point during the month. Prior to June 1999, the divisor was the time-weighted number of stocks on the list for the specified period. The results are calculated using the prices of the stocks at the close of trading of the stock market one full
day after the stock was added to the U.S. Select List (e.g., if the stock was added on the afternoon of 5/5, the recorded price is at the close on 5/6). The results do not reflect the execution of actual purchases or sales, and there is no guarantee that
a mutual fund following the U.S. Select List would be able to execute purchases and sales at the prices used to calculate the price returns. Because the U.S. Select List is a paper portfolio that is not managed to a target number of stocks, no “
re-balancing” of actual investments is done when stocks are added to or deleted from the U.S. Select List. Price returns are based on 100% investment in the stocks on the U.S. Select List.
|
| Price returns are calculated to include the price return plus dividends for the stock
during the month in which they are paid without being reinvested into the security. They do not reflect the market impact on the stock prices that may occur between the time the publication is made of additions to and deletions from the U.S. Select List
and the time a mutual fund following the U.S. Select List would be able to execute purchases and sales. They also do not reflect transaction fees, such as commissions, fees and interest charges, or the costs of running a mutual fund, such as management
fees, distribution fees and other expenses. They do not reflect the impact that an investment adviser’s portfolio management decisions and techniques may have on a mutual fund’s returns. Actual transactions and the effect of dividends, fees and
costs will result in returns that differ from those of the U.S. Select List.
|
**
|
The S&P 500® Index is an unmanaged index containing common stocks of 500 industrial, transportation, utility and
financial companies, regarded as generally representative of the U.S. stock market. The S&P 500® Index performance numbers shown are price returns reflecting the reinvestment of dividends. They do not reflect fees, brokerage commissions or other
costs of investing that are not incurred by an index.
|
| FOR MORE INFORMATION
|
| Annual/Semi-annual Report
|
| Additional information about the Fund’s investments is available in the Fund’s annual and semi-annual reports to
shareholders. In the Fund’s annual report, you will find a discussion of the market conditions and investment strategies that significantly affected the Fund’s performance during the last fiscal year.
|
| Statement of Additional Information
|
| Additional information about the Fund and its policies is also available in the Fund’s Additional Statement. The Additional
Statement is incorporated by reference into this Prospectus (is legally considered part of this Prospectus).
|
| The Fund’s annual and semi-annual reports, and the Additional Statement, are available free upon request by calling Goldman
Sachs at 1-800-526-7384.
|
| To obtain other information and for shareholder inquiries:
|
| By telephone – Call 1-800-526-7384
|
| By mail – Goldman Sachs Funds, 4900 Sears Tower, Chicago, IL 60606-6372
|
| By e-mail – [email protected]
|
| On the Internet – Text-only versions of the Fund’s documents are located online and may be downloaded from:
|
| SEC EDGAR database – http://www.sec.gov
|
| Goldman Sachs – http://www.gs.com (Prospectus Only)
|
| You may review and obtain copies of Fund documents by visiting the SEC’s Public Reference Room in Washington, D.C. You may
also obtain copies of Fund documents, after paying a duplicating fee, by writing to the SEC’s Public Reference Section, Washington, D.C. 20549-0102 or by electronic request to: [email protected]. Information on the operation of the public reference
room may be obtained by calling the SEC at (202) 942-8090.
|
| The Goldman Sachs Research Select Fund
SM
is a service mark of Goldman, Sachs & Co.
|
| The Fund’s investment company registration number is 811-5349.
|
|
|