
|
|
|
|
|
|
|
|
|
|
Previous: HARTFORD LIFE INS CO PUTNAM CAPITAL MGR TR SEPARATE ACCT TWO, 497, 2000-09-19 |
Next: CHASE FUNDING INC, 8-K, 2000-09-19 |
Fidelity®
Funds - 2001, 2003
Annual Report
July 31, 2000
(2_fidelity_logos)(Registered_Trademark)
|
President's Message |
3 |
Ned Johnson on investing strategies. |
|
Performance |
4 |
How the funds have done over time. |
|
Fund Talk |
11 |
The manager's review of the funds' performance, strategy and outlook. |
|
Target Timeline 2001 |
14 |
Investment Changes |
|
|
15 |
Investments |
|
|
22 |
Financial Statements |
|
Target Timeline 2003 |
26 |
Investment Changes |
|
|
27 |
Investments |
|
|
33 |
Financial Statements |
|
Notes |
37 |
Notes to the financial statements. |
|
Report of Independent Accountants |
41 |
The auditors' opinion. |
|
Distributions |
42 |
|
Standard & Poor's, S&P and S&P 500 are registered service marks of The McGraw-Hill Companies, Inc. and have been licensed for use by Fidelity Distributors Corporation.
Other third party marks appearing herein are the property of their respective owners.
All other marks appearing herein are registered or unregistered trademarks or service marks of FMR Corp. or an affiliated company.
(Recycle graphic) This report is printed on recycled paper using soy-based inks.
This report and the financial statements contained herein are submitted for the general information of the shareholders of the funds. This report is not authorized for distribution to prospective investors in the funds unless preceded or accompanied by an effective prospectus.
Mutual fund shares are not deposits or obligations of, or guaranteed by, any depository institution. Shares are not insured by the FDIC, Federal Reserve Board or any other agency, and are subject to investment risks, including possible loss of principal amount invested.
Neither the funds nor Fidelity Distributors Corporation is a bank.
For more information on any Fidelity fund, including charges and expenses, call 1-800-544-6666 for a free prospectus. Read it carefully before you invest or send money.
Annual Report
(photo_of_Edward_C_Johnson_3d)
Dear Shareholder:
The Federal Reserve Board's effort to keep inflation in check without over-cooling the U.S. economy has taken a toll on the stock market. Through July 2000, bellwether equity indexes such as the Dow Jones Industrial Average, NASDAQ and S&P 500® have negative returns for the year. On the other hand, fixed-income markets are enjoying strong performance. Except for high-yield, most bond sectors - corporates, mortgages, Treasuries and agencies - have returned 4%-6% year to date.
While it's impossible to predict the future direction of the markets with any degree of certainty, there are certain basic principles that can help investors plan for their future needs.
The longer your investment time frame, the less likely it is that you will be affected by short-term market volatility. A 10-year investment horizon appropriate for saving for a college education, for example, enables you to weather market cycles in a long-term fund, which may have a higher risk potential, but also has a higher potential rate of return.
An intermediate-length fund could make sense if your investment horizon is two to four years, while a short-term bond fund could be the right choice if you need your money in one or two years.
If your time horizon is less than a year, you might want to consider moving some of your bond investment into a money market fund. These funds seek income and a stable share price by investing in high-quality, short-term investments. Of course, it's important to remember that an investment in a money market fund is not insured or guaranteed by the Federal Deposit Insurance Corporation or any other government agency. Although money market funds seek to preserve the value of your investment at $1.00 per share, it is possible to lose money by investing in these types of funds.
Finally, no matter what your time horizon or portfolio diversity, it makes good sense to follow a regular investment plan, investing a certain amount of money in a fund at the same time each month or quarter and periodically reviewing your overall portfolio. By doing so, you won't get caught up in the excitement of a rapidly rising market, nor will you buy all your shares at market highs. While this strategy - known as dollar cost averaging - won't assure a profit or protect you from a loss in a declining market, it should help you lower the average cost of your purchases. Of course, you should consider your financial ability to continue your purchases through periods of low price levels before undertaking such a strategy.
If you have questions, please call us at 1-800-544-6666, or visit our web site at www.fidelity.com. We are available 24 hours a day, seven days a week to provide you the information you need to make the investments that are right for you.
Best regards,
/s/Edward C. Johnson 3d
Edward C. Johnson 3d
Annual Report
Fidelity Target Timeline 2001
There are several ways to evaluate a fund's historical performance. You can look at the total percentage change in value, the average annual percentage change or the growth of a hypothetical $10,000 investment. Total return reflects the change in the value of an investment, assuming reinvestment of the fund's dividend income and capital gains (the profits earned upon the sale of securities that have grown in value). You can also look at a fund's income, as reflected in its yield, to measure performance. If Fidelity had not reimbursed certain fund expenses, the total returns and dividends would have been lower.
Cumulative Total Returns
|
Periods ended July 31, 2000 |
|
Past 1 |
Life of |
|
Target Timeline 2001 |
|
4.96% |
25.74% |
|
LB Aggregate Bond |
|
5.97% |
27.86% |
|
U.S. Treasury Strips (8/15/01 and 11/15/01) |
|
5.24% |
25.63% |
Cumulative total returns show the fund's performance in percentage terms over a set period - in this case, one year or since the fund started on February 8, 1996. For example, if you had invested $1,000 in a fund that had a 5% return over the past year, the value of your investment would be $1,050. You can compare the fund's return to the Lehman Brothers Aggregate Bond Index - a market value-weighted index of investment-grade fixed-rate debt issues, including government, corporate, asset-backed, and mortgage-backed securities, with maturities of one year or more. You can also compare the fund to the average of the total returns of U.S. Treasury Strips maturing on 8/15/01 and 11/15/01, which reflects the performance of zero-coupon bonds with maturities similar to the fund's. These benchmarks reflect reinvestment of dividends and capital gains, if any.
Average Annual Total Returns
|
Periods ended July 31, 2000 |
|
Past 1 |
Life of |
|
Target Timeline 2001 |
|
4.96% |
5.25% |
|
LB Aggregate Bond |
|
5.97% |
5.64% |
|
U.S. Treasury Strips (8/15/01 and 11/15/01) |
|
5.24% |
5.23% |
Average annual total returns take the fund's cumulative return and show what would have happened if the fund performed at a constant rate each year.
Annual Report
Fidelity Target Timeline 2001
Performance - continued
$10,000 Over Life of Fund
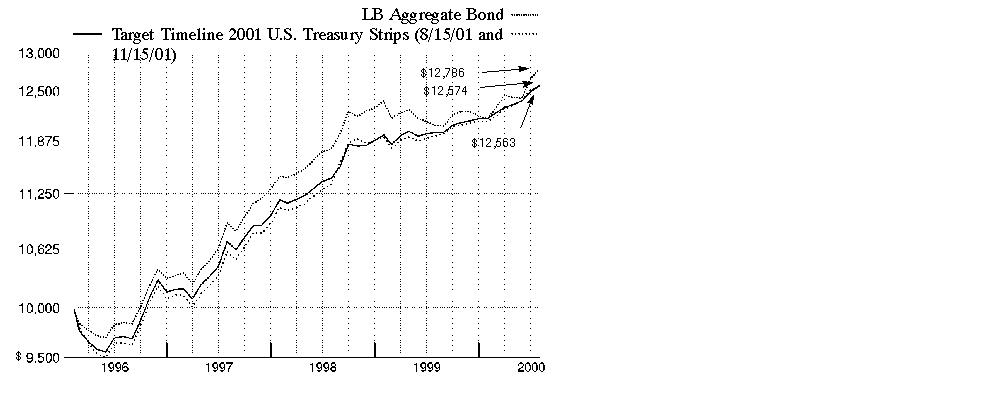
$10,000 Over Life of Fund: Let's say hypothetically that $10,000 was invested in Fidelity Target Timeline 2001 on February 8, 1996, when the fund started. As the chart shows, by July 31, 2000, the value of the investment would be $12,574 - a 25.74% increase on the initial investment. For comparison, look at how the Lehman Brothers Aggregate Bond Index did over the same period. With dividends and capital gains, if any, reinvested, the same $10,000 investment would be $12,786 - a 27.86% increase. If $10,000 was put in U.S. Treasury Strips (8/15/01 and 11/15/01), it would be valued at $12,563 - a 25.63% increase.
Understanding
Performance
How a fund did yesterday is no guarantee of how it will do tomorrow. Bond prices, for example, generally move in the opposite direction of interest rates. In turn, the share price, return and yield of a fund that invests in bonds will vary. That means if you sell your shares during a market downturn, you might lose money. But if you can ride out the market's ups and downs, you may have a gain.
3Annual Report
Fidelity Target Timeline 2001
Performance - continued
Total Return Components
|
|
Years ended July 31, |
February 8, 1996 |
|||
|
|
2000 |
1999 |
1998 |
1997 |
1996 |
|
Dividend returns |
6.34% |
6.68% |
6.95% |
7.71% |
3.12% |
|
Capital returns |
-1.38% |
-1.87% |
-0.21% |
2.55% |
-6.00% |
|
Total returns |
4.96% |
4.81% |
6.74% |
10.26% |
-2.88% |
Total return components include both dividend returns and capital returns. A dividend return reflects the actual dividends paid by the fund. A capital return reflects both the amount paid by the fund to shareholders as capital gain distributions and changes in the fund's share price. Both returns assume the dividends or capital gains, if any, paid by the fund are reinvested.
Dividends and Yield
|
Periods ended July 31, 2000 |
Past 1 |
Past 6 |
Past 1 |
|
Dividends per share |
4.79 ¢ |
28.75 ¢ |
58.23 ¢ |
|
Annualized dividend rate |
6.06% |
6.21% |
6.24% |
|
30-day annualized yield |
6.69% |
- |
- |
Dividends per share show the income paid by the fund for a set period. If you annualize this number, based on an average share price of $9.30 over the past one month, $9.29 over the past six months and $9.33 over the past one year, you can compare the fund's income over these three periods. The 30-day annualized yield is a standard formula for all bond funds based on the yields of the bonds in the fund, averaged over the past 30 days. This figure shows you the yield characteristics of the fund's investments at the end of the period. It also helps you compare funds from different companies on an equal basis. If Fidelity had not reimbursed certain expenses, the yield would have been 6.46%.
Annual Report
Fidelity Target Timeline 2003
There are several ways to evaluate a fund's historical performance. You can look at the total percentage change in value, the average annual percentage change or the growth of a hypothetical $10,000 investment. Total return reflects the change in the value of an investment, assuming reinvestment of the fund's dividend income and capital gains (the profits earned upon the sale of securities that have grown in value). You can also look at a fund's income, as reflected in its yield, to measure performance. If Fidelity had not reimbursed certain fund expenses, the total returns and dividends would have been lower.
Annual Report
Fidelity Target Timeline 2003
Performance - continued
Cumulative Total Returns
|
Periods ended July 31, 2000 |
|
Past 1 |
Life of |
|
Target Timeline 2003 |
|
4.70% |
24.18% |
|
LB Aggregate Bond |
|
5.97% |
27.86% |
|
U.S. Treasury Strips (8/15/03 and 11/15/03) |
|
5.51% |
26.27% |
Cumulative total returns show the fund's performance in percentage terms over a set period - in this case, one year or since the fund started on February 8, 1996. For example, if you had invested $1,000 in a fund that had a 5% return over the past year, the value of your investment would be $1,050. You can compare the fund's return to the Lehman Brothers Aggregate Bond Index - a market value-weighted index of investment-grade fixed-rate debt issues, including government, corporate, asset-backed, and mortgage-backed securities, with maturities of one year or more. You can also compare the fund to the average of the total returns of U.S. Treasury Strips maturing on 8/15/03 and 11/15/03, which reflects the performance of zero-coupon bonds with maturities similar to the fund's. These benchmarks reflect reinvestment of dividends and capital gains, if any.
Average Annual Total Returns
|
Periods ended July 31, 2000 |
|
Past 1 |
Life of |
|
Target Timeline 2003 |
|
4.70% |
4.95% |
|
LB Aggregate Bond |
|
5.97% |
5.64% |
|
U.S. Treasury Strips (8/15/03 and 11/15/03) |
|
5.51% |
5.34% |
Average annual total returns take the fund's cumulative return and show what would have happened if the fund performed at a constant rate each year.
Annual Report
Fidelity Target Timeline 2003
Performance - continued
$10,000 Over Life of Fund
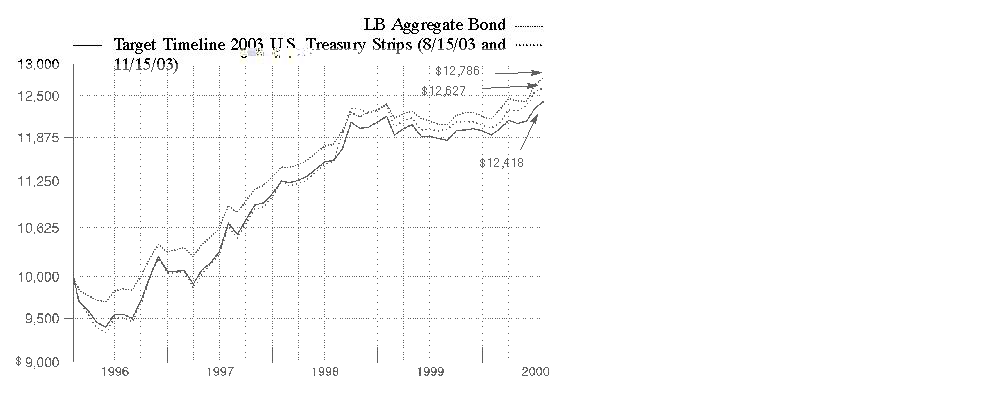
$10,000 Over Life of Fund: Let's say hypothetically that $10,000 was invested in Fidelity Target Timeline 2003 on February 8, 1996, when the fund started. As the chart shows, by July 31, 2000, the value of the investment would be $12,418 - a 24.18% increase on the initial investment. For comparison, look at how the Lehman Brothers Aggregate Bond Index did over the same period. With dividends and capital gains, if any, reinvested, the same $10,000 investment would be $12,786 - a 27.86% increase. If $10,000 was put in U.S. Treasury Strips (8/15/03 and 11/15/03), it would be valued at $12,627 - a 26.27% increase.
Understanding
Performance
How a fund did yesterday is no guarantee of how it will do tomorrow. Bond prices, for example, generally move in the opposite direction of interest rates. In turn, the share price, return and yield of a fund that invests in bonds will vary. That means if you sell your shares during a market downturn, you might lose money. But if you can ride out the market's ups and downs, you may have a gain.
3Annual Report
Fidelity Target Timeline 2003
Performance - continued
Total Return Components
|
|
Years ended July 31, |
February 8, 1996 |
|||
|
|
2000 |
1999 |
1998 |
1997 |
1996 |
|
Dividend returns |
7.18% |
6.99% |
7.17% |
7.29% |
3.07% |
|
Capital returns |
-2.48% |
-4.23% |
0.83% |
4.65% |
-7.60% |
|
Total returns |
4.70% |
2.76% |
8.00% |
11.94% |
-4.53% |
Total return components include both dividend returns and capital returns. A dividend return reflects the actual dividends paid by the fund. A capital return reflects both the amount paid by the fund to shareholders as capital gain distributions and changes in the fund's share price. Both returns assume the dividends or capital gains, if any, paid by the fund are reinvested.
Dividends and Yield
|
Periods ended July 31, 2000 |
Past 1 |
Past 6 |
Past 1 |
|
Dividends per share |
5.62 ¢ |
32.85 ¢ |
64.77 ¢ |
|
Annualized dividend rate |
7.31% |
7.30% |
7.12% |
|
30-day annualized yield |
6.95% |
- |
- |
Dividends per share show the income paid by the fund for a set period. If you annualize this number, based on an average share price of $9.05 over the past one month, $9.02 over the past six months and $9.10 over the past one year, you can compare the fund's income over these three periods. The 30-day annualized yield is a standard formula for all bond funds based on the yields of the bonds in the fund, averaged over the past 30 days. This figure shows you the yield characteristics of the fund's investments at the end of the period. It also helps you compare funds from different companies on an equal basis. If Fidelity had not reimbursed certain expenses, the yield would have been 6.52%.
Annual Report
Market Recap
Despite facing the challenge of five interest-rate increases during the 12-month period that ended July 31, 2000, the taxable bond market - as measured by the Lehman Brothers Aggregate Bond Index - returned 5.97%. The Federal Reserve Board's tightening policy, adopted to help slow down an overheated U.S. economy and ward off inflation, made for a sometimes difficult investing environment for bonds. During the first half of the period, the brunt of the Fed's action was felt by Treasuries, as they underperformed higher-yielding investment-grade spread sectors, such as corporate bonds and mortgage and government agency securities. In January, however, the momentum turned after the Treasury announced a plan to repurchase long-term debt and curtail future issuance. Treasury prices soared in response, sending their yields lower. This shift helped the Lehman Brothers Treasury Index return 6.48% during the period. At the same time, the Lehman Brothers Credit Bond Index - a measure of corporate bond performance - and the Lehman Brothers Mortgage-Backed Securities and U.S. Agency indexes returned 4.83%, 6.43% and 5.19%, respectively. Mortgage-backed securities rallied in the spring as a result of reduced supply, slower origination and a favorable prepayment environment. Elsewhere, rising default rates caused high-yield bonds to suffer more than most bonds, as the Merrill Lynch High Yield Master II Index returned -0.57% for the 12-month period.
(Portfolio Manager photograph)
An interview with Ford O'Neil, Portfolio Manager of Fidelity Target Timeline Funds 2001 and 2003
Q. How did the funds perform, Ford?
A. For the 12 months that ended July 31, 2000, Target Timeline 2001 and 2003 returned 4.96% and 4.70%, respectively. In comparison, U.S. Treasury Strips maturing at approximately the same times as the funds (August and November 2001 and 2003) averaged 5.24% and 5.51%, respectively. The Lehman Brothers Aggregate Bond Index had a 12-month return of 5.97%. The important thing to keep in mind is that it's difficult to measure these funds on a six- or 12-month time horizon; instead, they should be measured at maturity.
Q. What factors had the most influence on performance during the past 12 months?
A. The funds faced a stiff headwind of rising interest rates throughout the period, which constrained returns. Repeated efforts by the Federal Reserve Board to tighten monetary policy, coupled with the U.S. Treasury's decision in January to use government surplus proceeds to buy back long-term debt, spawned an inverted yield curve - which results when short-term bonds offer higher yields than longer-dated issues. Long-term Treasuries soared in response, inducing wider spreads and erasing the yield advantage enjoyed by the spread sectors - namely corporate bonds and government agencies - earlier in the period. Matters only got worse for some corporates, which suffered from declining credit quality related to the increased prevalence of share buybacks and recapitalizations in old economy companies. Short-term corporates slightly lagged comparable duration Treasuries, while intermediate issues underperformed their government counterparts. The story wasn't any brighter for agency securities, which underperformed across the curve thanks to growing uncertainty surrounding the credit quality of dominant issuers Fannie Mae and Freddie Mac. The 2003 fund paid the price for holding longer-duration corporates and agencies relative to an all-Treasury index. On the other hand, the 2001 fund didn't suffer as much because the yield advantage from owning corporates and agencies - in most cases - more than offset the price declines associated with the spread widening.
Annual Report
Fund Talk: The Manager's Overview - continued
Q. What were the challenges of meeting the funds' investment objective in this environment?
A. Our goal is to generate a predictable return, slightly greater than the index net of fees, over each fund's lifetime. We typically are successful at this task when spreads are either unchanged or tightening. However, when spreads are moving in the opposite direction, we hope that our yield advantage is greater than the losses incurred by the widening. In an environment such as the past 12 months, where spreads of some of the securities we owned doubled over a very short period of time, it was difficult to keep pace with an index consisting only of Treasuries.
Q. What were some of your key strategies, and how did they play out for the funds?
A. Given the "negative event risk" that threatened the credit quality of many corporate bonds during the period, I felt the best strategy to limit the funds' downside potential was to diversify and transform many of their bigger plays into several smaller positions, while simultaneously looking to improve the overall credit quality of the portfolios. I did so within the maturity constraints of the funds. Tactical allocations into different subsectors, teamed with strong security selection, helped mitigate the effects of our overweighting in corporates relative to the index. The funds' investments in Yankee bonds - or dollar-denominated foreign government and corporate debt - helped the most, benefiting in large part from our exposure to recovering Asian economies, particularly South Korea. Having good exposure to energy and the rebound in oil prices also helped, as did many of our bank and brokerage holdings. On the flip side, tobacco and select industrial issues trended lower, detracting from fund returns.
Q. What's your outlook?
A. It remains positive. We're beginning to see signs that the economy is downshifting, which could mean that we're close to the end of the Fed's yearlong tightening cycle. If so, corporate spreads could narrow - barring any major credit problems - from their most attractive levels in over a decade. I plan to maintain the funds' emphasis on higher-quality, defensive corporates, as well as short-duration agencies, for the yield advantage they offer relative to Treasuries and their potential for capital appreciation.
Annual Report
Fund Talk: The Manager's Overview - continued
The views expressed in this report reflect those of the portfolio manager only through the end of the period of the report as stated on the cover and do not necessarily represent the views of Fidelity or any other person in the Fidelity organization. Any such views are subject to change at any time based upon market or other conditions and Fidelity disclaims any responsibility to update such views. These views may not be relied on as investment advice and, because investment decisions for a Fidelity fund are based on numerous factors, may not be relied on as an indication of trading intent on behalf of any Fidelity fund.
Fund Facts
Goal: definable returns over the life of the funds by investing mainly in investment-grade quality debt securities whose average duration is approximately equal to each fund's maturity
Fund numbers: 381 (2001), 383 (2003)
Trading symbols: FTTBX (2001), FTARX (2003)
Start date: February 8, 1996
Size: as of July 31, 2000, more than $202 million, 2001 fund; more than $37 million, 2003 fund
Manager: Ford O'Neil, since 1998; manager, various Fidelity bond funds; joined Fidelity in 1990
3Ford O'Neil reflects on the inverted Treasury yield curve:
"Historically, inversions often have been the precursor to recession, getting their spark from aggressive Fed tightening at the short end of the curve. Recently, however, we've had more of a gradual approach to tightening, but nowhere near the magnitude of what we experienced in the 1970s, 80s and early 90s - the last three times we had an inverted yield curve. I believe the environment today is starkly different. Fundamentally, economic indicators are pointing more toward a slowdown - albeit from a torrid pace - than a recession.
"So, what's really behind the inversion? The answer lies in the technicals of the market. Influenced by a growing federal budget surplus, the U.S. Treasury announced midway through the period its intent to buy back higher-yielding long-term debt and reduce future bond issuance. This action, coupled with the government's desire to reduce the average maturity of its issues, induced a strong rally at the long end of the curve. Rising short-term rates - responding to an aggressive Fed, partially influenced by a booming domestic economy - ensured the curve's inversion. As long Treasury yields have fallen, comparable corporate spreads have widened, leaving their yields relatively unchanged. This all makes for a rather unfavorable risk/reward scenario for investors such as myself who demand more yield for the extra risk associated with longer-duration securities."
Annual Report
Fidelity Target Timeline 2001
|
Quality Diversification as of July 31, 2000 |
||
|
(Moody's Ratings) |
% of fund's investments |
% of fund's investments |
|
Aaa |
60.3 |
42.1 |
|
Aa |
7.7 |
10.1 |
|
A |
15.0 |
19.3 |
|
Baa |
14.7 |
20.9 |
|
Table excludes short-term investments. Where Moody's ratings are not available, we have used |
|
Average Years to Maturity as of July 31, 2000 |
||
|
|
|
6 months ago |
|
Years |
1.2 |
1.7 |
|
Average years to maturity is based on the average time remaining until principal payments are expected from each of the fund's bonds, weighted by dollar amount. |
|
Duration as of July 31, 2000 |
||
|
|
|
6 months ago |
|
Years |
1.1 |
1.5 |
|
Duration shows how much a bond fund's price fluctuates with changes in comparable interest rates. |
|
Asset Allocation (% of fund's net assets) |
|||||||
|
As of July 31, 2000 * |
As of January 31, 2000 ** |
||||||
 |
Corporate Bonds 33.9% |
|
|
Corporate Bonds 45.5% |
|
||
 |
U.S. Government |
|
|
U.S. Government |
|
||
 |
Other Investments 3.9% |
|
|
Other Investments 5.3% |
|
||
 |
Short-Term |
|
|
Short-Term |
|
||
|
* Foreign |
6.3% |
|
** Foreign |
8.5% |
|
||

Annual Report
Fidelity Target Timeline 2001
Showing Percentage of Net Assets
|
Nonconvertible Bonds - 33.9% |
|||||
|
Moody's Ratings |
Principal Amount |
Value |
|||
|
AEROSPACE & DEFENSE - 0.4% |
|||||
|
Lockheed Martin Corp. 6.85% 5/15/01 |
Baa3 |
|
$ 700,000 |
$ 697,060 |
|
|
BASIC INDUSTRIES - 0.7% |
|||||
|
Chemicals & Plastics - 0.6% |
|||||
|
Monsanto Co. 5.375% 12/1/01 |
A2 |
|
1,275,000 |
1,253,185 |
|
|
Paper & Forest Products - 0.1% |
|||||
|
Fort James Corp. 6.5% 9/15/02 |
Baa2 |
|
250,000 |
244,698 |
|
|
TOTAL BASIC INDUSTRIES |
1,497,883 |
||||
|
CONSTRUCTION & REAL ESTATE - 0.5% |
|||||
|
Real Estate Investment Trusts - 0.5% |
|||||
|
Avalon Properties, Inc. 7.375% 9/15/02 |
Baa1 |
|
900,000 |
889,956 |
|
|
Equity Office Properties Trust 6.375% 1/15/02 |
Baa1 |
|
150,000 |
146,927 |
|
|
|
1,036,883 |
||||
|
DURABLES - 1.2% |
|||||
|
Autos, Tires, & Accessories - 1.2% |
|||||
|
TRW, Inc.: |
|
|
|
|
|
|
6.45% 6/15/01 |
Baa1 |
|
1,500,000 |
1,485,330 |
|
|
6.5% 6/1/02 |
Baa1 |
|
950,000 |
927,257 |
|
|
|
2,412,587 |
||||
|
ENERGY - 1.4% |
|||||
|
Oil & Gas - 1.4% |
|||||
|
Oryx Energy Co. 10% 4/1/01 |
Baa1 |
|
1,500,000 |
1,522,200 |
|
|
Petro-Canada yankee 8.6% 10/15/01 |
A3 |
|
190,000 |
192,022 |
|
|
The Coastal Corp. 8.125% 9/15/02 |
Baa2 |
|
1,110,000 |
1,124,685 |
|
|
|
2,838,907 |
||||
|
FINANCE - 19.8% |
|||||
|
Banks - 7.8% |
|||||
|
Banc One Corp. 7.25% 8/1/02 |
A1 |
|
500,000 |
499,115 |
|
|
Bank of New York Co., Inc.: |
|
|
|
|
|
|
7.625% 7/15/02 |
A1 |
|
500,000 |
504,250 |
|
|
7.875% 11/15/02 |
A1 |
|
136,000 |
137,866 |
|
|
Bank One Corp. 6.4% 8/1/02 |
Aa3 |
|
300,000 |
294,582 |
|
|
BankAmerica Corp. 7.5% 10/15/02 |
Aa3 |
|
25,000 |
25,100 |
|
|
BanPonce Financial Corp. 7.3% 6/5/02 |
A3 |
|
400,000 |
399,132 |
|
|
Barclays Bank PLC yankee 5.95% 7/15/01 |
A1 |
|
1,000,000 |
994,150 |
|
|
Boatmens Bancshares, Inc. 9.25% 11/1/01 |
Aa3 |
|
1,000,000 |
1,023,730 |
|
|
Capital One Bank 6.76% 7/23/02 |
Baa2 |
|
500,000 |
489,035 |
|
|
Nonconvertible Bonds - continued |
|||||
|
Moody's Ratings |
Principal Amount |
Value |
|||
|
FINANCE - continued |
|||||
|
Banks - continued |
|||||
|
Central Fidelity Banks, Inc. 8.15% 11/15/02 |
A1 |
|
$ 1,200,000 |
$ 1,220,136 |
|
|
Citicorp 5.625% 2/15/01 |
Aa3 |
|
300,000 |
297,564 |
|
|
Firstar Corp. 6.35% 7/13/01 |
A1 |
|
1,200,000 |
1,191,240 |
|
|
Huntington Bancshares, Inc. 7.875% 11/15/02 |
A3 |
|
100,000 |
100,487 |
|
|
Integra Financial Corp. 8.5% 5/15/02 |
A2 |
|
350,000 |
355,957 |
|
|
Kansallis-Osake-Pankki (NY Branch) yankee |
A1 |
|
705,000 |
733,574 |
|
|
Korea Development Bank: |
|
|
|
|
|
|
6.625% 11/21/03 |
Baa2 |
|
70,000 |
67,423 |
|
|
7.125% 9/17/01 |
Baa2 |
|
1,090,000 |
1,081,912 |
|
|
MBNA Corp. 6.963% 9/12/02 |
Baa2 |
|
600,000 |
594,396 |
|
|
Mellon Financial Co. 9.25% 8/15/01 |
A2 |
|
557,000 |
567,672 |
|
|
National Westminster Bank PLC 9.45% 5/1/01 |
Aa3 |
|
1,250,000 |
1,270,875 |
|
|
NCNB Corp. 9.125% 10/15/01 |
Aa3 |
|
500,000 |
510,735 |
|
|
Providian National Bank 6.25% 5/7/01 |
Baa3 |
|
1,500,000 |
1,479,375 |
|
|
Summit Bancorp 8.625% 12/10/02 |
A3 |
|
250,000 |
254,420 |
|
|
US Bank NA, Minnesota: |
|
|
|
|
|
|
5.25% 6/4/03 |
Aa3 |
|
250,000 |
236,105 |
|
|
6.35% 9/28/01 |
Aa3 |
|
1,000,000 |
990,600 |
|
|
Wells Fargo & Co. 6.875% 4/15/03 |
Aa3 |
|
160,000 |
158,619 |
|
|
Westpac Banking Corp. 7.875% 10/15/02 |
A1 |
|
200,000 |
201,894 |
|
|
|
15,679,944 |
||||
|
Credit & Other Finance - 8.2% |
|||||
|
Aristar, Inc. 7.75% 6/15/01 |
A3 |
|
800,000 |
801,216 |
|
|
Associates Corp. of North America: |
|
|
|
|
|
|
5.875% 7/15/02 |
Aa3 |
|
250,000 |
243,380 |
|
|
6.45% 10/15/01 |
Aa3 |
|
725,000 |
717,018 |
|
|
AT&T Capital Corp. 6.25% 5/15/01 |
A1 |
|
1,200,000 |
1,188,636 |
|
|
Chrysler Financial Corp.: |
|
|
|
|
|
|
5.25% 10/22/01 |
A1 |
|
450,000 |
438,759 |
|
|
5.69% 11/15/01 |
A1 |
|
1,000,000 |
979,140 |
|
|
6.02% 4/9/01 |
A1 |
|
520,000 |
516,152 |
|
|
Countrywide Funding Corp. 8.25% 7/15/02 |
Baa1 |
|
1,250,000 |
1,267,850 |
|
|
Finova Capital Corp. 7.125% 5/1/02 |
Baa2 |
|
174,000 |
157,470 |
|
|
Ford Capital BV yankee 9.5% 7/1/01 |
A2 |
|
1,500,000 |
1,524,570 |
|
|
Ford Motor Credit Co. 5.125% 10/15/01 |
A2 |
|
200,000 |
195,380 |
|
|
General Electric Capital Corp. 6.33% 9/17/01 |
Aaa |
|
2,000,000 |
1,983,000 |
|
|
General Motors Acceptance Corp. 5.95% 4/20/01 |
A2 |
|
1,000,000 |
989,810 |
|
|
Greyhound Financial Corp. 7.82% 1/27/03 |
Baa1 |
|
100,000 |
90,631 |
|
|
Nonconvertible Bonds - continued |
|||||
|
Moody's Ratings |
Principal Amount |
Value |
|||
|
FINANCE - continued |
|||||
|
Credit & Other Finance - continued |
|||||
|
Household Finance Corp. 6.93% 4/11/01 |
A2 |
|
$ 1,500,000 |
$ 1,498,230 |
|
|
PNC Funding Corp. 6.95% 9/1/02 |
A2 |
|
2,000,000 |
1,982,920 |
|
|
Sanwa Business Credit Card, Inc. 7.25% 9/15/01 (b) |
A1 |
|
1,000,000 |
1,001,620 |
|
|
Southwestern Bell Capital Corp. 7.36% 5/1/02 |
Aa3 |
|
100,000 |
100,528 |
|
|
TXU Eastern Funding 6.15% 5/15/02 |
Baa1 |
|
200,000 |
195,994 |
|
|
U.S. West Capital Funding, Inc. 6.875% 8/15/01 |
Baa1 |
|
750,000 |
746,100 |
|
|
|
16,618,404 |
||||
|
Insurance - 0.6% |
|||||
|
Sun America, Inc. 6.58% 1/15/02 |
Baa1 |
|
200,000 |
198,944 |
|
|
Travelers Property Casualty Corp. 6.75% 4/15/01 |
A1 |
|
1,000,000 |
997,650 |
|
|
|
1,196,594 |
||||
|
Savings & Loans - 0.3% |
|||||
|
Great Western Financial Corp. 8.6% 2/1/02 |
A3 |
|
100,000 |
101,132 |
|
|
Household Bank FSB 6.87% 5/15/01 |
A2 |
|
250,000 |
248,438 |
|
|
Long Island Savings Bank FSB 7% 6/13/02 |
Baa3 |
|
250,000 |
245,728 |
|
|
|
595,298 |
||||
|
Securities Industry - 2.9% |
|||||
|
DLJ, Inc. 6% 12/1/01 |
A3 |
|
1,000,000 |
980,940 |
|
|
Goldman Sachs Group LP 6.2% 2/15/01 |
A1 |
|
1,000,000 |
993,720 |
|
|
Merrill Lynch & Co., Inc. 5.71% 1/15/02 |
Aa3 |
|
1,000,000 |
973,610 |
|
|
Morgan Stanley Dean Witter & Co. 7.125% 1/15/03 |
Aa3 |
|
1,000,000 |
996,740 |
|
|
Morgan Stanley Dean Witter Discover & Co. 6.5% 3/30/01 |
Aa3 |
|
1,000,000 |
995,620 |
|
|
Salomon Smith Barney Holdings, Inc. 6.65% 7/15/01 |
Aa3 |
|
1,000,000 |
996,510 |
|
|
|
5,937,140 |
||||
|
TOTAL FINANCE |
40,027,380 |
||||
|
INDUSTRIAL MACHINERY & EQUIPMENT - 0.7% |
|||||
|
Tyco International Group SA yankee 6.125% 6/15/01 |
Baa1 |
|
1,500,000 |
1,482,045 |
|
|
MEDIA & LEISURE - 0.1% |
|||||
|
Broadcasting - 0.1% |
|||||
|
Continental Cablevision, Inc. 8.5% 9/15/01 |
A2 |
|
250,000 |
252,845 |
|
|
Nonconvertible Bonds - continued |
|||||
|
Moody's Ratings |
Principal Amount |
Value |
|||
|
NONDURABLES - 1.3% |
|||||
|
Beverages - 0.8% |
|||||
|
Seagram JE & Sons, Inc.: |
|
|
|
|
|
|
5.79% 4/15/01 |
Baa3 |
|
$ 1,050,000 |
$ 1,036,644 |
|
|
6.25% 12/15/01 |
Baa3 |
|
650,000 |
638,801 |
|
|
|
1,675,445 |
||||
|
Tobacco - 0.5% |
|||||
|
Philip Morris Companies, Inc. 7.5% 1/15/02 |
A2 |
|
1,000,000 |
987,360 |
|
|
TOTAL NONDURABLES |
2,662,805 |
||||
|
RETAIL & WHOLESALE - 1.7% |
|||||
|
General Merchandise Stores - 1.0% |
|||||
|
Dayton Hudson Corp. 9.75% 7/1/02 |
A2 |
|
390,000 |
408,182 |
|
|
Federated Department Stores, Inc. 8.125% 10/15/02 |
Baa1 |
|
1,600,000 |
1,612,672 |
|
|
|
2,020,854 |
||||
|
Grocery Stores - 0.7% |
|||||
|
Safeway, Inc. 7% 9/15/02 |
Baa2 |
|
1,500,000 |
1,486,875 |
|
|
TOTAL RETAIL & WHOLESALE |
3,507,729 |
||||
|
TECHNOLOGY - 0.1% |
|||||
|
Computers & Office Equipment - 0.1% |
|||||
|
Comdisco, Inc. 5.95% 4/30/02 |
Baa1 |
|
250,000 |
237,618 |
|
|
TRANSPORTATION - 0.7% |
|||||
|
Air Transportation - 0.2% |
|||||
|
Delta Air Lines, Inc. 8.5% 3/15/02 |
Baa3 |
|
311,000 |
312,922 |
|
|
Railroads - 0.5% |
|||||
|
Norfolk Southern Corp. 6.875% 5/1/01 |
Baa1 |
|
1,000,000 |
994,420 |
|
|
TOTAL TRANSPORTATION |
1,307,342 |
||||
|
UTILITIES - 5.3% |
|||||
|
Electric Utility - 2.0% |
|||||
|
Commonwealth Edison Co. 7.375% 9/15/02 |
Baa1 |
|
1,500,000 |
1,495,485 |
|
|
Houston Industries, Inc. 9.375% 6/1/01 |
Baa1 |
|
1,067,000 |
1,078,492 |
|
|
Niagara Mohawk Power Corp. 9.25% 10/1/01 |
Baa2 |
|
500,000 |
507,605 |
|
|
Philadelphia Electric Co. 5.625% 11/1/01 |
Baa1 |
|
250,000 |
244,160 |
|
|
Texas Utilities Electric Co. 8.125% 2/1/02 |
A3 |
|
850,000 |
860,056 |
|
|
|
4,185,798 |
||||
|
Nonconvertible Bonds - continued |
|||||
|
Moody's Ratings |
Principal Amount |
Value |
|||
|
UTILITIES - continued |
|||||
|
Gas - 1.9% |
|||||
|
El Paso Energy Corp. 6.625% 7/15/01 |
Baa2 |
|
$ 1,200,000 |
$ 1,191,480 |
|
|
Enron Corp. 6.45% 11/15/01 |
Baa1 |
|
1,325,000 |
1,309,630 |
|
|
Southwest Gas Corp. 9.75% 6/15/02 |
Baa2 |
|
1,000,000 |
1,031,320 |
|
|
TransCanada Pipelines Ltd. 6.77% 4/30/01 |
A2 |
|
250,000 |
248,428 |
|
|
|
3,780,858 |
||||
|
Telephone Services - 1.4% |
|||||
|
GTE Corp. 9.1% 6/1/03 |
A2 |
|
95,000 |
99,277 |
|
|
Pacific Bell 8.7% 6/15/01 |
Aa3 |
|
250,000 |
253,195 |
|
|
Telecomunicaciones de Puerto Rico, Inc. 6.15% 5/15/02 |
Baa2 |
|
885,000 |
863,300 |
|
|
WorldCom, Inc. 6.125% 8/15/01 |
A3 |
|
1,600,000 |
1,581,072 |
|
|
|
2,796,844 |
||||
|
TOTAL UTILITIES |
10,763,500 |
||||
|
TOTAL NONCONVERTIBLE BONDS (Cost $69,642,019) |
68,724,584 |
||||
|
U.S. Government and Government Agency Obligations - 58.0% |
|||||
|
|
|||||
|
U.S. Government Agency Obligations - 20.4% |
|||||
|
Federal Home Loan Bank: |
|
|
|
|
|
|
5.875% 8/15/01 |
Aaa |
|
1,500,000 |
1,485,465 |
|
|
5.875% 9/17/01 |
Aaa |
|
40,000,000 |
39,581,200 |
|
|
Financing Corp. - coupon STRIPS 0% 5/2/01 |
Aaa |
|
300,000 |
284,619 |
|
|
TOTAL U.S. GOVERNMENT AGENCY OBLIGATIONS |
41,351,284 |
||||
|
U.S. Treasury Obligations - 37.6% |
|||||
|
U.S. Treasury Bonds 11.625% 11/15/02 |
Aaa |
|
5,000,000 |
5,542,200 |
|
|
U.S. Treasury Notes: |
|
|
|
|
|
|
5.5% 8/31/01 |
Aaa |
|
65,550,000 |
64,894,493 |
|
|
7.875% 8/15/01 |
Aaa |
|
5,630,000 |
5,709,158 |
|
|
TOTAL U.S. TREASURY OBLIGATIONS |
76,145,851 |
||||
|
TOTAL U.S. GOVERNMENT AND (Cost $118,066,844) |
117,497,135 |
||||
|
Foreign Government and Government Agency Obligations (c) - 3.4% |
|||||
|
Moody's Ratings |
Principal Amount |
Value |
|||
|
British Columbia Province 5.5%, 10/30/00 |
Aa2 |
|
$ 1,000,000 |
$ 997,000 |
|
|
Canadian Government 6.125% 7/15/02 |
Aa1 |
|
400,000 |
394,400 |
|
|
Irish Republic: |
|
|
|
|
|
|
7.64% 1/2/02 |
Aaa |
|
210,000 |
212,314 |
|
|
yankee 8.625% 4/15/01 |
Aaa |
|
85,000 |
85,925 |
|
|
Manitoba Province yankee 8% 4/15/02 |
Aa3 |
|
400,000 |
407,240 |
|
|
Nova Scotia Province yankee 9.375% 7/15/02 |
A3 |
|
1,275,000 |
1,326,383 |
|
|
Ontario Province yankee: |
|
|
|
|
|
|
7.375% 1/27/03 |
Aa3 |
|
150,000 |
151,164 |
|
|
7.75% 6/4/02 |
Aa3 |
|
2,150,000 |
2,177,585 |
|
|
Quebec Province 8.69% 2/22/01 |
A2 |
|
1,000,000 |
1,007,820 |
|
|
Swedish Kingdom yankee 0%, 4/1/01 |
Aa1 |
|
174,000 |
166,193 |
|
|
TOTAL FOREIGN GOVERNMENT AND (Cost $7,072,010) |
6,926,024 |
||||
|
Supranational Obligations - 0.5% |
|||||
|
|
|||||
|
African Development Bank yankee 7.7%
7/15/02 |
Aa1 |
|
875,000 |
884,406 |
|
|
Cash Equivalents - 2.3% |
|||
|
Maturity Amount |
|
||
|
Investments in repurchase agreements (U.S. Government Obligations), in a joint trading account at 6.65%, dated 7/31/00 due
8/1/00 |
$ 4,642,857 |
4,642,000 |
|
|
TOTAL INVESTMENT PORTFOLIO - 98.1% (Cost $200,325,350) |
198,674,149 |
|
|
NET OTHER ASSETS - 1.9% |
3,943,300 |
||
|
NET ASSETS - 100% |
$ 202,617,449 |
||
|
Legend |
|
(a) S&P credit ratings are used in the absence of a rating by Moody's Investors Service, Inc. |
|
(b) Security exempt from registration under Rule 144A of the Securities Act of 1933. These securities may be resold in transactions exempt from registration, normally
to qualified institutional buyers. At the period end, the value of these securities amounted to $1,001,620 |
|
(c) For foreign government obligations not individually rated by S&P or Moody's, the ratings listed have been assigned |
|
Other Information |
|
The composition of long-term debt holdings as a percentage of total value of investments in securities, is as follows (ratings are unaudited): |
|
Moody's Ratings |
S&P Ratings |
|||
|
Aaa, Aa, A |
83.0% |
|
AAA, AA, A |
62.7% |
|
Baa |
14.7% |
|
BBB |
14.3% |
|
Ba |
0.0% |
|
BB |
0.0% |
|
B |
0.0% |
|
B |
0.0% |
|
Caa |
0.0% |
|
CCC |
0.0% |
|
Ca, C |
0.0% |
|
CC, C |
0.0% |
|
|
|
|
D |
0.0% |
|
|
|
Purchases and sales of securities, other |
|
Income Tax Information |
|
At July 31, 2000, the aggregate cost of investment securities for income tax purposes was $200,373,953. Net unrealized depreciation aggregated $1,699,804, of
which $229,190 related |
|
At July 31, 2000, the fund had a capital loss carryforward of approximately $63,000 of which $26,000 and $37,000 will expire on July 31, 2005 and 2008, respectively. |
See accompanying notes which are an integral part of the financial statements.
Annual Report
Fidelity Target Timeline 2001
Statement of Assets and Liabilities
|
|
July 31, 2000 |
|
|
Assets |
|
|
|
Investment in securities, at value (including repurchase agreements of $4,642,000) (cost $200,325,350) - |
|
$ 198,674,149 |
|
Cash |
|
438 |
|
Receivable for fund shares sold |
|
265,150 |
|
Interest receivable |
|
4,049,692 |
|
Total assets |
|
202,989,429 |
|
Liabilities |
|
|
|
Payable for fund shares redeemed |
$ 170,276 |
|
|
Distributions payable |
81,138 |
|
|
Accrued management fee |
26,563 |
|
|
Other payables and accrued expenses |
94,003 |
|
|
Total liabilities |
|
371,980 |
|
Net Assets |
|
$ 202,617,449 |
|
Net Assets consist of: |
|
|
|
Paid in capital |
|
$ 204,554,819 |
|
Undistributed net investment income |
|
5,655 |
|
Accumulated undistributed net realized gain (loss) |
|
(291,824) |
|
Net unrealized appreciation (depreciation) on investments |
|
(1,651,201) |
|
Net Assets, for 21,774,591 shares outstanding |
|
$ 202,617,449 |
|
Net Asset Value, offering price and redemption price |
|
$9.31 |
See accompanying notes which are an integral part of the financial statements.
Annual Report
Fidelity Target Timeline 2001
Financial Statements - continued
Statement of Operations
|
|
Year ended July 31, 2000 |
|
|
Investment Income Interest |
|
$ 9,551,593 |
|
Security lending |
|
7,813 |
|
Total Income |
|
9,559,406 |
|
Expenses |
|
|
|
Management fee |
$ 624,417 |
|
|
Transfer agent fees |
181,600 |
|
|
Accounting and security lending fees |
62,458 |
|
|
Non-interested trustees' compensation |
404 |
|
|
Custodian fees and expenses |
5,263 |
|
|
Registration fees |
93,284 |
|
|
Audit |
26,514 |
|
|
Legal |
3,526 |
|
|
Miscellaneous |
62 |
|
|
Total expenses before reductions |
997,528 |
|
|
Expense reductions |
(491,464) |
506,064 |
|
Net investment income |
|
9,053,342 |
|
Realized and Unrealized Gain (Loss) Net realized gain (loss) on investment securities |
|
(243,492) |
|
Change in net unrealized appreciation (depreciation) on investment securities |
|
(1,299,131) |
|
Net gain (loss) |
|
(1,542,623) |
|
Net increase (decrease) in net assets resulting |
|
$ 7,510,719 |
See accompanying notes which are an integral part of the financial statements.
Annual Report
Fidelity Target Timeline 2001
Financial Statements - continued
Statement of Changes in Net Assets
|
|
Year ended |
Year ended |
|
Increase (Decrease) in Net Assets |
|
|
|
Operations |
$ 9,053,342 |
$ 1,037,235 |
|
Net realized gain (loss) |
(243,492) |
(19,781) |
|
Change in net unrealized appreciation (depreciation) |
(1,299,131) |
(356,371) |
|
Net increase (decrease) in net assets resulting |
7,510,719 |
661,083 |
|
Distributions to shareholders from net investment income |
(9,053,569) |
(1,038,591) |
|
Share transactions |
214,594,635 |
7,318,267 |
|
Reinvestment of distributions |
8,334,490 |
983,793 |
|
Cost of shares redeemed |
(36,232,949) |
(3,604,403) |
|
Net increase (decrease) in net assets resulting |
186,696,176 |
4,697,657 |
|
Redemption fees |
29,603 |
1,961 |
|
Total increase (decrease) in net assets |
185,182,929 |
4,322,110 |
|
Net Assets |
|
|
|
Beginning of period |
17,434,520 |
13,112,410 |
|
End of period (including undistributed net investment income of $5,655 and $3,455, respectively) |
$ 202,617,449 |
$ 17,434,520 |
|
Other Information Shares |
|
|
|
Sold |
22,922,349 |
757,745 |
|
Issued in reinvestment of distributions |
895,204 |
102,111 |
|
Redeemed |
(3,890,719) |
(374,885) |
|
Net increase (decrease) |
19,926,834 |
484,971 |
Annual Report
See accompanying notes which are an integral part of the financial statements.
Financial Highlights
|
Years ended July 31, |
2000 |
1999 |
1998 |
1997 |
1996 G |
|
Selected Per-Share Data |
|
|
|
|
|
|
Net asset value, |
$ 9.440 |
$ 9.620 |
$ 9.640 |
$ 9.400 |
$ 10.000 |
|
Income from Investment Operations |
.574 D |
.634 D |
.648 D |
.690 D |
.310 |
|
Net realized and unrealized gain (loss) |
(.124) |
(.178) |
(.019) |
.240 |
(.600) |
|
Total from investment operations |
.450 |
.456 |
.629 |
.930 |
(.290) |
|
Less Distributions |
|
|
|
|
|
|
From net investment income |
(.582) |
(.637) |
(.649) |
(.690) |
(.310) |
|
Redemption fees added to paid |
.002 |
.001 |
.000 |
.000 |
.000 |
|
Net asset value, end of period |
$ 9.310 |
$ 9.440 |
$ 9.620 |
$ 9.640 |
$ 9.400 |
|
Total Return B, C |
4.96% |
4.81% |
6.74% |
10.26% |
(2.88)% |
|
Ratios and Supplemental Data |
|
|
|
|
|
|
Net assets, end of period |
$ 202,617 |
$ 17,435 |
$ 13,112 |
$ 10,378 |
$ 6,180 |
|
Ratio of expenses to average |
.35% E |
.35% E |
.35% E |
.35% E |
.35% A, E |
|
Ratio of expenses to average net assets after expense reductions |
.35% |
.35% |
.35% |
.34% F |
.34% A, F |
|
Ratio of net investment income |
6.23% |
6.60% |
6.75% |
7.31% |
6.93% A |
|
Portfolio turnover rate |
24% |
16% |
47% |
97% |
93% A |
A Annualized
B Total returns for periods of less than one year are not annualized.
C The total returns would have been lower had certain expenses not been reduced during the periods shown.
D Net investment income per share has been calculated based on average shares outstanding during the period.
E FMR agreed to reimburse a portion of the fund's expenses during the period. Without this reimbursement, the fund's expense ratio would have been higher.
F FMR or the fund has entered into varying arrangements with third parties who either paid or reduced a portion of the fund's expenses.
G For the period February 8, 1996 (commencement of operations) to July 31, 1996.
See accompanying notes which are an integral part of the financial statements.
Annual Report
Fidelity Target Timeline 2003
|
Quality Diversification as of July 31, 2000 |
||
|
(Moody's Ratings) |
% of fund's investments |
% of fund's investments |
|
Aaa |
53.8 |
40.1 |
|
Aa |
5.6 |
7.8 |
|
A |
16.2 |
19.8 |
|
Baa |
20.8 |
28.4 |
|
Table excludes short-term investments. Where Moody's ratings are not available, we have used |
|
Average Years to Maturity as of July 31, 2000 |
||
|
|
|
6 months ago |
|
Years |
3.7 |
4.7 |
|
Average years to maturity is based on the average time remaining until principal payments are expected from each of the fund's bonds, weighted by dollar amount. |
|
Duration as of July 31, 2000 |
||
|
|
|
6 months ago |
|
Years |
3.0 |
3.6 |
|
Duration shows how much a bond fund's price fluctuates with changes in comparable interest rates. |
|
Asset Allocation (% of fund's net assets) |
|||||||
|
As of July 31, 2000 * |
As of January 31, 2000 ** |
||||||
|
Corporate Bonds 39.3% |
|
|
Corporate Bonds 50.9% |
|
||
|
U.S. Government |
|
|
U.S. Government |
|
||
|
Other Investments 2.7% |
|
|
Other Investments 3.8% |
|
||
|
Short-Term |
|
|
Short-Term |
|
||
|
* Foreign |
8.6% |
|
** Foreign |
11.8% |
|
||

Annual Report
Fidelity Target Timeline 2003
Showing Percentage of Net Assets
|
Nonconvertible Bonds - 39.3% |
|||||
|
Moody's Ratings |
Principal Amount |
Value |
|||
|
AEROSPACE & DEFENSE - 1.3% |
|||||
|
Defense Electronics - 1.3% |
|||||
|
Raytheon Co. 6.5% 7/15/05 |
Baa2 |
|
$ 500,000 |
$ 474,560 |
|
|
BASIC INDUSTRIES - 0.4% |
|||||
|
Paper & Forest Products - 0.4% |
|||||
|
Fort James Corp. 6.625% 9/15/04 |
Baa2 |
|
150,000 |
142,217 |
|
|
CONSTRUCTION & REAL ESTATE - 1.6% |
|||||
|
Real Estate - 0.7% |
|||||
|
Cabot Industrial Property LP 7.125% 5/1/04 |
Baa2 |
|
290,000 |
277,298 |
|
|
Real Estate Investment Trusts - 0.9% |
|||||
|
Equity Office Properties Trust 6.5% 1/15/04 |
Baa1 |
|
200,000 |
192,080 |
|
|
Spieker Properties LP 6.8% 5/1/04 |
Baa2 |
|
150,000 |
144,267 |
|
|
|
336,347 |
||||
|
TOTAL CONSTRUCTION & REAL ESTATE |
613,645 |
||||
|
DURABLES - 0.6% |
|||||
|
Autos, Tires, & Accessories - 0.6% |
|||||
|
Enron Corp. Series A, 8.375% 5/23/05 |
Baa1 |
|
230,000 |
238,328 |
|
|
ENERGY - 0.7% |
|||||
|
Energy Services - 0.5% |
|||||
|
Baker Hughes, Inc. 5.8% 2/15/03 |
A2 |
|
200,000 |
191,800 |
|
|
Oil & Gas - 0.2% |
|||||
|
Conoco, Inc. 5.9% 4/15/04 |
A3 |
|
75,000 |
71,865 |
|
|
TOTAL ENERGY |
263,665 |
||||
|
FINANCE - 21.5% |
|||||
|
Banks - 12.1% |
|||||
|
Bank of Montreal 6.1% 9/15/05 |
A1 |
|
125,000 |
116,584 |
|
|
Bank One Corp. 7.25% 8/15/04 |
A1 |
|
395,000 |
389,359 |
|
|
Bayerische Landesbank Gironzentrale yankee 6.375% 10/15/05 |
Aaa |
|
200,000 |
192,648 |
|
|
Capital One Bank 6.375% 2/15/03 |
Baa2 |
|
250,000 |
240,363 |
|
|
First National Boston Corp. 8% 9/15/04 |
A2 |
|
325,000 |
328,715 |
|
|
First Security Corp. 7% 7/15/05 |
A3 |
|
375,000 |
364,264 |
|
|
First Tennessee National Corp. 6.75% 11/15/05 |
A3 |
|
200,000 |
191,804 |
|
|
Korea Development Bank: |
|
|
|
|
|
|
6.625% 11/21/03 |
Baa2 |
|
10,000 |
9,632 |
|
|
7.375% 9/17/04 |
Baa2 |
|
225,000 |
218,403 |
|
|
Nonconvertible Bonds - continued |
|||||
|
Moody's Ratings |
Principal Amount |
Value |
|||
|
FINANCE - continued |
|||||
|
Banks - continued |
|||||
|
Korea Development Bank: - continued |
|
|
|
|
|
|
yankee 6.5% 11/15/02 |
Baa2 |
|
$ 100,000 |
$ 97,052 |
|
|
Meridian Bank Pennsylvania 6.625% 3/15/03 |
A1 |
|
250,000 |
244,300 |
|
|
Merita Bank Ltd. yankee 6.5% 1/15/06 |
A1 |
|
150,000 |
142,727 |
|
|
Signet Bank 7.8% 9/15/06 |
A1 |
|
250,000 |
249,190 |
|
|
Society National Bank 7.25% 6/1/05 |
A1 |
|
500,000 |
493,650 |
|
|
Sovran Financial Corp. 9.25% 6/15/06 |
Aa2 |
|
125,000 |
136,289 |
|
|
St. George Bank Ltd. yankee 7.15% 10/15/05 (b) |
Baa1 |
|
500,000 |
487,170 |
|
|
Swiss Bank Corp. 6.75% 7/15/05 |
Aa2 |
|
500,000 |
484,400 |
|
|
Union Planters Corp. 6.75% 11/1/05 |
Baa2 |
|
150,000 |
143,579 |
|
|
|
4,530,129 |
||||
|
Credit & Other Finance - 5.8% |
|||||
|
Abbey National PLC 6.69% 10/17/05 |
Aa3 |
|
300,000 |
290,076 |
|
|
Associates Corp. of North America 5.75% 11/1/03 |
Aa3 |
|
400,000 |
380,324 |
|
|
Finova Capital Corp. 6.12% 5/28/02 |
Baa2 |
|
300,000 |
270,000 |
|
|
Fleet Financial Group, Inc. 7.125% 4/15/06 |
A3 |
|
375,000 |
364,890 |
|
|
Ford Motor Credit Co. 7.5% 6/15/03 |
A2 |
|
250,000 |
249,870 |
|
|
PNC Funding Corp. 7.75% 6/1/04 |
A3 |
|
220,000 |
219,749 |
|
|
Sears Roebuck Acceptance Corp. 6% 3/20/03 |
A3 |
|
70,000 |
67,330 |
|
|
Southwestern Bell Capital Corp. 7.13% 6/1/05 |
A2 |
|
100,000 |
98,569 |
|
|
Sprint Capital Corp. 5.7% 11/15/03 |
Baa1 |
|
250,000 |
236,535 |
|
|
|
2,177,343 |
||||
|
Insurance - 0.9% |
|||||
|
Western National Corp. 7.125% 2/15/04 |
A2 |
|
351,000 |
344,528 |
|
|
Savings & Loans - 1.9% |
|||||
|
H.F. Ahmanson & Co. 7.875% 9/1/04 |
Baa1 |
|
700,000 |
701,792 |
|
|
Securities Industry - 0.8% |
|||||
|
Amvescap PLC yankee 6.6% 5/15/05 |
A3 |
|
50,000 |
46,679 |
|
|
Morgan Stanley Dean Witter & Co. 7.125% 1/15/03 |
Aa3 |
|
250,000 |
249,185 |
|
|
|
295,864 |
||||
|
TOTAL FINANCE |
8,049,656 |
||||
|
Nonconvertible Bonds - continued |
|||||
|
Moody's Ratings |
Principal Amount |
Value |
|||
|
MEDIA & LEISURE - 3.3% |
|||||
|
Broadcasting - 0.8% |
|||||
|
Cox Communications, Inc. 6.5% 11/15/02 |
Baa2 |
|
$ 200,000 |
$ 195,982 |
|
|
Time Warner, Inc. 7.75% 6/15/05 |
Baa3 |
|
111,000 |
111,935 |
|
|
|
307,917 |
||||
|
Entertainment - 0.5% |
|||||
|
Viacom, Inc. 6.75% 1/15/03 |
Baa1 |
|
200,000 |
196,780 |
|
|
Publishing - 2.0% |
|||||
|
News America Holdings, Inc. 8.5% 2/15/05 |
Baa3 |
|
710,000 |
731,662 |
|
|
TOTAL MEDIA & LEISURE |
1,236,359 |
||||
|
NONDURABLES - 1.5% |
|||||
|
Beverages - 0.6% |
|||||
|
Seagram JE & Sons, Inc. 6.4% 12/15/03 |
Baa3 |
|
250,000 |
241,390 |
|
|
Tobacco - 0.9% |
|||||
|
Philip Morris Companies, Inc. 7% 7/15/05 |
A2 |
|
255,000 |
240,717 |
|
|
RJ Reynolds Tobacco Holdings, Inc. 7.375% 5/15/03 |
Baa2 |
|
100,000 |
93,617 |
|
|
|
334,334 |
||||
|
TOTAL NONDURABLES |
575,724 |
||||
|
RETAIL & WHOLESALE - 1.0% |
|||||
|
General Merchandise Stores - 1.0% |
|||||
|
Dayton Hudson Corp. 7.5% 7/15/06 |
A2 |
|
375,000 |
375,600 |
|
|
TRANSPORTATION - 2.8% |
|||||
|
Air Transportation - 0.4% |
|||||
|
Delta Air Lines, Inc. 8.5% 3/15/02 |
Baa3 |
|
174,000 |
175,075 |
|
|
Railroads - 2.4% |
|||||
|
Canadian National Railway Co. 7% 3/15/04 |
Baa2 |
|
300,000 |
292,506 |
|
|
Norfolk Southern Corp. 7.875% 2/15/04 |
Baa1 |
|
400,000 |
402,248 |
|
|
Union Pacific 6.34% 11/25/03 |
Baa3 |
|
200,000 |
192,940 |
|
|
|
887,694 |
||||
|
TOTAL TRANSPORTATION |
1,062,769 |
||||
|
UTILITIES - 4.6% |
|||||
|
Electric Utility - 2.6% |
|||||
|
Commonwealth Edison Co. 6.625% 7/15/03 |
Baa1 |
|
250,000 |
242,648 |
|
|
Niagara Mohawk Power Corp. 7.375% 8/1/03 |
Baa2 |
|
200,000 |
199,592 |
|
|
Nonconvertible Bonds - continued |
|||||
|
Moody's Ratings |
Principal Amount |
Value |
|||
|
UTILITIES - continued |
|||||
|
Electric Utility - continued |
|||||
|
Philadelphia Electric Co.: |
|
|
|
|
|
|
6.5% 5/1/03 |
Baa1 |
|
$ 105,000 |
$ 101,989 |
|
|
6.625% 3/1/03 |
Baa1 |
|
270,000 |
263,650 |
|
|
Public Service Electric & Gas Co. 6.125% 8/1/02 |
A3 |
|
143,000 |
139,801 |
|
|
|
947,680 |
||||
|
Gas - 2.0% |
|||||
|
CMS Panhandle Holding Co. 6.125% 3/15/04 |
Baa3 |
|
100,000 |
94,800 |
|
|
Consolidated Natural Gas Co. 5.75% 8/1/03 |
A2 |
|
500,000 |
477,340 |
|
|
Enserch Corp. 6.25% 1/1/03 |
Baa2 |
|
190,000 |
184,251 |
|
|
|
756,391 |
||||
|
TOTAL UTILITIES |
1,704,071 |
||||
|
TOTAL NONCONVERTIBLE BONDS (Cost $15,290,426) |
14,736,594 |
||||
|
U.S. Government and Government Agency Obligations - 51.9% |
|||||
|
|
|||||
|
U.S. Government Agency Obligations - 25.0% |
|||||
|
Fannie Mae: |
|
|
|
|
|
|
5.125% 2/13/04 |
Aaa |
|
140,000 |
131,907 |
|
|
7% 7/15/05 |
Aaa |
|
1,060,000 |
1,060,827 |
|
|
Federal Home Loan Bank: |
|
|
|
|
|
|
6.25% 8/13/04 |
Aaa |
|
4,500,000 |
4,383,990 |
|
|
6.75% 5/1/02 |
Aaa |
|
2,000,000 |
1,994,680 |
|
|
9.5% 2/25/04 |
Aaa |
|
150,000 |
161,462 |
|
|
Freddie Mac: |
|
|
|
|
|
|
6.875% 1/15/05 |
Aaa |
|
45,000 |
44,782 |
|
|
7% 7/15/05 |
Aaa |
|
65,000 |
65,020 |
|
|
7.375% 5/15/03 |
Aaa |
|
1,500,000 |
1,515,705 |
|
|
TOTAL U.S. GOVERNMENT AGENCY OBLIGATIONS |
9,358,373 |
||||
|
U.S. Treasury Obligations - 26.9% |
|||||
|
U.S. Treasury Bonds: |
|
|
|
|
|
|
10.75% 5/15/03 |
Aaa |
|
6,700,000 |
7,430,697 |
|
|
U.S. Government and Government Agency Obligations - continued |
|||||
|
Moody's Ratings |
Principal Amount |
Value |
|||
|
U.S. Treasury Obligations - continued |
|||||
|
U.S. Treasury Bonds: - continued |
|
|
|
|
|
|
10.75% 8/15/05 |
Aaa |
|
$ 1,000,000 |
$ 1,191,090 |
|
|
11.75% 2/15/10 (callable) |
Aaa |
|
1,225,000 |
1,475,549 |
|
|
TOTAL U.S. TREASURY OBLIGATIONS |
10,097,336 |
||||
|
TOTAL U.S. GOVERNMENT AND (Cost $19,805,495) |
19,455,709 |
||||
|
Foreign Government and Government Agency Obligations (c) - 2.7% |
|||||
|
|
|||||
|
Manitoba Province yankee 6.125% 1/19/04 |
Aa3 |
|
250,000 |
243,475 |
|
|
Ontario Province 7%, 8/4/05 |
Aa3 |
|
275,000 |
272,902 |
|
|
Saskatchewan Province yankee 8% 7/15/04 |
A2 |
|
500,000 |
514,700 |
|
|
TOTAL FOREIGN GOVERNMENT AND (Cost $1,073,601) |
1,031,077 |
||||
|
Cash Equivalents - 3.5% |
|||
|
Maturity Amount |
|
||
|
Investments in repurchase agreements (U.S. Government Obligations), in a joint trading account at 6.65%, dated 7/31/00 due
8/1/00 |
$ 1,316,243 |
1,316,000 |
|
|
TOTAL INVESTMENT PORTFOLIO - 97.4% (Cost $37,485,522) |
36,539,380 |
||
|
NET OTHER ASSETS - 2.6% |
962,338 |
||
|
NET ASSETS - 100% |
$ 37,501,718 |
||
|
Legend |
|
(a) S&P credit ratings are used in the absence of a rating by Moody's Investors Service, Inc. |
|
(b) Security exempt from registration under Rule 144A of the Securities Act of 1933. These securities may be resold in transactions exempt from registration, normally to qualified institutional buyers. At the period end, the value of these securities amounted to $487,170 or 1.3% of net assets. |
|
(c) For foreign government obligations not individually rated by S&P or Moody's, the ratings listed have been assigned |
|
Other Information |
|
The composition of long-term debt holdings as a percentage of total value of investments in securities, is as follows (ratings are unaudited): |
|
Moody's Ratings |
S&P Ratings |
|||
|
Aaa, Aa, A |
75.6% |
|
AAA, AA, A |
47.6% |
|
Baa |
20.8% |
|
BBB |
23.6% |
|
Ba |
0.0% |
|
BB |
0.0% |
|
B |
0.0% |
|
B |
0.0% |
|
Caa |
0.0% |
|
CCC |
0.0% |
|
Ca, C |
0.0% |
|
CC, C |
0.0% |
|
|
|
|
D |
0.0% |
|
Purchases and sales of securities, other |
|
Income Tax Information |
|
At July 31, 2000, the aggregate cost |
|
At July 31, 2000, the fund had a capital loss carryforward of approximately $333,000 all of which will expire on July 31, 2008. |
See accompanying notes which are an integral part of the financial statements.
Annual Report
Fidelity Target Timeline 2003
Statement of Assets and Liabilities
|
|
July 31, 2000 |
|
|
Assets |
|
|
|
Investment in securities, at value (including repurchase agreements of $1,316,000) (cost $37,485,522) - |
|
$ 36,539,380 |
|
Receivable for fund shares sold |
|
261,357 |
|
Interest receivable |
|
765,052 |
|
Receivable from investment adviser for expense reductions |
|
1,371 |
|
Total assets |
|
37,567,160 |
|
Liabilities |
|
|
|
Payable for fund shares redeemed |
$ 10,660 |
|
|
Distributions payable |
19,232 |
|
|
Other payables and accrued expenses |
35,550 |
|
|
Total liabilities |
|
65,442 |
|
Net Assets |
|
$ 37,501,718 |
|
Net Assets consist of: |
|
|
|
Paid in capital |
|
$ 39,052,930 |
|
Undistributed net investment income |
|
5,416 |
|
Accumulated undistributed net realized gain (loss) |
|
(610,486) |
|
Net unrealized appreciation (depreciation) on investments |
|
(946,142) |
|
Net Assets, for 4,141,274 shares outstanding |
|
$ 37,501,718 |
|
Net Asset Value, offering price and redemption price |
|
$9.06 |
See accompanying notes which are an integral part of the financial statements.
Annual Report
Fidelity Target Timeline 2003
Financial Statements - continued
Statement of Operations
|
|
Year ended July 31, 2000 |
|
|
Investment Income Interest |
|
$ 2,110,401 |
|
Expenses |
|
|
|
Management fee |
$ 121,834 |
|
|
Transfer agent fees |
43,022 |
|
|
Accounting fees and expenses |
61,519 |
|
|
Non-interested trustees' compensation |
82 |
|
|
Custodian fees and expenses |
1,709 |
|
|
Registration fees |
27,215 |
|
|
Audit |
28,136 |
|
|
Legal |
1,835 |
|
|
Miscellaneous |
79 |
|
|
Total expenses before reductions |
285,431 |
|
|
Expense reductions |
(186,299) |
99,132 |
|
Net investment income |
|
2,011,269 |
|
Realized and Unrealized Gain (Loss) Net realized gain (loss) on investment securities |
|
(560,622) |
|
Change in net unrealized appreciation (depreciation) on investment securities |
|
(33,451) |
|
Net gain (loss) |
|
(594,073) |
|
Net increase (decrease) in net assets resulting |
|
$ 1,417,196 |
See accompanying notes which are an integral part of the financial statements.
Annual Report
Fidelity Target Timeline 2003
Financial Statements - continued
Statement of Changes in Net Assets
|
|
Year ended |
Year ended |
|
Increase (Decrease) in Net Assets |
|
|
|
Operations |
$ 2,011,269 |
$ 1,624,346 |
|
Net realized gain (loss) |
(560,622) |
(14,251) |
|
Change in net unrealized appreciation (depreciation) |
(33,451) |
(1,113,533) |
|
Net increase (decrease) in net assets resulting |
1,417,196 |
496,562 |
|
Distributions to shareholders |
(2,026,046) |
(1,639,211) |
|
From net realized gain |
- |
(90,269) |
|
In excess of net realized gain |
- |
(15,284) |
|
Total distributions |
(2,026,046) |
(1,744,764) |
|
Share transactions |
22,888,769 |
12,280,874 |
|
Reinvestment of distributions |
1,884,618 |
1,671,487 |
|
Cost of shares redeemed |
(10,387,122) |
(8,768,624) |
|
Net increase (decrease) in net assets resulting |
14,386,265 |
5,183,737 |
|
Redemption fees |
7,538 |
4,022 |
|
Total increase (decrease) in net assets |
13,784,953 |
3,939,557 |
|
Net Assets |
|
|
|
Beginning of period |
23,716,765 |
19,777,208 |
|
End of period (including undistributed net investment income of $5,416 and $13,804, respectively) |
$ 37,501,718 |
$ 23,716,765 |
|
Other Information Shares |
|
|
|
Sold |
2,520,940 |
1,260,185 |
|
Issued in reinvestment of distributions |
207,449 |
172,491 |
|
Redeemed |
(1,141,001) |
(907,278) |
|
Net increase (decrease) |
1,587,388 |
525,398 |
See accompanying notes which are an integral part of the financial statements.
Annual Report
Financial Highlights
|
Years ended July 31, |
2000 |
1999 |
1998 |
1997 |
1996 G |
|
Selected Per-Share Data |
|
|
|
|
|
|
Net asset value, beginning |
$ 9.290 |
$ 9.750 |
$ 9.670 |
$ 9.240 |
$ 10.000 |
|
Income from Investment Operations |
.645 D |
.677 D |
.670 D |
.634 D |
.307 |
|
Net realized and unrealized gain (loss) |
(.229) |
(.404) |
.078 |
.428 |
(.762) |
|
Total from investment operations |
.416 |
.273 |
.748 |
1.062 |
(.455) |
|
Less Distributions |
|
|
|
|
|
|
From net investment income |
(.648) |
(.685) |
(.670) |
(.634) |
(.306) |
|
From net realized gain |
- |
(.043) |
- |
- |
- |
|
In excess of net realized gain |
- |
(.007) |
- |
- |
- |
|
Total distributions |
(.648) |
(.735) |
(.670) |
(.634) |
(.306) |
|
Redemption fees added to |
.002 |
.002 |
.002 |
.002 |
.001 |
|
Net asset value, end of period |
$ 9.060 |
$ 9.290 |
$ 9.750 |
$ 9.670 |
$ 9.240 |
|
Total Return B, C |
4.70% |
2.76% |
8.00% |
11.94% |
(4.53)% |
|
Ratios and Supplemental Data |
|
|
|
|
|
|
Net assets, end of period |
$ 37,502 |
$ 23,717 |
$ 19,777 |
$ 13,211 |
$ 6,977 |
|
Ratio of expenses to average |
.35% E |
.35% E |
.35% E |
.35% E |
.35% A, E |
|
Ratio of expenses to average net assets after expense reductions |
.35% |
.35% |
.35% |
.34% F |
.34% A, F |
|
Ratio of net investment income |
7.10% |
7.00% |
6.92% |
6.76% |
6.93% A |
|
Portfolio turnover rate |
31% |
18% |
67% |
83% |
180% A |
A Annualized
B Total returns for periods of less than one year are not annualized.
C The total returns would have been lower had certain expenses not been reduced during the periods shown.
D Net investment income per share has been calculated based on average shares outstanding during the period.
E FMR agreed to reimburse a portion of the fund's expenses during the period. Without this reimbursement, the fund's expense ratio would have been higher.
F FMR or the fund has entered into varying arrangements with third parties who either paid or reduced a portion of the fund's expenses.
G For the period February 8, 1996 (commencement of operations) to July 31, 1996.
See accompanying notes which are an integral part of the financial statements.
Annual Report
For the period ended July 31, 2000
1. Significant Accounting Policies.
Fidelity Target Timeline 2001 and Fidelity Target Timeline 2003 (the funds) are funds of Fidelity Boston Street Trust (the trust). The trust is registered under the Investment Company Act of 1940, as amended, as an open-end management investment company organized as a Massachusetts business trust. Each fund is authorized to issue an unlimited number of shares. The financial statements have been prepared in conformity with generally accepted accounting principles which require management to make certain estimates and assumptions at the date of the financial statements. The target dates for Fidelity Target Timeline 2001 and Fidelity Target Timeline 2003 are September 30, 2001 and 2003, respectively. On those dates, the respective funds will mature. Target Timeline 2001 is expected to close to new accounts as of the close of business of the New York Stock Exchange on September 25, 2000. Current shareholders of Target Timeline 2001 will be able to continue to purchase shares in accounts existing on that date. Target Timeline 2003's Board of Trustees anticipates closing the fund to new accounts approximately one year prior to its target date. The funds' Board of Trustees expects to liquidate each fund within one month after the fund's target date. The following summarizes the significant accounting policies of the funds:
Security Valuation. Securities are valued based upon a computerized matrix system and/or appraisals by a pricing service, both of which consider market transactions and dealer-supplied valuations. Securities (including restricted securities) for which market quotations are not readily available are valued at their fair value as determined in good faith under consistently applied procedures under the general supervision of the Board of Trustees. Short-term securities with remaining maturities of sixty days or less for which quotations are not readily available are valued at amortized cost or original cost plus accrued interest, both of which approximate current value.
Income Taxes. As a qualified regulated investment company under Subchapter M of the Internal Revenue Code, each fund is not subject to income taxes to the extent that it distributes substantially all of its taxable income for its fiscal year. The schedule of investments includes information regarding income taxes under the caption "Income Tax Information."
Investment Income. Interest income, which includes accretion of original issue discount, is accrued as earned.
Expenses. Most expenses of the trust can be directly attributed to a fund. Expenses which cannot be directly attributed are apportioned among the funds in the trust.
Distributions to Shareholders. Distributions are declared daily and paid monthly from net investment income. Distributions from realized gains, if any, are recorded on the ex-dividend date.
Income and capital gain distributions are determined in accordance with income tax regulations which may differ from generally accepted accounting principles. These
Annual Report
Notes to Financial Statements - continued
1. Significant Accounting Policies - continued
Distributions to Shareholders - continued
differences, which may result in distribution reclassifications, are primarily due to differing treatments for market discount, capital loss carryforwards, and losses deferred due to wash sales and excise tax regulations.
Permanent book and tax basis differences relating to shareholder distributions will result in reclassifications to paid in capital. Undistributed net investment income and accumulated undistributed net realized gain (loss) on investments may include temporary book and tax basis differences which will reverse in a subsequent period. Any taxable income or gain remaining at fiscal year end is distributed in the following year.
Short-Term Trading (Redemption) Fees. Shares held in the funds less than 90 days are subject to a short-term trading fee equal to .50% of the proceeds of the redeemed shares. The fee, which is retained by the fund, is accounted for as an addition to paid in capital.
Security Transactions. Security transactions are accounted for as of trade date. Gains and losses on securities sold are determined on the basis of identified cost.
2. Operating Policies.
Joint Trading Account. Pursuant to an Exemptive Order issued by the Securities and Exchange Commission (the SEC), the funds, along with other affiliated entities of Fidelity Management & Research Company (FMR), may transfer uninvested cash balances into one or more joint trading accounts. These balances are invested in one or more repurchase agreements for U.S. Treasury or Federal Agency obligations.
Repurchase Agreements. The underlying U.S. Treasury, Federal Agency, or other obligations found to be satisfactory by FMR are transferred to an account of the funds, or to the Joint Trading Account, at a custodian bank. The securities are marked-to-market daily and maintained at a value at least equal to the principal amount of the repurchase agreement (including accrued interest). FMR, the funds' investment adviser, is responsible for determining that the value of the underlying securities remains in accordance with the market value requirements stated above.
Interfund Lending Program. Pursuant to an Exemptive Order issued by the SEC, each fund, along with other registered investment companies having management contracts with FMR, may participate in an interfund lending program. This program provides an alternative credit facility allowing the fund to borrow from, or lend money to, other participating funds.
Restricted Securities. The funds are permitted to invest in securities that are subject to legal or contractual restrictions on resale.
Annual Report
Notes to Financial Statements - continued
2. Operating Policies - continued
Restricted Securities - continued
These securities generally may be resold in transactions exempt from registration or to the public if the securities are registered. Disposal of these securities may involve time-consuming negotiations and expense, and prompt sale at an acceptable price may be difficult. At the end of the period, no funds had investments in restricted securities (excluding 144A issues).
3. Purchases and Sales of Investments.
Information regarding purchases and sales of securities (other than short-term securities), is included under the caption "Other Information" at the end of each applicable fund's schedule of investments.
4. Fees and Other Transactions with Affiliates.
Management Fee. As each fund's investment adviser, FMR receives a monthly fee that is calculated on the basis of a group fee rate plus a fixed individual fund fee rate applied to the average net assets of each fund. The group fee rate is the weighted average of a series of rates and is based on the monthly average net assets of all the mutual funds advised by FMR. The rates ranged from .0920% to .3700% for the period. The annual individual fund fee rate is .30%. In the event that these rates were lower than the contractual rates in effect during the period, FMR voluntarily implemented the above rates, as they resulted in the same or a lower management fee. For the period, the management fees were equivalent to annual rates of .43% of average net assets for each fund.
Sub-Adviser Fee. As each fund's investment sub-adviser, Fidelity Investments Money Management, Inc.(FIMM), a wholly owned subsidiary of FMR, receives a fee from FMR of 50% of the management fee payable to FMR. The fee is paid prior to any voluntary expense reimbursements which may be in effect.
Transfer Agent Fees. Fidelity Service Company, Inc. (FSC), an affiliate of FMR, is the funds' transfer, dividend disbursing and shareholder servicing agent. FSC receives account fees and asset-based fees that vary according to account size and type of account. FSC pays for typesetting, printing and mailing of all shareholder reports, except proxy statements. For the period, the transfer agent fees were equivalent to an annual rate of .13% and .15% of the average net assets of Fidelity Target Timeline 2001 and Fidelity Target Timeline 2003, respectively.
Accounting and Security Lending Fees. FSC maintains each fund's accounting records and administers the security lending program. The security lending fee is based on the number and duration of lending transactions. The accounting fee is based on the level of average net assets for the month plus out-of-pocket expenses.
5. Interfund Lending Program.
Fidelity Target Timeline 2001 participated in the interfund lending program as a lender. The average daily loan balance during the period for which the loan was
Annual Report
Notes to Financial Statements - continued
5. Interfund Lending
Program - continued
outstanding amounted to $3,793,000. The weighted average interest rate was 5.92%. Interest earned from the interfund lending program amounted to $3,118 and is included in interest income on the Statement of Operations. At period end there were no interfund loans outstanding.
6. Security Lending.
Certain funds lend portfolio securities from time to time in order to earn additional income. Each applicable fund receives collateral(in the form of U.S. Treasury obligations, letters of credit and/or cash) against the loaned securities and maintains collateral in an amount not less than 100% of the market value of the loaned securities during the period of the loan. The market value of the loaned securities is determined at the close of business of the funds and any additional required collateral is delivered to the funds on the next business day. If the borrower defaults on its obligation to return the securities loaned because of insolvency or other reasons, a fund could experience delays and costs in recovering the securities loaned or in gaining access to the collateral. At period end there were no security loans outstanding.
7. Expense Reductions.
FMR voluntarily agreed to reimburse each fund's operating expenses (excluding interest, taxes, certain securities lending fees, brokerage commissions and extraordinary expenses, if any) above an annual rate of
.35% of each fund's average net assets. For the period, the reimbursement reduced the expenses by $489,293 and $186,275 for Fidelity Target Timeline 2001 and Fidelity Target Timeline 2003, respectively.
FMR has directed certain portfolio trades to brokers who paid a portion of Fidelity Target Timeline 2001's expenses. For the period, the fund's expenses were reduced by $443 under this arrangement.
In addition, through an arrangement with the funds' custodian, credits realized as a result of uninvested cash balances were used to reduce a portion of each fund's expenses. During the period, Fidelity Target Timeline 2001 and Fidelity Target Timeline 2003's custodian fees were reduced by $1,728 and $24, respectively, under this arrangement.
8. Beneficial Interest.
At the end of the period, FMR and its affiliates was record owner of approximately 12% of the total outstanding shares of Target Timeline 2003.
Annual Report
To the Board of Trustees and Shareholders of Fidelity Target Timeline 2001 and Fidelity Target Timeline 2003:
We have audited the accompanying statements of assets and liabilities of Fidelity Target Timeline 2001 and Fidelity Target Timeline 2003 (the funds), each a fund of Fidelity Boston Street Trust (the Trust), including the portfolios of investments, as of July 31, 2000, and the related statements of operations for the year then ended, the statements of changes in net assets for each of the two years in the period then ended, and the financial highlights for each of the five years in the period then ended. These financial statements and financial highlights are the responsibility of the funds' management. Our responsibility is to express an opinion on these financial statements and financial highlights based on our audits.
We conducted our audits in accordance with auditing standards generally accepted in the United States of America. Those standards require that we plan and perform the audit to obtain reasonable assurance about whether the financial statements and financial highlights are free of material misstatement. An audit includes examining, on a test basis, evidence supporting the amounts and disclosures in the financial statements. Our procedures included confirmation of securities owned as of July 31, 2000, by correspondence with the custodian and brokers; where replies were not received from brokers, we performed other auditing procedures. An audit also includes assessing the accounting principles used and significant estimates made by management, as well as evaluating the overall financial statement presentation. We believe that our audits provide a reasonable basis for our opinion.
In our opinion, the financial statements and financial highlights referred to above present fairly, in all material respects, the financial position of Fidelity Target Timeline 2001 and Fidelity Target Timeline 2003 as of July 31, 2000, the results of their operations for the year then ended, the changes in their net assets for each of the two years in the period then ended, and their financial highlights for each of the five years in the period then ended, in conformity with accounting principles generally accepted in the United States of America.
/s/DELOITTE & TOUCHE LLP
DELOITTE & TOUCHE LLP
Boston, Massachusetts
September 1, 2000
Annual Report
A total of 45.32% and 45.17% of the dividends distributed during the fiscal year for Fidelity Target Timeline 2001 and Fidelity Target Timeline 2003, respectively, was derived from interest on U.S. Government securities which is generally exempt from state income tax.
The funds will notify shareholders in January 2001 of amounts for use in preparing 2000 income tax returns.
Annual Report
Fidelity offers several ways to conveniently manage your personal investments via your telephone or PC. You can access your account information, conduct trades and research your investments 24 hours a day.
By Phone
Fidelity Automated Service Telephone provides a single toll-free number to access account balances, positions, quotes and trading. It's easy to navigate the service, and on your first call, the system will help you create a personal identification number (PIN) for security.
(phone_graphic)Fidelity Automated
Service Telephone (FAST®)
1-800-544-5555
Press
1 For mutual fund and brokerage trading.
2 For quotes.*
3 For account balances and holdings.
4 To review orders and mutual
fund activity.
5 To change your PIN.
*0 To speak to a Fidelity representative.
By PC
Fidelity's web site on the Internet provides a wide range of information, including daily financial news, fund performance, interactive planning tools and news about Fidelity products and services.
(computer_graphic)Fidelity's Web Site
www.fidelity.com
If you are not currently on the Internet, call EarthLink Sprint at 1-800-288-2967, and be sure to ask for registration number SMD004 to receive a special Fidelity package that includes 30 days of free Internet access. EarthLink is North America's #1 independent Internet access provider.
(computer_graphic)
Fidelity On-line Xpress+®
Fidelity On-line Xpress+ software for Windows combines comprehensive portfolio management capabilities, securities trading and access to research and analysis tools . . . all on your desktop. Call Fidelity at 1-800-544-0240 or visit our web site for more information on how to manage your investments via your PC.
* When you call the quotes line, please remember that a fund's yield and return will vary and, except for money market funds, share price will also vary. This means that you may have a gain or loss when you sell your shares. There is no assurance that money market funds will be able to maintain a stable $1 share price; an investment in a money market fund is not insured or guaranteed by the U.S. government. Total returns are historical and include changes in share price, reinvestment of dividends and capital gains, and the effects of any sales charges.
Annual Report
For directions and hours,
please call 1-800-544-9797.
Arizona
7373 N. Scottsdale Road
Scottsdale, AZ
California
815 East Birch Street
Brea, CA
851 East Hamilton Avenue
Campbell, CA
527 North Brand Boulevard
Glendale, CA
19200 Von Karman Avenue
Irvine, CA
10100 Santa Monica Blvd.
Los Angeles, CA
251 University Avenue
Palo Alto, CA
1760 Challenge Way
Sacramento, CA
7676 Hazard Center Drive
San Diego, CA
8 Montgomery Street
San Francisco, CA
950 Northgate Drive
San Rafael, CA
1400 Civic Drive
Walnut Creek, CA
6300 Canoga Avenue
Woodland Hills, CA
Colorado
1625 Broadway
Denver, CO
Connecticut
48 West Putnam Avenue
Greenwich, CT
265 Church Street
New Haven, CT
300 Atlantic Street
Stamford, CT
29 South Main Street
West Hartford, CT
Delaware
222 Delaware Avenue
Wilmington, DE
Florida
4400 N. Federal Highway
Boca Raton, FL
90 Alhambra Plaza
Coral Gables, FL
4090 N. Ocean Boulevard
Ft. Lauderdale, FL
1907 West State Road 434
Longwood, FL
8880 Tamiami Trail, North
Naples, FL
2401 PGA Boulevard
Palm Beach Gardens, FL
8065 Beneva Road
Sarasota, FL
1502 N. Westshore Blvd.
Tampa, FL
Georgia
3445 Peachtree Road, N.E.
Atlanta, GA
1000 Abernathy Road
Atlanta, GA
Illinois
One North Franklin Street
Chicago, IL
1415 West 22nd Street
Oak Brook, IL
1700 East Golf Road
Schaumburg, IL
3232 Lake Avenue
Wilmette, IL
Indiana
4729 East 82nd Street
Indianapolis, IN
Maine
Three Canal Plaza
Portland, ME
Maryland
7401 Wisconsin Avenue
Bethesda, MD
One W. Pennsylvania Ave.
Towson, MD
Massachusetts
801 Boylston Street
Boston, MA
155 Congress Street
Boston, MA
25 State Street
Boston, MA
300 Granite Street
Braintree, MA
44 Mall Road
Burlington, MA
416 Belmont Street
Worcester, MA
Annual Report
Michigan
280 Old N. Woodward Ave.
Birmingham, MI
29155 Northwestern Hwy.
Southfield, MI
Minnesota
7600 France Avenue South
Edina, MN
Missouri
700 West 47th Street
Kansas City, MO
8885 Ladue Road
Ladue, MO
New Jersey
150 Essex Street
Millburn, NJ
56 South Street
Morristown, NJ
501 Route 17, South
Paramus, NJ
New York
1055 Franklin Avenue
Garden City, NY
999 Walt Whitman Road
Melville, L.I., NY
1271 Avenue of the Americas
New York, NY
71 Broadway
New York, NY
350 Park Avenue
New York, NY
North Carolina
4611 Sharon Road
Charlotte, NC
Ohio
600 Vine Street
Cincinnati, OH
28699 Chagrin Boulevard
Woodmere Village, OH
Oregon
16850 SW 72nd Avenue
Tigard, OR
Pennsylvania
1735 Market Street
Philadelphia, PA
439 Fifth Avenue
Pittsburgh, PA
Rhode Island
47 Providence Place
Providence, RI
Tennessee
6150 Poplar Avenue
Memphis, TN
Texas
10000 Research Boulevard
Austin, TX
4017 Northwest Parkway
Dallas, TX
1155 Dairy Ashford Street
Houston, TX
2701 Drexel Drive
Houston, TX
400 East Las Colinas Blvd.
Irving, TX
14100 San Pedro
San Antonio, TX
19740 IH 45 North
Spring, TX
Utah
215 South State Street
Salt Lake City, UT
Virginia
1861 International Drive
McLean, VA
Washington
411 108th Avenue, N.E.
Bellevue, WA
511 Pine Street
Seattle, WA
Washington, DC
1900 K Street, N.W.
Washington, DC
Wisconsin
595 North Barker Road
Brookfield, WI
Fidelity Brokerage Services, Inc., 100 Summer St., Boston, MA 02110 Member NYSE/SIPC
Annual Report
If more than one address is listed, please locate the address that is closest to you. We'll give your correspondence immediate attention and send you written confirmation upon completion of your request.
(letter_graphic)Making Changes
To Your Account
(such as changing name, address, bank, etc.)
Fidelity Investments
P.O. Box 770001
Cincinnati, OH 45277-0002
(letter_graphic)For Non-Retirement
Accounts
Buying shares
Fidelity Investments
P.O. Box 770001
Cincinnati, OH 45277-0003
Overnight Express
Fidelity Investments
2300 Litton Lane - KH1A
Hebron, KY 41048
Selling shares
Fidelity Investments
P.O. Box 660602
Dallas, TX 75266-0602
Overnight Express
Fidelity Investments
Attn: Redemptions - CP6I
400 East Las Colinas Blvd.
Irving, TX 75039-5587
General Correspondence
Fidelity Investments
P.O. Box 500
Merrimack, NH 03054-0500
(letter_graphic)For Retirement
Accounts
Buying shares
Fidelity Investments
P.O. Box 770001
Cincinnati, OH 45277-0003
Selling shares
Fidelity Investments
P.O. Box 660602
Dallas, TX 75266-0602
Overnight Express
Fidelity Investments
Attn: Redemptions - CP6R
400 East Las Colinas Blvd.
Irving, TX 75039-5587
General Correspondence
Fidelity Investments
P.O. Box 500
Merrimack, NH 03054-0500
Annual Report
Annual Report
Investment Adviser
Fidelity Management & Research Company
Boston, MA
Investment Sub-Advisers
Fidelity Management & Research
(U.K.) Inc.
Fidelity Management & Research
(Far East) Inc.
Fidelity Investments Money Management, Inc.
Fidelity Investments Japan Limited
Officers
Edward C. Johnson 3d, President
Robert C. Pozen, Senior Vice President
Dwight D. Churchill, Vice President
Stanley N. Griffith,
Assistant Vice President
David L. Murphy, Vice President
Ford E. O'Neil, Vice President
Eric D. Roiter, Secretary
Robert A. Dwight, Treasurer
Maria F. Dwyer, Deputy Treasurer
John H. Costello, Assistant Treasurer
Thomas J. Simpson, Assistant Treasurer
Board of Trustees
Ralph F. Cox *
Phyllis Burke Davis *
Robert M. Gates *
Edward C. Johnson 3d
Donald J. Kirk *
Ned C. Lautenbach *
Peter S. Lynch
Marvin L. Mann *
William O. McCoy *
Gerald C. McDonough *
Robert C. Pozen
Thomas R. Williams *
Advisory Board
J. Michael Cook
Abigail P. Johnson
Marie L. Knowles
* Independent trustees
General Distributor
Fidelity Distributors Corporation
Boston, MA
Transfer and Shareholder
Servicing Agent
Fidelity Service Company, Inc.
Boston, MA
Custodian
Bank of New York
New York, NY
Fidelity's Taxable Bond Funds
Capital & Income Fund
Ginnie Mae Fund
Government Income Fund
High Income Fund
Intermediate Bond Fund
Intermediate Government
Income Fund
International Bond Fund
Investment Grade Bond Fund
New Markets Income Fund
Short-Term Bond Fund
Spartan® Government Income Fund
Spartan Investment Grade Bond Fund
Strategic Income Fund
Target Timeline® 2001 & 2003
The Fidelity Telephone Connection
Mutual Fund 24-Hour Service
Exchanges/Redemptions
and Account Assistance 1-800-544-6666
Product Information 1-800-544-6666
Retirement Accounts 1-800-544-4774
(8 a.m. - 9 p.m.)
TDD Service 1-800-544-0118
for the deaf and hearing impaired
(9 a.m. - 9 p.m. Eastern time)
Fidelity Automated Service
Telephone (FAST®) (automated graphic) 1-800-544-5555
(automated graphic) Automated line for quickest service
(Fidelity Investment logo)(registered trademark)
Corporate Headquarters
82 Devonshire St., Boston, MA 02109
www.fidelity.com
TTI-ANN-0900 110513
1.536376.103
|
|