|
|
|
|
|
|
|
|
|
|
Previous: SCI SYSTEMS INC, 10-K, EX-10.(J)(1), 2000-09-28 |
Next: SCI SYSTEMS INC, 10-K, EX-21, 2000-09-28 |
|
S C I
S y s t e m s , I n c .
SCI – THE e-EMS COMPANY™ Our e-initiative gained momentum with Gene Sapp, the Company's Chief Executive Officer, declaring that we will be "SCI – The e-EMS Company.™" This bold and visionary declaration serves as the catalyst for everyone in the Company to make this goal a reality. Today, we are developing e-enabled processes that allow real time collaboration linking customers and the entire supply chain through Web-based communications. We believe that "e" stands for "e-fficiency" and that means reducing cost throughout the enterprise while providing e-enabled processes and e-solutions for every customer, regardless of their requirements. It has been said that electronics companies that are not willing to aggressively adapt e-business tools and Internet communications with dispatch will be market losers. SCI intends to be a winner. We will claim accelerated growth and increased return to shareholders while providing customers with optimized quality, state-of-the-art functionality, guaranteed availability, shortened time-to-market, maximum flexibility, leading edge technology, and enhanced customer experience.
CONTENTS LETTER TO SHAREHOLDERS RETURN ON e OPERATING AND FINANCIAL INFORMATION |
SCI HIGHLIGHTS
|
END-TO-END
SUPPLY CHAIN SOLUTIONS |
BROAD DESIGN AND ENGINEERING SERVICES SCI's end-to-end supply chain solutions include industry-leading engineering services. Our ISO 9001 certified product development resources provide electrical, mechanical, custom ASIC, software and test design, and complete turnkey systems development. SCI's design validation and qualification facilities and processes ensure faster time-to-market, product reliability and lower product support costs. Design centers are located in North America, Europe, and Southeast Asia. |
|
|
PRODUCT
DESIGN
|
||
|
|
||
|
ENGINEERING
|
||
|
|
||
|
ORDER
FULFILLMENT |
||
|
|
||
|
MATERIAL
AND
INVENTORY MANAGEMENT |
ADVANCED MANUFACTURING AND TECHNOLOGY SCI manufactures a broad range of electronic sub-assemblies and finished products in a worldwide network of 38 plants, all of which are ISO 9002 certified. We have invested heavily in facilities, equipment, people and processes. Advanced process development resources enable SCI and our customers to take advantage of and utilize continuously evolving state-of-the-art component packaging and manufacturing process innovations. |
|
|
|
||
|
MANUFACTURING
AND PROCESS CONTROL |
||
|
|
||
|
SYSTEM
BUILD/TEST |
||
|
|
||
|
LOGISTICS
AND
DISTRIBUTION |
PROFESSIONAL SUPPORT SERVICES SCI provides after-sales support. These services include in- and out-of-warranty repair solutions, spare parts management, refurbishment and product reconfiguration. Custom-designed to meet customer needs, these services provide high velocity electronic coordination and exceptional customer satisfaction. |
|
|
|
||
|
REPAIR
AND SERVICE |
FINANCIAL
PERFORMANCE
SCI Systems, Inc.
| (Dollar amounts in millions, except share data) | |||||||
| Fiscal Year Ended June 30, 2000 | 2000 | 1999 |
Change
|
||||
|
|
|||||||
| Net Sales | $ 8,343 | $ 6,711 | 24.3 | % | |||
| EBITDA | 473 | 350 | 35.1 | ||||
| Operating Income | 322 | 235 | 37.0 | ||||
| Net Income | 197 | 138 | 42.7 | ||||
| Diluted Earnings Per Share | 1.34 | 1.00 | 34.0 | ||||
| "Cash" Earnings Per Share | 1.45 | 1.03 | 40.8 | ||||
| Total Debt | 763 | 141 | 441.1 | ||||
| Shareholders' Equity | 1,368 | 1,165 | 17.4 | ||||
| Total Assets | $ 3,351 | $ 2,323 | 44.3 | ||||
| Common Shares Issued and Outstanding at Year End | 144,589,170 | 143,885,150 | 0.5 | ||||
|
|
|||||||
 |
 |
 |
||
|
NET SALES Sales reached a record $8.3 billion, including accelerated growth in telecommunications and other non-computer business. |
BOOKINGS SCI bookings reached a record $9.63 billion, reflecting the EMS industry's strong growth environment. |
DILUTED EARNINGS Diluted earnings per share advanced 34% to an all-time high of $1.34. |
|
SIGNIFICANT EVENTS OF THE YEAR NEW CEO NAMED Gene Sapp, formerly SCI COO, becomes CEO at the beginning of FY 2000 as well as Chairman at the beginning of FY 2001. NORTEL ACQUISITION SCI acquires Nortel assets and operations in Brockville, Ontario. KEY MANAGEMENT ADDITIONS Jim Moylan joins SCI as CFO and Bob Bradshaw joins as COO. STRATEGIC ACQUISITIONS SCI acquires TAG Manufacturing in San Jose and an ECI plant in Tel Aviv. STOCK SPLIT SCI effects a 2-for-1 stock split in the form of a stock dividend. CONVERTIBLE DEBT OFFERING SCI sells $575 million of convertible debentures in a highly successful offering. NOKIA ACQUISITION SCI solidifies Nokia relationship with the acquisition of the multi-media engineering group in Motala, Sweden. eHITEX FORMED SCI, with several customers, becomes a founding member of eHITEX, an Internet exchange for the electronics industry.
A. Eugene Sapp, Jr.
TO OUR SHAREHOLDERS, CUSTOMERS, EMPLOYEES, AND SUPPLIERS At SCI, we seek the highestRETURN ON all our initiatives. Today, as we transition SCI to a new age, we are making "RETURN ON e" the next critical measure of success. Our goal is to be e-business driven and to optimize the RETURN ON our e-investments just as we do our ROA. RECORD SALES, EARNINGS AND NEW BUSINESS Fiscal Year 2000 was one of great progress for SCI. Sales, earnings and new business contracts reached all-time highs, and future prospects are at unprecedented levels. During the year we:
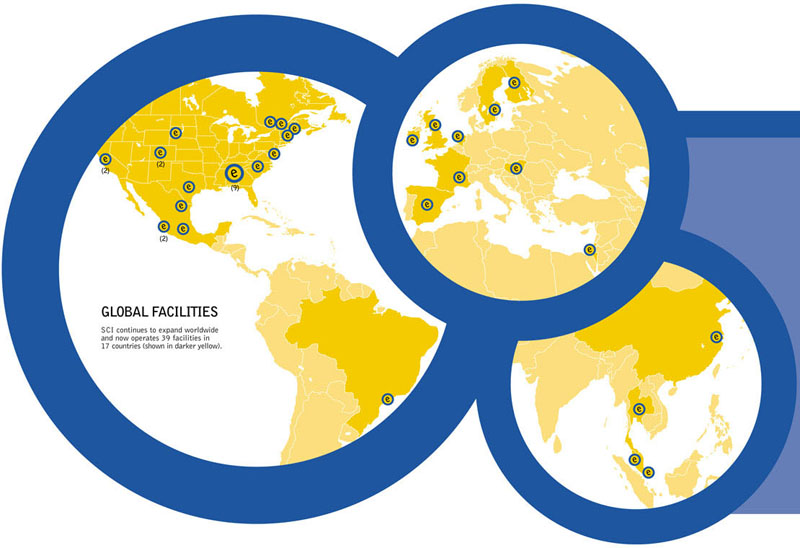
Customers continue to move rapidly in developing global strategic supply chain partnerships; and we are pleased that fiscal 2000 was a year in which SCI strengthened a number of such existing relationships and established several new ones with significant long-term potential. REVENUES UP 24% Sales for the year were a record $8.3 billion, up 24% from the $6.7 billion reported in 1999. Sales increased during the year from the $8.0 billion earlier expected due to accelerating growth in telecommunications and other noncomputer business segments. The acquisition and related agreements we closed with Nortel in September significantly contributed to topline growth with sales to Nortel exceeding $900 million for the full year. Also, growth in sales to a number of existing customers and the establishment of several new promising relationships contributed to the increase for the year. Finally, average selling price declines experienced in 1999 abated somewhat during the year 2000 due, in large part, to high demand for electronic components and a corresponding tight supply environment. International sales represented 50% of revenues in the year 2000 as compared to 42% in 1999. Growth in international sales is expected to continue to outpace domestic growth due to SCI's expanding multinational presence, accelerated outsourcing by international companies, and strong demand for low-cost manufacturing and related services from our lowest cost manufacturing centers, most notably those in Mexico, China, Malaysia, and Hungary. Going forward, our Canadian activities will rapidly expand to support Nortel, one of our fastest growing customers, along with other Canadian requirements. INCOME AND RETURNS BOTH ADVANCE Fully diluted earnings per share were $.38 and $1.34 for the fourth quarter and fiscal year compared to $.30 and $1.00 for the same periods in 1999, representing increases of 27% and 34%, respectively. Operating margins improved during the year, with a full year operating margin of 3.86% versus last year's 3.50%. Even more significant was the 4.02% margin we reported for the fourth quarter, which exceeded our intermediate term goal of 4.0%. We are pleased with this upward trend in margins resulting from business mix improvement and increased internal efficiency. We expect this positive direction to continue. SOLID BALANCE SHEET SCI's financial position remains strong, with liquidity and access to capital more than adequate to fund our continued growth. Shareholders' equity approached $1.4 billion at fiscal year end, and total debt was less than $800 million. During the year, Standard & Poor's affirmed our investment grade credit rating and Moody's rated our debt for the first time, also at the investment grade level. We renegotiated our bank credit facilities during fiscal 2000 and now have immediate access to over $600 million to fund future growth needs. Finally, in March we sold $575 million of subordinated convertible debentures in a highly successful offering, and we believe that the markets are open to SCI when additional capital is needed. HIGH GROWTH BUSINESS ENVIRONMENT New orders received during fiscal 2000 amounted to $9.6 billion compared to $7.1 billion in 1999, an increase of 35%. The EMS industry continues to benefit from the unabated trend toward outsourcing on a global basis, and we are confident that SCI's opportunities for growth and diversification have never been better. The business environment fully supports continued improvement in our business mix, engagement with a number of new customers, healthy organic growth with an impressive group of existing customers, and strategic acquisitions that will strengthen both our service offerings and customer base. While demand for desktop computers may not be expanding at historic rates, other business sectors we serve are experiencing rapid expansion that is significantly benefiting our ongoing growth and margin improvement. The Internet is expected to drive augmented growth in demand for a wide range of Web-oriented products and systems and spur the development of a multitude of technology innovations for some time to come. Today, EMS companies have penetrated only about one quarter of the available market, estimated to be about $600 billion. Further penetration, coupled with available market growth, will provide a superior growth environment for years to come. CUSTOMER AND PRODUCT DIVERSIFICATION CONTINUES SCI has long been blessed with one of the most diversified and highest quality customer bases in the global EMS industry. We also believe SCI produces the broadest range of subassemblies and finished products of any EMS company. All this notwithstanding, we have embarked on a growth strategy that includes priority focus on the addition of a number of multinational world-class, high growth companies to our customer base and continued emphasis on balanced industry segment participation. Our goal is to achieve industry leading business, product and customer mixes to provide the basis for sustained growth. We are also committed to maintaining a balance of mature, high growth, and emerging growth markets. During fiscal 2000, we made significant progress in achieving this diversification objective. Several major new customers were acquired. Our involvement with communication equipment grew substantially. SCI's personal computer business grew but declined as a percent of total business. Encouraging progress was made in posturing SCI for continued growth in other areas such as servers, peripheral products, set top boxes, "digital home appliances," and medical products. SCI – THE e-EMS COMPANY We enjoy an excellent reputation for delivering on the cornerstones of SCI's long-standing operating philosophy: cost competitiveness, high quality, and customer responsiveness. As we enter the new millennium, opportunities to enhance new business models and information technologies are numerous and compelling. When properly implemented, these opportunities will allow us to not only confirm our existing philosophy, but also to rise above the competition in delivering lower cost solutions, the highest quality products and services, and unmatched responsiveness and speed in customer dealings, supply chain management and adaptation to a full range of business dynamics. I have directed that SCI move with dispatch to employ the Internet and selected e-business tools to automate our customer and supplier transactions, so as to truly change the way business is conducted between SCI and our partners. "e" in today's business climate means not only being digitized and Web-enabled, but also connotes being innovative, progressive, energized, motivated, enlightened, focused, and much more. We are fully committed to being totally e-business driven and are making the necessary investments in our organization, technology, people, and information systems to get us there. Additionally, we are fully committed to excellence throughout the business that embodies those traits listed above. We therefore believe it highly appropriate that we identify ourselves as "SCI – The e-EMS Company™" and have registered that trademark so that we can be truly and distinctly identified as what we are and what we stand for in this new business age. Moreover, we are dedicating this annual report to delineating the returns we expect to realize from being the e-company we are in the process of becoming. GLOBAL FACILITIES SCI continues to expand
worldwide
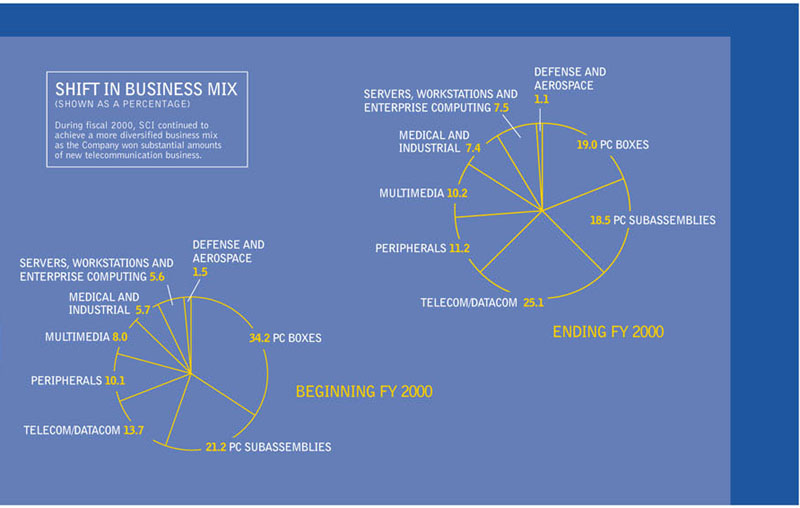
SHIFT
IN BUSINESS MIX During fiscal 2000,
SCI continued to
SUBSTANTIAL ORGANIZATIONAL AND MANAGEMENT DEVELOPMENTS Fiscal 2000 was a year of significant focus on defining and staffing an organization to facilitate our growth objectives and provide superior leadership well into the future. During the year, we organized the Company's operating divisions into two major groups and established two group executive vice president positions reporting to the chief operating officer. Pete Scheffler, a seasoned SCI executive, has been assigned responsibility for our Atlantic Group Divisions. The Pacific Group position will be filled in coming months. Our technology and product development resources were consolidated globally under our Technology Division with the emphasis on broadening this division's customer base as well as its geographic coverage. Our European Division was divided into Northern and Southern European Divisions to deal with the expanded number of European sites and accelerating EMS business that SCI is involved with there. Each of our operating divisions is managed by a highly qualified senior vice president with average tenures and minimum tenures with SCI of 17 years and five years, respectively. The breadth, depth, and experience of this team of operational executives are considered assets unmatched in the industry. I assumed the positions of Chief Executive Officer and Chairman at the beginning of fiscal years 2000 and 2001, respectively, after serving as Chief Operating Officer for 18 years. In the first half of the year, Jim Moylan joined us as our new Chief Financial Officer, and shortly thereafter, Bob Bradshaw was hired as our new Chief Operating Officer. These senior executives are making solid contributions to SCI's progress and are significantly adding to our leadership base so important in these times of great opportunity. In addition, three new corporate positions have been created and filled to sharpen our focus on supply chain management, information technology, and marketing. Bhawnesh Mathur has joined us as Senior Vice President of Supply Chain Management. Vin Melvin has filled the Chief Information Officer position and Bruce Leasure recently joined SCI as Vice President Corporate Marketing. The positions are critically linked to assure we are closely coordinated in our efforts to build strong, strategic relationships as SCI – The e-EMS Company. A FUTURE FULL OF OPPORTUNITY The outlook for SCI is very favorable. The market for EMS services continues to expand rapidly and dramatically as the world continues to become more and more electronic and as OEMs move with heightened commitment to engage reliable, proven, large-scale outsourcing partners. We strongly believe that SCI has the capabilities, employees, organization, management, customers, supplier partnerships, and financial strength to capitalize on these trends and many other available opportunities. Organization and management have always been among our strongest assets and we will continue to drive for unsurpassed excellence in these areas. Moreover, our strong strategic relationships and solid performance record will foster healthy organic growth while disciplined acquisitions will facilitate new growth, new customer development as well as service expansions. We are quite optimistic as we look to fiscal 2001 and believe that, as a leading e-EMS company, we are well positioned for sustained, long-term growth. As always, we are most appreciative of the contributions of our employees and directors and the support of our customers and suppliers. It is the team-work among all these constituencies that ultimately benefits our shareholders and assures the continual success of SCI. /s/ A. Eugene Sapp, Jr. A. Eugene Sapp, Jr. August 25, 2000
Olin B. King In 1961, Olin King and a few associates left NASA to found SCI Systems, originally named Space Craft, Inc., in the basement of his home. Throughout SCI's history he has been a key factor in the Company's success and his career achievements are in great measure reflected in the milestones of SCI's development and growth. It is indeed fitting that SCI's annual report to its shareholders for fiscal year 2000 call special attention to Olin upon his retirement as SCI's Chairman and recognize him for his vision, leadership, dedication, hard work, commitment to excellence, and uncompromising business ethics throughout the Company's history. Olin would quickly remind the reader that SCI's accomplishments have required a team of capable and motivated officers and managers and thousands of dedicated employees of many nationalities. However, his leadership has been invaluable and has well postured SCI for a very bright and prosperous future. While Olin has retired as an employee, SCI will continue to benefit from his business wisdom and judgment as he remains an active member of the Company's Board of Directors.
RETURN ON e
RETURN ON e We begin our journey into the world of e-business ahead of many in the EMS industry because we have already developed a common information technology footprint among all our facilities. We are not starting from scratch. Today, we are linked with a secure, scalable network architecture combined with integrated enterprise planning and financial systems, and a growing range of common plant-level applications. More importantly, we are building our e-initiatives on a platform of sound business and management concepts, as well as solid relationships with our customers and supply chain partners. WHATEVER IT TAKES Most tier-one EMS suppliers provide the quality, competitive pricing and global accessibility customers demand. The big differentiators are now superior management and customer responsiveness. SCI has long been the Company that will do "whatever it takes" to deliver exemplary products and service; now, SCI is going even further to heighten our customer responsiveness by investing heavily in e-enablement systems – systems that are open for business 24/7… systems that can speak any language … systems that can scour the earth for the best materials, the latest innovations, and the brightest minds. The way the world does business is being transformed and we are well on our way to being SCI – The e-EMS Company that is able to take full advantage of all the future holds.
RETURN ON e With e-enablement, SCI customers are gaining unprecedented flexibility and velocity to initiate and respond to changes in the business landscape. New levels of speed, agility, and performance are possible because pertinent data on a host of critical matters, from on-hand parts to shipping information, are being made available by SCI anytime, anywhere. IMMEDIATE, SIMPLIFIED COLLABORATION Once linked, customers can confer with SCI and our suppliers on-line in a seemingly virtual manufacturing environment. Reaction times are collapsed. Ideas are more easily shared. Communication is easier. Relationships are strengthened. And customers enjoy increased competitiveness in the marketplace. BETTER PLANNING AND BUSINESS DECISIONS SCI customers gain even more important returns with e-initiatives in place. Original Equipment Manufacturer (OEM) purchasing agents, engineers, and product designers can perform enhanced forecasting, scheduling and inventory management activities. They can effect "what if" scenarios and analyze the advantages and impact of changes in materials, production processes, delivery schedules, and a host of other variables. With e-enablement the whole customer-outsourcing partner paradigm shifts to a much more intimate level and the results are lower cost solutions, improved accuracy, heightened quality, enhanced decision-making, and quicker time-to-market.
RETURN ON e The streamlining effect of e-enablement is reaching into every corner of SCI from transaction processing to workforce training. No longer will extensive time be spent searching for a supplier, material or component. No longer will paper proposals have to be handled. Instead, SCI can post requests for quotes and items on an Internet exchange and responses will be e-mailed for perusal. This more efficient method frees managers to address more strategic issues and concentrate on customer service. PRODUCTIVITY SOARS The financial activities of SCI can be streamlined using Internet technology for invoicing, data exchange, banking, and even contract signings with digital signatures. Employee education can also be done more efficiently with convenient, accessible Web-based training that lets SCI employees keep their skills current and learn at their own pace. As an alternative to traditional classroom settings, e-learning is less expensive, eliminating travel costs and time as well as the need for printed literature. SAVE TIME. SAVE MONEY. With new Internet systems in place, SCI customer support is strengthened, able to respond to more customers more often. Our repair and service personnel can use the enhanced efficiency of on-line communication to address requests and solve problems. Plus, our researchers will have access to the latest developments, studies, new materials and technologies without ever leaving their desks.
RETURN ON e Better, faster business processes result when supply chain partners use Internet functionality to collaborate with us. Material providers – having access to key information that drives inventory and order fulfillment – act in tandem with SCI and our customers, greatly increasing supply chain performance. MORE VALUE-ADDED SERVICE The "Return on e" for supply chain management is much more than cost reduction. Innovation increases when SCI and suppliers work together. Product development, engineering considerations, production issues, and materials availability are substantially improved. The collaboration opens up new possibilities. Plus the speed and coordination that is achieved ultimately enhance the entire scope of value-added service we provide to our customers. IMPROVED RISK ASSESSMENT AND PROCUREMENT SCI is employing a five-point program to significantly improve our supply chain capabilities. Part of this program is to ensure the development of a robust electronic Purchase Order Process. We are integrating customers' requirements into a Web-based architecture so that we can more fully monitor and forecast supply-demand situations and develop risk assessment and management strategies. Moreover, SCI is an active founding member of eHitex, an Internet exchange for the EMS industry that will dramatically change the way materials are bought and sold.
In the years ahead, the EMS marketplace will continue its dramatic rate of change. While we will find ourselves surrounded by more and more technology, we will also find that, as always, people make the difference. At SCI we have a wide diversity of people and it is these men and women who will make our "Return on e" initiatives highly successful. |
SUMMARY OF FINANCIAL DATA
| (Dollars in millions, except per share data) | 2000 | 1999 | 1998 | 1997 | 1996 | ||||||||||
|
|
|||||||||||||||
| Sales | $ | 8,342.6 | $ | 6,710.8 | $ | 6,805.9 | $ | 5,762.7 | $ | 4,544.8 | |||||
| Depreciation and Amortization | 151.5 | 115.2 | 103.5 | 76.8 | 61.0 | ||||||||||
| Operating Income | 321.7 | 234.8 | 257.1 | 206.2 | 159.5 | ||||||||||
| Net Income | 196.7 | 137.8 | 145.1 | 112.7 | 81.0 | ||||||||||
| Diluted Earnings per Share | 1.34 | 1.00 | 1.06 | 0.84 | 0.67 | ||||||||||
| "Cash" Earnings per Share | 1.45 | 1.03 | 1.06 | 0.84 | 0.67 | ||||||||||
| Working Capital | 1,288.8 | 876.4 | 759.4 | 754.2 | 549.7 | ||||||||||
| Long-term Debt | 748.4 | 140.9 | 440.5 | 454.3 | 388.8 | ||||||||||
| Capital Expenditures | 596.4 | 156.1 | 236.8 | 111.4 | 109.9 | ||||||||||
| Net Property, Plant, and Equipment | 589.2 | 448.0 | 436.1 | 301.0 | 264.1 | ||||||||||
| Goodwill | 316.2 | 21.0 | 4.8 | 6.3 | 2.1 | ||||||||||
| Total Assets | 3,351.3 | 2,322.7 | 1,944.7 | 1,869.9 | 1,283.2 | ||||||||||
| Shareholders' Equity | 1,367.9 | 1,164.8 | 748.0 | 594.7 | 472.3 | ||||||||||
| Per Share | $ | 9.46 | $ | 8.09 | $ | 6.23 | $ | 4.98 | $ | 3.99 | |||||
| Employees | 31,707 | 25,325 | 23,287 | 18,470 | 15,524 | ||||||||||
| Operating Margin Before | |||||||||||||||
| Amortization of Intangibles | 4.15 | % | 3.60 | % | 3.80 | % | 3.59 | % | 3.53 | % | |||||
|
|
|||||||||||||||
|
"Cash" Earnings per Share are calculated by adding back the after-tax effect of amortization expense for intangibles to net income. No cash dividends were paid by the Company on its Common Stock during the periods presented above. |
|||||||||||||||
|
OPERATING AND FINANCIAL INFORMATION
Management's Discussion and Analysis of Financial Results Consolidated Statements of Income Consolidated Statements of Shareholders' Equity Consolidated Statements of Cash Flows Consolidated Statements of Comprehensive Income Notes to Consolidated Financial Statements Report of Ernst & Young LLP, Independent Auditors Board of Directors and Shareholder Information
MANAGEMENT'S DISCUSSION AND ANALYSIS OF FINANCIAL RESULTS The following discussion should be read in conjunction with the consolidated financial statements. Certain statements and information contained herein may constitute forward-looking statements within the meaning of the Private Securities Litigation Reform Act of 1995. In compliance with the safe harbor terms of this Act, the Company notes that a variety of factors could cause the Company's actual results and experience to differ materially from past performance or from anticipated results or other expectations expressed in the Company's forward-looking statements, as discussed more fully herein. Results of Operations Sales for fiscal year 2000 were $8.343 billion, a 24% increase over the $6.711 billion in fiscal 1999. A continued shift in business mix towards communications end markets contributed to the improved operating margins and earnings per share, especially in the fourth quarter. Communications products represented approximately 25% of fiscal 2000 fourth quarter sales, a previously declared goal of our product diversification strategy. The expansion of business with Nortel Networks resulting from the acquisition in August 1999 of their Brockville, Canada plant and new Nortel business for other SCI plants aided this sales growth. Besides the Nortel acquisition, we acquired the manufacturing assets of TAG Manufacturing, Inc. (a U.S.-based enclosure company), and ECI Telecom's Petah Tikva, Israel plant. These acquisitions also contributed to fiscal 2000's product diversification and sales growth. PC finished product sales, which historically have a higher asset turnover to mitigate their lower operating margin, declined to 19% of fiscal 2000 sales from the beginning of the year run rate of 34%. Volume increases during fiscal 2000 offset a moderate decline in average selling prices, which abated during the year as component shortages arose. Fiscal 1999 sales were slightly less (a 1% decrease) than the $6.806 billion in fiscal 1998. Market shifts and changeovers in customers' products, together with lower average selling prices, accounted for the lower fiscal 1999 sales.
OPERATING MARGIN
Operating margins
improved due to A majority of our revenue is generated by servicing multinational companies in various global manufacturing facilities. International (non-U.S.) operation sales accounted for 50% of fiscal 2000 sales, 42% in fiscal 1999 and 31% in fiscal 1998. Sales are expected to continue to grow faster internationally than domestically, especially in Mexico, Canada and Central Europe. International operations grew 50% and U.S. operations grew 6% in fiscal 2000, compared with 17% domestic sales decline and 33% international sales growth in fiscal 1999. The international operations' growth is attributable to both organic growth and acquisitions. Accelerated expansion of international production capacity began in fiscal 1999. These expansions, together with the acquisition of certain Scandinavian operations from Nokia in late fiscal 1998, and fiscal 1999's acquisition of an Ericsson Telecom Spanish facility and Hewlett-Packard's Verifone, Inc. China plant, and the aforementioned fiscal 2000 international acquisitions, generated the international sales growth over the last two fiscal years. Two of our Mexican plants will enter a third expansion phase shortly. Mexico represents the fastest growing geographic area for us. Its low production costs and geographic proximity to U.S. markets make it extremely attractive to our customers. Several major programs previously executed at our domestic facilities have been transferred to the Mexican plants. Bookings for fiscal 2000 of $9.632 billion were a record, reflecting business strength across a broad range of end markets, and giving rise to a backlog of $4.358 billion, the highest level ever. Our current mix of business, backlog, and prospects for new business puts us in a strong position for continued growth. Operating margins before amortization of intangibles improved to 4.15% in fiscal 2000 from 3.60% last fiscal year mainly as a result of the business mix shift and improved operating results in operations that were in a startup phase in fiscal 1999. Such operations are quickly approaching full production capacity in existing facilities that were expanded during fiscal 2000. Reduced losses, including currency exchange losses, at the Brazilian plant also contributed to the improved operating margin. Fiscal 1999's operating margins before amortization of intangibles declined from the 3.80% in fiscal 1998 primarily as a result of transition and startup costs associated with new and enlarged facilities and projects, industry price pressures, and increased international currency exchange losses. Goodwill and contract intangible amortization increased to .3% of sales in fiscal 2000 from less than .1% in fiscal 1999 and 1998. This increase is attributable to the intangible assets arising from several acquisitions closed during fiscal 2000 and represents the results of an aggressive acquisition program that will continue in fiscal 2001. Depreciation expense remained fairly consistent as a percent of sales in the last three fiscal years (1.52% in fiscal 2000, 1.61% in fiscal 1999, and 1.48% in fiscal 1998). The sales shift to higher margin/lower turnover products, together with a tightening in the availability of certain components, led to lower asset turnovers in fiscal 2000. Shortages and extended purchase lead times are currently being experienced on certain components. Also contributing to lower asset turnovers this fiscal year is higher capital intensity in the EMS industry, caused by increased cost of current production equipment and increased acquisition activity. Capital expenditures increased significantly in fiscal 2000. Net interest expense increased to .37% of sales in fiscal 2000 from .25% in fiscal 1999 as a result of increased borrowings and accounts receivables sold under the asset securitization program to fund revenue and asset growth. Interest expense may grow in the next fiscal year as debt increases to fund anticipated organic growth and acquisition activity. Net interest expense was .31% of sales in fiscal 1998. Fiscal 1999's net interest expense declined from that in fiscal 1998 mainly because of lower borrowing requirements and the May 1999 conversion of outstanding convertible notes into common stock. The effective income tax rate (33.0% in fiscal 2000, 36.5% in fiscal 1999 and 38.5% in fiscal 1998) differs from the U.S. statutory rate primarily due to the effects of state income taxes, offset by lower taxed international earnings considered permanently reinvested abroad. Increased lower taxed international earnings accounted for the lower effective income tax rates in fiscal 2000 and fiscal 1999. Capital Resources and Liquidity During fiscal 2000, organic growth fueled working capital needs as well as capital expenditures for plant expansions, and capital was used for several acquisitions. We expect organic growth and acquisitions to continue at a rapid pace; thus, access to the capital markets is very important to our continued growth and success. We have taken several steps to ensure ready access to capital. SCI has an investment grade rating on its debt from both Standard & Poor's and Moody's. As we grow, we intend to maintain or even improve that credit rating. We filed an $800 million universal shelf in January 2000 and pulled down $575 million of the shelf in a successful convertible debenture offering in March. During June, we renegotiated our two major bank facilities, increasing the amounts available and thus providing the financial capacity to handle future growth. Cash was consumed in our operating activities in fiscal 2000 in the amount of $68.0 million due to the need for working capital to support growth. This compared to cash generated by operating activities of $200.3 million in fiscal 1999 as growth slowed for a brief interval. In other than the working capital accounts, cash generated by operations totaled $360.8 million in fiscal 2000 versus $282.6 million in fiscal 1999, which demonstrates both the strong cash generation characteristics of the underlying business and the growth in the business over the previous fiscal year. Higher investing activity in fiscal 2000 required more use of cash than in the prior year. We expanded our facilities to meet increasing demand and expanded our acquisition activities. Acquisitions completed during fiscal 2000 were Nortel Networks' Brockville, Ontario, Canada plant and certain other manufacturing assets in August 1999, TAG Manufacturing, Inc.'s operations in December 1999, and ECI Telecom's Shemer manufacturing plant in January 2000. Other noncurrent assets cash usage increased because of investments in Uniwill Computer Corporation and eHITEX, and the acquisition of a noncurrent pension asset associated with the Nortel acquisition. Fiscal 2000 capital expenditures (including acquisition intangibles) were $596 million ($280 million in property, plant and equipment additions and $316 million in other acquisition expenditures). The Company has an ongoing program of actively investigating business opportunities generated by other companies' divestitures as well as acquisition of companies in related businesses, so cash needs are expected to be high again in fiscal 2001. Fiscal 2000 acquisitions were funded using the convertible note issue in March and available liquidity. Available liquidity at June 30, 2000 was $840 million, which consisted of $673 million in unused credit facilities and $167 million in cash and cash equivalents. The Company believes it can adequately fund its expected growth in the intermediate term.
"CASH" EARNINGS
The "cash" earnings
per share growth
FACILITY SCI expanded its
facilities to meet
Factors That May Affect Future Results Concentration
of customers Customer contracts can be canceled and volume levels changed or delayed at any time without notice, subject to cancellation costs, if any. Timely replacement of canceled, delayed, or reduced contracts with new business cannot be assured. These risks are exacerbated as a majority of our sales are to customers in the electronics industry, which is subject to rapid market and technological changes and frequent product obsolescence. Factors affecting the electronics industry in general or any of our major customers in particular could have a material adverse effect upon our results of operations. Our major contracts are with customers in the high technology industry. Credit terms relating to both accounts receivable and contract inventories are extended to customers after performing credit evaluations. When significant credit risks exist, letters of credit or other appropriate security are generally requested. However, credit losses on customer contracts have occurred in the past and no assurances can be given that credit losses, which could be material, will not reoccur. Management
of growth Operating
internationally Operating
in a highly competitive industry To remain competitive, we must continue to develop and provide technologically advanced engineering services, information systems, and manufacturing processes. We must also maintain high quality, offer flexible delivery schedules, deliver products on a timely basis, and continue to price our products and services competitively. Failure to satisfy any of the foregoing requirements could adversely affect us. Shortages
and prices of electronic components Operating
results may fluctuate Dependence
on key personnel Environmental
risks Interest rate
fluctuations International
currency exchange rates fluctuations During fiscal 1999, the Brazilian currency experienced severe devaluations which adversely impacted the fiscal 1999 operating results in Brazil. At June 30, 2000, we had approximately $35 million of net current assets offset by $23 million in long-term intercompany advances subject to this currency exposure. Approximately $19 million of inventory is subject to repricing arrangements for currency fluctuations. We use other international dollar denominated long-term intercompany advances to offset currency exposures in other international subsidiaries. At June 30, 2000, approximately $18 million of such advances were denominated in Finnish Marks and approximately $55 million denominated in Euros. The exchange rate fluctuations on these advances and the $23 million denominated in Brazilian Reais are reflected in the financial statements as translation adjustment in Shareholders' Equity. Volatility
of stock price
CAPITAL Substantial organic
growth and
BOOK VALUE Earnings growth retained
by us to fund |

CONSOLIDATED BALANCE SHEETS
|
June
30,
|
|||||||
|
|
|||||||
| (In Thousands of Dollars, Except Share and Per Share Data) |
2000
|
1999
|
|||||
|
|
|||||||
| Assets | |||||||
| Current Assets | |||||||
| Cash and cash equivalents |
$
|
166,759 |
$
|
216,085 | |||
| Accounts receivable, less allowances of $7,233 in 2000 and $12,630 in 1999 | 796,616 | 821,925 | |||||
| Inventories | 1,277,979 | 719,008 | |||||
| Refundable and deferred federal and foreign income taxes | 63,132 | 12,522 | |||||
| Other current assets | 86,272 | 62,159 | |||||
|
|
|||||||
| Total Current Assets | 2,390,758 | 1,831,699 | |||||
|
|
|||||||
| Property, Plant, and Equipment – Note B | |||||||
| Land and improvements | 34,110 | 29,515 | |||||
| Buildings and leasehold improvements, including construction-in-process | 226,568 | 176,388 | |||||
| Equipment | 894,138 | 725,487 | |||||
| Less accumulated depreciation and amortization | (565,657 | ) | (483,405 |
)
|
|||
|
|
|||||||
| Net Property, Plant, and Equipment | 589,159 | 447,985 | |||||
|
|
|||||||
| Goodwill and Contract Intangibles, net of accumulated amortization of $21,472 in 2000 and $17,146 in 1999 | 316,175 | 21,033 | |||||
| Other Noncurrent Assets | 55,212 | 21,943 | |||||
|
|
|||||||
| Total Assets |
$
|
3,351,304 |
$
|
2,322,660 | |||
|
|
|||||||
| Liabilities and Shareholders' Equity | |||||||
| Current Liabilities | |||||||
| Accounts payable and accrued expenses |
$
|
1,014,368 |
$
|
874,709 | |||
| Accrued payroll and related expenses | 53,504 | 44,142 | |||||
| Federal, foreign, and state income taxes |
|
19,743 |
|
36,117 |
|
||
| Current maturities of long-term debt | 14,361 | 341 | |||||
|
|
|||||||
| Total Current Liabilities | 1,101,976 | 955,309 | |||||
|
|
|||||||
| Deferred Income Taxes | 97,607 | 34,587 | |||||
| Noncurrent Employee Benefits | 34,745 | 27,094 | |||||
| Other Noncurrent Liabilities | 652 | -0- | |||||
| Long-term Debt – Note B | |||||||
| Industrial revenue bonds | 19,769 | 21,119 | |||||
| Long-term notes | 164,459 | 119,734 | |||||
| Convertible subordinated notes | 564,174 | -0- | |||||
|
|
|||||||
| Total Long-term Debt | 748,402 | 140,853 | |||||
|
|
|||||||
| Commitments and Contingencies – Notes B and I | |||||||
| Shareholders' Equity | |||||||
| Preferred stock, 500,000 shares authorized but unissued | -0- | -0- | |||||
| Common stock, $.10 par value: authorized 200,000,000 shares; issued 144,996,374 in 2000 and 144,276,474 in 1999 | 14,500 | 14,428 | |||||
| Capital in excess of par value | 477,531 | 462,179 | |||||
| Retained earnings | 900,531 | 703,796 | |||||
| Currency translation adjustment | (17,227 |
)
|
(11,288 |
)
|
|||
| Shares held in Rabbi Trusts, 288,472 shares in 2000 and 272,592 shares in 1999, at cost | (7,072 |
)
|
(3,957 |
)
|
|||
| Treasury stock – 118,732 shares at cost | (341 |
)
|
(341 |
)
|
|||
|
|
|||||||
| Total Shareholders' Equity | 1,367,922 | 1,164,817 | |||||
|
|
|||||||
| Total Liabilities and Shareholders' Equity |
$
|
3,351,304 |
$
|
2,322,660 | |||
|
|
|||||||
See notes to Consolidated Financial Statements.
CONSOLIDATED STATEMENTS OF INCOME
|
Years
ended June 30,
|
|||||||||||||||
|
|
|||||||||||||||
| (In Thousands of Dollars, Except Per Share Data) |
2000
|
1999
|
1998
|
||||||||||||
|
| |||||||||||||||
| Net sales |
$
|
8,342,580
|
|
$
|
6,710,785
|
|
$
|
6,805,893
|
|||||||
| Costs and expenses |
7,996,466
|
6,469,341
|
6,547,314
|
||||||||||||
| Goodwill and contract intangibles amortization expense |
24,443
|
6,642
|
1,478
|
||||||||||||
|
| |||||||||||||||
| Operating Income |
321,671
|
234,802
|
257,101
|
||||||||||||
|
| |||||||||||||||
| Other Income (Expense): | |||||||||||||||
| Interest expense (net of interest income of $4,886 in 2000, $7,141 in 1999, and $9,347 in 1998) |
(30,909
|
)
|
(16,938
|
)
|
(21,304
|
)
|
|||||||||
| Other income (expense), net |
2,873
|
(781
|
)
|
114
|
|||||||||||
|
| |||||||||||||||
| Income Before Income Taxes |
293,635
|
217,083
|
235,911
|
||||||||||||
| Income taxes – Note F |
96,900
|
79,235
|
90,826
|
||||||||||||
|
| |||||||||||||||
| Net Income |
$
|
196,735
|
$
|
137,848
|
$
|
145,085
|
|||||||||
|
| |||||||||||||||
| Earnings per Share – Note D: | |||||||||||||||
| Basic |
$
|
1.36
|
$
|
1.11
|
$
|
1.21
|
|||||||||
| Diluted |
1.34
|
1.00
|
1.06
|
||||||||||||
|
|
|||||||||||||||
See notes to Consolidated Financial Statements.
CONSOLIDATED STATEMENTS OF SHAREHOLDERS' EQUITY
|
Number
of
Shares Outstanding |
Common
Stock |
Capital
in
Excess of Par Value |
Retained
Earnings |
Currency
Translation Adjustment |
Rabbi
Trusts Shares |
Treasury
Stock |
Total
Shareholders' Equity |
|||||||||
|
|
||||||||||||||||
|
|
|
|||||||||||||||
| (In Thousands
of Dollars, Except Number of Shares) |
||||||||||||||||
| Balance July 1, 1997 | 119,430,848 |
|
$ 11,956 | $ 166,932 |
$ 420,863
|
$ (4,747 |
)
|
$ -0- |
$ (341
|
)
|
$ 594,663
|
|||||
| Stock options exercised | 660,040 | 66 | 7,520 |
7,586
|
||||||||||||
| Net income for year |
145,085
|
145,085
|
||||||||||||||
| Translation gain | 623 |
623
|
||||||||||||||
|
|
||||||||||||||||
| Balance June 30, 1998 | 120,090,888 | 12,022 | 174,452 |
565,948
|
(4,124 |
)
|
-0- |
(341
|
)
|
747,957
|
||||||
| Stock options exercised | 482,168 | 48 | 7,328 |
7,376
|
||||||||||||
| Conversion of notes in May 1999 | 23,584,686 | 2,358 | 280,399 |
282,757
|
||||||||||||
| Adoption of EITF No. 97-14 | (272,592 |
)
|
(3,957 | ) |
(3,957
|
)
|
||||||||||
| Net income for year |
137,848
|
137,848
|
||||||||||||||
| Translation loss | (7,164 |
)
|
(7,164
|
)
|
||||||||||||
|
|
||||||||||||||||
| Balance June 30, 1999 | 143,885,150 | 14,428 | 462,179 |
703,796
|
(11,288 |
)
|
(3,957 | ) |
(341
|
)
|
1,164,817 | |||||
| Stock options exercised | 719,900 | 72 | 15,352 |
15,424
|
||||||||||||
| Net income for year |
196,735
|
196,735
|
||||||||||||||
| Translation loss | (5,939 |
)
|
(5,939
|
)
|
||||||||||||
| Increase in Rabbi Trusts' shares | (15,880 |
)
|
(3,115 | ) |
(3,115
|
)
|
||||||||||
|
|
||||||||||||||||
| Balance June 30, 2000 | 144,589,170 | $14,500 | $477,531 |
$900,531
|
$(17,227 |
)
|
$(7,072 | ) |
$(341
|
)
|
$1,367,922
|
|||||
|
|
||||||||||||||||
See notes to Consolidated Financial Statements.
CONSOLIDATED STATEMENTS OF CASH FLOWS
|
Years
Ended June 30,
|
||||||||||
|
|
||||||||||
| (In Thousands of Dollars) |
2000
|
1999
|
1998
|
|||||||
|
|
||||||||||
| Operating Activities | ||||||||||
| Net income | $ | 196,735 | $ | 137,848 | $ | 145,085 | ||||
| Adjustments to reconcile net income to net cash (used in) provided by operating activities: | ||||||||||
| Depreciation and amortization | 151,548 | 115,212 | 103,534 | |||||||
| Deferred income taxes | 19,456 | 28,712 | 37,778 | |||||||
| Changes in current assets and liabilities: | ||||||||||
| Accounts receivable | 22,466 | (190,533 | ) | (2,741 | ) | |||||
| Inventories | (563,828 | ) | (79,936 | ) | (68,839 | ) | ||||
| Refundable income taxes | 758 | (522 | ) | (3,946 | ) | |||||
| Other current assets | (24,942 | ) | (45,215 | ) | (5,028 | ) | ||||
| Accounts payable and accrued expenses | 152,991 | 224,893 | (43,513 | ) | ||||||
| Income taxes | (23,905 | ) | 3,033 | (20,977 | ) | |||||
| Other noncash items – net | 748 | 6,767 | 2,558 | |||||||
|
|
||||||||||
| Net Cash (Used in) Provided by Operating Activities | (67,973 | ) | 200,259 | 143,911 | ||||||
|
|
||||||||||
| Investing Activities | ||||||||||
| Purchase of property, plant, and equipment | (280,154 | ) | (134,670 | ) | (236,799 | ) | ||||
| Acquisition costs in excess of underlying assets | (316,257 | ) | (21,390 | ) | -0 | - | ||||
| Other | (19,395 | ) | 1,116 | 2,403 | ||||||
|
|
||||||||||
| Net Cash Used in Investing Activities | (615,806 | ) | (154,944 | ) | (234,396 | ) | ||||
|
|
||||||||||
| Financing Activities | ||||||||||
| Payments on long-term debt | (1,037,383 | ) | (30,877 | ) | (241,748 | ) | ||||
| Proceeds from long-term debt | 1,659,252 | 13,177 | 224,107 | |||||||
| Issuance of common stock | 7,091 | 4,609 | 3,090 | |||||||
|
|
||||||||||
| Net Cash Provided by (Used in) Financing Activities | 628,960 | (13,091 | ) | (14,551 | ) | |||||
|
|
||||||||||
| Effect of exchange rate changes on cash | 5,493 | (485 | ) | (1,427 | ) | |||||
|
|
||||||||||
| Net (Decrease) Increase in Cash and Cash Equivalents | (49,326 | ) | 31,739 | (106,463 | ) | |||||
| Cash and cash equivalents at beginning of year | 216,085 | 184,346 | 290,809 | |||||||
|
|
||||||||||
| Cash and Cash Equivalents at End of Year | $ | 166,759 | $ | 216,085 | $ | 184,346 | ||||
|
|
||||||||||
Cash equivalents are primarily
short-term interest bearing deposits.
Interest paid was $28,189
in 2000, $26,072 in 1999, and $30,144 in 1998.
Income taxes paid (net of
refunds) were $83,976 in 2000, $48,775 in 1999, and $76,221 in 1998.
See notes to Consolidated Financial Statements.
CONSOLIDATED STATEMENTS OF COMPREHENSIVE INCOME
|
Years
Ended June 30,
|
||||||||||
|
|
||||||||||
| (In Thousands of Dollars) |
2000
|
1999
|
1998
|
|||||||
|
|
||||||||||
| Net Income |
$
|
196,735
|
$
|
137,848
|
|
$
|
145,085
|
|||
|
|
||||||||||
| Currency translation (loss) gain |
(7,586
|
) |
(7,164
|
) |
623
|
|||||
| Tax benefit |
1,647
|
-0-
|
-0
|
- | ||||||
|
|
||||||||||
| Other Comprehensive Income |
(5,939
|
) |
(7,164
|
) |
623
|
|||||
|
|
||||||||||
| Comprehensive Income |
$
|
190,796
|
$
|
130,684
|
$
|
145,708
|
||||
|
|
||||||||||
See notes to Consolidated Financial Statements.
|
NOTES TO CONSOLIDATED FINANCIAL STATEMENTS Note Business. SCI Systems, Inc. is a diversified international electronics manufacturing services provider. SCI designs, manufactures, distributes, and services electronic products for virtually every market segment in the Electronic Manufacturing Services Industry. Markets served include the computer, peripheral, datacom, telecom, medical, industrial, consumer, aerospace, defense, and multimedia industries, as well as the U.S. Government. Consolidated financial statements include accounts of the Company and its majority-owned subsidiaries after elimination of material intercompany accounts and transactions. Generally Accepted Accounting Principles require that management make estimates and assumptions in the preparation of the Company's financial statements. Such estimates and assumptions affect the recognition of revenue and expenses, recorded values of assets and liabilities, and disclosure of contingent liabilities. Actual results could differ from these estimates and assumptions. The functional currency of the majority of the Company's foreign operations is the U.S. dollar. Sales and cost of sales are generally recorded as units are shipped. Costs and expenses principally represent engineering, manufacturing, general and administrative, and other costs incurred in support of customer contracts. Credit risk. The Company's major contracts are with customers in the high technology industry. Credit terms relating to both accounts receivable and contract inventories are extended to customers after performing credit evaluations. When significant credit risks exist, letters of credit or other appropriate security are generally requested. Inventories primarily consist of costs incurred in support of customer contracts stated at the lower of cost (principally first-in, first-out method) or market, adjusted for potential contract valuation issues. Property, plant, and equipment are recorded at cost and depreciated on the straight-line method over the estimated useful lives of individual assets. Leasehold improvements are amortized over the shorter of the lease term or useful lives. Estimated useful lives currently range between three to five years for machinery, equipment, furniture and fixtures; and 10 to 20 years for land improvements and buildings. Depreciation expenses amounted to $126,520,000 in 2000, $107,922,000 in 1999 and $100,850,000 in 1998. Goodwill and contract intangibles include the unamortized excess of cost over the underlying net tangible value of assets acquired. Goodwill intangibles are amortized on a straight-line basis over their estimated useful lives (primarily 10 or 15 years). The estimated useful life assigned to individual acquired goodwill is established after reviewing its related product area, its market position and outlook, and other pertinent factors. Contract intangibles are amortized over the initial contract period. Long-lived asset impairment reviews are regularly conducted by the Company using projected future cash flows and such other factors as prescribed by Statement of Financial Accounting Standard No. 121. During fiscal 1999, an impairment provision of $4,081,000 was provided for certain intangibles and equipment. This provision is reflected in the financial statements as depreciation and amortization expense. Deferred income taxes are provided on temporary differences as certain contract related revenues and expenses are reported in periods which differ from those in which they are taxed. U.S. income taxes in excess of estimated foreign income tax credits have not been provided on certain undistributed earnings of foreign subsidiaries aggregating $126 million at June 30, 2000, which are considered to be permanently reinvested abroad. Otherwise, $25 million of additional deferred U.S. income taxes (net of related estimated foreign income tax credits) would have been provided. Research and development is conducted by the Company under both customer-sponsored and Company-sponsored programs. Company-sponsored programs include research and development related to government products and services, which are allocable and recoverable in the same manner as general and administrative expenses under U.S. Government regulations. Customer-sponsored research and development costs are accounted for as any other program cost. Total engineering costs incurred by the Company, including research and development, were $37,301,000 in 2000, $35,281,000 in 1999, and $36,961,000 in 1998. General and administrative expenses included in costs and expenses approximated $32,274,000 in 2000, $23,681,000 in 1999, and $21,976,000 in 1998. Forward currency exchange contracts are used in certain instances by the Company to reduce its risk on component purchases transacted in other than the applicable functional currency. Realized and unrealized gains or losses on such contracts that are effective hedges of liabilities, or projected cash flows, as determined prior to adoption of SFAS No. 133, are recognized as foreign currency exchanges gains or losses included in costs and expenses. Foreign currency exchange net gains (losses) included in costs and expenses approximated $580,000 in 2000, ($7,732,000) in 1999, and $794,000 in 1998. Stock split. The Company declared and paid a two-for-one stock split in the form of a 100% dividend in February 2000. All share and per share data in the financial statements reflect the effect of this stock split. Adoption of new financial accounting standards. The Company does not anticipate any material difference in the presentation of its financial statements when it adopts FASB Statement No. 133, Accounting for Derivative Instruments and Hedging Activities in July 2000. The Company also anticipates no impact when it adopts FASB Interpretation No. 44, Accounting for certain transactions involving stock compensation in fiscal 2001. Additionally, the Company has reviewed the Securities and Exchange Commission's Staff Accounting Bulletin 101 and believes its revenue recognition policies are in compliance. Note Industrial revenue bonds. The Company is obligated by lease or guarantee for $21,415,000 at June 30, 2000, and $21,545,000 at June 30, 1999, of industrial revenue bonds maturing through the year 2015. The majority of such borrowings currently bear variable interest ranging between 3.89% and 7.03%, and are secured by related properties or irrevocable letters of credit. Long-term notes. The Company is obligated under notes maturing through the year 2006 amounting to $20,023,000 and $20,128,000 at June 30, 2000, and 1999, respectively. Substantially all of the notes bear variable interest rates ranging between 4.96% and 7.50% at June 30, 2000. In July 1996, the Company borrowed $100,000,000 under a Senior Note agreement with a group of institutional lenders. The Notes bear interest at 7.59% and are payable in six annual installments of $16,667,000 beginning in July 2001. The interest rate may be adjusted upward by 0.75% if the Company fails to meet certain financial ratios. In June 2000, the Company entered into two credit agreements with a group of domestic and international banks, whereby the Company may borrow principal amounts up to $300,000,000 under a 364-day revolving credit line, and $200,000,000 under a five-year credit line. At June 30, 2000, $60,000,000 was outstanding under these agreements. These credit agreements bear variable interest based on a defined bank rate, which was 7.162% at June 30, 2000. The 364-day revolving credit line can be extended for one year under certain conditions. The Company can also request a $25,000,000 increase in the revolving credit line every six months up to $50,000,000. A similar provision exists in the five-year credit facility to increase the applicable credit line by $150,000,000. The agreements contain certain covenants, the most restrictive of which requires the Company to maintain a certain consolidated net worth which at June 30, 2000, was $1,027,200,000. A commitment fee is paid on the unused portion under the credit agreements together with a utilization fee. No compensating balances are required under the agreements. Short-term borrowings may be drawn under the credit agreements. Because of the Company's ability and intent to refinance such borrowings, total borrowings under the credit agreements up to $200,000,000 may be classified as long-term. The Company has a $300,000,000 asset securitization agreement expiring in June 2001 under which certain accounts receivable can be sold with limited recourse. As funds are collected, additional eligible receivables may be sold to bring the outstanding balance to the desired level. At June 30, 2000, $142,000,000 of receivables were sold under this agreement at a weighted discount rate of 6.62%. No amounts were sold under this agreement at June 30, 1999. A commitment fee is paid on the unused portion, together with a usage fee. Unused credit facilities and commitments at June 30, 2000, approximated $673,000,000. Convertible subordinated notes. In March 2000, the Company issued $575,000,000 of 3% Convertible Subordinated Notes maturing March 15, 2007. The Notes are convertible into the Company's common stock at $56.23 per share. The Company may redeem the Notes on or after May 20, 2003, although there is no mandatory redemption. The majority of June 30, 2000's deferred charges netted against long-term debt relate to the costs associated with the issuance of these Notes, including underwriters' discount. In May 1999 the then outstanding 5% Convertible Subordinated Notes due May 1, 2006, were substantially converted into 11,792,343 shares of common stock. Deferred charges netted against total year end long-term debt were $13,675,000 in 2000 and $479,000 in 1999. Debt, lease, and rental payments. Long-term debt maturities for the next five fiscal years are: $14,361,000 in 2001; $16,798,000 in 2002; $16,798,000 in 2003; $16,798,000 in 2004; and $76,798,000 in 2005. While the Company leases certain real property in its operations, annual rental expense and future commitments are not material to its operations. Note June 30, 2000's estimated fair values of the financial instruments represented by cash and cash equivalents, and trade receivables approximated their recorded values. Convertible Subordinated Notes outstanding at June 30, 2000, had a year end trading price of $563,500,000 on the New York Stock Exchange. No Convertible Notes were outstanding at June 30, 1999. All other debt instruments' fair value is estimated to approximate their recorded value, as their applicable interest rates approximate current market rates. The Company holds minority interest in two privately held entities: eHITEX, Inc. and UNIWILL Computer Corporation. Each investment represents less than 20% ownership of the respective entity. As such, both are accounted for under the cost method. As of June 30, 2000, the carrying amount of these two investments is approximately $16,500,000. It was not practicable to estimate the fair values of these investments because of the absence of a readily determinable market without incurring excessive cost. Investments held in Rabbi Trusts other than Company common stock are recorded at their fair value. Any gain or loss on such assets are offset by a corresponding decrease or increase in defined compensation expense and related accrual. Rabbi Trust assets included in other noncurrent assets amounted to $25,877,000 and $20,136,784 at June 30, 2000 and 1999, respectively. The Company has forward currency exchange contracts outstanding at June 30, 2000, to reduce its cash flow risk on certain subsidiary's purchase requirements in currencies other than its functional currency. Such Euro denominated contracts expire at various dates through September 25, 2000, and were for the following currencies and amounts: Swedish Krona in the amount of $19,154,000; Japanese Yen in the amount of $3,393,000; British Pounds in the amount of $24,412,000, and U.S. Dollars in the amount of $42,585,000. Note Basic earnings per share are computed by dividing reported net income for the period by the weighted average number of shares of common stock outstanding during the period. A reconciliation of the net income and weighted average number of shares used for the diluted earnings per share computations follows: |
| (In thousands of dollars, except share data) | 2000 | 1999 | 1998 | |||
|
|
||||||
| Net income | $196,735 | $137,848 | $145,085 | |||
| Add back after-tax interest expense for convertible subordinated notes | 3,618 | 7,965 | 9,232 | |||
|
|
||||||
| Adjusted net income | $200,353 | $145,813 | $154,317 | |||
|
|
||||||
| Weighted average number of shares outstanding during period | 144,240,042 | 124,071,098 | 119,721,188 | |||
| Applicable number of shares for stock options outstanding for period | 2,478,233 | 1,510,432 | 1,844,732 | |||
| Number of convertible shares for outstanding convertible subordinated notes | 2,938,394 | 19,642,998 | 23,589,744 | |||
|
|
||||||
| Weighted average number of shares | 149,656,669 | 145,224,528 | 145,155,664 | |||
|
|
||||||
| Diluted earnings per share | $1.34 | $1.00 | $1.06 | |||
|
|
||||||
|
Note The Company provides retirement benefits to its domestic employees who meet certain age and service requirements through three plans: a defined benefit supplemental pension plan; a qualified savings plan (401(k) Plan); and a deferred compensation plan. The Company provides defined pension benefits to its Brockville, Ontario, Canada employees under separate salaried and hourly plans. Additionally, post retirement medical benefits and a savings plan are provided to salaried employees at the Brockville location. The actuarial computed accrued post retirement medical benefits for the Brockville salaried employees at June 30, 2000, was $1,796,000. Fiscal 2000 expense for the plan was $233,000. Subsequent to year end, a post retirement medical insurance plan was instituted in the U.S. to cover employees who may retire prior to being eligible for Medicare. Once a retired employee is eligible for Medicare, coverage ceases under the plan. The actuarial computed liability for this plan as of the adoption date is approximately $1,500,000. Defined pension plan benefits are computed based upon compensation earned during the employee's career at the Company or its subsidiaries and years of credited service. The Company funds its retirement benefit obligations annually at amounts that approximate the maximum deductible for income taxes. Canadian tax regulations allow for a greater cash tax deduction than the pension expense recognized in the consolidated financial statements. In previous years, the Company's Brockville operation (acquired in fiscal 2000) took full advantage of this tax deduction resulting in a noncurrent prepaid pension expense asset of $10,886,000 at June 30, 2000. Company contributions to savings and deferred compensation plans are equal to a percentage of employees' contributions and are fully funded when the liability is incurred. The Company's and employees' contributions to the deferred compensation plan are held in an irrevocable "Rabbi Trust". Nonemployee Directors also participate in an irrevocable "Rabbi Trust" deferred compensation plan, and a one-year stock appreciation rights plan that expires in October 2000. The Company also has defined contribution pension plans for its European employees who meet certain requirements, and savings plans for its Pointe-Claire, Quebec, Canada, and Thai employees. Company contributions to these various plans amounted to $11,328,000 in 2000, $8,827,000 in 1999, and $7,482,000 in 1998. Summarized details for each of the defined pension benefit plans follows: |
|
Brockville
|
||||
|
|
||||
| (In thousands of dollars) |
U.S.
|
Hourly
|
Salaried
|
|
|
|
||||
| June 30, 2000's: | ||||
| Accumulated benefit obligation | $41,575 | $35,491 | $24,354 | |
| Fair value of assets | 34,600 | 40,443 | 28,688 | |
| Fiscal 2000 expense | 4,790 | 1,074 | 227 | |
|
|
||||
|
Note The provision for income taxes is summarized as follows: |
| (In thousands of dollars) | 2000 | 1999 | 1998 | |
|
|
||||
| Income before income taxes: | ||||
| Domestic | $177,972 | $131,809 | $156,219 | |
| Foreign | 115,663 | 85,274 | 79,692 | |
|
|
||||
| Total | $293,635 | $217,083 | $235,911 | |
|
|
||||
| Taxes currently payable: | ||||
| Domestic | $ 62,091 | $ 36,602 | $ 55,977 | |
| Foreign | 15,353 | 13,921 | (2,929 |
)
|
| Deferred taxes: | ||||
| Domestic | 7,413 | 10,131 | 15,419 | |
| Foreign | 12,043 | 18,581 | 22,359 | |
|
|
||||
| Total | $ 96,900 | $ 79,235 | $ 90,826 | |
|
|
||||
|
The reconciliation of the provision for income taxes and that based on the U.S. statutory rate is: |
| (In thousands of dollars) | 2000 | 1999 | 1998 | ||||
|
|
|||||||
| Income taxes at U.S. statutory rate | $102,772 |
|
$ 75,978 |
|
$ 82,569 | ||
| Effects of U.S. state income taxes, net of federal benefits | 3,642 | 2,999 | 5,780 | ||||
| Effects of loss carryforwards | (2,124 |
)
|
(657 |
)
|
31 | ||
| Effects of foreign operations | (17,909 |
)
|
(3,045 |
)
|
(1,607 |
)
|
|
| Permanent differences | 10,519 | 3,960 | 4,053 | ||||
|
|
|||||||
| Income taxes | $ 96,900 | $ 79,235 | $ 90,826 | ||||
|
|
|||||||
|
At June 30, 2000 and 1999, the net deferred tax asset was: |
|
2000
|
1999
|
|||||||
|
|
|
|||||||
| (In
thousands of dollars) Temporary Difference |
Amount
|
Deferred
Asset (Liability) |
Amount
|
Deferred
Asset (Liability) |
||||
|
|
||||||||
| Difference between book and tax recognized contract profits: | ||||||||
| U.S. | $ 65,042 | $ 22,765 | $ 69,067 | $ 24,173 | ||||
| Foreign | (76,732 | ) | (28,283 | ) | (78,006 | ) | (23,155 |
)
|
| Undistributed foreign earnings not currently taxable in U.S. | (169,793 | ) | (38,714 | ) | (145,874 | ) | (30,067 |
)
|
| Accrued expenses not currently deductible: | ||||||||
| U.S. | 43,773 | 15,320 | 44,905 | 15,384 | ||||
| Foreign | 1,204 | 215 | 2,240 | 632 | ||||
| Depreciation and amortization differences: | ||||||||
| U.S. | 3,229 | 1,130 | (1,564 | ) | (547 |
)
|
||
| Foreign | (29,957 | ) | (11,441 | ) | (45,951 | ) | (13,774 |
)
|
| Net foreign operating loss carryforwards | 3,942 | 1,314 | 4,891 | 1,416 | ||||
| Valuation allowance: | ||||||||
| Beginning of year | (4,891 | ) | (1,416 | ) | (6,871 | ) | (2,228 |
)
|
| Net change for year | 949 | 102 | 1,980 | 812 | ||||
|
|
||||||||
| Total | $(163,234 | ) | $(39,008 |
)
|
$(155,183 | ) | $ (27,354 |
)
|
|
|
||||||||
|
In accordance with SFAS No. 123, the U.S. income tax benefit associated with exercised stock options of $8,333,000 in 2000, $2,766,000 in 1999, and $4,497,000 in 1998 is classified as an addition to capital in excess of par value.
Note The Company operates principally in the Electronics Manufacturing Services (EMS) Industry, where it serves its major customers on a global basis. Accordingly, the Company is viewed by its management as a global provider of manufacturing services to its customers. Evaluations are not only made of individual plant performances but, most importantly, of worldwide services provided to strategic customers. The Company's external sales and long-lived assets associated with its domestic and foreign operations are as follows: |
|
Sales
|
Long-Lived
Assets
|
|||||||||||
|
|
|
|||||||||||
| (In thousands of dollars) |
Domestic
|
Foreign
|
Total
|
Domestic
|
Foreign
|
Total
|
||||||
|
|
||||||||||||
| 2000 |
$4,131,439
|
$4,211,141
|
$8,342,580
|
$162,063
|
$427,096
|
$589,159
|
||||||
| 1999 |
3,903,238
|
2,807,547
|
6,710,785
|
139,584
|
308,401
|
447,985
|
||||||
| 1998 |
4,699,582
|
2,106,311
|
6,805,893
|
164,897
|
271,200
|
436,097
|
||||||
|
|
||||||||||||
|
U.S. export sales approximated $175,000,000, $116,000,000, and $185,000,000 for the year ended June 30, 2000, 1999, and 1998, respectively. Sales to individual customer that exceeded 10% of annual consolidated sales in any of the last three fiscal years were: Hewlett-Packard ($2,629 million in 2000, $2,465 million in 1999, and $2,692 million in 1998); Nortel ($931 million in 2000); Dell ($681 million in 1999); and Compaq ($840 million in 1999). Note The Company's stock option plan grants options to officers. Under the plan, the Board of Directors may award options at less than market price, but to date has granted all options at not less than 100% of market value on grant date. Vesting is normally 20% upon granting, with 20% per annum thereafter. Options expire 10 years after granting. The Company's retired Chairman was granted accelerated full vesting on 268,000 shares on June 30, 2000. He exercised options on 1,745,000 shares in August 2000. Stock options are accounted for in accordance with APB Opinion 25 and related Interpretations. Accordingly, no nonmonetary fair value compensation expense associated with options has been recorded. Had fair value compensation costs been determined under SFAS No. 123, pro forma net income and diluted earnings per share would have been reflected as follows: |
| (In thousands of dollars, except share data) | 2000 | 1999 | 1998 | |||
|
|
||||||
| Net income: | ||||||
| As reported | $196,735 | $137,848 | $145,085 | |||
| Pro forma | 187,898 | 133,677 | 142,284 | |||
| Diluted earnings per share: | ||||||
| As reported | $ 1.34 | $ 1.00 | $ 1.06 | |||
| Pro forma | 1.28 | .97 | 1.04 | |||
|
|
||||||
|
These pro forma amounts were calculated using the Black-Scholes option pricing model based on the following weighted average assumptions: risk free interest rates of 6% in 2000, and 5% in 1999 and 1998; expected option lives of four years in 2000 and 1999, and three years in 1998; and, expected volatility factors of 66.0% in 2000, 55.5% in 1999, and 45.7% in 1998. Information relating to the changes in the Company's stock options follows: |
|
2000
|
1999
|
1998
|
||||||||||
|
|
|
|
||||||||||
| (Shares in thousands) |
Shares
|
Weighted
Average
Exercise Price |
Shares
|
Weighted
Average
Exercise Price |
Shares
|
Weighted
Average
Exercise Price |
||||||
|
|
|
|
||||||||||
| Outstanding at beginning of year |
6,295.9
|
|
$12.13
|
5,446.0
|
|
$10.75
|
4,923.4
|
|
$ 6.76
|
|||
| Granted |
2,267.0
|
$28.47
|
1,478.1
|
$16.82
|
1,402.0
|
$22.73
|
||||||
| Exercised |
(719.9
|
)
|
$43.20
|
(482.2
|
)
|
$ 9.56
|
(660.0
|
)
|
$ 4.68
|
|||
| Canceled |
(372.4
|
)
|
$26.09
|
(146.0
|
)
|
$17.12
|
(219.4
|
)
|
$16.01
|
|||
|
|
|
|
||||||||||
| Outstanding at end of year |
7,470.6
|
$16.82
|
6,295.9
|
$12.13
|
5,446.0
|
$10.75
|
||||||
|
|
|
|
||||||||||
| Exercisable at June 30 |
4,677.0
|
$12.45
|
3,783.0
|
$ 8.76
|
3,138.0
|
$ 6.93
|
||||||
|
|
|
|
||||||||||
|
Shares available for additional granting at June 30 were 1,646,200 in 2000, 3,540,800 in 1999, and 856,800 in 1998. During 1999, an additional 4,000,000 shares for stock options were authorized. The following table summarizes June 30, 2000's outstanding stock option information. |
|
(Shares
in thousands)
|
||||||||||
|
Range
of
Exercise Prices |
Number
Outstanding |
Weighted
Average
Remaining Contractual Life |
Weighted
Average
Exercise Prices |
Number
Exercisable |
Weighted
Average
Exercisable Price |
|||||
|
|
||||||||||
| $ 1.50 - $ 3.16 |
782.0
|
1.13 | $ 2.08 |
782.0
|
$ 2.08 | |||||
| $ 4.31 - $ 4.72 |
816.0
|
3.84 | $ 4.63 |
816.0
|
$ 4.63 | |||||
| $ 5.16 - $10.25 |
650.2
|
5.29 | $ 8.62 |
650.2
|
$ 8.62 | |||||
| $12.44 - $12.44 |
860.4
|
6.32 | $12.44 |
705.2
|
$12.44 | |||||
| $12.53 - $16.25 |
150.0
|
7.53 | $13.22 |
86.0
|
$13.49 | |||||
| $16.72 - $16.72 |
1,037.6
|
8.31 | $16.72 |
471.2
|
$16.72 | |||||
| $17.44 - $22.00 |
132.8
|
8.16 | $20.14 |
60.8
|
$20.37 | |||||
| $22.19 - $22.19 |
1,159.6
|
9.31 | $22.19 |
260.4
|
$22.19 | |||||
| $22.75 - $22.75 |
20.0
|
9.29 | $22.75 |
4.0
|
$22.75 | |||||
| $22.97 - $47.94 |
1,862.0
|
8.35 | $29.94 |
841.2
|
$26.53 | |||||
|
|
||||||||||
| $ 1.50 - $47.94 |
7,470.6
|
6.73 | $16.82 |
4,677.0
|
$12.45 | |||||
|
|
||||||||||
|
Note The Company has been sued by the Lemelson Medical Educational Research Foundation (Lemelson), together with 87 other defendants, including the Company's major domestic competitors and customers, alleging infringement on 15 patents relating to machine vision and use of bar coding and bar code readers in manufacturing. Lemelson has been successful in settling similar assertions against certain automobile and semiconductor manufacturers. Lemelson is requesting damages equal to a certain percent of sales for a 10-year period. The Company, together with other major defendants, intends to contest the validity of the patents. In addition, possible recourse exists against manufacturers of the equipment that Lemelson is alleging violated its patents. While no guarantee can be given, the Company does not believe that outcome of this lawsuit will result in any material adverse effect on the Company. The maximum exposure for this suit is currently estimated to be less than one percent of the Company's current assets, and the Company has provided for what it believes will be the likely outcome of the suit. Additionally, if Lemelson's patents are upheld, the Company believes it will be able to obtain adequate licenses to use them. The Company is involved in other lawsuits incidental to the conduct of business, but none are considered material. Note The Company has over the last three years acquired certain assets and operations from its customers and entered into multiyear manufacturing agreements for related products. Additionally, the Company has acquired other manufacturing companies that enhanced its strategic position. These acquisitions have been accounted for as purchases, with the excess of the purchase price over the underlying assets being assigned to intangible assets. None of the acquisitions are considered significant to the Company's operations, and accordingly, no pro forma information is presented. In August 1999, the Company acquired Nortel Networks' Brockville, Ontario, Canada plant and certain other manufacturing assets, and entered into a multiyear manufacturing agreement. This plant supplies optical, data, and network subassemblies to Nortel. In December 1999, the Company purchased the manufacturing assets of TAG Manufacturing, Inc. of San Jose, California. TAG makes fabricated sheet metal products and assemblies (which are generally referred to as enclosures) for Original Equipment Manufacturers (OEMs) and Electronic Manufacturing Services (EMS) providers supporting the computing, networking, communications, and medical electronic equipment industries. The Company intends to expand TAG's enclosure operation into other geographic areas. In January 2000, the Company purchased ECI Telecom's Shemer manufacturing plant, located in Petah Tikva, Israel, and entered into a multiyear supply agreement. This plant provides printed circuit board assemblies to ECI for use in their telecommunications products. The excess of the purchase price over the acquired underlying tangible assets ($316,257,000) for these acquisitions is being amortized primarily over 15 years, since they represent substantial market and product expansions. In May 1999, the Company acquired the operations of Hewlett-Packard's Verifone, Inc. Kunshan, China plant and manufacturing operations. This facility will also be used for manufacturing other SCI customer products. The Company acquired various assets and operations from Ericsson Telecom, AB in support of an agreement whereby SCI was designated as one of Ericsson's primary manufacturing partners. The principal assets acquired were certain assets in Sweden during fiscal year 1998, a Leganes, Spain manufacturing operation in October 1998, and a Mexico City manufacturing operation in August 1998. Also, in support of being designated as a customer's primary manufacturing partner, the Company acquired certain Nokia Corporation manufacturing operations in Motala, Sweden, and Oulu, Finland in May and June 1998, and an engineering operation in fiscal 2000. The Company has conducted other acquisitions in the past three years which are of a lesser magnitude than those discussed above. Note Subsequent to year end, the Company announced two additional acquisitions in August 2000: EOG Incorporated, a Mid-Atlantic electronics design and manufacturing services company with emphasis in telecommunications and optical networking activities; and Telrad Networks Ltd.'s Ma'alot, Israel facility that produces printed circuit board assemblies and other products for Telrad Networks and Nortel Networks. Note Quarterly financial
results and high and low stock prices, as reported on the New York Stock
Exchange, for the last two fiscal years were: |
|
2000
|
1999
|
|||||||||||||||||||||||
|
|
|
|||||||||||||||||||||||
| (In thousands
of dollars, except per share data) |
Fourth
Quarter |
Third
Quarter |
Second
Quarter |
First
Quarter |
Fourth
Quarter |
Third
Quarter |
Second
Quarter |
First
Quarter |
||||||||||||||||
|
|
|
|||||||||||||||||||||||
| Net sales | $ | 2,306,489 | $ | 2,216,718 | $ |
2,155,367
|
$ | 1,664,006 | $ | 1,802,254 | $ | 1,603,024 |
$
|
1,735,930 | $ | 1,569,577 | ||||||||
| Operating profit | 92,692 | 86,549 |
79,715
|
62,715 | 69,521 | 55,641 | 56,940 | 52,700 | ||||||||||||||||
| Net income | 57,010 | 49,719 |
49,325
|
40,681 | 42,833 | 32,388 | 32,657 | 29,970 | ||||||||||||||||
| Diluted earnings per share | $ | .38 | $ | .34 | $ |
.34
|
$ | .28 | $ | .30 | $ | .24 |
$
|
.24 | $ | .22 | ||||||||
| Market stock price range: | ||||||||||||||||||||||||
| High | $ | 58.375 | $ | 55.125 | $ |
43.156
|
$ | 28.438 | $ | 25.000 | $ | 29.688 |
$
|
28.969 | $ | 22.250 | ||||||||
| Low | 32.750 | 33.500 |
19.531
|
21.125 | 12.625 | 14.594 | 10.375 | 10.625 | ||||||||||||||||
|
|
|
|||||||||||||||||||||||
|
Quarterly and annual earnings per share are independently computed using the estimated effective income tax rate and Common Stock market prices applicable for that period. Consequently, the sum of individual quarterly diluted earnings per share may not equal the total for the year.
REPORT OF MANAGEMENT The management of SCI is responsible for the integrity of its consolidated financial statements. The accompanying consolidated financial statements have been prepared in conformity with generally accepted accounting principles as applied in the United States and include amounts based on the best estimates and judgements of management. Financial information included elsewhere in this report is consistent with that in the financial statements. We maintain a system of internal accounting controls designed to provide reasonable assurance at a reasonable cost that assets are safeguarded against loss or unauthorized use, and that transactions are conducted in accordance with management's authorization and accounted for properly. Ernst & Young LLP, our independent auditors, have audited the Company's consolidated financial statements. Their accompanying report is based on audits conducted in accordance with auditing standards generally accepted in the United States, which require a review of the system of internal auditing controls and tests of accounting procedures and records to the extent necessary for the purpose of forming their opinion on our consolidated financial statements. Our Board of Directors, through its Audit Committee, which is composed entirely of outside directors, oversees management's responsibilities in the preparation of the consolidated financial statements and selects the independent auditors, subject to stockholder ratification. The Audit Committee meets regularly with the independent auditors and representatives of management, to review the activities of each and to assure that each is properly discharging their responsibilities. To ensure complete independence, representatives of Ernst & Young LLP have full access to meet with the Audit Committee, with or without management representatives present, to discuss the results of their examinations and their opinions on the adequacy of internal controls and the quality of financial reporting. |
| /s/ A. Eugene Sapp, Jr. | /s/ James E. Moylan, Jr. | |
| A. Eugene Sapp,
Jr. Chairman, President, and Chief Executive Officer |
James E. Moylan,
Jr. Senior Vice President and Chief Financial Officer |
|
REPORT OF ERNST & YOUNG LLP, INDEPENDENT AUDITORS To the Board of
Directors and Shareholders We have audited the accompanying consolidated balance sheets of SCI Systems, Inc. as of June 30, 2000 and 1999, and the related consolidated statements of income, shareholders' equity, cash flows and comprehensive income for each of the three years in the period ended June 30, 2000. These financial statements are the responsibility of the Company's management. Our responsibility is to express an opinion on these financial statements based on our audits. We conducted our audits in accordance with accounting standards generally accepted in the United States. Those standards require that we plan and perform the audit to obtain reasonable assurance about whether the financial statements are free of material misstatement. An audit includes examining, on a test basis, evidence supporting the amounts and disclosures in the financial statements. An audit also includes assessing the accounting principles used and significant estimates made by management, as well as evaluating the overall financial statement presentation. We believe that our audits provide a reasonable basis for our opinion. In our opinion, the financial statements referred to above present fairly, in all material respects, the consolidated financial position of SCI Systems, Inc. at June 30, 2000 and 1999, and the consolidated results of its operations and its cash flows for each of the three years in the period ended June 30, 2000, in conformity with accounting principles generally accepted in the United States. /s/ Ernst & Young LLP Birmingham, Alabama
COMPANY OFFICERS |
|
Corporate Officers A. Eugene Sapp,
Jr. Robert C. Bradshaw
Peter M. Scheffler
James E. Moylan,
Jr. Michael M. Sullivan
Senior Vice Presidents
|
First Vice President
Vice Presidents
|
David L. Marler Assistant Vice Presidents |
BOARD OF DIRECTORS
|
A. Eugene Sapp,
Jr. 1 Howard H. Callaway
2, 4 William E. Fruhan
1, 2, 3 |
Olin B. King 3
Wayne Shortridge
1, 3 G. Robert Tod
2, 4 Jackie M. Ward
3, 4 |
Director Emeritus
Committees of
the Board |
SHAREHOLDER INFORMATION
|
Corporate/World
Headquarters Investor Relations
Transfer Agent
& Registrar |
Independent Auditors
Outside General
Counsel Agent Banks
Annual Meeting
|
Security Trading
Markets Common Stock Options
Form 10-K Report
|
|
Total Shareholder
Return
The graph above compares cumulative total return for the Company's common shares against the Dow Jones Industrial Average and the S&P 500 for the period of 1995 to 2000 assuming $100 invested on June 30, 1995. |
Quarterly Market Price
| 2000 |
High
|
Low
|
Close
|
||||||
|
|
|||||||||
| First | $ |
28.44
|
$ |
21.13
|
$ |
22.69
|
|||
| Second |
43.16
|
19.53
|
41.50
|
||||||
| Third |
55.13
|
33.50
|
53.31
|
||||||
| Fourth |
58.38
|
32.75
|
39.09
|
||||||
|
|
|||||||||
|
|
|||||||||
| 1999 |
High
|
Low
|
Close
|
||||||
|
|
|||||||||
| First | $ |
22.25
|
$ |
10.63
|
$ |
13.91
|
|||
| Second |
28.97
|
10.38
|
28.88
|
||||||
| Third |
29.69
|
14.59
|
15.13
|
||||||
| Fourth |
25.00
|
12.63
|
23.69
|
||||||
|
|
|||||||||
|
Safe Harbor Statement This document contains forward-looking statements within the meaning of the Private Securities Act of 1995. Actual results could differ from the forward-looking statements made herein. Nondiscrimination Policy No SCI employee or applicant for employment shall be discriminated against on account of race, color, religion, sex, national origin, disability or age.
Designed and produced by Corporate Reports Inc./Atlanta.
S C I S y s t e m s , I n c . 2 1 0 1
W e s t C l i n t o n
A v e n u e
|
|
|