
|
|
|
|
|
|
|
|
|
Spartan®
Semiannual Report
August 31, 2000
(Fidelity Investment logo)(registered trademark)
|
President's Message |
Ned Johnson on investing strategies |
|
|
Spartan California Municipal Income Fund |
||
|
|
Performance |
|
|
|
Fund Talk: The Manager's Overview |
|
|
|
Investment Changes |
|
|
|
Investments |
|
|
|
Financial Statements |
|
|
Spartan California Municipal Money Market Fund |
||
|
|
Performance |
|
|
|
Fund Talk: The Manager's Overview |
|
|
|
Investment Changes |
|
|
|
Investments |
|
|
|
Financial Statements |
|
|
Fidelity California Municipal Money Market Fund |
||
|
|
Performance |
|
|
|
Fund Talk: The Manager's Overview |
|
|
|
Investment Changes |
|
|
|
Investments |
|
|
|
Financial Statements |
|
|
Notes |
Notes to the Financial Statements |
|
|
|
|
|
Standard & Poor's, S&P and S&P 500 are registered service marks of The McGraw-Hill Companies, Inc. and have been licensed for use by Fidelity Distributors Corporation.
Other third party marks appearing herein are the property of their respective owners.
All other marks appearing herein are registered or unregistered trademarks or service marks of FMR Corp. or an affiliated company.
(Recycle graphic) This report is printed on recycled paper using soy-based inks.
This report and the financial statements contained herein are submitted for the general information of the shareholders of the funds. This report is not authorized for distribution to prospective investors in the funds unless preceded or accompanied by an effective prospectus.
Mutual fund shares are not deposits or obligations of, or guaranteed by, any depository institution. Shares are not insured by the FDIC, Federal Reserve Board or any other agency, and are subject to investment risks, including possible loss of principal amount invested.
Neither the funds nor Fidelity Distributors Corporation is a bank.
For more information on any Fidelity fund, including charges and expenses, call 1-800-544-6666 for a free prospectus. Read it carefully before you invest or send money.
Semiannual Report
(photo_of_Edward_C_Johnson_3d)
Dear Shareholder:
A slowing U.S. economy triggered an equity market rally during the later stages of summer, boosting most major stock indexes back into positive territory for calendar year 2000. One notable exception, however, was the Dow Jones Industrial Average, which posted a negative return during that timeframe. Fixed-income markets - particularly Treasuries - continued their yearlong trend of strong performance, as nearly every bond sector outperformed the stock market on a year-to-date basis.
While it's impossible to predict the future direction of the markets with any degree of certainty, there are certain basic principles that can help investors plan for their future needs.
The longer your investment time frame, the less likely it is that you will be affected by short-term market volatility. A 10-year investment horizon appropriate for saving for a college education, for example, enables you to weather market cycles in a long-term fund, which may have a higher risk potential, but also has a higher potential rate of return.
An intermediate-length fund could make sense if your investment horizon is two to four years, while a short-term bond fund could be the right choice if you need your money in one or two years.
If your time horizon is less than a year, you might want to consider moving some of your bond investment into a money market fund. These funds seek income and a stable share price by investing in high-quality, short-term investments. Of course, it's important to remember that an investment in a money market fund is not insured or guaranteed by the Federal Deposit Insurance Corporation or any other government agency. Although money market funds seek to preserve the value of your investment at $1.00 per share, it is possible to lose money by investing in these types of funds.
Finally, no matter what your time horizon or portfolio diversity, it makes good sense to follow a regular investment plan, investing a certain amount of money in a fund at the same time each month or quarter and periodically reviewing your overall portfolio. By doing so, you won't get caught up in the excitement of a rapidly rising market, nor will you buy all your shares at market highs. While this strategy - known as dollar cost averaging - won't assure a profit or protect you from a loss in a declining market, it should help you lower the average cost of your purchases. Of course, you should consider your financial ability to continue your purchases through periods of low price levels before undertaking such a strategy.
If you have questions, please call us at 1-800-544-6666, or visit our web site at www.fidelity.com. We are available 24 hours a day, seven days a week to provide you the information you need to make the investments that are right for you.
Best regards,
/s/Edward C. Johnson 3d
Edward C. Johnson 3d
Semiannual Report
Spartan California Municipal Income Fund
There are several ways to evaluate a fund's historical performance. You can look at the total percentage change in value, the average annual percentage change or the growth of a hypothetical $10,000 investment. Total return reflects the change in the value of an investment, assuming reinvestment of the fund's dividend income and capital gains (the profits earned upon the sale of securities that have grown in value). You can also look at the fund's income, as reflected in the fund's yield, to measure performance. If Fidelity had not reimbursed certain fund expenses, the past five year and past 10 year total returns would have been lower.
Cumulative Total Returns
|
Periods ended August 31, 2000 |
Past 6 |
Past 1 |
Past 5 |
Past 10 |
|
Spartan CA Municipal Income |
7.54% |
7.75% |
37.37% |
99.07% |
|
LB California Municipal Bond |
7.75% |
7.82% |
37.13% |
n/a* |
|
California Municipal Debt Funds Average |
8.00% |
6.47% |
31.08% |
94.23% |
Cumulative total returns show the fund's performance in percentage terms over a set period - in this case, six months, one year, five years or 10 years. For example, if you had invested $1,000 in a fund that had a 5% return over the past year, the value of your investment would be $1,050. You can compare the fund's returns to the performance of the Lehman Brothers California Municipal Bond Index - a market value-weighted index of California investment-grade municipal bonds with maturities of at least one year or more. To measure how the fund's performance stacked up against its peers, you can compare it to the California municipal debt funds average, which reflects the performance of mutual funds with similar objectives tracked by Lipper Inc. The past six months average represents a peer group of 113 mutual funds. These benchmarks include reinvested dividends and capital gains, if any.
Average Annual Total Returns
|
Periods ended August 31, 2000 |
|
Past 1 |
Past 5 |
Past 10 |
|
Spartan CA Municipal Income |
|
7.75% |
6.56% |
7.13% |
|
LB California Municipal Bond |
|
7.82% |
6.52% |
n/a* |
|
California Municipal Debt Funds Average |
|
6.47% |
5.54% |
6.83% |
Average annual total returns take the fund's cumulative return and show you what would have happened if the fund had performed at a constant rate each year. (Note: Lipper calculates average annual total returns by annualizing each fund's total return, then taking an arithmetic average. This may produce a different figure than that obtained by averaging the cumulative total returns and annualizing the result.)
* Not available
Semiannual Report
Spartan California Municipal Income Fund
Performance - continued
$10,000 Over 10 Years
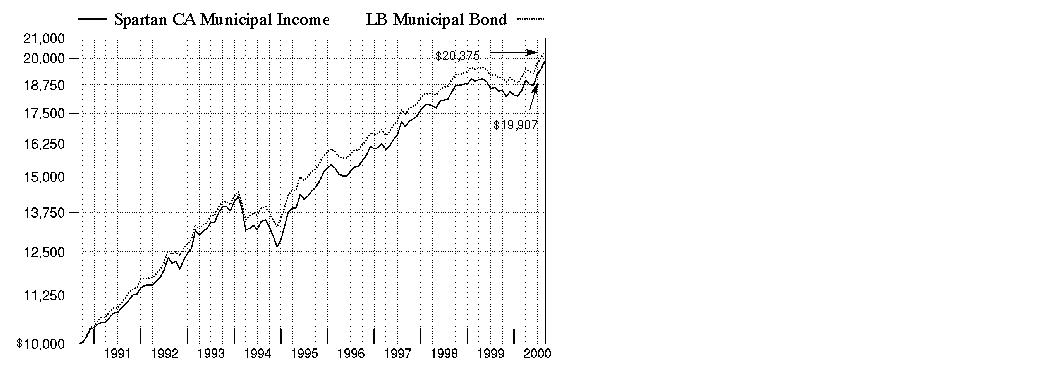
$10,000 Over 10 Years: Let's say hypothetically that $10,000 was invested in Spartan California Municipal Income Fund on August 31, 1990. As the chart shows, by August 31, 2000, the value of the investment would have grown to $19,907 - a 99.07% increase on the initial investment. For comparison, look at how the Lehman Brothers Municipal Bond Index - a market value-weighted index of investment-grade municipal bonds with maturities of one year or more - did over the same period. With dividends and capital gains, if any, reinvested, the same $10,000 would have grown to $20,375 - a 103.75% increase.
Understanding
Performance
How a fund did yesterday is no guarantee of how it will do tomorrow. Bond prices, for example, generally move in the opposite direction of interest rates. In turn, the share price, return and yield of a fund that invests in bonds will vary. That means if you sell your shares during a market downturn, you might lose money. But if you can ride out the market's ups and downs, you may have a gain.
3Semiannual Report
Spartan California Municipal Income Fund
Performance - continued
Total Return Components
|
|
Six months ended August 31, |
Year ended |
Years ended February 28, |
Year ended |
||
|
|
2000 |
2000 |
1999 |
1998 |
1997 |
1996 |
|
Dividend returns |
2.59% |
4.46% |
4.73% |
5.23% |
5.37% |
5.86% |
|
Capital returns |
4.95% |
-6.74% |
1.27% |
4.66% |
0.79% |
5.39% |
|
Total returns |
7.54% |
-2.28% |
6.00% |
9.89% |
6.16% |
11.25% |
Total return components include both dividend returns and capital returns. A dividend return reflects the actual dividends paid by the fund. A capital return reflects both the amount paid by the fund to shareholders as capital gain distributions and changes in the fund's share price. Both returns assume the dividends or capital gains, if any, paid by the fund are reinvested.
Dividends and Yield
|
Periods ended August 31, 2000 |
Past 1 |
Past 6 |
Past 1 |
|
Dividends per share |
4.88¢ |
28.82¢ |
56.59¢ |
|
Annualized dividend rate |
4.78% |
4.87% |
4.85% |
|
30-day annualized yield |
4.55% |
- |
- |
|
30-day annualized tax-equivalent yield |
7.84% |
- |
- |
Dividends per share show the income paid by the fund for a set period. If you annualize this number, based on an average share price of $12.02 over the past one month, $11.74 over the past six months and $11.66 over the past one year, you can compare the fund's income over these three periods. The 30-day annualized yield is a standard formula for all bond funds based on the yields of the bonds in the fund, averaged over the past 30 days. This figure shows you the yield characteristics of the fund's investments at the end of the period. It also helps you compare funds from different companies on an equal basis. The tax-equivalent yield shows what you would have to earn on a taxable investment to equal the fund's tax-free yield, if you're in the 41.95% combined effective 2000 federal and state income tax bracket, but does not reflect the payment of the federal alternative minimum tax, if applicable.
Semiannual Report
Spartan California Municipal Income Fund
Market Recap
The six-month period ending August 31, 2000, was a favorable one for the municipal bond market. As the period opened, municipal bond yields were generally higher than they had been in the recent past, enticing investors who sought to protect gains in stocks when the equity markets began to recoil in mid-March. At the same time, strong U.S. economic growth and higher tax revenues led to credit rating upgrades and budget surpluses for many municipal bond issuers such as U.S. state and local governments. Thus, this solvency - in addition to higher interest rates that discouraged borrowing - curtailed new issuance, and the resulting supply/demand imbalance spurred municipal prices even higher. As the period progressed, municipal bond investors were further heartened by strong evidence that the Federal Reserve Board's series of interest-rate hikes had successfully slowed the U.S. economy, indicating that further hikes may not be necessary. That sentiment was bolstered when the Fed bypassed two opportunities to hike rates further in June and August. For the overall six-month period ending August 31, 2000, the Lehman Brothers Municipal Bond Index - an index of over 35,000 investment-grade, fixed-rate, tax-exempt bonds - returned 6.79%. In comparison, this return surpassed the gains of the Lehman Brothers Treasury, Government Bond, U.S. Agency, Mortgage-Back Securities and Credit Bond Indexes during the same time frame.
(Portfolio Manager photograph)
An interview with Christine Thompson, Portfolio Manager of Spartan California Municipal Income Fund
Q. How did the fund perform, Christine?
A. For the six-month period that ended August 31, 2000, the fund had a total return of 7.54%. To get a sense of how the fund did relative to its competitors, the California municipal debt funds average returned 8.00% for the same six-month period, according to Lipper Inc. Additionally, the Lehman Brothers California Municipal Bond Index, which tracks the types of securities in which the fund invests, returned 7.75%. For the 12-month period that ended August 31, 2000, the fund had a total return of 7.75%. In comparison, the California municipal debt funds average returned 6.47% and the Lehman Brothers California Municipal Bond Index returned 7.82%.
Q. What were some of the main forces behind the fund's performance during the past six months?
A. Anticipation that interest-rate hikes were behind us and a favorable supply/demand imbalance caused the municipal market to rally and boosted the fund's performance. Starting in the spring of 2000, investors began to anticipate that the Federal Reserve Board's yearlong campaign to stave off inflation by raising interest rates was nearing a close. That optimism was based on economic indicators that suggested economic growth might be slowing. Whether or not the Fed is finished raising interest rates will depend on the direction of the economy from here. More favorable supply and demand conditions also helped propel the municipal market. The supply of California municipals was down 24% during the first eight months of 2000, compared to the same period a year earlier. Meanwhile, the demand for municipals strengthened as bargain-hunting investors sought out their value and attractive yields. The fund's total return was the result of the appreciation of its holdings plus the income generated by them.
Semiannual Report
Spartan California Municipal Income Fund
Fund Talk: The Manager's Overview - continued
Q. Why did the fund lag its peers during the six-month period?
A. The fund generally had less interest-rate sensitivity, as measured by its somewhat shorter duration, than some of its peers for the six-month period. In keeping with Fidelity's investment approach, I didn't lengthen or shorten duration - that is, I didn't make the fund more or less interest-rate sensitive - based on where I thought interest rates would be at some point down the road. Instead, I positioned the fund to emphasize the best value opportunities based on their performance potential under a variety of possible interest-rate scenarios. I managed the fund's duration to be in line with the California municipal market as a whole, an approach that caused short-term performance to lag relative to its peers, but which has generated competitive long-term results.
Q. What factors helped the fund's performance?
A. The fund's focus on premium coupon bonds, which pay interest rates above face - or par - value, helped. One appealing aspect of premiums was that they were somewhat insulated from unfavorable tax treatment that negatively affected the prices of lower coupon bonds as rates rose. It's estimated that roughly one-quarter to one-third of all municipal bonds suffered because they were subject to that unfavorable tax treatment.
Q. What's your outlook for the municipal market?
A. As it generally does, the municipal market's performance will depend on the direction of interest rates and the supply/demand environment. While I don't forecast the direction of interest rates, my outlook for the technical aspects of supply and demand is favorable. The supply of municipals has continued to decline in response to rising interest rates because many issuers now find it too expensive to issue new or refinance old debt. As municipal bond yields rose above 6%, we saw incredibly strong demand from individual investors. To the extent that those conditions continue to prevail, municipals could do well. Another factor that could bode well for municipals is the potential for increased demand from institutional investors. If their interest in municipals re-ignites, municipals should benefit.
Semiannual Report
Spartan California Municipal Income Fund
Fund Talk: The Manager's Overview - continued
The views expressed in this report reflect those of the portfolio manager only through the end of the period of the report as stated on the cover and do not necessarily represent the views of Fidelity or any other person in the Fidelity organization. Any such views are subject to change at any time based upon market or other conditions and Fidelity disclaims any responsibility to update such views. These views may not be relied on as investment advice and, because investment decisions for a Fidelity fund are based on numerous factors, may not be relied on as an indication of trading intent on behalf of any Fidelity fund.
Fund Facts
Goal: seeks a high level of current income, exempt from federal and California personal income taxes
Fund number: 091
Trading symbol: FCTFX
Start date: July 7, 1984
Size: as of August 31, 2000, more than $1.3 billion
Manager: Christine Thompson, since 1998; manager, various Fidelity and Spartan municipal income funds; joined Fidelity in 1985
3Christine Thompson on geographically diversifying the portfolio:
"One way I diversify the portfolio is to spread investments among a variety of issuers across the state, which helps protect the fund's performance against being too dependent on one sector of the economy or one area of the state. California, of course, is made up of several distinct regions, each of which tends to be driven by different economic, demographic and other factors, and each faces unique challenges looking ahead. For example, the technology- and financial services-dependent Silicon Valley/Bay Area region is currently challenged by the tech sector's volatility and the region's high cost of living. The Los Angeles area has been buoyed by the strength of the entertainment and high-tech industries. However, it is experiencing relatively high unemployment and relatively low income levels. Sacramento, where government employment plays a dominant role, is potentially one of the state's most stable regions thanks to a lower cost of living, less tight labor markets and better water availability. We'll continue to monitor each region's future challenges closely and factor them into our security selection."
Semiannual Report
Spartan California Municipal Income Fund
|
Top Five Sectors as of August 31, 2000 |
||
|
|
% of fund's |
% of fund's net assets |
|
General Obligations |
25.1 |
19.8 |
|
Transportation |
13.8 |
13.7 |
|
Electric Utilities |
11.5 |
12.3 |
|
Special Tax |
10.7 |
11.6 |
|
Escrowed/Pre-Refunded |
10.6 |
10.1 |
|
Average Years to Maturity as of August 31, 2000 |
||
|
|
|
6 months ago |
|
Years |
14.5 |
14.6 |
|
Average years to maturity is based on the average time remaining until principal payments are expected from each of the fund's bonds, weighted by dollar amount. |
|
Duration as of August 31, 2000 |
||
|
|
|
6 months ago |
|
Years |
6.9 |
7.3 |
|
Duration shows how much a bond fund's price fluctuates with changes in comparable interest rates. |
|
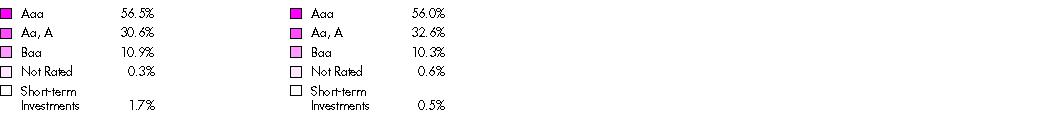
Quality Diversification (Moody's Ratings) |
As of August 31, 2000 As of February 29, 2000

|
Where Moody's ratings are not available, we have used S&P ® ratings. Amounts shown are as a percentage of the fund's investments. |
Semiannual Report
Spartan California Municipal Income Fund
(Unaudited)
Showing Percentage of Net Assets
|
Municipal Bonds - 96.6% |
|||||
|
Moody's Ratings (unaudited) (a) |
Principal Amount (000s) |
Value (Note 1) (000s) |
|||
|
California - 92.3% |
|||||
|
Alameda Corridor Trans. Auth. Rev. Sr. Lien Series A: |
|
|
|
|
|
|
4.75% 10/1/25 (MBIA Insured) |
Aaa |
|
$ 5,000 |
$ 4,499 |
|
|
5.25% 10/1/21 (MBIA Insured) |
Aaa |
|
7,475 |
7,381 |
|
|
Alameda County Ctfs. of Prtn Rfdg. (Santa Rita Jail Proj.) 5.7% 12/1/14 (MBIA Insured) |
Aaa |
|
2,000 |
2,089 |
|
|
Buena Park Cmnty. Redev. Agcy. Tax Allocation Rfdg. (Central Bus. District Proj.) Series A, 7.1% 9/1/14 |
BBB+ |
|
3,500 |
3,708 |
|
|
Burbank Redev. Agy. Rfdg.: |
|
|
|
|
|
|
(City Ctr. Redev. Proj.) Series A, 5% 12/1/15 (FSA Insured) |
Aaa |
|
4,000 |
4,008 |
|
|
(Golden State Redev. Proj.) Series A, |
Baa1 |
|
4,655 |
4,897 |
|
|
Cabrillo Unified School District (Cap. Appreciation) Series A: |
|
|
|
|
|
|
0% 8/1/10 (AMBAC Insured) |
Aaa |
|
2,150 |
1,364 |
|
|
0% 8/1/12 (AMBAC Insured) |
Aaa |
|
2,800 |
1,577 |
|
|
California Dept. of Wtr. Resources Central Valley Proj. Rev. (Wtr. Sys. Proj.): |
|
|
|
|
|
|
Series J1, 7% 12/1/12 |
Aa2 |
|
1,000 |
1,231 |
|
|
Series S, 5% 12/1/19 |
Aa2 |
|
3,160 |
3,080 |
|
|
California Edl. Facilities Auth. Rev.: |
|
|
|
|
|
|
(California Student Ln. Prog.) Series A, 6% 3/1/16 (MBIA Insured) (c) |
Aaa |
|
4,900 |
5,009 |
|
|
(Cap. Appreciation) (Loyola Marymount Proj.) 0% 10/1/07 (MBIA Insured) |
Aaa |
|
3,545 |
2,598 |
|
|
(Pepperdine Univ. Proj.): |
|
|
|
|
|
|
Series A: |
|
|
|
|
|
|
5% 11/1/18 |
A1 |
|
1,770 |
1,714 |
|
|
5% 11/1/29 |
A1 |
|
2,500 |
2,313 |
|
|
5.75% 9/15/30 |
A1 |
|
10,000 |
10,209 |
|
|
(Pooled College & Univ. Proj.) Series A, 6.125% 6/1/30 |
A2 |
|
3,435 |
3,592 |
|
|
(Scripps College Proj.) 5.125% 2/1/30 |
A1 |
|
6,000 |
5,666 |
|
|
(Stanford Univ. Proj.) Series N, 5.2% 12/1/27 |
Aaa |
|
20,000 |
19,490 |
|
|
Rfdg.: |
|
|
|
|
|
|
(Chapman Univ. Proj.) 5.375% 10/1/16 (AMBAC Insured) |
AAA |
|
2,000 |
2,039 |
|
|
(Claremont McKenna College Proj.): |
|
|
|
|
|
|
5% 11/1/29 |
Aa1 |
|
5,000 |
4,653 |
|
|
5.1% 11/1/17 |
Aa1 |
|
1,000 |
1,000 |
|
|
Municipal Bonds - continued |
|||||
|
Moody's Ratings (unaudited) (a) |
Principal Amount (000s) |
Value (Note 1) (000s) |
|||
|
California - continued |
|||||
|
California Edl. Facilities Auth. Rev.: - continued |
|
|
|
|
|
|
Rfdg.: |
|
|
|
|
|
|
(Santa Clara Univ. Proj.): |
|
|
|
|
|
|
5.25% 9/1/16 (AMBAC Insured) |
Aaa |
|
$ 1,650 |
$ 1,710 |
|
|
5.25% 9/1/17 (AMBAC Insured) |
Aaa |
|
1,000 |
1,024 |
|
|
5.25% 9/1/26 |
A1 |
|
7,910 |
7,757 |
|
|
(Stanford Univ. Proj.) Series O, |
Aaa |
|
8,000 |
7,674 |
|
|
(Univ. of Southern California Proj.): |
|
|
|
|
|
|
Series A, 5.7% 10/1/15 |
Aa2 |
|
5,675 |
5,997 |
|
|
Series C, 5.125% 10/1/28 |
Aa2 |
|
7,725 |
7,399 |
|
|
California Franchise Tax Board Ctfs. of Prtn. Rfdg. 5.5% 10/1/06 |
A1 |
|
1,825 |
1,949 |
|
|
California Gen. Oblig.: |
|
|
|
|
|
|
Rfdg. 4.75% 2/1/19 (FGIC Insured) |
Aaa |
|
2,000 |
1,880 |
|
|
3.6%, tender 6/1/01 (c) |
Aa3 |
|
25,000 |
24,850 |
|
|
4.5% 12/1/14 |
Aa3 |
|
2,250 |
2,151 |
|
|
4.5% 12/1/24 (FGIC Insured) |
Aaa |
|
5,000 |
4,337 |
|
|
5% 10/1/18 |
Aa3 |
|
5,000 |
4,906 |
|
|
5.25% 10/1/14 |
Aa3 |
|
3,000 |
3,076 |
|
|
5.25% 10/1/17 |
Aa3 |
|
1,500 |
1,513 |
|
|
5.5% 6/1/28 |
Aa3 |
|
5,000 |
5,027 |
|
|
5.75% 5/1/30 |
Aa3 |
|
3,080 |
3,167 |
|
|
6.6% 2/1/09 |
Aa3 |
|
3,000 |
3,488 |
|
|
6.75% 8/1/10 |
Aa3 |
|
5,675 |
6,749 |
|
|
California Health Facilities Fing. Auth. Rev.: |
|
|
|
|
|
|
(Cedars-Sinai Med. Ctr. Proj.) Series A: |
|
|
|
|
|
|
6.125% 12/1/30 |
A2 |
|
6,700 |
6,787 |
|
|
6.25% 12/1/34 |
A2 |
|
15,000 |
15,302 |
|
|
(Kaiser Permante Proj.) Series A, 5.55% 8/15/25 (MBIA Insured) |
Aaa |
|
4,720 |
4,733 |
|
|
Rfdg.: |
|
|
|
|
|
|
(Catholic Health Care West Proj.): |
|
|
|
|
|
|
Series 1988 A, 5% 7/1/06 |
Baa1 |
|
3,135 |
3,021 |
|
|
Series A: |
|
|
|
|
|
|
4.5% 7/1/02 |
Baa1 |
|
7,065 |
6,943 |
|
|
4.5% 7/1/03 |
Baa1 |
|
1,210 |
1,175 |
|
|
4.5% 7/1/04 |
Baa1 |
|
1,500 |
1,436 |
|
|
5% 7/1/01 |
Baa1 |
|
3,615 |
3,612 |
|
|
(Children's Hosp. Proj.) 6% 7/1/03 |
Aaa |
|
1,200 |
1,258 |
|
|
Municipal Bonds - continued |
|||||
|
Moody's Ratings (unaudited) (a) |
Principal Amount (000s) |
Value (Note 1) (000s) |
|||
|
California - continued |
|||||
|
California Hsg. Fin. Agcy. Home Mtg. Rev. |
Aaa |
|
$ 860 |
$ 856 |
|
|
California Hsg. Fin. Agcy. Rev.: |
|
|
|
|
|
|
(Cap. Appreciation) (Home Mtg. Prog.): |
|
|
|
|
|
|
Series 1983 A, 0% 2/1/15 |
Aa2 |
|
8,187 |
2,527 |
|
|
Series 1983 B, 0% 8/1/15 |
Aa2 |
|
170 |
52 |
|
|
Series C, 0% 8/1/21 (c) |
Aa2 |
|
340 |
69 |
|
|
(Home Mtg. Prog.): |
|
|
|
|
|
|
Series I, 4.95% 8/1/28 (MBIA Insured) (c) |
Aaa |
|
2,615 |
2,610 |
|
|
Series J, 4.85% 8/1/27 (MBIA Insured) (c) |
Aaa |
|
3,380 |
3,346 |
|
|
California Poll. Cont. Fing. Auth. Poll. Cont. Rev.: |
|
|
|
|
|
|
(Gen. Motors Corp. Proj.) 5.5% 4/1/08 |
A3 |
|
1,500 |
1,508 |
|
|
(Pacific Gas & Elec. Co. Proj.) Series B, 6.35% 6/1/09 (MBIA Insured) (c) |
Aaa |
|
7,000 |
7,410 |
|
|
Rfdg. (San Diego Gas & Elec. Co. Proj.) |
A2 |
|
4,000 |
4,353 |
|
|
California Pub. Cap. Impt. Fin. Auth. Rev. (A Joint Powers Agcy. Proj.) Series B, 8.1% 3/1/18 (MBIA Insured) |
Aaa |
|
8,560 |
8,636 |
|
|
California Pub. Works Board Lease Rev.: |
|
|
|
|
|
|
(Dept. of Corrections, Madera State |
|
|
|
|
|
|
5.5% 6/1/15 |
A1 |
|
8,250 |
8,745 |
|
|
5.5% 6/1/19 |
A1 |
|
3,000 |
3,025 |
|
|
6% 6/1/07 |
A1 |
|
1,590 |
1,743 |
|
|
(Dept. of Corrections, Susanville State Prison Proj.) Series D, 5.25% 6/1/15 (FSA Insured) |
Aaa |
|
4,000 |
4,179 |
|
|
(Substance Abuse Treatment Facilities |
Aaa |
|
3,000 |
3,124 |
|
|
(Various California State Univ. Projs.): |
|
|
|
|
|
|
Series A: |
|
|
|
|
|
|
6.1% 10/1/06 |
A1 |
|
1,210 |
1,313 |
|
|
6.5% 9/1/04 |
A |
|
1,090 |
1,182 |
|
|
Series B: |
|
|
|
|
|
|
5.5% 6/1/14 |
Aa3 |
|
2,750 |
2,839 |
|
|
5.5% 6/1/19 |
Aa3 |
|
2,000 |
2,018 |
|
|
6.4% 12/1/09 |
Aa3 |
|
3,700 |
4,264 |
|
|
Series C, 5.125% 9/1/22 (AMBAC Insured) |
Aaa |
|
10,000 |
9,699 |
|
|
Rfdg.: |
|
|
|
|
|
|
(California Cmnty. College Projs.) Series A, 5.25% 12/1/16 |
A1 |
|
4,450 |
4,497 |
|
|
Municipal Bonds - continued |
|||||
|
Moody's Ratings (unaudited) (a) |
Principal Amount (000s) |
Value (Note 1) (000s) |
|||
|
California - continued |
|||||
|
California Pub. Works Board Lease Rev.: - continued |
|
|
|
|
|
|
Rfdg.: |
|
|
|
|
|
|
(Dept. of Corrections, Monterey County State Prison Proj.) Series D: |
|
|
|
|
|
|
5.375% 11/1/12 |
A1 |
|
$ 1,250 |
$ 1,308 |
|
|
5.375% 11/1/13 |
A1 |
|
5,055 |
5,246 |
|
|
5.375% 11/1/14 |
A1 |
|
5,000 |
5,151 |
|
|
(Library & Courts Annex Proj.) Series A, 5.5% 5/1/09 |
A1 |
|
1,290 |
1,391 |
|
|
California Statewide Cmnty. Dev. Auth. Rev.: |
|
|
|
|
|
|
(Los Angeles Orthopaedic Hosp. Foundation Proj.) 5.75% 6/1/30 (AMBAC Insured) |
Aaa |
|
10,000 |
10,161 |
|
|
(Sisters Charity Leavenworth Proj.) 5% 12/1/14 |
Aa3 |
|
1,315 |
1,269 |
|
|
Rfdg.: |
|
|
|
|
|
|
(Children's Hosp. Proj.) 6% 6/1/13 |
Aaa |
|
2,470 |
2,762 |
|
|
(Saint Joseph Health Sys. Proj.): |
|
|
|
|
|
|
5.5% 7/1/14 |
Aa3 |
|
9,500 |
9,547 |
|
|
5.5% 7/1/23 |
Aa3 |
|
3,000 |
2,912 |
|
|
(Triad Health Care Hosp. Proj.) 6.25% 8/1/06 (Escrowed to Maturity) (d) |
AA- |
|
5,000 |
5,373 |
|
|
5.616% 7/1/13 (MBIA Insured) |
Aaa |
|
10,000 |
10,214 |
|
|
California Statewide Cmnty. Dev. Auth. Rev. Ctfs. of Prtn.: |
|
|
|
|
|
|
(Catholic Health Care West Proj.) 6% 7/1/09 |
Baa1 |
|
4,785 |
4,841 |
|
|
Rfdg. (Saint Joseph Health Sys. Proj.): |
|
|
|
|
|
|
5.25% 7/1/08 |
Aa3 |
|
2,710 |
2,743 |
|
|
5.5% 7/1/07 |
Aa3 |
|
1,425 |
1,465 |
|
|
California Univ. Rev. (Hsg. Sys. Proj.) Series 1999 AY, 5.875% 11/1/30 (FGIC Insured) |
Aaa |
|
3,000 |
3,122 |
|
|
Campbell Gen. Oblig. Ctfs. of Prtn. Rfdg. (Civic Ctr. Proj.) 6% 10/1/18 |
A2 |
|
4,965 |
5,084 |
|
|
Carson Redev. Agcy. Rfdg.: |
|
|
|
|
|
|
(Area #1 Redev. Proj.): |
|
|
|
|
|
|
6.375% 10/1/12 |
Baa1 |
|
3,965 |
4,146 |
|
|
6.375% 10/1/16 |
Baa1 |
|
2,000 |
2,072 |
|
|
(Area #2 Redev. Proj.) 5.5% 10/1/02 |
Baa2 |
|
100 |
102 |
|
|
Castaic Lake Wtr. Agcy. Ctfs. of Prtn. Rfdg. (Wtr. Sys. Impt. Proj.) Series A: |
|
|
|
|
|
|
7% 8/1/11 (MBIA Insured) |
Aaa |
|
1,500 |
1,821 |
|
|
7% 8/1/13 (MBIA Insured) |
Aaa |
|
4,740 |
5,811 |
|
|
7.25% 8/1/07 (MBIA Insured) |
Aaa |
|
1,755 |
2,065 |
|
|
Municipal Bonds - continued |
|||||
|
Moody's Ratings (unaudited) (a) |
Principal Amount (000s) |
Value (Note 1) (000s) |
|||
|
California - continued |
|||||
|
Central Valley Fing. Auth. Cogeneration Proj. Rev. (Carson Ice Gen. Proj.): |
|
|
|
|
|
|
5.5% 7/1/01 |
BBB- |
|
$ 1,400 |
$ 1,412 |
|
|
6% 7/1/09 |
BBB- |
|
4,800 |
4,993 |
|
|
Coalinga Gen. Oblig. Ctfs. of Prtn. 7% 4/1/10 |
A- |
|
3,505 |
3,580 |
|
|
Contra Costa County Ctfs. of Prtn. (Cap. Appreciation) (Merrithew Mem. Hosp. Proj.): |
|
|
|
|
|
|
0% 11/1/13 (Escrowed to Maturity) (d) |
Aaa |
|
6,805 |
3,500 |
|
|
0% 11/1/14 (Escrowed to Maturity) (d) |
Aaa |
|
3,000 |
1,441 |
|
|
Contra Costa Wtr. District Wtr. Rev. Series G, 5.75% 10/1/14 (MBIA Insured) |
Aaa |
|
2,000 |
2,107 |
|
|
Desert Hosp. District Hosp. Rev. Ctfs. of Prtn. 6.392% 7/28/20 (FSA Insured) (Pre-Refunded to 7/23/02 @ 102) (d) |
Aaa |
|
13,000 |
13,716 |
|
|
Duarte Ctfs. of Prtn. Rfdg. Series A: |
|
|
|
|
|
|
4.625% 4/1/07 |
Baa2 |
|
890 |
843 |
|
|
5% 4/1/11 |
Baa2 |
|
2,000 |
1,866 |
|
|
5% 4/1/12 |
Baa2 |
|
4,210 |
3,869 |
|
|
5% 4/1/13 |
Baa2 |
|
1,830 |
1,658 |
|
|
5.25% 4/1/08 |
Baa2 |
|
2,650 |
2,619 |
|
|
5.25% 4/1/09 |
Baa2 |
|
1,600 |
1,572 |
|
|
Elk Grove Unified School District Spl. Tax Rfdg. (Commty. Facilities District #1 Proj.) 6.5% 12/1/24 (AMBAC Insured) |
Aaa |
|
4,000 |
4,670 |
|
|
Encinitas Union School District (Cap. Appreciation): |
|
|
|
|
|
|
0% 8/1/03 (MBIA Insured) |
Aaa |
|
1,750 |
1,548 |
|
|
0% 8/1/04 (MBIA Insured) |
Aaa |
|
1,750 |
1,483 |
|
|
0% 8/1/10 (MBIA Insured) |
Aaa |
|
1,000 |
634 |
|
|
Escondido Union High School District (Cap. Appreciation): |
|
|
|
|
|
|
0% 11/1/15 (MBIA Insured) (Escrowed to Maturity) (d) |
Aaa |
|
3,000 |
1,358 |
|
|
0% 11/1/16 (MBIA Insured) (Escrowed to Maturity) (d) |
Aaa |
|
3,500 |
1,478 |
|
|
Eureka Unified School District Ctfs. of Prtn. |
Aaa |
|
660 |
687 |
|
|
Fairfield-Suisun Swr. District Swr. Rev. Rfdg. (Cap. Appreciation) Series A: |
|
|
|
|
|
|
0% 5/1/07 (MBIA Insured) |
Aaa |
|
1,635 |
1,220 |
|
|
0% 5/1/08 (MBIA Insured) |
Aaa |
|
2,085 |
1,484 |
|
|
0% 5/1/09 (MBIA Insured) |
Aaa |
|
2,080 |
1,409 |
|
|
Municipal Bonds - continued |
|||||
|
Moody's Ratings (unaudited) (a) |
Principal Amount (000s) |
Value (Note 1) (000s) |
|||
|
California - continued |
|||||
|
Foothill-De Anza Cmnty. College District: |
|
|
|
|
|
|
(Cap. Appreciation) 0% 8/1/15 (MBIA Insured) |
Aaa |
|
$ 2,415 |
$ 1,121 |
|
|
6% 8/1/30 |
Aa2 |
|
10,000 |
10,418 |
|
|
Foothill/Eastern Trans. Corridor Agcy. Toll Road Rev. (Cap. Appreciation) Sr. Lien Series A: |
|
|
|
|
|
|
0% 1/1/04 (Escrowed to Maturity) (d) |
Aaa |
|
1,600 |
1,378 |
|
|
0% 1/1/05 (Escrowed to Maturity) (d) |
Aaa |
|
1,000 |
822 |
|
|
0% 1/1/08 (Escrowed to Maturity) (b)(d) |
Aaa |
|
2,000 |
1,743 |
|
|
0% 1/1/15 (Escrowed to Maturity) (d) |
Aaa |
|
5,000 |
2,364 |
|
|
Foster City Pub. Fing. Auth. Rev. (Foster City Cmnty. Dev. Ln. Prog.) Series A: |
|
|
|
|
|
|
5.5% 9/1/09 |
A- |
|
370 |
389 |
|
|
5.8% 9/1/16 |
A- |
|
1,000 |
1,034 |
|
|
6% 9/1/06 |
A- |
|
1,355 |
1,417 |
|
|
6% 9/1/07 |
A- |
|
1,440 |
1,502 |
|
|
6% 9/1/13 |
A- |
|
1,925 |
1,992 |
|
|
Fremont Unifed School District Alameda County (Cap. Appreciation) Series F, 0% 8/1/09 (MBIA Insured) |
Aaa |
|
1,000 |
670 |
|
|
Fullerton Univ. Foundation Auxillary Organization Rev. Series A: |
|
|
|
|
|
|
5.75% 7/1/25 (MBIA Insured) |
Aaa |
|
1,250 |
1,294 |
|
|
5.75% 7/1/30 (MBIA Insured) |
Aaa |
|
1,000 |
1,032 |
|
|
Glendale Elec. Rev. 6% 2/1/30 (MBIA Insured) |
Aaa |
|
12,245 |
12,838 |
|
|
La Quinta Redev. Agcy. Tax. Allocation Rfdg. (Area #1 Redev. Proj.): |
|
|
|
|
|
|
7.3% 9/1/06 (MBIA Insured) |
Aaa |
|
620 |
720 |
|
|
7.3% 9/1/11 (MBIA Insured) |
Aaa |
|
555 |
689 |
|
|
Local Govt. Fin. Auth. Rev. (Cap. Appreciation) (Oakland Central District Proj.): |
|
|
|
|
|
|
0% 9/1/08 (MBIA Insured) |
Aaa |
|
3,710 |
2,602 |
|
|
0% 9/1/09 (MBIA Insured) |
Aaa |
|
3,565 |
2,379 |
|
|
Long Beach Hbr. Rev.: |
|
|
|
|
|
|
Rfdg. Series A: |
|
|
|
|
|
|
5% 5/15/03 (FGIC Insured) (c) |
Aaa |
|
1,900 |
1,936 |
|
|
5.5% 5/15/08 (FGIC Insured) (c) |
Aaa |
|
8,780 |
9,369 |
|
|
6% 5/15/09 (FGIC Insured) (c) |
Aaa |
|
3,000 |
3,317 |
|
|
6% 5/15/10 (FGIC Insured) (c) |
Aaa |
|
1,000 |
1,107 |
|
|
5.125% 5/15/13 (c) |
Aa3 |
|
12,450 |
12,584 |
|
|
5.5% 5/15/11 (MBIA Insured) (c) |
Aaa |
|
700 |
733 |
|
|
5.5% 5/15/15 (MBIA Insured) (c) |
Aaa |
|
3,710 |
3,790 |
|
|
Municipal Bonds - continued |
|||||
|
Moody's Ratings (unaudited) (a) |
Principal Amount (000s) |
Value (Note 1) (000s) |
|||
|
California - continued |
|||||
|
Long Beach Hbr. Rev.: - continued |
|
|
|
|
|
|
5.75% 5/15/07 (MBIA Insured) (c) |
Aaa |
|
$ 4,845 |
$ 5,194 |
|
|
6% 5/15/06 (MBIA Insured) (c) |
Aaa |
|
3,525 |
3,813 |
|
|
Los Angeles County Ctfs. of Prtn. (Cap. Appreciation): |
|
|
|
|
|
|
(Correctional Facilities Proj.): |
|
|
|
|
|
|
0% 9/1/10 (MBIA Insured) (Escrowed to Maturity) (d) |
Aaa |
|
3,770 |
2,329 |
|
|
0% 9/1/11 (MBIA Insured) (Escrowed to Maturity) (d) |
Aaa |
|
6,400 |
3,724 |
|
|
0% 9/1/13 (MBIA Insured) (Escrowed to Maturity) (d) |
Aaa |
|
3,380 |
1,753 |
|
|
(Disney Parking Proj.): |
|
|
|
|
|
|
0% 3/1/10 |
A3 |
|
2,000 |
1,240 |
|
|
0% 3/1/11 |
A3 |
|
1,950 |
1,135 |
|
|
0% 3/1/12 |
A3 |
|
2,180 |
1,191 |
|
|
0% 3/1/13 |
A3 |
|
6,490 |
3,312 |
|
|
0% 3/1/18 |
A3 |
|
3,000 |
1,071 |
|
|
0% 3/1/19 |
A3 |
|
3,175 |
1,059 |
|
|
0% 3/1/20 |
A3 |
|
1,000 |
312 |
|
|
Los Angeles County Metro. Trans. Auth. Sales Tax Rev. Rfdg. (Proposition A Proj.) First Tier Sr. Series C, 4.75% 7/1/17 (AMBAC Insured) |
Aaa |
|
3,310 |
3,154 |
|
|
Los Angeles County Pub. Works Fing. Auth. Rev.
(Reg'l. Park & Open Space District Proj.) |
Aa3 |
|
6,000 |
5,834 |
|
|
Los Angeles Dept. Arpts. Rev. (Los Angeles Int'l.
Arpt. Proj.) Series D, 5.625% 5/15/12 |
Aaa |
|
1,000 |
1,043 |
|
|
Los Angeles Dept. Wtr. & Pwr. Elec. Plant Rev.: |
|
|
|
|
|
|
Rfdg.: |
|
|
|
|
|
|
Second Issue: |
|
|
|
|
|
|
4.75% 11/15/19 (MBIA Insured) |
Aaa |
|
4,000 |
3,723 |
|
|
5.25% 11/15/26 (MBIA Insured) |
Aaa |
|
16,690 |
16,342 |
|
|
5.4% 11/15/31 (MBIA Insured) |
Aaa |
|
1,875 |
1,853 |
|
|
4.75% 8/15/12 (FGIC Insured) |
Aaa |
|
6,035 |
6,077 |
|
|
4.75% 8/15/16 (FGIC Insured) |
Aaa |
|
2,700 |
2,620 |
|
|
6.375% 2/1/20 |
Aa3 |
|
1,000 |
1,038 |
|
|
Second Issue: |
|
|
|
|
|
|
4.75% 10/15/20 |
Aa3 |
|
1,800 |
1,645 |
|
|
6.75% 10/15/04 (AMBAC Insured) |
Aaa |
|
2,400 |
2,631 |
|
|
9% 10/15/01 |
Aa3 |
|
110 |
116 |
|
|
Municipal Bonds - continued |
|||||
|
Moody's Ratings (unaudited) (a) |
Principal Amount (000s) |
Value (Note 1) (000s) |
|||
|
California - continued |
|||||
|
Los Angeles Dept. Wtr. & Pwr. Wtrwks. Rev.: |
|
|
|
|
|
|
Rfdg.: |
|
|
|
|
|
|
5.5% 10/15/10 |
Aa3 |
|
$ 2,630 |
$ 2,842 |
|
|
5.5% 10/15/11 (MBIA Insured) |
Aaa |
|
3,670 |
3,948 |
|
|
6.1% 10/15/39 (FGIC Insured) |
Aaa |
|
6,000 |
6,319 |
|
|
6.4% 5/15/28 |
Aa |
|
5,000 |
5,153 |
|
|
Los Angeles Gen. Oblig. Ctfs. of Prtn. (Dept. Pub. Social Svcs. Proj.) Series A, 5.5% 8/1/24 (AMBAC Insured) |
Aaa |
|
3,700 |
3,734 |
|
|
Los Angeles Hbr. Dept. Rev.: |
|
|
|
|
|
|
Series B: |
|
|
|
|
|
|
5% 8/1/03 (c) |
Aa3 |
|
2,500 |
2,555 |
|
|
5.25% 11/1/03 (c) |
Aa3 |
|
1,250 |
1,289 |
|
|
5.25% 11/1/06 (c) |
Aa3 |
|
7,380 |
7,750 |
|
|
5.25% 11/1/07 (c) |
Aa3 |
|
4,290 |
4,522 |
|
|
5.25% 11/1/10 (c) |
Aa3 |
|
9,105 |
9,501 |
|
|
5.25% 11/1/11 (c) |
Aa3 |
|
7,095 |
7,365 |
|
|
5.3% 8/1/06 (c) |
Aa3 |
|
2,000 |
2,102 |
|
|
5.5% 8/1/08 (c) |
Aa3 |
|
1,505 |
1,601 |
|
|
7.6% 10/1/18 (Escrowed to Maturity) (d) |
AAA |
|
14,810 |
18,841 |
|
|
Los Angeles Unified School District Series A, 6% 7/1/14 (FGIC Insured) |
Aaa |
|
1,200 |
1,354 |
|
|
M-S-R Pub. Pwr. Agcy. San Juan Proj. Rev. Rfdg. Series D, 6.75% 7/1/20 (MBIA Insured) (Escrowed to Maturity) (d) |
Aaa |
|
2,500 |
2,868 |
|
|
Manhattan Beach Unified School District |
Aaa |
|
975 |
651 |
|
|
Metro. Wtr. District Southern California Wtrwks. Rev.: |
|
|
|
|
|
|
Rfdg. Series A, 4.75% 7/1/22 |
Aa2 |
|
10,000 |
9,052 |
|
|
Series A: |
|
|
|
|
|
|
5% 7/1/26 |
Aa2 |
|
5,050 |
4,724 |
|
|
5% 7/1/30 (MBIA Insured) |
Aaa |
|
3,500 |
3,279 |
|
|
5.95% 8/5/22 (Pre-Refunded to |
Aa2 |
|
2,600 |
2,734 |
|
|
Modesto Gen. Oblig. Ctfs. of Prtn.: |
|
|
|
|
|
|
(Cmnty. Ctr. Refing. Proj.) Series A, 5% 11/1/23 (AMBAC Insured) |
Aaa |
|
2,500 |
2,401 |
|
|
(Golf Course Refing. Proj.) Series B, 5% 11/1/23 (FGIC Insured) |
Aaa |
|
1,585 |
1,522 |
|
|
Municipal Bonds - continued |
|||||
|
Moody's Ratings (unaudited) (a) |
Principal Amount (000s) |
Value (Note 1) (000s) |
|||
|
California - continued |
|||||
|
Modesto Irrigation District: |
|
|
|
|
|
|
Ctfs. of Prtn. (Geysers Geothermal Pwr. Proj.) Series 1986 A, 5% 10/1/17 (Escrowed to Maturity) (d) |
A1 |
|
$ 5,000 |
$ 4,909 |
|
|
Ctfs. of Prtn. Rfdg. & Cap. Impts. (Cap. Appreciation) Series A: |
|
|
|
|
|
|
0% 10/1/08 (MBIA Insured) (Escrowed to Maturity) (d) |
Aaa |
|
2,270 |
1,571 |
|
|
0% 10/1/09 (MBIA Insured) (Escrowed to Maturity) (d) |
Aaa |
|
2,270 |
1,495 |
|
|
0% 10/1/10 (MBIA Insured) (Escrowed to Maturity) (d) |
Aaa |
|
2,270 |
1,409 |
|
|
Moreno Valley Unified School District Ctfs. of Prtn. (Land Acquisition Proj.) Series F, 6.7% 9/1/11 (FSA Insured) (Pre-Refunded to 9/1/02 @ 102) (d) |
Aaa |
|
2,230 |
2,334 |
|
|
Northern California Pwr. Agcy. Multiple Cap. Facilities Rev. 6.538% 8/1/25 (MBIA Insured) (Pre-Refunded to 9/3/02 @ 102) (d) |
Aaa |
|
7,600 |
8,043 |
|
|
Northern California Pwr. Agcy. Pub. Pwr. Rev. Rfdg. (Hydro Elec. #1 Proj.) Series A, 7.5% 7/1/23 (AMBAC Insured) (Pre-Refunded to 7/1/21 @ 100) (d) |
Aaa |
|
3,825 |
4,800 |
|
|
Northern California Transmission Auth. Rev. |
Aaa |
|
7,100 |
8,681 |
|
|
Oakland Gen. Oblig. Ctfs. of Prtn. Rfdg. |
Aaa |
|
2,750 |
2,060 |
|
|
Oakland Redev. Agcy. Sub Tax Allocation (Central District Redev. Proj.) 5% 9/1/21 (MBIA Insured) |
Aaa |
|
1,000 |
959 |
|
|
Ontario Redev. Fing. Auth. Rev. (Cap. Appreciation) (Ctr. City Cimarron #1 Proj.): |
|
|
|
|
|
|
0% 8/1/08 (MBIA Insured) |
Aaa |
|
3,255 |
2,291 |
|
|
0% 8/1/09 (MBIA Insured) |
Aaa |
|
3,260 |
2,184 |
|
|
0% 8/1/10 (MBIA Insured) |
Aaa |
|
3,255 |
2,065 |
|
|
Orange County Arpt. Rev. Rfdg.: |
|
|
|
|
|
|
5.5% 7/1/02 (MBIA Insured) (c) |
Aaa |
|
2,000 |
2,046 |
|
|
5.5% 7/1/04 (MBIA Insured) (c) |
Aaa |
|
2,000 |
2,086 |
|
|
5.5% 7/1/11 (MBIA Insured) (c) |
Aaa |
|
4,000 |
4,224 |
|
|
6% 7/1/05 (MBIA Insured) (c) |
Aaa |
|
3,000 |
3,217 |
|
|
6% 7/1/07 (MBIA Insured) (c) |
Aaa |
|
9,135 |
9,982 |
|
|
Municipal Bonds - continued |
|||||
|
Moody's Ratings (unaudited) (a) |
Principal Amount (000s) |
Value (Note 1) (000s) |
|||
|
California - continued |
|||||
|
Orange County Pub. Fin. Auth. Waste Mgt. Sys. Rev. Rfdg.: |
|
|
|
|
|
|
5.75% 12/1/09 (AMBAC Insured) (c) |
Aaa |
|
$ 3,620 |
$ 3,954 |
|
|
5.75% 12/1/11 (AMBAC Insured) (c) |
Aaa |
|
4,000 |
4,369 |
|
|
Orange County Wtr. District Ctfs. of Prtn. Rfdg. Series A, 5.5% 8/15/09 (AMBAC Insured) |
Aaa |
|
1,000 |
1,051 |
|
|
Palmdale Elementary School District Spl. Tax Rfdg. (Cmnty. Facilities District #90-1) 5.8% 8/1/29 (FSA Insured) |
Aaa |
|
6,410 |
6,627 |
|
|
Placer County Wtr. Agcy. Rev. (Middle Fork Proj.) Series A, 3.75% 7/1/12 |
A+ |
|
8,830 |
8,035 |
|
|
Placer County Wtr. Agcy. Wtr. Rev. Ctfs. of Prtn. (Cap. Impt. Projs.) 5.5% 7/1/29 (AMBAC Insured) |
Aaa |
|
3,000 |
3,015 |
|
|
Pleasanton Joint Powers Fing. Auth. Rev. (Reassessment Proj.) Series A: |
|
|
|
|
|
|
5.7% 9/2/01 |
Baa1 |
|
1,145 |
1,160 |
|
|
5.8% 9/2/02 |
Baa1 |
|
4,970 |
5,103 |
|
|
6% 9/2/05 |
Baa1 |
|
2,135 |
2,259 |
|
|
6.15% 9/2/12 |
Baa1 |
|
12,205 |
12,822 |
|
|
Pomona Unified School District Series C, 6% 8/1/30 (FGIC Insured) |
Aaa |
|
4,535 |
4,746 |
|
|
Port of Oakland Port Rev.: |
|
|
|
|
|
|
Rfdg. (Cap. Appreciation) Series F: |
|
|
|
|
|
|
0% 11/1/05 (MBIA Insured) |
Aaa |
|
300 |
240 |
|
|
0% 11/1/06 (MBIA Insured) |
Aaa |
|
2,890 |
2,211 |
|
|
0% 11/1/07 (MBIA Insured) |
Aaa |
|
4,250 |
3,103 |
|
|
Series G: |
|
|
|
|
|
|
5.375% 11/1/08 (MBIA Insured) (c) |
Aaa |
|
1,805 |
1,917 |
|
|
6% 11/1/07 (MBIA Insured) (c) |
Aaa |
|
1,650 |
1,809 |
|
|
Rancho Wtr. District Fing. Auth. Rev. 6.427% 8/17/21 (AMBAC Insured) (Pre-Refunded to 9/11/01 @ 102) (d) |
Aaa |
|
6,900 |
7,195 |
|
|
Redding Elec. Sys. Rev. Ctfs. of Prtn. Rfdg. (Cap. Appreciation) Series A: |
|
|
|
|
|
|
0% 6/1/06 (FGIC Insured) |
Aaa |
|
1,730 |
1,348 |
|
|
0% 6/1/07 (FGIC Insured) |
Aaa |
|
1,890 |
1,406 |
|
|
0% 6/1/08 (FGIC Insured) |
Aaa |
|
1,300 |
922 |
|
|
Richmond Redev. Agcy. Tax Allocation Rev. |
Aaa |
|
105 |
112 |
|
|
Municipal Bonds - continued |
|||||
|
Moody's Ratings (unaudited) (a) |
Principal Amount (000s) |
Value (Note 1) (000s) |
|||
|
California - continued |
|||||
|
Riverside County Asset Leasing Corp. Leasehold Rev. (Riverside County Hosp. Proj.): |
|
|
|
|
|
|
Series A: |
|
|
|
|
|
|
5.75% 6/1/01 (MBIA Insured) |
Aaa |
|
$ 1,250 |
$ 1,266 |
|
|
6.375% 6/1/09 (MBIA Insured) |
Aaa |
|
5,000 |
5,369 |
|
|
6.5% 6/1/12 (MBIA Insured) |
Aaa |
|
15,500 |
18,158 |
|
|
Series B, 5.7% 6/1/16 (MBIA Insured) |
Aaa |
|
1,950 |
2,069 |
|
|
Riverside County Pub.Fing. Auth. Tax Allocation Rev. (Redev. Projs.) Series A: |
|
|
|
|
|
|
4.8% 10/1/07 |
Baa2 |
|
1,080 |
1,092 |
|
|
5% 10/1/08 |
Baa2 |
|
1,135 |
1,162 |
|
|
5% 10/1/09 |
Baa2 |
|
1,140 |
1,163 |
|
|
5.1% 10/1/10 |
Baa2 |
|
1,245 |
1,267 |
|
|
5.25% 10/1/12 |
Baa2 |
|
1,375 |
1,395 |
|
|
5.5% 10/1/22 |
Baa2 |
|
4,500 |
4,263 |
|
|
Riverside County Redev. Agcy. Tax Allocation |
|
|
|
|
|
|
7.5% 10/1/10 (Pre-Refunded to |
- |
|
1,000 |
1,055 |
|
|
7.5% 10/1/26 (Pre-Refunded to |
- |
|
2,500 |
2,639 |
|
|
Riverside Unified School District Ctfs. of Prtn.
(Cap. Appreciation) (Land Acquisition Proj.)
Series B, 7.375% 9/1/26 (FSA Insured) |
Aaa |
|
5,420 |
5,705 |
|
|
Sacramento City Fing. Auth. Lease Rev. Rfdg. Series A, 5.4% 11/1/20 (AMBAC Insured) |
Aaa |
|
2,000 |
2,034 |
|
|
Sacramento City Unified School District Series A, 6% 7/1/29 (FGIC Insured) |
Aaa |
|
6,300 |
6,614 |
|
|
Sacramento Cogeneration Auth. Cogeneration Proj. Rev. (Procter & Gamble Proj.): |
|
|
|
|
|
|
5.9% 7/1/02 |
BBB- |
|
1,000 |
1,024 |
|
|
6% 7/1/03 |
BBB- |
|
700 |
727 |
|
|
6.375% 7/1/10 |
BBB- |
|
700 |
749 |
|
|
6.5% 7/1/21 (Pre-Refunded to |
AAA |
|
3,200 |
3,588 |
|
|
Sacramento Muni. Util. District Elec. Rev.: |
|
|
|
|
|
|
Rfdg.: |
|
|
|
|
|
|
Series L, 5.125% 7/1/22 (MBIA Insured) |
Aaa |
|
4,000 |
3,880 |
|
|
Series M, 5.25% 7/1/28 |
A2 |
|
6,500 |
6,208 |
|
|
5.45% 11/15/08 (FGIC Insured) |
Aaa |
|
17,700 |
18,647 |
|
|
Sacramento Pwr. Auth. Cogeneration Proj. Rev.: |
|
|
|
|
|
|
6% 7/1/22 |
BBB- |
|
2,700 |
2,727 |
|
|
Municipal Bonds - continued |
|||||
|
Moody's Ratings (unaudited) (a) |
Principal Amount (000s) |
Value (Note 1) (000s) |
|||
|
California - continued |
|||||
|
Sacramento Pwr. Auth. Cogeneration Proj. Rev.: - continued |
|
|
|
|
|
|
6.5% 7/1/06 |
BBB- |
|
$ 4,500 |
$ 4,902 |
|
|
6.5% 7/1/07 |
BBB- |
|
2,000 |
2,200 |
|
|
6.5% 7/1/08 |
BBB- |
|
1,000 |
1,102 |
|
|
San Bernardino County: |
|
|
|
|
|
|
Ctfs. of Prtn (Cap. Facilities Proj.) Series B, 6.875% 8/1/24 (Escrowed to Maturity) (d) |
AAA |
|
8,500 |
10,252 |
|
|
Ctfs. of Prtn. Rfdg. (Med. Ctr. Fing. Prog.) |
A3 |
|
10,000 |
9,486 |
|
|
San Diego County Ctfs. of Prtn (Burnham |
|
|
|
|
|
|
5.7% 9/1/11 |
Baa3 |
|
800 |
847 |
|
|
6.25% 9/1/29 |
Baa3 |
|
6,800 |
6,932 |
|
|
San Diego County Wtr. Auth. Wtr. Rev. Ctfs. of Prtn. 5.632% 4/25/07 (FGIC Insured) |
Aaa |
|
5,000 |
5,338 |
|
|
San Diego Multi-Family Hsg. Rev. (Island Gardens Apts. Proj.) Series B, 9.5% 10/20/20 |
AAA |
|
1,585 |
1,585 |
|
|
San Diego Wtr. Util. Fund Ctfs. of Prtn. 4.75% 8/1/28 (FGIC Insured) |
Aaa |
|
10,000 |
8,910 |
|
|
San Francisco Bay Area Rapid Trans. District Sales Tax Rev. Rfdg. 5.25% 7/1/18 |
Aa3 |
|
4,500 |
4,528 |
|
|
San Francisco Bay Area Trans. Fing. Auth. (Bridge Toll Proj.): |
|
|
|
|
|
|
4.75% 8/1/01 (American Cap. Access |
A |
|
1,000 |
1,007 |
|
|
5% 8/1/02 (American Cap. Access |
A |
|
1,000 |
1,015 |
|
|
5.5% 8/1/05 (American Cap. Access |
A |
|
1,000 |
1,049 |
|
|
5.75% 2/1/07 (American Cap. Access |
A |
|
1,500 |
1,601 |
|
|
San Francisco City & County Arpt. Commission Int'l. Arpt. Rev.: |
|
|
|
|
|
|
(SFO Fuel Co. Proj.) Series A: |
|
|
|
|
|
|
5.125% 1/1/17 (AMBAC Insured) (c) |
Aaa |
|
6,000 |
5,898 |
|
|
5.25% 1/1/18 (AMBAC Insured) (c) |
Aaa |
|
4,515 |
4,463 |
|
|
5.25% 1/1/19 (AMBAC Insured) (c) |
Aaa |
|
4,750 |
4,667 |
|
|
Issue 10 A, Second Series 5.3% 5/1/05 (MBIA Insured) (c) |
Aaa |
|
2,805 |
2,920 |
|
|
Issue 18A, Second Series 6% 5/1/05 |
Aaa |
|
2,375 |
2,542 |
|
|
Municipal Bonds - continued |
|||||
|
Moody's Ratings (unaudited) (a) |
Principal Amount (000s) |
Value (Note 1) (000s) |
|||
|
California - continued |
|||||
|
San Francisco City & County Arpt. Commission Int'l. Arpt. Rev.: - continued |
|
|
|
|
|
|
Issue 22, Second Series 6% 5/1/03 |
Aaa |
|
$ 1,850 |
$ 1,928 |
|
|
Rfdg.: |
|
|
|
|
|
|
Second Series Issue 20, 4.5% 5/1/13 |
Aaa |
|
3,030 |
2,938 |
|
|
Second Series Issue 3, 6.1% 5/1/13 |
Aaa |
|
2,650 |
2,788 |
|
|
Second Series: |
|
|
|
|
|
|
Issue 09A, 5.125% 5/1/07 |
Aaa |
|
2,000 |
2,070 |
|
|
Issue 10A, 5.3% 5/1/06 (MBIA Insured) (c) |
Aaa |
|
3,680 |
3,851 |
|
|
Issue 12A, 5.625% 5/1/08 |
Aaa |
|
1,625 |
1,731 |
|
|
Issue 15A: |
|
|
|
|
|
|
5.5% 5/1/07 (FSA Insured) (c) |
Aaa |
|
5,680 |
6,033 |
|
|
5.5% 5/1/09 (FSA Insured) (c) |
Aaa |
|
1,355 |
1,449 |
|
|
5.6% 5/1/02 (FSA Insured) (c) |
Aaa |
|
4,295 |
4,388 |
|
|
Issue 16A: |
|
|
|
|
|
|
5.375% 5/1/18 (FSA Insured) (c) |
Aaa |
|
5,035 |
5,041 |
|
|
5.5% 5/1/06 (FSA Insured) (c) |
Aaa |
|
1,850 |
1,954 |
|
|
5.5% 5/1/08 (FSA Insured) (c) |
Aaa |
|
2,945 |
3,142 |
|
|
Issue 18A, 5.25% 5/1/11 (MBIA Insured) (c) |
Aaa |
|
3,280 |
3,413 |
|
|
Issue 23A: |
|
|
|
|
|
|
5.5% 5/1/07 (FGIC Insured) (c) |
Aaa |
|
1,045 |
1,110 |
|
|
5.5% 5/1/08 (FGIC Insured) (c) |
Aaa |
|
2,755 |
2,939 |
|
|
San Francisco City & County Pub. Util.
Commission Wtr. Rev. Rfdg. Series A, |
A1 |
|
1,000 |
1,066 |
|
|
San Francisco City & County Redev. Fing. Auth. Tax Allocation Rev.: |
|
|
|
|
|
|
(Cap. Appreciation) Series A: |
|
|
|
|
|
|
0% 8/1/08 (FGIC Insured) |
Aaa |
|
1,085 |
764 |
|
|
0% 8/1/09 (FGIC Insured) |
Aaa |
|
1,085 |
727 |
|
|
0% 8/1/10 (FGIC Insured) |
Aaa |
|
1,085 |
688 |
|
|
Rfdg. (Cap. Appreciation) (San Francisco
Redev. Proj.) Series B, 0% 8/1/10 |
Aaa |
|
1,475 |
936 |
|
|
San Francisco City & County Swr. Rev. (Cap. Appreciation) Series B: |
|
|
|
|
|
|
0% 10/1/06 (FGIC Insured) |
Aaa |
|
3,690 |
2,834 |
|
|
0% 10/1/07 (FGIC Insured) |
Aaa |
|
4,770 |
3,496 |
|
|
Municipal Bonds - continued |
|||||
|
Moody's Ratings (unaudited) (a) |
Principal Amount (000s) |
Value (Note 1) (000s) |
|||
|
California - continued |
|||||
|
San Francisco City & County Swr. Rev. (Cap. Appreciation) Series B: - continued |
|
|
|
|
|
|
0% 10/1/08 (FGIC Insured) |
Aaa |
|
$ 1,600 |
$ 1,118 |
|
|
San Joaquin County Ctfs. of Prtn. (Gen. Hosp. Proj.) 5.7% 9/1/01 (Escrowed to Maturity) (d) |
A2 |
|
2,250 |
2,287 |
|
|
San Joaquin Hills Trans. Corridor Agcy. Toll Road Rev.: |
|
|
|
|
|
|
(Cap. Appreciation) Jr. Lien: |
|
|
|
|
|
|
0% 1/1/07 (Escrowed to Maturity) (d) |
Aaa |
|
3,000 |
2,267 |
|
|
0% 1/1/08 (Escrowed to Maturity) (d) |
Aaa |
|
4,400 |
3,170 |
|
|
Jr. Lien, 0% 1/1/12 (Escrowed to Maturity) (d) |
Aaa |
|
15,000 |
8,586 |
|
|
Rfdg. Series A, 0% 1/15/10 (MBIA Insured) |
Aaa |
|
2,235 |
1,430 |
|
|
San Jose Arpt. Rev. Rfdg. 5.875% 3/1/07 |
Aaa |
|
1,905 |
2,084 |
|
|
San Jose Redev. Agcy. Tax Allocation (Merged Area Redev. Proj.): |
|
|
|
|
|
|
4.75% 8/1/18 (AMBAC Insured) |
Aaa |
|
1,910 |
1,798 |
|
|
4.75% 8/1/29 (AMBAC Insured) |
Aaa |
|
7,150 |
6,351 |
|
|
Sanger Unified School District Rfdg. 5.6% 8/1/23 (MBIA Insured) |
Aaa |
|
3,000 |
3,135 |
|
|
Santa Barbara High School District Series A: |
|
|
|
|
|
|
5.75% 8/1/25 (FGIC Insured) |
Aaa |
|
4,650 |
4,793 |
|
|
5.75% 8/1/30 (FGIC Insured) |
Aaa |
|
7,490 |
7,697 |
|
|
Santa Clara County Fing. Auth. Lease Rev. (VMC Facilities Replacement Proj.) Series A, 7.75% 11/15/09 (AMBAC Insured) |
Aaa |
|
3,725 |
4,668 |
|
|
Santa Clara County Trans. District Sales Tax Rev. Rfdg. Series A, 5.25% 6/1/21 |
AA |
|
8,500 |
8,362 |
|
|
Santa Cruz City Elementary School District |
Aaa |
|
2,730 |
2,818 |
|
|
Santa Cruz City High School District Series B: |
|
|
|
|
|
|
5.75% 8/1/26 (FGIC Insured) |
Aaa |
|
2,380 |
2,457 |
|
|
6% 8/1/29 (FGIC Insured) |
Aaa |
|
6,770 |
7,110 |
|
|
Santa Margarita/Dana Point Auth. Rev. Rfdg. & Impt. (Dists. 1, 2, 2A & 8 Proj.) Series A: |
|
|
|
|
|
|
7.25% 8/1/07 (MBIA Insured) |
Aaa |
|
2,200 |
2,588 |
|
|
7.25% 8/1/08 (MBIA Insured) |
Aaa |
|
1,780 |
2,133 |
|
|
7.25% 8/1/12 (MBIA Insured) |
Aaa |
|
1,865 |
2,329 |
|
|
Santa Monica Redev. Agcy. Tax Allocation |
Aaa |
|
8,395 |
8,670 |
|
|
Municipal Bonds - continued |
|||||
|
Moody's Ratings (unaudited) (a) |
Principal Amount (000s) |
Value (Note 1) (000s) |
|||
|
California - continued |
|||||
|
South Orange County Pub. Fing. Auth. Spl. Tax Rev.: |
|
|
|
|
|
|
(Foothill Area Proj.) Series C: |
|
|
|
|
|
|
7.5% 8/15/06 (FGIC Insured) |
Aaa |
|
$ 2,000 |
$ 2,341 |
|
|
7.5% 8/15/07 (FGIC Insured) |
Aaa |
|
2,290 |
2,730 |
|
|
8% 8/15/09 (FGIC Insured) |
Aaa |
|
3,650 |
4,620 |
|
|
Rfdg. Sr. Lien Series A, 7% 9/1/10 |
Aaa |
|
2,300 |
2,764 |
|
|
Southern California Pub. Pwr. Auth. Pwr. Proj. Rev.: |
|
|
|
|
|
|
(Multiple Proj.): |
|
|
|
|
|
|
6.75% 7/1/10 |
A |
|
1,400 |
1,627 |
|
|
6.75% 7/1/11 |
A |
|
6,500 |
7,611 |
|
|
(Multiple Projs.): |
|
|
|
|
|
|
6.75% 7/1/01 |
A |
|
1,520 |
1,554 |
|
|
7% 7/1/05 |
A |
|
920 |
946 |
|
|
Rfdg.: |
|
|
|
|
|
|
(Mead Adelanto Proj.) Series A, 4.75% 7/1/16 (AMBAC Insured) |
Aaa |
|
2,000 |
1,941 |
|
|
(Palo Verde Proj.) Series A, 5% 7/1/15 (AMBAC Insured) (Escrowed to Maturity) (d) |
Aaa |
|
1,000 |
984 |
|
|
Stanislaus County Ctfs. of Prtn. Rfdg. (Cap. Impt. Prog.) Series A, 5.25% 5/1/14 (MBIA Insured) |
Aaa |
|
1,500 |
1,541 |
|
|
Sulpher Springs Unified School District Series A: |
|
|
|
|
|
|
0% 9/1/07 (MBIA Insured) |
Aaa |
|
4,445 |
3,270 |
|
|
0% 9/1/08 (MBIA Insured) |
Aaa |
|
4,745 |
3,328 |
|
|
0% 9/1/09 (MBIA Insured) |
Aaa |
|
2,485 |
1,658 |
|
|
0% 9/1/12 (MBIA Insured) |
Aaa |
|
2,750 |
1,543 |
|
|
Tahoe-Truckee Joint Unified School District |
Aaa |
|
6,625 |
4,186 |
|
|
Univ. of California Rev. Rfdg. (Multiple Purp. Projs.) Series C, 9% 9/1/02 (AMBAC Insured) |
Aaa |
|
100 |
109 |
|
|
Upland Ctfs. of Prtn. Rfdg. (San Antonio Cmnty. Hosp. Proj.): |
|
|
|
|
|
|
5.25% 1/1/08 |
A |
|
3,700 |
3,673 |
|
|
5.25% 1/1/13 |
A |
|
8,500 |
8,290 |
|
|
Ventura Unified School District Series D, 5.875% 8/1/30 (FSA Insured) |
AAA |
|
1,645 |
1,706 |
|
|
West Covina Ctfs. of Prtn. (Queen of the Valley Hosp. Proj.): |
|
|
|
|
|
|
6% 8/15/03 (Escrowed to Maturity) (d) |
A2 |
|
925 |
975 |
|
|
Municipal Bonds - continued |
|||||
|
Moody's Ratings (unaudited) (a) |
Principal Amount (000s) |
Value (Note 1) (000s) |
|||
|
California - continued |
|||||
|
West Covina Ctfs. of Prtn. (Queen of the Valley Hosp. Proj.): - continued |
|
|
|
|
|
|
6.125% 8/15/04 (Escrowed to Maturity) (d) |
A2 |
|
$ 980 |
$ 1,052 |
|
|
Whittier Union High School District Series B, 5.875% 8/1/30 (FSA Insured) |
Aaa |
|
2,405 |
2,494 |
|
|
|
1,228,227 |
||||
|
Guam - 0.6% |
|||||
|
Guam Pwr. Auth. Rev. Rfdg. Series A: |
|
|
|
|
|
|
4% 10/1/01 |
Baa3 |
|
1,500 |
1,496 |
|
|
4% 10/1/02 |
Baa3 |
|
2,425 |
2,415 |
|
|
4% 10/1/03 |
Baa3 |
|
1,795 |
1,781 |
|
|
4% 10/1/04 |
Baa3 |
|
1,620 |
1,601 |
|
|
|
7,293 |
||||
|
Puerto Rico - 3.7% |
|||||
|
Puerto Rico Commonwealth Gen. Oblig.: |
|
|
|
|
|
|
(Pub. Impt. Proj.): |
|
|
|
|
|
|
5% 7/1/01 |
Baa1 |
|
4,000 |
4,025 |
|
|
5% 7/1/02 |
Baa1 |
|
4,305 |
4,359 |
|
|
5.25% 7/1/13 (MBIA Insured) |
Aaa |
|
6,000 |
6,337 |
|
|
Rfdg. (Pub. Impt. Proj.) 5.5% 7/1/11 |
Baa1 |
|
5,675 |
6,029 |
|
|
8% 7/1/02 |
Baa1 |
|
2,000 |
2,129 |
|
|
Puerto Rico Elec. Pwr. Auth. Pwr. Rev.: |
|
|
|
|
|
|
Series 2000 HH, 5.25% 7/1/09 (FSA Insured) |
Aaa |
|
4,230 |
4,475 |
|
|
Series FF, 5.25% 7/1/06 (MBIA Insured) |
Aaa |
|
2,875 |
3,020 |
|
|
Puerto Rico Muni. Fin. Agcy.: |
|
|
|
|
|
|
Rfdg. Series B: |
|
|
|
|
|
|
5.5% 7/1/02 (FSA Insured) |
Aaa |
|
5,105 |
5,232 |
|
|
5.5% 8/1/02 |
Baa1 |
|
9,000 |
9,200 |
|
|
Series A: |
|
|
|
|
|
|
5% 8/1/02 |
Baa1 |
|
1,805 |
1,827 |
|
|
5.5% 7/1/02 (FSA Insured) |
Aaa |
|
2,845 |
2,916 |
|
|
|
49,549 |
||||
|
TOTAL MUNICIPAL BONDS (Cost $1,232,239) |
1,285,069 |
||||
|
Municipal Notes - 1.6% |
|||
|
Principal Amount (000s) |
Value (Note 1) (000s) |
||
|
California - 1.6% |
|||
|
Los Angeles County Schools Pooled Fing. Prog. Ctfs. of Prtn. TRAN Series B, 5% 10/2/01 (FSA Insured) |
$ 5,000 |
$ 5,053 |
|
|
San Diego Unified School District TRAN 5.25% 10/4/01 |
10,000 |
10,136 |
|
|
Santa Barbara County Gen. Oblig. TRAN 5.25% 10/2/01 |
6,500 |
6,590 |
|
|
TOTAL MUNICIPAL NOTES (Cost $21,639) |
21,779 |
||
|
TOTAL INVESTMENT PORTFOLIO - 98.2% (Cost $1,253,878) |
1,306,848 |
||
|
NET OTHER ASSETS - 1.8% |
23,596 |
||
|
NET ASSETS - 100% |
$ 1,330,444 |
||
|
Security Type Abbreviations |
|
TRAN - TAX AND REVENUE |
|
Legend |
|
(a) S&P credit ratings are used in the absence of a rating by Moody's Investors Service, Inc. |
|
(b) Debt obligation initially issued in zero coupon form which converts to coupon form at a specified rate and date. The rate shown is the rate at period end. |
|
(c) Private activity obligations whose interest is subject to the federal alternative minimum tax for individuals. |
|
(d) Security collateralized by an amount sufficient to pay interest and principal. |
|
Other Information |
|
The composition of long-term debt holdings as a percentage of total value of investments in securities, is as follows (ratings are unaudited): |
|
Moody's Ratings |
S&P Ratings |
|||
|
Aaa, Aa, A |
80.5% |
|
AAA, AA, A |
82.8% |
|
Baa |
9.1% |
|
BBB |
6.9% |
|
Ba |
0.0% |
|
BB |
0.0% |
|
B |
0.0% |
|
B |
0.0% |
|
Caa |
0.0% |
|
CCC |
0.0% |
|
Ca, C |
0.0% |
|
CC, C |
0.0% |
|
|
|
|
D |
0.0% |
|
The percentage not rated by Moody's or S&P amounted to 0.3%. |
|
The distribution of municipal securities by revenue source, as a percentage of total net assets, is as follows: |
|
General Obligations |
25.1% |
|
Transportation |
13.8 |
|
Electric Utilities |
11.5 |
|
Special Tax |
10.7 |
|
Escrowed/Pre-Refunded |
10.6 |
|
Health Care |
8.6 |
|
Education |
7.3 |
|
Water & Sewer |
6.9 |
|
Others* (individually less than 5%) |
5.5 |
|
|
100.0% |
|
* Includes net other assets. |
|
Income Tax Information |
|
At August 31, 2000, the aggregate cost of investment securities for income tax purposes was $1,253,880,000. Net unrealized appreciation aggregated $52,968,000, of which $60,709,000 related to appreciated investment securities and $7,741,000 related to depreciated investment securities. |
See accompanying notes which are an integral part of the financial statements.
Semiannual Report
Spartan California Municipal Income Fund
Statement of Assets and Liabilities
|
Amounts in thousands (except per-share amount) |
August 31, 2000 (Unaudited) |
|
|
Assets |
|
|
|
Investment in securities, at value (cost $1,253,878) - |
|
$ 1,306,848 |
|
Cash |
|
12,104 |
|
Receivable for fund shares sold |
|
1,632 |
|
Interest receivable |
|
16,364 |
|
Total assets |
|
1,336,948 |
|
Liabilities |
|
|
|
Payable for investments purchased |
$ 2,893 |
|
|
Payable for fund shares redeemed |
1,631 |
|
|
Distributions payable |
1,571 |
|
|
Accrued management fee |
409 |
|
|
Total liabilities |
|
6,504 |
|
Net Assets |
|
$ 1,330,444 |
|
Net Assets consist of: |
|
|
|
Paid in capital |
|
$ 1,285,794 |
|
Undistributed net interest income |
|
11 |
|
Accumulated undistributed net realized |
|
(8,331) |
|
Net unrealized appreciation (depreciation) on investments |
|
52,970 |
|
Net Assets, for 110,058 shares outstanding |
|
$ 1,330,444 |
|
Net Asset Value, offering price and redemption price per share ($1,330,444 ÷ 110,058 shares) |
|
$12.09 |
See accompanying notes which are an integral part of the financial statements.
Semiannual Report
Spartan California Municipal Income Fund
Financial Statements - continued
Statement of Operations
|
Amounts in thousands (Unaudited) |
Six months ended August 31, 2000 (Unaudited) |
|
|
Interest Income |
|
$ 33,363 |
|
Expenses |
|
|
|
Management fee |
$ 2,343 |
|
|
Transfer agent fees |
470 |
|
|
Accounting fees and expenses |
156 |
|
|
Non-interested trustees' compensation |
3 |
|
|
Custodian fees and expenses |
13 |
|
|
Registration fees |
22 |
|
|
Audit |
17 |
|
|
Legal |
7 |
|
|
Miscellaneous |
11 |
|
|
Total expenses before reductions |
3,042 |
|
|
Expense reductions |
(337) |
2,705 |
|
Net interest income |
|
30,658 |
|
Realized and Unrealized Gain (Loss) Net realized gain (loss) on investment securities |
|
(2,017) |
|
Change in net unrealized appreciation (depreciation) |
|
62,769 |
|
Net gain (loss) |
|
60,752 |
|
Net increase (decrease) in net assets resulting |
|
$ 91,410 |
|
Other Information Expense reductions: |
|
|
|
Custodian credits |
$ 13 |
|
|
Transfer agent credits |
300 |
|
|
Accounting credits |
24 |
|
|
|
$ 337 |
|
See accompanying notes which are an integral part of the financial statements.
Semiannual Report
Spartan California Municipal Income Fund
Financial Statements - continued
Statement of Changes in Net Assets
|
Amounts in thousands |
Six months ended
August 31, 2000 |
Year ended
February 29, |
|
Increase (Decrease) in Net Assets |
|
|
|
Operations |
$ 30,658 |
$ 60,588 |
|
Net realized gain (loss) |
(2,017) |
1,686 |
|
Change in net unrealized appreciation (depreciation) |
62,769 |
(94,164) |
|
Net increase (decrease) in net assets resulting |
91,410 |
(31,890) |
|
Distributions to shareholders |
(30,690) |
(60,322) |
|
From net realized gain |
- |
(1,686) |
|
In excess of net realized gain |
- |
(4,227) |
|
Total distributions |
(30,690) |
(66,235) |
|
Share transactions |
163,163 |
353,712 |
|
Reinvestment of distributions |
21,296 |
46,838 |
|
Cost of shares redeemed |
(126,669) |
(449,241) |
|
Net increase (decrease) in net assets resulting |
57,790 |
(48,691) |
|
Total increase (decrease) in net assets |
118,510 |
(146,816) |
|
Net Assets |
|
|
|
Beginning of period |
1,211,934 |
1,358,750 |
|
End of period (including undistributed net interest |
$ 1,330,444 |
$ 1,211,934 |
|
Other Information Shares |
|
|
|
Sold |
13,884 |
29,745 |
|
Issued in reinvestment of distributions |
1,809 |
3,954 |
|
Redeemed |
(10,830) |
(38,006) |
|
Net increase (decrease) |
4,863 |
(4,307) |
See accompanying notes which are an integral part of the financial statements.
Semiannual Report
Financial Highlights
|
|
Six months ended August 31, 2000 |
Years ended February 28, |
||||
|
|
(Unaudited) |
2000 G |
1999 |
1998 |
1997 |
1996 G |
|
Selected Per-Share Data |
|
|
|
|
|
|
|
Net asset value, beginning of period |
$ 11.520 |
$ 12.410 |
$ 12.360 |
$ 11.810 |
$ 11.720 |
$ 11.120 |
|
Income from Investment
Operations |
.288 D |
.557 D |
.569 |
.589 |
.599 |
.625 |
|
Net realized |
.570 |
(.838) |
.154 |
.550 |
.096 |
.597 |
|
Total from investment operations |
.858 |
(.281) |
.723 |
1.139 |
.695 |
1.222 |
|
Less Distributions |
|
|
|
|
|
|
|
From net |
(.288) |
(.555) |
(.569) |
(.589) |
(.602) |
(.622) |
|
From net |
- |
(.015) |
(.104) |
- |
(.003) |
- |
|
In excess of net |
- |
(.039) |
- |
- |
- |
- |
|
Total distributions |
(.288) |
(.609) |
(.673) |
(.589) |
(.605) |
(.622) |
|
Net asset value, |
$ 12.090 |
$ 11.520 |
$ 12.410 |
$ 12.360 |
$ 11.810 |
$ 11.720 |
|
Total Return B, C |
7.54% |
(2.28)% |
6.00% |
9.89% |
6.16% |
11.25% |
|
Ratios and Supplemental Data |
|
|
|
|
|
|
|
Net assets, end of period (in millions) |
$ 1,330 |
$ 1,212 |
$ 1,359 |
$ 1,238 |
$ 486 |
$ 498 |
|
Ratio of expenses to average net assets |
.48% A |
.49% |
.52% |
.54% E |
.57% |
.58% |
|
Ratio of expenses to average net assets after expense reductions |
.43% A, F |
.49% |
.52% |
.53% F |
.57% |
.58% |
|
Ratio of net interest income to average net assets |
4.87% A |
4.69% |
4.59% |
4.85% |
5.19% |
5.44% |
|
Portfolio turnover |
22% A |
35% |
34% |
37% |
17% |
37% |
A Annualized
B Total returns for periods of less than one year are not annualized.
C The total returns would have been lower had certain expenses not been reduced during the periods shown.
D Net interest income per share has been calculated based on average shares outstanding during the period.
E FMR agreed to reimburse a portion of the fund's expenses during the period. Without this reimbursement, the fund's expense ratio would have been higher.
F FMR or the fund has entered into varying arrangements with third parties who either paid or reduced a portion of the fund's expenses.
G For the year ended February 29.
See accompanying notes which are an integral part of the financial statements.
Semiannual Report
Spartan California Municipal Money Market Fund
To evaluate a money market fund's historical performance, you can look at either total return or yield. Total return reflects the change in the value of an investment, assuming reinvestment of the fund's dividend income, and does not include the effect of the fund's $5 account closeout fee on an average-sized account. Yield measures the income paid by a fund. Since a money market fund tries to maintain a $1 share price, yield is an important measure of performance. If Fidelity had not reimbursed certain fund expenses, the past five year and past 10 year total returns would have been lower.
Cumulative Total Returns
|
Periods ended August 31, 2000 |
Past 6 |
Past 1 |
Past 5 |
Past 10 |
|
Spartan CA Municipal Money Market |
1.71% |
3.18% |
16.51% |
38.05% |
|
California Tax-Free |
1.57% |
2.87% |
15.08% |
33.42% |
Cumulative total returns show the fund's performance in percentage terms over a set period - in this case, six months, one year, five years or 10 years. For example, if you had invested $1,000 in a fund that had a 5% return over the past year, the value of your investment would be $1,050. To measure how the fund's performance stacked up against its peers, you can compare it to the California tax-free money market funds average, which reflects the performance of California tax-free money market funds with similar objectives tracked by iMoneyNet, Inc. The past six months average represents a peer group of 44 money market funds.
Average Annual Total Returns
|
Periods ended August 31, 2000 |
|
Past 1 |
Past 5 |
Past 10 |
|
Spartan CA Municipal Money Market |
|
3.18% |
3.10% |
3.28% |
|
California Tax-Free |
|
2.87% |
2.84% |
2.92% |
Average annual total returns take the fund's cumulative return and show you what would have happened if the fund had performed at a constant rate each year.
Semiannual Report
Spartan California Municipal Money Market Fund
Performance - continued
Yields
|
|
8/28/00 |
5/29/00 |
2/28/00 |
11/29/99 |
8/30/99 |
|
Spartan California |
3.41% |
3.40% |
2.65% |
3.11% |
2.64% |
|
|
|||||
|
California Tax-Free Money |
3.14% |
3.19% |
2.28% |
2.91% |
2.40% |
|
|
|||||
|
Spartan California |
5.89% |
5.85% |
4.57% |
5.33% |
4.54% |
|
|
|||||
|
Portion of fund's income |
17.09% |
12.99% |
24.71% |
17.54% |
20.94% |
|
|
|||||

Yield refers to the income paid by the fund over a given period. Yields for money market funds are usually for seven-day periods, expressed as annual percentage rates. A yield that assumes income earned is reinvested or compounded is called an effective yield. The table above shows the fund's current seven-day yield at quarterly intervals over the past year. You can compare these yields to the California tax-free money market funds average as tracked by iMoneyNet, Inc. Or you can look at the fund's tax-equivalent yield, which is based on a combined effective 2000 federal and state income tax rate of 41.95%. The fund's yields mentioned above reflect that a portion of the fund's income was subject to state taxes. A portion of the fund's income may be subject to the federal alternative minimum tax.
A money market fund's total returns and yields will vary, and reflect past results rather than predict future performance.
Comparing
Performance
Yields on tax-free investments are usually lower than yields on taxable investments. However, a straight comparison between the two may be misleading because it ignores the way taxes reduce taxable returns. Tax-equivalent yield - the yield you'd have to earn on a similar taxable investment to match the tax-free yield - makes the comparison more meaningful. Keep in mind that the U.S. government neither insures nor guarantees a money market fund. In fact, there is no assurance that a money market fund will maintain a $1 share price.
3Semiannual Report
Spartan California Municipal Money Market Fund
(Portfolio Manager photograph)
An interview with Diane McLaughlin, Portfolio Manager of Spartan California Municipal Money Market Fund
Q. What was the investment environment like during the six months that ended August 31, 2000, Diane?
A. Economic growth continued to be strong. Gross domestic product (GDP) grew at an annual rate of 4.8% in the first quarter of 2000 and at 5.6% in the second quarter, exhibiting the same vibrant pace seen in 1999. Both consumer confidence and consumer spending remained high. Business spending also was strong. The healthy economy led to a decline in unemployment, which fell to 3.9% in April, its lowest level in 30 years. During the first half of the six-month period, this backdrop encouraged the Federal Reserve Board to continue its program of short-term interest-rate hikes, which were intended to slow growth and head off inflation. Some inflation did surface at the consumer level. Fueled by increases in energy costs, consumer prices increased at an annual rate of 4.0% during the first six months of the year, up from 2.8% in the prior 12 months.
Q. What kind of approach did the Fed take?
A. In March and May, the Fed raised the rate banks charge each other for overnight loans, known as the fed funds target rate. With the first rate hike, the Fed raised the target rate by 0.25 percentage points. In May, however, the Fed became more aggressive, raising the fed funds target rate by 0.50 percentage points. This move came shortly after the employment cost index - a broad measure of the costs incurred by businesses for wages and benefits - rose at a higher-than-expected annual rate of 5.6% in the first quarter, up from 3.4% in 1999. Since May, the Fed has taken no further action on interest rates because the economy showed signs of slowing and inflation did not spike further. Market prices started to reflect the belief that the Fed was finished raising rates for the time being. In fact, there has been some talk that the economy has decelerated to the point where the Fed's next move may be a rate cut.
Q. What was your strategy with the fund?
A. Demand for California municipal money market securities was strong at the same time that new issuance declined. The combination of these technical factors caused yields on most very short-term California-exempt securities to fall to unattractive levels. As a result, I turned some of my focus - within the limits set by the fund's prospectus - to out-of-state investment opportunities that offered more appealing after-tax yields than tax-free alternatives in the California market. Even though more of shareholders' income will be taxable at the state level because of the out-of-state investments, I pursued this strategy so the fund could provide higher yields on a tax-adjusted basis than if I had chosen to invest the same assets in significantly lower-yielding tax-exempt California securities. On the other hand, there were times when one-year California-exempt notes were attractively priced. This was especially true in June - when many issuers came to market - so I added significantly to the fund's fixed-rate positions at that time.
Semiannual Report
Spartan California Municipal Money Market Fund
Fund Talk: The Manager's Overview - continued
Q. How did the fund perform?
A. The fund's seven-day yield on August 31, 2000, was 3.43%, compared to 2.65% six months ago. The latest yield was the equivalent of a 5.89% taxable yield for investors in the 41.95% combined state and federal tax bracket. The fund's yields reflect that a portion of the fund's income was subject to state taxes. Through August 31, 2000, the fund's six-month total return was 1.71%, compared to 1.57% for the California tax-free money market funds average, according to iMoneyNet, Inc.
Q. What is your outlook?
A. Recent data indicate that the economy is slowing. In addition, the steady decline in the value of the euro has made U.S. imports in Europe more expensive. This, combined with increases in oil prices, may help to slow U.S. economic growth. Looking at the fund, the supply/demand imbalance should continue to be a key driver of strategy.
The views expressed in this report reflect those of the portfolio manager only through the end of the period of the report as stated on the cover and do not necessarily represent the views of Fidelity or any other person in the Fidelity organization. Any such views are subject to change at any time based upon market or other conditions and Fidelity disclaims any responsibility to update such views. These views may not be relied on as investment advice and, because investment decisions for a Fidelity fund are based on numerous factors, may not be relied on as an indication of trading intent on behalf of any Fidelity fund.
Fund Facts
Goal: seeks as high a level of current income, exempt from federal and California state personal income tax, as is consistent with preservation of capital
Fund number: 457
Trading symbol: FSPXX
Start date: November 27, 1989
Size: as of August 31, 2000, more than $1.0 billion
Manager: Diane McLaughlin, since 1997; manager, various Fidelity and Spartan municipal money market funds; joined Fidelity in 1992
3Semiannual Report
Spartan California Municipal Money Market Fund
|
Maturity Diversification |
|||
|
Days |
% of fund's
investments |
% of fund's investments 2/29/00 |
% of fund's investments 8/31/99 |
|
0 - 30 |
77.3 |
70.7 |
67.2 |
|
31 - 90 |
8.5 |
4.5 |
17.2 |
|
91 - 180 |
2.4 |
18.8 |
1.4 |
|
181 - 397 |
11.8 |
6.0 |
14.2 |
|
Weighted Average Maturity |
|||
|
|
8/31/00 |
2/29/00 |
8/31/99 |
|
Spartan California Municipal |
49 Days |
43 Days |
59 Days |
|
California Tax Free Money Market |
49 Days |
41 Days |
58 Days |
|
Asset Allocation (% of fund's net assets) |
|||||||
|
As of August 31, 2000 |
As of February 29, 2000 |
||||||
 |
Variable Rate Demand Notes (VRDNs) 47.4% |
|
|
Variable Rate Demand Notes (VRDNs) 38.8% |
|
||
 |
Commercial Paper (including CP Mode) 16.4% |
|
|
Commercial Paper (including CP Mode) 14.4% |
|
||
 |
Tender Bonds 1.4% |
|
|
Tender Bonds 0.1% |
|
||
 |
Municipal Notes 17.3% |
|
|
Municipal Notes 22.8% |
|
||
 |
Municipal Money |
|
|
Municipal Money |
|
||
 |
Other Investments and Net Other Assets 1.2% |
|
|
Other Investments and Net Other Assets 4.2% |
|
||
*Source: iMoneyNet, Inc.®
Semiannual Report
Spartan California Municipal Money Market Fund
(Unaudited)
Showing Percentage of Net Assets
|
Municipal Securities - 99.4% |
|||
|
Principal Amount (000s) |
Value (Note 1) (000s) |
||
|
California - 82.2% |
|||
|
Anaheim Hsg. Auth. Multiple-family Hsg. Rev. Bonds |
$ 9,700 |
$ 9,700 |
|
|
Antioch Unified School District TRAN 5% 7/5/01 |
3,700 |
3,721 |
|
|
Berkeley Gen. Oblig. BAN Series 1999 2000, 4.25% 12/14/00 |
6,200 |
6,208 |
|
|
California Cmnty. College Fing. Auth. Rev. TRAN Series A, 5% 6/29/01 (FSA Insured) |
9,200 |
9,255 |
|
|
California Econ. Dev. Fing. Auth. Ind. Dev. Rev. (Calco LLC Proj.) Series 1997, 3.7%, LOC Wells Fargo Bank NA, San Francisco, VRDN (a)(d) |
1,000 |
1,000 |
|
|
California Gen. Oblig.: |
|
|
|
|
Participating VRDN: |
|
|
|
|
Series FRRI 00 L16, 4.05% (Liquidity Facility Lehman Brothers, Inc.) (a)(e) |
4,540 |
4,540 |
|
|
Series FRRI L6, 4% (Liquidity Facility Lehman Brothers, Inc.) (a)(e) |
18,000 |
18,000 |
|
|
Series FRRI L7, 4% (Liquidity Facility Lehman Brothers, Inc.) (a)(e) |
8,300 |
8,300 |
|
|
Series Merlots 99 M, 3.97% (Liquidity Facility First Union Nat'l. Bank, North Carolina) (a)(e) |
12,075 |
12,075 |
|
|
Series Merlots MMM, 4.03% (Liquidity Facility First Union Nat'l. Bank, North Carolina) (a)(e) |
3,925 |
3,925 |
|
|
Series Putters 132, 3.77% (Liquidity Facility J.P. Morgan & Co., Inc.) (a)(e) |
28,685 |
28,685 |
|
|
Series SG 85, 3.88% (Liquidity Facility Societe Generale) (a)(e) |
5,500 |
5,500 |
|
|
3.7% 9/7/00, CP |
30,000 |
29,999 |
|
|
3.75% 9/8/00, CP |
15,700 |
15,699 |
|
|
3.9% 9/7/00, CP |
8,800 |
8,800 |
|
|
3.9% 10/5/00, CP |
3,500 |
3,500 |
|
|
3.9% 11/10/00, CP |
8,000 |
8,000 |
|
|
3.95% 11/10/00, CP |
6,600 |
6,600 |
|
|
4% 9/6/00, CP |
4,200 |
4,200 |
|
|
4.05% 10/10/00, CP |
10,000 |
10,000 |
|
|
4.05% 10/18/00, CP |
10,310 |
10,310 |
|
|
4.15% 9/6/00, CP |
7,200 |
7,200 |
|
|
California Hsg. Fin. Agcy. Rev.: |
|
|
|
|
Bonds: |
|
|
|
|
(Home Mtg. Prog.) Series S, 4.25% 8/1/01 (d) |
6,900 |
6,900 |
|
|
Series PT 40D, 3.98%, tender 2/22/01 (Liquidity Facility Merrill Lynch & Co., Inc.) (d)(e)(f) |
5,865 |
5,865 |
|
|
Municipal Securities - continued |
|||
|
Principal Amount (000s) |
Value (Note 1) (000s) |
||
|
California - continued |
|||
|
California Hsg. Fin. Agcy. Rev.: - continued |
|
|
|
|
Participating VRDN: |
|
|
|
|
Series BA 96 C2, 3.88% (Liquidity Facility Bank of America NA) (a)(d)(e) |
$ 4,075 |
$ 4,075 |
|
|
Series BA 96 C1, 3.88% (Liquidity Facility Bank of America NA) (a)(d)(e) |
1,925 |
1,925 |
|
|
Series 1999 J2, 3.9% (MBIA Insured), VRDN (a)(d) |
2,500 |
2,500 |
|
|
Series 2000 M, 3.9% (FSA Insured), VRDN (a)(d) |
4,200 |
4,200 |
|
|
Series 2000 N, 3.9% (FSA Insured), VRDN (a)(d) |
3,000 |
3,000 |
|
|
California Infrastructure & Econ. Dev. Bank (California ISO Corp. Proj.) Series 2000, 3.6% (MBIA Insured), VRDN (a) |
9,000 |
9,000 |
|
|
California Poll. Cont. Fing. Auth. Envir. Impt. Rev. (Atlantic Richfield Co. Proj.) Series 1997 A, 3.6%, VRDN (a)(d) |
2,900 |
2,900 |
|
|
California Poll. Cont. Fing. Auth. Poll. Cont. Rev.: |
|
|
|
|
Bonds (Southern California Edison Co. Proj.) Series 1985 D: |
|
|
|
|
3.95% tender 9/12/00, CP mode |
7,750 |
7,750 |
|
|
4% tender 10/13/00, CP mode |
7,500 |
7,500 |
|
|
(Pacific Gas & Elec. Co. Proj.): |
|
|
|
|
Series 1996 C, 3.5%, LOC Bank of America NA, VRDN (a) |
12,300 |
12,300 |
|
|
Series E, 3.55%, LOC Morgan Guaranty Trust Co., NY, VRDN (a) |
10,375 |
10,375 |
|
|
California Poll. Cont. Fing. Auth. Resource Recovery Rev. Series 1987, 3.45%, (Stanislaus County) LOC Westdeutsche Landesbank Girozentrale, VRDN (a)(d) |
800 |
800 |
|
|
California School Cash Reserve Prog. Auth. TRAN Series A, 5.25% 7/3/01 (AMBAC Insured) |
27,400 |
27,615 |
|
|
California School Fin. Auth. BAN: |
|
|
|
|
Series A, 4.25% 10/1/00 |
5,475 |
5,477 |
|
|
Series B, 4.25% 10/1/00 |
2,700 |
2,701 |
|
|
California Statewide Cmnty. Dev. Auth. Multiple-family Rev. (Oakmont Stokton Proj.) Series 1997 C, 4%, LOC Commerzbank AG, VRDN (a)(d) |
5,960 |
5,960 |
|
|
California Statewide Cmnty. Dev. Auth. Rev.: |
|
|
|
|
(Covenant Retirement Commty., Inc. Proj.) Series 1995, 3.75%, LOC Lasalle Bank NA, VRDN (a) |
7,400 |
7,400 |
|
|
TRAN (Riverside Co. Proj.) Series C2, 4% 9/29/00 |
19,325 |
19,333 |
|
|
California Statewide Cmnty. Dev. Auth. Rev. Ctfs. of Prtn. Participating VRDN Series Merlots 99 E, 3.97% (Liquidity Facility First Union Nat'l. Bank, North Carolina) (a)(e) |
5,000 |
5,000 |
|
|
California Statewide Cmnty. Dev. Corp. Rev.: |
|
|
|
|
(Carvin Corp. Proj.) 4.35%, LOC California Teachers Retirement Sys., VRDN (a)(d) |
1,470 |
1,470 |
|
|
Municipal Securities - continued |
|||
|
Principal Amount (000s) |
Value (Note 1) (000s) |
||
|
California - continued |
|||
|
California Statewide Cmnty. Dev. Corp. Rev.: - continued |
|
|
|
|
(Kennerly-Spratling Proj.) Series 1995 A, 3.7%, LOC California Teachers Retirement Sys., VRDN (a)(d) |
$ 2,160 |
$ 2,160 |
|
|
(Northwest Pipe & Casing Co. Proj.) Series 1990, 4.35%, LOC California Teachers Retirement Sys., VRDN (a)(d) |
2,500 |
2,500 |
|
|
(Pasco Scientific Proj.) 4.35%, (S&P Investments) LOC California Teachers Retirement Sys., VRDN (a)(d) |
2,105 |
2,105 |
|
|
(Rapelli of California, Inc. Proj.) Series 1989, 4.35%, |
2,500 |
2,500 |
|
|
(Supreme Truck Bodies of California Proj.) 4.35%, |
2,400 |
2,400 |
|
|
California Veteran Affairs Home Purchase Rev. Participating VRDN Series BS 98 47, 3.8% (Liquidity Facility Bear Stearns Companies, Inc.) (a)(d)(e) |
2,820 |
2,820 |
|
|
Central Valley Schools Fin. Auth. Participating VRDN |
17,000 |
17,000 |
|
|
Contra Costa County TRAN Series A, 4% 9/29/00 |
3,600 |
3,602 |
|
|
Cucamonga County Wtr. District Participating VRDN Series FRRI A32, 4% (Liquidity Facility Bank of New York NA) (a)(e) |
4,200 |
4,200 |
|
|
Fontana Unified School District TRAN 5% 7/6/01 |
3,700 |
3,722 |
|
|
Foothill-De Anza Cmnty. College District (Cap. Appreciation) Participating VRDN Series Merlots 00 YY, 3.97% (Liquidity Facility First Union Nat'l. Bank, North Carolina) (a)(e) |
6,300 |
6,300 |
|
|
Grand Terrace Cmnty. Redev. (Mount Vernon Villas Proj.) 3.5%, LOC Fannie Mae, VRDN (a) |
6,800 |
6,800 |
|
|
Kern County Board Ed. TRAN 5% 7/3/01 |
11,000 |
11,064 |
|
|
Kern County High School District TRAN 5% 7/5/01 |
7,300 |
7,347 |
|
|
Lassen Muni. Util. District Rev. Rfdg. Series 1996 A, 4.1% |
5,035 |
5,035 |
|
|
Long Beach Hbr. Rev.: |
|
|
|
|
Participating VRDN Series SG 73, 3.98% (Liquidity Facility Societe Generale) (a)(d)(e) |
5,880 |
5,880 |
|
|
Series A, 4.1% 10/6/00, CP (d) |
6,300 |
6,300 |
|
|
Los Angeles County Gen. Oblig. TRAN Series A, 5% 6/29/01 |
26,100 |
26,276 |
|
|
Los Angeles County Metro. Trans. Auth. Sales Tax Rev.: |
|
|
|
|
Participating VRDN: |
|
|
|
|
Series SG 46, 3.88% (Liquidity Facility Societe Generale) (a)(e) |
3,600 |
3,600 |
|
|
Series SG 54, 3.88% (Liquidity Facility Societe Generale) (a)(e) |
3,000 |
3,000 |
|
|
Series 1993 A, 3.5% (MBIA Insured) (BPA Dexia Cr. Local de France), VRDN (a) |
9,300 |
9,300 |
|
|
Municipal Securities - continued |
|||
|
Principal Amount (000s) |
Value (Note 1) (000s) |
||
|
California - continued |
|||
|
Los Angeles County Pub. Works Fing. Auth. Lease Rev. Participating VRDN Series Merlots 00 JJJ, 4.13% (Liquidity Facility First Union Nat'l. Bank, North Carolina) (a)(e) |
$ 8,830 |
$ 8,830 |
|
|
Los Angeles County Schools Pooled Fing. Prog. Ctfs. of Prtn. TRAN: |
|
|
|
|
(Pooled Trans. Proj.) Series B, 4% 9/29/00 (FSA Insured) |
10,900 |
10,905 |
|
|
Series A, 5% 7/2/01 (FSA Insured) |
7,700 |
7,745 |
|
|
Los Angeles Dept. Arpts. Rev. Participating VRDN Series SG 61, 3.98% (Liquidity Facility Societe Generale) (a)(d)(e) |
2,600 |
2,600 |
|
|
Los Angeles Dept. Wtr. & Pwr. Wtrwks. Rev.: |
|
|
|
|
Participating VRDN Series Merlots 99 L, 3.97% (Liquidity Facility First Union Nat'l. Bank, North Carolina) (a)(e) |
8,500 |
8,500 |
|
|
4% 10/5/00, LOC Bank of America NA, LOC Bayerische Landesbank Girozentrale, CP |
6,100 |
6,100 |
|
|
4.15% 9/15/00, LOC Bank of America NA, |
9,000 |
9,000 |
|
|
Los Angeles Gen. Oblig. Participating VRDN Series 2000 N8, 4% (Liquidity Facility Bank of New York NA) (a)(e) |
23,700 |
23,700 |
|
|
Los Angeles Hbr. Dept. Rev. Participating VRDN: |
|
|
|
|
Series FRRI 7, 4.05% (Liquidity Facility Bank of New York NA) (a)(d)(e) |
10,600 |
10,600 |
|
|
Series FRRI A17, 4.1% (Liquidity Facility Commerzbank AG) (a)(d)(e) |
2,400 |
2,400 |
|
|
Series MSDW 00 349, 3.93% (Liquidity Facility Morgan Stanley Dean Witter & Co.) (a)(e) |
2,660 |
2,660 |
|
|
Series SG 59, 3.98% (Liquidity Facility Societe Generale) (a)(d)(e) |
8,950 |
8,950 |
|
|
Los Angeles Unified School District Participating VRDN |
12,600 |
12,600 |
|
|
Los Rios Cmnty. College District Participating VRDN Series FRRI A42, 4% (Liquidity Facility Bank of New York NA) (a)(e) |
2,900 |
2,900 |
|
|
Marin County Gen. Oblig. Participating VRDN Series FRRI A20, 4% (Liquidity Facility Bank of New York NA) (a)(e) |
16,000 |
16,000 |
|
|
Metro. Wtr. District Southern California Wtrwks. Rev.: |
|
|
|
|
Participating VRDN Series Merlots 99 O, 3.97% (Liquidity Facility First Union Nat'l. Bank, North Carolina) (a)(e) |
6,880 |
6,880 |
|
|
Series B, 4% 9/8/00, CP |
12,500 |
12,500 |
|
|
Milipitas Multiple-family Rev. (Crossing at Montague Proj.) Series A, 3.6%, LOC Fannie Mae, VRDN (a)(d) |
6,100 |
6,100 |
|
|
Northern California Transmission Auth. Rev. (Oregon Trans. Proj.) Series B, 4.05% 10/5/00, LOC Westdeutsche Landesbank Girozentrale, CP |
3,800 |
3,800 |
|
|
Oakland Gen. Oblig. Participating VRDN Series Merlots 00 A, 3.97% (Liquidity Facility First Union Nat'l. Bank, North Carolina) (a)(e) |
3,000 |
3,000 |
|
|
Municipal Securities - continued |
|||
|
Principal Amount (000s) |
Value (Note 1) (000s) |
||
|
California - continued |
|||
|
Oceanside Multiple-family Rev. (Lakeridge Apt. Proj.) |
$ 11,300 |
$ 11,300 |
|
|
Orange County Spl. Fing. Auth. Teeter Plan Rev. Series C, 3.5% (AMBAC Insured), VRDN (a) |
4,000 |
4,000 |
|
|
Peninsula Corridor Joint Powers Board: |
|
|
|
|
RAN: |
|
|
|
|
Series A, 4.45% 10/13/00 |
11,900 |
11,911 |
|
|
Series B, 4.4% 7/25/01 |
2,275 |
2,279 |
|
|
4.8% 6/7/01 |
2,800 |
2,810 |
|
|
Pleasant Hill Redev. Agcy. Multiple-family Hsg. Rev. |
1,460 |
1,460 |
|
|
Port of Oakland Gen. Oblig. Participating VRDN: |
|
|
|
|
Series Merlots 00 JJ, 4.02% (Liquidity Facility First Union Nat'l. Bank, North Carolina) (a)(d)(e) |
5,700 |
5,700 |
|
|
Series PA 690R, 3.98% (Liquidity Facility Merrill Lynch |
9,100 |
9,100 |
|
|
Series RobIns 5, 3.88% (Liquidity Facility Bank of |
2,200 |
2,200 |
|
|
Port of Oakland Port Rev. Participating VRDN Series FRRI A24, 4.05% (Liquidity Facility Commerzbank AG) (a)(d)(e) |
3,000 |
3,000 |
|
|
Sacramento County Gen. Oblig. Participating VRDN Series FRRI 99 A21, 4.5% (Liquidity Facility Bank of New York NA) (a)(e) |
22,800 |
22,800 |
|
|
San Bernardino County Indl. Dev. Auth. Rev. (W&H Voortman, Inc. Proj.) Series 1989, 4.35%, LOC California Teachers Retirement Sys., VRDN (a)(d) |
2,240 |
2,240 |
|
|
San Diego County Reg'l. Trans. Commission Sales Tax Rev. Series A, 4% 9/8/00 (Liquidity Facility Morgan Guaranty Trust Co., NY), CP |
10,200 |
10,200 |
|
|
San Diego Hsg. Auth. Multi-family Hsg. Issue K, 3.45% (Freddie Mac Guaranteed), VRDN (a) |
1,800 |
1,800 |
|
|
San Diego Ind. Dev. Rev.: |
|
|
|
|
Participating VRDN Series FRRI 00 L2, 4% (Liquidity Facility Lehman Brothers, Inc.) (a)(e) |
9,980 |
9,980 |
|
|
Rfdg. Bonds (San Diego Gas & Elec. Co. Proj.) Series 1995 A, 4% tender 10/13/00, CP mode |
1,000 |
1,000 |
|
|
San Diego Unified School District TRAN 4.25% 9/29/00 |
3,700 |
3,702 |
|
|
San Francisco Bay Area Transit Fing. Auth. Series A, 4% 10/13/00, LOC Bayerische Landesbank Girozentrale, CP |
6,000 |
6,000 |
|
|
San Francisco Redev. Agcy. Multiple-family Hsg. Rev. |
13,000 |
13,000 |
|
|
Municipal Securities - continued |
|||
|
Principal Amount (000s) |
Value (Note 1) (000s) |
||
|
California - continued |
|||
|
San Juan Unified School District Participating VRDN Series FRRI A41, 4% (Liquidity Facility Bank of New York NA) (a)(e) |
$ 16,530 |
$ 16,530 |
|
|
San Leandro Multiple-family Hsg. Rev. (Carlton Plaza Proj.) 3.7%, LOC Commerzbank AG, VRDN (a)(d) |
5,000 |
5,000 |
|
|
San Luis Obispo County Office of Ed. TRAN Series 2000, |
9,300 |
9,359 |
|
|
Santa Clara County Gen. Oblig. Participating VRDN |
9,000 |
9,000 |
|
|
Santa Clara Valley Wtr. District Ctfs. of Prtn. Participating VRDN Series Merlots 00 MM, 3.97% (Liquidity Facility First Union Nat'l. Bank, North Carolina) (a)(e) |
8,900 |
8,900 |
|
|
Santa Cruz County Board of Ed. TRAN 5% 6/29/01 |
9,100 |
9,156 |
|
|
Santa Rosa Multiple-family Hsg. Rev. (Quail Run Apts./Santa Rosa Hsg. Partners Proj.) Series 1997 A, 3.7%, |
5,750 |
5,750 |
|
|
Solano County Gen. Oblig. BAN 4.5% 12/15/00 |
4,400 |
4,409 |
|
|
Southern California Pub. Pwr. Auth. Transmission Proj. Rev. Series A, 3.5% (FSA Insured), VRDN (a) |
8,700 |
8,700 |
|
|
Univ. of California Rev.: |
|
|
|
|
Rfdg. Participating VRDN Series Merlots 97 G, 3.97% (Liquidity Facility First Union Nat'l. Bank, North Carolina) (a)(e) |
20,000 |
20,000 |
|
|
Series A, 3.95% 10/5/00, CP |
2,600 |
2,600 |
|
|
|
892,830 |
||
|
Guam - 0.5% |
|||
|
Guam Pwr. Auth. Rev. Participating VRDN Series PA 531, 4.08% (Liquidity Facility Merrill Lynch & Co., Inc.) (a)(e) |
5,085 |
5,085 |
|
|
Puerto Rico - 0.4% |
|||
|
Puerto Rico Commonwealth Gen. Oblig. Participating VRDN Series Merlots 00 EE, 3.97% (Liquidity Facility First Union Nat'l. Bank, North Carolina) (a)(e) |
4,300 |
4,300 |
|
|
Municipal Securities - continued |
|||
|
Shares |
Value (Note 1) (000s) |
||
|
Other - 16.3% |
|||
|
Fidelity Municipal Cash Central Fund, 4.28% (b)(c) |
177,404,057 |
$ 177,404 |
|
|
TOTAL INVESTMENT PORTFOLIO - 99.4% |
1,079,619 |
||
|
NET OTHER ASSETS - 0.6% |
6,971 |
||
|
NET ASSETS - 100% |
$ 1,086,590 |
||
|
Total Cost for Income Tax Purposes $ 1,079,605 |
|
Security Type Abbreviations |
|
BAN - BOND ANTICIPATION NOTE |
|
CP - COMMERCIAL PAPER |
|
RAN - REVENUE ANTICIPATION NOTE |
|
TRAN - TAX AND REVENUE |
|
VRDN - VARIABLE RATE DEMAND NOTE |
|
Legend |
|
(a) The coupon rate shown on floating or adjustable rate securities represents the rate at period end. |
|
(b) Information in this report regarding holdings by state and security types does not reflect the holdings of the Fidelity Municipal Cash Central Fund. A listing of the Fidelity Municipal Cash Central Fund's holdings as of its most recent fiscal period end is available upon request. |
|
(c) The rate quoted is the annualized seven-day yield of the fund at period end. |
|
(d) Private activity obligations whose interest is subject to the federal alternative minimum tax for individuals. |
|
(e) Provides evidence of ownership in one or more underlying municipal bonds. |
|
(f) Restricted securities - Investment in securities not registered under the Securities Act of 1933. |
|
Additional information on each holding is as follows: |
|
Security |
Acquisition Date |
Cost |
|
California Hsg. Fin. Agcy. Rev. Bonds Series PT 40D, 3.98%, tender 2/22/01 (Liquidity Facility Merrill Lynch |
8/31/00 |
$ 5,865 |
|
Other Information |
|
The fund invested in securities that are not registered under the Securities Act of 1933. These securities are subject to legal or contractual restrictions on resale. At the end of the period, restricted securities (excluding Rule 144A issues) amounted to $5,865,000 or 0.5% of net assets. |
|
Income Tax Information |
|
At February 29, 2000, the fund had a capital loss carryforward of approximately $462,000 of which $422,000 and $40,000 will expire on February 28, 2003 and 2006, respectively. |
See accompanying notes which are an integral part of the financial statements.
Semiannual Report
Spartan California Municipal Money Market Fund
Statement of Assets and Liabilities
|
Amounts in thousands (except per-share amount |
August 31, 2000 (Unaudited) |
|
|
Assets |
|
|
|
Investment in securities, at value - |
|
$ 1,079,619 |
|
Receivable for fund shares sold |
|
2,179 |
|
Interest receivable |
|
8,808 |
|
Total assets |
|
1,090,606 |
|
Liabilities |
|
|
|
Payable to custodian bank |
$ 17 |
|
|
Payable for fund shares redeemed |
3,340 |
|
|
Distributions payable |
190 |
|
|
Accrued management fee |
461 |
|
|
Other payables and accrued expenses |
8 |
|
|
Total liabilities |
|
4,016 |
|
Net Assets |
|
$ 1,086,590 |
|
Net Assets consist of: |
|
|
|
Paid in capital |
|
$ 1,086,938 |
|
Accumulated net realized gain (loss) on investments |
|
(362) |
|
Unrealized gain from accretion of discount |
|
14 |
|
Net Assets, for 1,086,934 shares outstanding |
|
$ 1,086,590 |
|
Net Asset Value, offering price and redemption price |
|
$1.00 |
See accompanying notes which are an integral part of the financial statements.
Semiannual Report
Spartan California Municipal Money Market Fund
Financial Statements - continued
Statement of Operations
|
Amounts in thousands (Unaudited) |
Six months ended August 31, 2000 (Unaudited) |
|
|
Interest Income |
|
$ 21,456 |
|
Expenses |
|
|
|
Management fee |
$ 2,772 |
|
|
Non-interested trustees' compensation |
2 |
|
|
Total expenses before reductions |
2,774 |
|
|
Expense reductions |
(33) |
2,741 |
|
Net interest income |
|
18,715 |
|
Realized and Unrealized Gain (Loss) Net realized gain (loss) on investment securities |
|
107 |
|
Increase (decrease) in net unrealized gain from |
|
14 |
|
Net gain (loss) |
|
121 |
|
Net increase in net assets resulting from operations |
|
$ 18,836 |
See accompanying notes which are an integral part of the financial statements.
Semiannual Report
Spartan California Municipal Money Market Fund
Financial Statements - continued
Statement of Changes in Net Assets
|
Amounts in thousands |
Six months ended
August 31, 2000 |
Year ended
February 29, |
|
Increase (Decrease) in Net Assets |
|
|
|
Operations |
$ 18,715 |
$ 33,029 |
|
Net realized gain (loss) |
107 |
133 |
|
Increase (decrease) in net unrealized gain from |
14 |
- |
|
Net increase (decrease) in net assets resulting |
18,836 |
33,162 |
|
Distributions to shareholders from net interest income |
(18,715) |
(33,029) |
|
Share transactions at net asset value of $1.00 per share |
457,830 |
1,052,760 |
|
Reinvestment of distributions from net interest income |
17,688 |
31,293 |
|
Cost of shares redeemed |
(528,578) |
(1,174,077) |
|
Net increase (decrease) in net assets and shares resulting from share transactions |
(53,060) |
(90,024) |
|
Total increase (decrease) in net assets |
(52,939) |
(89,891) |
|
Net Assets |
|
|
|
Beginning of period |
1,139,529 |
1,229,420 |
|
End of period |
$ 1,086,590 |
$ 1,139,529 |
See accompanying notes which are an integral part of the financial statements.
Semiannual Report
Financial Highlights
|
|
Six months ended August 31, 2000 |
Years ended February 28, |
||||
|
|
(Unaudited) |
2000 F |
1999 |
1998 |
1997 |
1996 F |
|
Selected Per-Share Data |
|
|
|
|
|
|
|
Net asset value, beginning of period |
$ 1.000 |
$ 1.000 |
$ 1.000 |
$ 1.000 |
$ 1.000 |
$ 1.000 |
|
Income from
Investment
Operations |
.017 |
.028 |
.028 |
.032 |
.031 |
.035 |
|
Less Distributions |
|
|
|
|
|
|
|
From net |
(.017) |
(.028) |
(.028) |
(.032) |
(.031) |
(.035) |
|
Net asset value, |
$ 1.000 |
$ 1.000 |
$ 1.000 |
$ 1.000 |
$ 1.000 |
$ 1.000 |
|
Total Return B, C |
1.71% |
2.79% |
2.84% |
3.26% |
3.18% |
3.60% |
|
Ratios and Supplemental Data |
|
|
|
|
|
|
|
Net assets, end of period (in millions) |
$ 1,087 |
$ 1,140 |
$ 1,229 |
$ 1,353 |
$ 1,344 |
$ 1,307 |
|
Ratio of expenses to average net assets |
.50% A |
.50% |
.50% |
.45% D |
.35% D |
.31% D |
|
Ratio of expenses to average net assets after expense reductions |
.49% A, E |
.49% E |
.49% E |
.45% |
.34% E |
.31% |
|
Ratio of net interest income to average net assets |
3.37% A |
2.75% |
2.81% |
3.21% |
3.14% |
3.55% |
A Annualized
B Total returns do not include the account closeout fee and for periods of less than one year are not annualized.
C The total returns would have been lower had certain expenses not been reduced during the periods shown.
D FMR agreed to reimburse a portion of the fund's expenses during the period. Without this reimbursement, the fund's expense ratio would have been higher.
E FMR or the fund has entered into varying arrangements with third parties who either paid or reduced a portion of the fund's expenses.
F For the year ended February 29.
See accompanying notes which are an integral part of the financial statements.
Semiannual Report
Fidelity California Municipal Money Market Fund
To evaluate a money market fund's historical performance, you can look at either total return or yield. Total return reflects the change in the value of an investment, assuming reinvestment of the fund's dividend income. Yield measures the income paid by a fund. Since a money market fund tries to maintain a $1 share price, yield is an important measure of performance.
Cumulative Total Returns
|
Periods ended August 31, 2000 |
Past 6 |
Past 1 |
Past 5 |
Past 10 |
|
Fidelity CA Municipal Money Market |
1.69% |
3.11% |
15.48% |
33.71% |
|
California Tax-Free |
1.57% |
2.87% |
15.08% |
33.42% |
Cumulative total returns show the fund's performance in percentage terms over a set period - in this case, six months, one year, five years or 10 years. For example, if you had invested $1,000 in a fund that had a 5% return over the past year, the value of your investment would be $1,050. To measure how the fund's performance stacked up against its peers, you can compare it to the California tax-free money market funds average, which reflects the performance of California tax-free money market funds with similar objectives tracked by iMoneyNet, Inc. The past six months average represents a peer group of 44 money market funds.
Average Annual Total Returns
|
Periods ended August 31, 2000 |
|
Past 1 |
Past 5 |
Past 10 |
|
Fidelity CA Municipal Money Market |
|
3.11% |
2.92% |
2.95% |
|
California Tax-Free |
|
2.87% |
2.84% |
2.92% |
Average annual total returns take the fund's cumulative return and show you what would have happened if the fund had performed at a constant rate each year.
Semiannual Report
Fidelity California Municipal Money Market Fund
Performance - continued
Yields
|
|
8/28/00 |
5/29/00 |
2/28/00 |
11/29/99 |
8/30/99 |
|
|
|||||
|
California Municipal |
3.39% |
3.45% |
2.48% |
3.05% |
2.55% |
|
|
|||||
|
California Tax-Free Money |
3.14% |
3.19% |
2.28% |
2.91% |
2.40% |
|
|
|||||
|
California Municipal |
5.84% |
5.97% |
4.26% |
5.24% |
4.38% |
|
|
|||||
|
Portion of fund's income |
19.45% |
7.45% |
26.34% |
21.79% |
21.48% |
|
|
|||||

Yield refers to the income paid by the fund over a given period. Yields for money market funds are usually for seven-day periods, expressed as annual percentage rates. A yield that assumes income earned is reinvested or compounded is called an effective yield. The table above shows the fund's current seven-day yield at quarterly intervals over the past year. You can compare these yields to the California tax-free money market funds average as tracked by iMoneyNet, Inc. Or you can look at the fund's tax-equivalent yield, which is based on a combined effective 2000 federal and state income tax rate of 41.95%. The fund's yields mentioned above reflect that a portion of the fund's income was subject to state taxes. A portion of the fund's income may be subject to the federal alternative minimum tax.
A money market fund's total returns and yields will vary, and reflect past results rather than predict future performance.
Comparing
Performance
Yields on tax-free investments are usually lower than yields on taxable investments. However, a straight comparison between the two may be misleading because it ignores the way taxes reduce taxable returns. Tax-equivalent yield - the yield you'd have to earn on a similar taxable investment to match the tax-free yield - makes the comparison more meaningful. Keep in mind that the U.S. government neither insures nor guarantees a money market fund. In fact, there is no assurance that a money market fund will maintain a $1 share price.
3Semiannual Report
Fidelity California Municipal Money Market Fund
(Portfolio Manager photograph)
An interview with Diane McLaughlin, Portfolio Manager of Fidelity California Municipal Money Market Fund
Q. What was the investment environment like during the six months that ended August 31, 2000, Diane?
A. Economic growth continued to be strong. Gross domestic product (GDP) grew at an annual rate of 4.8% in the first quarter of 2000 and at 5.6% in the second quarter, exhibiting the same vibrant pace seen in 1999. Both consumer confidence and consumer spending remained high. Business spending also was strong. The healthy economy led to a decline in unemployment, which fell to 3.9% in April, its lowest level in 30 years. During the first half of the six-month period, this backdrop encouraged the Federal Reserve Board to continue its program of short-term interest-rate hikes, which were intended to slow growth and head off inflation. Some inflation did surface at the consumer level. Fueled by increases in energy costs, consumer prices increased at an annual rate of 4.0% during the first six months of the year, up from 2.8% in the prior 12 months.
Q. What kind of approach did the Fed take?
A. In March and May, the Fed raised the rate banks charge each other for overnight loans, known as the fed funds target rate. With the first rate hike, the Fed raised the target rate by 0.25 percentage points. In May, however, the Fed became more aggressive, raising the fed funds target rate by 0.50 percentage points. This move came shortly after the employment cost index - a broad measure of the costs incurred by businesses for wages and benefits - rose at a higher-than-expected annual rate of 5.6% in the first quarter, up from 3.4% in 1999. Since May, the Fed has taken no further action on interest rates because the economy showed signs of slowing and inflation did not spike further. Market prices started to reflect the belief that the Fed was finished raising rates for the time being. In fact, there has been some talk that the economy has decelerated to the point where the Fed's next move may be a rate cut.
Q. What was your strategy with the fund?
A. Demand for California municipal money market securities was strong at the same time that new issuance declined. The combination of these technical factors caused yields on most very short-term California-exempt securities to fall to unattractive levels. As a result, I turned some of my focus - within the limits set by the fund's prospectus - to out-of-state investment opportunities that offered more appealing after-tax yields than tax-free alternatives in the California market. Even though more of shareholders' income will be taxable at the state level because of the out-of-state investments, I pursued this strategy so the fund could provide higher yields on a tax-adjusted basis than if I had chosen to invest the same assets in significantly lower-yielding tax-exempt California securities. On the other hand, there were times when one-year California-exempt notes were attractively priced. This was especially true in June - when many issuers came to market - so I added significantly to the fund's fixed-rate positions at that time.
Semiannual Report
Fidelity California Municipal Money Market Fund
Fund Talk: The Manager's Overview - continued
Q. How did the fund perform?
A. The fund's seven-day yield on August 31, 2000, was 3.39%, compared to 2.49% six months ago. The latest yield was the equivalent of a 5.84% taxable yield for investors in the 41.95% combined state and federal tax bracket. The fund's yields reflect that a portion of the fund's income was subject to state taxes. Through August 31, 2000, the fund's six-month total return was 1.69%, compared to 1.57% for the California tax-free money market funds average, according to iMoneyNet, Inc.
Q. What is your outlook?
A. Recent data indicate that the economy is slowing. In addition, the steady decline in the value of the euro has made U.S. imports in Europe more expensive. This, combined with increases in oil prices, may help to slow U.S. economic growth. Looking at the fund, the supply/demand imbalance should continue to be a key driver of strategy.
The views expressed in this report reflect those of the portfolio manager only through the end of the period of the report as stated on the cover and do not necessarily represent the views of Fidelity or any other person in the Fidelity organization. Any such views are subject to change at any time based upon market or other conditions and Fidelity disclaims any responsibility to update such views. These views may not be relied on as investment advice and, because investment decisions for a Fidelity fund are based on numerous factors, may not be relied on as an indication of trading intent on behalf of any Fidelity fund.
Fund Facts
Goal: seeks as high a level of current income, exempt from federal and California state personal income tax, as is consistent with preservation of capital
Fund number: 097
Trading symbol: FCFXX
Start date: July 7, 1984
Size: as of August 31, 2000, more than $2.1 billion
Manager: Diane McLaughlin, since 1997; manager, various Fidelity and Spartan municipal money market funds; joined Fidelity in 1992
3Semiannual Report
Fidelity California Municipal Money Market Fund
|
Maturity Diversification |
|||
|
Days |
% of fund's
investments |
% of fund's investments 2/29/00 |
% of fund's |
|
0 - 30 |
78.2 |
76.2 |
67.4 |
|
31 - 90 |
8.3 |
3.6 |
17.4 |
|
91 - 180 |
2.6 |
15.0 |
1.2 |
|
181 - 397 |
10.9 |
5.2 |
14.0 |
|
Weighted Average Maturity |
|||
|
|
8/31/00 |
2/29/00 |
8/31/99 |
|
Fidelity California Municipal |
47 Days |
37 Days |
57 Days |
|
California Tax-Free Money Market |
49 Days |
41 Days |
58 Days |
|
Asset Allocation (% of fund's net assets) |
|||||||
|
As of August 31, 2000 |
As of February 29, 2000 |
||||||
|
Variable Rate Demand Notes (VRDNs) 50.8% |
|
|
Variable Rate Demand Notes (VRDNs) 46.5% |
|
||
|
Commercial Paper (including CP Mode) 13.5% |
|
|
Commercial Paper (including CP Mode) 11.2% |
|
||
|
Tender Bonds 1.9% |
|
|
Tender Bonds 0.2% |
|
||
|
Municipal Notes 15.1% |
|
|
Municipal Notes 18.2% |
|
||
|
Municipal Money |
|
|
Municipal Money |
|
||
 |
Other Investments |
|
|
Other Investments |
|
||

*Source: iMoneyNet, Inc.®
Semiannual Report
Fidelity California Municipal Money Market Fund
(Unaudited)
Showing Percentage of Net Assets
|
Municipal Securities - 99.1% |
|||
|
Principal Amount (000s) |
Value (Note 1) (000s) |
||
|
California - 79.9% |
|||
|
Alameda County Ind. Dev. Auth. Rev. Rfdg. (Longview Fibre Co. Proj.) Series 1988, 4.45%, LOC ABN-AMRO Bank NV, VRDN (b) |
$ 1,750 |
$ 1,750 |
|
|
Anaheim Hsg. Auth. Multiple-family Hsg. Rev. Bonds (Park Vista Apt. Proj.) Series 2000 D, 4.15%, tender 12/29/00 (FGIC Guaranteed) (e) |
17,480 |
17,480 |
|
|
Antioch Unified School District TRAN 5% 7/5/01 |
6,300 |
6,337 |
|
|
Berkeley Gen. Oblig. BAN Series 1999 2000, 4.25% 12/14/00 |
8,300 |
8,311 |
|
|
California Cmnty. College Fing. Auth. Rev. TRAN Series A, 5% 6/29/01 (FSA Insured) |
15,800 |
15,895 |
|
|
California Dept. of Wtr. Resources Central Valley Proj. Rev. Series 1: |
|
|
|
|
3.95% 9/12/00, (Liquidity Facility Landesbank |
5,498 |
5,498 |
|
|
4% 9/11/00, (Liquidity Facility Landesbank |
6,672 |
6,672 |
|
|
California Gen. Oblig.: |
|
|
|
|
Participating VRDN: |
|
|
|
|
Series 000501, 3.93% (Liquidity Facility Citibank NA, New York) (b)(f) |
5,740 |
5,740 |
|
|
Series 990501 Class A, 3.93% (Liquidity Facility Citibank NA, New York) (b)(f) |
8,000 |
8,000 |
|
|
Series FRRI 00 A11, 4.05% (Liquidity Facility Bayerische Hypo-und Vereinsbank AG) (b)(f) |
4,600 |
4,600 |
|
|
Series FRRI 00 A9, 4.05% (Liquidity Facility Bayerische Hypo-und Vereinsbank AG) (b)(f) |
3,595 |
3,595 |
|
|
Series FRRI 00 L15, 4.05% (Liquidity Facility Lehman Brothers, Inc.) (b)(f) |
6,320 |
6,320 |
|
|
Series FRRI 00 L16, 4.05% (Liquidity Facility Lehman Brothers, Inc.) (b)(f) |
8,100 |
8,100 |
|
|
Series FRRI 00 L5, 4% (Liquidity Facility Lehman Brothers, Inc.) (b)(f) |
18,000 |
18,000 |
|
|
Series FRRI L7, 4% (Liquidity Facility Lehman Brothers, Inc.) (b)(f) |
9,700 |
9,700 |
|
|
Series Merlots 00 A, 4.02% (Liquidity Facility First Union Nat'l. Bank, North Carolina) (b)(e)(f) |
17,500 |
17,500 |
|
|
Series Merlots 00 XX, 3.97% (Liquidity Facility First Union Nat'l. Bank, North Carolina) (b)(f) |
7,380 |
7,380 |
|
|
Series Merlots 99 M, 3.97% (Liquidity Facility First Union Nat'l. Bank, North Carolina) (b)(f) |
16,000 |
16,000 |
|
|
Series Merlots MMM, 4.03% (Liquidity Facility First Union Nat'l. Bank, North Carolina) (b)(f) |
7,400 |
7,400 |
|
|
Series MSDW 98 194, 3.83% (Liquidity Facility Morgan Stanley Dean Witter & Co.) (b)(f) |
4,000 |
4,000 |
|
|
Series MSDW 98 195, 3.83% (Liquidity Facility Morgan Stanley Dean Witter & Co.) (b)(f) |
4,120 |
4,120 |
|
|
Municipal Securities - continued |
|||
|
Principal Amount (000s) |
Value (Note 1) (000s) |
||
|
California - continued |
|||
|
California Gen. Oblig.: - continued |
|
|
|
|
Participating VRDN: |
|
|
|
|
Series PA 607R, 3.88% (Liquidity Facility Merrill Lynch & Co., Inc.) (b)(f) |
$ 2,100 |
$ 2,100 |
|
|
Series PT 1211, 3.88% (Liquidity Facility Merrill Lynch & Co., Inc.) (b)(f) |
15,990 |
15,990 |
|
|
Series Putters 132, 3.77% (Liquidity Facility J.P. Morgan & Co., Inc.) (b)(f) |
22,205 |
22,205 |
|
|
Series Putters 142, 3.8% (Liquidity Facility Morgan Guaranty Trust Co., NY) (b)(f) |
1,300 |
1,300 |
|
|
3.9% 9/7/00, CP |
16,700 |
16,700 |
|
|
3.9% 10/5/00, CP |
6,800 |
6,800 |
|
|
3.9% 11/10/00, CP |
15,500 |
15,500 |
|
|
3.95% 11/10/00, CP |
12,800 |
12,800 |
|
|
4% 9/6/00, CP |
7,300 |
7,300 |
|
|
4% 9/8/00, CP |
17,500 |
17,500 |
|
|
4% 9/11/00, CP |
11,000 |
11,000 |
|
|
4.05% 10/6/00, CP |
10,000 |
10,000 |
|
|
4.05% 10/11/00, CP |
15,350 |
15,350 |
|
|
4.05% 10/18/00, CP |
18,600 |
18,600 |
|
|
4.1% 9/20/00, CP |
6,540 |
6,540 |
|
|
4.15% 9/6/00, CP |
13,800 |
13,800 |
|
|
California Health Facilities Fing. Auth. Rev. (Sutter Health Proj.) Series 1996 B, 3.45% (AMBAC Insured), VRDN (b) |
1,500 |
1,500 |
|
|
California Hsg. Fin. Agcy. Rev.: |
|
|
|
|
Bonds: |
|
|
|
|
(Home Mtg. Prog.) Series S, 4.25% 8/1/01 (e) |
12,100 |
12,100 |
|
|
Series PT 40B, 4.05%, tender 2/22/01 (Liquidity Facility Bayerische Hypo-und Vereinsbank AG) (e)(f)(g) |
22,610 |
22,610 |
|
|
Participating VRDN Series BA 96 C1, 3.88% (Liquidity Facility Bank of America NA) (b)(e)(f) |
3,225 |
3,225 |
|
|
Series 2000 M, 3.9% (FSA Insured), VRDN (b)(e) |
14,400 |
14,400 |
|
|
Series Q, 3.7%, LOC KBC Bank, NV, VRDN (b)(e) |
25,000 |
25,000 |
|
|
California Infrastructure & Econ. Dev. Bank (California ISO Corp. Proj.) Series 2000, 3.6% (MBIA Insured), VRDN (b) |
17,400 |
17,400 |
|
|
California Poll. Cont. Fing. Auth. Poll. Cont. Rev.: |
|
|
|
|
Bonds (Southern California Edison Co. Proj.) Series 1985 D, 4% tender 10/13/00, CP mode |
6,850 |
6,850 |
|
|
(Pacific Gas & Elec. Co. Proj.): |
|
|
|
|
Series 1996 B, 3.55%, LOC RaboBank Nederland Coop. Central, VRDN (b)(e) |
10,000 |
10,000 |
|
|
Series 1996 C, 3.5%, LOC Bank of America NA, VRDN (b) |
11,300 |
11,300 |
|
|
Municipal Securities - continued |
|||
|
Principal Amount (000s) |
Value (Note 1) (000s) |
||
|
California - continued |
|||
|
California Poll. Cont. Fing. Auth. Poll. Cont. Rev.: - continued |
|
|
|
|
(Pacific Gas & Elec. Co. Proj.): |
|
|
|
|
Series 1997 C, 3.45%, LOC KBC Bank, NV, VRDN (b)(e) |
$ 2,000 |
$ 2,000 |
|
|
Series D, 3.45%, LOC UBS AG, VRDN (b) |
1,100 |
1,100 |
|
|
Series E, 3.55%, LOC Morgan Guaranty Trust Co., NY, VRDN (b) |
20,300 |
20,300 |
|
|
California Poll. Cont. Fing. Auth. Solid Waste Disp. Rev.: |
|
|
|
|
(New United Motor Manufacturing Proj.) Series A, 3.75%, LOC California Teachers Retirement Sys., VRDN (b)(e) |
7,615 |
7,615 |
|
|
(Western Waste Industries Proj.) Series 1994 A, 3.95%, |
5,000 |
5,000 |
|
|
California Pub. Works Board Lease Rev. Participating VRDN: |
|
|
|
|
Series 2000 B, 3.88% (Liquidity Facility Bank of America NA) (b)(f) |
3,610 |
3,610 |
|
|
Series MSDW 00 210, 3.83% (Liquidity Facility Morgan Stanley Dean Witter & Co.) (b)(f) |
3,045 |
3,045 |
|
|
California School Cash Reserve Prog. Auth. TRAN Series A, 5.25% 7/3/01 (AMBAC Insured) |
54,600 |
55,027 |
|
|
California School Fin. Auth. BAN: |
|
|
|
|
Series A, 4.25% 10/1/00 |
7,800 |
7,803 |
|
|
Series B, 4.25% 10/1/00 |
8,655 |
8,660 |
|
|
California Statewide Cmnty. Dev. Auth. Indl. Dev. Rev. (Arthurmade Plastics, Inc. Proj.) Series 2000 A, 3.75%, |
6,100 |
6,100 |
|
|
California Statewide Cmnty. Dev. Auth. Multiple-family Rev.: |
|
|
|
|
(One Park Place Proj.) Series 1999, 3.55%, (Irvine Arpt. Complex Lp.) LOC Bank of America NA, VRDN (b)(e) |
4,000 |
4,000 |
|
|
(Sunrise of Moraga Proj.) Series 1997 G, 3.7%, LOC Commerzbank AG, (Oakmont of Moraga LLC) LOC Heller Finl., Inc., VRDN (b)(e) |
1,200 |
1,200 |
|
|
(Villa Paseo Proj.) 3.65%, LOC Fed. Home Ln. Bank, |
4,000 |
4,000 |
|
|
Rfdg. (Sunrise Fresno Proj.) Series B, 3.7%, LOC Fannie Mae, VRDN (b) |
3,600 |
3,600 |
|
|
California Statewide Cmnty. Dev. Auth. Rev.: |
|
|
|
|
(JTF Enterprises LLC Proj.) Series 1996 A, 4.35%, |
3,000 |
3,000 |
|
|
TRAN (Riverside Co. Proj.) Series C2, 4% 9/29/00 |
25,300 |
25,311 |
|
|
California Statewide Cmnty. Dev. Corp. Rev.: |
|
|
|
|
(American Zettler, Inc. Proj.) Series 1989, 4.35%, |
1,975 |
1,975 |
|
|
(Andercraft Prod., Inc. Proj.) Series 1989, 4.35%, |
525 |
525 |
|
|
Municipal Securities - continued |
|||
|
Principal Amount (000s) |
Value (Note 1) (000s) |
||
|
California - continued |
|||
|
California Statewide Cmnty. Dev. Corp. Rev.: - continued |
|
|
|
|
(Bro-Co. Gen. Partnership Proj.) Series 1990, 4.35%, |
$ 3,160 |
$ 3,160 |
|
|
(Cordeiro Vault Co., Inc. Proj.) Series 1996 M, 4.35%, |
990 |
990 |
|
|
(Duke, Inc. Proj.) Series 1996 E, 4.35%, LOC Wells Fargo Bank NA, San Francisco, VRDN (b)(e) |
1,140 |
1,140 |
|
|
(Evapco, Inc. Proj.) Series 1996 K, 4.35%, LOC Bank of America NA, VRDN (b)(e) |
1,330 |
1,330 |
|
|
(Fibrebond West, Inc. Proj.) Series 1996 N, 4.35%, |
3,700 |
3,700 |
|
|
(Fulton Properties Ltd., Inc. Proj.) Series 1996 F, 4.35%, |
2,705 |
2,705 |
|
|
(Lansmont Corp. Proj.) Series 1996 G, 4.35%, LOC Wells Fargo Bank NA, San Francisco, VRDN (b)(e) |
2,085 |
2,085 |
|
|
(Lynwood Enterprises LLC Proj.) Series 1997 D, 4.35%, |
3,400 |
3,400 |
|
|
(Merrill Packaging Proj.) 4.35%, LOC Wells Fargo Bank NA, San Francisco, VRDN (b)(e) |
1,360 |
1,360 |
|
|
(Peet's Coffee & Tea, Inc. Proj.) Series 1995 E, 4.35%, |
2,180 |
2,180 |
|
|
(Redline Synthetic Oil Corp. Proj.) 4.35%, (Kerrigan Timothy W & Dawn M) LOC California Teachers Retirement Sys., VRDN (b)(e) |
1,000 |
1,000 |
|
|
(Rix Ind. Proj.) Series 1996 I, 4.35%, LOC Wells Fargo Bank NA, San Francisco, VRDN (b)(e) |
1,680 |
1,680 |
|
|
(Setton Properties, Inc. Proj.) Series 1995 E, 4.35%, |
2,560 |
2,560 |
|
|
(Sunclipse, Inc., Alhambra Proj.) Series 1989, 4.35%, |
3,200 |
3,200 |
|
|
(Sunclipse, Inc., Union City Proj.) Series 1989, 4.35%, |
2,135 |
2,135 |
|
|
(Sys. Engineering & Mgmt. Co. Proj.) 4.35%, LOC California Teachers Retirement Sys., VRDN (b)(e) |
1,360 |
1,360 |
|
|
(Tri-Valleys Growers Proj.) Series 1995 F, 4.35%, |
7,400 |
7,400 |
|
|
(W&H Voortman, Inc. Proj.) Series 1990, 4.35%, |
900 |
900 |
|
|
California Univ. Rev. Participating VRDN Series FRRI 00 A7, 4% (Liquidity Facility Bayerische Hypo-und Vereinsbank AG) (b)(f) |
20,000 |
20,000 |
|
|
Camarillo City Multiple-family Hsg. Rev. (Hacienda de Camarillo Proj.) Series 1996, 3.6% (Fannie Mae Guaranteed), VRDN (b)(e) |
3,000 |
3,000 |
|
|
Municipal Securities - continued |
|||
|
Principal Amount (000s) |
Value (Note 1) (000s) |
||
|
California - continued |
|||
|
Central Valley Schools Fin. Auth. Participating VRDN |
$ 22,900 |
$ 22,900 |
|
|
Chula Vista Ind. Dev. Rev. Bonds (San Diego Gas & Elec. Co. Proj.) Series C, 4.05% tender 10/13/00, CP mode (e) |
3,000 |
3,000 |
|
|
Contra Costa County TRAN Series A, 4% 9/29/00 |
2,400 |
2,401 |
|
|
Fontana Unified School District TRAN 5% 7/6/01 |
6,300 |
6,337 |
|
|
Foothill-De Anza Cmnty. College District (Cap. Appreciation) Participating VRDN Series Merlots 00 YY, 3.97% (Liquidity Facility First Union Nat'l. Bank, North Carolina) (b)(f) |
3,700 |
3,700 |
|
|
Fowler Ind. Dev. Auth. Ind. Dev. Rev. (Bee Sweet Citrus, Inc. Proj.) Series 1995, 3.8%, LOC Bank of America NA, VRDN (b)(e) |
4,200 |
4,200 |
|
|
Grand Terrace Cmnty. Redev. (Mount Vernon Villas Proj.) 3.5%, LOC Fannie Mae, VRDN (b) |
12,700 |
12,700 |
|
|
Irvine Ranch Wtr. District Rev. Series 1985 B, 3.5%, LOC Landesbank Hessen-Thuringen, VRDN (b) |
2,000 |
2,000 |
|
|
Kern County Board Ed. TRAN 5% 7/3/01 |
19,000 |
19,111 |
|
|
Kern County High School District TRAN 5% 7/5/01 |
12,700 |
12,782 |
|
|
Lassen Muni. Util. District Rev. Rfdg. Series 1996 A, 4.1% |
2,460 |
2,460 |
|
|
Livermore Multiple-family Mtg. Rev. (Portola Meadows Apts. Proj.) Series 1989 A, 3.7%, LOC Bank of America NA, VRDN (b)(e) |
2,700 |
2,700 |
|
|
Long Beach Hbr. Rev.: |
|
|
|
|
Participating VRDN: |
|
|
|
|
Series FRRI A7, 4.05% (Liquidity Facility Bayerische Hypo-und Vereinsbank AG) (b)(e)(f) |
9,900 |
9,900 |
|
|
Series SG 73, 3.98% (Liquidity Facility Societe Generale) (b)(e)(f) |
3,000 |
3,000 |
|
|
Series A, 4.1% 10/6/00, CP (e) |
14,200 |
14,200 |
|
|
Los Angeles County Gen. Oblig. TRAN Series A, 5% 6/29/01 |
45,900 |
46,209 |
|
|
Los Angeles County Metro. Trans. Auth. Rev. Participating VRDN Series SGB 3, 3.93% (Liquidity Facility Societe Generale) (b)(f) |
5,500 |
5,500 |
|
|
Los Angeles County Metro. Trans. Auth. Sales Tax Rev.: |
|
|
|
|
Participating VRDN: |
|
|
|
|
Series SG 46, 3.88% (Liquidity Facility Societe Generale) (b)(f) |
2,930 |
2,930 |
|
|
Series SG 54, 3.88% (Liquidity Facility Societe Generale) (b)(f) |
2,525 |
2,525 |
|
|
Series 1993 A, 3.5% (MBIA Insured) (BPA Dexia Cr. Local de France), VRDN (b) |
25,750 |
25,750 |
|
|
Municipal Securities - continued |
|||
|
Principal Amount (000s) |
Value (Note 1) (000s) |
||
|
California - continued |
|||
|
Los Angeles County Pub. Works Fing. Auth. Lease Rev. Participating VRDN Series Merlots 00 JJJ, 4.13% (Liquidity Facility First Union Nat'l. Bank, North Carolina) (b)(f) |
$ 16,000 |
$ 16,000 |
|
|
Los Angeles County Schools Pooled Fing. Prog. Ctfs. of Prtn. TRAN: |
|
|
|
|
(Pooled Trans. Proj.) Series B, 4% 9/29/00 (FSA Insured) |
14,100 |
14,106 |
|
|
Series A, 5% 7/2/01 (FSA Insured) |
13,300 |
13,378 |
|
|
Los Angeles Dept. Arpts. Rev. Participating VRDN Series SG 61, 3.98% (Liquidity Facility Societe Generale) (b)(e)(f) |
3,400 |
3,400 |
|
|
Los Angeles Dept. Wtr. & Pwr. Elec. Plant Rev.: |
|
|
|
|
Series 2000 D Issue 2, 3.55% (Liquidity Facility Toronto Dominion Bank), VRDN (b) |
8,800 |
8,800 |
|
|
Series 2000 F Issue 2, 3.55% (Liquidity Facility Bank of America NA), VRDN (b) |
14,300 |
14,300 |
|
|
Los Angeles Dept. Wtr. & Pwr. Wtrwks. Rev.: |
|
|
|
|
Participating VRDN Series Merlots 99 L, 3.97% (Liquidity Facility First Union Nat'l. Bank, North Carolina) (a)(b)(f) |
13,800 |
13,800 |
|
|
3.95% 9/12/00, LOC Bank of America NA, LOC Bayerische Landesbank Girozentrale, CP |
3,000 |
3,000 |
|
|
4% 10/5/00, LOC Bank of America NA, LOC Bayerische Landesbank Girozentrale, CP |
7,600 |
7,600 |
|
|
4.1% 9/12/00, LOC Bank of America NA, LOC Bayerische Landesbank Girozentrale, CP |
11,000 |
11,000 |
|
|
Los Angeles Gen. Oblig. Participating VRDN Series 2000 N8, 4% (Liquidity Facility Bank of New York NA) (b)(f) |
51,400 |
51,400 |
|
|
Los Angeles Hbr. Dept. Rev. Participating VRDN: |
|
|
|
|
Series FRRI 7, 4.05% (Liquidity Facility Bank of New York NA) (b)(e)(f) |
6,020 |
6,020 |
|
|
Series FRRI A17, 4.1% (Liquidity Facility Commerzbank AG) (b)(e)(f) |
3,000 |
3,000 |
|
|
Series MSDW 00 349, 3.93% (Liquidity Facility Morgan Stanley Dean Witter & Co.) (b)(f) |
4,700 |
4,700 |
|
|
Series SG 59, 3.98% (Liquidity Facility Societe Generale) (b)(e)(f) |
4,725 |
4,725 |
|
|
Los Angeles Multiple-family Hsg. Rev. (Channel Gateway |
5,000 |
5,000 |
|
|
Los Angeles Unified School District Participating VRDN |
49,500 |
49,500 |
|
|
Los Angeles Wastewtr. Sys. Rev.: |
|
|
|
|
Participating VRDN Series SGA 26, 3.7% (Liquidity Facility Societe Generale) (b)(f) |
6,970 |
6,970 |
|
|
3.9% 11/9/00, CP |
5,500 |
5,500 |
|
|
Municipal Securities - continued |
|||
|
Principal Amount (000s) |
Value (Note 1) (000s) |
||
|
California - continued |
|||
|
Los Rios Cmnty. College District Participating VRDN Series FRRI A42, 4% (Liquidity Facility Bank of New York NA) (b)(f) |
$ 17,100 |
$ 17,100 |
|
|
Marin County Gen. Oblig. Participating VRDN Series FRRI A20, 4% (Liquidity Facility Bank of New York NA) (b)(f) |
19,280 |
19,280 |
|
|
Metro. Wtr. District Southern California Wtrwks. Rev.: |
|
|
|
|
Participating VRDN Series Merlots 99 O, 3.97% (Liquidity Facility First Union Nat'l. Bank, North Carolina) (b)(f) |
9,500 |
9,500 |
|
|
Series B, 4.15% 9/15/00, CP |
14,100 |
14,100 |
|
|
Milipitas Multiple-family Rev. (Crossing at Montague Proj.) Series A, 3.6%, LOC Fannie Mae, VRDN (b)(e) |
11,400 |
11,400 |
|
|
Northern California Transmission Auth. Rev. (Oregon Trans. Proj.) Series B, 4.05% 10/5/00, LOC Westdeutsche Landesbank Girozentrale, CP |
19,200 |
19,200 |
|
|
Oakland Gen. Oblig. TRAN Series 1999 2000, 4.25% 9/29/00 |
5,000 |
5,002 |
|
|
Oceanside Multiple-family Rev. (Lakeridge Apt. Proj.) Series 1994, 4.25% (Continental Casualty Co. Guaranteed), VRDN (b) |
15,400 |
15,400 |
|
|
Orange County Apt. Dev. Rev. (Riverbend Apts. Proj.) |
10,000 |
10,000 |
|
|
Orange County Spl. Fing. Auth. Teeter Plan Rev. Series C, 3.5% (AMBAC Insured), VRDN (b) |
12,300 |
12,300 |
|
|
Oxnard Redev. Agcy. Ctfs. of Prtn. (Channel Islands Bus. Ctr. Proj.) 4.2%, (Told Corp.) LOC Wells Fargo Bank NA, |
3,195 |
3,195 |
|
|
Paramount Hsg. Auth. Multiple-family Rev. (Century Place Apts. Proj.) Series 1999 A, 3.6% (Fannie Mae Guaranteed), VRDN (b)(e) |
10,500 |
10,500 |
|
|
Peninsula Corridor Joint Powers Board: |
|
|
|
|
RAN: |
|
|
|
|
Series A, 4.45% 10/13/00 |
15,100 |
15,114 |
|
|
Series B, 4.4% 7/25/01 |
4,100 |
4,107 |
|
|
4.8% 6/7/01 |
4,700 |
4,717 |
|
|
Pittsburg Multi-family Mtg. Rev. (Fountain Plaza Apt. Proj.) 4.15% (Fannie Mae Guaranteed), (700 Market Assoc. Xxvii Lp) VRDN (b) |
7,700 |
7,700 |
|
|
Placer County Union High School District TRAN 4.125% 10/1/00 |
4,000 |
4,002 |
|
|
Pleasant Hill Redev. Agcy. Multiple-family Hsg. Rev. (Chateau III Proj.) Series 1996 A, 3.7%, (Macengle Sr. Svc.) |
710 |
710 |
|
|
Port of Oakland Gen. Oblig. Participating VRDN: |
|
|
|
|
Series Merlots 00 JJ, 4.02% (Liquidity Facility First Union Nat'l. Bank, North Carolina) (b)(e)(f) |
9,300 |
9,300 |
|
|
Series PA 690R, 3.98% (Liquidity Facility Merrill |
15,500 |
15,500 |
|
|
Municipal Securities - continued |
|||
|
Principal Amount (000s) |
Value (Note 1) (000s) |
||
|
California - continued |
|||
|
Port of Oakland Gen. Oblig. Participating VRDN: - continued |
|
|
|
|
Series RobIns 5, 3.88% (Liquidity Facility Bank of New York NA) (b)(e)(f) |
$ 4,090 |
$ 4,090 |
|
|
Port of Oakland Port Rev.: |
|
|
|
|
Participating VRDN: |
|
|
|
|
Series FRRI A1, 4.05% (Liquidity Facility Commerzbank AG) (b)(e)(f) |
6,800 |
6,800 |
|
|
Series FRRI A24, 4.05% (Liquidity Facility Commerzbank AG) (b)(e)(f) |
11,925 |
11,925 |
|
|
Series B, 3.95% 9/12/00, LOC Commerzbank AG, |
10,000 |
10,000 |
|
|
Riverside County Ctfs. of Prtn. (Pub. Facility Fin. Prog.) |
6,800 |
6,800 |
|
|
Sacramento County Gen. Oblig. Participating VRDN |
37,900 |
37,900 |
|
|
San Bernardino County Indl. Dev. Auth. Rev. (NRI, Inc. Proj.) 4.35%, LOC California Teachers Retirement Sys., VRDN (b)(e) |
1,335 |
1,335 |
|
|
San Diego County Gen. Oblig. Series B1, 3.85% 9/14/00, LOC Landesbank Hessen-Thuringen, CP |
6,530 |
6,530 |
|
|
San Diego Hsg. Auth. Multi-family Hsg. (Canyon Rim Apt. Proj.) Series 2000 B, 3.6%, LOC Fannie Mae, VRDN (b)(e) |
9,440 |
9,440 |
|
|
San Diego Ind. Dev. Rev. Participating VRDN Series FRRI 00 L1, 4% (Liquidity Facility Lehman Brothers, Inc.) (b)(f) |
12,935 |
12,935 |
|
|
San Diego Unified School District TRAN 4.25% 9/29/00 |
4,600 |
4,602 |
|
|
San Francisco Bay Area Rapid Trans. District Sales Tax Rev. Participating VRDN Series PA 572, 3.88% (Liquidity Facility Merrill Lynch & Co., Inc.) (b)(f) |
1,250 |
1,250 |
|
|
San Francisco Bay Area Trans. Fing. Auth. Series C: |
|
|
|
|
3.95% 9/12/00, LOC Morgan Guaranty Trust Co., NY, CP |
17,500 |
17,500 |
|
|
4% 10/13/00, LOC Morgan Guaranty Trust Co., NY, CP |
2,200 |
2,200 |
|
|
San Francisco City & County Parking Meter Rev. Participating VRDN Series BA 96 A, 3.88% (Liquidity Facility Bank of America NA) (b)(f) |
10,075 |
10,075 |
|
|
San Francisco City & County Swr. Rev. Participating VRDN Series MSDW 00 237, 3.83% (Liquidity Facility Morgan Stanley Dean Witter & Co.) (b)(f) |
3,700 |
3,700 |
|
|
San Francisco Redev. Agcy. Multiple-family Hsg. Rev. (Bayside Village Aprts. Proj.) 3.65%, LOC Bank One, Arizona NA, VRDN (b) |
20,600 |
20,600 |
|
|
San Jose Multiple-family Hsg. Rev. (Carlton Plaza Proj.) |
4,000 |
4,000 |
|
|
Municipal Securities - continued |
|||
|
Principal Amount (000s) |
Value (Note 1) (000s) |
||
|
California - continued |
|||
|
San Juan Unified School District Participating VRDN Series FRRI A41, 4% (Liquidity Facility Bank of New York NA) (b)(f) |
$ 16,000 |
$ 16,000 |
|
|
San Leandro Multiple-family Hsg. Rev. (Carlton Plaza Proj.) 3.7%, LOC Commerzbank AG, VRDN (b)(e) |
3,220 |
3,220 |
|
|
San Luis Obispo County Office of Ed. TRAN Series 2000, |
16,350 |
16,453 |
|
|
Santa Barbara County School Fing. TRAN 5% 6/29/01 |
4,000 |
4,023 |
|
|
Santa Clara County Gen. Oblig. Participating VRDN |
20,000 |
20,000 |
|
|
Santa Clara Valley Wtr. District Ctfs. of Prtn. Participating VRDN Series Merlots 00 MM, 3.97% (Liquidity Facility First Union Nat'l. Bank, North Carolina) (b)(f) |
14,530 |
14,530 |
|
|
Santa Cruz County Board of Ed. TRAN 5% 6/29/01 |
15,825 |
15,923 |
|
|
Santa Cruz Indl. Dev. Auth. Rev. (Santa Cruz-Wilson Entities Ltd. Proj.) Series 1993, 4.35%, LOC California Teachers Retirement Sys., VRDN (b)(e) |
2,505 |
2,505 |
|
|
Santa Rosa Multiple-family Hsg. Rev. (Quail Run Apts./Santa Rosa Hsg. Partners Proj.) Series 1997 A, 3.7%, LOC U.S. Bank NA, Minnesota, VRDN (b)(e) |
1,750 |
1,750 |
|
|
Solano County Gen. Oblig. BAN 4.5% 12/15/00 |
6,600 |
6,613 |
|
|
Southern California Pub. Pwr. Auth. Pwr. Proj. Rev. Participating VRDN Series SG 35, 3.88% (Liquidity Facility Societe Generale) (b)(f) |
9,300 |
9,300 |
|
|
Southern California Pub. Pwr. Auth. Transmission Proj. Rev. Series A, 3.5% (FSA Insured), VRDN (b) |
16,800 |
16,800 |
|
|
Univ. of California Rev.: |
|
|
|
|
Participating VRDN Series FRRI N12, 4% (Liquidity Facility Bank of New York NA) (b)(f) |
13,950 |
13,950 |
|
|
Rfdg. Participating VRDN Series Merlots 97 G, 3.97% (Liquidity Facility First Union Nat'l. Bank, North Carolina) (b)(f) |
13,430 |
13,430 |
|
|
Series A, 3.95% 10/5/00, CP |
3,400 |
3,400 |
|
|
|
1,713,634 |
||
|
Guam - 0.3% |
|||
|
Guam Pwr. Auth. Rev. Participating VRDN Series PA 531, 4.08% (Liquidity Facility Merrill Lynch & Co., Inc.) (b)(f) |
5,940 |
5,940 |
|
|
Puerto Rico - 1.7% |
|||
|
Puerto Rico Commonwealth Gen. Oblig. Participating VRDN: |
|
|
|
|
Series Merlots 00 EE, 3.97% (Liquidity Facility First Union Nat'l. Bank, North Carolina) (b)(f) |
8,095 |
8,095 |
|
|
Series RobIns 3, 3.88% (Liquidity Facility Bank of |
22,595 |
22,595 |
|
|
Municipal Securities - continued |
|||
|
Principal Amount (000s) |
Value (Note 1) (000s) |
||
|
Puerto Rico - continued |
|||
|
Puerto Rico Commonwealth Hwy. & Trans. Auth. Rev. Participating VRDN Series Merlot 2000 FFF, 3.97% (Liquidity Facility First Union Nat'l. Bank, North Carolina) (b)(f) |
$ 3,500 |
$ 3,500 |
|
|
Puerto Rico Muni. Fin. Agcy. Participating VRDN |
3,330 |
3,330 |
|
|
|
37,520 |
||
|
Shares |
|
||
|
Other - 17.2% |
|||
|
Fidelity Municipal Cash Central Fund, 4.28% (c)(d) |
367,914,367 |
367,914 |
|
|
TOTAL INVESTMENT PORTFOLIO - 99.1% |
2,125,008 |
||
|
NET OTHER ASSETS - 0.9% |
19,128 |
||
|
NET ASSETS - 100% |
$ 2,144,136 |
||
|
Total Cost for Income Tax Purposes $ 2,125,008 |
|
Security Type Abbreviations |
|
BAN - BOND ANTICIPATION NOTE |
|
CP - COMMERCIAL PAPER |
|
RAN - REVENUE ANTICIPATION NOTE |
|
TRAN - TAX AND REVENUE |
|
VRDN - VARIABLE RATE DEMAND NOTE |
|
Legend |
|
(a) A portion of the security was purchased on a delayed delivery or when-issued basis. |
|
(b) The coupon rate shown on floating or adjustable rate securities represents the rate at period end. |
|
(c) Information in this report regarding holdings by state and security types does not reflect the holdings of the Fidelity Municipal Cash Central Fund. A listing of the Fidelity Municipal Cash Central Fund's holdings as of its most recent fiscal period end is available upon request. |
|
(d) The rate quoted is the annualized seven-day yield of the fund at period end. |
|
(e) Private activity obligations whose interest is subject to the federal alternative minimum tax for individuals. |
|
(f) Provides evidence of ownership in one or more underlying municipal bonds. |
|
(g) Restricted securities - Investment in securities not registered under the Securities Act of 1933. |
|
Additional information on each holding is as follows: |
|
Security |
Acquisition Date |
Cost |
|
California Hsg. Fin. Agcy. Rev. Bonds Series PT 40B, 4.05%, tender 2/22/01 (Liquidity Facility Bayerische Hypo-und Vereinsbank AG) |
8/31/00 |
$ 22,610 |
|
Other Information |
|
The fund invested in securities that are not registered under the Securities Act of 1933. These securities are subject to legal or contractual restrictions on resale. At the end of the period, restricted securities (excluding Rule 144A issues) amounted to $22,610,000 or 1.1% of net assets. |
|
Income Tax Information |
|
At February 29, 2000, the fund had a capital loss carryforward of approximately $352,000 of which $307,000, $7,000, $18,000 and $20,000 will expire on February 28, 2003, 2005, 2006 and 2007, respectively. |
See accompanying notes which are an integral part of the financial statements.
Semiannual Report
Fidelity California Municipal Money Market Fund
Statement of Assets and Liabilities
|
Amounts in thousands (except per-share amount) |
August 31, 2000 (Unaudited) |
|
|
Assets |
|
|
|
Investment in securities, at value - |
|
$ 2,125,008 |
|
Receivable for fund shares sold |
|
32,584 |
|
Interest receivable |
|
15,955 |
|
Prepaid expenses |
|
19 |
|
Total assets |
|
2,173,566 |
|
Liabilities |
|
|
|
Payable to custodian bank |
$ 21 |
|
|
Payable for investments purchased |
2,339 |
|
|
Payable for fund shares redeemed |
25,988 |
|
|
Distributions payable |
91 |
|
|
Accrued management fee |
655 |
|
|
Other payables and accrued expenses |
336 |
|
|
Total liabilities |
|
29,430 |
|
Net Assets |
|
$ 2,144,136 |
|
Net Assets consist of: |
|
|
|
Paid in capital |
|
$ 2,144,403 |
|
Accumulated net realized gain (loss) on investments |
|
(267) |
|
Net Assets, for 2,144,424 shares outstanding |
|
$ 2,144,136 |
|
Net Asset Value, offering price and redemption price |
|
$1.00 |
See accompanying notes which are an integral part of the financial statements.
Semiannual Report
Fidelity California Municipal Money Market Fund
Financial Statements - continued
Statement of Operations
|
Amounts in thousands |
Six months ended August 31, 2000 (Unaudited) |
|
|
Interest Income |
|
$ 37,944 |
|
Expenses |
|
|
|
Management fee |
$ 3,655 |
|
|
Transfer agent fees |
1,305 |
|
|
Accounting fees and expenses |
104 |
|
|
Non-interested trustees' compensation |
3 |
|
|
Custodian fees and expenses |
30 |
|
|
Registration fees |
106 |
|
|
Audit |
15 |
|
|
Legal |
6 |
|
|
Miscellaneous |
29 |
|
|
Total expenses before reductions |
5,253 |
|
|
Expense reductions |
(57) |
5,196 |
|
Net interest income |
|
32,748 |
|
Net Realized Gain (Loss) on Investments |
|
94 |
|
Net increase in net assets resulting from operations |
|
$ 32,842 |
|
Other information |
|
|
|
Expense reductions: |
|
$ 21 |
|
Transfer agent credits |
|
36 |
|
|
|
$ 57 |
See accompanying notes which are an integral part of the financial statements.
Semiannual Report
Fidelity California Municipal Money Market Fund
Financial Statements - continued
Statement of Changes in Net Assets
|
Amounts in thousands |
Six months ended
August 31, 2000 |
Year ended
February 29, |
|
Increase (Decrease) in Net Assets |
|
|
|
Operations |
$ 32,748 |
$ 41,223 |
|
Net realized gain (loss) |
94 |
130 |
|
Net increase (decrease) in net assets resulting |
32,842 |
41,353 |
|
Distributions to shareholders from net interest income |
(32,748) |
(41,223) |
|
Share transactions at net asset value of $1.00 per share |
4,904,970 |
7,583,578 |
|
Reinvestment of distributions from net interest income |
32,098 |
40,210 |
|
Cost of shares redeemed |
(4,640,148) |
(7,131,026) |
|
Net increase (decrease) in net assets and shares resulting from share transactions |
296,920 |
492,762 |
|
Total increase (decrease) in net assets |
297,014 |
492,892 |
|
Net Assets |
|
|
|
Beginning of period |
1,847,122 |
1,354,230 |
|
End of period |
$ 2,144,136 |
$ 1,847,122 |
See accompanying notes which are an integral part of the financial statements.
Semiannual Report
Financial Highlights
|
|
Six months ended August 31, 2000 |
Years ended February 28, |
||||
|
|
(unaudited) |
2000 E |
1999 |
1998 |
1997 |
1996 E |
|
Selected Per-Share Data |
|
|
|
|
|
|
|
Net asset value, beginning of period |
$ 1.000 |
$ 1.000 |
$ 1.000 |
$ 1.000 |
$ 1.000 |
$ 1.000 |
|
Income from Investment
Operations |
.017 |
.027 |
.027 |
.030 |
.029 |
.032 |
|
Less Distributions |
|
|
|
|
|
|
|
From net |
(.017) |
(.027) |
(.027) |
(.030) |
(.029) |
(.032) |
|
Net asset value, |
$ 1.000 |
$ 1.000 |
$ 1.000 |
$ 1.000 |
$ 1.000 |
$ 1.000 |
|
Total Return B, C |
1.69% |
2.69% |
2.71% |
3.07% |
2.90% |
3.21% |
|
Ratios and Supplemental Data |
|
|
|
|
|
|
|
Net assets, end of period (in millions) |
$ 2,144 |
$ 1,847 |
$ 1,354 |
$ 976 |
$ 820 |
$ 733 |
|
Ratio of expenses to average net assets |
.54% A |
.56% |
.59% |
.62% |
.62% |
.64% |
|
Ratio of expenses to average net assets after expense reductions |
.53% A, D |
.56% |
.59% |
.61% D |
.61% D |
.64% |
|
Ratio of net interest income to average net assets |
3.34% A |
2.67% |
2.66% |
3.02% |
2.86% |
3.17% |
A Annualized
B Total returns for periods of less than one year are not annualized.
C The total returns would have been lower had certain expenses not been reduced during the periods shown.
D FMR or the fund has entered into varying arrangements with third parties who either paid or reduced a portion of the fund's expenses.
E For the year ended February 29.
See accompanying notes which are an integral part of the financial statements.
Semiannual Report
For the period ended August 31, 2000 (Unaudited)
1. Significant Accounting Policies.
Spartan California Municipal Income Fund (the income fund) is a fund of Fidelity California Municipal Trust. Spartan California Municipal Money Market Fund and Fidelity California Municipal Money Market Fund (the money market funds) are funds of Fidelity California Municipal Trust II. Each trust is registered under the Investment Company Act of 1940, as amended (the 1940 Act), as an open-end management investment company. Fidelity California Municipal Trust and Fidelity California Municipal Trust II (the trusts) are organized as a Massachusetts business trust and a Delaware business trust, respectively. Each fund is authorized to issue an unlimited number of shares. The financial statements have been prepared in conformity with generally accepted accounting principles which require management to make certain estimates and assumptions at the date of the financial statements. Each fund may be affected by economic and political developments in the state of California. The following summarizes the significant accounting policies of the income fund and the money market funds:
Security Valuation.
Income Fund. Securities are valued based upon a computerized matrix system and/or appraisals by a pricing service, both of which consider market transactions and dealer-supplied valuations. Securities for which quotations are not readily available are valued at their fair value as determined in good faith under consistently applied procedures under the general supervision of the Board of
Trustees. Short-term securities with remaining maturities of sixty days or less for which quotations are not readily available are valued at amortized cost or original cost plus accrued interest, both of which approximate current value.
Money Market Funds. As permitted under Rule 2a-7 of the 1940 Act, and certain conditions therein, securities are valued initially at cost and thereafter assume a constant amortization to maturity of any discount or premium.
Income Taxes. As a qualified regulated investment company under Subchapter M of the Internal Revenue Code, each fund is not subject to income taxes to the extent that it distributes substantially all of its taxable income for the fiscal year. The schedules of investments include information regarding income taxes under the caption "Income Tax Information."
Interest Income. Interest income, which includes amortization of premium and accretion of original issue discount, is accrued as earned. For the money market funds, accretion of discount represents unrealized gain until realized at the time of a security disposition or maturity.
Expenses. Most expenses of each trust can be directly attributed to a fund. Expenses which cannot be directly attributed are apportioned among the funds in the trust.
Distributions to Shareholders. Dividends are declared daily and paid monthly from net interest income. Distributions to shareholders from realized capital gains on investments, if any, are recorded on the ex-dividend date.
Semiannual Report
Notes to Financial Statements (Unaudited) - continued
1. Significant Accounting
Policies - continued
Distributions to Shareholders -
continued
Income and capital gain distributions are determined in accordance with income tax regulations which may differ from generally accepted accounting principles. These differences, which may result in distribution reclassifications, are primarily due to differing treatments for futures transactions, market discount, capital loss carryforwards and losses deferred due to wash sales and futures transactions. The income fund also utilized earnings and profits distributed to shareholders on redemption of shares as a part of the dividends paid deduction for income tax purposes.
Permanent book and tax basis differences relating to shareholder distributions will result in reclassifications to paid in capital. Undistributed net interest income and accumulated undistributed net realized gain (loss) on investments may include temporary book and tax basis differences which will reverse in a subsequent period. Any taxable income or gain remaining at fiscal year end is distributed in the following year.
Security Transactions. Security transactions are accounted for as of trade date. Gains and losses on securities sold are determined on the basis of identified cost.
2. Operating Policies.
Fidelity Municipal Cash Central Fund. Pursuant to an Exemptive Order issued by the Securities and Exchange Commission (the SEC), the funds may invest in the Fidelity Municipal Cash Central Fund (the Cash Fund) managed by Fidelity Investments Money Management, Inc. (FIMM), an affiliate of Fidelity Management & Research Company (FMR). The Cash Fund is an open-end money market fund available only to investment companies and other accounts managed by FMR and its affiliates. The Cash Fund seeks preservation of capital, liquidity, and current income by investing in high-quality, short-term municipal securities of various states and municipalities. Income distributions from the Cash Fund are declared daily and paid monthly from net interest income. Income distributions earned by the fund are recorded as interest income in the accompanying financial statements.
Delayed Delivery Transactions and When Issued Securities. Each fund may purchase or sell securities on a delayed delivery or when issued basis. Payment and delivery may take place after the customary settlement period for that security. The price of the underlying securities and the date when the securities will be delivered and paid for are fixed at the time the transaction is negotiated. The values of the securities purchased on a delayed delivery basis are identified as such in each applicable fund's schedule of investments. Each fund may receive compensation for interest forgone in the purchase of a delayed delivery or when issued security. With respect to purchase commitments, each fund identifies securities as segregated in its records with a value at least equal to the amount of the commitment. Losses may arise due to changes in the value of the underlying securities or if the counterparty does not perform under
Semiannual Report
Notes to Financial Statements (Unaudited) - continued
2. Operating Policies -
continued
Delayed Delivery Transactions and When Issued Securities - continued
the contract, or if the issuer does not issue the securities due to political, economic, or other factors.
Restricted Securities. Certain funds are permitted to invest in securities that are subject to legal or contractual restrictions on resale. These securities generally may be resold in transactions exempt from registration or to the public if the securities are registered. Disposal of these securities may involve time-consuming negotiations and expense, and prompt sale at an acceptable price may be difficult. Information regarding restricted securities is included under the caption "Other Information" at the end of each applicable fund's schedule of investments.
3. Purchases and Sales of Investments.
Income Fund. Purchases and sales of securities, other than short-term securities, aggregated $171,449,000 and $139,259,000, respectively.
4. Fees and Other Transactions with Affiliates.
Management Fee. As the fund's investment adviser for the income fund and Fidelity California Municipal Money Market Fund, FMR receives a monthly fee that is calculated on the basis of a group fee rate plus a fixed individual fund fee rate applied to the average net assets of each fund. The group fee rate is the weighted average of a series of rates and is based on the monthly average net assets of all the mutual funds advised by FMR. The rates ranged from .0920% to .3700% for the period. The annual individual fund fee rate is .25%. In the event that these rates were lower than the contractual rates in effect during the period, FMR voluntarily implemented the above rates, as they resulted in the same or a lower management fee. For the period, the management fees were equivalent to annualized rates of .37% of average net assets for the income fund and Fidelity California Municipal Money Market Fund.
As Spartan California Municipal Money Market Fund's investment adviser, FMR receives a fee that is computed daily at an annual rate of .50% of the fund's average net assets. FMR pays all other expenses, except the compensation of the non-interested Trustees and certain exceptions such as interest, taxes, brokerage commissions and extraordinary expenses. The management fee paid to FMR by the fund is reduced by an amount equal to the fees and expenses paid by the fund to the non-interested Trustees.
FMR also bears the cost of providing shareholder services to Spartan California Municipal Money Market Fund. To offset the cost of providing these services, FMR or its affiliates collected certain transaction fees from shareholders which amounted to $4,000 for the period.
Sub-Adviser Fee. As each fund's investment sub-adviser, FIMM, a wholly owned subsidiary of FMR, receives a fee from FMR of 50% of the management fee payable to FMR. The fee is paid prior to any voluntary expense reimbursements which may be in effect.
Semiannual Report
Notes to Financial Statements (Unaudited) - continued
4. Fees and Other Transactions with Affiliates - continued
Transfer Agent and Accounting Fees. Citibank, N.A.(Citibank) is the custodian, transfer agent and shareholder servicing agent for the income fund and Fidelity California Municipal Money Market Fund. Citibank has entered into a sub-contract with Fidelity Service Company, Inc. (FSC), an affiliate of FMR, under which FSC performs the activities associated with the funds' transfer and shareholder servicing agent and accounting functions. The funds pay account fees and asset-based fees that vary according to account size and type of account. FSC pays for typesetting, printing and mailing of all shareholder reports, except proxy statements. The accounting fee is based on the level of average net assets for the month plus out-of-pocket expenses.
For the period, the transfer agent fees were equivalent to an annualized rate of .07% and .13% of average net assets for the income fund and Fidelity California Municipal Money Market Fund, respectively.
Money Market Insurance. Pursuant to an Exemptive Order issued by the SEC, the money market funds, along with other money market funds advised by FMR or its affiliates, have entered into insurance agreements with FIDFUNDS Mutual Limited (FIDFUNDS), an affiliated mutual insurance company. FIDFUNDS provides limited coverage for certain loss events including issuer default as to payment of principal or interest and bankruptcy or insolvency of a credit enhancement provider. The insurance does not cover losses resulting from changes in interest rates, ratings downgrades or other market conditions. Each fund may be subject to a special assessment of up to approximately 2.5 times the fund's annual gross premium if covered losses exceed certain levels. During the period, Fidelity California Municipal Money Market Fund paid premiums of $58,000 for the calendar year 2000 to FIDFUNDS, which are being amortized over one year. During the period, FMR has borne the cost of Spartan California Municipal Money Market Fund's premium payable to FIDFUNDS.
5. Expense Reductions.
Through arrangements with the income fund's and Fidelity California Municipal Money Market Fund's custodian and transfer agent, credits realized as a result of uninvested cash balances were used to reduce a portion of each applicable fund's expenses. For the period, the reductions under these arrangements are shown under the caption "Other Information" on each applicable fund's Statement of Operations.
In addition, through arrangements with Spartan California Municipal Money Market Fund's custodian and transfer agent, credits realized as a result of uninvested cash balances were used to reduce a portion of the fund's expenses. During the period, the fund's expenses were reduced by $33,000 under these arrangements.
Semiannual Report
Fidelity offers several ways to conveniently manage your personal investments via your telephone or PC. You can access your account information, conduct trades and research your investments 24 hours a day.
By Phone
Fidelity Automated Service Telephone provides a single toll-free number to access account balances, positions, quotes and trading. It's easy to navigate the service, and on your first call, the system will help you create a personal identification number (PIN) for security.
(phone_graphic)
Fidelity Automated
Service Telephone (FAST®)
1-800-544-5555
Press
1 For mutual fund and brokerage trading.
2 For quotes.*
3 For account balances and holdings.
4 To review orders and mutual
fund activity.
5 To change your PIN.
*0 To speak to a Fidelity representative.
By PC
Fidelity's web site on the Internet provides a wide range of information, including daily financial news, fund performance, interactive planning tools and news about Fidelity products and services.
(computer_graphic)
Fidelity's Web Site
www.fidelity.com
If you are not currently on the Internet, call EarthLink Sprint at 1-800-288-2967, and be sure to ask for registration number SMD004 to receive a special Fidelity package that includes 30 days of free Internet access. EarthLink is North America's #1 independent Internet access provider.
(computer_graphic)
Fidelity On-line Xpress+®
Fidelity On-line Xpress+ software for Windows combines comprehensive portfolio management capabilities, securities trading and access to research and analysis tools . . . all on your desktop. Call Fidelity at 1-800-544-0240 or visit our web site for more information on how to manage your investments via your PC.
* When you call the quotes line, please remember that a fund's yield and return will vary and, except for money market funds, share price will also vary. This means that you may have a gain or loss when you sell your shares. There is no assurance that money market funds will be able to maintain a stable $1 share price; an investment in a money market fund is not insured or guaranteed by the U.S. government. Total returns are historical and include changes in share price, reinvestment of dividends and capital gains, and the effects of any sales charges.
Semiannual Report
For directions and hours,
please call 1-800-544-9797.
Arizona
7373 N. Scottsdale Road
Scottsdale, AZ
California
815 East Birch Street
Brea, CA
851 East Hamilton Avenue
Campbell, CA
527 North Brand Boulevard
Glendale, CA
19200 Von Karman Avenue
Irvine, CA
10100 Santa Monica Blvd.
Los Angeles, CA
251 University Avenue
Palo Alto, CA
1760 Challenge Way
Sacramento, CA
7676 Hazard Center Drive
San Diego, CA
8 Montgomery Street
San Francisco, CA
950 Northgate Drive
San Rafael, CA
1400 Civic Drive
Walnut Creek, CA
6300 Canoga Avenue
Woodland Hills, CA
Colorado
1625 Broadway
Denver, CO
Connecticut
48 West Putnam Avenue
Greenwich, CT
265 Church Street
New Haven, CT
300 Atlantic Street
Stamford, CT
29 South Main Street
West Hartford, CT
Delaware
222 Delaware Avenue
Wilmington, DE
Florida
4400 N. Federal Highway
Boca Raton, FL
90 Alhambra Plaza
Coral Gables, FL
4090 N. Ocean Boulevard
Ft. Lauderdale, FL
1907 West State Road 434
Longwood, FL
8880 Tamiami Trail, North
Naples, FL
2401 PGA Boulevard
Palm Beach Gardens, FL
8065 Beneva Road
Sarasota, FL
1502 N. Westshore Blvd.
Tampa, FL
Georgia
3445 Peachtree Road, N.E.
Atlanta, GA
1000 Abernathy Road
Atlanta, GA
Illinois
One North Franklin Street
Chicago, IL
1415 West 22nd Street
Oak Brook, IL
1700 East Golf Road
Schaumburg, IL
3232 Lake Avenue
Wilmette, IL
Indiana
4729 East 82nd Street
Indianapolis, IN
Maine
Three Canal Plaza
Portland, ME
Maryland
7401 Wisconsin Avenue
Bethesda, MD
One W. Pennsylvania Ave.
Towson, MD
Massachusetts
801 Boylston Street
Boston, MA
155 Congress Street
Boston, MA
25 State Street
Boston, MA
300 Granite Street
Braintree, MA
44 Mall Road
Burlington, MA
416 Belmont Street
Worcester, MA
Semiannual Report
Michigan
280 Old N. Woodward Ave.
Birmingham, MI
29155 Northwestern Hwy.
Southfield, MI
Minnesota
7600 France Avenue South
Edina, MN
Missouri
700 West 47th Street
Kansas City, MO
8885 Ladue Road
Ladue, MO
New Jersey
150 Essex Street
Millburn, NJ
56 South Street
Morristown, NJ
501 Route 17, South
Paramus, NJ
New York
1055 Franklin Avenue
Garden City, NY
999 Walt Whitman Road
Melville, L.I., NY
1271 Avenue of the Americas
New York, NY
71 Broadway
New York, NY
350 Park Avenue
New York, NY
North Carolina
4611 Sharon Road
Charlotte, NC
Ohio
600 Vine Street
Cincinnati, OH
28699 Chagrin Boulevard
Woodmere Village, OH
Oregon
16850 SW 72nd Avenue
Tigard, OR
Pennsylvania
1735 Market Street
Philadelphia, PA
439 Fifth Avenue
Pittsburgh, PA
Rhode Island
47 Providence Place
Providence, RI
Tennessee
6150 Poplar Avenue
Memphis, TN
Texas
10000 Research Boulevard
Austin, TX
4017 Northwest Parkway
Dallas, TX
1155 Dairy Ashford Street
Houston, TX
2701 Drexel Drive
Houston, TX
400 East Las Colinas Blvd.
Irving, TX
14100 San Pedro
San Antonio, TX
19740 IH 45 North
Spring, TX
Utah
215 South State Street
Salt Lake City, UT
Virginia
1861 International Drive
McLean, VA
Washington
411 108th Avenue, N.E.
Bellevue, WA
511 Pine Street
Seattle, WA
Washington, DC
1900 K Street, N.W.
Washington, DC
Wisconsin
595 North Barker Road
Brookfield, WI
Fidelity Brokerage Services, Inc., 100 Summer St., Boston, MA 02110 Member NYSE/SIPC
Semiannual Report
If more than one address is listed, please locate the address that is closest to you. We'll give your correspondence immediate attention and send you written confirmation upon completion of your request.
(letter_graphic)
Making Changes
To Your Account
(such as changing name, address, bank, etc.)
Fidelity Investments
P.O. Box 770001
Cincinnati, OH 45277-0002
(letter_graphic)
For Non-Retirement
Accounts
Buying shares
Fidelity Investments
P.O. Box 770001
Cincinnati, OH 45277-0003
Overnight Express
Fidelity Investments
2300 Litton Lane - KH1A
Hebron, KY 41048
Selling shares
Fidelity Investments
P.O. Box 660602
Dallas, TX 75266-0602
Overnight Express
Fidelity Investments
Attn: Redemptions - CP6I
400 East Las Colinas Blvd.
Irving, TX 75039-5587
General Correspondence
Fidelity Investments
P.O. Box 500
Merrimack, NH 03054-0500
(letter_graphic)
For Retirement
Accounts
Buying shares
Fidelity Investments
P.O. Box 770001
Cincinnati, OH 45277-0003
Selling shares
Fidelity Investments
P.O. Box 660602
Dallas, TX 75266-0602
Overnight Express
Fidelity Investments
Attn: Redemptions - CP6R
400 East Las Colinas Blvd.
Irving, TX 75039-5587
General Correspondence
Fidelity Investments
P.O. Box 500
Merrimack, NH 03054-0500
Semiannual Report
Semiannual Report
Semiannual Report
Semiannual Report
Investment Adviser
Fidelity Management & Research
Company
Boston, MA
Investment Sub-Adviser
Fidelity Investments Money
Management, Inc.
Officers
Edward C. Johnson 3d, President
Robert C. Pozen, Senior Vice President
Boyce I. Greer, Vice President
Dwight D. Churchill, Vice President
Diane M. McLaughlin, Vice President -
Money Market Funds
Christine J. Thompson, Vice President -
Income Fund
Stanley N. Griffith, Assistant
Vice President
Eric D. Roiter, Secretary
Robert A. Dwight, Treasurer
Maria F. Dwyer, Deputy Treasurer
John H. Costello, Assistant Treasurer
Thomas J. Simpson, Assistant Treasurer
Board of Trustees
Ralph F. Cox *
Phyllis Burke Davis *
Robert M. Gates *
Edward C. Johnson 3d
Donald J. Kirk *
Ned C. Lautenbach *
Peter S. Lynch
Marvin L. Mann *
William O. McCoy *
Gerald C. McDonough *
Robert C. Pozen
Thomas R. Williams *
* Independent trustees
Advisory Board
J. Michael Cook
Abigail P. Johnson
Marie L. Knowles
General Distributor
Fidelity Distributors Corporation
Boston, MA
Transfer and Shareholder
Servicing Agents
Citibank, N.A.
New York, NY
and
Fidelity Service Company, Inc.
Boston, MA
Custodian
Citibank, N.A.
New York, NY
The Fidelity Telephone Connection
Mutual Fund 24-Hour Service
Exchanges/Redemptions
and Account Assistance 1-800-544-6666
Product Information 1-800-544-6666
Retirement Accounts 1-800-544-4774 (8 a.m. - 9 p.m.)
TDD Service 1-800-544-0118
for the deaf and hearing impaired
(9 a.m. - 9 p.m. Eastern time)
Fidelity Automated Service
Telephone (FAST®) (automated graphic) 1-800-544-5555
(automated graphic) Automated line for quickest service
CMS-SANN-1000 113116
1.536892.103
(Fidelity Investment logo)(registered trademark)
Corporate Headquarters
82 Devonshire St., Boston, MA 02109
www.fidelity.com
|
|