
|
|
|
|
|
|
|
|
|
|
Previous: CHECKERS DRIVE IN RESTAURANTS INC /DE, DEF 14A, 2000-09-01 |
Next: AMERICAN CENTURY INTERNATIONAL BOND FUNDS, N-30D, 2000-09-01 |
Like securities of all mutual funds, these securities have not been approved or disapproved by the Securities and Exchange Commission, and the Securities and Exchange Commission has not determined if this prospectus is accurate or complete. Any representation to the contrary is a criminal offense.
Fidelity
Funds®
Fidelity Freedom Income Fund®
(fund number 369, trading symbol FFFAX)
Fidelity Freedom 2000 Fund®
(fund number 370, trading symbol FFFBX)
Fidelity Freedom 2010 Fund®
(fund number 371, trading symbol FFFCX)
Fidelity Freedom 2020 Fund®
(fund number 372, trading symbol FFFDX)
Fidelity Freedom 2030 Fund®
(fund number 373, trading symbol FFFEX)
Fidelity Freedom 2040 FundSM
(fund number 718, trading symbol FFFFF)
Prospectus
September 4, 2000
(fidelity_logo_graphic)
82 Devonshire Street, Boston, MA 02109
|
Fund Summary |
Investment Summary |
|
|
|
Performance |
|
|
|
Fee Table |
|
|
Fund Basics |
Investment Details |
|
|
|
Valuing Shares |
|
|
Shareholder Information |
Buying and Selling Shares |
|
|
|
Exchanging Shares |
|
|
|
Account Features and Policies |
|
|
|
Dividends and Capital Gain Distributions |
|
|
|
Tax Consequences |
|
|
Fund Services |
Fund Management |
|
|
|
Fund Distribution |
|
|
Appendix |
Financial Highlights |
Prospectus
Investment Objective
Freedom Income Fund seeks high current income and, as a secondary objective, capital appreciation.
Principal Investment Strategies
Strategic Advisers, Inc. (Strategic Advisers)'s principal investment strategies include:

Principal Investment Risks
The fund is subject to the following principal investment risks:
Prospectus
Fund Summary - continued
An investment in the fund is not a deposit of a bank and is not insured or guaranteed by the Federal Deposit Insurance Corporation or any other government agency.
When you sell your shares of the fund, they could be worth more or less than what you paid for them.
Investment Objective
Freedom 2000 Fund seeks high total return.
Principal Investment Strategies
Strategic Advisers' principal investment strategies include:

Principal Investment Risks
The fund is subject to the following principal investment risks:
Prospectus
Fund Summary - continued
An investment in the fund is not a deposit of a bank and is not insured or guaranteed by the Federal Deposit Insurance Corporation or any other government agency.
When you sell your shares of the fund, they could be worth more or less than what you paid for them.
Investment Objective
Freedom 2010 Fund seeks high total return.
Principal Investment Strategies
Strategic Advisers' principal investment strategies include:
Prospectus
Fund Summary - continued

Principal Investment Risks
The fund is subject to the following principal investment risks:
An investment in the fund is not a deposit of a bank and is not insured or guaranteed by the Federal Deposit Insurance Corporation or any other government agency.
Prospectus
Fund Summary - continued
When you sell your shares of the fund, they could be worth more or less than what you paid for them.
Investment Objective
Freedom 2020 Fund seeks high total return.
Principal Investment Strategies
Strategic Advisers' principal investment strategies include:

Principal Investment Risks
The fund is subject to the following principal investment risks:
Prospectus
Fund Summary - continued
An investment in the fund is not a deposit of a bank and is not insured or guaranteed by the Federal Deposit Insurance Corporation or any other government agency.
When you sell your shares of the fund, they could be worth more or less than what you paid for them.
Investment Objective
Freedom 2030 Fund seeks high total return.
Principal Investment Strategies
Strategic Advisers' principal investment strategies include:
Prospectus
Fund Summary - continued

Principal Investment Risks
The fund is subject to the following principal investment risks:
Prospectus
Fund Summary - continued
An investment in the fund is not a deposit of a bank and is not insured or guaranteed by the Federal Deposit Insurance Corporation or any other government agency.
When you sell your shares of the fund, they could be worth more or less than what you paid for them.
Investment Objective
Freedom 2040 Fund seeks high total return.
Principal Investment Strategies
Strategic Advisers' principal investment strategies include:

Principal Investment Risks
The fund is subject to the following principal investment risks:
Prospectus
Fund Summary - continued
An investment in the fund is not a deposit of a bank and is not insured or guaranteed by the Federal Deposit Insurance Corporation or any other government agency.
Prospectus
Fund Summary - continued
When you sell your shares of the fund, they could be worth more or less than what you paid for them.
The following information illustrates the changes in the performance of each Freedom Fund (other than Freedom 2040) from year to year and compares the performance of each Freedom Fund (other than Freedom 2040) to the performance of a market index and a combination of market indexes over various periods of time. Returns are based on past results and are not an indication of future performance.
Performance history will be available for Freedom 2040 after the fund has been in operation for one calendar year.
|
Freedom Income |
|
Calendar Years |
|
|
|
|
|
|
|
1997 |
1998 |
1999 |
|
|
|
|
|
|
|
|
|
10.91% |
11.10% |
7.19% |
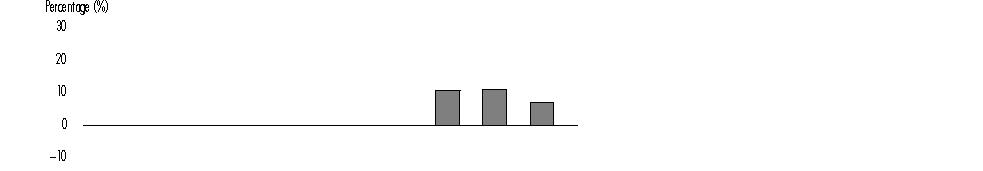
During the periods shown in the chart for Freedom Income, the highest return for a quarter was 5.01% (quarter ended June 30, 1997) and the lowest return for a quarter was 0.00% (quarter ended September 30, 1999).
The year-to-date return as of June 30, 2000 for Freedom Income was 3.87%.
Prospectus
Fund Summary - continued
|
Freedom 2000 |
|
Calendar Years |
|
|
|
|
|
|
|
1997 |
1998 |
1999 |
|
|
|
|
|
|
|
|
|
15.29% |
15.26% |
12.16% |
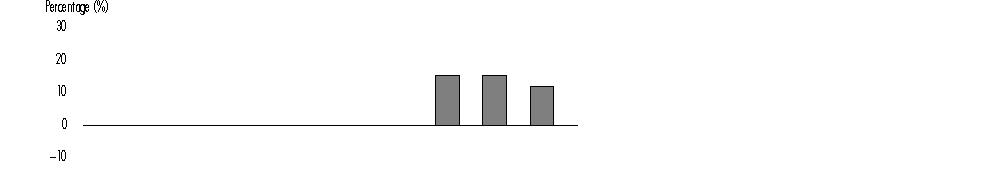
During the periods shown in the chart for Freedom 2000, the highest return for a quarter was 8.90% (quarter ended December 31, 1998) and the lowest return for a quarter was -2.66% (quarter ended September 30, 1998).
The year-to-date return as of June 30, 2000 for Freedom 2000 was 3.74%.
|
Freedom 2010 |
|
Calendar Years |
|
|
|
|
|
|
|
1997 |
1998 |
1999 |
|
|
|
|
|
|
|
|
|
19.36% |
19.31% |
19.04% |
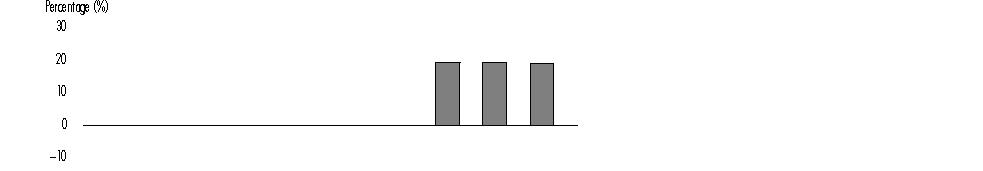
During the periods shown in the chart for Freedom 2010, the highest return for a quarter was 13.50% (quarter ended December 31, 1998) and the lowest return for a quarter was -5.99% (quarter ended September 30, 1998).
The year-to-date return as of June 30, 2000 for Freedom 2010 was 3.54%.
Prospectus
Fund Summary - continued
|
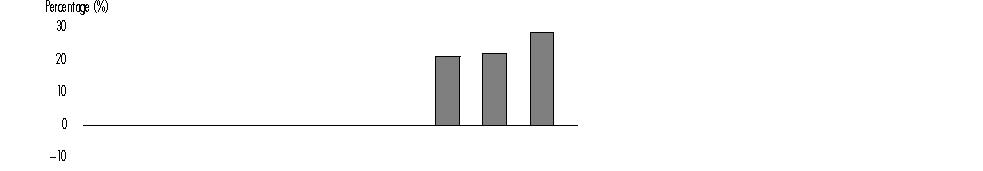
Freedom 2020 |
|
Calendar Years |
|
|
|
|
|
|
|
1997 |
1998 |
1999 |
|
|
|
|
|
|
|
|
|
21.24% |
21.67% |
25.31% |

During the periods shown in the chart for Freedom 2020, the highest return for a quarter was 17.19% (quarter ended December 31, 1998) and the lowest return for a quarter was -8.59% (quarter ended September 30, 1998).
The year-to-date return as of June 30, 2000 for Freedom 2020 was 3.36%.
|
Freedom 2030 |
|
Calendar Years |
|
|
|
|
|
|
|
1997 |
1998 |
1999 |
|
|
|
|
|
|
|
|
|
21.40% |
22.12% |
28.50% |
During the periods shown in the chart for Freedom 2030, the highest return for a quarter was 18.59% (quarter ended December 31, 1999) and the lowest return for a quarter was -9.71% (quarter ended September 30, 1998).
The year-to-date return as of June 30, 2000 for Freedom 2030 was 3.04%.
Prospectus
Fund Summary - continued
|
For the periods ended |
Past 1 |
Life of |
|
Freedom Income |
7.19% |
9.68% |
|
Lehman Bros. Aggregate Bond Index |
-0.82% |
5.93% |
|
Freedom Income Composite Index |
6.16% |
9.65% |
|
Freedom 2000 |
12.16% |
14.10% |
|
Lehman Bros. Aggregate Bond Index |
-0.82% |
5.93% |
|
Freedom 2000 Composite Index |
9.39% |
13.69% |
|
Freedom 2010 |
19.04% |
18.99% |
|
S&P 500 |
21.04% |
27.61% |
|
Freedom 2010 Composite Index |
13.99% |
17.89% |
|
Freedom 2020 |
25.31% |
22.36% |
|
S&P 500 |
21.04% |
27.61% |
|
Freedom 2020 Composite Index |
18.39% |
20.67% |
|
Freedom 2030 |
28.50% |
23.51% |
|
S&P 500 |
21.04% |
27.61% |
|
Freedom 2030 Composite Index |
20.30% |
21.33% |
A From October 17, 1996.
If Fidelity Management & Research Company (FMR) had not reimbursed certain fund expenses during these periods, Freedom Income's, Freedom 2000's, Freedom 2010's, Freedom 2020's, and Freedom 2030's returns would have been lower.
Fidelity Freedom Funds Composite Indexes are hypothetical representations of the performance of each Freedom Fund's asset classes according to their respective weightings adjusted on June 30 and December 31 of each calendar year for Freedom Funds with target retirement dates, to reflect the increasingly conservative asset allocations.
The following indexes are used to calculate a Freedom Fund's composite index: Wilshire 5000 Total Market Index (Wilshire 5000) for the domestic equity fund class, Morgan Stanley Capital International Europe, Australasia and Far East (EAFE) Index for the international equity fund class, Lehman Brothers Aggregate Bond Index for the investment-grade fixed-income fund class, Merrill Lynch High Yield Master II Index for the high yield fixed-income fund class, and Lehman Brothers 3-Month Treasury Bill Index for the money market fund class. The index weightings of each composite index are rebalanced monthly.
Prospectus
Fund Summary - continued
Standard & Poor's 500 Index (S&P 500®) is a market capitalization-weighted index of common stocks.
Wilshire 5000 Total Market Index is a market capitalization-weighted index of approximately 7,000 U.S. equity securities.
Morgan Stanley Capital International Europe, Australasia and Far East (EAFE) Index is a market capitalization-weighted index that is designed to represent the performance of developed stock markets outside the United States and Canada. As of March 31, 2000, the index included over 950 equity securities of companies domiciled in 20 countries.
The Lehman Brothers Aggregate Bond Index is a market value-weighted index of investment-grade fixed-rate debt issues, including government, corporate, asset-backed, and mortgage-backed securities, with maturities of one year or more.
Merrill Lynch High Yield Master II Index is a market value-weighted index of all domestic and yankee high-yield bonds, including deferred interest bonds and payment-in-kind securities. Issues included in the index have maturities of one year or more and have a credit rating lower than BBB-/Baa3, but are not in default.
The Lehman Brothers 3-Month Treasury Bill Index represents the average of Treasury Bill rates for each of the prior three months, adjusted to a bond equivalent yield basis (short-term and money market instruments).
The following table describes the fees and expenses that are incurred when you buy, hold, or sell shares of a Freedom Fund. The annual fund operating expenses provided below for Freedom Income, Freedom 2000, Freedom 2010, Freedom 2020, and Freedom 2030 do not reflect the effect of any expense reimbursements or reduction of certain expenses during the period. The annual fund operating expenses provided below for Freedom 2040 are based on estimated expenses.
Prospectus
Fund Summary - continued
Shareholder fees (paid by the investor directly)
|
Sales charge (load) on purchases and reinvested distributions |
None |
|
Deferred sales charge (load) on redemptions |
None |
|
Annual account maintenance fee (for accounts under $2,500) |
$12.00 |
Annual fund operating expenses (paid from fund assets)
|
Freedom Income |
Management fee |
0.10% |
|
|
Distribution and Service (12b-1) fee |
None |
|
|
Other expenses |
0.00% |
|
|
Total annual fund operating expensesA |
0.10% |
|
Freedom 2000 |
Management fee |
0.10% |
|
|
Distribution and Service (12b-1) fee |
None |
|
|
Other expenses |
0.00% |
|
|
Total annual fund operating expensesA |
0.10% |
|
Freedom 2010 |
Management fee |
0.10% |
|
|
Distribution and Service (12b-1) fee |
None |
|
|
Other expenses |
0.00% |
|
|
Total annual fund operating expensesA |
0.10% |
|
Freedom 2020 |
Management fee |
0.10% |
|
|
Distribution and Service (12b-1) fee |
None |
|
|
Other expenses |
0.00% |
|
|
Total annual fund operating expensesA |
0.10% |
|
Freedom 2030 |
Management fee |
0.10% |
|
|
Distribution and Service (12b-1) fee |
None |
|
|
Other expenses |
0.00% |
|
|
Total annual fund operating expensesA |
0.10% |
|
Freedom 2040 |
Management fee |
0.10% |
|
|
Distribution and Service (12b-1) fee |
None |
|
|
Other expenses |
0.00% |
|
|
Total annual fund operating expensesB |
0.10% |
A Effective November 1, 1996, FMR has voluntarily agreed to reimburse Freedom Income, Freedom 2000, Freedom 2010, Freedom 2020, and Freedom 2030 to the extent that total operating expenses (excluding interest, taxes, brokerage commissions, and extraordinary expenses) exceed 0.08% of its average net assets. This arrangement can be discontinued by FMR at any time.
B Effective September 6, 2000, FMR has voluntarily agreed to reimburse Freedom 2040 to the extent that total operating expenses (excluding interest, taxes, brokerage commissions, and extraordinary expenses) exceed 0.08% of its average net assets. This arrangement can be discontinued by FMR at any time.
Prospectus
Fund Summary - continued
Through arrangements with Freedom Income's, Freedom 2000's, Freedom 2010's, Freedom 2020's, and Freedom 2030's custodian and transfer agent, credits realized as a result of uninvested cash balances are used to reduce fund expenses. Including these reductions, the total fund operating expenses are shown in the table below.
|
|
Total Operating |
|
Freedom Income |
0.07%A |
|
Freedom 2000 |
0.07%A |
|
Freedom 2010 |
0.07%A |
|
Freedom 2020 |
0.07%A |
|
Freedom 2030 |
0.07%A |
A After reimbursement.
Each Freedom Fund will not incur any sales charges, but it may incur exchange fees or redemption fees (trading fees), if applicable, when it invests in underlying Fidelity funds.
In addition to the total operating expenses shown above, each Freedom Fund, as a shareholder in an underlying Fidelity fund, will indirectly bear its pro rata share of the fees and expenses incurred by the underlying Fidelity fund, and each Freedom Fund's investment return will be net of underlying Fidelity fund expenses.
The combined total expense ratios of each Freedom Fund (calculated as a percentage of average net assets) are as follows:
|
|
Combined total expense ratio after |
Combined total expense ratio before expense reimbursements and expense reductions for each Freedom Fund and the underlying Fidelity funds |
|
Freedom Income |
0.64% |
0.68% |
|
Freedom 2000 |
0.70% |
0.74% |
|
Freedom 2010 |
0.76% |
0.81% |
|
Freedom 2020 |
0.79% |
0.84% |
|
Freedom 2030 |
0.81% |
0.86% |
|
Freedom 2040 |
0.82%A |
0.87%A |
A Estimated.
Freedom Income's, Freedom 2000's, Freedom 2010's, Freedom 2020's, and Freedom 2030's combined total expense ratios are based on their total operating expense ratio plus a weighted average of the total operating expense ratios of the underlying Fidelity funds in which it was invested (for each underlying Fidelity fund's most recently reported fiscal-year) as of March 31, 2000. Freedom 2040's estimated combined total expense ratio is based on its estimated total operating expense ratio plus a weighted average of the total operating expense ratios of the underlying Fidelity funds in which it would have been invested (for each underlying Fidelity fund's most recently reported fiscal-year) as of March 31, 2000. The combined total expense ratios for each Freedom Fund may be higher or lower depending on the allocation of a fund's assets among the underlying Fidelity funds and the actual expenses of the underlying Fidelity funds.
Prospectus
Fund Summary - continued
This example helps you compare the cost of investing in the Freedom Funds with the cost of investing in other mutual funds.
Let's say, hypothetically, that each Freedom Fund's annual return is 5%, that your shareholder fees are exactly as described in the fee table, and that each Freedom Fund's combined total expense ratio includes each Freedom Fund's annual operating expenses exactly as described in the fee table and the weighted average of the total operating expenses of each of the underlying Fidelity funds, before expense reductions. This example illustrates the effect of fees and expenses, but is not meant to suggest actual or expected fees and expenses or returns, all of which may vary. For every $10,000 you invested, here's how much you would pay in total expenses if you close your account at the end of each time period indicated:
|
Freedom Income |
1 year |
$ 69 |
|
|
3 years |
$ 217 |
|
|
5 years |
$ 378 |
|
|
10 years |
$ 845 |
|
Freedom 2000 |
1 year |
$ 76 |
|
|
3 years |
$ 238 |
|
|
5 years |
$ 414 |
|
|
10 years |
$ 924 |
|
Freedom 2010 |
1 year |
$ 83 |
|
|
3 years |
$ 258 |
|
|
5 years |
$ 449 |
|
|
10 years |
$ 1,000 |
|
Freedom 2020 |
1 year |
$ 86 |
|
|
3 years |
$ 269 |
|
|
5 years |
$ 468 |
|
|
10 years |
$ 1,041 |
|
Freedom 2030 |
1 year |
$ 88 |
|
|
3 years |
$ 274 |
|
|
5 years |
$ 475 |
|
|
10 years |
$ 1,058 |
|
Freedom 2040 |
1 year |
$ 89 |
|
|
3 years |
$ 278 |
Prospectus
Investment Objective
Each of Freedom 2000 Fund, Freedom 2010 Fund, Freedom 2020 Fund, Freedom 2030 Fund, and Freedom 2040 Fund seeks high total return.
Freedom Income Fund seeks high current income and, as a secondary objective, capital appreciation.
Principal Investment Strategies
Strategic Advisers invests each Freedom Fund's assets in a combination of Fidelity funds: domestic and international equity funds, investment-grade and high yield fixed-income funds, and money market funds (underlying Fidelity funds). The Freedom Funds differ primarily due to their asset allocations among these fund types. The target asset allocation strategy for each Freedom Fund is designed to provide an approach to asset allocation that is neither overly aggressive nor overly conservative.
Strategic Advisers allocates the assets of each Freedom Fund with a target retirement date (Freedom 2000, Freedom 2010, Freedom 2020, Freedom 2030, and Freedom 2040) among underlying Fidelity funds according to an asset allocation strategy that becomes increasingly conservative over time. Each fund's name refers to the approximate retirement year of the investors for whom the fund's asset allocation strategy is designed. For example, Freedom 2040 is designed for investors planning to retire around the year 2040. Freedom 2040, whose target retirement is approximately 40 years away, will start with a relatively aggressive target asset allocation, with a substantial portion of its assets invested in equity funds and a modest portion of its assets invested in fixed-income funds. By contrast, Freedom 2000, which has reached its target retirement year, has a conservative target asset allocation, with less than half of its assets invested in equity funds and the majority of its assets invested in fixed-income and money market funds.
Freedom Income is designed for investors in their retirement years. Strategic Advisers allocates the fund's assets according to a stable target asset allocation that emphasizes fixed-income and money market funds but also includes a small amount of equity funds.
The table below lists the underlying Fidelity funds in which each Freedom Fund currently may invest and the approximate target asset allocation of each Freedom Fund (other than Freedom 2040) to each underlying Fidelity fund as of March 31, 2000. Freedom 2040's approximate target asset allocation to each underlying Fidelity fund is as of September 6, 2000. Strategic Advisers may change these percentages over time.
Prospectus
Fund Basics - continued
|
Fund Categories |
Freedom |
|
Freedom |
|
Freedom |
|
Freedom |
|
Freedom |
Freedom |
|
EQUITY FUNDS Domestic Equity Funds |
|
|
|
|
|
|
|
|
|
|
|
Fidelity Blue Chip Growth Fund |
3% |
|
5% |
|
7% |
|
9% |
|
11% |
11% |
|
Fidelity Disciplined Equity Fund |
3% |
|
5% |
|
7% |
|
9% |
|
11% |
11% |
|
Fidelity Equity-Income Fund |
3% |
|
5% |
|
7% |
|
9% |
|
11% |
11% |
|
Fidelity Fund |
3% |
|
5% |
|
7% |
|
9% |
|
11% |
11% |
|
Fidelity Growth & Income Portfolio |
3% |
|
5% |
|
7% |
|
9% |
|
11% |
11% |
|
Fidelity Growth Company Fund |
3% |
|
5% |
|
7% |
|
9% |
|
11% |
11% |
|
Fidelity OTC Portfolio |
2% |
|
3% |
|
5% |
|
6% |
|
7% |
9% |
|
International Equity Funds |
|
|
|
|
|
|
|
|
|
|
|
Fidelity Diversified International Fund |
0% |
|
1% |
|
2% |
|
3% |
|
3% |
4% |
|
Fidelity Europe Fund |
0% |
|
1% |
|
2% |
|
4% |
|
5% |
4% |
|
Fidelity Japan Fund |
0% |
|
<1% |
|
1% |
|
1% |
|
1% |
2% |
|
Fidelity Overseas Fund |
0% |
|
1% |
|
2% |
|
3% |
|
3% |
4% |
|
Fidelity Southeast Asia Fund |
0% |
|
<1% |
|
<1% |
|
1% |
|
1% |
1% |
|
FIXED-INCOME FUNDS Investment-Grade Fixed-Income Funds |
|
|
|
|
|
|
|
|
|
|
|
Fidelity Government Income Fund |
15% |
|
15% |
|
13% |
|
7% |
|
3% |
0% |
|
Fidelity Intermediate Bond Fund |
10% |
|
10% |
|
8% |
|
5% |
|
2% |
0% |
|
Fidelity Investment Grade Bond Fund |
15% |
|
15% |
|
13% |
|
7% |
|
3% |
0% |
|
High Yield |
|
|
|
|
|
|
|
|
|
|
|
Fidelity Capital & Income Fund |
0% |
|
3% |
|
6% |
|
8% |
|
8% |
10% |
|
Money Market Fund |
|
|
|
|
|
|
|
|
|
|
|
Fidelity Money Market Trust: |
40% |
|
23% |
|
6% |
|
0% |
|
0% |
0% |
|
Note: The allocation percentages may not add to 100% due to rounding. |
|
|||||||||
Prospectus
Fund Basics - continued
The chart below illustrates the approximate target asset allocation of each Freedom Fund (other than Freedom 2040) among equity, fixed-income,
and money market funds as of March 31, 2000. Freedom 2040's approximate target asset allocation is as of September 6, 2000. The chart also illustrates
how these allocations may change over time. The Freedom Funds' target asset allocations may differ from this illustration.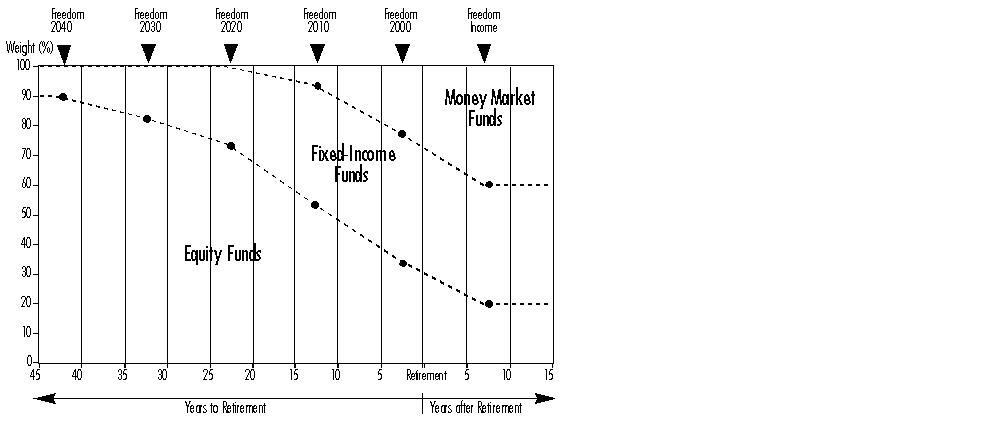
When the target asset allocation of a Freedom Fund with a target retirement date matches Freedom Income's target asset allocation (approximately five to ten years after the fund's retirement date), it is expected that the fund will be combined with Freedom Income and the fund's shareholders will become shareholders of Freedom Income.
Strategic Advisers intends to manage each Freedom Fund according to its target asset allocation strategy, and does not intend to trade actively among underlying Fidelity funds or intend to attempt to capture short-term market opportunities. However, Strategic Advisers may modify the target asset allocation strategy for any Freedom Fund and modify the selection of underlying Fidelity funds for any Freedom Fund from time to time.
Description of Underlying Fidelity Funds
Although the underlying Fidelity funds are categorized generally as equity (domestic or international), fixed-income (investment-grade or high yield), and money market funds, many of the underlying Fidelity funds may invest in a mix of securities of foreign and domestic issuers, investment-grade and high yield bonds, and other securities.
Prospectus
Fund Basics - continued
Domestic Equity Funds
Fidelity Blue Chip Growth Fund seeks growth of capital over the long term.
FMR normally invests the fund's assets primarily in common stocks of well-known and established companies.
FMR normally invests at least 65% of the fund's total assets in blue chip companies. FMR defines blue chip companies to include those with a market capitalization of at least $200 million, if the company's stock is included in the S&P 500 or the Dow Jones Industrial Average, or $1 billion if not included in either index.
FMR invests the fund's assets in companies FMR believes have above-average growth potential. Growth may be measured by factors such as earnings or revenue. Companies with high growth potential tend to be companies with higher than average price/earnings (P/E) ratios. Companies with strong growth potential often have new products, technologies, distribution channels, or other opportunities, or have a strong industry or market position. The stocks of these companies are often called "growth" stocks.
FMR may invest the fund's assets in securities of foreign issuers in addition to securities of domestic issuers.
In buying and selling securities for the fund, FMR relies on fundamental analysis of each issuer and its potential for success in light of its current financial condition, its industry position, and economic and market conditions. Factors considered include growth potential, earnings estimates, and management.
FMR may lend the fund's securities to broker-dealers or other institutions to earn income for the fund.
FMR may use various techniques, such as buying and selling futures contracts, to increase or decrease the fund's exposure to changing security prices or other factors that affect security values. If FMR's strategies do not work as intended, the fund may not achieve its objective.
Fidelity Disciplined Equity Fund seeks capital growth.
FMR normally invests at least 65% of the fund's total assets in common stocks.
FMR seeks to reduce the impact of industry weightings on the performance of the fund by considering each industry's weighting in the S&P 500 when allocating the fund's investments across industries.
FMR may invest the fund's assets in securities of foreign issuers in addition to securities of domestic issuers.
In buying and selling securities for the fund, FMR uses a disciplined approach that involves computer-aided, quantitative analysis supported by fundamental analysis. FMR's computer model systematically reviews thousands of stocks, using data such as historical earnings, dividend yield, earnings per share, and other quantitative factors. Then, the issuers of potential investments are analyzed further using fundamental factors such as growth potential, earnings estimates, and financial condition.
Prospectus
Fund Basics - continued
FMR may lend the fund's securities to broker-dealers or other institutions to earn income for the fund.
FMR may use various techniques, such as buying and selling futures contracts, to increase or decrease the fund's exposure to changing security prices or other factors that affect security values. If FMR's strategies do not work as intended, the fund may not achieve its objective.
Fidelity Equity-Income Fund seeks reasonable income. In pursuing this objective, the fund will also consider the potential for capital appreciation. The fund seeks a yield for its shareholders that exceeds the yield on the securities comprising the S&P 500.
FMR normally invests at least 65% of the fund's total assets in income-producing equity securities. FMR may also invest the fund's assets in other types of equity securities and debt securities, including lower-quality debt securities.
FMR may invest the fund's assets in securities of foreign issuers in addition to securities of domestic issuers.
FMR's emphasis on above-average income-producing equity securities tends to lead to investments in large cap "value" stocks. However, FMR is not constrained by any particular investment style. In buying and selling securities for the fund, FMR relies on fundamental analysis of each issuer and its potential for success in light of its current financial condition, its industry position, and economic and market conditions. Factors considered include growth potential, earnings estimates, and management.
FMR may lend the fund's securities to broker-dealers or other institutions to earn income for the fund.
FMR may use various techniques, such as buying and selling futures contracts, to increase or decrease the fund's exposure to changing security prices or other factors that affect security values. If FMR's strategies do not work as intended, the fund may not achieve its objective.
Fidelity Fund seeks long-term capital growth.
FMR normally invests the fund's assets primarily in common stocks. FMR, to some extent, limits the emphasis on the fund's growth objective by investing a portion of the fund's assets in securities selected for their current income characteristics. FMR may from time to time invest a portion of the fund's assets in bonds, including lower-quality debt securities.
FMR may invest the fund's assets in securities of foreign issuers in addition to securities of domestic issuers.
FMR is not constrained by any particular investment style. At any given time, FMR may tend to buy "growth" stocks or "value" stocks, or a combination of both types. In buying and selling securities for the fund, FMR relies on fundamental analysis of each issuer and its potential for success in light of its current financial condition, its industry position, and economic and market conditions. Factors considered include growth potential, earnings estimates, and management.
Prospectus
Fund Basics - continued
FMR may lend the fund's securities to broker-dealers or other institutions to earn income for the fund.
FMR may use various techniques, such as buying and selling futures contracts, to increase or decrease the fund's exposure to changing security prices or other factors that affect security values. If FMR's strategies do not work as intended, the fund may not achieve its objective.
Fidelity Growth & Income Portfolio seeks high total return through a combination of current income and capital appreciation.
FMR normally invests a majority of the fund's assets in common stocks with a focus on those that pay current dividends and show potential for capital appreciation. FMR may also invest the fund's assets in bonds, including lower-quality debt securities, as well as stocks that are not currently paying dividends, but offer prospects for future income or capital appreciation.
FMR may invest the fund's assets in securities of foreign issuers in addition to securities of domestic issuers.
FMR is not constrained by any particular investment style. At any given time, FMR may tend to buy "growth" stocks or "value" stocks, or a combination of both types. In buying and selling securities for the fund, FMR relies on fundamental analysis of each issuer and its potential for success in light of its current financial condition, its industry position, and economic and market conditions. Factors considered include growth potential, earnings estimates, and management.
FMR may lend the fund's securities to broker-dealers or other institutions to earn income for the fund.
FMR may use various techniques, such as buying and selling futures contracts, to increase or decrease the fund's exposure to changing security prices or other factors that affect security values. If FMR's strategies do not work as intended, the fund may not achieve its objective.
Fidelity Growth Company Fund seeks capital appreciation.
FMR normally invests the fund's assets primarily in common stocks.
FMR invests the fund's assets in companies FMR believes have above-average growth potential. Growth may by measured by factors such as earnings or revenue.
Companies with high growth potential tend to be companies with higher than average price/earnings (P/E) ratios. Companies with strong growth potential often have new products, technologies, distribution channels, or other opportunities, or have a strong industry or market position. The stocks of these companies are often called "growth" stocks.
FMR may invest the fund's assets in securities of foreign issuers in addition to securities of domestic issuers.
In buying and selling securities for the fund, FMR relies on fundamental analysis of each issuer and its potential for success in light of its current financial condition, its industry position, and economic and market conditions. Factors considered include growth potential, earnings estimates, and management.
Prospectus
Fund Basics - continued
FMR may lend the fund's securities to broker-dealers or other institutions to earn income for the fund.
FMR may use various techniques, such as buying and selling futures contracts, to increase or decrease the fund's exposure to changing security prices or other factors that affect security values. If FMR's strategies do not work as intended, the fund may not achieve its objective.
Fidelity OTC Portfolio seeks capital appreciation.
FMR normally invests the fund's assets primarily in common stocks.
FMR normally invests at least 65% of the fund's total assets in securities principally traded on the over-the-counter (OTC) market. OTC securities are securities principally traded on the OTC market (a telephone or computer network that connects securities dealers). However, OTC securities can be listed for trading on the New York or American Stock Exchange or a foreign exchange and may include American Depositary Receipts and securities eligible for unlisted trading privileges on such exchanges. Securities that begin to trade principally on an exchange after purchase continue to be considered OTC securities for the purpose of the 65% policy. OTC securities can be issued by companies of any size. However, the OTC market has more small and medium-sized companies than other markets. FMR may also invest the fund's assets in non-OTC securities.
FMR will invest more than 25% of the fund's total assets in the technology sector.
FMR may invest the fund's assets in securities of foreign issuers in addition to securities of domestic issuers.
Because the fund is considered non-diversified, FMR may invest a significant percentage of the fund's assets in a single issuer.
FMR is not constrained by any particular investment style. At any given time, FMR may tend to buy "growth" stocks or "value" stocks or a combination of both types. In buying and selling securities for the fund, FMR relies on fundamental analysis of each issuer and its potential for success in light of its current financial condition, its industry position, and economic and market conditions. Factors considered include growth potential, earnings estimates, and management.
FMR may lend the fund's securities to broker-dealers or other institutions to earn income for the fund.
FMR may use various techniques, such as buying and selling futures contracts, to increase or decrease the fund's exposure to changing security prices or other factors that affect security values. If FMR's strategies do not work as intended, the fund may not achieve its objective.
International Equity Funds
Fidelity Diversified International Fund seeks capital growth.
Prospectus
Fund Basics - continued
FMR normally invests at least 65% of the fund's total assets in foreign securities. FMR normally invests the fund's assets primarily in common stocks.
FMR normally diversifies the fund's investments across different countries and regions. In allocating the fund's investments across countries and regions, FMR will consider the size of the market in each country and region relative to the size of the international market as a whole.
In buying and selling securities for the fund, FMR uses a disciplined approach that involves computer-aided, quantitative analysis supported by fundamental analysis. FMR's computer model systematically reviews thousands of stocks, using data such as historical earnings, dividend yield, earnings per share, and other quantitative factors. Then, the issuers of potential investments are analyzed further using fundamental factors such as growth potential, earnings estimates, and financial condition.
FMR may lend the fund's securities to broker-dealers or other institutions to earn income for the fund.
FMR may use various techniques, such as buying and selling futures contracts, to increase or decrease the fund's exposure to changing security prices or other factors that affect security values. If FMR's strategies do not work as intended, the fund may not achieve its objective.
Fidelity Europe Fund seeks growth of capital over the long-term.
FMR normally invests at least 65% of the fund's total assets in securities of issuers that have their principal activities in Europe. Europe includes Austria, Belgium, Belarus, Bulgaria, the Czech Republic, Denmark, Estonia, Finland, France, Germany, Greece, Hungary, Ireland, Italy, Latvia, Lithuania, Luxembourg, the Netherlands, Norway, Poland, Portugal, Russia, Slovakia, Slovenia, Spain, Sweden, Switzerland, Turkey, and the United Kingdom. FMR normally invests the fund's assets primarily in common stocks.
FMR normally diversifies the fund's investments across different European countries. In allocating the fund's investments across countries, FMR will consider the size of the market in each country relative to the size of the markets in Europe as a whole.
In buying and selling securities for the fund, FMR relies on fundamental analysis of each issuer and its potential for success in light of its current financial condition, its industry position, and economic and market conditions. Factors considered include growth potential, earnings estimates, and management.
FMR may lend the fund's securities to broker-dealers or other institutions to earn income for the fund.
FMR may use various techniques, such as buying and selling futures contracts, to increase or decrease the fund's exposure to changing security prices or other factors that affect security values. If FMR's strategies do not work as intended, the fund may not achieve its objective.
Fidelity Japan Fund seeks long-term growth of capital.
Prospectus
Fund Basics - continued
FMR normally invests at least 65% of the fund's total assets in securities of Japanese issuers. FMR normally invests the fund's assets primarily in common stocks.
In buying and selling securities for the fund, FMR relies on fundamental analysis of each issuer and its potential for success in light of its current financial condition, its industry position, and economic and market conditions. Factors considered include growth potential, earnings estimates, and management.
FMR may lend the fund's securities to broker-dealers or other institutions to earn income for the fund.
FMR may use various techniques, such as buying and selling futures contracts, to increase or decrease the fund's exposure to changing security prices or other factors that affect security values. If FMR's strategies do not work as intended, the fund may not achieve its objective.
Fidelity Overseas Fund seeks long-term growth of capital.
FMR normally invests at least 65% of the fund's total assets in foreign securities. FMR normally invests the fund's assets primarily in common stocks.
FMR normally diversifies the fund's investments across different countries and regions. In allocating the fund's investments across countries and regions, FMR will consider the size of the market in each country and region relative to the size of the international market as a whole.
In buying and selling securities for the fund, FMR relies on fundamental analysis of each issuer and its potential for success in light of its current financial condition, its industry position, and economic and market conditions. Factors considered include growth potential, earnings estimates, and management.
FMR may lend the fund's securities to broker-dealers or other institutions to earn income for the fund.
FMR may use various techniques, such as buying and selling futures contracts, to increase or decrease the fund's exposure to changing security prices or other factors that affect security values. If FMR's strategies do not work as intended, the fund may not achieve its objective.
Fidelity Southeast Asia Fund seeks capital appreciation.
FMR normally invests at least 65% of the fund's total assets in securities of Southeast Asian issuers. Southeast Asia includes Hong Kong, Indonesia, South Korea, Malaysia, the Philippines, the People's Republic of China, Singapore, Taiwan, and Thailand. FMR normally invests the fund's assets primarily in common stocks.
FMR normally diversifies the fund's investments across different Southeast Asian countries. In allocating the fund's investments across countries, FMR will consider the size of the market in each country relative to the size of the markets in Southeast Asia as a whole.
In buying and selling securities for the fund, FMR relies on fundamental analysis of each issuer and its potential for success in light of its current financial condition, its industry position, and economic and market conditions. Factors considered include growth potential, earnings estimates, and management.
Prospectus
Fund Basics - continued
FMR may lend the fund's securities to broker-dealers or other institutions to earn income for the fund.
FMR may use various techniques, such as buying and selling futures contracts, to increase or decrease the fund's exposure to changing security prices or other factors that affect security values. If FMR's strategies do not work as intended, the fund may not achieve its objective.
Investment-Grade Fixed-Income Funds
Fidelity Government Income Fund seeks a high level of current income, consistent with preservation of principal.
FMR normally invests the fund's assets in U.S. Government securities and instruments related to U.S. Government securities. FMR normally invests at least 65% of the fund's total assets in U.S. Government securities. FMR does not currently intend to invest more than 40% of the fund's assets in mortgage securities.
FMR uses the Lehman Brothers Government Bond Index as a guide in structuring the fund and selecting its investments. FMR manages the fund to have similar overall interest rate risk to the index. As of July 31, 1999, the dollar-weighted average maturity of the fund and the index was approximately 8.6 and 8.9 years, respectively. In determining a security's maturity for purposes of calculating the fund's average maturity, an estimate of the average time for its principal to be paid may be used. This can be substantially shorter than its stated maturity.
FMR allocates the fund's assets among different market sectors (for example, U.S. Treasury or U.S. Government agency securities) and different maturities based on its view of the relative value of each sector or maturity.
Because the fund is considered non-diversified, FMR may invest a significant percentage of the fund's assets in a single issuer.
In buying and selling securities for the fund, FMR analyzes a security's structural features and current price compared to its estimated long-term value, any short-term trading opportunities resulting from market inefficiencies, and the credit quality of its issuer.
FMR may use various techniques, such as buying and selling futures contracts, to increase or decrease the fund's exposure to changing security prices, interest rates, or other factors that affect security values. If FMR's strategies do not work as intended, the fund may not achieve its objective.
Fidelity Intermediate Bond Fund seeks a high level of current income.
FMR normally invests the fund's assets in U.S. dollar-denominated investment-grade bonds (those of medium and high quality).
FMR uses the Lehman Brothers Intermediate Government/<R>Credit</R> Bond Index as a guide in structuring the fund and selecting its investments. FMR manages the fund to have similar overall interest rate risk to the index. In addition, the fund normally maintains a dollar-weighted average maturity between three and 10 years. As of April 30, 1999, the dollar-weighted average maturity of the fund and the index was approximately 5.5 and 4.4 years, respectively. In determining a security's maturity for purposes of calculating the fund's average maturity, an estimate of the average time for its principal to be paid may be used. This can be substantially shorter than its stated maturity.
Prospectus
Fund Basics - continued
FMR allocates the fund's assets among different market sectors (for example, corporate or government securities) and different maturities based on its view of the relative value of each sector or maturity.
In buying and selling securities for the fund, FMR analyzes a security's structural features and current price compared to its estimated long-term value, any short-term trading opportunities resulting from market inefficiencies, and the credit quality of its issuer.
To earn additional income for the fund, FMR may use a trading strategy that involves selling mortgage securities and simultaneously agreeing to purchase similar securities on a later date at a set price. This trading strategy may result in an increased portfolio turnover rate which increases transaction costs and may increase taxable gains.
FMR may use various techniques, such as buying and selling futures contracts, to increase or decrease the fund's exposure to changing security prices, interest rates, or other factors that affect security values. If FMR's strategies do not work as intended, the fund may not achieve its objective.
Fidelity Investment Grade Bond Fund seeks a high level of current income.
FMR normally invests the fund's assets in U.S. dollar-denominated investment-grade bonds (those of medium and high quality).
FMR uses the Lehman Brothers Aggregate Bond Index as a guide in structuring the fund and selecting its investments. FMR manages the fund to have similar overall interest rate risk to the index. As of April 30, 1999, the dollar-weighted average maturity of the fund and the index was approximately 8.8 and 9.0 years, respectively. In determining a security's maturity for purposes of calculating the fund's average maturity, an estimate of the average time for its principal to be paid may be used. This can be substantially shorter than its stated maturity.
FMR allocates the fund's assets among different market sectors (for example, corporate or government securities) and different maturities based on its view of the relative value of each sector or maturity.
In buying and selling securities for the fund, FMR analyzes a security's structural features and current price compared to its estimated long-term value, any short-term trading opportunities resulting from market inefficiencies, and the credit quality of its issuer.
Prospectus
Fund Basics - continued
To earn additional income for the fund, FMR may use a trading strategy that involves selling mortgage securities and simultaneously agreeing to purchase similar securities on a later date at a set price. This trading strategy may result in an increased portfolio turnover rate which increases transaction costs and may increase taxable gains.
FMR may use various techniques, such as buying and selling futures contracts, to increase or decrease the fund's exposure to changing security prices, interest rates, or other factors that affect security values. If FMR's strategies do not work as intended, the fund may not achieve its objective.
High Yield Fixed-Income Fund
Fidelity Capital & Income Fund seeks to provide a combination of income and capital growth.
FMR invests the fund's assets in equity and debt securities. FMR has the flexibility to invest the fund's assets in securities of any type or quality, including defaulted securities, but expects to invest the majority of the fund's assets in debt securities and convertible securities, with an emphasis on lower-quality debt securities. Many lower-quality debt securities are subject to legal or contractual restrictions limiting FMR's ability to resell the securities to the general public. FMR may invest in companies whose financial condition is troubled or uncertain and that may be involved in bankruptcy proceedings, reorganizations, or financial restructurings.
FMR may invest the fund's assets in securities of foreign issuers in addition to securities of domestic issuers.
In buying and selling securities for the fund, FMR relies on fundamental analysis of each issuer and its potential for success in light of its current financial condition, its industry position, and economic and market conditions. Factors considered include a security's structural features and current price compared to its long-term value, and the earnings potential, credit standing, and management of the security's issuer.
FMR may use various techniques, such as buying and selling futures contracts, to increase or decrease the fund's exposure to changing security prices, interest rates, or other factors that affect security values. If FMR's strategies do not work as intended, the fund may not achieve its objective.
Money Market Fund
Retirement Money Market Portfolio seeks to obtain as high a level of current income as is consistent with the preservation of capital and liquidity.
FMR invests the fund's assets in U.S. dollar-denominated money market securities of domestic and foreign issuers and repurchase agreements. FMR also may enter into reverse repurchase agreements for the fund.
FMR will invest more than 25% of the fund's total assets in the financial services industry.
In buying and selling securities for the fund, FMR complies with industry-standard requirements for money market funds regarding the quality, maturity, and diversification of the fund's investments. FMR stresses maintaining a stable $1.00 share price, liquidity, and income.
Prospectus
Fund Basics - continued
Principal Investment Risks
Many factors affect each Freedom Fund's performance. Each Freedom Fund's share price and Freedom Income's yield change daily based on the performance of the underlying Fidelity funds in which it invests. The ability of each Freedom Fund to meet its investment objective is directly related to its target asset allocation among underlying Fidelity funds and the ability of those funds to meet their investment objectives. When you sell your shares of a Freedom Fund, they could be worth more or less than what you paid for them.
The following factors can significantly affect a Freedom Fund's performance:
Stock Market Volatility. The value of equity securities fluctuates in response to issuer, political, market, and economic developments. In the short term, equity prices can fluctuate dramatically in response to these developments. Different parts of the market and different types of equity securities can react differently to these developments. For example, large cap stocks can react differently from small cap stocks, and "growth" stocks can react differently from "value" stocks. Issuer, political, or economic developments can affect a single issuer, issuers within an industry or economic sector or geographic region, or the market as a whole.
Interest Rate Changes. Debt and money market securities have varying levels of sensitivity to changes in interest rates. In general, the price of a debt or money market security can fall when interest rates rise and can rise when interest rates fall. Securities with longer maturities, mortgage securities, and the securities of issuers in the financial services sector can be more sensitive to interest rate changes. In other words, the longer the maturity of a security, the greater the impact a change in interest rates could have on the security's price. In addition, short-term and long-term interest rates do not necessarily move in the same amount or the same direction. Short-term securities tend to react to changes in short-term interest rates, and long-term securities tend to react to changes in long-term interest rates.
Foreign Exposure. Foreign securities, foreign currencies, and securities issued by U.S. entities with substantial foreign operations, and securities for which an entity located in a foreign country provides credit support or a maturity-shortening structure can involve additional risks relating to political, economic, or regulatory conditions in foreign countries. These risks include fluctuations in foreign currencies; withholding or other taxes; trading, settlement, custodial, and other operational risks; and the less stringent investor protection and disclosure standards of some foreign markets. All of these factors can make foreign investments, especially those in emerging markets, more volatile and potentially less liquid than U.S. investments. In addition, foreign markets can perform differently from the U.S. market.
Investing in emerging markets can involve risks in addition to and greater than those generally associated with investing in more developed foreign markets. The extent of economic development; political stability; market depth, infrastructure, and capitalization; and regulatory oversight can be less than in more developed markets. Emerging market economies can be subject to greater social, economic, regulatory, and political uncertainties. All of these factors can make emerging market securities more volatile and potentially less liquid than securities issued in more developed markets.
Prospectus
Fund Basics - continued
Geographic Concentration. Political and economic conditions and changes in regulatory, tax, or economic policy in a country could significantly affect the market in that country and in surrounding or related countries.
Asia. Asia includes countries in all stages of economic development, from the highly developed economy of Japan to the emerging market economy of the People's Republic of China. Most Asian economies are characterized by over-extension of credit, currency devaluations and restrictions, rising unemployment, high inflation, decreased exports, and economic recessions. Currency devaluations in any one country can have a significant effect on the entire region. Recently, the markets in each Asian country have suffered significant downturns as well as significant volatility. Increased political and social unrest in some or all Asian countries could cause further economic and market uncertainty.
The Japanese economy is currently in a recession. The economy is characterized by government intervention and protectionism, an unstable financial services sector, and relatively high unemployment. Economic growth is dependent on international trade, government support of the financial services sector and other troubled sectors, and consistent government policy. The United States is Japan's largest single trading partner, but close to half of Japan's trade is conducted with developing nations, almost all of which are in Southeast Asia.
The Southeast Asia economies are generally in recessions. Many of their economies are characterized by high inflation, undeveloped financial services sectors, and heavy reliance on international trade. Currency devaluations or restrictions, political and social instability, and general economic conditions have resulted in significant market downturns and volatility. A small number of industries represent a large portion of the Southeast Asian market as a whole. The Southeast Asian market also tends to be relatively concentrated in certain issuers. For example, as of June 19, 2000, Samsung Electronics accounted for approximately 11% of the MSCI AC Far East Free ex Japan Index.
Europe. Europe includes both developed and emerging markets. Most developed countries in Western Europe are members of the European Union (EU), and many are also members of the EMU, which requires compliance with restrictions on inflation rates, deficits, and debt levels. Unemployment in Europe is historically high. Many Eastern European countries continue to move toward market economies. However, their markets remain relatively undeveloped and can be particularly sensitive to political and economic developments. The tight fiscal and monetary controls necessary to join the EMU can significantly affect every country in Europe.
Prospectus
Fund Basics - continued
Financial Services Exposure. Financial services companies are highly dependent on the supply of short-term financing. The value of securities of issuers in the financial services sector can be sensitive to changes in government regulation and interest rates and to economic downturns in the United States and abroad.
Industry Concentration. Market conditions, interest rates, and economic, regulatory, or financial developments could significantly affect a group of related industries, and the securities of companies in that group of related industries could react similarly to these or other developments.
The technology industries can be significantly affected by obsolescence of existing technology, short product cycles, falling prices and profits, and competition from new market entrants.
Prepayment. Many types of debt securities, including mortgage securities, are subject to prepayment risk. Prepayment occurs when the issuer of a security can repay principal prior to the security's maturity. Securities subject to prepayment can offer less potential for gains during a declining interest rate environment and similar or greater potential for loss in a rising interest rate environment. In addition, the potential impact of prepayment features on the price of a debt security can be difficult to predict and result in greater volatility.
Issuer-Specific Changes. Changes in the financial condition of an issuer, changes in specific economic or political conditions that affect a particular type of security or issuer, and changes in general economic or political conditions can affect the credit quality or value of an issuer's securities. Entities providing credit support or a maturity-shortening structure also can be affected by these types of changes. If the structure of a security fails to function as intended, the security could decline in value. The value of securities of smaller, less well-known issuers can be more volatile than that of larger issuers. Smaller issuers can have more limited product lines, markets, or financial resources. Lower-quality debt securities (those of less than investment-grade quality) and certain types of other securities tend to be particularly sensitive to these changes.
Lower-quality debt securities and certain types of other securities involve greater risk of default or price changes due to changes in the credit quality of the issuer. The value of lower-quality debt securities and certain types of other securities often fluctuates in response to company, political, or economic developments and can decline significantly over short periods of time or during periods of general or regional economic difficulty. Lower-quality debt securities can be thinly traded or have restrictions on resale, making them difficult to sell at an acceptable price. The default rate for lower-quality debt securities is likely to be higher during economic recessions or periods of high interest rates.
Prospectus
Fund Basics - continued
"Growth" Investing. "Growth" stocks can react differently to issuer, political, market, and economic developments than the market as a whole and other types of stocks. "Growth" stocks tend to be more expensive relative to their earnings or assets compared to other types of stocks. As a result, "growth" stocks tend to be sensitive to changes in their earnings and more volatile than other types of stocks.
"Value" Investing. "Value" stocks can react differently to issuer, political, market, and economic developments than the market as a whole and other types of stocks. "Value" stocks tend to be inexpensive relative to their earnings or assets compared to other types of stocks. However, "value" stocks can continue to be inexpensive for long periods of time and may not ever realize their full value.
Quantitative Investing. The value of securities selected using quantitative analysis can react differently to issuer, political, market, and economic developments than the market as a whole or securities selected using only fundamental analysis. The factors used in quantitative analysis and the weight placed on those factors may not be predictive of a security's value. In addition, factors that affect a security's value can change over time and these changes may not be reflected in the quantitative model.
In response to market, economic, political, or other conditions, Strategic Advisers may temporarily use a different investment strategy for defensive purposes. If Strategic Advisers does so, different factors could affect a Freedom Fund's performance and the fund may not achieve its investment objective.
Fundamental Investment Policies
The policies discussed below are fundamental, that is, subject to change only by shareholder approval.
Each of Freedom 2000 Fund, Freedom 2010 Fund, Freedom 2020 Fund, Freedom 2030 Fund and Freedom 2040 Fund seeks high total return.
Freedom Income Fund seeks high current income and, as a secondary objective, capital appreciation.
Each fund is open for business each day the New York Stock Exchange (NYSE) is open.
Each fund's net asset value per share (NAV) is the value of a single share. Fidelity normally calculates each fund's NAV as of the close of business of the NYSE, normally 4:00 p.m. Eastern time. However, NAV may be calculated earlier if trading on the NYSE is restricted or as permitted by the Securities and Exchange Commission (SEC). Each fund's assets are valued as of this time for the purpose of computing the fund's NAV.
To the extent that each fund's assets are traded in other markets on days when the NYSE is closed, the value of the fund's assets may be affected on days when the fund is not open for business. In addition, trading in some of a fund's assets may not occur on days when the fund is open for business.
The assets of each Freedom Fund consist primarily of shares of the underlying Fidelity funds, which are valued at their respective NAVs. Most underlying Fidelity fund assets are valued primarily on the basis of market quotations or on the basis of information furnished by a pricing service. Certain short-term securities are valued on the basis of amortized cost. If market quotations or information furnished by a pricing service is not readily available or does not accurately reflect fair value for a security held by an underlying Fidelity fund or if the value of a security held by an underlying Fidelity fund has been materially affected by events occurring after the close of the exchange or market on which the security is principally traded (for example, a foreign exchange or market), that security may be valued by another method that the Board of Trustees believes accurately reflects fair value. A security's valuation may differ depending on the method used for determining value. A money market underlying Fidelity fund's assets are valued on the basis of amortized cost.
Prospectus
Fidelity Investments was established in 1946 to manage one of America's first mutual funds. Today, Fidelity is the largest mutual fund company in the country, and is known as an innovative provider of high-quality financial services to individuals and institutions.
In addition to its mutual fund business, the company operates one of America's leading discount brokerage firms, <R>Fidelity Brokerage Services LLC (FBS LLC)</R>. Fidelity is also a leader in providing tax-advantaged retirement plans for individuals investing on their own or through their employer.
For account, product, and service information, please use the following web site and phone numbers:
Please use the following addresses:
Buying Shares
Fidelity Investments
P.O. Box 770001
Cincinnati, OH 45277-0002
Overnight Express
Fidelity Investments
2300 Litton Lane - KH1A
Hebron, KY 41048
Selling Shares
Fidelity Investments
P.O. Box 660602
Dallas, TX 75266-0602
Overnight Express
Fidelity Investments
Attn: Redemptions - CP6I
400 East Las Colinas Blvd.
Irving, TX 75039-5587
You may buy or sell shares of the funds through a retirement account or an investment professional. If you invest through a retirement account or an investment professional, the procedures for buying, selling, and exchanging shares of a fund and the account features and policies may differ. Additional fees may also apply to your investment in a fund, including a transaction fee if you buy or sell shares of the fund through a broker or other investment professional.
Certain methods of contacting Fidelity, such as by telephone or electronically, may be unavailable or delayed (for example, during periods of unusual market activity). In addition, the level and type of service available may be restricted based on criteria established by Fidelity.
Prospectus
Shareholder Information - continued
The different ways to set up (register) your account with Fidelity are listed in the following table.
|
Ways to Set Up Your Account |
|
Individual or Joint Tenant For your general investment needs |
|
Retirement For tax-advantaged retirement savings |
|
|
|
|
|
|
|
|
|
|
|
Gifts or Transfers to a Minor (UGMA, UTMA) To invest for a child's education or other future needs |
|
Trust For money being invested by a trust |
|
Business or Organization For investment needs of corporations, associations, partnerships, or other groups |
The price to buy one share of each fund is the fund's NAV. Each fund's shares are sold without a sales charge.
Your shares will be bought at the next NAV calculated after your investment is received in proper form.
Short-term or excessive trading into and out of a fund may harm performance by disrupting portfolio management strategies and by increasing expenses. Accordingly, a fund may reject any purchase orders, including exchanges, particularly from market timers or investors who, in FMR's opinion, have a pattern of short-term or excessive trading or whose trading has been or may be disruptive to that fund. For these purposes, FMR may consider an investor's trading history in that fund or other Fidelity funds, and accounts under common ownership or control.
Each fund may stop offering shares completely or may offer shares only on a limited basis, for a period of time or permanently.
When you place an order to buy shares, note the following:
Certain financial institutions that have entered into sales agreements with Fidelity Distributors Corporation (FDC) may enter confirmed purchase orders on behalf of customers by phone, with payment to follow no later than the time when a fund is priced on the following business day. If payment is not received by that time, the order will be canceled and the financial institution could be held liable for resulting fees or losses.
Prospectus
Shareholder Information - continued
|
Minimums |
|
To Open an Account $2,500 |
|
For certain Fidelity retirement accountsA $500 |
|
To Add to an Account $250 |
|
Through regular investment plans $100 |
|
Minimum Balance $2,000 |
|
For certain Fidelity retirement accountsA $500 |
|
A Fidelity Traditional IRA, Roth IRA, Rollover IRA, SEP-IRA, and Keogh accounts. |
There is no minimum account balance or initial or subsequent purchase minimum for investments through Fidelity Portfolio Advisory ServicesSM , certain Fidelity retirement accounts funded through salary deduction, or accounts opened with the proceeds of distributions from such retirement accounts. In addition, each fund may waive or lower purchase minimums in other circumstances.
|
Key Information |
|
|
Phone |
To Open an Account
To Add to an Account
|
|
Internet |
To Open an Account
To Add to an Account
|
|
Mail |
To Open an Account
To Add to an Account
|
|
In Person |
To Open an Account
To Add to an Account
|
|
Wire |
To Open an Account
To Add to an Account
|
|
Automatically |
To Open an Account
To Add to an Account
|
The price to sell one share of each fund is the fund's NAV.
Your shares will be sold at the next NAV calculated after your order is received in proper form.
Certain requests must include a signature guarantee. It is designed to protect you and Fidelity from fraud. Your request must be made in writing and include a signature guarantee if any of the following situations apply:
You should be able to obtain a signature guarantee from a bank, broker (including Fidelity Investor Centers), dealer, credit union (if authorized under state law), securities exchange or association, clearing agency, or savings association. A notary public cannot provide a signature guarantee.
When you place an order to sell shares, note the following:
Prospectus
Shareholder Information - continued
|
Key Information |
|
|
Phone |
|
|
Internet |
|
|
Mail |
Individual, Joint Tenant, Sole Proprietorship, UGMA, UTMA
Retirement Account
Trust
Business or Organization
Executor, Administrator, Conservator, Guardian
|
|
In Person |
Individual, Joint Tenant, Sole Proprietorship, UGMA, UTMA
Retirement Account
Trust
Business or Organization
Executor, Administrator, Conservator, Guardian
|
|
Automatically |
|
An exchange involves the redemption of all or a portion of the shares of one fund and the purchase of shares of another fund.
As a shareholder, you have the privilege of exchanging shares of a fund for shares of other Fidelity funds including each of the underlying Fidelity funds.
However, you should note the following policies and restrictions governing exchanges:
Prospectus
Shareholder Information - continued
The funds may terminate or modify the exchange privileges in the future.
Other funds may have different exchange restrictions, and may impose trading fees of up to 2.00% of the amount exchanged. Check each fund's prospectus for details.
The following features are available to buy and sell shares of the funds.
Automatic Investment and Withdrawal Programs. Fidelity offers convenient services that let you automatically transfer money into your account, between accounts, or out of your account. While automatic investment programs do not guarantee a profit and will not protect you against loss in a declining market, they can be an excellent way to invest for retirement, a home, educational expenses, and other long-term financial goals. Automatic withdrawal or exchange programs can be a convenient way to provide a consistent income flow or to move money between your investments.
|
Fidelity Automatic Account Builder |
||
|
Minimum $100 |
Frequency Monthly or quarterly |
Procedures
|
|
Direct Deposit |
||
|
Minimum $100 |
Frequency Every pay period |
Procedures
|
|
A Because their share prices fluctuate, these funds may not be appropriate choices for direct deposit of your entire check. |
||
|
Fidelity Automatic Exchange Service |
||
|
Minimum $100 |
Frequency Monthly, bimonthly, quarterly, or annually |
Procedures
|
|
Personal Withdrawal Service |
||
|
Frequency Monthly |
Procedures
|
|
Other Features. The following other features are also available to buy and sell shares of the funds.
|
Wire |
|
|
Fidelity Money Line |
|
|
Fidelity On-Line Xpress+® |
|
Call 1-800-544-0240 or visit Fidelity's web site for more information.
|
|
Fidelity Online Trading |
|
|
FAST |
|
Call 1-800-544-5555.
|
The following policies apply to you as a shareholder.
Combination with Freedom Income Fund. Each Freedom Fund with a target retirement date may be combined with Freedom Income, without a vote of shareholders, if the funds' Board of Trustees determines at the time of the proposed combination that combining the funds is in the best interests of the funds and their shareholders. Prior to a combination, Fidelity will notify shareholders of a Freedom Fund with a target retirement date of the combination and any tax consequences.
Statements and reports that Fidelity sends to you include the following:
Prospectus
Shareholder Information - continued
To reduce expenses, only one copy of most financial reports and prospectuses may be mailed to households, even if more than one person in the household holds shares of a fund. Call Fidelity at 1-800-544-8544 if you need additional copies of financial reports or prospectuses. If you do not want the mailing of these documents to be combined with those for other members of your household, contact Fidelity in writing at P.O. Box 5000, Cincinnati, Ohio 45273-8692.
Electronic copies of most financial reports and prospectuses are available at Fidelity's web site. To participate in Fidelity's electronic delivery program, call Fidelity or visit Fidelity's web site for more information.
You may initiate many transactions by telephone or electronically. Fidelity will not be responsible for any losses resulting from unauthorized transactions if it follows reasonable security procedures designed to verify the identity of the investor. Fidelity will request personalized security codes or other information, and may also record calls. For transactions conducted through the Internet, Fidelity recommends the use of an Internet browser with 128-bit encryption. You should verify the accuracy of your confirmation statements immediately after you receive them. If you do not want the ability to sell and exchange by telephone, call Fidelity for instructions.
When you sign your account application, you will be asked to certify that your social security or taxpayer identification number is correct and that you are not subject to 31% backup withholding for failing to report income to the IRS. If you violate IRS regulations, the IRS can require a fund to withhold 31% of your taxable distributions and redemptions.
Fidelity may deduct an annual maintenance fee of $12.00 from accounts with a value of less than $2,500, subject to an annual maximum charge of $24.00 per shareholder. It is expected that accounts will be valued on the second Friday in November of each year. Accounts opened after September 30 will not be subject to the fee for that year. The fee, which is payable to Fidelity, is designed to offset in part the relatively higher costs of servicing smaller accounts. This fee will not be deducted from Fidelity brokerage accounts, retirement accounts (except non-prototype retirement accounts), accounts using regular investment plans, or if total assets with Fidelity exceed $30,000. Eligibility for the $30,000 waiver is determined by aggregating accounts with Fidelity maintained by Fidelity Service Company, Inc. or <R>FBS LLC</R> which are registered under the same social security number or which list the same social security number for the custodian of a Uniform Gifts/Transfers to Minors Act account.
Prospectus
Shareholder Information - continued
If your account balance falls below $2,000 (except accounts not subject to account minimums), you will be given 30 days' notice to reestablish the minimum balance. If you do not increase your balance, Fidelity may close your account and send the proceeds to you. Your shares will be sold at the NAV on the day your account is closed.
Fidelity may charge a fee for certain services, such as providing historical account documents.
Dividends and Capital Gain Distributions
Each Freedom Fund earns dividends, interest, and other income from its investments, and distributes this income (less expenses) to shareholders as dividends. Each Freedom Fund also realizes capital gains from its investments, and distributes these gains (less any losses) to shareholders as capital gain distributions.
Each Freedom Fund with a target retirement date normally pays dividends and capital gain distributions in May and December.
Freedom Income normally pays dividends monthly and pays capital gain distributions in May and December.
When you open an account, specify on your application how you want to receive your distributions. The following options may be available for each fund's distributions:
1. Reinvestment Option. Your dividends and capital gain distributions will be automatically reinvested in additional shares of the fund. If you do not indicate a choice on your application, you will be assigned this option.
2. Income-Earned Option. Your capital gain distributions will be automatically reinvested in additional shares of the fund. Your dividends will be paid in cash.
3. Cash Option. Your dividends and capital gain distributions will be paid in cash.
4. Directed Dividends® Option. Your dividends will be automatically invested in shares of another identically registered Fidelity fund. Your capital gain distributions will be automatically invested in shares of another identically registered Fidelity fund, automatically reinvested in additional shares of the fund, or paid in cash.
Not all distribution options are available for every account. If the option you prefer is not listed on your account application, or if you want to change your current option, call Fidelity.
If you elect to receive distributions paid in cash by check and the U.S. Postal Service does not deliver your checks, your distribution option may be converted to the Reinvestment Option. You will not receive interest on amounts represented by uncashed distribution checks.
Prospectus
Shareholder Information - continued
As with any investment, your investment in a fund could have tax consequences for you. If you are not investing through a tax-advantaged retirement account, you should consider these tax consequences.
Taxes on distributions. Distributions you receive from each fund are subject to federal income tax, and may also be subject to state or local taxes.
For federal tax purposes, each fund's dividends and distributions of short-term capital gains are taxable to you as ordinary income, while each fund's distributions of long-term capital gains are taxable to you generally as capital gains.
If you buy shares when a fund has realized but not yet distributed income or capital gains, you will be "buying a dividend" by paying the full price for the shares and then receiving a portion of the price back in the form of a taxable distribution.
Any taxable distributions you receive from a fund will normally be taxable to you when you receive them, regardless of your distribution option.
Taxes on transactions. Your redemptions, including exchanges, may result in a capital gain or loss for federal tax purposes. A capital gain or loss on your investment in a fund generally is the difference between the cost of your shares and the price you receive when you sell them.
Prospectus
Each fund is a mutual fund, an investment that pools shareholders' money and invests it toward a specified goal.
Strategic Advisers is each Freedom Fund's investment manager.
FMR, an affiliate of Strategic Advisers, is each underlying Fidelity fund's manager.
As of March 31, 2000, Strategic Advisers had approximately $21.1 billion in discretionary assets under management.
As of March 31, 2000, FMR had approximately $639.1 billion in discretionary assets under management.
As the manager, Strategic Advisers administers the asset allocation program for each Freedom Fund.
As the manager for the underlying Fidelity funds, FMR is responsible for choosing each fund's investments and handling their business affairs. FMR is also responsible for handling the business affairs for each Freedom Fund.
Ren Cheng is Vice President and co-manager of the Freedom Funds, which he has managed since inception. He also manages structured investments for Fidelity Management Trust Company. Mr. Cheng joined Fidelity as a portfolio manager in 1994. Previously, he was a senior portfolio manager for Putnam Investments from 1985 to 1994.
Scott Stewart is Vice President and co-manager of the Freedom Funds, which he has managed since inception. He also is a Senior Vice President and head of Fidelity's structured equity group. Mr. Stewart joined Fidelity in 1987 as a portfolio manager.
From time to time a manager, analyst, or other Fidelity employee may express views regarding a particular company, security, industry, or market sector. The views expressed by any such person are the views of only that individual as of the time expressed and do not necessarily represent the views of Fidelity or any other person in the Fidelity organization. Any such views are subject to change at any time based upon market or other conditions and Fidelity disclaims any responsibility to update such views. These views may not be relied on as investment advice and, because investment decisions for a Fidelity fund are based on numerous factors, may not be relied on as an indication of trading intent on behalf of any Fidelity fund.
Each Freedom Fund pays a management fee to Strategic Advisers. The management fee is calculated and paid to Strategic Advisers every month.
Strategic Advisers is responsible for the payment of all other expenses of each Freedom Fund with limited exceptions.
Each Freedom Fund's annual management fee rate is 0.10% of its average net assets.
For the fiscal year ended March 31, 2000, Freedom Income, Freedom 2000, Freedom 2010, Freedom 2020, and Freedom 2030 paid a management fee of 0.08% of the fund's average net assets, after reimbursement.
Prospectus
Fund Services - continued
Strategic Advisers pays FMR an administration fee for handling the business affairs for each Freedom Fund.
FMR may, from time to time, agree to reimburse the funds for management fees above a specified limit. FMR retains the ability to be repaid by a fund if expenses fall below the specified limit prior to the end of the fiscal year. Reimbursement arrangements, which may be discontinued by FMR at any time, can decrease a fund's expenses and boost its performance.
FDC distributes each fund's shares.
Each Freedom Fund has adopted a Distribution and Service Plan pursuant to Rule 12b-1 under the Investment Company Act of 1940 that recognizes that Strategic Advisers or FMR may use its management or administration fee revenues, respectively, as well as its past profits or its resources from any other source, to pay FDC for expenses incurred in connection with providing services intended to result in the sale of Freedom Fund shares and/or shareholder support services. Strategic Advisers or FMR, directly or through FDC, may pay significant amounts to intermediaries, such as banks, broker-dealers, and other service-providers, that provide those services. Currently, the Board of Trustees of each Freedom Fund has authorized such payments.
If payments made by Strategic Advisers or FMR to FDC or to intermediaries under a Distribution and Service Plan were considered to be paid out of a Freedom Fund's assets on an ongoing basis, they might increase the cost of your investment and might cost you more than paying other types of sales charges.
To receive payments made pursuant to a Distribution and Service Plan, intermediaries must sign the appropriate agreement with FDC in advance.
Strategic Advisers and FMR may allocate brokerage transactions in a manner that takes into account the sale of shares of a fund, provided that the fund receives brokerage services and commission rates comparable to those of other broker-dealers.
No dealer, sales representative, or any other person has been authorized to give any information or to make any representations, other than those contained in this prospectus and in the related statement of additional information (SAI), in connection with the offer contained in this prospectus. If given or made, such other information or representations must not be relied upon as having been authorized by the funds or FDC. This prospectus and the related SAI do not constitute an offer by the funds or by FDC to sell shares of the funds to or to buy shares of the funds from any person to whom it is unlawful to make such offer.
Prospectus
The financial highlights tables are intended to help you understand each fund's financial history for the period of the fund's operations. Certain information reflects financial results for a single fund share. The total returns in the table represent the rate that an investor would have earned (or lost) on an investment in the fund (assuming reinvestment of all dividends and distributions). This information has been audited by PricewaterhouseCoopers LLP, independent accountants, whose report, along with Freedom Income's, Freedom 2000's, Freedom 2010's, Freedom 2020's, and Freedom 2030's financial highlights and financial statements, are included in the funds' annual report. An annual report for Freedom 2040 will be available once the fund has completed its first fiscal year. A free copy of each annual report is available upon request. Freedom 2040 commenced operations on September 6, 2000.
Fidelity Freedom Income Fund
|
Years ended March 31, |
2000 |
1999 |
1998 |
1997 E |
|
Selected Per-Share Data |
|
|
|
|
|
Net asset value, beginning of period |
$ 11.25 |
$ 10.95 |
$ 10.06 |
$ 10.00 |
|
Income from Investment Operations |
|
|
|
|
|
Net investment income D |
.52 |
.49 |
.50 |
.22 |
|
Net realized and unrealized gain (loss) |
.45 |
.40 |
.96 |
(.02) |
|
Total from investment operations |
.97 |
.89 |
1.46 |
.20 |
|
Less Distributions |
|
|
|
|
|
From net investment income |
$ (.52) |
$ (.47) |
$ (.51) |
$ (.14) |
|
From net realized gain |
(.12) |
(.12) |
(.06) |
- |
|
Total distributions |
(.64) |
(.59) |
(.57) |
(.14) |
|
Net asset value, end of period |
$ 11.58 |
$ 11.25 |
$ 10.95 |
$ 10.06 |
|
Total Return B, C |
8.96% |
8.41% |
14.88% |
1.99% |
|
Ratios and Supplemental Data (amounts do not include the activity of the underlying funds) |
|
|
|
|
|
Net assets, end of period (000 omitted) |
$ 306,834 |
$ 197,638 |
$ 55,472 |
$ 9,427 |
|
Ratio of expenses to average net assets |
.08% F |
.08% F |
.08% F |
.08% A, F |
|
Ratio of expenses to average net assets after |
.07% G |
.07% G |
.08% |
.08% A |
|
Ratio of net investment income to average net assets |
4.59% |
4.46% |
4.71% |
4.95% A |
|
Portfolio turnover rate |
37% |
29% |
33% |
32% A |
A Annualized
B Total returns for periods of less than one year are not annualized.
C The total returns would have been lower had certain expenses not been reduced during the periods shown.
D Net investment income per share has been calculated based on average shares outstanding during the period.
E For the period October 17, 1996 (commencement of operations) to March 31, 1997.
F Strategic Advisers agreed to reimburse a portion of the fund's expenses during the period. Without this reimbursement, the fund's expense ratio would have been higher.
G Strategic Advisers or the fund has entered into varying arrangements with third parties who either paid or reduced a portion of the fund's expenses.
Prospectus
Appendix - continued
Fidelity Freedom 2000 Fund
|
Years ended March 31, |
2000 |
1999 |
1998 |
1997 E |
|
Selected Per-Share Data |
|
|
|
|
|
Net asset value, beginning of period |
$ 12.60 |
$ 11.98 |
$ 10.12 |
$ 10.00 |
|
Income from Investment Operations |
|
|
|
|
|
Net investment income D |
.50 |
.45 |
.60 |
.18 |
|
Net realized and unrealized gain (loss) |
1.18 |
.78 |
1.71 |
.03 |
|
Total from investment operations |
1.68 |
1.23 |
2.31 |
.21 |
|
Less Distributions |
|
|
|
|
|
From net investment income |
(.52) |
(.40) |
(.33) |
(.09) |
|
From net realized gain |
(.29) |
(.21) |
(.12) |
- |
|
Total distributions |
(.81) |
(.61) |
(.45) |
(.09) |
|
Net asset value, end of period |
$ 13.47 |
$ 12.60 |
$ 11.98 |
$ 10.12 |
|
Total Return B, C |
13.81% |
10.51% |
23.25% |
2.09% |
|
Ratios and Supplemental Data (amounts do not include the activity of the underlying funds) |
|
|
|
|
|
Net assets, end of period (000 omitted) |
$ 743,948 |
$ 563,718 |
$ 325,126 |
$ 15,946 |
|
Ratio of expenses to average net assets |
.08% F |
.08% F |
.08% F |
.08% A, F |
|
Ratio of expenses to average net assets after |
.07% G |
.07% G |
.08% |
.08% A |
|
Ratio of net investment income to average net assets |
3.88% |
3.76% |
3.72% |
4.00% A |
|
Portfolio turnover rate |
37% |
27% |
24% |
19% A |
A Annualized
B Total returns for periods of less than one year are not annualized.
C The total returns would have been lower had certain expenses not been reduced during the periods shown.
D Net investment income per share has been calculated based on average shares outstanding during the period.
E For the period October 17, 1996 (commencement of operations) to March 31, 1997.
F Strategic Advisers agreed to reimburse a portion of the fund's expenses during the period. Without this reimbursement, the fund's expense ratio would have been higher.
G Strategic Advisers or the fund has entered into varying arrangements with third parties who either paid or reduced a portion of the fund's expenses.
Prospectus
Appendix - continued
Fidelity Freedom 2010 Fund
|
Years ended March 31, |
2000 |
1999 |
1998 |
1997 E |
|
Selected Per-Share Data |
|
|
|
|
|
Net asset value, beginning of period |
$ 13.76 |
$ 12.81 |
$ 10.15 |
$ 10.00 |
|
Income from Investment Operations |
|
|
|
|
|
Net investment income D |
.43 |
.36 |
.30 |
.11 |
|
Net realized and unrealized gain (loss) |
2.27 |
1.22 |
2.82 |
.15 |
|
Total from investment operations |
2.70 |
1.58 |
3.12 |
.26 |
|
Less Distributions |
|
|
|
|
|
From net investment income |
(.49) |
(.35) |
(.37) |
(.11) |
|
From net realized gain |
(.42) |
(.28) |
(.09) |
- |
|
Total distributions |
(.91) |
(.63) |
(.46) |
(.11) |
|
Net asset value, end of period |
$ 15.55 |
$ 13.76 |
$ 12.81 |
$ 10.15 |
|
Total Return B, C |
20.32% |
12.65% |
31.31% |
2.59% |
|
Ratios and Supplemental Data (amounts do not include the activity of the underlying funds) |
|
|
||
|
Net assets, end of period (000 omitted) |
$ 2,013,087 |
$ 1,088,909 |
$ 647,356 |
$ 23,600 |
|
Ratio of expenses to average net assets |
.08% F |
.08% F |
.08% F |
.08% A, F |
|
Ratio of expenses to average net assets after |
.07% G |
.07% G |
.08% |
.08% A |
|
Ratio of net investment income to average net assets |
2.98% |
2.82% |
2.54% |
2.56% A |
|
Portfolio turnover rate |
33% |
27% |
20% |
3% A |
A Annualized
B Total returns for periods of less than one year are not annualized.
C The total returns would have been lower had certain expenses not been reduced during the periods shown.
D Net investment income per share has been calculated based on average shares outstanding during the period.
E For the period October 17, 1996 (commencement of operations) to March 31, 1997.
F Strategic Advisers agreed to reimburse a portion of the fund's expenses during the period. Without this reimbursement, the fund's expense ratio would have been higher.
G Strategic Advisers or the fund has entered into varying arrangements with third parties who either paid or reduced a portion of the fund's expenses.
Prospectus
Appendix - continued
Fidelity Freedom 2020 Fund
|
Years ended March 31, |
2000 |
1999 |
1998 |
1997 E |
|
Selected Per-Share Data |
|
|
|
|
|
Net asset value, beginning of period |
$ 14.55 |
$ 13.28 |
$ 10.21 |
$ 10.00 |
|
Income from Investment Operations |
|
|
|
|
|
Net investment income D |
.32 |
.27 |
.21 |
.08 |
|
Net realized and unrealized gain (loss) |
3.43 |
1.55 |
3.33 |
.22 |
|
Total from investment operations |
3.75 |
1.82 |
3.54 |
.30 |
|
Less Distributions |
|
|
|
|
|
From net investment income |
(.35) |
(.28) |
(.34) |
(.09) |
|
In excess of net investment income |
(.10) |
- |
- |
- |
|
From net realized gain |
(.57) |
(.27) |
(.13) |
- |
|
Total distributions |
(1.02) |
(.55) |
(.47) |
(.09) |
|
Net asset value, end of period |
$ 17.28 |
$ 14.55 |
$ 13.28 |
$ 10.21 |
|
Total Return B, C |
26.74% |
14.00% |
35.36% |
2.99% |
|
Ratios and Supplemental Data (amounts do not include the activity of the underlying funds) |
|
|
||
|
Net assets, end of period (000 omitted) |
$ 1,964,178 |
$ 994,648 |
$ 577,603 |
$ 14,958 |
|
Ratio of expenses to average net assets |
.08% F |
.08% F |
.08% F |
.08% A, F |
|
Ratio of expenses to average net assets after |
.07% G |
.07% G |
.08% |
.08% A |
|
Ratio of net investment income to average net assets |
2.07% |
2.03% |
1.76% |
1.75% A |
|
Portfolio turnover rate |
28% |
18% |
15% |
21% A |
A Annualized
B Total returns for periods of less than one year are not annualized.
C The total returns would have been lower had certain expenses not been reduced during the periods shown.
D Net investment income per share has been calculated based on average shares outstanding during the period.
E For the period October 17,1996 (commencement of operations) to March 31,1997.
F Strategic Advisers agreed to reimburse a portion of the fund's expenses during the period. Without this reimbursement, the fund's expense ratio would have been higher.
G Strategic Advisers or the fund has entered into varying arrangements with third parties who either paid or reduced a portion of the fund's expenses.
Prospectus
Appendix - continued
Fidelity Freedom 2030 Fund
|
Years ended March 31, |
2000 |
1999 |
1998 |
1997 E |
|
Selected Per-Share Data |
|
|
|
|
|
Net asset value, beginning of period |
$ 14.55 |
$ 13.42 |
$ 10.21 |
$ 10.00 |
|
Income from Investment Operations |
|
|
|
|
|
Net investment income D |
.27 |
.25 |
.22 |
.08 |
|
Net realized and unrealized gain (loss) |
3.91 |
1.60 |
3.42 |
.22 |
|
Total from investment operations |
4.18 |
1.85 |
3.64 |
.30 |
|
Less Distributions |
|
|
|
|
|
From net investment income |
(.28) |
(.24) |
(.17) |
(.09) |
|
In excess of net investment income |
(.13) |
- |
(.14) |
- |
|
From net realized gain |
(.48) |
(.48) |
(.12) |
- |
|
Total distributions |
(.89) |
(.72) |
(.43) |
(.09) |
|
Net asset value, end of period |
$ 17.84 |
$ 14.55 |
$ 13.42 |
$ 10.21 |
|
Total Return B, C |
29.64% |
14.29% |
36.28% |
2.99% |
|
Ratios and Supplemental Data (amounts do not include the activity of the underlying funds) |
|
|
||
|
Net assets, end of period (000 omitted) |
$ 1,216,369 |
$ 365,657 |
$ 115,072 |
$ 5,725 |
|
Ratio of expenses to average net assets |
.08% F |
.08% F |
.08% F |
.08% A, F |
|
Ratio of expenses to average net assets after |
.07% G |
.07% G |
.08% |
.08% A |
|
Ratio of net investment income to average net assets |
1.71% |
1.87% |
1.78% |
1.71% A |
|
Portfolio turnover rate |
26% |
16% |
34% |
19% A |
A Annualized
B Total returns for periods of less than one year are not annualized.
C The total returns would have been lower had certain expenses not been reduced during the periods shown.
D Net investment income per share has been calculated based on average shares outstanding during the period.
E For the period October 17,1996 (commencement of operations) to March 31, 1997.
F Strategic Advisers agreed to reimburse a portion of the fund's expenses during the period. Without this reimbursement, the fund's expense ratio would have been higher.
G Strategic Advisers or the fund has entered into varying arrangements with third parties who either paid or reduced a portion of the fund's expenses.
Prospectus
You can obtain additional information about the funds. The funds' SAI includes more detailed information about each fund and its investments. The SAI is incorporated herein by reference (legally forms a part of the prospectus). For Freedom 2040, a financial report will be available once the fund has completed its first annual or semi-annual period. Each fund's annual and semi-annual reports include a discussion of the fund's holdings and recent market conditions and the fund's investment strategies that affected performance.
For a free copy of any of these documents or to request other information or ask questions about a fund, call Fidelity at 1-800-544-8544. In addition, you may visit Fidelity's web site at www.fidelity.com for a free copy of a prospectus or an annual or semi-annual report or to request other information.
|
<R>The SAI, the funds' annual and semi-annual reports and other related materials are available from the Electronic Data Gathering, Analysis, and Retrieval (EDGAR) Database on the SEC's web site (http://www.sec.gov). You can obtain copies of this information, after paying a duplicating fee, by sending a request by e-mail to [email protected] or by writing the Public Reference Section of the SEC, Washington, D.C. 20549-0102. You can also review and copy information about the funds, including the funds' SAI, at the SEC's Public Reference Room in Washington, D.C. Call 1-202-942-8090 for information on the operation of the SEC's Public Reference Room.</R> Investment Company Act of 1940, File Number, 811-6440. |
<R>Fidelity Freedom Funds, Fidelity Freedom Income Fund, Fidelity Freedom 2000 Fund, Fideltiy Freedom 2010 Fund, Fidelity Freedom 2020 Fund, Fidelity Freedom 2030 Fund, </R>Fidelity Investments & (Pyramid) Design, Fidelity, Fidelity Money Line, Fidelity Automatic Account Builder, Fidelity On-Line Xpress+, Directed Dividends, and FAST are registered trademarks of FMR Corp.
Fidelity Freedom 2040 Fund and Fidelity Portfolio Advisory Services are service marks of FMR Corp.
The third party marks appearing above are the marks of their respective owners.
1.702545.103 FF-pro-0500-01
FIDELITY FREEDOM FUNDS®
Fidelity Freedom Income Fund®
Fidelity Freedom 2000 Fund®
Fidelity Freedom 2010 Fund®
Fidelity Freedom 2020 Fund®
Fidelity Freedom 2030 Fund®
Fidelity Freedom 2040 FundSM
Funds of Fidelity Aberdeen Street Trust
STATEMENT OF ADDITIONAL INFORMATION
September 4, 2000
This statement of additional information (SAI) is not a prospectus. Portions of Freedom Income's, Freedom 2000's, Freedom 2010's, Freedom 2020's, and Freedom 2030's annual reports are incorporated herein. The annual reports are supplied with this SAI. An annual report for Freedom 2040 will be available once the fund has completed its first annual period.
To obtain a free additional copy of the prospectus, dated September 4, 2000, or an annual report, please call Fidelity at 1-800-544-8544 or visit Fidelity's web site at www.fidelity.com.
|
TABLE OF CONTENTS |
PAGE |
|
Investment Policies and Limitations |
|
|
Special Considerations Regarding Canada |
|
|
Special Considerations Regarding Europe |
|
|
Special Considerations Regarding Japan |
|
|
Special Considerations Regarding Asia Pacific Region (ex Japan) |
|
|
Special Considerations Regarding Latin America |
|
|
Special Considerations Regarding Russia |
|
|
Special Considerations Regarding Africa |
|
|
Portfolio Transactions |
|
|
Valuation |
|
|
Performance |
|
|
Additional Purchase, Exchange and Redemption Information |
|
|
Distributions and Taxes |
|
|
Trustees and Officers |
|
|
Control of Investment Advisers |
|
|
Management Contracts |
|
|
Distribution Services |
|
|
Transfer and Service Agent Agreements |
|
|
Description of the Trust |
|
|
Financial Statements |
|
|
Appendix |
FF-ptb-0500-01
1.475644.103
(fidelity_logo_graphic)
82 Devonshire Street, Boston, MA 02109
INVESTMENT POLICIES AND LIMITATIONS
The following policies and limitations supplement those set forth in the prospectus. Unless otherwise noted, whenever an investment policy or limitation states a maximum percentage of a Freedom Fund's assets that may be invested in any security or other asset, or sets forth a policy regarding quality standards, such standard or percentage limitation will be determined immediately after and as a result of the Freedom Fund's acquisition of such security or other asset. Accordingly, any subsequent change in values, net assets, or other circumstances will not be considered when determining whether the investment complies with the Freedom Fund's investment policies and limitations.
A Freedom Fund's fundamental investment policies and limitations cannot be changed without approval by a "majority of the outstanding voting securities" (as defined in the Investment Company Act of 1940 (the 1940 Act)) of the fund. However, except for the fundamental investment limitations listed below, the investment policies and limitations described in this SAI are not fundamental and may be changed without shareholder approval.
Investment Limitations of Fidelity Freedom Income Fund, Fidelity Freedom 2000 Fund, Fidelity Freedom 2010 Fund, Fidelity Freedom 2020 Fund, and Fidelity Freedom 2030 Fund
The following are each fund's fundamental investment limitations set forth in their entirety. Each fund may not:
(1) With respect to 75% of the fund's total assets, purchase the securities of any issuer (other than securities issued or guaranteed by the U.S. Government or any of its agencies or instrumentalities, or securities of other investment companies) if, as a result, (a) more than 5% of the fund's total assets would be invested in the securities of that issuer, or (b) the fund would hold more than 10% of the outstanding voting securities of that issuer;
(2) issue senior securities, except in connection with the insurance program established by the fund pursuant to an exemptive order issued by the Securities and Exchange Commission or as otherwise permitted under the Investment Company Act of 1940;
(3) borrow money, except that the fund may borrow money for temporary or emergency purposes (not for leveraging or investment) in an amount not exceeding 33 1/3% of its total assets (including the amount borrowed) less liabilities (other than borrowings). Any borrowings that come to exceed this amount will be reduced within three days (not including Sundays and holidays) to the extent necessary to comply with the 33 1/3% limitation;
(4) underwrite securities issued by others, except to the extent that the fund may be considered an underwriter within the meaning of the Securities Act of 1933 in the disposition of restricted securities;
(5) purchase the securities of any issuer (other than securities issued or guaranteed by the U.S. Government or any of its agencies or instrumentalities) if, as a result, more than 25% of the fund's total assets would be invested in the securities of companies whose principal business activities are in the same industry (provided that investments in other investment companies shall not be considered an investment in any particular industry for purposes of this investment limitation);
(6) purchase or sell real estate unless acquired as a result of ownership of securities or other instruments (but this shall not prevent the fund from investing in securities or other instruments backed by real estate or securities of companies engaged in the real estate business);
(7) purchase or sell physical commodities unless acquired as a result of ownership of securities or other instruments (but this shall not prevent the fund from purchasing or selling options and futures contracts or from investing in securities or other instruments backed by physical commodities); or
(8) lend any security or make any other loan if, as a result, more than 33 1/3% of its total assets would be lent to other parties, but this limitation does not apply to purchases of debt securities or to repurchase agreements.
(9) Each fund may, notwithstanding any other fundamental investment policy or limitation, invest all of its assets in the securities of a single open-end management investment company managed by Fidelity Management & Research Company or an affiliate or successor with substantially the same fundamental investment objective, policies, and limitations as the fund.
The following investment limitations are not fundamental and may be changed without shareholder approval.
(i) Each fund does not currently intend to sell securities short, unless it owns or has the right to obtain securities equivalent in kind and amount to the securities sold short, and provided that transactions in futures contracts and options are not deemed to constitute selling securities short.
(ii) Each fund does not currently intend to purchase securities on margin, except that the fund may obtain such short-term credits as are necessary for the clearance of transactions, and provided that margin payments in connection with futures contracts and options on futures contracts shall not constitute purchasing securities on margin.
(iii) Each fund may borrow money only (a) from a bank or from a registered investment company or portfolio for which FMR or an affiliate serves as investment adviser or (b) by engaging in reverse repurchase agreements with any party (reverse repurchase agreements are treated as borrowings for purposes of fundamental investment limitation (3)).
(iv) Each fund does not currently intend to purchase any security if, as a result, more than 10% of its net assets would be invested in securities that are deemed to be illiquid because they are subject to legal or contractual restrictions on resale or because they cannot be sold or disposed of in the ordinary course of business at approximately the prices at which they are valued.
(v) Each fund does not currently intend to lend assets other than securities to other parties, except by (a) lending money (up to 15% of the fund's net assets) to a registered investment company or portfolio for which FMR or an affiliate serves as investment adviser or (b) acquiring loans, loan participations, or other forms of direct debt instruments and, in connection therewith, assuming any associated unfunded commitments of the sellers. (This limitation does not apply to purchases of debt securities or to repurchase agreements.)
(vi) Each fund does not currently intend to invest all of its assets in the securities of a single open-end management investment company managed by Fidelity Management & Research Company or an affiliate or successor with substantially the same fundamental investment objective, policies, and limitations as the fund.
Investment Limitations of Fidelity Freedom 2040 Fund
The following are the fund's fundamental investment limitations set forth in their entirety. The fund may not:
(1) With respect to 75% of the fund's total assets, purchase the securities of any issuer (other than securities issued or guaranteed by the U.S. Government or any of its agencies or instrumentalities, or securities of other investment companies) if, as a result, (a) more than 5% of the fund's total assets would be invested in the securities of that issuer, or (b) the fund would hold more than 10% of the outstanding voting securities of that issuer;
(2) issue senior securities, except in connection with the insurance program established by the fund pursuant to an exemptive order issued by the Securities and Exchange Commission or as otherwise permitted under the Investment Company Act of 1940;
(3) borrow money, except that the fund may borrow money for temporary or emergency purposes (not for leveraging or investment) in an amount not exceeding 33 1/3% of its total assets (including the amount borrowed) less liabilities (other than borrowings). Any borrowings that come to exceed this amount will be reduced within three days (not including Sundays and holidays) to the extent necessary to comply with the 33 1/3% limitation;
(4) underwrite securities issued by others, except to the extent that the fund may be considered an underwriter within the meaning of the Securities Act of 1933 in the disposition of restricted securities or in connection with investments in other investment companies;
(5) purchase the securities of any issuer (other than securities issued or guaranteed by the U.S. Government or any of its agencies or instrumentalities, or securities of other investment companies) if, as a result, more than 25% of the fund's total assets would be invested in the securities of companies whose principal business activities are in the same industry;
(6) purchase or sell real estate unless acquired as a result of ownership of securities or other instruments (but this shall not prevent the fund from investing in securities or other instruments backed by real estate or securities of companies engaged in the real estate business);
(7) purchase or sell physical commodities unless acquired as a result of ownership of securities or other instruments (but this shall not prevent the fund from purchasing or selling options and futures contracts or from investing in securities or other instruments backed by physical commodities); or
(8) lend any security or make any other loan if, as a result, more than 33 1/3% of its total assets would be lent to other parties, but this limitation does not apply to purchases of debt securities or to repurchase agreements.
The following investment limitations are not fundamental and may be changed without shareholder approval.
(i) The fund does not currently intend to sell securities short, unless it owns or has the right to obtain securities equivalent in kind and amount to the securities sold short, and provided that transactions in futures contracts and options are not deemed to constitute selling securities short.
(ii) The fund does not currently intend to purchase securities on margin, except that the fund may obtain such short-term credits as are necessary for the clearance of transactions, and provided that margin payments in connection with futures contracts and options on futures contracts shall not constitute purchasing securities on margin.
(iii) The fund may borrow money only (a) from a bank or from a registered investment company or portfolio for which FMR or an affiliate serves as investment adviser or (b) by engaging in reverse repurchase agreements with any party (reverse repurchase agreements are treated as borrowings for purposes of fundamental investment limitation (3)).
(iv) The fund does not currently intend to purchase any security if, as a result, more than 10% of its net assets would be invested in securities that are deemed to be illiquid because they are subject to legal or contractual restrictions on resale or because they cannot be sold or disposed of in the ordinary course of business at approximately the prices at which they are valued.
(v) The fund does not currently intend to lend assets other than securities to other parties, except by (a) lending money (up to 15% of the fund's net assets) to a registered investment company or portfolio for which FMR or an affiliate serves as investment adviser or (b) acquiring loans, loan participations, or other forms of direct debt instruments and, in connection therewith, assuming any associated unfunded commitments of the sellers. (This limitation does not apply to purchases of debt securities or to repurchase agreements.)
With respect to limitation (iv), if through a change in values, net assets, or other circumstances, each Freedom Fund were in a position where more than 10% of its net assets were invested in illiquid securities, it would consider appropriate steps to protect liquidity.
For the Freedom Funds' limitations on futures and options transactions, see the section entitled "Limitations on Futures and Options Transactions" on page <Click Here>.
Notwithstanding the foregoing investment limitations, the underlying Fidelity funds in which the Freedom Funds may invest have adopted certain investment limitations that may be more or less restrictive than those listed above, thereby permitting a Freedom Fund to engage indirectly in investment strategies that are prohibited under the investment limitations listed above. The investment limitations of each underlying Fidelity fund are set forth in its SAI.
In accordance with each Freedom Fund's investment program as set forth in the prospectus, a Freedom Fund may invest more than 25% of its assets in any one underlying Fidelity fund. However, each of the underlying Fidelity funds in which a Freedom Fund may invest (other than Fidelity Money Market Trust: Retirement Money Market Portfolio and Fidelity OTC Portfolio) will not concentrate more than 25% of its total assets in any one industry, except that Fidelity Money Market Trust: Retirement Money Market Portfolio will invest more than 25% of its total assets in the financial services industry and Fidelity OTC Portfolio will invest more than 25% of its total assets in the technology industry.
Investment Practices of the Freedom Funds
The following pages contain more detailed information about types of instruments in which a Freedom Fund may invest, strategies Strategic Advisers, Inc. (Strategic Advisers) may employ in pursuit of a Freedom Fund's investment objective, and a summary of related risks. Strategic Advisers may not buy all of these instruments or use all of these techniques unless it believes that doing so will help a Freedom Fund achieve its goal.
Borrowing. Each Freedom Fund may borrow from banks or from other funds advised by Fidelity Management & Research Company (FMR) or its affiliates, or through reverse repurchase agreements. If a fund borrows money, its share price may be subject to greater fluctuation until the borrowing is paid off. If a fund makes additional investments while borrowings are outstanding, this may be considered a form of leverage.
Cash Management. A fund can hold uninvested cash or can invest it in cash equivalents such as money market securities, repurchase agreements or shares of money market funds. Generally, these securities offer less potential for gains than other types of securities.
Central Cash Funds are money market funds managed by FMR or its affiliates that seek to earn a high level of current income (free from federal income tax in the case of a municipal money market fund) while maintaining a stable $1.00 share price. The funds comply with industry-standard requirements for money market funds regarding the quality, maturity, and diversification of their investments.
Dollar-Weighted Average Maturity is derived by multiplying the value of each investment by the time remaining to its maturity, adding these calculations, and then dividing the total by the value of the fund's portfolio. An obligation's maturity is typically determined on a stated final maturity basis, although there are some exceptions to this rule.
For example, if it is probable that the issuer of an instrument will take advantage of a maturity-shortening device, such as a call, refunding, or redemption provision, the date on which the instrument will probably be called, refunded, or redeemed may be considered to be its maturity date. Also, the maturities of mortgage securities, including collateralized mortgage obligations, and some asset-backed securities are determined on a weighted average life basis, which is the average time for principal to be repaid. For a mortgage security, this average time is calculated by estimating the timing of principal payments, including unscheduled prepayments, during the life of the mortgage. The weighted average life of these securities is likely to be substantially shorter than their stated final maturity.
Futures Contracts. In purchasing a futures contract, the buyer agrees to purchase a specified underlying instrument at a specified future date. In selling a futures contract, the seller agrees to sell a specified underlying instrument at a specified future date. The price at which the purchase and sale will take place is fixed when the buyer and seller enter into the contract. Some currently available futures contracts are based on specific securities, such as U.S. Treasury bonds or notes, and some are based on indices of securities prices, such as the Standard & Poor's 500 Index (S&P 500®). Futures can be held until their delivery dates, or can be closed out before then if a liquid secondary market is available.
The value of a futures contract tends to increase and decrease in tandem with the value of its underlying instrument. Therefore, purchasing futures contracts will tend to increase a fund's exposure to positive and negative price fluctuations in the underlying instrument, much as if it had purchased the underlying instrument directly. When a fund sells a futures contract, by contrast, the value of its futures position will tend to move in a direction contrary to the market. Selling futures contracts, therefore, will tend to offset both positive and negative market price changes, much as if the underlying instrument had been sold.
Limitations on Futures and Options Transactions. Each of Freedom Income, Freedom 2000, Freedom 2010, Freedom 2020, and Freedom 2030 has filed a notice of eligibility for exclusion from the definition of the term "commodity pool operator" with the Commodity Futures Trading Commission (CFTC) and the National Futures Association, which regulate trading in the futures markets. Freedom 2040 intends to file a notice of eligibility for exclusion from the definition of the term "commodity pool operator" with the Commodity Futures Trading Commission (CFTC) and the National Futures Association, which regulate trading in the futures markets, before engaging in any purchases or sales of futures contracts or options on futures contracts. The funds intend to comply with Rule 4.5 under the Commodity Exchange Act, which limits the extent to which the funds can commit assets to initial margin deposits and option premiums.
In addition, each fund will not: (a) sell futures contracts, purchase put options, or write call options if, as a result, more than 25% of the fund's total assets would be hedged with futures and options under normal conditions; (b) purchase futures contracts or write put options if, as a result, the fund's total obligations upon settlement or exercise of purchased futures contracts and written put options would exceed 25% of its total assets under normal conditions; or (c) purchase call options if, as a result, the current value of option premiums for call options purchased by the fund would exceed 5% of the fund's total assets. These limitations do not apply to options attached to or acquired or traded together with their underlying securities, and do not apply to securities that incorporate features similar to options.
The above limitations on the funds' investments in futures contracts and options, and the funds' policies regarding futures contracts and options discussed elsewhere in this SAI, may be changed as regulatory agencies permit.
Illiquid Securities cannot be sold or disposed of in the ordinary course of business at approximately the prices at which they are valued. Difficulty in selling securities may result in a loss or may be costly to a fund. Under the supervision of the Board of Trustees, FMR, on behalf of Strategic Advisers, determines the liquidity of a fund's investments and, through reports from FMR, the Board monitors investments in illiquid securities. In determining the liquidity of a fund's investments, FMR may consider various factors, including (1) the frequency and volume of trades and quotations, (2) the number of dealers and prospective purchasers in the marketplace, (3) dealer undertakings to make a market, and (4) the nature of the security and the market in which it trades (including any demand, put or tender features, the mechanics and other requirements for transfer, any letters of credit or other credit enhancement features, any ratings, the number of holders, the method of soliciting offers, the time required to dispose of the security, and the ability to assign or offset the rights and obligations of the security).
Interfund Borrowing and Lending Program. Pursuant to an exemptive order issued by the Securities and Exchange Commission (SEC), a fund may lend money to, and borrow money from, other funds advised by FMR or its affiliates. A fund will lend through the program only when the returns are higher than those available from an investment in repurchase agreements, and will borrow through the program only when the costs are equal to or lower than the cost of bank loans. Interfund loans and borrowings normally extend overnight, but can have a maximum duration of seven days. Loans may be called on one day's notice. A fund may have to borrow from a bank at a higher interest rate if an interfund loan is called or not renewed. Any delay in repayment to a lending fund could result in a lost investment opportunity or additional borrowing costs.
Investment-Grade Debt Securities. Investment-grade debt securities are medium and high-quality securities. Some may possess speculative characteristics and may be more sensitive to economic changes and to changes in the financial conditions of issuers. A debt security is considered to be investment-grade if it is rated investment-grade by Moody's Investors Service, Standard & Poor's, or Fitch Inc., or is unrated but considered to be of equivalent quality by FMR.
Repurchase Agreements involve an agreement to purchase a security and to sell that security back to the original seller at an agreed-upon price. The resale price reflects the purchase price plus an agreed-upon incremental amount which is unrelated to the coupon rate or maturity of the purchased security. As protection against the risk that the original seller will not fulfill its obligation, the securities are held in a separate account at a bank, marked-to-market daily, and maintained at a value at least equal to the sale price plus the accrued incremental amount. The value of the security purchased may be more or less than the price at which the counterparty has agreed to purchase the security. In addition, delays or losses could result if the other party to the agreement defaults or becomes insolvent. The Freedom Funds will engage in repurchase agreement transactions with parties whose creditworthiness has been reviewed and found satisfactory by FMR on behalf of Strategic Advisers.
Restricted Securities are subject to legal restrictions on their sale. Difficulty in selling securities may result in a loss or be costly to a fund. Restricted securities generally can be sold in privately negotiated transactions, pursuant to an exemption from registration under the Securities Act of 1933, or in a registered public offering. Where registration is required, the holder of a registered security may be obligated to pay all or part of the registration expense and a considerable period may elapse between the time it decides to seek registration and the time it may be permitted to sell a security under an effective registration statement. If, during such a period, adverse market conditions were to develop, the holder might obtain a less favorable price than prevailed when it decided to seek registration of the security.
Reverse Repurchase Agreements. In a reverse repurchase agreement, a fund sells a security to another party, such as a bank or broker-dealer, in return for cash and agrees to repurchase that security at an agreed-upon price and time. The Freedom Funds will enter into reverse repurchase agreements with parties whose creditworthiness has been reviewed and found satisfactory by FMR on behalf of Strategic Advisers. Such transactions may increase fluctuations in the market value of fund assets and may be viewed as a form of leverage.
Securities Lending. A fund may lend securities to parties such as broker-dealers or other institutions, including Fidelity Brokerage Services <R>LLC (FBS LLC)</R>. FBSI is a member of the New York Stock Exchange (NYSE) and <R>an indirect</R> subsidiary of FMR Corp.
Securities lending allows a fund to retain ownership of the securities loaned and, at the same time, earn additional income. The borrower provides the fund with collateral in an amount at least equal to the value of the securities loaned. The fund maintains the ability to obtain the right to vote or consent on proxy proposals involving material events affecting securities loaned. If the borrower defaults on its obligation to return the securities loaned because of insolvency or other reasons, a fund could experience delays and costs in recovering the securities loaned or in gaining access to the collateral. These delays and costs could be greater for foreign securities. If a fund is not able to recover the securities loaned, a fund may sell the collateral and purchase a replacement investment in the market. The value of the collateral could decrease below the value of the replacement investment by the time the replacement investment is purchased. Loans will be made only to parties deemed by Strategic Advisers to be in good standing and when, in Strategic Advisers' judgment, the income earned would justify the risks.
Cash received as collateral through loan transactions may be invested in other eligible securities. Investing this cash subjects that investment, as well as the securities loaned, to market appreciation or depreciation.
Sources of Liquidity or Credit Support. Issuers may employ various forms of credit and liquidity enhancements, including letters of credit, guarantees, puts, and demand features, and insurance provided by domestic or foreign entities such as banks and other financial institutions. Strategic Advisers may rely on FMR's evaluation of the credit of the liquidity or credit enhancement provider in determining whether to purchase a security supported by such enhancement. In evaluating the credit of a foreign bank or other foreign entities, FMR will consider whether adequate public information about the entity is available and whether the entity may be subject to unfavorable political or economic developments, currency controls, or other government restrictions that might affect its ability to honor its commitment. Changes in the credit quality of the entity providing the enhancement could affect the value of the security or a fund's share price.
Temporary Defensive Policies. Each of the Freedom Funds reserves the right to invest without limitation in Fidelity Money Market Trust: Retirement Money Market Portfolio for temporary, defensive purposes.
Investment Practices of the Underlying Fidelity Funds
The following pages contain more detailed information about types of instruments in which an underlying Fidelity fund may invest, strategies FMR may employ in pursuit of an underlying Fidelity fund's investment objective, and a summary of related risks. FMR may not buy all of these instruments or use all of these techniques unless it believes that doing so will help an underlying Fidelity fund achieve its goal.
Affiliated Bank Transactions. A fund may engage in transactions with financial institutions that are, or may be considered to be, "affiliated persons" of the fund under the 1940 Act. These transactions may involve repurchase agreements with custodian banks; short-term obligations of, and repurchase agreements with, the 50 largest U.S. banks (measured by deposits); municipal securities; U.S. Government securities with affiliated financial institutions that are primary dealers in these securities; short-term currency transactions; and short-term borrowings. In accordance with exemptive orders issued by the SEC, the Board of Trustees has established and periodically reviews procedures applicable to transactions involving affiliated financial institutions.
Asset-Backed Securities represent interests in pools of mortgages, loans, receivables or other assets. Payment of interest and repayment of principal may be largely dependent upon the cash flows generated by the assets backing the securities and, in certain cases, supported by letters of credit, surety bonds, or other credit enhancements. Asset-backed security values may also be affected by other factors including changes in interest rates, the availability of information concerning the pool and its structure, the creditworthiness of the servicing agent for the pool, the originator of the loans or receivables, or the entities providing the credit enhancement. In addition, these securities may be subject to prepayment risk.
Borrowing. Each fund may borrow from banks or from other funds advised by FMR or its affiliates, or through reverse repurchase agreements. If a fund borrows money, its share price may be subject to greater fluctuation until the borrowing is paid off. If a fund makes additional investments while borrowings are outstanding, this may be considered a form of leverage.
Cash Management. A fund can hold uninvested cash or can invest it in cash equivalents such as money market securities, repurchase agreements or shares of money market funds. Generally, these securities offer less potential for gains than other types of securities.
Central Cash Funds are money market funds managed by FMR or its affiliates that seek to earn a high level of current income (free from federal income tax in the case of a municipal money market fund) while maintaining a stable $1.00 share price. The funds comply with industry-standard requirements for money market funds regarding the quality, maturity, and diversification of their investments.
Common Stock represents an equity or ownership interest in an issuer. In the event an issuer is liquidated or declares bankruptcy, the claims of owners of bonds and preferred stock take precedence over the claims of those who own common stock.
Convertible Securities are bonds, debentures, notes, preferred stocks or other securities that may be converted or exchanged (by the holder or by the issuer) into shares of the underlying common stock (or cash or securities of equivalent value) at a stated exchange ratio. A convertible security may also be called for redemption or conversion by the issuer after a particular date and under certain circumstances (including a specified price) established upon issue. If a convertible security held by a fund is called for redemption or conversion, the fund could be required to tender it for redemption, convert it into the underlying common stock, or sell it to a third party.
Convertible securities generally have less potential for gain or loss than common stocks. Convertible securities generally provide yields higher than the underlying common stocks, but generally lower than comparable non-convertible securities. Because of this higher yield, convertible securities generally sell at prices above their "conversion value," which is the current market value of the stock to be received upon conversion. The difference between this conversion value and the price of convertible securities will vary over time depending on changes in the value of the underlying common stocks and interest rates. When the underlying common stocks decline in value, convertible securities will tend not to decline to the same extent because of the interest or dividend payments and the repayment of principal at maturity for certain types of convertible securities. However, securities that are convertible other than at the option of the holder generally do not limit the potential for loss to the same extent as securities convertible at the option of the holder. When the underlying common stocks rise in value, the value of convertible securities may also be expected to increase. At the same time, however, the difference between the market value of convertible securities and their conversion value will narrow, which means that the value of convertible securities will generally not increase to the same extent as the value of the underlying common stocks. Because convertible securities may also be interest-rate sensitive, their value may increase as interest rates fall and decrease as interest rates rise. Convertible securities are also subject to credit risk, and are often lower-quality securities.
Debt Securities are used by issuers to borrow money. The issuer usually pays a fixed, variable or floating rate of interest, and must repay the amount borrowed at the maturity of the security. Some debt securities, such as zero coupon bonds, do not pay interest but are sold at a deep discount from their face values. Debt securities include corporate bonds, government securities, and mortgage and other asset-backed securities.
Dollar-Weighted Average Maturity is derived by multiplying the value of each investment by the time remaining to its maturity, adding these calculations, and then dividing the total by the value of the fund's portfolio. An obligation's maturity is typically determined on a stated final maturity basis, although there are some exceptions to this rule.
For example, if it is probable that the issuer of an instrument will take advantage of a maturity-shortening device, such as a call, refunding, or redemption provision, the date on which the instrument will probably be called, refunded, or redeemed may be considered to be its maturity date. Also, the maturities of mortgage securities, including collateralized mortgage obligations, and some asset-backed securities are determined on a weighted average life basis, which is the average time for principal to be repaid. For a mortgage security, this average time is calculated by estimating the timing of principal payments, including unscheduled prepayments, during the life of the mortgage. The weighted average life of these securities is likely to be substantially shorter than their stated final maturity.
Domestic and Foreign Investments (money market fund only) include U.S. dollar-denominated time deposits, certificates of deposit, and bankers' acceptances of U.S. banks and their branches located outside of the United States, U.S. branches and agencies of foreign banks, and foreign branches of foreign banks. Domestic and foreign investments may also include U.S. dollar-denominated securities issued or guaranteed by other U.S. or foreign issuers, including U.S. and foreign corporations or other business organizations, foreign governments, foreign government agencies or instrumentalities, and U.S. and foreign financial institutions, including savings and loan institutions, insurance companies, mortgage bankers, and real estate investment trusts, as well as banks.
The obligations of foreign branches of U.S. banks may be general obligations of the parent bank in addition to the issuing branch, or may be limited by the terms of a specific obligation and by governmental regulation. Payment of interest and repayment of principal on these obligations may also be affected by governmental action in the country of domicile of the branch (generally referred to as sovereign risk). In addition, evidence of ownership of portfolio securities may be held outside of the United States and a fund may be subject to the risks associated with the holding of such property overseas. Various provisions of federal law governing the establishment and operation of U.S. branches do not apply to foreign branches of U.S. banks.
Obligations of U.S. branches and agencies of foreign banks may be general obligations of the parent bank in addition to the issuing branch, or may be limited by the terms of a specific obligation and by federal and state regulation, as well as by governmental action in the country in which the foreign bank has its head office.
Obligations of foreign issuers involve certain additional risks. These risks may include future unfavorable political and economic developments, withholding taxes, seizures of foreign deposits, currency controls, interest limitations, or other governmental restrictions that might affect repayment of principal or payment of interest, or the ability to honor a credit commitment. Additionally, there may be less public information available about foreign entities. Foreign issuers may be subject to less governmental regulation and supervision than U.S. issuers. Foreign issuers also generally are not bound by uniform accounting, auditing, and financial reporting requirements comparable to those applicable to U.S. issuers.
Exposure to Foreign Markets. Foreign securities, foreign currencies, and securities issued by U.S. entities with substantial foreign operations may involve significant risks in addition to the risks inherent in U.S. investments.
Foreign investments involve risks relating to local political, economic, regulatory, or social instability, military action or unrest, or adverse diplomatic developments, and may be affected by actions of foreign governments adverse to the interests of U.S. investors. Such actions may include expropriation or nationalization of assets, confiscatory taxation, restrictions on U.S. investment or on the ability to repatriate assets or convert currency into U.S. dollars, or other government intervention. Additionally, governmental issuers of foreign debt securities may be unwilling to pay interest and repay principal when due and may require that the conditions for payment be renegotiated. There is no assurance that FMR will be able to anticipate these potential events or counter their effects. In addition, the value of securities denominated in foreign currencies and of dividends and interest paid with respect to such securities will fluctuate based on the relative strength of the U.S. dollar.
The risks of foreign investing may be magnified for investments in emerging markets, which may have relatively unstable governments, economies based on only a few industries, and securities markets that trade a small number of securities.
It is anticipated that in most cases the best available market for foreign securities will be on an exchange or in over-the-counter (OTC) markets located outside of the United States. Foreign stock markets, while growing in volume and sophistication, are generally not as developed as those in the United States, and securities of some foreign issuers may be less liquid and more volatile than securities of comparable U.S. issuers. Foreign security trading, settlement and custodial practices (including those involving securities settlement where fund assets may be released prior to receipt of payment) are often less developed than those in U.S. markets, and may result in increased risk or substantial delays in the event of a failed trade or the insolvency of, or breach of duty by, a foreign broker-dealer, securities depository or foreign subcustodian. In addition, the costs associated with foreign investments, including withholding taxes, brokerage commissions and custodial costs, are generally higher than with U.S. investments.
Foreign markets may offer less protection to investors than U.S. markets. Foreign issuers are generally not bound by uniform accounting, auditing, and financial reporting requirements and standards of practice comparable to those applicable to U.S. issuers. Adequate public information on foreign issuers may not be available, and it may be difficult to secure dividends and information regarding corporate actions on a timely basis. In general, there is less overall governmental supervision and regulation of securities exchanges, brokers, and listed companies than in the United States. OTC markets tend to be less regulated than stock exchange markets and, in certain countries, may be totally unregulated. Regulatory enforcement may be influenced by economic or political concerns, and investors may have difficulty enforcing their legal rights in foreign countries.
Some foreign securities impose restrictions on transfer within the United States or to U.S. persons. Although securities subject to such transfer restrictions may be marketable abroad, they may be less liquid than foreign securities of the same class that are not subject to such restrictions.
American Depositary Receipts (ADRs) as well as other "hybrid" forms of ADRs, including European Depositary Receipts (EDRs) and Global Depositary Receipts (GDRs), are certificates evidencing ownership of shares of a foreign issuer. These certificates are issued by depository banks and generally trade on an established market in the United States or elsewhere. The underlying shares are held in trust by a custodian bank or similar financial institution in the issuer's home country. The depository bank may not have physical custody of the underlying securities at all times and may charge fees for various services, including forwarding dividends and interest and corporate actions. ADRs are alternatives to directly purchasing the underlying foreign securities in their national markets and currencies. However, ADRs continue to be subject to many of the risks associated with investing directly in foreign securities. These risks include foreign exchange risk as well as the political and economic risks of the underlying issuer's country.
The risks of foreign investing may be magnified for investments in emerging markets. Security prices in emerging markets can be significantly more volatile than those in more developed markets, reflecting the greater uncertainties of investing in less established markets and economies. In particular, countries with emerging markets may have relatively unstable governments, may present the risks of nationalization of businesses, restrictions on foreign ownership and prohibitions on the repatriation of assets, and may have less protection of property rights than more developed countries. The economies of countries with emerging markets may be based on only a few industries, may be highly vulnerable to changes in local or global trade conditions, and may suffer from extreme and volatile debt burdens or inflation rates. Local securities markets may trade a small number of securities and may be unable to respond effectively to increases in trading volume, potentially making prompt liquidation of holdings difficult or impossible at times.
Foreign Currency Transactions. A fund (other than the money market fund) may conduct foreign currency transactions on a spot (i.e., cash) or forward basis (i.e., by entering into forward contracts to purchase or sell foreign currencies). Although foreign exchange dealers generally do not charge a fee for such conversions, they do realize a profit based on the difference between the prices at which they are buying and selling various currencies. Thus, a dealer may offer to sell a foreign currency at one rate, while offering a lesser rate of exchange should the counterparty desire to resell that currency to the dealer. Forward contracts are customized transactions that require a specific amount of a currency to be delivered at a specific exchange rate on a specific date or range of dates in the future. Forward contracts are generally traded in an interbank market directly between currency traders (usually large commercial banks) and their customers. The parties to a forward contract may agree to offset or terminate the contract before its maturity, or may hold the contract to maturity and complete the contemplated currency exchange.
The following discussion summarizes the principal currency management strategies involving forward contracts that could be used by a fund. A fund may also use swap agreements, indexed securities, and options and futures contracts relating to foreign currencies for the same purposes.
A "settlement hedge" or "transaction hedge" is designed to protect a fund against an adverse change in foreign currency values between the date a security is purchased or sold and the date on which payment is made or received. Entering into a forward contract for the purchase or sale of the amount of foreign currency involved in an underlying security transaction for a fixed amount of U.S. dollars "locks in" the U.S. dollar price of the security. Forward contracts to purchase or sell a foreign currency may also be used by a fund in anticipation of future purchases or sales of securities denominated in foreign currency, even if the specific investments have not yet been selected by FMR.
A fund may also use forward contracts to hedge against a decline in the value of existing investments denominated in foreign currency. For example, if a fund owned securities denominated in pounds sterling, it could enter into a forward contract to sell pounds sterling in return for U.S. dollars to hedge against possible declines in the pound's value. Such a hedge, sometimes referred to as a "position hedge," would tend to offset both positive and negative currency fluctuations, but would not offset changes in security values caused by other factors. A fund could also hedge the position by selling another currency expected to perform similarly to the pound sterling. This type of hedge, sometimes referred to as a "proxy hedge," could offer advantages in terms of cost, yield, or efficiency, but generally would not hedge currency exposure as effectively as a direct hedge into U.S. dollars. Proxy hedges may result in losses if the currency used to hedge does not perform similarly to the currency in which the hedged securities are denominated.
A fund may enter into forward contracts to shift its investment exposure from one currency into another. This may include shifting exposure from U.S. dollars to a foreign currency, or from one foreign currency to another foreign currency. This type of strategy, sometimes known as a "cross-hedge," will tend to reduce or eliminate exposure to the currency that is sold, and increase exposure to the currency that is purchased, much as if a fund had sold a security denominated in one currency and purchased an equivalent security denominated in another. Cross-hedges protect against losses resulting from a decline in the hedged currency, but will cause a fund to assume the risk of fluctuations in the value of the currency it purchases.
Successful use of currency management strategies will depend on FMR's skill in analyzing currency values. Currency management strategies may substantially change a fund's investment exposure to changes in currency exchange rates and could result in losses to a fund if currencies do not perform as FMR anticipates. For example, if a currency's value rose at a time when FMR had hedged a fund by selling that currency in exchange for dollars, a fund would not participate in the currency's appreciation. If FMR hedges currency exposure through proxy hedges, a fund could realize currency losses from both the hedge and the security position if the two currencies do not move in tandem. Similarly, if FMR increases a fund's exposure to a foreign currency and that currency's value declines, a fund will realize a loss. There is no assurance that FMR's use of currency management strategies will be advantageous to a fund or that it will hedge at appropriate times.
Foreign Repurchase Agreements. Foreign repurchase agreements involve an agreement to purchase a foreign security and to sell that security back to original seller at an agreed-upon price in either U.S. dollars or foreign currency. Unlike typical U.S. repurchase agreements, foreign repurchase agreements may not be fully collateralized at all times. The value of a security purchased by a fund may be more or less than the price at which the counterparty has agreed to repurchase the security. In the event of default by the counterparty, the fund may suffer a loss if the value of the security purchased is less than the agreed-upon repurchase price, or if the fund is unable to successfully assert a claim to the collateral under foreign laws. As a result, foreign repurchase agreements may involve higher credit risks than repurchase agreements in U.S. markets, as well as risks associated with currency fluctuations. In addition, as with other emerging market investments, repurchase agreements with counterparties located in emerging markets or relating to emerging markets may involve issuers or counterparties with lower credit ratings than typical U.S. repurchase agreements.
Funds' Rights as Shareholders. The funds do not intend to direct or administer the day-to-day operations of any company. A fund, however, may exercise its rights as a shareholder and may communicate its views on important matters of policy to management, the Board of Directors, and shareholders of a company when FMR determines that such matters could have a significant effect on the value of the fund's investment in the company. The activities in which a fund may engage, either individually or in conjunction with others, may include, among others, supporting or opposing proposed changes in a company's corporate structure or business activities; seeking changes in a company's directors or management; seeking changes in a company's direction or policies; seeking the sale or reorganization of the company or a portion of its assets; or supporting or opposing third-party takeover efforts. This area of corporate activity is increasingly prone to litigation and it is possible that a fund could be involved in lawsuits related to such activities. FMR will monitor such activities with a view to mitigating, to the extent possible, the risk of litigation against a fund and the risk of actual liability if a fund is involved in litigation. No guarantee can be made, however, that litigation against a fund will not be undertaken or liabilities incurred.
Futures and Options. The following paragraphs pertain to futures and options: Combined Positions, Correlation of Price Changes, Futures Contracts, Futures Margin Payments, Limitations on Futures and Options Transactions, Liquidity of Options and Futures Contracts, Options and Futures Relating to Foreign Currencies, OTC Options, Purchasing Put and Call Options, and Writing Put and Call Options.
Combined Positions involve purchasing and writing options in combination with each other, or in combination with futures or forward contracts, to adjust the risk and return characteristics of the overall position. For example, purchasing a put option and writing a call option on the same underlying instrument would construct a combined position whose risk and return characteristics are similar to selling a futures contract. Another possible combined position would involve writing a call option at one strike price and buying a call option at a lower price, to reduce the risk of the written call option in the event of a substantial price increase. Because combined options positions involve multiple trades, they result in higher transaction costs and may be more difficult to open and close out.
Correlation of Price Changes. Because there are a limited number of types of exchange-traded options and futures contracts, it is likely that the standardized contracts available will not match a fund's current or anticipated investments exactly. A fund may invest in options and futures contracts based on securities with different issuers, maturities, or other characteristics from the securities in which the fund typically invests, which involves a risk that the options or futures position will not track the performance of the fund's other investments.
Options and futures prices can also diverge from the prices of their underlying instruments, even if the underlying instruments match a fund's investments well. Options and futures prices are affected by such factors as current and anticipated short-term interest rates, changes in volatility of the underlying instrument, and the time remaining until expiration of the contract, which may not affect security prices the same way. Imperfect correlation may also result from differing levels of demand in the options and futures markets and the securities markets, from structural differences in how options and futures and securities are traded, or from imposition of daily price fluctuation limits or trading halts. A fund may purchase or sell options and futures contracts with a greater or lesser value than the securities it wishes to hedge or intends to purchase in order to attempt to compensate for differences in volatility between the contract and the securities, although this may not be successful in all cases. If price changes in a fund's options or futures positions are poorly correlated with its other investments, the positions may fail to produce anticipated gains or result in losses that are not offset by gains in other investments.
Futures Contracts. In purchasing a futures contract, the buyer agrees to purchase a specified underlying instrument at a specified future date. In selling a futures contract, the seller agrees to sell a specified underlying instrument at a specified future date. The price at which the purchase and sale will take place is fixed when the buyer and seller enter into the contract. Some currently available futures contracts are based on specific securities, such as U.S. Treasury bonds or notes, and some are based on indices of securities prices, such as the S&P 500. Futures can be held until their delivery dates, or can be closed out before then if a liquid secondary market is available.
Futures may be based on foreign indexes such as the CAC 40 (France), DAX 30 (Germany), EuroTop 100 (Europe), IBEX (Spain), FTSE 100 (United Kingdom), All Ordinary (Australia), Hang Seng (Hong Kong), and Nikkei 225, Nikkei 300 and TOPIX (Japan).
The value of a futures contract tends to increase and decrease in tandem with the value of its underlying instrument. Therefore, purchasing futures contracts will tend to increase a fund's exposure to positive and negative price fluctuations in the underlying instrument, much as if it had purchased the underlying instrument directly. When a fund sells a futures contract, by contrast, the value of its futures position will tend to move in a direction contrary to the market. Selling futures contracts, therefore, will tend to offset both positive and negative market price changes, much as if the underlying instrument had been sold.
Futures Margin Payments. The purchaser or seller of a futures contract is not required to deliver or pay for the underlying instrument unless the contract is held until the delivery date. However, both the purchaser and seller are required to deposit "initial margin" with a futures broker, known as a futures commission merchant (FCM), when the contract is entered into. Initial margin deposits are typically equal to a percentage of the contract's value. If the value of either party's position declines, that party will be required to make additional "variation margin" payments to settle the change in value on a daily basis. The party that has a gain may be entitled to receive all or a portion of this amount. Initial and variation margin payments do not constitute purchasing securities on margin for purposes of a fund's investment limitations. In the event of the bankruptcy of an FCM that holds margin on behalf of a fund, the fund may be entitled to return of margin owed to it only in proportion to the amount received by the FCM's other customers, potentially resulting in losses to the fund.
Although futures exchanges generally operate similarly in the United States and abroad, foreign futures exchanges may follow trading, settlement and margin procedures that are different from those for U.S. exchanges. Futures contracts traded outside the United States may involve greater risk of loss than U.S.-traded contracts, including potentially greater risk of losses due to insolvency of a futures broker, exchange member or other party that may owe initial or variation margin to a fund. Because initial and variation margin payments may be measured in foreign currency, a futures contract traded outside the United States may also involve the risk of foreign currency fluctuation.
Limitations on Futures and Options Transactions. Each fund (other than the money market fund) has filed a notice of eligibility for exclusion from the definition of the term "commodity pool operator" with the Commodity Futures Trading Commission (CFTC) and the National Futures Association, which regulate trading in the futures markets. The funds intend to comply with Rule 4.5 under the Commodity Exchange Act, which limits the extent to which the funds can commit assets to initial margin deposits and option premiums.
In addition, each equity fund will not: (a) sell futures contracts, purchase put options, or write call options if, as a result, more than 25% of the fund's total assets would be hedged with futures and options under normal conditions; (b) purchase futures contracts or write put options if, as a result, the fund's total obligations upon settlement or exercise of purchased futures contracts and written put options would exceed 25% of its total assets under normal conditions; or (c) purchase call options if, as a result, the current value of option premiums for call options purchased by the fund would exceed 5% of the fund's total assets. These limitations do not apply to options attached to or acquired or traded together with their underlying securities, and do not apply to securities that incorporate features similar to options.
In addition, each bond fund will not: (a) sell futures contracts, purchase put options, or write call options if, as a result, more than 25% of the fund's total assets would be hedged with futures and options under normal conditions; (b) purchase futures contracts or write put options if, as a result, the fund's total obligations upon settlement or exercise of purchased futures contracts and written put options would exceed 25% of its total assets; or (c) purchase call options if, as a result, the current value of option premiums for call options purchased by the fund would exceed 5% of the fund's total assets. These limitations do not apply to options attached to or acquired or traded together with their underlying securities, and do not apply to securities that incorporate features similar to options.
Fidelity Government Income Fund further limits its options and futures investments to options and futures contracts relating to U.S. Government securities.
The above limitations on the bond and equity funds' investments in futures contracts and options, and the funds' policies regarding futures contracts and options discussed elsewhere in this SAI, may be changed as regulatory agencies permit.
Liquidity of Options and Futures Contracts. There is no assurance a liquid secondary market will exist for any particular options or futures contract at any particular time. Options may have relatively low trading volume and liquidity if their strike prices are not close to the underlying instrument's current price. In addition, exchanges may establish daily price fluctuation limits for options and futures contracts, and may halt trading if a contract's price moves upward or downward more than the limit in a given day. On volatile trading days when the price fluctuation limit is reached or a trading halt is imposed, it may be impossible to enter into new positions or close out existing positions. If the secondary market for a contract is not liquid because of price fluctuation limits or otherwise, it could prevent prompt liquidation of unfavorable positions, and potentially could require a fund to continue to hold a position until delivery or expiration regardless of changes in its value. As a result, a fund's access to other assets held to cover its options or futures positions could also be impaired.
Options and Futures Relating to Foreign Currencies. Currency futures contracts are similar to forward currency exchange contracts, except that they are traded on exchanges (and have margin requirements) and are standardized as to contract size and delivery date. Most currency futures contracts call for payment or delivery in U.S. dollars. The underlying instrument of a currency option may be a foreign currency, which generally is purchased or delivered in exchange for U.S. dollars, or may be a futures contract. The purchaser of a currency call obtains the right to purchase the underlying currency, and the purchaser of a currency put obtains the right to sell the underlying currency.
The uses and risks of currency options and futures are similar to options and futures relating to securities or indices, as discussed above. A fund may purchase and sell currency futures and may purchase and write currency options to increase or decrease its exposure to different foreign currencies. Currency options may also be purchased or written in conjunction with each other or with currency futures or forward contracts. Currency futures and options values can be expected to correlate with exchange rates, but may not reflect other factors that affect the value of a fund's investments. A currency hedge, for example, should protect a Yen-denominated security from a decline in the Yen, but will not protect a fund against a price decline resulting from deterioration in the issuer's creditworthiness. Because the value of a fund's foreign-denominated investments changes in response to many factors other than exchange rates, it may not be possible to match the amount of currency options and futures to the value of the fund's investments exactly over time.
OTC Options. Unlike exchange-traded options, which are standardized with respect to the underlying instrument, expiration date, contract size, and strike price, the terms of OTC options (options not traded on exchanges) generally are established through negotiation with the other party to the option contract. While this type of arrangement allows the purchaser or writer greater flexibility to tailor an option to its needs, OTC options generally involve greater credit risk than exchange-traded options, which are guaranteed by the clearing organization of the exchanges where they are traded.
Purchasing Put and Call Options. By purchasing a put option, the purchaser obtains the right (but not the obligation) to sell the option's underlying instrument at a fixed strike price. In return for this right, the purchaser pays the current market price for the option (known as the option premium). Options have various types of underlying instruments, including specific securities, indices of securities prices, and futures contracts. The purchaser may terminate its position in a put option by allowing it to expire or by exercising the option. If the option is allowed to expire, the purchaser will lose the entire premium. If the option is exercised, the purchaser completes the sale of the underlying instrument at the strike price. A purchaser may also terminate a put option position by closing it out in the secondary market at its current price, if a liquid secondary market exists.
The buyer of a typical put option can expect to realize a gain if security prices fall substantially. However, if the underlying instrument's price does not fall enough to offset the cost of purchasing the option, a put buyer can expect to suffer a loss (limited to the amount of the premium, plus related transaction costs).
The features of call options are essentially the same as those of put options, except that the purchaser of a call option obtains the right to purchase, rather than sell, the underlying instrument at the option's strike price. A call buyer typically attempts to participate in potential price increases of the underlying instrument with risk limited to the cost of the option if security prices fall. At the same time, the buyer can expect to suffer a loss if security prices do not rise sufficiently to offset the cost of the option.
Writing Put and Call Options. The writer of a put or call option takes the opposite side of the transaction from the option's purchaser. In return for receipt of the premium, the writer assumes the obligation to pay the strike price for the option's underlying instrument if the other party to the option chooses to exercise it. The writer may seek to terminate a position in a put option before exercise by closing out the option in the secondary market at its current price. If the secondary market is not liquid for a put option, however, the writer must continue to be prepared to pay the strike price while the option is outstanding, regardless of price changes. When writing an option on a futures contract, a fund will be required to make margin payments to an FCM as described above for futures contracts.
If security prices rise, a put writer would generally expect to profit, although its gain would be limited to the amount of the premium it received. If security prices remain the same over time, it is likely that the writer will also profit, because it should be able to close out the option at a lower price. If security prices fall, the put writer would expect to suffer a loss. This loss should be less than the loss from purchasing the underlying instrument directly, however, because the premium received for writing the option should mitigate the effects of the decline.
Writing a call option obligates the writer to sell or deliver the option's underlying instrument, in return for the strike price, upon exercise of the option. The characteristics of writing call options are similar to those of writing put options, except that writing calls generally is a profitable strategy if prices remain the same or fall. Through receipt of the option premium, a call writer mitigates the effects of a price decline. At the same time, because a call writer must be prepared to deliver the underlying instrument in return for the strike price, even if its current value is greater, a call writer gives up some ability to participate in security price increases.
Illiquid Securities cannot be sold or disposed of in the ordinary course of business at approximately the prices at which they are valued. Difficulty in selling securities may result in a loss or may be costly to a fund. Under the supervision of the Board of Trustees, FMR determines the liquidity of a fund's investments and, through reports from FMR, the Board monitors investments in illiquid securities. In determining the liquidity of a fund's investments, FMR may consider various factors, including (1) the frequency and volume of trades and quotations, (2) the number of dealers and prospective purchasers in the marketplace, (3) dealer undertakings to make a market, and (4) the nature of the security and the market in which it trades (including any demand, put or tender features, the mechanics and other requirements for transfer, any letters of credit or other credit enhancement features, any ratings, the number of holders, the method of soliciting offers, the time required to dispose of the security, and the ability to assign or offset the rights and obligations of the security).
Indexed Securities are instruments whose prices are indexed to the prices of other securities, securities indices, currencies, or other financial indicators. Indexed securities typically, but not always, are debt securities or deposits whose value at maturity or coupon rate is determined by reference to a specific instrument or statistic.
Mortgage-indexed securities, for example, could be structured to replicate the performance of mortgage securities and the characteristics of direct ownership.
Currency-indexed securities typically are short-term to intermediate-term debt securities whose maturity values or interest rates are determined by reference to the values of one or more specified foreign currencies, and may offer higher yields than U.S. dollar-denominated securities. Currency-indexed securities may be positively or negatively indexed; that is, their maturity value may increase when the specified currency value increases, resulting in a security that performs similarly to a foreign-denominated instrument, or their maturity value may decline when foreign currencies increase, resulting in a security whose price characteristics are similar to a put on the underlying currency. Currency-indexed securities may also have prices that depend on the values of a number of different foreign currencies relative to each other.
The performance of indexed securities depends to a great extent on the performance of the security, currency, or other instrument to which they are indexed, and may also be influenced by interest rate changes in the United States and abroad. Indexed securities may be more volatile than the underlying instruments. Indexed securities are also subject to the credit risks associated with the issuer of the security, and their values may decline substantially if the issuer's creditworthiness deteriorates. Recent issuers of indexed securities have included banks, corporations, and certain U.S. Government agencies.
Interfund Borrowing and Lending Program. Pursuant to an exemptive order issued by the SEC, a fund may lend money to, and borrow money from, other funds advised by FMR or its affiliates. A fund will lend through the program only when the returns are higher than those available from an investment in repurchase agreements, and will borrow through the program only when the costs are equal to or lower than the cost of bank loans. Interfund loans and borrowings normally extend overnight, but can have a maximum duration of seven days. Loans may be called on one day's notice. A fund may have to borrow from a bank at a higher interest rate if an interfund loan is called or not renewed. Any delay in repayment to a lending fund could result in a lost investment opportunity or additional borrowing costs.
Investment-Grade Debt Securities. Investment-grade debt securities are medium and high-quality securities. Some may possess speculative characteristics and may be more sensitive to economic changes and to changes in the financial conditions of issuers. A debt security is considered to be investment-grade if it is rated investment-grade by Moody's Investors Service, Standard & Poor's, or Fitch Inc., or is unrated but considered to be of equivalent quality by FMR.
Issuer Location. FMR determines where an issuer or its principal activities are located by looking at such factors as the issuer's country of organization, the primary trading market for the issuer's securities, and the location of the issuer's assets, personnel, sales, and earnings. The issuer of a security is considered to be located in a particular country if (1) the security is issued or guaranteed by the government of the country or any of its agencies, political subdivisions, or instrumentalities; (2) the security has its primary trading market in that country; or (3) the issuer is organized under the laws of that country, derives at least 50% of its revenues or profits from goods sold, investments made, or services performed in the country, or has at least 50% of its assets located in the country.
Loans and Other Direct Debt Instruments. Direct debt instruments are interests in amounts owed by a corporate, governmental, or other borrower to lenders or lending syndicates (loans and loan participations), to suppliers of goods or services (trade claims or other receivables), or to other parties. Direct debt instruments involve a risk of loss in case of default or insolvency of the borrower and may offer less legal protection to the purchaser in the event of fraud or misrepresentation, or there may be a requirement that a fund supply additional cash to a borrower on demand.
Purchasers of loans and other forms of direct indebtedness depend primarily upon the creditworthiness of the borrower for payment of interest and repayment of principal. If scheduled interest or principal payments are not made, the value of the instrument may be adversely affected. Loans that are fully secured provide more protections than an unsecured loan in the event of failure to make scheduled interest or principal payments. However, there is no assurance that the liquidation of collateral from a secured loan would satisfy the borrower's obligation, or that the collateral could be liquidated. Indebtedness of borrowers whose creditworthiness is poor involves substantially greater risks and may be highly speculative. Borrowers that are in bankruptcy or restructuring may never pay off their indebtedness, or may pay only a small fraction of the amount owed. Direct indebtedness of developing countries also involves a risk that the governmental entities responsible for the repayment of the debt may be unable, or unwilling, to pay interest and repay principal when due.
Investments in loans through direct assignment of a financial institution's interests with respect to a loan may involve additional risks. For example, if a loan is foreclosed, the purchaser could become part owner of any collateral, and would bear the costs and liabilities associated with owning and disposing of the collateral. In addition, it is conceivable that under emerging legal theories of lender liability, a purchaser could be held liable as a co-lender. Direct debt instruments may also involve a risk of insolvency of the lending bank or other intermediary.
A loan is often administered by a bank or other financial institution that acts as agent for all holders. The agent administers the terms of the loan, as specified in the loan agreement. Unless, under the terms of the loan or other indebtedness, the purchaser has direct recourse against the borrower, the purchaser may have to rely on the agent to apply appropriate credit remedies against a borrower. If assets held by the agent for the benefit of a purchaser were determined to be subject to the claims of the agent's general creditors, the purchaser might incur certain costs and delays in realizing payment on the loan or loan participation and could suffer a loss of principal or interest.
Direct indebtedness may include letters of credit, revolving credit facilities, or other standby financing commitments that obligate purchasers to make additional cash payments on demand. These commitments may have the effect of requiring a purchaser to increase its investment in a borrower at a time when it would not otherwise have done so, even if the borrower's condition makes it unlikely that the amount will ever be repaid.
Each fund limits the amount of total assets that it will invest in any one issuer or in issuers within the same industry (see each fund's investment limitations). For purposes of these limitations, a fund generally will treat the borrower as the "issuer" of indebtedness held by the fund. In the case of loan participations where a bank or other lending institution serves as financial intermediary between a fund and the borrower, if the participation does not shift to the fund the direct debtor-creditor relationship with the borrower, SEC interpretations require a fund, in appropriate circumstances, to treat both the lending bank or other lending institution and the borrower as "issuers" for these purposes. Treating a financial intermediary as an issuer of indebtedness may restrict a fund's ability to invest in indebtedness related to a single financial intermediary, or a group of intermediaries engaged in the same industry, even if the underlying borrowers represent many different companies and industries.
Lower-Quality Debt Securities. Lower-quality debt securities have poor protection with respect to the payment of interest and repayment of principal, or may be in default. These securities are often considered to be speculative and involve greater risk of loss or price changes due to changes in the issuer's capacity to pay. The market prices of lower-quality debt securities may fluctuate more than those of higher-quality debt securities and may decline significantly in periods of general economic difficulty, which may follow periods of rising interest rates.
The market for lower-quality debt securities may be thinner and less active than that for higher-quality debt securities, which can adversely affect the prices at which the former are sold. Adverse publicity and changing investor perceptions may affect the liquidity of lower-quality debt securities and the ability of outside pricing services to value lower-quality debt securities.
Because the risk of default is higher for lower-quality debt securities, FMR's research and credit analysis are an especially important part of managing securities of this type. FMR will attempt to identify those issuers of high-yielding securities whose financial condition is adequate to meet future obligations, has improved, or is expected to improve in the future. FMR's analysis focuses on relative values based on such factors as interest or dividend coverage, asset coverage, earnings prospects, and the experience and managerial strength of the issuer.
A fund may choose, at its expense or in conjunction with others, to pursue litigation or otherwise to exercise its rights as a security holder to seek to protect the interests of security holders if it determines this to be in the best interest of the fund's shareholders.
Money Market Securities are high-quality, short-term obligations. Money market securities may be structured to be, or may employ a trust or other form so that they are, eligible investments for money market funds. For example, put features can be used to modify the maturity of a security or interest rate adjustment features can be used to enhance price stability. If a structure fails to function as intended, adverse tax or investment consequences may result. Neither the Internal Revenue Service (IRS) nor any other regulatory authority has ruled definitively on certain legal issues presented by certain structured securities. Future tax or other regulatory determinations could adversely affect the value, liquidity, or tax treatment of the income received from these securities or the nature and timing of distributions made by the funds.
Mortgage Securities are issued by government and non-government entities such as banks, mortgage lenders, or other institutions. A mortgage security is an obligation of the issuer backed by a mortgage or pool of mortgages or a direct interest in an underlying pool of mortgages. Some mortgage securities, such as collateralized mortgage obligations (or "CMOs"), make payments of both principal and interest at a range of specified intervals; others make semiannual interest payments at a predetermined rate and repay principal at maturity (like a typical bond). Mortgage securities are based on different types of mortgages, including those on commercial real estate or residential properties. Stripped mortgage securities are created when the interest and principal components of a mortgage security are separated and sold as individual securities. In the case of a stripped mortgage security, the holder of the "principal-only" security (PO) receives the principal payments made by the underlying mortgage, while the holder of the "interest-only" security (IO) receives interest payments from the same underlying mortgage.
Fannie Maes and Freddie Macs are pass-through securities issued by Fannie Mae and Freddie Mac, respectively. Fannie Mae and Freddie Mac, which guarantee payment of interest and repayment of principal on Fannie Maes and Freddie Macs, respectively, are federally chartered corporations supervised by the U.S. Government that act as governmental instrumentalities under authority granted by Congress. Fannie Mae is authorized to borrow from the U.S. Treasury to meet its obligations. Fannie Maes and Freddie Macs are not backed by the full faith and credit of the U.S. Government.
The value of mortgage securities may change due to shifts in the market's perception of issuers and changes in interest rates. In addition, regulatory or tax changes may adversely affect the mortgage securities market as a whole. Non-government mortgage securities may offer higher yields than those issued by government entities, but also may be subject to greater price changes than government issues. Mortgage securities are subject to prepayment risk, which is the risk that early principal payments made on the underlying mortgages, usually in response to a reduction in interest rates, will result in the return of principal to the investor, causing it to be invested subsequently at a lower current interest rate. Alternatively, in a rising interest rate environment, mortgage security values may be adversely affected when prepayments on underlying mortgages do not occur as anticipated, resulting in the extension of the security's effective maturity and the related increase in interest rate sensitivity of a longer-term instrument. The prices of stripped mortgage securities tend to be more volatile in response to changes in interest rates than those of non-stripped mortgage securities.
To earn additional income for a fund, FMR may use a trading strategy that involves selling mortgage securities and simultaneously agreeing to purchase similar securities on a later date at a set price. This trading strategy may result in an increased portfolio turnover rate which increases costs and may increase taxable gains.
Municipal Securities are issued to raise money for a variety of public or private purposes, including general financing for state and local governments, or financing for specific projects or public facilities. They may be issued in anticipation of future revenues and may be backed by the full taxing power of a municipality, the revenues from a specific project, or the credit of a private organization. The value of some or all municipal securities may be affected by uncertainties in the municipal market related to legislation or litigation involving the taxation of municipal securities or the rights of municipal securities holders. A municipal security may be owned directly or through a participation interest.
Preferred Stock represents a class of equity or ownership interest in an issuer that pays dividends at a specified rate and that has precedence over common stock in the payment of dividends. In the event an issuer is liquidated or declares bankruptcy, the claims of owners of bonds take precedence over the claims of those who own preferred and common stock.
Put Features entitle the holder to sell a security back to the issuer or a third party at any time or at specified intervals. In exchange for this benefit, a fund may accept a lower interest rate. Securities with put features are subject to the risk that the put provider is unable to honor the put feature (purchase the security). Put providers often support their ability to buy securities on demand by obtaining letters of credit or other guarantees from other entities. Demand features, standby commitments, and tender options are types of put features.
Real Estate Investment Trusts. Equity real estate investment trusts own real estate properties, while mortgage real estate investment trusts make construction, development, and long-term mortgage loans. Their value may be affected by changes in the value of the underlying property of the trusts, the creditworthiness of the issuer, property taxes, interest rates, and tax and regulatory requirements, such as those relating to the environment. Both types of trusts are dependent upon management skill, are not diversified, and are subject to heavy cash flow dependency, defaults by borrowers, self-liquidation, and the possibility of failing to qualify for tax-free status of income under the Internal Revenue Code and failing to maintain exemption from the 1940 Act.
Repurchase Agreements involve an agreement to purchase a security and to sell that security back to the original seller at an agreed-upon price. The resale price reflects the purchase price plus an agreed-upon incremental amount which is unrelated to the coupon rate or maturity of the purchased security. As protection against the risk that the original seller will not fulfill its obligation, the securities are held in a separate account at a bank, marked-to-market daily, and maintained at a value at least equal to the sale price plus the accrued incremental amount. The value of the security purchased may be more or less than the price at which the counterparty has agreed to purchase the security. In addition, delays or losses could result if the other party to the agreement defaults or becomes insolvent. The funds will engage in repurchase agreement transactions with parties whose creditworthiness has been reviewed and found satisfactory by FMR.
Restricted Securities are subject to legal restrictions on their sale. Difficulty in selling securities may result in a loss or be costly to a fund. Restricted securities generally can be sold in privately negotiated transactions, pursuant to an exemption from registration under the Securities Act of 1933, or in a registered public offering. Where registration is required, the holder of a registered security may be obligated to pay all or part of the registration expense and a considerable period may elapse between the time it decides to seek registration and the time it may be permitted to sell a security under an effective registration statement. If, during such a period, adverse market conditions were to develop, the holder might obtain a less favorable price than prevailed when it decided to seek registration of the security.
Reverse Repurchase Agreements. In a reverse repurchase agreement, a fund sells a security to another party, such as a bank or broker-dealer, in return for cash and agrees to repurchase that security at an agreed-upon price and time. The funds will enter into reverse repurchase agreements with parties whose creditworthiness has been reviewed and found satisfactory by FMR. Such transactions may increase fluctuations in the market value of fund assets and a fund's yield and may be viewed as a form of leverage.
Securities of Other Investment Companies, including shares of closed-end investment companies, unit investment trusts, and open-end investment companies, represent interests in professionally managed portfolios that may invest in any type of instrument. Investing in other investment companies involves substantially the same risks as investing directly in the underlying instruments, but may involve additional expenses at the investment company-level, such as portfolio management fees and operating expenses. Certain types of investment companies, such as closed-end investment companies, issue a fixed number of shares that trade on a stock exchange or over-the-counter at a premium or a discount to their net asset value. Others are continuously offered at net asset value, but may also be traded in the secondary market.
The extent to which a fund can invest in securities of other investment companies is limited by federal securities laws.
Securities Lending. A fund may lend securities to parties such as broker-dealers or other institutions, including Fidelity Brokerage Services<R> LLC (FBS LLC)</R>. FBSI is a member of the New York Stock Exchange (NYSE) and <R>an indirect</R> subsidiary of FMR Corp.
Securities lending allows a fund to retain ownership of the securities loaned and, at the same time, earn additional income. The borrower provides the fund with collateral in an amount at least equal to the value of the securities loaned. The fund maintains the ability to obtain the right to vote or consent on proxy proposals involving material events affecting securities loaned. If the borrower defaults on its obligation to return the securities loaned because of insolvency or other reasons, a fund could experience delays and costs in recovering the securities loaned or in gaining access to the collateral. These delays and costs could be greater for foreign securities. If a fund is not able to recover the securities loaned, a fund may sell the collateral and purchase a replacement investment in the market. The value of the collateral could decrease below the value of the replacement investment by the time the replacement investment is purchased. Loans will be made only to parties deemed by FMR to be in good standing and when, in FMR's judgment, the income earned would justify the risks.
Cash received as collateral through loan transactions may be invested in other eligible securities. Investing this cash subjects that investment, as well as the securities loaned, to market appreciation or depreciation.
Short Sales "Against the Box" (growth and money market funds) are short sales of securities that a fund owns or has the right to obtain (equivalent in kind or amount to the securities sold short). If a fund enters into a short sale against the box, it will be required to set aside securities equivalent in kind and amount to the securities sold short (or securities convertible or exchangeable into such securities) and will be required to hold such securities while the short sale is outstanding.
Short sales against the box could be used to protect the net asset value per share (NAV) of a money market fund in anticipation of increased interest rates, without sacrificing the current yield of the securities sold short. A money market fund will incur transaction costs in connection with opening and closing short sales against the box. A fund (other than the money market fund) will incur transaction costs, including interest expenses, in connection with opening, maintaining, and closing short sales against the box.
Short Sales (growth & income and high yield funds). Stocks underlying a fund's convertible security holdings can be sold short. For example, if FMR anticipates a decline in the price of the stock underlying a convertible security held by a fund, it may sell the stock short. If the stock price subsequently declines, the proceeds of the short sale could be expected to offset all or a portion of the effect of the stock's decline on the value of the convertible security. Each fund currently intends to hedge no more than 15% of its total assets with short sales on equity securities underlying its convertible security holdings under normal circumstances.
A fund will be required to set aside securities equivalent in kind and amount to those sold short (or securities convertible or exchangeable into such securities) and will be required to hold them aside while the short sale is outstanding. A fund will incur transaction costs, including interest expenses, in connection with opening, maintaining, and closing short sales.
Sources of Credit or Liquidity Support. Issuers may employ various forms of credit and liquidity enhancements, including letters of credit, guarantees, puts, and demand features, and insurance provided by domestic or foreign entities such as banks and other financial institutions. FMR may rely on its evaluation of the credit of the liquidity or credit enhancement provider in determining whether to purchase a security supported by such enhancement. In evaluating the credit of a foreign bank or other foreign entities, FMR will consider whether adequate public information about the entity is available and whether the entity may be subject to unfavorable political or economic developments, currency controls, or other government restrictions that might affect its ability to honor its commitment. Changes in the credit quality of the entity providing the enhancement could affect the value of the security or a fund's share price.
Sovereign Debt Obligations are issued or guaranteed by foreign governments or their agencies, including debt of Latin American nations or other developing countries. Sovereign debt may be in the form of conventional securities or other types of debt instruments such as loans or loan participations. Sovereign debt of developing countries may involve a high degree of risk, and may be in default or present the risk of default. Governmental entities responsible for repayment of the debt may be unable or unwilling to repay principal and pay interest when due, and may require renegotiation or rescheduling of debt payments. In addition, prospects for repayment of principal and payment of interest may depend on political as well as economic factors. Although some sovereign debt, such as Brady Bonds, is collateralized by U.S. Government securities, repayment of principal and payment of interest is not guaranteed by the U.S. Government.
Stripped Securities are the separate income or principal components of a debt security. The risks associated with stripped securities are similar to those of other debt securities, although stripped securities may be more volatile, and the value of certain types of stripped securities may move in the same direction as interest rates. U.S. Treasury securities that have been stripped by a Federal Reserve Bank are obligations issued by the U.S. Treasury.
Privately stripped government securities are created when a dealer deposits a U.S. Treasury security or other U.S. Government security with a custodian for safekeeping. The custodian issues separate receipts for the coupon payments and the principal payment, which the dealer then sells.
Because the SEC does not consider privately stripped government securities to be U.S. Government securities for purposes of Rule 2a-7, a fund must evaluate them as it would non-government securities pursuant to regulatory guidelines applicable to money market funds.
Swap Agreements can be individually negotiated and structured to include exposure to a variety of different types of investments or market factors. Depending on their structure, swap agreements may increase or decrease a fund's exposure to long- or short-term interest rates (in the United States or abroad), foreign currency values, mortgage securities, corporate borrowing rates, or other factors such as security prices or inflation rates. Swap agreements can take many different forms and are known by a variety of names.
In a typical cap or floor agreement, one party agrees to make payments only under specified circumstances, usually in return for payment of a fee by the other party. For example, the buyer of an interest rate cap obtains the right to receive payments to the extent that a specified interest rate exceeds an agreed-upon level, while the seller of an interest rate floor is obligated to make payments to the extent that a specified interest rate falls below an agreed-upon level. An interest rate collar combines elements of buying a cap and selling a floor.
Swap agreements will tend to shift a fund's investment exposure from one type of investment to another. For example, if the fund agreed to exchange payments in dollars for payments in foreign currency, the swap agreement would tend to decrease the fund's exposure to U.S. interest rates and increase its exposure to foreign currency and interest rates. Caps and floors have an effect similar to buying or writing options. Depending on how they are used, swap agreements may increase or decrease the overall volatility of a fund's investments and its share price and yield.
The most significant factor in the performance of swap agreements is the change in the specific interest rate, currency, or other factors that determine the amounts of payments due to and from a fund. If a swap agreement calls for payments by the fund, the fund must be prepared to make such payments when due. In addition, if the counterparty's creditworthiness declined, the value of a swap agreement would be likely to decline, potentially resulting in losses. A fund may be able to eliminate its exposure under a swap agreement either by assignment or other disposition, or by entering into an offsetting swap agreement with the same party or a similarly creditworthy party.
Temporary Defensive Policies. Each of Fidelity Blue Chip Growth Fund, Fidelity Disciplined Equity Fund, Fidelity Equity-Income Fund, Fidelity Fund, Fidelity Growth & Income Portfolio, Fidelity Growth Company Fund, Fidelity OTC Portfolio, Fidelity Diversified International Fund, Fidelity Europe Fund, Fidelity Japan Fund, Fidelity Overseas Fund, and Fidelity Southeast Asia Fund reserves the right to invest without limitation in preferred stocks and investment-grade debt instruments for temporary, defensive purposes.
Each of Fidelity Government Income Fund, Fidelity Intermediate Bond Fund, and Fidelity Investment Grade Bond Fund reserves the right to invest without limitation in investment-grade money market or short-term debt instruments for temporary, defensive purposes.
Fidelity Capital & Income Fund reserves the right to invest without limitation in investment-grade securities for temporary, defensive purposes.
Variable and Floating Rate Securities provide for periodic adjustments in the interest rate paid on the security. Variable rate securities provide for a specified periodic adjustment in the interest rate, while floating rate securities have interest rates that change whenever there is a change in a designated benchmark rate. Some variable or floating rate securities are structured with put features that permit holders to demand payment of the unpaid principal balance plus accrued interest from the issuers or certain financial intermediaries.
Warrants. Warrants are instruments which entitle the holder to buy an equity security at a specific price for a specific period of time. Changes in the value of a warrant do not necessarily correspond to changes in the value of its underlying security. The price of a warrant may be more volatile than the price of its underlying security, and a warrant may offer greater potential for capital appreciation as well as capital loss.
Warrants do not entitle a holder to dividends or voting rights with respect to the underlying security and do not represent any rights in the assets of the issuing company. A warrant ceases to have value if it is not exercised prior to its expiration date. These factors can make warrants more speculative than other types of investments.
When-Issued and Forward Purchase or Sale Transactions involve a commitment to purchase or sell specific securities at a predetermined price or yield in which payment and delivery take place after the customary settlement period for that type of security. Typically, no interest accrues to the purchaser until the security is delivered.
When purchasing securities pursuant to one of these transactions, the purchaser assumes the rights and risks of ownership, including the risks of price and yield fluctuations and the risk that the security will not be issued as anticipated. Because payment for the securities is not required until the delivery date, these risks are in addition to the risks associated with a fund's investments. If a fund remains substantially fully invested at a time when a purchase is outstanding, the purchases may result in a form of leverage. When a fund has sold a security pursuant to one of these transactions, the fund does not participate in further gains or losses with respect to the security. If the other party to a delayed-delivery transaction fails to deliver or pay for the securities, a fund could miss a favorable price or yield opportunity or suffer a loss.
A fund may renegotiate a when-issued or forward transaction and may sell the underlying securities before delivery, which may result in capital gains or losses for the fund.
Zero Coupon Bonds do not make interest payments; instead, they are sold at a discount from their face value and are redeemed at face value when they mature. Because zero coupon bonds do not pay current income, their prices can be more volatile than other types of fixed-income securities when interest rates change. In calculating a fund's dividend, a portion of the difference between a zero coupon bond's purchase price and its face value is considered income.
The following pages contain detailed information about special considerations of underlying international Fidelity funds, in which certain Freedom Funds may invest.
SPECIAL CONSIDERATIONS REGARDING CANADA
Political. Canada's parliamentary system of government is, in general, stable. However, from time to time, some provinces, but particularly Quebec, have called for a revamping of the legal and financial relationship between the federal government in Ottawa and the provinces. To date, referendums on Quebec sovereignty have been defeated, but the issue remains unresolved. The Supreme Court of Canada decided in August 1998 that if there was a "clear answer" to a "clear question" in a referendum, then the federal government would be obliged to negotiate with Quebec.
Economic. Canada is a major producer of commodities such as forest products, metals, agricultural products, and energy related products like oil, gas, and hydroelectricity. Accordingly, changes in the supply and demand of industrial and basic materials, both domestically and internationally, can have a significant effect on Canadian market performance.
In addition, Canada relies considerably on the health of the United States' economy, its biggest trading partner and largest foreign investor. The expanding economic and financial integration of the United States and Canada will likely make the Canadian economy and securities market increasingly sensitive to U.S. economic and market events.
Currency. For U.S. investors, investing in any foreign currency entails an additional risk that is not faced when investing in the domestic market. Since Canada let its currency float in 1970, its value has been in a steady decline against the U.S. dollar. While the decline has helped Canada stay competitive in export markets, U.S. investors have seen their investment returns eroded by the impact of currency conversion.
SPECIAL CONSIDERATIONS REGARDING EUROPE
On January 1, 1999, eleven of the fifteen member countries of the European Union (EU) fixed their currencies irrevocably to the euro, the new unit of currency of the European Economic and Monetary Union (EMU). At that time each member's currency was converted at a fixed rate to the euro. Initially, use of the euro will be confined mainly to the wholesale financial markets, while its widespread use in the retail sector will follow the circulation of euro banknotes and coins on January 1, 2002. At that time, the national banknotes and coins of participating member countries will cease to be legal tender. In addition to adopting a single currency, member countries will no longer control their own monetary policies. Instead, the authority to direct monetary policy will be exercised by the new European Central Bank.
While economic and monetary convergence in the European Union may offer new opportunities for those investing in the region, investors should be aware that the success of the union is not wholly assured. Europe must grapple with a number of challenges, any one of which could threaten the survival of this monumental undertaking. Eleven disparate economies must adjust to a unified monetary system, the absence of exchange rate flexibility, and the loss of economic sovereignty. The Continent's economies are diverse, its governments decentralized, and its cultures differ widely. Unemployment is historically high and could pose political risk. One or more member countries might exit the union, placing the currency and banking system in jeopardy.
Political. For those countries in Western and Eastern Europe that were not included in the first round of the EU implementation, the prospects for eventual membership serve as a strong political impetus for many governments to employ tight fiscal and monetary policies. Particularly for the Eastern European countries, aspirations to join the EU are likely to push governments to act decisively.
At the same time, there could become an increasingly widening gap between rich and poor within the aspiring countries, those countries who are close to meeting membership criteria, and those who are not likely to join the EMU. Realigning traditional alliances could alter trading relationships and potentially provoke divisive socioeconomic splits. Despite relative calm in Western Europe in recent years, the risk of regional conflict or targeted terrorist activity could disrupt European markets.
In the transition to the single economic system, significant political decisions will be made which will effect the market regulation, subsidization, and privatization across all industries, from agricultural products to telecommunications.
Economic. As economic conditions across member states vary from robust to dismal, there is continued concern about national-level support for the currency and the accompanying coordination of fiscal and wage policy among the eleven EMU member nations. According to the Maastricht treaty, member countries must maintain inflation below 3.3%, public debt below 60% of GDP, and a deficit of 3% or less of GDP to qualify for participation in the euro. These requirements severely limit member countries' ability to implement monetary policy to address regional economic conditions. Countries that did not qualify for the euro, such as Greece, risk being left farther behind.
Foreign Trade. The EU has recently been involved in a number of trade disputes with major trading partners, including the United States. Tariffs and embargoes have been levied upon imports of agricultural products and meat that have resulted in the affected nation levying retaliatory tariffs upon imports from Europe. These disputes can adversely affect the valuations of the European companies that export the targeted products.
Currency. For U.S. investors, investing in any foreign currency entails an additional risk that is not faced when investing in the domestic market. However, investing in euro-denominated securities entails risk of being exposed to a new currency that may not fully reflect the strengths and weaknesses of the disparate economies that make up the Union. This has been the case in the first six months of 1999, when the initial exchange rates of the euro versus many of the world's major currencies steadily declined. In this environment, U.S. and other foreign investors experienced erosion of their investment returns in the region. In addition, many European countries rely heavily upon export dependent businesses and any strength in the exchange rate between the euro and the dollar can have either a positive or a negative effect upon corporate profits.
Germany. The German economy is heavily industrialized, with a strong emphasis on manufacturing and exports. Therefore, Germany's economic growth is heavily dependent on the prosperity of its trading partners and on currency exchange rates. Germany is closely tied to a number of Eastern European emerging market economies and weakness in these economies will likely dampen demand for German exports. Germany continues to struggle with its incorporation of former East Germany and the country as a whole faces high labor costs and high unemployment.
France. In recent years, the country's economic growth has been hit by a series of general strikes. France's strong labor unions reacted negatively to government cuts driven by the country's effort to meet EMU membership criteria. Recently, unions have demanded a lower retirement age and a shorter work week. Economic growth also is limited by the country's pay-as-you-go pension system; spending on pensions accounts for about 10% of GDP.
Nordic Countries. Faced with stronger global competition, the Nordic countries - Norway, Finland, Denmark, and Sweden - have had to scale down their historically generous welfare programs, resulting in drops in domestic demand and increased unemployment. Major industries in the region, such as forestry, agriculture, and oil, are heavily resource dependent and face pressure as a result of high labor costs. Pension reform, union regulation, and further cuts in liberal social programs will likely need to be addressed as the Nordic countries face increased international competition.
United Kingdom. The United Kingdom continues to be overtly less enthusiastic about EMU than other countries in Europe and has not committed itself to joining the euro. While the UK views independence from the EMU as a competitive advantage, the country may not benefit from its independence if economic conditions on the continent improve. If the continental European stock markets make more compelling prospects for economic growth, there is concern that the UK market may lag its European counterparts.
Eastern Europe. Investing in the securities of Eastern European issuers is highly speculative and involves risks not usually associated with investing in the more developed markets of Western Europe.
The economies of the Eastern European nations are embarking on the transition from communism at different paces with appropriately different characteristics. Most Eastern European markets suffer from thin trading activity, dubious investor protections, and often, a dearth of reliable corporate information. Information and transaction costs, differential taxes, and sometimes political or transfer risk give a comparative advantage to the domestic investor rather than the foreign investor. In addition, these markets are particularly sensitive to political, economic, and currency events in Russia and have recently suffered heavy losses as a result of their trading and investment links to the troubled Russian economy and currency.
SPECIAL CONSIDERATIONS REGARDING JAPAN
Fueled by public investment, protectionist trade policies, and innovative management styles, the Japanese economy has transformed itself since World War II into the world's second largest economy. Despite its impressive history, investors face special risks when investing in Japan.
Economic. Since Japan's bubble economy collapsed eight years ago, the nation has drifted between modest growth and recession. By mid-year 1998, the world's second largest economy had slipped into its deepest recession since World War II. Much of the blame can be placed on government inaction in implementing long-neglected structural reforms despite strong and persistent prodding from the International Monetary Fund and the G7 member nations. Steps have been taken to deregulate and liberalize protected areas of the economy, but the pace of change has been disappointedly slow.
The most pressing need for action is the daunting task of overhauling the nation's financial institutions and securing public support for taxpayer-funded bailouts. Banks, in particular, must dispose of their huge overhang of bad loans and trim their balance sheets in preparation for greater competition from foreign institutions as more areas of the financial sector are opened. Successful financial sector reform would allow Japan's financial institutions to act as a catalyst for economic recovery at home and across the troubled Asian region.
Foreign Trade. Much of Japan's economy is dependent upon international trade. The country is a leading exporter of automobiles and industrial machinery as well as industrial and consumer electronics. While the United States is Japan's largest single trading partner, close to half of Japan's trade is conducted with developing nations, almost all of which are in Southeast Asia. For the past two years, Southeast Asia's economies have been mired in economic stagnation causing a steep decline in Japan's exports to the area. Japan's hope for economic recovery and renewed export growth is largely dependent upon the pace of economic recovery in Southeast Asia.
Natural Resource Dependency. An island nation with limited natural resources, Japan is also heavily dependent upon imports of essential products such as oil, forest products, and industrial metals. Accordingly, Japan's industrial sector and domestic economy are highly sensitive to fluctuations in international commodity prices. In addition, many of these commodities are traded in U.S. dollars and any strength in the exchange rate between the yen and the dollar can have either a positive or a negative effect upon corporate profits.
Natural Disasters. The Japanese islands have been subjected to periodic natural disasters including earthquakes, monsoons, and tidal waves. These events have often inflicted substantial economic disruption upon the nation's populace and industries.
SPECIAL CONSIDERATIONS REGARDING ASIA PACIFIC REGION (EX JAPAN)
Many countries in the region have historically faced political uncertainty, corruption, military intervention, and social unrest. Examples include the ethnic, sectarian, and separatist violence found in Indonesia, and the nuclear arms threats between India and Pakistan. To the extent that such events continue in the future, they can be expected to have a negative effect on economic and securities market conditions in the region.
Economic. The economic health of the region depends, in great part, on each country's respective ability to carry out fiscal and monetary reforms and its ability to address the International Monetary Fund's mandated benchmarks. The majority of the countries in the region can be characterized as either developing or newly industrialized economies, which tend to experience more volatile economic cycles than developed countries. In addition, a number of countries in the region have historically faced hyperinflation, a deterrent to productivity and economic growth.
Currency. For U.S. investors, investing in any currency entails an additional risk that is not faced when investing in the domestic market. Some countries in the region may impose restrictions on converting local currency, effectively preventing foreigners from selling assets and repatriating funds. While flexible exchange rates through most of the region should allow greater control of domestic liquidity conditions, the region's currencies generally face above-average volatility with potentially negative implications for economic and security market conditions.
Natural Disasters. The Asia Pacific region has been subjected to periodic natural disasters such as earthquakes, monsoons, and tidal waves. These events have often inflicted substantial economic disruption upon the populace and industry of the countries in that region.
China and Hong Kong. As with all transition economies, China's ability to develop and sustain a credible legal, regulatory, monetary, and socioeconomic system could influence the course of outside investment. Hong Kong is closely tied to China, economically and through China's 1997 acquisition of the country as a Special Autonomous Region (SAR). Hong Kong's success depends, in large part, on its ability to retain the legal, financial and monetary systems that allow economic freedom and market expansion.
Southeast Asia. The semiconductor industry comprised a significant segment of the Southeast Asian market as a whole, as represented by the MSCI AC Far East Free ex Japan Index as of June 19, 2000. The semiconductor industry has historically been subject to wide fluctuations in demand and manufacturing capacity and, as a result, can be highly price-sensitive. The industry can be significantly affected by currency fluctuations, rapid technology change, and increasing competition from other low-cost emerging economies.
SPECIAL CONSIDERATIONS REGARDING LATIN AMERICA
As an emerging market, Latin America has long suffered from political, economic, and social instability. For investors, this has meant additional risk caused by periods of regional conflict, political corruption, totalitarianism, protectionist measures, nationalization, hyperinflation, debt crises, and currency devaluation. However, much has changed in the past decade. Democracy is beginning to become well established in some countries. A move to a more mature and accountable political environment is well under way. Domestic economies have been deregulated and have enjoyed sound levels of growth. Privatization of state-owned companies is almost completed. Foreign trade restrictions have been relaxed. Large fiscal deficits have been reduced and inflation controlled. Nonetheless, the volatile stock markets of 1998 have clearly demonstrated that investors in the region continue to face a number of potential risks.
Political. While investors recently have benefited from friendlier forms of government, the Latin American political climate is still vulnerable to sudden changes. Many countries in the region have been in recession and have faced high unemployment. Corruption remains part of the political landscape. This could lead to social unrest and changes in governments that are less favorable to investors. The investor friendly trends of social, economic, and market reforms seen over the past several years could be reversed. Also, as has historically been the case, the stock markets may be subject to increased volatility as some countries approach elections: Argentina, Chile, Mexico, and Peru.
Social Unrest. Latin America continues to suffer from one of the most inequitable distributions of wealth in the world, as well as rampant delinquency and street crime. The recent reforms and the move to democracy, which were initially welcomed by the population, so far have failed to significantly improve the living conditions of the majority of people. This could lead to social unrest, occasional labor strikes, rebellion, or civil war.
Economic. Many countries in the region have experienced periods of hyperinflation which adversely impacted and may continue to impact their economies and local stock markets. Despite signs that inflation has been tamed, the risk of hyperinflation persists.
Foreign Trade. One key to the recent economic growth in the region has been the reduction of trade barriers and a series of free-trade agreements. These are currently under pressure given the recent macro-economic imbalances between many trading partners. One example would be Mercosur, which includes Argentina, Brazil, Uruguay, and Paraguay. As long as the economies perform well and the regimes maintain similar economic and currency policies, all will benefit from this agreement. However, the recent devaluation of Brazil's currency, combined with recessions in the region, has created tension between the largest trading partners, Brazil and Argentina. This could threaten the pace of vital trade integration and regional economic stability.
Currency. For U.S. investors, investing in any foreign market entails the risk of currency fluctuations; any weakness in the local currency could erode the investment returns to U.S. investors upon currency conversion. As is typical of emerging markets, Latin America has a long history of currency devaluation, evidenced by the Mexican peso crisis and the more recent Brazilian devaluation. The region remains exposed to currency speculators, particularly if the economic or political conditions worsen. Countries where the currency is artificially pegged to the dollar are most at risk. For example, predatory speculation may shift to Argentina if the cost of maintaining the currency board reaches an unsustainable level given the negative impact of the Brazilian devaluation, the economic recession, the deterioration of the foreign trade balances, and the mounting fiscal deficit.
Sovereign Debt. Although austerity programs in many countries have significantly reduced fiscal deficits, the region is still facing significant debt. Interest on the debt is subject to market conditions and may reach levels that would impair economic activity and create a difficult and costly environment for borrowers. In addition, governments may be forced to reschedule or freeze their debt repayment, which could negatively impact the stock market.
Natural Resources Dependency. Commodities such as agricultural products, minerals, and metals account for a significant percentage of exports of many Latin American countries. As a result, these economies have been particularly sensitive to the fluctuation of commodity prices. As an example, Chile has been affected by the change in the prices of copper and pulp, which has adversely affected its economy and stock market. Similarly, because the U.S. is Mexico's largest trading partner - accounting for more than four-fifths of its exports - any economic downturn in the U.S. economy could adversely impact the Mexican economy and stock market.
Natural Disasters. The region has been subjected to periodic natural disasters, such as earthquakes and floods. These events have often inflicted substantial damage upon the populations and the economy. More recently, weather disorders attributed to the "El Nino" effect have placed a serious drag on the economy of some countries, such as Peru and Ecuador.
Financial Reporting Standards. As is typical of many emerging markets, many companies in the region are still controlled by families and their associates. Accordingly, these owners may not always act in the best interests of public shareholders. In addition, rules for disclosing financial information are less stringent, which increases the difficulty of accessing reliable and viable information.
SPECIAL CONSIDERATIONS REGARDING RUSSIA
Investing in Russian securities is highly speculative and involves greater risks than generally encountered when investing in the securities markets of the U.S. and most other developed countries. Over the past century, Russia has experienced political and economic turbulence and has endured decades of communist rule under which tens of millions of its citizens were collectivized into state agricultural and industrial enterprises. For most of the past decade, Russia's government has been faced with the daunting task of stabilizing its domestic economy, while transforming it into a modern and efficient structure able to compete in international markets and respond to the needs of its citizens. However, to date, many of the country's economic reform initiatives have floundered as the proceeds of International Monetary Fund and other economic assistance have been squandered or stolen. In this environment, there is always the risk that the nation's government will abandon the current program of economic reform and replace it with radically different political and economic policies that would be detrimental to the interests of foreign investors. This could entail a return to a centrally planned economy and nationalization of private enterprises similar to what existed under the old Soviet Union. As recently as 1998, the government imposed a moratorium on the repayment of its international debt and the restructuring of the repayment terms.
Foreign investors also face a high degree of currency risk when investing in Russian securities. In a surprise move in August 1998, Russia devalued the ruble, defaulted on short-term domestic bonds, and declared a moratorium on commercial debt payments. In light of these and other recent government actions, foreign investors face the possibility of further devaluations. In addition, there is the risk the government may impose capital controls on foreign portfolio investments in the event of extreme financial or political crisis. Such capital controls would prevent the sale of a portfolio of foreign assets and the repatriation of proceeds.
Many of Russia's businesses have failed to mobilize the available factors of production because the country's privatization program virtually ensured the predominance of the old management teams that are largely non-market-oriented in their management approach. A combination of poor accounting standards, inept management, endemic corruption, and limited shareholder rights pose a significant risk, particularly to foreign investors.
Compared to most national stock markets, the Russian securities market suffers from a variety of problems not encountered in more developed markets. Among these are thin trading activity, inadequate regulatory protection for the rights of investors, and lax custody procedures. Additionally, there is a dearth of solid corporate information available to investors.
The Russian economy is heavily dependent upon the export of a range of commodities including most industrial metals, forestry products, oil, and gas. Accordingly, it is strongly affected by international commodity prices and is particularly vulnerable to any weakening in global demand for these products.
SPECIAL CONSIDERATIONS REGARDING AFRICA
Africa is a highly diverse and politically unstable continent of over 50 countries and 840 million people. Civil wars, coups, and even genocidal warfare have beset much of this region in recent years. Nevertheless, the continent is home to an abundance of natural resources, including natural gas, aluminum, crude oil, copper, iron, bauxite, cotton, diamonds, and timber. Wealthier African countries generally have strong connections to European partners; evidence of these relationships is seen in the growing market capitalization and foreign investment. Economic performance remains closely tied to world commodity markets, particularly oil, as well as agricultural conditions, such as drought.
Several Northern African countries have substantial oil reserves and, accordingly, their economies react strongly to world oil prices. They share a regional and sometimes religious identification with the oil producing nations of the Middle East and can be strongly affected by political and economic developments in those countries. As in the south, weather conditions have a strong impact on many of their natural resources, as was the case in 1995, when severe drought adversely affected economic growth.
Several African countries have active equity markets, many established since 1989. The oldest market, in Egypt, was established in 1883, while the youngest, in Zambia, was established in 1994. The mean age for all equity markets is 40 years old. A total of 1,830 firms are listed on the respective exchanges. With the exception of the relatively large and liquid South African stock market, sub-Saharan Africa is probably the riskiest of all the world's emerging markets.
During the past two decades, sub-Saharan Africa has lagged behind other developing regions in economic growth. The area attracts only a modest share of foreign direct investment and remains highly dependent on foreign aid. The financial markets are small and underdeveloped and offer little regulatory protection for investors. Except for South Africa, the most fundamental problem in all of the countries in the region is the absence of an effective court system to ensure the enforceability of contracts. Investors in the area generally face a high risk of continuing political and economic instability as well as currency exchange rate volatility.
South Africa. South Africa has a highly developed and industrialized economy. It is rich in mineral resources and is the world's largest producer and exporter of gold. The nation's new government has made remarkable progress in consolidating the nation's peaceful transition to democracy and in redressing the socioeconomic disparities created by apartheid. It has a sophisticated financial structure with a large and active stock exchange that ranks 19th in the world in terms of market capitalization. Nevertheless, investors in South Africa face a number of risks common to other developing regions. The nation's heavy dependence upon the export of natural resources makes its economy and stock market vulnerable to weak global demand and declines in commodity prices. The country's currency reserves have been a constant problem and its currency can be vulnerable to devaluation. There is also the risk that ethnic and civic conflict could result in the abandonment of many of the nation's free market reforms to the detriment of shareholders.
PORTFOLIO TRANSACTIONS OF THE FREEDOM FUNDS
Portfolio Transactions of the Freedom Funds
All orders for the purchase or sale of portfolio securities (normally, shares of the underlying Fidelity funds) are placed on behalf of each Freedom Fund by Strategic Advisers, either itself or through its affiliates, pursuant to authority contained in each Freedom Fund's management contract. A Freedom Fund will not incur any commissions or sales charges when it invests in underlying Fidelity funds, but it may incur such costs if it invests directly in other types of securities.
Strategic Advisers is also responsible for the placement of transaction orders for other investment companies and investment accounts for which it or its affiliates act as investment adviser. In selecting broker-dealers, subject to applicable limitations of the federal securities laws, Strategic Advisers considers various relevant factors, including, but not limited to: the size and type of the transaction; the nature and character of the markets for the security to be purchased or sold; the execution efficiency, settlement capability, and financial condition of the broker-dealer firm; the broker-dealer's execution services rendered on a continuing basis; and the reasonableness of any commissions.
Generally, commissions for investments traded on foreign exchanges will be higher than for investments traded on U.S. exchanges and may not be subject to negotiation.
Futures transactions are executed and cleared through FCMs who receive commissions for their services.
The Freedom Funds may execute portfolio transactions with broker-dealers who provide research and execution services to the Freedom Funds or other investment accounts over which Strategic Advisers or its affiliates exercise investment discretion. Such services may include advice concerning the value of securities; the advisability of investing in, purchasing, or selling securities; and the availability of securities or the purchasers or sellers of securities. In addition, such broker-dealers may furnish analyses and reports concerning issuers, industries, securities, economic factors and trends, portfolio strategy, and performance of investment accounts; and effect securities transactions and perform functions incidental thereto (such as clearance and settlement).
The selection of such broker-dealers for transactions in equity securities is generally made by Strategic Advisers (to the extent possible consistent with execution considerations) in accordance with a ranking of broker-dealers determined periodically by Strategic Advisers' investment staff based upon the quality of research and execution services provided.
For transactions in fixed-income securities, Strategic Advisers' selection of broker-dealers is generally based on the availability of a security and its price and, to a lesser extent, on the overall quality of execution and other services, including research, provided by the broker-dealer.
The receipt of research from broker-dealers that execute transactions on behalf of a Freedom Fund may be useful to Strategic Advisers in rendering investment management services to that fund or its other clients, and conversely, such research provided by broker-dealers who have executed transaction orders on behalf of other Strategic Advisers clients may be useful to Strategic Advisers in carrying out its obligations to a Freedom Fund. The receipt of such research has not reduced Strategic Advisers' normal independent research activities; however, it enables Strategic Advisers to avoid the additional expenses that could be incurred if Strategic Advisers tried to develop comparable information through its own efforts.
Fixed-income securities are generally purchased from an issuer or underwriter acting as principal for the securities, on a net basis with no brokerage commission paid. However, the dealer is compensated by a difference between the security's original purchase price and the selling price, the so-called "bid-asked spread." Securities may also be purchased from underwriters at prices that include underwriting fees.
Subject to applicable limitations of the federal securities laws, a fund may pay a broker-dealer commissions for agency transactions that are in excess of the amount of commissions charged by other broker-dealers in recognition of their research and execution services. In order to cause a Freedom Fund to pay such higher commissions, Strategic Advisers must determine in good faith that such commissions are reasonable in relation to the value of the brokerage and research services provided by such executing broker-dealers, viewed in terms of a particular transaction or Strategic Advisers' overall responsibilities to that fund or its other clients. In reaching this determination, Strategic Advisers will not attempt to place a specific dollar value on the brokerage and research services provided, or to determine what portion of the compensation should be related to those services.
To the extent permitted by applicable law, Strategic Advisers is authorized to allocate portfolio transactions in a manner that takes into account assistance received in the distribution of shares of the Freedom Funds or other Fidelity funds and to use the research services of brokerage and other firms that have provided such assistance. Strategic Advisers may use research services provided by and place agency transactions with National Financial Services <R>(NFS)</R> and Fidelity Brokerage Services Japan LLC (FBSJ), indirect subsidiaries of FMR Corp., if the commissions are fair, reasonable, and comparable to commissions charged by non-affiliated, qualified brokerage firms for similar services. Strategic Advisers and FMR may also place agency transactions with REDIBook ECN LLC (REDIBook), an electronic communication network (ECN) in which a wholly-owned subsidiary of FMR Corp. has an equity ownership interest, if the commissions are fair, reasonable, and comparable to commissions charged by non-affiliated, qualified brokerage firms for similar services.
Section 11(a) of the Securities Exchange Act of 1934 prohibits members of national securities exchanges from executing exchange transactions for investment accounts which they or their affiliates manage, unless certain requirements are satisfied. Pursuant to such requirements, the Board of Trustees has authorized NFSC to execute portfolio transactions on national securities exchanges in accordance with approved procedures and applicable SEC rules.
The Trustees of the Freedom Funds periodically review Strategic Advisers' performance of its responsibilities in connection with the placement of portfolio transactions on behalf of the Freedom Funds and review the commissions paid by the Freedom Funds over representative periods of time to determine if they are reasonable in relation to the benefits to the funds.
Freedom Income's, Freedom 2000's, Freedom 2010's, Freedom 2020's, and Freedom 2030's turnover rates for the fiscal periods ended March 31, 2000 and 1999 are presented in the table below.
Turnover Rates |
2000 |
1999 |
|
Freedom Income |
37% |
29% |
|
Freedom 2000 |
37% |
27% |
|
Freedom 2010 |
33% |
27% |
|
Freedom 2020 |
28% |
18% |
|
Freedom 2030 |
26% |
16% |
A fund may pay both commissions and spreads in connection with the placement of portfolio transactions. For the fiscal years ended March 31, 2000, 1999, and 1998, Freedom Income, Freedom 2000, Freedom 2010, Freedom 2020, and Freedom 2030 paid no brokerage commissions.
Portfolio Transactions of the Underlying Fidelity Funds
All orders for the purchase or sale of portfolio securities are placed on behalf of each underlying Fidelity fund by FMR pursuant to authority contained in the management contract. Because the market for most OTC securities is made by market makers or dealers, rather than on an exchange, FMR will place most of its orders on behalf of Fidelity OTC Portfolio with dealers. Ordinarily commissions are not charged on such orders. Thus, Fidelity OTC Portfolio should incur a relatively small amount of commission expenses. When Fidelity OTC Portfolio places an order with a dealer, it pays a spread, which is included in the cost of the security, and is the difference between the dealer's cost and the cost to the fund.
FMR is also responsible for the placement of transaction orders for other investment companies and investment accounts for which it or its affiliates act as investment adviser. In selecting broker-dealers, subject to applicable limitations of the federal securities laws, FMR considers various relevant factors, including, but not limited to: the size and type of the transaction; the nature and character of the markets for the security to be purchased or sold; the execution efficiency, settlement capability, and financial condition of the broker-dealer firm; the broker-dealer's execution services rendered on a continuing basis; the reasonableness of any commissions; and, if applicable, arrangements for payment of fund expenses.
If FMR grants investment management authority to a sub-adviser, that sub-adviser is authorized to place orders for the purchase and sale of portfolio securities, and will do so in accordance with the policies described above.
Generally, commissions for investments traded on foreign exchanges will be higher than for investments traded on U.S. exchanges and may not be subject to negotiation.
Futures transactions are executed and cleared through FCMs who receive commissions for their services.
Each of the underlying Fidelity funds may execute portfolio transactions with broker-dealers who provide research and execution services to the fund or other investment accounts over which FMR or their affiliates exercise investment discretion. Such services may include advice concerning the value of securities; the advisability of investing in, purchasing, or selling securities; and the availability of securities or the purchasers or sellers of securities. In addition, such broker-dealers may furnish analyses and reports concerning issuers, industries, securities, economic factors and trends, portfolio strategy, and performance of investment accounts; and effect securities transactions and perform functions incidental thereto (such as clearance and settlement).
The selection of such broker-dealers for transactions in equity securities is generally made by FMR (to the extent possible consistent with execution considerations) in accordance with a ranking of broker-dealers determined periodically by FMR's investment staff based upon the quality of research and execution services provided.
For transactions in fixed-income securities, FMR's selection of broker-dealers is generally based on the availability of a security and its price and, to a lesser extent, on the overall quality of execution and other services, including research, provided by the broker-dealer.
The receipt of research from broker-dealers that execute transactions on behalf of an underlying Fidelity fund may be useful to FMR in rendering investment management services to that fund or its other clients, and conversely, such research provided by broker-dealers who have executed transaction orders on behalf of other FMR clients may be useful to FMR in carrying out its obligations to an underlying Fidelity fund. The receipt of such research has not reduced FMR's normal independent research activities; however, it enables FMR to avoid the additional expenses that could be incurred if FMR tried to develop comparable information through its own efforts.
Fixed-income securities are generally purchased from an issuer or underwriter acting as principal for the securities, on a net basis with no brokerage commission paid. However, the dealer is compensated by a difference between the security's original purchase price and the selling price, the so-called "bid-asked spread." Securities may also be purchased from underwriters at prices that include underwriting fees.
Subject to applicable limitations of the federal securities laws, a fund may pay a broker-dealer commissions for agency transactions that are in excess of the amount of commissions charged by other broker-dealers in recognition of their research and execution services. In order to cause a fund to pay such higher commissions, FMR must determine in good faith that such commissions are reasonable in relation to the value of the brokerage and research services provided by such executing broker-dealers, viewed in terms of a particular transaction or FMR's overall responsibilities to that fund or its other clients. In reaching this determination, FMR will not attempt to place a specific dollar value on the brokerage and research services provided, or to determine what portion of the compensation should be related to those services.
To the extent permitted by applicable law, FMR is authorized to allocate portfolio transactions in a manner that takes into account assistance received in the distribution of shares of the underlying Fidelity funds or other Fidelity funds and to use the research services of brokerage and other firms that have provided such assistance. FMR may use research services provided by and place agency transactions with <R>NFS</R> and FBSJ, indirect subsidiaries of FMR Corp., if the commissions are fair, reasonable, and comparable to commissions charged by non-affiliated, qualified brokerage firms for similar services. FMR may also place agency transactions with REDIBook ECN LLC (REDIBook), an electronic communication network (ECN) in which a wholly-owned subsidiary of FMR Corp. has an equity ownership interest, if the commissions are fair, reasonable, and comparable to commissions charged by non-affiliated, qualified brokerage firms for similar services.
FMR may allocate brokerage transactions to broker-dealers (including affiliates of FMR) who have entered into arrangements with FMR under which the broker-dealer allocates a portion of the commissions paid by a fund toward the reduction of that fund's expenses. The transaction quality must, however, be comparable to those of other qualified broker-dealers.
Section 11(a) of the Securities Exchange Act of 1934 prohibits members of national securities exchanges from executing exchange transactions for investment accounts which they or their affiliates manage, unless certain requirements are satisfied. Pursuant to such requirements, the Board of Trustees has authorized NFSC to execute portfolio transactions on national securities exchanges in accordance with approved procedures and applicable SEC rules.
The Trustees of each underlying Fidelity fund periodically review FMR's performance of its responsibilities in connection with the placement of portfolio transactions on behalf of the fund and review the commissions paid by the fund over representative periods of time to determine if they are reasonable in relation to the benefits to the fund.
Freedom Funds and Underlying Fidelity Funds
The Trustees of the funds have approved procedures in conformity with Rule 10f-3 under the 1940 Act whereby a fund may purchase securities that are offered in underwritings in which an affiliate of FMR participates. These procedures prohibit a fund from directly or indirectly benefiting an FMR affiliate in connection with such underwritings. In addition, for underwritings where an FMR affiliate participates as a principal underwriter, certain restrictions may apply that could, among other things, limit the amount of securities that the fund could purchase in the underwritings.
From time to time the Trustees will review whether the recapture for the benefit of a fund of some portion of the brokerage commissions or similar fees paid by the fund on portfolio transactions is legally permissible and advisable. The funds seek to recapture soliciting broker-dealer fees on the tender of portfolio securities, but at present no other recapture arrangements are in effect. The Trustees intend to continue to review whether recapture opportunities are available and are legally permissible and, if so, to determine in the exercise of their business judgment whether it would be advisable for a fund to seek such recapture.
Although the Trustees and officers of the Freedom Funds are substantially the same as those of the underlying Fidelity funds and other funds managed by FMR or its affiliates, investment decisions for the Freedom Funds are made independently from those of other funds or investment accounts managed by FMR or its affiliates. It sometimes happens that the same security is held in the portfolio of more than one of these funds or investment accounts. Simultaneous transactions are inevitable when several funds and investment accounts are managed by the same investment adviser, or an affiliate thereof, particularly when the same security is suitable for the investment objective of more than one fund or investment account.
When two or more of the Freedom Funds and underlying Fidelity funds are simultaneously engaged in the purchase or sale of the same security, the prices and amounts are allocated in accordance with procedures believed to be appropriate and equitable for each fund. In some cases this system could have a detrimental effect on the price or value of the security as far as each fund is concerned. In other cases, however, the ability of the funds to participate in volume transactions will produce better executions and prices for the funds. It is the current opinion of the Trustees that the desirability of retaining Strategic Advisers or FMR as investment adviser to each of the Freedom Funds and underlying Fidelity funds, as applicable, outweighs any disadvantages that may be said to exist from exposure to simultaneous transactions.
Each fund's NAV is the value of a single share. The NAV of each fund is computed by adding the value of the fund's investments, cash, and other assets, subtracting its liabilities, and dividing the result by the number of shares outstanding.
The assets of each Freedom Fund consist primarily of shares of the underlying Fidelity funds, which are valued at their respective NAVs.
Valuation of Underlying Fidelity Funds
Growth and Growth & Income Funds. Portfolio securities are valued by various methods depending on the primary market or exchange on which they trade. Most equity securities for which the primary market is the United States are valued at last sale price or, if no sale has occurred, at the closing bid price. Most equity securities for which the primary market is outside the United States are valued using the official closing price or the last sale price in the principal market in which they are traded. If the last sale price (on the local exchange) is unavailable, the last evaluated quote or closing bid price normally is used. Securities of other open-end investment companies are valued at their respective NAVs.
Fixed-income securities and other assets for which market quotations are readily available may be valued at market values determined by such securities' most recent bid prices (sales prices if the principal market is an exchange) in the principal market in which they normally are traded, as furnished by recognized dealers in such securities or assets. Or, fixed-income securities and convertible securities may be valued on the basis of information furnished by a pricing service that uses a valuation matrix which incorporates both dealer-supplied valuations and electronic data processing techniques. Use of pricing services has been approved by the Board of Trustees. A number of pricing services are available, and the funds may use various pricing services or discontinue the use of any pricing service.
Futures contracts and options are valued on the basis of market quotations, if available.
Independent brokers or quotation services provide prices of foreign securities in their local currency. Fidelity Service Company, Inc. (FSC) gathers all exchange rates daily at the close of the NYSE using the last quoted price on the local currency and then translates the value of foreign securities from their local currencies into U.S. dollars. Any changes in the value of forward contracts due to exchange rate fluctuations and days to maturity are included in the calculation of NAV. If an event that is expected to materially affect the value of a portfolio security occurs after the close of an exchange or market on which that security is traded, then that security will be valued in good faith by a committee appointed by the Board of Trustees.
Short-term securities with remaining maturities of sixty days or less for which market quotations and information furnished by a pricing service are not readily available are valued either at amortized cost or at original cost plus accrued interest, both of which approximate current value.
The procedures set forth above need not be used to determine the value of the securities owned by a fund if, in the opinion of a committee appointed by the Board of Trustees, some other method would more accurately reflect the fair value of such securities. For example, securities and other assets for which there is no readily available market value may be valued in good faith by a committee appointed by the Board of Trustees. In making a good faith determination of the value of a security, the committee may review price movements in futures contracts and ADRs, market and trading trends, the bid/ask quotes of brokers and off-exchange institutional trading.
Taxable Bond Funds. Portfolio securities are valued by various methods depending on the primary market or exchange on which they trade. Fixed-income securities and other assets for which market quotations are readily available may be valued at market values determined by such securities' most recent bid prices (sales prices if the principal market is an exchange) in the principal market in which they normally are traded, as furnished by recognized dealers in such securities or assets. Or, fixed-income securities and convertible securities may be valued on the basis of information furnished by a pricing service that uses a valuation matrix which incorporates both dealer-supplied valuations and electronic data processing techniques. Use of pricing services has been approved by the Board of Trustees. A number of pricing services are available, and the funds may use various pricing services or discontinue the use of any pricing service.
Most equity securities for which the primary market is the United States are valued at last sale price or, if no sale has occurred, at the closing bid price. Most equity securities for which the primary market is outside the United States are valued using the official closing price or the last sale price in the principal market in which they are traded. If the last sale price (on the local exchange) is unavailable, the last evaluated quote or closing bid price normally is used.
Futures contracts and options are valued on the basis of market quotations, if available. Securities of other open-end investment companies are valued at their respective NAVs.
Independent brokers or quotation services provide prices of foreign securities in their local currency. FSC gathers all exchange rates daily at the close of the NYSE using the last quoted price on the local currency and then translates the value of foreign securities from their local currencies into U.S. dollars. Any changes in the value of forward contracts due to exchange rate fluctuations and days to maturity are included in the calculation of NAV. If an event that is expected to materially affect the value of a portfolio security occurs after the close of an exchange or market on which that security is traded, then that security will be valued in good faith by a committee appointed by the Board of Trustees.
Short-term securities with remaining maturities of sixty days or less for which market quotations and information furnished by a pricing service are not readily available are valued either at amortized cost or at original cost plus accrued interest, both of which approximate current value.
The procedures set forth above need not be used to determine the value of the securities owned by a fund if, in the opinion of a committee appointed by the Board of Trustees, some other method would more accurately reflect the fair value of such securities. For example, securities and other assets for which there is no readily available market value may be valued in good faith by a committee appointed by the Board of Trustees. In making a good faith determination of the value of a security, the committee may review price movements in futures contracts and ADRs, market and trading trends, the bid/ask quotes of brokers and off-exchange institutional trading.
Money Market Fund. Portfolio securities and other assets are valued on the basis of amortized cost. This technique involves initially valuing an instrument at its cost as adjusted for amortization of premium or accretion of discount rather than its current market value. The amortized cost value of an instrument may be higher or lower than the price the fund would receive if it sold the instrument.
Securities of other open-end investment companies are valued at their respective NAVs.
At such intervals as they deem appropriate, the Trustees consider the extent to which NAV calculated by using market valuations would deviate from the $1.00 per share calculated using amortized cost valuation. If the Trustees believe that a deviation from the fund's amortized cost per share may result in material dilution or other unfair results to shareholders, the Trustees have agreed to take such corrective action, if any, as they deem appropriate to eliminate or reduce, to the extent reasonably practicable, the dilution or unfair results. Such corrective action could include selling portfolio instruments prior to maturity to realize capital gains or losses or to shorten average portfolio maturity; withholding dividends; redeeming shares in kind; establishing NAV by using available market quotations; and such other measures as the Trustees may deem appropriate.
The Freedom Funds and the underlying Fidelity funds may quote performance in various ways, and the Freedom Funds may quote the performance of various underlying Fidelity funds. All performance information supplied by the funds in advertising is historical and is not intended to indicate future returns. The share price of a bond or equity fund, the yield, if applicable, of a bond, money market, or equity fund, and return fluctuate in response to market conditions and other factors, and the value of an equity or bond fund's shares when redeemed may be more or less than their original cost. The following paragraphs describe how yield and return are calculated by the Freedom Funds and the underlying Fidelity funds.
Yield Calculations (Freedom Income). The yield for Freedom Income is the asset-weighted average of the yields of the underlying Fidelity funds in which it invests, reduced by Freedom Income's expenses. The asset-weighted yield is calculated by multiplying the yield of each underlying fund by the value of Freedom Income's investment in that fund, adding together the results, dividing the sum by Freedom Income's total net assets and then subtracting the annualized expenses of Freedom Income. The asset-weighted yield is currently calculated once a month as of the last day of the prior month. In those cases where a yield is not published for an underlying fund, that fund's yield is assumed to be zero for purposes of this calculation.
Yield Calculations (Money Market Fund).To compute the yield for a money market fund for a period, the net change in value of a hypothetical account containing one share reflects the value of additional shares purchased with dividends from the one original share and dividends declared on both the original share and any additional shares. The net change is then divided by the value of the account at the beginning of the period to obtain a base period return. This base period return is annualized to obtain a current annualized yield. A money market fund also may calculate an effective yield by compounding the base period return over a one-year period. In addition to the current yield, a money market fund may quote yields in advertising based on any historical seven-day period. Yields for a money market fund are calculated on the same basis as other money market funds, as required by applicable regulation.
Yield information may be useful in reviewing a fund's performance and in providing a basis for comparison with other investment alternatives. However, a fund's yield fluctuates, unlike investments that pay a fixed interest rate over a stated period of time. When comparing investment alternatives, investors should also note the quality and maturity of the portfolio securities of respective investment companies they have chosen to consider.
Investors should recognize that in periods of declining interest rates a fund's yield will tend to be somewhat higher than prevailing market rates, and in periods of rising interest rates a fund's yield will tend to be somewhat lower. Also, when interest rates are falling, the inflow of net new money to a fund from the continuous sale of its shares will likely be invested in instruments producing lower yields than the balance of the fund's holdings, thereby reducing a fund's current yield. In periods of rising interest rates, the opposite can be expected to occur.
Yield Calculations (Bond and Equity Funds). Yields for a fund are computed by dividing a fund's interest and dividend income for a given 30-day or one-month period, net of expenses, by the average number of shares entitled to receive distributions during the period, dividing this figure by the fund's NAV or offering price, as applicable at the end of the period, and annualizing the result (assuming compounding of income) in order to arrive at an annual percentage rate. Yields do not reflect Fidelity Capital & Income Fund's trading fee or Fidelity Diversified International Fund's, Fidelity Europe Fund's, Fidelity Japan Fund's, Fidelity Overseas Fund's and Fidelity Southeast Asia Fund's short-term trading fee. Income is calculated for purposes of yield quotations in accordance with standardized methods applicable to all stock and bond funds. Dividends from equity securities are treated as if they were accrued on a daily basis, solely for the purposes of yield calculations. In general, interest income is reduced with respect to bonds trading at a premium over their par value by subtracting a portion of the premium from income on a daily basis, and is increased with respect to bonds trading at a discount by adding a portion of the discount to daily income. For a fund's investments denominated in foreign currencies, income and expenses are calculated first in their respective currencies, and then are converted to U.S. dollars, either when they are actually converted or at the end of the 30-day or one month period, whichever is earlier. Income is adjusted to reflect gains and losses from principal repayments received by a fund with respect to mortgage-related securities and other asset-backed securities. Other capital gains and losses generally are excluded from the calculation as are gains and losses from currency exchange rate fluctuations.
Income calculated for the purposes of calculating a fund's yield differs from income as determined for other accounting purposes. Because of the different accounting methods used, and because of the compounding of income assumed in yield calculations, a fund's yield may not equal its distribution rate, the income paid to an investor's account, or the income reported in the fund's financial statements.
Yield information may be useful in reviewing a fund's performance and in providing a basis for comparison with other investment alternatives. However, a fund's yield fluctuates, unlike investments that pay a fixed interest rate over a stated period of time. When comparing investment alternatives, investors should also note the quality and maturity of the portfolio securities of respective investment companies they have chosen to consider.
Investors should recognize that in periods of declining interest rates a fund's yield will tend to be somewhat higher than prevailing market rates, and in periods of rising interest rates a fund's yield will tend to be somewhat lower. Also, when interest rates are falling, the inflow of net new money to a fund from the continuous sale of its shares will likely be invested in instruments producing lower yields than the balance of the fund's holdings, thereby reducing a fund's current yield. In periods of rising interest rates, the opposite can be expected to occur.
Return Calculations. Returns quoted in advertising reflect all aspects of a fund's return, including the effect of reinvesting dividends and capital gain distributions, and any change in a fund's NAV over a stated period. A cumulative return reflects actual performance over a stated period of time. Average annual returns are calculated by determining the growth or decline in value of a hypothetical historical investment in a fund over a stated period, and then calculating the annually compounded percentage rate that would have produced the same result if the rate of growth or decline in value had been constant over the period. For example, a cumulative return of 100% over ten years would produce an average annual return of 7.18%, which is the steady annual rate of return that would equal 100% growth on a compounded basis in ten years. Average annual returns covering periods of less than one year are calculated by determining a fund's return for the period, extending that return for a full year (assuming that return remains constant over the year), and quoting the result as an annual return. While average annual returns are a convenient means of comparing investment alternatives, investors should realize that a fund's performance is not constant over time, but changes from year to year, and that average annual returns represent averaged figures as opposed to the actual year-to-year performance of a fund.
In addition to average annual returns, a fund may quote unaveraged or cumulative returns reflecting the simple change in value of an investment over a stated period. Average annual and cumulative returns may be quoted as a percentage or as a dollar amount, and may be calculated for a single investment, a series of investments, or a series of redemptions, over any time period. Returns may be broken down into their components of income and capital (including capital gains and changes in share price) to illustrate the relationship of these factors and their contributions to return. Returns may be quoted on a before-tax or after-tax basis. After-tax returns reflect the return of a hypothetical account after payment of federal and/or state taxes using assumed tax rates. After-tax returns may assume that taxes are paid at the time of distribution or once a year or are paid in cash or by selling shares, that shares are held through the entire period, sold on the last day of the period, or sold at a future date, and distributions are reinvested or paid in cash. Returns may or may not include the effect of a fund's trading fee, the effect of a fund's maximum sales charge or the effect of a fund's small account fee. Excluding a fund's trading fee, sales charge or small account fee from a return calculation produces a higher return figure. Returns, yields, if applicable, and other performance information may be quoted numerically or in a table, graph, or similar illustration.
Net Asset Value. Charts and graphs using a fund's NAVs, adjusted NAVs, and benchmark indexes may be used to exhibit performance. An adjusted NAV includes any distributions paid by a fund and reflects all elements of its return. Unless otherwise indicated, a fund's adjusted NAVs are not adjusted for sales charges, if any.
Moving Averages. A fund may illustrate performance using moving averages. A long-term moving average is the average of each week's adjusted closing NAV for a specified period. A short-term moving average is the average of each day's adjusted closing NAV for a specified period. Moving Average Activity Indicators combine adjusted closing NAVs from the last business day of each week with moving averages for a specified period to produce indicators showing when an NAV has crossed, stayed above, or stayed below its moving average. The 13-week and 39-week long-term moving averages for Freedom Income, Freedom 2000, Freedom 2010, Freedom 2020, and Freedom 2030 are shown in the table below.
|
Fund |
13-Week |
39-Week |
|
Freedom Income* |
$ 11.37 |
$ 11.06 |
|
Freedom 2000* |
$ 13.15 |
$ 12.60 |
|
Freedom 2010* |
$ 15.09 |
$ 14.18 |
|
Freedom 2020* |
$ 16.66 |
$ 15.39 |
|
Freedom 2030* |
$ 17.18 |
$ 15.74 |
* On March 31, 2000.
Historical Fund Results. The following table shows Freedom Income's, Freedom 2000's, Freedom 2010's, Freedom 2020's, and Freedom 2030's returns and for Freedom Income, its 30-day yield, for the fiscal period ended March 31, 2000.
|
Average Annual Returns |
Cumulative Returns |
||||
|
|
Thirty- |
One |
Life of |
One |
Life of |
|
Freedom Income |
4.96% |
8.96% |
9.86% |
8.96% |
38.39% |
|
Freedom 2000 |
N/A |
13.81% |
14.21% |
13.81% |
58.26% |
|
Freedom 2010 |
N/A |
20.32% |
19.04% |
20.32% |
82.58% |
|
Freedom 2020 |
N/A |
26.74% |
22.47% |
26.74% |
101.43% |
|
Freedom 2030 |
N/A |
29.64% |
23.60% |
29.64% |
107.96% |
* From October 17, 1996 (commencement of operations).
** The yield for Freedom Income is the asset-weighted average of the yields of the underlying Fidelity funds in which it invests, reduced by Freedom Income's expenses.
Note: If FMR had not reimbursed certain fund expenses during these periods, each Freedom Fund's returns would have been lower.
Note: If FMR had not reimbursed certain fund expenses during these periods, Freedom Income's yield would have been 4.94%.
Historical Fund Results - Underlying Fidelity Funds. The following table shows the underlying Fidelity funds' 7-day or 30-day yields and/or return for the fiscal period ended March 31, 2000. Returns include the effect of a fund's maximum sales charge, if any, but do not include the effect of Fidelity Capital & Income Fund's trading fee or Fidelity Europe Fund's, Fidelity Japan Fund's, Fidelity Southeast Asia Fund's, Fidelity Diversified International Fund's, and Fidelity Overseas Fund's short-term trading fee.
|
|
Average Annual Total Returns |
Cumulative Total Returns |
||||||
|
Underlying Fidelity Fund |
Thirty-
/Seven- |
One |
Five |
Ten |
One |
Five |
Ten |
|
|
Fidelity Blue Chip Growth Fund1 |
N/A |
24.39% |
26.00% |
22.88% |
24.39% |
217.60% |
685.15% |
|
|
Fidelity Capital & Income Fund2 |
10.73% |
6.78% |
11.09% |
13.57% |
6.78% |
69.19% |
257.03% |
|
|
Fidelity Disciplined Equity Fund |
N/A |
22.18% |
23.91% |
18.79% |
22.18% |
192.07% |
459.44% |
|
|
Fidelity Diversified International Fund3 |
N/A |
47.07% |
22.41% |
15.68% |
47.07% |
174.83% |
233.32% |
|
|
Fidelity Equity-Income Fund |
N/A |
2.17% |
17.94% |
14.94% |
2.17% |
128.16% |
302.59% |
|
|
Fidelity Europe Fund4 |
N/A |
30.28% |
22.51% |
13.75% |
30.28% |
175.98% |
262.63% |
|
|
Fidelity Fund |
N/A |
21.29% |
26.99% |
18.73% |
21.29% |
230.24% |
456.55% |
|
|
Fidelity Government Income Fund |
6.43% |
1.67% |
6.41% |
7.73% |
1.67% |
36.45% |
110.54% |
|
|
Fidelity Growth & Income Portfolio |
N/A |
8.88% |
22.90% |
18.69% |
8.88% |
180.34% |
454.58% |
|
|
Fidelity Growth Company Fund5 |
N/A |
95.57% |
37.49% |
25.58% |
95.57% |
391.35% |
875.10% |
|
|
Fidelity Intermediate Bond Fund |
6.91% |
2.12% |
6.03% |
7.16% |
2.12% |
34.04% |
99.69% |
|
|
Fidelity Investment Grade Bond Fund |
6.76% |
1.53% |
6.53% |
7.96% |
1.53% |
37.19% |
115.06% |
|
|
Fidelity Japan Fund6 |
N/A |
108.71% |
17.12% |
15.15% |
108.71% |
120.34% |
189.82% |
|
|
Fidelity Money Market Trust: |
5.74% |
5.27% |
5.39% |
5.13% |
5.27% |
29.99% |
64.84% |
|
|
Fidelity OTC Portfolio7 |
N/A |
82.56% |
37.27% |
24.83% |
82.56% |
387.37% |
818.90% |
|
|
Fidelity Overseas Fund3 |
N/A |
39.74% |
17.59% |
11.07% |
39.74% |
124.82% |
185.77% |
|
|
Fidelity Southeast Asia Fund8 |
N/A |
98.81% |
8.24% |
9.56% |
98.81% |
48.54% |
88.65% |
|
* Fidelity Diversified International Fund commenced operations on December 27, 1991.
Fidelity Japan Fund commenced operations on September 15, 1992.
Fidelity Southeast Asia Fund commenced operations on April 19, 1993.
(dagger) Yields shown are for the 30-day period ended March 31, 2000, except for the yield shown for Fidelity Money Market Trust: Retirement Money Market Portfolio, which is for the seven-day period ended March 31, 2000.
1 Total return figures include the effect of Fidelity Blue Chip Growth Fund's 3.0% sales charge which was in effect prior to October 1, 1998.
2 Total return figures do not include the effect of Fidelity Capital & Income Fund's 1.5% redemption fee, applicable to shares held less than 365 days. In addition, when considering historical performance, be aware that effective December 30, 1990, the fund adopted a new investment objective and changed its name from Fidelity High Income Fund to Fidelity Capital & Income Fund. Accordingly, historical performance may not be representative of the fund's future performance under its current investment objective and policies.
3 Total return figures do not include the effect of Fidelity Diversified International Fund's and Fidelity Overseas Fund's 1.00% short-term trading fee, applicable to shares held less than 30 days that are redeemed after May 31, 2000.
4 Total return figures include the effect of Fidelity Europe Fund's 3.0% sales charge (eliminated effective March 1, 2000), but do not include the effect of the fund's 1.0% short-term trading fee, applicable to shares held less than 90 days that were redeemed on or before February 29, 2000.
5 Total return figures include the effect of Fidelity Growth Company's 3.0% sales charge which was in effect prior to January 1, 1997.
6 Total return figures include the effect of Fidelity Japan Fund's 3.0% sales charge, but do not include the effect of the fund's 1.5% short-term trading fee, applicable to shares held less than 90 days.
7 Total return figures include the effect of Fidelity OTC Portfolio's 3.0% sales charge which was in effect prior to October 1, 1998.
8 Total return figures include the effect of Fidelity Southeast Asia Fund's 3.0% sales charge, but do not include the effect of the fund's 1.5% short-term trading fee, applicable to shares held less than 90 days.
Note: If FMR had not reimbursed certain underlying Fidelity fund expenses during these periods, Fidelity Diversified International Fund's, Fidelity Europe Fund's, Fidelity Intermediate Bond Fund's, Fidelity Japan Fund's, Fidelity Money Market Trust: Retirement Money Market Portfolio's, and Fidelity Southeast Asia Fund's returns would have been lower.
The performance data relating to the underlying Fidelity funds set forth above is not indicative of future performance of either the underlying Fidelity funds or the Freedom Funds. The returns of Fidelity Japan Fund and Fidelity Southeast Asia Fund include the effect of sales charges that will not be incurred by the Freedom Funds when they purchase shares of those funds.
The following tables show the income and capital elements of Freedom Income's, Freedom 2000's, Freedom 2010's, Freedom 2020's, and Freedom 2030's cumulative return. The tables compare each fund's return to the record of the S&P 500, the Dow Jones Industrial Average (DJIA), and the cost of living, as measured by the Consumer Price Index (CPI), over the same period. The S&P 500 and DJIA comparisons are provided to show how each fund's return compared to the record of a market capitalization-weighted index of common stocks and a narrower set of stocks of major industrial companies, respectively, over the same period. Each fund has the ability to invest in securities not included in either index, and its investment portfolio may or may not be similar in composition to the indexes. The S&P 500 and DJIA returns are based on the prices of unmanaged groups of stocks and, unlike each fund's returns, do not include the effect of brokerage commissions or other costs of investing.
The following tables show the growth in value of a hypothetical $10,000 investment in Freedom Income, Freedom 2000, Freedom 2010, Freedom 2020, and Freedom 2030 during the life of each fund, assuming all distributions were reinvested. Returns are based on past results and are not an indication of future performance. Tax consequences of different investments have not been factored into the figures below.
During the period from October 17, 1996 (commencement of operations) to March 31, 2000, a hypothetical $10,000 investment in Freedom Income would have grown to $13,839.
|
FREEDOM INCOME |
INDEXES |
||||||
|
Period Ended March 31 |
Value of |
Value of |
Value of |
Total |
S&P 500 |
DJIA |
Cost of |
|
2000 |
$ 11,580 |
$ 1,910 |
$ 349 |
$ 13,839 |
$ 22,345 |
$ 19,098 |
$ 10,809 |
|
1999 |
$ 11,250 |
$ 1,250 |
$ 201 |
$ 12,701 |
$ 18,945 |
$ 16,858 |
$ 10,423 |
|
1998 |
$ 10,950 |
$ 702 |
$ 65 |
$ 11,717 |
$ 15,993 |
$ 14,906 |
$ 10,246 |
|
1997* |
$ 10,060 |
$ 139 |
$ 0 |
$ 10,199 |
$ 10,806 |
$ 10,966 |
$ 10,107 |
* From October 17, 1996 (commencement of operations).
** From month-end closest to initial investment date.
Explanatory Notes: With an initial investment of $10,000 in Freedom Income on October 17, 1996, the net amount invested in fund shares was $10,000. The cost of the initial investment ($10,000) together with the aggregate cost of reinvested dividends and capital gain distributions for the period covered (their cash value at the time they were reinvested) amounted to $12,120. If distributions had not been reinvested, the amount of distributions earned from the fund over time would have been smaller, and cash payments for the period would have amounted to $1,640 for dividends and $300 for capital gain distributions.
During the period from October 17, 1996 (commencement of operations) to March 31, 2000, a hypothetical $10,000 investment in Freedom 2000 would have grown to $15,826.
|
FREEDOM 2000 |
INDEXES |
||||||
|
Period Ended March 31 |
Value of |
Value of |
Value of |
Total |
S&P 500 |
DJIA |
Cost of |
|
2000 |
$ 13,470 |
$ 1,615 |
$ 741 |
$ 15,826 |
$ 22,345 |
$ 19,098 |
$ 10,809 |
|
1999 |
$ 12,600 |
$ 933 |
$ 372 |
$ 13,905 |
$ 18,945 |
$ 16,858 |
$ 10,423 |
|
1998 |
$ 11,980 |
$ 470 |
$ 133 |
$ 12,583 |
$ 15,993 |
$ 14,906 |
$ 10,246 |
|
1997* |
$ 10,120 |
$ 89 |
$ 0 |
$ 10,209 |
$ 10,806 |
$ 10,966 |
$ 10,107 |
* From October 17, 1996 (commencement of operations).
** From month-end closest to initial investment date.
Explanatory Notes: With an initial investment of $10,000 in Freedom 2000 on October 17, 1996, the net amount invested in fund shares was $10,000. The cost of the initial investment ($10,000) together with the aggregate cost of reinvested dividends and capital gain distributions for the period covered (their cash value at the time they were reinvested) amounted to $12,101. If distributions had not been reinvested, the amount of distributions earned from the fund over time would have been smaller, and cash payments for the period would have amounted to $1,340 for dividends and $620 for capital gain distributions.
During the period from October 17, 1996 (commencement of operations) to March 31, 2000, a hypothetical $10,000 investment in Freedom 2010 would have grown to $18,258.
|
FREEDOM 2010 |
INDEXES |
||||||
|
Period Ended March 31 |
Value of |
Value of |
Value of |
Total |
S&P 500 |
DJIA |
Cost of |
|
2000 |
$ 15,550 |
$ 1,712 |
$ 996 |
$ 18,258 |
$ 22,345 |
$ 19,098 |
$ 10,809 |
|
1999 |
$ 13,760 |
$ 990 |
$ 425 |
$ 15,175 |
$ 18,945 |
$ 16,858 |
$ 10,423 |
|
1998 |
$ 12,810 |
$ 558 |
$ 103 |
$ 13,471 |
$ 15,993 |
$ 14,906 |
$ 10,246 |
|
1997* |
$ 10,150 |
$ 109 |
$ 0 |
$ 10,259 |
$ 10,806 |
$ 10,966 |
$ 10,107 |
* From October 17, 1996 (commencement of operations).
** From month-end closest to initial investment date.
Explanatory Notes: With an initial investment of $10,000 in Freedom 2010 on October 17, 1996, the net amount invested in fund shares was $10,000. The cost of the initial investment ($10,000) together with the aggregate cost of reinvested dividends and capital gain distributions for the period covered (their cash value at the time they were reinvested) amounted to $12,265. If distributions had not been reinvested, the amount of distributions earned from the fund over time would have been smaller, and cash payments for the period would have amounted to $1,320 for dividends and $790 for capital gain distributions.
During the period from October 17, 1996 (commencement of operations) to March 31, 2000, a hypothetical $10,000 investment in Freedom 2020 would have grown to $20,143.
|
FREEDOM 2020 |
INDEXES |
||||||
|
Period Ended March 31 |
Value of |
Value of |
Value of |
Total |
S&P 500 |
DJIA |
Cost of |
|
2000 |
$ 17,280 |
$ 1,587 |
$ 1,276 |
$ 20,143 |
$ 22,345 |
$ 19,098 |
$ 10,809 |
|
1999 |
$ 14,550 |
$ 872 |
$ 471 |
$ 15,893 |
$ 18,945 |
$ 16,858 |
$ 10,423 |
|
1998 |
$ 13,280 |
$ 510 |
$ 151 |
$ 13,941 |
$ 15,993 |
$ 14,906 |
$ 10,246 |
|
1997* |
$ 10,210 |
$ 89 |
$ 0 |
$ 10,299 |
$ 10,806 |
$ 10,966 |
$ 10,107 |
* From October 17, 1996 (commencement of operations).
** From month-end closest to initial investment date.
Explanatory Notes: With an initial investment of $10,000 in Freedom 2020 on October 17, 1996, the net amount invested in fund shares was $10,000. The cost of the initial investment ($10,000) together with the aggregate cost of reinvested dividends and capital gain distributions for the period covered (their cash value at the time they were reinvested) amounted to $12,280. If distributions had not been reinvested, the amount of distributions earned from the fund over time would have been smaller, and cash payments for the period would have amounted to $1,160 for dividends and $970 for capital gain distributions.
During the period from October 17, 1996 (commencement of operations) to March 31, 2000, a hypothetical $10,000 investment in Freedom 2030 would have grown to $20,796.
|
FREEDOM 2030 |
INDEXES |
||||||
|
Period Ended March 31 |
Value of |
Value of |
Value of |
Total |
S&P 500 |
DJIA |
Cost of |
|
2000 |
$ 17,840 |
$ 1,475 |
$ 1,481 |
$ 20,796 |
$ 22,345 |
$ 19,098 |
$ 10,809 |
|
1999 |
$ 14,550 |
$ 788 |
$ 703 |
$ 16,041 |
$ 18,945 |
$ 16,858 |
$ 10,423 |
|
1998 |
$ 13,420 |
$ 475 |
$ 140 |
$ 14,035 |
$ 15,993 |
$ 14,906 |
$ 10,246 |
|
1997* |
$ 10,210 |
$ 89 |
$ 0 |
$ 10,299 |
$ 10,806 |
$ 10,966 |
$ 10,107 |
* From October 17, 1996 (commencement of operations).
** From month-end closest to initial investment date.
Explanatory Notes: With an initial investment of $10,000 in Freedom 2030 on October 17, 1996, the net amount invested in fund shares was $10,000. The cost of the initial investment ($10,000) together with the aggregate cost of reinvested dividends and capital gain distributions for the period covered (their cash value at the time they were reinvested) amounted to $12,283. If distributions had not been reinvested, the amount of distributions earned from the fund over time would have been smaller, and cash payments for the period would have amounted to $1,050 for dividends and $1,080 for capital gain distributions.
Freedom 2040 may compare its return to the record of the S&P 500, the DJIA, and the cost of living, as measured by the CPI, over the same period. The S&P 500 and DJIA comparisons would show how the fund's return compared to the record of a market capitalization-weighted index of common stocks and a narrower set of stocks of major industrial companies, respectively. Freedom 2040 has the ability to invest in securities not included in either index, and its investment portfolio may or may not be similar in composition to the indexes. The S&P 500 and DJIA returns are based on the prices of unmanaged groups of stocks and, unlike the fund's returns, do not include the effect of brokerage commissions or other costs of investing.
After-Tax Results for Freedom Income, Freedom 2000, Freedom 2010, Freedom 2020, and Freedom 2030. The following table shows Freedom Income's, Freedom 2000's, Freedom 2010's, Freedom 2020's, and Freedom 2030's pre-liquidation and post-liquidation after-tax returns, as provided by Morningstar, Inc., for the fiscal period ended March 31, 2000.
The pre-liquidation calculation assumes (i) that taxes are paid on distributions at the time of the distribution, (ii) that shares were held for the entire measurement period, and (iii) that no taxes have been paid on accumulated capital appreciation. The post-liquidation calculation assumes (i) that taxes are paid on distributions at the time of the distribution and (ii) that shares have been sold at the end of the measurement period.
The pre-liquidation and post-liquidation after-tax calculations assume the highest individual federal income and capital gains tax rates in effect at the time the distribution is paid. The applicable tax rate is applied to distributions as if they were paid in cash and the remainder of the distribution is assumed to be reinvested in shares of the fund. State and local taxes are not considered.
The post-liquidation after-tax calculation assumes the long-term capital gains tax rate on accumulated capital appreciation for all periods. If there would have been a capital loss on liquidation, the loss is recorded as a tax benefit, increasing the post-liquidation return.
After-tax returns are based on past results and are not an indication of future performance. Actual after-tax returns will differ depending on your individual circumstances.
|
|
Average Annual Returns |
|
Fund Name |
One |
|
Freedom Income - Pre-Liquidation Returns |
6.74% |
|
Freedom Income - Post-Liquidation Returns |
6.13% |
|
Freedom 2000 - Pre-Liquidation Returns |
11.53% |
|
Freedom 2000 - Post-Liquidation Returns |
10.10% |
|
Freedom 2010 - Pre-Liquidation Returns |
18.06% |
|
Freedom 2010 - Post-Liquidation Returns |
15.37% |
|
Freedom 2020 - Pre-Liquidation Returns |
24.43% |
|
Freedom 2020 - Post-Liquidation Returns |
20.55% |
|
Freedom 2030 - Pre-Liquidation Returns |
27.59% |
|
Freedom 2030 - Post-Liquidation Returns |
22.94% |
INTERNATIONAL INDEXES, MARKET CAPITALIZATION, AND
NATIONAL STOCK MARKET RETURN
The following tables show the total market capitalization of certain countries according to the Morgan Stanley Capital International indexes database, the total market capitalization of Latin American countries according to the Morgan Stanley Capital International database, and the performance of national stock markets as measured in U.S. dollars by the Morgan Stanley Capital International stock market indexes for the twelve months ended March 31, 2000. Of course, these results are not indicative of future stock market performance or the funds' performance. Market conditions during the periods measured fluctuated widely. Brokerage commissions and other fees are not factored into the values of the indexes.
Market Capitalization. Companies outside the United States now make up nearly two-thirds of the world's stock market capitalization. According to Morgan Stanley Capital International, the size of the markets as measured in U.S. dollars grew from $7,920.2 billion in 1999 to $10,659.6 billion in 2000.
The following table measures the total market capitalization of certain countries according to the Morgan Stanley Capital International indexes database. The value of each market is measured in billions of U.S. dollars as of March 31, 2000.
|
Total Market Capitalization |
|||
|
Australia |
$ 230.8 |
Japan |
$ 2,825.3 |
|
Austria |
$ 19.9 |
Malaysia |
$ 94.6 |
|
Belgium |
$ 70.6 |
Netherlands |
$ 510.7 |
|
Canada |
$ 504.1 |
Norway |
$ 34.7 |
|
Denmark |
$ 84.7 |
Singapore |
$ 85.1 |
|
France |
$ 1,074.8 |
Spain |
$ 279.1 |
|
Germany |
$ 959.7 |
Sweden |
$ 319.8 |
|
Hong Kong |
$ 236.8 |
Switzerland |
$ 541.8 |
|
Italy |
$ 420.4 |
United Kingdom |
$ 2,022.6 |
|
|
|
United States |
$ 10,315.4 |
The following table measures the total market capitalization of Latin American countries according to the Morgan Stanley Capital International database. The value of each market is measured in billions of U.S. dollars as of March 31, 2000.
|
|
|
Total Market Capitalization - Latin America |
|
|
Argentina |
$ 24.2 |
|
Brazil |
$ 139.4 |
|
Chile |
$ 39.2 |
|
Colombia |
$ 3.7 |
|
Mexico |
$ 132.7 |
|
Venezuela |
$ 6.7 |
|
Peru |
$ 8.2 |
|
Total Latin America |
$ 354.1 |
National Stock Market Performance. Certain national stock markets have outperformed the U.S. stock market. The first table below represents the performance of national stock markets as measured in U.S. dollars by the Morgan Stanley Capital International stock market indexes for the twelve months ended March 31, 2000. The second table shows the same performance as measured in local currency. Each table measures return based on the period's change in price, dividends paid on stocks in the index, and the effect of reinvesting dividends net of any applicable foreign taxes. These are unmanaged indexes composed of a sampling of selected companies representing an approximation of the market structure of the designated country.
|
Stock Market Performance |
|||
|
Australia |
1.92% |
Japan |
45.14% |
|
Austria |
-18.05% |
Malaysia |
148.73% |
|
Belgium |
-23.25% |
Netherlands |
11.04% |
|
Canada |
67.25% |
Norway |
11.04% |
|
Denmark |
38.46% |
Singapore |
42.81% |
|
France |
35.69% |
Spain |
14.29% |
|
Germany |
38.68% |
Sweden |
100.47% |
|
Hong Kong |
50.16% |
Switzerland |
-6.36% |
|
Italy |
2.59% |
United Kingdom |
1.82% |
|
|
|
United States |
17.27% |
|
Stock Market Performance |
|||
|
Australia |
6.03% |
Japan |
25.73% |
|
Austria |
-7.56% |
Malaysia |
111.52% |
|
Belgium |
-13.42% |
Netherlands |
25.24% |
|
Canada |
60.52% |
Norway |
21.22% |
|
Denmark |
56.44% |
Singapore |
41.33% |
|
France |
53.05% |
Spain |
28.92% |
|
Germany |
56.42% |
Sweden |
110.62% |
|
Hong Kong |
50.88% |
Switzerland |
5.16% |
|
Italy |
15.71% |
United Kingdom |
3.03% |
|
|
|
United States |
17.27% |
The following table shows the average annualized stock market returns measured in U.S. dollars as of March 31, 2000.
|
Stock Market Performance |
||
|
|
Five Years Ended |
Ten Years Ended |
|
Germany |
20.88% |
11.72% |
|
Hong Kong |
13.27% |
19.69% |
|
Japan |
2.58% |
3.15% |
|
Spain |
29.52% |
15.33% |
|
United Kingdom |
17.34% |
14.16% |
|
United States |
27.08% |
18.67% |
Performance Comparisons. A fund's performance may be compared to the performance of other mutual funds in general, or to the performance of particular types of mutual funds. These comparisons may be expressed as mutual fund rankings prepared by Lipper Inc. (Lipper), an independent service located in Summit, New Jersey that monitors the performance of mutual funds. Generally, Lipper rankings are based on return, assume reinvestment of distributions, do not take sales charges or trading fees into consideration, and are prepared without regard to tax consequences. Lipper may also rank based on yield. In addition to the mutual fund rankings, a fund's performance may be compared to stock, bond, and money market mutual fund performance indexes prepared by Lipper or other organizations. When comparing these indexes, it is important to remember the risk and return characteristics of each type of investment. For example, while stock mutual funds may offer higher potential returns, they also carry the highest degree of share price volatility. Likewise, money market funds may offer greater stability of principal, but generally do not offer the higher potential returns available from stock mutual funds.
From time to time, a fund's performance may also be compared to other mutual funds tracked by financial or business publications and periodicals. For example, a fund may quote Morningstar, Inc. in its advertising materials. Morningstar, Inc. is a mutual fund rating service that rates mutual funds on the basis of risk-adjusted performance. Rankings that compare the performance of Fidelity funds to one another in appropriate categories over specific periods of time may also be quoted in advertising.
A fund's performance may also be compared to that of each benchmark index representing the universe of securities in which the fund may invest. The return of each index reflects reinvestment of all dividends and capital gains paid by securities included in each index. Unlike a fund's returns, however, each index's returns do not reflect brokerage commissions, transaction fees, or other costs of investing directly in the securities included in the index.
The performance of each Freedom Fund may be compared to the performance of a target asset allocation composite index (Composite Index). A Freedom Fund's Composite Index is a representation of the performance of the asset classes (domestic and international equity funds, investment-grade and high yield fixed-income funds, and money market funds) in which a Freedom Fund is invested and is based on the weightings of each asset class in a Freedom Fund. The following indexes are used to calculate a Freedom Fund's Composite Index: Wilshire 5000 Total Market Index (Wilshire 5000) for the domestic equity fund class, Morgan Stanley Capital International Europe, Australasia and Far East Index (MSCI EAFE) for the international equity fund class, Lehman Brothers Aggregate Bond Index for the investment-grade fixed-income fund class, Merrill Lynch High Yield Master II Index for the high yield fixed-income fund class, and Lehman Brothers 3-Month Treasury Bill Index for the money market fund class. The index weightings of each Composite Index are rebalanced monthly.
The index weightings in the Fidelity Freedom 2000 Composite Index, Fidelity Freedom 2010 Composite Index, Fidelity Freedom 2020 Composite Index, Fidelity Freedom 2030 Composite Index, and Fidelity Freedom 2040 Composite Index are adjusted semi-annually to reflect the changing asset allocations of the Freedom Funds with target retirement dates. On June 30 of each calendar year, the index weightings will be adjusted to reflect the average of the Freedom Fund's actual asset allocation as of March 31 and its projected target asset allocation as of September 30, as reported in the Freedom Funds' Annual Report for the fiscal year ended March 31. On December 31, the index weightings will be adjusted to reflect each Freedom Fund's actual asset allocation as of September 30 and its projected target asset allocation as of March 31, as reported in the Freedom Funds' Semi-Annual Report for the period ended September 30.
The index weightings in the Fidelity Freedom Income Composite Index are not adjusted semi-annually, as Freedom Income maintains a stable asset allocation strategy.
|
The Freedom Funds' Composite Index Weightings: |
|||||
|
|
Wilshire 5000 |
MSCI EAFE |
Lehman Brothers Aggregate Bond Index |
Merrill Lynch
High Yield |
Lehman Brothers
3-Month |
|
Freedom Income |
20.0% |
-- |
40.0% |
-- |
40.0% |
|
Freedom 2000 |
39.2% |
4.4% |
40.9% |
4.0% |
11.5% |
|
Freedom 2010 |
59.2% |
9.7% |
24.1% |
7.0% |
-- |
|
Freedom 2020 |
70.0% |
12.4% |
10.1% |
7.5% |
-- |
|
Freedom 2030 |
70.0% |
15.0% |
5.0% |
10.0% |
-- |
* The weightings of the Composite Indexes of the Freedom Funds' did not change on December 31, 1996.
|
The Freedom Funds' Composite Index Weightings: |
|||||
|
|
Wilshire 5000 |
MSCI EAFE |
Lehman Brothers Aggregate Bond Index |
Merrill Lynch
High Yield |
Lehman Brothers
3-Month |
|
Freedom Income |
20.0% |
-- |
40.0% |
-- |
40.0% |
|
Freedom 2000 |
38.2% |
4.5% |
40.8% |
4.0% |
12.5% |
|
Freedom 2010 |
57.7% |
9.5% |
25.0% |
7.1% |
0.7% |
|
Freedom 2020 |
69.1% |
12.6% |
10.7% |
7.6% |
-- |
|
Freedom 2030 |
69.6% |
15.1% |
5.3% |
10.0% |
-- |
|
The Freedom Funds' Composite Index Weightings: |
|||||
|
|
Wilshire 5000 |
MSCI EAFE |
Lehman Brothers Aggregate Bond Index |
Merrill Lynch
High Yield |
Lehman Brothers
3-Month |
|
Freedom Income |
20.0% |
-- |
40.0% |
-- |
40.0% |
|
Freedom 2000 |
37.9% |
4.3% |
40.5% |
3.9% |
13.4% |
|
Freedom 2010 |
56.8% |
9.2% |
25.7% |
7.0% |
1.3% |
|
Freedom 2020 |
68.6% |
12.4% |
11.4% |
7.6% |
-- |
|
Freedom 2030 |
69.6% |
15.0% |
5.5% |
9.9% |
-- |
|
The Freedom Funds' Composite Index Weightings: |
|||||
|
|
Wilshire 5000 |
MSCI EAFE |
Lehman Brothers Aggregate Bond Index |
Merrill Lynch
High Yield |
Lehman Brothers
3-Month |
|
Freedom Income |
20.0% |
-- |
40.0% |
-- |
40.0% |
|
Freedom 2000 |
36.8% |
3.9% |
40.3% |
3.6% |
15.4% |
|
Freedom 2010 |
55.2% |
8.5% |
27.2% |
6.7% |
2.4% |
|
Freedom 2020 |
67.9% |
11.9% |
12.7% |
7.5% |
-- |
|
Freedom 2030 |
70.0% |
14.5% |
6.0% |
9.5% |
-- |
|
The Freedom Funds' Composite Index Weightings: |
|||||
|
|
Wilshire 5000 |
MSCI EAFE |
Lehman Brothers Aggregate Bond Index |
Merrill Lynch
High Yield |
Lehman Brothers
3-Month |
|
Freedom Income |
20.0% |
-- |
40.0% |
-- |
40.0% |
|
Freedom 2000 |
34.9% |
3.4% |
40.5% |
3.4% |
17.8% |
|
Freedom 2010 |
52.4% |
7.8% |
29.5% |
6.6% |
3.7% |
|
Freedom 2020 |
66.3% |
11.3% |
14.8% |
7.6% |
-- |
|
Freedom 2030 |
70.0% |
13.9% |
6.8% |
9.3% |
-- |
|
The Freedom Funds' Composite Index Weightings: |
|||||
|
|
Wilshire 5000 |
MSCI EAFE |
Lehman Brothers Aggregate Bond Index |
Merrill Lynch
High Yield |
Lehman Brothers
3-Month |
|
Freedom Income |
20.0% |
-- |
40.0% |
-- |
40.0% |
|
Freedom 2000 |
33.7% |
3.4% |
39.8% |
3.3% |
19.8% |
|
Freedom 2010 |
50.2% |
7.6% |
31.1% |
6.3% |
4.8% |
|
Freedom 2020 |
64.7% |
11.4% |
16.3% |
7.6% |
-- |
|
Freedom 2030 |
69.8% |
13.9% |
7.4% |
8.9% |
-- |
|
The Freedom Funds' Composite Index Weightings: |
|||||
|
|
Wilshire 5000 |
MSCI EAFE |
Lehman Brothers Aggregate Bond Index |
Merrill Lynch
High Yield |
Lehman Brothers
3-Month |
|
Freedom Income |
20.0% |
-- |
40.0% |
-- |
40.0% |
|
Freedom 2000 |
32.7% |
3.3% |
39.7% |
3.1% |
21.2% |
|
Freedom 2010 |
48.6% |
7.3% |
32.5% |
6.1% |
5.5% |
|
Freedom 2020 |
63.9% |
11.1% |
17.5% |
7.5% |
-- |
|
Freedom 2030 |
69.8% |
13.7% |
7.8% |
8.7% |
-- |
|
The Freedom Funds' Composite Index Weightings: |
|||||
|
|
Wilshire 5000 |
MSCI EAFE |
Lehman Brothers Aggregate Bond Index |
Merrill Lynch
High Yield |
Lehman Brothers
3-Month |
|
Freedom Income |
20.0% |
-- |
40.0% |
-- |
40.0% |
|
Freedom 2000 |
30.8% |
2.8% |
40.0% |
2.7% |
23.7% |
|
Freedom 2010 |
46.3% |
6.6% |
34.7% |
5.9% |
6.5% |
|
Freedom 2020 |
62.8% |
10.7% |
18.9% |
7.6% |
-- |
|
Freedom 2030 |
69.9% |
13.4% |
8.3% |
8.4% |
-- |
|
Freedom 2040* |
75.0% |
15.0% |
-- |
10.0% |
-- |
* The weightings in the Freedom 2040 Composite Index are as of August 31, 2000.
Wilshire 5000 Total Market Index is a market capitalization-weighted index of approximately 7,000 U.S. equity securities which contains all actively traded common stocks with readily available price data traded on the New York Stock Exchange, American Stock Exchange and NASDAQ.
MSCI EAFE. The Morgan Stanley Capital International Europe, Australasia, Far East (EAFE) Index is a market capitalization-weighted index that is designed to represent the performance of developed stock markets outside of the United States and Canada. The index returns for periods after January 1, 1997 are adjusted for tax withholding rates applicable to U.S.-based mutual funds organized as Massachusetts business trusts. Effective October 1, 1998, the country of Malaysia was removed from this index. The index returns reflect the inclusion of Malaysia prior to October 1, 1998.
Lehman Brothers Aggregate Bond Index is a market value-weighted index for investment-grade fixed-rate debt issues, including government, corporate, asset-backed, and mortgage-backed securities. Issues included in the index have an outstanding par value of at least $100 million and maturities of at least one year. Government and corporate issues include all public obligations of the U.S. Treasury (excluding flower bonds and foreign-targeted issues) and U.S. Government agencies, as well as nonconvertible investment-grade, SEC-registered corporate debt. Mortgage-backed securities include 15- and 30-year fixed-rate securities backed by mortgage pools of the Government National Mortgage Association (GNMA), Federal Home Loan Mortgage Corporation (FHLMC), and Fannie Mae. Asset-backed securities include credit card, auto, and home equity loans.
Merrill Lynch High Yield Master II Index is a market value-weighted index of all domestic and yankee high-yield bonds, including deferred interest bonds and payment-in-kind securities. Issues included in the index have maturities of one year or more and have a credit rating lower than BBB-/Baa3, but are not in default. Issues must have an outstanding par value of at least $50 million to be included in the index.
Lehman Brothers 3-Month Treasury Bill Index is a representation of the average of T-Bill rates for each of the prior three months, adjusted to a bond equivalent yield basis (short-term instruments).
The following table represents the comparative indexes' calendar year-to-year performance.
|
|
Wilshire 5000 |
MSCI EAFE |
Lehman Brothers Aggregate Bond Index |
Merrill Lynch
High Yield |
Lehman Brothers 3-Month Treasury Bill Index |
|
1999 |
23.56% |
27.22% |
-0.82% |
2.51% |
4.90% |
|
1998 |
23.43% |
20.27% |
8.69% |
2.95% |
5.31% |
|
1997 |
31.29% |
2.01% |
9.65% |
13.27% |
5.52% |
|
1996 |
21.21% |
6.05% |
3.63% |
11.27% |
5.38% |
|
1995 |
36.45% |
11.21% |
18.47% |
20.46% |
6.09% |
|
1994 |
-0.06% |
7.78% |
-2.92% |
-1.03% |
4.26% |
|
1993 |
11.28% |
32.56% |
9.75% |
16.69% |
3.20% |
|
1992 |
8.97% |
-12.17% |
7.40% |
17.44% |
2.92% |
|
1991 |
34.21% |
12.13% |
16.00% |
39.17% |
6.22% |
|
1990 |
-6.18% |
-23.45% |
8.96% |
-4.36% |
8.21% |
Each of Freedom 2010, Freedom 2020, Freedom 2030, and Freedom 2040 may compare its performance to that of the Standard & Poor's 500 Index, a market capitalization-weighted index of common stocks.
Each of the Freedom Funds may compare its performance to that of the Wilshire 5000 Total Market Index, a market capitalization-weighted index of approximately 7,000 U.S. equity securities which contains all actively traded common stocks with readily available price data traded on the New York Stock Exchange, American Stock Exchange, and NASDAQ. The performance of this index over any period since its inception may be quoted in fund advertising.
Each of Freedom 2000, Freedom 2010, Freedom 2020, Freedom 2030, and Freedom 2040 may compare its performance to that of the EAFE, a market capitalization-weighted index that is designed to represent the performance of developed stock markets outside the United States and Canada. As of March 31, 2000, the index included over 950 equity securities of companies domiciled in 20 countries. The index returns for the EAFE for the periods after January 1, 1997, may be adjusted for tax withholding rates applicable to U.S.-based mutual funds organized as Massachusetts business trusts. Effective October 1, 1998, the country of Malaysia was removed from this index. The index returns reflect the inclusion of Malaysia prior to October 1, 1998. The performance of this index over any period since its inception may be quoted in fund advertising.
Each of the Freedom Funds may compare its performance to the Lehman Brothers Aggregate Bond Index, a market value-weighted index for investment-grade fixed-rate debt issues, including government, corporate, asset-backed, and mortgage-backed securities. Issues included in the index have an outstanding par value of at least $100 million and maturities of at least one year. Government and corporate issues include all public obligations of the U.S. Treasury (excluding flower bonds and foreign-targeted issues) and U.S. Government agencies, as well as nonconvertible investment-grade, SEC-registered corporate debt. Mortgage-backed securities include 15- and 30-year fixed-rate securities backed by mortgage pools of the Government National Mortgage Association (GNMA), Federal Home Loan Mortgage Corporation (FHLMC), and Fannie Mae. Asset-backed securities include credit card, auto, and home equity loans.
Each of Freedom 2000, Freedom 2010, Freedom 2020, Freedom 2030, and Freedom 2040 may compare its performance to that of the Merrill Lynch High Yield Master II Index, a market value-weighted index of all domestic and yankee high-yield bonds, including deferred interest bonds and payment-in-kind securities. Issues included in the index have maturities of one year or more and have a credit rating lower than BBB-/Baa3, but are not in default. Issues must have an outstanding par value of at least $50 million to be included in the index.
Each of Freedom Income, Freedom 2000, and Freedom 2010 may compare its performance to the Lehman Brothers 3-Month Treasury Bill Index, a representation of the average of T-Bill rates for each of the prior three months, adjusted to a bond equivalent yield basis (short-term instruments).
A fund may be compared in advertising to Certificates of Deposit (CDs) or other investments issued by banks or other depository institutions. Mutual funds differ from bank investments in several respects. For example, a fund may offer greater liquidity or higher potential returns than CDs, a fund does not guarantee an investor's principal or return, and fund shares are not FDIC insured.
Fidelity may provide information designed to help individuals understand their investment goals and explore various financial strategies. Such information may include information about current economic, market, and political conditions; materials that describe general principles of investing, such as asset allocation, diversification, risk tolerance, and goal setting; questionnaires designed to help create a personal financial profile; worksheets used to project savings needs based on assumed rates of inflation and hypothetical rates of return; and action plans offering investment alternatives. Materials may also include discussions of Fidelity's asset allocation funds and other Fidelity funds, products, and services.
Ibbotson Associates of Chicago, Illinois (Ibbotson) provides historical returns of the capital markets in the United States, including common stocks, small capitalization stocks, long-term corporate bonds, intermediate-term government bonds, long-term government bonds, Treasury bills, the U.S. rate of inflation (based on the CPI), and combinations of various capital markets. The performance of these capital markets is based on the returns of different indexes.
Fidelity funds may use the performance of these capital markets in order to demonstrate general risk-versus-reward investment scenarios. Performance comparisons may also include the value of a hypothetical investment in any of these capital markets. The risks associated with the security types in any capital market may or may not correspond directly to those of the funds. Ibbotson calculates returns in the same method as the funds. The funds may also compare performance to that of other compilations or indexes that may be developed and made available in the future.
In advertising materials, Fidelity may reference or discuss its products and services, which may include other Fidelity funds; retirement investing; brokerage products and services; model portfolios or allocations; saving for college or other goals; and charitable giving. In addition, Fidelity may quote or reprint financial or business publications and periodicals as they relate to current economic and political conditions, fund management, portfolio composition, investment philosophy, investment techniques, the desirability of owning a particular mutual fund, and Fidelity services and products. Fidelity may also reprint, and use as advertising and sales literature, articles from Fidelity Focus®, a quarterly magazine provided free of charge to Fidelity fund shareholders.
A fund may present its fund number, Quotron(TM) number, and CUSIP number, and discuss or quote its current portfolio manager.
Volatility. A fund may quote various measures of volatility and benchmark correlation in advertising. In addition, the fund may compare these measures to those of other funds. Measures of volatility seek to compare a fund's historical share price fluctuations or returns to those of a benchmark. Measures of benchmark correlation indicate how valid a comparative benchmark may be. All measures of volatility and correlation are calculated using averages of historical data. In advertising, a fund may also discuss or illustrate examples of interest rate sensitivity.
Momentum Indicators indicate a fund's price movements over specific periods of time. Each point on the momentum indicator represents a fund's percentage change in price movements over that period.
A fund may advertise examples of the effects of periodic investment plans, including the principle of dollar cost averaging. In such a program, an investor invests a fixed dollar amount in a fund at periodic intervals, thereby purchasing fewer shares when prices are high and more shares when prices are low. While such a strategy does not assure a profit or guard against loss in a declining market, the investor's average cost per share can be lower than if fixed numbers of shares are purchased at the same intervals. In evaluating such a plan, investors should consider their ability to continue purchasing shares during periods of low price levels.
As of March 31, 2000, FMR advised over $36 billion in municipal fund assets, $142 billion in taxable fixed-income fund assets, $150 billion in money market fund assets, $664 billion in equity fund assets, $23 billion in international fund assets, and $43 billion in Spartan® fund assets. The funds may reference the growth and variety of money market mutual funds and the adviser's innovation and participation in the industry. The equity funds under management figure represents the largest amount of equity fund assets under management by a mutual fund investment adviser in the United States, making FMR America's leading equity (stock) fund manager. FMR, its subsidiaries, and affiliates maintain a worldwide information and communications network for the purpose of researching and managing investments abroad.
Each Freedom Fund may reference, illustrate, or discuss the performance of the underlying Fidelity funds.
ADDITIONAL PURCHASE, EXCHANGE AND REDEMPTION INFORMATION
A fund may make redemption payments in whole or in part in readily marketable securities or other property, valued for this purpose as they are valued in computing each fund's NAV, if Strategic Advisers determines it is in the best interests of the fund. Shareholders that receive securities or other property on redemption may realize a gain or loss for tax purposes, and will incur any costs of sale, as well as the associated inconveniences.
Dividends. A portion of each Freedom Fund's income may qualify for the dividends-received deduction available to corporate shareholders to the extent that each Freedom Fund's income is derived from qualifying dividends or from the qualifying portion of dividends from an underlying Fidelity fund. For each Freedom Fund and for those underlying Fidelity funds that may earn other types of income that do not qualify for the dividends-received deduction available to corporate shareholders, such as interest, short-term capital gains (including short-term capital gains distributed by an underlying Fidelity fund as a dividend as well as short-term capital gains earned on the sale of underlying Fidelity fund shares or other securities), and non-qualifying dividends, the percentage of fund dividends that qualifies for the deduction generally will be less than 100%. A portion of each Freedom Fund's dividends derived from certain U.S. Government securities, including the portion of dividends from an underlying Fidelity fund derived from certain U.S. Government securities, and securities of certain other investment companies may be exempt from state and local taxation.
Capital Gain Distributions. Each Freedom Fund's long-term capital gain distributions, including amounts attributable to an underlying Fidelity fund's long-term capital gain distributions, are federally taxable to shareholders generally as capital gains.
Returns of Capital. If a fund's distributions exceed its taxable income and capital gains realized during a taxable year, all or a portion of the distributions made in the same taxable year may be recharacterized as a return of capital to shareholders. A return of capital distribution will generally not be taxable, but will reduce each shareholder's cost basis in the fund and result in a higher reported capital gain or lower reported capital loss when those shares on which the distribution was received are sold.
Tax Status of the Funds. Each Freedom Fund intends to qualify each year as a "regulated investment company" under Subchapter M of the Internal Revenue Code so that it will not be liable for federal tax on income and capital gains distributed to shareholders. In order to qualify as a regulated investment company, and avoid being subject to federal income or excise taxes at the fund level, each Freedom Fund intends to distribute substantially all of its net investment income and net realized capital gains within each calendar year as well as on a fiscal year basis, and intends to comply with other tax rules applicable to regulated investment companies.
Five to ten years after a Freedom Fund with a target retirement date reaches its target retirement year, its asset allocation target is expected to match Freedom Income Fund's asset allocation target. It is expected that at such time the assets of the Freedom Fund with a target retirement date will be combined with the assets of Freedom Income Fund. The Trustees reserve the right to engage in such transactions in the best interests of the funds, taking into account then existing laws and regulations. The trust's Trust Instrument empowers the Trustees to take these actions with or without seeking shareholder approval. A combination of assets may result in a capital gain or loss for shareholders of a Freedom Fund with a target retirement date.
Other Tax Information. The information above is only a summary of some of the tax consequences generally affecting each Freedom Fund and its shareholders, and no attempt has been made to discuss individual tax consequences. It is up to you or your tax preparer to determine whether the sale of shares of a fund resulted in a capital gain or loss or other tax consequence to you. In addition to federal income taxes, shareholders may be subject to state and local taxes on fund distributions, and shares may be subject to state and local personal property taxes. Investors should consult their tax advisers to determine whether a Freedom Fund is suitable to their particular tax situation.
The Trustees, Members of the Advisory Board, and executive officers of the trust and funds, as applicable, are listed below. The Board of Trustees governs each Freedom Fund and is responsible for protecting the interests of shareholders. The Trustees are experienced executives who meet periodically throughout the year to oversee each Freedom Fund's activities, review contractual arrangements with companies that provide services to each Freedom Fund, and review each Freedom Fund's performance. Except as indicated, each individual has held the office shown or other offices in the same company for the past five years or, if shorter, the period of a fund's operations. All persons named as Trustees and Members of the Advisory Board also serve in similar capacities for other funds advised by FMR or its affiliates, including the underlying Fidelity funds. If the interests of a Freedom Fund and an underlying Fidelity fund were to diverge, a conflict of interest could arise and affect how the Trustees and Members of the Advisory Board fulfill their fiduciary duties to the affected funds. Strategic Advisers has structured the Freedom Funds to avoid these potential conflicts, although there may be situations where a conflict of interest is unavoidable. In such instances, Strategic Advisers, the Trustees, and Members of the Advisory Board would take reasonable steps to minimize and, if possible, eliminate the conflict. The business address of each Trustee, Member of the Advisory Board, and officer who is an "interested person" (as defined in the 1940 Act) is 82 Devonshire Street, Boston, Massachusetts 02109, which is also the address of FMR. The business address of all the other Trustees is Fidelity Investments, P.O. Box 9235, Boston, Massachusetts 02205-9235. Those Trustees who are "interested persons" by virtue of their affiliation with the trust, Strategic Advisers, or FMR are indicated by an asterisk (*).
*EDWARD C. JOHNSON 3d (70), Trustee, is President of Fidelity Freedom 2000 Fund, Fidelity Freedom 2010 Fund, Fidelity Freedom 2020 Fund, Fidelity Freedom 2030 Fund, Fidelity Freedom 2040 Fund, and Fidelity Freedom Income Fund. Mr. Johnson also serves as President of other Fidelity funds. He is Chief Executive Officer, Chairman, and a Director of FMR Corp.; a Director and Chairman of the Board and of the Executive Committee of FMR; Chairman and a Director of Fidelity Management & Research (U.K.) Inc. and of Fidelity Management & Research (Far East) Inc.; Chairman (1998) and a Director (1997) of Fidelity Investments Money Management, Inc.; Chairman and Representative Director of Fidelity Investments Japan Limited (1997); and a Director of FDC and of FMR Co., Inc. (2000). Abigail Johnson, Member of the Advisory Board of Fidelity Aberdeen Street Trust, is Mr. Johnson's daughter.
ABIGAIL P. JOHNSON (38), Member of the Advisory Board of Fidelity Aberdeen Street Trust (1999), is Vice President of certain Equity Funds (1997), and is a Director of FMR Corp. (1994). Before assuming her current responsibilities, Ms. Johnson managed a number of Fidelity funds. Edward C. Johnson 3d, Trustee and President of the Funds, is Ms. Johnson's father.
J. MICHAEL COOK (57), Member of the Advisory Board (2000). Prior to Mr. Cook's retirement in May 1999, he served as Chairman and Chief Executive Officer of Deloitte & Touche LLP, Chairman of the Deloitte & Touche Foundation, and a member of the Board of Deloitte Touche Tohmatsu. He currently serves as an Executive in Residence of the Columbia Business School and as a Director of Dow Chemical Company (2000), HCA - The Healthcare Company (1999), and Children First (1999). He is a member of the Executive Committee of the Securities Regulation Institute, a member of the Advisory Board of Boardroom Consultants, past chairman and a member of the Board of Catalyst (a leading organization for the advancement of women in business), and a Director of the STAR Foundation (Society to Advance the Retarded and Handicapped). He also serves as a member of the Board and Executive Committee and as Co-Chairman of the Audit and Finance Committee of the Center for Strategic & International Studies, a member of the Board of Overseers of the Columbia Business School, and a Member of the Advisory Board of the Graduate School of Business of the University of Florida.
RALPH F. COX (68), Trustee, is President of RABAR Enterprises (management consulting-petroleum industry, 1994). Prior to February 1994, he was President of Greenhill Petroleum Corporation (petroleum exploration and production). Until March 1990, Mr. Cox was President and Chief Operating Officer of Union Pacific Resources Company (exploration and production). He is a Director of Waste Management Inc. (non-hazardous waste, 1993), CH2M Hill Companies (engineering), and Abraxas Petroleum (petroleum exploration and production, 1999). In addition, he is a member of advisory boards of Texas A&M University and the University of Texas at Austin.
PHYLLIS BURKE DAVIS (68), Trustee. Mrs. Davis is retired from Avon Products, Inc. where she held various positions including Senior Vice President of Corporate Affairs and Group Vice President of U.S. sales, distribution, and manufacturing. She is currently a Director of BellSouth Corporation (telecommunications), Eaton Corporation (manufacturing), and the TJX Companies, Inc. (retail stores), and previously served as a Director of Hallmark Cards, Inc., Nabisco Brands, Inc., and Standard Brands, Inc. In addition, she is a member of the Board of Directors of the Southampton Hospital in Southampton, N.Y. (1998).
ROBERT M. GATES (56), Trustee (1997), is a consultant, author, and lecturer (1993). Mr. Gates was Director of the Central Intelligence Agency (CIA) from 1991-1993. From 1989 to 1991, Mr. Gates served as Assistant to the President of the United States and Deputy National Security Advisor. Mr. Gates is a Director of Charles Stark Draper Laboratory (non-profit), NACCO Industries, Inc. (mining and manufacturing), and TRW Inc. (automotive, space, defense, and information technology). Mr. Gates previously served as a Director of LucasVarity PLC (automotive components and diesel engines). He is currently serving as Dean of the George Bush School of Government and Public Service at Texas A&M University (1999-2001). Mr. Gates also is a Trustee of the Forum for International Policy and of the Endowment Association of the College of William and Mary.
DONALD J. KIRK (67), Trustee, is Chairman of the Board of Directors of National Arts Stabilization Inc., Chairman of the Board of Trustees of the Greenwich Hospital Association, a Director of the Yale-New Haven Health Services Corp. (1998), Vice Chairman of the Public Oversight Board of the American Institute of Certified Public Accountants' SEC Practice Section (1995), and as a Public Governor of the National Association of Securities Dealers, Inc. (1996). Mr. Kirk was an Executive-in-Residence (1995-2000) and a Professor (1987-1995) at Columbia University Graduate School of Business. Prior to 1987, he was Chairman of the Financial Accounting Standards Board. Mr. Kirk previously served as a Director of General Re Corporation (reinsurance, 1987-1998) and as a Director of Valuation Research Corp. (appraisals and valuations, 1993-1995).
MARIE L. KNOWLES (53), Member of the Advisory Board (2000). Beginning in 1972, Ms. Knowles served in various positions with Atlantic Richfield Company (ARCO) (diversified energy) including Executive Vice President and Chief Financial Officer (1996-2000); Director (1996-1998); and Senior Vice President (1993-1996). In addition, Ms. Knowles served as President of ARCO Transportation Company (1993-1996). She currently serves as a Director of Phelps Dodge Corporation (copper mining and manufacturing), URS Corporation (multidisciplinary engineering, 1999), and America West Holdings Corporation (aviation and travel services, 1999). Ms. Knowles also serves as a member of the National Board of the Smithsonian Institution and she is a trustee of the Brookings Institution.
NED C. LAUTENBACH (56), Trustee (2000), has been a partner of Clayton, Dubilier & Rice, Inc. (private equity investment firm) since September 1998. Mr. Lautenbach was Senior Vice President of IBM Corporation from 1992 until his retirement in July 1998. From 1993 to 1995, he was Chairman of IBM World Trade Corporation. He also was a member of IBM's Corporate Executive Committee from 1994 to July 1998. Mr. Lautenbach has served as Chairman, President, and Chief Executive officer of Dynatech Corporation (global communications equipment) since 1999 and a Director since 1998. He is also a Director of PPG Industries Inc. (glass, coating and chemical manufacturer), Eaton Corporation (global manufacturer of highly engineered products), Axcelis Technologies, Inc. (semiconductors, 2000), and the Philharmonic Center for the Arts in Naples, Florida. He also serves on the Board of Trustees of Fairfield University.
*PETER S. LYNCH (57), Trustee, is Vice Chairman and a Director of FMR; and a Director of FMR Co., Inc. (2000). Prior to May 31, 1990, he was a Director of FMR and Executive Vice President of FMR (a position he held until March 31, 1991); Vice President of Fidelity® Magellan® Fund and FMR Growth Group Leader; and Managing Director of FMR Corp. Mr. Lynch was also Vice President of Fidelity Investments Corporate Services (1991-1992). In addition, he serves as a Trustee of Boston College, Massachusetts Eye & Ear Infirmary, Historic Deerfield (1989) and Society for the Preservation of New England Antiquities, and as an Overseer of the Museum of Fine Arts of Boston.
WILLIAM O. McCOY (66), Trustee (1997), is the Interim Chancellor for the University of North Carolina at Chapel Hill. Previously he had served from 1995 through 1998 as Vice President of Finance for the University of North Carolina (16-school system). Prior to his retirement in December 1994, Mr. McCoy was Vice Chairman of the Board of BellSouth Corporation (telecommunications, 1984) and President of BellSouth Enterprises (1986). He is currently a Director of Liberty Corporation (holding company, 1984), Duke-Weeks Realty Corporation (real estate, 1994), Carolina Power and Light Company (electric utility, 1996), the Kenan Transport Company (trucking, 1996), and Dynatech Corporation (electronics, 1999). Previously, he was a Director of First American Corporation (bank holding company, 1979-1996). In addition, Mr. McCoy served as a member of the Board of Visitors for the University of North Carolina at Chapel Hill (1994-1998) and currently serves on the Board of Visitors of the Kenan-Flager Business School (University of North Carolina at Chapel Hill, 1988).
GERALD C. McDONOUGH (72), Trustee and Chairman of the non-interested Trustees, is Chairman of G.M. Management Group (strategic advisory services). Mr. McDonough is a Director and Chairman of the Board of York International Corp. (air conditioning and refrigeration), a Director of Associated Estates Realty Corporation (a real estate investment trust, 1993), and a Director of Barpoint.com (online wireless product information service, 2000). Mr. McDonough served as a Director of ACME-Cleveland Corp. (metal working, telecommunications, and electronic products) from 1987-1996 and Brush-Wellman Inc. (metal refining) from 1983-1997. He also served as a Director of Commercial Intertech Corp. (hydraulic systems, building systems, and metal products) from 1992-2000 and CUNO, Inc. (liquid and gas filtration products) from 1996-2000.
MARVIN L. MANN (67), Trustee, is Chairman Emeritus of Lexmark International, Inc. (office machines, 1991) where he still remains a member of the Board. Prior to 1991, he held the positions of Vice President of International Business Machines Corporation ("IBM") and President and General Manager of various IBM divisions and subsidiaries. Mr. Mann is a Director of M.A. Hanna Company (chemicals, 1993), Imation Corp. (imaging and information storage, 1997). He is a Board member of Dynatech Corporation (electronics, 1999).
*ROBERT C. POZEN (53), Trustee (1997), is Senior Vice President of Fidelity Freedom 2000 Fund (1997), Fidelity Freedom 2010 Fund (1997), Fidelity Freedom 2020 Fund (1997), Fidelity Freedom 2030 Fund (1997), Fidelity Freedom 2040 Fund, and Fidelity Freedom Income Fund (1997). Mr. Pozen also serves as Senior Vice President of other Fidelity funds (1997). He is President and a Director of FMR (1997), Fidelity Management & Research (U.K.) Inc. (1997), Fidelity Management & Research (Far East) Inc. (1997), Fidelity Investments Money Management, Inc. (1998), and FMR Co., Inc. (2000); a Director of Strategic Advisers, Inc. (1999); and Vice Chairman of Fidelity Investments (2000). Previously, Mr. Pozen served as General Counsel, Managing Director, and Senior Vice President of FMR Corp.
THOMAS R. WILLIAMS (71), Trustee, is President of The Wales Group, Inc. (management and financial advisory services). Prior to retiring in 1987, Mr. Williams served as Chairman of the Board of First Wachovia Corporation (bank holding company), and Chairman and Chief Executive Officer of The First National Bank of Atlanta and First Atlanta Corporation (bank holding company). He is currently a Director of National Life Insurance Company of Vermont and American Software, Inc. Mr. Williams was previously a Director of ConAgra, Inc. (agricultural products), Georgia Power Company (electric utility), and Avado, Inc. (restaurants).
ROBERT A. LAWRENCE (47), is Vice President of Fidelity Freedom 2000 Fund (1997), Fidelity Freedom 2010 Fund (1997), Fidelity Freedom 2020 Fund (1997), Fidelity Freedom 2030 Fund (1997), Fidelity Freedom 2040 Fund, and Fidelity Freedom Income Fund (1997). Mr. Lawrence serves as Vice President of certain High Income Bond Funds (2000), Vice President of Fidelity Real Estate High Income Fund (1995) and Fidelity Real Estate High Income Fund II (1996), Vice President of certain Equity Funds (1997), and Senior Vice President of FMR (1993).
REN Y. CHENG (43), is Vice President of Fidelity Freedom 2000 Fund (1998), Fidelity Freedom 2010 Fund (1998), Fidelity Freedom 2020, Fidelity Freedom 2030 Fund, Fidelity Freedom 2040 Fund, and Fidelity Freedom Income Fund (1998). Prior to joining Fidelity as a portfolio manager in 1994, Mr. Cheng spent nine years at Putnam Investments, most recently as a senior vice president and senior portfolio manager.
SCOTT D. STEWART (41), is Vice President of Fidelity Freedom 2000 Fund (1996), Fidelity Freedom 2010 Fund (1996), Fidelity Freedom 2020 Fund (1996), Fidelity Freedom 2030 Fund (1996), Fidelity Freedom 2040 Fund, and Fidelity Freedom Income Fund (1996). Mr. Stewart is also a Senior Vice President and group leader of Fidelity's Structured Equity Group. Prior to his current responsibilities, Mr. Stewart has managed a variety of Fidelity funds.
ERIC D. ROITER (51), is Secretary of Fidelity Freedom 2000 Fund (1998), Fidelity Freedom 2010 Fund (1998), Fidelity Freedom 2020 Fund (1998), Fidelity Freedom 2030 Fund (1998), Fidelity Freedom 2040 Fund, and Fidelity Freedom Income Fund (1998). He also serves as Secretary of other Fidelity funds (1998); Vice President, General Counsel, and Clerk of FMR (1998); and Vice President and Clerk of FDC (1998). Prior to joining Fidelity, Mr. Roiter was with the law firm of Debevoise & Plimpton, as an associate (1981-1984) and as a partner (1985-1997), and served as an Assistant General Counsel of the U.S. Securities and Exchange Commission (1979-1981). Mr. Roiter was an Adjunct Member, Faculty of Law, at Columbia University Law School (1996-1997).
ROBERT A. DWIGHT (42), is Treasurer of Fidelity Freedom 2000 Fund (2000), Fidelity Freedom 2010 Fund (2000), Fidelity Freedom 2020 Fund (2000), Fidelity Freedom 2030 Fund (2000), Fidelity Freedom 2040 Fund, and Fidelity Freedom Income Fund (2000). Mr. Dwight also serves as Treasurer of other Fidelity funds (2000) and is an employee of FMR. Prior to becoming Treasurer of the Fidelity funds, he served as President of Fidelity Accounting and Custody Services (FACS). Before joining Fidelity, Mr. Dwight was Senior Vice President of fund accounting operations for The Boston Company.
MARIA F. DWYER (41), is Deputy Treasurer of Fidelity Freedom 2000 Fund (2000), Fidelity Freedom 2010 Fund (2000), Fidelity Freedom 2020 Fund (2000), Fidelity Freedom 2030 Fund (2000), Fidelity Freedom 2040 Fund, and Fidelity Freedom Income Fund (2000). She also serves as Deputy Treasurer of other Fidelity funds (2000) and is a Vice President (1999) and an employee (1996) of FMR. Prior to joining Fidelity, Ms. Dwyer served as Director of Compliance for MFS Investment Management.
JOHN H. COSTELLO (53), is Assistant Treasurer of Fidelity Freedom 2000 Fund, Fidelity Freedom 2010 Fund, Fidelity Freedom 2020 Fund, Fidelity Freedom 2030 Fund, Fidelity Freedom 2040 Fund (2000), and Fidelity Freedom Income Fund. Mr. Costello also serves as Assistant Treasurer of other Fidelity funds and is an employee of FMR.
The following table sets forth information describing the compensation of each Trustee and Member of the Advisory Board of each fund for his or her services for the fiscal year ended March 31, 2000, or calendar year ended December 31, 1999, as applicable.
|
Compensation Table |
||||||||||||||||
|
AGGREGATE COMPENSATION FROM A FUND |
Edward |
Abigail
P. |
J. |
Ralph
F. |
Phyllis Burke Davis |
Robert |
E. |
Donald |
Marie |
Ned |
Peter |
William |
Gerald
C. |
Marvin L. Mann |
Robert |
Thomas
R. |
|
Freedom IncomeB |
$ 0 |
$ 0 |
$ 8 |
$ 67 |
$ 66 |
$ 67 |
$ 46 |
$ 66 |
$ 0 |
$ 37 |
$ 0 |
$ 66 |
$ 83 |
$ 67 |
$ 0 |
$ 65 |
|
Freedom 2000B |
$ 0 |
$ 0 |
$ 18 |
$ 177 |
$ 174 |
$ 177 |
$ 126 |
$ 177 |
$ 0 |
$ 93 |
$ 0 |
$ 174 |
$ 221 |
$ 178 |
$ 0 |
$ 173 |
|
Freedom 2010B |
$ 0 |
$ 0 |
$ 47 |
$ 384 |
$ 380 |
$ 384 |
$ 260 |
$ 383 |
$ 0 |
$ 216 |
$ 0 |
$ 378 |
$ 480 |
$ 386 |
$ 0 |
$ 377 |
|
Freedom 2020B |
$ 0 |
$ 0 |
$ 45 |
$ 355 |
$ 352 |
$ 355 |
$ 238 |
$ 354 |
$ 0 |
$ 201 |
$ 0 |
$ 350 |
$ 444 |
$ 357 |
$ 0 |
$ 349 |
|
Freedom 2030B |
$ 0 |
$ 0 |
$ 25 |
$ 160 |
$ 159 |
$ 160 |
$ 99 |
$ 159 |
$ 0 |
$ 98 |
$ 0 |
$ 157 |
$ 200 |
$ 161 |
$ 0 |
$ 157 |
|
Freedom 2040B,+ |
$ 0 |
$ 0 |
$ 35 |
$ 35 |
$ 35 |
$ 35 |
$ 0 |
$ 35 |
$ 35 |
$ 35 |
$ 0 |
$ 35 |
$ 43 |
$ 35 |
$ 0 |
$ 35 |
|
TOTAL COMPENSATION FROM THE FUND COMPLEX*, A |
$ 0 |
$ 0 |
$ 0 |
$217,500 |
$211,500 |
$217,500 |
$217,500 |
$217,500 |
$ 0 |
$ 54,000 |
$ 0 |
$214,500 |
$269,000 |
$217,500 |
$ 0 |
$213,000 |
* Information is for the calendar year ended December 31, 1999 for 236 funds in the complex.
** Interested Trustees of the funds and Ms. Johnson are compensated by FMR.
*** During the period from October 14, 1999 through December 31, 1999, Mr. Lautenbach served as a Member of the Advisory Board. Effective January 1, 2000, Mr. Lautenbach serves as a Member of the Board of Trustees.
**** Mr. Jones served on the Board of Trustees through December 31, 1999.
***** Effective March 16, 2000, Mr. Cook serves as a Member of the Advisory Board.
****** Effective June 15, 2000, Ms. Knowles serves as a Member of the Advisory Board.
+ Estimated for the fund's first full year.
A Compensation figures include cash, amounts required to be deferred, and may include amounts deferred at the election of Trustees. For the calendar year ended December 31, 1999, the Trustees accrued required deferred compensation from the funds as follows: Ralph F. Cox, $75,000; Phyllis Burke Davis, $75,000; Robert M. Gates, $75,000; E. Bradley Jones, $75,000; Donald J. Kirk, $75,000; William O. McCoy, $75,000; Gerald C. McDonough, $87,500; Marvin L. Mann, $75,000; and Thomas R. Williams, $75,000. Certain of the non-interested Trustees elected voluntarily to defer a portion of their compensation as follows: Ralph F. Cox, $53,735; William O. McCoy, $53,735; and Thomas R. Williams, $62,319.
B Compensation figures include cash, and may include amounts required to be deferred and amounts deferred at the election of Trustees.
Under a deferred compensation plan adopted in September 1995 and amended in November 1996 and January 2000 (the Plan), non-interested Trustees must defer receipt of a portion of, and may elect to defer receipt of an additional portion of, their annual fees. Amounts deferred under the Plan are treated as though equivalent dollar amounts had been invested in shares of a cross-section of Fidelity funds including funds in each major investment discipline and representing a majority of Fidelity's assets under management (the Reference Funds). The amounts ultimately received by the Trustees under the Plan will be directly linked to the investment performance of the Reference Funds. Deferral of fees in accordance with the Plan will have a negligible effect on a fund's assets, liabilities, and net income per share, and will not obligate a fund to retain the services of any Trustee or to pay any particular level of compensation to the Trustee. A fund may invest in the Reference Funds under the Plan without shareholder approval.
As of the public offering of shares of Freedom 2040, 100% of Freedom 2040's total outstanding shares was held by an FMR affiliate. FMR Corp. is the ultimate parent company of this FMR affiliate. By virtue of their ownership interest in FMR Corp., as described in the "Control of Investment Advisers" section on this page, Mr. Edward C. Johnson 3d, Trustee and President of the fund, and Ms. Abigail P. Johnson, Member of the Advisory Board of Fidelity Aberdeen Street Trust, may be deemed to be a beneficial owner of these shares.
As of June 30, 2000, approximately 3.21% of Freedom Income's total outstanding shares was held by an FMR affiliate. FMR Corp. is the ultimate parent company of this FMR affiliate. By virtue of their ownership interest in FMR Corp., as described in the "Control of Investment Advisers" section on this page, Mr. Edward C. Johnson 3d, Trustee and President of the fund, Ms. Abigail P. Johnson, Member of the Advisory Board of Fidelity Aberdeen Street Trust, may be deemed to be a beneficial owner of these shares. As of the above date, with the exception of Mr. Johnson 3d's and Ms. Johnson's deemed ownership of Freedom Income's shares, the Trustees, Members of the Advisory Board, and officers of the funds owned, in the aggregate, less than 1% of the fund's total outstanding shares.
As of June 30, the following owned of record or beneficially 5% or more (up to and including 25%) of Freedom Income's outstanding shares:
R.B. Pamplin Corporation, Greenville, SC (13.78%); General Motors Corporation, New York, NY (6.65%).
CONTROL OF INVESTMENT ADVISERS
FMR Corp., organized in 1972, is the ultimate parent company of FMR and Strategic Advisers. The voting common stock of FMR Corp. is divided into two classes. Class B is held predominantly by members of the Edward C. Johnson 3d family and is entitled to 49% of the vote on any matter acted upon by the voting common stock. Class A is held predominantly by non-Johnson family member employees of FMR Corp. and its affiliates and is entitled to 51% of the vote on any such matter. The Johnson family group and all other Class B shareholders have entered into a shareholders' voting agreement under which all Class B shares will be voted in accordance with the majority vote of Class B shares. Under the 1940 Act, control of a company is presumed where one individual or group of individuals owns more than 25% of the voting stock of that company. Therefore, through their ownership of voting common stock and the execution of the shareholders' voting agreement, members of the Johnson family may be deemed, under the 1940 Act, to form a controlling group with respect to FMR Corp.
At present, the principal operating activities of FMR Corp. are those conducted by its division, Fidelity Investments Retail Marketing Company, which provides marketing services to various companies within the Fidelity organization.
The funds, FMR, Strategic Advisers, and Fidelity Distributors Corporation (FDC) have adopted a code of ethics under Rule 17j-1 of the 1940 Act that sets forth employees' fiduciary responsibilities regarding the funds, establishes procedures for personal investing, and restricts certain transactions. Employees subject to the code of ethics, including Fidelity investment personnel, may invest in securities for their own investment accounts, including securities that may be purchased or held by the funds.
Each Freedom Fund has entered into a management contract with Strategic Advisers, pursuant to which Strategic Advisers furnishes investment advisory and other services.
Management Services. Under the terms of its management contract with each fund, Strategic Advisers acts as investment adviser and, subject to the supervision of the Board of Trustees, directs the investments of the fund in accordance with its investment objective, policies and limitations. Strategic Advisers is authorized, in its discretion, to allocate each fund's assets among the underlying Fidelity funds in which the fund may invest. Strategic Advisers also provides each fund with all necessary office facilities and personnel for servicing the fund's investments and compensates all personnel of each fund or Strategic Advisers performing services relating to research, statistical and investment activities.
Strategic Advisers in turn has entered into administration agreements with FMR on behalf of each Freedom Fund. Under the terms of each administration agreement, FMR or its affiliates provide the management and administrative services (other than investment advisory services) necessary for the operation of each Freedom Fund. These services include providing facilities for maintaining each fund's organization; supervising relations with custodians, transfer and pricing agents, accountants, underwriters and other persons dealing with each fund; preparing all general shareholder communications and conducting shareholder relations; maintaining each fund's records and the registration of each fund's shares under federal securities laws and making necessary filings under state laws; developing management and shareholder services for each fund; and furnishing reports, evaluations and analyses on a variety of subjects to the Trustees.
Management-Related Expenses. Under the terms of each Freedom Fund's management contract, Strategic Advisers, either itself or through an affiliate, is responsible for payment of all operating expenses of each Freedom Fund with certain exceptions. Under the terms of each administration agreement, FMR pays all management and administrative expenses (other than investment advisory expenses) for which Strategic Advisers is responsible. Specific expenses payable by FMR include expenses for typesetting, printing, and mailing proxy materials to shareholders, legal expenses, fees of the custodian and auditor, and each fund's proportionate share of insurance premiums and Investment Company Institute dues. Each administration agreement further provides that FMR will pay for typesetting, printing, and mailing prospectuses, statements of additional information, notices, and reports to shareholders; however, under the terms of each Freedom Fund's transfer agent agreement, the transfer agent bears the costs of providing these services to existing shareholders. In addition, FMR compensates all officers of each fund and all Trustees who are "interested persons" of the trust, Strategic Advisers, or FMR. FMR also pays all fees associated with transfer agent, dividend disbursing, and shareholder services, pricing and bookkeeping services, and the cost of administration of each Freedom Fund's securities lending program.
Each Freedom Fund pays the following expenses: fees and expenses of the non-interested Trustees, interest on borrowings, taxes, brokerage commissions (if any), shareholder charges (if any) associated with investing in the underlying Fidelity funds, and such non-recurring expenses as may arise, including costs of any litigation to which a fund may be a party, and any obligation it may have to indemnify the officers and Trustees with respect to litigation.
Management Fees. For the services of Strategic Advisers under each management contract, each Freedom Fund pays Strategic Advisers a monthly management fee at the annual rate of 0.10% of its average net assets throughout the month. The management fee paid to Strategic Advisers by each Freedom Fund is reduced by an amount equal to the fees and expenses paid by each Freedom Fund to the non-interested Trustees.
For the services of FMR under each administration agreement, Strategic Advisers pays FMR a monthly administration fee equal to the monthly management fee received by Strategic Advisers from each Freedom Fund, minus an amount equal to an annual rate of 0.02% of that fund's average net assets throughout the month.
The following table shows the amount of management fees paid by Freedom Income, Freedom 2000, Freedom 2010, Freedom 2020, and Freedom 2030 to Strategic Advisers for the past three fiscal years, and the amount of credits reducing management fees for each fund.
|
Fund |
Fiscal Years Ended |
Amount of |
Management Fees |
|
Freedom Income |
2000 |
$ 32,530 |
$ 212,969* |
|
|
1999 |
$ 10,273 |
$ 116,588* |
|
|
1998 |
$ 33 |
$ 24,292* |
|
Freedom 2000 |
2000 |
$ 78,019 |
$ 565,574* |
|
|
1999 |
$ 48,347 |
$ 378,241* |
|
|
1998 |
$ 3,562 |
$ 88,363* |
|
Freedom 2010 |
2000 |
$ 139,048 |
$ 1,301,085* |
|
|
1999 |
$ 69,453 |
$ 723,047* |
|
|
1998 |
$ 7,774 |
$ 152,611* |
|
Freedom 2020 |
2000 |
$ 132,695 |
$ 1,208,279* |
|
|
1999 |
$ 69,229 |
$ 654,849* |
|
|
1998 |
$ 5,024 |
$ 124,538* |
|
Freedom 2030 |
2000 |
$ 80,687 |
$ 552,983* |
|
|
1999 |
$ 24,815 |
$ 191,985* |
|
|
1998 |
$ 253 |
$ 41,724* |
* After reduction of fees and expenses paid by the fund to the non-interested Trustees.
FMR may, from time to time, voluntarily reimburse all or a portion of a Freedom Fund's operating expenses (exclusive of interest, taxes, brokerage commissions, shareholder charges, and extraordinary expenses), which is subject to revision or discontinuance. FMR retains the ability to be repaid for these expense reimbursements in the amount that expenses fall below the limit prior to the end of the fiscal year.
Expense reimbursements by FMR will increase each Freedom Fund's returns and yield and repayment of the reimbursement by each fund will lower its returns and yield.
FMR voluntarily agreed to reimburse Freedom Income, Freedom 2000, Freedom 2010, Freedom 2020, and Freedom 2030 if and to the extent that its aggregate operating expenses, including management fees, were in excess of an annual rate of its average net assets. The table below shows the periods of reimbursement and levels of expense limitations; the dollar amount of management fees incurred under each fund's contract before reimbursement; and the dollar amount of management fees reimbursed by FMR under the expense reimbursement for each period.
|
|
Fiscal Years Ended |
Management Fee |
Amount of |
|
Freedom Income |
2000 |
$ 245,499* |
$ 49,732 |
|
|
1999 |
$ 126,861* |
$ 24,831 |
|
|
1998 |
$ 24,325* |
$ 4,813 |
|
Freedom 2000 |
2000 |
$ 643,593* |
$ 129,329 |
|
|
1999 |
$ 426,588* |
$ 85,083 |
|
|
1998 |
$ 91,925* |
$ 17,482 |
|
Freedom 2010 |
2000 |
$ 1,440,133* |
$ 289,947 |
|
|
1999 |
$ 792,500* |
$ 158,244 |
|
|
1998 |
$ 160,385* |
$ 30,159 |
|
Freedom 2020 |
2000 |
$ 1,340,974* |
$ 270,355 |
|
|
1999 |
$ 724,078* |
$ 144,340 |
|
|
1998 |
$ 129,562* |
$ 24,214 |
|
Freedom 2030 |
2000 |
$ 633,670* |
$ 140,666 |
|
|
1999 |
$ 216,800* |
$ 43,119 |
|
|
1998 |
$ 41,977* |
$ 8,077 |
* After reduction of fees and expenses paid by the fund to the non-interested Trustees.
Each Freedom Fund has entered into a distribution agreement with FDC, an affiliate of Strategic Advisers and FMR. FDC is a broker-dealer registered under the Securities Exchange Act of 1934 and is a member of the National Association of Securities Dealers, Inc. The distribution agreements call for FDC to use all reasonable efforts, consistent with its other business, to secure purchasers for shares of each fund, which are continuously offered at NAV. Promotional and administrative expenses in connection with the offer and sale of shares are paid by Strategic Advisers or FMR.
The Trustees have approved a Distribution and Service Plan on behalf of each Freedom Fund (the Plans) pursuant to Rule 12b-1 under the 1940 Act (the Rule). The Rule provides in substance that a mutual fund may not engage directly or indirectly in financing any activity that is primarily intended to result in the sale of shares of the fund except pursuant to a plan approved on behalf of the fund under the Rule. The Plans, as approved by the Trustees, allow the Freedom Funds, Strategic Advisers and FMR to incur certain expenses that might be considered to constitute indirect payment by the funds of distribution expenses.
Under each Plan, if the payment of management fees by the Freedom Funds to Strategic Advisers, or the payment of administration fees by Strategic Advisers to FMR out of the management fees, is deemed to be indirect financing by the fund of the distribution of its shares, such payment is authorized by the Plan. Each Plan specifically recognizes that Strategic Advisers or FMR may use its past profits or its other resources, including management fees paid to Strategic Advisers by the funds, or administration fees paid to FMR by Strategic Advisers out of the management fees, to pay FDC for expenses incurred in connection with providing services intended to result in the sale of Freedom Fund shares and/or shareholder support services. In addition, each Plan provides that Strategic Advisers or FMR, directly or through FDC, may pay significant amounts to intermediaries, such as banks, broker-dealers and other service-providers, that provide those services. Currently, the Board of Trustees has authorized such payments for the Freedom Funds.
Prior to approving each Plan, the Trustees carefully considered all pertinent factors relating to the implementation of the Plan, and determined that there is a reasonable likelihood that the Plan will benefit the Freedom Funds and its shareholders. In particular, the Trustees noted that each Plan does not authorize payments by the Freedom Funds other than those made to Strategic Advisers under its management contract with each fund. To the extent that each Plan gives Strategic Advisers, FMR and FDC greater flexibility in connection with the distribution of fund shares, additional sales of fund shares or stabilization of cash flows may result. Furthermore, certain shareholder support services may be provided more effectively under the Plans by local entities with whom shareholders have other relationships.
The Glass-Steagall Act generally prohibits federally and state chartered or supervised banks from directly engaging in the business of underwriting, selling or distributing securities. FDC believes that the Glass-Steagall Act should not preclude a bank from performing shareholder support services, or servicing and recordkeeping functions. FDC intends to engage banks only to perform such functions. However, changes in federal or state statutes and regulations pertaining to the permissible activities of banks, as well as further judicial or administrative decisions or interpretations, could prevent a bank from continuing to perform all or a part of the contemplated services. If a bank were prohibited from so acting, the Trustees would consider what actions, if any, would be necessary to continue to provide efficient and effective shareholder services. In such event, changes in the operation of the funds might occur, including possible termination of any automatic investment or redemption or other services then provided by the bank. It is not expected that shareholders would suffer any adverse financial consequences as a result of any of these occurrences. In addition, state securities laws on this issue may differ from the interpretations of federal law expressed herein, and banks and other financial institutions may be required to register as dealers pursuant to state law.
Each Freedom Fund may execute portfolio transactions with, and purchase securities issued by, depository institutions that receive payments under the Plans. No preference for the instruments of such depository institutions will be shown in the selection of investments.
FDC may compensate intermediaries that satisfy certain criteria established from time to time by FDC relating to the level or type of services provided by the intermediary, the sale or expected sale of significant amounts of shares, or other factors.
TRANSFER AND SERVICE AGENT AGREEMENTS
Each Freedom Fund has entered into a transfer agent agreement with Fidelity Investments Institutional Operations Company, Inc. (FIIOC), an affiliate of Strategic Advisers and FMR. Under the terms of the agreements, FIIOC performs transfer agency, dividend disbursing, and shareholder services for each Freedom Fund.
For providing transfer agency services, FIIOC receives no fees from each Freedom Fund; however, each underlying Fidelity fund pays its respective transfer, dividend disbursing, and shareholder servicing agent (either FIIOC or an affiliate of FIIOC) fees based, in part, on the number of accounts in and assets of each Freedom Fund invested in such underlying Fidelity fund.
FIIOC pays out-of-pocket expenses associated with providing transfer agent services. In addition, FIIOC bears the expense of typesetting, printing, and mailing prospectuses, statements of additional information, and all other reports, notices, and statements to existing shareholders, with the exception of proxy statements.
Each Freedom Fund has also entered into a service agent agreement with FSC, an affiliate of Strategic Advisers and FMR. Under the terms of the agreements, FSC calculates the NAV and dividends for each Freedom Fund, maintains each Freedom Fund's portfolio and general accounting records, and administers each Freedom Fund's securities lending program.
For providing pricing and bookkeeping services, FSC receives a monthly fee based on each Freedom Fund's average daily net assets throughout the month.
For administering each Freedom Fund's securities lending program, FSC is paid based on the number and duration of individual securities loans.
FMR bears the cost of pricing and bookkeeping services and administration of the securities lending program under the terms of its administration agreements with Strategic Advisers.
Trust Organization. The Freedom Funds are funds of Fidelity Aberdeen Street Trust, an open-end management investment company organized as a Delaware business trust on June 20, 1991. Currently, there are six funds in Fidelity Aberdeen Street Trust: Fidelity Freedom 2000 Fund, Fidelity Freedom 2010 Fund, Fidelity Freedom 2020 Fund, Fidelity Freedom 2030 Fund, Fidelity Freedom 2040 Fund, and Fidelity Freedom Income Fund. The Trustees are permitted to create additional funds in the trust and to create additional classes of the funds.
The assets of the trust received for the issue or sale of shares of each fund and all income, earnings, profits, and proceeds thereof, subject to the rights of creditors, are allocated to such fund, and constitute the underlying assets of such fund. The underlying assets of each fund in the trust shall be charged with the liabilities and expenses attributable to such fund. Any general expenses of the trust shall be allocated between or among any one or more of the funds.
Shareholder Liability. The trust is a business trust organized under Delaware law. Delaware law provides that shareholders shall be entitled to the same limitations of personal liability extended to stockholders of private corporations for profit. The courts of some states, however, may decline to apply Delaware law on this point. The Trust Instrument contains an express disclaimer of shareholder liability for the debts, liabilities, obligations, and expenses of the trust. The Trust Instrument provides that the trust shall not have any claim against shareholders except for the payment of the purchase price of shares and requires that each agreement, obligation, or instrument entered into or executed by the trust or the Trustees relating to the trust or to a fund shall include a provision limiting the obligations created thereby to the trust or to one or more funds and its or their assets. The Trust Instrument further provides that shareholders of a fund shall not have a claim on or right to any assets belonging to any other fund.
The Trust Instrument provides for indemnification out of each fund's property of any shareholder or former shareholder held personally liable for the obligations of the fund solely by reason of his or her being or having been a shareholder and not because of his or her acts or omissions or for some other reason. The Trust Instrument also provides that each fund shall, upon request, assume the defense of any claim made against any shareholder for any act or obligation of the fund and satisfy any judgment thereon. Thus, the risk of a shareholder incurring financial loss on account of shareholder liability is limited to circumstances in which Delaware law does not apply, no contractual limitation of liability was in effect, and a fund is unable to meet its obligations. Strategic Advisers believes that, in view of the above, the risk of personal liability to shareholders is extremely remote.
Voting Rights. Each fund's capital consists of shares of beneficial interest. As a shareholder, you are entitled to one vote for each dollar of net asset value you own. The voting rights of shareholders can be changed only by a shareholder vote. Shares may be voted in the aggregate, by fund, and by class.
The shares have no preemptive or conversion rights. Shares are fully paid and nonassessable, except as set forth under the heading "Shareholder Liability" above.
On matters submitted for consideration by shareholders of any underlying Fidelity fund, a Freedom Fund will vote its shares in proportion to the vote of all other holders of shares of that underlying Fidelity fund or, in certain limited instances, the Freedom Fund will vote its shares in the manner indicated by a vote of its shareholders.
The trust or a fund or a class may be terminated upon the sale of its assets to, or merger with, another open-end management investment company, series, or class thereof, or upon liquidation and distribution of its assets. Generally, the merger of the trust or a fund or a class with another operating mutual fund or the sale of all or a portion of the assets of the trust or a fund or a class to another operating mutual fund requires approval by a vote of shareholders of the trust or the fund or the class. However, the Trustees may, without prior shareholder approval, authorize a transfer of all assets of a Freedom Fund with a target retirement date into Freedom Income Fund, or any successor thereto, or reorganize or terminate the trust or a fund or a class. In the event of the dissolution or liquidation of the trust, shareholders of each of its funds are entitled to receive the underlying assets of such fund available for distribution. In the event of the dissolution or liquidation of a fund or a class, shareholders of that fund or that class are entitled to receive the underlying assets of the fund or class available for distribution.
Custodian. The Bank of New York, 110 Washington Street, New York, New York, is custodian of the assets of each fund. The custodian is responsible for the safekeeping of a fund's assets and the appointment of any subcustodian banks and clearing agencies. The Chase Manhattan Bank, headquartered in New York, also may serve as a special purpose custodian of certain assets in connection with repurchase agreement transactions.
FMR, its officers and directors, its affiliated companies, Members of the Advisory Board, and Members of the Board of Trustees may, from time to time, conduct transactions with various banks, including banks serving as custodians for certain funds advised by FMR. Transactions that have occurred to date include mortgages and personal and general business loans. In the judgment of FMR, the terms and conditions of those transactions were not influenced by existing or potential custodial or other fund relationships.
Auditor. PricewaterhouseCoopers LLP, 160 Federal Street, Boston, Massachusetts, serves as independent accountant for each fund. The auditor examines financial statements for the funds and provides other audit, tax, and related services.
Freedom Income's, Freedom 2000's, Freedom 2010's, Freedom 2020's, and Freedom 2030's financial statements and financial highlights for the fiscal year ended March 31, 2000, and report of the auditor, are included in the funds' annual report and are incorporated herein by reference. An annual report for Freedom 2040 will be available once the fund has completed its first annual period.
Fidelity Freedom Funds, Fidelity Freedom Income Fund, Fidelity Freedom 2000 Fund, Fidelity Freedom 2010 Fund, Fidelity Freedom 2020 Fund, Fidelity Freedom 2030 Fund, Fidelity, Fidelity Investments & (Pyramid) Design, Fidelity Focus, Spartan, Fidelity Investments, and Magellan are registered trademarks of FMR Corp.
Fidelity Freedom 2040 Fund <R>is a</R> service mark of FMR Corp.
The third party marks appearing above are the marks of their respective owners.
|
|