
|
|
|
|
|
|
|
|
|
|
Previous: GOODYS FAMILY CLOTHING INC /TN, 10-Q, EX-27, 2000-11-21 |
Next: INTERNATIONAL THERMAL PACKAGING INC, 10-Q, 2000-11-21 |
Fidelity®
Funds - Income, 2000, 2010, 2020, 2030, 2040
Semiannual Report
September 30, 2000
(2_fidelity_logos)(Registered_Trademark)
|
President's Message |
3 |
Ned Johnson on investing strategies. |
|
Performance |
4 |
How the funds have done over time. |
|
Fund Talk |
15 |
The managers' review of the funds' performance, strategy and outlook. |
|
Freedom Income |
19 21 23 |
Investment Changes Investments Financial Statements |
|
Freedom 2000 |
27 29 31 |
Investment Changes Investments Financial Statements |
|
Freedom 2010 |
35 37 39 |
Investment Changes Investments Financial Statements |
|
Freedom 2020 |
43 45 47 |
Investment Changes Investments Financial Statements |
|
Freedom 2030 |
51 53 55 |
Investment Changes Investments Financial Statements |
|
Freedom 2040 |
59 61 62 |
Investment Summary Investments Financial Statements |
|
Notes |
66 |
Notes to the financial statements. |
|
|
|
|
Standard & Poor's, S&P and S&P 500 are registered service marks of The McGraw-Hill Companies, Inc. and have been licensed for use by Fidelity Distributors Corporation.
Other third party marks appearing herein are the property of their respective owners.
All other marks appearing herein are registered or unregistered trademarks or service marks of FMR Corp. or an affiliated company.
(Recycle graphic) This report is printed on recycled paper using soy-based inks.
This report and the financial statements contained herein are submitted for the general information of the shareholders of the fund. This report is not authorized for distribution to prospective investors in the fund unless preceded or accompanied by an effective prospectus.
Mutual fund shares are not deposits or obligations of, or guaranteed by, any depository institution. Shares are not insured by the FDIC, Federal Reserve Board or any other agency, and are subject to investment risks, including possible loss of principal amount invested.
Neither the funds nor Fidelity Distributors Corporation is a bank.
For more information on any Fidelity fund, including charges and expenses, call 1-800-544-6666 for a free prospectus. Read it carefully before you invest or send money.
Semiannual Report
(photo_of_Edward_C_Johnson_3d)
Dear Shareholder:
Disappointing third quarter corporate earnings announcements resulted in negative performance for many major U.S. equity indexes through the first nine months of 2000. A weak euro and the highest oil prices in 10 years frightened many investors into selling shares of large U.S. corporations with multinational presence. In fixed-income markets, 30-year Treasury prices also dropped, and these securities outyielded 10-year Treasury notes for the first time since January.
While it's impossible to predict the future direction of the markets with any degree of certainty, there are certain basic principles that can help investors plan for their future needs.
First, investors are encouraged to take a long-term view of their portfolios. If you can afford to leave your money invested through the inevitable up and down cycles of the financial markets, you will greatly reduce your vulnerability to any single decline. We know from experience, for example, that stock prices have gone up over longer periods of time, have significantly outperformed other types of investments and have stayed ahead of inflation.
Second, you can further manage your investing risk through diversification. Freedom Funds are already diversified because they invest in stock, bond and money market funds with both domestic and foreign exposures. If you have a short investment time horizon, you might want to consider moving some of your investment into a money market fund, which seeks income and a stable share price by investing in high-quality, short-term investments. Of course, it's important to remember that an investment in a money market fund is not insured or guaranteed by the Federal Deposit Insurance Corporation or any other government agency. Although money market funds seek to preserve the value of your investment at $1.00 per share, it is possible to lose money by investing in these types of funds.
Finally, no matter what your time horizon or portfolio diversity, it makes good sense to follow a regular investment plan, investing a certain amount of money in a fund at the same time each month or quarter and periodically reviewing your overall portfolio. By doing so, you won't get caught up in the excitement of a rapidly rising market, nor will you buy all your shares at market highs. While this strategy - known as dollar cost averaging - won't assure a profit or protect you from a loss in a declining market, it should help you lower the average cost of your purchases. Of course, you should consider your financial ability to continue your purchases through periods of low price levels before undertaking such a strategy.
If you have questions, please call us at 1-800-544-6666, or visit our web site at www.fidelity.com. We are available 24 hours a day, seven days a week to provide you the information you need to make the investments that are right for you.
Best regards,
/s/Edward C. Johnson 3d
Edward C. Johnson 3d
Semiannual Report
Fidelity Freedom Income Fund®
There are several ways to evaluate a fund's historical performance. You can look at the total percentage change in value, the average annual percentage change or the growth of a hypothetical $10,000 investment. Total return reflects the change in the value of an investment, assuming reinvestment of the fund's dividend income and capital gains (the profits earned upon the sale of securities that have grown in value). If Fidelity had not reimbursed certain fund expenses, the fund's total returns would have been lower.
Cumulative Total Returns
|
Periods ended September 30, 2000 |
Past 6 |
Past 1 |
Life of |
|
Fidelity Freedom Income |
2.89% |
10.61% |
42.39% |
|
Fidelity Freedom Income Composite |
2.34% |
8.77% |
40.56% |
|
Wilshire 5000 |
-4.32% |
17.47% |
107.85% |
|
LB Aggregate Bond |
4.81% |
6.99% |
28.85% |
|
LB 3 Month T-Bill |
3.09% |
5.82% |
23.10% |
Cumulative total returns show the fund's performance in percentage terms over a set period - in this case, six months, one year or since the fund started on October 17, 1996. For example, if you had invested $1,000 in a fund that had a 5% return over the past year, the value of your investment would be $1,050. You can compare the fund's returns to the performance of the Fidelity Freedom Income Composite Index, a hypothetical combination of the following unmanaged indices: the Wilshire 5000 Total Market Index, the Lehman Brothers Aggregate Bond Index, and the Lehman Brothers 3 Month Treasury Bill Index according to the composite benchmark weightings. These benchmarks include reinvested dividends and capital gains, if any.
Average Annual Total Returns
|
Periods ended September 30, 2000 |
|
Past 1 |
Life of |
|
Fidelity Freedom Income |
|
10.61% |
9.34% |
|
Fidelity Freedom Income Composite |
|
8.77% |
8.99% |
Average annual total returns take the fund's cumulative return and show you what would have happened if the
fund had performed at a constant rate each year.
Semiannual Report
Fidelity Freedom Income Fund
Performance - continued
$10,000 Over Life of Fund
$10,000 Over Life of Fund: Let's say hypothetically that $10,000 was invested in Fidelity Freedom Income Fund on October 17, 1996, when the fund started. As the chart shows, by September 30, 2000, the value of the investment would have grown to $14,239 - a 42.39% increase on the initial investment. For comparison, look at how the Lehman Brothers Aggregate Bond Index, a market value-weighted index of investment-grade fixed-rate debt issues, including government, corporate, asset-backed, and mortgage-backed securities, with maturities of one year or more, did over the same period. With dividends and capital gains, if any, reinvested, the same $10,000 investment would have grown to $12,885 - a 28.85% increase. With dividends and capital gains, if any, reinvested, the same $10,000 investment in the Fidelity Freedom Income Composite Index would have grown to $14,056 - a 40.56% increase.
Understanding
Performance
How a fund did yesterday is no guarantee of how it will do tomorrow. The stock market, for example, has a history of long-term growth and short-term volatility. In turn, the share price and return of a fund that invests in stocks will vary. That means if you sell your shares during a market downturn, you might lose money. But if you can ride out the market's ups and downs, you may have a gain.
3Semiannual Report
Fidelity Freedom 2000 Fund®
There are several ways to evaluate a fund's historical performance. You can look at the total percentage change in value, the average annual percentage change or the growth of a hypothetical $10,000 investment. Total return reflects the change in the value of an investment, assuming reinvestment of the fund's dividend income and capital gains (the profits earned upon the sale of securities that have grown in value). If Fidelity had not reimbursed certain fund expenses, the fund's total returns would have been lower.
Cumulative Total Returns
|
Periods ended September 30, 2000 |
Past 6 |
Past 1 |
Life of |
|
Fidelity Freedom 2000 |
1.75% |
13.90% |
61.03% |
|
Fidelity Freedom 2000 Composite |
0.92% |
10.35% |
55.94% |
|
Wilshire 5000 |
-4.32% |
17.47% |
107.85% |
|
MSCI EAFE |
-11.63% |
3.37% |
39.47% |
|
LB Aggregate Bond |
4.81% |
6.99% |
28.85% |
|
ML High Yield Master II |
1.30% |
1.00% |
22.87% |
|
LB 3 Month T-Bill |
3.09% |
5.82% |
23.10% |
Cumulative total returns show the fund's performance in percentage terms over a set period - in this case, six months, one year or since the fund started on October 17, 1996. For example, if you had invested $1,000 in a fund that had a 5% return over the past year, the value of your investment would be $1,050. You can compare the fund's returns to the performance of the Fidelity Freedom 2000 Composite Index, a hypothetical combination of the following unmanaged indices: the Wilshire 5000 Total Market Index, the Morgan Stanley Capital International Europe, Australasia, Far East (MSCI EAFE) Index, the Lehman Brothers Aggregate Bond Index, the Merrill Lynch High Yield Master II Index, and the Lehman Brothers 3 Month Treasury Bill Index. The index weightings are adjusted twice a year to reflect the fund's changing asset allocations. These benchmarks include reinvested dividends and capital gains, if any.
Average Annual Total Returns
|
Periods ended September 30, 2000 |
|
Past 1 |
Life of |
|
Fidelity Freedom 2000 |
|
13.90% |
12.80% |
|
Fidelity Freedom 2000 Composite |
|
10.35% |
11.89% |
Average annual total returns take the fund's cumulative return and show you what would have happened if the
fund had performed at a constant rate each year.
Semiannual Report
Fidelity Freedom 2000 Fund
Performance - continued
$10,000 Over Life of Fund
$10,000 Over Life of Fund: Let's say hypothetically that $10,000 was invested in Fidelity Freedom 2000 Fund on October 17, 1996, when the fund started. As the chart shows, by September 30, 2000 the value of the investment would have grown to $16,103 - a 61.03% increase on the initial investment. For comparison, look at how the Lehman Brothers Aggregate Bond Index, a market value-weighted index of investment-grade fixed-rate debt issues, including government, corporate, asset-backed, and mortgage-backed securities, with maturities of one year or more, did over the same period. With dividends and capital gains, if any, reinvested, the same $10,000 investment would have grown to $12,885 - a 28.85% increase. With dividends and capital gains, if any, reinvested, the same $10,000 investment in the Fidelity Freedom 2000 Composite Index would have grown to $15,594 - a 55.94% increase.
Understanding
Performance
How a fund did yesterday is no guarantee of how it will do tomorrow. The stock market, for example, has a history of long-term growth and short-term volatility. In turn, the share price and return of a fund that invests in stocks will vary. That means if you sell your shares during a market downturn, you might lose money. But if you can ride out the market's ups and downs, you may have a gain.
3Semiannual Report
Fidelity Freedom 2010 Fund®
There are several ways to evaluate a fund's historical performance. You can look at the total percentage change in value, the average annual percentage change or the growth of a hypothetical $10,000 investment. Total return reflects the change in the value of an investment, assuming reinvestment of the fund's dividend income and capital gains (the profits earned upon the sale of securities that have grown in value). If Fidelity had not reimbursed certain fund expenses, the fund's total returns would have been lower.
Cumulative Total Returns
|
Periods ended September 30, 2000 |
Past 6 |
Past 1 |
Life of |
|
Fidelity Freedom 2010 |
0.21% |
17.75% |
82.97% |
|
Fidelity Freedom 2010 Composite |
-0.99% |
12.08% |
72.13% |
|
Wilshire 5000 |
-4.32% |
17.47% |
107.85% |
|
MSCI EAFE |
-11.63% |
3.37% |
39.47% |
|
LB Aggregate Bond |
4.81% |
6.99% |
28.85% |
|
ML High Yield Master II |
1.30% |
1.00% |
22.87% |
|
LB 3 Month T-Bill |
3.09% |
5.82% |
23.10% |
Cumulative total returns show the fund's performance in percentage terms over a set period - in this case, six months, one year or since the fund started on October 17, 1996. For example, if you had invested $1,000 in a fund that had a 5% return over the past year, the value of your investment would be $1,050. You can compare the fund's returns to the performance of the Fidelity Freedom 2010 Composite Index, a hypothetical combination of the following unmanaged indices: the Wilshire 5000 Total Market Index, the Morgan Stanley Capital International Europe, Australasia, Far East (MSCI EAFE) Index, the Lehman Brothers Aggregate Bond Index, the Merrill Lynch High Yield Master II Index, and the Lehman Brothers 3 Month Treasury Bill Index. The index weightings are adjusted twice a year to reflect the fund's changing asset allocations. These benchmarks include reinvested dividends and capital gains, if any.
Average Annual Total Returns
|
Periods ended September 30, 2000 |
|
Past 1 |
Life of |
|
Fidelity Freedom 2010 |
|
17.75% |
16.50% |
|
Fidelity Freedom 2010 Composite |
|
12.08% |
14.71% |
Average annual total returns take the fund's cumulative return and show you what would have happened if the
fund had performed at a constant rate each year.
Semiannual Report
Fidelity Freedom 2010 Fund
Performance - continued
$10,000 Over Life of Fund
$10,000 Over Life of Fund: Let's say hypothetically that $10,000 was invested in Fidelity Freedom 2010 Fund on October 17, 1996, when the fund started. As the chart shows, by September 30, 2000, the value of the investment would have grown to $18,297 - an 82.97% increase on the initial investment. For comparison, look at how the S&P 500® Index, a market capitalization-weighted index of common stocks, did over the same period. With dividends and capital gains, if any, reinvested, the same $10,000 investment would have grown to $21,540 - a 115.40% increase. With dividends and capital gains, if any, reinvested, the same $10,000 investment in the Fidelity Freedom 2010 Composite Index would have grown to $17,213 - a 72.13% increase.
Understanding
Performance
How a fund did yesterday is no guarantee of how it will do tomorrow. The stock market, for example, has a history of long-term growth and short-term volatility. In turn, the share price and return of a fund that invests in stocks will vary. That means if you sell your shares during a market downturn, you might lose money. But if you can ride out the market's ups and downs, you may have a gain.
3Semiannual Report
Fidelity Freedom 2020 Fund®
There are several ways to evaluate a fund's historical performance. You can look at the total percentage change in value, the average annual percentage change or the growth of a hypothetical $10,000 investment. Total return reflects the change in the value of an investment, assuming reinvestment of the fund's dividend income and capital gains (the profits earned upon the sale of securities that have grown in value). If Fidelity had not reimbursed certain fund expenses, the fund's total returns would have been lower.
Cumulative Total Returns
|
Periods ended September 30, 2000 |
Past 6 |
Past 1 |
Life of |
|
Fidelity Freedom 2020 |
-1.42% |
21.27% |
98.56% |
|
Fidelity Freedom 2020 Composite |
-3.04% |
13.23% |
81.88% |
|
Wilshire 5000 |
-4.32% |
17.47% |
107.85% |
|
MSCI EAFE |
-11.63% |
3.37% |
39.47% |
|
LB Aggregate Bond |
4.81% |
6.99% |
28.85% |
|
ML High Yield Master II |
1.30% |
1.00% |
22.87% |
Cumulative total returns show the fund's performance in percentage terms over a set period - in this case, six months, one year or since the fund started on October 17, 1996. For example, if you had invested $1,000 in a fund that had a 5% return over the past year, the value of your investment would be $1,050. You can compare the fund's returns to the performance of the Fidelity Freedom 2020 Composite Index, a hypothetical combination of the following unmanaged indices: the Wilshire 5000 Total Market Index, the Morgan Stanley Capital International Europe, Australasia, Far East (MSCI EAFE) Index, the Lehman Brothers Aggregate Bond Index, and the Merrill Lynch High Yield Master II Index. The index weightings are adjusted twice a year to reflect the fund's changing asset allocations. These benchmarks include reinvested dividends and capital gains, if any.
Average Annual Total Returns
|
Periods ended September 30, 2000 |
|
Past 1 |
Life of |
|
Fidelity Freedom 2020 |
|
21.27% |
18.93% |
|
Fidelity Freedom 2020 Composite |
|
13.23% |
16.32% |
Average annual total returns take the fund's cumulative return and show you what would have happened if the
fund had performed at a constant rate each year.
Semiannual Report
Fidelity Freedom 2020 Fund
Performance - continued
$10,000 Over Life of Fund
$10,000 Over Life of Fund: Let's say hypothetically that $10,000 was invested in Fidelity Freedom 2020 Fund on October 17, 1996, when the fund started. As the chart shows, by September 30, 2000, the value of the investment would have grown to $19,856 - a 98.56% increase on the initial investment. For comparison, look at how the S&P 500 Index, a market capitalization-weighted index of common stocks, did over the same period. With dividends and capital gains, if any, reinvested, the same $10,000 investment would have grown to $21,540 - a 115.40% increase. With dividends and capital gains, if any, reinvested, the same $10,000 investment in the Fidelity Freedom 2020 Composite Index would have grown to $18,188 - an 81.88% increase.
Understanding
Performance
How a fund did yesterday is no guarantee of how it will do tomorrow. The stock market, for example, has a history of long-term growth and short-term volatility. In turn, the share price and return of a fund that invests in stocks will vary. That means if you sell your shares during a market downturn, you might lose money. But if you can ride out the market's ups and downs, you may have a gain.
3Semiannual Report
Fidelity Freedom 2030 Fund®
There are several ways to evaluate a fund's historical performance. You can look at the total percentage change in value, the average annual percentage change or the growth of a hypothetical $10,000 investment. Total return reflects the change in the value of an investment, assuming reinvestment of the fund's dividend income and capital gains (the profits earned upon the sale of securities that have grown in value). If Fidelity had not reimbursed certain fund expenses, the fund's total returns would have been lower.
Cumulative Total Returns
|
Periods ended September 30, 2000 |
Past 6 |
Past 1 |
Life of |
|
Fidelity Freedom 2030 |
-2.28% |
22.48% |
103.22% |
|
Fidelity Freedom 2030 Composite |
-4.09% |
13.41% |
83.08% |
|
Wilshire 5000 |
-4.32% |
17.47% |
107.85% |
|
MSCI EAFE |
-11.63% |
3.37% |
39.47% |
|
LB Aggregate Bond |
4.81% |
6.99% |
28.85% |
|
ML High Yield Master II |
1.30% |
1.00% |
22.87% |
Cumulative total returns show the fund's performance in percentage terms over a set period - in this case, six months, one year or since the fund started on October 17, 1996. For example, if you had invested $1,000 in a fund that had a 5% return over the past year, the value of your investment would be $1,050. You can compare the fund's returns to the performance of the Fidelity Freedom 2030 Composite Index, a hypothetical combination of the following unmanaged indices: the Wilshire 5000 Total Market Index, the Morgan Stanley Capital International Europe, Australasia, Far East (MSCI EAFE) Index, the Lehman Brothers Aggregate Bond Index, and the Merrill Lynch High Yield Master II Index. The index weightings are adjusted twice a year to reflect the fund's changing asset allocations. These benchmarks include reinvested dividends and capital gains, if any.
Average Annual Total Returns
|
Periods ended September 30, 2000 |
|
Past 1 |
Life of |
|
Fidelity Freedom 2030 |
|
22.48% |
19.63% |
|
Fidelity Freedom 2030 Composite |
|
13.41% |
16.52% |
Average annual total returns take the fund's cumulative return and show you what would have happened if the
fund had performed at a constant rate each year.
Semiannual Report
Fidelity Freedom 2030 Fund
Performance - continued
$10,000 Over Life of Fund

$10,000 Over Life of Fund: Let's say hypothetically that $10,000 was invested in Fidelity Freedom 2030 Fund on October 17, 1996, when the fund started. As the chart shows, by September 30, 2000, the value of the investment would have grown to $20,322 - a 103.22% increase on the initial investment. For comparison, look at how the S&P 500 Index, a market capitalization-weighted index of common stocks, did over the same period. With dividends and capital gains, if any, reinvested, the same $10,000 investment would have grown to $21,540 - a 115.40% increase. With dividends and capital gains, if any, reinvested, the same $10,000 investment in the Fidelity Freedom 2030 Composite Index would have grown to $18,308 - an 83.08% increase.
Understanding
Performance
How a fund did yesterday is no guarantee of how it will do tomorrow. The stock market, for example, has a history of long-term growth and short-term volatility. In turn, the share price and return of a fund that invests in stocks will vary. That means if you sell your shares during a market downturn, you might lose money. But if you can ride out the market's ups and downs, you may have a gain.
3Semiannual Report
Fidelity Freedom 2040 Fund SM
There are several ways to evaluate a fund's historical performance. You can look at the total percentage change in value, the average annual percentage change or the growth of a hypothetical $10,000 investment. Total return reflects the change in the value of an investment, assuming reinvestment of the fund's dividend income and capital gains (the profits earned upon the sale of securities that have grown in value). If Fidelity had not reimbursed certain fund expenses, the fund's total returns would have been lower.
Cumulative Total Returns
|
Periods ended September 30, 2000 |
Life of |
|
Fidelity Freedom 2040 |
-3.00% |
|
Fidelity Freedom 2040 Composite |
-3.14% |
|
Wilshire 5000 |
-3.07% |
|
MSCI EAFE |
-4.58% |
|
ML High Yield Master II |
-1.49% |
Cumulative total returns show the fund's performance in percentage terms over a set period - in this case since the fund started on September 6, 2000. For example, if you had invested $1,000 in a fund that had a 5% return over the past year, the value of your investment would be $1,050. You can compare the fund's returns to the performance of the Fidelity Freedom 2040 Composite Index, a hypothetical combination of the following unmanaged indices: the Wilshire 5000 Total Market Index, the Morgan Stanley Capital International Europe, Australasia, Far East (MSCI EAFE) Index, and the Merrill Lynch High Yield Master II Index. The index weightings are adjusted twice a year to reflect the fund's changing asset allocations. These benchmarks include reinvested dividends and capital gains, if any.
Average Annual Total Returns
Average annual total returns take the fund's cumulative return and show you what would have happened if the fund had performed at a constant rate each year.
These numbers will be reported once the fund is a year old. In addition, the growth of the hypothetical $10,000 investment in the fund will appear in the fund's next report six months from now.
Semiannual Report
Market Recap
In May, the Federal Reserve Board made its latest, largest and potentially its last in a series of interest-rate hikes to slow the U.S. economy. Apparently, the Fed's actions were successful. As data emerged that indicated clear signs of an economic slowdown, the Fed bypassed opportunities to raise rates for the remainder of the six-month period ending September 30, 2000. In response, the U.S. stock market had mixed results. The prospect of a decelerating U.S. economy was particularly hard on tech stocks, as illustrated by the six-month return of -19.60% for the NASDAQ Composite Index. Investors abandoned tech and gravitated toward sectors that traditionally hold up better in a slower-growth climate, such as health care and energy. But as the period progressed, two events threatened to slow growth further: surging oil prices and a weak European currency. This resulted in a flurry of disappointing third-quarter earnings announcements, leaving many U.S. equity indexes with negative returns. The Standard & Poor's 500SM Index, for example, fell 3.60% during the six-month period, while the Dow Jones Industrial Average declined 1.71%. Anticipation that the Fed was done raising rates, combined with persistent flights-to-safety from risk-averse investors concerned about volatility in equity markets, helped lift bonds over stocks during the period. The Lehman Brothers Aggregate Bond Index - a popular measure of taxable-bond performance - returned 4.81%.
(Portfolio Manager photograph)
(Portfolio Manager photograph)
An interview with Scott Stewart (right) and Ren Cheng, Portfolio Managers of Fidelity Freedom Funds
Q. How did the funds perform, Scott?
S.S. Every portfolio outperformed its benchmark. For the six-month period that ended September 30, 2000, the Income, 2000 and 2010 portfolios returned 2.89%, 1.75% and 0.21%, respectively. The 2020 and 2030 portfolios returned -1.42% and -2.28%, respectively, during the same period. Each Freedom Fund compares its performance to a composite benchmark, which comprises various indexes and reflects the fund's target allocation mix. During the past six months, the composite benchmarks for the Income, 2000 and 2010 portfolios returned 2.34%, 0.92%, and -0.99%, respectively. The composite benchmarks for the 2020 and 2030 portfolios returned -3.04% and -4.09%, respectively, during the same period. For the 12-month period that ended September 30, 2000, the Income, 2000 and 2010 portfolios returned 10.61%, 13.90% and 17.75%, respectively. The 2020 and 2030 portfolios returned 21.27% and 22.48%, respectively, during the same period. In comparison, the composite benchmarks for the Income, 2000 and 2010 portfolios returned 8.77%, 10.35% and 12.08%, respectively. Additionally, the benchmarks for the 2020 and 2030 portfolios returned 13.23% and 13.41%, respectively, during the past year. Since its inception on September 6, 2000 through September 30, 2000, the 2040 portfolio returned -3.00%, while its composite benchmark returned -3.14%.
Semiannual Report
Fund Talk: The Managers' Overview - continued
Q. Turning to you Ren, what factors helped the Freedom portfolios outperform their benchmarks during the six-month period?
R.C. The portfolios did what we designed them to do: tap into the value of Fidelity's fundamental stock picking talent without taking on any significant risk beyond that of the benchmarks. During the past six months - a period of tremendous volatility - the investment structure of the Freedom portfolios held up well. We accomplished this performance by monitoring the aggregate risk of each portfolio, making sure risk was closely correlated with each benchmark. Through this analysis, we attempted to limit the downside of the portfolio during periods of extreme market conditions, such as the one we just experienced. Additionally, the portfolios' structure kept each of them diversified across a variety of analytical measures, including sectors, industries, investment objectives and market capitalizations. This diversification, and our management discipline that monitors these various characteristics, also prevented the portfolios from suffering too much during the extreme market swings, such as the technology correction in the spring. At the same time, the diversification benefited the portfolios when market sentiment favored other areas, such as pharmaceuticals and financials.
Q. Why did the performance of the 2020 and 2030 portfolios suffer in comparison to the shorter-term portfolios?
R.C. Those two portfolios are more aggressive than the other portfolios. Given that the Freedom Funds are designed for investors to take on age-appropriate risk in their investments, the portfolios have varying degrees of asset allocation. The 2020 and 2030 portfolios, as well as the recently launched 2040 portfolio, each have a higher concentration of underlying Fidelity equity funds than the other, more-conservative portfolios in the group. Equities, both international and domestic, performed worse than bonds during the past six months. As a result, the absolute performance of the longer-term portfolios declined more than the Income, 2000 and 2010 portfolios, which held higher concentrations of fixed-income and money market funds.
Q. Which investment categories performed well? Which underperformed?
R.C. The only investment categories to show positive returns during the past six months were the bond and money market fund categories, which held up relatively well compared to the slumping equity markets. Our holdings in underlying bond funds boosted returns. On the downside, the high-yield portion of the portfolios underperformed on both an absolute and relative basis, in part because the high-yield market had a higher-than-expected default rate. Among our equity categories, the portfolios' domestic holdings were hurt by a technology correction, reflected most notably in the negative returns of OTC Portfolio and Growth Company. At the same time, the portfolios' investments in other underlying domestic equity funds, such as Equity Income and Growth & Income, generated positive returns. On the international front, the devaluation of the euro and historically high oil prices hurt our positions in all five underlying international funds, which delivered negative returns. Holdings in the Southeast Asia and Japan funds suffered the most due to region-specific issues.
Semiannual Report
Fund Talk: The Managers' Overview - continued
Q. What is your outlook, Ren?
R.C. I expect market volatility to continue, but at the same time I am confident the Freedom Funds will continue to perform well relative to their benchmarks. The portfolios are designed to attempt to control the downside of volatile market swings, such as those that occurred during the period. Historical analysis has shown that if one can control a portfolio's risk during sharp market declines in the short-term, the long-term performance of the portfolio will be that much better. In essence, if you can control the downside, the upside should take care of itself. We'll gradually reallocate each Freedom Fund's target investment mix during the coming months. The table below illustrates the target mix we'd like to achieve for each fund by the next time we address our shareholders on March 31, 2001.
|
|
Income |
2000 |
2010 |
2020 |
2030 |
2040 |
|
Domestic Equity Funds |
20.0% |
27.5% |
43.2% |
61.4% |
70.0% |
75.0% |
|
International Equity Funds |
- |
1.9% |
5.8% |
10.3% |
12.9% |
15.0% |
|
Inv. Grade Fixed-Income Funds |
40.0% |
40.5% |
37.5% |
20.8% |
9.2% |
- |
|
High Yield Fixed-Income Funds |
- |
2.0% |
5.5% |
7.5% |
7.9% |
10.0% |
|
Money Market Funds |
40.0% |
28.1% |
8.0% |
- |
- |
- |
The views expressed in this report reflect those of the portfolio managers only through the end of the period of the report as stated on the cover and do not necessarily represent the views of Fidelity or any other person in the Fidelity organization. Any such views are subject to change at any time based upon market or other conditions and Fidelity disclaims any responsibility to update such views. These views may not be relied on as investment advice and, because investment decisions for a Fidelity fund are based on numerous factors, may not be relied on as an indication of trading intent on behalf of any Fidelity fund.
Reflecting the changes to the target investment mixes described above, each Fund's composite benchmark will change its allocation, as necessary, as of January 1, 2001. The table below illustrates these changes.
Composite Benchmarks
|
|
Income |
2000 |
2010 |
2020 |
2030 |
2040 |
|
Wilshire 5000 |
20.0% |
28.5% |
44.0% |
61.8% |
70.0% |
75.0% |
|
MSCI EAFE |
- |
2.1% |
6.0% |
10.4% |
13.0% |
15.0% |
|
LB Aggregate Bond |
40.0% |
40.3% |
36.8% |
20.3% |
9.0% |
- |
|
ML High Yield Master II |
- |
2.2% |
5.6% |
7.5% |
8.0% |
10.0% |
|
LB 3 Month T-Bill |
40.0% |
26.9% |
7.6% |
- |
- |
- |
Semiannual Report
Fund Talk: The Managers' Overview - continued
Fund Facts
Goal: The Income Fund seeks high current income and, as a secondary objective, capital appreciation. The 2000, 2010, 2020, 2030 and 2040 Funds each seek high total return. Each Fund seeks to achieve its goal by investing in a combination of underlying Fidelity equity, fixed-income and money market funds.
Fund numbers: Income (369); 2000 (370); 2010 (371); 2020 (372); 2030 (373); 2040 (718)
Trading symbol: FFFAX; FFFBX; FFFCX; FFFDX; FFFEX; FFFFF
Size: as of September 30, 2000, more than $379 million (Income); $656 million (2000); $2.1 billion (2010); $1.7 billion (2020); $1.2 billion (2030); $4 million (2040)
Managers: Ren Cheng, since inception; manager, various structured investments for Fidelity Management Trust Company; joined Fidelity in 1994; Scott Stewart, since inception; manager, Fidelity Fifty, 1993 - 1999; founder and head of Fidelity's Structured Equity Group, since 1987; joined Fidelity in 1987
3Ren Cheng on his structured investment process:
"In making investment decisions, I regularly compare the aggregate holdings of all the underlying funds in each Freedom Fund. I compare the risk characteristics of each asset class - domestic, international, bond, high yield, and money market - to those of the benchmarks. Since risk control is the key component of our investment strategy, I may, as necessary, adjust the asset allocation of the Funds if a specific measurement, such as industry weight or capitalization, falls too far out of line with each Fund's benchmark. If, for example, a manager of an underlying growth fund is making a large bet in technology, skewing a Freedom Fund too far in that direction, I may neutralize it by selling some of that underlying fund and buying more of a more value-oriented fund.
"By monitoring the aggregate holdings, I try to maintain an optimal level of risk. Placing a major emphasis on risk control enables the Freedom Funds to benefit from Fidelity's expertise in active stock selection."
Note to shareholders: Effective December 1, 2000, Fidelity Mid-Cap Stock Fund will be added as an underlying fund of the Freedom Funds to provide additional mid-cap exposure.
Semiannual Report
Fidelity Freedom Income Fund
|
Fund Holdings as of September 30, 2000 |
||
|
|
% of fund's investments |
% of fund's investments |
|
Domestic Equity Funds |
|
|
|
Blue Chip Growth Fund |
2.9% |
2.9% |
|
Disciplined Equity Fund |
3.0 |
3.0 |
|
Equity-Income Fund |
3.1 |
3.1 |
|
Fidelity Fund |
2.9 |
2.9 |
|
Growth & Income Portfolio |
3.0 |
3.0 |
|
Growth Company Fund |
3.0 |
2.8 |
|
OTC Portfolio |
1.9 |
1.9 |
|
|
19.8 |
19.6 |
|
Investment Grade Fixed-Income Funds |
|
|
|
Government Income Fund |
15.2 |
15.2 |
|
Intermediate Bond Fund |
9.9 |
9.9 |
|
Investment Grade Bond Fund |
15.2 |
15.2 |
|
|
40.3 |
40.3 |
|
Money Market Fund |
|
|
|
Fidelity Money Market Trust: |
39.9 |
40.1 |
|
|
100.0% |
100.0% |
Semiannual Report
Fidelity Freedom Income Fund
Investment Changes - continued
Asset Allocation
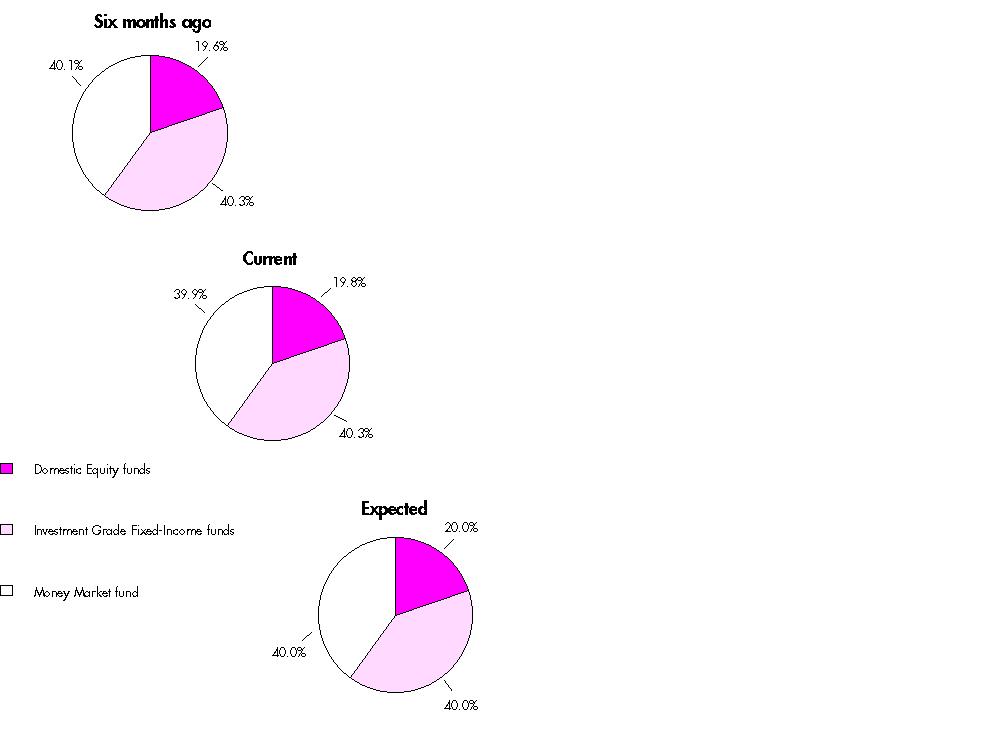
The six months ago allocation is based on the fund's holdings as of March 31, 2000. The current allocation is based on the fund's holdings as of September 30, 2000. The expected allocation represents the fund's anticipated target asset allocation at March 31, 2001.
Semiannual Report
Fidelity Freedom Income Fund
(Unaudited)
Showing Percentage of Total Value of Investment in Securities
|
Equity Funds - 19.8% |
|||
|
Shares |
Value (Note 1) |
||
|
Domestic Equity Funds - 19.8% |
|||
|
Blue Chip Growth Fund |
186,181 |
$ 11,092,688 |
|
|
Disciplined Equity Fund |
353,595 |
11,187,736 |
|
|
Equity-Income Fund |
220,373 |
11,836,212 |
|
|
Fidelity Fund |
289,169 |
11,086,746 |
|
|
Growth & Income Portfolio |
252,360 |
11,308,231 |
|
|
Growth Company Fund |
122,650 |
11,449,419 |
|
|
OTC Portfolio |
120,012 |
7,048,292 |
|
|
TOTAL EQUITY FUNDS (Cost $64,840,207) |
75,009,324 |
||
|
Fixed-Income Funds - 40.3% |
|||
|
|
|
|
|
|
Investment Grade Fixed-Income Funds - 40.3% |
|||
|
Government Income Fund |
6,008,561 |
57,622,104 |
|
|
Intermediate Bond Fund |
3,821,205 |
37,677,085 |
|
|
Investment Grade Bond Fund |
8,224,488 |
57,653,660 |
|
|
TOTAL FIXED-INCOME FUNDS (Cost $154,287,113) |
152,952,849 |
||
|
Money Market Fund - 39.9% |
|||
|
|
|
|
|
|
Fidelity Money Market Trust: |
151,490,646 |
151,490,644 |
|
|
Cash Equivalents - 0.0% |
|||
|
Maturity Amount |
|
||
|
Investments in repurchase agreements (U.S. Treasury Obligations), in a joint trading account at 6.52%, dated 9/29/00 due 10/2/00 |
$ 208,113 |
208,000 |
|
|
TOTAL INVESTMENT IN SECURITIES - 100% (Cost $370,825,966) |
$ 379,660,817 |
||
|
Other Information |
|
Purchases and redemptions of the underlying fund shares aggregated $162,153,959 and $88,236,889, respectively. |
|
Income Tax Information |
|
At September 30, 2000, the aggregate cost of investment securities for income tax purposes was $372,934,288. Net unrealized appreciation aggregated $6,726,529, of which $11,012,767 related to appreciated investment securities and $4,286,238 related to depreciated investment securities. |
See accompanying notes which are an integral part of the financial statements.
Semiannual Report
Fidelity Freedom Income Fund
Statement of Assets and Liabilities
|
|
September 30, 2000 (Unaudited) |
|
|
Assets |
|
|
|
Investment in securities, at value (including repurchase agreements of $208,000) (cost $370,825,966) - |
|
$ 379,660,817 |
|
Cash |
|
626 |
|
Receivable for Freedom Fund shares sold |
|
1,369,764 |
|
Dividends receivable |
|
1,593,890 |
|
Total assets |
|
382,625,097 |
|
Liabilities |
|
|
|
Payable for underlying fund shares purchased |
$ 2,157,862 |
|
|
Payable for Freedom Fund shares redeemed |
941,068 |
|
|
Accrued management fee |
24,491 |
|
|
Total liabilities |
|
3,123,421 |
|
Net Assets |
|
$ 379,501,676 |
|
Net Assets consist of: |
|
|
|
Paid in capital |
|
$ 367,432,498 |
|
Undistributed net investment income |
|
2,238,277 |
|
Accumulated undistributed net realized gain (loss) |
|
996,050 |
|
Net unrealized appreciation (depreciation) on investments |
|
8,834,851 |
|
Net Assets, for 33,233,368 shares outstanding |
|
$ 379,501,676 |
|
Net Asset Value, offering price and redemption price per share ($379,501,676 ÷ 33,233,368 shares) |
|
$11.42 |
Semiannual Report
See accompanying notes which are an integral part of the financial statements.
Fidelity Freedom Income Fund
Financial Statements - continued
Statement of Operations
|
|
Six months ended September 30, 2000 (Unaudited) |
|
|
Investment Income Income distributions from underlying funds |
|
$ 8,679,697 |
|
Interest |
|
1,969 |
|
Total income |
|
8,681,666 |
|
Expenses |
|
|
|
Management fee |
$ 168,783 |
|
|
Non-interested trustees' compensation |
518 |
|
|
Total expenses before reductions |
169,301 |
|
|
Expense reductions |
(77,272) |
92,029 |
|
Net investment income |
|
8,589,637 |
|
Realized and Unrealized Gain (Loss) |
|
|
|
Realized gain (loss) on sale of underlying fund shares |
(925,698) |
|
|
Capital gain distributions from underlying funds |
2,910,495 |
1,984,797 |
|
Change in net unrealized appreciation (depreciation) on investment securities |
|
(363,091) |
|
Net gain (loss) |
|
1,621,706 |
|
Net increase (decrease) in net assets resulting |
|
$ 10,211,343 |
|
Other Information |
|
|
|
Expense reductions |
|
$ 33,649 |
|
Custodian credits |
|
22 |
|
Transfer agent credits |
|
43,601 |
|
|
|
$ 77,272 |
Semiannual Report
See accompanying notes which are an integral part of the financial statements.
Fidelity Freedom Income Fund
Financial Statements - continued
Statement of Changes in Net Assets
|
|
Six months ended
September 30, 2000 |
Year ended |
|
Increase (Decrease) in Net Assets |
|
|
|
Operations |
$ 8,589,637 |
$ 11,308,494 |
|
Net realized gain (loss) |
1,984,797 |
7,947,484 |
|
Change in net unrealized appreciation (depreciation) |
(363,091) |
3,587,636 |
|
Net increase (decrease) in net assets resulting |
10,211,343 |
22,843,614 |
|
Distributions to shareholders |
(7,879,527) |
(11,479,859) |
|
From net realized gain |
(5,879,020) |
(2,572,145) |
|
Total distributions |
(13,758,547) |
(14,052,004) |
|
Share transactions |
245,461,566 |
325,878,686 |
|
Reinvestment of distributions |
13,545,077 |
13,824,904 |
|
Cost of Freedom Fund shares redeemed |
(182,791,826) |
(239,298,677) |
|
Net increase (decrease) in net assets resulting |
76,214,817 |
100,404,913 |
|
Total increase (decrease) in net assets |
72,667,613 |
109,196,523 |
|
Net Assets |
|
|
|
Beginning of period |
306,834,063 |
197,637,540 |
|
End of period (including undistributed net investment income of $2,238,277 and $1,528,167, |
$ 379,501,676 |
$ 306,834,063 |
|
Other Information Shares |
|
|
|
Sold |
21,674,169 |
28,961,004 |
|
Issued in reinvestment of distributions |
1,203,696 |
1,231,741 |
|
Redeemed |
(16,148,505) |
(21,255,056) |
|
Net increase (decrease) |
6,729,360 |
8,937,689 |
See accompanying notes which are an integral part of the financial statements.
Semiannual Report
Financial Highlights
|
|
Six months ended September 30, 2000 |
Years ended March 31, |
|||
|
|
(Unaudited) |
2000 |
1999 |
1998 |
1997 E |
|
Selected Per-Share Data |
|
|
|
|
|
|
Net asset value, |
$ 11.58 |
$ 11.25 |
$ 10.95 |
$ 10.06 |
$ 10.00 |
|
Income from Investment Operations |
|
|
|
|
|
|
Net investment income D |
.29 |
.52 |
.49 |
.50 |
.22 |
|
Net realized and |
.03 |
.45 |
.40 |
.96 |
(.02) |
|
Total from investment |
.32 |
.97 |
.89 |
1.46 |
.20 |
|
Less Distributions |
|
|
|
|
|
|
From net |
(.27) |
(.52) |
(.47) |
(.51) |
(.14) |
|
From net realized gain |
(.21) |
(.12) |
(.12) |
(.06) |
- |
|
Total distributions |
(.48) |
(.64) |
(.59) |
(.57) |
(.14) |
|
Net asset value, |
$ 11.42 |
$ 11.58 |
$ 11.25 |
$ 10.95 |
$ 10.06 |
|
Total Return B, C |
2.89% |
8.96% |
8.41% |
14.88% |
1.99% |
|
Ratios and Supplemental Data (amounts do not include the |
|
|
|
|
|
|
Net assets, end of period |
$ 379,502 |
$ 306,834 |
$ 197,638 |
$ 55,472 |
$ 9,427 |
|
Ratio of expenses to average net assets |
.08% A, F |
.08% F |
.08% F |
.08% F |
.08% A, F |
|
Ratio of expenses to |
.05% A, G |
.07% G |
.07% G |
.08% |
.08% A |
|
Ratio of net investment income to average net assets |
5.07% A |
4.59% |
4.46% |
4.71% |
4.95% A |
|
Portfolio turnover rate |
52% A |
37% |
29% |
33% |
32% A |
A Annualized
B Total returns for periods of less than one year are not annualized.
C The total returns would have been lower had certain expenses not been reduced during the periods shown.
D Net investment income per share has been calculated based on average shares outstanding during the period.
E For the period October 17, 1996 (commencement of operations) to March 31, 1997.
F FMR agreed to reimburse a portion of the fund's expenses during the period. Without this reimbursement, the fund's expense ratio would have been higher.
G FMR or the fund has entered into varying arrangements with third parties who either paid or reduced a portion of the fund's expenses.
See accompanying notes which are an integral part of the financial statements.
Semiannual Report
Fidelity Freedom 2000 Fund
|
Fund Holdings as of September 30, 2000 |
||
|
|
% of fund's investments |
% of fund's investments |
|
Domestic Equity Funds |
|
|
|
Blue Chip Growth Fund |
4.6% |
4.8% |
|
Disciplined Equity Fund |
4.6 |
4.9 |
|
Equity-Income Fund |
4.9 |
5.0 |
|
Fidelity Fund |
4.6 |
4.8 |
|
Growth & Income Portfolio |
4.7 |
4.9 |
|
Growth Company Fund |
4.8 |
4.6 |
|
OTC Portfolio |
2.9 |
3.1 |
|
|
31.1 |
32.1 |
|
International Equity Funds |
|
|
|
Diversified International Fund |
0.7 |
0.8 |
|
Europe Fund |
0.9 |
1.1 |
|
Japan Fund |
0.3 |
0.3 |
|
Overseas Fund |
0.7 |
0.8 |
|
Southeast Asia Fund |
0.1 |
0.1 |
|
|
2.7 |
3.1 |
|
High Yield Fixed-Income Funds |
|
|
|
Capital & Income Fund |
2.7 |
3.0 |
|
|
|
|
|
Investment Grade Fixed-Income Funds |
|
|
|
Government Income Fund |
15.1 |
15.1 |
|
Intermediate Bond Fund |
9.9 |
9.8 |
|
Investment Grade Bond Fund |
15.2 |
15.0 |
|
|
40.2 |
39.9 |
|
Money Market Fund |
|
|
|
Fidelity Money Market Trust: |
23.3 |
21.9 |
|
|
100.0% |
100.0% |
Semiannual Report
Fidelity Freedom 2000 Fund
Investment Changes - continued
Asset Allocation
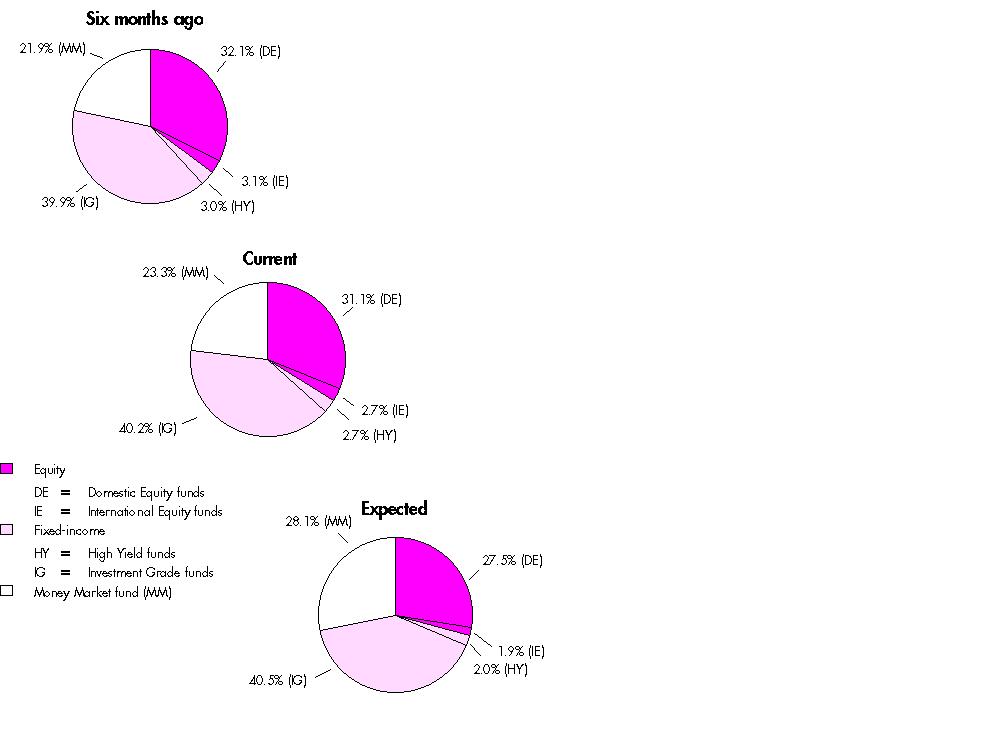
The fund invests according to an asset allocation strategy that becomes increasingly conservative over time. The six months ago allocation is based on the fund's holdings as of March 31, 2000. The current allocation is based on the fund's holdings as of September 30, 2000. The expected allocation represents the fund's anticipated target asset allocation at March 31, 2001.
Semiannual Report
Fidelity Freedom 2000 Fund
(Unaudited)
Showing Percentage of Total Value of Investment in Securities
|
Equity Funds - 33.8% |
|||
|
Shares |
Value (Note 1) |
||
|
Domestic Equity Funds - 31.1% |
|||
|
Blue Chip Growth Fund |
506,268 |
$ 30,163,464 |
|
|
Disciplined Equity Fund |
962,071 |
30,439,919 |
|
|
Equity-Income Fund |
600,408 |
32,247,932 |
|
|
Fidelity Fund |
786,302 |
30,146,814 |
|
|
Growth & Income Portfolio |
686,451 |
30,759,883 |
|
|
Growth Company Fund |
333,327 |
31,116,041 |
|
|
OTC Portfolio |
325,605 |
19,122,759 |
|
|
TOTAL DOMESTIC EQUITY FUNDS |
203,996,812 |
||
|
International Equity Funds - 2.7% |
|||
|
Diversified International Fund |
191,166 |
4,563,139 |
|
|
Europe Fund |
163,781 |
5,996,010 |
|
|
Japan Fund |
75,902 |
1,700,965 |
|
|
Overseas Fund |
106,076 |
4,499,748 |
|
|
Southeast Asia Fund |
55,533 |
725,815 |
|
|
TOTAL INTERNATIONAL EQUITY FUNDS |
17,485,677 |
||
|
TOTAL EQUITY FUNDS (Cost $175,994,129) |
221,482,489 |
||
|
Fixed-Income Funds - 42.9% |
|||
|
|
|
|
|
|
High Yield Fixed-Income Funds - 2.7% |
|||
|
Capital & Income Fund |
2,043,786 |
17,760,504 |
|
|
Investment Grade Fixed-Income Funds - 40.2% |
|||
|
Government Income Fund |
10,360,629 |
99,358,432 |
|
|
Intermediate Bond Fund |
6,587,843 |
64,956,129 |
|
|
Investment Grade Bond Fund |
14,180,919 |
99,408,245 |
|
|
TOTAL INVESTMENT GRADE FIXED-INCOME FUNDS |
263,722,806 |
||
|
TOTAL FIXED-INCOME FUNDS (Cost $286,479,506) |
281,483,310 |
||
|
Money Market Fund - 23.3% |
|||
|
|
|
|
|
|
Fidelity Money Market Trust: |
153,204,148 |
153,204,148 |
|
|
Cash Equivalents - 0.0% |
|||
|
Maturity Amount |
Value (Note 1) |
||
|
Investments in repurchase agreements (U.S. Treasury Obligations), in a joint trading account at 6.52%, |
$ 210,114 |
$ 210,000 |
|
|
TOTAL INVESTMENT IN SECURITIES - 100% (Cost $615,887,783) |
$ 656,379,947 |
||
|
Other Information |
|
Purchases and redemptions of the underlying fund shares aggregated $232,568,932 and $308,186,903, respectively. |
|
Income Tax Information |
|
At September 30, 2000, the aggregate cost of investment securities for income tax purposes was $620,145,909. Net unrealized appreciation aggregated $36,234,038, of which $46,836,328 related to appreciated investment securities and $10,602,290 related to depreciated investment securities. |
See accompanying notes which are an integral part of the financial statements.
Semiannual Report
Fidelity Freedom 2000 Fund
Statement of Assets and Liabilities
|
|
September 30, 2000 (Unaudited) |
|
|
Assets |
|
|
|
Investment in securities, at value (including repurchase agreements of $210,000) (cost $615,887,783) - |
|
$ 656,379,947 |
|
Cash |
|
67 |
|
Receivable for Freedom Fund shares sold |
|
1,862,696 |
|
Dividends receivable |
|
2,241,764 |
|
Total assets |
|
660,484,474 |
|
Liabilities |
|
|
|
Payable for underlying fund shares purchased |
$ 2,536,473 |
|
|
Payable for Freedom Fund shares redeemed |
1,655,655 |
|
|
Accrued management fee |
43,266 |
|
|
Total liabilities |
|
4,235,394 |
|
Net Assets |
|
$ 656,249,080 |
|
Net Assets consist of: |
|
|
|
Paid in capital |
|
$ 591,542,002 |
|
Undistributed net investment income |
|
14,721,287 |
|
Accumulated undistributed net realized |
|
9,493,627 |
|
Net unrealized appreciation (depreciation) on investments |
|
40,492,164 |
|
Net Assets, for 50,170,489 shares outstanding |
|
$ 656,249,080 |
|
Net Asset Value, offering price and redemption price |
|
$13.08 |
See accompanying notes which are an integral part of the financial statements.
Semiannual Report
Fidelity Freedom 2000 Fund
Financial Statements - continued
Statement of Operations
|
|
Six months ended September 30, 2000 (Unaudited) |
|
|
Investment Income Income distributions from underlying funds |
|
$ 15,105,307 |
|
Interest |
|
3,496 |
|
Total income |
|
15,108,803 |
|
Expenses |
|
|
|
Management fee |
$ 348,827 |
|
|
Non-interested trustees' compensation |
1,131 |
|
|
Total expenses before reductions |
349,958 |
|
|
Expense reductions |
(153,224) |
196,734 |
|
Net investment income |
|
14,912,069 |
|
Realized and Unrealized Gain (Loss) |
|
|
|
Realized gain (loss) on sale of underlying fund shares |
4,664,543 |
|
|
Capital gain distributions from underlying funds |
8,111,959 |
12,776,502 |
|
Change in net unrealized appreciation (depreciation) |
|
(16,833,866) |
|
Net gain (loss) |
|
(4,057,364) |
|
Net increase (decrease) in net assets resulting |
|
$ 10,854,705 |
|
Other Information |
|
|
|
Expense reductions |
|
$ 71,187 |
|
Transfer agent credits |
|
82,037 |
|
|
|
$ 153,224 |
See accompanying notes which are an integral part of the financial statements.
Semiannual Report
Fidelity Freedom 2000 Fund
Financial Statements - continued
Statement of Changes in Net Assets
|
|
Six months ended
September 30, 2000 |
Year ended |
|
Increase (Decrease) in Net Assets |
|
|
|
Operations |
$ 14,912,069 |
$ 25,062,155 |
|
Net realized gain (loss) |
12,776,502 |
38,011,230 |
|
Change in net unrealized appreciation (depreciation) |
(16,833,866) |
22,984,096 |
|
Net increase (decrease) in net assets resulting |
10,854,705 |
86,057,481 |
|
Distributions to shareholders |
(7,501,048) |
(26,666,342) |
|
From net realized gain |
(27,128,457) |
(14,199,445) |
|
Total distributions |
(34,629,505) |
(40,865,787) |
|
Share transactions |
301,648,647 |
492,959,491 |
|
Reinvestment of distributions |
34,552,746 |
40,781,091 |
|
Cost of Freedom Fund shares redeemed |
(400,125,626) |
(398,701,795) |
|
Net increase (decrease) in net assets resulting from share transactions |
(63,924,233) |
135,038,787 |
|
Total increase (decrease) in net assets |
(87,699,033) |
180,230,481 |
|
Net Assets |
|
|
|
Beginning of period |
743,948,113 |
563,717,632 |
|
End of period (including undistributed net investment income of $14,721,287 and $7,310,266, |
$ 656,249,080 |
$ 743,948,113 |
|
Other Information Shares |
|
|
|
Sold |
23,226,837 |
38,299,772 |
|
Issued in reinvestment of distributions |
2,755,407 |
3,206,894 |
|
Redeemed |
(31,035,557) |
(31,012,430) |
|
Net increase (decrease) |
(5,053,313) |
10,494,236 |
See accompanying notes which are an integral part of the financial statements.
Semiannual Report
Financial Highlights
|
|
Six months ended September 30, 2000 |
Years ended March 31, |
|||
|
|
(Unaudited) |
2000 |
1999 |
1998 |
1997 E |
|
Selected Per-Share Data |
|
|
|
|
|
|
Net asset value, |
$ 13.47 |
$ 12.60 |
$ 11.98 |
$ 10.12 |
$ 10.00 |
|
Income from Investment Operations |
|
|
|
|
|
|
Net investment income D |
.28 |
.50 |
.45 |
.60 |
.18 |
|
Net realized and |
(.07) |
1.18 |
.78 |
1.71 |
.03 |
|
Total from investment |
.21 |
1.68 |
1.23 |
2.31 |
.21 |
|
Less Distributions |
|
|
|
|
|
|
From net investment income |
(.13) |
(.52) |
(.40) |
(.33) |
(.09) |
|
From net realized gain |
(.47) |
(.29) |
(.21) |
(.12) |
- |
|
Total distributions |
(.60) |
(.81) |
(.61) |
(.45) |
(.09) |
|
Net asset value, end of period |
$ 13.08 |
$ 13.47 |
$ 12.60 |
$ 11.98 |
$ 10.12 |
|
Total Return B, C |
1.75% |
13.81% |
10.51% |
23.25% |
2.09% |
|
Ratios and Supplemental Data (amounts do not include the |
|
|
|
|
|
|
Net assets, end of period |
$ 656,249 |
$ 743,948 |
$ 563,718 |
$ 325,126 |
$ 15,946 |
|
Ratio of expenses to average net assets |
.08% A, F |
.08% F |
.08% F |
.08% F |
.08% A, F |
|
Ratio of expenses to |
.06% A, G |
.07% G |
.07% G |
.08% |
.08% A |
|
Ratio of net investment income to average net assets |
4.26% A |
3.88% |
3.76% |
3.72% |
4.00% A |
|
Portfolio turnover rate |
66% A |
37% |
27% |
24% |
19% A |
A Annualized
B Total returns for periods of less than one year are not annualized.
C The total returns would have been lower had certain expenses not been reduced during the periods shown.
D Net investment income per share has been calculated based on average shares outstanding during the period.
E For the period October 17, 1996 (commencement of operations) to March 31, 1997.
F FMR agreed to reimburse a portion of the fund's expenses during the period. Without this reimbursement, the fund's expense ratio would have been higher.
G FMR or the fund has entered into varying arrangements with third parties who either paid or reduced a portion of the fund's expenses.
See accompanying notes which are an integral part of the financial statements.
Semiannual Report
Fidelity Freedom 2010 Fund
|
Fund Holdings as of September 30, 2000 |
||
|
|
% of fund's investments |
% of fund's investments |
|
Domestic Equity Funds |
|
|
|
Blue Chip Growth Fund |
6.9% |
7.2% |
|
Disciplined Equity Fund |
7.0 |
7.3 |
|
Equity-Income Fund |
7.4 |
7.4 |
|
Fidelity Fund |
6.9 |
7.1 |
|
Growth & Income Portfolio |
7.1 |
7.2 |
|
Growth Company Fund |
7.1 |
6.9 |
|
OTC Portfolio |
4.4 |
4.6 |
|
|
46.8 |
47.7 |
|
International Equity Funds |
|
|
|
Diversified International Fund |
1.7 |
1.8 |
|
Europe Fund |
2.2 |
2.4 |
|
Japan Fund |
0.6 |
0.7 |
|
Overseas Fund |
1.6 |
1.8 |
|
Southeast Asia Fund |
0.2 |
0.3 |
|
|
6.3 |
7.0 |
|
High Yield Fixed-Income Funds |
|
|
|
Capital & Income Fund |
5.8 |
6.1 |
|
|
|
|
|
Investment Grade Fixed-Income Funds |
|
|
|
Government Income Fund |
13.1 |
12.6 |
|
Intermediate Bond Fund |
8.5 |
8.2 |
|
Investment Grade Bond Fund |
13.1 |
12.6 |
|
|
34.7 |
33.4 |
|
Money Market Fund |
|
|
|
Fidelity Money Market Trust: |
6.4 |
5.8 |
|
|
100.0% |
100.0% |
Semiannual Report
Fidelity Freedom 2010 Fund
Investment Changes - continued
Asset Allocation
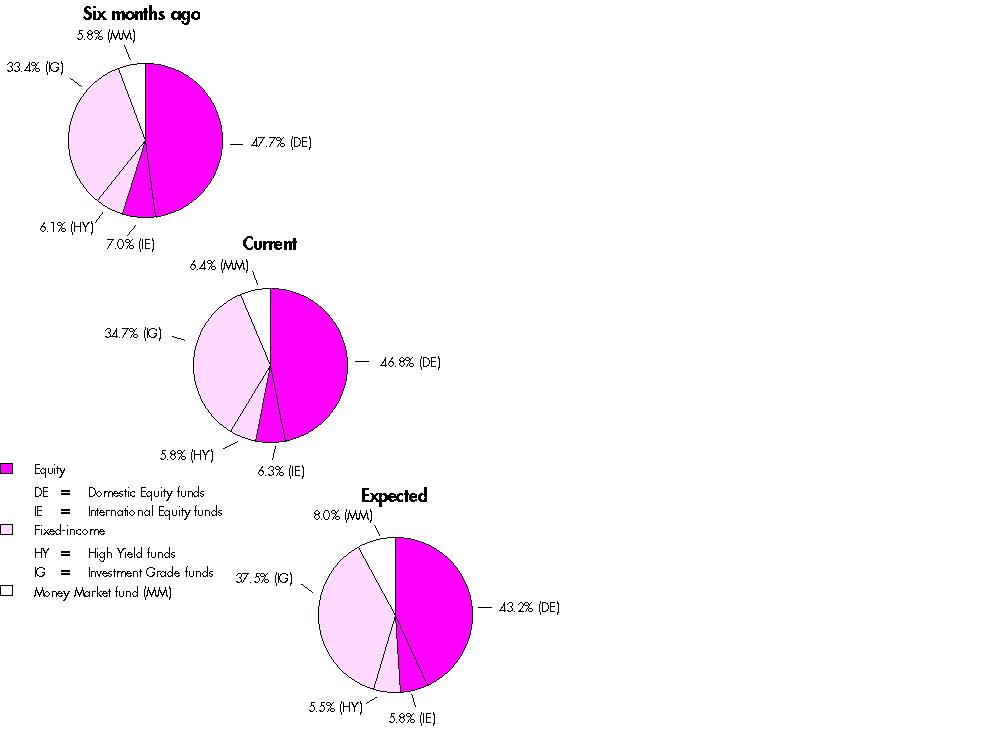
The six months ago allocation is based on the fund's holdings as of March 31, 2000. The current allocation is based on the fund's holdings as of September 30, 2000. The expected allocation represents the fund's anticipated target asset allocation at March 31, 2001.
Semiannual Report
Fidelity Freedom 2010 Fund
(Unaudited)
Showing Percentage of Total Value of Investment in Securities
|
Equity Funds - 53.1% |
|||
|
Shares |
Value (Note 1) |
||
|
Domestic Equity Funds - 46.8% |
|||
|
Blue Chip Growth Fund |
2,506,690 |
$ 149,348,598 |
|
|
Disciplined Equity Fund |
4,761,927 |
150,667,356 |
|
|
Equity-Income Fund |
2,970,525 |
159,546,883 |
|
|
Fidelity Fund |
3,893,102 |
149,261,522 |
|
|
Growth & Income Portfolio |
3,398,756 |
152,298,277 |
|
|
Growth Company Fund |
1,650,640 |
154,087,202 |
|
|
OTC Portfolio |
1,613,414 |
94,755,825 |
|
|
TOTAL DOMESTIC EQUITY FUNDS |
1,009,965,663 |
||
|
International Equity Funds - 6.3% |
|||
|
Diversified International Fund |
1,517,889 |
36,231,999 |
|
|
Europe Fund |
1,280,842 |
46,891,621 |
|
|
Japan Fund |
575,061 |
12,887,119 |
|
|
Overseas Fund |
842,093 |
35,721,568 |
|
|
Southeast Asia Fund |
423,028 |
5,528,972 |
|
|
TOTAL INTERNATIONAL EQUITY FUNDS |
137,261,279 |
||
|
TOTAL EQUITY FUNDS (Cost $963,603,774) |
1,147,226,942 |
||
|
Fixed-Income Funds - 40.5% |
|||
|
|
|
|
|
|
High Yield Fixed-Income Funds - 5.8% |
|||
|
Capital & Income Fund |
14,410,291 |
125,225,427 |
|
|
Investment Grade Fixed-Income Funds - 34.7% |
|||
|
Government Income Fund |
29,461,752 |
282,538,201 |
|
|
Intermediate Bond Fund |
18,734,246 |
184,719,664 |
|
|
Investment Grade Bond Fund |
40,285,762 |
282,403,190 |
|
|
TOTAL INVESTMENT GRADE FIXED-INCOME FUNDS |
749,661,055 |
||
|
TOTAL FIXED-INCOME FUNDS (Cost $883,380,559) |
874,886,482 |
||
|
Money Market Fund - 6.4% |
|||
|
|
|
|
|
|
Fidelity Money Market Trust: |
137,080,954 |
137,080,954 |
|
|
Cash Equivalents - 0.0% |
|||
|
Maturity Amount |
Value (Note 1) |
||
|
Investments in repurchase agreements (U.S. Treasury Obligations), in a joint trading account at 6.52%, |
$ 264,143 |
$ 264,000 |
|
|
TOTAL INVESTMENT IN SECURITIES - 100% (Cost $1,984,329,287) |
$ 2,159,458,378 |
||
|
Other Information |
|
Purchases and redemptions of the underlying fund shares aggregated $1,026,656,135 and $810,695,628, respectively. |
|
Income Tax Information |
|
At September 30, 2000, the aggregate cost of investment securities for income tax purposes was $1,999,108,820. Net unrealized appreciation aggregated $160,349,558, of which $195,939,433 related to appreciated investment securities and $35,589,875 related to depreciated investment securities. |
See accompanying notes which are an integral part of the financial statements.
Semiannual Report
Fidelity Freedom 2010 Fund
Statement of Assets and Liabilities
|
|
September 30, 2000 (Unaudited) |
|
|
Assets |
|
|
|
Investment in securities, at value (including repurchase agreements of $264,000) (cost $1,984,329,287) - |
|
$ 2,159,458,378 |
|
Cash |
|
734 |
|
Receivable for Freedom Fund shares sold |
|
6,338,936 |
|
Dividends receivable |
|
5,319,796 |
|
Total assets |
|
2,171,117,844 |
|
Liabilities |
|
|
|
Payable for underlying fund shares purchased |
$ 9,180,694 |
|
|
Payable for Freedom Fund shares redeemed |
2,521,518 |
|
|
Accrued management fee |
142,391 |
|
|
Total liabilities |
|
11,844,603 |
|
Net Assets |
|
$ 2,159,273,241 |
|
Net Assets consist of: |
|
|
|
Paid in capital |
|
$ 1,927,017,917 |
|
Undistributed net investment income |
|
33,821,065 |
|
Accumulated undistributed net realized |
|
23,305,168 |
|
Net unrealized appreciation (depreciation) on investments |
|
175,129,091 |
|
Net Assets, for 144,261,081 shares outstanding |
|
$ 2,159,273,241 |
|
Net Asset Value, offering price and redemption price |
|
$14.97 |
See accompanying notes which are an integral part of the financial statements.
Semiannual Report
Fidelity Freedom 2010 Fund
Financial Statements - continued
Statement of Operations
|
|
Six months ended September 30, 2000 (Unaudited) |
|
|
Investment Income Income distributions from underlying funds |
|
$ 34,650,550 |
|
Interest |
|
5,231 |
|
Total income |
|
34,655,781 |
|
Expenses |
|
|
|
Management fee |
$ 1,064,160 |
|
|
Non-interested trustees' compensation |
3,333 |
|
|
Total expenses before reductions |
1,067,493 |
|
|
Expense reductions |
(384,891) |
682,602 |
|
Net investment income |
|
33,973,179 |
|
Realized and Unrealized Gain (Loss) |
|
|
|
Realized gain (loss) on sale of underlying fund shares |
(6,994,133) |
|
|
Capital gain distributions from underlying funds |
39,829,648 |
32,835,515 |
|
Change in net unrealized appreciation (depreciation) on investment securities |
|
(62,940,056) |
|
Net gain (loss) |
|
(30,104,541) |
|
Net increase (decrease) in net assets resulting |
|
$ 3,868,638 |
|
Other Information Expense Reductions |
|
|
|
Reimbursement from investment adviser |
|
$ 217,600 |
|
Transfer agent credits |
|
167,291 |
|
|
|
$ 384,891 |
See accompanying notes which are an integral part of the financial statements.
Semiannual Report
Fidelity Freedom 2010 Fund
Financial Statements - continued
Statement of Changes in Net Assets
|
|
Six months ended
September 30, 2000 |
Year ended |
|
Increase (Decrease) in Net Assets |
|
|
|
Operations |
$ 33,973,179 |
$ 43,079,015 |
|
Net realized gain (loss) |
32,835,515 |
104,776,910 |
|
Change in net unrealized appreciation (depreciation) |
(62,940,056) |
137,436,334 |
|
Net increase (decrease) in net assets resulting |
3,868,638 |
285,292,259 |
|
Distributions to shareholders |
(13,265,402) |
(49,841,025) |
|
From net realized gain |
(73,696,753) |
(39,013,598) |
|
Total distributions |
(86,962,155) |
(88,854,623) |
|
Share transactions |
1,042,761,883 |
1,114,303,078 |
|
Reinvestment of distributions |
86,862,616 |
88,773,017 |
|
Cost of Freedom Fund shares redeemed |
(900,344,596) |
(475,336,139) |
|
Net increase (decrease) in net assets resulting |
229,279,903 |
727,739,956 |
|
Total increase (decrease) in net assets |
146,186,386 |
924,177,592 |
|
Net Assets |
|
|
|
Beginning of period |
2,013,086,855 |
1,088,909,263 |
|
End of period (including undistributed net investment income of $33,821,065 and $13,113,288, respectively) |
$ 2,159,273,241 |
$ 2,013,086,855 |
|
Other Information Shares |
|
|
|
Sold |
69,600,716 |
76,923,629 |
|
Issued in reinvestment of distributions |
6,032,127 |
6,204,166 |
|
Redeemed |
(60,811,049) |
(32,821,268) |
|
Net increase (decrease) |
14,821,794 |
50,306,527 |
See accompanying notes which are an integral part of the financial statements.
Semiannual Report
Financial Highlights
|
|
Six months ended September 30, 2000 |
Years ended March 31, |
|||
|
|
(Unaudited) |
2000 |
1999 |
1998 |
1997 E |
|
Selected Per-Share Data |
|
|
|
|
|
|
Net asset value, |
$ 15.55 |
$ 13.76 |
$ 12.81 |
$ 10.15 |
$ 10.00 |
|
Income from Investment Operations |
|
|
|
|
|
|
Net investment income D |
.24 |
.43 |
.36 |
.30 |
.11 |
|
Net realized and |
(.23) |
2.27 |
1.22 |
2.82 |
.15 |
|
Total from investment |
.01 |
2.70 |
1.58 |
3.12 |
.26 |
|
Less Distributions |
|
|
|
|
|
|
From net investment |
(.09) |
(.49) |
(.35) |
(.37) |
(.11) |
|
From net realized gain |
(.50) |
(.42) |
(.28) |
(.09) |
- |
|
Total distributions |
(.59) |
(.91) |
(.63) |
(.46) |
(.11) |
|
Net asset value, |
$ 14.97 |
$ 15.55 |
$ 13.76 |
$ 12.81 |
$ 10.15 |
|
Total Return B, C |
.21% |
20.32% |
12.65% |
31.31% |
2.59% |
|
Ratios and Supplemental Data (amounts do not include the |
|
|
|
|
|
|
Net assets, end of period (000 omitted) |
$ 2,159,273 |
$ 2,013,087 |
$ 1,088,909 |
$ 647,356 |
$ 23,600 |
|
Ratio of expenses to |
.08% A, F |
.08% F |
.08% F |
.08% F |
.08% A, F |
|
Ratio of expenses to |
.06% A, G |
.07% G |
.07% G |
.08% |
.08% A |
|
Ratio of net investment
income to average |
3.18% A |
2.98% |
2.82% |
2.54% |
2.56% A |
|
Portfolio turnover rate |
76% A |
33% |
27% |
20% |
3% A |
A Annualized
B Total returns for periods of less than one year are not annualized.
C The total returns would have been lower had certain expenses not been reduced during the periods shown.
D Net investment income per share has been calculated based on average shares outstanding during the period.
E For the period October 17, 1996 (commencement of operations) to March 31, 1997.
F FMR agreed to reimburse a portion of the fund's expenses during the period. Without this reimbursement, the fund's expense ratio would have been higher.
G FMR or the fund has entered into varying arrangements with third parties who either paid or reduced a portion of the fund's expenses.
See accompanying notes which are an integral part of the financial statements.
Semiannual Report
Fidelity Freedom 2020 Fund
|
Fund Holdings as of September 30, 2000 |
||
|
|
% of fund's investments |
% of fund's investments |
|
Domestic Equity Funds |
|
|
|
Blue Chip Growth Fund |
9.4% |
9.5% |
|
Disciplined Equity Fund |
9.4 |
9.6 |
|
Equity-Income Fund |
10.0 |
9.9 |
|
Fidelity Fund |
9.4 |
9.5 |
|
Growth & Income Portfolio |
9.6 |
9.6 |
|
Growth Company Fund |
9.7 |
9.2 |
|
OTC Portfolio |
5.9 |
6.1 |
|
|
63.4 |
63.4 |
|
International Equity Funds |
|
|
|
Diversified International Fund |
2.7 |
2.7 |
|
Europe Fund |
3.5 |
3.8 |
|
Japan Fund |
1.0 |
1.1 |
|
Overseas Fund |
2.6 |
2.8 |
|
Southeast Asia Fund |
0.4 |
0.5 |
|
|
10.2 |
10.9 |
|
High Yield Fixed-Income Funds |
|
|
|
Capital & Income Fund |
7.4 |
7.6 |
|
|
|
|
|
Investment Grade Fixed-Income Funds |
|
|
|
Government Income Fund |
7.1 |
6.8 |
|
Intermediate Bond Fund |
4.7 |
4.5 |
|
Investment Grade Bond Fund |
7.2 |
6.8 |
|
|
19.0 |
18.1 |
|
|
100.0% |
100.0% |
Semiannual Report
Fidelity Freedom 2020 Fund
Investment Changes - continued
Asset Allocation
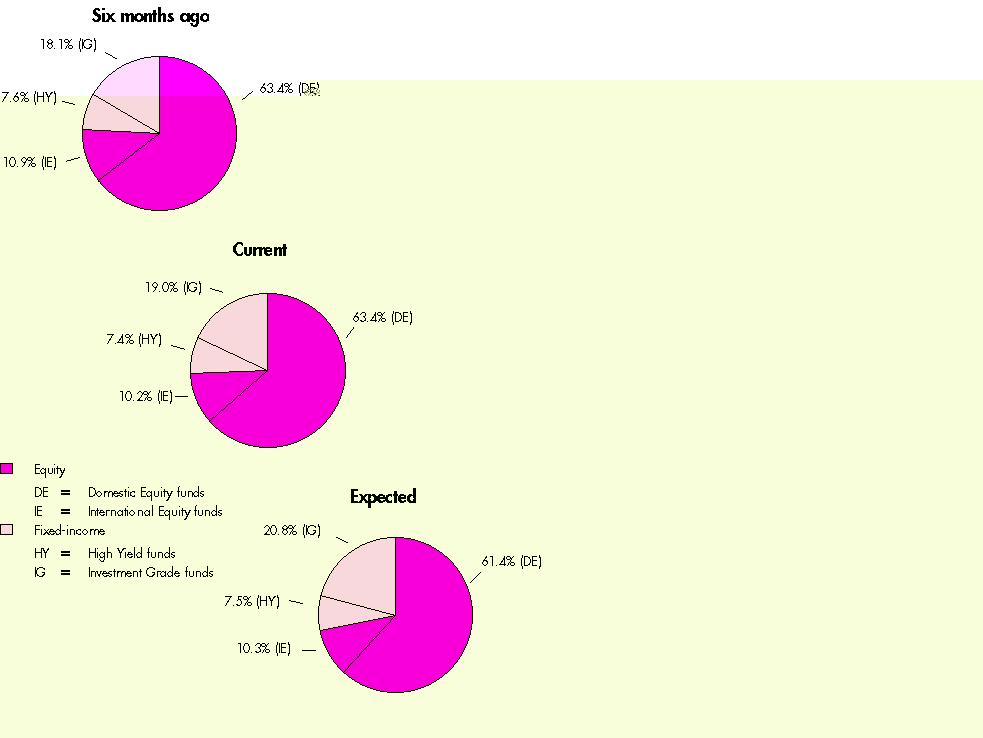
The fund invests according to an asset allocation strategy that becomes increasingly conservative over time. The six months ago allocation is based on the fund's holdings as of March 31, 2000. The current allocation is based on the fund's holdings as of September 30, 2000. The expected allocation represents the fund's anticipated target asset allocation at March 31, 2001.
Semiannual Report
Fidelity Freedom 2020 Fund
(Unaudited)
Showing Percentage of Total Value of Investment in Securities
|
Equity Funds - 73.6% |
|||
|
Shares |
Value (Note 1) |
||
|
Domestic Equity Funds - 63.4% |
|||
|
Blue Chip Growth Fund |
2,796,771 |
$ 166,631,628 |
|
|
Disciplined Equity Fund |
5,313,529 |
168,120,060 |
|
|
Equity-Income Fund |
3,314,157 |
178,003,387 |
|
|
Fidelity Fund |
4,344,065 |
166,551,437 |
|
|
Growth & Income Portfolio |
3,792,408 |
169,937,796 |
|
|
Growth Company Fund |
1,841,153 |
171,871,619 |
|
|
OTC Portfolio |
1,799,784 |
105,701,334 |
|
|
TOTAL DOMESTIC EQUITY FUNDS |
1,126,817,261 |
||
|
International Equity Funds - 10.2% |
|||
|
Diversified International Fund |
2,006,555 |
47,896,474 |
|
|
Europe Fund |
1,702,628 |
62,333,215 |
|
|
Japan Fund |
772,770 |
17,317,770 |
|
|
Overseas Fund |
1,113,312 |
47,226,699 |
|
|
Southeast Asia Fund |
567,547 |
7,417,833 |
|
|
TOTAL INTERNATIONAL EQUITY FUNDS |
182,191,991 |
||
|
TOTAL EQUITY FUNDS (Cost $1,083,468,162) |
1,309,009,252 |
||
|
Fixed-Income Funds - 26.4% |
|||
|
|
|
|
|
|
High Yield Fixed-Income Funds - 7.4% |
|||
|
Capital & Income Fund |
15,123,208 |
131,420,674 |
|
|
Investment Grade Fixed-Income Funds - 19.0% |
|||
|
Government Income Fund |
13,292,131 |
127,471,538 |
|
|
Intermediate Bond Fund |
8,451,518 |
83,331,971 |
|
|
Investment Grade Bond Fund |
18,193,722 |
127,537,989 |
|
|
TOTAL INVESTMENT GRADE FIXED-INCOME FUNDS |
338,341,498 |
||
|
TOTAL FIXED-INCOME FUNDS (Cost $478,642,810) |
469,762,172 |
||
|
Cash Equivalents - 0.0% |
|||
|
Maturity Amount |
Value (Note 1) |
||
|
Investments in repurchase agreements (U.S. Treasury Obligations), in a joint trading account at 6.52%, dated 9/29/00 due
10/2/00 |
$ 134,073 |
$ 134,000 |
|
|
TOTAL INVESTMENT IN SECURITIES - 100% (Cost $1,562,244,972) |
$ 1,778,905,424 |
||
|
Other Information |
|
Purchases and redemptions of the underlying fund shares aggregated $759,466,172 and $852,004,965, respectively. |
|
Income Tax Information |
|
At September 30, 2000, the aggregate cost of investment securities for income tax purposes was $1,572,692,309. Net unrealized appreciation aggregated $206,213,115, of which $235,824,464 related to appreciated investment securities and $29,611,349 related to depreciated investment securities. |
See accompanying notes which are an integral part of the financial statements.
Semiannual Report
Fidelity Freedom 2020 Fund
Statement of Assets and Liabilities
|
|
September 30, 2000 (Unaudited) |
|
|
Assets |
|
|
|
Investment in securities, at value (including repurchase agreements of $134,000) (cost $1,562,244,972) - |
|
$ 1,778,905,424 |
|
Cash |
|
986 |
|
Receivable for Freedom Fund shares sold |
|
5,740,992 |
|
Dividends receivable |
|
3,561,796 |
|
Total assets |
|
1,788,209,198 |
|
Liabilities |
|
|
|
Payable for underlying fund shares purchased |
$ 6,499,445 |
|
|
Payable for Freedom Fund shares redeemed |
2,815,203 |
|
|
Accrued management fee |
117,220 |
|
|
Total liabilities |
|
9,431,868 |
|
Net Assets |
|
$ 1,778,777,330 |
|
Net Assets consist of: |
|
|
|
Paid in capital |
|
$ 1,503,157,147 |
|
Undistributed net investment income |
|
18,439,871 |
|
Accumulated undistributed net realized gain (loss) |
|
40,519,860 |
|
Net unrealized appreciation (depreciation) on investments |
|
216,660,452 |
|
Net Assets, for 109,226,279 shares outstanding |
|
$ 1,778,777,330 |
|
Net Asset Value, offering price and redemption price |
|
$16.29 |
See accompanying notes which are an integral part of the financial statements.
Semiannual Report
Fidelity Freedom 2020 Fund
Financial Statements - continued
Statement of Operations
|
|
Six months ended September 30, 2000 (Unaudited) |
|
|
Investment Income Income distributions from underlying funds |
|
$ 19,446,483 |
|
Interest |
|
7,671 |
|
Total income |
|
19,454,154 |
|
Expenses |
|
|
|
Management fee |
$ 929,977 |
|
|
Non-interested trustees' compensation |
2,997 |
|
|
Total expenses before reductions |
932,974 |
|
|
Expense reductions |
(347,393) |
585,581 |
|
Net investment income |
|
18,868,573 |
|
Realized and Unrealized Gain (Loss) |
|
|
|
Realized gain (loss) on sale of underlying fund shares |
6,626,965 |
|
|
Capital gain distributions from underlying funds |
44,204,707 |
50,831,672 |
|
Change in net unrealized appreciation (depreciation) |
|
(99,546,222) |
|
Net gain (loss) |
|
(48,714,550) |
|
Net increase (decrease) in net assets resulting |
|
$ (29,845,977) |
|
Other Information |
|
|
|
Expense reductions Reimbursement from investment adviser |
|
$ 189,937 |
|
Transfer agent credits |
|
157,456 |
|
|
|
$ 347,393 |
See accompanying notes which are an integral part of the financial statements.
Semiannual Report
Fidelity Freedom 2020 Fund
Financial Statements - continued
Statement of Changes in Net Assets
|
|
Six months ended
September 30, 2000 |
Year ended |
|
Increase (Decrease) in Net Assets |
|
|
|
Operations |
$ 18,868,573 |
$ 27,825,560 |
|
Net realized gain (loss) |
50,831,672 |
114,727,926 |
|
Change in net unrealized appreciation (depreciation) |
(99,546,222) |
197,716,542 |
|
Net increase (decrease) in net assets resulting |
(29,845,977) |
340,270,028 |
|
Distributions to shareholders |
(8,576,714) |
(30,565,990) |
|
In excess of net investment income |
- |
(9,190,347) |
|
From net realized gain |
(79,613,763) |
(45,679,122) |
|
Total distributions |
(88,190,477) |
(85,435,459) |
|
Share transactions |
725,698,788 |
1,070,824,990 |
|
Reinvestment of distributions |
88,097,858 |
85,369,347 |
|
Cost of Freedom Fund shares redeemed |
(881,161,205) |
(441,498,703) |
|
Net increase (decrease) in net assets resulting |
(67,364,559) |
714,695,634 |
|
Total increase (decrease) in net assets |
(185,401,013) |
969,530,203 |
|
Net Assets |
|
|
|
Beginning of period |
1,964,178,343 |
994,648,140 |
|
End of period (including undistributed net investment income of $18,439,871 and $8,148,012, respectively) |
$ 1,778,777,330 |
$ 1,964,178,343 |
|
Other Information Shares |
|
|
|
Sold |
44,358,793 |
67,843,604 |
|
Issued in reinvestment of distributions |
5,589,964 |
5,511,982 |
|
Redeemed |
(54,411,168) |
(28,010,025) |
|
Net increase (decrease) |
(4,462,411) |
45,345,561 |
See accompanying notes which are an integral part of the financial statements.
Semiannual Report
Financial Highlights
|
|
Six months ended September 30, 2000 |
Years ended March 31, |
|||
|
|
(Unaudited) |
2000 |
1999 |
1998 |
1997 E |
|
Selected Per-Share Data |
|
|
|
|
|
|
Net asset value, |
$ 17.28 |
$ 14.55 |
$ 13.28 |
$ 10.21 |
$ 10.00 |
|
Income from Investment Operations |
|
|
|
|
|
|
Net investment income D |
.16 |
.32 |
.27 |
.21 |
.08 |
|
Net realized and |
(.43) |
3.43 |
1.55 |
3.33 |
.22 |
|
Total from investment |
(.27) |
3.75 |
1.82 |
3.54 |
.30 |
|
Less Distributions |
|
|
|
|
|
|
From net investment |
(.07) |
(.35) |
(.28) |
(.34) |
(.09) |
|
In excess of net |
- |
(.10) |
- |
- |
- |
|
From net realized gain |
(.65) |
(.57) |
(.27) |
(.13) |
- |
|
Total distributions |
(.72) |
(1.02) |
(.55) |
(.47) |
(.09) |
|
Net asset value, |
$ 16.29 |
$ 17.28 |
$ 14.55 |
$ 13.28 |
$ 10.21 |
|
Total Return B, C |
(1.42)% |
26.74% |
14.00% |
35.36% |
2.99% |
|
Ratios and Supplemental Data (amounts do not include the |
|
|
|
|
|
|
Net assets, end of period |
$ 1,778,777 |
$ 1,964,178 |
$ 994,648 |
$ 577,603 |
$ 14,958 |
|
Ratio of expenses to |
.08% A, F |
.08% F |
.08% F |
.08% F |
.08% A, F |
|
Ratio of expenses to |
.06% A, G |
.07% G |
.07% G |
.08% |
.08% A |
|
Ratio of net investment
income to average |
2.02% A |
2.07% |
2.03% |
1.76% |
1.75% A |
|
Portfolio turnover rate |
80% A |
28% |
18% |
15% |
21% A |
A Annualized
B Total returns for periods of less than one year are not annualized.
C The total returns would have been lower had certain expenses not been reduced during the periods shown.
D Net investment income per share has been calculated based on average shares outstanding during the period.
E For the period October 17, 1996 (commencement of operations) to March 31, 1997.
F FMR agreed to reimburse a portion of the fund's expenses during the period. Without this reimbursement, the fund's expense ratio would have been higher.
G FMR or the fund has entered into varying arrangements with third parties who either paid or reduced a portion of the fund's expenses.
See accompanying notes which are an integral part of the financial statements.
Semiannual Report
Fidelity Freedom 2030 Fund
|
Fund Holdings as of September 30, 2000 |
||
|
|
% of fund's investments |
% of fund's investments |
|
Domestic Equity Funds |
|
|
|
Blue Chip Growth Fund |
10.4% |
10.5% |
|
Disciplined Equity Fund |
10.5 |
10.6 |
|
Equity-Income Fund |
11.2 |
10.9 |
|
Fidelity Fund |
10.4 |
10.4 |
|
Growth & Income Portfolio |
10.6 |
10.5 |
|
Growth Company Fund |
10.8 |
10.1 |
|
OTC Portfolio |
6.6 |
6.7 |
|
|
70.5 |
69.7 |
|
International Equity Funds |
|
|
|
Diversified International Fund |
3.3 |
3.4 |
|
Europe Fund |
4.4 |
4.7 |
|
Japan Fund |
1.2 |
1.4 |
|
Overseas Fund |
3.3 |
3.4 |
|
Southeast Asia Fund |
0.5 |
0.7 |
|
|
12.7 |
13.6 |
|
High Yield Fixed-Income Funds |
|
|
|
Capital & Income Fund |
8.3 |
8.6 |
|
|
|
|
|
Investment Grade Fixed-Income Funds |
|
|
|
Government Income Fund |
3.2 |
3.1 |
|
Intermediate Bond Fund |
2.1 |
2.0 |
|
Investment Grade Bond Fund |
3.2 |
3.0 |
|
|
8.5 |
8.1 |
|
|
100.0% |
100.0% |
Semiannual Report
Fidelity Freedom 2030 Fund
Investment Changes - continued
Asset Allocation
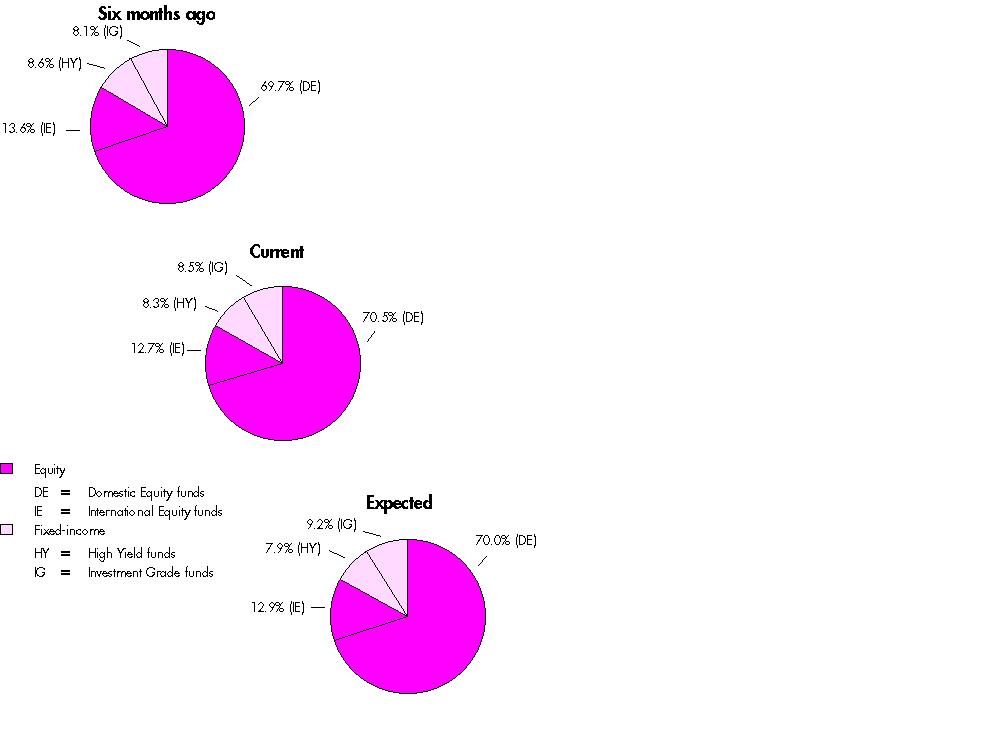
The fund invests according to an asset allocation strategy that becomes increasingly conservative over time. The six months ago allocation is based on the fund's holdings as of March 31, 2000. The current allocation is based on the fund's holdings as of September 30, 2000. The expected allocation represents the fund's anticipated target asset allocation at March 31, 2001.
Semiannual Report
Fidelity Freedom 2030 Fund
(Unaudited)
Showing Percentage of Total Value of Investment in Securities
|
Equity Funds - 83.2% |
|||
|
Shares |
Value (Note 1) |
||
|
Domestic Equity Funds - 70.5% |
|||
|
Blue Chip Growth Fund |
2,265,073 |
$ 134,953,020 |
|
|
Disciplined Equity Fund |
4,303,355 |
136,158,153 |
|
|
Equity-Income Fund |
2,684,261 |
144,171,671 |
|
|
Fidelity Fund |
3,517,626 |
134,865,764 |
|
|
Growth & Income Portfolio |
3,070,934 |
137,608,566 |
|
|
Growth Company Fund |
1,491,269 |
139,209,991 |
|
|
OTC Portfolio |
1,457,366 |
85,591,096 |
|
|
TOTAL DOMESTIC EQUITY FUNDS |
912,558,261 |
||
|
International Equity Funds - 12.7% |
|||
|
Diversified International Fund |
1,808,278 |
43,163,586 |
|
|
Europe Fund |
1,542,310 |
56,463,956 |
|
|
Japan Fund |
706,020 |
15,821,916 |
|
|
Overseas Fund |
1,003,397 |
42,564,103 |
|
|
Southeast Asia Fund |
517,817 |
6,767,870 |
|
|
TOTAL INTERNATIONAL EQUITY FUNDS |
164,781,431 |
||
|
TOTAL EQUITY FUNDS (Cost $976,555,781) |
1,077,339,692 |
||
|
Fixed-Income Funds - 16.8% |
|||
|
|
|
|
|
|
High Yield Fixed-Income Funds - 8.3% |
|||
|
Capital & Income Fund |
12,321,758 |
107,076,075 |
|
|
Investment Grade Fixed-Income Funds - 8.5% |
|||
|
Government Income Fund |
4,316,472 |
41,394,969 |
|
|
Intermediate Bond Fund |
2,742,484 |
27,040,890 |
|
|
Investment Grade Bond Fund |
5,908,146 |
41,416,100 |
|
|
TOTAL INVESTMENT GRADE FIXED-INCOME FUNDS |
109,851,959 |
||
|
TOTAL FIXED-INCOME FUNDS (Cost $224,354,620) |
216,928,034 |
||
|
Cash Equivalents - 0.0% |
|||
|
Maturity Amount |
Value (Note 1) |
||
|
Investments in repurchase agreements (U.S. Treasury Obligations), in a joint trading account at 6.52%, |
$ 241,131 |
$ 241,000 |
|
|
TOTAL INVESTMENT IN SECURITIES - 100% (Cost $1,201,151,401) |
$ 1,294,508,726 |
||
|
Other Information |
|
Purchases and redemptions of the underlying fund shares aggregated $546,347,991 and $395,779,886, respectively. |
|
Income Tax Information |
|
At September 30, 2000, the aggregate cost of investment securities for income tax purposes was $1,210,819,711. Net unrealized appreciation aggregated $83,689,015, of which $114,371,271 related to appreciated investment securities and $30,682,256 related to depreciated investment securities. |
See accompanying notes which are an integral part of the financial statements.
Semiannual Report
Fidelity Freedom 2030 Fund
Statement of Assets and Liabilities
|
|
September 30, 2000 (Unaudited) |
|
|
Assets |
|
|
|
Investment in securities, at value (including repurchase agreements of $241,000) (cost $1,201,151,401) - |
|
$ 1,294,508,726 |
|
Cash |
|
106 |
|
Receivable for Freedom Fund shares sold |
|
4,075,987 |
|
Dividends receivable |
|
2,067,675 |
|
Total assets |
|
1,300,652,494 |
|
Liabilities |
|
|
|
Payable for underlying fund shares purchased |
$ 3,527,176 |
|
|
Payable for Freedom Fund shares redeemed |
2,681,611 |
|
|
Accrued management fee |
85,797 |
|
|
Total liabilities |
|
6,294,584 |
|
Net Assets |
|
$ 1,294,357,910 |
|
Net Assets consist of: |
|
|
|
Paid in capital |
|
$ 1,169,283,106 |
|
Undistributed net investment income |
|
9,490,237 |
|
Accumulated undistributed net realized |
|
22,227,242 |
|
Net unrealized appreciation (depreciation) on investments |
|
93,357,325 |
|
Net Assets, for 76,423,836 shares outstanding |
|
$ 1,294,357,910 |
|
Net Asset Value, offering price and redemption price |
|
$16.94 |
See accompanying notes which are an integral part of the financial statements.
Semiannual Report
Fidelity Freedom 2030 Fund
Financial Statements - continued
Statement of Operations
|
|
Six months ended September 30, 2000 (Unaudited) |
|
|
Investment Income Income distributions from underlying funds |
|
$ 9,711,309 |
|
Interest |
|
4,856 |
|
Total income |
|
9,716,165 |
|
Expenses |
|
|
|
Management fee |
$ 627,218 |
|
|
Non-interested trustees' compensation |
1,950 |
|
|
Total expenses before reductions |
629,168 |
|
|
Expense reductions |
(246,408) |
382,760 |
|
Net investment income |
|
9,333,405 |
|
Realized and Unrealized Gain (Loss) |
|
|
|
Realized gain (loss) on sale of underlying fund shares |
(8,515,612) |
|
|
Capital gain distributions from underlying funds |
35,914,973 |
27,399,361 |
|
Change in net unrealized appreciation (depreciation) on investment securities |
|
(64,175,127) |
|
Net gain (loss) |
|
(36,775,766) |
|
Net increase (decrease) in net assets resulting |
|
$ (27,442,361) |
|
Other Information Expense reductions |
|
|
|
Reimbursement from investment adviser |
|
$ 116,118 |
|
Custodian credits |
|
9 |
|
Transfer agent credits |
|
130,281 |
|
|
|
$ 246,408 |
See accompanying notes which are an integral part of the financial statements.
Semiannual Report
Fidelity Freedom 2030 Fund
Financial Statements - continued
Statement of Changes in Net Assets
|
|
Six months ended
September 30, 2000 |
Year ended |
|
Increase (Decrease) in Net Assets |
|
|
|
Operations |
$ 9,333,405 |
$ 10,839,705 |
|
Net realized gain (loss) |
27,399,361 |
47,888,924 |
|
Change in net unrealized appreciation (depreciation) |
(64,175,127) |
124,367,144 |
|
Net increase (decrease) in net assets resulting |
(27,442,361) |
183,095,773 |
|
Distributions to shareholders |
(2,974,922) |
(11,857,366) |
|
In excess of net investment income |
- |
(5,567,916) |
|
From net realized gain |
(32,724,681) |
(16,766,828) |
|
Total distributions |
(35,699,603) |
(34,192,110) |
|
Share transactions |
626,326,685 |
1,047,707,036 |
|
Reinvestment of distributions |
35,645,861 |
34,158,038 |
|
Cost of Freedom Fund shares redeemed |
(520,841,491) |
(380,056,821) |
|
Net increase (decrease) in net assets resulting |
141,131,055 |
701,808,253 |
|
Total increase (decrease) in net assets |
77,989,091 |
850,711,916 |
|
Net Assets |
|
|
|
Beginning of period |
1,216,368,819 |
365,656,903 |
|
End of period (including undistributed net investment income of $9,490,237 and $3,131,754, respectively) |
$ 1,294,357,910 |
$ 1,216,368,819 |
|
Other Information Shares |
|
|
|
Sold |
36,917,460 |
64,352,067 |
|
Issued in reinvestment of distributions |
2,164,290 |
2,150,226 |
|
Redeemed |
(30,834,169) |
(23,460,029) |
|
Net increase (decrease) |
8,247,581 |
43,042,264 |
See accompanying notes which are an integral part of the financial statements.
Semiannual Report
Financial Highlights
|
|
Six months ended September 30, 2000 |
Years ended March 31, |
|||
|
|
(Unaudited) |
2000 |
1999 |
1998 |
1997 E |
|
Selected Per-Share Data |
|
|
|
|
|
|
Net asset value, |
$ 17.84 |
$ 14.55 |
$ 13.42 |
$ 10.21 |
$ 10.00 |
|
Income from Investment Operations |
|
|
|
|
|
|
Net investment |
.13 |
.27 |
.25 |
.22 |
.08 |
|
Net realized and un |
(.55) |
3.91 |
1.60 |
3.42 |
.22 |
|
Total from investment |
(.42) |
4.18 |
1.85 |
3.64 |
.30 |
|
Less Distributions |
|
|
|
|
|
|
From net investment |
(.04) |
(.28) |
(.24) |
(.17) |
(.09) |
|
In excess of net |
- |
(.13) |
- |
(.14) |
- |
|
From net realized gain |
(.44) |
(.48) |
(.48) |
(.12) |
- |
|
Total distributions |
(.48) |
(.89) |
(.72) |
(.43) |
(.09) |
|
Net asset value, |
$ 16.94 |
$ 17.84 |
$ 14.55 |
$ 13.42 |
$ 10.21 |
|
Total Return B, C |
(2.28)% |
29.64% |
14.29% |
36.28% |
2.99% |
|
Ratios and Supplemental Data (amounts do not include the activity |
|
|
|
|
|
|
Net assets, end of period (000 omitted) |
$ 1,294,358 |
$ 1,216,369 |
$ 365,657 |
$ 115,072 |
$ 5,725 |
|
Ratio of expenses to |
.08% A, F |
.08% F |
.08% F |
.08% F |
.08% A, F |
|
Ratio of expenses to |
.06% A, G |
.07% G |
.07% G |
.08% |
.08% A |
|
Ratio of net investment
income to average |
1.48% A |
1.71% |
1.87% |
1.78% |
1.71% A |
|
Portfolio turnover rate |
62% A |
26% |
16% |
34% |
19% A |
A Annualized
B Total returns for periods of less than one year are not annualized.
C The total returns would have been lower had certain expenses not been reduced during the periods shown.
D Net investment income per share has been calculated based on average shares outstanding during the period.
E For the period October 17, 1996 (commencement of operations) to March 31, 1997.
F FMR agreed to reimburse a portion of the fund's expenses during the period. Without this reimbursement, the fund's expense ratio would have been higher.
G FMR or the fund has entered into varying arrangements with third parties who either paid or reduced a portion of the fund's expenses.
See accompanying notes which are an integral part of the financial statements.
Semiannual Report
Fidelity Freedom 2040 Fund
|
Fund Holdings as of September 30, 2000 |
|
|
|
% of fund's investments |
|
Domestic Equity Funds |
|
|
Blue Chip Growth Fund |
11.2% |
|
Disciplined Equity Fund |
11.2 |
|
Equity-Income Fund |
11.4 |
|
Fidelity Fund |
11.2 |
|
Growth & Income Portfolio |
11.3 |
|
Growth Company Fund |
11.4 |
|
OTC Portfolio |
7.3 |
|
|
75.0 |
|
International Equity Funds |
|
|
Diversified International Fund |
3.8 |
|
Europe Fund |
5.3 |
|
Japan Fund |
1.5 |
|
Overseas Fund |
3.7 |
|
Southeast Asia Fund |
0.7 |
|
|
15.0 |
|
High Yield Fixed-Income Funds |
|
|
Capital & Income Fund |
10.0 |
|
|
100.0% |
Semiannual Report
Fidelity Freedom 2040 Fund
Investment Summary - continued
Asset Allocation
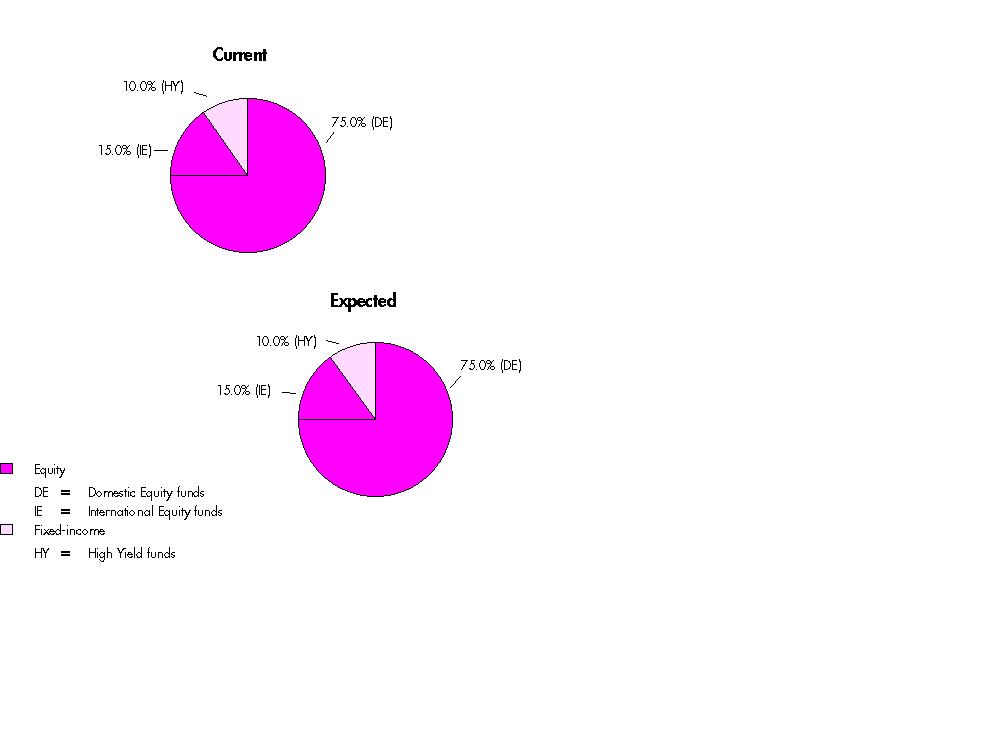
The fund invests according to an asset allocation strategy that becomes increasingly conservative over time. The current allocation is based on the fund's holdings as of September 30, 2000. The expected allocation represents the fund's anticipated target asset allocation at March 31, 2000.
Semiannual Report
Fidelity Freedom 2040 Fund
(Unaudited)
Showing Percentage of Total Value of Investment in Securities
|
Equity Funds - 90.0% |
|||
|
Shares |
Value (Note 1) |
||
|
Domestic Equity Funds - 75.0% |
|||
|
Blue Chip Growth Fund |
8,479 |
$ 505,208 |
|
|
Disciplined Equity Fund |
15,961 |
505,001 |
|
|
Equity-Income Fund |
9,588 |
514,981 |
|
|
Fidelity Fund |
13,168 |
504,875 |
|
|
Growth & Income Portfolio |
11,406 |
511,109 |
|
|
Growth Company Fund |
5,497 |
513,186 |
|
|
OTC Portfolio |
5,648 |
331,691 |
|
|
TOTAL DOMESTIC EQUITY FUNDS |
3,386,051 |
||
|
International Equity Funds - 15.0% |
|||
|
Diversified International Fund |
7,113 |
169,788 |
|
|
Europe Fund |
6,486 |
237,448 |
|
|
Japan Fund |
2,995 |
67,121 |
|
|
Overseas Fund |
3,952 |
167,644 |
|
|
Southeast Asia Fund |
2,554 |
33,377 |
|
|
TOTAL INTERNATIONAL EQUITY FUNDS |
675,378 |
||
|
TOTAL EQUITY FUNDS (Cost $4,115,716) |
4,061,429 |
||
|
Fixed-Income Funds - 10.0% |
|||
|
|
|
|
|
|
High Yield Fixed-Income Funds - 10.0% |
|||
|
Capital & Income Fund |
51,837 |
450,466 |
|
|
TOTAL INVESTMENT IN SECURITIES - 100% (Cost $4,572,934) |
$ 4,511,895 |
||
|
Other Information |
|
Purchases and redemptions of the underlying fund shares aggregated $4,869,934 and $297,000, respectively. |
|
Income Tax Information |
|
At September 30, 2000, the aggregate cost of investment securities for income tax purposes was $4,572,934. Net unrealized depreciation aggregated $61,039, of which $6,617 related to appreciated investment securities and $67,656 related to depreciated investment securities. |
See accompanying notes which are an integral part of the financial statements.
Semiannual Report
Fidelity Freedom 2040 Fund
Statement of Assets and Liabilities
|
|
September 30, 2000 (Unaudited) |
|
|
Assets |
|
|
|
Investment in securities, at value (cost $4,572,934) - |
|
$ 4,511,895 |
|
Cash |
|
155 |
|
Receivable for Freedom Fund shares sold |
|
1,151,525 |
|
Dividends receivable |
|
949 |
|
Total assets |
|
5,664,524 |
|
Liabilities |
|
|
|
Payable for underlying fund shares purchased |
$ 1,152,474 |
|
|
Accrued management fee |
93 |
|
|
Total liabilities |
|
1,152,567 |
|
Net Assets |
|
$ 4,511,957 |
|
Net Assets consist of: |
|
|
|
Paid in capital |
|
$ 4,562,695 |
|
Undistributed net investment income |
|
1,968 |
|
Accumulated undistributed net realized gain (loss) |
|
8,333 |
|
Net unrealized appreciation (depreciation) on investments |
|
(61,039) |
|
Net Assets, for 465,006 shares outstanding |
|
$ 4,511,957 |
|
Net Asset Value, offering price and redemption price per share ($4,511,957 ÷ 465,006 shares) |
|
$9.70 |
See accompanying notes which are an integral part of the financial statements.
Semiannual Report
Fidelity Freedom 2040 Fund
Financial Statements - continued
Statement of Operations
|
|
September 6, 2000 (commencement of operations) to September 30, 2000 (Unaudited) |
|
|
Investment Income Income distributions from underlying funds |
|
$ 1,915 |
|
Interest |
|
146 |
|
Total income |
|
2,061 |
|
Expenses |
|
|
|
Management fee |
$ 111 |
|
|
Expense reductions |
(18) |
93 |
|
Net investment income |
|
1,968 |
|
Realized and Unrealized Gain (Loss) Capital gain distributions from underlying funds |
|
8,333 |
|
Change in net unrealized appreciation (depreciation) |
|
(61,039) |
|
Net gain (loss) |
|
(52,706) |
|
Net increase (decrease) in net assets resulting |
|
$ (50,738) |
|
Other Information Expense reductions |
|
|
|
Reimbursement from investment adviser |
|
$ 18 |
See accompanying notes which are an integral part of the financial statements.
Semiannual Report
Fidelity Freedom 2040 Fund
Financial Statements - continued
Statement of Changes in Net Assets
|
|
September 6, 2000
(commencement of |
|
Increase (Decrease) in Net Assets |
|
|
Operations |
$ 1,968 |
|
Net realized gain (loss) |
8,333 |
|
Change in net unrealized appreciation (depreciation) |
(61,039) |
|
Net increase (decrease) in net assets resulting from operations |
(50,738) |
|
Share transactions |
4,636,614 |
|
Cost of Freedom Fund shares redeemed |
(73,919) |
|
Net increase (decrease) in net assets resulting from share transactions |
4,562,695 |
|
Total increase (decrease) in net assets |
4,511,957 |
|
Net Assets |
|
|
Beginning of period |
- |
|
End of period (including undistributed net investment income of $1,968) |
$ 4,511,957 |
|
Other Information Shares |
|
|
Sold |
472,621 |
|
Redeemed |
(7,615) |
|
Net increase (decrease) |
465,006 |
See accompanying notes which are an integral part of the financial statements.
Semiannual Report
Financial Highlights
|
|
September 6, 2000 (commencement of operations) to September 30, 2000 |
|
|
(Unaudited) |
|
Selected Per-Share Data |
|
|
Net asset value, beginning of period |
$ 10.00 |
|
Income from Investment Operations |
|
|
Net investment income D |
.00 |
|
Net realized and unrealized gain (loss) |
(.30) |
|
Total from investment operations |
(.30) |
|
Net asset value, end of period |
$ 9.70 |
|
Total Return B, C |
(3.00)% |
|
Ratios and Supplemental Data (amounts do not include the activity of the underlying funds) |
|
|
Net assets, end of period (000 omitted) |
$ 4,512 |
|
Ratio of expenses to average net assets |
.08% A, E |
|
Ratio of expenses to average net assets after expense reductions |
.08% A |
|
Ratio of net investment income to average net assets |
1.77% A |
|
Portfolio turnover rate |
131% A |
A Annualized
B Total returns for periods of less than one year are not annualized.
C The total returns would have been lower had certain expenses not been reduced during the periods shown.
D Net investment income per share has been calculated based on average shares outstanding during the period.
E FMR agreed to reimburse a portion of the fund's expenses during the period. Without this reimbursement, the fund's expense ratio would have been higher.
See accompanying notes which are an integral part of the financial statements.
Semiannual Report
For the period ended September 30, 2000 (Unaudited)
1. Significant Accounting Policies.
Freedom Income Fund, Freedom 2000 Fund, Freedom 2010 Fund, Freedom 2020 Fund, Freedom 2030 Fund and Freedom 2040 Fund (the funds) are funds of Fidelity Aberdeen Street Trust (the trust). The trust is registered under the Investment Company Act of 1940, as amended, as an open-end management investment company organized as a Delaware business trust. Each fund is authorized to issue an unlimited number of shares. The funds primarily invest in a combination of other Fidelity equity, fixed income, and money market funds (the Underlying Funds) managed by Fidelity Management & Research Company (FMR). The financial statements have been prepared in conformity with generally accepted accounting principles which require management to make certain estimates and assumptions at the date of the financial statements. The following summarizes the significant accounting policies of the funds:
Security Valuation. Investments in the Underlying Funds are valued at the closing net asset value per share of each Underlying Fund on the day of valuation. Short-term securities maturing within sixty days of their purchase date are valued either at amortized cost or original cost plus accrued interest, both of which approximate current value.
Income Taxes. As a qualified regulated investment company under Subchapter M of the Internal Revenue Code, each fund, except for Freedom 2040 Fund, is not subject to income taxes to the extent that it distributes substantially all of its taxable income for the fiscal year. Freedom 2040 Fund intends to qualify as a regulated investment company under Subchapter M of the Internal Revenue Code. By so qualifying, the fund will not be subject to income taxes to the extent that it distributes substantially all of its taxable income for its fiscal year. The schedules of investments include information regarding income taxes under the caption "Income Tax Information."
Investment Income. Income and capital gain distributions from the Underlying Funds, if any, are recorded on the ex-dividend date. Interest income is accrued as earned.
Expenses. Most expenses of the trust can be directly attributed to a fund. Expenses which cannot be directly attributed are apportioned between the funds in the trust. Expenses included in the accompanying financial statements reflect the expenses of each fund and do not include any expenses associated with the Underlying Funds.
Distributions to Shareholders. Distributions from net investment income to shareholders of the Freedom Income Fund are paid monthly, while distributions from capital gains, if any, are recorded on the ex-dividend date. Income and capital gain distributions to shareholders of the other Freedom Funds are recorded on the ex-dividend date.
Income and capital gain distributions are determined in accordance with income tax regulations which may differ from generally accepted accounting principles. These differences, which may result in distribution reclassifications, are primarily due to differing treatments for the short-term gain distributions from the Underlying Funds and losses deferred due to wash sales.
Permanent book and tax basis differences relating to shareholder distributions will
Semiannual Report
Notes to Financial Statements (Unaudited) - continued
1. Significant Accounting
Policies - continued
Distributions to Shareholders -
continued
result in reclassifications to paid in capital. Undistributed net investment income and accumulated undistributed net realized gain (loss) on investments may include temporary book and tax basis differences which will reverse in a subsequent period. Any taxable income or gain remaining at fiscal year end is distributed in the following year.
Security Transactions. Security transactions, normally shares of the Underlying Funds, are accounted for as of trade date. Gains and losses on securities sold are determined on the basis of identified cost.
2. Operating Policies.
Joint Trading Account. Pursuant to an Exemptive Order issued by the Securities and Exchange Commission, the funds, along with other affiliated entities of FMR, may transfer uninvested cash balances into one or more joint trading accounts. These balances are invested in one or more repurchase agreements for U.S. Treasury or Federal Agency obligations.
Repurchase Agreements. The underlying U.S. Treasury, Federal Agency, or other obligations found to be satisfactory by FMR are transferred to an account of the funds, or to the Joint Trading Account, at a custodian bank. The securities are marked-to-market daily and maintained at a value at least equal to the principal amount of the repurchase agreement (including accrued interest). FMR is responsible for determining that the value of the underlying securities remains in accordance with the market value requirements stated above.
3. Purchases and Sales of Investments.
Information regarding purchases and redemptions of the Underlying Fund shares is included under the caption "Other Information" at the end of each applicable fund's schedule of investments.
4. Fees and Other Transactions with Affiliates.
Management Fee.Each fund pays a management fee to Strategic Advisers, Inc. (Strategic Advisers), an affiliate of FMR. Strategic Advisers receives a fee that is computed daily at an annual rate of .10% of the fund's average net assets. The management fee paid to Strategic Advisers by each fund is reduced by an amount equal to the fees and expenses paid by each fund to the non-interested Trustees.
Other Transactions. Strategic Advisers has entered into an administration agreement with FMR under which FMR provides management and administrative services (other than investment advisory services) necessary for the operation of each fund. Pursuant to this agreement, FMR pays all expenses of each fund, except the compensation of the non-interested trustees and certain exceptions such as interest, taxes, brokerage commissions, and extraordinary expenses. FMR also contracts with other Fidelity companies to perform the services necessary for the operation of each fund. For the services under the agreement, Strategic Advisers pays FMR a monthly
Semiannual Report
Notes to Financial Statements (Unaudited) - continued
4. Fees and Other Transactions with Affiliates - continued
Other Transactions - continued
administration fee equal to the management fee received by Strategic Advisers, minus an amount equal to an annual rate of .02% of each fund's average net assets.
5. Expense Reductions.
FMR voluntarily agreed to reimburse each fund's total operating expenses (excluding interest, taxes, brokerage commissions and extraordinary expenses) above an annual rate of .08% of the fund's average net assets.
In addition, through arrangements with the funds' custodian and transfer agent, credits realized as a result of uninvested cash balances were used to reduce a portion of each applicable fund's expenses. For the period, the reductions under these arrangements are shown under the caption "Other Information" on each applicable fund's Statement of Operations.
6. Beneficial Interest.
At the end of the period, one shareholder was record owner of approximately 13% of the total outstanding shares of the Freedom Income Fund.
Semiannual Report
Fidelity offers several ways to conveniently manage your personal investments via your telephone or PC. You can access your account information, conduct trades and research your investments 24 hours a day.
By Phone
Fidelity Automated Service Telephone provides a single toll-free number to access account balances, positions, quotes and trading. It's easy to navigate the service, and on your first call, the system will help you create a personal identification number (PIN) for security.
(phone_graphic)Fidelity Automated
Service Telephone (FAST®)
1-800-544-5555
Press
1 For mutual fund and brokerage trading.
2 For quotes.*
3 For account balances and holdings.
4 To review orders and mutual
fund activity.
5 To change your PIN.
*0 To speak to a Fidelity representative.
By PC
Fidelity's web site on the Internet provides a wide range of information, including daily financial news, fund performance, interactive planning tools and news about Fidelity products and services.
(computer_graphic)Fidelity's Web Site
www.fidelity.com
If you are not currently on the Internet, call EarthLink Sprint at 1-800-288-2967, and be sure to ask for registration number SMD004 to receive a special Fidelity package that includes 30 days of free Internet access. EarthLink is North America's #1 independent Internet access provider.
(computer_graphic)
Fidelity On-line Xpress+®
Fidelity On-line Xpress+ software for Windows combines comprehensive portfolio management capabilities, securities trading and access to research and analysis tools . . . all on your desktop. Call Fidelity at 1-800-544-0240 or visit our web site for more information on how to manage your investments via your PC.
* When you call the quotes line, please remember that a fund's yield and return will vary and, except for money market funds, share price will also vary. This means that you may have a gain or loss when you sell your shares. There is no assurance that money market funds will be able to maintain a stable $1 share price; an investment in a money market fund is not insured or guaranteed by the U.S. government. Total returns are historical and include changes in share price, reinvestment of dividends and capital gains, and the effects of any sales charges.
Semiannual Report
For directions and hours,
please call 1-800-544-9797.
Arizona
7373 N. Scottsdale Road
Scottsdale, AZ
California
815 East Birch Street
Brea, CA
851 East Hamilton Avenue
Campbell, CA
527 North Brand Boulevard
Glendale, CA
19200 Von Karman Avenue
Irvine, CA
10100 Santa Monica Blvd.
Los Angeles, CA
251 University Avenue
Palo Alto, CA
1760 Challenge Way
Sacramento, CA
7676 Hazard Center Drive
San Diego, CA
8 Montgomery Street
San Francisco, CA
950 Northgate Drive
San Rafael, CA
1400 Civic Drive
Walnut Creek, CA
6300 Canoga Avenue
Woodland Hills, CA
Colorado
1625 Broadway
Denver, CO
Connecticut
48 West Putnam Avenue
Greenwich, CT
265 Church Street
New Haven, CT
300 Atlantic Street
Stamford, CT
29 South Main Street
West Hartford, CT
Delaware
222 Delaware Avenue
Wilmington, DE
Florida
4400 N. Federal Highway
Boca Raton, FL
90 Alhambra Plaza
Coral Gables, FL
4090 N. Ocean Boulevard
Ft. Lauderdale, FL
1907 West State Road 434
Longwood, FL
8880 Tamiami Trail, North
Naples, FL
2401 PGA Boulevard
Palm Beach Gardens, FL
8065 Beneva Road
Sarasota, FL
1502 N. Westshore Blvd.
Tampa, FL
Georgia
3445 Peachtree Road, N.E.
Atlanta, GA
1000 Abernathy Road
Atlanta, GA
Illinois
One North Franklin Street
Chicago, IL
1415 West 22nd Street
Oak Brook, IL
1700 East Golf Road
Schaumburg, IL
3232 Lake Avenue
Wilmette, IL
Indiana
4729 East 82nd Street
Indianapolis, IN
Maine
Three Canal Plaza
Portland, ME
Maryland
7401 Wisconsin Avenue
Bethesda, MD
One W. Pennsylvania Ave.
Towson, MD
Massachusetts
801 Boylston Street
Boston, MA
155 Congress Street
Boston, MA
25 State Street
Boston, MA
300 Granite Street
Braintree, MA
44 Mall Road
Burlington, MA
416 Belmont Street
Worcester, MA
Semiannual Report
Michigan
280 Old N. Woodward Ave.
Birmingham, MI
29155 Northwestern Hwy.
Southfield, MI
Minnesota
7600 France Avenue South
Edina, MN
Missouri
700 West 47th Street
Kansas City, MO
8885 Ladue Road
Ladue, MO
New Jersey
150 Essex Street
Millburn, NJ
56 South Street
Morristown, NJ
501 Route 17, South
Paramus, NJ
New York
1055 Franklin Avenue
Garden City, NY
999 Walt Whitman Road
Melville, L.I., NY
1271 Avenue of the Americas
New York, NY
71 Broadway
New York, NY
350 Park Avenue
New York, NY
North Carolina
4611 Sharon Road
Charlotte, NC
Ohio
600 Vine Street
Cincinnati, OH
28699 Chagrin Boulevard
Woodmere Village, OH
Oregon
16850 SW 72nd Avenue
Tigard, OR
Pennsylvania
1735 Market Street
Philadelphia, PA
12001 Perry Highway
Wexford, PA
Rhode Island
47 Providence Place
Providence, RI
Tennessee
6150 Poplar Avenue
Memphis, TN
Texas
10000 Research Boulevard
Austin, TX
4017 Northwest Parkway
Dallas, TX
1155 Dairy Ashford Street
Houston, TX
2701 Drexel Drive
Houston, TX
400 East Las Colinas Blvd.
Irving, TX
14100 San Pedro
San Antonio, TX
19740 IH 45 North
Spring, TX
Utah
215 South State Street
Salt Lake City, UT
Virginia
1861 International Drive
McLean, VA
Washington
411 108th Avenue, N.E.
Bellevue, WA
511 Pine Street
Seattle, WA
Washington, DC
1900 K Street, N.W.
Washington, DC
Wisconsin
595 North Barker Road
Brookfield, WI
Fidelity Brokerage Services, Inc., 100 Summer St., Boston, MA 02110 Member NYSE/SIPC
Semiannual Report
Investment Adviser
Strategic Advisers, Inc.
Boston, MA
Officers
Edward C. Johnson 3d, President
Robert C. Pozen, Senior Vice President
Robert A. Lawrence, Vice President
Scott D. Stewart, Vice President
Ren Y. Cheng, Vice President
Eric D. Roiter, Secretary
Robert A. Dwight, Treasurer
Maria F. Dwyer, Deputy Treasurer
Thomas J. Simpson, Assistant Treasurer
John H. Costello, Assistant Treasurer
Board of Trustees
Ralph F. Cox *
Phyllis Burke Davis *
Robert M. Gates *
Edward C. Johnson 3d
Donald J. Kirk *
Ned C. Lautenbach *
Peter S. Lynch
Marvin L. Mann *
William O. McCoy *
Gerald C. McDonough *
Robert C. Pozen
Thomas R. Williams *
Advisory Board
J. Michael Cook
Abigail P. Johnson
Marie L. Knowles
* Independent trustees
General Distributor
Fidelity Distributors Corporation
Boston, MA
Transfer and Shareholder
Servicing Agent
Fidelity Investments Institutional
Operations Company, Inc.
Boston, MA
Custodian
The Bank of New York
New York, NY
Fidelity's Asset Allocation Funds
Asset ManagerSM
Asset Manager AggressiveSM
Asset Manager: Growth®
Asset Manager: Income®
Fidelity Freedom Funds ® -
Income, 2000, 2010, 2020, 2030, 2040
The Fidelity Telephone Connection
Mutual Fund 24-Hour Service
Exchanges/Redemptions
and Account Assistance 1-800-544-6666
Product Information 1-800-544-6666
Retirement Accounts 1-800-544-4774
(8 a.m. - 9 p.m.)
TDD Service 1-800-544-0118
for the deaf and hearing impaired
(9 a.m. - 9 p.m. Eastern time)
Fidelity Automated Service
Telephone (FAST®) (automated graphic) 1-800-544-5555
(automated graphic) Automated line for quickest service
(Fidelity Investment logo)(registered trademark)
Corporate Headquarters
82 Devonshire St., Boston, MA 02109
www.fidelity.com
FF-SANN-1100 116201
1.537284.103
|
|