
|
|
|
|
|
|
|
|
|
|
Previous: SCI CAPITAL MANAGEMENT INC, 13F-HR, 2000-10-17 |
Next: STRUCTURED ASSET MORTGAGE INVESTMENTS INC, 8-K, 2000-10-17 |
Fidelity ®
Daily Income
Trust
Annual Report
August 31, 2000
(Fidelity Investment logo)(registered trademark)
Contents
|
President's Message |
Ned Johnson on investing strategies. |
|
|
Performance |
How the fund has done over time. |
|
|
Fund Talk |
The manager's review of fund performance, strategy and outlook. |
|
|
Investment Changes |
A summary of major shifts in the fund's investments over the past six months and one year. |
|
|
Investments |
A complete list of the fund's investments. |
|
|
Financial Statements |
Statements of assets and liabilities,
operations, and changes in net assets, |
|
|
Notes |
Notes to the financial statements. |
|
|
Report of Independent Accountants |
The auditors' opinion. |
|
|
|
|
|
Third party marks appearing herein are the property of their respective owners.
All other marks appearing herein are registered or unregistered trademarks or service marks of FMR Corp. or an affiliated company.
(Recycle graphic) This report is printed on recycled paper using soy-based inks.
This report and the financial statements contained herein are submitted for the general
information of the shareholders of the fund. This report is not authorized for distribution to
prospective investors in the fund unless preceded or accompanied by an effective prospectus.
Mutual fund shares are not deposits or obligations of, or guaranteed
by, any depository institution. Shares are not insured by the FDIC,
the Federal Reserve Board, or any other agency, and are subject to
investment risks, including possible loss of principal amount invested.
Neither the fund nor Fidelity Distributors Corporation is a bank.
For more information on any Fidelity fund, including charges and expenses, call 1-800-544-6666 for a free prospectus. Read it carefully before you invest or send money.
Annual Report
(photo_of_Edward_C_Johnson_3d)
(Photograph of Edward C. Johnson 3d.)
Dear Shareholder:
A slowing U.S. economy triggered an equity market rally during the later stages of summer, boosting most major stock indexes back into positive territory for calendar year 2000. One notable exception, however, was the Dow Jones Industrial Average, which posted a negative return during that timeframe. Fixed-income markets - particularly Treasuries - continued their yearlong trend of strong performance, as nearly every bond sector outperformed the stock market on a year-to-date basis.
While it's impossible to predict the future direction of the markets with any degree of certainty, there are certain basic principles that can help investors plan for their future needs.
First, investors are encouraged to take a long-term view of their portfolios. If you can afford to leave your money invested through the inevitable up and down cycles of the financial markets, you will greatly reduce your vulnerability to any single decline. We know from experience, for example, that stock prices have gone up over longer periods of time, have significantly outperformed other types of investments and have stayed ahead of inflation.
Second, you can further manage your investing risk through diversification. A stock mutual fund, for instance, is already diversified, because it invests in many different companies. You can increase your diversification further by investing in a number of different stock funds, or in such other investment categories as bonds. You should also keep money you'll need in the near future in a more stable investment.
Finally, no matter what your time horizon or portfolio diversity, it makes good sense to follow a regular investment plan, investing a certain amount of money in a fund at the same time each month or quarter and periodically reviewing your overall portfolio. By doing so, you won't get caught up in the excitement of a rapidly rising market, nor will you buy all your shares at market highs. While this strategy - known as dollar cost averaging - won't assure a profit or protect you from a loss in a declining market, it should help you lower the average cost of your purchases. Of course, you should consider your financial ability to continue your purchases through periods of low price levels before undertaking such a strategy.
If you have questions, please call us at 1-800-544-6666, or visit our web site at www.fidelity.com. We are available 24 hours a day, seven days a week to provide you the information you need to make the investments that are right for you.
Best regards,
/s/Edward C. Johnson 3d
Edward C. Johnson 3d
Annual Report
To evaluate a money market fund's historical performance, you can look at either total return or yield. Total return reflects the change in the value of an investment, assuming reinvestment of the fund's dividend income. Yield measures the income paid by a fund. Since a money market fund tries to maintain a $1 share price, yield is an important measure of performance.
Cumulative Total Returns
|
Periods ended August 31, 2000 |
|
Past 1 |
Past 5 |
Past 10 |
|
Fidelity Daily Income Trust |
|
5.76% |
29.26% |
60.95% |
|
All Taxable Money Market Funds Average |
|
5.49% |
28.18% |
58.58% |
Cumulative total returns show the fund's performance in percentage terms over a set period - in this case, one year, five years or 10 years. For example, if you had invested $1,000 in a fund that had a 5% return over the past year, the value of your investment would be $1,050. To measure how the fund's performance stacked up against its peers, you can compare it to the all taxable money market funds average, which reflects the performance of taxable money market funds with similar objectives tracked by iMoneyNet, Inc. The past one year average represents a peer group of 974 money market funds.
Average Annual Total Returns
|
Periods ended August 31, 2000 |
|
Past 1 |
Past 5 |
Past 10 |
|
Fidelity Daily Income Trust |
|
5.76% |
5.27% |
4.87% |
|
All Taxable Money Market Funds Average |
|
5.49% |
5.08% |
4.71% |
Average annual total returns take the fund's cumulative return and show you what would have happened if the fund had performed at a constant rate each year.
Annual Report
Performance - continued
Yields
|
|
8/29/00 |
5/30/00 |
2/29/00 |
11/30/99 |
8/31/99 |
|
|
|||||
|
|
6.20% |
6.01% |
5.56% |
5.29% |
4.95% |
|
|
|||||
|
All Taxable Money |
6.00% |
5.76% |
5.27% |
5.03% |
4.64% |
|
|
|||||
|
|
8/30/00 |
5/31/00 |
3/1/00 |
12/1/99 |
9/1/99 |
|
|
|||||
|
|
2.12% |
2.10% |
2.09% |
2.07% |
2.06% |
|
|
|||||

Yield refers to the income paid by the fund over a given period. Yields for money market funds are usually for seven-day periods, expressed as annual percentage rates. A yield that assumes income earned is reinvested or compounded is called an effective yield. The table above shows the fund's current seven-day yield at quarterly intervals over the past year. You can compare these yields to the all taxable money market funds average and the bank money market deposit account (MMDA) average. Figures for the all taxable money market funds average are from iMoneyNet, Inc. The MMDA average is supplied by BANK RATE MONITOR.(TM)
A money market fund's total returns and yields will vary, and reflect past results rather than predict future performance.
Comparing
Performance
There are some important differences between a bank money market deposit account (MMDA) and a money market fund. First, the U.S. government neither insures nor guarantees a money market fund. In fact, there is no assurance that a money market fund will maintain a $1 share price. Second, a money market fund returns to its shareholders income earned by the fund's investments after expenses. This is in contrast to banks, which set their MMDA rates periodically based on current interest rates, competitors' rates, and internal criteria.
3
Annual Report
Fund Talk: The Manager's Overview
(Portfolio Manager photograph)
An interview with Robert Duby, Portfolio Manager of Fidelity Daily Income Trust
Q. Bob, what was the investment environment like during the 12 months that ended August 31, 2000?
A. The U.S. economy posted very strong performance, as unemployment reached its lowest rate in 30 years and real GDP - gross domestic product adjusted for inflation - enjoyed robust gains. This growth was fueled by high levels of personal consumption and business investment. Commodity prices rose due to improving global economic conditions and strong demand on the domestic front. This development led to the expectation among market participants that the Federal Reserve Board would hike short-term interest rates in order to slow growth and head off inflation. Because of increasing energy prices we did see consumer and producer prices rise during the period, despite significant improvements in productivity.
Q. What was the Fed's reaction to these developments?
A. It implemented a program of interest-rate hikes, because of strong real GDP growth and concerns about the impact of wage pressures within firm labor markets. Starting in June 1999, the Fed raised the rate banks charge each other for overnight loans - known as the fed funds target rate - six times altogether. Four of these rate hikes occurred during the one-year period that ended August 31, 2000. Three of them - in November 1999, February 2000 and March 2000 - came in increments of 0.25 percentage points. The last, in May 2000, was an increase of 0.50 percentage points, the first increase of such magnitude in more than five years. The Fed chose to strike at growth more forcefully at that time because of continued solid GDP growth, an increase in the core rate of inflation, a decline in the unemployment rate and a larger-than-expected increase in average hourly earnings. Since May, however, continued emerging evidence of an economic slowdown has prompted the Fed to keep key short-term interest rates unchanged.
Q. What was your strategy as all of this unfolded?
A. My strategy shifted periodically during the 12 months, as I sought to capitalize on Fed rate hikes while maintaining adequate portfolio liquidity to accommodate cash outflows. I lengthened the fund's average maturity early in the period through purchases of securities with maturities of six months or longer. These longer-term securities offered attractive risk/reward tradeoffs. But expectations for further Fed rate hikes pervaded the market in the fourth quarter of 1999 as 2000 approached. Accordingly, I positioned the fund defensively by shortening its average maturity. Through the rest of the period, I shortened the fund's average maturity at times when the market priced in overly optimistic expectations for changes in Fed monetary policy. Conversely, I lengthened the fund's average maturity when the market priced in overly aggressive expectations of Fed rate hikes.
Annual Report
Fund Talk: The Manager's Overview - continued
Q. How did the fund perform?
A. The fund's seven-day yield on August 31, 2000, was 6.21%, compared to 4.95% 12 months ago. For the 12 months that ended August 31, 2000, the fund had a total return of 5.76%, compared to 5.49% for the all taxable money market funds average, according to iMoneyNet, Inc.
Q. What is your outlook?
A. Economic data continue to suggest that the Fed's monetary policy has begun to soften economic activity. Slower retail and home sales demonstrate that the Fed rate hikes appear to have tempered consumer spending. In turn, manufacturing activity has declined, coming off of record levels. It's still unclear as to whether the economy is taking a breather or if the Fed has successfully implemented a "soft landing" - slowing economic growth enough to keep inflation at bay, but not so much as to plunge the economy into a recession. Money market prices currently reflect that the Fed has finished its rate-hike program. In any event, it appears the Fed will remain on hold until after the November elections, unless there is some dramatic pick-up in inflation.
The views expressed in this report reflect those of the portfolio manager only through the end of the period of the report as stated on the cover and do not necessarily represent the views of Fidelity or any other person in the Fidelity organization. Any such views are subject to change at any time based upon market or other conditions and Fidelity disclaims any responsibility to update such views. These views may not be relied on as investment advice and, because investment decisions for a Fidelity fund are based on numerous factors, may not be relied on as an indication of trading intent on behalf of any Fidelity fund.
Fund Facts
Goal: to provide current
income while maintaining
a stable $1 share price by
investing in high-quality,
short-term money market
securities
Fund number: 031
Trading symbol: FDTXX
Start date: May 31, 1974
Size: as of August 31, 2000,
more than $3.0 billion
Manager: Robert Duby, since
1998; manager, several
taxable money market funds;
joined Fidelity in 1982
Annual Report
Investment Changes
Maturity Diversification
Days
% of fund's
investments % of fund's
investments
2/29/00
% of fund's
investments
8/31/99
0 - 30
64.0
55.4
58.7
31 - 90
28.8
30.1
19.1
91 - 180
3.2
14.0
16.6
181 - 397
4.0
0.5
5.6
Weighted Average Maturity
8/31/00
2/29/00
8/31/99
Fidelity Daily Income Trust
42 Days
46 Days
56 Days
All Taxable Money Market 51 Days
49 Days
56 Days
Asset Allocation (% of fund's net assets)
As of August 31, 2000
As of February 29, 2000
Commercial Paper 61.2%
Commercial Paper 58.3%
Bank CDs, BAs,
Bank CDs, BAs,
Government
Government
Other Investments
Other Investments
Annual Report
Investments August 31, 2000
Showing Percentage of Net Assets
Certificates of Deposit - 10.9%
Due Date
Annualized Yield at
Time of Purchase
Principal Amount
(000s)
Value (Note 1)
(000s)
Domestic Certificates Of Deposit - 10.9%
American Express Centurion Bank
9/11/00
6.53%
$ 25,000
$ 25,000
9/28/00
6.54
25,000
25,000
Chase Manhattan Bank USA NA
9/5/00
6.70
25,000
25,000
Citibank NA, New York
11/3/00
6.78
48,000
48,000
11/15/00
7.02
35,000
35,000
First Tennessee Bank NA, Memphis
9/25/00
6.53
65,000
65,000
First Union National Bank, North Carolina
4/30/01
7.00
45,000
45,000
5/15/01
7.35
50,000
50,000
U.S. Bank NA, Minnesota
9/1/00
6.72 (b)
10,000
10,000
TOTAL CERTIFICATES OF DEPOSIT
328,000
Commercial Paper - 61.2%
Asset Securitization Coop. Corp.
9/25/00
6.56 (b)
25,000
24,999
AT&T Corp.
9/5/00
6.56
20,000
19,986
9/19/00
6.65 (b)
15,000
15,000
Bank of America Corp.
9/11/00
6.30
25,000
24,958
Centric Capital Corp.
9/11/00
6.72
20,000
19,963
CIESCO LP
11/8/00
6.57
50,000
49,388
Citibank Credit Card Master Trust I (Dakota Certificate Program)
9/13/00
6.55
55,445
55,325
11/9/00
6.64
15,000
14,812
ConAgra, Inc.
9/15/00
6.69
5,000
4,987
9/25/00
6.73
19,000
18,915
Conoco, Inc.
9/29/00
6.69
25,000
24,871
Commercial Paper - continued
Due Date
Annualized Yield at
Time of Purchase
Principal Amount
(000s)
Value (Note 1)
(000s)
Corporate Receivables Corp.
9/20/00
6.56%
$ 10,000
$ 9,966
10/2/00
6.58
20,000
19,888
10/13/00
6.57
15,000
14,886
10/25/00
6.58
35,000
34,659
11/16/00
6.60
20,000
19,726
CXC, Inc.
9/25/00
6.56
15,000
14,935
11/8/00
6.62
10,000
9,877
11/21/00
6.61
50,000
49,269
Delaware Funding Corp.
9/11/00
6.57
10,000
9,982
9/13/00
6.58
20,452
20,408
9/25/00
6.54
26,215
26,101
10/24/00
6.58
35,000
34,665
11/22/00
6.61
25,587
25,208
Dominion Resources, Inc.
9/12/00
6.73
5,000
4,990
9/21/00
6.75
25,000
24,907
Edison Asset Securitization LLC
9/25/00
6.55
100,000
99,567
10/10/00
6.60
9,815
9,746
10/27/00
6.58
25,000
24,747
Enterprise Funding Corp.
10/26/00
6.58
15,850
15,693
Falcon Asset Securitization Corp.
9/19/00
6.54
26,295
26,209
9/20/00
6.55
87,525
87,224
9/26/00
6.56
25,449
25,334
GE Capital International Funding, Inc.
9/13/00
6.34
50,000
49,898
General Electric Capital Corp.
9/5/00
6.54
47,500
47,466
9/5/00
6.77
50,000
49,963
General Electric Capital Services, Inc.
11/6/00
6.59
45,000
44,465
11/20/00
7.00
25,000
24,625
11/21/00
7.00
25,000
24,620
2/7/01
6.72
30,000
29,136
General Motors Acceptance Corp.
9/21/00
6.53
50,000
49,820
9/25/00
6.53
25,000
24,892
Commercial Paper - continued
Due Date
Annualized Yield at
Time of Purchase
Principal Amount
(000s)
Value (Note 1)
(000s)
Household Finance Corp.
9/12/00
6.55%
$ 25,000
$ 24,950
Kitty Hawk Funding Corp.
9/20/00
6.40
10,000
9,967
9/20/00
6.41
5,882
5,863
10/12/00
6.59
20,238
20,088
Lehman Brothers Holdings, Inc.
9/11/00
6.72 (b)
18,000
18,000
9/20/00
6.72 (b)
4,000
4,000
Marsh USA, Inc.
9/19/00
6.50
30,000
29,906
National Rural Utility Coop. Finance Corp.
9/13/00
6.30
25,000
24,949
New Center Asset Trust
9/21/00
6.55
20,000
19,928
Park Avenue Receivables Corp.
9/15/00
6.55
34,692
34,604
Phillips Petroleum Co.
9/29/00
6.75
15,000
14,922
Preferred Receivables Funding Corp.
9/15/00
6.58
30,000
29,924
9/25/00
6.54
45,414
45,217
10/23/00
6.58
17,135
16,974
11/15/00
6.64
11,400
11,245
Salomon Smith Barney Holdings, Inc.
10/12/00
6.59
10,000
9,926
Southern Co.
9/26/00
6.61
5,000
4,977
Three Rivers Funding Corp.
9/5/00
6.57
20,230
20,215
Triple-A One Funding Corp.
9/12/00
6.54
25,000
24,950
9/20/00
6.55
100,000
99,654
Variable Funding Capital Corp.
9/21/00
6.75
25,000
24,908
11/22/00
6.62
30,000
29,555
Ventures Business Trust
9/6/00
6.56
25,000
24,977
9/25/00
6.55
40,000
39,826
Commercial Paper - continued
Due Date
Annualized Yield at
Time of Purchase
Principal Amount
(000s)
Value (Note 1)
(000s)
WorldCom, Inc.
9/5/00
6.69%
$ 10,000
$ 9,993
9/15/00
6.68
15,000
14,961
TOTAL COMMERCIAL PAPER
1,840,555
Bank Notes - 11.8%
American Express Centurion Bank
9/1/00
6.68 (b)
25,000
25,000
9/23/00
6.59 (b)
40,000
40,000
Bank of America NA
11/2/00
6.63
35,000
35,000
2/20/01
6.72
50,000
50,000
5/4/01
7.20
25,000
25,000
Bank One NA
10/16/00
6.75
25,000
25,000
Bank One NA, Chicago
10/23/00
6.70 (b)
15,000
14,998
First Union National Bank, North Carolina
10/4/00
6.86 (b)
25,000
25,000
Lasalle Bank NA
9/11/00
6.70
25,000
25,000
10/16/00
6.56
40,000
40,000
11/20/00
7.01
50,000
50,000
TOTAL BANK NOTES
354,998
Master Notes - 1.5%
Goldman Sachs Group, Inc.
10/19/00
6.65 (c)
25,000
25,000
J.P. Morgan Securities, Inc.
9/7/00
6.61 (b)
20,000
20,000
TOTAL MASTER NOTES
45,000
Medium-Term Notes - 3.2%
Due Date
Annualized Yield at
Time of Purchase
Principal Amount
(000s)
Value (Note 1)
(000s)
Centex Home Mortgage LLC
9/20/00
6.76% (a)(b)
$ 15,000
$ 15,000
CIT Group, Inc.
9/1/00
6.61 (b)
15,000
14,993
General Motors Acceptance Corp.
9/28/00
6.56 (b)
15,000
14,996
General Motors Acceptance Corp. Mortgage Credit
9/1/00
6.69
25,000
25,000
Merrill Lynch & Co., Inc.
9/5/00
6.59 (b)
25,000
24,999
TOTAL MEDIUM-TERM NOTES
94,988
Short-Term Notes - 5.3%
GE Life & Annuity Assurance Co.
9/1/00
6.72 (b)(c)
25,000
25,000
Monumental Life Insurance Co.
9/1/00
6.76 (b)(c)
14,000
14,000
11/1/00
6.91 (b)(c)
15,000
15,000
New York Life Insurance Co.
10/1/00
6.90 (b)(c)
7,000
7,000
12/1/00
6.81 (b)(c)
16,000
16,000
Pacific Life Insurance Co.
9/8/00
6.89 (b)(c)
10,000
10,000
Strategic Money Market Trust Series 1999 A6,
9/13/00
6.78 (a)(b)
26,000
26,000
Strategic Money Market Trust Series 2000 B,
9/13/00
6.81 (a)(b)
10,000
10,000
Travelers Insurance Co.
10/2/00
6.88 (b)(c)
35,000
35,000
TOTAL SHORT-TERM NOTES
158,000
Repurchase Agreements - 5.2%
Maturity
Amount (000s)
Value (Note 1)
(000s)
In a joint trading account (U.S. Government Obligations) dated 8/31/00 due 9/1/00 At 6.67%
$ 603
$ 603
With:
Morgan Stanley & Co. At 6.75%, dated 8/31/00 due 9/1/00 (Commercial Paper Obligations) (principal amount $45,253,000) 0%, 9/13/00 -
11/22/00
44,008
44,000
Salomon Smith Barney At 6.76%, dated 8/31/00 due 9/1/00 (Commercial Paper Obligations) (principal amount $116,105,000) 0% - 6.74%,
9/18/00 - 11/29/00
113,021
113,000
TOTAL REPURCHASE AGREEMENTS
157,603
TOTAL INVESTMENT PORTFOLIO - 99.1%
2,979,144
NET OTHER ASSETS - 0.9%
27,265
NET ASSETS - 100%
$ 3,006,409
Total Cost for Income Tax Purposes $ 2,979,144
Legend
(a) Security exempt from registration under Rule 144A of the Securities Act of 1933. These securities may be resold in transactions exempt from registration, normally to qualified
institutional buyers. At the period end, the value of these securities amounted to $51,000,000 or 1.7% of net assets.
(b) The coupon rate shown on floating or adjustable rate securities represents the rate at period end. The due dates on these types of securities reflects the next interest rate reset date
or, when applicable, the final maturity date.
(c) Restricted securities - Investment in securities not registered under the Securities Act of 1933.
Additional information on each holding is as follows:
Security
Acquisition Date
Cost GE Life & Annuity Assurance Co. 6.72%, 9/1/00
4/8/00
$ 25,000
Goldman Sachs Group, Inc. 6.65%, 10/19/00
8/16/00
$ 25,000
Monumental Life Insurance Co.: 6.76%, 9/1/00
7/31/98 - 9/17/98
$ 14,000
6.91%, 11/1/00
2/1/00
$ 15,000
New York Life Insurance Co.: 6.81%, 12/1/00
8/28/00
$ 16,000
6.90%, 10/1/00
12/20/99
$ 7,000
Pacific Life Insurance Co. 6.89%, 9/8/00
8/31/99
$ 10,000
Travelers 3/30/00
$ 35,000
Income Tax Information
At August 31, 2000, the fund had a capital loss carryforward of approximately $1,128,000 of which $336,000, $536,000, $19,000, $99,000, $109,000, $15,000 and $14,000
will expire on August 31, 2001, 2002, 2003, 2004, 2006, 2007 and 2008, respectively.
See accompanying notes which are an integral part of the financial statements.
Annual Report
Statement of Assets and Liabilities
Amounts in thousands (except per share amount)
August 31, 2000
Assets
Investment in securities, at value (including repurchase agreements of $157,603) -
$ 2,979,144
Receivable for fund shares sold
55,940
Interest receivable
10,231
Other receivables
3
Prepaid expenses
37
Total assets
3,045,355
Liabilities
Payable to custodian bank
$ 12
Payable for fund shares redeemed
37,122
Distributions payable
495
Accrued management fee
920
Other payables and accrued expenses
397
Total liabilities
38,946
Net Assets
$ 3,006,409
Net Assets consist of:
Paid in capital
$ 3,007,537
Accumulated net realized gain (loss) on investments
(1,128)
Net Assets, for 3,006,910 shares outstanding
$ 3,006,409
Net Asset Value, offering price and redemption price
$1.00
See accompanying notes which are an integral part of the financial statements.
Annual Report
Financial Statements - continued
Statement of Operations
Amounts in thousands
Year ended August 31, 2000
Interest Income
$ 178,243
Expenses
Management fee
$ 9,952
Transfer agent fees
3,808
Accounting fees and expenses
261
Non-interested trustees' compensation
11
Custodian fees and expenses
50
Registration fees
239
Audit
33
Legal
13
Miscellaneous
117
Total expenses before reductions
14,484
Expense reductions
(65)
14,419
Net interest income
163,824
Net Realized Gain (Loss) on Investments
7
Net increase in net assets resulting from operations
$ 163,831
See accompanying notes which are an integral part of the financial statements.
Annual Report
Financial Statements - continued
Statement of Changes in Net Assets
Amounts in thousands
Year ended Year ended Increase (Decrease) in Net Assets
Operations $ 163,824
$ 129,487
Net realized gain (loss)
7
(25)
Net increase (decrease) in net assets resulting 163,831
129,462
Distributions to shareholders from net interest income
(163,824)
(129,487)
Share transactions at net asset value of $1.00 per share 15,456,165
12,419,943
Reinvestment of distributions from net interest income
159,219
126,012
Cost of shares redeemed
(15,367,304)
(12,412,784)
Net increase (decrease) in net assets and shares resulting from share transactions
248,080
133,171
Total increase (decrease) in net assets
248,087
133,146
Net Assets
Beginning of period
2,758,322
2,625,176
End of period
$ 3,006,409
$ 2,758,322
See accompanying notes which are an integral part of the financial statements.
Annual Report
Financial Highlights
Years ended August 31,
2000
1999
1998
1997
1996
Selected Per-Share Data
Net asset value, $ 1.000
$ 1.000
$ 1.000
$ 1.000
$ 1.000
Income from Investment Operations .056
.047
.052
.051
.051
Less Distributions
From net interest income
(.056)
(.047)
(.052)
(.051)
(.051)
Net asset value, end of period
$ 1.000
$ 1.000
$ 1.000
$ 1.000
$ 1.000
Total Return A
5.76%
4.84%
5.31%
5.18%
5.25%
Ratios and Supplemental Data
Net assets, end of period $ 3,006
$ 2,758
$ 2,625
$ 2,425
$ 2,317
Ratio of expenses to average .50%
.48%
.50%
.50%
.50%
Ratio of expenses to average net assets after expense reductions
.50%
.48%
.50%
.49% B
.50%
Ratio of net interest income to average net assets
5.62%
4.74%
5.19%
5.07%
5.11%
A The total returns would have been lower had certain expenses not been reduced during the periods shown.
B FMR or the fund has entered into varying arrangements with third parties who either paid or reduced a portion of the fund's expenses.
See accompanying notes which are an integral part of the financial statements.
Annual Report
Notes to Financial Statements For the period ended August 31, 2000
1. Significant Accounting Policies.
Fidelity Daily Income Trust (the fund) is a fund of Fidelity Union Street Trust II (the trust) and is authorized to issue an unlimited number of shares. The trust is
registered under the Investment Company Act of 1940, as amended (the 1940 Act), as an open-end management investment company organized as a Delaware
business trust. The financial statements have been prepared in conformity with generally accepted accounting principles which require management to make certain
estimates and assumptions at the date of the financial statements. The following summarizes the significant accounting policies of the fund:
Security Valuation. As permitted under Rule 2a-7 of the 1940 Act, and certain conditions therein, securities are valued initially at cost and thereafter assume a
constant amortization to maturity of any discount or premium.
Income Taxes. As a qualified regulated investment company under Subchapter M of the Internal Revenue Code, the fund is not subject to income taxes to the extent
that it distributes substantially all of its taxable income for its fiscal year. The schedule of investments includes information regarding income taxes under the caption
"Income Tax Information."
Interest Income. Interest income, which includes amortization of premium and accretion of discount, is accrued as earned.
Expenses. Most expenses of the trust can be directly attributed to a fund. Expenses which cannot be directly attributed are apportioned among the funds in the trust.
Deferred Trustee Compensation. Under a Deferred Compensation Plan (the Plan) non-interested Trustees must defer receipt of a portion of, and may elect to
defer receipt of an additional portion of, their annual compensation. Deferred amounts are treated as though equivalent dollar amounts had been invested in shares of
the fund or are invested in a cross-section of other Fidelity money market funds. Deferred amounts remain in the fund until distributed in accordance with the Plan.
Distributions to Shareholders. Dividends are declared daily and paid monthly from net interest income.
Security Transactions. Security transactions are accounted for as of trade date. Gains and losses on securities sold are determined on the basis of identified cost.
2. Operating Policies.
Joint Trading Account. Pursuant to an Exemptive Order issued by the Securities and Exchange Commission (the SEC), the fund, along with other affiliated entities
of Fidelity Management & Research Company (FMR), may transfer uninvested cash balances into one or more joint trading accounts. These balances are invested in one
or more repurchase agreements for U.S. Treasury or Federal Agency obligations.
Repurchase Agreements. The underlying U.S. Treasury, Federal Agency, or other obligations found to be satisfactory
Annual Report
Notes to Financial Statements - continued
2. Operating Policies - Repurchase Agreements - continued
by FMR are transferred to an account of the fund, or to the Joint Trading Account, at a custodian bank. The securities are marked-to-market daily and maintained at a
value at least equal to the principal amount of the repurchase agreement (including accrued interest). FMR, the fund's investment adviser, is responsible for
determining that the value of the underlying securities remains in accordance with the market value requirements stated above.
Interfund Lending Program. Pursuant to an Exemptive Order issued by the SEC, the fund, along with other registered investment companies having management
contracts with FMR, may participate in an interfund lending program. This program provides an alternative credit facility allowing the fund to borrow from, or lend
money to, other participating funds.
When-Issued Securities. The fund may purchase or sell securities on a when-issued basis. Payment and delivery may take place after the customary settlement
period for that security. The price of the underlying securities is fixed at the time the transaction is negotiated. The fund may receive compensation for interest forgone
in the purchase of a when-issued security. With respect to purchase commitments, the fund identifies securities as segregated in its records with a value at least equal
to the amount of the commitment. Losses may arise due to changes in the value of the underlying securities, if the counterparty does not perform under the contract, or
if the issuer does not issue the securities due to political, economic, or other factors.
Restricted Securities. The fund is permitted to invest in securities that are subject to legal or contractual restrictions on resale. These securities generally may be
resold in transactions exempt from registration or to the public if the securities are registered. Disposal of these securities may involve time-consuming negotiations
and expense, and prompt sale at an acceptable price may be difficult. At the end of the period, restricted securities (excluding 144A issues) amounted to $147,000,000 or
4.9% of net assets.
3. Fees and Other Transactions with Affiliates.
Management Fee. As the fund's investment adviser, FMR receives a monthly fee computed daily and paid monthly, based on the fund's average net assets and gross
income earned each month. The portion of the fee based on average net assets is graduated ranging from an annual rate of .10% of average net assets up to $2 billion
to an annual rate of .05% of average net assets in excess of $6 billion. The portion of the fee based on gross income is equal to 4% of the gross income earned by the
fund each month (exclusive of gains realized from the sales of investments) provided the amount of such fee, at a minimum, amounts to an annual rate of .20% and,
at a maximum, does not exceed an annual rate of .40% of the fund's average
Annual Report
Notes to Financial Statements - continued
3. Fees and Other Transactions with Affiliates - continued
Management Fee - continued
net assets. For the period, the total management fee was equivalent to an annual rate of .34%. The gross income-based portion of this fee was equal to $7,131,000, or
an annual rate of .24% of the fund's average net assets.
Sub-Adviser Fee. As the fund's investment sub-adviser, Fidelity Investments Money Management, Inc. (FIMM), a wholly owned subsidiary of FMR, receives a fee
from FMR of 50% of the management fee payable to FMR. The fee is paid prior to any voluntary expense reimbursements which may be in effect.
Transfer Agent Fees. Fidelity Service Company, Inc. (FSC), an affiliate of FMR, is the fund's transfer, dividend disbursing and shareholder servicing agent. FSC
receives account fees and asset-based fees that vary according to account size and type of account. FSC pays for typesetting, printing and mailing of all shareholder
reports, except proxy statements. For the period, the transfer agent fees were equivalent to an annual rate of .13% of average net assets.
Accounting Fees. FSC maintains the fund's accounting records. The fee is based on the level of average net assets for the month plus out-of-pocket expenses.
Money Market Insurance. Pursuant to an Exemptive Order issued by the SEC, the fund, along with other money market funds advised by FMR or its affiliates, has
entered into insurance agreements with FIDFUNDS Mutual Limited (FIDFUNDS), an affiliated mutual insurance company. FIDFUNDS provides limited coverage for
certain loss events including issuer default as to payment of principal or interest and bankruptcy or insolvency of a credit enhancement provider. The insurance does
not cover losses resulting from changes in interest rates, ratings downgrades or other market conditions. The fund may be subject to a special assessment of up to
approximately 2.5 times the fund's annual gross premium if covered losses exceed certain levels. During the period, the fund paid premiums of $111,000 for the calendar
year 2000 to FIDFUNDS, which are being amortized over one year.
4. Interfund Lending Program.
The fund participated in the interfund lending program as a lender. The average daily loan balance during the period for which the loans were outstanding amounted to
$7,945,000. The weighted average interest rate was 5.92%. Interest earned from the interfund lending program amounted to $3,000 and is included in interest income
on the Statement of Operations. At period end there were no interfund loans outstanding.
5. Expense Reductions.
Through an arrangement with the fund's transfer agent, credits realized as a result of uninvested cash balances were used to reduce a portion of the fund's expenses.
During the period, the fund's transfer agent fees were reduced by $65,000 under this arrangement.
Annual Report
Report of Independent Accountants
To the Trustees of Fidelity Union Street Trust II and the Shareholders of Fidelity Daily Income Trust:
In our opinion, the accompanying statement of assets and liabilities, including the schedule of investments, and the related statements of operations and of changes
in net assets and the financial highlights present fairly, in all material respects, the financial position of Fidelity Daily Income Trust (a fund of Fidelity Union Street
Trust II) at August 31, 2000, and the results of its operations, the changes in its net assets and the financial highlights for the periods indicated, in conformity with
accounting principles generally accepted in the United States. These financial statements and financial highlights (hereafter referred to as "financial statements")
are the responsibility of the Fidelity Daily Income Trust's management; our responsibility is to express an opinion on these financial statements based on our audits.
We conducted our audits of these financial statements in accordance with auditing standards generally accepted in the United States which require that we plan and
perform the audit to obtain reasonable assurance about whether the financial statements are free of material misstatement. An audit includes examining, on a test
basis, evidence supporting the amounts and disclosures in the financial statements, assessing the accounting principles used and significant estimates made by
management, and evaluating the overall financial statement presentation. We believe that our audits, which included
confirmation of securities at August 31, 2000 by correspondence with the custodian and brokers, provide a reasonable basis for the opinion expressed above.
/s/PricewaterhouseCoopers LLP Boston, Massachusetts Annual Report
Investment Adviser
Fidelity Management & Research Sub-Adviser
Fidelity Investments Officers
Edward C. Johnson 3d, President
Robert C. Pozen, Senior Vice President
Dwight D. Churchill, Vice President
Boyce I. Greer, Vice President
Robert K. Duby, Vice President
Eric D. Roiter, Secretary
Robert A. Dwight, Treasurer
Maria F. Dwyer, Deputy Treasurer
Stanley N. Griffith, Assistant John H. Costello, Assistant Treasurer
Thomas J. Simpson, Assistant Treasurer
Board of Trustees
Ralph F. Cox *
8/31/00
Funds Average*


TDs, and Notes 32.7%
TDs, and Notes 30.6%

Securities 0.0%
Securities 10.4%

and Net Other
Assets 6.1%
and Net Other
Assets 0.7%

(000's)
Insurance Co. 6.88%, 10/2/00
See accompanying schedule
per share ($3,006,409 ÷ 3,006,910 shares)
August 31,
2000
August 31,
1999
Net interest income
from operations
Proceeds from sales of shares
beginning of period
Net interest income
(in millions)
net assets
continued
PricewaterhouseCoopers LLP
October 6, 2000
Company
Boston, MA
Money Management, Inc.
Vice President
Phyllis Burke Davis *
Robert M. Gates *
Edward C. Johnson 3d
Donald J. Kirk *
Ned C. Lautenbach *
Peter S. Lynch
Marvin L. Mann *
William O. McCoy *
Gerald C. McDonough *
Robert C. Pozen
Thomas R. Williams *
Advisory Board
J. Michael Cook
Abigail P. Johnson
Marie L. Knowles
* Independent trustees
General Distributor
Fidelity Distributors Corporation
Boston, MA
Transfer and Shareholder
Servicing Agent
Fidelity Service Company, Inc.
Boston, MA
Custodian
Bank of New York
New York, NY
Fidelity's Taxable
Money Market Funds
Fidelity Cash Reserves
Fidelity Daily Income Trust
Fidelity U.S. Government Reserves
Spartan® Money Market Fund
Spartan U.S. Government
Money Market Fund
Spartan U.S. Treasury
Money Market Fund
The Fidelity Telephone Connection
Mutual Fund 24-Hour Service
Exchanges/Redemptions
and Account Assistance 1-800-544-6666
Product Information 1-800-544-6666
Retirement Accounts 1-800-544-4774 (8 a.m. - 9 p.m.)
TDD Service 1-800-544-0118
for the deaf and hearing impaired
(9 a.m. - 9 p.m. Eastern time)
Fidelity Automated Service
Telephone (FAST®) (automated graphic) 1-800-544-5555
(automated graphic) Automated line for quickest service
FDI-ANN-1000 113108
1.536737.103
(Fidelity Investment logo)(registered trademark)
Corporate Headquarters
82 Devonshire St., Boston, MA 02109
www.fidelity.com
Fidelity®
Municipal Money Market
Fund
Annual Report
August 31, 2000
(Fidelity Investment logo)(registered trademark)
Contents
|
President's Message |
Ned Johnson on investing strategies. |
|
|
Performance |
How the fund has done over time. |
|
|
Fund Talk |
The manager's review of fund performance, strategy and outlook. |
|
|
Investment Changes |
A summary of major shifts in the fund's
investments over the past six months |
|
|
Investments |
A complete list of the fund's investments. |
|
|
Financial Statements |
Statements of assets and liabilities,
operations, and changes in net assets, |
|
|
Notes |
Notes to the financial statements. |
|
|
Report of Independent Accountants |
The auditors' opinion. |
|
|
Distributions |
|
Third party marks appearing herein are the property of their respective owners.
All other marks appearing herein are registered or unregistered trademarks or service marks of FMR Corp. or an affiliated company.
(Recycle graphic) This report is printed on recycled paper using soy-based inks.
This report and the financial statements contained herein are submitted for the general information of the shareholders of the fund. This report is not authorized for distribution to prospective investors in the fund unless preceded or accompanied by an effective prospectus.
Mutual fund shares are not deposits or obligations of, or guaranteed by, any depository institution. Shares are not insured by the FDIC, the Federal Reserve Board or any other agency, and are subject to investment risks, including possible loss of principal amount invested.
Neither the fund nor Fidelity Distributors Corporation is a bank.
For more information on any Fidelity fund, including charges and expenses, call 1-800-544-6666 for a free prospectus. Read it carefully before you invest or send money.
Annual Report
(photo_of_Edward_C_Johnson_3d)
(Photograph of Edward C. Johnson 3d.)
Dear Shareholder:
A slowing U.S. economy triggered an equity market rally during the later stages of summer, boosting most major stock indexes back into positive territory for calendar year 2000. One notable exception, however, was the Dow Jones Industrial Average, which posted a negative return during that timeframe. Fixed-income markets - particularly Treasuries - continued their yearlong trend of strong performance, as nearly every bond sector outperformed the stock market on a year-to-date basis.
While it's impossible to predict the future direction of the markets with any degree of certainty, there are certain basic principles that can help investors plan for their future needs.
First, investors are encouraged to take a long-term view of their portfolios. If you can afford to leave your money invested through the inevitable up and down cycles of the financial markets, you will greatly reduce your vulnerability to any single decline. We know from experience, for example, that stock prices have gone up over longer periods of time, have significantly outperformed other types of investments and have stayed ahead of inflation.
Second, you can further manage your investing risk through diversification. A stock mutual fund, for instance, is already diversified, because it invests in many different companies. You can increase your diversification further by investing in a number of different stock funds, or in such other investment categories as bonds. You should also keep money you'll need in the near future in a more stable investment.
Finally, no matter what your time horizon or portfolio diversity, it makes good sense to follow a regular investment plan, investing a certain amount of money in a fund at the same time each month or quarter and periodically reviewing your overall portfolio. By doing so, you won't get caught up in the excitement of a rapidly rising market, nor will you buy all your shares at market highs. While this strategy - known as dollar cost averaging - won't assure a profit or protect you from a loss in a declining market, it should help you lower the average cost of your purchases. Of course, you should consider your financial ability to continue your purchases through periods of low price levels before undertaking such a strategy.
If you have questions, please call us at 1-800-544-6666, or visit our web site at www.fidelity.com. We are available 24 hours a day, seven days a week to provide you the information you need to make the investments that are right for you.
Best regards,
/s/Edward C. Johnson 3d
Edward C. Johnson 3d
Annual Report
To evaluate a money market fund's historical performance, you can look at either total return or yield. Total return reflects the change in the value of an investment, assuming reinvestment of the fund's dividend income. Yield measures the income paid by a fund. Since a money market fund tries to maintain a $1 share price, yield is an important measure of performance.
Cumulative Total Returns
|
Periods ended August 31, 2000 |
|
Past 1 |
Past 5 |
Past 10 |
|
Fidelity Municipal Money Market |
|
3.55% |
17.17% |
37.44% |
|
All Tax-Free Money Market |
|
3.29% |
16.21% |
34.80% |
Cumulative total returns show the fund's performance in percentage terms over a set period - in this case, one year, five years or 10 years. For example, if you had invested $1,000 in a fund that had a 5% return over the past year, the value of your investment would be $1,050. To measure how the fund's performance stacked up against its peers, you can compare it to the all tax-free money market funds average, which reflects the performance of municipal money market funds with similar objectives tracked by iMoneyNet, Inc. The past one year average represents a peer group of 461 money market funds.
Average Annual Total Returns
|
Periods ended August 31, 2000 |
|
Past 1 |
Past 5 |
Past 10 |
|
Fidelity Municipal Money Market |
|
3.55% |
3.22% |
3.23% |
|
All Tax-Free Money Market |
|
3.29% |
3.05% |
3.03% |
Average annual total returns take the fund's cumulative return and show you what would have happened if the fund had performed at a constant rate each year.
Annual Report
Performance - continued
Yields
|
|
8/28/00 |
5/29/00 |
2/28/00 |
11/29/99 |
8/30/99 |
|
Fidelity Municipal Money Market Fund |
3.81% |
3.95% |
3.37% |
3.34% |
2.90% |
|
All Tax-Free Money Market Funds Average |
3.56% |
3.60% |
3.12% |
3.16% |
2.66% |
|
Fidelity Municipal Money Market Fund Tax-Equivalent |
5.95% |
6.17% |
5.27% |
5.22% |
4.53% |
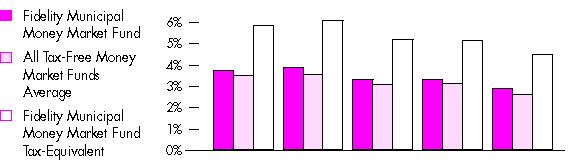
Yield refers to the income paid by the fund over a given period. Yields for money market funds
are usually for seven-day periods, expressed as annual percentage rates. A
yield that assumes income earned is reinvested or compounded is called an effective yield. The table above shows the
fund's current seven-day yield at quarterly intervals over
the past year. You can compare these yields to the all tax-free money market funds average as tracked by iMoneyNet, Inc. Or you can look at the fund's tax-equivalent
yield, which assumes you're in the 36% federal tax bracket. A portion of the fund's income may be subject to the alternative federal minimum tax. Comparing Yields on tax-free investments
are usually lower than yields on
taxable investments. However,
a straight comparison between
the two may be misleading
because it ignores the way
taxes reduce taxable returns.
Tax-equivalent yield - the yield
you'd have to earn on a similar
taxable investment to match the
tax-free yield - makes the
comparison more meaningful.
Keep in mind that the U.S.
government neither insures nor
guarantees a money market
fund. In fact, there is no
assurance that a money fund
will maintain a $1 share price.
Performance
A money market fund's total returns and yields will vary, and reflect past results rather than predict future performance.
Annual Report
Fund Talk: The Manager's Overview
(Portfolio Manager photograph)
An interview with Diane McLaughlin, Portfolio Manager of Fidelity Municipal Money Market Fund
Q. What was the investment environment like during the 12 months that ended August 31, 2000, Diane?
A. Throughout the period, the U.S. economy demonstrated considerable strength. Real GDP - gross domestic product adjusted for inflation - grew at an annual rate of 6.9% in the fourth quarter of 1999, its largest gain in three years. In 2000, real GDP grew at an annual rate of 4.8% in the first quarter and 5.6% in the second quarter. The American consumer, buoyed with confidence, helped support economic growth through healthy spending. Business investment provided yet another stimulus to economic growth. The healthy economy led to a decline in unemployment, which fell to 3.9% in April, its lowest level in 30 years.
Q. How did the Federal Reserve Board react to the state of the U.S. economy?
A. Against this backdrop, the Federal Reserve Board felt the need to restrain growth and head off any inflationary pressures that might be building. To do so, the Fed implemented a series of six hikes in the rate banks charge each other for overnight loans - the fed funds target rate - starting in June 1999. Four of those rate increases occurred during the period covered by this report. Three of them - in November 1999, February 2000 and March 2000 - came in increments of 0.25 percentage points each. The last, in May 2000 - a hike of 0.50 percentage points - came on the heels of an unexpectedly sharp increase in the employment cost index, a broad measure of the costs incurred by businesses for wages and benefits. During the last three months of the period, however, the Fed chose to leave rates unchanged. While some indications of price inflation surfaced, most price gains were offset by improvements in productivity. More importantly, later in the period there were signs that economic growth was slowing to a more sustainable rate.
Q. What was your strategy with the fund?
A. For most of the period, I kept the fund's average maturity shorter than that of its peers. The combination of low supply and strong demand caused yields on longer-term one-year notes to fall to unattractive levels. Supply was low because, with the strong economy, municipalities had less of a need to come to market to raise funds. On the other hand, demand for one-year, fixed-rate notes remained strong as the municipal money market was flooded with assets. We found few opportunities to buy one-year notes that incorporated enough yield to compensate the fund for the anticipated rise in rates. At times, rates on short-term variable-rate demand notes (VRDNs) - whose yields are reset every seven days - spiked up. One such period was the turn into the year 2000, when very soft demand caused short-term money market securities to offer yields that were, in some cases, higher than those offered by taxable alternatives. Another opportunity arose in April, when money market managers sold VRDNs to meet redemptions as shareholders withdrew funds to pay taxes. Yields on VRDNs rose, with some again offering yields as high as those provided by taxable money market securities. These were opportunities for the fund to add VRDNs and, because of its overweighting in VRDNs at those times, the fund was positioned to take advantage of the increases in yield.
Annual Report
Fund Talk: The Manager's Overview - continued
Q. How did the fund perform?
A. The fund's seven-day yield on August 31, 2000, was 3.82%, compared to 2.90% 12 months ago. The latest yield was the equivalent of a 5.97% taxable yield for investors in the 36% federal tax bracket. Through August 31, 2000, the fund's 12-month total return was 3.55%, compared to 3.29% for the all tax-free money market funds average, according to iMoneyNet, Inc.
Q. What is your outlook?
A. Recent economic data indicate that the economy is slowing. In addition, sharp increases in oil prices and the steady decline in the value of the euro - which has made U.S. imports in Europe more expensive - may help slow U.S. economic growth. Although the Fed indicated at its last meeting its continued bias toward raising rates, the market at this point sees very little chance the Fed will do so. In fact, recent market sentiment has reflected a higher chance of a Fed rate cut in the near future. Looking at the fund, I'll continue to take advantage of opportunities arising from supply/demand imbalances.
The views expressed in this report reflect those of the portfolio manager only through the end of the period of the report as stated on the cover and do not necessarily represent the views of Fidelity or any other person in the Fidelity organization. Any such views are subject to change at any time based upon market or other conditions and Fidelity disclaims any responsibility to update such views. These views may not be relied on as investment advice and, because investment decisions for a Fidelity fund are based on numerous factors, may not be relied on as an indication of trading intent on behalf of any Fidelity fund.
Fund Facts
Goal: tax-free income with share-price stability by investing in high-quality, short-term municipal securities
Fund number: 010
Trading symbol: FTEXX
Start date: January 2, 1980
Size: as of August 31, 2000, more than $7.9 billion
Manager: Diane McLaughlin, since 1996; manager, various Fidelity and Spartan municipal money market funds; joined Fidelity in 1992
3Annual Report
Investment Changes
Maturity Diversification
Days
% of fund's
investments % of fund's
investments
2/29/00
% of fund's 0 - 30
83.4
75.8
73.0
31 - 90
9.0
14.9
7.7
91 - 180
3.4
3.2
9.2
181 - 397
4.2
6.1
10.1
Weighted Average Maturity
8/31/00
2/29/00
8/31/99
Fidelity Municipal Money 27 Days
32 Days
54 Days
All Tax-Free Money Market 42 Days
39 Days
51 Days
Asset Allocation (% of fund's net assets)
As of August 31, 2000
As of February 29, 2000
Variable Rate
Variable Rate
Commercial Paper
(including
Commercial Paper
(including
Tender Bonds 4.5%
Tender Bonds 4.5%
Municipal Notes 2.9%
Municipal Notes 5.8%
Other Investments
Other Investments
Annual Report
Investments August 31, 2000
Showing Percentage of Net Assets
Municipal Securities - 99.1%
Principal
Amount (000s)
Value (Note 1)
(000s)
Alabama - 1.1%
Alabama Hsg. Fin. Auth. Multi-family Hsg. Rev. (Gazebo East Proj.) Series 1991 B, 4.4%, LOC Amsouth Bank NA, Birmingham, VRDN (b)
$ 3,240
$ 3,240
Alabama Ind. Dev. Auth. Rev. (Southern Ionics Proj.) 4.45%, LOC Southtrust Bank NA, VRDN (b)(c)
3,000
3,000
Alabama Pub. School & College Auth. Rev. Participating VRDN Series ROC 00 1, 4.33% (Liquidity Facility Salomon Smith Barney Hldgs., Inc.) (b)(e)
11,345
11,345
Cap. City Edl. Bldg. Auth. Rev. (Montgomery Academy Proj.) Series 1999 B, 4.35%, LOC Amsouth Bank NA, Birmingham, VRDN (b)
6,000
6,000
Courtland Ind. Dev. Board Rev. (Specialty Minerals, Inc. Proj.) 4.45%, LOC Wachovia Bank NA, VRDN (b)(c)
5,000
5,000
Daphne-Villa Mercy Spl. Care Facilities Fing. Auth. Rev. (Mercy Med. Hosp. Proj.) 4.25%, LOC Southtrust Bank NA, VRDN (b)
11,700
11,700
Decatur Ind. Dev. Board Ind. Dev. Rev. (Monsanto Co. Proj.) Series 1996, 4.45%, VRDN (b)(c)
1,900
1,900
Decatur Ind. Dev. Board Solid Waste Disp. Rev. (Trico Steel Co. Proj.) Series 1997, 4.3%, LOC Chase Manhattan Bank, VRDN (b)(c)
8,300
8,300
Jackson Ind. Dev. Board Rev. (Specialty Minerals, Inc. Proj.) 4.45%, LOC Wachovia Bank NA, VRDN (b)(c)
6,100
6,100
Lafayette Ind. Dev. Rev. (Kardoes Rubber Co., Inc. Proj.) 4.45%, LOC Amsouth Bank NA, Birmingham, VRDN (b)(c)
3,485
3,485
Mobile Ind. Dev. Board Rev. (Newark Group Ind. Proj.) 4.5%, LOC First Union Nat'l. Bank, North Carolina, VRDN (b)(c)
6,675
6,675
Montgomery Ind. Dev. Board Poll. Cont. Rev. Bonds (Gen. Elec. Co. Proj.) Series 1990, 4.25% tender 9/22/00, CP mode
14,600
14,600
Montgomery Ind. Dev. Board Rev. (Feldmeier/Alabama Equip. Proj.) Series 1996, 4.45%, LOC Southtrust Bank NA, VRDN (b)(c)
805
805
Roanoke Ind. Dev. Board Indl. Dev. Rev. (Steelfab, Inc. Proj.) Series 1997, 4.45%, LOC Bank of America NA, VRDN (b)(c)
1,330
1,330
Tuscaloosa County Ind. Dev. Auth. Rev. (Hanna Steel Co. Proj.) 4.4%, LOC Bank of America NA, VRDN (b)(c)
785
785
84,265
Alaska - 1.5%
Alaska Arpt. Participating VRDN Series Merlots 99 I, 4.42% (Liquidity Facility First Union Nat'l. Bank, North Carolina) (b)(c)(e)
7,500
7,500
Alaska Hsg. Fin. Corp. Participating VRDN:
Series BA 97 F, 4.33% (Liquidity Facility Bank of America NA) (b)(e)
7,185
7,185
Municipal Securities - continued
Principal
Amount (000s)
Value (Note 1)
(000s)
Alaska - continued
Alaska Hsg. Fin. Corp. Participating VRDN: - continued
Series FRRI 00 N13, 4.5% (Liquidity Facility Bank of New York NA) (b)(e)
$ 7,500
$ 7,500
Series FRRI 98 2, 4.45% (Liquidity Facility Bank of New York NA) (b)(e)
5,600
5,600
Series FRRI 99 2, 4.5% (Liquidity Facility Commerzbank AG) (b)(e)
2,400
2,400
Series Merlots 99 D, 4.37% (Liquidity Facility First Union Nat'l. Bank, North Carolina) (b)(e)
10,900
10,900
Alaska Ind. Dev. & Export Auth. Rev. (Fairbanks Gold Mining Proj.) Series 1997, 4.45%, LOC Bank of Nova Scotia, VRDN (b)(c)
52,400
52,400
Valdez Marine Term. Rev.:
Participating VRDN Series MSDW 98 146, 4.33% (Liquidity Facility Morgan Stanley Dean Witter & Co.) (b)(e)
15,500
15,500
Rfdg. Bonds (Atlantic Richfield Co. Proj.) Series 1994 A, 4.3% tender 10/11/00, CP mode
13,100
13,100
122,085
Arizona - 2.0%
Arizona Health Facilities Auth. Rev.:
(Arizona Health Care Pooled Fing. Prog.) Series 2000 A, 4.35%, (Liquidity Facility Landesbank Hessen-Thurigen), VRDN (b)
35,600
35,600
(Blood Sys., Inc. Proj.) Series 1995, 4.35%, LOC Bank One, Arizona NA, VRDN (b)
7,045
7,045
Casa Grande Indl. Dev. Auth. Indl. Dev. Rev. (Aztec Pulp & Paper Prod. Proj.) Series 2000 A, 4.45%, LOC Bank of America NA, VRDN (b)(c)
5,000
5,000
Cochise County Poll. Cont. Rev. Solid Waste Disp. Rev. Bonds (Arizona Elec. Pwr. Coop. Proj.) 4.1%, tender 9/1/00 (Nat'l. Rural Util. Coop. Fin.
Corp. Guaranteed) (c)
6,800
6,800
Maricopa County Ind. Dev. Auth. Ind. Dev. Rev.:
Bonds (Citizens Communications Co. Proj.) Series 1988, 4.65% tender 9/1/00, CP mode (c)
2,920
2,920
(Clayton Homes Proj.) Series 1998, 4.4%, LOC Wachovia Bank NA, VRDN (b)(c)
4,200
4,200
Maricopa County Poll. Cont. Rev. Bonds (Southern California Edison Co. Proj.) Series 1985 E:
4.35% tender 10/13/00, CP mode
2,900
2,900
4.5% tender 9/7/00, CP mode
2,000
2,000
Mohave County Ind. Dev. Auth. Ind. Dev. Rev. Bonds
4.4% tender 9/8/00, CP mode (c)
5,100
5,100
4.65% tender 9/8/00, CP mode (c)
14,260
14,260
Municipal Securities - continued
Principal
Amount (000s)
Value (Note 1)
(000s)
Arizona - continued
Navajo County Ind. Dev. Auth. Ind. Rev. (Citizens Utils. Co. Proj.) Series 1997, 4.6%, VRDN (b)(c)
$ 3,800
$ 3,800
Phoenix Ind. Dev. Auth. Multi-family Hsg. Rev. (Bell Square Apt. Proj.) Series 1995, 4.4%, (OEC The Lakes LLC) 6,000
6,000
Phoenix Ind. Dev. Auth. Rev.:
(Marlyn Nutraceuticals Proj.) 4.5%, LOC Bank One, 3,300
3,300
(Plastican Proj.) Series 1997, 4.5%, LOC Fleet Bank NA, VRDN (b)(c)
2,625
2,625
Rfdg. (V.A.W. of America Proj.) Series 1997, 4.45%, 1,100
1,100
Phoenix Indl. Dev. Auth. Rev. (Independent Newspaper, Inc. Proj.) Series 2000, 4.45%, LOC First Union Nat'l. Bank, North Carolina, VRDN (b)(c)
2,100
2,100
Pima County Ind. Dev. Auth. Single Family Hsg. Rev. Participating VRDN Series RF 99 5, 4.43% (Liquidity Facility Bank of New York NA) (b)(c)(e)
12,350
12,350
Pima County Indl. Dev. Auth. Single Family Mtg. Rev. Bonds 4.1% 9/1/00 (Pacific Life Ins. Co. Guaranteed) (c)
3,750
3,750
Salt River Proj. Agric. Impt. & Pwr. District Elec. Sys. Rev.:
Participating VRDN Series MSDW 00 274, 4.33% (Liquidity Facility Morgan Stanley Dean Witter & Co.) (b)(e)
10,000
10,000
Series 1997 A, 4.3% 10/5/00, CP
4,950
4,950
Series B, 4.2% 10/20/00, CP
8,065
8,065
Yavapai County Ind. Dev. Auth. Ind. Dev. Rev.:
Bonds:
(Citizens Communications Co. Proj.) Series 1993, 4.4% tender 9/11/00, CP mode (c)
6,500
6,500
(Citizens Utils. Co. Proj.) Series 1997, 4.4% tender 9/8/00, CP mode (c)
3,000
3,000
(Oxycal Lab. Proj.) Series 1999 A, 4.5%, LOC Bank One, Arizona NA, VRDN (b)(c)
2,900
2,900
156,265
Arkansas - 1.0%
Arkansas Dev. Auth. Ind. Dev. Rev. (Stratton Seed Co. Proj.) Series 1999, 4.45%, LOC Bank of America NA, VRDN (b)(c)
3,700
3,700
Arkansas Dev. Fin. Auth. Participating VRDN Series BA 98 C, 4.38% (Liquidity Facility Bank of America NA) (b)(c)(e)
6,475
6,475
Arkansas Dev. Fin. Auth. Multi-family Hsg. Rev. (Kiehl Partners LP Proj.) Series 1998, 4.45%, LOC Bank One, Louisiana NA, VRDN (b)(c)
5,200
5,200
Municipal Securities - continued
Principal
Amount (000s)
Value (Note 1)
(000s)
Arkansas - continued
Arkansas Hosp. Equip. Fin. Auth. (Arkansas Hosp. Assoc. Pooled Fing. Prog.) Series 1998 A, 4.35%, LOC Bank of America NA, VRDN (b)
$ 18,000
$ 18,000
Clark County Solid Waste Disp. Rev. (Reynolds Metals Co. Proj.) Series 1992, 4.45%, LOC Suntrust Bank, VRDN (b)(c)
15,800
15,800
Columbia County Solid Waste Disp. Rev. (Albemarle Corp. Proj.) Series 1999, 4.45%, LOC Bank of America NA, VRDN (b)(c)
5,500
5,500
Miller County Solid Waste Disp. Rev. (Tyson Foods, Inc. Proj.) Series 1996, 4.33%, LOC Commerzbank AG, 21,850
21,850
Pine Bluff Ind. Dev. Rev. (Rolling Pin Corp. Proj.) Series 1998, 4.5%, LOC Wells Fargo Bank NA, San Francisco, VRDN (b)(c)
3,400
3,400
West Memphis Ind. Dev. Rev. (Proform Co. LLC Proj.) 975
975
80,900
California - 0.1%
California Student Ed. Ln. Marketing Corp. Student Ln. Rev. Rfdg. Bonds Series 1994 A, 4.8%, tender 6/1/01, LOC State Street Bank & Trust Co. (c)
6,000
6,000
Orange County Hsg. Fin. Auth. Participating VRDN Series 96C0906, 4.35% (Liquidity Facility Citibank NA, New York) (b)(c)(e)
4,310
4,310
10,310
Colorado - 3.4%
Aurora Multi-family Hsg. Rev. (Aurora Meadows Apts. Proj.) Series 1996, 4.5% (Fannie Mae Guaranteed), VRDN (b)(c)
8,300
8,300
Colorado Hsg. Fin. Auth. Multi-family Hsg. Rev. Participating VRDN:
Series BA 96 E, 4.38% (Liquidity Facility Bank of America NA) (b)(c)(e)
7,700
7,700
Series FRRI 00 A4, 4.55% (Liquidity Facility Bayerische Hypo-und Vereinsbank AG) (b)(c)(e)
6,900
6,900
Series Putters 120, 4.35% (Liquidity Facility Morgan Guaranty Trust Co., NY) (b)(c)(e)
7,865
7,865
Colorado Springs Utils. Rev. Participating VRDN Series SGB 28, 4.33% (Liquidity Facility Societe Generale) (b)(e)
11,480
11,480
Colorado Student Oblig. Auth.:
Series 1999 A2, 4.35% (AMBAC Insured), VRDN (b)(c)
9,500
9,500
Series 1999 A3, 4.35% (AMBAC Insured), VRDN (b)(c)
7,300
7,300
Municipal Securities - continued
Principal
Amount (000s)
Value (Note 1)
(000s)
Colorado - continued
Denver City & County Arpt. Rev.:
Bonds:
Series 1997 A:
4.2% tender 10/20/00, LOC Bayerische Landesbank Girozentrale, CP mode (c)
$ 13,100
$ 13,100
4.3% tender 10/19/00, LOC Bayerische Landesbank Girozentrale, CP mode (c)
3,300
3,300
4.3% tender 11/10/00, LOC Bayerische Landesbank Girozentrale, CP mode (c)
7,800
7,800
4.3% tender 11/17/00, LOC Bayerische Landesbank Girozentrale, CP mode (c)
11,000
11,000
4.35% tender 11/16/00, LOC Bayerische Landesbank Girozentrale, CP mode (c)
9,600
9,600
Series PT 249, 4.45%, tender 2/22/01 (Liquidity Facility Banco Santander SA) (c)(e)(f)
6,050
6,050
Participating VRDN:
Series 1997 Q, 4.37% (Liquidity Facility First Union Nat'l. Bank, North Carolina) (b)(e)
6,600
6,600
Series CDC 97 K, 4.4% (Liquidity Facility Caisse des Depots et Consignations) (b)(c)(e)
32,430
32,430
Series FRRI A44, 4.5% (Liquidity Facility Bank of New York NA) (b)(c)(e)
10,000
10,000
Series FRRI A72, 4.5% (Liquidity Facility Bayerische Hypo-und Vereinsbank AG) (b)(c)(e)
17,700
17,700
Series FRRI A73, 4.5% (Liquidity Facility Bayerische Hypo-und Vereinsbank AG) (b)(c)(e)
9,750
9,750
Series MSDW 98 153, 4.33% (Liquidity Facility Morgan Stanley Dean Witter & Co.) (b)(e)
6,000
6,000
Series PA 762, 4.38% (Liquidity Facility Merrill Lynch & Co., Inc.) (b)(c)(e)
4,995
4,995
Series PA 764R, 4.38% (Liquidity Facility Merrill Lynch & Co., Inc.) (b)(c)(e)
4,995
4,995
Series 2000 A, 4.3% 11/10/00, LOC Westdeutsche Landesbank Girozentrale, LOC Bayerische Landesbank Girozentrale, CP (c)
17,300
17,300
Series 2000 C, 4.35% (MBIA Insured), VRDN (b)(c)
13,600
13,600
Denver City & County Spl. Facilites Arpt. Rev. (Worldport at DIA Proj.) Series A, 4.5%, LOC Morgan Guaranty Trust Co., NY, VRDN (b)(c)
22,580
22,580
Fort Collins Ind. Dev. Rev. (Phelps-Tointon Millwork Proj.) Series 1993, 4.5%, LOC Bank One, Colorado NA, VRDN (b)(c)
1,180
1,180
Municipal Securities - continued
Principal
Amount (000s)
Value (Note 1)
(000s)
Colorado - continued
Fort Collins Multi-family Hsg. Rev. Bonds (Dry Creek Apt. Proj.) 5.05%, tender 11/1/00, (Redwood Housing LP) LOC Fifth Third Bank, Cincinnati (c)
$ 4,490
$ 4,490
Westminster County Multi-family Hsg. Rev. Rfdg. (Lakeview Apts. Proj.) Series 1997, 4.5% (68th Ave. Partners LP) (Fannie Mae Guaranteed),
VRDN (b)(c)
4,510
4,510
266,025
Connecticut - 0.1%
Connecticut Hsg. Fin. Auth. Participating VRDN Series Merlots 97 L, 4.32% (Liquidity Facility First Union Nat'l. Bank, North Carolina) (b)(c)(e)
4,625
4,625
Delaware - 0.6%
Delaware Econ. Dev. Auth. Multi-family Rev. (Schoolhouse 23,600
23,600
Delaware Econ. Dev. Auth. Rev.:
(Delmarva Pwr. & Lt. Co. Proj.):
Series 1987, 4.55%, VRDN (b)(c)
1,100
1,100
Series 1994, 4.55%, VRDN (b)(c)
2,000
2,000
Series 1999 B, 4.3%, VRDN (b)(c)
5,500
5,500
Rfdg. (Philip Morris Co., Inc. Proj.) Series 1992, 4.4%, VRDN (b)
3,300
3,300
Delaware Gen. Oblig. Participating VRDN Series ROC 00 9, 4.33% (Liquidity Facility Salomon Smith Barney Hldgs., Inc.) (b)(e)
9,215
9,215
Delaware Hsg. Auth. Rev. Participating VRDN Series 96C0801, 4.35% (Liquidity Facility Citibank NA, New York) (b)(c)(e)
5,830
5,830
50,545
District of Columbia - 1.4%
District of Columbia Gen. Oblig. Participating VRDN:
Series ROC 2 99 10, 4.33% (Liquidity Facility Salomon Smith Barney Hldgs., Inc.) (b)(e)
5,905
5,905
Series ROC 2 99 12, 4.33% (Liquidity Facility Salomon Smith Barney Hldgs., Inc.) (b)(e)
6,420
6,420
District of Columbia Hsg. Fin. Agcy. Single Family Mtg. Rev. Participating VRDN Series RF 00 4, 4.48% (Liquidity Facility Bank of New York
NA) (b)(c)(e)
8,505
8,505
District of Columbia Hsg. Fin. Agcy. Mtg. Rev.:
Bonds:
Series 2000 B, 4.35% 3/21/01 (Trinity Fdg. Guaranteed) (c)
21,500
21,500
Series 2000 E, 4.6% 7/23/01 (c)
8,500
8,500
Participating VRDN Series CDC 00 I, 4.4% (Liquidity Facility Caisse des Depots et Consignations) (b)(c)(e)
6,555
6,555
Municipal Securities - continued
Principal
Amount (000s)
Value (Note 1)
(000s)
District of Columbia - continued
District of Columbia Rev.:
(Arnold & Porter Proj.) Series 1999, 4.35%, LOC Crestar Bank, VRDN (b)(c)
$ 7,250
$ 7,250
(Fort Lincoln New Town/Premdist LLC Proj.) Series 2000, 4.35%, LOC First Union Nat'l. Bank, North Carolina, VRDN (b)(c)
7,200
7,200
District of Columbia Wtr. & Swr. Auth. Participating VRDN:
Series 985201, 4.33% (Liquidity Facility Citibank NA, 12,300
12,300
Series ROC 2 99 5, 4.33% (Liquidity Facility Salomon Smith Barney Hldgs., Inc.) (b)(e)
4,750
4,750
Metro. Washington Apts. Auth. PFC Rev. Series A:
4.3% 9/7/00 (Liquidity Facility Westdeutsche Landesbank Girozentrale), CP (c)
1,700
1,700
4.3% 11/7/00 (Liquidity Facility Westdeutsche Landesbank Girozentrale), CP (c)
5,000
5,000
4.35% 11/16/00 (Liquidity Facility Westdeutsche Landesbank Girozentrale), CP (c)
15,600
15,600
111,185
Florida - 4.4%
Broward County Port Facilities Rev. Rfdg. (Port Everglades Proj.) Series 1998, 4.3% (AMBAC Insured) (BPA Bank of Nova Scotia), VRDN (b)(c)
7,000
7,000
Dade County Spl. Rev. (Youth Fair & Exposition Proj.) 4.3%, LOC Suntrust Bank, VRDN (b)
4,225
4,225
Escambia County Hsg. Fin. Rev. Participating VRDN 12,700
12,700
Florida Board of Ed. Cap. Outlay Participating VRDN:
Series MSDW 00 374, 4.33% (Liquidity Facility Morgan Stanley Dean Witter & Co.) (b)(e)
9,330
9,330
Series PT 1223, 4.33% (Liquidity Facility Merrill Lynch & Co., Inc.) (b)(e)
4,000
4,000
Florida Cap. Projects Fin. Auth. (Florida Hosp. Assoc. Cap. Proj.) Series 1998 A, 4.25% (FSA Insured), VRDN (b)
3,600
3,600
Florida Division Bond Fin. Dept. Gen. Svcs. Revs. Participating VRDN Series MSDW 00 317, 4.33% (Liquidity Facility Morgan Stanley Dean Witter
& Co.) (b)(e)
6,955
6,955
Florida Hsg. Fin. Agcy.:
(Banyan Bay Apts. Proj.) 4.25%, LOC Fannie Mae, VRDN (b)(c)
5,275
5,275
(Kings Colony Proj.) Series 1985 D, 4.25%, (Gables Realty Ltd. Partnership) LOC Cr. Suisse First Boston Bank, VRDN (b)
6,900
6,900
Municipal Securities - continued
Principal
Amount (000s)
Value (Note 1)
(000s)
Florida - continued
Florida Hsg. Fin. Agcy.: - continued
Rfdg. (Hillsborough-Oxford Proj.) Series D, 4.45% (Continental Casualty Co. Guaranteed), VRDN (b)
$ 8,790
$ 8,790
Florida Hsg. Fin. Corp. Rev. (Valencia Village Apts. Proj.) Series G, 4.3%, LOC Key Bank Nat'l. Assoc., 5,880
5,880
Florida Local Govt. Fin. Auth. Rev.:
Series A:
4.1% 9/7/00, LOC First Union Nat'l. Bank, North Carolina, CP
6,100
6,100
4.2% 10/6/00, LOC First Union Nat'l. Bank, North Carolina, CP
11,832
11,832
4.35% 11/16/00, LOC First Union Nat'l. Bank, North Carolina, CP
7,350
7,350
Series B, 4.35% 12/6/00, LOC First Union Nat'l. Bank, North Carolina, CP (c)
6,500
6,500
Highlands County Health Facilities Auth. Rev. (Adventist Health Sys. Sunbelt Proj.) 4.32% (MBIA Insured) (BPA Bank One NA, Chicago), VRDN (b)
12,600
12,600
Lee County Hosp. Board Directors Hosp. Rev. Bonds
Series 1985 C, 4.45% tender 9/12/00 (Liquidity Facility Suntrust Bank), CP mode
17,000
17,000
Series 1985 D, 4.45% tender 9/12/00 (Liquidity Facility Suntrust Bank), CP mode
6,000
6,000
Series 1992 B, 4.45% tender 9/12/00 (Liquidity Facility Suntrust Bank), CP mode
20,600
20,600
Series 1995 A, 4.45% tender 9/12/00 (Liquidity Facility Suntrust Bank), CP mode
1,600
1,600
Series 1997 B, 4.45% tender 9/12/00 (Liquidity Facility Suntrust Bank), CP mode
22,905
22,905
Miami Dade County Hsg. Fin. Auth. Participating VRDN 6,580
6,580
Orange County Health Facilities Auth. Rev. (Florida Hosp. Assoc. Health Proj.) Series 2000 A, 4.35%, (Liquidity Facility Bank of New York NA),
(Liquidity Facility Bank of Nova Scotia), VRDN (b)
32,600
32,600
Orange County Hsg. Fin. Auth. Homeowner Rev. Bonds 6,500
6,500
Orange County Indl. Dev. Auth. Indl. Dev. Rev. (Advanced Drainage Sys., Inc. Proj.) 4.45%, LOC Nat'l. City Bank, VRDN (b)(c)
1,600
1,600
Municipal Securities - continued
Principal
Amount (000s)
Value (Note 1)
(000s)
Florida - continued
Orlando Utils. Commission Wtr. & Elec. Rev. Series 1999 A, 4.3% 9/6/00, CP
$ 12,200
$ 12,200
Palm Beach County Rev. (Saint Andrews School Boca Raton Proj.) Series 1998, 4.3%, LOC Bank of America NA, VRDN (b)
6,000
6,000
Sarasota County Pub. Hosp. District Rev. Bonds (Sarasota Memorial Hosp. Proj.) Series A:
4.25% tender 10/18/00, CP mode
26,800
26,800
4.35% tender 10/13/00, CP mode
5,400
5,400
Sunshine State Govt. Fing. Commission Rev.:
Series A:
4.3% 9/6/00 (FGIC Insured) (AMBAC Insured), CP
19,965
19,965
4.35% 9/7/00 (FGIC Insured) (AMBAC Insured), CP
5,000
5,000
Series C:
4.2% 9/6/00 (FGIC Insured) (AMBAC Insured), CP
20,280
20,280
4.35% 9/6/00 (FGIC Insured) (AMBAC Insured), CP (c)
2,000
2,000
4.4% 9/6/00 (FGIC Insured) (AMBAC Insured), CP (c)
14,100
14,100
346,167
Georgia - 4.6%
Albany Dougherty Payroll Dev. Auth. Poll. Cont. Rev. Rfdg. (Philip Morris Co. Proj.) 4.4%, VRDN (b)
9,590
9,590
Albany-Dougherty County Hosp. Auth. Rev. (Phoebe Puttnay Memorial Hosp. Proj.) Series 1996, 4.35% (AMBAC Insured) (BPA Suntrust Bank),
VRDN (b)
100
100
Atlanta Arpt. Rev. Participating VRDN:
Series Merlots 00 CCC, 4.42% (Liquidity Facility First Union Nat'l. Bank, North Carolina) (b)(c)(e)
5,000
5,000
Series MSDW 00 313, 4.38% (Liquidity Facility Morgan Stanley Dean Witter & Co.) (b)(c)(e)
3,350
3,350
Series MSDW 00 375, 4.33% (Liquidity Facility Morgan Stanley Dean Witter & Co.) (b)(e)
9,670
9,670
Series PA 677R, 4.33% (Liquidity Facility Merrill Lynch & Co., Inc.) (b)(e)
5,730
5,730
Atlanta Urban Residential Fin. Auth. Multi-family Rev.:
(Brentwood Creek Apartments Proj.) Series 1999, 4.35%, LOC Suntrust Bank, VRDN (b)
4,720
4,720
(Carver Redev. Proj.) Series 2000, 4.35%, LOC Suntrust Bank, VRDN (b)(c)
7,000
7,000
(Villages of Cascade Proj.) Series 1997 A, 4.35%, 6,700
6,700
Bibb County Dev. Auth. Rev. Rfdg. & Impt. Series 1998, 4.3%, LOC Suntrust Bank, VRDN (b)
13,700
13,700
Municipal Securities - continued
Principal
Amount (000s)
Value (Note 1)
(000s)
Georgia - continued
Bibb County Dev. Auth. Solid Waste Disp. Rev. (Swift Creek Envir. Proj.) 4.35%, LOC Suntrust Bank, VRDN (b)(c)
$ 5,100
$ 5,100
Burke County Ind. Dev. Auth. Poll. Cont. Rev. Participating VRDN Series CDC 00 G, 4.35% (Liquidity Facility Caisse des Depots et
Consignations) (b)(e)
12,120
12,120
Canton Hsg. Auth. Multi-family Hsg. Rev. (Canton Mill Lofts Proj.) Series 1999, 4.35%, LOC First Union Nat'l. Bank, North Carolina, VRDN (b)(c)
13,100
13,100
Cherokee County Dev. Auth. Rev. (Blue Circle Aggregates, Inc. Proj.) Series 1997, 4.4%, LOC Den Danske Bank Group AS, VRDN (b)(c)
3,500
3,500
Clayton County Hsg. Auth. Multi-family Hsg. Rev. (Hyde Park Club Apts. Proj.) Series 1997, 4.35%, (Mount Zion Road Partners Ltd.) LOC Fannie
Mae, VRDN (b)(c)
7,000
7,000
Cobb County Dev. Auth. Ind. Dev. Rev. (Amoena Corp. Proj.) Series 1992, 4.45%, LOC ABN-AMRO Bank NV, VRDN (b)(c)
1,750
1,750
Crisp County Solid Waste Mgmt. Auth. Rev. Series 1998, 4.38% (FSA Insured), VRDN (b)(c)
16,500
16,500
Dawson County Dev. Auth. (Phillips & Brooks/Gladwin, Inc. Proj.) Series 1999, 4.4%, LOC Bank of America NA, VRDN (b)(c)
2,400
2,400
De Kalb County Dev. Auth. Ind. Dev. Rev. (Qualex Proj.) 4.45%, LOC Comerica Bank, Texas, VRDN (b)(c)
2,600
2,600
De Kalb County Hsg. Auth. Multi-family Hsg. Rev.:
(Bryton Hill Apts. Proj.) Series 1996, 4.4%, 2,000
2,000
(Eagles Trace Apts. Proj.) Series 1996, 4.35%, 9,350
9,350
(Lenox Pointe Proj.) Series 1996 A, 4.35%, 8,305
8,305
(Robins Landing Proj.) 4.35%, (Glenwood Drive Partners Ltd.) LOC Bank of America NA, VRDN (b)(c)
6,250
6,250
Floyd County Dev. Auth. Rev. (Darlington School Proj.) 12,800
12,800
Fulton County Dev. Auth. (Woodward Academy, Inc. Proj.) Series 1997, 4.3%, LOC Suntrust Bank, VRDN (b)
9,000
9,000
Fulton County Hsg. Auth. Multi-family Hsg. Rev.:
(Champions Green Apts. Proj.) Series A, 4.325%, 10,565
10,565
(Walton Falls Apt. Proj.) Series 1999, 4.38%, 9,000
9,000
Georgia Gen. Oblig. Participating VRDN Series Putters 128, 4.3% (Liquidity Facility J.P. Morgan & Co., Inc.) (b)(e)
9,495
9,495
Municipal Securities - continued
Principal
Amount (000s)
Value (Note 1)
(000s)
Georgia - continued
Georgia Muni. Elec. Auth.:
Bonds (Gen. Resolution Projs.) Series 1985 B, 4.2% tender 10/13/00, LOC Morgan Guaranty Trust Co., NY, $ 14,500
$ 14,500
Series B:
4.25% 10/20/00, LOC Morgan Guaranty Trust Co., NY, LOC Bayerische Landesbank Girozentrale, CP
2,100
2,100
4.3% 10/5/00, LOC Morgan Guaranty Trust Co., NY, LOC Bayerische Landesbank Girozentrale, CP
17,570
17,570
Georgia Port Auth. Rev. (Colonel's Island Term. Proj.) 4.35%, LOC Suntrust Bank, VRDN (b)(c)
2,800
2,800
Gwinnett County Dev. Auth. Ind. Dev. Rev.:
(Curtis 1000, Inc. Proj.) Series 1996, 4.35%, LOC Suntrust Bank, VRDN (b)(c)
1,200
1,200
(Klockner Namasco Corp. Proj.) 4.4%, LOC Bank of America NA, VRDN (b)(c)
1,000
1,000
(Network Publications Proj.) Series 8, 4.4%, LOC Bank of America NA, VRDN (b)
2,400
2,400
(O'Neal Steel, Inc. Proj.) 4.4%, LOC Bank of America NA, VRDN (b)(c)
600
600
(Shepherd Construction Co., Inc. Proj.) 4.35%, LOC Suntrust Bank, VRDN (b)(c)
800
800
Gwinnett County Hsg. Auth. Multi-family Hsg. Rev. (Herrington Woods Apt. Proj.) Series 1996 A, 4.35% (Atlanta Herrington Road Partners Ltd.)
(Fannie Mae Guaranteed), VRDN (b)(c)
10,900
10,900
Henry County Dev. Auth. Solid Waste Rev. (Atlas Roofing Corp. Proj.) Series 1997, 4.35%, LOC Suntrust Bank, VRDN (b)(c)
2,500
2,500
Jenkins County Dev. Auth. Ind. Rev. (Metal Industries, Inc. Proj.) 4.4%, LOC Bank of America NA, VRDN (b)(c)
2,000
2,000
Lafayette Dev. Auth. Rev. (The Dixie Group Proj.) Series 1998, 4.35%, LOC Suntrust Bank, VRDN (b)(c)
3,000
3,000
Metro. Atlanta Rapid Transit Auth. Sales Tax Rev. Participating VRDN Series SG 57, 4.33% (Liquidity Facility Societe Generale) (b)(e)
13,605
13,605
Paulding County Ind. Bldg. Auth. Rev. (Cadillac Products, Inc. Proj.) Series 1994, 4.45%, LOC Bank One NA, Michigan, VRDN (b)(c)
3,310
3,310
Richmond County Dev. Auth. Solid Waste Disp. Rev. (Evergreen Nylon Recycling Proj.) Series 1998, 4.45%, 23,000
23,000
Roswell Hsg. Auth. Multi-family Hsg. Rev.:
(Autumnbrook Apts. Proj.) Series 1991 A, 4.4%, 7,165
7,165
Municipal Securities - continued
Principal
Amount (000s)
Value (Note 1)
(000s)
Georgia - continued
Roswell Hsg. Auth. Multi-family Hsg. Rev.: - continued
Rfdg. (Roswell-Oxford Proj.) Series 1990, 4.45% (Continental Casualty Co. Guaranteed), VRDN (b)
$ 6,100
$ 6,100
Savannah Econ. Dev. Auth. Rev.:
(Home Depot, Inc. Proj.) Series 1995 A, 4.35%, VRDN (b)(c)
1,500
1,500
(Kaolin Term., Inc. Proj.) 4.4%, LOC Bank of America NA, VRDN (b)(c)
7,750
7,750
Summerville Ind. Dev. Auth. Facility Rev. (Image Ind., Inc. Proj.) Series 1997, 4.4%, LOC First Union Nat'l. Bank, North Carolina, VRDN (b)(c)
13,000
13,000
Vienna Dev. Auth. Ind. Dev. Rev. (Mid-Georgia Processing Co. Proj.) 4.4%, LOC Bank of America NA, VRDN (b)(c)
3,800
3,800
Wayne County Indl. Dev. Auth. Wtr. Disp. Rev. (Rayonier Proj.) Series 2000, 4.35%, LOC Suntrust Bank, VRDN (b)(c)
11,700
11,700
Worth County Ind. Dev. Auth. Ind. Dev. Rev. Rfdg. (Seabrook Peanut Co. Proj.) Series 1996 B, 4.35%, LOC Suntrust Bank, VRDN (b)
1,645
1,645
360,340
Hawaii - 1.2%
Hawaii Dept. of Budget & Fin. Spl. Purp. Rev. Bonds:
(Citizens Communications Co. Proj.) Series 1988 B, 4,810
4,810
(Citizens Communications the Gas Co. Proj.) Series 2000, 4.45% tender 10/6/00, CP mode (c)
6,000
6,000
(Citizens Utils. Co. Proj.) Series 1985, 6,200
6,200
Hawaii Gen. Oblig. Participating VRDN:
Series 001101, 4.33% (Liquidity Facility Citibank NA, 6,470
6,470
Series ROC 00 6, 4.33% (Liquidity Facility Salomon Smith Barney Hldgs., Inc.) (b)(e)
39,395
39,395
Hawaii Hsg. & Cmnty. Dev. Corp.:
Bonds Series 2000 M, 4.4%, tender 3/15/01 (Liquidity Facility Bank of America NA) (c)(e)
16,015
16,015
Participating VRDN Series PA 706 R, 4.38% (Liquidity Facility Merrill Lynch & Co., Inc.) (b)(c)(e)
5,630
5,630
Honolulu City & County Gen. Oblig. Series A, 4.25%, 12,050
12,050
96,570
Idaho - 0.1%
Idaho Hsg. & Fin. Assoc.:
Bonds Series PT 247, 4.45%, tender 2/22/01 (Liquidity Facility Banco Santander SA) (c)(e)(f)
3,015
3,015
Municipal Securities - continued
Principal
Amount (000s)
Value (Note 1)
(000s)
Idaho - continued
Idaho Hsg. & Fin. Assoc.: - continued
Participating VRDN:
Series PA 145 A, 4.38% (Liquidity Facility Merrill Lynch $ 2,525
$ 2,525
Series PT 1152, 4.38% (Liquidity Facility Merrill Lynch 5,305
5,305
10,845
Illinois - 10.1%
Bolingbrook Multi-family Hsg. Rev. (Amberton Apts. Proj.) 4.3%, LOC Lasalle Bank NA, VRDN (b)(c)
12,300
12,300
Carol Stream Multi-family Rev. (Saint Charles Square Proj.) 4.4% (Fannie Mae Guaranteed), VRDN (b)(c)
2,000
2,000
Chicago Arpt. Spl. Facilities Rev. (Centerpoint O'Hare Proj.) 4.35%, LOC Bank One NA, Chicago, VRDN (b)(c)
16,700
16,700
Chicago Board of Ed. Participating VRDN:
Series BA 96 BB, 4.38% (Liquidity Facility Bank of America NA) (b)(e)
18,690
18,690
Series Merlots 97 E, 4.37% (Liquidity Facility First Union Nat'l. Bank, North Carolina) (b)(e)
8,700
8,700
Series SGA 98, 4.35% (Liquidity Facility Societe Generale) (b)(e)
7,820
7,820
Chicago Gas Supply Rev.:
Bonds (Peoples Gas Lt. & Coke Co. Proj.) 4.05%, tender 12/1/00 (c)
7,825
7,825
Rfdg. (Peoples Gas Lt. & Coke Co. Proj.) Series 2000 C, 4.25%, VRDN (b)(c)
8,000
8,000
Chicago Gen. Oblig. Bonds Series 1999, 4%, tender 10/26/00
22,900
22,900
Chicago Ind. Dev. Rev.:
(Chicago Scenic Studios, Inc. Proj.) Series 2000, 4.35%, LOC Harris Trust & Savings Bank, Chicago, VRDN (b)(c)
4,230
4,230
(Flying Food Fare Midway Proj.) 4.45%, LOC Bank of America NA, VRDN (b)(c)
5,500
5,500
(Guernsey Bel, Inc. Proj.) Series 1996 B, 4.3%, LOC Harris Trust & Savings Bank, Chicago, VRDN (b)(c)
1,400
1,400
Chicago Midway Arpt. Rev. (American TransAir Proj.) 5,000
5,000
Chicago O'Hare Int'l. Arpt. Rev.:
Participating VRDN Series BA 99 X2, 4.36% (Liquidity Facility Bank of America NA) (b)(c)(e)
32,670
32,670
Series 1988 A, 4.45%, LOC Bayerische Landesbank Girozentrale, VRDN (b)(c)
61,500
61,500
Municipal Securities - continued
Principal
Amount (000s)
Value (Note 1)
(000s)
Illinois - continued
Chicago O'Hare Int'l. Arpt. Rev.: - continued
Series A, 4.35% 11/16/00, LOC Commerzbank AG, CP (c)
$ 6,000
$ 6,000
Chicago Rev. (HomeStart Prog.) Series 2000 A, 4.35%, 22,000
22,000
Chicago Sales Tax Rev. Participating VRDN Series Merlots 00 AAA, 4.37% (Liquidity Facility First Union Nat'l. Bank, North Carolina) (b)(e)
12,470
12,470
Chicago Single Family Mtg. Rev.:
Bonds:
Series 2000 B, 4.4% 3/1/01 (Trinity Fdg. Guaranteed) (c)
5,750
5,750
Series PT 448, 4.45%, tender 2/22/01 (Liquidity Facility Merrill Lynch & Co., Inc.) (c)(e)(f)
5,125
5,125
Participating VRDN Series FRRI 00 L12, 4.55% (Liquidity Facility Lehman Brothers, Inc.) (b)(c)(e)
6,475
6,475
Chicago Wtr. Rev. Participating VRDN:
Series Merlots 00 TT, 4.37% (Liquidity Facility First Union Nat'l. Bank, North Carolina) (b)(e)
9,200
9,200
Series Merlots 97 V, 4.37% (Liquidity Facility First Union Nat'l. Bank, North Carolina) (b)(e)
8,280
8,280
City of Rolling Meadows Solid Waste Disp. Rev. 12,200
12,200
Fulton Indl. Dev. Rev. (JT Cullen Co., Inc. Proj.) 4.45%, 4,585
4,585
Glendale Heights Participating VRDN Series PT 106, 4.38% (Liquidity Facility Merrill Lynch & Co., Inc.) (b)(e)
2,600
2,600
Illinois Dev. Fin. Auth. Envir. Facilities Rev. (Citizens Utils. Co. Proj.) Series 1997, 4.6%, VRDN (b)(c)
16,425
16,425
Illinois Dev. Fin. Auth. Ind. Dev. Rev.:
(Mapes & Sprowl Steel Ltd. Proj.) Series 1996 A, 4.45%, LOC Lasalle Bank NA, VRDN (b)(c)
2,763
2,763
(Overton Gear & Tool Corp. Proj.) Series 1994, 4.35%, 1,440
1,440
(R&R Enterprises 2nd Proj.) Series 1999 A, 4.35%, 6,235
6,235
Illinois Dev. Fin. Auth. Multi-family Hsg. Rev. Rfdg. (Garden Glen Apts. Proj.) Series 1993, 4.35%, LOC Commerzbank AG, VRDN (b)
17,610
17,610
Illinois Dev. Fin. Auth. Poll. Cont. Rev.:
(Illinois Pwr. Co. Proj.) Series 1987 D, 4.45%, 20,700
20,700
Rfdg. (Uno-Ven Co. Proj.) Series 1994, 4.25%, 3,700
3,700
Series A, 4.3% (MBIA Insured), VRDN (b)(c)
40,500
40,500
Municipal Securities - continued
Principal
Amount (000s)
Value (Note 1)
(000s)
Illinois - continued
Illinois Dev. Fin. Auth. Poll. Cont. Rev.: - continued
Series B, 4.35% (MBIA Insured), VRDN (b)(c)
$ 36,600
$ 36,600
Series C, 4.3% (MBIA Insured), VRDN (b)(c)
15,200
15,200
Illinois Dev. Fin. Auth. Rev.:
(AMR Pooled Fing. Prog.) Series A, 4.35% (Bank of America NA Guaranteed), VRDN (b)
22,155
22,155
(Local Govt. Fing. Prog.):
Series 1999 A, 4.35% (AMBAC Insured), VRDN (b)
37,000
37,000
Series 1999 B, 4.35% (AMBAC Insured), VRDN (b)
16,800
16,800
(Museum of Contemporary Art Proj.) Series 1994, 4.25%, LOC Bank One NA, Michigan, LOC Harris Trust & Savings Bank, Chicago, VRDN (b)
16,100
16,100
Illinois Edl. Facilities Auth. Rev.:
Participating VRDN:
Series 981302, 4.33% (Liquidity Facility Citibank NA, New York) (b)(e)
11,600
11,600
Series Merlots 97 U, 4.37% (Liquidity Facility First Union Nat'l. Bank, North Carolina) (b)(e)
9,040
9,040
4.1% 10/27/00, CP
15,500
15,500
Illinois Gen. Oblig. Participating VRDN:
Series 001302, 4.33% (Liquidity Facility Citibank NA, 5,000
5,000
Series 001304, 4.33% (Liquidity Facility Citibank NA, 9,100
9,100
Series Putters 133, 4.32% (Liquidity Facility J.P. Morgan & Co., Inc.) (b)(e)
7,575
7,575
Series ROC 00 10, 4.33% (Liquidity Facility Salomon Smith Barney Hldgs., Inc.) (b)(e)
12,365
12,365
Illinois Health Facilities Auth. Rev.:
(Resurrection Health Care Proj.) Series B, 4.25% 7,950
7,950
(Swedish Covenant Hosp. Proj.):
Series 1995, 4.25% (AMBAC Insured), VRDN (b)
15,170
15,170
Series 1998, 4.25% (AMBAC Insured), VRDN (b)
9,300
9,300
Illinois Hsg. Dev. Auth. Multi-family Hsg. Rev. Bonds:
Series 1999 B1, 4.2%, tender 12/22/00
3,350
3,350
Series 1999 B2, 4.25%, tender 12/22/00 (c)
1,435
1,435
Illinois Hsg. Dev. Auth. Rev. Participating VRDN 10,000
10,000
Illinois Int'l. Port District Facilities (Southdown, Inc. Proj.) 4,500
4,500
Municipal Securities - continued
Principal
Amount (000s)
Value (Note 1)
(000s)
Illinois - continued
Illinois Reg'l. Trans. Auth. Participating VRDN:
Series SG 3, 4.33% (Liquidity Facility Societe Generale) (b)(e)
$ 4,000
$ 4,000
Series SGB 19, 4.33% (Liquidity Facility Societe Generale) (b)(e)
8,675
8,675
Illinois Student Assistance Commission Student Ln. Rev.:
Series 1996 A, 4.3%, LOC Bank of America NA, VRDN (b)(c)
19,800
19,800
Series AI, 4.3% (MBIA Insured), VRDN (b)(c)
11,500
11,500
Series AII, 4.3% (MBIA Insured), VRDN (b)(c)
17,500
17,500
Lisle Village Multi-family Hsg. Rev. (Devonshire of Lisle Proj.) Series 1991, 4.32%, (Ponds of Pembroke LP) LOC Freddie Mac, VRDN (b)(c)
3,800
3,800
Metro. Pier & Exposition Auth. Dedicated Tax Rev. Participating VRDN Series MSDW 00 296, 4.33% (Liquidity Facility Morgan Stanley Dean Witter
& Co.) (b)(e)
2,495
2,495
Mundelein Ind. Dev. Rev. (Print-O-Tape Proj.) Series 1997, 4.35%, LOC Harris Trust & Savings Bank, Chicago, VRDN (b)(c)
4,730
4,730
Palos Hills Multi-family Hsg. Rev. (Green Oaks Proj.) 2,800
2,800
Rockford Ind. Dev. Rev. (Ringcan Corp. Proj.) Series 1998, 4.35%, LOC Suntrust Bank, VRDN (b)(c)
1,800
1,800
Saint Charles Ind. Dev. Rev. (Pier 1 Imports-Midwest, Inc. Proj.) Series 1986, 4.45%, LOC Bank One, Texas NA, VRDN (b)(c)
7,100
7,100
Southwestern Illinois Dev. Auth. Solid Waste Disp. Rev. 6,400
6,400
Univ. of Illinois Rev. Participating VRDN:
Series Merlots 00 S, 4.37% (Liquidity Facility First Union Nat'l. Bank, North Carolina) (b)(e)
3,500
3,500
Series SG 65, 4.33% (Liquidity Facility Societe Generale) (b)(e)
2,705
2,705
Vernon Hills Ind. Dev. Rev. (Accurate Transmissions Proj.) 4.5%, LOC Harris Trust & Savings Bank, Chicago, VRDN (b)(c)
5,235
5,235
West Chicago Ind. Dev. Auth. Ind. Dev. Rev. (Bison Gear & Engineering Corp. Proj.) 4.45%, (Bullock Family LP) 5,660
5,660
Will-Kankakee Reg'l. Dev. Auth. Indl. Dev. Rev. (Unimast, Inc. Proj.) Series 2000, 4.35%, LOC Citibank NA, New York, VRDN (b)(c)
3,000
3,000
795,733
Municipal Securities - continued
Principal
Amount (000s)
Value (Note 1)
(000s)
Indiana - 3.1%
Burns Hbr. Ind. Dev. Rev. (J&F Steel Corp. Proj.) 4.5%, $ 7,600
$ 7,600
Columbus Rev. Rfdg. (Rock-Tenn Co. Mill Division Proj.) 4,450
4,450
Connersville Econ. Dev. Rev. (Inland Southern Corp. Proj.) Series 1997, 4.4%, LOC Bank of America NA, VRDN (b)(c)
2,500
2,500
Crawford County Econ. Dev. Rev. (Jasper Engine Exchange Proj.) Series 1997, 4.45%, LOC PNC Bank NA, VRDN (b)(c)
3,200
3,200
Elkhart County Econ. Dev. Rev. (Burger Dairy Proj.) 4.7%, 1,705
1,705
Elkhart County Multifamily Hsg. Rev. (Pedcor Invts. Proj.) 6,200
6,200
Fort Wayne Poll. Cont. Rev. (Gen. Motors Corp. Proj.) 4.35%, VRDN (b)
9,000
9,000
Franklin Econ. Dev. Rev. (Pedcor Invts. LP-Lakeview II Proj.) 4.32%, LOC Fed. Home Ln. Bank, Indianapolis, VRDN (b)(c)
2,178
2,178
Greenwood Econ. Dev. Rev. (Endress & Hauser, Inc. Proj.) Series A, 4.5%, LOC Deutsche Bank AG, VRDN (b)(c)
4,000
4,000
Indiana Bond Bank TAN Series 2000 A2, 4.75% 1/18/01, LOC Bank of America NA
31,600
31,666
Indiana Dev. Fin. Auth. (Mid-American Energy Resources Proj.) Series 1999, 4.35%, LOC Lasalle Bank NA, VRDN (b)(c)
5,000
5,000
Indiana Edl. Facilities Auth. Rev. BAN (Wabash College Proj.) 4.85% 5/3/01
10,000
10,023
Indiana Hsg. Fin. Auth.:
Bonds Series PT 246, 4.45%, tender 2/22/01 (Liquidity Facility Merrill Lynch & Co., Inc.) (c)(e)(f)
6,420
6,420
Participating VRDN Series Merlots 97 H, 4.42% (Liquidity Facility First Union Nat'l. Bank, North Carolina) (b)(c)(e)
8,590
8,590
Indiana Office Bldg. Communication Cap. Complex Rev. 21,800
21,800
Indiana Port Commission Port Rev. (Kosmos Cement Co. Proj.) Series 2000, 4.35%, LOC Suntrust Bank, VRDN (b)(c)
5,500
5,500
Indianapolis Arpt. Auth. Rev. Participating VRDN Series SGA 31, 4.3% (Liquidity Facility Societe Generale) (b)(e)
5,000
5,000
Indianapolis Arpt. Facilities Rev. 4.35% 11/16/00, 18,600
18,600
Indianapolis Econ. Dev. Rev. (US LLC Proj.) Series 1996, 4.5%, LOC Bank One, Indiana NA, VRDN (b)(c)
605
605
Indianapolis Gas Util. Sys. Rev. 4.45% 9/8/00, CP
6,400
6,400
Municipal Securities - continued
Principal
Amount (000s)
Value (Note 1)
(000s)
Indiana - continued
Kendallville Ind. Dev. Rev. Rfdg. (Philip Morris Co., Inc. Proj.) Series 1993, 4.4%, VRDN (b)
$ 2,475
$ 2,475
Lawrence County Ind. Dev. Rev. (D&M Tool Proj.) 4.43%, 2,180
2,180
Logansport Ind. Dev. Rev. (Nelson Tube Co. Proj.) Series 1996, 4.43%, LOC Huntington Nat'l. Bank, Columbus, VRDN (b)(c)
1,485
1,485
Morristown Envir. Impt. Rev. (Eftec, Inc. Proj.) Series 2000, 4.45%, LOC First Union Nat'l. Bank, North Carolina, VRDN (b)(c)
7,700
7,700
Muncie Ind. Dev. Rev. (Diamond Plastics Corp. Proj.) 3,300
3,300
Petersburg Solid Waste Disp. Rev. (Indianapolis Pwr. & Lt.
Series 1995 C, 4.55%, VRDN (b)(c)
20,800
20,800
Series 1996, 4.55%, VRDN (b)(c)
6,000
6,000
Series A, 4.25%, VRDN (b)(c)
9,700
9,700
Purdue Univ. Univ. Rev. Participating VRDN Series PA 760R, 4.33% (Liquidity Facility Merrill Lynch & Co., Inc.) (b)(e)
4,400
4,400
Rockport Ind. Dev. Rev. (AK Steel Corp. Proj.) Series 1998 A, 4.3%, LOC PNC Bank NA, VRDN (b)(c)
10,000
10,000
Rockport Poll. Cont. Rev. (AK Steel Corp. Proj.) Series 1997 A, 4.3%, LOC PNC Bank NA, VRDN (b)(c)
9,000
9,000
Scottsburg Ind. Dev. Rev. (Multi-Color Corp. Proj.) 4.45%, 3,000
3,000
Sullivan Poll. Cont. Rev. Bonds (Hoosier Energy Rural Elec. Coop. Proj.) Series 1985 L2, 4.35% tender 11/17/00 (Nat'l. Rural Util. Coop. Fin. Corp.
Guaranteed), CP mode
7,400
7,400
247,877
Iowa - 0.3%
Iowa Fin. Auth. Rev. (Wheaton Franciscan Svcs. Proj.) 15,700
15,700
Iowa Fin. Auth. Small Bus. Dev. Rev. (Corporate Ctr. Proj.) 4.55%, LOC Bank of America NA, VRDN (b)
6,000
6,000
21,700
Kansas - 0.7%
Burlington Poll. Cont. Rev. Bonds (Kansas Elec. Pwr. Coop. Proj.) Series 1985 C2, 4.3% tender 11/10/00 (Nat'l. Rural Util. Coop. Fin. Corp.
Guaranteed), CP mode
2,200
2,200
Chanute Indl. Dev. Rev. (Ash Grove Cement Co. Proj.) 21,500
21,500
Municipal Securities - continued
Principal
Amount (000s)
Value (Note 1)
(000s)
Kansas - continued
Kansas City Util. Sys. Rev. Rfdg. & Impt. Participating VRDN Series FRRI 1, 4.45% (Liquidity Facility Bank of New York NA) (b)(e)
$ 14,840
$ 14,840
Kansas Dept. of Trans. Hwy. Rev. Participating VRDN 5,000
5,000
La Cygne Envir. Impt. Rev. Rfdg. (Kansas City Pwr. & Lt. Co. Proj.) Series 1994, 4.4%, VRDN (b)
7,500
7,500
Wichita Arpt. Facilities Rev. (Cessna Citation Proj.) 4.4%, 3,745
3,745
54,785
Kentucky - 3.4%
Boone County Ind. Dev. Rev. (Hennegan Co. Proj.) 4.34%, 1,115
1,115
Carroll County Solid Waste Disp. Rev.:
(Celotex Corp. Proj.) 4.4%, LOC Bank of America NA, VRDN (b)(c)
7,900
7,900
(North American Stainless Proj.) 4.35%, LOC Bank One NA, Chicago, VRDN (b)(c)
7,800
7,800
Daviess County Exempt Facilities Rev. (Kimberly-Clark Tissue Co. Proj.) 4.35% (Kimberly-Clark Corp. Guaranteed), VRDN (b)(c)
4,000
4,000
Daviess County Solid Waste Disp. Facilities Rev. (Scott Paper Co. Proj.):
Series 1993 A, 4.35% (Kimberly-Clark Corp. Guaranteed), VRDN (b)(c)
20,450
20,450
Series 1993 B, 4.35% (Kimberly-Clark Corp. Guaranteed), VRDN (b)(c)
8,900
8,900
Series 1994 A, 4.35% (Kimberly-Clark Corp. Guaranteed), VRDN (b)(c)
5,000
5,000
Elizabethtown Ind. Bldg. Rev. (Altec Proj.) Series 1997, 4.4%, LOC Wachovia Bank NA, VRDN (b)(c)
5,000
5,000
Franklin County Ind. Dev. Rev. (Certified Tool & Manufacturing Proj.) 4.5%, LOC Bank One, Illinois NA, VRDN (b)(c)
2,880
2,880
Glasgow Indl. Bldg. Rev. (Felker Brothers Corp. Proj.) 4.45%, LOC Firstar Bank NA, VRDN (b)(c)
5,000
5,000
Henderson County Indl. Dev. Auth. (Pittsburg Tank & Tower Co. Proj.) 4.39%, LOC Firstar Bank NA, VRDN (b)(c)
7,000
7,000
Jefferson County Hosp. Rev. Participating VRDN Series FRRI L4, 4.45% (Liquidity Facility Lehman Brothers, Inc.) (b)(e)
7,800
7,800
Jefferson County Ind. Bldg. Rev. (Wynn Starr Foods Proj.) Series 1996, 4.5%, LOC Bank One, Kentucky NA, VRDN (b)(c)
2,160
2,160
Municipal Securities - continued
Principal
Amount (000s)
Value (Note 1)
(000s)
Kentucky - continued
Jefferson County Poll. Cont. Rev. Bonds (Louisville Gas & Elec. Co. Proj.):
Series 1993 A, 4.4% tender 9/13/00, CP mode
$ 14,450
$ 14,450
Series 1996 A, 4.4% tender 9/13/00, CP mode
9,000
9,000
Series 1997 A, 4.4% tender 9/13/00, CP mode (c)
25,500
25,500
Jefferson County Retirement Home Rev. (Nazareth Library Proj.) 4.35%, LOC Fifth Third Bank, Cincinnati, VRDN (b)
3,500
3,500
Kentucky Econ. Dev. Fin. Auth. Indl. Bldg. Rev. (Goodwill Industries Kentucky, Inc. Proj.) 4.35%, LOC Bank One, Kentucky NA, VRDN (b)
2,960
2,960
Kentucky Hsg. Corp. Hsg. Rev. Bonds Series 2000 D, 4.4%, tender 12/1/00 (c)
6,000
6,000
Larue County Indl. Dev. Rev. (CMH Hodgenville, Inc. Proj.) Series 2000, 4.4%, LOC Wachovia Bank NA, VRDN (b)(c)
6,000
6,000
Louisville & Jefferson County Reg'l. Arpt. Auth. Sys. Rev.:
Series 1996 A, 4.4%, LOC Nat'l. City Bank, Kentucky, VRDN (b)(c)
29,150
29,150
Series AA1, 4.4%, LOC Nat'l. City Bank, Kentucky, VRDN (b)(c)
8,900
8,900
Louisville & Jefferson County Swr. District Rev. Participating VRDN Series 991701, 4.33% (Liquidity Facility Citibank NA, New York) (b)(e)
6,115
6,115
Perry County Solid Waste Disp. Rev. (TJ Int'l. Proj.) 3,355
3,355
Trimble County Poll. Cont. Rev. Bonds (Louisville Gas & Elec. Co. Proj.):
Series 1992 A, 4.4% tender 9/13/00, CP mode
41,365
41,365
Series 1997 A, 4.6% tender 9/22/00, CP mode (c)
27,400
27,400
Walton Ind. Bldg. Rev. (Clarion Manufacturing Corp. of America Proj.) 4.41%, LOC Fifth Third Bank, Cincinnati, VRDN (b)(c)
1,770
1,770
270,470
Louisiana - 1.3%
Caddo Parish Indl. Dev. Board Exempt Facilities Rev. 13,000
13,000
Jefferson Parish Home Mtg. Auth. Single Family Mtg. Rev. Bonds Series C2, 4.65% 6/29/01 (c)
8,000
8,000
Jefferson Parish Hosp. Svc. District #2 Participating VRDN Series CDC 99 C, 4.35% (Liquidity Facility Caisse des Depots et Consignations) (b)(e)
13,500
13,500
Municipal Securities - continued
Principal
Amount (000s)
Value (Note 1)
(000s)
Louisiana - continued
Lincoln Parish Exempt Facilities Rev. (Williamette Inds., Inc. Proj.) Series 1996, 4.25%, LOC Deutsche Bank AG, VRDN (b)(c)
$ 3,300
$ 3,300
Louisiana Hsg. Fin. Agcy. Mtg. Rev. Bonds Series 2000 C, 5.25%, tender 6/1/01 (AMBAC Guaranteed) (c)
4,100
4,100
Louisiana Hsg. Fin. Agcy. Rev. Participating VRDN Series RF 99 3, 4.48% (Liquidity Facility Bank of New York NA) (b)(c)(e)
7,390
7,390
Louisiana Pub. Facilities Auth. Rev. (Equip. & Cap. Pooled Ln. Prog.) Series 2000, 4.33%, (University Facilities, Inc.) 6,820
6,820
Lousiana Local Govt. Envir. Facilities Cmnty. Dev. Auth. Rev. (Shreveport/Independence Proj.) 4.35% (MBIA Insured), VRDN (b)
13,500
13,500
New Orleans Aviation Board Rev. Series 1997 A, 4.4% 11,900
11,900
Saint James Parish Gen. Oblig. (American Iron Prod. Proj.) Series 1997, 4.45%, LOC Bank of America NA, 7,000
7,000
South Louisiana Port Commission Port Facilities Rev. (Holnam, Inc. Proj.) 4.45%, LOC Wachovia Bank NA, VRDN (b)(c)
4,900
4,900
West Baton Rouge Parish Indl. District #3 Rev.:
(Dow Chemical Co. Proj.) Series 1995, 4.5%, VRDN (b)(c)
2,400
2,400
Rfdg. Bonds (Dow Chemical Co. Proj.) Series 1991, 4.2% tender 9/14/00, CP mode
4,800
4,800
100,610
Maine - 0.1%
Maine Hsg. Auth. Mtg. Purchase Rev. Participating VRDN Series 1999 P, 4.38% (Liquidity Facility Bank of America NA) (b)(c)(e)
11,000
11,000
Maryland - 2.2%
Baltimore County Metro. District 4.2% 10/13/00, CP
10,000
10,000
Baltimore Gen. Oblig. Rev. Rfdg. Participating VRDN 13,900
13,900
Howard County Econ. Dev. Rev. (Pace, Inc. Proj.) 4.4%, 1,500
1,500
Maryland Cmnty. Dev. Administration Dept. Hsg. & Cmnty. Dev.:
Bonds:
Series D, 4.7% 6/14/01 (c)
11,000
11,000
4.05% 12/14/00 (c)
10,000
10,000
Participating VRDN:
Series FRRI A66, 4.5% (Liquidity Facility Bayerische Hypo-und Vereinsbank AG) (b)(e)
21,800
21,800
Municipal Securities - continued
Principal
Amount (000s)
Value (Note 1)
(000s)
Maryland - continued
Maryland Cmnty. Dev. Administration Dept. Hsg. & Cmnty. Dev.: - continued
Series Merlots 00 lll, 4.43% (Liquidity Facility First Union Nat'l. Bank, North Carolina) (b)(c)(e)
$ 13,420
$ 13,420
Series MSDW 00 270, 4.33% (Liquidity Facility Morgan Stanley Dean Witter & Co.) (b)(e)
4,995
4,995
Maryland Econ. Dev. Auth. Rev. (Grafco Ind. Ltd. Proj.) 3,000
3,000
Maryland Econ. Dev. Corp. Rev. (CHF College Park Proj.) Series 2000 A, 4.3%, LOC First Union Nat'l. Bank, 9,700
9,700
Montgomery County Hsg. Opportunity Commission Hsg. Rev.:
(Draper Lane Apts. Proj.) 4.45% (FGIC Insured), VRDN (b)(c)
19,300
19,300
(The Grand Proj.) Series 1997 1, 4.25%, (Wisconsin Park Assoc. LP) LOC Fannie Mae, VRDN (b)(c)
45,600
45,600
Northeast Maryland Waste Disp. Auth. Participating VRDN 8,415
8,415
172,630
Massachusetts - 0.3%
Massachusetts Bay Trans. Auth. RAN Series 1999 B, 4.25% 9/1/00
11,200
11,200
Massachusetts Tpk. Auth. Western Tpk. Rev. Participating VRDN Series BA 97 N, 4.41% (Liquidity Facility Bank of America NA) (b)(e)
12,850
12,850
24,050
Michigan - 1.9%
Clinton Econ. Dev. Corp. Rev. (Clinton Area Care Ctr. Proj.) 4.33%, LOC Northern Trust Co., Chicago, VRDN (b)
5,700
5,700
Detroit Swr. Disp. Rev.:
Participating VRDN:
Series BS 99 81, 4.3% (Liquidity Facility Bear Stearns Companies, Inc.) (b)(e)
9,700
9,700
Series Merlots 00 I, 4.37% (Liquidity Facility First Union Nat'l. Bank, North Carolina) (b)(e)
3,200
3,200
Series SG 133, 4.33% (Liquidity Facility Societe Generale) (b)(e)
17,825
17,825
Series 1998 B, 4.25% (MBIA Insured) (BPA Morgan Guaranty Trust Co., NY), VRDN (b)
11,550
11,550
Detroit Wtr. Supply Sys. Rev. Participating VRDN 6,995
6,995
Municipal Securities - continued
Principal
Amount (000s)
Value (Note 1)
(000s)
Michigan - continued
Detroit Wtr. Sys. Rev. Participating VRDN:
Series 992201, 4.33% (Liquidity Facility Citibank NA, $ 7,000
$ 7,000
Series 992202, 4.33% (Liquidity Facility Citibank NA, 12,520
12,520
Michigan Hosp. Fin. Auth. Rev.:
Participating VRDN Series 1997 X, 4.37% (Liquidity Facility First Union Nat'l. Bank, North Carolina) (b)(e)
7,200
7,200
(United Memorial Hosp. Assoc. Proj.) Series 1999, 4.33%, LOC Huntington Nat'l. Bank, Columbus, VRDN (b)(c)
6,600
6,600
Michigan Hsg. Dev. Auth. Single Family Mtg. Rev. Bonds Series 1999 B, 3.95%, tender 12/1/00 (c)
2,300
2,300
Michigan Strategic Fund Ltd. Oblig. Rev.:
(Dow Chemical Co. Proj.) Series 1999, 4.5%, VRDN (b)(c)
3,400
3,400
(Fintex LLC Proj.) Series 2000, 4.45%, LOC Comerica Bank, Detroit, VRDN (b)(c)
3,600
3,600
(Majestic Ind., Inc. Proj.) 4.45%, LOC Comerica Bank, Detroit, VRDN (b)(c)
2,200
2,200
(Nat'l. Rubber Michigan, Inc. Proj.) Series 1995, 4.35%, LOC Nat'l. Bank of Canada, VRDN (b)(c)
2,100
2,100
(Orchestra Place Renewal Proj.) Series 2000, 4.29%, 6,500
6,500
Michigan Strategic Fund Poll. Cont. Rev. Bonds
4.2% tender 9/8/00, CP mode (c)
2,000
2,000
4.3% tender 11/10/00, CP mode (c)
8,050
8,050
Michigan Strategic Fund Solid Waste Disp. Rev.:
(Grayling Gen. Station Proj.) Series 1990, 4.25%, 7,319
7,319
(Great Lakes Recovery Proj.) 4.35%, LOC Bank One NA, Michigan, VRDN (b)(c)
1,300
1,300
Oakland County Econ. Dev. Corp. (Pontiac Vision 6,705
6,705
Wayne Charter County Arpt. Rev. Participating VRDN 4,245
4,245
Wayne-Westland Cmnty. Schools Participating VRDN:
Series MSDW 98 56, 4.33% (Liquidity Facility Morgan Stanley Dean Witter & Co.) (b)(e)
4,805
4,805
Series MSDW 98 67, 4.33% (Liquidity Facility Morgan Stanley Dean Witter & Co.) (b)(e)
3,800
3,800
146,614
Municipal Securities - continued
Principal
Amount (000s)
Value (Note 1)
(000s)
Minnesota - 0.7%
Becker Poll. Cont. Rev. Rfdg. (Northern States Pwr. Co.- $ 8,500
$ 8,500
Cloquet Ind. Facilities Rev. (Potlatch Corp. Proj.) Series C, 4.35%, LOC Wachovia Bank NA, VRDN (b)(c)
5,000
5,000
Dakota County Cmnty. Dev. Agcy. Single Family Rev. Rfdg. Bonds Series C, 4.3% 4/1/01 (c)
9,250
9,250
Hennepin County Gen. Oblig. Rfdg. Series 1996 C, 4.4%, VRDN (b)(c)
2,500
2,500
Minneapolis Saint Paul Metro. Arpts. Commission Rev. Participating VRDN Series FRRI A33, 4.45% (Liquidity Facility Bank of New York
NA) (b)(c)(e)
3,000
3,000
Minnesota Hsg. Fin. Agcy. Bonds:
(Residential Hsg. Fin. Prog.) Series PT 114, 4.33%, tender 2/22/01 (Liquidity Facility Merrill Lynch & Co., Inc.) (e)(f)
10,700
10,700
Series 2000 H, 4.4%, tender 8/30/01 (c)
9,610
9,610
Rochester Health Care Facilities Rev. Bonds (Mayo Foundation/Mayo Med. Ctr. Proj.) Series 1992 A, 4.6% tender 9/11/00, CP mode
9,600
9,600
58,160
Mississippi - 1.4%
DeSoto County Ind. Dev. Rev. (Flavorite Labs. Proj.) 700
700
Lowndes County Solid Waste Disp. Rev. Rfdg. (Weyerhaeuser Co. Proj.) Series 1999, 4.4%, VRDN (b)(c)
15,500
15,500
Mississippi Bus. Fin. Corp. Rev. (Calgon Carbon Corp. Proj.) Series 1997, 4.45%, LOC PNC Bank NA, VRDN (b)(c)
2,000
2,000
Mississippi Bus. Fin. Corp. Solid Waste Disp. Rev. Bonds (Choctaw Generation Ltd. Proj.) Series 1998, 4.3% tender 9/13/00, LOC Chase
Manhattan Bank, CP mode (c)
52,600
52,600
Mississippi Dev. Bank Spl. Oblig. Participating VRDN 12,885
12,885
Mississippi Gen. Oblig. Participating VRDN:
Series 992401, 4.33% (Liquidity Facility Citibank NA, 10,900
10,900
Series Putters 138, 4.32% (Liquidity Facility J.P. Morgan & Co., Inc.) (b)(e)
9,995
9,995
Mississippi Home Corp. Multi-family Hsg. Rev. (Colony Park Apts. Proj.) Series 1998 I, 4.45%, (Pearl Partners LP) 5,400
5,400
109,980
Municipal Securities - continued
Principal
Amount (000s)
Value (Note 1)
(000s)
Missouri - 0.7%
Clay County Ind. Dev. Auth. Ind. Rev. (K.C. Salad Real Estate Co. LLC Proj.) 4.4%, LOC Lasalle Bank NA, VRDN (b)(c)
$ 5,000
$ 5,000
Independence Ind. Dev. Auth. Ind. Dev. Rev. (Interlock Realty Co. Proj.) 4.6%, LOC Firstar Bank NA, VRDN (b)(c)
220
220
Lees Summit Ind. Dev. Rev. (BHA Technical, Inc. Proj.) 5,400
5,400
Missouri Dev. Fin. Board Ind. Dev. Rev. (Kawasaki Motors Manufacturing Corp. Proj.) Series 1999, 4.5%, LOC Westdeutsche Landesbank
Girozentrale, VRDN (b)(c)
8,000
8,000
Missouri Envir. Impt. & Energy Resource Auth. Rev. Rfdg. (Kansas City Pwr. & Lt. Co.) Series 1992, 4.3%, VRDN (b)
9,100
9,100
Missouri Higher Ed. Ln. Auth. Student Ln. Rev. Series 1991 B, 4.4% (MBIA Insured) (BPA State Street Bank & Trust Co.), VRDN (b)(c)
1,500
1,500
Missouri Hsg. Dev. Commission Single Family Mtg. Rev.:
Bonds:
(GIC Transamerica Life Proj.) Series A3, 4.3% 1/1/01 (c)
9,335
9,335
Series PT 341, 4.45%, tender 2/22/01 (Liquidity Facility Bayerische Hypo-und Vereinsbank AG) (c)(e)(f)
7,255
7,255
Participating VRDN:
Series FRRI A64, 4.5% (Liquidity Facility Bayerische Hypo-und Vereinsbank AG) (b)(c)(e)
2,700
2,700
Series PA 157, 4.38% (Liquidity Facility Merrill Lynch & Co., Inc.) (b)(c)(e)
1,945
1,945
Saint Louis Gen. Fund Rev. TRAN 5.25% 6/28/01
2,000
2,011
52,466
Montana - 0.1%
Montana Board of Hsg. Participating VRDN:
Series 2000 I, 4.38% (Liquidity Facility Bank of America NA) (b)(c)(e)
8,595
8,595
Series PT 87, 4.38% (Liquidity Facility Merrill Lynch & Co., Inc.) (b)(c)(e)
470
470
9,065
Nebraska - 0.6%
Nebhelp, Inc. Rev. Series C, 4.35%, LOC Student Ln. Marketing Assoc., VRDN (b)(c)
5,900
5,900
Nebraska Invt. Fin. Auth. Single Family Mtg. Rev. Participating VRDN:
Series 2000 H, 4.38% (Liquidity Facility Bank of America NA) (b)(c)(e)
7,495
7,495
Series BA 98 J, 4.38% (Liquidity Facility Bank of America NA) (b)(c)(e)
10,000
10,000
Municipal Securities - continued
Principal
Amount (000s)
Value (Note 1)
(000s)
Nebraska - continued
Nebraska Invt. Fin. Auth. Single Family Mtg. Rev. Participating VRDN: - continued
Series FRRI A3, 4.5% (Liquidity Facility Bayerische Hypo-und Vereinsbank AG) (b)(c)(e)
$ 3,085
$ 3,085
Series Merlots 00 O, 4.42% (Liquidity Facility First Union Nat'l. Bank, North Carolina) (b)(c)(e)
3,900
3,900
Series Merlots 00 UU, 4.42% (Liquidity Facility First Union Nat'l. Bank, North Carolina) (b)(c)(e)
15,000
15,000
45,380
Nevada - 1.6%
Clark County Spl. Facilities Arpt. Rev.:
Bonds (Signature Flight Support Proj.) Series 1998, 4.7%, tender 12/1/00, LOC Bayerische Landesbank Girozentrale (c)
7,535
7,535
Series 1998 B, 4.45% (MBIA Insured), VRDN (b)(c)
27,700
27,700
Series 1999 B2, 4.25%, LOC Bayerische Landesbank Girozentrale, VRDN (b)
10,000
10,000
Director of State Dept. Bus. & Ind. (Valley Joist, Inc. Proj.) Series A, 4.45%, LOC Toronto Dominion Bank, VRDN (b)(c)
8,250
8,250
Las Vegas Valley Wtr. District Series 1998 A, 4.6% 9,300
9,300
Nevada Gen. Oblig. Participating VRDN:
Series 962801, 4.33% (Liquidity Facility Citibank NA, 21,230
21,230
Series SG 39, 4.33% (Liquidity Facility Societe Generale) (b)(e)
9,160
9,160
Series SGB 31, 4.33% (Liquidity Facility Societe Generale) (b)(e)
23,100
23,100
Nevada Hsg. Division (Oakmont at Flamingo Rd. Proj.) 9,500
9,500
125,775
New Hampshire - 1.6%
New Hampshire Bus. Fin. Auth. Poll. Cont. Rev. Bonds
4.3% tender 9/22/00, CP mode (c)
30,500
30,500
4.4% tender 9/7/00, CP mode (c)
9,700
9,700
New Hampshire Bus. Fin. Auth. Rev. (Luminscent Sys., Inc. Proj.) Series 1998, 4.5%, LOC HSBC Bank USA, VRDN (b)(c)
4,850
4,850
Municipal Securities - continued
Principal
Amount (000s)
Value (Note 1)
(000s)
New Hampshire - continued
New Hampshire Bus. Fin. Auth. Solid Waste Disp. Rev. $ 10,200
$ 10,200
New Hampshire Hsg. Fin. Auth. Multi-family Hsg. Rev.:
(Fairways Proj.) 4.25%, (Greenways Ltd. partnership) 29,300
29,300
Rfdg. (Nashua-Oxford Proj.) Series 1990, 4.45% (Continental Casualty Co. Guaranteed), VRDN (b)
16,900
16,900
New Hampshire Hsg. Fin. Auth. Single Family Mtg.
Bonds Series 1999 D, 4% 12/1/00 (c)
3,600
3,600
Participating VRDN:
Series Merlots 97 F, 4.42% (Liquidity Facility First Union Nat'l. Bank, North Carolina) (b)(c)(e)
6,380
6,380
Series PA 351, 4.38% (Liquidity Facility Merrill Lynch & Co., Inc.) (b)(c)(e)
6,940
6,940
Series PT 348, 4.38% (Liquidity Facility Merrill Lynch & Co., Inc.) (b)(c)(e)
5,195
5,195
123,565
New Jersey - 0.1%
East Brunswick Township Gen. Oblig. BAN 4.75% 5/11/01
5,000
5,000
New Mexico - 0.8%
Dona Ana County Ind. Dev. Rev. (Karr Tool & Manufacturing Proj.) Series 1996, 4.45%, LOC Firstar Bank NA, VRDN (b)(c)
2,550
2,550
Farmington Poll. Cont. Rev. Participating VRDN Series Merlots 00 DD, 4.37% (Liquidity Facility First Union Nat'l. Bank, North Carolina) (b)(e)
15,900
15,900
New Mexico Edl. Assistance Foundation Student Ln. Rev. Bonds Series PT 262, 4.45%, tender 2/22/01 (Liquidity Facility Banco De Santander
Puerto Rico) (c)(e)(f)
5,835
5,835
New Mexico Hosp. Equip. Ln. Council Rev. (Pooled Ln. Prog.) Series 2000 A, 4.35%, (Liquidity Facility Landesbank Hessen-Thuringen), VRDN (b)
23,500
23,500
New Mexico Mtg. Fin. Auth.:
Bonds (Single Family Mtg. Prog.) Series PT 225, 4.45%, tender 2/22/01 (Liquidity Facility Merrill Lynch & Co., Inc.) (c)(e)(f)
10,055
10,055
Municipal Securities - continued
Principal
Amount (000s)
Value (Note 1)
(000s)
New Mexico - continued
New Mexico Mtg. Fin. Auth.: - continued
Participating VRDN Series PA 118, 4.4% (Liquidity Facility Merrill Lynch & Co., Inc.) (b)(c)(e)
$ 3,235
$ 3,235
New Mexico Single Family Hsg. Rev. Participating VRDN Series RF 00 B2, 4.43% (Liquidity Facility Bank of New York NA) (b)(c)(e)
5,315
5,315
66,390
New York - 1.9%
Long Island Pwr. Auth. Elec. Sys. Rev.:
Bonds Series PT 1043, 4.6%, tender 2/13/01 (Liquidity Facility Bank of America NA) (e)
7,400
7,400
Participating VRDN:
Series PA 420, 4.29% (Liquidity Facility Merrill Lynch & Co., Inc.) (b)(e)
9,200
9,200
Series PA 421, 4.29% (Liquidity Facility Merrill Lynch & Co., Inc.) (b)(e)
8,710
8,710
Series PA 565, 4.29% (Liquidity Facility Merrill Lynch & Co., Inc.) (b)(e)
5,800
5,800
Nassau County Gen. Oblig. RAN Series 2000 A, 6% 3/20/01, LOC Bank of Nova Scotia, LOC First Union Nat'l. Bank, North Carolina
8,300
8,367
New York City Gen. Oblig. Participating VRDN 19,005
19,005
New York City Metro Trans. Auth. Rev. Participating VRDN Series 983204, 4.3% (Liquidity Facility Citibank NA, New York) (b)(e)
8,900
8,900
New York City Muni. Wtr. Fin. Auth. Wtr. & Swr. Sys. Rev. Series 1:
4.3% 10/5/00, LOC Commerzbank AG, LOC Toronto Dominion Bank, CP
30,300
30,300
4.3% 10/12/00, LOC Commerzbank AG, LOC Toronto Dominion Bank, CP
13,000
13,000
New York Gen. Oblig. Bonds 4.55% tender 9/19/00, 9,900
9,900
New York State Mtg. Agcy. Participating VRDN 11,930
11,930
Municipal Securities - continued
Principal
Amount (000s)
Value (Note 1)
(000s)
New York - continued
New York State Pwr. Auth. Rev. & Gen. Purp. Series 1, 4.3% 10/2/00, CP
$ 7,300
$ 7,300
New York Transitional Fin. Auth. Rev. Participating VRDN Series 003204, 4.3% (Liquidity Facility Citibank NA, 6,900
6,900
146,712
Non State Specific - 0.2%
Stephens Equity Trust II Participating VRDN Series 1996, 4.43%, LOC HSBC Bank USA (b)(e)
19,081
19,081
North Carolina - 0.9%
Buncombe County Ind. Facilities & Poll. Cont. Fin. Auth. Rev. (Gold Star Coating Proj.) Series 1997, 4.45%, 2,745
2,745
Catawba County Ind. Facilities & Poll. Cont. Fin. Auth. Rev. (Kroehler Furniture Proj.) Series 1998, 4.45%, 4,600
4,600
Charlotte Arpt. Rev. Participating VRDN Series ROC 2 99 R9, 4.35% (Liquidity Facility Salomon Smith Barney Hldgs., Inc.) (b)(c)(e)
3,000
3,000
Columbus County Ind. Facilities & Poll. Cont. Rev. (Interkordsa, Inc. Proj.) Series 2000, 4.4%, LOC Bank of America NA, VRDN (b)(c)
8,250
8,250
Gaston County Ind. Facilities & Poll. Cont. Fing. Auth. Rev. (Quality Metal Products, Inc. Proj.) Series 1999, 4.4%, 5,000
5,000
Henderson County Ind. Facilities & Poll. Cont. Fin. Auth. Rev. (American Coating Technologies Proj.) 4.4%, LOC Bank of America NA, VRDN (b)(c)
4,050
4,050
North Carolina Eastern Muni. Pwr. Agcy. Pwr. Sys. Rev. Participating VRDN Series PA 685 R, 4.33% (Liquidity Facility Merrill Lynch & Co.,
Inc.) (b)(e)
4,995
4,995
North Carolina Edl. Facilities Fin. Agcy. Rev. (Providence Day School Proj.) Series 1999, 4.25%, LOC Bank of America NA, VRDN (b)
11,405
11,405
North Carolina Hsg. Fin. Agcy. Participating VRDN 5,000
5,000
Rockingham County Indl. Facilities & Poll. Cont. Fing. Auth. Rev. (Pine Brick Co., Inc. Proj.) Series 2000, 4.35%, 8,800
8,800
Surry County Ind. Facilities & Poll. Cont. Rev. (Intex Corp. Proj.) 4.4%, LOC Bank of America NA, VRDN (b)(c)
800
800
Municipal Securities - continued
Principal
Amount (000s)
Value (Note 1)
(000s)
North Carolina - continued
Union County Ind. Facilities & Poll. Cont. Fing. Auth. Rev. (Rock-Tennessee Converting Corp. Proj.) 4.35%, $ 5,350
$ 5,350
Wilmington Hsg. Auth. Multi-family Rev. (Garden Lake Estates Proj.) Series 1999, 4.35%, LOC Suntrust Bank, VRDN (b)(c)
6,000
6,000
69,995
North Dakota - 0.3%
North Dakota Hsg. Fin. Agcy. Rev. Bonds Series B, 4.25% 3/1/01 (c)
25,200
25,200
Ohio - 4.1%
American Muni. Pwr. BAN:
(Cleveland Pub. Pwr. Proj.) 3.9% 9/1/00
3,665
3,665
4.55% 8/22/01 (a)
2,025
2,025
Bowling Green Gen. Oblig. BAN:
4.75% 9/6/01 (a)
2,295
2,302
5.25% 6/14/01
3,690
3,702
Canfield Local School District BAN 4.5% 9/28/00
9,475
9,479
Clark County Multi-family Rev. (Masonic Home Proj.) 7,300
7,300
Clinton County Hosp. Rev. (Ohio Hosp. Cap., Inc. Pooled Fing. Prog.) Series 1998, 4.35%, LOC Fifth Third Bank, Cincinnati, VRDN (b)
14,580
14,580
Cuyahoga County Health Care Facilities Rev. (Althenheim Proj.) 4.33%, (West Side Deutscher Fra Verein) LOC Firstar Bank NA, VRDN (b)
8,300
8,300
Delaware County Health Care Facilities (Willow Brook Christian Cmnty. Proj.) Series 1999, 4.33%, LOC Huntington Nat'l. Bank, Columbus,
VRDN (b)
6,600
6,600
Delaware Gen. Oblig. BAN 5% 9/1/00
4,500
4,500
Dublin Gen. Oblig. BAN 4.5% 12/15/00
6,500
6,506
Geauga County Health Care Facilities Rev. (Heather Hill Lifecare Proj.) 4.33%, LOC Bank One NA, VRDN (b)
10,480
10,480
Greene County Gen. Oblig. BAN 5.5% 6/1/01
16,165
16,246
Hamilton County Swr. Sys. Rev. Participating VRDN 6,435
6,435
Lorain County Hosp. Rev. (Elyria United Methodist Village Proj.) Series 1996 B, 4.3%, LOC Bank One NA, VRDN (b)
4,320
4,320
Lorain County Independent Living Facilities (Elyria United Methodist Village Proj.) 4.3%, LOC Bank One NA, VRDN (b)
4,735
4,735
Montgomery County Multi-family Hsg. Dev. Rev. (Timber Creek Village Apts. Proj.) Series 1998, 4.36%, LOC Key Bank Nat'l. Assoc., VRDN (b)(c)
3,800
3,800
Municipal Securities - continued
Principal
Amount (000s)
Value (Note 1)
(000s)
Ohio - continued
Ohio Air Quality Dev. Auth. Rev.:
(Duquesne Lt. Co. Proj.) 4.4% (AMBAC Insured), VRDN (b)(c)
$ 4,500
$ 4,500
(JMG Fdg. LP Proj.) 4.35%, (Ohio Pwr. Co.) 4,900
4,900
Ohio Hsg. Fin. Agcy. Mtg. Rev.:
Bonds:
Series 2000 A2, 4.05% 9/1/00 (c)
9,900
9,900
Series 2000 C, 4.15%, tender 9/1/00 (c)
11,600
11,600
Series PT 241, 4.45%, tender 2/22/01 (Liquidity Facility Bayerische Hypo-und Vereinsbank AG) (c)(e)(f)
20,020
20,020
Participating VRDN:
Series 1999 A, 4.38% (Liquidity Facility Caisse des Depots et Consignations) (b)(c)(e)
16,900
16,900
Series 1999 Q, 4.38% (Liquidity Facility Bank of America NA) (b)(e)
23,500
23,500
Series 2000 F, 4.36% (Liquidity Facility Bank of America NA) (b)(c)(e)
11,695
11,695
Series BA 98 B, 4.38% (Liquidity Facility Bank of America NA) (b)(c)(e)
20,300
20,300
Series BA 98 Q, 4.38% (Liquidity Facility Bank of America NA) (b)(c)(e)
15,900
15,900
Series FRRI 25, 4.35% (Liquidity Facility Bank of New York NA) (b)(c)(e)
3,100
3,100
Series PT 282, 4.38% (Liquidity Facility Landesbank Hessen-Thuringen) (b)(c)(e)
5,495
5,495
Ohio Hsg. Fin. Agcy. Multi-family Hsg. Rev.:
(Club at Spring Valley Apts. Proj.) Series 1996 A, 4.35%, (Dayton Spring Valley Partners Ltd.) LOC Key Bank Nat'l. Assoc., VRDN (b)(c)
5,000
5,000
(Pedcor Invt. Willowlake Apts. Proj.) Series A, 4.4%, 1,420
1,420
Ohio Hsg. Fin. Agcy. Single Family Mtg. Participating VRDN:
Series 14, 4.4% (Liquidity Facility Bank of New York NA) (b)(c)(e)
2,200
2,200
Series FRRI A25, 4.35% (Liquidity Facility Commerzbank AG) (b)(c)(e)
17,160
17,160
Ohio Wtr. Dev. Auth. (Waste Mgmt., Inc. Proj.) Series 2000 A, 4.35%, LOC Fleet Nat'l. Bank, VRDN (b)(c)
8,100
8,100
Ohio Wtr. Dev. Auth. Poll. Cont. Rev. Rfdg. Series 1999 A, 4.4% (Duquesne Lt. Co.) (AMBAC Insured), VRDN (b)(c)
15,300
15,300
Richland County Ind. Dev. Rev. (Sabin Robbins Paper Co. Proj.) Series 1997, 4.34%, LOC Fifth Third Bank, Cincinnati, VRDN (b)(c)
1,000
1,000
Municipal Securities - continued
Principal
Amount (000s)
Value (Note 1)
(000s)
Ohio - continued
Stark County Ind. Dev. Rev.:
(H-P Products, Inc. Proj.) 4.45%, LOC Key Bank Nat'l. Assoc., VRDN (b)(c)
$ 2,205
$ 2,205
(Kidd Dev. Proj.) 4.5%, LOC Bank One NA, VRDN (b)(c)
1,500
1,500
Teays Valley Local School District BAN 5.125% 11/14/00
5,000
5,005
Univ. of Cincinnati BAN 5.25% 3/1/01
5,300
5,313
326,988
Oklahoma - 1.7%
Guymon Util. Auth. Rev. (Seaboard Proj.) Series 1995, 4.35%, LOC Suntrust Bank, VRDN (b)(c)
3,300
3,300
Oklahoma Dev. Fin. Auth. Rev. (Oklahoma Hosp. Assoc. Proj.):
Series 1999 A, 4.35% (CDC Fdg. Corp. Guaranteed), VRDN (b)
38,600
38,600
Series 2000 A, 4.35% (CDC Fdg. Corp. Guaranteed), VRDN (b)
11,700
11,700
Oklahoma Hsg. Fin. Agcy. Rev. Participating VRDN Series RF 00 5, 4.48% (Liquidity Facility Bank of New York NA) (b)(c)(e)
7,270
7,270
Oklahoma Hsg. Fin. Auth. Single Family Rev.:
Bonds:
(Homeownership Ln. Prog.) Series 2000 A4, 4.3%, tender 2/1/01 (c)
12,751
12,751
Series PT 104, 4.45%, tender 2/22/01 (Liquidity Facility Bayerische Hypo-und Vereinsbank AG) (c)(e)(f)
3,125
3,125
Series PT 167, 4.45%, tender 2/22/01 (Liquidity Facility BNP Paribas Sa) (c)(e)(f)
4,680
4,680
Series PT 305, 4.45%, tender 2/22/01 (Liquidity Facility Landesbank Hessen-Thuringen) (c)(e)(f)
5,480
5,480
Series PT 342, 4.45%, tender 2/22/01 (Liquidity Facility Bayerische Hypo-und Vereinsbank AG) (c)(e)(f)
5,395
5,395
Participating VRDN:
Series CDC 96 G, 4.4% (Liquidity Facility Caisse des Depots et Consignations) (b)(c)(e)
4,820
4,820
Series LB 99 A5, 4.5% (Liquidity Facility Bayerische Hypo-und Vereinsbank AG) (b)(c)(e)
3,900
3,900
Southeastern Oklahoma Ind. Auth. Solid Waste Disp. Rev. (Weyerhaeuser Co. Proj.):
Series 2000 A, 4.5%, VRDN (b)(c)
6,000
6,000
Series 2000 B, 4.4%, VRDN (b)
3,900
3,900
Municipal Securities - continued
Principal
Amount (000s)
Value (Note 1)
(000s)
Oklahoma - continued
Southeastern Oklahoma Ind. Auth. Solid Waste Disp. Rev. (Weyerhaeuser Co. Proj.): - continued
4.5%, VRDN (b)(c)
$ 15,400
$ 15,400
Tulsa Int'l. Arpt. Gen. Rev. Participating VRDN Series BA 97 B1, 4.43% (Liquidity Facility Bank of America NA) (b)(c)(e)
10,005
10,005
136,326
Oregon - 0.5%
Lane County Poll. Cont. Rev. (Weyerhaeuser Co. Proj.) 6,500
6,500
Oregon Econ. Dev. Rev. (Behlen Manufacturing Co. Proj.) Series 172, 4.5%, LOC Nat'l. Bank of Canada, VRDN (b)(c)
3,600
3,600
Oregon Health Hsg. Edl. & Cultural Facilities Auth.:
Bonds (Lewis & Clark College Proj.) Series 2000 A, 4.3% tender 10/5/00, LOC California Teachers Retirement Sys., LOC Canadian Imperial
Bank of Commerce, CP mode
6,000
6,000
(Hillside Manor Proj.) Series 2000 A, 4.33%, LOC Bank One, Arizona NA, VRDN (b)
12,350
12,350
Oregon Hsg. & Cmnty. Svcs. Dept. Bonds Series 2000 C, 4.25% 3/29/01
6,500
6,500
Port of Portland Arpt. Rev. Participating VRDN Series PA 574, 4.38% (Liquidity Facility Merrill Lynch & Co., Inc.) (b)(c)(e)
5,135
5,135
40,085
Pennsylvania - 3.7%
Allegheny County Arpt. Rev. Participating VRDN Series PA 567, 4.32% (Liquidity Facility Merrill Lynch & Co., Inc.) (b)(c)(e)
8,305
8,305
Allegheny County Hosp. Dev. Auth. Participating VRDN 3,600
3,600
Allegheny County Hosp. Dev. Auth. Rev. (Presbyterian Univ. Health Sys. Proj.) Series 1990 D, 4.25% (MBIA Insured), VRDN (b)
8,600
8,600
Allegheny County Ind. Dev. Auth. Rev. Rfdg. (Duquesne Lt. Co. Proj.) Series 1999 A, 4.35% (AMBAC Insured), VRDN (b)
19,600
19,600
Baldwin & Whitehall School District TRAN 4.98% 6/29/01
2,000
2,001
Beaver County Ind. Dev. Auth. Participating VRDN 19,800
19,800
Beaver County Ind. Dev. Auth. Poll. Cont. Rev. Participating VRDN Series 953503, 4.33% (Liquidity Facility Citibank NA, New York) (b)(e)
10,000
10,000
Beaver County Indl. Dev. Auth. Poll. Cont. Rev. Rfdg. (Duquesne Lt. Co. Proj.) Series 1999 A, 4.35% 10,500
10,500
Coatesville Area School District TRAN 4.64% 6/29/01
5,230
5,232
Municipal Securities - continued
Principal
Amount (000s)
Value (Note 1)
(000s)
Pennsylvania - continued
Crawford County Ind. Dev. Auth. Rev. (Clear Lake Lumber, Inc. Proj.) Series 1997, 4.45%, LOC PNC Bank NA, VRDN (b)(c)
$ 3,645
$ 3,645
Dauphin County Gen. Auth. Rev. (School District Pooled Fing. Prog.) 4.35% (AMBAC Insured) (BPA Bank of Nova Scotia) (BPA Commerzbank AG),
VRDN (b)
22,000
22,000
Emmaus Gen. Auth. Rev. (Pennsylvania Ln. Prog.) 50,000
50,000
Harrisburg Wtr. Auth. Rev. Participating VRDN Series SGA 80, 4.3% (Liquidity Facility Societe Generale) (b)(e)
5,400
5,400
Lancaster County Hosp. Auth. Rev. (Health Ctr. Willow Valley Proj.) Series B, 4.31% (MBIA Insured) (BPA PNC Bank NA), VRDN (b)
9,735
9,735
Lycoming County Ind. Dev. Auth. (Coastal Aluminum Rolling Mills Proj.) Series 1995, 4.4%, LOC First Union Nat'l. Bank, North Carolina,
VRDN (b)(c)
1,820
1,820
New Garden Gen. Auth. Muni. Rev. (Muni. Pooled Fing. Prog.) Series 1999, 4.35% (AMBAC Insured), VRDN (b)
20,000
20,000
North Pennsylvania Wtr. Auth. Wtr. Rev. Participating VRDN Series SGA 30, 4.3% (Liquidity Facility Societe Generale) (b)(e)
12,000
12,000
Northampton County Ind. Dev. Auth. Rev. (Binney & Smith, Inc. Proj.) Series 1997 A, 4.4%, LOC Bank One NA, Chicago, VRDN (b)(c)
1,900
1,900
Northeastern Pennsylvania Hosp. & Ed. Auth. Health Care Rev. (Wyoming Valley Health Care Proj.) Series 1994 A, 4.45% (AMBAC Insured),
VRDN (b)
13,800
13,800
Pennsylvania Econ. Dev. Fing. Auth. Exempt Facilities Rev. Bonds (Approved Solid Waste Proj.) Series 1999, 4.1% 12/15/00 (Bayerische
Landesbank Girozentrale Guaranteed) (c)
6,000
6,000
Pennsylvania Econ. Dev. Fing. Auth. Ind. Dev. Rev.:
(Alpha Carb Enterprises Proj.) Series 1995 D1, 4.45%, 800
800
Series 1995 A6, 4.45%, (RM Kerner Co.) 1,500
1,500
Series 1996 D5, 4.45%, (Tarco Roofing Materials, Inc.) 2,600
2,600
Series 1997 B1, 4.45%, (Hannibal-Pherson Properties) 1,500
1,500
Series 1997 B6, 4.45%, (Matrix Tool, Inc.) 900
900
Series 1997 B7, 4.45%, (North American Communications, Inc.) LOC PNC Bank NA, VRDN (b)(c)
600
600
Series 1997 B8, 4.45%, (John R. & Cheryl A. Petrs Partnership) LOC PNC Bank NA, VRDN (b)(c)
1,000
1,000
Series 1997 B9, 4.45%, (Turner Dairy Farms, Inc.) 1,100
1,100
Municipal Securities - continued
Principal
Amount (000s)
Value (Note 1)
(000s)
Pennsylvania - continued
Pennsylvania Higher Ed. Assistance Agcy. Student Ln. Rev. Series 2000 A, 4.35% (AMBAC Insured), VRDN (b)(c)
$ 19,800
$ 19,800
Pennsylvania Hsg. Fin. Agcy. Participating VRDN 1,440
1,440
Philadelphia Arpt. Rev. Participating VRDN Series SG 118, 4.32% (Liquidity Facility Societe Generale) (b)(c)(e)
5,000
5,000
Philadelphia Ind. Dev. Rev. (Cliveden-Maplewood Convalescent Ctr., Inc. Proj.) Series 1999, 4.35%, 6,740
6,740
Southcentral Pennsylvania Gen. Auth. Rev. Series 2000 A, 4.31% (AMBAC Insured), VRDN (b)
7,000
7,000
Venango Ind. Dev. Auth. Resource Recovery Rev. Bonds (Scrubgrass Proj.):
Series 1990 B, 4.25% tender 9/22/00, LOC Nat'l. Westminster Bank PLC, CP mode (c)
4,200
4,200
Series 1993, 4.25% tender 9/22/00, LOC Nat'l. Westminster Bank PLC, CP mode (c)
2,215
2,215
290,333
Rhode Island - 0.3%
Rhode Island Gen. Oblig. Participating VRDN 4,963
4,963
Rhode Island Hsg. & Mtg. Fin. Corp. Participating VRDN Series FRRI 30, 4.5% (Liquidity Facility Bank of New York NA) (b)(c)(e)
8,075
8,075
Rhode Island Ind. Facilities Corp. Ind. Dev. Rev.:
(Calise & Sons Bakery Proj.) Series 1999, 4.5%, 6,200
6,200
(NFA Corp. Proj.) 4.35%, LOC BankBoston NA, 1,900
1,900
21,138
South Carolina - 1.9%
Berkeley County Poll. Cont. Facilities Rev. (Alumax, Inc. Proj.) 4.33% (Alcoa, Inc. Guaranteed), VRDN (b)
6,100
6,100
Marlboro County Solid Waste Disp. Fac. (Willamette Ind., Inc. Proj.) Series 1995, 4.25%, LOC Deutsche Bank AG, VRDN (b)(c)
9,300
9,300
Oconee County Poll. Cont. Rev. (Duke Energy Corp. Proj.) Series B, 4.5%, VRDN (b)(c)
2,600
2,600
Orangeburg County Solid Waste Disp. Facilities Rev. Participating VRDN Series Merlots 97 B, 4.42% (Liquidity Facility First Union Nat'l. Bank,
North Carolina) (b)(c)(e)
5,650
5,650
South Carolina Edl. Facilities Auth. (Allen Univ. Proj.) 4.3%, LOC Bank of America NA, VRDN (b)
2,350
2,350
Municipal Securities - continued
Principal
Amount (000s)
Value (Note 1)
(000s)
South Carolina - continued
South Carolina Hsg. Fin. & Dev. Auth. Mtg. Rev. Participating VRDN Series PT 326, 4.38% (Liquidity Facility Commerzbank AG) (b)(c)(e)
$ 42,600
$ 42,600
South Carolina Jobs Econ. Dev. Auth. Econ. Dev. Rev.:
(Carolina Ceramics LLC Proj.) 4.4%, LOC Wachovia Bank NA, VRDN (b)(c)
5,600
5,600
(Chambers Richland Co. Landfill Proj.) Series 1997, 4.35%, LOC Suntrust Bank, VRDN (b)(c)
7,000
7,000
(Mohawk Ind., Inc. Proj.):
Series 1997 B, 4.43%, LOC First Union Nat'l. Bank, 1,800
1,800
Series A, 4.43%, LOC First Union Nat'l. Bank, North Carolina, VRDN (b)(c)
1,500
1,500
Series C, 4.43%, LOC First Union Nat'l. Bank, North Carolina, VRDN (b)(c)
3,900
3,900
(Ring Missouri LP Proj.) Series 1999, 4.35%, LOC Suntrust Bank, VRDN (b)(c)
5,800
5,800
(Tarmac Mid-Atlantic, Inc. Proj.) 4.4%, LOC Wachovia Bank NA, VRDN (b)(c)
7,500
7,500
(TMC, Inc. Proj.) 4.43%, LOC Southtrust Bank NA, VRDN (b)(c)
6,000
6,000
(Turnils North America Proj.) Series 1999, 4.35%, 5,900
5,900
(Virtual Image Technology Proj.) Series 1998, 4.45%, 1,800
1,800
South Carolina Jobs Econ. Dev. Auth. Healthcare Facilities 2,600
2,600
South Carolina Port Auth. Rev. Participating VRDN 5,000
5,000
South Carolina Pub. Svc. Auth. Rev.:
4.1% 9/14/00, CP
4,500
4,500
4.3% 9/6/00, CP
16,091
16,091
4.55% 10/12/00, CP
6,800
6,800
150,391
South Dakota - 0.3%
South Dakota Hsg. Dev. Auth. Bonds:
Series F, 4.5% 6/28/01
4,500
4,500
Series G, 4.5% 6/28/01 (c)
7,000
7,000
Series I, 3.85% 9/28/00 (c)
8,500
8,500
20,000
Municipal Securities - continued
Principal
Amount (000s)
Value (Note 1)
(000s)
Tennessee - 3.2%
Chattanooga Ind. Dev. Board Ind. Rev.:
(Burner Systems Int'l., Inc. Proj.) 4.4%, LOC Bank of America NA, VRDN (b)(c)
$ 2,000
$ 2,000
(Chattanooga Bakery, Inc. Proj.) 4.35%, LOC Suntrust Bank, VRDN (b)(c)
2,900
2,900
Clarksville Pub. Bldg. Auth. Rev. (Pooled Fing. Prog.) 4.25%, LOC Bank of America NA, VRDN (b)
10,000
10,000
Cleveland Ind. Dev. Board Rev. (Cormetech, Inc. Proj.) 7,700
7,700
Cumberland County Ind. Dev. Board Ind. Dev. Rev. 1,050
1,050
Dickson County Ind. Dev. Board Ind. Dev. Rev. (Tennessee Bun Co. Proj.) Series 1996, 4.45%, LOC PNC Bank NA, VRDN (b)(c)
1,900
1,900
Fayetteville & Lincoln County Ind. Dev. Rev. (V.A.W. of America, Inc. Proj.) Series 1997, 4.45%, LOC Bank of America NA, VRDN (b)(c)
2,000
2,000
Jackson Ind. Dev. Board Solid Waste Disp. Rev. (Florida Steel Corp. Proj.) Series 1995, 4.4%, LOC Bank of America NA, VRDN (b)(c)
3,000
3,000
Johnson City Health & Edl. Hosp. Rev. Participating VRDN Series FRRI 00 A2, 4.45% (Liquidity Facility Bank of New York NA) (b)(e)
4,300
4,300
Knox County Health & Ed. Hsg. Facilities Board Rev. 62,300
62,300
Knox County Health Edl. & Hsg. Facilities Board Hosp. Facilities Rev. Participating VRDN Series PA 750, 4.35% (Liquidity Facility Merrill Lynch &
Co., Inc.) (b)(e)
5,035
5,035
Knox County Ind. Dev. Board Ind. Dev. Rev. (Southern Foundry Supply, Inc. Proj.) 4.35%, LOC Suntrust Bank, 1,900
1,900
Loudon County Indl. Exempt Facilites Rev. (Kimberly Clark Corp. Proj.) 4.35%, VRDN (b)(c)
8,700
8,700
McMinn County Ind. Dev. Board Solid Waste Disp. Facilities Rev. (Bowater, Inc. Proj.) Series 1999, 4.4%, LOC Wachovia Bank NA, VRDN (b)(c)
12,800
12,800
Memphis Gen. Oblig. Participating VRDN Series SGB 23, 4.33% (Liquidity Facility Societe Generale) (b)(e)
3,700
3,700
Municipal Securities - continued
Principal
Amount (000s)
Value (Note 1)
(000s)
Tennessee - continued
Memphis-Shelby County Arpt. Auth. Arpt. Rev. Participating VRDN Series Merlots 00 C, 4.42% (Liquidity Facility First Union Nat'l. Bank, North
Carolina) (b)(c)(e)
$ 16,800
$ 16,800
Memphis-Shelby County Ind. Poll. Cont. Rev. (Birmingham Steel Co. Proj.) Series 1996, 4.45%, LOC PNC Bank NA, VRDN (b)(c)
4,300
4,300
Metro. Govt. Nashville & Davidson County Participating 7,600
7,600
Metro. Govt. Nashville & Davidson County Health & Ed. Facilities Board Rev. (Adventist Health Sys. Proj.) Series A, 4.25%, LOC Suntrust Bank,
VRDN (b)
5,800
5,800
Savannah Ind. Dev. Corp. Ind. Dev. Rev. (Shiloh Foods Proj.) 4.4%, LOC Bank of America NA, VRDN (b)(c)
2,400
2,400
Selmer McNairy County Ind. Dev. Board Rev. 5,000
5,000
Shelby County Participating VRDN Series 964201 Class A, 4.33% (Liquidity Facility Citibank NA, New York) (b)(e)
14,125
14,125
Shelby County Gen. Oblig. Series 1999 A, 4.15% 9/12/00, CP
26,200
26,200
South Pittsburg Ind. Dev. Board Rev. (Lodge Manufacturing Proj.) 4.35%, LOC Suntrust Bank, VRDN (b)(c)
1,400
1,400
Sullivan County Ind. Dev. Board Rev. Rfdg. (BC Realty Proj.) Series 1995, 4.35%, LOC First Tennessee Bank NA, VRDN (b)
2,800
2,800
Tennessee Hsg. Dev. Agcy.:
Bonds Series 2C, 4.75% 3/15/01 (c)
7,000
7,000
Participating VRDN:
Series PA 660R, 4.38% (Liquidity Facility Merrill Lynch & Co., Inc.) (b)(c)(e)
7,110
7,110
Series PT 272, 4.38% (Liquidity Facility Bayerische Hypo-und Vereinsbank AG) (b)(c)(e)
7,555
7,555
Volunteer Student Fund Corp. Student Ln. Rev.:
Series 1988 A1, 4.25%, LOC State Street Bank & Trust Co., VRDN (b)(c)
5,475
5,475
Series 1988 A2, 4.25%, LOC State Street Bank & Trust Co., VRDN (b)(c)
6,600
6,600
Williamson County Ind. Dev. Board Rev. (Telco, Inc. Proj.) Series 1996, 4.45%, LOC Bank of America NA, 1,800
1,800
251,250
Municipal Securities - continued
Principal
Amount (000s)
Value (Note 1)
(000s)
Texas - 15.6%
Austin Arpt. Sys. Rev. Participating VRDN Series Merlots 00 J, 4.42% (Liquidity Facility First Union Nat'l. Bank, North Carolina) (b)(c)(e)
$ 14,500
$ 14,500
Austin Combined Util. Sys. Rev.:
Participating VRDN Series BA 98 V, 4.33% (Liquidity Facility Bank of America NA) (b)(e)
12,100
12,100
Series A, 4.25% 10/11/00, LOC Morgan Guaranty Trust Co., NY, LOC State Street Bank & Trust Co., CP
6,532
6,532
Austin Gen. Oblig. Participating VRDN Series 1999 2, 4.33% (Liquidity Facility Bayerische Hypo-und Vereinsbank AG) (b)(e)
15,395
15,395
Austin Hsg. Fin. Corp. Multi-family Hsg. Rev. (Riverchase Proj.) Series 1985 A, 4.39%, LOC Household Fin. Corp., VRDN (b)
1,600
1,600
Austin Wtr. & Wastewtr. Sys. Participating VRDN 7,190
7,190
Austin Wtr. & Wastewtr. Sys. Rev. Participating VRDN 10,195
10,195
Bexar County Health Facilities Dev. Corp. Rev. (Warm Springs Rehabilitation Proj.) Series 1997, 4.35%, LOC Chase Bank of Texas NA, VRDN (b)
5,300
5,300
Brazos Hbr. Ind. Dev. Corp. Poll. Cont. Rev. Bonds (Dow Chemical Co. Proj.) Series 1986:
4.3% tender 10/13/00, CP mode
2,500
2,500
4.45% tender 9/8/00, CP mode
8,800
8,800
Brazos River Auth. Poll. Cont. Rev. Rfdg.:
(Texas Utils. Elec. Co. Proj.) 4.25% (MBIA Insured), VRDN (b)(c)
12,800
12,800
Bonds (Texas Utils. Elec. Co. Proj.):
Series 1994 A, 4.25% tender 10/20/00, LOC Chase Manhattan Bank of Delaware, CP mode (c)
1,500
1,500
Series B, 4.8% tender 9/6/00, LOC Chase Manhattan Bank of Delaware, CP mode (c)
22,100
22,100
Brazos River Hbr. Navigation Brazoria County Envir. Facilities Rev. (Merey Sweeny LP Proj.) Series 2000 A, 4.45%, 7,000
7,000
Brazos River Hbr. Navigation District of Brazoria County Poll. Cont. Rev. Bonds (Dow Chemical Co. Proj.) Series 1988:
4.2% tender 9/8/00, CP mode (c)
5,000
5,000
4.25% tender 10/18/00, CP mode (c)
20,000
20,000
4.4% tender 10/16/00, CP mode (c)
2,200
2,200
Municipal Securities - continued
Principal
Amount (000s)
Value (Note 1)
(000s)
Texas - continued
Brazos River Hbr. Navigation District of Brazoria County Rev.:
Bonds (Dow Chemical Co. Proj.):
Series 1991:
4.2% tender 9/14/00, CP mode
$ 8,200
$ 8,200
4.3% tender 10/11/00, CP mode
6,800
6,800
Series 1992:
4.2% tender 9/8/00, CP mode (c)
8,000
8,000
4.25% tender 10/18/00, CP mode (c)
24,010
24,010
4.35% tender 10/13/00, CP mode (c)
4,400
4,400
4.4% tender 10/16/00, CP mode (c)
5,000
5,000
(Dow Chemical Co. Proj.):
Series 1992 A, 4.5%, VRDN (b)(c)
5,400
5,400
Series 1993, 4.5%, VRDN (b)(c)
5,200
5,200
Series 1996, 4.5%, VRDN (b)(c)
3,400
3,400
Series 1997, 4.5%, VRDN (b)(c)
4,000
4,000
Series 2000, 4.5%, VRDN (b)(c)
3,700
3,700
Brownsville Ind. Dev. Corp. Rev. Rfdg. (Rich-Seapak Corp. Proj.) Series 1997, 4.35%, LOC Suntrust Bank, VRDN (b)(c)
1,500
1,500
Calhoun County Navigator District Port Rev. (Formosa Plastics Corp. Proj.) Series 2000, 4.45%, LOC Bank of America NA, VRDN (b)(c)
5,500
5,500
Calhoun County Solid Waste Disp. Rev. (Fomosa Plastics Corp. Proj.) Series 2000, 4.45%, LOC Bank of America NA, VRDN (b)(c)
5,500
5,500
Camp County Ind. Dev. Corp. Envir. Facilities Rev. (Pilgrim's Pride Corp. Proj.) Series 1999, 4.3%, LOC Harris Trust & Savings Bank, Chicago,
VRDN (b)(c)
17,000
17,000
Clear Creek Independent School District Participating VRDN Series PA 687 R, 4.33% (Liquidity Facility Merrill Lynch & Co., Inc.) (b)(e)
11,150
11,150
Comal County Health Facilities Dev. Rev.:
(McKenna Memorial Health Sys. Proj.) 4.35%, 6,600
6,600
(McKenna Memorial Hosp. Proj.) Series 1999, 4.35%, 4,900
4,900
Corpus Christi Util. Sys. Rev.:
Series A 4.3% 10/23/00, CP
6,700
6,700
Series A, 4.4% 9/14/00, CP
9,300
9,300
Dallas Area Rapid Transit Sales Tax Rev.:
Series C, 4.05% 9/13/00, LOC Bayerische Landesbank Girozentrale, LOC Westdeutsche Landesbank Girozentrale, CP
11,300
11,300
Series D, 4.35% 11/17/00, LOC Westdeutsche Landesbank Girozentrale, CP
5,000
5,000
Municipal Securities - continued
Principal
Amount (000s)
Value (Note 1)
(000s)
Texas - continued
Dallas Fort Worth Int'l. Arpt. Participating VRDN:
Series Merlots 00 II, 4.42% (Liquidity Facility First Union Nat'l. Bank, North Carolina) (b)(c)(e)
$ 11,695
$ 11,695
Series PA 678 R, 4.38% (Liquidity Facility Merrill Lynch & Co., Inc.) (b)(c)(e)
7,045
7,045
Dallas Fort Worth Reg'l. Arpt. Rev. Rfdg. Participating VRDN Series 954301 Class A, 4.33% (Liquidity Facility Citibank NA, New York) (b)(e)
24,435
24,435
Denton Util. Sys. Rev. Rfdg. Participating VRDN 15,230
15,230
Dublin Econ. Dev. Corp. Indl. Dev. Auth. Rev. (Universal Blanchers LLC Proj.) 4.35%, LOC Harris Trust & Savings Bank, Chicago, VRDN (b)(c)
4,200
4,200
El Paso Ind. Dev. Auth. Rev. (Camden Wire Co., Inc. Proj.) Series 1996, 4.5%, LOC Chase Manhattan Bank of Delaware, VRDN (b)(c)
2,300
2,300
Fort Worth Gen. Oblig. Series B, 4.3% 10/11/00, CP
11,400
11,400
Galveston Ind. Dev. Corp. Rev. Rfdg. (Mitchell Interests Proj.) 4.45%, LOC Bank One, Texas NA, VRDN (b)(c)
4,400
4,400
Georgetown Ind. Dev. Corp. Rev. (Chatsworth Prods., Inc. Proj.) Series 1996, 4.5%, LOC Bank One, Texas NA, VRDN (b)(c)
3,595
3,595
Grand Prairie Ind. Dev. Auth. Ind. Dev. Rev. (Precision/API Ketema Proj.) Series 1996, 4.5%, LOC HSBC Bank USA, VRDN (b)(c)
3,235
3,235
Greater East Texas Higher Ed. Auth. Student Ln. Rev.:
Bonds:
Series 1993 B, 4.8%, tender 6/1/01, LOC Student Ln. Marketing Assoc. (c)
5,600
5,600
Series 1995 A, 4.5%, tender 5/1/01, LOC Student Ln. Marketing Assoc. (c)
9,600
9,600
Rfdg. Bonds:
Series 1992 A, 3.8%, tender 9/1/00, LOC Student Ln. Marketing Assoc.
7,500
7,500
Series 1992 B, 3.85%, tender 9/1/00, LOC Student Ln. Marketing Assoc. (c)
7,500
7,500
Greater Texas Student Ln. Corp. Student Ln. Rev.:
Bonds Series 2000 A, 4.25%, tender 2/1/01, 10,000
10,000
Rfdg. Bonds Series 1996 B, 4.8%, tender 6/1/01, 4,250
4,250
Municipal Securities - continued
Principal
Amount (000s)
Value (Note 1)
(000s)
Texas - continued
Gulf Coast Ind. Dev. Auth.:
(Mueller Flow Tech., Inc. Proj.) Series 1997, 4.5%, $ 5,000
$ 5,000
(S&S X-ray Prod., Inc. Proj.) Series 1999, 4.45%, 8,075
8,075
Gulf Coast Indl. Dev. Auth. Marine Term. (Amoco Oil Co. Proj.) Series 1993, 4.45%, VRDN (b)(c)
3,400
3,400
Gulf Coast Waste Disp. Auth. Poll. Cont. Rev. (Air Products Proj.):
Series 1999, 4.3%, LOC Bank One NA, Chicago, VRDN (b)(c)
1,500
1,500
Series 2000, 4.3%, LOC Bank One NA, VRDN (b)(c)
22,600
22,600
Harlingen Ind. Dev. Auth. Ind. Dev. Rev. (Gibbs-Texas Die Casting Proj.) 4.55%, LOC Bank of America NA, VRDN (b)(c)
5,575
5,575
Harris County Cultural Ed. Facilities Fin. Corp. Rev. 27,300
27,300
Harris County Gen. Oblig.:
Series B, 4.3% 10/13/00, CP
2,990
2,990
Series C, 4.3% 10/13/00, CP
5,500
5,500
Series D, 4.2% 10/20/00, CP
3,908
3,908
Harris County Health Facilities Dev. Corp. Hosp. Rev.:
Participating VRDN Series FRRI 99 A53, 4.45% (Liquidity Facility Bayerische Hypo-und Vereinsbank AG) (b)(e)
6,200
6,200
(Children's Hosp. Proj.) Series 1999 B1, 4.3% (MBIA Insured), VRDN (b)
5,200
5,200
Harris County Health Facilities Dev. Corp. Spl. Facilities Rev. (Texas Med. Ctr. Proj.) Series 1999 B, 4.35% (FSA Insured), VRDN (b)
15,200
15,200
Harris County Hsg. Fin. Corp. Multi-family Hsg. Rev. (Quail Chase Apts. Proj.) Series 1999, 4.3%, LOC Gen. Elec. Cap. Corp., VRDN (b)(c)
11,110
11,110
Houston Gen. Oblig.:
Participating VRDN Series SGA 28, 4.3% (Liquidity Facility Societe Generale) (b)(e)
6,530
6,530
Series B:
4.1% 9/12/00, CP
11,700
11,700
4.2% 9/8/00, CP
9,100
9,100
4.45% 9/11/00, CP
9,800
9,800
Houston Higher Ed. Fin. Corp. Higher Ed. Rev. Participating VRDN:
Series SG 127, 4.33% (Liquidity Facility Societe Generale) (b)(e)
6,915
6,915
Series SG 139, 4.33% (Liquidity Facility Societe Generale) (b)(e)
15,645
15,645
Municipal Securities - continued
Principal
Amount (000s)
Value (Note 1)
(000s)
Texas - continued
Houston Wtr. & Swr. Sys. Rev.:
Participating VRDN Series FRRI A29, 4.45% (Liquidity Facility Bank of New York NA) (b)(e)
$ 10,150
$ 10,150
Series A, 4.6% 9/11/00, CP
3,800
3,800
Hunt Memorial Hosp. District Rev. Bonds Series 1998, 4%, tender 12/1/00 (FSA Insured)
6,720
6,720
Hurst Euless Bedford Independent School District Rfdg. Participating VRDN Series SG 98, 4.33% (Liquidity Facility Societe Generale) (b)(e)
5,270
5,270
Lower Colorado River Auth. Rev. Participating VRDN 6,000
6,000
McKinney Ind. Dev. Board Ind. Dev. Rev. (Delta Daily Food, Inc. Proj.) Series 1994, 4.35%, LOC RaboBank Nederland Coop. Central, VRDN (b)(c)
7,000
7,000
North Central Texas Health Facilities Dev. Corp. Rev. Bonds (Dallas Methodist Hosp. Proj.) Series 1998:
4.3% tender 10/13/00 (AMBAC Insured) (Liquidity Facility Dexia Cr. Local de France), CP mode
14,500
14,500
4.85% tender 9/8/00 (AMBAC Insured) (Liquidity Facility Dexia Cr. Local de France), CP mode
14,200
14,200
North East Texas Independent School District Participating VRDN Series SG 143, 4.33% (Liquidity Facility Societe Generale) (b)(e)
41,300
41,300
North Texas Higher Ed. Auth. Student Ln. Rev.:
Series 1991 C, 4.3% (AMBAC Insured) (BPA Student Ln. Marketing Assoc.), VRDN (b)(c)
10,200
10,200
Series 1991 F, 4.3% (AMBAC Insured) (BPA Student Ln. Marketing Assoc.), VRDN (b)(c)
7,600
7,600
Series 1993 A, 4.3%, LOC Student Ln. Marketing Assoc., VRDN (b)(c)
20,000
20,000
Series A, 4.3% (AMBAC Insured) (BPA Student Ln. 7,400
7,400
North Texas Tollway Auth. Participating VRDN 6,495
6,495
Polly Ryon Hosp. Auth. Texas Rev. (Polly Ryon Memorial Hosp. Proj.) 4.35%, LOC Chase Bank of Texas NA, VRDN (b)
4,050
4,050
Port Arthur Navigation District Indl. Dev. Corp. Exempt Facilities Rev. (Air Products & Chemicals, Inc. Proj.) 7,000
7,000
Municipal Securities - continued
Principal
Amount (000s)
Value (Note 1)
(000s)
Texas - continued
Port Corpus Christi Ind. Dev. Corp. Solid Waste Disp. Rev. (Coastal Refining & Marketing Proj.) 4.3%, LOC BNP Paribas Sa, VRDN (b)(c)
$ 4,900
$ 4,900
Port Corpus Christi Ind. Dev. Corp. Waste Cont. Rev. 25,000
25,000
Sabine River Auth. Poll. Cont. Rev. Rfdg. (Texas Utils. 25,400
25,400
San Antonio Elec. & Gas Rev.:
Participating VRDN:
Series SG 101, 4.33% (Liquidity Facility Societe Generale) (b)(e)
15,625
15,625
Series SG 105, 4.33% (Liquidity Facility Societe Generale) (b)(e)
23,980
23,980
Rfdg. Participating VRDN Series SG 104, 4.33% 11,725
11,725
San Antonio Gen. Oblig. 4.05% 9/13/00, CP
5,000
5,000
San Antonio Hotel Occupancy Tax Rev. Participating VRDN Series SG 51, 4.33% (Liquidity Facility Societe Generale) (b)(e)
4,150
4,150
San Antonio Ind. Dev. Auth. Ind. Dev. Rev. (LGC Bldg. & KLN Steel Proj.) Series 1998, 4.45%, LOC Bank of America NA, VRDN (b)(c)
2,300
2,300
San Antonio Wtr. Rev. Participating VRDN 8,700
8,700
San Marcos Ind. Dev. Corp. Ind. Dev. Rev. (Butler Manufacturing Co. Proj.) Series 1995, 4.39%, 3,000
3,000
Socorro Independent School District Variable Rate 8,400
8,400
Southeast Texas Hsg. Fin. Corp. Multi-family Hsg. Rev. 6,500
6,500
Tarrant County Health Facilities Dev. Corp. Health Sys. Rev. Participating VRDN Series Merlots 00 BB, 4.37% (Liquidity Facility First Union Nat'l.
Bank, North Carolina) (b)(e)
7,905
7,905
Tarrant County Health Facilities Dev. Corp. Rev. (Carter Blood Care Proj.) Series 1998, 4.35%, LOC Chase Bank of Texas NA, VRDN (b)
6,550
6,550
Terrell Dev. Corp. Ind. Dev. Rev. (Consolidated Sys. Proj.) 4.4%, LOC Wachovia Bank NA, VRDN (b)(c)
4,600
4,600
Municipal Securities - continued
Principal
Amount (000s)
Value (Note 1)
(000s)
Texas - continued
Texas A&M Univ. Rev. Participating VRDN Series SGA 21, 4.3% (Liquidity Facility Societe Generale) (b)(e)
$ 6,370
$ 6,370
Texas Dept. Hsg. & Cmnty. Affairs Mtg. Rev. Participating VRDN Series PT 9, 4.33% (Liquidity Facility Merrill Lynch & Co., Inc.) (b)(e)
940
940
Texas Dept. Hsg. & Cmnty. Affairs Single Family Mtg. Rev. Series A:
4.3% 10/27/00, CP (c)
12,800
12,800
4.35% 10/20/00, CP (c)
8,105
8,105
Texas Gen. Oblig.:
Participating VRDN:
Series FRRI 00 L18, 4.45% (Liquidity Facility Lehman Brothers, Inc.) (b)(e)
18,100
18,100
Series FRRI 00 N19, 4.45% (Liquidity Facility Bank of 66,900
66,900
Series Merlots 00 QQ, 4.42% (Liquidity Facility First Union Nat'l. Bank, North Carolina) (b)(c)(e)
17,100
17,100
Rfdg. (Veterans Land Proj.) Series A, 4.3%, VRDN (b)(c)
24,510
24,510
TRAN 5.25% 8/31/01
77,300
78,007
Texas Pub. Fin. Auth. Rev. Series 1993 A, 4.1% 9/6/00, CP
6,400
6,400
Univ. of Texas Univ. Rev.:
Participating VRDN:
Series MSDW 98 97, 4.33% (Liquidity Facility Morgan Stanley Dean Witter & Co.) (b)(e)
5,125
5,125
Series SGA 78, 4.3% (Liquidity Facility Societe Generale) (b)(e)
5,500
5,500
Series SGA 79, 4.3% (Liquidity Facility Societe Generale) (b)(e)
7,300
7,300
Series A, 4.3% 10/4/00, CP
7,990
7,990
1,233,072
Utah - 1.5%
Intermountain Pwr. Agcy. Ctfs. of Prtn. Rfdg. Participating VRDN Series 96C4402 Class A, 4.33% (Liquidity Facility Citibank NA, New York) (b)(e)
4,170
4,170
Intermountain Pwr. Agcy. Pwr. Supply Rev.:
Bonds Series 1985 F, 4.075%, tender 9/15/00 28,400
28,400
Series 1997 B2, 4.3% 10/4/00, CP
7,900
7,900
Series 1997 B3, 4.3% 10/5/00, CP
38,800
38,800
Series 1998 B4, 4.55% 9/8/00, CP
14,000
14,000
Series 1998 B5, 4.3% 10/12/00, CP
11,300
11,300
Municipal Securities - continued
Principal
Amount (000s)
Value (Note 1)
(000s)
Utah - continued
Provo City Hsg. Rev. (Branbury Park Proj.) Series 1987 A, 4.3%, LOC Bank One, Arizona NA, VRDN (b)
$ 8,370
$ 8,370
Salt Lake City Arpt. Rev. Rfdg. Series 2000 A, 4.25%, 6,300
6,300
Toole City Ind. Dev. Rev. (Nelson & Sons Proj. ) Series 1997, 4.45%, LOC Key Bank Nat'l. Assoc., VRDN (b)(c)
1,140
1,140
Utah Hsg. Fin. Agcy. Participating VRDN Series PT 84B, 4.38% (Liquidity Facility Merrill Lynch & Co., Inc.) (b)(c)(e)
180
180
120,560
Vermont - 0.1%
Vermont Econ. Dev. Auth. Ind. Dev. Rev. (Huber and Suhner Proj.) 4.45%, LOC Key Bank Nat'l. Assoc., VRDN (b)(c)
1,730
1,730
Vermont Ind. Dev. Auth. Ind. Dev. Rev. (Ryegate Proj.) 10,200
10,200
11,930
Virginia - 2.3%
Amelia County Ind. Dev. Auth. Exempt Facilities Rev. (Chambers Waste Sys. Proj.) Series 1991, 4.35%, 4,400
4,400
Botetourt County Ind. Dev. Auth. Ind. Dev. Rev. (Virginia Forge Co. Proj.) Series 1996, 4.35%, LOC Harris Trust & Savings Bank, Chicago,
VRDN (b)(c)
900
900
Chesapeake Ind. Dev. Auth. Poll. Cont. Rev.:
Bonds (Virginia Elec. & Pwr. Co. Proj.) Series 1985, 4.35% tender 10/6/00, CP mode
8,700
8,700
(Branch Group Proj.) Series 1999, 4.4%, LOC Bank of America NA, VRDN (b)(c)
5,500
5,500
Chesterfield County Ind. Dev. Auth. Poll. Cont. Rev. Bonds (Virginia Elec. & Pwr. Co. Proj.):
Series 1985, 4.25% tender 10/13/00, CP mode
4,500
4,500
Series 1987 A, 4.35% tender 9/8/00, CP mode
3,000
3,000
Series 1987 B, 4.45% tender 9/12/00, CP mode
9,315
9,315
Series 1987 C, 4.35% tender 9/8/00, CP mode
15,000
15,000
Frederick County Ind. Dev. Auth. Rev. (Nat'l. Wildlife Federation Proj.) Series 1996, 4.4%, LOC Bank of America NA, VRDN (b)(c)
3,590
3,590
Greensville County Ind. Dev. Auth. Rev. (Beach Mold & Tool Virginia, Inc. Proj.) 4.45%, LOC Bank One, Kentucky NA, VRDN (b)(c)
780
780
Municipal Securities - continued
Principal
Amount (000s)
Value (Note 1)
(000s)
Virginia - continued
Halifax County Ind. Dev. Auth. Poll. Cont. Rev. Bonds $ 4,900
$ 4,900
Louisa Ind. Dev. Auth. Poll. Cont. Rev. Bonds (Virginia Elec. & Pwr. Co. Proj.):
Series 1985, 4.2% tender 10/20/00, CP mode
4,000
4,000
Series 1987, 4.35% tender 9/8/00, CP mode
18,000
18,000
Lynchburg Indl. Dev. Auth. Hosp. Facilities First Mtg. Rev. (Mid-Atlantic States, Inc./Cap. Assets Fing. Prog.) 1,800
1,800
Mecklenburg County Ind. Dev. Auth. Rev. (American Bldg. Co. Proj.) 4.45%, LOC Canadian Imperial Bank of Commerce, VRDN (b)(c)
710
710
Virginia College Bldg. Auth. Edl. Facilities Rev. Participating VRDN Series Putters 134, 4.32% (Liquidity Facility 14,525
14,525
Virginia Commonwealth Trans. Participating VRDN 7,000
7,000
Virginia Commonwealth Trans. Board Trans. Rev. Participating VRDN Series SG 134, 4.33% (Liquidity Facility Societe Generale) (b)(e)
7,635
7,635
Virginia Hsg. Dev. Auth. Commonwealth Mtg. Rev.:
Bonds:
Series A:
4.15%, tender 9/12/00 (c)
3,600
3,600
4.15%, tender 10/19/00 (c)
7,100
7,100
Series B, 4.15%, tender 10/19/00
7,900
7,900
Participating VRDN:
Series FRRI A65, 4.3% (Liquidity Facility Bayerische Hypo-und Vereinsbank AG) (b)(c)(e)
9,700
9,700
Series Merlots 00 CC, 4.42% (Liquidity Facility First Union Nat'l. Bank, North Carolina) (b)(c)(e)
8,200
8,200
Virginia Pub. School Auth. Participating VRDN 4,195
4,195
Virginia Trans. Board Trans. Contract Rev. Participating VRDN Series FRRI 99 A6, 4.3% (Liquidity Facility Bayerische Hypo-und Vereinsbank
AG) (b)(e)
6,980
6,980
York County Ind. Dev. Auth. Ind. Dev. Rev. (Philip Morris Co. Proj.) Series 1991, 4.4%, VRDN (b)
4,000
4,000
Municipal Securities - continued
Principal
Amount (000s)
Value (Note 1)
(000s)
Virginia - continued
York County Ind. Dev. Auth. Poll. Cont. Rev. Bonds
4.25% tender 9/8/00, CP mode
$ 12,800
$ 12,800
4.35% tender 9/8/00, CP mode
6,600
6,600
185,330
Washington - 4.0%
Chelan County Pub. Util. District #1 Rev. Participating VRDN Series Merlots 00 R, 4.42% (Liquidity Facility First Union Nat'l. Bank, North
Carolina) (b)(c)(e)
11,555
11,555
Kent Gen. Oblig. Participating VRDN Series SGA 27, 4.3% (Liquidity Facility Societe Generale) (b)(e)
5,070
5,070
King County Gen. Oblig. Participating VRDN Series SGA 19, 4.3% (Liquidity Facility Societe Generale) (b)(e)
11,260
11,260
King County Hsg. Auth. Rev. (Overlake TOD Hsg. Proj.) 4.4%, LOC Bank of America Nat'l. Trust & Savings Assoc., VRDN (b)(c)
7,175
7,175
King County Swr. Rev.:
Participating VRDN Series Merlots 00 E, 4.37% (Liquidity Facility First Union Nat'l. Bank, North Carolina) (b)(e)
6,300
6,300
Series A, 4.3% 10/11/00 (Liquidity Facility Bayerische Landesbank Girozentrale), CP
3,000
3,000
Pierce County Econ. Dev. Corp. Rev. (Pacific LLC Proj.) 4.55%, LOC Wells Fargo Bank NA, San Francisco, VRDN (b)(c)
2,635
2,635
Port Seattle Gen. Oblig.:
Participating VRDN:
Series MSDW 00 235, 4.43% (Liquidity Facility Morgan Stanley Dean Witter & Co.) (b)(c)(e)
3,210
3,210
Series PA 704, 4.38% (Liquidity Facility Merrill Lynch & Co., Inc.) (b)(c)(e)
3,440
3,440
Series PA 752, 4.4% (Liquidity Facility Merrill Lynch & 4,995
4,995
Series PA 759R, 4.38% (Liquidity Facility Merrill Lynch & Co., Inc.) (b)(c)(e)
5,100
5,100
Series 1985, 4.25%, VRDN (b)
3,700
3,700
Series 1997, 4.45%, LOC Canadian Imperial Bank of Commerce, VRDN (b)(c)
70,330
70,330
Series 1999 B, 4.45%, LOC Commerzbank AG, VRDN (b)(c)
37,815
37,815
Series A:
4.2% 10/13/00, LOC Bank of America NA, CP
6,780
6,780
4.25% 10/11/00, LOC Bank of America NA, CP
2,755
2,755
Municipal Securities - continued
Principal
Amount (000s)
Value (Note 1)
(000s)
Washington - continued
Port Seattle Gen. Oblig.: - continued
Series B:
4.25% 10/11/00, LOC Bank of America NA, CP (c)
$ 4,655
$ 4,655
4.3% 10/6/00, LOC Bank of America NA, CP (c)
3,110
3,110
Seattle Gen. Oblig. Ltd. Tax Participating VRDN Series SGB 12, 4.33% (Liquidity Facility Societe Generale) (b)(e)
7,400
7,400
Seattle Hsg. Auth. Rev. (New Holly Phase II Proj.) 4.5%, (Othello Street LP) LOC Key Bank Nat'l. Assoc., 3,360
3,360
Tacoma Elec. Sys. Rev. Bonds 6.514% 1/2/15 7,800
8,005
Washington Econ. Dev. Fin. Auth. Rev.:
(Ferry Brothers, Inc. Proj.) 4.4%, LOC Key Bank Nat'l. Assoc., VRDN (b)(c)
4,725
4,725
(Hunter Douglas Proj.) Series 1997 A, 4.35%, 2,200
2,200
Washington Gen. Oblig. Participating VRDN:
Series 004704, 4.33% (Liquidity Facility Citibank NA, 5,600
5,600
Series 984702, 4.33% (Liquidity Facility Citibank NA, 12,200
12,200
Series 984703, 4.33% (Liquidity Facility Citibank NA, 9,900
9,900
Series RobIns 6, 4.36% (Liquidity Facility Bank of 9,900
9,900
Series SG 37, 4.33% (Liquidity Facility Societe Generale) (b)(e)
5,580
5,580
Series SGA 35, 4.3% (Liquidity Facility Societe Generale) (b)(e)
12,500
12,500
Series SGA 36, 4.3% (Liquidity Facility Societe Generale) (b)(e)
11,000
11,000
Series SGB 09, 4.33% (Liquidity Facility Societe Generale) (b)(e)
4,100
4,100
Series SGB 11, 4.33% (Liquidity Facility Societe Generale) (b)(e)
6,200
6,200
Washington Hsg. Fin. Commission:
Bonds (Single Family Mtg. Prog.) Series 2A, 4.4% 4/1/01 (c)
9,450
9,450
Participating VRDN Series Merlots 97 D, 4.42% 6,610
6,610
Municipal Securities - continued
Principal
Amount (000s)
Value (Note 1)
(000s)
Washington - continued
Washington Hsg. Fin. Commission Multi-family Hsg. Rev. (Winterhill Apt. Proj.) Series 1996 A, 4.4% (FSA Insured), LOC Wells Fargo Bank NA, San
Francisco, VRDN (b)(c)
$ 6,525
$ 6,525
Washington Hsg. Fin. Commission Single Family Mtg. Rev. Participating VRDN Series PT 86, 4.38% (Liquidity Facility Merrill Lynch & Co.,
Inc.) (b)(c)(e)
2,570
2,570
320,710
West Virginia - 1.3%
Braxton County Solid Waste Rfdg. (Weyerhaeuser Co. Proj.) Series 1999, 4.3%, VRDN (b)(c)
14,000
14,000
Grant County Poll. Cont. Rev. Bonds (Virginia Elec. &
Series 1986, 4.25% tender 9/11/00, CP mode (c)
6,100
6,100
Series 1994, 4.2% tender 10/6/00, CP mode
10,000
10,000
Grant County Solid Waste Disp. Rev. Bonds (Virginia Elec. & Pwr. Co. Proj.) Series 1996, 4.4% tender 9/11/00, CP mode (c)
18,000
18,000
Marion County Solid Waste Disp. Rev. (Grant Town Cogeneration Proj.) Series 1990 A, 4.3%, (American Bituminous Pwr. Partners) LOC Nat'l. Westminster
Bank PLC, VRDN (b)(c)
32,800
32,800
West Virginia Hosp. Fin. Auth. Rev. (WVHA Pooled Ln. Fing. Prog.) Series 2000 A, 4.39%, (Liquidity Facility Bank of Nova Scotia), (Liquidity
Facility BNP Paribas Sa), VRDN (b)
22,400
22,400
103,300
Wisconsin - 2.3%
Green Bay School District BAN 5.15% 4/13/01
13,400
13,400
Milwaukee County Gen. Oblig. Participating VRDN:
Series FRRI 00 A8, 4.45% (Liquidity Facility Bank of 23,100
23,100
Series FRRI A37, 4.45% (Liquidity Facility Bank of 19,800
19,800
Oak Creek Ind. Dev. Rev. (Outlook Packaging, Inc. Proj.) 4.4%, LOC Bank of America NA, VRDN (b)(c)
1,800
1,800
Platteville Ind. Dev. Rev. (Woodward Communications Proj.) 4.35%, LOC Harris Trust & Savings Bank, Chicago, VRDN (b)(c)
1,350
1,350
Racine Ind. Dev. Rev. (Burlington Graphic Sys. Proj.) 1,455
1,455
River Falls Ind. Dev. Rev. (Quadion Corp. Proj.) 4.4%, 2,130
2,130
Southeast Wisconsin Participating VRDN Series Merlots 00 Y, 4.37% (Liquidity Facility First Union Nat'l. Bank, North Carolina) (b)(e)
5,000
5,000
Municipal Securities - continued
Principal
Amount (000s)
Value (Note 1)
(000s)
Wisconsin - continued
Sturgeon Bay Ind. Dev. Rev. (Marine Travelift Proj.) $ 1,600
$ 1,600
Sturtevant Ind. Dev. Rev. (Quadra, Inc. Proj.) 4.5%, 1,675
1,675
Sun Prairie Ind. Rev. (Flambeau Corp. Proj.) Series 1995, 4.45%, LOC Firstar Bank NA, VRDN (b)(c)
4,885
4,885
Univ. of Wisconsin Hosp. & Clinics Auth. Participating VRDN Series Merlots 00 RR, 4.37% (Liquidity Facility First Union Nat'l. Bank, North
Carolina) (b)(e)
5,830
5,830
Wauwatosa Hsg. Auth. Rev. Rfdg. (San Camillo, Inc. Proj.) Series 1995 B, 4.33%, LOC Firstar Bank NA, VRDN (b)
2,250
2,250
Wisconsin Gen. Oblig.:
Participating VRDN Series PT 1231, 4.33% (Liquidity Facility Merrill Lynch & Co., Inc.) (b)(e)
3,540
3,540
Ctfs. of Prtn. Participating VRDN Series 944904 4,200
4,200
Series 1997 A, 4.2% 10/20/00, CP
18,500
18,500
Wisconsin Health & Edl. Facilities Auth. Rev.:
(Aurora Health Care, Inc. Proj.) Series C, 4.25%, 10,930
10,930
(Felician Svcs., Inc. Oblig. Group Proj.):
Series 1997 A, 4.25% (AMBAC Insured), VRDN (b)
3,000
3,000
Series 1997 B, 4.25% (AMBAC Insured), VRDN (b)
3,500
3,500
(Wheaton Franciscan Svcs. Proj.) Series 1997, 4.25%, 2,000
2,000
Wisconsin Hsg. & Econ. Dev. Auth. Home Ownership Rev. Bonds Series PT 207, 4.45%, tender 2/22/01 (Liquidity Facility Bayerische Hypo-und
Vereinsbank AG) (c)(e)(f)
12,470
12,470
Wisconsin Hsg. & Econ. Dev. Auth. Single Family Rev. Participating VRDN Series PT 324, 4.4% (Liquidity Facility Merrill Lynch & Co., Inc.) (b)(c)(e)
13,880
13,880
Wisconsin Trans. Rev. Series 1997 A, 4.2% 10/12/00, CP
23,095
23,095
179,390
Wyoming - 0.5%
Laramie County Ind. Dev. Rev. (Cheyenne Lt. Fuel & Pwr. Proj.) 4.4% (AMBAC Insured), VRDN (b)(c)
8,500
8,500
Wyoming Cmnty. Dev. Auth. Participating VRDN 18,200
18,200
Municipal Securities - continued
Principal
Amount (000s)
Value (Note 1)
(000s)
Wyoming - continued
Wyoming Cmnty. Dev. Auth. Hsg. Rev.:
Bonds Series PT 359, 4.45%, tender 2/22/01 $ 8,655
$ 8,655
Participating VRDN Series PT 112, 4.33% 2,390
2,390
37,745
TOTAL INVESTMENT PORTFOLIO - 99.1%
7,830,913
NET OTHER ASSETS - 0.9%
71,311
NET ASSETS - 100%
$ 7,902,224
Total Cost for Income Tax Purposes $ 7,830,912
Security Type Abbreviations
BAN - BOND ANTICIPATION NOTE
CP - COMMERCIAL PAPER
RAN - REVENUE ANTICIPATION NOTE
TAN - TAX ANTICIPATION NOTE
TRAN - TAX AND REVENUE VRDN - VARIABLE RATE DEMAND NOTE
Legend
(a) Security purchased on a delayed delivery or when-issued basis.
(b) The coupon rate shown on floating or adjustable rate securities represents the rate at period end.
(c) Private activity obligations whose interest is subject to the federal alternative minimum tax for individuals.
(d) Security collateralized by an amount sufficient to pay interest and principal.
(e) Provides evidence of ownership in one or more underlying municipal bonds.
(f) Restricted securities - Investment in securities not registered under the Securities Act of 1933.
Additional information on each holding is as follows:
Security
Acquisition
Date
Cost Chicago Single Family
Mtg. Rev. Bonds Series
PT 448, 4.45%, tender
2/22/01 (Liquidity
Facility Merrill Lynch &
Co., Inc.)
8/10/00
$ 5,125
Denver City & County
Arpt. Rev. Bonds 1/8/99
$ 6,050
Idaho Hsg. & Fin. Assoc.
Bonds Series PT 247,
4.45%, tender 2/22/01
(Liquidity Facility Banco
Santander SA)
1/8/99
$ 3,015
Indiana Hsg. Fin. Auth.
Bonds Series PT 246,
4.45%, tender 2/22/01
(Liquidity Facility Merrill
Lynch & Co., Inc.)
6/23/99
$ 6,420
Security
Acquisition
Date
Cost Minnesota Hsg. Fin.
Agcy. Bonds (Residential
Hsg. Fin. Prog.) Series
PT 114, 4.33%, tender
2/22/01 (Liquidity
Facility Merrill Lynch &
Co., Inc.)
12/2/97 $ 10,700
Missouri Hsg. Dev.
Commission Single
Family Mtg. Rev. Bonds
Series PT 341, 4.45%,
tender 2/22/01
(Liquidity Facility
Bayerische Hypo-und
Vereinsbank AG)
3/16/00
$ 7,255
New Mexico Edl.
Assistance Foundation
Student Ln. Rev. Bonds
Series PT 262, 4.45%,
tender 2/22/01
(Liquidity Facility
Banco De Santander
Puerto Rico)
6/4/99
$ 5,835
New Mexico Mtg. Fin.
Auth. Bonds (Single
Family Mtg. Prog.)
Series PT 225, 4.45%,
tender 2/22/01
(Liquidity Facility Merrill
Lynch & Co., Inc.)
10/5/99
$ 10,055
Ohio Hsg. Fin. Agcy.
Mtg. Rev. Bonds 11/13/98
- 8/31/00
$ 20,020
Oklahoma Hsg. Fin.
Auth. Single Family Rev.
Bonds Series PT 104,
4.45%, tender 2/22/01
(Liquidity Facility
Bayerische Hypo-und
Vereinsbank AG)
3/26/97 $ 3,125
Security
Acquisition
Date
Cost Oklahoma Hsg. 3/26/98 $ 4,680
Oklahoma Hsg. Fin.
Auth. Single Family
Rev. Bonds Series PT
305, 4.45%, tender
2/22/01 (Liquidity
Facility Landesbank
Hessen-Thuringen)
11/4/99
$ 5,480
Oklahoma Hsg. Fin.
Auth. Single Family Rev.
Bonds Series PT 342,
4.45%, tender 2/22/01
(Liquidity Facility
Bayerische Hypo-und
Vereinsbank AG)
3/22/00
$ 5,395
Socorro Independent
School District Variable
Rate TRAN 5.1%
7/31/01
8/29/00
$ 8,400
Wisconsin Hsg. & Econ.
Dev. Auth. Home
Ownership Rev. Bonds
Series PT 207, 4.45%,
tender 2/22/01
(Liquidity Facility
Bayerische Hypo-und
Vereinsbank AG)
7/30/98
$ 12,470
Wyoming Cmnty. Dev.
Auth. Hsg. Rev. Bonds
Series PT 359, 4.45%,
tender 2/22/01
(Liquidity Facility
Banco Santander SA)
7/20/00
$ 8,655
Income Tax Information
At August 31, 2000, the fund had a capital loss carryforward of approximately $517,000 of which $489,000 and $28,000 will expire on August 31, 2004 and 2008, respectively.
See accompanying notes which are an integral part of the financial statements.
Annual Report
Statement of Assets and Liabilities
Amounts in thousands (except per-share amount)
August 31, 2000
Assets
Investment in securities, at value -
$ 7,830,913
Receivable for investments sold on a delayed delivery basis
5,618
Receivable for fund shares sold
125,090
Interest receivable
58,254
Prepaid expenses
90
Total assets
8,019,965
Liabilities
Payable to custodian bank
$ 278
Payable for investments purchased 17,696
Delayed delivery
4,327
Payable for fund shares redeemed
91,412
Distributions payable
582
Accrued management fee
1,807
Other payables and accrued expenses
1,639
Total liabilities
117,741
Net Assets
$ 7,902,224
Net Assets consist of:
Paid in capital
$ 7,902,795
Accumulated undistributed net realized
(572)
Unrealized gain from accretion of discount
1
Net Assets, for 7,902,787 shares outstanding
$ 7,902,224
Net Asset Value, offering price and redemption price
$1.00
See accompanying notes which are an integral part of the financial statements.
Annual Report
Financial Statements - continued
Statement of Operations
Amounts in thousands
Year ended August 31, 2000
Interest Income
$ 288,440
Expenses
Management fee
$ 20,057
Transfer agent fees
11,515
Accounting fees and expenses
702
Non-interested trustees' compensation
27
Custodian fees and expenses
160
Registration fees
865
Audit
46
Legal
30
Miscellaneous
272
Total expenses before reductions
33,674
Expense reductions
(24)
33,650
Net interest income
254,790
Realized and Unrealized Gain (Loss)
Net realized gain (loss) on investment securities
27
Increase (decrease) in net unrealized gain from
1
Net gain (loss)
28
Net increase (decrease) in net assets
$ 254,818
See accompanying notes which are an integral part of the financial statements.
Annual Report
Financial Statements - continued
Statement of Changes in Net Assets
Amounts in thousands
Year ended Year ended Increase (Decrease) in Net Assets
Operations $ 254,790
$ 160,343
Net realized gain (loss)
27
(99)
Increase (decrease) in net unrealized gain from 1
(1)
Net increase (decrease) in net assets resulting 254,818
160,243
Distributions to shareholders from net interest income
(254,790)
(160,343)
Share transactions at net asset value of $1.00 per share 34,096,914
23,601,542
Reinvestment of distributions from net interest income
247,658
155,567
Cost of shares redeemed
(32,755,619)
(22,512,547)
Net increase (decrease) in net assets and shares resulting from share transactions
1,588,953
1,244,562
Total increase (decrease) in net assets
1,588,981
1,244,462
Net Assets
Beginning of period
6,313,243
5,068,781
End of period
$ 7,902,224
$ 6,313,243
See accompanying notes which are an integral part of the financial statements.
Annual Report
Financial Highlights
Years ended August 31,
2000
1999
1998 C
1997 D
1996 D
1995 D
Selected Per-Share Data
Net asset value, beginning of period
$ 1.000
$ 1.000
$ 1.000
$ 1.000
$ 1.000
$ 1.000
Income from Investment Operations .035
.028
.027
.032
.031
.034
Less Distributions
From net interest (.035)
(.028)
(.027)
(.032)
(.031)
(.034)
Net asset value, end of period
$ 1.000
$ 1.000
$ 1.000
$ 1.000
$ 1.000
$ 1.000
Total Return B
3.55%
2.83%
2.70%
3.28%
3.17%
3.48%
Ratios and Supplemental Data
Net assets, $ 7,902
$ 6,313
$ 5,069
$ 4,132
$ 3,674
$ 3,606
Ratio of expenses to average net assets
.46%
.47%
.49% A
.49%
.49%
.50%
Ratio of net interest income to average net assets
3.51%
2.79%
3.20% A
3.23%
3.12%
3.43%
A Annualized
B Total returns for periods of less than one year are not annualized.
C Ten months ended August 31
D For the year ended October 31
See accompanying notes which are an integral part of the financial statements.
Annual Report
For the period ended August 31, 2000
1. Significant Accounting Policies.
Fidelity Municipal Money Market Fund (the fund) is a fund of Fidelity Union Street Trust II (the trust) and is authorized to issue an unlimited number of shares. The
trust is registered under the Investment Company Act of 1940, as amended (the 1940 Act), as an open-end management investment company organized as a Delaware
business trust. The financial statements have been prepared in conformity with generally accepted accounting principles which require management to make certain
estimates and assumptions at the date of the financial statements. The following summarizes the significant accounting policies of the fund:
Security Valuation. As permitted under Rule 2a-7 of the 1940 Act, and certain conditions therein, securities are valued initially at cost and thereafter assume a
constant amortization to maturity of any discount or premium.
Income Taxes. As a qualified regulated investment company under Subchapter M of the Internal Revenue Code, the fund is not subject to income taxes to the extent
that it distributes substantially all of its taxable income for its fiscal year. The schedule of investments includes information regarding income taxes under the caption
"Income Tax Information."
Interest Income. Interest income, which includes amortization of premium and accretion of discount, is accrued as earned. Accretion of discount represents
unrealized gain until realized at the time of a security disposition or maturity.
Expenses. Most expenses of the trust can be directly attributed to a fund. Expenses which cannot be directly attributed are apportioned among the funds in the trust.
Distributions to Shareholders. Dividends are declared daily and paid monthly from net interest income.
Security Transactions. Security transactions are accounted for as of trade date. Gains and losses on securities sold are determined on the basis of identified cost.
2. Operating Policies.
Fidelity Municipal Cash Central Fund. Pursuant to an Exemptive Order issued by the Securities and Exchange Commission (the SEC), the fund may invest in the
Fidelity Municipal Cash Central Fund (the Cash Fund) managed by Fidelity Investments Money Management, Inc. (FIMM), an affiliate of Fidelity Management &
Research Company (FMR). The Cash Fund is an open-end money market fund available only to investment companies and other accounts managed by FMR and its
affiliates. The Cash Fund seeks preservation of capital, liquidity, and current income by investing in high-quality, short-term municipal securities of various states and
municipalities. Income distributions from the Cash Fund are declared daily and paid monthly from net interest income. Income distributions earned by the fund are
recorded as interest income in the accompanying financial statements.
Annual Report
Notes to Financial Statements - continued
2. Operating Policies - Delayed Delivery Transactions and When Issued Securities. The fund may purchase or sell securities on a delayed delivery or when issued basis. Payment and
delivery may take place after the customary settlement period for that security. The price of the underlying securities and the date when the securities will be delivered
and paid for are fixed at the time the transaction is negotiated. The values of the securities purchased on a delayed delivery or when issued basis are identified as such in
the fund's schedule of investments. The fund may receive compensation for interest forgone in the purchase of a delayed delivery security. With respect to purchase
commitments, the fund identifies securities as segregated in its records with a value at least equal to the amount of the commitment. Losses may arise due to changes in
the value of the underlying securities or if the counterparty does not perform under the contract, or if the issuer does not issue the securities due to political,
economic, or other factors.
Restricted Securities. The fund is permitted to invest in securities that are subject to legal or contractual restrictions on resale. These securities generally may be
resold in transactions exempt from registration or to the public if the securities are registered. Disposal of these securities may involve time-consuming negotiations
and expense, and prompt sale at an acceptable price may be difficult. At the end of the period, restricted securities (excluding 144A issues) amounted to $122,680,000
or 1.6% of net assets.
3. Fees and Other Transactions with Affiliates.
Management Fee. As the fund's investment adviser, FMR receives a monthly fee that is calculated on the basis of a group fee rate plus a fixed individual fund fee rate
applied to the average net assets of the fund. The group fee rate is the weighted average of a series of rates and is based on the monthly average net assets of all the
mutual funds advised by FMR. The rates ranged from .0920% to .3700% for the period. The annual individual fund fee rate is .15%. In the event that these rates were
lower than the contractual rates in effect during the period, FMR voluntarily implemented the above rates, as they resulted in the same or a lower management fee. For
the period, the management fee was equivalent to an annual rate of .28% of average net assets.
Sub-Adviser Fee. As the fund's investment sub-adviser, FIMM, a wholly owned subsidiary of FMR, receives a fee from FMR of 50% of the management fee payable to
FMR. The fee is paid prior to any voluntary expense reimbursements which may be in effect.
Transfer Agent and Accounting Fees. Citibank, N.A.(Citibank) is the custodian, transfer agent and shareholder servicing agent for the fund. Citibank has entered
into a sub-contract with Fidelity Service Company, Inc. (FSC), an affiliate of FMR, under which FSC performs the activities associated with the fund's transfer and
shareholder servicing agent and accounting functions. The fund pays account fees and asset-based fees that vary according
Annual Report
Notes to Financial Statements - continued
3. Fees and Other Transactions with Affiliates - continued
Transfer Agent and Accounting to account size and type of account. FSC pays for typesetting, printing and mailing of all shareholder reports, except proxy statements. The accounting fee is based on
the level of average net assets for the month plus out-of-pocket expenses.
For the period, the transfer agent fees were equivalent to an annual rate of .16% of average net assets.
Money Market Insurance. Pursuant to an Exemptive Order issued by the SEC, the fund, along with other money market funds advised by FMR or its affiliates, has
entered into insurance agreements with FIDFUNDS Mutual Limited (FIDFUNDS), an affiliated mutual insurance company. FIDFUNDS provides limited coverage for
certain loss events including issuer default as to payment of principal or interest and bankruptcy or insolvency of a credit enhancement provider. The insurance does
not cover losses resulting from changes in interest rates, ratings downgrades or other market conditions. The fund may be subject to a special assessment of up to
approximately 2.5 times the fund's annual gross premium if covered losses exceed certain levels. During the period, the fund paid premiums of $269,000 for the
calendar year 2000 to FIDFUNDS, which are being amortized over one year.
4. Expense Reductions.
Through an arrangement with the fund's custodian, credits realized as a result of uninvested cash balances were used to reduce a portion of the fund's expenses.
During the period, the fund's custodian fees were reduced by $24,000 under this arrangement.
Annual Report
Report of Independent Accountants
To the Trustees of Fidelity Union Street Trust II and the Shareholders of Fidelity Municipal Money Market Fund:
In our opinion, the accompanying statement of assets and liabilities, including the schedule of investments, and the related statements of operations and of changes
in net assets and the financial highlights present fairly, in all material respects, the financial position of Fidelity Municipal Money Market Fund (a fund of Fidelity
Union Street Trust II) at August 31, 2000, and the results of its operations, the changes in its net assets and the financial highlights for the periods indicated, in
conformity with accounting principles generally accepted in the United States. These financial statements and financial highlights (hereafter referred to as "financial
statements") are the responsibility of the Fidelity Municipal Money Market Fund's management; our responsibility is to express an opinion on these financial
statements based on our audits. We conducted our audits of these financial statements in accordance with auditing standards generally accepted in the United States
which require that we plan and perform the audit to obtain reasonable assurance about whether the financial statements are free of material misstatement. An audit
includes examining, on a test basis, evidence supporting the amounts and disclosures in the financial statements, assessing the accounting principles used and
significant estimates made by management, and evaluating the overall financial statement presentation. We believe that our audits, which included
confirmation of securities at August 31, 2000 by correspondence with the custodian and brokers, provide a reasonable basis for the opinion expressed above.
/s/PricewaterhouseCoopers LLP Boston, Massachusetts Annual Report
During fiscal year ended 2000, 100% of the fund's income dividends was free from federal income tax, and 47.22% of the fund's income dividends was subject to the
federal alternative minimum tax.
Annual Report
Managing Your Investments
Fidelity offers several ways to conveniently manage your personal investments via your telephone or PC. You can access your account information, conduct
trades and research your investments 24 hours a day.
By Phone
Fidelity Automated Service Telephone provides a single toll-free number to access account balances, positions, quotes and trading. It's easy to navigate the service,
and on your first call, the system will help you create a personal identification number (PIN) for security.
(phone_graphic)
Fidelity Automated Press
1 For mutual fund and brokerage trading.
2 For quotes.* 3 For account balances and holdings.
4 To review orders and mutual 5 To change your PIN.
*0 To speak to a Fidelity representative.
By PC
Fidelity's web site on the Internet provides a wide range of information, including daily financial news, fund performance, interactive planning tools and news
about Fidelity products and services.
(computer_graphic)
Fidelity's Web Site If you are not currently on the Internet, call EarthLink Sprint at 1-800-288-2967, and be sure to ask for registration number SMD004 to receive a special Fidelity
package that includes 30 days of free Internet access. EarthLink is North America's #1 independent Internet access provider.
(computer_graphic)
Fidelity On-line Xpress+®
Fidelity On-line Xpress+ software for Windows combines comprehensive portfolio management capabilities, securities trading and access to research and
analysis tools . . . all on your desktop. Call Fidelity at 1-800-544-0240 or visit our web site for more information on how to manage your investments via your PC. * When you call the quotes line, please remember that a fund's yield and
return will vary and,
except for money market funds, share price will also vary. This means that you may have a gain
or loss when you sell your shares. There is no assurance that money market funds will be able to
maintain a stable $1 share price; an investment in a money market fund is not insured or
guaranteed by the U.S. government. Total returns are historical and include changes in share price,
reinvestment of dividends and capital gains, and the effects of any sales charges.
8/31/00
investments
8/31/99
Market Fund
Funds Average *
Demand Notes
(VRDNs) 71.7%
Demand Notes
(VRDNs) 59.5%
CP Mode) 17.7%
CP Mode) 25.9%

and Net
Other Assets 3.2%
and Net
Other Assets 4.3%

(Citizens Communications Co. Proj.) Series 1993 E:
LOC Gen. Elec. Cap. Corp., VRDN (b)
Arizona NA, VRDN (b)(c)
LOC Bank of America NA, VRDN (b)(c)
VRDN (b)(c)
Series 1996, 4.35%, LOC U.S. Bank NA, Minnesota, VRDN (b)(c)
Trust Prog.) 4.55%, (American Mtg. & Guarantee Co.)
LOC HSBC Bank USA, VRDN (b)
New York) (b)(e)
Series RF 00 15, 4.43% (Liquidity Facility Bank of
New York NA) (b)(c)(e)
VRDN (b)(c)
(Lee Memorial Hosp. Proj.):
Series Merlots 00 HHH, 4.42% (Liquidity Facility First Union Nat'l. Bank, North Carolina) (b)(c)(e)
Series A2, 3.95% 12/1/00 (c)
LOC Suntrust Bank, VRDN (b)(c)
LOC PNC Bank NA, VRDN (b)(c)
LOC Fannie Mae, VRDN (b)(c)
LOC Southtrust Bank NA, VRDN (b)
Series 2000, 4.35%, LOC Suntrust Bank, VRDN (b)
LOC Southtrust Bank NA, VRDN (b)
LOC Wachovia Bank NA, VRDN (b)(c)
CP mode
LOC BNP Paribas Sa, VRDN (b)(c)
LOC Amsouth Bank NA, Birmingham, VRDN (b)
4.4% tender 9/8/00, CP mode (c)
4.35% tender 9/8/00, CP mode
New York) (b)(e)
LOC Landesbank Hessen-Thuringen, VRDN (b)
& Co., Inc.) (b)(c)(e)
& Co., Inc.) (b)(c)(e)
Series 1999, 4.5%, LOC Bank One, Indiana NA, VRDN (b)(c)
LOC Northern Trust Co., Chicago, LOC Bank One NA, VRDN (b)
(BFI Waste Sys. of North America Proj.) Series 1999, 4.33%, LOC Bayerische Hypo-und Vereinsbank AG, VRDN (b)(c)
LOC Firstar Bank NA, VRDN (b)(c)
LOC Harris Trust & Savings Bank, Chicago, VRDN (b)(c)
LOC Harris Trust & Savings Bank, Chicago, VRDN (b)(c)
LOC Morgan Guaranty Trust Co., NY, VRDN (b)(c)
LOC Bank One NA, Michigan, VRDN (b)
New York) (b)(e)
New York) (b)(e)
(FSA Insured), VRDN (b)
Series Merlots 00 W, 4.42% (Liquidity Facility First Union Nat'l. Bank, North Carolina) (b)(c)(e)
Series 2000, 4.35%, LOC Suntrust Bank, VRDN (b)(c)
Series 1998, 4.3%, LOC Lasalle Bank NA, VRDN (b)(c)
(Shell Oil Co./Wood River Proj.) Series 1992, 4.45%, VRDN (b)(c)
LOC Bank of America NA, VRDN (b)(c)
LOC Societe Generale, VRDN (b)(c)
Series 1995, 4.35%, LOC Suntrust Bank, VRDN (b)(c)
LOC Old Kent Bank, Michigan, VRDN (b)(c)
Series 2000, 4.4%, LOC Fed. Home Ln. Bank, Indianapolis, VRDN (b)(c)
Series A, 4.4% 10/23/00 (Liquidity Facility Bank One NA, Michigan), CP
LOC Bank One, Indiana NA, CP (c)
LOC Huntington Nat'l. Bank, Columbus, VRDN (b)(c)
Series 1996, 4.45%, LOC Bank of America NA,
VRDN (b)(c)
Co. Proj.):
LOC PNC Bank NA, VRDN (b)(c)
Series 1998 B, 4.25% (MBIA Insured), VRDN (b)
Series 2000, 4.4%, LOC Bank of America NA,
VRDN (b)(c)
Series 001601, 4.33% (Liquidity Facility Citibank NA,
New York) (b)(e)
LOC Westdeutsche Landesbank Girozentrale, VRDN (b)(c)
LOC Firstar Bank NA, VRDN (b)
Series 1998, 4.3%, LOC Wachovia Bank NA,
VRDN (b)(c)
(Atlas Proj.) Series 1996 A, 4.5%, (Penzoil Products Co.) LOC Deutsche Bank AG, VRDN (b)(c)
LOC KBC Bank, NV, VRDN (b)
(MBIA Insured), VRDN (b)(c)
VRDN (b)(c)
Series SGA 20, 4.3% (Liquidity Facility Societe Generale) (b)(e)
LOC Bank of America NA, VRDN (b)(c)
Series 1996, 4.4%, LOC Bank of America NA,
VRDN (b)(c)
North Carolina, VRDN (b)
Series 97C2001, 4.33% (Liquidity Facility Citibank NA,
New York) (b)(e)
Series Merlots 00 D, 4.37% (Liquidity Facility First Union Nat'l. Bank, North Carolina) (b)(e)
New York) (b)(e)
New York) (b)(e)
LOC Michigan Nat'l. Bank Farmngtn Hls, VRDN (b)
(Dow Chemical Co. Proj.) Series 1988:
LOC Barclays Bank PLC, VRDN (b)(c)
School Proj.) Series 2000, 4.8%, LOC Comerica Bank, Detroit, VRDN (b)
Series MSDW 98 108, 4.38% (Liquidity Facility Morgan Stanley Dean Witter & Co.) (b)(c)(e)
Sherco 1 & 2 Proj.) Series 2000 A, 4.5%, VRDN (b)
Series 1991 A, 4.35%, LOC First Tennessee Bank NA, Memphis, VRDN (b)
Series Merlots 00 HH, 4.37% (Liquidity Facility First Union Nat'l. Bank, North Carolina) (b)(e)
New York) (b)(e)
LOC Amsouth Bank NA, Birmingham, VRDN (b)(c)
Series 1998 A, 4.4%, LOC Bank of America NA, VRDN (b)(c)
9/11/00, LOC UBS AG, LOC Westdeutsche Landesbank Girozentrale, CP
New York) (b)(e)
Series 1996 A, 4.4%, LOC UBS AG, VRDN (b)(c)
(New England Pwr. Co. Proj.) Series 1990 A:
(Lonza Biologies, Inc. Proj.) 4.355%, LOC Deutsche Bank AG, VRDN (b)(c)
LOC Gen. Elec. Cap. Corp., VRDN (b)(c)
Acquisition Rev.:
Series PT 1027, 4.29% (Liquidity Facility Bank of America NA) (b)(e)
LOC Morgan Guaranty Trust Co., NY, LOC Bayerische Landesbank Girozentrale, CP mode
Series Merlots 97 J, 4.37% (Liquidity Facility First Union Nat'l. Bank, North Carolina) (b)(c)(e)
New York) (b)(e)
LOC Comerica Bank, Detroit, VRDN (b)(c)
LOC Nat'l. City Bank, VRDN (b)(c)
LOC Bank of America NA, VRDN (b)(c)
Series 1998 L, 4.38% (Liquidity Facility Bank of America NA) (b)(c)(e)
LOC Wachovia Bank NA, VRDN (b)(c)
LOC Suntrust Bank, VRDN (b)(c)
Series 1999, 4.33% (AMBAC Insured), VRDN (b)
Series MSDW 00 272, 4.31% (Liquidity Facility Morgan Stanley Dean Witter & Co.) (b)(e)
LOC Societe Generale, VRDN (b)(c)
LOC Bank One NA, VRDN (b)(c)
Series 1994, 4.4%, VRDN (b)
Series PA 748, 4.38% (Liquidity Facility Merrill Lynch & Co., Inc.) (b)(e)
Series 953504, 4.33% (Liquidity Facility Citibank NA,
New York) (b)(e)
(AMBAC Insured), VRDN (b)(c)
Series 2000 A, 4.31% (FSA Insured), VRDN (b)
LOC PNC Bank NA, VRDN (b)(c)
LOC PNC Bank NA, VRDN (b)(c)
LOC PNC Bank NA, VRDN (b)(c)
LOC PNC Bank NA, VRDN (b)(c)
LOC PNC Bank NA, VRDN (b)(c)
LOC PNC Bank NA, VRDN (b)(c)
Series PT 119B, 4.32% (Liquidity Facility Merrill Lynch & Co., Inc.) (b)(c)(e)
LOC PNC Bank NA, VRDN (b)
Series MSDW 00 248, 4.33% (Liquidity Facility Morgan Stanley Dean Witter & Co.) (b)(e)
LOC Fleet Nat'l. Bank, VRDN (b)(c)
VRDN (b)(c)
North Carolina, VRDN (b)(c)
LOC Suntrust Bank, VRDN (b)(c)
LOC Bank of America NA, VRDN (b)(c)
Rev. (The Methodist Home Proj.) Series 1994, 4.3%,
LOC Bank of America NA, VRDN (b)
Series FRRI A22, 4.5% (Liquidity Facility Bayerische Hypo-und Vereinsbank AG) (b)(c)(e)
Series 1999, 4.4%, LOC Wachovia Bank NA,
VRDN (b)(c)
(Delbar Products, Inc. Proj.) 4.45%, LOC PNC Bank NA, VRDN (b)(c)
(Pooled Hosp. Ln. Prog.) Series 1999 A, 4.35% (CDC Fdg. Corp. Guaranteed), VRDN (b)
VRDN (b)(c)
VRDN Series SGA 11, 4.3% (Liquidity Facility Societe Generale) (b)(e)
(United Stainless Proj.) 4.4%, LOC Bank of America NA, VRDN (b)(c)
VRDN (b)(c)
Series Merlots 00 LLL, 4.38% (Liquidity Facility First Union Nat'l. Bank, North Carolina) (b)(e)
Series 004303, 4.33% (Liquidity Facility Citibank NA,
New York) (b)(e)
LOC Chase Manhattan Bank, VRDN (b)(c)
LOC Chase Bank of Texas NA, VRDN (b)
LOC Chase Bank of Texas NA, VRDN (b)
Series SGA 32, 4.3% (Liquidity Facility Societe Generale) (b)(e)
LOC Student Ln. Marketing Assoc. (c)
LOC Student Ln. Marketing Assoc. (c)
LOC Bank One NA, Michigan, VRDN (b)(c)
LOC Chase Bank of Texas NA, VRDN (b)(c)
(Houston Music Hall-Hobby Ctr. Proj.) Series 1999, 4.35%, LOC Chase Bank of Texas NA, VRDN (b)
Series 004302, 4.33% (Liquidity Facility Citibank NA,
New York) (b)(e)
Marketing Assoc.), VRDN (b)(c)
Series MSDW 00 268, 4.33% (Liquidity Facility Morgan Stanley Dean Witter & Co.) (b)(e)
Series 2000, 4.3%, LOC Bayerische Hypo-und Vereinsbank AG, VRDN (b)(c)
(Coastal Refining & Marketing Proj.) Series 1997, 4.3%, LOC BNP Paribas Sa, VRDN (b)(c)
Elec. Co. Proj.) Series 1997 A, 4.35% (MBIA Insured), VRDN (b)(c)
(Liquidity Facility Societe Generale) (b)(e)
Series Merlots 00 VV, 4.37% (Liquidity Facility
First Union Nat'l. Bank, North Carolina) (b)(e)
LOC Bank of America NA, VRDN (b)(c)
TRAN 5.1% 7/31/01 (b)(f)
(Oaks of Hitchcock Apt. Proj.) Series 2000 A, 4.3%,
LOC Gen. Elec. Cap. Corp., VRDN (b)(c)
New York NA) (b)(e)
(AMBAC Insured)
LOC Westdeutsche Landesbank Girozentrale, VRDN (b)(c)
Series 1990, 4.3%, LOC ABN-AMRO Bank NV,
VRDN (b)(c)
LOC Morgan Guaranty Trust Co., NY, VRDN (b)(c)
(Virginia Elec. & Pwr. Co. Proj.) Series 1992, 4.25% tender 9/11/00, CP mode (c)
Series 1985 D, 4.25% (AMBAC Insured) (BPA Mellon
Bank NA, Pittsburgh), VRDN (b)
J.P. Morgan & Co., Inc.) (b)(e)
Series 994601, 4.33% (Liquidity Facility Citibank NA,
New York) (b)(e)
Series Putters 139, 4.32% (Liquidity Facility J.P. Morgan & Co., Inc.) (b)(e)
(Virginia Elec. & Pwr. Co. Proj.) Series 1985:
Co., Inc.) (b)(c)(e)
VRDN (b)(c)
(AMBAC Insured) (Pre-Refunded to 1/1/01 @ 102) (d)
LOC ABN-AMRO Bank NV, VRDN (b)(c)
New York) (b)(e)
New York) (b)(e)
New York) (b)(e)
New York NA) (b)(e)
(Liquidity Facility First Union Nat'l. Bank, North Carolina) (b)(c)(e)
Pwr. Co. Proj.):
New York NA) (b)(e)
New York NA) (b)(e)
Series 1994, 4.5%, (Philip M. & Jamie S. Holtje)
LOC Harris Trust & Savings Bank, Chicago, VRDN (b)(c)
LOC U.S. Bank NA, Minnesota, VRDN (b)(c)
Series 1996, 4.45%, LOC Firstar Bank NA, VRDN (b)(c)
LOC Bank One, Wisconsin, VRDN (b)(c)
Class A, 4.35% (Liquidity Facility Citibank NA,
New York) (b)(c)(e)
LOC Bank One NA, Chicago, VRDN (b)
LOC Toronto Dominion Bank, VRDN (b)
Series Merlots 00 KK, 4.37% (Liquidity Facility First Union Nat'l. Bank, North Carolina) (b)(e)
(Liquidity Facility Banco Santander SA) (c)(e)(f)
(Liquidity Facility Merrill Lynch & Co., Inc.) (b)(e)
ANTICIPATION NOTE
(000s)
Series PT 249, 4.45%,
tender 2/22/01
(Liquidity Facility Banco
Santander SA)
(000s)
- 5/14/99
Series PT 241, 4.45%,
tender 2/22/01
(Liquidity Facility
Bayerische Hypo-und
Vereinsbank AG)
- 8/31/00
(000s)
Fin. Auth. Single Family
Rev. Bonds Series PT
167, 4.45%, tender
2/22/01 (Liquidity
Facility BNP Paribas Sa)
- 8/31/00
See accompanying schedule
Regular delivery
gain (loss) on investments
per share ($7,902,224 ÷ 7,902,787 shares)
accretion of discount
resulting from operations
August 31,
2000
August 31,
1999
Net interest income
accretion of discount
from operations
Proceeds from sales of shares
Net interest income
income
end of period
(in millions)
continued
Fees - continued
PricewaterhouseCoopers LLP
October 6, 2000
Service Telephone (FAST®)
1-800-544-5555
fund activity.
www.fidelity.com
Annual Report
Investment Adviser
Fidelity Management & Research
Company
Boston, MA
Investment Sub-Adviser
Fidelity Investments
Money Management, Inc.
Officers
Edward C. Johnson 3d, President
Robert C. Pozen, Senior Vice President
Boyce I. Greer, Vice President
Dwight D. Churchill, Vice President
Diane M. McLaughlin, Vice President
Stanley N. Griffith, Assistant Vice President
Eric D. Roiter, Secretary
Robert A. Dwight, Treasurer
Maria F. Dwyer, Deputy Treasurer
John H. Costello, Assistant Treasurer
Thomas J. Simpson, Assistant Treasurer
Board of Trustees
Ralph F. Cox *
Phyllis Burke Davis *
Robert M. Gates *
Edward C. Johnson 3d
Donald J. Kirk *
Ned C. Lautenbach *
Peter S. Lynch
Marvin L. Mann *
William O. McCoy *
Gerald C. McDonough *
Robert C. Pozen
Thomas R. Williams *
Advisory Board
J. Michael Cook
Abigail P. Johnson
Marie L. Knowles
General Distributor
Fidelity Distributors Corporation
Boston, MA
Transfer and Shareholder
Servicing Agents
Citibank, N.A.
New York, NY
and
Fidelity Service Company, Inc.
Boston, MA
* Independent trustees
Custodian
Citibank, N.A.
New York, NY
Fidelity's Municipal
Money Market Funds
California Municipal Money Market
Connecticut Municipal Money Market
Massachusetts Municipal Money Market
Michigan Municipal Money Market
Municipal Money Market
New Jersey Municipal Money Market
New York Municipal Money Market
Ohio Municipal Money Market
Spartan® Arizona Municipal
Money Market
Spartan California Municipal Money Market
Spartan Connecticut Municipal
Money Market
Spartan Florida Municipal Money Market
Spartan Massachusetts Municipal
Money Market
Spartan Municipal Money
Spartan New Jersey Municipal
Money Market
Spartan New York Municipal
Money Market
Spartan Pennsylvania Municipal
Money Market
The Fidelity Telephone Connection
Mutual Fund 24-Hour Service
Exchanges/Redemptions
and Account Assistance 1-800-544-6666
Product Information 1-800-544-6666
Retirement Accounts 1-800-544-4774 (8 a.m. - 9 p.m.)
TDD Service 1-800-544-0118
for the deaf and hearing impaired
(9 a.m. - 9 p.m. Eastern time)
Fidelity Automated Service
Telephone (FAST®) (automated graphic) 1-800-544-5555
(automated graphic) Automated line for quickest service
MMM-ANN-1000 112778
1.538360.103
(Fidelity Investment logo)(registered trademark)
Corporate Headquarters
82 Devonshire St., Boston, MA 02109
www.fidelity.com
Spartan®
Municipal
Money
Fund
Annual Report
August 31, 2000
(2_fidelity_logos) (Registered_Trademark)
Contents
|
President's Message |
Ned Johnson on investing strategies. |
|
|
Performance |
How the fund has done over time. |
|
|
Fund Talk |
The manager's review of fund performance, strategy and outlook. |
|
|
Investment Changes |
A summary of major shifts in the fund's
investments over the past six months |
|
|
Investments |
A complete list of the fund's investments. |
|
|
Financial Statements |
Statements of assets and liabilities,
operations, and changes in net assets, |
|
|
Notes |
Notes to the financial statements. |
|
|
Report of Independent Accountants |
The auditors' opinion. |
|
|
Distributions |
|
Third party marks appearing herein are the property of their respective owners.
All other marks appearing herein are registered or unregistered trademarks or service marks of FMR Corp. or an affiliated company.
(Recycle graphic) This report is printed on recycled paper using soy-based inks.
This report and the financial statements contained herein are submitted for the general information of the shareholders of the fund. This report is not authorized for distribution to prospective investors in the fund unless preceded or accompanied by an effective prospectus.
Mutual fund shares are not deposits or obligations of, or guaranteed by, any depository institution. Shares are not insured by the FDIC, the Federal Reserve Board or any other agency, and are subject to investment risks, including possible loss of principal amount invested.
Neither the fund nor Fidelity Distributors Corporation is a bank.
For more information on any Fidelity fund, including charges and expenses, call 1-800-544-6666 for a free prospectus. Read it carefully before you invest or send money.
Annual Report
(photo_of_Edward_C_Johnson_3d)
(Photograph of Edward C. Johnson 3d.)
Dear Shareholder:
A slowing U.S. economy triggered an equity market rally during the later stages of summer, boosting most major stock indexes back into positive territory for calendar year 2000. One notable exception, however, was the Dow Jones Industrial Average, which posted a negative return during that timeframe. Fixed-income markets - particularly Treasuries - continued their yearlong trend of strong performance, as nearly every bond sector outperformed the stock market on a year-to-date basis.
While it's impossible to predict the future direction of the markets with any degree of certainty, there are certain basic principles that can help investors plan for their future needs.
First, investors are encouraged to take a long-term view of their portfolios. If you can afford to leave your money invested through the inevitable up and down cycles of the financial markets, you will greatly reduce your vulnerability to any single decline. We know from experience, for example, that stock prices have gone up over longer periods of time, have significantly outperformed other types of investments and have stayed ahead of inflation.
Second, you can further manage your investing risk through diversification. A stock mutual fund, for instance, is already diversified, because it invests in many different companies. You can increase your diversification further by investing in a number of different stock funds, or in such other investment categories as bonds. You should also keep money you'll need in the near future in a more stable investment.
Finally, no matter what your time horizon or portfolio diversity, it makes good sense to follow a regular investment plan, investing a certain amount of money in a fund at the same time each month or quarter and periodically reviewing your overall portfolio. By doing so, you won't get caught up in the excitement of a rapidly rising market, nor will you buy all your shares at market highs. While this strategy - known as dollar cost averaging - won't assure a profit or protect you from a loss in a declining market, it should help you lower the average cost of your purchases. Of course, you should consider your financial ability to continue your purchases through periods of low price levels before undertaking such a strategy.
If you have questions, please call us at 1-800-544-6666, or visit our web site at www.fidelity.com. We are available 24 hours a day, seven days a week to provide you the information you need to make the investments that are right for you.
Best regards,
/s/Edward C. Johnson 3d
Edward C. Johnson 3d
Annual Report
To evaluate a money market fund's historical performance, you can look at either total return or yield. Total return reflects the change in the value of an investment, assuming reinvestment of the fund's dividend income, but does not include the effect of the fund's $5 account closeout fee on an average-sized account. Yield measures the income paid by a fund. Since a money market fund tries to maintain a $1 share price, yield is an important measure of performance. If Fidelity had not reimbursed certain fund expenses, the total returns would have been lower.
Cumulative Total Returns
|
Periods ended August 31, 2000 |
|
Past 1 |
Past 5 |
Life of |
|
Spartan Municipal Money |
|
3.63% |
17.93% |
37.63% |
|
All Tax-Free Money Market Funds Average |
|
3.29% |
16.21% |
n/a* |
Cumulative total returns show the fund's performance in percentage terms over a set period - in this case, one year, five years or since the fund started on January 14, 1991. For example, if you had invested $1,000 in a fund that had a 5% return over the past year, the value of your investment would be $1,050. To measure how the fund's performance stacked up against its peers, you can compare it to the all tax-free money market funds average, which reflects the performance of all tax-free money market funds with similar objectives tracked by iMoneyNet, Inc. The past one year average represents a peer group of 461 money market funds.
Average Annual Total Returns
|
Periods ended August 31, 2000 |
|
Past 1 |
Past 5 |
Life of |
|
Spartan Municipal Money |
|
3.63% |
3.35% |
3.37% |
|
All Tax-Free Money Market Funds Average |
|
3.29% |
3.05% |
n/a* |
Average annual total returns take the fund's cumulative return and show you what would have happened if the fund had performed at a constant rate each year.
* Not available
Annual Report
Performance - continued
Yields
|
|
8/28/00 |
5/29/00 |
2/28/00 |
11/29/99 |
8/30/99 |
|
|
|||||
|
Spartan Municipal |
3.90% |
3.95% |
3.46% |
3.44% |
2.94% |
|
|
|||||
|
If Fidelity had not |
3.80% |
3.85% |
3.36% |
3.34% |
2.84% |
|
|
|||||
|
All Tax-Free Money Market |
3.56% |
3.60% |
3.12% |
3.16% |
2.66% |
|
|
|||||
|
Spartan Municipal Money |
6.09% |
6.17% |
5.41% |
5.38% |
4.59% |
|
|
|||||
|
If Fidelity had not |
5.94% |
6.02% |
5.25% |
5.22% |
4.44% |
|
|
|||||
Yield refers to the income paid by the fund over a given period. Yields for money market funds are usually for seven-day periods, expressed as annual percentage rates. A yield that assumes income earned is reinvested or compounded is called an effective yield. The table above shows the fund's current seven-day yield at quarterly intervals over the past year. If the adviser had not reimbursed certain portfolio expenses during the periods shown, the yields would have been lower. You can compare these yields to the all tax-free money market funds average as tracked by iMoneyNet, Inc. Or you can look at the fund's tax-equivalent yield, which assumes you're in the 36% federal tax bracket. A portion of the fund's income may be subject to the federal alternative minimum tax.
A money market fund's total returns and yields will vary, and reflect past results rather than predict future performance.
Comparing Yields on tax-free investments
are usually lower than yields on
taxable investments. However,
a straight comparison between
the two may be misleading
because it ignores the way
taxes reduce taxable returns.
Tax-equivalent yield - the yield
you'd have to earn on a similar
taxable investment to match the
tax-free yield - makes the
comparison more meaningful.
Keep in mind that the U.S.
government neither insures nor
guarantees a money market
fund. In fact, there is no
assurance that a money fund
will maintain a $1 share price.
Performance
Annual Report
Fund Talk: The Manager's Overview
(Portfolio Manager photograph)
An interview with Diane McLaughlin, Portfolio Manager of Spartan Municipal Money Fund
Q. What was the investment environment like during the 12 months that ended August 31, 2000, Diane?
A. Throughout the period, the U.S. economy demonstrated considerable strength. Real GDP - gross domestic product adjusted for inflation - grew at an annual rate of 6.9% in the fourth quarter of 1999, its largest gain in three years. In 2000, real GDP grew at an annual rate of 4.8% in the first quarter and 5.6% in the second quarter. The American consumer, buoyed with confidence, helped support economic growth through healthy spending. Business investment provided yet another stimulus to economic growth. The healthy economy led to a decline in unemployment, which fell to 3.9% in April, its lowest level in 30 years.
Q. How did the Federal Reserve Board react to the state of the economy?
A. Against this backdrop, the Federal Reserve Board felt the need to restrain growth and head off any inflationary pressures that might be building. To do so, the Fed implemented a series of six hikes in the rate banks charge each other for overnight loans - the fed funds target rate - starting in June 1999. Four of those rate increases occurred during the period covered by this report. Three of them - in November 1999, February 2000 and March 2000 - came in increments of 0.25 percentage points each. The last, in May 2000 - a hike of 0.50 percentage points - came on the heels of an unexpectedly sharp increase in the employment cost index, a broad measure of the costs incurred by businesses for wages and benefits. During the last three months of the period, however, the Fed chose to leave rates unchanged. While some indications of price inflation surfaced, most price gains were offset by improvements in productivity. More importantly, later in the period there were signs that economic growth was slowing to a more sustainable rate.
Q. What was your strategy with the fund?
A. For most of the period, I kept the fund's average maturity shorter than that of its peers. The combination of low supply and strong demand caused yields on longer-term one-year notes to fall to unattractive levels. Supply was low because, with the strong economy, municipalities had less of a need to come to market to raise funds. On the other hand, demand for one-year, fixed-rate notes remained strong as the municipal money market was flooded with assets. We found few opportunities to buy one-year notes that incorporated enough yield to compensate the fund for the anticipated rise in rates. At times, rates on short-term variable-rate demand notes (VRDNs) - whose yields are reset every seven days - spiked up. One such period was the turn into the year 2000, when very soft demand caused short-term money market securities to offer yields that were, in some cases, higher than those offered by taxable alternatives. Another opportunity arose in April, when money market managers sold VRDNs to meet redemptions as shareholders withdrew funds to pay taxes. Yields on VRDNs rose, with some once again offering yields as high as those provided by taxable money market securities. These were opportunities for the fund to add VRDNs and, because of its overweighting in VRDNs at those times, the fund was positioned to take advantage of the increases in yield.
Annual Report
Fund Talk: The Manager's Overview - continued
Q. How did the fund perform?
A. The fund's seven-day yield on August 31, 2000, was 3.91%, compared to 2.95% 12 months ago. The latest yield was the equivalent of a 6.11% taxable yield for investors in the 36% federal tax bracket. Through August 31, 2000, the fund's 12-month total return was 3.63%, compared to 3.29% for the all tax-free money market funds average, according to iMoneyNet, Inc.
Q. What is your outlook?
A. Recent economic data indicate that the economy is slowing. In addition, sharp increases in oil prices and the steady decline in the value of the euro - which has made U.S. imports in Europe more expensive - may help slow U.S. economic growth. Although the Fed indicated at its last meeting its continued bias toward raising rates, the market at this point sees very little chance the Fed will do so. In fact, recent market sentiment has reflected a higher chance of a Fed rate cut in the near future. Looking at the fund, I'll continue to take advantage of opportunities arising from supply/demand imbalances.
The views expressed in this report reflect those of the portfolio manager only through the end of the period of the report as stated on the cover and do not necessarily represent the views of Fidelity or any other person in the Fidelity organization. Any such views are subject to change at any time based upon market or other conditions and Fidelity disclaims any responsibility to update such views. These views may not be relied on as investment advice and, because investment decisions for a Fidelity fund are based on numerous factors, may not be relied on as an indication of trading intent on behalf of any Fidelity fund.
Fund Facts
Goal: tax-free income with share-price stability by investing in high-quality, short-term municipal securities
Fund number: 460
Trading symbol: FIMXX
Start date: January 14, 1991
Size: as of August 31, 2000, more than $2.2 billion
Manager: Diane McLaughlin, since 1997; manager, various Fidelity and Spartan municipal money market funds; joined Fidelity in 1992
3Annual Report
Investment Changes
Maturity Diversification
Days
% of fund's
investments % of fund's
investments
2/29/00
% of fund's 0 - 30
83.9
73.9
73.3
31 - 90
8.0
14.4
7.9
91 - 180
3.8
5.1
8.1
181 - 397
4.3
6.6
10.7
Weighted Average Maturity
8/31/00
2/29/00
8/31/99
Spartan Municipal Money Fund
28 Days
34 Days
54 Days
All Tax-Free Money Market 42 Days
39 Days
51 Days
Asset Allocation (% of fund's net assets)
As of August 31, 2000
As of February 29, 2000
Variable Rate
Variable Rate
Commercial Paper
(including
Commercial Paper
(including
Tender Bonds 6.1%
Tender Bonds 5.3%
Municipal Notes 2.4%
Municipal Notes 7.4%
Other Investments
Other Investments
*Source: iMoneyNet, Inc.®
Annual Report
Showing Percentage of Net Assets
Investments August 31, 2000
Municipal Securities - 98.8%
Principal
Amount (000s)
Value (Note 1)
(000s)
Alabama - 1.9%
Alabama Pub. School & College Auth. Rev. Participating VRDN Series Putters 124, 4.32% (Liquidity Facility J.P. Morgan & Co.,
Inc.) (a)(d)
$ 5,000
$ 5,000
Ashland Ind. Dev. Board Rev. (Wellborn Cabinet, Inc. Proj.) Series 1991 A, 4.45%, LOC Amsouth Bank NA, Birmingham, VRDN (a)(b)
450
450
Auburn Ind. Dev. Board Ind. Dev. Rev. (Donaldson Co., Inc. Proj.) Series 1999, 4.45%, LOC Bank of America NA, VRDN (a)(b)
3,000
3,000
Colbert County Ind. Dev. Board Ind. Dev. Rev. (Golden Poultry Co., Inc. Proj.) Series 1990, 4.35%, LOC Suntrust Bank, VRDN (a)(b)
2,500
2,500
Columbiana Ind. Dev. Board Rev. (NFA Corp. Proj.) 6,000
6,000
Courtland Ind. Dev. Board Rev. (Specialty Minerals, Inc. Proj.) 4.45%, LOC Wachovia Bank NA, VRDN (a)(b)
3,000
3,000
Daphne-Villa Mercy Spl. Care Facilities Fing. Auth. Rev. (Mercy Med. Hosp. Proj.) 4.25%, LOC Southtrust 3,300
3,300
Decatur Ind. Dev. Board Ind. Dev. Rev. (Monsanto Co. Proj.) Series 1996, 4.45%, (Pharmacia Corp.) VRDN (a)(b)
1,285
1,285
Florence Ind. Dev. Board Ind. Dev. Rev. (Robert J. Bevis Proj.) Series 1990, 4.35%, (Jami, Inc.) LOC Bank of America NA, VRDN (a)(b)
1,700
1,700
Jackson Ind. Dev. Board Rev. (Specialty Minerals, Inc. Proj.) 4.45%, LOC Wachovia Bank NA, VRDN (a)(b)
2,100
2,100
Lafayette Ind. Dev. Rev. (Kardoes Rubber Co., Inc. Proj.) 4.45%, LOC Amsouth Bank NA, Birmingham, VRDN (a)(b)
1,900
1,900
Montgomery Ind. Dev. Board Poll. Cont. Rev. Bonds (Gen. Elec. Co. Proj.) Series 1990, 4.25% tender 9/22/00, CP mode
4,100
4,100
Montgomery Ind. Dev. Board Rev.:
(Contech Construction Proj.) Series 1996, 4.45%, LOC Mellon Bank NA, Pittsburgh, VRDN (a)(b)
2,700
2,700
(Feldmeier/Alabama Equip. Proj.) Series 1996, 4.45%, LOC Southtrust Bank NA, VRDN (a)(b)
955
955
Roanoke Ind. Dev. Board Indl. Dev. Rev.:
(Steelfab, Inc. Proj.) Series 1997, 4.45%, LOC Bank of America NA, VRDN (a)(b)
880
880
(Wehadkee/Rock Mills Proj.) Series 1992, 4.35%, LOC Suntrust Bank, VRDN (a)(b)
800
800
Tuscaloosa County Ind. Dev. Auth. Rev. (Hanna Steel Co. Proj.) 4.4%, LOC Bank of America NA, VRDN (a)(b)
1,475
1,475
41,145
Municipal Securities - continued
Principal
Amount (000s)
Value (Note 1)
(000s)
Alaska - 0.6%
Alaska Hsg. Fin. Corp. Participating VRDN:
Series BA 97 F, 4.33% (Liquidity Facility Bank of America NA) (a)(d)
$ 2,100
$ 2,100
Series FRRI 98 2, 4.45% (Liquidity Facility Bank of New York NA) (a)(d)
2,900
2,900
Series FRRI 99 2, 4.5% (Liquidity Facility Commerzbank AG) (a)(d)
900
900
Series Merlots 99 D, 4.37% (Liquidity Facility First Union Nat'l. Bank, North Carolina) (a)(d)
3,700
3,700
Valdez Marine Term. Rev. Rfdg. Bonds (Atlantic Richfield Co. Proj.) Series 1994 A, 4.3% tender 10/11/00, CP mode
3,600
3,600
13,200
Arizona - 2.7%
Arizona Health Facilities Auth. Rev. (Arizona Health Care Pooled Fing. Prog.) Series 2000 A, 4.35%, (Liquidity 10,200
10,200
Glendale Wtr. & Swr. Rev. Bonds 4.75% 7/1/01 2,800
2,802
Maricopa County Poll. Cont. Rev. Bonds (Southern California Edison Co. Proj.):
Series 1985 B, 4.6% tender 9/11/00, CP mode
3,750
3,750
Series 1985 E, 4.35% tender 10/13/00, CP mode
3,500
3,500
Mohave County Ind. Dev. Auth. Ind. Dev. Rev. Bonds:
(Citizens Communications Co. Proj.) Series 1993 E, 4.4% tender 9/8/00, CP mode (b)
2,700
2,700
(Citizens Utils. Co. Proj.) Series 1988 B, 4.65% tender 9/1/00, CP mode (b)
2,000
2,000
Phoenix Ind. Dev. Auth. Participating VRDN Series PT 1082, 4.38% (Liquidity Facility Merrill Lynch & Co., Inc.) (a)(d)
9,210
9,210
Phoenix Ind. Dev. Auth. Rev. (Plastican Proj.) Series 1997, 4.5%, LOC Fleet Bank NA, VRDN (a)(b)
1,650
1,650
Pima County Ind. Dev. Auth. Single Family Hsg. Rev. Participating VRDN Series RF 99 5, 4.43% (Liquidity Facility Bank of New York
NA) (a)(b)(d)
3,440
3,440
Salt River Proj. Agric. Impt. & Pwr. District Elec. Sys. Rev.:
Series 1997 A:
4.3% 10/5/00, CP
4,000
4,000
4.55% 9/8/00, CP
4,800
4,800
Series B, 4.2% 10/20/00, CP
2,300
2,300
Municipal Securities - continued
Principal
Amount (000s)
Value (Note 1)
(000s)
Arizona - continued
Yavapai County Ind. Dev. Auth. Ind. Dev. Rev. Bonds (Citizens Communications Co. Proj.) Series 1993:
4.4% tender 9/8/00, CP mode (b)
$ 2,400
$ 2,400
4.65% tender 9/8/00, CP mode (b)
7,600
7,600
60,352
Arkansas - 1.2%
Arkansas Dev. Fin. Auth. Participating VRDN Series BA 98 C, 4.38% (Liquidity Facility Bank of America NA) (a)(b)(d)
3,250
3,250
Arkansas Dev. Fin. Auth. Multi-family Hsg. Rev. (Kiehl Partners LP Proj.) Series 1998, 4.45%, LOC Bank One, Louisiana NA,
VRDN (a)(b)
3,000
3,000
Arkansas Hosp. Equip. Fin. Auth. (Arkansas Hosp. Assoc. Pooled Fing. Prog.) Series 1998 A, 4.35%, LOC Bank of America NA,
VRDN (a)
3,100
3,100
Blytheville Ind. Dev. Rev. (Arkansas Steel Processing Proj.) Series 1992, 4.4%, LOC Cr. Agricole Indosuez, VRDN (a)(b)
9,500
9,500
Harrison Ind. Dev. Rev. (Rock-Tenn Converting Co. Proj.) Series 1993, 4.35%, LOC Suntrust Bank, VRDN (a)(b)
2,500
2,500
Miller County Solid Waste Disp. Rev. (Tyson Foods, Inc. Proj.) Series 1996, 4.33%, LOC Commerzbank AG, VRDN (a)(b)
3,150
3,150
Pine Bluff Ind. Dev. Rev. (Rolling Pin Corp. Proj.) Series 1998, 4.5%, LOC Wells Fargo Bank NA, San Francisco, VRDN (a)(b)
2,300
2,300
26,800
California - 0.2%
California Student Ed. Ln. Marketing Corp. Student Ln. Rev. Rfdg. Bonds Series 1994 A, 4.8%, tender 6/1/01, LOC State Street Bank
& Trust Co. (b)
4,000
4,000
Los Angeles Reg'l. Arpt. Impt. Rev. (Compagne Nationale Air France Int'l. Arpt. Proj.) 4.4%, LOC Societe Generale, VRDN (a)(b)
1,425
1,425
5,425
Colorado - 4.4%
Aurora Multi-family Hsg. Rev. (Aurora Meadows Apts. Proj.) Series 1996, 4.5% (Fannie Mae Guaranteed), VRDN (a)(b)
5,100
5,100
Colorado Hsg. Fin. Auth. Multi-family Hsg. Rev. Participating VRDN:
Series BA 96 E, 4.38% (Liquidity Facility Bank of America NA) (a)(b)(d)
2,200
2,200
Series FRRI 00 A3, 4.55% (Liquidity Facility Bayerische Hypo-und Vereinsbank AG) (a)(b)(d)
5,900
5,900
Municipal Securities - continued
Principal
Amount (000s)
Value (Note 1)
(000s)
Colorado - continued
Colorado Hsg. Fin. Auth. Multi-family Hsg. Rev. Participating VRDN: - continued
Series FRRI L9, 4.5% (Liquidity Facility Lehman Brothers, Inc.) (a)(b)(d)
$ 5,975
$ 5,975
Colorado Springs Utils. Rev. Participating VRDN Series SGB 28, 4.33% (Liquidity Facility Societe Generale) (a)(d)
18,800
18,800
Colorado Student Oblig. Auth. (Student Ln. Prog.) Series 1990 A, 4.35% (AMBAC Insured), VRDN (a)(b)
12,600
12,600
Denver City & County Arpt. Rev.:
Bonds:
Series 1997 A:
4.2% tender 10/20/00, LOC Bayerische Landesbank Girozentrale, CP mode (b)
3,800
3,800
4.25% tender 10/20/00, LOC Bayerische Landesbank Girozentrale, CP mode (b)
1,300
1,300
4.3% tender 11/10/00, LOC Bayerische Landesbank Girozentrale, CP mode (b)
2,200
2,200
4.3% tender 11/17/00, LOC Bayerische Landesbank Girozentrale, CP mode (b)
4,000
4,000
4.35% tender 11/16/00, LOC Bayerische Landesbank Girozentrale, CP mode (b)
2,800
2,800
Series PT 249, 4.45%, tender 2/22/01 (Liquidity Facility Banco Santander SA) (b)(d)(e)
1,900
1,900
Participating VRDN:
Series 1997 Q, 4.37% (Liquidity Facility First Union Nat'l. Bank, North Carolina) (a)(d)
3,160
3,160
Series CDC 97 K, 4.4% (Liquidity Facility Caisse des Depots et Consignations) (a)(b)(d)
6,700
6,700
Series FRRI A43, 4.5% (Liquidity Facility Bank of New York NA) (a)(b)(d)
5,500
5,500
Series FRRI A72, 4.5% (Liquidity Facility Bayerische Hypo-und Vereinsbank AG) (a)(b)(d)
2,300
2,300
Series 2000 A, 4.3% 11/10/00, LOC Westdeutsche Landesbank Girozentrale, LOC Bayerische Landesbank Girozentrale, CP (b)
4,800
4,800
Series 2000 C, 4.35% (MBIA Insured), VRDN (a)(b)
3,800
3,800
Monte Vista Swr. Rev. Series 1992, 4.4%, (Ae Staley Mfg. Co.) LOC Wachovia Bank NA, VRDN (a)(b)
2,565
2,565
Westminster County Multi-family Hsg. Rev. Rfdg. (Lakeview Apts. Proj.) Series 1997, 4.5% (68th Avenue Partners LP) (Fannie Mae
Guaranteed), VRDN (a)(b)
2,600
2,600
98,000
Municipal Securities - continued
Principal
Amount (000s)
Value (Note 1)
(000s)
Connecticut - 0.1%
Connecticut Hsg. Fin. Auth. Participating VRDN Series Merlots 97 L, 4.32% (Liquidity Facility First Union Nat'l. Bank, North
Carolina) (a)(b)(d)
$ 2,640
$ 2,640
Delaware - 0.3%
Delaware Econ. Dev. Auth. Rev. (Delmarva Pwr. & Lt. Co. Proj.) Series 1999 A, 4.4%, VRDN (a)
3,975
3,975
Delaware Hsg. Auth. Rev. Participating VRDN Series 96C0801, 4.35% (Liquidity Facility Citibank NA, New York) (a)(b)(d)
2,000
2,000
5,975
District of Columbia - 1.4%
District of Columbia Hsg. Fin. Agcy. Mtg. Rev. Bonds:
Series 2000 B, 4.35% 3/21/01 (Trinity Fdg. Guaranteed) (b)
6,500
6,500
Series 2000 E, 4.6% 7/23/01 (b)
2,500
2,500
District of Columbia Hsg. Fin. Agcy. Single Family Mtg. Rev. Participating VRDN Series RF 00 4, 4.48% (Liquidity Facility Bank of New
York NA) (a)(b)(d)
2,500
2,500
District of Columbia Hsg. Fin. Auth. Multi-family Hsg. Rev. (Mount Vernon Plaza Apts. Proj.) Series 1991, 4.32%, LOC Bank One NA,
VRDN (a)(b)
13,105
13,105
District of Columbia Rev. (Fort Lincoln New Town/Premdist LLC Proj.) Series 2000, 4.35%, LOC First Union Nat'l. Bank, North
Carolina, VRDN (a)(b)
2,160
2,160
Metro. Washington Apts. Auth. PFC Rev. Series A, 4.35% 11/16/00 (Liquidity Facility Westdeutsche Landesbank Girozentrale),
CP (b)
4,400
4,400
31,165
Florida - 4.3%
Charlotte County Hsg. Fin. Multi-family Rev. (Murdock Circle Apt. Proj.) Series 2000, 4.28%, LOC Bank of America NA, VRDN (a)(b)
3,500
3,500
Escambia County Hsg. Fin. Rev. Participating VRDN Series RF 00 15, 4.43% (Liquidity Facility Bank of New York NA) (a)(b)(d)
3,600
3,600
Florida Cap. Projects Fin. Auth. (Florida Hosp. Assoc. Cap. Proj.) Series 1998 A, 4.25% (FSA Insured), VRDN (a)
4,800
4,800
Florida Hsg. Fin. Agcy. (Kings Colony Proj.) Series 1985 D, 4.25%, (Gables Realty Ltd. Partnership) LOC Cr. Suisse First Boston Bank,
VRDN (a)
2,100
2,100
Florida Hsg. Fin. Corp. Rev. (Heritage Point Apts. Proj.) Series I1, 4.3%, LOC Key Bank Nat'l. Assoc., VRDN (a)(b)
4,750
4,750
Municipal Securities - continued
Principal
Amount (000s)
Value (Note 1)
(000s)
Florida - continued
Greater Orlando Aviation Auth. Arpt. Facilities Rev. Participating VRDN Series PA 535, 4.38% (Liquidity Facility Merrill Lynch & Co.,
Inc.) (a)(b)(d)
$ 4,795
$ 4,795
Lee County Hosp. Board Directors Hosp. Rev. Bonds (Lee Memorial Hosp. Proj.):
Series 1992 B:
4.4% tender 10/13/00 (Liquidity Facility Suntrust Bank), CP mode
3,000
3,000
4.45% tender 9/12/00 (Liquidity Facility Suntrust Bank), CP mode
10,600
10,600
Series 1997 B, 4.45% tender 9/12/00 (Liquidity Facility Suntrust Bank), CP mode
5,000
5,000
Orange County Health Facilities Auth. Rev. (Florida Hosp. Assoc. Health Proj.) Series 2000 A, 4.35%, (Liquidity Facility Bank of New
York NA), (Liquidity Facility Bank of Nova Scotia), VRDN (a)
9,400
9,400
Orange County Hsg. Fin. Auth. Homeowner Rev. Bonds 2,000
2,000
Orange County Hsg. Fin. Auth. Multi-family Hsg. Rev. (Wtr. View Club Proj.) Series 1997 D, 4.35%, LOC Fannie Mae, VRDN (a)(b)
2,665
2,665
Orlando Utils. Commission Wtr. & Elec. Rev. Series 1999 A:
4.3% 9/6/00, CP
7,900
7,900
4.3% 9/7/00, CP
6,500
6,500
Sarasota County Pub. Hosp. District Rev. Bonds (Sarasota Mem- 7,100
7,100
Sunshine State Govt. Fing. Commission Rev.:
Series A:
4.2% 9/6/00 (FGIC Insured) (AMBAC Insured), CP
8,575
8,575
4.3% 9/6/00 (FGIC Insured) (AMBAC Insured), CP
5,600
5,600
Series C, 4.4% 9/6/00 (FGIC Insured) (AMBAC Insured), CP (b)
3,900
3,900
95,785
Georgia - 6.0%
Atlanta Arpt. Rev. Participating VRDN:
Series PA 677R, 4.33% (Liquidity Facility Merrill Lynch & Co., Inc.) (a)(d)
3,100
3,100
Series SG 138, 4.33% (Liquidity Facility Societe Generale) (a)(d)
11,500
11,500
Bibb County Gen. Oblig. Participating VRDN Series CDC 00 A, 4.38% (Liquidity Facility Caisse des Depots et Consignations) (a)(d)
6,200
6,200
Bulloch County Dev. Auth. Indl. Dev. Rev. (Gold Kist, Inc. Proj.) Series 1995, 4.4%, (Southern States Coop.) LOC Wachovia Bank NA,
VRDN (a)(b)
5,700
5,700
Municipal Securities - continued
Principal
Amount (000s)
Value (Note 1)
(000s)
Georgia - continued
Cherokee County Dev. Auth. Rev. (Blue Circle Aggregates, Inc. Proj.) Series 1997, 4.4%, LOC Den Danske Bank Group AS,
VRDN (a)(b)
$ 2,000
$ 2,000
Crisp County Solid Waste Mgmt. Auth. Rev. Series 1998, 4.38% (FSA Insured), VRDN (a)(b)
7,000
7,000
De Kalb County Dev. Auth. Ind. Dev. Rev. (Qualex Proj.) 4.45%, LOC Comerica Bank, Texas, VRDN (a)(b)
1,710
1,710
De Kalb County Hsg. Auth. Multi-family Hsg. Rev. (Lenox Pointe Proj.) Series 1996 A, 4.35%, LOC Southtrust Bank NA, VRDN (a)
2,400
2,400
Floyd County Dev. Auth. Rev. (Darlington School Proj.) 3,600
3,600
Georgia Muni. Elec. Auth.:
Bonds (Gen. Resolution Projs.) Series 1985 A, 4.2% tender 10/12/00, LOC Morgan Guaranty Trust Co., NY, CP mode
11,035
11,035
Series B:
4.3% 10/5/00, LOC Morgan Guaranty Trust Co., NY, LOC Bayerische Landesbank Girozentrale, CP
6,200
6,200
4.3% 10/19/00, LOC Morgan Guaranty Trust Co., NY, LOC Bayerische Landesbank Girozentrale, CP
2,000
2,000
Georgia Port Auth. Rev.:
(Colonel's Island Term. Proj.) 4.35%, LOC Suntrust Bank, VRDN (a)(b)
1,700
1,700
(Mayor's Point Term. Proj.) Series 1992, 4.35%, LOC Suntrust Bank, VRDN (a)(b)
2,500
2,500
Greene County Dev. Auth. Ind. Dev. Rev. (Chipman-Union, Inc. Proj.) Series 1991, 4.35%, LOC Suntrust Bank, VRDN (a)(b)
1,200
1,200
Gwinnett County Dev. Auth. Ind. Dev. Rev.:
(Curtis 1000, Inc. Proj.) Series 1996, 4.35%, LOC Suntrust Bank, VRDN (a)(b)
4,060
4,060
(Klockner Namasco Corp. Proj.) 4.4%, LOC Bank of America NA, VRDN (a)(b)
1,800
1,800
(O'Neal Steel, Inc. Proj.) 4.4%, LOC Bank of America NA, VRDN (a)(b)
500
500
(Shepherd Construction Co., Inc. Proj.) 4.35%, LOC Suntrust Bank, VRDN (a)(b)
700
700
Henry County Dev. Auth. Solid Waste Rev. (Atlas Roofing Corp. Proj.) Series 1997, 4.35%, LOC Suntrust Bank, VRDN (a)(b)
5,600
5,600
Jenkins County Dev. Auth. Ind. Rev. (Metal Industries, Inc. Proj.) 4.4%, LOC Bank of America NA, VRDN (a)(b)
1,300
1,300
Municipal Securities - continued
Principal
Amount (000s)
Value (Note 1)
(000s)
Georgia - continued
Macon-Bibb County Ind. Auth. Dev. (Diamond Plastics Corp. Proj.) Series 1999, 4.4%, LOC Bank of America NA, VRDN (a)(b)
$ 5,700
$ 5,700
Paulding County Ind. Bldg. Auth. Rev. (Cadillac Products, Inc. Proj.) Series 1994, 4.45%, LOC Bank One NA, Michigan, VRDN (a)(b)
2,040
2,040
Pierce County Ind. Dev. & Bldg. Auth. Ind. Dev. Rev. (American Egg Products, Inc. Proj.) Series 1989, 4.35%, LOC Suntrust Bank,
VRDN (a)(b)
1,155
1,155
Richmond County Dev. Auth. Solid Waste Disp. Rev. (Evergreen Nylon LLC Proj.) 4.45%, LOC Banque Nationale de Paris (BNP),
VRDN (a)(b)
3,600
3,600
Savannah Econ. Dev. Auth. Rev.:
(Home Depot, Inc. Proj.) Series 1995 A, 4.35%, VRDN (a)(b)
15,600
15,600
(Kaolin Term., Inc. Proj.) 4.4%, LOC Bank of America NA, VRDN (a)(b)
10,200
10,200
Savannah Port Auth. Rev. (Pier 1 Imports, Inc. Proj.) 4.45%, LOC Bank One, Texas NA, VRDN (a)(b)
4,100
4,100
Summerville Ind. Dev. Auth. Facility Rev. (Image Ind., Inc. Proj.) Series 1997, 4.4%, LOC First Union Nat'l. Bank, North Carolina,
VRDN (a)(b)
3,600
3,600
Vienna Dev. Auth. Ind. Dev. Rev. (Mid-Georgia Processing Co. Proj.) 4.4%, LOC Bank of America NA, VRDN (a)(b)
900
900
Wayne County Indl. Dev. Auth. Wtr. Disp. Rev. (Rayonier Proj.) Series 2000, 4.35%, LOC Suntrust Bank, VRDN (a)(b)
3,300
3,300
Worth County Ind. Dev. Auth. Ind. Dev. Rev. Rfdg. (Seabrook Peanut Co. Proj.) Series 1996 B, 4.35%, LOC Suntrust Bank, VRDN (a)
1,155
1,155
133,155
Hawaii - 0.4%
Hawaii Arpt. Sys. Rev. Participating VRDN Series PA 765, 4.38% (Liquidity Facility Merrill Lynch & Co., Inc.) (a)(b)(d)
2,500
2,500
Hawaii Dept. of Budget & Fin. Spl. Purp. Rev. Bonds:
(Citizens Communication Proj.) Series 1988 B, 4.65% tender 9/8/00, CP mode (b)
3,190
3,190
(Citizens Communications the Gas Co. Proj.) Series 2000, 4.45% tender 10/6/00, CP mode (b)
2,000
2,000
Hawaii Hsg. Fin. & Dev. Corp. Participating VRDN Series PT 35, 4.38% (Liquidity Facility BNP Paribas Sa) (a)(b)(d)
1,810
1,810
9,500
Municipal Securities - continued
Principal
Amount (000s)
Value (Note 1)
(000s)
Idaho - 0.2%
Idaho Hsg. & Fin. Assoc.:
Bonds Series PT 247, 4.45%, tender 2/22/01 (Liquidity Facility Banco Santander SA) (b)(d)(e)
$ 2,280
$ 2,280
Participating VRDN Series PA 145 A, 4.38% (Liquidity Facility Merrill Lynch & Co., Inc.) (a)(b)(d)
2,264
2,264
4,544
Illinois - 6.3%
Belvidere Ind. Dev. Rev. (R&D Thiel, Inc. Proj.) Series 1996, 4.4%, LOC U.S. Bank NA, Minnesota, VRDN (a)(b)
1,960
1,960
Carol Stream Multi-family Rev. (Saint Charles Square Proj.) 4.4% (Fannie Mae Guaranteed), VRDN (a)(b)
1,415
1,415
Chicago Board of Ed. Participating VRDN Series Merlots 97 E, 4.37% (Liquidity Facility First Union Nat'l. Bank, North Carolina) (a)(d)
3,125
3,125
Chicago Gas Supply Rev. Bonds (Peoples Gas Lt. & Coke Co. Proj.) 4.05%, tender 12/1/00 (b)
2,600
2,600
Chicago Gen. Oblig.:
Bonds Series 1999, 4%, tender 10/26/00
7,100
7,100
Participating VRDN Series PA 643 R, 4.33% (Liquidity Facility Merrill Lynch & Co., Inc.) (a)(d)
3,000
3,000
Chicago O'Hare Int'l. Arpt. Rev. Participating VRDN Series 1999 X1, 4.36% (Liquidity Facility Bank of America NA) (a)(b)(d)
9,700
9,700
Chicago Rev. (HomeStart Prog.) Series 2000 A, 4.35%, LOC Northern Trust Co., Chicago, LOC Bank One NA, VRDN (a)
6,100
6,100
Chicago Wtr. Rev. Participating VRDN:
Series Merlots 00 TT, 4.37% (Liquidity Facility First Union Nat'l. Bank, North Carolina) (a)(d)
2,600
2,600
Series Merlots 97 V, 4.37% (Liquidity Facility First Union Nat'l. Bank, North Carolina) (a)(d)
4,660
4,660
City of Rolling Meadows Solid Waste Disp. Rev. (BFI Waste Sys. of North America Proj.) Series 1999, 4.33%, LOC Bayerische
Hypo-und Vereinsbank AG, VRDN (a)(b)
4,500
4,500
Cook County Gen. Oblig. Participating VRDN Series PA 591, 4.33% (Liquidity Facility Merrill Lynch & Co., Inc.) (a)(d)
5,305
5,305
Danville Ind. Dev. Rev. (Freight Car Svcs., Inc. Proj.) 4.5%, LOC Fleet Nat'l. Bank, VRDN (a)(b)
5,300
5,300
Fulton Indl. Dev. Rev. (JT Cullen Co., Inc. Proj.) 4.45%, LOC Firstar Bank NA, VRDN (a)(b)
2,500
2,500
Glendale Heights Participating VRDN Series PT 106, 4.38% (Liquidity Facility Merrill Lynch & Co., Inc.) (a)(d)
1,500
1,500
Municipal Securities - continued
Principal
Amount (000s)
Value (Note 1)
(000s)
Illinois - continued
Hodgkins Indl. Dev. Rev. (Central Blacktop Co., Inc. Proj.) 4.35%, LOC Harris Trust & Savings Bank, Chicago, VRDN (a)(b)
$ 5,025
$ 5,025
Illinois Dev. Fin. Auth. Envir. Facilities Rev. (Citizens Utils. Co. Proj.) Series 1997, 4.6%, VRDN (a)(b)
4,600
4,600
Illinois Dev. Fin. Auth. Ind. Dev. Rev. (Yale-South Haven Proj.) Series 1994, 4.5%, LOC Bank One, Indiana NA, VRDN (a)(b)
1,890
1,890
Illinois Dev. Fin. Auth. Ind. Dev. Rev.:
(Belmont Steel Proj.) Series 1991, 4.5%, LOC Lasalle Bank NA, VRDN (a)(b)
3,100
3,100
(Camcraft Proj.) Series 1993, 4.5%, (Bertsche Family LP) LOC American Nat'l. Bank & Trust, Chicago, VRDN (a)(b)
200
200
(Chicago Fineblanking Corp. Proj.) 4.5%, LOC 1,900
1,900
(Cloverhill Pastry Vend Proj.) 4.5%, LOC American Nat'l. Bank & Trust, Chicago, VRDN (a)(b)
400
400
(Grayhill, Inc. Proj.) Series 1995 B, 4.35%, LOC Harris Trust & Savings Bank, Chicago, VRDN (a)(b)
685
685
(Mapes & Sprowl Steel Ltd. Proj.) Series 1996 A, 1,814
1,814
Illinois Dev. Fin. Auth. Poll. Cont. Rev.:
Series B, 4.35% (MBIA Insured), VRDN (a)(b)
3,100
3,100
Series C, 4.3% (MBIA Insured), VRDN (a)(b)
7,800
7,800
Illinois Dev. Fin. Auth. Rev.:
(AMR Pooled Fing. Prog.) Series A, 4.35% (Bank of America NA Guaranteed), VRDN (a)
7,570
7,570
(Local Govt. Fing. Prog.) Series 1999 B, 4.35% 5,200
5,200
Rfdg. (Rich Products, Corp. Proj.) Series 1988, 4.35%, LOC Suntrust Bank, VRDN (a)(b)
6,300
6,300
Illinois Edl. Facilities Auth. Rev.:
Participating VRDN Series Merlots 97 U, 4.37% (Liquidity Facility First Union Nat'l. Bank, North Carolina) (a)(d)
4,535
4,535
4.1% 10/27/00, (University of Chicago) CP
4,500
4,500
Illinois Gen. Oblig. Participating VRDN:
Series 001304, 4.33% (Liquidity Facility Citibank NA, 2,600
2,600
Series ROC 00 10, 4.33% (Liquidity Facility Salomon Smith Barney Hldgs., Inc.) (a)(d)
6,200
6,200
Illinois Health Facilities Auth. Rev. (Decatur Memorial Hosp. Proj.) Series 1996 A, 4.25% (MBIA Insured) 2,950
2,950
Municipal Securities - continued
Principal
Amount (000s)
Value (Note 1)
(000s)
Illinois - continued
Illinois Hsg. Dev. Auth. Rev. Participating VRDN Series Merlots 00 W, 4.42% (Liquidity Facility First Union Nat'l. Bank, North
Carolina) (a)(b)(d)
$ 2,890
$ 2,890
Lisle Village Multi-family Hsg. Rev. (Devonshire of Lisle Proj.) Series 1991, 4.32%, (Ponds of Pembroke LP) LOC Freddie Mac,
VRDN (a)(b)
2,200
2,200
Mundelein Ind. Dev. Rev. (Print-O-Tape Proj.) Series 1997, 4.35%, LOC Harris Trust & Savings Bank, Chicago, VRDN (a)(b)
400
400
Univ. of Illinois Rev. Participating VRDN Series SG 65, 4.33% (Liquidity Facility Societe Generale) (a)(d)
3,000
3,000
140,224
Indiana - 2.8%
Columbus Rev. Rfdg. (Rock-Tenn Co. Mill Division Proj.) Series 1995, 4.35%, LOC Suntrust Bank, VRDN (a)(b)
2,300
2,300
Crawford County Econ. Dev. Rev. (Jasper Engine Exchange Proj.) Series 1997, 4.45%, LOC PNC Bank NA, VRDN (a)(b)
2,000
2,000
Elkhart County Multifamily Hsg. Rev. (Pedcor Invts. Proj.) 2,000
2,000
Hebron Econ. Dev. Rev. (Aarons Misty Glen Apt. Proj.) 3,175
3,175
Indiana Bond Bank TAN Series 2000 A2, 4.75% 1/18/01, LOC Bank of America NA
9,700
9,720
Indiana Hsg. Fin. Auth. Participating VRDN Series Merlots 97 H, 4.42% (Liquidity Facility First Union Nat'l. Bank, North
Carolina) (a)(b)(d)
5,050
5,050
Indiana Office Bldg. Communication Cap. Complex Rev. 3,100
3,100
Indianapolis Arpt. Facilities Rev. 4.35% 11/16/00, LOC Bank One, Indiana NA, CP (b)
5,400
5,400
Indianapolis Econ. Dev. Rev.:
(EPI Printers, Inc. Proj.) Series 1995, 4.45%, LOC Comerica Bank, Detroit, VRDN (a)(b)
1,175
1,175
(US LLC Proj.) Series 1996, 4.5%, LOC Bank One, 620
620
Rfdg. (Morningside of College Park) Series 1993, 4.3%, LOC Bank One, Indiana NA, VRDN (a)
5,815
5,815
Indianapolis Ind. Dev. Rev. (SOHL Assoc. LLC Proj.) 2,600
2,600
Lawrence County Ind. Dev. Rev. (D&M Tool Proj.) 4.43%, LOC Huntington Nat'l. Bank, Columbus, VRDN (a)(b)
1,310
1,310
Municipal Securities - continued
Principal
Amount (000s)
Value (Note 1)
(000s)
Indiana - continued
Lebanon Econ. Dev. Rev. (White Castle Sys., Inc. Proj.) 4.5%, LOC Bank One NA, VRDN (a)(b)
$ 1,510
$ 1,510
Logansport Ind. Dev. Rev. (Nelson Tube Co. Proj.) Series 1996, 4.43%, LOC Huntington Nat'l. Bank, Columbus, VRDN (a)(b)
1,110
1,110
Morristown Envir. Impt. Rev. (Eftec, Inc. Proj.) Series 2000, 4.45%, LOC First Union Nat'l. Bank, North Carolina, VRDN (a)(b)
2,300
2,300
Muncie Ind. Dev. Rev. (Diamond Plastics Corp. Proj.) Series 1996, 4.45%, LOC Bank of America NA, VRDN (a)(b)
900
900
Petersburg Poll. Cont. Rev. Rfdg. Bonds (Indianapolis Pwr. & Lt. Co. Proj.) 4.6% tender 9/11/00, CP mode
4,000
4,000
Petersburg Solid Waste Disp. Rev. (Indianapolis Pwr. & Lt. Co. Proj.) Series 1995 C, 4.55%, VRDN (a)(b)
5,600
5,600
Sullivan Poll. Cont. Rev. Bonds (Hoosier Energy Rural Elec. Coop. Proj.) Series 1985 L5, 4.35% tender 11/17/00 (Nat'l. Rural Util.
Coop. Fin. Corp. Guaranteed), CP mode
1,400
1,400
61,085
Iowa - 0.6%
Clinton Ind. Dev. Rev. (Sethness Prods. Co. Proj.) 4.35%, LOC Northern Trust Co., Chicago, VRDN (a)(b)
2,700
2,700
Iowa Fin. Auth. Ind. Dev. Rev. (Grafco Industries Proj.) Series 1999, 4.45%, LOC Bank of America NA, VRDN (a)(b)
3,700
3,700
Iowa Fin. Auth. Single Family Rev. Bonds Series 2000 N, 4.4%, tender 3/15/01 (Liquidity Facility Bank of America NA) (b)(d)
2,125
2,125
Waterloo Ind. Dev. Rev. (O'Neal Metals, Inc. Proj.) 4.45%, LOC Bank of America NA, VRDN (a)(b)
5,000
5,000
13,525
Kansas - 0.4%
Olathe Indl. Rev. (Garmin Int'l., Inc. Proj.) Series 1995, 4.35%, LOC Bank of America NA, VRDN (a)(b)
3,445
3,445
Wichita Solid Waste Disp. Rev. (Weyerhaeuser Co. Proj.) 4.5%, VRDN (a)(b)
4,950
4,950
8,395
Kentucky - 3.4%
Carroll County Solid Waste Disp. Rev.:
(Celotex Corp. Proj.) 4.4%, LOC Bank of America NA, VRDN (a)(b)
7,890
7,890
(North American Stainless Proj.) 4.35%, LOC Bank One NA, Chicago, VRDN (a)(b)
2,200
2,200
Municipal Securities - continued
Principal
Amount (000s)
Value (Note 1)
(000s)
Kentucky - continued
Cynthiana Ind. Dev. Rev. (E.D. Bullard Co. Proj.) Series 1992, 4.45%, LOC Bank of America NA, VRDN (a)(b)
$ 1,455
$ 1,455
Daviess County Solid Waste Disp. Facilities Rev. (Scott Paper Co. Proj.) Series 1993 A, 4.35% (Kimberly-Clark Corp. Guaranteed),
VRDN (a)(b)
3,600
3,600
Franklin County Ind. Dev. Rev. (Certified Tool & Manufacturing Proj.) 4.5%, LOC Bank One, Illinois NA, VRDN (a)(b)
1,855
1,855
Jefferson County Hosp. Rev. Participating VRDN Series FRRI L4, 4.45% (Liquidity Facility Lehman Brothers, Inc.) (a)(d)
2,300
2,300
Jefferson County Poll. Cont. Rev. Bonds (Louisville Gas &
Series 1993 A, 4.4% tender 9/13/00, CP mode
3,415
3,415
Series 1996 A, 4.4% tender 9/13/00, CP mode
6,000
6,000
Series 1997 A, 4.4% tender 9/13/00, CP mode (b)
4,500
4,500
Kentucky Econ. Dev. Fin. Auth. Indl. Bldg. Rev. (Republic Svcs., Inc. Proj.) Series 2000, 4.35%, LOC Bank of America NA, VRDN (a)(b)
5,000
5,000
Louisville & Jefferson County Reg'l. Arpt. Auth. Sys. Rev.:
Series 1996 A, 4.4%, LOC Nat'l. City Bank, Kentucky, VRDN (a)(b)
11,850
11,850
Series AA1, 4.4%, LOC Nat'l. City Bank, Kentucky, VRDN (a)(b)
2,850
2,850
McCraken County Ind. Bldg. Rev. (Tyler Mountain Wtr. Proj.) Series 1996, 4.5%, LOC Bank One, Kentucky NA, VRDN (a)(b)
2,100
2,100
Scott County Ind. Bldg. Rev. (Ropak Corp. Proj.) Series 1994, 4.5%, LOC Bank One NA, VRDN (a)(b)
2,200
2,200
Trimble County Poll. Cont. Rev. Bonds (Louisville Gas &
Series 1992 A, 4.4% tender 9/13/00, CP mode
8,635
8,635
Series 1997 A, 4.6% tender 9/22/00, CP mode (b)
7,600
7,600
Walton Ind. Bldg. Rev. (Clarion Manufacturing Corp. of America Proj.) 4.41%, LOC Fifth Third Bank, 1,340
1,340
74,790
Louisiana - 1.6%
De Quincy Rev. (Recycle, Inc. South. Proj.) Series 1995, 4.45%, LOC Fleet Bank NA, VRDN (a)(b)
3,225
3,225
Jefferson Parish Hosp. Svc. District #2 Participating VRDN Series CDC 99 C, 4.35% (Liquidity Facility Caisse des Depots et
Consignations) (a)(d)
3,800
3,800
Municipal Securities - continued
Principal
Amount (000s)
Value (Note 1)
(000s)
Louisiana - continued
Louisiana Gen. Oblig. Participating VRDN Series MSDW 00 259, 4.33% (Liquidity Facility Morgan Stanley Dean $ 3,500
$ 3,500
Louisiana Hsg. Fin. Agcy. Mtg. Rev. Participating VRDN 3,400
3,400
Lousiana Local Govt. Envir. Facilities Cmnty. Dev. Auth. Rev. (Shreveport/Independence Proj.) 4.35% (MBIA Insured), VRDN (a)
3,900
3,900
New Orleans Aviation Board Rev. Series 1997 A, 4.4% 6,800
6,800
Saint James Parish Gen. Oblig. (American Iron Prod. Proj.) Series 1997, 4.45%, LOC Bank of America NA, VRDN (a)(b)
1,000
1,000
South Louisiana Port Commission Port Facilities Rev. (Holnam, Inc. Proj.) 4.45%, LOC Wachovia Bank NA, VRDN (a)(b)
2,600
2,600
West Baton Rouge Parish Indl. District #3 Rev. (Dow
Series 1994 A, 4.5%, VRDN (a)(b)
7,600
7,600
Series 1995, 4.5%, VRDN (a)(b)
100
100
35,925
Maine - 0.1%
Fort Fairfield Rev. (Atlantic Custom Processors Proj.) 2,000
2,000
Maryland - 1.6%
Howard County Econ. Dev. Rev. (Pace, Inc. Proj.) 4.4%, LOC Bank of America NA, VRDN (a)(b)
4,000
4,000
Maryland Cmnty. Dev. Administration Dept. Hsg. & Cmnty. Dev.:
Bonds Series D, 4.7% 6/14/01 (b)
3,100
3,100
Participating VRDN:
Series FRRI A66, 4.5% (Liquidity Facility Bayerische Hypo-und Vereinsbank AG) (a)(d)
6,800
6,800
Series Merlots 00 lll, 4.43% (Liquidity Facility First Union Nat'l. Bank, North Carolina) (a)(b)(d)
3,800
3,800
Series PT 36, 4.38% (Liquidity Facility Merrill Lynch & Co., Inc.) (a)(b)(d)
1,135
1,135
Maryland Econ. Dev. Auth. Rev. (Grafco Ind. Ltd. Proj.) Series 1996, 4.4%, LOC Bank of America NA, VRDN (a)(b)
1,800
1,800
Montgomery County Hsg. Opportunity Commission Hsg. Rev.:
(Draper Lane Apts. Proj.) 4.45% (FGIC Insured), VRDN (a)(b)
4,400
4,400
Municipal Securities - continued
Principal
Amount (000s)
Value (Note 1)
(000s)
Maryland - continued
Montgomery County Hsg. Opportunity Commission Hsg. Rev.: - continued
(The Grand Proj.) Series 1997 1, 4.25%, (Wisconsin Park Assoc. LP) LOC Fannie Mae, VRDN (a)(b)
$ 7,600
$ 7,600
Prince Georges County Econ. Dev. Rev. (Cintas Corp. #41 Proj.) 4.45%, LOC PNC Bank NA, VRDN (a)(b)
1,875
1,875
34,510
Massachusetts - 0.6%
Massachusetts Bay Trans. Auth.:
Participating VRDN Series Merlots 00 H, 4.32% (Liquidity Facility First Union Nat'l. Bank, North Carolina) (a)(d)
3,900
3,900
RAN Series 1999 B, 4.25% 9/1/00
3,300
3,300
Massachusetts Tpk. Auth. Western Tpk. Rev. Participating VRDN Series BA 97 N, 4.41% (Liquidity Facility Bank of America NA) (a)(d)
6,600
6,600
13,800
Michigan - 1.7%
Detroit Swr. Disp. Rev. Participating VRDN:
Series BS 99 81, 4.3% (Liquidity Facility Bear Stearns Companies, Inc.) (a)(d)
3,400
3,400
Series SG 133, 4.33% (Liquidity Facility Societe Generale) (a)(d)
4,200
4,200
Detroit Wtr. Supply Sys. Rev. Participating VRDN Series Merlots 00 D, 4.37% (Liquidity Facility First Union Nat'l. Bank, North
Carolina) (a)(d)
2,100
2,100
Detroit Wtr. Sys. Rev. Participating VRDN Series 992202, 4.33% (Liquidity Facility Citibank NA, New York) (a)(d)
3,900
3,900
Michigan Hosp. Fin. Auth. Rev. Participating VRDN:
Series 1997 X, 4.37% (Liquidity Facility First Union Nat'l. Bank, North Carolina) (a)(d)
4,100
4,100
Series BS 97 23, 4.3% (Liquidity Facility Bear Stearns Companies, Inc.) (a)(d)
6,000
6,000
Michigan Strategic Fund Ltd. Oblig. Rev.:
Participating VRDN Series PT 244, 4.33% (Liquidity Facility BNP Paribas Sa) (a)(d)
2,495
2,495
(Dow Chemical Co. Proj.) Series 1999, 4.5%, VRDN (a)(b)
4,300
4,300
Municipal Securities - continued
Principal
Amount (000s)
Value (Note 1)
(000s)
Michigan - continued
Michigan Strategic Fund Solid Waste Disp. Rev. (Great Lakes Recovery Proj.) 4.35%, LOC Bank One NA, Michigan, VRDN (a)(b)
$ 800
$ 800
Saint Clair County Econ. Dev. Corp. Poll. Cont. Rev. Participating VRDN Series MSDW 00 282, 4.33% (Liquidity Facility Morgan
Stanley Dean Witter & Co.) (a)(d)
5,745
5,745
37,040
Minnesota - 0.7%
Minneapolis Saint Paul Metro. Arpts. Commission Rev. Participating VRDN Series Merlots 00 ZZ, 4.37% (Liquidity Facility First Union
Nat'l. Bank, North Carolina) (a)(d)
3,800
3,800
Minnesota Hsg. Fin. Agcy. Bonds:
(Residential Hsg. Fin. Prog.) Series PT 114, 4.33%, tender 2/22/01 (Liquidity Facility Merrill Lynch & Co., Inc.) (d)(e)
3,600
3,600
Series 2000 H, 4.4%, tender 8/30/01 (b)
2,665
2,665
Minnesota Pub. Facilities Auth. Wtr. Poll. Cont. Rev. Participating VRDN Series ROC 2 99 1, 4.33% (Liquidity Facility Salomon Smith
Barney Hldgs., Inc.) (a)(d)
2,800
2,800
Saint Paul Port Auth. Indl. Dev. Rev. (Weyerhaeuser Co. Proj.) Series 1993, 4.4%, VRDN (a)
2,200
2,200
15,065
Mississippi - 1.1%
DeSoto County Ind. Dev. Rev. (Flavorite Labs. Proj.) 2,200
2,200
Mississippi Bus. Fin. Corp. Ind. Dev. Rev. (Pillowtex Corp. Proj.) Series 1992, 4.4%, LOC Bank of America NA, VRDN (a)(b)
2,300
2,300
Mississippi Bus. Fin. Corp. Rev. (Calgon Carbon Corp. Proj.) Series 1997, 4.45%, LOC PNC Bank NA, VRDN (a)(b)
1,000
1,000
Mississippi Bus. Fin. Corp. Solid Waste Disp. Rev. Bonds (Choctaw Generation Ltd. Proj.) Series 1998, 4.3% tender 9/13/00, LOC
Chase Manhattan Bank, CP mode (b)
8,400
8,400
Mississippi Dev. Bank Spl. Oblig. Participating VRDN 3,400
3,400
Mississippi Gen. Oblig. Participating VRDN Series 992401, 4.33% (Liquidity Facility Citibank NA, New York) (a)(d)
3,600
3,600
Mississippi Home Corp. Multi-family Hsg. Rev. (Colony Park Apts. Proj.) Series 1998 I, 4.45%, (Pearl Partners LP) LOC Amsouth Bank
NA, Birmingham, VRDN (a)(b)
2,600
2,600
23,500
Municipal Securities - continued
Principal
Amount (000s)
Value (Note 1)
(000s)
Missouri - 0.7%
Lees Summit Ind. Dev. Rev. (BHA Technical, Inc. Proj.) Series 1998 A, 4.4%, LOC Bank of America NA, VRDN (a)(b)
$ 2,200
$ 2,200
Missouri Dev. Fin. Board Ind. Dev. Rev. (LA Grange Foundry Proj.) Series 1996, 4.44%, LOC Harris Trust & Savings Bank, Chicago,
VRDN (a)(b)
2,550
2,550
Missouri Gen. Oblig. Participating VRDN Series MSDW 00 238, 4.33% (Liquidity Facility Morgan Stanley Dean 4,313
4,313
Missouri Health & Edl. Facilities Auth. Rev. Participating VRDN Series CDC 00 H, 4.35% (Liquidity Facility Caisse des Depots et
Consignations) (a)(d)
3,700
3,700
Missouri Hsg. Dev. Commission Single Family Mtg. Rev. Bonds (GIC Transamerica Life Proj.) Series A3, 4.3% 1/1/01 (b)
2,800
2,800
15,563
Montana - 0.1%
Montana Board of Hsg. Participating VRDN:
Series 2000 I, 4.38% (Liquidity Facility Bank of 2,400
2,400
Series PT 87, 4.38% (Liquidity Facility Merrill 300
300
2,700
Nebraska - 0.4%
Nebraska Invt. Fin. Auth. Single Family Mtg. Rev.
Series BA 98 J, 4.38% (Liquidity Facility Bank of 4,995
4,995
Series Merlots 00 UU, 4.42% (Liquidity Facility First Union Nat'l. Bank, North Carolina) (a)(b)(d)
4,300
4,300
9,295
Nevada - 1.3%
Clark County School District Participating VRDN Series MSDW 00 378, 4.33% (Liquidity Facility Morgan Stanley Dean Witter &
Co.) (a)(d)
2,400
2,400
Clark County Spl. Facilities Arpt. Rev. Bonds (Signature Flight Support Corp. Proj.) Series 1997 A, 4.7%, tender 12/1/00, LOC
Bayerische Landesbank Girozentrale (b)
7,140
7,140
Las Vegas Valley Wtr. District Series 1998 A:
4.2% 10/13/00, LOC UBS AG, LOC Westdeutsche Landesbank Girozentrale, CP
4,000
4,000
4.6% 9/11/00, LOC UBS AG, LOC Westdeutsche Landesbank Girozentrale, CP
2,700
2,700
Municipal Securities - continued
Principal
Amount (000s)
Value (Note 1)
(000s)
Nevada - continued
Nevada Director of Dept. Commerce Ind. Dev. Rev. (Primex Corp. Proj.) 4.5%, LOC Bank One, Indiana NA, VRDN (a)(b)
$ 1,825
$ 1,825
Nevada Gen. Oblig. Participating VRDN:
Series 962801, 4.33% (Liquidity Facility Citibank NA, 3,200
3,200
Series SGB 31, 4.33% (Liquidity Facility Societe Generale) (a)(d)
7,600
7,600
28,865
New Hampshire - 1.6%
New Hampshire Bus. Fin. Auth. Ind. Dev. Rev. (Wiggins Airways Proj.) Series 1998, 4.35%, LOC BankBoston NA, VRDN (a)(b)
4,500
4,500
New Hampshire Bus. Fin. Auth. Poll. Cont. Rev. Bonds
4.3% tender 9/22/00, CP mode (b)
4,000
4,000
4.4% tender 9/7/00, CP mode (b)
14,300
14,300
New Hampshire Bus. Fin. Auth. Solid Waste Disp. Rev. (Lonza Biologies, Inc. Proj.) 4.355%, LOC Deutsche Bank AG, VRDN (a)(b)
6,800
6,800
New Hampshire Hsg. Fin. Auth. Multi-family Hsg. Rev. Rfdg. (Nashua-Oxford Proj.) Series 1990, 4.45% (Continental Casualty Co.
Guaranteed), VRDN (a)
1,100
1,100
New Hampshire Hsg. Fin. Auth. Single Family Mtg. Acquisition Rev.:
Bonds Series 1999 C, 3.95% 12/1/00
2,135
2,135
Participating VRDN Series Merlots 97 F, 4.42% (Liquidity Facility First Union Nat'l. Bank, North Carolina) (a)(b)(d)
3,195
3,195
36,030
New Jersey - 0.1%
Moorestown Township Gen. Oblig. BAN 5.5% 6/1/01
2,000
2,011
New Mexico - 1.0%
Dona Ana County Ind. Dev. Rev. (Karr Tool & Manufacturing Proj.) Series 1996, 4.45%, LOC Firstar Bank NA, VRDN (a)(b)
1,700
1,700
Espanol Ind. Dev. Rev. (Nambee Mills, Inc. Proj.) Series A, 4.45%, LOC Nat'l. City Bank, Indiana, VRDN (a)(b)
2,975
2,975
Farmington Poll. Cont. Rev. Participating VRDN Series Merlots 00 DD, 4.37% (Liquidity Facility First Union Nat'l. Bank, North
Carolina) (a)(d)
4,200
4,200
New Mexico Hosp. Equip. Ln. Council Rev. (Pooled Ln. Prog.) Series 2000 A, 4.35%, (Liquidity Facility Landesbank Hessen-Thuringen),
VRDN (a)
6,700
6,700
Municipal Securities - continued
Principal
Amount (000s)
Value (Note 1)
(000s)
New Mexico - continued
New Mexico Mtg. Fin. Auth. Bonds (Single Family Mtg. Prog.) Series 2000, 4.2% 10/1/00 (Trinity Plus Fdg. Co. Llc Guaranteed) (b)
$ 4,500
$ 4,500
New Mexico Single Family Hsg. Rev. Participating VRDN Series RF 00 B2, 4.43% (Liquidity Facility Bank of 2,000
2,000
22,075
New York - 0.9%
Nassau County Gen. Oblig. RAN Series 2000 A, 6% 3/20/01, LOC Bank of Nova Scotia, LOC First Union 2,400
2,419
New York City Muni. Wtr. Fin. Auth. Wtr. & Swr. Sys.
4.3% 10/5/00, LOC Commerzbank AG, LOC Toronto Dominion Bank, CP
4,000
4,000
4.3% 10/12/00, LOC Commerzbank AG, LOC Toronto Dominion Bank, CP
8,200
8,200
New York State Mtg. Agcy. Participating VRDN Series Merlots 97 J, 4.37% (Liquidity Facility First Union Nat'l. Bank, North
Carolina) (a)(b)(d)
6,280
6,280
20,899
Non State Specific - 0.2%
Stephens Equity Trust III Participating VRDN Series 1996, 4.53%, LOC Bayerische Hypo-und Vereinsbank AG (a)(b)(d)
5,299
5,299
North Carolina - 2.0%
Buncombe County Ind. Facilities & Poll. Cont. Fin. Auth. Rev. (Gold Star Coating Proj.) Series 1997, 4.45%, LOC Comerica Bank,
Detroit, VRDN (a)(b)
1,700
1,700
Catawba County Ind. Facilities & Poll. Cont. Fin. Auth. Rev. (Kroehler Furniture Proj.) Series 1998, 4.45%, LOC Nat'l. City Bank,
VRDN (a)(b)
1,905
1,905
Columbus County Ind. Facilities & Poll. Cont. Rev. (Conflandey Proj.) 4.45%, LOC BNP Paribas Sa, VRDN (a)(b)
5,000
5,000
Henderson County Ind. Facilities & Poll. Cont. Fin. Auth. Rev. (American Coating Technologies Proj.) 4.4%, LOC Bank of America NA,
VRDN (a)(b)
1,700
1,700
Mecklenburg County Ind. Facilities & Poll. Cont. Fin. Auth. Rev. (Stefano Foods, Inc. Proj.) Series 1996, 4.4%, LOC Bank of America
NA, VRDN (a)(b)
2,500
2,500
North Carolina Eastern Muni. Pwr. Agcy. Pwr. Sys. Rev. Participating VRDN Series PA 693, 4.33% (Liquidity Facility Merrill Lynch &
Co., Inc.) (a)(d)
3,495
3,495
Municipal Securities - continued
Principal
Amount (000s)
Value (Note 1)
(000s)
North Carolina - continued
Piedmont Triad Arpt. Auth. Spl. Facilities Rev. (Triad Int'l. Maintenance Corp. Proj.) Series 1989, 4.4%, LOC Citibank NA, New York,
VRDN (a)(b)
$ 9,300
$ 9,300
Rockingham County Indl. Facilities & Poll. Cont. Fing. Auth. Rev.:
(New Generation Corp. Proj.) Series 1999, 4.35%, LOC Wachovia Bank NA, VRDN (a)(b)
8,500
8,500
Rfdg. (Philip Morris Cos. Proj.) 4.35%, VRDN (a)
7,200
7,200
Surry County Ind. Facilities & Poll. Cont. Rev. (Intex Corp. Proj.) 4.4%, LOC Bank of America NA, VRDN (a)(b)
700
700
Wake County Ind. Facilities & Poll. Cont. Fin. Agcy. Ind. Dev. Rev. (Carolina Ind. LLC Proj.) Series 1997, 4.35%, LOC Harris Trust &
Savings Bank, Chicago, VRDN (a)(b)
2,955
2,955
44,955
North Dakota - 0.5%
Fargo Ind. Dev. Rev. (Owen Ind., Inc. Proj.) Series 1997, 4.4%, LOC Mellon Bank NA, Pittsburgh, VRDN (a)(b)
850
850
Hebron Ind. Dev. Rev. (Dacco, Inc. Proj.) 4.4%, LOC U.S. Bank NA, Minnesota, VRDN (a)(b)
1,500
1,500
North Dakota Hsg. Fin. Agcy. Rev. Bonds Series B, 7,800
7,800
10,150
Ohio - 3.8%
Clark County Multi-family Rev. (Masonic Home Proj.) 2,500
2,500
Dublin Gen. Oblig. BAN 4.5% 12/15/00
3,000
3,003
Franklin County Ind. Dev. Rev. (Berwick Steel Co. Proj.) 5.2%, LOC Sanwa Bank Ltd., VRDN (a)
3,400
3,400
Franklin County Multi-family Rev. (Golf Pointe Apts. Proj.) Series 2000 A, 4.3%, LOC Lasalle Bank NA, VRDN (a)(b)
2,200
2,200
Franklin Multi-family Rev. Bonds (260 East Naghten Street Proj.) 5.05%, tender 8/1/01, LOC Fifth Third Bank, Cincinnati (b)
1,650
1,650
Ohio Air Quality Dev. Auth. Rev.:
(Duquesne Lt. Co. Proj.) 4.4% (AMBAC Insured), VRDN (a)(b)
6,250
6,250
Series 1994 A, 4.35%, (Ohio Pwr. Co.) LOC Societe Generale, VRDN (a)(b)
4,500
4,500
Ohio Hsg. Fin. Agcy. Mtg. Rev.:
Bonds:
Series 2000 A2, 4.05% 9/1/00 (b)
3,100
3,100
Series 2000 C, 4.15%, tender 9/1/00 (b)
3,400
3,400
Municipal Securities - continued
Principal
Amount (000s)
Value (Note 1)
(000s)
Ohio - continued
Ohio Hsg. Fin. Agcy. Mtg. Rev.: - continued
Bonds:
Series PT 241, 4.45%, tender 2/22/01 (Liquidity Facility Bayerische Hypo-und Vereinsbank AG) (b)(d)(e)
$ 7,220
$ 7,220
Participating VRDN:
Series 1999 A, 4.38% (Liquidity Facility Caisse des 4,800
4,800
Series 1999 Q, 4.38% (Liquidity Facility Bank of 8,370
8,370
Series 2000 F, 4.36% (Liquidity Facility Bank of 3,500
3,500
Series BA 98 Q, 4.38% (Liquidity Facility Bank of 4,495
4,495
Ohio Hsg. Fin. Agcy. Multi-family Hsg. Rev. (Pedcor Invt. Willowlake Apts. Proj.) Series A, 4.4%, LOC 1,000
1,000
Ohio Wtr. Dev. Auth. (Waste Mgmt., Inc. Proj.) Series 2000 A, 4.35%, LOC Fleet Nat'l. Bank, VRDN (a)(b)
2,200
2,200
Ohio Wtr. Dev. Auth. Poll. Cont. Rev.:
(Philip Morris Co., Inc. Proj.) 4.4%, VRDN (a)
6,000
6,000
Rfdg. Series 1999 B, 4.35% (Duquesne Lt. Co.) 4,000
4,000
Summit County Gen. Oblig. BAN 5.5% 5/31/01
3,900
3,919
Summit County Indl. Dev. Rev. (Ganzhorn Properties Proj.) 4.5%, LOC Bank One NA, VRDN (a)(b)
915
915
Univ. of Cincinnati BAN Series AW, 5.25% 3/1/01
3,465
3,473
Zanesville-Muskingum Port Auth. Indl. Dev. Rev. (Almana II LLC Proj.) Series 2000, 4.43%, LOC Bank One NA, VRDN (a)(b)
3,300
3,300
83,195
Oklahoma - 2.6%
Oklahoma Dev. Fin. Auth. Rev.:
(Oklahoma Hosp. Assoc. Proj.):
Series 1999 A, 4.35% (CDC Fdg. Corp. 14,300
14,300
Series 2000 A, 4.35% (CDC Fdg. Corp. 3,600
3,600
(Shawnee Fdg. LP Proj.) Series 1996, 4.35%, LOC 4,000
4,000
Oklahoma Hsg. Fin. Agcy. Rev. Participating VRDN 2,000
2,000
Municipal Securities - continued
Principal
Amount (000s)
Value (Note 1)
(000s)
Oklahoma - continued
Oklahoma Hsg. Fin. Auth. Single Family Rev.:
Bonds:
(Homeownership Ln. Prog.) Series 2000 A4, 4.3%, tender 2/1/01 (b)
$ 3,900
$ 3,900
Series PT 104, 4.45%, tender 2/22/01 (Liquidity Facility Bayerische Hypo-und Vereinsbank AG) (b)(d)(e)
1,765
1,765
Series PT 167, 4.45%, tender 2/22/01 (Liquidity Facility BNP Paribas Sa) (b)(d)(e)
2,400
2,400
Participating VRDN Series CDC 96 G, 4.4% (Liquidity Facility Caisse des Depots et Consignations) (a)(b)(d)
1,300
1,300
Oklahoma Ind. Fin. Auth. Bonds Series L, 4.4%, tender 11/1/00, LOC Landesbank Hessen-Thuringen (b)
7,600
7,600
Oklahoma Student Ln. Auth. Rev. Series 2000 A4, 4.3% (MBIA Insured), VRDN (a)(b)
4,800
4,800
Southeastern Oklahoma Ind. Auth. Solid Waste Disp. Rev. (Weyerhaeuser Co. Proj.) 4.5%, VRDN (a)(b)
3,500
3,500
Tulsa Ind. Auth. Ind. Dev. Rev. (Southwest United Ind., Inc./Southwest Aeroservices Proj.) Series 1998, 4.45%, LOC Bank of America
NA, VRDN (a)(b)
4,800
4,800
Tulsa Int'l. Arpt. Gen. Rev. Participating VRDN Series BA 97 B1, 4.43% (Liquidity Facility Bank of America NA) (a)(b)(d)
2,750
2,750
56,715
Oregon - 0.9%
Lane County Swr. Disp. Rev. (Weyerhauser Co. Proj.) 4.5%, VRDN (a)(b)
7,100
7,100
Oregon Econ. Dev. Dept. Solid Waste Disp. Rev. (Weyerhaeuser Co. Proj.) Series CL, 4.5%, VRDN (a)(b)
3,000
3,000
Oregon Econ. Dev. Rev. (Behlen Manufacturing Co. Proj.) Series 172, 4.5%, LOC Nat'l. Bank of Canada, VRDN (a)(b)
1,900
1,900
Oregon Health Hsg. Edl. & Cultural Facilities Auth.:
Bonds (Lewis & Clark College Proj.) Series 2000 A, 4.3% tender 10/5/00, LOC California Teachers Retirement Sys., LOC Canadian
Imperial Bank of Commerce, CP mode
2,000
2,000
(Hillside Manor Proj.) Series 2000 A, 4.33%, LOC Bank One, Arizona NA, VRDN (a)
3,800
3,800
Portland Econ. Dev. Rev. (Columbia Aluminum Recycling Proj.) 4.4%, LOC U.S. Bank NA, Minnesota, VRDN (a)(b)
2,800
2,800
20,600
Pennsylvania - 2.5%
Allegheny County Arpt. Rev. Participating VRDN Series PA 567, 4.32% (Liquidity Facility Merrill Lynch & Co., Inc.) (a)(b)(d)
2,600
2,600
Municipal Securities - continued
Principal
Amount (000s)
Value (Note 1)
(000s)
Pennsylvania - continued
Allegheny County Hosp. Dev. Auth. Rev. (Presbyterian Univ. Health Sys. Proj.) Series 1990 D, 4.25% (MBIA Insured), VRDN (a)
$ 2,500
$ 2,500
Allegheny County Ind. Dev. Auth. Rev. Rfdg. (Duquesne Lt. Co. Proj.) Series 1999 A, 4.35% (AMBAC Insured), VRDN (a)
6,100
6,100
Berks County Ind. Dev. Auth. Rev.:
(Brentwood Industries, Inc. Proj.) Series 2000, 4.4%, LOC First Union Nat'l. Bank, North Carolina, VRDN (a)(b)
2,900
2,900
(Giorgi Mushroom Co. Proj.) Series C, 4.35%, LOC First Union Nat'l. Bank, North Carolina, VRDN (a)(b)
6,130
6,130
(KTB Real Estate Partnership Proj.) 4.45%, LOC First Union Nat'l. Bank, North Carolina, VRDN (a)(b)
2,500
2,500
Crawford County Ind. Dev. Auth. Rev. (Clear Lake Lumber, Inc. Proj.) Series 1997, 4.45%, LOC PNC Bank NA, VRDN (a)(b)
2,730
2,730
Erie County Ind. Dev. Auth. Rev. (Carlisle Corp. Proj.) 1,500
1,500
Harrisburg Wtr. Auth. Rev. Participating VRDN Series SGA 80, 4.3% (Liquidity Facility Societe Generale) (a)(d)
1,810
1,810
New Garden Gen. Auth. Muni. Rev. (Muni. Pooled Fing. Prog.) Series 1999, 4.35% (AMBAC Insured), VRDN (a)
6,200
6,200
Northeastern Pennsylvania Hosp. & Ed. Auth. Health Care Rev. (Wyoming Valley Health Care Proj.) Series 1994 A, 4.45% (AMBAC
Insured), VRDN (a)
4,000
4,000
Northumberland County Ind. Dev. Auth. Rev. (Furman Farms, Inc. Proj.) 4.4%, LOC First Union Nat'l. Bank, North Carolina,
VRDN (a)(b)
2,085
2,085
Pennsylvania Econ. Dev. Fing. Auth. Ind. Dev. Rev.:
(BPS Dev. Proj.) Series 1989 D3, 4.45%, LOC PNC Bank NA, VRDN (a)(b)
150
150
(Giffen, Schlaegle & Pirillia Proj.) Series 1992 A3, 4.45%, LOC PNC Bank NA, VRDN (a)(b)
425
425
Series 1994 B3, 4.45%, (Dodge Regupol, Inc.) LOC PNC Bank NA, VRDN (a)(b)
1,300
1,300
Series 1995 D10, 4.45%, (PHB, Inc.) LOC PNC Bank NA, VRDN (a)(b)
900
900
Series 1995 D4, 4.45%, (Electrical Device Mfg. Corp.) 900
900
Series 1997 B3, 4.45%, (Hennessy Prod., Inc.) LOC PNC Bank NA, VRDN (a)(b)
1,200
1,200
Series 1997 B4, 4.45%, (Howard Ind.) LOC PNC Bank NA, VRDN (a)(b)
1,500
1,500
Municipal Securities - continued
Principal
Amount (000s)
Value (Note 1)
(000s)
Pennsylvania - continued
Pennsylvania Higher Ed. Assistance Agcy. Student Ln. Rev. Series 2000 A, 4.35% (AMBAC Insured), VRDN (a)(b)
$ 5,700
$ 5,700
Venango Ind. Dev. Auth. Resource Recovery Rev. Bonds (Scrubgrass Proj.) Series 1990 A, 4.25% tender 9/22/00, LOC Nat'l.
Westminster Bank PLC, CP mode (b)
2,600
2,600
55,730
Rhode Island - 0.1%
Rhode Island Ind. Facilities Corp. Ind. Dev. Rev. (Calise & Sons Bakery Proj.) Series 1999, 4.5%, LOC Fleet Nat'l. Bank, VRDN (a)(b)
2,200
2,200
South Carolina - 4.0%
Abbeville City Ind. Dev. Rev. (Springs Ind., Inc. Proj.) 4.4%, LOC Wachovia Bank NA, VRDN (a)(b)
4,000
4,000
Dorchester County Ind. Dev. Rev. (SYN Strand, Inc. Proj.) Series 1994, 4.4%, LOC Wachovia Bank NA, VRDN (a)(b)
6,650
6,650
Marion County Ind. Dev. Rev. (New South, Inc. Proj.) Series 1994, 4.45%, LOC Bank of America NA, VRDN (a)(b)
2,550
2,550
Marlboro County Solid Waste Disp. Facilities Rev. (Willamette Ind., Inc. Proj.) Series 1995, 4.25%, LOC Deutsche Bank AG,
VRDN (a)(b)
2,700
2,700
Orangeburg County Solid Waste Disp. Facilities Rev. Participating VRDN Series Merlots 97 B, 4.42% (Liquidity Facility First Union
Nat'l. Bank, North Carolina) (a)(b)(d)
3,175
3,175
South Carolina Hsg. Fin. & Dev. Auth. Mtg. Rev.:
Bonds Series PT 270, 4.45%, tender 2/22/01 (Liquidity Facility Bayerische Hypo-und Vereinsbank AG) (b)(d)(e)
5,535
5,535
Participating VRDN Series PT 326, 4.38% (Liquidity Facility Commerzbank AG) (a)(b)(d)
11,980
11,980
South Carolina Jobs Econ. Dev. Auth. Econ. Dev. Rev.:
(Alexander Machinery, Inc. Proj.) Series 1994, 4.45%, LOC Bank of America NA, VRDN (a)(b)
2,100
2,100
(Alfmeier Corp. Proj.) 4.4%, LOC Bayerische Landesbank Girozentrale, VRDN (a)(b)
3,300
3,300
(Chambers Richland Co. Landfill Proj.) Series 1997, 4.35%, LOC Suntrust Bank, VRDN (a)(b)
2,000
2,000
(Foundry, Steel, Champion Tooling and Machining Proj.) 2,500
2,500
(Keys Printing Co. Proj.) 4.4%, LOC Wachovia Bank NA, VRDN (a)(b)
3,200
3,200
Municipal Securities - continued
Principal
Amount (000s)
Value (Note 1)
(000s)
South Carolina - continued
South Carolina Jobs Econ. Dev. Auth. Econ. Dev. Rev.: - continued
(Mohawk Ind., Inc. Proj.):
Series 1997 B, 4.43%, LOC First Union Nat'l. Bank, North Carolina, VRDN (a)(b)
$ 1,200
$ 1,200
Series A, 4.43%, LOC First Union Nat'l. Bank, North Carolina, VRDN (a)(b)
1,000
1,000
Series C, 4.43%, LOC First Union Nat'l. Bank, North Carolina, VRDN (a)(b)
2,325
2,325
(Paxar Corp. Proj.) Series 1996, 4.4%, LOC Wachovia Bank NA, VRDN (a)(b)
3,800
3,800
(Ring Missouri LP Proj.) Series 1999, 4.35%, LOC Suntrust Bank, VRDN (a)(b)
2,200
2,200
(Turnils North America Proj.) Series 1999, 4.35%, LOC Suntrust Bank, VRDN (a)(b)
2,100
2,100
South Carolina Jobs Econ. Dev. Auth. Rev.:
(Titan Wheel Int'l. Proj.) Series 1995, 4.45%, LOC Bank of America NA, VRDN (a)(b)
9,500
9,500
(Wellman, Inc. Proj.) 4.4%, LOC Wachovia Bank NA, VRDN (a)(b)
7,500
7,500
South Carolina Port Auth. Rev. Participating VRDN Series FRRI A22, 4.5% (Liquidity Facility Bayerische Hypo-und Vereinsbank
AG) (a)(b)(d)
2,025
2,025
South Carolina Pub. Svc. Auth. Rev. 4.1% 9/14/00, CP
2,800
2,800
Spatanburg County Ind. Dev. Rev. (Prym-Dritz Corp. Proj.) 4.4%, LOC Wachovia Bank NA, VRDN (a)(b)
500
500
Union County Ind. Dev. Auth. Rev. (Fed. Paper Board Proj.) 4.4%, LOC Wachovia Bank NA, VRDN (a)(b)
4,000
4,000
88,640
South Dakota - 0.9%
South Dakota Hsg. Dev. Auth.:
Bonds:
Series F, 4.5% 6/28/01
3,000
3,000
Series I, 3.85% 9/28/00 (b)
3,000
3,000
Participating VRDN Series Merlots 00 GGG, 4.42% (Liquidity Facility First Union Nat'l. Bank, North Carolina) (a)(b)(d)
13,300
13,300
19,300
Municipal Securities - continued
Principal
Amount (000s)
Value (Note 1)
(000s)
Tennessee - 3.5%
Chattanooga Ind. Dev. Board Ind. Rev. (Burner Systems Int'l., Inc. Proj.) 4.4%, LOC Bank of America NA, VRDN (a)(b)
$ 1,500
$ 1,500
Claiborne County Ind. Dev. Board Ind. Dev. Rev. (Royal Sterilization Sys. Proj.) 4.4%, LOC First Tennessee Bank NA, Memphis,
VRDN (a)(b)
1,300
1,300
Cumberland County Ind. Dev. Board Ind. Dev. Rev. (Delbar Products, Inc. Proj.) 4.45%, LOC PNC Bank NA, VRDN (a)(b)
1,000
1,000
Huntingdon Indl. Dev. Board Rev. (Behlen Manufacturing Co. Proj.) Series 2000, 4.38%, LOC Bank of America NA, VRDN (a)(b)
4,000
4,000
Jackson Ind. Dev. Board Solid Waste Disp. Rev. (Florida Steel Corp. Proj.) Series 1995, 4.4%, LOC Bank of America NA, VRDN (a)(b)
5,000
5,000
Loudon County Indl. Exempt Facilites Rev. (Kimberly Clark Corp. Proj.) 4.35%, VRDN (a)(b)
2,900
2,900
McMinn County Ind. Dev. Board Ind. Rev. (Southern Ionics, Inc. Proj.) 4.45%, LOC Southtrust Bank NA, VRDN (a)(b)
1,800
1,800
McMinn County Ind. Dev. Board Solid Waste Disp. Facilities Rev. (Bowater, Inc. Proj.) Series 1999, 4.4%, LOC Wachovia Bank NA,
VRDN (a)(b)
4,700
4,700
Memphis-Shelby County Arpt. Auth. Arpt. Rev. Participating VRDN Series Merlots 00 C, 4.42% (Liquidity Facility First Union Nat'l.
Bank, North Carolina) (a)(b)(d)
5,200
5,200
Memphis-Shelby County Ind. Poll. Cont. Rev. (Birmingham Steel Co. Proj.) Series 1996, 4.45%, LOC PNC Bank NA, VRDN (a)(b)
3,200
3,200
Morristown Ind. Dev. Board Ind. Dev. Rev.:
(BOS Automotive Prod. Proj.) 4.4%, LOC Bayerische Hypo-und Vereinsbank AG, VRDN (a)(b)
3,000
3,000
(Lakeway Container, Inc. Proj.) Series 1993, 4.4%, LOC First Tennessee Bank NA, Memphis, VRDN (a)(b)
1,700
1,700
Oak Ridge Indl. Dev. Board Econ. Dev. Rev. (Manufacturing Sciences, Inc. Proj.) 4.35%, LOC ABN-AMRO Bank NV, VRDN (a)(b)
3,800
3,800
Savannah Ind. Dev. Corp. Ind. Dev. Rev. (Shiloh Foods Proj.) 4.4%, LOC Bank of America NA, VRDN (a)(b)
2,800
2,800
Sevier County Pub. Bldg. Auth. Rev. Series II D1, 4.38% (AMBAC Insured), VRDN (a)(b)
12,200
12,200
Shelby County Gen. Oblig. Series 1999 A, 3,900
3,900
South Pittsburg Ind. Dev. Board Rev. (Lodge Manufacturing Proj.) 4.35%, LOC Suntrust Bank, VRDN (a)(b)
1,400
1,400
Municipal Securities - continued
Principal
Amount (000s)
Value (Note 1)
(000s)
Tennessee - continued
Tennessee Hsg. Dev. Agcy.:
Bonds (Home Ownership Prog.):
Series 2C, 4.75% 3/15/01 (b)
$ 2,135
$ 2,135
Series PT 59B, 4.45%, tender 2/22/01 (Liquidity Facility Merrill Lynch & Co., Inc.) (b)(d)(e)
4,880
4,880
Participating VRDN:
Series PA 660R, 4.38% (Liquidity Facility Merrill Lynch & Co., Inc.) (a)(b)(d)
2,000
2,000
Series PT 25, 4.38% (Liquidity Facility Merrill Lynch & Co., Inc.) (a)(b)(d)
3,850
3,850
Series PT 59A, 4.38% (Liquidity Facility Merrill Lynch & Co., Inc.) (a)(b)(d)
1,555
1,555
Trenton Ind. Dev. Rev. (Dyersburg Fabrics, Inc. Proj.) Series 1990, 4.35%, LOC First Union Nat'l. Bank, North Carolina, VRDN (a)(b)
2,045
2,045
Williamson County Ind. Dev. Board Rev. (Telco, Inc. Proj.) Series 1996, 4.45%, LOC Bank of America NA, VRDN (a)(b)
1,500
1,500
77,365
Texas - 13.8%
Austin Arpt. Sys. Rev. Participating VRDN Series Merlots 00 J, 4.42% (Liquidity Facility First Union Nat'l. Bank, North
Carolina) (a)(b)(d)
4,305
4,305
Austin Combined Util. Sys. Rev. Participating VRDN Series BA 98 V, 4.33% (Liquidity Facility Bank of America NA) (a)(d)
3,900
3,900
Bell County Ind. Dev. Corp. Ind. Dev. Rev. (Metal Sales Manufacturing Corp. Proj.) 4.5%, LOC Firstar Bank NA, VRDN (a)(b)
1,400
1,400
Brazos Hbr. Ind. Dev. Corp. Poll. Cont. Rev. Bonds (Dow Chemical Co. Proj.) Series 1986, 4.05% tender 9/13/00, CP mode
2,300
2,300
Brazos River Auth. Poll. Cont. Rev.:
Bonds (Texas Utils. Elec. Co. Proj.) Series 1994 A, 4.35% tender 10/13/00, LOC Chase Manhattan Bank of Delaware, CP mode (b)
2,000
2,000
Rfdg.:
(Texas Utils. Elec. Co. Proj.) 4.25% (MBIA Insured), VRDN (a)(b)
7,200
7,200
Bonds (Texas Utils. Elec. Co. Proj.) Series B, 4.8% tender 9/6/00, LOC Chase Manhattan Bank of Delaware, 7,070
7,070
Municipal Securities - continued
Principal
Amount (000s)
Value (Note 1)
(000s)
Texas - continued
Brazos River Hbr. Navigation District of Brazoria County Poll. Cont. Rev. Bonds (Dow Chemical Co. Proj.) Series 1988:
4.25% tender 10/20/00, CP mode (b)
$ 1,980
$ 1,980
4.4% tender 10/16/00, CP mode (b)
2,000
2,000
Brazos River Hbr. Navigation District of Brazoria County Rev.:
Bonds (Dow Chemical Co. Proj.):
Series 1991:
4.2% tender 9/14/00, CP mode
21,000
21,000
4.3% tender 10/11/00, CP mode
2,400
2,400
Series 1992, 4.2% tender 9/8/00, CP mode (b)
8,590
8,590
(Dow Chemical Co. Proj.):
Series 1998, 4.5%, VRDN (a)(b)
7,500
7,500
Series 1999, 4.5%, VRDN (a)(b)
6,250
6,250
Series 2000, 4.5%, VRDN (a)(b)
1,600
1,600
Brownsville Ind. Dev. Corp. Rev. Rfdg. (Rich-Seapak Corp. Proj.) Series 1997, 4.35%, LOC Suntrust Bank, VRDN (a)(b)
1,000
1,000
Calhoun County Solid Waste Disp. Rev. (Fomosa Plastics Corp. Proj.) Series 2000, 4.45%, LOC Bank of America NA, VRDN (a)(b)
3,100
3,100
Cleburne Ind. Dev. Corp. Ind. Dev. Rev. (Southwestern Analytical Chemical Proj.) 4.5%, LOC Nat'l. City Bank, VRDN (a)(b)
1,250
1,250
Corpus Christi Util. Sys. Rev.:
Series A 4.3% 10/23/00, CP
1,800
1,800
Series A, 4.4% 9/14/00, CP
2,700
2,700
Dallas Area Rapid Transit Sales Tax Rev.:
Series B, 4.2% 10/20/00, LOC Bayerische Landesbank Girozentrale, LOC Westdeutsche Landesbank Girozentrale, CP
3,000
3,000
Series C, 4.05% 9/13/00, LOC Bayerische Landesbank Girozentrale, LOC Westdeutsche Landesbank Girozentrale, CP
2,200
2,200
Dallas Fort Worth Int'l. Arpt. Participating VRDN Series Merlots 00 II, 4.42% (Liquidity Facility First Union Nat'l. Bank, North
Carolina) (a)(b)(d)
3,200
3,200
Dallas Wtrwks. & Swr. Sys. Rev. Bonds Series PT 371, 4.4%, tender 2/22/01 (Liquidity Facility Merrill Lynch & Co., Inc.) (d)(e)
9,930
9,930
El Paso Ind. Dev. Auth. Rev. (Camden Wire Co., Inc. Proj.) Series 1996, 4.5%, LOC Chase Manhattan Bank of Delaware, VRDN (a)(b)
1,200
1,200
Fort Worth Gen. Oblig. Series B:
4.3% 10/11/00, CP
2,100
2,100
4.4% 10/11/00, CP
2,200
2,200
4.55% 9/8/00, CP
2,000
2,000
Municipal Securities - continued
Principal
Amount (000s)
Value (Note 1)
(000s)
Texas - continued
Georgetown Ind. Dev. Corp. Rev. (Chatsworth Prods., Inc. Proj.) Series 1996, 4.5%, LOC Bank One, Texas NA, VRDN (a)(b)
$ 2,580
$ 2,580
Grand Prairie Ind. Dev. Auth. Ind. Dev. Rev. (Precision/API Ketema Proj.) Series 1996, 4.5%, LOC HSBC Bank USA, VRDN (a)(b)
795
795
Greater East Texas Higher Ed. Auth. Student Ln. Rev.:
Bonds:
Series 1993 B, 4.8%, tender 6/1/01, LOC Student Ln. Marketing Assoc. (b)
9,400
9,400
Series 1995 A, 4.5%, tender 5/1/01, LOC Student Ln. Marketing Assoc. (b)
3,400
3,400
Rfdg. Bonds:
Series 1992 A, 3.8%, tender 9/1/00, LOC Student Ln. Marketing Assoc.
4,300
4,300
Series 1992 B, 3.85%, tender 9/1/00, LOC Student Ln. Marketing Assoc. (b)
4,900
4,900
Gulf Coast Ind. Dev. Auth. Solid Waste Disp. Rev. (Citgo Petroleum Corp. Proj.) 4.45%, LOC Wachovia Bank NA, VRDN (a)(b)
500
500
Gulf Coast Waste Disp. Auth. Poll. Cont. Rev. (Air Products Proj.) Series 1999, 4.3%, LOC Bank One NA, Chicago, VRDN (a)(b)
4,800
4,800
Harlingen Ind. Dev. Auth. Ind. Dev. Rev. (Gibbs-Texas Die Casting Proj.) 4.55%, LOC Bank of America NA, VRDN (a)(b)
3,200
3,200
Houston Gen. Oblig.:
Series 1993 A, 4.3% 11/8/00, LOC Westdeutsche Landesbank Girozentrale, CP (b)
5,000
5,000
Series B, 4.2% 9/8/00, CP
2,500
2,500
Houston Higher Ed. Fin. Corp. Higher Ed. Rev. Participating VRDN:
Series SG 127, 4.33% (Liquidity Facility Societe Generale) (a)(d)
2,400
2,400
Series SG 139, 4.33% (Liquidity Facility Societe Generale) (a)(d)
4,300
4,300
Lower Colorado River Auth. Rev. Participating VRDN Series PA 590R, 4.33% (Liquidity Facility Merrill Lynch & Co., Inc.) (a)(d)
6,000
6,000
North Central Texas Health Facilities Dev. Corp. Rev. Bonds (Dallas Methodist Hosp. Proj.) Series 1998:
4.3% tender 10/13/00 (AMBAC Insured) (Liquidity Facility Dexia Cr. Local de France), CP mode
4,000
4,000
4.85% tender 9/8/00 (AMBAC Insured) (Liquidity Facility Dexia Cr. Local de France), CP mode
4,000
4,000
North Texas Muni. Wtr. District Wtrwks. Rev. Rfdg. Bonds Series 1992, 6% 9/1/00 (MBIA Insured)
5,000
5,000
Municipal Securities - continued
Principal
Amount (000s)
Value (Note 1)
(000s)
Texas - continued
Port Arthur Navigation District Indl. Dev. Corp. Exempt Facilities Rev. (Air Products & Chemicals, Inc. Proj.) Series 2000, 4.3%, LOC Bayerische
Hypo-und Vereinsbank AG, VRDN (a)(b)
$ 7,000
$ 7,000
San Antonio Elec. & Gas Rev. Participating VRDN:
Series SG 101, 4.33% (Liquidity Facility Societe Generale) (a)(d)
4,000
4,000
Series SG 105, 4.33% (Liquidity Facility Societe Generale) (a)(d)
4,420
4,420
San Antonio Ind. Dev. Auth. Ind. Dev. Rev. (LGC Bldg. & KLN Steel Proj.) Series 1998, 4.45%, LOC Bank of America NA, VRDN (a)(b)
1,000
1,000
San Antonio Wtr. Rev.:
Participating VRDN Series Merlots 00 VV, 4.37% (Liquidity Facility First Union Nat'l. Bank, North Carolina) (a)(d)
2,500
2,500
Series 1995, 4.35% 11/17/00, CP
3,000
3,000
San Marcos Ind. Dev. Corp. Ind. Dev. Rev. (Butler Manufacturing Co. Proj.) Series 1995, 4.39%, LOC Bank of America NA,
VRDN (a)(b)
3,250
3,250
Sunbelt Ind. Dev. Corp. Rev. (Fort Dearborn Lithograph Proj.) Series 1995, 4.5%, LOC Bank One NA, Michigan, VRDN (a)(b)
1,500
1,500
Terrell Dev. Corp. Ind. Dev. Rev. (Consolidated Sys. Proj.) 4.4%, LOC Wachovia Bank NA, VRDN (a)(b)
1,500
1,500
Texas Dept. Hsg. & Cmnty. Affairs Single Family Mtg. Rev. Series A:
4.3% 10/27/00, CP (b)
5,465
5,465
4.35% 10/20/00, CP (b)
1,845
1,845
Texas Gen. Oblig.:
Bonds Series PT 453, 4.45%, tender 2/8/01 (Liquidity Facility Bayerische Hypo-und Vereinsbank AG) (b)(d)
2,475
2,475
Participating VRDN:
Series FRRI 00 L18, 4.45% (Liquidity Facility Lehman Brothers, Inc.) (a)(d)
40,000
40,001
Series Merlots 00 QQ, 4.42% (Liquidity Facility First Union Nat'l. Bank, North Carolina) (a)(b)(d)
4,990
4,990
Series MSDW 00 290, 4.33% (Liquidity Facility Morgan Stanley Dean Witter & Co.) (a)(d)
4,460
4,460
TRAN 5.25% 8/31/01
21,700
21,899
Texas Pub. Fin. Auth. Rev. Series 1993 A, 4.1% 9/6/00, CP
1,900
1,900
Univ. of Texas Univ. Rev. Participating VRDN:
Series MSDW 98 97, 4.33% (Liquidity Facility Morgan Stanley Dean Witter & Co.) (a)(d)
7,500
7,500
Series SGA 78, 4.3% (Liquidity Facility Societe Generale) (a)(d)
4,500
4,500
305,455
Municipal Securities - continued
Principal
Amount (000s)
Value (Note 1)
(000s)
Utah - 1.0%
Intermountain Pwr. Agcy. Pwr. Supply Rev.:
Bonds Series 1985 E, 4.075%, tender 9/15/00 (AMBAC Insured)
$ 8,300
$ 8,300
Series 1997 B2, 4.3% 10/4/00, CP
2,200
2,200
Series 1997 B3:
4.2% 10/13/00, CP
9,000
9,000
4.25% 10/11/00, CP
1,800
1,800
Utah Hsg. Fin. Agcy. Participating VRDN:
Series PT 84A, 4.38% (Liquidity Facility Merrill Lynch & Co., Inc.) (a)(b)(d)
650
650
Series PT 84B, 4.38% (Liquidity Facility Merrill Lynch & Co., Inc.) (a)(b)(d)
510
510
22,460
Vermont - 0.1%
Vermont Econ. Dev. Auth. Ind. Dev. Rev. (Huber and Suhner Proj.) 4.45%, LOC Key Bank Nat'l. Assoc., VRDN (a)(b)
1,255
1,255
Virginia - 3.2%
Botetourt County Ind. Dev. Auth. Ind. Dev. Rev. (Virginia Forge Co. Proj.) Series 1996, 4.35%, LOC Harris Trust & Savings Bank,
Chicago, VRDN (a)(b)
1,490
1,490
Chesapeake Ind. Dev. Auth. Poll. Cont. Rev. Bonds (Virginia Elec. & Pwr. Co. Proj.) Series 1985, 4.35% tender 10/6/00, CP mode
2,400
2,400
Chesterfield County Ind. Dev. Auth. Poll. Cont. Rev. Bonds (Virginia Elec. & Pwr. Co. Proj.):
Series 1985, 4.25% tender 9/8/00, CP mode
4,700
4,700
Series 1987 A, 4.35% tender 9/8/00, CP mode
12,300
12,300
Frederick County Ind. Dev. Auth. Rev. (Nat'l. Wildlife Federation Proj.) Series 1996, 4.4%, (Winchester Wildlife Trust) LOC Bank of
America NA, VRDN (a)(b)
5,000
5,000
Greensville County Ind. Dev. Auth. Dev. Rev. (Beach Mold & Tool Virginia, Inc. Proj.):
Series 1996 A, 4.45%, LOC Bank One, Kentucky NA, VRDN (a)(b)
1,330
1,330
Series 1996 B, 4.45%, LOC Bank One, Kentucky NA, VRDN (a)(b)
2,150
2,150
Greensville County Ind. Dev. Auth. Rev. (Beach Mold & Tool Virginia, Inc. Proj.) 4.45%, LOC Bank One, Kentucky NA, VRDN (a)(b)
900
900
Halifax County Ind. Dev. Auth. Poll. Cont. Rev. Bonds (Virginia Elec. & Pwr. Co. Proj.) Series 1992, 4.25% tender 9/11/00, CP
mode (b)
13,100
13,100
Municipal Securities - continued
Principal
Amount (000s)
Value (Note 1)
(000s)
Virginia - continued
Mecklenburg County Ind. Dev. Auth. Rev. (American Bldg. Co. Proj.) 4.45%, LOC Canadian Imperial Bank of Commerce, VRDN (a)(b)
$ 4,140
$ 4,140
Virginia Hsg. Dev. Auth. Commonwealth Mtg. Rev. Bonds:
Series A, 4.15%, tender 9/12/00 (b)
3,100
3,100
Series B, 4.15%, tender 10/19/00
2,300
2,300
Sub Series B, 4.12%, tender 9/12/00
4,900
4,900
Virginia Pub. School Auth. Participating VRDN Series Putters 139, 4.32% (Liquidity Facility J.P. Morgan & Co., Inc.) (a)(d)
12,795
12,795
70,605
Washington - 5.3%
Chelan County Pub. Util. District #1 Rev. Participating VRDN Series Merlots 00 R, 4.42% (Liquidity Facility First Union Nat'l. Bank,
North Carolina) (a)(b)(d)
3,400
3,400
King County Swr. Rev.:
Participating VRDN Series Merlots 00 E, 4.37% (Liquidity Facility First Union Nat'l. Bank, North Carolina) (a)(d)
1,900
1,900
Series A, 4.45% 9/11/00 (Liquidity Facility Bayerische Landesbank Girozentrale), CP
2,000
2,000
Pierce County Econ. Dev. Corp. Rev. (Pacific LLC Proj.) 4.55%, LOC Wells Fargo Bank NA, San Francisco, VRDN (a)(b)
2,900
2,900
Port Grays Hbr. Ind. Dev. Corp. Solid Waste Disp. Rev. (Pacific Veneer, Weyerhaeuser Co. Proj.):
Series 1993, 4.5%, VRDN (a)(b)
2,365
2,365
4.5%, VRDN (a)(b)
9,650
9,650
Port Longview Ind. Dev. Corp. Solid Waste Disp. Rev. (Weyerhaeuser Co. Proj.) Series 1993, 4.5%, VRDN (a)(b)
22,400
22,400
Port Seattle Gen. Oblig.:
Series 1997, 4.45%, LOC Canadian Imperial Bank of Commerce, VRDN (a)(b)
10,500
10,500
Series 1999 B, 4.45%, LOC Commerzbank AG, VRDN (a)(b)
3,000
3,000
Seattle Gen. Oblig. Ltd. Tax Participating VRDN Series SGB 12, 4.33% (Liquidity Facility Societe Generale) (a)(d)
2,600
2,600
Seattle Hsg. Auth. Rev. (New Holly Phase II Proj.) 4.5%, (Othello Street LP) LOC Key Bank Nat'l. Assoc., VRDN (a)(b)
3,700
3,700
Snohomish Pub. Hosp. District #2 Rfdg. & Impt. (Stevens Health Care Proj.) Series 1999, 4.25%, LOC Bank of America NA, VRDN (a)
7,100
7,100
Tacoma Elec. Sys. Rev. Bonds 6.514% 1/2/15 (AMBAC Insured) (Pre-Refunded to 1/1/01 @ 102) (c)
2,200
2,258
Municipal Securities - continued
Principal
Amount (000s)
Value (Note 1)
(000s)
Washington - continued
Washington Econ. Dev. Fin. Auth. Rev. (Hunter Douglas Proj.) Series 1997 A, 4.35%, LOC ABN-AMRO Bank NV, VRDN (a)(b)
$ 1,300
$ 1,300
Washington Gen. Oblig. Participating VRDN:
Series 984702, 4.33% (Liquidity Facility Citibank NA, New York) (a)(d)
12,500
12,500
Series SGA 34, 4.3% (Liquidity Facility Societe Generale) (a)(d)
3,255
3,255
Series SGA 35, 4.3% (Liquidity Facility Societe Generale) (a)(d)
8,990
8,990
Series SGB 9, 4.33% (Liquidity Facility Societe Generale) (a)(d)
5,000
5,000
Washington Hsg. Fin. Commission:
Bonds (Single Family Mtg. Prog.) Series 2AS, 4.4% 4/1/01 (b)
2,700
2,700
Participating VRDN Series Merlots 97 D, 4.42% (Liquidity Facility First Union Nat'l. Bank, North Carolina) (a)(b)(d)
3,975
3,975
Washington Hsg. Fin. Commission Single Family Mtg. Rev. Participating VRDN Series PT 86, 4.38% (Liquidity Facility Merrill Lynch &
Co., Inc.) (a)(b)(d)
1,790
1,790
Washington Motor Vehicle Fuel Tax Participating VRDN Series 964701, 4.33% (Liquidity Facility Citibank NA, New York) (a)(d)
4,000
4,000
117,283
West Virginia - 0.9%
Grant County Poll. Cont. Rev. Bonds (Virginia Elec. & Pwr. Co. Proj.) Series 1986, 4.25% tender 9/11/00, CP mode (b)
1,300
1,300
Grant County Solid Waste Disp. Rev. Bonds (Virginia Elec. & Pwr. Co. Proj.) Series 1996, 4.6% tender 9/8/00, CP mode (b)
6,500
6,500
West Virginia Econ. Dev. Auth. Ind. Rev. (Smith Svc., Inc. Proj.) Series 1999, 4.43%, LOC Huntington Nat'l. Bank, Columbus,
VRDN (a)(b)
5,500
5,500
West Virginia Hosp. Fin. Auth. Rev. (WVHA Pooled Ln. Fing. Prog.) Series 2000 A, 4.39%, (Liquidity Facility Bank of Nova Scotia),
(Liquidity Facility BNP Paribas Sa), VRDN (a)
6,200
6,200
West Virginia Pub. Energy Auth. Energy Rev. Bonds (Morgantown Energy Assoc. Proj.) 4.3% tender 10/6/00, LOC Dexia Cr. Local de
France, CP mode (b)
1,150
1,150
20,650
Wisconsin - 2.5%
Ashwaubenon Ind. Dev. Rev. (Tufco Proj.) Series 1992, 4.5%, LOC Bank One, Wisconsin, VRDN (a)(b)
1,500
1,500
Municipal Securities - continued
Principal
Amount (000s)
Value (Note 1)
(000s)
Wisconsin - continued
Butler Ind. Dev. Rev. (Western States Envelope Co. Proj.) $ 2,305
$ 2,305
Green Bay School District BAN 5.15% 4/13/01
3,800
3,800
Hartford Cmnty. Dev. Auth. Ind. Dev. Rev. (TNT/Larpen Supply Proj.) 4.5%, LOC Bank One, Wisconsin, VRDN (a)(b)
2,045
2,045
Milwaukee County Gen. Oblig. Participating VRDN:
Series FRRI 00 A8, 4.45% (Liquidity Facility Bank of 7,000
7,000
Series FRRI A37, 4.45% (Liquidity Facility Bank of 6,900
6,900
Oak Creek Ind. Dev. Rev. (Outlook Packaging, Inc. Proj.) 4.4%, LOC Bank of America NA, VRDN (a)(b)
1,800
1,800
Platteville Ind. Dev. Rev. (Woodward Communications Proj.) 4.35%, LOC Harris Trust & Savings Bank, Chicago, VRDN (a)(b)
1,250
1,250
Pleasant Prairie Village Ind. Dev. Rev. (Muskie Enterprises, Inc. Proj.) Series 1995, 4.35%, LOC Harris Trust & Savings Bank, Chicago,
VRDN (a)(b)
4,500
4,500
Raymond Ind. Dev. Rev. (Richard S. Werner, Inc. Proj.) 2,160
2,160
Rhinelander Ind. Rev. (Red Arrow Prod. Co., Inc. Proj.) 5,600
5,600
Sturgeon Bay Ind. Dev. Rev. (Marine Travelift Proj.) 1,100
1,100
Sturtevant Ind. Dev. Rev. (Quadra, Inc. Proj.) 4.5%, LOC Bank One, Wisconsin, VRDN (a)(b)
1,300
1,300
Wisconsin Gen. Oblig. Ctfs. of Prtn. Participating VRDN 5,480
5,480
Wisconsin Hsg. & Econ. Dev. Auth. Home Ownership Rev. Bonds Series PT 445, 4.45%, tender 2/22/01 (Liquidity Facility Banco
Santander SA) (b)(d)(e)
7,995
7,995
54,735
Municipal Securities - continued
Principal
Amount (000s)
Value (Note 1)
(000s)
Wyoming - 0.3%
Wyoming Cmnty. Dev. Auth. Participating VRDN $ 5,045
$ 5,045
Wyoming Cmnty. Dev. Auth. Hsg. Rev. Participating VRDN Series PT 112, 4.33% (Liquidity Facility Merrill 1,395
1,395
6,440
TOTAL INVESTMENT PORTFOLIO - 98.8%
2,188,015
NET OTHER ASSETS - 1.2%
25,675
NET ASSETS - 100%
$ 2,213,690
Total Cost for Income Tax Purposes $ 2,188,015
Security Type Abbreviations
BAN - BOND ANTICIPATION NOTE
CP - COMMERCIAL PAPER
RAN - REVENUE ANTICIPATION NOTE
TAN - TAX ANTICIPATION NOTE
TRAN - TAX AND REVENUE VRDN - VARIABLE RATE DEMAND NOTE
Legend
(a) The coupon rate shown on floating or adjustable rate securities represents the rate at period end.
(b) Private activity obligations whose interest is subject to the federal alternative minimum tax for individuals.
(c) Security collateralized by an amount sufficient to pay interest and principal.
(d) Provides evidence of ownership in one or more underlying municipal bonds.
(e) Restricted securities - Investment in securities not registered under the Securities Act of 1933.
Additional information on each holding is as follows:
Security
Acquisition Date
Cost
(000s)
Dallas Wtrwks. &
Swr. Sys. Rev. Bonds
Series PT 371, 4.4%,
tender 2/22/01
(Liquidity Facility
Merrill Lynch & Co.,
Inc.)
6/30/00
$ 9,930
Denver City &
County Arpt. Rev.
Bonds Series PT 249,
4.45%, tender
2/22/01 (Liquidity
Facility Banco
Santander SA)
1/8/99
$ 1,900
Idaho Hsg. & Fin.
Assoc. Bonds Series
PT 247, 4.45%,
tender 2/22/01
(Liquidity Facility
Banco Santander SA)
1/8/99
$ 2,280
Minnesota Hsg. Fin.
Agcy. Bonds
(Residential Hsg. Fin.
Prog.) Series PT 114,
4.33%, tender
2/22/01 (Liquidity
Facility Merrill Lynch
& Co., Inc.)
12/30/97
$ 3,600
Ohio Hsg. Fin. Agcy.
Mtg. Rev. Bonds
Series PT 241,
4.45%, tender
2/22/01 (Liquidity
Facility Bayerische
Hypo-und
Vereinsbank AG)
11/13/98 - 8/31/00
$ 7,220
Oklahoma Hsg. Fin.
Auth. Single Family
Rev. Bonds Series PT
104, 4.45%, tender
2/22/01 (Liquidity
Facility Bayerische
Hypo-und
Vereinsbank AG)
3/26/97 $ 1,765
Oklahoma Hsg. Fin.
Auth. Single Family
Rev. Bonds Series PT
167, 4.45%, tender
2/22/01 (Liquidity
Facility BNP Paribas
Sa)
3/26/98 $ 2,400
South Carolina Hsg.
Fin. & Dev. Auth.
Mtg. Rev. Bonds
Series PT 270,
4.45%, tender
2/22/01 (Liquidity
Facility Bayerische
Hypo-und
Vereinsbank AG)
6/4/99
$ 5,535
Tennessee Hsg. Dev.
Agcy. Bonds (Home
Ownership Prog.)
Series PT 59B,
4.45%, tender
2/22/01 (Liquidity
Facility Merrill Lynch
& Co., Inc.)
6/12/97
$ 4,880
Wisconsin Hsg. &
Econ. Dev. Auth.
Home Ownership
Rev. Bonds Series PT
445, 4.45%, tender
2/22/01 (Liquidity
Facility Banco
Santander SA)
7/20/00
$ 7,995
Income Tax Information
At August 31, 2000, the fund had a capital loss carryforward of approximately $320,000 of which $1,000, $46,000, $26,000, $125,000, $14,000, $95,000,
$9,000 and $4,000 will expire on August 31, 2001, 2002, 2003, 2004, 2005, 2006, 2007 and 2008, respectively.
See accompanying notes which are an integral part of the financial statements.
Annual Report
Statement of Assets and Liabilities
Amounts in thousands (except per-share amount)
August 31, 2000
Assets
Investment in securities, at value -
$ 2,188,015
Receivable for fund shares sold
15,557
Interest receivable
16,654
Total assets
2,220,226
Liabilities
Payable to custodian bank
$ 238
Payable for investments purchased
3,600
Payable for fund shares redeemed
1,360
Distributions payable
583
Accrued management fee
745
Other payables and accrued expenses
10
Total liabilities
6,536
Net Assets
$ 2,213,690
Net Assets consist of:
Paid in capital
$ 2,214,014
Accumulated undistributed net realized gain (loss)
(324)
Net Assets, for 2,214,012 shares outstanding
$ 2,213,690
Net Asset Value, offering price and redemption price per share ($2,213,690 ÷ 2,214,012 shares)
$1.00
See accompanying notes which are an integral part of the financial statements.
Annual Report
Financial Statements - continued
Statement of Operations
Amounts in thousands
Year ended August 31, 2000
Interest Income
$ 86,677
Expenses
Management fee
$ 10,945
Non-interested trustees' compensation
7
Total expenses before reductions
10,952
Expense reductions
(2,294)
8,658
Net interest income
78,019
Net Realized Gain (Loss) on Investments
20
Net increase (decrease) in net assets resulting
$ 78,039
See accompanying notes which are an integral part of the financial statements.
Annual Report
Financial Statements - continued
Statement of Changes in Net Assets
Amounts in thousands
Year ended Year ended Increase (Decrease) in Net Assets
Operations $ 78,019
$ 64,717
Net realized gain (loss)
20
(14)
Net increase (decrease) in net assets resulting 78,039
64,703
Distributions to shareholders from net interest income
(78,019)
(64,717)
Share transactions at net asset value of $1.00 per share 2,564,755
2,581,058
Reinvestment of distributions from net interest income
71,578
59,578
Cost of shares redeemed
(2,638,997)
(2,701,588)
Net increase (decrease) in net assets and shares resulting from share transactions
(2,664)
(60,952)
Total increase (decrease) in net assets
(2,644)
(60,966)
Net Assets
Beginning of period
2,216,334
2,277,300
End of period
$ 2,213,690
$ 2,216,334
See accompanying notes which are an integral part of the financial statements.
Annual Report
Financial Highlights
Years ended August 31,
2000
1999
1998
1997
1996
Selected Per-Share Data
Net asset value, $ 1.000
$ 1.000
$ 1.000
$ 1.000
$ 1.000
Income from Investment Operations .036
.029
.033
.033
.034
Less Distributions
From net interest income
(.036)
(.029)
(.033)
(.033)
(.034)
Net asset value, end of period
$ 1.000
$ 1.000
$ 1.000
$ 1.000
$ 1.000
Total Return A, B
3.63%
2.95%
3.40%
3.38%
3.41%
Ratios and Supplemental Data
Net assets, end of period $ 2,214
$ 2,216
$ 2,277
$ 2,329
$ 2,380
Ratio of expenses to average .40% C
.40% C
.40% C
.40% C
.40% C
Ratio of expenses to average .40%
.39% D
.39% D
.40%
.39% D
Ratio of net interest income to average net assets
3.56%
2.91%
3.35%
3.33%
3.36%
A The total returns would have been lower had certain expenses not been reduced during the periods shown.
B Total returns do not include the account closeout fee.
C FMR agreed to reimburse a portion of the fund's expenses during the period. Without this reimbursement, the fund's expense ratio would have been higher.
D FMR or the fund has entered into varying arrangements with third parties who either paid or reduced a portion of the fund's expenses.
See accompanying notes which are an integral part of the financial statements.
Annual Report
Notes to Financial Statements
For the period ended August 31, 2000
1. Significant Accounting Policies.
Spartan Municipal Money Fund (the fund) is a fund of Fidelity Union Street Trust II (the trust) and is authorized to issue an unlimited number of shares.
The trust is registered under the Investment Company Act of 1940, as amended (the 1940 Act), as an open-end management investment company
organized as a Delaware business trust. The financial statements have been prepared in conformity with generally accepted accounting principles which
require management to make certain estimates and assumptions at the date of the financial statements. The following summarizes the significant
accounting policies of the fund:
Security Valuation. As permitted under Rule 2a-7 of the 1940 Act, and certain conditions therein, securities are valued initially at cost and thereafter
assume a constant amortization to maturity of any discount or premium.
Income Taxes. As a qualified regulated investment company under Subchapter M of the Internal Revenue Code, the fund is not subject to income taxes to
the extent that it distributes substantially all of its taxable income for its fiscal year. The schedule of investments includes information regarding income
taxes under the caption "Income Tax Information."
Interest Income. Interest income, which includes amortization of premium and accretion of discount, is accrued as earned. Accretion of discount
represents unrealized gain until realized at the time of a security disposition or maturity.
Expenses. Most expenses of the trust can be directly attributed to a fund. Expenses which cannot be directly attributed are apportioned among the funds
in the trust.
Distributions to Shareholders. Dividends are declared daily and paid monthly from net interest income.
Security Transactions. Security transactions are accounted for as of trade date. Gains and losses on securities sold are determined on the basis of
identified cost.
2. Operating Policies.
Fidelity Municipal Cash Central Fund. Pursuant to an Exemptive Order issued by the Securities and Exchange Commission (the SEC), the fund may
invest in the Fidelity Municipal Cash Central Fund (the Cash Fund) managed by Fidelity Investments Money Management, Inc. (FIMM), an affiliate of
Fidelity Management & Research Company (FMR). The Cash Fund is an open-end money market fund available only to investment companies and other
accounts managed by FMR and its affiliates. The Cash Fund seeks preservation of capital, liquidity, and current income by investing in high-quality,
short-term municipal securities of various states and municipalities. Income distributions from the Cash Fund are declared daily and paid monthly from
net interest income. Income distributions earned by the fund are recorded as interest income in the accompanying financial statements.
When-Issued Securities. The fund may purchase or sell securities on a when-issued basis. Payment and delivery may take place after the customary
settlement period for
Annual Report
Notes to Financial Statements - continued
2. Operating Policies - When-Issued Securities - continued
that security. The price of the underlying securities is fixed at the time the transaction is negotiated. The fund may receive compensation for interest
forgone in the purchase of a when-issued security. With respect to purchase commitments, the fund identifies securities as segregated in its records with a
value at least equal to the amount of the commitment. Losses may arise due to changes in the value of the underlying securities, if the counterparty does not
perform under the contract, or if the issuer does not issue the securities due to political, economic, or other factors.
Restricted Securities. The fund is permitted to invest in securities that are subject to legal or contractual restrictions on resale. These securities generally
may be resold in transactions exempt from registration or to the public if the securities are registered. Disposal of these securities may involve
time-consuming negotiations and expense, and prompt sale at an acceptable price may be difficult. At the end of the period, restricted securities (excluding
144A issues) amounted to $47,505,000 or 2.1% of net assets.
3. Fees and Other Transactions with Affiliates.
Management Fee. As the fund's investment adviser, FMR receives a fee that is computed daily at an annual rate of .50% of the fund's average net assets.
FMR pays all other expenses, except the compensation
of the non-interested Trustees and certain exceptions such as interest, taxes, brokerage commissions and extraordinary expenses. The management fee
paid to FMR by the fund is reduced by an amount equal to the fees and expenses paid by the fund to the non-interested Trustees.
FMR also bears the cost of providing shareholder services to the fund. To offset the cost of providing these services, FMR or its affiliates collected certain
transaction fees from shareholders which amounted to $13,000 for the period.
Sub-Adviser Fee. As the fund's investment sub-adviser, FIMM, a wholly owned subsidiary of FMR, receives a fee from FMR of 50% of the management fee
payable to FMR. The fee is paid prior to any voluntary expense reimbursements which may be in effect.
Money Market Insurance. Pursuant to an Exemptive Order issued by the SEC, the fund, along with other money market funds advised by FMR or its
affiliates, has entered into insurance agreements with FIDFUNDS Mutual Limited (FIDFUNDS), an affiliated mutual insurance company. FIDFUNDS
provides limited coverage for certain loss events including issuer default as to payment of principal or interest and bankruptcy or insolvency of a credit
enhancement provider. The insurance does not cover losses resulting from changes in interest rates, ratings downgrades or other market conditions. The
fund may be subject to a special assessment of up to approximately 2.5 times the fund's annual gross premium if covered losses exceed certain levels. During
the period, FMR has borne the cost of the fund's premium payable to FIDFUNDS.
Annual Report
Notes to Financial Statements - continued
4. Expense Reductions.
FMR voluntarily agreed to reimburse the fund's operating expenses (excluding interest, taxes, brokerage commissions and extraordinary expenses, if any)
above an annual rate of .40% of average net assets. For the period, the reimbursement reduced the expenses by $2,190,000.
In addition, through arrangements with the fund's custodian and transfer agent, credits realized as a result of uninvested cash balances were used to
reduce a portion of the fund's expenses. During the period, the fund's expenses were reduced by $104,000 under these arrangements.
Annual Report
Report of Independent Accountants
To the Trustees of Fidelity Union Street Trust II and the Shareholders of Spartan Municipal Money Fund:
In our opinion, the accompanying statement of assets and liabilities, including the schedule of investments, and the related statements of operations and
of changes in net assets and the financial highlights present fairly, in all material respects, the financial position of Spartan Municipal Money Fund (a
fund of Fidelity Union Street Trust II) at August 31, 2000, and the results of its operations, the changes in its net assets and the financial highlights for
the periods indicated, in conformity with accounting principles generally accepted in the United States. These financial statements and financial
highlights (hereafter referred to as "financial statements") are the responsibility of the Spartan Municipal Money Fund's management; our responsibility
is to express an opinion on these financial statements based on our audits. We conducted our audits of these financial statements in accordance with
auditing standards generally accepted in the United States which require that we plan and perform the audit to obtain reasonable assurance about
whether the financial statements are free of material misstatement. An audit includes examining, on a test basis, evidence supporting the amounts and
disclosures in the financial statements, assessing the accounting principles used and significant estimates made by management, and evaluating the
overall financial statement presentation. We believe that our audits, which included
confirmation of securities at August 31, 2000 by correspondence with the custodian and brokers, provide a reasonable basis for the opinion expressed
above.
/s/PricewaterhouseCoopers LLP Boston, Massachusetts Annual Report
Distributions
During fiscal year ended 2000, 100% of the fund's income dividends was free from federal income tax, and 55.85% of the fund's income dividends was
subject to the federal alternative minimum tax.
Annual Report
Managing Your Investments
Fidelity offers several ways to conveniently manage your personal investments via your telephone or PC. You can access your account information,
conduct trades and research your investments 24 hours a day.
By Phone
Fidelity Automated Service Telephone provides a single toll-free number to access account balances, positions, quotes and trading. It's easy to navigate
the service, and on your first call, the system will help you create a personal identification number (PIN) for security.
(phone_graphic)
Fidelity Automated Press
1 For mutual fund and brokerage trading.
2 For quotes.* 3 For account balances and holdings.
4 To review orders and mutual 5 To change your PIN.
*0 To speak to a Fidelity representative.
By PC
Fidelity's web site on the Internet provides a wide range of information, including daily financial news, fund performance, interactive planning tools
and news about Fidelity products and services.
(computer_graphic)
Fidelity's Web Site If you are not currently on the Internet, call EarthLink Sprint at 1-800-288-2967, and be sure to ask for registration number SMD004 to receive a
special Fidelity package that includes 30 days of free Internet access. EarthLink is North America's #1 independent Internet access provider.
(computer_graphic)
Fidelity On-line Xpress+®
Fidelity On-line Xpress+ software for Windows combines comprehensive portfolio management capabilities, securities trading and access to research
and analysis tools . . . all on your desktop. Call Fidelity at 1-800-544-0240 or visit our web site for more information on how to manage your investments
via your PC. * When you call the quotes line, please remember that a fund's yield and return will vary and,
except for money market funds, share price will also vary. This means that you may have a gain
or loss when you sell your shares. There is no assurance that money market funds will be able to
maintain a stable $1 share price; an investment in a money market fund is not insured or
guaranteed by the U.S. government. Total returns are historical and include changes in share price,
reinvestment of dividends and capital gains, and the effects of any sales charges. Annual Report
To Write Fidelity
If more than one address is listed, please locate the address that is closest to you. We'll give your correspondence immediate attention and send you
written confirmation upon completion of your request.
(letter_graphic)
Making Changes (such as changing name, address, bank, etc.)
Fidelity Investments (letter_graphic)
For Non-Retirement Buying shares
Fidelity Investments Overnight Express Selling shares
Fidelity Investments Overnight Express 400 East Las Colinas Blvd. General Correspondence
Fidelity Investments (letter_graphic)
For Retirement Buying shares
Fidelity Investments Selling shares
Fidelity Investments Overnight Express 400 East Las Colinas Blvd. General Correspondence
Fidelity Investments Annual Report
Investment Adviser
Fidelity Management & Research Company
Boston, MA
Investment Sub-Adviser
Fidelity Investments Officers
Edward C. Johnson 3d, President
Robert C. Pozen, Senior Vice President
Boyce I. Greer, Vice President
Dwight D. Churchill, Vice President
Diane M. McLaughlin, Vice President
Stanley N. Griffith, Assistant Vice President
Eric D. Roiter, Secretary
Robert A. Dwight, Treasurer
Maria F. Dwyer, Deputy Treasurer
John H. Costello, Assistant Treasurer
Thomas J. Simpson, Assistant Treasurer
Board of Trustees
Ralph F. Cox *
Phyllis Burke Davis *
Robert M. Gates *
Edward C. Johnson 3d
Donald J. Kirk *
Ned C. Lautenbach *
Peter S. Lynch
Marvin L. Mann *
William O. McCoy *
Gerald C. McDonough *
Robert C. Pozen
Thomas R. Williams *
Advisory Board
J. Michael Cook
Abigail P. Johnson
Marie L. Knowles
General Distributor
Fidelity Distributors Corporation
Boston, MA
Transfer and Shareholder Fidelity Service Company, Inc.
Boston, MA * Independent trustees
Custodian
Citibank, N.A.
New York, NY
Fidelity's Municipal California Municipal Money Market
Connecticut Municipal Money Market
Massachusetts Municipal Money Market
Michigan Municipal Money Market
Municipal Money Market
New Jersey Municipal Money Market
New York Municipal Money Market
Ohio Municipal Money Market
Spartan(automated graphic) Arizona Municipal Spartan California Municipal Spartan Connecticut Municipal Spartan Florida Municipal Money Market
Spartan Massachusetts Municipal Spartan Municipal Money
Spartan New Jersey Municipal Spartan New York Municipal Spartan Pennsylvania Municipal The Fidelity Telephone Connection
Mutual Fund 24-Hour Service
Exchanges/Redemptions Product Information 1-800-544-6666
Retirement Accounts 1-800-544-4774 (8 a.m. - 9 p.m.)
TDD Service 1-800-544-0118 Fidelity Automated Service (automated graphic) Automated line for quickest service
SMM-ANN-1000 112770 (Fidelity Investment logo)(registered trademark) Spartan®
Arizona Funds
Annual Report
August 31, 2000
(2_fidelity_logos) (Registered_Trademark)
Contents
President's Message
Ned Johnson on investing strategies.
Spartan Arizona Municipal Income Fund
Performance
How the fund has done over time.
Fund Talk
The manager's review of fund
performance, strategy and outlook.
Investment Changes
A summary of major shifts in the fund's
investments over the past six months.
Investments
A complete list of the fund's investments
with their market values.
Financial Statements
Statements of assets and liabilities,
operations, and changes in net assets, Spartan Arizona Municipal Money Market Fund
Performance
How the fund has done over time.
Fund Talk
The manager's review of fund
performance, strategy and outlook.
Investment Changes
A summary of major shifts in the fund's
investments over the past six months Investments
A complete list of the fund's investments.
Financial Statements
Statements of assets and liabilities,
operations, and changes in net assets, Notes
Notes to the financial statements
Report of Independent
Accountants
The auditors' opinion.
Proxy Voting Results
Standard & Poor's, S&P and S&P 500 are registered service marks of The McGraw-Hill Companies, Inc. and have been licensed for use by Fidelity Distributors Corporation.
Other third party marks appearing herein are the property of their respective owners.
All other marks appearing herein are registered or unregistered trademarks or service marks of FMR Corp. or an affiliated company.
(Recycle graphic) This report is printed on recycled paper using soy-based inks.
This report and the financial statements contained herein are submitted for the general
information of the shareholders of the funds. This report is not authorized for distribution to
prospective investors in the funds unless preceded or accompanied by an effective prospectus.
Mutual fund shares are not deposits or obligations of, or guaranteed
by, any depository institution. Shares are not insured by the FDIC,
Federal Reserve Board or any other agency, and are subject to
investment risks, including possible loss of principal amount
invested.
Neither the funds nor Fidelity Distributors Corporation is a bank.
For more information on any Fidelity fund, including charges and expenses, call 1-800-544-6666
for a free prospectus. Read it carefully before you invest or send money.
8/31/00
investments
8/31/99
Funds Average *
Demand Notes
(VRDNs) 69.8%
Demand Notes
(VRDNs) 57.9%
CP Mode) 18.1%
CP Mode) 24.7%
and Net
Other Assets 3.6%
and Net
Other Assets 4.7%

Series 1992 A, 4.45%, LOC Amsouth Bank NA, Birmingham, VRDN (a)(b)
Bank NA, VRDN (a)
Facility Landesbank Hessen-Thuringen), VRDN (a)
(FGIC Insured)
Series 2000 B2, 4.65% 6/29/01 (AMBAC Guaranteed) (b)
orial Hosp. Proj.) Series A, 4.25% tender 10/18/00, CP mode
Series 2000, 4.35%, LOC Suntrust Bank, VRDN (a)
Bank One NA, Michigan, VRDN (a)(b)
4.45%, LOC Lasalle Bank NA, VRDN (a)(b)
(AMBAC Insured), VRDN (a)
New York) (a)(d)
(BPA Bank One NA), VRDN (a)
Series 2000, 4.4%, LOC Fed. Home Ln. Bank, Indianapolis, VRDN (a)(b)
Series 1996 A, 4.4%, (Hebron Pointe LLC) LOC Fed.
Home Ln. Bank, Indianapolis, VRDN (a)(b)
Series A, 4.4% 10/23/00 (Liquidity Facility Bank One NA, Michigan), CP
Indiana NA, VRDN (a)(b)
Series 1995, 4.45%, LOC BankBoston NA, VRDN (a)(b)
Elec. Co. Proj.):
Elec. Co. Proj.):
Cincinnati, VRDN (a)(b)
Witter & Co.) (a)(d)
Series LB 99 A52, 4.5% (Liquidity Facility Bayerische Hypo-und Vereinsbank AG) (a)(b)(d)
(MBIA Insured), VRDN (a)(b)
Chemical Co. Proj.):
Series 1998, 4.45%, LOC PNC Bank NA, VRDN (a)(b)
Series 1991 B, 4.4%, LOC First Tennessee Bank NA, Memphis, VRDN (a)(b)
Series Merlots 00 HH, 4.37% (Liquidity Facility First
Union Nat'l. Bank, North Carolina) (a)(d)
Witter & Co.) (a)(d)
America NA) (a)(b)(d)
Lynch & Co., Inc.) (a)(b)(d)
Participating VRDN:
America NA) (a)(b)(d)
New York) (a)(d)
(New England Pwr. Co. Proj.) Series 1990 A:
New York NA) (a)(b)(d)
Nat'l. Bank, North Carolina
Rev. Series 1:
4.25% 3/1/01 (b)
Series 1999, 4.33% (AMBAC Insured), VRDN (a)
Depots et Consignations) (a)(b)(d)
America NA) (a)(d)
America NA) (a)(b)(d)
America NA) (a)(b)(d)
Bank One NA, VRDN (a)(b)
(AMBAC Insured), VRDN (a)(b)
Guaranteed), VRDN (a)
Guaranteed), VRDN (a)
Bank of Nova Scotia, VRDN (a)(b)
Series RF 00 5, 4.48% (Liquidity Facility Bank of
New York NA) (a)(b)(d)
Series 1993, 4.35%, LOC Suntrust Bank, VRDN (a)(b)
LOC PNC Bank NA, VRDN (a)(b)
Series 1996, 4.4%, LOC Wachovia Bank NA, VRDN (a)(b)
4.15% 9/12/00, CP
CP mode (b)
Series 1996, 4.45%, LOC Firstar Bank NA, VRDN (a)(b)
New York NA) (a)(d)
New York NA) (a)(d)
Series 1996, 4.5%, LOC Bank One, Wisconsin, VRDN (a)(b)
Series 1994, 4.5%, LOC Bank One, Wisconsin, VRDN (a)(b)
Series 1996, 4.45%, LOC Firstar Bank NA, VRDN (a)(b)
Series 944904 Class A, 4.35% (Liquidity Facility
Citibank NA, New York) (a)(b)(d)
Series Merlots 00 KK, 4.37% (Liquidity Facility
First Union Nat'l. Bank, North Carolina) (a)(d)
Lynch & Co., Inc.) (a)(d)
ANTICIPATION NOTE
- 8/31/00
- 8/31/00
See accompanying schedule
on investments
from operations
August 31,
2000
August 31,
1999
Net interest income
from operations
Proceeds from sales of shares
beginning of period
Net interest income
(in millions)
net assets
net assets after expense reductions
continued
PricewaterhouseCoopers LLP
October 6, 2000
Service Telephone (FAST®)
1-800-544-5555
fund activity.
www.fidelity.com
To Your Account
P.O. Box 770001
Cincinnati, OH 45277-0002
Accounts
P.O. Box 770001
Cincinnati, OH 45277-0003
Fidelity Investments
2300 Litton Lane - KH1A
Hebron, KY 41048
P.O. Box 660602
Dallas, TX 75266-0602
Fidelity Investments
Attn: Redemptions - CP6I
Irving, TX 75039-5587
P.O. Box 500
Merrimack, NH 03054-0500
Accounts
P.O. Box 770001
Cincinnati, OH 45277-0003
P.O. Box 660602
Dallas, TX 75266-0602
Fidelity Investments
Attn: Redemptions - CP6R
Irving, TX 75039-5587
P.O. Box 500
Merrimack, NH 03054-0500
Money Management, Inc.
Servicing Agents
and
Citibank, N.A.
New York, NY
Money Market Funds
Money Market
Money Market
Money Market
Money Market
Money Market
Money Market
Money Market
and Account Assistance 1-800-544-6666
for the deaf and hearing impaired
(9 a.m. - 9 p.m. Eastern time)
Telephone (FAST®) (automated graphic) 1-800-544-5555
1.536690.103
Corporate Headquarters
82 Devonshire St., Boston, MA 02109
www.fidelity.com
Municipal
as well as financial highlights.
and one year.
as well as financial highlights.
Annual Report
(Photograph of Edward C. Johnson 3d.)
Dear Shareholder:
A slowing U.S. economy triggered an equity market rally during the later stages of summer, boosting most major stock indexes back into positive territory for calendar year 2000. One notable exception, however, was the Dow Jones Industrial Average, which posted a negative return during that timeframe. Fixed-income markets - particularly Treasuries - continued their yearlong trend of strong performance, as nearly every bond sector outperformed the stock market on a year-to-date basis.
While it's impossible to predict the future direction of the markets with any degree of certainty, there are certain basic principles that can help investors plan for their future needs.
The longer your investment time frame, the less likely it is that you will be affected by short-term market volatility. A 10-year investment horizon appropriate for saving for a college education, for example, enables you to weather market cycles in a long-term fund, which may have a higher risk potential, but also has a higher potential rate of return.
An intermediate-length fund could make sense if your investment horizon is two to four years, while a short-term bond fund could be the right choice if you need your money in one or two years.
If your time horizon is less than a year, you might want to consider moving some of your bond investment into a money market fund. These funds seek income and a stable share price by investing in high-quality, short-term investments. Of course, it's important to remember that an investment in a money market fund is not insured or guaranteed by the Federal Deposit Insurance Corporation or any other government agency. Although money market funds seek to preserve the value of your investment at $1.00 per share, it is possible to lose money by investing in these types of funds.
Finally, no matter what your time horizon or portfolio diversity, it makes good sense to follow a regular investment plan, investing a certain amount of money in a fund at the same time each month or quarter and periodically reviewing your overall portfolio. By doing so, you won't get caught up in the excitement of a rapidly rising market, nor will you buy all your shares at market highs. While this strategy - known as dollar cost averaging - won't assure a profit or protect you from a loss in a declining market, it should help you lower the average cost of your purchases. Of course, you should consider your financial ability to continue your purchases through periods of low price levels before undertaking such a strategy.
If you have questions, please call us at 1-800-544-6666, or visit our web site at www.fidelity.com. We are available 24 hours a day, seven days a week to provide you the information you need to make the investments that are right for you.
Best regards,
/s/Edward C. Johnson 3d
Edward C. Johnson 3d
Annual Report
Spartan Arizona Municipal Income Fund
There are several ways to evaluate a fund's historical performance. You can look at the total percentage change in value, the average annual percentage change or the growth of a hypothetical $10,000 investment. Total return reflects the change in the value of an investment, assuming reinvestment of the fund's dividend income and capital gains (the profits earned upon the sale of securities that have grown in value). You can also look at the fund's income, as reflected in the fund's yield, to measure performance. If Fidelity had not reimbursed certain fund expenses, the past five year and life of fund total returns would have been lower.
Cumulative Total Returns
|
Periods ended August 31, 2000 |
|
Past 1 |
Past 5 |
Life of |
|
Spartan Arizona Municipal Income |
|
6.69% |
29.99% |
45.26% |
|
LB Arizona 4 Plus Year Enhanced |
|
6.67% |
n/a* |
n/a* |
|
Arizona Municipal Debt Funds Average |
|
5.10% |
28.39% |
n/a* |
Cumulative total returns show the fund's performance in percentage terms over a set period - in this case, one year, five years or since the fund started on October 11, 1994. For example, if you had invested $1,000 in a fund that had a 5% return over the past year, the value of your investment would be $1,050. You can compare the fund's returns to the performance of the Lehman Brothers Arizona 4 Plus Year Enhanced Municipal Bond Index - a market value-weighted index of Arizona investment-grade municipal bonds with maturities of four years or more. To measure how the fund's performance stacked up against its peers, you can compare it to the Arizona municipal debt funds average, which reflects the performance of mutual funds with similar objectives tracked by Lipper Inc. The past one year average represents a peer group of 39 mutual funds. These benchmarks will include reinvested dividends and capital gains, if any, and exclude the effect of sales charges.
Average Annual Total Returns
|
Periods ended August 31, 2000 |
Past 1 |
Past 5 |
Life of |
|
Spartan Arizona Municipal Income |
6.69% |
5.39% |
6.54% |
|
LB Arizona 4 Plus Year Enhanced |
6.67% |
n/a* |
n/a* |
|
Arizona Municipal Debt Funds Average |
5.10% |
5.12% |
n/a* |
Average annual total returns take the fund's cumulative return and show you what would have happened if the fund had performed at a constant rate each year. (Note: Lipper calculates average annual total returns by annualizing each fund's total return, then taking an arithmetic average. This may produce a different figure than that obtained by averaging the cumulative total returns and annualizing the result.)
* Not available
Annual Report
Spartan Arizona Municipal Income Fund
Performance - continued
$10,000 Over Life of Fund
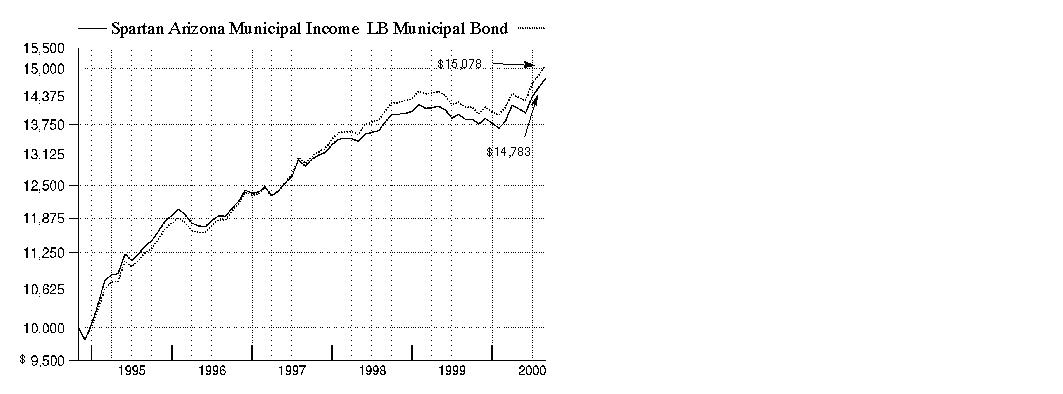
$10,000 Over Life of Fund: Let's say hypothetically that $10,000 was invested in Spartan Arizona Municipal Income Fund on October 31, 1994, shortly after the fund started. As the chart shows, by August 31, 2000, the value of the investment would have grown to $14,783 - a 47.83% increase on the initial investment. For comparison, look at how the Lehman Brothers Municipal Bond Index - a market-value oriented index of investment-grade municipal bonds with maturities of one year or more - did over the same period. With dividends and capital gains, if any, reinvested, the same $10,000 would have grown to $15,078 - a 50.78% increase.
Understanding
Performance
How a fund did yesterday is no guarantee of how it will do tomorrow. Bond prices, for example, generally move in the opposite direction of interest rates. In turn, the share price, return and yield of a fund that invests in bonds will vary. That means if you sell your shares during a market downturn, you might lose money. But if you can ride out the market's ups and downs, you may have a gain.
3Annual Report
Spartan Arizona Municipal Income Fund
Performance - continued
Total Return Components
|
|
|
Years ended August 31, |
||||
|
|
|
2000 |
1999 |
1998 |
1997 |
1996 |
|
Dividend returns |
|
4.85% |
4.13% |
4.55% |
4.80% |
4.92% |
|
Capital returns |
|
1.84% |
-3.75% |
2.61% |
3.36% |
-0.20% |
|
Total returns |
|
6.69% |
0.38% |
7.16% |
8.16% |
4.72% |
Total return components include both dividend returns and capital returns. A dividend return reflects the actual dividends paid by the fund. A capital return reflects both the amount paid by the fund to shareholders as capital gain distributions and changes in the fund's share price. Both returns assume the dividends or capital gains, if any, paid by the fund are reinvested.
Dividends and Yield
|
Periods ended August 31, 2000 |
Past 1 |
Past 6 |
Past 1 |
|
Dividends per share |
4.12¢ |
24.71¢ |
48.52¢ |
|
Annualized dividend rate |
4.54% |
4.69% |
4.66% |
|
30-day annualized yield |
4.53% |
- |
- |
|
30-day annualized tax-equivalent yield |
7.45% |
- |
- |
Dividends per share show the income paid by the fund for a set period. If you annualize this number, based on an average share price of $10.68 over the past one month, $10.46 over the past six months and $10.41 over the past one year, you can compare the fund's income over these three periods. The 30-day annualized yield is a standard formula for all bond funds based on the yields of the bonds in the fund, averaged over the past 30 days. This figure shows you the yield characteristics of the fund's investments at the end of the period. It also helps you compare funds from different companies on an equal basis. The tax-equivalent yield shows what you would have to earn on a taxable investment to equal the fund's tax-free yield, if you're in the 39.23% combined effective 2000 federal and state income tax bracket. The tax-equivalent yield also reflects that a portion of the fund's income was subject to state taxes, but does not reflect the payment of the federal alternative minimum tax, if applicable.
Annual Report
Spartan Arizona Municipal Income Fund
Fund Talk: The Manager's Overview
Market Recap
After struggling in the first half of the 12-month period ending August 31, 2000, municipal bonds roared back to life in the second half. At the period's outset, muni performance was tempered by a series of interest-rate hikes by the Federal Reserve Board. Munis also had to compete with record-setting equity performance and a strong rally in Treasuries. Beginning in February, however, bargain-hunting investors became attracted to the generally higher yields municipal bonds offered, and the muni market rallied. Demand continued to grow in March as equity markets tumbled. A number of investors, seeking to protect their gains in stocks, reinvested assets into the relative safety of muni bonds. But as demand grew, supply tapered off. Many municipal bond issuers, such as U.S. state and local governments, limited their issuance, partly because higher interest rates discouraged borrowing. The resulting supply/demand imbalance boosted municipal bond prices. The market received another lift in the summer of 2000 when it became apparent that the U.S. economy was slowing and the Fed bypassed opportunities to hike rates in June and August. For the overall 12-month period, the Lehman Brothers Municipal Bond Index - an index of over 35,000 investment-grade, fixed-rate, tax-exempt bonds - returned 6.77%. The overall taxable-bond market, as measured by the Lehman Brothers Aggregate Bond Index, gained 7.56% in the same time frame.
(Portfolio Manager photograph)
An interview with Christine Thompson, Portfolio Manager of Spartan Arizona Municipal Income Fund
Q. How did the fund perform, Christine?
A. For the 12-month period that ended August 31, 2000, the fund had a total return of 6.69%. To get a sense of how the fund did relative to its competitors, the Arizona municipal debt funds average returned 5.10% for the same 12-month period, according to Lipper Inc. Additionally, the Lehman Brothers Arizona 4 Plus Year Enhanced Municipal Bond Index, which tracks the types of securities in which the fund invests, returned 6.67%.
Q. What were some of the main forces behind the fund's performance during the past year?
A. In the first half, the municipal market and the fund came under pressure due to inflationary fears and rising interest rates. But in the second half, the municipal market rallied and boosted the fund's performance. Beginning in the spring of 2000, investors began to anticipate that the Federal Reserve Board's yearlong campaign to stave off inflation by raising interest rates was nearing a close. That was based on economic indicators that suggested economic growth might be slowing. More favorable supply and demand conditions also helped propel the municipal market. The supply of Arizona municipals was down 10% during the first eight months of 2000, compared to the same period a year earlier. Meanwhile, the demand for municipals strengthened as bargain-hunting investors sought out their value and attractive yields. The fund's total return was the result of the appreciation of its holdings plus the income generated by them.
Annual Report
Spartan Arizona Municipal Income Fund
Fund Talk: The Manager's Overview - continued
Q. Why did the fund beat its peers during the period?
A. In keeping with Fidelity's investment approach, I didn't lengthen or shorten duration - that is, I didn't make the fund more or less interest-rate sensitive - based on where I thought interest rates would be at some point down the road. Instead, I managed the fund's duration to be in line with the Arizona municipal market as a whole. Given that interest rates were pretty volatile during the period, some peers may have suffered if they were positioned with too little or too much interest-rate sensitivity at the wrong time. Rather than make a bet on interest rates, I positioned the fund to emphasize the best value opportunities based on their performance potential under a variety of possible interest-rate scenarios. That leads to another factor that helped performance. Early in the period, I found that certain bonds - such as those trading at prices just below their face value - were very attractively priced. Since then, many of those bonds have performed better than the overall market because they enjoyed very strong demand from individual investors.
Q. What other factors helped the fund's performance?
A. The fund's focus on premium coupon bonds, which pay interest rates above face - or par - value, helped. One appealing aspect of premiums was that they were somewhat insulated from unfavorable tax treatment that hurt the prices of lower coupon bonds as rates rose. It's estimated that roughly one-quarter to one-third of all municipal bonds suffered because they were subject to that unfavorable tax treatment.
Q. Were there any disappointments?
A. Unfortunately, the health care sector continued to struggle in response to concerns about competition, reductions in reimbursements from Medicaid and HMOs, and other factors. Fortunately, the fund had only a small stake in health care holdings, and those that we did hold remained in good shape from a financial perspective.
Q. What choices did you make in terms of credit quality and why?
A. As of August 31, 2000, nearly half of the fund's investments were in bonds with the highest credit rating of Aaa; nearly all of those were insured. The fund's emphasis on higher-quality bonds helped performance for the 12-month period because, generally speaking, below-investment-grade bonds performed relatively poorly. The fund's focus on higher-quality securities reflected that, for the most part, I didn't feel lower-quality bonds offered enough incentive by way of additional yield for owning them. In addition, higher-quality bonds tend to make up the vast majority of the Arizona municipal market.
Q. What's your outlook for the municipal market?
A. As it generally does, the municipal market's performance will depend on the direction of interest rates and the supply/demand environment. While I don't forecast the direction of interest rates, my outlook for the technical aspects of supply and demand is favorable. The supply of municipals has continued to decline in response to rising interest rates because many issuers now find it too expensive to issue new or refinance old debt. As municipal bond yields rose above 6%, we saw incredibly strong demand from individual investors. To the extent that those conditions continue to prevail, municipals could do well. Another factor that could bode well for municipals is the potential for increased demand from institutional investors. Should their interest in municipals re-ignite, municipals should benefit.
The views expressed in this report reflect those of the portfolio manager only through the end of the period of the report as stated on the cover and do not necessarily represent the views of Fidelity or any other person in the Fidelity organization. Any such views are subject to change at any time based upon market or other conditions and Fidelity disclaims any responsibility to update such views. These views may not be relied on as investment advice and, because investment decisions for a Fidelity fund are based on numerous factors, may not be relied on as an indication of trading intent on behalf of any Fidelity fund.
Fund Facts
Goal: seeks a high level of
current income, exempt from
federal income tax and Arizona
personal income tax
Fund number: 434
Trading symbol: FSAZX
Start date: October 11, 1994
Size: as of August 31, 2000,
more than $34 million
Manager: Christine Thompson,
since 1998; manager, various
Fidelity and Spartan municipal
income funds; joined Fidelity
in 1985
Christine Thompson on her investment approach:
"I use the Lehman Brothers Arizona 4 Plus Year Enhanced Municipal Bond Index as a representation of the overall market in which the fund invests. The index includes most of the universe of Arizona bonds. I manage the fund to have similar overall interest-rate sensitivity to the index. Beyond that, however, the fund can and does vary significantly from the index, with respect to sector, issuer and structural composition. The fund's holdings reflect my research conclusions on the relative value of bonds.
"One example of how the fund can vary from the index is its large stake relative to the index in education bonds, particularly those backed by Arizona colleges and universities. Based on my analysis, an increasing number of students are expected to seek advanced degrees in the state over the next several years. That's mainly because a sizable portion of the very large ´baby boomlet' population - the children of ´baby boomers' - is expected to enter college during the next several years. Furthermore, education bonds provide a good way to diversify the fund away from economically sensitive bonds such as general obligation bonds, which are supported by tax revenues."
Annual Report
Spartan Arizona Municipal Income Fund
Fund Talk: The Manager's Overview - continued
Annual Report
Spartan Arizona Municipal Income Fund
|
Top Five Sectors as of August 31, 2000 |
||
|
|
% of fund's |
% of fund's net assets |
|
General Obligations |
33.7 |
29.9 |
|
Special Tax |
22.6 |
17.3 |
|
Health Care |
9.9 |
11.6 |
|
Education |
8.8 |
10.4 |
|
Electric Utilities |
8.2 |
9.7 |
|
Average Years to Maturity as of August 31, 2000 |
||
|
|
|
6 months ago |
|
Years |
13.0 |
13.2 |
|
Average years to maturity is based on the average time remaining until principal payments are expected from each of the fund's bonds, weighted by dollar amount. |
|
Duration as of August 31, 2000 |
||
|
|
|
6 months ago |
|
Years |
6.8 |
6.9 |
|
Duration shows how much a bond fund's price fluctuates with changes in comparable interest rates. |
|
Quality Diversification (Moody's Ratings) |
As of August 31, 2000 As of February 29, 2000

|
Where Moody's ratings are not available, we have used S&P ratings. Amounts shown are as a percentage of the fund's investments. |
Annual Report
Spartan Arizona Municipal Income Fund
Showing Percentage of Net Assets
|
Municipal Bonds - 98.1% |
|||||
|
Moody's Ratings (unaudited) (a) |
Principal Amount |
Value |
|||
|
Arizona - 90.7% |
|||||
|
Arizona Health Facilities Auth. Hosp. Sys. Rev.: |
|
|
|
|
|
|
(Phoenix Children's Hosp. Proj.) Series A, 6.25% 11/15/29 |
A2 |
|
$ 1,000,000 |
$ 1,002,240 |
|
|
Rfdg. (Saint Lukes Health Sys. Proj.) |
Aaa |
|
345,000 |
376,188 |
|
|
Arizona Student Ln. Aquisition Auth. Student Ln. Rev. Rfdg. Sub Series B1, 6.15% 5/1/29 (b) |
A2 |
|
500,000 |
507,585 |
|
|
Arizona Trans. Board Excise Tax Rev.: |
|
|
|
|
|
|
(Maricopa County Reg'l. Area Road Proj.) Series A: |
|
|
|
|
|
|
5% 7/1/01 |
Aa2 |
|
1,000,000 |
1,006,100 |
|
|
5.75% 7/1/05 (AMBAC Insured) |
Aaa |
|
400,000 |
421,984 |
|
|
Rfdg. (Maricopa County Reg'l. Area |
|
|
|
|
|
|
Series A, 6.5% 7/1/04 (AMBAC Insured) |
Aaa |
|
100,000 |
107,229 |
|
|
Series B, 6% 7/1/05 (AMBAC Insured) |
Aaa |
|
150,000 |
159,854 |
|
|
Arizona Trans. Board Hwy. Rev.: |
|
|
|
|
|
|
Rfdg. 5.75% 7/1/19 |
Aa1 |
|
670,000 |
686,335 |
|
|
Series A, 6.5% 7/1/11 (Pre-Refunded to 7/1/01 @ 101.5) (c) |
Aaa |
|
300,000 |
309,777 |
|
|
Arizona Univ. Rev. Rfdg. 6% 7/1/06 |
A1 |
|
1,000,000 |
1,074,200 |
|
|
Central Arizona Wtr. Conservation District Contract Rev.: |
|
|
|
|
|
|
(Central Arizona Proj.) Series B, 6.3% 11/1/02 (MBIA Insured) |
Aaa |
|
200,000 |
206,398 |
|
|
Rfdg. (Central Arizona Proj.) Series A: |
|
|
|
|
|
|
5.5% 11/1/09 |
A1 |
|
1,000,000 |
1,058,400 |
|
|
5.5% 11/1/10 |
A1 |
|
375,000 |
396,953 |
|
|
Chandler Gen. Oblig.: |
|
|
|
|
|
|
6.25% 7/1/10 |
Aa2 |
|
500,000 |
556,550 |
|
|
6.5% 7/1/10 (MBIA Insured) |
Aaa |
|
200,000 |
226,778 |
|
|
6.5% 7/1/11 (MBIA Insured) |
Aaa |
|
225,000 |
256,280 |
|
|
Chandler Wtr. & Swr. Rev. 5.5% 7/1/15 (MBIA Insured) |
Aaa |
|
1,000,000 |
1,019,680 |
|
|
Cochise County Unified School District #68
(Sierra Vista Proj.) Series B, 9% 7/1/02 |
Aaa |
|
200,000 |
216,006 |
|
|
Flagstaff Gen. Oblig. 4.5% 7/1/13 |
Aaa |
|
200,000 |
189,992 |
|
|
Municipal Bonds - continued |
|||||
|
Moody's Ratings (unaudited) (a) |
Principal Amount |
Value |
|||
|
Arizona - continued |
|||||
|
Glendale Ind. Dev. Auth. Edl. Facilities Rev. Rfdg. (American Graduate School Int'l. Proj.) 6.55% 7/1/06 (AMBAC Insured) (Pre-Refunded to 7/1/05 @ 101) (c) |
AAA |
|
$ 150,000 |
$ 164,936 |
|
|
Maricopa County Hosp. Rev. Rfdg. (Sun Health Corp. Proj.) 6.125% 4/1/18 |
Baa1 |
|
300,000 |
288,765 |
|
|
Maricopa County Ind. Dev. Auth. Health Facilities Rev. Rfdg. (Catholic Health Care West Proj.) Series A, 5% 7/1/03 |
Baa1 |
|
500,000 |
494,190 |
|
|
Maricopa County Ind. Dev. Auth. Hosp. |
AA+ |
|
1,000,000 |
925,330 |
|
|
Maricopa County School District #1 Rfdg. (Cap. Appreciation) (Phoenix Elementary Proj.) Second Series, 0% 7/1/05 (MBIA Insured) |
Aaa |
|
500,000 |
400,395 |
|
|
Maricopa County School District #14 Rfdg. (Creighton Proj.) 6.5% 7/1/04 (FGIC Insured) |
Aaa |
|
200,000 |
214,458 |
|
|
Maricopa County School District #28 Kyrene
Elementary Rfdg. (Cap. Appreciation) |
Aaa |
|
955,000 |
691,726 |
|
|
Maricopa County School District #3 Rfdg. (Cap. Appreciation) (Temple Elementary Proj.) 0% 7/1/08 (AMBAC Insured) |
Aaa |
|
500,000 |
344,695 |
|
|
Maricopa County School District #4 Rfdg. (Mesa Univ. Proj.) 5.25% 7/1/04 (FSA Insured) |
Aaa |
|
300,000 |
308,643 |
|
|
Maricopa County Unified School District #41 Gilbert Rfdg. (Cap. Appreciation) 0% 1/1/06 (FGIC Insured) |
Aaa |
|
1,000,000 |
780,610 |
|
|
Maricopa County Unified School District #80 (Chandler Proj.) 6.6% 7/1/06 (FGIC Insured) |
Aaa |
|
400,000 |
442,272 |
|
|
Mesa Gen. Oblig. Rfdg. 5.7% 7/1/03 |
Aaa |
|
250,000 |
258,713 |
|
|
Mesa Ind. Dev. Auth. Rev. (Discovery Health |
Aaa |
|
500,000 |
506,255 |
|
|
Mohave County Ind. Dev. Auth. Ind. Dev. Rev. (North Star Steel Co. Proj.) Series B, 5.5% 12/1/20 (b) |
A+ |
|
250,000 |
238,195 |
|
|
Navajo County Poll. Cont. Corp. Rev. Rfdg. (Pub. Svc. Co. Proj.) Series A, 5.875% 8/15/28 |
Baa1 |
|
200,000 |
196,656 |
|
|
Peoria Gen. Oblig. 7.5% 4/1/02 (FGIC Insured) |
Aaa |
|
450,000 |
471,470 |
|
|
Phoenix Arpt. Rev. Series D, 6.4% 7/1/12 (MBIA Insured) (b) |
Aaa |
|
810,000 |
860,876 |
|
|
Municipal Bonds - continued |
|||||
|
Moody's Ratings (unaudited) (a) |
Principal Amount |
Value |
|||
|
Arizona - continued |
|||||
|
Phoenix Civic Impt. Corp. Arpt. Excise Tax Rev. Rfdg. Sr. Lien: |
|
|
|
|
|
|
5% 7/1/03 (b) |
Aa2 |
|
$ 500,000 |
$ 506,125 |
|
|
5.25% 7/1/09 (b) |
Aa2 |
|
400,000 |
411,712 |
|
|
Phoenix Civic Impt. Corp. Excise Tax Rev.: |
|
|
|
|
|
|
(Muni. Courthouse Proj.) Sr. Lien Series A: |
|
|
|
|
|
|
5.5% 7/1/11 |
Aa2 |
|
200,000 |
210,114 |
|
|
5.75% 7/1/15 |
Aa2 |
|
675,000 |
707,663 |
|
|
5.375% 7/1/29 |
Aa2 |
|
560,000 |
541,335 |
|
|
Phoenix Civic Impt. Corp. Muni. Facilities |
|
|
|
|
|
|
5.75% 7/1/10 (FGIC Insured) |
Aaa |
|
340,000 |
365,707 |
|
|
5.75% 7/1/14 (FGIC Insured) |
Aaa |
|
1,000,000 |
1,056,470 |
|
|
Phoenix Civic Impt. Corp. Wtr. Sys. Rev. Jr. Lien, 5.45% 7/1/19 |
Aa3 |
|
500,000 |
499,825 |
|
|
Phoenix Gen. Oblig.: |
|
|
|
|
|
|
Rfdg.: |
|
|
|
|
|
|
Series 1995 A, 6% 7/1/11 |
Aa1 |
|
1,485,000 |
1,637,326 |
|
|
Series A, 7.5% 7/1/08 |
Aa1 |
|
510,000 |
604,059 |
|
|
4.5% 7/1/18 |
Aa1 |
|
400,000 |
352,568 |
|
|
4.5% 7/1/22 |
Aa1 |
|
495,000 |
420,008 |
|
|
Phoenix Street & Hwy. User Rev. Rfdg. Jr. Lien, 6.25% 7/1/11 (MBIA Insured) |
Aaa |
|
250,000 |
261,255 |
|
|
Pima County Ind. Dev. Auth. Rev. Rfdg. (HealthPartners Proj.) Series A, 5.625% 4/1/14 (MBIA Insured) |
Aaa |
|
200,000 |
205,560 |
|
|
Pima County Unified School District #1 Tucson Rfdg. 7.5% 7/1/10 (FGIC Insured) |
Aaa |
|
250,000 |
303,998 |
|
|
Scottsdale Gen. Oblig. Rfdg. 5.5% 7/1/09 |
Aa1 |
|
100,000 |
106,035 |
|
|
Scottsdale Street & Hwy. User Rev. Rfdg. 5.5% 7/1/07 |
A1 |
|
500,000 |
526,320 |
|
|
Scottsdale Wtr. & Swr. Rev. (1989 Proj.) |
Aa1 |
|
150,000 |
171,140 |
|
|
Tempe Union High School District #213: |
|
|
|
|
|
|
(1994 Proj.): |
|
|
|
|
|
|
Series B, 7% 7/1/03 (FGIC Insured) |
Aaa |
|
400,000 |
427,040 |
|
|
Series C, 4% 7/1/12 (MBIA Insured) |
Aaa |
|
200,000 |
183,396 |
|
|
Rfdg. & Impt. 7% 7/1/08 (FGIC Insured) |
Aaa |
|
310,000 |
358,208 |
|
|
Tucson Gen. Oblig.: |
|
|
|
|
|
|
Rfdg. 6.75% 7/1/03 (FGIC Insured) |
Aaa |
|
200,000 |
212,482 |
|
|
Series A, 6% 7/1/13 |
Aa2 |
|
800,000 |
874,776 |
|
|
Tucson Street & Hwy. User Rev.: |
|
|
|
|
|
|
Rfdg. Sr. Lien, 6% 7/1/10 (MBIA Insured) |
Aaa |
|
400,000 |
439,664 |
|
|
Municipal Bonds - continued |
|||||
|
Moody's Ratings (unaudited) (a) |
Principal Amount |
Value |
|||
|
Arizona - continued |
|||||
|
Tucson Street & Hwy. User Rev.: - continued |
|
|
|
|
|
|
Sr. Lien Series A, 7% 7/1/11 (MBIA Insured) |
Aaa |
|
$ 300,000 |
$ 354,234 |
|
|
Tucson Wtr. Rev. Series 1994 C, 6.75% 7/1/07 (FGIC Insured) |
Aaa |
|
200,000 |
225,408 |
|
|
Univ. of Arizona Ctfs. of Prtn. (Univ. of Arizona Parking & Student Hsg. Proj.) 5.75% 6/1/24 (AMBAC Insured) |
Aaa |
|
500,000 |
509,295 |
|
|
Univ. of Arizona Univ. Rev. Rfdg.: |
|
|
|
|
|
|
5.25% 6/1/13 (FSA Insured) |
Aaa |
|
500,000 |
506,630 |
|
|
6.375% 6/1/05 |
A1 |
|
400,000 |
420,176 |
|
|
Yuma County Hosp. District #001 6.35% 11/15/07 (Escrowed to Maturity) (c) |
A |
|
265,000 |
283,259 |
|
|
|
31,048,502 |
||||
|
Puerto Rico - 7.4% |
|||||
|
Puerto Rico Commonwealth Hwy. & Trans. Auth. Hwy. Rev.: |
|
|
|
|
|
|
Rfdg. Series W, 5.5% 7/1/17 |
Baa1 |
|
100,000 |
100,539 |
|
|
Series Y, 5.5% 7/1/36 |
Baa1 |
|
500,000 |
502,490 |
|
|
Puerto Rico Commonwealth Hwy. & Trans. Auth. Rev. Series B, 6% 7/1/31 |
Baa1 |
|
250,000 |
264,993 |
|
|
Puerto Rico Elec. Pwr. Auth. Pwr. Rev. Series DD, 5% 7/1/28 (MBIA Insured) |
Aaa |
|
1,000,000 |
937,320 |
|
|
Puerto Rico Pub. Bldgs Auth. Rev. (Govt. Facilities Proj.) Series B, 5% 7/1/27 (AMBAC Insured) |
Aaa |
|
750,000 |
702,720 |
|
|
|
2,508,062 |
||||
|
TOTAL INVESTMENT PORTFOLIO - 98.1% (Cost $32,898,001) |
33,556,564 |
||
|
NET OTHER ASSETS - 1.9% |
664,887 |
||
|
NET ASSETS - 100% |
$ 34,221,451 |
||
|
Legend |
|
(a) S&P credit ratings are used in the absence of a rating by Moody's Investors Service, Inc. |
|
(b) Private activity obligations whose interest is subject to the federal alternative minimum tax for individuals. |
|
(c) Security collateralized by an amount sufficient to pay interest and principal. |
|
Other Information |
|
The composition of long-term debt holdings as a percentage of total value of investments in securities, is as follows (ratings are unaudited): |
|
Moody's Ratings |
S&P Ratings |
|||
|
Aaa, Aa, A |
90.5% |
|
AAA, AA, A |
89.8% |
|
Baa |
5.5% |
|
BBB |
2.3% |
|
Ba |
0.0% |
|
BB |
0.0% |
|
B |
0.0% |
|
B |
0.0% |
|
Caa |
0.0% |
|
CCC |
0.0% |
|
Ca, C |
0.0% |
|
CC, C |
0.0% |
|
|
|
|
D |
0.0% |
|
|
|
The distribution of municipal securities by revenue source, as a percentage of total net assets, is as follows: |
|
General Obligations |
33.7% |
|
Special Tax |
22.6 |
|
Health Care |
9.9 |
|
Education |
8.8 |
|
Electric Utilities |
8.2 |
|
Water & Sewer |
5.7 |
|
Transportation |
5.2 |
|
Others* (individually less than 5%) |
5.9 |
|
|
100.0% |
|
* Includes short-term investments |
|
Income Tax Information |
|
At August 31, 2000, the aggregate cost of investment securities for income tax purposes was $32,898,001. Net unrealized appreciation aggregated $658,563, of which $869,195 related to appreciated investment securities and $210,632 related to depreciated investment securities. |
|
The fund hereby designates approximately $3,000 as a capital gain dividend for the purpose of the dividend paid deduction. |
|
The fund hereby designates 100% of the long-term capital gain dividends distributed during the fiscal year as 20%-rate capital gain dividends. |
|
At August 31, 2000, the fund had a capital loss carryforward of approximately $94,000 all of which will expire on |
|
During the fiscal year ended August 31, 2000, 100% of the fund's income dividends was free from federal income tax, and 9.21% of the fund's income dividends was subject to the federal alternative minimum tax. |
|
The fund will notify shareholders in January 2001 of amounts for use in preparing 2000 income tax returns. |
See accompanying notes which are an integral part of the financial statements.
Annual Report
Spartan Arizona Municipal Income Fund
Statement of Assets and Liabilities
|
|
August 31, 2000 |
|
|
Assets |
|
|
|
Investment in securities, at value (cost $32,898,001) - |
|
$ 33,556,564 |
|
Cash |
|
416,108 |
|
Receivable for fund shares sold |
|
9,736 |
|
Interest receivable |
|
350,997 |
|
Other receivables |
|
14,085 |
|
Total assets |
|
34,347,490 |
|
Liabilities |
|
|
|
Payable for fund shares redeemed |
$ 74,038 |
|
|
Distributions payable |
36,426 |
|
|
Accrued management fee |
15,575 |
|
|
Total liabilities |
|
126,039 |
|
Net Assets |
|
$ 34,221,451 |
|
Net Assets consist of: |
|
|
|
Paid in capital |
|
$ 33,681,745 |
|
Undistributed net interest income |
|
7,039 |
|
Accumulated undistributed net realized |
|
(125,896) |
|
Net unrealized appreciation (depreciation) on investments |
|
658,563 |
|
Net Assets, for 3,192,187 shares outstanding |
|
$ 34,221,451 |
|
Net Asset Value, offering price and redemption price |
|
$10.72 |
See accompanying notes which are an integral part of the financial statements.
Annual Report
Spartan Arizona Municipal Income Fund
Financial Statements - continued
Statement of Operations
|
|
Year ended August 31, 2000 |
|
|
Interest Income |
|
$ 1,518,236 |
|
Expenses |
|
|
|
Management fee |
$ 161,912 |
|
|
Non-interested trustees' compensation |
90 |
|
|
Total expenses before reductions |
162,002 |
|
|
Expense reductions |
(20,244) |
141,758 |
|
Net interest income |
|
1,376,478 |
|
Realized and Unrealized Gain (Loss) Net realized gain (loss) on: |
|
|
|
Investment securities |
(1,696) |
|
|
Futures contracts |
3,245 |
1,549 |
|
Change in net unrealized appreciation (depreciation) |
|
625,970 |
|
Net gain (loss) |
|
627,519 |
|
Net increase (decrease) in net assets resulting |
|
$ 2,003,997 |
See accompanying notes which are an integral part of the financial statements.
Annual Report
Spartan Arizona Municipal Income Fund
Financial Statements - continued
Statement of Changes in Net Assets
|
|
Year ended |
Year ended |
|
Increase (Decrease) in Net Assets |
|
|
|
Operations |
$ 1,376,478 |
$ 1,155,047 |
|
Net realized gain (loss) |
1,549 |
(55,209) |
|
Change in net unrealized appreciation (depreciation) |
625,970 |
(1,075,095) |
|
Net increase (decrease) in net assets resulting |
2,003,997 |
24,743 |
|
Distributions to shareholders |
(1,375,127) |
(1,155,047) |
|
From net realized gain |
(1,549) |
(36,964) |
|
In excess of net realized gain |
(9,168) |
(54,789) |
|
Total distributions |
(1,385,844) |
(1,246,800) |
|
Share transactions |
14,362,543 |
10,812,895 |
|
Reinvestment of distributions |
1,010,735 |
942,439 |
|
Cost of shares redeemed |
(11,422,361) |
(5,501,589) |
|
Net increase (decrease) in net assets resulting |
3,950,917 |
6,253,745 |
|
Redemption fees |
10,061 |
4,734 |
|
Total increase (decrease) in net assets |
4,579,131 |
5,036,422 |
|
Net Assets |
|
|
|
Beginning of period |
29,642,320 |
24,605,898 |
|
End of period (including undistributed net interest |
$ 34,221,451 |
$ 29,642,320 |
|
Other Information Shares |
|
|
|
Sold |
1,380,229 |
994,437 |
|
Issued in reinvestment of distributions |
96,992 |
86,645 |
|
Redeemed |
(1,099,530) |
(507,000) |
|
Net increase (decrease) |
377,691 |
574,082 |
See accompanying notes which are an integral part of the financial statements.
Annual Report
Financial Highlights
|
Years ended August 31, |
2000 |
1999 |
1998 |
1997 |
1996 |
|
Selected Per-Share Data |
|
|
|
|
|
|
Net asset value, beginning |
$ 10.530 |
$ 10.980 |
$ 10.740 |
$ 10.460 |
$ 10.640 |
|
Income from Investment Operations |
.486 B |
.458 |
.473 |
.483 |
.514 |
|
Net realized and unrealized gain (loss) |
.189 |
(.412) |
.279 |
.351 |
(.022) |
|
Total from investment operations |
.675 |
.046 |
.752 |
.834 |
.492 |
|
Less Distributions |
|
|
|
|
|
|
From net interest income |
(.485) |
(.458) |
(.473) |
(.484) |
(.514) |
|
From net realized gain |
(.001) |
(.016) |
(.040) |
(.070) |
(.160) |
|
In excess of net realized gain |
(.003) |
(.024) |
- |
- |
- |
|
Total distributions |
(.489) |
(.498) |
(.513) |
(.554) |
(.674) |
|
Redemption fees added to |
.004 |
.002 |
.001 |
.000 |
.002 |
|
Net asset value, end of period |
$ 10.720 |
$ 10.530 |
$ 10.980 |
$ 10.740 |
$ 10.460 |
|
Total Return A |
6.69% |
0.38% |
7.16% |
8.16% |
4.72% |
|
Ratios and Supplemental Data |
|
|
|
|
|
|
Net assets, end of period |
$ 34,221 |
$ 29,642 |
$ 24,606 |
$ 19,766 |
$ 20,388 |
|
Ratio of expenses to |
.55% |
.55% |
.55% |
.55% |
.30% C |
|
Ratio of expenses to average net assets after expense reductions |
.48% D |
.54% D |
.54% D |
.53% D |
.30% |
|
Ratio of net interest income to average net assets |
4.67% |
4.21% |
4.35% |
4.55% |
4.82% |
|
Portfolio turnover rate |
37% |
12% |
25% |
27% |
32% |
A The total returns would have been lower had certain expenses not been reduced during the periods shown.
B Net interest income per share has been calculated based on average shares outstanding during the period.
C FMR agreed to reimburse a portion of the fund's expenses during the period. Without this reimbursement, the fund's expense ratio would have been higher.
D FMR or the fund has entered into varying arrangements with third parties who either paid or reduced a portion of the fund's expenses.
See accompanying notes which are an integral part of the financial statements.
Annual Report
Spartan Arizona Municipal Money Market Fund
To evaluate a money market fund's historical performance, you can look at either total return or yield. Total return reflects the change in the value of an investment, assuming reinvestment of the fund's dividend income, but does not include the effect of the fund's $5 account closeout fee on an average-sized account. Yield measures the income paid by a fund. Since a money market fund tries to maintain a $1 share price, yield is an important measure of performance. If Fidelity had not reimbursed certain fund expenses, the past five year and life of fund total returns would have been lower.
Cumulative Total Returns
|
Periods ended August 31, 2000 |
|
Past 1 |
Past 5 |
Life of |
|
Spartan AZ Municipal Money Market |
|
3.50% |
17.81% |
21.86% |
|
All Tax-Free Money Market Funds Average |
|
3.29% |
16.21% |
n/a* |
Cumulative total returns show the fund's performance in percentage terms over a set period - in this case, one year, five years or since the fund started on October 11, 1994. For example, if you had invested $1,000 in a fund that had a 5% return over the past year, the value of your investment would be $1,050. To measure how the fund's performance stacked up against its peers, you can compare it to the all tax-free money market funds average, which reflects the performance of all tax-free money market funds with similar objectives tracked by iMoneyNet, Inc. The past one year average represents a peer group of 461 money market funds.
Average Annual Total Returns
|
Periods ended August 31, 2000 |
|
Past 1 |
Past 5 |
Life of |
|
Spartan AZ Municipal Money Market |
|
3.50% |
3.33% |
3.41% |
|
All Tax-Free Money Market Funds Average |
|
3.29% |
3.05% |
n/a* |
Average annual total returns take the fund's cumulative return and show you what would have happened if the fund had performed at a constant rate each year.
* Not available
Annual Report
Spartan Arizona Municipal Money Market
Performance - continued
Yields
|
|
8/28/00 |
5/29/00 |
2/28/00 |
11/29/99 |
8/30/99 |
|||
|
|
||||||||
|
Spartan Arizona Municipal |
3.81% |
3.76% |
3.32% |
3.27% |
2.86% |
|||
|
|
||||||||
|
All Tax-Free Money |
3.56% |
3.60% |
3.12% |
3.16% |
2.66% |
|||
|
|
||||||||
|
Spartan Arizona Municipal |
6.26% |
6.20% |
5.48% |
5.38% |
4.71% |
|||
|
|
||||||||
|
Portion of fund's income subject |
7.03% |
9.71% |
1.17% |
5.67% |
0.04% |
|||

Yield refers to the income paid by the fund over a given period. Yields for money market funds are usually for seven-day periods, expressed as annual percentage rates. A yield that assumes income earned is reinvested or compounded is called an effective yield. The table above shows the fund's current seven-day yield at quarterly intervals over the past year. You can compare these yields to the all tax-free money market funds average tracked by iMoneyNet, Inc. Or you can look at the fund's tax-equivalent yield, which is based on a combined effective 2000 federal and state income tax rate of 39.23%. The fund's yields mentioned above reflect that a portion of the fund's income was subject to state taxes. A portion of the fund's income may be subject to the federal alternative minimum tax.
A money market fund's total returns and yields will vary, and reflect past results rather than predict future performance.
Comparing Yields on tax-free investments are
usually lower than yields on
taxable investments. However, a
straight comparison between the
two may be misleading because
it ignores the way taxes reduce
taxable returns. Tax-equivalent
yield - the yield you'd have to
earn on a similar taxable
investment to match the tax-free
yield - makes the comparison
more meaningful. Keep in mind
that the U.S. government
neither insures nor guarantees a
money market fund. In fact,
there is no assurance that a
money fund will maintain a $1
share price.
Performance
Annual Report
Spartan Arizona Municipal Money Market Fund
Fund Talk: The Manager's Overview
(Portfolio Manager photograph)
Note to shareholders: Norm Lind became Portfolio Manager of Spartan Arizona Municipal Money Market Fund on July 1, 2000.
Q. Norm, what was the investment environment like during the 12 months that ended August 31, 2000?
A. During most of the period, the backdrop seemed ripe for the build-up of inflationary pressures. Economic growth was robust, unemployment reached historic lows and consumer spending was strong. To dampen growth and keep inflation at bay, the Federal Reserve Board implemented a program of short-term interest-rate hikes. As the period progressed, market participants tried to gauge the pace of the Fed's tightening monetary policy approach. Through the second quarter of 2000, inflation remained subdued despite strong growth. As a result, the Fed followed a deliberate approach, raising the rate banks charge each other for overnight loans - known as the fed funds target rate - by increments of 0.25 percentage points in November 1999, and in February and March 2000. The Fed did this after having raised rates by the same amount twice previously, in June and August 1999. In April and May, there was a general recognition of inflationary pressures and the employment cost index - a broad measure of the costs incurred by businesses for wages and benefits - posted a higher-than-expected gain. The Fed responded by becoming more aggressive, raising the fed funds target rate in May by 0.50 percentage points, to 6.50%. Since that time, however, broad indicators have demonstrated a slowing of the economy amid relatively tame inflation, with the exception of higher oil prices.
Q. How was the fund managed during this period?
A. Throughout the period, Arizona's money market yield curve - a representation of the difference between short- and long-term money market yields - remained relatively flat. That means that long-term - one-year - fixed-rate money market securities did not offer much of a yield advantage over short-term, variable-rate money market securities. Yields on longer-term notes remained low because there was a lack of supply of these bonds during a period when demand was fairly solid. The healthy Arizona economy helped contribute to the short supply, as municipalities reaped revenues due to vibrant economic growth. As a result of this backdrop, the fund concentrated on finding opportunities among short-term securities such as variable rate demand notes (VRDNs). Yields on these instruments are reset at regular intervals, usually daily or weekly. This approach helped the fund capture higher market yields as the Fed continued to raise short-term rates. Holding a large percentage in VRDNs also helped boost the fund's performance in April and early May, due to a unique circumstance. With the run-up in the equity market in 1999, many investors earned more capital gains than usual and needed to pay higher tax bills. As a result, investors redeemed shares of money market funds to pay their taxes. Fund managers in turn, sold VRDNs to meet redemptions. Dealers of VRDNs were therefore forced to raise yields - in some cases as high as levels seen in taxable markets - to attract buyers. The fund took advantage of these buying opportunities to add yield.
Annual Report
Spartan Arizona Municipal Money Market Fund
Fund Talk: The Manager's Overview - continued
Q. How did the fund perform?
A. The fund's seven-day yield on August 31, 2000, was 3.82%, compared to 2.86% 12 months ago. The more recent seven-day yield was the equivalent of a 6.28% taxable rate of return for Arizona investors in the 39.23% combined state and federal income tax bracket. The fund's yields reflect that a portion of the fund's income was subject to state taxes. Through August 31, 2000, the fund's 12-month total return was 3.50%, compared to 3.29% for the all tax-free money market funds average, according to iMoneyNet, Inc.
Q. What is your outlook?
A. Market rates currently reflect the sentiment that the Fed may have completed its latest round of interest-rate hikes. Data showing subdued growth, a less tight labor market and tame inflation have left the market fairly positive about the coming months. The one blemish on this benign landscape would be higher oil prices, which some fear might incite price hikes elsewhere in the economy. Thus far, however, that scenario has not come to pass. Therefore, it appears likely that the Fed will stay on the sidelines at least through November's election.
The views expressed in this report reflect those of the portfolio manager only through the end of the period of the report as stated on the cover and do not necessarily represent the views of Fidelity or any other person in the Fidelity organization. Any such views are subject to change at any time based upon market or other conditions and Fidelity disclaims any responsibility to update such views. These views may not be relied on as investment advice and, because investment decisions for a Fidelity fund are based on numerous factors, may not be relied on as an indication of trading intent on behalf of any Fidelity fund.
Fund Facts
Goal: seeks a high level
of current income, exempt
from federal income tax and
Arizona personal income tax
Fund number: 433
Trading symbol: FSAXX
Start date: October 11, 1994
Size: as of August 31, 2000,
more than $105 million
Manager: Norm Lind, since
July 2000; manager, various
Fidelity and Spartan municipal
money market funds; joined
Fidelity in 1986
Annual Report
Spartan Arizona Municipal Money Market Fund
Investment Changes
Maturity Diversification
Days
% of fund's
investments % of fund's
investments
2/29/00
% of fund's 0 - 30
93.1
70.7
56.5
31 - 90
2.8
11.0
14.3
91 - 180
0.0
16.3
20.7
181 - 397
4.1
2.0
8.5
Weighted Average Maturity
8/31/00
2/29/00
8/31/99
Spartan Arizona Municipal Money 21 Days
35 Days
62 Days
All Tax-Free Money Market 42 Days
39 Days
51 Days
Asset Allocation (% of fund's net assets)
As of August 31, 2000
As of February 29, 2000
Variable Rate
Variable Rate
Commercial Paper
(including
Commercial Paper
(including
Tender Bonds 1.0%
Tender Bonds 1.0%
Municipal Notes 1.9%
Municipal Notes 3.1%
Other Investments
Other Investments
*Source: IBC's MONEY FUND REPORT®
Annual Report
Spartan Arizona Municipal Money Market Fund
Investments
Showing Percentage of Net Assets
Municipal Securities - 99.5%
Principal
Amount
Value Arizona - 96.8%
Apache County Ind. Dev. Auth. (Imperial Components, Inc. Proj.) Series 1996, 4.35%, LOC Harris Trust & Savings Bank, Chicago, VRDN (a)(d)
$ 1,800,000
$ 1,800,000
Arizona Edl. Ln. Marketing Corp. Series 1991 A, 4.3%, 14,000,000
14,000,000
Arizona Health Facilities Auth. Rev. (Blood Sys., Inc. Proj.) Series 1995, 4.35%, LOC Bank One, Arizona NA, VRDN (a)
900,000
900,000
Arizona School District Fing. Prog. Ctfs. of Prtn. TAN Series 2000, 4.875% 7/31/01 (AMBAC Insured)
2,000,000
2,009,569
Arizona Trans. Board Hwy. Rev. Participating VRDN Series MSDW 00 367, 4.35% (Liquidity Facility Morgan Stanley Dean Witter & Co.) (a)(e)
2,855,000
2,855,000
Casa Grande Indl. Dev. Auth. Indl. Dev. Rev. (Aztec Pulp & Paper Prod. Proj.) Series 2000 A, 4.45%, LOC Bank of America NA, VRDN (a)(d)
1,000,000
1,000,000
Chandler Indl. Dev. Auth. Indl. Dev. Rev. (Red Rock Stamping Co. Proj.) Series 2000, 4.45%, LOC Key Bank Nat'l. 3,250,000
3,250,000
Cochise County Poll. Cont. Rev. Solid Waste Disp. Rev. Bonds (Arizona Elec. Pwr. Coop. Proj.) 4.1%, tender 9/1/00 (Nat'l. Rural Util. Coop. Fin.
Corp. Guaranteed) (d)
1,000,000
1,000,000
Coconino County Poll. Cont. Corp. Rev. (Arizona Pub. Svc. Co. Navajo Proj.) Series 1994 A, 4.2%, LOC Kredietbank, VRDN (a)(d)
1,750,000
1,750,000
Flagstaff Indl. Dev. Auth. Indl. Dev. Rev. Bonds (Citizens Utils. Co. Proj.) 4.65% tender 9/7/00, CP mode (d)
2,100,000
2,100,000
Flagstaff Indl. Dev. Auth. Solid Waste Disp. Rev. (Norton Envir., Inc. Proj.) Series 1997, 4.45%, LOC Key Bank Nat'l. Assoc., VRDN (a)(d)
2,500,000
2,500,000
Glendale Indl. Dev. Auth. Indl. Dev. Rev. (Superior Bedding 1,500,000
1,500,000
Glendale Wtr. & Swr. Rev. Bonds 4.75% 7/1/01 1,175,000
1,175,923
Maricopa County Indl. Dev. Auth. Rev. (Orangewood CCRC Proj.) Series A, 4.25%, LOC Banque Nationale de Paris (BNP), VRDN (a)
500,000
500,000
Maricopa County Ind. Dev. Auth. Ind. Dev. Rev.:
Bonds (Citizens Communications Co. Proj.) Series 1988, 4.65% tender 9/1/00, CP mode (d)
1,000,000
1,000,000
(Clayton Homes Proj.) Series 1998, 4.4%, LOC Wachovia Bank NA, VRDN (a)(d)
1,000,000
1,000,000
Municipal Securities - continued
Principal
Amount
Value Arizona - continued
Maricopa County Poll. Cont. Rev.:
Bonds (Southern California Edison Co. Proj.):
Series 1985 B, 4.6% tender 9/11/00, CP mode
$ 1,000,000
$ 1,000,000
Series 1985 D, 4.35% tender 9/8/00, CP mode
1,000,000
1,000,000
Series 1985 E, 4.35% tender 9/8/00, CP mode
2,200,000
2,200,000
Series 1985 F, 4.2% tender 9/8/00, CP mode
5,250,000
5,250,000
(Arizona Pub. Svc. Co. Proj.) Series 1994 E, 4.3%, 500,000
500,000
(Southern California Edison Co. Proj.) Series 2000 B, 4.35%, VRDN (a)
600,000
600,000
Mesa Ind. Dev. Auth. Rev. (Discovery Health Sys. Proj.) 4,650,000
4,650,000
Mesa Muni. Dev. Corp. Bonds Series 1985, 4.2% tender 9/13/00, LOC Westdeutsche Landesbank Girozentrale, 1,500,000
1,500,000
Mohave County Ind. Dev. Auth. Ind. Dev. Rev.:
Bonds:
(Citizens Communications Co. Proj.) Series 1993 E, 900,000
900,000
(Citizens Utils. Co. Proj.) Series 1988 B, 4.8% tender 10/19/00, CP mode (d)
1,000,000
1,000,000
(Citizens Utils. Co. Proj.) Series 1997 4.6%, VRDN (a)(d)
2,090,000
2,090,000
Phoenix Civic Impt. Board Arpt. Rev. Participating VRDN Series PA 405, 4.38% (Liquidity Facility Merrill Lynch & Co., Inc.) (a)(e)
1,920,000
1,920,000
Phoenix Ind. Dev. Auth. Participating VRDN Series PT 1082, 4.38% (Liquidity Facility Merrill Lynch & Co., Inc.) (a)(e)
945,000
945,000
Phoenix Ind. Dev. Auth. Multi-family Hsg. Rev. (Bell Square Apt. Proj.) Series 1995, 4.4%, LOC Gen. Elec. Cap. Corp., VRDN (a)
1,000,000
1,000,000
Phoenix Ind. Dev. Auth. Rev.:
(Marlyn Nutraceuticals Proj.) 4.5%, LOC Bank One, 1,000,000
1,000,000
(Plastican Proj.) Series 1997, 4.5%, LOC Fleet Bank NA, VRDN (a)(d)
3,885,000
3,885,000
Rfdg. (V.A.W. of America Proj.) Series 1997, 4.45%, 1,000,000
1,000,000
Phoenix Indl. Dev. Auth. Rev. (Independent Newspaper, Inc. Proj.) Series 2000, 4.45%, LOC First Union Nat'l. Bank, North Carolina, VRDN (a)(d)
1,070,000
1,070,000
Municipal Securities - continued
Principal
Amount
Value Arizona - continued
Pima County Ind. Dev. Auth. Multi-family Hsg. Rev. $ 2,925,000
$ 2,925,000
Pima County Ind. Dev. Auth. Single Family Hsg. 2,000,000
2,000,000
Pima County Indl. Dev. Auth. Indl. Rev. (Tucson Elec. Pwr. Co. Proj.) Series 1982 A, 4.25%, LOC Toronto Dominion Bank, VRDN (a)
3,700,000
3,700,000
Pima County Indl. Dev. Auth. Single Family Mtg. Rev. Bonds 4.1% 9/1/00 (Pacific Life Ins. Co. Guaranteed) (d)
1,000,000
1,000,000
Pinal County Ind. Dev. Auth. Hosp. Rev. (Casa Grande Med. Ctr. Proj.) Series 1995, 4.3%, LOC Chase Manhattan Bank, VRDN (a)
4,805,000
4,805,000
Pinal County Ind. Dev. Poll. Cont. Rev. (Magma Copper Co. Proj.) Series 1992, 4.2%, LOC BNP Paribas Sa, VRDN (a)
4,665,000
4,665,000
Salt River Proj. Agric. Impt. & Pwr. District Elec. Sys. Rev.:
Participating VRDN Series MSDW 00 208, 4.33% 2,495,000
2,495,000
Series B, 4.55% 10/16/00, CP
2,000,000
2,000,000
Tucson & Pima County Indl. Dev. Auth. Single Family Mtg. 1,100,000
1,100,000
Tucson Arpt. Auth. Spl. Facility Rev. (LearJet, Inc. Proj.) 1,300,000
1,300,000
Yavapai County Ind. Dev. Auth. Ind. Dev. Rev.:
Bonds:
(Citizens Communications Co. Proj.) Series 1993, 4.65% tender 9/7/00, CP mode (d)
1,000,000
1,000,000
(Citizens Utils. Co. Proj.) Series 1997, 4.65% tender 9/7/00, CP mode (d)
1,500,000
1,500,000
(Oxycal Lab. Proj.) Series 1999 A, 4.5%, LOC Bank One, Arizona NA, VRDN (a)(d)
1,000,000
1,000,000
Yuma County Ind. Dev. Auth. Rev. (Meadowcraft, Inc. Proj.) Series 1997, 4.45%, LOC Bank of America NA, VRDN (a)(d)
3,000,000
3,000,000
102,340,492
Municipal Securities - continued
Shares
Value Other - 2.7%
Fidelity Municipal Cash Central Fund, 4.28% (b)(c)
2,847,344
$ 2,847,344
TOTAL INVESTMENT PORTFOLIO - 99.5%
105,187,836
NET OTHER ASSETS - 0.5%
515,998
NET ASSETS - 100%
$ 105,703,834
Total Cost for Income Tax Purposes $ 105,187,836
Security Type Abbreviations
CP - COMMERCIAL PAPER
TAN - TAX ANTICIPATION NOTE
VRDN - VARIABLE RATE DEMAND NOTE
Legend
(a) The coupon rate shown on floating or adjustable rate securities represents the rate at period end.
(b) Information in this report regarding holdings by state and security types does not reflect the holdings of the Fidelity Municipal Cash Central Fund. A listing of the Fidelity
Municipal Cash Central Fund's holdings as of its most recent fiscal period end is available upon request.
(c) The rate quoted is the annualized seven-day yield of the fund at period end.
(d) Private activity obligations whose interest is subject to the federal alternative minimum tax for individuals.
(e) Provides evidence of ownership in one or more underlying municipal bonds.
Income Tax Information
At August 31, 2000, the fund had a capital loss carryforward of approximately $34,000 all of which will expire on During the fiscal year ended August 31, 2000, 100.00% of the fund's income dividends was free from federal income tax, and 45.66% of the fund's income dividends was subject to
the federal alternative minimum tax (unaudited).
The fund will notify shareholders in January 2001 of amounts for use in preparing 2000 income tax returns.
See accompanying notes which are an integral part of the financial statements.
Annual Report
Spartan Arizona Municipal Money Market Fund
Statement of Assets and Liabilities
August 31, 2000
Assets
Investment in securities, at value -
$ 105,187,836
Receivable for fund shares sold
37,991
Interest receivable
702,338
Total assets
105,928,165
Liabilities
Payable to custodian bank
$ 57,954
Payable for fund shares redeemed
106,159
Distributions payable
14,897
Accrued management fee
45,244
Other payables and accrued expenses
77
Total liabilities
224,331
Net Assets
$ 105,703,834
Net Assets consist of:
Paid in capital
$ 105,742,732
Accumulated net realized gain (loss) on investments
(38,898)
Net Assets, for 105,715,950 shares outstanding
$ 105,703,834
Net Asset Value, offering price and redemption price
$1.00
See accompanying notes which are an integral part of the financial statements.
Annual Report
Spartan Arizona Municipal Money Market Fund Statement of Operations
Year ended August 31, 2000
Interest Income
$ 3,957,290
Expenses
Management fee
$ 499,571
Non-interested trustees' compensation
299
Total expenses before reductions
499,870
Expense reductions
(638)
499,232
Net interest income
3,458,058
Net Realized Gain (Loss) on Investments
(15,144)
Net increase in net assets resulting from operations
$ 3,442,914
See accompanying notes which are an integral part of the financial statements.
Annual Report
Spartan Arizona Municipal Money Market Fund Statement of Changes in Net Assets
Year ended Year ended Increase (Decrease) in Net Assets
Operations $ 3,458,058
$ 2,580,497
Net realized gain (loss)
(15,144)
(23,612)
Net increase (decrease) in net assets resulting 3,442,914
2,556,885
Distributions to shareholders from net interest income
(3,458,058)
(2,580,497)
Share transactions at net asset value of $1.00 per share 113,958,442
93,042,199
Reinvestment of distributions from net interest income
3,239,350
2,439,841
Cost of shares redeemed
(102,135,902)
(99,324,559)
Net increase (decrease) in net assets and shares resulting from share transactions
15,061,890
(3,842,519)
Total increase (decrease) in net assets
15,046,746
(3,866,131)
Net Assets
Beginning of period
90,657,088
94,523,219
End of period
$ 105,703,834
$ 90,657,088
See accompanying notes which are an integral part of the financial statements.
Annual Report
Financial Highlights
Years ended August 31,
2000
1999
1998
1997
1996
Selected Per-Share Data
Net asset value, $ 1.000
$ 1.000
$ 1.000
$ 1.000
$ 1.000
Income from Investment Operations .034
.028
.034
.033
.035
Less Distributions
From net interest income
(.034)
(.028)
(.034)
(.033)
(.035)
Net asset value, end of period
$ 1.000
$ 1.000
$ 1.000
$ 1.000
$ 1.000
Total Return A, B
3.50%
2.84%
3.41%
3.39%
3.52%
Ratios and Supplemental Data
Net assets, end of period $ 105,704
$ 90,657
$ 94,523
$ 88,134
$ 82,741
Ratio of expenses to average .50%
.50%
.36% C
.35% C
.22% C
Ratio of net interest income to average net assets
3.46%
2.79%
3.36%
3.34%
3.44%
A The total returns would have been lower had certain expenses not been reduced during the periods shown.
B Total returns do not include the account closeout fee.
C FMR agreed to reimburse a portion of the fund's expenses during the period. Without this reimbursement, the fund's expense ratio would have been higher.
See accompanying notes which are an integral part of the financial statements.
Annual Report
For the period ended August 31, 2000
1. Significant Accounting Policies.
Spartan Arizona Municipal Income Fund (the income fund) is a fund of Fidelity Union Street Trust. Spartan Arizona Municipal Money Market Fund (the money
market fund) is a fund of Fidelity Union Street Trust II. Each trust is registered under the Investment Company Act of 1940, as amended (the 1940 Act), as an
open-end management investment company. Fidelity Union Street Trust and Fidelity Union Street Trust II (the trusts) are organized as a Massachusetts business trust
and a Delaware business trust, respectively. Each fund is authorized to issue an unlimited number of shares. The financial statements have been prepared in conformity
with generally accepted accounting principles which require management to make certain estimates and assumptions at the date of the financial statements. Each
fund may be affected by economic and political developments in the state of Arizona. The following summarizes the significant accounting policies of the income fund and
the money market fund:
Security Valuation.
Income Fund. Securities are valued based upon a computerized matrix system and/or appraisals by a pricing service, both of which consider market transactions
and dealer-supplied valuations. Securities for which quotations are not readily available are valued at their fair value as determined in good faith under consistently
applied procedures under the general supervision of the Board of Trustees. Short-term securities with remaining maturities of sixty days or less for which quotations
are not readily available are valued at amortized cost or original cost plus accrued interest, both of which approximate current value.
Money Market Fund. As permitted under Rule 2a-7 of the 1940 Act, and certain conditions therein, securities are valued initially at cost and thereafter assume a
constant amortization to maturity of any discount or premium.
Income Taxes. As a qualified regulated investment company under Subchapter M of the Internal Revenue Code, each fund is not subject to income taxes to the
extent that it distributes substantially all of its taxable income for the fiscal year. The schedules of investments include information regarding income taxes under the
caption "Income Tax Information."
Interest Income. Interest income, which includes amortization of premium and accretion of original issue discount, is accrued as earned. For the money market fund,
accretion of discount represents unrealized gain until realized at the time of a security disposition or maturity.
Expenses. Most expenses of each trust can be directly attributed to a fund. Expenses which cannot be directly attributed are apportioned among the funds in the trust.
Distributions to Shareholders. Dividends are declared daily and paid monthly from net interest income. Distributions to shareholders from realized capital gains on
investments, if any, are recorded on the ex-dividend date.
Annual Report
Notes to Financial Statements - continued
1. Significant Accounting Distributions to Shareholders - Income and capital gain distributions are determined in accordance with income tax regulations which may differ from generally accepted accounting principles.
These differences, which may result in distribution reclassifications, are primarily due to differing treatments for futures transactions, market discount, capital loss
carryforwards and losses deferred due to futures transactions and excise tax regulations.
Permanent book and tax basis differences relating to shareholder distributions will result in reclassifications to paid in capital. Undistributed net interest income and
accumulated undistributed net realized gain (loss) on investments may include temporary book and tax basis differences which will reverse in a subsequent period. Any
taxable income or gain remaining at fiscal year end is distributed in the following year.
Short-Term Trading (Redemption) Fees. Shares held in the income fund less than 180 days are subject to a short-term trading fee equal to .50% of the proceeds of the
redeemed shares. The fee, which is retained by the fund, is accounted for as an addition to paid in capital.
Security Transactions. Security transactions are accounted for as of trade date. Gains and losses on securities sold are determined on the basis of identified cost.
2. Operating Policies.
Fidelity Municipal Cash Central Fund. Pursuant to an Exemptive Order issued by the Securities and Exchange Commission (the SEC), the funds may invest in the
Fidelity Municipal Cash Central Fund (the Cash Fund) managed by Fidelity Investments Money Management, Inc. (FIMM), an affiliate of Fidelity Management &
Research Company (FMR). The Cash Fund is an open-end money market fund available only to investment companies and other accounts managed by FMR and its
affiliates. The Cash Fund seeks preservation of capital, liquidity, and current income by investing in high-quality, short-term municipal securities of various states and
municipalities. Income distributions from the Cash Fund are declared daily and paid monthly from net interest income. Income distributions earned by the funds are
recorded as interest income in the accompanying financial statements.
Delayed Delivery Transactions. Each fund may purchase or sell securities on a delayed delivery basis. Payment and delivery may take place after the customary
settlement period for that security. The price of the underlying securities and the date when the securities will be delivered and paid for are fixed at the time the
transaction is negotiated. Each fund may receive compensation for interest forgone in the purchase of a delayed delivery security. With respect to purchase commitments,
each fund identifies securities as segregated in its records with a value at least equal to the
Annual Report
Notes to Financial Statements - continued
2. Operating Policies - Delayed Delivery Transactions - amount of the commitment. Losses may arise due to changes in the value of the underlying securities or if the counterparty does not perform under the contract.
Futures Contracts. The income fund may use futures contracts to manage its exposure to the bond market and to fluctuations in interest rates. Buying futures tends to
increase the fund's exposure to the underlying instrument, while selling futures tends to decrease the fund's exposure to the underlying instrument or hedge other
fund investments. Losses may arise from changes in the value of the underlying instruments or if the counterparties do not perform under the contracts' terms. Gains
(losses) are realized upon the expiration or closing of the futures contracts. Futures contracts are valued at the settlement price established each day by the board of
trade or exchange on which they are traded.
3. Purchases and Sales of Investments.
Income Fund. Purchases and sales of securities, other than short-term securities, aggregated $14,383,941 and $10,582,080, respectively.
The market value of futures contracts opened and closed during the period amounted to $333,357 and $330,112, respectively.
4. Fees and Other Transactions with Affiliates.
Management Fee. As each fund's investment adviser, FMR receives a fee that is computed daily at an annual rate of .55% and .50% of average net assets for the income
fund and the money market fund, respectively. FMR pays all other expenses, except the compensation of the non-interested Trustees and certain exceptions such as
interest, taxes, brokerage commissions and extraordinary expenses. The management fee paid to FMR by each fund is reduced by an amount equal to the fees and
expenses paid by each fund to the non-interested Trustees.
FMR also bears the cost of providing shareholder services to the money market fund. To offset the cost of providing these services, FMR or its affiliates collected certain
transaction fees from shareholders which amounted to $768 for the period.
Sub-Adviser Fee. As each funds' investment sub-adviser, FIMM, a wholly owned subsidiary of FMR, receives a fee from FMR of 50% of the management fee payable to
FMR. The fee is paid prior to any voluntary expense reimbursements which may be in effect.
Money Market Insurance. Pursuant to an Exemptive Order issued by the SEC, the money market fund, along with other money market funds advised by FMR or its
affiliates, has entered into insurance agreements with FIDFUNDS Mutual Limited (FIDFUNDS), an affiliated mutual insurance company. FIDFUNDS provides limited
coverage for certain loss events
Annual Report
Notes to Financial Statements - continued
4. Fees and Other Transactions with Affiliates - Money Market Insurance - including issuer default as to payment of principal or interest and bankruptcy or insolvency of a credit enhancement provider. The insurance does not cover losses
resulting from changes in interest rates, ratings downgrades or other market conditions. The fund may be subject to a special assessment of up to approximately 2.5
times the fund's annual gross premium if covered losses exceed certain levels. During the period, FMR has borne the cost of the fund's premium payable to FIDFUNDS.
5. Expense Reductions.
Through arrangements with the funds' custodian and transfer agent, credits realized as a result of uninvested cash balances were used to reduce a portion of each
applicable fund's expenses. During the period, the credits reduced expenses by $20,244 and $638 for the income fund and the money market fund, respectively, under
these arrangements.
6. Beneficial Interest.
At the end of the period, one shareholder was record owner of approximately 12% of the total outstanding shares of the money market fund.
Annual Report
Report of Independent Accountants
To the Trustees of Fidelity Union Street Trust and Fidelity Union Street Trust II and the Shareholders of Spartan Arizona Municipal Income Fund and
Spartan Arizona Municipal Money Market Fund:
In our opinion, the accompanying statements of assets and liabilities, including the schedules of investments, and the related statements of operations and of changes
in net assets and the financial highlights present fairly, in all material respects, the financial position of Spartan Arizona Municipal Income Fund (a fund of Fidelity
Union Street Trust) and Spartan Arizona Municipal Money Market Fund (a fund of Fidelity Union Street Trust II) at August 31, 2000, and the results of operations,
the changes in their net assets and the financial highlights for the periods indicated, in conformity with accounting principles generally accepted in the United
States. These financial statements and financial highlights (hereafter referred to as "financial statements") are the responsibility of the funds' management; our
responsibility is to express an opinion on these financial statements based on our audits. We conducted our audits of these financial statements in accordance with
auditing standards generally accepted in the United States which require that we plan and perform the audit to obtain reasonable assurance about whether the
financial statements are free of material misstatement. An audit includes examining, on a test basis, evidence supporting the amounts and disclosures in the financial
statements, assessing the accounting principles used and significant estimates made by management, and evaluating the overall financial statement presentation. We
believe that our audits, which included confirmation of securities at August 31, 2000 by correspondence with the custodian, provide a reasonable basis for the opinion
expressed above.
/s/PricewaterhouseCoopers LLP Boston, Massachusetts Annual Report
A special meeting of Spartan Arizona Municipal Income Fund's shareholders was held on September 13, 2000. The results of votes taken among shareholders on
proposals before them are reported below. Each vote reported represents one dollar of net asset value held on the record date for the meeting.
PROPOSAL 1
To elect as Trustees the following twelve nominees.*
8/31/00
investments
8/31/99
Market Fund
Funds Average *
Demand Notes
(VRDNs) 71.6%
Demand Notes
(VRDNs) 52.2%
CP Mode) 19.3%
CP Mode) 29.3%
and Net
Other Assets 6.2%
and Net
Other Assets 14.4%

(Note 1)
LOC Dresdner Bank AG, VRDN (a)(d)
Assoc., VRDN (a)(d)
Co. Proj.) Series 1994, 4.35%, LOC Harris Trust & Savings Bank, Chicago, VRDN (a)(d)
(FGIC Insured)
(Note 1)
LOC Bank of America NA, VRDN (a)
Series B, 4.25% (MBIA Insured), VRDN (a)
CP mode
4.65% tender 9/7/00, CP mode (d)
Arizona NA, VRDN (a)(d)
LOC Bank of America NA, VRDN (a)(d)
(Note 1)
(La Cholla Apt. Proj.) Series 1996, 4.35%,
LOC Chase Bank of Texas NA, VRDN (a)
Rev. Participating VRDN Series RF 99 5, 4.43%
(Liquidity Facility Bank of New York NA) (a)(d)(e)
(Liquidity Facility Morgan Stanley Dean Witter & Co.) (a)(e)
Rev. Bonds Series 1C, 4.7% 7/3/01 (d)
Series 1998 A, 4.45%, LOC Bank of America NA, VRDN (a)(d)
(Note 1)
August 31, 2008.
See accompanying schedule
per share ($105,703,834 ÷ 105,715,950 shares)
Financial Statements - continued
Financial Statements - continued
August 31,
2000
August 31,
1999
Net interest income
from operations
Proceeds from sales of shares
beginning of period
Net interest income
(000 omitted)
net assets
Policies - continued
continued
continued
continued
continued
continued
PricewaterhouseCoopers LLP
October 6, 2000
|
|
# of |
% of |
|
J. Michael Cook |
||
|
Affirmative |
719,905,794.09 |
94.672 |
|
Withheld |
40,517,203.69 |
5.328 |
|
TOTAL |
760,422,997.78 |
100.000 |
|
Ralph F. Cox |
||
|
Affirmative |
719,013,933.36 |
94.554 |
|
Withheld |
41,409,064.42 |
5.446 |
|
TOTAL |
760,422,997.78 |
100.000 |
|
Phyllis Burke Davis |
||
|
Affirmative |
718,961,403.49 |
94.548 |
|
Withheld |
41,461,594.29 |
5.452 |
|
TOTAL |
760,422,997.78 |
100.000 |
|
Robert M. Gates |
||
|
Affirmative |
719,482,012.45 |
94.616 |
|
Withheld |
40,940,985.33 |
5.384 |
|
TOTAL |
760,422,997.78 |
100.000 |
|
Edward C. Johnson 3d |
||
|
Affirmative |
719,048,405.90 |
94.559 |
|
Withheld |
41,374,591.88 |
5.441 |
|
TOTAL |
760,422,997.78 |
100.000 |
|
Donald J. Kirk |
||
|
Affirmative |
719,305,522.72 |
94.593 |
|
Withheld |
41,117,475.06 |
5.407 |
|
TOTAL |
760,422,997.78 |
100.000 |
|
|
# of |
% of |
|
Marie L. Knowles |
||
|
Affirmative |
720,009,886.09 |
94.685 |
|
Withheld |
40,413,111.69 |
5.315 |
|
TOTAL |
760,422,997.78 |
100.000 |
|
Ned C. Lautenbach |
||
|
Affirmative |
719,749,038.52 |
94.651 |
|
Withheld |
40,673,959.26 |
5.349 |
|
TOTAL |
760,422,997.78 |
100.000 |
|
Peter S. Lynch |
||
|
Affirmative |
715,851,375.12 |
94.139 |
|
Withheld |
44,571,622.66 |
5.861 |
|
TOTAL |
760,422,997.78 |
100.000 |
|
William O. McCoy |
||
|
Affirmative |
718,919,774.43 |
94.542 |
|
Withheld |
41,503,223.35 |
5.458 |
|
TOTAL |
760,422,997.78 |
100.000 |
|
Marvin L. Mann |
||
|
Affirmative |
719,517,282.26 |
94.621 |
|
Withheld |
40,905,715.52 |
5.379 |
|
TOTAL |
760,422,997.78 |
100.000 |
|
Robert C. Pozen |
||
|
Affirmative |
719,858,604.16 |
94.666 |
|
Withheld |
40,564,393.62 |
5.334 |
|
TOTAL |
760,422,997.78 |
100.000 |
|
PROPOSAL 2 |
||
|
To ratify the selection of Pricewaterhouse Coopers LLP as independent accountants of the fund. |
||
|
|
# of |
% of |
|
Affirmative |
20,349,637.06 |
96,659 |
|
Against |
364,232.25 |
1.730 |
|
Abstain |
339,086.88 |
1.611 |
|
TOTAL |
21,052,956.19 |
100.000 |
|
PROPOSAL 3 |
||
|
To adopt an Amended and Restated |
||
|
|
# of |
% of |
|
Affirmative |
676,198,304.03 |
89.494 |
|
Against |
27,996,750.36 |
3.706 |
|
Abstain |
51,382,916.46 |
6.800 |
|
TOTAL |
755,577,970.85 |
100.000 |
|
Broker |
4,845,026.93 |
|
|
PROPOSAL 4 |
||
|
To amend the fund's fundamental investment limitation concerning the concentration of its assets in a single industry. |
||
|
|
# of |
% of |
|
Affirmative |
19,185,600.82 |
91.692 |
|
Against |
1,339,721.30 |
6.403 |
|
Abstain |
398,542.66 |
1.905 |
|
TOTAL |
20,923,864.78 |
100.000 |
|
Broker |
129,091.41 |
|
|
PROPOSAL 5 |
||
|
To amend the fund's fundamental investment limitation concerning underwriting. |
||
|
|
# of |
% of |
|
Affirmative |
19,046,639.21 |
91.028 |
|
Against |
1,369,740.58 |
6.547 |
|
Abstain |
507,484.99 |
2.425 |
|
TOTAL |
20,923,864.78 |
100.000 |
|
Broker |
129,091.41 |
|
*Denotes trust-wide proposals and voting results.
Annual Report
Investment Adviser
Fidelity Management & Research Company
Boston, MA
Sub-Adviser
Fidelity Investments
Money Management, Inc.
Officers
Edward C. Johnson 3d, President
Robert C. Pozen, Senior Vice President
Boyce I. Greer, Vice President -
Money Market Fund
Norman U. Lind, Vice President -
Money Market Fund
Dwight D. Churchill, Vice President -
Income Fund
Christine J. Thompson, Vice President -
Income Fund
Stanley N. Griffith, Assistant Vice President
Eric D. Roiter, Secretary
Robert A. Dwight, Treasurer
Maria F. Dwyer, Deputy Treasurer
John H. Costello, Assistant Treasurer
Thomas J. Simpson, Assistant Treasurer
Board of Trustees
Ralph F. Cox *
Phyllis Burke Davis *
Robert M. Gates *
Edward C. Johnson 3d
Donald J. Kirk *
Ned C. Lautenbach *
Peter S. Lynch
Marvin L. Mann *
William O. McCoy *
Gerald C. McDonough *
Robert C. Pozen
Thomas R. Williams *
* Independent trustees
Advisory Board
J. Michael Cook
Abigail P. Johnson
Marie L. Knowles
General Distributor
Fidelity Distributors Corporation
Boston, MA
Transfer and Shareholder
Servicing Agents
Citibank, N.A.
New York, NY
and
Fidelity Service Company, Inc.
Boston, MA
Custodian
Citibank, N.A.
New York, NY
The Fidelity Telephone Connection
Mutual Fund 24-Hour Service
Exchanges/Redemptions
and Account Assistance 1-800-544-6666
Product Information 1-800-544-6666
Retirement Accounts 1-800-544-4774 (8 a.m. - 9 p.m.)
TDD Service 1-800-544-0118
for the deaf and hearing impaired
(9 a.m. - 9 p.m. Eastern time)
Fidelity Automated Service
Telephone (FAST®) (automated graphic) 1-800-544-5555
(automated graphic) Automated line for quickest service
AZI/SPZ-ANN-1000 112772
1.536826.103
(Fidelity Investment logo)(registered trademark)
Corporate Headquarters
82 Devonshire St., Boston, MA 02109
www.fidelity.com
|
|