
|
|
|
|
|
|
|
|
|
|
Previous: MASSMUTUAL INSTITUTIONAL FUNDS, NSAR-A, EX-99, 2000-08-29 |
Next: JP MORGAN SERIES TRUST II, N-30D, 2000-08-29 |
| MassMutual Mid Cap Growth Equity II Fund | ||
| Portfolio Manager Report | 143 | |
| Portfolio of Investments | 146 | |
| Financial Statements | 148 | |
| MassMutual Small Cap Growth Equity Fund | ||
| Portfolio Manager Report | 152 | |
| Portfolio of Investments | 155 | |
| Financial Statements | 158 | |
| MassMutual Emerging Growth Fund | ||
| Portfolio Manager Report | 162 | |
| Portfolio of Investments | 165 | |
| Financial Statements | 167 | |
| MassMutual International Equity Fund | ||
| Portfolio Manager Report | 171 | |
| Portfolio of Investments | 174 | |
| Financial Statements | 176 | |
| Notes to Financial Statements | 181 | |

| MassMutual Institutional Funds – Letter to Shareholders (Continued)
|
| MassMutual Expands Fund Offerings
|
| I’d like to announce some exciting additions to the MassMutual Institutional Funds. Through our comprehensive due diligence
process, we’ve uncovered significant investor demand for a number of fund types and managers that were not previously addressed by our selections. As a result, we’ve added six new funds, listed as follows, with their managers (sub-advisers) in
parentheses: Large Cap Value (Davis Selected Advisers), Aggressive Growth (Janus Capital Corporation), OTC 100 (Deutsche Asset Management/Bankers Trust Company), Focused Value (Harris Associates), Mid Cap Growth Equity II (T. Rowe Price Associates), and
Emerging Growth (RS Investment Management). These new choices span a broad range of investment styles and market sectors—value vs. growth, active vs. indexed, and large-cap vs. emerging growth. All of our new managers have produced excellent
long-term track records, and have passed through our extensive selection process. We will continue to monitor all of our funds carefully so that you and your participants can be assured of access to top-flight investment management talent.
|

Ÿ
|
maximize current income to the extent consistent with liquidity and the preservation of capital
|
Ÿ
|
invest in a diversified portfolio of money market instruments
|
Ÿ
|
invest in high quality debt instruments with remaining maturity not to exceed 397 days
|
| MassMutual Prime Fund – Portfolio Manager Report (Continued)
|
| MassMutual Prime Fund
Total Return
|
|||||||||
|---|---|---|---|---|---|---|---|---|---|
| Five Year | Since Inception | ||||||||
| Year-To-Date | One Year | Average Annual | Average Annual | ||||||
| 1/1/00 - 6/30/00 | 7/1/99 - 6/30/00 | 7/1/95 - 6/30/00 | 10/3/94 - 6/30/00 | ||||||
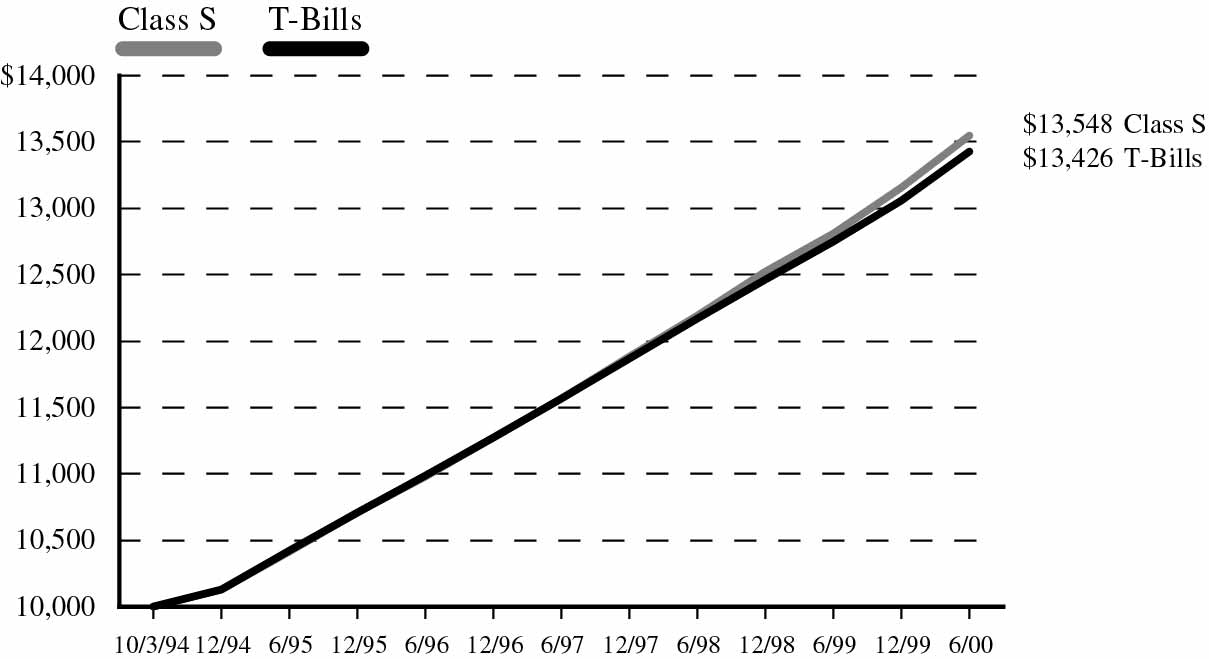
| Class S | 2.96% | 5.75% | 5.39% | 5.43% | |||||
| |
|||||||||
| 91-Day
Treasury Bills |
2.82% | 5.33% | 5.20% | 5.26% | |||||
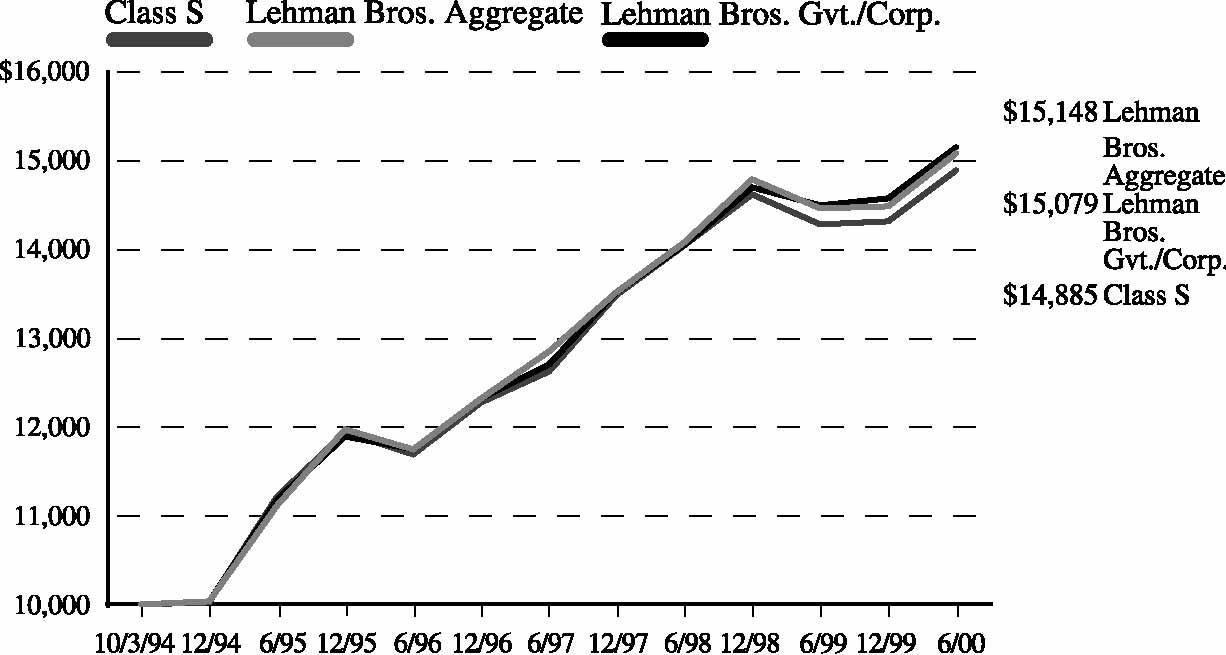
GROWTH OF A $10,000 INVESTMENT SINCE INCEPTION
| MassMutual Prime Fund
Total Return
|
|||||||
|---|---|---|---|---|---|---|---|
| Since Inception | |||||||
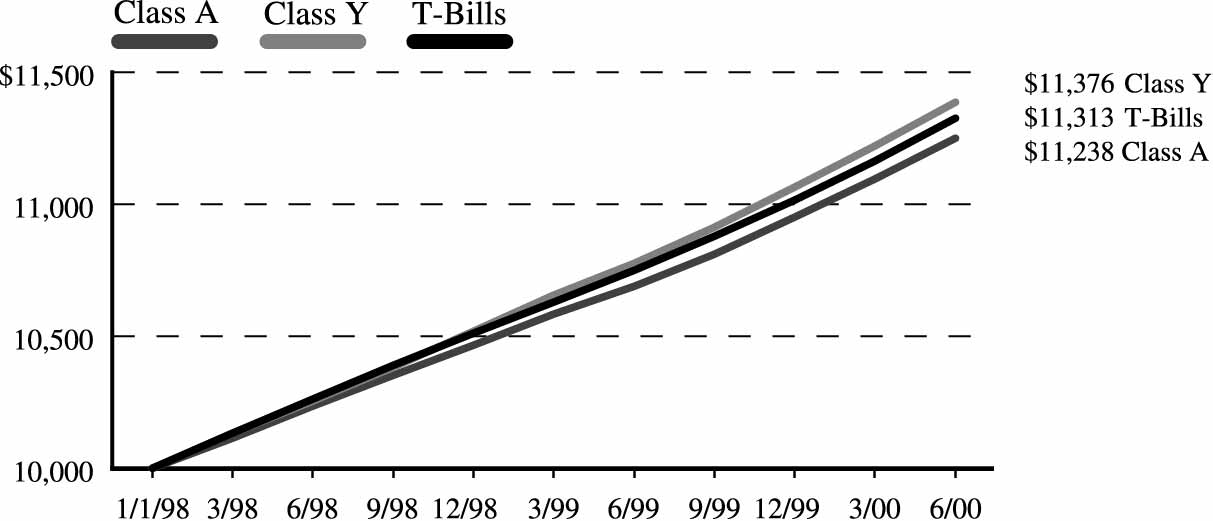
| Year-To-Date | One Year | Average Annual | |||||
| 1/1/00 - 6/30/00 | 7/1/99 - 6/30/00 | 1/1/98 - 6/30/00 | |||||
| Class A | 2.72% | 5.21% | 4.78% | ||||
| Class Y | 2.92% | 5.64% | 5.29% | ||||
| |
|||||||
| 91-Day
Treasury Bills |
2.82% | 5.33% | 5.06% | ||||
| MassMutual Prime Fund
Total Return
|
|||||||
|---|---|---|---|---|---|---|---|
| Since Inception | |||||||
| Year-To-Date | One Year | Average Annual | |||||
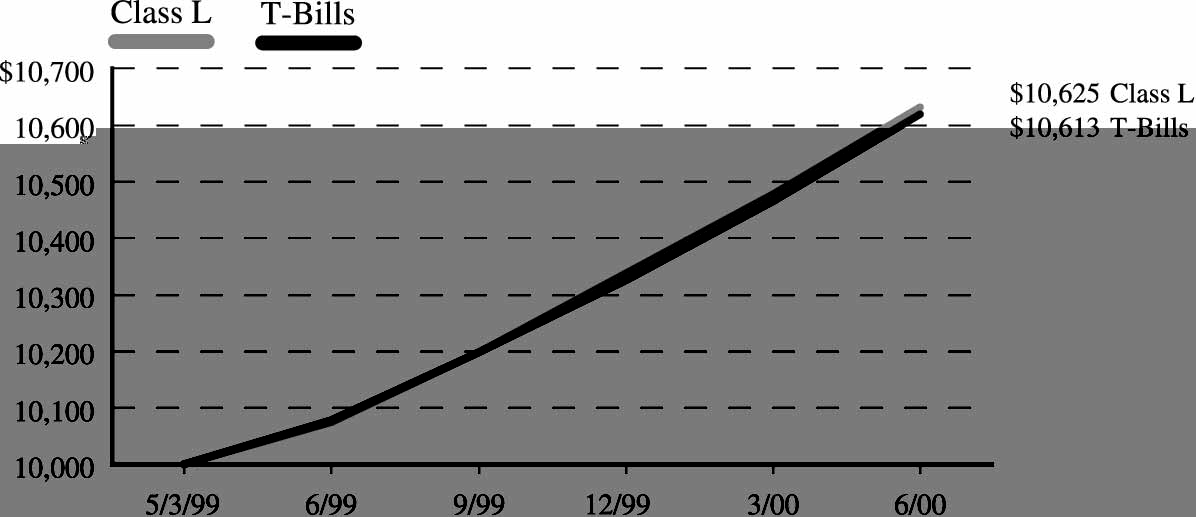
| 1/1/00 - 6/30/00 | 7/1/99 - 6/30/00 | 5/3/99 - 6/30/00 | |||||
| Class L | 2.81% | 5.48% | 5.34% | ||||
| |
|||||||
| 91-Day
Treasury Bills |
2.82% | 5.33% | 5.23% | ||||
| Principal
Amount |
Market Value |
|||||
|---|---|---|---|---|---|---|
| SHORT-TERM INVESTMENTS — 100.0% | ||||||
| Commercial Paper — 99.3% | ||||||
| Atlas Copco AB | ||||||
| 6.240% | 07/05/2000 | $ 9,425,000 | $ 9,418,466 | |||
| Atlas Copco AB | ||||||
| 6.340% | 07/26/2000 | 6,500,000 | 6,471,382 | |||
| Baxter International, Inc. | ||||||
| 6.560% | 07/11/2000 | 14,965,000 | 14,937,731 | |||
| Bestfoods | ||||||
| 6.130% | 07/10/2000 | 4,495,000 | 4,488,112 | |||
| Burlington Northern
Santa Fe Corp. |
||||||
| 6.260% | 08/21/2000 | 4,100,000 | 4,063,639 | |||
| Burlington Northern
Santa Fe Corp. |
||||||
| 6.330% | 07/28/2000 | 4,615,000 | 4,593,090 | |||
| Case Credit Corporation | ||||||
| 6.500% | 07/20/2000 | 7,400,000 | 7,374,614 | |||
| Case Credit Corporation | ||||||
| 6.830% | 08/22/2000 | 8,000,000 | 7,921,076 | |||
| Case Credit Corporation | ||||||
| 6.900% | 09/11/2000 | 2,500,000 | 2,465,021 | |||
| Caterpillar Financial
Services Corp. |
||||||
| 6.060% | 08/16/2000 | 4,600,000 | 4,564,380 | |||
| Caterpillar Financial
Services Corp. |
||||||
| 6.120% | 11/14/2000 | 4,855,000 | 4,732,134 | |||
| Comdisco, Inc. | ||||||
| 6.850% | 09/26/2000 | 8,500,000 | 8,356,634 | |||
| Comdisco, Inc. | ||||||
| 6.880% | 07/25/2000 | 5,600,000 | 5,574,315 | |||
| Comdisco, Inc. | ||||||
| 6.900% | 07/18/2000 | 3,325,000 | 3,314,166 | |||
| ConAgra, Inc. | ||||||
| 6.750% | 08/08/2000 | 2,515,000 | 2,497,081 | |||
| ConAgra, Inc. | ||||||
| 6.780% | 08/30/2000 | 5,165,000 | 5,104,612 | |||
| ConAgra, Inc. | ||||||
| 6.800% | 08/30/2000 | 235,000 | 232,253 | |||
| ConAgra, Inc. | ||||||
| 6.820% | 08/25/2000 | 1,980,000 | 1,959,369 | |||
| ConAgra, Inc. | ||||||
| 6.820% | 08/29/2000 | 3,520,000 | 3,480,656 | |||
| Cox Enterprises, Inc. | ||||||
| 6.850% | 07/19/2000 | 11,165,000 | 11,126,760 | |||
| Crown Cork & Seal
Company, Inc. |
||||||
| 6.300% | 07/14/2000 | 4,575,000 | 4,564,592 | |||
| Principal
Amount |
Market Value |
|||||
|---|---|---|---|---|---|---|
| Crown Cork & Seal
Company, Inc. |
||||||
| 6.850% | 08/04/2000 | $ 5,975,000 | $ 5,936,345 | |||
| Crown Cork & Seal
Company, Inc. |
||||||
| 6.850% | 08/15/2000 | 7,500,000 | 7,435,781 | |||
| CSX Corporation | ||||||
| 6.650% | 07/12/2000 | 10,000,000 | 9,979,680 | |||
| CVS Corporation | ||||||
| 6.720% | 08/01/2000 | 11,525,000 | 11,458,309 | |||
| Dominion Resources, Inc. | ||||||
| 6.320% | 08/10/2000 | 11,000,000 | 10,922,755 | |||
| Dominion Resources, Inc. | ||||||
| 6.890% | 08/16/2000 | 6,400,000 | 6,343,655 | |||
| Eastman Chemical
Company |
||||||
| 6.730% | 07/18/2000 | 10,000,000 | 9,968,219 | |||
| Eastman Chemical
Company |
||||||
| 6.770% | 08/02/2000 | 5,000,000 | 4,969,911 | |||
| Eastman Chemical
Company |
||||||
| 6.810% | 07/07/2000 | 2,970,000 | 2,966,629 | |||
| Enron Corp. | ||||||
| 6.500% | 07/13/2000 | 11,050,000 | 11,026,058 | |||
| Enron Corp. | ||||||
| 6.750% | 08/18/2000 | 4,600,000 | 4,558,600 | |||
| Finova Capital
Corporation |
||||||
| 6.210% | 09/29/2000 | 1,715,000 | 1,684,871 | |||
| Finova Capital
Corporation |
||||||
| 6.380% | 08/11/2000 | 2,055,000 | 2,040,068 | |||
| General Electric Capital
Corporation |
||||||
| 5.740% | 08/25/2000 | 475,000 | 470,835 | |||
| Goodyear Tire & Rubber
Company |
||||||
| 6.300% | 07/31/2000 | 7,035,000 | 6,998,067 | |||
| Goodyear Tire & Rubber
Company |
||||||
| 6.350% | 07/28/2000 | 5,840,000 | 5,812,187 | |||
| Goodyear Tire & Rubber
Company |
||||||
| 6.375% | 07/27/2000 | 2,730,000 | 2,717,431 | |||
| Houston Industries
Finance Co. L.P. |
||||||
| 7.020% | 09/11/2000 | 1,200,000 | 1,183,210 | |||
| Principal
Amount |
Market Value |
|||||
|---|---|---|---|---|---|---|
| Houston Industries
Finance Co. L.P. |
||||||
| 7.150% | 11/30/2000 | $ 16,300,000 | $ 15,816,460 | |||
| International Paper
Company |
||||||
| 6.800% | 09/25/2000 | 17,000,000 | 16,716,524 | |||
| John Deere Capital
Corporation |
||||||
| 6.670% | 09/21/2000 | 17,535,000 | 17,268,176 | |||
| Pentair, Inc. | ||||||
| 6.960% | 09/29/2000 | 5,160,000 | 5,069,349 | |||
| Praxair, Inc. | ||||||
| 6.890% | 08/11/2000 | 11,300,000 | 11,211,329 | |||
| Praxair, Inc. | ||||||
| 6.850% | 08/14/2000 | 5,415,000 | 5,369,664 | |||
| Public Service Company
of Colorado |
||||||
| 6.750% | 07/06/2000 | 5,190,000 | 5,185,134 | |||
| Public Service Company
of Colorado |
||||||
| 6.850% | 09/06/2000 | 12,440,000 | 12,277,865 | |||
| Public Service Electric
and Gas Company |
||||||
| 6.790% | 08/07/2000 | 5,500,000 | 5,461,618 | |||
| Public Service Electric
and Gas Company |
||||||
| 6.810% | 08/03/2000 | 6,500,000 | 6,459,424 | |||
| Public Service Electric
and Gas Company |
||||||
| 6.840% | 08/04/2000 | 6,300,000 | 6,259,302 | |||
| Safeway, Inc. | ||||||
| 6.370% | 07/27/2000 | 3,700,000 | 3,682,978 | |||
| Safeway, Inc. | ||||||
| 6.770% | 08/17/2000 | 7,000,000 | 6,938,130 | |||
| Safeway, Inc. | ||||||
| 6.920% | 08/18/2000 | 6,600,000 | 6,539,104 | |||
| Solutia, Inc. | ||||||
| 6.850% | 08/08/2000 | 5,385,000 | 5,346,064 | |||
| Solutia, Inc. | ||||||
| 6.870% | 08/23/2000 | 12,400,000 | 12,274,584 | |||
| TRW, Inc. | ||||||
| 6.280% | 07/21/2000 | 6,200,000 | 6,178,369 | |||
| TRW, Inc. | ||||||
| 6.700% | 10/30/2000 | 3,445,000 | 3,363,510 | |||
| TRW, Inc. | ||||||
| 6.750% | 07/24/2000 | 5,000,000 | 4,978,438 | |||
| TRW, Inc. | ||||||
| 6.850% | 09/20/2000 | 3,600,000 | 3,543,420 | |||
| Union Carbide
Corporation |
||||||
| 6.820% | 08/24/2000 | 9,000,000 | 8,907,930 | |||
| MassMutual Prime Fund – Portfolio of Investments (Continued)
|
| Principal
Amount |
Market Value |
|||||
|---|---|---|---|---|---|---|
| Union Carbide
Corporation |
||||||
| 6.850% | 08/14/2000 | $ 1,980,000 | $ 1,963,423 | |||
| UOP | ||||||
| 6.920% | 11/17/2000 | 13,120,000 | 12,763,865 | |||
| VF Corporation | ||||||
| 6.180% | 07/17/2000 | 12,135,000 | 12,101,670 | |||
| VF Corporation | ||||||
| 6.850% | 09/01/2000 | 5,000,000 | 4,939,625 | |||
| Washington Mutual
Financial Corporation |
||||||
| 6.900% | 07/06/2000 | 3,190,000 | 3,186,943 | |||
| Xerox Corporation | ||||||
| 6.760% | 08/02/2000 | 5,045,000 | 5,014,685 | |||
| Xerox Corporation | ||||||
| 6.900% | 08/31/2000 | 10,000,000 | 9,886,333 | |||
| 442,416,610 | ||||||
| Discount Note — 0.7% | ||||||
| Federal Farm Credit
Bank |
||||||
| 5.750% | 12/26/2000 | 3,285,000 | 3,186,715 | |||
| TOTAL SHORT-TERM
INVESTMENTS (Cost $445,566,790) * |
445,603,325 | |||||
| TOTAL INVESTMENTS — 100.0% | 445,603,325 | |||||
| Other Assets/ | ||||||
| (Liabilities) — (0.0%) | (184,292) | |||||
| NET ASSETS — 100.0% | $ 445,419,033 | |||||
| June 30, 2000
(Unaudited) |
|||
|---|---|---|---|
| Assets: | |||
| Short-term investments, at value (cost $445,566,790 ) (Note 2) | $445,603,325 | ||
| Cash | 1,636 | ||
| Receivables from: | |||
| Interest | 917 | ||
| Total assets | 445,605,878 | ||
| Liabilities: | |||
| Payables for: | |||
| Directors’ fees and expenses (Note 3) | 2,187 | ||
| Affiliates (Note 3): | |||
| Investment management fees | 128,927 | ||
| Administration fees | 37,750 | ||
| Service fees | 4,432 | ||
| Accrued expenses and other liabilities | 13,549 | ||
| Total liabilities | 186,845 | ||
| Net assets | $445,419,033 | ||
| Net assets consist of: | |||
| Paid-in capital | $433,534,040 | ||
| Undistributed net investment income | 12,000,098 | ||
| Accumulated net realized loss on investments | (78,570 | ) | |
| Net unrealized depreciation on investments | (36,535 | ) | |
| $445,419,033 | |||
| Net assets: | |||
| Class A | $ 12,985,788 | ||
| Class L | $ 6,580,573 | ||
| Class Y | $ 50,960,780 | ||
| Class S | $374,891,892 | ||
| Shares outstanding: | |||
| Class A | 83,504 | ||
| Class L | 42,159 | ||
| Class Y | 325,831 | ||
| Class S | 2,393,120 | ||
| Net asset value, offering price and redemption price per share: | |||
| Class A | $ 155.51 | ||
| Class L | $ 156.09 | ||
| Class Y | $ 156.40 | ||
| Class S | $ 156.65 | ||
| MassMutual Prime Fund – Financial Statements (Continued)
|
| Six months ended
June 30, 2000 (Unaudited) |
|||
|---|---|---|---|
| Investment income: (Note 2) | |||
| Interest | $12,890,104 | ||
| Expenses: (Note 2) | |||
| Investment management fees (Note 3) | 707,810 | ||
| Custody fees | 16,322 | ||
| Audit and legal fees | 7,957 | ||
| Directors’ fees (Note 3) . | 4,789 | ||
| 736,878 | |||
| Administration fees (Note 3): | |||
| Class A | 9,807 | ||
| Class L | 6,113 | ||
| Class Y | 43,133 | ||
| Class S | 143,021 | ||
| Service fees (Note 3): | |||
| Class A | 7,378 | ||
| Total expenses | 946,330 | ||
| Net investment income | 11,943,774 | ||
| Realized and unrealized gain (loss): | |||
| Net realized loss on investment transactions | (36,594 | ) | |
| Net change in unrealized appreciation (depreciation) on investments | (13,660 | ) | |
| Net realized and unrealized loss | (50,254 | ) | |
| Net increase in net assets resulting from operations | $11,893,520 | ||
| MassMutual Prime Fund – Financial Statements (Continued)
|
| Increase (Decrease) in Net Assets: | Six months ended
June 30, 2000 (Unaudited) |
Year ended
December 31, 1999 |
||||
|---|---|---|---|---|---|---|
| Operations: | ||||||
| Net investment income | $ 11,943,774 | $ 14,103,233 | ||||
| Net realized loss on investment transactions | (36,594 | ) | (21,292 | ) | ||
| Net change in unrealized appreciation (depreciation) on investments | (13,660 | ) | (63,776 | ) | ||
| Net increase in net assets resulting from operations | 11,893,520 | 14,018,165 | ||||
| Distributions to shareholders (Note 2): | ||||||
| From net investment income: | ||||||
| Class A | - | (30,930 | ) | |||
| Class L | - | (52,197 | )* | |||
| Class Y | - | (1,354,719 | ) | |||
| Class S | - | (12,628,175 | ) | |||
| Total distributions from net investment income | - | (14,066,021 | ) | |||
| Net fund share transactions (Note 5): | ||||||
| Class A | 9,273,858 | 3,451,433 | ||||
| Class L | (3,369,556 | ) | 9,877,872 | * | ||
| Class Y | 16,193,718 | 33,761,084 | ||||
| Class S | 47,840,106 | 64,112,361 | ||||
| Increase in net assets from net fund share transactions | 69,938,126 | 111,202,750 | ||||
| Total increase in net assets | 81,831,646 | 111,154,894 | ||||
| Net assets: | ||||||
| Beginning of period | 363,587,387 | 252,432,493 | ||||
| End of period (including undistributed net
investment income of $12,000,098
and $56,324, respectively) |
$445,419,033 | $363,587,387 | ||||
*
|
For the period from May 3, 1999 (commencement of operations) through December 31, 1999.
|
| MassMutual Prime Fund – Financial Statements (Continued)
|
| Class A |
|||||||||
|---|---|---|---|---|---|---|---|---|---|
| Six months ended
6/30/00 (Unaudited) |
Year ended
12/31/99 |
Year ended
12/31/98† |
|||||||
| Net asset value, beginning of period | $151.41 | $150.83 | $691.21 | ||||||
| Income (Loss) from investment operations: | |||||||||
| Net investment income | 4.27 | *** | 7.55 | *** | 32.03 | *** | |||
| Net realized and unrealized gain (loss) on investments | (0.17 | ) | (0.75 | ) | (0.09 | ) | |||
| Total income (loss) from investment operation s | 4.10 | 6.80 | 31.94 | ||||||
| Less distributions to shareholders: | |||||||||
| From net investment income | - | (6.22 | ) | (572.32 | ) | ||||
| Net asset value, end of period | $155.51 | $151.41 | $150.83 | ||||||
| Total Return@ | 2.72% | ** | 4.59% | 4.60% | |||||
| Ratios / Supplemental Data: | |||||||||
| Net assets, end of period (000’s) | $12,986 | $ 3,548 | $ 120 | ||||||
| Net expenses to average daily net assets | 0.95% | * | 1.04% | 1.20% | |||||
| Net investment income to average daily net assets | 5.59% | * | 4.89% | 4.59% | |||||
| Class L |
|||||||||
| Six months ended
6/30/00 (Unaudited) |
Period ended
12/31/99+ |
||||||||
| Net asset value, beginning of period | $151.84 | $152.99 | |||||||
| Income (Loss) from investment operations: | |||||||||
| Net investment income | 4.53 | *** | 6.37 | *** | |||||
| Net realized and unrealized gain (loss) on investments | (0.28 | ) | (1.24 | ) | |||||
| Total income (loss) from investment operation s | 4.25 | 5.13 | |||||||
| Less distributions to shareholders: | |||||||||
| From net investment income | - | (6.28 | ) | ||||||
| Net asset value, end of period | $156.09 | $151.84 | |||||||
| Total Return@ | 2.81% | ** | 3.34% | ** | |||||
| Ratios / Supplemental Data: | |||||||||
| Net assets, end of period (000’s) | $ 6,581 | $ 9,842 | |||||||
| Net expenses to average daily net assets | 0.71% | * | 0.76% | * | |||||
| Net investment income to average daily net assets | 5.90% | * | 6.11% | * | |||||
*
|
Annualized
|
**
|
Percentage represents results for the period and are not annualized.
|
***
|
Per share amount calculated on the average shares method.
|
+
|
For the period from May 3, 1999 (commencement of operations) through December 31, 1999.
|
†
|
Amounts have been restated to reflect reverse stock splits.
|
@
|
Employee retirement benefit plans that invest plan assets in the Separate Investment Accounts (SIAs) may be subject to
certain charges as set forth in their respective Plan Documents. Total return figures would be lower for the periods presented if they reflected these charges.
|
| MassMutual Prime Fund – Financial Statements (Continued)
|
| Class Y |
||||||||||||||||||
|---|---|---|---|---|---|---|---|---|---|---|---|---|---|---|---|---|---|---|
| Six months ended
6/30/00 (Unaudited) |
Year ended
12/31/99 |
Year ended
12/31/98† |
||||||||||||||||
| Net asset value, beginning of period | $ 151.97 | $ 150.73 | $ 690.78 | |||||||||||||||
| Income (Loss) from investment operations: | ||||||||||||||||||
| Net investment income | 4.48 | *** | 8.78 | *** | 36.67 | *** | ||||||||||||
| Net realized and unrealized gain (loss) on
investments |
(0.05 | ) | (1.20 | ) | (1.30 | ) | ||||||||||||
| Total income from investment operations | 4.43 | 7.58 | 35.37 | |||||||||||||||
| Less distributions to shareholders: | ||||||||||||||||||
| From net investment income | - | (6.34 | ) | (575.42 | ) | |||||||||||||
| Net asset value, end of period | $ 156.40 | $ 151.97 | $ 150.73 | |||||||||||||||
| Total Return@ | 2.92% | ** | 5.13% | 5.14% | ||||||||||||||
| Ratios / Supplemental Data: | ||||||||||||||||||
| Net assets, end of period (000’s) | $ 50,961 | $ 33,392 | $ 556 | |||||||||||||||
| Net expenses to average daily net assets | 0.55% | * | 0.57% | 0.74% | ||||||||||||||
| Net investment income to average daily net assets | 5.84% | * | 5.60% | 5.21% | ||||||||||||||
| Class S (1) |
||||||||||||||||||
| Six months ended
6/30/00 (Unaudited) |
Year ended
12/31/99 |
Year ended
12/31/98 |
Year ended
12/31/97 |
Year ended
12/31/96 |
Year ended
12/31/95 |
|||||||||||||
| Net asset value, beginning of period | $ 152.14 | $ 150.74 | $ 150.84 | $ 151.00 | $ 151.06 | $ 150.36 | ||||||||||||
| Income (Loss) from investment operations: | ||||||||||||||||||
| Net investment income | 4.54 | *** | 7.82 | *** | 8.10 | *** | 8.14 | *** | 7.85 | *** | 8.70 | *** | ||||||
| Net realized and unrealized gain (loss) on
investments |
(0.03 | ) | (0.13 | ) | 0.03 | (0.01 | ) | 0.06 | (0.02 | ) | ||||||||
| Total income (loss) from investment operation s | 4.51 | 7.69 | 8.13 | 8.13 | 7.91 | 8.68 | ||||||||||||
| Less distributions to shareholders: | ||||||||||||||||||
| From net investment income | - | (6.29 | ) | (8.23 | ) | (8.29 | ) | (7.97 | ) | (7.98 | ) | |||||||
| Net asset value, end of period | $ 156.65 | $ 152.14 | $ 150.74 | $ 150.84 | $ 151.00 | $ 151.06 | ||||||||||||
| Total Return@ | 2.96% | ** | 5.10% | 5.39% | 5.39% | 5.24% | 5.78% | |||||||||||
| Ratios / Supplemental Data: | ||||||||||||||||||
| Net assets, end of period (000’s) | $374,892 | $316,805 | $251,757 | $241,370 | $258,729 | $253,936 | ||||||||||||
| Net investment income to average daily net assets | 5.92% | * | 5.06% | 5.23% | 5.25% | 5.10% | 5.61% | |||||||||||
| Ratio of expenses to average daily net assets: | ||||||||||||||||||
| Before expense waiver | 0.45% | * | 0.48% | 0.55% | 0.55% | 0.55% | 0.55% | |||||||||||
| After expense waiver # | N/A | N/A | N/A | 0.54% | 0.52% | 0.52% | ||||||||||||
*
|
Annualized
|
**
|
Percentage represents results for the period and are not annualized.
|
***
|
Per share amount calculated on the average shares method.
|
†
|
Amounts have been restated to reflect reverse stock splits.
|
(1)
|
Class S shares were previously designated as Class 4 shares.
|
#
|
Computed after giving effect to the voluntary partial waiver of management fee by MassMutual, which terminated May 1, 1997
.
|
@
|
Employee retirement benefit plans that invest plan assets in the Separate Investment Accounts (SIAs) may be subject to
certain charges as set forth in their respective Plan Documents. Total return figures would be lower for the periods presented if they reflected these charges.
|
Ÿ
|
achieve a high total return primarily from current income while minimizing fluctuations in capital values
|
Ÿ
|
invest primarily in a diversified portfolio of short-term, investment grade, fixed income securities
|
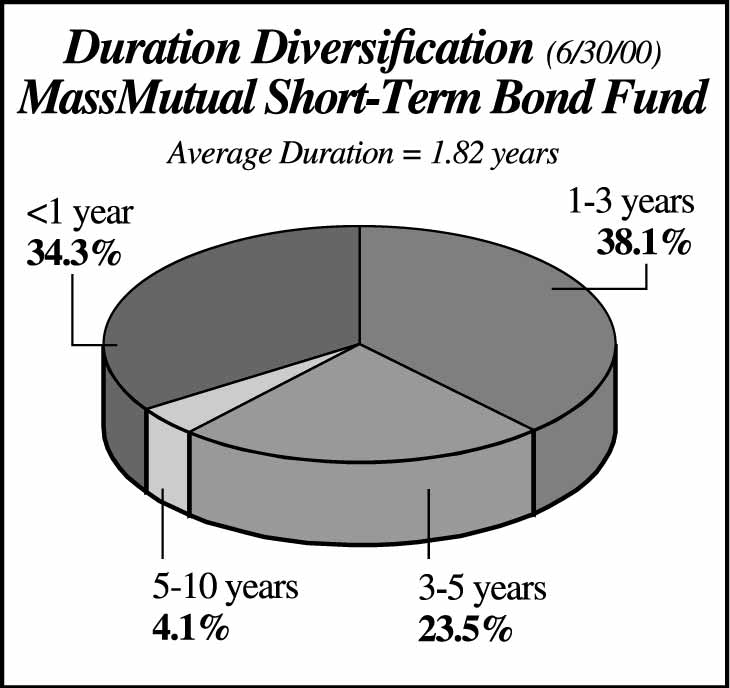
Ÿ
|
maintain duration below three years
|
Ÿ
|
diversify investments among market sectors on the basis of relative merit
|
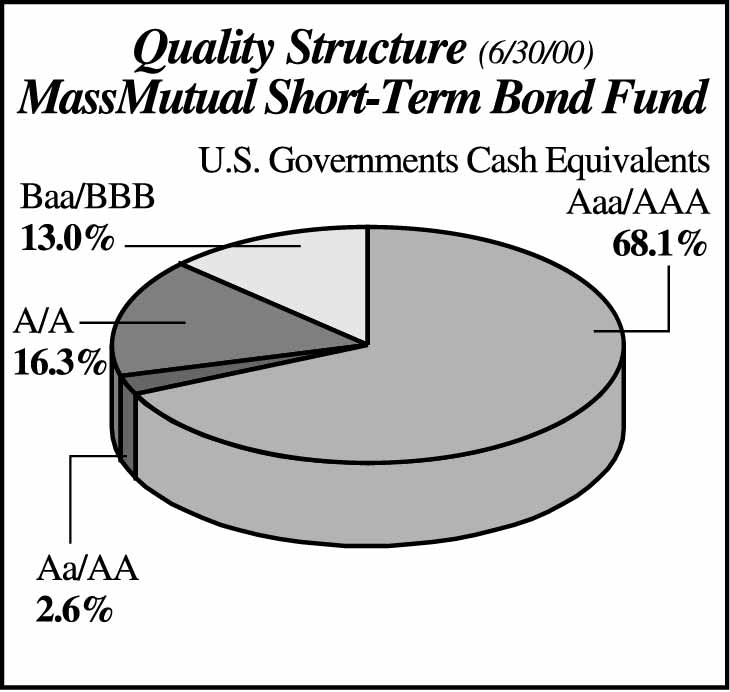
| MassMutual Short-Term Bond Fund – Portfolio Manager Report (Continued)
|
 |
 |
| MassMutual Short-Term Bond Fund – Portfolio Manager Report (Continued)
|
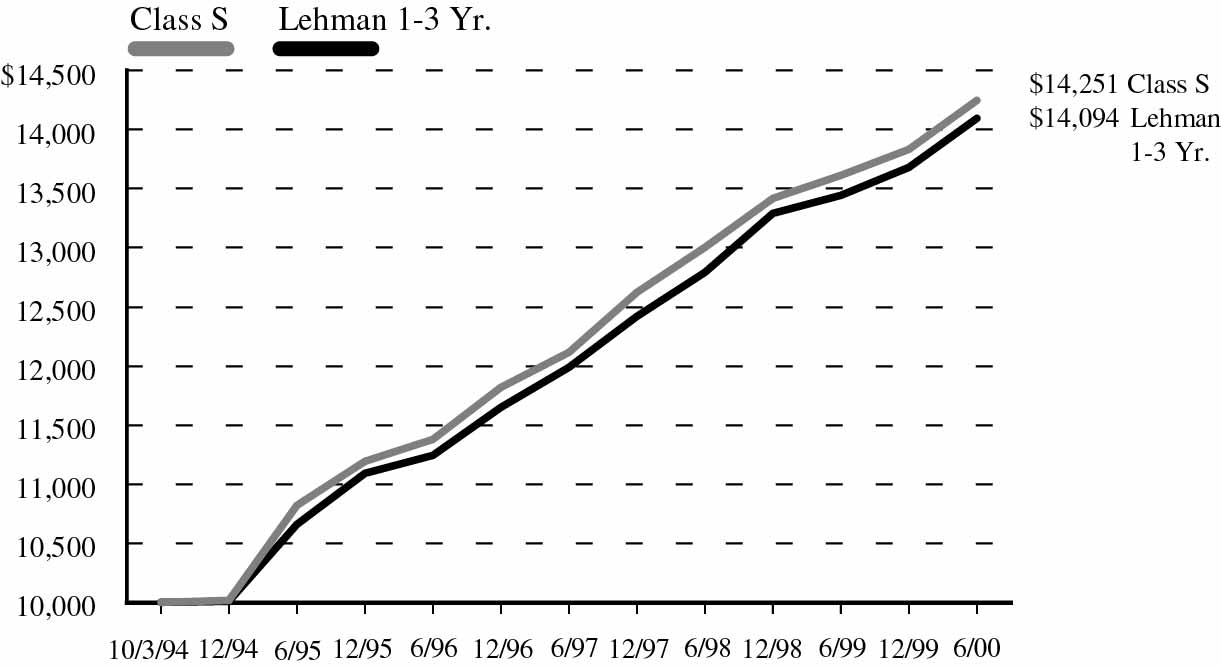
| MassMutual Short-Term Bond Fund
Total Return
|
|||||||||
|---|---|---|---|---|---|---|---|---|---|
| Year-To-Date
1/1/00-6/30/00 |
One Year
7/1/99 - 6/30/00 |
Five Year
Average Annual 7/1/95 - 6/30/00 |
Since Inception
Average Annual 10/3/94 - 6/30/00 |
||||||
| Class S | 3.01% | 4.68% | 5.66% | 6.36% | |||||
| |
|||||||||
| Lehman Brothers | |||||||||
| 1-3 Year | 3.00% | 4.86% | 5.74% | 6.15% | |||||
| Government Bond Index | |||||||||
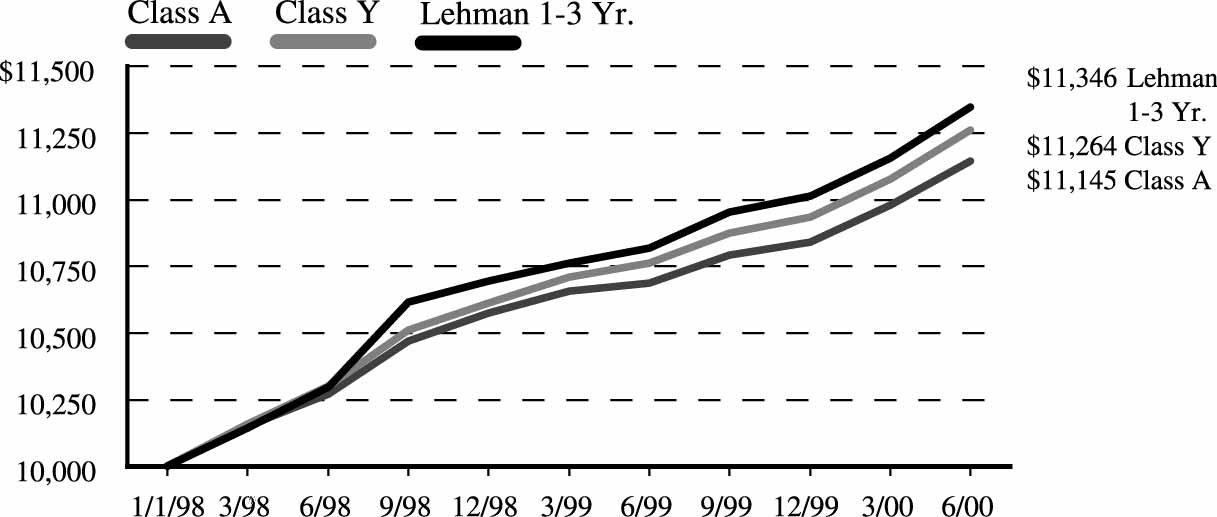
| MassMutual Short-Term Bond Fund
Total Return
|
|||||||
|---|---|---|---|---|---|---|---|
| Year-To-Date
1/1/00 - 6/30/00 |
One Year
7/1/99 - 6/30/00 |
Since Inception
Average Annual 1/1/98 - 6/30/00 |
|||||
| Class A | 2.81% | 4.26% | 4.43% | ||||
| Class Y | 3.01% | 4.65% | 4.88% | ||||
| |
|||||||
| Lehman Brothers | |||||||
| 1-3 Year | 3.00% | 4.86% | 5.18% | ||||
| Government Bond Index | |||||||
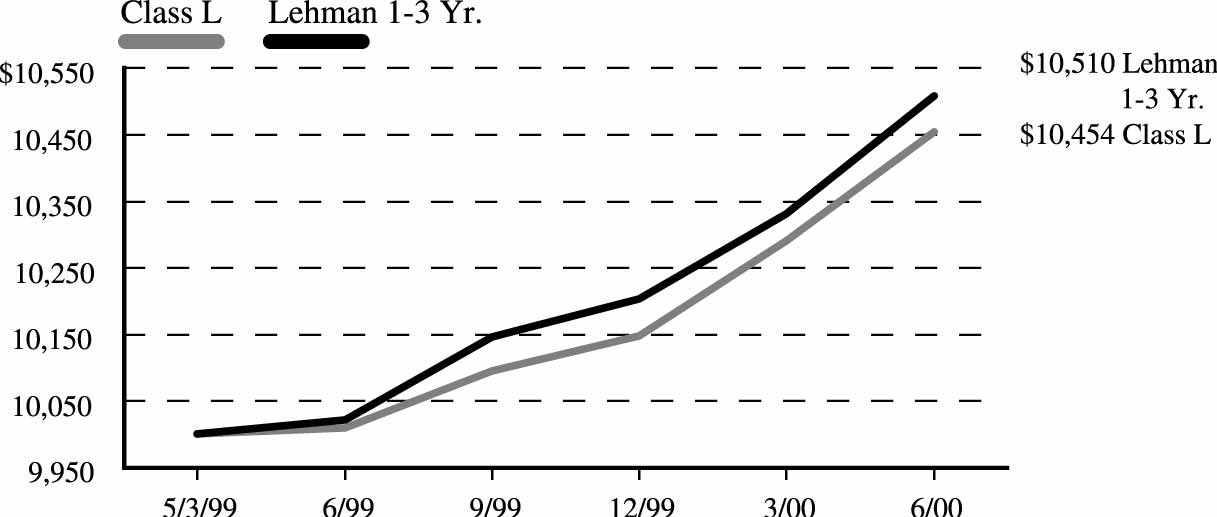
| MassMutual Short-Term Bond Fund
Total Return
|
|||||||
|---|---|---|---|---|---|---|---|
| Year-To-Date
1/1/00 - 6/30/00 |
One Year
7/1/99 - 6/30/00 |
Since Inception
Average Annual 5/3/99 - 6/30/00 |
|||||
| Class L | 3.02% | 4.45% | 3.89% | ||||
| |
|||||||
| Lehman Brothers | |||||||
| 1-3 Year | 3.00% | 4.86% | 4.35% | ||||
| Government Bond Index | |||||||
| Principal
Amount |
Market Value |
|||||
|---|---|---|---|---|---|---|
| BONDS & NOTES — 91.7% | ||||||
| ASSET BACKED SECURITIES — 7.0% | ||||||
| Boston Edison Company
Series 1999-1, Class A4 |
||||||
| 6.910% | 09/15/2009 | $ 2,500,000 | $ 2,455,075 | |||
| California Infrastructure
SCE-1, 1997-1, Class A5 |
||||||
| 6.280% | 09/25/2005 | 300,000 | 294,006 | |||
| California Infrastructure
SDG&E-1,1997-1, Class A5 |
||||||
| 6.190% | 09/25/2005 | 200,000 | 195,582 | |||
| Chase Manhattan
Auto Owner Trust 1997-A, Class A4 |
||||||
| 6.400% | 07/16/2001 | 470,882 | 470,585 | |||
| Chase Manhattan RV
Owner Trust 1997-A, Class A7 |
||||||
| 6.140% | 10/16/2006 | 1,000,000 | 990,620 | |||
| First Bank Corporate
Card Master Trust 1997-1, Class A |
||||||
| 6.400% | 02/15/2003 | 1,000,000 | 989,680 | |||
| First Security Auto
Owner Trust 1999-1, Class A4 |
||||||
| 5.740% | 06/15/2004 | 5,000,000 | 4,881,250 | |||
| Ford Credit Auto Owner
Trust Series 1999-A, Class A3 |
||||||
| 5.310% | 04/16/2001 | 47,016 | 46,986 | |||
| Metlife Capital
Equipment Loan Trust Series 1997-A, Class A |
||||||
| 6.850% | 05/20/2008 | 1,000,000 | 991,460 | |||
| Peco Energy Transition
Trust Series 1999-A, Class A4 |
||||||
| 5.800% | 03/01/2007 | 2,000,000 | 1,901,300 | |||
| Railcar Trust
No. 1992-1 |
||||||
| 7.750% | 06/01/2004 | 738,567 | 739,498 | |||
| Rental Car Finance
Corp. Series 1999-1A, Class A† |
||||||
| 5.900% | 02/25/2007 | 1,000,000 | 954,560 | |||
| Student Loan Marketing
Association Series 1998-1, Class A1 |
||||||
| 6.554% | 01/25/2007 | 1,250,882 | 1,249,005 | |||
| TOTAL ASSET BACKED
SECURITIES (Cost $16,513,017) |
16,159,607 | |||||
| Principal
Amount |
Market Value |
|||||
|---|---|---|---|---|---|---|
| CORPORATE DEBT — 42.5% | ||||||
| AirTouch
Communications, Inc. |
||||||
| 7.500% | 07/15/2006 | $ 1,000,000 | $ 989,280 | |||
| America West Airlines,
Inc. 1996-1, Class A |
||||||
| 6.850% | 07/02/2009 | 1,891,695 | 1,760,657 | |||
| Associates Corporation
of North America |
||||||
| 6.750% | 08/01/2001 | 1,500,000 | 1,490,025 | |||
| AT&T Corp. * | ||||||
| 5.625% | 03/15/2004 | 3,000,000 | 2,819,400 | |||
| BHP Finance (USA)
Limited |
||||||
| 7.875% | 12/01/2002 | 1,000,000 | 1,001,900 | |||
| Bombardier Capital, Inc.† | ||||||
| 6.000% | 01/15/2002 | 2,000,000 | 1,952,582 | |||
| CIT Group, Inc., The | ||||||
| 7.375% | 03/15/2003 | 2,500,000 | 2,485,075 | |||
| Crown Cork & Seal
Company, Inc. |
||||||
| 7.125% | 09/01/2002 | 4,000,000 | 3,819,236 | |||
| CSC Enterprises† | ||||||
| 6.500% | 11/15/2001 | 2,000,000 | 1,991,300 | |||
| CSX Corporation | ||||||
| 7.050% | 05/01/2002 | 2,900,000 | 2,852,643 | |||
| Dana Corporation | ||||||
| 6.250% | 03/01/2004 | 5,000,000 | 4,725,500 | |||
| Duke Capital Corp. | ||||||
| 7.250% | 10/01/2004 | 3,000,000 | 2,972,463 | |||
| Emerald Investment
Grade CBO, Ltd.† |
||||||
| 7.553% | 05/24/2011 | 2,000,000 | 2,000,000 | |||
| FNMA (Benchmark
Note) |
||||||
| 5.125% | 02/13/2004 | 10,000,000 | 9,385,900 | |||
| FNMA (Benchmark
Note) Series B |
||||||
| 6.625% | 01/15/2002 | 15,000,000 | 14,934,300 | |||
| Ford Motor Credit
Corporation |
||||||
| 7.500% | 03/15/2005 | 2,500,000 | 2,487,625 | |||
| General American
Transportation Corporation |
||||||
| 6.750% | 03/01/2006 | 1,000,000 | 938,790 | |||
| Principal
Amount |
Market Value |
|||||
|---|---|---|---|---|---|---|
| General Electric
Capital Corporation Series MTNA |
||||||
| 5.500% | 04/15/2002 | $ 2,100,000 | $ 2,041,893 | |||
| Heller Financial, Inc. | ||||||
| 6.250% | 03/01/2001 | 2,000,000 | 1,981,340 | |||
| Heller Financial, Inc. | ||||||
| 6.330% | 07/28/2000 | 2,000,000 | 1,999,004 | |||
| IMC Global, Inc. | ||||||
| 6.625% | 10/15/2001 | 1,500,000 | 1,470,105 | |||
| Joseph E. Seagram &
Sons, Inc. |
||||||
| 6.250% | 12/15/2001 | 3,200,000 | 3,147,197 | |||
| MAPCO, Inc. | ||||||
| 7.250% | 03/01/2009 | 1,250,000 | 1,205,575 | |||
| Maytag Corp.
Series MTND |
||||||
| 7.610% | 03/03/2003 | 2,000,000 | 1,981,264 | |||
| Norfolk Southern
Corporation |
||||||
| 7.350% | 05/15/2007 | 1,000,000 | 973,380 | |||
| Occidental Petroleum
Corporation |
||||||
| 6.750% | 11/15/2002 | 2,900,000 | 2,840,927 | |||
| SuperValu, Inc. | ||||||
| 7.625% | 09/15/2004 | 2,500,000 | 2,488,482 | |||
| Textron Financial Corp. | ||||||
| 7.125% | 12/09/2004 | 3,500,000 | 3,430,805 | |||
| Times Mirror Co. | ||||||
| 6.650% | 10/15/2001 | 4,000,000 | 3,963,955 | |||
| TRW, Inc. | ||||||
| 8.750% | 05/15/2006 | 2,000,000 | 2,037,436 | |||
| Union Oil Of California
Series MTNA |
||||||
| 9.875% | 08/15/2002 | 2,500,000 | 2,621,275 | |||
| Valero Energy
Corporation |
||||||
| 7.375% | 03/15/2006 | 1,000,000 | 965,448 | |||
| Vulcan Materials
Company |
||||||
| 5.750% | 04/01/2004 | 5,000,000 | 4,720,349 | |||
| Walt Disney Company,
The |
||||||
| 6.375% | 03/30/2001 | 1,500,000 | 1,494,435 | |||
| TOTAL CORPORATE DEBT
(Cost $99,542,447) |
97,969,546 | |||||
| MassMutual Short-Term Bond Fund – Portfolio of Investments (Continued)
|
| Principal
Amount |
Market Value |
|||||
|---|---|---|---|---|---|---|
| NON-U.S. GOVERNMENT AGENCY
OBLIGATIONS — 2.7% |
||||||
| Collateralized Mortgage
Obligations |
||||||
| Asset Securitization
Corporation Series 1995-MD4, Class A1 |
||||||
| 7.100% | 08/13/2029 | $ 2,351,628 | $ 2,326,018 | |||
| Merrill Lynch Mortgage
Investors, Inc. Series 1998-ASPI, Class C† |
||||||
| 7.640% | 10/01/2003 | 4,000,000 | 4,000,000 | |||
| TOTAL NON-U.S. GOVERNMENT
AGENCY OBLIGATIONS (Cost $6,469,392) |
6,326,018 | |||||
| U.S. GOVERNMENT AGENCY
OBLIGATIONS — 7.0% |
||||||
| Federal Home Loan Mortgage
Corporation (FHLMC) — 0.3% |
||||||
| Collateralized Mortgage
Obligations — 0.3% |
||||||
| FHLMC Series 1704
Class PE |
||||||
| 6.000% | 07/15/2007 | 727,350 | 723,255 | |||
| Pass-Through Securities — 0.0% | ||||||
| FHLMC | ||||||
| 4.750% | 09/01/2006 | 103,717 | 100,249 | |||
| 823,504 | ||||||
| Federal National Mortgage
Association (FNMA) — 1.3% |
||||||
| Collateralized Mortgage
Obligations — 1.1% |
||||||
| FNMA Series 1993-71
Class PG |
||||||
| 6.250% | 07/25/2007 | 2,500,000 | 2,481,250 | |||
| Pass-Through Securities — 0.2% | ||||||
| FNMA | ||||||
| 8.000% | 05/01/2013 | 179,809 | 179,244 | |||
| FNMA | ||||||
| 9.000% | 10/01/2009 | 169,708 | 173,791 | |||
| 353,035 | ||||||
| 2,834,285 | ||||||
| Government National Mortgage
Association (GNMA) — 2.4% |
||||||
| Pass-Through Securities | ||||||
| GNMA | ||||||
| 7.500% | 08/15/2029 | 4,795,044 | 4,761,656 | |||
| GNMA | ||||||
| 8.000% | ||||||
| 05/15/2001-11/15/2007 | 696,784 | 709,625 | ||||
| 5,471,281 | ||||||
| Principal
Amount |
Market Value |
|||||
|---|---|---|---|---|---|---|
| U.S. Government Guaranteed Notes — 3.0% | ||||||
| 1994-A Baxter
Springs, KS |
||||||
| 6.310% | 08/01/2001 | $ 500,000 | $ 496,725 | |||
| 1994-A Detroit, MI | ||||||
| 6.310% | 08/01/2001 | 450,000 | 447,053 | |||
| 1994-A Jacksonville, FL | ||||||
| 6.310% | 08/01/2001 | 1,485,000 | 1,475,273 | |||
| 1994-A Los Angeles
County, CA |
||||||
| 6.310% | 08/01/2001 | 225,000 | 223,526 | |||
| 1994-A Tacoma, WA | ||||||
| 6.310% | 08/01/2001 | 195,000 | 193,723 | |||
| 1994-A Trenton, NJ | ||||||
| 6.310% | 08/01/2001 | 145,000 | 144,050 | |||
| U.S. Dept. of Housing and
Urban Development, Series 1997-A |
||||||
| 6.110% | 08/01/2000 | 4,000,000 | 3,997,712 | |||
| 6,978,062 | ||||||
| TOTAL U.S. GOVERNMENT
AGENCY OBLIGATIONS (Cost $15,744,475) |
16,107,132 | |||||
| U.S. TREASURY OBLIGATIONS — 32.5% | ||||||
| U.S. Treasury Note | ||||||
| 5.500% | 07/31/2001 | 32,000,000 | 31,674,880 | |||
| U.S. Treasury Note | ||||||
| 5.625% | 11/30/2000 | 36,000,000 | 35,904,240 | |||
| U.S. Treasury Note | ||||||
| 6.125% | 08/15/2007 | 2,250,000 | 2,234,880 | |||
| U.S. Treasury Note | ||||||
| 6.500% | 10/15/2006 | 5,100,000 | 5,161,353 | |||
| TOTAL U.S. TREASURY
OBLIGATIONS (Cost $75,127,878) |
74,975,353 | |||||
| TOTAL BONDS & NOTES
(Cost $213,397,209) |
211,537,656 | |||||
| SHORT-TERM INVESTMENTS — 6.9% | ||||||
| Commercial Paper | ||||||
| Case Credit
Corporation |
||||||
| 6.830% | 08/11/2000 | 368,000 | 365,138 | |||
| Case Credit
Corporation |
||||||
| 6.850% | 08/18/2000 | 395,000 | 391,392 | |||
| Case Credit
Corporation |
||||||
| 6.930% | 08/18/2000 | 1,455,000 | 1,441,556 | |||
| Principal
Amount |
Market Value |
|||||
|---|---|---|---|---|---|---|
| Case Credit Corporation | ||||||
| 7.000% | 08/31/2000 | $ 3,075,000 | $ 3,038,459 | |||
| Comdisco, Inc. | ||||||
| 7.000% | 07/10/2000 | 230,000 | 229,597 | |||
| Crown Cork & Seal
Company, Inc. |
||||||
| 6.680% | 07/19/2000 | 610,000 | 607,963 | |||
| Finova Capital
Corporation |
||||||
| 6.470% | 10/20/2000 | 180,000 | 176,108 | |||
| Finova Capital
Corporation |
||||||
| 6.520% | 10/20/2000 | 425,000 | 415,811 | |||
| Houston Industries
Finance Co. L.P. |
||||||
| 7.000% | 09/22/2000 | 2,030,000 | 1,997,355 | |||
| Houston Industries
Finance Co. L.P. |
||||||
| 7.050% | 08/21/2000 | 3,850,000 | 3,811,548 | |||
| Houston Industries
Finance Co. L.P. |
||||||
| 7.090% | 09/06/2000 | 670,000 | 661,159 | |||
| UOP | ||||||
| 6.870% | 07/11/2000 | 1,800,000 | 1,796,565 | |||
| US West Capital
Funding Corporation |
||||||
| 6.900% | 07/31/2000 | 920,000 | 914,710 | |||
| 15,847,361 | ||||||
| TOTAL SHORT-TERM
INVESTMENTS (Cost $15,848,258) |
15,847,361 | |||||
| TOTAL INVESTMENTS — 98.6%
(Cost $229,245,467) ** |
227,385,017 | |||||
| Other Assets/
(Liabilities) — 1.4% |
3,331,715 | |||||
| NET ASSETS — 100.0% | $230,716,732 | |||||
*
|
All or a portion of this security is segregated to cover forward purchase commitments. (Note 2).
|
**
|
Aggregate cost for Federal tax purposes. (Note 7).
|
†
|
Securities exempt from registration under rule 144A of the Securities Act of 1933. These securities may be resold in transactions
exempt from registration, normally to qualified institutional buyers.
|
| June 30, 2000
(Unaudited) |
|||
|---|---|---|---|
| Assets: | |||
| Investments, at value (cost $213,397,209) (Note 2) | $211,537,656 | ||
| Short-term investments, at value (cost $15,848,258) (Note 2) | 15,847,361 | ||
| Total Investments | 227,385,017 | ||
| Cash | 1,821 | ||
| Receivables from: | |||
| Investments sold | 5,004 | ||
| Interest and dividends | 3,440,598 | ||
| Settlement of investments purchased on a forward commitment basis (Note 2) | 9,060 | ||
| Total assets | 230,841,500 | ||
| Liabilities: | |||
| Payables for: | |||
| Investments purchased | 6,667 | ||
| Directors’ fees and expenses (Note 3) | 2,184 | ||
| Affiliates (Note 3): | |||
| Investment management fees | 75,274 | ||
| Administration fees | 26,567 | ||
| Service fees | 320 | ||
| Accrued expenses and other liabilities | 13,756 | ||
| Total liabilities | 124,768 | ||
| Net assets | $230,716,732 | ||
| Net assets consist of: | |||
| Paid-in capital | $227,267,386 | ||
| Undistributed net investment income | 6,423,260 | ||
| Accumulated net realized loss on investments | (1,122,524 | ) | |
| Net unrealized depreciation on investments and forward commitments | (1,851,390 | ) | |
| $230,716,732 | |||
| Net assets: | |||
| Class A | $ 1,998,156 | ||
| Class L | $ 25,984,500 | ||
| Class Y | $ 1,843,782 | ||
| Class S | $200,890,294 | ||
| Shares outstanding: | |||
| Class A | 194,762 | ||
| Class L | 2,543,624 | ||
| Class Y | 179,785 | ||
| Class S | 19,556,812 | ||
| Net asset value, offering price and redemption price per share: | |||
| Class A | $ 10.26 | ||
| Class L | $ 10.22 | ||
| Class Y | $ 10.26 | ||
| Class S | $ 10.27 | ||
| MassMutual Short-Term Bond Fund – Financial Statements (Continued)
|
| Six months ended
June 30, 2000 (Unaudited) |
|||
|---|---|---|---|
| Investment income: (Note 2) | |||
| Interest | $7,021,194 | ||
| Expenses: (Note 2) | |||
| Investment management fees (Note 3) | 435,154 | ||
| Custody fees | 11,573 | ||
| Audit and legal fees | 7,396 | ||
| Directors’ fees (Note 3) | 4,775 | ||
| 458,898 | |||
| Administration fees (Note 3): | |||
| Class A | 512 | ||
| Class L | 17,275 | ||
| Class Y | 1,478 | ||
| Class S | 119,367 | ||
| Service fees (Note 3): | |||
| Class A | 404 | ||
| Total expenses | 597,934 | ||
| Net investment income | 6,423,260 | ||
| Realized and unrealized gain (loss): | |||
| Net realized gain on investment transactions and forward commitments | (1,067,149 | ) | |
| Net change in unrealized appreciation (depreciation
)
on investments |
1,230,562 | ||
| Net realized and unrealized gain | 163,413 | ||
| Net increase in net assets resulting from operations | $6,586,673 | ||
| MassMutual Short-Term Bond Fund – Financial Statements (Continued)
|
| Six months ended
June 30, 2000 (Unaudited) |
Year ended
December 31, 1999 |
|||||
|---|---|---|---|---|---|---|
| Increase (Decrease) in Net Assets: | ||||||
| Operations: | ||||||
| Net investment income | $ 6,423,260 | $ 12,911,773 | ||||
| Net realized gain (loss) on investment
transactions and forward
commitments |
(1,067,149 | ) | 291,880 | |||
| Net change in unrealized appreciation
(depreciation) on investment
transactions and forward commitments |
1,230,562 | (5,926,712 | ) | |||
| Net increase in net assets resulting from operations | 6,586,673 | 7,276,941 | ||||
| Distributions to shareholders (Note 2): | ||||||
| From net investment income: | ||||||
| Class A | - | (7,429 | ) | |||
| Class L | - | (87,813 | )* | |||
| Class Y | - | (110,663 | ) | |||
| Class S | - | (12,705,868 | ) | |||
| Total distributions from net investment income | - | (12,911,773 | ) | |||
| In excess of net investment income: | ||||||
| Class A | - | (1 | ) | |||
| Class L | - | (10 | )* | |||
| Class Y | - | (13 | ) | |||
| Class S | - | (1,450 | ) | |||
| Total distributions in excess of net investment income | - | (1,474 | ) | |||
| From net realized gains: | ||||||
| Class A | - | (174 | ) | |||
| Class L | - | (1,874 | )* | |||
| Class Y | - | (2,352 | ) | |||
| Class S | - | (272,917 | ) | |||
| Total distributions from net realized gains | - | (277,317 | ) | |||
| Net fund share transactions (Note 5): | ||||||
| Class A | 1,849,107 | 9,336 | ||||
| Class L | 23,996,494 | 1,601,579 | * | |||
| Class Y | (16,500 | ) | 1,634,490 | |||
| Class S | (16,302,482 | ) | (66,799,674 | ) | ||
|
Increase (decrease) in net assets from net fund share
transactions |
9,526,619 | (63,554,269 | ) | |||
| Total increase (decrease) in net assets | 16,113,292 | (69,467,892 | ) | |||
| Net assets: | ||||||
| Beginning of period | 214,603,440 | 284,071,332 | ||||
| End of period (including undistributed net
investment income of
$6,423,260 and $0, respectively) |
$230,716,732 | $214,603,440 | ||||
*
|
For the period from May 3, 1999 (commencement of operations) through December 31, 1999.
|
| MassMutual Short-Term Bond Fund – Financial Statements (Continued)
|
| Class A |
|||||||||
|---|---|---|---|---|---|---|---|---|---|
| Six months ended
6/30/00 (Unaudited) |
Year ended
12/31/99 |
Year ended
12/31/98† |
|||||||
| Net asset value, beginning of period | $ 9.98 | $10.31 | $10.25 | ||||||
| Income (Loss) from investment operations: | |||||||||
| Net investment income | 0.31 | *** | 0.50 | *** | 0.52 | *** | |||
| Net realized and unrealized gain (loss) on investments | (0.03 | ) | (0.24 | ) | 0.05 | ||||
| Total income (loss) from investment operations | 0.28 | 0.26 | 0.57 | ||||||
| Less distributions to shareholders: | |||||||||
| From net investment income | - | (0.58 | ) | (0.50 | ) | ||||
| In excess of net investment income | - | (0.00 | )**** | - | |||||
| From net realized gains | - | (0.01 | ) | (0.01 | ) | ||||
| Total distributions | - | (0.59 | ) | (0.51 | ) | ||||
| Net asset value, end of period | $ 10.26 | $ 9.98 | $10.31 | ||||||
| Total Return@ | 2.81% | ** | 2.51% | 5.75% | |||||
| Ratios / Supplemental Data: | |||||||||
| Net assets, end of period (000’s) | $ 1,998 | $ 134 | $ 129 | ||||||
| Net expenses to average daily net assets | 1.02% | * | 1.05% | 1.20% | |||||
| Net investment income to average daily net assets | 6.12% | * | 4.81% | 4.95% | |||||
| Portfolio turnover rate | 37% | ** | 59% | 44% | |||||
| Class L |
|||||||||
| Six months ended
6/30/00 (Unaudited) |
Period ended
12/31/99+ |
||||||||
| Net asset value, beginning of period | $ 9.92 | $10.42 | |||||||
| Income (Loss) from investment operations: | |||||||||
| Net investment income | 0.29 | *** | 0.38 | *** | |||||
| Net realized and unrealized gain (loss) on investments | 0.01 | (0.23 | ) | ||||||
| Total income (loss) from investment operations | 0.30 | 0.15 | |||||||
| Less distributions to shareholders: | |||||||||
| From net investment income | - | (0.64 | ) | ||||||
| In excess of net investment income | - | (0.00 | )**** | ||||||
| From net realized gains | - | (0.01 | ) | ||||||
| Total distributions | - | (0.65 | ) | ||||||
| Net asset value, end of period | $ 10.22 | $ 9.92 | |||||||
| Total Return@ | 3.02% | ** | 1.48% | ** | |||||
| Ratios / Supplemental Data: | |||||||||
| Net assets, end of period (000’s) | $25,985 | $1,524 | |||||||
| Net expenses to average daily net assets | 0.74% | * | 0.75% | * | |||||
| Net investment income to average daily net assets | 5.77% | * | 5.39% | * | |||||
| Portfolio turnover rate | 37% | ** | 59% | ** | |||||
*
|
Annualized
|
**
|
Percentage represents results for the period and are not annualized.
|
***
|
Per share amount calculated on the average shares method.
|
****
|
Distributions in excess of net investment income is less than $0.01 per share.
|
+
|
For the period from May 3, 1999 (commencement of operations) through December 31, 1999.
|
†
|
Amounts have been restated to reflect reverse stock splits.
|
@
|
Employee retirement benefit plans that invest plan assets in the Separate Investment Accounts (SIAs) may be subject to
certain charges as set forth in their respective Plan Documents. Total return figures would be lower for the periods presented if they reflected these charges.
|
| MassMutual Short-Term Bond Fund – Financial Statements (Continued)
|
| Class Y |
||||||||||||||||||
|---|---|---|---|---|---|---|---|---|---|---|---|---|---|---|---|---|---|---|
| Six months ended
6/30/00 (Unaudited) |
Year ended
12/31/99 |
Year ended
12/31/98† |
||||||||||||||||
| Net asset value, beginning of period | $ 9.96 | $ 10.31 | $ 10.24 | |||||||||||||||
| Income (Loss) from investment operations: | ||||||||||||||||||
| Net investment income | 0.29 | *** | 0.57 | *** | 0.57 | *** | ||||||||||||
| Net realized and unrealized gain (loss) on investments | 0.01 | (0.27 | ) | 0.06 | ||||||||||||||
| Total income (loss) from investment operations | 0.30 | 0.30 | 0.63 | |||||||||||||||
| Less distributions to shareholders: | ||||||||||||||||||
| From net investment income | - | (0.64 | ) | (0.55 | ) | |||||||||||||
| In excess of net investment income | - | (0.00 | )**** | - | ||||||||||||||
| From net realized gains | - | (0.01 | ) | (0.01 | ) | |||||||||||||
| Total distributions | - | (0.65 | ) | (0.56 | ) | |||||||||||||
| Net asset value, end of period | $ 10.26 | $ 9.96 | $ 10.31 | |||||||||||||||
| Total Return@ | 3.01% | ** | 3.04% | 6.12% | ||||||||||||||
| Ratios / Supplemental Data: | ||||||||||||||||||
| Net assets, end of period (000’s) | $ 1,844 | $ 1,808 | $ 269 | |||||||||||||||
| Net expenses to average daily net assets | 0.59% | * | 0.61% | 0.74% | ||||||||||||||
| Net investment income to average daily net assets | 5.85% | * | 5.45% | 5.40% | ||||||||||||||
| Portfolio turnover rate | 37% | ** | 59% | 44% | ||||||||||||||
| Class S (1) |
||||||||||||||||||
| Six months ended
6/30/00 (Unaudited) |
Year ended
12/31/99 |
Year ended
12/31/98 |
Year ended
12/31/97 |
Year ended
12/31/96 |
Year ended
12/31/95 |
|||||||||||||
| Net asset value, beginning of period | $ 9.97 | $ 10.30 | $ 10.23 | $ 10.11 | $ 10.15 | $ 9.85 | ||||||||||||
| Income (Loss) from investment operations: | ||||||||||||||||||
| Net investment income | 0.30 | *** | 0.56 | *** | 0.56 | 0.65 | *** | 0.60 | 0.66 | |||||||||
| Net realized and unrealized gain (loss) on investments | - | (0.24 | ) | 0.08 | 0.04 | (0.03 | ) | 0.50 | ||||||||||
| Total income (loss) from investment operations | 0.30 | 0.32 | 0.64 | 0.69 | 0.57 | 1.16 | ||||||||||||
| Less distributions to shareholders: | ||||||||||||||||||
| From net investment income | - | (0.64 | ) | (0.56 | ) | (0.57 | ) | (0.60 | ) | (0.66 | ) | |||||||
| In excess of net investment income | - | (0.00 | )**** | - | - | - | - | |||||||||||
| From net realized gains | - | (0.01 | ) | (0.01 | ) | 0.00 | (0.01 | ) | (0.20 | ) | ||||||||
| Total distributions | - | (0.65 | ) | (0.57 | ) | (0.57 | ) | (0.61 | ) | (0.86 | ) | |||||||
| Net asset value, end of period | $ 10.27 | $ 9.97 | $ 10.30 | $ 10.23 | $ 10.11 | $ 10.15 | ||||||||||||
| Total Return@ | 3.01% | ** | 3.10% | 6.29% | 6.84% | 5.57% | 11.77% | |||||||||||
| Ratios / Supplemental Data: | ||||||||||||||||||
| Net assets, end of period (000’s) | $200,890 | $211,137 | $283,673 | $200,268 | $145,182 | $122,904 | ||||||||||||
| Ratio of expenses to average daily net assets: | ||||||||||||||||||
| Before expense waiver | 0.54% | * | 0.54% | 0.55% | 0.55% | 0.55% | 0.55% | |||||||||||
| After expense waiver # | N/A | N/A | N/A | 0.54% | 0.52% | 0.52% | ||||||||||||
| Net investment income to average daily net assets | 5.91% | * | 5.34% | 5.58% | 6.22% | 6.00% | 6.32% | |||||||||||
| Portfolio turnover rate | 37% | ** | 59% | 44% | 48% | 61% | 114% | |||||||||||
*
|
Annualized
|
**
|
Percentage represents results for the period and are not annualized.
|
***
|
Per share amount calculated on the average shares method.
|
****
|
Distributions in excess of net investment income is less than $0.01 per share.
|
†
|
Amounts have been restated to reflect reverse stock splits.
|
(1)
|
Class S shares were previously designated as Class 4 shares.
|
#
|
Computed after giving effect to the voluntary partial waiver of management fee by MassMutual, which terminated May 1, 1997.
|
@
|
Employee retirement benefit plans that invest plan assets in the Separate Investment Accounts (SIAs) may be subject to
certain charges as set forth in their respective Plan Documents. Total return figures would be lower for the periods presented if they reflected these charges.
|
Ÿ
|
achieve a high total return consistent with prudent investment risk and the preservation of capital
|
Ÿ
|
invest primarily in a diversified portfolio of investment grade, fixed income securities
|
Ÿ
|
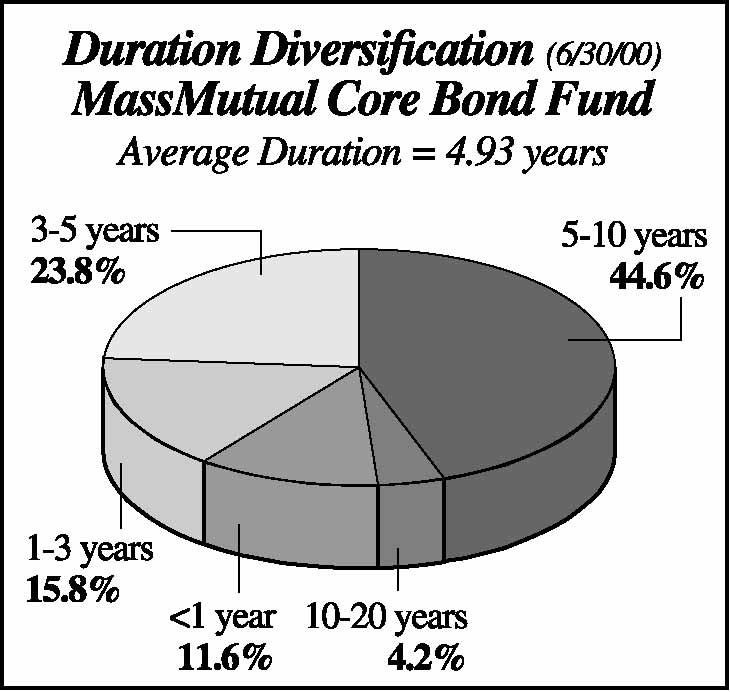
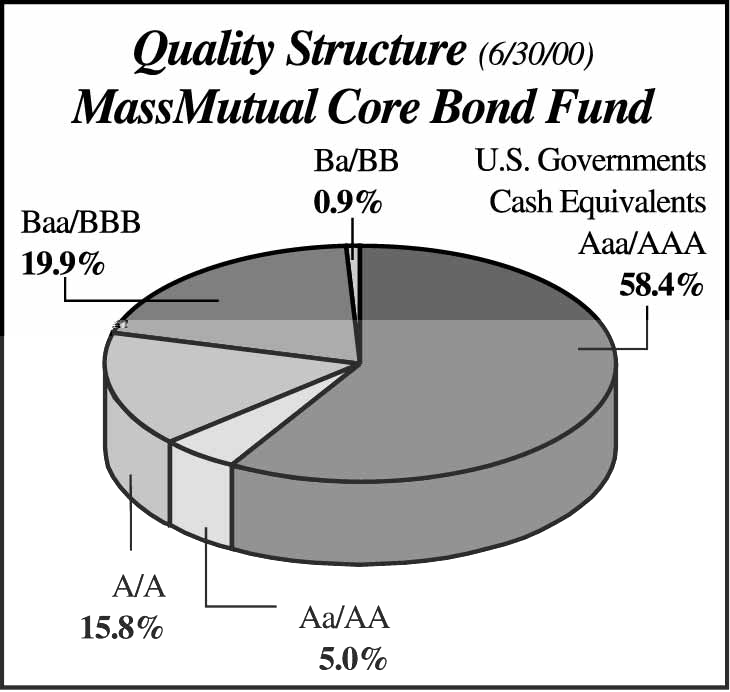
maintain duration within 10% of the duration of the Lehman Brothers Aggregate Bond Index
|
Ÿ
|
diversify investments by industry, sector, maturity, issuer class, and quality sectors to reduce risk of capital erosion
|
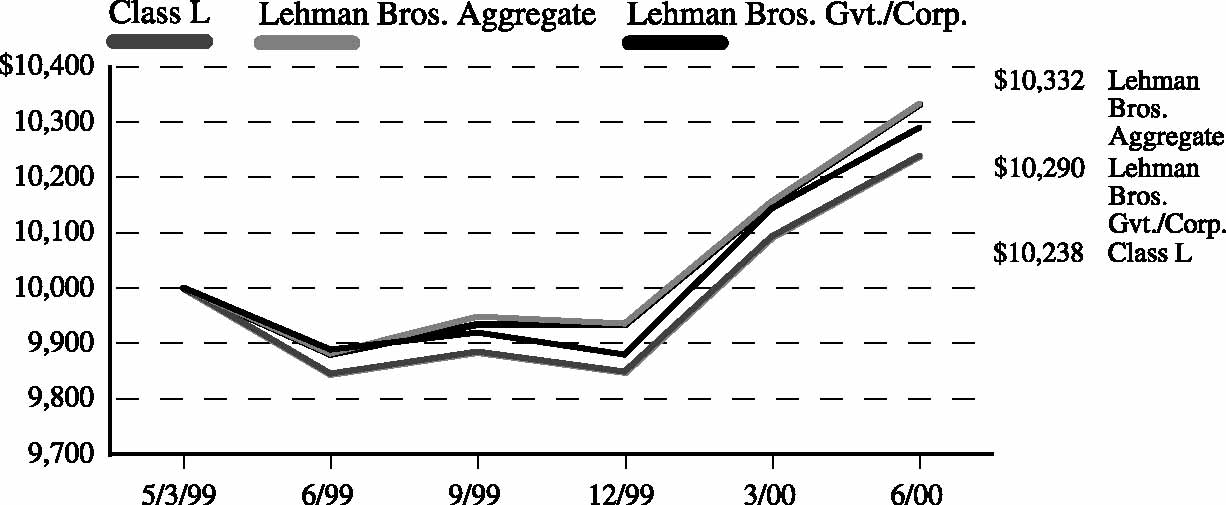
| MassMutual Core Bond Fund – Portfolio Manager Report (Continued)
|
What is your outlook?
 |
 |
| MassMutual Core Bond Fund – Portfolio Manager Report (Continued)
|
| Year-To-Date
1/1/00-6/30/00 |
One Year
7/1/99-6/30/00 |
Five Year
Average Annual 7/1/95-6/30/00 |
Since
Inception Average Annual 10/3/94-6/30/00 |
||||||||
|---|---|---|---|---|---|---|---|---|---|---|---|
| Class S | 4.04 | % | 4.24 | % | 5.83% | 7.17% | |||||
| Lehman Brothers | |||||||||||
| Aggregate Bond
Index |
3.99 | % | 4.56 | % | 6.25% | 7.49% | |||||
| Lehman Brothers | |||||||||||
| Government/
Corporate Bond Index |
4.16 | % | 4.30 | % | 6.09% | 7.40% | |||||
| Year-To-Date
1/1/00-6/30/00 |
One Year
7/1/99 - 6/30/00 |
Since Inception
Average Annual 1/1/98 - 6/30/00 |
||||||||
|---|---|---|---|---|---|---|---|---|---|---|
| Class A | 3.85 | % | 3.86 | % | 3.58 | % | ||||
| Class Y | 4.05 | % | 4.21 | % | 3.96 | % | ||||
| Lehman Brothers | ||||||||||
| Aggregate Bond
Index |
3.99 | % | 4.56 | % | 4.67 | % | ||||
| Lehman Brothers | ||||||||||
| Government/
Corporate Bond Index |
4.16 | % | 4.30 | % | 4.48 | % | ||||
| Year-To-Date
1/1/00-6/30/00 |
One Year
7/1/99-6/30/00 |
Since Inception
Average Annual 5/3/99 - 6/30/00 |
||||||||
|---|---|---|---|---|---|---|---|---|---|---|
| Class L | 3.96 | % | 3.99 | % | 2.04 | % | ||||
| Lehman Brothers | ||||||||||
| Aggregate Bond
Index |
3.99 | % | 4.56 | % | 2.84 | % | ||||
| Lehman Brothers | ||||||||||
| Government/
Corporate Bond Index |
4.16 | % | 4.30 | % | 2.48 | % | ||||
| Principal
Amount |
Market Value |
|||||
|---|---|---|---|---|---|---|
| BONDS & NOTES — 87.7% | ||||||
| ASSET BACKED SECURITIES — 6.1% | ||||||
| California
Infrastructure SCE-1, 1997-1, Class A5 |
||||||
| 6.280% | 09/25/2005 | $ 700,000 | $ 686,014 | |||
| California
Infrastructure SDG&E-1,1997-1, Class A5 |
||||||
| 6.190% | 09/25/2005 | 500,000 | 488,955 | |||
| Case Equipment Loan
Trust 1998-A, Class A4 |
||||||
| 5.830% | 02/15/2005 | 2,986,379 | 2,940,867 | |||
| Caterpillar Financial
Asset Trust, 1997-B, Class A3 |
||||||
| 6.160% | 09/25/2003 | 1,378,164 | 1,373,754 | |||
| Chase Manhattan Auto
Owner Trust 1998-A, Class A4 |
||||||
| 5.800% | 12/16/2002 | 3,750,000 | 3,704,137 | |||
| Chase Manhattan RV
Owner Trust 1997-A, Class A7 |
||||||
| 6.140% | 10/16/2006 | 4,500,000 | 4,457,790 | |||
| Community Program
Loan Trust, 1987-A, Class A4 |
||||||
| 4.500% | 10/01/2018 | 1,297,989 | 1,161,979 | |||
| Metlife Capital
Equipment Loan Trust Series 1997-A, Class A |
||||||
| 6.850% | 05/20/2008 | 2,500,000 | 2,478,650 | |||
| Peco Energy Transition
Trust Series 1999-A, Class A6 |
||||||
| 6.050% | 03/01/2009 | 2,300,000 | 2,147,717 | |||
| Peco Energy Transition
Trust Series 1999-A, Class A7 |
||||||
| 6.130% | 03/01/2009 | 1,200,000 | 1,106,232 | |||
| Premier Auto Trust
Series 1998-4, Class A3 |
||||||
| 5.690% | 06/08/2002 | 3,883,633 | 3,860,952 | |||
| Premier Auto Trust
Series 1998-5, Class A3 |
||||||
| 5.070% | 07/08/2002 | 2,000,000 | 1,974,840 | |||
| Railcar Trust No.
1992-1 |
||||||
| 7.750% | 06/01/2004 | 861,662 | 862,748 | |||
| Principal
Amount |
Market Value |
|||||
|---|---|---|---|---|---|---|
| Rental Car Finance
Corp. Series 1999- 1A, Class A† |
||||||
| 5.900% | 02/25/2007 | $ 2,000,000 | $ 1,909,120 | |||
| Textron Financial
Corporation Series 1998-A, Class A2† |
||||||
| 5.890% | 01/15/2005 | 3,500,000 | 3,440,500 | |||
| Toyota Auto Lease
Trust Series 1998-B, Class A1 |
||||||
| 5.350% | 07/25/2002 | 3,500,000 | 3,481,800 | |||
| Travelers Funding Ltd.
Class A-1† |
||||||
| 6.300% | 02/18/2014 | 3,100,000 | 2,728,000 | |||
| TOTAL ASSET BACKED
SECURITIES (Cost $39,820,636) |
38,804,055 | |||||
| CORPORATE DEBT — 42.5% | ||||||
| AirTouch
Communications, Inc. |
||||||
| 7.500% | 07/15/2006 | 3,000,000 | 2,967,840 | |||
| Alcan Aluminum
Limited |
||||||
| 6.250% | 11/01/2008 | 2,500,000 | 2,314,947 | |||
| America West Airlines,
Inc. 1996-1, Class A |
||||||
| 6.850% | 07/02/2009 | 4,256,313 | 3,961,479 | |||
| American Airlines, Inc.
1994-A Pass Through Trusts, Class A4* |
||||||
| 9.780% | 11/26/2011 | 1,611,145 | 1,684,951 | |||
| American General
Finance Corporation |
||||||
| 5.750% | 11/01/2003 | 2,000,000 | 1,889,900 | |||
| AMR Corporation* | ||||||
| 9.000% | 08/01/2012 | 2,000,000 | 1,967,400 | |||
| Associates Corporation
of North America |
||||||
| 6.750% | 08/01/2001 | 2,000,000 | 1,986,700 | |||
| Associates Corporation
of North America* |
||||||
| 7.875% | 09/30/2001 | 1,500,000 | 1,508,370 | |||
| AT&T—Liberty Media
Group |
||||||
| 8.250% | 02/01/2030 | 5,300,000 | 4,866,794 | |||
| Barrick Gold
Corporation |
||||||
| 7.500% | 05/01/2007 | 4,000,000 | 3,870,360 | |||
| Principal
Amount |
Market Value |
|||||
|---|---|---|---|---|---|---|
| BellSouth Capital
Funding Corporation* |
||||||
| 7.750% | 02/15/2010 | $ 5,000,000 | $ 5,000,200 | |||
| BHP Finance (USA)
Limited |
||||||
| 6.420% | 03/01/2026 | 3,500,000 | 3,384,780 | |||
| Bombardier Capital,
Inc.† |
||||||
| 6.000% | 01/15/2002 | 4,000,000 | 3,905,164 | |||
| Boston Scientific
Corporation |
||||||
| 6.625% | 03/15/2005 | 6,300,000 | 5,729,220 | |||
| Capitol Records, Inc.† | ||||||
| 8.375% | 08/15/2009 | 5,500,000 | 5,632,220 | |||
| Celulosa Arauco y
Constitucion, S.A. |
||||||
| 6.950% | 09/15/2005 | 2,000,000 | 1,890,200 | |||
| Champion
International Corporation |
||||||
| 6.400% | 02/15/2026 | 2,500,000 | 2,320,950 | |||
| The Charles Schwab
Corporation |
||||||
| 6.250% | 01/23/2003 | 2,500,000 | 2,416,473 | |||
| The CIT Group, Inc. | ||||||
| 5.500% | 02/15/2004 | 4,000,000 | 3,687,040 | |||
| The Columbia Gas
System, Inc. |
||||||
| 6.610% | 11/28/2002 | 3,000,000 | 2,915,880 | |||
| Comcast Cable
Communications, Inc. |
||||||
| 8.375% | 05/01/2007 | 2,500,000 | 2,575,725 | |||
| Commercial Credit
Company* |
||||||
| 7.750% | 03/01/2005 | 3,000,000 | 3,024,750 | |||
| ConAgra, Inc. | ||||||
| 7.000% | 10/01/2028 | 3,000,000 | 2,399,580 | |||
| Continental Airlines,
Inc., Series 1996-2B |
||||||
| 8.560% | 07/02/2014 | 1,584,230 | 1,619,443 | |||
| Continental Airlines,
Inc., Series 1996-B |
||||||
| 7.820% | 04/15/2015 | 1,774,438 | 1,745,495 | |||
| Crown Cork & Seal
Company, Inc. |
||||||
| 6.750% | 12/15/2003 | 3,550,000 | 3,333,343 | |||
| Crown Cork & Seal
Company, Inc. |
||||||
| 7.125% | 09/01/2002 | 3,300,000 | 3,150,870 | |||
| CSX Corporation | ||||||
| 7.050% | 05/01/2002 | 3,000,000 | 2,951,010 | |||
| CSX Corporation | ||||||
| 7.250% | 05/01/2027 | 4,000,000 | 3,777,400 | |||
| MassMutual Core Bond Fund – Portfolio of Investments (Continued)
|
| Principal
Amount |
Market Value |
|||||
|---|---|---|---|---|---|---|
| Donnelley (R.R.) &
Sons Co. |
||||||
| 6.625% | 04/15/2029 | $ 3,750,000 | $ 3,117,450 | |||
| Dover Corporation | ||||||
| 6.250% | 06/01/2008 | 2,000,000 | 1,762,960 | |||
| Duke Capital Corp. | ||||||
| 7.500% | 10/01/2009 | 3,850,000 | 3,792,866 | |||
| Emerald Investment
Grade CBO, Ltd.† |
||||||
| 7.553% | 05/24/2011 | 3,000,000 | 3,000,000 | |||
| ERAC USA Finance
Company† |
||||||
| 6.750% | 05/15/2007 | 3,000,000 | 2,786,580 | |||
| FBG Finance Limited† | ||||||
| 7.875% | 06/01/2016 | 3,000,000 | 3,093,660 | |||
| Fletcher Challenge
Capital Canada, Inc. |
||||||
| 6.750% | 03/24/2005 | 2,000,000 | 1,843,320 | |||
| Fletcher Challenge
Capital Canada, Inc. |
||||||
| 7.750% | 06/20/2006 | 2,500,000 | 2,412,375 | |||
| Ford Motor Credit
Corporation |
||||||
| 7.375% | 10/28/2009 | 3,000,000 | 2,901,810 | |||
| General American
Transportation Corporation |
||||||
| 6.750% | 03/01/2006 | 3,000,000 | 2,816,370 | |||
| General Electric
Capital Corporation |
||||||
| 8.750% | 05/21/2007 | 1,500,000 | 1,627,290 | |||
| General Electric
Capital Corporation Series MTNA |
||||||
| 5.500% | 04/15/2002 | 5,600,000 | 5,445,048 | |||
| General Mills, Inc. | ||||||
| 8.900% | 06/15/2006 | 2,250,000 | 2,445,795 | |||
| The Goldman Sachs
Group, L.P.† |
||||||
| 6.200% | 02/15/2001 | 2,500,000 | 2,481,975 | |||
| Goodyear Tire &
Rubber Company |
||||||
| 8.500% | 03/15/2007 | 3,535,000 | 3,626,627 | |||
| Halliburton Company | ||||||
| 5.625% | 12/01/2008 | 2,750,000 | 2,464,162 | |||
| Heller Financial, Inc. | ||||||
| 6.250% | 03/01/2001 | 2,500,000 | 2,476,675 | |||
| Heller Financial, Inc. | ||||||
| 7.375% | 11/01/2009 | 2,500,000 | 2,358,650 | |||
| Hershey Foods
Corporation* |
||||||
| 7.200% | 08/15/2027 | 5,000,000 | 4,770,000 | |||
| Household Finance
Corporation |
||||||
| 6.500% | 11/15/2008 | 2,400,000 | 2,183,520 | |||
| ICI Wilmington, Inc. | ||||||
| 7.050% | 09/15/2007 | 2,000,000 | 1,868,880 | |||
| IMC Global, Inc. | ||||||
| 6.625% | 10/15/2001 | 3,000,000 | 2,940,210 | |||
| IMCERA Group, Inc.* | ||||||
| 6.000% | 10/15/2003 | 1,000,000 | 936,230 | |||
| Principal
Amount |
Market Value |
|||||
|---|---|---|---|---|---|---|
| Interpool, Inc. | ||||||
| 7.350% | 08/01/2007 | $ 2,000,000 | $ 1,630,104 | |||
| The Kroger Co. | ||||||
| 7.000% | 05/01/2018 | 1,800,000 | 1,561,212 | |||
| Lafarge Corporation | ||||||
| 6.375% | 07/15/2005 | 2,000,000 | 1,809,320 | |||
| LASMO (USA), Inc. | ||||||
| 6.750% | 12/15/2007 | 5,000,000 | 4,647,070 | |||
| Leucadia National
Corporation |
||||||
| 7.750% | 08/15/2013 | 2,500,000 | 2,445,425 | |||
| Marsh & McLennan
Companies, Inc. |
||||||
| 7.125% | 06/15/2009 | 2,000,000 | 1,915,774 | |||
| Meritor Automotive,
Inc. |
||||||
| 6.800% | 02/15/2009 | 4,000,000 | 3,442,400 | |||
| Midway Airlines Corp.
Pass Through Certificates Class B† |
||||||
| 8.140% | 01/02/2013 | 2,686,300 | 2,401,150 | |||
| Millipore Corporation | ||||||
| 7.500% | 04/01/2007 | 3,750,000 | 3,556,125 | |||
| Mobil Corporation* | ||||||
| 8.625% | 08/15/2021 | 4,500,000 | 4,954,320 | |||
| Morgan Stanley Dean
Witter & Co. |
||||||
| 5.625% | 01/20/2004 | 5,500,000 | 5,186,610 | |||
| Newmont Mining
Corporation* |
||||||
| 8.625% | 04/01/2002 | 2,000,000 | 1,999,220 | |||
| News America
Holdings, Inc. |
||||||
| 9.250% | 02/01/2013 | 3,000,000 | 3,241,830 | |||
| Norfolk Southern
Corporation* |
||||||
| 7.050% | 05/01/2037 | 5,000,000 | 4,886,800 | |||
| Norsk Hydro ASA† | ||||||
| 8.750% | 10/23/2001 | 500,000 | 505,254 | |||
| North Finance
(Bermuda) Limited† |
||||||
| 7.000% | 09/15/2005 | 2,000,000 | 1,945,100 | |||
| Pepsi Bottling
Holdings, Inc.*† |
||||||
| 5.625% | 02/17/2009 | 2,000,000 | 1,758,554 | |||
| Raytheon Company | ||||||
| 6.550% | 03/15/2010 | 1,750,000 | 1,567,265 | |||
| Raytheon Company | ||||||
| 6.750% | 08/15/2007 | 2,500,000 | 2,348,825 | |||
| Republic Services, Inc. | ||||||
| 7.125% | 05/15/2009 | 3,750,000 | 3,362,770 | |||
| Ryder System, Inc. | ||||||
| 6.600% | 11/15/2005 | 3,800,000 | 3,551,708 | |||
| Scholastic Corporation | ||||||
| 7.000% | 12/15/2003 | 3,000,000 | 2,923,590 | |||
| Sears Roebuck
Acceptance Corp. |
||||||
| 6.750% | 09/15/2005 | 3,500,000 | 3,336,935 | |||
| Principal
Amount |
Market Value |
|||||
|---|---|---|---|---|---|---|
| Sprint Capital
Corporation |
||||||
| 6.125% | 11/15/2008 | $ 2,000,000 | $ 1,782,740 | |||
| Sprint Capital
Corporation |
||||||
| 6.900% | 05/01/2019 | 2,000,000 | 1,778,320 | |||
| SuperValu, Inc. | ||||||
| 7.875% | 08/01/2009 | 7,000,000 | 6,875,176 | |||
| Texaco, Inc. | ||||||
| 5.500% | 01/15/2009 | 5,000,000 | 4,417,880 | |||
| Texaco, Inc. | ||||||
| 8.500% | 02/15/2003 | 2,500,000 | 2,557,800 | |||
| Thomas & Betts
Corporation* |
||||||
| 8.250% | 01/15/2004 | 2,500,000 | 2,508,625 | |||
| Time Warner, Inc. Pass-
Thru Asset Trust 1997-1† |
||||||
| 6.100% | 12/30/2001 | 4,000,000 | 3,923,640 | |||
| Times Mirror Co. | ||||||
| 7.450% | 10/15/2009 | 3,600,000 | 3,511,043 | |||
| TRW, Inc. | ||||||
| 8.750% | 05/15/2006 | 6,000,000 | 6,112,308 | |||
| TTX Company† | ||||||
| 6.290% | 05/15/2002 | 5,000,000 | 4,892,410 | |||
| Union Tank Car Co. | ||||||
| 6.790% | 05/01/2010 | 4,800,000 | 4,395,016 | |||
| United Air Lines, Inc. | ||||||
| 10.110% | 02/19/2006 | 659,119 | 671,958 | |||
| US Air, Inc., Class B | ||||||
| 7.500% | 10/15/2009 | 1,353,620 | 1,239,916 | |||
| US West Capital
Funding, Inc. |
||||||
| 6.125% | 07/15/2002 | 2,000,000 | 1,942,800 | |||
| Valero Energy
Corporation |
||||||
| 7.375% | 03/15/2006 | 2,000,000 | 1,930,896 | |||
| Vulcan Materials
Company |
||||||
| 6.000% | 04/01/2009 | 3,000,000 | 2,678,327 | |||
| WPP Finance (USA)
Corporation |
||||||
| 6.625% | 07/15/2005 | 2,250,000 | 2,134,186 | |||
| TOTAL CORPORATE DEBT
(Cost $280,799,328) |
269,961,339 | |||||
| NON-U.S. GOVERNMENT AGENCY | ||||||
| OBLIGATIONS — 3.3% | ||||||
| Collateralized Mortgage Obligations | ||||||
| Asset Securitization
Corporation Series 1995-MD4, Class A1 |
||||||
| 7.100% | 08/13/2029 | 6,171,526 | 6,104,318 | |||
| CS First Boston
Mortgage Securities Corp. Series 1998-C2, Class A1 |
||||||
| 5.960% | 12/15/2007 | 2,724,376 | 2,581,603 | |||
| MassMutual Core Bond Fund – Portfolio of Investments (Continued)
|
| Principal
Amount |
Market Value |
|||||
|---|---|---|---|---|---|---|
| Merrill Lynch Mortgage
Investors, Inc., Series 1997- Cl-CTL, A-1 |
||||||
| 6.310% | 11/15/2026 | $ 3,679,577 | $ 3,494,733 | |||
| Prudential Home
Mortgage Securities 1993-26 Class A6 |
||||||
| 6.750% | 07/25/2008 | 3,100,658 | 3,083,201 | |||
| Salomon Brothers
Mortgage Securities 1997-TZH, Class B† |
||||||
| 7.491% | 03/25/2022 | 3,000,000 | 2,949,390 | |||
| Starwood Commercial
Mortgage Trust Series 1999-C1A, Class B† |
||||||
| 6.920% | 02/05/2009 | 3,000,000 | 2,722,500 | |||
| TOTAL NON-U.S. GOVERNMENT
AGENCY OBLIGATIONS (Cost $22,129,794) |
20,935,745 | |||||
| U.S. GOVERNMENT AGENCY
OBLIGATIONS — 10.6% |
||||||
| Federal Home Loan Mortgage
Corporation (FHLMC) — 2.2% |
||||||
| Collateralized Mortgage Obligations — 1.5% | ||||||
| FHLMC Series 1322
Class G |
||||||
| 7.500% | 02/15/2007 | 823,253 | 826,596 | |||
| FHLMC Series 1337
Class D |
||||||
| 6.000% | 08/15/2007 | 1,000,000 | 962,810 | |||
| FHLMC Series 1460
Class H |
||||||
| 7.000% | 05/15/2007 | 2,000,000 | 1,988,740 | |||
| FHLMC Series 1490
Class PJ |
||||||
| 6.000% | 05/15/2007 | 600,000 | 595,872 | |||
| FHLMC Series 1667,
Class PE |
||||||
| 4.000% | 03/15/2008 | 5,000,000 | 4,931,250 | |||
| FHLMC Series B Class 3 | ||||||
| 12.500% | 09/30/2013 | 65,399 | 69,830 | |||
| 9,375,098 | ||||||
| Pass-Through Securities — 0.7% | ||||||
| FHLMC | ||||||
| 6.420% | 12/01/2005 | 4,738,473 | 4,563,149 | |||
| FHLMC | ||||||
| 9.000% | 03/01/2017 | 140,067 | 144,473 | |||
| 4,707,622 | ||||||
| 14,082,720 | ||||||
| Principal
Amount |
Market Value |
|||||
|---|---|---|---|---|---|---|
| Federal National Mortgage
Association (FNMA) — 6.1% |
||||||
| Collateralized Mortgage Obligations — 2.5% | ||||||
| FNMA Series 1989-20
Class A |
||||||
| 6.750% | 04/25/2018 | $ 3,769,031 | $ 3,674,126 | |||
| FNMA Series 1993-134
Class GA |
||||||
| 6.500% | 02/25/2007 | 5,000,000 | 4,946,850 | |||
| FNMA Series 1993-221
Class D |
||||||
| 6.000% | 12/25/2008 | 2,500,000 | 2,412,500 | |||
| FNMA Series 1994-43
Class PE |
||||||
| 6.000% | 12/25/2019 | 187,941 | 186,648 | |||
| FNMA Series 1996-54
Class C |
||||||
| 6.000% | 09/25/2008 | 5,000,000 | 4,790,600 | |||
| 16,010,724 | ||||||
| Pass-Through Securities — 3.6% | ||||||
| FNMA | ||||||
| 6.000% | 10/01/2028-
02/01/2029 |
12,037,462 | 11,018,011 | |||
| FNMA | ||||||
| 6.500% | 11/01/2028 | 12,752,331 | 12,035,012 | |||
| FNMA | ||||||
| 8.000% | 05/01/2013 | 119,872 | 119,496 | |||
| 23,172,519 | ||||||
| 39,183,243 | ||||||
| Government National Mortgage Association | ||||||
| (GNMA) — 2.3% | ||||||
| Pass-Through Securities | ||||||
| GNMA | ||||||
| 7.000% | 08/15/2023-
11/15/2023 |
3,241,377 | 3,162,352 | |||
| GNMA | ||||||
| 7.500% | 01/15/2017-
06/15/2017 |
4,306,907 | 4,305,529 | |||
| GNMA | ||||||
| 8.000% | 04/15/2001-
01/15/2009 |
6,680,837 | 6,801,720 | |||
| GNMA | ||||||
| 9.000% | 12/15/2004-
10/15/2009 |
126,364 | 130,173 | |||
| GNMA | ||||||
| 11.000% | 08/15/2000-
12/15/2000 |
1,643 | 1,654 | |||
| 14,401,428 | ||||||
| TOTAL U.S. GOVERNMENT
AGENCY OBLIGATIONS (Cost $69,416,406) |
67,667,391 | |||||
| Principal
Amount |
Market Value |
|||||
|---|---|---|---|---|---|---|
| U.S. TREASURY OBLIGATIONS — 25.2% | ||||||
| U.S. Treasury Bonds — 7.1% | ||||||
| U.S. Treasury Bond | ||||||
| 7.500% | 11/15/2016 | $ 15,545,000 | $ 17,556,057 | |||
| U.S. Treasury Bond | ||||||
| 8.875% | 08/15/2017 | 21,800,000 | 27,788,242 | |||
| 45,344,299 | ||||||
| U.S. Treasury Notes — 15.6% | ||||||
| U.S. Treasury Note | ||||||
| 5.500% | 05/15/2009 | 30,065,000 | 28,768,297 | |||
| U.S. Treasury Note | ||||||
| 5.750% | 08/15/2003 | 7,600,000 | 7,470,572 | |||
| U.S. Treasury Note | ||||||
| 6.500% | 10/15/2006 | 52,175,000 | 52,802,665 | |||
| U.S. Treasury Note | ||||||
| 6.875% | 05/15/2006 | 2,000,000 | 2,058,440 | |||
| U.S. Treasury Note | ||||||
| 7.500% | 02/15/2005 | 7,400,000 | 7,756,088 | |||
| 98,856,062 | ||||||
| U.S. Treasury Strip — 2.5% | ||||||
| U.S. Treasury Strip —
Principal Only |
||||||
| 0.000% | 05/15/2016 | 43,000,000 | 16,182,620 | |||
| TOTAL U.S. TREASURY
OBLIGATIONS (Cost $159,386,814) |
160,382,981 | |||||
| TOTAL BONDS & NOTES
(Cost $571,552,978) |
557,751,511 | |||||
| SHORT-TERM INVESTMENTS — 23.2% | ||||||
| Cash Equivalents — 12.3% | ||||||
| Bank of America Bank Note** | ||||||
| 6.670% | 03/22/2001 | 1,671,724 | 1,671,724 | |||
| Bank of Montreal Bank Note** | ||||||
| 6.630% | 08/16/2000 | 2,669,390 | 2,669,390 | |||
| Bank of Nova Scotia
Eurodollar Time Deposit** |
||||||
| 7.000% | 07/03/2000 | 3,343,450 | 3,343,450 | |||
| Credit Agricole Bank
Eurodollar Time Deposit** |
||||||
| 6.750% | 07/06/2000 | 11,144,834 | 11,144,834 | |||
| Credit Agricole Bank
Eurodollar Time Deposit** |
||||||
| 6.750% | 07/07/2000 | 1,671,722 | 1,671,722 | |||
| Den Danske Bank
Eurodollar Time Deposit** |
||||||
| 6.810% | 07/05/2000 | 3,529,659 | 3,529,659 | |||
| First Union Bank Note** | ||||||
| 6.900% | 05/09/2001 | 1,671,728 | 1,671,728 | |||
| MassMutual Core Bond Fund – Portfolio of Investments (Continued)
|
| Principal
Amount |
Market Value |
|||||
|---|---|---|---|---|---|---|
| Fleet National Bank
Eurodollar Time Deposit** |
||||||
| 7.260% | 10/31/2000 | $ 712,944 | $ 712,944 | |||
| HypoVereinsbank
Eurodollar Time Deposit** |
||||||
| 6.750% | 07/05/2000 | 5,431,043 | 5,431,043 | |||
| Merrimac Money
Market Fund** |
||||||
| 6.440% | 07/03/2000 | 9,497,391 | 9,497,391 | |||
| MetLife Insurance Company
Funding Agreement** |
||||||
| 6.690% | 08/01/2000 | 15,000,000 | 15,000,000 | |||
| Morgan Stanley Dean
Witter & Co.** |
||||||
| 6.890% | 07/17/2000 | 16,123,867 | 16,123,867 | |||
| Morgan Stanley Dean
Witter & Co.** |
||||||
| 6.910% | 11/22/2000 | 874,348 | 874,348 | |||
| Paribas Bank
Eurodollar Time Deposit** |
||||||
| 6.750% | 07/05/2000 | 4,686,900 | 4,686,900 | |||
| 78,029,000 | ||||||
| Commercial Paper — 10.9% | ||||||
| Appalachian Power Company | ||||||
| 6.970% | 07/18/2000 | 4,255,000 | 4,240,995 | |||
| Comdisco, Inc. | ||||||
| 6.780% | 07/10/2000 | 4,120,000 | 4,113,017 | |||
| ConAgra, Inc. | ||||||
| 6.800% | 07/13/2000 | 4,845,000 | 4,834,018 | |||
| Crown Cork & Seal
Company, Inc. |
||||||
| 6.820% | 07/21/2000 | 5,990,000 | 5,967,305 | |||
| Dana Credit
Corporation |
||||||
| 6.750% | 07/05/2000 | 5,945,000 | 5,940,541 | |||
| Eastman Chemical
Company |
||||||
| 6.750% | 07/06/2000 | 5,060,000 | 5,055,256 | |||
| Federated Department
Stores |
||||||
| 6.750% | 07/07/2000 | 5,900,000 | 5,893,362 | |||
| Houston Industries
Finance Co. L.P. |
||||||
| 6.920% | 07/12/2000 | 5,000,000 | 4,989,428 | |||
| IMC Global, Inc. | ||||||
| 6.780% | 07/06/2000 | 5,915,000 | 5,909,430 | |||
| Pentair, Inc. | ||||||
| 6.960% | 07/19/2000 | 5,000,000 | 4,982,600 | |||
| Solutia, Inc. | ||||||
| 6.800% | 07/14/2000 | 4,775,000 | 4,763,275 | |||
| Union Carbide
Corporation |
||||||
| 6.830% | 07/28/2000 | 7,050,000 | 7,013,886 | |||
| Principal
Amount |
Market Value |
|||||
|---|---|---|---|---|---|---|
| US West Capital
Funding Corporation |
||||||
| 6.950% | 07/17/2000 | $ 5,455,000 | $ 5,438,150 | |||
| 69,141,263 | ||||||
| TOTAL SHORT-TERM
INVESTMENTS (At Amortized Cost) |
147,170,263 | |||||
| TOTAL INVESTMENTS — 110.9%
(Cost $718,723,241) *** |
704,921,774 | |||||
| Other Assets/
(Liabilities) — (10.9%) |
(69,141,007) | |||||
| NET ASSETS — 100.0% | $ 635,780,767 | |||||
*
|
All or a portion of this security is segregated to cover forward purchase commitments. (Note 2).
|
**
|
Represents investment of security lending collateral. (Note 2).
|
***
|
Aggregate cost for Federal tax purposes. (Note 7).
|
†
|
Securities exempt from registration under rule 144A of the Securities Act of 1933. These securities may be resold in transactions
exempt from registration, normally to qualified institutional buyers.
|
| MassMutual Core Bond Fund – Financial Statements (Continued)
|
| Six months ended
June 30, 2000 (Unaudited) |
|||
|---|---|---|---|
| Investment income: (Note 2) | |||
| Interest (including securities lending income of $83,723) | $21,312,230 | ||
| Expenses: (Note 2) | |||
| Investment management fees (Note 3) | 1,461,308 | ||
| Custody fees | 32,478 | ||
| Audit and legal fees | 10,768 | ||
| Directors’ fees (Note 3) | 4,828 | ||
| 1,509,382 | |||
| Administration fees (Note 3): | |||
| Class A | 2,032 | ||
| Class L | 20,184 | ||
| Class Y | 13,822 | ||
| Class S | 267,680 | ||
| Service fees (Note 3): | |||
| Class A | 1,732 | ||
| Total expenses | 1,814,832 | ||
| Net investment income | 19,497,398 | ||
| Realized and unrealized gain (loss): | |||
| Net realized loss on investment transactions and forward commitments | (3,924,204 | ) | |
| Net change in unrealized appreciation (depreciation) on investments and forward commitments | 8,766,885 | ||
| Net realized and unrealized gain | 4,842,681 | ||
| Net increase in net assets resulting from operations | $24,340,079 | ||
| MassMutual Core Bond Fund – Financial Statements (Continued)
|
| Six months ended
June 30, 2000 (Unaudited) |
Year ended
December 31, 1999 |
|||||
|---|---|---|---|---|---|---|
| Increase (Decrease) in Net Assets: | ||||||
| Operations: | ||||||
| Net investment income | $ 19,497,398 | $ 38,476,527 | ||||
| Net realized loss on investment transactions and forward commitments | (3,924,204 | ) | (7,813,872 | ) | ||
| Net change in unrealized appreciation
(depreciation) on investments and
forward commitments |
8,766,885 | (43,678,928 | ) | |||
| Net increase (decrease) in net assets resulting from operations | 24,340,079 | (13,016,273 | ) | |||
| Distributions to shareholders (Note 2): | ||||||
| From net investment income: | ||||||
| Class A | - | (35,668 | ) | |||
| Class L | - | (145,284 | )* | |||
| Class Y | - | (1,199,642 | ) | |||
| Class S | - | (36,453,705 | ) | |||
| Total distributions from net investment income | - | (37,834,299 | ) | |||
| In excess of net investment income: | ||||||
| Class A | - | (107 | ) | |||
| Class L | - | (145 | )* | |||
| Class Y | - | (2,717 | ) | |||
| Class S | - | (490,472 | ) | |||
| Total distributions in excess of net investment income | - | (493,441 | ) | |||
| From net realized gains: | ||||||
| Class A | - | (52 | ) | |||
| Class L | - | (69 | )* | |||
| Class Y | - | (1,298 | ) | |||
| Class S | - | (234,456 | ) | |||
| Total distributions from net realized gains | - | (235,875 | ) | |||
| Net fund share transactions (Note 5): | ||||||
| Class A | 2,849,557 | 472,018 | ||||
| Class L | 28,454,902 | 2,505,877 | * | |||
| Class Y | 792,313 | 20,271,088 | ||||
| Class S | (37,066,242 | ) | (65,259,795 | ) | ||
| Decrease in net assets from net fund share transactions | (4,969,470 | ) | (42,010,812 | ) | ||
| Total increase (decrease) in net assets | 19,370,609 | (93,590,700 | ) | |||
| Net assets: | ||||||
| Beginning of period | 616,410,158 | 710,000,858 | ||||
| End of period (including undistributed net
investment income of $20,101,923
and $604,525, respectively) |
$635,780,767 | $616,410,158 | ||||
| * For the period from May 3, 1999 (commencement of operations) through December 31, 1999.
|
| MassMutual Core Bond Fund – Financial Statements (Continued)
|
| Class A |
|||||||||
|---|---|---|---|---|---|---|---|---|---|
| Six months ended
6/30/00 (Unaudited) |
Year ended
12/31/99 |
Year ended
12/31/98† |
|||||||
| Net asset value, beginning of period | $ 10.12 | $ 11.06 | $10.85 | ||||||
| Income (Loss) from investment operations: | |||||||||
| Net investment income | 0.31 | *** | 0.62 | *** | 0.59 | *** | |||
| Net realized and unrealized gain (loss) on investments | 0.08 | (0.89 | ) | 0.25 | |||||
| Total income (loss) from investment operations | 0.39 | (0.27 | ) | 0.84 | |||||
| Less distributions to shareholders: | |||||||||
| From net investment income | - | (0.66 | ) | (0.52 | ) | ||||
| From net realized gains | - | (0.01 | ) | (0.11 | ) | ||||
| In excess of net realized gains | - | (0.00 | )**** | - | |||||
| Total distributions | - | (0.67 | ) | (0.63 | ) | ||||
| Net asset value, end of period | $ 10.51 | $ 10.12 | $11.06 | ||||||
| Total Return@ | 3.85% | ** | (2.43)% | 7.75% | |||||
| Ratios / Supplemental Data: | |||||||||
| Net assets, end of period (000’s) | $ 3,486 | $ 576 | $ 141 | ||||||
| Net expenses to average daily net assets | 1.05% | * | 1.07% | 1.20% | |||||
| Net investment income to average daily net assets | 6.10% | * | 5.70% | 5.26% | |||||
| Portfolio turnover rate | 14% | ** | 61% | 51% | |||||
| Class L |
|||||||||
| Six months ended
6/30/00 (Unaudited) |
Period ended
12/31/99+ |
||||||||
| Net asset value, beginning of period | $ 10.11 | $ 10.97 | |||||||
| Income (Loss) from investment operations: | |||||||||
| Net investment income | 0.32 | *** | 0.44 | *** | |||||
| Net realized and unrealized gain (loss) on investments | 0.08 | (0.61 | ) | ||||||
| Total income (loss) from investment operations | 0.40 | (0.17 | ) | ||||||
| Less distributions to shareholders: | |||||||||
| From net investment income | - | (0.68 | ) | ||||||
| From net realized gains | - | (0.01 | ) | ||||||
| In excess of net realized gains | - | (0.00 | )**** | ||||||
| Total distributions | - | (0.69 | ) | ||||||
| Net asset value, end of period | $ 10.51 | $ 10.11 | |||||||
| Total Return@ | 3.96% | ** | (1.52)% | ** | |||||
| Ratios / Supplemental Data: | |||||||||
| Net assets, end of period (000’s) | $31,692 | $ 2,361 | |||||||
| Net expenses to average daily net assets | 0.79% | * | 0.80% | * | |||||
| Net investment income to average daily net assets | 6.28% | * | 6.11% | * | |||||
| Portfolio turnover rate | 14% | ** | 61% | ** | |||||
*
|
Annualized
|
**
|
Percentage represents results for the period and are not annualized.
|
***
|
Per share amount calculated on the average shares method.
|
****
|
Distributions in excess of net realized gains is less than $0.01 per share.
|
+
|
For the period from May 3, 1999 (commencement of operations) through December 31, 1999.
|
†
|
Amounts have been restated to reflect reverse stock splits.
|
@
|
Employee retirement benefit plans that invest plan assets in the Separate Investment Accounts (SIAs) may be subject to certain
charges as set forth in their respective Plan Documents. Total return figures would be lower for the periods presented if they reflected these charges.
|
| MassMutual Core Bond Fund – Financial Statements (Continued)
|
| Class Y |
||||||||||||||||||
|---|---|---|---|---|---|---|---|---|---|---|---|---|---|---|---|---|---|---|
| Six months ended
6/30/00 (Unaudited) |
Year ended
12/31/99 |
Year ended
12/31/98† |
||||||||||||||||
| Net asset value, beginning of period | $ 10.12 | $ 11.06 | $ 10.86 | |||||||||||||||
| Income (Loss) from investment operations: | ||||||||||||||||||
| Net investment income | 0.32 | *** | 0.68 | 0.65 | *** | |||||||||||||
| Net realized and unrealized gain (loss) on investments | 0.09 | (0.92 | ) | 0.25 | ||||||||||||||
| Total income (loss) from investment operations | 0.41 | (0.24 | ) | 0.90 | ||||||||||||||
| Less distributions to shareholders: | ||||||||||||||||||
| From net investment income | - | (0.69 | ) | (0.59 | ) | |||||||||||||
| From net realized gains | - | (0.01 | ) | (0.11 | ) | |||||||||||||
| In excess of net realized gains | - | (0.00 | )**** | - | ||||||||||||||
| Total distributions | - | (0.70 | ) | (0.70 | ) | |||||||||||||
| Net asset value, end of period | $ 10.53 | $ 10.12 | $ 11.06 | |||||||||||||||
| Total Return@ | 4.05% | ** | (2.16)% | 8.25% | ||||||||||||||
| Ratios / Supplemental Data: | ||||||||||||||||||
| Net assets, end of period (000’s) | $ 21,022 | $ 19,471 | $ 400 | |||||||||||||||
| Net expenses to average daily net assets | 0.64% | * | 0.65% | 0.74% | ||||||||||||||
| Net investment income to average daily net assets | 6.36% | * | 6.29% | 5.73% | ||||||||||||||
| Portfolio turnover rate | 14% | ** | 61% | 51% | ||||||||||||||
| Class S (1) |
||||||||||||||||||
| Six months ended
6/30/00 (Unaudited) |
Year ended
12/31/99 |
Year ended
12/31/98 |
Year ended
12/31/97 |
Year ended
12/31/96 |
Year ended
12/31/95 |
|||||||||||||
| Net asset value, beginning of period | $ 10.14 | $ 11.06 | $ 10.81 | $ 10.45 | $ 10.75 | $ 9.84 | ||||||||||||
| Income (Loss) from investment operations: | ||||||||||||||||||
| Net investment income | 0.33 | *** | 0.66 | *** | 0.67 | *** | 0.69 | *** | 0.67 | *** | 0.72 | *** | ||||||
| Net realized and unrealized gain (loss) on investments | 0.08 | (0.89 | ) | 0.24 | 0.33 | (0.37 | ) | 1.17 | ||||||||||
| Total income (loss) from investment operations | 0.41 | (0.23 | ) | 0.91 | 1.02 | 0.30 | 1.89 | |||||||||||
| Less distributions to shareholders: | ||||||||||||||||||
| From net investment income | - | (0.68 | ) | (0.56 | ) | (0.64 | ) | (0.54 | ) | (0.65 | ) | |||||||
| From net realized gains | - | (0.01 | ) | (0.10 | ) | (0.02 | ) | (0.06 | ) | (0.33 | ) | |||||||
| In excess of net realized gains | - | (0.00 | )**** | - | - | - | - | |||||||||||
| Total distributions | - | (0.69 | ) | (0.66 | ) | (0.66 | ) | (0.60 | ) | (0.98 | ) | |||||||
| Net asset value, end of period | $ 10.55 | $ 10.14 | $ 11.06 | $ 10.81 | $ 10.45 | $ 10.75 | ||||||||||||
| Total Return@ | 4.04% | ** | (2.08)% | 8.44% | 9.78% | 2.80% | 19.15% | |||||||||||
| Ratios / Supplemental Data: | ||||||||||||||||||
| Net assets, end of period (000’s) | $579,581 | $594,002 | $709,459 | $455,931 | $356,699 | $253,540 | ||||||||||||
| Ratio of expenses to average daily net assets: | ||||||||||||||||||
| Before expense waiver | 0.59% | * | 0.57% | 0.55% | 0.55% | 0.56% | 0.56% | |||||||||||
| After expense waiver # | N/A | N/A | N/A | 0.54% | 0.51% | 0.51% | ||||||||||||
| Net investment income to average daily net assets | 6.41% | * | 6.07% | 5.92% | 6.34% | 6.26% | 6.56% | |||||||||||
| Portfolio turnover rate | 14% | ** | 61% | 51% | 54% | 54% | 104% | |||||||||||
*
|
Annualized
|
**
|
Percentage represents results for the period and are not annualized.
|
***
|
Per share amount calculated on the average shares method.
|
****
|
Distributions in excess of net realized gains is less than $0.01 per share.
|
†
|
Amounts have been restated to reflect reverse stock splits.
|
(1)
|
Class S shares were previously designated as Class 4 shares.
|
#
|
Computed after giving effect to the voluntary partial waiver of management fee by MassMutual, which terminated May 1, 1997.
|
@
|
Employee retirement benefit plans that invest plan assets in the Separate Investment Accounts (SIAs) may be subject to
certain charges as set forth in their respective Plan Documents. Total return figures would be lower for the periods presented if they reflected these charges.
|
Ÿ
|
achieve a high total return consistent with prudent investment risk and the preservation of capital
|
Ÿ
|
invest in a diversified portfolio of fixed income securities across the credit quality spectrum, including investment grade and
high-yield issues
|
Ÿ
|
maintain duration roughly comparable to that of the Lehman Brothers Intermediate Aggregate Bond Index, with overall credit quality
of at least BBB
|
Ÿ
|
diversify investments by industry, sector, maturity, issuer class, and quality sectors to reduce risk of capital erosion
|
 |
 |
| MassMutual Diversified Bond Fund – Portfolio Manager Report (Continued)
|
| MassMutual Diversified Bond Fund
Total Return
|
|||||||
|---|---|---|---|---|---|---|---|
| Year-To-Date
1/1/00 - 6/30/00 |
One Year
7/1/99 - 6/30/00 |
Since Inception
Average Annual 5/3/99 - 6/30/00 |
|||||
| Class S | 2.51% | 3.39% | 1.94% | ||||
| Class A | 2.30% | 2.99% | 1.50% | ||||
| Class Y | 2.41% | 3.28% | 1.84% | ||||
| Class L | 2.41% | 3.16% | 1.73% | ||||
| |
|||||||
| Lehman Brothers | |||||||
| Intermediate | 3.42% | 4.58% | 3.21% | ||||
| Aggregate Bond Index | |||||||
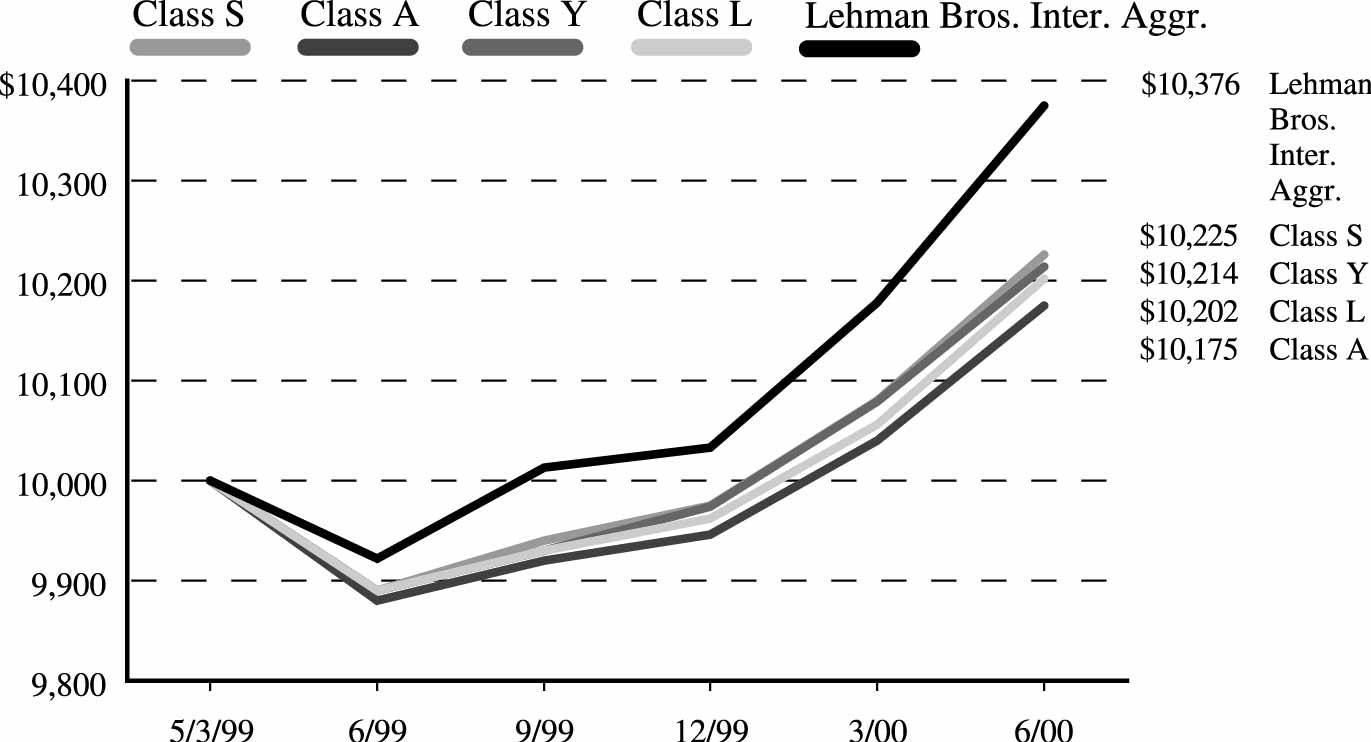
| Principal
Amount |
Market
Value |
|||||
|---|---|---|---|---|---|---|
| BONDS & NOTES — 89.3% | ||||||
| CORPORATE DEBT — 29.2% | ||||||
| AES Corporation | ||||||
| 9.500% | 06/01/2009 | $ 200,000 | $ 196,000 | |||
| Archibald Candy Corp. | ||||||
| 10.250% | 07/01/2004 | 125,000 | 90,625 | |||
| Associates Corporation
of North America |
||||||
| 5.800% | 04/20/2004 | 500,000 | 468,320 | |||
| AT&T Corp. | ||||||
| 5.625% | 03/15/2004 | 250,000 | 234,950 | |||
| Boston Scientific
Corporation |
||||||
| 6.625% | 03/15/2005 | 250,000 | 227,350 | |||
| Brand Scaffold
Services, Inc. |
||||||
| 10.250% | 02/15/2008 | 125,000 | 110,000 | |||
| Building Material Corp. | ||||||
| 8.000% | 12/01/2008 | 250,000 | 196,250 | |||
| Capitol Records, Inc.† | ||||||
| 8.375% | 08/15/2009 | 250,000 | 256,010 | |||
| Century
Communications Corp. Zero Coupon Series B |
||||||
| 0.000% | 01/15/2008 | 125,000 | 50,625 | |||
| ContiFinancial
Corporation |
||||||
| 8.125% | 04/01/2008 | 125,000 | 16,562 | |||
| Continental Airlines,
Inc. |
||||||
| 8.000% | 12/15/2005 | 100,000 | 92,000 | |||
| Crown Cork & Seal
Company, Inc. |
||||||
| 7.125% | 09/01/2002 | 150,000 | 143,221 | |||
| CSX Corporation | ||||||
| 6.250% | 10/15/2008 | 250,000 | 217,407 | |||
| Dana Corporation | ||||||
| 6.250% | 03/01/2004 | 250,000 | 236,275 | |||
| Derby Cycle
Corporation |
||||||
| 10.000% | 05/15/2008 | 125,000 | 50,000 | |||
| Diageo Capital PLC | ||||||
| 6.125% | 08/15/2005 | 500,000 | 473,584 | |||
| Elgin National
Industries, Inc. Series B |
||||||
| 11.000% | 11/01/2007 | 125,000 | 103,750 | |||
| Eott Energy Partners LP | ||||||
| 11.000% | 10/01/2009 | 100,000 | 101,500 | |||
| Express Scripts, Inc. | ||||||
| 9.625% | 06/15/2009 | 125,000 | 121,250 | |||
| Ford Motor Credit
Corporation |
||||||
| 7.375% | 10/28/2009 | 100,000 | 96,727 | |||
| Principal
Amount |
Market
Value |
|||||
|---|---|---|---|---|---|---|
| GenTek, Inc. | ||||||
| 11.000% | 08/01/2009 | $ 100,000 | $ 101,250 | |||
| Gulf Canada Resources
Limited |
||||||
| 8.350% | 08/01/2006 | 125,000 | 123,125 | |||
| Haynes International,
Inc. |
||||||
| 11.625% | 09/01/2004 | 125,000 | 87,500 | |||
| Home Depot
Exchangeable Trust† |
||||||
| 1.000% | 02/14/2006 | 100,000 | 92,000 | |||
| Icn Pharmaceuticals,
Inc. |
||||||
| 9.250% | 08/15/2005 | 250,000 | 247,500 | |||
| Imax Corp. | ||||||
| 7.875% | 12/01/2005 | 250,000 | 226,250 | |||
| International Game
Technology |
||||||
| 8.375% | 05/15/2009 | 125,000 | 118,125 | |||
| JL French Automotive
Casting Series B |
||||||
| 11.500% | 06/01/2009 | 125,000 | 113,750 | |||
| Kitty Hawk, Inc. | ||||||
| 9.950% | 11/15/2004 | 125,000 | 49,375 | |||
| The Kroger Co. | ||||||
| 7.650% | 04/15/2007 | 250,000 | 245,128 | |||
| LDM Technologies,
Inc. Series B |
||||||
| 10.750% | 01/15/2007 | 125,000 | 98,750 | |||
| Lyondell Chemical
Company Series A† |
||||||
| 9.625% | 05/01/2007 | 125,000 | 123,125 | |||
| Lyondell Chemical
Company Series B† |
||||||
| 9.875% | 05/01/2007 | 125,000 | 123,437 | |||
| News America
Holdings, Inc. |
||||||
| 8.625% | 02/01/2003 | 250,000 | 256,390 | |||
| Northwest Airlines, Inc. | ||||||
| 7.875% | 03/15/2008 | 250,000 | 220,430 | |||
| Pacer International,
Inc. Series B |
||||||
| 11.750% | 06/01/2007 | 125,000 | 124,688 | |||
| Pepsi Bottling
Holdings, Inc.† |
||||||
| 5.625% | 02/17/2009 | 250,000 | 219,819 | |||
| Petroleos Mexicanos
Series P |
||||||
| 9.500% | 09/15/2027 | 125,000 | 122,603 | |||
| Primark Corporation | ||||||
| 9.250% | 12/15/2008 | 125,000 | 126,250 | |||
| Raytheon Company | ||||||
| 6.500% | 07/15/2005 | 250,000 | 237,318 | |||
| SCG Holding Corp. | ||||||
| 12.000% | 08/01/2009 | 65,000 | 69,388 | |||
| Principal
Amount |
Market
Value |
|||||
|---|---|---|---|---|---|---|
| Solectron Corp. Zero
Coupon |
||||||
| 0.000% | 05/08/2020 | $ 220,000 | $ 138,600 | |||
| Sprint Capital
Corporation |
||||||
| 5.875% | 05/01/2004 | 250,000 | 234,693 | |||
| SuperValu, Inc. | ||||||
| 7.875% | 08/01/2009 | 250,000 | 245,542 | |||
| TRW, Inc. | ||||||
| 8.750% | 05/15/2006 | 250,000 | 254,680 | |||
| Western Gas
Resources, Inc. |
||||||
| 10.000% | 06/15/2009 | 125,000 | 129,063 | |||
| Worldtex, Inc. Series B | ||||||
| 9.625% | 12/15/2007 | 50,000 | 18,750 | |||
| TOTAL CORPORATE DEBT
(Cost $8,242,985) |
7,629,935 | |||||
| U.S. GOVERNMENT AGENCY
OBLIGATIONS — 33.7% |
||||||
| Federal Home Loan Mortgage Corporation
(FHLMC) — 6.7% |
||||||
| Pass-Through Securities | ||||||
| FHLMC | ||||||
| 7.500% | 06/01/2024-
04/01/2028 |
1,777,256 | 1,758,371 | |||
| Federal National Mortgage Association
(FNMA) — 16.2% |
||||||
| Pass-Through Securities | ||||||
| FNMA | ||||||
| 6.000% | 11/01/2028-
04/01/2029 |
1,659,316 | 1,518,789 | |||
| FNMA | ||||||
| 6.500% | 04/01/2029-
06/01/2029 |
2,888,379 | 2,726,117 | |||
| 4,244,906 | ||||||
| Government National
Mortgage Association (GNMA) — 10.8% |
||||||
| Pass-Through Securities | ||||||
| GNMA | ||||||
| 7.000% | 10/15/2027-
05/15/2029 |
2,185,072 | 2,123,944 | |||
| GNMA | ||||||
| 8.000% | 08/15/2026-
3/15/2027 |
687,441 | 695,175 | |||
| 2,819,119 | ||||||
| TOTAL U.S. GOVERNMENT
AGENCY OBLIGATIONS |
||||||
| (Cost $9,237,717) | 8,822,396 | |||||
| MassMutual Diversified Bond Fund – Portfolio of Investments (Continued)
|
| Principal
Amount |
Market
Value |
|||||
|---|---|---|---|---|---|---|
| U.S. TREASURY OBLIGATIONS — 26.4% | ||||||
| U.S. Treasury Note | ||||||
| 5.500% | 05/15/2009 | $ 240,000 | $ 229,649 | |||
| U.S. Treasury Note | ||||||
| 5.750% | 08/15/2003 | 650,000 | 638,931 | |||
| U.S. Treasury Note | ||||||
| 6.500% | 10/15/2006 | 1,625,000 | 1,644,549 | |||
| U.S. Treasury Note | ||||||
| 7.500% | 11/15/2001 | 4,350,000 | 4,405,071 | |||
| TOTAL U.S. TREASURY
OBLIGATIONS |
||||||
| (Cost $7,099,045) | 6,918,200 | |||||
| TOTAL BONDS & NOTES | ||||||
| (Cost $24,579,747) | 23,370,531 | |||||
| SHORT-TERM INVESTMENTS — 9.6% | ||||||
| Commercial Paper | ||||||
| Countrywide Home
Loans, Inc. |
||||||
| 6.880% | 07/06/2000 | 1,200,000 | 1,198,853 | |||
| Houston Industries
Finance Co. L.P. |
||||||
| 7.100% | 07/05/2000 | 300,000 | 299,763 | |||
| US West Capital
Funding Corporation |
||||||
| 7.250% | 07/07/2000 | 1,015,000 | 1,013,774 | |||
| TOTAL SHORT-TERM
INVESTMENTS |
||||||
| (At Amortized Cost) | 2,512,390 | |||||
| TOTAL INVESTMENTS — 98.9% | ||||||
| (Cost $27,092,137)* | 25,882,921 | |||||
| Other Assets/
(Liabilities) — 1.1% |
282,081 | |||||
| NET ASSETS — 100.0% | $ 26,165,002 | |||||
*
|
Aggregate cost for Federal tax purposes. (Note 7).
|
†
|
Securities exempt from registration under Rule 144A of the Securities Act of 1933. These securities may be resold in transactions
exempt from registration, normally to qualified institutional buyers.
|
| June 30, 2000
(Unaudited) |
|||
|---|---|---|---|
| Assets: | |||
| Investments, at value (cost $24,579,747) (Note 2 ) | $23,370,531 | ||
| Short-term investments, at amortized cost (Note 2) | 2,512,390 | ||
| Total Investments | 25,882,921 | ||
| Cash | 4,124 | ||
| Receivables from: | |||
| Interest | 302,559 | ||
| Investment adviser (Note 3) | 2,095 | ||
| Total assets | 26,191,699 | ||
| Liabilities: | |||
| Payables for: | |||
| Directors’ fees and expenses (Note 3) | 3,475 | ||
| Affiliates (Note 3): | |||
| Investment management fees | 10,605 | ||
| Administration fees | 2,662 | ||
| Service fees | 79 | ||
| Accrued expenses and other liabilities | 9,876 | ||
| Total liabilities | 26,697 | ||
| Net assets | $26,165,002 | ||
| Net assets consist of: | |||
| Paid-in capital | $26,649,558 | ||
| Undistributed net investment income | 858,486 | ||
| Accumulated net realized loss on investments | (133,826 | ) | |
| Net unrealized depreciation on investments | (1,209,216 | ) | |
| $26,165,002 | |||
| Net assets: | |||
| Class A | $ 297,724 | ||
| Class L | $ 103,011 | ||
| Class Y | $ 168,398 | ||
| Class S | $25,595,869 | ||
| Shares outstanding: | |||
| Class A | 30,455 | ||
| Class L | 10,525 | ||
| Class Y | 17,196 | ||
| Class S | 2,612,607 | ||
| Net asset value, offering price and redemption price per share: | |||
| Class A | $ 9.78 | ||
| Class L | $ 9.79 | ||
| Class Y | $ 9.79 | ||
| Class S | $ 9.80 | ||
| MassMutual Diversified Bond Fund – Financial Statements (Continued)
|
| Six months ended
June 30, 2000 (Unaudited) |
|||
|---|---|---|---|
| Investment income: (Note 2) | |||
| Interest | $ 950,503 | ||
| Total investment income | 950,503 | ||
| Expenses: (Note 2) | |||
| Investment management fees (Note 3) | 63,368 | ||
| Audit and legal fees | 6,284 | ||
| Directors’ fees (Note 3) | 4,311 | ||
| Custody fees | 3,870 | ||
| 77,833 | |||
| Administration fees (Note 3): | |||
| Class A | 193 | ||
| Class L | 162 | ||
| Class Y | 136 | ||
| Class S | 15,382 | ||
| Service fees (Note 3): | |||
| Class A | 149 | ||
| Total expenses | 93,855 | ||
| Expenses reimbursed (Note 3) | (3,450 | ) | |
| Net expenses | 90,405 | ||
| Net investment income | 860,098 | ||
| Realized and unrealized gain (loss): | |||
| Net realized loss on investment transactions | (16,436 | ) | |
| Net change in unrealized appreciation (depreciation) on investments | (211,573 | ) | |
| Net realized and unrealized loss | (228,009 | ) | |
| Net increase in net assets resulting from operations | $ 632,089 | ||
| MassMutual Diversified Bond Fund – Financial Statements (Continued)
|
| Increase (Decrease) in Net Assets: | Six months ended
June 30, 2000 (Unaudited) |
Period ended
December 31, 1999* |
||||
|---|---|---|---|---|---|---|
| Operations: | ||||||
| Net investment income | $ 860,098 | $ 1,052,357 | ||||
| Net realized loss on investment transactions | (16,436 | ) | (116,392 | ) | ||
| Net change in unrealized appreciation (depreciation) on investments | (211,573 | ) | (997,643 | ) | ||
| Net increase (decrease) in net assets resulting from operations | 632,089 | (61,678 | ) | |||
| Distributions to shareholders (Note 2): | ||||||
| From net investment income: | ||||||
| Class A | - | (3,900 | ) | |||
| Class L | - | (4,063 | ) | |||
| Class Y | - | (6,001 | ) | |||
| Class S | - | (1,039,391 | ) | |||
| Total distributions from net investment income | - | (1,053,355 | ) | |||
| In excess of net investment income: | ||||||
| Class A | - | (6 | ) | |||
| Class L | - | (6 | ) | |||
| Class Y | - | (9 | ) | |||
| Class S | - | (1,591 | ) | |||
| Total distributions in excess of net investment income | - | (1,612 | ) | |||
| Net fund share transactions (Note 5): | ||||||
| Class A | 194,023 | 104,906 | ||||
| Class L | - | 105,069 | ||||
| Class Y | 18,134 | 152,299 | ||||
| Class S | (1,381 | ) | 26,076,508 | |||
| Increase in net assets from net fund share transactions | 210,776 | 26,438,782 | ||||
| Total increase in net assets | 842,865 | 25,322,137 | ||||
| Net assets: | ||||||
| Beginning of period | 25,322,137 | - | ||||
| End of period (including undistributed net
investment income of $858,486 and
distributions in excess of net investment income of $1,612, respectively) |
$26,165,002 | $25,322,137 | ||||
*
|
For the period from May 3, 1999 (commencement of operations) through December 31, 1999.
|
| MassMutual Diversified Bond Fund – Financial Statements (Continued)
|
| Class A |
Class L |
|||||||||||
|---|---|---|---|---|---|---|---|---|---|---|---|---|
| Six months ended
6/30/00 (Unaudited) |
Period ended
12/31/99† |
Six months ended
6/30/00 (Unaudited) |
Period ended
12/31/99† |
|||||||||
| Net asset value, beginning of period | $9.56 | $10.00 | $ 9.56 | $ 10.00 | ||||||||
| Income (Loss) from investment operations: | ||||||||||||
| Net investment income | 0.31 | *** | 0.39 | *** | 0.31 | *** | 0.41 | *** | ||||
| Net realized and unrealized gain (loss) on investments | (0.09 | ) | (0.44 | ) | (0.08 | ) | (0.45 | ) | ||||
| Total income (loss) from investment operations | 0.22 | (0.05 | ) | 0.23 | (0.04 | ) | ||||||
| Less distributions to shareholders: | ||||||||||||
| From net investment income | - | (0.39 | ) | - | (0.40 | ) | ||||||
| In excess of net investment income from distributions | - | (0.00 | )**** | - | (0.00 | )**** | ||||||
| Total distributions | - | (0.39 | ) | - | (0.40 | ) | ||||||
| Net asset value, end of period | $9.78 | $ 9.56 | $ 9.79 | $ 9.56 | ||||||||
| Total Return@ | 2.30% | ** | (0.54)% | ** | 2.41% | ** | (0.38)% | ** | ||||
| Ratios / Supplemental Data: | ||||||||||||
| Net assets, end of period (000’s) | $298 | $ 100 | $ 103 | $ 101 | ||||||||
| Ratio of expenses to average daily net assets: | ||||||||||||
| Before expense waiver | 1.19% | * | 1.19% | * | 0.94% | * | 0.94% | * | ||||
| After expense waiver # | 1.15% | * | N/A | 0.91% | * | N/A | ||||||
| Net investment income to average daily net assets | 6.41% | * | 5.92% | * | 6.59% | * | 6.17% | * | ||||
| Portfolio turnover rate | 9% | ** | 32% | ** | 9% | ** | 32% | ** | ||||
| Class Y |
Class S |
|||||||||||
| Six months ended
6/30/00 (Unaudited) |
Period ended
12/31/99† |
Six months ended
6/30/00 (Unaudited) |
Period ended
12/31/99† |
|||||||||
| Net asset value, beginning of period | $9.56 | $10.00 | $ 9.56 | $ 10.00 | ||||||||
| Income (Loss) from investment operations: | ||||||||||||
| Net investment income | 0.32 | *** | 0.42 | *** | 0.32 | *** | 0.42 | *** | ||||
| Net realized and unrealized gain (loss) on investments | (0.09 | ) | (0.45 | ) | (0.08 | ) | (0.44 | ) | ||||
| Total income (loss) from investment operations | 0.23 | (0.03 | ) | 0.24 | (0.02 | ) | ||||||
| Less distributions to shareholders: | ||||||||||||
| From net investment income | - | (0.41 | ) | - | (0.42 | ) | ||||||
| In excess of net investment income from distributions | - | (0.00 | )**** | - | (0.00 | )**** | ||||||
| Total distributions | - | (0.41 | ) | - | (0.42 | ) | ||||||
| Net asset value, end of period | $9.79 | $ 9.56 | $ 9.80 | $ 9.56 | ||||||||
| Total Return@ | 2.41% | ** | (0.26)% | ** | 2.51% | ** | (0.25)% | ** | ||||
| Ratios / Supplemental Data: | ||||||||||||
| Net assets, end of period (000’s) | $168 | $ 146 | $25,596 | $24,975 | ||||||||
| Ratio of expenses to average daily net assets: | ||||||||||||
| Before expense waiver | 0.79% | * | 0.80% | * | 0.74% | * | 0.74% | * | ||||
| After expense waiver # | 0.76% | * | N/A | 0.71% | * | N/A | ||||||
| Net investment income to average daily net assets | 6.74% | * | 6.35% | * | 6.79% | * | 6.33% | * | ||||
| Portfolio turnover rate | 9% | ** | 32% | ** | 9% | ** | 32% | ** | ||||
*
|
Annualized
|
**
|
Percentage represents results for the period and are not annualized.
|
***
|
Per share amount calculated on the average shares method.
|
****
|
Distributions in excess of net investment income is less than $0.01 per share.
|
†
|
For the period from May 3, 1999 (commencement of operations) through December 31, 1999.
|
#
|
Computed after giving effect to an agreement by MassMutual to waive certain fees and expenses of the Fund for the period
May 1, 2000 through June 30, 2000.
|
@
|
Employee retirement benefit plans that invest plan assets in the Separate Investment Accounts (SIAs) may be subject to
certain charges as set forth in their respective Plan Documents. Total return figures would be lower for the periods presented if they reflected these charges.
|
Ÿ
|
achieve a high total rate of return over an extended period of time consistent with the preservation of capital values
|
Ÿ
|
invest in a diversified portfolio of equity securities, fixed-income securities and money market instruments
|
Ÿ
|
manage the allocation of investments, under normal circumstances, in three sectors with the following ranges:
|
| Prime segment no more than 35% of net assets
|
| Core Bond segment no more than 35% of net assets
|
| Core Equity segment no more than 65% of net assets
|
What is your outlook?
 |
MassMutual Balanced Fund
Largest Stock Holdings (6/30/00)
General Electric Company
Marsh & McLennan Companies, Inc.
Boeing Co.
The Bank of New York Company, Incorporated
BP Amoco plc Sponsored ADR
The McGraw-Hill Companies, Inc.
Exxon Mobil Corp.
Kimberly-Clark Corporation
AT&T—Liberty Media Group
American Home Products Corporation
|
| MassMutual Balanced Fund – Portfolio Manager Report (Continued)
|
| Year-To-Date
1/1/00-6/30/00 |
One Year
7/1/99-6/30/00 |
Five Year
Average Annual 7/1/95-6/30/00 |
Since
Inception Average Annual 10/3/94-6/30/00 |
||||||
|---|---|---|---|---|---|---|---|---|---|
| Class S | -0.45% | -5.74% | 10.13% | 10.89% | |||||
| Lipper Balanced
Fund Index |
-0.12% | 2.51% | 13.35% | 13.74% | |||||
| Lehman Brothers
Aggregate Bond Index |
3.99% | 4.56% | 6.25% | 7.49% | |||||
| Standard &
Poor’s 500 Composite Index |
-0.42% | 7.25% | 23.81% | 24.32% | |||||
| Lehman Brothers
Gvt./Corp. Bond Index |
4.16% | 4.30% | 6.09% | 7.40% | |||||
| Year-To-Date
1/1/00-6/30/00 |
One Year
7/1/99-6/30/00 |
Since Inception
Average Annual 1/1/98-6/30/00 |
|||||
|---|---|---|---|---|---|---|---|
| Class A | -0.68% | -6.19% | 3.73% | ||||
| Class Y | -0.45% | -5.81% | 4.16% | ||||
| Lipper Balanced
Fund Index |
-0.12% | 2.51% | 9.53% | ||||
| Lehman Brothers
Aggregate Bond Index |
3.99% | 4.56% | 4.67% | ||||
| Standard &
Poor’s 500 Composite Index |
-0.42% | 7.25% | 19.15% | ||||
| Lehman Brothers
Gvt./Corp. Bond Index |
4.16% | 4.30% | 4.48% | ||||
| Year-To-Year
1/1/00-6/30/00 |
One Year
7/1/99-6/30/00 |
Since Inception
Average Annual 5/3/99-6/30/00 |
|||||
|---|---|---|---|---|---|---|---|
| Class L | -0.53% | -5.96% | -4.48% | ||||
| Lipper Balanced
Fund Index |
-0.12% | 2.51% | 3.18% | ||||
| Lehman Brothers
Aggregate Bond Index |
3.99% | 4.56% | 2.84% | ||||
| Standard &
Poor’s 500 Composite Index |
-0.42% | 7.25% | 8.96% | ||||
| Lehman Brothers
Gvt./Corp. Bond Index |
4.16% | 4.30% | 2.48% | ||||

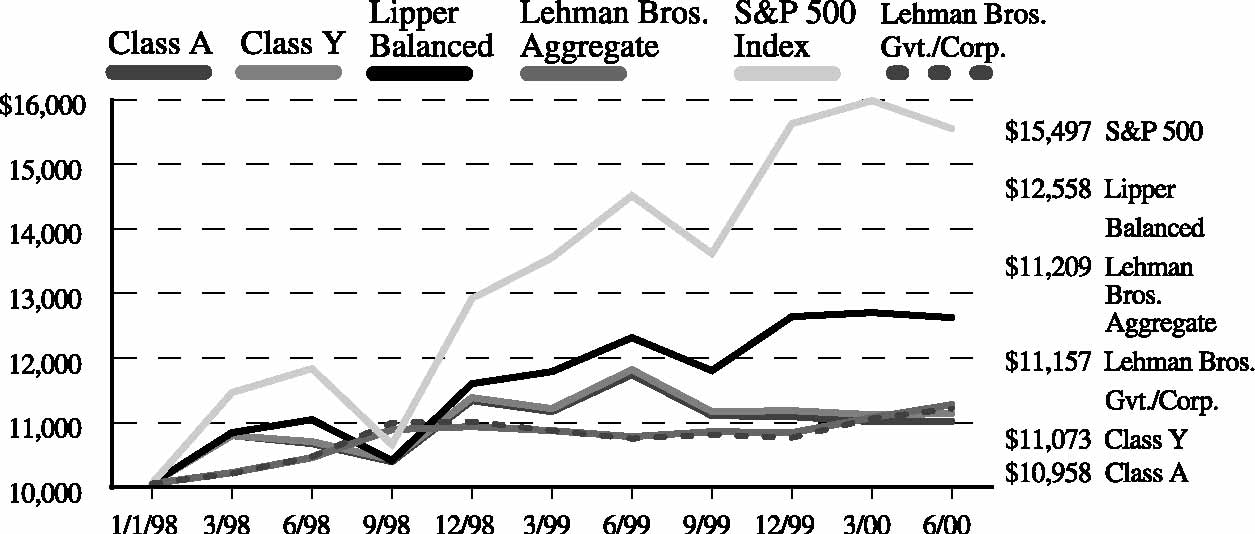
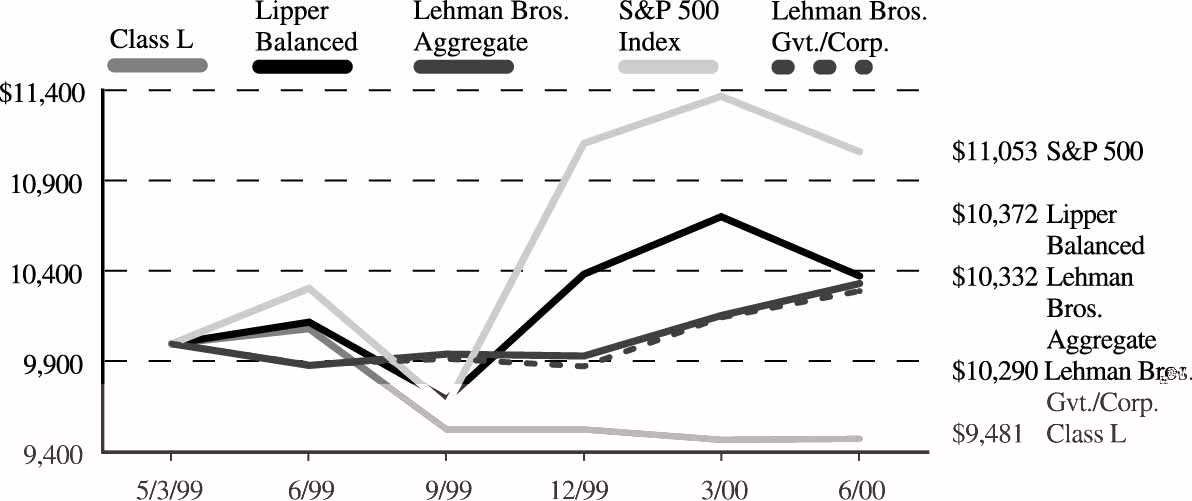
| Number of
Shares |
Market Value |
|||||
|---|---|---|---|---|---|---|
| EQUITIES — 65.6% | ||||||
| Aerospace & Defense — 4.4% | ||||||
| Boeing Co. | 272,900 | $ 11,410,631 | ||||
| Honeywell International,
Inc. |
202,450 | 6,820,034 | ||||
| TRW, Inc. | 121,000 | 5,248,375 | ||||
| 23,479,040 | ||||||
| Automotive & Parts — 1.6% | ||||||
| Ford Motor Company | 85,700 | 3,685,100 | ||||
| General Motors Corp. | 77,900 | 4,523,069 | ||||
| Visteon Corp.* | 11,221 | 136,054 | ||||
| 8,344,223 | ||||||
| Banking, Savings & Loans — 4.7% | ||||||
| The Bank of New York
Company, Inc. |
213,100 | 9,909,150 | ||||
| Chase Manhattan
Corp. |
58,050 | 2,673,928 | ||||
| Fleet Boston Financial
Corp. |
93,378 | 3,174,852 | ||||
| Wachovia Corp. | 83,600 | 4,535,300 | ||||
| Wells Fargo &
Company |
121,000 | 4,688,750 | ||||
| 24,981,980 | ||||||
| Beverages — 1.0% | ||||||
| Brown-Forman
Corporation Cl. B |
93,700 | 5,036,375 | ||||
| Broadcasting, Publishing & Printing — 2.6% | ||||||
| The McGraw-Hill
Companies, Inc. |
170,000 | 9,180,000 | ||||
| News Corporation
Limited Sponsored† |
82,100 | 4,474,450 | ||||
| 13,654,450 | ||||||
| Chemicals — 1.4% | ||||||
| Rohm & Haas
Company |
213,000 | 7,348,500 | ||||
| Communications — 3.6% | ||||||
| Alcatel SA Sponsored† | 57,900 | 3,850,350 | ||||
| GTE Corporation | 125,000 | 7,781,250 | ||||
| SBC Communications,
Inc. |
179,103 | 7,746,205 | ||||
| 19,377,805 | ||||||
| Computer Integrated Systems Design — 1.4% | ||||||
| Computer Sciences
Corp.* |
98,900 | 7,386,594 | ||||
| Number of
Shares |
Market Value |
|||||
|---|---|---|---|---|---|---|
| Computers & Information — 1.5% | ||||||
| Compaq Computer Corp. | 146,600 | $ 3,747,462 | ||||
| Jabil Circuit, Inc.* | 82,900 | 4,113,912 | ||||
| 7,861,374 | ||||||
| Computers & Office Equipment — 0.8% | ||||||
| International Business
Machines Corporation |
36,600 | 4,009,987 | ||||
| Containers — 1.3% | ||||||
| Sealed Air Corp.* | 86,900 | 4,551,387 | ||||
| Temple-Inland, Inc. | 60,500 | 2,541,000 | ||||
| 7,092,387 | ||||||
| Cosmetics & Personal Care — 1.7% | ||||||
| Kimberly-Clark
Corporation |
159,200 | 9,134,100 | ||||
| Electric Utilities — 1.2% | ||||||
| Dominion Resources, Inc. | 86,400 | 3,704,400 | ||||
| Teco Energy, Inc. | 136,300 | 2,734,519 | ||||
| 6,438,919 | ||||||
| Electrical Equipment & Electronics — 4.2% | ||||||
| General Electric
Company |
292,100 | 15,481,300 | ||||
| Micron Technology, Inc.* | 54,700 | 4,817,019 | ||||
| SCI Systems, Inc.* | 54,600 | 2,139,637 | ||||
| 22,437,956 | ||||||
| Energy — 8.6% | ||||||
| Apache Corporation | 125,000 | 7,351,562 | ||||
| BP Amoco PLC
Sponsored† |
162,636 | 9,199,099 | ||||
| Burlington Resources,
Inc. |
150,000 | 5,737,500 | ||||
| Chevron Corporation | 60,000 | 5,088,750 | ||||
| Coastal Corp. | 62,000 | 3,774,250 | ||||
| Conoco, Inc. Cl. A | 121,000 | 2,662,000 | ||||
| Exxon Mobil Corp. | 116,569 | 9,150,667 | ||||
| Total Fina Elf SA
Sponsored† |
36,300 | 2,788,294 | ||||
| 45,752,122 | ||||||
| Entertainment & Leisure — 1.6% | ||||||
| AT&T—Liberty Media
Group* |
360,600 | 8,744,550 | ||||
| Financial Services — 2.4% | ||||||
| American Express
Company |
135,000 | 7,036,875 | ||||
| American General
Corporation |
97,500 | 5,947,500 | ||||
| 12,984,375 | ||||||
| Number of
Shares |
Market Value |
|||||
|---|---|---|---|---|---|---|
| Foods — 1.7% | ||||||
| Bestfoods | 72,000 | $ 4,986,000 | ||||
| General Mills, Inc. | 111,400 | 4,261,050 | ||||
| 9,247,050 | ||||||
| Forest Products & Paper — 0.6% | ||||||
| Weyerhaeuser Company | 73,800 | 3,173,400 | ||||
| Healthcare — 2.5% | ||||||
| Becton, Dickinson
and Company |
195,800 | 5,617,012 | ||||
| Schering-Plough
Corp. |
152,800 | 7,716,400 | ||||
| 13,333,412 | ||||||
| Industrial — Diversified — 1.8% | ||||||
| Illinois Tool Works, Inc. | 100,000 | 5,700,000 | ||||
| Tyco International Ltd. | 76,652 | 3,631,388 | ||||
| 9,331,388 | ||||||
| Insurance — 3.4% | ||||||
| The Hartford
Financial Services Group, Inc. |
119,300 | 6,673,344 | ||||
| Marsh & McLennan
Companies, Inc. |
110,900 | 11,582,119 | ||||
| MBIA, Inc. | 600 | 28,913 | ||||
| 18,284,376 | ||||||
| Miscellaneous — 0.8% | ||||||
| Avery-Dennison Corp. | 66,700 | 4,477,238 | ||||
| Pharmaceuticals — 4.4% | ||||||
| American Home
Products Corp. |
141,400 | 8,307,250 | ||||
| Merck & Co., Inc. | 104,100 | 7,976,663 | ||||
| Pharmacia Corp. | 143,395 | 7,411,729 | ||||
| 23,695,642 | ||||||
| Restaurants — 1.0% | ||||||
| McDonald’s Corp. | 169,000 | 5,566,438 | ||||
| Retail — 1.6% | ||||||
| RadioShack
Corporation |
98,100 | 4,647,488 | ||||
| Target Corporation | 66,000 | 3,828,000 | ||||
| 8,475,488 | ||||||
| Retail-Grocery — 0.9% | ||||||
| Albertson’s, Inc. | 145,450 | 4,836,213 | ||||
| Telephone Utilities — 0.9% | ||||||
| BellSouth
Corporation |
117,400 | 5,004,175 | ||||
| MassMutual Balanced Fund – Portfolio of Investments (Continued)
|
| Number of
Shares |
Market Value |
|||||
|---|---|---|---|---|---|---|
| Tobacco — 0.8% | ||||||
| Fortune Brands, Inc. | 180,000 | $ 4,151,250 | ||||
| Transportation — 1.2% | ||||||
| Burlington Northern
Santa Fe Corp. |
149,500 | 3,429,156 | ||||
| Galileo International, Inc. | 33,000 | 688,875 | ||||
| Norfolk Southern
Corporation |
166,900 | 2,482,638 | ||||
| 6,600,669 | ||||||
| TOTAL EQUITIES
(Cost $261,472,183) |
350,241,476 | |||||
| Principal
Amount |
||||||
| BONDS & NOTES — 29.7% | ||||||
| ASSET BACKED SECURITIES — 1.8% | ||||||
| California Infrastructure SCE-1,
1997-1, Class A5 |
||||||
| 6.280% | 09/25/2005 | $ 150,000 | 147,003 | |||
| California Infrastructure SDG&E-1,
1997-1, Class A5 |
||||||
| 6.190% | 09/25/2005 | 100,000 | 97,791 | |||
| Case Equipment Loan Trust 1998-A,
Class A4 |
||||||
| 5.830% | 02/15/2005 | 639,938 | 630,186 | |||
| Caterpillar Financial Asset Trust,
1997-B, Class A3 |
||||||
| 6.160% | 09/25/2003 | 393,761 | 392,501 | |||
| Chase Manhattan Auto Owner Trust
1998-A, Class A4 |
||||||
| 5.800% | 12/16/2002 | 1,000,000 | 987,770 | |||
| Chase Manhattan RV Owner Trust
1997-A, Class A7 |
||||||
| 6.140% | 10/16/2006 | 1,000,000 | 990,620 | |||
| Metlife Capital Equipment Loan Trust
Series 1997-A, Class A |
||||||
| 6.850% | 05/20/2008 | 750,000 | 743,595 | |||
| Peco Energy Transition Trust Series
1999-A, Class A6 |
||||||
| 6.050% | 03/01/2009 | 650,000 | 606,963 | |||
| Peco Energy Transition Trust Series
1999-A, Class A7 |
||||||
| 6.130% | 03/01/2009 | 350,000 | 322,651 | |||
| Premier Auto Trust Series 1998-4,
Class A3 |
||||||
| 5.690% | 06/08/2002 | 970,908 | 965,238 | |||
| Premier Auto Trust Series 1998-5,
Class A3 |
||||||
| 5.070% | 07/08/2002 | 500,000 | 493,710 | |||
| Railcar Trust No. 1992-1 | ||||||
| 7.750% | 06/01/2004 | 246,189 | 246,499 | |||
| Rental Car Finance Corp. Series
1999-1A, Class A†† |
||||||
| 5.900% | 02/25/2007 | 600,000 | 572,736 | |||
| Principal
Amount |
Market Value |
|||||||
|---|---|---|---|---|---|---|---|---|
| Textron Financial
Corporation Series 1998-A, Class A2†† |
||||||||
| 5.890% | 01/15/2005 | $ 1,000,000 | $ 983,000 | |||||
| Toyota Auto Lease
Trust Series 1998-B, Class A1 |
||||||||
| 5.350% | 07/25/2002 | 1,000,000 | 994,800 | |||||
| Travelers Funding Ltd.
Class A-1†† |
||||||||
| 6.300% | 02/18/2014 | 700,000 | 616,000 | |||||
| TOTAL ASSET BACKED
SECURITIES (Cost $10,053,810) |
9,791,063 | |||||||
| CORPORATE DEBT — 13.4% | ||||||||
| AirTouch Communications, Inc. | ||||||||
| 7.500% | 07/15/2006 | 1,000,000 | 989,280 | |||||
| Alcan Aluminum Limited | ||||||||
| 6.250% | 11/01/2008 | 500,000 | 462,989 | |||||
| America West Airlines, Inc.
1996-1, Class A |
||||||||
| 6.850% | 07/02/2009 | 945,847 | 880,329 | |||||
| American Airlines, Inc. 1994-A Pass
Through Trusts, Class A4 |
||||||||
| 9.780% | 11/26/2011 | 805,572 | 842,476 | |||||
| American General Finance
Corporation |
||||||||
| 5.750% | 11/01/2003 | 500,000 | 472,475 | |||||
| AMR Corporation | ||||||||
| 9.000% | 08/01/2012 | 500,000 | 491,850 | |||||
| Associates Corporation of North
America |
||||||||
| 6.750% | 08/01/2001 | 1,000,000 | 993,350 | |||||
| AT&T—Liberty Media Group | ||||||||
| 8.250% | 02/01/2030 | 1,800,000 | 1,652,873 | |||||
| Barrick Gold Corporation | ||||||||
| 7.500% | 05/01/2007 | 1,000,000 | 967,590 | |||||
| BellSouth Capital Funding
Corporation |
||||||||
| 7.750% | 02/15/2010 | 1,500,000 | 1,500,060 | |||||
| BHP Finance (USA) Limited | ||||||||
| 6.420% | 03/01/2026 | 1,000,000 | 967,080 | |||||
| Bombardier Capital, Inc.†† | ||||||||
| 6.000% | 01/15/2002 | 1,000,000 | 976,291 | |||||
| Boston Scientific Corporation | ||||||||
| 6.625% | 03/15/2005 | 2,000,000 | 1,818,800 | |||||
| Celulosa Arauco y Constitucion, S.A. | ||||||||
| 6.950% | 09/15/2005 | 500,000 | 472,550 | |||||
| Champion International Corporation | ||||||||
| 6.400% | 02/15/2026 | 1,000,000 | 928,380 | |||||
| The Charles Schwab Corporation | ||||||||
| 6.250% | 01/23/2003 | 1,000,000 | 966,589 | |||||
| The CIT Group, Inc. | ||||||||
| 5.625% | 10/15/2003 | 500,000 | 468,440 | |||||
| Principal
Amount |
Market Value |
|||||
|---|---|---|---|---|---|---|
| The CIT Group, Inc. | ||||||
| 6.375% | 10/01/2002 | $ 1,000,000 | $ 973,090 | |||
| Comcast Cable Communications, Inc. | ||||||
| 8.375% | 05/01/2007 | 750,000 | 772,717 | |||
| ConAgra, Inc. | ||||||
| 7.000% | 10/01/2028 | 750,000 | 599,895 | |||
| Continental Airlines, Inc.,
Series 1996-2B |
||||||
| 8.560% | 07/02/2014 | 452,637 | 462,698 | |||
| Continental Airlines, Inc.,
Series 1996-B |
||||||
| 7.820% | 04/15/2015 | 443,610 | 436,374 | |||
| Crown Cork & Seal Company, Inc. | ||||||
| 6.750% | 12/15/2003 | 1,000,000 | 938,970 | |||
| Crown Cork & Seal Company, Inc. | ||||||
| 7.125% | 09/01/2002 | 1,100,000 | 1,050,290 | |||
| CSX Corporation | ||||||
| 7.050% | 05/01/2002 | 500,000 | 491,835 | |||
| CSX Corporation | ||||||
| 7.250% | 05/01/2027 | 1,200,000 | 1,133,220 | |||
| Donnelley (R.R.) & Sons Co. | ||||||
| 6.625% | 04/15/2029 | 1,000,000 | 831,320 | |||
| Dover Corporation | ||||||
| 6.250% | 06/01/2008 | 500,000 | 440,740 | |||
| Duke Capital Corp. | ||||||
| 7.500% | 10/01/2009 | 1,300,000 | 1,280,708 | |||
| The E.W. Scripps Company | ||||||
| 6.625% | 10/15/2007 | 1,000,000 | 950,250 | |||
| Emerald Investment
Grade CBO, Ltd.†† |
||||||
| 7.553% | 05/24/2011 | 1,000,000 | 1,000,000 | |||
| ERAC USA Finance
Company†† |
||||||
| 6.750% | 05/15/2007 | 1,250,000 | 1,161,075 | |||
| FBG Finance Limited†† | ||||||
| 7.875% | 06/01/2016 | 1,000,000 | 1,031,220 | |||
| Fletcher Challenge
Capital Canada, Inc. |
||||||
| 6.750% | 03/24/2005 | 500,000 | 460,830 | |||
| Fletcher Challenge
Capital Canada, Inc. |
||||||
| 7.750% | 06/20/2006 | 500,000 | 482,475 | |||
| Ford Motor Credit Corporation | ||||||
| 7.375% | 10/28/2009 | 3,000,000 | 2,901,810 | |||
| General American
Transportation Corporation |
||||||
| 6.750% | 03/01/2006 | 1,000,000 | 938,790 | |||
| General Electric
Capital Corporation Series MTNA |
||||||
| 6.520% | 10/08/2002 | 1,600,000 | 1,577,851 | |||
| General Mills, Inc. | ||||||
| 8.900% | 06/15/2006 | 500,000 | 543,510 | |||
| The Goldman Sachs Group, L.P.†† | ||||||
| 6.200% | 02/15/2001 | 1,000,000 | 992,790 | |||
| MassMutual Balanced Fund – Portfolio of Investments (Continued)
|
| Principal
Amount |
Market Value |
|||||
|---|---|---|---|---|---|---|
| Goodyear Tire & Rubber
Company |
||||||
| 8.500% | 03/15/2007 | $ 1,160,000 | $ 1,190,067 | |||
| Halliburton Company | ||||||
| 5.625% | 12/01/2008 | 750,000 | 672,044 | |||
| Heller Financial, Inc. | ||||||
| 6.250% | 03/01/2001 | 500,000 | 495,335 | |||
| Heller Financial, Inc. | ||||||
| 7.375% | 11/01/2009 | 2,000,000 | 1,886,920 | |||
| Hershey Foods Corporation | ||||||
| 7.200% | 08/15/2027 | 1,250,000 | 1,192,500 | |||
| Household Finance
Corporation |
||||||
| 6.500% | 11/15/2008 | 1,500,000 | 1,364,700 | |||
| ICI Wilmington, Inc. | ||||||
| 7.050% | 09/15/2007 | 500,000 | 467,220 | |||
| IMC Global, Inc. | ||||||
| 6.625% | 10/15/2001 | 500,000 | 490,035 | |||
| Interpool, Inc. | ||||||
| 7.350% | 08/01/2007 | 500,000 | 407,526 | |||
| The Kroger Co. | ||||||
| 7.000% | 05/01/2018 | 700,000 | 607,138 | |||
| LASMO (USA), Inc. | ||||||
| 6.750% | 12/15/2007 | 1,250,000 | 1,161,767 | |||
| Leucadia National Corporation | ||||||
| 7.750% | 08/15/2013 | 1,000,000 | 978,170 | |||
| Marsh & McLennan
Companies, Inc. |
||||||
| 7.125% | 06/15/2009 | 500,000 | 478,943 | |||
| Meritor Automotive, Inc. | ||||||
| 6.800% | 02/15/2009 | 1,000,000 | 860,600 | |||
| Midway Airlines Corp.
Pass Through Certificates Class B†† |
||||||
| 8.140% | 01/02/2013 | 485,593 | 434,047 | |||
| Millipore Corporation | ||||||
| 7.500% | 04/01/2007 | 1,000,000 | 948,300 | |||
| Mobil Corporation | ||||||
| 8.625% | 08/15/2021 | 1,000,000 | 1,100,960 | |||
| Morgan Stanley Dean
Witter & Co. |
||||||
| 5.625% | 01/20/2004 | 1,000,000 | 943,020 | |||
| Newmont Mining Corporation | ||||||
| 8.625% | 04/01/2002 | 1,000,000 | 999,610 | |||
| News America Holdings, Inc. | ||||||
| 9.250% | 02/01/2013 | 1,000,000 | 1,080,610 | |||
| Norfolk Southern Corporation | ||||||
| 7.050% | 05/01/2037 | 1,350,000 | 1,319,436 | |||
| North Finance (Bermuda)
Limited†† |
||||||
| 7.000% | 09/15/2005 | 1,000,000 | 972,550 | |||
| Pepsi Bottling Holdings,
Inc.†† |
||||||
| 5.625% | 02/17/2009 | 500,000 | 439,638 | |||
| Principal
Amount |
Market Value |
|||||
|---|---|---|---|---|---|---|
| Raytheon Company | ||||||
| 6.550% | 03/15/2010 | $ 750,000 | $ 671,685 | |||
| Raytheon Company | ||||||
| 6.750% | 08/15/2007 | 500,000 | 469,765 | |||
| Republic Services, Inc. | ||||||
| 7.125% | 05/15/2009 | 1,000,000 | 896,739 | |||
| Ryder System, Inc. | ||||||
| 6.600% | 11/15/2005 | 750,000 | 700,995 | |||
| Scholastic Corporation | ||||||
| 7.000% | 12/15/2003 | 750,000 | 730,897 | |||
| Sprint Capital Corporation | ||||||
| 6.125% | 11/15/2008 | 500,000 | 445,685 | |||
| Sprint Capital Corporation | ||||||
| 6.900% | 05/01/2019 | 500,000 | 444,580 | |||
| SuperValu, Inc. | ||||||
| 7.875% | 08/01/2009 | 1,000,000 | 982,168 | |||
| Texaco, Inc. | ||||||
| 5.500% | 01/15/2009 | 1,000,000 | 883,576 | |||
| Thomas & Betts Corporation | ||||||
| 8.250% | 01/15/2004 | 500,000 | 501,725 | |||
| Time Warner, Inc.
Pass-Thru Asset Trust 1997-1†† |
||||||
| 6.100% | 12/30/2001 | 750,000 | 735,683 | |||
| Times Mirror Co. | ||||||
| 7.450% | 10/15/2009 | 1,300,000 | 1,267,876 | |||
| TRW, Inc. | ||||||
| 8.750% | 05/15/2006 | 2,000,000 | 2,037,436 | |||
| Union Tank Car Co. | ||||||
| 6.790% | 05/01/2010 | 1,000,000 | 915,628 | |||
| US Air, Inc., Class B | ||||||
| 7.500% | 10/15/2009 | 451,207 | 413,305 | |||
| Valero Energy Corporation | ||||||
| 7.375% | 03/15/2006 | 500,000 | 482,724 | |||
| Vulcan Materials Company | ||||||
| 6.000% | 04/01/2009 | 1,000,000 | 892,776 | |||
| WPP Finance (USA)
Corporation |
||||||
| 6.625% | 07/15/2005 | 375,000 | 355,698 | |||
| TOTAL CORPORATE DEBT
(Cost $74,308,897) |
71,623,937 | |||||
| NON-U.S. GOVERNMENT AGENCY
OBLIGATIONS — 0.8% |
||||||
| Collateralized Mortgage Obligations | ||||||
| Asset Securitization
Corporation Series 1995-MD4, Class A1 |
||||||
| 7.100% | 08/13/2029 | 1,381,685 | 1,366,638 | |||
| CS First Boston
Mortgage Securities Corp. Series 1998- C2, Class A1 |
||||||
| 5.960% | 12/15/2007 | 681,094 | 645,401 | |||
| Principal
Amount |
Market Value |
|||||
|---|---|---|---|---|---|---|
| Merrill Lynch
Mortgage Investors, Inc., Series 1997- Cl-CTL, A-1 |
||||||
| 6.310% | 11/15/2026 | $ 817,684 | $ 776,607 | |||
| Salomon Brothers
Mortgage Securities 1997-TZH, Class B†† |
||||||
| 7.491% | 03/25/2022 | 750,000 | 737,348 | |||
| Starwood Commercial
Mortgage Trust Series 1999-C1A, Class B†† |
||||||
| 6.920% | 02/05/2009 | 1,000,000 | 907,500 | |||
| TOTAL NON-U.S. GOVERNMENT
AGENCY OBLIGATIONS (Cost $4,744,665) |
4,433,494 | |||||
| U.S. GOVERNMENT AGENCY
OBLIGATIONS — 6.2% |
||||||
| Federal Home Loan Mortgage Corporation
(FHLMC) — 0.3% |
||||||
| Collateralized Mortgage Obligations — 0.1% | ||||||
| FHLMC Series 1322
Class G |
||||||
| 7.500% | 02/15/2007 | 411,627 | 413,298 | |||
| Pass-Through Securities — 0.2% | ||||||
| FHLMC | ||||||
| 6.420% | 12/01/2005 | 1,232,003 | 1,186,419 | |||
| FHLMC | ||||||
| 9.000% | 03/01/2017 | 70,033 | 72,237 | |||
| 1,258,656 | ||||||
| 1,671,954 | ||||||
| Federal National Mortgage Association
(FNMA) — 3.7% |
||||||
| Collateralized Mortgage Obligations — 1.2% | ||||||
| FNMA Series 1993-
134 Class GA |
||||||
| 6.500% | 02/25/2007 | 1,000,000 | 989,370 | |||
| FNMA Series 1993-
221 Class D |
||||||
| 6.000% | 12/25/2008 | 1,000,000 | 965,000 | |||
| FNMA Series 1993-
231, Class M |
||||||
| 6.000% | 12/25/2008 | 2,500,000 | 2,395,300 | |||
| FNMA Series 1996-54
Class C |
||||||
| 6.000% | 09/25/2008 | 2,000,000 | 1,916,240 | |||
| 6,265,910 | ||||||
| MassMutual Balanced Fund – Portfolio of Investments (Continued)
|
| Principal
Amount |
Market Value |
|||||
|---|---|---|---|---|---|---|
| Pass-Through Securities — 2.5% | ||||||
| FNMA | ||||||
| 6.000% | 11/01/2028 | $ 1,402,363 | $ 1,283,597 | |||
| FNMA | ||||||
| 7.500% | 10/01/2029-
04/01/2030 |
10,053,565 | 9,908,993 | |||
| FNMA | ||||||
| 8.000% | 05/01/2013-
05/01/2030 |
2,118,309 | 2,126,047 | |||
| 13,318,637 | ||||||
| 19,584,547 | ||||||
| Government National Mortgage Association
(GNMA) — 1.7% |
||||||
| Pass-Through Securities | ||||||
| GNMA | ||||||
| 6.500% | 10/15/2028-
03/15/2029 |
5,513,711 | 5,233,354 | |||
| GNMA | ||||||
| 7.000% | 08/15/2023-
10/15/2023 |
717,638 | 700,143 | |||
| GNMA | ||||||
| 7.500% | 10/15/2006-
06/15/2017 |
1,337,248 | 1,344,437 | |||
| GNMA | ||||||
| 8.000% | 11/15/2004-
01/15/2009 |
1,430,702 | 1,451,208 | |||
| GNMA | ||||||
| 9.000% | 12/15/2008-
05/15/2009 |
238,856 | 248,660 | |||
| 8,977,802 | ||||||
| U.S. Government Guaranteed Notes — 0.5% | ||||||
| 1991-A Fairfax
County, VA |
||||||
| 8.740% | 08/01/2001 | 200,000 | 203,612 | |||
| 1991-A Jefferson
Park, CA |
||||||
| 8.740% | 08/01/2001 | 1,740,000 | 1,771,424 | |||
| 1991-A Monroe
County, NY |
||||||
| 8.740% | 08/01/2001 | 500,000 | 509,030 | |||
| 1991-A Rochester, NY | ||||||
| 8.740% | 08/01/2001 | 60,000 | 61,084 | |||
| 2,545,150 | ||||||
| TOTAL U.S. GOVERNMENT
AGENCY OBLIGATIONS (Cost $33,024,471) |
32,779,453 | |||||
| Principal
Amount |
Market Value |
|||||
|---|---|---|---|---|---|---|
| U.S. TREASURY OBLIGATIONS — 7.5% | ||||||
| U.S. Treasury Bonds — 1.4% | ||||||
| U.S. Treasury Bond | ||||||
| 7.500% | 11/15/2016 | $ 275,000 | $ 310,577 | |||
| U.S. Treasury Bond | ||||||
| 8.750% | 05/15/2017 | 5,750,000 | 7,242,298 | |||
| 7,552,875 | ||||||
| U.S. Treasury Notes — 6.0% | ||||||
| U.S. Treasury Note | ||||||
| 5.500% | 05/15/2009 | 2,500,000 | 2,392,175 | |||
| U.S. Treasury Note | ||||||
| 6.500% | 08/15/2005 | 11,065,000 | 11,179,080 | |||
| U.S. Treasury Note | ||||||
| 6.500% | 10/15/2006 | 18,160,000 | 18,378,465 | |||
| 31,949,720 | ||||||
| U.S. Treasury Strip — 0.1% | ||||||
| U.S. Treasury Strip—Principal Only | ||||||
| 0.000% | 08/15/2015 | 700,000 | 275,667 | |||
| TOTAL U.S. TREASURY
OBLIGATIONS (Cost $39,536,469) |
39,778,262 | |||||
| TOTAL BONDS & NOTES
(Cost $161,668,312) |
158,406,209 | |||||
| SHORT-TERM INVESTMENTS — 9.0% | ||||||
| Cash Equivalents — 5.4% | ||||||
| Bank of America Bank Note** | ||||||
| 6.670% | 03/22/2001 | 620,524 | 620,524 | |||
| Bank of Montreal Bank Note** | ||||||
| 6.630% | 08/16/2000 | 1,034,207 | 1,034,207 | |||
| Bank of Nova Scotia
Eurodollar Time Deposit** |
||||||
| 7.000% | 07/03/2000 | 1,241,049 | 1,241,049 | |||
| Credit Agricole Bank
Eurodollar Time Deposit** |
||||||
| 6.750% | 07/06/2000 | 2,136,829 | 2,136,829 | |||
| Credit Agricole Bank
Eurodollar Time Deposit** |
||||||
| 6.750% | 07/07/2000 | 620,524 | 620,524 | |||
| Den Danske Bank
Eurodollar Time Deposit** |
||||||
| 6.810% | 07/05/2000 | 2,275,256 | 2,275,256 | |||
| First Union Bank Note** | ||||||
| 6.900% | 05/09/2001 | 620,524 | 620,524 | |||
| Fleet National Bank
Eurodollar Time Deposit** |
||||||
| 7.260% | 10/31/2000 | 420,579 | 420,579 | |||
| HypoVereinsbank
Eurodollar Time Deposit** |
||||||
| 6.750% | 07/05/2000 | 2,171,036 | 2,171,036 | |||
| Principal
Amount |
Market Value |
|||||
|---|---|---|---|---|---|---|
| Merrimac Money Market Fund** | ||||||
| 6.440% | 07/03/2000 | $ 11,494,819 | $ 11,494,819 | |||
| Morgan Stanley Dean Witter & Co.** | ||||||
| 6.890% | 07/17/2000 | 4,432,305 | 4,432,305 | |||
| Morgan Stanley Dean Witter & Co.** | ||||||
| 6.910% | 11/22/2000 | 413,682 | 413,682 | |||
| Paribas Bank
Eurodollar Time Deposit** |
||||||
| 6.750% | 07/05/2000 | 1,482,098 | 1,482,098 | |||
| 28,963,432 | ||||||
| Commercial Paper — 3.6% | ||||||
| Countrywide Home Loans, Inc. | ||||||
| 7.000% | 07/03/2000 | 1,335,000 | 1,334,481 | |||
| Enron Corp. | ||||||
| 7.100% | 07/06/2000 | 5,005,000 | 5,000,064 | |||
| Houston Industries
Finance Co. L.P. |
||||||
| 7.150% | 07/05/2000 | 5,000,000 | 4,996,028 | |||
| Mead Corporation | ||||||
| 6.800% | 07/17/2000 | 3,525,000 | 3,514,347 | |||
| UOP | ||||||
| 7.120% | 07/07/2000 | 400,000 | 399,525 | |||
| US West Capital
Funding Corporation |
||||||
| 7.200% | 07/07/2000 | 4,025,000 | 4,020,170 | |||
| 19,264,615 | ||||||
| |
||||||
| TOTAL SHORT-TERM
INVESTMENTS (At Amortized Cost) |
48,228,047 | |||||
| |
||||||
| TOTAL INVESTMENTS — 104.3%
(Cost $471,368,542)*** |
556,875,732 | |||||
| Other Assets/
(Liabilities) — (4.3%) |
(23,047,633) | |||||
| |
||||||
| NET ASSETS — 100.0% | $533,828,099 | |||||
| |
||||||
*
|
Non-income producing security.
|
| **
|
Represents investment of security lending collateral. (Note 2).
|
***
|
Aggregate cost for Federal tax purposes. (Note 7).
|
†
|
American Depository Receipt
|
††
|
Securities exempt from registration under Rule 144A of the Securities Act of 1933. These securities may be resold in transactions
exempt from registration, normally to qualified institutional buyers.
|
| June 30, 2000
(Unaudited) |
||
|---|---|---|
| Assets: | ||
| Investments, at value (cost $423,140,495) (Note 2) | $ 508,647,685 | |
| Short-term investments, at amortized cost (Note 2) | 48,228,047 | |
| Total Investments | 556,875,732 | |
| Receivables from: | ||
| Investments sold | 7,157,540 | |
| Interest and dividends | 2,718,374 | |
| Foreign taxes withheld | 9,944 | |
| Total assets | 566,761,590 | |
| Liabilities: | ||
| Payables for: | ||
| Investments purchased | 2,834,383 | |
| Securities on loan (Note 2) | 28,963,432 | |
| Directors’ fees and expenses (Note 3) | 2,191 | |
| Affiliates (Note 3): | ||
| Investment management fees | 224,208 | |
| Administration fees | 48,766 | |
| Service fees | 1,693 | |
| Due to Custodian | 827,159 | |
| Accrued expenses and other liabilities | 31,659 | |
| Total liabilities | 32,933,491 | |
| Net assets | $ 533,828,099 | |
| Net assets consist of: | ||
| Paid-in capital | $ 417,421,783 | |
| Undistributed net investment income | 10,287,550 | |
| Accumulated net realized gain on investments | 20,611,576 | |
| Net unrealized appreciation on investments | 85,507,190 | |
| $ 533,828,099 | ||
| Net assets: | ||
| Class A | $ 2,997,165 | |
| Class L | $ 4,751,675 | |
| Class Y | $ 27,348,603 | |
| Class S | $ 498,730,656 | |
| Shares outstanding: | ||
| Class A | 228,415 | |
| Class L | 361,353 | |
| Class Y | 2,074,943 | |
| Class S | 37,797,234 | |
| Net asset value, offering price and redemption price per share: | ||
| Class A | $ 13.12 | |
| Class L | $ 13.15 | |
| Class Y | $ 13.18 | |
| Class S | $ 13.19 | |
| MassMutual Balanced Fund – Financial Statements (Continued)
|
| Six months ended
June 30, 2000 (Unaudited) |
|||
|---|---|---|---|
| Investment income: (Note 2) | |||
| Interest (including securities lending income of $49,240) | $ 8,410,229 | ||
| Dividends (net of withholding tax of $16,925) | 3,697,474 | ||
| Total investment income | 12,107,703 | ||
| Expenses: (Note 2) | |||
| Investment management fees (Note 3) | 1,453,484 | ||
| Custody fees | 34,785 | ||
| Audit and legal fees | 11,138 | ||
| Directors’ fees (Note 3) | 4,809 | ||
| 1,504,216 | |||
| Administration fees (Note 3): | |||
| Class A | 3,751 | ||
| Class L | 10,133 | ||
| Class Y | 68,472 | ||
| Class S | 231,208 | ||
| Service fees (Note 3): | |||
| Class A | 2,373 | ||
| Total expenses | 1,820,153 | ||
| Net investment income | 10,287,550 | ||
| Realized and unrealized gain (loss): | |||
| Net realized gain on investment transactions | 22,646,830 | ||
| Net change in unrealized appreciation (depreciation) on investments | (39,371,872 | ) | |
| Net realized and unrealized loss | (16,725,042 | ) | |
| Net decrease in net assets resulting from operations | $ (6,437,492 | ) | |
| MassMutual Balanced Fund – Financial Statements (Continued)
|
| Six months ended
June 30, 2000 (Unaudited) |
Year ended
December 31, 1999 |
|||||
|---|---|---|---|---|---|---|
| Increase (Decrease) in Net Assets: | ||||||
| Operations: | ||||||
| Net investment income | $ 10,287,550 | $ 26,696,755 | ||||
| Net realized gain on investment transactions | 22,646,830 | 1,114,487 | ||||
| Net change in unrealized appreciation (depreciation) on investments | (39,371,872 | ) | (39,221,960 | ) | ||
| Net decrease in net assets resulting from operations | (6,437,492 | ) | (11,410,718 | ) | ||
| Distributions to shareholders (Note 2): | ||||||
| From net investment income: | ||||||
| Class A | - | (19,468 | ) | |||
| Class L | - | (6,213 | )* | |||
| Class Y | - | (2,098,684 | ) | |||
| Class S | - | (24,046,239 | ) | |||
| Total distributions from net investment income | - | (26,170,604 | ) | |||
| Tax return of capital: | ||||||
| Class A | - | (78 | ) | |||
| Class L | - | (25 | )* | |||
| Class Y | - | (8,376 | ) | |||
| Class S | - | (95,975 | ) | |||
| Total tax return of capital | - | (104,454 | ) | |||
| From net realized gains: | ||||||
| Class A | - | (4,853 | ) | |||
| Class L | - | (1,926 | )* | |||
| Class Y | - | (960,076 | ) | |||
| Class S | - | (11,126,488 | ) | |||
| Total distributions from net realized gains | - | (12,093,343 | ) | |||
| Net fund share transactions (Note 5): | ||||||
| Class A | 2,344,027 | 434,080 | ||||
| Class L | 4,647,923 | 187,869 | * | |||
| Class Y | (32,045,959 | ) | 61,686,034 | |||
| Class S | (150,285,821 | ) | (69,915,062 | ) | ||
| Decrease in net assets from net fund share transactions | (175,339,830 | ) | (7,607,079 | ) | ||
| Total decrease in net assets | (181,777,322 | ) | (57,386,198 | ) | ||
| Net assets: | ||||||
| Beginning of period | 715,605,421 | 772,991,619 | ||||
| End of period (including undistributed net
investment income of $10,287,550
and $0, respectively) |
$533,828,099 | $715,605,421 | ||||
*
|
For the period from May 3, 1999 (commencement of operations) through December 31, 1999.
|
| MassMutual Balanced Fund – Financial Statements (Continued)
|
| Class A |
|||||||||
|---|---|---|---|---|---|---|---|---|---|
| Six months ended
6/30/00 (Unaudited) |
Year ended
12/31/99 |
Year ended
12/31/98† |
|||||||
| Net asset value, beginning of period | $13.21 | $14.20 | $14.03 | ||||||
| Income (Loss) from investment operations: | |||||||||
| Net investment income | 0.18 | *** | 0.40 | *** | 0.41 | *** | |||
| Net realized and unrealized gain (loss) on investments | (0.27 | ) | (0.70 | ) | 1.36 | ||||
| Total income (loss) from investment operations | (0.09 | ) | (0.30 | ) | 1.77 | ||||
| Less distributions to shareholders: | |||||||||
| From net investment income | - | (0.47 | ) | (0.58 | ) | ||||
| Tax return of capital | - | (0.00 | )**** | - | |||||
| From net realized gains | - | (0.22 | ) | (1.02 | ) | ||||
| Total distributions | - | (0.69 | ) | (1.60 | ) | ||||
| Net asset value, end of period | $13.12 | $13.21 | $14.20 | ||||||
| Total Return@ | (0.68)% | ** | (2.17)% | 12.78% | |||||
| Ratios / Supplemental Data: | |||||||||
| Net assets, end of period (000’s) | $2,997 | $ 573 | $ 177 | ||||||
| Net expenses to average daily net assets | 1.15% | * | 1.15% | 1.20% | |||||
| Net investment income to average daily net assets | 2.75% | * | 2.87% | 2.76% | |||||
| Portfolio turnover rate | 24% | ** | 19% | 30% | |||||
| Class L |
|||||||||
| Six months ended
6/30/00 (Unaudited) |
Period ended
12/31/99+ |
||||||||
| Net asset value, beginning of period | $13.22 | $14.62 | |||||||
| Income (Loss) from investment operations: | |||||||||
| Net investment income | 0.20 | *** | 0.47 | *** | |||||
| Net realized and unrealized gain (loss) on investments | (0.27 | ) | (1.15 | ) | |||||
| Total income (loss) from investment operations | (0.07 | ) | (0.68 | ) | |||||
| Less distributions to shareholders: | |||||||||
| From net investment income | - | (0.50 | ) | ||||||
| Tax return of capital | - | (0.00 | )**** | ||||||
| From net realized gains | - | (0.22 | ) | ||||||
| Total distributions | - | (0.72 | ) | ||||||
| Net asset value, end of period | $13.15 | $13.22 | |||||||
| Total Return@ | (0.53)% | ** | (4.69)% | ** | |||||
| Ratios / Supplemental Data: | |||||||||
| Net assets, end of period (000’s) | $4,752 | $ 173 | |||||||
| Net expenses to average daily net assets | 0.90% | * | 0.89% | * | |||||
| Net investment income to average daily net assets | 3.16% | * | 4.97% | * | |||||
| Portfolio turnover rate | 24% | ** | 19% | ** | |||||
*
|
Annualized
|
**
|
Percentage represents results for the period and are not annualized.
|
***
|
Per share amount calculated on the average shares method.
|
****
|
Tax return of capital is less than $0.01 per share.
|
+
|
For the period from May 3, 1999 (commencement of operations) through December 31, 1999.
|
†
|
Amounts have been restated to reflect reverse stock splits.
|
@
|
Employee retirement benefit plans that invest plan assets in the Separate Investment Accounts (SIAs) may be subject to certain
charges as set forth in their respective Plan Documents. Total return figures would be lower for the periods presented if they reflected these charges.
|
| MassMutual Balanced Fund – Financial Statements (Continued)
|
| Class Y |
||||||||||||||||||
|---|---|---|---|---|---|---|---|---|---|---|---|---|---|---|---|---|---|---|
| Six months ended
6/30/00 (Unaudited) |
Year ended
12/31/99 |
Year ended
12/31/98† |
||||||||||||||||
| Net asset value, beginning of period | $ 13.24 | $ 14.20 | $ 14.06 | |||||||||||||||
| Income (Loss) from investment operations: | ||||||||||||||||||
| Net investment income | 0.21 | *** | 0.46 | *** | 0.48 | *** | ||||||||||||
| Net realized and unrealized gain (loss) on investments | (0.27 | ) | (0.71 | ) | 1.36 | |||||||||||||
| Total income (loss) from investment operations | (0.06 | ) | (0.25 | ) | 1.84 | |||||||||||||
| Less distributions to shareholders: | ||||||||||||||||||
| From net investment income | - | (0.49 | ) | (0.67 | ) | |||||||||||||
| Tax return of capital | - | (0.00 | )**** | - | ||||||||||||||
| From net realized gains | - | (0.22 | ) | (1.03 | ) | |||||||||||||
| Total distributions | - | (0.71 | ) | (1.70 | ) | |||||||||||||
| Net asset value, end of period | $ 13.18 | $ 13.24 | $ 14.20 | |||||||||||||||
| Total Return@ | (0.45)% | ** | (1.77)% | 13.23% | ||||||||||||||
| Ratios/Supplemental Data: | ||||||||||||||||||
| Net assets, end of period (000’s) | $ 27,349 | $ 59,381 | $ 1,051 | |||||||||||||||
| Net expenses to average daily net assets | 0.74% | * | 0.75% | 0.76% | ||||||||||||||
| Net investment income to average daily net assets | 3.27% | * | 3.23% | 3.21% | ||||||||||||||
| Portfolio turnover rate | 24% | ** | 19% | 30% | ||||||||||||||
| Class S (1) |
||||||||||||||||||
| Six months ended
6/30/00 (Unaudited) |
Year ended
12/31/99 |
Year ended
12/31/98 |
Year ended
12/31/97 |
Year ended
12/31/96 |
Year ended
12/31/95 |
|||||||||||||
| Net asset value, beginning of period | $ 13.25 | $ 14.20 | $ 13.59 | $ 12.34 | $ 11.51 | $ 9.92 | ||||||||||||
| Income (Loss) from investment operations: | ||||||||||||||||||
| Net investment income | 0.22 | *** | 0.48 | *** | 0.49 | *** | 0.48 | 0.46 | 0.44 | |||||||||
| Net realized and unrealized gain (loss) on investments | (0.28 | ) | (0.70 | ) | 1.33 | 1.82 | 1.02 | 1.68 | ||||||||||
| Total income (loss) from investment operations | (0.06 | ) | (0.22 | ) | 1.82 | 2.30 | 1.48 | 2.12 | ||||||||||
| Less distributions to shareholders: | ||||||||||||||||||
| From net investment income | - | (0.51 | ) | (0.48 | ) | (0.48 | ) | (0.46 | ) | (0.44 | ) | |||||||
| Tax return of capital | - | (0.00 | )**** | - | - | - | - | |||||||||||
| From net realized gains | - | (0.22 | ) | (0.73 | ) | (0.57 | ) | (0.19 | ) | (0.09 | ) | |||||||
| Total distributions | - | (0.73 | ) | (1.21 | ) | (1.05 | ) | (0.65 | ) | (0.53 | ) | |||||||
| Net asset value, end of period | $ 13.19 | $ 13.25 | $ 14.20 | $ 13.59 | $ 12.34 | $ 11.51 | ||||||||||||
| Total Return@ | (0.45)% | ** | (1.58)% | 13.50% | 18.72% | 12.83% | 21.31% | |||||||||||
| Ratios/Supplemental Data: | ||||||||||||||||||
| Net assets, end of period (000’s) | $498,731 | $655,478 | $771,763 | $655,135 | $563,280 | $456,773 | ||||||||||||
| Ratio of expenses to average daily net assets: | ||||||||||||||||||
| Before expense waiver | 0.58% | * | 0.57% | 0.54% | 0.55% | 0.55% | 0.55% | |||||||||||
| After expense waiver # | N/A | N/A | N/A | 0.54% | 0.51% | 0.51% | ||||||||||||
| Net investment income to average daily net assets | 3.42% | * | 3.36% | 3.42% | 3.57% | 3.83% | 4.18% | |||||||||||
| Portfolio turnover rate | 24% | ** | 19% | 30% | 28% | 26% | 23% | |||||||||||
*
|
Annualized
|
**
|
Percentage represents results for the period and are not annualized.
|
***
|
Per share amount calculated on the average shares method.
|
****
|
Tax return of capital is less than $0.01 per share.
|
†
|
Amounts have been restated to reflect reverse stock splits.
|
(1)
|
Class S shares were previously designated as Class 4 shares.
|
#
|
Computed after giving effect to the voluntary partial waiver of management fee by MassMutual, which terminated May 1, 1997.
|
@
|
Employee retirement benefit plans that invest plan assets in the Separate Investment Accounts (SIAs) may be subject to certain
charges as set forth in their respective Plan Documents. Total return figures would be lower for the periods presented if they reflected these charges.
|
| (Formerly known as MassMutual Value Equity Fund)
|
Ÿ
|
achieve long-term growth of capital and income
|
Ÿ
|
invest in a diversified portfolio of equity securities of larger, well-established companies (generally companies with market
capitalization over $2.0 billion)
|
Ÿ
|
utilize a value-oriented strategy in making investment decisions
|
Ÿ
|
utilize fundamental analysis to identify companies which
|
| —are of high investment quality
|
| —offer above-average dividend growth potential
|
| —are attractively valued in the marketplace
|
| MassMutual Core Equity Fund
|
| Largest Stock Holdings (6/30/00)
|
| General Electric Company
|
| BP Amoco plc Sponsored ADR
|
| Boeing Co.
|
| Marsh & McLennan Companies, Inc.
|
| Exxon Mobil Corp.
|
| SBC Communications, Inc.
|
| GTE Corporation
|
| Kimberly-Clark Corporation
|
| AT&T—Liberty Media Group
|
| The Bank of New York Company, Incorporated
|
| MassMutual Core Equity Fund – Portfolio Manager Report (Continued)
|
| (Formerly known as MassMutual Value Equity Fund)
|
| Year-To-
Date |
One Year | Five Year
Average Annual |
Since Inception
Average Annual |
||||||
|---|---|---|---|---|---|---|---|---|---|
| 11/1/00 - 6/30/00 | 7/1/99 - 6/30/00 | 7/1/95 - 6/30/00 | 10/3/94 - 6/30/00 | ||||||
| Class S | -4.03% | -13.05% | 13.87% | 14.93% | |||||
| Standard &
Poor’s 500 Composite Index |
-0.42% | 7.25% | 23.81% | 24.32% | |||||
| Year-To-Date | One Year | Since Inception
Average Annual |
|||||
|---|---|---|---|---|---|---|---|
| 1/1/00 - 6/30/00 | 7/1/99 - 6/30/00 | 1/1/98 - 6/30/00 | |||||
| Class A | -4.29% | -13.52% | 2.94% | ||||
| Class Y | -4.10% | -13.17% | 3.39% | ||||
| Standard &
Poor’s 500 Composite Index |
-0.42% | 7.25% | 19.15% | ||||
| Year-To-Date | One Year | Since Inception
Average Annual |
|||||
|---|---|---|---|---|---|---|---|
| 1/1/00 - 6/30/00 | 7/1/99 - 6/30/00 | 5/3/99 - 6/30/00 | |||||
| Class L | -4.10% | -13.21% | -9.88% | ||||
| Standard &
Poor’s 500 Composite Index |
-0.42% | 7.25% | 8.96% | ||||
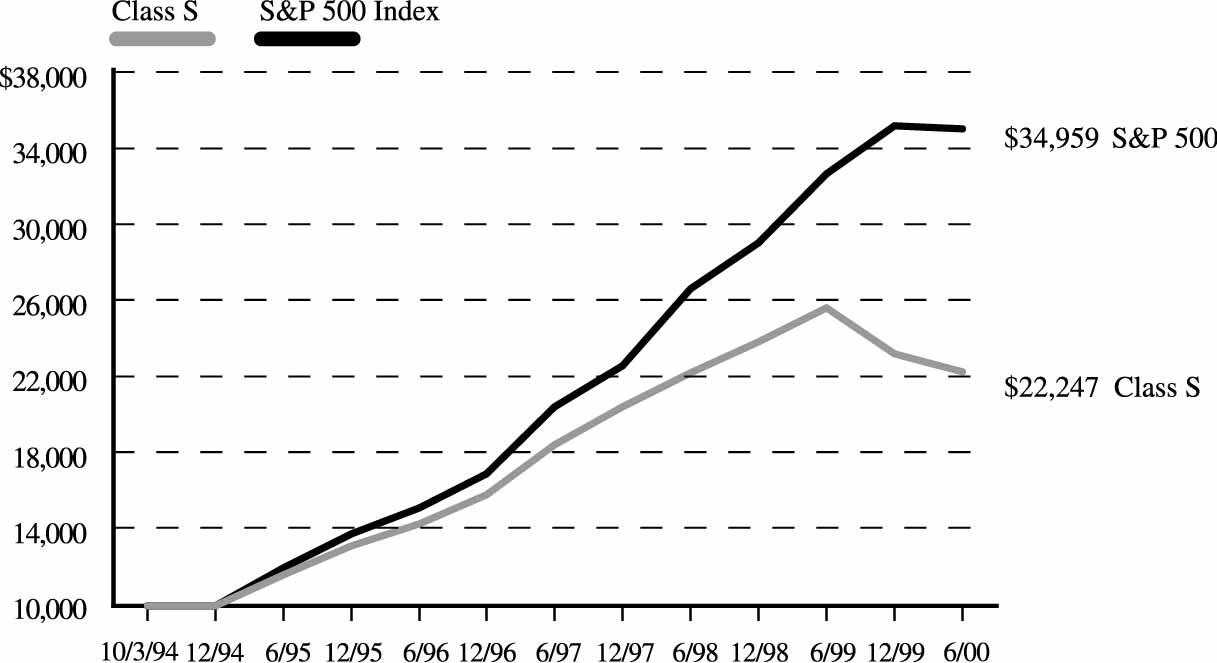
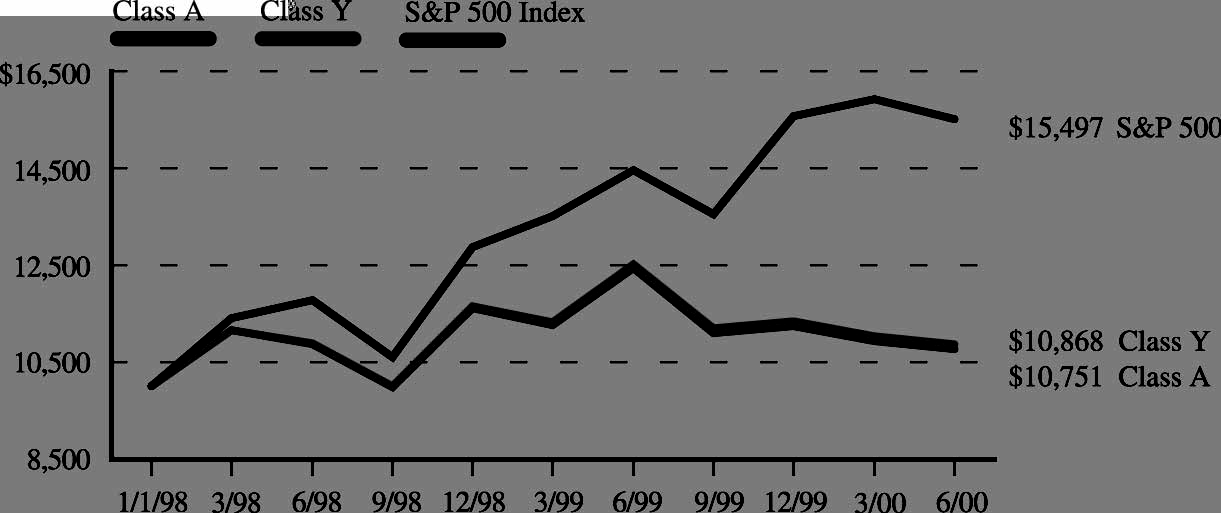
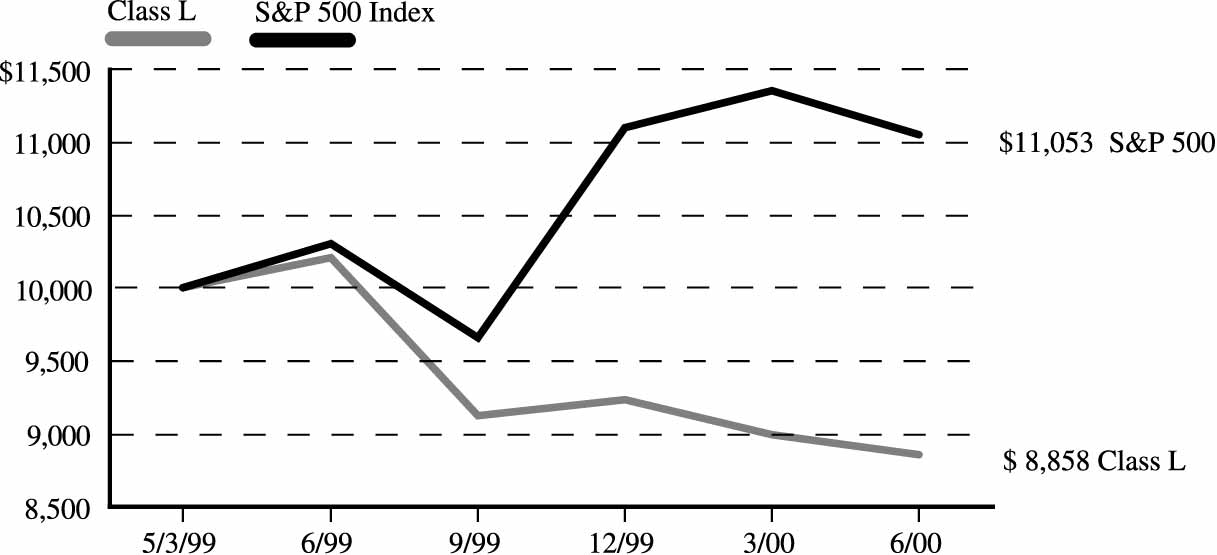
| (Formerly known as MassMutual Value Equity Fund)
|
| Number of
Shares |
Market Value |
|||
|---|---|---|---|---|
| EQUITIES — 100.4% | ||||
| Aerospace & Defense — 6.3% | ||||
| Boeing Co. | 1,754,200 | $ 73,347,487 | ||
| Honeywell International,
Inc. |
1,301,031 | 43,828,482 | ||
| TRW, Inc. | 550,000 | 23,856,250 | ||
| 141,032,219 | ||||
| Automotive & Parts — 2.5% | ||||
| Ford Motor Company | 580,300 | 24,952,900 | ||
| General Motors Corp. | 502,500 | 29,176,406 | ||
| Visteon Corp.* | 75,981 | 921,265 | ||
| 55,050,571 | ||||
| Banking, Savings & Loans — 7.1% | ||||
| Bank of New York
Company, Incorporated |
1,177,700 | 54,763,050 | ||
| Chase Manhattan Corp. | 373,500 | 17,204,344 | ||
| Fleet Boston Financial
Corp. |
603,032 | 20,503,088 | ||
| Wachovia Corp. | 538,000 | 29,186,500 | ||
| Wells Fargo & Company | 977,700 | 37,885,875 | ||
| 159,542,857 | ||||
| Beverages — 1.4% | ||||
| Brown-Forman
Corporation Cl. B |
600,000 | 32,250,000 | ||
| Broadcasting, Publishing & Printing — 3.4% | ||||
| The McGraw-Hill
Companies, Inc. |
900,000 | 48,600,000 | ||
| News Corporation Limited
Sponsored† |
525,600 | 28,645,200 | ||
| 77,245,200 | ||||
| Chemicals — 2.1% | ||||
| Rohm & Haas Company | 1,374,200 | 47,409,900 | ||
| Communications — 6.6% | ||||
| Alcatel SA Sponsored† | 371,900 | 24,731,350 | ||
| GTE Corporation | 973,500 | 60,600,375 | ||
| SBC Communications,
Inc. |
1,464,181 | 63,325,828 | ||
| 148,657,553 | ||||
| Computer Integrated Systems Design — 2.1% | ||||
| Computer Sciences Corp.* | 635,600 | 47,471,375 | ||
| Computers & Information — 2.3% | ||||
| Compaq Computer Corp. | 939,300 | 24,010,856 | ||
| Jabil Circuit, Inc.* | 534,600 | 26,529,525 | ||
| 50,540,381 | ||||
| Number of
Shares |
Market Value |
|||
|---|---|---|---|---|
| Computers & Office Equipment — 1.0% | ||||
| International Business
Machines Corporation |
199,907 | $ 21,902,311 | ||
| Containers — 2.3% | ||||
| Sealed Air Corp.* | 562,000 | 29,434,750 | ||
| Temple-Inland, Inc. | 528,800 | 22,209,600 | ||
| 51,644,350 | ||||
| Cosmetics & Personal Care — 2.6% | ||||
| Kimberly-Clark
Corporation |
1,000,000 | 57,375,000 | ||
| Electric Utilities — 2.3% | ||||
| Dominion Resources, Inc. | 730,600 | 31,324,475 | ||
| Teco Energy, Inc. | 1,007,800 | 20,218,987 | ||
| 51,543,462 | ||||
| Electrical Equipment & Electronics — 6.4% | ||||
| General Electric
Company |
1,877,800 | 99,523,400 | ||
| Micron Technology, Inc.* | 349,100 | 30,742,619 | ||
| SCI Systems, Inc.* | 348,200 | 13,645,087 | ||
| 143,911,106 | ||||
| Energy — 13.4% | ||||
| Apache Corporation | 722,700 | 42,503,794 | ||
| BP Amoco PLC
Sponsored† |
1,300,668 | 73,569,034 | ||
| Burlington Resources, Inc. | 701,600 | 26,836,200 | ||
| Chevron Corporation | 317,000 | 26,885,562 | ||
| Coastal Corp. | 398,400 | 24,252,600 | ||
| Conoco, Inc. Cl. A | 849,000 | 18,678,000 | ||
| Exxon Mobil Corp. | 911,431 | 71,547,334 | ||
| Total Fina Elf SA
Sponsored† |
230,300 | 17,689,919 | ||
| 301,962,443 | ||||
| Entertainment & Leisure — 2.5% | ||||
| AT&T—Liberty Media
Group* |
2,314,400 | 56,124,200 | ||
| Financial Services — 4.1% | ||||
| American Express
Company |
1,050,000 | 54,731,250 | ||
| American General
Corporation |
627,400 | 38,271,400 | ||
| 93,002,650 | ||||
| Number of
Shares |
Market Value |
|||
|---|---|---|---|---|
| Foods — 3.5% | ||||
| Bestfoods | 599,400 | $ 41,508,450 | ||
| General Mills, Inc. | 978,000 | 37,408,500 | ||
| 78,916,950 | ||||
| Forest Products & Paper — 0.9% | ||||
| Weyerhaeuser Company | 476,800 | 20,502,400 | ||
| Healthcare — 3.5% | ||||
| Becton, Dickinson and
Company |
1,000,000 | 28,687,500 | ||
| Schering-Plough Corp. | 1,000,000 | 50,500,000 | ||
| 79,187,500 | ||||
| Industrial – Diversified — 2.2% | ||||
| Illinois Tool Works, Inc. | 450,000 | 25,650,000 | ||
| Tyco International Ltd. | 492,026 | 23,309,732 | ||
| 48,959,732 | ||||
| Insurance — 5.1% | ||||
| The Hartford Financial
Services Group, Inc. |
740,500 | 41,421,719 | ||
| Marsh & McLennan
Companies, Inc. |
700,000 | 73,106,250 | ||
| MBIA, Inc. | 3,700 | 178,294 | ||
| 114,706,263 | ||||
| Miscellaneous — 1.5% | ||||
| Avery-Dennison Corp. | 500,000 | 33,562,500 | ||
| Pharmaceuticals — 5.9% | ||||
| American Home
Products Corporation |
605,600 | 35,579,000 | ||
| Merck & Co., Inc. | 666,200 | 51,047,575 | ||
| Pharmacia Corp. | 900,478 | 46,543,457 | ||
| 133,170,032 | ||||
| Restaurants — 1.6% | ||||
| McDonald’s Corp. | 1,086,400 | 35,783,300 | ||
| Retail — 2.4% | ||||
| RadioShack Corporation | 631,300 | 29,907,837 | ||
| Target Corporation | 428,000 | 24,824,000 | ||
| 54,731,837 | ||||
| Retail-Grocery — 1.4% | ||||
| Albertson’s, Inc. | 934,568 | 31,074,386 | ||
| Telephone Utilities — 1.4% | ||||
| BellSouth Corporation | 754,800 | 32,173,350 | ||
| Tobacco — 1.3% | ||||
| Fortune Brands, Inc. | 1,250,300 | 28,835,044 | ||
| MassMutual Core Equity Fund – Portfolio of Investments (Continued)
|
| (Formerly known as MassMutual Value Equity Fund)
|
| Number of
Shares |
Market Value |
|||||||
|---|---|---|---|---|---|---|---|---|
| Transportation — 1.3% | ||||||||
| Burlington Northern
Santa Fe Corp. |
1,037,280 | $ 23,792,610 | ||||||
| Galileo International,
Inc. |
220,100 | 4,594,587 | ||||||
| 28,387,197 | ||||||||
| TOTAL EQUITIES
(Cost $1,638,439,658) |
2,256,656,069 | |||||||
| Principal
Amount |
||||||||
| SHORT-TERM INVESTMENTS — 4.0% | ||||||||
| Cash Equivalents | ||||||||
| Bank of America Bank Note** | ||||||||
| 6.670% | 03/22/2001 | $ 1,930,235 | 1,930,235 | |||||
| Bank of Montreal Bank Note** | ||||||||
| 6.630% | 08/16/2000 | 2,817,598 | 2,817,598 | |||||
| Bank of Nova Scotia
Eurodollar Time Deposit** |
||||||||
| 7.000% | 07/03/2000 | 3,860,469 | 3,860,469 | |||||
| Credit Agricole Bank
Eurodollar Time Deposit** |
||||||||
| 6.750% | 07/06/2000 | 12,868,231 | 12,868,231 | |||||
| Credit Agricole Bank
Eurodollar Time Deposit** |
||||||||
| 6.750% | 07/07/2000 | 1,930,235 | 1,930,235 | |||||
| Den Danske Bank
Eurodollar Time Deposit** |
||||||||
| 6.810% | 07/05/2000 | 9,077,530 | 9,077,530 | |||||
| First Union Bank Note** | ||||||||
| 6.900% | 05/09/2001 | 1,930,235 | 1,930,235 | |||||
| Fleet National Bank
Eurodollar Time Deposit** |
||||||||
| 7.260% | 10/31/2000 | 771,787 | 771,787 | |||||
| HypoVereinsbank
Eurodollar Time Deposit** |
||||||||
| 6.750% | 07/05/2000 | 15,085,289 | 15,085,289 | |||||
| Merrimac Money Market Fund** | ||||||||
| 6.440% | 07/03/2000 | 18,603,126 | 18,603,126 | |||||
| MetLife Insurance Company
Funding Agreement** |
||||||||
| 6.690% | 08/01/2000 | 5,000,000 | 5,000,000 | |||||
| Morgan Stanley Dean
Witter & Co.** |
||||||||
| 6.890% | 07/17/2000 | 837,202 | 837,202 | |||||
| Morgan Stanley Dean
Witter & Co.** |
||||||||
| 6.910% | 11/22/2000 | 1,662,246 | 1,662,246 | |||||
| Principal
Amount |
Market Value |
|||||||||
|---|---|---|---|---|---|---|---|---|---|---|
| Paribas Bank
Eurodollar Time Deposit** |
||||||||||
| 6.750% | 07/05/2000 | $13,720,941 | $ 13,720,941 | |||||||
| 90,095,124 | ||||||||||
| TOTAL SHORT-TERM
INVESTMENTS |
||||||||||
| (At Amortized Cost) | 90,095,124 | |||||||||
| TOTAL INVESTMENTS — 104.4% | ||||||||||
| (Cost $1,728,534,782) *** | 2,346,751,193 | |||||||||
| Other Assets/
(Liabilities) — (4.4%) |
(99,487,807 | ) | ||||||||
| NET ASSETS — 100.0% | $2,247,263,386 | |||||||||
*
|
Non-income producing security.
|
**
|
Represents investment of security lending collateral. (Note 2).
|
| ***Aggregate cost for Federal tax purposes. (Note 7).
|
†
|
American Depository Receipt
|
| (Formerly known as MassMutual Value Equity Fund)
|
| June 30, 2000
(Unaudited) |
||
|---|---|---|
| Assets: | ||
| Investments, at value (cost $1,638,439,658) (Note 2) | $2,256,656,069 | |
| Short-term investments, at amortized cost (Note 2) | 90,095,124 | |
| Total Investments | 2,346,751,193 | |
| Receivables from: | ||
| Investments sold | 15,947,071 | |
| Interest and dividends | 2,747,263 | |
| Foreign taxes withheld | 63,089 | |
| Total assets | 2,365,508,616 | |
| Liabilities: | ||
| Payables for: | ||
| Investments purchased | 18,162,334 | |
| Securities on loan (Note 2) | 90,095,124 | |
| Directors’ fees and expenses (Note 3) | 2,220 | |
| Affiliates (Note 3): | ||
| Investment management fees | 960,286 | |
| Administration fees | 136,393 | |
| Service fees | 2,673 | |
| Due to Custodian | 8,789,221 | |
| Accrued expenses and other liabilities | 96,979 | |
| Total liabilities | 118,245,230 | |
| Net assets | $2,247,263,386 | |
| Net assets consist of: | ||
| Paid-in capital | $1,271,927,431 | |
| Undistributed net investment income | 18,795,617 | |
| Accumulated net realized gain on investments | 338,323,927 | |
| Net unrealized appreciation on investments | 618,216,411 | |
| $2,247,263,386 | ||
| Net assets: | ||
| Class A | $ 5,779,689 | |
| Class L | $ 19,071,302 | |
| Class Y | $ 21,618,461 | |
| Class S | $2,200,793,934 | |
| Shares outstanding: | ||
| Class A | 370,174 | |
| Class L | 1,216,380 | |
| Class Y | 1,378,532 | |
| Class S | 140,009,782 | |
| Net asset value, offering price and redemption price per share: | ||
| Class A | $ 15.61 | |
| Class L | $ 15.68 | |
| Class Y | $ 15.68 | |
| Class S | $ 15.72 | |
| MassMutual Core Equity Fund – Financial Statements (Continued)
|
| (Formerly known as MassMutual Value Equity Fund)
|
| Six months ended
June 30, 2000 (Unaudited) |
|||
|---|---|---|---|
| Investment income: (Note 2) | |||
| Dividends (net of withholding tax of $82,279) | $ 24,783,542 | ||
| Interest (including securities lending income of $79,192) | 1,072,569 | ||
| Total investment income | 25,856,111 | ||
| Expenses: (Note 2) | |||
| Investment management fees (Note 3) | 6,058,379 | ||
| Custody fees | 118,212 | ||
| Audit and legal fees | 29,427 | ||
| Directors’ fees (Note 3) | 4,958 | ||
| 6,210,976 | |||
| Administration fees (Note 3): | |||
| Class A | 5,238 | ||
| Class L | 15,722 | ||
| Class Y | 18,439 | ||
| Class S | 805,994 | ||
| Service fees (Note 3): | |||
| Class A | 4,125 | ||
| Total expenses | 7,060,494 | ||
| Net investment income | 18,795,617 | ||
| Realized and unrealized gain (loss): | |||
| Net realized gain on investment transactions | 274,263,433 | ||
| Net change in unrealized appreciation (depreciation) on investments | (412,794,332 | ) | |
| Net realized and unrealized loss | (138,530,899 | ) | |
| Net decrease in net assets resulting from operations | $(119,735,282 | ) | |
| MassMutual Core Equity Fund – Financial Statements (Continued)
|
| (Formerly known as MassMutual Value Equity Fund)
|
| Six months ended
June 30, 2000 (Unaudited) |
Year ended
December 31, 1999 |
|||||
|---|---|---|---|---|---|---|
| Increase (Decrease) in Net Assets: | ||||||
| Operations: | ||||||
| Net investment income | $ 18,795,617 | $ 48,018,681 | ||||
| Net realized gain on investment transactions | 274,263,433 | 244,882,522 | ||||
| Net change in unrealized appreciation (depreciation) on investments | (412,794,332 | ) | (380,145,282 | ) | ||
| Net decrease in net assets resulting from operations | (119,735,282 | ) | (87,244,079 | ) | ||
| Distributions to shareholders (Note 2): | ||||||
| From net investment income: | ||||||
| Class A | - | (28,703 | ) | |||
| Class L | - | (38,830 | )* | |||
| Class Y | - | (424,325 | ) | |||
| Class S | - | (47,633,175 | ) | |||
| Total distributions from net investment income | - | (48,125,033 | ) | |||
| In excess of net investment income: | ||||||
| Class A | - | (370 | ) | |||
| Class L | - | (500 | )* | |||
| Class Y | - | (5,469 | ) | |||
| Class S | - | (613,908 | ) | |||
| Total distributions in excess of net investment income | - | (620,247 | ) | |||
| From net realized gains: | ||||||
| Class A | - | (117,796 | ) | |||
| Class L | - | (145,744 | )* | |||
| Class Y | - | (1,595,827 | ) | |||
| Class S | - | (199,382,279 | ) | |||
| Total distributions from net realized gains | - | (201,241,646 | ) | |||
| Net fund share transactions (Note 5): | ||||||
| Class A | 4,023,802 | 1,767,511 | ||||
| Class L | 16,900,439 | 2,589,158 | * | |||
| Class Y | 2,057,933 | 22,336,326 | ||||
| Class S | (534,856,681 | ) | (397,747,697 | ) | ||
| Decrease in net assets from net fund share transactions | (511,874,507 | ) | (371,054,702 | ) | ||
| Total decrease in net assets | (631,609,789 | ) | (708,285,707 | ) | ||
| Net assets: | ||||||
| Beginning of period | 2,878,873,175 | 3,587,158,882 | ||||
| End of period (including undistributed net
investment income of $18,795,617
and $0, respectively) |
$2,247,263,386 | $2,878,873,175 | ||||
| * For the period from May 3, 1999 (commencement of operations) through December 31, 1999.
|
| MassMutual Core Equity Fund – Financial Statements (Continued)
|
| (Formerly known as MassMutual Value Equity Fund)
|
| Class A |
|||||||||
|---|---|---|---|---|---|---|---|---|---|
| Six months ended
6/30/00 (Unaudited) |
Year ended
12/31/99 |
Year ended
12/31/98† |
|||||||
| Net asset value, beginning of period | $ 16.31 | $ 18.40 | $ 18.02 | ||||||
| Income (Loss) from investment operations: | |||||||||
| Net investment income | 0.08 | *** | 0.17 | *** | 0.19 | *** | |||
| Net realized and unrealized gain (loss) on investments | (0.78 | ) | (0.75 | ) | 2.60 | ||||
| Total income (loss) from investment operations | (0.70 | ) | (0.58 | ) | 2.79 | ||||
| Less distributions to shareholders: | |||||||||
| From net investment income | - | (0.28 | ) | (0.43 | ) | ||||
| In excess of net investment income | - | (0.00 | )**** | - | |||||
| From net realized gains | - | (1.23 | ) | (1.98 | ) | ||||
| Total distributions | - | (1.51 | ) | (2.41 | ) | ||||
| Net asset value, end of period | $ 15.61 | $ 16.31 | $ 18.40 | ||||||
| Total Return@ | (4.29)% | ** | (3.13)% | 15.96% | |||||
| Ratios / Supplemental Data: | |||||||||
| Net assets, end of period (000’s) | $ 5,780 | $ 1,841 | $ 227 | ||||||
| Net expenses to average daily net assets | 1.09% | * | 1.10% | 1.20% | |||||
| Net investment income to average daily net assets | 0.99% | * | 0.92% | 1.01% | |||||
| Portfolio turnover rate | 30% | ** | 10% | 12% | |||||
| Class L |
|||||||||
| Six months ended
6/30/00 (Unaudited) |
Period ended
12/31/99+ |
||||||||
| Net asset value, beginning of period | $ 16.35 | $ 19.36 | |||||||
| Income (Loss) from investment operations: | |||||||||
| Net investment income | 0.10 | *** | 0.20 | *** | |||||
| Net realized and unrealized gain (loss) on investments | (0.77 | ) | (1.68 | ) | |||||
| Total income (loss) from investment operations | (0.67 | ) | (1.48 | ) | |||||
| Less distributions to shareholders: | |||||||||
| From net investment income | - | (0.30 | ) | ||||||
| In excess of net investment income | - | (0.00 | )**** | ||||||
| From net realized gains | - | (1.23 | ) | ||||||
| Total distributions | - | (1.53 | ) | ||||||
| Net asset value, end of period | $ 15.68 | $ 16.35 | |||||||
| Total Return@ | (4.10)% | ** | (7.63)% | ** | |||||
| Ratios / Supplemental Data: | |||||||||
| Net assets, end of period (000’s) | $19,071 | $ 2,380 | |||||||
| Net expenses to average daily net assets | 0.84% | * | 0.84% | * | |||||
| Net investment income to average daily net assets | 1.28% | * | 1.68% | * | |||||
| Portfolio turnover rate | 30% | ** | 10% | ** | |||||
*
|
Annualized
|
**
|
Percentage represents results for the period and are not annualized.
|
***
|
Per share amount calculated on the average shares method.
|
****
|
Distributions in excess of net investment income is less than $0.01 per share.
|
+
|
For the period from May 3, 1999 (commencement of operations) through December 31, 1999.
|
†
|
Amounts have been restated to reflect reverse stock splits.
|
@
|
Employee retirement benefit plans that invest plan assets in the Separate Investment Accounts (SIAs) may be subject to certain
charges as set forth in their respective Plan Documents. Total return figures would be lower for the periods presented if they reflected these charges.
|
| MassMutual Core Equity Fund – Financial Statements (Continued)
|
| (Formerly known as MassMutual Value Equity Fund)
|
| Class Y |
||||||||||||||||||
|---|---|---|---|---|---|---|---|---|---|---|---|---|---|---|---|---|---|---|
| Six months ended
6/30/00 (Unaudited) |
Year ended
12/31/99 |
Year ended
12/31/98† |
||||||||||||||||
| Net asset value, beginning of period | $ 16.35 | $ 18.39 | $ 18.03 | |||||||||||||||
| Income (Loss) from investment operations: | ||||||||||||||||||
| Net investment income | 0.11 | *** | 0.23 | *** | 0.27 | *** | ||||||||||||
| Net realized and unrealized gain (loss) on
investments |
(0.78 | ) | (0.73 | ) | 2.63 | |||||||||||||
| Total income (loss) from investment
operations |
(0.67 | ) | (0.50 | ) | 2.90 | |||||||||||||
| Less distributions to shareholders: | ||||||||||||||||||
| From net investment income | - | (0.31 | ) | (0.56 | ) | |||||||||||||
| In excess of net investment income | - | (0.00 | )**** | - | ||||||||||||||
| From net realized gains | - | (1.23 | ) | (1.98 | ) | |||||||||||||
| Total distributions | - | (1.54 | ) | (2.54 | ) | |||||||||||||
| Net asset value, end of period | $ 15.68 | $ 16.35 | $ 18.39 | |||||||||||||||
| Total Return@ | (4.10)% | ** | (2.71)% | 16.49% | ||||||||||||||
| Ratios / Supplemental Data: | ||||||||||||||||||
| Net assets, end of period (000’s) | $ 21,618 | $ 20,262 | $ 754 | |||||||||||||||
| Net expenses to average daily net assets | 0.68% | * | 0.69% | 0.75% | ||||||||||||||
| Net investment income to average daily net assets | 1.45% | * | 1.26% | 1.43% | ||||||||||||||
| Portfolio turnover rate | 30% | ** | 10% | 12% | ||||||||||||||
| Class S (1) |
||||||||||||||||||
| Six months ended
6/30/00 (Unaudited) |
Year ended
12/31/99 |
Year ended
12/31/98 |
Year ended
12/31/97 |
Year ended
12/31/96 |
Year ended
12/31/95 |
|||||||||||||
| Net asset value, beginning of period | $ 16.38 | $ 18.39 | $ 17.00 | $ 14.46 | $ 12.63 | $ 9.91 | ||||||||||||
| Income (Loss) from investment operations: | ||||||||||||||||||
| Net investment income | 0.12 | *** | 0.27 | *** | 0.31 | 0.32 | 0.34 | 0.31 | ||||||||||
| Net realized and unrealized gain (loss) on
investments |
(0.78 | ) | (0.75 | ) | 2.49 | 3.83 | 2.22 | 2.82 | ||||||||||
| Total income (loss) from investment
operations |
(0.66 | ) | (0.48 | ) | 2.80 | 4.15 | 2.56 | 3.13 | ||||||||||
| Less distributions to shareholders: | ||||||||||||||||||
| From net investment income | - | (0.30 | ) | (0.31 | ) | (0.31 | ) | (0.34 | ) | (0.31 | ) | |||||||
| In excess of net investment income | - | (0.00 | )**** | - | - | - | - | |||||||||||
| From net realized gains | - | (1.23 | ) | (1.10 | ) | (1.30 | ) | (0.39 | ) | (0.10 | ) | |||||||
| Total distributions | - | (1.53 | ) | (1.41 | ) | (1.61 | ) | (0.73 | ) | (0.41 | ) | |||||||
| Net asset value, end of period | $ 15.72 | $ 16.38 | $ 18.39 | $ 17.00 | $ 14.46 | $ 12.63 | ||||||||||||
| Total Return@ | (4.03)% | ** | (2.60)% | 16.75% | 29.01% | 20.24% | 31.54% | |||||||||||
| Ratios / Supplemental Data: | ||||||||||||||||||
| Net assets, end of period (000’s) | $2,200,794 | $2,854,390 | $3,586,177 | $3,197,848 | $2,485,743 | $2,125,248 | ||||||||||||
| Ratio of expenses to average daily net assets: | ||||||||||||||||||
| Before expense waiver | 0.58% | * | 0.57% | 0.54% | 0.55% | 0.55% | 0.55% | |||||||||||
| After expense waiver # | N/A | N/A | N/A | 0.54% | 0.51% | 0.51% | ||||||||||||
| Net investment income to average daily net assets | 1.55% | * | 1.45% | 1.67% | 1.91% | 2.42% | 2.72% | |||||||||||
| Portfolio turnover rate | 30% | ** | 10% | 12% | 20% | 13% | 16% | |||||||||||
*
|
Annualized
|
**
|
Percentage represents results for the period and are not annualized.
|
***
|
Per share amount calculated on the average shares method.
|
****
|
Distributions in excess of net investment income is less than $0.01 per share.
|
†
|
Amounts have been restated to reflect reverse stock splits.
|
(1)
|
Class S shares were previously designated as Class 4 shares.
|
#
|
Computed after giving effect to the voluntary partial waiver of management by MassMutual, which terminated May 1, 1997.
|
@
|
Employee retirement benefit plans that invest plan assets in the Separate Investment Accounts (SIAs) may be subject to certain
charges as set forth in their respective Plan Documents. Total return figures would be lower for the periods presented if they reflected these charges.
|
Ÿ
|
achieve capital growth and income
|
Ÿ
|
invest primarily in a diversified portfolio of equity securities of larger, well-established companies (generally companies with
market capitalization over $5.0 billion)
|
Ÿ
|
utilize a value-oriented strategy in making investment decisions
|
Ÿ
|
utilize fundamental analysis to identify companies which
|
—
|
are of high investment quality or possess a unique product, market position or operating characteristics
|
—
|
offer above-average levels of profitability or superior growth potential
|
—
|
are attractively valued in the marketplace
|
| MassMutual Large Cap Value Fund
|
| Largest Stock Holdings (6/30/00)
|
| American Express Company
|
| Hewlett-Packard Company
|
| Citigroup, Inc.
|
| American International Group, Inc.
|
| American Home Products Corporation
|
| Household International, Inc.
|
| International Business Machines Corporation
|
| Tyco International Ltd.
|
| Wells Fargo & Company
|
| Texas Instruments, Inc.
|
| MassMutual Large Cap Value Fund – Portfolio Manager Report (Continued)
|
| MassMutual Large Cap Value Fund
Total Return
|
|||
|---|---|---|---|
| Since Inception
5/1/00 - 6/30/00 |
|||
| Class S | -2.10% | ||
| Class A | -2.20% | ||
| Class Y | -2.10% | ||
| Class L | -2.20% | ||
| |
|||
| Standard & Poor’s
500 Composite Index |
0.36% | ||
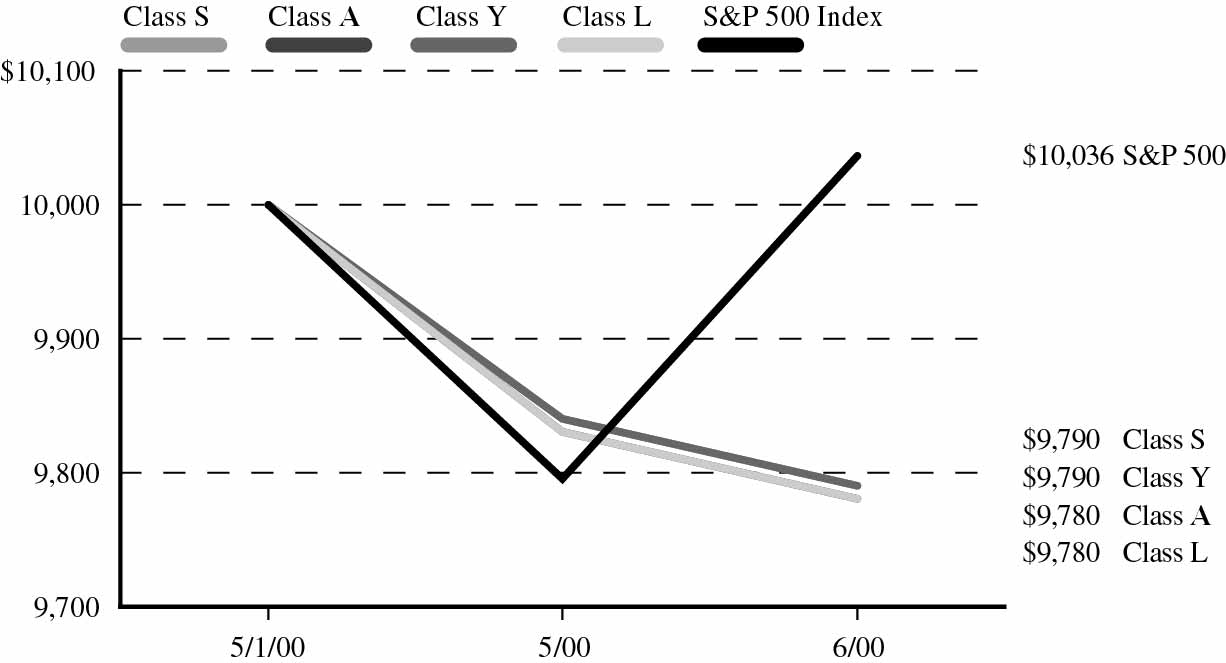
| Number of
Shares |
Market Value |
|||
|---|---|---|---|---|
| EQUITIES — 88.4% | ||||
| Advertising — 0.1% | ||||
| WPP Group Plc
Sponsored† |
1,800 | $ 130,725 | ||
| Banking, Savings & Loans — 12.1% | ||||
| Citigroup, Inc. | 131,400 | 7,916,850 | ||
| Federal Home Loan
Mortgage Corp. |
65,400 | 2,648,700 | ||
| Golden West Financial
Corp. |
99,000 | 4,040,437 | ||
| Providian Financial
Corp. |
30,700 | 2,763,000 | ||
| Wells Fargo &
Company |
154,000 | 5,967,500 | ||
| 23,336,487 | ||||
| Broadcasting, Publishing & Printing — 4.0% | ||||
| Dow Jones & Co., Inc. | 7,200 | 527,400 | ||
| Gannett Co., Inc. | 20,100 | 1,202,231 | ||
| MediaOne Group, Inc.* | 74,700 | 4,953,357 | ||
| Tribune Co. | 30,700 | 1,074,500 | ||
| 7,757,488 | ||||
| Building Materials & Construction — 2.9% | ||||
| Masco Corp. | 220,400 | 3,980,975 | ||
| Vulcan Materials Co. | 38,500 | 1,643,469 | ||
| 5,624,444 | ||||
| Communications — 4.8% | ||||
| Lucent Technologies,
Inc. |
69,600 | 4,123,800 | ||
| Tellabs, Inc.* | 75,400 | 5,160,187 | ||
| 9,283,987 | ||||
| Computer Programming Services — 0.2% | ||||
| SAP AG Sponsored† | 9,700 | 455,294 | ||
| Computers & Information — 2.0% | ||||
| Lexmark International
Group, Inc.* |
57,700 | 3,880,325 | ||
| Computers & Office Equipment — 8.0% | ||||
| Hewlett-Packard
Company |
70,900 | 8,853,637 | ||
| International Business
Machines Corp. |
59,600 | 6,529,925 | ||
| 15,383,562 | ||||
| Containers — 1.4% | ||||
| Sealed Air Corp.* | 50,400 | 2,639,700 | ||
| Number of
Shares |
Market Value |
|||
|---|---|---|---|---|
| Cosmetics & Personal Care — 0.3% | ||||
| Gillette Company | 15,400 | $ 538,037 | ||
| Electrical Equipment & Electronics — 7.9% | ||||
| Intel Corp. | 30,100 | 4,023,994 | ||
| Koninklijke Philips
Electronics NV NY Shares |
21,100 | 1,002,250 | ||
| Molex, Inc. | 29,100 | 1,400,437 | ||
| Motorola, Inc. | 118,400 | 3,441,000 | ||
| Texas Instruments, Inc. | 77,700 | 5,337,019 | ||
| 15,204,700 | ||||
| Energy — 0.5% | ||||
| Devon Energy
Corporation |
17,400 | 977,662 | ||
| Financial Services — 13.6% | ||||
| American Express
Company |
186,400 | 9,716,100 | ||
| AvalonBay
Communities, Inc. |
3,200 | 133,600 | ||
| Berkshire Hathaway,
Inc. Cl. A* |
73 | 3,927,400 | ||
| Donaldson, Lufkin &
Jenrette, Inc. |
11,400 | 483,787 | ||
| Household
International, Inc. |
162,600 | 6,758,062 | ||
| Morgan Stanley Dean
Witter & Co. |
61,900 | 5,153,175 | ||
| 26,172,124 | ||||
| Healthcare — 2.3% | ||||
| Bristol-Myers Squibb
Company |
77,700 | 4,526,025 | ||
| Industrial — Diversified — 3.3% | ||||
| Tyco International Ltd. | 133,100 | 6,305,613 | ||
| Insurance — 6.8% | ||||
| American International
Group, Inc. |
64,800 | 7,614,000 | ||
| Chubb Corp. | 12,000 | 738,000 | ||
| Progressive Corp. | 25,700 | 1,901,800 | ||
| Sun Life Financial
Services of Canada* |
16,600 | 280,125 | ||
| Transatlantic
Holdings, Inc. |
30,400 | 2,546,000 | ||
| 13,079,925 | ||||
| Lodging — 0.8% | ||||
| Marriott International,
Inc. Cl. A |
41,100 | 1,482,169 | ||
| Number of
Shares |
Market Value |
|||
|---|---|---|---|---|
| Machinery & Components — 1.4% | ||||
| Applied Materials, Inc.* | 9,600 | $ 870,000 | ||
| Dover Corporation | 48,100 | 1,951,056 | ||
| 2,821,056 | ||||
| Medical Supplies — 1.1% | ||||
| Agilent Technologies,
Inc.* |
28,734 | 2,119,133 | ||
| Pharmaceuticals — 6.3% | ||||
| American Home
Products Corp. |
123,500 | 7,255,625 | ||
| Eli Lilly & Co. | 13,900 | 1,388,263 | ||
| Merck & Co., Inc. | 8,100 | 620,663 | ||
| Pharmacia Corp. | 9,500 | 491,031 | ||
| Smithkline Beecham
Plc Sponsored† |
37,200 | 2,424,975 | ||
| 12,180,557 | ||||
| Prepackaged Software — 1.3% | ||||
| BMC Software, Inc.* | 54,700 | 1,995,697 | ||
| Novell, Inc.* | 50,400 | 466,200 | ||
| 2,461,897 | ||||
| Restaurants — 2.6% | ||||
| McDonald’s Corp. | 152,100 | 5,009,794 | ||
| Retail — 2.4% | ||||
| Costco Wholesale
Corp.* |
141,700 | 4,676,100 | ||
| Telephone Utilities — 1.1% | ||||
| AT&T Corp. | 9,950 | 314,669 | ||
| AT&T Wireless Group* | 20,800 | 579,800 | ||
| Globalstar
Telecommunication Ltd.* |
17,200 | 154,800 | ||
| Loral Space &
Communications* |
49,300 | 342,019 | ||
| Sprint Corp.
(FON Group) |
7,900 | 402,900 | ||
| Worldcom, Inc.* | 9,300 | 426,638 | ||
| 2,220,826 | ||||
| Tobacco — 1.1% | ||||
| Philip Morris
Companies, Inc. |
78,400 | 2,082,500 | ||
| Transportation — 0.1% | ||||
| Kansas City Southern
Industries, Inc. |
1,700 | 150,769 | ||
| TOTAL EQUITIES | ||||
| (Cost $174,243,872) | 170,500,899 | |||
| MassMutual Large Cap Value Fund – Portfolio of Investments (Continued)
|
| Principal
Amount |
Market Value |
|||||
|---|---|---|---|---|---|---|
| SHORT-TERM INVESTMENTS — 10.9% | ||||||
| Cash Equivalents — 2.6% | ||||||
| Bank of America Bank Note** | ||||||
| 6.670% | 03/22/2001 | $ 108,759 | $ 108,759 | |||
| Bank of Montreal
Bank Note** |
||||||
| 6.630% | 08/16/2000 | 181,264 | 181,264 | |||
| Bank of Nova Scotia
Eurodollar Time Deposit** |
||||||
| 7.000% | 07/03/2000 | 217,517 | 217,517 | |||
| Credit Agricole Bank
Eurodollar Time Deposit** |
||||||
| 6.750% | 07/07/2000 | 108,759 | 108,759 | |||
| Den Danske Bank
Eurodollar Time Deposit** |
||||||
| 6.810% | 07/05/2000 | 398,782 | 398,782 | |||
| First Union Bank Note** | ||||||
| 6.900% | 05/09/2001 | 108,759 | 108,759 | |||
| Fleet National Bank
Eurodollar Time Deposit** |
||||||
| 7.260% | 10/31/2000 | 1,182,830 | 1,182,830 | |||
| HypoVereinsbank
Eurodollar Time Deposit** |
||||||
| 6.750% | 07/05/2000 | 906,322 | 906,322 | |||
| Merrimac Money
Market Fund** |
||||||
| 6.440% | 07/03/2000 | 1,138,341 | 1,138,341 | |||
| Morgan Stanley Dean
Witter & Co.** |
||||||
| 6.890% | 07/17/2000 | 217,517 | 217,517 | |||
| Morgan Stanley Dean
Witter & Co.** |
||||||
| 6.910% | 11/22/2000 | 72,506 | 72,506 | |||
| Paribas Bank
Eurodollar Time Deposit** |
||||||
| 6.750% | 07/05/2000 | 435,035 | 435,035 | |||
| 5,076,391 | ||||||
| Principal
Amount |
Market Value |
|||||||
|---|---|---|---|---|---|---|---|---|
| Repurchase Agreement — 8.3% | ||||||||
| Investors Bank & Trust Company
Repurchase Agreement, dated 06/30/00, 6.03%, |
||||||||
| due | 07/03/00 (a) | $15,958,702 | $ 15,958,702 | |||||
| TOTAL SHORT-TERM
INVESTMENTS |
||||||||
| (At Amortized Cost) | 21,035,093 | |||||||
| TOTAL INVESTMENTS — 99.3% | ||||||||
| (Cost $195,278,965)*** | 191,535,992 | |||||||
| Other Assets/
(Liabilities) — 0.7% |
1,395,723 | |||||||
| NET ASSETS — 100.0% | $ 192,931,715 | |||||||
*
|
Non-income producing security.
|
**
|
Represents investment of security lending collateral. (Note 2).
|
***
|
Aggregate cost for Federal tax purposes. (Note 7).
|
†
|
American Depository Receipt
|
(a)
|
Maturity value of $15,966,721. Collateralized by U.S. Government Agency obligations with rates of 7.125-7.309%, maturity dates of
10/20/2023-06/01/2025, and aggregate market value, including accrued interest, of $16,756,638.
|
| June 30, 2000
(Unaudited) |
|||
|---|---|---|---|
| Assets: | |||
| Investments, at value (cost $174,243,872) (Note 2) | $170,500,899 | ||
| Short-term investments, at amortized cost (Note 2) | 21,035,093 | ||
| Total Investments | 191,535,992 | ||
| Cash | 6,562,018 | ||
| Receivables from: | |||
| Interest and dividends | 182,096 | ||
| Total assets | 198,280,106 | ||
| Liabilities: | |||
| Payables for: | |||
| Investments purchased | 145,725 | ||
| Securities on loan (Note 2) | 5,076,391 | ||
| Directors’ fees and expenses (Note 3) | 1,335 | ||
| Affiliates (Note 3): | |||
| Investment management fees | 95,013 | ||
| Administration fees | 14,514 | ||
| Service fees | 63 | ||
| Accrued expenses and other liabilities | 15,350 | ||
| Total liabilities | 5,348,391 | ||
| Net assets | $192,931,715 | ||
| Net assets consist of: | |||
| Paid-in capital | $196,710,741 | ||
| Undistributed net investment income | 187,318 | ||
| Accumulated net realized loss on investments | (223,371 | ) | |
| Net unrealized depreciation on investments | (3,742,973 | ) | |
| $192,931,715 | |||
| Net assets: | |||
| Class A | $ 743,555 | ||
| Class L | $ 12,714,600 | ||
| Class Y | $ 98,861 | ||
| Class S | $179,374,699 | ||
| Shares outstanding: | |||
| Class A | 76,004 | ||
| Class L | 1,300,310 | ||
| Class Y | 10,100 | ||
| Class S | 18,323,161 | ||
| Net asset value, offering price and redemption price per share: | |||
| Class A | $ 9.78 | ||
| Class L | $ 9.78 | ||
| Class Y | $ 9.79 | ||
| Class S | $ 9.79 | ||
| MassMutual Large Cap Value Fund – Financial Statements (Continued)
|
| Period ended
June 30, 2000* (Unaudited) |
|||
|---|---|---|---|
| Investment income: (Note 2) | |||
| Dividends (net of withholding tax of $11) | $ 188,862 | ||
| Interest (including securities lending income of $217) | 190,355 | ||
| Total investment income | 379,217 | ||
| Expenses: (Note 2) | |||
| Investment management fees (Note 3) | 153,981 | ||
| Custody fees | 11,839 | ||
| Audit and legal fees | 2,456 | ||
| Directors’ fees (Note 3) | 1,335 | ||
| 169,611 | |||
| Administration fees (Note 3): | |||
| Class A | 82 | ||
| Class L | 2,912 | ||
| Class Y | 29 | ||
| Class S | 19,202 | ||
| Service fees (Note 3): | |||
| Class A | 63 | ||
| Total expenses | 191,899 | ||
| Net investment income | 187,318 | ||
| Realized and unrealized gain (loss): | |||
| Net realized loss on investment transactions | (223,371 | ) | |
| Net change in unrealized appreciation (depreciation) on investments | (3,742,973 | ) | |
| Net realized and unrealized loss | (3,966,344 | ) | |
| Net decrease in net assets resulting from operations | $(3,779,026 | ) | |
*
|
For the period from May 1, 2000 (commencement of operations) through June 30, 2000.
|
| MassMutual Large Cap Value Fund – Financial Statements (Continued)
|
| Period ended
June 30, 2000* (Unaudited) |
|||
|---|---|---|---|
| Increase (Decrease) in Net Assets: | |||
| Operations: | |||
| Net investment income | $ 187,318 | ||
| Net realized loss on investment transactions | (223,371 | ) | |
| Net change in unrealized appreciation (depreciation) on investments | (3,742,973 | ) | |
| Net decrease in net assets resulting from operations | (3,779,026 | ) | |
| Net fund share transactions (Note 5): | ||
| Class A | 748,777 | |
| Class L | 13,115,362 | |
| Class Y | 101,000 | |
| Class S | 182,745,602 | |
| Increase in net assets from net fund share transactions | 196,710,741 | |
| Total increase in net assets | 192,931,715 | |
| Net assets: | ||
| Beginning of period | - | |
| End of period (including undistributed net investment income of $187,318) | $192,931,715 | |
| * For the period from May 1, 2000 (commencement of operations) through June 30, 2000.
|
| MassMutual Large Cap Value Fund – Financial Statements (Continued)
|
| Class A |
Class L |
Class Y |
Class S |
|||||||||
|---|---|---|---|---|---|---|---|---|---|---|---|---|
| Period ended
6/30/00† (Unaudited) |
Period ended
6/30/00† (Unaudited) |
Period ended
6/30/00† (Unaudited) |
Period ended
6/30/00† (Unaudited) |
|||||||||
| Net asset value, beginning of period | $ 10.00 | $ 10.00 | $ 10.00 | $ 10.00 | ||||||||
| Income (Loss) from investment operations: | ||||||||||||
| Net investment income | 0.01 | *** | 0.01 | *** | 0.01 | *** | 0.01 | *** | ||||
| Net realized and unrealized gain (loss) on investments | (0.23 | ) | (0.23 | ) | (0.22 | ) | (0.22 | ) | ||||
| Total income (loss) from investment operations | (0.22 | ) | (0.22 | ) | (0.21 | ) | (0.21 | ) | ||||
| Net asset value, end of period | $ 9.78 | $ 9.78 | $ 9.79 | $ 9.79 | ||||||||
| Total Return@ | (2.20)% | ** | (2.20)% | ** | (2.10)% | ** | (2.10)% | ** | ||||
| Ratios / Supplemental Data: | ||||||||||||
| Net assets, end of period (000’s) | $ 744 | $12,715 | $ 99 | $179,375 | ||||||||
| Net expenses to average daily net assets | 1.33% | * | 1.06% | * | 0.89% | * | 0.80% | * | ||||
| Net investment income to average daily net assets | 0.36% | * | 0.69% | * | 0.67% | * | 0.80% | * | ||||
| Portfolio turnover rate | 5% | ** | 5% | ** | 5% | ** | 5% | ** | ||||
*
|
Annualized
|
**
|
Percentage represents results for the period and are not annualized.
|
***
|
Per share amount calculated on the average shares method.
|
†
|
For the period from May 1, 2000 (commencement of operations) through June 30, 2000.
|
@
|
Employee retirement benefits plans that invest plan assets in the Separate Investment Accounts (SIAs) may be subject to certain
charges as set forth in their respective Plan Documents. Total return figures would be lower for the periods presented if they reflected these charges.
|
Ÿ
|
achieve long-term growth of capital through performance that closely tracks that of the Standard & Poor’s 500 Index
|
Ÿ
|
invest in a portfolio of equity securities mirroring the composition and sector weightings of the Standard & Poor’s 500
Index
|
| MassMutual Indexed Equity Fund – Portfolio Manager Report (Continued)
|
| MassMutual Indexed Equity Fund
|
| Largest Stock Holdings (6/30/00)
|
| General Electric Company
|
| Intel Corp.
|
| Cisco Systems, Inc.
|
| Microsoft Corp.
|
| Pfizer, Inc.
|
| Exxon Mobil Corp.
|
| Wal-Mart Stores, Inc.
|
| Oracle Corporation
|
| Citigroup, Inc.
|
| Nortel Networks Corporation
|
| MassMutual Indexed Equity Fund – Portfolio Manager Report (Continued)
|
| Year-To-Date | One Year | Since Inception
Average Annual |
|||||
|---|---|---|---|---|---|---|---|
| 1/1/00 - 6/30/00 | 7/1/99 - 6/30/00 | 3/1/98 - 6/30/00 | |||||
| Class S | -0.72% | 6.74% | 16.00% | ||||
| Class A | -0.94% | 6.32% | 15.40% | ||||
| Class Y | -0.65% | 6.73% | 15.91% | ||||
| Standard & Poor’s
500 Composite Index |
-0.42% | 7.25% | 16.56% | ||||
| Year-To-Date | Since Inception | ||||
|---|---|---|---|---|---|
| 1/1/00 - 6/30/00 | 7/1/99 - 6/30/00 | ||||
| Class L | -0.72% | 6.58% | |||
| Standard & Poor’s
500 Composite Index |
-0.42% | 7.25% | |||
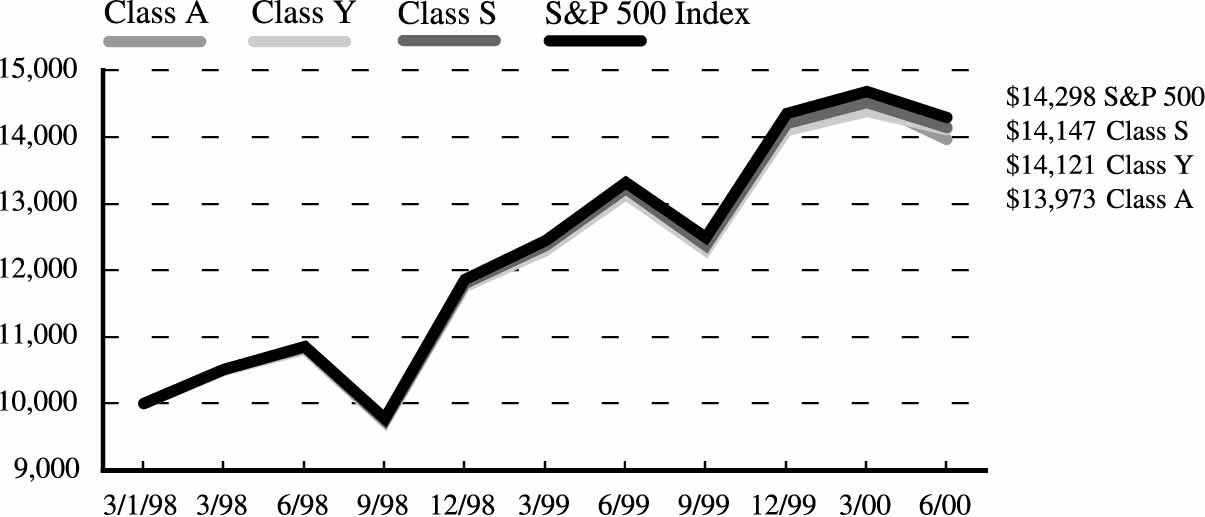
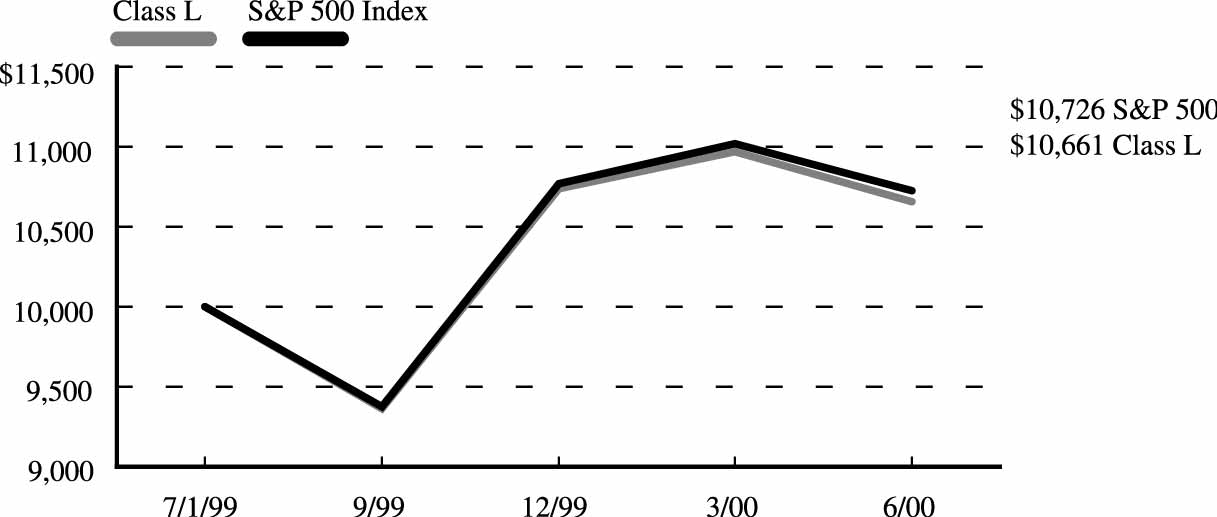
| Number of
Shares |
Market Value |
|||
|---|---|---|---|---|
| EQUITIES — 98.6% | ||||
| Advertising — 0.3% | ||||
| Interpublic Group
Cos., Inc. |
18,900 | $ 812,700 | ||
| Omnicom Group, Inc. | 12,000 | 1,068,750 | ||
| Young & Rubicam,
Inc. |
4,700 | 268,781 | ||
| 2,150,231 | ||||
| Aerospace & Defense — 0.8% | ||||
| Boeing Co. | 58,900 | 2,462,756 | ||
| General Dynamics
Corp. |
13,800 | 721,050 | ||
| Goodrich (B.F.) Co. | 7,500 | 255,469 | ||
| Honeywell
International, Inc. |
53,600 | 1,805,650 | ||
| Lockheed Martin
Corporation |
27,100 | 672,419 | ||
| Northrop Grumman
Corp. |
4,800 | 318,000 | ||
| Raytheon Co. Cl. B | 23,300 | 448,525 | ||
| TRW, Inc. | 8,400 | 364,350 | ||
| 7,048,219 | ||||
| Air Transportation — 0.2% | ||||
| AMR Corp./Del* | 10,100 | 267,019 | ||
| Delta Air Lines, Inc. | 8,700 | 439,894 | ||
| Southwest Airlines Co. | 34,100 | 645,769 | ||
| US Airways Group,
Inc.* |
4,800 | 187,200 | ||
| 1,539,882 | ||||
| Apparel, Textiles & Shoes — 0.5% | ||||
| Gap, Inc. | 57,500 | 1,796,875 | ||
| LIZ Claiborne, Inc. | 4,300 | 151,575 | ||
| Limited, Inc. | 29,200 | 631,450 | ||
| Nike, Inc. Cl. B | 18,900 | 752,456 | ||
| Nordstrom, Inc. | 9,200 | 221,950 | ||
| Reebok International
Ltd.* |
4,200 | 66,937 | ||
| Russell Corp. | 2,000 | 40,000 | ||
| Springs Industries,
Inc. Cl. A |
1,100 | 35,200 | ||
| VF Corporation | 8,100 | 192,881 | ||
| 3,889,324 | ||||
| Automotive & Parts — 0.9% | ||||
| Cooper Tire & Rubber
Company |
5,000 | 55,625 | ||
| Dana Corp. | 11,700 | 247,894 | ||
| Delphi Automotive
Systems Corporation |
39,400 | 573,762 | ||
| Number of
Shares |
Market Value |
|||
|---|---|---|---|---|
| Ford Motor Company | 81,900 | $ 3,521,700 | ||
| General Motors Corp. | 36,100 | 2,096,056 | ||
| Genuine Parts Co. | 12,300 | 246,000 | ||
| Goodyear Tire &
Rubber Company |
10,600 | 212,000 | ||
| Navistar International
Corp.* |
4,600 | 142,887 | ||
| Paccar, Inc. | 5,500 | 218,281 | ||
| Visteon Corp.* | 10,723 | 130,022 | ||
| 7,444,227 | ||||
| Banking, Savings & Loans — 6.3% | ||||
| Amsouth
Bancorporation |
26,600 | 418,950 | ||
| Bank of America
Corp. |
111,800 | 4,807,400 | ||
| The Bank of New
York Company, Incorporated |
49,800 | 2,315,700 | ||
| Bank One Corp. | 77,500 | 2,058,594 | ||
| BB&T Corporation | 23,600 | 563,450 | ||
| Capital One Financial
Corp. |
13,600 | 606,900 | ||
| Charter One
Financial, Inc. |
14,200 | 326,600 | ||
| Chase Manhattan
Corp. |
83,950 | 3,866,947 | ||
| Citigroup, Inc. | 227,700 | 13,718,925 | ||
| Comerica,
Incorporated |
10,600 | 475,675 | ||
| Fifth Third Bancorp | 20,900 | 1,321,925 | ||
| First Union Corp. | 66,700 | 1,654,994 | ||
| Firstar Corporation | 66,300 | 1,396,444 | ||
| Fleet Boston Financial
Corp. |
61,800 | 2,101,200 | ||
| Federal Home Loan
Mortgage Corp. |
47,100 | 1,907,550 | ||
| Golden West Financial
Corp. |
10,900 | 444,856 | ||
| Huntington
Bancshares, Inc. |
15,600 | 246,675 | ||
| KeyCorp | 30,400 | 535,800 | ||
| Mellon Financial
Corp. |
33,100 | 1,206,081 | ||
| National City Corp. | 41,800 | 713,213 | ||
| Northern Trust Corp. | 15,000 | 975,937 | ||
| Old Kent Financial
Corp. |
9,450 | 252,787 | ||
| PNC Financial
Services Group |
19,900 | 932,813 | ||
| Number of
Shares |
Market Value |
|||
|---|---|---|---|---|
| Providian Financial
Corp. |
9,700 | $ 873,000 | ||
| Regions Financial
Corp. |
14,900 | 296,138 | ||
| SouthTrust Corp. | 11,500 | 260,188 | ||
| State Street Corp. | 10,800 | 1,145,475 | ||
| Summit Bancorp | 11,900 | 293,038 | ||
| Suntrust Banks, Inc. | 20,400 | 932,025 | ||
| Synovus Financial
Corp. |
19,100 | 336,638 | ||
| U.S. Bancorp | 51,000 | 981,750 | ||
| Union Planters Corp. | 9,600 | 268,200 | ||
| Wachovia Corp. | 13,800 | 748,650 | ||
| Washington Mutual,
Inc. |
36,900 | 1,065,487 | ||
| Wells Fargo &
Company |
108,700 | 4,212,125 | ||
| 54,262,130 | ||||
| Beverages — 2.0% | ||||
| Anheuser-Busch
Companies, Inc. |
30,500 | 2,277,969 | ||
| Brown-Forman
Corporation Cl. B |
4,700 | 252,625 | ||
| Coca-Cola Company,
The |
166,600 | 9,569,088 | ||
| Coca-Cola
Enterprises, Inc. |
28,700 | 468,169 | ||
| Coors (Adolph) Cl. B | 2,500 | 151,250 | ||
| Pepsico, Inc. | 98,200 | 4,363,762 | ||
| 17,082,863 | ||||
| Broadcasting, Publishing & Printing — 2.1% | ||||
| American Greetings
Corp. Cl. A |
4,400 | 83,600 | ||
| Clear Channel
Communications, Inc.* |
22,900 | 1,717,500 | ||
| Comcast Corp. Cl. A* | 60,600 | 2,454,300 | ||
| Dow Jones & Co., Inc. | 6,000 | 439,500 | ||
| Gannett Co., Inc. | 18,000 | 1,076,625 | ||
| Harcourt General, Inc. | 4,800 | 261,000 | ||
| Knight Ridder, Inc. | 5,200 | 276,575 | ||
| The McGraw-Hill
Companies, Inc. |
13,300 | 718,200 | ||
| MediaOne Group, Inc.* | 41,700 | 2,765,283 | ||
| Meredith Corp. | 3,500 | 118,125 | ||
| New York Times Co.
Cl. A |
11,600 | 458,200 | ||
| Times Mirror
Company Cl. A |
4,100 | 358,750 | ||
| MassMutual Indexed Equity Fund – Portfolio of Investments (Continued)
|
| Number of
Shares |
Market Value |
|||
|---|---|---|---|---|
| Tribune Co. | 16,000 | $ 560,000 | ||
| Viacom, Inc. Cl. B* | 103,124 | 7,031,768 | ||
| 18,319,426 | ||||
| Building Materials & Construction — 1.2% | ||||
| Centex Corp. | 4,000 | 94,000 | ||
| Home Depot Inc. | 155,400 | 7,760,288 | ||
| Kaufman & Broad
Home Corp. |
3,300 | 65,381 | ||
| Louisiana-Pacific
Corp. |
7,400 | 80,475 | ||
| Lowe’s Companies, Inc. | 25,800 | 1,059,413 | ||
| Masco Corp. | 30,200 | 545,488 | ||
| Owens Corning | 3,700 | 34,225 | ||
| Vulcan Materials Co. | 6,700 | 286,006 | ||
| 9,925,276 | ||||
| Chemicals — 0.9% | ||||
| Air Products and
Chemicals, Inc. |
15,400 | 474,512 | ||
| Ashland, Inc. | 4,700 | 164,794 | ||
| Dow Chemical
Company |
44,100 | 1,331,269 | ||
| E. I. du Pont de
Nemours and Company |
70,500 | 3,084,375 | ||
| Eastman Chemical
Company |
5,200 | 248,300 | ||
| Engelhard
Corporation |
8,500 | 145,031 | ||
| FMC Corp.* | 2,100 | 121,800 | ||
| Great Lakes Chemical
Corp. |
3,700 | 116,550 | ||
| Hercules, Inc. | 7,100 | 99,844 | ||
| International Flavors
& Fragrances, Inc. |
7,100 | 214,331 | ||
| PPG Industries, Inc. | 11,700 | 518,456 | ||
| Praxair, Inc. | 10,700 | 400,581 | ||
| Rohm & Haas
Company |
14,700 | 507,150 | ||
| Union Carbide Corp. | 9,000 | 445,500 | ||
| W.R. Grace &
Company* |
4,800 | 58,200 | ||
| 7,930,693 | ||||
| Commercial Services — 0.6% | ||||
| Allied Waste
Industries, Inc.* |
12,300 | 123,000 | ||
| Block H & R, Inc. | 7,000 | 226,625 | ||
| Cendant Corporation | 48,400 | 677,600 | ||
| Convergys
Corporation* |
10,300 | 534,312 | ||
| Donnelley (R.R.) &
Sons Co. |
8,500 | 191,781 | ||
| Number of
Shares |
Market Value |
|||
|---|---|---|---|---|
| Dun & Bradstreet
Corp. |
10,900 | $ 312,012 | ||
| Ecolab, Inc. | 8,700 | 339,844 | ||
| Equifax, Inc. | 9,900 | 259,875 | ||
| Fluor Corporation | 5,100 | 161,288 | ||
| Ikon Office Solutions,
Inc. |
7,567 | 29,322 | ||
| Paychex, Inc. | 24,950 | 1,047,900 | ||
| PerkinElmer, Inc. | 3,300 | 218,213 | ||
| Quintiles
Transnational Corp.* |
7,700 | 108,762 | ||
| Ryder System, Inc. | 4,700 | 89,006 | ||
| Waste Management,
Inc. |
43,900 | 834,100 | ||
| 5,153,640 | ||||
| Communications — 6.3% | ||||
| ADC
Telecommunications, Inc.* |
20,300 | 1,702,662 | ||
| Andrew Corp.* | 5,400 | 181,237 | ||
| Global Crossing Ltd.* | 57,100 | 1,502,444 | ||
| GTE Corporation | 64,900 | 4,040,025 | ||
| Lucent Technologies,
Inc. |
218,400 | 12,940,200 | ||
| Network Appliance,
Inc.* |
20,600 | 1,658,300 | ||
| Nextel
Communications, Inc. Cl. A* |
50,200 | 3,071,612 | ||
| Nortel Networks
Corporation |
198,900 | 13,574,925 | ||
| Qualcomm, Inc.* | 49,800 | 2,988,000 | ||
| SBC Communications,
Inc. |
230,300 | 9,960,475 | ||
| Scientific-Atlanta, Inc. | 10,700 | 797,150 | ||
| Tellabs, Inc.* | 27,100 | 1,854,656 | ||
| 54,271,686 | ||||
| Computer Integrated Systems Design — 1.7% | ||||
| 3com Corp.* | 23,100 | 1,331,138 | ||
| Autodesk, Inc. | 4,200 | 145,687 | ||
| Cabletron Systems* | 12,300 | 310,575 | ||
| Computer Sciences
Corp.* |
11,300 | 843,969 | ||
| Parametric
Technology Corp.* |
19,000 | 209,000 | ||
| Sapient Corp.* | 3,900 | 417,056 | ||
| Shared Medical
Systems Corp. |
1,900 | 138,581 | ||
| Sun Microsystems,
Inc.* |
106,500 | 9,684,844 | ||
| Number of
Shares |
Market Value |
|||
|---|---|---|---|---|
| Teradyne, Inc.* | 11,600 | $ 852,600 | ||
| Unisys Corporation* | 21,100 | 307,269 | ||
| 14,240,719 | ||||
| Computer Programming Services — 0.1% | ||||
| Mercury Interactive
Corp.* |
4,700 | 454,725 | ||
| Computers & Information — 6.9% | ||||
| Apple Computer, Inc.* | 21,800 | 1,141,775 | ||
| Cisco Systems, Inc.* | 470,300 | 29,893,444 | ||
| Compaq Computer
Corp. |
114,300 | 2,921,794 | ||
| Comverse Technology,
Inc.* |
10,300 | 957,900 | ||
| Dell Computer Corp.* | 173,100 | 8,535,994 | ||
| EMC Corp.* | 145,500 | 11,194,406 | ||
| Gateway, Inc.* | 21,400 | 1,214,450 | ||
| Lexmark International
Group, Inc.* |
8,600 | 578,350 | ||
| Seagate Technology, Inc.* | 15,000 | 825,000 | ||
| Solectron Corp.* | 40,000 | 1,675,000 | ||
| 58,938,113 | ||||
| Computers & Office Equipment — 2.9% | ||||
| Electronic Data
Systems Corporation |
31,800 | 1,311,750 | ||
| Hewlett-Packard
Company |
67,800 | 8,466,525 | ||
| International Business
Machines Corporation |
119,600 | 13,103,675 | ||
| Pitney Bowes, Inc. | 17,900 | 716,000 | ||
| Xerox Corp. | 44,800 | 929,600 | ||
| 24,527,550 | ||||
| Containers — 0.1% | ||||
| Ball Corp. | 2,100 | 67,594 | ||
| Bemis Company, Inc. | 3,700 | 124,413 | ||
| Crown Cork & Seal
Company, Inc. |
8,700 | 130,500 | ||
| Owens-Illinois, Inc.* | 10,100 | 118,044 | ||
| Pactiv Corporation* | 11,900 | 93,713 | ||
| Sealed Air Corp.* | 5,600 | 293,300 | ||
| Temple-Inland, Inc. | 3,900 | 163,800 | ||
| 991,364 | ||||
| Cosmetics & Personal Care — 1.5% | ||||
| Alberto-Culver Co.
Cl. B |
3,800 | 116,137 | ||
| Avon Products, Inc | 16,300 | 725,350 | ||
| Colgate-Palmolive
Company |
39,300 | 2,353,088 | ||
| Gillette Company | 70,400 | 2,459,600 | ||
| MassMutual Indexed Equity Fund – Portfolio of Investments (Continued)
|
| Number of
Shares |
Market Value |
|||
|---|---|---|---|---|
| Kimberly-Clark
Corporation |
37,500 | $ 2,151,562 | ||
| Procter & Gamble
Company, The |
88,800 | 5,083,800 | ||
| 12,889,537 | ||||
| Data Processing and Preparation — 0.5% | ||||
| Automatic Data
Processing, Inc. |
42,500 | 2,276,406 | ||
| Ceridian Corp.* | 9,800 | 235,812 | ||
| Deluxe Corp. | 4,900 | 115,456 | ||
| First Data Corp. | 28,300 | 1,404,388 | ||
| IMS Health, Inc. | 20,800 | 374,400 | ||
| NCR Corporation* | 6,600 | 256,987 | ||
| 4,663,449 | ||||
| Electric Utilities — 1.6% | ||||
| AES Corp.* | 28,900 | 1,318,562 | ||
| Ameren Corporation | 9,300 | 313,875 | ||
| American Electric
Power Company |
21,840 | 647,010 | ||
| C P & L Energy, Inc. | 10,800 | 344,925 | ||
| Cinergy Corp. | 10,800 | 274,725 | ||
| CMS Energy Corp. | 7,900 | 174,788 | ||
| Consolidated Edison,
Inc. |
14,900 | 441,412 | ||
| Constellation Energy
Group, Inc. |
10,200 | 332,138 | ||
| Dominion Resources,
Inc. |
16,100 | 690,287 | ||
| DTE Energy Company | 9,900 | 302,569 | ||
| Duke Energy
Corporation |
24,700 | 1,392,462 | ||
| Edison International | 23,600 | 483,800 | ||
| Entergy Corp. | 16,700 | 454,031 | ||
| FirstEnergy
Corporation |
15,800 | 369,325 | ||
| Florida Progress Corp. | 6,600 | 309,375 | ||
| FPL Group, Inc. | 12,200 | 603,900 | ||
| GPU, Inc. | 8,400 | 227,325 | ||
| New Century Energies,
Inc. |
7,800 | 234,000 | ||
| Niagara Mohawk
Holdings, Inc.* |
12,100 | 168,644 | ||
| Northern States Power
Company |
10,600 | 213,988 | ||
| PECO Energy Co. | 11,400 | 459,562 | ||
| PG&E Corp. | 26,000 | 640,250 | ||
| Pinnacle West Capital
Corporation |
5,700 | 193,087 | ||
| PPL Corporation | 9,800 | 214,987 | ||
| Public Service
Enterprise Group |
14,800 | 512,450 | ||
| Number of
Shares |
Market Value |
|||
|---|---|---|---|---|
| Reliant Energy, Inc. | 20,000 | $ 591,250 | ||
| Southern Co. | 43,700 | 1,018,756 | ||
| TXU Corporation | 18,200 | 536,900 | ||
| Unicom Corporation | 12,000 | 464,250 | ||
| 13,928,633 | ||||
| Electrical Equipment & Electronics — 11.5% | ||||
| Adaptec, Inc.* | 7,000 | 159,250 | ||
| Advanced Micro
Devices* |
9,900 | 764,775 | ||
| Altera Corp.* | 13,500 | 1,375,312 | ||
| American Power
Conversion Corp.* |
11,900 | 485,669 | ||
| Analog Devices, Inc.* | 23,500 | 1,786,000 | ||
| Conexant Systems, Inc.* | 14,400 | 700,200 | ||
| Emerson Electric Co. | 29,100 | 1,756,912 | ||
| General Electric
Company |
667,400 | 35,372,200 | ||
| Intel Corp. | 225,300 | 30,119,794 | ||
| Johnson Controls, Inc. | 6,100 | 313,006 | ||
| Kla-Tencor Corp.* | 12,400 | 726,175 | ||
| Linear Technology
Corp. |
21,000 | 1,342,687 | ||
| LSI Logic Corp.* | 20,100 | 1,087,912 | ||
| Maxim Intergrated
Products* |
18,700 | 1,270,431 | ||
| Micron Technology,
Inc.* |
38,100 | 3,355,181 | ||
| MIPS Technologies,
Inc. Cl. B* |
1,829 | 70,416 | ||
| Molex, Inc. | 13,300 | 640,062 | ||
| Motorola, Inc. | 143,500 | 4,170,469 | ||
| National
Semiconductor Corp.* |
12,900 | 732,075 | ||
| Novellus Systems, Inc.* | 7,800 | 441,188 | ||
| PE Corp.-PE
Biosystems Group |
14,000 | 922,250 | ||
| Rockwell
International Corp. |
12,800 | 403,200 | ||
| Sanmina Corp.* | 8,700 | 743,850 | ||
| Texas Instruments, Inc. | 109,600 | 7,528,150 | ||
| Thomas & Betts Corp. | 3,900 | 74,587 | ||
| Xilinx, Inc.* | 21,700 | 1,791,606 | ||
| 98,133,357 | ||||
| Energy — 6.0% | ||||
| Amerada Hess Corp. | 6,200 | 382,850 | ||
| Anadarko Petroleum
Corp. |
8,700 | 429,019 | ||
| Apache Corporation | 7,800 | 458,738 | ||
| Burlington Resources,
Inc. |
14,700 | 562,275 | ||
| Number of
Shares |
Market Value |
|||
|---|---|---|---|---|
| Chevron Corporation | 44,300 | $ 3,757,194 | ||
| Coastal Corp. | 14,400 | 876,600 | ||
| Columbia Energy
Group |
5,600 | 367,500 | ||
| Conoco, Inc. Cl. B | 42,300 | 1,038,994 | ||
| Eastern Enterprises | 1,800 | 113,400 | ||
| EL Paso Energy
Corporation |
15,500 | 789,531 | ||
| Enron Corp. | 48,400 | 3,121,800 | ||
| Exxon Mobil Corp. | 234,800 | 18,431,800 | ||
| Halliburton Co. | 30,000 | 1,415,625 | ||
| Kerr-McGee Corp. | 6,500 | 383,094 | ||
| Nicor, Inc. | 3,300 | 107,663 | ||
| Occidental Petroleum
Corp. |
25,000 | 526,562 | ||
| Oneok, Inc. | 2,200 | 57,063 | ||
| Peoples Energy Corp. | 2,500 | 80,938 | ||
| Phillips Petroleum Co. | 17,200 | 871,825 | ||
| Rowan Cos., Inc.* | 6,300 | 191,363 | ||
| Royal Dutch
Petroleum Company NY Shares |
144,800 | 8,914,250 | ||
| Schlumberger Ltd. | 37,200 | 2,776,050 | ||
| Sempra Energy | 13,900 | 236,300 | ||
| Sunoco, Inc. | 6,100 | 179,569 | ||
| Texaco, Inc. | 37,300 | 1,986,225 | ||
| Tosco Corp. | 9,900 | 280,294 | ||
| Transocean Sedco
Forex, Inc. |
14,300 | 764,156 | ||
| Union Pacific
Resources Group |
17,200 | 378,400 | ||
| Unocal Corporation | 16,500 | 546,563 | ||
| USX-Marathon Group | 21,000 | 526,312 | ||
| The Williams
Companies, Inc. |
29,500 | 1,229,781 | ||
| 51,781,734 | ||||
| Entertainment & Leisure — 1.5% | ||||
| Brunswick Corp. | 6,200 | 102,687 | ||
| Harley-Davidson, Inc. | 20,400 | 785,400 | ||
| Harrah’s
Entertainment Inc.* |
8,700 | 182,156 | ||
| Polaroid Corp. | 3,000 | 54,188 | ||
| Time Warner, Inc. | 87,500 | 6,650,000 | ||
| Walt Disney Company,
The |
139,600 | 5,418,225 | ||
| 13,192,656 | ||||
| Financial Services — 3.5% | ||||
| American Express
Company |
90,700 | 4,727,738 | ||
| American General
Corporation |
16,600 | 1,012,600 | ||
| MassMutual Indexed Equity Fund – Portfolio of Investments (Continued)
|
| Number of
Shares |
Market Value |
|||
|---|---|---|---|---|
| Associates First
Capital Corp. Cl. A |
49,500 | $ 1,104,469 | ||
| Bear Stearns
Companies, Inc. |
7,700 | 320,513 | ||
| Countrywide Credit
Industries, Inc. |
7,900 | 239,469 | ||
| Federal National
Mortgage Association |
68,000 | 3,548,750 | ||
| Franklin Resources,
Inc. |
16,900 | 513,338 | ||
| Household
International, Inc. |
32,000 | 1,330,000 | ||
| Lehman Brothers
Holdings, Inc. |
8,100 | 765,956 | ||
| MBNA Corp. | 54,400 | 1,475,600 | ||
| Merrill Lynch & Co.
Inc. |
25,400 | 2,921,000 | ||
| J.P. Morgan &
Company |
10,900 | 1,200,363 | ||
| Morgan Stanley Dean
Witter & Co. |
76,900 | 6,401,925 | ||
| Paine Webber Group,
Inc. |
9,700 | 441,350 | ||
| Price (T. Rowe)
Associates |
8,200 | 348,500 | ||
| Schwab (Charles)
Corp. |
89,900 | 3,022,887 | ||
| SLM Holding Corp. | 11,000 | 411,812 | ||
| 29,786,270 | ||||
| Foods — 1.6% | ||||
| Archer-Daniels-
Midland |
41,000 | 402,312 | ||
| Bestfoods | 18,800 | 1,301,900 | ||
| Campbell Soup
Company |
28,800 | 838,800 | ||
| ConAgra, Inc. | 33,200 | 632,875 | ||
| General Mills, Inc. | 20,300 | 776,475 | ||
| Great Atlantic &
Pacific TEA Co. |
2,600 | 43,225 | ||
| Heinz (H. J.)
Company |
23,900 | 1,045,625 | ||
| Hershey Foods Corp. | 9,300 | 451,050 | ||
| Kellogg Co. | 27,300 | 812,175 | ||
| The Kroger Co.* | 56,300 | 1,242,119 | ||
| Nabisco Group
Holdings Corp. |
22,000 | 570,625 | ||
| Quaker Oats Co. | 9,000 | 676,125 | ||
| Ralston-Ralston
Purina Group |
20,400 | 406,725 | ||
| Safeway, Inc.* | 34,300 | 1,547,788 | ||
| Sara Lee Corp. | 58,700 | 1,133,644 | ||
| Starbucks Corp.* | 12,400 | 473,525 | ||
| Number of
Shares |
Market Value |
|||
|---|---|---|---|---|
| SuperValu, Inc. | 9,400 | $ 179,188 | ||
| Sysco Corp. | 22,300 | 939,387 | ||
| Wrigley (WM.) JR Co. | 7,800 | 625,463 | ||
| 14,099,026 | ||||
| Forest Products & Paper — 0.4% | ||||
| Boise Cascade Corp. | 4,000 | 103,500 | ||
| Fort James
Corporation |
14,700 | 339,938 | ||
| Georgia-Pacific Group | 11,700 | 307,125 | ||
| International Paper
Company |
32,597 | 971,798 | ||
| Mead Corp. | 7,000 | 176,750 | ||
| Potlatch Corp. | 2,100 | 69,563 | ||
| Westvaco Corporation | 6,800 | 168,725 | ||
| Weyerhaeuser
Company |
15,900 | 683,700 | ||
| Willamette Industries,
Inc. |
7,600 | 207,100 | ||
| 3,028,199 | ||||
| Healthcare — 1.9% | ||||
| Becton, Dickinson
and Company |
17,000 | 487,688 | ||
| Bristol-Myers Squibb
Company |
133,100 | 7,753,075 | ||
| The Healthcare
Company |
38,100 | 1,157,288 | ||
| Healthsouth Corp.* | 26,200 | 188,312 | ||
| Humana, Inc.* | 11,600 | 56,550 | ||
| Manor Care, Inc.* | 7,100 | 49,700 | ||
| Schering-Plough Corp. | 99,200 | 5,009,600 | ||
| Tenet Healthcare
Corporation |
21,100 | 569,700 | ||
| UnitedHealth Group
Incorporated |
10,900 | 934,675 | ||
| Wellpoint Health
Networks* |
4,400 | 318,725 | ||
| 16,525,313 | ||||
| Holding Company – Diversified — 0.2% | ||||
| Seagram Co. Ltd. | 29,600 | 1,716,800 | ||
| Home Construction, Furnishings &
Appliances — 0.1% |
||||
| Armstrong Holdings, Inc. | 2,700 | 41,344 | ||
| Leggett & Platt, Inc. | 13,300 | 219,450 | ||
| Maytag Corp. | 5,700 | 210,188 | ||
| Pulte Corp. | 2,900 | 62,712 | ||
| Whirlpool Corp. | 5,000 | 233,125 | ||
| 766,819 | ||||
| Household Products — 0.9% | ||||
| The Clorox Company | 15,900 | 712,519 | ||
| Corning Incorporated | 18,600 | 5,019,675 | ||
| Number of
Shares |
Market Value |
|||
|---|---|---|---|---|
| Snap-On, Inc. | 4,200 | $ 111,825 | ||
| Tupperware Corp. | 3,900 | 85,800 | ||
| Unilever NV NY Shares | 38,600 | 1,659,800 | ||
| 7,589,619 | ||||
| Industrial – Distribution — 0.0% | ||||
| W.W. Grainger, Inc. | 6,300 | 194,119 | ||
| Industrial – Diversified — 0.8% | ||||
| Illinois Tool Works,
Inc. |
20,400 | 1,162,800 | ||
| McDermott
International, Inc. |
4,400 | 38,775 | ||
| Tyco International Ltd. | 114,200 | 5,410,225 | ||
| 6,611,800 | ||||
| Information Retrieval Services — 1.5% | ||||
| America Online Inc.* | 155,900 | 8,223,725 | ||
| Yahoo!, Inc.* | 36,500 | 4,521,437 | ||
| 12,745,162 | ||||
| Insurance — 2.8% | ||||
| Aetna, Inc. | 9,600 | 616,200 | ||
| Aflac, Inc. | 17,900 | 822,281 | ||
| Allstate Corp. | 50,200 | 1,116,950 | ||
| American
International Group, Inc. |
104,000 | 12,220,000 | ||
| AON Corp. | 17,600 | 546,700 | ||
| Chubb Corp. | 12,100 | 744,150 | ||
| CIGNA Corporation | 11,400 | 1,065,900 | ||
| Cincinnati Financial
Corp. |
11,400 | 358,387 | ||
| Conseco, Inc. | 22,100 | 215,475 | ||
| The Hartford
Financial Services Group, Inc. |
15,100 | 844,656 | ||
| Jefferson-Pilot
Corporation |
7,200 | 406,350 | ||
| Lincoln National
Corp. |
13,200 | 476,850 | ||
| Loews Corp. | 7,300 | 438,000 | ||
| Marsh & McLennan
Companies, Inc. |
18,100 | 1,890,319 | ||
| MBIA, Inc. | 6,900 | 332,494 | ||
| MGIC Investment
Corp. |
7,300 | 332,150 | ||
| Progressive Corp. | 5,000 | 370,000 | ||
| Safeco Corp. | 8,900 | 176,888 | ||
| St. Paul Companies | 14,300 | 487,987 | ||
| Torchmark Corp. | 8,900 | 219,719 | ||
| UnumProvident Corp. | 16,200 | 325,013 | ||
| 24,006,469 | ||||
| MassMutual Indexed Equity Fund – Portfolio of Investments (Continued)
|
| Number of
Shares |
Market Value |
|||
|---|---|---|---|---|
| Lodging — 0.1% | ||||
| Hilton Hotels Corp. | 24,800 | $ 232,500 | ||
| Marriott International,
Inc. Cl. A |
16,800 | 605,850 | ||
| 838,350 | ||||
| Machinery & Components — 1.3% | ||||
| Applied Materials, Inc.* | 54,200 | 4,911,875 | ||
| Baker Hughes, Inc. | 22,600 | 723,200 | ||
| Black & Decker
Corporation |
5,800 | 228,012 | ||
| Briggs & Stratton Corp. | 1,700 | 58,225 | ||
| Caterpillar, Inc. | 24,100 | 816,388 | ||
| Cummins Engine Co.,
Inc. |
2,800 | 76,300 | ||
| Danaher Corporation | 9,600 | 474,600 | ||
| Deere & Co. | 16,600 | 614,200 | ||
| Dover Corporation | 13,800 | 559,762 | ||
| Ingersoll-Rand Co. | 11,200 | 450,800 | ||
| Pall Corporation | 8,600 | 159,100 | ||
| Parker-Hannifin
Corporation |
7,700 | 263,725 | ||
| The Stanley Works | 6,200 | 147,250 | ||
| Timken Co. | 4,500 | 83,813 | ||
| United Technologies
Corp. |
32,200 | 1,895,775 | ||
| 11,463,025 | ||||
| Manufacturing — 0.0% | ||||
| Millipore Corp. | 3,100 | 233,662 | ||
| Manufacturing – Diversified — 0.2% | ||||
| Cooper Industries, Inc. | 6,300 | 205,144 | ||
| Eaton Corp. | 4,900 | 328,300 | ||
| ITT Industries, Inc. | 6,100 | 185,288 | ||
| National Service
Industries, Inc. |
2,800 | 54,600 | ||
| Textron, Inc. | 10,100 | 548,556 | ||
| 1,321,888 | ||||
| Medical Supplies — 1.4% | ||||
| Agilent Technologies,
Inc.* |
30,507 | 2,249,891 | ||
| Allergan, Inc. | 8,900 | 663,050 | ||
| Bard (C.R.), Inc. | 3,500 | 168,438 | ||
| Bausch & Lomb Inc. | 3,600 | 278,550 | ||
| Baxter International, Inc. | 19,600 | 1,378,125 | ||
| Biomet, Inc. | 7,600 | 292,125 | ||
| Boston Scientific Corp.* | 28,000 | 614,250 | ||
| Guidant Corp.* | 20,800 | 1,029,600 | ||
| Mallinckrodt Group, Inc. | 4,700 | 204,156 | ||
| Number of
Shares |
Market Value |
|||
|---|---|---|---|---|
| Medtronic, Inc. | 80,500 | $ 4,009,906 | ||
| St. Jude Medical, Inc.* | 5,600 | 256,900 | ||
| Tektronix, Inc. | 3,200 | 236,800 | ||
| Thermo Electron Corp.* | 10,700 | 225,369 | ||
| 11,607,160 | ||||
| Metals & Mining — 0.5% | ||||
| Alcan Aluminium Ltd. | 14,700 | 455,700 | ||
| Alcoa, Inc. | 59,640 | 1,729,560 | ||
| Allegheny
Technologies, Inc. |
5,600 | 100,800 | ||
| Barrick Gold Corp. | 26,600 | 483,787 | ||
| Bethlehem Steel Corp.* | 8,800 | 31,350 | ||
| Crane Co. | 4,500 | 109,406 | ||
| Freeport-McMoran
Copper & Gold, Inc. Cl. B* |
11,000 | 101,750 | ||
| Homestake Mining
Company |
17,400 | 119,625 | ||
| Inco Ltd.* | 13,000 | 199,875 | ||
| Newmont Mining
Corp. |
11,300 | 244,362 | ||
| Nucor Corp. | 5,800 | 192,487 | ||
| Phelps Dodge Corp. | 5,400 | 200,812 | ||
| Placer Dome, Inc. | 22,000 | 210,375 | ||
| USX-U.S. Steel Group,
Inc. |
5,900 | 109,519 | ||
| Worthington
Industries, Inc. |
6,000 | 63,000 | ||
| 4,352,408 | ||||
| Miscellaneous — 0.3% | ||||
| Avery-Dennison Corp. | 7,600 | 510,150 | ||
| Minnesota Mining &
Manufacturing Co. |
26,900 | 2,219,250 | ||
| 2,729,400 | ||||
| Pharmaceuticals — 8.5% | ||||
| Abbott Laboratories | 103,700 | 4,621,131 | ||
| Alza Corp.* | 6,900 | 407,963 | ||
| American Home
Products Corp. |
88,200 | 5,181,750 | ||
| Amgen, Inc.* | 69,000 | 4,847,250 | ||
| Biogen, Inc.* | 10,200 | 657,900 | ||
| Cardinal Health, Inc. | 19,100 | 1,413,400 | ||
| Eli Lilly & Co. | 75,900 | 7,580,512 | ||
| Johnson & Johnson | 93,900 | 9,566,062 | ||
| Mckesson HBOC, Inc. | 19,300 | 404,094 | ||
| Medimmune, Inc.* | 14,900 | 1,102,600 | ||
| Merck & Co., Inc. | 155,100 | 11,884,538 | ||
| Pfizer, Inc. | 424,825 | 20,391,600 | ||
| Number of
Shares |
Market Value |
|||
|---|---|---|---|---|
| Pharmacia Corp. | 84,500 | $ 4,367,594 | ||
| Sigma-Aldrich | 6,900 | 201,825 | ||
| Watson
Pharmaceutical, Inc.* |
6,600 | 354,750 | ||
| 72,982,969 | ||||
| Photography Equipment/Supplies — 0.1% | ||||
| Eastman Kodak Co. | 21,300 | 1,267,350 | ||
| Prepackaged Software — 6.3% | ||||
| Adobe Systems, Inc. | 8,000 | 1,040,000 | ||
| BMC Software, Inc.* | 16,500 | 601,993 | ||
| Citrix Systems, Inc.* | 14,200 | 268,912 | ||
| Computer Associates
International, Inc. |
39,800 | 2,037,262 | ||
| Compuware Corp.* | 24,600 | 255,225 | ||
| Microsoft Corp.* | 354,100 | 28,328,000 | ||
| Novell, Inc.* | 22,500 | 208,125 | ||
| Oracle Corporation* | 191,400 | 16,089,560 | ||
| Peoplesoft, Inc.* | 18,400 | 308,200 | ||
| Siebel Systems, Inc.* | 13,800 | 2,257,162 | ||
| Veritas Software
Corp.* |
26,700 | 3,017,517 | ||
| 54,411,956 | ||||
| Restaurants — 0.4% | ||||
| Darden Restaurants, Inc. | 8,600 | 139,750 | ||
| McDonald’s Corp. | 91,300 | 3,007,194 | ||
| Tricon Global
Restaurants, Inc.* |
10,200 | 288,150 | ||
| Wendy’s International,
Inc. |
8,100 | 144,281 | ||
| 3,579,375 | ||||
| Retail — 3.8% | ||||
| Autozone, Inc.* | 9,400 | 206,800 | ||
| Bed Bath & Beyond, Inc.* | 9,500 | 344,375 | ||
| Best Buy Co., Inc.* | 13,900 | 879,175 | ||
| Circuit City Stores | 13,800 | 457,988 | ||
| Cons Stores Corp.* | 7,600 | 91,200 | ||
| Costco Wholesale
Corp.* |
30,100 | 993,300 | ||
| CVS Corporation | 26,500 | 1,060,000 | ||
| Dillards, Inc. Cl. A | 7,200 | 88,200 | ||
| Dollar General Corp. | 22,450 | 437,775 | ||
| Federated Department
Stores* |
14,200 | 479,250 | ||
| K Mart Corp.* | 33,100 | 225,494 | ||
| Kohls Corp.* | 22,100 | 1,229,312 | ||
| Longs Drug Stores, Inc. | 2,700 | 58,725 | ||
| MassMutual Indexed Equity Fund – Portfolio of Investments (Continued)
|
| Number of
Shares |
Market Value |
|||||
|---|---|---|---|---|---|---|
| The May Department
Stores Company |
22,600 | $ 542,400 | ||||
| Newell Rubbermaid,
Inc. |
19,000 | 489,250 | ||||
| Office Depot, Inc.* | 22,500 | 140,625 | ||||
| J.C. Penney Co., Inc. | 17,700 | 326,344 | ||||
| RadioShack
Corporation |
13,100 | 620,613 | ||||
| Rite Aid Corp. | 17,700 | 116,156 | ||||
| Sears Roebuck and Co. | 23,800 | 776,475 | ||||
| Sherwin-Williams Co. | 11,200 | 237,300 | ||||
| Staples, Inc.* | 31,800 | 488,925 | ||||
| Target Corporation | 29,600 | 1,716,800 | ||||
| Tiffany & Co. | 4,100 | 276,750 | ||||
| TJX Companies, Inc. | 21,100 | 395,625 | ||||
| Toys R US, Inc.* | 16,300 | 237,369 | ||||
| Walgreen Co. | 68,000 | 2,188,750 | ||||
| Wal-Mart Stores, Inc. | 300,400 | 17,310,550 | ||||
| |
||||||
| 32,415,526 | ||||||
| |
||||||
| Retail-Grocery — 0.1% | ||||||
| Albertson’s, Inc. | 28,600 | 950,950 | ||||
| Winn-Dixie Stores, Inc. | 9,900 | 141,694 | ||||
| |
||||||
| 1,092,644 | ||||||
| |
||||||
| Telephone Utilities — 4.4% | ||||||
| Alltel Corp. | 21,200 | 1,313,075 | ||||
| AT&T Corp. | 215,700 | 6,821,513 | ||||
| Bell Atlantic Corp. | 104,900 | 5,330,231 | ||||
| BellSouth Corporation | 127,200 | 5,421,900 | ||||
| CenturyTel, Inc. | 9,700 | 278,875 | ||||
| Sprint Corp.
(FON Group) |
58,900 | 3,003,900 | ||||
| Sprint Corp.
(PCS Group)* |
62,900 | 3,742,550 | ||||
| US West, Inc. | 34,100 | 2,924,075 | ||||
| Worldcom, Inc.* | 191,700 | 8,794,238 | ||||
| |
||||||
| 37,630,357 | ||||||
| |
||||||
| Tobacco — 0.5% | ||||||
| Fortune Brands, Inc. | 11,100 | 255,994 | ||||
| Philip Morris
Companies, Inc. |
154,300 | 4,098,594 | ||||
| UST, Inc. | 12,300 | 180,656 | ||||
| |
||||||
| 4,535,244 | ||||||
| |
||||||
| Toys, Games — 0.1% | ||||||
| Hasbro, Inc. | 11,900 | 179,244 | ||||
| Mattel, Inc. | 28,400 | 374,525 | ||||
| |
||||||
| 553,769 | ||||||
| |
||||||
| Number of
Shares |
Market Value |
|||||
|---|---|---|---|---|---|---|
| Transportation — 0.5% | ||||||
| Burlington Northern
Santa Fe Corp. |
28,900 | $ 662,894 | ||||
| Carnival Corp. | 42,400 | 826,800 | ||||
| CSX Corp. | 14,700 | 311,456 | ||||
| FedEx Corporation* | 20,600 | 782,800 | ||||
| Kansas City Southern
Industries, Inc. |
7,400 | 656,288 | ||||
| Norfolk Southern
Corporation |
25,700 | 382,288 | ||||
| Union Pacific Corp. | 16,700 | 621,031 | ||||
| |
||||||
| 4,243,557 | ||||||
| |
||||||
| Travel — 0.0% | ||||||
| Sabre Holdings Corp. | 8,900 | 253,650 | ||||
| |
||||||
| TOTAL EQUITIES | ||||||
| (Cost $728,525,175) | 845,341,320 | |||||
| |
||||||
| Principal
Amount |
||||||
| |
||||||
| SHORT-TERM INVESTMENTS — 4.0% | ||||||
| Cash Equivalents — 2.6% | ||||||
| Bank of America
Bank Note** |
||||||
| 6.670% | 03/22/2001 | $ 478,988 | 478,988 | |||
| Bank of Montreal
Bank Note** |
||||||
| 6.630% | 08/16/2000 | 748,006 | 748,006 | |||
| Bank of Nova Scotia
Eurodollar Time Deposit** |
||||||
| 7.000% | 07/03/2000 | 957,980 | 957,980 | |||
| Credit Agricole Bank
Eurodollar Time Deposit** |
||||||
| 6.750% | 07/06/2000 | 3,776,485 | 3,776,485 | |||
| Credit Agricole Bank
Eurodollar Time Deposit** |
||||||
| 6.750% | 07/07/2000 | 478,991 | 478,991 | |||
| Den Danske Bank
Eurodollar Time Deposit** |
||||||
| 6.810% | 07/05/2000 | 1,756,292 | 1,756,292 | |||
| First Union Bank Note** | ||||||
| 6.900% | 05/09/2001 | 478,988 | 478,988 | |||
| Fleet National Bank
Eurodollar Time Deposit** |
||||||
| 7.260% | 10/31/2000 | 464,445 | 464,445 | |||
| HypoVereinsbank
Eurodollar Time Deposit** |
||||||
| 6.750% | 07/05/2000 | 3,991,585 | 3,991,585 | |||
| Merrimac Money
Market Fund** |
||||||
| 6.440% | 07/03/2000 | 5,713,430 | 5,713,430 | |||
| Morgan Stanley Dean
Witter & Co.** |
||||||
| 6.890% | 07/17/2000 | 1,054,907 | 1,054,907 | |||
| Principal
Amount |
Market Value |
||||||||
|---|---|---|---|---|---|---|---|---|---|
| Morgan Stanley Dean
Witter & Co.** |
|||||||||
| 6.910% | 11/22/2000 | $ 541,163 | $ 541,163 | ||||||
| Paribus Bank
Eurodollar Time Deposit** |
|||||||||
| 6.750% | 07/05/2000 | 1,915,162 | 1,915,962 | ||||||
| |
|||||||||
| 22,357,222 | |||||||||
| |
|||||||||
| Repurchase Agreement — 1.3% | |||||||||
| Investors Bank & Trust Company
Repurchase Agreement, dated 06/30/00, 6.03%, |
|||||||||
| due 07/03/00 (a) | 10,988,776 | 10,988,776 | |||||||
| |
|||||||||
| U.S. Treasury Obligations — 0.1% | |||||||||
| US Treasury Bills | |||||||||
| 5.050-
5.720% |
07/13/2000 | 620,000 | 618,835 | ||||||
| |
|||||||||
| TOTAL SHORT-TERM
INVESTMENTS |
|||||||||
| (At Amortized Cost) | 33,964,833 | ||||||||
| |
|||||||||
| TOTAL INVESTMENTS — 102.6% | |||||||||
| (Cost $762,490,008)*** | 879,306,153 | ||||||||
| Other Assets/
(Liabilities) — (2.6%) |
(22,325,361 | ) | |||||||
| |
|||||||||
| NET ASSETS — 100.0% | $ 856,980,792 | ||||||||
| |
|||||||||
*
|
Non-income producing security.
|
**
|
Represents investment of security lending collateral. (Note 2).
|
***
|
Aggregate cost for Federal tax purposes. (Note 7).
|
(a)
|
Maturity value of $10,994,298. Collateralized by U.S. Government Agency obligation with a rate of 7.846%, maturity date of
06/01/2024, and aggregate market value, including accrued interest, of $11,538,653.
|
| MassMutual Indexed Equity Fund – Financial Statements (Continued)
|
| Six months ended
June 30, 2000 (Unaudited) |
|||
|---|---|---|---|
| Investment income: (Note 2) | |||
| Dividends (net of withholding tax of $8,835) | $ 4,835,118 | ||
| Interest (including securities lending income of $702) | 624,607 | ||
| Total investment income | 5,459,725 | ||
| Expenses: (Note 2) | |||
| Investment management fees (Note 3) | 286,431 | ||
| Custody fees | 29,534 | ||
| Audit and legal fees | 12,381 | ||
| Directors’ fees (Note 3) | 4,762 | ||
| Other expenses | 3,478 | ||
| 336,586 | |||
| Administration fees (Note 3): | |||
| Class A | 25,622 | ||
| Class L | 14,205 | ||
| Class Y | 100,506 | ||
| Class S | 1,338,966 | ||
| Service fees (Note 3): | |||
| Class A | 12,580 | ||
| Total expenses | 1,828,465 | ||
| Net investment income | 3,631,260 | ||
| Realized and unrealized gain (loss): | |||
| Net realized gain (loss) on: | |||
| Investment transactions | 9,359,588 | ||
| Closed futures contracts | 105,739 | ||
| Net realized gain | 9,465,327 | ||
| Net change in unrealized appreciation (depreciation) on: | |||
| Investments | (20,313,648 | ) | |
| Open futures contracts | (56,647 | ) | |
| Net unrealized loss | (20,370,295 | ) | |
| Net realized and unrealized loss | (10,904,968 | ) | |
| Net decrease in net assets resulting from operations | $ (7,273,708 | ) | |
| MassMutual Indexed Equity Fund – Financial Statements (Continued)
|
| Six months ended
June 30, 2000 (Unaudited) |
Period ended
December 31, 1999* |
|||||
|---|---|---|---|---|---|---|
| Increase (Decrease) in Net Assets: | ||||||
| Operations: | ||||||
| Net investment income | $ 3,631,260 | $ 5,671,067 | ||||
| Net realized gain on investment transactions and futures contracts | 9,465,327 | 9,556,323 | ||||
| Net change in unrealized appreciation
(depreciation) on investments and
futures |
(20,370,295 | ) | 99,551,070 | |||
| Net increase (decrease) in net assets resulting from operations | (7,273,708 | ) | 114,778,460 | |||
| Distributions to shareholders (Note 2): | ||||||
| From net investment income: | ||||||
| Class A | - | (15,268 | ) | |||
| Class L | - | (15,109 | )** | |||
| Class Y | - | (368,392 | ) | |||
| Class S | - | (5,820,953 | ) | |||
| Total distributions from net investment income | - | (6,219,722 | ) | |||
| From net realized gains: | ||||||
| Class A | - | (19,403 | ) | |||
| Class L | - | (15,415 | )** | |||
| Class Y | - | (425,843 | ) | |||
| Class S | - | (8,586,752 | ) | |||
| Total distributions from net realized gains | - | (9,047,413 | ) | |||
| Net fund share transactions (Note 5): | ||||||
| Class A | 13,086,536 | 1,808,292 | ||||
| Class L | 6,469,300 | 1,652,365 | ** | |||
| Class Y | 22,121,474 | 41,823,182 | ||||
| Class S | (40,933,389 | ) | 291,051,476 | |||
| Increase in net assets from net fund share transactions | 743,921 | 336,335,315 | ||||
| Total increase (decrease) in net assets | (6,529,787 | ) | 435,846,640 | |||
| Net assets: | ||||||
| Beginning of period | 863,510,579 | 427,663,939 | ||||
| End of period (including undistributed net
investment income of $3,714,145
and $82,885, respectively) |
$856,980,792 | $863,510,579 | ||||
*
|
For the period from March 1, 1999 through December 31, 1999.
|
**
|
For the period July 1, 1999 (commencement of operations) through December 31, 1999.
|
| MassMutual Indexed Equity Fund – Financial Statements (Continued)
|
| Class A |
|||||||||
|---|---|---|---|---|---|---|---|---|---|
| Six months ended
6/30/00 (Unaudited) |
Period ended
12/31/99†† |
Year ended
2/28/99 |
|||||||
| Net asset value, beginning of period | $ 13.81 | $11.81 | $10.00 | ||||||
| Income (Loss) from investment operations: | |||||||||
| Net investment income | 0.03 | *** | 0.07 | *** | 0.06 | *** | |||
| Net realized and unrealized gain (loss) on investments | (0.16 | ) | 2.18 | 1.78 | |||||
| Total income (loss) from investment operations | (0.13 | ) | 2.25 | 1.84 | |||||
| Less distributions to shareholders: | |||||||||
| From net investment income | - | (0.10 | ) | (0.03 | ) | ||||
| From net realized gains | - | (0.15 | ) | - | |||||
| Total distributions | - | (0.25 | ) | (0.03 | ) | ||||
| Net asset value, end of period | $ 13.68 | $13.81 | $11.81 | ||||||
| Total Return@ | (0.94)% | ** | 19.14% | ** | 18.40% | ||||
| Ratios / Supplemental Data: | |||||||||
| Net assets, end of period (000’s) | $15,244 | $2,066 | $ 118 | ||||||
| Net expenses to average daily net assets | 0.85% | * | 0.85% | * | 1.09% | ||||
| Net investment income to average daily net assets | 0.41% | * | 0.59% | * | 0.57% | ||||
| Portfolio turnover rate | 4% | ** | N/A | N/A | |||||
| Class L |
|||||||||
| Six months ended
6/30/00 (Unaudited) |
Period ended
12/31/99† |
||||||||
| Net asset value, beginning of period | $ 13.80 | $13.11 | |||||||
| Income (Loss) from investment operations: | |||||||||
| Net investment income | 0.04 | *** | 0.06 | *** | |||||
| Net realized and unrealized gain (loss) on investments | (0.14 | ) | 0.90 | ||||||
| Total income (loss) from investment operations | (0.10 | ) | 0.96 | ||||||
| Less distributions to shareholders: | |||||||||
| From net investment income | - | (0.12 | ) | ||||||
| From net realized gains | - | (0.15 | ) | ||||||
| Total distributions | - | (0.27 | ) | ||||||
| Net asset value, end of period | $ 13.70 | $13.80 | |||||||
| Total Return@ | (0.72)% | ** | 7.38% | ** | |||||
| Ratios / Supplemental Data: | |||||||||
| Net assets, end of period (000’s) | $ 8,302 | $1,772 | |||||||
| Net expenses to average daily net assets | 0.60% | * | 0.60% | * | |||||
| Net investment income to average daily net assets | 0.65% | * | 0.90% | * | |||||
| Portfolio turnover rate | 4% | ** | N/A | ||||||
*
|
Annualized
|
**
|
Percentage represents results for the period and are not annualized.
|
***
|
Per share amount calculated on the average shares method.
|
†
|
For the period from July 1, 1999 (commencement of operations) through December 31, 1999.
|
††
|
For the period from March 1, 1999 through December 31, 1999.
|
@
|
Employee retirement benefit plans that invest plan assets in the Separate Investment Accounts (SIAs) may be subject to certain
charges as set forth in their respective Plan Documents. Total return figures would be lower for the periods presented if they reflected these charges.
|
| MassMutual Indexed Equity Fund – Financial Statements (Continued)
|
| Class Y |
|||||||||||||||||||
|---|---|---|---|---|---|---|---|---|---|---|---|---|---|---|---|---|---|---|---|
| Six months ended
6/30/00 (Unaudited) |
Period ended
12/31/99†† |
Year ended
2/28/99 |
|||||||||||||||||
| Net asset value, beginning of period | $ 13.81 | $ 11.79 | $ 10.00 | ||||||||||||||||
| Income (Loss) from investment operations: | |||||||||||||||||||
| Net investment income | 0.05 | *** | 0.11 | *** | 0.12 | *** | |||||||||||||
| Net realized and unrealized gain (loss) on investments | (0.14 | ) | 2.18 | 1.78 | |||||||||||||||
| Total income (loss) from investment operations | (0.09 | ) | 2.29 | 1.90 | |||||||||||||||
| Less distributions to shareholders: | |||||||||||||||||||
| From net investment income | - | (0.12 | ) | (0.11 | ) | ||||||||||||||
| From net realized gains | - | (0.15 | ) | - | |||||||||||||||
| Total distributions | - | (0.27 | ) | (0.11 | ) | ||||||||||||||
| Net asset value, end of period | $ 13.72 | $ 13.81 | $ 11.79 | ||||||||||||||||
| Total Return@ | (0.65)% | ** | 19.46% | ** | 18.98% | ||||||||||||||
| Ratios / Supplemental Data: | |||||||||||||||||||
| Net assets, end of period (000’s) | $ 68,548 | $ 46,253 | $ 859 | ||||||||||||||||
| Net expenses to average daily net assets | 0.44% | * | 0.44% | * | 0.52% | ||||||||||||||
| Net investment income to average daily net assets | 0.81% | * | 1.01% | * | 1.09% | ||||||||||||||
| Portfolio turnover rate | 4% | ** | N/A | N/A | |||||||||||||||
| Class S |
|||||||||||||||||||
| Six months ended
6/30/00 (Unaudited) |
Period ended
12/31/99†† |
Year ended
2/28/99 |
|||||||||||||||||
| Net asset value, beginning of period | $ 13.88 | $ 11.82 | $ 10.00 | ||||||||||||||||
| Income (Loss) from investment operations: | |||||||||||||||||||
| Net investment income (loss) | 0.06 | *** | 0.12 | *** | 0.13 | *** | |||||||||||||
| Net realized and unrealized gain (loss) on investments | (0.16 | ) | 2.19 | 1.78 | |||||||||||||||
| Total income (loss) from investment operations | (0.10 | ) | 2.31 | 1.91 | |||||||||||||||
| Less distributions to shareholders: | |||||||||||||||||||
| From net investment income | - | (0.10 | ) | (0.09 | ) | ||||||||||||||
| From net realized gains | - | (0.15 | ) | - | |||||||||||||||
| Total distributions | - | (0.25 | ) | (0.09 | ) | ||||||||||||||
| Net asset value, end of period | $ 13.78 | $ 13.88 | $ 11.82 | ||||||||||||||||
| Total Return@ | (0.72)% | ** | 19.61% | ** | 19.13% | ||||||||||||||
| Ratios / Supplemental Data: | |||||||||||||||||||
| Net assets, end of period (000’s) | $764,888 | $813,419 | $426,687 | ||||||||||||||||
| Net expenses to average daily net assets | 0.41% | * | 0.42% | * | 0.43% | ||||||||||||||
| Net investment income to average daily net assets | 0.85% | * | 1.06% | * | 1.23% | ||||||||||||||
| Portfolio turnover rate | 4% | ** | N/A | N/A | |||||||||||||||
*
|
Annualized
|
**
|
Percentage represents results for the period and are not annualized.
|
***
|
Per share amount calculated on the average shares method.
|
†
|
For the period from July 1, 1999 (commencement of operations) through December 31, 1999.
|
††
|
For the period from March 1, 1999 through December 31, 1999.
|
@
|
Employee retirement benefit plans that invest plan assets in the Separate Investment Accounts (SIAs) may be subject to certain
charges as set forth in their respective Plan Documents. Total return figures would be lower for the periods presented if they reflected these charges.
|
Ÿ
|
achieve long-term growth of capital and future income
|
Ÿ
|
invest primarily in a diversified portfolio of equity securities, which may consist of up to 30% foreign securities (including
those of companies in emerging markets)
|
Ÿ
|
utilize a growth-oriented strategy in making investment decisions
|
Ÿ
|
utilize fundamental analysis to identify companies which
|
| —are of high investment quality or possess a unique product, market position or operating characteristics
|
| —offer above-average levels of profitability or superior growth potential
|
| MassMutual Growth Equity Fund – Portfolio Manager Report (Continued)
|
| MassMutual Growth Equity Fund
|
| Largest Stock Holdings (6/30/00)
|
| Microsoft Corp.
|
| Cisco Systems, Inc.
|
| Nortel Networks Corporation
|
| Micron Technology, Inc
|
| Intel Corp.
|
| Tyco International Ltd.
|
| VeriSign, Inc.
|
| Corning Incorporated
|
| Pfizer, Inc.
|
| General Electric Company
|
| MassMutual Growth Equity Fund – Portfolio Manager Report (Continued)
|
| MassMutual Growth Equity Fund
Total Return
|
|||||||
|---|---|---|---|---|---|---|---|
| Year-To-Date
1/1/00 - 6/30/00 |
One Year
7/1/99 - 6/30/00 |
Since Inception
Average Annual 5/3/99 - 6/30/00 |
|||||
| Class S | 4.25% | 26.83% | 29.46% | ||||
| Class A | 4.03% | 26.39% | 28.97% | ||||
| Class Y | 4.18% | 26.74% | 29.38% | ||||
| Class L | 4.10% | 26.64% | 29.30% | ||||
| |
|||||||
| Standard & Poor’s
500 Composite Index |
-0.42% | 7.25% | 8.96% | ||||
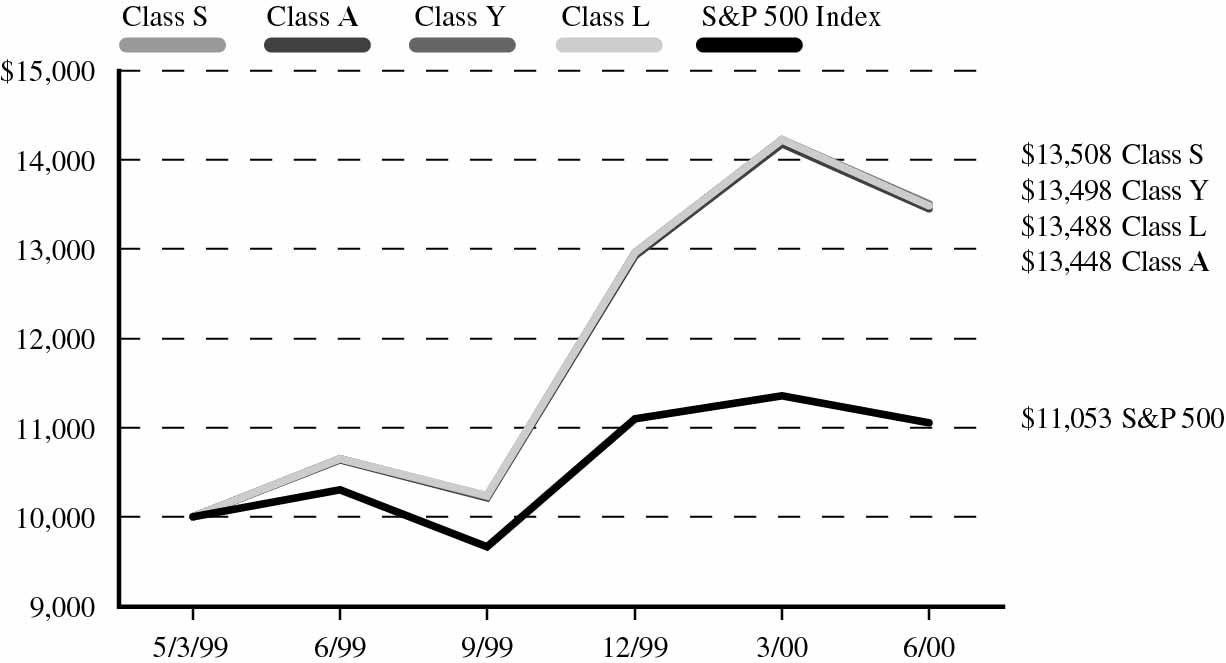
| Number of
Shares |
Market Value |
|||
|---|---|---|---|---|
| EQUITIES — 95.8% | ||||
| Apparel, Textiles & Shoes — 0.5% | ||||
| Fast Retailing Company | 3,000 | $ 1,258,961 | ||
| Banking, Savings & Loans — 3.2% | ||||
| Citigroup, Inc. | 43,710 | 2,633,527 | ||
| Federal Home Loan
Mortgage Corp. |
49,100 | 1,988,550 | ||
| Providian Financial Corp. | 14,240 | 1,281,600 | ||
| State Street Corp. | 16,130 | 1,710,788 | ||
| 7,614,465 | ||||
| Beverages — 2.0% | ||||
| Anheuser-Busch
Companies, Inc. |
31,900 | 2,382,531 | ||
| Coca-Cola Company, The | 41,000 | 2,354,937 | ||
| 4,737,468 | ||||
| Broadcasting, Publishing & Printing — 4.0% | ||||
| Comcast Corp. Cl. A* | 60,940 | 2,468,070 | ||
| Infinity Broadasting
Corp.* |
32,475 | 1,183,308 | ||
| UnitedGlobalCom, Inc.
Cl. A* |
10,900 | 509,575 | ||
| Univision
Communications, Inc.* |
10,240 | 1,059,840 | ||
| USA Networks, Inc.* | 62,400 | 1,349,400 | ||
| Viacom, Inc. Cl. B* | 47,130 | 3,213,677 | ||
| 9,783,870 | ||||
| Communications — 8.1% | ||||
| American Tower Corp.
Cl. A* |
60,300 | 2,513,756 | ||
| China Unicom Limited† | 490 | 10,412 | ||
| Ericsson (LM ) CL. B | 20,000 | 397,914 | ||
| Global Crossing Ltd.* | 92,000 | 2,420,750 | ||
| Juniper Networks, Inc.* | 2,900 | 422,131 | ||
| Nextel Communications,
Inc. Cl. A* |
23,000 | 1,407,312 | ||
| Nortel Networks
Corporation |
94,780 | 6,468,735 | ||
| NTL Incorporated* | 27,875 | 1,669,016 | ||
| Tellabs, Inc.* | 17,800 | 1,218,187 | ||
| Vodafone AirTouch PLC | 790,486 | 3,195,223 | ||
| 19,723,436 | ||||
| Number of
Shares |
Market Value |
|||
|---|---|---|---|---|
| Computer Integrated Systems Design — 3.3% | ||||
| Cabletron Systems* | 19,500 | $ 492,375 | ||
| Cadence Design Systems,
Inc.* |
84,300 | 1,717,612 | ||
| Computer Sciences
Corp.* |
39,960 | 2,984,512 | ||
| Sun Microsystems, Inc.* | 30,600 | 2,782,687 | ||
| 7,977,186 | ||||
| Computer Programming Services — 2.3% | ||||
| Mercury Interactive
Corp.* |
6,400 | 619,200 | ||
| VeriSign, Inc.* | 27,882 | 4,921,173 | ||
| 5,540,373 | ||||
| Computers & Information — 7.6% | ||||
| Cisco Systems, Inc.* | 109,900 | 6,985,519 | ||
| Compaq Computer Corp. | 31,000 | 792,437 | ||
| Comverse Technology,
Inc.* |
18,100 | 1,683,300 | ||
| Dell Computer Corp.* | 67,100 | 3,308,869 | ||
| EMC Corp.* | 44,300 | 3,408,331 | ||
| Foundry Networks, Inc.* | 2,300 | 253,000 | ||
| Seagate Technology, Inc.* | 37,400 | 2,057,000 | ||
| 18,488,456 | ||||
| Data Processing and Preparation — 2.6% | ||||
| Automatic Data
Processing, Inc. |
59,700 | 3,197,681 | ||
| The BISYS Group, Inc.* | 15,000 | 922,500 | ||
| First Data Corp. | 38,210 | 1,896,171 | ||
| Fiserv, Inc.* | 7,200 | 311,400 | ||
| 6,327,752 | ||||
| Electric Utilities — 1.8% | ||||
| AES Corp.* | 96,600 | 4,407,375 | ||
| Electrical Equipment &
Electronics — 13.0% |
||||
| Altera Corp.* | 12,200 | 1,243,637 | ||
| Analog Devices, Inc.* | 14,440 | 1,097,440 | ||
| Atmel Corp.* | 15,860 | 584,837 | ||
| Capstone Turbine
Corporation* |
260 | 11,716 | ||
| Emerson Electric Co. | 17,100 | 1,032,412 | ||
| Flextronics International
Ltd.* |
41,673 | 2,862,414 | ||
| General Electric
Company |
85,110 | 4,510,830 | ||
| Number of
Shares |
Market Value |
|||
|---|---|---|---|---|
| Intel Corp. | 45,100 | $ 6,029,306 | ||
| LSI Logic Corp.* | 41,675 | 2,255,659 | ||
| Marvell Technology
Group Limited* |
200 | 11,400 | ||
| Microchip Technology,
Inc.* |
14,690 | 855,922 | ||
| Micron Technology, Inc.* | 71,000 | 6,252,437 | ||
| Motorola, Inc. | 40,173 | 1,167,528 | ||
| National Semiconductor
Corp.* |
35,060 | 1,989,655 | ||
| PE Corp.-PE Biosystems
Group |
23,400 | 1,541,475 | ||
| Stratos Lightwave, Inc.* | 250 | 6,969 | ||
| 31,453,637 | ||||
| Energy — 5.1% | ||||
| Apache Corporation | 5,800 | 341,113 | ||
| Coastal Corp. | 27,200 | 1,655,800 | ||
| Conoco, Inc. Cl. B | 10 | 246 | ||
| Dynegy, Inc. | 10,500 | 717,281 | ||
| Enron Corp. | 7,300 | 470,850 | ||
| Global Marine, Inc.* | 41,500 | 1,169,781 | ||
| Halliburton Co. | 39,700 | 1,873,344 | ||
| Noble Drilling Corp.* | 28,910 | 1,190,731 | ||
| Royal Dutch Petroleum
Company |
48,700 | 3,039,085 | ||
| Transocean Sedco Forex,
Inc. |
35,800 | 1,913,063 | ||
| 12,371,294 | ||||
| Entertainment & Leisure — 1.6% | ||||
| AT&T — Liberty Media
Group* |
69,440 | 1,683,920 | ||
| Time Warner, Inc. | 27,800 | 2,112,800 | ||
| 3,796,720 | ||||
| Financial Services — 1.0% | ||||
| American Express
Company |
13,590 | 708,379 | ||
| Associates First Capital
Corp. Cl. A |
53,200 | 1,187,025 | ||
| HSBC Holdings PLC | 49,800 | 569,588 | ||
| 2,464,992 | ||||
| MassMutual Growth Equity Fund – Portfolio of Investments (Continued)
|
| Number of
Shares |
Market Value |
|||
|---|---|---|---|---|
| Foods — 2.2% | ||||
| The Kroger Co.* | 46,300 | $ 1,021,494 | ||
| Safeway, Inc.* | 94,540 | 4,266,118 | ||
| 5,287,612 | ||||
| Healthcare — 1.5% | ||||
| Bristol-Myers Squibb
Company |
41,000 | 2,388,250 | ||
| The Healthcare Company | 40,400 | 1,227,150 | ||
| 3,615,400 | ||||
| Household Products — 2.3% | ||||
| The Clorox Company | 13,900 | 622,894 | ||
| Corning, Incorporated | 18,050 | 4,871,244 | ||
| 5,494,138 | ||||
| Industrial — Diversified — 2.4% | ||||
| Tyco International Ltd. | 123,480 | 5,849,865 | ||
| Insurance — 3.8% | ||||
| American International
Group, Inc. |
33,835 | 3,975,613 | ||
| AXA Financial, Inc. | 53,800 | 1,829,200 | ||
| The Hartford Financial
Services Group, Inc. |
39,400 | 2,203,938 | ||
| Marsh & McLennan
Companies, Inc. |
12,000 | 1,253,250 | ||
| 9,262,001 | ||||
| Internet Content — 0.1% | ||||
| BEA Systems, Inc.* | 6,400 | 316,400 | ||
| Internet Software — 0.1% | ||||
| Vignette Corp.* | 2,900 | 150,845 | ||
| Machinery & Components — 2.3% | ||||
| Applied Materials, Inc.* | 6,400 | 580,000 | ||
| Baker Hughes, Inc. | 71,600 | 2,291,200 | ||
| Deere & Co. | 27,900 | 1,032,300 | ||
| Lam Research Corp.* | 42,000 | 1,575,000 | ||
| 5,478,500 | ||||
| Medical Supplies — 1.6% | ||||
| Bausch & Lomb, Inc. | 17,760 | 1,374,180 | ||
| Waters Corp.* | 19,610 | 2,447,573 | ||
| 3,821,753 | ||||
| Pharmaceuticals — 7.5% | ||||
| Abbott Laboratories | 72,200 | 3,217,413 | ||
| Alza Corp.* | 10,200 | 603,075 | ||
| Number of
Shares |
Market Value |
|||
|---|---|---|---|---|
| American Home
Products Corporation |
75,550 | $ 4,438,563 | ||
| Cardinal Health, Inc. | 2,120 | 156,880 | ||
| Genzyme Corporation* | 4,200 | 249,638 | ||
| Pfizer, Inc. | 98,687 | 4,736,976 | ||
| Pharmacia Corp. | 77,654 | 4,013,741 | ||
| Sepracor, Inc.* | 6,800 | 820,250 | ||
| 18,236,536 | ||||
| Prepackaged Software — 8.5% | ||||
| Art Technology Group,
Inc.* |
2,900 | 292,719 | ||
| BMC Software, Inc.* | 37,200 | 1,357,220 | ||
| Check Point Software
Tech* |
9,400 | 1,990,450 | ||
| Commerce One, Inc.* | 5,400 | 245,025 | ||
| Computer Associates
Internationational, Inc. |
45,470 | 2,327,496 | ||
| E. Piphany, Inc.* | 5,100 | 546,656 | ||
| I2 Technologies, Inc.* | 900 | 93,839 | ||
| Microsoft Corp.* | 91,680 | 7,334,400 | ||
| Oracle Corporation* | 39,000 | 3,278,438 | ||
| Rational Software Corp.* | 24,000 | 2,230,500 | ||
| Siebel Systems, Inc.* | 5,170 | 845,618 | ||
| Veritas Software Corp.* | 1,000 | 113,016 | ||
| 20,655,377 | ||||
| Restaurants — 0.0% | ||||
| McDonald’s Corp. | 300 | 9,881 | ||
| Retail — 2.4% | ||||
| CVS Corporation | 82,360 | 3,294,400 | ||
| Office Depot, Inc.* | 19,360 | 121,000 | ||
| RadioShack Corporation | 38,400 | 1,819,200 | ||
| Wal-Mart Stores, Inc. | 10,200 | 587,775 | ||
| 5,822,375 | ||||
| Telephone Utilities — 4.7% | ||||
| Alltel Corp. | 10,700 | 662,731 | ||
| Amdocs Ltd.* | 12,000 | 921,000 | ||
| Metromedia Fiber
Network, Inc.* |
69,760 | 2,768,600 | ||
| NEXTLINK
Communications, Inc.* |
34,000 | 1,289,875 | ||
| Sprint Corp. (PCS
Group)* |
56,040 | 3,334,380 | ||
| VoiceStream Wireless
Corporation* |
4,900 | 569,855 | ||
| Worldcom, Inc.* | 42,400 | 1,945,100 | ||
| 11,491,541 | ||||
| Number of
Shares |
Market Value |
|||
|---|---|---|---|---|
| Tobacco — 0.3% | ||||
| Philip Morris
Companies, Inc. |
29,800 | $ 791,563 | ||
| TOTAL EQUITIES
(Cost $218,847,190) |
232,229,772 | |||
| Principal
Amount |
||||||
|---|---|---|---|---|---|---|
| SHORT-TERM INVESTMENTS — 11.8% | ||||||
| Cash Equivalents — 7.4% | ||||||
| Bank of America Bank Note** | ||||||
| 6.670% | 03/22/2001 | $ 383,232 | 383,232 | |||
| Bank of Montreal Bank Note** | ||||||
| 6.630% | 08/16/2000 | 638,720 | 638,720 | |||
| Bank of Nova Scotia
Eurodollar Time Deposit** |
||||||
| 7.000% | 07/03/2000 | 766,465 | 766,465 | |||
| Credit Agricole Bank
Eurodollar Time Deposit** |
||||||
| 6.750% | 07/06/2000 | 2,521,768 | 2,521,768 | |||
| Credit Agricole Bank
Eurodollar Time Deposit** |
||||||
| 6.750% | 07/07/2000 | 383,232 | 383,232 | |||
| Den Danske Bank
Eurodollar Time Deposit** |
||||||
| 6.810% | 07/05/2000 | 2,505,187 | 2,505,187 | |||
| First Union Bank Note** | ||||||
| 6.900% | 05/09/2001 | 383,232 | 383,232 | |||
| Fleet National Bank
Eurodollar Time Deposit** |
||||||
| 7.260% | 10/31/2000 | 1,312,627 | 1,312,627 | |||
| HypoVereinsbank
Eurodollar Time Deposit** |
||||||
| 6.750% | 07/05/2000 | 3,193,602 | 3,193,602 | |||
| Merrimac Money Market Fund** | ||||||
| 6.440% | 07/03/2000 | 4,011,166 | 4,011,166 | |||
| Morgan Stanley Dean Witter & Co.** | ||||||
| 6.910% | 11/22/2000 | 255,488 | 255,488 | |||
| Paribus Bank
Eurodollar Time Deposit** |
||||||
| 6.750% | 07/05/2000 | 1,532,929 | 1,532,929 | |||
| 17,887,648 | ||||||
| MassMutual Growth Equity Fund – Portfolio of Investments (Continued)
|
| Principal
Amount |
Market Value |
||||||
|---|---|---|---|---|---|---|---|
| Repurchase Agreement — 4.4% | |||||||
| Investors Bank & Trust Company
Repurchase Agreement, dated 06/30/00, 6.03%, |
|||||||
| due 07/03/00 (a) | $10,786,921 | $ 10,786,921 | |||||
| TOTAL SHORT-TERM
INVESTMENTS (At Amortized Cost) |
28,674,569 | ||||||
| TOTAL INVESTMENTS — 107.6%
(Cost $247,521,759) *** |
260,904,341 | ||||||
| Other Assets/
(Liabilities) — (7.6%) |
(18,469,244 | ) | |||||
| NET ASSETS — 100.0% | $242,435,097 | ||||||
*
|
Non-income producing security.
|
**
|
Represents investment of security lending collateral. (Note 2).
|
***
|
Aggregate cost for Federal tax purposes. (Note 7).
|
†
|
American Depository Receipt
|
(a)
|
Maturity value of $10,792,341. Collateralized by U.S. Government Agency obligation with a rate of 6.750%, maturity date of
07/20/2022, and aggregate market value, including accrued interest, of $11,326,489.
|
| June 30, 2000
(Unaudited) |
|||
|---|---|---|---|
| Assets: | |||
| Investments, at value (cost $218,847,190) (Note 2) | $232,229,772 | ||
| Short-term investments, at amortized cost (Note 2) | 28,674,569 | ||
| Total Investments | 260,904,341 | ||
| Receivables from: | |||
| Investments sold | 3,743,411 | ||
| Open forward foreign currency contracts (Note 2) | 2,570 | ||
| Interest and dividends | 108,217 | ||
| Foreign taxes withheld | 2,033 | ||
| Investment adviser (Note 3) | 11,397 | ||
| Total assets | 264,771,969 | ||
| Liabilities: | |||
| Payables for: | |||
| Investments purchased | 4,059,065 | ||
| Securities on loan (Note 2) | 17,887,648 | ||
| Directors’ fees and expenses (Note 3) | 3,476 | ||
| Affiliates (Note 3): | |||
| Investment management fees | 127,449 | ||
| Administration fees | 26,525 | ||
| Service fees | 7,345 | ||
| Due to Custodian | 199,517 | ||
| Accrued expenses and other liabilities | 25,847 | ||
| Total liabilities | 22,336,872 | ||
| Net assets | $242,435,097 | ||
| Net assets consist of: | |||
| Paid-in capital | $215,474,340 | ||
| Undistributed net investment loss | (41,887 | ) | |
| Accumulated net realized gain on investments and foreign currency translations | 13,620,440 | ||
| Net unrealized appreciation on investments,
forward foreign currency contracts, foreign currency and other
assets and liabilities |
13,382,204 | ||
| $242,435,097 | |||
| Net assets: | |||
| Class A | $ 14,473,240 | ||
| Class L | $ 34,750,562 | ||
| Class Y | $ 42,519,620 | ||
| Class S | $150,691,675 | ||
| Shares outstanding: | |||
| Class A | 1,078,749 | ||
| Class L | 2,582,249 | ||
| Class Y | 3,156,354 | ||
| Class S | 11,178,005 | ||
| Net asset value, offering price and redemption price per share: | |||
| Class A | $ 13.42 | ||
| Class L | $ 13.46 | ||
| Class Y | $ 13.47 | ||
| Class S | $ 13.48 | ||
| MassMutual Growth Equity Fund – Financial Statements (Continued)
|
| Six months ended
June 30, 2000 (Unaudited) |
|||
|---|---|---|---|
| Investment income: (Note 2) | |||
| Dividends (net of withholding tax of $3,934) | $ 327,239 | ||
| Interest (including securities lending income of $16,185) | 372,867 | ||
| Total investment income | 700,106 | ||
| Expenses: (Note 2) | |||
| Investment management fees (Note 3) | 556,064 | ||
| Custody fees | 51,596 | ||
| Audit and legal fees | 6,075 | ||
| Directors’ fees (Note 3) | 4,319 | ||
| 618,054 | |||
| Administration fees (Note 3): | |||
| Class A | 13,460 | ||
| Class L | 31,815 | ||
| Class Y | 26,648 | ||
| Class S | 42,428 | ||
| Service fees (Note 3): | |||
| Class A | 11,311 | ||
| Total expenses | 743,716 | ||
| Expenses reimbursed (Note 3) | (16,540 | ) | |
| Net expenses | 727,176 | ||
| Net investment loss | (27,070 | ) | |
| Realized and unrealized gain (loss): | |||
| Net realized gain (loss) on: | |||
| Investment transactions | 11,718,722 | ||
| Foreign currency transactions | (35,294 | ) | |
| Net realized gain | 11,683,428 | ||
| Net change in unrealized appreciation (depreciation) on: | |||
| Investments | (5,896,098 | ) | |
| Translation of assets and liabilities in foreign currencies | (402 | ) | |
| Net unrealized loss | (5,896,500 | ) | |
| Net realized and unrealized gain | 5,786,928 | ||
| Net increase in net assets resulting from operations | $ 5,759,858 | ||
| MassMutual Growth Equity Fund – Financial Statements (Continued)
|
| Six months ended
June 30, 2000 (Unaudited) |
Period ended
December 31, 1999* |
|||||
|---|---|---|---|---|---|---|
| Increase (Decrease) in Net Assets: | ||||||
| Operations: | ||||||
| Net investment loss | $ (27,070 | ) | $ (50,616 | ) | ||
| Net realized gain on investment, forward
commitment and foreign currency
transactions |
11,683,428 | 2,191,795 | ||||
| Net change in unrealized appreciation
(depreciation) on investments, forward
commitments and translation of assets and liabilities in foreign currencies |
(5,896,500 | ) | 19,278,704 | |||
| Net increase in net assets resulting from operations | 5,759,858 | 21,419,883 | ||||
| Distributions to shareholders (Note 2): | ||||||
| From net realized gains: | ||||||
| Class A | - | (4,845 | ) | |||
| Class L | - | (17,880 | ) | |||
| Class Y | - | (68,299 | ) | |||
| Class S | - | (127,960 | ) | |||
| Total distributions from net realized gains | - | (218,984 | ) | |||
| Net fund share transactions (Note 5): | ||||||
| Class A | 11,922,934 | 1,948,843 | ||||
| Class L | 25,063,293 | 7,137,491 | ||||
| Class Y | 7,109,695 | 27,417,526 | ||||
| Class S | 84,150,372 | 50,724,186 | ||||
| Increase in net assets from net fund share transactions | 128,246,294 | 87,228,046 | ||||
| Total increase in net assets | 134,006,152 | 108,428,945 | ||||
| Net assets: | ||||||
| Beginning of period | 108,428,945 | - | ||||
| End of period (including undistributed net
investment loss of $41,887 and
$14,817, respectively) |
$242,435,097 | $108,428,945 | ||||
| * For the period from May 3, 1999 (commencement of operations) through December 31, 1999.
|
| MassMutual Growth Equity Fund – Financial Statements (Continued)
|
| Class A |
Class L |
|||||||||||
|---|---|---|---|---|---|---|---|---|---|---|---|---|
| Six months
ended 6/30/00 (Unaudited) |
Period ended
12/31/99† |
Six months
ended 6/30/00 (Unaudited) |
Period ended
12/31/99† |
|||||||||
| Net asset value, beginning of period | $ 12.90 | $ 10.00 | $ 12.93 | $ 10.00 | ||||||||
| Income (Loss) from investment operations: | ||||||||||||
| Net investment loss | (0.03 | )*** | (0.05 | )*** | (0.01 | )*** | (0.03 | )*** | ||||
| Net realized and unrealized gain on investments | 0.55 | 2.98 | 0.54 | 2.99 | ||||||||
| Total income from investment operations | 0.52 | 2.93 | 0.53 | 2.96 | ||||||||
| Less distributions to shareholders: | ||||||||||||
| From net realized gains | - | (0.03 | ) | - | (0.03 | ) | ||||||
| Net asset value, end of period | $ 13.42 | $ 12.90 | $ 13.46 | $ 12.93 | ||||||||
| Total Return@ | 4.03% | ** | 29.27% | ** | 4.10% | ** | 29.57% | ** | ||||
| Ratios / Supplemental Data: | ||||||||||||
| Net assets, end of period (000’s) | $14,473 | $ 2,379 | $ 34,751 | $ 8,912 | ||||||||
| Ratio of expenses to average daily net assets | ||||||||||||
| Before expense waiver | 1.30% | * | 1.50% | * | 1.05% | * | 1.25% | * | ||||
| After expense waiver # | 1.27% | * | N/A | 1.02% | * | N/A | ||||||
| Net investment loss to average daily net assets | (0.42)% | * | (0.68)% | * | (0.16)% | * | (0.41)% | * | ||||
| Portfolio turnover rate | 119% | ** | 114% | ** | 119% | ** | 114% | ** | ||||
| Class Y |
Class S |
|||||||||||
| Six months
ended 6/30/00 (Unaudited) |
Period ended
12/31/99† |
Six months
ended 6/30/00 (Unaudited) |
Period ended
12/31/99† |
|||||||||
| Net asset value, beginning of period | $ 12.93 | $ 10.00 | $ 12.93 | $ 10.00 | ||||||||
| Income (Loss) from investment operations: | ||||||||||||
| Net investment income (loss) | (0.00 | )**** | (0.02 | )*** | 0.00 | **** | (0.01 | )*** | ||||
| Net realized and unrealized gain on investments | 0.54 | 2.98 | 0.55 | 2.97 | ||||||||
| Total income from investment operations | 0.54 | 2.96 | 0.55 | 2.96 | ||||||||
| Less distributions to shareholders: | ||||||||||||
| From net realized gains | - | (0.03 | ) | - | (0.03 | ) | ||||||
| Net asset value, end of period | $ 13.47 | $ 12.93 | $ 13.48 | $ 12.93 | ||||||||
| Total Return@ | 4.18% | ** | 29.57% | ** | 4.25% | ** | 29.57% | ** | ||||
| Ratios / Supplemental Data: | ||||||||||||
| Net assets, end of period (000’s) | $42,520 | $34,170 | $150,692 | $62,968 | ||||||||
| Ratio of expenses to average daily net assets | ||||||||||||
| Before expense waiver | 0.91% | * | 1.12% | * | 0.84% | * | 0.97% | * | ||||
| After expense waiver # | 0.89% | * | N/A | 0.82% | * | N/A | ||||||
| Net investment income (loss) to average daily net assets | (0.04)% | * | (0.26)% | * | 0.03% | * | (0.10)% | * | ||||
| Portfolio turnover rate | 119% | ** | 114% | ** | 119% | ** | 114% | ** | ||||
*
|
Annualized
|
**
|
Percentage represents results for the period and are not annualized.
|
***
|
Per share amount calculated on the average shares method.
|
****
|
For the six months ended June 30, 2000 for Class Y and Class S net investment loss and net investment income is less than $0.01
per share, respectively.
|
†
|
For the period from May 3, 1999 (commencement of operations) through December 31, 1999.
|
#
|
Computed after giving effect to an agreement by MassMutual to waive certain fees and expenses of the Fund for the period May 1,
2000 through June 30, 2000.
|
@
|
Employee retirement benefit plans that invest plan assets in the Separate Investment Accounts (SIAs) may be subject to certain
charges as set forth in their respective Plan Documents. Total return figures would be lower for the periods presented if they reflected these charges.
|
Ÿ
|
achieve long-term capital appreciation
|
Ÿ
|
invest primarily in a non-diversified portfolio of equity securities of companies of any size, in the U.S. and abroad, including
larger, more well-established companies and smaller, emerging growth companies
|
Ÿ
|
utilize a growth-oriented strategy in making investment decisions
|
Ÿ
|
utilize fundamental analysis to identify companies which
|
| —are of high investment quality or possess a unique product, market position or operating characteristics
|
| —offer above-average levels of profitability or superior growth potential
|
| MassMutual Aggressive Growth Fund
|
| Largest Stock Holdings (6/30/00)
|
| VeriSign, Inc.
|
| Nokia Corp. Sponsored ADR
|
| Veritas Software Corp.
|
| Jds Uniphase Corp.
|
| Cisco Systems, Inc.
|
| Sun Microsystems, Inc.
|
| Brocade Communications Systems, Inc.
|
| Juniper Networks, Inc.
|
| Vodafone AirTouch Plc Sponsored ADR
|
| Tibco Software, Inc.
|
| MassMutual Aggressive Growth Fund – Portfolio Manager Report (Continued)
|
| MassMutual Aggressive Growth Fund
Total Return
|
|||
|---|---|---|---|
| Since Inception
5/1/00 - 6/30/00 |
|||
| Class S | -2.20% | ||
| Class A | -2.30% | ||
| Class Y | -2.30% | ||
| Class L | -2.20% | ||
| |
|||
| Standard & Poor’s
500 Composite Index |
0.36% | ||
GROWTH OF A $10,000 INVESTMENT SINCE INCEPTION

| Number of
Shares |
Market Value |
|||
|---|---|---|---|---|
| EQUITIES — 77.4% | ||||
| Advertising — 0.1% | ||||
| Doubleclick, Inc.* | 1,465 | $ 55,853 | ||
| Apparel, Textiles & Shoes — 1.3% | ||||
| Gap, Inc. | 15,000 | 468,750 | ||
| Nike, Inc. Cl. B | 7,000 | 278,687 | ||
| 747,437 | ||||
| Banking, Savings & Loans — 1.2% | ||||
| Firstar Corporation | 20,000 | 421,250 | ||
| Washington Mutual, Inc. | 9,355 | 270,126 | ||
| 691,376 | ||||
| Broadcasting, Publishing & Printing — 3.1% | ||||
| Clear Channel
Communications, Inc.* |
8,000 | 600,000 | ||
| Comcast Corp. Cl. A* | 10,000 | 405,000 | ||
| Cox Communications,
Inc. Cl. A* |
11,000 | 501,187 | ||
| New York Times Co. Cl. A | 7,000 | 276,500 | ||
| 1,782,687 | ||||
| Building Materials & Construction — 0.6% | ||||
| Home Depot, Inc. | 6,410 | 320,099 | ||
| Commercial Services — 0.7% | ||||
| PE Corporation-Celera
Genomics Group* |
4,000 | 374,000 | ||
| Communications — 10.5% | ||||
| COLT Telecom Group PLC | 10,000 | 333,058 | ||
| COLT Telecom Group
PLC Sponsored*† |
2,000 | 271,250 | ||
| Echostar Communications
Corp.* |
11,000 | 364,203 | ||
| Juniper Networks, Inc.* | 7,000 | 1,018,937 | ||
| Nextel Communications,
Inc. Cl. A* |
8,000 | 489,500 | ||
| Nokia Corp. Sponsored† | 55,000 | 2,746,563 | ||
| NTT Mobile
Communications Network, Inc. |
15 | 406,894 | ||
| Oni Systems Corp.* | 640 | 75,010 | ||
| Vodafone AirTouch PLC | 97,936 | 395,867 | ||
| 6,101,282 | ||||
| Computer Hardware — 0.9% | ||||
| Psion PLC | 54,000 | 522,385 | ||
| Number of
Shares |
Market Value |
|||
|---|---|---|---|---|
| Computer Integrated Systems Design — 4.6% | ||||
| Aether Systems, Inc.* | 4,000 | $ 820,000 | ||
| Sun Microsystems, Inc.* | 20,000 | 1,818,750 | ||
| 2,638,750 | ||||
| Computer Programming Services — 6.4% | ||||
| Macromedia, Inc.* | 1,675 | 161,952 | ||
| VeriSign, Inc.* | 20,000 | 3,530,000 | ||
| 3,691,952 | ||||
| Computer Related Services — 0.5% | ||||
| Inktomi Corp.* | 2,395 | 283,209 | ||
| Computers & Information — 5.1% | ||||
| Cisco Systems, Inc.* | 30,000 | 1,906,875 | ||
| Comverse Technology,
Inc.* |
6,000 | 558,000 | ||
| Symbol Technologies,
Inc. |
9,475 | 511,650 | ||
| 2,976,525 | ||||
| Cosmetics & Personal Care — 1.3% | ||||
| Colgate-Palmolive
Company |
13,000 | 778,375 | ||
| Electrical Equipment & Electronics — 11.4% | ||||
| ASM Lithography Holding
NV* |
15,000 | 661,875 | ||
| Bookham Technology
PLC Sponsored*† |
5,000 | 296,250 | ||
| Conexant Systems, Inc.* | 9,000 | 437,625 | ||
| Jds Uniphase Corp.* | 16,000 | 1,918,000 | ||
| PE Corp.-PE Biosystems
Group |
10,000 | 658,750 | ||
| Taiwan Semiconductor
Manufacturing Co. Limited*† |
6,050 | 234,816 | ||
| Taiwan Semiconductor
Manufacturing Co. Limited Sponsored*† |
10,325 | 400,094 | ||
| Texas Instruments, Inc. | 10,000 | 686,875 | ||
| Vishay Intertechnology,
Inc.* |
12,000 | 455,250 | ||
| Xilinx, Inc.* | 10,000 | 825,625 | ||
| 6,575,160 | ||||
| Entertainment & Leisure — 2.4% | ||||
| Harley-Davidson, Inc. | 18,000 | 693,000 | ||
| Time Warner, Inc. | 9,000 | 684,000 | ||
| 1,377,000 | ||||
| Number of
Shares |
Market Value |
|||
|---|---|---|---|---|
| Financial Services — 0.7% | ||||
| E*trade Group, Inc.* | 6,335 | $ 104,528 | ||
| Schwab (Charles) Corp. | 9,000 | 302,625 | ||
| 407,153 | ||||
| Foods — 0.7% | ||||
| The Kroger Co.* | 19,000 | 419,188 | ||
| Information Retrieval Services — 1.7% | ||||
| America Online, Inc.* | 8,000 | 422,000 | ||
| Yahoo!, Inc.* | 4,670 | 578,496 | ||
| 1,000,496 | ||||
| Lodging — 0.5% | ||||
| MGM Grand, Inc. | 8,795 | 282,539 | ||
| Machinery & Components — 1.4% | ||||
| Applied Materials, Inc.* | 9,000 | 815,625 | ||
| Media — 1.4% | ||||
| Grupo Televisa SA,
Sponsored*†† |
12,000 | 827,250 | ||
| Pharmaceuticals — 3.4% | ||||
| Abgenix, Inc.* | 1,450 | 173,796 | ||
| Genentech, Inc.* | 4,000 | 688,000 | ||
| Pfizer, Inc. | 14,360 | 689,280 | ||
| Pharmacia Corp. | 8,475 | 438,052 | ||
| 1,989,128 | ||||
| Prepackaged Software — 12.2% | ||||
| Art Technology Group, Inc.* | 7,000 | 706,563 | ||
| Brocade Communications
Systems, Inc.* |
6,000 | 1,100,906 | ||
| Check Point Software Tech* | 3,000 | 635,250 | ||
| I2 Technologies, Inc.* | 7,000 | 729,859 | ||
| Oracle Corporation* | 8,000 | 672,500 | ||
| Tibco Software, Inc.* | 8,000 | 857,875 | ||
| Veritas Software Corp.* | 21,000 | 2,373,328 | ||
| 7,076,281 | ||||
| Retail — 1.7% | ||||
| Tiffany & Co. | 5,000 | 337,500 | ||
| Walgreen Co. | 20,525 | 660,648 | ||
| 998,148 | ||||
| Retail – Internet — 0.3% | ||||
| Priceline.com, Inc.* | 5,150 | 195,620 | ||
| MassMutual Aggressive Growth Fund – Portfolio of Investments (Continued)
|
| Number of
Shares |
Market Value |
|||
|---|---|---|---|---|
| Telephone Utilities — 3.3% | ||||
| Level 3
Communications, Inc.* |
3,000 | $ 264,000 | ||
| SK Telecom Co., Ltd† | 12,000 | 435,750 | ||
| Telefonica SA
Sponsored*† |
4,780 | 306,219 | ||
| Vodafone AirTouch Plc
Sponsored† |
22,000 | 911,625 | ||
| |
||||
| 1,917,594 | ||||
| |
||||
| TOTAL EQUITIES
(Cost $45,233,596) |
44,845,112 | |||
| |
||||
| Principal
Amount |
||||||
|---|---|---|---|---|---|---|
| BONDS & NOTES — 0.5% | ||||||
| CORPORATE DEBT — 0.5% | ||||||
| Level 3 Communications,
Inc.††† |
||||||
| 11.000% | 03/15/2008 | $ 270,000 | 267,300 | |||
| |
||||||
| TOTAL CORPORATE DEBT | ||||||
| (Cost $264,710) | 267,300 | |||||
| |
||||||
| TOTAL BONDS & NOTES | ||||||
| (Cost $264,710) | 267,300 | |||||
| |
||||||
| SHORT-TERM INVESTMENTS — 7.9% | ||||||
| Repurchase Agreement | ||||||
| Investors Bank & Trust Company
Repurchase Agreement, dated 06/30/00 6.03%, |
||||||
| due 07/03/00 (a) | 4,579,414 | 4,579,414 | ||||
| |
||||||
| TOTAL SHORT-TERM
INVESTMENTS |
||||||
| (At Amortized Cost) | 4,579,414 | |||||
| |
||||||
| TOTAL INVESTMENTS — 85.8% | ||||||
| (Cost $49,813,010)** | 49,691,826 | |||||
| Other Assets/(Liabilities) — 14.2% | 8,225,742 | |||||
| |
||||||
| NET ASSETS — 100.0% | $57,917,568 | |||||
| |
||||||
*
|
Non-income producing security.
|
**
|
Aggregate cost for Federal tax purposes. (Note 7).
|
†
|
American Depository Receipt
|
††
|
Global Depository Receipt
|
†††
|
Securities exempt from registration under Rule 144A of the Securities Act of 1933. These securities may be resold in transactions
exempt from registration, normally to qualified institutional buyers.
|
(a)
|
Maturity value of $4,581,715. Collateralized by U.S. Government Agency obligation with a rate of 7.500%, maturity date of
02/01/2010, and aggregate market value, including accrued interest, of $4,808,519.
|
| June 30, 2000
(Unaudited) |
|||
|---|---|---|---|
| Assets: | |||
| Investments, at value (cost $45,498,306) (Note 2 ) | $45,112,412 | ||
| Short-term investments, at amortized cost (Note 2) | 4,579,414 | ||
| Total Investments | 49,691,826 | ||
| Cash | 7,747,509 | ||
| Foreign currency, at value (cost $275,734) | 276,542 | ||
| Receivables from: | |||
| Investments sold | 491,932 | ||
| Interest and dividends | 73,276 | ||
| Total assets | 58,281,085 | ||
| Liabilities: | |||
| Payables for: | |||
| Investments purchased | 317,439 | ||
| Directors’ fees and expenses (Note 3) | 1,330 | ||
| Affiliates (Note 3): | |||
| Investment management fees | 26,817 | ||
| Administration fees | 5,375 | ||
| Service fees | 151 | ||
| Accrued expenses and other liabilities | 12,405 | ||
| Total liabilities | 363,517 | ||
| Net assets | $57,917,568 | ||
| Net assets consist of: | |||
| Paid-in capital | $58,283,654 | ||
| Undistributed net investment income | 63,080 | ||
| Accumulated net realized loss on investments and foreign currency translations | (43,622 | ) | |
| Net unrealized depreciation on investments,
forward foreign currency contracts, foreign currency and other
assets and liabilities |
(385,544 | ) | |
| $57,917,568 | |||
| Net assets: | |||
| Class A | $ 1,474,100 | ||
| Class L | $ 9,410,594 | ||
| Class Y | $ 149,847 | ||
| Class S | $46,883,027 | ||
| Shares outstanding: | |||
| Class A | 150,934 | ||
| Class L | 962,353 | ||
| Class Y | 15,330 | ||
| Class S | 4,794,170 | ||
| Net asset value, offering price and redemption price per share: | |||
| Class A | $ 9.77 | ||
| Class L | $ 9.78 | ||
| Class Y | $ 9.77 | ||
| Class S | $ 9.78 | ||
| MassMutual Aggressive Growth Fund – Financial Statements (Continued)
|
| Period ended
June 30, 2000* (Unaudited) |
|||
|---|---|---|---|
| Investment income: (Note 2) | |||
| Dividends (net of withholding tax of $192) | $ 9,321 | ||
| Interest | 116,262 | ||
| Total investment income | 125,583 | ||
| Expenses: (Note 2) | |||
| Investment management fees (Note 3) | 41,294 | ||
| Custody fees | 10,449 | ||
| Audit and legal fees | 1,956 | ||
| Directors’ fees (Note 3) | 1,330 | ||
| 55,029 | |||
| Administration fees (Note 3): | |||
| Class A | 208 | ||
| Class L | 2,502 | ||
| Class Y | 32 | ||
| Class S | 4,581 | ||
| Service fees (Note 3): | |||
| Class A | 151 | ||
| Total expenses | 62,503 | ||
| Net investment income | 63,080 | ||
| Realized and unrealized gain (loss): | |||
| Net realized gain (loss) on: | |||
| Investment transactions | (44,703 | ) | |
| Foreign currency transactions | 1,081 | ||
| Net realized loss | (43,622 | ) | |
| Net change in unrealized appreciation (depreciation) on: | |||
| Investments | (385,894 | ) | |
| Translation of assets and liabilities in foreign currencies | 350 | ||
| Net unrealized loss | (385,544 | ) | |
| Net realized and unrealized loss | (429,166 | ) | |
| Net decrease in net assets resulting from operations | $(366,086 | ) | |
*
|
For the period from May 1, 2000 (commencement of operations) through June 30, 2000.
|
| MassMutual Aggressive Growth Fund – Financial Statements (Continued)
|
| Period ended
June 30, 2000* (Unaudited) |
|||
|---|---|---|---|
| Increase (Decrease) in Net Assets: | |||
| Operations: | |||
| Net investment income | $ 63,080 | ||
| Net realized gain on investment and foreign currency transactions | (43,622 | ) | |
| Net change in unrealized appreciation
(depreciation) on investments and translation of assets and
liabilities in foreign currencies |
(385,544 | ) | |
| Net decrease in net assets resulting from operations | (366,086 | ) | |
| Net fund share transactions (Note 5): | |||
| Class A | 1,465,241 | ||
| Class L | 9,073,335 | ||
| Class Y | 153,850 | ||
| Class S | 47,591,228 | ||
| Increase in net assets from net fund share transactions | 58,283,654 | ||
| Total increase in net assets | 57,917,568 | ||
| Net assets: | |||
| Beginning of Period | - | ||
| End of period (including undistributed net investment income of $63,080) | $57,917,568 | ||
*
|
For the period from May 1, 2000 (commencement of operations) through June 30, 2000.
|
| MassMutual Aggressive Growth Fund – Financial Statements (Continued)
|
| Class A |
Class L |
Class Y |
Class S |
|||||||||
|---|---|---|---|---|---|---|---|---|---|---|---|---|
| Period ended
6/30/00† (Unaudited) |
Period ended
6/30/00† (Unaudited) |
Period ended
6/30/00† (Unaudited) |
Period ended
6/30/00† (Unaudited) |
|||||||||
| Net asset value, beginning of period | $10.00 | $10.00 | $10.00 | $ 10.00 | ||||||||
| Income (Loss) from investment operations: | ||||||||||||
| Net investment income | 0.01 | *** | 0.02 | *** | 0.02 | *** | 0.02 | *** | ||||
| Net realized and unrealized gain (loss) on investments | (0.24 | ) | (0.24 | ) | (0.25 | ) | (0.24 | ) | ||||
| Total income (loss) from investment operations | (0.23 | ) | (0.22 | ) | (0.23 | ) | (0.22 | ) | ||||
| Net asset value, end of period | $ 9.77 | $ 9.78 | $ 9.77 | $ 9.78 | ||||||||
| Total Return@ | (2.30)% | ** | (2.20)% | ** | (2.30)% | ** | (2.20)% | ** | ||||
| Ratios / Supplemental Data: | ||||||||||||
| Net assets, end of period (000’s) | $1,474 | $9,411 | $ 150 | $46,883 | ||||||||
| Net expenses to average daily net assets | 1.60% | * | 1.29% | * | 1.21% | * | 1.07% | * | ||||
| Net investment income to average daily net assets | 0.59% | * | 0.93% | * | 0.98% | * | 1.15% | * | ||||
| Portfolio turnover rate | 5% | ** | 5% | ** | 5% | ** | 5% | ** | ||||
*
|
Annualized
|
**
|
Percentage represents the results for the period and are not annualized.
|
***
|
Per share amount calculated on the average shares method.
|
†
|
For the period from May 1, 2000 (commencement of operations) through June 30, 2000.
|
@
|
Employee retirement benefits plans that invest plan assets in the Separate Investment Accounts (SIAs) may be subject to
certain charges as set forth in their respective Plan Documents. Total return figures would be lower for the periods presented if they reflected these charges.
|
Ÿ
|
achieve long-term growth of capital in such a way that the Fund’s performance closely tracks the total return of the 100
largest publically traded over-the-counter common stocks
|
Ÿ
|
invest at least 80% of its assets in a portfolio of equity securities mirroring the composition and sector weightings of companies
included in the NASDAQ 100 Index®
|
| MassMutual OTC 100 Fund – Portfolio Manager Report (Continued)
|
| MassMutual OTC 100 Fund
|
| Largest Stock Holdings (6/30/00)
|
| Cisco Systems, Inc.
|
| Intel Corp.
|
| Microsoft Corp.
|
| Oracle Corporation
|
| Jds Uniphase Corp.
|
| Sun Microsystems, Inc.
|
| Nextel Communications, Inc. Cl. A
|
| Qualcomm, Inc.
|
| Worldcom, Inc.
|
| Dell Computer Corp.
|
| MassMutual OTC 100 Fund – Portfolio Manager Report (Continued)
|
| MassMutual OTC 100 Fund
Total Return
|
|||
|---|---|---|---|
| Since
Inception 5/1/00 - 6/30/00 |
|||
| Class S | -1.80% | ||
| Class A | -1.80% | ||
| Class Y | -1.80% | ||
| Class L | -1.80% | ||
| |
|||
| NASDAQ 100
Index® |
-0.24% | ||
GROWTH OF A $10,000 INVESTMENT SINCE INCEPTION
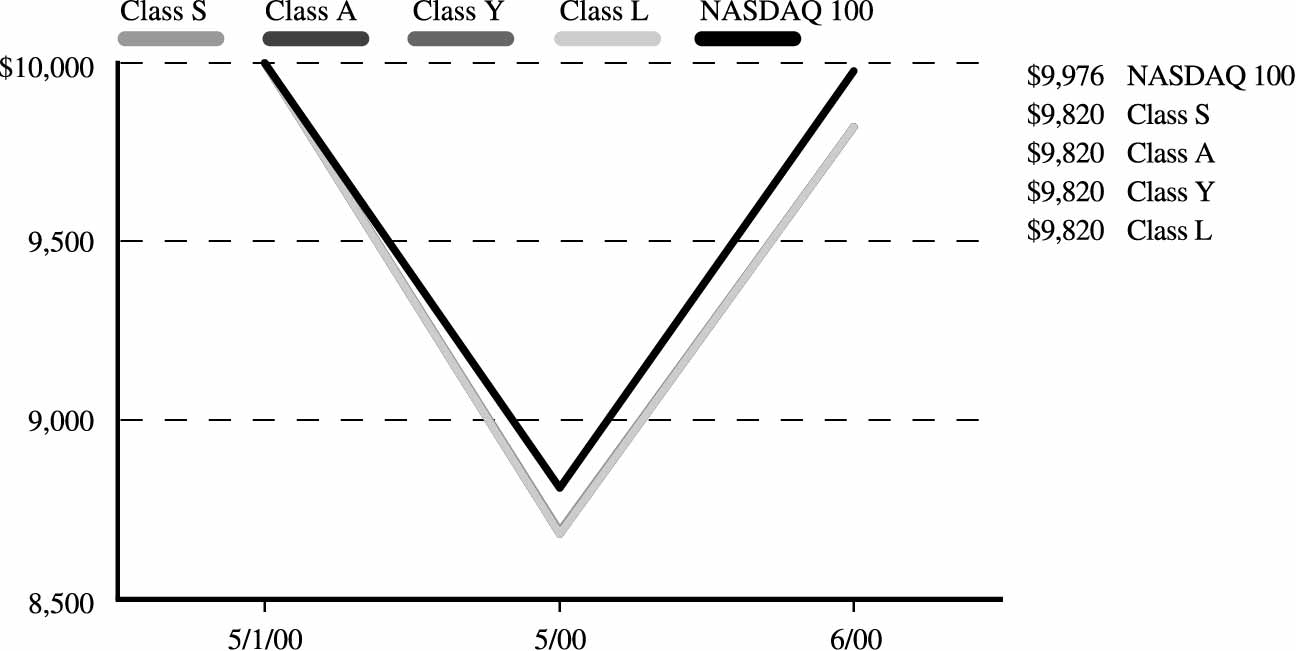
| Number of
Shares |
Market Value |
|||
|---|---|---|---|---|
| EQUITIES — 96.1% | ||||
| Air Transportation — 0.1% | ||||
| Northwest Airlines Corp.* | 900 | $ 27,394 | ||
| Automotive & Parts — 0.1% | ||||
| Paccar, Inc. | 1,100 | 43,656 | ||
| Broadcasting, Publishing & Printing — 1.4% | ||||
| Adelphia Communications
Corp. Cl. A* |
1,500 | 70,312 | ||
| Comcast Corp. Cl. A* | 5,400 | 218,700 | ||
| USA Networks, Inc.* | 4,300 | 92,988 | ||
| 382,000 | ||||
| Commercial Services — 2.0% | ||||
| Apollo Group, Inc. Cl. A* | 900 | 25,200 | ||
| Cintas Corp. | 2,500 | 91,719 | ||
| Concord EFS, Inc.* | 3,000 | 78,000 | ||
| eBay, Inc.* | 2,500 | 135,781 | ||
| Paychex, Inc. | 4,400 | 184,800 | ||
| Quintiles Transnational
Corp.* |
2,000 | 28,250 | ||
| 543,750 | ||||
| Communications — 12.8% | ||||
| ADC Telecommunications,
Inc.* |
5,000 | 419,375 | ||
| Ciena Corp.* | 2,100 | 350,044 | ||
| Echostar Communications
Corp.* |
3,000 | 99,328 | ||
| Global Crossing Ltd.* | 11,900 | 313,119 | ||
| Mcleodusa, Inc.* | 5,900 | 122,056 | ||
| Network Appliance, Inc.* | 4,000 | 322,000 | ||
| Nextel Communications,
Inc. Cl. A* |
11,700 | 715,894 | ||
| NTL Incorporated* | 3,500 | 209,563 | ||
| PanAmSat Corp.* | 2,500 | 109,219 | ||
| Qualcomm, Inc.* | 11,200 | 672,000 | ||
| Tellabs, Inc.* | 2,900 | 198,469 | ||
| 3,531,067 | ||||
| Communications Equipment — 1.1% | ||||
| Ericsson LM Cl. B† | 14,900 | 298,000 | ||
| Computer and Data Processing Services — 0.3% | ||||
| At Home Corp. Series A* | 3,600 | 74,700 | ||
| Computer Integrated Systems Design — 4.3% | ||||
| 3com Corp.* | 2,200 | 126,775 | ||
| Broadvision, Inc.* | 3,600 | 182,925 | ||
| Parametric Technology Corp.* | 4,700 | 51,700 | ||
| Sun Microsystems, Inc.* | 8,700 | 791,156 | ||
| Synopsys, Inc.* | 1,000 | 34,563 | ||
| 1,187,119 | ||||
| Number of
Shares |
Market Value |
|||
|---|---|---|---|---|
| Computer Programming Services — 1.8% | ||||
| RealNetworks, Inc.* | 1,800 | $ 91,012 | ||
| VeriSign, Inc.* | 2,300 | 405,950 | ||
| 496,962 | ||||
| Computer Related Services — 0.1% | ||||
| CNET Networks, Inc.* | 1,200 | 29,475 | ||
| Computers & Information — 11.1% | ||||
| Apple Computer, Inc.* | 5,700 | 298,537 | ||
| Cisco Systems, Inc.* | 31,300 | 1,989,506 | ||
| Comverse Technology, Inc.* | 2,000 | 186,000 | ||
| Dell Computer Corp.* | 12,000 | 591,750 | ||
| 3,065,793 | ||||
| Containers — 0.1% | ||||
| Smurfit-Stone Container
Corp.* |
3,000 | 38,625 | ||
| Data Processing and Preparation — 0.3% | ||||
| Fiserv, Inc.* | 1,900 | 82,175 | ||
| Electrical Equipment & Electronics — 23.5% | ||||
| Adaptec, Inc.* | 1,100 | 25,025 | ||
| Altera Corp.* | 3,500 | 356,781 | ||
| American Power
Conversion Corporation* |
3,200 | 130,600 | ||
| Applied Micro Circuits
Corp.* |
1,800 | 177,750 | ||
| Atmel Corp.* | 2,100 | 77,437 | ||
| Conexant Systems, Inc.* | 3,000 | 145,875 | ||
| Intel Corp. | 14,700 | 1,965,206 | ||
| Jds Uniphase Corp.* | 8,900 | 1,066,888 | ||
| Kla-Tencor Corp.* | 2,800 | 163,975 | ||
| Linear Technology Corp. | 5,300 | 338,869 | ||
| Maxim Intergrated
Products* |
5,000 | 339,687 | ||
| Microchip Technology, Inc.* | 800 | 46,612 | ||
| Molex, Inc. | 1,200 | 57,750 | ||
| PMC-Sierra, Inc.* | 2,000 | 355,375 | ||
| Qlogic Corp.* | 900 | 59,456 | ||
| RF Micro Devices, Inc.* | 1,100 | 96,388 | ||
| Sanmina Corp.* | 1,700 | 145,350 | ||
| SDL, Inc.* | 1,100 | 313,706 | ||
| Visx, Inc.* | 900 | 25,256 | ||
| Vitesse Semiconductor
Corp.* |
2,200 | 161,837 | ||
| Xilinx, Inc.* | 5,400 | 445,838 | ||
| 6,495,661 | ||||
| Financial Services — 0.3% | ||||
| Nasdaq 100 Shares* | 941 | 87,689 | ||
| Number of
Shares |
Market Value |
|||
|---|---|---|---|---|
| Foods — 0.4% | ||||
| Starbucks Corp.* | 3,200 | $ 122,200 | ||
| Healthcare — 0.1% | ||||
| Pacificare Health
Systems* |
400 | 24,075 | ||
| Home Construction, Furnishings &
Appliances — 0.7% |
||||
| Gemstar International
Group Ltd.* |
2,700 | 165,923 | ||
| Miller (Herman), Inc. | 800 | 20,700 | ||
| 186,623 | ||||
| Information Retrieval Services — 2.4% | ||||
| CMGI, Inc.* | 3,900 | 178,669 | ||
| Lycos, Inc.* | 1,700 | 91,800 | ||
| Yahoo!, Inc.* | 3,300 | 408,788 | ||
| 679,257 | ||||
| Machinery & Components — 1.7% | ||||
| Applied Materials, Inc.* | 5,200 | 471,250 | ||
| Medical Supplies — 0.3% | ||||
| Biomet, Inc. | 2,000 | 76,875 | ||
| Pharmaceuticals — 5.3% | ||||
| Amgen, Inc.* | 6,000 | 421,500 | ||
| Biogen, Inc.* | 2,300 | 148,350 | ||
| Chiron Corp.* | 3,200 | 152,000 | ||
| Genzyme Corporation* | 1,300 | 77,269 | ||
| Immunex Corp.* | 8,600 | 425,163 | ||
| Medimmune, Inc.* | 2,800 | 207,200 | ||
| Sigma-Aldrich | 1,100 | 32,175 | ||
| 1,463,657 | ||||
| Prepackaged Software — 18.6% | ||||
| Adobe Systems, Inc. | 1,500 | 195,000 | ||
| BMC Software, Inc.* | 2,300 | 83,914 | ||
| Citrix Systems, Inc.* | 2,800 | 53,025 | ||
| Compuware Corp.* | 2,800 | 29,050 | ||
| Electronic Arts, Inc.* | 800 | 58,350 | ||
| I2 Technologies, Inc.* | 2,600 | 271,091 | ||
| Intuit, Inc.* | 3,200 | 132,400 | ||
| Legato Systems, Inc.* | 1,200 | 18,150 | ||
| Microsoft Corp.* | 22,800 | 1,824,000 | ||
| Network Associates, Inc.* | 1,800 | 36,675 | ||
| Novell, Inc.* | 5,000 | 46,250 | ||
| Oracle Corporation* | 14,900 | 1,252,531 | ||
| Peoplesoft, Inc.* | 4,900 | 82,075 | ||
| Siebel Systems, Inc.* | 2,900 | 474,331 | ||
| Veritas Software Corp.* | 5,100 | 576,380 | ||
| 5,133,222 | ||||
| MassMutual OTC 100 – Portfolio of Investments (Continued)
|
| Number of
Shares |
Market Value |
|||
|---|---|---|---|---|
| Retail — 1.1% | ||||
| Bed Bath & Beyond, Inc.* | 2,400 | $ 87,000 | ||
| Costco Wholesale
Corp.* |
3,000 | 99,000 | ||
| Dollar Tree Stores, Inc.* | 1,200 | 47,475 | ||
| Staples, Inc.* | 4,000 | 61,500 | ||
| 294,975 | ||||
| Retail – Internet — 0.4% | ||||
| Amazon.com, Inc.* | 2,900 | 105,306 | ||
| Telephone Utilities — 5.8% | ||||
| Level 3
Communications, Inc.* |
3,200 | 281,600 | ||
| Metromedia Fiber
Network, Inc.* |
6,600 | 261,938 | ||
| NEXTLINK
Communications, Inc.* |
3,300 | 125,194 | ||
| VoiceStream Wireless
Corporation* |
2,900 | 337,261 | ||
| Worldcom, Inc.* | 12,900 | 591,788 | ||
| 1,597,781 | ||||
| TOTAL EQUITIES
(Cost $26,851,184) |
26,539,287 | |||
| Principal
Amount |
|||||||
|---|---|---|---|---|---|---|---|
| SHORT-TERM INVESTMENTS — 10.2% | |||||||
| Cash Equivalents — 6.2% | |||||||
| Bank of America Bank Note** | |||||||
| 6.670% | 03/22/2001 | $ 36,880 | 36,880 | ||||
| Bank of Montreal Bank Note** | |||||||
| 6.630% | 08/16/2000 | 61,467 | 61,467 | ||||
| Bank of Nova Scotia
Eurodollar Time Deposit** |
|||||||
| 7.000% | 07/03/2000 | 73,760 | 73,760 | ||||
| Credit Agricole Bank
Eurodollar Time Deposit** |
|||||||
| 6.750% | 07/07/2000 | 36,880 | 36,880 | ||||
| Den Danske Bank
Eurodollar Time Deposit** |
|||||||
| 6.810% | 07/05/2000 | 135,227 | 135,227 | ||||
| First Union Bank Note** | |||||||
| 6.900% | 05/09/2001 | 36,880 | 36,880 | ||||
| Principal
Amount |
Market Value |
|||||
|---|---|---|---|---|---|---|
| Fleet National Bank
Eurodollar Time Deposit** |
||||||
| 7.260% | 10/31/2000 | $ 401,096 | $ 401,096 | |||
| HypoVereinsbank
Eurodollar Time Deposit** |
||||||
| 6.750% | 07/05/2000 | 307,333 | 307,333 | |||
| Merrimac Money
Market Fund** |
||||||
| 6.440% | 07/03/2000 | 386,010 | 386,010 | |||
| Morgan Stanley Dean
Witter & Co.** |
||||||
| 6.890% | 07/17/2000 | 73,760 | 73,760 | |||
| Morgan Stanley Dean
Witter & Co.** |
||||||
| 6.910% | 11/22/2000 | 24,587 | 24,587 | |||
| Paribas Bank
Eurodollar Time Deposit** |
||||||
| 6.750% | 07/05/2000 | 147,520 | 147,520 | |||
| 1,721,400 | ||||||
| Repurchase Agreements — 3.6% | ||||||
| Investors Bank & Trust Company
Repurchase Agreement, dated 06/30/00, 6.03%, |
||||||
| due 07/03/00 (a) | 986,508 | 986,508 | ||||
| U.S. Treasury Obligations — 0.4% | ||||||
| US Treasury Bills | ||||||
| 5.290-
5.670% |
07/13/2000 | 110,000 | 109,798 | |||
| TOTAL SHORT-TERM
INVESTMENTS |
||||||
| (At Amortized Cost) | 2,817,706 | |||||
| TOTAL INVESTMENTS — 106.3% | ||||||
| (Cost $29,668,890)*** | 29,356,993 | |||||
| Other Assets/
(Liabilities) — (6.3%) |
(1,728,329) | |||||
| NET ASSETS — 100.0% | $27,628,664 | |||||
*
|
Non-income producing security.
|
**
|
Represents investment of security lending collateral. (Note 2).
|
***
|
Aggregate cost for Federal tax purposes. (Note 7).
|
†
|
American Depository Receipt
|
(a)
|
Maturity value of $987,004. Collateralized by U. S. Government Agency obligation with a rate of 6.500%, maturity date of
05/01/2029, and aggregate market value, including accrued interest, of $1,036,608.
|
| June 30, 2000
(Unaudited) |
|||
|---|---|---|---|
| Assets: | |||
| Investments, at value (cost $26,851,185) (Note 2 ) | $26,539,287 | ||
| Short-term investments, at amortized cost (Note 2) | 2,817,706 | ||
| Total Investments | 29,356,993 | ||
| Receivables from: | |||
| Interest and dividends | 1,116 | ||
| Receivable for variation margin on open futures contracts (Note 2) | 17,200 | ||
| Total assets | 29,375,309 | ||
| Liabilities: | |||
| Payables for: | |||
| Securities on loan (Note 2) | 1,721,400 | ||
| Directors’ fees and expenses (Note 3) | 1,330 | ||
| Affiliates (Note 3): | |||
| Investment management fees | 3,240 | ||
| Administration fees | 8,198 | ||
| Service fees | 72 | ||
| Accrued expenses and other liabilities | 12,405 | ||
| Total liabilities | 1,746,645 | ||
| Net assets | $27,628,664 | ||
| Net assets consist of: | |||
| Paid-in capital | $27,945,356 | ||
| Undistributed net investment loss | (16,951 | ) | |
| Accumulated net realized gain on investments and futures contracts | 13,767 | ||
| Net unrealized depreciation on investments and futures contracts | (313,508 | ) | |
| $27,628,664 | |||
| Net assets: | |||
| Class A | $ 511,549 | ||
| Class L | $ 287,558 | ||
| Class Y | $ 336,655 | ||
| Class S | $26,492,902 | ||
| Shares outstanding: | |||
| Class A | 52,097 | ||
| Class L | 29,287 | ||
| Class Y | 34,282 | ||
| Class S | 2,696,782 | ||
| Net asset value, offering price and redemption price per share: | |||
| Class A | $ 9.82 | ||
| Class L | $ 9.82 | ||
| Class Y | $ 9.82 | ||
| Class S | $ 9.82 | ||
| MassMutual OTC 100 Fund – Financial Statements (Continued)
|
| Period ended
June 30, 2000* (Unaudited) |
|||
|---|---|---|---|
| Investment income: (Note 2) | |||
| Dividends | $ 931 | ||
| Interest (including securities lending income of $121) | 17,579 | ||
| Total investment income | 18,510 | ||
| Expenses: (Note 2) | |||
| Investment management fees (Note 3) | 6,150 | ||
| Custody fees | 10,449 | ||
| Audit and legal fees | 1,956 | ||
| Directors’ fees (Note 3) | 1,330 | ||
| 19,885 | |||
| Administration fees (Note 3): | |||
| Class A | 180 | ||
| Class L | 154 | ||
| Class Y | 104 | ||
| Class S | 15,066 | ||
| Service fees (Note 3): | |||
| Class A | 72 | ||
| Total expenses | 35,461 | ||
| Net investment loss | (16,951 | ) | |
| Realized and unrealized gain (loss): | |||
| Net realized gain (loss) on: | |||
| Investment transactions | (7,179 | ) | |
| Closed futures contracts | 20,946 | ||
| Net realized gain | 13,767 | ||
| Net change in unrealized appreciation (depreciation) on: | |||
| Investments | (311,898 | ) | |
| Open futures contract s | (1,610 | ) | |
| Net unrealized loss | (313,508 | ) | |
| Net realized and unrealized loss | (299,741 | ) | |
| Net decrease in net assets resulting from operations | $(316,692 | ) | |
*
|
For the period from May 1, 2000 (commencement of operations) through June 30, 2000.
|
| MassMutual OTC 100 Fund – Financial Statements (Continued)
|
| Period ended
June 30, 2000* (Unaudited) |
|||
|---|---|---|---|
| Increase (Decrease) in Net Assets: | |||
| Operations: | |||
| Net investment loss | $ (16,951 | ) | |
| Net realized gain on investment transactions and futures contracts | 13,767 | ||
| Net change in unrealized appreciation (depreciation) on investments and futures contracts | (313,508 | ) | |
| Net decrease in net assets resulting from operations | (316,692 | ) | |
| Net fund share transactions (Note 5): | |||
| Class A | 509,265 | ||
| Class L | 282,842 | ||
| Class Y | 343,712 | ||
| Class S | 26,809,537 | ||
| Increase in net assets from net fund share transactions | 27,945,356 | ||
| Total increase in net assets | 27,628,664 | ||
| Net assets: | |||
| Beginning of period | - | ||
| End of period (including undistributed net investment loss of $16,951) | $27,628,664 | ||
*
|
For the period from May 1, 2000 (commencement of operations) through June 30, 2000.
|
| MassMutual OTC 100 Fund – Financial Statements (Continued)
|
| Class A |
Class L |
Class Y |
Class S |
|||||||||
|---|---|---|---|---|---|---|---|---|---|---|---|---|
| Period ended
6/30/00† (Unaudited) |
Period ended
6/30/00† (Unaudited) |
Period ended
6/30/00† (Unaudited) |
Period ended
6/30/00† (Unaudited) |
|||||||||
| Net asset value, beginning of period | $ 10.00 | $ 10.00 | $ 10.00 | $ 10.00 | ||||||||
| Income (Loss) from investment operations: | ||||||||||||
| Net investment loss | (0.01 | ) | (0.01 | ) | (0.00 | )*** | (0.01 | ) | ||||
| Net realized and unrealized gain (loss) on investments | (0.17 | ) | (0.17 | ) | (0.18 | ) | (0.17 | ) | ||||
| Total income (loss) from investment operations | (0.18 | ) | (0.18 | ) | (0.18 | ) | (0.18 | ) | ||||
| Net asset value, end of period | $ 9.82 | $ 9.82 | $ 9.82 | $ 9.82 | ||||||||
| Total Return@ | (1.80)% | ** | (1.80)% | ** | (1.80)% | ** | (1.80)% | ** | ||||
| Ratios / Supplemental Data: | ||||||||||||
| Net assets, end of period (000’s) | $ 512 | $ 288 | $ 337 | $26,493 | ||||||||
| Net expenses to average daily net assets | 1.37% | * | 1.12% | * | 0.97% | * | 0.86% | * | ||||
| Net investment loss to average daily net assets | (1.05)% | * | (0.82)% | * | (0.65)% | * | (0.41)% | * | ||||
| Portfolio turnover rate | 8% | ** | 8% | ** | 8% | ** | 8% | ** | ||||
*
|
Annualized
|
**
|
Percentage represents results for the period and are not annualized.
|
***
|
Net investment loss is less than $0.01 per share.
|
†
|
For the period from May 1, 2000 (commencement of operations) through June 30, 2000.
|
@
|
Employee retirement benefit plans that invest plan assets in the Separate Investment Accounts (SIAs) may be subject to certain
charges as set forth in their respective Plan Documents. Total return figures would be lower for the periods presented if they reflected these charges.
|
Ÿ
|
achieve growth of capital over the long term
|
Ÿ
|
invest in a concentrated portfolio of approximately 20 equity securities of small and mid-sized companies (companies with market
capitalization, at the time of purchase, of $1 to $10 billion)
|
Ÿ
|
utilize a value-oriented strategy in making investment decisions
|
Ÿ
|
utilize fundamental analysis to identify companies which
|
| —are of high investment quality or possess a unique product, market position or operating characteristics
|
| —offer above-average levels of profitability or superior growth potential
|
| —are attractively valued in the marketplace
|
| MassMutual Focused Value Fund – Portfolio Manager Report (Continued)
|
| MassMutual Focused Value Fund
|
| Largest Stock Holdings (6/30/00)
|
| Washington Mutual, Inc.
|
| Tricon Global Restaurants, Inc.
|
| Citizen Communications Company
|
| Cendant Corporation
|
| Jones Apparel Group, Inc.
|
| Equifax, Inc.
|
| Toys R US, Inc.
|
| Energizer Holdings, Inc.
|
| Electronic Data Systems Corporation
|
| Ceridian Corp.
|
| MassMutual Focused Value Fund – Portfolio Manager Report (Continued)
|
| Since Inception
5/1/00 - 6/30/00 |
|||||
|---|---|---|---|---|---|
| Class S | -5.50% | ||||
| Class A | -5.60% | ||||
| Class Y | -5.60% | ||||
| Class L | -5.60% | ||||
| Russell 2500 Index | 1.46% | ||||
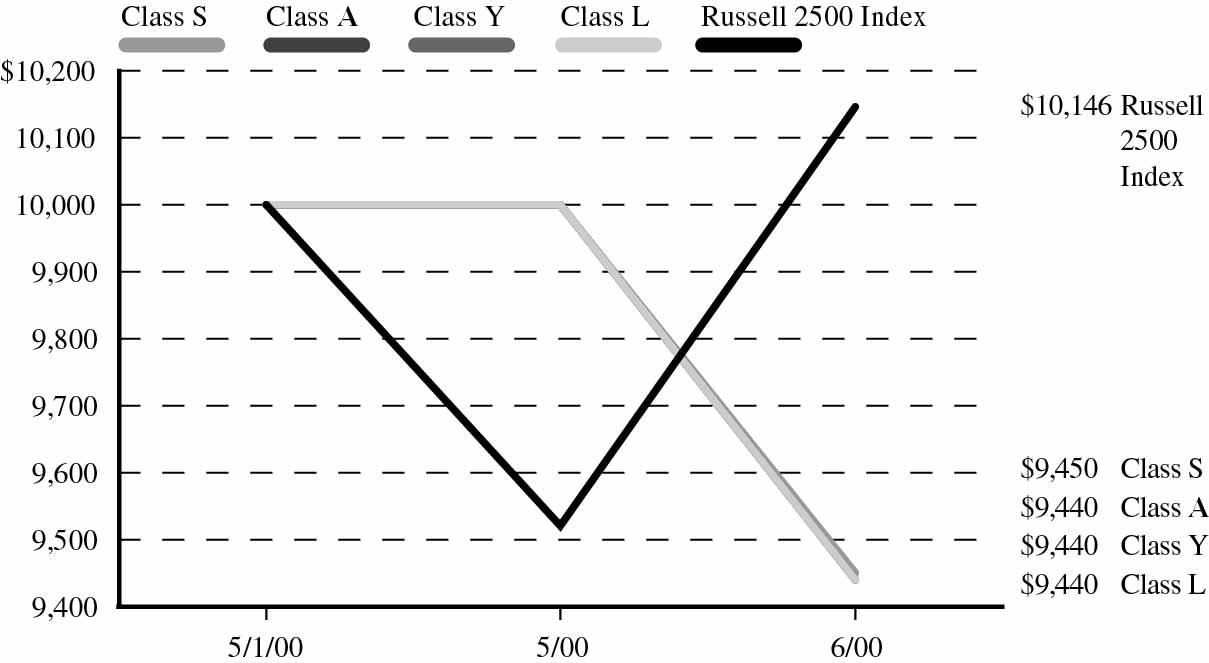
| Number of
Shares |
Market Value |
|||
|---|---|---|---|---|
| EQUITIES — 80.1% | ||||
| Apparel, Textiles & Shoes — 5.1% | ||||
| Jones Apparel Group, Inc.* | 56,000 | $ 1,316,000 | ||
| Banking, Savings & Loans — 6.7% | ||||
| Washington Mutual, Inc. | 60,000 | 1,732,500 | ||
| Building Materials & Construction — 4.5% | ||||
| USG Corp. | 38,000 | 1,154,250 | ||
| Commercial Services — 11.1% | ||||
| Cendant Corporation | 110,000 | 1,540,000 | ||
| Equifax, Inc. | 50,000 | 1,312,500 | ||
| 2,852,500 | ||||
| Communications — 6.0% | ||||
| Citizen Communications
Company |
90,000 | 1,552,500 | ||
| Computers & Office Equipment — 4.8% | ||||
| Electronic Data Systems
Corporation |
30,000 | 1,237,500 | ||
| Cosmetics & Personal Care — 3.6% | ||||
| Dial Corp. | 90,000 | 933,750 | ||
| Data Processing and Preparation — 4.8% | ||||
| Ceridian Corp.* | 51,000 | 1,227,187 | ||
| Electrical Equipment & Electronics — 4.9% | ||||
| Energizer Holdings, Inc.* | 70,000 | 1,277,500 | ||
| Number of
Shares |
Market Value |
|||
|---|---|---|---|---|
| Forest Products & Paper — 3.6% | ||||
| Fort James Corporation | 40,000 | $ 925,000 | ||
| Information Retrieval Services — 4.3% | ||||
| Nova Corp./Georgia* | 40,000 | 1,117,500 | ||
| Manufacturing – Diversified — 4.4% | ||||
| Cooper Industries, Inc. | 35,000 | 1,139,688 | ||
| Restaurants — 6.6% | ||||
| Tricon Global
Restaurants, Inc.* |
60,000 | 1,695,000 | ||
| Retail — 5.1% | ||||
| Toys R US, Inc.* | 90,000 | 1,310,625 | ||
| Toys, Games — 4.6% | ||||
| Mattel, Inc. | 90,000 | 1,186,875 | ||
| TOTAL EQUITIES
(Cost $21,928,156)** |
20,658,375 | |||
| TOTAL INVESTMENTS — 80.1% | ||||
| Other Assets/
(Liabilities) — 19.9% |
5,139,063 | |||
| NET ASSETS — 100.0% | $ 25,797,438 | |||
*
|
Non-income producing security.
|
**
|
Aggregate cost for Federal tax purposes. (Note 7).
|
| June 30, 2000
(Unaudited) |
|||
|---|---|---|---|
| Assets: | |||
| Investments, at value (cost $21,928,156) (Note 2 ) | $20,658,375 | ||
| Cash | 5,114,454 | ||
| Receivables from: | |||
| Interest and dividends | 55,350 | ||
| Total assets | 25,828,179 | ||
| Liabilities: | |||
| Payables for: | |||
| Directors’ fees and expenses (Note 3) | 1,330 | ||
| Affiliates (Note 3): | |||
| Investment management fees | 14,827 | ||
| Administration fees | 2,134 | ||
| Service fees | 45 | ||
| Accrued expenses and other liabilities | 12,405 | ||
| Total liabilities | 30,741 | ||
| Net assets | $25,797,438 | ||
| Net assets consist of: | |||
| Paid-in capital | $27,301,058 | ||
| Undistributed net investment income | 66,799 | ||
| Accumulated net realized loss on investments | (300,638 | ) | |
| Net unrealized depreciation on investments | (1,269,781 | ) | |
| $25,797,438 | |||
| Net assets: | |||
| Class A | $ 307,001 | ||
| Class L | $ 1,623,794 | ||
| Class Y | $ 95,201 | ||
| Class S | $23,771,442 | ||
| Shares outstanding: | |||
| Class A | 32,527 | ||
| Class L | 172,010 | ||
| Class Y | 10,080 | ||
| Class S | 2,515,547 | ||
| Net asset value, offering price and redemption price per share: | |||
| Class A | $ 9.44 | ||
| Class L | $ 9.44 | ||
| Class Y | $ 9.44 | ||
| Class S | $ 9.45 | ||
| MassMutual Focused Value Fund – Financial Statements (Continued)
|
| Period ended
June 30, 2000* (Unaudited) |
|||
|---|---|---|---|
| Investment income: (Note 2) | |||
| Dividends | $ 53,125 | ||
| Interest | 60,879 | ||
| Total investment income | 114,004 | ||
| Expenses: (Note 2) | |||
| Investment management fees (Note 3) | 29,454 | ||
| Custody fees | 10,449 | ||
| Audit and legal fees | 1,956 | ||
| Directors’ fees (Note 3) | 1,330 | ||
| 43,189 | |||
| Administration fees (Note 3): | |||
| Class A | 60 | ||
| Class L | 412 | ||
| Class Y | 30 | ||
| Class S | 3,469 | ||
| Service fees (Note 3): | |||
| Class A | 45 | ||
| Total expenses | 47,205 | ||
| Net investment income | 66,799 | ||
| Realized and unrealized gain (loss): | |||
| Net realized loss on investment transactions | (300,638 | ) | |
| Net change in unrealized appreciation (depreciation) on investments | (1,269,781 | ) | |
| Net realized and unrealized loss | (1,570,419 | ) | |
| Net decrease in net assets resulting from operations | $(1,503,620 | ) | |
| * For the period from May 1, 2000 (commencement of operations) through June 30, 2000.
|
| MassMutual Focused Value Fund – Financial Statements (Continued)
|
| Period ended
June 30, 2000* (Unaudited) |
|||
|---|---|---|---|
| Increase (Decrease) in Net Assets: | |||
| Operations: | |||
| Net investment income | $ 66,799 | ||
| Net realized loss on investment transactions | (300,638 | ) | |
| Net change in unrealized appreciation (depreciation) on investments | (1,269,781 | ) | |
| Net decrease in net assets resulting from operations | (1,503,620 | ) | |
| Net fund share transactions (Note 5): | |||
| Class A | 314,562 | ||
| Class L | 1,735,202 | ||
| Class Y | 101,000 | ||
| Class S | 25,150,294 | ||
| Increase in net assets from net fund share transactions | 27,301,058 | ||
| Total increase in net assets | 25,797,438 | ||
| Net assets: | |||
| Beginning of period | - | ||
| End of period (including undistributed net investment income of $66,799) | $25,797,438 | ||
| * For the period from May 1, 2000 (commencement of operations) through June 30, 2000.
|
| MassMutual Focused Value Fund – Financial Statements (Continued)
|
| Class A |
Class L |
Class Y |
Class S |
|||||||||
|---|---|---|---|---|---|---|---|---|---|---|---|---|
| Period ended
6/30/00† (Unaudited) |
Period ended
6/30/00† (Unaudited) |
Period ended
6/30/00† (Unaudited) |
Period ended
6/30/00† (Unaudited) |
|||||||||
| Net asset value, beginning of period | $10.00 | $10.00 | $10.00 | $ 10.00 | ||||||||
| Income (Loss) from investment operations: | ||||||||||||
| Net investment income | 0.01 | *** | 0.02 | *** | 0.02 | *** | 0.03 | *** | ||||
| Net realized and unrealized gain (loss) on investments | (0.57 | ) | (0.58 | ) | (0.58 | ) | (0.58 | ) | ||||
| Total income (loss) from investment operations | (0.56 | ) | (0.56 | ) | (0.56 | ) | (0.55 | ) | ||||
| Net asset value, end of period | $ 9.44 | $ 9.44 | $ 9.44 | $ 9.45 | ||||||||
| Total Return@ | (5.60 | )%** | (5.60 | )%** | (5.60 | )%** | (5.50 | )%** | ||||
| Ratios / Supplemental Data: | ||||||||||||
| Net assets, end of period (000’s) | $ 307 | $1,624 | $ 95 | $23,771 | ||||||||
| Net expenses to average daily net assets | 1.65% | * | 1.38% | * | 1.23% | * | 1.09% | * | ||||
| Net investment income to average daily net assets | 0.90% | * | 1.31% | * | 1.46% | * | 1.58% | * | ||||
| Portfolio turnover rate | 7% | ** | 7% | ** | 7% | ** | 7% | ** | ||||
*
|
Annualized
|
**
|
Percentage represents results for the period and are not annualized.
|
***
|
Per share amount calculated on the average shares method.
|
†
|
For the period from May 1, 2000 (commencement of operations) through June 30, 2000.
|
@
|
Employee retirement benefit plans that invest plan assets in the Separate Investment Accounts (SIAs) may be subject to
certain charges as set forth in their respective Plan Documents. Total return figures would be lower for the periods presented if they reflected these charges.
|
Ÿ
|
achieve long-term growth of capital and income
|
Ÿ
|
invest primarily in a diversified portfolio of equity securities of smaller companies (companies with market capitalization, at
the time of purchase, within the range of capitalizations of companies included in the Lipper, Inc. Small Cap Category)
|
Ÿ
|
utilize a value-oriented strategy in making investment decisions
|
Ÿ
|
utilize fundamental analysis to identify companies which
|
| —are of high investment quality or possess a unique product, market position or operating characteristics
|
| —offer above-average levels of profitability or superior growth potential
|
| —are attractively valued in the marketplace
|
| MassMutual Small Cap Value Equity Fund – Portfolio Manager Report (Continued)
|
| MassMutual Small Cap Value Equity Fund
|
| Largest Stock Holdings (6/30/00)
|
| Advo, Inc.
|
| Ct Communications, Inc.
|
| C.H. Robinson Worldwide, Inc.
|
| Carlisle Cos., Inc.
|
| Commerce Bancorp, Inc. NJ
|
| OM Group, Inc.
|
| Olin Corp.
|
| Precision Drilling Corporation
|
| True North Communications, Inc.
|
| Reliance Steel & Aluminum Company
|
| MassMutual Small Cap Value Equity Fund – Portfolio Manager Report (Continued)
|
| Year-To-Date | One Year | Five Year
Average Annual |
Since Inception
Average Annual |
||||||
|---|---|---|---|---|---|---|---|---|---|
| 1/1/00 - 6/30/00 | 7/1/99 - 6/30/00 | 7/1/95 - 6/30/00 | 10/3/94 - 6/30/00 | ||||||
| Class S | 8.62% | 3.51% | 13.01% | 12.20% | |||||
| Russell
2000 Index |
3.06% | 14.35% | 14.28% | 14.59% | |||||
| Year-To-Date | One Year | Since Inception
Average Annual |
|||||
|---|---|---|---|---|---|---|---|
| 1/1/00 - 6/30/00 | 7/1/99 - 6/30/00 | 1/1/98 - 6/30/00 | |||||
| Class A | 8.41% | 3.06% | -0.94% | ||||
| Class Y | 8.55% | 3.41% | -0.54% | ||||
| Russell
2000 Index |
3.06% | 14.35% | 8.20% | ||||
| Year-To-Date | One Year | Since Inception
Average Annual |
|||||
|---|---|---|---|---|---|---|---|
| 1/1/00 - 6/30/00 | 7/1/99 - 6/30/00 | 5/3/99 - 6/30/00 | |||||
| Class L | 8.56% | 3.38% | 10.04% | ||||
| Russell
2000 Index |
3.06% | 14.35% | 17.97% | ||||

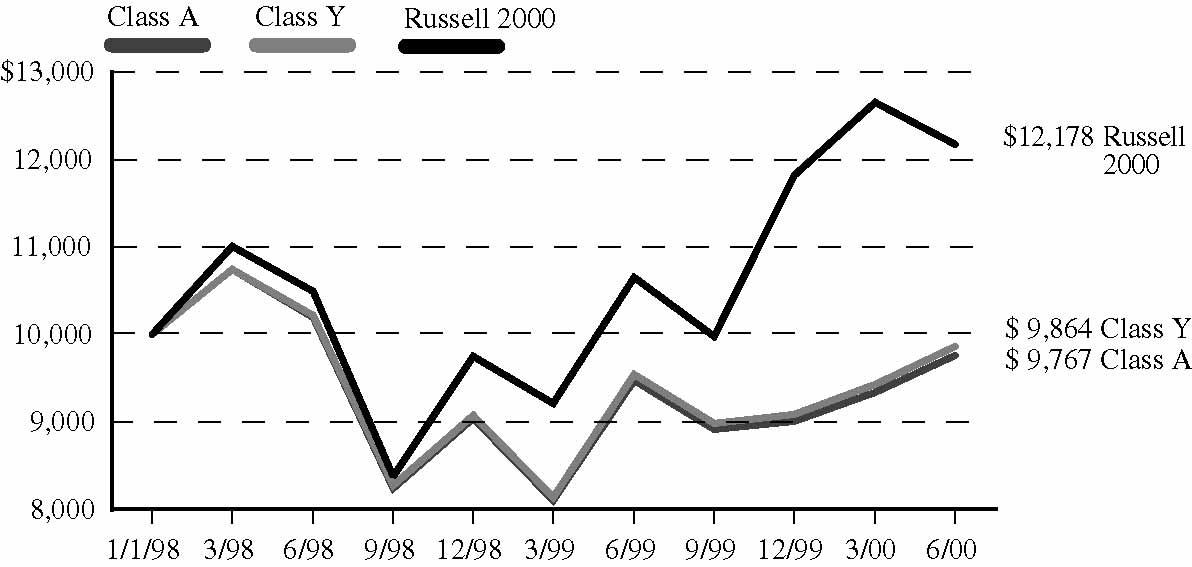
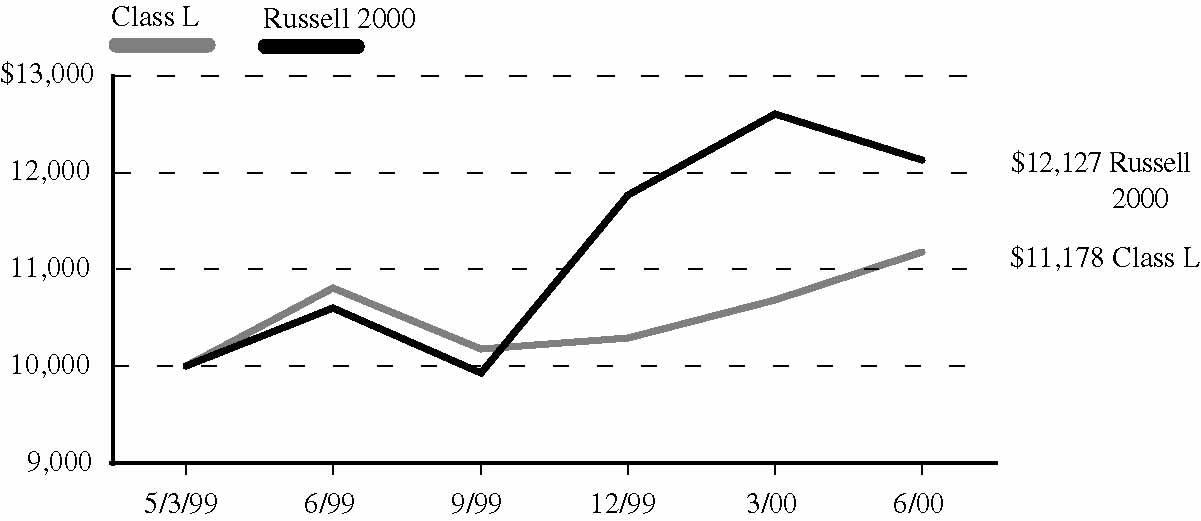
| Number of
Shares |
Market Value |
|||
|---|---|---|---|---|
| EQUITIES — 96.9% | ||||
| Advertising — 2.0% | ||||
| Ackerley Group, Inc. | 236,400 | $ 2,777,700 | ||
| Harte Hanks
Communications, Inc. |
394,800 | 9,870,000 | ||
| 12,647,700 | ||||
| Automotive & Parts — 1.0% | ||||
| Dura Automotive
Systems, Inc.* |
104,000 | 1,124,500 | ||
| Myers Industries, Inc. | 143,295 | 1,540,419 | ||
| United Auto Group, Inc.* | 396,400 | 3,617,150 | ||
| 6,282,069 | ||||
| Banking, Savings & Loans — 9.6% | ||||
| Banknorth Group, Inc. | 721,552 | 11,048,765 | ||
| CCB Financial
Corporation |
216,000 | 7,992,000 | ||
| Commerce Bancorp, Inc. NJ | 345,600 | 15,897,602 | ||
| First Republic Bank* | 232,600 | 4,637,462 | ||
| Hudson City Bancorp, Inc. | 228,500 | 3,898,781 | ||
| Sovereign Bancorp, Inc. | 530,396 | 3,729,373 | ||
| Webster Financial
Corporation |
556,048 | 12,337,315 | ||
| 59,541,298 | ||||
| Broadcasting, Publishing & Printing — 2.6% | ||||
| Houghton Mifflin
Company |
203,300 | 9,491,569 | ||
| McClatchy Newspapers, Inc. | 204,950 | 6,788,969 | ||
| 16,280,538 | ||||
| Building Materials & Construction — 1.4% | ||||
| Elcor Corporation | 381,500 | 8,774,500 | ||
| Chemicals — 6.6% | ||||
| Olin Corp. | 866,700 | 14,300,550 | ||
| OM Group, Inc. | 352,600 | 15,514,400 | ||
| Spartech Corporation | 407,300 | 10,997,100 | ||
| 40,812,050 | ||||
| Number of
Shares |
Market Value |
|||
|---|---|---|---|---|
| Commercial Services — 5.2% | ||||
| ABM Industries, Inc. | 290,600 | $ 6,683,800 | ||
| Advo, Inc. * | 578,100 | 24,280,200 | ||
| Landauer, Inc. | 86,700 | 1,349,269 | ||
| 32,313,269 | ||||
| Communications — 6.6% | ||||
| Ct Communications, Inc. | 663,800 | 18,876,812 | ||
| Inet Technologies, Inc.* | 156,400 | 8,484,700 | ||
| True North
Communications, Inc. |
315,500 | 13,882,000 | ||
| 41,243,512 | ||||
| Computers & Information — 1.9% | ||||
| Xircom, Inc.* | 251,500 | 11,946,250 | ||
| Containers — 1.1% | ||||
| U.S. Can Corporation* | 391,000 | 6,793,625 | ||
| Electric Utilities — 3.4% | ||||
| Calpine Corporation* | 175,300 | 11,525,975 | ||
| EL Paso Electric Co.* | 831,500 | 9,302,406 | ||
| 20,828,381 | ||||
| Electrical Equipment & Electronics — 13.1% | ||||
| Benchmark Electronics,
Inc.* |
302,300 | 11,052,844 | ||
| Burr-Brown Corp.* | 121,300 | 10,515,194 | ||
| Cognex Corporation* | 236,600 | 12,244,050 | ||
| Cohu, Inc. | 295,600 | 7,971,977 | ||
| Dallas Semiconductor
Corporation |
323,800 | 13,194,850 | ||
| Lattice Semiconductor
Corporation* |
148,200 | 10,244,325 | ||
| Micrel, Inc.* | 146,200 | 6,350,562 | ||
| Teleflex, Incorporated | 266,500 | 9,527,375 | ||
| 81,101,177 | ||||
| Energy — 5.2% | ||||
| Newfield Exploration Co.* | 216,100 | 8,454,913 | ||
| Precision Drilling
Corporation |
368,400 | 14,229,450 | ||
| Stone Energy Corp.* | 161,500 | 9,649,625 | ||
| 32,333,988 | ||||
| Number of
Shares |
Market Value |
|||
|---|---|---|---|---|
| Financial Services — 2.1% | ||||
| Eaton Vance Corp. | 289,100 | $13,370,875 | ||
| Foods — 3.7% | ||||
| International Home
Foods, Inc.* |
425,400 | 8,906,813 | ||
| Morrison Management
Specialists, Inc. |
489,280 | 13,791,580 | ||
| 22,698,393 | ||||
| Healthcare — 1.7% | ||||
| Health Management
Associates Cl. A* |
796,400 | 10,402,975 | ||
| Industrial – Diversified — 2.6% | ||||
| Carlisle Cos., Inc. | 357,300 | 16,078,500 | ||
| Insurance — 3.6% | ||||
| HCC Insurance Holdings | 481,300 | 9,084,538 | ||
| Highlands Insurance
Group, Inc.* |
522,600 | 4,899,375 | ||
| White Mountains
Insurance Group, Inc. |
53,000 | 8,480,000 | ||
| 22,463,913 | ||||
| Machinery & Components — 6.0% | ||||
| Hardinge, Inc. | 378,550 | 3,951,116 | ||
| Helix Technology
Corporation |
343,500 | 13,396,500 | ||
| Regal-Beloit Corporation | 304,150 | 4,885,409 | ||
| Roper Industries, Inc. | 516,600 | 13,237,875 | ||
| Tennant Co. | 43,700 | 1,638,750 | ||
| 37,109,650 | ||||
| Medical Supplies — 3.3% | ||||
| Bacou USA, Inc.* | 272,800 | 5,456,000 | ||
| Biomet, Inc. | 174,400 | 6,703,500 | ||
| Invacare Corporation | 311,600 | 8,179,500 | ||
| 20,339,000 | ||||
| MassMutual Small Cap Value Equity Fund – Portfolio of Investments (Continued)
|
| Number of
Shares |
Market Value |
|||
|---|---|---|---|---|
| Metals & Mining — 4.8% | ||||
| CompX International, Inc. | 446,300 | $ 9,065,469 | ||
| Matthews International
Corp. |
237,000 | 6,873,000 | ||
| Reliance Steel &
Aluminum Company |
722,550 | 13,818,769 | ||
| |
||||
| 29,757,238 | ||||
| |
||||
| Miscellaneous — 0.6% | ||||
| Crossmann
Communities, Inc.* |
214,200 | 3,534,300 | ||
| |
||||
| Pharmaceuticals — 1.0% | ||||
| Bindley Western
Industries, Inc. |
225,066 | 5,950,182 | ||
| |
||||
| Real Estate — 0.9% | ||||
| Mid-Atlantic Realty Trust | 572,500 | 5,725,000 | ||
| |
||||
| Retail — 2.0% | ||||
| BJ’s Wholesale Club,
Inc.* |
383,300 | 12,648,900 | ||
| |
||||
| Transportation — 4.9% | ||||
| C.H. Robinson
Worldwide, Inc. |
344,400 | 17,047,800 | ||
| Hub Group, Inc. Cl. A* | 252,200 | 3,767,238 | ||
| M.S. Carriers, Inc.* | 559,900 | 9,868,237 | ||
| |
||||
| 30,683,275 | ||||
| |
||||
| TOTAL EQUITIES | ||||
| (Cost $492,054,582) | 601,660,558 | |||
| |
||||
| Principal
Amount |
Market Value |
|||||
|---|---|---|---|---|---|---|
| SHORT-TERM INVESTMENTS — 6.5% | ||||||
| Cash Equivalents — 3.6% | ||||||
| Bank of America Bank Note** | ||||||
| 6.670% | 03/22/2001 | $ 482,122 | $ 482,122 | |||
| Bank of Montreal Bank Note** | ||||||
| 6.630% | 08/16/2000 | 803,537 | 803,537 | |||
| Bank of Nova Scotia
Eurodollar Time Deposit** |
||||||
| 7.000% | 07/03/2000 | 964,244 | 964,244 | |||
| Credit Agricole Bank
Eurodollar Time Deposit** |
||||||
| 6.750% | 07/06/2000 | 3,214,147 | 3,214,147 | |||
| Credit Agricole Bank
Eurodollar Time Deposit** |
||||||
| 6.750% | 07/07/2000 | 482,122 | 482,122 | |||
| Den Danske Bank
Eurodollar Time Deposit** |
||||||
| 6.810% | 07/05/2000 | 1,767,781 | 1,767,781 | |||
| First Union Bank Note** | ||||||
| 6.900% | 05/09/2001 | 482,122 | 482,122 | |||
| Fleet National Bank
Eurodollar Time Deposit** |
||||||
| 7.260% | 10/31/2000 | 2,993,529 | 2,993,529 | |||
| HypoVereinsbank
Eurodollar Time Deposit** |
||||||
| 6.750% | 07/05/2000 | 4,017,683 | 4,017,683 | |||
| Merrimac Money Market Fund** | ||||||
| 6.440% | 07/03/2000 | 5,046,210 | 5,046,210 | |||
| Morgan Stanley Dean Witter & Co.** | ||||||
| 6.910% | 11/22/2000 | 321,415 | 321,415 | |||
| Paribas Bank
Eurodollar Time Deposit** |
||||||
| 6.750% | 07/05/2000 | 1,928,488 | 1,928,488 | |||
| |
||||||
| 22,503,400 | ||||||
| |
||||||
| Principal
Amount |
Market Value |
||||||
|---|---|---|---|---|---|---|---|
| Repurchase Agreement — 2.9% | |||||||
| Investors Bank & Trust Company
Repurchase Agreement, dated 06/30/00, 6.03%, due 07/03/00 (a) |
$18,009,934 | $ 18,009,934 | |||||
| TOTAL SHORT-TERM
INVESTMENTS (At Amortized Cost) |
40,513,334 | ||||||
| TOTAL INVESTMENTS — 103.4%
(Cost $532,567,916)*** |
642,173,892 | ||||||
| Other Assets/
(Liabilities) — (3.4%) |
(21,158,043 | ) | |||||
| NET ASSETS — 100.0% | $621,015,849 | ||||||
| Notes to Portfolio of Investments | ||
| * | Non-income producing security. | |
| ** | Represents investment of security lending
collateral. (Note 2). |
|
| *** | Aggregate cost for Federal tax purposes. (Note 7). | |
| (a) | Maturity value of $18,018,984. Collateralized by
U.S. Government Agency obligations with rates of 7.338-7.375%, maturity dates of 01/15/2024- 01/20/2026, and aggregate market value, including accrued interest, of $18,910,442. |
|
| June 30, 2000
(Unaudited) |
||
|---|---|---|
| Assets: | ||
| Investments, at value (cost $492,054,582) (Note 2) | $601,660,558 | |
| Short-term investments, at amortized cost (Note 2) | 40,513,334 | |
| Total Investments | 642,173,892 | |
| Cash | 474 | |
| Receivables from: | ||
| Investments sold | 1,959,248 | |
| Interest and dividends | 429,232 | |
| Total assets | 644,562,846 | |
| Liabilities: | ||
| Payables for: | ||
| Investments purchased | 669,961 | |
| Securities on loan (Note 2) | 22,503,400 | |
| Directors’ fees and expenses (Note 3) | 2,191 | |
| Affiliates (Note 3): | ||
| Investment management fees | 295,040 | |
| Administration fees | 45,720 | |
| Service fees | 686 | |
| Accrued expenses and other liabilities | 29,999 | |
| Total liabilities | 23,546,997 | |
| Net assets | $621,015,849 | |
| Net assets consist of: | ||
| Paid-in capital | $471,226,157 | |
| Undistributed net investment income | 2,746,551 | |
| Accumulated net realized gain on investments | 37,437,165 | |
| Net unrealized appreciation on investments | 109,605,976 | |
| $621,015,849 | ||
| Net assets: | ||
| Class A | $ 1,900,160 | |
| Class L | $ 10,470,132 | |
| Class Y | $ 4,622,948 | |
| Class S | $604,022,609 | |
| Shares outstanding: | ||
| Class A | 129,237 | |
| Class L | 711,744 | |
| Class Y | 314,026 | |
| Class S | 40,937,687 | |
| Net asset value, offering price and redemption price per share: | ||
| Class A | $ 14.70 | |
| Class L | $ 14.71 | |
| Class Y | $ 14.72 | |
| Class S | $ 14.75 | |
| MassMutual Small Cap Value Equity Fund – Financial Statements (Continued)
|
| Six months ended
June 30, 2000 (Unaudited) |
||
|---|---|---|
| Investment income: (Note 2) | ||
| Dividends | $ 3,786,946 | |
| Interest (including securities lending income of $32,017) | 904,631 | |
| Total investment income | 4,691,577 | |
| Expenses: (Note 2) | ||
| Investment management fees (Note 3) | 1,787,814 | |
| Custody fees | 29,961 | |
| Audit and legal fees | 10,680 | |
| Directors’ fees (Note 3) | 4,807 | |
| 1,833,262 | ||
| Administration fees (Note 3): | ||
| Class A | 1,327 | |
| Class L | 9,831 | |
| Class Y | 3,770 | |
| Class S | 255,921 | |
| Service fees (Note 3): | ||
| Class A | 992 | |
| Total expenses | 2,105,103 | |
| Net investment income | 2,586,474 | |
| Realized and unrealized gain (loss): | ||
| Net realized gain (loss) on investment transactions | 26,955,141 | |
| Net change in unrealized appreciation (depreciation) on investments | 20,930,452 | |
| Net realized and unrealized gain | 47,885,593 | |
| Net increase in net assets resulting from operations | $50,472,067 | |
| MassMutual Small Cap Value Equity Fund – Financial Statements (Continued)
|
| Six months ended
June 30, 2000 (Unaudited) |
Year ended
December 31, 1999 |
||||||||||||
|---|---|---|---|---|---|---|---|---|---|---|---|---|---|
| Increase (Decrease) in Net Assets: | |||||||||||||
| Operations: | |||||||||||||
| Net investment income | $ 2,586,474 | $ 6,744,026 | |||||||||||
| Net realized gain on investment transactions | 26,955,141 | 26,505,919 | |||||||||||
| Net change in unrealized appreciation (depreciation) on investments | 20,930,452 | (30,483,393 | ) | ||||||||||
| Net increase in net assets resulting from operations | 50,472,067 | 2,766,552 | |||||||||||
| Distributions to shareholders (Note 2): | |||||||||||||
| From net investment income: | |||||||||||||
| Class A | - | (1,763 | ) | ||||||||||
| Class L | - | (16,505 | )* | ||||||||||
| Class Y | - | (48,682 | ) | ||||||||||
| Class S | - | (6,643,376 | ) | ||||||||||
| Total distributions from net investment income | - | (6,710,326 | ) | ||||||||||
| From net realized gains: | |||||||||||||
| Class A | - | (6,683 | ) | ||||||||||
| Class L | - | (39,188 | )* | ||||||||||
| Class Y | - | (113,305 | ) | ||||||||||
| Class S | - | (16,524,157 | ) | ||||||||||
| Total distributions from net realized gains | - | (16,683,333 | ) | ||||||||||
| Net fund share transactions (Note 5): | |||||||||||||
| Class A | 1,543,268 | 95,826 | |||||||||||
| Class L | 8,218,254 | 1,675,872 | * | ||||||||||
| Class Y | 285,310 | 3,537,934 | |||||||||||
| Class S | (85,989,069 | ) | (21,516,291 | ) | |||||||||
| Decrease in net assets from net fund share transactions | (75,942,237 | ) | (16,206,659 | ) | |||||||||
| Total decrease in net assets | (25,470,170 | ) | (36,833,766 | ) | |||||||||
| Net assets: | |||||||||||||
| Beginning of period | 646,486,019 | 683,319,785 | |||||||||||
| End of period (including undistributed net
investment income of $2,746,551
and $160,077, respectively) |
$621,015,849 | $646,486,019 | |||||||||||
| * For the period from May 3, 1999 (commencement of operations) through December 31, 1999.
|
| MassMutual Small Cap Value Equity Fund – Financial Statements (Continued)
|
| Class A |
|||||||||
|---|---|---|---|---|---|---|---|---|---|
| Six months ended
6/30/00 (Unaudited) |
Year ended
12/31/99 |
Year ended
12/31/98† |
|||||||
| Net asset value, beginning of period | $ 13.56 | $ 14.07 | $ 17.48 | ||||||
| Income (Loss) from investment operations: | |||||||||
| Net investment income | 0.02 | *** | 0.07 | *** | 0.03 | *** | |||
| Net realized and unrealized gain (loss) on investments | 1.12 | (0.13 | ) | (1.78 | ) | ||||
| Total income (loss) from investment operations | 1.14 | (0.06 | ) | (1.75 | ) | ||||
| Less distributions to shareholders: | |||||||||
| From net investment income | - | (0.09 | ) | (0.12 | ) | ||||
| From net realized gains | - | (0.36 | ) | (1.54 | ) | ||||
| Total distributions | - | (0.45 | ) | (1.66 | ) | ||||
| Net asset value, end of period | $ 14.70 | $ 13.56 | $ 14.07 | ||||||
| Total Return@ | 8.41% | ** | (0.36)% | (9.58)% | |||||
| Ratios / Supplemental Data: | |||||||||
| Net assets, end of period (000’s) | $ 1,900 | $ 262 | $ 174 | ||||||
| Net expenses to average daily net assets | 1.19% | * | 1.22% | 1.30% | |||||
| Net investment income to average daily net assets | 0.26% | * | 0.49% | 0.19% | |||||
| Portfolio turnover rate | 32% | ** | 34% | 31% | |||||
| Class L |
|||||||||
| Six months ended
6/30/00 (Unaudited) |
Period ended
12/31/99+ |
||||||||
| Net asset value, beginning of period | $ 13.55 | $ 13.66 | |||||||
| Income (Loss) from investment operations: | |||||||||
| Net investment income | 0.04 | *** | 0.08 | *** | |||||
| Net realized and unrealized gain (loss) on investments | 1.12 | 0.32 | |||||||
| Total income (loss) from investment operations | 1.16 | 0.40 | |||||||
| Less distributions to shareholders: | |||||||||
| From net investment income | - | (0.15 | ) | ||||||
| From net realized gains | - | (0.36 | ) | ||||||
| Total distributions | - | (0.51 | ) | ||||||
| Net asset value, end of period | $ 14.71 | $ 13.55 | |||||||
| Total Return@ | 8.56% | ** | 2.97% | ** | |||||
| Ratios / Supplemental Data: | |||||||||
| Net assets, end of period (000’s) | $10,470 | $ 1,634 | |||||||
| Net expenses to average daily net assets | 0.94% | * | 0.94% | * | |||||
| Net investment income to average daily net assets | 0.54% | * | 0.83% | * | |||||
| Portfolio turnover rate | 32% | ** | 34% | ** | |||||
*
|
Annualized.
|
**
|
Percentage represents results for the period and are not annualized.
|
***
|
Per share amount calculated on the average shares method.
|
+
|
For the period from May 3, 1999 (commencement of operations) through December 31, 1999.
|
†
|
Amounts have been restated to reflect reverse stock splits.
|
@
|
Employee retirement benefit plans that invest plan assets in the Separate Investment Accounts (SIAs) may be subject to certain
charges as set forth in their respective Plan Documents. Total return figures would be lower for the periods presented if they reflected these charges.
|
| MassMutual Small Cap Value Equity Fund – Financial Statements (Continued)
|
| Class Y |
||||||||||||||||||
|---|---|---|---|---|---|---|---|---|---|---|---|---|---|---|---|---|---|---|
| Six months ended
6/30/00 (Unaudited) |
Year ended
12/31/99 |
Year ended
12/31/98† |
||||||||||||||||
| Net asset value, beginning of period | $ 13.56 | $ 14.06 | $ 17.51 | |||||||||||||||
| Income (Loss) from investment operations: | ||||||||||||||||||
| Net investment income | 0.05 | *** | 0.12 | *** | 0.11 | *** | ||||||||||||
| Net realized and unrealized gain (loss) on
investments |
1.11 | (0.11 | ) | (1.81 | ) | |||||||||||||
| Total income (loss) from investment
operations |
1.16 | 0.01 | (1.70 | ) | ||||||||||||||
| Less distributions to shareholders: | ||||||||||||||||||
| From net investment income | - | (0.15 | ) | (0.21 | ) | |||||||||||||
| From net realized gains | - | (0.36 | ) | (1.54 | ) | |||||||||||||
| Total distributions | - | (0.51 | ) | (1.75 | ) | |||||||||||||
| Net asset value, end of period | $ 14.72 | $ 13.56 | $ 14.06 | |||||||||||||||
| Total Return@ | 8.55% | ** | 0.13% | (9.25)% | ||||||||||||||
| Ratios / Supplemental Data: | ||||||||||||||||||
| Net assets, end of period (000’s) | $ 4,623 | $ 3,990 | $ 568 | |||||||||||||||
| Net expenses to average daily net assets | 0.78% | * | 0.80% | 0.85% | ||||||||||||||
| Net investment income to average daily net assets | 0.73% | * | 0.86% | 0.67% | ||||||||||||||
| Portfolio turnover rate | 32% | ** | 34% | 31% | ||||||||||||||
| Class S (1) |
||||||||||||||||||
| Six months ended
6/30/00 (Unaudited) |
Year ended
12/31/99 |
Year ended
12/31/98 |
Year ended
12/31/97 |
Year ended
12/31/96 |
Year ended
12/31/95 |
|||||||||||||
| Net asset value, beginning of period | $ 13.58 | 14.06 | $ 16.61 | $ 13.43 | $ 11.44 | $ 9.69 | ||||||||||||
| Income (Loss) from investment operations: | ||||||||||||||||||
| Net investment income | 0.06 | *** | 0.14 | *** | 0.13 | 0.13 | 0.31 | 0.19 | ||||||||||
| Net realized and unrealized gain (loss) on
investments |
1.11 | (0.11 | ) | (1.67 | ) | 4.73 | 2.29 | 1.75 | ||||||||||
| Total income (loss) from investment
operations |
1.17 | 0.03 | (1.54 | ) | 4.86 | 2.60 | 1.94 | |||||||||||
| Less distributions to shareholders: | ||||||||||||||||||
| From net investment income | - | (0.15 | ) | (0.13 | ) | (0.14 | ) | (0.30 | ) | (0.19 | ) | |||||||
| From net realized gains | - | (0.36 | ) | (0.88 | ) | (1.54 | ) | (0.31 | ) | - | ||||||||
| Total distributions | - | (0.51 | ) | (1.01 | ) | (1.68 | ) | (0.61 | ) | (0.19 | ) | |||||||
| Net asset value, end of period | $ 14.75 | 13.58 | $ 14.06 | $ 16.61 | $ 13.43 | $ 11.44 | ||||||||||||
| Total Return@ | 8.62% | ** | 0.25% | (9.02)% | 36.36% | 22.82% | 20.01% | |||||||||||
| Ratios / Supplemental Data: | ||||||||||||||||||
| Net assets, end of period (000’s) | $604,023 | $640,600 | $682,578 | $690,378 | $456,935 | $380,398 | ||||||||||||
| Ratio of expenses to average daily net assets: | ||||||||||||||||||
| Before expense waiver | 0.68% | * | 0.67% | 0.64% | 0.65% | 0.65% | 0.65% | |||||||||||
| After expense waiver # | N/A | N/A | N/A | 0.64% | 0.61% | 0.61% | ||||||||||||
| Net investment income to average daily net assets | 0.84% | * | 1.03% | 0.86% | 0.89% | 2.40% | 1.78% | |||||||||||
| Portfolio turnover rate | 32% | ** | 34% | 31% | 31% | 28% | 28% | |||||||||||
*
|
Annualized.
|
**
|
Percentage represents results for the period and are not annualized.
|
***
|
Per share amount calculated on the average shares method.
|
†
|
Amounts have been restated to reflect reverse stock splits.
|
(1)
|
Class S shares were previously designated as Class 4 shares.
|
#
|
Computed after giving effect to the voluntary partial waiver of management fee by MassMutual, which terminated May 1, 1997.
|
@
|
Employee retirement benefit plans that invest plan assets in the Separate Investment Accounts (SIAs) may be subject to certain
charges as set forth in their respective Plan Documents. Total return figures would be lower for the periods presented if they reflected these charges.
|
Ÿ
|
achieve long-term growth of capital
|
Ÿ
|
invest primarily in a diversified portfolio of equity securities of mid-sized companies (companies with market capitalization, at
the time of purchase, of $500 million to $5 billion)
|
Ÿ
|
utilize a growth-oriented strategy in making investment decisions
|
Ÿ
|
utilize fundamental analysis to identify companies which
|
| —are of high investment quality or possess a unique product, market position or operating characteristics
|
| —offer above-average levels of profitability or superior growth potential
|
| MassMutual Mid Cap Growth Equity Fund
|
| Largest Stock Holdings (6/30/00)
|
| SDL, Inc.
|
| Exodus Communications, Inc.
|
| ADC Telecommunications, Inc.
|
| Jabil Circut, Inc.
|
| Rational Software Corp.
|
| Scientific-Atlanta, Inc.
|
| Vitesse Semiconductor Corp.
|
| VoiceStream Wireless Corporation
|
| Millennium Pharmaceuticals
|
| Forest Laboratories, Inc. Cl. A
|
| MassMutual Mid Cap Growth Equity Fund – Portfolio Manager Report (Continued)
|
| Year-to-Date
1/1/00-6/30/00 |
One Year
7/1/99-6/30/00 |
Since Inception
Average Annual 5/3/99-6/30/00 |
|||||
|---|---|---|---|---|---|---|---|
| Class S | 5.16% | 41.78% | 38.89% | ||||
| Class A | 5.04% | 41.34% | 38.40% | ||||
| Class Y | 5.24% | 41.88% | 38.97% | ||||
| Class L | 5.10% | 41.45% | 38.73% | ||||
| Russell 2500
Index |
5.69% | 18.34% | 22.26% | ||||
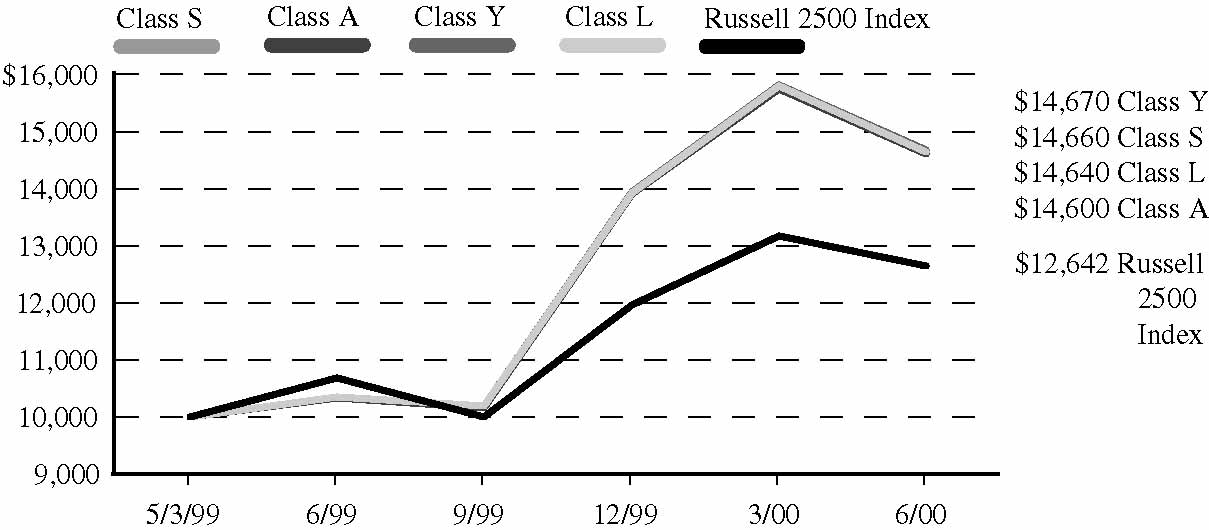
| |
| Number of
Shares |
Market Value |
|||
|---|---|---|---|---|
| EQUITIES — 96.9% | ||||
| Advertising — 3.2% | ||||
| Lamar Advertising Co.* | 28,500 | $ 1,234,406 | ||
| MyPoints.com, Inc.* | 33,000 | 625,452 | ||
| TMP Worldwide, Inc.* | 18,100 | 1,336,006 | ||
| Young & Rubicam, Inc. | 39,600 | 2,264,625 | ||
| 5,460,489 | ||||
| Aerospace & Defense — 1.0% | ||||
| Bombardier, Inc. Cl. B | 63,500 | 1,722,857 | ||
| Air Transportation — 0.8% | ||||
| Southwest Airlines Co. | 74,300 | 1,407,056 | ||
| Broadcasting, Publishing & Printing — 6.7% | ||||
| Cablevision Systems
Corp. Cl. A* |
25,300 | 1,717,237 | ||
| Citadel Communications
Corp.* |
44,800 | 1,565,200 | ||
| Hispanic Broadcasting
Corp.* |
42,200 | 1,397,875 | ||
| Liberty Digital, Inc. Cl. A* | 34,800 | 1,044,000 | ||
| Readers Digest
Association Cl. A |
50,700 | 2,015,325 | ||
| TV Guide, Inc. Cl. A* | 57,700 | 1,976,225 | ||
| Univision
Communications, Inc.* |
15,600 | 1,614,600 | ||
| 11,330,462 | ||||
| Commercial Services — 5.0% | ||||
| Concord EFS, Inc.* | 83,850 | 2,180,100 | ||
| Dycom Industries, Inc.* | 38,850 | 1,787,100 | ||
| PerkinElmer, Inc. | 30,100 | 1,990,362 | ||
| Quanta Services, Inc.* | 21,800 | 1,199,000 | ||
| StorageNetworks, Inc.* | 1,100 | 99,275 | ||
| Time Warner Telecom,
Inc. Cl. A* |
18,200 | 1,171,625 | ||
| 8,427,462 | ||||
| Communications — 14.0% | ||||
| ADC Telecommunications,
Inc.* |
38,200 | 3,204,025 | ||
| Andrew Corp.* | 42,500 | 1,426,406 | ||
| Ciena Corp.* | 13,300 | 2,216,944 | ||
| Crown Castle
International Corp.* |
56,000 | 2,044,000 | ||
| Gilat Satellite Networks Ltd.* | 16,000 | 1,110,000 | ||
| GT Group Telecom, Inc.
Cl. B* |
21,900 | 346,294 | ||
| IDT Corp.* | 49,800 | 1,690,087 | ||
| McleodUSA, Inc.* | 108,700 | 2,248,731 | ||
| Microcell
Telecommunications, Inc.* |
36,900 | 1,333,012 | ||
| Number of
Shares |
Market Value |
|||
|---|---|---|---|---|
| Powerwave Technologies,
Inc.* |
33,800 | $ 1,487,200 | ||
| Scientific-Atlanta, Inc. | 35,200 | 2,622,400 | ||
| Titan Corp.* | 50,600 | 2,264,350 | ||
| Viasat, Inc.* | 32,700 | 1,773,975 | ||
| 23,767,424 | ||||
| Computer Programming Services — 3.8% | ||||
| Macromedia, Inc.* | 19,200 | 1,856,400 | ||
| Mercury Interactive
Corp.* |
24,300 | 2,351,025 | ||
| VeriSign, Inc.* | 12,942 | 2,284,263 | ||
| 6,491,688 | ||||
| Computer Related Services — 2.4% | ||||
| Acxiom Corp.* | 44,500 | 1,212,625 | ||
| Genuity, Inc.* | 68,800 | 629,953 | ||
| Inktomi Corp.* | 18,100 | 2,140,325 | ||
| 3,982,903 | ||||
| Computers & Information — 1.6% | ||||
| Jabil Circuit, Inc.* | 56,400 | 2,798,850 | ||
| Cosmetics & Personal Care — 1.2% | ||||
| Estee Lauder Companies,
Inc. Cl. A |
39,700 | 1,962,669 | ||
| Data Processing and Preparation — 1.7% | ||||
| Fiserv, Inc.* | 48,300 | 2,088,975 | ||
| Homestore.com, Inc.* | 25,700 | 750,119 | ||
| 2,839,094 | ||||
| Electric Utilities — 1.2% | ||||
| Calpine Corporation* | 31,500 | 2,071,125 | ||
| Electrical Equipment & Electronics — 15.8% | ||||
| Alpha Industries* | 24,000 | 1,057,500 | ||
| Applied Micro Circuits
Corp.* |
16,800 | 1,659,000 | ||
| ATMI, Inc.* | 33,500 | 1,557,750 | ||
| Bookham Technology
PLC Sponsored*† |
23,900 | 1,416,075 | ||
| Flextronics International
Ltd.* |
28,500 | 1,957,594 | ||
| Globespan, Inc.* | 14,800 | 1,806,756 | ||
| Integrated Device
Technology, Inc.* |
22,300 | 1,335,212 | ||
| Lattice Semiconductor
Corporation* |
32,500 | 2,246,562 | ||
| LSI Logic Corp.* | 39,000 | 2,110,875 | ||
| Novellus Systems, Inc.* | 16,500 | 933,281 | ||
| Qlogic Corp.* | 22,900 | 1,512,831 | ||
| RF Micro Devices, Inc.* | 15,900 | 1,393,238 | ||
| Number of
Shares |
Market Value |
|||
|---|---|---|---|---|
| SCI Systems, Inc.* | 43,000 | $ 1,685,063 | ||
| SDL, Inc.* | 12,500 | 3,564,844 | ||
| Vitesse Semiconductor
Corp.* |
34,800 | 2,559,975 | ||
| 26,796,556 | ||||
| Energy — 5.9% | ||||
| BJ Services Co.* | 20,900 | 1,306,250 | ||
| Dynegy, Inc. | 21,825 | 1,490,920 | ||
| Global Marine, Inc.* | 58,900 | 1,660,244 | ||
| Nabors Industries, Inc.* | 52,600 | 2,186,188 | ||
| Noble Affiliates, Inc. | 42,700 | 1,590,575 | ||
| Triton Energy Ltd.* | 8,900 | 349,881 | ||
| Varco International, Inc.* | 62,611 | 1,455,706 | ||
| 10,039,764 | ||||
| Entertainment & Leisure — 3.0% | ||||
| AT&T — Liberty Media
Group* |
87,800 | 2,129,150 | ||
| Harley-Davidson, Inc. | 39,600 | 1,524,600 | ||
| Premier Parks, Inc.* | 63,500 | 1,444,625 | ||
| 5,098,375 | ||||
| Foods — 1.1% | ||||
| Starbucks Corp.* | 47,800 | 1,825,363 | ||
| Healthcare — 3.1% | ||||
| Health Management
Associates Cl. A* |
160,200 | 2,092,613 | ||
| Human Genome Sciences,
Inc.* |
10,000 | 1,333,750 | ||
| Lincare Holdings, Inc.* | 73,300 | 1,805,013 | ||
| 5,231,376 | ||||
| Internet Software — 2.0% | ||||
| Exodus Communications,
Inc.* |
74,400 | 3,427,050 | ||
| Lodging — 0.9% | ||||
| MGM Grand, Inc. | 48,000 | 1,542,000 | ||
| Machinery & Components — 1.6% | ||||
| Dover Corporation | 34,100 | 1,383,181 | ||
| Smith International, Inc.* | 17,700 | 1,288,781 | ||
| 2,671,962 | ||||
| Medical Supplies — 0.7% | ||||
| Waters Corp.* | 9,300 | 1,160,756 | ||
| MassMutual Mid Cap Growth Equity Fund – Portfolio of Investments (Continued)
|
| Number of
Shares |
Market Value |
|||
|---|---|---|---|---|
| Pharmaceuticals — 6.5% | ||||
| Biovail Corporation* | 24,100 | $ 1,336,044 | ||
| Celgene Corp.* | 23,900 | 1,407,113 | ||
| Forest Laboratories, Inc.
Cl. A* |
23,900 | 2,413,900 | ||
| Medimmune, Inc.* | 27,200 | 2,012,800 | ||
| Millennium
Pharmaceuticals* |
22,100 | 2,472,438 | ||
| QLT, Inc.* | 17,900 | 1,383,894 | ||
| 11,026,189 | ||||
| Prepackaged Software — 4.2% | ||||
| Art Technology Group, Inc.* | 20,700 | 2,089,406 | ||
| ISS Group, Inc.* | 23,400 | 2,310,385 | ||
| Rational Software
Corp.* |
28,700 | 2,667,306 | ||
| 7,067,097 | ||||
| Retail — 2.7% | ||||
| CVS Corporation | 43,500 | 1,740,000 | ||
| RadioShack Corporation | 26,700 | 1,264,913 | ||
| Tiffany & Co. | 22,500 | 1,518,750 | ||
| 4,523,663 | ||||
| Retail — Internet — 0.5% | ||||
| Ticketmaster Online-
CitySearch, Inc.* |
50,800 | 809,625 | ||
| Telephone Utilities — 6.3% | ||||
| Flag Telecom Holdings
Ltd.* |
55,800 | 830,025 | ||
| Mastec, Inc.* | 38,400 | 1,466,400 | ||
| NEXTLINK
Communications, Inc.* |
51,000 | 1,934,813 | ||
| Tritel, Inc.* | 54,000 | 1,603,125 | ||
| VoiceStream Wireless
Corporation* |
21,463 | 2,496,080 | ||
| Western Wireless
Corporation Cl. A* |
41,900 | 2,283,550 | ||
| 10,613,993 | ||||
| TOTAL EQUITIES | ||||
| (Cost $152,406,898) | 164,095,848 | |||
| Principal
Amount |
Market Value |
|||
|---|---|---|---|---|
| SHORT-TERM INVESTMENTS — 13.6% | ||||
| Cash Equivalents — 9.9% | ||||
| Bank of America Bank Note** | ||||
| 6.670%, 03/22/2001 | $ 360,591 | $ 360,591 | ||
| Bank of Montreal Bank Note** | ||||
| 6.630%, 08/16/2000 | 600,985 | 600,985 | ||
| Bank of Nova Scotia
Eurodollar Time Deposit** |
||||
| 7.000%, 07/03/2000 | 721,182 | 721,182 | ||
| Credit Agricole Bank
Eurodollar Time Deposit** |
||||
| 6.750%, 07/06/2000 | 2,403,941 | 2,403,941 | ||
| Credit Agricole Bank
Eurodollar Time Deposit** |
||||
| 6.750%, 07/07/2000 | 360,591 | 360,591 | ||
| Den Danske Bank
Eurodollar Time Deposit** |
||||
| 6.810%, 07/05/2000 | 1,322,168 | 1,322,168 | ||
| First Union Bank Note** | ||||
| 6.900%, 05/09/2001 | 360,591 | 360,591 | ||
| Fleet National Bank
Eurodollar Time Deposit** |
||||
| 7.260%, 10/31/2000 | 1,517,755 | 1,517,755 | ||
| HypoVereinsbank
Eurodollar Time Deposit** |
||||
| 6.750%, 07/05/2000 | 3,004,927 | 3,004,927 | ||
| Merrimac Money Market Fund** | ||||
| 6.440%, 07/03/2000 | 3,774,188 | 3,774,188 | ||
| Morgan Stanley Dean
Witter & Co.** |
||||
| 6.890%, 07/17/2000 | 721,182 | 721,182 | ||
| Morgan Stanley Dean
Witter & Co.** |
||||
| 6.910%, 11/22/2000 | 240,394 | 240,394 | ||
| Paribus Bank
Eurodollar Time Deposit** |
||||
| 6.750%, 07/05/2000 | 1,442,365 | 1,442,365 | ||
| 16,830,860 | ||||
| Principal
Amount |
Market Value |
||||
|---|---|---|---|---|---|
| Repurchase Agreement — 3.7% | |||||
| Investors Bank & Trust Company
Repurchase Agreement, dated 06/30/00, 6.03%, due 07/03/00 (a) |
$6,326,910 | $ 6,326,910 | |||
| TOTAL SHORT-TERM
INVESTMENTS (At Amortized Cost) |
23,157,770 | ||||
| TOTAL
INVESTMENTS — 110.5% |
|||||
| (Cost $175,564,668)*** | 187,253,618 | ||||
| Other Assets/
(Liabilities) —(10.5%) |
(17,814,571 | ) | |||
| NET ASSETS — 100.0% | $ 169,439,047 | ||||
*
|
Non-income producing security.
|
**
|
Represents investment of security lending collateral. (Note 2).
|
***
|
Aggregate cost for Federal tax purposes. (Note 7).
|
†
|
American Depository Receipt
|
(a)
|
Maturity value of $6,330,090. Collateralized by U.S. Government Agency obligations with a rates of 7.830, maturity date of
02/01/2026, and aggregate market value, including accrued interest, of $6,643,356.
|
| June 30, 2000
(Unaudited) |
|||
|---|---|---|---|
| Assets: | |||
| Investments, at value (cost $152,406,898) (Note 2) | $164,095,848 | ||
| Short-term investments, at amortized cost (Note 2) | 23,157,770 | ||
| Total Investments | 187,253,618 | ||
| Receivables from: | |||
| Investments sold | 858,608 | ||
| Interest and dividends | 35,502 | ||
| Foreign taxes withheld | 290 | ||
| Investment adviser (Note 3) | 10,269 | ||
| Total assets | 188,158,287 | ||
| Liabilities: | |||
| Payables for: | |||
| Investments purchased | 1,753,585 | ||
| Securities on loan (Note 2) | 16,830,860 | ||
| Directors’ fees and expenses (Note 3) | 3,486 | ||
| Affiliates (Note 3): | |||
| Investment management fees | 95,478 | ||
| Administration fees | 18,433 | ||
| Service fees | 3,377 | ||
| Accrued expenses and other liabilities | 14,021 | ||
| Total liabilities | 18,719,240 | ||
| Net assets | $169,439,047 | ||
| Net assets consist of: | |||
| Paid-in capital | $138,299,606 | ||
| Undistributed net investment loss | (316,178 | ) | |
| Accumulated net realized gain on investments | 19,766,669 | ||
| Net unrealized appreciation on investments | 11,688,950 | ||
| $169,439,047 | |||
| Net assets: | |||
| Class A | $ 7,314,175 | ||
| Class L | $ 15,600,809 | ||
| Class Y | $ 46,088,662 | ||
| Class S | $100,435,401 | ||
| Shares outstanding: | |||
| Class A | 501,126 | ||
| Class L | 1,065,399 | ||
| Class Y | 3,142,705 | ||
| Class S | 6,848,745 | ||
| Net asset value, offering price and redemption price per share: | |||
| Class A | $ 14.60 | ||
| Class L | $ 14.64 | ||
| Class Y | $ 14.67 | ||
| Class S | $ 14.66 | ||
| MassMutual Mid Cap Growth Equity Fund – Financial Statements (Continued)
|
| Six months ended
June 30, 2000 (Unaudited) |
|||
|---|---|---|---|
| Investment income: (Note 2) | |||
| Dividends (net of withholding tax of $435) | $ 52,193 | ||
| Interest (including securities lending income of $8,062) | 265,482 | ||
| Total investment income | 317,675 | ||
| Expenses: (Note 2) | |||
| Investment management fees (Note 3) | 512,655 | ||
| Custody fees | 26,639 | ||
| Audit and legal fees | 6,154 | ||
| Directors’ fees (Note 3) | 4,320 | ||
| 549,768 | |||
| Administration fees (Note 3): | |||
| Class A | 6,263 | ||
| Class L | 14,091 | ||
| Class Y | 34,962 | ||
| Class S | 38,867 | ||
| Service fees (Note 3): | |||
| Class A | 5,092 | ||
| Total expenses | 649,043 | ||
| Expenses reimbursed (Note 3) | (15,190 | ) | |
| Net expenses | 633,853 | ||
| Net investment loss | (316,178 | ) | |
| Realized and unrealized gain (loss): | |||
| Net realized gain on investment transactions | 14,859,776 | ||
| Net change in unrealized appreciation (depreciation) on investments | (11,275,059 | ) | |
| Net realized and unrealized gain | 3,584,717 | ||
| Net increase in net assets resulting from operations | $ 3,268,539 | ||
| MassMutual Mid Cap Growth Equity Fund – Financial Statements (Continued)
|
| Six months ended
June 30, 2000 (Unaudited) |
Period ended
December 31, 1999* |
|||||
|---|---|---|---|---|---|---|
| Increase (Decrease) in Net Assets: | ||||||
| Operations: | ||||||
| Net investment loss | $ (316,178 | ) | $ (126,566 | ) | ||
| Net realized gain on investment transactions | 14,859,776 | 5,033,459 | ||||
| Net change in unrealized appreciation (depreciation) on investments | (11,275,059 | ) | 22,964,009 | |||
| Net increase in net assets resulting from operations | 3,268,539 | 27,870,902 | ||||
| Net fund share transactions (Note 5): | ||||||
| Class A | 6,428,698 | 517,978 | ||||
| Class L | 10,770,711 | 3,464,583 | ||||
| Class Y | 2,627,914 | 30,694,288 | ||||
| Class S | 38,788,023 | 45,007,411 | ||||
| Increase in net assets from net fund share transactions | 58,615,346 | 79,684,260 | ||||
| Total increase in net assets | 61,883,885 | 107,555,162 | ||||
| Net assets: | ||||||
| Beginning of period | 107,555,162 | - | ||||
| End of period (including undistributed net
investment loss of $316,178)
and $0, respectively) |
$169,439,047 | $107,555,162 | ||||
| * For the period from May 3, 1999 (commencement of operations) through December 31, 1999.
|
| MassMutual Mid Cap Growth Equity Fund – Financial Statements (Continued)
|
| Class A |
Class L |
||||||||||||||||||||||||
|---|---|---|---|---|---|---|---|---|---|---|---|---|---|---|---|---|---|---|---|---|---|---|---|---|---|
| Six months ended
6/30/2000 (Unaudited) |
Period ended
12/31/99† |
Six months ended
6/30/2000 (Unaudited) |
Period ended
12/31/99† |
||||||||||||||||||||||
| Net asset value, beginning of period | $ 13.90 | $ 10.00 | $ 13.93 | $ 10.00 | |||||||||||||||||||||
| Income (Loss) from investment operations: | |||||||||||||||||||||||||
| Net investment loss | (0.06 | )*** | (0.07 | )*** | (0.04 | )*** | (0.05 | )*** | |||||||||||||||||
| Net realized and unrealized gain (loss) on investments | 0.76 | 3.97 | 0.75 | 3.98 | |||||||||||||||||||||
| Total income (loss) from investment operations | 0.70 | 3.90 | 0.71 | 3.93 | |||||||||||||||||||||
| Net asset value, end of period | $ 14.60 | $ 13.90 | $ 14.64 | $ 13.93 | |||||||||||||||||||||
| Total Return@ | 5.04% | ** | 39.00% | ** | 5.10% | ** | 39.30% | ** | |||||||||||||||||
| Ratios / Supplemental Data: | |||||||||||||||||||||||||
| Net assets, end of period (000’s) | $ 7,314 | $ 682 | $ 15,601 | $ 4,642 | |||||||||||||||||||||
| Ratio of expenses to average daily net assets | |||||||||||||||||||||||||
| Before expense waiver | 1.31% | * | 1.36% | * | 1.06% | * | 1.12% | * | |||||||||||||||||
| After expense waiver # | 1.28% | * | N/A | 1.03% | * | N/A | |||||||||||||||||||
| Net investment loss to average daily net assets | (0.84)% | * | (0.86)% | * | (0.59)% | * | (0.63)% | * | |||||||||||||||||
| Portfolio turnover rate | 88% | ** | 127% | ** | 88% | ** | 127% | ** | |||||||||||||||||
| Class Y |
Class S |
||||||||||||||||||||||||
| Six months ended
6/30/2000 (Unaudited) |
Period ended
12/31/99† |
Six months ended
6/30/2000 (Unaudited) |
Period ended
12/31/99† |
||||||||||||||||||||||
| Net asset value, beginning of period | $ 13.94 | $ 10.00 | $ 13.94 | $ 10.00 | |||||||||||||||||||||
| Income (Loss) from investment operations: | |||||||||||||||||||||||||
| Net investment loss | (0.03 | )*** | (0.04 | ) | (0.03 | )*** | (0.02 | )*** | |||||||||||||||||
| Net realized and unrealized gain (loss) on investments | 0.76 | 3.98 | 0.75 | 3.96 | |||||||||||||||||||||
| Total income (loss) from investment operations | 0.73 | 3.94 | 0.72 | 3.94 | |||||||||||||||||||||
| Net asset value, end of period | $ 14.67 | $ 13.94 | $ 14.66 | $ 13.94 | |||||||||||||||||||||
| Total Return@ | 5.24% | ** | 39.40% | ** | 5.16% | ** | 39.40% | ** | |||||||||||||||||
| Ratios / Supplemental Data: | |||||||||||||||||||||||||
| Net assets, end of period (000’s) | $46,089 | $41,952 | $100,435 | $60,279 | |||||||||||||||||||||
| Ratio of expenses to average daily net assets | |||||||||||||||||||||||||
| Before expense waiver | 0.91% | * | 0.98% | * | 0.84% | * | 0.89% | * | |||||||||||||||||
| After expense waiver # | 0.89% | * | N/A | 0.82% | * | N/A | |||||||||||||||||||
| Net investment loss to average daily net assets | (0.46)% | * | (0.48)% | * | (0.38)% | * | (0.32)% | * | |||||||||||||||||
| Portfolio turnover rate | 88% | ** | 127% | ** | 88% | ** | 127% | ** | |||||||||||||||||
*
|
Annualized
|
**
|
Percentage represents results for the period and are not annualized.
|
***
|
Per share amount calculated on the average shares method.
|
†
|
For the period from May 3, 1999 (commencement of operations) through December 31, 1999.
|
#
|
Computed after giving effect to an agreement by MassMutual to waive certain fees and expenses of the Fund for the period May 1,
2000 through June 30, 2000.
|
@
|
Employee retirement benefits plans that invest plan assets in the Separate Investment Accounts (SIAs) may be subject to certain
charges as set forth in their respective Plan Documents. Total return figures would be lower for the periods presented if they reflected these charges.
|
Ÿ
|
achieve growth of capital over the long term
|
Ÿ
|
invest primarily in a diversified portfolio of equity securities of mid-sized companies (companies with market capitalization, at
the time of purchase, of $500 million to $5 billion)
|
Ÿ
|
utilize a growth-oriented strategy in making investment decisions
|
Ÿ
|
utilize fundamental analysis to identify companies which
|
| —are of high investment quality or possess a unique product, market position or operating characteristics
|
| —offer above-average levels of profitability with superior growth potential
|
| MassMutual Mid Cap Growth Equity II Fund – Portfolio Manager Report (Continued)
|
| MassMutual Mid Cap Growth
Equity II Fund |
| Largest Stock Holdings (6/30/00)
|
| Government Reserve Investment
|
| Analog Devices, Inc.
|
| Western Wireless Corporation Cl. A
|
| Waters Corp.
|
| AmeriSource Health Corp. Cl. A
|
| Devon Energy Corporation
|
| Sepracor, Inc.
|
| VoiceStream Wireless Corporation
|
| Xilinx, Inc.
|
| Robert Half International, Inc.
|
| MassMutual Mid Cap Growth Equity II Fund – Portfolio Manager Report (Continued)
|
| MassMutual Mid Cap Growth Equity II Fund
Total Return
|
|||
|---|---|---|---|
| Since Inception
6/1/00 - 6/30/00 |
|||
| Class S | 3.40% | ||
| Class A | 3.40% | ||
| Class Y | 3.40% | ||
| Class L | 3.40% | ||
| |
|||
| Standard & Poor’s
400 Composite Index |
1.47% |
||
| Number of
Shares |
Market Value |
|||
|---|---|---|---|---|
| EQUITIES — 92.4% | ||||
| Advertising — 2.5% | ||||
| Catalina Marketing
Corporation* |
17,000 | $ 1,734,000 | ||
| Doubleclick, Inc.* | 26,500 | 1,010,312 | ||
| Lamar Advertising Co.* | 14,900 | 645,356 | ||
| TMP Worldwide, Inc.* | 13,000 | 959,562 | ||
| 4,349,230 | ||||
| Apparel, Textiles & Shoes — 0.6% | ||||
| Jones Apparel Group, Inc.* | 43,300 | 1,017,550 | ||
| Banking, Savings & Loans — 2.0% | ||||
| Capital One Financial Corp. | 29,500 | 1,316,437 | ||
| Heller Financial, Inc. | 72,200 | 1,480,100 | ||
| North Fork Bancorporation | 47,000 | 710,875 | ||
| 3,507,412 | ||||
| Broadcasting, Publishing & Printing — 1.6% | ||||
| Charter Communications,
Inc. Cl. A* |
42,700 | 701,881 | ||
| Rogers Communications,
Inc. Cl. B |
36,100 | 1,028,850 | ||
| Univision
Communications, Inc.* |
9,600 | 993,600 | ||
| 2,724,331 | ||||
| Building Materials & Construction — 0.6% | ||||
| Martin Marietta
Materials, Inc. |
23,600 | 954,325 | ||
| Commercial Services — 8.1% | ||||
| Affymetrix, Inc.* | 5,800 | 957,725 | ||
| Concord EFS, Inc.* | 86,000 | 2,236,000 | ||
| Hertz Corp. Cl. A | 40,000 | 1,122,500 | ||
| Incyte Pharmaceuticals, Inc.* | 8,200 | 673,937 | ||
| Manpower, Inc. | 50,000 | 1,600,000 | ||
| Republic Services, Inc.* | 131,100 | 2,097,600 | ||
| Robert Half
International, Inc.* |
86,200 | 2,456,700 | ||
| StorageNetworks, Inc.* | 500 | 45,125 | ||
| United Rentals, Inc.* | 49,000 | 839,125 | ||
| Viad Corp. | 67,800 | 1,847,550 | ||
| 13,876,262 | ||||
| Communications — 1.8% | ||||
| Allegiance Telecom, Inc.* | 8,500 | 544,000 | ||
| Crown Castle
International Corp.* |
42,000 | 1,533,000 | ||
| Efficient Networks, Inc.* | 5,000 | 367,812 | ||
| McleodUSA, Inc.* | 32,400 | 670,275 | ||
| 3,115,087 | ||||
| Number of
Shares |
Market Value |
|||
|---|---|---|---|---|
| Computer Integrated Systems Design — 0.1% | ||||
| eLoyalty Corporation* | 14,300 | $ 182,325 | ||
| Computer Programming Services — 1.4% | ||||
| Ciber, Inc.* | 64,800 | 858,600 | ||
| Macromedia, Inc.* | 8,800 | 850,850 | ||
| Mercury Interactive Corp.* | 7,400 | 715,950 | ||
| 2,425,400 | ||||
| Computer Related Services — 0.6% | ||||
| CNET Networks, Inc.* | 29,500 | 724,594 | ||
| Espeed, Inc. Cl. A* | 4,300 | 186,781 | ||
| XPedior, Inc.* | 12,600 | 174,037 | ||
| 1,085,412 | ||||
| Computer Software & Processing — 1.1% | ||||
| Tech Data Corp.* | 44,200 | 1,925,462 | ||
| Computers & Information — 0.5% | ||||
| Jabil Circuit, Inc.* | 17,700 | 878,362 | ||
| Data Processing and Preparation — 2.8% | ||||
| Affiliated Computer
Services, Inc. Cl. A* |
50,100 | 1,656,431 | ||
| The BISYS Group, Inc.* | 7,400 | 455,100 | ||
| Ceridian Corp.* | 56,000 | 1,347,500 | ||
| CyberSources Corp.* | 1,000 | 13,812 | ||
| Fiserv, Inc.* | 10,700 | 462,775 | ||
| Homestore.com, Inc.* | 32,500 | 948,594 | ||
| 4,884,212 | ||||
| Electrical Equipment & Electronics — 11.1% | ||||
| Analog Devices, Inc.* | 44,900 | 3,412,400 | ||
| CTS Corp. | 4,600 | 207,000 | ||
| Flextronics International Ltd.* | 15,500 | 1,064,656 | ||
| Kla-Tencor Corp.* | 23,600 | 1,382,075 | ||
| Lattice Semiconductor
Corporation* |
23,600 | 1,631,350 | ||
| Maxim Integrated
Products* |
30,200 | 2,051,712 | ||
| Molex, Inc. Cl. A | 28,750 | 1,006,250 | ||
| PMC-Sierra, Inc.* | 11,100 | 1,972,331 | ||
| Sanmina Corp.* | 17,100 | 1,462,050 | ||
| SCI Systems, Inc.* | 35,600 | 1,395,075 | ||
| Teleflex, Incorporated | 28,700 | 1,063,694 | ||
| Xilinx, Inc.* | 30,200 | 2,493,387 | ||
| 19,141,980 | ||||
| Number of
Shares |
Market Value |
|||
|---|---|---|---|---|
| Energy — 5.2% | ||||
| BJ Services Co.* | 28,200 | $ 1,762,500 | ||
| Devon Energy Corporation | 46,400 | 2,607,100 | ||
| Diamond Offshore
Drilling, Inc. |
30,000 | 1,053,750 | ||
| Ocean Energy, Inc.* | 114,900 | 1,630,144 | ||
| Tidewater, Inc. | 50,200 | 1,807,200 | ||
| 8,860,694 | ||||
| Entertainment & Leisure — 0.6% | ||||
| Premier Parks, Inc.* | 47,900 | 1,089,725 | ||
| Financial Services — 5.2% | ||||
| E*trade Group, Inc.* | 61,200 | 1,009,800 | ||
| Federated Investors, Inc.
Cl. B |
67,800 | 2,377,237 | ||
| NextCard, Inc.* | 13,300 | 113,050 | ||
| Pinnacle Holdings, Inc.* | 25,800 | 1,393,200 | ||
| Waddell & Reed
Financial, Inc. Cl. A |
66,500 | 2,182,031 | ||
| Waddell & Reed
Financial, Inc. Cl. B |
61,400 | 1,784,437 | ||
| 8,859,755 | ||||
| Healthcare — 1.9% | ||||
| Lincare Holdings, Inc.* | 58,900 | 1,450,412 | ||
| Wellpoint Health
Networks* |
25,100 | 1,818,181 | ||
| 3,268,593 | ||||
| Information Retrieval Services — 1.9% | ||||
| Internet Capital Group, Inc.* | 29,500 | 1,091,960 | ||
| Nova Corp./Georgia* | 76,000 | 2,123,250 | ||
| 3,215,210 | ||||
| Insurance — 3.0% | ||||
| ACE Ltd. | 50,000 | 1,400,000 | ||
| MGIC Investment Corp. | 27,200 | 1,237,600 | ||
| Protective Life Corp. | 35,300 | 939,863 | ||
| Radian Group, Inc. | 29,000 | 1,500,750 | ||
| 5,078,213 | ||||
| Internet Software — 0.2% | ||||
| Covad Communications
Group, Inc.* |
17,100 | 275,738 | ||
| Machinery & Components — 1.6% | ||||
| Danaher Corporation | 23,600 | 1,166,725 | ||
| Smith International, Inc.* | 21,200 | 1,543,625 | ||
| 2,710,350 | ||||
| MassMutual Mid Cap Growth Equity II Fund – Portfolio of Investments (Continued)
|
| Number of
Shares |
Market Value |
|||
|---|---|---|---|---|
| Manufacturing — 1.5% | ||||
| Millipore Corp. | 11,700 | $ 881,888 | ||
| Pentair, Inc. | 50,100 | 1,778,550 | ||
| 2,660,438 | ||||
| Manufacturing — Diversified — 0.4% | ||||
| ITT Industries, Inc. | 25,000 | 759,375 | ||
| Medical Supplies — 2.4% | ||||
| Sybron International
Corporation* |
75,100 | 1,487,919 | ||
| Waters Corp.* | 21,500 | 2,683,469 | ||
| 4,171,388 | ||||
| Metals & Mining — 0.3% | ||||
| Allegheny Technologies,
Inc. |
30,000 | 540,000 | ||
| Pharmaceuticals — 11.5% | ||||
| Abgenix, Inc.* | 5,900 | 707,170 | ||
| Alza Corp.* | 3,100 | 183,288 | ||
| AmeriSource Health
Corp. Cl. A* |
86,200 | 2,672,200 | ||
| Gilead Sciences, Inc.* | 31,100 | 2,211,988 | ||
| Idec Pharmaceuticals
Corp.* |
11,800 | 1,384,288 | ||
| Medimmune, Inc.* | 32,300 | 2,390,200 | ||
| Omnicare, Inc. | 129,000 | 1,169,063 | ||
| QLT, Inc.* | 15,500 | 1,198,344 | ||
| Sepracor, Inc.* | 21,400 | 2,581,375 | ||
| Shire Pharmaceuticals
Group PLC Sponsored*† |
40,000 | 2,075,000 | ||
| Teva Pharmaceutical
Sponsored† |
44,200 | 2,450,338 | ||
| Watson Pharmaceutical,
Inc.* |
14,600 | 784,750 | ||
| 19,808,004 | ||||
| Prepackaged Software — 8.1% | ||||
| Cambridge Technology
Partners, Inc.* |
29,500 | 257,205 | ||
| Commerce One, Inc.* | 11,700 | 531,070 | ||
| Digex, Inc.* | 13,300 | 903,569 | ||
| Electronic Arts, Inc.* | 20,000 | 1,458,750 | ||
| Informatica Corp.* | 13,300 | 1,089,769 | ||
| Intuit, Inc.* | 50,700 | 2,097,713 | ||
| ISS Group, Inc.* | 11,100 | 1,095,952 | ||
| Keane, Inc.* | 56,700 | 1,226,138 | ||
| NETIQ Corp.* | 14,800 | 882,450 | ||
| Peregrine Systems, Inc.* | 44,200 | 1,533,188 | ||
| Sungard Data Systems, Inc.* | 40,500 | 1,255,500 | ||
| USinternetworking, Inc.* | 33,800 | 690,788 | ||
| Vitria Technology, Inc.* | 15,500 | 947,438 | ||
| 13,969,530 | ||||
| Number of
Shares |
Market Value |
|||
|---|---|---|---|---|
| Restaurants — 0.8% | ||||
| Outback Steakhouse, Inc.* | 50,000 | $ 1,462,500 | ||
| Retail — 6.1% | ||||
| BJ’s Wholesale Club, Inc.* | 50,000 | 1,650,000 | ||
| Borders Group, Inc.* | 34,500 | 536,906 | ||
| Circuit City Stores | 64,600 | 2,143,913 | ||
| Cons Stores Corp.* | 57,500 | 690,000 | ||
| Family Dollar Stores, Inc. | 92,100 | 1,801,706 | ||
| MSC Industrial Direct
Co. Cl. A* |
37,600 | 787,250 | ||
| O’Reilly Automotive, Inc.* | 56,000 | 777,000 | ||
| Shopko Stores, Inc.* | 28,700 | 441,263 | ||
| TJX Companies, Inc. | 85,400 | 1,601,250 | ||
| 10,429,288 | ||||
| Retail – Grocery — 0.8% | ||||
| HomeGrocer.com, Inc.* | 40,000 | 241,252 | ||
| Whole Foods Market, Inc.* | 25,500 | 1,053,469 | ||
| 1,294,721 | ||||
| Retail – Internet — 0.5% | ||||
| Priceline.com, Inc.* | 23,600 | 896,432 | ||
| Telephone Utilities — 4.1% | ||||
| AT & T Canada, Inc.* | 25,100 | 833,006 | ||
| Rythms
Netconnections, Inc.* |
30,000 | 376,875 | ||
| VoiceStream Wireless
Corporation* |
21,500 | 2,500,383 | ||
| Western Wireless
Corporation Cl. A* |
61,600 | 3,357,200 | ||
| 7,067,464 | ||||
| Transportation — 1.5% | ||||
| C.H. Robinson
Worldwide, Inc. |
12,300 | 608,850 | ||
| Expeditors International
of Washington, Inc. |
11,800 | 560,500 | ||
| Galileo International, Inc. | 57,500 | 1,200,313 | ||
| Royal Caribbean Cruises
Ltd. |
8,200 | 151,700 | ||
| 2,521,363 | ||||
| TOTAL EQUITIES
(Cost $153,433,999) |
159,006,131 | |||
| Number of
Shares |
Market Value |
|||
|---|---|---|---|---|
| MUTUAL FUNDS — 2.4% | ||||
| Financial Services — 2.4% | ||||
| Reserve Government
Portfolio |
4,150,000 | $ 4,150,000 | ||
| TOTAL MUTUAL FUNDS
(Cost $4,150,000) |
4,150,000 | |||
| Principal
Amount |
||||||
|---|---|---|---|---|---|---|
| SHORT-TERM INVESTMENTS — 5.1% | ||||||
| Repurchase Agreement | ||||||
| Investors Bank & Trust Company
Repurchase Agreement, dated 06/30/00, 6.03%, due 07/03/00 (a) |
$8,672,207 | 8,672,207 | ||||
| TOTAL SHORT-TERM
INVESTMENTS |
||||||
| (At Amortized Cost) | 8,672,207 | |||||
| TOTAL INVESTMENTS — 99.9% | ||||||
| (Cost $166,256,206)** | 171,828,338 | |||||
| Other Assets/
(Liabilities) — 0.1% |
196,568 | |||||
| NET ASSETS — 100.0% | $ 172,024,906 | |||||
*
|
Non-income producing security.
|
**
|
Aggregate cost for Federal tax purposes. (Note 7).
|
†
|
American Depository Receipt
|
(a)
|
Maturity value of $8,676, 565. Collateralized by U.S. Government Agency obligation with a rate of 7.552%, maturity date of
10/01/2026, and aggregate market value, including accrued interest, of $9,106,013.
|
| June 30, 2000
(Unaudited) |
|||
|---|---|---|---|
| Assets: | |||
| Investments, at value (cost $157,584,000) (Note 2) | $163,156,131 | ||
| Short-term investments, at amortized cost (Note 2) | 8,672,207 | ||
| Total Investments | 171,828,338 | ||
| Cash | 412,727 | ||
| Receivables from: | |||
| Investments sold | 470,930 | ||
| Interest and dividends | 46,764 | ||
| Total assets | 172,758,759 | ||
| Liabilities: | |||
| Payables for: | |||
| Investments purchased | 587,723 | ||
| Directors’ fees and expenses (Note 3) | 754 | ||
| Affiliates (Note 3): | |||
| Investment management fees | 104,552 | ||
| Administration fees | 32,019 | ||
| Service fees | 22 | ||
| Accrued expenses and other liabilities | 8,783 | ||
| Total liabilities | 733,853 | ||
| Net assets | $172,024,906 | ||
| Net assets consist of: | |||
| Paid-in capital | $167,000,387 | ||
| Undistributed net investment loss | (43,421 | ) | |
| Accumulated net realized loss on investments | (504,191 | ) | |
| Net unrealized appreciation on investments | 5,572,131 | ||
| $172,024,906 | |||
| Net assets: | |||
| Class A | $ 104,389 | ||
| Class L | $104,440,238 | ||
| Class Y | $ 104,424 | ||
| Class S | $ 67,375,855 | ||
| Shares outstanding: | |||
| Class A | 10,100 | ||
| Class L | 10,102,782 | ||
| Class Y | 10,100 | ||
| Class S | 6,516,180 | ||
| Net asset value, offering price and redemption price per share: | |||
| Class A | $ 10.34 | ||
| Class L | $ 10.34 | ||
| Class Y | $ 10.34 | ||
| Class S | $ 10.34 | ||
| MassMutual Mid Cap Growth Equity II Fund – Financial Statements (Continued)
|
| Period ended
June 30, 2000* (Unaudited) |
|||
|---|---|---|---|
| Investment income: (Note 2) | |||
| Dividends | $ 39,663 | ||
| Interest | 63,046 | ||
| Total investment income | 102,709 | ||
| Expenses: (Note 2) | |||
| Investment management fees (Note 3) | 104,552 | ||
| Custody fees | 7,206 | ||
| Audit and legal fees | 1,577 | ||
| Directors’ fees (Note 3) | 754 | ||
| 114,089 | |||
| Administration fees (Note 3): | |||
| Class A | 28 | ||
| Class L | 27,337 | ||
| Class Y | 15 | ||
| Class S | 4,639 | ||
| Service fees (Note 3): | |||
| Class A | 22 | ||
| Total expenses | 146,130 | ||
| Net investment loss | (43,421 | ) | |
| Realized and unrealized gain (loss): | |||
| Net realized loss on investment transactions | (504,191 | ) | |
| Net change in unrealized appreciation (depreciation) on investments | 5,572,131 | ||
| Net realized and unrealized gain | 5,067,940 | ||
| Net increase in net assets resulting from operations | $5,024,519 | ||
| * For the period from June 1, 2000 (commencement of operations) through June 30, 2000.
|
| MassMutual Mid Cap Growth Equity II Fund – Financial Statements (Continued)
|
| Period ended
June 30, 2000* (Unaudited) |
|||
|---|---|---|---|
| Increase (Decrease) in Net Assets: | |||
| Operations: | |||
| Net investment loss | $ (43,421 | ) | |
| Net realized gain on investment transactions | (504,191 | ) | |
| Net change in unrealized appreciation (depreciation) on investments | 5,572,131 | ||
| Net increase in net assets resulting from operations | 5,024,519 | ||
| Net fund share transactions (Note 5): | |||
| Class A | 101,000 | ||
| Class L | 101,392,477 | ||
| Class Y | 101,000 | ||
| Class S | 65,405,910 | ||
| Increase in net assets from net fund share transactions | 167,000,387 | ||
| Total increase in net assets | 172,024,906 | ||
| Net assets: | |||
| Beginning of period | - | ||
| End of period (including undistributed net investment loss of $43,421) | $172,024,906 | ||
| * For the period from June 1, 2000 (commencement of operations) through June 30, 2000.
|
| MassMutual Mid Cap Growth Equity II Fund – Financial Statements (Continued)
|
| Class A |
Class L |
Class Y |
Class S |
|||||||||
|---|---|---|---|---|---|---|---|---|---|---|---|---|
| Period ended
6/30/00† (Unaudited) |
Period ended
6/30/00† (Unaudited) |
Period ended
6/30/00† (Unaudited) |
Period ended
6/30/00† (Unaudited) |
|||||||||
| Net asset value, beginning of period | $ 10.00 | $ 10.00 | $ 10.00 | $ 10.00 | ||||||||
| Income (Loss) from investment operations: | ||||||||||||
| Net investment loss | (0.01 | ) | (0.00 | )*** | (0.00 | )*** | (0.00 | )*** | ||||
| Net realized and unrealized gain (loss) on investments | 0.35 | 0.34 | 0.34 | 0.34 | ||||||||
| Total income (loss) from investment operations | 0.34 | 0.34 | 0.34 | 0.34 | ||||||||
| Net asset value, end of period | $ 10.34 | $ 10.34 | $ 10.34 | $ 10.34 | ||||||||
| Total Return@ | 3.40% | ** | 3.40% | ** | 3.40% | ** | 3.40% | ** | ||||
| Ratios / Supplemental Data: | ||||||||||||
| Net assets, end of period (000’s) | $ 104 | $104,440 | $ 104 | $67,376 | ||||||||
| Net expenses to average daily net assets | 1.39% | * | 1.14% | * | 0.99% | * | 0.90% | * | ||||
| Net investment loss to average daily net assets | (0.67)% | * | (0.41)% | * | (0.26)% | * | (0.17)% | * | ||||
| Portfolio turnover rate | 18% | ** | 18% | ** | 18% | ** | 18% | ** | ||||
*
|
Annualized
|
**
|
Percentage represents results for the period and are not annualized.
|
***
|
Net investment loss is less than $0.01 per share.
|
†
|
For the period from June 1, 2000 (commencement of operations) through June 30, 2000.
|
@
|
Employee retirement benefit plans that invest plan assets in the Separate Investment Accounts (SIAs) may be subject to certain
charges as set forth in their respective Plan Documents. Total return figures would be lower for the periods presented if they reflected these charges.
|
Ÿ
|
achieve long-term capital appreciation
|
Ÿ
|
invest primarily in a diversified portfolio of equity securities of smaller companies (companies whose market capitalizations are
included in the Lipper, Inc. Small Cap Category)
|
Ÿ
|
utilize a growth-oriented strategy in making investment decisions
|
Ÿ
|
utilize fundamental analysis to identify companies which
|
—
|
are of high investment quality or possess a unique product, market position or operating characteristics
|
| —offer above-average levels of profitability or superior growth potential
|
| MassMutual Small Cap Growth Equity Fund
|
| Largest Stock Holdings (6/30/00)
|
| Advance Fibre Communications, Inc.
|
| Dendrite International, Inc.
|
| Visx, Inc.
|
| Emmis Communications Corp.
|
| Acxiom Corp.
|
| Human Genome Sciences, Inc.
|
| Cerner Corporation
|
| Tekelec
|
| Primark Corporation
|
| Getty Images, Inc.
|
| MassMutual Small Cap Growth Equity Fund – Portfolio Manager Report (Continued)
|
| MassMutual Small Cap Growth Equity Fund
Total Return
|
|||||||
|---|---|---|---|---|---|---|---|
| Year-To-Date
1/1/00-6/30/00 |
One Year
7/1/99-6/30/00 |
Since Inception
Average Annual 5/3/99-6/30/00 |
|||||
| Class S | 6.22% | 56.38% | 58.46% | ||||
| Class A | 5.92% | 55.46% | 57.67% | ||||
| Class Y | 6.17% | 56.11% | 58.23% | ||||
| Class L | 6.11% | 55.86% | 58.02% | ||||
| |
|||||||
| Russell 2000
Index |
3.06% | 14.35% | 17.97% | ||||
| Number of
Shares |
Market Value |
|||
|---|---|---|---|---|
| EQUITIES — 85.3% | ||||
| Advertising — 1.7% | ||||
| Catalina Marketing
Corporation* |
11,175 | $ 1,139,850 | ||
| Getty Images, Inc.* | 73,000 | 2,705,562 | ||
| 3,845,412 | ||||
| Air Transportation — 0.7% | ||||
| Midwest Express
Holdings* |
75,600 | 1,625,400 | ||
| Apparel, Textiles & Shoes — 0.3% | ||||
| Pacific Sunwear Of
California* |
10,800 | 202,500 | ||
| Skechers U.S.A., Inc.,
Cl. A* |
7,500 | 118,594 | ||
| Vans, Inc.* | 15,350 | 224,494 | ||
| 545,588 | ||||
| Banking, Savings & Loans — 1.0% | ||||
| Bank United Corp. Cl. A | 26,625 | 936,867 | ||
| City National Corp. | 7,625 | 264,969 | ||
| Financial Federal Corp.* | 11,325 | 196,772 | ||
| Heller Financial, Inc. | 23,100 | 473,550 | ||
| National Commerce
Bancorp |
9,400 | 150,987 | ||
| Pacific Century Financial
Corporation |
12,000 | 175,500 | ||
| 2,198,645 | ||||
| Beverages — 0.3% | ||||
| The Robert Mondavi
Corporation * |
22,800 | 699,675 | ||
| Broadcasting, Publishing & Printing — 2.1% | ||||
| Emmis Communications
Corp.* |
72,900 | 3,016,237 | ||
| Entercom
Communications Corp.* |
16,550 | 806,812 | ||
| Insight Communications
Company, Inc.* |
20,850 | 325,781 | ||
| Spanish Broadcasting
System, Inc. Cl. A* |
31,300 | 643,606 | ||
| 4,792,436 | ||||
| Building Materials & Construction — 0.2% | ||||
| Akorn, Inc.* | 30,100 | 238,919 | ||
| Cabot Microelectronics
Corp.* |
4,800 | 219,600 | ||
| 458,519 | ||||
| Number of
Shares |
Market Value |
|||
|---|---|---|---|---|
| Chemicals — 1.8% | ||||
| Albemarle Corp. | 24,250 | $ 478,937 | ||
| General Chemical Group,
Inc.* |
12,300 | 8,456 | ||
| Geon Company | 30,350 | 561,475 | ||
| Georgia Gulf Corp. | 28,100 | 584,831 | ||
| Minerals Technologies, Inc. | 15,300 | 703,800 | ||
| OM Group, Inc. | 12,900 | 567,600 | ||
| Solutia, Inc. | 8,900 | 122,375 | ||
| Wellman, Inc. | 62,700 | 1,014,956 | ||
| 4,042,430 | ||||
| Commercial Services — 6.7% | ||||
| Affymetrix, Inc.* | 6,550 | 1,081,569 | ||
| Diamond Technology
Partners, Inc.* |
14,925 | 1,313,400 | ||
| Diversa Corporation* | 5,350 | 177,219 | ||
| Dycom Industries, Inc.* | 13,437 | 618,102 | ||
| Exelixis, Inc.* | 7,800 | 260,325 | ||
| Gene Logic, Inc.* | 45,400 | 1,620,212 | ||
| iBEAM Broadcasting
Corp.* |
26,400 | 475,200 | ||
| ITT Educational Services,
Inc.* |
116,300 | 2,042,519 | ||
| Maximus, Inc.* | 54,200 | 1,199,175 | ||
| MemberWorks,
Incorporated* |
46,700 | 1,570,287 | ||
| Millennium
Pharmaceuticals* |
13,000 | 1,454,375 | ||
| Netratings, Inc.* | 17,075 | 437,547 | ||
| Neurocrine Biosciences,
Inc.* |
12,300 | 437,419 | ||
| Orchid BioSciences, Inc.* | 21,975 | 834,364 | ||
| Stewart Enterprises, Inc.
Cl. A |
6,200 | 21,894 | ||
| StorageNetworks, Inc.* | 2,175 | 196,294 | ||
| Universal Compression
Holdings, Inc.* |
5,050 | 169,175 | ||
| Valassis Communications,
Inc.* |
16,100 | 613,812 | ||
| Wireless Facilities, Inc.* | 10,100 | 514,469 | ||
| 15,037,357 | ||||
| Communications — 9.1% | ||||
| Accelerated Networks, Inc.* | 1,475 | 62,227 | ||
| Advanced Fibre
Communications, Inc.* |
92,550 | 4,193,672 | ||
| Allegiance Telecom, Inc.* | 18,225 | 1,166,400 | ||
| CapRock
Communications Corp.* |
41,900 | 817,050 | ||
| Ditech Communications
Corp.* |
3,800 | 359,337 | ||
| Exfo Electro Optical
Engineering, Inc.* |
1,075 | 47,166 | ||
| Glenayre Technologies, Inc.* | 152,600 | 1,611,837 | ||
| Number of
Shares |
Market Value |
|||
|---|---|---|---|---|
| LifeMinders, Inc.* | 5,850 | $ 172,941 | ||
| Metawave Communications
Corp.* |
7,375 | 196,820 | ||
| MGC Communications, Inc.* | 9,600 | 575,400 | ||
| Motient Corp.* | 24,350 | 381,991 | ||
| NBC Internet, Inc. Cl. A* | 30,900 | 386,250 | ||
| Net2Phone, Inc.* | 12,900 | 460,369 | ||
| Netro Corp.* | 11,850 | 679,894 | ||
| Oni Systems Corp.* | 2,400 | 281,287 | ||
| Polycom, Inc.* | 23,900 | 2,248,842 | ||
| Sawtek, Inc.* | 24,400 | 1,404,525 | ||
| SBA Communications
Corp.* |
5,800 | 301,237 | ||
| Tekelec* | 59,900 | 2,886,431 | ||
| Titan Corp.* | 6,900 | 308,775 | ||
| Turnstone Systems, Inc.* | 7,850 | 1,300,524 | ||
| Ulticom, Inc.* | 2,600 | 62,441 | ||
| US Wireless Corporation* | 1,200 | 25,650 | ||
| Williams Communications
Group* |
8,425 | 279,605 | ||
| Winstar Communications,
Inc.* |
3,750 | 127,031 | ||
| 20,337,702 | ||||
| Computer and Data Processing Services — 0.0% | ||||
| LendingTree, Inc.* | 2,100 | 15,750 | ||
| Computer Integrated Systems Design — 2.1% | ||||
| Aether Systems, Inc.* | 1,700 | 348,500 | ||
| Clarent Corp.* | 13,600 | 972,400 | ||
| Digital Insight Corp.* | 51,300 | 1,744,200 | ||
| Nuance Communications* | 1,350 | 112,472 | ||
| Optimal Robotics Corp.* | 5,100 | 195,712 | ||
| Software.com, Inc.* | 8,900 | 1,155,887 | ||
| Websense, Inc.* | 5,950 | 149,494 | ||
| 4,678,665 | ||||
| Computer Programming Services — 1.7% | ||||
| DSET Corp.* | 14,900 | 452,587 | ||
| Mercury Interactive
Corp.* |
18,100 | 1,751,175 | ||
| Metasolv Software, Inc.* | 3,400 | 149,600 | ||
| Netegrity, Inc.* | 19,625 | 1,478,008 | ||
| 3,831,370 | ||||
| Computer Related Services — 3.7% | ||||
| Acxiom Corp.* | 108,900 | 2,967,525 | ||
| CheckFree Holdings
Corporation* |
48,550 | 2,503,359 | ||
| Corillian Corp.* | 17,725 | 294,678 | ||
| Digitas, Inc.* | 11,950 | 194,934 | ||
| Espeed, Inc. Cl. A* | 24,200 | 1,051,187 | ||
| MassMutual Small Cap Growth Equity Fund – Portfolio of Investments (Continued)
|
| Number of
Shares |
Market Value |
|||
|---|---|---|---|---|
| Fastnet Corporation* | 9,600 | $ 36,000 | ||
| Healthgate Data Corp.* | 15,400 | 25,025 | ||
| Keynote Systems, Inc.* | 16,900 | 1,192,506 | ||
| 8,265,214 | ||||
| Computer Software & Processing — 1.9% | ||||
| Allscripts, Inc.* | 87,275 | 2,007,325 | ||
| Certicom Corp. | 20,700 | 1,417,627 | ||
| Pinnacle Systems, Inc.* | 33,900 | 762,221 | ||
| 4,187,173 | ||||
| Computers & Information — 1.4% | ||||
| C-Cube Microsystems, Inc.* | 41,200 | 808,550 | ||
| Cirrus Logic, Inc.* | 18,200 | 291,200 | ||
| M-Systems Flash Disk
Pioneers* |
13,225 | 1,029,897 | ||
| Safeguard Scientifics, Inc.* | 18,300 | 586,744 | ||
| Visual Networks, Inc.* | 17,200 | 490,200 | ||
| 3,206,591 | ||||
| Data Processing and Preparation — 1.6% | ||||
| Factset Research
Systems, Inc. |
43,300 | 1,223,225 | ||
| Fiserv, Inc.* | 38,100 | 1,647,825 | ||
| National Computer
Systems, Inc. |
11,300 | 556,525 | ||
| Verio, Inc.* | 4,400 | 244,131 | ||
| 3,671,706 | ||||
| Electrical Equipment & Electronics — 10.5% | ||||
| Anaren Microwave, Inc.* | 8,475 | 1,112,212 | ||
| ATMI, Inc.* | 42,000 | 1,953,000 | ||
| August Technology Corp.* | 3,950 | 64,928 | ||
| Capstone Turbine
Corporation* |
2,200 | 99,137 | ||
| Cypress Semiconductor
Corp.* |
19,450 | 821,762 | ||
| Ddi Corp.* | 17,575 | 500,887 | ||
| Electro Scientific
Industries, Inc.* |
20,550 | 904,843 | ||
| Exar Corp.* | 17,650 | 1,538,859 | ||
| Fairchild Semiconductor
International Cl. A* |
21,880 | 886,140 | ||
| Genesis Microchip, Inc.* | 10,600 | 189,475 | ||
| Gentex Corp.* | 101,200 | 2,542,650 | ||
| Integrated Circuit
Systems, Inc.* |
13,100 | 224,337 | ||
| JNI Corp.* | 14,500 | 458,562 | ||
| Lattice Semiconductor
Corporation* |
13,825 | 955,653 | ||
| Manufacturers Services Ltd.* | 5,375 | 110,523 | ||
| Microchip Technology, Inc.* | 14,837 | 864,487 | ||
| MKS Instruments, Inc.* | 18,300 | 715,987 | ||
| MMC Networks, Inc.* | 6,700 | 358,031 | ||
| New Focus, Inc.* | 3,950 | 324,394 | ||
| Photronics, Inc.* | 7,900 | 224,162 | ||
| Number of
Shares |
Market Value |
|||
|---|---|---|---|---|
| Rambus, Inc.* | 20,800 | $ 2,142,400 | ||
| Rayovac Corp.* | 14,100 | 315,487 | ||
| Silicon Image, Inc.* | 18,650 | 930,169 | ||
| Silicon Laboratories, Inc.* | 5,250 | 278,906 | ||
| Stratos Lightwave, Inc.* | 2,875 | 80,141 | ||
| Therma-Wave, Inc.* | 1,350 | 30,122 | ||
| Transwitch Corp.* | 5,900 | 455,406 | ||
| Virata Corp.* | 11,900 | 709,538 | ||
| Visx, Inc.* | 123,800 | 3,474,138 | ||
| Vyyo Inc. Common Syock* | 11,700 | 315,900 | ||
| 23,582,236 | ||||
| Energy — 2.4% | ||||
| Core Laboratories NV* | 10,075 | 292,175 | ||
| Devon Energy
Corporation |
7,500 | 421,406 | ||
| Global Industries Ltd.* | 131,100 | 2,474,513 | ||
| Global Marine, Inc.* | 13,900 | 391,806 | ||
| National-Oilwell, Inc.* | 35,075 | 1,153,091 | ||
| Spinnaker Exploration
Company* |
21,650 | 554,781 | ||
| 5,287,772 | ||||
| Entertainment & Leisure — 0.6% | ||||
| American Classic Voyages
Co.* |
20,925 | 431,578 | ||
| Anchor Gaming* | 18,475 | 885,645 | ||
| Meade Instruments Corp.* | 2,900 | 72,863 | ||
| 1,390,086 | ||||
| Financial Services — 0.8% | ||||
| Allied Capital Corp. | 30,625 | 520,625 | ||
| Donaldson, Lufkin &
Jenrette, Inc. |
11,300 | 479,544 | ||
| Gabelli Asset Management,
Inc. Cl. A* |
15,900 | 397,500 | ||
| Southwest Securities Group | 8,500 | 316,625 | ||
| 1,714,294 | ||||
| Foods — 1.0% | ||||
| American Italian Pasta
Co. Cl. A* |
85,300 | 1,764,644 | ||
| Keebler Foods Company | 11,175 | 414,872 | ||
| 2,179,516 | ||||
| Healthcare — 1.6% | ||||
| Accredo Health, Inc.* | 9,700 | 335,256 | ||
| Community Health
Systems, Inc.* |
5,250 | 84,984 | ||
| Hooper Holmes, Inc. | 26,200 | 209,600 | ||
| Human Genome
Sciences, Inc.* |
22,200 | 2,960,925 | ||
| 3,590,765 | ||||
| Number of
Shares |
Market Value |
|||
|---|---|---|---|---|
| Industrial — Diversified — 0.2% | ||||
| Gentek, Inc. | 33,675 | $ 376,739 | ||
| Industrial Materials — 0.2% | ||||
| Symyx Technologies* | 11,200 | 477,225 | ||
| Information Retrieval Services — 2.5% | ||||
| Agile Software Corp.* | 18,800 | 1,328,925 | ||
| Gartner Group, Inc. Cl. A | 21,900 | 262,800 | ||
| go.com* | 104,900 | 1,252,244 | ||
| Primark Corportion* | 74,200 | 2,763,950 | ||
| 5,607,919 | ||||
| Insurance — 0.3% | ||||
| Renaissancere Holdings Ltd. | 15,225 | 663,239 | ||
| Internet Content — 0.3% | ||||
| Media Metrix, Inc.* | 14,850 | 377,747 | ||
| Vicinity Corp.* | 10,100 | 198,213 | ||
| 575,960 | ||||
| Internet Software — 0.7% | ||||
| SmartForce PLC†* | 31,450 | 1,509,600 | ||
| Machinery & Components — 2.1% | ||||
| Brooks Automation, Inc.* | 5,775 | 369,239 | ||
| Cooper Cameron Corp.* | 8,375 | 552,750 | ||
| Gasonics International
Corp.* |
37,175 | 1,466,089 | ||
| Lam Research Corp.* | 35,275 | 1,322,813 | ||
| PRI Automation, Inc.* | 16,475 | 1,077,310 | ||
| 4,788,201 | ||||
| Medical Supplies — 1.2% | ||||
| Aclara BioSciences, Inc.* | 2,400 | 122,250 | ||
| Cyberonics, Inc.* | 8,100 | 97,200 | ||
| Cytyc Corp.* | 22,400 | 1,195,600 | ||
| Eclipse Surgical
Technologies, Inc.* |
33,800 | 147,875 | ||
| Kensey Nash Corp.* | 17,925 | 199,416 | ||
| LTX Corp.* | 14,300 | 499,606 | ||
| Oratec Interventions, Inc.* | 7,800 | 260,325 | ||
| Sonic Innovations, Inc.* | 2,525 | 46,870 | ||
| 2,569,142 | ||||
| Metals & Mining — 0.0% | ||||
| Gulf Island Fabrication, Inc.* | 5,400 | 91,800 | ||
| Pharmaceuticals — 4.7% | ||||
| Abgenix, Inc.* | 10,020 | 1,200,991 | ||
| Bindley Western
Industries, Inc. |
16,000 | 423,000 | ||
| Charles River
Laboratories International, Inc.* |
3,350 | 74,328 | ||
| MassMutual Small Cap Growth Equity Fund – Portfolio of Investments (Continued)
|
| Number of
Shares |
Market Value |
|||
|---|---|---|---|---|
| Corixa Corp.* | 9,800 | $ 420,788 | ||
| Enzon, Inc.* | 5,600 | 238,000 | ||
| Gilead Sciences, Inc.* | 17,950 | 1,276,694 | ||
| Idec Pharmaceuticals
Corp.* |
8,300 | 973,694 | ||
| Ilex Oncology, Inc.* | 5,600 | 197,400 | ||
| Ligand Pharmaceuticals,
Inc. Cl. B* |
53,800 | 709,488 | ||
| Maxygen, Inc.* | 4,400 | 249,769 | ||
| Molecular Devices Corp.* | 1,125 | 77,836 | ||
| Omnicare, Inc. | 11,500 | 104,219 | ||
| Pharmacyclics, Inc.* | 40,800 | 2,488,800 | ||
| Vertex Pharmaceuticals,
Inc.* |
18,975 | 1,999,491 | ||
| Vical, Inc.* | 5,300 | 102,025 | ||
| 10,536,523 | ||||
| Prepackaged Software — 11.3% | ||||
| Accrue Software, Inc.* | 15,000 | 532,500 | ||
| Actuate Software
Corporation* |
26,500 | 1,414,438 | ||
| Allaire Corp.* | 9,600 | 352,800 | ||
| Alteon Websystems, Inc.* | 9,625 | 963,102 | ||
| Art Technology Group, Inc.* | 17,550 | 1,771,453 | ||
| Aspen Technology, Inc.* | 18,000 | 693,000 | ||
| Cerner Corporation* | 107,500 | 2,929,375 | ||
| Citrix Systems, Inc.* | 13,400 | 253,763 | ||
| Dendrite International,
Inc.* |
120,200 | 4,004,163 | ||
| E. Piphany, Inc.* | 4,100 | 439,469 | ||
| Informatica Corp.* | 14,000 | 1,147,125 | ||
| ISS Group, Inc.* | 9,100 | 898,483 | ||
| Liberate Technologies,
Inc.* |
8,500 | 249,156 | ||
| Mediaplex, Inc.* | 24,425 | 471,708 | ||
| NEON Systems* | 20,000 | 375,000 | ||
| Net Perceptions, Inc.* | 28,675 | 455,216 | ||
| Otg Software Inc.* | 5,100 | 145,669 | ||
| Packeteer, Inc.* | 21,600 | 629,100 | ||
| Peregrine Systems, Inc.* | 12,200 | 423,188 | ||
| Precise Software
Solutions Ltd.* |
2,700 | 64,800 | ||
| Quest Software, Inc.* | 21,000 | 1,162,875 | ||
| Retek, Inc.* | 18,500 | 592,000 | ||
| Sequoia Software Corp.* | 8,525 | 139,597 | ||
| Software Technologies
Corp.* |
12,925 | 396,636 | ||
| Sonic Foundry Inc.* | 12,300 | 258,300 | ||
| Transaction Systems
Architects Cl. A* |
127,200 | 2,178,300 | ||
| Tumbleweed
Communications Corporation* |
11,900 | 605,413 | ||
| USinternetworking, Inc.* | 34,200 | 698,963 | ||
| WebTrends Corporation* | 19,900 | 769,881 | ||
| Witness Systems, Inc.* | 14,775 | 360,141 | ||
| 25,375,614 | ||||
| Number of
Shares |
Market Value |
|||
|---|---|---|---|---|
| Restaurants — 0.7% | ||||
| Papa John’s
International, Inc.* |
67,600 | $ 1,656,200 | ||
| Retail — 2.2% | ||||
| BJ’s Wholesale Club, Inc.* | 7,400 | 244,200 | ||
| Cost Plus, Inc.* | 21,662 | 621,429 | ||
| Kenneth Cole
Productions Cl. A* |
15,950 | 638,000 | ||
| MSC Industrial Direct Co.
Cl. A* |
114,600 | 2,399,438 | ||
| O’Reilly Automotive, Inc.* | 69,000 | 957,375 | ||
| 4,860,442 | ||||
| Retail — Internet — 0.1% | ||||
| Ticketmaster Online-
CitySearch, Inc.* |
19,200 | 306,000 | ||
| Telephone Utilities — 5.6% | ||||
| Choice One
Communications, Inc.* |
19,875 | 811,148 | ||
| Digital Island, Inc.* | 13,000 | 632,125 | ||
| Flag Telecom Holdings Ltd.* | 8,500 | 126,438 | ||
| Goamerica Inc.* | 8,500 | 131,219 | ||
| iBasis, Inc.* | 38,350 | 1,651,447 | ||
| Illuminet Holdings, Inc.* | 35,525 | 1,807,334 | ||
| Intermedia
Communications, Inc.* |
62,800 | 1,868,300 | ||
| ITC Deltacom, Inc.* | 11,000 | 245,438 | ||
| RCN Corporation* | 39,700 | 1,007,388 | ||
| Redback Networks, Inc.* | 8,600 | 1,530,800 | ||
| TeleCorp PCS, Inc.* | 5,500 | 221,719 | ||
| Western Wireless
Corporation Cl. A* |
47,900 | 2,610,550 | ||
| 12,643,906 | ||||
| TOTAL EQUITIES | ||||
| (Cost $179,285,113) | 191,222,812 | |||
| Principal
Amount |
||||||
|---|---|---|---|---|---|---|
| SHORT-TERM INVESTMENTS — 25.2% | ||||||
| Cash Equivalents — 16.0% | ||||||
| Bank of America Bank Note** | ||||||
| 6.670% | 03/22/2001 | $ 769,182 | 769,182 | |||
| Bank of Montreal Bank Note** | ||||||
| 6.630% | 08/16/2000 | 829,612 | 829,612 | |||
| Bank of Nova Scotia Eurodollar Time Deposit** | ||||||
| 7.000% | 07/03/2000 | 1,538,362 | 1,538,362 | |||
| Credit Agricole Bank Eurodollar Time Deposit** | ||||||
| 6.750% | 07/06/2000 | 5,127,875 | 5,127,875 | |||
| Credit Agricole Bank Eurodollar Time Deposit** | ||||||
| 6.750% | 07/07/2000 | 769,185 | 769,185 | |||
| Den Danske Bank Eurodollar Time Deposit** | ||||||
| 6.810% | 07/05/2000 | 2,820,332 | 2,820,332 | |||
| First Union Bank Note** | ||||||
| 6.900% | 05/09/2001 | 769,182 | 769,182 | |||
| Principal
Amount |
Market Value |
||||||
|---|---|---|---|---|---|---|---|
| Fleet National Bank Eurodollar Time Deposit** | |||||||
| 7.260% | 10/31/2000 | $6,191,683 | $ 6,191,683 | ||||
| HypoVereinsbank Eurodollar Time Deposit** | |||||||
| 6.750% | 07/05/2000 | 6,409,844 | 6,409,844 | ||||
| Merrimac Money Market Fund** | |||||||
| 6.440% | 07/03/2000 | 5,850,765 | 5,850,765 | ||||
| Morgan Stanley Dean Witter & Co.** | |||||||
| 6.890% | 07/17/2000 | 1,236,569 | 1,236,569 | ||||
| Morgan Stanley Dean Witter & Co.** | |||||||
| 6.910% | 11/22/2000 | 512,784 | 512,784 | ||||
| Paribus Bank Eurodollar Time Deposit** | |||||||
| 6.750% | 07/05/2000 | 3,076,724 | 3,076,724 | ||||
| 35,902,099 | |||||||
| Repurchase Agreement — 9.2% | |||||||
| Investors Bank & Trust Company
Repurchase Agreement, dated 06/30/00, 6.03%, due 07/03/00 (a) |
20,668,112 | 20,668,112 | |||||
| TOTAL SHORT-TERM
INVESTMENTS (At Amortized Cost) |
56,570,211 | ||||||
| TOTAL INVESTMENTS — 110.5%
(Cost $235,855,324) *** |
247,793,023 | ||||||
| Other Assets/
(Liabilities) — (10.5%) |
(23,550,525 | ) | |||||
| NET ASSETS — 100.0% | $224,242,498 | ||||||
| |
|||||||
*
|
Non-income producing security.
|
**
|
Represents investment of security lending collateral. (Note 2).
|
***
|
Aggregate cost for Federal tax purposes. (Note 7).
|
†
|
American Depository Receipt
|
(a)
|
Maturity value of $20,678,498. Collateralized by U.S. Government Agency obligations with rates of 6.500% through 7.125%, maturity
dates of 07/01/2014 through 11/20/2024, and aggregate market value, including accrued interest, of $21,701,575.
|
| June 30, 2000
(Unaudited) |
||
|---|---|---|
| Assets: | ||
| Investments, at value (cost $179,285,113) (Note 2) | $191,222,812 | |
| Short-term investments, at amortized cost (Note 2) | 56,570,211 | |
| Total Investments | 247,793,023 | |
| Cash | 12,454,145 | |
| Receivables from: | ||
| Investments sold | 559,237 | |
| Interest and dividends | 167,722 | |
| Foreign taxes withheld | 182 | |
| Investment adviser (Note 3) | 18,206 | |
| Total assets | 260,992,515 | |
| Liabilities: | ||
| Payables for: | ||
| Investments purchased | 654,577 | |
| Securities on loan (Note 2) | 35,902,099 | |
| Directors’ fees and expenses (Note 3) | 3,578 | |
| Affiliates (Note 3): | ||
| Investment management fees | 141,157 | |
| Administration fees | 28,682 | |
| Service fees | 4,032 | |
| Accrued expenses and other liabilities | 15,892 | |
| Total liabilities | 36,750,017 | |
| Net assets | $224,242,498 | |
| Net assets consist of: | ||
| Paid-in capital | $197,579,036 | |
| Undistributed net investment income | 209,481 | |
| Accumulated net realized gain on investments | 14,516,282 | |
| Net unrealized appreciation on investments | 11,937,699 | |
| $224,242,498 | ||
| Net assets: | ||
| Class A | $ 9,965,827 | |
| Class L | $ 11,575,106 | |
| Class Y | $ 35,346,722 | |
| Class S | $167,354,843 | |
| Shares outstanding: | ||
| Class A | 592,928 | |
| Class L | 687,034 | |
| Class Y | 2,095,391 | |
| Class S | 9,903,808 | |
| Net asset value, offering price and redemption price per share: | ||
| Class A | $ 16.81 | |
| Class L | $ 16.85 | |
| Class Y | $ 16.87 | |
| Class S | $ 16.90 | |
| MassMutual Small Cap Growth Equity Fund – Financial Statements (Continued)
|
| Six months ended
June 30, 2000 (Unaudited) |
|||
|---|---|---|---|
| Investment income: (Note 2) | |||
| Dividends | $ 120,579 | ||
| Interest (including securities lending income of $81,780) | 1,122,316 | ||
| Total investment income | 1,242,895 | ||
| Expenses: (Note 2) | |||
| Investment management fees (Note 3) | 832,158 | ||
| Custody fees | 52,291 | ||
| Audit and legal fees | 6,723 | ||
| Directors’ fees (Note 3) | 4,426 | ||
| 895,598 | |||
| Administration fees (Note 3): | |||
| Class A | 9,757 | ||
| Class L | 18,132 | ||
| Class Y | 40,458 | ||
| Class S | 92,739 | ||
| Service fees (Note 3): | |||
| Class A | 5,986 | ||
| Total expenses | 1,062,670 | ||
| Expenses reimbursed (Note 3) | (29,256 | ) | |
| Net expenses | 1,033,414 | ||
| Net investment income | 209,481 | ||
| Realized and unrealized gain (loss): | |||
| Net realized gain on investment transactions | 9,575,632 | ||
| Net change in unrealized appreciation (depreciation) on investments | (11,439,095 | ) | |
| Net realized and unrealized loss | (1,863,463 | ) | |
| Net decrease in net assets resulting from operations | $ (1,653,982 | ) | |
| MassMutual Small Cap Growth Equity Fund – Financial Statements (Continued)
|
| Six months ended
June 30, 2000 (Unaudited) |
Period ended
December 31, 1999* |
|||||
|---|---|---|---|---|---|---|
| Increase (Decrease) in Net Assets: | ||||||
| Operations: | ||||||
| Net investment income | $ 209,481 | $ 53,797 | ||||
| Net realized gain on investment transactions | 9,575,632 | 6,075,827 | ||||
| Net change in unrealized appreciation (depreciation) on investments | (11,439,095 | ) | 23,376,794 | |||
| Net increase (decrease) in net assets resulting from operations | (1,653,982 | ) | 23,506,418 | |||
| Distributions to shareholders (Note 2): | ||||||
| From net investment income: | ||||||
| Class A | - | - | ||||
| Class L | - | (437 | ) | |||
| Class Y | - | (6,008 | ) | |||
| Class S | - | (47,352 | ) | |||
| Total distributions from net investment income | - | (53,797 | ) | |||
| In excess of net investment income: | ||||||
| Class A | - | - | ||||
| Class L | - | (34 | ) | |||
| Class Y | - | (463 | ) | |||
| Class S | - | (3,652 | ) | |||
| Total distributions in excess of net investment income | - | (4,149 | ) | |||
| From net realized gains: | ||||||
| Class A | - | (18,351 | ) | |||
| Class L | - | (22,915 | ) | |||
| Class Y | - | (116,771 | ) | |||
| Class S | - | (972,991 | ) | |||
| Total distributions from net realized gains | - | (1,131,028 | ) | |||
| Net fund share transactions (Note 5): | ||||||
| Class A | 8,050,130 | 1,305,965 | ||||
| Class L | 9,304,194 | 1,687,697 | ||||
| Class Y | 23,446,629 | 10,436,617 | ||||
| Class S | 76,233,011 | 67,114,793 | ||||
| Increase in net assets from net fund share transactions | 117,033,964 | 80,545,072 | ||||
| Total increase in net assets | 115,379,982 | 108,862,516 | ||||
| Net assets: | ||||||
| Beginning of period | 108,862,516 | - | ||||
| End of period (including undistributed net
investment income of $209,481 and
$0, respectively) |
$224,242,498 | $108,862,516 | ||||
| * For the period from May 3, 1999 (commencement of operations) through December 31, 1999.
|
| MassMutual Small Cap Growth Equity Fund – Financial Statements (Continued)
|
| Class A |
Class L |
|||||||||||
|---|---|---|---|---|---|---|---|---|---|---|---|---|
| Six months ended
6/30/00 (Unaudited) |
Period ended
12/31/99† |
Six months ended
6/30/00 (Unaudited) |
Period ended
12/31/99† |
|||||||||
| Net asset value, beginning of period | $ 15.86 | $ 10.00 | $ 15.88 | $ 10.00 | ||||||||
| Income (Loss) from investment operations: | ||||||||||||
| Net investment loss | (0.03 | )*** | (0.03 | )*** | (0.01 | )*** | (0.01 | )*** | ||||
| Net realized and unrealized gain (loss) on investments | 0.98 | 6.06 | 0.98 | 6.06 | ||||||||
| Total income (loss) from investment operations | 0.95 | 6.03 | 0.97 | 6.05 | ||||||||
| Less distributions to shareholders: | ||||||||||||
| From net investment income | - | - | - | (0.00 | )**** | |||||||
| In excess of net investment income | - | - | - | (0.00 | )**** | |||||||
| From net realized gains | - | (0.17 | ) | - | (0.17 | ) | ||||||
| Total distributions | - | (0.17 | ) | - | (0.17 | ) | ||||||
| Net asset value, end of period | $ 16.81 | $ 15.86 | $ 16.85 | $ 15.88 | ||||||||
| Total Return@ | 5.92% | ** | 60.42% | ** | 6.11% | ** | 60.55% | ** | ||||
| Ratios / Supplemental Data: | ||||||||||||
| Net assets, end of period (000’s) | $ 9,966 | $ 1,742 | $ 11,575 | $ 2,198 | ||||||||
| Ratio of expenses to average daily net assets: | ||||||||||||
| Before expense waiver | 1.55% | * | 1.79% | * | 1.29% | * | 1.52% | * | ||||
| After expense waiver # | 1.50% | * | N/A | 1.26% | * | N/A | ||||||
| Net investment loss to average daily net assets | (0.34)% | * | (0.39)% | * | (0.07)% | * | (0.12)% | * | ||||
| Portfolio turnover rate | 53% | ** | 68% | ** | 53% | ** | 68% | ** | ||||
| Class Y |
Class S |
|||||||||||
| Six months ended
6/30/00 (Unaudited) |
Period ended
12/31/99† |
Six months ended
6/30/00 (Unaudited) |
Period ended
12/31/99† |
|||||||||
| Net asset value, beginning of period | $ 15.90 | $ 10.00 | $ 15.91 | $ 10.00 | ||||||||
| Income (Loss) from investment operations: | ||||||||||||
| Net investment income | 0.01 | *** | 0.01 | *** | 0.02 | *** | 0.02 | *** | ||||
| Net realized and unrealized gain (loss) on investments | 0.96 | 6.07 | 0.97 | 6.07 | ||||||||
| Total income (loss) from investment operations | 0.97 | 6.08 | 0.99 | 6.09 | ||||||||
| Less distributions to shareholders: | ||||||||||||
| From net investment income | - | (0.01 | ) | - | (0.01 | ) | ||||||
| In excess of net investment income | - | (0.00 | )**** | - | (0.00 | )**** | ||||||
| From net realized gains | - | (0.17 | ) | - | (0.17 | ) | ||||||
| Total distributions | - | (0.18 | ) | - | (0.18 | ) | ||||||
| Net asset value, end of period | $ 16.87 | $ 15.90 | $ 16.90 | $ 15.91 | ||||||||
| Total Return@ | 6.17% | ** | 60.71% | ** | 6.22% | 60.91% | ||||||
| Ratios / Supplemental Data: | ||||||||||||
| Net assets, end of period (000’s) | $35,347 | $12,667 | $167,355 | $92,254 | ||||||||
| Ratio of expenses to average daily net assets: | ||||||||||||
| Before expense waiver | 1.14% | * | 1.31% | * | 1.00% | * | 1.19% | * | ||||
| After expense waiver # | 1.11% | * | N/A | 0.97% | * | N/A | ||||||
| Net investment income to average daily net assets | 0.10% | * | 0.14% | * | 0.26% | * | 0.19% | * | ||||
| Portfolio turnover rate | 53% | ** | 68% | ** | 53% | ** | 68% | ** | ||||
*
|
Annualized
|
**
|
Percentage represents results for the period and are not annualized.
|
***
|
Per share amount calculated on the average shares method.
|
****
|
Distributions from net investment income/in excess of net investment income is less than $0.01 per share.
|
†
|
For the period from May 3, 1999 (commencement of operations) through December 31, 1999.
|
#
|
Computed after giving effect to an agreement by MassMutual to waive certain fees and expenses of the Fund for the period May 1,
2000 through June 30, 2000.
|
@
|
Employee retirement benefit plans that invest plan assets in the Separate Investment Accounts (SIAs) may be subject to
certain charges as set forth in their respective Plan Documents. Total return figures would be lower for the periods presented if they reflected these charges.
|
Ÿ
|
achieve capital appreciation
|
Ÿ
|
invest primarily in a diversified portfolio of equity securities of smaller, emerging growth companies
|
Ÿ
|
utilize a growth-oriented strategy in making investment decisions
|
Ÿ
|
utilize fundamental analysis to identify companies which
|
| —are of high investment quality or possess a unique product, market position or operating characteristics
|
| —offer above-average levels of profitability or superior growth potential
|
| MassMutual Emerging Growth Fund – Portfolio Manager Report (Continued)
|
| MassMutual Emerging Growth Fund
|
| Largest Stock Holdings (6/30/00)
|
| Firepond, Inc.
|
| Protein Design Labs, Inc.
|
| Software.com, Inc.
|
| NETIQ Corp.
|
| SonicWall, Inc.
|
| Proxicom, Inc.
|
| Metromedia Fiber Network, Inc.
|
| Professional Detailing, Inc.
|
| PLX Technology, Inc.
|
| Tibco Software, Inc.
|
| MassMutual Emerging Growth Fund – Portfolio Manager Report (Continued)
|
| MassMutual Emerging Growth Fund
Total Return
|
|||
|---|---|---|---|
| Since
Inception 5/1/00 - 6/30/00 |
|||
| Class S | 7.60% | ||
| Class A | 7.60% | ||
| Class Y | 7.60% | ||
| Class L | 7.60% | ||
| |
|||
| Russell 2000 Index | 2.39% | ||
GROWTH OF A $10,000 INVESTMENT SINCE INCEPTION
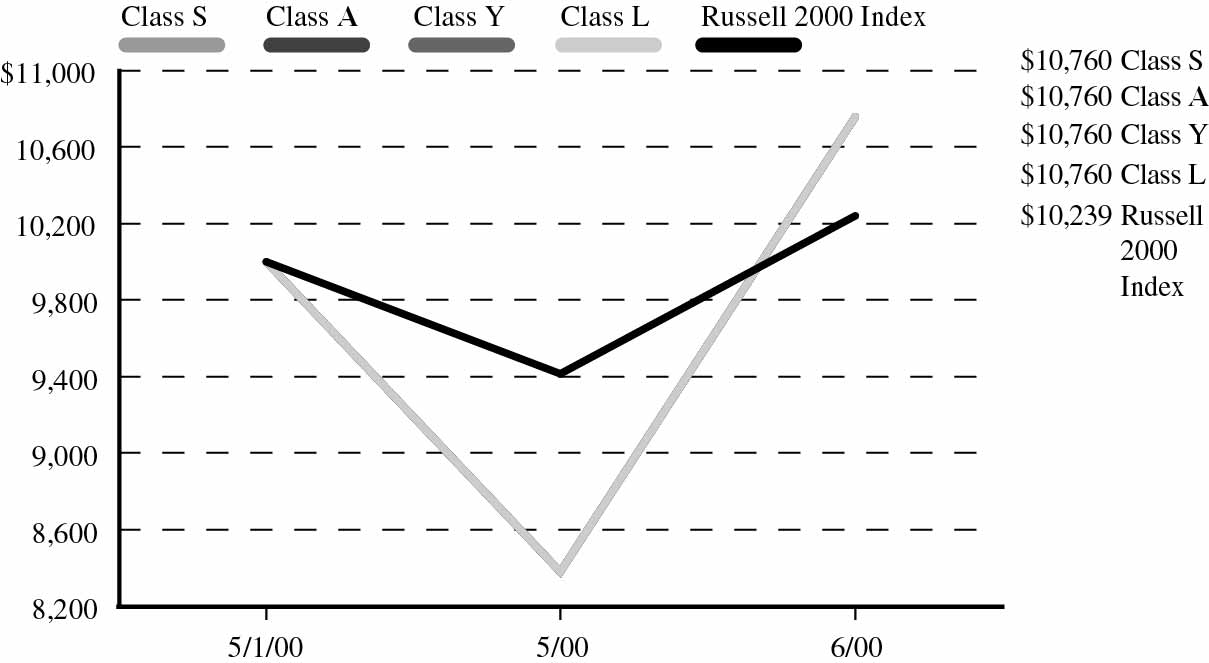
| Number of
Shares |
Market Value |
|||
|---|---|---|---|---|
| EQUITIES — 84.9% | ||||
| Advertising — 2.9% | ||||
| Lamar Advertising Co.* | 4,100 | $ 177,581 | ||
| MyPoints.com, Inc.* | 39,000 | 739,171 | ||
| NetCreations, Inc.* | 4,900 | 224,481 | ||
| TMP Worldwide, Inc.* | 5,300 | 391,206 | ||
| 1,532,439 | ||||
| Banking, Savings & Loans — 0.6% | ||||
| Financial Federal Corp.* | 18,500 | 321,437 | ||
| Broadcasting, Publishing & Printing — 1.0% | ||||
| COX Radio, Inc. Cl. A* | 13,100 | 366,800 | ||
| Hispanic Broadcasting
Corp.* |
4,900 | 162,312 | ||
| 529,112 | ||||
| Commercial Services — 3.8% | ||||
| Critical Path, Inc.* | 3,700 | 215,756 | ||
| Ebenx, Inc.* | 400 | 8,475 | ||
| Netcentives, Inc.* | 34,000 | 633,250 | ||
| On Assignment, Inc.* | 5,700 | 173,850 | ||
| Professional Detailing,
Inc.* |
23,000 | 783,437 | ||
| Teletech Holdings, Inc.* | 5,700 | 177,056 | ||
| 1,991,824 | ||||
| Communications — 9.8% | ||||
| Allegiance Telecom, Inc.* | 8,600 | 550,400 | ||
| American Tower Corp.
Cl. A* |
13,100 | 546,106 | ||
| AudioCodes Ltd.* | 5,700 | 684,000 | ||
| CapRock
Communications Corp.* |
650 | 12,675 | ||
| Ciena Corp.* | 2,100 | 350,044 | ||
| Copper Mountain
Networks, Inc.* |
4,350 | 383,344 | ||
| DSL.Net, Inc.* | 34,500 | 355,781 | ||
| Echostar
Communications Corp.* |
11,700 | 387,380 | ||
| Exfo Electro Optical
Engineering, Inc.* |
100 | 4,387 | ||
| LifeMinders, Inc.* | 13,950 | 412,397 | ||
| McleodUSA, Inc.* | 24,600 | 508,912 | ||
| Powerwave Technologies,
Inc.* |
2,500 | 110,000 | ||
| Turnstone Systems, Inc.* | 3,300 | 546,717 | ||
| Westell Technologies,
Inc. Cl. A* |
16,000 | 240,000 | ||
| 5,092,143 | ||||
| Number of
Shares |
Market Value |
|||
|---|---|---|---|---|
| Computer Integrated Systems Design — 3.1% | ||||
| Exchange Applications,
Inc.* |
23,000 | $ 612,375 | ||
| Software.com, Inc.* | 7,800 | 1,013,025 | ||
| 1,625,400 | ||||
| Computer Programming Services — 3.3% | ||||
| Macromedia, Inc.* | 7,000 | 676,812 | ||
| Portal Software* | 7,400 | 472,675 | ||
| RealNetworks, Inc.* | 3,700 | 187,081 | ||
| Viant Corp.* | 12,300 | 364,387 | ||
| 1,700,955 | ||||
| Computer Related Services — 4.5% | ||||
| Acxiom Corp.* | 10,100 | 275,225 | ||
| Espeed, Inc. Cl. A* | 6,150 | 267,141 | ||
| Keynote Systems, Inc.* | 6,600 | 465,712 | ||
| Lante Corp.* | 7,800 | 159,412 | ||
| NaviSite, Inc.* | 13,300 | 556,106 | ||
| Register.com* | 11,100 | 339,244 | ||
| Scient Corp.* | 6,200 | 273,575 | ||
| 2,336,415 | ||||
| Computers & Information — 4.2% | ||||
| Extreme Networks* | 5,300 | 559,150 | ||
| Foundry Networks, Inc.* | 6,800 | 748,000 | ||
| Immersion Corporation* | 4,900 | 147,000 | ||
| Interlink Electronics, Inc.* | 6,200 | 259,625 | ||
| Paradyne Networks* | 15,200 | 494,950 | ||
| 2,208,725 | ||||
| Data Processing and Preparation — 0.9% | ||||
| Homestore.com, Inc.* | 16,000 | 467,000 | ||
| Electrical Equipment & Electronics — 11.5% | ||||
| Alpha Industries* | 3,600 | 158,625 | ||
| Anaren Microwave, Inc.* | 5,500 | 721,789 | ||
| Applied Micro Circuits
Corp.* |
2,100 | 207,375 | ||
| Avanex Corp.* | 2,100 | 200,550 | ||
| Cobalt Networks, Inc.* | 10,300 | 596,112 | ||
| Cree, Inc.* | 4,300 | 574,050 | ||
| Exar Corp.* | 4,100 | 357,469 | ||
| Globespan, Inc.* | 2,100 | 256,364 | ||
| Intersil Holding Corp.* | 12,300 | 664,969 | ||
| Manufacturers Services Ltd.* | 300 | 6,169 | ||
| Microsemi Corp.* | 6,200 | 210,412 | ||
| Next Level
Communications, Inc.* |
7,800 | 668,850 | ||
| Number of
Shares |
Market Value |
|||
|---|---|---|---|---|
| Nvidia Corp.* | 4,400 | $ 279,675 | ||
| PLX Technology, Inc.* | 18,700 | 776,050 | ||
| Power Integrations, Inc.* | 13,500 | 318,094 | ||
| 5,996,553 | ||||
| Entertainment & Leisure — 0.8% | ||||
| Macrovision Corp.* | 6,200 | 396,316 | ||
| Financial Services — 3.4% | ||||
| Knight Trading Group, Inc.* | 4,900 | 146,081 | ||
| NextCard, Inc.* | 72,200 | 613,700 | ||
| Pinnacle Holdings, Inc.* | 11,100 | 599,400 | ||
| Waddell & Reed
Financial, Inc. Cl. A |
12,300 | 403,594 | ||
| 1,762,775 | ||||
| Healthcare — 1.5% | ||||
| Community Health
Systems, Inc.* |
600 | 9,713 | ||
| Province Healthcare Co.* | 11,900 | 429,888 | ||
| Sunrise Assisted Living,
Inc.* |
19,700 | 364,450 | ||
| 804,051 | ||||
| Information Retrieval Services — 0.6% | ||||
| Psinet, Inc.* | 13,100 | 329,138 | ||
| Internet Content — 1.2% | ||||
| BEA Systems, Inc.* | 12,300 | 608,081 | ||
| Internet Software — 3.1% | ||||
| Firepond, Inc.* | 36,500 | 1,314,000 | ||
| Webmethods, Inc.* | 2,100 | 330,094 | ||
| 1,644,094 | ||||
| Lodging — 0.7% | ||||
| Four Seasons Hotels, Inc. | 5,700 | 354,469 | ||
| Medical Supplies — 3.4% | ||||
| Cytyc Corp.* | 13,100 | 699,213 | ||
| LTX Corp.* | 4,500 | 157,219 | ||
| Resmed, Inc.* | 16,300 | 436,025 | ||
| Techne Corp.* | 3,750 | 487,500 | ||
| 1,779,957 | ||||
| Pharmaceuticals — 3.5% | ||||
| Abgenix, Inc.* | 3,700 | 443,480 | ||
| Albany Molecular
Research, Inc.* |
6,600 | 359,288 | ||
| MassMutual Emerging Growth Fund – Portfolio of Investments (Continued)
|
| Number of
Shares |
Market Value |
|||
|---|---|---|---|---|
| Charles River
Laboratories International, Inc.* |
250 | $ 5,547 | ||
| Protein Design Labs, Inc.* | 6,200 | 1,022,709 | ||
| |
||||
| 1,831,024 | ||||
| |
||||
| Prepackaged Software — 15.0% | ||||
| Art Technology Group, Inc.* | 5,700 | 575,344 | ||
| Digex, Inc.* | 7,800 | 529,913 | ||
| Informatica Corp.* | 7,000 | 573,563 | ||
| ISS Group, Inc.* | 6,750 | 666,457 | ||
| NETIQ Corp.* | 16,800 | 1,001,700 | ||
| Netopia, Inc.* | 8,200 | 330,050 | ||
| Ondisplay, Inc.* | 5,700 | 464,194 | ||
| Peregrine Systems, Inc.* | 13,900 | 482,156 | ||
| Proxicom, Inc.* | 16,800 | 804,300 | ||
| SonicWall, Inc.* | 10,300 | 907,044 | ||
| Tibco Software, Inc.* | 7,000 | 750,641 | ||
| Vitria Technology, Inc.* | 8,600 | 525,675 | ||
| WatchGuard
Technologies* |
3,700 | 203,269 | ||
| |
||||
| 7,814,306 | ||||
| |
||||
| Retail — 0.7% | ||||
| Bed Bath & Beyond, Inc.* | 9,800 | 355,250 | ||
| |
||||
| Telephone Utilities — 5.1% | ||||
| Dobson Communications
Corp. Cl. A* |
12,700 | 244,475 | ||
| Metrocall, Inc.* | 51,400 | 462,600 | ||
| Metromedia Fiber
Network, Inc.* |
20,100 | 797,719 | ||
| NEXTLINK
Communications, Inc.* |
18,272 | 693,194 | ||
| WebLink Wireless, Inc.* | 16,000 | 212,000 | ||
| West Teleservices Corp.* | 10,450 | 264,516 | ||
| |
||||
| 2,674,504 | ||||
| |
||||
| Transportation — 0.3% | ||||
| Forward Air Corporation* | 4,100 | 164,000 | ||
| |
||||
| TOTAL EQUITIES
(Cost $40,333,884) |
44,319,968 | |||
| |
||||
| Principal
Amount |
Market Value |
|||||
|---|---|---|---|---|---|---|
| SHORT-TERM INVESTMENTS — 22.1% | ||||||
| Cash Equivalents — 13.9% | ||||||
| Bank of America Bank Note** | ||||||
| 6.670% | 03/22/2001 | $ 155,791 | $ 155,791 | |||
| Bank of Montreal Bank Note** | ||||||
| 6.630% | 08/16/2000 | 259,652 | 259,652 | |||
| Bank of Nova Scotia
Eurodollar Time Deposit** |
||||||
| 7.000% | 07/03/2000 | 311,582 | 311,582 | |||
| Credit Agricole Bank
Eurodollar Time Deposit** |
||||||
| 6.750% | 07/06/2000 | 1,038,607 | 1,038,607 | |||
| Credit Agricole Bank
Eurodollar Time Deposit** |
||||||
| 6.750% | 07/07/2000 | 155,791 | 155,791 | |||
| Den Danske Bank
Eurodollar Time Deposit** |
||||||
| 6.810% | 07/05/2000 | 571,234 | 571,234 | |||
| First Union Bank Note** | ||||||
| 6.900% | 05/09/2001 | 155,791 | 155,791 | |||
| Fleet National Bank
Eurodollar Time Deposit** |
||||||
| 7.260% | 10/31/2000 | 655,736 | 655,736 | |||
| HypoVereinsbank
Eurodollar Time Deposit** |
||||||
| 6.750% | 07/05/2000 | 1,298,259 | 1,298,259 | |||
| Merrimac Money
Market Fund** |
||||||
| 6.440% | 07/03/2000 | 1,630,613 | 1,630,613 | |||
| Morgan Stanley Dean
Witter & Co.** |
||||||
| 6.890% | 07/17/2000 | 311,582 | 311,582 | |||
| Morgan Stanley Dean
Witter & Co.** |
||||||
| 6.910% | 11/22/2000 | 103,861 | 103,861 | |||
| Paribus Bank
Eurodollar Time Deposit** |
||||||
| 6.750% | 07/05/2000 | 623,165 | 623,165 | |||
| 7,271,664 | ||||||
| Principal
Amount |
Market Value |
||||||
|---|---|---|---|---|---|---|---|
| Repurchase Agreement — 8.2% | |||||||
| Investors Bank & Trust Company
Repurchase Agreement, dated 06/30/00 6.03%, |
|||||||
| due 07/03/00 (a) | $ 4,256,668 | $ 4,256,668 | |||||
| |
|||||||
| TOTAL SHORT-TERM
INVESTMENTS |
|||||||
| (At Amortized Cost) | 11,528,332 | ||||||
| |
|||||||
| TOTAL INVESTMENTS — 107.0% | |||||||
| (Cost $51,862,216) *** | 55,848,300 | ||||||
| Other Assets/
(Liabilities) — (7.0%) |
(3,636,962 | ) | |||||
| |
|||||||
| NET ASSETS — 100.0% | $ 52,211,338 | ||||||
| |
|||||||
Notes to Portfolio of Investments
*
|
Non-income producing security.
|
**
|
Represents investment of security lending collateral. (Note 2).
|
***
|
Aggregate cost for Federal tax purposes. (Note 7).
|
(a)
|
Maturity value of $4,258,807. Collateralized by U.S. Government Agency obligation with a rate of 7.450%, maturity date of
8/01/2027, and aggregate market value, including accrued interest, of $4,469,970.
|
| June 30, 2000
(Unaudited) |
|||
|---|---|---|---|
| Assets: | |||
| Investments, at value (cost $40,333,884) (Note 2 ) | $44,319,968 | ||
| Short-term investments, at amortized cost (Note 2) | 11,528,332 | ||
| Total Investments | 55,848,300 | ||
| Cash | 3,538,675 | ||
| Receivables from: | |||
| Investments sold | 130,194 | ||
| Interest and dividends | 21,702 | ||
| Total assets | 59,538,871 | ||
| Liabilities: | |||
| Payables for: | |||
| Investments purchased | 13,850 | ||
| Securities on loan (Note 2) | 7,271,664 | ||
| Directors’ fees and expenses (Note 3) | 1,330 | ||
| Affiliates (Note 3): | |||
| Investment management fees | 24,653 | ||
| Administration fees | 3,567 | ||
| Service fees | 65 | ||
| Accrued expenses and other liabilities | 12,404 | ||
| Total liabilities | 7,327,533 | ||
| Net assets | $52,211,338 | ||
| Net assets consist of: | |||
| Paid-in capital | $48,146,180 | ||
| Undistributed net investment loss | (8,051 | ) | |
| Accumulated net realized gain on investments | 87,125 | ||
| Net unrealized appreciation on investments | 3,986,084 | ||
| $52,211,338 | |||
| Net assets: | |||
| Class A | $ 417,412 | ||
| Class L | $ 5,547,404 | ||
| Class Y | $ 5,414,187 | ||
| Class S | $40,832,335 | ||
| Shares outstanding: | |||
| Class A | 38,811 | ||
| Class L | 515,491 | ||
| Class Y | 502,982 | ||
| Class S | 3,795,609 | ||
| Net asset value, offering price and redemption price per share: | |||
| Class A | $ 10.76 | ||
| Class L | $ 10.76 | ||
| Class Y | $ 10.76 | ||
| Class S | $ 10.76 | ||
| MassMutual Emerging Growth Fund – Financial Statements (Continued)
|
| Period ended
June 30, 2000* (Unaudited) |
|||
|---|---|---|---|
| Investment income: (Note 2) | |||
| Interest (including securities lending income of $1,472) | $ 50,553 | ||
| Expenses: (Note 2) | |||
| Investment management fees (Note 3) | 39,598 | ||
| Custody fees | 10,449 | ||
| Audit and legal fees | 1,956 | ||
| Directors’ fees (Note 3) | 1,330 | ||
| 53,333 | |||
| Administration fees (Note 3): | |||
| Class A | 87 | ||
| Class L | 1,167 | ||
| Class Y | 69 | ||
| Class S | 3,883 | ||
| Service fees (Note 3): | |||
| Class A | 65 | ||
| Total expenses | 58,604 | ||
| Net investment loss | (8,051 | ) | |
| Realized and unrealized gain (loss): | |||
| Net realized gain on investment transactions | 87,125 | ||
| Net change in unrealized appreciation (depreciation) on investments | 3,986,084 | ||
| Net realized and unrealized gain | 4,073,209 | ||
| Net increase in net assets resulting from operations | $4,065,158 | ||
| * For the period from May 1, 2000 (commencement of operations) through June 30, 2000.
|
| MassMutual Emerging Growth Fund – Financial Statements (Continued)
|
| Period ended
June 30, 2000* (Unaudited) |
|||
|---|---|---|---|
| Increase (Decrease) in Net Assets: | |||
| Operations: | |||
| Net investment loss | $ (8,051 | ) | |
| Net realized gain on investment transactions | 87,125 | ||
| Net change in unrealized appreciation (depreciation) on investments | 3,986,084 | ||
| Net increase in net assets resulting from operations | 4,065,158 | ||
| Net fund share transactions (Note 5): | |||
| Class A | 383,080 | ||
| Class L | 4,871,781 | ||
| Class Y | 5,300,802 | ||
| Class S | 37,590,517 | ||
| Increase in net assets from net fund share transactions | 48,146,180 | ||
| Total increase in net assets | 52,211,338 | ||
| Net assets: | |||
| Beginning of period | - | ||
| End of period (including undistributed net investment loss of $8,051) | $52,211,338 | ||
| * For the period from May 1, 2000 (commencement of operations) through June 30, 2000.
|
| MassMutual Emerging Growth Fund – Financial Statements (Continued)
|
| Class A |
Class L |
Class Y |
Class S |
|||||||||
|---|---|---|---|---|---|---|---|---|---|---|---|---|
| Period ended
6/30/00† (Unaudited) |
Period ended
6/30/00† (Unaudited) |
Period ended
6/30/00† (Unaudited) |
Period ended
6/30/00† (Unaudited) |
|||||||||
| Net asset value, beginning of period | $ 10.00 | $ 10.00 | $10.00 | $ 10.00 | ||||||||
| Income (Loss) from investment operations: | ||||||||||||
| Net investment loss | (0.00 | )*** | (0.00 | )*** | (0.00 | )*** | (0.00 | )*** | ||||
| Net realized and unrealized gain (loss) on investments | 0.76 | 0.76 | 0.76 | 0.76 | ||||||||
| Total income (loss) from investment operations | 0.76 | 0.76 | 0.76 | 0.76 | ||||||||
| Net asset value, end of period | $ 10.76 | $ 10.76 | $10.76 | $ 10.76 | ||||||||
| Total Return@ | 7.60% | ** | 7.60% | ** | 7.60% | ** | 7.60% | ** | ||||
| Ratios / Supplemental Data: | ||||||||||||
| Net assets, end of period (000’s) | $ 417 | $ 5,547 | $5,414 | $40,832 | ||||||||
| Net expenses to average daily net assets | 1.66% | * | 1.38% | * | 1.55% | * | 1.15% | * | ||||
| Net investment loss to average daily net assets | (0.69)% | * | (0.24)% | * | 0.04% | * | (0.15)% | * | ||||
| Portfolio turnover rate | 9% | ** | 9% | ** | 9% | ** | 9% | ** | ||||
*
|
Annualized
|
**
|
Percentage represents results for the period and are not annualized.
|
***
|
Net investment loss is less than $0.01 per share.
|
†
|
For the period from May 1, 2000 (commencement of operations) through June 30, 2000.
|
@
|
Employee retirement benefit plans that invest plan assets in the Separate Investment Accounts (SIAs) may be subject to certain
charges as set forth in their respective Plan Documents. Total Return figures would be lower for the period presented if they reflected these charges.
|
Ÿ
|
achieve a high total rate of return over the long term
|
Ÿ
|
invest in a diversified portfolio of foreign and domestic equity securities
|
Ÿ
|
utilize dominant themes to guide investment decisions with respect to risks of investing in foreign securities (economic,
political and social influences that are expected to dictate long-term growth trends)
|
| MassMutual International Equity Fund | ||
|---|---|---|
| Largest Country Weightings (6/30/00) | ||
| % of Fund | ||
| Japan | 19.77% | |
| United Kingdom | 18.08% | |
| Germany | 7.78% | |
| Netherlands | 7.10% | |
| France | 6.91% | |
| Brazil | 5.08% | |
| Switzerland | 3.58% | |
| Australia | 2.05% | |
| Spain | 1.99% | |
| Canada | 1.69% | |
| MassMutual International Equity Fund – Portfolio Manager Report (Continued)
|
| Year-To-Date | One Year | Five Year
Average Annual |
Since Inception
Average Annual |
||||||
|---|---|---|---|---|---|---|---|---|---|
| 1/1/00 - 6/30/00 | 7/1/99 - 6/30/00 | 7/1/95 - 6/30/00 | 10/3/94 - 6/30/00 | ||||||
| Class S | 6.66% | 56.94% | 19.86% | 16.07% | |||||
| MSCI EAFE | -4.05% | 17.17% | 11.33% | 10.07% | |||||
| Year-To-Date | One Year | Since Inception
Average Annual |
|||||
|---|---|---|---|---|---|---|---|
| 1/1/00 - 6/30/00 | 7/1/99 - 6/30/00 | 1/1/98 - 6/30/00 | |||||
| Class A | 6.45% | 56.23% | 24.71% | ||||
| Class Y | 6.61% | 56.83% | 25.25% | ||||
| MSCI EAFE | -4.05% | 17.17% | 16.40% | ||||
| Year-To-Date | One Year | Since Inception
Average Annual |
|||||
|---|---|---|---|---|---|---|---|
| 1/1/00 - 6/30/00 | 7/1/99 - 6/30/00 | 5/3/99 - 6/30/00 | |||||
| Class L | 6.57% | 56.47% | 48.05% | ||||
| MSCI EAFE | -4.05% | 17.17% | 13.12% | ||||

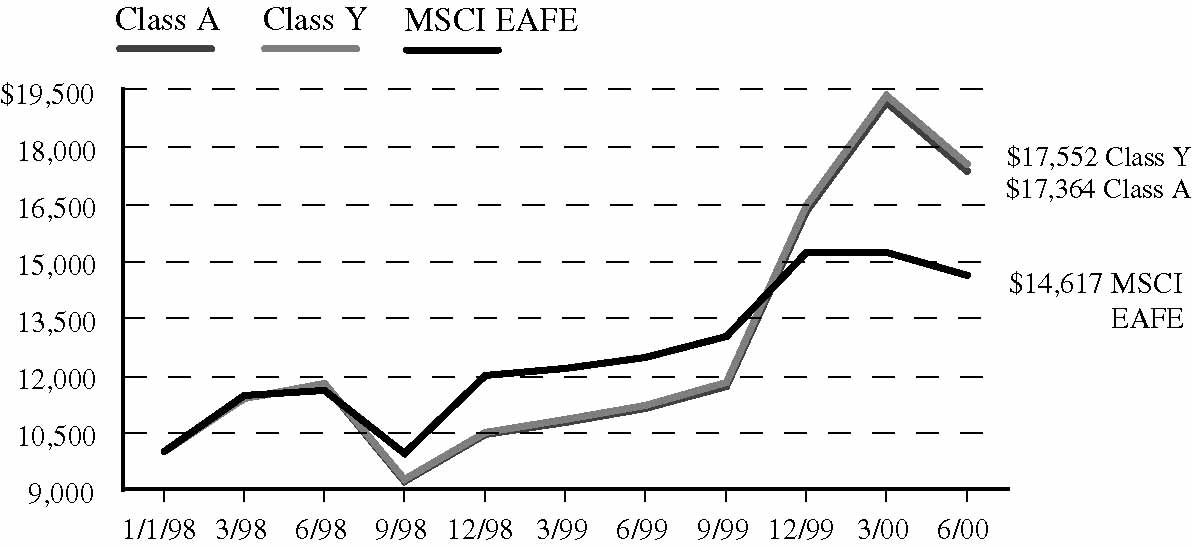
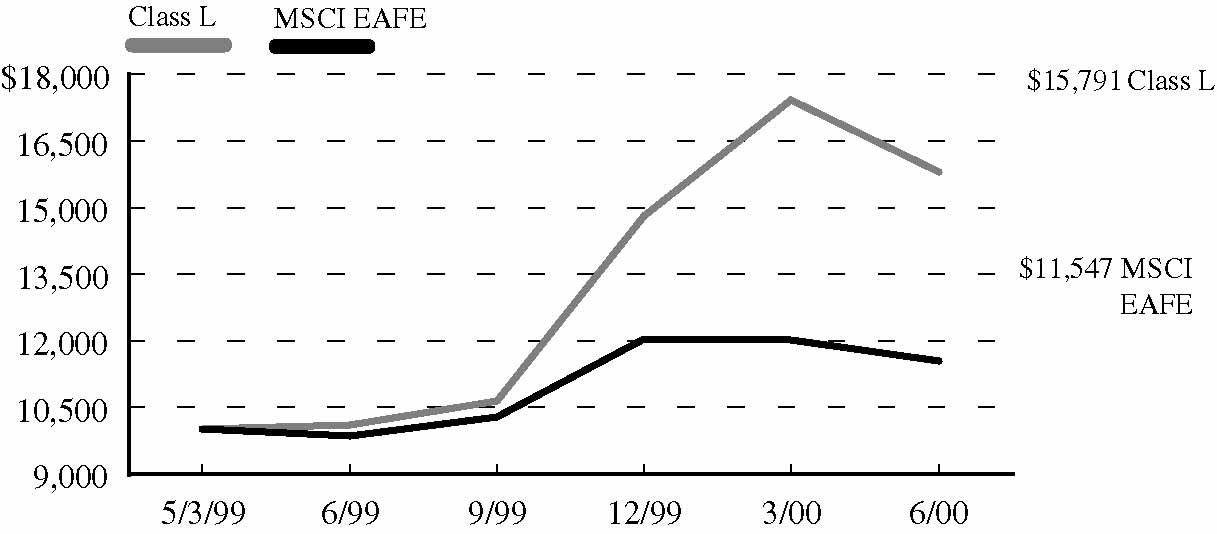
| Number of
Shares |
Market Value |
|||
|---|---|---|---|---|
| EQUITIES — 98.0% | ||||
| Aerospace & Defense — 2.3% | ||||
| Embraer—Empresa
Brasileira de Aeronautica SA |
5,400,000 | $ 30,862,080 | ||
| Autos & Housing — 3.0% | ||||
| Aucnet, Inc. | 269,080 | 12,843,431 | ||
| Ducati Motor Holding SpA* | 2,862,500 | 7,367,503 | ||
| Porsche AG, Preference | 7,600 | 20,653,764 | ||
| 40,864,698 | ||||
| Banking — 1.9% | ||||
| Espirito Santo Financial
Group†† |
460,200 | 8,283,600 | ||
| Unibanco-Uniao de
Banco Brasileiros SA, Sponsored††† |
622,500 | 17,896,875 | ||
| 26,180,475 | ||||
| Communications — 2.6% | ||||
| Alcatel SA Sponsored†† | 545,000 | 36,242,500 | ||
| Communications Equipment — 1.0% | ||||
| Ericsson LM CL. B†† | 668,720 | 13,374,400 | ||
| Computer Hardware — 3.8% | ||||
| Imagineer Co. Ltd.* | 205,000 | 3,875,177 | ||
| Psion PLC | 5,060,000 | 48,949,428 | ||
| 52,824,605 | ||||
| Computer Software/Services — 8.6% | ||||
| Aldata Solution Oyj* | 100,000 | 680,600 | ||
| Cap Gemini SA | 88,900 | 15,722,827 | ||
| Computer Service
Solutions Holding NV |
767,000 | 17,866,268 | ||
| Getronics NV* | 2,402,511 | 37,193,753 | ||
| Lernout & Hauspie
Speech Products NV* |
317,800 | 14,003,063 | ||
| Misys PLC | 1,257,509 | 10,622,933 | ||
| Solution 6 Holdings
Ltd.* |
3,770,200 | 7,357,168 | ||
| Unit 4* | 316,300 | 15,144,918 | ||
| 118,591,530 | ||||
| Consumer Services — 0.6% | ||||
| Brunel International NV | 79,100 | 470,115 | ||
| Prosegur, CIA de
Seguridad SA |
688,486 | 8,084,685 | ||
| 8,554,800 | ||||
| Number of
Shares |
Market Value |
|||
|---|---|---|---|---|
| Diversified Financial — 3.1% | ||||
| ICICI Limited
Sponsored †† |
728,400 | $ 13,657,500 | ||
| Julius Baer Holding AG,
Cl. B |
5,220 | 20,705,813 | ||
| Magnus Holding NV | 1,403,000 | 8,271,106 | ||
| 42,634,419 | ||||
| Electrical Equipment — 10.4% | ||||
| Halma PLC | 5,386,700 | 8,318,142 | ||
| Mitsubishi Electric
Corporation |
2,491,000 | 27,028,596 | ||
| Toshiba Corporation | 7,313,000 | 82,736,357 | ||
| Ushio, Inc. | 921,000 | 25,418,587 | ||
| 143,501,682 | ||||
| Electronics — 4.7% | ||||
| Sharp Corporation | 1,595,800 | 28,280,608 | ||
| Sony Corporation | 179,280 | 16,775,481 | ||
| STMicroelectronics NV,
NY Shares |
300,000 | 19,256,250 | ||
| 64,312,339 | ||||
| Entertainment & Leisure — 5.4% | ||||
| Granada Group PLC | 1,399,580 | 13,984,183 | ||
| Infogrames
Entertainment SA* |
203,480 | 5,207,928 | ||
| Nintendo Co. Ltd. | 177,400 | 31,052,948 | ||
| TelePizza SA* | 1,767,600 | 9,997,015 | ||
| Village Roadshow Ltd.,
Cl. A Preference |
11,894,036 | 13,283,259 | ||
| 73,525,333 | ||||
| Healthcare/Drugs — 9.2% | ||||
| Actelion Ltd.* | 11,539 | 3,775,217 | ||
| Biocompatibles
International PLC* |
4,725,926 | 21,750,129 | ||
| Elan Corp. PLC*†† | 368,780 | 17,862,781 | ||
| Fujisawa Pharmaceutical
Company Limited |
466,000 | 18,895,182 | ||
| Genset Sponsored*†† | 550,800 | 12,737,250 | ||
| NeuroSearch A/S* | 107,795 | 8,449,457 | ||
| NiCox SA* | 206,570 | 11,583,929 | ||
| Oxford GlycoSciences PLC* | 169,000 | 4,838,233 | ||
| PowderJect
Pharmaceuticals PLC* |
2,335,925 | 14,145,427 | ||
| Serono SA Cl. B | 15,400 | 12,880,173 | ||
| 126,917,778 | ||||
| Number of
Shares |
Market Value |
|||
|---|---|---|---|---|
| Healthcare/Supplies & Services — 6.5% | ||||
| Fresenius Medical Care
AG, Preference |
339,300 | $ 13,985,708 | ||
| Hoya Corp | 244,000 | 21,908,955 | ||
| Jomed NV* | 39,100 | 1,550,921 | ||
| Nichii Gakkan
Company |
134,250 | 5,900,314 | ||
| Novogen Ltd.* | 4,993,300 | 11,992,409 | ||
| Ortivus AB, A Shares* | 228,600 | 807,987 | ||
| Ortivus AB, B Shares* | 730,410 | 2,456,734 | ||
| Pliva d.d., Sponsored†,††† | 632,550 | 6,804,467 | ||
| SSL International PLC | 2,151,900 | 23,293,026 | ||
| 88,700,521 | ||||
| Industrial Services — 4.1% | ||||
| 3i Group PLC | 1,026,899 | 21,127,317 | ||
| Bellsystem 24, Inc. | 4,100 | 2,015,094 | ||
| Boskalis Westminster | 1,148,702 | 18,774,271 | ||
| Fomento de
Construcciones y Contratas SA |
710,100 | 13,477,769 | ||
| ICTS International NV* | 245,000 | 1,316,875 | ||
| 56,711,326 | ||||
| Insurance — 1.2% | ||||
| Axa | 56,500 | 8,936,447 | ||
| Ceres, Inc., Preferred
Callable Stocks* |
900,000 | 3,600,000 | ||
| Ockham Holdings PLC | 2,777,000 | 3,531,511 | ||
| 16,067,958 | ||||
| Manufacturing — 6.0% | ||||
| GSI Lumonics, Inc.* | 763,400 | 26,814,425 | ||
| Hamamatsu Photonics K K | 286,000 | 20,408,960 | ||
| Jenoptik AG | 1,154,800 | 33,264,707 | ||
| Sauer, Inc. | 200,000 | 1,975,000 | ||
| 82,463,092 | ||||
| Media — 12.6% | ||||
| Carlton
Communications PLC |
1,048,500 | 13,492,308 | ||
| Grupo Televisa SA,
Sponsored*††† |
318,200 | 21,935,913 | ||
| Impresa Sociedade
Gestora de Participacoes, S.A.* |
166,700 | 1,837,667 | ||
| Naspers Limited,
N Shares |
1,155,500 | 9,629,475 | ||
| MassMutual International Equity Fund – Portfolio of Investments (Continued)
|
| Number of
Shares |
Market Value |
|||
|---|---|---|---|---|
| ProSieben Media AG,
Preferred |
352,510 | $ 42,239,053 | ||
| Reed International PLC | 9,000,000 | 78,344,100 | ||
| Singapore Press
Holdings Ltd. |
400,000 | 6,246,480 | ||
| 173,724,996 | ||||
| Non-Durable Household Goods — 0.7% | ||||
| Wella AG | 52,000 | 1,485,432 | ||
| Wella AG, Preference | 278,900 | 8,635,413 | ||
| 10,120,845 | ||||
| Oil & Gas — 0.6% | ||||
| Expro International
Group PLC |
1,323,000 | 8,211,861 | ||
| Real Estate — 1.3% | ||||
| Brazil Realty SA†,††† | 176,000 | 2,634,227 | ||
| IRSA Inversiones y
Representaciones SA |
2,427,181 | 5,583,730 | ||
| Solidere*††† | 1,499,100 | 9,628,120 | ||
| 17,846,077 | ||||
| Retail: General — 1.7% | ||||
| Gucci Group NV | 72,900 | 6,907,275 | ||
| SkyePharma PLC* | 12,731,000 | 16,575,762 | ||
| 23,483,037 | ||||
| Telecommunications — 1.0% | ||||
| Debitel AG | 62,900 | 3,316,239 | ||
| Toyo Communication
Equipment Co., Ltd. |
709,000 | 10,574,522 | ||
| 13,890,761 | ||||
| Telephone Utilities — 3.2% | ||||
| CCT Telecom Holdings
LTD |
7,768,000 | 1,943,554 | ||
| DDI Corporation | 650 | 6,266,451 | ||
| Tele Norte Leste
Participacoes SA |
153,040 | 3,615,570 | ||
| Tele Norte Leste
Participacoes SA |
888,706,771 | 17,240,911 | ||
| Tele Norte Leste
Participacoes SA Preference |
103,928,734 | 2,431,932 | ||
| Telesp Celular
Participacoes SA, Preferred |
332,363,124 | 6,015,773 | ||
| Videsh Sanchar Nigam
Ltd.††† |
500,000 | 6,770,600 | ||
| 44,284,791 | ||||
| Number of
Shares |
Market Value |
|||
|---|---|---|---|---|
| Tobacco — 1.4% | ||||
| Compagnie Financiere
Richemont AG, A Units |
7,190 | $ 19,433,447 | ||
| Transportation — 1.1% | ||||
| MIF Ltd.* | 334,194 | 3,323,359 | ||
| Smit Internationale NV | 517,368 | 12,150,594 | ||
| 15,473,953 | ||||
| TOTAL EQUITIES
(Cost $1,173,172,070) |
1,348,799,304 | |||
| Principal
Amount |
||||||
|---|---|---|---|---|---|---|
| SHORT-TERM INVESTMENTS — 13.6% | ||||||
| Cash Equivalents | ||||||
| Bank of America Bank Note** | ||||||
| 6.670% | 03/22/2001 | $ 4,029,189 | 4,029,189 | |||
| Bank of Montreal Bank Note** | ||||||
| 6.630% | 08/16/2000 | 7,715,315 | 7,715,315 | |||
| Bank of Nova Scotia
Eurodollar Time Deposit** |
||||||
| 7.000% | 07/03/2000 | 8,058,380 | 8,058,380 | |||
| Credit Agricole Bank
Eurodollar Time Deposit** |
||||||
| 6.750% | 07/06/2000 | 27,014,397 | 27,014,397 | |||
| Credit Agricole Bank
Eurodollar Time Deposit** |
||||||
| 6.750% | 07/07/2000 | 4,029,190 | 4,029,190 | |||
| Den Danske Bank
Eurodollar Time Deposit** |
||||||
| 6.810% | 07/05/2000 | 13,073,694 | 13,073,694 | |||
| First Union Bank Note** | ||||||
| 6.900% | 05/09/2001 | 4,029,189 | 4,029,189 | |||
| Fleet National Bank
Eurodollar Time Deposit** |
||||||
| 7.260% | 10/31/2000 | 758,405 | 758,405 | |||
| HypoVereinsbank
Eurodollar Time Deposit** |
||||||
| 6.750% | 07/05/2000 | 46,076,579 | 46,076,579 | |||
| Merrimac Money Market Fund** | ||||||
| 6.440% | 07/03/2000 | 45,272,182 | 45,272,182 | |||
| MetLife Insurance Company
Funding Agreement** |
||||||
| 6.690% | 08/01/2000 | 10,000,000 | 10,000,000 | |||
| Morgan Stanley Dean Witter & Co.** | ||||||
| 6.890% | 07/17/2000 | 2,205,976 | 2,205,976 | |||
| Principal
Amount |
Market Value |
|||||
|---|---|---|---|---|---|---|
| Morgan Stanley Dean Witter & Co.** | ||||||
| 6.910% | 11/22/2000 | $ 2,686,125 | $ 2,686,125 | |||
| Paribas Bank
Eurodollar Time Deposit** |
||||||
| 6.750% | 07/05/2000 | 13,116,755 | 13,116,755 | |||
| 188,065,376 | ||||||
| TOTAL SHORT-TERM
INVESTMENTS (At Amortized Cost) |
188,065,376 | |||||
| TOTAL INVESTMENTS — 111.6% | ||||||
| (Cost $1,361,237,446)*** | 1,536,864,680 | |||||
| Other Assets/
(Liabilities) — (11.6%) |
(160,226,287) | |||||
| NET ASSETS — 100.0% | $ 1,376,638,393 | |||||
*
|
Non-income producing security.
|
**
|
Represents investment of security lending collateral. (Note 2).
|
| ***
|
Aggregate cost for Federal tax purposes. (Note 7).
|
†
|
Securities exempt from registration under Rule 144A of the Securities Act of 1933. These securities may be resold in transactions
exempt from registration, normally to qualified institutional buyers.
|
††
|
American Depository Receipt
|
†††
|
Global Depository Receipt
|
| June 30, 2000
(Unaudited) |
||
|---|---|---|
| Assets: | ||
| Investments, at value (cost $1,173,172,070) (Note 2) | $1,348,799,304 | |
| Short-term investments, at amortized cost (Note 2) | 188,065,376 | |
| Total Investments | 1,536,864,680 | |
| Cash | 873,117 | |
| Receivables from: | ||
| Investments sold | 67,121,905 | |
| Interest and dividends | 3,558,900 | |
| Foreign taxes withheld | 1,030,930 | |
| Total assets | 1,609,449,532 | |
| Liabilities: | ||
| Payables for: | ||
| Investments purchased | 3,008,306 | |
| Open forward foreign currency contracts (Note 2) | 196,210 | |
| Securities on loan (Note 2) | 188,065,376 | |
| Directors’ fees and expenses (Note 3) | 2,200 | |
| Affiliates (Note 3): | ||
| Investment management fees | 943,935 | |
| Administration fees | 133,586 | |
| Service fees | 2,079 | |
| Due to Custodian | 40,438,283 | |
| Accrued expenses and other liabilities | 21,164 | |
| Total liabilities | 232,811,139 | |
| Net assets | $1,376,638,393 | |
| Net assets consist of: | ||
| Paid-in capital | $ 956,258,147 | |
| Undistributed net investment income | 6,695,953 | |
| Accumulated net realized gain on investments and foreign currency translations | 238,024,223 | |
| Net unrealized appreciation on investments,
forward foreign currency contracts, foreign currency and
other assets and liabilities |
175,660,070 | |
| $1,376,638,393 | ||
| Net assets: | ||
| Class A | $ 7,678,212 | |
| Class L | $ 34,782,385 | |
| Class Y | $ 17,247,893 | |
| Class S | $1,316,929,903 | |
| Shares outstanding: | ||
| Class A | 426,553 | |
| Class L | 1,932,135 | |
| Class Y | 954,340 | |
| Class S | 72,784,796 | |
| Net asset value, offering price and redemption price per share: | ||
| Class A | $ 18.00 | |
| Class L | $ 18.00 | |
| Class Y | $ 18.07 | |
| Class S | $ 18.09 | |
| MassMutual International Equity Fund – Financial Statements (Continued)
|
| Six months ended
June 30, 2000 (Unaudited) |
|||
|---|---|---|---|
| Investment income: (Note 2) | |||
| Dividends (net of withholding tax of $1,728,153) | $ 12,434,517 | ||
| Interest (including securities lending income of $622,979) | 1,249,446 | ||
| Total investment income | 13,683,963 | ||
| Expenses: (Note 2) | |||
| Investment management fees (Note 3) | 5,734,540 | ||
| Custody fees | 417,717 | ||
| Audit and legal fees | 16,480 | ||
| Directors’ fees (Note 3) | 4,869 | ||
| 6,173,606 | |||
| Administration fees (Note 3): | |||
| Class A | 3,233 | ||
| Class L | 27,036 | ||
| Class Y | 11,585 | ||
| Class S | 756,149 | ||
| Service fees (Note 3): | |||
| Class A | 2,738 | ||
| Total expenses | 6,974,347 | ||
| Net investment income | 6,709,616 | ||
| Realized and unrealized gain (loss): | |||
| Net realized gain (loss) on: | |||
| Investment transactions | 236,730,304 | ||
| Foreign currency transactions | (2,527,578 | ) | |
| Net realized gain | 234,202,726 | ||
| Net change in unrealized appreciation (depreciation) on: | |||
| Investments | (178,133,555 | ) | |
| Translation of assets and liabilities in foreign currencies | 52,367 | ||
| Net unrealized loss | (178,081,188 | ) | |
| Net realized and unrealized gain | 56,121,538 | ||
| Net increase in net assets resulting from operations | $ 62,831,154 | ||
| MassMutual International Equity Fund – Financial Statements (Continued)
|
| Six months ended
June 30, 2000 (Unaudited) |
Year ended
December 31, 1999 |
|||||
|---|---|---|---|---|---|---|
| Increase (Decrease) in Net Assets: | ||||||
| Operations: | ||||||
| Net investment income | $ 6,709,616 | $ 3,082,511 | ||||
| Net realized gain on investment and foreign currency transactions | 234,202,726 | 47,989,982 | ||||
| Net change in unrealized appreciation
(depreciation) on investments and
translation of assets and liabilities in foreign currencies |
(178,081,188 | ) | 340,790,615 | |||
| Net increase in net assets resulting from operations | 62,831,154 | 391,863,108 | ||||
| Distributions to shareholders (Note 2): | ||||||
| From net investment income: | ||||||
| Class A | - | (132 | ) | |||
| Class L | - | (13,159 | )* | |||
| Class Y | - | (17,720 | ) | |||
| Class S | - | (1,820,199 | ) | |||
| Total distributions from net investment income | - | (1,851,210 | ) | |||
| From net realized gains: | ||||||
| Class A | - | (22,842 | ) | |||
| Class L | - | (291,010 | )* | |||
| Class Y | - | (372,924 | ) | |||
| Class S | - | (49,909,963 | ) | |||
| Total distributions from net realized gains | - | (50,596,739 | ) | |||
| Net fund share transactions (Note 5): | ||||||
| Class A | 7,183,225 | 289,776 | ||||
| Class L | 26,551,711 | 5,771,331 | * | |||
| Class Y | 7,659,231 | 6,877,168 | ||||
| Class S | 167,337,062 | 111,587,226 | ||||
| Increase in net assets from net fund share transactions | 208,731,229 | 124,525,501 | ||||
| Total increase in net assets | 271,562,383 | 463,940,660 | ||||
| Net assets: | ||||||
| Beginning of period | 1,105,076,010 | 641,135,350 | ||||
| End of period (including undistributed net
investment income of $6,695,953
and undistributed net investment loss of $13,663, respectively) |
$1,376,638,393 | $1,105,076,010 | ||||
| * For the period from May 3, 1999 (commencement of operations) through December 31, 1999.
|
| MassMutual International Equity Fund – Financial Statements (Continued)
|
| Class A |
|||||||||
|---|---|---|---|---|---|---|---|---|---|
| Six months ended
6/30/00 (Unaudited) |
Year ended
12/31/99 |
Year ended
12/31/98† |
|||||||
| Net asset value, beginning of period | $ 16.91 | $ 11.37 | $ 12.81 | ||||||
| Income (Loss) from investment operations: | |||||||||
| Net investment income (loss) | 0.06 | *** | (0.04 | )*** | 0.01 | *** | |||
| Net realized and unrealized gain (loss) on investments | 1.03 | 6.39 | 0.53 | ||||||
| Total income (loss) from investment operations | 1.09 | 6.35 | 0.54 | ||||||
| Less distributions to shareholders: | |||||||||
| From net investment income | - | (0.00 | )**** | (0.12 | ) | ||||
| From net realized gains | - | (0.81 | ) | (1.86 | ) | ||||
| Total distributions | - | (0.81 | ) | (1.98 | ) | ||||
| Net asset value, end of period | $ 18.00 | $ 16.91 | $ 11.37 | ||||||
| Total Return@ | 6.45% | ** | 56.25% | 4.40% | |||||
| Ratios / Supplemental Data: | |||||||||
| Net assets, end of period (000’s) | $ 7,678 | $ 548 | $ 135 | ||||||
| Net expenses to average daily net assets | 1.50% | * | 1.55% | 1.69% | |||||
| Net investment income (loss) to average daily net assets | 0.69% | * | (0.28)% | 0.10% | |||||
| Portfolio turnover rate | 40% | ** | 63% | 80% | |||||
| Class L |
|||||||||
| Six months ended
6/30/00 (Unaudited) |
Period ended
12/31/99+ |
||||||||
| Net asset value, beginning of period | $ 16.89 | $ 12.00 | |||||||
| Income (Loss) from investment operations: | |||||||||
| Net investment income (loss) | 0.09 | *** | (0.05 | )*** | |||||
| Net realized and unrealized gain (loss) on investments | 1.02 | 5.78 | |||||||
| Total income (loss) from investment operations | 1.11 | 5.73 | |||||||
| Less distributions to shareholders: | |||||||||
| From net investment income | - | (0.03 | ) | ||||||
| From net realized gains | - | (0.81 | ) | ||||||
| Total distributions | - | (0.84 | ) | ||||||
| Net asset value, end of period | $ 18.00 | $ 16.89 | |||||||
| Total Return@ | 6.57% | ** | 48.17% | ** | |||||
| Ratios / Supplemental Data: | |||||||||
| Net assets, end of period (000’s) | $34,782 | $ 7,335 | |||||||
| Net expenses to average daily net assets | 1.23% | * | 1.26% | * | |||||
| Net investment income (loss) to average daily net assets | 0.96% | * | (0.54)% | * | |||||
| Portfolio turnover rate | 40% | ** | 63% | ** | |||||
*
|
Annualized
|
**
|
Percentage represents results for the period and are not annualized.
|
***
|
Per share amount calculated on the average shares method.
|
****
|
Distributions from income is less than $0.01 per share.
|
+
|
For the period from May 3, 1999 (commencement of operations) through December 31, 1999.
|
†
|
Amounts have been restated to reflect reverse stock splits.
|
@
|
Employee retirement benefit plans that invest plan assets in the Separate Investment Accounts (SIAs) may be subject to certain
charges as set forth in their respective Plan Documents. Total return figures would be lower for the periods presented if they reflected these charges.
|
| MassMutual International Equity Fund – Financial Statements (Continued)
|
| Class Y |
||||||||||||||||||
|---|---|---|---|---|---|---|---|---|---|---|---|---|---|---|---|---|---|---|
| Six months
ended 6/30/00 (Unaudited) |
Year ended
12/31/99 |
Year ended
12/31/98† |
||||||||||||||||
| Net asset value, beginning of period | $ 16.95 | $ 11.37 | $ 12.83 | |||||||||||||||
| Income (Loss) from investment operations: | ||||||||||||||||||
| Net investment income (loss) | 0.09 | *** | (0.01 | )*** | 0.06 | *** | ||||||||||||
| Net realized and unrealized gain (loss) on investments | 1.03 | 6.44 | 0.55 | |||||||||||||||
| Total income (loss) from investment operations | 1.12 | 6.43 | 0.61 | |||||||||||||||
| Less distributions to shareholders: | ||||||||||||||||||
| From net investment income | - | (0.04 | ) | (0.21 | ) | |||||||||||||
| From net realized gains | - | (0.81 | ) | (1.86 | ) | |||||||||||||
| Total distributions | - | (0.85 | ) | (2.07 | ) | |||||||||||||
| Net asset value, end of period | $ 18.07 | $ 16.95 | $ 11.37 | |||||||||||||||
| Total Return@ | 6.61% | ** | 57.04% | 4.84% | ||||||||||||||
| Ratios / Supplemental Data: | ||||||||||||||||||
| Net assets, end of period (000’s) | $ 17,248 | $ 9,335 | $ 503 | |||||||||||||||
| Net expenses to average daily net assets | 1.06% | * | 1.11% | 1.23% | ||||||||||||||
| Net investment income (loss) to average daily net assets | 0.96% | * | (0.09)% | 0.43% | ||||||||||||||
| Portfolio turnover rate | 40% | ** | 63% | 80% | ||||||||||||||
| Class S(1) |
||||||||||||||||||
| Six months
ended 6/30/00 (Unaudited) |
Year ended
12/31/99 |
Year ended
12/31/98 |
Year ended
12/31/97 |
Year ended
12/31/96 |
Year ended
12/31/95 |
|||||||||||||
| Net asset value, beginning of period | $ 16.96 | $ 11.37 | $ 12.38 | $ 11.11 | $ 9.58 | $ 9.28 | ||||||||||||
| Income (Loss) from investment operations: | ||||||||||||||||||
| Net investment income | 0.09 | *** | 0.05 | *** | 0.10 | 0.06 | 0.06 | 0.07 | ||||||||||
| Net realized and unrealized gain (loss) on investments | 1.04 | 6.38 | 0.51 | 1.69 | 1.71 | 0.41 | ||||||||||||
| Total income (loss) from investment operations | 1.13 | 6.43 | 0.61 | 1.75 | 1.77 | 0.48 | ||||||||||||
| Less distributions to shareholders: | ||||||||||||||||||
| From net investment income | - | (0.03 | ) | (0.17 | ) | (0.07 | ) | (0.24 | ) | (0.07 | ) | |||||||
| In excess of net investment income | - | - | - | - | - | (0.11 | ) | |||||||||||
| From net realized gains | - | (0.81 | ) | (1.45 | ) | (0.41 | ) | - | - | |||||||||
| Total distributions | - | (0.84 | ) | (1.62 | ) | (0.48 | ) | (0.24 | ) | (0.18 | ) | |||||||
| Net asset value, end of period | $ 18.09 | $ 16.96 | $ 11.37 | $ 12.38 | $ 11.11 | $ 9.58 | ||||||||||||
| Total Return@ | 6.66% | ** | 56.98% | 5.05% | 15.79% | 18.51% | 5.13% | |||||||||||
| Ratios / Supplemental Data: | ||||||||||||||||||
| Net assets, end of period (000’s) | $1,316,930 | $1,087,858 | $640,498 | $546,790 | $356,311 | $220,718 | ||||||||||||
| Ratio of expenses to average daily net assets: | ||||||||||||||||||
| Before expense waiver | 1.03% | * | 1.06% | 1.04% | 1.07% | 1.07% | 1.09% | |||||||||||
| After expense waiver # | N/A | N/A | N/A | 1.06% | 1.00% | 1.00% | ||||||||||||
| Net investment income to average daily net assets | 1.00% | * | 0.42% | 0.73% | 0.53% | 0.59% | 0.76% | |||||||||||
| Portfolio turnover rate | 40% | ** | 63% | 80% | 83% | 58% | 121% | |||||||||||
*
|
Annualized
|
**
|
Percentage represents results for the period and are not annualized.
|
***
|
Per share amount calculated on the average shares method.
|
†
|
Amounts have been restated to reflect reverse stock splits.
|
(1)
|
Class S shares were previously designated as Class 4 shares.
|
#
|
Computed after giving effect to the voluntary partial waiver of management fee by MassMutual, which terminated May 1, 1997.
|
@
|
Employee retirement benefit plans that invest plan assets in the Separate Investment Accounts (SIAs) may be subject to certain
charges as set forth in their respective Plan Documents. Total return figures would be lower for the periods presented if they reflected these charges.
|
| 1. The Fund
|
MassMutual Institutional Funds (the “Trust”) is registered under the Investment Company Act of 1940, as amended
(the “1940 Act”), as an open-end, management investment company. The Trust is organized under the laws of the Commonwealth of Massachusetts as a Massachusetts business trust pursuant to an Agreement and Declaration of Trust dated May 28, 1993,
as amended. The Trust consists of the following series (each individually referred to as a “Fund” or collectively as the “Funds”): MassMutual Prime Fund (“Prime Fund”), MassMutual Short-Term Bond Fund (“Short-Term Bond
Fund”), MassMutual Core Bond Fund (“Core Bond Fund”), MassMutual Diversified Bond Fund (“Diversified Bond Fund”), MassMutual Balanced Fund (“Balanced Fund”), MassMutual Core Equity Fund (“Core Equity Fund”),
MassMutual Large Cap Value Fund (“Large Cap Value Fund”), MassMutual Indexed Equity Fund (“Indexed Equity Fund”), MassMutual Growth Equity Fund (“Growth Equity Fund”), MassMutual Aggressive Growth Fund (“Aggressive
Growth Fund”), MassMutual OTC 100 Fund (“OTC 100 Fund”), MassMutual Focused Value Fund (“Focused Value Fund”), MassMutual Small Cap Value Equity Fund (“Small Cap Value Equity Fund”), MassMutual Mid Cap Growth Equity Fund
(“Mid Cap Growth Equity Fund”), MassMutual Mid Cap Growth Equity II Fund (“Mid Cap Growth Equity II Fund”), MassMutual Small Cap Growth Equity Fund (“Small Cap Growth Equity Fund”), MassMutual Emerging Growth Fund (“
Emerging Growth Fund”), and MassMutual International Equity Fund (“International Equity Fund”).
|
| Large Cap Value Fund, Aggressive Growth Fund, OTC 100 Fund, Focused Value Fund and Emerging Growth Fund commenced operations May
1, 2000. Additionally, Mid Cap Growth Equity II Fund commenced operations June 1, 2000.
|
| Prior to May 1, 2000, Indexed Equity Fund was a “feeder” fund. The Fund invested all of its assets in the S&P
500® Index Master Portfolio (the “Master Portfolio”) managed by Barclays Global Fund Advisors (“BFGA”). Effective April 30, 2000, the Fund terminated the master-feeder structure and received an in-kind distribution of its pro-rata
share of each security held by the Master Portfolio, the sum total of which equaled the Fund’s investment in the Master Portfolio as of April 30, 2000. As of May 1, 2000, the Fund operates as a stand-alone open-end management investment company.
|
| During the reporting period, each Fund had four classes of shares: Class A, Class L, Class Y, and Class S. The principal economic
difference among the Classes is the level of service and administration fees borne by the Classes. The classes of shares are offered to different types of investors, as outlined in the Trust’s Prospectus.
|
| 2. Significant
Accounting
Policies
|
The following is a summary of significant accounting policies followed consistently by each Fund in the preparation of the
financial statements in conformity with generally accepted accounting principles. The preparation of the financial statements in accordance with generally accepted accounting principles requires management to make estimates and assumptions that affect the
reported amounts and disclosures in the financial statements. Actual results could differ from those estimates.
|
| Investment
Valuation
|
Equity securities are valued on the basis of valuations furnished by a pricing service, authorized by the Trustees, which
provides the last reported sale price for securities listed on a national securities exchange or on the NASDAQ National Market System, or in the case of over-the-counter securities not so listed, the last reported bid price. Debt securities (other than
short-term obligations with a remaining maturity of sixty days or less) are valued on the basis of valuations furnished by a pricing service, authorized by the Trustees, which determines valuations taking into account appropriate factors such as
institutional-size trading in similar groups of securities, yield, quality, coupon rate, maturity, type of issue, trading characteristics and other market data. Money market obligations with a remaining maturity of sixty days or less are valued at either
amortized cost or at original cost plus accrued interest, whichever approximates current market value. All other securities and other assets, including debt securities for which the prices supplied by a pricing agent are deemed by MassMutual not to be
representative of market values, including restricted securities and securities for which no market quotation is available,
are valued at fair value in accordance with procedures approved by and determined in good faith by the Trustees, although the actual calculation may be done by others.
|
| Notes to Financial Statements (Continued)
|
| Portfolio securities traded on more than one national securities exchange are valued at the last price on the business day as of
which such value is being determined at the close of the exchange representing the principal market for such securities. All assets and liabilities expressed in foreign currencies will be converted into U.S. dollars at the mean between the buying and
selling rates of such currencies against U.S. dollars last quoted by any major bank. If such quotations are not available, the rate of exchange will be determined in accordance with policies established by the Trustees.
|
| Securities Lending
|
Each Fund may lend its securities to qualified brokers. The loans are collateralized at all times with cash or securities
with a market value at least equal to 102% of the market value of the securities on loan. As with other extensions of credit, the Funds may bear the risk of delay in recovery or even loss of rights in the collateral should the borrower of the securities
fail financially. The Funds receive compensation for lending their securities. At June 30, 2000, the Funds loaned securities having the following market values, collateralized by cash, which were invested in short-term instruments in the following amounts:
|
| Securities
on loan |
Collateral |
|||
|---|---|---|---|---|
| Core Bond Fund | $76,657,872 | $78,029,000 | ||
| Balanced Fund | 28,459,274 | 28,963,432 | ||
| Core Equity Fund | 87,028,991 | 90,095,124 | ||
| Large Cap Value Fund | 4,903,764 | 5,076,391 | ||
| Indexed Equity Fund | 21,586,980 | 22,357,222 | ||
| Growth Equity Fund | 17,361,462 | 17,887,648 | ||
| OTC 100 Fund | 1,663,031 | 1,721,400 | ||
| Small Cap Value Equity Fund | 21,640,913 | 22,503,400 | ||
| Mid Cap Growth Equity Fund | 16,213,279 | 16,830,860 | ||
| Small Cap Growth Equity Fund | 34,685,321 | 35,902,099 | ||
| Emerging Growth Fund | 7,013,008 | 7,271,664 | ||
| International Equity Fund | 179,482,681 | 188,065,376 | ||
| Accounting for Investments
|
Investment transactions are accounted for on the trade date. Realized gains and losses on sales of investments and unrealized
appreciation and depreciation of investments are computed on the specific identification cost method. Interest income, adjusted for amortization of discounts and premiums on investments, is earned from the settlement date and is recorded on the accrual
basis. Dividend income is recorded on the ex-dividend date.
|
| Federal Income Tax
|
It is each Fund’s intent to continue to comply with the provisions of subchapter M of the Internal Revenue Code of 1986,
as amended (the “Code”), applicable to a regulated investment company. Under such provisions, the Funds will not be subject to federal income taxes on their ordinary income and net realized capital gain to the extent they are distributed or
deemed to have been distributed to their shareholders. Therefore, no Federal income tax provision is required.
|
| Dividends and Distributions to Shareholders
|
Dividends from net investment income and distributions of any net realized capital gains of each Fund are declared and paid annually and at
other times as may be required to satisfy tax or regulatory requirements. Distributions to shareholders are recorded on the ex-dividend date. Income and capital gain distributions are determined in accordance with income tax regulations which may differ
from generally accepted accounting principles. These differences are primarily due to investments in forward contracts, passive foreign investment companies, the deferral of wash sale losses, and paydowns on certain mortgage-backed securities. As a
result, net investment income and net realized gain on investment transactions for a reporting period may differ significantly from distributions during such period.
Accordingly, the Funds may periodically make reclassifications among certain of their capital accounts without impacting the net asset value of the Funds.
|
| Foreign Currency
Translation
|
The books and records of the Funds are maintained in U.S. dollars. The market values of foreign currencies, foreign
securities and other assets and liabilities denominated in foreign currencies are translated into U.S. dollars at the mean of the buying and selling rates of such currencies against the U.S. dollar at the end of each business day. Purchases and sales of
foreign securities and income and expense
items are translated at the rates of exchange prevailing on the respective dates of such transactions. The Funds do not isolate that portion of the results of operations arising from changes in the exchange rates from that portion arising from changes in the market prices of securities. |
| Net realized foreign currency gains and losses resulting from changes in exchange rates include foreign currency gains and losses
between trade date and settlement date on investment securities transactions, foreign currency transactions and the difference between the amounts of dividends recorded on the books of the Funds and the amount actually received.
|
| Forward Foreign
Currency Contracts
|
Each Fund may enter into forward foreign currency contracts in order to convert foreign denominated securities or obligations
to U.S. dollar denominated investments. The International Equity Fund may engage in such transactions to manage the value of portfolio holdings against future movements in certain foreign currency exchange rates. A forward foreign currency contract is an
agreement between two parties to buy and sell a currency at a set price on a future date. The market value of a forward currency contract fluctuates with changes in forward foreign currency exchange rates. Forward foreign currency contracts are marked to
market daily and the change in their value is recorded by the Funds as an unrealized gain or loss. When a forward foreign currency contract is extinguished, through delivery or offset by entering into another forward foreign currency contract, the Funds
record a realized gain or loss equal to the difference between the value of the contract at the time it was opened and the value of the contract at the time it was extinguished or offset.
|
| Forward foreign currency contracts involve a risk of loss from the potential inability of counterparties to meet the terms of
their contracts and from unanticipated movements in foreign currency values and interest rates.
|
| The notional or contractual amounts of these instruments represent the investments the Funds have in particular classes of
financial instruments and do not necessarily represent the amounts potentially subject to risk. The measurement of the risk associated with these instruments is meaningful only when all related and offsetting transactions are considered. A summary of the
obligations for the Growth Equity Fund and the International Equity Fund under these financial instruments at June 30, 2000 is as follows:
|
| Notes to Financial Statements (Continued)
|
| |
||||||||||||
|---|---|---|---|---|---|---|---|---|---|---|---|---|
| Settlement
Date |
Contracts to
Deliver/Receive |
Units of
Currency |
In Exchange
for U.S. Dollars |
Contracts at
Value |
Unrealized
Appreciation (Depreciation) |
|||||||
| Growth Equity Fund | ||||||||||||
| BUYS | ||||||||||||
| 06/27/00 | Euro | 188,752 | $ 178,050 | $ 180,938 | $ 2,888 | |||||||
| 07/03/00 | Euro | 177,234 | 168,780 | 169,897 | 1,117 | |||||||
| |
||||||||||||
| $ 4,005 | ||||||||||||
| |
||||||||||||
| SELLS | ||||||||||||
| 07/05/00 | Swedish Krona | 2,391,607 | 270,421 | 272,681 | (2,260 | ) | ||||||
| 07/06/00 | British Pound | 206,363 | 313,259 | 312,434 | 825 | |||||||
| |
||||||||||||
| $ (1,435 | ) | |||||||||||
| |
||||||||||||
| International Equity Fund | ||||||||||||
| BUYS | ||||||||||||
| 07/05/00 | British Pound | 41,791 | 63,330 | 63,271 | (59 | ) | ||||||
| 07/05/00 | British Pound | 37,059 | 56,160 | 56,108 | (52 | ) | ||||||
| |
||||||||||||
| $ (111 | ) | |||||||||||
| |
||||||||||||
| SELLS | ||||||||||||
| 07/03/00 | Swiss Franc | 441,964 | 268,966 | 271,794 | (2,828 | ) | ||||||
| 07/03/00 | Swiss Franc | 344,942 | 209,920 | 212,128 | (2,208 | ) | ||||||
| 07/03/00 | Euro | 292,869 | 276,937 | 280,744 | (3,807 | ) | ||||||
| 07/03/00 | Euro | 56,072 | 53,021 | 53,750 | (729 | ) | ||||||
| 07/03/00 | Euro | 1,334,509 | 1,261,912 | 1,279,260 | (17,348 | ) | ||||||
| 07/31/00 | Euro | 5,893,886 | 5,568,543 | 5,649,879 | (81,336 | ) | ||||||
| 07/31/00 | Euro | 1,957,810 | 1,854,829 | 1,876,756 | (21,927 | ) | ||||||
| 07/31/00 | Euro | 5,885,318 | 5,575,750 | 5,641,666 | (65,916 | ) | ||||||
| |
||||||||||||
| $(196,099 | ) | |||||||||||
| |
||||||||||||
| |
||||||||||||
| Forward
Commitments
|
Each Fund may purchase or sell securities on a “when issued” or delayed delivery or on a forward commitment basis. The Funds use
forward commitments to manage interest rate exposure or as a temporary substitute for purchasing or selling particular debt securities. Delivery and payment for securities purchased on a forward commitment basis can take place a month or more after the
date of the transaction. The Funds instruct the custodian to segregate assets in a separate account with a current market value at least equal to the amount of its forward purchase commitments. The price of the underlying security and the date when the
securities will be delivered and paid for are fixed at the time the transaction is negotiated. The value of the forward commitment is determined by management using a commonly accepted pricing model and fluctuates based upon changes in the value of the
underlying security and market repurchase rates. Such rates equate the counterparty’s cost to purchase and finance the underlying security to the earnings received on the security and forward delivery proceeds. The Funds record on a daily basis the
unrealized appreciation/depreciation based upon changes in the value of the forward commitment. When a forward commitment contract is closed, the Funds record a realized gain or loss equal to the difference between the value of the contract at the time it
was opened and the value of the contract at the time it was extinguished. Forward commitments involve a risk of loss if the value of the security to be purchased declines prior to the settlement date. The Funds could also be exposed to loss if they cannot
close out their forward commitments because of an illiquid secondary market, or the inability of counterparties to perform. The Funds monitor exposure to ensure counterparties are creditworthy and concentration of exposure is minimized. A summary of open
obligations for the Short-Term Bond Fund and the Core Bond Fund under these forward commitments at June 30, 2000, is as follows:
|
| Notes to Financial Statements (Continued)
|
| |
| Forward Commitment
Contracts to Buy |
Expiration
of Contracts |
Aggregate
Face Value of Contracts |
Cost |
Market
Value |
Unrealized
Appreciation |
||||||
|---|---|---|---|---|---|---|---|---|---|---|---|
| Short-Term Bond Fund | |||||||||||
| FNMA | |||||||||||
| 7.5% 07/01/2030 | Jul-00 | $ 2,000,000 | $ 1,962,500 | $ 1,971,560 | $ 9,060 | ||||||
| Core Bond Fund | |||||||||||
| FNMA | |||||||||||
| 7.5% 07/01/2030 | July-00 | 14,000,000 | $13,735,469 | 13,800,920 | 65,451 | ||||||
| FNMA | |||||||||||
| 8.0% 07/01/2030 | July-00 | 6,000,000 | 5,928,750 | 6,025,320 | 96,570 | ||||||
| FNMA | |||||||||||
| 8.0% 08/01/2030 | August-00 | 13,000,000 | 12,976,172 | 13,038,610 | 62,438 | ||||||
| $224,459 | |||||||||||
| Financial Futures
Contracts
|
The Fund may purchase or sell financial futures contracts and options on such futures contracts for the purpose of hedging the market risk
on existing securities or the intended purchase of securities. Futures contracts are contracts for delayed delivery of securities at a specific future date and at a specific price or yield. Upon entering into a contract, the Fund deposits and maintains as
collateral such initial margin as required by the exchange on which the transaction is effected. Pursuant to the contract, the Fund agrees to receive from or pay to the broker an amount of cash equal to the daily fluctuation in value of the contract. Such
receipts or payments are known as variation margin and are recorded by the Fund as unrealized gains or losses. When the contract is closed, the Fund records a realized gain or loss equal to the difference between the value of the contract at the time it
was opened and the value at the time it was closed. A summary of open futures contracts for the Indexed Equity Fund and the OTC 100 Fund at June 30, 2000, is as follows:
|
| |
| Number of
Contracts |
Type |
Expiration
Date |
Notional
Contract Value |
Net
Unrealized Depreciation |
||||||
|---|---|---|---|---|---|---|---|---|---|---|
| Indexed Equity Fund | ||||||||||
| BUYS | ||||||||||
| 12 | S & P 500 | 09/15/00 | $4,404,300 | $(56,647 | ) | |||||
| OTC 100 Fund | ||||||||||
| BUYS | ||||||||||
| 2 | NASDAQ 100 | 09/15/00 | 763,400 | (1,610 | ) | |||||
| Allocation of
Operating Activity
|
In maintaining the records for the Funds, the income and expense accounts are allocated to each class of shares. Investment income,
unrealized and realized gains or losses are prorated among the classes of shares based on the relative net assets of each. Expenses are allocated to each class of shares depending on the nature of the expenditures. Administration and service fees, which
are directly attributable to a class of shares, are charged to that class’ operations. Expenses of the Fund not directly attributable to the operations of any class of shares or Fund are prorated among the Funds and classes to which the expense
relates based on the relative net assets of each.
|
| Notes to Financial Statements (Continued)
|
3.
|
Management
|
| Fees and Other
|
| Transactions
|
| With Affiliates
|
| Investment
Management Fees |
Under agreements between the Trust and Massachusetts Mutual Life Insurance Company (“MassMutual”) with respect to each Fund,
MassMutual is responsible for providing investment management for each Fund. In return for this service, MassMutual receives advisory fees monthly based upon each Fund’s average daily net assets at the following annual rates:
|
| Prime Fund | 0.35 | % | |
| Short-Term Bond Fund | 0.40 | % | |
| Core Bond Fund | 0.48 | % | |
| Diversified Bond Fund | 0.50 | % | |
| Balanced Fund | 0.48 | % | |
| Core Equity Fund | 0.50 | % | |
| Large Cap Value Fund | 0.65 | % | |
| Indexed Equity Fund | 0.10 | % | |
| Growth Equity Fund | 0.68 | % | |
| Aggressive Growth Fund | 0.73 | % | |
| OTC 100 Fund | 0.15 | % | |
| Focused Value Fund | 0.69 | % | |
| Small Cap Value Equity Fund | 0.58 | % | |
| Mid Cap Growth Equity Fund | 0.70 | % | |
| Mid Cap Growth Equity II Fund | 0.75 | % | |
| Small Cap Growth Equity Fund | 0.82 | % | |
| Emerging Growth Fund | 0.79 | % | |
| International Equity Fund | 0.85 | % |
| Prior to May 1, 2000, the Indexed Equity Fund was not charged a direct investment advisory fee. BFGA received advisory fees in the
amount of 0.05% of the average daily net assets of Master Portfolio in which the Indexed Equity Fund invested. This resulted in the Indexed Equity Fund being charged this fee indirectly.
|
| Effective January 1, 2000, David L. Babson and Company Inc. (“DLB”) receives a sub-advisory fee equal to an annual rate
of 0.05% of the average daily net assets of the Prime Fund, 0.08% of the average daily net assets of the Short-Term Bond Fund, 0.10% of the average daily net assets of the Core Bond Fund, 0.10% of the average daily net assets of the Diversified Bond Fund
and 0.09% of the average daily net assets of the Prime and Core Bond Segments of the Balanced Fund. (Note 8).
|
| DLB continues to provide sub-advisory services for investment and reinvestment of the assets of the Core Equity Fund, Small Cap
Value Equity Fund and the Core Equity sector of the Balanced Fund. DLB receives a fee equal to an annual rate of 0.13% of the average daily net assets of the Core Equity Fund and the Core Equity sector of the Balanced Fund and 0.25% of the average daily
net assets of the Small Cap Value Equity Fund.
|
| MassMutual has entered into an investment sub-advisory agreement with its subsidiary OppenheimerFunds, Inc. (“OFI”).
This agreement provides that OFI manage the investment and reinvestment of the assets of the International Equity Fund. OFI receives a fee equal to an annual rate of 0.50% of the average daily net assets of the International Equity Fund.
|
| MassMutual has also entered into investment sub-advisory agreements with the following unaffiliated investment sub-advisers; Davis
Select Advisers, L.P. (“Davis”), Bankers Trust Company doing business under the marketing name Deutche Asset Management (“DAM’’), Massachusetts Financial Services
|
| Notes to Financial Statements (Continued)
|
| Company (“MFS”), Janus Capital Corporation (“Janus”), Harris Associates LP (“Harris Associates”),
Miller Anderson & Sherrerd, LLP (“MAS”), T. Rowe Price Associates, Inc. (“T. Rowe Price”), J.P. Morgan Investment Management, Inc. (“J.P. Morgan”), Waddell & Reed Investment Management Company (“Waddell &
Reed”) and RS Investment Management L.P. (“RS”). MassMutual pays a sub-advisory fee to each of these sub-advisers based upon (1) the average daily net assets of the specified Fund which it manages, and (2) the average daily net assets of
all other funds or accounts of MassMutual or its affiliates for which the sub-adviser provides sub-advisory services.
|
| The sub-advisory agreement with Davis provides that Davis manage the investment and reinvestment of the assets of the Large Cap
Value Fund. Davis receives a fee equal to an annual rate of 0.45% of the first $100,000,000, 0.40% on the next $400,000,000 and 0.35% of aggregate net assets under management in excess of $500,000,000.
|
| The sub-advisory agreement with DAM provides that DAM manage the investment and reinvestment of the assets of the Indexed Equity
Fund and OTC 100 Fund. DAM receives a fee equal to an annual rate of 0.01% of the first $1,000,000,000 and 0.0075% of aggregate net assets under management in excess of $1,000,000,000 for the Indexed Equity Fund. For the OTC 100 Fund, DAM receives a fee
equal to an annual rate of 0.05% of the first $200,000,000, 0.04% on the next $200,000,000 and 0.02% of aggregate net assets under management in excess of $400,000,000.
|
| The sub-advisory agreement with MFS provides that MFS manage the investment and reinvestment of the assets of the Growth Equity
Fund. MFS receives a fee equal to an annual rate of 0.40% of the first $300,000,000, 0.37% of the next $300,000,000, 0.35% of the next $300,000,000, 0.32% of the next $600,000,000 and 0.25% of aggregate net assets under management in excess of
$1,500,000,000.
|
| The sub-advisory agreement with Janus provides that Janus manage the investment and reinvestment of the assets of the Aggressive
Growth Fund. Janus receives a fee equal to an annual rate of 0.55% of the first $100,000,000, 0.50% on the next $400,000,000 and 0.45% of net assets in excess of $500,000,000.
|
| The sub-advisory agreement with Harris Associates provides that Harris Associates manage the investment and reinvestment of the
assets of the Focused Value Fund. Harris Associates receives a fee equal to an annual rate of 0.50% of the first $100,000,000, 0.45% on the next $400,000,000 and 0.40% of aggregate net assets under management in excess of $500,000,000.
|
| The sub-advisory agreement with MAS provides that MAS manage the investment and reinvestment of the assets of the Mid Cap Growth
Equity Fund. MAS receives a fee equal to an annual rate of 0.55% of the first $150,000,000 and 0.50% of aggregate net assets under management in excess of $150,000,000.
|
| The sub-advisory agreement with T. Rowe Price provides that T. Rowe Price manage the investment and reinvestment of the assets of
the Mid Cap Growth Equity II Fund. T. Rowe Price receives a fee equal to an annual rate of 0.50% on aggregate net assets under management.
|
| The sub-advisory agreement with J.P. Morgan provides that J.P. Morgan manage a portion of the investment and reinvestment of the
assets of the Small Cap Growth Equity Fund. J.P. Morgan receives a fee equal to an annual rate of 0.60% of the first $200,000,000, 0.55% of the next $300,000,000 and 0.50% of aggregate net assets under management in excess $500,000,000.
|
| The sub-advisory agreement with Waddell & Reed provides that Waddell & Reed manage a portion of the investment and
reinvestment of the assets of the Small Cap Growth Equity Fund. Waddell & Reed receives a fee equal to an annual rate of 0.75% of the first $100,000,000 and 0.70% of aggregate net assets under management in excess $100,000,000.
|
| The sub-advisory agreement with RS provides that RS manage the investment and reinvestment of the assets of the Emerging Growth
Fund. RS receives a fee equal to an annual rate of 0.65% of the first $200,000,000, 0.60% on the next $200,000,000 and 0.55% of aggregate net assets under management in excess of $400,000,000.
|
| Notes to Financial Statements (Continued)
|
| Administration Fees
|
Under separate administrative and shareholder services agreements between each Fund and MassMutual, MassMutual provides certain
administrative and shareholder services and bears some class specific administrative expenses. In return for these services, MassMutual receives an administrative services fee monthly based upon the average daily net assets of the applicable class of
shares of the Fund at the following annual rates:
|
| Class A |
Class L |
Class Y |
Class S |
|||||
|---|---|---|---|---|---|---|---|---|
| Prime Fund | 0.3323% | 0.3323% | 0.1823% | 0.0823% | ||||
| Short-Term Bond Fund | 0.3167% | 0.3167% | 0.1667% | 0.1167% | ||||
| Core Bond Fund | 0.2932% | 0.2932% | 0.1432% | 0.0932% | ||||
| Diversified Bond Fund | 0.3232% | 0.3232% | 0.1732% | 0.1232% | ||||
| Balanced Fund | 0.3952% | 0.3952% | 0.2452% | 0.0852% | ||||
| Core Equity Fund | 0.3175% | 0.3175% | 0.1675% | 0.0675% | ||||
| Large Cap Value Fund | 0.3244% | 0.3244% | 0.1744% | 0.0844% | ||||
| Indexed Equity Fund | 0.4797% | 0.4797% | 0.3297% | 0.2997% | ||||
| Growth Equity Fund | 0.2975% | 0.2975% | 0.1475% | 0.0875% | ||||
| Aggressive Growth Fund | 0.3444% | 0.3444% | 0.1944% | 0.0944% | ||||
| OTC 100 Fund | 0.6244% | 0.6244% | 0.4744% | 0.3744% | ||||
| Focused Value Fund | 0.3344% | 0.3344% | 0.1844% | 0.0844% | ||||
| Small Cap Value Equity Fund | 0.3345% | 0.3345% | 0.1845% | 0.0845% | ||||
| Mid Cap Growth Equity Fund | 0.3075% | 0.3075% | 0.1575% | 0.0875% | ||||
| Mid Cap Growth Equity II Fund | 0.3244% | 0.3244% | 0.1744% | 0.0844% | ||||
| Small Cap Growth Equity Fund | 0.4075% | 0.4075% | 0.2575% | 0.1175% | ||||
| Emerging Growth Fund | 0.3344% | 0.3344% | 0.1844% | 0.0844% | ||||
| International Equity Fund | 0.2952% | 0.2952% | 0.1452% | 0.1152% |
| Prior to May 1, 2000, MassMutual received an administrative services fee at the following annual rates for the Indexed Equity Fund:
|
| Class A | 0.5345% | |
| Class L | 0.5345% | |
| Class Y | 0.3845% | |
| Class S | 0.3545% |
| Service Fees
|
MML Distributors, LLC (the “Distributor”) acts as distributor to each Fund. Pursuant to separate 12b-1 Plans adopted by the Funds,
Class A shares of each fund pay a fee of 0.25% to: (i) the Distributor for services provided and expenses incurred by its connection with the distribution of Class A shares of the Fund; and (ii) MassMutual for services provided and expenses incurred by it
for purposes of maintaining or providing personal services to Class A shareholders. The Distribution fee may be spent by the Distributor on any activities or expenses primarily intended to result in the sale of Class A shares of the Fund. The Servicing
Fee may be spent by MassMutual on personal services rendered to Class A shareholders of a Fund and/or maintenance of Class A shareholder accounts. The Distributor is a majority owned subsidiary of MassMutual.
|
| Expense Waivers
|
MassMutual has agreed to cap the fees and expenses of the following Funds’ through April 30, 2001, as follows:
|
| Class A |
Class L |
Class Y |
Class S |
|||||
|---|---|---|---|---|---|---|---|---|
| Diversified Bond Fund | 1.09% | 0.84% | 0.69% | 0.64% | ||||
| Growth Equity Fund | 1.24% | 0.99% | 0.84% | 0.78% | ||||
| Mid Cap Growth Equity Fund | 1.27% | 1.02% | 0.87% | 0.80% | ||||
| Small Cap Growth Equity Fund | 1.49% | 1.24% | 1.09% | 0.95% |
| Notes to Financial Statements (Continued)
|
| Other
|
Certain officers and trustees of the Funds are also officers of MassMutual. The compensation of unaffiliated directors of the Funds is borne
by the Funds.
|
| At June 30, 2000, MassMutual or separate investment accounts thereof owned 97.77% of the outstanding shares of the Trust.
|
| 4. Purchases And
Sales of
Investments
|
Cost of purchases and proceeds from sales of investment securities (excluding short-term investments) for the six months ended June 30, 2000
were as follows:
|
| Long-Term U.S.
Government Securities |
Other Long-Term
Securities |
||||||||
|---|---|---|---|---|---|---|---|---|---|
| Purchases | |||||||||
| Short-Term Bond Fund | $47,563,172 | $ 37,956,470 | |||||||
| Core Bond Fund | 36,973,752 | 40,950,008 | |||||||
| Diversified Bond Fund | 1,459,377 | 1,810,075 | |||||||
| Balanced Fund | 3,116,211 | 131,803,605 | |||||||
| Core Equity Fund | - | 730,215,862 | |||||||
| Large Cap Value Fund | - | 90,466,397 | |||||||
| Indexed Equity Fund | - | 20,541,594 | |||||||
| Growth Equity Fund | - | 307,906,663 | |||||||
| Aggressive Growth Fund | - | 46,555,479 | |||||||
| OTC 100 Fund | - | 28,152,621 | |||||||
| Focused Value Fund | - | 23,115,563 | |||||||
| Small Cap Value Equity Fund | - | 184,482,490 | |||||||
| Mid Cap Growth Equity Fund | - | 181,515,548 | |||||||
| Mid Cap Growth Equity Fund II | - | 19,124,105 | |||||||
| Small Cap Growth Equity Fund | - | 191,040,947 | |||||||
| Emerging Growth Fund | - | 42,079,786 | |||||||
| International Equity Fund | - | 716,568,777 | |||||||
| Sales | |||||||||
| Short-Term Bond Fund | $63,889,174 | $ 10,852,065 | |||||||
| Core Bond Fund | 58,852,421 | 52,576,639 | |||||||
| Diversified Bond Fund | 861,250 | 1,176,796 | |||||||
| Balanced Fund | 74,920,129 | 189,215,191 | |||||||
| Core Equity Fund | - | 1,151,996,947 | |||||||
| Large Cap Value Fund | - | 4,642,058 | |||||||
| Indexed Equity Fund | - | 57,930,231 | |||||||
| Growth Equity Fund | - | 181,186,610 | |||||||
| Aggressive Growth Fund | - | 1,012,470 | |||||||
| OTC 100 Fund | - | 1,294,258 | |||||||
| Focused Value Fund | - | 886,768 | |||||||
| Small Cap Value Equity Fund | - | 223,471,701 | |||||||
| Mid Cap Growth Equity Fund | - | 121,774,976 | |||||||
| Mid Cap Growth Equity Fund II | - | 14,573,166 | |||||||
| Small Cap Growth Equity Fund | - | 84,516,771 | |||||||
| Emerging Growth Fund | - | 1,833,028 | |||||||
| International Equity Fund | - | 527,015,589 | |||||||
| Notes to Financial Statements (Continued)
|
| 5. Capital Share
Transactions
|
The Funds are authorized to issue an unlimited number of shares, with no par value in each class of shares. Changes in shares outstanding
for each Fund are as follows:
|
| Class A |
||||||||||||
|---|---|---|---|---|---|---|---|---|---|---|---|---|
| Six months ended June 30, 2000 | Year ended December 31, 1999* | |||||||||||
| Shares |
Amount |
Shares |
Amount |
|||||||||
| Prime Fund | ||||||||||||
| Sold | 902,525 | $138,730,398 | 73,374 | $ 11,352,761 | ||||||||
| Issued as reinvestment of dividends | - | - | 204 | 30,930 | ||||||||
| Redeemed | (842,452 | ) | (129,456,540 | ) | (50,941 | ) | (7,932,258 | ) | ||||
| Net increase | 60,073 | $ 9,273,858 | 22,637 | $ 3,451,433 | ||||||||
| Short-Term Bond Fund | ||||||||||||
| Sold | 181,296 | $ 1,849,128 | 20,024 | $ 211,639 | ||||||||
| Issued as reinvestment of dividends | - | - | 761 | 7,604 | ||||||||
| Redeemed | (2 | ) | (21 | ) | (19,858 | ) | (209,907 | ) | ||||
| Net increase | 181,294 | $ 1,849,107 | 927 | $ 9,336 | ||||||||
| Core Bond Fund | ||||||||||||
| Sold | 331,118 | $ 3,429,893 | 52,002 | 559,070 | ||||||||
| Issued as reinvestment of dividends | - | - | 3,529 | 35,827 | ||||||||
| Redeemed | (56,154 | ) | (580,336 | ) | (11,402 | ) | (122,879 | ) | ||||
| Net increase | 274,964 | $ 2,849,557 | 44,129 | $ 472,018 | ||||||||
| Diversified Bond Fund | ||||||||||||
| Sold | 20,134 | $ 195,823 | 10,100 | $ 101,000 | ||||||||
| Issued as reinvestment of dividends | - | - | 408 | 3,906 | ||||||||
| Redeemed | (186 | ) | (1,800 | ) | - | - | ||||||
| Net increase | 19,948 | $ 194,023 | 10,508 | $ 104,906 | ||||||||
| Balanced Fund | ||||||||||||
| Sold | 227,386 | $ 2,890,762 | 41,448 | $ 579,667 | ||||||||
| Issued as reinvestment of dividends | - | - | 1,839 | 24,399 | ||||||||
| Redeemed | (42,368 | ) | (546,735 | ) | (12,355 | ) | (169,986 | ) | ||||
| Net increase | 185,018 | $ 2,344,027 | 30,932 | $ 434,080 | ||||||||
| Core Equity Fund | ||||||||||||
| Sold | 306,219 | $ 4,794,328 | 107,405 | $ 1,899,077 | ||||||||
| Issued as reinvestment of dividends | - | - | 9,032 | 146,869 | ||||||||
| Redeemed | (48,931 | ) | (770,526 | ) | (15,904 | ) | (278,435 | ) | ||||
| Net increase | 257,288 | $ 4,023,802 | 100,533 | $ 1,767,511 | ||||||||
| Large Cap Value Fund† | ||||||||||||
| Sold | 76,004 | $ 748,777 | - | $ - | ||||||||
| Issued as reinvestment of dividends | - | - | - | - | ||||||||
| Redeemed | - | - | - | - | ||||||||
| Net increase | 76,004 | $ 748,777 | - | $ - | ||||||||
| Indexed Equity Fund | ||||||||||||
| Sold | 1,114,032 | $ 15,119,928 | 157,478 | $ 2,049,106 | ||||||||
| Issued as reinvestment of dividends | - | - | 2,531 | 34,671 | ||||||||
| Redeemed | (149,707 | ) | (2,033,392 | ) | (20,398 | ) | (275,485 | ) | ||||
| Net increase | 964,325 | $ 13,086,536 | 139,611 | $ 1,808,292 | ||||||||
| Growth Equity Fund | ||||||||||||
| Sold | 1,004,220 | $ 13,362,034 | 204,224 | $ 2,164,106 | ||||||||
| Issued as reinvestment of dividends | - | - | 380 | 4,845 | ||||||||
| Redeemed | (109,953 | ) | (1,439,100 | ) | (20,122 | ) | (220,108 | ) | ||||
| Net increase | 894,267 | $ 11,922,934 | 184,482 | $ 1,948,843 | ||||||||
| Notes to Financial Statements (Continued)
|
| Class A |
||||||||||||
|---|---|---|---|---|---|---|---|---|---|---|---|---|
| Six months ended June 30, 2000 | Year ended December 31, 1999* | |||||||||||
| Shares |
Amount |
Shares |
Amount |
|||||||||
| Aggressive Growth Fund† | ||||||||||||
| Sold | 174,659 | $1,696,338 | - | $ - | ||||||||
| Issued as reinvestment of dividends | - | - | - | - | ||||||||
| Redeemed | (23,725 | ) | (231,096 | ) | - | - | ||||||
| Net increase | 150,934 | $1,465,242 | - | $ - | ||||||||
| OTC 100 Fund† | ||||||||||||
| Sold | 57,304 | $ 560,067 | - | $ - | ||||||||
| Issued as reinvestment of dividends | - | - | - | - | ||||||||
| Redeemed | (5,207 | ) | (50,802 | ) | - | - | ||||||
| Net increase | 52,097 | $ 509,265 | - | $ - | ||||||||
| Focused Value Fund† | ||||||||||||
| Sold | 32,612 | $ 315,383 | - | $ - | ||||||||
| Issued as reinvestment of dividends | - | - | - | - | ||||||||
| Redeemed | (85 | ) | (822 | ) | - | - | ||||||
| Net increase | 32,527 | $ 314,561 | - | $ - | ||||||||
| Small Cap Value Equity Fund | ||||||||||||
| Sold | 124,645 | $1,750,040 | 6,813 | $ 93,693 | ||||||||
| Issued as reinvestment of dividends | - | - | 629 | 8,446 | ||||||||
| Redeemed | (14,745 | ) | (206,772 | ) | (469 | ) | (6,313 | ) | ||||
| Net increase | 109,900 | $1,543,268 | 6,973 | $ 95,826 | ||||||||
| Mid Cap Growth Equity Fund | ||||||||||||
| Sold | 483,687 | $6,874,365 | 52,662 | $ 564,110 | ||||||||
| Issued as reinvestment of dividends | - | - | - | - | ||||||||
| Redeemed | (31,596 | ) | (445,667 | ) | (3,627 | ) | (46,132 | ) | ||||
| Net increase | 452,091 | $6,428,698 | 49,035 | $ 517,978 | ||||||||
| Mid Cap Growth Equity II Fund†† | ||||||||||||
| Sold | 10,100 | $ 101,000 | - | $ - | ||||||||
| Issued as reinvestment of dividends | - | - | - | - | ||||||||
| Redeemed | - | - | - | - | ||||||||
| Net increase | 10,100 | $ 101,000 | - | $ - | ||||||||
| Small Cap Growth Equity Fund | ||||||||||||
| Sold | 543,042 | $9,015,165 | 110,847 | $1,319,106 | ||||||||
| Issued as reinvestment of dividends | - | - | 1,169 | 18,351 | ||||||||
| Redeemed | (59,938 | ) | (965,035 | ) | (2,192 | ) | (31,492 | ) | ||||
| Net increase | 483,104 | $8,050,130 | 109,824 | $1,305,965 | ||||||||
| Emerging Growth Fund† | ||||||||||||
| Sold | 38,811 | $ 383,083 | - | $ - | ||||||||
| Issued as reinvestment of dividends | - | - | - | - | ||||||||
| Redeemed | - | (3 | ) | - | - | |||||||
| Net increase | 38,811 | $ 383,080 | - | $ - | ||||||||
| International Equity Fund | ||||||||||||
| Sold | 405,752 | $7,385,666 | 20,124 | $ 282,108 | ||||||||
| Issued as reinvestment of dividends | - | - | 1,388 | 22,974 | ||||||||
| Redeemed | (11,606 | ) | (202,441 | ) | (940 | ) | (15,306 | ) | ||||
| Net increase | 394,146 | $7,183,225 | 20,572 | $ 289,776 | ||||||||
| Notes to Financial Statements (Continued)
|
| Class L |
||||||||||||
|---|---|---|---|---|---|---|---|---|---|---|---|---|
| Six months ended June 30, 2000 | Period from May 3, 1999
(commencement of operations) through December 31, 1999** |
|||||||||||
| Shares |
Amount |
Shares |
Amount |
|||||||||
| Prime Fund | ||||||||||||
| Sold | 913,763 | $140,460,935 | 229,479 | $ 35,616,950 | ||||||||
| Issued as reinvestment of dividends | - | - | 344 | 52,197 | ||||||||
| Redeemed | (936,425 | ) | (143,830,491 | ) | (165,002 | ) | (25,791,275 | ) | ||||
| Net increase (decrease) | (22,662 | ) | $ (3,369,556 | ) | 64,821 | $ 9,877,872 | ||||||
| Short-Term Bond Fund | ||||||||||||
| Sold | 2,976,269 | $ 29,942,423 | 250,614 | $ 2,628,682 | ||||||||
| Issued as reinvestment of dividends | - | - | 9,033 | 89,697 | ||||||||
| Redeemed | (586,173 | ) | (5,945,929 | ) | (106,119 | ) | (1,116,800 | ) | ||||
| Net increase | 2,390,096 | $ 23,996,494 | 153,528 | $ 1,601,579 | ||||||||
| Core Bond Fund | ||||||||||||
| Sold | 3,291,592 | $ 33,749,311 | 314,607 | $ 3,392,536 | ||||||||
| Issued as reinvestment of dividends | - | - | 14,348 | 145,498 | ||||||||
| Redeemed | (508,826 | ) | (5,294,409 | ) | (95,473 | ) | (1,032,157 | ) | ||||
| Net increase | 2,782,766 | $ 28,454,902 | 233,482 | $ 2,505,877 | ||||||||
| Diversified Bond Fund | ||||||||||||
| Sold | - | $ - | 10,100 | $ 101,000 | ||||||||
| Issued as reinvestment of dividends | - | - | 425 | 4,069 | ||||||||
| Redeemed | - | - | - | - | ||||||||
| Net increase | - | $ - | 10,525 | $ 105,069 | ||||||||
| Balanced Fund | ||||||||||||
| Sold | 532,513 | $ 6,972,899 | 12,470 | $ 179,705 | ||||||||
| Issued as reinvestment of dividends | - | - | 613 | 8,164 | ||||||||
| Redeemed | (184,243 | ) | (2,324,976 | ) | - | - | ||||||
| Net increase | 348,270 | $ 4,647,923 | 13,083 | $ 187,869 | ||||||||
| Core Equity Fund | ||||||||||||
| Sold | 1,220,716 | $ 19,273,362 | 190,854 | $ 3,428,515 | ||||||||
| Issued as reinvestment of dividends | - | - | 11,353 | 185,074 | ||||||||
| Redeemed | (149,875 | ) | (2,372,923 | ) | (56,669 | ) | (1,024,431 | ) | ||||
| Net increase | 1,070,841 | $ 16,900,439 | 145,538 | $ 2,589,158 | ||||||||
| Large Cap Value Fund† | ||||||||||||
| Sold | 1,317,511 | $ 13,287,865 | - | $ - | ||||||||
| Issued as reinvestment of dividends | - | - | - | - | ||||||||
| Redeemed | (17,201 | ) | (172,503 | ) | - | - | ||||||
| Net increase | 1,300,310 | $ 13,115,362 | - | $ - | ||||||||
| Indexed Equity Fund | ||||||||||||
| Sold | 686,785 | $ 9,312,516 | 133,785 | $ 1,725,507 | ||||||||
| Issued as reinvestment of dividends | - | - | 2,220 | 30,524 | ||||||||
| Redeemed | (209,187 | ) | (2,843,216 | ) | (7,644 | ) | (103,666 | ) | ||||
| Net increase | 477,598 | $ 6,469,300 | 128,361 | $ 1,652,365 | ||||||||
| Growth Equity Fund | ||||||||||||
| Sold | 2,321,048 | $ 30,754,777 | 781,425 | $ 8,169,552 | ||||||||
| Issued as reinvestment of dividends | - | - | 1,399 | 17,880 | ||||||||
| Redeemed | (428,308 | ) | (5,691,484 | ) | (93,315 | ) | (1,049,941 | ) | ||||
| Net increase | 1,892,740 | $ 25,063,293 | 689,509 | $ 7,137,491 | ||||||||
| Notes to Financial Statements (Continued)
|
| Class L |
||||||||||||
|---|---|---|---|---|---|---|---|---|---|---|---|---|
| Six months ended June 30, 2000 | Period from May 3, 1999
(commencement of operations) through December 31, 1999** |
|||||||||||
| Shares |
Amount |
Shares |
Amount |
|||||||||
| Aggressive Growth Fund† | ||||||||||||
| Sold | 1,037,411 | $ 9,815,242 | - | $ - | ||||||||
| Issued as reinvestment of dividends | - | - | - | - | ||||||||
| Redeemed | (75,058 | ) | (741,907 | ) | - | - | ||||||
| Net increase | 962,353 | $ 9,073,335 | - | $ - | ||||||||
| OTC 100 Fund† | ||||||||||||
| Sold | 29,837 | $ 288,104 | - | $ - | ||||||||
| Issued as reinvestment of dividends | - | - | - | - | ||||||||
| Redeemed | (550 | ) | (5,262 | ) | - | - | ||||||
| Net increase | 29,287 | $ 282,842 | - | $ - | ||||||||
| Focused Value Fund† | ||||||||||||
| Sold | 175,135 | $ 1,765,728 | - | $ - | ||||||||
| Issued as reinvestment of dividends | - | - | - | - | ||||||||
| Redeemed | (3,125 | ) | (30,526 | ) | - | - | ||||||
| Net increase | 172,010 | $ 1,735,202 | - | $ - | ||||||||
| Small Cap Value Equity Fund | ||||||||||||
| Sold | 848,804 | $ 11,880,407 | 171,086 | $ 2,386,181 | ||||||||
| Issued as reinvestment of dividends | - | - | 4,162 | 55,693 | ||||||||
| Redeemed | (257,626 | ) | (3,662,153 | ) | (54,682 | ) | (766,002 | ) | ||||
| Net increase | 591,178 | $ 8,218,254 | 120,566 | $ 1,675,872 | ||||||||
| Mid Cap Growth Equity Fund | ||||||||||||
| Sold | 866,772 | $ 12,707,624 | 348,047 | $ 3,652,290 | ||||||||
| Issued as reinvestment of dividends | - | - | - | - | ||||||||
| Redeemed | (134,630 | ) | (1,936,913 | ) | (14,789 | ) | (187,707 | ) | ||||
| Net increase | 732,142 | $ 10,770,711 | 333,258 | $ 3,464,583 | ||||||||
| Mid Cap Growth Equity II Fund†† | ||||||||||||
| Sold | 10,329,748 | $103,774,118 | - | $ - | ||||||||
| Issued as reinvestment of dividends | - | - | - | - | ||||||||
| Redeemed | (226,966 | ) | (2,381,641 | ) | - | - | ||||||
| Net increase | 10,102,782 | $101,392,477 | - | $ - | ||||||||
| Small Cap Growth Equity Fund | ||||||||||||
| Sold | 989,982 | $ 16,548,646 | 166,224 | $ 2,023,659 | ||||||||
| Issued as reinvestment of dividends | - | - | 1,488 | 23,386 | ||||||||
| Redeemed | (441,358 | ) | (7,244,452 | ) | (29,302 | ) | (359,348 | ) | ||||
| Net increase | 548,624 | $ 9,304,194 | 138,410 | $ 1,687,697 | ||||||||
| Emerging Growth Fund† | ||||||||||||
| Sold | 517,679 | $ 4,893,294 | - | $ - | ||||||||
| Issued as reinvestment of dividends | - | - | - | - | ||||||||
| Redeemed | (2,188 | ) | (21,513 | ) | - | - | ||||||
| Net increase | 515,491 | $ 4,871,781 | - | $ - | ||||||||
| International Equity Fund | ||||||||||||
| Sold | 1,987,828 | $ 35,459,147 | 547,706 | $ 7,233,586 | ||||||||
| Issued as reinvestment of dividends | - | - | 18,072 | 304,169 | ||||||||
| Redeemed | (489,828 | ) | (8,907,436 | ) | (131,642 | ) | (1,766,424 | ) | ||||
| Net increase | 1,498,000 | $ 26,551,711 | 434,136 | $ 5,771,331 | ||||||||
| Notes to Financial Statements (Continued)
|
| Class Y |
||||||||||||
|---|---|---|---|---|---|---|---|---|---|---|---|---|
| Six months ended June 30, 2000 | Year ended December 31, 1999* | |||||||||||
| Shares |
Amount |
Shares |
Amount |
|||||||||
| Prime Fund | ||||||||||||
| Sold | 2,345,800 | $361,651,308 | 1,209,819 | $187,356,002 | ||||||||
| Issued as reinvestment of dividends | - | - | 8,916 | 1,354,719 | ||||||||
| Redeemed | (2,239,696 | ) | (345,457,590 | ) | (1,002,697 | ) | (154,949,637 | ) | ||||
| Net increase | 106,104 | $ 16,193,718 | 216,038 | $ 33,761,084 | ||||||||
| Short-Term Bond Fund | ||||||||||||
| Sold | 14,862 | $ 150,556 | 231,843 | $ 2,448,022 | ||||||||
| Issued as reinvestment of dividends | - | - | 11,337 | 113,028 | ||||||||
| Redeemed | (16,655 | ) | (167,056 | ) | (87,675 | ) | (926,560 | ) | ||||
| Net increase (decrease) | (1,793 | ) | $ (16,500 | ) | 155,505 | $ 1,634,490 | ||||||
| Core Bond Fund | ||||||||||||
| Sold | 718,036 | $ 7,364,180 | 2,255,686 | $ 24,322,491 | ||||||||
| Issued as reinvestment of dividends | - | - | 118,565 | 1,203,657 | ||||||||
| Redeemed | (644,558 | ) | (6,571,867 | ) | (486,712 | ) | (5,255,060 | ) | ||||
| Net increase | 73,478 | $ 792,313 | 1,887,539 | $ 20,271,088 | ||||||||
| Diversified Bond Fund | ||||||||||||
| Sold | 4,088 | $ 39,223 | 14,723 | $ 146,750 | ||||||||
| Issued as reinvestment of dividends | - | - | 628 | 6,010 | ||||||||
| Redeemed | (2,197 | ) | (21,089 | ) | (46 | ) | (461 | ) | ||||
| Net increase | 1,891 | $ 18,134 | 15,305 | $ 152,299 | ||||||||
| Balanced Fund | ||||||||||||
| Sold | 96,496 | $ 1,228,224 | 5,336,744 | $ 62,321,909 | ||||||||
| Issued as reinvestment of dividends | - | - | 228,629 | 3,067,136 | ||||||||
| Redeemed | (2,505,990 | ) | (33,274,183 | ) | (1,154,966 | ) | (3,703,011 | ) | ||||
| Net increase (decrease) | (2,409,494 | ) | $ (32,045,959 | ) | 4,410,407 | $ 61,686,034 | ||||||
| Core Equity Fund | ||||||||||||
| Sold | 781,636 | $ 11,982,670 | 1,603,200 | $ 29,226,856 | ||||||||
| Issued as reinvestment of dividends | - | - | 124,119 | 2,025,621 | ||||||||
| Redeemed | (642,493 | ) | (9,924,737 | ) | (528,923 | ) | (8,916,151 | ) | ||||
| Net increase | 139,143 | $ 2,057,933 | 1,198,396 | $ 22,336,326 | ||||||||
| Large Cap Value Fund† | ||||||||||||
| Sold | 10,100 | $ 101,000 | - | $ - | ||||||||
| Issued as reinvestment of dividends | - | - | - | - | ||||||||
| Redeemed | - | - | - | - | ||||||||
| Net increase | 10,100 | $ 101,000 | - | $ - | ||||||||
| Indexed Equity Fund | ||||||||||||
| Sold | 3,088,022 | $ 41,367,117 | 4,004,645 | $ 51,359,107 | ||||||||
| Issued as reinvestment of dividends | - | - | 57,981 | 794,235 | ||||||||
| Redeemed | (1,438,889 | ) | (19,245,643 | ) | (786,666 | ) | (10,330,160 | ) | ||||
| Net increase | 1,649,133 | $ 22,121,474 | 3,275,960 | $ 41,823,182 | ||||||||
| Growth Equity Fund | ||||||||||||
| Sold | 1,156,828 | $ 15,594,092 | 2,953,387 | $ 30,935,957 | ||||||||
| Issued as reinvestment of dividends | - | - | 5,344 | 68,299 | ||||||||
| Redeemed | (644,006 | ) | (8,484,397 | ) | (315,199 | ) | (3,586,730 | ) | ||||
| Net increase | 512,822 | $ 7,109,695 | 2,643,532 | $ 27,417,526 | ||||||||
| Notes to Financial Statements (Continued)
|
| Class Y |
||||||||||||
|---|---|---|---|---|---|---|---|---|---|---|---|---|
| Six months ended June 30, 2000 | Year ended December 31, 1999* | |||||||||||
| Shares |
Amount |
Shares |
Amount |
|||||||||
| Aggressive Growth Fund† | ||||||||||||
| Sold | 15,330 | $ 153,850 | - | $ - | ||||||||
| Issued as reinvestment of dividends | - | - | - | - | ||||||||
| Redeemed | - | - | - | - | ||||||||
| Net increase | 15,330 | $ 153,850 | - | $ - | ||||||||
| OTC 100 Fund† | ||||||||||||
| Sold | 34,282 | $ 343,712 | - | $ - | ||||||||
| Issued as reinvestment of dividends | - | - | - | - | ||||||||
| Redeemed | - | - | - | - | ||||||||
| Net increase | 34,282 | $ 343,712 | - | $ - | ||||||||
| Focused Value Fund† | ||||||||||||
| Sold | 10,080 | $ 101,000 | - | $ - | ||||||||
| Issued as reinvestment of dividends | - | - | - | - | ||||||||
| Redeemed | - | - | - | - | ||||||||
| Net increase | 10,080 | $ 101,000 | - | $ - | ||||||||
| Small Cap Value Equity Fund | ||||||||||||
| Sold | 99,336 | $ 1,380,693 | 320,351 | $ 4,424,499 | ||||||||
| Issued as reinvestment of dividends | - | - | 12,102 | 161,987 | ||||||||
| Redeemed | (79,661 | ) | (1,095,383 | ) | (78,501 | ) | (1,048,552 | ) | ||||
| Net increase | 19,675 | $ 285,310 | 253,952 | $ 3,537,934 | ||||||||
| Mid Cap Growth Equity Fund | ||||||||||||
| Sold | 1,174,568 | $17,511,178 | 3,317,139 | $ 34,191,909 | ||||||||
| Issued as reinvestment of dividends | - | - | - | - | ||||||||
| Redeemed | (1,040,665 | ) | (14,883,264 | ) | (308,339 | ) | (3,497,621 | ) | ||||
| Net increase | 133,903 | $ 2,627,914 | 3,008,800 | $ 30,694,288 | ||||||||
| Mid Cap Growth Equity II Fund†† | ||||||||||||
| Sold | 10,100 | $ 101,000 | - | $ - | ||||||||
| Issued as reinvestment of dividends | - | - | - | - | ||||||||
| Redeemed | - | - | - | - | ||||||||
| Net increase | 10,100 | $ 101,000 | - | $ - | ||||||||
| Small Cap Growth Equity Fund | ||||||||||||
| Sold | 2,560,241 | $44,607,185 | 898,796 | $ 11,950,977 | ||||||||
| Issued as reinvestment of dividends | - | - | 7,835 | 123,242 | ||||||||
| Redeemed | (1,261,644 | ) | (21,160,556 | ) | (109,837 | ) | (1,637,602 | ) | ||||
| Net increase | 1,298,597 | $23,446,629 | 796,794 | $ 10,436,617 | ||||||||
| Emerging Growth Fund† | ||||||||||||
| Sold | 502,992 | $ 5,300,906 | - | $ - | ||||||||
| Issued as reinvestment of dividends | - | - | - | - | ||||||||
| Redeemed | (10 | ) | (104 | ) | - | - | ||||||
| Net increase | 502,982 | $ 5,300,802 | - | $ - | ||||||||
| International Equity Fund | ||||||||||||
| Sold | 1,098,650 | $20,363,021 | 568,711 | $ 7,778,845 | ||||||||
| Issued as reinvestment of dividends | - | - | 23,432 | 390,644 | ||||||||
| Redeemed | (695,113 | ) | (12,703,790 | ) | (85,588 | ) | (1,292,321 | ) | ||||
| Net increase | 403,537 | $ 7,659,231 | 506,555 | $ 6,877,168 | ||||||||
| Notes to Financial Statements (Continued)
|
| Class S |
||||||||||||
|---|---|---|---|---|---|---|---|---|---|---|---|---|
| Six months ended June 30, 2000 | Year ended December 31, 1999* | |||||||||||
| Shares |
Amount |
Shares |
Amount |
|||||||||
| Prime Fund | ||||||||||||
| Sold | 4,404,490 | $ 679,780,069 | 6,949,101 | $ 1,072,954,160 | ||||||||
| Issued as reinvestment of dividends | - | - | 83,012 | 12,628,175 | ||||||||
| Redeemed | (4,093,693 | ) | (631,939,963 | ) | (6,619,900 | ) | (1,021,469,974 | ) | ||||
| Net increase | 310,797 | $ 47,840,106 | 412,213 | $ 64,112,361 | ||||||||
| Short-Term Bond Fund | ||||||||||||
| Sold | 3,118,271 | $ 31,398,978 | 6,231,576 | $ 65,280,828 | ||||||||
| Issued as reinvestment of dividends | - | - | 1,300,624 | 12,980,235 | ||||||||
| Redeemed | (4,735,589 | ) | (47,701,460 | ) | (13,888,005 | ) | (145,060,737 | ) | ||||
| Net decrease | (1,617,318 | ) | $ (16,302,482 | ) | (6,355,805 | ) | $ (66,799,674 | ) | ||||
| Core Bond Fund | ||||||||||||
| Sold | 13,458,080 | $ 138,701,004 | 24,635,752 | $ 266,969,331 | ||||||||
| Issued as reinvestment of dividends | - | - | 3,651,807 | 37,178,633 | ||||||||
| Redeemed | (17,088,036 | ) | (175,767,246 | ) | (33,871,158 | ) | (369,407,759 | ) | ||||
| Net decrease | (3,629,956 | ) | $ (37,066,242 | ) | (5,583,599 | ) | $ (65,259,795 | ) | ||||
| Diversified Bond Fund | ||||||||||||
| Sold | 1,359 | $ 12,999 | 2,533,958 | $ 25,335,526 | ||||||||
| Issued as reinvestment of dividends | - | - | 108,776 | 1,040,982 | ||||||||
| Redeemed | (1,486 | ) | (14,381 | ) | (30,000 | ) | (300,000 | ) | ||||
| Net increase (decrease) | (127 | ) | $ (1,382 | ) | 2,612,734 | $ 26,076,508 | ||||||
| Balanced Fund | ||||||||||||
| Sold | 5,998,665 | $ 78,064,559 | 15,470,302 | $ 220,776,192 | ||||||||
| Issued as reinvestment of dividends | - | - | 2,625,658 | 35,268,702 | ||||||||
| Redeemed | (17,672,543 | ) | (228,350,380 | ) | (22,990,430 | ) | (325,959,956 | ) | ||||
| Net decrease | (11,673,878 | ) | $ (150,285,821 | ) | (4,894,470 | ) | $ (69,915,062 | ) | ||||
| Core Equity Fund | ||||||||||||
| Sold | 18,696,495 | $ 289,851,489 | 36,534,385 | $ 671,947,291 | ||||||||
| Issued as reinvestment of dividends | - | - | 15,026,432 | 247,629,362 | ||||||||
| Redeemed | (52,968,945 | ) | (824,708,170 | ) | (72,256,616 | ) | (1,317,324,350 | ) | ||||
| Net decrease | (34,272,450 | ) | $ (534,856,681 | ) | (20,695,799 | ) | $ (397,747,697 | ) | ||||
| Large Cap Value Fund† | ||||||||||||
| Sold | 18,852,786 | $ 187,985,765 | - | $ - | ||||||||
| Issued as reinvestment of dividends | - | - | - | - | ||||||||
| Redeemed | (529,625 | ) | (5,240,163 | ) | - | - | ||||||
| Net increase | 18,323,161 | $ 182,745,602 | - | $ - | ||||||||
| Indexed Equity Fund | ||||||||||||
| Sold | 22,524,859 | $ 305,039,390 | 38,235,209 | $ 492,911,870 | ||||||||
| Issued as reinvestment of dividends | - | - | 1,052,750 | 14,407,704 | ||||||||
| Redeemed | (25,643,498 | ) | (345,972,779 | ) | (16,751,920 | ) | (216,268,098 | ) | ||||
| Net increase (decrease) | (3,118,639 | ) | $ (40,933,389 | ) | 22,536,039 | $ 291,051,476 | ||||||
| Growth Equity Fund | ||||||||||||
| Sold | 9,603,292 | $ 127,010,839 | 5,330,081 | $ 56,121,602 | ||||||||
| Issued as reinvestment of dividends | - | - | 10,005 | 127,960 | ||||||||
| Redeemed | (3,294,962 | ) | (42,860,467 | ) | (470,411 | ) | (5,525,376 | ) | ||||
| Net increase | 6,308,330 | $ 84,150,372 | 4,869,675 | $ 50,724,186 | ||||||||
| Notes to Financial Statements (Continued)
|
| Class S |
||||||||||||
|---|---|---|---|---|---|---|---|---|---|---|---|---|
| Six months ended June 30, 2000 | Year ended December 31, 1999* | |||||||||||
| Shares |
Amount |
Shares |
Amount |
|||||||||
| Aggressive Growth Fund† | ||||||||||||
| Sold | 4,872,275 | $ 48,363,149 | - | $ - | ||||||||
| Issued as reinvestment of dividends | - | - | - | - | ||||||||
| Redeemed | (78,105 | ) | (771,921 | ) | - | - | ||||||
| Net increase | 4,794,170 | $ 47,591,228 | - | $ - | ||||||||
| OTC 100 Fund† | ||||||||||||
| Sold | 2,787,011 | $ 27,691,027 | - | $ - | ||||||||
| Issued as reinvestment of dividends | - | - | - | - | ||||||||
| Redeemed | (90,229 | ) | (881,490 | ) | - | - | ||||||
| Net increase | 2,696,782 | $ 26,809,537 | - | $ - | ||||||||
| Focused Value Fund† | ||||||||||||
| Sold | 2,545,568 | $ 25,451,070 | - | $ - | ||||||||
| Issued as reinvestment of dividends | - | - | - | - | ||||||||
| Redeemed | (30,021 | ) | (300,775 | ) | - | - | ||||||
| Net increase | 2,515,547 | $ 25,150,295 | - | $ - | ||||||||
| Small Cap Value Equity Fund | ||||||||||||
| Sold | 8,401,052 | $ 116,973,777 | 15,290,501 | $ 207,849,275 | ||||||||
| Issued as reinvestment of dividends | - | - | 1,725,684 | 23,167,535 | ||||||||
| Redeemed | (14,640,039 | ) | (202,962,846 | ) | (18,384,285 | ) | (252,533,101 | ) | ||||
| Net decrease | (6,238,987 | ) | $ (85,989,069 | ) | (1,368,100 | ) | $ (21,516,291 | ) | ||||
| Mid Cap Growth Equity Fund | ||||||||||||
| Sold | 6,248,260 | $ 91,471,346 | 4,926,414 | $ 51,900,529 | ||||||||
| Issued as reinvestment of dividends | - | - | - | - | ||||||||
| Redeemed | (3,725,120 | ) | (52,683,323 | ) | (600,808 | ) | (6,893,118 | ) | ||||
| Net increase | 2,523,140 | $ 38,788,023 | 4,325,606 | $ 45,007,411 | ||||||||
| Mid Cap Growth Equity II Fund†† | ||||||||||||
| Sold | 6,727,435 | $ 67,626,332 | - | $ - | ||||||||
| Issued as reinvestment of dividends | - | - | - | - | ||||||||
| Redeemed | (211,255 | ) | (2,220,423 | ) | - | - | ||||||
| Net increase | 6,516,180 | $ 65,405,909 | - | $ - | ||||||||
| Small Cap Growth Equity Fund | ||||||||||||
| Sold | 10,597,126 | $ 185,017,338 | 6,239,242 | $ 72,748,441 | ||||||||
| Issued as reinvestment of dividends | - | - | 65,056 | 1,023,995 | ||||||||
| Redeemed | (6,492,748 | ) | (108,784,327 | ) | (504,868 | ) | (6,657,643 | ) | ||||
| Net increase | 4,104,378 | $ 76,233,011 | 5,799,430 | $ 67,114,793 | ||||||||
| Emerging Growth Fund† | ||||||||||||
| Sold | 3,853,523 | $ 38,171,629 | - | $ - | ||||||||
| Issued as reinvestment of dividends | - | - | - | - | ||||||||
| Redeemed | (57,914 | ) | (581,112 | ) | - | - | ||||||
| Net increase | 3,795,609 | $ 37,590,517 | - | $ - | ||||||||
| International Equity Fund | ||||||||||||
| Sold | 61,745,287 | $1,149,437,495 | 36,807,063 | $ 483,253,984 | ||||||||
| Issued as reinvestment of dividends | - | - | 3,183,628 | 51,730,162 | ||||||||
| Redeemed | (53,085,817 | ) | (982,100,433 | ) | (32,217,521 | ) | (423,396,920 | ) | ||||
| Net increase | 8,659,470 | $ 167,337,062 | 7,773,170 | $ 111,587,226 | ||||||||
†
|
For the period May 1, 2000 (commencement of operations) through June 30, 2000.
|
††
|
For the period June 1, 2000 (commencement of operations) through June 30, 2000.
|
*
|
For the period March 1, 1999 through December 31, 1999 for the Indexed Equity Fund.
|
**
|
For the period July 1, 1999 (commencement of operations) through December 31, 1999 for the Indexed Equity Fund.
|
| Notes to Financial Statements (Continued)
|
| 6. Foreign
Securities
|
The International Equity Fund invests substantially all of its assets in foreign securities. The other Funds may also invest in foreign
securities, subject to certain percentage restrictions. Investing in securities of foreign companies and foreign governments involves special risks and considerations not typically associated with investing in securities of U.S. companies and the U.S.
Government. These risks include revaluation of currencies and future adverse political and economic developments. Moreover, securities of many foreign companies and foreign governments and their markets may be less liquid and their prices more volatile
than those of securities of comparable U.S. companies and the U.S. Government.
|
| 7. Federal
Income
Tax
Information
|
At June 30, 2000, the cost of securities and the unrealized appreciation (depreciation) in the value of investments owned by the Funds, as
computed on a Federal income tax basis, are as follows:
|
| Fund name |
Federal
Income Tax Cost |
Tax Basis
Unrealized Appreciation |
Tax Basis
Unrealized Depreciation |
Net Unrealized
Appreciation (Depreciation) |
||||||
|---|---|---|---|---|---|---|---|---|---|---|
| Prime Fund | $ 445,566,790 | $ 11,847 | $ (48,382 | ) | $ (36,535 | ) | ||||
| Short Term Bond Fund | 229,245,467 | 800,622 | (2,661,072 | ) | (1,860,450 | ) | ||||
| Core Bond Fund | 718,723,241 | 4,991,347 | (18,792,814 | ) | (13,801,467 | ) | ||||
| Diversified Bond Fund | 27,092,137 | 48,215 | (1,257,431 | ) | (1,209,216 | ) | ||||
| Balanced Fund | 471,368,542 | 99,347,215 | (13,840,025 | ) | 85,507,190 | |||||
| Core Equity Fund | 1,728,534,782 | 672,302,200 | (54,085,789 | ) | 618,216,411 | |||||
| Large Cap Value Fund | 195,278,965 | 5,008,928 | (8,751,901 | ) | (3,742,973 | ) | ||||
| Indexed Equity Fund | 762,490,008 | 144,349,578 | (27,533,433 | ) | 116,816,145 | |||||
| Growth Equity Fund | 247,521,759 | 19,139,884 | (5,757,302 | ) | 13,382,582 | |||||
| Aggressive Growth Fund | 50,077,720 | 2,210,283 | (2,596,177 | ) | (385,894 | ) | ||||
| OTC 100 Fund | 29,668,891 | 1,732,645 | (2,044,543 | ) | (311,898 | ) | ||||
| Focused Value Fund | 21,928,156 | 635,492 | (1,905,273 | ) | (1,269,781 | ) | ||||
| Small Cap Value Equity Fund | 532,567,916 | 158,000,425 | (48,394,449 | ) | 109,605,976 | |||||
| Mid Cap Growth Equity Fund | 175,564,668 | 22,414,227 | (10,725,277 | ) | 11,688,950 | |||||
| Mid Cap Growth Equity II Fund | 166,256,207 | 14,042,874 | (8,470,743 | ) | 5,572,131 | |||||
| Small Cap Growth Equity Fund | 235,855,324 | 30,774,433 | (18,836,734 | ) | 11,937,699 | |||||
| Emerging Growth Fund | 51,862,216 | 6,189,809 | (2,203,725 | ) | 3,986,084 | |||||
| International Equity Fund | 1,361,237,446 | 279,451,085 | (103,823,851 | ) | 175,627,234 | |||||
| At December 31, 1999, the following Funds had available, for Federal income tax purposes, unused capital losses:
|
| Amount |
Expiration Date |
|||
|---|---|---|---|---|
| Prime Fund | $ 21,292 | 12/31/2007 | ||
| Prime Fund | 8,471 | 12/31/2006 | ||
| Prime Fund | 7,761 | 12/31/2005 | ||
| Prime Fund | 2,368 | 12/31/2004 | ||
| Prime Fund | 2,082 | 12/31/2003 | ||
| Core Bond Fund | 6,973,915 | 12/31/2007 | ||
| Diversified Bond Fund | 108,510 | 12/31/2007 |
| The following Funds elected to defer to January 1, 2000 post-October losses:
|
| Amount |
||
|---|---|---|
| Short Term Bond Fund | $ 10,211 | |
| Core Bond Fund | 439,887 | |
| Diversified Bond Fund | 5,071 | |
| Balanced Fund | 1,458,909 | |
| Growth Equity Fund | 14,637 | |
| International Equity Fund | 16,559 |
| Notes to Financial Statements (Continued)
|
8.
|
Corporate
Reorganization |
| Effective January 1, 2000, MassMutual completed an internal corporate reorganization among certain of the investment advisory
functions and subsidiaries of (the “Reorganization”). The Reorganization combined the business operations of MassMutual’s Investment Management division (the “IM Division”) and Charter Oak Capital Management, Inc. (“Charter
Oak”), a majority-owned indirect subsidiary of MassMutual, with and into DLB. DLB is a majority-owned (85%) indirect subsidiary of MassMutual. DLB is registered with the Securities & Exchange Commission as an investment adviser under the
Investment Advisers Act of 1940, as amended (the “Advisers Act”) and, prior to the Reorganization, served as investment sub-adviser to the MassMutual Core Equity Fund, the MassMutual Small Cap Value Equity Fund and the Core Equity segment of the
MassMutual Balanced Fund.
|
| As a result of the Reorganization, MassMutual appointed DLB to serve as investment sub-adviser for the MassMutual Prime Fund,
MassMutual Short-Term Bond Fund, MassMutual Core Bond Fund, MassMutual Diversified Bond Fund and the Prime and Core Bond segments of the MassMutual Balanced Fund were transferred to DLB. The Trustees of the Trust, including a majority of the Trustees who
are disinterested, approved MassMutual’s appointment of DLB as sub-adviser. No increase in fees or change in portfolio management personnel for any of the Funds occurred as a result of the Reorganization or the appointment of DLB as sub-adviser to
such Funds.
|
|
|