
|
|
|
|
|
|
|
|
|
(2_fidelity_logos)
Balanced Portfolio
Semiannual Report
June 30, 2000
|
Market Environment |
3 |
A review of what happened in world markets during the past six months. |
|
Performance and Investment Summary |
4 |
How the fund has done over time, and an overview of the fund's investments at the end of the period. |
|
Fund Talk |
7 |
The managers' review of fund performance, strategy |
|
Investments |
8 |
A complete list of the fund's investments with their |
|
Financial Statements |
19 |
Statements of assets and liabilities, operations, and |
|
Notes |
23 |
Notes to the financial statements. |
|
Proxy Voting Results |
26 |
|
Fidelity Variable Insurance Products are separate account options which are purchased through a variable insurance contract.
Standard & Poor's, S&P and S&P 500 are registered service marks of The McGraw-Hill Companies, Inc. and have been licensed for use by Fidelity Distributors Corporation.
Other third party marks appearing herein are the property of their respective owners.
All other marks appearing herein are registered or unregistered trademarks or service marks of FMR Corp. or an affiliated company.
(Recycle graphic) This report is printed on recycled paper using soy-based inks.
The views expressed in this report reflect those of the fund's portfolio manager only through the end of the period of the report as stated on the cover and do not necessarily represent the views of Fidelity or any other person in the Fidelity organization. Any such views are subject to change at any time based upon market or other conditions and Fidelity disclaims any responsibility to update such views. These views may not be relied on as investment advice and, because investment decisions for a Fidelity fund are based on numerous factors, may not be relied on as an indication of trading intent on behalf of any Fidelity fund.
This report and the financial statements contained herein are submitted for the general information of the shareholders of the fund. This report is not authorized for distribution to prospective investors in the fund unless preceded or accompanied by an effective prospectus.
Mutual fund shares are not deposits or obligations of, or guaranteed by, any depository institution. Shares are not insured by the FDIC, Federal Reserve Board or any other agency, and are subject to investment risks, including possible loss of principal amount invested.
Neither the fund nor Fidelity Distributors Corporation is a bank.
Semiannual Report
After reaching record heights in the first quarter of 2000, several of the most notable U.S. equity market indexes - including the Standard & Poor's 500SM, NASDAQ and Dow Jones Industrial Average - tumbled into negative territory by the end of the second quarter. Leading the market down was the same sector that drove it to new highs just a few months prior: technology. Beginning in mid-March, investors abandoned technology en masse, as concerns about excessive valuations and impending inflation pervaded the market. The ripple effect of the tech sell-off spread rapidly around the world, and international equity markets trended downward in response. As stocks cooled, domestic bond performance heated up, helping many U.S. fixed-income categories outpace their equity counterparts for the overall six-month period. Meanwhile, emerging-market bonds held on to most of their strong first quarter gains, but international developed-market bonds felt the pinch of inflation, as several central banks around the world began to implement interest-rate hikes to slow their respective economies.
At the mid-way point of 2000, the U.S. stock market's unprecedented streak of five consecutive double-digit annual increases appeared to be in jeopardy. The Dow Jones Industrial Average - an index of 30 blue-chip stocks - declined 8.42% during the six-month period ending June 30, 2000. The broad-based S&P 500® and the technology-concentrated NASDAQ index also disappeared below the surface, returning -0.42% and -2.44%, respectively. In a 10-week stretch from March through June, the NASDAQ dropped 33%, making dot-com investors anything but dot-calm as Internet stocks bore the brunt of the decline. As the spectacular growth of the technology sector waned, previously out-of-favor sectors began to lure investors' attention. The consistent, steady growth of the health sector was the primary beneficiary, as it wore the crown of best-performing sector for the first six months of 2000. The natural resources and real-estate sectors were surprising runners-up in the performance derby. But not all was lost for the technology sector. In June, economic reports showed strong evidence that the Federal Reserve Board's series of interest-rate hikes - including three during the first half of this year - were winning the battle against inflation. This news, combined with the Fed's decision to eschew another hike in June, fueled a renewed enthusiasm for tech stocks, as evidenced by the NASDAQ's 16.64% return for the final month of the period.
Reacting similarly to the U.S. stock market - and no doubt largely as a direct result of the U.S. market - most foreign stock markets started the six-month period off on a high note before stumbling in the second quarter. Japan and the Pacific Region in general fell particularly hard. After a stellar 1999, Japanese equities were shaken by their country's economic downturn and an unsteady U.S. market. "New Japan" stocks - Internet, electronic, telecom and software securities - led the
decline. The TOPIX Index, a benchmark of the Japanese market, fell 10.34% during the period. And even the best-performing Pacific Region fund had a negative return, according to Lipper Inc. Weak tech performance in the second quarter also hurt European stock markets, causing the Morgan Stanley Capital International Europe Index to decline 3.10% for the first half of 2000. One of the only non-U.S. stock markets that didn't suffer a negative second quarter was Canada. Often overlooked, the Canadian stock market quietly piled up an impressive six-month return of 21.89% - as measured by the Toronto Stock Exchange (TSE) 300.
Despite being challenged with a series of interest-rate hikes - almost always a detriment to fixed-income offerings - U.S. bond markets still managed to post solid returns relative to equities through the first six months of this year. U.S. government bonds were one of the top performers. In January, the U.S. Treasury announced its intent to repurchase long-term debt and curtail future issuance. Treasury prices soared in response and helped the Lehman Brothers Long-Term Government Bond Index return 8.77% for the period. The Lehman Brothers Aggregate Bond Index, a popular measure of taxable-bond performance, rose 3.99% for the past six months, while tax-free municipals were even more robust, gaining 4.48% according to the Lehman Brothers Municipal Bond Index. Underperformance in the bond market was pretty much limited to the high-yield sector. Faced with a rising interest-rate backdrop and poor technicals - including an unfavorable supply/demand condition and an increased default rate - the high-yield market stumbled to a negative return of 1.00%, as measured by the Merrill Lynch High Yield Master II Index, for the past six months.
International bond investors faced a myriad of negative factors throughout the majority of the six-month period ending June 30, 2000. Strong global economic growth and the threat of rising interest rates, currency fluctuations, and a weakening euro continued to plague global debt issues. Additionally, poor liquidity hampered bond prices in non-U.S. developed markets. Combined, those factors helped drag down the Salomon Brothers Non-U.S. World Government Bond Index, which returned -1.95%. On the bright side, a number of favorable factors propelled demand for emerging-market bonds, which was reflected in the 6.95% return of the J.P. Morgan Emerging Markets Bond Index Global - a popular benchmark of emerging-market debt. Credit momentum, which was driven by improving fundamentals - such as the Russian government's Soviet-era debt restructuring and new political leadership - fostered the rally in emerging-market bonds. Elsewhere, Brazil's better-than-expected economic growth fueled a sharp increase in foreign direct investment. Often large commodity suppliers, emerging-market countries also benefited from a sharp increase in oil prices.
Semiannual Report
Performance
There are several ways to evaluate a fund's historical performance. You can look at the total percentage change in value, the average annual percentage change or the growth of a hypothetical $10,000 investment. Total return reflects the change in the value of an investment, assuming reinvestment of the fund's dividend income and capital gains (the profits earned upon the sale of securities that have grown in value). If Fidelity had not reimbursed certain fund expenses, the past five years and life of fund total returns would have been lower.
Average Annual Total Returns
|
Periods ended |
Past 1 |
Past 5 |
Life of |
|
Fidelity® VIP: Balanced - |
-0.43% |
11.87% |
12.20% |
|
Fidelity Balanced 60/40 Composite |
6.44% |
16.78% |
18.45% |
|
S&P 500 ® |
7.25% |
23.80% |
25.60% |
|
LB Aggregate Bond |
4.57% |
6.25% |
7.81% |
Average annual total returns take the fund's cumulative return and show what would have happened if the fund had performed at a constant rate each year.
You can compare the fund's returns to the performance of the Fidelity Balanced 60/40 Composite Index - a hypothetical combination of unmanaged indices using a weighting of 60% equity and 40% bond. The composite index combines the total returns of the Standard & Poor's 500 Index and the Lehman Brothers Aggregate Bond Index.
Figures for more than one year assume a steady compounded rate of return and are not the fund's year-by-year results, which fluctuated over the periods shown. The life of fund figures are from commencement of operations, January 3, 1995.
Performance numbers are net of all fund operating expenses, but do not include any insurance charges imposed by your insurance company's separate account. If performance information included the effect of these additional charges, the total returns would have been lower.
Past performance is no guarantee of future results. Principal and investment return will vary and you may have a gain or loss when you withdraw your money.
Understanding Performance
How a fund did yesterday is no guarantee of how it will do tomorrow. The stock market, for example, has a history of long-term growth and short-term volatility. In turn, the share price and return of a fund that invests in stocks will vary. That means if you sell your shares during a market downturn, you might lose money. But if you can ride out the market's ups and downs, you may have a gain.
3$10,000 Over Life of Fund
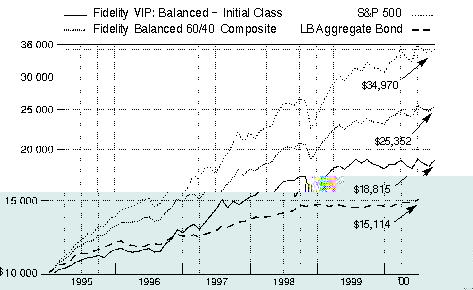
$10,000 Over Life of Fund: Let's say hypothetically that $10,000 was invested in Fidelity® Variable Insurance Products: Balanced Portfolio - Initial Class on January 3, 1995, when the fund started. As the chart shows, by June 30, 2000, the value of the investment would have grown to $18,815 - an 88.15% increase on the initial investment. For comparison, look at how both the Standard & Poor's 500 Index, a market capitalization-weighted index of common stocks, and the Lehman Brothers Aggregate Bond Index, a market value-weighted index of investment-grade fixed-rate debt issues, including government, corporate, asset-backed, and mortgage-backed securities, with maturities of one year or more, did over the same period. With dividends and capital gains, if any, reinvested, the same $10,000 investment in the Standard & Poor's 500 Index would have grown to $34,970 - a 249.70% increase. If $10,000 was invested in the Lehman Brothers Aggregate Bond Index, it would have grown to $15,114 - a 51.14% increase. You can also look at how the Fidelity Balanced 60/40 Composite Index did over the same period. With dividends and interest, if any, reinvested, the same $10,000 would have grown to $25,352 - a 153.52% increase.
Investment Summary
|
Top Five Stocks as of June 30, 2000 |
|
|
|
% of fund's |
|
General Electric Co. |
3.6 |
|
Cisco Systems, Inc. |
2.3 |
|
Intel Corp. |
1.7 |
|
Exxon Mobil Corp. |
1.4 |
|
Pfizer, Inc. |
1.3 |
|
|
10.3 |
|
Top Five Market Sectors as of June 30, 2000 |
|
|
|
% of fund's |
|
Technology |
20.0 |
|
Finance |
10.4 |
|
Utilities |
9.2 |
|
Media & Leisure |
7.8 |
|
Health |
6.4 |
|
Asset Allocation as of June 30, 2000 |
|||
|
% of fund's net assets * |
|||
 |
Stocks 57.2% |
|
|
 |
Bonds 40.7% |
|
|
 |
Short-Term Investments |
|
|

|
* Foreign investments 6.4% |
Semiannual Report
Performance
There are several ways to evaluate a fund's historical performance. You can look at the total percentage change in value, the average annual percentage change or the growth of a hypothetical $10,000 investment. Total return reflects the change in the value of an investment, assuming reinvestment of the fund's dividend income and capital gains (the profits earned upon the sale of securities that have grown in value). The initial offering of Service Class shares took place on November 3, 1997. Performance for Service Class shares reflects an asset based distribution fee (12b-1 fee), and returns prior to November 3, 1997 are those of Initial Class and do not include the effects of Service Class' 12b-1 fee. Had Service Class shares' 12b-1 fee been reflected, returns prior to November 3, 1997 would have been lower. If Fidelity had not reimbursed certain fund expenses, the past five years and life of fund total returns would have been lower.
Average Annual Total Returns
|
Periods ended |
Past 1 |
Past 5 |
Life of |
|
Fidelity VIP: Balanced - |
-0.57% |
11.77% |
12.11% |
|
Fidelity Balanced 60/40 Composite |
6.44% |
16.78% |
18.45% |
|
S&P 500 |
7.25% |
23.80% |
25.60% |
|
LB Aggregate Bond |
4.57% |
6.25% |
7.81% |
Average annual total returns take the fund's cumulative return and show what would have happened if the fund had performed at a constant rate each year.
You can compare the fund's returns to the performance of the Fidelity Balanced 60/40 Composite Index - a hypothetical combination of unmanaged indices using a weighting of 60% equity and 40% bond. The composite index combines the total returns of the Standard & Poor's 500 Index and the Lehman Brothers Aggregate Bond Index.
Figures for more than one year assume a steady compounded rate of return and are not the fund's year-by-year results, which fluctuated over the periods shown. The life of fund figures are from commencement of operations, January 3, 1995.
Performance numbers are net of all fund operating expenses, but do not include any insurance charges imposed by your insurance company's separate account. If performance information included the effect of these additional charges, the total returns would have been lower.
Past performance is no guarantee of future results. Principal and investment return will vary and you may have a gain or loss when you withdraw your money.
Understanding Performance
How a fund did yesterday is no guarantee of how it will do tomorrow. The stock market, for example, has a history of long-term growth and short-term volatility. In turn, the share price and return of a fund that invests in stocks will vary. That means if you sell your shares during a market downturn, you might lose money. But if you can ride out the market's ups and downs, you may have a gain.
3$10,000 Over Life of Fund
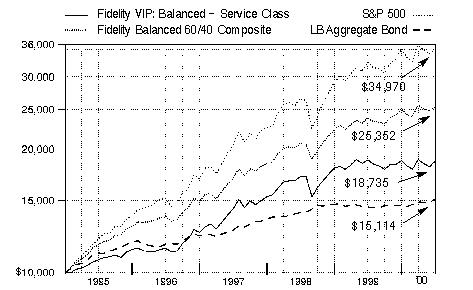
$10,000 Over Life of Fund: Let's say hypothetically that $10,000 was invested in Fidelity Variable Insurance Products: Balanced Portfolio - Service Class on January 3, 1995, when the fund started. As the chart shows, by June 30, 2000, the value of the investment would have grown to $18,735 - an 87.35% increase on the initial investment. For comparison, look at how both the Standard & Poor's 500 Index, a market capitalization-weighted index of common stocks, and the Lehman Brothers Aggregate Bond Index, a market value-weighted index of investment-grade fixed-rate debt issues, including government, corporate, asset-backed, and mortgage-backed securities, with maturities of one year or more, did over the same period. With dividends and capital gains, if any, reinvested, the same $10,000 investment in the Standard & Poor's 500 Index would have grown to $34,970 - a 249.70% increase. If $10,000 was invested in the Lehman Brothers Aggregate Bond Index, it would have grown to $15,114 - a 51.14% increase. You can also look at how the Fidelity Balanced 60/40 Composite Index did over the same period. With dividends and interest, if any, reinvested, the same $10,000 would have grown to $25,352 - a 153.52% increase.
Investment Summary
|
Top Five Stocks as of June 30, 2000 |
|
|
|
% of fund's |
|
General Electric Co. |
3.6 |
|
Cisco Systems, Inc. |
2.3 |
|
Intel Corp. |
1.7 |
|
Exxon Mobil Corp. |
1.4 |
|
Pfizer, Inc. |
1.3 |
|
|
10.3 |
|
Top Five Market Sectors as of June 30, 2000 |
|
|
|
% of fund's |
|
Technology |
20.0 |
|
Finance |
10.4 |
|
Utilities |
9.2 |
|
Media & Leisure |
7.8 |
|
Health |
6.4 |
|
Asset Allocation as of June 30, 2000 |
|||
|
% of fund's net assets * |
|||
|
Stocks 57.2% |
|
|
|
Bonds 40.7% |
|
|
|
Short-Term Investments |
|
|
|
* Foreign investments 6.4% |
Semiannual Report
Performance
There are several ways to evaluate a fund's historical performance. You can look at the total percentage change in value, the average annual percentage change or the growth of a hypothetical $10,000 investment. Total return reflects the change in the value of an investment, assuming reinvestment of the fund's dividend income and capital gains (the profits earned upon the sale of securities that have grown in value). The initial offering of Service Class 2 shares took place on January 12, 2000. Performance for Service Class 2 shares reflects an asset based distribution fee (12b-1 fee). Returns from November 3, 1997 through January 12, 2000 are those of Service Class which reflects a different 12b-1 fee. Service Class 2 returns prior to November 3, 1997 are those of Initial Class, and do not include the effects of a 12b-1 fee. Had Service Class 2's 12b-1 fee been reflected, returns prior to January 12, 2000 would have been lower. If Fidelity had not reimbursed certain fund expenses, the past five years and life of fund total returns would have been lower.
Average Annual Total Returns
|
Periods ended |
Past 1 |
Past 5 |
Life of |
|
Fidelity VIP: Balanced - |
-0.63% |
11.76% |
12.09% |
|
Fidelity Balanced 60/40 Composite |
6.44% |
16.78% |
18.45% |
|
S&P 500 |
7.25% |
23.80% |
25.60% |
|
LB Aggregate Bond |
4.57% |
6.25% |
7.81% |
Average annual total returns take the fund's cumulative return and show what would have happened if the fund had performed at a constant rate each year.
You can compare the fund's returns to the performance of the Fidelity Balanced 60/40 Composite Index - a hypothetical combination of unmanaged indices using a weighting of 60% equity and 40% bond. The composite index combines the total returns of the Standard & Poor's 500 Index and the Lehman Brothers Aggregate Bond Index.
Figures for more than one year assume a steady compounded rate of return and are not the fund's year-by-year results, which fluctuated over the periods shown. The life of fund figures are from commencement of operations, January 3, 1995.
Performance numbers are net of all fund operating expenses, but do not include any insurance charges imposed by your insurance company's separate account. If performance information included the effect of these additional charges, the total returns would have been lower.
Past performance is no guarantee of future results. Principal and investment return will vary and you may have a gain or loss when you withdraw your money.
Understanding Performance
How a fund did yesterday is no guarantee of how it will do tomorrow. The stock market, for example, has a history of long-term growth and short-term volatility. In turn, the share price and return of a fund that invests in stocks will vary. That means if you sell your shares during a market downturn, you might lose money. But if you can ride out the market's ups and downs, you may have a gain.
3$10,000 Over Life of Fund
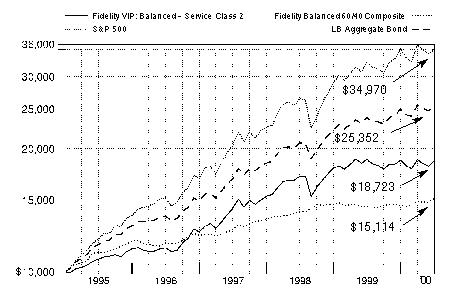
$10,000 Over Life of Fund: Let's say hypothetically that $10,000 was invested in Fidelity Variable Insurance Products: Balanced Portfolio - Service Class 2 on January 3, 1995, when the fund started. As the chart shows, by June 30, 2000, the value of the investment would have grown to $18,723 - an 87.23% increase on the initial investment. For comparison, look at how both the Standard & Poor's 500 Index, a market capitalization-weighted index of common stocks, and the Lehman Brothers Aggregate Bond Index, a market value-weighted index of investment-grade fixed-rate debt issues, including government, corporate, asset-backed, and mortgage-backed securities, with maturities of one year or more, did over the same period. With dividends and capital gains, if any, reinvested, the same $10,000 investment in the Standard & Poor's 500 Index would have grown to $34,970 - a 249.70% increase. If $10,000 was invested in the Lehman Brothers Aggregate Bond Index, it would have grown to $15,114 - a 51.14% increase. You can also look at how the Fidelity Balanced 60/40 Composite Index did over the same period. With dividends and interest, if any, reinvested, the same $10,000 would have grown to $25,352 - a 153.52% increase.
Investment Summary
|
Top Five Stocks as of June 30, 2000 |
|
|
|
% of fund's |
|
General Electric Co. |
3.6 |
|
Cisco Systems, Inc. |
2.3 |
|
Intel Corp. |
1.7 |
|
Exxon Mobil Corp. |
1.4 |
|
Pfizer, Inc. |
1.3 |
|
|
10.3 |
|
Top Five Market Sectors as of June 30, 2000 |
|
|
|
% of fund's |
|
Technology |
20.0 |
|
Finance |
10.4 |
|
Utilities |
9.2 |
|
Media & Leisure |
7.8 |
|
Health |
6.4 |
|
Asset Allocation as of June 30, 2000 |
|||
|
% of fund's net assets * |
|||
|
Stocks 57.2% |
|
|
|
Bonds 40.7% |
|
|
|
Short-Term Investments |
|
|
|
* Foreign investments 6.4% |
Semiannual Report
(automated graphic) (automated graphic)
An interview with John Avery (right), Lead Portfolio Manager of Balanced Portfolio, and Kevin Grant, manager for fixed-income investments
Q. How did the fund perform, John?
J.A. For the six- and 12-month periods that ended June 30, 2000, the fund underperformed the Fidelity Balanced 60/40 Composite Index, which returned 1.45% and 6.44%, respectively, during these time frames.
Q. Why did the fund trail its benchmark during the
six-month period?
J.A. Having an average underweighting in technology hurt during the sector's impressive run-up early in the period. The fund's underexposure to tech was double trouble in the sense that most other areas of the market in which the fund was invested had a difficult period. So, even though the technology group corrected sharply in the spring - as the market turned elsewhere for growth - it was up so much in the first half that, for all intents and purposes, our fate was sealed.
Q. What were some of your strategies and how did they influence performance?
J.A. I maintained an emphasis on equities during the market's upturn, adding convertible securities in lieu of pure stocks. I used convertibles as an indirect, less volatile way to participate in some of the growth stories I liked within the technology sector. This strategy helped provide some nice yield and afforded us the added benefit of downside protection, as convertible securities gave back less than their pure stock equivalents during the correction. When things started to fall apart for tech, I took advantage of the opportunity to increase the fund's concentration in large, high-quality companies, many of which had dropped sharply from their highs of the period. However, the fund was hurt for not owning enough of the period's top performers along the way, namely Oracle and Intel. On a more positive note, the fund's healthy exposure to large drug companies such as Warner-Lambert and Eli Lilly helped, as the group rallied behind renewed enthusiasm for strong new product pipelines. Warner-Lambert merged with Pfizer - another fund holding - just prior to the close of the period. The fund's lack of exposure to a generally weak consumer nondurables sector, and some good picks in media stocks such as Viacom, further aided relative performance.
Q. What other stocks performed well for the fund? Which disappointed?
J.A. A number of the fund's financial holdings performed well - most notably Bank of New York and Morgan Stanley Dean Witter - benefiting from strong capital markets activity. Tech stocks we did own, including Texas Instruments, EMC and Micron Technology, also added meaningfully to performance. Conversely, those that weren't so hot included Motorola, Alltel and Lucent. Motorola was, by far, the fund's worst performer, slipping on execution problems and narrowing margins in its cellular handset business. Traditional telecommunications providers AT&T and WorldCom fell prey to increased competition and falling prices.
Q. Turning to you, Kevin, how did the fund's bond investments fare?
K.G. The investment-grade portion of the fund performed well during the six-month period, benefiting from its exposure to a strong rally in the government market. An announcement by the U.S. Treasury in January of its intent to repurchase long-term debt and reduce future issuance sent the price of the long bond higher and its yield lower. This action, coupled with rising short-term interest rates, induced an inverted yield curve, which occurs when short-term issues provide a higher yield than their longer-term counterparts. This inversion hurt the spread sectors - most notably corporate bonds and mortgage securities - with yield spreads widening out significantly relative to comparable duration Treasuries. The fund was well-positioned for these changes, as we responded to the buybacks by reducing our exposure to long-term corporates in exchange for more Treasuries, which worked out beautifully. This strategy helped the fund's bond subportfolio outperform the Lehman Brothers Aggregate Bond Index during the period. So, despite the Federal Reserve Board's efforts to raise rates during the period, the supply/demand imbalance spurred by the Treasury buybacks helped ensure our success.
Q. John, what's your outlook?
J.A. I'm bullish overall, as business remains strong in many areas of the economy, although I temper that enthusiasm with concern about interest rates rising further. In this uncertain environment, I believe the market will begin to focus more on revenues and earnings. As such, the companies capable of delivering robust top-line growth and strong bottom-line earnings should be the ones to reap the rewards. Given the extent to which technology and the Internet have transformed the global landscape, I expect we'll see strong performance from this sector going forward.
The views expressed in this report reflect those of the portfolio managers only through the end of the period of the report as stated on the cover. The managers' views are subject to change at any time based on market or other conditions. For more information, see page 2.
Fund Facts
Goal: seeks income and capital growth consistent with reasonable risk by investing in a diversified portfolio of stocks and bonds
Start date: January 3, 1995
Size: as of June 30, 2000, more than $304 million
Manager: John Avery, since 1998, and
Kevin Grant, since 1996; John Avery joined
Fidelity in 1995; Kevin Grant joined Fidelity in 1993
Semiannual Report
Fidelity Variable Insurance Products: Balanced Portfolio
(Unaudited)
Showing Percentage of Net Assets
|
Common Stocks - 56.8% |
|||
|
Shares |
Value (Note 1) |
||
|
AEROSPACE & DEFENSE - 0.4% |
|||
|
Aerospace & Defense - 0.2% |
|||
|
Boeing Co. |
13,700 |
$ 572,831 |
|
|
Textron, Inc. |
4,200 |
228,113 |
|
|
|
800,944 |
||
|
Ship Building & Repair - 0.2% |
|||
|
General Dynamics Corp. |
9,700 |
506,825 |
|
|
TOTAL AEROSPACE & DEFENSE |
1,307,769 |
||
|
BASIC INDUSTRIES - 0.5% |
|||
|
Chemicals & Plastics - 0.4% |
|||
|
E.I. du Pont de Nemours and Co. |
14,104 |
617,050 |
|
|
Praxair, Inc. |
16,100 |
602,744 |
|
|
|
1,219,794 |
||
|
Metals & Mining - 0.1% |
|||
|
Alcoa, Inc. |
13,000 |
377,000 |
|
|
TOTAL BASIC INDUSTRIES |
1,596,794 |
||
|
DURABLES - 0.3% |
|||
|
Autos, Tires, & Accessories - 0.2% |
|||
|
AutoNation, Inc. |
3,700 |
26,131 |
|
|
Danaher Corp. |
9,600 |
474,600 |
|
|
|
500,731 |
||
|
Consumer Electronics - 0.1% |
|||
|
General Motors Corp. Class H (a) |
5,400 |
473,850 |
|
|
TOTAL DURABLES |
974,581 |
||
|
ENERGY - 3.7% |
|||
|
Energy Services - 0.8% |
|||
|
Diamond Offshore Drilling, Inc. |
15,200 |
533,900 |
|
|
Halliburton Co. |
12,900 |
608,719 |
|
|
Nabors Industries, Inc. (a) |
16,800 |
698,250 |
|
|
Schlumberger Ltd. (NY Shares) |
9,000 |
671,625 |
|
|
|
2,512,494 |
||
|
Oil & Gas - 2.9% |
|||
|
BP Amoco PLC |
63,962 |
602,975 |
|
|
Burlington Resources, Inc. |
15,000 |
573,750 |
|
|
Chevron Corp. |
10,000 |
848,125 |
|
|
Conoco, Inc. Class B |
50,800 |
1,247,775 |
|
|
Exxon Mobil Corp. |
53,366 |
4,189,231 |
|
|
Royal Dutch Petroleum Co. (NY Shares) |
21,400 |
1,317,438 |
|
|
|
8,779,294 |
||
|
TOTAL ENERGY |
11,291,788 |
||
|
FINANCE - 7.4% |
|||
|
Banks - 1.0% |
|||
|
Bank of America Corp. |
15,100 |
649,300 |
|
|
|
|||
|
Shares |
Value (Note 1) |
||
|
Bank of New York Co., Inc. |
41,700 |
$ 1,939,050 |
|
|
Chase Manhattan Corp. |
10,500 |
483,656 |
|
|
|
3,072,006 |
||
|
Credit & Other Finance - 2.3% |
|||
|
American Express Co. |
70,900 |
3,695,663 |
|
|
Citigroup, Inc. |
56,325 |
3,393,581 |
|
|
|
7,089,244 |
||
|
Federal Sponsored Credit - 1.2% |
|||
|
Fannie Mae |
32,400 |
1,690,875 |
|
|
Freddie Mac |
45,300 |
1,834,650 |
|
|
|
3,525,525 |
||
|
Insurance - 1.5% |
|||
|
AFLAC, Inc. |
9,300 |
427,219 |
|
|
American International Group, Inc. |
30,300 |
3,560,250 |
|
|
Hartford Financial Services Group, Inc. |
8,400 |
469,875 |
|
|
|
4,457,344 |
||
|
Securities Industry - 1.4% |
|||
|
Charles Schwab Corp. |
25,150 |
845,669 |
|
|
Merrill Lynch & Co., Inc. |
7,500 |
862,500 |
|
|
Morgan Stanley Dean Witter & Co. |
31,900 |
2,655,675 |
|
|
|
4,363,844 |
||
|
TOTAL FINANCE |
22,507,963 |
||
|
HEALTH - 5.9% |
|||
|
Drugs & Pharmaceuticals - 5.6% |
|||
|
American Home Products Corp. |
15,900 |
934,125 |
|
|
Amgen, Inc. |
11,600 |
814,900 |
|
|
Bristol-Myers Squibb Co. |
48,200 |
2,807,650 |
|
|
Eli Lilly & Co. |
39,000 |
3,895,125 |
|
|
Merck & Co., Inc. |
11,300 |
865,863 |
|
|
Pfizer, Inc. |
84,700 |
4,065,600 |
|
|
Schering-Plough Corp. |
72,400 |
3,656,200 |
|
|
|
17,039,463 |
||
|
Medical Equipment & Supplies - 0.3% |
|||
|
Johnson & Johnson |
4,600 |
468,625 |
|
|
Medtronic, Inc. |
10,000 |
498,125 |
|
|
|
966,750 |
||
|
TOTAL HEALTH |
18,006,213 |
||
|
INDUSTRIAL MACHINERY & EQUIPMENT - 4.4% |
|||
|
Electrical Equipment - 3.6% |
|||
|
General Electric Co. |
206,400 |
10,939,184 |
|
|
Industrial Machinery & Equipment - 0.8% |
|||
|
Tyco International Ltd. |
53,870 |
2,552,091 |
|
|
TOTAL INDUSTRIAL MACHINERY & EQUIPMENT |
13,491,275 |
||
|
Common Stocks - continued |
|||
|
Shares |
Value (Note 1) |
||
|
MEDIA & LEISURE - 4.3% |
|||
|
Broadcasting - 1.6% |
|||
|
AT&T Corp. - Liberty Media Group |
44,000 |
$ 1,067,000 |
|
|
Cable Satisfaction International, Inc. warrants 3/1/10 (a) |
200 |
540 |
|
|
Clear Channel Communications, Inc. (a) |
15,400 |
1,155,000 |
|
|
Infinity Broadcasting Corp. Class A (a) |
29,600 |
1,078,550 |
|
|
NTL, Inc. warrants 10/14/08 (a) |
199 |
8,159 |
|
|
Time Warner, Inc. |
20,208 |
1,535,808 |
|
|
UIH Australia/Pacific, Inc. warrants 5/15/06 (a) |
150 |
4,500 |
|
|
|
4,849,557 |
||
|
Entertainment - 1.8% |
|||
|
MGM Grand, Inc. |
12,500 |
401,563 |
|
|
Viacom, Inc. Class B (non-vtg.) (a) |
56,389 |
3,845,025 |
|
|
Walt Disney Co. |
29,100 |
1,129,444 |
|
|
|
5,376,032 |
||
|
Publishing - 0.7% |
|||
|
McGraw-Hill Companies, Inc. |
42,100 |
2,273,400 |
|
|
Restaurants - 0.2% |
|||
|
McDonald's Corp. |
20,500 |
675,219 |
|
|
TOTAL MEDIA & LEISURE |
13,174,208 |
||
|
NONDURABLES - 1.6% |
|||
|
Beverages - 0.9% |
|||
|
Anheuser-Busch Companies, Inc. |
16,700 |
1,247,281 |
|
|
Seagram Co. Ltd. |
6,100 |
358,460 |
|
|
The Coca-Cola Co. |
19,300 |
1,108,544 |
|
|
|
2,714,285 |
||
|
Household Products - 0.5% |
|||
|
Clorox Co. |
14,700 |
658,744 |
|
|
Colgate-Palmolive Co. |
12,100 |
724,488 |
|
|
|
1,383,232 |
||
|
Tobacco - 0.2% |
|||
|
Philip Morris Companies, Inc. |
22,400 |
595,000 |
|
|
TOTAL NONDURABLES |
4,692,517 |
||
|
RETAIL & WHOLESALE - 2.9% |
|||
|
Apparel Stores - 0.2% |
|||
|
Mothers Work, Inc. (a)(k) |
3 |
34 |
|
|
The Limited, Inc. |
26,800 |
579,550 |
|
|
|
579,584 |
||
|
General Merchandise Stores - 1.6% |
|||
|
Kohls Corp. (a) |
9,300 |
517,313 |
|
|
Target Corp. |
21,400 |
1,241,200 |
|
|
Wal-Mart Stores, Inc. |
54,900 |
3,163,613 |
|
|
|
4,922,126 |
||
|
Retail & Wholesale, Miscellaneous - 1.1% |
|||
|
Best Buy Co., Inc. (a) |
800 |
50,600 |
|
|
|
|||
|
Shares |
Value (Note 1) |
||
|
Home Depot, Inc. |
53,550 |
$ 2,674,153 |
|
|
Lowe's Companies, Inc. |
11,100 |
455,794 |
|
|
|
3,180,547 |
||
|
TOTAL RETAIL & WHOLESALE |
8,682,257 |
||
|
SERVICES - 0.7% |
|||
|
Advertising - 0.5% |
|||
|
Omnicom Group, Inc. |
17,200 |
1,531,875 |
|
|
Services - 0.2% |
|||
|
Ecolab, Inc. |
18,100 |
707,031 |
|
|
TOTAL SERVICES |
2,238,906 |
||
|
TECHNOLOGY - 19.0% |
|||
|
Communications Equipment - 5.3% |
|||
|
Cisco Systems, Inc. (a) |
111,000 |
7,055,438 |
|
|
Comverse Technology, Inc. (a) |
8,100 |
753,300 |
|
|
Corning, Inc. |
4,000 |
1,079,500 |
|
|
Lucent Technologies, Inc. |
30,200 |
1,789,350 |
|
|
Nokia AB sponsored ADR |
34,200 |
1,707,863 |
|
|
Nortel Networks Corp. |
53,100 |
3,683,465 |
|
|
|
16,068,916 |
||
|
Computer Services & Software - 3.4% |
|||
|
America Online, Inc. (a) |
25,950 |
1,368,863 |
|
|
BEA Systems, Inc. (a) |
14,100 |
697,069 |
|
|
DecisionOne Corp. |
583 |
6 |
|
|
DecisionOne Corp.: |
|
|
|
|
Class A warrants 4/18/07 (a) |
342 |
0 |
|
|
Class B warrants 4/18/07 (a) |
590 |
0 |
|
|
Class C warrants 4/18/07 (a) |
350 |
0 |
|
|
Inktomi Corp. (a) |
3,400 |
402,050 |
|
|
Microsoft Corp. (a) |
40,400 |
3,232,000 |
|
|
Oracle Corp. (a) |
38,700 |
3,253,219 |
|
|
VeriSign, Inc. (a) |
4,392 |
775,188 |
|
|
Yahoo!, Inc. (a) |
6,200 |
768,025 |
|
|
|
10,496,420 |
||
|
Computers & Office Equipment - 4.5% |
|||
|
Compaq Computer Corp. |
33,600 |
858,900 |
|
|
Dell Computer Corp. (a) |
42,700 |
2,105,644 |
|
|
EMC Corp. (a) |
50,100 |
3,854,569 |
|
|
Hewlett-Packard Co. |
8,400 |
1,048,950 |
|
|
International Business Machines Corp. |
24,000 |
2,629,500 |
|
|
Network Appliance, Inc. (a) |
8,300 |
668,150 |
|
|
Pitney Bowes, Inc. |
11,000 |
440,000 |
|
|
Sun Microsystems, Inc. (a) |
22,800 |
2,073,375 |
|
|
|
13,679,088 |
||
|
Electronic Instruments - 0.5% |
|||
|
Applied Materials, Inc. (a) |
10,400 |
942,500 |
|
|
KLA-Tencor Corp. (a) |
8,400 |
491,925 |
|
|
|
1,434,425 |
||
|
Common Stocks - continued |
|||
|
Shares |
Value (Note 1) |
||
|
TECHNOLOGY - continued |
|||
|
Electronics - 5.3% |
|||
|
Analog Devices, Inc. (a) |
12,900 |
$ 980,400 |
|
|
Broadcom Corp. Class A (a) |
4,200 |
919,538 |
|
|
Flextronics International Ltd. (a) |
6,500 |
446,469 |
|
|
Insilco Corp. warrants 8/15/07 (a) |
60 |
0 |
|
|
Intel Corp. |
39,300 |
5,253,919 |
|
|
JDS Uniphase Corp. (a) |
12,200 |
1,462,475 |
|
|
Micron Technology, Inc. (a) |
20,400 |
1,796,475 |
|
|
Motorola, Inc. |
32,900 |
956,156 |
|
|
Sanmina Corp. (a) |
7,900 |
675,450 |
|
|
Texas Instruments, Inc. |
55,100 |
3,784,681 |
|
|
|
16,275,563 |
||
|
TOTAL TECHNOLOGY |
57,954,412 |
||
|
UTILITIES - 5.7% |
|||
|
Cellular - 2.5% |
|||
|
China Telecom (Hong Kong) Ltd. (a) |
90,000 |
800,156 |
|
|
Leap Wireless International, Inc.: |
|
|
|
|
warrants 4/15/10 (a)(g) |
75 |
0 |
|
|
warrants 4/15/10 (a) |
65 |
0 |
|
|
Loral Orion Network Systems, Inc.: |
|
|
|
|
warrants 1/15/07 (CV ratio .47) (a) |
290 |
725 |
|
|
warrants 1/15/07 (CV ratio .6) (a) |
50 |
213 |
|
|
McCaw International Ltd. warrants 4/16/07 (a)(g) |
290 |
725 |
|
|
Nextel Communications, Inc. Class A (a) |
23,400 |
1,431,788 |
|
|
Sprint Corp. - PCS Group Series 1 (a) |
35,100 |
2,088,450 |
|
|
Vodafone AirTouch PLC sponsored ADR |
37,800 |
1,566,338 |
|
|
VoiceStream Wireless Corp. (a) |
14,700 |
1,709,564 |
|
|
|
7,597,959 |
||
|
Electric Utility - 0.3% |
|||
|
AES Corp. (a) |
21,800 |
994,625 |
|
|
Gas - 0.5% |
|||
|
Dynegy, Inc. Class A |
11,600 |
792,425 |
|
|
Enron Corp. |
9,200 |
593,400 |
|
|
|
1,385,825 |
||
|
Telephone Services - 2.4% |
|||
|
Allegiance Telecom, Inc. (a) |
6,900 |
441,600 |
|
|
AT&T Corp. |
16,604 |
525,102 |
|
|
BellSouth Corp. |
32,000 |
1,364,000 |
|
|
KMC Telecom Holdings, Inc. warrants 4/15/08 (a)(g) |
70 |
175 |
|
|
Level 3 Communications, Inc. (a) |
5,400 |
475,200 |
|
|
McLeodUSA, Inc. Class A (a) |
37,600 |
777,850 |
|
|
Ono Finance PLC rights 5/31/09 (a)(g) |
210 |
2,100 |
|
|
Qwest Communications |
13,600 |
675,750 |
|
|
SBC Communications, Inc. |
37,170 |
1,607,603 |
|
|
|
|||
|
Shares |
Value (Note 1) |
||
|
Sprint Corp. - FON Group |
12,300 |
$ 627,300 |
|
|
WorldCom, Inc. (a) |
19,489 |
894,058 |
|
|
|
7,390,738 |
||
|
TOTAL UTILITIES |
17,369,147 |
||
|
TOTAL COMMON STOCKS (Cost $133,038,091) |
173,287,830 |
||
|
Preferred Stocks - 0.4% |
|||
|
|
|
|
|
|
Convertible Preferred Stocks - 0.2% |
|||
|
MEDIA & LEISURE - 0.2% |
|||
|
Broadcasting - 0.2% |
|||
|
MediaOne Group, Inc. |
4,700 |
423,000 |
|
|
Nonconvertible Preferred Stocks - 0.2% |
|||
|
ENERGY - 0.0% |
|||
|
Energy Services - 0.0% |
|||
|
R&B Falcon Corp. 13.875% |
113 |
128,255 |
|
|
FINANCE - 0.0% |
|||
|
Insurance - 0.0% |
|||
|
American Annuity Group Capital |
50 |
44,513 |
|
|
HEALTH - 0.1% |
|||
|
Medical Facilities Management - 0.1% |
|||
|
Fresenius Medical Care Capital |
190 |
173,333 |
|
|
MEDIA & LEISURE - 0.1% |
|||
|
Broadcasting - 0.1% |
|||
|
CSC Holdings, Inc. 11.125% pay-in-kind |
2,136 |
223,212 |
|
|
Publishing - 0.0% |
|||
|
PRIMEDIA, Inc. Series D, $10.00 |
600 |
55,500 |
|
|
TOTAL MEDIA & LEISURE |
278,712 |
||
|
TOTAL NONCONVERTIBLE PREFERRED STOCKS |
624,813 |
||
|
TOTAL PREFERRED STOCKS (Cost $970,382) |
1,047,813 |
||
|
Corporate Bonds - 15.2% |
|||||
|
Moody's Ratings (unaudited) (b) |
Principal Amount |
|
|||
|
Convertible Bonds - 1.1% |
|||||
|
HEALTH - 0.4% |
|||||
|
Drugs & Pharmaceuticals - 0.4% |
|||||
|
Roche Holdings, Inc. |
- |
|
$ 1,261,000 |
1,153,815 |
|
|
Corporate Bonds - continued |
|||||
|
Moody's Ratings (unaudited) (b) |
Principal Amount |
Value |
|||
|
Convertible Bonds - continued |
|||||
|
MEDIA & LEISURE - 0.2% |
|||||
|
Broadcasting - 0.2% |
|||||
|
Liberty Media Corp. |
Baa3 |
|
$ 481,000 |
$ 521,885 |
|
|
TECHNOLOGY - 0.4% |
|||||
|
Computers & Office Equipment - 0.4% |
|||||
|
Juniper Networks, Inc. 4.75% 3/15/07 |
B- |
|
1,220,000 |
1,349,625 |
|
|
UTILITIES - 0.1% |
|||||
|
Cellular - 0.1% |
|||||
|
Nextel Communications, Inc. 5.25% 1/15/10 (g) |
B1 |
|
308,000 |
318,780 |
|
|
Telephone Services - 0.0% |
|||||
|
Level 3 Communications, Inc. 6% 3/15/10 |
Caa1 |
|
203,000 |
183,842 |
|
|
TOTAL UTILITIES |
502,622 |
||||
|
TOTAL CONVERTIBLE BONDS |
3,527,947 |
||||
|
Nonconvertible Bonds - 14.1% |
|||||
|
AEROSPACE & DEFENSE - 0.1% |
|||||
|
Defense Electronics - 0.1% |
|||||
|
Raytheon Co. |
Baa2 |
|
240,000 |
240,662 |
|
|
BASIC INDUSTRIES - 0.4% |
|||||
|
Chemicals & Plastics - 0.2% |
|||||
|
Huntsman Corp. |
B2 |
|
370,000 |
337,625 |
|
|
Lyondell Chemical Co. 10.875% 5/1/09 |
B2 |
|
340,000 |
337,450 |
|
|
|
675,075 |
||||
|
Metals & Mining - 0.0% |
|||||
|
Kaiser Aluminum & Chemical
Corp. |
B3 |
|
160,000 |
145,600 |
|
|
Packaging & Containers - 0.1% |
|||||
|
Gaylord Container Corp. 9.75% 6/15/07 |
Caa1 |
|
210,000 |
163,800 |
|
|
Paper & Forest Products - 0.1% |
|||||
|
APP China Group Ltd. |
B3 |
|
150,000 |
94,500 |
|
|
|
|||||
|
Moody's Ratings (unaudited) (b) |
Principal Amount |
Value |
|||
|
Fort James Corp. |
Baa2 |
|
$ 45,000 |
$ 43,274 |
|
|
Repap New Brunswick, Inc. yankee 10.625% 4/15/05 |
Caa1 |
|
230,000 |
202,400 |
|
|
|
340,174 |
||||
|
TOTAL BASIC INDUSTRIES |
1,324,649 |
||||
|
CONSTRUCTION & REAL ESTATE - 1.1% |
|||||
|
Building Materials - 0.1% |
|||||
|
Dayton Superior Corp. |
B3 |
|
160,000 |
158,400 |
|
|
Construction - 0.0% |
|||||
|
Lennar Corp. |
Ba1 |
|
25,000 |
24,625 |
|
|
Real Estate - 0.2% |
|||||
|
Duke Realty LP |
Baa1 |
|
500,000 |
491,350 |
|
|
LNR Property Corp. |
B1 |
|
160,000 |
139,200 |
|
|
|
630,550 |
||||
|
Real Estate Investment Trusts - 0.8% |
|||||
|
CenterPoint Properties Trust 6.75% 4/1/05 |
Baa2 |
|
100,000 |
93,160 |
|
|
Equity Office |
|
|
|
|
|
|
6.5% 1/15/04 |
Baa1 |
|
1,000,000 |
954,410 |
|
|
6.625% 2/15/05 |
Baa1 |
|
200,000 |
188,948 |
|
|
6.75% 2/15/08 |
Baa1 |
|
100,000 |
91,609 |
|
|
Ocwen Asset Investment Corp. 11.5% 7/1/05 |
- |
|
120,000 |
92,400 |
|
|
ProLogis Trust |
Baa1 |
|
70,000 |
66,675 |
|
|
Spieker Properties LP: |
|
|
|
|
|
|
6.8% 5/1/04 |
Baa2 |
|
90,000 |
86,265 |
|
|
6.875% 2/1/05 |
Baa2 |
|
1,000,000 |
956,150 |
|
|
|
2,529,617 |
||||
|
TOTAL CONSTRUCTION & REAL ESTATE |
3,343,192 |
||||
|
ENERGY - 0.6% |
|||||
|
Coal - 0.0% |
|||||
|
P&L Coal Holdings Corp. 9.625% 5/15/08 |
B2 |
|
135,000 |
125,213 |
|
|
Energy Services - 0.0% |
|||||
|
R&B Falcon Corp. |
Ba3 |
|
100,000 |
109,000 |
|
|
Oil & Gas - 0.6% |
|||||
|
Anadarko Petroleum Corp. 7.2% 3/15/29 |
Baa1 |
|
385,000 |
351,209 |
|
|
Apache Corp.: |
|
|
|
|
|
|
7.625% 7/1/19 |
Baa1 |
|
155,000 |
149,662 |
|
|
7.7% 3/15/26 |
Baa1 |
|
65,000 |
62,636 |
|
|
Corporate Bonds - continued |
|||||
|
Moody's Ratings (unaudited) (b) |
Principal Amount |
Value |
|||
|
Nonconvertible Bonds - continued |
|||||
|
ENERGY - continued |
|||||
|
Oil & Gas - continued |
|||||
|
Apache Finance Property Ltd. 6.5% 12/15/07 |
Baa1 |
|
$ 100,000 |
$ 90,750 |
|
|
Chesapeake Energy Corp. 9.625% 5/1/05 |
B2 |
|
250,000 |
243,750 |
|
|
Conoco, Inc. |
A3 |
|
125,000 |
119,300 |
|
|
Ocean Energy, Inc. |
Ba1 |
|
190,000 |
179,550 |
|
|
Phillips Petroleum Co. 6.375% 3/30/09 |
Baa2 |
|
250,000 |
225,868 |
|
|
Plains Resources, Inc. Series B 10.25% 3/15/06 |
B2 |
|
200,000 |
198,000 |
|
|
YPF Sociedad Anonima |
B1 |
|
50,000 |
49,050 |
|
|
|
1,669,775 |
||||
|
TOTAL ENERGY |
1,903,988 |
||||
|
FINANCE - 3.0% |
|||||
|
Banks - 1.1% |
|||||
|
ABN-Amro Bank NV, Chicago 6.625% 10/31/01 |
A1 |
|
500,000 |
494,055 |
|
|
Bank of Tokyo-Mitsubishi Ltd. 8.4% 4/15/10 |
A3 |
|
200,000 |
201,960 |
|
|
BankBoston Corp. |
A3 |
|
200,000 |
192,736 |
|
|
Barclays Bank PLC yankee 5.95% 7/15/01 |
A1 |
|
350,000 |
347,501 |
|
|
Capital One Bank |
Baa2 |
|
250,000 |
239,713 |
|
|
Capital One Financial Corp. 7.125% 8/1/08 |
Baa3 |
|
210,000 |
195,437 |
|
|
Commonwealth Bank of Australia 8.5% 6/1/10 |
A1 |
|
100,000 |
103,774 |
|
|
Korea Development Bank: |
|
|
|
|
|
|
6.625% 11/21/03 |
Baa2 |
|
170,000 |
163,537 |
|
|
7.375% 9/17/04 |
Baa2 |
|
160,000 |
155,056 |
|
|
MBNA Corp.: |
|
|
|
|
|
|
6.34% 6/2/03 |
Baa2 |
|
100,000 |
95,790 |
|
|
6.875% 11/15/02 |
Baa2 |
|
300,000 |
295,734 |
|
|
Sanwa Finance Aruba AEC 8.35% 7/15/09 |
Baa1 |
|
600,000 |
597,336 |
|
|
Sumitomo Bank International Finance NV 8.5% 6/15/09 |
Baa1 |
|
100,000 |
100,469 |
|
|
Summit Bancorp |
BBB+ |
|
100,000 |
101,231 |
|
|
|
3,284,329 |
||||
|
|
|||||
|
Moody's Ratings (unaudited) (b) |
Principal Amount |
Value |
|||
|
Credit & Other Finance - 1.8% |
|||||
|
Ahmanson Capital Trust I 8.36% 12/1/26 (g) |
A3 |
|
$ 250,000 |
$ 227,325 |
|
|
AMRESCO, Inc. |
Caa3 |
|
220,000 |
102,300 |
|
|
Associates Corp. of North America 6% 7/15/05 |
Aa3 |
|
250,000 |
233,693 |
|
|
Bellsouth Capital Funding Corp. 7.75% 2/15/10 |
Aa3 |
|
160,000 |
160,006 |
|
|
Daimler-Chrysler NA Holding
Corp. |
A1 |
|
100,000 |
98,811 |
|
|
ERP Operating LP: |
|
|
|
|
|
|
6.55% 11/15/01 |
A3 |
|
50,000 |
49,279 |
|
|
7.1% 6/23/04 |
A3 |
|
200,000 |
193,952 |
|
|
Finova Capital Corp.: |
|
|
|
|
|
|
6.11% 2/18/03 |
Baa2 |
|
200,000 |
176,000 |
|
|
7.25% 11/8/04 |
Baa2 |
|
100,000 |
89,000 |
|
|
Ford Motor Credit Co.: |
|
|
|
|
|
|
6.5% 2/28/02 |
A2 |
|
1,000,000 |
984,150 |
|
|
7.875% 6/15/10 |
A2 |
|
1,040,000 |
1,041,477 |
|
|
Household Finance Corp. 8% 5/9/05 |
A2 |
|
300,000 |
302,541 |
|
|
Imperial Credit Capital Trust I 10.25% 6/14/02 |
B2 |
|
20,000 |
17,000 |
|
|
Imperial Credit Industries 9.875% 1/15/07 |
B3 |
|
330,000 |
237,600 |
|
|
Newcourt Credit Group, Inc. 6.875% 2/16/05 |
A1 |
|
340,000 |
323,513 |
|
|
Sprint Capital Corp.: |
|
|
|
|
|
|
5.875% 5/1/04 |
Baa1 |
|
375,000 |
353,265 |
|
|
6.875% 11/15/28 |
Baa1 |
|
735,000 |
635,510 |
|
|
Trizec Finance Ltd. yankee 10.875% 10/15/05 |
Baa3 |
|
100,000 |
98,000 |
|
|
TXU Eastern Funding 6.75% 5/15/09 |
Baa1 |
|
100,000 |
89,417 |
|
|
U.S. West Capital Funding, Inc. 6.875% 7/15/28 |
Baa1 |
|
60,000 |
51,537 |
|
|
|
5,464,376 |
||||
|
Savings & Loans - 0.1% |
|||||
|
Long Island Savings Bank FSB 6.2% 4/2/01 |
Baa3 |
|
500,000 |
499,445 |
|
|
TOTAL FINANCE |
9,248,150 |
||||
|
HEALTH - 0.0% |
|||||
|
Medical Facilities Management - 0.0% |
|||||
|
Unilab Corp. |
B3 |
|
70,000 |
72,100 |
|
|
INDUSTRIAL MACHINERY & EQUIPMENT - 0.4% |
|||||
|
Industrial Machinery & Equipment - 0.3% |
|||||
|
Tyco International Group SA yankee 6.875% 1/15/29 |
Baa1 |
|
1,000,000 |
844,770 |
|
|
Corporate Bonds - continued |
|||||
|
Moody's Ratings (unaudited) (b) |
Principal Amount |
Value |
|||
|
Nonconvertible Bonds - continued |
|||||
|
INDUSTRIAL MACHINERY & EQUIPMENT - continued |
|||||
|
Pollution Control - 0.1% |
|||||
|
Allied Waste |
|
|
|
|
|
|
7.625% 1/1/06 |
Ba2 |
|
$ 155,000 |
$ 134,850 |
|
|
7.875% 1/1/09 |
Ba2 |
|
170,000 |
144,500 |
|
|
WMX Technologies, Inc. 7.1% 8/1/26 |
Ba1 |
|
120,000 |
112,946 |
|
|
|
392,296 |
||||
|
TOTAL INDUSTRIAL MACHINERY & EQUIPMENT |
1,237,066 |
||||
|
MEDIA & LEISURE - 3.0% |
|||||
|
Broadcasting - 2.6% |
|||||
|
ACME Television LLC/ACME Financial Corp. 0% 9/30/04 (e) |
B3 |
|
200,000 |
191,000 |
|
|
Adelphia Communications Corp. 9.875% 3/1/05 |
B1 |
|
150,000 |
146,250 |
|
|
Ascent Entertainment Group, Inc. 0% 12/15/04 (e) |
Ba1 |
|
230,000 |
186,300 |
|
|
British Sky Broadcasting Group PLC 8.2% 7/15/09 |
Baa3 |
|
650,000 |
608,036 |
|
|
Cable Satisfaction International, Inc. 12.75% 3/1/10 |
Caa1 |
|
200,000 |
194,500 |
|
|
Callahan Nordrhein Westfalen 14% 7/15/10 (g) |
B3 |
|
250,000 |
250,000 |
|
|
CapStar Broadcasting
Partners, Inc. |
B2 |
|
190,000 |
173,375 |
|
|
Charter Communications Holdings LLC/Charter Communications Holdings Capital Corp.: |
|
|
|
|
|
|
0% 1/15/10 (e) |
B2 |
|
320,000 |
181,600 |
|
|
8.25% 4/1/07 |
B2 |
|
180,000 |
159,300 |
|
|
8.625% 4/1/09 |
B2 |
|
180,000 |
158,850 |
|
|
Continental Cablevision, Inc. 8.3% 5/15/06 |
A2 |
|
215,000 |
220,093 |
|
|
Diamond Cable
Communications PLC |
B3 |
|
210,000 |
161,175 |
|
|
Earthwatch, Inc. 0% 7/15/07 unit (e)(g) |
- |
|
130,000 |
83,200 |
|
|
EchoStar DBS Corp. 9.375% 2/1/09 |
B2 |
|
260,000 |
250,900 |
|
|
Impsat Fiber Networks, Inc. 13.75% 2/15/05 (g) |
B3 |
|
195,000 |
173,550 |
|
|
International Cabletel, Inc. 0% 2/1/06 (e) |
B3 |
|
250,000 |
230,000 |
|
|
LIN Holdings Corp. |
B3 |
|
270,000 |
177,525 |
|
|
|
|||||
|
Moody's Ratings (unaudited) (b) |
Principal Amount |
Value |
|||
|
Nielsen Media Research, Inc. 7.6% 6/15/09 |
Baa2 |
|
$ 150,000 |
$ 143,127 |
|
|
NorthPoint Communication Holdings, Inc. 12.875% 2/15/10 |
Caa1 |
|
150,000 |
103,500 |
|
|
NTL, Inc. 0% 4/1/08 (e) |
B3 |
|
560,000 |
347,200 |
|
|
Olympus Communications LP/Olympus Capital Corp. 10.625% 11/15/06 |
B1 |
|
170,000 |
166,600 |
|
|
Satelites Mexicanos SA de CV 11.28% 6/30/04 (g)(i) |
B1 |
|
74,000 |
67,340 |
|
|
Shaw Communications, Inc. 8.25% 4/11/10 |
Baa2 |
|
140,000 |
141,135 |
|
|
Spectrasite Holdings, Inc.: |
|
|
|
|
|
|
0% 3/15/10 (e) |
B3 |
|
65,000 |
34,938 |
|
|
10.75% 3/15/10 |
B3 |
|
25,000 |
24,875 |
|
|
TCI Communications
Financing III |
A3 |
|
180,000 |
198,864 |
|
|
Telewest PLC 0% 10/1/07 (e) |
B1 |
|
270,000 |
257,850 |
|
|
Time Warner, Inc. |
Baa3 |
|
910,000 |
927,918 |
|
|
UIH Australia/Pacific, Inc.: |
|
|
|
|
|
|
Series B 0% 5/15/06 (e) |
B2 |
|
380,000 |
349,600 |
|
|
Series D 0% 5/15/06 (e) |
B2 |
|
30,000 |
27,600 |
|
|
United Pan-Europe Communications NV: |
|
|
|
|
|
|
0% 8/1/09 (e) |
B2 |
|
230,000 |
115,000 |
|
|
0% 2/1/10 (e) |
B2 |
|
270,000 |
126,900 |
|
|
10.875% 11/1/07 |
B2 |
|
480,000 |
432,000 |
|
|
10.875% 8/1/09 |
B2 |
|
275,000 |
242,000 |
|
|
11.25% 11/1/09 |
B2 |
|
15,000 |
13,125 |
|
|
USA Networks, Inc./USANi
LLC |
Baa3 |
|
580,000 |
552,450 |
|
|
|
7,817,676 |
||||
|
Entertainment - 0.0% |
|||||
|
Regal Cinemas, Inc. 9.5% 6/1/08 |
Ca |
|
355,000 |
88,750 |
|
|
Lodging & Gaming - 0.0% |
|||||
|
Horseshoe Gaming LLC 8.625% 5/15/09 |
B2 |
|
70,000 |
65,800 |
|
|
KSL Recreation Group, Inc. 10.25% 5/1/07 |
B2 |
|
90,000 |
85,500 |
|
|
|
151,300 |
||||
|
Publishing - 0.3% |
|||||
|
News America Holdings, Inc. 7.375% 10/17/08 |
Baa3 |
|
500,000 |
480,685 |
|
|
News America, Inc.: |
|
|
|
|
|
|
7.125% 4/8/28 |
Baa3 |
|
80,000 |
66,850 |
|
|
7.28% 6/30/28 |
Baa3 |
|
200,000 |
172,432 |
|
|
7.3% 4/30/28 |
Baa3 |
|
170,000 |
145,143 |
|
|
|
865,110 |
||||
|
Corporate Bonds - continued |
|||||
|
Moody's Ratings (unaudited) (b) |
Principal Amount |
Value |
|||
|
Nonconvertible Bonds - continued |
|||||
|
MEDIA & LEISURE - continued |
|||||
|
Restaurants - 0.1% |
|||||
|
AFC Enterprises, Inc. 10.25% 5/15/07 |
B3 |
|
$ 170,000 |
$ 161,500 |
|
|
TOTAL MEDIA & LEISURE |
9,084,336 |
||||
|
NONDURABLES - 0.2% |
|||||
|
Beverages - 0.1% |
|||||
|
Seagram JE & Sons, Inc.: |
|
|
|
|
|
|
6.625% 12/15/05 |
Baa3 |
|
150,000 |
143,370 |
|
|
6.8% 12/15/08 |
Baa3 |
|
200,000 |
187,565 |
|
|
|
330,935 |
||||
|
Tobacco - 0.1% |
|||||
|
RJ Reynolds Tobacco
Holdings, Inc. |
Baa2 |
|
200,000 |
185,752 |
|
|
TOTAL NONDURABLES |
516,687 |
||||
|
RETAIL & WHOLESALE - 0.3% |
|||||
|
Drug Stores - 0.1% |
|||||
|
Rite Aid Corp.: |
|
|
|
|
|
|
6.5% 12/15/05 (g) |
Caa1 |
|
420,000 |
216,300 |
|
|
7.125% 1/15/07 |
Caa1 |
|
110,000 |
58,300 |
|
|
|
274,600 |
||||
|
General Merchandise Stores - 0.1% |
|||||
|
Federated Department Stores,
Inc. |
Baa1 |
|
500,000 |
483,520 |
|
|
Grocery Stores - 0.1% |
|||||
|
Jitney-Jungle Stores |
|
|
|
|
|
|
10.375% 9/15/07 (d) |
C |
|
450,000 |
9,000 |
|
|
12% 3/1/06 (d) |
Caa3 |
|
10,000 |
1,250 |
|
|
Kroger Co. 6% 7/1/00 |
Baa3 |
|
200,000 |
199,962 |
|
|
|
210,212 |
||||
|
TOTAL RETAIL & WHOLESALE |
968,332 |
||||
|
SERVICES - 0.1% |
|||||
|
Printing - 0.0% |
|||||
|
Sullivan Graphics, Inc. 12.75% 8/1/05 |
Caa1 |
|
40,000 |
40,200 |
|
|
Services - 0.1% |
|||||
|
SITEL Corp. |
B3 |
|
250,000 |
220,000 |
|
|
TOTAL SERVICES |
260,200 |
||||
|
|
|||||
|
Moody's Ratings (unaudited) (b) |
Principal Amount |
Value |
|||
|
TECHNOLOGY - 0.6% |
|||||
|
Computer Services & Software - 0.3% |
|||||
|
Concentric Network Corp. 12.75% 12/15/07 |
B- |
|
$ 50,000 |
$ 52,500 |
|
|
Covad Communications
Group, Inc. |
B3 |
|
355,000 |
275,125 |
|
|
Exodus Communications, Inc. 11.625% 7/15/10 (g) |
B |
|
280,000 |
281,400 |
|
|
PSINet, Inc. |
B3 |
|
260,000 |
239,200 |
|
|
|
848,225 |
||||
|
Computers & Office Equipment - 0.2% |
|||||
|
Comdisco, Inc.: |
|
|
|
|
|
|
5.95% 4/30/02 |
Baa1 |
|
300,000 |
284,763 |
|
|
7.25% 9/1/02 |
Baa1 |
|
250,000 |
241,973 |
|
|
Globix Corp. |
B- |
|
95,000 |
78,375 |
|
|
|
605,111 |
||||
|
Electronic Instruments - 0.0% |
|||||
|
Telecommunications Techniques Co. LLC 9.75% 5/15/08 |
B3 |
|
80,000 |
73,600 |
|
|
Electronics - 0.1% |
|||||
|
ChipPAC International Ltd. 12.75% 8/1/09 |
B3 |
|
40,000 |
43,000 |
|
|
Hadco Corp. |
B2 |
|
140,000 |
140,350 |
|
|
SCG Holding Corp./Semiconductor Components Industries LLC 12% 8/1/09 |
B2 |
|
52,000 |
55,510 |
|
|
|
238,860 |
||||
|
TOTAL TECHNOLOGY |
1,765,796 |
||||
|
TRANSPORTATION - 0.9% |
|||||
|
Air Transportation - 0.4% |
|||||
|
Atlas Air, Inc.: |
|
|
|
|
|
|
8.77% 1/2/11 |
Ba1 |
|
86,129 |
83,115 |
|
|
9.375% 11/15/06 |
B3 |
|
220,000 |
213,400 |
|
|
Continental Airlines, Inc. pass thru trust certificates: |
|
|
|
|
|
|
7.434% 3/15/06 |
Baa1 |
|
70,000 |
67,683 |
|
|
7.73% 9/15/12 |
Baa1 |
|
28,243 |
26,975 |
|
|
Delta Air Lines, Inc. |
Baa3 |
|
500,000 |
464,750 |
|
|
US Air, Inc. |
B3 |
|
430,000 |
425,700 |
|
|
|
1,281,623 |
||||
|
Railroads - 0.5% |
|||||
|
Burlington Northern |
|
|
|
|
|
|
6.875% 12/1/27 |
Baa2 |
|
1,000,000 |
860,780 |
|
|
Corporate Bonds - continued |
|||||
|
Moody's Ratings (unaudited) (b) |
Principal Amount |
Value |
|||
|
Nonconvertible Bonds - continued |
|||||
|
TRANSPORTATION - continued |
|||||
|
Railroads - continued |
|||||
|
Burlington Northern |
|
|
|
|
|
|
7.29% 6/1/36 |
Baa2 |
|
$ 150,000 |
$ 146,609 |
|
|
Norfolk Southern Corp. 7.05% 5/1/37 |
Baa1 |
|
340,000 |
332,302 |
|
|
|
1,339,691 |
||||
|
TOTAL TRANSPORTATION |
2,621,314 |
||||
|
UTILITIES - 3.4% |
|||||
|
Cellular - 0.5% |
|||||
|
Cellnet Data Systems, Inc. 0% 10/1/07 (e) |
- |
|
300,000 |
24,000 |
|
|
Clearnet Communications, Inc. yankee 0% 12/15/05 (e) |
B3 |
|
200,000 |
206,000 |
|
|
Crown Castle International Corp. 10.75% 8/1/11 |
B3 |
|
45,000 |
45,675 |
|
|
Dobson Communications Corp. 10.875% 7/1/10 (g) |
- |
|
50,000 |
50,375 |
|
|
Leap Wireless International, Inc.: |
|
|
|
|
|
|
0% 4/15/10 (e)(g) |
- |
|
65,000 |
27,300 |
|
|
12.5% 4/15/10 (g) |
Caa2 |
|
75,000 |
66,000 |
|
|
McCaw International Ltd. 0% 4/15/07 (e) |
Caa1 |
|
270,000 |
205,200 |
|
|
Millicom International Cellular
SA |
Caa1 |
|
241,000 |
204,850 |
|
|
Nextel |
|
|
|
|
|
|
0% 10/31/07 (e) |
B1 |
|
420,000 |
312,900 |
|
|
9.375% 11/15/09 |
B1 |
|
170,000 |
163,200 |
|
|
VoiceStream |
|
|
|
|
|
|
0% 11/15/09 (e) |
B2 |
|
295,000 |
197,650 |
|
|
10.375% 11/15/09 |
B2 |
|
170,000 |
176,800 |
|
|
|
1,679,950 |
||||
|
Electric Utility - 0.4% |
|||||
|
Avon Energy Partners Holdings 6.46% 3/4/08 (g) |
Baa2 |
|
300,000 |
267,204 |
|
|
Dominion Resources, Inc. 8.125% 6/15/10 |
Baa1 |
|
165,000 |
166,115 |
|
|
Illinois Power Co. |
Baa1 |
|
150,000 |
146,427 |
|
|
Israel Electric Corp. Ltd. 7.75% 12/15/27 (g) |
A3 |
|
545,000 |
467,147 |
|
|
|
|||||
|
Moody's Ratings (unaudited) (b) |
Principal Amount |
Value |
|||
|
Niagara Mohawk Power Corp. 8.875% 5/15/07 |
Baa3 |
|
$ 75,000 |
$ 77,640 |
|
|
Texas Utilities Co. |
Baa3 |
|
100,000 |
90,325 |
|
|
|
1,214,858 |
||||
|
Gas - 0.3% |
|||||
|
CMS Panhandle |
|
|
|
|
|
|
6.125% 3/15/04 |
Baa3 |
|
150,000 |
141,675 |
|
|
7% 7/15/29 |
Baa3 |
|
150,000 |
125,880 |
|
|
Reliant Energy Resources Corp. 8.125% 7/15/05 (g) |
Baa1 |
|
500,000 |
499,900 |
|
|
|
767,455 |
||||
|
Telephone Services - 2.2% |
|||||
|
Allegiance Telecom, Inc. 12.875% 5/15/08 |
B3 |
|
200,000 |
216,500 |
|
|
Cable & Wireless Optus Ltd. 8% 6/22/10 (g) |
Baa1 |
|
700,000 |
695,681 |
|
|
Deutsche Telekom International Finance BV 8.25% 6/15/30 |
Aa2 |
|
935,000 |
949,895 |
|
|
Esat Telecom Group PLC 0% 2/1/07 (e) |
Aa1 |
|
230,000 |
213,900 |
|
|
Global Crossing Holdings Ltd. 9.625% 5/15/08 |
Ba2 |
|
180,000 |
176,400 |
|
|
Global TeleSystems Group, Inc. 9.875% 2/15/05 |
Caa1 |
|
330,000 |
227,700 |
|
|
Globenet Communication
Group Ltd. |
Caa1 |
|
560,000 |
565,600 |
|
|
Hermes Europe Railtel BV 11.5% 8/15/07 |
B3 |
|
150,000 |
125,250 |
|
|
ICG Holdings, Inc. |
B3 |
|
260,000 |
249,600 |
|
|
Intermedia Communications,
Inc. |
B3 |
|
330,000 |
200,475 |
|
|
KMC Telecom Holdings, Inc. 13.5% 5/15/09 |
Caa2 |
|
170,000 |
141,100 |
|
|
NEXTLINK Communications,
Inc. |
B2 |
|
500,000 |
287,500 |
|
|
Ono Finance PLC |
Caa1 |
|
215,000 |
203,175 |
|
|
Rhythms NetConnections, Inc. 14% 2/15/10 (g) |
B3 |
|
200,000 |
144,000 |
|
|
Telecomunicaciones de Puerto
Rico, Inc. |
Baa2 |
|
220,000 |
204,882 |
|
|
Teleglobe Canada, Inc.: |
|
|
|
|
|
|
7.2% 7/20/09 |
Baa1 |
|
449,000 |
429,626 |
|
|
7.7% 7/20/29 |
Baa1 |
|
666,000 |
627,152 |
|
|
Versatel Telecom |
B3 |
|
150,000 |
152,250 |
|
|
Viatel, Inc. 11.25% 4/15/08 |
B3 |
|
250,000 |
187,500 |
|
|
Corporate Bonds - continued |
|||||
|
Moody's Ratings (unaudited) (b) |
Principal Amount |
Value |
|||
|
Nonconvertible Bonds - continued |
|||||
|
UTILITIES - continued |
|||||
|
Telephone Services - continued |
|||||
|
WinStar Communications, Inc. 12.75% 4/15/10 (g) |
B3 |
|
$ 450,000 |
$ 434,250 |
|
|
WorldCom, Inc. |
A3 |
|
184,000 |
190,782 |
|
|
|
6,623,218 |
||||
|
TOTAL UTILITIES |
10,285,481 |
||||
|
TOTAL NONCONVERTIBLE BONDS |
42,871,953 |
||||
|
TOTAL CORPORATE BONDS (Cost $48,683,174) |
46,399,900 |
||||
|
U.S. Government and Government |
|||||
|
|
|||||
|
U.S. Government Agency Obligations - 1.7% |
|||||
|
Fannie Mae: |
|
|
|
|
|
|
6.5% 4/29/09 |
Aaa |
|
1,600,000 |
1,494,752 |
|
|
7.125% 2/15/05 |
Aaa |
|
1,315,000 |
1,320,339 |
|
|
7.25% 5/15/30 |
Aaa |
|
660,000 |
673,435 |
|
|
Federal Home Loan Bank 7.59% 3/10/05 |
Aaa |
|
190,000 |
193,859 |
|
|
Freddie Mac: |
|
|
|
|
|
|
5.75% 3/15/09 |
Aaa |
|
800,000 |
728,624 |
|
|
6.25% 7/15/04 |
Aaa |
|
310,000 |
301,379 |
|
|
6.875% 1/15/05 |
Aaa |
|
185,000 |
183,844 |
|
|
7% 7/15/05 |
Aaa |
|
250,000 |
249,650 |
|
|
Government Trust Certificates (assets of Trust guaranteed by U.S. Government through Defense Security Assistance Agency) Class 2-E, 9.4% 5/15/02 |
Aaa |
|
34,670 |
35,168 |
|
|
Tennessee Valley Authority 7.125% 5/1/30 |
Aaa |
|
140,000 |
140,588 |
|
|
TOTAL U.S. GOVERNMENT AGENCY OBLIGATIONS |
5,321,638 |
||||
|
U.S. Treasury Obligations - 8.7% |
|||||
|
U.S. Treasury Bonds: |
|
|
|
|
|
|
6.125% 8/15/29 |
Aaa |
|
1,660,000 |
1,676,600 |
|
|
8.875% 8/15/17 |
Aaa |
|
3,805,000 |
4,850,195 |
|
|
9.875% 11/15/15 |
Aaa |
|
625,000 |
847,463 |
|
|
14% 11/15/11 |
Aaa |
|
490,000 |
680,488 |
|
|
U.S. Treasury Notes: |
|
|
|
|
|
|
5.5% 5/31/03 |
Aaa |
|
6,000,000 |
5,861,220 |
|
|
5.5% 2/15/08 |
Aaa |
|
100,000 |
95,719 |
|
|
5.625% 9/30/01 |
Aaa |
|
140,000 |
138,512 |
|
|
|
|||||
|
Moody's Ratings (unaudited) (b) |
Principal Amount |
Value |
|||
|
5.875% 10/31/01 |
Aaa |
|
$ 1,950,000 |
$ 1,934,771 |
|
|
5.875% 11/15/04 |
Aaa |
|
2,850,000 |
2,808,590 |
|
|
6.5% 5/31/02 |
Aaa |
|
3,010,000 |
3,013,763 |
|
|
7% 7/15/06 |
Aaa |
|
3,750,000 |
3,885,938 |
|
|
U.S. Treasury Notes - |
Aaa |
|
1,430,000 |
709,652 |
|
|
TOTAL U.S. TREASURY OBLIGATIONS |
26,502,911 |
||||
|
TOTAL U.S. GOVERNMENT AND GOVERNMENT AGENCY OBLIGATIONS (Cost $31,715,419) |
31,824,549 |
||||
|
U.S. Government Agency - |
|||||
|
|
|||||
|
Fannie Mae - 9.1% |
|||||
|
5.5% 2/1/11 |
Aaa |
|
156,534 |
145,429 |
|
|
6% 4/1/09 to 1/1/29 |
Aaa |
|
1,860,194 |
1,734,133 |
|
|
6.5% 11/1/25 to 7/1/29 |
Aaa |
|
11,136,937 |
10,514,432 |
|
|
6.5% 7/1/30 (h) |
Aaa |
|
3,500,000 |
3,298,750 |
|
|
7% 12/1/24 to 9/1/28 |
Aaa |
|
3,344,454 |
3,236,903 |
|
|
7.5% 5/1/15 to 1/1/30 |
Aaa |
|
8,490,673 |
8,375,883 |
|
|
8% 12/1/29 |
Aaa |
|
499,027 |
501,053 |
|
|
TOTAL FANNIE MAE |
27,806,583 |
||||
|
Freddie Mac - 0.1% |
|||||
|
7.5% 1/1/27 |
Aaa |
|
367,456 |
363,782 |
|
|
Government National Mortgage Association - 3.8% |
|||||
|
6.5% 4/15/28 to 4/15/29 |
Aaa |
|
10,337,543 |
9,813,560 |
|
|
7% 1/15/28 to 12/15/28 |
Aaa |
|
636,734 |
619,020 |
|
|
7.5% 6/15/27 to 3/15/28 |
Aaa |
|
1,153,223 |
1,145,846 |
|
|
TOTAL GOVERNMENT NATIONAL |
11,578,426 |
||||
|
TOTAL U.S. GOVERNMENT AGENCY - (Cost $41,146,234) |
39,748,791 |
||||
|
Asset-Backed Securities - 0.8% |
|||||
|
|
|||||
|
American Express Credit
Account Master Trust |
A1 |
|
200,000 |
192,297 |
|
|
Ford Credit Auto |
|
|
|
|
|
|
6.2% 12/15/02 |
Aa2 |
|
510,000 |
503,067 |
|
|
6.4% 12/15/02 |
Aa2 |
|
80,000 |
78,960 |
|
|
7.03% 11/15/03 |
Aaa |
|
145,000 |
144,887 |
|
|
Key Auto Finance Trust: |
|
|
|
|
|
|
6.3% 10/15/03 |
A2 |
|
197,699 |
196,711 |
|
|
6.65% 10/15/03 |
Baa3 |
|
59,053 |
58,979 |
|
|
Asset-Backed Securities - continued |
|||||
|
Moody's Ratings (unaudited) (b) |
Principal Amount |
Value |
|||
|
Premier Auto Trust |
Aaa |
|
$ 1,000,000 |
$ 970,310 |
|
|
Sears Credit Account Master
Trust II |
A2 |
|
200,000 |
200,000 |
|
|
TOTAL ASSET-BACKED SECURITIES (Cost $2,390,044) |
2,345,211 |
||||
|
Commercial Mortgage Securities - 0.9% |
|||||
|
|
|||||
|
CS First Boston Mortgage Securities Corp.: |
|
|
|
|
|
|
Series 1997-C2 Class D, 7.27% 1/17/35 |
Baa2 |
|
220,000 |
202,245 |
|
|
Series 1998-FL1: |
|
|
|
|
|
|
Class D, 7.1415% 12/10/00 (g)(i) |
A2 |
|
300,000 |
299,543 |
|
|
Class E, 7.4913% 1/10/13 (g)(i) |
Baa2 |
|
420,000 |
418,130 |
|
|
DLJ Commercial Mortgage Corp. 7.62% 5/10/10 |
Aaa |
|
500,000 |
501,484 |
|
|
GS Mortgage Securities Corp. II Series 1998-GLII Class E, 7.1905% 4/13/31 (g)(i) |
Baa3 |
|
500,000 |
432,285 |
|
|
Prudential Securities Secd Financing Corp. Series 2000-C1, Class A2 7.727% 2/15/10 |
Aaa |
|
450,000 |
454,359 |
|
|
Thirteen Affiliates of General Growth Properties, Inc. sequential pay Series 1 Class A2, 6.602% 12/15/10 (g) |
Aaa |
|
500,000 |
473,242 |
|
|
TOTAL COMMERCIAL MORTGAGE SECURITIES (Cost $2,876,556) |
2,781,288 |
||||
|
Foreign Government and Government |
|||||
|
|
|||||
|
Korean Republic yankee: |
|
|
|
|
|
|
8.75% 4/15/03 |
Baa2 |
|
80,000 |
81,437 |
|
|
8.875% 4/15/08 |
Baa2 |
|
116,000 |
119,654 |
|
|
Quebec Province yankee: |
|
|
|
|
|
|
6.86% 4/15/26 (f) |
A2 |
|
250,000 |
240,255 |
|
|
7.125% 2/9/24 |
A2 |
|
30,000 |
28,337 |
|
|
7.5% 7/15/23 |
A2 |
|
30,000 |
29,574 |
|
|
United Mexican States 9.875% 2/1/10 |
Baa3 |
|
200,000 |
209,000 |
|
|
TOTAL FOREIGN GOVERNMENT AND GOVERNMENT AGENCY OBLIGATIONS (Cost $727,451) |
708,257 |
||||
|
Supranational Obligations - 0.2% |
|||||
|
Moody's Ratings (unaudited) (b) |
Principal Amount |
Value |
|||
|
Inter-American Development
Bank yankee 6.29%
7/16/27 |
Aaa |
|
$ 500,000 |
$ 476,310 |
|
|
Cash Equivalents - 3.0% |
|||
|
Shares |
|
||
|
Taxable Central Cash Fund, |
9,219,794 |
9,219,794 |
|
|
TOTAL INVESTMENT PORTFOLIO - 100.9% (Cost $271,264,000) |
307,839,743 |
||
|
NET OTHER ASSETS - (0.9)% |
(2,855,046) |
||
|
NET ASSETS - 100% |
$ 304,984,697 |
||
|
Security Type Abbreviations |
||
|
PIES |
- |
Premium Income Equity Securities |
|
Legend |
|
(a) Non-income producing |
|
(b) S&P credit ratings are used in the absence of a rating by Moody's Investors Service, Inc. |
|
(c) The rate quoted is the annualized seven-day yield of the fund at |
|
(d) Non-income producing - issuer filed for protection under the |
|
(e) Debt obligation initially issued in zero coupon form which converts to coupon form at a specified rate and date. The rate shown is the rate at period end. |
|
(f) Debt obligation initially issued at one coupon which converts to a higher coupon at a specified date. The rate shown is the rate at period end. |
|
(g) Security exempt from registration under Rule 144A of the Securities Act |
|
(h) Security purchased on a delayed delivery or when-issued basis. |
|
(i) The coupon rate shown on floating or adjustable rate securities represents the rate at period end. |
|
(j) For foreign government obligations not individually rated by S&P |
|
(k) Restricted securities - Investment in securities not registered under the Securities Act of 1933. |
|
Additional information on each holding is as follows: |
|
Security |
Acquisition Date |
Acquisition Cost |
|
Mothers Work, Inc. |
6/18/98 |
$ 18 |
|
Other Information |
|
The composition of long-term debt holdings as a percentage of total value |
|
Moody's Ratings |
S&P Ratings |
|||
|
Aaa, Aa, A |
27.2% |
|
AAA, AA, A |
25.5% |
|
Baa |
6.9% |
|
BBB |
5.9% |
|
Ba |
0.4% |
|
BB |
0.6% |
|
B |
3.9% |
|
B |
4.7% |
|
Caa |
0.9% |
|
CCC |
0.7% |
|
Ca, C |
0.0% |
|
CC, C |
0.0% |
|
|
|
|
D |
0.0% |
|
The percentage not rated by Moody's or S&P amounted to 0.5%. FMR has determined that unrated debt securities that are lower quality account for 0.5% of the total value of investment in securities. |
|
Purchases and sales of securities, other than short-term securities, aggregated $224,411,074 and $262,292,592, respectively, of which long-term U.S. government and government agency obligations aggregated $59,871,450 and $60,369,656, respectively. |
|
The fund placed a portion of its portfolio transactions with brokerage firms which are affiliates of Fidelity Management & Research Company. The commissions paid to these affiliated firms were $8,986 for the period. |
|
The fund invested in securities that are not registered under the Securities Act of 1933. These securities are subject to legal or contractual restrictions on resale. At the end of the period, restricted securities (excluding Rule 144A issues) amounted to $34 and 0% of net assets. |
|
Income Tax Information |
|
At June 30, 2000, the aggregate cost of investment securities for income tax purposes was $266,299,649. Net unrealized appreciation aggregated $41,540,094, of which $50,485,729 related to appreciated investment securities and $8,945,635 related to depreciated investment securities. |
See accompanying notes which are an integral part of the financial statements.
Balanced Portfolio
Statement of Assets and Liabilities
|
|
June 30, 2000 (Unaudited) |
|
|
Assets |
|
|
|
Investment in securities, at value |
|
$ 307,839,743 |
|
Commitment to sell securities on a delayed delivery basis |
$ (5,690,625) |
|
|
Receivable for securities sold on a delayed delivery basis |
5,685,000 |
(5,625) |
|
Receivable for investments sold, regular delivery |
|
3,535,259 |
|
Cash |
|
23,298 |
|
Receivable for fund shares sold |
|
242,446 |
|
Dividends receivable |
|
49,966 |
|
Interest receivable |
|
1,666,464 |
|
Other receivables |
|
44,424 |
|
Total assets |
|
313,395,975 |
|
Liabilities |
|
|
|
Payable for investments purchased |
4,592,826 |
|
|
Delayed delivery |
3,294,642 |
|
|
Payable for fund shares redeemed |
376,552 |
|
|
Accrued management fee |
108,417 |
|
|
Distribution fees payable |
2,544 |
|
|
Other payables and |
36,297 |
|
|
Total liabilities |
|
8,411,278 |
|
Net Assets |
|
$ 304,984,697 |
|
Net Assets consist of: |
|
|
|
Paid in capital |
|
$ 259,384,219 |
|
Undistributed net investment income |
|
5,026,674 |
|
Accumulated undistributed net realized gain (loss) on investments and foreign currency transactions |
|
4,004,148 |
|
Net unrealized appreciation
(depreciation) on investments |
|
36,569,656 |
|
Net Assets |
|
$ 304,984,697 |
|
Initial Class: |
|
$15.09 |
|
Service Class: |
|
$15.03 |
|
Service Class 2: |
|
$15.02 |
Statement of Operations
|
|
Six months ended June 30, 2000 (Unaudited) |
|
|
Investment Income Dividends |
|
$ 1,026,288 |
|
Interest |
|
4,833,980 |
|
Security lending |
|
131 |
|
Total income |
|
5,860,399 |
|
Expenses |
|
|
|
Management fee |
$ 667,765 |
|
|
Transfer agent fees |
101,971 |
|
|
Distribution fees |
13,916 |
|
|
Accounting and security lending fees |
59,780 |
|
|
Non-interested trustees' compensation |
506 |
|
|
Custodian fees and expenses |
13,860 |
|
|
Audit |
14,098 |
|
|
Legal |
1,823 |
|
|
Reports to shareholders |
309 |
|
|
Miscellaneous |
137 |
|
|
Total expenses before reductions |
874,165 |
|
|
Expense reductions |
(26,193) |
847,972 |
|
Net investment income |
|
5,012,427 |
|
Realized and Unrealized Gain (Loss) Net realized gain (loss) on: |
|
|
|
Investment securities |
4,969,880 |
|
|
Foreign currency transactions |
(4,097) |
4,965,783 |
|
Change in net unrealized appreciation (depreciation) on: |
|
|
|
Investment securities |
(11,411,603) |
|
|
Assets and liabilities in |
(1,569) |
|
|
Delayed delivery commitments |
(5,625) |
(11,418,797) |
|
Net gain (loss) |
|
(6,453,014) |
|
Net increase (decrease) in net assets resulting from operations |
|
$ (1,440,587) |
|
Other Information Expense reductions |
|
$ 25,816 |
|
Custodian credits |
|
377 |
|
|
|
$ 26,193 |
See accompanying notes which are an integral part of the financial statements.
Semiannual Report
Fidelity Variable Insurance Products: Balanced
Portfolio
Financial Statements - continued
Statement of Changes in Net Assets
|
Increase (Decrease) in Net Assets |
Six months ended |
Year ended |
|
Operations |
$ 5,012,427 |
$ 10,132,202 |
|
Net realized gain (loss) |
4,965,783 |
7,580,954 |
|
Change in net unrealized appreciation (depreciation) |
(11,418,797) |
(2,525,268) |
|
Net increase (decrease) in net assets resulting from operations |
(1,440,587) |
15,187,888 |
|
Distributions to shareholders |
(10,025,969) |
(7,479,403) |
|
From net realized gain |
(8,369,238) |
(8,692,279) |
|
Total distributions |
(18,395,207) |
(16,171,682) |
|
Share transactions - net increase (decrease) |
(27,604,335) |
36,165,081 |
|
Total increase (decrease) in net assets |
(47,440,129) |
35,181,287 |
|
Net Assets |
|
|
|
Beginning of period |
352,424,826 |
317,243,539 |
|
End of period (including undistributed net investment income of $5,026,674 and $10,132,202, respectively) |
$ 304,984,697 |
$ 352,424,826 |
|
|
|
Other Information: |
|
|
Six months ended June 30, 2000 |
Year ended |
||
|
|
Shares |
Dollars |
Shares |
Dollars |
|
Share transactions |
800,778 |
$ 11,898,820 |
4,444,110 |
$ 70,037,773 |
|
Reinvested |
1,146,173 |
16,906,054 |
1,027,536 |
15,608,277 |
|
Redeemed |
(4,066,967) |
(61,054,219) |
(4,234,242) |
(66,752,172) |
|
Net increase (decrease) |
(2,120,016) |
$ (32,249,345) |
1,237,404 |
$ 18,893,878 |
|
Service Class |
289,094 |
$ 4,329,594 |
1,108,300 |
$ 17,387,242 |
|
Reinvested |
100,855 |
1,483,571 |
37,189 |
563,405 |
|
Redeemed |
(125,685) |
(1,874,764) |
(43,583) |
(679,444) |
|
Net increase (decrease) |
264,264 |
$ 3,938,401 |
1,101,906 |
$ 17,271,203 |
|
Service Class 2 A |
47,040 |
$ 701,059 |
- |
$ - |
|
Reinvested |
380 |
5,581 |
- |
- |
|
Redeemed |
(2) |
(31) |
- |
- |
|
Net increase (decrease) |
47,418 |
$ 706,609 |
- |
$ - |
|
Distributions |
|
$ 9,221,484 |
|
$ 7,218,828 |
|
Service Class |
|
801,470 |
|
260,575 |
|
Service Class 2 A |
|
3,015 |
|
- |
|
Total |
|
$ 10,025,969 |
|
$ 7,479,403 |
|
From net realized gain |
|
$ 7,684,570 |
|
$ 8,389,449 |
|
Service Class |
|
682,102 |
|
302,830 |
|
Service Class 2 A |
|
2,566 |
|
- |
|
Total |
|
$ 8,369,238 |
|
$ 8,692,279 |
|
|
|
$ 18,395,207 |
|
$ 16,171,682 |
H Service Class 2 commenced sale of shares January 12, 2000.
See accompanying notes which are an integral part of the financial statements.
Balanced Portfolio
Financial Highlights - Initial Class
|
|
Six months ended |
Years ended December 31, |
||||
|
Selected Per-Share Data |
(Unaudited) |
1999 |
1998 |
1997 |
1996 |
1995 H |
|
Net asset value, beginning of period |
$ 16.00 |
$ 16.11 |
$ 14.58 |
$ 12.23 |
$ 11.17 |
$ 10.00 |
|
Income from Investment Operations |
|
|
|
|
|
|
|
Net investment income |
.24 D |
.45 D |
.44 D |
.44 D |
.33 |
.14 |
|
Net realized and unrealized gain (loss) |
(.27) |
.24 |
2.00 |
2.22 |
.78 |
1.25 |
|
Total from investment operations |
(.03) |
.69 |
2.44 |
2.66 |
1.11 |
1.39 |
|
Less Distributions |
|
|
|
|
|
|
|
From net investment income |
(.48) |
(.37) |
(.36) |
(.31) |
(.01) |
(.14) |
|
From net realized gain |
(.40) |
(.43) |
(.55) |
- |
(.04) |
(.08) |
|
Total distributions |
(.88) |
(.80) |
(.91) |
(.31) |
(.05) |
(.22) |
|
Net asset value, end of period |
$ 15.09 |
$ 16.00 |
$ 16.11 |
$ 14.58 |
$ 12.23 |
$ 11.17 |
|
Total Return B, C |
(0.06)% |
4.55% |
17.64% |
22.18% |
9.98% |
13.92% |
|
Ratios and Supplemental Data |
|
|
|
|
|
|
|
Net assets, end of period (000 omitted) |
$ 274,792 |
$ 325,371 |
$ 307,681 |
$ 214,538 |
$ 103,110 |
$ 43,155 |
|
Ratio of expenses to average net assets |
.55% A |
.57% |
.59% |
.61% |
.72% |
1.42% F |
|
Ratio of expenses to average net assets after |
.53% A, G |
.55% G |
.58% G |
.60% G |
.71% G |
1.42% |
|
Ratio of net investment income to average net assets |
3.20% A |
2.87% |
2.94% |
3.28% |
3.63% |
3.56% |
|
Portfolio turnover |
148% A |
108% |
94% |
98% |
163% |
248% |
Financial Highlights - Service Class
|
|
Six months ended |
Years ended December 31, |
||
|
Selected Per-Share Data |
(Unaudited) |
1999 |
1998 |
1997 E |
|
Net asset value, beginning of period |
$ 15.94 |
$ 16.07 |
$ 14.59 |
$ 14.16 |
|
Income from Investment Operations |
|
|
|
|
|
Net investment income D |
.23 |
.43 |
.41 |
.08 |
|
Net realized and unrealized gain (loss) |
(.27) |
.24 |
1.98 |
.35 |
|
Total from investment operations |
(.04) |
.67 |
2.39 |
.43 |
|
Less Distributions |
|
|
|
|
|
From net investment income |
(.47) |
(.37) |
(.36) |
- |
|
From net realized gain |
(.40) |
(.43) |
(.55) |
- |
|
Total distributions |
(.87) |
(.80) |
(.91) |
- |
|
Net asset value, end of period |
$ 15.03 |
$ 15.94 |
$ 16.07 |
$ 14.59 |
|
Total Return B, C |
(0.13)% |
4.43% |
17.27% |
3.04% |
|
Ratios and Supplemental Data |
|
|
|
|
|
Net assets, end of period (000 omitted) |
$ 29,480 |
$ 27,054 |
$ 9,562 |
$ 10 |
|
Ratio of expenses to average net assets |
.65% A |
.67% |
.70% |
.71% A |
|
Ratio of expenses to average net assets after expense reductions |
.63% A, G |
.66% G |
.69% G |
.71% A |
|
Ratio of net investment income to average net assets |
3.10% A |
2.77% |
2.79% |
3.43% A |
|
Portfolio turnover |
148% A |
108% |
94% |
98% |
|
A Annualized B The total returns would have been lower had certain expenses not been reduced during the periods shown. C Total returns for periods of less than one year are not annualized and do not reflect charges attributable to your insurance company's separate account. Inclusion of these charges would reduce the total returns shown. D Net investment income per share has been calculated based on average shares outstanding during the period. E For the period November 3, 1997 (commencement of sale of Service Class shares) to December 31, 1997. F FMR agreed to reimburse a portion of the class' expenses during the period. Without this reimbursement, the class' expense ratio would have been higher. G FMR or the fund has entered into varying arrangements with third parties who either paid or reduced a portion of the class' expenses. H For the period January 3, 1995 (commencement of operations of Initial Class shares) to December 31, 1995. |
||||
See accompanying notes which are an integral part of the financial statements.
Semiannual Report
Financial Highlights - Service Class 2
|
|
Six months ended |
|
Selected Per-Share Data |
(Unaudited) |
|
Net asset value, beginning of period |
$ 15.59 |
|
Income from Investment Operations |
|
|
Net investment income D |
.20 |
|
Net realized and unrealized gain (loss) |
.10 G |
|
Total from investment operations |
.30 |
|
Less Distributions |
|
|
From net investment income |
(.47) |
|
From net realized gain |
(.40) |
|
Total distributions |
(.87) |
|
Net asset value, end of period |
$ 15.02 |
|
Total Return B, C |
2.05% |
|
Ratios and Supplemental Data |
|
|
Net assets, end of period (000 omitted) |
$ 712 |
|
Ratio of expenses to average net assets |
.79% A |
|
Ratio of expenses to average net assets after expense reductions |
.77% A, F |
|
Ratio of net investment income to average net assets |
2.96% A |
|
Portfolio turnover |
148% A |
|
A Annualized B The total returns would have been lower had certain expenses not been reduced during the periods shown. C Total returns for periods of less than one year are not annualized and do not reflect charges attributable to your insurance company's separate account. Inclusion of these charges would reduce the total returns shown. D Net investment income per share has been calculated based on average shares outstanding during the period. E For the period January 12, 2000 (commencement of sale of Service Class 2 shares) to June 30, 2000. F FMR or the fund has entered into varying arrangements with third parties who either paid or reduced a portion of the class' expenses. G The amount shown for a share outstanding does not correspond with the aggregate net loss on investments for the period due to the timing of sales and repurchases of class shares in relation to fluctuating market values of the investments of the fund. |
|
See accompanying notes which are an integral part of the financial statements.
Balanced Portfolio
For the period ended June 30, 2000 (Unaudited)
1. Significant Accounting Policies.
Balanced Portfolio (the fund) is a fund of Variable Insurance Products Fund III (the trust) (referred to in this report as Fidelity Variable Insurance Products: Balanced Portfolio) and is authorized to issue an unlimited number of shares. The trust is registered under the Investment Company Act of 1940, as amended (the 1940 Act), as an open-end management investment company organized as a Massachusetts business trust. Shares of the fund may only be purchased by insurance companies for the purpose of funding variable annuity or variable life insurance contracts. The fund offers three classes of shares: the fund's original class of shares (Initial Class shares), Service Class shares and Service Class 2 shares. The fund commenced sale of Service Class 2 shares on January 12, 2000. All classes have equal rights and voting privileges, except for matters affecting a single class. Investment income, realized and unrealized capital gains and losses, the common expenses of the fund, and certain fund-level expense reductions, if any, are allocated on a pro rata basis to each class based on the relative net assets of each class to the total net assets of the fund. Each class of shares differs in its respective distribution plan.
The financial statements have been prepared in conformity with generally accepted accounting principles which require management to make certain estimates and assumptions at the date of the financial statements. The following summarizes the significant accounting policies of the fund:
Security Valuation. Equity securities for which quotations are readily available are valued at the last sale price, or if no sale price, at the closing bid price. Foreign equity securities are valued based on quotations from the principal market in which such securities are normally traded. If trading or events occurring in other markets after the close of the principal market in which foreign securities are traded, and before the close of the business of the fund, are expected to materially affect the value of those securities, then they are valued at their fair value taking this trading or these events into account. Fair value is determined in good faith under consistently applied procedures under the general supervision of the Board of Trustees. Debt securities for which quotations are readily available are valued by a pricing service at their market values as determined by their most recent bid prices in the principal market (sales prices if the principal market is an exchange) in which such securities are normally traded. Securities (including restricted securities) for which market quotations are not readily available are valued at their fair value. Short-term securities with remaining maturities of sixty days or less for which quotations are not readily available are valued at amortized cost or original cost plus accrued interest, both of which approximate current value.
Foreign Currency Translation. The accounting records of the fund are maintained in U.S. dollars. Investment securities and other assets and liabilities denominated in a foreign currency are translated into U.S. dollars at the prevailing rates of exchange at period end. Purchases and sales of securities, income receipts and expense payments are translated into U.S. dollars at the prevailing exchange rate on the respective dates of the transactions.
Net realized gains and losses on foreign currency transactions represent net gains and losses from sales and maturities of foreign currency contracts, disposition of foreign currencies, the difference between the amount of net investment income accrued and the U.S. dollar amount actually received, and gains and losses between trade and settlement date on purchases and sales of securities. The effects of changes in foreign currency exchange rates on investments in securities are included with the net realized and unrealized gain or loss on investment securities.
Income Taxes. As a qualified regulated investment company under Subchapter M of the Internal Revenue Code, the fund is not subject to income taxes to the extent that it distributes substantially all of its taxable income for its fiscal year. The schedule of investments includes information regarding income taxes under the caption "Income Tax Information."
Investment Income. Dividend income is recorded on the ex-dividend date, except certain dividends from foreign securities where the ex-dividend date may have passed, are recorded as soon as the fund is informed of the ex-dividend date. Non-cash dividends included in dividend income, if any, are recorded at the fair market value of the securities received. Interest income, which includes accretion of original issue discount, is accrued as earned. Investment income is recorded net of foreign taxes withheld where recovery of such taxes is uncertain.
Expenses. Most expenses of the trust can be directly attributed to a fund. Expenses which cannot be directly attributed are apportioned among the funds in the trust.
Distributions to Shareholders. Distributions are recorded on the ex-dividend date. Income dividends and capital gain distributions are declared separately for each class.
Income and capital gain distributions are determined in accordance with income tax regulations which may differ from generally accepted accounting principles. These differences, which may result in distribution reclassifications, are primarily due to differing treatments for litigation proceeds, paydown gains/losses on certain securities, foreign currency transactions, market discount, non-taxable dividends, and losses deferred due to wash sales.
Permanent book and tax basis differences relating to shareholder distributions will result in reclassifications to paid in capital. Undistributed net investment income and accumulated undistributed net realized gain (loss) on investments and foreign currency transactions may include temporary book and tax basis differences which will reverse in a subsequent period. Any taxable income or gain remaining at fiscal year end is distributed in the following year.
Semiannual Report
Notes to Financial Statements (Unaudited) - continued
1. Significant Accounting Policies - continued
Security Transactions. Security transactions are accounted for as of trade date. Gains and losses on securities sold are determined on the basis of identified cost.
2. Operating Policies.
Foreign Currency Contracts. The fund generally uses foreign currency contracts to facilitate transactions in foreign-denominated securities. Losses may arise from changes in the value of the foreign currency or if the counterparties do not perform under the contracts' terms. The U.S. dollar value of foreign currency contracts is determined using contractual currency exchange rates established at the time of each trade.
Joint Trading Account. Pursuant to an Exemptive Order issued by the Securities and Exchange Commission (the SEC), the fund, along with other affiliated entities of Fidelity Management & Research Company (FMR), may transfer uninvested cash balances into one or more joint trading accounts. These balances are invested in one or more repurchase agreements for U.S. Treasury or Federal Agency obligations.
Repurchase Agreements. The underlying U.S. Treasury, Federal Agency, or other obligations found to be satisfactory by FMR are transferred to an account of the fund, or to the Joint Trading Account, at a bank custodian. The securities are marked-to-market daily and maintained at a value at least equal to the principal amount of the repurchase agreement (including accrued interest). FMR, the fund's investment adviser, is responsible for determining that the value of the underlying securities remains in accordance with the market value requirements stated above.
Central Cash Funds. Pursuant to an Exemptive Order issued by the SEC, the fund may invest in the Taxable Central Cash Fund and the Central Cash Collateral Fund (the Cash Funds) managed by Fidelity Investments Money Management, Inc., an affiliate of FMR. The Cash Funds are open-end money market funds available only to investment companies and other accounts managed by FMR and its affiliates. The Cash Funds seek preservation of capital, liquidity, and current income. Income distributions from the Cash Funds are declared daily and paid monthly from net interest income. Income distributions earned by the fund are recorded as either interest income or security lending income in the accompanying financial statements.
Delayed Delivery Transactions. The fund may purchase or sell securities on a delayed delivery basis. Payment and delivery may take place after the customary settlement period for that security. The price of the underlying securities and the date when the securities will be delivered and paid for are fixed at the time the transaction is negotiated. The market values of the securities purchased on a delayed delivery basis are identified as such in the fund's schedule of investments. The fund may receive compensation for interest forgone in the purchase of a delayed delivery security. With respect to purchase commitments, the fund identifies securities as segregated in its records with a value at least equal to the amount of the commitment. Losses may arise due to changes in the market value of the underlying securities or if the counterparty does not perform under the contract.
Restricted Securities. The fund is permitted to invest in securities that are subject to legal or contractual restrictions on resale. These securities generally may be resold in transactions exempt from registration or to the public if the securities are registered. Disposal of these securities may involve time-consuming negotiations and expense, and prompt sale at an acceptable price may be difficult Information regarding restricted securities is included under the caption "Other Information" at the end of the fund's schedule of investments.
3. Purchases and Sales of Investments.
Information regarding purchases and sales of securities (other than short-term securities) is included under the caption "Other Information" at the end of the fund's schedule of investments.
4. Fees and Other Transactions with Affiliates.
Management Fee. As the fund's investment adviser, FMR receives a monthly fee that is calculated on the basis of a group fee rate plus a fixed individual fund fee rate applied to the average net assets of the fund. The group fee rate is the weighted average of a series of rates and is based on the monthly average net assets of all the mutual funds advised by FMR. The rates ranged from .2167% to .5200% for the period. The annual individual fund fee rate is .15%. In the event that these rates were lower than the contractual rates in effect during the period, FMR voluntarily implemented the above rates, as they resulted in the same or a lower management fee. For the period, the management fee was equivalent to an annualized rate of .43% of average net assets.
Distribution and Service Plan. In accordance with Rule 12b-1 of the 1940 Act, the Board of Trustees has adopted separate Distribution and Service Plans with respect to each class of shares (collectively referred to as "the Plans"). Under certain of the Plans, the class pays Fidelity Distributors Corporation (FDC), an affiliate of FMR, a 12b-1 fee. For the period, this fee is based on an annual rate of .10% of Service Class' average net assets and .25% of Service Class 2's average net assets. Initial Class shares are not subject to a 12b-1 fee.
For the period, each class paid FDC the following amounts, all of which was reallowed to insurance companies, for the distribution of shares and providing shareholder support services.
|
Service Class |
$ 13,703 |
|
Service Class 2 |
213 |
|
|
$ 13,916 |
Balanced Portfolio
Notes to Financial Statements (Unaudited) - continued
4. Fees and Other Transactions with
Affiliates - continued
Transfer Agent Fees. Fidelity Investments Institutional Operations Company, Inc. (FIIOC), an affiliate of FMR, is the fund's transfer, dividend disbursing, and shareholder servicing agent. FIIOC receives account fees and asset-based fees that vary according to account size and type of account. FIIOC pays a portion of the expenses related to the typesetting, printing and mailing of all shareholder reports, except proxy statements. For the period, the transfer agent fees of the fund were equivalent to an annualized rate of .07% of average net assets.
For the period, the following amounts were paid to FIIOC:
|
Initial Class |
$ 92,789 |
|
Service Class |
9,127 |
|
Service Class 2 |
55 |
|
|
$ 101,971 |
Accounting and Security Lending Fees. Fidelity Service Company, Inc. (FSC), an affiliate of FMR, maintains the fund's accounting records and administers the security lending program. The security lending fee is based on the number and duration of lending transactions. The accounting fee is based on the level of average net assets for the month plus out-of-pocket expenses.
Brokerage Commissions. The fund placed a portion of its portfolio transactions with brokerage firms which are affiliates of FMR. The commissions paid to these affiliated firms are shown under the caption "Other Information" at the end of the fund's schedule of investments.
5. Security Lending.
The fund lends portfolio securities from time to time in order to earn additional income. The fund receives collateral in the form of U.S. Treasury obligations, letters of credit, and/or cash against the loaned securities, and maintains collateral in an amount not less than 100% of the market value of the loaned securities during the period of the loan. The market value of the loaned securities is determined at the close of business of the fund and any additional required collateral is delivered to the fund on the next business day. If the borrower defaults on its obligation to return the securities loaned because of insolvency or other reasons, the fund could experience delays and costs in recovering the securities loaned or in gaining access to the collateral. At period end there were no security loans outstanding.
6. Expense Reductions.
FMR has directed certain portfolio trades to brokers who paid a portion of the fund's expenses.
In addition, through an arrangement with the fund's custodian, credits realized as a result of uninvested cash balances were used to reduce a portion of the fund's expenses.
For the period, the reductions under these arrangements are shown under the caption "Other Information" on the fund's Statement of Operations.
7. Beneficial Interest.
At the end of the period, Fidelity Investments Life Insurance Company (FILI) and its subsidiaries, affiliates of FMR, were the record owners of approximately 36% of the outstanding shares of the fund. In addition, one unaffiliated insurance company was record owner of 52% of the total outstanding shares of the fund.
Balanced Portfolio
A special meeting of the fund's shareholders was held on July 19, 2000. The results of votes taken among shareholders on proposals before them are reported below. Each vote reported represents one dollar of net asset value held on the record date for the meeting.
PROPOSAL 1
To elect as Trustees the following twelve nominees.*
|
|
# of Dollars Voted |
% of Dollars Voted |
Ralph F. Cox
|
Affirmative |
2,995,348,207.84 |
97.862 |
|
Withheld |
65,444,305.52 |
2.138 |
|
TOTAL |
3,060,792,513.36 |
100.000 |
Phyllis Burke Davis
|
Affirmative |
2,995,012,849.06 |
97.851 |
|
Withheld |
65,779,664.30 |
2.149 |
|
TOTAL |
3,060,792,513.36 |
100.000 |
Robert M. Gates
|
Affirmative |
2,994,325,628.16 |
97.828 |
|
Withheld |
66,466,885.20 |
2.172 |
|
TOTAL |
3,060,792,513.36 |
100.000 |
Edward C. Johnson 3d
|
Affirmative |
2,994,212,266.77 |
97.825 |
|
Withheld |
66,580,246.59 |
2.175 |
|
TOTAL |
3,060,792,513.36 |
100.000 |
Donald J. Kirk
|
Affirmative |
2,996,527,468.99 |
97.900 |
|
Withheld |
64,265,044.37 |
2.100 |
|
TOTAL |
3,060,792,513.36 |
100.000 |
Ned C. Lautenbach
|
Affirmative |
2,997,430,896.97 |
97.930 |
|
Withheld |
63,361,616.39 |
2.070 |
|
TOTAL |
3,060,792,513.36 |
100.000 |
|
|
# of Dollars Voted |
% of Dollars Voted |
Peter S. Lynch
|
Affirmative |
2,997,391,112.97 |
97.929 |
|
Withheld |
63,401,400.39 |
2.071 |
|
TOTAL |
3,060,792,513.36 |
100.000 |
William O. McCoy
|
Affirmative |
2,997,364,420.76 |
97.928 |
|
Withheld |
63,428,092.60 |
2.072 |
|
TOTAL |
3,060,792,513.36 |
100.000 |
Gerald C. McDonough
|
Affirmative |
2,992,594,911.89 |
97.772 |
|
Withheld |
68,197,601.47 |
2.228 |
|
TOTAL |
3,060,792,513.36 |
100.000 |
Marvin L. Mann
|
Affirmative |
2,996,491,839.67 |
97.899 |
|
Withheld |
64,300,673.69 |
2.101 |
|
TOTAL |
3,060,792,513.36 |
100.000 |
Robert C. Pozen
|
Affirmative |
2,997,304,419.99 |
97.926 |
|
Withheld |
63,488,093.37 |
2.074 |
|
TOTAL |
3,060,792,513.36 |
100.000 |
Thomas R. Williams
|
Affirmative |
2,993,561,996.24 |
97.803 |
|
Withheld |
67,230,517.12 |
2.197 |
|
TOTAL |
3,060,792,513.36 |
100.000 |
Semiannual Report
Proxy Voting Results - continued
PROPOSAL 2
To ratify the selection of Deloitte & Touche LLP as independent accountants of the fund.
|
|
# of Dollars Voted |
% of Dollars Voted |
|
Affirmative |
276,319,488.69 |
94.617 |
|
Against |
4,151,739.32 |
1.422 |
|
Abstain |
11,567,630.61 |
3.961 |
|
TOTAL |
292,038,858.62 |
100.000 |
PROPOSAL 3
To authorize the Trustees to adopt an Amended and Restated Declaration of Trust.*
|
|
# of Dollars Voted |
% of Dollars Voted |
|
Affirmative |
2,837,267,199.92 |
92.697 |
|
Against |
49,473,422.32 |
1.617 |
|
Abstain |
174,051,891.12 |
5.686 |
|
TOTAL |
3,060,792,513.36 |
100.000 |
PROPOSAL 4
To approve an amended management contract for the fund that would reduce the management fee payable to FMR by the fund as FMR's assets under management increase.
|
|
# of Dollars Voted |
% of Dollars Voted |
|
Affirmative |
272,189,750.93 |
93.203 |
|
Against |
4,507,278.92 |
1.544 |
|
Abstain |
15,341,828.77 |
5.253 |
|
TOTAL |
292,038,858.62 |
100.000 |
PROPOSAL 5
To approve an amended sub-advisory agreement with FMR U.K. to provide investment advice and research services or investment management services.
|
|
# of Dollars Voted |
% of Dollars Voted |
|
Affirmative |
268,161,500.09 |
91.824 |
|
Against |
5,337,639.43 |
1.828 |
|
Abstain |
18,539,719.10 |
6.348 |
|
TOTAL |
292,038,858.62 |
100.000 |
PROPOSAL 6
To approve an amended sub-advisory agreement with FMR Far East to provide investment advice and research services or investment management services.
|
|
# of Dollars Voted |
% of Dollars Voted |
|
Affirmative |
267,614,072.73 |
91.636 |
|
Against |
5,806,227.04 |
1.989 |
|
Abstain |
18,618,558.85 |
6.375 |
|
TOTAL |
292,038,858.62 |
100.000 |
PROPOSAL 7
To modify the fund's fundamental investment objective and eliminate a fundamental investment policy of the fund.
|
|
# of Dollars Voted |
% of Dollars Voted |
|
Affirmative |
267,914,892.06 |
91.739 |
|
Against |
7,333,491.83 |
2.512 |
|
Abstain |
16,790,474.73 |
5.749 |
|
TOTAL |
292,038,858.62 |
100.000 |
PROPOSAL 8
To amend the fundamental investment limitation concerning diversification.
|
|
# of Dollars Voted |
% of Dollars Voted |
|
Affirmative |
267,037,890.43 |
91.439 |
|
Against |
7,842,324.91 |
2.686 |
|
Abstain |
17,158,643.28 |
5.875 |
|
TOTAL |
292,038,858.62 |
100.000 |
PROPOSAL 9
To amend the fundamental investment limitation concerning underwriting.
|
|
# of Dollars Voted |
% of Dollars Voted |
|
Affirmative |
266,860,588.67 |
91.378 |
|
Against |
8,492,005.75 |
2.908 |
|
Abstain |
16,686,264.20 |
5.714 |
|
TOTAL |
292,038,858.62 |
100.000 |
PROPOSAL 10
To amend the fundamental investment limitation concerning concentration.
|
|
# of Dollars Voted |
% of Dollars Voted |
|
Affirmative |
267,900,537.74 |
91.735 |
|
Against |
7,342,176.47 |
2.514 |
|
Abstain |
16,796,144.41 |
5.751 |
|
TOTAL |
292,038,858.62 |
100.000 |
* Denotes trust-wide proposals and voting results.
Balanced Portfolio
Semiannual Report
Balanced Portfolio
Balanced Portfolio
Balanced Portfolio
Investment Adviser
Fidelity Management & Research Company
Boston, MA
Investment Sub-Advisers
Fidelity Investments Money Management, Inc.
Fidelity Management & Research (U.K.) Inc.
Fidelity Management & Research (Far East) Inc.
Fidelity Investments Japan Limited
Officers
Edward C. Johnson 3d, President
Robert C. Pozen, Senior Vice President
Richard A. Spillane, Jr., Vice President
John Avery, Vice President
Kevin E. Grant, Vice President
Eric D. Roiter, Secretary
Robert A. Dwight, Treasurer
Maria F. Dwyer, Deputy Treasurer
John H. Costello, Assistant Treasurer
Board of Trustees
Ralph F. Cox *
Phyllis Burke Davis *
Robert M. Gates *
Edward C. Johnson 3d
Donald J. Kirk *
Ned C. Lautenbach *
Peter S. Lynch
Marvin L. Mann *
William O. McCoy *
Gerald C. McDonough *
Robert C. Pozen
Thomas R. Williams *
Advisory Board
J. Michael Cook
Marie L. Knowles
* Independent trustees
General Distributor
Fidelity Distributors Corporation
Boston, MA
Transfer and Shareholder Servicing Agent
Fidelity Investments Institutional Operations Co., Inc.
Boston, MA
Custodian
The Chase Manhattan Bank
New York, NY
VIPBAL-SANN-0800 108583
1.705697.102
(2_fidelity_logos)
Growth & Income Portfolio
Semiannual Report
June 30, 2000
|
Market Environment |
3 |
A review of what happened in world markets during the |
|
Performance and Investment Summary |
4 |
How the fund has done over time, and an overview of the fund's investments at the end of the period. |
|
Fund Talk |
7 |
The manager's review of fund performance, strategy |
|
Investments |
8 |
A complete list of the fund's investments with their |
|
Financial Statements |
11 |
Statements of assets and liabilities, operations, and |
|
Notes |
15 |
Notes to the financial statements. |
|
Proxy Voting Results |
18 |
|
Fidelity Variable Insurance Products are separate account options which are purchased through a variable insurance contract.
Standard & Poor's, S&P and S&P 500 are registered service marks of The McGraw-Hill Companies, Inc. and have been licensed for use by Fidelity Distributors Corporation.
Other third party marks appearing herein are the property of their respective owners.
All other marks appearing herein are registered or unregistered trademarks or service marks of FMR Corp. or an affiliated company.
(Recycle graphic) This report is printed on recycled paper using soy-based inks.
The views expressed in this report reflect those of the fund's portfolio manager only through the end of the period of the report as stated on the cover and do not necessarily represent the views of Fidelity or any other person in the Fidelity organization. Any such views are subject to change at any time based upon market or other conditions and Fidelity disclaims any responsibility to update such views. These views may not be relied on as investment advice and, because investment decisions for a Fidelity fund are based on numerous factors, may not be relied on as an indication of trading intent on behalf of any Fidelity fund.
This report and the financial statements contained herein are submitted for the general information of the shareholders of the fund. This report is not authorized for distribution to prospective investors in the fund unless preceded or accompanied by an effective prospectus.
Mutual fund shares are not deposits or obligations of, or guaranteed by, any depository institution. Shares are not insured by the FDIC, Federal Reserve Board or any other agency, and are subject to investment risks, including possible loss of principal amount invested.
Neither the fund nor Fidelity Distributors Corporation is a bank.
Annual Report
After reaching record heights in the first quarter of 2000, several of the most notable U.S. equity market indexes - including the Standard & Poor's 500SM, NASDAQ and Dow Jones Industrial Average - tumbled into negative territory by the end of the second quarter. Leading the market down was the same sector that drove it to new highs just a few months prior: technology. Beginning in mid-March, investors abandoned technology en masse, as concerns about excessive valuations and impending inflation pervaded the market. The ripple effect of the tech sell-off spread rapidly around the world, and international equity markets trended downward in response. As stocks cooled, domestic bond performance heated up, helping many U.S. fixed-income categories outpace their equity counterparts for the overall six-month period. Meanwhile, emerging-market bonds held on to most of their strong first quarter gains, but international developed-market bonds felt the pinch of inflation, as several central banks around the world began to implement interest-rate hikes to slow their respective economies.
At the mid-way point of 2000, the U.S. stock market's unprecedented streak of five consecutive double-digit annual increases appeared to be in jeopardy. The Dow Jones Industrial Average - an index of 30 blue-chip stocks - declined 8.42% during the six-month period ending June 30, 2000. The broad-based S&P 500® and the technology-concentrated NASDAQ index also disappeared below the surface, returning -0.42% and -2.44%, respectively. In a 10-week stretch from March through June, the NASDAQ dropped 33%, making dot-com investors anything but dot-calm as Internet stocks bore the brunt of the decline. As the spectacular growth of the technology sector waned, previously out-of-favor sectors began to lure investors' attention. The consistent, steady growth of the health sector was the primary beneficiary, as it wore the crown of best-performing sector for the first six months of 2000. The natural resources and real-estate sectors were surprising runners-up in the performance derby. But not all was lost for the technology sector. In June, economic reports showed strong evidence that the Federal Reserve Board's series of interest-rate hikes - including three during the first half of this year - were winning the battle against inflation. This news, combined with the Fed's decision to eschew another hike in June, fueled a renewed enthusiasm for tech stocks, as evidenced by the NASDAQ's 16.64% return for the final month of the period.
Reacting similarly to the U.S. stock market - and no doubt largely as a direct result of the U.S. market - most foreign stock markets started the six-month period off on a high note before stumbling in the second quarter. Japan and the Pacific Region in general fell particularly hard. After a stellar 1999, Japanese equities were shaken by their country's economic downturn and an unsteady U.S. market. "New Japan" stocks - Internet, electronic, telecom and software securities - led the
decline. The TOPIX Index, a benchmark of the Japanese market, fell 10.34% during the period. And even the best-performing Pacific Region fund had a negative return, according to Lipper Inc. Weak tech performance in the second quarter also hurt European stock markets, causing the Morgan Stanley Capital International Europe Index to decline 3.10% for the first half of 2000. One of the only non-U.S. stock markets that didn't suffer a negative second quarter was Canada. Often overlooked, the Canadian stock market quietly piled up an impressive six-month return of 21.89% - as measured by the Toronto Stock Exchange (TSE) 300.
Despite being challenged with a series of interest-rate hikes - almost always a detriment to fixed-income offerings - U.S. bond markets still managed to post solid returns relative to equities through the first six months of this year. U.S. government bonds were one of the top performers. In January, the U.S. Treasury announced its intent to repurchase long-term debt and curtail future issuance. Treasury prices soared in response and helped the Lehman Brothers Long-Term Government Bond Index return 8.77% for the period. The Lehman Brothers Aggregate Bond Index, a popular measure of taxable-bond performance, rose 3.99% for the past six months, while tax-free municipals were even more robust, gaining 4.48% according to the Lehman Brothers Municipal Bond Index. Underperformance in the bond market was pretty much limited to the high-yield sector. Faced with a rising interest-rate backdrop and poor technicals - including an unfavorable supply/demand condition and an increased default rate - the high-yield market stumbled to a negative return of 1.00%, as measured by the Merrill Lynch High Yield Master II Index, for the past six months.
International bond investors faced a myriad of negative factors throughout the majority of the six-month period ending June 30, 2000. Strong global economic growth and the threat of rising interest rates, currency fluctuations, and a weakening euro continued to plague global debt issues. Additionally, poor liquidity hampered bond prices in non-U.S. developed markets. Combined, those factors helped drag down the Salomon Brothers Non-U.S. World Government Bond Index, which returned -1.95%. On the bright side, a number of favorable factors propelled demand for emerging-market bonds, which was reflected in the 6.95% return of the J.P. Morgan Emerging Markets Bond Index Global - a popular benchmark of emerging-market debt. Credit momentum, which was driven by improving fundamentals - such as the Russian government's Soviet-era debt restructuring and new political leadership - fostered the rally in emerging-market bonds. Elsewhere, Brazil's better-than-expected economic growth fueled a sharp increase in foreign direct investment. Often large commodity suppliers, emerging-market countries also benefited from a sharp increase in oil prices.
Semiannual Report
Performance
There are several ways to evaluate a fund's historical performance. You can look at the total percentage change in value, the average annual percentage change or the growth of a hypothetical $10,000 investment. Total return reflects the change in the value of an investment, assuming reinvestment of the fund's dividend income and capital gains (the profits earned upon the sale of securities that have grown in value). If Fidelity had not reimbursed certain fund expenses, the life of fund total return would have been lower.
Average Annual Total Returns
|
Periods ended |
Past 1 |
Life of |
|
Fidelity VIP: Growth & Income - Initial Class |
-1.03% |
17.93% |
|
S&P 500 ® |
7.25% |
22.43% |
Average annual returns take the fund's cumulative return and show you what would have happened if the fund had performed at a constant rate each year.
You can compare the fund's returns to the performance of the Standard & Poor's 500SM Index - a market capitalization-weighted index of common stocks. This benchmark includes reinvested dividends and capital gains, if any.
Figures for more than one year assume a steady compounded rate of return and are not the fund's year-by-year results, which fluctuated over the periods shown. The life of fund figures are from commencement of operations, December 31, 1996.
Performance numbers are net of all fund operating expenses, but do not include any insurance charges imposed by your insurance company's separate account. If performance information included the effect of these additional charges, the total returns would be lower.
Past performance is no guarantee of future results. Principal and
investment return will vary and you may have a gain or loss when
you withdraw your money.
Understanding Performance
How a fund did yesterday is no guarantee of how it will do tomorrow. The stock market, for example, has a history of long-term growth and short-term volatility. In turn, the share price and return of a fund that invests in stocks will vary. That means if you sell your shares during a market downturn, you might lose money. But if you can ride out the market's ups and downs, you may have a gain.
3$10,000 Over Life of Fund
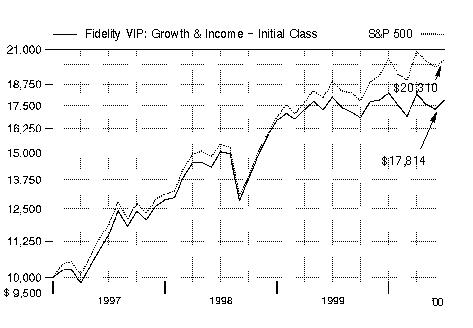
$10,000 Over Life of Fund: Let's say hypothetically that $10,000 was invested in Fidelity Variable Insurance Products: Growth & Income Portfolio - Initial Class on December 31, 1996, when the fund started. As the chart shows, by June 30, 2000, the value of the investment would have grown to $17,814 - a 78.14% increase on the initial investment. For comparison, look at how the Standard & Poor's 500 Index did over the same period. With dividends and capital gains, if any, reinvested, the same $10,000 investment would have grown to $20,310 - a 103.10% increase.
Investment Summary
|
Top Five Stocks as of June 30, 2000 |
|
|
|
% of fund's |
|
Microsoft Corp. |
4.3 |
|
Exxon Mobil Corp. |
4.2 |
|
Fannie Mae |
3.9 |
|
Intel Corp. |
3.8 |
|
Cisco Systems, Inc. |
3.7 |
|
|
19.9 |
|
Top Five Market Sectors as of June 30, 2000 |
|
|
|
% of fund's |
|
Technology |
23.2 |
|
Finance |
18.2 |
|
Utilities |
10.0 |
|
Health |
7.0 |
|
Energy |
6.1 |
|
Asset Allocation as of June 30, 2000 |
|||
|
% of fund's net assets* |
|||
|
Stocks and |
|
|
|
Short-Term Investments |
|
|
|
* Foreign investments 6.2% |
Semiannual Report
Performance
There are several ways to evaluate a fund's historical performance. You can look at the total percentage change in value, the average annual percentage change or the growth of a hypothetical $10,000 investment. Total return reflects the change in the value of an investment, assuming reinvestment of the fund's dividend income and capital gains (the profits earned upon the sale of securities that have grown in value). The initial offering of Service Class shares took place on November 3, 1997. Performance for Service Class shares reflects an asset based distribution fee (12b-1 fee), and returns prior to November 3, 1997 are those of Initial Class and do not include the effects of Service Class' 12b-1 fee. Had Service Class shares' 12b-1 fee been reflected, returns prior to November 3, 1997 would have been lower. If Fidelity had not reimbursed certain fund expenses, the life of fund total return would have been lower.
Average Annual Total Returns
|
Periods ended |
Past 1 |
Life of |
|
Fidelity VIP: Growth & Income - Service Class |
-1.15% |
17.79% |
|
S&P 500 |
7.25% |
22.43% |
Average annual returns take the fund's cumulative return and show you what would have happened if the fund had performed at a constant rate each year.
You can compare the fund's returns to the performance of the Standard & Poor's 500 Index - a market capitalization-weighted index of common stocks. This benchmark includes reinvested dividends and capital gains, if any.
Figures for more than one year assume a steady compounded rate of return and are not the fund's year-by-year results, which fluctuated over the periods shown. The life of fund figures are from commencement of operations, December 31, 1996.
Performance numbers are net of all fund operating expenses, but do not include any insurance charges imposed by your insurance company's separate account. If performance information included the effect of these additional charges, the total returns would be lower.
Past performance is no guarantee of future results. Principal and
investment return will vary and you may have a gain or loss when
you withdraw your money.
Understanding Performance
How a fund did yesterday is no guarantee of how it will do tomorrow. The stock market, for example, has a history of long-term growth and short-term volatility. In turn, the share price and return of a fund that invests in stocks will vary. That means if you sell your shares during a market downturn, you might lose money. But if you can ride out the market's ups and downs, you may have a gain.
3$10,000 Over Life of Fund
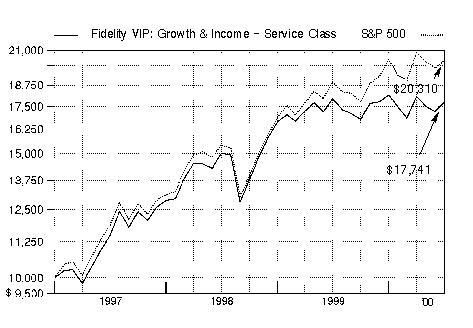
$10,000 Over Life of Fund: Let's say hypothetically that $10,000 was invested in Fidelity Variable Insurance Products: Growth & Income Portfolio - Service Class on December 31, 1996, when the fund started. As the chart shows, by June 30, 2000, the value of the investment would have grown to $17,741 - a 77.41% increase on the initial investment. For comparison, look at how the Standard & Poor's 500 Index did over the same period. With dividends and capital gains, if any, reinvested, the same $10,000 investment would have grown to $20,310 - a 103.10% increase.
Investment Summary
|
Top Five Stocks as of June 30, 2000 |
|
|
|
% of fund's |
|
Microsoft Corp. |
4.3 |
|
Exxon Mobil Corp. |
4.2 |
|
Fannie Mae |
3.9 |
|
Intel Corp. |
3.8 |
|
Cisco Systems, Inc. |
3.7 |
|
|
19.9 |
|
Top Five Market Sectors as of June 30, 2000 |
|
|
|
% of fund's |
|
Technology |
23.2 |
|
Finance |
18.2 |
|
Utilities |
10.0 |
|
Health |
7.0 |
|
Energy |
6.1 |
|
Asset Allocation as of June 30, 2000 |
|||
|
% of fund's net assets* |
|||
|
Stocks and |
|
|
|
Short-Term Investments |
|
|
|
* Foreign investments 6.2% |
Semiannual Report
Performance
There are several ways to evaluate a fund's historical performance. You can look at the total percentage change in value, the average annual percentage change or the growth of a hypothetical $10,000 investment. Total return reflects the change in the value of an investment, assuming reinvestment of the fund's dividend income and capital gains (the profits earned upon the sale of securities that have grown in value). The initial offering of Service Class 2 shares took place on January 12, 2000. Performance for Service Class 2 shares reflects an asset based distribution fee (12b-1 fee). Returns from November 3, 1997 to January 12, 2000 are those of Service Class which reflect a different 12b-1 fee. Service Class 2 returns prior to November 3, 1997 are those of Initial Class and do not include the effects of a 12b-1 fee. Had Service Class 2's 12b-1 fee been reflected, returns prior to January 12, 2000 would have been lower. If Fidelity had not reimbursed certain fund expenses, the life of fund total return would have been lower.
Average Annual Total Returns
|
Periods ended |
Past 1 |
Life of |
|
Fidelity VIP: Growth & Income - Service Class 2 |
-1.21% |
17.77% |
|
S&P 500 |
7.25% |
22.43% |
Average annual returns take the fund's cumulative return and show you what would have happened if the fund had performed at a constant rate each year.
You can compare the fund's returns to the performance of the Standard & Poor's 500 Index - a market capitalization-weighted index of common stocks. This benchmark includes reinvested dividends and capital gains, if any.
Figures for more than one year assume a steady compounded rate of return and are not the fund's year-by-year results, which fluctuated over the periods shown. The life of fund figures are from commencement of operations, December 31, 1996.
Performance numbers are net of all fund operating expenses, but do not include any insurance charges imposed by your insurance company's separate account. If performance information included the effect of these additional charges, the total returns would be lower.
Past performance is no guarantee of future results. Principal and
investment return will vary and you may have a gain or loss when
you withdraw your money.
Understanding Performance
How a fund did yesterday is no guarantee of how it will do tomorrow. The stock market, for example, has a history of long-term growth and short-term volatility. In turn, the share price and return of a fund that invests in stocks will vary. That means if you sell your shares during a market downturn, you might lose money. But if you can ride out the market's ups and downs, you may have a gain.
3$10,000 Over Life of Fund
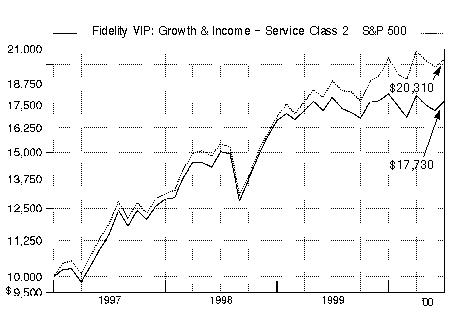
$10,000 Over Life of Fund: Let's say hypothetically that $10,000 was
invested in Fidelity Variable Insurance Products: Growth & Income Portfolio
- Service Class 2 on December 31, 1996, when the fund started. As the chart
shows, by June 30, 2000, the value of the investment would have grown to
$17,730 - a 77.30% increase on the initial investment. For comparison,
look at how the Standard & Poor's 500 Index did over the same period. With
dividends and capital gains, if any, reinvested,
the same $10,000 investment would have grown to $20,310 - a
103.10% increase.
Investment Summary
|
Top Five Stocks as of June 30, 2000 |
|
|
|
% of fund's |
|
Microsoft Corp. |
4.3 |
|
Exxon Mobil Corp. |
4.2 |
|
Fannie Mae |
3.9 |
|
Intel Corp. |
3.8 |
|
Cisco Systems, Inc. |
3.7 |
|
|
19.9 |
|
Top Five Market Sectors as of June 30, 2000 |
|
|
|
% of fund's |
|
Technology |
23.2 |
|
Finance |
18.2 |
|
Utilities |
10.0 |
|
Health |
7.0 |
|
Energy |
6.1 |
|
Asset Allocation as of June 30, 2000 |
|||
|
% of fund's net assets* |
|||
|
Stocks and |
|
|
|
Short-Term Investments |
|
|
|
* Foreign investments 6.2% |
Semiannual Report
(Portfolio Manager photograph)
An interview with Louis
Salemy, Portfolio
Manager of Growth &
Income Portfolio
Q. How did the fund perform, Louis?
A. For the six- and 12-month periods that ended June 30, 2000, the fund's returns fell short of the -0.42% and 7.25% returns recorded by the Standard & Poor's 500 Index, respectively.
Q. Why did the fund underperform the index during the past six months?
A. At the beginning of the period, one of the primary difficulties was an underweighting in the technology sector. This time period witnessed a speculative bubble in technology shares that finally burst in the spring of 2000, flattening many formerly high-flying technology stocks that had little or no earnings. The fund's emphasis on growth at a reasonable price prevented it from owning many of the best-performing stocks during this period. An overweighting in the finance sector, which faced a stiff headwind in the form of sharply higher interest rates, also undermined performance. Stock selection in the finance sector hurt as well, as a number of the fund's finance holdings detracted significantly from performance.
Q. The Federal Reserve Board raised short-term interest rates three times during the period. Why did you continue to overweight finance stocks, which tend to do poorly when rates rise?
A. Most of the overweighting was accounted for by two mortgage loan providers: Fannie Mae and Freddie Mac. These government-sponsored enterprises (GSEs) tend to be less sensitive to rising interest rates than banks, which I underweighted. Although the share prices of these two holdings did poorly during the period, they did not accurately reflect the earnings outlook, which remained excellent. Unfortunately, the herd instinct took over, and investors appeared to lump Fannie and Freddie with the rate-sensitive segments of the finance sector. Since the spring correction, however, investors have seemed more willing to evaluate stocks on the basis of earnings and other fundamental factors - a potentially positive development for these two stocks.
Q. What stocks did well for the fund?
A. Intel was one of the better performers. The stock firmed because of
a shortage of microprocessors and expectations of improving personal
computer demand in the second half of 2000. Intel also manufactures
memory components for the cellular phone market, which experienced
robust growth during the period. Another technology standout, Cisco
Systems, has a significant share of the market for the routers used to
expand the Internet. Drug giant Eli Lilly also per-
formed well. The company had a very successful test of Zovant, a new
drug for treating sepsis, or blood poisoning. In addition, Lilly benefited
from greater investor interest in drug stocks, which are thought to offer
relatively stable earnings streams in a slowing economy.
Q. What stocks were disappointing?
A. The biggest detractor, Microsoft, received an unfavorable ruling in the federal government's antitrust suit against the company. The ruling may, despite the company's appeals, result in splitting Microsoft into two separate companies. In the consumer nondurables sector, Procter & Gamble fell sharply following a warning from the company that its earnings would fall short of analysts' estimates due, in part, to higher raw materials prices. Freddie Mac and Fannie Mae also made the list of stocks that detracted most from performance. This is a case where I felt that investors missed the boat - for the reasons I gave previously. Because of my strong conviction about these stocks, I used weakness in their prices as an opportunity to add to the fund's positions in them.
Q. What's your outlook, Louis?
A. Higher interest rates have begun to slow the economy, and I believe that more slowing can be expected over the next six to 12 months, as the Federal Reserve Board's series of interest-rate hikes percolates through the economy. While a slowing economy should alleviate concerns about inflation, it might also create a lot more earnings risk. With valuations relatively high, we probably will continue to see stocks punished severely when a company fails to meet earnings estimates. Investing in stocks with attractive growth prospects at reasonable prices is the fund's overall strategy, but finding companies that can deliver stable earnings growth under a variety of economic conditions also will be important in the period just ahead.
The views expressed in this report reflect those of the portfolio manager only through the end of the period of the report as stated on the cover. The manager's views are subject to change at any time based on market or other conditions. For more information, see page 2.
Fund Facts
Goal: seeks high total return through a combination of current income and capital appreciation
Start date: December 31, 1996
Size: as of June 30, 2000, more than $1.2 billion
Manager: Louis Salemy, since 1998; manager, Fidelity Growth & Income II, since 1998; various Fidelity Select Portfolios, 1992-1998; joined Fidelity in 1992
3Semiannual Report
Fidelity Variable Insurance Products: Growth & Income Portfolio
(Unaudited)
Showing Percentage of Net Assets
|
Common Stocks - 88.1% |
|||
|
Shares |
Value (Note 1) |
||
|
AEROSPACE & DEFENSE - 0.6% |
|||
|
Boeing Co. |
181,300 |
$ 7,580,606 |
|
|
BASIC INDUSTRIES - 0.4% |
|||
|
Packaging & Containers - 0.4% |
|||
|
Ball Corp. |
165,401 |
5,323,845 |
|
|
CONSTRUCTION & REAL ESTATE - 1.2% |
|||
|
Real Estate Investment Trusts - 1.2% |
|||
|
Equity Office Properties Trust |
263,600 |
7,265,475 |
|
|
Equity Residential Properties Trust (SBI) |
159,000 |
7,314,000 |
|
|
|
14,579,475 |
||
|
DURABLES - 1.8% |
|||
|
Consumer Durables - 0.8% |
|||
|
Minnesota Mining & Manufacturing Co. |
118,700 |
9,792,750 |
|
|
Consumer Electronics - 1.0% |
|||
|
General Motors Corp. Class H (a) |
139,800 |
12,267,450 |
|
|
TOTAL DURABLES |
22,060,200 |
||
|
ENERGY - 6.1% |
|||
|
Energy Services - 0.8% |
|||
|
Schlumberger Ltd. (NY Shares) |
123,700 |
9,231,113 |
|
|
Oil & Gas - 5.3% |
|||
|
BP Amoco PLC sponsored ADR |
232,262 |
13,137,319 |
|
|
Exxon Mobil Corp. |
661,528 |
51,929,948 |
|
|
|
65,067,267 |
||
|
TOTAL ENERGY |
74,298,380 |
||
|
FINANCE - 18.2% |
|||
|
Banks - 4.2% |
|||
|
Bank of New York Co., Inc. |
536,700 |
24,956,550 |
|
|
Mellon Financial Corp. |
316,900 |
11,547,044 |
|
|
Wachovia Corp. |
271,200 |
14,712,600 |
|
|
|
51,216,194 |
||
|
Credit & Other Finance - 3.7% |
|||
|
American Express Co. |
298,600 |
15,564,525 |
|
|
Associates First Capital Corp. Class A |
1,363,000 |
30,411,938 |
|
|
|
45,976,463 |
||
|
Federal Sponsored Credit - 7.3% |
|||
|
Fannie Mae |
918,200 |
47,918,563 |
|
|
Freddie Mac |
1,021,132 |
41,355,846 |
|
|
|
89,274,409 |
||
|
Insurance - 0.9% |
|||
|
American International Group, Inc. |
76,537 |
8,993,098 |
|
|
PMI Group, Inc. |
47,800 |
2,270,500 |
|
|
|
11,263,598 |
||
|
Securities Industry - 2.1% |
|||
|
Charles Schwab Corp. |
218,150 |
7,335,294 |
|
|
|
|||
|
Shares |
Value (Note 1) |
||
|
Merrill Lynch & Co., Inc. |
68,200 |
$ 7,843,000 |
|
|
Morgan Stanley Dean Witter & Co. |
127,200 |
10,589,400 |
|
|
|
25,767,694 |
||
|
TOTAL FINANCE |
223,498,358 |
||
|
HEALTH - 7.0% |
|||
|
Drugs & Pharmaceuticals - 6.4% |
|||
|
Allergan, Inc. |
90,600 |
6,749,700 |
|
|
Bristol-Myers Squibb Co. |
447,100 |
26,043,575 |
|
|
Eli Lilly & Co. |
385,400 |
38,491,825 |
|
|
Merck & Co., Inc. |
91,100 |
6,980,538 |
|
|
|
78,265,638 |
||
|
Medical Equipment & Supplies - 0.6% |
|||
|
Baxter International, Inc. |
109,500 |
7,699,219 |
|
|
TOTAL HEALTH |
85,964,857 |
||
|
INDUSTRIAL MACHINERY & EQUIPMENT - 4.5% |
|||
|
Electrical Equipment - 2.6% |
|||
|
General Electric Co. |
599,700 |
31,784,100 |
|
|
Industrial Machinery & Equipment - 1.9% |
|||
|
Caterpillar, Inc. |
144,700 |
4,901,713 |
|
|
Ingersoll-Rand Co. |
132,400 |
5,329,100 |
|
|
Tyco International Ltd. |
266,720 |
12,635,860 |
|
|
|
22,866,673 |
||
|
TOTAL INDUSTRIAL MACHINERY & EQUIPMENT |
54,650,773 |
||
|
MEDIA & LEISURE - 5.8% |
|||
|
Broadcasting - 4.0% |
|||
|
Comcast Corp. Class A (special) (a) |
230,500 |
9,335,250 |
|
|
EchoStar Communications Corp. |
327,800 |
10,853,253 |
|
|
Infinity Broadcasting Corp. Class A (a) |
408,825 |
14,896,561 |
|
|
Pegasus Communications Corp. (a) |
282,900 |
13,879,781 |
|
|
|
48,964,845 |
||
|
Entertainment - 0.7% |
|||
|
Walt Disney Co. |
217,800 |
8,453,363 |
|
|
Publishing - 1.1% |
|||
|
McGraw-Hill Companies, Inc. |
256,500 |
13,851,000 |
|
|
TOTAL MEDIA & LEISURE |
71,269,208 |
||
|
NONDURABLES - 3.4% |
|||
|
Foods - 1.1% |
|||
|
Bestfoods |
166,700 |
11,543,975 |
|
|
Nabisco Holdings Corp. Class A |
43,800 |
2,299,500 |
|
|
|
13,843,475 |
||
|
Household Products - 0.2% |
|||
|
Procter & Gamble Co. |
40,300 |
2,307,175 |
|
|
Common Stocks - continued |
|||
|
Shares |
Value (Note 1) |
||
|
NONDURABLES - continued |
|||
|
Tobacco - 2.1% |
|||
|
Philip Morris Companies, Inc. |
941,760 |
$ 25,015,500 |
|
|
TOTAL NONDURABLES |
41,166,150 |
||
|
RETAIL & WHOLESALE - 5.6% |
|||
|
Drug Stores - 0.9% |
|||
|
Walgreen Co. |
322,500 |
10,380,469 |
|
|
General Merchandise Stores - 2.5% |
|||
|
Wal-Mart Stores, Inc. |
539,800 |
31,105,975 |
|
|
Retail & Wholesale, Miscellaneous - 2.2% |
|||
|
Bed Bath & Beyond, Inc. (a) |
233,900 |
8,478,875 |
|
|
Home Depot, Inc. |
374,000 |
18,676,625 |
|
|
|
27,155,500 |
||
|
TOTAL RETAIL & WHOLESALE |
68,641,944 |
||
|
SERVICES - 0.3% |
|||
|
Advertising - 0.3% |
|||
|
Omnicom Group, Inc. |
35,100 |
3,126,094 |
|
|
TECHNOLOGY - 23.2% |
|||
|
Communications Equipment - 6.5% |
|||
|
Cisco Systems, Inc. (a) |
715,300 |
45,466,256 |
|
|
Lucent Technologies, Inc. |
72,000 |
4,266,000 |
|
|
Nokia AB sponsored ADR |
260,700 |
13,018,706 |
|
|
Nortel Networks Corp. |
246,000 |
17,064,640 |
|
|
|
79,815,602 |
||
|
Computer Services & Software - 6.8% |
|||
|
Adobe Systems, Inc. |
53,400 |
6,942,000 |
|
|
IMS Health, Inc. |
595,000 |
10,710,000 |
|
|
Intuit, Inc. (a) |
99,800 |
4,129,225 |
|
|
Microsoft Corp. (a) |
659,100 |
52,727,994 |
|
|
VERITAS Software Corp. (a) |
73,800 |
8,340,553 |
|
|
|
82,849,772 |
||
|
Computers & Office Equipment - 3.9% |
|||
|
Compaq Computer Corp. |
630,900 |
16,127,381 |
|
|
EMC Corp. (a) |
249,300 |
19,180,519 |
|
|
Pitney Bowes, Inc. |
301,400 |
12,056,000 |
|
|
|
47,363,900 |
||
|
Electronics - 6.0% |
|||
|
Intel Corp. |
345,500 |
46,189,031 |
|
|
LSI Logic Corp. (a) |
90,600 |
4,903,725 |
|
|
Micron Technology, Inc. (a) |
81,400 |
7,168,288 |
|
|
Texas Instruments, Inc. |
226,200 |
15,537,113 |
|
|
|
73,798,157 |
||
|
TOTAL TECHNOLOGY |
283,827,431 |
||
|
|
|||
|
Shares |
Value (Note 1) |
||
|
UTILITIES - 10.0% |
|||
|
Cellular - 3.6% |
|||
|
Nextel Communications, Inc. |
374,500 |
$ 22,914,719 |
|
|
Vodafone AirTouch PLC sponsored ADR |
524,900 |
21,750,544 |
|
|
|
44,665,263 |
||
|
Electric Utility - 0.5% |
|||
|
IPALCO Enterprises, Inc. |
302,800 |
6,093,850 |
|
|
Telephone Services - 5.9% |
|||
|
Allegiance Telecom, Inc. (a) |
119,400 |
7,641,600 |
|
|
AT&T Corp. |
235,450 |
7,446,106 |
|
|
BellSouth Corp. |
248,200 |
10,579,525 |
|
|
NEXTLINK Communications, Inc. |
203,800 |
7,731,663 |
|
|
Qwest Communications |
137,700 |
6,841,969 |
|
|
SBC Communications, Inc. |
728,530 |
31,508,923 |
|
|
WorldCom, Inc. (a) |
1 |
23 |
|
|
|
71,749,809 |
||
|
TOTAL UTILITIES |
122,508,922 |
||
|
TOTAL COMMON STOCKS (Cost $974,550,110) |
1,078,496,243 |
||
|
U.S. Treasury Obligations - 0.1% |
||||
|
|
Principal Amount |
|
||
|
U.S. Treasury Bills, yield at date of
purchase 5.57% 8/17/00 (c) |
|
$ 1,500,000 |
1,489,463 |
|
|
Cash Equivalents - 11.9% |
|||
|
Shares |
|
||
|
Central Cash Collateral Fund, 6.71% (b) |
5,919,200 |
5,919,200 |
|
|
Taxable Central Cash Fund, 6.59% (b) |
140,027,095 |
140,027,095 |
|
|
TOTAL CASH EQUIVALENTS (Cost $145,946,295) |
145,946,295 |
||
|
TOTAL INVESTMENT PORTFOLIO - 100.1% (Cost $1,121,985,345) |
1,225,932,001 |
||
|
NET OTHER ASSETS - (0.1)% |
(717,905) |
||
|
NET ASSETS - 100% |
$ 1,225,214,096 |
||
|
Futures Contracts |
|||||
|
|
Expiration Date |
Underlying |
Unrealized Gain/(Loss) |
||
|
Purchased |
|||||
|
70 S&P 500 Stock Index Contracts |
Sept. 2000 |
$ 25,691,750 |
$ (194,795) |
||
|
The face value of futures purchased as a percentage of net assets - 2.1% |
|
Legend |
|
(a) Non-income producing |
|
(b) The rate quoted is the annualized seven-day yield of the fund at |
|
(c) Security or a portion of the security was pledged to cover margin requirements for futures contracts. At the period end, the value of securities pledged amounted to $1,489,463. |
|
Other Information |
|
Purchases and sales of securities, other than short-term securities, aggregated $339,324,728 and $468,732,226, respectively. |
|
The market value of futures contracts opened and closed during the period amounted to $73,545,687 and $48,716,990, respectively. |
|
The fund placed a portion of its portfolio transactions with brokerage firms which are affiliates of Fidelity Management & Research Company. The commissions paid to these affiliated firms were $27,856 for the period. |
|
The fund participated in the security lending program. At period end, the value of securities loaned amounted to $6,002,310. The fund received cash collateral of $5,919,200 which was invested in cash equivalents. |
|
Income Tax Information |
|
At June 30, 2000, the aggregate cost of investment securities for income tax purposes was $1,123,779,759. Net unrealized appreciation aggregated $102,152,242, of which $210,748,476 related to appreciated investment securities and $108,596,234 related to depreciated investment securities. |
See accompanying notes which are an integral part of the financial statements.
Growth & Income Portfolio
Statement of Assets and Liabilities
|
|
June 30, 2000 (Unaudited) |
|
|
Assets |
|
|
|
Investment in securities, at value (cost
$1,121,985,345) - |
|
$ 1,225,932,001 |
|
Receivable for investments sold |
|
9,778,991 |
|
Receivable for fund shares sold |
|
972,216 |
|
Dividends receivable |
|
979,605 |
|
Interest receivable |
|
739,383 |
|
Receivable for daily variation |
|
176,750 |
|
Other receivables |
|
15,747 |
|
Total assets |
|
1,238,594,693 |
|
Liabilities |
|
|
|
Payable for investments purchased |
$ 5,986,196 |
|
|
Payable for fund shares redeemed |
898,008 |
|
|
Accrued management fee |
485,655 |
|
|
Distribution fees payable |
13,646 |
|
|
Other payables and |
77,892 |
|
|
Collateral on securities loaned, |
5,919,200 |
|
|
Total liabilities |
|
13,380,597 |
|
Net Assets |
|
$ 1,225,214,096 |
|
Net Assets consist of: |
|
|
|
Paid in capital |
|
$ 1,061,452,605 |
|
Undistributed net investment income |
|
6,495,495 |
|
Accumulated undistributed |
|
53,514,137 |
|
Net unrealized appreciation
(depreciation) on investments |
|
103,751,859 |
|
Net Assets |
|
$ 1,225,214,096 |
|
Initial Class: |
|
$15.48 |
|
Service Class: |
|
$15.41 |
|
Service Class 2: |
|
$15.40 |
Statement of Operations
|
|
Six months ended June 30, 2000 (Unaudited) |
|
|
Investment Income Dividends |
|
$ 6,835,962 |
|
Interest |
|
2,943,179 |
|
Security lending |
|
86,077 |
|
Total income |
|
9,865,218 |
|
Expenses |
|
|
|
Management fee |
$ 2,904,405 |
|
|
Transfer agent fees |
394,900 |
|
|
Distribution fees |
64,785 |
|
|
Accounting and security lending fees |
148,951 |
|
|
Non-interested trustees' compensation |
1,956 |
|
|
Custodian fees and expenses |
12,206 |
|
|
Audit |
12,783 |
|
|
Legal |
5,249 |
|
|
Reports to shareholders |
4,672 |
|
|
Miscellaneous |
303 |
|
|
Total expenses before reductions |
3,550,210 |
|
|
Expense reductions |
(82,248) |
3,467,962 |
|
Net investment income |
|
6,397,256 |
|
Realized and Unrealized Gain (Loss) Net realized gain (loss) on: |
|
|
|
Investment securities |
54,093,706 |
|
|
Foreign currency transactions |
8,989 |
|
|
Futures contracts |
1,057,848 |
55,160,543 |
|
Change in net unrealized appreciation (depreciation) on: |
|
|
|
Investment securities |
(94,278,054) |
|
|
Assets and liabilities in |
(2) |
|
|
Futures contracts |
(194,795) |
(94,472,851) |
|
Net gain (loss) |
|
(39,312,308) |
|
Net increase (decrease) in net assets resulting from operations |
|
$ (32,915,052) |
|
Other Information Expense reductions |
|
$ 81,894 |
|
Custodian credits |
|
354 |
|
|
|
$ 82,248 |
See accompanying notes which are an integral part of the financial statements.
Semiannual Report
Fidelity Variable Insurance Products: Growth & Income
Portfolio
Financial Statements - continued
Statement of Changes in Net Assets
|
Increase (Decrease) in Net Assets |
Six months ended |
Year ended |
|
Operations |
$ 6,397,256 |
$ 14,349,137 |
|
Net realized gain (loss) |
55,160,543 |
94,527,839 |
|
Change in net unrealized appreciation (depreciation) |
(94,472,851) |
5,576,047 |
|
Net increase (decrease) in net assets resulting from operations |
(32,915,052) |
114,453,023 |
|
Distributions to shareholders |
(14,244,194) |
(7,463,706) |
|
From net realized gain |
(92,962,107) |
(14,927,412) |
|
Total distributions |
(107,206,301) |
(22,391,118) |
|
Share transactions - net increase (decrease) |
10,338,716 |
102,753,346 |
|
Total increase (decrease) in net assets |
(129,782,637) |
194,815,251 |
|
Net Assets |
|
|
|
Beginning of period |
1,354,996,733 |
1,160,181,482 |
|
End of period (including undistributed net investment income of $6,495,495 and $14,353,340, respectively) |
$ 1,225,214,096 |
$ 1,354,996,733 |
|
|
|
Other Information: |
|
|
Six months ended June 30, 2000 |
Year ended |
||
|
|
Shares |
Dollars |
Shares |
Dollars |
|
Share transactions |
4,848,084 |
$ 75,165,202 |
16,149,212 |
$ 265,569,682 |
|
Reinvested |
6,348,551 |
97,958,146 |
1,401,034 |
21,996,237 |
|
Redeemed |
(15,652,464) |
(244,802,304) |
(15,445,916) |
(257,900,936) |
|
Net increase (decrease) |
(4,455,829) |
$ (71,678,956) |
2,104,330 |
$ 29,664,983 |
|
Service Class |
4,709,059 |
$ 72,777,536 |
4,435,269 |
$ 73,604,463 |
|
Reinvested |
601,152 |
9,239,713 |
25,216 |
394,881 |
|
Redeemed |
(148,738) |
(2,281,362) |
(55,277) |
(910,981) |
|
Net increase (decrease) |
5,161,473 |
$ 79,735,887 |
4,405,208 |
$ 73,088,363 |
|
Service Class 2 A |
149,950 |
$ 2,273,384 |
- |
$ - |
|
Reinvested |
550 |
8,442 |
- |
- |
|
Redeemed |
(3) |
(41) |
- |
- |
|
Net increase (decrease) |
150,497 |
$ 2,281,785 |
- |
$ - |
|
Distributions Initial Class |
|
$ 13,015,418 |
|
$ 7,332,079 |
|
Service Class |
|
1,227,654 |
|
131,627 |
|
Service Class 2 A |
|
1,122 |
|
- |
|
Total |
|
$ 14,244,194 |
|
$ 7,463,706 |
|
From net realized gain Initial Class |
|
$ 84,942,728 |
|
$ 14,664,158 |
|
Service Class |
|
8,012,059 |
|
263,254 |
|
Service Class 2 A |
|
7,320 |
|
- |
|
Total |
|
$ 92,962,107 |
|
$ 14,927,412 |
|
|
|
$ 107,206,301 |
|
$ 22,391,118 |
A Service Class 2 commenced sale of shares January 12, 2000.
See accompanying notes which are an integral part of the financial statements.
Growth & Income Portfolio
Financial Highlights - Initial Class
|
|
Six months ended |
Years ended December 31, |
|||
|
Selected Per-Share Data |
(Unaudited) |
1999 |
1998 |
1997 |
1996 H |
|
Net asset value, beginning of period |
$ 17.30 |
$ 16.15 |
$ 12.53 |
$ 9.90 |
$ 10.00 |
|
Income from Investment Operations |
|
|
|
|
|
|
Net investment income |
.08 D |
.18 D |
.15 D |
.13 D |
.00 |
|
Net realized and unrealized gain (loss) |
(.47) |
1.27 |
3.54 |
2.84 |
(.10) |
|
Total from investment operations |
(.39) |
1.45 |
3.69 |
2.97 |
(.10) |
|
Less Distributions |
|
|
|
|
|
|
From net investment income |
(.19) |
(.10) |
- |
(.08) |
- |
|
From net realized gain |
(1.24) |
(.20) |
(.07) |
(.26) |
- |
|
Total distributions |
(1.43) |
(.30) |
(.07) |
(.34) |
- |
|
Net asset value, end of period |
$ 15.48 |
$ 17.30 |
$ 16.15 |
$ 12.53 |
$ 9.90 |
|
Total Return B, C |
(2.23)% |
9.17% |
29.59% |
30.09% |
(1.00)% |
|
Ratios and Supplemental Data |
|
|
|
|
|
|
Net assets, end of period (000 omitted) |
$ 1,057,884 |
$ 1,259,396 |
$ 1,141,806 |
$ 345,287 |
$ 990 |
|
Ratio of expenses to average net assets |
.57% A |
.60% |
.61% |
.70% |
1.00% A, F |
|
Ratio of expenses to average net assets after expense reductions |
.56% A, G |
.59% G |
.60% G |
.70% |
1.00% A |
|
Ratio of net investment income to average net assets |
1.06% A |
1.08% |
1.08% |
1.14% |
3.89% A |
|
Portfolio turnover |
60% A |
58% |
66% |
81% |
0% A |
Financial Highlights - Service Class
|
|
Six months ended |
Years ended December 31, |
||
|
Selected Per-Share Data |
(Unaudited) |
1999 |
1998 |
1997 E |
|
Net asset value, beginning of period |
$ 17.24 |
$ 16.11 |
$ 12.53 |
$ 12.35 |
|
Income from Investment Operations |
|
|
|
|
|
Net investment income D |
.07 |
.16 |
.15 |
.03 |
|
Net realized and unrealized gain (loss) |
(.47) |
1.27 |
3.50 |
.49 |
|
Total from investment operations |
(.40) |
1.43 |
3.65 |
.52 |
|
Less Distributions |
|
|
|
|
|
From net investment income |
(.19) |
(.10) |
- |
(.08) |
|
From net realized gain |
(1.24) |
(.20) |
(.07) |
(.26) |
|
Total distributions |
(1.43) |
(.30) |
(.07) |
(.34) |
|
Net asset value, end of period |
$ 15.41 |
$ 17.24 |
$ 16.11 |
$ 12.53 |
|
Total Return B, C |
(2.30)% |
9.06% |
29.27% |
4.29% |
|
Ratios and Supplemental Data |
|
|
|
|
|
Net assets, end of period (000 omitted) |
$ 165,012 |
$ 95,600 |
$ 18,375 |
$ 10 |
|
Ratio of expenses to average net assets |
.67% A |
.70% |
.71% |
.80% A |
|
Ratio of expenses to average net assets after expense reductions |
.66% A, G |
.69% G |
.70% G |
.80% A |
|
Ratio of net investment income to average net assets |
.96% A |
.98% |
1.05% |
1.24% A |
|
Portfolio turnover |
60% A |
58% |
66% |
81% |
|
A Annualized B The total returns would have been lower had certain expenses not been reduced during the periods shown. C Total returns for periods of less than one year are not annualized and do not reflect charges attributable to your insurance company's separate account. Inclusion of these charges would reduce the total returns shown. D Net investment income per share has been calculated based on average shares outstanding during the period. E For the period November 3, 1997 (commencement of sale of Service Class shares) to December 31, 1997. F FMR agreed to reimburse a portion of the class' expenses during the period. Without this reimbursement, the class' expense ratio would have been higher. G FMR or the fund has entered into varying arrangements with third parties who either paid or reduced a portion of the class' expenses. H For the period December 31, 1996 (commencement of operations of Initial Class shares). |
||||
See accompanying notes which are an integral part of the financial statements.
Semiannual Report
Financial Highlights - Service Class 2
|
|
Six months ended |
|
Selected Per-Share Data |
(Unaudited) |
|
Net asset value, beginning of period |
$ 16.94 |
|
Income from Investment Operations |
|
|
Net investment income D |
.05 |
|
Net realized and unrealized gain (loss) |
(.16) |
|
Total from investment operations |
(.11) |
|
Less Distributions |
|
|
From net investment income |
(.19) |
|
From net realized gain |
(1.24) |
|
Total distributions |
(1.43) |
|
Net asset value, end of period |
$ 15.40 |
|
Total Return B, C |
(0.63)% |
|
Ratios and Supplemental Data |
|
|
Net assets, end of period (000 omitted) |
$ 2,318 |
|
Ratio of expenses to average net assets |
.81% A |
|
Ratio of expenses to average net assets after expense reductions |
.80% A, E |
|
Ratio of net investment income to average net assets |
.82% A |
|
Portfolio turnover |
60% A |
|
A Annualized B The total returns would have been lower had certain expenses not been reduced during the periods shown. C Total returns for periods of less than one year are not annualized and do not reflect charges attributable to your insurance company's separate account. Inclusion of these charges would reduce the total returns shown. D Net investment income per share has been calculated based on average shares outstanding during the period. E FMR or the fund has entered into varying arrangements with third parties who either paid or reduced a portion of the class' expenses. F For the period January 12, 2000 (commencement of sale of Service Class 2 shares) to June 30, 2000. |
|
See accompanying notes which are an integral part of the financial statements.
Growth & Income Portfolio
For the period ended June 30, 2000 (Unaudited)
1. Significant Accounting Policies.
Growth & Income Portfolio (the fund) is a fund of Variable Insurance Products Fund III (the trust) (referred to in this report as Fidelity Variable Insurance Products: Growth & Income Portfolio) and is authorized to issue an unlimited number of shares. The trust is registered under the Investment Company Act of 1940, as amended (the 1940 Act), as an open-end management investment company organized as a Massachusetts business trust. Shares of the fund may only be purchased by insurance companies for the purpose of funding variable annuity or variable life insurance contracts. The fund offers three classes of shares: the fund's original class of shares (Initial Class shares), Service Class shares and Service Class 2 shares. The fund commenced sale of Service Class 2 shares on January 12, 2000. All classes have equal rights and voting privileges, except for matters affecting a single class. Investment income, realized and unrealized capital gains and losses, the common expenses of the fund, and certain fund-level expense reductions, if any, are allocated on a pro rata basis to each class based on the relative net assets of each class to the total net assets of the fund. Each class of shares differs in its respective distribution plan.
The financial statements have been prepared in conformity with generally accepted accounting principles which require management to make certain estimates and assumptions at the date of the financial statements. The following summarizes the significant accounting policies of the fund:
Security Valuation. Securities for which exchange quotations are readily available are valued at the last sale price, or if no sale price, at the closing bid price. Foreign securities are valued based on quotations from the principal market in which such securities are normally traded. If trading or events occurring in other markets after the close of the principal market in which foreign securities are traded, and before the close of the business of the fund, are expected to materially affect the value of those securities, then they are valued at their fair value taking this trading or these events into account. Fair value is determined in good faith under consistently applied procedures under the general supervision of the Board of Trustees. Securities for which exchange quotations are not readily available (and in certain cases debt securities which trade on an exchange) are valued primarily using dealer-supplied valuations or at their fair value. Short-term securities with remaining maturities of sixty days or less for which quotations are not readily available are valued at amortized cost or original cost plus accrued interest, both of which approximate current value.
Foreign Currency Translation. The accounting records of the fund are maintained in U.S. dollars. Investment securities and other assets and liabilities denominated in a foreign currency are translated into U.S. dollars at the prevailing rates of exchange at period end. Purchases and sales of securities, income receipts and expense payments are translated into U.S. dollars at the prevailing exchange rate on the respective dates of the transactions.
Net realized gains and losses on foreign currency transactions represent net gains and losses from sales and maturities of foreign currency contracts, disposition of foreign currencies, the difference between the amount of net investment income accrued and the U.S. dollar amount actually received, and gains and losses between trade and settlement date on purchases and sales of securities. The effects of changes in foreign currency exchange rates on investments in securities are included with the net realized and unrealized gain or loss on investment securities.
Income Taxes. As a qualified regulated investment company under Subchapter M of the Internal Revenue Code, the fund is not subject to income taxes to the extent that it distributes substantially all of its taxable income for its fiscal year. The schedule of investments includes information regarding income taxes under the caption "Income Tax Information."
Investment Income. Dividend income is recorded on the ex-dividend date, except certain dividends from foreign securities where the ex-dividend date may have passed, are recorded as soon as the fund is informed of the ex-dividend date. Non-cash dividends included in dividend income, if any, are recorded at the fair market value of the securities received. Interest income, which includes accretion of original issue discount, is accrued as earned. Investment income is recorded net of foreign taxes withheld where recovery of such taxes is uncertain.
Expenses. Most expenses of the trust can be directly attributed to a fund. Expenses which cannot be directly attributed are apportioned among the funds in the trust.
Distributions to Shareholders. Distributions are recorded on the ex-dividend date. Income dividends and capital gain distributions are declared separately for each class.
Income and capital gain distributions are determined in accordance with income tax regulations which may differ from generally accepted accounting principles. These differences, which may result in distribution reclassifications, are primarily due to differing treatments for foreign currency transactions, non-taxable dividends, and losses deferred due to wash sales.
Permanent book and tax basis differences relating to shareholder distributions will result in reclassifications to paid in capital. Undistributed net investment income and accumulated undistributed net realized gain (loss) on investments and foreign currency transactions may include temporary book and tax basis differences which will reverse in a subsequent period. Any taxable income or gain remaining at fiscal year end is distributed in the following year.
Security Transactions. Security transactions are accounted for as of trade date. Gains and losses on securities sold are determined on the basis of identified cost.
Semiannual Report
Notes to Financial Statements (Unaudited) - continued
2. Operating Policies.
Foreign Currency Contracts. The fund generally uses foreign currency contracts to facilitate transactions in foreign-denominated securities. Losses may arise from changes in the value of the foreign currency or if the counterparties do not perform under the contracts' terms. The U.S. dollar value of foreign currency contracts is determined using contractual currency exchange rates established at the time of each trade.
Central Cash Funds. Pursuant to an Exemptive Order issued by the Securities and Exchange Commission (the SEC), the fund may invest in the Taxable Central Cash Fund and the Central Cash Collateral Fund (the Cash Funds) managed by Fidelity Investments Money Management, Inc., an affiliate of Fidelity Management & Research Company (FMR). The Cash Funds are open-end money market funds available only to investment companies and other accounts managed by FMR and its affiliates. The Cash Funds seek preservation of capital, liquidity, and current income. Income distributions from the Cash Funds are declared daily and paid monthly from net interest income. Income distributions earned by the fund are recorded as either interest income or security lending income in the accompanying financial statements.
Futures Contracts. The fund may use futures contracts to manage its exposure to the stock market. Buying futures tends to increase the fund's exposure to the underlying instrument, while selling futures tends to decrease the fund's exposure to the underlying instrument or hedge other fund investments. Futures contracts involve, to varying degrees, risk of loss in excess of the futures variation margin reflected in the Statement of Assets and Liabilities. The underlying face amount at value of any open futures contracts at period end is shown in the schedule of investments under the caption "Futures Contracts." This amount reflects each contract's exposure to the underlying instrument at period end. Losses may arise from changes in the value of the underlying instruments or if the counterparties do not perform under the contracts' terms. Gains (losses) are realized upon the expiration or closing of the futures contracts. Futures contracts are valued at the settlement price established each day by the board of trade or exchange on which they are traded.
3. Purchases and Sales of Investments.
Information regarding purchases and sales of securities (other than short-term securities), and the market value of futures contracts opened and closed, is included under the caption "Other Information" at the end of the fund's schedule of investments.
4. Fees and Other Transactions with Affiliates.
Management Fee. As the fund's investment adviser, FMR receives a monthly fee that is calculated on the basis of a group fee rate plus a fixed individual fund fee rate applied to the average net assets of the fund. The group fee rate is the weighted average of a series of rates and is based on the monthly average net assets of all the mutual funds advised by FMR. The rates ranged from .2167% to .5200% for the period. The annual individual fund fee rate is .20%. In the event that these rates were lower than the contractual rates in effect during the period, FMR voluntarily implemented the above rates, as they resulted in the same or a lower management fee. For the period, the management fee was equivalent to an annualized rate of .48% of average net assets.
Distribution and Service Plan. In accordance with Rule 12b-1 of the 1940 Act, the Board of Trustees has adopted separate Distribution and Service Plans with respect to each class of shares (collectively referred to as "the Plans"). Under certain of the Plans, the class pays Fidelity Distributors Corporation (FDC), an affiliate of FMR, a 12b-1 fee. For the period, this fee is based on an annual rate of .10% of Service Class' average net assets and .25% of Service Class 2's average net assets. Initial Class shares are not subject to a 12b-1 fee.
For the period, each class paid FDC the following amounts, all of which was reallowed to insurance companies, for the distribution of shares and providing shareholder support services.
|
Service Class |
$ 64,293 |
|
Service Class 2 |
492 |
|
|
$ 64,785 |
Transfer Agent Fees. Fidelity Investments Institutional Operations Company, Inc. (FIIOC), an affiliate of FMR, is the fund's transfer, dividend disbursing, and shareholder servicing agent. FIIOC receives account fees and asset-based fees that vary according to account size and type of account. FIIOC pays a portion of the expenses related to the typesetting, printing and mailing of all shareholder reports, except proxy statements. For the period, the transfer agent fees of the fund were equivalent to an annualized rate of .07% of average net assets.
For the period, the following amounts were paid to FIIOC:
|
Initial Class |
$ 351,138 |
|
Service Class |
43,630 |
|
Service Class 2 |
132 |
|
|
$ 394,900 |
Accounting and Security Lending Fees. Fidelity Service Company, Inc., an affiliate of FMR, maintains the fund's accounting records and administers the security lending program. The security lending fee is based on the number and duration of lending transactions. The accounting fee is based on the level of average net assets for the month plus out-of-pocket expenses.
Brokerage Commissions. The fund placed a portion of its portfolio transactions with brokerage firms which are affiliates of FMR. The commissions paid to these affiliated firms are shown under the caption "Other Information" at the end of the fund's schedule of investments.
Growth & Income Portfolio
Notes to Financial Statements (Unaudited) - continued
5. Security Lending.
The fund lends portfolio securities from time to time in order to earn additional income. The fund receives collateral in the form of U.S. Treasury obligations, letters of credit, and/or cash against the loaned securities, and maintains collateral in an amount not less than 100% of the market value of the loaned securities during the period of the loan. The market value of the loaned securities is determined at the close of business of the fund and any additional required collateral is delivered to the fund on the next business day. If the borrower defaults on its obligation to return the securities loaned because of insolvency or other reasons, the fund could experience delays and costs in recovering the securities loaned or in gaining access to the collateral. Information regarding the value of securities loaned and the value of collateral at period end is included under the caption "Other Information" at the end of the fund's schedule of investments.
6. Expense Reductions.
FMR has directed certain portfolio trades to brokers who paid a portion of the fund's expenses.
In addition, through an arrangement with the fund's custodian, credits realized as a result of uninvested cash balances were used to reduce a portion of the fund's expenses.
For the period, the reductions under these arrangements are shown under the caption "Other Information" on the fund's Statement of Operations.
7. Beneficial Interest.
At the end of the period, Fidelity Investments Life Insurance Company (FILI) and its subsidiaries, affiliates of FMR, were the record owners of approximately 40% of the outstanding shares of the fund. In addition, three unaffiliated insurance companies were each record owners of more than 10% of the total outstanding shares of the fund, totaling 42%.
Growth & Income Portfolio
A special meeting of the fund's shareholders was held on July 19, 2000. The results of votes taken among shareholders on proposals before them are reported below. Each vote reported represents one dollar of net asset value held on the record date for the meeting.
PROPOSAL 1
To elect as Trustees the following twelve nominees.*
|
|
# of Dollars Voted |
% of Dollars Voted |
Ralph F. Cox
|
Affirmative |
2,995,348,207.84 |
97.862 |
|
Withheld |
65,444,305.52 |
2.138 |
|
TOTAL |
3,060,792,513.36 |
100.000 |
Phyllis Burke Davis
|
Affirmative |
2,995,012,849.06 |
97.851 |
|
Withheld |
65,779,664.30 |
2.149 |
|
TOTAL |
3,060,792,513.36 |
100.000 |
Robert M. Gates
|
Affirmative |
2,994,325,628.16 |
97.828 |
|
Withheld |
66,466,885.20 |
2.172 |
|
TOTAL |
3,060,792,513.36 |
100.000 |
Edward C. Johnson 3d
|
Affirmative |
2,994,212,266.77 |
97.825 |
|
Withheld |
66,580,246.59 |
2.175 |
|
TOTAL |
3,060,792,513.36 |
100.000 |
Donald J. Kirk
|
Affirmative |
2,996,527,468.99 |
97.900 |
|
Withheld |
64,265,044.37 |
2.100 |
|
TOTAL |
3,060,792,513.36 |
100.000 |
Ned C. Lautenbach
|
Affirmative |
2,997,430,896.97 |
97.930 |
|
Withheld |
63,361,616.39 |
2.070 |
|
TOTAL |
3,060,792,513.36 |
100.000 |
Peter S. Lynch
|
Affirmative |
2,997,391,112.97 |
97.929 |
|
Withheld |
63,401,400.39 |
2.071 |
|
TOTAL |
3,060,792,513.36 |
100.000 |
|
|
# of Dollars Voted |
% of Dollars Voted |
William O. McCoy
|
Affirmative |
2,997,364,420.76 |
97.928 |
|
Withheld |
63,428,092.60 |
2.072 |
|
TOTAL |
3,060,792,513.36 |
100.000 |
Gerald C. McDonough
|
Affirmative |
2,992,594,911.89 |
97.772 |
|
Withheld |
68,197,601.47 |
2.228 |
|
TOTAL |
3,060,792,513.36 |
100.000 |
Marvin L. Mann
|
Affirmative |
2,996,491,839.67 |
97.899 |
|
Withheld |
64,300,673.69 |
2.101 |
|
TOTAL |
3,060,792,513.36 |
100.000 |
Robert C. Pozen
|
Affirmative |
2,997,304,419.99 |
97.926 |
|
Withheld |
63,488,093.37 |
2.074 |
|
TOTAL |
3,060,792,513.36 |
100.000 |
Thomas R. Williams
|
Affirmative |
2,993,561,996.24 |
97.803 |
|
Withheld |
67,230,517.12 |
2.197 |
|
TOTAL |
3,060,792,513.36 |
100.000 |
Semiannual Report
Notes to Financial Statements (Unaudited) - continued
PROPOSAL 2
To ratify the selection of Deloitte & Touche LLP as independent accountants of the fund.
|
|
# of Dollars Voted |
% of Dollars Voted |
|
Affirmative |
1,094,741,303.86 |
94.882 |
|
Against |
8,150,336.78 |
0.707 |
|
Abstain |
50,895,725.39 |
4.411 |
|
TOTAL |
1,153,787,366.03 |
100.000 |
PROPOSAL 3
To authorize the Trustees to adopt an Amended and Restated Declaration of Trust.*
|
|
# of Dollars Voted |
% of Dollars Voted |
|
Affirmative |
2,837,267,199.92 |
92.697 |
|
Against |
49,473,422.32 |
1.617 |
|
Abstain |
174,051,891.12 |
5.686 |
|
TOTAL |
3,060,792,513.36 |
100.000 |
PROPOSAL 4
To approve an amended management contract for the fund that would reduce the management fee payable to FMR by the fund as FMR's assets under management increase.
|
|
# of Dollars Voted |
% of Dollars Voted |
|
Affirmative |
1,065,660,945.04 |
92.362 |
|
Against |
14,930,318.61 |
1.294 |
|
Abstain |
73,196,102.38 |
6.344 |
|
TOTAL |
1,153,787,366.03 |
100.000 |
PROPOSAL 5
To approve an amended sub-advisory agreement with FMR U.K. to provide investment advice and research services or investment management services.
|
|
# of Dollars Voted |
% of Dollars Voted |
|
Affirmative |
1,052,012,765.56 |
91.179 |
|
Against |
14,716,021.72 |
1.276 |
|
Abstain |
87,058,578.75 |
7.545 |
|
TOTAL |
1,153,787,366.03 |
100.000 |
PROPOSAL 6
To approve an amended sub-advisory agreement with FMR Far East to provide investment advice and research services or investment management services.
|
|
# of Dollars Voted |
% of Dollars Voted |
|
Affirmative |
1,047,279,358.30 |
90.769 |
|
Against |
18,168,639.12 |
1.575 |
|
Abstain |
88,339,368.61 |
7.656 |
|
TOTAL |
1,153,787,366.03 |
100.000 |
PROPOSAL 7
To amend the fundamental investment limitation concerning diversification.
|
|
# of Dollars Voted |
% of Dollars Voted |
|
Affirmative |
1,045,547,591.12 |
90.619 |
|
Against |
27,126,923.06 |
2.351 |
|
Abstain |
81,112,851.85 |
7.030 |
|
TOTAL |
1,153,787,366.03 |
100.000 |
PROPOSAL 8
To amend the fundamental limitation concerning underwriting.
|
|
# of Dollars Voted |
% of Dollars Voted |
|
Affirmative |
1,041,821,757.51 |
90.296 |
|
Against |
27,809,789.09 |
2.410 |
|
Abstain |
84,155,819.43 |
7.294 |
|
TOTAL |
1,153,787,366.03 |
100.000 |
PROPOSAL 9
To amend the fundamental limitation concerning concentration.
|
|
# of Dollars Voted |
% of Dollars Voted |
|
Affirmative |
1,042,706,287.48 |
90.372 |
|
Against |
26,973,368.78 |
2.338 |
|
Abstain |
84,107,709.77 |
7.290 |
|
TOTAL |
1,153,787,366.03 |
100.000 |
* Denotes trust-wide proposals and voting results.
Growth & Income Portfolio
Investment Adviser
Fidelity Management & Research Company
Boston, MA
Investment Sub-Advisers
Fidelity Management & Research (U.K.) Inc.
Fidelity Management & Research (Far East) Inc.
Fidelity Investments Japan Limited
Officers
Edward C. Johnson 3d, President
Robert C. Pozen, Senior Vice President
Richard A. Spillane, Jr., Vice President
Eric D. Roiter, Secretary
Robert A. Dwight, Treasurer
Maria F. Dwyer, Deputy Treasurer
John H. Costello, Assistant Treasurer
Board of Trustees
Ralph F. Cox *
Phyllis Burke Davis *
Robert M. Gates *
Edward C. Johnson 3d
Donald J. Kirk *
Ned C. Lautenbach *
Peter S. Lynch
Marvin L. Mann *
William O. McCoy *
Gerald C. McDonough *
Robert C. Pozen
Thomas R. Williams *
Advisory Board
J. Michael Cook
Marie L. Knowles
* Independent trustees
General Distributor
Fidelity Distributors Corporation
Boston, MA
Transfer and Shareholder Servicing Agent
Fidelity Investments Institutional Operations Co., Inc.
Boston, MA
Custodian
The Chase Manhattan Bank
New York, NY
VIPGI-SANN-0800 108589
1.705698.102
(2_fidelity_logos)
Growth Opportunities Portfolio
Semiannual Report
June 30, 2000
|
Market Environment |
3 |
A review of what happened in world markets during the past six months. |
|
Performance and Investment Summary |
4 |
How the fund has done over time, and an overview of the fund's investments at the end of the period. |
|
Fund Talk |
7 |
The manager's review of fund performance, strategy |
|
Investments |
8 |
A complete list of the fund's investments with their |
|
Financial Statements |
11 |
Statements of assets and liabilities, operations, and |
|
Notes |
15 |
Notes to the financial statements. |
|
Proxy Voting Results |
18 |
|
Fidelity Variable Insurance Products are separate account options which are purchased through a variable insurance contract.
Standard & Poor's, S&P and S&P 500 are registered service marks of The McGraw-Hill Companies, Inc. and have been licensed for use by Fidelity Distributors Corporation.
Other third party marks appearing herein are the property of their respective owners.
All other marks appearing herein are registered or unregistered trademarks or service marks of FMR Corp. or an affiliated company.
(Recycle graphic) This report is printed on recycled paper using soy-based inks.
The views expressed in this report reflect those of the fund's portfolio manager only through the end of the period of the report as stated on the cover and do not necessarily represent the views of Fidelity or any other person in the Fidelity organization. Any such views are subject to change at any time based upon market or other conditions and Fidelity disclaims any responsibility to update such views. These views may not be relied on as investment advice and, because investment decisions for a Fidelity fund are based on numerous factors, may not be relied on as an indication of trading intent on behalf of any Fidelity fund.
This report and the financial statements contained herein are submitted for the general information of the shareholders of the fund. This report is not authorized for distribution to prospective investors in the fund unless preceded or accompanied by an effective prospectus.
Mutual fund shares are not deposits or obligations of, or guaranteed by, any depository institution. Shares are not insured by the FDIC, Federal Reserve Board or any other agency, and are subject to investment risks, including possible loss of principal amount invested.
Neither the fund nor Fidelity Distributors Corporation is a bank.
Annual Report
After reaching record heights in the first quarter of 2000, several of the most notable U.S. equity market indexes - including the Standard & Poor's 500SM, NASDAQ and Dow Jones Industrial Average - tumbled into negative territory by the end of the second quarter. Leading the market down was the same sector that drove it to new highs just a few months prior: technology. Beginning in mid-March, investors abandoned technology en masse, as concerns about excessive valuations and impending inflation pervaded the market. The ripple effect of the tech sell-off spread rapidly around the world, and international equity markets trended downward in response. As stocks cooled, domestic bond performance heated up, helping many U.S. fixed-income categories outpace their equity counterparts for the overall six-month period. Meanwhile, emerging-market bonds held on to most of their strong first quarter gains, but international developed-market bonds felt the pinch of inflation, as several central banks around the world began to implement interest-rate hikes to slow their respective economies.
At the mid-way point of 2000, the U.S. stock market's unprecedented streak of five consecutive double-digit annual increases appeared to be in jeopardy. The Dow Jones Industrial Average - an index of 30 blue-chip stocks - declined 8.42% during the six-month period ending June 30, 2000. The broad-based S&P 500® and the technology-concentrated NASDAQ index also disappeared below the surface, returning -0.42% and -2.44%, respectively. In a 10-week stretch from March through June, the NASDAQ dropped 33%, making dot-com investors anything but dot-calm as Internet stocks bore the brunt of the decline. As the spectacular growth of the technology sector waned, previously out-of-favor sectors began to lure investors' attention. The consistent, steady growth of the health sector was the primary beneficiary, as it wore the crown of best-performing sector for the first six months of 2000. The natural resources and real-estate sectors were surprising runners-up in the performance derby. But not all was lost for the technology sector. In June, economic reports showed strong evidence that the Federal Reserve Board's series of interest-rate hikes - including three during the first half of this year - were winning the battle against inflation. This news, combined with the Fed's decision to eschew another hike in June, fueled a renewed enthusiasm for tech stocks, as evidenced by the NASDAQ's 16.64% return for the final month of the period.
Reacting similarly to the U.S. stock market - and no doubt largely as a direct result of the U.S. market - most foreign stock markets started the six-month period off on a high note before stumbling in the second quarter. Japan and the Pacific Region in general fell particularly hard. After a stellar 1999, Japanese equities were shaken by their country's economic downturn and an unsteady U.S. market. "New Japan" stocks - Internet, electronic, telecom and software securities - led the
decline. The TOPIX Index, a benchmark of the Japanese market, fell 10.34% during the period. And even the best-performing Pacific Region fund had a negative return, according to Lipper Inc. Weak tech performance in the second quarter also hurt European stock markets, causing the Morgan Stanley Capital International Europe Index to decline 3.10% for the first half of 2000. One of the only non-U.S. stock markets that didn't suffer a negative second quarter was Canada. Often overlooked, the Canadian stock market quietly piled up an impressive six-month return of 21.89% - as measured by the Toronto Stock Exchange (TSE) 300.
Despite being challenged with a series of interest-rate hikes - almost always a detriment to fixed-income offerings - U.S. bond markets still managed to post solid returns relative to equities through the first six months of this year. U.S. government bonds were one of the top performers. In January, the U.S. Treasury announced its intent to repurchase long-term debt and curtail future issuance. Treasury prices soared in response and helped the Lehman Brothers Long-Term Government Bond Index return 8.77% for the period. The Lehman Brothers Aggregate Bond Index, a popular measure of taxable-bond performance, rose 3.99% for the past six months, while tax-free municipals were even more robust, gaining 4.48% according to the Lehman Brothers Municipal Bond Index. Underperformance in the bond market was pretty much limited to the high-yield sector. Faced with a rising interest-rate backdrop and poor technicals - including an unfavorable supply/demand condition and an increased default rate - the high-yield market stumbled to a negative return of 1.00%, as measured by the Merrill Lynch High Yield Master II Index, for the past six months.
International bond investors faced a myriad of negative factors throughout the majority of the six-month period ending June 30, 2000. Strong global economic growth and the threat of rising interest rates, currency fluctuations, and a weakening euro continued to plague global debt issues. Additionally, poor liquidity hampered bond prices in non-U.S. developed markets. Combined, those factors helped drag down the Salomon Brothers Non-U.S. World Government Bond Index, which returned -1.95%. On the bright side, a number of favorable factors propelled demand for emerging-market bonds, which was reflected in the 6.95% return of the J.P. Morgan Emerging Markets Bond Index Global - a popular benchmark of emerging-market debt. Credit momentum, which was driven by improving fundamentals - such as the Russian government's Soviet-era debt restructuring and new political leadership - fostered the rally in emerging-market bonds. Elsewhere, Brazil's better-than-expected economic growth fueled a sharp increase in foreign direct investment. Often large commodity suppliers, emerging-market countries also benefited from a sharp increase in oil prices.
Semiannual Report
Performance
There are several ways to evaluate a fund's historical performance. You can look at the total percentage change in value, the average annual percentage change or the growth of a hypothetical $10,000 investment. Total return reflects the change in the value of an investment, assuming reinvestment of the fund's dividend income and capital gains (the profits earned upon the sale of securities that have grown in value). If Fidelity had not reimbursed certain fund expenses, the past five year and life of fund total returns would have been lower.
Average Annual Total Returns
|
Periods ended |
Past 1 |
Past 5 |
Life of |
|
Fidelity VIP: Growth Opportunities - |
-5.65% |
16.68% |
18.58% |
|
S&P 500 ® |
7.25% |
23.80% |
25.60% |
Average annual returns take the fund's cumulative return and show you what would have happened if the fund had performed at a constant rate each year.
You can compare the fund's return to the performance of the Standard & Poor's 500 SM Index - a market capitalization-weighted index of common stocks. This benchmark reflects the reinvestment of dividends and capital gains, if any.
Figures for more than one year assume a steady compounded rate of return and are not the fund's year-by-year results, which fluctuated over the periods shown. The life of fund figures are from commencement of operations, January 3, 1995.
Performance numbers are net of all fund operating expenses, but do not include any insurance charges imposed by your insurance company's separate account. If performance information included the effect of these additional charges, the total return would be lower.
Past performance is no guarantee of future results. Principal and investment return will vary and you may have a gain or loss when you withdraw your money.
Understanding Performance
How a fund did yesterday is no guarantee of how it will do tomorrow. The stock market, for example, has a history of long-term growth and short-term volatility. In turn, the share price and return of a fund that invests in stocks will vary. That means if you sell your shares during a market downturn, you might lose money. But if you can ride out the market's ups and downs, you may have a gain.
3$10,000 Over Life of Fund
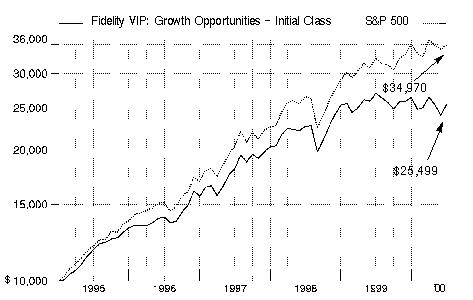
$10,000 Over Life of Fund: Let's say hypothetically that $10,000 was invested in Fidelity Variable Insurance Products: Growth Opportunities Portfolio - Initial Class on January 3, 1995, when the fund started. As the chart shows, by June 30, 2000, the value of the investment would have grown to $25,499 - a 154.99% increase on the initial investment. For comparison, look at how the Standard & Poor's 500 Index did over the same period. With dividends and capital gains, if any, reinvested, the same $10,000 investment would have grown to $34,970 - a 249.70% increase.
Investment Summary
|
Top Five Stocks as of June 30, 2000 |
|
|
|
% of fund's |
|
General Electric Co. |
4.2 |
|
Cisco Systems, Inc. |
4.2 |
|
Eli Lilly & Co. |
2.9 |
|
Intel Corp. |
2.7 |
|
Oracle Corp. |
2.4 |
|
|
16.4 |
|
Top Five Market Sectors as of June 30, 2000 |
|
|
|
% of fund's |
|
Technology |
42.8 |
|
Finance |
11.8 |
|
Health |
10.3 |
|
Energy |
6.4 |
|
Utilities |
5.8 |
|
Asset Allocation as of June 30, 2000 |
|||
|
% of fund's net assets* |
|||
|
Stocks 93.6% |
|
|
|
Short-Term Investments |
|
|
|
* Foreign investments 10.0% |
Semiannual Report
Performance
There are several ways to evaluate a fund's historical performance. You can look at the total percentage change in value, the average annual percentage change or the growth of a hypothetical $10,000 investment. Total return reflects the change in the value of an investment, assuming reinvestment of the fund's dividend income and capital gains (the profits earned upon the sale of securities that have grown in value). The initial offering of Service Class shares took place on November 3, 1997. Performance for Service Class shares reflects an asset based distribution fee (12b-1 fee), and returns prior to November 3, 1997 are those of Initial Class and do not include the effects of Service Class' 12b-1 fee. Had Service Class shares' 12b-1 fee been reflected, returns prior to November 3, 1997 would have been lower. If Fidelity had not reimbursed certain fund expenses, the past five year and life of fund total returns would have been lower.
Average Annual Total Returns
|
Periods ended |
Past 1 |
Past 5 |
Life of |
|
Fidelity VIP: Growth Opportunities - |
-5.74% |
16.63% |
18.53% |
|
S&P 500 |
7.25% |
23.80% |
25.60% |
Average annual returns take the fund's cumulative return and show you what would have happened if the fund had performed at a constant rate each year.
You can compare the fund's return to the performance of the Standard & Poor's 500 Index - a market capitalization-weighted index of common stocks. This benchmark reflects the reinvestment of dividends and capital gains, if any.
Figures for more than one year assume a steady compounded rate of return and are not the fund's year-by-year results, which fluctuated over the periods shown. The life of the fund figures are from commencement of operations, January 3, 1995.
Performance numbers are net of all fund operating expenses, but do not include any insurance charges imposed by your insurance company's separate account. If performance information included the effect of these additional charges, the total return would be lower.
Past performance is no guarantee of future results. Principal and investment return will vary and you may have a gain or loss when you withdraw your money.
Understanding Performance
How a fund did yesterday is no guarantee of how it will do tomorrow. The stock market, for example, has a history of long-term growth and short-term volatility. In turn, the share price and return of a fund that invests in stocks will vary. That means if you sell your shares during a market downturn, you might lose money. But if you can ride out the market's ups and downs, you may have a gain.
3$10,000 Over Life of Fund
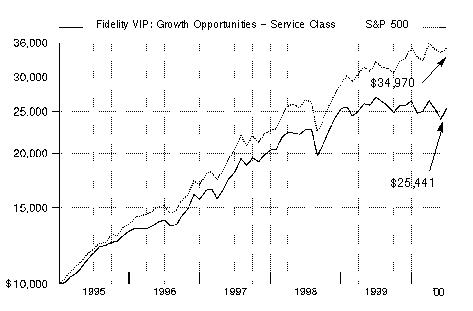
$10,000 Over Life of Fund: Let's say hypothetically that $10,000 was invested in Fidelity Variable Insurance Products: Growth Opportunities Portfolio - Service Class on January 3, 1995, when the fund started. As the chart shows, by June 30, 2000, the value of the investment would have grown to $25,441 - a 154.41% increase on the initial investment. For comparison, look at how the Standard & Poor's 500 Index did over the same period. With dividends and capital gains, if any, reinvested, the same $10,000 investment would have grown to $34,970 - a 249.70% increase.
Investment Summary
|
Top Five Stocks as of June 30, 2000 |
|
|
|
% of fund's |
|
General Electric Co. |
4.2 |
|
Cisco Systems, Inc. |
4.2 |
|
Eli Lilly & Co. |
2.9 |
|
Intel Corp. |
2.7 |
|
Oracle Corp. |
2.4 |
|
|
16.4 |
|
Top Five Market Sectors as of June 30, 2000 |
|
|
|
% of fund's |
|
Technology |
42.8 |
|
Finance |
11.8 |
|
Health |
10.3 |
|
Energy |
6.4 |
|
Utilities |
5.8 |
|
Asset Allocation as of June 30, 2000 |
|||
|
% of fund's net assets* |
|||
|
Stocks 93.6% |
|
|
|
Short-Term Investments |
|
|
|
* Foreign investments 10.0% |
Semiannual Report
Performance
There are several ways to evaluate a fund's historical performance. You can look at the total percentage change in value, the average annual percentage change or the growth of a hypothetical $10,000 investment. Total return reflects the change in the value of an investment, assuming reinvestment of the fund's dividend income and capital gains (the profits earned upon the sale of securities that have grown in value). The initial offering of Service Class 2 shares took place on January 12, 2000. Performance for Service Class 2 shares reflects an asset based distribution fee (12b-1 fee). Returns from November 3, 1997 to January 12, 2000 are those of Service Class which reflect a different 12b-1 fee. Service Class 2 returns prior to November 3, 1997 are those of Initial Class and do not include the effects of a 12b-1 fee. Had Service Class 2's 12b-1 fee been reflected, returns prior to January 12, 2000 would have been lower. If Fidelity had not reimbursed certain fund expenses, the past five year and life of fund total returns would have been lower.
Average Annual Total Returns
|
Periods ended |
Past 1 |
Past 5 |
Life of |
|
Fidelity VIP: Growth Opportunities - |
-5.79% |
16.62% |
18.52% |
|
S&P 500 |
7.25% |
23.80% |
25.60% |
Average annual returns take the fund's cumulative return and show you what would have happened if the fund had performed at a constant rate each year.
You can compare the fund's return to the performance of the Standard & Poor's 500 Index - a market capitalization-weighted index of common stocks. This benchmark reflects the reinvestment of dividends and capital gains, if any.
Figures for more than one year assume a steady compounded rate of return and are not the fund's year-by-year results, which fluctuated over the periods shown. The life of the fund figures are from commencement of operations, January 3, 1995.
Performance numbers are net of all fund operating expenses, but do not include any insurance charges imposed by your insurance company's separate account. If performance information included the effect of these additional charges, the total return would be lower.
Past performance is no guarantee of future results. Principal and investment return will vary and you may have a gain or loss when you withdraw your money.
Understanding Performance
How a fund did yesterday is no guarantee of how it will do tomorrow. The stock market, for example, has a history of long-term growth and short-term volatility. In turn, the share price and return of a fund that invests in stocks will vary. That means if you sell your shares during a market downturn, you might lose money. But if you can ride out the market's ups and downs, you may have a gain.
3$10,000 Over Life of Fund
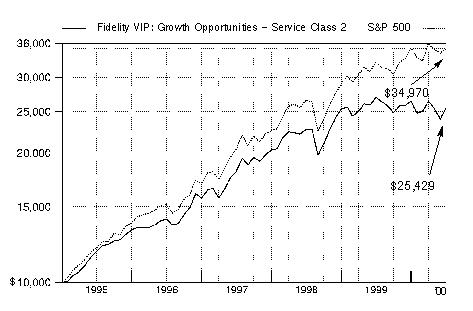
$10,000 Over Life of Fund: Let's say hypothetically that $10,000 was invested in Fidelity Variable Insurance Products: Growth Opportunities Portfolio - Service Class 2 on January 3, 1995, when the fund started. As the chart shows, by June 30, 2000, the value of the investment would have grown to $25,429 - a 154.29% increase on the initial investment. For comparison, look at how the Standard & Poor's 500 Index did over the same period. With dividends and capital gains, if any, reinvested, the same $10,000 investment would have grown to $34,970 - a 249.70% increase.
Investment Summary
|
Top Five Stocks as of June 30, 2000 |
|
|
|
% of fund's |
|
General Electric Co. |
4.2 |
|
Cisco Systems, Inc. |
4.2 |
|
Eli Lilly & Co. |
2.9 |
|
Intel Corp. |
2.7 |
|
Oracle Corp. |
2.4 |
|
|
16.4 |
|
Top Five Market Sectors as of June 30, 2000 |
|
|
|
% of fund's |
|
Technology |
42.8 |
|
Finance |
11.8 |
|
Health |
10.3 |
|
Energy |
6.4 |
|
Utilities |
5.8 |
|
Asset Allocation as of June 30, 2000 |
|||
|
% of fund's net assets* |
|||
|
Stocks 93.6% |
|
|
|
Short-Term Investments |
|
|
|
* Foreign investments 10.0% |
Semiannual Report
(Portfolio Manager photograph)
Note to shareholders: Bettina Doulton became Portfolio Manager of Growth Opportunities Portfolio on February 1, 2000.
Q. How did the fund perform, Bettina?
A. For the six-month period ending June 30, 2000, the fund underperformed the Standard & Poor's 500 Index, which returned -0.42%. For the 12-month period that ended June 30, 2000, the fund also trailed the S&P 500, which returned 7.25%.
Q. Why did the fund underperform its benchmark?
A. Early in the period, the fund was considerably underweighted in technology and telecommunications - the sectors that drove equity markets to record heights. Our lack of exposure here was a big detractor from performance. After taking over the fund in February, I repositioned it to be more in line with expectations - with more of a growth emphasis than a value proposition - and increased the tech position to approximately 43% of net assets at the end of the period, compared to just over 16% six months ago.
Q. Was that strategy successful?
A. On a short-term basis, the repositioning seemed poorly timed. Fund performance was negatively affected by the massive rotation away from technology that began in mid-March and lasted through the end of May. Several factors contributed to the tech sell-off: interest-rate hikes, fears of a slowdown in earnings growth, high valuations and illiquidity. Tech stocks did rebound in June, however, and the fund more than doubled the return of the S&P for the month.
Q. What other changes did you make to the fund since taking over?
A. In light of margin pressures and credit concerns in the finance sector, I reduced the sector's aggregate weighting to 11.8% of net assets compared to 20.6% six months ago. I also shifted the sector's asset allocation, reducing the fund's positions in regional banks, mortgage insurance companies and GSEs - government-sponsored enterprises such as Fannie Mae and Freddie Mac - while adding more capital markets exposure, which was a plus. Two other moves also helped. I reduced the fund's consumer nondurables holdings, largely due to the elimination of the Philip Morris position. I was less enamored with the company's fundamental prospects than my predecessor. I also eliminated the fund's bond position, as I expect to focus largely on equity investments.
Q. Which stocks were among the best absolute contributors?
A. Despite the technology sector's spring decline, six of the fund's 10 best-performing stocks came from that area. Most are very familiar names: Micron Technology, Intel, Oracle, Adobe Systems, Analog Devices and Nortel. All benefited from the growth prospects surrounding the rapid acceleration and penetration of Internet- and wireless-related communications. General Electric, the fund's largest holding at the end of the period, also was a strong contributor. GE experienced an acceleration in revenue and profit growth due to market share gains, acquisitions and strong global economies. Eli Lilly was another winner, benefiting from investor appreciation of its strong product pipeline and increased confidence in the company's earnings growth potential.
Q. Which stocks did not perform as well as you expected?
A. Although I have reduced these positions dramatically since taking over the fund, Fannie Mae and Freddie Mac significantly detracted from performance during the period. Several factors caused the underperformance of these stocks, including the Federal Reserve Board's recent string of interest-rate hikes and increased political bantering about capital ratios and funding requirements. Two other disappointments were retailers Home Depot and Wal-Mart. Despite continuing to deliver strong results, these stocks came under pressure as investors grew increasingly concerned that results would come under pressure due to slowing consumer spending caused by interest-rate increases.
Q. What is your outlook, Bettina?
A. It comes down to whether the technology sector's recent struggle was a short-term rotation or a permanent change in leadership. I believe it was just a violent short-term rotation similar to what we experienced at this time last year. On a medium-term basis, I expect the companies that are the enablers of our networked, communications economy - those that provide servers, data storage, fiber optics, etc. - are going to lead, because we still appear to be in the early stages of the "e-economy" build out.
The views expressed in this report reflect those of the portfolio manager only through the end of the period of the report as stated on the cover. The manager's views are subject to change at any time based on market or other conditions. For more information, see page 2.
Fund Facts
Goal: to provide capital growth by investing primarily in common stocks
Start date: January 3, 1995
Size: as of June 30, 2000, more than
$1.5 billion
Manager: Bettina Doulton, since February 2000; joined Fidelity in 1986
3Semiannual Report
Fidelity Variable Insurance Products: Growth Opportunities Portfolio
(Unaudited)
Showing Percentage of Net Assets
|
Common Stocks - 93.6% |
|||
|
Shares |
Value (Note 1) |
||
|
AEROSPACE & DEFENSE - 1.1% |
|||
|
Boeing Co. |
374,200 |
$ 15,646,238 |
|
|
Textron, Inc. |
30,200 |
1,640,238 |
|
|
|
17,286,476 |
||
|
BASIC INDUSTRIES - 0.3% |
|||
|
Chemicals & Plastics - 0.3% |
|||
|
Praxair, Inc. |
122,000 |
4,567,375 |
|
|
ENERGY - 6.4% |
|||
|
Energy Services - 1.3% |
|||
|
Baker Hughes, Inc. |
36,700 |
1,174,400 |
|
|
Halliburton Co. |
272,200 |
12,844,438 |
|
|
Schlumberger Ltd. (NY Shares) |
92,300 |
6,887,888 |
|
|
|
20,906,726 |
||
|
Oil & Gas - 5.1% |
|||
|
BP Amoco PLC sponsored ADR |
221,190 |
12,511,059 |
|
|
Chevron Corp. |
27,000 |
2,289,938 |
|
|
Conoco, Inc. Class B |
97,868 |
2,403,883 |
|
|
Cooper Cameron Corp. (a) |
72,300 |
4,771,800 |
|
|
Exxon Mobil Corp. |
417,300 |
32,758,050 |
|
|
Royal Dutch Petroleum Co. (NY Shares) |
178,300 |
10,976,594 |
|
|
Tosco Corp. |
257,300 |
7,284,806 |
|
|
TotalFinaElf SA: |
|
|
|
|
Class B |
6,153 |
947,562 |
|
|
sponsored ADR |
94,405 |
7,251,484 |
|
|
|
81,195,176 |
||
|
TOTAL ENERGY |
102,101,902 |
||
|
FINANCE - 11.8% |
|||
|
Banks - 1.1% |
|||
|
Bank of America Corp. |
65,200 |
2,803,600 |
|
|
Bank of Tokyo-Mitsubishi Ltd. |
255,000 |
3,081,070 |
|
|
Bank of Tokyo-Mitsubishi Ltd. ADR |
44,500 |
539,563 |
|
|
Chase Manhattan Corp. |
232,800 |
10,723,350 |
|
|
|
17,147,583 |
||
|
Credit & Other Finance - 2.9% |
|||
|
American Express Co. |
499,400 |
26,031,225 |
|
|
Citigroup, Inc. |
340,200 |
20,497,050 |
|
|
|
46,528,275 |
||
|
Federal Sponsored Credit - 4.1% |
|||
|
Fannie Mae |
712,400 |
37,178,375 |
|
|
Freddie Mac |
688,000 |
27,864,000 |
|
|
|
65,042,375 |
||
|
Insurance - 2.2% |
|||
|
Allmerica Financial Corp. |
41,500 |
2,173,563 |
|
|
American International Group, Inc. |
184,175 |
21,640,563 |
|
|
CIGNA Corp. |
92,812 |
8,677,922 |
|
|
|
|||
|
Shares |
Value (Note 1) |
||
|
Hartford Financial Services Group, Inc. |
13,700 |
$ 766,344 |
|
|
The Chubb Corp. |
37,200 |
2,287,800 |
|
|
|
35,546,192 |
||
|
Securities Industry - 1.5% |
|||
|
Daiwa Securities Group, Inc. |
72,000 |
950,764 |
|
|
Morgan Stanley Dean Witter & Co. |
155,900 |
12,978,675 |
|
|
Nomura Securities Co. Ltd. |
391,000 |
9,570,317 |
|
|
|
23,499,756 |
||
|
TOTAL FINANCE |
187,764,181 |
||
|
HEALTH - 10.3% |
|||
|
Drugs & Pharmaceuticals - 9.0% |
|||
|
American Home Products Corp. |
82,900 |
4,870,375 |
|
|
Amgen, Inc. |
71,300 |
5,008,825 |
|
|
Bristol-Myers Squibb Co. |
373,600 |
21,762,200 |
|
|
Eli Lilly & Co. |
466,400 |
46,581,700 |
|
|
Merck & Co., Inc. |
149,200 |
11,432,450 |
|
|
Pfizer, Inc. |
449,693 |
21,585,264 |
|
|
Schering-Plough Corp. |
650,600 |
32,855,300 |
|
|
|
144,096,114 |
||
|
Medical Equipment & Supplies - 1.3% |
|||
|
Abbott Laboratories |
102,200 |
4,554,288 |
|
|
Johnson & Johnson |
148,300 |
15,108,063 |
|
|
|
19,662,351 |
||
|
TOTAL HEALTH |
163,758,465 |
||
|
INDUSTRIAL MACHINERY & EQUIPMENT - 5.3% |
|||
|
Electrical Equipment - 4.2% |
|||
|
General Electric Co. |
1,269,700 |
67,294,088 |
|
|
Industrial Machinery & Equipment - 1.1% |
|||
|
Deere & Co. |
156,600 |
5,794,200 |
|
|
Ingersoll-Rand Co. |
60,400 |
2,431,100 |
|
|
Tyco International Ltd. |
194,200 |
9,200,225 |
|
|
|
17,425,525 |
||
|
TOTAL INDUSTRIAL MACHINERY & EQUIPMENT |
84,719,613 |
||
|
MEDIA & LEISURE - 4.7% |
|||
|
Broadcasting - 1.9% |
|||
|
AT&T Corp. - Liberty Media Group |
501,244 |
12,155,167 |
|
|
Charter Communications, Inc. |
167,700 |
2,756,569 |
|
|
Comcast Corp. Class A (special) (a) |
77,500 |
3,138,750 |
|
|
Cox Communications, Inc. Class A (a) |
78,213 |
3,563,580 |
|
|
Infinity Broadcasting Corp. Class A (a) |
23,400 |
852,638 |
|
|
Time Warner, Inc. |
89,500 |
6,802,000 |
|
|
Univision Communications, Inc. |
6,100 |
631,350 |
|
|
|
29,900,054 |
||
|
Entertainment - 2.2% |
|||
|
Fox Entertainment Group, Inc. Class A (a) |
239,400 |
7,271,775 |
|
|
Common Stocks - continued |
|||
|
Shares |
Value (Note 1) |
||
|
MEDIA & LEISURE - continued |
|||
|
Entertainment - continued |
|||
|
Viacom, Inc. Class B (non-vtg.) (a) |
328,428 |
$ 22,394,684 |
|
|
Walt Disney Co. |
133,500 |
5,181,469 |
|
|
|
34,847,928 |
||
|
Publishing - 0.1% |
|||
|
McGraw-Hill Companies, Inc. |
35,400 |
1,911,600 |
|
|
Restaurants - 0.5% |
|||
|
McDonald's Corp. |
268,700 |
8,850,306 |
|
|
TOTAL MEDIA & LEISURE |
75,509,888 |
||
|
NONDURABLES - 0.5% |
|||
|
Beverages - 0.1% |
|||
|
The Coca-Cola Co. |
27,300 |
1,568,044 |
|
|
Household Products - 0.4% |
|||
|
Avon Products, Inc. |
16,900 |
752,050 |
|
|
Clorox Co. |
41,700 |
1,868,681 |
|
|
Procter & Gamble Co. |
67,320 |
3,854,070 |
|
|
|
6,474,801 |
||
|
TOTAL NONDURABLES |
8,042,845 |
||
|
RETAIL & WHOLESALE - 4.6% |
|||
|
General Merchandise Stores - 2.5% |
|||
|
Kohls Corp. (a) |
56,400 |
3,137,250 |
|
|
Target Corp. |
119,400 |
6,925,200 |
|
|
Wal-Mart Stores, Inc. |
533,700 |
30,754,463 |
|
|
|
40,816,913 |
||
|
Retail & Wholesale, Miscellaneous - 2.1% |
|||
|
Home Depot, Inc. |
394,000 |
19,675,375 |
|
|
Lowe's Companies, Inc. |
320,900 |
13,176,956 |
|
|
|
32,852,331 |
||
|
TOTAL RETAIL & WHOLESALE |
73,669,244 |
||
|
SERVICES - 0.0% |
|||
|
Advertising - 0.0% |
|||
|
Interpublic Group of Companies, Inc. |
13,800 |
593,400 |
|
|
Services - 0.0% |
|||
|
Gartner Group, Inc. Class B (a) |
106 |
1,047 |
|
|
TOTAL SERVICES |
594,447 |
||
|
TECHNOLOGY - 42.8% |
|||
|
Communications Equipment - 11.1% |
|||
|
Ciena Corp. (a) |
61,700 |
10,284,619 |
|
|
Cisco Systems, Inc. (a) |
1,046,300 |
66,505,444 |
|
|
Corning, Inc. |
50,500 |
13,628,688 |
|
|
Lucent Technologies, Inc. |
226,200 |
13,402,350 |
|
|
Nokia AB sponsored ADR |
533,900 |
26,661,631 |
|
|
|
|||
|
Shares |
Value (Note 1) |
||
|
Nortel Networks Corp. |
481,200 |
$ 33,380,101 |
|
|
Telefonaktiebolaget LM Ericsson sponsored ADR |
665,500 |
13,310,000 |
|
|
|
177,172,833 |
||
|
Computer Services & Software - 9.9% |
|||
|
Adobe Systems, Inc. |
134,700 |
17,511,000 |
|
|
Amazon.com, Inc. (a) |
10,200 |
370,388 |
|
|
America Online, Inc. (a) |
266,600 |
14,063,150 |
|
|
Automatic Data Processing, Inc. |
224,300 |
12,014,069 |
|
|
BEA Systems, Inc. (a) |
75,100 |
3,712,756 |
|
|
BroadVision, Inc. (a) |
111,400 |
5,660,513 |
|
|
Computer Sciences Corp. (a) |
9,700 |
724,469 |
|
|
E.piphany, Inc. |
13,000 |
1,393,438 |
|
|
First Data Corp. |
61,700 |
3,061,863 |
|
|
i2 Technologies, Inc. (a) |
25,800 |
2,690,053 |
|
|
InfoSpace.com, Inc. (a) |
47,000 |
2,596,750 |
|
|
Microsoft Corp. (a) |
242,100 |
19,368,000 |
|
|
Oracle Corp. (a) |
456,600 |
38,382,939 |
|
|
Phone.com, Inc. |
24,100 |
1,569,513 |
|
|
Redback Networks, Inc. |
16,100 |
2,883,913 |
|
|
Siebel Systems, Inc. (a) |
93,500 |
15,293,094 |
|
|
VeriSign, Inc. (a) |
82,537 |
14,567,781 |
|
|
Yahoo!, Inc. (a) |
23,000 |
2,849,125 |
|
|
|
158,712,814 |
||
|
Computers & Office Equipment - 7.2% |
|||
|
Compaq Computer Corp. |
285,500 |
7,298,094 |
|
|
Dell Computer Corp. (a) |
217,200 |
10,710,675 |
|
|
EMC Corp. (a) |
270,500 |
20,811,594 |
|
|
Hewlett-Packard Co. |
76,600 |
9,565,425 |
|
|
International Business Machines Corp. |
34,100 |
3,736,081 |
|
|
Network Appliance, Inc. (a) |
154,700 |
12,453,350 |
|
|
SCI Systems, Inc. (a) |
490,600 |
19,225,388 |
|
|
Sun Microsystems, Inc. (a) |
345,200 |
31,391,625 |
|
|
|
115,192,232 |
||
|
Electronic Instruments - 2.8% |
|||
|
Agilent Technologies, Inc. |
86,915 |
6,409,981 |
|
|
Applied Materials, Inc. (a) |
178,900 |
16,212,813 |
|
|
KLA-Tencor Corp. (a) |
118,600 |
6,945,513 |
|
|
LAM Research Corp. (a) |
404,000 |
15,150,000 |
|
|
|
44,718,307 |
||
|
Electronics - 11.8% |
|||
|
Analog Devices, Inc. (a) |
245,100 |
18,627,600 |
|
|
Broadcom Corp. Class A (a) |
7,100 |
1,554,456 |
|
|
Flextronics International Ltd. (a) |
119,171 |
8,185,558 |
|
|
Intel Corp. |
316,500 |
42,312,094 |
|
|
JDS Uniphase Corp. (a) |
116,200 |
13,929,475 |
|
|
Methode Electronics, Inc. Class A |
4,300 |
166,088 |
|
|
Micron Technology, Inc. (a) |
335,200 |
29,518,550 |
|
|
Molex, Inc. Class A |
145,810 |
5,103,350 |
|
|
Motorola, Inc. |
60,000 |
1,743,750 |
|
|
National Semiconductor Corp. (a) |
228,600 |
12,973,050 |
|
|
Samsung Electronics Co. Ltd. |
2,800 |
926,616 |
|
|
Common Stocks - continued |
|||
|
Shares |
Value (Note 1) |
||
|
TECHNOLOGY - continued |
|||
|
Electronics - continued |
|||
|
Sanmina Corp. (a) |
59,500 |
$ 5,087,250 |
|
|
SDL, Inc. (a) |
13,700 |
3,907,069 |
|
|
Texas Instruments, Inc. |
541,900 |
37,221,756 |
|
|
Xilinx, Inc. (a) |
83,700 |
6,910,481 |
|
|
|
188,167,143 |
||
|
TOTAL TECHNOLOGY |
683,963,329 |
||
|
TRANSPORTATION - 0.0% |
|||
|
Air Transportation - 0.0% |
|||
|
Southwest Airlines Co. |
31,500 |
596,531 |
|
|
UTILITIES - 5.8% |
|||
|
Cellular - 4.5% |
|||
|
China Telecom (Hong Kong) Ltd. sponsored ADR (a) |
34,100 |
6,063,406 |
|
|
Nextel Communications, Inc. Class A (a) |
291,000 |
17,805,563 |
|
|
Nextel Partners, Inc. Class A |
2,500 |
81,406 |
|
|
QUALCOMM, Inc. (a) |
27,800 |
1,668,000 |
|
|
Sprint Corp. - PCS Group Series 1 (a) |
316,800 |
18,849,600 |
|
|
Vodafone AirTouch PLC |
122,991 |
509,643 |
|
|
Vodafone AirTouch PLC sponsored ADR |
378,900 |
15,700,669 |
|
|
VoiceStream Wireless Corp. (a) |
91,800 |
10,676,053 |
|
|
|
71,354,340 |
||
|
Electric Utility - 0.3% |
|||
|
AES Corp. (a) |
113,000 |
5,155,625 |
|
|
Telephone Services - 1.0% |
|||
|
Level 3 Communications, Inc. (a) |
105,100 |
9,248,800 |
|
|
NEXTLINK Communications, Inc. Class A |
132,800 |
5,038,100 |
|
|
U.S. WEST, Inc. |
16,300 |
1,397,725 |
|
|
|
15,684,625 |
||
|
TOTAL UTILITIES |
92,194,590 |
||
|
TOTAL COMMON STOCKS (Cost $1,159,260,000) |
1,494,768,886 |
||
|
Cash Equivalents - 6.9% |
|||
|
Shares |
Value (Note 1) |
||
|
Central Cash Collateral Fund, 6.71% (b) |
1,235,200 |
$ 1,235,200 |
|
|
Taxable Central Cash Fund, 6.59% (b) |
109,058,384 |
109,058,384 |
|
|
TOTAL CASH EQUIVALENTS (Cost $110,293,584) |
110,293,584 |
||
|
TOTAL INVESTMENT PORTFOLIO - 100.5% (Cost $1,269,553,584) |
1,605,062,470 |
|
NET OTHER ASSETS - (0.5)% |
(7,485,639) |
||
|
NET ASSETS - 100% |
$ 1,597,576,831 |
||
|
Legend |
|
(a) Non-income producing |
|
(b) The rate quoted is the annualized seven-day yield of the fund at |
|
Other Information |
|
Purchases and sales of securities, other than short-term securities, aggregated $1,110,429,310 and $1,386,467,463, respectively, of which long-term U.S. government and government agency obligations aggregated $0 and $110,516,388, respectively. |
|
The market value of futures contracts opened and closed during the period amounted to $2,939,068 and $2,727,952, respectively. |
|
The fund placed a portion of its portfolio transactions with brokerage firms which are affiliates of Fidelity Management & Research Company. The commissions paid to these affiliated firms were $41,941 for the period. |
|
The fund participated in the security lending program. At period end, the value of securities loaned amounted to $1,236,406. The fund received cash collateral of $1,235,200 which was invested in cash equivalents. |
|
Distribution of investments by country of issue, as a percentage of total |
|
United States of America |
90.0% |
|
Canada |
2.1 |
|
United Kingdom |
1.8 |
|
Finland |
1.7 |
|
Others (individually less than 1%) |
4.4 |
|
|
100.0% |
|
Income Tax Information |
|
At June 30, 2000, the aggregate cost of investment securities for income tax purposes was $1,270,414,331. Net unrealized appreciation aggregated $334,648,139, of which $383,735,051 related to appreciated investment securities and $49,086,912 related to depreciated investment securities. |
See accompanying notes which are an integral part of the financial statements.
Growth Opportunities Portfolio
Statement of Assets and Liabilities
|
|
June 30, 2000 (Unaudited) |
|
|
Assets |
|
|
|
Investment in securities, at value |
|
$ 1,605,062,470 |
|
Foreign currency held at value |
|
869,422 |
|
Receivable for investments sold |
|
18,787,103 |
|
Receivable for fund shares sold |
|
2,992,234 |
|
Dividends receivable |
|
563,371 |
|
Interest receivable |
|
475,311 |
|
Other receivables |
|
13,116 |
|
Total assets |
|
1,628,763,027 |
|
Liabilities |
|
|
|
Payable to custodian bank |
$ 1,150,566 |
|
|
Payable for investments purchased |
27,237,658 |
|
|
Payable for fund shares redeemed |
663,655 |
|
|
Accrued management fee |
760,615 |
|
|
Distribution fees payable |
30,888 |
|
|
Other payables and |
107,614 |
|
|
Collateral on securities loaned, |
1,235,200 |
|
|
Total liabilities |
|
31,186,196 |
|
Net Assets |
|
$ 1,597,576,831 |
|
Net Assets consist of: |
|
|
|
Paid in capital |
|
$ 1,297,693,607 |
|
Undistributed net |
|
1,554,523 |
|
Accumulated undistributed |
|
(37,177,356) |
|
Net unrealized appreciation
(depreciation) on investments |
|
335,506,057 |
|
Net Assets |
|
$ 1,597,576,831 |
|
Initial Class: |
|
$20.61 |
|
Service Class: |
|
$20.58 |
|
Service Class 2: |
|
$20.57 |
Statement of Operations
|
|
Six months ended June 30, 2000 (Unaudited) |
|
|
Investment Income Dividends |
|
$ 4,944,088 |
|
Interest |
|
2,196,303 |
|
Security lending |
|
43,224 |
|
Total income |
|
7,183,615 |
|
Expenses |
|
|
|
Management fee |
$ 4,713,628 |
|
|
Transfer agent fees |
531,307 |
|
|
Distribution fees |
171,473 |
|
|
Accounting and security lending fees |
182,021 |
|
|
Non-interested trustees' compensation |
2,651 |
|
|
Custodian fees and expenses |
44,138 |
|
|
Registration fees |
956 |
|
|
Audit |
17,449 |
|
|
Legal |
7,156 |
|
|
Reports to shareholders |
7,396 |
|
|
Miscellaneous |
395 |
|
|
Total expenses before reductions |
5,678,570 |
|
|
Expense reductions |
(279,920) |
5,398,650 |
|
Net investment income |
|
1,784,965 |
|
Realized and Unrealized Gain (Loss) Net realized gain (loss) on: |
|
|
|
Investment securities |
(31,567,618) |
|
|
Foreign currency transactions |
(17,618) |
|
|
Futures contracts |
(211,116) |
(31,796,352) |
|
Change in net unrealized appreciation (depreciation) on: |
|
|
|
Investment securities |
(41,408,261) |
|
|
Assets and liabilities in |
105 |
(41,408,156) |
|
Net gain (loss) |
|
(73,204,508) |
|
Net increase (decrease) in net assets resulting from operations |
|
$ (71,419,543) |
|
Other Information Expense reductions |
|
$ 276,910 |
|
Custodian credits |
|
3,010 |
|
|
|
$ 279,920 |
See accompanying notes which are an integral part of the financial statements.
Semiannual Report
Fidelity Variable Insurance Products: Growth
Opportunities Portfolio
Financial Statements - continued
Statement of Changes in Net Assets
|
Increase (Decrease) in Net Assets |
Six months ended |
Year ended |
|
|
|
|
|
Operations |
$ 1,784,965 |
$ 21,853,752 |
|
Net realized gain (loss) |
(31,796,352) |
109,839,194 |
|
Change in net unrealized appreciation (depreciation) |
(41,408,156) |
(54,923,099) |
|
Net increase (decrease) in net assets resulting from operations |
(71,419,543) |
76,769,847 |
|
Distributions to shareholders |
(21,794,226) |
(17,518,652) |
|
From net realized gain |
(111,302,559) |
(32,887,198) |
|
Total distributions |
(133,096,785) |
(50,405,850) |
|
Share transactions - net increase (decrease) |
(84,271,368) |
140,493,459 |
|
Total increase (decrease) in net assets |
(288,787,696) |
166,857,456 |
|
Net Assets |
|
|
|
Beginning of period |
1,886,364,527 |
1,719,507,071 |
|
End of period (including undistributed net investment income of $1,554,523 and $21,419,780, respectively) |
$ 1,597,576,831 |
$ 1,886,364,527 |
|
|
|
Other Information: |
|
|
Six months ended June 30, 2000 |
Year ended |
||
|
|
Shares |
Dollars |
Shares |
Dollars |
|
Share transactions |
7,804,052 |
$ 162,982,845 |
14,140,894 |
$ 318,792,928 |
|
Reinvested |
5,190,171 |
107,280,842 |
2,116,413 |
45,714,518 |
|
Redeemed |
(20,232,012) |
(422,309,444) |
(18,293,067) |
(412,962,598) |
|
Net increase (decrease) |
(7,237,789) |
$ (152,045,757) |
(2,035,760) |
$ (48,455,152) |
|
Service Class |
3,431,508 |
$ 71,121,191 |
9,385,140 |
$ 211,858,592 |
|
Reinvested |
1,249,806 |
25,808,498 |
217,292 |
4,691,331 |
|
Redeemed |
(1,604,623) |
(33,520,138) |
(1,230,823) |
(27,601,312) |
|
Net increase (decrease) |
3,076,691 |
$ 63,409,551 |
8,371,609 |
$ 188,948,611 |
|
Service Class 2 A |
234,557 |
$ 4,716,010 |
- |
$ - |
|
Reinvested |
361 |
7,445 |
- |
- |
|
Redeemed |
(17,302) |
(358,617) |
- |
- |
|
Net increase (decrease) |
217,616 |
$ 4,364,838 |
- |
$ - |
|
Distributions |
|
$ 17,669,786 |
|
$ 15,930,817 |
|
Service Class |
|
4,123,251 |
|
1,587,835 |
|
Service Class 2 A |
|
1,189 |
|
- |
|
Total |
|
$ 21,794,226 |
|
$ 17,518,652 |
|
From net realized gain |
|
$ 89,611,056 |
|
$ 29,783,702 |
|
Service Class |
|
21,685,247 |
|
3,103,496 |
|
Service Class 2 A |
|
6,256 |
|
- |
|
Total |
|
$ 111,302,559 |
|
$ 32,887,198 |
|
|
|
$ 133,096,785 |
|
$ 50,405,850 |
G Service Class 2 commenced sale of shares January 12, 2000.
See accompanying notes which are an integral part of the financial statements.
Growth Opportunities Portfolio
Financial Highlights - Initial Class
|
|
Six months ended |
Years ended December 31, |
||||
|
Selected Per-Share Data |
(Unaudited) |
1999 |
1998 |
1997 |
1996 |
1995 E |
|
Net asset value, beginning of period |
$ 23.15 |
$ 22.88 |
$ 19.27 |
$ 15.40 |
$ 13.07 |
$ 10.00 |
|
Income from Investment Operations |
|
|
|
|
|
|
|
Net investment income |
.02 D |
.27 D |
.26 D |
.29 D |
.26 |
.11 |
|
Net realized and unrealized gain (loss) |
(.86) |
.66 |
4.29 |
4.18 |
2.12 |
3.14 |
|
Total from investment operations |
(.84) |
.93 |
4.55 |
4.47 |
2.38 |
3.25 |
|
Less Distributions |
|
|
|
|
|
|
|
From net investment income |
(.28) |
(.23) |
(.21) |
(.25) |
- |
(.11) |
|
From net realized gain |
(1.42) |
(.43) |
(.73) |
(.35) |
(.05) |
(.07) |
|
Total distributions |
(1.70) |
(.66) |
(.94) |
(.60) |
(.05) |
(.18) |
|
Net asset value, end of period |
$ 20.61 |
$ 23.15 |
$ 22.88 |
$ 19.27 |
$ 15.40 |
$ 13.07 |
|
Total Return B, C |
(3.65)% |
4.27% |
24.61% |
29.95% |
18.27% |
32.52% |
|
Ratios and Supplemental Data |
|
|
|
|
|
|
|
Net assets, end of period (000 omitted) |
$ 1,222,938 |
$ 1,541,587 |
$ 1,570,011 |
$ 1,025,766 |
$ 383,085 |
$ 164,303 |
|
Ratio of expenses to average net assets |
.67% A |
.69% |
.71% |
.74% |
.77% |
.85% G |
|
Ratio of expenses to average net assets after |
.64% A, H |
.68% H |
.70% H |
.73% H |
.76% H |
.83% H |
|
Ratio of net investment income to average net assets |
.24% A |
1.20% |
1.27% |
1.68% |
2.29% |
2.49% |
|
Portfolio turnover |
138% A |
42% |
29% |
26% |
28% |
38% |
Financial Highlights - Service Class
|
|
Six months ended |
Years ended December 31, |
||
|
Selected Per-Share Data |
(Unaudited) |
1999 |
1998 |
1997 F |
|
Net asset value, beginning of period |
$ 23.12 |
$ 22.86 |
$ 19.27 |
$ 18.50 |
|
Income from Investment Operations |
|
|
|
|
|
Net investment income D |
.01 |
.25 |
.23 |
.04 |
|
Net realized and unrealized gain (loss) |
(.86) |
.66 |
4.30 |
.73 |
|
Total from investment operations |
(.85) |
.91 |
4.53 |
.77 |
|
Less Distributions |
|
|
|
|
|
From net investment income |
(.27) |
(.22) |
(.21) |
- |
|
From net realized gain |
(1.42) |
(.43) |
(.73) |
- |
|
Total distributions |
(1.69) |
(.65) |
(.94) |
- |
|
Net asset value, end of period |
$ 20.58 |
$ 23.12 |
$ 22.86 |
$ 19.27 |
|
Total ReturnB, C |
(3.70)% |
4.18% |
24.51% |
4.16% |
|
Ratios and Supplemental Data |
|
|
|
|
|
Net assets, end of period (000 omitted) |
$ 370,164 |
$ 344,778 |
$ 149,496 |
$ 2,589 |
|
Ratio of expenses to average net assets |
.77% A |
.79% |
.80% |
.84% A |
|
Ratio of expenses to average net assets after expense reductions |
.74% A, H |
.78% H |
.79% H |
.83% A, H |
|
Ratio of net investment income to average net assets |
.14% A |
1.09% |
1.16% |
1.72% A |
|
Portfolio turnover |
138% A |
42% |
29% |
26% |
|
A Annualized B The total returns would have been lower had certain expenses not been reduced during the periods shown. C Total returns for periods of less than one year are not annualized and do not reflect charges attributable to your insurance company's separate account. Inclusion of these charges would reduce the total returns shown. D Net investment income per share has been calculated based on average shares outstanding during the period. E For the period January 3, 1995 (commencement of sale of Initial Class shares) to December 31, 1995. F For the period November 3, 1997 (commencement of sale of Service Class shares) to December 31, 1997. G FMR agreed to reimburse a portion of the class' expenses during the period. Without this reimbursement, the class' expense ratio would have been higher. H FMR or the fund has entered into varying arrangements with third parties who either paid or reduced a portion of the class' expenses. |
||||
See accompanying notes which are an integral part of the financial statements.
Semiannual Report
Financial Highlights - Service Class 2
|
|
Six months ended |
|
Selected Per-Share Data |
(Unaudited) |
|
Net asset value, beginning of period |
$ 22.70 |
|
Income from Investment Operations |
|
|
Net investment income (loss) D |
(.00) |
|
Net realized and unrealized gain (loss) |
(.44) |
|
Total from investment operations |
(.44) |
|
Less Distributions |
|
|
From net investment income |
(.27) |
|
From net realized gain |
(1.42) |
|
Total distributions |
(1.69) |
|
Net asset value, end of period |
$ 20.57 |
|
Total Return B, C |
(1.97)% |
|
Ratios and Supplemental Data |
|
|
Net assets, end of period (000 omitted) |
$ 4,476 |
|
Ratio of expenses to average net assets |
.96% A |
|
Ratio of expenses to average net assets after expense reductions |
.92% A, F |
|
Ratio of net investment income (loss) to average net assets |
(.05)% A |
|
Portfolio turnover |
138% A |
|
A Annualized B The total returns would have been lower had certain expenses not been reduced during the periods shown. C Total returns for periods of less than one year are not annualized and do not reflect charges attributable to your insurance company's separate account. Inclusion of these charges would reduce the total returns shown. D Net investment income (loss) per share has been calculated based on average shares outstanding during the period. E For the period January 12, 2000 (commencement of sale of Service Class 2 shares) to June 30, 2000. F FMR or the fund has entered into varying arrangements with third parties who either paid or reduced a portion of the class' expenses. |
|
See accompanying notes which are an integral part of the financial statements.
Growth Opportunities Portfolio
For the period ended June 30, 2000 (Unaudited)
1. Significant Accounting Policies.
Growth Opportunities Portfolio (the fund) is a fund of Variable Insurance Products Fund III (the trust) (referred to in this report as Fidelity Variable Insurance Products: Growth Opportunities Portfolio) and is authorized to issue an unlimited number of shares. The trust is registered under the Investment Company Act of 1940, as amended (the 1940 Act), as an open-end management investment company organized as a Massachusetts business trust. Shares of the fund may only be purchased by insurance companies for the purpose of funding variable annuity or variable life insurance contracts. The fund offers three classes of shares: the fund's original class of shares (Initial Class shares), Service Class shares and Service Class 2 shares. The fund commenced sale of Service Class 2 shares on January 12, 2000. All classes have equal rights and voting privileges, except for matters affecting a single class. Investment income, realized and unrealized capital gains and losses, the common expenses of the fund, and certain fund-level expense reductions, if any, are allocated on a pro rata basis to each class based on the relative net assets of each class to the total net assets of the fund. Each class of shares differs in its respective distribution plan.
The financial statements have been prepared in conformity with generally accepted accounting principles which require management to make certain estimates and assumptions at the date of the financial statements. The following summarizes the significant accounting policies of the fund:
Security Valuation. Securities for which exchange quotations are readily available are valued at the last sale price, or if no sale price, at the closing bid price. Foreign securities are valued based on quotations from the principal market in which such securities are normally traded. If trading or events occurring in other markets after the close of the principal market in which foreign securities are traded, and before the close of the business of the fund, are expected to materially affect the value of those securities, then they are valued at their fair value taking this trading or these events into account. Fair value is determined in good faith under consistently applied procedures under the general supervision of the Board of Trustees. Securities for which exchange quotations are not readily available (and in certain cases debt securities which trade on an exchange) are valued primarily using dealer-supplied valuations or at their fair value. Short-term securities with remaining maturities of sixty days or less for which quotations are not readily available are valued at amortized cost or original cost plus accrued interest, both of which approximate current value.
Foreign Currency Translation. The accounting records of the fund are maintained in U.S. dollars. Investment securities and other assets and liabilities denominated in a foreign currency are translated into U.S. dollars at the prevailing rates of exchange at period end. Purchases and sales of securities, income receipts and expense payments are translated into U.S. dollars at the prevailing exchange rate on the respective dates of the transactions.
Net realized gains and losses on foreign currency transactions represent net gains and losses from sales and maturities of foreign currency contracts, disposition of foreign currencies, the difference between the amount of net investment income accrued and the U.S. dollar amount actually received, and gains and losses between trade and settlement date on purchases and sales of securities. The effects of changes in foreign currency exchange rates on investments in securities are included with the net realized and unrealized gain or loss on investment securities.
Income Taxes. As a qualified regulated investment company under Subchapter M of the Internal Revenue Code, the fund is not subject to income taxes to the extent that it distributes substantially all of its taxable income for its fiscal year. The schedule of investments includes information regarding income taxes under the caption "Income Tax Information."
Investment Income. Dividend income is recorded on the ex-dividend date, except certain dividends from foreign securities where the ex-dividend date may have passed, are recorded as soon as the fund is informed of the ex-dividend date. Non-cash dividends included in dividend income, if any, are recorded at the fair market value of the securities received. Interest income, which includes accretion of original issue discount, is accrued as earned. Investment income is recorded net of foreign taxes withheld where recovery of such taxes is uncertain.
Expenses. Most expenses of the trust can be directly attributed to a fund. Expenses which cannot be directly attributed are apportioned among the funds in the trust.
Distributions to Shareholders. Distributions are recorded on the ex-dividend date. Income dividends and capital gain distributions are declared separately for each class.
Income and capital gain distributions are determined in accordance with income tax regulations which may differ from generally accepted accounting principles. These differences, which may result in distribution reclassifications, are primarily due to differing treatments for futures transactions, foreign currency transactions, market discount, and losses deferred due to wash sales.
Permanent book and tax basis differences relating to shareholder distributions will result in reclassifications to paid in capital. Undistributed net investment income and accumulated undistributed net realized gain (loss) on investments and foreign currency transactions may include temporary book and tax basis differences which will reverse in a subsequent period. Any taxable income or gain remaining at fiscal year end is distributed in the following year.
Security Transactions. Security transactions are accounted for as of trade date. Gains and losses on securities sold are determined on the basis of identified cost.
Semiannual Report
Notes to Financial Statements (Unaudited) - continued
2. Operating Policies.
Foreign Currency Contracts. The fund generally uses foreign currency contracts to facilitate transactions in foreign-denominated securities. Losses may arise from changes in the value of the foreign currency or if the counterparties do not perform under the contracts' terms. The U.S. dollar value of foreign currency contracts is determined using contractual currency exchange rates established at the time of each trade.
Joint Trading Account. Pursuant to an Exemptive Order issued by the Securities and Exchange Commission (the SEC), the fund, along with other affiliated entities of Fidelity Management & Research Company (FMR), may transfer uninvested cash balances into one or more joint trading accounts. These balances are invested in one or more repurchase agreements for U.S. Treasury or Federal Agency obligations.
Repurchase Agreements. The underlying U.S. Treasury, Federal Agency, or other obligations found to be satisfactory by FMR are transferred to an account of the fund, or to the Joint Trading Account, at a bank custodian. The securities are marked-to-market daily and maintained at a value at least equal to the principal amount of the repurchase agreement (including accrued interest). FMR, the fund's investment adviser, is responsible for determining that the value of the underlying securities remains in accordance with the market value requirements stated above.
Central Cash Funds. Pursuant to an Exemptive Order issued by the SEC, the fund may invest in the Taxable Central Cash Fund and the Central Cash Collateral Fund (the Cash Funds) managed by Fidelity Investments Money Management, Inc., an affiliate of FMR. The Cash Funds are open-end money market funds available only to investment companies and other accounts managed by FMR and its affiliates. The Cash Funds seek preservation of capital, liquidity, and current income. Income distributions from the Cash Funds are declared daily and paid monthly from net interest income. Income distributions earned by the fund are recorded as either interest income or security lending income in the accompanying financial statements.
Futures Contracts. The fund may use futures contracts to manage its exposure to the stock market. Buying futures tends to increase the fund's exposure to the underlying instrument, while selling futures tends to decrease the fund's exposure to the underlying instrument or hedge other fund investments. Losses may arise from changes in the value of the underlying instruments or if the counterparties do not perform under the contracts' terms. Gains (losses) are realized upon the expiration or closing of the futures contracts. Futures contracts are valued at the settlement price established each day by the board of trade or exchange on which they are traded.
3. Purchases and Sales of Investments.
Information regarding purchases and sales of securities (other than short-term securities), and the market value of futures contracts opened and closed, is included under the caption "Other Information" at the end of the fund's schedule of investments.
4. Fees and Other Transactions with Affiliates.
Management Fee. As the fund's investment adviser, FMR receives a monthly fee that is calculated on the basis of a group fee rate plus a fixed individual fund fee rate applied to the average net assets of the fund. The group fee rate is the weighted average of a series of rates and is based on the monthly average net assets of all the mutual funds advised by FMR. The rates ranged from .2167% to .5200% for the period. The annual individual fund fee rate is .30%. In the event that these rates were lower than the contractual rates in effect during the period, FMR voluntarily implemented the above rates, as they resulted in the same or a lower management fee. For the period, the management fee was equivalent to an annualized rate of .58% of average net assets.
Distribution and Service Plan. In accordance with Rule 12b-1 of the 1940 Act, the Board of Trustees has adopted separate Distribution and Service Plans with respect to each class of shares (collectively referred to as "the Plans"). Under certain of the Plans, the class pays Fidelity Distributors Corporation (FDC), an affiliate of FMR, a 12b-1 fee. For the period, this fee is based on an annual rate of .10% of Service Class' average net assets and .25% of Service Class 2's average net assets. Initial Class shares are not subject to a 12b-1 fee.
For the period, each class paid FDC the following amounts, all of which was reallowed to insurance companies, for the distribution of shares and providing shareholder support services.
|
Service Class |
$ 170,539 |
|
Service Class 2 |
934 |
|
|
$ 171,473 |
Transfer Agent Fees. Fidelity Investments Institutional Operations Company, Inc. (FIIOC), an affiliate of FMR, is the fund's transfer, dividend disbursing, and shareholder servicing agent. FIIOC receives account fees and asset-based fees that vary according to account size and type of account. FIIOC pays a portion of the expenses related to the typesetting, printing and mailing of all shareholder reports, except proxy statements. For the period, the transfer agent fees of the fund were equivalent to an annualized rate of .07% of average net assets.
For the period, the following amounts were paid to FIIOC:
|
Initial Class |
$ 417,276 |
|
Service Class |
113,605 |
|
Service Class 2 |
426 |
|
|
$ 531,307 |
Growth Opportunities Portfolio
Notes to Financial Statements (Unaudited) - continued
4. Fees and Other Transactions with Affiliates - continued
Accounting and Security Lending Fees. Fidelity Service Company, Inc., an affiliate of FMR, maintains the fund's accounting records and administers the security lending program. The security lending fee is based on the number and duration of lending transactions. The accounting fee is based on the level of average net assets for the month plus out-of-pocket expenses.
Brokerage Commissions. The fund placed a portion of its portfolio transactions with brokerage firms which are affiliates of FMR. The commissions paid to these affiliated firms are shown under the caption "Other Information" at the end of the fund's schedule of investments.
5. Security Lending.
The fund lends portfolio securities from time to time in order to earn additional income. The fund receives collateral in the form of U.S. Treasury obligations, letters of credit, and/or cash against the loaned securities, and maintains collateral in an amount not less than 100% of the market value of the loaned securities during the period of the loan. The market value of the loaned securities is determined at the close of business of the fund and any additional required collateral is delivered to the fund on the next business day. If the borrower defaults on its obligation to return the securities loaned because of insolvency or other reasons, the fund could experience delays and costs in recovering the securities loaned or in gaining access to the collateral. Information regarding the value of securities loaned and the value of collateral at period end is included under the caption "Other Information" at the end of the fund's schedule of investments.
6. Expense Reductions.
FMR has directed certain portfolio trades to brokers who paid a portion of the fund's expenses.
In addition, through an arrangement with the fund's custodian, credits realized as a result of uninvested cash balances were used to reduce a portion of the fund's expenses.
For the period, the reductions under these arrangements are shown under the caption "Other Information" on the fund's Statement of Operations.
7. Beneficial Interest.
At the end of the period, Fidelity Investments Life Insurance Company (FILI) and its subsidiaries, affiliates of FMR, were the record owners of approximately 15% of the outstanding shares of the fund. In addition, one unaffiliated insurance company was record owner of 66% of the total outstanding shares of the fund.
Growth Opportunities Portfolio
A special meeting of the fund's shareholders was held on July 19, 2000. The results of votes taken among shareholders on proposals before them are reported below. Each vote reported represents one dollar of net asset value held on the record date for the meeting.
PROPOSAL 1
To elect as Trustees the following twelve nominees.*
|
|
# of Dollars Voted |
% of Dollars Voted |
Ralph F. Cox
|
Affirmative |
2,995,348,207.84 |
97.862 |
|
Withheld |
65,444,305.52 |
2.138 |
|
TOTAL |
3,060,792,513.36 |
100.000 |
Phyllis Burke Davis
|
Affirmative |
2,995,012,849.06 |
97.851 |
|
Withheld |
65,779,664.30 |
2.149 |
|
TOTAL |
3,060,792,513.36 |
100.000 |
Robert M. Gates
|
Affirmative |
2,994,325,628.16 |
97.828 |
|
Withheld |
66,466,885.20 |
2.172 |
|
TOTAL |
3,060,792,513.36 |
100.000 |
Edward C. Johnson 3d
|
Affirmative |
2,994,212,266.77 |
97.825 |
|
Withheld |
66,580,246.59 |
2.175 |
|
TOTAL |
3,060,792,513.36 |
100.000 |
Donald J. Kirk
|
Affirmative |
2,996,527,468.99 |
97.900 |
|
Withheld |
64,265,044.37 |
2.100 |
|
TOTAL |
3,060,792,513.36 |
100.000 |
Ned. C. Lautenbach
|
Affirmative |
2,997,430,896.97 |
97.930 |
|
Withheld |
63,361,616.39 |
2.070 |
|
TOTAL |
3,060,792,513.36 |
100.000 |
|
|
# of Dollars Voted |
% of Dollars Voted |
Peter S. Lynch
|
Affirmative |
2,997,391,112.97 |
97.929 |
|
Withheld |
63,401,400.39 |
2.071 |
|
TOTAL |
3,060,792,513.36 |
100.000 |
William O. McCoy
|
Affirmative |
2,997,364,420.76 |
97.928 |
|
Withheld |
63,428,092.60 |
2.072 |
|
TOTAL |
3,060,792,513.36 |
100.000 |
Gerald C. McDonough
|
Affirmative |
2,992,594,911.89 |
97.772 |
|
Withheld |
68,197,601.47 |
2.228 |
|
TOTAL |
3,060,792,513.36 |
100.000 |
Marvin L. Mann
|
Affirmative |
2,996,491,839.67 |
97.899 |
|
Withheld |
64,300,673.69 |
2.101 |
|
TOTAL |
3,060,792,513.36 |
100.000 |
Robert C. Pozen
|
Affirmative |
2,997,304,419.99 |
97.926 |
|
Withheld |
63,488,093.37 |
2.074 |
|
TOTAL |
3,060,792,513.36 |
100.000 |
Thomas R. Williams
|
Affirmative |
2,993,561,996.24 |
97.803 |
|
Withheld |
67,230,517.12 |
2.197 |
|
TOTAL |
3,060,792,513.36 |
100.000 |
Semiannual Report
Notes to Financial Statements (Unaudited) - continued
PROPOSAL 2
To ratify the selection of Deloitte & Touche LLP as independent accountants of the fund.
|
|
# of Dollars Voted |
% of Dollars Voted |
|
Affirmative |
1,377,496,384.11 |
94.671 |
|
Against |
12,255,144.99 |
0.842 |
|
Abstain |
65,286,057.94 |
4.487 |
|
TOTAL |
1,455,037,587.04 |
100.000 |
PROPOSAL 3
To authorize the Trustees to adopt an amended and restated Declaration of Trust.*
|
|
# of Dollars Voted |
% of Dollars Voted |
|
Affirmative |
2,837,267,199.92 |
92.697 |
|
Against |
49,473,422.32 |
1.617 |
|
Abstain |
174,051,891.12 |
5.686 |
|
TOTAL |
3,060,792,513.36 |
100.000 |
PROPOSAL 6
To approve an amended management contract for the fund that would reduce the management fee payable to FMR by the fund as FMR's assets under management increase.
|
|
# of Dollars Voted |
% of Dollars Voted |
|
Affirmative |
1,340,780,422.20 |
92.147 |
|
Against |
27,115,319.81 |
1.864 |
|
Abstain |
87,141,845.03 |
5.989 |
|
TOTAL |
1,455,037,587.04 |
100.000 |
PROPOSAL 8
To approve an amended sub-advisory agreement with FMR U.K. to provide investment advice and research services or investment management services.
|
|
# of Dollars Voted |
% of Dollars Voted |
|
Affirmative |
1,331,739,032.83 |
91.526 |
|
Against |
27,683,762.48 |
1.903 |
|
Abstain |
95,614,791.73 |
6.571 |
|
TOTAL |
1,455,037,587.04 |
100.000 |
* Denotes trust-wide proposals and voting results.
PROPOSAL 10
To approve an amended sub-advisory agreement with FMR Far East to provide investment advice and research services or investment management services.
|
|
# of Dollars Voted |
% of Dollars Voted |
|
Affirmative |
1,323,899,985.14 |
90.987 |
|
Against |
34,015,265.88 |
2.338 |
|
Abstain |
97,122,336.02 |
6.675 |
|
TOTAL |
1,455,037,587.04 |
100.000 |
PROPOSAL 13
Diversification - To amend the fundamental investment limitation concerning diversification.
|
|
# of Dollars Voted |
% of Dollars Voted |
|
Affirmative |
1,328,921,810.70 |
91.332 |
|
Against |
33,755,864.67 |
2.320 |
|
Abstain |
92,359,911.67 |
6.348 |
|
TOTAL |
1,455,037,587.04 |
100.000 |
PROPOSAL 14
Underwriting - To amend the fundamental limitation concerning underwriting.
|
|
# of Dollars Voted |
% of Dollars Voted |
|
Affirmative |
1,331,436,859.78 |
91.505 |
|
Against |
31,609,505.60 |
2.173 |
|
Abstain |
91,991,221.66 |
6.322 |
|
TOTAL |
1,455,037,587.04 |
100.000 |
PROPOSAL 15
Concentration - To amend the fundamental limitation concerning concentration.
|
|
# of Dollars Voted |
% of Dollars Voted |
|
Affirmative |
1,327,032,945.65 |
91.203 |
|
Against |
34,495,489.11 |
2.370 |
|
Abstain |
93,509,152.28 |
6.427 |
|
TOTAL |
1,455,037,587.04 |
100.000 |
Growth Opportunities Portfolio
Semiannual Report
Growth Opportunities Portfolio
Growth Opportunities Portfolio
Growth Opportunities Portfolio
Investment Adviser
Fidelity Management & Research Company
Boston, MA
Investment Sub-Advisers
Fidelity Management & Research (U.K.) Inc.
Fidelity Management & Research (Far East) Inc.
Fidelity Investments Japan Limited
Officers
Edward C. Johnson 3d, President
Robert C. Pozen, Senior Vice President
Abigail P. Johnson, Vice President
Bettina Doulton, Vice President
Eric D. Roiter, Secretary
Robert A. Dwight, Treasurer
Maria F. Dwyer, Deputy Treasurer
John Costello, Assistant Treasurer
Board of Trustees
Ralph F. Cox *
Phyllis Burke Davis *
Robert M. Gates *
Edward C. Johnson 3d
Donald J. Kirk *
Ned C. Lautenbach *
Peter S. Lynch
Marvin L. Mann *
William O. McCoy *
Gerald C. McDonough *
Robert C. Pozen
Thomas R. Williams *
Advisory Board
J. Michael Cook
Marie L. Knowles
* Independent trustees
General Distributor
Fidelity Distributors Corporation
Boston, MA
Transfer and Shareholder Servicing Agent
Fidelity Investments Institutional Operations Co., Inc.
Boston, MA
Custodian
Brown Brothers Harriman & Co.
Boston, MA
VIPGRO-SANN-0800 108588
1.705699.102
(2_fidelity_logos)
Mid Cap Portfolio
Semiannual Report
June 30, 2000
|
Market Environment |
3 |
A review of what happened in world markets during the past six months. |
|
Performance and Investment Summary |
4 |
How the fund has done over time, and an overview of the fund's investments at the end of the period. |
|
Fund Talk |
7 |
The manager's review of fund performance, strategy |
|
Investments |
8 |
A complete list of the fund's investments with their |
|
Financial Statements |
14 |
Statements of assets and liabilities, operations, and |
|
Notes |
18 |
Notes to the financial statements. |
|
Proxy Voting Results |
21 |
|
Fidelity Variable Insurance Products are separate account options which are purchased through a variable insurance contract.
Standard & Poor's, S&P and S&P 500 are registered service marks of The McGraw-Hill Companies, Inc. and have been licensed for use by Fidelity Distributors Corporation.
Other third party marks appearing herein are the property of their respective owners.
All other marks appearing herein are registered or unregistered trademarks or service marks of FMR Corp. or an affiliated company.
(Recycle graphic) This report is printed on recycled paper using soy-based inks.
The views expressed in this report reflect those of the fund's portfolio managers only through the end of the period of the report as stated on the cover and do not necessarily represent the views of Fidelity or any other person in the Fidelity organization. Any such views are subject to change at any time based upon market or other conditions and Fidelity disclaims any responsibility to update such views. These views may not be relied on as investment advice and, because investment decisions for a Fidelity fund are based on numerous factors, may not be relied on as an indication of trading intent on behalf of any Fidelity fund.
This report and the financial statements contained herein are submitted for the general information of the shareholders of the fund. This report is not authorized for distribution to prospective investors in the fund unless preceded or accompanied by an effective prospectus.
Mutual fund shares are not deposits or obligations of, or guaranteed by, any depository institution. Shares are not insured by the FDIC, Federal Reserve Board or any other agency, and are subject to investment risks, including possible loss of principal amount invested.
Neither the fund nor Fidelity Distributors Corporation is a bank.
Annual Report
After reaching record heights in the first quarter of 2000, several of the most notable U.S. equity market indexes - including the Standard & Poor's 500SM, NASDAQ and Dow Jones Industrial Average - tumbled into negative territory by the end of the second quarter. Leading the market down was the same sector that drove it to new highs just a few months prior: technology. Beginning in mid-March, investors abandoned technology en masse, as concerns about excessive valuations and impending inflation pervaded the market. The ripple effect of the tech sell-off spread rapidly around the world, and international equity markets trended downward in response. As stocks cooled, domestic bond performance heated up, helping many U.S. fixed-income categories outpace their equity counterparts for the overall six-month period. Meanwhile, emerging-market bonds held on to most of their strong first quarter gains, but international developed-market bonds felt the pinch of inflation, as several central banks around the world began to implement interest-rate hikes to slow their respective economies.
At the mid-way point of 2000, the U.S. stock market's unprecedented streak of five consecutive double-digit annual increases appeared to be in jeopardy. The Dow Jones Industrial Average - an index of 30 blue-chip stocks - declined 8.42% during the six-month period ending June 30, 2000. The broad-based S&P 500® and the technology-concentrated NASDAQ index also disappeared below the surface, returning -0.42% and -2.44%, respectively. In a 10-week stretch from March through June, the NASDAQ dropped 33%, making dot-com investors anything but dot-calm as Internet stocks bore the brunt of the decline. As the spectacular growth of the technology sector waned, previously out-of-favor sectors began to lure investors' attention. The consistent, steady growth of the health sector was the primary beneficiary, as it wore the crown of best-performing sector for the first six months of 2000. The natural resources and real-estate sectors were surprising runners-up in the performance derby. But not all was lost for the technology sector. In June, economic reports showed strong evidence that the Federal Reserve Board's series of interest-rate hikes - including three during the first half of this year - were winning the battle against inflation. This news, combined with the Fed's decision to eschew another hike in June, fueled a renewed enthusiasm for tech stocks, as evidenced by the NASDAQ's 16.64% return for the final month of the period.
Reacting similarly to the U.S. stock market - and no doubt largely as a direct result of the U.S. market - most foreign stock markets started the six-month period off on a high note before stumbling in the second quarter. Japan and the Pacific Region in general fell particularly hard. After a stellar 1999, Japanese equities were shaken by their country's economic downturn and an unsteady U.S. market. "New Japan" stocks - Internet, electronic, telecom and software securities - led the
decline. The TOPIX Index, a benchmark of the Japanese market, fell 10.34% during the period. And even the best-performing Pacific Region fund had a negative return, according to Lipper Inc. Weak tech performance in the second quarter also hurt European stock markets, causing the Morgan Stanley Capital International Europe Index to decline 3.10% for the first half of 2000. One of the only non-U.S. stock markets that didn't suffer a negative second quarter was Canada. Often overlooked, the Canadian stock market quietly piled up an impressive six-month return of 21.89% - as measured by the Toronto Stock Exchange (TSE) 300.
Despite being challenged with a series of interest-rate hikes - almost always a detriment to fixed-income offerings - U.S. bond markets still managed to post solid returns relative to equities through the first six months of this year. U.S. government bonds were one of the top performers. In January, the U.S. Treasury announced its intent to repurchase long-term debt and curtail future issuance. Treasury prices soared in response and helped the Lehman Brothers Long-Term Government Bond Index return 8.77% for the period. The Lehman Brothers Aggregate Bond Index, a popular measure of taxable-bond performance, rose 3.99% for the past six months, while tax-free municipals were even more robust, gaining 4.48% according to the Lehman Brothers Municipal Bond Index. Underperformance in the bond market was pretty much limited to the high-yield sector. Faced with a rising interest-rate backdrop and poor technicals - including an unfavorable supply/demand condition and an increased default rate - the high-yield market stumbled to a negative return of 1.00%, as measured by the Merrill Lynch High Yield Master II Index, for the past six months.
International bond investors faced a myriad of negative factors throughout the majority of the six-month period ending June 30, 2000. Strong global economic growth and the threat of rising interest rates, currency fluctuations, and a weakening euro continued to plague global debt issues. Additionally, poor liquidity hampered bond prices in non-U.S. developed markets. Combined, those factors helped drag down the Salomon Brothers Non-U.S. World Government Bond Index, which returned -1.95%. On the bright side, a number of favorable factors propelled demand for emerging-market bonds, which was reflected in the 6.95% return of the J.P. Morgan Emerging Markets Bond Index Global - a popular benchmark of emerging-market debt. Credit momentum, which was driven by improving fundamentals - such as the Russian government's Soviet-era debt restructuring and new political leadership - fostered the rally in emerging-market bonds. Elsewhere, Brazil's better-than-expected economic growth fueled a sharp increase in foreign direct investment. Often large commodity suppliers, emerging-market countries also benefited from a sharp increase in oil prices.
Semiannual Report
Performance
There are several ways to evaluate a fund's historical performance. You can look at the total percentage change in value, the average annual percentage change or the growth of a hypothetical $10,000 investment. Total return reflects the change in the value of an investment, assuming reinvestment of the fund's dividend income and capital gains (the profits earned upon the sale of securities that have grown in value). If Fidelity had not reimbursed certain fund expenses, the total returns would have been lower.
Average Annual Total Returns
|
Periods ended |
Past 1 |
Life of |
|
Fidelity VIP: Mid Cap - Initial Class |
61.46% |
53.21% |
|
S&P MidCap 400 |
16.98% |
20.14% |
Average annual returns take the fund's cumulative return and show you what would have happened if the fund had performed at a constant rate each year.
You can compare the fund's returns to the performance of the Standard & Poor's MidCap 400 Index - a market capitalization-weighted index of 400 medium-capitalization stocks. This benchmark includes reinvested dividends and capital gains, if any.
Figures for more than one year assume a steady compounded rate of return and are not the fund's year-by-year results, which fluctuated over the periods shown. The life of fund figures are from commencement of operations, December 28, 1998.
Performance numbers are net of all fund operating expenses, but do not include any insurance charges imposed by your insurance company's separate account. If performance information included the effect of these additional charges, the total returns would be lower.
Past performance is no guarantee of future results. Principal and investment return will vary and you may have a gain or loss when you withdraw your money.
Understanding Performance
How a fund did yesterday is no guarantee of how it will do tomorrow. The stock market, for example, has a history of long-term growth and short-term volatility. In turn, the share price and return of a fund that invests in stocks will vary. That means if you sell your shares during a market downturn, you might lose money. But if you can ride out the market's ups and downs, you may have a gain.
3$10,000 Over Life of Fund
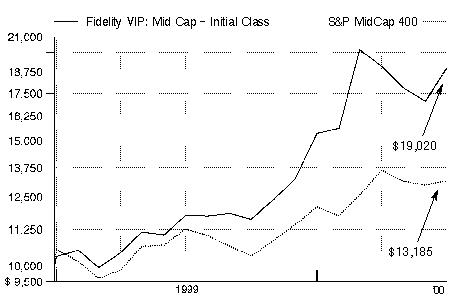
$10,000 Over Life of Fund: Let's say hypothetically that $10,000 was invested in Fidelity Variable Insurance Products: Mid Cap Portfolio - Initial Class on December 28, 1998, when the fund started. As the chart shows, by June 30, 2000, the value of the investment would have grown to $19,020 - a 90.20% increase on the initial investment. For comparison, look at how the Standard & Poor's MidCap 400 Index did over the same period. With dividends and capital gains, if any, reinvested, the same $10,000 investment would have grown to $13,185 - a 31.85% increase.
Investment Summary
|
Top Five Stocks as of June 30, 2000 |
|
|
|
% of fund's |
|
Nextel Communications, Inc. Class A |
2.6 |
|
Kopin Corp. |
1.7 |
|
Calpine Corp. |
1.5 |
|
Freddie Mac |
1.3 |
|
Brocade Communications Systems, Inc. |
1.0 |
|
|
8.1 |
|
Top Five Market Sectors as of June 30, 2000 |
|
|
|
% of fund's |
|
Technology |
31.7 |
|
Health |
13.5 |
|
Energy |
10.8 |
|
Utilities |
8.8 |
|
Finance |
6.5 |
|
Asset Allocation as of June 30, 2000 |
|||
|
% of fund's net assets * |
|||
|
Stocks and |
|
|
|
Short-Term |
|
|
|
* Foreign investments 4.7% |
Semiannual Report
Performance
There are several ways to evaluate a fund's historical performance. You can look at the total percentage change in value, the average annual percentage change or the growth of a hypothetical $10,000 investment. Total return reflects the change in the value of an investment, assuming reinvestment of the fund's dividend income and capital gains (the profits earned upon the sale of securities that have grown in value). Performance for Service Class shares reflects an asset based distribution fee (12b-1 fee). If Fidelity had not reimbursed certain fund expenses, the total returns would have been lower.
Average Annual Total Returns
|
Periods ended |
Past 1 |
Life of |
|
Fidelity VIP: Mid Cap - Service Class |
61.43% |
53.10% |
|
S&P MidCap 400 |
16.98% |
20.14% |
Average annual returns take the fund's cumulative return and show you what would have happened if the fund had performed at a constant rate each year.
You can compare the fund's returns to the performance of the Standard & Poor's MidCap 400 Index - a market capitalization-weighted index of 400 medium-capitalization stocks. This benchmark includes reinvested dividends and capital gains, if any.
Figures for more than one year assume a steady compounded rate of return and are not the fund's year-by-year results, which fluctuated over the periods shown. The life of fund figures are from commencement of operations, December 28, 1998.
Performance numbers are net of all fund operating expenses, but do not include any insurance charges imposed by your insurance company's separate account. If performance information included the effect of these additional charges, the total returns would be lower.
Past performance is no guarantee of future results. Principal and investment return will vary and you may have a gain or loss when you withdraw your money.
Understanding Performance
How a fund did yesterday is no guarantee of how it will do tomorrow. The stock market, for example, has a history of long-term growth and short-term volatility. In turn, the share price and return of a fund that invests in stocks will vary. That means if you sell your shares during a market downturn, you might lose money. But if you can ride out the market's ups and downs, you may have a gain.
3$10,000 Over Life of Fund
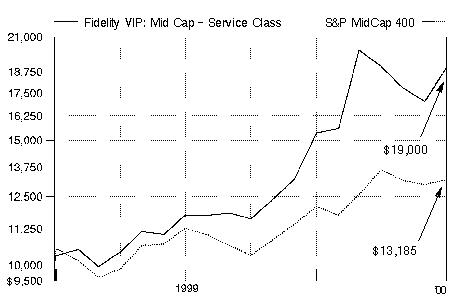
$10,000 Over Life of Fund: Let's say hypothetically that $10,000 was invested in Fidelity Variable Insurance Products: Mid Cap Portfolio - Service Class - on December 28, 1998, when the fund started. As the chart shows, by June 30, 2000, the value of the investment would have grown to $19,000 - a 90.00% increase on the initial investment. For comparison, look at how the Standard & Poor's MidCap 400 Index did over the same period. With dividends and capital gains, if any, reinvested, the same $10,000 investment would have grown to $13,185 - a 31.85% increase.
Investment Summary
|
Top Five Stocks as of June 30, 2000 |
|
|
|
% of fund's |
|
Nextel Communications, Inc. Class A |
2.6 |
|
Kopin Corp. |
1.7 |
|
Calpine Corp. |
1.5 |
|
Freddie Mac |
1.3 |
|
Brocade Communications Systems, Inc. |
1.0 |
|
|
8.1 |
|
Top Five Market Sectors as of June 30, 2000 |
|
|
|
% of fund's |
|
Technology |
31.7 |
|
Health |
13.5 |
|
Energy |
10.8 |
|
Utilities |
8.8 |
|
Finance |
6.5 |
|
Asset Allocation as of June 30, 2000 |
|||
|
% of fund's net assets * |
|||
|
Stocks and |
|
|
|
Short-Term |
|
|
|
* Foreign investments 4.7% |
Semiannual Report
Performance
There are several ways to evaluate a fund's historical performance. You can look at the total percentage change in value, the average annual percentage change or the growth of a hypothetical $10,000 investment. Total return reflects the change in the value of an investment, assuming reinvestment of the fund's dividend income and capital gains (the profits earned upon the sale of securities that have grown in value). The initial offering of Service Class 2 shares took place January 12, 2000. Performance for Service Class 2 shares reflects an asset based distribution fee (12b-1 fee). Returns from December 28, 1998 to January 12, 2000 are those of Service Class which reflect a different 12b-1 fee. Had Service Class 2's 12b-1 fee been reflected, returns prior to January 12, 2000 would have been lower. If Fidelity had not reimbursed certain fund expenses, the total returns would have been lower.
Average Annual Total Returns
|
Periods ended |
Past 1 |
Life of |
|
Fidelity VIP: Mid Cap - Service Class 2 |
61.26% |
52.99% |
|
S&P MidCap 400 |
16.98% |
20.14% |
Average annual returns take the fund's cumulative return and show you what would have happened if the fund had performed at a constant rate each year.
You can compare the fund's returns to the performance of the Standard & Poor's MidCap 400 Index - a market capitalization-weighted index of 400 medium-capitalization stocks. This benchmark includes reinvested dividends and capital gains, if any.
Figures for more than one year assume a steady compounded rate of return and are not the fund's year-by-year results, which fluctuated over the periods shown. The life of fund figures are from commencement of operations, December 28, 1998.
Performance numbers are net of all fund operating expenses, but do not include any insurance charges imposed by your insurance company's separate account. If performance information included the effect of these additional charges, the total returns would be lower.
Past performance is no guarantee of future results. Principal and investment return will vary and you may have a gain or loss when you withdraw your money.
Understanding Performance
How a fund did yesterday is no guarantee of how it will do tomorrow. The stock market, for example, has a history of long-term growth and short-term volatility. In turn, the share price and return of a fund that invests in stocks will vary. That means if you sell your shares during a market downturn, you might lose money. But if you can ride out the market's ups and downs, you may have a gain.
3$10,000 Over Life of Fund
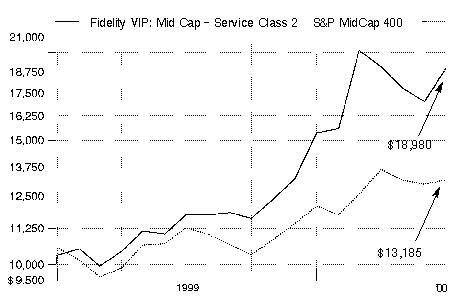
$10,000 Over Life of Fund: Let's say hypothetically that $10,000 was invested in Fidelity Variable Insurance Products: Mid Cap Portfolio - Service Class 2 - on December 28, 1998, when the fund started. As the chart shows, by June 30, 2000, the value of the investment would have grown to $18,980 - an 89.80% increase on the initial investment. For comparison, look at how the Standard & Poor's MidCap 400 Index did over the same period. With dividends and capital gains, if any, reinvested, the same $10,000 investment would have grown to $13,185 - a 31.85% increase.
Investment Summary
|
Top Five Stocks as of June 30, 2000 |
|
|
|
% of fund's |
|
Nextel Communications, Inc. Class A |
2.6 |
|
Kopin Corp. |
1.7 |
|
Calpine Corp. |
1.5 |
|
Freddie Mac |
1.3 |
|
Brocade Communications Systems, Inc. |
1.0 |
|
|
8.1 |
|
Top Five Market Sectors as of June 30, 2000 |
|
|
|
% of fund's |
|
Technology |
31.7 |
|
Health |
13.5 |
|
Energy |
10.8 |
|
Utilities |
8.8 |
|
Finance |
6.5 |
|
Asset Allocation as of June 30, 2000 |
|||
|
% of fund's net assets * |
|||
|
Stocks and |
|
|
|
Short-Term |
|
|
|
* Foreign investments 4.7% |
Semiannual Report
(Portfolio Manager photograph)
An interview with
David Felman,
Portfolio Manager
of Mid Cap Portfolio
Q. How did the fund perform, David?
A. The fund performed very well, substantially exceeding the performance of its benchmark, the Standard & Poor's MidCap 400 Index, which had a total return of 8.97% for the six-month period ending June 30, 2000 and a 16.98% return for the 12-month period.
Q. What factors affected performance?
A. We started the period by continuing a very good run in technology and biotechnology into March. The technology run was driven by excitement about the Internet, with continued bullishness for Internet infrastructure stocks. Enthusiasm for biotechnology stocks was strong due to breakthroughs in genomics, or gene-mapping. In early March, however, things seemed to fall apart for both sectors. The catalyst for biotechnology's decline was a government announcement raising questions about whether patents would be issued for genes. That started a cascade that began in March and lasted until early June. Valuations were so high that anything that possibly could threaten stock values eventually did. In early June, however, stocks in these two sectors started coming back.
Q. What were your principal strategies during this period of volatility?
A. We had a very strong weighting in technology early in the period, exceeding 45% of net assets in late February. This helped the fund greatly in the rally. We did get hit in the correction that began in March, but we practiced prudent risk management, selling some stocks with extremely high valuations, and taking some money off the table. I also reduced our holdings in some Internet stocks when I started to see cracks in Internet usage and a reduction in advertising on the Web. I remained bullish on telecommunications service providers, such as Nextel, as I was still optimistic about the growth potential for wireless communications in the United States. By the end of the period, the technology weighting declined to 31.7% of net assets. Part of this reduction was a result of stock prices losing value and part of it was a result of my decisions to reduce the size of holdings. Throughout the period, I avoided traditional defensive areas such as cyclicals, natural resources and utilities other than telecommunications companies. As a risk-management tactic, I was more comfortable increasing my cash position than investing in these industries. The fund did underperform the S&P MidCap 400 Index from early March through early June, but I thought that was an acceptable price to pay for the very good performance early in the period. Overall, we were well ahead of mid-cap stock indexes for the six-month period.
Q. What were some of the investments that helped performance?
A. Nextel Communications, the fund's largest position at the end of the period, was a big contributor. Kopin, which makes wafers for the amplifiers of wireless handsets, also helped performance. Kopin and Research in Motion, which manufactures two-way pagers with access to the Internet, both benefited from increased wireless usage. Another strong contributor was Veritas Software, whose data protection products were in demand as data storage related to the Internet grew.
Q. What were some of the disappointments?
A. DoubleClick had performed well earlier, but its stock fell as advertising on the Internet declined. DoubleClick is the largest provider of advertising on the Internet. Most of the other detractors from performance, relative to the S&P Mid Cap 400 Index, were companies such as QLogic Corp., which had good performance but which I underweighted. QLogic produces components for fiber-optic communications systems.
Q. What is your outlook for the mid-cap stock market?
A. The rapid growth of wireless communications and increased Internet usage are major long-term trends. However, the stocks that benefited from this growth during the period reached very high valuations and then suffered sharp corrections in March through early June. Investors are wondering what will happen next. I believe that technology will continue to be a driving force for global change, and I think that the growth potential of wireless communications remains very strong in the United States.
The views expressed in this report reflect those of the portfolio manager only through the end of the period of the report as stated on the cover. The manager's views are subject to change at any time based on market or other conditions. For more information, see page 2.
Fund Facts
Goal: long-term growth of capital by investing primarily in common stocks of companies with medium-sized capitalizations
Start date: December 28, 1998
Size: as of June 30, 2000, more than $296 million
Manager: David Felman, since 1999; joined Fidelity in 1993
3Semiannual Report
Fidelity Variable Insurance Products: Mid Cap Portfolio
(Unaudited)
Showing Percentage of Net Assets
|
Common Stocks - 87.3% |
|||
|
Shares |
Value (Note 1) |
||
|
BASIC INDUSTRIES - 1.3% |
|||
|
Chemicals & Plastics - 1.2% |
|||
|
Avery Dennison Corp. |
17,400 |
$ 1,167,975 |
|
|
Dow Chemical Co. |
8,300 |
250,556 |
|
|
Ivex Packaging Corp. (a) |
14,900 |
165,763 |
|
|
Lyondell Chemical Co. |
41,800 |
700,150 |
|
|
M.A. Hanna Co. |
47,300 |
425,700 |
|
|
Sealed Air Corp. (a) |
9,800 |
513,275 |
|
|
Union Carbide Corp. |
4,700 |
232,650 |
|
|
|
3,456,069 |
||
|
Packaging & Containers - 0.0% |
|||
|
Bemis Co., Inc. |
4,800 |
161,400 |
|
|
Paper & Forest Products - 0.1% |
|||
|
Trex Co., Inc. (a) |
6,000 |
300,000 |
|
|
TOTAL BASIC INDUSTRIES |
3,917,469 |
||
|
CONSTRUCTION & REAL ESTATE - 0.4% |
|||
|
Building Materials - 0.1% |
|||
|
Applied Films Corp. (a) |
9,600 |
351,600 |
|
|
Engineering - 0.3% |
|||
|
Bouygues SA |
600 |
400,659 |
|
|
Quanta Services, Inc. (a) |
9,900 |
544,500 |
|
|
|
945,159 |
||
|
TOTAL CONSTRUCTION & REAL ESTATE |
1,296,759 |
||
|
DURABLES - 1.6% |
|||
|
Autos, Tires, & Accessories - 0.5% |
|||
|
SPX Corp. |
11,090 |
1,341,197 |
|
|
Consumer Electronics - 0.7% |
|||
|
Black & Decker Corp. |
3,700 |
145,456 |
|
|
General Motors Corp. Class H (a) |
22,100 |
1,939,275 |
|
|
|
2,084,731 |
||
|
Home Furnishings - 0.0% |
|||
|
Leggett & Platt, Inc. |
6,700 |
110,550 |
|
|
Textiles & Apparel - 0.4% |
|||
|
Jones Apparel Group, Inc. (a) |
11,300 |
265,550 |
|
|
Liz Claiborne, Inc. |
18,670 |
658,118 |
|
|
Timberland Co. Class A (a) |
5,200 |
368,225 |
|
|
|
1,291,893 |
||
|
TOTAL DURABLES |
4,828,371 |
||
|
ENERGY - 10.8% |
|||
|
Energy Services - 6.4% |
|||
|
BJ Services Co. (a) |
28,980 |
1,811,250 |
|
|
Cal Dive International, Inc. (a) |
9,700 |
525,619 |
|
|
Coflexip SA sponsored ADR |
2,300 |
139,150 |
|
|
Diamond Offshore Drilling, Inc. |
15,300 |
537,413 |
|
|
ENSCO International, Inc. |
46,110 |
1,651,314 |
|
|
Global Marine, Inc. |
73,500 |
2,071,781 |
|
|
|
|||
|
Shares |
Value (Note 1) |
||
|
Grey Wolf, Inc. (a) |
162,000 |
$ 810,000 |
|
|
Halliburton Co. |
24,700 |
1,165,531 |
|
|
Hanover Compressor Co. (a) |
23,700 |
900,600 |
|
|
Helmerich & Payne, Inc. |
20,100 |
751,238 |
|
|
Nabors Industries, Inc. (a) |
40,080 |
1,665,825 |
|
|
Noble Drilling Corp. |
43,590 |
1,795,363 |
|
|
Pride International, Inc. (a) |
9,000 |
222,750 |
|
|
R&B Falcon Corp. (a) |
30,800 |
725,725 |
|
|
Rowan Companies, Inc. (a) |
4,300 |
130,613 |
|
|
Smith International, Inc. (a) |
10,400 |
757,250 |
|
|
Tidewater, Inc. |
25,950 |
934,200 |
|
|
Transocean Sedco Forex, Inc. |
14,260 |
762,019 |
|
|
Varco International, Inc. (a) |
30,548 |
710,229 |
|
|
Weatherford International, Inc. |
25,930 |
1,032,338 |
|
|
|
19,100,208 |
||
|
Oil & Gas - 4.4% |
|||
|
Anadarko Petroleum Corp. |
18,100 |
892,556 |
|
|
Apache Corp. |
37,450 |
2,202,528 |
|
|
Burlington Resources, Inc. |
14,700 |
562,275 |
|
|
Cooper Cameron Corp. (a) |
12,560 |
828,960 |
|
|
Devon Energy Corp. |
19,700 |
1,106,894 |
|
|
EOG Resources, Inc. |
9,140 |
306,190 |
|
|
Grant Prideco, Inc. (a) |
8,730 |
218,250 |
|
|
Kerr-McGee Corp. |
2,770 |
163,257 |
|
|
Murphy Oil Corp. |
2,000 |
118,875 |
|
|
Noble Affiliates, Inc. |
14,470 |
539,008 |
|
|
Ocean Energy, Inc. (a) |
39,290 |
557,427 |
|
|
Santa Fe Snyder Corp. (a) |
144,670 |
1,645,621 |
|
|
Tosco Corp. |
23,530 |
666,193 |
|
|
USX - Marathon Group |
7,590 |
190,224 |
|
|
Valero Energy Corp. |
18,700 |
593,725 |
|
|
Vastar Resources, Inc. |
21,640 |
1,777,185 |
|
|
Veritas DGC, Inc. (a) |
22,600 |
587,600 |
|
|
|
12,956,768 |
||
|
TOTAL ENERGY |
32,056,976 |
||
|
FINANCE - 6.5% |
|||
|
Banks - 0.9% |
|||
|
Bank of New York Co., Inc. |
15,300 |
711,450 |
|
|
Bank One Corp. |
39,200 |
1,041,250 |
|
|
PNC Financial Services Group, Inc. |
16,600 |
778,125 |
|
|
|
2,530,825 |
||
|
Credit & Other Finance - 0.5% |
|||
|
Concord EFS, Inc. (a) |
16,500 |
429,000 |
|
|
Household International, Inc. |
14,000 |
581,875 |
|
|
Providian Financial Corp. |
6,700 |
603,000 |
|
|
|
1,613,875 |
||
|
Federal Sponsored Credit - 1.3% |
|||
|
Freddie Mac |
92,410 |
3,742,605 |
|
|
Insurance - 3.7% |
|||
|
Ace Ltd. |
23,200 |
649,600 |
|
|
Common Stocks - continued |
|||
|
Shares |
Value (Note 1) |
||
|
FINANCE - continued |
|||
|
Insurance - continued |
|||
|
AFLAC, Inc. |
8,950 |
$ 411,141 |
|
|
Allmerica Financial Corp. |
12,720 |
666,210 |
|
|
AMBAC Financial Group, Inc. |
24,640 |
1,350,580 |
|
|
American General Corp. |
4,590 |
279,990 |
|
|
Brown & Brown, Inc. |
500 |
26,000 |
|
|
CIGNA Corp. |
25,650 |
2,398,275 |
|
|
First Health Group Corp. (a) |
14,300 |
469,219 |
|
|
Hartford Financial Services Group, Inc. |
6,270 |
350,728 |
|
|
Jefferson-Pilot Corp. |
3,600 |
203,175 |
|
|
MBIA, Inc. |
5,310 |
255,876 |
|
|
MetLife, Inc. |
60,000 |
1,263,750 |
|
|
Protective Life Corp. |
22,780 |
606,518 |
|
|
Reliastar Financial Corp. |
23,939 |
1,255,301 |
|
|
The Chubb Corp. |
4,360 |
268,140 |
|
|
XL Capital Ltd. Class A |
10,400 |
562,900 |
|
|
|
11,017,403 |
||
|
Securities Industry - 0.1% |
|||
|
Lehman Brothers Holdings, Inc. |
3,000 |
283,688 |
|
|
TOTAL FINANCE |
19,188,396 |
||
|
HEALTH - 13.5% |
|||
|
Drugs & Pharmaceuticals - 10.4% |
|||
|
Abgenix, Inc. (a) |
6,100 |
731,142 |
|
|
Alkermes, Inc. (a) |
4,100 |
193,213 |
|
|
Allergan, Inc. |
10,100 |
752,450 |
|
|
ALZA Corp. (a) |
12,200 |
721,325 |
|
|
Aviron (a) |
28,880 |
891,670 |
|
|
Bristol-Myers Squibb Co. |
10,800 |
629,100 |
|
|
Celgene Corp. (a) |
23,550 |
1,386,506 |
|
|
Cephalon, Inc. (a) |
31,540 |
1,888,458 |
|
|
Chiron Corp. (a) |
12,830 |
609,425 |
|
|
COR Therapeutics, Inc. (a) |
28,420 |
2,424,581 |
|
|
Corixa Corp. (a) |
9,500 |
407,906 |
|
|
CV Therapeutics, Inc. (a) |
7,605 |
527,122 |
|
|
Elan Corp. PLC sponsored ADR (a) |
20,200 |
978,438 |
|
|
Eli Lilly & Co. |
7,500 |
749,063 |
|
|
Forest Laboratories, Inc. (a) |
6,370 |
643,370 |
|
|
Gene Logic, Inc. (a) |
10,480 |
374,005 |
|
|
Genentech, Inc. |
3,170 |
545,240 |
|
|
Gilead Sciences, Inc. (a) |
7,010 |
498,586 |
|
|
Human Genome Sciences, Inc. (a) |
620 |
82,693 |
|
|
ImClone Systems, Inc. (a) |
16,400 |
1,253,575 |
|
|
IVAX Corp. (a) |
6,500 |
269,750 |
|
|
Millennium Pharmaceuticals, Inc. (a) |
13,762 |
1,539,624 |
|
|
Myriad Genetics, Inc. (a) |
9,000 |
1,332,703 |
|
|
Noven Pharmaceuticals, Inc. (a) |
1,100 |
33,069 |
|
|
PE Corp. - Celera Genomics Group (a) |
9,300 |
869,550 |
|
|
Protein Design Labs, Inc. (a) |
8,210 |
1,354,265 |
|
|
QLT, Inc. (a) |
21,260 |
1,651,402 |
|
|
Schering-Plough Corp. |
9,700 |
489,850 |
|
|
|
|||
|
Shares |
Value (Note 1) |
||
|
Sepracor, Inc. (a) |
12,560 |
$ 1,515,050 |
|
|
Teva Pharmaceutical Industries Ltd. ADR |
28,200 |
1,563,338 |
|
|
Titan Pharmaceuticals, Inc. (a) |
15,100 |
649,300 |
|
|
United Therapeutics Corp. |
26,100 |
2,828,588 |
|
|
Vertex Pharmaceuticals, Inc. (a) |
5,300 |
558,488 |
|
|
|
30,942,845 |
||
|
Medical Equipment & Supplies - 0.8% |
|||
|
Millipore Corp. |
8,700 |
655,763 |
|
|
MiniMed, Inc. (a) |
3,900 |
460,200 |
|
|
Novoste Corp. (a) |
10,300 |
628,300 |
|
|
Stryker Corp. |
10,800 |
472,500 |
|
|
Sybron International, Inc. (a) |
8,730 |
172,963 |
|
|
|
2,389,726 |
||
|
Medical Facilities Management - 2.3% |
|||
|
Express Scripts, Inc. Class A (a) |
10,800 |
670,950 |
|
|
Laboratory Corp. of America Holdings |
5,700 |
439,613 |
|
|
Quest Diagnostics, Inc. (a) |
24,500 |
1,831,375 |
|
|
Trigon Healthcare, Inc. (a) |
43,170 |
2,225,953 |
|
|
UnitedHealth Group, Inc. |
14,600 |
1,251,950 |
|
|
Wellpoint Health Networks, Inc. (a) |
4,800 |
347,700 |
|
|
|
6,767,541 |
||
|
TOTAL HEALTH |
40,100,112 |
||
|
INDUSTRIAL MACHINERY & EQUIPMENT - 2.8% |
|||
|
Electrical Equipment - 2.2% |
|||
|
Adaptive Broadband Corp. (a) |
21,140 |
776,895 |
|
|
Adtran, Inc. (a) |
16,300 |
975,963 |
|
|
American Power Conversion Corp. (a) |
7,300 |
297,931 |
|
|
ANTEC Corp. (a) |
11,200 |
465,500 |
|
|
California Amplifier, Inc. (a) |
320 |
14,640 |
|
|
Harris Corp. |
5,600 |
183,400 |
|
|
Pace Micro Technology PLC |
88,944 |
1,284,515 |
|
|
Powerwave Technologies, Inc. (a) |
6,700 |
294,800 |
|
|
Scientific-Atlanta, Inc. |
16,840 |
1,254,580 |
|
|
Vyyo, Inc. |
32,600 |
880,200 |
|
|
|
6,428,424 |
||
|
Industrial Machinery & Equipment - 0.6% |
|||
|
Asyst Technologies, Inc. (a) |
21,900 |
750,075 |
|
|
Ingersoll-Rand Co. |
10,100 |
406,525 |
|
|
Varian Semiconductor Equipment Associates, Inc. (a) |
9,400 |
590,438 |
|
|
|
1,747,038 |
||
|
TOTAL INDUSTRIAL MACHINERY & EQUIPMENT |
8,175,462 |
||
|
MEDIA & LEISURE - 3.1% |
|||
|
Broadcasting - 2.4% |
|||
|
EchoStar Communications Corp. |
23,020 |
762,178 |
|
|
Pegasus Communications Corp. (a) |
53,240 |
2,612,088 |
|
|
Radio One, Inc.: |
|
|
|
|
Class A |
6,070 |
179,444 |
|
|
Common Stocks - continued |
|||
|
Shares |
Value (Note 1) |
||
|
MEDIA & LEISURE - continued |
|||
|
Broadcasting - continued |
|||
|
Radio One, Inc.: - continued |
|
|
|
|
Class D (non-vtg.) (a) |
15,140 |
$ 334,026 |
|
|
TiVo, Inc. |
29,200 |
1,022,000 |
|
|
UnitedGlobalCom, Inc. Class A (a) |
5,090 |
237,958 |
|
|
Univision Communications, Inc. |
8,580 |
888,030 |
|
|
USA Networks, Inc. (a) |
43,300 |
936,363 |
|
|
|
6,972,087 |
||
|
Entertainment - 0.7% |
|||
|
Mandalay Resort Group (a) |
18,100 |
362,000 |
|
|
MGM Grand, Inc. |
41,900 |
1,346,038 |
|
|
Park Place Entertainment Corp. (a) |
5,400 |
65,813 |
|
|
Premier Parks, Inc. (a) |
10,400 |
236,600 |
|
|
|
2,010,451 |
||
|
Publishing - 0.0% |
|||
|
Reader's Digest Association, Inc. |
860 |
34,185 |
|
|
Restaurants - 0.0% |
|||
|
Jack in the Box, Inc. (a) |
2,880 |
70,920 |
|
|
TOTAL MEDIA & LEISURE |
9,087,643 |
||
|
NONDURABLES - 1.7% |
|||
|
Agriculture - 0.1% |
|||
|
Nutreco Holding NV |
11,573 |
441,603 |
|
|
Foods - 1.2% |
|||
|
Bestfoods |
4,200 |
290,850 |
|
|
Keebler Foods Co. |
22,840 |
847,935 |
|
|
Nabisco Group Holdings Corp. |
45,910 |
1,190,791 |
|
|
Nabisco Holdings Corp. Class A |
10,800 |
567,000 |
|
|
Quaker Oats Co. |
7,200 |
540,900 |
|
|
|
3,437,476 |
||
|
Household Products - 0.4% |
|||
|
Avon Products, Inc. |
24,610 |
1,095,145 |
|
|
TOTAL NONDURABLES |
4,974,224 |
||
|
PRECIOUS METALS - 0.4% |
|||
|
Agnico-Eagle Mines Ltd. |
8,930 |
56,095 |
|
|
Newmont Mining Corp. |
900 |
19,463 |
|
|
Stillwater Mining Co. (a) |
37,520 |
1,045,870 |
|
|
|
1,121,428 |
||
|
RETAIL & WHOLESALE - 1.1% |
|||
|
Apparel Stores - 0.2% |
|||
|
AnnTaylor Stores Corp. (a) |
21,800 |
722,125 |
|
|
General Merchandise Stores - 0.3% |
|||
|
Consolidated Stores Corp. (a) |
1,900 |
22,800 |
|
|
|
|||
|
Shares |
Value (Note 1) |
||
|
Costco Wholesale Corp. (a) |
13,400 |
$ 442,200 |
|
|
Dollar Tree Stores, Inc. (a) |
7,650 |
302,653 |
|
|
|
767,653 |
||
|
Grocery Stores - 0.3% |
|||
|
Safeway, Inc. (a) |
17,100 |
771,638 |
|
|
Retail & Wholesale, Miscellaneous - 0.3% |
|||
|
Best Buy Co., Inc. (a) |
13,000 |
822,250 |
|
|
Circuit City Stores, Inc. - |
4,600 |
152,663 |
|
|
Ventro Corp. |
3,500 |
66,063 |
|
|
|
1,040,976 |
||
|
TOTAL RETAIL & WHOLESALE |
3,302,392 |
||
|
SERVICES - 2.5% |
|||
|
Advertising - 0.9% |
|||
|
ADVO, Inc. (a) |
20,600 |
865,200 |
|
|
DoubleClick, Inc. (a) |
8,180 |
311,863 |
|
|
TMP Worldwide, Inc. (a) |
19,500 |
1,439,344 |
|
|
|
2,616,407 |
||
|
Printing - 0.0% |
|||
|
Valassis Communications, Inc. (a) |
1,360 |
51,850 |
|
|
Services - 1.6% |
|||
|
ACNielsen Corp. (a) |
23,100 |
508,200 |
|
|
Cintas Corp. |
29,390 |
1,078,246 |
|
|
Convergys Corp. (a) |
9,000 |
466,875 |
|
|
Ecolab, Inc. |
28,939 |
1,130,430 |
|
|
Profit Recovery Group |
21,600 |
359,100 |
|
|
Robert Half International, Inc. (a) |
24,640 |
702,240 |
|
|
True North Communications |
11,400 |
501,600 |
|
|
|
4,746,691 |
||
|
TOTAL SERVICES |
7,414,948 |
||
|
TECHNOLOGY - 31.7% |
|||
|
Communications Equipment - 3.9% |
|||
|
ADC Telecommunications, Inc. (a) |
8,300 |
696,163 |
|
|
Advanced Fibre Communications, Inc. (a) |
2,430 |
110,109 |
|
|
Andrew Corp. (a) |
17,000 |
570,563 |
|
|
Ciena Corp. (a) |
4,790 |
798,433 |
|
|
Comverse Technology, Inc. (a) |
14,850 |
1,381,050 |
|
|
Corning, Inc. |
5,903 |
1,593,072 |
|
|
Ditech Communications Corp. |
900 |
85,106 |
|
|
Efficient Networks, Inc. |
9,800 |
720,913 |
|
|
Jabil Circuit, Inc. (a) |
29,740 |
1,475,848 |
|
|
Metricom, Inc. (a) |
10,230 |
285,161 |
|
|
Natural MicroSystems Corp. (a) |
22,050 |
2,479,247 |
|
|
Tekelec (a) |
7,800 |
375,863 |
|
|
Terayon Communication Systems, Inc. (a) |
1,200 |
77,081 |
|
|
Turnstone Systems, Inc. |
3,200 |
530,150 |
|
|
Common Stocks - continued |
|||
|
Shares |
Value (Note 1) |
||
|
TECHNOLOGY - continued |
|||
|
Communications Equipment - continued |
|||
|
Tut Systems, Inc. (a) |
2,600 |
$ 149,175 |
|
|
Westell Technologies, Inc. Class A (a) |
8,800 |
132,000 |
|
|
|
11,459,934 |
||
|
Computer Services & Software - 8.4% |
|||
|
Active Software, Inc. |
13,500 |
1,048,781 |
|
|
Adobe Systems, Inc. |
10,630 |
1,381,900 |
|
|
Affiliated Computer Services, Inc. |
3,220 |
106,461 |
|
|
Affymetrix, Inc. (a) |
4,300 |
710,038 |
|
|
Amazon.com, Inc. (a) |
24,500 |
889,656 |
|
|
Amdocs Ltd. (a) |
7,947 |
609,932 |
|
|
Ariba, Inc. |
5,000 |
490,234 |
|
|
Autodesk, Inc. |
11,800 |
409,313 |
|
|
BEA Systems, Inc. (a) |
24,520 |
1,212,208 |
|
|
BroadVision, Inc. (a) |
2,300 |
116,869 |
|
|
Business Objects SA sponsored ADR (a) |
4,400 |
387,750 |
|
|
CACI International, Inc. Class A (a) |
12,200 |
237,900 |
|
|
Cadence Design Systems, Inc. (a) |
19,620 |
399,758 |
|
|
Check Point Software |
3,200 |
677,600 |
|
|
Clarent Corp. |
2,500 |
178,750 |
|
|
CNET Networks, Inc. (a) |
23,700 |
582,131 |
|
|
Covad Communications Group, Inc. (a) |
25,200 |
406,350 |
|
|
Digital Insight Corp. |
4,900 |
166,600 |
|
|
Electronic Arts, Inc. (a) |
3,010 |
219,542 |
|
|
Foundry Networks, Inc. |
4,600 |
506,000 |
|
|
Interact Commerce Corp. (a) |
7,080 |
83,632 |
|
|
Internap Network Services Corp. |
3,300 |
137,002 |
|
|
Intuit, Inc. (a) |
7,830 |
323,966 |
|
|
Keynote Systems, Inc. |
6,300 |
444,544 |
|
|
Macromedia, Inc. (a) |
900 |
87,019 |
|
|
Manugistics Group, Inc. (a) |
1,500 |
70,125 |
|
|
Marketwatch.com, Inc. (a) |
200 |
3,763 |
|
|
Mercury Interactive Corp. (a) |
2,700 |
261,225 |
|
|
Metasolv Software, Inc. |
11,330 |
498,520 |
|
|
National Computer Systems, Inc. |
7,200 |
354,600 |
|
|
New Era of Networks, Inc. (a) |
2,370 |
100,725 |
|
|
Opus360 Corp. |
20 |
74 |
|
|
Orbotech Ltd. |
8,400 |
780,150 |
|
|
Pharmacopeia, Inc. (a) |
3,400 |
157,675 |
|
|
Phone.com, Inc. |
4,900 |
319,113 |
|
|
Polycom, Inc. (a) |
13,400 |
1,260,856 |
|
|
Priceline.com, Inc. (a) |
24,500 |
930,617 |
|
|
Puma Technology, Inc. (a) |
4,160 |
111,540 |
|
|
Rational Software Corp. (a) |
14,300 |
1,329,006 |
|
|
Redback Networks, Inc. |
6,320 |
1,132,070 |
|
|
Software.com, Inc. |
2,100 |
272,738 |
|
|
VERITAS Software Corp. (a) |
24,605 |
2,780,749 |
|
|
Vignette Corp. (a) |
10,080 |
524,318 |
|
|
|
|||
|
Shares |
Value (Note 1) |
||
|
Vitria Technology, Inc. |
6,800 |
$ 415,650 |
|
|
webMethods, Inc. |
12,000 |
1,886,250 |
|
|
|
25,003,700 |
||
|
Computers & Office Equipment - 4.7% |
|||
|
Alteon Websystems, Inc. |
5,700 |
570,356 |
|
|
Apple Computer, Inc. (a) |
80 |
4,190 |
|
|
Brocade Communications |
16,860 |
3,093,547 |
|
|
CDW Computer Centers, Inc. (a) |
30,800 |
1,925,000 |
|
|
Comdisco, Inc. |
5,400 |
120,488 |
|
|
Copper Mountain Networks, Inc. |
3,300 |
290,813 |
|
|
Juniper Networks, Inc. |
15,060 |
2,192,171 |
|
|
MMC Networks, Inc. (a) |
21,600 |
1,154,250 |
|
|
MRV Communications, Inc. (a) |
6,100 |
410,225 |
|
|
Network Appliance, Inc. (a) |
24,080 |
1,938,440 |
|
|
ScanSource, Inc. (a) |
7,130 |
277,179 |
|
|
SCI Systems, Inc. (a) |
7,100 |
278,231 |
|
|
Symbol Technologies, Inc. |
9,645 |
520,830 |
|
|
Tech Data Corp. (a) |
25,500 |
1,110,844 |
|
|
|
13,886,564 |
||
|
Electronic Instruments - 4.1% |
|||
|
Aclara Biosciences, Inc. |
6,200 |
315,813 |
|
|
Agilent Technologies, Inc. |
10,350 |
763,313 |
|
|
Aurora Biosciences Corp. (a) |
17,100 |
1,166,006 |
|
|
FEI Co. (a) |
29,700 |
905,850 |
|
|
KLA-Tencor Corp. (a) |
4,820 |
282,271 |
|
|
Kulicke & Soffa Industries, Inc. (a) |
12,100 |
718,438 |
|
|
Novellus Systems, Inc. (a) |
14,950 |
845,609 |
|
|
PE Corp. - Biosystems Group |
7,910 |
521,071 |
|
|
PerkinElmer, Inc. |
36,950 |
2,443,319 |
|
|
Photon Dynamics, Inc. (a) |
18,700 |
1,396,656 |
|
|
Tektronix, Inc. |
13,200 |
976,800 |
|
|
Waters Corp. (a) |
14,910 |
1,860,954 |
|
|
|
12,196,100 |
||
|
Electronics - 10.6% |
|||
|
Altera Corp. (a) |
28,450 |
2,900,122 |
|
|
Analog Devices, Inc. (a) |
7,440 |
565,440 |
|
|
Atmel Corp. (a) |
11,300 |
416,688 |
|
|
Celestica, Inc. (sub. vtg.) (a) |
7,720 |
375,962 |
|
|
Chartered Semiconductor |
3,540 |
318,600 |
|
|
Cypress Semiconductor Corp. (a) |
20,640 |
872,040 |
|
|
Digital Microwave Corp. (a) |
8,300 |
316,438 |
|
|
E Tek Dynamics, Inc. (a) |
3,130 |
825,733 |
|
|
GlobeSpan, Inc. |
12,400 |
1,513,769 |
|
|
Infineon Technologies AG |
5,200 |
408,550 |
|
|
KEMET Corp. (a) |
8,160 |
204,510 |
|
|
Kopin Corp. (a) |
72,470 |
5,018,548 |
|
|
Lattice Semiconductor Corp. (a) |
8,100 |
559,913 |
|
|
Linear Technology Corp. |
20 |
1,279 |
|
|
LSI Logic Corp. (a) |
2,900 |
156,963 |
|
|
Merix Corp. (a) |
9,500 |
446,500 |
|
|
Microchip Technology, Inc. (a) |
14,900 |
868,158 |
|
|
Common Stocks - continued |
|||
|
Shares |
Value (Note 1) |
||
|
TECHNOLOGY - continued |
|||
|
Electronics - continued |
|||
|
Micron Technology, Inc. (a) |
17,140 |
$ 1,509,391 |
|
|
National Semiconductor Corp. (a) |
33,430 |
1,897,153 |
|
|
NVIDIA Corp. (a) |
12,600 |
800,888 |
|
|
Plexus Corp. (a) |
5,000 |
565,000 |
|
|
PMC-Sierra, Inc. (a) |
3,870 |
687,651 |
|
|
Power-One, Inc. (a) |
10,700 |
1,219,131 |
|
|
QLogic Corp. (a) |
7,132 |
471,158 |
|
|
Rambus, Inc. (a) |
14,100 |
1,452,300 |
|
|
S3, Inc. |
34,100 |
502,975 |
|
|
Sanmina Corp. (a) |
33,600 |
2,872,800 |
|
|
SDL, Inc. (a) |
4,400 |
1,254,825 |
|
|
Three-Five Systems, Inc. (a) |
2,704 |
159,536 |
|
|
TriQuint Semiconductor, Inc. |
8,600 |
822,913 |
|
|
Vishay Intertechnology, Inc. (a) |
18,220 |
691,221 |
|
|
Vitesse Semiconductor Corp. (a) |
5,990 |
440,639 |
|
|
Xilinx, Inc. (a) |
3,100 |
255,944 |
|
|
|
31,372,738 |
||
|
TOTAL TECHNOLOGY |
93,919,036 |
||
|
TRANSPORTATION - 1.1% |
|||
|
Air Transportation - 0.2% |
|||
|
Continental Airlines, Inc. Class B (a) |
4,900 |
230,300 |
|
|
Northwest Airlines Corp. Class A (a) |
9,700 |
295,244 |
|
|
Southwest Airlines Co. |
13,350 |
252,816 |
|
|
|
778,360 |
||
|
Railroads - 0.0% |
|||
|
Wabtec Corp. |
296 |
3,071 |
|
|
Shipping - 0.5% |
|||
|
Teekay Shipping Corp. |
45,000 |
1,479,375 |
|
|
Trucking & Freight - 0.4% |
|||
|
Forward Air Corp. (a) |
11,985 |
479,400 |
|
|
Landstar System, Inc. (a) |
10,100 |
601,581 |
|
|
|
1,080,981 |
||
|
TOTAL TRANSPORTATION |
3,341,787 |
||
|
UTILITIES - 8.8% |
|||
|
Cellular - 4.2% |
|||
|
China Telecom (Hong Kong) Ltd. sponsored ADR (a) |
3,400 |
604,563 |
|
|
Clearnet Communications, Inc. |
24,450 |
677,102 |
|
|
Microcell Telecommunications, Inc. |
26,430 |
955,979 |
|
|
Millicom International Cellular SA (a) |
1,430 |
50,050 |
|
|
Nextel Communications, Inc. Class A (a) |
123,420 |
7,551,737 |
|
|
Nextel Partners, Inc. Class A |
6,300 |
205,144 |
|
|
|
|||
|
Shares |
Value (Note 1) |
||
|
Sprint Corp. - PCS Group Series 1 (a) |
37,110 |
$ 2,208,045 |
|
|
VoiceStream Wireless Corp. (a) |
2,790 |
324,468 |
|
|
|
12,577,088 |
||
|
Electric Utility - 2.8% |
|||
|
AES Corp. (a) |
30,960 |
1,412,550 |
|
|
Calpine Corp. (a) |
68,000 |
4,471,000 |
|
|
Constellation Energy Corp. |
8,100 |
263,756 |
|
|
IPALCO Enterprises, Inc. |
15,680 |
315,560 |
|
|
Montana Power Co. |
13,100 |
462,594 |
|
|
NiSource, Inc. |
39,900 |
743,138 |
|
|
Northern States Power Co. |
16,000 |
323,000 |
|
|
NRG Energy, Inc. |
4,500 |
82,125 |
|
|
PECO Energy Co. |
6,000 |
241,875 |
|
|
|
8,315,598 |
||
|
Gas - 1.3% |
|||
|
Columbia Energy Group |
60 |
3,938 |
|
|
Dynegy, Inc. Class A |
28,470 |
1,944,857 |
|
|
Enron Corp. |
8,150 |
525,675 |
|
|
Kinder Morgan, Inc. |
36,580 |
1,264,296 |
|
|
|
3,738,766 |
||
|
Telephone Services - 0.5% |
|||
|
Allegiance Telecom, Inc. (a) |
2,200 |
140,800 |
|
|
CenturyTel, Inc. |
31,400 |
902,750 |
|
|
ITXC Corp. |
14,210 |
503,123 |
|
|
|
1,546,673 |
||
|
TOTAL UTILITIES |
26,178,125 |
||
|
TOTAL COMMON STOCKS (Cost $230,321,148) |
258,903,128 |
||
|
U.S. Treasury Obligations - 0.3% |
|||||
|
Moody's Ratings (unaudited) |
Principal Amount |
|
|||
|
U.S. Treasury Bills, yield at
date of purchase 5.59% to
6.03% 7/13/00 to
8/17/00 (c) |
- |
|
$ 925,000 |
919,853 |
|
|
Cash Equivalents - 18.5% |
|||
|
Maturity Amount |
Value |
||
|
Investments in repurchase agreements (U.S. Treasury Obligations), in a joint trading account at 6.58%, dated 6/30/00 due 7/3/00 |
$ 18,919,371 |
$ 18,909,000 |
|
|
Shares |
|
||
|
Central Cash Collateral Fund, 6.71% (b) |
6,731,354 |
6,731,354 |
|
|
Taxable Central Cash Fund, 6.59% (b) |
29,086,263 |
29,086,263 |
|
|
TOTAL CASH EQUIVALENTS (Cost $54,726,617) |
54,726,617 |
|
|
TOTAL INVESTMENT PORTFOLIO - 106.1% (Cost $285,967,116) |
314,549,598 |
|
|
NET OTHER ASSETS - (6.1)% |
(18,181,476) |
|
|
NET ASSETS - 100% |
$ 296,368,122 |
|
|
Futures Contracts |
|||||
|
|
Expiration Date |
Underlying |
Unrealized Gain/(Loss) |
||
|
Purchased |
|||||
|
57 S&P 400 Midcap Index Contracts |
Sept. 2000 |
$ 13,916,550 |
$ (412,213) |
||
|
The face value of futures purchased as a percentage of net assets - 4.7% |
|
Legend |
|
(a) Non-income producing |
|
(b) The rate quoted is the annualized seven-day yield of the fund at |
|
(c) Security or a portion of the security was pledged to cover margin requirements for futures contracts. At the period end, the value of securities pledged amounted to $919,853. |
|
Other Information |
|
Purchases and sales of securities, other than short-term securities, |
|
The market value of futures contracts opened and closed during the |
|
The fund placed a portion of its portfolio transactions with brokerage firms which are affiliates of Fidelity Management & Research Company. The commissions paid to these affiliated firms were $16,684 for the period. |
|
The fund participated in the security lending program. At period end, the value of securities loaned amounted to $6,633,405. The fund received cash collateral of $6,731,354 which was invested in cash equivalents. |
|
Income Tax Information |
|
At June 30, 2000, the aggregate cost of investment securities for income tax purposes was $289,737,660. Net unrealized appreciation aggregated $24,811,938, of which $35,724,103 related to appreciated investment securities and $10,912,165 related to depreciated investment securities. |
See accompanying notes which are an integral part of the financial statements.
Mid Cap Portfolio
Statement of Assets and Liabilities
|
|
June 30, 2000 (Unaudited) |
|
|
Assets |
|
|
|
Investment in securities, at value
(including repurchase agreements of
$18,909,000) |
|
$ 314,549,598 |
|
Cash |
|
323,420 |
|
Receivable for investments sold |
|
13,596,246 |
|
Receivable for fund shares sold |
|
3,012,314 |
|
Dividends receivable |
|
66,918 |
|
Interest receivable |
|
128,429 |
|
Other receivables |
|
10,808 |
|
Total assets |
|
331,687,733 |
|
Liabilities |
|
|
|
Payable for investments purchased |
$ 27,374,504 |
|
|
Payable for fund shares redeemed |
834,902 |
|
|
Accrued management fee |
115,770 |
|
|
Distribution fees payable |
12,793 |
|
|
Payable for daily variation on |
208,051 |
|
|
Other payables and |
42,237 |
|
|
Collateral on securities loaned, |
6,731,354 |
|
|
Total liabilities |
|
35,319,611 |
|
Net Assets |
|
$ 296,368,122 |
|
Net Assets consist of: |
|
|
|
Paid in capital |
|
$ 271,976,722 |
|
Undistributed net investment income |
|
97,845 |
|
Accumulated undistributed net realized gain (loss) on investments and foreign currency transactions |
|
(3,876,611) |
|
Net unrealized appreciation
(depreciation) on investments |
|
28,170,166 |
|
Net Assets |
|
$ 296,368,122 |
|
Initial Class: |
|
$18.82 |
|
Service Class: |
|
$18.80 |
|
Service Class 2: |
|
$18.78 |
Statement of Operations
|
|
Six months ended June 30, 2000 (Unaudited) |
|
|
Investment Income Dividends |
|
$ 177,301 |
|
Interest |
|
380,016 |
|
Security lending |
|
16,068 |
|
Total income |
|
573,385 |
|
Expenses |
|
|
|
Management fee |
$ 306,603 |
|
|
Transfer agent fees |
43,421 |
|
|
Distribution fees |
44,790 |
|
|
Accounting and security lending fees |
32,445 |
|
|
Non-interested trustees' compensation |
111 |
|
|
Custodian fees and expenses |
58,064 |
|
|
Audit |
8,158 |
|
|
Legal |
586 |
|
|
Reports to Shareholders |
236 |
|
|
Miscellaneous |
69 |
|
|
Total expenses before reductions |
494,483 |
|
|
Expense reductions |
(19,437) |
475,046 |
|
Net investment income |
|
98,339 |
|
Realized and Unrealized Gain (Loss) Net realized gain (loss) on: |
|
|
|
Investment securities |
(3,838,305) |
|
|
Foreign currency transactions |
1,931 |
|
|
Futures contracts |
126,879 |
(3,709,495) |
|
Change in net unrealized appreciation (depreciation) on: |
|
|
|
Investment securities |
24,218,897 |
|
|
Assets and liabilities in |
(23) |
|
|
Futures contracts |
(424,407) |
23,794,467 |
|
Net gain (loss) |
|
20,084,972 |
|
Net increase (decrease) in net assets resulting from operations |
|
$ 20,183,311 |
|
Other Information Expense reductions |
|
$ 19,080 |
|
Custodian credits |
|
357 |
|
|
|
$ 19,437 |
See accompanying notes which are an integral part of the financial statements.
Semiannual Report
Variable Insurance Products: Portfolio
Financial Statements - continued
Statement of Changes in Net Assets
|
Increase (Decrease) in Net Assets |
Six months ended |
Year ended |
|
Operations |
$ 98,339 |
$ (3,279) |
|
Net realized gain (loss) |
(3,709,495) |
139,917 |
|
Change in net unrealized appreciation (depreciation) |
23,794,467 |
4,343,490 |
|
Net increase (decrease) in net assets resulting from operations |
20,183,311 |
4,480,128 |
|
Distributions to shareholders |
- |
(139,917) |
|
In excess of net realized gain |
(131,105) |
(32,523) |
|
Total distributions |
(131,105) |
(172,440) |
|
Share transactions - net increase (decrease) |
248,664,126 |
22,312,614 |
|
Total increase (decrease) in net assets |
268,716,332 |
26,620,302 |
|
Net Assets |
|
|
|
Beginning of period |
27,651,790 |
1,031,488 |
|
End of period (including undistributed net investment income of $97,845 and $0, respectively) |
$ 296,368,122 |
$ 27,651,790 |
|
|
|
Other Information: |
|
|
Six months ended |
Year ended December 31, 1999 |
||
|
|
Shares |
Dollars |
Shares |
Dollars |
|
Share transactions |
7,954,588 |
$ 141,197,057 |
67,742 |
$ 873,931 |
|
Reinvested |
507 |
8,466 |
755 |
10,914 |
|
Redeemed |
(130,836) |
(2,260,660) |
(4,140) |
(54,766) |
|
Net increase (decrease) |
7,824,259 |
$ 138,944,863 |
64,357 |
$ 830,079 |
|
Service Class |
5,632,594 |
$ 100,266,360 |
1,749,215 |
$ 22,631,585 |
|
Reinvested |
7,312 |
121,968 |
11,186 |
161,526 |
|
Redeemed |
(474,562) |
(8,379,137) |
(110,484) |
(1,310,576) |
|
Net increase (decrease) |
5,165,344 |
$ 92,009,191 |
1,649,917 |
$ 21,482,535 |
|
Service Class 2 A |
1,052,073 |
$ 19,316,295 |
- |
$ - |
|
Reinvested |
40 |
671 |
- |
- |
|
Redeemed |
(99,362) |
(1,606,894) |
- |
- |
|
Net increase (decrease) |
952,751 |
$ 17,710,072 |
- |
$ - |
|
Distributions |
|
|
|
|
|
From net realized gain |
|
$ - |
|
$ 8,856 |
|
Service Class |
|
- |
|
131,061 |
|
Service Class 2 A |
|
- |
|
- |
|
Total |
|
$ - |
|
$ 139,917 |
|
In excess of net realized gain |
|
$ 8,466 |
|
$ 2,058 |
|
Service Class |
|
121,968 |
|
30,465 |
|
Service Class 2 A |
|
671 |
|
- |
|
Total |
|
$ 131,105 |
|
$ 32,523 |
|
|
|
$ 131,105 |
|
$ 172,440 |
G Service Class 2 commenced sale of shares January 12, 2000.
See accompanying notes which are an integral part of the financial statements.
Mid Cap Portfolio
Financial Highlights - Initial Class
|
|
Six months ended |
Years ended |
|
|
Selected Per-Share Data |
(Unaudited) |
1999 |
1998 E |
|
Net asset value, beginning of period |
$ 15.25 |
$ 10.31 |
$ 10.00 |
|
Income from Investment Operations |
|
|
|
|
Net investment income (loss) D |
.02 |
.00 |
.00 |
|
Net realized and unrealized gain (loss) |
3.60 |
5.05 |
.31 |
|
Total from investment operations |
3.62 |
5.05 |
.31 |
|
Less Distributions |
|
|
|
|
From net realized gain |
- |
(.09) |
- |
|
In excess of net realized gain |
(.05) |
(.02) |
- |
|
Total distributions |
(.05) |
(.11) |
- |
|
Net asset value, end of period |
$ 18.82 |
$ 15.25 |
$ 10.31 |
|
Total Return B, C |
23.78% |
49.04% |
3.10% |
|
Ratios and Supplemental Data |
|
|
|
|
Net assets, end of period (000 omitted) |
$ 149,444 |
$ 1,744 |
$ 516 |
|
Ratio of expenses to average net assets |
.84% A |
1.00% G |
1.00% A, G |
|
Ratio of expenses to average net assets after expense reductions |
.80% A, H |
.97% H |
1.00% A |
|
Ratio of net investment income (loss) to average net assets |
.25% A |
.01% |
(.27)% A |
|
Portfolio turnover |
239% A |
163% |
125% A |
Financial Highlights - Service Class
|
|
Six months ended |
Years ended |
|
|
Selected Per-Share Data |
(Unaudited) |
1999 |
1998 F |
|
Net asset value, beginning of period |
$ 15.24 |
$ 10.31 |
$ 10.00 |
|
Income from Investment Operations |
|
|
|
|
Net investment income (loss) D |
.01 |
(.01) |
.00 |
|
Net realized and unrealized gain (loss) |
3.60 |
5.05 |
.31 |
|
Total from investment operations |
3.61 |
5.04 |
.31 |
|
Less Distributions |
|
|
|
|
From net realized gain |
- |
(.09) |
- |
|
In excess of net realized gain |
(.05) |
(.02) |
- |
|
Total distributions |
(.05) |
(.11) |
- |
|
Net asset value, end of period |
$ 18.80 |
$ 15.24 |
$ 10.31 |
|
Total Return B, C |
23.73% |
48.94% |
3.10% |
|
Ratios and Supplemental Data |
|
|
|
|
Net assets, end of period (000 omitted) |
$ 129,033 |
$ 25,908 |
$ 516 |
|
Ratio of expenses to average net assets |
.92% A |
1.10% G |
1.10% A, G |
|
Ratio of expenses to average net assets after expense reductions |
.88% A, H |
1.07% H |
1.10% A |
|
Ratio of net investment income (loss) to average net assets |
.17% A |
(.09)% |
(.35)% A |
|
Portfolio turnover |
239% A |
163% |
125% A |
|
A Annualized B The total returns would have been lower had certain expenses not been reduced during the periods shown. C Total returns for periods of less than one year are not annualized and do not reflect charges attributable to your insurance company's separate account. Inclusion of these charges would reduce the total returns shown. D Net investment income (loss) per share has been calculated based on average shares outstanding during the period. E For the period December 28, 1998 (commencement of sale of Initial Class shares) to December 31, 1998. F For the period December 28, 1998 (commencement of sale of Service Class shares) to December 31, 1998. G FMR agreed to reimburse a portion of the class' expenses during the period. Without this reimbursement, the class' expense ratio would have been higher. H FMR or the fund has entered into varying arrangements with third parties who either paid or reduced a portion of the class' expenses. |
|||
See accompanying notes which are an integral part of the financial statements.
Semiannual Report
Financial Highlights - Service Class 2
|
|
Six months ended |
|
Selected Per-Share Data |
(Unaudited) |
|
Net asset value, beginning of period |
$ 14.82 |
|
Income from Investment Operations |
|
|
Net investment income D |
.00 |
|
Net realized and unrealized gain (loss) |
4.01 |
|
Total from investment operations |
4.01 |
|
Less Distributions |
|
|
In excess of net realized gain |
(.05) |
|
Net asset value, end of period |
$ 18.78 |
|
Total Return B, C |
27.10% |
|
Ratios and Supplemental Data |
|
|
Net assets, end of period (000 omitted) |
$ 17,891 |
|
Ratio of expenses to average net assets |
1.07% A |
|
Ratio of expenses to average net assets after expense reductions |
1.04% A, F |
|
Ratio of net investment income to average net assets |
.02% A |
|
Portfolio turnover |
239% A |
|
A Annualized B The total returns would have been lower had certain expenses not been reduced during the periods shown. C Total returns for periods of less than one year are not annualized and do not reflect charges attributable to your insurance company's separate account. Inclusion of these charges would reduce the total returns shown. D Net investment income per share has been calculated based on average shares outstanding during the period. E For the period January 12, 2000 (commencement of sale of Service Class 2 shares) to June 30, 2000. F FMR or the fund has entered into varying arrangements with third parties who either paid or reduced a portion of the class' expenses. |
|
See accompanying notes which are an integral part of the financial statements.
Mid Cap Portfolio
For the period ended June 30, 2000 (Unaudited)
1. Significant Accounting Policies.
Mid Cap Portfolio (the fund) is a fund of Variable Insurance Products Fund III (the trust) (referred to in this report as Fidelity Variable Insurance Products: Mid Cap Portfolio) and is authorized to issue an unlimited number of shares. The trust is registered under the Investment Company Act of 1940, as amended (the 1940 Act), as an open-end management investment company organized as a Massachusetts business trust. Shares of the fund may only be purchased by insurance companies for the purpose of funding variable annuity or variable life insurance contracts. The fund offers three classes of shares: the fund's original class of shares (Initial Class shares), Service Class shares and Service Class 2 shares. The fund commenced sale of Service Class 2 shares on January 12, 2000. All classes have equal rights and voting privileges, except for matters affecting a single class. Investment income, realized and unrealized capital gains and losses, the common expenses of the fund, and certain fund-level expense reductions, if any, are allocated on a pro rata basis to each class based on the relative net assets of each class to the total net assets of the fund. Each class of shares differs in its respective distribution plan.
The financial statements have been prepared in conformity with generally accepted accounting principles which require management to make certain estimates and assumptions at the date of the financial statements. The following summarizes the significant accounting policies of the fund:
Security Valuation. Securities for which exchange quotations are readily available are valued at the last sale price, or if no sale price, at the closing bid price. Foreign securities are valued based on quotations from the principal market in which such securities are normally traded. If trading or events occurring in other markets after the close of the principal market in which foreign securities are traded, and before the close of the business of the fund, are expected to materially affect the value of those securities, then they are valued at their fair value taking this trading or these events into account. Fair value is determined in good faith under consistently applied procedures under the general supervision of the Board of Trustees. Securities for which exchange quotations are not readily available (and in certain cases debt securities which trade on an exchange) are valued primarily using dealer-supplied valuations or at their fair value. Short-term securities with remaining maturities of sixty days or less for which quotations are not readily available are valued at amortized cost or original cost plus accrued interest, both of which approximate current value.
Foreign Currency Translation. The accounting records of the fund are maintained in U.S. dollars. Investment securities and other assets and liabilities denominated in a foreign currency are translated into U.S. dollars at the prevailing rates of exchange at period end. Purchases and sales of securities, income receipts and expense payments are translated into U.S. dollars at the prevailing exchange rate on the respective dates of the transactions.
Net realized gains and losses on foreign currency transactions represent net gains and losses from sales and maturities of foreign currency contracts, disposition of foreign currencies, the difference between the amount of net investment income accrued and the U.S. dollar amount actually received, and gains and losses between trade and settlement date on purchases and sales of securities. The effects of changes in foreign currency exchange rates on investments in securities are included with the net realized and unrealized gain or loss on investment securities.
Income Taxes. As a qualified regulated investment company under Subchapter M of the Internal Revenue Code, the fund is not subject to income taxes to the extent that it distributes substantially all of its taxable income for its fiscal year. The schedule of investments includes information regarding income taxes under the caption "Income Tax Information."
Investment Income. Dividend income is recorded on the ex-dividend date, except certain dividends from foreign securities where the ex-dividend date may have passed, are recorded as soon as the fund is informed of the ex-dividend date. Non-cash dividends included in dividend income, if any, are recorded at the fair market value of the securities received. Interest income, which includes accretion of original issue discount, is accrued as earned. Investment income is recorded net of foreign taxes withheld where recovery of such taxes is uncertain.
Expenses. Most expenses of the trust can be directly attributed to a fund. Expenses which cannot be directly attributed are apportioned among the funds in the trust.
Distributions to Shareholders. Distributions are recorded on the ex-dividend date. Income dividends and capital gain distributions are declared separately for each class.
Income and capital gain distributions are determined in accordance with income tax regulations which may differ from generally accepted accounting principles. These differences, which may result in distribution reclassifications, are primarily due to differing treatments for futures transactions, foreign currency transactions, net operating losses, and losses deferred due to wash sales.
Permanent book and tax basis differences relating to shareholder distributions will result in reclassifications to paid in capital. Undistributed net investment income and accumulated undistributed net realized gain (loss) on investments and foreign currency transactions may include temporary book and tax basis differences which will reverse in a subsequent period. Any taxable income or gain remaining at fiscal year end is distributed in the following year.
Security Transactions. Security transactions are accounted for as of trade date. Gains and losses on securities sold are determined on the basis of identified cost.
Semiannual Report
Notes to Financial Statements (Unaudited) - continued
2. Operating Policies.
Foreign Currency Contracts. The fund generally uses foreign currency contracts to facilitate transactions in foreign-denominated securities. Losses may arise from changes in the value of the foreign currency or if the counterparties do not perform under the contracts' terms. The U.S. dollar value of foreign currency contracts is determined using contractual currency exchange rates established at the time of each trade.
Joint Trading Account. Pursuant to an Exemptive Order issued by the Securities and Exchange Commission (the SEC), the fund, along with other affiliated entities of Fidelity Management & Research Company (FMR), may transfer uninvested cash balances into one or more joint trading accounts. These balances are invested in one or more repurchase agreements for U.S. Treasury or Federal Agency obligations.
Repurchase Agreements. The underlying U.S. Treasury, Federal Agency, or other obligations found to be satisfactory by FMR are transferred to an account of the fund, or to the Joint Trading Account, at a bank custodian. The securities are marked-to-market daily and maintained at a value at least equal to the principal amount of the repurchase agreement (including accrued interest). FMR, the fund's investment adviser, is responsible for determining that the value of the underlying securities remains in accordance with the market value requirements stated above.
Central Cash Funds. Pursuant to an Exemptive Order issued by the SEC, the fund may invest in the Taxable Central Cash Fund and the Central Cash Collateral Fund (the Cash Funds) managed by Fidelity Investments Money Management, Inc., an affiliate of FMR. The Cash Funds are open-end money market funds available only to investment companies and other accounts managed by FMR and its affiliates. The Cash Funds seek preservation of capital, liquidity, and current income. Income distributions from the Cash Funds are declared daily and paid monthly from net interest income. Income distributions earned by the fund are recorded as either interest income or security lending income in the accompanying financial statements.
Futures Contracts. The fund may use futures contracts to manage its exposure to the stock market. Buying futures tends to increase the fund's exposure to the underlying instrument, while selling futures tends to decrease the fund's exposure to the underlying instrument or hedge other fund investments. Futures contracts involve, to varying degrees, risk of loss in excess of the futures variation margin reflected in the Statement of Assets and Liabilities. The underlying face amount at value of any open futures contracts at period end is shown in the schedule of investments under the caption "Futures Contracts." This amount reflects each contract's exposure to the underlying instrument at period end. Losses may arise from changes in the value of the underlying instruments or if the counterparties do not perform under the contracts' terms. Gains (losses) are realized upon the expiration or closing of the futures contracts. Futures contracts are valued at the settlement price established each day by the board of trade or exchange on which they are traded.
3. Purchases and Sales of Investments.
Information regarding purchases and sales of securities (other than short-term securities), and the market value of futures contracts opened and closed, is included under the caption "Other Information" at the end of the fund's schedule of investments.
4. Fees and Other Transactions with Affiliates.
Management Fee. As the fund's investment adviser, FMR receives a monthly fee that is calculated on the basis of a group fee rate plus a fixed individual fund fee rate applied to the average net assets of the fund. The group fee rate is the weighted average of a series of rates and is based on the monthly average net assets of all the mutual funds advised by FMR. The rates ranged from .2167% to .5200% for the period. The annual individual fund fee rate is .30%. In the event that these rates were lower than the contractual rates in effect during the period, FMR voluntarily implemented the above rates, as they resulted in the same or a lower management fee. For the period, the management fee was equivalent to an annualized rate of .56% of average net assets.
Distribution and Service Plan. In accordance with Rule 12b-1 of the 1940 Act, the Board of Trustees has adopted separate Distribution and Service Plans with respect to each Class of shares (collectively referred to as "the Plans"). Under certain of the Plans, the class pays Fidelity Distributors Corporation (FDC), an affiliate of FMR, a 12b-1 fee. For the period, this fee is based on an annual rate of .10% of Service Class' average net assets and .25% of Service Class 2's average net assets. Initial Class shares are not subject to a 12b-1 fee.
For the period, each class paid FDC the following amounts, all of which was reallowed to insurance companies, for the distribution of shares and providing shareholder support services.
|
Service Class |
$ 36,074 |
|
Service Class 2 |
8,716 |
|
|
$ 44,790 |
Transfer Agent Fees. Fidelity Investments Institutional Operations Company, Inc. (FIIOC), an affiliate of FMR, is the fund's transfer, dividend disbursing, and shareholder servicing agent. FIIOC receives account fees and asset-based fees that vary according to account size and type of account. FIIOC pays a portion of the expenses related to the typesetting, printing and mailing of all shareholder reports, except proxy statements. For the period, the transfer agent fees of the fund were equivalent to an annualized rate of .08% of average net assets.
Mid Cap Portfolio
Notes to Financial Statements (Unaudited) - continued
4. Fees and Other Transactions with Affiliates - continued
Transfer Agent Fees - continued
For the period, the following amounts were paid to FIIOC:
|
Initial Class |
$ 13,418 |
|
Service Class |
27,121 |
|
Service Class 2 |
2,882 |
|
|
$ 43,421 |
Accounting and Security Lending Fees. Fidelity Service Company, Inc. (FSC), an affiliate of FMR, maintains the fund's accounting records and administers the security lending program. The security lending fee is based on the number and duration of lending transactions. The accounting fee is based on the level of average net assets for the month plus out-of-pocket expenses.
Brokerage Commissions. The fund placed a portion of its portfolio transactions with brokerage firms which are affiliates of FMR. The commissions paid to these affiliated firms are shown under the caption "Other Information" at the end of the fund's schedule of investments.
5. Security Lending.
The fund lends portfolio securities from time to time in order to earn additional income. The fund receives collateral in the form of U.S. Treasury obligations, letters of credit, and/or cash against the loaned securities, and maintains collateral in an amount not less than 100% of the market value of the loaned securities during the period of the loan. The market value of the loaned securities is determined at the close of business of the fund and any additional required collateral is delivered to the fund on the next business day. If the borrower defaults on its obligation to return the securities loaned because of insolvency or other reasons, the fund could experience delays and costs in recovering the securities loaned or in gaining access to the collateral. Information regarding the value of securities loaned and the value of collateral at period end is included under the caption "Other Information" at the end of the fund's schedule of investments.
6. Expense Reductions.
FMR has directed certain portfolio trades to brokers who paid a portion of the fund's expenses.
In addition, through an arrangement with the fund's custodian, credits realized as a result of uninvested cash balances were used to reduce a portion of the fund's expenses.
For the period, the reductions under these arrangements are shown under the caption "Other Information" on the fund's Statement of Operations.
7. Beneficial Interest.
At the end of the period, Fidelity Investments Life Insurance Company (FILI) and its subsidiaries, affiliates of FMR, were the record owners of approximately 44% of the outstanding shares of the fund. In addition, one unaffiliated insurance company was record owner of 28% of the total outstanding shares of the fund.
Mid Cap Portfolio
A special meeting of the fund's shareholders was held on July 19, 2000. The results of votes taken among shareholders on proposals before them are reported below. Each vote reported represents one dollar of net asset value held on the record date for the meeting.
PROPOSAL 1
To elect as Trustees the following twelve nominees.*
|
|
# of Dollars Voted |
% of Dollars Voted |
Ralph F. Cox
|
Affirmative |
2,995,348,207.84 |
97.862 |
|
Withheld |
65,444,305.52 |
2.138 |
|
TOTAL |
3,060,792,513.36 |
100.000 |
Phyllis Burke Davis
|
Affirmative |
2,995,012,849.06 |
97.851 |
|
Withheld |
65,779,664.30 |
2.149 |
|
TOTAL |
3,060,792,513.36 |
100.000 |
Robert M. Gates
|
Affirmative |
2,994,325,628.16 |
97.828 |
|
Withheld |
66,466,885.20 |
2.172 |
|
TOTAL |
3,060,792,513.36 |
100.000 |
Edward C. Johnson 3d
|
Affirmative |
2,994,212,266.77 |
97.825 |
|
Withheld |
66,580,246.59 |
2.175 |
|
TOTAL |
3,060,792,513.36 |
100.000 |
Donald J. Kirk
|
Affirmative |
2,996,527,468.99 |
97.900 |
|
Withheld |
64,265,044.37 |
2.100 |
|
TOTAL |
3,060,792,513.36 |
100.000 |
Ned C. Lautenbach
|
Affirmative |
2,997,430,896.97 |
97.930 |
|
Withheld |
63,361,616.39 |
2.070 |
|
TOTAL |
3,060,792,513.36 |
100.000 |
|
|
# of Dollars Voted |
% of Dollars Voted |
Peter S. Lynch
|
Affirmative |
2,997,391,112.97 |
97.929 |
|
Withheld |
63,401,400.39 |
2.071 |
|
TOTAL |
3,060,792,513.36 |
100.000 |
William O. McCoy
|
Affirmative |
2,997,364,420.76 |
97.928 |
|
Withheld |
63,428,092.60 |
2.072 |
|
TOTAL |
3,060,792,513.36 |
100.000 |
Gerald C. McDonough
|
Affirmative |
2,992,594,911.89 |
97.772 |
|
Withheld |
68,197,601.47 |
2.228 |
|
TOTAL |
3,060,792,513.36 |
100.000 |
Marvin L. Mann
|
Affirmative |
2,996,491,839.67 |
97.899 |
|
Withheld |
64,300,673.69 |
2.101 |
|
TOTAL |
3,060,792,513.36 |
100.000 |
Robert C. Pozen
|
Affirmative |
2,997,304,419.99 |
97.926 |
|
Withheld |
63,488,093.37 |
2.074 |
|
TOTAL |
3,060,792,513.36 |
100.000 |
Thomas R. Williams
|
Affirmative |
2,993,561,996.24 |
97.803 |
|
Withheld |
67,230,517.12 |
2.197 |
|
TOTAL |
3,060,792,513.36 |
100.000 |
Semiannual Report
PROPOSAL 2
To ratify the selection of PricewaterhouseCoopers LLP as independent accountants of the fund.
|
|
# of Dollars Voted |
% of Dollars Voted |
|
Affirmative |
152,524,752.89 |
95.370 |
|
Against |
1,456,201.90 |
0.911 |
|
Abstain |
5,947,746.88 |
3.719 |
|
TOTAL |
159,928,701.67 |
100.000 |
PROPOSAL 3
To authorize the Trustees to adopt an amended and restated Declaration of Trust.*
|
|
# of Dollars Voted |
% of Dollars Voted |
|
Affirmative |
2,837,267,199.92 |
92.697 |
|
Against |
49,473,422.32 |
1.617 |
|
Abstain |
174,051,891.12 |
5.686 |
|
TOTAL |
3,060,792,513.36 |
100.000 |
PROPOSAL 4
To approve an amended management contract for the fund that would reduce the management fee payable to FMR by the fund as FMR's assets under management increase.
|
|
# of Dollars Voted |
% of Dollars Voted |
|
Affirmative |
149,727,278.77 |
93.621 |
|
Against |
2,405,860.33 |
1.505 |
|
Abstain |
7,795,562.57 |
4.874 |
|
TOTAL |
159,928,701.67 |
100.000 |
PROPOSAL 5
To amend the fundamental limitation concerning underwriting.
|
|
# of Dollars Voted |
% of Dollars Voted |
|
Affirmative |
147,993,847.24 |
92.537 |
|
Against |
3,567,046.24 |
2.231 |
|
Abstain |
8,367,808.19 |
5.232 |
|
TOTAL |
159,928,701.67 |
100.000 |
PROPOSAL 6
To amend the fundamental limitation concerning concentration.
|
|
# of Dollars Voted |
% of Dollars Voted |
|
Affirmative |
147,959,308.60 |
92.516 |
|
Against |
3,629,590.53 |
2.269 |
|
Abstain |
8,339,802.54 |
5.215 |
|
TOTAL |
159,928,701.67 |
100.000 |
* Denotes trust-wide proposals and voting results.
Semiannual Report
Semiannual Report
Investment Adviser
Fidelity Management & Research Company
Boston, MA
Investment Sub-Advisers
Fidelity Management & Research (U.K.) Inc.
Fidelity Management & Research (Far East) Inc.
Fidelity Investments Japan Limited
Officers
Edward C. Johnson 3d, President
Robert C. Pozen, Senior Vice President
Abigail P. Johnson, Vice President
David Felman, Vice President
Eric D. Roiter, Secretary
Robert A. Dwight, Treasurer
Maria F. Dwyer, Deputy Treasurer
John H. Costello, Assistant Treasurer
Board of Trustees
Ralph F. Cox *
Phyllis Burke Davis *
Robert M. Gates *
Edward C. Johnson 3d
Donald J. Kirk *
Ned C. Lautenbach *
Peter S. Lynch
Marvin L. Mann *
William O. McCoy *
Gerald C. McDonough *
Robert C. Pozen
Thomas R. Williams *
Advisory Board
J. Michael Cook
Marie L. Knowles
* Independent trustees
General Distributor
Fidelity Distributors Corporation
Boston, MA
Transfer and Shareholder Servicing Agent
Fidelity Investments Institutional Operations Co., Inc.
Boston, MA
Custodian
Brown Brothers Harriman & Co.
Boston, MA
VIPMID-SANN-0800 108582
1.723369.101
(2_fidelity_logos)
Overseas Portfolio
Mid Cap Portfolio
Growth Portfolio
Contrafund® Portfolio
Growth Opportunities Portfolio
Index 500 Portfolio
Growth & Income Portfolio
Equity-Income Portfolio
Balanced Portfolio
Asset Manager: Growth® Portfolio
Asset Manager SM Portfolio
High Income Portfolio
Investment Grade Bond Portfolio
Money Market Portfolio
Semiannual Report
June 30, 2000
Market Environment |
4 |
A review of what happened in world markets during the past six months. |
Overseas Portfolio |
5 |
Performance and Investment Summary |
Mid Cap Portfolio |
14 |
Performance and Investment Summary
|
|
Growth Portfolio |
28 |
Performance and Investment Summary
|
|
Contrafund Portfolio |
39 |
Performance and Investment Summary
|
|
Growth Opportunities Portfolio |
53 |
Performance and Investment Summary
|
|
Index 500 Portfolio |
64 |
Performance and Investment Summary
|
|
Growth & Income Portfolio |
77 |
Performance and Investment Summary
|
|
Equity-Income Portfolio |
88 |
Performance and Investment Summary
|
|
Balanced Portfolio |
101 |
Performance and Investment Summary
|
|
Asset Manager: Growth Portfolio |
120 |
Performance and Investment Summary
|
|
Asset Manager Portfolio |
140 |
Performance and Investment Summary
|
|
High Income Portfolio |
161 |
Performance and Investment Summary
|
|
Investment Grade Bond Portfolio |
177 |
Performance and Investment Summary
|
|
Money Market Portfolio |
188 |
Performance
|
|
Notes to Financial Statements |
196 |
Notes to the Financial Statements |
Fidelity Variable Insurance Products are separate account options which are purchased through a variable insurance contract.
Standard & Poor's, S&P and S&P 500 are registered service marks of The McGraw-Hill Companies, Inc. and have been licensed for use by Fidelity Distributors Corporation.
Other third party marks appearing herein are the property of their respective owners.
All other marks appearing herein are registered or unregistered trademarks or service marks of FMR Corp. or an affiliated company.
(Recycle graphic) This report is printed on recycled paper using soy-based inks.
The views expressed in this report reflect those of each fund's portfolio manager only through the end of the period of the report as stated on the cover and do not necessarily represent the views of Fidelity or any other person in the Fidelity organization. Any such views are subject to change at any time based upon market or other conditions and Fidelity disclaims any responsibility to update such views. These views may not be relied on as investment advice and, because investment decisions for a Fidelity fund are based on numerous factors, may not be relied on as an indication of trading intent on behalf of any Fidelity fund.
This report and the financial statements contained herein are submitted for the general information of the shareholders of the funds. This report is not
authorized for distribution to prospective investors in the funds unless preceded or accompanied by an effective prospectus.
Mutual fund shares are not deposits or obligations of, or guaranteed by, any depository institution. Shares are not insured by the FDIC,
Federal Reserve Board or any other agency, and are subject to investment risks, including possible loss of principal amount invested.
Neither the funds nor Fidelity Distributors Corporation is a bank.
Semiannual Report
After reaching record heights in the first quarter of 2000, several of the most notable U.S. equity market indexes - including the Standard & Poor's 500SM, NASDAQ and Dow Jones Industrial Average - tumbled into negative territory by the end of the second quarter. Leading the market down was the same sector that drove it to new highs just a few months prior: technology. Beginning in mid-March, investors abandoned technology en masse, as concerns about excessive valuations and impending inflation pervaded the market. The ripple effect of the tech sell-off spread rapidly around the world, and international equity markets trended downward in response. As stocks cooled, domestic bond performance heated up, helping many U.S. fixed-income categories outpace their equity counterparts for the overall six-month period. Meanwhile, emerging-market bonds held on to most of their strong first quarter gains, but international developed-market bonds felt the pinch of inflation, as several central banks around the world began to implement interest-rate hikes to slow their respective economies.
At the mid-way point of 2000, the U.S. stock market's unprecedented streak of five consecutive double-digit annual increases appeared to be in jeopardy. The Dow Jones Industrial Average - an index of 30 blue-chip stocks - declined 8.42% during the six-month period ending June 30, 2000. The broad-based S&P 500® and the technology-concentrated NASDAQ index also disappeared below the surface, returning -0.42% and -2.44%, respectively. In a 10-week stretch from March through June, the NASDAQ dropped 33%, making dot-com investors anything but dot-calm as Internet stocks bore the brunt of the decline. As the spectacular growth of the technology sector waned, previously out-of-favor sectors began to lure investors' attention. The consistent, steady growth of the health sector was the primary beneficiary, as it wore the crown of best-performing sector for the first six months of 2000. The natural resources and real-estate sectors were surprising runners-up in the performance derby. But not all was lost for the technology sector. In June, economic reports showed strong evidence that the Federal Reserve Board's series of interest-rate hikes - including three during the first half of this year - were winning the battle against inflation. This news, combined with the Fed's decision to eschew another hike in June, fueled a renewed enthusiasm for tech stocks, as evidenced by the NASDAQ's 16.64% return for the final month of the period.
Reacting similarly to the U.S. stock market - and no doubt largely as a direct result of the U.S. market - most foreign stock markets started the six-month period off on a high note before stumbling in the second quarter. Japan and the Pacific Region in general fell particularly hard. After a stellar 1999, Japanese equities were shaken by their country's economic downturn and an unsteady U.S. market. "New Japan" stocks - Internet, electronic, telecom and software securities - led the
decline. The TOPIX Index, a benchmark of the Japanese market, fell 10.34% during the period. And even the best-performing Pacific Region fund had a negative return, according to Lipper Inc. Weak tech performance in the second quarter also hurt European stock markets, causing the Morgan Stanley Capital International Europe Index to decline 3.10% for the first half of 2000. One of the only non-U.S. stock markets that didn't suffer a negative second quarter was Canada. Often overlooked, the Canadian stock market quietly piled up an impressive six-month return of 21.89% - as measured by the Toronto Stock Exchange (TSE) 300.
Despite being challenged with a series of interest-rate hikes - almost always a detriment to fixed-income offerings - U.S. bond markets still managed to post solid returns relative to equities through the first six months of this year. U.S. government bonds were one of the top performers. In January, the U.S. Treasury announced its intent to repurchase long-term debt and curtail future issuance. Treasury prices soared in response and helped the Lehman Brothers Long-Term Government Bond Index return 8.77% for the period. The Lehman Brothers Aggregate Bond Index, a popular measure of taxable-bond performance, rose 3.99% for the past six months, while tax-free municipals were even more robust, gaining 4.48% according to the Lehman Brothers Municipal Bond Index. Underperformance in the bond market was pretty much limited to the high-yield sector. Faced with a rising interest-rate backdrop and poor technicals - including an unfavorable supply/demand condition and an increased default rate - the high-yield market stumbled to a negative return of 1.00%, as measured by the Merrill Lynch High Yield Master II Index, for the past six months.
International bond investors faced a myriad of negative factors throughout the majority of the six-month period ending June 30, 2000. Strong global economic growth and the threat of rising interest rates, currency fluctuations, and a weakening euro continued to plague global debt issues. Additionally, poor liquidity hampered bond prices in non-U.S. developed markets. Combined, those factors helped drag down the Salomon Brothers Non-U.S. World Government Bond Index, which returned -1.95%. On the bright side, a number of favorable factors propelled demand for emerging-market bonds, which was reflected in the 6.95% return of the J.P. Morgan Emerging Markets Bond Index Global - a popular benchmark of emerging-market debt. Credit momentum, which was driven by improving fundamentals - such as the Russian government's Soviet-era debt restructuring and new political leadership - fostered the rally in emerging-market bonds. Elsewhere, Brazil's better-than-expected economic growth fueled a sharp increase in foreign direct investment. Often large commodity suppliers, emerging-market countries also benefited from a sharp increase in oil prices.
Semiannual Report
Performance
There are several ways to evaluate a fund's historical performance. You can look at the total percentage change in value, the average annual percentage change or the growth of a hypothetical $10,000 investment. Total return reflects the change in the value of an investment, assuming reinvestment of the fund's dividend income and capital gains (the profits earned upon the sale of securities that have grown in value).
Average Annual Total Returns
|
Periods ended |
Past 1 |
Past 5 |
Past 10 |
|
Fidelity VIP: Overseas - |
25.24% |
15.19% |
9.85% |
|
MSCI EAFE |
17.38% |
11.49% |
8.04% |
Average annual returns take the fund's cumulative return and show you what would have happened if the fund had performed at a constant rate each year.
You can compare the fund's returns to the performance of the Morgan Stanley Capital International Europe, Australasia, Far East (EAFE) Index - a
market capitalization-weighted index that is designed to represent the performance of developed stock markets outside the United States and
Canada. As of June 30, 2000, the index included 947 equity securities of companies domiciled in
20 countries.
Figures for more than one year assume a steady compounded rate of return and are not the fund's year-by-year results, which fluctuated over the periods shown.
Performance numbers are net of all fund operating expenses, but do not include any insurance charges imposed by your insurance company's separate account. If performance information included the effect of these additional charges, the total returns would have been lower.
Past performance is no guarantee of future results. Principal and investment return will vary and you may have a gain or loss when you withdraw your money. Foreign investments involve greater risks and potential rewards than U.S. investments. These risks include political and economic uncertainties of foreign countries, as well as the risk of currency fluctuations.
Understanding Performance
Many markets around the globe offer the potential for significant growth over time; however, investing in foreign markets means assuming greater risks than investing in the United States. Factors like changes in a country's financial markets, its local political and economic climate, and the fluctuating value of its currency create these risks. For these reasons an international fund's performance may be more volatile than a fund that invests exclusively in the United States.
3$10,000 Over 10 Years
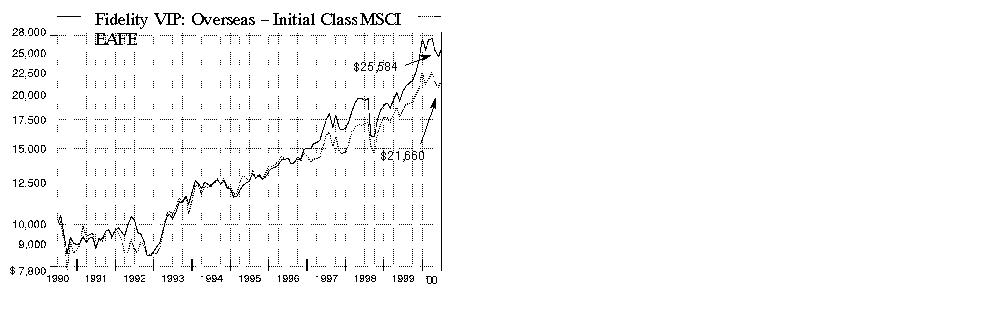
$10,000 Over 10 Years: Let's say hypothetically that $10,000 was invested in Fidelity Variable Insurance Products: Overseas Portfolio - Initial Class on June 30, 1990. As the chart shows, by June 30, 2000, the value of the investment would have grown to $25,584 - a 155.84% increase on the initial investment. For comparison, look at how the Morgan Stanley Capital International EAFE Index did over the same period. With dividends and capital gains, if any, reinvested, the same $10,000 investment would have grown to $21,660 - a 116.60% increase.
Investment Summary
|
Top Five Stocks as of June 30, 2000 |
|
|
|
% of fund's |
|
TotalFinaElf SA Class B (France) |
4.7 |
|
Furukawa Electric Co. Ltd. (Japan) |
4.5 |
|
BP Amoco PLC (United Kingdom) |
4.0 |
|
Vodafone AirTouch PLC (United Kingdom) |
3.6 |
|
Samsung Electronics Co. Ltd. (Korea (South)) |
2.9 |
|
|
19.7 |
|
Top Five Market Sectors as of June 30, 2000 |
|
|
|
% of fund's |
|
Technology |
16.4 |
|
Utilities |
15.7 |
|
Energy |
14.3 |
|
Finance |
13.3 |
|
Industrial Machinery & Equipment |
8.8 |
|
Top Five Countries as of June 30, 2000 |
|
|
(excluding cash equivalents) |
% of fund's |
|
Japan |
22.3 |
|
United Kingdom |
16.5 |
|
France |
10.2 |
|
Netherlands |
8.0 |
|
Switzerland |
3.7 |
|
Percentages are adjusted for the effect of open futures contracts, if applicable. |
Semiannual Report
(Portfolio Manager photograph)
An interview with Richard Mace, Portfolio Manager of Overseas Portfolio
Q. How did the fund perform, Rick?
A. For the six months that ended June 30, 2000, the fund lagged the -3.97% return of the Morgan Stanley Capital International EAFE Index, which tracks the performance of stocks in Europe, Australasia and the Far East. For the 12 months that ended June 30, 2000, the fund's return topped the 17.38% return of the EAFE index.
Q. Why did the fund underperform its index during the past six months?
A. The fund's high concentration in Japanese technology and European and Japanese telephone utilities stocks - which were among the most positive sectors for the fund in the prior period - turned out to be the biggest relative detractor from performance this period. This weakness was due to a global correction in both sectors that was fueled by unsustainable valuations, some disappointing earnings reports and concerns about higher interest rates. In January and February, continued strong returns from the fund's positions in selected Japanese technology stocks - such as Kyocera - and Internet-related companies - such as Softbank - were short-lived when technology stocks retreated in March, turning advances in those stocks into detractors from performance for the remainder of the period. Among the utilities stocks that gave up some of their gains from the fourth quarter of 1999 and hurt the fund most were European and Japanese telephone utilities such as Vodafone AirTouch, British Telecommunications, DDI and Nippon Telegraph & Telephone.
Q. There seemed to be an effort to make the fund more concentrated during the period . . .
A. That's true. It was an extremely difficult period. Volatile market conditions created some unusual opportunities to buy more of the fund's most attractive stocks at cheaper prices. Therefore, I eliminated some of the fund's smaller and less attractive holdings to increase our positions in the stocks with the greatest potential for growth. My effort to increase the fund's concentration reduced the total number of stocks in the portfolio by about 27%. Further, the strategy also boosted the weighting of the fund's top-10 positions to 28.1% of the fund's net assets, from 19.7% of net assets six months earlier.
Q. Why did the fund's energy position rise from the prior period? What was your strategy there?
A. The energy sector looked attractive for several reasons. First, OPEC (Organization of Petroleum Exporting Countries) curtailed production during a period of increasing global demand, and this caused oil inventories to fall to very low levels. Second, as demand continued to grow and inventories remained low, I felt that oil prices might remain above the levels most investors were expecting - and that meant energy stocks were cheap as they reflected a $16-$18 per barrel oil price assumption. Third, I thought the earnings estimates for these companies were generally too low. Most were generating substantial cash flow and were benefiting from continuing industry consolidation activity. In this environment, I added to some of the fund's existing positions in oil producers such as TotalFinaElf and BP Amoco, both of which were among the fund's top-five holdings at the end of the period. In addition, I initiated positions in a number of tanker stocks on expectations that OPEC would need to increase production in an effort to ease oil prices. This worked out well as production quotas were eventually raised and prices for tanker stocks - such as fund holding Overseas Shipholding - increased substantially.
Q. What were some of the fund's top performers?
Which stocks disappointed?
A. Furukawa, a Japanese company that provides materials and components used in the manufacturing of electronics equipment such as cell phones, bucked the sell-off in the technology sector and stood out as the fund's top performer. TotalFinaElf, the French oil producer, was the fund's second-biggest contributor as investors reacted positively to its acquisition of Elf Aquitane and the rising demand for oil. On the down side, Kyocera, the fund's largest detractor, and Vodafone AirTouch both suffered from overall weakness in the technology and utilities sectors.
Q. What's your outlook, Rick?
A. I'll continue to look for undervalued companies that have good growth prospects and are consistently reporting strong earnings. In partnership with our team of 100 international research analysts, we'll maintain our global stock selection process using a bottom-up approach, while monitoring country and industry weightings. I expect consolidation to remain a major theme across a variety of sectors as corporate managements seek to cut costs, boost growth and increase their global competitiveness by acquiring competitors.
The views expressed in this report reflect those of the portfolio manager only through the end of the period of the report as stated on the cover. The manager's views are subject to change at any time based upon market or other conditions. For more information, see page 2.
Fund Facts
Goal: seeks long-term growth of capital primarily by investments in foreign securities
Start date: January 28, 1987
Size: as of June 30, 2000, more than $3.0 billion
Manager: Richard Mace, since 1996; joined Fidelity in 1987
3Semiannual Report
Fidelity Variable Insurance Products: Overseas Portfolio
(Unaudited)
Showing Percentage of Net Assets
|
Common Stocks - 90.5% |
|||
|
Shares |
Value (Note 1) |
||
|
Australia - 1.1% |
|||
|
Broken Hill Proprietary Co. Ltd. |
676,793 |
$ 7,977,892 |
|
|
Cable & Wireless Optus Ltd. (a) |
2,839,300 |
8,439,288 |
|
|
News Corp. Ltd. |
795,223 |
10,834,913 |
|
|
News Corp. Ltd. sponsored ADR (preferred ltd. vtg.) |
163,800 |
7,780,500 |
|
|
|
35,032,593 |
||
|
Belgium - 0.2% |
|||
|
Electrabel SA |
22,500 |
5,556,997 |
|
|
Brazil - 0.3% |
|||
|
Aracruz Celulose SA sponsored ADR |
212,400 |
4,101,975 |
|
|
Telesp Celular Participacoes SA ADR |
141,800 |
6,363,275 |
|
|
|
10,465,250 |
||
|
Canada - 2.8% |
|||
|
Alberta Energy Co. Ltd. |
189,500 |
7,654,238 |
|
|
Anderson Exploration Ltd. (a) |
355,200 |
6,453,820 |
|
|
BCE, Inc. |
59,000 |
1,398,784 |
|
|
Canada Occidental Petroleum Ltd. |
153,000 |
4,149,240 |
|
|
Canadian Natural Resources Ltd. (a) |
279,600 |
8,120,770 |
|
|
Celestica, Inc. (sub. vtg.) (a) |
199,800 |
9,730,213 |
|
|
Cinar Films, Inc. Class B (ltd. vtg.) (a) |
136,500 |
477,750 |
|
|
Crestar Energy, Inc. (a) |
277,500 |
4,226,697 |
|
|
Mitel Corp. (a) |
112,300 |
2,343,850 |
|
|
Nortel Networks Corp. |
92,652 |
6,427,126 |
|
|
Rio Alto Exploration Ltd. (a) |
257,500 |
4,713,441 |
|
|
Suncor Energy, Inc. |
196,500 |
4,539,210 |
|
|
Talisman Energy, Inc. (a) |
659,100 |
21,836,444 |
|
|
Telesystem International Wireless, Inc. (sub. vtg.) (a) |
213,900 |
3,915,360 |
|
|
|
85,986,943 |
||
|
Denmark - 0.4% |
|||
|
Novo-Nordisk AS (B Shares) (a) |
64,800 |
11,018,365 |
|
|
Finland - 2.8% |
|||
|
Metsa-Serla Oyj Class B Free Shares |
164,200 |
1,213,949 |
|
|
Nokia AB |
770,000 |
38,451,874 |
|
|
Sampo Insurance Co. Ltd. |
131,100 |
5,315,171 |
|
|
Sonera Corp. |
221,200 |
10,075,906 |
|
|
UPM-Kymmene Corp. |
1,284,600 |
31,861,548 |
|
|
|
86,918,448 |
||
|
France - 10.2% |
|||
|
Aventis SA |
166,260 |
12,064,242 |
|
|
AXA SA de CV |
127,026 |
19,994,115 |
|
|
Banque Nationale de Paris (BNP) |
159,240 |
15,312,225 |
|
|
Canal Plus SA |
28,800 |
4,835,382 |
|
|
Castorama Dubois Investissements SA |
34,750 |
8,585,789 |
|
|
Compagnie de St. Gobain |
23,000 |
3,106,824 |
|
|
France Telecom SA |
280,400 |
39,160,182 |
|
|
Rhodia SA |
361,700 |
6,072,769 |
|
|
Sanofi-Synthelabo SA |
193,168 |
9,195,203 |
|
|
Societe Generale Class A |
168,800 |
10,144,686 |
|
|
|
|||
|
Shares |
Value (Note 1) |
||
|
Suez Lyonnaise des Eaux |
33,800 |
$ 5,916,684 |
|
|
Television Francaise 1 SA |
208,940 |
14,550,237 |
|
|
TotalFinaElf SA Class B |
945,444 |
145,598,378 |
|
|
Vivendi SA |
245,500 |
21,651,302 |
|
|
|
316,188,018 |
||
|
Germany - 3.7% |
|||
|
Allianz AG (Reg.) |
47,200 |
16,943,449 |
|
|
BASF AG |
517,700 |
20,791,502 |
|
|
Deutsche Telekom AG |
218,700 |
12,476,006 |
|
|
E.On AG |
159,700 |
7,693,464 |
|
|
Intershop Communication AG (a) |
6,800 |
3,093,584 |
|
|
JUMPtec Industrielle Computertechnik AG |
5,292 |
467,978 |
|
|
Kali Und Salz Beteiligungs AG |
590,850 |
9,018,262 |
|
|
Munich Reinsurance AG (Reg.) |
28,192 |
8,848,047 |
|
|
Siemens AG |
193,500 |
29,165,113 |
|
|
Software AG |
18,200 |
1,684,103 |
|
|
United Internet AG (a) |
21,700 |
2,670,392 |
|
|
|
112,851,900 |
||
|
Hong Kong - 1.4% |
|||
|
China Telecom (Hong Kong) Ltd. (a) |
3,618,000 |
32,166,283 |
|
|
Hutchison Whampoa Ltd. |
578,600 |
7,273,693 |
|
|
Johnson Electric Holdings Ltd. |
480,000 |
4,541,023 |
|
|
|
43,980,999 |
||
|
Ireland - 0.2% |
|||
|
Bank of Ireland, Inc. |
1,151,438 |
7,205,598 |
|
|
Israel - 0.2% |
|||
|
Check Point Software |
24,600 |
5,209,050 |
|
|
Italy - 1.9% |
|||
|
Banca Intesa Spa |
3,138,646 |
14,144,182 |
|
|
Olivetti & Co. Spa |
1,883,500 |
6,856,455 |
|
|
San Paolo Imi Spa |
404,100 |
7,124,648 |
|
|
Telecom Italia Mobile Spa |
1,313,900 |
13,410,072 |
|
|
Telecom Italia Spa |
1,130,524 |
15,551,776 |
|
|
|
57,087,133 |
||
|
Japan - 22.3% |
|||
|
Asahi Chemical Industry Co. Ltd. |
527,000 |
3,728,070 |
|
|
Canon, Inc. |
445,000 |
22,416,876 |
|
|
DDI Corp. |
2,836 |
27,284,664 |
|
|
Fuji Bank Ltd. |
902,000 |
6,857,310 |
|
|
Fujitsu Ltd. |
749,000 |
25,927,468 |
|
|
Furukawa Electric Co. Ltd. |
6,630,000 |
138,515,852 |
|
|
Hitachi Chemical Co. Ltd. |
132,000 |
3,056,593 |
|
|
Hitachi Zosen Corp. (a) |
1,563,000 |
1,415,280 |
|
|
Hoya Corp. |
80,000 |
7,168,459 |
|
|
Ito-Yokado Co. Ltd. |
387,000 |
23,288,626 |
|
|
KDD Corp. |
73,900 |
7,458,310 |
|
|
Kyocera Corp. |
287,200 |
49,344,552 |
|
|
Mitsubishi Electric Corp. |
1,303,000 |
14,109,074 |
|
|
Mitsubishi Estate Co. Ltd. |
646,000 |
7,604,301 |
|
|
Common Stocks - continued |
|||
|
Shares |
Value (Note 1) |
||
|
Japan - continued |
|||
|
Mitsui Fudosan Co. Ltd. |
288,000 |
$ 3,123,939 |
|
|
NEC Corp. |
885,000 |
27,797,115 |
|
|
Net One Systems Co. Ltd. |
159 |
3,659,310 |
|
|
Nikko Securities Co. Ltd. |
4,280,000 |
42,388,230 |
|
|
Nintendo Co. Ltd. |
39,000 |
6,812,677 |
|
|
Nippon Telegraph & Telephone Corp. |
3,306 |
43,967,744 |
|
|
Nomura Securities Co. Ltd. |
2,238,000 |
54,778,440 |
|
|
NTT DoCoMo, Inc. |
365 |
9,880,683 |
|
|
Oki Electric Industry Co. Ltd. (a) |
719,000 |
5,594,935 |
|
|
Omron Corp. |
772,000 |
20,971,138 |
|
|
ORIX Corp. |
57,600 |
8,502,547 |
|
|
Rohm Co. Ltd. |
24,300 |
7,105,263 |
|
|
Sakura Bank Ltd. |
1,052,000 |
7,273,307 |
|
|
Softbank Corp. |
131,700 |
17,887,946 |
|
|
Sony Corp. |
199,600 |
18,824,776 |
|
|
Takeda Chemical Industries Ltd. |
455,000 |
29,869,837 |
|
|
Toko, Inc. |
586,000 |
4,427,335 |
|
|
Tokyo Broadcasting System, Inc. |
136,000 |
5,875,118 |
|
|
Tokyo Seimitsu Co. Ltd. |
128,800 |
17,251,085 |
|
|
Trans Cosmos, Inc. |
31,600 |
4,745,067 |
|
|
Yamanouchi Pharmaceutical Co. Ltd. |
117,000 |
6,389,644 |
|
|
Zeon Corp. |
712,000 |
5,070,364 |
|
|
|
690,371,935 |
||
|
Korea (South) - 3.6% |
|||
|
Kookmin Bank |
228,100 |
2,904,886 |
|
|
Samsung Electro-Mechanics Co. (a) |
152,610 |
9,566,997 |
|
|
Samsung Electronics Co. Ltd. |
271,340 |
89,795,721 |
|
|
SK Telecom Co. Ltd. ADR |
286,100 |
10,389,006 |
|
|
|
112,656,610 |
||
|
Marshall Islands - 0.6% |
|||
|
Teekay Shipping Corp. |
592,500 |
19,478,438 |
|
|
Mexico - 2.8% |
|||
|
Grupo Televisa SA de CV sponsored GDR (a) |
253,400 |
17,468,763 |
|
|
Telefonos de Mexico SA de CV Series L sponsored ADR |
552,800 |
31,578,700 |
|
|
TV Azteca SA de CV sponsored ADR |
1,962,700 |
25,883,106 |
|
|
Wal-Mart de Mexico SA de CV |
5,402,000 |
12,644,151 |
|
|
|
87,574,720 |
||
|
Netherlands - 8.0% |
|||
|
ABN AMRO Holding NV |
404,000 |
9,889,256 |
|
|
Akzo Nobel NV (a) |
312,300 |
13,257,377 |
|
|
Equant NV (NY Shares) (a) |
312,000 |
13,416,000 |
|
|
Heineken NV |
94,600 |
5,753,034 |
|
|
ING Groep NV |
352,462 |
23,805,164 |
|
|
Koninklijke Ahold NV (a) |
711,949 |
20,938,618 |
|
|
Koninklijke KPN NV |
235,600 |
10,529,567 |
|
|
Koninklijke Philips Electronics NV |
1,201,984 |
56,643,652 |
|
|
|
|||
|
Shares |
Value (Note 1) |
||
|
Nutreco Holding NV |
123,833 |
$ 4,725,220 |
|
|
Royal Dutch Petroleum Co. |
801,800 |
49,360,809 |
|
|
STMicroelectronics NV (NY Shares) |
152,700 |
9,801,431 |
|
|
United Pan-Europe Communications NV Class A (a) |
372,200 |
9,725,099 |
|
|
Vendex KBB NV |
496,457 |
8,425,258 |
|
|
VNU NV |
106,700 |
5,506,648 |
|
|
Wolters Kluwer NV |
239,700 |
6,379,665 |
|
|
|
248,156,798 |
||
|
Norway - 1.3% |
|||
|
Bergesen dy ASA: |
|
|
|
|
(A Shares) |
509,100 |
10,433,470 |
|
|
(B Shares) |
489,051 |
9,367,702 |
|
|
DNB Holding ASA |
1,026,200 |
4,253,976 |
|
|
Frontline Ltd. (a) |
769,900 |
9,413,186 |
|
|
TANDBERG ASA (a) |
186,400 |
4,438,664 |
|
|
VMETRO ASA |
121,900 |
1,419,439 |
|
|
|
39,326,437 |
||
|
Russia - 0.0% |
|||
|
Mobile TeleSystems Ojsc sponsored ADR (a) |
21,100 |
472,113 |
|
|
Singapore - 0.8% |
|||
|
Chartered Semiconductor |
196,100 |
17,649,000 |
|
|
Overseas Union Bank Ltd. |
862,296 |
3,342,716 |
|
|
United Overseas Bank Ltd. |
329,472 |
2,154,097 |
|
|
|
23,145,813 |
||
|
Spain - 1.7% |
|||
|
Altadis SA |
245,727 |
3,771,677 |
|
|
Banco Santander Central Hispano SA |
1,538,868 |
16,221,435 |
|
|
Telefonica SA (a) |
1,445,100 |
31,017,446 |
|
|
|
51,010,558 |
||
|
Sweden - 0.1% |
|||
|
Netcom AB (B Shares) (a) |
25,300 |
1,873,808 |
|
|
Switzerland - 3.7% |
|||
|
ABB Ltd. (Reg.) |
60,751 |
7,262,817 |
|
|
Credit Suisse Group (Reg.) |
131,154 |
26,058,947 |
|
|
Gretag Imaging Holding AG (Reg. D) |
6,500 |
1,249,694 |
|
|
Julius Baer Holding AG |
1,792 |
7,077,149 |
|
|
Nestle SA (Reg.) |
21,218 |
42,417,812 |
|
|
The Swatch Group AG (Reg.) |
46,400 |
12,088,660 |
|
|
UBS AG |
109,468 |
16,019,380 |
|
|
Valora Holding AG |
8,500 |
2,357,641 |
|
|
|
114,532,100 |
||
|
Taiwan - 2.4% |
|||
|
Macronix International Co. Ltd. (a) |
1,754,890 |
4,397,934 |
|
|
Taiwan Semiconductor |
6,292,976 |
29,903,157 |
|
|
Common Stocks - continued |
|||
|
Shares |
Value (Note 1) |
||
|
Taiwan - continued |
|||
|
United Microelectronics Corp. |
9,392,400 |
$ 26,136,703 |
|
|
Winbond Electronics Corp. (a) |
4,298,450 |
12,451,165 |
|
|
|
72,888,959 |
||
|
United Kingdom - 16.5% |
|||
|
Amvescap PLC |
871,400 |
14,012,286 |
|
|
BAE SYSTEMS PLC |
1,589,329 |
9,933,370 |
|
|
BP Amoco PLC |
13,057,386 |
123,092,995 |
|
|
Cable & Wireless PLC |
1,959,100 |
33,256,173 |
|
|
Carlton Communications PLC |
1,578,600 |
20,355,258 |
|
|
Diageo PLC |
476,100 |
4,282,905 |
|
|
Granada Group PLC |
715,800 |
7,166,733 |
|
|
HSBC Holdings PLC (Reg.) |
938,894 |
10,879,433 |
|
|
Lloyds TSB Group PLC |
1,473,800 |
13,951,109 |
|
|
Marconi PLC |
639,700 |
8,345,654 |
|
|
Misys PLC |
631,300 |
5,343,866 |
|
|
Prudential Corp. PLC |
454,200 |
6,669,727 |
|
|
Reed International PLC |
537,300 |
4,686,734 |
|
|
Reuters Group PLC |
767,400 |
12,782,007 |
|
|
Rio Tinto PLC (Reg.) |
768,500 |
12,590,797 |
|
|
Royal Bank of Scotland Group PLC |
1,639,500 |
27,507,564 |
|
|
Shell Transport & Trading Co. PLC (Reg.) |
6,057,900 |
50,419,383 |
|
|
SMG PLC |
787,200 |
4,257,260 |
|
|
SmithKline Beecham PLC |
1,620,442 |
21,126,500 |
|
|
SSL International PLC |
96,600 |
1,047,777 |
|
|
Unilever PLC |
363,810 |
2,285,180 |
|
|
Vodafone AirTouch PLC |
26,557,103 |
110,045,894 |
|
|
WPP Group PLC |
465,700 |
6,817,406 |
|
|
|
510,856,011 |
||
|
United States of America - 1.5% |
|||
|
Bristol-Myers Squibb Co. |
151,000 |
8,795,750 |
|
|
Eli Lilly & Co. |
119,500 |
11,935,063 |
|
|
OMI Corp. |
443,100 |
2,409,356 |
|
|
Overseas Shipholding Group, Inc. |
533,300 |
13,132,513 |
|
|
Schering-Plough Corp. |
186,300 |
9,408,150 |
|
|
|
45,680,832 |
||
|
TOTAL COMMON STOCKS (Cost $2,098,252,397) |
2,795,526,426 |
||
|
Investment Companies - 0.1% |
|||
|
|
|
|
|
|
Multi-National - 0.1% |
|||
|
European Warrant Fund, Inc. |
306,000 |
4,475,250 |
|
|
Cash Equivalents - 12.4% |
|||
|
Shares |
Value (Note 1) |
||
|
Central Cash Collateral Fund, 6.71% (b) |
164,583,560 |
$ 164,583,560 |
|
|
Taxable Central Cash Fund, 6.59% (b) |
218,019,162 |
218,019,162 |
|
|
TOTAL CASH EQUIVALENTS (Cost $382,602,722) |
382,602,722 |
||
|
TOTAL INVESTMENT PORTFOLIO - 103.0% (Cost $2,485,876,718) |
3,182,604,398 |
|
|
NET OTHER ASSETS - (3.0)% |
(92,987,924) |
|
|
NET ASSETS - 100% |
$ 3,089,616,474 |
|
|
Legend |
|
(a) Non-income producing |
|
(b) The rate quoted is the annualized seven-day yield of the fund at |
|
Other Information |
|
Purchases and sales of securities, other than short-term securities, aggregated $1,789,627,683 and $1,514,198,966, respectively, of which U.S. government and government agency obligations aggregated $0 and $4,435,324, respectively. |
|
The market value of futures contracts opened and closed during the period amounted to $0 and $16,650,996, respectively. |
|
The fund placed a portion of its portfolio transactions with brokerage firms which are affiliates of Fidelity Management & Research Company. The commissions paid to these affiliated firms were $1,080 for the period. |
|
The fund participated in the security lending program. At the period end, the value of securities loaned amounted to $164,478,909. The fund received cash collateral of $164,583,560 which was invested in cash equivalents and U.S. Treasury Obligations valued at $7,170,000. |
|
Income Tax Information |
|
At June 30, 2000, the aggregate cost of investment securities for income tax purposes was $2,495,276,806. Net unrealized appreciation aggregated $687,327,592, of which $794,595,136 related to appreciated investment securities and $107,267,544 related to depreciated investment securities. |
See accompanying notes which are an integral part of the financial statements.
Overseas Portfolio
Statement of Assets and Liabilities
|
|
June 30, 2000 (Unaudited) |
|
|
Assets |
|
|
|
Investment in securities, at value (cost $2,485,876,718) - |
|
$ 3,182,604,398 |
|
Foreign currency held at value |
|
14,800,284 |
|
Receivable for investments sold |
|
87,398,285 |
|
Receivable for fund shares sold |
|
55,319,628 |
|
Dividends receivable |
|
4,560,497 |
|
Interest receivable |
|
1,166,523 |
|
Other receivables |
|
32,299 |
|
Total assets |
|
3,345,881,914 |
|
Liabilities |
|
|
|
Payable to custodian bank |
$ 24 |
|
|
Payable for investments purchased |
88,348,263 |
|
|
Payable for fund shares redeemed |
755,883 |
|
|
Accrued management fee |
1,845,001 |
|
|
Distribution fees payable |
20,958 |
|
|
Other payables and |
711,751 |
|
|
Collateral on securities loaned, |
164,583,560 |
|
|
Total liabilities |
|
256,265,440 |
|
Net Assets |
|
$ 3,089,616,474 |
|
Net Assets consist of: |
|
|
|
Paid in capital |
|
$ 2,238,651,656 |
|
Undistributed net investment income |
|
6,881,028 |
|
Accumulated undistributed |
|
147,360,600 |
|
Net unrealized appreciation (depreciation) on investments |
|
696,723,190 |
|
Net Assets |
|
$ 3,089,616,474 |
|
Initial Class : |
|
$23.46 |
|
Service Class: |
|
$23.41 |
|
Service Class 2: |
|
$23.38 |
Statement of Operations
|
|
Six months ended June 30, 2000 (Unaudited) |
|
|
Investment Income Dividends |
|
$ 28,919,045 |
|
Interest |
|
5,991,504 |
|
Security lending |
|
369,625 |
|
|
|
35,280,174 |
|
Less foreign taxes withheld |
|
(3,264,911) |
|
Total income |
|
32,015,263 |
|
Expenses |
|
|
|
Management fee |
$ 10,781,118 |
|
|
Transfer agent fees |
996,099 |
|
|
Distribution fees |
100,086 |
|
|
Accounting and security lending fees |
697,742 |
|
|
Non-interested trustees' compensation |
12,169 |
|
|
Custodian fees and expenses |
703,855 |
|
|
Registration fees |
159,039 |
|
|
Audit |
23,591 |
|
|
Legal |
11,063 |
|
|
Miscellaneous |
25,459 |
|
|
Total expenses before reductions |
13,510,221 |
|
|
Expense reductions |
(262,270) |
13,247,951 |
|
Net investment income |
|
18,767,312 |
|
Realized and Unrealized Gain (Loss) Net realized gain (loss) on: |
|
|
|
Investment securities |
157,476,657 |
|
|
Foreign currency transactions |
(157,449) |
|
|
Futures contracts |
966,799 |
158,286,007 |
|
Change in net unrealized appreciation (depreciation) on: |
|
|
|
Investment securities |
(308,240,636) |
|
|
Assets and liabilities in |
(88,785) |
|
|
Futures contracts |
(450,390) |
(308,779,811) |
|
Net gain (loss) |
|
(150,493,804) |
|
Net increase (decrease) in net assets resulting from operations |
|
$ (131,726,492) |
|
Other Information Expense reductions |
|
$ 249,713 |
|
Custodian credits |
|
12,557 |
|
|
|
$ 262,270 |
See accompanying notes which are an integral part of the financial statements.
Semiannual Report
Fidelity Variable Insurance Products: Overseas Portfolio
Financial Statements - continued
Statement of Changes in Net Assets
|
Increase (Decrease) in Net Assets |
Six months ended |
Year ended |
|
Operations |
$ 18,767,312 |
$ 24,385,652 |
|
Net realized gain (loss) |
158,286,007 |
279,081,035 |
|
Change in net unrealized appreciation (depreciation) |
(308,779,811) |
567,840,640 |
|
Net increase (decrease) in net assets resulting from operations |
(131,726,492) |
871,307,327 |
|
Distributions to shareholders |
(29,474,912) |
(31,839,750) |
|
In excess of net investment income |
(12,018,477) |
- |
|
From net realized gain |
(261,723,630) |
(51,354,434) |
|
Total distributions |
(303,217,019) |
(83,194,184) |
|
Share transactions - net increase (decrease) |
643,337,117 |
(16,452,995) |
|
Total increase (decrease) in net assets |
208,393,606 |
771,660,148 |
|
Net Assets |
|
|
|
Beginning of period |
2,881,222,868 |
2,109,562,720 |
|
End of period (including undistributed net investment income of $6,881,028 and $10,707,600, respectively) |
$ 3,089,616,474 |
$ 2,881,222,868 |
|
Other Information: |
|
|
Six months ended June 30, 2000 |
Year ended |
||
|
|
Shares |
Dollars |
Shares |
Dollars |
|
Share transactions |
85,476,599 |
$ 2,061,439,529 |
137,488,784 |
$ 2,927,082,596 |
|
Reinvested |
11,650,005 |
284,959,119 |
4,250,326 |
81,691,268 |
|
Redeemed |
(76,595,523) |
(1,846,989,611) |
(145,444,173) |
(3,101,747,139) |
|
Net increase (decrease) |
20,531,081 |
$ 499,409,037 |
(3,705,063) |
$ (92,973,275) |
|
Service Class |
36,993,399 |
$ 881,191,616 |
18,969,271 |
$ 422,534,083 |
|
Reinvested |
747,240 |
18,247,617 |
78,277 |
1,502,916 |
|
Redeemed |
(31,673,883) |
(757,892,720) |
(15,508,477) |
(347,516,719) |
|
Net increase (decrease) |
6,066,756 |
$ 141,546,513 |
3,539,071 |
$ 76,520,280 |
|
Service Class 2 A |
107,413 |
$ 2,478,164 |
- |
$ - |
|
Reinvested |
421 |
10,283 |
- |
- |
|
Redeemed |
(4,671) |
(106,880) |
- |
- |
|
Net increase (decrease) |
103,163 |
$ 2,381,567 |
- |
$ - |
|
Distributions |
|
$ 27,739,213 |
|
$ 31,264,560 |
|
Service Class |
|
1,734,722 |
|
575,190 |
|
Service Class 2 A |
|
977 |
|
- |
|
Total |
|
$ 29,474,912 |
|
$ 31,839,750 |
|
In excess of net investment income |
|
$ 11,310,740 |
|
$ - |
|
Service Class |
|
707,338 |
|
- |
|
Service Class 2 A |
|
399 |
|
- |
|
Total |
|
$ 12,018,477 |
|
$ - |
|
From net realized gain |
|
$ 245,909,166 |
|
$ 50,426,708 |
|
Service Class |
|
15,805,557 |
|
927,726 |
|
Service Class 2 A |
|
8,907 |
|
- |
|
Total |
|
$ 261,723,630 |
|
$ 51,354,434 |
|
|
|
$ 303,217,019 |
|
$ 83,194,184 |
A Service Class 2 commenced sale of shares January 12, 2000.
See accompanying notes which are an integral part of the financial statements.
Overseas Portfolio
Financial Highlights - Initial Class
|
|
Six months ended |
Years ended December 31, |
||||
|
Selected Per-Share Data |
(Unaudited) |
1999 |
1998 |
1997 |
1996 |
1995 |
|
Net asset value, beginning of period |
$ 27.44 |
$ 20.06 |
$ 19.20 |
$ 18.84 |
$ 17.06 |
$ 15.67 |
|
Income from Investment Operations |
|
|
|
|
|
|
|
Net investment income |
.15 D |
.24 D |
.23 D |
.30 D |
.32 D, E |
.17 |
|
Net realized and unrealized gain (loss) |
(1.43) |
7.95 |
2.13 |
1.70 |
1.88 |
1.34 |
|
Total from investment operations |
(1.28) |
8.19 |
2.36 |
2.00 |
2.20 |
1.51 |
|
Less Distributions |
|
|
|
|
|
|
|
From net investment income |
(.26) |
(.31) |
(.38) |
(.33) |
(.20) |
(.06) |
|
In excess of net investment income |
(.11) |
- |
- |
- |
- |
- |
|
From net realized gain |
(2.33) |
(.50) |
(1.12) |
(1.31) |
(.22) |
(.02) |
|
In excess of net realized gain |
- |
- |
- |
- |
- |
(.04) |
|
Total distributions |
(2.70) |
(.81) |
(1.50) |
(1.64) |
(.42) |
(.12) |
|
Net asset value, end of period |
$ 23.46 |
$ 27.44 |
$ 20.06 |
$ 19.20 |
$ 18.84 |
$ 17.06 |
|
Total Return B, C |
(5.07)% |
42.55% |
12.81% |
11.56% |
13.15% |
9.74% |
|
Ratios and Supplemental Data |
|
|
|
|
|
|
|
Net assets, end of period (000 omitted) |
$ 2,821,728 |
$ 2,736,851 |
$ 2,074,843 |
$ 1,926,322 |
$ 1,667,601 |
$ 1,343,134 |
|
Ratio of expenses to average net assets |
.90% A |
.91% |
.91% |
.92% |
.93% |
.91% |
|
Ratio of expenses to average net assets after expense reductions |
.88% A, G |
.87% G |
.89% G |
.90% G |
.92% G |
.91% |
|
Ratio of net investment income to average net assets |
1.27% A |
1.10% |
1.19% |
1.55% |
1.84% |
1.88% |
|
Portfolio turnover |
110% A |
78% |
84% |
67% |
92% |
50% |
Financial Highlights - Service Class
|
|
Six months ended |
Years ended December 31, |
||
|
Selected Per-Share Data |
(Unaudited) |
1999 |
1998 |
1997 F |
|
Net asset value, beginning of period |
$ 27.39 |
$ 20.04 |
$ 19.20 |
$ 19.36 |
|
Income from Investment Operations |
|
|
|
|
|
Net investment income D |
.14 |
.22 |
.15 |
.01 |
|
Net realized and unrealized gain (loss) |
(1.43) |
7.94 |
2.19 |
(.17) |
|
Total from investment operations |
(1.29) |
8.16 |
2.34 |
(.16) |
|
Less Distributions |
|
|
|
|
|
From net investment income |
(.26) |
(.31) |
(.38) |
- |
|
In excess of net investment income |
(.10) |
- |
- |
- |
|
From net realized gain |
(2.33) |
(.50) |
(1.12) |
- |
|
Total distributions |
(2.69) |
(.81) |
(1.50) |
- |
|
Net asset value, end of period |
$ 23.41 |
$ 27.39 |
$ 20.04 |
$ 19.20 |
|
Total Return B, C |
(5.12)% |
42.44% |
12.69% |
(0.83)% |
|
Ratios and Supplemental Data |
|
|
|
|
|
Net assets, end of period (000 omitted) |
$ 265,477 |
$ 144,371 |
$ 34,720 |
$ 931 |
|
Ratio of expenses to average net assets |
1.00% A |
1.01% |
1.01% |
1.02% A |
|
Ratio of expenses to average net assets after expense reductions |
.99% A, G |
.98% G |
.97% G |
1.01% A, G |
|
Ratio of net investment income to average net assets |
1.17% A |
1.00% |
.80% |
.31% A |
|
Portfolio turnover |
110% A |
78% |
84% |
67% |
|
A Annualized B The total returns would have been lower had certain expenses not been reduced during the periods shown. C Total returns for periods of less than one year are not annualized and do not reflect charges attributable to your insurance company's separate account. Inclusion of these charges would reduce the total returns shown. D Net investment income per share has been calculated based on average shares outstanding during the period. E Investment income per share reflects a special dividend which amounted to $.05 per share. F For the period November 3, 1997 (commencement of sale of Service Class shares) to December 31, 1997. G FMR or the fund has entered into varying arrangements with third parties who either paid or reduced a portion of the class' expenses. |
||||
See accompanying notes which are an integral part of the financial statements.
Semiannual Report
Financial Highlights - Service Class 2
|
|
Six months ended |
|
Selected Per-Share Data |
(Unaudited) |
|
Net asset value, beginning of period |
$ 26.16 |
|
Income from Investment Operations |
|
|
Net investment income D |
.10 |
|
Net realized and unrealized gain (loss) |
(.19) |
|
Total from investment operations |
(.09) |
|
Less Distributions |
|
|
From net investment income |
(.26) |
|
In excess of net investment income |
(.10) |
|
From net realized gain |
(2.33) |
|
Total distributions |
(2.69) |
|
Net asset value, end of period |
$ 23.38 |
|
Total Return B, C |
(0.78)% |
|
Ratios and Supplemental Data |
|
|
Net assets, end of period (000 omitted) |
$ 2,412 |
|
Ratio of expenses to average net assets |
1.20% A |
|
Ratio of expenses to average net assets after expense reductions |
1.18% A, F |
|
Ratio of net investment income to average net assets |
.97% A |
|
Portfolio turnover |
110% A |
|
A Annualized B The total return would have been lower had certain expenses not been reduced during the period shown. C Total returns for periods of less than one year are not annualized and do not reflect charges attributable to your insurance company's separate account. Inclusion of these charges would reduce the total returns shown. D Net investment income per share has been calculated based on average shares outstanding during the period. E For the period January 12, 2000 (commencement of sale of Service Class 2 shares) to June 30, 2000. F FMR or the fund has entered into varying arrangements with third parties who either paid or reduced a portion of the class' expenses. |
|
See accompanying notes which are an integral part of the financial statements.
Overseas Portfolio
Performance
There are several ways to evaluate a fund's historical performance. You can look at the total percentage change in value, the average annual percentage change or the growth of a hypothetical $10,000 investment. Total return reflects the change in the value of an investment, assuming reinvestment of the fund's dividend income and capital gains (the profits earned upon the sale of securities that have grown in value). If Fidelity had not reimbursed certain fund expenses, the total returns would have been lower.
Average Annual Total Returns
|
Periods ended |
Past 1 |
Life of |
|
Fidelity VIP: Mid Cap - Initial Class |
61.46% |
53.21% |
|
S&P MidCap 400 |
16.98% |
20.14% |
Average annual returns take the fund's cumulative return and show you what would have happened if the fund had performed at a constant rate each year.
You can compare the fund's returns to the performance of the Standard & Poor's MidCap 400 Index - a market capitalization-weighted index of 400 medium-capitalization stocks. This benchmark includes reinvested dividends and capital gains, if any.
Figures for more than one year assume a steady compounded rate of return and are not the fund's year-by-year results, which fluctuated over the periods shown. The life of fund figures are from commencement of operations, December 28, 1998.
Performance numbers are net of all fund operating expenses, but do not include any insurance charges imposed by your insurance company's separate account. If performance information included the effect of these additional charges, the total returns would be lower.
Past performance is no guarantee of future results. Principal and investment return will vary and you may have a gain or loss when you withdraw your money.
Understanding Performance
How a fund did yesterday is no guarantee of how it will do tomorrow. The stock market, for example, has a history of long-term growth and short-term volatility. In turn, the share price and return of a fund that invests in stocks will vary. That means if you sell your shares during a market downturn, you might lose money. But if you can ride out the market's ups and downs, you may have a gain.
3$10,000 Over Life of Fund
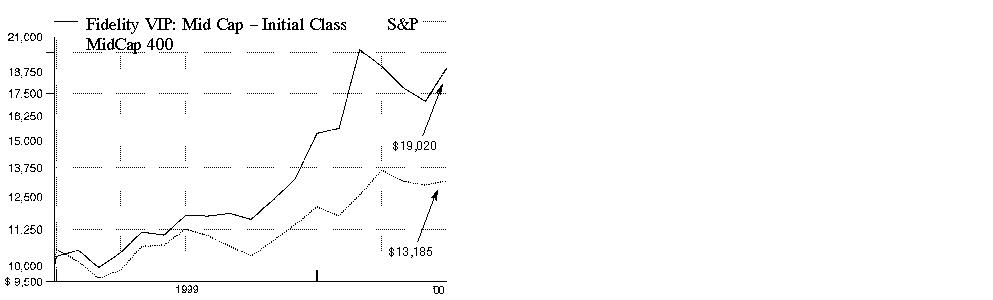
$10,000 Over Life of Fund: Let's say hypothetically that $10,000 was invested in Fidelity Variable Insurance Products: Mid Cap Portfolio - Initial Class on December 28, 1998, when the fund started. As the chart shows, by June 30, 2000, the value of the investment would have grown to $19,020 - a 90.20% increase on the initial investment. For comparison, look at how the Standard & Poor's MidCap 400 Index did over the same period. With dividends and capital gains, if any, reinvested, the same $10,000 investment would have grown to $13,185 - a 31.85% increase.
Investment Summary
|
Top Five Stocks as of June 30, 2000 |
|
|
|
% of fund's |
|
Nextel Communications, Inc. Class A |
2.6 |
|
Kopin Corp. |
1.7 |
|
Calpine Corp. |
1.5 |
|
Freddie Mac |
1.3 |
|
Brocade Communications Systems, Inc. |
1.0 |
|
|
8.1 |
|
Top Five Market Sectors as of June 30, 2000 |
|
|
|
% of fund's |
|
Technology |
31.7 |
|
Health |
13.5 |
|
Energy |
10.8 |
|
Utilities |
8.8 |
|
Finance |
6.5 |
|
Asset Allocation as of June 30, 2000 |
|||
|
% of fund's net assets * |
|||
|
Stocks and |
|
|
|
Short-Term |
|
|

|
* Foreign investments 4.7% |
Semiannual Report
(Portfolio Manager photograph)
An interview with
David Felman,
Portfolio Manager
of Mid Cap Portfolio
Q. How did the fund perform, David?
A. The fund performed very well, substantially exceeding the performance of its benchmark, the Standard & Poor's MidCap 400 Index, which had a total return of 8.97% for the six-month period ending June 30, 2000 and a 16.98% return for the 12-month period.
Q. What factors affected performance?
A. We started the period by continuing a very good run in technology and biotechnology into March. The technology run was driven by excitement about the Internet, with continued bullishness for Internet infrastructure stocks. Enthusiasm for biotechnology stocks was strong due to breakthroughs in genomics, or gene-mapping. In early March, however, things seemed to fall apart for both sectors. The catalyst for biotechnology's decline was a government announcement raising questions about whether patents would be issued for genes. That started a cascade that began in March and lasted until early June. Valuations were so high that anything that possibly could threaten stock values eventually did. In early June, however, stocks in these two sectors started coming back.
Q. What were your principal strategies during this period of volatility?
A. We had a very strong weighting in technology early in the period, exceeding 45% of net assets in late February. This helped the fund greatly in the rally. We did get hit in the correction that began in March, but we practiced prudent risk management, selling some stocks with extremely high valuations, and taking some money off the table. I also reduced our holdings in some Internet stocks when I started to see cracks in Internet usage and a reduction in advertising on the Web. I remained bullish on telecommunications service providers, such as Nextel, as I was still optimistic about the growth potential for wireless communications in the United States. By the end of the period, the technology weighting declined to 31.7% of net assets. Part of this reduction was a result of stock prices losing value and part of it was a result of my decisions to reduce the size of holdings. Throughout the period, I avoided traditional defensive areas such as cyclicals, natural resources and utilities other than telecommunications companies. As a risk-management tactic, I was more comfortable increasing my cash position than investing in these industries. The fund did underperform the S&P MidCap 400 Index from early March through early June, but I thought that was an acceptable price to pay for the very good performance early in the period. Overall, we were well ahead of mid-cap stock indexes for the six-month period.
Q. What were some of the investments that helped performance?
A. Nextel Communications, the fund's largest position at the end of the period, was a big contributor. Kopin, which makes wafers for the amplifiers of wireless handsets, also helped performance. Kopin and Research in Motion, which manufactures two-way pagers with access to the Internet, both benefited from increased wireless usage. Another strong contributor was Veritas Software, whose data protection products were in demand as data storage related to the Internet grew.
Q. What were some of the disappointments?
A. DoubleClick had performed well earlier, but its stock fell as advertising on the Internet declined. DoubleClick is the largest provider of advertising on the Internet. Most of the other detractors from performance, relative to the S&P Mid Cap 400 Index, were companies such as QLogic Corp., which had good performance but which I underweighted. QLogic produces components for fiber-optic communications systems.
Q. What is your outlook for the mid-cap stock market?
A. The rapid growth of wireless communications and increased Internet usage are major long-term trends. However, the stocks that benefited from this growth during the period reached very high valuations and then suffered sharp corrections in March through early June. Investors are wondering what will happen next. I believe that technology will continue to be a driving force for global change, and I think that the growth potential of wireless communications remains very strong in the United States.
The views expressed in this report reflect those of the portfolio manager only through the end of the period of the report as stated on the cover. The manager's views are subject to change at any time based on market or other conditions. For more information, see page 2.
Fund Facts
Goal: long-term growth of capital by investing primarily in common stocks of companies with medium-sized capitalizations
Start date: December 28, 1998
Size: as of June 30, 2000, more than $296 million
Manager: David Felman, since 1999; joined Fidelity in 1993
3Semiannual Report
Fidelity Variable Insurance Products: Mid Cap Portfolio
(Unaudited)
Showing Percentage of Net Assets
|
Common Stocks - 87.3% |
|||
|
Shares |
Value (Note 1) |
||
|
BASIC INDUSTRIES - 1.3% |
|||
|
Chemicals & Plastics - 1.2% |
|||
|
Avery Dennison Corp. |
17,400 |
$ 1,167,975 |
|
|
Dow Chemical Co. |
8,300 |
250,556 |
|
|
Ivex Packaging Corp. (a) |
14,900 |
165,763 |
|
|
Lyondell Chemical Co. |
41,800 |
700,150 |
|
|
M.A. Hanna Co. |
47,300 |
425,700 |
|
|
Sealed Air Corp. (a) |
9,800 |
513,275 |
|
|
Union Carbide Corp. |
4,700 |
232,650 |
|
|
|
3,456,069 |
||
|
Packaging & Containers - 0.0% |
|||
|
Bemis Co., Inc. |
4,800 |
161,400 |
|
|
Paper & Forest Products - 0.1% |
|||
|
Trex Co., Inc. (a) |
6,000 |
300,000 |
|
|
TOTAL BASIC INDUSTRIES |
3,917,469 |
||
|
CONSTRUCTION & REAL ESTATE - 0.4% |
|||
|
Building Materials - 0.1% |
|||
|
Applied Films Corp. (a) |
9,600 |
351,600 |
|
|
Engineering - 0.3% |
|||
|
Bouygues SA |
600 |
400,659 |
|
|
Quanta Services, Inc. (a) |
9,900 |
544,500 |
|
|
|
945,159 |
||
|
TOTAL CONSTRUCTION & REAL ESTATE |
1,296,759 |
||
|
DURABLES - 1.6% |
|||
|
Autos, Tires, & Accessories - 0.5% |
|||
|
SPX Corp. |
11,090 |
1,341,197 |
|
|
Consumer Electronics - 0.7% |
|||
|
Black & Decker Corp. |
3,700 |
145,456 |
|
|
General Motors Corp. Class H (a) |
22,100 |
1,939,275 |
|
|
|
2,084,731 |
||
|
Home Furnishings - 0.0% |
|||
|
Leggett & Platt, Inc. |
6,700 |
110,550 |
|
|
Textiles & Apparel - 0.4% |
|||
|
Jones Apparel Group, Inc. (a) |
11,300 |
265,550 |
|
|
Liz Claiborne, Inc. |
18,670 |
658,118 |
|
|
Timberland Co. Class A (a) |
5,200 |
368,225 |
|
|
|
1,291,893 |
||
|
TOTAL DURABLES |
4,828,371 |
||
|
ENERGY - 10.8% |
|||
|
Energy Services - 6.4% |
|||
|
BJ Services Co. (a) |
28,980 |
1,811,250 |
|
|
Cal Dive International, Inc. (a) |
9,700 |
525,619 |
|
|
Coflexip SA sponsored ADR |
2,300 |
139,150 |
|
|
Diamond Offshore Drilling, Inc. |
15,300 |
537,413 |
|
|
ENSCO International, Inc. |
46,110 |
1,651,314 |
|
|
Global Marine, Inc. |
73,500 |
2,071,781 |
|
|
|
|||
|
Shares |
Value (Note 1) |
||
|
Grey Wolf, Inc. (a) |
162,000 |
$ 810,000 |
|
|
Halliburton Co. |
24,700 |
1,165,531 |
|
|
Hanover Compressor Co. (a) |
23,700 |
900,600 |
|
|
Helmerich & Payne, Inc. |
20,100 |
751,238 |
|
|
Nabors Industries, Inc. (a) |
40,080 |
1,665,825 |
|
|
Noble Drilling Corp. |
43,590 |
1,795,363 |
|
|
Pride International, Inc. (a) |
9,000 |
222,750 |
|
|
R&B Falcon Corp. (a) |
30,800 |
725,725 |
|
|
Rowan Companies, Inc. (a) |
4,300 |
130,613 |
|
|
Smith International, Inc. (a) |
10,400 |
757,250 |
|
|
Tidewater, Inc. |
25,950 |
934,200 |
|
|
Transocean Sedco Forex, Inc. |
14,260 |
762,019 |
|
|
Varco International, Inc. (a) |
30,548 |
710,229 |
|
|
Weatherford International, Inc. |
25,930 |
1,032,338 |
|
|
|
19,100,208 |
||
|
Oil & Gas - 4.4% |
|||
|
Anadarko Petroleum Corp. |
18,100 |
892,556 |
|
|
Apache Corp. |
37,450 |
2,202,528 |
|
|
Burlington Resources, Inc. |
14,700 |
562,275 |
|
|
Cooper Cameron Corp. (a) |
12,560 |
828,960 |
|
|
Devon Energy Corp. |
19,700 |
1,106,894 |
|
|
EOG Resources, Inc. |
9,140 |
306,190 |
|
|
Grant Prideco, Inc. (a) |
8,730 |
218,250 |
|
|
Kerr-McGee Corp. |
2,770 |
163,257 |
|
|
Murphy Oil Corp. |
2,000 |
118,875 |
|
|
Noble Affiliates, Inc. |
14,470 |
539,008 |
|
|
Ocean Energy, Inc. (a) |
39,290 |
557,427 |
|
|
Santa Fe Snyder Corp. (a) |
144,670 |
1,645,621 |
|
|
Tosco Corp. |
23,530 |
666,193 |
|
|
USX - Marathon Group |
7,590 |
190,224 |
|
|
Valero Energy Corp. |
18,700 |
593,725 |
|
|
Vastar Resources, Inc. |
21,640 |
1,777,185 |
|
|
Veritas DGC, Inc. (a) |
22,600 |
587,600 |
|
|
|
12,956,768 |
||
|
TOTAL ENERGY |
32,056,976 |
||
|
FINANCE - 6.5% |
|||
|
Banks - 0.9% |
|||
|
Bank of New York Co., Inc. |
15,300 |
711,450 |
|
|
Bank One Corp. |
39,200 |
1,041,250 |
|
|
PNC Financial Services Group, Inc. |
16,600 |
778,125 |
|
|
|
2,530,825 |
||
|
Credit & Other Finance - 0.5% |
|||
|
Concord EFS, Inc. (a) |
16,500 |
429,000 |
|
|
Household International, Inc. |
14,000 |
581,875 |
|
|
Providian Financial Corp. |
6,700 |
603,000 |
|
|
|
1,613,875 |
||
|
Federal Sponsored Credit - 1.3% |
|||
|
Freddie Mac |
92,410 |
3,742,605 |
|
|
Insurance - 3.7% |
|||
|
Ace Ltd. |
23,200 |
649,600 |
|
|
Common Stocks - continued |
|||
|
Shares |
Value (Note 1) |
||
|
FINANCE - continued |
|||
|
Insurance - continued |
|||
|
AFLAC, Inc. |
8,950 |
$ 411,141 |
|
|
Allmerica Financial Corp. |
12,720 |
666,210 |
|
|
AMBAC Financial Group, Inc. |
24,640 |
1,350,580 |
|
|
American General Corp. |
4,590 |
279,990 |
|
|
Brown & Brown, Inc. |
500 |
26,000 |
|
|
CIGNA Corp. |
25,650 |
2,398,275 |
|
|
First Health Group Corp. (a) |
14,300 |
469,219 |
|
|
Hartford Financial Services Group, Inc. |
6,270 |
350,728 |
|
|
Jefferson-Pilot Corp. |
3,600 |
203,175 |
|
|
MBIA, Inc. |
5,310 |
255,876 |
|
|
MetLife, Inc. |
60,000 |
1,263,750 |
|
|
Protective Life Corp. |
22,780 |
606,518 |
|
|
Reliastar Financial Corp. |
23,939 |
1,255,301 |
|
|
The Chubb Corp. |
4,360 |
268,140 |
|
|
XL Capital Ltd. Class A |
10,400 |
562,900 |
|
|
|
11,017,403 |
||
|
Securities Industry - 0.1% |
|||
|
Lehman Brothers Holdings, Inc. |
3,000 |
283,688 |
|
|
TOTAL FINANCE |
19,188,396 |
||
|
HEALTH - 13.5% |
|||
|
Drugs & Pharmaceuticals - 10.4% |
|||
|
Abgenix, Inc. (a) |
6,100 |
731,142 |
|
|
Alkermes, Inc. (a) |
4,100 |
193,213 |
|
|
Allergan, Inc. |
10,100 |
752,450 |
|
|
ALZA Corp. (a) |
12,200 |
721,325 |
|
|
Aviron (a) |
28,880 |
891,670 |
|
|
Bristol-Myers Squibb Co. |
10,800 |
629,100 |
|
|
Celgene Corp. (a) |
23,550 |
1,386,506 |
|
|
Cephalon, Inc. (a) |
31,540 |
1,888,458 |
|
|
Chiron Corp. (a) |
12,830 |
609,425 |
|
|
COR Therapeutics, Inc. (a) |
28,420 |
2,424,581 |
|
|
Corixa Corp. (a) |
9,500 |
407,906 |
|
|
CV Therapeutics, Inc. (a) |
7,605 |
527,122 |
|
|
Elan Corp. PLC sponsored ADR (a) |
20,200 |
978,438 |
|
|
Eli Lilly & Co. |
7,500 |
749,063 |
|
|
Forest Laboratories, Inc. (a) |
6,370 |
643,370 |
|
|
Gene Logic, Inc. (a) |
10,480 |
374,005 |
|
|
Genentech, Inc. |
3,170 |
545,240 |
|
|
Gilead Sciences, Inc. (a) |
7,010 |
498,586 |
|
|
Human Genome Sciences, Inc. (a) |
620 |
82,693 |
|
|
ImClone Systems, Inc. (a) |
16,400 |
1,253,575 |
|
|
IVAX Corp. (a) |
6,500 |
269,750 |
|
|
Millennium Pharmaceuticals, Inc. (a) |
13,762 |
1,539,624 |
|
|
Myriad Genetics, Inc. (a) |
9,000 |
1,332,703 |
|
|
Noven Pharmaceuticals, Inc. (a) |
1,100 |
33,069 |
|
|
PE Corp. - Celera Genomics Group (a) |
9,300 |
869,550 |
|
|
Protein Design Labs, Inc. (a) |
8,210 |
1,354,265 |
|
|
QLT, Inc. (a) |
21,260 |
1,651,402 |
|
|
Schering-Plough Corp. |
9,700 |
489,850 |
|
|
|
|||
|
Shares |
Value (Note 1) |
||
|
Sepracor, Inc. (a) |
12,560 |
$ 1,515,050 |
|
|
Teva Pharmaceutical Industries Ltd. ADR |
28,200 |
1,563,338 |
|
|
Titan Pharmaceuticals, Inc. (a) |
15,100 |
649,300 |
|
|
United Therapeutics Corp. |
26,100 |
2,828,588 |
|
|
Vertex Pharmaceuticals, Inc. (a) |
5,300 |
558,488 |
|
|
|
30,942,845 |
||
|
Medical Equipment & Supplies - 0.8% |
|||
|
Millipore Corp. |
8,700 |
655,763 |
|
|
MiniMed, Inc. (a) |
3,900 |
460,200 |
|
|
Novoste Corp. (a) |
10,300 |
628,300 |
|
|
Stryker Corp. |
10,800 |
472,500 |
|
|
Sybron International, Inc. (a) |
8,730 |
172,963 |
|
|
|
2,389,726 |
||
|
Medical Facilities Management - 2.3% |
|||
|
Express Scripts, Inc. Class A (a) |
10,800 |
670,950 |
|
|
Laboratory Corp. of America Holdings |
5,700 |
439,613 |
|
|
Quest Diagnostics, Inc. (a) |
24,500 |
1,831,375 |
|
|
Trigon Healthcare, Inc. (a) |
43,170 |
2,225,953 |
|
|
UnitedHealth Group, Inc. |
14,600 |
1,251,950 |
|
|
Wellpoint Health Networks, Inc. (a) |
4,800 |
347,700 |
|
|
|
6,767,541 |
||
|
TOTAL HEALTH |
40,100,112 |
||
|
INDUSTRIAL MACHINERY & EQUIPMENT - 2.8% |
|||
|
Electrical Equipment - 2.2% |
|||
|
Adaptive Broadband Corp. (a) |
21,140 |
776,895 |
|
|
Adtran, Inc. (a) |
16,300 |
975,963 |
|
|
American Power Conversion Corp. (a) |
7,300 |
297,931 |
|
|
ANTEC Corp. (a) |
11,200 |
465,500 |
|
|
California Amplifier, Inc. (a) |
320 |
14,640 |
|
|
Harris Corp. |
5,600 |
183,400 |
|
|
Pace Micro Technology PLC |
88,944 |
1,284,515 |
|
|
Powerwave Technologies, Inc. (a) |
6,700 |
294,800 |
|
|
Scientific-Atlanta, Inc. |
16,840 |
1,254,580 |
|
|
Vyyo, Inc. |
32,600 |
880,200 |
|
|
|
6,428,424 |
||
|
Industrial Machinery & Equipment - 0.6% |
|||
|
Asyst Technologies, Inc. (a) |
21,900 |
750,075 |
|
|
Ingersoll-Rand Co. |
10,100 |
406,525 |
|
|
Varian Semiconductor Equipment Associates, Inc. (a) |
9,400 |
590,438 |
|
|
|
1,747,038 |
||
|
TOTAL INDUSTRIAL MACHINERY & EQUIPMENT |
8,175,462 |
||
|
MEDIA & LEISURE - 3.1% |
|||
|
Broadcasting - 2.4% |
|||
|
EchoStar Communications Corp. |
23,020 |
762,178 |
|
|
Pegasus Communications Corp. (a) |
53,240 |
2,612,088 |
|
|
Radio One, Inc.: |
|
|
|
|
Class A |
6,070 |
179,444 |
|
|
Common Stocks - continued |
|||
|
Shares |
Value (Note 1) |
||
|
MEDIA & LEISURE - continued |
|||
|
Broadcasting - continued |
|||
|
Radio One, Inc.: - continued |
|
|
|
|
Class D (non-vtg.) (a) |
15,140 |
$ 334,026 |
|
|
TiVo, Inc. |
29,200 |
1,022,000 |
|
|
UnitedGlobalCom, Inc. Class A (a) |
5,090 |
237,958 |
|
|
Univision Communications, Inc. |
8,580 |
888,030 |
|
|
USA Networks, Inc. (a) |
43,300 |
936,363 |
|
|
|
6,972,087 |
||
|
Entertainment - 0.7% |
|||
|
Mandalay Resort Group (a) |
18,100 |
362,000 |
|
|
MGM Grand, Inc. |
41,900 |
1,346,038 |
|
|
Park Place Entertainment Corp. (a) |
5,400 |
65,813 |
|
|
Premier Parks, Inc. (a) |
10,400 |
236,600 |
|
|
|
2,010,451 |
||
|
Publishing - 0.0% |
|||
|
Reader's Digest Association, Inc. |
860 |
34,185 |
|
|
Restaurants - 0.0% |
|||
|
Jack in the Box, Inc. (a) |
2,880 |
70,920 |
|
|
TOTAL MEDIA & LEISURE |
9,087,643 |
||
|
NONDURABLES - 1.7% |
|||
|
Agriculture - 0.1% |
|||
|
Nutreco Holding NV |
11,573 |
441,603 |
|
|
Foods - 1.2% |
|||
|
Bestfoods |
4,200 |
290,850 |
|
|
Keebler Foods Co. |
22,840 |
847,935 |
|
|
Nabisco Group Holdings Corp. |
45,910 |
1,190,791 |
|
|
Nabisco Holdings Corp. Class A |
10,800 |
567,000 |
|
|
Quaker Oats Co. |
7,200 |
540,900 |
|
|
|
3,437,476 |
||
|
Household Products - 0.4% |
|||
|
Avon Products, Inc. |
24,610 |
1,095,145 |
|
|
TOTAL NONDURABLES |
4,974,224 |
||
|
PRECIOUS METALS - 0.4% |
|||
|
Agnico-Eagle Mines Ltd. |
8,930 |
56,095 |
|
|
Newmont Mining Corp. |
900 |
19,463 |
|
|
Stillwater Mining Co. (a) |
37,520 |
1,045,870 |
|
|
|
1,121,428 |
||
|
RETAIL & WHOLESALE - 1.1% |
|||
|
Apparel Stores - 0.2% |
|||
|
AnnTaylor Stores Corp. (a) |
21,800 |
722,125 |
|
|
General Merchandise Stores - 0.3% |
|||
|
Consolidated Stores Corp. (a) |
1,900 |
22,800 |
|
|
|
|||
|
Shares |
Value (Note 1) |
||
|
Costco Wholesale Corp. (a) |
13,400 |
$ 442,200 |
|
|
Dollar Tree Stores, Inc. (a) |
7,650 |
302,653 |
|
|
|
767,653 |
||
|
Grocery Stores - 0.3% |
|||
|
Safeway, Inc. (a) |
17,100 |
771,638 |
|
|
Retail & Wholesale, Miscellaneous - 0.3% |
|||
|
Best Buy Co., Inc. (a) |
13,000 |
822,250 |
|
|
Circuit City Stores, Inc. - |
4,600 |
152,663 |
|
|
Ventro Corp. |
3,500 |
66,063 |
|
|
|
1,040,976 |
||
|
TOTAL RETAIL & WHOLESALE |
3,302,392 |
||
|
SERVICES - 2.5% |
|||
|
Advertising - 0.9% |
|||
|
ADVO, Inc. (a) |
20,600 |
865,200 |
|
|
DoubleClick, Inc. (a) |
8,180 |
311,863 |
|
|
TMP Worldwide, Inc. (a) |
19,500 |
1,439,344 |
|
|
|
2,616,407 |
||
|
Printing - 0.0% |
|||
|
Valassis Communications, Inc. (a) |
1,360 |
51,850 |
|
|
Services - 1.6% |
|||
|
ACNielsen Corp. (a) |
23,100 |
508,200 |
|
|
Cintas Corp. |
29,390 |
1,078,246 |
|
|
Convergys Corp. (a) |
9,000 |
466,875 |
|
|
Ecolab, Inc. |
28,939 |
1,130,430 |
|
|
Profit Recovery Group |
21,600 |
359,100 |
|
|
Robert Half International, Inc. (a) |
24,640 |
702,240 |
|
|
True North Communications |
11,400 |
501,600 |
|
|
|
4,746,691 |
||
|
TOTAL SERVICES |
7,414,948 |
||
|
TECHNOLOGY - 31.7% |
|||
|
Communications Equipment - 3.9% |
|||
|
ADC Telecommunications, Inc. (a) |
8,300 |
696,163 |
|
|
Advanced Fibre Communications, Inc. (a) |
2,430 |
110,109 |
|
|
Andrew Corp. (a) |
17,000 |
570,563 |
|
|
Ciena Corp. (a) |
4,790 |
798,433 |
|
|
Comverse Technology, Inc. (a) |
14,850 |
1,381,050 |
|
|
Corning, Inc. |
5,903 |
1,593,072 |
|
|
Ditech Communications Corp. |
900 |
85,106 |
|
|
Efficient Networks, Inc. |
9,800 |
720,913 |
|
|
Jabil Circuit, Inc. (a) |
29,740 |
1,475,848 |
|
|
Metricom, Inc. (a) |
10,230 |
285,161 |
|
|
Natural MicroSystems Corp. (a) |
22,050 |
2,479,247 |
|
|
Tekelec (a) |
7,800 |
375,863 |
|
|
Terayon Communication Systems, Inc. (a) |
1,200 |
77,081 |
|
|
Turnstone Systems, Inc. |
3,200 |
530,150 |
|
|
Common Stocks - continued |
|||
|
Shares |
Value (Note 1) |
||
|
TECHNOLOGY - continued |
|||
|
Communications Equipment - continued |
|||
|
Tut Systems, Inc. (a) |
2,600 |
$ 149,175 |
|
|
Westell Technologies, Inc. Class A (a) |
8,800 |
132,000 |
|
|
|
11,459,934 |
||
|
Computer Services & Software - 8.4% |
|||
|
Active Software, Inc. |
13,500 |
1,048,781 |
|
|
Adobe Systems, Inc. |
10,630 |
1,381,900 |
|
|
Affiliated Computer Services, Inc. |
3,220 |
106,461 |
|
|
Affymetrix, Inc. (a) |
4,300 |
710,038 |
|
|
Amazon.com, Inc. (a) |
24,500 |
889,656 |
|
|
Amdocs Ltd. (a) |
7,947 |
609,932 |
|
|
Ariba, Inc. |
5,000 |
490,234 |
|
|
Autodesk, Inc. |
11,800 |
409,313 |
|
|
BEA Systems, Inc. (a) |
24,520 |
1,212,208 |
|
|
BroadVision, Inc. (a) |
2,300 |
116,869 |
|
|
Business Objects SA sponsored ADR (a) |
4,400 |
387,750 |
|
|
CACI International, Inc. Class A (a) |
12,200 |
237,900 |
|
|
Cadence Design Systems, Inc. (a) |
19,620 |
399,758 |
|
|
Check Point Software |
3,200 |
677,600 |
|
|
Clarent Corp. |
2,500 |
178,750 |
|
|
CNET Networks, Inc. (a) |
23,700 |
582,131 |
|
|
Covad Communications Group, Inc. (a) |
25,200 |
406,350 |
|
|
Digital Insight Corp. |
4,900 |
166,600 |
|
|
Electronic Arts, Inc. (a) |
3,010 |
219,542 |
|
|
Foundry Networks, Inc. |
4,600 |
506,000 |
|
|
Interact Commerce Corp. (a) |
7,080 |
83,632 |
|
|
Internap Network Services Corp. |
3,300 |
137,002 |
|
|
Intuit, Inc. (a) |
7,830 |
323,966 |
|
|
Keynote Systems, Inc. |
6,300 |
444,544 |
|
|
Macromedia, Inc. (a) |
900 |
87,019 |
|
|
Manugistics Group, Inc. (a) |
1,500 |
70,125 |
|
|
Marketwatch.com, Inc. (a) |
200 |
3,763 |
|
|
Mercury Interactive Corp. (a) |
2,700 |
261,225 |
|
|
Metasolv Software, Inc. |
11,330 |
498,520 |
|
|
National Computer Systems, Inc. |
7,200 |
354,600 |
|
|
New Era of Networks, Inc. (a) |
2,370 |
100,725 |
|
|
Opus360 Corp. |
20 |
74 |
|
|
Orbotech Ltd. |
8,400 |
780,150 |
|
|
Pharmacopeia, Inc. (a) |
3,400 |
157,675 |
|
|
Phone.com, Inc. |
4,900 |
319,113 |
|
|
Polycom, Inc. (a) |
13,400 |
1,260,856 |
|
|
Priceline.com, Inc. (a) |
24,500 |
930,617 |
|
|
Puma Technology, Inc. (a) |
4,160 |
111,540 |
|
|
Rational Software Corp. (a) |
14,300 |
1,329,006 |
|
|
Redback Networks, Inc. |
6,320 |
1,132,070 |
|
|
Software.com, Inc. |
2,100 |
272,738 |
|
|
VERITAS Software Corp. (a) |
24,605 |
2,780,749 |
|
|
Vignette Corp. (a) |
10,080 |
524,318 |
|
|
|
|||
|
Shares |
Value (Note 1) |
||
|
Vitria Technology, Inc. |
6,800 |
$ 415,650 |
|
|
webMethods, Inc. |
12,000 |
1,886,250 |
|
|
|
25,003,700 |
||
|
Computers & Office Equipment - 4.7% |
|||
|
Alteon Websystems, Inc. |
5,700 |
570,356 |
|
|
Apple Computer, Inc. (a) |
80 |
4,190 |
|
|
Brocade Communications |
16,860 |
3,093,547 |
|
|
CDW Computer Centers, Inc. (a) |
30,800 |
1,925,000 |
|
|
Comdisco, Inc. |
5,400 |
120,488 |
|
|
Copper Mountain Networks, Inc. |
3,300 |
290,813 |
|
|
Juniper Networks, Inc. |
15,060 |
2,192,171 |
|
|
MMC Networks, Inc. (a) |
21,600 |
1,154,250 |
|
|
MRV Communications, Inc. (a) |
6,100 |
410,225 |
|
|
Network Appliance, Inc. (a) |
24,080 |
1,938,440 |
|
|
ScanSource, Inc. (a) |
7,130 |
277,179 |
|
|
SCI Systems, Inc. (a) |
7,100 |
278,231 |
|
|
Symbol Technologies, Inc. |
9,645 |
520,830 |
|
|
Tech Data Corp. (a) |
25,500 |
1,110,844 |
|
|
|
13,886,564 |
||
|
Electronic Instruments - 4.1% |
|||
|
Aclara Biosciences, Inc. |
6,200 |
315,813 |
|
|
Agilent Technologies, Inc. |
10,350 |
763,313 |
|
|
Aurora Biosciences Corp. (a) |
17,100 |
1,166,006 |
|
|
FEI Co. (a) |
29,700 |
905,850 |
|
|
KLA-Tencor Corp. (a) |
4,820 |
282,271 |
|
|
Kulicke & Soffa Industries, Inc. (a) |
12,100 |
718,438 |
|
|
Novellus Systems, Inc. (a) |
14,950 |
845,609 |
|
|
PE Corp. - Biosystems Group |
7,910 |
521,071 |
|
|
PerkinElmer, Inc. |
36,950 |
2,443,319 |
|
|
Photon Dynamics, Inc. (a) |
18,700 |
1,396,656 |
|
|
Tektronix, Inc. |
13,200 |
976,800 |
|
|
Waters Corp. (a) |
14,910 |
1,860,954 |
|
|
|
12,196,100 |
||
|
Electronics - 10.6% |
|||
|
Altera Corp. (a) |
28,450 |
2,900,122 |
|
|
Analog Devices, Inc. (a) |
7,440 |
565,440 |
|
|
Atmel Corp. (a) |
11,300 |
416,688 |
|
|
Celestica, Inc. (sub. vtg.) (a) |
7,720 |
375,962 |
|
|
Chartered Semiconductor |
3,540 |
318,600 |
|
|
Cypress Semiconductor Corp. (a) |
20,640 |
872,040 |
|
|
Digital Microwave Corp. (a) |
8,300 |
316,438 |
|
|
E Tek Dynamics, Inc. (a) |
3,130 |
825,733 |
|
|
GlobeSpan, Inc. |
12,400 |
1,513,769 |
|
|
Infineon Technologies AG |
5,200 |
408,550 |
|
|
KEMET Corp. (a) |
8,160 |
204,510 |
|
|
Kopin Corp. (a) |
72,470 |
5,018,548 |
|
|
Lattice Semiconductor Corp. (a) |
8,100 |
559,913 |
|
|
Linear Technology Corp. |
20 |
1,279 |
|
|
LSI Logic Corp. (a) |
2,900 |
156,963 |
|
|
Merix Corp. (a) |
9,500 |
446,500 |
|
|
Microchip Technology, Inc. (a) |
14,900 |
868,158 |
|
|
Common Stocks - continued |
|||
|
Shares |
Value (Note 1) |
||
|
TECHNOLOGY - continued |
|||
|
Electronics - continued |
|||
|
Micron Technology, Inc. (a) |
17,140 |
$ 1,509,391 |
|
|
National Semiconductor Corp. (a) |
33,430 |
1,897,153 |
|
|
NVIDIA Corp. (a) |
12,600 |
800,888 |
|
|
Plexus Corp. (a) |
5,000 |
565,000 |
|
|
PMC-Sierra, Inc. (a) |
3,870 |
687,651 |
|
|
Power-One, Inc. (a) |
10,700 |
1,219,131 |
|
|
QLogic Corp. (a) |
7,132 |
471,158 |
|
|
Rambus, Inc. (a) |
14,100 |
1,452,300 |
|
|
S3, Inc. |
34,100 |
502,975 |
|
|
Sanmina Corp. (a) |
33,600 |
2,872,800 |
|
|
SDL, Inc. (a) |
4,400 |
1,254,825 |
|
|
Three-Five Systems, Inc. (a) |
2,704 |
159,536 |
|
|
TriQuint Semiconductor, Inc. |
8,600 |
822,913 |
|
|
Vishay Intertechnology, Inc. (a) |
18,220 |
691,221 |
|
|
Vitesse Semiconductor Corp. (a) |
5,990 |
440,639 |
|
|
Xilinx, Inc. (a) |
3,100 |
255,944 |
|
|
|
31,372,738 |
||
|
TOTAL TECHNOLOGY |
93,919,036 |
||
|
TRANSPORTATION - 1.1% |
|||
|
Air Transportation - 0.2% |
|||
|
Continental Airlines, Inc. Class B (a) |
4,900 |
230,300 |
|
|
Northwest Airlines Corp. Class A (a) |
9,700 |
295,244 |
|
|
Southwest Airlines Co. |
13,350 |
252,816 |
|
|
|
778,360 |
||
|
Railroads - 0.0% |
|||
|
Wabtec Corp. |
296 |
3,071 |
|
|
Shipping - 0.5% |
|||
|
Teekay Shipping Corp. |
45,000 |
1,479,375 |
|
|
Trucking & Freight - 0.4% |
|||
|
Forward Air Corp. (a) |
11,985 |
479,400 |
|
|
Landstar System, Inc. (a) |
10,100 |
601,581 |
|
|
|
1,080,981 |
||
|
TOTAL TRANSPORTATION |
3,341,787 |
||
|
UTILITIES - 8.8% |
|||
|
Cellular - 4.2% |
|||
|
China Telecom (Hong Kong) Ltd. sponsored ADR (a) |
3,400 |
604,563 |
|
|
Clearnet Communications, Inc. |
24,450 |
677,102 |
|
|
Microcell Telecommunications, Inc. |
26,430 |
955,979 |
|
|
Millicom International Cellular SA (a) |
1,430 |
50,050 |
|
|
Nextel Communications, Inc. Class A (a) |
123,420 |
7,551,737 |
|
|
Nextel Partners, Inc. Class A |
6,300 |
205,144 |
|
|
|
|||
|
Shares |
Value (Note 1) |
||
|
Sprint Corp. - PCS Group Series 1 (a) |
37,110 |
$ 2,208,045 |
|
|
VoiceStream Wireless Corp. (a) |
2,790 |
324,468 |
|
|
|
12,577,088 |
||
|
Electric Utility - 2.8% |
|||
|
AES Corp. (a) |
30,960 |
1,412,550 |
|
|
Calpine Corp. (a) |
68,000 |
4,471,000 |
|
|
Constellation Energy Corp. |
8,100 |
263,756 |
|
|
IPALCO Enterprises, Inc. |
15,680 |
315,560 |
|
|
Montana Power Co. |
13,100 |
462,594 |
|
|
NiSource, Inc. |
39,900 |
743,138 |
|
|
Northern States Power Co. |
16,000 |
323,000 |
|
|
NRG Energy, Inc. |
4,500 |
82,125 |
|
|
PECO Energy Co. |
6,000 |
241,875 |
|
|
|
8,315,598 |
||
|
Gas - 1.3% |
|||
|
Columbia Energy Group |
60 |
3,938 |
|
|
Dynegy, Inc. Class A |
28,470 |
1,944,857 |
|
|
Enron Corp. |
8,150 |
525,675 |
|
|
Kinder Morgan, Inc. |
36,580 |
1,264,296 |
|
|
|
3,738,766 |
||
|
Telephone Services - 0.5% |
|||
|
Allegiance Telecom, Inc. (a) |
2,200 |
140,800 |
|
|
CenturyTel, Inc. |
31,400 |
902,750 |
|
|
ITXC Corp. |
14,210 |
503,123 |
|
|
|
1,546,673 |
||
|
TOTAL UTILITIES |
26,178,125 |
||
|
TOTAL COMMON STOCKS (Cost $230,321,148) |
258,903,128 |
||
|
U.S. Treasury Obligations - 0.3% |
|||||
|
Moody's Ratings (unaudited) |
Principal Amount |
|
|||
|
U.S. Treasury Bills, yield at date of purchase 5.59% to 6.03% 7/13/00 to 8/17/00 (c) |
- |
|
$ 925,000 |
919,853 |
|
|
Cash Equivalents - 18.5% |
|||
|
Maturity Amount |
Value |
||
|
Investments in repurchase agreements (U.S. Treasury Obligations), in a joint trading account at 6.58%, dated 6/30/00 due 7/3/00 |
$ 18,919,371 |
$ 18,909,000 |
|
|
Shares |
|
||
|
Central Cash Collateral Fund, 6.71% (b) |
6,731,354 |
6,731,354 |
|
|
Taxable Central Cash Fund, 6.59% (b) |
29,086,263 |
29,086,263 |
|
|
TOTAL CASH EQUIVALENTS (Cost $54,726,617) |
54,726,617 |
|
|
TOTAL INVESTMENT PORTFOLIO - 106.1% (Cost $285,967,116) |
314,549,598 |
|
|
NET OTHER ASSETS - (6.1)% |
(18,181,476) |
|
|
NET ASSETS - 100% |
$ 296,368,122 |
|
|
Futures Contracts |
|||||
|
|
Expiration Date |
Underlying |
Unrealized Gain/(Loss) |
||
|
Purchased |
|||||
|
57 S&P 400 Midcap Index Contracts |
Sept. 2000 |
$ 13,916,550 |
$ (412,213) |
||
|
The face value of futures purchased as a percentage of net assets - 4.7% |
|
Legend |
|
(a) Non-income producing |
|
(b) The rate quoted is the annualized seven-day yield of the fund at |
|
(c) Security or a portion of the security was pledged to cover margin requirements for futures contracts. At the period end, the value of securities pledged amounted to $919,853. |
|
Other Information |
|
Purchases and sales of securities, other than short-term securities, |
|
The market value of futures contracts opened and closed during the |
|
The fund placed a portion of its portfolio transactions with brokerage firms which are affiliates of Fidelity Management & Research Company. The commissions paid to these affiliated firms were $16,684 for the period. |
|
The fund participated in the security lending program. At period end, the value of securities loaned amounted to $6,633,405. The fund received cash collateral of $6,731,354 which was invested in cash equivalents. |
|
Income Tax Information |
|
At June 30, 2000, the aggregate cost of investment securities for income tax purposes was $289,737,660. Net unrealized appreciation aggregated $24,811,938, of which $35,724,103 related to appreciated investment securities and $10,912,165 related to depreciated investment securities. |
See accompanying notes which are an integral part of the financial statements.
Mid Cap Portfolio
Statement of Assets and Liabilities
|
|
June 30, 2000 (Unaudited) |
|
|
Assets |
|
|
|
Investment in securities, at value (including repurchase agreements of $18,909,000) |
|
$ 314,549,598 |
|
Cash |
|
323,420 |
|
Receivable for investments sold |
|
13,596,246 |
|
Receivable for fund shares sold |
|
3,012,314 |
|
Dividends receivable |
|
66,918 |
|
Interest receivable |
|
128,429 |
|
Other receivables |
|
10,808 |
|
Total assets |
|
331,687,733 |
|
Liabilities |
|
|
|
Payable for investments purchased |
$ 27,374,504 |
|
|
Payable for fund shares redeemed |
834,902 |
|
|
Accrued management fee |
115,770 |
|
|
Distribution fees payable |
12,793 |
|
|
Payable for daily variation on |
208,051 |
|
|
Other payables and |
42,237 |
|
|
Collateral on securities loaned, |
6,731,354 |
|
|
Total liabilities |
|
35,319,611 |
|
Net Assets |
|
$ 296,368,122 |
|
Net Assets consist of: |
|
|
|
Paid in capital |
|
$ 271,976,722 |
|
Undistributed net investment income |
|
97,845 |
|
Accumulated undistributed net realized gain (loss) on investments and foreign currency transactions |
|
(3,876,611) |
|
Net unrealized appreciation (depreciation) on investments |
|
28,170,166 |
|
Net Assets |
|
$ 296,368,122 |
|
Initial Class: |
|
$18.82 |
|
Service Class: |
|
$18.80 |
|
Service Class 2: |
|
$18.78 |
Statement of Operations
|
|
Six months ended June 30, 2000 (Unaudited) |
|
|
Investment Income Dividends |
|
$ 177,301 |
|
Interest |
|
380,016 |
|
Security lending |
|
16,068 |
|
Total income |
|
573,385 |
|
Expenses |
|
|
|
Management fee |
$ 306,603 |
|
|
Transfer agent fees |
43,421 |
|
|
Distribution fees |
44,790 |
|
|
Accounting and security lending fees |
32,445 |
|
|
Non-interested trustees' compensation |
111 |
|
|
Custodian fees and expenses |
58,064 |
|
|
Audit |
8,158 |
|
|
Legal |
586 |
|
|
Reports to Shareholders |
236 |
|
|
Miscellaneous |
69 |
|
|
Total expenses before reductions |
494,483 |
|
|
Expense reductions |
(19,437) |
475,046 |
|
Net investment income |
|
98,339 |
|
Realized and Unrealized Gain (Loss) Net realized gain (loss) on: |
|
|
|
Investment securities |
(3,838,305) |
|
|
Foreign currency transactions |
1,931 |
|
|
Futures contracts |
126,879 |
(3,709,495) |
|
Change in net unrealized appreciation (depreciation) on: |
|
|
|
Investment securities |
24,218,897 |
|
|
Assets and liabilities in |
(23) |
|
|
Futures contracts |
(424,407) |
23,794,467 |
|
Net gain (loss) |
|
20,084,972 |
|
Net increase (decrease) in net assets resulting from operations |
|
$ 20,183,311 |
|
Other Information Expense reductions |
|
$ 19,080 |
|
Custodian credits |
|
357 |
|
|
|
$ 19,437 |
See accompanying notes which are an integral part of the financial statements.
Semiannual Report
Variable Insurance Products: Portfolio
Financial Statements - continued
Statement of Changes in Net Assets
|
Increase (Decrease) in Net Assets |
Six months ended |
Year ended |
|
Operations |
$ 98,339 |
$ (3,279) |
|
Net realized gain (loss) |
(3,709,495) |
139,917 |
|
Change in net unrealized appreciation (depreciation) |
23,794,467 |
4,343,490 |
|
Net increase (decrease) in net assets resulting from operations |
20,183,311 |
4,480,128 |
|
Distributions to shareholders |
- |
(139,917) |
|
In excess of net realized gain |
(131,105) |
(32,523) |
|
Total distributions |
(131,105) |
(172,440) |
|
Share transactions - net increase (decrease) |
248,664,126 |
22,312,614 |
|
Total increase (decrease) in net assets |
268,716,332 |
26,620,302 |
|
Net Assets |
|
|
|
Beginning of period |
27,651,790 |
1,031,488 |
|
End of period (including undistributed net investment income of $97,845 and $0, respectively) |
$ 296,368,122 |
$ 27,651,790 |
|
|
|
Other Information: |
|
|
Six months ended |
Year ended December 31, 1999 |
||
|
|
Shares |
Dollars |
Shares |
Dollars |
|
Share transactions |
7,954,588 |
$ 141,197,057 |
67,742 |
$ 873,931 |
|
Reinvested |
507 |
8,466 |
755 |
10,914 |
|
Redeemed |
(130,836) |
(2,260,660) |
(4,140) |
(54,766) |
|
Net increase (decrease) |
7,824,259 |
$ 138,944,863 |
64,357 |
$ 830,079 |
|
Service Class |
5,632,594 |
$ 100,266,360 |
1,749,215 |
$ 22,631,585 |
|
Reinvested |
7,312 |
121,968 |
11,186 |
161,526 |
|
Redeemed |
(474,562) |
(8,379,137) |
(110,484) |
(1,310,576) |
|
Net increase (decrease) |
5,165,344 |
$ 92,009,191 |
1,649,917 |
$ 21,482,535 |
|
Service Class 2 A |
1,052,073 |
$ 19,316,295 |
- |
$ - |
|
Reinvested |
40 |
671 |
- |
- |
|
Redeemed |
(99,362) |
(1,606,894) |
- |
- |
|
Net increase (decrease) |
952,751 |
$ 17,710,072 |
- |
$ - |
|
Distributions |
|
|
|
|
|
From net realized gain |
|
$ - |
|
$ 8,856 |
|
Service Class |
|
- |
|
131,061 |
|
Service Class 2 A |
|
- |
|
- |
|
Total |
|
$ - |
|
$ 139,917 |
|
In excess of net realized gain |
|
$ 8,466 |
|
$ 2,058 |
|
Service Class |
|
121,968 |
|
30,465 |
|
Service Class 2 A |
|
671 |
|
- |
|
Total |
|
$ 131,105 |
|
$ 32,523 |
|
|
|
$ 131,105 |
|
$ 172,440 |
A Service Class 2 commenced sale of shares January 12, 2000.
See accompanying notes which are an integral part of the financial statements.
Mid Cap Portfolio
Financial Highlights - Initial Class
|
|
Six months ended |
Years ended |
|
|
Selected Per-Share Data |
(Unaudited) |
1999 |
1998 E |
|
Net asset value, beginning of period |
$ 15.25 |
$ 10.31 |
$ 10.00 |
|
Income from Investment Operations |
|
|
|
|
Net investment income (loss) D |
.02 |
.00 |
.00 |
|
Net realized and unrealized gain (loss) |
3.60 |
5.05 |
.31 |
|
Total from investment operations |
3.62 |
5.05 |
.31 |
|
Less Distributions |
|
|
|
|
From net realized gain |
- |
(.09) |
- |
|
In excess of net realized gain |
(.05) |
(.02) |
- |
|
Total distributions |
(.05) |
(.11) |
- |
|
Net asset value, end of period |
$ 18.82 |
$ 15.25 |
$ 10.31 |
|
Total Return B, C |
23.78% |
49.04% |
3.10% |
|
Ratios and Supplemental Data |
|
|
|
|
Net assets, end of period (000 omitted) |
$ 149,444 |
$ 1,744 |
$ 516 |
|
Ratio of expenses to average net assets |
.84% A |
1.00% G |
1.00% A, G |
|
Ratio of expenses to average net assets after expense reductions |
.80% A, H |
.97% H |
1.00% A |
|
Ratio of net investment income (loss) to average net assets |
.25% A |
.01% |
(.27)% A |
|
Portfolio turnover |
239% A |
163% |
125% A |
Financial Highlights - Service Class
|
|
Six months ended |
Years ended |
|
|
Selected Per-Share Data |
(Unaudited) |
1999 |
1998 F |
|
Net asset value, beginning of period |
$ 15.24 |
$ 10.31 |
$ 10.00 |
|
Income from Investment Operations |
|
|
|
|
Net investment income (loss) D |
.01 |
(.01) |
.00 |
|
Net realized and unrealized gain (loss) |
3.60 |
5.05 |
.31 |
|
Total from investment operations |
3.61 |
5.04 |
.31 |
|
Less Distributions |
|
|
|
|
From net realized gain |
- |
(.09) |
- |
|
In excess of net realized gain |
(.05) |
(.02) |
- |
|
Total distributions |
(.05) |
(.11) |
- |
|
Net asset value, end of period |
$ 18.80 |
$ 15.24 |
$ 10.31 |
|
Total Return B, C |
23.73% |
48.94% |
3.10% |
|
Ratios and Supplemental Data |
|
|
|
|
Net assets, end of period (000 omitted) |
$ 129,033 |
$ 25,908 |
$ 516 |
|
Ratio of expenses to average net assets |
.92% A |
1.10% G |
1.10% A, G |
|
Ratio of expenses to average net assets after expense reductions |
.88% A, H |
1.07% H |
1.10% A |
|
Ratio of net investment income (loss) to average net assets |
.17% A |
(.09)% |
(.35)% A |
|
Portfolio turnover |
239% A |
163% |
125% A |
|
A Annualized B The total returns would have been lower had certain expenses not been reduced during the periods shown. C Total returns for periods of less than one year are not annualized and do not reflect charges attributable to your insurance company's separate account. Inclusion of these charges would reduce the total returns shown. D Net investment income (loss) per share has been calculated based on average shares outstanding during the period. E For the period December 28, 1998 (commencement of sale of Initial Class shares) to December 31, 1998. F For the period December 28, 1998 (commencement of sale of Service Class shares) to December 31, 1998. G FMR agreed to reimburse a portion of the class' expenses during the period. Without this reimbursement, the class' expense ratio would have been higher. H FMR or the fund has entered into varying arrangements with third parties who either paid or reduced a portion of the class' expenses. |
|||
See accompanying notes which are an integral part of the financial statements.
Semiannual Report
Financial Highlights - Service Class 2
|
|
Six months ended |
|
Selected Per-Share Data |
(Unaudited) |
|
Net asset value, beginning of period |
$ 14.82 |
|
Income from Investment Operations |
|
|
Net investment income D |
.00 |
|
Net realized and unrealized gain (loss) |
4.01 |
|
Total from investment operations |
4.01 |
|
Less Distributions |
|
|
In excess of net realized gain |
(.05) |
|
Net asset value, end of period |
$ 18.78 |
|
Total Return B, C |
27.10% |
|
Ratios and Supplemental Data |
|
|
Net assets, end of period (000 omitted) |
$ 17,891 |
|
Ratio of expenses to average net assets |
1.07% A |
|
Ratio of expenses to average net assets after expense reductions |
1.04% A, F |
|
Ratio of net investment income to average net assets |
.02% A |
|
Portfolio turnover |
239% A |
|
A Annualized B The total returns would have been lower had certain expenses not been reduced during the periods shown. C Total returns for periods of less than one year are not annualized and do not reflect charges attributable to your insurance company's separate account. Inclusion of these charges would reduce the total returns shown. D Net investment income per share has been calculated based on average shares outstanding during the period. E For the period January 12, 2000 (commencement of sale of Service Class 2 shares) to June 30, 2000. F FMR or the fund has entered into varying arrangements with third parties who either paid or reduced a portion of the class' expenses. |
|
See accompanying notes which are an integral part of the financial statements.
Mid Cap Portfolio
A special meeting of the fund's shareholders was held on July 19, 2000. The results of votes taken among shareholders on proposals before them are reported below. Each vote reported represents one dollar of net asset value held on the record date for the meeting.
PROPOSAL 1
To elect as Trustees the following twelve nominees.*
|
|
# of Dollars Voted |
% of Dollars Voted |
Ralph F. Cox
|
Affirmative |
2,995,348,207.84 |
97.862 |
|
Withheld |
65,444,305.52 |
2.138 |
|
TOTAL |
3,060,792,513.36 |
100.000 |
Phyllis Burke Davis
|
Affirmative |
2,995,012,849.06 |
97.851 |
|
Withheld |
65,779,664.30 |
2.149 |
|
TOTAL |
3,060,792,513.36 |
100.000 |
Robert M. Gates
|
Affirmative |
2,994,325,628.16 |
97.828 |
|
Withheld |
66,466,885.20 |
2.172 |
|
TOTAL |
3,060,792,513.36 |
100.000 |
Edward C. Johnson 3d
|
Affirmative |
2,994,212,266.77 |
97.825 |
|
Withheld |
66,580,246.59 |
2.175 |
|
TOTAL |
3,060,792,513.36 |
100.000 |
Donald J. Kirk
|
Affirmative |
2,996,527,468.99 |
97.900 |
|
Withheld |
64,265,044.37 |
2.100 |
|
TOTAL |
3,060,792,513.36 |
100.000 |
Ned C. Lautenbach
|
Affirmative |
2,997,430,896.97 |
97.930 |
|
Withheld |
63,361,616.39 |
2.070 |
|
TOTAL |
3,060,792,513.36 |
100.000 |
|
|
# of Dollars Voted |
% of Dollars Voted |
Peter S. Lynch
|
Affirmative |
2,997,391,112.97 |
97.929 |
|
Withheld |
63,401,400.39 |
2.071 |
|
TOTAL |
3,060,792,513.36 |
100.000 |
William O. McCoy
|
Affirmative |
2,997,364,420.76 |
97.928 |
|
Withheld |
63,428,092.60 |
2.072 |
|
TOTAL |
3,060,792,513.36 |
100.000 |
Gerald C. McDonough
|
Affirmative |
2,992,594,911.89 |
97.772 |
|
Withheld |
68,197,601.47 |
2.228 |
|
TOTAL |
3,060,792,513.36 |
100.000 |
Marvin L. Mann
|
Affirmative |
2,996,491,839.67 |
97.899 |
|
Withheld |
64,300,673.69 |
2.101 |
|
TOTAL |
3,060,792,513.36 |
100.000 |
Robert C. Pozen
|
Affirmative |
2,997,304,419.99 |
97.926 |
|
Withheld |
63,488,093.37 |
2.074 |
|
TOTAL |
3,060,792,513.36 |
100.000 |
Thomas R. Williams
|
Affirmative |
2,993,561,996.24 |
97.803 |
|
Withheld |
67,230,517.12 |
2.197 |
|
TOTAL |
3,060,792,513.36 |
100.000 |
Semiannual Report
PROPOSAL 2
To ratify the selection of PricewaterhouseCoopers LLP as independent accountants of the fund.
|
|
# of Dollars Voted |
% of Dollars Voted |
|
Affirmative |
152,524,752.89 |
95.370 |
|
Against |
1,456,201.90 |
0.911 |
|
Abstain |
5,947,746.88 |
3.719 |
|
TOTAL |
159,928,701.67 |
100.000 |
PROPOSAL 3
To authorize the Trustees to adopt an amended and restated Declaration of Trust.*
|
|
# of Dollars Voted |
% of Dollars Voted |
|
Affirmative |
2,837,267,199.92 |
92.697 |
|
Against |
49,473,422.32 |
1.617 |
|
Abstain |
174,051,891.12 |
5.686 |
|
TOTAL |
3,060,792,513.36 |
100.000 |
PROPOSAL 4
To approve an amended management contract for the fund that would reduce the management fee payable to FMR by the fund as FMR's assets under management increase.
|
|
# of Dollars Voted |
% of Dollars Voted |
|
Affirmative |
149,727,278.77 |
93.621 |
|
Against |
2,405,860.33 |
1.505 |
|
Abstain |
7,795,562.57 |
4.874 |
|
TOTAL |
159,928,701.67 |
100.000 |
PROPOSAL 5
To amend the fundamental limitation concerning underwriting.
|
|
# of Dollars Voted |
% of Dollars Voted |
|
Affirmative |
147,993,847.24 |
92.537 |
|
Against |
3,567,046.24 |
2.231 |
|
Abstain |
8,367,808.19 |
5.232 |
|
TOTAL |
159,928,701.67 |
100.000 |
PROPOSAL 6
To amend the fundamental limitation concerning concentration.
|
|
# of Dollars Voted |
% of Dollars Voted |
|
Affirmative |
147,959,308.60 |
92.516 |
|
Against |
3,629,590.53 |
2.269 |
|
Abstain |
8,339,802.54 |
5.215 |
|
TOTAL |
159,928,701.67 |
100.000 |
* Denotes trust-wide proposals and voting results.
Mid Cap Portfolio
Performance
There are several ways to evaluate a fund's historical performance. You can look at the total percentage change in value, the average annual percentage change or the growth of a hypothetical $10,000 investment. Total return reflects the change in the value of an investment, assuming reinvestment of the fund's dividend income and capital gains (the profits earned upon the sale of securities that have grown in value).
Average Annual Total Returns
|
Periods ended |
Past 1 |
Past 5 |
Past 10 |
|
Fidelity VIP: Growth - Initial Class |
26.26% |
25.56% |
20.08% |
|
Russell 3000 ® Growth |
25.86% |
27.43% |
19.49% |
Average annual returns take the fund's cumulative return and show you what would have happened if the fund had performed at a constant rate each year.
You can compare the fund's returns to the performance of the Russell 3000 Growth Index - a market capitalization-weighted index of growth-oriented stocks of U.S. domiciled corporations. This benchmark reflects the reinvestment of dividends and capital gains, if any.
Figures for more than one year assume a steady compounded rate of return and are not the fund's year-by-year results, which fluctuated over the periods shown.
Performance numbers are net of all fund operating expenses, but do not include any insurance charges imposed by your insurance company's separate account. If performance information included the effect of these additional charges, the total returns would have been lower.
Past performance is no guarantee of future results. Principal and investment return will vary and you may have a gain or loss when you withdraw your money.
Understanding Performance
How a fund did yesterday is no guarantee of how it will do tomorrow. The stock market, for example, has a history of long-term growth and short-term volatility. In turn, the share price and return of a fund that invests in stocks will vary. That means if you sell your shares during a market downturn, you might lose money. But if you can ride out the market's ups and downs, you may have a gain.
3$10,000 Over 10 Years

$10,000 Over 10 Years: Let's say hypothetically that $10,000 was invested in Fidelity Variable Insurance Products: Growth Portfolio - Initial Class on June 30, 1990. As the chart shows, by June 30, 2000, the value of the investment would have grown to $62,339 - a 523.39% increase on the initial investment. For comparison, look at how the Russell 3000 Growth Index did over the same period. With dividends and capital gains, if any, reinvested, the same $10,000 investment would have grown to $59,313 - a 493.13% increase.
Investment Summary
|
Top Five Stocks as of June 30, 2000 |
|
|
|
% of fund's |
|
Cisco Systems, Inc. |
4.5 |
|
Intel Corp. |
4.4 |
|
Pfizer, Inc. |
3.6 |
|
General Electric Co. |
2.9 |
|
Eli Lilly & Co. |
2.6 |
|
|
18.0 |
|
Top Five Market Sectors as of June 30, 2000 |
|
|
|
% of fund's |
|
Technology |
42.6 |
|
Health |
14.9 |
|
Finance |
8.3 |
|
Media & Leisure |
6.9 |
|
Utilities |
6.5 |
|
Asset Allocation as of June 30, 2000 |
||
|
% of fund's net assets * |
|
Stocks 98.4% |
|
|
|
Short-Term |
|
|

|
* Foreign investments 11.4% |
Semiannual Report
(Portfolio Manager photograph)
An interview with Jennifer Uhrig, Portfolio Manager of Growth Portfolio
Q. How did the fund perform, Jennifer?
A. Pretty well. For the six months that ended June 30, 2000, the fund posted a higher return than the Russell 3000 Growth Index, which returned 4.04%. For the 12 months that ended June 30, 2000, the fund also outperformed the index, which returned 25.86%.
Q. The period was marked by a high degree of volatility within the technology sector. How did this affect the fund?
A. Technology stocks performed well during the first half of the period, but succumbed to investor fears during much of the second as high valuations succumbed to the effects of higher interest rates, and the group suffered a significant downturn. The fund was underweighted in technology stocks relative to the Russell index, but nonetheless had just under 43% of its net assets in the sector at the end of the period. Many of its technology names were of the small-cap variety, and these stocks were among the hardest hit during the technology slide. On the plus side, the fund's positions in communications equipment providers such as Nokia and Ericsson helped. These stocks typically trade in line with technology, so their solid performance during the period was a pleasant surprise.
Q. Despite the volatility, some of the fund's bigger-cap technology names fared well . . .
A. The fund's stakes in market leaders such as Cisco Systems, EMC Corp. and Intel generated nice results. Cisco - the main player in the Internet infrastructure area - performed well on the heels of accelerating earnings and revenue growth. EMC, which specializes in data storage, also enjoyed strong earnings growth, and Intel benefited from a shortage of high-end microprocessors. Microsoft was one big-cap that didn't come through, however, as its performance was hampered by both the ongoing federal government case against it and a slowdown in the company's applications business. Microsoft also was in the process of implementing a new Internet strategy, and its success is yet to be proven.
Q. What other types of stocks contributed positively?
A. The fund's investments in the oil services group - including names such as Baker Hughes, Halliburton and Smith International - performed well. Oil prices remained at relatively high levels during the period, which made the return on exploration quite attractive. In addition, we've seen lower levels of exploration in recent years, indicating that activity will need to pick up in order to meet production estimates. These companies - which sell the equipment used to drill for oil - were in a solid position to benefit from this environment. Finally, the fund's underweighting in consumer nondurables positions worked out well relative to the index.
Q. At just under 15%, health stocks occupied the second-largest position - after technology - in the portfolio. How did this group perform?
A. The fund's health-related investments were spread mostly among drug and biotechnology stocks, and each group performed well. Drug stocks Eli Lilly - which had eight drugs in the latter stages of development - and Warner-Lambert were among the fund's better performers. Biotechnology stocks - particularly those involved in the field of human genomics - fell along with technology in April, but enjoyed a fairly good rebound as we closed the period. The fund's positions in Millennium Pharmaceuticals and Genentech provided a favorable boost.
Q. What's your outlook?
A. Technology has been the key market driver for some time, and the sector has been very unpredictable. Performance has bounced around depending on whether technology stocks have had a good week or a bad week. Earnings growth continues to be strong for technology, so the sector could do well if the economy slows and interest rates stabilize. Outside of technology, the key economic question is whether we're in for a soft landing - in which the economy slows, but in a gradual fashion - or a hard landing, which could translate into a recession. Obviously, a soft landing would be better. More stocks outside of tech could participate, and economically sensitive stocks would stand a chance. If we see a hard landing, I may look to add to the fund's consumer nondurables positions or to the drug stocks, both of which tend to perform well going into a recession.
The views expressed in this report reflect those of the portfolio manager only through the end of the period of the report as stated on the cover. The manager's views are subject to change at any time based on market or other conditions. For more information, see page 2.
Fund Facts
Goal: to increase the value of the fund's shares over the long term by investing in stocks with above-average growth potential
Start date: October 9, 1986
Size: as of June 30, 2000, more than $20.2 billion
Manager: Jennifer Uhrig, since 1997; joined Fidelity in 1987
3Semiannual Report
Fidelity Variable Insurance Products: Growth Portfolio
(Unaudited)
Showing Percentage of Net Assets
|
Common Stocks - 98.4% |
|||
|
Shares |
Value (Note 1) |
||
|
AEROSPACE & DEFENSE - 0.7% |
|||
|
BFGoodrich Co. |
657,900 |
$ 22,409,719 |
|
|
Boeing Co. |
1,827,800 |
76,424,888 |
|
|
Textron, Inc. |
31,600 |
1,716,275 |
|
|
United Technologies Corp. |
822,200 |
48,407,025 |
|
|
|
148,957,907 |
||
|
BASIC INDUSTRIES - 1.3% |
|||
|
Chemicals & Plastics - 0.2% |
|||
|
Cytec Industries, Inc. (a) |
888,200 |
21,927,438 |
|
|
Lyondell Chemical Co. |
1,473,400 |
24,679,450 |
|
|
|
46,606,888 |
||
|
Metals & Mining - 0.4% |
|||
|
CommScope, Inc. (a) |
1,266,100 |
51,910,100 |
|
|
Falconbridge Ltd. |
802,500 |
9,892,351 |
|
|
Inco Ltd. (a) |
1,402,000 |
21,496,386 |
|
|
Martin Marietta Materials, Inc. |
143,900 |
5,818,956 |
|
|
|
89,117,793 |
||
|
Packaging & Containers - 0.2% |
|||
|
Owens-Illinois, Inc. (a) |
3,285,700 |
38,401,619 |
|
|
Paper & Forest Products - 0.5% |
|||
|
Kimberly-Clark Corp. |
1,625,400 |
93,257,325 |
|
|
TOTAL BASIC INDUSTRIES |
267,383,625 |
||
|
CONSTRUCTION & REAL ESTATE - 0.3% |
|||
|
Building Materials - 0.1% |
|||
|
Vulcan Materials Co. |
350,200 |
14,949,163 |
|
|
Engineering - 0.2% |
|||
|
Fluor Corp. |
583,770 |
18,461,726 |
|
|
Stolt Offshore SA (a) |
1,551,600 |
21,916,350 |
|
|
Stolt Offshore SA Class A sponsored ADR (a) |
206,050 |
2,446,844 |
|
|
|
42,824,920 |
||
|
TOTAL CONSTRUCTION & REAL ESTATE |
57,774,083 |
||
|
DURABLES - 0.8% |
|||
|
Consumer Durables - 0.0% |
|||
|
Minnesota Mining & Manufacturing Co. |
55,400 |
4,570,500 |
|
|
Consumer Electronics - 0.7% |
|||
|
Gemstar International Group Ltd. (a) |
872,300 |
53,605,561 |
|
|
Pioneer Corp. |
190,000 |
7,401,434 |
|
|
Sanyo Electric Co. Ltd. |
822,000 |
7,396,605 |
|
|
Sony Corp. |
837,300 |
78,967,860 |
|
|
|
147,371,460 |
||
|
|
|||
|
Shares |
Value (Note 1) |
||
|
Textiles & Apparel - 0.1% |
|||
|
Shaw Industries, Inc. |
1,045,400 |
$ 13,067,500 |
|
|
TOTAL DURABLES |
165,009,460 |
||
|
ENERGY - 3.5% |
|||
|
Energy Services - 2.3% |
|||
|
Baker Hughes, Inc. |
3,032,770 |
97,048,640 |
|
|
BJ Services Co. (a) |
635,700 |
39,731,250 |
|
|
Coflexip SA sponsored ADR |
928,500 |
56,174,250 |
|
|
Global Industries Ltd. (a) |
406,300 |
7,668,913 |
|
|
Halliburton Co. |
2,470,100 |
116,557,844 |
|
|
Smith International, Inc. (a) |
868,950 |
63,270,422 |
|
|
Varco International, Inc. (a) |
1,295,500 |
30,120,375 |
|
|
Weatherford International, Inc. |
1,328,840 |
52,904,443 |
|
|
|
463,476,137 |
||
|
Oil & Gas - 1.2% |
|||
|
Apache Corp. |
679,200 |
39,945,450 |
|
|
Burlington Resources, Inc. |
676,400 |
25,872,300 |
|
|
Grant Prideco, Inc. (a) |
1,328,840 |
33,221,000 |
|
|
National-Oilwell, Inc. (a) |
1,050,000 |
34,518,750 |
|
|
Newfield Exploration Co. (a) |
1,396,300 |
54,630,238 |
|
|
Noble Affiliates, Inc. |
1,435,000 |
53,453,750 |
|
|
|
241,641,488 |
||
|
TOTAL ENERGY |
705,117,625 |
||
|
FINANCE - 8.3% |
|||
|
Banks - 0.9% |
|||
|
Bank One Corp. |
5,755,590 |
152,882,859 |
|
|
Chuo Mitsui Trust & Banking Co. Ltd. |
3,483,000 |
15,177,760 |
|
|
Sumitomo Trust & Banking Ltd. |
2,482,000 |
17,675,062 |
|
|
|
185,735,681 |
||
|
Credit & Other Finance - 1.2% |
|||
|
American Express Co. |
1,696,600 |
88,435,275 |
|
|
Associates First Capital Corp. Class A |
3,188,900 |
71,152,331 |
|
|
Citigroup, Inc. |
1,278,100 |
77,005,525 |
|
|
|
236,593,131 |
||
|
Federal Sponsored Credit - 1.3% |
|||
|
Fannie Mae |
3,578,100 |
186,732,094 |
|
|
Freddie Mac |
1,969,500 |
79,764,750 |
|
|
|
266,496,844 |
||
|
Insurance - 3.3% |
|||
|
Ace Ltd. |
2,117,000 |
59,276,000 |
|
|
AFLAC, Inc. |
881,600 |
40,498,500 |
|
|
Allmerica Financial Corp. |
657,910 |
34,458,036 |
|
|
AMBAC Financial Group, Inc. |
435,400 |
23,865,363 |
|
|
American International Group, Inc. |
1,682,031 |
197,638,643 |
|
|
Everest Re Group Ltd. |
1,198,800 |
39,410,550 |
|
|
Hartford Financial Services Group, Inc. |
143,200 |
8,010,250 |
|
|
Marsh & McLennan Companies, Inc. |
569,600 |
59,487,600 |
|
|
PartnerRe Ltd. |
1,170,500 |
41,479,594 |
|
|
Common Stocks - continued |
|||
|
Shares |
Value (Note 1) |
||
|
FINANCE - continued |
|||
|
Insurance - continued |
|||
|
The Chubb Corp. |
1,051,200 |
$ 64,648,800 |
|
|
XL Capital Ltd. Class A |
1,922,400 |
104,049,900 |
|
|
|
672,823,236 |
||
|
Securities Industry - 1.6% |
|||
|
Charles Schwab Corp. |
3,193,650 |
107,386,481 |
|
|
Daiwa Securities Group, Inc. |
5,334,000 |
70,435,770 |
|
|
Nikko Securities Co. Ltd. |
5,626,000 |
55,718,735 |
|
|
Nomura Securities Co. Ltd. |
3,836,000 |
93,891,911 |
|
|
|
327,432,897 |
||
|
TOTAL FINANCE |
1,689,081,789 |
||
|
HEALTH - 14.9% |
|||
|
Drugs & Pharmaceuticals - 13.3% |
|||
|
Abgenix, Inc. (a) |
466,671 |
55,934,894 |
|
|
Alkermes, Inc. (a) |
1,152,700 |
54,320,988 |
|
|
American Home Products Corp. |
1,349,200 |
79,265,500 |
|
|
Bristol-Myers Squibb Co. |
5,479,300 |
319,169,225 |
|
|
Cambridge Antibody Technology Group PLC (a) |
598,796 |
26,887,857 |
|
|
Elan Corp. PLC sponsored ADR (a) |
2,800,400 |
135,644,375 |
|
|
Eli Lilly & Co. |
5,317,800 |
531,115,275 |
|
|
Exelixis, Inc. |
534,300 |
17,832,263 |
|
|
Genentech, Inc. |
791,300 |
136,103,600 |
|
|
Human Genome Sciences, Inc. (a) |
525,300 |
70,061,888 |
|
|
Medarex, Inc. (a) |
598,600 |
50,581,700 |
|
|
Merck & Co., Inc. |
2,394,800 |
183,501,550 |
|
|
Millennium Pharmaceuticals, Inc. (a) |
913,240 |
102,168,725 |
|
|
Pfizer, Inc. |
15,050,025 |
722,401,200 |
|
|
Protein Design Labs, Inc. (a) |
140,600 |
23,192,409 |
|
|
Schering-Plough Corp. |
3,671,970 |
185,434,485 |
|
|
|
2,693,615,934 |
||
|
Medical Equipment & Supplies - 1.2% |
|||
|
Cardinal Health, Inc. |
1,739,400 |
128,715,600 |
|
|
Johnson & Johnson |
697,400 |
71,047,625 |
|
|
Medtronic, Inc. |
858,600 |
42,769,013 |
|
|
|
242,532,238 |
||
|
Medical Facilities Management - 0.4% |
|||
|
HCA - The Healthcare Co. |
1,859,800 |
56,491,425 |
|
|
HEALTHSOUTH Corp. (a) |
2,273,300 |
16,339,344 |
|
|
|
72,830,769 |
||
|
TOTAL HEALTH |
3,008,978,941 |
||
|
|
|||
|
Shares |
Value (Note 1) |
||
|
INDUSTRIAL MACHINERY & EQUIPMENT - 3.0% |
|||
|
Electrical Equipment - 2.9% |
|||
|
Capstone Turbine Corp. |
11,400 |
$ 513,713 |
|
|
General Electric Co. |
11,108,200 |
588,734,600 |
|
|
|
589,248,313 |
||
|
Industrial Machinery & Equipment - 0.1% |
|||
|
ASM Lithography Holding NV (a) |
255,000 |
11,251,875 |
|
|
TOTAL INDUSTRIAL MACHINERY & EQUIPMENT |
600,500,188 |
||
|
MEDIA & LEISURE - 6.9% |
|||
|
Broadcasting - 4.2% |
|||
|
AT&T Corp. - Liberty Media Group Class A (a) |
2,554,380 |
61,943,715 |
|
|
Clear Channel Communications, Inc. (a) |
1,191,300 |
89,347,500 |
|
|
Comcast Corp. Class A (special) (a) |
2,027,300 |
82,105,650 |
|
|
Cox Communications, Inc. Class A (a) |
1,380,400 |
62,894,475 |
|
|
EchoStar Communications Corp. |
1,538,800 |
50,948,706 |
|
|
Mediacom Communications Corp. |
1,151,200 |
17,699,700 |
|
|
MediaOne Group, Inc. (a) |
2,421,600 |
160,585,377 |
|
|
NTL, Inc. (a) |
647,594 |
38,774,691 |
|
|
Time Warner, Inc. |
2,574,468 |
195,659,568 |
|
|
UnitedGlobalCom, Inc. Class A (a) |
928,200 |
43,393,350 |
|
|
USA Networks, Inc. (a) |
2,526,700 |
54,639,888 |
|
|
|
857,992,620 |
||
|
Entertainment - 0.9% |
|||
|
Viacom, Inc. Class B (non-vtg.) (a) |
1,750,025 |
119,329,830 |
|
|
Walt Disney Co. |
1,500,600 |
58,242,038 |
|
|
|
177,571,868 |
||
|
Leisure Durables & Toys - 0.2% |
|||
|
Harley-Davidson, Inc. |
1,293,100 |
49,784,350 |
|
|
Restaurants - 1.6% |
|||
|
Brinker International, Inc. (a) |
1,974,900 |
57,765,825 |
|
|
Darden Restaurants, Inc. |
2,937,700 |
47,737,625 |
|
|
McDonald's Corp. |
3,556,900 |
117,155,394 |
|
|
Outback Steakhouse, Inc. (a) |
2,031,250 |
59,414,063 |
|
|
Tricon Global Restaurants, Inc. (a) |
834,760 |
23,581,970 |
|
|
Wendy's International, Inc. |
838,100 |
14,928,656 |
|
|
|
320,583,533 |
||
|
TOTAL MEDIA & LEISURE |
1,405,932,371 |
||
|
NONDURABLES - 4.0% |
|||
|
Beverages - 1.4% |
|||
|
Coca-Cola Enterprises, Inc. |
2,170,300 |
35,403,019 |
|
|
Pepsi Bottling Group, Inc. |
2,176,500 |
63,526,594 |
|
|
The Coca-Cola Co. |
3,240,600 |
186,131,963 |
|
|
|
285,061,576 |
||
|
Common Stocks - continued |
|||
|
Shares |
Value (Note 1) |
||
|
NONDURABLES - continued |
|||
|
Foods - 0.4% |
|||
|
American Italian Pasta Co. Class A (a) |
642,000 |
$ 13,281,375 |
|
|
Keebler Foods Co. |
1,651,762 |
61,321,664 |
|
|
|
74,603,039 |
||
|
Household Products - 1.0% |
|||
|
Clorox Co. |
1,788,200 |
80,133,713 |
|
|
Colgate-Palmolive Co. |
578,800 |
34,655,650 |
|
|
Procter & Gamble Co. |
1,701,360 |
97,402,860 |
|
|
|
212,192,223 |
||
|
Tobacco - 1.2% |
|||
|
Philip Morris Companies, Inc. |
9,198,800 |
244,343,125 |
|
|
TOTAL NONDURABLES |
816,199,963 |
||
|
PRECIOUS METALS - 0.4% |
|||
|
Barrick Gold Corp. |
1,434,000 |
25,909,828 |
|
|
Homestake Mining Co. |
2,249,300 |
15,463,938 |
|
|
Newmont Mining Corp. |
1,472,000 |
31,832,000 |
|
|
Placer Dome, Inc. |
1,426,100 |
13,389,254 |
|
|
TOTAL PRECIOUS METALS |
86,595,020 |
||
|
RETAIL & WHOLESALE - 4.2% |
|||
|
Drug Stores - 0.4% |
|||
|
Walgreen Co. |
2,329,560 |
74,982,713 |
|
|
General Merchandise Stores - 1.4% |
|||
|
Kohls Corp. (a) |
1,211,100 |
67,367,438 |
|
|
Wal-Mart Stores, Inc. |
3,864,300 |
222,680,288 |
|
|
|
290,047,726 |
||
|
Grocery Stores - 0.4% |
|||
|
Safeway, Inc. (a) |
1,715,200 |
77,398,400 |
|
|
Retail & Wholesale, Miscellaneous - 2.0% |
|||
|
Best Buy Co., Inc. (a) |
1,651,000 |
104,425,750 |
|
|
Home Depot, Inc. |
4,848,350 |
242,114,478 |
|
|
Tiffany & Co., Inc. |
876,700 |
59,177,250 |
|
|
|
405,717,478 |
||
|
TOTAL RETAIL & WHOLESALE |
848,146,317 |
||
|
SERVICES - 0.3% |
|||
|
Advertising - 0.2% |
|||
|
TMP Worldwide, Inc. (a) |
527,000 |
38,899,188 |
|
|
Services - 0.1% |
|||
|
Media Metrix, Inc. (a) |
453,100 |
11,525,731 |
|
|
Register.com, Inc. |
257,300 |
7,863,731 |
|
|
|
19,389,462 |
||
|
TOTAL SERVICES |
58,288,650 |
||
|
|
|||
|
Shares |
Value (Note 1) |
||
|
TECHNOLOGY - 42.6% |
|||
|
Communications Equipment - 11.0% |
|||
|
ADC Telecommunications, Inc. (a) |
1,574,400 |
$ 132,052,800 |
|
|
Advanced Fibre |
332,100 |
15,048,281 |
|
|
Aspect Communications Corp. (a) |
701,700 |
27,585,581 |
|
|
Ciena Corp. (a) |
674,000 |
112,347,375 |
|
|
Cisco Systems, Inc. (a) |
14,336,200 |
911,244,690 |
|
|
Comverse Technology, Inc. (a) |
742,500 |
69,052,500 |
|
|
Corning, Inc. |
710,900 |
191,854,138 |
|
|
Ditech Communications Corp. |
490,700 |
46,401,819 |
|
|
Lucent Technologies, Inc. |
5,005,635 |
296,583,874 |
|
|
Nokia AB sponsored ADR |
2,526,800 |
126,182,075 |
|
|
Nortel Networks Corp. |
3,470,160 |
240,719,643 |
|
|
Telefonaktiebolaget LM Ericsson sponsored ADR |
3,149,200 |
62,984,000 |
|
|
|
2,232,056,776 |
||
|
Computer Services & Software - 7.3% |
|||
|
Adobe Systems, Inc. |
571,400 |
74,282,000 |
|
|
Affymetrix, Inc. (a) |
324,900 |
53,649,113 |
|
|
Art Technology Group, Inc. |
742,100 |
74,905,719 |
|
|
Automatic Data Processing, Inc. |
1,415,500 |
75,817,719 |
|
|
BEA Systems, Inc. (a) |
1,548,050 |
76,531,722 |
|
|
BroadVision, Inc. (a) |
1,454,300 |
73,896,619 |
|
|
Citrix Systems, Inc. (a) |
32,100 |
607,894 |
|
|
Data Return Corp. |
130,300 |
3,778,700 |
|
|
Digex, Inc. Class A (c) |
1,235,800 |
83,957,163 |
|
|
Electronic Arts, Inc. (a) |
984,000 |
71,770,500 |
|
|
Healtheon/WebMD (a) |
1,039,500 |
15,397,594 |
|
|
Inktomi Corp. (a) |
295,000 |
34,883,750 |
|
|
Intertrust Technologies Corp. |
874,400 |
17,979,850 |
|
|
Intuit, Inc. (a) |
2,675,600 |
110,702,950 |
|
|
Microsoft Corp. (a) |
2,735,523 |
218,841,840 |
|
|
Nuance Communications, Inc. |
219,500 |
18,287,094 |
|
|
Oracle Corp. (a) |
2,368,100 |
199,068,406 |
|
|
PeopleSoft, Inc. (a) |
846,600 |
14,180,550 |
|
|
Razorfish, Inc. Class A (a) |
524,200 |
8,419,963 |
|
|
Software.com, Inc. |
256,900 |
33,364,888 |
|
|
Trans Cosmos, Inc. |
153,800 |
23,094,662 |
|
|
Travelocity.com, Inc. (a) |
466,200 |
7,634,025 |
|
|
Usinternetworking, Inc. (a) |
573,800 |
11,727,038 |
|
|
VeriSign, Inc. (a) |
485,907 |
85,762,586 |
|
|
VERITAS Software Corp. (a) |
558,675 |
63,139,004 |
|
|
Viant Corp. |
179,300 |
5,311,763 |
|
|
Vignette Corp. (a) |
461,800 |
24,020,816 |
|
|
|
1,481,013,928 |
||
|
Computers & Office Equipment - 10.6% |
|||
|
Brocade Communications |
427,500 |
78,439,570 |
|
|
CDW Computer Centers, Inc. (a) |
1,554,400 |
97,150,000 |
|
|
Compaq Computer Corp. |
2,698,000 |
68,967,625 |
|
|
Common Stocks - continued |
|||
|
Shares |
Value (Note 1) |
||
|
TECHNOLOGY - continued |
|||
|
Computers & Office Equipment - continued |
|||
|
Dell Computer Corp. (a) |
6,459,900 |
$ 318,553,819 |
|
|
EMC Corp. (a) |
5,129,740 |
394,669,371 |
|
|
Gateway, Inc. (a) |
1,011,000 |
57,374,250 |
|
|
Hewlett-Packard Co. |
1,720,400 |
214,834,950 |
|
|
International Business Machines Corp. |
2,986,500 |
327,208,406 |
|
|
Lexmark International Group, Inc. |
742,800 |
49,953,300 |
|
|
MRV Communications, Inc. (a) |
1,744,800 |
117,337,800 |
|
|
SCI Systems, Inc. (a) |
1,534,500 |
60,133,219 |
|
|
Softbank Corp. |
429,900 |
58,390,495 |
|
|
Sun Microsystems, Inc. (a) |
3,416,100 |
310,651,594 |
|
|
|
2,153,664,399 |
||
|
Electronic Instruments - 1.1% |
|||
|
Agilent Technologies, Inc. |
1,702,760 |
125,578,550 |
|
|
Applied Materials, Inc. (a) |
736,300 |
66,727,188 |
|
|
Varian, Inc. (a) |
347,700 |
16,037,663 |
|
|
|
208,343,401 |
||
|
Electronics - 12.6% |
|||
|
Advanced Micro Devices, Inc. (a) |
565,000 |
43,646,250 |
|
|
Bookham Technology PLC sponsored ADR |
577,500 |
34,216,875 |
|
|
Broadcom Corp. Class A (a) |
396,000 |
86,699,250 |
|
|
Chartered Semiconductor |
888,500 |
79,965,000 |
|
|
Intel Corp. |
6,712,700 |
897,404,081 |
|
|
JDS Uniphase Corp. (a) |
1,341,200 |
160,776,350 |
|
|
Kyocera Corp. |
351,500 |
60,392,096 |
|
|
LSI Logic Corp. (a) |
1,405,900 |
76,094,338 |
|
|
Marvell Technology Group Ltd. (a) |
7,800 |
444,600 |
|
|
Micron Technology, Inc. (a) |
1,485,400 |
130,808,038 |
|
|
Mitsubishi Electric Corp. |
9,445,000 |
102,271,840 |
|
|
Motorola, Inc. |
3,130,200 |
90,971,438 |
|
|
PMC-Sierra, Inc. (a) |
291,000 |
51,707,063 |
|
|
Samsung Electronics Co. Ltd. |
170,080 |
56,285,311 |
|
|
Sanmina Corp. (a) |
1,014,700 |
86,756,850 |
|
|
SDL, Inc. (a) |
248,800 |
70,954,650 |
|
|
Stratos Lightwave, Inc. (a) |
8,100 |
225,788 |
|
|
Taiwan Semiconductor Manufacturing Co. Ltd. sponsored ADR (a) |
1,796,354 |
69,608,718 |
|
|
|
|||
|
Shares |
Value (Note 1) |
||
|
Texas Instruments, Inc. |
5,659,200 |
$ 388,716,300 |
|
|
Xilinx, Inc. (a) |
857,800 |
70,822,113 |
|
|
|
2,558,766,949 |
||
|
TOTAL TECHNOLOGY |
8,633,845,453 |
||
|
TRANSPORTATION - 0.7% |
|||
|
Air Transportation - 0.2% |
|||
|
Southwest Airlines Co. |
2,211,100 |
41,872,706 |
|
|
Railroads - 0.5% |
|||
|
Burlington Northern Santa Fe Corp. |
1,209,300 |
27,738,319 |
|
|
Canadian National Railway Co. |
1,458,980 |
42,473,514 |
|
|
Union Pacific Corp. |
684,000 |
25,436,250 |
|
|
|
95,648,083 |
||
|
TOTAL TRANSPORTATION |
137,520,789 |
||
|
UTILITIES - 6.5% |
|||
|
Cellular - 3.7% |
|||
|
AT&T Corp. - Wireless Group |
1,172,100 |
32,672,288 |
|
|
China Telecom (Hong Kong) Ltd. sponsored ADR (a) |
723,050 |
128,567,328 |
|
|
China Unicom Ltd. sponsored ADR |
2,673,200 |
56,805,500 |
|
|
Nextel Communications, Inc. Class A (a) |
1,992,200 |
121,897,738 |
|
|
Sprint Corp. - PCS Group Series 1 (a) |
1,787,180 |
106,337,210 |
|
|
Vodafone AirTouch PLC |
32,309,376 |
133,881,853 |
|
|
Vodafone AirTouch PLC sponsored ADR |
1,652,650 |
68,481,684 |
|
|
VoiceStream Wireless Corp. (a) |
874,073 |
101,651,958 |
|
|
|
750,295,559 |
||
|
Electric Utility - 0.8% |
|||
|
AES Corp. (a) |
2,006,000 |
91,523,750 |
|
|
Calpine Corp. (a) |
1,211,900 |
79,682,425 |
|
|
|
171,206,175 |
||
|
Telephone Services - 2.0% |
|||
|
DDI Corp. |
6,392 |
61,496,324 |
|
|
iBasis, Inc. |
468,100 |
20,157,556 |
|
|
McLeodUSA, Inc. Class A (a) |
3,343,800 |
69,174,863 |
|
|
Metromedia Fiber Network, Inc. |
2,442,800 |
96,948,625 |
|
|
NEXTLINK Communications, Inc. Class A |
1,691,593 |
64,174,809 |
|
|
Sprint Corp. - FON Group |
756,000 |
38,556,000 |
|
|
TeraBeam Networks (d) |
60,800 |
228,000 |
|
|
Time Warner Telecom, Inc. Class A |
784,500 |
50,502,188 |
|
|
|
401,238,365 |
||
|
TOTAL UTILITIES |
1,322,740,099 |
||
|
TOTAL COMMON STOCKS (Cost $14,218,076,542) |
19,952,072,280 |
||
|
Cash Equivalents - 3.7% |
|||
|
Shares |
Value (Note 1) |
||
|
Central Cash Collateral Fund, 6.71% (b) |
296,344,139 |
$ 296,344,139 |
|
|
Taxable Central Cash Fund, 6.59% (b) |
454,771,936 |
454,771,936 |
|
|
TOTAL CASH EQUIVALENTS (Cost $751,116,075) |
751,116,075 |
|
|
TOTAL INVESTMENT PORTFOLIO - 102.1% (Cost $14,969,192,617) |
20,703,188,355 |
|
|
NET OTHER ASSETS - (2.1)% |
(422,988,881) |
|
|
NET ASSETS - 100% |
$ 20,280,199,474 |
|
|
Legend |
|
(a) Non-income producing |
|
(b) The rate quoted is the annualized seven-day yield of the fund at |
|
(c) Transactions during the period with companies which are or were affiliates are as follows: |
|
Affiliate |
Purchase |
Sales |
Dividend |
Value |
|
Coflexip SA |
$ - |
$ - |
$ - |
$ - |
|
Digex, Inc. |
313,744 |
- |
- |
83,957,163 |
|
TOTALS |
$ 313,744 |
$ - |
$ - |
$ 83,957,163 |
|
(d) Restricted securities - Investment in securities not registered under the Securities Act of 1933. |
|
Additional information on each holding is as follows: |
|
Security |
Acquisition Date |
Acquisition Cost |
|
TeraBeam Networks |
4/7/00 |
$ 228,000 |
|
Other Information |
|
Purchases and sales of securities, other than short-term securities, aggregated $10,740,018,866 and $9,565,681,575, respectively. |
|
The fund placed a portion of its portfolio transactions with brokerage firms which are affiliates of Fidelity Management & Research Company. The commissions paid to these affiliated firms were $332,074 for the period. |
|
The fund invested in securities that are not registered under the Securities Act of 1933. These securities are subject to legal or contractual restrictions on resale. At the end of the period, restricted securities (excluding Rule 144A issues) amounted to $228,000 or 0.0% of net assets. |
|
The fund participated in the security lending program. At period end, the value of securities loaned amounted to $302,340,051. The fund received cash collateral of $296,344,139 which was invested in cash equivalents. |
|
The fund participated in the interfund lending program as a borrower. |
|
Distribution of investments by country of issue, as a percentage of total |
|
United States of America |
88.6% |
|
Japan |
3.2 |
|
Canada |
1.7 |
|
United Kingdom |
1.3 |
|
Others (individually less than 1%) |
5.2 |
|
|
100.0% |
|
Income Tax Information |
|
At June 30, 2000, the aggregate cost of investment securities for income tax purposes was $15,074,908,308. Net unrealized appreciation aggregated $5,628,280,047, of which $6,454,968,371 related to appreciated investment securities and $826,688,324 related to depreciated investment securities. |
See accompanying notes which are an integral part of the financial statements.
Growth Portfolio
Statement of Assets and Liabilities
|
|
June 30, 2000 (Unaudited) |
|
|
Assets |
|
|
|
Investment in securities, at value (cost $14,969,192,617) - |
|
$ 20,703,188,355 |
|
Receivable for investments sold |
|
154,406,528 |
|
Receivable for fund shares sold |
|
13,515,281 |
|
Dividends receivable |
|
13,538,228 |
|
Interest receivable |
|
1,031,263 |
|
Other receivables |
|
825,472 |
|
Total assets |
|
20,886,505,127 |
|
Liabilities |
|
|
|
Payable for investments purchased |
$ 288,895,972 |
|
|
Payable for fund shares redeemed |
10,484,314 |
|
|
Accrued management fee |
9,499,178 |
|
|
Distribution fees payable |
135,980 |
|
|
Other payables and |
946,070 |
|
|
Collateral on securities loaned, |
296,344,139 |
|
|
Total liabilities |
|
606,305,653 |
|
Net Assets |
|
$ 20,280,199,474 |
|
Net Assets consist of: |
|
|
|
Paid in capital |
|
$ 13,338,505,241 |
|
Distributions in excess of |
|
(3,734,826) |
|
Accumulated undistributed |
|
1,211,401,186 |
|
Net unrealized appreciation (depreciation) on investments |
|
5,734,027,873 |
|
Net Assets |
|
$ 20,280,199,474 |
|
Initial Class: |
|
$51.54 |
|
Service Class: |
|
$51.39 |
|
Service Class 2: |
|
$51.35 |
Statement of Operations
|
|
Six months ended June 30, 2000 (Unaudited) |
|
|
Investment Income Dividends |
|
$ 52,399,181 |
|
Interest |
|
4,779,796 |
|
Security lending |
|
1,284,282 |
|
Total income |
|
58,463,259 |
|
Expenses |
|
|
|
Management fee |
$ 54,947,825 |
|
|
Transfer agent fees |
6,350,319 |
|
|
Distribution fees |
652,691 |
|
|
Accounting and security lending fees |
641,945 |
|
|
Non-interested trustees' compensation |
68,264 |
|
|
Custodian fees and expenses |
339,442 |
|
|
Registration fees |
89,572 |
|
|
Audit |
46,992 |
|
|
Legal |
69,742 |
|
|
Interest |
6,948 |
|
|
Miscellaneous |
83,780 |
|
|
Total expenses before reductions |
63,297,520 |
|
|
Expense reductions |
(1,596,136) |
61,701,384 |
|
Net investment income (loss) |
|
(3,238,125) |
|
Realized and Unrealized Gain (Loss) Net realized gain (loss) on: |
|
|
|
Investment securities |
1,263,186,366 |
|
|
Foreign currency transactions |
270,216 |
1,263,456,582 |
|
Change in net unrealized appreciation (depreciation) on: |
|
|
|
Investment securities |
(303,021,726) |
|
|
Assets and liabilities in |
10,711 |
(303,011,015) |
|
Net gain (loss) |
|
960,445,567 |
|
Net increase (decrease) in net assets resulting from operations |
|
$ 957,207,442 |
|
Other Information Expense reductions |
|
$ 1,592,303 |
|
Custodian credits |
|
3,833 |
|
|
|
$ 1,596,136 |
See accompanying notes which are an integral part of the financial statements.
Semiannual Report
Fidelity Variable Insurance Products: Growth Portfolio
Financial Statements - continued
Statement of Changes in Net Assets
|
Increase (Decrease) in Net Assets |
Six months ended |
Year ended |
|
Operations |
$ (3,238,125) |
$ 19,639,750 |
|
Net realized gain (loss) |
1,263,456,582 |
2,028,922,212 |
|
Change in net unrealized appreciation (depreciation) |
(303,011,015) |
2,640,487,583 |
|
Net increase (decrease) in net assets resulting from operations |
957,207,442 |
4,689,049,545 |
|
Distributions to shareholders |
(20,008,543) |
(20,716,861) |
|
From net realized gain |
(2,010,393,014) |
(1,302,572,634) |
|
Total distributions |
(2,030,401,557) |
(1,323,289,495) |
|
Share transactions - net increase (decrease) |
3,294,652,295 |
3,313,015,561 |
|
Total increase (decrease) in net assets |
2,221,458,180 |
6,678,775,611 |
|
Net Assets |
|
|
|
Beginning of period |
18,058,741,294 |
11,379,965,683 |
|
End of period (including under (over) distribution of net investment income of $(3,734,826) |
$ 20,280,199,474 |
$ 18,058,741,294 |
|
|
|
Other Information: |
|
|
Six months ended June 30, 2000 |
Year ended |
||
|
|
Shares |
Dollars |
Shares |
Dollars |
|
Share transactions |
36,209,385 |
$ 1,867,900,668 |
82,051,942 |
$ 3,738,420,624 |
|
Reinvested |
38,128,847 |
1,912,161,690 |
31,299,165 |
1,303,923,236 |
|
Redeemed |
(26,208,895) |
(1,332,024,693) |
(51,848,071) |
(2,361,030,389) |
|
Net increase (decrease) |
48,129,337 |
$ 2,448,037,665 |
61,503,036 |
$ 2,681,313,471 |
|
Service Class |
14,784,762 |
$ 754,915,605 |
14,009,513 |
$ 648,480,975 |
|
Reinvested |
2,363,626 |
118,228,594 |
465,535 |
19,366,259 |
|
Redeemed |
(703,110) |
(35,750,550) |
(792,556) |
(36,145,144) |
|
Net increase (decrease) |
16,445,278 |
$ 837,393,649 |
13,682,492 |
$ 631,702,090 |
|
Service Class 2 A |
191,871 |
$ 9,432,086 |
- |
$ - |
|
Reinvested |
225 |
11,274 |
- |
- |
|
Redeemed |
(4,542) |
(222,379) |
- |
- |
|
Net increase (decrease) |
187,554 |
$ 9,220,981 |
- |
$ - |
|
Distributions |
|
$ 19,026,484 |
|
$ 20,413,671 |
|
Service Class |
|
981,965 |
|
303,190 |
|
Service Class 2 A |
|
94 |
|
- |
|
Total |
|
$ 20,008,543 |
|
$ 20,716,861 |
|
From net realized gain |
|
$ 1,893,135,205 |
|
$ 1,283,509,565 |
|
Service Class |
|
117,246,629 |
|
19,063,069 |
|
Service Class 2 A |
|
11,180 |
|
- |
|
Total |
|
$ 2,010,393,014 |
|
$ 1,302,572,634 |
|
|
|
$ 2,030,401,557 |
|
$ 1,323,289,495 |
A Service Class 2 commenced sale of shares January 12, 2000.
See accompanying notes which are an integral part of the financial statements.
Growth Portfolio
Financial Highlights - Initial Class
|
|
Six months ended |
Years ended December 31, |
||||
|
Selected Per-Share Data |
(Unaudited) |
1999 |
1998 |
1997 |
1996 |
1995 |
|
Net asset value, beginning of period |
$ 54.93 |
$ 44.87 |
$ 37.10 |
$ 31.14 |
$ 29.20 |
$ 21.69 |
|
Income from Investment Operations |
|
|
|
|
|
|
|
Net investment income (loss) |
(.01) D |
.07 D |
.08 D |
.20 D |
.22 |
.08 |
|
Net realized and unrealized gain (loss) |
2.65 |
15.10 |
12.85 |
6.91 |
3.82 |
7.55 |
|
Total from investment operations |
2.64 |
15.17 |
12.93 |
7.11 |
4.04 |
7.63 |
|
Less Distributions |
|
|
|
|
|
|
|
From net investment income |
(.06) |
(.08) |
(.19) |
(.21) |
(.08) |
(.12) |
|
From net realized gain |
(5.97) |
(5.03) |
(4.97) |
(.94) |
(2.02) |
- |
|
Total distributions |
(6.03) |
(5.11) |
(5.16) |
(1.15) |
(2.10) |
(.12) |
|
Net asset value, end of period |
$ 51.54 |
$ 54.93 |
$ 44.87 |
$ 37.10 |
$ 31.14 |
$ 29.20 |
|
Total Return B, C |
5.11% |
37.44% |
39.49% |
23.48% |
14.71% |
35.36% |
|
Ratios and Supplemental Data |
|
|
|
|
|
|
|
Net assets, end of period (000 omitted) |
$ 18,566,075 |
$ 17,142,411 |
$ 11,243,824 |
$ 7,727,132 |
$ 6,086,424 |
$ 4,162,702 |
|
Ratio of expenses to average net assets |
.65% A |
.66% |
.68% |
.69% |
.69% |
.70% |
|
Ratio of expenses to average net assets after |
.64% A, F |
.65% F |
.66% F |
.67% F |
.67% F |
.70% |
|
Ratio of net investment income (loss) to average net assets |
(.03)% A |
.14% |
.21% |
.58% |
.81% |
.37% |
|
Portfolio turnover |
101% A |
84% |
123% |
113% |
81% |
108% |
Financial Highlights - Service Class
|
|
Six months ended |
Years ended December 31, |
||
|
Selected Per-Share Data |
(Unaudited) |
1999 |
1998 |
1997 E |
|
Net asset value, beginning of period |
$ 54.80 |
$ 44.82 |
$ 37.09 |
$ 36.92 |
|
Income from Investment Operations |
|
|
|
|
|
Net investment income (loss) D |
(.03) |
.02 |
.06 |
.03 |
|
Net realized and unrealized gain (loss) |
2.64 |
15.07 |
12.83 |
.14 |
|
Total from investment operations |
2.61 |
15.09 |
12.89 |
.17 |
|
Less Distributions |
|
|
|
|
|
From net investment income |
(.05) |
(.08) |
(.19) |
- |
|
From net realized gain |
(5.97) |
(5.03) |
(4.97) |
- |
|
Total distributions |
(6.02) |
(5.11) |
(5.16) |
- |
|
Net asset value, end of period |
$ 51.39 |
$ 54.80 |
$ 44.82 |
$ 37.09 |
|
Total Return B, C |
5.06% |
37.29% |
39.38% |
.46% |
|
Ratios and Supplemental Data |
|
|
|
|
|
Net assets, end of period (000 omitted) |
$ 1,704,494 |
$ 916,330 |
$ 136,142 |
$ 2,015 |
|
Ratio of expenses to average net assets |
.76% A |
.77% |
.80% |
.79% A |
|
Ratio of expenses to average net assets after expense reductions |
.74% A, F |
.75% F |
.75% F |
.77% A, F |
|
Ratio of net investment income (loss) to average net assets |
(.13)% A |
.04% |
.15% |
.70% A |
|
Portfolio turnover |
101% A |
84% |
123% |
113% |
|
A Annualized B Total returns for periods of less than one year are not annualized and do not reflect charges attributable to your insurance company's separate account. Inclusion of these charges would reduce the total returns shown. C The total returns would have been lower had certain expenses not been reduced during the periods shown. D Net investment income (loss) per share has been calculated based on average shares outstanding during the period. E For the period November 3, 1997 (commencement of sale of Service Class shares) to December 31, 1997. F FMR or the fund has entered into varying arrangements with third parties who either paid or reduced a portion of the class' expenses. |
||||
See accompanying notes which are an integral part of the financial statements.
Semiannual Report
Financial Highlights - Service Class 2
|
|
Six months ended |
|
Selected Per-Share Data |
(Unaudited) |
|
Net asset value, beginning of period |
$ 53.40 |
|
Income from Investment Operations |
|
|
Net investment income (loss) D |
(.07) |
|
Net realized and unrealized gain (loss) |
4.04 |
|
Total from investment operations |
3.97 |
|
Less Distributions |
|
|
From net investment income |
(.05) |
|
From net realized gain |
(5.97) |
|
Total distributions |
(6.02) |
|
Net asset value, end of period |
$ 51.35 |
|
Total Return B, C |
7.74% |
|
Ratios and Supplemental Data |
|
|
Net assets, end of period (000 omitted) |
$ 9,630 |
|
Ratio of expenses to average net assets |
.94% A |
|
Ratio of expenses to average net assets after expense reductions |
.92% A, F |
|
Ratio of net investment income (loss) to average net assets |
(.31)% A |
|
Portfolio turnover |
101% A |
|
A Annualized B Total returns for periods of less than one year are not annualized and do not reflect charges attributable to your insurance company's separate account. Inclusion of these charges would reduce the total returns shown. C The total returns would have been lower had certain expenses not been reduced during the periods shown. D Net investment income (loss) per share has been calculated based on average shares outstanding during the period. E For the period January 12, 2000 (commencement of sale of Service Class 2 shares) to June 30, 2000. F FMR or the fund has entered into varying arrangements with third parties who either paid or reduced a portion of the class' expenses. |
|
See accompanying notes which are an integral part of the financial statements.
Growth Portfolio
Performance
There are several ways to evaluate a fund's historical performance. You can look at the total percentage change in value, the average annual percentage change or the growth of a hypothetical $10,000 investment. Total return reflects the change in the value of an investment, assuming reinvestment of the fund's dividend income and capital gains (the profits earned upon the sale of securities that have grown in value).
Average Annual Total Returns
|
Periods ended |
Past 1 |
Past 5 |
Life of |
|
Fidelity® VIP: Contrafund - |
10.22% |
21.82% |
24.63% |
|
S&P 500 ® |
7.25% |
23.80% |
25.60% |
Average annual returns take the fund's cumulative return and show you what would have happened if the fund had performed at a constant rate each year.
You can compare the fund's return to the performance of the Standard & Poor's 500 SM Index - a market capitalization-weighted index of common stocks. This benchmark reflects the reinvestment of dividends and capital gains, if any.
Figures for more than one year assume a steady compounded rate of return and are not the fund's year-by-year results, which fluctuated over the periods shown. The life of the fund figures are from commencement of operations, January 3, 1995.
Performance numbers are net of all fund operating expenses, but do not include any insurance charges imposed by your insurance company's separate account. If performance information included the effect of these additional charges, the total return would be lower.
Past performance is no guarantee of future results. Principal and investment return will vary and you may have a gain or loss when you withdraw your money.
Understanding Performance
How a fund did yesterday is no guarantee of how it will do tomorrow. The stock market, for example, has a history of long-term growth and short-term volatility. In turn, the share price and return of a fund that invests in stocks will vary. That means if you sell your shares during a market downturn, you might lose money. But if you can ride out the market's ups and downs, you may have a gain.
3$10,000 Over Life of Fund
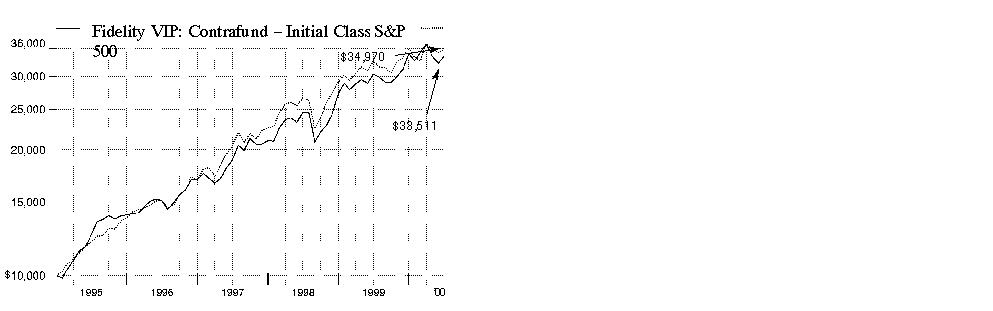
$10,000 Over Life of Fund: Let's say hypothetically that $10,000 was invested in Fidelity® Variable Insurance Products: Contrafund Portfolio Initial Class on January 3, 1995, when the fund started. As the chart shows, by June 30, 2000, the value of the investment would have grown to $33,511 - a 235.11% increase on the initial investment. For comparison, look at how the Standard & Poor's 500 Index did over the same period. With dividends and capital gains, if any, reinvested, the same $10,000 investment would have grown to $34,970 - a 249.70% increase.
Investment Summary
|
Top Five Stocks as of June 30, 2000 |
|
|
|
% of fund's |
|
Cisco Systems, Inc. |
4.3 |
|
Viacom, Inc. Class B (non-vtg.) |
4.1 |
|
McDonald's Corp. |
2.9 |
|
BP Amoco PLC sponsored ADR |
1.9 |
|
Exxon Mobil Corp. |
1.8 |
|
|
15.0 |
|
Top Five Market Sectors as of June 30, 2000 |
|
|
|
% of fund's |
|
Technology |
23.9 |
|
Media & Leisure |
13.0 |
|
Finance |
12.0 |
|
Utilities |
9.6 |
|
Energy |
7.1 |
|
Asset Allocation as of June 30, 2000 |
|||
|
% of fund's net assets * |
|||
|
Stocks and |
|
|
|
Bonds 2.3% |
|
|
|
Short-Term Investments |
|
|

|
* Foreign investments 15.5% |
Semiannual Report
(Portfolio Manager photograph)
An interview with Will Danoff, Portfolio Manager of Contrafund
Q. How did the fund perform, Will?
A. Performance was disappointing. For the six months that ended June 30, 2000, the fund trailed the Standard & Poor's 500 Index, which returned -0.42%. For the 12 months that ended June 30, 2000, the fund's performance topped the S&P 500, which returned 7.25%.
Q. What factors influenced the fund's performance during the six-month period?
A. The biggest drag on performance was the fund's low weighting in health stocks relative to the S&P 500. I kept the fund's exposure to the group at around half that of the index because the growth rates for health stocks were slowing. Health stocks rebounded during the period - returning around 25% - and the fund's low weighting ultimately hurt. Technology stocks, which accounted for approximately one-third of the S&P 500 at the end of the period, also played a key role. At the beginning of the period, I was concerned about high valuations and excessive speculation throughout the sector. As a result, I kept the fund underweighted relative to the index, and my decision to do so worked out well as technology stock prices corrected during April and May.
Q. What was your strategy in terms of the fund's technology investments?
A. I firmly believe that the Internet will be a major growth engine of the world economy for years to come. Dot-com stocks had been a major driver behind the market since mid-1998, but many of them were selling at valuations that drastically exceeded their potential earnings growth rates. When Internet stocks declined, the whole sector followed suit. At that time, I upgraded the fund's technology holdings by adding to its positions in leading technology names such as Cisco Systems and Nortel Networks, as well as emerging-but-profitable leaders such as Brocade Communications and Broadcom. These companies were well-positioned to benefit from the continued buildout of the Internet infrastructure. While the fund's investments in semiconductor names such as Micron Technology and Texas Instruments performed well during the period, a higher weighting in technology overall would have helped performance.
Q. The fund's emphasis on media and leisure stocks helped performance. Can you elaborate?
A. I viewed media stocks as beneficiaries of the Internet tidal wave, because I felt the Internet would serve as a significant outlet for media companies' content. Unlike many of the new dot-com companies, traditional media companies were producing positive earnings and cash flow. By investing in these stocks, the fund participated in the Internet investment theme, but with its risk limited by the real earnings and cash flow from these companies. This strategy proved wise, as the fund's investments in Time Warner and Viacom were particularly lucrative during the period. Consolidation also was prevalent throughout the media group, as America Online announced its intent to aquire Time Warner in January, and the Viacom-CBS merger produced better-than-expected results.
Q. Which stocks were disappointing?
A. McDonald's was a disappointment. I was initially attracted to the stock as a turnaround story, but the company's sales during the period were weaker than I had hoped. Rising interest rates hurt the stock of Home Depot, but the company continued to execute well and remained a core holding. Microsoft performed poorly during the period, as the ongoing federal government antitrust suit against the company and slowing revenue growth hurt its stock.
Q. What's your outlook?
A. The market remains extremely expensive. Price-to-earnings (P/E) ratios - which tell investors how much they're paying for a company's earnings power - have risen dramatically during the period and currently stand at almost twice their 75-year average. Corporate earnings thus far in 2000 have been very good - S&P earnings for the first quarter of 2000 were up 29% - but they may slow considering the six interest-rate hikes we've seen over the past year. Inflation is rising, but it remains under control. Against this uncertain backdrop, I'll try to concentrate on finding high-quality companies that are gaining market share, have sustainable competitive advantages and are in growing markets.
The views expressed in this report reflect those of the portfolio manager only through the end of the period of the report as stated on the cover. The manager's views are subject to change at any time based on market or other conditions. For more information, see page 2.
Fund Facts
Goal: long term capital appreciation
Start date: January 3, 1995
Size: as of June 30, 2000, more than
$10.2 billion
Manager: Will Danoff, since inception; joined Fidelity in 1986
3Semiannual Report
Fidelity Variable Insurance Products: Contrafund Portfolio
(Unaudited)
Showing Percentage of Net Assets
|
Common Stocks - 90.0% |
|||
|
Shares |
Value (Note 1) |
||
|
AEROSPACE & DEFENSE - 0.2% |
|||
|
Aerospace & Defense - 0.1% |
|||
|
Boeing Co. |
21,980 |
$ 919,039 |
|
|
Bombardier, Inc. Class B (non-vtg.) |
237,100 |
6,437,974 |
|
|
Northrop Grumman Corp. |
18,600 |
1,232,250 |
|
|
United Technologies Corp. |
21,701 |
1,277,646 |
|
|
|
9,866,909 |
||
|
Ship Building & Repair - 0.1% |
|||
|
General Dynamics Corp. |
186,200 |
9,728,950 |
|
|
TOTAL AEROSPACE & DEFENSE |
19,595,859 |
||
|
BASIC INDUSTRIES - 0.8% |
|||
|
Chemicals & Plastics - 0.6% |
|||
|
Avery Dennison Corp. |
332,400 |
22,312,350 |
|
|
Pharmacia Corp. |
373,500 |
19,305,281 |
|
|
Sealed Air Corp. (a) |
41,900 |
2,194,513 |
|
|
Spartech Corp. |
172,600 |
4,660,200 |
|
|
Valspar Corp. |
404,200 |
13,641,750 |
|
|
|
62,114,094 |
||
|
Metals & Mining - 0.2% |
|||
|
Alcoa, Inc. |
246,200 |
7,139,800 |
|
|
Broken Hill Proprietary Co. Ltd. |
791,982 |
9,335,716 |
|
|
|
16,475,516 |
||
|
Paper & Forest Products - 0.0% |
|||
|
Bowater, Inc. |
6,500 |
286,813 |
|
|
TOTAL BASIC INDUSTRIES |
78,876,423 |
||
|
CONSTRUCTION & REAL ESTATE - 0.5% |
|||
|
Building Materials - 0.1% |
|||
|
Fastenal Co. |
101,600 |
5,143,500 |
|
|
Fortune Brands, Inc. |
230,500 |
5,315,906 |
|
|
|
10,459,406 |
||
|
Construction - 0.1% |
|||
|
Ashtead Group PLC |
24,700 |
35,971 |
|
|
Jacobs Engineering Group, Inc. (a) |
290,530 |
9,496,699 |
|
|
|
9,532,670 |
||
|
Engineering - 0.0% |
|||
|
360networks, Inc. (sub. vtg.) |
220,400 |
3,379,318 |
|
|
Tetra Tech, Inc. (a) |
9,100 |
208,163 |
|
|
|
3,587,481 |
||
|
Real Estate - 0.0% |
|||
|
ResortQuest International, Inc. (a) |
192,100 |
984,513 |
|
|
Real Estate Investment Trusts - 0.3% |
|||
|
Equity Office Properties Trust |
448,600 |
12,364,538 |
|
|
Equity Residential Properties Trust (SBI) |
115,100 |
5,294,600 |
|
|
Glenborough Realty Trust, Inc. |
213,600 |
3,724,650 |
|
|
|
|||
|
Shares |
Value (Note 1) |
||
|
Pinnacle Holdings, Inc. (a) |
93,900 |
$ 5,070,600 |
|
|
Spieker Properties, Inc. |
46,600 |
2,143,600 |
|
|
|
28,597,988 |
||
|
TOTAL CONSTRUCTION & REAL ESTATE |
53,162,058 |
||
|
DURABLES - 3.4% |
|||
|
Autos, Tires, & Accessories - 2.2% |
|||
|
Danaher Corp. |
837,422 |
41,400,050 |
|
|
Gentex Corp. (a) |
172,700 |
4,339,088 |
|
|
Goodyear Tire & Rubber Co. |
22,500 |
450,000 |
|
|
Lear Corp. (a) |
190,800 |
3,816,000 |
|
|
Midas, Inc. |
304,800 |
6,096,000 |
|
|
Sonic Automotive, Inc. Class A (a) |
50,000 |
534,375 |
|
|
SPX Corp. |
1,053,141 |
127,364,240 |
|
|
Toyota Motor Corp. |
305,000 |
13,895,020 |
|
|
TRW, Inc. |
612,500 |
26,567,188 |
|
|
|
224,461,961 |
||
|
Consumer Durables - 0.1% |
|||
|
Blyth, Inc. |
69,000 |
2,035,500 |
|
|
Boyds Collection, Ltd. (a) |
408,500 |
3,472,250 |
|
|
|
5,507,750 |
||
|
Consumer Electronics - 1.1% |
|||
|
General Motors Corp. Class H (a) |
232,100 |
20,366,775 |
|
|
Harman International Industries, Inc. |
461,000 |
28,121,000 |
|
|
Pioneer Corp. |
402,000 |
15,659,876 |
|
|
Sony Corp. |
499,700 |
47,127,958 |
|
|
|
111,275,609 |
||
|
Home Furnishings - 0.0% |
|||
|
Herman Miller, Inc. |
86,900 |
2,248,538 |
|
|
The Bombay Company, Inc. (a) |
429,100 |
1,260,481 |
|
|
|
3,509,019 |
||
|
Textiles & Apparel - 0.0% |
|||
|
Delta Woodside Industries |
88,700 |
194,031 |
|
|
Timberland Co. Class A (a) |
7,600 |
538,175 |
|
|
Warnaco Group, Inc. Class A |
571,100 |
4,426,025 |
|
|
|
5,158,231 |
||
|
TOTAL DURABLES |
349,912,570 |
||
|
ENERGY - 7.1% |
|||
|
Energy Services - 0.5% |
|||
|
Baker Hughes, Inc. |
432,000 |
13,824,000 |
|
|
ENSCO International, Inc. |
107,100 |
3,835,519 |
|
|
Global Marine, Inc. |
117,300 |
3,306,394 |
|
|
Hanover Compressor Co. (a) |
225,100 |
8,553,800 |
|
|
Schlumberger Ltd. (NY Shares) |
286,600 |
21,387,525 |
|
|
|
50,907,238 |
||
|
Oil & Gas - 6.6% |
|||
|
Alberta Energy Co. Ltd. |
1,046,700 |
42,278,055 |
|
|
Common Stocks - continued |
|||
|
Shares |
Value (Note 1) |
||
|
ENERGY - continued |
|||
|
Oil & Gas - continued |
|||
|
Apache Corp. |
402,000 |
$ 23,642,625 |
|
|
BP Amoco PLC sponsored ADR |
3,497,532 |
197,829,154 |
|
|
Canada Occidental Petroleum Ltd. |
559,700 |
15,178,625 |
|
|
Canadian Natural Resources Ltd. (a) |
168,930 |
4,906,444 |
|
|
Chevron Corp. |
408,600 |
34,654,388 |
|
|
Cooper Cameron Corp. (a) |
22,900 |
1,511,400 |
|
|
Devon Energy Corp. |
36,640 |
2,058,710 |
|
|
EOG Resources, Inc. |
416,600 |
13,956,100 |
|
|
Exxon Mobil Corp. |
2,329,171 |
182,839,924 |
|
|
Newfield Exploration Co. (a) |
174,100 |
6,811,663 |
|
|
Royal Dutch Petroleum Co. (NY Shares) |
534,900 |
32,929,781 |
|
|
Santa Fe Snyder Corp. (a) |
257,300 |
2,926,788 |
|
|
Suncor Energy, Inc. |
1,445,940 |
33,401,653 |
|
|
Talisman Energy, Inc. (a) |
186,300 |
6,172,249 |
|
|
Tosco Corp. |
651,000 |
18,431,438 |
|
|
TotalFinaElf SA sponsored ADR |
526,823 |
40,466,592 |
|
|
Vastar Resources, Inc. |
261,200 |
21,451,050 |
|
|
|
681,446,639 |
||
|
TOTAL ENERGY |
732,353,877 |
||
|
FINANCE - 12.0% |
|||
|
Banks - 1.6% |
|||
|
Bank of New York Co., Inc. |
476,900 |
22,175,850 |
|
|
Bank One Corp. |
1,587,400 |
42,165,313 |
|
|
Commerce Bancorp, Inc. |
32,000 |
1,472,000 |
|
|
Fifth Third Bancorp |
250,800 |
15,863,100 |
|
|
Firstar Corp. |
806,100 |
16,978,481 |
|
|
M&T Bank Corp. |
33,230 |
14,953,500 |
|
|
Mellon Financial Corp. |
137,700 |
5,017,444 |
|
|
Northern Trust Corp. |
249,000 |
16,200,563 |
|
|
PNC Financial Services Group, Inc. |
74,400 |
3,487,500 |
|
|
Royal Bank of Scotland Group PLC |
704,573 |
11,821,340 |
|
|
Wells Fargo & Co. |
225,400 |
8,734,250 |
|
|
|
158,869,341 |
||
|
Credit & Other Finance - 3.0% |
|||
|
American Express Co. |
964,700 |
50,284,988 |
|
|
Associates First Capital Corp. Class A |
2,427,604 |
54,165,914 |
|
|
Citigroup, Inc. |
2,820,000 |
169,905,000 |
|
|
Concord EFS, Inc. (a) |
144,500 |
3,757,000 |
|
|
Household International, Inc. |
578,700 |
24,052,219 |
|
|
MBNA Corp. |
93,100 |
2,525,338 |
|
|
|
304,690,459 |
||
|
Federal Sponsored Credit - 0.8% |
|||
|
Fannie Mae |
1,593,000 |
83,134,688 |
|
|
Freddie Mac |
62,800 |
2,543,400 |
|
|
|
85,678,088 |
||
|
Insurance - 4.5% |
|||
|
Ace Ltd. |
170,200 |
4,765,600 |
|
|
AFLAC, Inc. |
211,500 |
9,715,781 |
|
|
|
|||
|
Shares |
Value (Note 1) |
||
|
American International Group, Inc. |
1,303,156 |
$ 153,120,830 |
|
|
Berkshire Hathaway, Inc. Class A (a) |
1,683 |
90,545,400 |
|
|
Canada Life Financial Corp. |
210,300 |
4,275,603 |
|
|
CIGNA Corp. |
187,870 |
17,565,845 |
|
|
Everest Re Group Ltd. |
80,200 |
2,636,575 |
|
|
Hartford Financial Services Group, Inc. |
361,600 |
20,227,000 |
|
|
John Hancock Financial Services, Inc. |
37,600 |
890,650 |
|
|
Marsh & McLennan Companies, Inc. |
175,275 |
18,305,283 |
|
|
MetLife, Inc. |
3,458,700 |
72,848,869 |
|
|
Mutual Risk Management Ltd. |
24,200 |
418,963 |
|
|
PartnerRe Ltd. |
135,300 |
4,794,694 |
|
|
PMI Group, Inc. |
96,900 |
4,602,750 |
|
|
RenaissanceRe Holdings Ltd. |
128,500 |
5,597,781 |
|
|
The Chubb Corp. |
267,300 |
16,438,950 |
|
|
The St. Paul Companies, Inc. |
151,500 |
5,169,938 |
|
|
XL Capital Ltd. Class A |
442,500 |
23,950,313 |
|
|
Zenith National Insurance Corp. |
127,700 |
2,713,625 |
|
|
|
458,584,450 |
||
|
Savings & Loans - 0.5% |
|||
|
Golden West Financial Corp. |
1,330,500 |
54,301,031 |
|
|
TCF Financial Corp. |
55,200 |
1,417,950 |
|
|
|
55,718,981 |
||
|
Securities Industry - 1.6% |
|||
|
AXA Financial, Inc. |
20,600 |
700,400 |
|
|
Daiwa Securities Group, Inc. |
5,186,000 |
68,481,421 |
|
|
Morgan Stanley Dean Witter & Co. |
125,500 |
10,447,875 |
|
|
Nikko Securities Co. Ltd. |
3,741,000 |
37,050,086 |
|
|
Nomura Securities Co. Ltd. |
2,049,000 |
50,152,379 |
|
|
|
166,832,161 |
||
|
TOTAL FINANCE |
1,230,373,480 |
||
|
HEALTH - 7.0% |
|||
|
Drugs & Pharmaceuticals - 4.9% |
|||
|
Accredo Health, Inc. (a) |
6,500 |
224,656 |
|
|
Allergan, Inc. |
68,800 |
5,125,600 |
|
|
ALZA Corp. (a) |
18,700 |
1,105,638 |
|
|
Amgen, Inc. |
73,800 |
5,184,450 |
|
|
Cephalon, Inc. (a) |
41,500 |
2,484,813 |
|
|
COR Therapeutics, Inc. (a) |
18,600 |
1,586,813 |
|
|
Elan Corp. PLC sponsored ADR (a) |
502,000 |
24,315,625 |
|
|
Eli Lilly & Co. |
964,482 |
96,327,640 |
|
|
Forest Laboratories, Inc. (a) |
75,600 |
7,635,600 |
|
|
Genentech, Inc. |
334,460 |
57,527,120 |
|
|
Gilead Sciences, Inc. (a) |
37,200 |
2,645,850 |
|
|
Immunex Corp. (a) |
1,423,770 |
70,387,629 |
|
|
Medimmune, Inc. (a) |
74,700 |
5,527,800 |
|
|
Pfizer, Inc. |
3,194,575 |
153,339,600 |
|
|
Schering-Plough Corp. |
1,426,900 |
72,058,450 |
|
|
|
505,477,284 |
||
|
Common Stocks - continued |
|||
|
Shares |
Value (Note 1) |
||
|
HEALTH - continued |
|||
|
Medical Equipment & Supplies - 1.5% |
|||
|
Boston Scientific Corp. (a) |
132,800 |
$ 2,913,300 |
|
|
Cardinal Health, Inc. |
214,800 |
15,895,200 |
|
|
DENTSPLY International, Inc. |
91,000 |
2,803,938 |
|
|
Edwards Lifesciences Corp. (a) |
4,600 |
85,100 |
|
|
Guidant Corp. (a) |
37,838 |
1,872,981 |
|
|
Medtronic, Inc. |
949,300 |
47,287,006 |
|
|
Millipore Corp. |
130,300 |
9,821,363 |
|
|
MiniMed, Inc. (a) |
98,100 |
11,575,800 |
|
|
Novoste Corp. (a) |
52,800 |
3,220,800 |
|
|
Novoste Corp. (a)(d) |
167,000 |
10,187,000 |
|
|
ORATEC Interventions, Inc. |
67,400 |
2,249,475 |
|
|
Patterson Dental Co. (a) |
470,100 |
23,975,100 |
|
|
Priority Healthcare Corp. (a) |
7,100 |
527,619 |
|
|
Smith & Nephew PLC |
1,658,322 |
6,138,246 |
|
|
Varian Medical Systems, Inc. (a) |
425,500 |
16,647,688 |
|
|
|
155,200,616 |
||
|
Medical Facilities Management - 0.6% |
|||
|
Chronimed, Inc. |
2,100 |
15,488 |
|
|
HCA - The Healthcare Co. |
233,400 |
7,089,525 |
|
|
Health Management Associates, Inc. Class A (a) |
119,800 |
1,564,888 |
|
|
Oxford Health Plans, Inc. (a) |
205,200 |
4,886,325 |
|
|
UnitedHealth Group, Inc. |
484,900 |
41,580,175 |
|
|
Universal Health Services, Inc. |
40,700 |
2,665,850 |
|
|
|
57,802,251 |
||
|
TOTAL HEALTH |
718,480,151 |
||
|
INDUSTRIAL MACHINERY & EQUIPMENT - 1.5% |
|||
|
Electrical Equipment - 1.3% |
|||
|
Alcatel SA sponsored ADR |
617,150 |
41,040,475 |
|
|
Allen Telecom, Inc. (a) |
479,500 |
8,481,156 |
|
|
American Power Conversion Corp. (a) |
16,700 |
681,569 |
|
|
General Electric Co. |
381,300 |
20,208,900 |
|
|
Hutchison Whampoa Ltd. |
993,900 |
12,494,510 |
|
|
Koninklijke Philips Electronics NV |
414,200 |
19,674,500 |
|
|
Littelfuse, Inc. (a) |
3,700 |
181,300 |
|
|
Loral Space & Communications Ltd. (a) |
846,933 |
5,875,598 |
|
|
Pinnacle Systems (a) |
439,700 |
9,886,380 |
|
|
Rayovac Corp. (a) |
553,950 |
12,394,631 |
|
|
Roper Industries, Inc. |
118,700 |
3,041,688 |
|
|
|
133,960,707 |
||
|
Industrial Machinery & Equipment - 0.1% |
|||
|
Exide Corp. |
100 |
800 |
|
|
Mettler-Toledo International, Inc. (a) |
153,700 |
6,148,000 |
|
|
|
|||
|
Shares |
Value (Note 1) |
||
|
MSC Industrial Direct, Inc. (a) |
57,500 |
$ 1,203,906 |
|
|
Sandvik AB |
56,300 |
1,184,960 |
|
|
|
8,537,666 |
||
|
Pollution Control - 0.1% |
|||
|
Waste Management, Inc. |
387,600 |
7,364,400 |
|
|
TOTAL INDUSTRIAL MACHINERY & EQUIPMENT |
149,862,773 |
||
|
MEDIA & LEISURE - 13.0% |
|||
|
Broadcasting - 3.2% |
|||
|
American Tower Corp. Class A (a) |
2,553,250 |
106,438,609 |
|
|
AT&T Corp. - Liberty Media Group |
1,471,816 |
35,691,538 |
|
|
Carlton Communications PLC |
1,628,640 |
21,000,498 |
|
|
Clear Channel Communications, Inc. (a) |
148,700 |
11,152,500 |
|
|
Cox Radio, Inc. Class A (a) |
191,500 |
5,362,000 |
|
|
Grupo Televisa SA de CV |
139,200 |
9,596,100 |
|
|
Infinity Broadcasting Corp. Class A (a) |
2,899,160 |
105,638,143 |
|
|
Time Warner, Inc. |
337,903 |
25,680,628 |
|
|
Westwood One, Inc. |
263,800 |
9,002,175 |
|
|
|
329,562,191 |
||
|
Entertainment - 5.4% |
|||
|
Fox Entertainment Group, Inc. |
533,700 |
16,211,138 |
|
|
MGM Grand, Inc. |
317,200 |
10,190,050 |
|
|
Park Place Entertainment Corp. (a) |
922,700 |
11,245,406 |
|
|
Premier Parks, Inc. (a) |
553,900 |
12,601,225 |
|
|
Viacom, Inc.: |
|
|
|
|
Class A (a) |
475,100 |
32,484,963 |
|
|
Class B (non-vtg.) (a) |
6,230,551 |
424,845,696 |
|
|
Walt Disney Co. |
1,303,620 |
50,596,751 |
|
|
|
558,175,229 |
||
|
Leisure Durables & Toys - 0.5% |
|||
|
Callaway Golf Co. |
622,800 |
10,159,425 |
|
|
Harley-Davidson, Inc. |
794,600 |
30,592,100 |
|
|
Mattel, Inc. |
608,000 |
8,018,000 |
|
|
|
48,769,525 |
||
|
Lodging & Gaming - 0.3% |
|||
|
Aztar Corp. (a) |
57,500 |
891,250 |
|
|
Starwood Hotels & Resorts |
911,100 |
29,667,694 |
|
|
|
30,558,944 |
||
|
Publishing - 0.5% |
|||
|
Harte Hanks Communications, Inc. |
19,500 |
487,500 |
|
|
McGraw-Hill Companies, Inc. |
280,900 |
15,168,600 |
|
|
PRIMEDIA, Inc. (a) |
275,200 |
6,260,800 |
|
|
Reader's Digest Association, Inc. |
653,640 |
25,982,190 |
|
|
United News & Media PLC |
90,900 |
1,310,005 |
|
|
|
49,209,095 |
||
|
Restaurants - 3.1% |
|||
|
CEC Entertainment, Inc. (a) |
196,000 |
5,022,500 |
|
|
Common Stocks - continued |
|||
|
Shares |
Value (Note 1) |
||
|
MEDIA & LEISURE - continued |
|||
|
Restaurants - continued |
|||
|
McDonald's Corp. |
9,129,400 |
$ 300,699,613 |
|
|
Outback Steakhouse, Inc. (a) |
45,350 |
1,326,488 |
|
|
Pizzaexpress PLC |
20,902 |
200,080 |
|
|
PJ America, Inc. (a)(c) |
581,700 |
5,671,575 |
|
|
Ryan's Family Steak Houses, Inc. (a) |
188,500 |
1,590,469 |
|
|
|
314,510,725 |
||
|
TOTAL MEDIA & LEISURE |
1,330,785,709 |
||
|
NONDURABLES - 3.0% |
|||
|
Foods - 1.9% |
|||
|
Booker PLC (a) |
2,151,689 |
4,724,802 |
|
|
Earthgrains Co. |
840,100 |
16,329,444 |
|
|
General Mills, Inc. |
264,200 |
10,105,650 |
|
|
Keebler Foods Co. |
859,200 |
31,897,800 |
|
|
Nestle SA (Reg.) |
7,933 |
15,859,200 |
|
|
PepsiCo, Inc. |
548,700 |
24,382,856 |
|
|
Quaker Oats Co. |
846,000 |
63,555,750 |
|
|
Sysco Corp. |
394,400 |
16,614,100 |
|
|
Wm. Wrigley Jr. Co. |
80,700 |
6,471,131 |
|
|
|
189,940,733 |
||
|
Household Products - 1.1% |
|||
|
Avon Products, Inc. |
1,140,300 |
50,743,350 |
|
|
Colgate-Palmolive Co. |
936,400 |
56,066,950 |
|
|
Estee Lauder Companies, Inc. |
182,400 |
9,017,400 |
|
|
Yankee Candle Co., Inc. |
61,800 |
1,336,425 |
|
|
|
117,164,125 |
||
|
TOTAL NONDURABLES |
307,104,858 |
||
|
PRECIOUS METALS - 0.9% |
|||
|
Barrick Gold Corp. |
2,174,060 |
39,281,395 |
|
|
Franco Nevada Mining Corp. Ltd. |
1,499,464 |
17,319,037 |
|
|
Gold Fields Ltd. |
932,600 |
3,658,873 |
|
|
Newmont Mining Corp. |
773,100 |
16,718,288 |
|
|
Placer Dome, Inc. |
1,698,845 |
15,949,980 |
|
|
|
92,927,573 |
||
|
RETAIL & WHOLESALE - 4.6% |
|||
|
Apparel Stores - 0.8% |
|||
|
Charming Shoppes, Inc. (a) |
1,479,600 |
7,536,713 |
|
|
Claire's Stores, Inc. |
304,800 |
5,867,400 |
|
|
Talbots, Inc. |
344,700 |
18,936,956 |
|
|
The Limited, Inc. |
783,800 |
16,949,675 |
|
|
|
|||
|
Shares |
Value (Note 1) |
||
|
TJX Companies, Inc. |
1,762,400 |
$ 33,045,000 |
|
|
Venator Group, Inc. (a) |
2,300 |
23,575 |
|
|
|
82,359,319 |
||
|
Drug Stores - 1.6% |
|||
|
CVS Corp. |
3,220,202 |
128,808,080 |
|
|
Rite Aid Corp. |
173,400 |
1,137,938 |
|
|
Walgreen Co. |
1,136,600 |
36,584,313 |
|
|
|
166,530,331 |
||
|
General Merchandise Stores - 0.5% |
|||
|
Costco Wholesale Corp. (a) |
415,400 |
13,708,200 |
|
|
Dollar Tree Stores, Inc. (a) |
173,450 |
6,862,116 |
|
|
JCPenney Co., Inc. |
651,700 |
12,015,719 |
|
|
Kohls Corp. (a) |
232,500 |
12,932,813 |
|
|
Michaels Stores, Inc. (a) |
74,300 |
3,403,869 |
|
|
Stein Mart, Inc. (a) |
241,400 |
2,474,350 |
|
|
Tuesday Morning Corp. (a) |
250,900 |
2,634,450 |
|
|
|
54,031,517 |
||
|
Grocery Stores - 0.2% |
|||
|
Fleming Companies, Inc. |
556,356 |
7,267,400 |
|
|
Iceland Group PLC |
470,067 |
1,987,743 |
|
|
Krispy Kreme Doughnuts, Inc. |
6,500 |
477,750 |
|
|
Safeway PLC |
1,616,114 |
6,300,727 |
|
|
|
16,033,620 |
||
|
Retail & Wholesale, Miscellaneous - 1.5% |
|||
|
Bed Bath & Beyond, Inc. (a) |
856,100 |
31,033,625 |
|
|
Best Buy Co., Inc. (a) |
382,400 |
24,186,800 |
|
|
Good Guys, Inc. (a) |
28,700 |
104,038 |
|
|
Guitar Center, Inc. (a) |
18,200 |
191,100 |
|
|
Home Depot, Inc. |
1,625,290 |
81,162,919 |
|
|
Staples, Inc. (a) |
1,420,350 |
21,837,881 |
|
|
|
158,516,363 |
||
|
TOTAL RETAIL & WHOLESALE |
477,471,150 |
||
|
SERVICES - 1.0% |
|||
|
Advertising - 0.5% |
|||
|
Getty Images, Inc. (a) |
48,200 |
1,786,413 |
|
|
Interpublic Group of Companies, Inc. |
55,700 |
2,395,100 |
|
|
Omnicom Group, Inc. |
194,240 |
17,299,500 |
|
|
TMP Worldwide, Inc. (a) |
8,300 |
612,644 |
|
|
Young & Rubicam, Inc. |
499,300 |
28,553,719 |
|
|
|
50,647,376 |
||
|
Educational Services - 0.0% |
|||
|
Apollo Group, Inc. Class A (a) |
70,700 |
1,979,600 |
|
|
Printing - 0.1% |
|||
|
Reynolds & Reynolds Co. Class A |
134,000 |
2,445,500 |
|
|
Valassis Communications, Inc. (a) |
32,700 |
1,246,688 |
|
|
|
3,692,188 |
||
|
Services - 0.4% |
|||
|
Carlisle Holdings Ltd. (a) |
205,500 |
1,509,141 |
|
|
Gartner Group, Inc. Class B (a) |
38,777 |
382,923 |
|
|
Common Stocks - continued |
|||
|
Shares |
Value (Note 1) |
||
|
SERVICES - continued |
|||
|
Services - continued |
|||
|
Learning Tree International, Inc. (a) |
2,800 |
$ 171,500 |
|
|
NOVA Corp. (a) |
312,600 |
8,733,263 |
|
|
Professional Detailing, Inc. (a) |
9,500 |
323,594 |
|
|
Robert Half International, Inc. (a) |
130,000 |
3,705,000 |
|
|
Storagenetworks, Inc. |
5,400 |
487,350 |
|
|
True North Communications |
58,100 |
2,556,400 |
|
|
Viad Corp. |
967,812 |
26,372,877 |
|
|
|
44,242,048 |
||
|
TOTAL SERVICES |
100,561,212 |
||
|
TECHNOLOGY - 23.9% |
|||
|
Communications Equipment - 7.3% |
|||
|
ADC Telecommunications, Inc. (a) |
552,700 |
46,357,713 |
|
|
Advanced Fibre |
24,400 |
1,105,625 |
|
|
Andrew Corp. (a) |
111,000 |
3,725,438 |
|
|
Centillium Communications, Inc. (a) |
14,400 |
993,600 |
|
|
Ciena Corp. (a) |
37,800 |
6,300,788 |
|
|
Cisco Systems, Inc. (a) |
6,866,788 |
436,470,182 |
|
|
Comverse Technology, Inc. (a) |
41,600 |
3,868,800 |
|
|
Corning, Inc. |
275,700 |
74,404,538 |
|
|
Jabil Circuit, Inc. (a) |
73,600 |
3,652,400 |
|
|
NEC Corp. |
210,000 |
6,595,926 |
|
|
Nokia AB sponsored ADR |
1,072,400 |
53,552,975 |
|
|
Nortel Networks Corp. |
1,352,190 |
93,799,333 |
|
|
Plantronics, Inc. (a) |
56,600 |
6,537,300 |
|
|
Tellabs, Inc. (a) |
239,500 |
16,390,781 |
|
|
|
753,755,399 |
||
|
Computer Services & Software - 5.1% |
|||
|
Adobe Systems, Inc. |
1,016,100 |
132,093,000 |
|
|
Amdocs Ltd. (a) |
170,200 |
13,062,850 |
|
|
Art Technology Group, Inc. |
15,700 |
1,584,719 |
|
|
Automatic Data Processing, Inc. |
1,439,900 |
77,124,644 |
|
|
BEA Systems, Inc. (a) |
16,200 |
800,888 |
|
|
Black Box Corp. (a) |
203,600 |
16,119,394 |
|
|
BroadVision, Inc. (a) |
176,500 |
8,968,406 |
|
|
Ceridian Corp. (a) |
101,020 |
2,430,794 |
|
|
Computer Sciences Corp. (a) |
209,200 |
15,624,625 |
|
|
DST Systems, Inc. (a) |
136,700 |
10,406,288 |
|
|
E.piphany, Inc. |
37,200 |
3,987,375 |
|
|
Electronic Data Systems Corp. |
536,100 |
22,114,125 |
|
|
Exodus Communications, Inc. (a) |
107,900 |
4,970,144 |
|
|
Extensity, Inc. |
4,900 |
167,825 |
|
|
Fiserv, Inc. (a) |
101,800 |
4,402,850 |
|
|
Forsoft Ltd. (a)(c) |
831,800 |
6,446,450 |
|
|
Foundry Networks, Inc. |
90,600 |
9,966,000 |
|
|
Go2Net, Inc. (a) |
148,100 |
7,451,281 |
|
|
Infonet Services Corp. Class B |
361,320 |
4,313,258 |
|
|
Macromedia, Inc. (a) |
208,400 |
20,149,675 |
|
|
Mentor Graphics Corp. (a) |
230,400 |
4,579,200 |
|
|
Micromuse, Inc. (a) |
42,000 |
6,950,344 |
|
|
|
|||
|
Shares |
Value (Note 1) |
||
|
Microsoft Corp. (a) |
59,070 |
$ 4,725,600 |
|
|
National Computer Systems, Inc. |
130,500 |
6,427,125 |
|
|
National Instrument Corp. (a) |
28,500 |
1,243,313 |
|
|
Nuance Communications, Inc. |
43,200 |
3,599,100 |
|
|
Oracle Corp. (a) |
298,900 |
25,126,281 |
|
|
Paychex, Inc. |
61,500 |
2,583,000 |
|
|
Polycom, Inc. (a) |
127,250 |
11,973,430 |
|
|
Rational Software Corp. (a) |
413,600 |
38,438,950 |
|
|
SEI Investments Co. |
46,600 |
1,855,263 |
|
|
Siebel Systems, Inc. (a) |
74,900 |
12,250,831 |
|
|
Software.com, Inc. |
48,800 |
6,337,900 |
|
|
The Bisys Group (a) |
58,900 |
3,622,350 |
|
|
Unisys Corp. (a) |
1,682,358 |
24,499,338 |
|
|
VeriSign, Inc. (a) |
14,500 |
2,559,250 |
|
|
Vignette Corp. (a) |
16,900 |
879,064 |
|
|
webMethods, Inc. |
13,200 |
2,074,875 |
|
|
|
521,909,805 |
||
|
Computers & Office Equipment - 4.2% |
|||
|
Apple Computer, Inc. (a) |
199,300 |
10,438,338 |
|
|
Brocade Communications |
520,000 |
95,411,875 |
|
|
Canon, Inc. |
406,000 |
20,452,251 |
|
|
CDW Computer Centers, Inc. (a) |
61,700 |
3,856,250 |
|
|
Copper Mountain Networks, Inc. |
66,100 |
5,825,063 |
|
|
Dell Computer Corp. (a) |
432,100 |
21,307,931 |
|
|
Diebold, Inc. |
346,000 |
9,644,750 |
|
|
EMC Corp. (a) |
249,600 |
19,203,600 |
|
|
Extreme Networks, Inc. (a) |
22,300 |
2,352,650 |
|
|
Handspring, Inc. |
12,700 |
342,900 |
|
|
Hewlett-Packard Co. |
738,050 |
92,163,994 |
|
|
Insight Enterprises, Inc. (a) |
108,800 |
6,453,200 |
|
|
Juniper Networks, Inc. |
77,600 |
11,295,650 |
|
|
Network Appliance, Inc. (a) |
34,500 |
2,777,250 |
|
|
Oak Technology, Inc. (a) |
162,800 |
3,510,375 |
|
|
Palm, Inc. |
318,200 |
10,619,925 |
|
|
RSA Security, Inc. (a) |
82,800 |
5,733,900 |
|
|
Sun Microsystems, Inc. (a) |
851,700 |
77,451,469 |
|
|
Symbol Technologies, Inc. |
510,860 |
27,586,440 |
|
|
|
426,427,811 |
||
|
Electronic Instruments - 1.9% |
|||
|
Agilent Technologies, Inc. |
1,010,574 |
74,529,833 |
|
|
LAM Research Corp. (a) |
200 |
7,500 |
|
|
Lernout & Hauspie Speech |
129,600 |
5,710,500 |
|
|
Novellus Systems, Inc. (a) |
276,300 |
15,628,219 |
|
|
PerkinElmer, Inc. |
48,250 |
3,190,531 |
|
|
Tektronix, Inc. |
82,300 |
6,090,200 |
|
|
Teradyne, Inc. (a) |
143,800 |
10,569,300 |
|
|
Thermo Electron Corp. (a) |
1,149,050 |
24,201,866 |
|
|
Waters Corp. (a) |
480,600 |
59,984,888 |
|
|
|
199,912,837 |
||
|
Electronics - 5.4% |
|||
|
Altera Corp. (a) |
152,900 |
15,586,244 |
|
|
Common Stocks - continued |
|||
|
Shares |
Value (Note 1) |
||
|
TECHNOLOGY - continued |
|||
|
Electronics - continued |
|||
|
Amphenol Corp. Class A (a) |
62,100 |
$ 4,110,244 |
|
|
Analog Devices, Inc. (a) |
224,200 |
17,039,200 |
|
|
Arrow Electronics, Inc. (a) |
52,100 |
1,615,100 |
|
|
Broadcom Corp. Class A (a) |
94,900 |
20,777,169 |
|
|
Conexant Systems, Inc. (a) |
68,500 |
3,330,813 |
|
|
Fairchild Semiconductor |
62,000 |
2,511,000 |
|
|
Flextronics International Ltd. (a) |
178,000 |
12,226,375 |
|
|
Infineon Technologies AG |
561,500 |
44,498,875 |
|
|
Intel Corp. |
24,580 |
3,286,039 |
|
|
Intersil Holding Corp. Class A |
134,400 |
7,266,000 |
|
|
JDS Uniphase Corp. (a) |
50,900 |
6,101,638 |
|
|
Kyocera Corp. |
232,600 |
39,963,589 |
|
|
Linear Technology Corp. |
347,900 |
22,243,856 |
|
|
LSI Logic Corp. (a) |
152,400 |
8,248,650 |
|
|
Merix Corp. (a) |
20,700 |
972,900 |
|
|
Micron Technology, Inc. (a) |
1,457,600 |
128,359,900 |
|
|
Molex, Inc. Class A |
143,200 |
5,012,000 |
|
|
National Semiconductor Corp. (a) |
46,700 |
2,650,225 |
|
|
NVIDIA Corp. (a) |
277,600 |
17,644,950 |
|
|
Power-One, Inc. (a) |
45,500 |
5,184,156 |
|
|
Sanmina Corp. (a) |
130,600 |
11,166,300 |
|
|
STMicroelectronics NV (NY Shares) |
234,600 |
15,058,388 |
|
|
TDK Corp. |
67,000 |
9,631,013 |
|
|
Texas Instruments, Inc. |
1,479,200 |
101,602,550 |
|
|
Vitesse Semiconductor Corp. (a) |
280,800 |
20,656,350 |
|
|
Xilinx, Inc. (a) |
213,500 |
17,627,094 |
|
|
Zoran Corp. (a) |
162,400 |
10,708,250 |
|
|
|
555,078,868 |
||
|
TOTAL TECHNOLOGY |
2,457,084,720 |
||
|
TRANSPORTATION - 1.5% |
|||
|
Air Transportation - 0.5% |
|||
|
Continental Airlines, Inc. Class B (a) |
385,900 |
18,137,300 |
|
|
Ryanair Holdings PLC sponsored ADR (a) |
341,700 |
12,472,050 |
|
|
Southwest Airlines Co. |
1,265,387 |
23,963,266 |
|
|
|
54,572,616 |
||
|
Railroads - 0.1% |
|||
|
Canadian Pacific Ltd. |
245,200 |
6,359,797 |
|
|
Trucking & Freight - 0.9% |
|||
|
C.H. Robinson Worldwide, Inc. |
418,700 |
20,725,650 |
|
|
Expeditors International of |
229,400 |
10,896,500 |
|
|
Forward Air Corp. (a) |
17,200 |
688,000 |
|
|
Ocean Group PLC(OLD) |
1,781,680 |
29,460,613 |
|
|
|
|||
|
Shares |
Value (Note 1) |
||
|
Swift Transportation Co., Inc. (a) |
1,093,300 |
$ 15,306,200 |
|
|
United Parcel Service, Inc. Class B |
281,700 |
16,620,300 |
|
|
|
93,697,263 |
||
|
TOTAL TRANSPORTATION |
154,629,676 |
||
|
UTILITIES - 9.6% |
|||
|
Cellular - 4.8% |
|||
|
AT&T Corp. - Wireless Group |
939,700 |
26,194,138 |
|
|
China Telecom (Hong Kong) Ltd. sponsored ADR (a) |
37,300 |
6,632,406 |
|
|
Crown Castle International Corp. (a) |
494,800 |
18,060,200 |
|
|
Dobson Communications Corp. Class A |
69,600 |
1,339,800 |
|
|
Nextel Communications, Inc. Class A (a) |
1,869,900 |
114,414,506 |
|
|
NTT DoCoMo, Inc. |
1,141 |
30,887,287 |
|
|
Sprint Corp. - PCS Group Series 1 (a) |
2,093,000 |
124,533,500 |
|
|
Triton PCS Holdings, Inc. Class A |
439,730 |
25,394,408 |
|
|
Vodafone AirTouch PLC sponsored ADR |
3,203,400 |
132,740,888 |
|
|
VoiceStream Wireless Corp. (a) |
46,750 |
5,436,879 |
|
|
|
485,634,012 |
||
|
Electric Utility - 0.7% |
|||
|
AES Corp. (a) |
1,018,900 |
46,487,313 |
|
|
Calpine Corp. (a) |
130,700 |
8,593,525 |
|
|
DPL, Inc. |
68,800 |
1,509,300 |
|
|
Duke Energy Corp. |
128,400 |
7,238,550 |
|
|
Northern States Power Co. |
313,400 |
6,326,763 |
|
|
NRG Energy, Inc. |
248,100 |
4,527,825 |
|
|
|
74,683,276 |
||
|
Gas - 0.5% |
|||
|
Dynegy, Inc. Class A |
700,656 |
47,863,563 |
|
|
Enron Corp. |
61,300 |
3,953,850 |
|
|
|
51,817,413 |
||
|
Telephone Services - 3.6% |
|||
|
Allegiance Telecom, Inc. (a) |
231,280 |
14,801,920 |
|
|
BellSouth Corp. |
1,588,200 |
67,697,025 |
|
|
Cable & Wireless PLC sponsored ADR |
734,900 |
36,790,931 |
|
|
DDI Corp. |
2,103 |
20,232,598 |
|
|
Energis PLC (a) |
219,335 |
8,245,079 |
|
|
McLeodUSA, Inc. Class A (a) |
2,005,074 |
41,479,968 |
|
|
Metromedia Fiber Network, Inc. |
56,300 |
2,234,406 |
|
|
NEXTLINK Communications, Inc. Class A |
492,400 |
18,680,425 |
|
|
Nippon Telegraph & Telephone Corp. |
3,410 |
45,350,879 |
|
|
Qwest Communications |
889,944 |
44,219,093 |
|
|
SBC Communications, Inc. |
69,106 |
2,988,835 |
|
|
Common Stocks - continued |
|||
|
Shares |
Value (Note 1) |
||
|
UTILITIES - continued |
|||
|
Telephone Services - continued |
|||
|
Time Warner Telecom, Inc. Class A |
80,203 |
$ 5,163,068 |
|
|
U.S. WEST, Inc. |
730,400 |
62,631,800 |
|
|
|
370,516,027 |
||
|
TOTAL UTILITIES |
982,650,728 |
||
|
TOTAL COMMON STOCKS (Cost $7,454,454,140) |
9,235,832,817 |
||
|
U.S. Treasury Obligations - 2.3% |
|||||
|
Moody's Ratings (unaudited) |
Principal Amount |
|
|||
|
U.S. Treasury Bills, yield at date of purchase 5.6% to 5.62% 8/17/00 (e) |
- |
|
$ 2,000,000 |
1,985,950 |
|
|
U.S. Treasury Bonds: |
|
|
|
|
|
|
5.5% 8/15/28 |
Aaa |
|
22,500,000 |
20,636,775 |
|
|
6.125% 11/15/27 |
Aaa |
|
63,000,000 |
62,862,030 |
|
|
6.375% 8/15/27 |
Aaa |
|
66,000,000 |
67,969,440 |
|
|
6.5% 11/15/26 |
Aaa |
|
20,000,000 |
20,890,600 |
|
|
6.75% 8/15/26 |
Aaa |
|
9,900,000 |
10,653,291 |
|
|
6.875% 8/15/25 |
Aaa |
|
36,500,000 |
39,779,160 |
|
|
7.625% 2/15/25 |
Aaa |
|
9,500,000 |
11,233,750 |
|
|
TOTAL U.S. TREASURY OBLIGATIONS (Cost $235,882,664) |
236,010,996 |
||||
|
Cash Equivalents - 7.4% |
|||
|
Shares |
|
||
|
Central Cash Collateral Fund, 6.71% (b) |
125,228,100 |
125,228,100 |
|
|
Taxable Central Cash Fund, 6.59% (b) |
628,988,088 |
628,988,088 |
|
|
TOTAL CASH EQUIVALENTS (Cost $754,216,188) |
754,216,188 |
||
|
TOTAL INVESTMENT PORTFOLIO - 99.7% (Cost $8,444,552,992) |
10,226,060,001 |
||
|
NET OTHER ASSETS - 0.3% |
32,329,993 |
||
|
NET ASSETS - 100% |
$ 10,258,389,994 |
||
|
Futures Contracts |
|||||
|
|
Expiration Date |
Underlying Face Amount at Value |
Unrealized |
||
|
Purchased |
|||||
|
150 S&P 500 Stock Index Contracts |
Sept. 2000 |
$ 55,053,750 |
$ (206,670) |
||
|
The face value of futures purchased as a percentage of net assets - 0.5% |
|
Legend |
|
(a) Non-income producing |
|
(b) The rate quoted is the annualized seven-day yield of the fund at |
|
(c) Transactions during the period with companies which are or were affiliates are as follows: |
|
Affiliate |
|
Purchase |
|
Sales |
|
Dividend |
|
Value |
|
Forsoft Ltd. |
|
$ - |
|
$ - |
|
$ - |
|
$ 6,446,450 |
|
PJ America, Inc. |
|
- |
|
- |
|
- |
|
5,671,575 |
|
TOTALS |
|
$ - |
|
$ - |
|
$ - |
|
$ 12,118,025 |
|
(d) Security exempt from registration under Rule 144A of the Securities Act |
|
(e) Security or a portion of the security was pledged to cover margin requirements for futures contracts. At the period end, the value of securities pledged amounted to $1,985,950. |
|
Other Information |
|
Purchases and sales of securities, other than short-term securities, aggregated $8,415,238,617 and $8,270,968,679, respectively, of which long-term U.S. government and government agency obligations aggregated $0 and $5,867,969, respectively. |
|
The market value of futures contracts opened and closed during the period amounted to $740,575,595 and $702,738,997, respectively. |
|
The fund placed a portion of its portfolio transactions with brokerage firms which are affiliates of Fidelity Management & Research Company. The commissions paid to these affiliated firms were $336,878 for the period. |
|
The fund participated in the security lending program. At period end, the value of securities loaned amounted to $122,412,563. The fund received cash collateral of $125,228,100 which was invested in cash equivalents. |
|
Distribution of investments by country of issue, as a percentage of total |
|
United States of America |
84.5% |
|
United Kingdom |
4.6 |
|
Japan |
3.9 |
|
Canada |
2.9 |
|
Others (individually less than 1%) |
4.1 |
|
|
100.0% |
|
Income Tax Information |
|
At June 30, 2000, the aggregate cost of investment securities for income |
See accompanying notes which are an integral part of the financial statements.
Contrafund Portfolio
Statement of Assets and Liabilities
|
|
June 30, 2000 (Unaudited) |
|
|
Assets |
|
|
|
Investment in securities, at value |
|
$ 10,226,060,001 |
|
Foreign currency held at value (cost $3,198,136) |
|
3,200,762 |
|
Receivable for investments sold |
|
227,343,121 |
|
Receivable for fund shares sold |
|
5,795,420 |
|
Dividends receivable |
|
6,174,594 |
|
Interest receivable |
|
8,752,007 |
|
Receivable for daily variation on futures contracts |
|
394,650 |
|
Other receivables |
|
1,705,788 |
|
Total assets |
|
10,479,426,343 |
|
Liabilities |
|
|
|
Payable for investments purchased |
$ 88,850,142 |
|
|
Payable for fund shares redeemed |
1,847,512 |
|
|
Accrued management fee |
4,877,662 |
|
|
Distribution fees payable |
94,923 |
|
|
Other payables and |
138,010 |
|
|
Collateral on securities loaned, |
125,228,100 |
|
|
Total liabilities |
|
221,036,349 |
|
Net Assets |
|
$ 10,258,389,994 |
|
Net Assets consist of: |
|
|
|
Paid in capital |
|
$ 8,001,539,614 |
|
Undistributed net |
|
28,658,206 |
|
Accumulated undistributed |
|
446,882,094 |
|
Net unrealized appreciation (depreciation) on investments |
|
1,781,310,080 |
|
Net Assets |
|
$ 10,258,389,994 |
|
Initial Class: |
|
$25.09 |
|
Service Class: |
|
$25.03 |
|
Service Class 2: |
|
$25.02 |
Statement of Operations
|
|
Six months ended June 30, 2000 (Unaudited) |
|
|
Investment Income Dividends |
|
$ 27,621,948 |
|
Interest |
|
31,147,532 |
|
Security lending |
|
1,347,457 |
|
Total income |
|
60,116,937 |
|
Expenses |
|
|
|
Management fee |
$ 28,674,384 |
|
|
Transfer agent fees |
3,272,693 |
|
|
Distribution fees |
484,572 |
|
|
Accounting and security lending fees |
450,247 |
|
|
Non-interested trustees' compensation |
15,815 |
|
|
Custodian fees and expenses |
315,685 |
|
|
Registration fees |
43,475 |
|
|
Audit |
31,520 |
|
|
Legal |
36,304 |
|
|
Miscellaneous |
70,060 |
|
|
Total expenses before reductions |
33,394,755 |
|
|
Expense reductions |
(1,509,996) |
31,884,759 |
|
Net investment income |
|
28,232,178 |
|
Realized and Unrealized Gain (Loss) Net realized gain (loss) on: |
|
|
|
Investment securities |
529,036,819 |
|
|
Foreign currency transactions |
41,699 |
|
|
Futures contracts |
(2,603,401) |
526,475,117 |
|
Change in net unrealized appreciation (depreciation) on: |
|
|
|
Investment securities |
(684,382,795) |
|
|
Assets and liabilities in |
11,087 |
|
|
Futures contracts |
(216,147) |
(684,587,855) |
|
Net gain (loss) |
|
(158,112,738) |
|
Net increase (decrease) in net assets resulting from operations |
|
$ (129,880,560) |
|
Other Information Expense reductions |
|
$ 1,501,131 |
|
Custodian credits |
|
8,865 |
|
|
|
$ 1,509,996 |
See accompanying notes which are an integral part of the financial statements.
Semiannual Report
Variable Insurance Products: Contrafund Portfolio
Financial Statements - continued
Statement of Changes in Net Assets
|
Increase (Decrease) in Net Assets |
Six months ended |
Year ended |
|
Operations |
$ 28,232,178 |
$ 37,064,074 |
|
Net realized gain (loss) |
526,475,117 |
1,238,554,251 |
|
Change in net unrealized appreciation (depreciation) |
(684,587,855) |
533,893,873 |
|
Net increase (decrease) in net assets resulting from operations |
(129,880,560) |
1,809,512,198 |
|
Distributions to shareholders |
(34,082,876) |
(32,779,255) |
|
From net realized gain |
(1,237,208,385) |
(240,381,202) |
|
Total distributions |
(1,271,291,261) |
(273,160,457) |
|
Share transactions - net increase (decrease) |
1,879,217,135 |
1,702,847,259 |
|
Total increase (decrease) in net assets |
478,045,314 |
3,239,199,000 |
|
Net Assets |
|
|
|
Beginning of period |
9,780,344,680 |
6,541,145,680 |
|
End of period (including undistributed net investment income of $28,658,206 and $34,775,260, respectively) |
$ 10,258,389,994 |
$ 9,780,344,680 |
|
|
|
Other Information: |
|
|
Six months ended June 30, 2000 |
Year ended December 31, 1999 |
||
|
|
Shares |
Dollars |
Shares |
Dollars |
|
Share transactions |
31,827,829 |
$ 821,871,536 |
75,689,715 |
$ 1,921,467,155 |
|
Reinvested |
45,653,334 |
1,161,877,344 |
11,119,147 |
266,192,366 |
|
Redeemed |
(22,956,691) |
(590,350,809) |
(39,357,256) |
(1,004,869,657) |
|
Net increase (decrease) |
54,524,472 |
$ 1,393,398,071 |
47,451,606 |
$ 1,182,789,864 |
|
Service Class |
14,727,745 |
$ 380,358,381 |
20,768,738 |
$ 530,250,534 |
|
Reinvested |
4,305,875 |
109,369,238 |
291,308 |
6,968,091 |
|
Redeemed |
(1,309,500) |
(32,733,410) |
(669,866) |
(17,161,230) |
|
Net increase (decrease) |
17,724,120 |
$ 456,994,209 |
20,390,180 |
$ 520,057,395 |
|
Service Class 2 A |
1,156,782 |
$ 29,090,053 |
- |
$ - |
|
Reinvested |
1,759 |
44,679 |
- |
- |
|
Redeemed |
(12,454) |
(309,877) |
- |
- |
|
Net increase (decrease) |
1,146,087 |
$ 28,824,855 |
- |
$ - |
|
Distributions |
|
$ 31,149,527 |
|
$ 31,943,084 |
|
Service Class |
|
2,932,151 |
|
836,171 |
|
Service Class 2 A |
|
1,198 |
|
- |
|
Total |
|
$ 34,082,876 |
|
$ 32,779,255 |
|
From net realized gain |
|
$ 1,130,727,819 |
|
$ 234,249,282 |
|
Service Class |
|
106,437,085 |
|
6,131,920 |
|
Service Class 2 A |
|
43,481 |
|
- |
|
Total |
|
$ 1,237,208,385 |
|
$ 240,381,202 |
|
|
|
$ 1,271,291,261 |
|
$ 273,160,457 |
A Service Class 2 commenced sale of shares January 12, 2000.
See accompanying notes which are an integral part of the financial statements.
Contrafund Portfolio
Financial Highlights - Initial Class
|
|
Six months ended |
Years ended December 31, |
||||
|
Selected Per-Share Data |
(Unaudited) |
1999 |
1998 |
1997 |
1996 |
1995 E |
|
Net asset value, beginning of period |
$ 29.15 |
$ 24.44 |
$ 19.94 |
$ 16.56 |
$ 13.79 |
$ 10.00 |
|
Income from Investment Operations |
|
|
|
|
|
|
|
Net investment income |
.07 C |
.12 C |
.13 C |
.16 C |
.14 |
.06 |
|
Net realized and unrealized gain (loss) |
(.40) |
5.59 |
5.54 |
3.73 |
2.76 |
3.91 |
|
Total from investment operations |
(.33) |
5.71 |
5.67 |
3.89 |
2.90 |
3.97 |
|
Less Distributions |
|
|
|
|
|
|
|
From net investment income |
(.10) |
(.12) |
(.14) |
(.14) |
- |
(.06) |
|
From net realized gain |
(3.63) |
(.88) |
(1.03) |
(.37) |
(.13) |
(.12) |
|
Total distributions |
(3.73) |
(1.00) |
(1.17) |
(.51) |
(.13) |
(.18) |
|
Net asset value, end of period |
$ 25.09 |
$ 29.15 |
$ 24.44 |
$ 19.94 |
$ 16.56 |
$ 13.79 |
|
Total Return B, G |
(1.31)% |
24.25% |
29.98% |
24.14% |
21.22% |
39.72% |
|
Ratios and Supplemental Data |
|
|
|
|
|
|
|
Net assets, end of period (000 omitted) |
$ 9,119,275 |
$ 9,005,129 |
$ 6,388,592 |
$ 4,107,868 |
$ 2,394,103 |
$ 877,000 |
|
Ratio of expenses to average net assets |
.66% A |
.67% |
.70% |
.71% |
.74% |
.72% |
|
Ratio of expenses to average net assets after |
.63% A, F |
.65% F |
.66% F |
.68% F |
.71% F |
.72% |
|
Ratio of net investment income to average net assets |
.58% A |
.48% |
.62% |
.90% |
1.33% |
1.07% |
|
Portfolio turnover |
178% A |
172% |
201% |
142% |
178% |
132% |
Financial Highlights - Service Class
|
|
Six months ended |
Years ended December 31, |
||
|
Selected Per-Share Data |
(Unaudited) |
1999 |
1998 |
1997 D |
|
Net asset value, beginning of period |
$ 29.10 |
$ 24.42 |
$ 19.93 |
$ 19.99 |
|
Income from Investment Operations |
|
|
|
|
|
Net investment income C |
.06 |
.10 |
.11 |
.03 |
|
Net realized and unrealized gain (loss) |
(.40) |
5.58 |
5.55 |
(.09) |
|
Total from investment operations |
(.34) |
5.68 |
5.66 |
(.06) |
|
Less Distributions |
|
|
|
|
|
From net investment income |
(.10) |
(.12) |
(.14) |
- |
|
From net realized gain |
(3.63) |
(.88) |
(1.03) |
- |
|
Total distributions |
(3.73) |
(1.00) |
(1.17) |
- |
|
Net asset value, end of period |
$ 25.03 |
$ 29.10 |
$ 24.42 |
$ 19.93 |
|
Total Return B, G |
(1.36)% |
24.15% |
29.94% |
(0.30)% |
|
Ratios and Supplemental Data |
|
|
|
|
|
Net assets, end of period (000 omitted) |
$ 1,110,439 |
$ 775,216 |
$ 152,553 |
$ 3,722 |
|
Ratio of expenses to average net assets |
.76% A |
.78% |
.80% |
.81% A |
|
Ratio of expenses to average net assets after expense reductions |
.73% A, F |
.75% F |
.75% F |
.78% A, F |
|
Ratio of net investment income to average net assets |
.47% A |
.37% |
.53% |
1.14% A |
|
Portfolio turnover |
178% A |
172% |
201% |
142% |
|
A Annualized B The total returns would have been lower had certain expenses not been reduced during the periods shown. C Net investment income per share has been calculated based on average shares outstanding during the period. D For the period November 3, 1997 (commencement of sale of Service Class shares) to December 31, 1997. E For the period January 3, 1995 (commencement of operations of Initial Class shares) to December 31, 1995. F FMR or the fund has entered into varying arrangements with third parties who either paid or reduced a portion of the class' expenses. G Total returns for periods of less than one year are not annualized and do not reflect charges attributable to your insurance company's separate account. Inclusion of these charges would reduce the total returns shown. |
||||
See accompanying notes which are an integral part of the financial statements.
Semiannual Report
Financial Highlights - Service Class 2
|
|
Six months ended |
|
Selected Per-Share Data |
(Unaudited) |
|
Net asset value, beginning of period |
$ 28.20 |
|
Income from Investment Operations |
|
|
Net investment income C |
.04 |
|
Net realized and unrealized gain (loss) |
.51 G |
|
Total from investment operations |
.55 |
|
Less Distributions |
|
|
From net investment income |
(.10) |
|
From net realized gain |
(3.63) |
|
Total distributions |
(3.73) |
|
Net asset value, end of period |
$ 25.02 |
|
Total Return B, F |
1.75% |
|
Ratios and Supplemental Data |
|
|
Net assets, end of period (000 omitted) |
$ 28,675 |
|
Ratio of expenses to average net assets |
.91% A |
|
Ratio of expenses to average net assets after expense reductions |
.88% A, E |
|
Ratio of net investment income to average net assets |
.32% A |
|
Portfolio turnover |
178% A |
|
A Annualized B The total returns would have been lower had certain expenses not been reduced during the periods shown. C Net investment income per share has been calculated based on average shares outstanding during the period. D For the period January 12, 2000 (commencement of sale of Service Class 2 shares) to June 30, 2000. E FMR or the fund has entered into varying arrangements with third parties who either paid or reduced a portion of the class' expenses. F Total returns for periods of less than one year are not annualized and do not reflect charges attributable to your insurance company's separate account. Inclusion of these charges would reduce the total returns shown. G The amount shown for a share outstanding does not correspond with the aggregate net loss on investments for the period due to the timing of sales and repurchases of class shares in relation to fluctuating |
|
See accompanying notes which are an integral part of the financial statements.
Contrafund Portfolio
Performance
There are several ways to evaluate a fund's historical performance. You can look at the total percentage change in value, the average annual percentage change or the growth of a hypothetical $10,000 investment. Total return reflects the change in the value of an investment, assuming reinvestment of the fund's dividend income and capital gains (the profits earned upon the sale of securities that have grown in value). If Fidelity had not reimbursed certain fund expenses, the past five year and life of fund total returns would have been lower.
Average Annual Total Returns
|
Periods ended |
Past 1 |
Past 5 |
Life of |
|
Fidelity VIP: Growth Opportunities - |
-5.65% |
16.68% |
18.58% |
|
S&P 500 ® |
7.25% |
23.80% |
25.60% |
Average annual returns take the fund's cumulative return and show you what would have happened if the fund had performed at a constant rate each year.
You can compare the fund's return to the performance of the Standard & Poor's 500 SM Index - a market capitalization-weighted index of common stocks. This benchmark reflects the reinvestment of dividends and capital gains, if any.
Figures for more than one year assume a steady compounded rate of return and are not the fund's year-by-year results, which fluctuated over the periods shown. The life of fund figures are from commencement of operations, January 3, 1995.
Performance numbers are net of all fund operating expenses, but do not include any insurance charges imposed by your insurance company's separate account. If performance information included the effect of these additional charges, the total return would be lower.
Past performance is no guarantee of future results. Principal and investment return will vary and you may have a gain or loss when you withdraw your money.
Understanding Performance
How a fund did yesterday is no guarantee of how it will do tomorrow. The stock market, for example, has a history of long-term growth and short-term volatility. In turn, the share price and return of a fund that invests in stocks will vary. That means if you sell your shares during a market downturn, you might lose money. But if you can ride out the market's ups and downs, you may have a gain.
3$10,000 Over Life of Fund
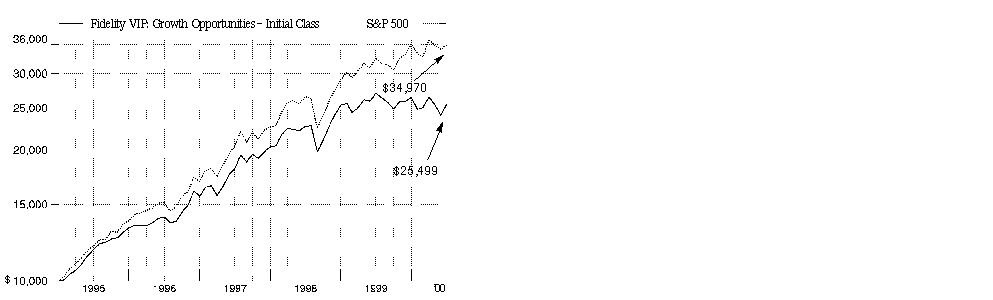
$10,000 Over Life of Fund: Let's say hypothetically that $10,000 was invested in Fidelity Variable Insurance Products: Growth Opportunities Portfolio - Initial Class on January 3, 1995, when the fund started. As the chart shows, by June 30, 2000, the value of the investment would have grown to $25,499 - a 154.99% increase on the initial investment. For comparison, look at how the Standard & Poor's 500 Index did over the same period. With dividends and capital gains, if any, reinvested, the same $10,000 investment would have grown to $34,970 - a 249.70% increase.
Investment Summary
|
Top Five Stocks as of June 30, 2000 |
|
|
|
% of fund's |
|
General Electric Co. |
4.2 |
|
Cisco Systems, Inc. |
4.2 |
|
Eli Lilly & Co. |
2.9 |
|
Intel Corp. |
2.7 |
|
Oracle Corp. |
2.4 |
|
|
16.4 |
|
Top Five Market Sectors as of June 30, 2000 |
|
|
|
% of fund's |
|
Technology |
42.8 |
|
Finance |
11.8 |
|
Health |
10.3 |
|
Energy |
6.4 |
|
Utilities |
5.8 |
|
Asset Allocation as of June 30, 2000 |
|||
|
% of fund's net assets* |
|||
|
Stocks 93.6% |
|
|
|
Short-Term Investments |
|
|

|
* Foreign investments 10.0% |
Semiannual Report
(Portfolio Manager photograph)
Note to shareholders: Bettina Doulton became Portfolio Manager of Growth Opportunities Portfolio on February 1, 2000.
Q. How did the fund perform, Bettina?
A. For the six-month period ending June 30, 2000, the fund underperformed the Standard & Poor's 500 Index, which returned -0.42%. For the 12-month period that ended June 30, 2000, the fund also trailed the S&P 500, which returned 7.25%.
Q. Why did the fund underperform its benchmark?
A. Early in the period, the fund was considerably underweighted in technology and telecommunications - the sectors that drove equity markets to record heights. Our lack of exposure here was a big detractor from performance. After taking over the fund in February, I repositioned it to be more in line with expectations - with more of a growth emphasis than a value proposition - and increased the tech position to approximately 43% of net assets at the end of the period, compared to just over 16% six months ago.
Q. Was that strategy successful?
A. On a short-term basis, the repositioning seemed poorly timed. Fund performance was negatively affected by the massive rotation away from technology that began in mid-March and lasted through the end of May. Several factors contributed to the tech sell-off: interest-rate hikes, fears of a slowdown in earnings growth, high valuations and illiquidity. Tech stocks did rebound in June, however, and the fund more than doubled the return of the S&P for the month.
Q. What other changes did you make to the fund since taking over?
A. In light of margin pressures and credit concerns in the finance sector, I reduced the sector's aggregate weighting to 11.8% of net assets compared to 20.6% six months ago. I also shifted the sector's asset allocation, reducing the fund's positions in regional banks, mortgage insurance companies and GSEs - government-sponsored enterprises such as Fannie Mae and Freddie Mac - while adding more capital markets exposure, which was a plus. Two other moves also helped. I reduced the fund's consumer nondurables holdings, largely due to the elimination of the Philip Morris position. I was less enamored with the company's fundamental prospects than my predecessor. I also eliminated the fund's bond position, as I expect to focus largely on equity investments.
Q. Which stocks were among the best absolute contributors?
A. Despite the technology sector's spring decline, six of the fund's 10 best-performing stocks came from that area. Most are very familiar names: Micron Technology, Intel, Oracle, Adobe Systems, Analog Devices and Nortel. All benefited from the growth prospects surrounding the rapid acceleration and penetration of Internet- and wireless-related communications. General Electric, the fund's largest holding at the end of the period, also was a strong contributor. GE experienced an acceleration in revenue and profit growth due to market share gains, acquisitions and strong global economies. Eli Lilly was another winner, benefiting from investor appreciation of its strong product pipeline and increased confidence in the company's earnings growth potential.
Q. Which stocks did not perform as well as you expected?
A. Although I have reduced these positions dramatically since taking over the fund, Fannie Mae and Freddie Mac significantly detracted from performance during the period. Several factors caused the underperformance of these stocks, including the Federal Reserve Board's recent string of interest-rate hikes and increased political bantering about capital ratios and funding requirements. Two other disappointments were retailers Home Depot and Wal-Mart. Despite continuing to deliver strong results, these stocks came under pressure as investors grew increasingly concerned that results would come under pressure due to slowing consumer spending caused by interest-rate increases.
Q. What is your outlook, Bettina?
A. It comes down to whether the technology sector's recent struggle was a short-term rotation or a permanent change in leadership. I believe it was just a violent short-term rotation similar to what we experienced at this time last year. On a medium-term basis, I expect the companies that are the enablers of our networked, communications economy - those that provide servers, data storage, fiber optics, etc. - are going to lead, because we still appear to be in the early stages of the "e-economy" build out.
The views expressed in this report reflect those of the portfolio manager only through the end of the period of the report as stated on the cover. The manager's views are subject to change at any time based on market or other conditions. For more information, see page 2.
Fund Facts
Goal: to provide capital growth by investing primarily in common stocks
Start date: January 3, 1995
Size: as of June 30, 2000, more than
$1.5 billion
Manager: Bettina Doulton, since February 2000; joined Fidelity in 1986
3Semiannual Report
Fidelity Variable Insurance Products: Growth Opportunities Portfolio
(Unaudited)
Showing Percentage of Net Assets
|
Common Stocks - 93.6% |
|||
|
Shares |
Value (Note 1) |
||
|
AEROSPACE & DEFENSE - 1.1% |
|||
|
Boeing Co. |
374,200 |
$ 15,646,238 |
|
|
Textron, Inc. |
30,200 |
1,640,238 |
|
|
|
17,286,476 |
||
|
BASIC INDUSTRIES - 0.3% |
|||
|
Chemicals & Plastics - 0.3% |
|||
|
Praxair, Inc. |
122,000 |
4,567,375 |
|
|
ENERGY - 6.4% |
|||
|
Energy Services - 1.3% |
|||
|
Baker Hughes, Inc. |
36,700 |
1,174,400 |
|
|
Halliburton Co. |
272,200 |
12,844,438 |
|
|
Schlumberger Ltd. (NY Shares) |
92,300 |
6,887,888 |
|
|
|
20,906,726 |
||
|
Oil & Gas - 5.1% |
|||
|
BP Amoco PLC sponsored ADR |
221,190 |
12,511,059 |
|
|
Chevron Corp. |
27,000 |
2,289,938 |
|
|
Conoco, Inc. Class B |
97,868 |
2,403,883 |
|
|
Cooper Cameron Corp. (a) |
72,300 |
4,771,800 |
|
|
Exxon Mobil Corp. |
417,300 |
32,758,050 |
|
|
Royal Dutch Petroleum Co. (NY Shares) |
178,300 |
10,976,594 |
|
|
Tosco Corp. |
257,300 |
7,284,806 |
|
|
TotalFinaElf SA: |
|
|
|
|
Class B |
6,153 |
947,562 |
|
|
sponsored ADR |
94,405 |
7,251,484 |
|
|
|
81,195,176 |
||
|
TOTAL ENERGY |
102,101,902 |
||
|
FINANCE - 11.8% |
|||
|
Banks - 1.1% |
|||
|
Bank of America Corp. |
65,200 |
2,803,600 |
|
|
Bank of Tokyo-Mitsubishi Ltd. |
255,000 |
3,081,070 |
|
|
Bank of Tokyo-Mitsubishi Ltd. ADR |
44,500 |
539,563 |
|
|
Chase Manhattan Corp. |
232,800 |
10,723,350 |
|
|
|
17,147,583 |
||
|
Credit & Other Finance - 2.9% |
|||
|
American Express Co. |
499,400 |
26,031,225 |
|
|
Citigroup, Inc. |
340,200 |
20,497,050 |
|
|
|
46,528,275 |
||
|
Federal Sponsored Credit - 4.1% |
|||
|
Fannie Mae |
712,400 |
37,178,375 |
|
|
Freddie Mac |
688,000 |
27,864,000 |
|
|
|
65,042,375 |
||
|
Insurance - 2.2% |
|||
|
Allmerica Financial Corp. |
41,500 |
2,173,563 |
|
|
American International Group, Inc. |
184,175 |
21,640,563 |
|
|
CIGNA Corp. |
92,812 |
8,677,922 |
|
|
|
|||
|
Shares |
Value (Note 1) |
||
|
Hartford Financial Services Group, Inc. |
13,700 |
$ 766,344 |
|
|
The Chubb Corp. |
37,200 |
2,287,800 |
|
|
|
35,546,192 |
||
|
Securities Industry - 1.5% |
|||
|
Daiwa Securities Group, Inc. |
72,000 |
950,764 |
|
|
Morgan Stanley Dean Witter & Co. |
155,900 |
12,978,675 |
|
|
Nomura Securities Co. Ltd. |
391,000 |
9,570,317 |
|
|
|
23,499,756 |
||
|
TOTAL FINANCE |
187,764,181 |
||
|
HEALTH - 10.3% |
|||
|
Drugs & Pharmaceuticals - 9.0% |
|||
|
American Home Products Corp. |
82,900 |
4,870,375 |
|
|
Amgen, Inc. |
71,300 |
5,008,825 |
|
|
Bristol-Myers Squibb Co. |
373,600 |
21,762,200 |
|
|
Eli Lilly & Co. |
466,400 |
46,581,700 |
|
|
Merck & Co., Inc. |
149,200 |
11,432,450 |
|
|
Pfizer, Inc. |
449,693 |
21,585,264 |
|
|
Schering-Plough Corp. |
650,600 |
32,855,300 |
|
|
|
144,096,114 |
||
|
Medical Equipment & Supplies - 1.3% |
|||
|
Abbott Laboratories |
102,200 |
4,554,288 |
|
|
Johnson & Johnson |
148,300 |
15,108,063 |
|
|
|
19,662,351 |
||
|
TOTAL HEALTH |
163,758,465 |
||
|
INDUSTRIAL MACHINERY & EQUIPMENT - 5.3% |
|||
|
Electrical Equipment - 4.2% |
|||
|
General Electric Co. |
1,269,700 |
67,294,088 |
|
|
Industrial Machinery & Equipment - 1.1% |
|||
|
Deere & Co. |
156,600 |
5,794,200 |
|
|
Ingersoll-Rand Co. |
60,400 |
2,431,100 |
|
|
Tyco International Ltd. |
194,200 |
9,200,225 |
|
|
|
17,425,525 |
||
|
TOTAL INDUSTRIAL MACHINERY & EQUIPMENT |
84,719,613 |
||
|
MEDIA & LEISURE - 4.7% |
|||
|
Broadcasting - 1.9% |
|||
|
AT&T Corp. - Liberty Media Group |
501,244 |
12,155,167 |
|
|
Charter Communications, Inc. |
167,700 |
2,756,569 |
|
|
Comcast Corp. Class A (special) (a) |
77,500 |
3,138,750 |
|
|
Cox Communications, Inc. Class A (a) |
78,213 |
3,563,580 |
|
|
Infinity Broadcasting Corp. Class A (a) |
23,400 |
852,638 |
|
|
Time Warner, Inc. |
89,500 |
6,802,000 |
|
|
Univision Communications, Inc. |
6,100 |
631,350 |
|
|
|
29,900,054 |
||
|
Entertainment - 2.2% |
|||
|
Fox Entertainment Group, Inc. Class A (a) |
239,400 |
7,271,775 |
|
|
Common Stocks - continued |
|||
|
Shares |
Value (Note 1) |
||
|
MEDIA & LEISURE - continued |
|||
|
Entertainment - continued |
|||
|
Viacom, Inc. Class B (non-vtg.) (a) |
328,428 |
$ 22,394,684 |
|
|
Walt Disney Co. |
133,500 |
5,181,469 |
|
|
|
34,847,928 |
||
|
Publishing - 0.1% |
|||
|
McGraw-Hill Companies, Inc. |
35,400 |
1,911,600 |
|
|
Restaurants - 0.5% |
|||
|
McDonald's Corp. |
268,700 |
8,850,306 |
|
|
TOTAL MEDIA & LEISURE |
75,509,888 |
||
|
NONDURABLES - 0.5% |
|||
|
Beverages - 0.1% |
|||
|
The Coca-Cola Co. |
27,300 |
1,568,044 |
|
|
Household Products - 0.4% |
|||
|
Avon Products, Inc. |
16,900 |
752,050 |
|
|
Clorox Co. |
41,700 |
1,868,681 |
|
|
Procter & Gamble Co. |
67,320 |
3,854,070 |
|
|
|
6,474,801 |
||
|
TOTAL NONDURABLES |
8,042,845 |
||
|
RETAIL & WHOLESALE - 4.6% |
|||
|
General Merchandise Stores - 2.5% |
|||
|
Kohls Corp. (a) |
56,400 |
3,137,250 |
|
|
Target Corp. |
119,400 |
6,925,200 |
|
|
Wal-Mart Stores, Inc. |
533,700 |
30,754,463 |
|
|
|
40,816,913 |
||
|
Retail & Wholesale, Miscellaneous - 2.1% |
|||
|
Home Depot, Inc. |
394,000 |
19,675,375 |
|
|
Lowe's Companies, Inc. |
320,900 |
13,176,956 |
|
|
|
32,852,331 |
||
|
TOTAL RETAIL & WHOLESALE |
73,669,244 |
||
|
SERVICES - 0.0% |
|||
|
Advertising - 0.0% |
|||
|
Interpublic Group of Companies, Inc. |
13,800 |
593,400 |
|
|
Services - 0.0% |
|||
|
Gartner Group, Inc. Class B (a) |
106 |
1,047 |
|
|
TOTAL SERVICES |
594,447 |
||
|
TECHNOLOGY - 42.8% |
|||
|
Communications Equipment - 11.1% |
|||
|
Ciena Corp. (a) |
61,700 |
10,284,619 |
|
|
Cisco Systems, Inc. (a) |
1,046,300 |
66,505,444 |
|
|
Corning, Inc. |
50,500 |
13,628,688 |
|
|
Lucent Technologies, Inc. |
226,200 |
13,402,350 |
|
|
Nokia AB sponsored ADR |
533,900 |
26,661,631 |
|
|
|
|||
|
Shares |
Value (Note 1) |
||
|
Nortel Networks Corp. |
481,200 |
$ 33,380,101 |
|
|
Telefonaktiebolaget LM Ericsson sponsored ADR |
665,500 |
13,310,000 |
|
|
|
177,172,833 |
||
|
Computer Services & Software - 9.9% |
|||
|
Adobe Systems, Inc. |
134,700 |
17,511,000 |
|
|
Amazon.com, Inc. (a) |
10,200 |
370,388 |
|
|
America Online, Inc. (a) |
266,600 |
14,063,150 |
|
|
Automatic Data Processing, Inc. |
224,300 |
12,014,069 |
|
|
BEA Systems, Inc. (a) |
75,100 |
3,712,756 |
|
|
BroadVision, Inc. (a) |
111,400 |
5,660,513 |
|
|
Computer Sciences Corp. (a) |
9,700 |
724,469 |
|
|
E.piphany, Inc. |
13,000 |
1,393,438 |
|
|
First Data Corp. |
61,700 |
3,061,863 |
|
|
i2 Technologies, Inc. (a) |
25,800 |
2,690,053 |
|
|
InfoSpace.com, Inc. (a) |
47,000 |
2,596,750 |
|
|
Microsoft Corp. (a) |
242,100 |
19,368,000 |
|
|
Oracle Corp. (a) |
456,600 |
38,382,939 |
|
|
Phone.com, Inc. |
24,100 |
1,569,513 |
|
|
Redback Networks, Inc. |
16,100 |
2,883,913 |
|
|
Siebel Systems, Inc. (a) |
93,500 |
15,293,094 |
|
|
VeriSign, Inc. (a) |
82,537 |
14,567,781 |
|
|
Yahoo!, Inc. (a) |
23,000 |
2,849,125 |
|
|
|
158,712,814 |
||
|
Computers & Office Equipment - 7.2% |
|||
|
Compaq Computer Corp. |
285,500 |
7,298,094 |
|
|
Dell Computer Corp. (a) |
217,200 |
10,710,675 |
|
|
EMC Corp. (a) |
270,500 |
20,811,594 |
|
|
Hewlett-Packard Co. |
76,600 |
9,565,425 |
|
|
International Business Machines Corp. |
34,100 |
3,736,081 |
|
|
Network Appliance, Inc. (a) |
154,700 |
12,453,350 |
|
|
SCI Systems, Inc. (a) |
490,600 |
19,225,388 |
|
|
Sun Microsystems, Inc. (a) |
345,200 |
31,391,625 |
|
|
|
115,192,232 |
||
|
Electronic Instruments - 2.8% |
|||
|
Agilent Technologies, Inc. |
86,915 |
6,409,981 |
|
|
Applied Materials, Inc. (a) |
178,900 |
16,212,813 |
|
|
KLA-Tencor Corp. (a) |
118,600 |
6,945,513 |
|
|
LAM Research Corp. (a) |
404,000 |
15,150,000 |
|
|
|
44,718,307 |
||
|
Electronics - 11.8% |
|||
|
Analog Devices, Inc. (a) |
245,100 |
18,627,600 |
|
|
Broadcom Corp. Class A (a) |
7,100 |
1,554,456 |
|
|
Flextronics International Ltd. (a) |
119,171 |
8,185,558 |
|
|
Intel Corp. |
316,500 |
42,312,094 |
|
|
JDS Uniphase Corp. (a) |
116,200 |
13,929,475 |
|
|
Methode Electronics, Inc. Class A |
4,300 |
166,088 |
|
|
Micron Technology, Inc. (a) |
335,200 |
29,518,550 |
|
|
Molex, Inc. Class A |
145,810 |
5,103,350 |
|
|
Motorola, Inc. |
60,000 |
1,743,750 |
|
|
National Semiconductor Corp. (a) |
228,600 |
12,973,050 |
|
|
Samsung Electronics Co. Ltd. |
2,800 |
926,616 |
|
|
Common Stocks - continued |
|||
|
Shares |
Value (Note 1) |
||
|
TECHNOLOGY - continued |
|||
|
Electronics - continued |
|||
|
Sanmina Corp. (a) |
59,500 |
$ 5,087,250 |
|
|
SDL, Inc. (a) |
13,700 |
3,907,069 |
|
|
Texas Instruments, Inc. |
541,900 |
37,221,756 |
|
|
Xilinx, Inc. (a) |
83,700 |
6,910,481 |
|
|
|
188,167,143 |
||
|
TOTAL TECHNOLOGY |
683,963,329 |
||
|
TRANSPORTATION - 0.0% |
|||
|
Air Transportation - 0.0% |
|||
|
Southwest Airlines Co. |
31,500 |
596,531 |
|
|
UTILITIES - 5.8% |
|||
|
Cellular - 4.5% |
|||
|
China Telecom (Hong Kong) Ltd. sponsored ADR (a) |
34,100 |
6,063,406 |
|
|
Nextel Communications, Inc. Class A (a) |
291,000 |
17,805,563 |
|
|
Nextel Partners, Inc. Class A |
2,500 |
81,406 |
|
|
QUALCOMM, Inc. (a) |
27,800 |
1,668,000 |
|
|
Sprint Corp. - PCS Group Series 1 (a) |
316,800 |
18,849,600 |
|
|
Vodafone AirTouch PLC |
122,991 |
509,643 |
|
|
Vodafone AirTouch PLC sponsored ADR |
378,900 |
15,700,669 |
|
|
VoiceStream Wireless Corp. (a) |
91,800 |
10,676,053 |
|
|
|
71,354,340 |
||
|
Electric Utility - 0.3% |
|||
|
AES Corp. (a) |
113,000 |
5,155,625 |
|
|
Telephone Services - 1.0% |
|||
|
Level 3 Communications, Inc. (a) |
105,100 |
9,248,800 |
|
|
NEXTLINK Communications, Inc. Class A |
132,800 |
5,038,100 |
|
|
U.S. WEST, Inc. |
16,300 |
1,397,725 |
|
|
|
15,684,625 |
||
|
TOTAL UTILITIES |
92,194,590 |
||
|
TOTAL COMMON STOCKS (Cost $1,159,260,000) |
1,494,768,886 |
||
|
Cash Equivalents - 6.9% |
|||
|
Shares |
Value (Note 1) |
||
|
Central Cash Collateral Fund, 6.71% (b) |
1,235,200 |
$ 1,235,200 |
|
|
Taxable Central Cash Fund, 6.59% (b) |
109,058,384 |
109,058,384 |
|
|
TOTAL CASH EQUIVALENTS (Cost $110,293,584) |
110,293,584 |
||
|
TOTAL INVESTMENT PORTFOLIO - 100.5% (Cost $1,269,553,584) |
1,605,062,470 |
|
NET OTHER ASSETS - (0.5)% |
(7,485,639) |
||
|
NET ASSETS - 100% |
$ 1,597,576,831 |
||
|
Legend |
|
(a) Non-income producing |
|
(b) The rate quoted is the annualized seven-day yield of the fund at |
|
Other Information |
|
Purchases and sales of securities, other than short-term securities, aggregated $1,110,429,310 and $1,386,467,463, respectively, of which long-term U.S. government and government agency obligations aggregated $0 and $110,516,388, respectively. |
|
The market value of futures contracts opened and closed during the period amounted to $2,939,068 and $2,727,952, respectively. |
|
The fund placed a portion of its portfolio transactions with brokerage firms which are affiliates of Fidelity Management & Research Company. The commissions paid to these affiliated firms were $41,941 for the period. |
|
The fund participated in the security lending program. At period end, the value of securities loaned amounted to $1,236,406. The fund received cash collateral of $1,235,200 which was invested in cash equivalents. |
|
Distribution of investments by country of issue, as a percentage of total |
|
United States of America |
90.0% |
|
Canada |
2.1 |
|
United Kingdom |
1.8 |
|
Finland |
1.7 |
|
Others (individually less than 1%) |
4.4 |
|
|
100.0% |
|
Income Tax Information |
|
At June 30, 2000, the aggregate cost of investment securities for income tax purposes was $1,270,414,331. Net unrealized appreciation aggregated $334,648,139, of which $383,735,051 related to appreciated investment securities and $49,086,912 related to depreciated investment securities. |
See accompanying notes which are an integral part of the financial statements.
Growth Opportunities Portfolio
Statement of Assets and Liabilities
|
|
June 30, 2000 (Unaudited) |
|
|
Assets |
|
|
|
Investment in securities, at value |
|
$ 1,605,062,470 |
|
Foreign currency held at value |
|
869,422 |
|
Receivable for investments sold |
|
18,787,103 |
|
Receivable for fund shares sold |
|
2,992,234 |
|
Dividends receivable |
|
563,371 |
|
Interest receivable |
|
475,311 |
|
Other receivables |
|
13,116 |
|
Total assets |
|
1,628,763,027 |
|
Liabilities |
|
|
|
Payable to custodian bank |
$ 1,150,566 |
|
|
Payable for investments purchased |
27,237,658 |
|
|
Payable for fund shares redeemed |
663,655 |
|
|
Accrued management fee |
760,615 |
|
|
Distribution fees payable |
30,888 |
|
|
Other payables and |
107,614 |
|
|
Collateral on securities loaned, |
1,235,200 |
|
|
Total liabilities |
|
31,186,196 |
|
Net Assets |
|
$ 1,597,576,831 |
|
Net Assets consist of: |
|
|
|
Paid in capital |
|
$ 1,297,693,607 |
|
Undistributed net |
|
1,554,523 |
|
Accumulated undistributed |
|
(37,177,356) |
|
Net unrealized appreciation (depreciation) on investments |
|
335,506,057 |
|
Net Assets |
|
$ 1,597,576,831 |
|
Initial Class: |
|
$20.61 |
|
Service Class: |
|
$20.58 |
|
Service Class 2: |
|
$20.57 |
Statement of Operations
|
|
Six months ended June 30, 2000 (Unaudited) |
|
|
Investment Income Dividends |
|
$ 4,944,088 |
|
Interest |
|
2,196,303 |
|
Security lending |
|
43,224 |
|
Total income |
|
7,183,615 |
|
Expenses |
|
|
|
Management fee |
$ 4,713,628 |
|
|
Transfer agent fees |
531,307 |
|
|
Distribution fees |
171,473 |
|
|
Accounting and security lending fees |
182,021 |
|
|
Non-interested trustees' compensation |
2,651 |
|
|
Custodian fees and expenses |
44,138 |
|
|
Registration fees |
956 |
|
|
Audit |
17,449 |
|
|
Legal |
7,156 |
|
|
Reports to shareholders |
7,396 |
|
|
Miscellaneous |
395 |
|
|
Total expenses before reductions |
5,678,570 |
|
|
Expense reductions |
(279,920) |
5,398,650 |
|
Net investment income |
|
1,784,965 |
|
Realized and Unrealized Gain (Loss) Net realized gain (loss) on: |
|
|
|
Investment securities |
(31,567,618) |
|
|
Foreign currency transactions |
(17,618) |
|
|
Futures contracts |
(211,116) |
(31,796,352) |
|
Change in net unrealized appreciation (depreciation) on: |
|
|
|
Investment securities |
(41,408,261) |
|
|
Assets and liabilities in |
105 |
(41,408,156) |
|
Net gain (loss) |
|
(73,204,508) |
|
Net increase (decrease) in net assets resulting from operations |
|
$ (71,419,543) |
|
Other Information Expense reductions |
|
$ 276,910 |
|
Custodian credits |
|
3,010 |
|
|
|
$ 279,920 |
See accompanying notes which are an integral part of the financial statements.
Semiannual Report
Fidelity Variable Insurance Products: Growth Opportunities Portfolio
Financial Statements - continued
Statement of Changes in Net Assets
|
Increase (Decrease) in Net Assets |
Six months ended |
Year ended |
|
|
|
|
|
Operations |
$ 1,784,965 |
$ 21,853,752 |
|
Net realized gain (loss) |
(31,796,352) |
109,839,194 |
|
Change in net unrealized appreciation (depreciation) |
(41,408,156) |
(54,923,099) |
|
Net increase (decrease) in net assets resulting from operations |
(71,419,543) |
76,769,847 |
|
Distributions to shareholders |
(21,794,226) |
(17,518,652) |
|
From net realized gain |
(111,302,559) |
(32,887,198) |
|
Total distributions |
(133,096,785) |
(50,405,850) |
|
Share transactions - net increase (decrease) |
(84,271,368) |
140,493,459 |
|
Total increase (decrease) in net assets |
(288,787,696) |
166,857,456 |
|
Net Assets |
|
|
|
Beginning of period |
1,886,364,527 |
1,719,507,071 |
|
End of period (including undistributed net investment income of $1,554,523 and $21,419,780, respectively) |
$ 1,597,576,831 |
$ 1,886,364,527 |
|
|
|
Other Information: |
|
|
Six months ended June 30, 2000 |
Year ended |
||
|
|
Shares |
Dollars |
Shares |
Dollars |
|
Share transactions |
7,804,052 |
$ 162,982,845 |
14,140,894 |
$ 318,792,928 |
|
Reinvested |
5,190,171 |
107,280,842 |
2,116,413 |
45,714,518 |
|
Redeemed |
(20,232,012) |
(422,309,444) |
(18,293,067) |
(412,962,598) |
|
Net increase (decrease) |
(7,237,789) |
$ (152,045,757) |
(2,035,760) |
$ (48,455,152) |
|
Service Class |
3,431,508 |
$ 71,121,191 |
9,385,140 |
$ 211,858,592 |
|
Reinvested |
1,249,806 |
25,808,498 |
217,292 |
4,691,331 |
|
Redeemed |
(1,604,623) |
(33,520,138) |
(1,230,823) |
(27,601,312) |
|
Net increase (decrease) |
3,076,691 |
$ 63,409,551 |
8,371,609 |
$ 188,948,611 |
|
Service Class 2 A |
234,557 |
$ 4,716,010 |
- |
$ - |
|
Reinvested |
361 |
7,445 |
- |
- |
|
Redeemed |
(17,302) |
(358,617) |
- |
- |
|
Net increase (decrease) |
217,616 |
$ 4,364,838 |
- |
$ - |
|
Distributions |
|
$ 17,669,786 |
|
$ 15,930,817 |
|
Service Class |
|
4,123,251 |
|
1,587,835 |
|
Service Class 2 A |
|
1,189 |
|
- |
|
Total |
|
$ 21,794,226 |
|
$ 17,518,652 |
|
From net realized gain |
|
$ 89,611,056 |
|
$ 29,783,702 |
|
Service Class |
|
21,685,247 |
|
3,103,496 |
|
Service Class 2 A |
|
6,256 |
|
- |
|
Total |
|
$ 111,302,559 |
|
$ 32,887,198 |
|
|
|
$ 133,096,785 |
|
$ 50,405,850 |
A Service Class 2 commenced sale of shares January 12, 2000.
See accompanying notes which are an integral part of the financial statements.
Growth Opportunities Portfolio
Financial Highlights - Initial Class
|
|
Six months ended |
Years ended December 31, |
||||
|
Selected Per-Share Data |
(Unaudited) |
1999 |
1998 |
1997 |
1996 |
1995 E |
|
Net asset value, beginning of period |
$ 23.15 |
$ 22.88 |
$ 19.27 |
$ 15.40 |
$ 13.07 |
$ 10.00 |
|
Income from Investment Operations |
|
|
|
|
|
|
|
Net investment income |
.02 D |
.27 D |
.26 D |
.29 D |
.26 |
.11 |
|
Net realized and unrealized gain (loss) |
(.86) |
.66 |
4.29 |
4.18 |
2.12 |
3.14 |
|
Total from investment operations |
(.84) |
.93 |
4.55 |
4.47 |
2.38 |
3.25 |
|
Less Distributions |
|
|
|
|
|
|
|
From net investment income |
(.28) |
(.23) |
(.21) |
(.25) |
- |
(.11) |
|
From net realized gain |
(1.42) |
(.43) |
(.73) |
(.35) |
(.05) |
(.07) |
|
Total distributions |
(1.70) |
(.66) |
(.94) |
(.60) |
(.05) |
(.18) |
|
Net asset value, end of period |
$ 20.61 |
$ 23.15 |
$ 22.88 |
$ 19.27 |
$ 15.40 |
$ 13.07 |
|
Total Return B, C |
(3.65)% |
4.27% |
24.61% |
29.95% |
18.27% |
32.52% |
|
Ratios and Supplemental Data |
|
|
|
|
|
|
|
Net assets, end of period (000 omitted) |
$ 1,222,938 |
$ 1,541,587 |
$ 1,570,011 |
$ 1,025,766 |
$ 383,085 |
$ 164,303 |
|
Ratio of expenses to average net assets |
.67% A |
.69% |
.71% |
.74% |
.77% |
.85% G |
|
Ratio of expenses to average net assets after |
.64% A, H |
.68% H |
.70% H |
.73% H |
.76% H |
.83% H |
|
Ratio of net investment income to average net assets |
.24% A |
1.20% |
1.27% |
1.68% |
2.29% |
2.49% |
|
Portfolio turnover |
138% A |
42% |
29% |
26% |
28% |
38% |
Financial Highlights - Service Class
|
|
Six months ended |
Years ended December 31, |
||
|
Selected Per-Share Data |
(Unaudited) |
1999 |
1998 |
1997 F |
|
Net asset value, beginning of period |
$ 23.12 |
$ 22.86 |
$ 19.27 |
$ 18.50 |
|
Income from Investment Operations |
|
|
|
|
|
Net investment income D |
.01 |
.25 |
.23 |
.04 |
|
Net realized and unrealized gain (loss) |
(.86) |
.66 |
4.30 |
.73 |
|
Total from investment operations |
(.85) |
.91 |
4.53 |
.77 |
|
Less Distributions |
|
|
|
|
|
From net investment income |
(.27) |
(.22) |
(.21) |
- |
|
From net realized gain |
(1.42) |
(.43) |
(.73) |
- |
|
Total distributions |
(1.69) |
(.65) |
(.94) |
- |
|
Net asset value, end of period |
$ 20.58 |
$ 23.12 |
$ 22.86 |
$ 19.27 |
|
Total ReturnB, C |
(3.70)% |
4.18% |
24.51% |
4.16% |
|
Ratios and Supplemental Data |
|
|
|
|
|
Net assets, end of period (000 omitted) |
$ 370,164 |
$ 344,778 |
$ 149,496 |
$ 2,589 |
|
Ratio of expenses to average net assets |
.77% A |
.79% |
.80% |
.84% A |
|
Ratio of expenses to average net assets after expense reductions |
.74% A, H |
.78% H |
.79% H |
.83% A, H |
|
Ratio of net investment income to average net assets |
.14% A |
1.09% |
1.16% |
1.72% A |
|
Portfolio turnover |
138% A |
42% |
29% |
26% |
|
A Annualized B The total returns would have been lower had certain expenses not been reduced during the periods shown. C Total returns for periods of less than one year are not annualized and do not reflect charges attributable to your insurance company's separate account. Inclusion of these charges would reduce the total returns shown. D Net investment income per share has been calculated based on average shares outstanding during the period. E For the period January 3, 1995 (commencement of sale of Initial Class shares) to December 31, 1995. F For the period November 3, 1997 (commencement of sale of Service Class shares) to December 31, 1997. G FMR agreed to reimburse a portion of the class' expenses during the period. Without this reimbursement, the class' expense ratio would have been higher. H FMR or the fund has entered into varying arrangements with third parties who either paid or reduced a portion of the class' expenses. |
||||
See accompanying notes which are an integral part of the financial statements.
Semiannual Report
Financial Highlights - Service Class 2
|
|
Six months ended |
|
Selected Per-Share Data |
(Unaudited) |
|
Net asset value, beginning of period |
$ 22.70 |
|
Income from Investment Operations |
|
|
Net investment income (loss) D |
(.00) |
|
Net realized and unrealized gain (loss) |
(.44) |
|
Total from investment operations |
(.44) |
|
Less Distributions |
|
|
From net investment income |
(.27) |
|
From net realized gain |
(1.42) |
|
Total distributions |
(1.69) |
|
Net asset value, end of period |
$ 20.57 |
|
Total Return B, C |
(1.97)% |
|
Ratios and Supplemental Data |
|
|
Net assets, end of period (000 omitted) |
$ 4,476 |
|
Ratio of expenses to average net assets |
.96% A |
|
Ratio of expenses to average net assets after expense reductions |
.92% A, F |
|
Ratio of net investment income (loss) to average net assets |
(.05)% A |
|
Portfolio turnover |
138% A |
|
A Annualized B The total returns would have been lower had certain expenses not been reduced during the periods shown. C Total returns for periods of less than one year are not annualized and do not reflect charges attributable to your insurance company's separate account. Inclusion of these charges would reduce the total returns shown. D Net investment income (loss) per share has been calculated based on average shares outstanding during the period. E For the period January 12, 2000 (commencement of sale of Service Class 2 shares) to June 30, 2000. F FMR or the fund has entered into varying arrangements with third parties who either paid or reduced a portion of the class' expenses. |
|
See accompanying notes which are an integral part of the financial statements.
Growth Opportunities Portfolio
A special meeting of the fund's shareholders was held on July 19, 2000. The results of votes taken among shareholders on proposals before them are reported below. Each vote reported represents one dollar of net asset value held on the record date for the meeting.
PROPOSAL 1
To elect as Trustees the following twelve nominees.*
|
|
# of Dollars Voted |
% of Dollars Voted |
Ralph F. Cox
|
Affirmative |
2,995,348,207.84 |
97.862 |
|
Withheld |
65,444,305.52 |
2.138 |
|
TOTAL |
3,060,792,513.36 |
100.000 |
Phyllis Burke Davis
|
Affirmative |
2,995,012,849.06 |
97.851 |
|
Withheld |
65,779,664.30 |
2.149 |
|
TOTAL |
3,060,792,513.36 |
100.000 |
Robert M. Gates
|
Affirmative |
2,994,325,628.16 |
97.828 |
|
Withheld |
66,466,885.20 |
2.172 |
|
TOTAL |
3,060,792,513.36 |
100.000 |
Edward C. Johnson 3d
|
Affirmative |
2,994,212,266.77 |
97.825 |
|
Withheld |
66,580,246.59 |
2.175 |
|
TOTAL |
3,060,792,513.36 |
100.000 |
Donald J. Kirk
|
Affirmative |
2,996,527,468.99 |
97.900 |
|
Withheld |
64,265,044.37 |
2.100 |
|
TOTAL |
3,060,792,513.36 |
100.000 |
Ned. C. Lautenbach
|
Affirmative |
2,997,430,896.97 |
97.930 |
|
Withheld |
63,361,616.39 |
2.070 |
|
TOTAL |
3,060,792,513.36 |
100.000 |
|
|
# of Dollars Voted |
% of Dollars Voted |
Peter S. Lynch
|
Affirmative |
2,997,391,112.97 |
97.929 |
|
Withheld |
63,401,400.39 |
2.071 |
|
TOTAL |
3,060,792,513.36 |
100.000 |
William O. McCoy
|
Affirmative |
2,997,364,420.76 |
97.928 |
|
Withheld |
63,428,092.60 |
2.072 |
|
TOTAL |
3,060,792,513.36 |
100.000 |
Gerald C. McDonough
|
Affirmative |
2,992,594,911.89 |
97.772 |
|
Withheld |
68,197,601.47 |
2.228 |
|
TOTAL |
3,060,792,513.36 |
100.000 |
Marvin L. Mann
|
Affirmative |
2,996,491,839.67 |
97.899 |
|
Withheld |
64,300,673.69 |
2.101 |
|
TOTAL |
3,060,792,513.36 |
100.000 |
Robert C. Pozen
|
Affirmative |
2,997,304,419.99 |
97.926 |
|
Withheld |
63,488,093.37 |
2.074 |
|
TOTAL |
3,060,792,513.36 |
100.000 |
Thomas R. Williams
|
Affirmative |
2,993,561,996.24 |
97.803 |
|
Withheld |
67,230,517.12 |
2.197 |
|
TOTAL |
3,060,792,513.36 |
100.000 |
Semiannual Report
Notes to Financial Statements (Unaudited) - continued
PROPOSAL 2
To ratify the selection of Deloitte & Touche LLP as independent accountants of the fund.
|
|
# of Dollars Voted |
% of Dollars Voted |
|
Affirmative |
1,377,496,384.11 |
94.671 |
|
Against |
12,255,144.99 |
0.842 |
|
Abstain |
65,286,057.94 |
4.487 |
|
TOTAL |
1,455,037,587.04 |
100.000 |
PROPOSAL 3
To authorize the Trustees to adopt an amended and restated Declaration of Trust.*
|
|
# of Dollars Voted |
% of Dollars Voted |
|
Affirmative |
2,837,267,199.92 |
92.697 |
|
Against |
49,473,422.32 |
1.617 |
|
Abstain |
174,051,891.12 |
5.686 |
|
TOTAL |
3,060,792,513.36 |
100.000 |
PROPOSAL 6
To approve an amended management contract for the fund that would reduce the management fee payable to FMR by the fund as FMR's assets under management increase.
|
|
# of Dollars Voted |
% of Dollars Voted |
|
Affirmative |
1,340,780,422.20 |
92.147 |
|
Against |
27,115,319.81 |
1.864 |
|
Abstain |
87,141,845.03 |
5.989 |
|
TOTAL |
1,455,037,587.04 |
100.000 |
PROPOSAL 8
To approve an amended sub-advisory agreement with FMR U.K. to provide investment advice and research services or investment management services.
|
|
# of Dollars Voted |
% of Dollars Voted |
|
Affirmative |
1,331,739,032.83 |
91.526 |
|
Against |
27,683,762.48 |
1.903 |
|
Abstain |
95,614,791.73 |
6.571 |
|
TOTAL |
1,455,037,587.04 |
100.000 |
* Denotes trust-wide proposals and voting results.
PROPOSAL 10
To approve an amended sub-advisory agreement with FMR Far East to provide investment advice and research services or investment management services.
|
|
# of Dollars Voted |
% of Dollars Voted |
|
Affirmative |
1,323,899,985.14 |
90.987 |
|
Against |
34,015,265.88 |
2.338 |
|
Abstain |
97,122,336.02 |
6.675 |
|
TOTAL |
1,455,037,587.04 |
100.000 |
PROPOSAL 13
Diversification - To amend the fundamental investment limitation concerning diversification.
|
|
# of Dollars Voted |
% of Dollars Voted |
|
Affirmative |
1,328,921,810.70 |
91.332 |
|
Against |
33,755,864.67 |
2.320 |
|
Abstain |
92,359,911.67 |
6.348 |
|
TOTAL |
1,455,037,587.04 |
100.000 |
PROPOSAL 14
Underwriting - To amend the fundamental limitation concerning underwriting.
|
|
# of Dollars Voted |
% of Dollars Voted |
|
Affirmative |
1,331,436,859.78 |
91.505 |
|
Against |
31,609,505.60 |
2.173 |
|
Abstain |
91,991,221.66 |
6.322 |
|
TOTAL |
1,455,037,587.04 |
100.000 |
PROPOSAL 15
Concentration - To amend the fundamental limitation concerning concentration.
|
|
# of Dollars Voted |
% of Dollars Voted |
|
Affirmative |
1,327,032,945.65 |
91.203 |
|
Against |
34,495,489.11 |
2.370 |
|
Abstain |
93,509,152.28 |
6.427 |
|
TOTAL |
1,455,037,587.04 |
100.000 |
Growth Opportunities Portfolio
Performance
There are several ways to evaluate a fund's historical performance. You can look at the total percentage change in value, the average annual percentage change or the growth of a hypothetical $10,000 investment. Total return reflects the change in the value of an investment, assuming reinvestment of the fund's dividend income and capital gains (the profits earned upon the sale of securities that have grown in value). If Fidelity had not reimbursed certain fund expenses, the total returns would have been lower.
Average Annual Total Returns
|
Periods ended |
Past 1 |
Past 5 |
Life of |
|
Fidelity® VIP: Index 500 - |
6.94% |
23.42% |
19.52% |
|
S&P 500 ® |
7.25% |
23.80% |
19.89% |
Average annual returns take the fund's cumulative return and show you what would have happened if the fund had performed at a constant rate each year.
You can compare the fund's returns to the performance of the Standard & Poor's 500 Index - a market capitalization-weighted index of common stocks. This benchmark includes reinvested dividends and capital gains, if any.
Figures for more than one year assume a steady compounded rate of return and are not the fund's year-by-year results, which fluctuated over the periods shown. The life of fund figures are from commencement of operations, August 27, 1992.
Performance numbers are net of all fund operating expenses, but do not include any insurance charges imposed by your insurance company's separate account. If performance information included the effect of these additional charges, the total returns would be lower.
Past performance is no guarantee of future results. Principal and investment return will vary and you may have a gain or loss when you withdraw your money.
Understanding Performance
How a fund did yesterday is no guarantee of how it will do tomorrow. The stock market, for example, has a history of long-term growth and short-term volatility. In turn, the share price and return of a fund that invests in stocks will vary. That means if you sell your shares during a market downturn, you might lose money. But if you can ride out the market's ups and downs, you may have a gain.
3$10,000 Over Life of Fund
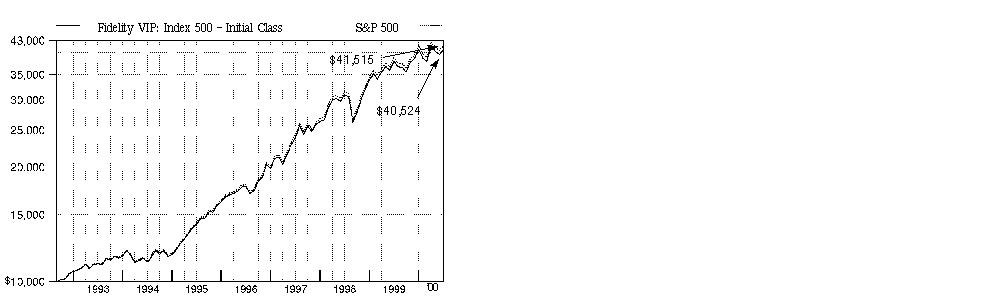
$10,000 Over Life of Fund: Let's say hypothetically that $10,000 was invested in Fidelity® Variable Insurance Products: Index 500 Portfolio - Initial Class on August 27, 1992, when the fund started. As the chart shows, by June 30, 2000 the value of the investment would have grown to $40,524 - a 305.24% increase on the initial investment. For comparison, look at how the Standard & Poor's 500 Index did over the same period. With dividends and capital gains, if any, reinvested, the same $10,000 investment would have grown to $41,515 - a 315.15% increase.
Investment Summary
|
Top Ten Stocks as of June 30, 2000 |
|
|
|
% of fund's |
|
General Electric Co. |
4.1 |
|
Intel Corp. |
3.5 |
|
Cisco Systems, Inc. |
3.4 |
|
Microsoft Corp. |
3.3 |
|
Pfizer, Inc. |
2.4 |
|
Exxon Mobil Corp. |
2.1 |
|
Wal-Mart Stores, Inc. |
2.0 |
|
Oracle Corp. |
1.9 |
|
Nortel Networks Corp. |
1.6 |
|
Citigroup, Inc. |
1.6 |
|
|
25.9 |
|
Top Ten Market Sectors as of June 30, 2000 |
|
|
|
% of fund's |
|
Technology |
32.4 |
|
Finance |
12.4 |
|
Health |
10.9 |
|
Utilities |
9.1 |
|
Industrial Machinery & Equipment |
5.7 |
|
Retail & Wholesale |
5.4 |
|
Nondurables |
5.4 |
|
Energy |
5.3 |
|
Media & Leisure |
4.4 |
|
Basic Industries |
2.6 |
Semiannual Report
(Portfolio Manager photograph)
An interview with Dean Barr, who oversees the Index 500 Portfolio's investment management personnel as Managing Director for Bankers Trust, sub-adviser of the fund
Q. How did the fund perform, Dean?
A. For the six-month period that ended June 30, 2000, the fund closely tracked the -0.42% return of the Standard & Poor's 500 Index. For the 12 months that ended June 30, 2000, fund performance also fell in line with the index, which returned 7.25%.
Q. What was the market environment like over the past six months?
A. It was a grueling round trip. The stock market battled through one of the most volatile periods on record, yet had very little to show for its efforts. Technology-enabled productivity gains helped keep the lid on inflation, allowing the economy to advance at a feverish pace. In this high-growth environment, speculative investors rallied seemingly indiscriminately around smaller-sized tech stocks expected to give shape to the new economy. Amid the tech rush, the broader market retreated into bear territory. A quarter-point interest-rate hike levied by the Federal Reserve Board in February, expected to slow the advances of new economy stocks, had the opposite effect of pushing old economy stocks lower, further widening the performance disparity between the two groups. In late March, however, the tables turned on tech stocks.
Q. What sparked this reversal of fortune?
A. Concerns about seemingly overstretched valuations and further Fed tightening spurred a flight to safety, with jittery investors fleeing smaller-cap tech stocks en masse for the predictability found in large, value-oriented companies. The S&P 500 - home to many of these well-known stocks - benefited from this migration, although the party was short-lived. Another quarter-point hike on March 24, coupled with expectations for an even bigger increase in May, pulled the entire market into a steep decline, culminating in a 5.8% drop in the index on April 14. Stocks forged a recovery later in the month, only to turn back again in May when the Fed dropped a half-point bomb on them. Investors - seeing signs of a slowdown and sensing the smoke was clearing on the rate front - eased their way back into the market, focusing on seasoned growth companies with actual revenues and earnings.
Q. What areas of technology survived the tumult, and which didn't?
A. Not surprisingly, semiconductors - providing the lifeblood for the digital age - led the way, posting impressive gains during the six-month period. Chips were in high demand thanks to growing usage of personal computers and wireless communications devices worldwide. Index standouts Intel, Micron Technology, Texas Instruments and Altera were the big winners here. Not far behind were the providers of networking equipment - central to the development of broadband services - most notably Corning, Nortel, Cisco and Network Appliance. Conversely, Internet stocks - namely AOL and Yahoo! - lost ground, as did Microsoft, which was plagued by antitrust litigation.
Q. How did other sectors of the market fare?
A. Health stocks rode the biotech wave to a strong turnaround during the period. Most biotech and genomics stocks fell sharply in the spring, but recovered nicely in June behind investors' renewed enthusiasm for the sector when researchers reported a successful mapping of the human genome. PE Corp. and Amgen were notable contributors. Drug stocks, such as Eli Lilly and Pfizer, rallied as exciting new product pipelines overcame concerns that presidential campaign rhetoric would dominate the investment landscape. Among financials, banks got a bounce out of the rotation in April and May, but ended up generally flat to down thanks to rising rates. Investment management firms and brokerage houses, however, did quite well, benefiting from robust capital markets activity. Lehman Brothers was one of the stars here. Energy stocks, particularly companies engaged in oil services, such as Baker Hughes, got a lift from the rebound in oil prices. On the downside, retailers such as Wal-Mart and Home Depot suffered from the fear of a slowdown in consumer spending. Utilities also underperformed due to the poor performance of traditional telecommunications providers, such as AT&T and WorldCom, which slipped on increased competition and pricing pressures in their long-distance businesses.
Q. What's your outlook?
A. In choosing not to raise rates further on June 28, the Fed acknowledged that the economy appears to be cooling, for now at least. More evidence of a slowdown will be needed before we can be sure that the Fed will stop tightening. Strong technology-related spending should continue to fuel productivity growth, which, hopefully, will dampen inflationary pressures and keep corporate profits rising. If so, growth stocks could prosper and continue to outperform in the coming months.
The views expressed in this report reflect those of Bankers Trust only through the end of the period of the report as stated on the cover. Any such views are subject to change at any time based on market or other conditions. For more information, see page 2.
Fund Facts
Goal: to provide returns that correspond to those of the S&P 500 index
Start date: August 27, 1992
Size: as of June 30, 2000, more than
$4.8 billion
Manager: Bankers Trust, since 1997
3Semiannual Report
Fidelity Variable Insurance Products: Index 500 Portfolio
(Unaudited)
Showing Percentage of Net Assets
|
|
||
|
Common Stocks - 97.8% |
|||
|
Shares |
Value (Note 1) |
||
|
AEROSPACE & DEFENSE - 1.1% |
|||
|
Aerospace & Defense - 1.0% |
|||
|
BFGoodrich Co. |
41,200 |
$ 1,403,375 |
|
|
Boeing Co. |
324,668 |
13,575,181 |
|
|
Honeywell International, Inc. |
295,662 |
9,960,114 |
|
|
Lockheed Martin Corp. |
147,986 |
3,671,903 |
|
|
Northrop Grumman Corp. |
26,000 |
1,722,500 |
|
|
Rockwell International Corp. |
70,900 |
2,233,350 |
|
|
Textron, Inc. |
55,600 |
3,019,775 |
|
|
United Technologies Corp. |
177,600 |
10,456,200 |
|
|
|
46,042,398 |
||
|
Defense Electronics - 0.0% |
|||
|
Raytheon Co. Class B |
126,400 |
2,433,200 |
|
|
Ship Building & Repair - 0.1% |
|||
|
General Dynamics Corp. |
75,100 |
3,923,975 |
|
|
TOTAL AEROSPACE & DEFENSE |
52,399,573 |
||
|
BASIC INDUSTRIES - 2.6% |
|||
|
Chemicals & Plastics - 1.5% |
|||
|
Air Products & Chemicals, Inc. |
83,500 |
2,572,844 |
|
|
Armstrong Holdings, Inc. |
14,900 |
228,156 |
|
|
Ashland, Inc. |
26,700 |
936,169 |
|
|
Avery Dennison Corp. |
42,200 |
2,832,675 |
|
|
Dow Chemical Co. |
246,000 |
7,426,125 |
|
|
E.I. du Pont de Nemours and Co. |
390,379 |
17,079,081 |
|
|
Eastman Chemical Co. |
29,375 |
1,402,656 |
|
|
Engelhard Corp. |
47,300 |
807,056 |
|
|
FMC Corp. |
11,500 |
667,000 |
|
|
Great Lakes Chemical Corp. |
21,600 |
680,400 |
|
|
Hercules, Inc. |
39,500 |
555,469 |
|
|
Pharmacia Corp. |
473,423 |
24,470,051 |
|
|
PPG Industries, Inc. |
65,100 |
2,884,744 |
|
|
Praxair, Inc. |
59,500 |
2,227,531 |
|
|
Rohm & Haas Co. |
81,936 |
2,826,792 |
|
|
Sealed Air Corp. (a) |
31,260 |
1,637,243 |
|
|
Union Carbide Corp. |
50,100 |
2,479,950 |
|
|
W.R. Grace & Co. (a) |
26,800 |
324,950 |
|
|
|
72,038,892 |
||
|
Iron & Steel - 0.1% |
|||
|
Allegheny Technologies, Inc. |
34,492 |
620,856 |
|
|
Bethlehem Steel Corp. (a) |
45,000 |
160,313 |
|
|
Crane Co. |
24,300 |
590,794 |
|
|
Nucor Corp. |
34,900 |
1,158,244 |
|
|
USX - U.S. Steel Group |
35,600 |
660,825 |
|
|
Worthington Industries, Inc. |
32,550 |
341,775 |
|
|
3,532,807 |
|||
|
Metals & Mining - 0.3% |
|||
|
Alcan Aluminium Ltd. |
85,157 |
2,645,878 |
|
|
Alcoa, Inc. |
322,504 |
9,352,616 |
|
|
Freeport-McMoRan Copper & Gold, Inc. Class B (a) |
59,500 |
550,375 |
|
|
|
|||
|
Shares |
Value (Note 1) |
||
|
Inco Ltd. (a) |
69,436 |
$ 1,064,638 |
|
|
Phelps Dodge Corp. |
31,157 |
1,158,651 |
|
|
|
14,772,158 |
||
|
Packaging & Containers - 0.1% |
|||
|
Ball Corp. |
10,730 |
345,372 |
|
|
Bemis Co., Inc. |
16,500 |
554,813 |
|
|
Crown Cork & Seal Co., Inc. |
45,800 |
687,000 |
|
|
Owens-Illinois, Inc. (a) |
54,800 |
640,475 |
|
|
Tupperware Corp. |
20,900 |
459,800 |
|
|
|
2,687,460 |
||
|
Paper & Forest Products - 0.6% |
|||
|
Boise Cascade Corp. |
20,700 |
535,613 |
|
|
Fort James Corp. |
83,400 |
1,928,625 |
|
|
Georgia-Pacific Corp. |
64,400 |
1,690,500 |
|
|
International Paper Co. |
182,336 |
5,435,892 |
|
|
Kimberly-Clark Corp. |
205,632 |
11,798,136 |
|
|
Louisiana-Pacific Corp. |
43,800 |
476,325 |
|
|
Mead Corp. |
37,900 |
956,975 |
|
|
Pactiv Corp. (a) |
70,200 |
552,825 |
|
|
Potlatch Corp. |
12,100 |
400,813 |
|
|
Temple-Inland, Inc. |
20,900 |
877,800 |
|
|
Westvaco Corp. |
33,450 |
829,978 |
|
|
Weyerhaeuser Co. |
86,900 |
3,736,700 |
|
|
Willamette Industries, Inc. |
38,800 |
1,057,300 |
|
|
|
30,277,482 |
||
|
TOTAL BASIC INDUSTRIES |
123,308,799 |
||
|
CONSTRUCTION & REAL ESTATE - 0.2% |
|||
|
Building Materials - 0.2% |
|||
|
Fortune Brands, Inc. |
61,300 |
1,413,731 |
|
|
Masco Corp. |
167,000 |
3,016,438 |
|
|
Owens Corning |
20,400 |
188,700 |
|
|
Sherwin-Williams Co. |
62,300 |
1,319,981 |
|
|
Vulcan Materials Co. |
37,500 |
1,600,781 |
|
|
|
7,539,631 |
||
|
Construction - 0.0% |
|||
|
Centex Corp. |
22,200 |
521,700 |
|
|
Kaufman & Broad Home Corp. |
17,700 |
350,681 |
|
|
Pulte Corp. |
16,100 |
348,163 |
|
|
|
1,220,544 |
||
|
Engineering - 0.0% |
|||
|
Fluor Corp. |
28,300 |
894,988 |
|
|
TOTAL CONSTRUCTION & REAL ESTATE |
9,655,163 |
||
|
DURABLES - 1.6% |
|||
|
Autos, Tires, & Accessories - 1.0% |
|||
|
AutoZone, Inc. (a) |
52,050 |
1,145,100 |
|
|
Cooper Tire & Rubber Co. |
30,300 |
337,088 |
|
|
Cummins Engine Co., Inc. |
15,500 |
422,375 |
|
|
Dana Corp. |
62,466 |
1,323,498 |
|
|
Common Stocks - continued |
|||
|
Shares |
Value (Note 1) |
||
|
DURABLES - continued |
|||
|
Autos, Tires, & Accessories - continued |
|||
|
Danaher Corp. |
53,200 |
$ 2,630,075 |
|
|
Delphi Automotive Systems Corp. |
213,335 |
3,106,691 |
|
|
Eaton Corp. |
27,300 |
1,829,100 |
|
|
Ford Motor Co. |
452,100 |
19,440,300 |
|
|
General Motors Corp. |
199,878 |
11,605,416 |
|
|
Genuine Parts Co. |
66,550 |
1,331,000 |
|
|
Goodyear Tire & Rubber Co. |
58,700 |
1,174,000 |
|
|
Johnson Controls, Inc. |
31,700 |
1,626,606 |
|
|
Navistar International Corp. (a) |
24,570 |
763,206 |
|
|
PACCAR, Inc. |
30,090 |
1,194,197 |
|
|
TRW, Inc. |
45,400 |
1,969,225 |
|
|
Visteon Corp. (a) |
59,194 |
717,727 |
|
|
|
50,615,604 |
||
|
Consumer Durables - 0.3% |
|||
|
Minnesota Mining & Manufacturing Co. |
149,200 |
12,309,000 |
|
|
Snap-On, Inc. |
21,900 |
583,088 |
|
|
|
12,892,088 |
||
|
Consumer Electronics - 0.1% |
|||
|
Black & Decker Corp. |
32,700 |
1,285,519 |
|
|
Maytag Corp. |
33,100 |
1,220,563 |
|
|
Whirlpool Corp. |
25,500 |
1,188,938 |
|
|
|
3,695,020 |
||
|
Home Furnishings - 0.1% |
|||
|
Leggett & Platt, Inc. |
73,900 |
1,219,350 |
|
|
Newell Rubbermaid, Inc. |
105,493 |
2,716,445 |
|
|
|
3,935,795 |
||
|
Textiles & Apparel - 0.1% |
|||
|
Liz Claiborne, Inc. |
23,600 |
831,900 |
|
|
NIKE, Inc. Class B |
105,900 |
4,216,144 |
|
|
Reebok International Ltd. (a) |
21,300 |
339,469 |
|
|
Russell Corp. |
13,000 |
260,000 |
|
|
Springs Industries, Inc. Class A |
6,700 |
214,400 |
|
|
VF Corp. |
44,500 |
1,059,656 |
|
|
|
6,921,569 |
||
|
TOTAL DURABLES |
78,060,076 |
||
|
ENERGY - 5.3% |
|||
|
Energy Services - 0.7% |
|||
|
Baker Hughes, Inc. |
122,230 |
3,911,360 |
|
|
Halliburton Co. |
166,700 |
7,866,156 |
|
|
McDermott International, Inc. |
20,700 |
182,419 |
|
|
Rowan Companies, Inc. (a) |
31,000 |
941,625 |
|
|
Schlumberger Ltd. (NY Shares) |
207,200 |
15,462,300 |
|
|
Transocean Sedco Forex, Inc. |
68,606 |
3,666,133 |
|
|
|
32,029,993 |
||
|
Oil & Gas - 4.6% |
|||
|
Amerada Hess Corp. |
34,600 |
2,136,550 |
|
|
Anadarko Petroleum Corp. |
47,100 |
2,322,619 |
|
|
|
|||
|
Shares |
Value (Note 1) |
||
|
Apache Corp. |
42,300 |
$ 2,487,769 |
|
|
Burlington Resources, Inc. |
81,557 |
3,119,555 |
|
|
Chevron Corp. |
245,700 |
20,838,431 |
|
|
Conoco, Inc. Class B |
234,031 |
5,748,386 |
|
|
Exxon Mobil Corp. |
1,290,933 |
101,338,241 |
|
|
Kerr-McGee Corp. |
34,894 |
2,056,565 |
|
|
Occidental Petroleum Corp. |
137,900 |
2,904,519 |
|
|
Phillips Petroleum Co. |
95,500 |
4,840,656 |
|
|
Royal Dutch Petroleum Co. (NY Shares) |
801,975 |
49,371,586 |
|
|
Sunoco, Inc. |
33,700 |
992,044 |
|
|
Texaco, Inc. |
206,700 |
11,006,775 |
|
|
The Coastal Corp. |
79,800 |
4,857,825 |
|
|
Tosco Corp. |
55,300 |
1,565,681 |
|
|
Union Pacific Resources Group, Inc. |
91,912 |
2,022,064 |
|
|
Unocal Corp. |
90,850 |
3,009,406 |
|
|
USX - Marathon Group |
116,100 |
2,909,756 |
|
|
|
223,528,428 |
||
|
TOTAL ENERGY |
255,558,421 |
||
|
FINANCE - 12.4% |
|||
|
Banks - 4.2% |
|||
|
AmSouth Bancorp. |
143,900 |
2,266,425 |
|
|
Bank of America Corp. |
619,240 |
26,627,320 |
|
|
Bank of New York Co., Inc. |
275,700 |
12,820,050 |
|
|
Bank One Corp. |
429,199 |
11,400,598 |
|
|
BB&T Corp. |
129,300 |
3,087,038 |
|
|
Capital One Financial Corp. |
74,800 |
3,337,950 |
|
|
Chase Manhattan Corp. |
462,669 |
21,311,691 |
|
|
Comerica, Inc. |
59,000 |
2,647,625 |
|
|
Fifth Third Bancorp |
115,725 |
7,319,606 |
|
|
First Union Corp. |
369,645 |
9,171,816 |
|
|
Firstar Corp. |
367,142 |
7,732,928 |
|
|
FleetBoston Financial Corp. |
336,783 |
11,450,622 |
|
|
Huntington Bancshares, Inc. |
84,104 |
1,329,895 |
|
|
J.P. Morgan & Co., Inc. |
60,700 |
6,684,588 |
|
|
KeyCorp |
168,214 |
2,964,772 |
|
|
Mellon Financial Corp. |
183,500 |
6,686,281 |
|
|
National City Corp. |
231,442 |
3,948,979 |
|
|
Northern Trust Corp. |
83,500 |
5,432,719 |
|
|
PNC Financial Services Group, Inc. |
110,400 |
5,175,000 |
|
|
Regions Financial Corp. |
79,800 |
1,586,025 |
|
|
SouthTrust Corp. |
63,600 |
1,438,950 |
|
|
State Street Corp. |
60,000 |
6,363,750 |
|
|
Summit Bancorp |
66,100 |
1,627,713 |
|
|
SunTrust Banks, Inc. |
113,000 |
5,162,688 |
|
|
Synovus Finanical Corp. |
101,700 |
1,792,463 |
|
|
U.S. Bancorp |
275,551 |
5,304,357 |
|
|
Union Planters Corp. |
51,100 |
1,427,606 |
|
|
Wachovia Corp. |
76,200 |
4,133,850 |
|
|
Wells Fargo & Co. |
602,100 |
23,331,375 |
|
|
|
203,564,680 |
||
|
Common Stocks - continued |
|||
|
Shares |
Value (Note 1) |
||
|
FINANCE - continued |
|||
|
Credit & Other Finance - 2.7% |
|||
|
American Express Co. |
503,037 |
$ 26,220,804 |
|
|
Associates First Capital Corp. Class A |
274,748 |
6,130,315 |
|
|
Citigroup, Inc. |
1,254,329 |
75,573,322 |
|
|
Countrywide Credit Industries, Inc. |
42,300 |
1,282,219 |
|
|
Household International, Inc. |
177,082 |
7,359,971 |
|
|
MBNA Corp. |
301,725 |
8,184,291 |
|
|
Old Kent Financial Corp. |
47,775 |
1,277,981 |
|
|
Providian Financial Corp. |
53,700 |
4,833,000 |
|
|
|
130,861,903 |
||
|
Federal Sponsored Credit - 0.7% |
|||
|
Fannie Mae |
376,500 |
19,648,594 |
|
|
Freddie Mac |
260,900 |
10,566,450 |
|
|
SLM Holding Corp. |
60,100 |
2,249,994 |
|
|
|
32,465,038 |
||
|
Insurance - 2.9% |
|||
|
Aetna, Inc. |
53,400 |
3,427,613 |
|
|
AFLAC, Inc. |
99,400 |
4,566,188 |
|
|
Allstate Corp. |
278,242 |
6,190,885 |
|
|
American General Corp. |
92,352 |
5,633,472 |
|
|
American International Group, Inc. |
576,012 |
67,681,410 |
|
|
Aon Corp. |
92,525 |
2,874,058 |
|
|
CIGNA Corp. |
63,000 |
5,890,500 |
|
|
Cincinnati Financial Corp. |
60,300 |
1,895,681 |
|
|
Conseco, Inc. |
122,116 |
1,190,631 |
|
|
Hartford Financial Services Group, Inc. |
84,400 |
4,721,125 |
|
|
Jefferson-Pilot Corp. |
39,700 |
2,240,569 |
|
|
Lincoln National Corp. |
73,100 |
2,640,738 |
|
|
Loews Corp. |
39,100 |
2,346,000 |
|
|
Marsh & McLennan Companies, Inc. |
100,250 |
10,469,859 |
|
|
MBIA, Inc. |
36,300 |
1,749,206 |
|
|
MGIC Investment Corp. |
39,700 |
1,806,350 |
|
|
Progressive Corp. |
26,600 |
1,968,400 |
|
|
SAFECO Corp. |
49,400 |
981,825 |
|
|
The Chubb Corp. |
68,400 |
4,206,600 |
|
|
The St. Paul Companies, Inc. |
79,192 |
2,702,427 |
|
|
Torchmark Corp. |
49,100 |
1,212,156 |
|
|
UnumProvident Corp. |
89,638 |
1,798,362 |
|
|
|
138,194,055 |
||
|
Savings & Loans - 0.2% |
|||
|
Charter One Financial, Inc. |
78,400 |
1,803,200 |
|
|
Golden West Financial Corp. |
60,800 |
2,481,400 |
|
|
Washington Mutual, Inc. |
204,662 |
5,909,615 |
|
|
|
10,194,215 |
||
|
Securities Industry - 1.7% |
|||
|
Bear Stearns Companies, Inc. |
42,397 |
1,764,775 |
|
|
Charles Schwab Corp. |
498,000 |
16,745,250 |
|
|
Franklin Resources, Inc. |
92,900 |
2,821,838 |
|
|
Lehman Brothers Holdings, Inc. |
44,700 |
4,226,944 |
|
|
Merrill Lynch & Co., Inc. |
138,500 |
15,927,500 |
|
|
Morgan Stanley Dean Witter & Co. |
422,912 |
35,207,424 |
|
|
|
|||
|
Shares |
Value (Note 1) |
||
|
PaineWebber Group, Inc. |
53,300 |
$ 2,425,150 |
|
|
T. Rowe Price Associates, Inc. |
44,700 |
1,899,750 |
|
|
|
81,018,631 |
||
|
TOTAL FINANCE |
596,298,522 |
||
|
HEALTH - 10.9% |
|||
|
Drugs & Pharmaceuticals - 7.7% |
|||
|
Allergan, Inc. |
49,500 |
3,687,750 |
|
|
ALZA Corp. (a) |
44,300 |
2,619,238 |
|
|
American Home Products Corp. |
488,400 |
28,693,500 |
|
|
Amgen, Inc. |
390,200 |
27,411,550 |
|
|
Bausch & Lomb, Inc. |
20,100 |
1,555,238 |
|
|
Biogen, Inc. (a) |
56,600 |
3,650,700 |
|
|
Bristol-Myers Squibb Co. |
737,100 |
42,936,075 |
|
|
Eli Lilly & Co. |
420,892 |
42,036,589 |
|
|
Medimmune, Inc. (a) |
72,800 |
5,387,200 |
|
|
Merck & Co., Inc. |
859,700 |
65,874,513 |
|
|
Pfizer, Inc. |
2,363,825 |
113,463,600 |
|
|
Quintiles Transnational Corp. (a) |
42,900 |
605,963 |
|
|
Schering-Plough Corp. |
549,900 |
27,769,950 |
|
|
Sigma-Aldrich Corp. |
37,500 |
1,096,875 |
|
|
Watson Pharmaceuticals, Inc. (a) |
35,900 |
1,929,625 |
|
|
|
368,718,366 |
||
|
Medical Equipment & Supplies - 2.8% |
|||
|
Abbott Laboratories |
575,300 |
25,636,806 |
|
|
Baxter International, Inc. |
109,200 |
7,678,125 |
|
|
Becton, Dickinson & Co. |
94,400 |
2,708,100 |
|
|
Biomet, Inc. |
42,700 |
1,641,281 |
|
|
Boston Scientific Corp. (a) |
156,400 |
3,431,025 |
|
|
C.R. Bard, Inc. |
19,500 |
938,438 |
|
|
Cardinal Health, Inc. |
105,650 |
7,818,100 |
|
|
Guidant Corp. (a) |
115,400 |
5,712,300 |
|
|
Johnson & Johnson |
520,400 |
53,015,750 |
|
|
Mallinckrodt, Inc. |
25,900 |
1,125,031 |
|
|
McKesson HBOC, Inc. |
105,748 |
2,214,099 |
|
|
Medtronic, Inc. |
446,800 |
22,256,225 |
|
|
Millipore Corp. |
16,100 |
1,213,538 |
|
|
St. Jude Medical, Inc. (a) |
29,329 |
1,345,468 |
|
|
|
136,734,286 |
||
|
Medical Facilities Management - 0.4% |
|||
|
HCA - The Healthcare Co. |
210,412 |
6,391,265 |
|
|
HEALTHSOUTH Corp. (a) |
144,300 |
1,037,156 |
|
|
Humana, Inc. (a) |
60,500 |
294,938 |
|
|
Manor Care, Inc. (a) |
38,600 |
270,200 |
|
|
Tenet Healthcare Corp. |
112,300 |
3,032,100 |
|
|
UnitedHealth Group, Inc. |
63,400 |
5,436,550 |
|
|
Wellpoint Health Networks, Inc. (a) |
23,800 |
1,724,013 |
|
|
|
18,186,222 |
||
|
TOTAL HEALTH |
523,638,874 |
||
|
Common Stocks - continued |
|||
|
Shares |
Value (Note 1) |
||
|
INDUSTRIAL MACHINERY & EQUIPMENT - 5.7% |
|||
|
Electrical Equipment - 4.4% |
|||
|
American Power Conversion Corp. (a) |
64,000 |
$ 2,612,000 |
|
|
Emerson Electric Co. |
161,100 |
9,726,413 |
|
|
General Electric Co. |
3,687,400 |
195,432,166 |
|
|
Scientific-Atlanta, Inc. |
59,900 |
4,462,550 |
|
|
Thomas & Betts Corp. |
21,600 |
413,100 |
|
|
W.W. Grainger, Inc. |
34,600 |
1,066,113 |
|
|
|
213,712,342 |
||
|
Industrial Machinery & Equipment - 1.2% |
|||
|
Briggs & Stratton Corp. |
8,600 |
294,550 |
|
|
Caterpillar, Inc. |
132,800 |
4,498,600 |
|
|
Cooper Industries, Inc. |
35,146 |
1,144,442 |
|
|
Deere & Co. |
88,500 |
3,274,500 |
|
|
Dover Corp. |
77,800 |
3,155,763 |
|
|
Illinois Tool Works, Inc. |
112,300 |
6,401,100 |
|
|
Ingersoll-Rand Co. |
61,200 |
2,463,300 |
|
|
ITT Industries, Inc. |
35,500 |
1,078,313 |
|
|
Pall Corp. |
46,500 |
860,250 |
|
|
Parker-Hannifin Corp. |
41,925 |
1,435,931 |
|
|
The Stanley Works |
33,500 |
795,625 |
|
|
Timken Co. |
22,584 |
420,627 |
|
|
Tyco International Ltd. |
631,842 |
29,933,515 |
|
|
|
55,756,516 |
||
|
Pollution Control - 0.1% |
|||
|
Allied Waste Industries, Inc. (a) |
64,500 |
645,000 |
|
|
Waste Management, Inc. |
242,209 |
4,601,971 |
|
|
|
5,246,971 |
||
|
TOTAL INDUSTRIAL MACHINERY & EQUIPMENT |
274,715,829 |
||
|
MEDIA & LEISURE - 4.4% |
|||
|
Broadcasting - 1.6% |
|||
|
Clear Channel Communications, Inc. (a) |
127,200 |
9,540,000 |
|
|
Comcast Corp. Class A (special) (a) |
337,300 |
13,660,650 |
|
|
MediaOne Group, Inc. (a) |
229,200 |
15,199,111 |
|
|
Time Warner, Inc. |
490,440 |
37,273,440 |
|
|
|
75,673,201 |
||
|
Entertainment - 1.5% |
|||
|
Carnival Corp. |
230,800 |
4,500,600 |
|
|
Viacom, Inc. Class B (non-vtg.) (a) |
571,393 |
38,961,860 |
|
|
Walt Disney Co. |
774,700 |
30,068,044 |
|
|
|
73,530,504 |
||
|
Leisure Durables & Toys - 0.2% |
|||
|
Brunswick Corp. |
34,100 |
564,781 |
|
|
Harley-Davidson, Inc. |
113,200 |
4,358,200 |
|
|
Hasbro, Inc. |
66,804 |
1,006,235 |
|
|
Mattel, Inc. |
157,176 |
2,072,759 |
|
|
|
8,001,975 |
||
|
Lodging & Gaming - 0.1% |
|||
|
Harrah's Entertainment, Inc. (a) |
39,500 |
827,031 |
|
|
|
|||
|
Shares |
Value (Note 1) |
||
|
Hilton Hotels Corp. |
137,800 |
$ 1,291,875 |
|
|
Marriott International, Inc. Class A |
92,900 |
3,350,206 |
|
|
|
5,469,112 |
||
|
Publishing - 0.5% |
|||
|
American Greetings Corp. Class A |
26,200 |
497,800 |
|
|
Dow Jones & Co., Inc. |
29,700 |
2,175,525 |
|
|
Gannett Co., Inc. |
99,600 |
5,957,325 |
|
|
Harcourt General, Inc. |
22,400 |
1,218,000 |
|
|
Knight-Ridder, Inc. |
32,300 |
1,717,956 |
|
|
McGraw-Hill Companies, Inc. |
74,100 |
4,001,400 |
|
|
Meredith Corp. |
19,200 |
648,000 |
|
|
The New York Times Co. Class A |
65,300 |
2,579,350 |
|
|
Tribune Co. |
116,747 |
4,086,145 |
|
|
|
22,881,501 |
||
|
Restaurants - 0.5% |
|||
|
Darden Restaurants, Inc. |
50,600 |
822,250 |
|
|
McDonald's Corp. |
499,300 |
16,445,694 |
|
|
Starbucks Corp. (a) |
68,500 |
2,615,844 |
|
|
Tricon Global Restaurants, Inc. (a) |
58,910 |
1,664,208 |
|
|
Wendy's International, Inc. |
46,000 |
819,375 |
|
|
|
22,367,371 |
||
|
TOTAL MEDIA & LEISURE |
207,923,664 |
||
|
NONDURABLES - 5.4% |
|||
|
Beverages - 1.7% |
|||
|
Adolph Coors Co. Class B |
13,200 |
798,600 |
|
|
Anheuser-Busch Companies, Inc. |
168,800 |
12,607,250 |
|
|
Brown-Forman Corp. Class B (non-vtg.) |
22,700 |
1,220,125 |
|
|
Coca-Cola Enterprises, Inc. |
159,300 |
2,598,581 |
|
|
Seagram Co. Ltd. |
165,400 |
9,719,554 |
|
|
The Coca-Cola Co. |
923,900 |
53,066,506 |
|
|
|
80,010,616 |
||
|
Foods - 1.7% |
|||
|
Archer-Daniels-Midland Co. |
224,928 |
2,207,106 |
|
|
Bestfoods |
105,300 |
7,292,025 |
|
|
Campbell Soup Co. |
159,900 |
4,657,088 |
|
|
ConAgra, Inc. |
183,100 |
3,490,344 |
|
|
General Mills, Inc. |
113,800 |
4,352,850 |
|
|
H.J. Heinz Co. |
133,850 |
5,855,938 |
|
|
Hershey Foods Corp. |
50,700 |
2,458,950 |
|
|
Kellogg Co. |
150,400 |
4,474,400 |
|
|
Nabisco Group Holdings Corp. |
126,500 |
3,281,094 |
|
|
PepsiCo, Inc. |
538,500 |
23,929,594 |
|
|
Quaker Oats Co. |
50,800 |
3,816,350 |
|
|
Ralston Purina Co. |
112,800 |
2,248,950 |
|
|
Sara Lee Corp. |
330,900 |
6,390,506 |
|
|
Sysco Corp. |
124,500 |
5,244,563 |
|
|
Wm. Wrigley Jr. Co. |
43,900 |
3,520,231 |
|
|
|
83,219,989 |
||
|
Household Products - 1.5% |
|||
|
Avon Products, Inc. |
90,500 |
4,027,250 |
|
|
Common Stocks - continued |
|||
|
Shares |
Value (Note 1) |
||
|
NONDURABLES - continued |
|||
|
Household Products - continued |
|||
|
Clorox Co. |
87,700 |
$ 3,930,056 |
|
|
Colgate-Palmolive Co. |
217,700 |
13,034,788 |
|
|
Gillette Co. |
390,100 |
13,629,119 |
|
|
International Flavors & Fragrances, Inc. |
39,100 |
1,180,331 |
|
|
Procter & Gamble Co. |
491,600 |
28,144,100 |
|
|
Unilever NV (NY Shares) |
214,452 |
9,221,436 |
|
|
|
73,167,080 |
||
|
Tobacco - 0.5% |
|||
|
Philip Morris Companies, Inc. |
854,500 |
22,697,656 |
|
|
UST, Inc. |
63,900 |
938,531 |
|
|
|
23,636,187 |
||
|
TOTAL NONDURABLES |
260,033,872 |
||
|
PRECIOUS METALS - 0.1% |
|||
|
Barrick Gold Corp. |
147,700 |
2,668,676 |
|
|
Homestake Mining Co. |
92,200 |
633,875 |
|
|
Newmont Mining Corp. |
63,065 |
1,363,781 |
|
|
Placer Dome, Inc. |
122,500 |
1,150,118 |
|
|
|
5,816,450 |
||
|
RETAIL & WHOLESALE - 5.4% |
|||
|
Apparel Stores - 0.3% |
|||
|
Gap, Inc. |
318,475 |
9,952,344 |
|
|
The Limited, Inc. |
161,480 |
3,492,005 |
|
|
TJX Companies, Inc. |
116,600 |
2,186,250 |
|
|
|
15,630,599 |
||
|
Drug Stores - 0.4% |
|||
|
CVS Corp. |
146,700 |
5,868,000 |
|
|
Longs Drug Stores Corp. |
14,100 |
306,675 |
|
|
Rite Aid Corp. |
98,700 |
647,719 |
|
|
Walgreen Co. |
376,400 |
12,115,375 |
|
|
|
18,937,769 |
||
|
General Merchandise Stores - 2.8% |
|||
|
Consolidated Stores Corp. (a) |
39,700 |
476,400 |
|
|
Costco Wholesale Corp. (a) |
167,078 |
5,513,574 |
|
|
Dillards, Inc. Class A |
37,600 |
460,600 |
|
|
Dollar General Corp. |
111,616 |
2,176,512 |
|
|
Federated Department Stores, Inc. (a) |
76,400 |
2,578,500 |
|
|
JCPenney Co., Inc. |
95,500 |
1,760,781 |
|
|
Kmart Corp. (a) |
178,800 |
1,218,075 |
|
|
Kohls Corp. (a) |
122,700 |
6,825,188 |
|
|
Nordstrom, Inc. |
51,200 |
1,235,200 |
|
|
Sears, Roebuck & Co. |
131,700 |
4,296,713 |
|
|
Target Corp. |
164,300 |
9,529,400 |
|
|
The May Department Stores Co. |
125,800 |
3,019,200 |
|
|
Wal-Mart Stores, Inc. |
1,664,900 |
95,939,863 |
|
|
|
135,030,006 |
||
|
|
|||
|
Shares |
Value (Note 1) |
||
|
Grocery Stores - 0.5% |
|||
|
Albertson's, Inc. |
160,681 |
$ 5,342,643 |
|
|
Great Atlantic & Pacific Tea, Inc. |
13,900 |
231,088 |
|
|
Kroger Co. (a) |
314,900 |
6,947,481 |
|
|
Safeway, Inc. (a) |
185,500 |
8,370,688 |
|
|
SUPERVALU, Inc. |
47,600 |
907,375 |
|
|
Winn-Dixie Stores, Inc. |
53,600 |
767,150 |
|
|
|
22,566,425 |
||
|
Retail & Wholesale, Miscellaneous - 1.4% |
|||
|
Alberto-Culver Co. Class B |
19,900 |
608,194 |
|
|
Bed Bath & Beyond, Inc. (a) |
51,700 |
1,874,125 |
|
|
Best Buy Co., Inc. (a) |
76,400 |
4,832,300 |
|
|
Circuit City Stores, Inc. - Circuit City Group |
76,300 |
2,532,206 |
|
|
Home Depot, Inc. |
860,450 |
42,968,722 |
|
|
Lowe's Companies, Inc. |
143,100 |
5,876,044 |
|
|
Office Depot, Inc. (a) |
124,000 |
775,000 |
|
|
RadioShack Corp. |
71,700 |
3,396,788 |
|
|
Staples, Inc. (a) |
176,150 |
2,708,306 |
|
|
Tiffany & Co., Inc. |
22,500 |
1,518,750 |
|
|
Toys 'R' Us, Inc. (a) |
90,500 |
1,317,906 |
|
|
|
68,408,341 |
||
|
TOTAL RETAIL & WHOLESALE |
260,573,140 |
||
|
SERVICES - 0.6% |
|||
|
Advertising - 0.3% |
|||
|
Interpublic Group of Companies, Inc. |
104,900 |
4,510,700 |
|
|
Omnicom Group, Inc. |
66,300 |
5,904,844 |
|
|
Young & Rubicam, Inc. |
26,000 |
1,486,875 |
|
|
|
11,902,419 |
||
|
Leasing & Rental - 0.0% |
|||
|
Ryder System, Inc. |
28,700 |
543,506 |
|
|
Printing - 0.0% |
|||
|
Deluxe Corp. |
28,900 |
680,956 |
|
|
R.R. Donnelley & Sons Co. |
49,100 |
1,107,819 |
|
|
|
1,788,775 |
||
|
Services - 0.3% |
|||
|
Cendant Corp. (a) |
260,441 |
3,646,174 |
|
|
Convergys Corp. (a) |
57,700 |
2,993,188 |
|
|
Dun & Bradstreet Corp. |
60,100 |
1,720,363 |
|
|
Ecolab, Inc. |
48,600 |
1,898,438 |
|
|
H&R Block, Inc. |
38,000 |
1,230,250 |
|
|
National Service Industries, Inc. |
15,200 |
296,400 |
|
|
|
11,784,813 |
||
|
TOTAL SERVICES |
26,019,513 |
||
|
TECHNOLOGY - 32.4% |
|||
|
Communications Equipment - 7.9% |
|||
|
3Com Corp. |
129,500 |
7,462,438 |
|
|
ADC Telecommunications, Inc. (a) |
113,000 |
9,477,875 |
|
|
Common Stocks - continued |
|||
|
Shares |
Value (Note 1) |
||
|
TECHNOLOGY - continued |
|||
|
Communications Equipment - continued |
|||
|
Andrew Corp. (a) |
33,212 |
$ 1,114,678 |
|
|
Cabletron Systems, Inc. (a) |
67,900 |
1,714,475 |
|
|
Cisco Systems, Inc. (a) |
2,593,900 |
164,874,769 |
|
|
Comverse Technology, Inc. (a) |
54,900 |
5,105,700 |
|
|
Corning, Inc. |
104,600 |
28,228,925 |
|
|
Lucent Technologies, Inc. |
1,224,406 |
72,546,056 |
|
|
Nortel Networks Corp. |
1,103,580 |
76,553,641 |
|
|
Tellabs, Inc. (a) |
151,600 |
10,375,125 |
|
|
|
377,453,682 |
||
|
Computer Services & Software - 8.9% |
|||
|
Adobe Systems, Inc. |
46,800 |
6,084,000 |
|
|
America Online, Inc. (a) |
858,300 |
45,275,325 |
|
|
Autodesk, Inc. |
22,700 |
787,406 |
|
|
Automatic Data Processing, Inc. |
235,300 |
12,603,256 |
|
|
BMC Software, Inc. (a) |
91,200 |
3,327,375 |
|
|
Ceridian Corp. (a) |
52,400 |
1,260,875 |
|
|
Citrix Systems, Inc. (a) |
67,500 |
1,278,281 |
|
|
Computer Associates International, Inc. |
213,312 |
10,918,908 |
|
|
Computer Sciences Corp. (a) |
62,600 |
4,675,438 |
|
|
Compuware Corp. (a) |
134,700 |
1,397,513 |
|
|
Electronic Data Systems Corp. |
175,900 |
7,255,875 |
|
|
Equifax, Inc. |
52,200 |
1,370,250 |
|
|
First Data Corp. |
156,600 |
7,771,275 |
|
|
IMS Health, Inc. |
115,100 |
2,071,800 |
|
|
Mercury Interactive Corp. (a) |
26,200 |
2,534,850 |
|
|
Microsoft Corp. (a) |
1,961,200 |
156,896,000 |
|
|
NCR Corp. (a) |
36,300 |
1,413,431 |
|
|
Novell, Inc. (a) |
124,300 |
1,149,775 |
|
|
Oracle Corp. (a) |
1,064,550 |
89,488,734 |
|
|
Parametric Technology Corp. (a) |
101,300 |
1,114,300 |
|
|
Paychex, Inc. |
138,525 |
5,818,050 |
|
|
PeopleSoft, Inc. (a) |
101,000 |
1,691,750 |
|
|
Sabre Holdings Corp. Class A |
52,664 |
1,500,924 |
|
|
Sapient Corp. (a) |
21,400 |
2,288,463 |
|
|
Shared Medical Systems Corp. |
9,500 |
692,906 |
|
|
Siebel Systems, Inc. (a) |
76,200 |
12,463,463 |
|
|
Unisys Corp. (a) |
116,600 |
1,697,988 |
|
|
VERITAS Software Corp. (a) |
148,600 |
16,794,122 |
|
|
Yahoo!, Inc. (a) |
201,500 |
24,960,813 |
|
|
|
426,583,146 |
||
|
Computers & Office Equipment - 7.1% |
|||
|
Adaptec, Inc. (a) |
38,500 |
875,875 |
|
|
Apple Computer, Inc. (a) |
128,000 |
6,704,000 |
|
|
Compaq Computer Corp. |
647,762 |
16,558,416 |
|
|
Dell Computer Corp. (a) |
956,200 |
47,152,613 |
|
|
EMC Corp. (a) |
810,750 |
62,377,078 |
|
|
Gateway, Inc. (a) |
119,100 |
6,758,925 |
|
|
Hewlett-Packard Co. |
373,700 |
46,665,788 |
|
|
International Business Machines Corp. |
662,500 |
72,585,156 |
|
|
|
|||
|
Shares |
Value (Note 1) |
||
|
Lexmark International Group, Inc. |
48,100 |
$ 3,234,725 |
|
|
Network Appliance, Inc. (a) |
116,300 |
9,362,150 |
|
|
Pitney Bowes, Inc. |
99,800 |
3,992,000 |
|
|
Seagate Technology, Inc. (a) |
78,400 |
4,312,000 |
|
|
Sun Microsystems, Inc. (a) |
596,700 |
54,262,406 |
|
|
Xerox Corp. |
250,000 |
5,187,500 |
|
|
|
340,028,632 |
||
|
Electronic Instruments - 1.2% |
|||
|
Agilent Technologies, Inc. |
169,020 |
12,465,225 |
|
|
Applied Materials, Inc. (a) |
297,800 |
26,988,125 |
|
|
KLA-Tencor Corp. (a) |
68,000 |
3,982,250 |
|
|
Novellus Systems, Inc. (a) |
43,001 |
2,432,244 |
|
|
PE Corp. - Biosystems Group |
78,000 |
5,138,250 |
|
|
PerkinElmer, Inc. |
18,400 |
1,216,700 |
|
|
Tektronix, Inc. |
17,050 |
1,261,700 |
|
|
Teradyne, Inc. (a) |
64,900 |
4,770,150 |
|
|
Thermo Electron Corp. (a) |
57,200 |
1,204,775 |
|
|
|
59,459,419 |
||
|
Electronics - 7.2% |
|||
|
Advanced Micro Devices, Inc. (a) |
60,200 |
4,650,450 |
|
|
Altera Corp. (a) |
76,200 |
7,767,638 |
|
|
Analog Devices, Inc. (a) |
131,200 |
9,971,200 |
|
|
Broadcom Corp. Class A (a) |
79,300 |
17,361,744 |
|
|
Conexant Systems, Inc. (a) |
81,900 |
3,982,388 |
|
|
Intel Corp. |
1,252,400 |
167,430,225 |
|
|
Linear Technology Corp. |
116,400 |
7,442,325 |
|
|
LSI Logic Corp. (a) |
111,900 |
6,056,588 |
|
|
Maxim Integrated Products, Inc. (a) |
103,800 |
7,051,913 |
|
|
Micron Technology, Inc. (a) |
210,800 |
18,563,575 |
|
|
Molex, Inc. |
73,700 |
3,546,813 |
|
|
Motorola, Inc. |
796,515 |
23,148,717 |
|
|
National Semiconductor Corp. (a) |
64,500 |
3,660,375 |
|
|
Sanmina Corp. (a) |
48,200 |
4,121,100 |
|
|
Solectron Corp. (a) |
222,400 |
9,313,000 |
|
|
Texas Instruments, Inc. |
616,700 |
42,359,581 |
|
|
Xilinx, Inc. (a) |
120,000 |
9,907,500 |
|
|
|
346,335,132 |
||
|
Photographic Equipment - 0.1% |
|||
|
Eastman Kodak Co. |
118,000 |
7,021,000 |
|
|
Polaroid Corp. |
16,700 |
301,644 |
|
|
|
7,322,644 |
||
|
TOTAL TECHNOLOGY |
1,557,182,655 |
||
|
TRANSPORTATION - 0.6% |
|||
|
Air Transportation - 0.2% |
|||
|
AMR Corp. |
55,300 |
1,461,994 |
|
|
Delta Air Lines, Inc. |
48,200 |
2,437,113 |
|
|
Southwest Airlines Co. |
183,575 |
3,476,452 |
|
|
US Airways Group, Inc. (a) |
26,700 |
1,041,300 |
|
|
|
8,416,859 |
||
|
Common Stocks - continued |
|||
|
Shares |
Value (Note 1) |
||
|
TRANSPORTATION - continued |
|||
|
Railroads - 0.3% |
|||
|
Burlington Northern Santa Fe Corp. |
160,054 |
$ 3,671,239 |
|
|
CSX Corp. |
81,638 |
1,729,705 |
|
|
Kansas City Southern Industries, Inc. |
39,800 |
3,529,763 |
|
|
Norfolk Southern Corp. |
138,500 |
2,060,188 |
|
|
Union Pacific Corp. |
92,900 |
3,454,719 |
|
|
|
14,445,614 |
||
|
Trucking & Freight - 0.1% |
|||
|
FedEx Corp. (a) |
109,140 |
4,147,320 |
|
|
TOTAL TRANSPORTATION |
27,009,793 |
||
|
UTILITIES - 9.1% |
|||
|
Cellular - 1.3% |
|||
|
ALLTEL Corp. |
117,300 |
7,265,269 |
|
|
Nextel Communications, Inc. Class A (a) |
283,000 |
17,316,063 |
|
|
QUALCOMM, Inc. (a) |
279,800 |
16,788,000 |
|
|
Sprint Corp. - PCS Group Series 1 (a) |
341,400 |
20,313,300 |
|
|
|
61,682,632 |
||
|
Electric Utility - 1.6% |
|||
|
AES Corp. (a) |
154,400 |
7,044,500 |
|
|
Ameren Corp. |
46,700 |
1,576,125 |
|
|
American Electric Power Co., Inc. |
121,837 |
3,609,421 |
|
|
Cinergy Corp. |
53,613 |
1,363,781 |
|
|
CMS Energy Corp. |
42,800 |
946,950 |
|
|
Consolidated Edison, Inc. |
84,900 |
2,515,163 |
|
|
Constellation Energy Corp. |
51,200 |
1,667,200 |
|
|
CP&L Energy, Inc. |
50,400 |
1,609,650 |
|
|
Dominion Resources, Inc. |
89,557 |
3,839,756 |
|
|
DTE Energy Co. |
57,100 |
1,745,119 |
|
|
Duke Energy Corp. |
140,707 |
7,932,357 |
|
|
Edison International |
124,200 |
2,546,100 |
|
|
Entergy Corp. |
86,000 |
2,338,125 |
|
|
FirstEnergy Corp. |
78,900 |
1,844,288 |
|
|
Florida Progress Corp. |
37,100 |
1,739,063 |
|
|
FPL Group, Inc. |
67,700 |
3,351,150 |
|
|
GPU, Inc. |
40,900 |
1,106,856 |
|
|
New Century Energies, Inc. |
37,800 |
1,134,000 |
|
|
Niagara Mohawk Holdings, Inc. (a) |
67,500 |
940,781 |
|
|
Northern States Power Co. |
46,900 |
946,794 |
|
|
PECO Energy Co. |
63,400 |
2,555,813 |
|
|
PG&E Corp. |
144,000 |
3,546,000 |
|
|
Pinnacle West Capital Corp. |
32,400 |
1,097,550 |
|
|
PPL Corp. |
50,640 |
1,110,915 |
|
|
Public Service Enterprise Group, Inc. |
81,300 |
2,815,013 |
|
|
Reliant Energy, Inc. |
102,322 |
3,024,894 |
|
|
Southern Co. |
242,400 |
5,650,950 |
|
|
|
|||
|
Shares |
Value (Note 1) |
||
|
TXU Corp. |
98,500 |
$ 2,905,750 |
|
|
Unicom Corp. |
66,400 |
2,568,850 |
|
|
|
75,072,914 |
||
|
Gas - 0.7% |
|||
|
Columbia Energy Group |
30,400 |
1,995,000 |
|
|
Eastern Enterprises Co. |
10,100 |
636,300 |
|
|
El Paso Energy Corp. |
85,300 |
4,344,969 |
|
|
Enron Corp. |
278,100 |
17,937,450 |
|
|
NICOR, Inc. |
17,600 |
574,200 |
|
|
ONEOK, Inc. |
11,506 |
298,437 |
|
|
Peoples Energy Corp. |
13,300 |
430,588 |
|
|
Sempra Energy |
75,141 |
1,277,397 |
|
|
Williams Companies, Inc. |
162,400 |
6,770,050 |
|
|
|
34,264,391 |
||
|
Telephone Services - 5.5% |
|||
|
AT&T Corp. |
1,175,405 |
37,172,183 |
|
|
Bell Atlantic Corp. |
577,578 |
29,348,182 |
|
|
BellSouth Corp. |
704,500 |
30,029,313 |
|
|
CenturyTel, Inc. |
52,300 |
1,503,625 |
|
|
Global Crossing Ltd. (a) |
318,725 |
8,386,452 |
|
|
GTE Corp. |
359,800 |
22,397,550 |
|
|
Qwest Communications International, Inc. (a) |
9,947 |
494,242 |
|
|
SBC Communications, Inc. |
1,275,870 |
55,181,378 |
|
|
Sprint Corp. - FON Group |
326,600 |
16,656,600 |
|
|
U.S. WEST, Inc. |
189,492 |
16,248,939 |
|
|
WorldCom, Inc. (a) |
1,074,655 |
49,299,798 |
|
|
|
266,718,262 |
||
|
TOTAL UTILITIES |
437,738,199 |
||
|
TOTAL COMMON STOCKS (Cost $2,899,268,000) |
4,695,932,543 |
||
|
U.S. Treasury Obligations - 2.4% |
||||
|
Moody's Ratings (unaudited) |
Principal Amount |
|
||
|
U.S. Treasury Bills, yield at date of purchase 5.68% |
- |
$ 116,450,000 |
114,682,780 |
|
|
Cash Equivalents - 0.8% |
||||
|
|
Shares |
|
||
|
Bankers Trust Institutional Daily |
39,754,793 |
39,754,793 |
||
|
TOTAL INVESTMENT PORTFOLIO - 101.0% (Cost $3,053,627,367) |
4,850,370,116 |
||
|
NET OTHER ASSETS - (1.0)% |
(46,355,055) |
||
|
NET ASSETS - 100% |
$ 4,804,015,061 |
||
|
Futures Contracts |
|||||
|
|
Expiration Date |
Underlying Face Amount at Value |
Unrealized Gain/Loss |
||
|
Purchased |
|||||
|
274 S&P 500 Stock Index Contracts |
Sept. 2000 |
$ 100,564,851 |
$ (654,705) |
||
|
The face value of futures purchased as a percentage of net assets - 2.1% |
|
Legend |
|
(a) Non-income producing |
|
(b) Security or a portion of the security was pledged to cover margin requirements for futures contracts. At the period end, the value of securities pledged amounted to $7,127,769. |
|
(c) The rate quoted is the annualized daily yield of the fund at |
|
Other Information |
|
Purchases of securities, other than short-term securities aggregated $222,776,885. Sales of securities, other than short-term securities, aggregated $923,876,945, of which $766,371,542 represents the value of securities delivered in redemption of fund shares. The realized gain (loss) of $35,507,297 on securities delivered in redemption of fund shares is not taxable to the fund. |
|
The market value of futures contracts opened and closed during the period amounted to $600,789,704 and $561,095,562, respectively. |
|
The fund placed a portion of its portfolio transactions with brokerage firms which are affiliates of Fidelity Management & Research Company or Bankers Trust Company. The commissions paid to these affiliated firms were $0 and $19,320, respectively, for the period. |
|
The fund participated in the security lending program. At period end, the value of securities loaned amounted to $38,752,243. The fund received |
|
Income Tax Information |
|
At June 30, 2000, the aggregate cost of investment securities for income |
See accompanying notes which are an integral part of the financial statements.
Index 500 Portfolio
Statement of Assets and Liabilities
|
|
June 30, 2000 (Unaudited) |
|
|
Assets |
|
|
|
Investment in securities, at value |
|
$ 4,850,370,116 |
|
Cash |
|
810,569 |
|
Receivable for investments sold |
|
1,449,070 |
|
Receivable for fund shares sold |
|
13,222,207 |
|
Dividends receivable |
|
3,661,604 |
|
Interest receivable |
|
4,847 |
|
Receivable for daily variation on futures contracts |
|
802,951 |
|
Total assets |
|
4,870,321,364 |
|
Liabilities |
|
|
|
Payable for investments purchased |
$ 21,169,951 |
|
|
Payable for fund shares redeemed |
4,225,085 |
|
|
Accrued management fee |
799,398 |
|
|
Other payables and |
357,076 |
|
|
Collateral on securities loaned, |
39,754,793 |
|
|
Total liabilities |
|
66,306,303 |
|
Net Assets |
|
$ 4,804,015,061 |
|
Net Assets consist of: |
|
|
|
Paid in capital |
|
$ 2,966,769,627 |
|
Undistributed net investment income |
|
23,406,752 |
|
Accumulated undistributed net realized gain (loss) on investments and foreign currency transactions |
|
17,750,423 |
|
Net unrealized appreciation (depreciation) on investments |
|
1,796,088,259 |
|
Net Assets |
|
$ 4,804,015,061 |
|
Initial Class: |
|
$163.92 |
|
Service Class 2: |
|
$163.72 |
Statement of Operations
|
|
Six months ended June 30, 2000 (Unaudited) |
|
|
Investment Income Dividends |
|
$ 27,728,094 |
|
Interest |
|
2,374,504 |
|
Security lending |
|
273,278 |
|
Total income |
|
30,375,876 |
|
Expenses |
|
|
|
Management fee |
$ 6,002,485 |
|
|
Transfer agent fees |
1,638,175 |
|
|
Distribution fees |
116 |
|
|
Accounting fees |
331,008 |
|
|
Non-interested trustees' compensation |
8,015 |
|
|
Registration fees |
59,131 |
|
|
Audit |
33,825 |
|
|
Legal |
17,261 |
|
|
Miscellaneous |
37,818 |
|
|
Total expenses before reductions |
8,127,834 |
|
|
Expense reductions |
(1,159,409) |
6,968,425 |
|
Net investment income |
|
23,407,451 |
|
Realized and Unrealized Gain (Loss) Net realized gain (loss) on: |
|
|
|
Investment securities |
30,967,239 |
|
|
Foreign currency transactions |
53 |
|
|
Futures contracts |
(7,060,446) |
23,906,846 |
|
Change in net unrealized appreciation (depreciation) on: |
|
|
|
Investment securities |
(91,497,383) |
|
|
Assets and liabilities in |
215 |
|
|
Futures contracts |
(1,826,245) |
(93,323,413) |
|
Net gain (loss) |
|
(69,416,567) |
|
Net increase (decrease) in net assets resulting from operations |
|
$ (46,009,116) |
|
Other Information Expense reductions |
|
|
|
Initial Class |
|
$ 1,138,105 |
|
Service Class 2 |
|
22 |
|
Custodian credits |
|
21,282 |
|
|
|
$ 1,159,409 |
See accompanying notes which are an integral part of the financial statements.
Semiannual Report
Fidelity Variable Insurance Products: Index 500 Portfolio
Financial Statements - continued
Statement of Changes in Net Assets
|
Increase (Decrease) in Net Assets |
Six months ended |
Year ended |
|
Operations |
$ 23,407,451 |
$ 51,674,088 |
|
Net realized gain (loss) |
23,906,846 |
9,155,111 |
|
Change in net unrealized appreciation (depreciation) |
(93,323,413) |
832,662,055 |
|
Net increase (decrease) in net assets resulting from operations |
(46,009,116) |
893,491,254 |
|
Distributions to shareholders |
(51,736,686) |
(39,106,912) |
|
From net realized gain |
(22,615,438) |
(26,536,833) |
|
Total distributions |
(74,352,124) |
(65,643,745) |
|
Share transactions - net increase (decrease) |
(614,358,389) |
938,819,660 |
|
Total increase (decrease) in net assets |
(734,719,629) |
1,766,667,169 |
|
Net Assets |
|
|
|
Beginning of period |
5,538,734,690 |
3,772,067,521 |
|
End of period (including undistributed net investment income of $23,406,752 and $51,598,237, respectively) |
$ 4,804,015,061 |
$ 5,538,734,690 |
|
|
|
Other Information: |
|
|
Six months ended June 30, 2000 |
Year ended |
||
|
|
Shares |
Dollars |
Shares |
Dollars |
|
Share transactions |
4,611,791 |
$ 746,908,804 |
12,455,112 |
$ 1,868,929,324 |
|
Reinvested |
477,249 |
74,350,653 |
468,884 |
65,643,745 |
|
Redeemed |
(8,866,876) |
(1,435,720,785) |
(6,545,615) |
(995,753,409) |
|
Net increase (decrease) |
(3,777,836) |
$ (614,461,328) |
6,378,381 |
$ 938,819,660 |
|
Service Class 2 A |
612 |
$ 101,469 |
- |
$ - |
|
Reinvested |
10 |
1,470 |
- |
- |
|
Redeemed |
- |
- |
- |
- |
|
Net increase (decrease) |
622 |
$ 102,939 |
- |
$ - |
|
Distributions |
|
$ 51,735,663 |
|
$ 39,106,912 |
|
Service Class 2 A |
|
1,023 |
|
- |
|
Total |
|
$ 51,736,686 |
|
$ 39,106,912 |
|
From net realized gain |
|
$ 22,614,991 |
|
$ 26,536,833 |
|
Service Class 2 A |
|
447 |
|
- |
|
Total |
|
$ 22,615,438 |
|
$ 26,536,833 |
|
|
|
$ 74,352,124 |
|
$ 65,643,745 |
A Service Class 2 commenced sale of shares January 12, 2000.
See accompanying notes which are an integral part of the financial statements.
Index 500 Portfolio
Financial Highlights - Initial Class
|
|
Six months ended |
Years ended December 31, |
||||
|
Selected Per-Share Data |
(Unaudited) |
1999 |
1998 |
1997 |
1996 |
1995 |
|
Net asset value, beginning of period |
$ 167.41 |
$ 141.24 |
$ 114.40 |
$ 89.05 |
$ 75.71 |
$ 56.22 |
|
Income from Investment Operations |
|
|
|
|
|
|
|
Net investment income |
.76 D |
1.64 D |
1.65 D |
1.80 D |
1.04 |
.85 |
|
Net realized and unrealized gain (loss) |
(1.85) |
26.88 |
29.70 |
26.67 |
15.55 |
19.72 |
|
Total from investment operations |
(1.09) |
28.52 |
31.35 |
28.47 |
16.59 |
20.57 |
|
Less Distributions |
|
|
|
|
|
|
|
From net investment income |
(1.67) |
(1.40) |
(1.36) |
(1.03) |
(.91) |
(.95) |
|
From net realized gain |
(.73) |
(.95) |
(3.15) |
(2.09) |
(2.34) |
(.11) |
|
In excess of net realized gain |
- |
- |
- |
- |
- |
(.02) |
|
Total distributions |
(2.40) |
(2.35) |
(4.51) |
(3.12) |
(3.25) |
(1.08) |
|
Net asset value, end of period |
$ 163.92 |
$ 167.41 |
$ 141.24 |
$ 114.40 |
$ 89.05 |
$ 75.71 |
|
Total Return B, C |
(0.58)% |
20.52% |
28.31% |
32.83% |
22.71% |
37.19% |
|
Ratios and Supplemental Data |
|
|
|
|
|
|
|
Net assets, end of period (000 omitted) |
$ 4,803,913 |
$ 5,538,735 |
$ 3,772,068 |
$ 2,098,042 |
$ 823,243 |
$ 245,700 |
|
Ratio of expenses to average net assets |
.28% A, F |
.28% F |
.28% F |
.28% F |
.28% F |
.28% F |
|
Ratio of net investment income to average net assets |
.94% A |
1.09% |
1.33% |
1.74% |
2.26% |
2.70% |
|
Portfolio turnover |
9% A |
8% |
4% |
9% |
14% |
16% |
Financial Highlights - Service Class 2
|
|
Six months ended |
|
Selected Per-Share Data |
(Unaudited) |
|
Net asset value, beginning of period |
$ 163.25 |
|
Income from Investment Operations |
|
|
Net investment income D |
.52 |
|
Net realized and unrealized gain (loss) |
2.35 G |
|
Total from investment operations |
2.87 |
|
Less Distributions |
|
|
From net investment income |
(1.67) |
|
From net realized gain |
(.73) |
|
Total distributions |
(2.40) |
|
Net asset value, end of period |
$ 163.72 |
|
Total Return B, C |
1.83% |
|
Ratios and Supplemental Data |
|
|
Net assets, end of period (000 omitted) |
$ 102 |
|
Ratio of expenses to average net assets |
.53% A, F |
|
Ratio of net investment income to average net assets |
.69% A |
|
Portfolio turnover |
9% A |
|
A Annualized B Total returns for periods of less than one year are not annualized and do not reflect charges attributable to your insurance company's separate account. Inclusion of these charges would reduce the total returns shown. C The total returns would have been lower had certain expenses not been reduced during the periods shown. D Net investment income per share has been calculated based on average shares outstanding during the period. E For the period January 12, 2000 (commencement of sale of Service Class 2 shares) to June 30, 2000. F FMR agreed to reimburse a portion of the class' expenses during the period. Without this reimbursement, the class' expense ratio would have been higher. G The amount shown for a share outstanding does not correspond with the aggregate net loss on investments for the period due to the timing of sales and repurchases of class shares in relation to fluctuating market values of the investments of the fund. |
|
See accompanying notes which are an integral part of the financial statements.
Semiannual Report
Performance
There are several ways to evaluate a fund's historical performance. You can look at the total percentage change in value, the average annual percentage change or the growth of a hypothetical $10,000 investment. Total return reflects the change in the value of an investment, assuming reinvestment of the fund's dividend income and capital gains (the profits earned upon the sale of securities that have grown in value). If Fidelity had not reimbursed certain fund expenses, the life of fund total return would have been lower.
Average Annual Total Returns
|
Periods ended |
Past 1 |
Life of |
|
Fidelity VIP: Growth & Income - Initial Class |
-1.03% |
17.93% |
|
S&P 500 ® |
7.25% |
22.43% |
Average annual returns take the fund's cumulative return and show you what would have happened if the fund had performed at a constant rate each year.
You can compare the fund's returns to the performance of the Standard & Poor's 500 SM Index - a market capitalization-weighted index of common stocks. This benchmark includes reinvested dividends and capital gains, if any.
Figures for more than one year assume a steady compounded rate of return and are not the fund's year-by-year results, which fluctuated over the periods shown. The life of fund figures are from commencement of operations, December 31, 1996.
Performance numbers are net of all fund operating expenses, but do not include any insurance charges imposed by your insurance company's separate account. If performance information included the effect of these additional charges, the total returns would be lower.
Past performance is no guarantee of future results. Principal and investment return will vary and you may have a gain or loss when you withdraw your money.
Understanding Performance
How a fund did yesterday is no guarantee of how it will do tomorrow. The stock market, for example, has a history of long-term growth and short-term volatility. In turn, the share price and return of a fund that invests in stocks will vary. That means if you sell your shares during a market downturn, you might lose money. But if you can ride out the market's ups and downs, you may have a gain.
3$10,000 Over Life of Fund

$10,000 Over Life of Fund: Let's say hypothetically that $10,000 was invested in Fidelity Variable Insurance Products: Growth & Income Portfolio - Initial Class on December 31, 1996, when the fund started. As the chart shows, by June 30, 2000, the value of the investment would have grown to $17,814 - a 78.14% increase on the initial investment. For comparison, look at how the Standard & Poor's 500 Index did over the same period. With dividends and capital gains, if any, reinvested, the same $10,000 investment would have grown to $20,310 - a 103.10% increase.
Investment Summary
|
Top Five Stocks as of June 30, 2000 |
|
|
|
% of fund's |
|
Microsoft Corp. |
4.3 |
|
Exxon Mobil Corp. |
4.2 |
|
Fannie Mae |
3.9 |
|
Intel Corp. |
3.8 |
|
Cisco Systems, Inc. |
3.7 |
|
|
19.9 |
|
Top Five Market Sectors as of June 30, 2000 |
|
|
|
% of fund's |
|
Technology |
23.2 |
|
Finance |
18.2 |
|
Utilities |
10.0 |
|
Health |
7.0 |
|
Energy |
6.1 |
|
Asset Allocation as of June 30, 2000 |
|||
|
% of fund's net assets* |
|||
|
Stocks and |
|
|
|
Short-Term Investments |
|
|

|
* Foreign investments 6.2% |
Semiannual Report
(Portfolio Manager photograph)
An interview with Louis Salemy, Portfolio Manager of Growth & Income Portfolio
Q. How did the fund perform, Louis?
A. For the six- and 12-month periods that ended June 30, 2000, the fund's returns fell short of the -0.42% and 7.25% returns recorded by the Standard & Poor's 500 Index, respectively.
Q. Why did the fund underperform the index during the past six months?
A. At the beginning of the period, one of the primary difficulties was an underweighting in the technology sector. This time period witnessed a speculative bubble in technology shares that finally burst in the spring of 2000, flattening many formerly high-flying technology stocks that had little or no earnings. The fund's emphasis on growth at a reasonable price prevented it from owning many of the best-performing stocks during this period. An overweighting in the finance sector, which faced a stiff headwind in the form of sharply higher interest rates, also undermined performance. Stock selection in the finance sector hurt as well, as a number of the fund's finance holdings detracted significantly from performance.
Q. The Federal Reserve Board raised short-term interest rates three times during the period. Why did you continue to overweight finance stocks, which tend to do poorly when rates rise?
A. Most of the overweighting was accounted for by two mortgage loan providers: Fannie Mae and Freddie Mac. These government-sponsored enterprises (GSEs) tend to be less sensitive to rising interest rates than banks, which I underweighted. Although the share prices of these two holdings did poorly during the period, they did not accurately reflect the earnings outlook, which remained excellent. Unfortunately, the herd instinct took over, and investors appeared to lump Fannie and Freddie with the rate-sensitive segments of the finance sector. Since the spring correction, however, investors have seemed more willing to evaluate stocks on the basis of earnings and other fundamental factors - a potentially positive development for these two stocks.
Q. What stocks did well for the fund?
A. Intel was one of the better performers. The stock firmed because of a shortage of microprocessors and expectations of improving personal
computer demand in the second half of 2000. Intel also manufactures memory components for the cellular phone market, which experienced robust
growth during the period. Another technology standout, Cisco Systems, has a significant share of the market for the routers used to expand the
Internet. Drug giant Eli Lilly also per-
formed well. The company had a very successful test of Zovant, a new drug for treating sepsis, or blood poisoning. In addition, Lilly benefited from
greater investor interest in drug stocks, which are thought to offer relatively stable earnings streams in a slowing economy.
Q. What stocks were disappointing?
A. The biggest detractor, Microsoft, received an unfavorable ruling in the federal government's antitrust suit against the company. The ruling may, despite the company's appeals, result in splitting Microsoft into two separate companies. In the consumer nondurables sector, Procter & Gamble fell sharply following a warning from the company that its earnings would fall short of analysts' estimates due, in part, to higher raw materials prices. Freddie Mac and Fannie Mae also made the list of stocks that detracted most from performance. This is a case where I felt that investors missed the boat - for the reasons I gave previously. Because of my strong conviction about these stocks, I used weakness in their prices as an opportunity to add to the fund's positions in them.
Q. What's your outlook, Louis?
A. Higher interest rates have begun to slow the economy, and I believe that more slowing can be expected over the next six to 12 months, as the Federal Reserve Board's series of interest-rate hikes percolates through the economy. While a slowing economy should alleviate concerns about inflation, it might also create a lot more earnings risk. With valuations relatively high, we probably will continue to see stocks punished severely when a company fails to meet earnings estimates. Investing in stocks with attractive growth prospects at reasonable prices is the fund's overall strategy, but finding companies that can deliver stable earnings growth under a variety of economic conditions also will be important in the period just ahead.
The views expressed in this report reflect those of the portfolio manager only through the end of the period of the report as stated on the cover. The manager's views are subject to change at any time based on market or other conditions. For more information, see page 2.
Fund Facts
Goal: seeks high total return through a combination of current income and capital appreciation
Start date: December 31, 1996
Size: as of June 30, 2000, more than $1.2 billion
Manager: Louis Salemy, since 1998; manager, Fidelity Growth & Income II, since 1998; various Fidelity Select Portfolios, 1992-1998; joined Fidelity in 1992
3Semiannual Report
Fidelity Variable Insurance Products: Growth & Income Portfolio
(Unaudited)
Showing Percentage of Net Assets
|
Common Stocks - 88.1% |
|||
|
Shares |
Value (Note 1) |
||
|
AEROSPACE & DEFENSE - 0.6% |
|||
|
Boeing Co. |
181,300 |
$ 7,580,606 |
|
|
BASIC INDUSTRIES - 0.4% |
|||
|
Packaging & Containers - 0.4% |
|||
|
Ball Corp. |
165,401 |
5,323,845 |
|
|
CONSTRUCTION & REAL ESTATE - 1.2% |
|||
|
Real Estate Investment Trusts - 1.2% |
|||
|
Equity Office Properties Trust |
263,600 |
7,265,475 |
|
|
Equity Residential Properties Trust (SBI) |
159,000 |
7,314,000 |
|
|
|
14,579,475 |
||
|
DURABLES - 1.8% |
|||
|
Consumer Durables - 0.8% |
|||
|
Minnesota Mining & Manufacturing Co. |
118,700 |
9,792,750 |
|
|
Consumer Electronics - 1.0% |
|||
|
General Motors Corp. Class H (a) |
139,800 |
12,267,450 |
|
|
TOTAL DURABLES |
22,060,200 |
||
|
ENERGY - 6.1% |
|||
|
Energy Services - 0.8% |
|||
|
Schlumberger Ltd. (NY Shares) |
123,700 |
9,231,113 |
|
|
Oil & Gas - 5.3% |
|||
|
BP Amoco PLC sponsored ADR |
232,262 |
13,137,319 |
|
|
Exxon Mobil Corp. |
661,528 |
51,929,948 |
|
|
|
65,067,267 |
||
|
TOTAL ENERGY |
74,298,380 |
||
|
FINANCE - 18.2% |
|||
|
Banks - 4.2% |
|||
|
Bank of New York Co., Inc. |
536,700 |
24,956,550 |
|
|
Mellon Financial Corp. |
316,900 |
11,547,044 |
|
|
Wachovia Corp. |
271,200 |
14,712,600 |
|
|
|
51,216,194 |
||
|
Credit & Other Finance - 3.7% |
|||
|
American Express Co. |
298,600 |
15,564,525 |
|
|
Associates First Capital Corp. Class A |
1,363,000 |
30,411,938 |
|
|
|
45,976,463 |
||
|
Federal Sponsored Credit - 7.3% |
|||
|
Fannie Mae |
918,200 |
47,918,563 |
|
|
Freddie Mac |
1,021,132 |
41,355,846 |
|
|
|
89,274,409 |
||
|
Insurance - 0.9% |
|||
|
American International Group, Inc. |
76,537 |
8,993,098 |
|
|
PMI Group, Inc. |
47,800 |
2,270,500 |
|
|
|
11,263,598 |
||
|
Securities Industry - 2.1% |
|||
|
Charles Schwab Corp. |
218,150 |
7,335,294 |
|
|
|
|||
|
Shares |
Value (Note 1) |
||
|
Merrill Lynch & Co., Inc. |
68,200 |
$ 7,843,000 |
|
|
Morgan Stanley Dean Witter & Co. |
127,200 |
10,589,400 |
|
|
|
25,767,694 |
||
|
TOTAL FINANCE |
223,498,358 |
||
|
HEALTH - 7.0% |
|||
|
Drugs & Pharmaceuticals - 6.4% |
|||
|
Allergan, Inc. |
90,600 |
6,749,700 |
|
|
Bristol-Myers Squibb Co. |
447,100 |
26,043,575 |
|
|
Eli Lilly & Co. |
385,400 |
38,491,825 |
|
|
Merck & Co., Inc. |
91,100 |
6,980,538 |
|
|
|
78,265,638 |
||
|
Medical Equipment & Supplies - 0.6% |
|||
|
Baxter International, Inc. |
109,500 |
7,699,219 |
|
|
TOTAL HEALTH |
85,964,857 |
||
|
INDUSTRIAL MACHINERY & EQUIPMENT - 4.5% |
|||
|
Electrical Equipment - 2.6% |
|||
|
General Electric Co. |
599,700 |
31,784,100 |
|
|
Industrial Machinery & Equipment - 1.9% |
|||
|
Caterpillar, Inc. |
144,700 |
4,901,713 |
|
|
Ingersoll-Rand Co. |
132,400 |
5,329,100 |
|
|
Tyco International Ltd. |
266,720 |
12,635,860 |
|
|
|
22,866,673 |
||
|
TOTAL INDUSTRIAL MACHINERY & EQUIPMENT |
54,650,773 |
||
|
MEDIA & LEISURE - 5.8% |
|||
|
Broadcasting - 4.0% |
|||
|
Comcast Corp. Class A (special) (a) |
230,500 |
9,335,250 |
|
|
EchoStar Communications Corp. |
327,800 |
10,853,253 |
|
|
Infinity Broadcasting Corp. Class A (a) |
408,825 |
14,896,561 |
|
|
Pegasus Communications Corp. (a) |
282,900 |
13,879,781 |
|
|
|
48,964,845 |
||
|
Entertainment - 0.7% |
|||
|
Walt Disney Co. |
217,800 |
8,453,363 |
|
|
Publishing - 1.1% |
|||
|
McGraw-Hill Companies, Inc. |
256,500 |
13,851,000 |
|
|
TOTAL MEDIA & LEISURE |
71,269,208 |
||
|
NONDURABLES - 3.4% |
|||
|
Foods - 1.1% |
|||
|
Bestfoods |
166,700 |
11,543,975 |
|
|
Nabisco Holdings Corp. Class A |
43,800 |
2,299,500 |
|
|
|
13,843,475 |
||
|
Household Products - 0.2% |
|||
|
Procter & Gamble Co. |
40,300 |
2,307,175 |
|
|
Common Stocks - continued |
|||
|
Shares |
Value (Note 1) |
||
|
NONDURABLES - continued |
|||
|
Tobacco - 2.1% |
|||
|
Philip Morris Companies, Inc. |
941,760 |
$ 25,015,500 |
|
|
TOTAL NONDURABLES |
41,166,150 |
||
|
RETAIL & WHOLESALE - 5.6% |
|||
|
Drug Stores - 0.9% |
|||
|
Walgreen Co. |
322,500 |
10,380,469 |
|
|
General Merchandise Stores - 2.5% |
|||
|
Wal-Mart Stores, Inc. |
539,800 |
31,105,975 |
|
|
Retail & Wholesale, Miscellaneous - 2.2% |
|||
|
Bed Bath & Beyond, Inc. (a) |
233,900 |
8,478,875 |
|
|
Home Depot, Inc. |
374,000 |
18,676,625 |
|
|
|
27,155,500 |
||
|
TOTAL RETAIL & WHOLESALE |
68,641,944 |
||
|
SERVICES - 0.3% |
|||
|
Advertising - 0.3% |
|||
|
Omnicom Group, Inc. |
35,100 |
3,126,094 |
|
|
TECHNOLOGY - 23.2% |
|||
|
Communications Equipment - 6.5% |
|||
|
Cisco Systems, Inc. (a) |
715,300 |
45,466,256 |
|
|
Lucent Technologies, Inc. |
72,000 |
4,266,000 |
|
|
Nokia AB sponsored ADR |
260,700 |
13,018,706 |
|
|
Nortel Networks Corp. |
246,000 |
17,064,640 |
|
|
|
79,815,602 |
||
|
Computer Services & Software - 6.8% |
|||
|
Adobe Systems, Inc. |
53,400 |
6,942,000 |
|
|
IMS Health, Inc. |
595,000 |
10,710,000 |
|
|
Intuit, Inc. (a) |
99,800 |
4,129,225 |
|
|
Microsoft Corp. (a) |
659,100 |
52,727,994 |
|
|
VERITAS Software Corp. (a) |
73,800 |
8,340,553 |
|
|
|
82,849,772 |
||
|
Computers & Office Equipment - 3.9% |
|||
|
Compaq Computer Corp. |
630,900 |
16,127,381 |
|
|
EMC Corp. (a) |
249,300 |
19,180,519 |
|
|
Pitney Bowes, Inc. |
301,400 |
12,056,000 |
|
|
|
47,363,900 |
||
|
Electronics - 6.0% |
|||
|
Intel Corp. |
345,500 |
46,189,031 |
|
|
LSI Logic Corp. (a) |
90,600 |
4,903,725 |
|
|
Micron Technology, Inc. (a) |
81,400 |
7,168,288 |
|
|
Texas Instruments, Inc. |
226,200 |
15,537,113 |
|
|
|
73,798,157 |
||
|
TOTAL TECHNOLOGY |
283,827,431 |
||
|
|
|||
|
Shares |
Value (Note 1) |
||
|
UTILITIES - 10.0% |
|||
|
Cellular - 3.6% |
|||
|
Nextel Communications, Inc. |
374,500 |
$ 22,914,719 |
|
|
Vodafone AirTouch PLC sponsored ADR |
524,900 |
21,750,544 |
|
|
|
44,665,263 |
||
|
Electric Utility - 0.5% |
|||
|
IPALCO Enterprises, Inc. |
302,800 |
6,093,850 |
|
|
Telephone Services - 5.9% |
|||
|
Allegiance Telecom, Inc. (a) |
119,400 |
7,641,600 |
|
|
AT&T Corp. |
235,450 |
7,446,106 |
|
|
BellSouth Corp. |
248,200 |
10,579,525 |
|
|
NEXTLINK Communications, Inc. |
203,800 |
7,731,663 |
|
|
Qwest Communications |
137,700 |
6,841,969 |
|
|
SBC Communications, Inc. |
728,530 |
31,508,923 |
|
|
WorldCom, Inc. (a) |
1 |
23 |
|
|
|
71,749,809 |
||
|
TOTAL UTILITIES |
122,508,922 |
||
|
TOTAL COMMON STOCKS (Cost $974,550,110) |
1,078,496,243 |
||
|
U.S. Treasury Obligations - 0.1% |
||||
|
|
Principal Amount |
|
||
|
U.S. Treasury Bills, yield at date of purchase 5.57% 8/17/00 (c) |
|
$ 1,500,000 |
1,489,463 |
|
|
Cash Equivalents - 11.9% |
|||
|
Shares |
|
||
|
Central Cash Collateral Fund, 6.71% (b) |
5,919,200 |
5,919,200 |
|
|
Taxable Central Cash Fund, 6.59% (b) |
140,027,095 |
140,027,095 |
|
|
TOTAL CASH EQUIVALENTS (Cost $145,946,295) |
145,946,295 |
||
|
TOTAL INVESTMENT PORTFOLIO - 100.1% (Cost $1,121,985,345) |
1,225,932,001 |
||
|
NET OTHER ASSETS - (0.1)% |
(717,905) |
||
|
NET ASSETS - 100% |
$ 1,225,214,096 |
||
|
Futures Contracts |
|||||
|
|
Expiration Date |
Underlying |
Unrealized Gain/(Loss) |
||
|
Purchased |
|||||
|
70 S&P 500 Stock Index Contracts |
Sept. 2000 |
$ 25,691,750 |
$ (194,795) |
||
|
The face value of futures purchased as a percentage of net assets - 2.1% |
|
Legend |
|
(a) Non-income producing |
|
(b) The rate quoted is the annualized seven-day yield of the fund at |
|
(c) Security or a portion of the security was pledged to cover margin requirements for futures contracts. At the period end, the value of securities pledged amounted to $1,489,463. |
|
Other Information |
|
Purchases and sales of securities, other than short-term securities, aggregated $339,324,728 and $468,732,226, respectively. |
|
The market value of futures contracts opened and closed during the period amounted to $73,545,687 and $48,716,990, respectively. |
|
The fund placed a portion of its portfolio transactions with brokerage firms which are affiliates of Fidelity Management & Research Company. The commissions paid to these affiliated firms were $27,856 for the period. |
|
The fund participated in the security lending program. At period end, the value of securities loaned amounted to $6,002,310. The fund received cash collateral of $5,919,200 which was invested in cash equivalents. |
|
Income Tax Information |
|
At June 30, 2000, the aggregate cost of investment securities for income tax purposes was $1,123,779,759. Net unrealized appreciation aggregated $102,152,242, of which $210,748,476 related to appreciated investment securities and $108,596,234 related to depreciated investment securities. |
See accompanying notes which are an integral part of the financial statements.
Growth & Income Portfolio
Statement of Assets and Liabilities
|
|
June 30, 2000 (Unaudited) |
|
|
Assets |
|
|
|
Investment in securities, at value (cost $1,121,985,345) - |
|
$ 1,225,932,001 |
|
Receivable for investments sold |
|
9,778,991 |
|
Receivable for fund shares sold |
|
972,216 |
|
Dividends receivable |
|
979,605 |
|
Interest receivable |
|
739,383 |
|
Receivable for daily variation |
|
176,750 |
|
Other receivables |
|
15,747 |
|
Total assets |
|
1,238,594,693 |
|
Liabilities |
|
|
|
Payable for investments purchased |
$ 5,986,196 |
|
|
Payable for fund shares redeemed |
898,008 |
|
|
Accrued management fee |
485,655 |
|
|
Distribution fees payable |
13,646 |
|
|
Other payables and |
77,892 |
|
|
Collateral on securities loaned, |
5,919,200 |
|
|
Total liabilities |
|
13,380,597 |
|
Net Assets |
|
$ 1,225,214,096 |
|
Net Assets consist of: |
|
|
|
Paid in capital |
|
$ 1,061,452,605 |
|
Undistributed net investment income |
|
6,495,495 |
|
Accumulated undistributed |
|
53,514,137 |
|
Net unrealized appreciation (depreciation) on investments |
|
103,751,859 |
|
Net Assets |
|
$ 1,225,214,096 |
|
Initial Class: |
|
$15.48 |
|
Service Class: |
|
$15.41 |
|
Service Class 2: |
|
$15.40 |
Statement of Operations
|
|
Six months ended June 30, 2000 (Unaudited) |
|
|
Investment Income Dividends |
|
$ 6,835,962 |
|
Interest |
|
2,943,179 |
|
Security lending |
|
86,077 |
|
Total income |
|
9,865,218 |
|
Expenses |
|
|
|
Management fee |
$ 2,904,405 |
|
|
Transfer agent fees |
394,900 |
|
|
Distribution fees |
64,785 |
|
|
Accounting and security lending fees |
148,951 |
|
|
Non-interested trustees' compensation |
1,956 |
|
|
Custodian fees and expenses |
12,206 |
|
|
Audit |
12,783 |
|
|
Legal |
5,249 |
|
|
Reports to shareholders |
4,672 |
|
|
Miscellaneous |
303 |
|
|
Total expenses before reductions |
3,550,210 |
|
|
Expense reductions |
(82,248) |
3,467,962 |
|
Net investment income |
|
6,397,256 |
|
Realized and Unrealized Gain (Loss) Net realized gain (loss) on: |
|
|
|
Investment securities |
54,093,706 |
|
|
Foreign currency transactions |
8,989 |
|
|
Futures contracts |
1,057,848 |
55,160,543 |
|
Change in net unrealized appreciation (depreciation) on: |
|
|
|
Investment securities |
(94,278,054) |
|
|
Assets and liabilities in |
(2) |
|
|
Futures contracts |
(194,795) |
(94,472,851) |
|
Net gain (loss) |
|
(39,312,308) |
|
Net increase (decrease) in net assets resulting from operations |
|
$ (32,915,052) |
|
Other Information Expense reductions |
|
$ 81,894 |
|
Custodian credits |
|
354 |
|
|
|
$ 82,248 |
See accompanying notes which are an integral part of the financial statements.
Semiannual Report
Fidelity Variable Insurance Products: Growth & Income Portfolio
Financial Statements - continued
Statement of Changes in Net Assets
|
Increase (Decrease) in Net Assets |
Six months ended |
Year ended |
|
Operations |
$ 6,397,256 |
$ 14,349,137 |
|
Net realized gain (loss) |
55,160,543 |
94,527,839 |
|
Change in net unrealized appreciation (depreciation) |
(94,472,851) |
5,576,047 |
|
Net increase (decrease) in net assets resulting from operations |
(32,915,052) |
114,453,023 |
|
Distributions to shareholders |
(14,244,194) |
(7,463,706) |
|
From net realized gain |
(92,962,107) |
(14,927,412) |
|
Total distributions |
(107,206,301) |
(22,391,118) |
|
Share transactions - net increase (decrease) |
10,338,716 |
102,753,346 |
|
Total increase (decrease) in net assets |
(129,782,637) |
194,815,251 |
|
Net Assets |
|
|
|
Beginning of period |
1,354,996,733 |
1,160,181,482 |
|
End of period (including undistributed net investment income of $6,495,495 and $14,353,340, respectively) |
$ 1,225,214,096 |
$ 1,354,996,733 |
|
|
|
Other Information: |
|
|
Six months ended June 30, 2000 |
Year ended |
||
|
|
Shares |
Dollars |
Shares |
Dollars |
|
Share transactions |
4,848,084 |
$ 75,165,202 |
16,149,212 |
$ 265,569,682 |
|
Reinvested |
6,348,551 |
97,958,146 |
1,401,034 |
21,996,237 |
|
Redeemed |
(15,652,464) |
(244,802,304) |
(15,445,916) |
(257,900,936) |
|
Net increase (decrease) |
(4,455,829) |
$ (71,678,956) |
2,104,330 |
$ 29,664,983 |
|
Service Class |
4,709,059 |
$ 72,777,536 |
4,435,269 |
$ 73,604,463 |
|
Reinvested |
601,152 |
9,239,713 |
25,216 |
394,881 |
|
Redeemed |
(148,738) |
(2,281,362) |
(55,277) |
(910,981) |
|
Net increase (decrease) |
5,161,473 |
$ 79,735,887 |
4,405,208 |
$ 73,088,363 |
|
Service Class 2 A |
149,950 |
$ 2,273,384 |
- |
$ - |
|
Reinvested |
550 |
8,442 |
- |
- |
|
Redeemed |
(3) |
(41) |
- |
- |
|
Net increase (decrease) |
150,497 |
$ 2,281,785 |
- |
$ - |
|
Distributions Initial Class |
|
$ 13,015,418 |
|
$ 7,332,079 |
|
Service Class |
|
1,227,654 |
|
131,627 |
|
Service Class 2 A |
|
1,122 |
|
- |
|
Total |
|
$ 14,244,194 |
|
$ 7,463,706 |
|
From net realized gain Initial Class |
|
$ 84,942,728 |
|
$ 14,664,158 |
|
Service Class |
|
8,012,059 |
|
263,254 |
|
Service Class 2 A |
|
7,320 |
|
- |
|
Total |
|
$ 92,962,107 |
|
$ 14,927,412 |
|
|
|
$ 107,206,301 |
|
$ 22,391,118 |
A Service Class 2 commenced sale of shares January 12, 2000.
See accompanying notes which are an integral part of the financial statements.
Growth & Income Portfolio
Financial Highlights - Initial Class
|
|
Six months ended |
Years ended December 31, |
|||
|
Selected Per-Share Data |
(Unaudited) |
1999 |
1998 |
1997 |
1996 H |
|
Net asset value, beginning of period |
$ 17.30 |
$ 16.15 |
$ 12.53 |
$ 9.90 |
$ 10.00 |
|
Income from Investment Operations |
|
|
|
|
|
|
Net investment income |
.08 D |
.18 D |
.15 D |
.13 D |
.00 |
|
Net realized and unrealized gain (loss) |
(.47) |
1.27 |
3.54 |
2.84 |
(.10) |
|
Total from investment operations |
(.39) |
1.45 |
3.69 |
2.97 |
(.10) |
|
Less Distributions |
|
|
|
|
|
|
From net investment income |
(.19) |
(.10) |
- |
(.08) |
- |
|
From net realized gain |
(1.24) |
(.20) |
(.07) |
(.26) |
- |
|
Total distributions |
(1.43) |
(.30) |
(.07) |
(.34) |
- |
|
Net asset value, end of period |
$ 15.48 |
$ 17.30 |
$ 16.15 |
$ 12.53 |
$ 9.90 |
|
Total Return B, C |
(2.23)% |
9.17% |
29.59% |
30.09% |
(1.00)% |
|
Ratios and Supplemental Data |
|
|
|
|
|
|
Net assets, end of period (000 omitted) |
$ 1,057,884 |
$ 1,259,396 |
$ 1,141,806 |
$ 345,287 |
$ 990 |
|
Ratio of expenses to average net assets |
.57% A |
.60% |
.61% |
.70% |
1.00% A, F |
|
Ratio of expenses to average net assets after expense reductions |
.56% A, G |
.59% G |
.60% G |
.70% |
1.00% A |
|
Ratio of net investment income to average net assets |
1.06% A |
1.08% |
1.08% |
1.14% |
3.89% A |
|
Portfolio turnover |
60% A |
58% |
66% |
81% |
0% A |
Financial Highlights - Service Class
|
|
Six months ended |
Years ended December 31, |
||
|
Selected Per-Share Data |
(Unaudited) |
1999 |
1998 |
1997 E |
|
Net asset value, beginning of period |
$ 17.24 |
$ 16.11 |
$ 12.53 |
$ 12.35 |
|
Income from Investment Operations |
|
|
|
|
|
Net investment income D |
.07 |
.16 |
.15 |
.03 |
|
Net realized and unrealized gain (loss) |
(.47) |
1.27 |
3.50 |
.49 |
|
Total from investment operations |
(.40) |
1.43 |
3.65 |
.52 |
|
Less Distributions |
|
|
|
|
|
From net investment income |
(.19) |
(.10) |
- |
(.08) |
|
From net realized gain |
(1.24) |
(.20) |
(.07) |
(.26) |
|
Total distributions |
(1.43) |
(.30) |
(.07) |
(.34) |
|
Net asset value, end of period |
$ 15.41 |
$ 17.24 |
$ 16.11 |
$ 12.53 |
|
Total Return B, C |
(2.30)% |
9.06% |
29.27% |
4.29% |
|
Ratios and Supplemental Data |
|
|
|
|
|
Net assets, end of period (000 omitted) |
$ 165,012 |
$ 95,600 |
$ 18,375 |
$ 10 |
|
Ratio of expenses to average net assets |
.67% A |
.70% |
.71% |
.80% A |
|
Ratio of expenses to average net assets after expense reductions |
.66% A, G |
.69% G |
.70% G |
.80% A |
|
Ratio of net investment income to average net assets |
.96% A |
.98% |
1.05% |
1.24% A |
|
Portfolio turnover |
60% A |
58% |
66% |
81% |
|
A Annualized B The total returns would have been lower had certain expenses not been reduced during the periods shown. C Total returns for periods of less than one year are not annualized and do not reflect charges attributable to your insurance company's separate account. Inclusion of these charges would reduce the total returns shown. D Net investment income per share has been calculated based on average shares outstanding during the period. E For the period November 3, 1997 (commencement of sale of Service Class shares) to December 31, 1997. F FMR agreed to reimburse a portion of the class' expenses during the period. Without this reimbursement, the class' expense ratio would have been higher. G FMR or the fund has entered into varying arrangements with third parties who either paid or reduced a portion of the class' expenses. H For the period December 31, 1996 (commencement of operations of Initial Class shares). |
||||
See accompanying notes which are an integral part of the financial statements.
Semiannual Report
Financial Highlights - Service Class 2
|
|
Six months ended |
|
Selected Per-Share Data |
(Unaudited) |
|
Net asset value, beginning of period |
$ 16.94 |
|
Income from Investment Operations |
|
|
Net investment income D |
.05 |
|
Net realized and unrealized gain (loss) |
(.16) |
|
Total from investment operations |
(.11) |
|
Less Distributions |
|
|
From net investment income |
(.19) |
|
From net realized gain |
(1.24) |
|
Total distributions |
(1.43) |
|
Net asset value, end of period |
$ 15.40 |
|
Total Return B, C |
(0.63)% |
|
Ratios and Supplemental Data |
|
|
Net assets, end of period (000 omitted) |
$ 2,318 |
|
Ratio of expenses to average net assets |
.81% A |
|
Ratio of expenses to average net assets after expense reductions |
.80% A, E |
|
Ratio of net investment income to average net assets |
.82% A |
|
Portfolio turnover |
60% A |
|
A Annualized B The total returns would have been lower had certain expenses not been reduced during the periods shown. C Total returns for periods of less than one year are not annualized and do not reflect charges attributable to your insurance company's separate account. Inclusion of these charges would reduce the total returns shown. D Net investment income per share has been calculated based on average shares outstanding during the period. E FMR or the fund has entered into varying arrangements with third parties who either paid or reduced a portion of the class' expenses. F For the period January 12, 2000 (commencement of sale of Service Class 2 shares) to June 30, 2000. |
|
See accompanying notes which are an integral part of the financial statements.
Growth & Income Portfolio
A special meeting of the fund's shareholders was held on July 19, 2000. The results of votes taken among shareholders on proposals before them are reported below. Each vote reported represents one dollar of net asset value held on the record date for the meeting.
PROPOSAL 1
To elect as Trustees the following twelve nominees.*
|
|
# of Dollars Voted |
% of Dollars Voted |
Ralph F. Cox
|
Affirmative |
2,995,348,207.84 |
97.862 |
|
Withheld |
65,444,305.52 |
2.138 |
|
TOTAL |
3,060,792,513.36 |
100.000 |
Phyllis Burke Davis
|
Affirmative |
2,995,012,849.06 |
97.851 |
|
Withheld |
65,779,664.30 |
2.149 |
|
TOTAL |
3,060,792,513.36 |
100.000 |
Robert M. Gates
|
Affirmative |
2,994,325,628.16 |
97.828 |
|
Withheld |
66,466,885.20 |
2.172 |
|
TOTAL |
3,060,792,513.36 |
100.000 |
Edward C. Johnson 3d
|
Affirmative |
2,994,212,266.77 |
97.825 |
|
Withheld |
66,580,246.59 |
2.175 |
|
TOTAL |
3,060,792,513.36 |
100.000 |
Donald J. Kirk
|
Affirmative |
2,996,527,468.99 |
97.900 |
|
Withheld |
64,265,044.37 |
2.100 |
|
TOTAL |
3,060,792,513.36 |
100.000 |
Ned C. Lautenbach
|
Affirmative |
2,997,430,896.97 |
97.930 |
|
Withheld |
63,361,616.39 |
2.070 |
|
TOTAL |
3,060,792,513.36 |
100.000 |
Peter S. Lynch
|
Affirmative |
2,997,391,112.97 |
97.929 |
|
Withheld |
63,401,400.39 |
2.071 |
|
TOTAL |
3,060,792,513.36 |
100.000 |
|
|
# of Dollars Voted |
% of Dollars Voted |
William O. McCoy
|
Affirmative |
2,997,364,420.76 |
97.928 |
|
Withheld |
63,428,092.60 |
2.072 |
|
TOTAL |
3,060,792,513.36 |
100.000 |
Gerald C. McDonough
|
Affirmative |
2,992,594,911.89 |
97.772 |
|
Withheld |
68,197,601.47 |
2.228 |
|
TOTAL |
3,060,792,513.36 |
100.000 |
Marvin L. Mann
|
Affirmative |
2,996,491,839.67 |
97.899 |
|
Withheld |
64,300,673.69 |
2.101 |
|
TOTAL |
3,060,792,513.36 |
100.000 |
Robert C. Pozen
|
Affirmative |
2,997,304,419.99 |
97.926 |
|
Withheld |
63,488,093.37 |
2.074 |
|
TOTAL |
3,060,792,513.36 |
100.000 |
Thomas R. Williams
|
Affirmative |
2,993,561,996.24 |
97.803 |
|
Withheld |
67,230,517.12 |
2.197 |
|
TOTAL |
3,060,792,513.36 |
100.000 |
Semiannual Report
Proxy Voting Results - continued
PROPOSAL 2
To ratify the selection of Deloitte & Touche LLP as independent accountants of the fund.
|
|
# of Dollars Voted |
% of Dollars Voted |
|
Affirmative |
1,094,741,303.86 |
94.882 |
|
Against |
8,150,336.78 |
0.707 |
|
Abstain |
50,895,725.39 |
4.411 |
|
TOTAL |
1,153,787,366.03 |
100.000 |
PROPOSAL 3
To authorize the Trustees to adopt an Amended and Restated Declaration of Trust.*
|
|
# of Dollars Voted |
% of Dollars Voted |
|
Affirmative |
2,837,267,199.92 |
92.697 |
|
Against |
49,473,422.32 |
1.617 |
|
Abstain |
174,051,891.12 |
5.686 |
|
TOTAL |
3,060,792,513.36 |
100.000 |
PROPOSAL 4
To approve an amended management contract for the fund that would reduce the management fee payable to FMR by the fund as FMR's assets under management increase.
|
|
# of Dollars Voted |
% of Dollars Voted |
|
Affirmative |
1,065,660,945.04 |
92.362 |
|
Against |
14,930,318.61 |
1.294 |
|
Abstain |
73,196,102.38 |
6.344 |
|
TOTAL |
1,153,787,366.03 |
100.000 |
PROPOSAL 5
To approve an amended sub-advisory agreement with FMR U.K. to provide investment advice and research services or investment management services.
|
|
# of Dollars Voted |
% of Dollars Voted |
|
Affirmative |
1,052,012,765.56 |
91.179 |
|
Against |
14,716,021.72 |
1.276 |
|
Abstain |
87,058,578.75 |
7.545 |
|
TOTAL |
1,153,787,366.03 |
100.000 |
PROPOSAL 6
To approve an amended sub-advisory agreement with FMR Far East to provide investment advice and research services or investment management services.
|
|
# of Dollars Voted |
% of Dollars Voted |
|
Affirmative |
1,047,279,358.30 |
90.769 |
|
Against |
18,168,639.12 |
1.575 |
|
Abstain |
88,339,368.61 |
7.656 |
|
TOTAL |
1,153,787,366.03 |
100.000 |
PROPOSAL 7
To amend the fundamental investment limitation concerning diversification.
|
|
# of Dollars Voted |
% of Dollars Voted |
|
Affirmative |
1,045,547,591.12 |
90.619 |
|
Against |
27,126,923.06 |
2.351 |
|
Abstain |
81,112,851.85 |
7.030 |
|
TOTAL |
1,153,787,366.03 |
100.000 |
PROPOSAL 8
To amend the fundamental limitation concerning underwriting.
|
|
# of Dollars Voted |
% of Dollars Voted |
|
Affirmative |
1,041,821,757.51 |
90.296 |
|
Against |
27,809,789.09 |
2.410 |
|
Abstain |
84,155,819.43 |
7.294 |
|
TOTAL |
1,153,787,366.03 |
100.000 |
PROPOSAL 9
To amend the fundamental limitation concerning concentration.
|
|
# of Dollars Voted |
% of Dollars Voted |
|
Affirmative |
1,042,706,287.48 |
90.372 |
|
Against |
26,973,368.78 |
2.338 |
|
Abstain |
84,107,709.77 |
7.290 |
|
TOTAL |
1,153,787,366.03 |
100.000 |
* Denotes trust-wide proposals and voting results.
Growth & Income Portfolio
Performance
There are several ways to evaluate a fund's historical performance. You can look at the total percentage change in value, the average annual percentage change or the growth of a hypothetical $10,000 investment. Total return reflects the change in the value of an investment, assuming reinvestment of the fund's dividend income and capital gains (the profits earned upon the sale of securities that have grown in value).
Average Annual Total Returns
|
Periods ended |
Past 1 |
Past 5 |
Past 10 |
|
Fidelity VIP: Equity-Income - |
-8.20% |
14.29% |
14.68% |
|
Russell 3000® Value |
-8.38% |
17.20% |
15.03% |
Average annual returns take the fund's cumulative return and show you what would have happened if the fund had performed at a constant rate each year.
You can compare the fund's returns to the performance of the Russell 3000 Value Index - a market capitalization-weighted index of value-oriented stocks of U.S. domiciled corporations. This benchmark reflects the reinvestment of dividends and capital gains, if any.
Figures for more than one year assume a steady compounded rate of return and are not the fund's year-by-year results, which fluctuated over the periods shown.
Performance numbers are net of all fund operating expenses, but do not include any insurance charges imposed by your insurance company's separate account. If performance information included the effect of these additional charges, the total returns would have been lower.
Past performance is no guarantee of future results. Principal and investment return will vary and you may have a gain or loss when
you withdraw your money.
Understanding Performance
How a fund did yesterday is no guarantee of how it will do tomorrow. The stock market, for example, has a history of long-term growth and short-term volatility. In turn, the share price and return of a fund that invests in stocks will vary. That means if you sell your shares during a market downturn, you might lose money. But if you can ride out the market's ups and downs, you may have a gain.
3$10,000 Over 10 Years
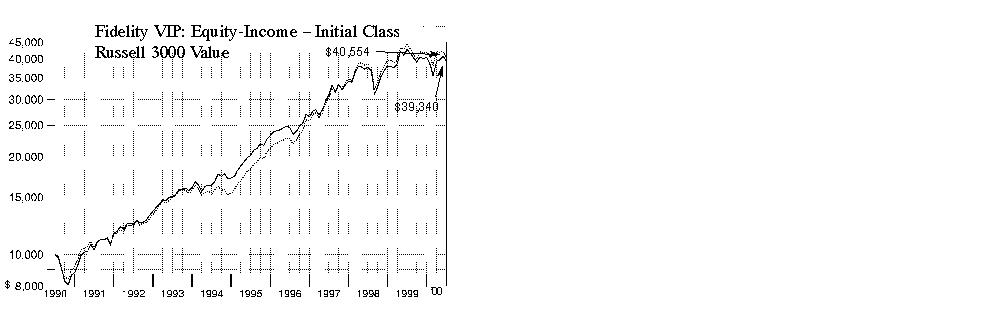
$10,000 Over 10 Years: Let's say hypothetically that $10,000 was invested in Fidelity Variable Insurance Products: Equity-Income Portfolio - Initial Class on June 30, 1990. As the chart shows, by June 30, 2000, the value of the investment would have grown to $39,340 - a 293.40% increase on the initial investment. For comparison, look at how the Russell 3000 Value Index did over the same period. With dividends and capital gains, if any, reinvested, the same $10,000 investment would have grown to $40,554 - a 305.54% increase.
Investment Summary
|
Top Five Stocks as of June 30, 2000 |
|
|
|
% of fund's |
|
General Electric Co. |
3.8 |
|
Citigroup, Inc. |
3.6 |
|
Exxon Mobil Corp. |
3.4 |
|
BP Amoco PLC sponsored ADR |
2.6 |
|
Viacom, Inc. Class B (non-vtg.) |
2.4 |
|
|
15.8 |
|
Top Five Market Sectors as of June 30, 2000 |
|
|
|
% of fund's |
|
Finance |
24.2 |
|
Energy |
15.9 |
|
Utilities |
10.3 |
|
Health |
7.8 |
|
Industrial Machinery & Equipment |
7.6 |
|
Asset Allocation as of June 30, 2000 |
|||
|
% of fund's net assets* |
|||
|
Stocks 96.5% |
|
|
|
Bonds 2.1% |
|
|
|
Short-Term Investments |
|
|

|
* Foreign investments 9.7% |
Semiannual Report
(Portfolio Manager photograph)
An interview with
Steve Petersen,
Portfolio Manager of
Equity-Income Portfolio
Q. How did the fund perform, Steve?
A. For the six-month period ending June 30, 2000, the fund outperformed the Russell 3000 Value Index, which returned -3.56%. The fund also outperformed the Russell index's 12-month return of -8.38% for the one-year period ending June 30, 2000.
Q. What helped the fund outperform its benchmark?
A. The most important aspect of the fund's performance relative to the index was the huge swing in technology stock prices and the impact it had. From the beginning of the year through mid-March, technology stocks led the market. That came to an end as the NASDAQ plummeted and was still struggling to recover at the end of the period. The Russell 3000 Value Index, which focuses on companies with value characteristics, closely reflects the fund's investment strategy. However, with a lower weighting in technology stocks than the Russell index, the fund was not as exposed to these wild swings. Consequently, the underweighting in technology stocks helped the fund's relative performance.
Q. How did financial stocks - the fund's largest sector weighting - do?
A. Their performance was mixed. Although fund holding American Express' fundamentals were good, the company, which focuses on high-end travel and entertainment spending, was hurt by the perception of a slowing economy, and its high valuation added to concern about a possible decline in its earnings momentum. Fannie Mae continued to be plagued by Congress' current debate about whether the U.S. government should continue to implicitly guarantee its debt. Fannie Mae also was hurt by higher interest rates. On the positive side, financial companies that earned a higher percentage of their revenues from transactions or asset management businesses did well during the period. Fund holding Citigroup benefited from subsidiary Salomon Smith Barney's strong revenues, and Bank of New York's growing revenues from its successful custody business helped its performance.
Q. Pharmaceutical stocks appeared to come back from their slump last year . . .
A. Yes, they were disappointments last year. The U.S. government had considered providing coverage to Medicare patients for prescription drugs, potentially cutting drug companies' profits. This year, however, an evolving perception of a slowing economy helped pharmaceutical stocks, which are considered to be defensive, to come back strongly. As a result, the fund's pharmaceutical holdings performed very well. Eli Lilly was one example of a strong pharmaceutical stock. The company's performance was boosted by its development of a drug to treat sepsis, an often fatal condition resulting from severe infections. This drug could be a possible source of significant revenues for the company. The company's stock soared following the reports of promising clinical test results. Schering-Plough was another beneficiary of the general recovery in pharmaceutical stock prices.
Q. Which stocks were disappointments?
A. Along with many other companies, AT&T was hurt by announcements that its earnings growth would be lower than expected. Its core business - consumer long-distance telephone service - has been rather flat over the past few years. Prices have declined while competition has increased. Honeywell's expectations for earnings growth also slipped. This multi-industry company saw a softening in a couple of its business lines, and its performance slumped. SBC Communications, a telephone company specializing in local service, also announced slower-than-expected earnings growth, and its stock performance suffered.
Q. What's your near-term outlook, Steve?
A. The big question is how much the economy will slow. If it strengthens once again, showing the last couple of months to be an anomaly, it would cause more worry about increasingly drastic steps the Federal Reserve Board could take - such as increasing interest rates significantly - to slow the economy, potentially causing a recession. On the other hand, if the Fed's tightening moves have been sufficient to slow the economy and reduce expectations for growth, perhaps even causing a bit of a correction in technology stocks, the market would probably perceive that as a very positive scenario. No matter what scenario evolves, I will continue to invest in what I believe to be the cheapest part of the market. I'm focusing on finding very solid companies, looking for good value and strong dividend yields. Although this area could remain out of favor for some time, there are still some terrific opportunities in this universe, and I'll continue to search for them.
The views expressed in this report reflect those of the portfolio manager only through the end of the period of the report as stated on the cover. The manager's views are subject to change at any time based upon market or other conditions. For more information, see page 2.
Fund Facts
Goal: seeks reasonable income while maintaining a yield that exceeds the composite dividend yield of the S&P 500; also considers the potential for capital appreciation
Start date: October 9, 1986
Size: as of June 30, 2000, more than $9.9 billion
Manager: Stephen Petersen, since 1997; joined Fidelity in 1980
3Semiannual Report
Fidelity Variable Insurance Products: Equity-Income Portfolio
(Unaudited)
Showing Percentage of Net Assets
|
Common Stocks - 93.5% |
|||
|
Shares |
Value (Note 1) |
||
|
AEROSPACE & DEFENSE - 3.5% |
|||
|
Aerospace & Defense - 3.2% |
|||
|
Boeing Co. |
1,678,000 |
$ 70,161,375 |
|
|
Honeywell International, Inc. |
1,758,825 |
59,250,417 |
|
|
Rockwell International Corp. |
592,100 |
18,651,150 |
|
|
Textron, Inc. |
1,515,000 |
82,283,438 |
|
|
United Technologies Corp. |
1,466,300 |
86,328,413 |
|
|
|
316,674,793 |
||
|
Ship Building & Repair - 0.3% |
|||
|
General Dynamics Corp. |
505,700 |
26,422,825 |
|
|
TOTAL AEROSPACE & DEFENSE |
343,097,618 |
||
|
BASIC INDUSTRIES - 4.7% |
|||
|
Chemicals & Plastics - 2.5% |
|||
|
Arch Chemicals, Inc. |
292,600 |
6,400,625 |
|
|
Celanese AG |
151,110 |
2,911,858 |
|
|
Crompton Corp. |
1,090,651 |
13,360,475 |
|
|
Dow Chemical Co. |
820,200 |
24,759,788 |
|
|
E.I. du Pont de Nemours and Co. |
609,449 |
26,663,394 |
|
|
Engelhard Corp. |
557,500 |
9,512,344 |
|
|
Great Lakes Chemical Corp. |
1,060,100 |
33,393,150 |
|
|
Hercules Trust II unit |
15,700 |
8,713,500 |
|
|
Hercules, Inc. |
856,100 |
12,038,906 |
|
|
IMC Global, Inc. |
1,626,800 |
21,148,400 |
|
|
M.A. Hanna Co. |
979,200 |
8,812,800 |
|
|
Millennium Chemicals, Inc. |
749,200 |
12,736,400 |
|
|
Olin Corp. |
712,700 |
11,759,550 |
|
|
Praxair, Inc. |
446,900 |
16,730,819 |
|
|
Rohm & Haas Co. |
122,300 |
4,219,350 |
|
|
Solutia, Inc. |
1,249,300 |
17,177,875 |
|
|
Union Carbide Corp. |
376,200 |
18,621,900 |
|
|
|
248,961,134 |
||
|
Iron & Steel - 0.5% |
|||
|
Allegheny Technologies, Inc. |
782,050 |
14,076,900 |
|
|
Dofasco, Inc. |
749,800 |
12,332,070 |
|
|
Nucor Corp. |
628,100 |
20,845,069 |
|
|
|
47,254,039 |
||
|
Metals & Mining - 0.9% |
|||
|
Alcoa, Inc. |
2,308,216 |
66,938,264 |
|
|
Phelps Dodge Corp. |
556,500 |
20,694,844 |
|
|
Ryerson Tull, Inc. |
753,323 |
7,815,726 |
|
|
|
95,448,834 |
||
|
Packaging & Containers - 0.2% |
|||
|
Ball Corp. |
387,075 |
12,458,977 |
|
|
Owens-Illinois, Inc. (a) |
700,700 |
8,189,431 |
|
|
|
20,648,408 |
||
|
Paper & Forest Products - 0.6% |
|||
|
Bowater, Inc. |
798,600 |
35,238,225 |
|
|
International Paper Co. |
165,910 |
4,946,192 |
|
|
|
|||
|
Shares |
Value (Note 1) |
||
|
Pentair, Inc. |
236,600 |
$ 8,399,300 |
|
|
Smurfit-Stone Container Corp. (a) |
755,400 |
9,725,775 |
|
|
|
58,309,492 |
||
|
TOTAL BASIC INDUSTRIES |
470,621,907 |
||
|
CONSTRUCTION & REAL ESTATE - 1.4% |
|||
|
Building Materials - 0.4% |
|||
|
Fortune Brands, Inc. |
805,700 |
18,581,456 |
|
|
Masco Corp. |
1,265,800 |
22,863,513 |
|
|
|
41,444,969 |
||
|
Real Estate Investment Trusts - 1.0% |
|||
|
Alexandria Real Estate Equities, Inc. |
109,600 |
3,760,650 |
|
|
Crescent Real Estate Equities Co. |
810,400 |
16,613,200 |
|
|
Duke-Weeks Realty Corp. |
434,622 |
9,724,667 |
|
|
Equity Office Properties Trust |
524,500 |
14,456,531 |
|
|
Equity Residential Properties Trust (SBI) |
649,500 |
29,877,000 |
|
|
Public Storage, Inc. |
609,700 |
14,289,844 |
|
|
Spieker Properties, Inc. |
277,000 |
12,742,000 |
|
|
|
101,463,892 |
||
|
TOTAL CONSTRUCTION & REAL ESTATE |
142,908,861 |
||
|
DURABLES - 2.4% |
|||
|
Autos, Tires, & Accessories - 1.2% |
|||
|
AutoNation, Inc. |
642,800 |
4,539,775 |
|
|
Eaton Corp. |
428,300 |
28,696,100 |
|
|
Goodyear Tire & Rubber Co. |
407,100 |
8,142,000 |
|
|
Johnson Controls, Inc. |
333,600 |
17,117,850 |
|
|
Meritor Automotive, Inc. |
408,600 |
4,494,600 |
|
|
Navistar International Corp. (a) |
387,600 |
12,039,825 |
|
|
Pep Boys-Manny, Moe & Jack |
662,100 |
3,972,600 |
|
|
TRW, Inc. |
801,700 |
34,773,738 |
|
|
|
113,776,488 |
||
|
Consumer Durables - 0.9% |
|||
|
Minnesota Mining & Manufacturing Co. |
682,500 |
56,306,250 |
|
|
Snap-On, Inc. |
1,102,000 |
29,340,750 |
|
|
|
85,647,000 |
||
|
Consumer Electronics - 0.1% |
|||
|
Black & Decker Corp. |
252,600 |
9,930,338 |
|
|
General Motors Corp. Class H (a) |
43,086 |
3,780,797 |
|
|
|
13,711,135 |
||
|
Home Furnishings - 0.2% |
|||
|
Newell Rubbermaid, Inc. |
822,067 |
21,168,225 |
|
|
Textiles & Apparel - 0.0% |
|||
|
Kellwood Co. |
85,800 |
1,812,525 |
|
|
TOTAL DURABLES |
236,115,373 |
||
|
ENERGY - 15.7% |
|||
|
Energy Services - 2.3% |
|||
|
Baker Hughes, Inc. |
1,817,400 |
58,156,800 |
|
|
Common Stocks - continued |
|||
|
Shares |
Value (Note 1) |
||
|
ENERGY - continued |
|||
|
Energy Services - continued |
|||
|
Halliburton Co. |
2,882,900 |
$ 136,036,844 |
|
|
Schlumberger Ltd. (NY Shares) |
409,500 |
30,558,938 |
|
|
|
224,752,582 |
||
|
Oil & Gas - 13.4% |
|||
|
Amerada Hess Corp. |
246,500 |
15,221,375 |
|
|
Anadarko Petroleum Corp. |
587,900 |
28,990,819 |
|
|
BP Amoco PLC sponsored ADR |
4,538,242 |
256,694,313 |
|
|
Burlington Resources, Inc. |
1,192,100 |
45,597,825 |
|
|
Chevron Corp. |
1,280,171 |
108,574,503 |
|
|
Conoco, Inc.: |
|
|
|
|
Class A |
721,200 |
15,866,400 |
|
|
Class B |
1,931,915 |
47,452,662 |
|
|
Exxon Mobil Corp. |
4,334,118 |
340,228,263 |
|
|
Occidental Petroleum Corp. |
985,000 |
20,746,563 |
|
|
Royal Dutch Petroleum Co. (NY Shares) |
1,968,600 |
121,191,938 |
|
|
Santa Fe Snyder Corp. (a) |
1,336,203 |
15,199,309 |
|
|
Tosco Corp. |
449,800 |
12,734,963 |
|
|
TotalFinaElf SA: |
|
|
|
|
Class B |
448,000 |
68,992,001 |
|
|
sponsored ADR |
2,183,396 |
167,712,105 |
|
|
Ultramar Diamond Shamrock Corp. |
713,600 |
17,706,200 |
|
|
Union Pacific Resources Group, Inc. |
645,500 |
14,201,000 |
|
|
USX - Marathon Group |
1,621,100 |
40,628,819 |
|
|
|
1,337,739,058 |
||
|
TOTAL ENERGY |
1,562,491,640 |
||
|
FINANCE - 23.5% |
|||
|
Banks - 10.2% |
|||
|
Bank of America Corp. |
2,935,590 |
126,230,370 |
|
|
Bank of New York Co., Inc. |
4,579,000 |
212,923,500 |
|
|
Bank One Corp. |
1,119,438 |
29,735,072 |
|
|
Chase Manhattan Corp. |
2,924,450 |
134,707,478 |
|
|
Comerica, Inc. |
1,601,800 |
71,880,775 |
|
|
Firstar Corp. |
138,900 |
2,925,581 |
|
|
FleetBoston Financial Corp. |
2,006,200 |
68,210,800 |
|
|
Mellon Financial Corp. |
2,266,900 |
82,600,169 |
|
|
National Bank of Canada |
2,476,636 |
36,969,710 |
|
|
PNC Financial Services Group, Inc. |
233,000 |
10,921,875 |
|
|
U.S. Bancorp |
2,928,094 |
56,365,810 |
|
|
Wachovia Corp. |
442,500 |
24,005,625 |
|
|
Wells Fargo & Co. |
3,967,200 |
153,729,000 |
|
|
|
1,011,205,765 |
||
|
Credit & Other Finance - 7.2% |
|||
|
American Express Co. |
3,251,616 |
169,490,484 |
|
|
Associates First Capital Corp. Class A |
3,623,656 |
80,852,825 |
|
|
|
|||
|
Shares |
Value (Note 1) |
||
|
Citigroup, Inc. |
5,969,898 |
$ 359,686,355 |
|
|
Household International, Inc. |
2,527,647 |
105,055,328 |
|
|
|
715,084,992 |
||
|
Federal Sponsored Credit - 2.7% |
|||
|
Fannie Mae |
4,308,800 |
224,865,500 |
|
|
Freddie Mac |
762,900 |
30,897,450 |
|
|
SLM Holding Corp. |
412,700 |
15,450,456 |
|
|
|
271,213,406 |
||
|
Insurance - 2.5% |
|||
|
Ace Ltd. |
1,474,100 |
41,274,800 |
|
|
American International Group, Inc. |
315,900 |
37,118,250 |
|
|
Everest Re Group Ltd. |
96,800 |
3,182,300 |
|
|
Hartford Financial Services Group, Inc. |
1,691,600 |
94,623,875 |
|
|
Highlands Insurance Group, Inc. (a) |
371,100 |
3,479,063 |
|
|
Protective Life Corp. |
180,700 |
4,811,138 |
|
|
The Chubb Corp. |
382,500 |
23,523,750 |
|
|
The St. Paul Companies, Inc. |
374,200 |
12,769,575 |
|
|
UnumProvident Corp. |
1,063,700 |
21,340,481 |
|
|
XL Capital Ltd. Class A |
180,700 |
9,780,388 |
|
|
|
251,903,620 |
||
|
Savings & Loans - 0.2% |
|||
|
TCF Financial Corp. |
573,000 |
14,718,938 |
|
|
Securities Industry - 0.7% |
|||
|
Franklin Resources, Inc. |
243,700 |
7,402,388 |
|
|
Morgan Stanley Dean Witter & Co. |
410,600 |
34,182,450 |
|
|
Nomura Securities Co. Ltd. |
1,061,000 |
25,969,582 |
|
|
Waddell & Reed Financial, Inc. Class B |
94,498 |
2,746,348 |
|
|
|
70,300,768 |
||
|
TOTAL FINANCE |
2,334,427,489 |
||
|
HEALTH - 7.8% |
|||
|
Drugs & Pharmaceuticals - 5.8% |
|||
|
Bristol-Myers Squibb Co. |
2,457,400 |
143,143,550 |
|
|
Eli Lilly & Co. |
2,053,000 |
205,043,375 |
|
|
Merck & Co., Inc. |
1,595,700 |
122,270,513 |
|
|
Schering-Plough Corp. |
2,129,530 |
107,541,265 |
|
|
|
577,998,703 |
||
|
Medical Equipment & Supplies - 1.3% |
|||
|
Abbott Laboratories |
1,616,600 |
72,039,738 |
|
|
Becton, Dickinson & Co. |
680,800 |
19,530,450 |
|
|
Cardinal Health, Inc. |
481,100 |
35,601,400 |
|
|
|
127,171,588 |
||
|
Medical Facilities Management - 0.7% |
|||
|
HCA - The Healthcare Co. |
2,259,150 |
68,621,681 |
|
|
TOTAL HEALTH |
773,791,972 |
||
|
Common Stocks - continued |
|||
|
Shares |
Value (Note 1) |
||
|
INDUSTRIAL MACHINERY & EQUIPMENT - 7.4% |
|||
|
Electrical Equipment - 4.2% |
|||
|
General Electric Co. |
7,160,900 |
$ 379,527,680 |
|
|
Siemens AG |
253,900 |
38,268,849 |
|
|
|
417,796,529 |
||
|
Industrial Machinery & Equipment - 3.2% |
|||
|
Caterpillar, Inc. |
1,009,800 |
34,206,975 |
|
|
CNH Global NV |
506,200 |
4,682,350 |
|
|
Deere & Co. |
1,258,250 |
46,555,250 |
|
|
Ingersoll-Rand Co. |
799,500 |
32,179,875 |
|
|
ITT Industries, Inc. |
218,600 |
6,639,975 |
|
|
Kennametal, Inc. |
500,708 |
10,733,928 |
|
|
Parker-Hannifin Corp. |
641,100 |
21,957,675 |
|
|
The Stanley Works |
293,700 |
6,975,375 |
|
|
Tyco International Ltd. |
3,208,246 |
151,990,654 |
|
|
|
315,922,057 |
||
|
Pollution Control - 0.0% |
|||
|
Republic Services, Inc. Class A (a) |
341,200 |
5,459,200 |
|
|
TOTAL INDUSTRIAL MACHINERY & EQUIPMENT |
739,177,786 |
||
|
MEDIA & LEISURE - 5.8% |
|||
|
Broadcasting - 1.4% |
|||
|
Clear Channel Communications, Inc. (a) |
123,500 |
9,262,500 |
|
|
MediaOne Group, Inc. (a) |
636,110 |
42,182,840 |
|
|
Time Warner, Inc. |
1,167,754 |
88,749,334 |
|
|
|
140,194,674 |
||
|
Entertainment - 2.9% |
|||
|
Fox Entertainment Group, Inc. |
721,700 |
21,921,638 |
|
|
Mandalay Resort Group (a) |
534,500 |
10,690,000 |
|
|
Viacom, Inc. Class B (non-vtg.) (a) |
3,482,118 |
237,436,921 |
|
|
Walt Disney Co. |
586,900 |
22,779,056 |
|
|
|
292,827,615 |
||
|
Lodging & Gaming - 0.6% |
|||
|
Harrah's Entertainment, Inc. (a) |
424,500 |
8,887,969 |
|
|
Starwood Hotels & Resorts |
1,465,981 |
47,736,006 |
|
|
|
56,623,975 |
||
|
Publishing - 0.4% |
|||
|
Reader's Digest Association, Inc. |
953,200 |
37,889,700 |
|
|
Restaurants - 0.5% |
|||
|
McDonald's Corp. |
1,562,400 |
51,461,550 |
|
|
TOTAL MEDIA & LEISURE |
578,997,514 |
||
|
NONDURABLES - 3.6% |
|||
|
Beverages - 0.1% |
|||
|
Brown-Forman Corp. Class B (non-vtg.) |
147,800 |
7,944,250 |
|
|
|
|||
|
Shares |
Value (Note 1) |
||
|
Foods - 0.7% |
|||
|
Nabisco Group Holdings Corp. |
967,700 |
$ 25,099,719 |
|
|
Nabisco Holdings Corp. Class A |
779,200 |
40,908,000 |
|
|
|
66,007,719 |
||
|
Household Products - 1.8% |
|||
|
Avon Products, Inc. |
915,600 |
40,744,200 |
|
|
Clorox Co. |
649,300 |
29,096,756 |
|
|
Dial Corp. |
624,300 |
6,477,113 |
|
|
Gillette Co. |
769,200 |
26,873,925 |
|
|
International Flavors & Fragrances, Inc. |
244,600 |
7,383,863 |
|
|
Procter & Gamble Co. |
438,400 |
25,098,400 |
|
|
Unilever NV (NY Shares) |
241,485 |
10,383,855 |
|
|
Unilever PLC |
6,090,714 |
38,257,265 |
|
|
|
184,315,377 |
||
|
Tobacco - 1.0% |
|||
|
Philip Morris Companies, Inc. |
3,741,200 |
99,375,625 |
|
|
TOTAL NONDURABLES |
357,642,971 |
||
|
RETAIL & WHOLESALE - 2.5% |
|||
|
Apparel Stores - 0.9% |
|||
|
Charming Shoppes, Inc. (a) |
612,800 |
3,121,450 |
|
|
Footstar, Inc. (a) |
206,300 |
6,859,475 |
|
|
The Limited, Inc. |
2,635,400 |
56,990,525 |
|
|
TJX Companies, Inc. |
1,362,300 |
25,543,125 |
|
|
Venator Group, Inc. (a) |
221,300 |
2,268,325 |
|
|
|
94,782,900 |
||
|
General Merchandise Stores - 1.6% |
|||
|
Ames Department Stores, Inc. |
203,500 |
1,577,125 |
|
|
Consolidated Stores Corp. (a) |
2,020,156 |
24,241,875 |
|
|
Federated Department Stores, Inc. (a) |
1,102,700 |
37,216,125 |
|
|
Hudson's Bay Co. (e) |
302,500 |
3,207,869 |
|
|
JCPenney Co., Inc. |
328,100 |
6,049,344 |
|
|
Target Corp. |
870,700 |
50,500,600 |
|
|
Wal-Mart Stores, Inc. |
608,600 |
35,070,575 |
|
|
|
157,863,513 |
||
|
TOTAL RETAIL & WHOLESALE |
252,646,413 |
||
|
SERVICES - 1.3% |
|||
|
Printing - 0.2% |
|||
|
New England Business Service, Inc. |
207,200 |
3,367,000 |
|
|
R.R. Donnelley & Sons Co. |
535,300 |
12,077,706 |
|
|
|
15,444,706 |
||
|
Services - 1.1% |
|||
|
ACNielsen Corp. (a) |
750,100 |
16,502,200 |
|
|
Brascan Corp. Class A (ltd. vtg.) |
2,699,800 |
31,730,172 |
|
|
Dun & Bradstreet Corp. |
134,300 |
3,844,338 |
|
|
H&R Block, Inc. |
1,073,800 |
34,764,275 |
|
|
Per-Se Technologies, Inc. (a) |
9,540 |
89,438 |
|
|
Common Stocks - continued |
|||
|
Shares |
Value (Note 1) |
||
|
SERVICES - continued |
|||
|
Services - continued |
|||
|
Per-Se Technologies, Inc. warrants 7/8/03 (a) |
12,807 |
$ 0 |
|
|
Viad Corp. |
775,800 |
21,140,550 |
|
|
|
108,070,973 |
||
|
TOTAL SERVICES |
123,515,679 |
||
|
TECHNOLOGY - 3.5% |
|||
|
Communications Equipment - 0.1% |
|||
|
Nortel Networks Corp. |
122,804 |
8,518,724 |
|
|
Computer Services & Software - 0.9% |
|||
|
IMS Health, Inc. |
891,500 |
16,047,000 |
|
|
Microsoft Corp. (a) |
196,400 |
15,712,000 |
|
|
NCR Corp. (a) |
683,800 |
26,625,463 |
|
|
Sabre Holdings Corp. Class A |
145,116 |
4,135,806 |
|
|
Unisys Corp. (a) |
2,059,717 |
29,994,629 |
|
|
|
92,514,898 |
||
|
Computers & Office Equipment - 2.1% |
|||
|
Compaq Computer Corp. |
2,037,300 |
52,078,481 |
|
|
Hewlett-Packard Co. |
157,800 |
19,705,275 |
|
|
International Business Machines Corp. |
567,400 |
62,165,763 |
|
|
Pitney Bowes, Inc. |
1,582,000 |
63,280,000 |
|
|
Xerox Corp. |
463,100 |
9,609,325 |
|
|
|
206,838,844 |
||
|
Electronic Instruments - 0.3% |
|||
|
Thermo Electron Corp. (a) |
1,295,400 |
27,284,363 |
|
|
Photographic Equipment - 0.1% |
|||
|
Eastman Kodak Co. |
257,200 |
15,303,400 |
|
|
TOTAL TECHNOLOGY |
350,460,229 |
||
|
TRANSPORTATION - 1.2% |
|||
|
Air Transportation - 0.2% |
|||
|
AMR Corp. |
371,000 |
9,808,313 |
|
|
Southwest Airlines Co. |
435,000 |
8,237,813 |
|
|
|
18,046,126 |
||
|
Railroads - 1.0% |
|||
|
Burlington Northern Santa Fe Corp. |
2,998,700 |
68,782,681 |
|
|
CSX Corp. |
559,200 |
11,848,050 |
|
|
Union Pacific Corp. |
409,400 |
15,224,563 |
|
|
|
95,855,294 |
||
|
TOTAL TRANSPORTATION |
113,901,420 |
||
|
UTILITIES - 9.2% |
|||
|
Cellular - 0.1% |
|||
|
AT&T Corp. - Wireless Group |
453,300 |
12,635,738 |
|
|
Electric Utility - 2.4% |
|||
|
Allegheny Energy, Inc. |
1,148,700 |
31,445,663 |
|
|
|
|||
|
Shares |
Value (Note 1) |
||
|
American Electric Power Co., Inc. |
997,100 |
$ 29,539,088 |
|
|
Cinergy Corp. |
415,000 |
10,556,563 |
|
|
DPL, Inc. |
168,354 |
3,693,266 |
|
|
Entergy Corp. |
3,187,300 |
86,654,719 |
|
|
IPALCO Enterprises, Inc. |
431,500 |
8,683,938 |
|
|
Niagara Mohawk Holdings, Inc. (a) |
1,682,100 |
23,444,269 |
|
|
NRG Energy, Inc. |
308,800 |
5,635,600 |
|
|
PG&E Corp. |
1,551,878 |
38,214,996 |
|
|
|
237,868,102 |
||
|
Telephone Services - 6.7% |
|||
|
AT&T Corp. |
4,236,400 |
133,976,150 |
|
|
Bell Atlantic Corp. |
1,266,240 |
64,340,820 |
|
|
BellSouth Corp. |
2,151,399 |
91,703,382 |
|
|
GTE Corp. |
1,087,100 |
67,671,975 |
|
|
Pathnet, Inc. warrants 4/15/08 (a)(e) |
510 |
5,100 |
|
|
SBC Communications, Inc. |
5,353,193 |
231,525,597 |
|
|
U.S. WEST, Inc. |
189,300 |
16,232,475 |
|
|
WorldCom, Inc. (a) |
1,309,716 |
60,083,199 |
|
|
|
665,538,698 |
||
|
TOTAL UTILITIES |
916,042,538 |
||
|
TOTAL COMMON STOCKS (Cost $7,320,124,457) |
9,295,839,410 |
||
|
Preferred Stocks - 3.0% |
|||
|
|
|
|
|
|
Convertible Preferred Stocks - 3.0% |
|||
|
BASIC INDUSTRIES - 0.2% |
|||
|
Chemicals & Plastics - 0.1% |
|||
|
Monsanto Co. $1.625 ACES |
283,800 |
12,966,113 |
|
|
Paper & Forest Products - 0.1% |
|||
|
Georgia-Pacific Corp. $3.75 PEPS |
314,100 |
9,854,888 |
|
|
TOTAL BASIC INDUSTRIES |
22,821,001 |
||
|
ENERGY - 0.2% |
|||
|
Oil & Gas - 0.2% |
|||
|
Apache Corp. $2.015 ACES |
183,100 |
9,349,635 |
|
|
The Coastal Corp. $1.20 PRIDES |
368,900 |
11,938,711 |
|
|
|
21,288,346 |
||
|
FINANCE - 0.7% |
|||
|
Credit & Other Finance - 0.4% |
|||
|
Federal-Mogul Financing Trust $3.50 |
490,300 |
10,725,313 |
|
|
Union Pacific Capital Trust: |
|
|
|
|
$3.125 |
403,200 |
15,926,400 |
|
|
$3.125 TIDES (e) |
384,500 |
15,187,750 |
|
|
|
41,839,463 |
||
|
Preferred Stocks - continued |
|||
|
Shares |
Value (Note 1) |
||
|
Convertible Preferred Stocks - continued |
|||
|
FINANCE - continued |
|||
|
Insurance - 0.3% |
|||
|
Ace Ltd. $4.125 PRIDES |
225,800 |
$ 14,126,725 |
|
|
MetLife, Inc. $4.00 |
225,800 |
15,523,750 |
|
|
|
29,650,475 |
||
|
TOTAL FINANCE |
71,489,938 |
||
|
INDUSTRIAL MACHINERY & EQUIPMENT - 0.2% |
|||
|
Electrical Equipment - 0.1% |
|||
|
Loral Space & Communications Ltd. Series C: |
|
|
|
|
$3.00 (e) |
183,200 |
4,122,000 |
|
|
$3.00 |
208,700 |
4,695,750 |
|
|
|
8,817,750 |
||
|
Industrial Machinery & Equipment - 0.1% |
|||
|
Ingersoll Rand Co./Ingersoll Rand Finance $1.68 Growth PRIDES |
530,100 |
10,188,522 |
|
|
TOTAL INDUSTRIAL MACHINERY & EQUIPMENT |
19,006,272 |
||
|
MEDIA & LEISURE - 0.9% |
|||
|
Broadcasting - 0.6% |
|||
|
Cox Communications, Inc.: |
|
|
|
|
$2.27 PRIDES |
159,500 |
9,884,215 |
|
|
$6.858 PRIZES |
146,000 |
16,078,250 |
|
|
MediaOne Group, Inc. |
|
|
|
|
$3.04 PIES |
317,100 |
12,763,275 |
|
|
$3.63 PIES |
249,900 |
22,491,000 |
|
|
|
61,216,740 |
||
|
Entertainment - 0.1% |
|||
|
Premier Parks, Inc. $4.05 PIES |
273,300 |
11,956,875 |
|
|
Publishing - 0.2% |
|||
|
Readers Digest Automatic Common Exchange Securities Trust $1.93 TRACES |
464,700 |
16,409,951 |
|
|
TOTAL MEDIA & LEISURE |
89,583,566 |
||
|
NONDURABLES - 0.3% |
|||
|
Beverages - 0.3% |
|||
|
Seagram Co. Ltd. $3.76 ACES |
473,400 |
25,001,674 |
|
|
RETAIL & WHOLESALE - 0.0% |
|||
|
General Merchandise Stores - 0.0% |
|||
|
Kmart Financing I $3.875 |
100,000 |
3,643,750 |
|
|
UTILITIES - 0.5% |
|||
|
Electric Utility - 0.3% |
|||
|
Alliant Energy Resources, Inc. $4.91 (e) |
52,700 |
3,642,888 |
|
|
|
|||
|
Shares |
Value (Note 1) |
||
|
NiSource, Inc. $3.875 PIES |
299,300 |
$ 11,148,925 |
|
|
TXU Corp. $1.6575 PRIDES |
398,400 |
13,844,400 |
|
|
|
28,636,213 |
||
|
Gas - 0.2% |
|||
|
Enron Corp. (EOG Resources, Inc.) $1.5575 ACES |
484,900 |
14,910,675 |
|
|
TOTAL UTILITIES |
43,546,888 |
||
|
TOTAL CONVERTIBLE PREFERRED STOCKS |
296,381,435 |
||
|
Nonconvertible Preferred Stocks - 0.0% |
|||
|
CONSTRUCTION & REAL ESTATE - 0.0% |
|||
|
Real Estate Investment Trusts - 0.0% |
|||
|
California Federal Preferred |
31,590 |
671,288 |
|
|
MEDIA & LEISURE - 0.0% |
|||
|
Broadcasting - 0.0% |
|||
|
CSC Holdings, Inc. 11.125% pay-in-kind |
23,622 |
2,468,499 |
|
|
Publishing - 0.0% |
|||
|
PRIMEDIA, Inc. 8.625% |
6,123 |
520,455 |
|
|
TOTAL MEDIA & LEISURE |
2,988,954 |
||
|
TOTAL NONCONVERTIBLE PREFERRED STOCKS |
3,660,242 |
||
|
TOTAL PREFERRED STOCKS (Cost $317,222,517) |
300,041,677 |
||
|
Corporate Bonds - 2.1% |
|||||
|
Moody's Ratings (unaudited) (b) |
Principal Amount |
|
|||
|
Convertible Bonds - 1.7% |
|||||
|
CONSTRUCTION & REAL ESTATE - 0.4% |
|||||
|
Real Estate Investment Trusts - 0.4% |
|||||
|
Liberty Property LP |
Ba2 |
|
$ 27,985,000 |
36,363,009 |
|
|
DURABLES - 0.1% |
|||||
|
Consumer Electronics - 0.1% |
|||||
|
Sunbeam Corp. |
Caa2 |
|
60,290,000 |
9,344,950 |
|
|
FINANCE - 0.0% |
|||||
|
Insurance - 0.0% |
|||||
|
Loews Corp. |
A2 |
|
4,320,000 |
3,591,000 |
|
|
MEDIA & LEISURE - 0.6% |
|||||
|
Broadcasting - 0.1% |
|||||
|
Cox Communications, Inc. 1% 4/19/20 |
Baa3 |
|
26,600,000 |
13,815,508 |
|
|
Corporate Bonds - continued |
|||||
|
Moody's Ratings (unaudited) (b) |
Principal Amount |
Value |
|||
|
Convertible Bonds - continued |
|||||
|
Publishing - 0.5% |
|||||
|
News America Holdings, Inc. liquid yield option notes 0% 3/11/13 |
Baa3 |
|
$ 42,720,000 |
$ 47,448,250 |
|
|
TOTAL MEDIA & LEISURE |
61,263,758 |
||||
|
NONDURABLES - 0.0% |
|||||
|
Foods - 0.0% |
|||||
|
Chiquita Brands International, Inc. |
B3 |
|
820,000 |
721,600 |
|
|
TECHNOLOGY - 0.2% |
|||||
|
Computer Services & Software - 0.0% |
|||||
|
Softkey International, Inc. 5.5% 11/1/00 (e) |
- |
|
1,340,000 |
1,313,200 |
|
|
Computers & Office Equipment - 0.1% |
|||||
|
Quantum Corp. |
B2 |
|
7,730,000 |
6,097,038 |
|
|
Electronics - 0.1% |
|||||
|
Solectron Corp. |
BBB |
|
13,410,000 |
8,548,875 |
|
|
Vitesse Semiconductor Corp. 4% 3/15/05 (e) |
B2 |
|
7,770,000 |
7,187,250 |
|
|
|
15,736,125 |
||||
|
TOTAL TECHNOLOGY |
23,146,363 |
||||
|
UTILITIES - 0.4% |
|||||
|
Cellular - 0.1% |
|||||
|
Nextel Communications, Inc. 5.25% 1/15/10 (e) |
B1 |
|
13,390,000 |
13,858,650 |
|
|
Telephone Services - 0.3% |
|||||
|
Level 3 Communications, Inc. 6% 3/15/10 |
Caa1 |
|
13,380,000 |
12,117,263 |
|
|
Telefonos de Mexico SA de CV 4.25% 6/15/04 |
Baa3 |
|
9,430,000 |
12,659,775 |
|
|
|
24,777,038 |
||||
|
TOTAL UTILITIES |
38,635,688 |
||||
|
TOTAL CONVERTIBLE BONDS |
173,066,368 |
||||
|
Nonconvertible Bonds - 0.4% |
|||||
|
BASIC INDUSTRIES - 0.0% |
|||||
|
Chemicals & Plastics - 0.0% |
|||||
|
Lyondell Chemical Co. 9.875% 5/1/07 |
Ba3 |
|
1,340,000 |
1,326,600 |
|
|
Corporate Bonds - continued |
|||||
|
Moody's Ratings (unaudited) (b) |
Principal Amount |
Value |
|||
|
Nonconvertible Bonds - continued |
|||||
|
ENERGY - 0.0% |
|||||
|
Energy Services - 0.0% |
|||||
|
RBF Finance Co. |
Ba3 |
|
$ 1,520,000 |
$ 1,641,600 |
|
|
FINANCE - 0.0% |
|||||
|
Credit & Other Finance - 0.0% |
|||||
|
Macsaver Financial Services, Inc. |
Ba2 |
|
1,000,000 |
620,000 |
|
|
HEALTH - 0.0% |
|||||
|
Medical Facilities Management - 0.0% |
|||||
|
Tenet Healthcare Corp. 8.125% 12/1/08 |
Ba3 |
|
1,550,000 |
1,418,250 |
|
|
INDUSTRIAL MACHINERY & EQUIPMENT - 0.0% |
|||||
|
Pollution Control - 0.0% |
|||||
|
Allied Waste |
|
|
|
|
|
|
7.625% 1/1/06 |
Ba2 |
|
950,000 |
826,500 |
|
|
7.875% 1/1/09 |
Ba2 |
|
1,065,000 |
905,250 |
|
|
|
1,731,750 |
||||
|
MEDIA & LEISURE - 0.2% |
|||||
|
Broadcasting - 0.2% |
|||||
|
Adelphia Communications Corp. 9.875% 3/1/07 |
B1 |
|
2,425,000 |
2,303,750 |
|
|
Century Communications Corp. Series B, |
B1 |
|
440,000 |
180,400 |
|
|
Charter Communications Holdings LLC/Charter Communications Holdings Capital Corp. 8.625% 4/1/09 |
B2 |
|
1,340,000 |
1,182,550 |
|
|
NTL Communications Corp. 11.5% 10/1/08 |
B3 |
|
4,140,000 |
4,171,050 |
|
|
Telewest PLC 0% 10/1/07 (d) |
B1 |
|
2,265,000 |
2,163,075 |
|
|
United Pan-Europe Communications NV 10.875% 11/1/07 |
B2 |
|
2,380,000 |
2,142,000 |
|
|
|
12,142,825 |
||||
|
Entertainment - 0.0% |
|||||
|
Regal Cinemas, Inc. 8.875% 12/15/10 |
Ca |
|
2,340,000 |
561,600 |
|
|
Lodging & Gaming - 0.0% |
|||||
|
HMH Properties, Inc. 7.875% 8/1/08 |
Ba2 |
|
230,000 |
205,275 |
|
|
Restaurants - 0.0% |
|||||
|
Domino's, Inc. |
B3 |
|
1,020,000 |
946,050 |
|
|
TOTAL MEDIA & LEISURE |
13,855,750 |
||||
|
Corporate Bonds - continued |
|||||
|
Moody's Ratings (unaudited) (b) |
Principal Amount |
Value |
|||
|
Nonconvertible Bonds - continued |
|||||
|
TECHNOLOGY - 0.0% |
|||||
|
Computer Services & Software - 0.0% |
|||||
|
PSINet, Inc. |
B3 |
|
$ 1,335,000 |
$ 1,228,200 |
|
|
UTILITIES - 0.2% |
|||||
|
Cellular - 0.1% |
|||||
|
Nextel |
|
|
|
|
|
|
0% 10/31/07 (d) |
B1 |
|
3,765,000 |
2,804,925 |
|
|
12% 11/1/08 |
B1 |
|
1,410,000 |
1,505,175 |
|
|
|
4,310,100 |
||||
|
Telephone Services - 0.1% |
|||||
|
Global Crossing Holdings Ltd. 9.625% 5/15/08 |
Ba2 |
|
1,335,000 |
1,308,300 |
|
|
McLeodUSA, Inc. |
B1 |
|
910,000 |
887,250 |
|
|
NEXTLINK Communications, Inc. 9.625% 10/1/07 |
B2 |
|
2,780,000 |
2,606,250 |
|
|
Pathnet, Inc. |
- |
|
510,000 |
285,600 |
|
|
Rhythms NetConnections, Inc. 12.75% 4/15/09 |
B3 |
|
1,670,000 |
1,135,600 |
|
|
WinStar |
|
|
|
|
|
|
0% 4/15/10 (d)(e) |
B3 |
|
1,449,000 |
673,785 |
|
|
12.75% 4/15/10 (e) |
B3 |
|
4,031,000 |
3,889,915 |
|
|
|
10,786,700 |
||||
|
TOTAL UTILITIES |
15,096,800 |
||||
|
TOTAL NONCONVERTIBLE BONDS |
36,918,950 |
||||
|
TOTAL CORPORATE BONDS (Cost $193,683,286) |
209,985,318 |
||||
|
Cash Equivalents - 1.0% |
|||
|
Shares |
|
||
|
Central Cash Collateral Fund, 6.71% (c) |
1,698,015 |
1,698,015 |
|
|
Taxable Central Cash Fund, 6.59% (c) |
94,619,327 |
94,619,327 |
|
|
TOTAL CASH EQUIVALENTS (Cost $96,317,342) |
96,317,342 |
||
|
TOTAL INVESTMENT PORTFOLIO - 99.6% (Cost $7,927,347,602) |
9,902,183,747 |
||
|
NET OTHER ASSETS - 0.4% |
41,016,147 |
||
|
NET ASSETS - 100% |
$ 9,943,199,894 |
||
|
Security Type Abbreviations |
||
|
ACES |
- |
Automatic Common Exchange Securities |
|
PEPS |
- |
Participating Equity Preferred Shares/Premium Exchangeable Participating Shares |
|
PIES |
- |
Premium Income Equity Securities |
|
PRIDES |
- |
Preferred Redeemable Increased Dividend |
|
PRIZES |
- |
Participating Redeemable Indexed Zero-Premium Exchangeable Securities |
|
TIDES |
- |
Term Income Deferred Equity Securities |
|
TRACES |
- |
Trust Automatic Common Exchange Securities |
|
Legend |
|
(a) Non-income producing |
|
(b) S&P credit ratings are used in the absence of a rating by Moody's Investors Service, Inc. |
|
(c) The rate quoted is the annualized seven-day yield of the fund at |
|
(d) Debt obligation initially issued in zero coupon form which converts to coupon form at a specified rate and date. The rate shown is the rate at period end. |
|
(e) Security exempt from registration under Rule 144A of the Securities |
|
Other Information |
|
Purchases and sales of securities, other than short-term securities, |
|
The fund placed a portion of its portfolio transactions with brokerage |
|
The fund participated in the security lending program. At period end, the value of securities loaned amounted to $1,591,025. The fund received cash collateral of $1,698,015 which was invested in cash equivalents. |
|
The fund participated in the interfund lending program as a borrower. |
|
The fund participated in the bank borrowing program. The average daily loan balance during the period for which loans were outstanding amounted to $13,171,318. The weighted average interest rate was 6.09%. Interest expense includes $49,044 paid under the bank borrowing program. |
|
Income Tax Information |
|
At June 30, 2000, the aggregate cost of investment securities for income tax purposes was $7,931,739,825. Net unrealized appreciation aggregated $1,970,443,922, of which $2,830,722,007 related to appreciated investment securities and $860,278,085 related to depreciated investment securities. |
See accompanying notes which are an integral part of the financial statements.
Equity-Income Portfolio
Statement of Assets and Liabilities
|
|
June 30, 2000 (Unaudited) |
|
|
Assets |
|
|
|
Investment in securities, at value |
|
$ 9,902,183,747 |
|
Cash |
|
80,267 |
|
Receivable for investments sold |
|
46,351,579 |
|
Receivable for fund shares sold |
|
3,306,224 |
|
Dividends receivable |
|
18,707,830 |
|
Interest receivable |
|
3,548,270 |
|
Other receivables |
|
639,455 |
|
Total assets |
|
9,974,817,372 |
|
Liabilities |
|
|
|
Payable for investments purchased |
$ 16,883,268 |
|
|
Payable for fund shares redeemed |
8,328,602 |
|
|
Accrued management fee |
4,071,933 |
|
|
Distribution fees payable |
43,292 |
|
|
Other payables and |
592,368 |
|
|
Collateral on securities loaned, |
1,698,015 |
|
|
Total liabilities |
|
31,617,478 |
|
Net Assets |
|
$ 9,943,199,894 |
|
Net Assets consist of: |
|
|
|
Paid in capital |
|
$ 7,592,710,655 |
|
Undistributed net investment income |
|
94,996,781 |
|
Accumulated undistributed net realized gain (loss) on investments and foreign currency transactions |
|
280,716,353 |
|
Net unrealized appreciation (depreciation) on investments |
|
1,974,776,105 |
|
Net Assets |
|
$ 9,943,199,894 |
|
Initial Class: |
|
$22.91 |
|
Service Class: |
|
$22.86 |
|
Service Class 2: |
|
$22.84 |
Statement of Operations
|
|
Six months ended June 30, 2000 (Unaudited) |
|
|
Investment Income Dividends |
|
$ 114,821,549 |
|
Interest |
|
7,423,512 |
|
Security lending |
|
109,307 |
|
Total income |
|
122,354,368 |
|
Expenses |
|
|
|
Management fee |
$ 24,432,214 |
|
|
Transfer agent fees |
3,355,035 |
|
|
Distribution fees |
226,077 |
|
|
Accounting and security lending fees |
443,177 |
|
|
Non-interested trustees' compensation |
25,855 |
|
|
Custodian fees and expenses |
117,627 |
|
|
Registration fees |
1,500 |
|
|
Audit |
39,228 |
|
|
Legal |
42,473 |
|
|
Interest |
220,630 |
|
|
Miscellaneous |
59,950 |
|
|
Total expenses before reductions |
28,963,766 |
|
|
Expense reductions |
(585,247) |
28,378,519 |
|
Net investment income |
|
93,975,849 |
|
Realized and Unrealized Gain (Loss) Net realized gain (loss) on: |
|
|
|
Investment securities |
290,121,682 |
|
|
Foreign currency transactions |
(169,714) |
289,951,968 |
|
Change in net unrealized appreciation (depreciation) on: |
|
|
|
Investment securities |
(725,820,111) |
|
|
Assets and liabilities in |
(72,517) |
(725,892,628) |
|
Net gain (loss) |
|
(435,940,660) |
|
Net increase (decrease) in net assets resulting from operations |
|
$ (341,964,811) |
|
Other Information Expense reductions |
|
$ 583,627 |
|
Custodian credits |
|
1,620 |
|
|
|
$ 585,247 |
See accompanying notes which are an integral part of the financial statements.
Semiannual Report
Fidelity Variable Insurance Products: Equity-Income Portfolio
Financial Statements - continued
Statement of Changes in Net Assets
|
|
Six months ended June 30, 2000 (Unaudited) |
Year ended
December 31, |
|
Increase (Decrease) in Net Assets |
|
|
|
Operations |
$ 93,975,849 |
$ 185,905,580 |
|
Net realized gain (loss) |
289,951,968 |
697,598,663 |
|
Change in net unrealized appreciation (depreciation) |
(725,892,628) |
(178,860,281) |
|
Net increase (decrease) in net assets resulting from operations |
(341,964,811) |
704,643,962 |
|
Distributions to shareholders |
(185,023,672) |
(170,985,891) |
|
From net realized gain |
(697,715,914) |
(377,968,784) |
|
Total distributions |
(882,739,586) |
(548,954,675) |
|
Share transactions - net increase (decrease) |
(283,718,779) |
(339,122,770) |
|
Total increase (decrease) in net assets |
(1,508,423,176) |
(183,433,483) |
|
Net Assets |
|
|
|
Beginning of period |
11,451,623,070 |
11,635,056,553 |
|
End of period (including undistributed net investment income of $94,996,781 and $185,982,649, respectively) |
$ 9,943,199,894 |
$ 11,451,623,070 |
|
|
||||
|
Other Information: |
||||
|
|
Six months ended June 30, 2000 |
Year ended December 31, 1999 |
||
|
|
Shares |
Dollars |
Shares |
Dollars |
|
Share transactions |
20,194,962 |
$ 468,135,483 |
41,506,315 |
$ 1,076,558,536 |
|
Reinvested |
38,143,294 |
847,544,035 |
22,601,688 |
537,468,103 |
|
Redeemed |
(74,517,854) |
(1,710,461,582) |
(84,630,671) |
(2,163,179,248) |
|
Net increase (decrease) |
(16,179,598) |
$ (394,782,064) |
(20,522,668) |
$ (549,152,609) |
|
Service Class |
4,641,894 |
107,791,908 |
8,201,124 |
211,555,674 |
|
Reinvested |
1,585,963 |
35,176,653 |
483,645 |
11,486,572 |
|
Redeemed |
(1,892,879) |
(43,575,460) |
(507,589) |
(13,012,407) |
|
Net increase (decrease) |
4,334,978 |
$ 99,393,101 |
8,177,180 |
$ 210,029,839 |
|
Service Class 2 A |
523,075 |
$ 11,931,422 |
- |
$ - |
|
Reinvested |
852 |
18,898 |
- |
- |
|
Redeemed |
(11,973) |
(280,136) |
- |
- |
|
Net increase (decrease) |
511,954 |
$ 11,670,184 |
- |
$ - |
|
Distributions |
|
$ 177,777,529 |
|
$ 167,408,106 |
|
Service Class |
|
7,242,252 |
|
3,577,785 |
|
Service Class 2 A |
|
3,891 |
|
- |
|
Total |
|
$ 185,023,672 |
|
$ 170,985,891 |
|
From net realized gain |
|
$ 669,766,506 |
|
$ 370,059,997 |
|
Service Class |
|
27,934,401 |
|
7,908,787 |
|
Service Class 2 A |
|
15,007 |
|
- |
|
Total |
|
$ 697,715,914 |
|
$ 377,968,784 |
|
|
|
$ 882,739,586 |
|
$ 548,954,675 |
A Service Class 2 commenced sale of shares January 12, 2000.
See accompanying notes which are an integral part of the financial statements.
Equity-Income Portfolio
Financial Highlights - Initial Class
|
|
Six months ended |
Years ended December 31, |
||||
|
Selected Per-Share Data |
(Unaudited) |
1999 |
1998 |
1997 |
1996 |
1995 |
|
Net asset value, beginning of period |
$ 25.71 |
$ 25.42 |
$ 24.28 |
$ 21.03 |
$ 19.27 |
$ 15.35 |
|
Income from Investment Operations |
|
|
|
|
|
|
|
Net investment income |
.21 D |
.41 D |
.38 D |
.36 D |
.35 |
.41 |
|
Net realized and unrealized gain (loss) |
(.96) |
1.10 |
2.31 |
5.06 |
2.30 |
4.69 |
|
Total from investment operations |
(.75) |
1.51 |
2.69 |
5.42 |
2.65 |
5.10 |
|
Less Distributions |
|
|
|
|
|
|
|
From net investment income |
(.43) |
(.38) |
(.34) |
(.36) |
(.03) |
(.40) |
|
From net realized gain |
(1.62) |
(.84) |
(1.21) |
(1.81) |
(.86) |
(.78) |
|
Total distributions |
(2.05) |
(1.22) |
(1.55) |
(2.17) |
(.89) |
(1.18) |
|
Net asset value, end of period |
$ 22.91 |
$ 25.71 |
$ 25.42 |
$ 24.28 |
$ 21.03 |
$ 19.27 |
|
Total Return B, C |
(2.67)% |
6.33% |
11.63% |
28.11% |
14.28% |
35.09% |
|
Ratios and Supplemental Data |
|
|
|
|
|
|
|
Net assets, end of period (000 omitted) |
$ 9,442,871 |
$ 11,014,291 |
$ 11,409,912 |
$ 10,106,742 |
$ 6,961,090 |
$ 4,879,435 |
|
Ratio of expenses to average net assets |
.56% A |
.57% |
.58% |
.58% |
.58% |
.61% |
|
Ratio of expenses to average net assets after |
.55% A, F |
.56% F |
.57% F |
.57% F |
.56% F |
.61% |
|
Ratio of net investment income to average net assets |
1.83% A |
1.57% |
1.58% |
1.65% |
1.97% |
2.56% |
|
Portfolio turnover |
19% A |
27% |
28% |
44% |
186% |
87% |
Financial Highlights - Service Class
|
|
Six months ended |
Years ended December 31, |
||
|
Selected Per-Share Data |
(Unaudited) |
1999 |
1998 |
1997 E |
|
Net asset value, beginning of period |
$ 25.66 |
$ 25.39 |
$ 24.27 |
$ 23.44 |
|
Income from Investment Operations |
|
|
|
|
|
Net investment income D |
.20 |
.38 |
.36 |
.05 |
|
Net realized and unrealized gain (loss) |
(.96) |
1.11 |
2.31 |
.78 |
|
Total from investment operations |
(.76) |
1.49 |
2.67 |
.83 |
|
Less Distributions |
|
|
|
|
|
From net investment income |
(.42) |
(.38) |
(.34) |
- |
|
From net realized gain |
(1.62) |
(.84) |
(1.21) |
- |
|
Total distributions |
(2.04) |
(1.22) |
(1.55) |
- |
|
Net asset value, end of period |
$ 22.86 |
$ 25.66 |
$ 25.39 |
$ 24.27 |
|
Total Return B, C |
(2.72)% |
6.25% |
11.54% |
3.54% |
|
Ratios and Supplemental Data |
|
|
|
|
|
Net assets, end of period (000 omitted) |
$ 488,635 |
$ 437,332 |
$ 225,145 |
$ 5,328 |
|
Ratio of expenses to average net assets |
.66% A |
.67% |
.68% |
.68% A |
|
Ratio of expenses to average net assets after expense reductions |
.65% A, F |
.66% F |
.67% F |
.65% A, F |
|
Ratio of net investment income to average net assets |
1.73% A |
1.47% |
1.51% |
1.63% A |
|
Portfolio turnover |
19% A |
27% |
28% |
44% |
|
A Annualized B Total returns for periods of less than one year are not annualized and do not reflect charges attributable to your insurance company's separate account. Inclusion of these charges would reduce the total returns shown. C The total returns would have been lower had certain expenses not been reduced during the periods shown. D Net investment income per share has been calculated based on average shares outstanding during the period. E For the period November 3, 1997 (commencement of sale of Service Class shares) to December 31, 1997. F FMR or the fund has entered into varying arrangements with third parties who either paid or reduced a portion of the class' expenses. |
||||
See accompanying notes which are an integral part of the financial statements.
Semiannual Report
Financial Highlights - Service Class 2
|
|
Six months ended |
|
Selected Per-Share Data |
(Unaudited) |
|
Net asset value, beginning of period |
$ 25.18 |
|
Income from Investment Operations |
|
|
Net investment income D |
.17 |
|
Net realized and unrealized gain (loss) |
(.47) |
|
Total from investment operations |
(.30) |
|
Less Distributions |
|
|
From net investment income |
(.42) |
|
From net realized gain |
(1.62) |
|
Total distributions |
(2.04) |
|
Net asset value, end of period |
$ 22.84 |
|
Total Return B, C |
(0.95)% |
|
Ratios and Supplemental Data |
|
|
Net assets, end of period (000 omitted) |
$ 11,694 |
|
Ratio of expenses to average net assets |
.82% A |
|
Ratio of expenses to average net assets after expense reductions |
.80% A, F |
|
Ratio of net investment income to average net assets |
1.58% A |
|
Portfolio turnover |
19% A |
|
A Annualized B Total returns for periods of less than one year are not annualized and do not reflect charges attributable to your insurance company's separate account. Inclusion of these charges would reduce the total returns shown. C The total return would have been lower had certain expenses not been reduced during the period shown. D Net investment income per share has been calculated based on average shares outstanding during the period. E For the period January 12, 2000 (commencement of sale of Service Class 2 shares) to June 30, 2000. F FMR or the fund has entered into varying arrangements with third parties who either paid or reduced a portion of the class' expenses. |
|
See accompanying notes which are an integral part of the financial statements.
Equity-Income Portfolio
Performance
There are several ways to evaluate a fund's historical performance. You can look at the total percentage change in value, the average annual percentage change or the growth of a hypothetical $10,000 investment. Total return reflects the change in the value of an investment, assuming reinvestment of the fund's dividend income and capital gains (the profits earned upon the sale of securities that have grown in value). If Fidelity had not reimbursed certain fund expenses, the past five years and life of fund total returns would have been lower.
Average Annual Total Returns
|
Periods ended |
Past 1 |
Past 5 |
Life of |
|
Fidelity® VIP: Balanced - |
-0.43% |
11.87% |
12.20% |
|
Fidelity Balanced 60/40 Composite |
6.44% |
16.78% |
18.45% |
|
S&P 500 ® |
7.25% |
23.80% |
25.60% |
|
LB Aggregate Bond |
4.57% |
6.25% |
7.81% |
Average annual total returns take the fund's cumulative return and show what would have happened if the fund had performed at a constant rate each year.
You can compare the fund's returns to the performance of the Fidelity Balanced 60/40 Composite Index - a hypothetical combination of unmanaged indices using a weighting of 60% equity and 40% bond. The composite index combines the total returns of the Standard & Poor's 500 Index and the Lehman Brothers Aggregate Bond Index.
Figures for more than one year assume a steady compounded rate of return and are not the fund's year-by-year results, which fluctuated over the periods shown. The life of fund figures are from commencement of operations, January 3, 1995.
Performance numbers are net of all fund operating expenses, but do not include any insurance charges imposed by your insurance company's separate account. If performance information included the effect of these additional charges, the total returns would have been lower.
Past performance is no guarantee of future results. Principal and investment return will vary and you may have a gain or loss when you withdraw your money.
Understanding Performance
How a fund did yesterday is no guarantee of how it will do tomorrow. The stock market, for example, has a history of long-term growth and short-term volatility. In turn, the share price and return of a fund that invests in stocks will vary. That means if you sell your shares during a market downturn, you might lose money. But if you can ride out the market's ups and downs, you may have a gain.
3$10,000 Over Life of Fund
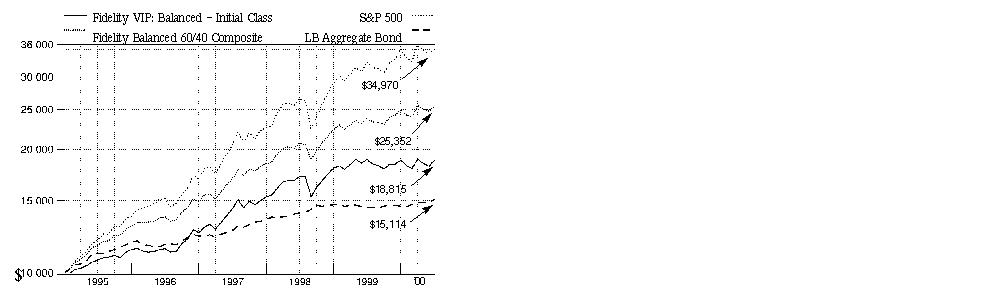
$10,000 Over Life of Fund: Let's say hypothetically that $10,000 was invested in Fidelity® Variable Insurance Products: Balanced Portfolio - Initial Class on January 3, 1995, when the fund started. As the chart shows, by June 30, 2000, the value of the investment would have grown to $18,815 - an 88.15% increase on the initial investment. For comparison, look at how both the Standard & Poor's 500 Index, a market capitalization-weighted index of common stocks, and the Lehman Brothers Aggregate Bond Index, a market value-weighted index of investment-grade fixed-rate debt issues, including government, corporate, asset-backed, and mortgage-backed securities, with maturities of one year or more, did over the same period. With dividends and capital gains, if any, reinvested, the same $10,000 investment in the Standard & Poor's 500 Index would have grown to $34,970 - a 249.70% increase. If $10,000 was invested in the Lehman Brothers Aggregate Bond Index, it would have grown to $15,114 - a 51.14% increase. You can also look at how the Fidelity Balanced 60/40 Composite Index did over the same period. With dividends and interest, if any, reinvested, the same $10,000 would have grown to $25,352 - a 153.52% increase.
Investment Summary
|
Top Five Stocks as of June 30, 2000 |
|
|
|
% of fund's |
|
General Electric Co. |
3.6 |
|
Cisco Systems, Inc. |
2.3 |
|
Intel Corp. |
1.7 |
|
Exxon Mobil Corp. |
1.4 |
|
Pfizer, Inc. |
1.3 |
|
|
10.3 |
|
Top Five Market Sectors as of June 30, 2000 |
|
|
|
% of fund's |
|
Technology |
20.0 |
|
Finance |
10.4 |
|
Utilities |
9.2 |
|
Media & Leisure |
7.8 |
|
Health |
6.4 |
|
Asset Allocation as of June 30, 2000 |
|||
|
% of fund's net assets * |
|||
|
Stocks 57.2% |
|
|
|
Bonds 40.7% |
|
|
|
Short-Term Investments |
|
|

|
* Foreign investments 6.4% |
Semiannual Report
(portfolio manager photographs)
An interview with John Avery (right), Lead Portfolio Manager of Balanced Portfolio, and Kevin Grant, manager for fixed-income investments
Q. How did the fund perform, John?
J.A. For the six- and 12-month periods that ended June 30, 2000, the fund underperformed the Fidelity Balanced 60/40 Composite Index, which returned 1.45% and 6.44%, respectively, during these time frames.
Q. Why did the fund trail its benchmark during the
six-month period?
J.A. Having an average underweighting in technology hurt during the sector's impressive run-up early in the period. The fund's underexposure to tech was double trouble in the sense that most other areas of the market in which the fund was invested had a difficult period. So, even though the technology group corrected sharply in the spring - as the market turned elsewhere for growth - it was up so much in the first half that, for all intents and purposes, our fate was sealed.
Q. What were some of your strategies and how did they influence performance?
J.A. I maintained an emphasis on equities during the market's upturn, adding convertible securities in lieu of pure stocks. I used convertibles as an indirect, less volatile way to participate in some of the growth stories I liked within the technology sector. This strategy helped provide some nice yield and afforded us the added benefit of downside protection, as convertible securities gave back less than their pure stock equivalents during the correction. When things started to fall apart for tech, I took advantage of the opportunity to increase the fund's concentration in large, high-quality companies, many of which had dropped sharply from their highs of the period. However, the fund was hurt for not owning enough of the period's top performers along the way, namely Oracle and Intel. On a more positive note, the fund's healthy exposure to large drug companies such as Warner-Lambert and Eli Lilly helped, as the group rallied behind renewed enthusiasm for strong new product pipelines. Warner-Lambert merged with Pfizer - another fund holding - just prior to the close of the period. The fund's lack of exposure to a generally weak consumer nondurables sector, and some good picks in media stocks such as Viacom, further aided relative performance.
Q. What other stocks performed well for the fund? Which disappointed?
J.A. A number of the fund's financial holdings performed well - most notably Bank of New York and Morgan Stanley Dean Witter - benefiting from strong capital markets activity. Tech stocks we did own, including Texas Instruments, EMC and Micron Technology, also added meaningfully to performance. Conversely, those that weren't so hot included Motorola, Alltel and Lucent. Motorola was, by far, the fund's worst performer, slipping on execution problems and narrowing margins in its cellular handset business. Traditional telecommunications providers AT&T and WorldCom fell prey to increased competition and falling prices.
Q. Turning to you, Kevin, how did the fund's bond investments fare?
K.G. The investment-grade portion of the fund performed well during the six-month period, benefiting from its exposure to a strong rally in the government market. An announcement by the U.S. Treasury in January of its intent to repurchase long-term debt and reduce future issuance sent the price of the long bond higher and its yield lower. This action, coupled with rising short-term interest rates, induced an inverted yield curve, which occurs when short-term issues provide a higher yield than their longer-term counterparts. This inversion hurt the spread sectors - most notably corporate bonds and mortgage securities - with yield spreads widening out significantly relative to comparable duration Treasuries. The fund was well-positioned for these changes, as we responded to the buybacks by reducing our exposure to long-term corporates in exchange for more Treasuries, which worked out beautifully. This strategy helped the fund's bond subportfolio outperform the Lehman Brothers Aggregate Bond Index during the period. So, despite the Federal Reserve Board's efforts to raise rates during the period, the supply/demand imbalance spurred by the Treasury buybacks helped ensure our success.
Q. John, what's your outlook?
J.A. I'm bullish overall, as business remains strong in many areas of the economy, although I temper that enthusiasm with concern about interest rates rising further. In this uncertain environment, I believe the market will begin to focus more on revenues and earnings. As such, the companies capable of delivering robust top-line growth and strong bottom-line earnings should be the ones to reap the rewards. Given the extent to which technology and the Internet have transformed the global landscape, I expect we'll see strong performance from this sector going forward.
The views expressed in this report reflect those of the portfolio managers only through the end of the period of the report as stated on the cover. The managers' views are subject to change at any time based on market or other conditions. For more information, see page 2.
Fund Facts
Goal: seeks income and capital growth consistent with reasonable risk by investing in a diversified portfolio of stocks and bonds
Start date: January 3, 1995
Size: as of June 30, 2000, more than $304 million
Manager: John Avery, since 1998, and
Kevin Grant, since 1996; John Avery joined
Fidelity in 1995; Kevin Grant joined Fidelity in 1993
Semiannual Report
Fidelity Variable Insurance Products: Balanced Portfolio
(Unaudited)
Showing Percentage of Net Assets
|
Common Stocks - 56.8% |
|||
|
Shares |
Value (Note 1) |
||
|
AEROSPACE & DEFENSE - 0.4% |
|||
|
Aerospace & Defense - 0.2% |
|||
|
Boeing Co. |
13,700 |
$ 572,831 |
|
|
Textron, Inc. |
4,200 |
228,113 |
|
|
|
800,944 |
||
|
Ship Building & Repair - 0.2% |
|||
|
General Dynamics Corp. |
9,700 |
506,825 |
|
|
TOTAL AEROSPACE & DEFENSE |
1,307,769 |
||
|
BASIC INDUSTRIES - 0.5% |
|||
|
Chemicals & Plastics - 0.4% |
|||
|
E.I. du Pont de Nemours and Co. |
14,104 |
617,050 |
|
|
Praxair, Inc. |
16,100 |
602,744 |
|
|
|
1,219,794 |
||
|
Metals & Mining - 0.1% |
|||
|
Alcoa, Inc. |
13,000 |
377,000 |
|
|
TOTAL BASIC INDUSTRIES |
1,596,794 |
||
|
DURABLES - 0.3% |
|||
|
Autos, Tires, & Accessories - 0.2% |
|||
|
AutoNation, Inc. |
3,700 |
26,131 |
|
|
Danaher Corp. |
9,600 |
474,600 |
|
|
|
500,731 |
||
|
Consumer Electronics - 0.1% |
|||
|
General Motors Corp. Class H (a) |
5,400 |
473,850 |
|
|
TOTAL DURABLES |
974,581 |
||
|
ENERGY - 3.7% |
|||
|
Energy Services - 0.8% |
|||
|
Diamond Offshore Drilling, Inc. |
15,200 |
533,900 |
|
|
Halliburton Co. |
12,900 |
608,719 |
|
|
Nabors Industries, Inc. (a) |
16,800 |
698,250 |
|
|
Schlumberger Ltd. (NY Shares) |
9,000 |
671,625 |
|
|
|
2,512,494 |
||
|
Oil & Gas - 2.9% |
|||
|
BP Amoco PLC |
63,962 |
602,975 |
|
|
Burlington Resources, Inc. |
15,000 |
573,750 |
|
|
Chevron Corp. |
10,000 |
848,125 |
|
|
Conoco, Inc. Class B |
50,800 |
1,247,775 |
|
|
Exxon Mobil Corp. |
53,366 |
4,189,231 |
|
|
Royal Dutch Petroleum Co. (NY Shares) |
21,400 |
1,317,438 |
|
|
|
8,779,294 |
||
|
TOTAL ENERGY |
11,291,788 |
||
|
FINANCE - 7.4% |
|||
|
Banks - 1.0% |
|||
|
Bank of America Corp. |
15,100 |
649,300 |
|
|
|
|||
|
Shares |
Value (Note 1) |
||
|
Bank of New York Co., Inc. |
41,700 |
$ 1,939,050 |
|
|
Chase Manhattan Corp. |
10,500 |
483,656 |
|
|
|
3,072,006 |
||
|
Credit & Other Finance - 2.3% |
|||
|
American Express Co. |
70,900 |
3,695,663 |
|
|
Citigroup, Inc. |
56,325 |
3,393,581 |
|
|
|
7,089,244 |
||
|
Federal Sponsored Credit - 1.2% |
|||
|
Fannie Mae |
32,400 |
1,690,875 |
|
|
Freddie Mac |
45,300 |
1,834,650 |
|
|
|
3,525,525 |
||
|
Insurance - 1.5% |
|||
|
AFLAC, Inc. |
9,300 |
427,219 |
|
|
American International Group, Inc. |
30,300 |
3,560,250 |
|
|
Hartford Financial Services Group, Inc. |
8,400 |
469,875 |
|
|
|
4,457,344 |
||
|
Securities Industry - 1.4% |
|||
|
Charles Schwab Corp. |
25,150 |
845,669 |
|
|
Merrill Lynch & Co., Inc. |
7,500 |
862,500 |
|
|
Morgan Stanley Dean Witter & Co. |
31,900 |
2,655,675 |
|
|
|
4,363,844 |
||
|
TOTAL FINANCE |
22,507,963 |
||
|
HEALTH - 5.9% |
|||
|
Drugs & Pharmaceuticals - 5.6% |
|||
|
American Home Products Corp. |
15,900 |
934,125 |
|
|
Amgen, Inc. |
11,600 |
814,900 |
|
|
Bristol-Myers Squibb Co. |
48,200 |
2,807,650 |
|
|
Eli Lilly & Co. |
39,000 |
3,895,125 |
|
|
Merck & Co., Inc. |
11,300 |
865,863 |
|
|
Pfizer, Inc. |
84,700 |
4,065,600 |
|
|
Schering-Plough Corp. |
72,400 |
3,656,200 |
|
|
|
17,039,463 |
||
|
Medical Equipment & Supplies - 0.3% |
|||
|
Johnson & Johnson |
4,600 |
468,625 |
|
|
Medtronic, Inc. |
10,000 |
498,125 |
|
|
|
966,750 |
||
|
TOTAL HEALTH |
18,006,213 |
||
|
INDUSTRIAL MACHINERY & EQUIPMENT - 4.4% |
|||
|
Electrical Equipment - 3.6% |
|||
|
General Electric Co. |
206,400 |
10,939,184 |
|
|
Industrial Machinery & Equipment - 0.8% |
|||
|
Tyco International Ltd. |
53,870 |
2,552,091 |
|
|
TOTAL INDUSTRIAL MACHINERY & EQUIPMENT |
13,491,275 |
||
|
Common Stocks - continued |
|||
|
Shares |
Value (Note 1) |
||
|
MEDIA & LEISURE - 4.3% |
|||
|
Broadcasting - 1.6% |
|||
|
AT&T Corp. - Liberty Media Group |
44,000 |
$ 1,067,000 |
|
|
Cable Satisfaction International, Inc. warrants 3/1/10 (a) |
200 |
540 |
|
|
Clear Channel Communications, Inc. (a) |
15,400 |
1,155,000 |
|
|
Infinity Broadcasting Corp. Class A (a) |
29,600 |
1,078,550 |
|
|
NTL, Inc. warrants 10/14/08 (a) |
199 |
8,159 |
|
|
Time Warner, Inc. |
20,208 |
1,535,808 |
|
|
UIH Australia/Pacific, Inc. warrants 5/15/06 (a) |
150 |
4,500 |
|
|
|
4,849,557 |
||
|
Entertainment - 1.8% |
|||
|
MGM Grand, Inc. |
12,500 |
401,563 |
|
|
Viacom, Inc. Class B (non-vtg.) (a) |
56,389 |
3,845,025 |
|
|
Walt Disney Co. |
29,100 |
1,129,444 |
|
|
|
5,376,032 |
||
|
Publishing - 0.7% |
|||
|
McGraw-Hill Companies, Inc. |
42,100 |
2,273,400 |
|
|
Restaurants - 0.2% |
|||
|
McDonald's Corp. |
20,500 |
675,219 |
|
|
TOTAL MEDIA & LEISURE |
13,174,208 |
||
|
NONDURABLES - 1.6% |
|||
|
Beverages - 0.9% |
|||
|
Anheuser-Busch Companies, Inc. |
16,700 |
1,247,281 |
|
|
Seagram Co. Ltd. |
6,100 |
358,460 |
|
|
The Coca-Cola Co. |
19,300 |
1,108,544 |
|
|
|
2,714,285 |
||
|
Household Products - 0.5% |
|||
|
Clorox Co. |
14,700 |
658,744 |
|
|
Colgate-Palmolive Co. |
12,100 |
724,488 |
|
|
|
1,383,232 |
||
|
Tobacco - 0.2% |
|||
|
Philip Morris Companies, Inc. |
22,400 |
595,000 |
|
|
TOTAL NONDURABLES |
4,692,517 |
||
|
RETAIL & WHOLESALE - 2.9% |
|||
|
Apparel Stores - 0.2% |
|||
|
Mothers Work, Inc. (a)(k) |
3 |
34 |
|
|
The Limited, Inc. |
26,800 |
579,550 |
|
|
|
579,584 |
||
|
General Merchandise Stores - 1.6% |
|||
|
Kohls Corp. (a) |
9,300 |
517,313 |
|
|
Target Corp. |
21,400 |
1,241,200 |
|
|
Wal-Mart Stores, Inc. |
54,900 |
3,163,613 |
|
|
|
4,922,126 |
||
|
Retail & Wholesale, Miscellaneous - 1.1% |
|||
|
Best Buy Co., Inc. (a) |
800 |
50,600 |
|
|
|
|||
|
Shares |
Value (Note 1) |
||
|
Home Depot, Inc. |
53,550 |
$ 2,674,153 |
|
|
Lowe's Companies, Inc. |
11,100 |
455,794 |
|
|
|
3,180,547 |
||
|
TOTAL RETAIL & WHOLESALE |
8,682,257 |
||
|
SERVICES - 0.7% |
|||
|
Advertising - 0.5% |
|||
|
Omnicom Group, Inc. |
17,200 |
1,531,875 |
|
|
Services - 0.2% |
|||
|
Ecolab, Inc. |
18,100 |
707,031 |
|
|
TOTAL SERVICES |
2,238,906 |
||
|
TECHNOLOGY - 19.0% |
|||
|
Communications Equipment - 5.3% |
|||
|
Cisco Systems, Inc. (a) |
111,000 |
7,055,438 |
|
|
Comverse Technology, Inc. (a) |
8,100 |
753,300 |
|
|
Corning, Inc. |
4,000 |
1,079,500 |
|
|
Lucent Technologies, Inc. |
30,200 |
1,789,350 |
|
|
Nokia AB sponsored ADR |
34,200 |
1,707,863 |
|
|
Nortel Networks Corp. |
53,100 |
3,683,465 |
|
|
|
16,068,916 |
||
|
Computer Services & Software - 3.4% |
|||
|
America Online, Inc. (a) |
25,950 |
1,368,863 |
|
|
BEA Systems, Inc. (a) |
14,100 |
697,069 |
|
|
DecisionOne Corp. |
583 |
6 |
|
|
DecisionOne Corp.: |
|
|
|
|
Class A warrants 4/18/07 (a) |
342 |
0 |
|
|
Class B warrants 4/18/07 (a) |
590 |
0 |
|
|
Class C warrants 4/18/07 (a) |
350 |
0 |
|
|
Inktomi Corp. (a) |
3,400 |
402,050 |
|
|
Microsoft Corp. (a) |
40,400 |
3,232,000 |
|
|
Oracle Corp. (a) |
38,700 |
3,253,219 |
|
|
VeriSign, Inc. (a) |
4,392 |
775,188 |
|
|
Yahoo!, Inc. (a) |
6,200 |
768,025 |
|
|
|
10,496,420 |
||
|
Computers & Office Equipment - 4.5% |
|||
|
Compaq Computer Corp. |
33,600 |
858,900 |
|
|
Dell Computer Corp. (a) |
42,700 |
2,105,644 |
|
|
EMC Corp. (a) |
50,100 |
3,854,569 |
|
|
Hewlett-Packard Co. |
8,400 |
1,048,950 |
|
|
International Business Machines Corp. |
24,000 |
2,629,500 |
|
|
Network Appliance, Inc. (a) |
8,300 |
668,150 |
|
|
Pitney Bowes, Inc. |
11,000 |
440,000 |
|
|
Sun Microsystems, Inc. (a) |
22,800 |
2,073,375 |
|
|
|
13,679,088 |
||
|
Electronic Instruments - 0.5% |
|||
|
Applied Materials, Inc. (a) |
10,400 |
942,500 |
|
|
KLA-Tencor Corp. (a) |
8,400 |
491,925 |
|
|
|
1,434,425 |
||
|
Common Stocks - continued |
|||
|
Shares |
Value (Note 1) |
||
|
TECHNOLOGY - continued |
|||
|
Electronics - 5.3% |
|||
|
Analog Devices, Inc. (a) |
12,900 |
$ 980,400 |
|
|
Broadcom Corp. Class A (a) |
4,200 |
919,538 |
|
|
Flextronics International Ltd. (a) |
6,500 |
446,469 |
|
|
Insilco Corp. warrants 8/15/07 (a) |
60 |
0 |
|
|
Intel Corp. |
39,300 |
5,253,919 |
|
|
JDS Uniphase Corp. (a) |
12,200 |
1,462,475 |
|
|
Micron Technology, Inc. (a) |
20,400 |
1,796,475 |
|
|
Motorola, Inc. |
32,900 |
956,156 |
|
|
Sanmina Corp. (a) |
7,900 |
675,450 |
|
|
Texas Instruments, Inc. |
55,100 |
3,784,681 |
|
|
|
16,275,563 |
||
|
TOTAL TECHNOLOGY |
57,954,412 |
||
|
UTILITIES - 5.7% |
|||
|
Cellular - 2.5% |
|||
|
China Telecom (Hong Kong) Ltd. (a) |
90,000 |
800,156 |
|
|
Leap Wireless International, Inc.: |
|
|
|
|
warrants 4/15/10 (a)(g) |
75 |
0 |
|
|
warrants 4/15/10 (a) |
65 |
0 |
|
|
Loral Orion Network Systems, Inc.: |
|
|
|
|
warrants 1/15/07 (CV ratio .47) (a) |
290 |
725 |
|
|
warrants 1/15/07 (CV ratio .6) (a) |
50 |
213 |
|
|
McCaw International Ltd. warrants 4/16/07 (a)(g) |
290 |
725 |
|
|
Nextel Communications, Inc. Class A (a) |
23,400 |
1,431,788 |
|
|
Sprint Corp. - PCS Group Series 1 (a) |
35,100 |
2,088,450 |
|
|
Vodafone AirTouch PLC sponsored ADR |
37,800 |
1,566,338 |
|
|
VoiceStream Wireless Corp. (a) |
14,700 |
1,709,564 |
|
|
|
7,597,959 |
||
|
Electric Utility - 0.3% |
|||
|
AES Corp. (a) |
21,800 |
994,625 |
|
|
Gas - 0.5% |
|||
|
Dynegy, Inc. Class A |
11,600 |
792,425 |
|
|
Enron Corp. |
9,200 |
593,400 |
|
|
|
1,385,825 |
||
|
Telephone Services - 2.4% |
|||
|
Allegiance Telecom, Inc. (a) |
6,900 |
441,600 |
|
|
AT&T Corp. |
16,604 |
525,102 |
|
|
BellSouth Corp. |
32,000 |
1,364,000 |
|
|
KMC Telecom Holdings, Inc. warrants 4/15/08 (a)(g) |
70 |
175 |
|
|
Level 3 Communications, Inc. (a) |
5,400 |
475,200 |
|
|
McLeodUSA, Inc. Class A (a) |
37,600 |
777,850 |
|
|
Ono Finance PLC rights 5/31/09 (a)(g) |
210 |
2,100 |
|
|
Qwest Communications |
13,600 |
675,750 |
|
|
SBC Communications, Inc. |
37,170 |
1,607,603 |
|
|
|
|||
|
Shares |
Value (Note 1) |
||
|
Sprint Corp. - FON Group |
12,300 |
$ 627,300 |
|
|
WorldCom, Inc. (a) |
19,489 |
894,058 |
|
|
|
7,390,738 |
||
|
TOTAL UTILITIES |
17,369,147 |
||
|
TOTAL COMMON STOCKS (Cost $133,038,091) |
173,287,830 |
||
|
Preferred Stocks - 0.4% |
|||
|
|
|
|
|
|
Convertible Preferred Stocks - 0.2% |
|||
|
MEDIA & LEISURE - 0.2% |
|||
|
Broadcasting - 0.2% |
|||
|
MediaOne Group, Inc. |
4,700 |
423,000 |
|
|
Nonconvertible Preferred Stocks - 0.2% |
|||
|
ENERGY - 0.0% |
|||
|
Energy Services - 0.0% |
|||
|
R&B Falcon Corp. 13.875% |
113 |
128,255 |
|
|
FINANCE - 0.0% |
|||
|
Insurance - 0.0% |
|||
|
American Annuity Group Capital |
50 |
44,513 |
|
|
HEALTH - 0.1% |
|||
|
Medical Facilities Management - 0.1% |
|||
|
Fresenius Medical Care Capital |
190 |
173,333 |
|
|
MEDIA & LEISURE - 0.1% |
|||
|
Broadcasting - 0.1% |
|||
|
CSC Holdings, Inc. 11.125% pay-in-kind |
2,136 |
223,212 |
|
|
Publishing - 0.0% |
|||
|
PRIMEDIA, Inc. Series D, $10.00 |
600 |
55,500 |
|
|
TOTAL MEDIA & LEISURE |
278,712 |
||
|
TOTAL NONCONVERTIBLE PREFERRED STOCKS |
624,813 |
||
|
TOTAL PREFERRED STOCKS (Cost $970,382) |
1,047,813 |
||
|
Corporate Bonds - 15.2% |
|||||
|
Moody's Ratings (unaudited) (b) |
Principal Amount |
|
|||
|
Convertible Bonds - 1.1% |
|||||
|
HEALTH - 0.4% |
|||||
|
Drugs & Pharmaceuticals - 0.4% |
|||||
|
Roche Holdings, Inc. |
- |
|
$ 1,261,000 |
1,153,815 |
|
|
Corporate Bonds - continued |
|||||
|
Moody's Ratings (unaudited) (b) |
Principal Amount |
Value |
|||
|
Convertible Bonds - continued |
|||||
|
MEDIA & LEISURE - 0.2% |
|||||
|
Broadcasting - 0.2% |
|||||
|
Liberty Media Corp. |
Baa3 |
|
$ 481,000 |
$ 521,885 |
|
|
TECHNOLOGY - 0.4% |
|||||
|
Computers & Office Equipment - 0.4% |
|||||
|
Juniper Networks, Inc. 4.75% 3/15/07 |
B- |
|
1,220,000 |
1,349,625 |
|
|
UTILITIES - 0.1% |
|||||
|
Cellular - 0.1% |
|||||
|
Nextel Communications, Inc. 5.25% 1/15/10 (g) |
B1 |
|
308,000 |
318,780 |
|
|
Telephone Services - 0.0% |
|||||
|
Level 3 Communications, Inc. 6% 3/15/10 |
Caa1 |
|
203,000 |
183,842 |
|
|
TOTAL UTILITIES |
502,622 |
||||
|
TOTAL CONVERTIBLE BONDS |
3,527,947 |
||||
|
Nonconvertible Bonds - 14.1% |
|||||
|
AEROSPACE & DEFENSE - 0.1% |
|||||
|
Defense Electronics - 0.1% |
|||||
|
Raytheon Co. |
Baa2 |
|
240,000 |
240,662 |
|
|
BASIC INDUSTRIES - 0.4% |
|||||
|
Chemicals & Plastics - 0.2% |
|||||
|
Huntsman Corp. |
B2 |
|
370,000 |
337,625 |
|
|
Lyondell Chemical Co. 10.875% 5/1/09 |
B2 |
|
340,000 |
337,450 |
|
|
|
675,075 |
||||
|
Metals & Mining - 0.0% |
|||||
|
Kaiser Aluminum & Chemical Corp. |
B3 |
|
160,000 |
145,600 |
|
|
Packaging & Containers - 0.1% |
|||||
|
Gaylord Container Corp. 9.75% 6/15/07 |
Caa1 |
|
210,000 |
163,800 |
|
|
Paper & Forest Products - 0.1% |
|||||
|
APP China Group Ltd. |
B3 |
|
150,000 |
94,500 |
|
|
|
|||||
|
Moody's Ratings (unaudited) (b) |
Principal Amount |
Value |
|||
|
Fort James Corp. |
Baa2 |
|
$ 45,000 |
$ 43,274 |
|
|
Repap New Brunswick, Inc. yankee 10.625% 4/15/05 |
Caa1 |
|
230,000 |
202,400 |
|
|
|
340,174 |
||||
|
TOTAL BASIC INDUSTRIES |
1,324,649 |
||||
|
CONSTRUCTION & REAL ESTATE - 1.1% |
|||||
|
Building Materials - 0.1% |
|||||
|
Dayton Superior Corp. |
B3 |
|
160,000 |
158,400 |
|
|
Construction - 0.0% |
|||||
|
Lennar Corp. |
Ba1 |
|
25,000 |
24,625 |
|
|
Real Estate - 0.2% |
|||||
|
Duke Realty LP |
Baa1 |
|
500,000 |
491,350 |
|
|
LNR Property Corp. |
B1 |
|
160,000 |
139,200 |
|
|
|
630,550 |
||||
|
Real Estate Investment Trusts - 0.8% |
|||||
|
CenterPoint Properties Trust 6.75% 4/1/05 |
Baa2 |
|
100,000 |
93,160 |
|
|
Equity Office |
|
|
|
|
|
|
6.5% 1/15/04 |
Baa1 |
|
1,000,000 |
954,410 |
|
|
6.625% 2/15/05 |
Baa1 |
|
200,000 |
188,948 |
|
|
6.75% 2/15/08 |
Baa1 |
|
100,000 |
91,609 |
|
|
Ocwen Asset Investment Corp. 11.5% 7/1/05 |
- |
|
120,000 |
92,400 |
|
|
ProLogis Trust |
Baa1 |
|
70,000 |
66,675 |
|
|
Spieker Properties LP: |
|
|
|
|
|
|
6.8% 5/1/04 |
Baa2 |
|
90,000 |
86,265 |
|
|
6.875% 2/1/05 |
Baa2 |
|
1,000,000 |
956,150 |
|
|
|
2,529,617 |
||||
|
TOTAL CONSTRUCTION & REAL ESTATE |
3,343,192 |
||||
|
ENERGY - 0.6% |
|||||
|
Coal - 0.0% |
|||||
|
P&L Coal Holdings Corp. 9.625% 5/15/08 |
B2 |
|
135,000 |
125,213 |
|
|
Energy Services - 0.0% |
|||||
|
R&B Falcon Corp. |
Ba3 |
|
100,000 |
109,000 |
|
|
Oil & Gas - 0.6% |
|||||
|
Anadarko Petroleum Corp. 7.2% 3/15/29 |
Baa1 |
|
385,000 |
351,209 |
|
|
Apache Corp.: |
|
|
|
|
|
|
7.625% 7/1/19 |
Baa1 |
|
155,000 |
149,662 |
|
|
7.7% 3/15/26 |
Baa1 |
|
65,000 |
62,636 |
|
|
Corporate Bonds - continued |
|||||
|
Moody's Ratings (unaudited) (b) |
Principal Amount |
Value |
|||
|
Nonconvertible Bonds - continued |
|||||
|
ENERGY - continued |
|||||
|
Oil & Gas - continued |
|||||
|
Apache Finance Property Ltd. 6.5% 12/15/07 |
Baa1 |
|
$ 100,000 |
$ 90,750 |
|
|
Chesapeake Energy Corp. 9.625% 5/1/05 |
B2 |
|
250,000 |
243,750 |
|
|
Conoco, Inc. |
A3 |
|
125,000 |
119,300 |
|
|
Ocean Energy, Inc. |
Ba1 |
|
190,000 |
179,550 |
|
|
Phillips Petroleum Co. 6.375% 3/30/09 |
Baa2 |
|
250,000 |
225,868 |
|
|
Plains Resources, Inc. Series B 10.25% 3/15/06 |
B2 |
|
200,000 |
198,000 |
|
|
YPF Sociedad Anonima |
B1 |
|
50,000 |
49,050 |
|
|
|
1,669,775 |
||||
|
TOTAL ENERGY |
1,903,988 |
||||
|
FINANCE - 3.0% |
|||||
|
Banks - 1.1% |
|||||
|
ABN-Amro Bank NV, Chicago 6.625% 10/31/01 |
A1 |
|
500,000 |
494,055 |
|
|
Bank of Tokyo-Mitsubishi Ltd. 8.4% 4/15/10 |
A3 |
|
200,000 |
201,960 |
|
|
BankBoston Corp. |
A3 |
|
200,000 |
192,736 |
|
|
Barclays Bank PLC yankee 5.95% 7/15/01 |
A1 |
|
350,000 |
347,501 |
|
|
Capital One Bank |
Baa2 |
|
250,000 |
239,713 |
|
|
Capital One Financial Corp. 7.125% 8/1/08 |
Baa3 |
|
210,000 |
195,437 |
|
|
Commonwealth Bank of Australia 8.5% 6/1/10 |
A1 |
|
100,000 |
103,774 |
|
|
Korea Development Bank: |
|
|
|
|
|
|
6.625% 11/21/03 |
Baa2 |
|
170,000 |
163,537 |
|
|
7.375% 9/17/04 |
Baa2 |
|
160,000 |
155,056 |
|
|
MBNA Corp.: |
|
|
|
|
|
|
6.34% 6/2/03 |
Baa2 |
|
100,000 |
95,790 |
|
|
6.875% 11/15/02 |
Baa2 |
|
300,000 |
295,734 |
|
|
Sanwa Finance Aruba AEC 8.35% 7/15/09 |
Baa1 |
|
600,000 |
597,336 |
|
|
Sumitomo Bank International Finance NV 8.5% 6/15/09 |
Baa1 |
|
100,000 |
100,469 |
|
|
Summit Bancorp |
BBB+ |
|
100,000 |
101,231 |
|
|
|
3,284,329 |
||||
|
|
|||||
|
Moody's Ratings (unaudited) (b) |
Principal Amount |
Value |
|||
|
Credit & Other Finance - 1.8% |
|||||
|
Ahmanson Capital Trust I 8.36% 12/1/26 (g) |
A3 |
|
$ 250,000 |
$ 227,325 |
|
|
AMRESCO, Inc. |
Caa3 |
|
220,000 |
102,300 |
|
|
Associates Corp. of North America 6% 7/15/05 |
Aa3 |
|
250,000 |
233,693 |
|
|
Bellsouth Capital Funding Corp. 7.75% 2/15/10 |
Aa3 |
|
160,000 |
160,006 |
|
|
Daimler-Chrysler NA Holding Corp. |
A1 |
|
100,000 |
98,811 |
|
|
ERP Operating LP: |
|
|
|
|
|
|
6.55% 11/15/01 |
A3 |
|
50,000 |
49,279 |
|
|
7.1% 6/23/04 |
A3 |
|
200,000 |
193,952 |
|
|
Finova Capital Corp.: |
|
|
|
|
|
|
6.11% 2/18/03 |
Baa2 |
|
200,000 |
176,000 |
|
|
7.25% 11/8/04 |
Baa2 |
|
100,000 |
89,000 |
|
|
Ford Motor Credit Co.: |
|
|
|
|
|
|
6.5% 2/28/02 |
A2 |
|
1,000,000 |
984,150 |
|
|
7.875% 6/15/10 |
A2 |
|
1,040,000 |
1,041,477 |
|
|
Household Finance Corp. 8% 5/9/05 |
A2 |
|
300,000 |
302,541 |
|
|
Imperial Credit Capital Trust I 10.25% 6/14/02 |
B2 |
|
20,000 |
17,000 |
|
|
Imperial Credit Industries 9.875% 1/15/07 |
B3 |
|
330,000 |
237,600 |
|
|
Newcourt Credit Group, Inc. 6.875% 2/16/05 |
A1 |
|
340,000 |
323,513 |
|
|
Sprint Capital Corp.: |
|
|
|
|
|
|
5.875% 5/1/04 |
Baa1 |
|
375,000 |
353,265 |
|
|
6.875% 11/15/28 |
Baa1 |
|
735,000 |
635,510 |
|
|
Trizec Finance Ltd. yankee 10.875% 10/15/05 |
Baa3 |
|
100,000 |
98,000 |
|
|
TXU Eastern Funding 6.75% 5/15/09 |
Baa1 |
|
100,000 |
89,417 |
|
|
U.S. West Capital Funding, Inc. 6.875% 7/15/28 |
Baa1 |
|
60,000 |
51,537 |
|
|
|
5,464,376 |
||||
|
Savings & Loans - 0.1% |
|||||
|
Long Island Savings Bank FSB 6.2% 4/2/01 |
Baa3 |
|
500,000 |
499,445 |
|
|
TOTAL FINANCE |
9,248,150 |
||||
|
HEALTH - 0.0% |
|||||
|
Medical Facilities Management - 0.0% |
|||||
|
Unilab Corp. |
B3 |
|
70,000 |
72,100 |
|
|
INDUSTRIAL MACHINERY & EQUIPMENT - 0.4% |
|||||
|
Industrial Machinery & Equipment - 0.3% |
|||||
|
Tyco International Group SA yankee 6.875% 1/15/29 |
Baa1 |
|
1,000,000 |
844,770 |
|
|
Corporate Bonds - continued |
|||||
|
Moody's Ratings (unaudited) (b) |
Principal Amount |
Value |
|||
|
Nonconvertible Bonds - continued |
|||||
|
INDUSTRIAL MACHINERY & EQUIPMENT - continued |
|||||
|
Pollution Control - 0.1% |
|||||
|
Allied Waste |
|
|
|
|
|
|
7.625% 1/1/06 |
Ba2 |
|
$ 155,000 |
$ 134,850 |
|
|
7.875% 1/1/09 |
Ba2 |
|
170,000 |
144,500 |
|
|
WMX Technologies, Inc. 7.1% 8/1/26 |
Ba1 |
|
120,000 |
112,946 |
|
|
|
392,296 |
||||
|
TOTAL INDUSTRIAL MACHINERY & EQUIPMENT |
1,237,066 |
||||
|
MEDIA & LEISURE - 3.0% |
|||||
|
Broadcasting - 2.6% |
|||||
|
ACME Television LLC/ACME Financial Corp. 0% 9/30/04 (e) |
B3 |
|
200,000 |
191,000 |
|
|
Adelphia Communications Corp. 9.875% 3/1/05 |
B1 |
|
150,000 |
146,250 |
|
|
Ascent Entertainment Group, Inc. 0% 12/15/04 (e) |
Ba1 |
|
230,000 |
186,300 |
|
|
British Sky Broadcasting Group PLC 8.2% 7/15/09 |
Baa3 |
|
650,000 |
608,036 |
|
|
Cable Satisfaction International, Inc. 12.75% 3/1/10 |
Caa1 |
|
200,000 |
194,500 |
|
|
Callahan Nordrhein Westfalen 14% 7/15/10 (g) |
B3 |
|
250,000 |
250,000 |
|
|
CapStar Broadcasting Partners, Inc. |
B2 |
|
190,000 |
173,375 |
|
|
Charter Communications Holdings LLC/Charter Communications Holdings Capital Corp.: |
|
|
|
|
|
|
0% 1/15/10 (e) |
B2 |
|
320,000 |
181,600 |
|
|
8.25% 4/1/07 |
B2 |
|
180,000 |
159,300 |
|
|
8.625% 4/1/09 |
B2 |
|
180,000 |
158,850 |
|
|
Continental Cablevision, Inc. 8.3% 5/15/06 |
A2 |
|
215,000 |
220,093 |
|
|
Diamond Cable Communications PLC |
B3 |
|
210,000 |
161,175 |
|
|
Earthwatch, Inc. 0% 7/15/07 unit (e)(g) |
- |
|
130,000 |
83,200 |
|
|
EchoStar DBS Corp. 9.375% 2/1/09 |
B2 |
|
260,000 |
250,900 |
|
|
Impsat Fiber Networks, Inc. 13.75% 2/15/05 (g) |
B3 |
|
195,000 |
173,550 |
|
|
International Cabletel, Inc. 0% 2/1/06 (e) |
B3 |
|
250,000 |
230,000 |
|
|
LIN Holdings Corp. |
B3 |
|
270,000 |
177,525 |
|
|
|
|||||
|
Moody's Ratings (unaudited) (b) |
Principal Amount |
Value |
|||
|
Nielsen Media Research, Inc. 7.6% 6/15/09 |
Baa2 |
|
$ 150,000 |
$ 143,127 |
|
|
NorthPoint Communication Holdings, Inc. 12.875% 2/15/10 |
Caa1 |
|
150,000 |
103,500 |
|
|
NTL, Inc. 0% 4/1/08 (e) |
B3 |
|
560,000 |
347,200 |
|
|
Olympus Communications LP/Olympus Capital Corp. 10.625% 11/15/06 |
B1 |
|
170,000 |
166,600 |
|
|
Satelites Mexicanos SA de CV 11.28% 6/30/04 (g)(i) |
B1 |
|
74,000 |
67,340 |
|
|
Shaw Communications, Inc. 8.25% 4/11/10 |
Baa2 |
|
140,000 |
141,135 |
|
|
Spectrasite Holdings, Inc.: |
|
|
|
|
|
|
0% 3/15/10 (e) |
B3 |
|
65,000 |
34,938 |
|
|
10.75% 3/15/10 |
B3 |
|
25,000 |
24,875 |
|
|
TCI Communications Financing III |
A3 |
|
180,000 |
198,864 |
|
|
Telewest PLC 0% 10/1/07 (e) |
B1 |
|
270,000 |
257,850 |
|
|
Time Warner, Inc. |
Baa3 |
|
910,000 |
927,918 |
|
|
UIH Australia/Pacific, Inc.: |
|
|
|
|
|
|
Series B 0% 5/15/06 (e) |
B2 |
|
380,000 |
349,600 |
|
|
Series D 0% 5/15/06 (e) |
B2 |
|
30,000 |
27,600 |
|
|
United Pan-Europe Communications NV: |
|
|
|
|
|
|
0% 8/1/09 (e) |
B2 |
|
230,000 |
115,000 |
|
|
0% 2/1/10 (e) |
B2 |
|
270,000 |
126,900 |
|
|
10.875% 11/1/07 |
B2 |
|
480,000 |
432,000 |
|
|
10.875% 8/1/09 |
B2 |
|
275,000 |
242,000 |
|
|
11.25% 11/1/09 |
B2 |
|
15,000 |
13,125 |
|
|
USA Networks, Inc./USANi LLC |
Baa3 |
|
580,000 |
552,450 |
|
|
|
7,817,676 |
||||
|
Entertainment - 0.0% |
|||||
|
Regal Cinemas, Inc. 9.5% 6/1/08 |
Ca |
|
355,000 |
88,750 |
|
|
Lodging & Gaming - 0.0% |
|||||
|
Horseshoe Gaming LLC 8.625% 5/15/09 |
B2 |
|
70,000 |
65,800 |
|
|
KSL Recreation Group, Inc. 10.25% 5/1/07 |
B2 |
|
90,000 |
85,500 |
|
|
|
151,300 |
||||
|
Publishing - 0.3% |
|||||
|
News America Holdings, Inc. 7.375% 10/17/08 |
Baa3 |
|
500,000 |
480,685 |
|
|
News America, Inc.: |
|
|
|
|
|
|
7.125% 4/8/28 |
Baa3 |
|
80,000 |
66,850 |
|
|
7.28% 6/30/28 |
Baa3 |
|
200,000 |
172,432 |
|
|
7.3% 4/30/28 |
Baa3 |
|
170,000 |
145,143 |
|
|
|
865,110 |
||||
|
Corporate Bonds - continued |
|||||
|
Moody's Ratings (unaudited) (b) |
Principal Amount |
Value |
|||
|
Nonconvertible Bonds - continued |
|||||
|
MEDIA & LEISURE - continued |
|||||
|
Restaurants - 0.1% |
|||||
|
AFC Enterprises, Inc. 10.25% 5/15/07 |
B3 |
|
$ 170,000 |
$ 161,500 |
|
|
TOTAL MEDIA & LEISURE |
9,084,336 |
||||
|
NONDURABLES - 0.2% |
|||||
|
Beverages - 0.1% |
|||||
|
Seagram JE & Sons, Inc.: |
|
|
|
|
|
|
6.625% 12/15/05 |
Baa3 |
|
150,000 |
143,370 |
|
|
6.8% 12/15/08 |
Baa3 |
|
200,000 |
187,565 |
|
|
|
330,935 |
||||
|
Tobacco - 0.1% |
|||||
|
RJ Reynolds Tobacco Holdings, Inc. |
Baa2 |
|
200,000 |
185,752 |
|
|
TOTAL NONDURABLES |
516,687 |
||||
|
RETAIL & WHOLESALE - 0.3% |
|||||
|
Drug Stores - 0.1% |
|||||
|
Rite Aid Corp.: |
|
|
|
|
|
|
6.5% 12/15/05 (g) |
Caa1 |
|
420,000 |
216,300 |
|
|
7.125% 1/15/07 |
Caa1 |
|
110,000 |
58,300 |
|
|
|
274,600 |
||||
|
General Merchandise Stores - 0.1% |
|||||
|
Federated Department Stores, Inc. |
Baa1 |
|
500,000 |
483,520 |
|
|
Grocery Stores - 0.1% |
|||||
|
Jitney-Jungle Stores |
|
|
|
|
|
|
10.375% 9/15/07 (d) |
C |
|
450,000 |
9,000 |
|
|
12% 3/1/06 (d) |
Caa3 |
|
10,000 |
1,250 |
|
|
Kroger Co. 6% 7/1/00 |
Baa3 |
|
200,000 |
199,962 |
|
|
|
210,212 |
||||
|
TOTAL RETAIL & WHOLESALE |
968,332 |
||||
|
SERVICES - 0.1% |
|||||
|
Printing - 0.0% |
|||||
|
Sullivan Graphics, Inc. 12.75% 8/1/05 |
Caa1 |
|
40,000 |
40,200 |
|
|
Services - 0.1% |
|||||
|
SITEL Corp. |
B3 |
|
250,000 |
220,000 |
|
|
TOTAL SERVICES |
260,200 |
||||
|
|
|||||
|
Moody's Ratings (unaudited) (b) |
Principal Amount |
Value |
|||
|
TECHNOLOGY - 0.6% |
|||||
|
Computer Services & Software - 0.3% |
|||||
|
Concentric Network Corp. 12.75% 12/15/07 |
B- |
|
$ 50,000 |
$ 52,500 |
|
|
Covad Communications Group, Inc. |
B3 |
|
355,000 |
275,125 |
|
|
Exodus Communications, Inc. 11.625% 7/15/10 (g) |
B |
|
280,000 |
281,400 |
|
|
PSINet, Inc. |
B3 |
|
260,000 |
239,200 |
|
|
|
848,225 |
||||
|
Computers & Office Equipment - 0.2% |
|||||
|
Comdisco, Inc.: |
|
|
|
|
|
|
5.95% 4/30/02 |
Baa1 |
|
300,000 |
284,763 |
|
|
7.25% 9/1/02 |
Baa1 |
|
250,000 |
241,973 |
|
|
Globix Corp. |
B- |
|
95,000 |
78,375 |
|
|
|
605,111 |
||||
|
Electronic Instruments - 0.0% |
|||||
|
Telecommunications Techniques Co. LLC 9.75% 5/15/08 |
B3 |
|
80,000 |
73,600 |
|
|
Electronics - 0.1% |
|||||
|
ChipPAC International Ltd. 12.75% 8/1/09 |
B3 |
|
40,000 |
43,000 |
|
|
Hadco Corp. |
B2 |
|
140,000 |
140,350 |
|
|
SCG Holding Corp./Semiconductor Components Industries LLC 12% 8/1/09 |
B2 |
|
52,000 |
55,510 |
|
|
|
238,860 |
||||
|
TOTAL TECHNOLOGY |
1,765,796 |
||||
|
TRANSPORTATION - 0.9% |
|||||
|
Air Transportation - 0.4% |
|||||
|
Atlas Air, Inc.: |
|
|
|
|
|
|
8.77% 1/2/11 |
Ba1 |
|
86,129 |
83,115 |
|
|
9.375% 11/15/06 |
B3 |
|
220,000 |
213,400 |
|
|
Continental Airlines, Inc. pass thru trust certificates: |
|
|
|
|
|
|
7.434% 3/15/06 |
Baa1 |
|
70,000 |
67,683 |
|
|
7.73% 9/15/12 |
Baa1 |
|
28,243 |
26,975 |
|
|
Delta Air Lines, Inc. |
Baa3 |
|
500,000 |
464,750 |
|
|
US Air, Inc. |
B3 |
|
430,000 |
425,700 |
|
|
|
1,281,623 |
||||
|
Railroads - 0.5% |
|||||
|
Burlington Northern |
|
|
|
|
|
|
6.875% 12/1/27 |
Baa2 |
|
1,000,000 |
860,780 |
|
|
Corporate Bonds - continued |
|||||
|
Moody's Ratings (unaudited) (b) |
Principal Amount |
Value |
|||
|
Nonconvertible Bonds - continued |
|||||
|
TRANSPORTATION - continued |
|||||
|
Railroads - continued |
|||||
|
Burlington Northern |
|
|
|
|
|
|
7.29% 6/1/36 |
Baa2 |
|
$ 150,000 |
$ 146,609 |
|
|
Norfolk Southern Corp. 7.05% 5/1/37 |
Baa1 |
|
340,000 |
332,302 |
|
|
|
1,339,691 |
||||
|
TOTAL TRANSPORTATION |
2,621,314 |
||||
|
UTILITIES - 3.4% |
|||||
|
Cellular - 0.5% |
|||||
|
Cellnet Data Systems, Inc. 0% 10/1/07 (e) |
- |
|
300,000 |
24,000 |
|
|
Clearnet Communications, Inc. yankee 0% 12/15/05 (e) |
B3 |
|
200,000 |
206,000 |
|
|
Crown Castle International Corp. 10.75% 8/1/11 |
B3 |
|
45,000 |
45,675 |
|
|
Dobson Communications Corp. 10.875% 7/1/10 (g) |
- |
|
50,000 |
50,375 |
|
|
Leap Wireless International, Inc.: |
|
|
|
|
|
|
0% 4/15/10 (e)(g) |
- |
|
65,000 |
27,300 |
|
|
12.5% 4/15/10 (g) |
Caa2 |
|
75,000 |
66,000 |
|
|
McCaw International Ltd. 0% 4/15/07 (e) |
Caa1 |
|
270,000 |
205,200 |
|
|
Millicom International Cellular SA |
Caa1 |
|
241,000 |
204,850 |
|
|
Nextel |
|
|
|
|
|
|
0% 10/31/07 (e) |
B1 |
|
420,000 |
312,900 |
|
|
9.375% 11/15/09 |
B1 |
|
170,000 |
163,200 |
|
|
VoiceStream |
|
|
|
|
|
|
0% 11/15/09 (e) |
B2 |
|
295,000 |
197,650 |
|
|
10.375% 11/15/09 |
B2 |
|
170,000 |
176,800 |
|
|
|
1,679,950 |
||||
|
Electric Utility - 0.4% |
|||||
|
Avon Energy Partners Holdings 6.46% 3/4/08 (g) |
Baa2 |
|
300,000 |
267,204 |
|
|
Dominion Resources, Inc. 8.125% 6/15/10 |
Baa1 |
|
165,000 |
166,115 |
|
|
Illinois Power Co. |
Baa1 |
|
150,000 |
146,427 |
|
|
Israel Electric Corp. Ltd. 7.75% 12/15/27 (g) |
A3 |
|
545,000 |
467,147 |
|
|
|
|||||
|
Moody's Ratings (unaudited) (b) |
Principal Amount |
Value |
|||
|
Niagara Mohawk Power Corp. 8.875% 5/15/07 |
Baa3 |
|
$ 75,000 |
$ 77,640 |
|
|
Texas Utilities Co. |
Baa3 |
|
100,000 |
90,325 |
|
|
|
1,214,858 |
||||
|
Gas - 0.3% |
|||||
|
CMS Panhandle |
|
|
|
|
|
|
6.125% 3/15/04 |
Baa3 |
|
150,000 |
141,675 |
|
|
7% 7/15/29 |
Baa3 |
|
150,000 |
125,880 |
|
|
Reliant Energy Resources Corp. 8.125% 7/15/05 (g) |
Baa1 |
|
500,000 |
499,900 |
|
|
|
767,455 |
||||
|
Telephone Services - 2.2% |
|||||
|
Allegiance Telecom, Inc. 12.875% 5/15/08 |
B3 |
|
200,000 |
216,500 |
|
|
Cable & Wireless Optus Ltd. 8% 6/22/10 (g) |
Baa1 |
|
700,000 |
695,681 |
|
|
Deutsche Telekom International Finance BV 8.25% 6/15/30 |
Aa2 |
|
935,000 |
949,895 |
|
|
Esat Telecom Group PLC 0% 2/1/07 (e) |
Aa1 |
|
230,000 |
213,900 |
|
|
Global Crossing Holdings Ltd. 9.625% 5/15/08 |
Ba2 |
|
180,000 |
176,400 |
|
|
Global TeleSystems Group, Inc. 9.875% 2/15/05 |
Caa1 |
|
330,000 |
227,700 |
|
|
Globenet Communication Group Ltd. |
Caa1 |
|
560,000 |
565,600 |
|
|
Hermes Europe Railtel BV 11.5% 8/15/07 |
B3 |
|
150,000 |
125,250 |
|
|
ICG Holdings, Inc. |
B3 |
|
260,000 |
249,600 |
|
|
Intermedia Communications, Inc. |
B3 |
|
330,000 |
200,475 |
|
|
KMC Telecom Holdings, Inc. 13.5% 5/15/09 |
Caa2 |
|
170,000 |
141,100 |
|
|
NEXTLINK Communications, Inc. |
B2 |
|
500,000 |
287,500 |
|
|
Ono Finance PLC |
Caa1 |
|
215,000 |
203,175 |
|
|
Rhythms NetConnections, Inc. 14% 2/15/10 (g) |
B3 |
|
200,000 |
144,000 |
|
|
Telecomunicaciones de Puerto Rico, Inc. |
Baa2 |
|
220,000 |
204,882 |
|
|
Teleglobe Canada, Inc.: |
|
|
|
|
|
|
7.2% 7/20/09 |
Baa1 |
|
449,000 |
429,626 |
|
|
7.7% 7/20/29 |
Baa1 |
|
666,000 |
627,152 |
|
|
Versatel Telecom |
B3 |
|
150,000 |
152,250 |
|
|
Viatel, Inc. 11.25% 4/15/08 |
B3 |
|
250,000 |
187,500 |
|
|
Corporate Bonds - continued |
|||||
|
Moody's Ratings (unaudited) (b) |
Principal Amount |
Value |
|||
|
Nonconvertible Bonds - continued |
|||||
|
UTILITIES - continued |
|||||
|
Telephone Services - continued |
|||||
|
WinStar Communications, Inc. 12.75% 4/15/10 (g) |
B3 |
|
$ 450,000 |
$ 434,250 |
|
|
WorldCom, Inc. |
A3 |
|
184,000 |
190,782 |
|
|
|
6,623,218 |
||||
|
TOTAL UTILITIES |
10,285,481 |
||||
|
TOTAL NONCONVERTIBLE BONDS |
42,871,953 |
||||
|
TOTAL CORPORATE BONDS (Cost $48,683,174) |
46,399,900 |
||||
|
U.S. Government and Government |
|||||
|
|
|||||
|
U.S. Government Agency Obligations - 1.7% |
|||||
|
Fannie Mae: |
|
|
|
|
|
|
6.5% 4/29/09 |
Aaa |
|
1,600,000 |
1,494,752 |
|
|
7.125% 2/15/05 |
Aaa |
|
1,315,000 |
1,320,339 |
|
|
7.25% 5/15/30 |
Aaa |
|
660,000 |
673,435 |
|
|
Federal Home Loan Bank 7.59% 3/10/05 |
Aaa |
|
190,000 |
193,859 |
|
|
Freddie Mac: |
|
|
|
|
|
|
5.75% 3/15/09 |
Aaa |
|
800,000 |
728,624 |
|
|
6.25% 7/15/04 |
Aaa |
|
310,000 |
301,379 |
|
|
6.875% 1/15/05 |
Aaa |
|
185,000 |
183,844 |
|
|
7% 7/15/05 |
Aaa |
|
250,000 |
249,650 |
|
|
Government Trust Certificates (assets of Trust guaranteed by U.S. Government through Defense Security Assistance Agency) Class 2-E, 9.4% 5/15/02 |
Aaa |
|
34,670 |
35,168 |
|
|
Tennessee Valley Authority 7.125% 5/1/30 |
Aaa |
|
140,000 |
140,588 |
|
|
TOTAL U.S. GOVERNMENT AGENCY OBLIGATIONS |
5,321,638 |
||||
|
U.S. Treasury Obligations - 8.7% |
|||||
|
U.S. Treasury Bonds: |
|
|
|
|
|
|
6.125% 8/15/29 |
Aaa |
|
1,660,000 |
1,676,600 |
|
|
8.875% 8/15/17 |
Aaa |
|
3,805,000 |
4,850,195 |
|
|
9.875% 11/15/15 |
Aaa |
|
625,000 |
847,463 |
|
|
14% 11/15/11 |
Aaa |
|
490,000 |
680,488 |
|
|
U.S. Treasury Notes: |
|
|
|
|
|
|
5.5% 5/31/03 |
Aaa |
|
6,000,000 |
5,861,220 |
|
|
5.5% 2/15/08 |
Aaa |
|
100,000 |
95,719 |
|
|
5.625% 9/30/01 |
Aaa |
|
140,000 |
138,512 |
|
|
|
|||||
|
Moody's Ratings (unaudited) (b) |
Principal Amount |
Value |
|||
|
5.875% 10/31/01 |
Aaa |
|
$ 1,950,000 |
$ 1,934,771 |
|
|
5.875% 11/15/04 |
Aaa |
|
2,850,000 |
2,808,590 |
|
|
6.5% 5/31/02 |
Aaa |
|
3,010,000 |
3,013,763 |
|
|
7% 7/15/06 |
Aaa |
|
3,750,000 |
3,885,938 |
|
|
U.S. Treasury Notes - |
Aaa |
|
1,430,000 |
709,652 |
|
|
TOTAL U.S. TREASURY OBLIGATIONS |
26,502,911 |
||||
|
TOTAL U.S. GOVERNMENT AND GOVERNMENT AGENCY OBLIGATIONS (Cost $31,715,419) |
31,824,549 |
||||
|
U.S. Government Agency - |
|||||
|
|
|||||
|
Fannie Mae - 9.1% |
|||||
|
5.5% 2/1/11 |
Aaa |
|
156,534 |
145,429 |
|
|
6% 4/1/09 to 1/1/29 |
Aaa |
|
1,860,194 |
1,734,133 |
|
|
6.5% 11/1/25 to 7/1/29 |
Aaa |
|
11,136,937 |
10,514,432 |
|
|
6.5% 7/1/30 (h) |
Aaa |
|
3,500,000 |
3,298,750 |
|
|
7% 12/1/24 to 9/1/28 |
Aaa |
|
3,344,454 |
3,236,903 |
|
|
7.5% 5/1/15 to 1/1/30 |
Aaa |
|
8,490,673 |
8,375,883 |
|
|
8% 12/1/29 |
Aaa |
|
499,027 |
501,053 |
|
|
TOTAL FANNIE MAE |
27,806,583 |
||||
|
Freddie Mac - 0.1% |
|||||
|
7.5% 1/1/27 |
Aaa |
|
367,456 |
363,782 |
|
|
Government National Mortgage Association - 3.8% |
|||||
|
6.5% 4/15/28 to 4/15/29 |
Aaa |
|
10,337,543 |
9,813,560 |
|
|
7% 1/15/28 to 12/15/28 |
Aaa |
|
636,734 |
619,020 |
|
|
7.5% 6/15/27 to 3/15/28 |
Aaa |
|
1,153,223 |
1,145,846 |
|
|
TOTAL GOVERNMENT NATIONAL |
11,578,426 |
||||
|
TOTAL U.S. GOVERNMENT AGENCY - (Cost $41,146,234) |
39,748,791 |
||||
|
Asset-Backed Securities - 0.8% |
|||||
|
|
|||||
|
American Express Credit Account Master Trust |
A1 |
|
200,000 |
192,297 |
|
|
Ford Credit Auto |
|
|
|
|
|
|
6.2% 12/15/02 |
Aa2 |
|
510,000 |
503,067 |
|
|
6.4% 12/15/02 |
Aa2 |
|
80,000 |
78,960 |
|
|
7.03% 11/15/03 |
Aaa |
|
145,000 |
144,887 |
|
|
Key Auto Finance Trust: |
|
|
|
|
|
|
6.3% 10/15/03 |
A2 |
|
197,699 |
196,711 |
|
|
6.65% 10/15/03 |
Baa3 |
|
59,053 |
58,979 |
|
|
Asset-Backed Securities - continued |
|||||
|
Moody's Ratings (unaudited) (b) |
Principal Amount |
Value |
|||
|
Premier Auto Trust |
Aaa |
|
$ 1,000,000 |
$ 970,310 |
|
|
Sears Credit Account Master Trust II |
A2 |
|
200,000 |
200,000 |
|
|
TOTAL ASSET-BACKED SECURITIES (Cost $2,390,044) |
2,345,211 |
||||
|
Commercial Mortgage Securities - 0.9% |
|||||
|
|
|||||
|
CS First Boston Mortgage Securities Corp.: |
|
|
|
|
|
|
Series 1997-C2 Class D, 7.27% 1/17/35 |
Baa2 |
|
220,000 |
202,245 |
|
|
Series 1998-FL1: |
|
|
|
|
|
|
Class D, 7.1415% 12/10/00 (g)(i) |
A2 |
|
300,000 |
299,543 |
|
|
Class E, 7.4913% 1/10/13 (g)(i) |
Baa2 |
|
420,000 |
418,130 |
|
|
DLJ Commercial Mortgage Corp. 7.62% 5/10/10 |
Aaa |
|
500,000 |
501,484 |
|
|
GS Mortgage Securities Corp. II Series 1998-GLII Class E, 7.1905% 4/13/31 (g)(i) |
Baa3 |
|
500,000 |
432,285 |
|
|
Prudential Securities Secd Financing Corp. Series 2000-C1, Class A2 7.727% 2/15/10 |
Aaa |
|
450,000 |
454,359 |
|
|
Thirteen Affiliates of General Growth Properties, Inc. sequential pay Series 1 Class A2, 6.602% 12/15/10 (g) |
Aaa |
|
500,000 |
473,242 |
|
|
TOTAL COMMERCIAL MORTGAGE SECURITIES (Cost $2,876,556) |
2,781,288 |
||||
|
Foreign Government and Government |
|||||
|
|
|||||
|
Korean Republic yankee: |
|
|
|
|
|
|
8.75% 4/15/03 |
Baa2 |
|
80,000 |
81,437 |
|
|
8.875% 4/15/08 |
Baa2 |
|
116,000 |
119,654 |
|
|
Quebec Province yankee: |
|
|
|
|
|
|
6.86% 4/15/26 (f) |
A2 |
|
250,000 |
240,255 |
|
|
7.125% 2/9/24 |
A2 |
|
30,000 |
28,337 |
|
|
7.5% 7/15/23 |
A2 |
|
30,000 |
29,574 |
|
|
United Mexican States 9.875% 2/1/10 |
Baa3 |
|
200,000 |
209,000 |
|
|
TOTAL FOREIGN GOVERNMENT AND GOVERNMENT AGENCY OBLIGATIONS (Cost $727,451) |
708,257 |
||||
|
Supranational Obligations - 0.2% |
|||||
|
Moody's Ratings (unaudited) (b) |
Principal Amount |
Value |
|||
|
Inter-American Development Bank yankee 6.29% 7/16/27 |
Aaa |
|
$ 500,000 |
$ 476,310 |
|
|
Cash Equivalents - 3.0% |
|||
|
Shares |
|
||
|
Taxable Central Cash Fund, |
9,219,794 |
9,219,794 |
|
|
TOTAL INVESTMENT PORTFOLIO - 100.9% (Cost $271,264,000) |
307,839,743 |
||
|
NET OTHER ASSETS - (0.9)% |
(2,855,046) |
||
|
NET ASSETS - 100% |
$ 304,984,697 |
||
|
Security Type Abbreviations |
||
|
PIES |
- |
Premium Income Equity Securities |
|
Legend |
|
(a) Non-income producing |
|
(b) S&P credit ratings are used in the absence of a rating by Moody's Investors Service, Inc. |
|
(c) The rate quoted is the annualized seven-day yield of the fund at |
|
(d) Non-income producing - issuer filed for protection under the |
|
(e) Debt obligation initially issued in zero coupon form which converts to coupon form at a specified rate and date. The rate shown is the rate at period end. |
|
(f) Debt obligation initially issued at one coupon which converts to a higher coupon at a specified date. The rate shown is the rate at period end. |
|
(g) Security exempt from registration under Rule 144A of the Securities Act |
|
(h) Security purchased on a delayed delivery or when-issued basis. |
|
(i) The coupon rate shown on floating or adjustable rate securities represents the rate at period end. |
|
(j) For foreign government obligations not individually rated by S&P |
|
(k) Restricted securities - Investment in securities not registered under the Securities Act of 1933. |
|
Additional information on each holding is as follows: |
|
Security |
Acquisition Date |
Acquisition Cost |
|
Mothers Work, Inc. |
6/18/98 |
$ 18 |
|
Other Information |
|
The composition of long-term debt holdings as a percentage of total value |
|
Moody's Ratings |
S&P Ratings |
|||
|
Aaa, Aa, A |
27.2% |
|
AAA, AA, A |
25.5% |
|
Baa |
6.9% |
|
BBB |
5.9% |
|
Ba |
0.4% |
|
BB |
0.6% |
|
B |
3.9% |
|
B |
4.7% |
|
Caa |
0.9% |
|
CCC |
0.7% |
|
Ca, C |
0.0% |
|
CC, C |
0.0% |
|
|
|
|
D |
0.0% |
|
The percentage not rated by Moody's or S&P amounted to 0.5%. FMR has determined that unrated debt securities that are lower quality account for 0.5% of the total value of investment in securities. |
|
Purchases and sales of securities, other than short-term securities, aggregated $224,411,074 and $262,292,592, respectively, of which long-term U.S. government and government agency obligations aggregated $59,871,450 and $60,369,656, respectively. |
|
The fund placed a portion of its portfolio transactions with brokerage firms which are affiliates of Fidelity Management & Research Company. The commissions paid to these affiliated firms were $8,986 for the period. |
|
The fund invested in securities that are not registered under the Securities Act of 1933. These securities are subject to legal or contractual restrictions on resale. At the end of the period, restricted securities (excluding Rule 144A issues) amounted to $34 and 0% of net assets. |
|
Income Tax Information |
|
At June 30, 2000, the aggregate cost of investment securities for income tax purposes was $266,299,649. Net unrealized appreciation aggregated $41,540,094, of which $50,485,729 related to appreciated investment securities and $8,945,635 related to depreciated investment securities. |
See accompanying notes which are an integral part of the financial statements.
Balanced Portfolio
Statement of Assets and Liabilities
|
|
June 30, 2000 (Unaudited) |
|
|
Assets |
|
|
|
Investment in securities, at value |
|
$ 307,839,743 |
|
Commitment to sell securities on a delayed delivery basis |
$ (5,690,625) |
|
|
Receivable for securities sold on a delayed delivery basis |
5,685,000 |
(5,625) |
|
Receivable for investments sold, regular delivery |
|
3,535,259 |
|
Cash |
|
23,298 |
|
Receivable for fund shares sold |
|
242,446 |
|
Dividends receivable |
|
49,966 |
|
Interest receivable |
|
1,666,464 |
|
Other receivables |
|
44,424 |
|
Total assets |
|
313,395,975 |
|
Liabilities |
|
|
|
Payable for investments purchased |
4,592,826 |
|
|
Delayed delivery |
3,294,642 |
|
|
Payable for fund shares redeemed |
376,552 |
|
|
Accrued management fee |
108,417 |
|
|
Distribution fees payable |
2,544 |
|
|
Other payables and |
36,297 |
|
|
Total liabilities |
|
8,411,278 |
|
Net Assets |
|
$ 304,984,697 |
|
Net Assets consist of: |
|
|
|
Paid in capital |
|
$ 259,384,219 |
|
Undistributed net investment income |
|
5,026,674 |
|
Accumulated undistributed net realized gain (loss) on investments and foreign currency transactions |
|
4,004,148 |
|
Net unrealized appreciation (depreciation) on investments |
|
36,569,656 |
|
Net Assets |
|
$ 304,984,697 |
|
Initial Class: |
|
$15.09 |
|
Service Class: |
|
$15.03 |
|
Service Class 2: |
|
$15.02 |
Statement of Operations
|
|
Six months ended June 30, 2000 (Unaudited) |
|
|
Investment Income Dividends |
|
$ 1,026,288 |
|
Interest |
|
4,833,980 |
|
Security lending |
|
131 |
|
Total income |
|
5,860,399 |
|
Expenses |
|
|
|
Management fee |
$ 667,765 |
|
|
Transfer agent fees |
101,971 |
|
|
Distribution fees |
13,916 |
|
|
Accounting and security lending fees |
59,780 |
|
|
Non-interested trustees' compensation |
506 |
|
|
Custodian fees and expenses |
13,860 |
|
|
Audit |
14,098 |
|
|
Legal |
1,823 |
|
|
Reports to shareholders |
309 |
|
|
Miscellaneous |
137 |
|
|
Total expenses before reductions |
874,165 |
|
|
Expense reductions |
(26,193) |
847,972 |
|
Net investment income |
|
5,012,427 |
|
Realized and Unrealized Gain (Loss) Net realized gain (loss) on: |
|
|
|
Investment securities |
4,969,880 |
|
|
Foreign currency transactions |
(4,097) |
4,965,783 |
|
Change in net unrealized appreciation (depreciation) on: |
|
|
|
Investment securities |
(11,411,603) |
|
|
Assets and liabilities in |
(1,569) |
|
|
Delayed delivery commitments |
(5,625) |
(11,418,797) |
|
Net gain (loss) |
|
(6,453,014) |
|
Net increase (decrease) in net assets resulting from operations |
|
$ (1,440,587) |
|
Other Information Expense reductions |
|
$ 25,816 |
|
Custodian credits |
|
377 |
|
|
|
$ 26,193 |
See accompanying notes which are an integral part of the financial statements.
Semiannual Report
Fidelity Variable Insurance Products: Balanced Portfolio
Financial Statements - continued
Statement of Changes in Net Assets
|
Increase (Decrease) in Net Assets |
Six months ended |
Year ended |
|
Operations |
$ 5,012,427 |
$ 10,132,202 |
|
Net realized gain (loss) |
4,965,783 |
7,580,954 |
|
Change in net unrealized appreciation (depreciation) |
(11,418,797) |
(2,525,268) |
|
Net increase (decrease) in net assets resulting from operations |
(1,440,587) |
15,187,888 |
|
Distributions to shareholders |
(10,025,969) |
(7,479,403) |
|
From net realized gain |
(8,369,238) |
(8,692,279) |
|
Total distributions |
(18,395,207) |
(16,171,682) |
|
Share transactions - net increase (decrease) |
(27,604,335) |
36,165,081 |
|
Total increase (decrease) in net assets |
(47,440,129) |
35,181,287 |
|
Net Assets |
|
|
|
Beginning of period |
352,424,826 |
317,243,539 |
|
End of period (including undistributed net investment income of $5,026,674 and $10,132,202, respectively) |
$ 304,984,697 |
$ 352,424,826 |
|
|
|
Other Information: |
|
|
Six months ended June 30, 2000 |
Year ended |
||
|
|
Shares |
Dollars |
Shares |
Dollars |
|
Share transactions |
800,778 |
$ 11,898,820 |
4,444,110 |
$ 70,037,773 |
|
Reinvested |
1,146,173 |
16,906,054 |
1,027,536 |
15,608,277 |
|
Redeemed |
(4,066,967) |
(61,054,219) |
(4,234,242) |
(66,752,172) |
|
Net increase (decrease) |
(2,120,016) |
$ (32,249,345) |
1,237,404 |
$ 18,893,878 |
|
Service Class |
289,094 |
$ 4,329,594 |
1,108,300 |
$ 17,387,242 |
|
Reinvested |
100,855 |
1,483,571 |
37,189 |
563,405 |
|
Redeemed |
(125,685) |
(1,874,764) |
(43,583) |
(679,444) |
|
Net increase (decrease) |
264,264 |
$ 3,938,401 |
1,101,906 |
$ 17,271,203 |
|
Service Class 2 A |
47,040 |
$ 701,059 |
- |
$ - |
|
Reinvested |
380 |
5,581 |
- |
- |
|
Redeemed |
(2) |
(31) |
- |
- |
|
Net increase (decrease) |
47,418 |
$ 706,609 |
- |
$ - |
|
Distributions |
|
$ 9,221,484 |
|
$ 7,218,828 |
|
Service Class |
|
801,470 |
|
260,575 |
|
Service Class 2 A |
|
3,015 |
|
- |
|
Total |
|
$ 10,025,969 |
|
$ 7,479,403 |
|
From net realized gain |
|
$ 7,684,570 |
|
$ 8,389,449 |
|
Service Class |
|
682,102 |
|
302,830 |
|
Service Class 2 A |
|
2,566 |
|
- |
|
Total |
|
$ 8,369,238 |
|
$ 8,692,279 |
|
|
|
$ 18,395,207 |
|
$ 16,171,682 |
A Service Class 2 commenced sale of shares January 12, 2000.
See accompanying notes which are an integral part of the financial statements.
Balanced Portfolio
Financial Highlights - Initial Class
|
|
Six months ended |
Years ended December 31, |
||||
|
Selected Per-Share Data |
(Unaudited) |
1999 |
1998 |
1997 |
1996 |
1995 H |
|
Net asset value, beginning of period |
$ 16.00 |
$ 16.11 |
$ 14.58 |
$ 12.23 |
$ 11.17 |
$ 10.00 |
|
Income from Investment Operations |
|
|
|
|
|
|
|
Net investment income |
.24 D |
.45 D |
.44 D |
.44 D |
.33 |
.14 |
|
Net realized and unrealized gain (loss) |
(.27) |
.24 |
2.00 |
2.22 |
.78 |
1.25 |
|
Total from investment operations |
(.03) |
.69 |
2.44 |
2.66 |
1.11 |
1.39 |
|
Less Distributions |
|
|
|
|
|
|
|
From net investment income |
(.48) |
(.37) |
(.36) |
(.31) |
(.01) |
(.14) |
|
From net realized gain |
(.40) |
(.43) |
(.55) |
- |
(.04) |
(.08) |
|
Total distributions |
(.88) |
(.80) |
(.91) |
(.31) |
(.05) |
(.22) |
|
Net asset value, end of period |
$ 15.09 |
$ 16.00 |
$ 16.11 |
$ 14.58 |
$ 12.23 |
$ 11.17 |
|
Total Return B, C |
(0.06)% |
4.55% |
17.64% |
22.18% |
9.98% |
13.92% |
|
Ratios and Supplemental Data |
|
|
|
|
|
|
|
Net assets, end of period (000 omitted) |
$ 274,792 |
$ 325,371 |
$ 307,681 |
$ 214,538 |
$ 103,110 |
$ 43,155 |
|
Ratio of expenses to average net assets |
.55% A |
.57% |
.59% |
.61% |
.72% |
1.42% F |
|
Ratio of expenses to average net assets after |
.53% A, G |
.55% G |
.58% G |
.60% G |
.71% G |
1.42% |
|
Ratio of net investment income to average net assets |
3.20% A |
2.87% |
2.94% |
3.28% |
3.63% |
3.56% |
|
Portfolio turnover |
148% A |
108% |
94% |
98% |
163% |
248% |
Financial Highlights - Service Class
|
|
Six months ended |
Years ended December 31, |
||
|
Selected Per-Share Data |
(Unaudited) |
1999 |
1998 |
1997 E |
|
Net asset value, beginning of period |
$ 15.94 |
$ 16.07 |
$ 14.59 |
$ 14.16 |
|
Income from Investment Operations |
|
|
|
|
|
Net investment income D |
.23 |
.43 |
.41 |
.08 |
|
Net realized and unrealized gain (loss) |
(.27) |
.24 |
1.98 |
.35 |
|
Total from investment operations |
(.04) |
.67 |
2.39 |
.43 |
|
Less Distributions |
|
|
|
|
|
From net investment income |
(.47) |
(.37) |
(.36) |
- |
|
From net realized gain |
(.40) |
(.43) |
(.55) |
- |
|
Total distributions |
(.87) |
(.80) |
(.91) |
- |
|
Net asset value, end of period |
$ 15.03 |
$ 15.94 |
$ 16.07 |
$ 14.59 |
|
Total Return B, C |
(0.13)% |
4.43% |
17.27% |
3.04% |
|
Ratios and Supplemental Data |
|
|
|
|
|
Net assets, end of period (000 omitted) |
$ 29,480 |
$ 27,054 |
$ 9,562 |
$ 10 |
|
Ratio of expenses to average net assets |
.65% A |
.67% |
.70% |
.71% A |
|
Ratio of expenses to average net assets after expense reductions |
.63% A, G |
.66% G |
.69% G |
.71% A |
|
Ratio of net investment income to average net assets |
3.10% A |
2.77% |
2.79% |
3.43% A |
|
Portfolio turnover |
148% A |
108% |
94% |
98% |
|
A Annualized B The total returns would have been lower had certain expenses not been reduced during the periods shown. C Total returns for periods of less than one year are not annualized and do not reflect charges attributable to your insurance company's separate account. Inclusion of these charges would reduce the total returns shown. D Net investment income per share has been calculated based on average shares outstanding during the period. E For the period November 3, 1997 (commencement of sale of Service Class shares) to December 31, 1997. F FMR agreed to reimburse a portion of the class' expenses during the period. Without this reimbursement, the class' expense ratio would have been higher. G FMR or the fund has entered into varying arrangements with third parties who either paid or reduced a portion of the class' expenses. H For the period January 3, 1995 (commencement of operations of Initial Class shares) to December 31, 1995. |
||||
See accompanying notes which are an integral part of the financial statements.
Semiannual Report
Financial Highlights - Service Class 2
|
|
Six months ended |
|
Selected Per-Share Data |
(Unaudited) |
|
Net asset value, beginning of period |
$ 15.59 |
|
Income from Investment Operations |
|
|
Net investment income D |
.20 |
|
Net realized and unrealized gain (loss) |
.10 G |
|
Total from investment operations |
.30 |
|
Less Distributions |
|
|
From net investment income |
(.47) |
|
From net realized gain |
(.40) |
|
Total distributions |
(.87) |
|
Net asset value, end of period |
$ 15.02 |
|
Total Return B, C |
2.05% |
|
Ratios and Supplemental Data |
|
|
Net assets, end of period (000 omitted) |
$ 712 |
|
Ratio of expenses to average net assets |
.79% A |
|
Ratio of expenses to average net assets after expense reductions |
.77% A, F |
|
Ratio of net investment income to average net assets |
2.96% A |
|
Portfolio turnover |
148% A |
|
A Annualized B The total returns would have been lower had certain expenses not been reduced during the periods shown. C Total returns for periods of less than one year are not annualized and do not reflect charges attributable to your insurance company's separate account. Inclusion of these charges would reduce the total returns shown. D Net investment income per share has been calculated based on average shares outstanding during the period. E For the period January 12, 2000 (commencement of sale of Service Class 2 shares) to June 30, 2000. F FMR or the fund has entered into varying arrangements with third parties who either paid or reduced a portion of the class' expenses. G The amount shown for a share outstanding does not correspond with the aggregate net loss on investments for the period due to the timing of sales and repurchases of class shares in relation to fluctuating market values of the investments of the fund. |
|
See accompanying notes which are an integral part of the financial statements.
Balanced Portfolio
A special meeting of the fund's shareholders was held on July 19, 2000. The results of votes taken among shareholders on proposals before them are reported below. Each vote reported represents one dollar of net asset value held on the record date for the meeting.
PROPOSAL 1
To elect as Trustees the following twelve nominees.*
|
|
# of Dollars Voted |
% of Dollars voted |
Ralph F. Cox
|
Affirmative |
2,995,348,207.84 |
97.862 |
|
Withheld |
65,444,305.52 |
2.138 |
|
TOTAL |
3,060,792,513.36 |
100.000 |
Phyllis Burke Davis
|
Affirmative |
2,995,012,849.06 |
97.851 |
|
Withheld |
65,779,664.30 |
2.149 |
|
TOTAL |
3,060,792,513.36 |
100.000 |
Robert M. Gates
|
Affirmative |
2,994,325,628.16 |
97.828 |
|
Withheld |
66,466,885.20 |
2.172 |
|
TOTAL |
3,060,792,513.36 |
100.000 |
Edward C. Johnson 3d
|
Affirmative |
2,994,212,266.77 |
97.825 |
|
Withheld |
66,580,246.59 |
2.175 |
|
TOTAL |
3,060,792,513.36 |
100.000 |
Donald J. Kirk
|
Affirmative |
2,996,527,468.99 |
97.900 |
|
Withheld |
64,265,044.37 |
2.100 |
|
TOTAL |
3,060,792,513.36 |
100.000 |
Ned C. Lautenbach
|
Affirmative |
2,997,430,896.97 |
97.930 |
|
Withheld |
63,361,616.39 |
2.070 |
|
TOTAL |
3,060,792,513.36 |
100.000 |
|
|
# of Dollars Voted |
% of Dollars voted |
Peter S. Lynch
|
Affirmative |
2,997,391,112.97 |
97.929 |
|
Withheld |
63,401,400.39 |
2.071 |
|
TOTAL |
3,060,792,513.36 |
100.000 |
William O. McCoy
|
Affirmative |
2,997,364,420.76 |
97.928 |
|
Withheld |
63,428,092.60 |
2.072 |
|
TOTAL |
3,060,792,513.36 |
100.000 |
Gerald C. McDonough
|
Affirmative |
2,992,594,911.89 |
97.772 |
|
Withheld |
68,197,601.47 |
2.228 |
|
TOTAL |
3,060,792,513.36 |
100.000 |
Marvin L. Mann
|
Affirmative |
2,996,491,839.67 |
97.899 |
|
Withheld |
64,300,673.69 |
2.101 |
|
TOTAL |
3,060,792,513.36 |
100.000 |
Robert C. Pozen
|
Affirmative |
2,997,304,419.99 |
97.926 |
|
Withheld |
63,488,093.37 |
2.074 |
|
TOTAL |
3,060,792,513.36 |
100.000 |
Thomas R. Williams
|
Affirmative |
2,993,561,996.24 |
97.803 |
|
Withheld |
67,230,517.12 |
2.197 |
|
TOTAL |
3,060,792,513.36 |
100.000 |
Semiannual Report
Proxy Voting Results - continued
PROPOSAL 2
To ratify the selection of Deloitte & Touche LLP as independent accountants of the fund.
|
|
# of Dollars Voted |
% of Dollars voted |
|
Affirmative |
276,319,488.69 |
94.617 |
|
Against |
4,151,739.32 |
1.422 |
|
Abstain |
11,567,630.61 |
3.961 |
|
TOTAL |
292,038,858.62 |
100.000 |
PROPOSAL 3
To authorize the Trustees to adopt an Amended and Restated Declaration of Trust.*
|
|
# of Dollars Voted |
% of Dollars voted |
|
Affirmative |
2,837,267,199.92 |
92.697 |
|
Against |
49,473,422.32 |
1.617 |
|
Abstain |
174,051,891.12 |
5.686 |
|
TOTAL |
3,060,792,513.36 |
100.000 |
PROPOSAL 4
To approve an amended management contract for the fund that would reduce the management fee payable to FMR by the fund as FMR's assets under management increase.
|
|
# of Dollars Voted |
% of Dollars voted |
|
Affirmative |
272,189,750.93 |
93.203 |
|
Against |
4,507,278.92 |
1.544 |
|
Abstain |
15,341,828.77 |
5.253 |
|
TOTAL |
292,038,858.62 |
100.000 |
PROPOSAL 5
To approve an amended sub-advisory agreement with FMR U.K. to provide investment advice and research services or investment management services.
|
|
# of Dollars Voted |
% of Dollars voted |
|
Affirmative |
268,161,500.09 |
91.824 |
|
Against |
5,337,639.43 |
1.828 |
|
Abstain |
18,539,719.10 |
6.348 |
|
TOTAL |
292,038,858.62 |
100.000 |
PROPOSAL 6
To approve an amended sub-advisory agreement with FMR Far East to provide investment advice and research services or investment management services.
|
|
# of Dollars Voted |
% of Dollars voted |
|
Affirmative |
267,614,072.73 |
91.636 |
|
Against |
5,806,227.04 |
1.989 |
|
Abstain |
18,618,558.85 |
6.375 |
|
TOTAL |
292,038,858.62 |
100.000 |
PROPOSAL 7
To modify the fund's fundamental investment objective and eliminate a fundamental investment policy of the fund.
|
|
# of Dollars Voted |
% of Dollars voted |
|
Affirmative |
267,914,892.06 |
91.739 |
|
Against |
7,333,491.83 |
2.512 |
|
Abstain |
16,790,474.73 |
5.749 |
|
TOTAL |
292,038,858.62 |
100.000 |
PROPOSAL 8
To amend the fundamental investment limitation concerning diversification.
|
|
# of Dollars Voted |
% of Dollars voted |
|
Affirmative |
267,037,890.43 |
91.439 |
|
Against |
7,842,324.91 |
2.686 |
|
Abstain |
17,158,643.28 |
5.875 |
|
TOTAL |
292,038,858.62 |
100.000 |
PROPOSAL 9
To amend the fundamental investment limitation concerning underwriting.
|
|
# of Dollars Voted |
% of Dollars voted |
|
Affirmative |
266,860,588.67 |
91.378 |
|
Against |
8,492,005.75 |
2.908 |
|
Abstain |
16,686,264.20 |
5.714 |
|
TOTAL |
292,038,858.62 |
100.000 |
PROPOSAL 10
To amend the fundamental investment limitation concerning concentration.
|
|
# of Dollars Voted |
% of Dollars voted |
|
Affirmative |
267,900,537.74 |
91.735 |
|
Against |
7,342,176.47 |
2.514 |
|
Abstain |
16,796,144.41 |
5.751 |
|
TOTAL |
292,038,858.62 |
100.000 |
* Denotes trust-wide proposals and voting results.
Balanced Portfolio
Performance
There are several ways to evaluate a fund's historical performance. You can look at the total percentage change in value, the average annual percentage change or the growth of a hypothetical $10,000 investment. Total return reflects the change in the value of an investment, assuming reinvestment of the fund's dividend income and capital gains (the profits earned upon the sale of securities that have grown in value). If Fidelity had not reimbursed certain fund expenses, the past five year and life of fund total returns would have been lower.
Average Annual Total Returns
|
Periods ended |
Past 1 |
Past 5 |
Life of |
|
Fidelity VIP: Asset Mgr: Growth - |
5.78% |
17.22% |
17.90% |
|
Asset Manager: Growth Composite |
6.73% |
18.15% |
19.50% |
|
S&P 500 ® |
7.25% |
23.80% |
25.60% |
|
LB Aggregate Bond |
4.57% |
6.25% |
7.81% |
|
LB 3 Month T-Bill |
5.57% |
5.41% |
n/a* |
Average annual returns take the fund's cumulative return and show you what would have happened if the fund had performed at a constant rate each year.
You can compare the fund's returns to those of the Asset Manager: Growth Composite Index - a hypothetical combination of unmanaged indices. The composite index combines the total returns of the Standard & Poor's 500 SM Index, the Lehman Brothers Aggregate Bond Index and the Lehman Brothers 3 Month Treasury Bill Index weighted according to the fund's neutral mix.**
The benchmarks listed in the table above include reinvested dividends and capital gains, if any.
Figures for more than one year assume a steady compounded rate of return and are not the fund's year-by-year results, which fluctuated over the periods shown. The life of fund figures are from commencement of operations, January 3, 1995.
Performance numbers are net of all fund operating expenses, but do not include any insurance charges imposed by your insurance company's separate account. If performance information included the effect of these additional charges, the total return would have been lower.
Past performance is no guarantee of future results. Principal and investment return will vary and you may have a gain or loss when you withdraw your money.
* not available
** 70% stocks, 25% bonds and 5% short-term instruments effective January 1, 1997.
Understanding Performance
How a fund did yesterday is no guarantee of how it will do tomorrow. The stock market, for example, has a history of long-term growth and short-term volatility. In turn, the share price and return of a fund that invests in stocks will vary. That means if you sell your shares during a market downturn, you might lose money. But if you can ride out the market's ups and downs, you may have a gain.
3$10,000 Over Life of Fund
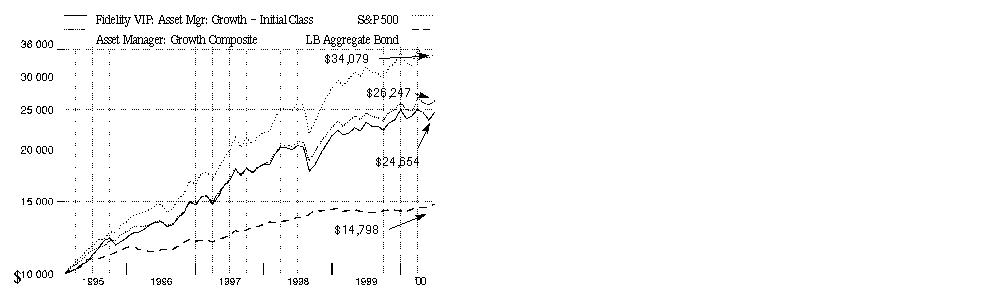
$10,000 Over Life of Fund: Let's say hypothetically that $10,000 was invested in Fidelity Variable Insurance Products: Asset Manager: Growth Portfolio - Initial Class on January 31, 1995, shortly after the fund started. As the chart shows, by June 30, 2000, the value of the investment would have grown to $24,654 - a 146.54% increase. With reinvested dividends and capital gains, if any, a $10,000 investment in the Standard & Poor's 500 Index would have grown to $34,079 - a 240.79% increase. If $10,000 was invested in the Lehman Brothers Aggregate Bond Index, it would have grown to $14,798 - a 47.98% increase.
You can also look at how the Asset Manager: Growth Composite Index did over the same period. With reinvested dividends and capital gains, if any, a $10,000 investment in the index would have grown to $26,247 - a 162.47% increase.
Investment Summary
|
Top Five Stocks as of June 30, 2000 |
|
|
|
% of fund's |
|
General Electric Co. |
2.8 |
|
Intel Corp. |
2.4 |
|
Cisco Systems, Inc. |
2.4 |
|
Microsoft Corp. |
2.3 |
|
Pfizer, Inc. |
1.6 |
|
|
11.5 |
|
Top Five Market Sectors as of June 30, 2000 |
|
|
(stocks only) |
% of fund's |
|
Technology |
29.1 |
|
Health |
9.3 |
|
Finance |
6.4 |
|
Utilities |
6.0 |
|
Energy |
4.5 |
|
Asset Allocation as of June 30, 2000 |
|||
|
% of fund's net assets * |
|||
|
Stock Class 73.4% |
|
|
|
Bond Class 20.6% |
|
|
|
Short-Term Class 6.0% |
|
|

|
* Foreign |
|
|
Asset allocations in the pie charts reflect the categorization of assets as defined in the fund's prospectus. Financial Statement categorizations conform to accounting standards and will differ from the pie chart.
Semiannual Report
(Portfolio Manager photograph)
Note to shareholders: Bart Grenier became Portfolio Manager of Asset Manager: Growth Portfolio on May 1, 2000.
Q. How did the fund perform, Bart?
A. For the six- and 12-month periods that ended June 30, 2000, the fund trailed the Asset Manager: Growth Composite Index, which returned 0.95% and 6.73%, respectively.
Q. What asset allocation strategies did you pursue during the six-month period?
A. The fund continued to slightly emphasize equities, with just over 71% of its assets on average invested in this class during the period. The fund's neutral allocation mix typically calls for 70% to be invested in stocks, 25% in bonds and 5% in short-term and money market instruments. Given the bullish environment for stocks in the first quarter of 2000, the fund's overexposure here garnered it an advantage over the composite index early in the period. However, even with the equity rally in June, the fund's gains during the period were more than offset by its losses suffered during the sharp, broad market decline of April and May. On the bond side, the fund focused on high-yield securities, which hurt, although our exposure to investment-grade debt did help offset some of those losses.
Q. What factors influenced performance of the equity subportfolio?
A. Steve Snider maintained the fund's tilt toward the sectors of the economy with a high growth orientation. The fund's overweighting in technology aided performance, as we were able to uncover several large, high-quality tech names that effectively weathered the correction in the spring and posted big numbers for the period. We also took advantage of several good growth stories among some smaller-cap companies that fared extremely well. Our best tech picks overall included Texas Instruments, LSI Logic, Integrated Device Technology and Comverse. The fund's exposure to health stocks, particularly IVAX, Techne and Pfizer, helped amid a rally in biotechnology shares. Growth-oriented financials, including mutual fund distributor Waddell & Reed and insurer American International Group, were meaningful contributors. Conversely, we were caught holding a handful of disappointments within the tech sector, notably Microsoft, Lucent Technologies, QLogic and Harmonic. Steve sold off fund positions in Waddell & Reed, QLogic and Harmonic prior to the close of the period. The decline in retail stocks during the period dragged down fund holdings Wal-Mart and Home Depot. Poorly performing utility stocks, most notably Qualcomm and AT&T, also weighed on performance. Overall, the equity subportfolio trailed the Standard & Poor's 500 Index slightly during the six-month period, but outperformed it during the past 12 months.
Q. How did the fund's bond subportfolio fare?
A. Charlie Morrison and his team did a nice job of positioning the investment-grade component of the fund to benefit from changing market conditions. The decision to reduce the fund's exposure to long-term corporate bonds was a good one, as the performance of these securities deteriorated along side all other spread sectors during the period. A driving influence at this time was the U.S. Treasury's announcement in January of its intention to reduce new borrowing and use government surplus proceeds to repurchase outstanding debt. This move sparked a tremendous rally in long-term Treasuries. So, despite the Federal Reserve Board's actions to raise rates during the period, the much improved supply/demand picture painted by the Treasury buybacks led to a positive return for the investment-grade subportfolio. On the other hand, high-yield bonds suffered from poor liquidity and declining credit quality. Fred Hoff - who directed the fund's high-yield investments until June 1, 2000, when Mark Notkin took over - helped limit our losses by avoiding the names that fell the furthest amid the period's downtrend.
Q. And the fund's short-term/money market investments?
A. John Todd felt that concerns surrounding Y2K were overblown and, thus, used the opportunity to extend the average maturity of the fund's money-market subportfolio early on to take advantage of a steeply sloped yield curve. Early in 2000, however, the yield curve flattened out dramatically. In response, we let the average maturity roll down, believing that strong economic growth and the risk of rising inflation were likely to set off a protracted period of Fed tightening. Shareholders should note that John may choose to invest in a money market mutual fund rather than invest directly in money market securities in the future.
Q. What's your outlook?
A. It's still unclear as to whether or not the Fed can successfully orchestrate a soft landing, which would be very constructive for stocks. There's a lot of conflicting evidence out there in terms of economic data that will have to get cleared up before we can know for sure if the economy has actually slowed down a couple notches to be considered a soft landing. Until then, I think we'll be in sort of a narrow trading range in terms of the equity market. Security selection in this type of environment will become even more important, which bodes well for us given the strength of Fidelity's research.
The views expressed in this report reflect those of the portfolio manager only through the end of the period of the report as stated on the cover. The manager's views are subject to change at any time based on market or other conditions. For more information, see page 2.
Fund Facts
Goal: maximize total return over the long term by allocating its assets among stocks, bonds and short-term instruments
Start date: January 3, 1995
Size: as of June 30, 2000, more than
$564 million
Manager: Bart Grenier, since May 2000; joined Fidelity in 1991
3Semiannual Report
Fidelity Variable Insurance Products: Asset Manager: Growth Portfolio
(Unaudited)
Showing Percentage of Net Assets
|
Common Stocks - 68.7% |
|||
|
Shares |
Value (Note 1) |
||
|
AEROSPACE & DEFENSE - 0.3% |
|||
|
Northrop Grumman Corp. |
8,400 |
$ 556,500 |
|
|
Textron, Inc. |
16,700 |
907,019 |
|
|
|
1,463,519 |
||
|
BASIC INDUSTRIES - 0.8% |
|||
|
Chemicals & Plastics - 0.6% |
|||
|
Eastman Chemical Co. |
8,600 |
410,650 |
|
|
Engelhard Corp. |
24,200 |
412,913 |
|
|
Pharmacia Corp. |
38,700 |
2,000,306 |
|
|
Praxair, Inc. |
11,500 |
430,531 |
|
|
W.R. Grace & Co. (a) |
37,300 |
452,263 |
|
|
|
3,706,663 |
||
|
Paper & Forest Products - 0.2% |
|||
|
Westvaco Corp. |
39,800 |
987,538 |
|
|
TOTAL BASIC INDUSTRIES |
4,694,201 |
||
|
CONSTRUCTION & REAL ESTATE - 0.1% |
|||
|
Engineering - 0.1% |
|||
|
MasTec, Inc. (a) |
20,100 |
767,569 |
|
|
DURABLES - 0.2% |
|||
|
Consumer Durables - 0.1% |
|||
|
Minnesota Mining & Manufacturing Co. |
5,500 |
453,750 |
|
|
Consumer Electronics - 0.1% |
|||
|
Whirlpool Corp. |
8,300 |
386,988 |
|
|
Textiles & Apparel - 0.0% |
|||
|
Liz Claiborne, Inc. |
10,400 |
366,600 |
|
|
TOTAL DURABLES |
1,207,338 |
||
|
ENERGY - 4.5% |
|||
|
Energy Services - 0.1% |
|||
|
BJ Services Co. (a) |
11,900 |
743,750 |
|
|
Oil & Gas - 4.4% |
|||
|
Amerada Hess Corp. |
28,000 |
1,729,000 |
|
|
EOG Resources, Inc. |
25,400 |
850,900 |
|
|
Exxon Mobil Corp. |
106,800 |
8,383,800 |
|
|
Murphy Oil Corp. |
28,200 |
1,676,138 |
|
|
Noble Affiliates, Inc. |
21,300 |
793,425 |
|
|
Occidental Petroleum Corp. |
89,600 |
1,887,200 |
|
|
Ocean Energy, Inc. (a) |
136,900 |
1,942,269 |
|
|
Royal Dutch Petroleum Co. (NY Shares) |
66,300 |
4,081,594 |
|
|
Tosco Corp. |
26,600 |
753,113 |
|
|
Valero Energy Corp. |
54,400 |
1,727,200 |
|
|
Vintage Petroleum, Inc. |
35,800 |
807,738 |
|
|
|
24,632,377 |
||
|
TOTAL ENERGY |
25,376,127 |
||
|
|
|||
|
Shares |
Value (Note 1) |
||
|
FINANCE - 6.4% |
|||
|
Banks - 1.1% |
|||
|
Bank of America Corp. |
50,800 |
$ 2,184,400 |
|
|
Northern Trust Corp. |
10,100 |
657,131 |
|
|
Silicon Valley Bancshares (a) |
36,600 |
1,560,075 |
|
|
Wells Fargo & Co. |
51,000 |
1,976,250 |
|
|
|
6,377,856 |
||
|
Credit & Other Finance - 1.7% |
|||
|
American Express Co. |
41,400 |
2,157,975 |
|
|
Citigroup, Inc. |
125,700 |
7,573,425 |
|
|
|
9,731,400 |
||
|
Insurance - 1.9% |
|||
|
American International Group, Inc. |
47,100 |
5,534,250 |
|
|
CIGNA Corp. |
22,300 |
2,085,050 |
|
|
First Health Group Corp. (a) |
23,500 |
771,094 |
|
|
Hartford Financial Services Group, Inc. |
13,500 |
755,156 |
|
|
Marsh & McLennan Companies, Inc. |
7,100 |
741,506 |
|
|
PMI Group, Inc. |
13,200 |
627,000 |
|
|
|
10,514,056 |
||
|
Savings & Loans - 0.2% |
|||
|
Dime Bancorp, Inc. |
37,000 |
582,750 |
|
|
Golden West Financial Corp. |
17,300 |
706,056 |
|
|
|
1,288,806 |
||
|
Securities Industry - 1.5% |
|||
|
Bear Stearns Companies, Inc. |
33,900 |
1,411,088 |
|
|
Eaton Vance Corp. (non-vtg.) |
19,100 |
883,375 |
|
|
Lehman Brothers Holdings, Inc. |
16,700 |
1,579,194 |
|
|
Merrill Lynch & Co., Inc. |
14,600 |
1,679,000 |
|
|
Morgan Stanley Dean Witter & Co. |
35,200 |
2,930,400 |
|
|
|
8,483,057 |
||
|
TOTAL FINANCE |
36,395,175 |
||
|
HEALTH - 9.2% |
|||
|
Drugs & Pharmaceuticals - 6.2% |
|||
|
American Home Products Corp. |
40,400 |
2,373,500 |
|
|
Amgen, Inc. |
31,600 |
2,219,900 |
|
|
Andrx Corp. (a) |
14,700 |
939,652 |
|
|
Bristol-Myers Squibb Co. |
61,300 |
3,570,725 |
|
|
Eli Lilly & Co. |
33,700 |
3,365,788 |
|
|
Forest Laboratories, Inc. (a) |
9,400 |
949,400 |
|
|
IVAX Corp. (a) |
63,500 |
2,635,250 |
|
|
Jones Pharma, Inc. |
41,100 |
1,641,431 |
|
|
Merck & Co., Inc. |
70,700 |
5,417,388 |
|
|
Pfizer, Inc. |
192,675 |
9,248,400 |
|
|
Schering-Plough Corp. |
45,400 |
2,292,700 |
|
|
|
34,654,134 |
||
|
Medical Equipment & Supplies - 2.0% |
|||
|
Abbott Laboratories |
47,000 |
2,094,438 |
|
|
Johnson & Johnson |
43,000 |
4,380,625 |
|
|
Millipore Corp. |
15,300 |
1,153,238 |
|
|
Common Stocks - continued |
|||
|
Shares |
Value (Note 1) |
||
|
HEALTH - continued |
|||
|
Medical Equipment & Supplies - continued |
|||
|
Techne Corp. (a) |
22,400 |
$ 2,912,000 |
|
|
Varian Medical Systems, Inc. (a) |
19,000 |
743,375 |
|
|
|
11,283,676 |
||
|
Medical Facilities Management - 1.0% |
|||
|
Quest Diagnostics, Inc. (a) |
14,100 |
1,053,975 |
|
|
Trigon Healthcare, Inc. (a) |
20,300 |
1,046,719 |
|
|
UnitedHealth Group, Inc. |
32,400 |
2,778,300 |
|
|
Universal Health Services, Inc. Class B (a) |
14,100 |
923,550 |
|
|
|
5,802,544 |
||
|
TOTAL HEALTH |
51,740,354 |
||
|
INDUSTRIAL MACHINERY & EQUIPMENT - 4.4% |
|||
|
Electrical Equipment - 3.5% |
|||
|
Adtran, Inc. (a) |
25,300 |
1,514,838 |
|
|
General Electric Co. |
304,600 |
16,143,777 |
|
|
Scientific-Atlanta, Inc. |
30,600 |
2,279,700 |
|
|
|
19,938,315 |
||
|
Industrial Machinery & Equipment - 0.9% |
|||
|
Asyst Technologies, Inc. (a) |
37,800 |
1,294,650 |
|
|
Deere & Co. |
34,400 |
1,272,800 |
|
|
Tyco International Ltd. |
52,300 |
2,477,713 |
|
|
|
5,045,163 |
||
|
TOTAL INDUSTRIAL MACHINERY & EQUIPMENT |
24,983,478 |
||
|
MEDIA & LEISURE - 2.7% |
|||
|
Broadcasting - 0.5% |
|||
|
NTL, Inc. warrants 10/14/08 (a) |
427 |
17,507 |
|
|
Time Warner, Inc. |
39,800 |
3,024,800 |
|
|
|
3,042,307 |
||
|
Entertainment - 1.3% |
|||
|
Mandalay Resort Group (a) |
65,300 |
1,306,000 |
|
|
Viacom, Inc. Class B (non-vtg.) (a) |
47,100 |
3,211,631 |
|
|
Walt Disney Co. |
64,000 |
2,484,000 |
|
|
|
7,001,631 |
||
|
Leisure Durables & Toys - 0.2% |
|||
|
Brunswick Corp. |
30,300 |
501,844 |
|
|
Callaway Golf Co. |
30,700 |
500,794 |
|
|
|
1,002,638 |
||
|
Publishing - 0.6% |
|||
|
Dow Jones & Co., Inc. |
18,400 |
1,347,800 |
|
|
Gannett Co., Inc. |
7,100 |
424,669 |
|
|
McGraw-Hill Companies, Inc. |
25,600 |
1,382,400 |
|
|
The New York Times Co. Class A |
11,200 |
442,400 |
|
|
|
3,597,269 |
||
|
|
|||
|
Shares |
Value (Note 1) |
||
|
Restaurants - 0.1% |
|||
|
Brinker International, Inc. (a) |
18,300 |
$ 535,275 |
|
|
TOTAL MEDIA & LEISURE |
15,179,120 |
||
|
NONDURABLES - 2.4% |
|||
|
Beverages - 1.4% |
|||
|
Anheuser-Busch Companies, Inc. |
13,500 |
1,008,281 |
|
|
Pepsi Bottling Group, Inc. |
84,200 |
2,457,588 |
|
|
The Coca-Cola Co. |
76,400 |
4,388,225 |
|
|
|
7,854,094 |
||
|
Foods - 0.6% |
|||
|
Quaker Oats Co. |
14,100 |
1,059,263 |
|
|
Sysco Corp. |
49,400 |
2,080,975 |
|
|
|
3,140,238 |
||
|
Household Products - 0.4% |
|||
|
Procter & Gamble Co. |
40,700 |
2,330,075 |
|
|
TOTAL NONDURABLES |
13,324,407 |
||
|
PRECIOUS METALS - 0.0% |
|||
|
Placer Dome, Inc. |
11,500 |
107,970 |
|
|
RETAIL & WHOLESALE - 3.2% |
|||
|
Apparel Stores - 0.6% |
|||
|
Talbots, Inc. |
30,000 |
1,648,125 |
|
|
The Limited, Inc. |
45,600 |
986,100 |
|
|
Venator Group, Inc. (a) |
79,600 |
815,900 |
|
|
|
3,450,125 |
||
|
General Merchandise Stores - 1.7% |
|||
|
BJ's Wholesale Club, Inc. (a) |
49,600 |
1,636,800 |
|
|
Wal-Mart Stores, Inc. |
137,800 |
7,940,725 |
|
|
|
9,577,525 |
||
|
Retail & Wholesale, Miscellaneous - 0.9% |
|||
|
Home Depot, Inc. |
71,200 |
3,555,550 |
|
|
Tiffany & Co., Inc. |
24,300 |
1,640,250 |
|
|
|
5,195,800 |
||
|
TOTAL RETAIL & WHOLESALE |
18,223,450 |
||
|
SERVICES - 0.5% |
|||
|
Advertising - 0.2% |
|||
|
TMP Worldwide, Inc. (a) |
12,100 |
893,131 |
|
|
Services - 0.3% |
|||
|
Manpower, Inc. |
6,600 |
211,200 |
|
|
Robert Half International, Inc. (a) |
25,200 |
718,200 |
|
|
Teletech Holdings, Inc. (a) |
25,900 |
804,519 |
|
|
|
1,733,919 |
||
|
TOTAL SERVICES |
2,627,050 |
||
|
Common Stocks - continued |
|||
|
Shares |
Value (Note 1) |
||
|
TECHNOLOGY - 29.1% |
|||
|
Communications Equipment - 6.2% |
|||
|
ADC Telecommunications, Inc. (a) |
11,300 |
$ 947,788 |
|
|
Cable Design Technologies Corp. (a) |
40,800 |
1,366,800 |
|
|
Cisco Systems, Inc. (a) |
213,700 |
13,583,306 |
|
|
Comverse Technology, Inc. (a) |
17,700 |
1,646,100 |
|
|
Corning, Inc. |
8,500 |
2,293,938 |
|
|
Lucent Technologies, Inc. |
102,100 |
6,049,425 |
|
|
Nokia AB sponsored ADR |
14,300 |
714,106 |
|
|
Nortel Networks Corp. |
102,500 |
7,110,267 |
|
|
Tollgrade Communications, Inc. (a) |
11,200 |
1,484,000 |
|
|
|
35,195,730 |
||
|
Computer Services & Software - 6.2% |
|||
|
Adobe Systems, Inc. |
4,000 |
520,000 |
|
|
Amdocs Ltd. (a) |
10,300 |
790,525 |
|
|
America Online, Inc. (a) |
70,600 |
3,724,150 |
|
|
BEA Systems, Inc. (a) |
19,200 |
949,200 |
|
|
BroadVision, Inc. (a) |
10,800 |
548,775 |
|
|
Microsoft Corp. (a) |
161,000 |
12,880,000 |
|
|
Oracle Corp. (a) |
108,600 |
9,129,188 |
|
|
Remedy Corp. (a) |
16,100 |
897,575 |
|
|
Siebel Systems, Inc. (a) |
5,800 |
948,663 |
|
|
Sybase, Inc. (a) |
88,500 |
2,035,500 |
|
|
Symantec Corp. (a) |
11,300 |
609,494 |
|
|
Yahoo!, Inc. (a) |
16,800 |
2,081,100 |
|
|
|
35,114,170 |
||
|
Computers & Office Equipment - 4.6% |
|||
|
Apple Computer, Inc. (a) |
13,000 |
680,875 |
|
|
Dell Computer Corp. (a) |
79,300 |
3,910,481 |
|
|
EMC Corp. (a) |
66,800 |
5,139,425 |
|
|
Hewlett-Packard Co. |
37,800 |
4,720,275 |
|
|
International Business Machines Corp. |
53,700 |
5,883,506 |
|
|
Maxtor Corp. (a) |
55,900 |
590,444 |
|
|
Sun Microsystems, Inc. (a) |
57,500 |
5,228,906 |
|
|
|
26,153,912 |
||
|
Electronic Instruments - 2.5% |
|||
|
Applied Materials, Inc. (a) |
33,700 |
3,054,063 |
|
|
Credence Systems Corp. (a) |
30,200 |
1,666,663 |
|
|
Electro Scientific Industries, Inc. (a) |
29,600 |
1,303,325 |
|
|
KLA-Tencor Corp. (a) |
10,500 |
614,906 |
|
|
Kulicke & Soffa Industries, Inc. (a) |
13,700 |
813,438 |
|
|
LAM Research Corp. (a) |
39,100 |
1,466,250 |
|
|
LTX Corp. (a) |
19,700 |
688,269 |
|
|
Meade Instruments Corp. (a) |
64,400 |
1,618,050 |
|
|
Teradyne, Inc. (a) |
23,000 |
1,690,500 |
|
|
Trimble Navigation Ltd. (a) |
17,300 |
844,456 |
|
|
|
13,759,920 |
||
|
Electronics - 9.6% |
|||
|
Advanced Micro Devices, Inc. (a) |
27,200 |
2,101,200 |
|
|
Altera Corp. (a) |
20,300 |
2,069,331 |
|
|
Amkor Technology, Inc. (a) |
16,900 |
596,781 |
|
|
Amphenol Corp. Class A (a) |
39,600 |
2,621,025 |
|
|
|
|||
|
Shares |
Value (Note 1) |
||
|
Analog Devices, Inc. (a) |
22,500 |
$ 1,710,000 |
|
|
Arrow Electronics, Inc. (a) |
14,900 |
461,900 |
|
|
Atmel Corp. (a) |
36,700 |
1,353,313 |
|
|
AVX Corp. |
50,000 |
1,146,875 |
|
|
Burr-Brown Corp. (a) |
30,700 |
2,661,306 |
|
|
Cypress Semiconductor Corp. (a) |
38,900 |
1,643,525 |
|
|
Integrated Device Technology, Inc. (a) |
45,700 |
2,736,288 |
|
|
Intel Corp. |
103,400 |
13,823,288 |
|
|
International Rectifier Corp. (a) |
41,800 |
2,340,800 |
|
|
KEMET Corp. (a) |
49,800 |
1,248,113 |
|
|
LSI Logic Corp. (a) |
10,400 |
562,900 |
|
|
Microchip Technology, Inc. (a) |
10,800 |
629,269 |
|
|
Motorola, Inc. |
65,697 |
1,909,319 |
|
|
National Semiconductor Corp. (a) |
7,600 |
431,300 |
|
|
PMC-Sierra, Inc. (a) |
3,800 |
675,213 |
|
|
SDL, Inc. (a) |
3,900 |
1,112,231 |
|
|
Semtech Corp. (a) |
28,400 |
2,172,156 |
|
|
Technitrol, Inc. |
5,600 |
542,500 |
|
|
Texas Instruments, Inc. |
72,000 |
4,945,500 |
|
|
Three-Five Systems, Inc. (a) |
11,000 |
649,000 |
|
|
Vishay Intertechnology, Inc. (a) |
51,000 |
1,934,813 |
|
|
Xilinx, Inc. (a) |
24,100 |
1,989,756 |
|
|
|
54,067,702 |
||
|
TOTAL TECHNOLOGY |
164,291,434 |
||
|
TRANSPORTATION - 0.1% |
|||
|
Air Transportation - 0.0% |
|||
|
Delta Air Lines, Inc. |
4,600 |
232,588 |
|
|
Trucking & Freight - 0.1% |
|||
|
C.H. Robinson Worldwide, Inc. |
5,000 |
247,500 |
|
|
TOTAL TRANSPORTATION |
480,088 |
||
|
UTILITIES - 4.8% |
|||
|
Cellular - 0.2% |
|||
|
McCaw International Ltd. warrants 4/16/07 (a)(f) |
910 |
2,275 |
|
|
QUALCOMM, Inc. (a) |
5,500 |
330,000 |
|
|
Sprint Corp. - PCS Group Series 1 (a) |
13,500 |
803,250 |
|
|
|
1,135,525 |
||
|
Electric Utility - 1.0% |
|||
|
Calpine Corp. (a) |
29,400 |
1,933,050 |
|
|
Entergy Corp. |
26,400 |
717,750 |
|
|
PECO Energy Co. |
18,000 |
725,625 |
|
|
PPL Corp. |
30,900 |
677,869 |
|
|
Public Service Enterprise Group, Inc. |
24,800 |
858,700 |
|
|
TXU Corp. |
26,700 |
787,650 |
|
|
|
5,700,644 |
||
|
Gas - 0.3% |
|||
|
Columbia Energy Group |
12,000 |
787,500 |
|
|
Enron Corp. |
11,200 |
722,400 |
|
|
|
1,509,900 |
||
|
Common Stocks - continued |
|||
|
Shares |
Value (Note 1) |
||
|
UTILITIES - continued |
|||
|
Telephone Services - 3.3% |
|||
|
AT&T Corp. |
114,800 |
$ 3,630,550 |
|
|
Bell Atlantic Corp. |
48,000 |
2,439,000 |
|
|
BellSouth Corp. |
58,200 |
2,480,775 |
|
|
GTE Corp. |
29,800 |
1,855,050 |
|
|
Ono Finance PLC rights 5/31/09 (a)(f) |
310 |
3,100 |
|
|
Pathnet, Inc. warrants 4/15/08 (a)(f) |
840 |
8,400 |
|
|
SBC Communications, Inc. |
105,500 |
4,562,875 |
|
|
WorldCom, Inc. (a) |
87,800 |
4,027,825 |
|
|
|
19,007,575 |
||
|
TOTAL UTILITIES |
27,353,644 |
||
|
TOTAL COMMON STOCKS (Cost $325,944,798) |
388,214,924 |
||
|
Nonconvertible Preferred Stocks - 1.8% |
|||
|
|
|
|
|
|
CONSTRUCTION & REAL ESTATE - 0.1% |
|||
|
Real Estate Investment Trusts - 0.1% |
|||
|
California Federal Preferred Capital Corp. $2.2812 |
30,171 |
641,134 |
|
|
FINANCE - 0.0% |
|||
|
Insurance - 0.0% |
|||
|
American Annuity Group Capital Trust II 8.875% |
160 |
142,442 |
|
|
HEALTH - 0.1% |
|||
|
Medical Facilities Management - 0.1% |
|||
|
Fresenius Medical Care Capital Trust II 7.875% |
386 |
352,140 |
|
|
MEDIA & LEISURE - 0.4% |
|||
|
Broadcasting - 0.3% |
|||
|
Adelphia Communications Corp. $13.00 |
2,183 |
224,849 |
|
|
CSC Holdings, Inc. 11.125% pay-in-kind |
14,567 |
1,522,252 |
|
|
|
1,747,101 |
||
|
Publishing - 0.1% |
|||
|
PRIMEDIA, Inc.: |
|
|
|
|
$9.20 |
4,338 |
376,322 |
|
|
Series D, $10.00 |
4,544 |
420,320 |
|
|
|
796,642 |
||
|
TOTAL MEDIA & LEISURE |
2,543,743 |
||
|
|
|||
|
Shares |
Value (Note 1) |
||
|
UTILITIES - 1.2% |
|||
|
Cellular - 0.6% |
|||
|
Crown Castle International Corp. 12.75% pay-in-kind |
358 |
$ 365,160 |
|
|
Nextel Communications, Inc. 11.125% pay-in-kind |
2,851 |
2,751,215 |
|
|
|
3,116,375 |
||
|
Telephone Services - 0.6% |
|||
|
Adelphia Business Solution, Inc. 12.875% pay-in-kind |
873 |
781,335 |
|
|
Intermedia Communications, Inc. 13.5% pay-in-kind |
820 |
795,400 |
|
|
IXC Communications, Inc. 12.5% pay-in-kind |
263 |
263,000 |
|
|
NEXTLINK Communications, Inc. 14% pay-in-kind |
33,088 |
1,687,488 |
|
|
|
3,527,223 |
||
|
TOTAL UTILITIES |
6,643,598 |
||
|
TOTAL NONCONVERTIBLE (Cost $10,734,609) |
10,323,057 |
||
|
Corporate Bonds - 13.9% |
|||||
|
Moody's Ratings (unaudited) (b) |
Principal Amount |
|
|||
|
Convertible Bonds - 0.4% |
|||||
|
HEALTH - 0.3% |
|||||
|
Medical Facilities Management - 0.3% |
|||||
|
Tenet Healthcare Corp. 6% 12/1/05 |
B1 |
|
$ 1,290,000 |
1,062,638 |
|
|
Total Renal Care Holdings, Inc. 7% 5/15/09 (f) |
B3 |
|
500,000 |
332,500 |
|
|
|
1,395,138 |
||||
|
MEDIA & LEISURE - 0.1% |
|||||
|
Lodging & Gaming - 0.1% |
|||||
|
Hilton Hotels Corp. 5% 5/15/06 |
Ba2 |
|
660,000 |
521,400 |
|
|
TOTAL CONVERTIBLE BONDS |
1,916,538 |
||||
|
Nonconvertible Bonds - 13.5% |
|||||
|
AEROSPACE & DEFENSE - 0.1% |
|||||
|
Ship Building & Repair - 0.1% |
|||||
|
Newport News Shipbuilding, Inc. 9.25% 12/1/06 |
Ba3 |
|
652,000 |
652,000 |
|
|
BASIC INDUSTRIES - 1.0% |
|||||
|
Chemicals & Plastics - 0.6% |
|||||
|
Avecia Group PLC 11% 7/1/09 |
B2 |
|
635,000 |
622,300 |
|
|
Corporate Bonds - continued |
|||||
|
Moody's Ratings (unaudited) (b) |
Principal Amount |
Value |
|||
|
Nonconvertible Bonds - continued |
|||||
|
BASIC INDUSTRIES - continued |
|||||
|
Chemicals & Plastics - continued |
|||||
|
Huntsman Corp. 9.5% 7/1/07 (f) |
B2 |
|
$ 565,000 |
$ 515,563 |
|
|
Huntsman ICI Chemicals LLC 10.125% 7/1/09 |
B2 |
|
200,000 |
200,000 |
|
|
Lyondell Chemical Co.: |
|
|
|
|
|
|
9.875% 5/1/07 |
Ba3 |
|
890,000 |
881,100 |
|
|
10.875% 5/1/09 |
B2 |
|
440,000 |
436,700 |
|
|
Sovereign Specialty Chemicals, Inc. 11.875% 3/15/10 |
B3 |
|
305,000 |
313,769 |
|
|
Sterling Chemicals, Inc. 11.75% 8/15/06 |
Caa3 |
|
470,000 |
380,700 |
|
|
|
3,350,132 |
||||
|
Metals & Mining - 0.0% |
|||||
|
Kaiser Aluminum & Chemical Corp. 12.75% 2/1/03 |
B3 |
|
305,000 |
277,550 |
|
|
Packaging & Containers - 0.3% |
|||||
|
Gaylord Container Corp.: |
|
|
|
|
|
|
9.375% 6/15/07 |
Caa1 |
|
560,000 |
431,200 |
|
|
9.75% 6/15/07 |
Caa1 |
|
660,000 |
514,800 |
|
|
Norampac, Inc. 9.5% 2/1/08 |
B1 |
|
390,000 |
376,350 |
|
|
Packaging Corp. of America 9.625% 4/1/09 |
B2 |
|
370,000 |
365,375 |
|
|
|
1,687,725 |
||||
|
Paper & Forest Products - 0.1% |
|||||
|
Potlatch Corp. 6.25% 3/15/02 |
Baa1 |
|
80,000 |
77,378 |
|
|
Repap New Brunswick, Inc. yankee 10.625% 4/15/05 |
Caa1 |
|
380,000 |
334,400 |
|
|
|
411,778 |
||||
|
TOTAL BASIC INDUSTRIES |
5,727,185 |
||||
|
CONSTRUCTION & REAL ESTATE - 0.2% |
|||||
|
Building Materials - 0.0% |
|||||
|
Numatics, Inc. 9.625% 4/1/08 |
B3 |
|
30,000 |
24,000 |
|
|
Construction - 0.1% |
|||||
|
Blount, Inc. 13% 8/1/09 |
B3 |
|
270,000 |
274,725 |
|
|
Engineering - 0.0% |
|||||
|
Anteon Corp. 12% 5/15/09 |
B3 |
|
170,000 |
153,000 |
|
|
Real Estate - 0.0% |
|||||
|
Duke-Weeks Realty LP 6.875% 3/15/05 |
Baa2 |
|
100,000 |
94,976 |
|
|
|
|||||
|
Moody's Ratings (unaudited) (b) |
Principal Amount |
Value |
|||
|
Real Estate Investment Trusts - 0.1% |
|||||
|
CenterPoint Properties Trust: |
|
|
|
|
|
|
6.75% 4/1/05 |
Baa2 |
|
$ 100,000 |
$ 93,160 |
|
|
7.125% 3/15/04 |
Baa2 |
|
110,000 |
105,585 |
|
|
Equity Office Properties Trust: |
|
|
|
|
|
|
6.375% 2/15/03 |
Baa1 |
|
100,000 |
96,114 |
|
|
6.75% 2/15/08 |
Baa1 |
|
100,000 |
91,609 |
|
|
Pinnacle Holdings, Inc. 0% 3/15/08 (e) |
B3 |
|
285,000 |
198,075 |
|
|
|
584,543 |
||||
|
TOTAL CONSTRUCTION & REAL ESTATE |
1,131,244 |
||||
|
DURABLES - 0.0% |
|||||
|
Autos, Tires, & Accessories - 0.0% |
|||||
|
TRW, Inc. 6.5% 6/1/02 |
Baa1 |
|
120,000 |
116,878 |
|
|
Consumer Electronics - 0.0% |
|||||
|
Whirlpool Corp. 8.6% 5/1/10 |
Baa1 |
|
40,000 |
41,276 |
|
|
Textiles & Apparel - 0.0% |
|||||
|
Jones Apparel Group, Inc. 7.875% 6/15/06 |
Baa2 |
|
135,000 |
128,887 |
|
|
TOTAL DURABLES |
287,041 |
||||
|
ENERGY - 0.4% |
|||||
|
Coal - 0.1% |
|||||
|
P&L Coal Holdings Corp. 9.625% 5/15/08 |
B2 |
|
330,000 |
306,075 |
|
|
Energy Services - 0.1% |
|||||
|
Baker Hughes, Inc. 5.8% 2/15/03 |
A2 |
|
90,000 |
86,184 |
|
|
R&B Falcon Corp. 6.5% 4/15/03 |
Ba3 |
|
320,000 |
296,800 |
|
|
RBF Finance Co. 11% 3/15/06 |
Ba3 |
|
300,000 |
321,000 |
|
|
|
703,984 |
||||
|
Oil & Gas - 0.2% |
|||||
|
Apache Corp. 7.625% 7/1/19 |
Baa1 |
|
75,000 |
72,417 |
|
|
Chesapeake Energy Corp. 9.625% 5/1/05 |
B2 |
|
680,000 |
663,000 |
|
|
Occidental Petroleum Corp. 9.75% 6/15/01 |
Baa3 |
|
100,000 |
101,880 |
|
|
Oryx Energy Co.: |
|
|
|
|
|
|
8% 10/15/03 |
Baa1 |
|
95,000 |
94,964 |
|
|
8.125% 10/15/05 |
Baa1 |
|
140,000 |
141,666 |
|
|
8.375% 7/15/04 |
Baa1 |
|
195,000 |
196,743 |
|
|
Corporate Bonds - continued |
|||||
|
Moody's Ratings (unaudited) (b) |
Principal Amount |
Value |
|||
|
Nonconvertible Bonds - continued |
|||||
|
ENERGY - continued |
|||||
|
Oil & Gas - continued |
|||||
|
Petro-Canada 7% 11/15/28 |
A3 |
|
$ 50,000 |
$ 43,660 |
|
|
Phillips Petroleum Co. 8.75% 5/25/10 |
Baa2 |
|
60,000 |
63,205 |
|
|
|
1,377,535 |
||||
|
TOTAL ENERGY |
2,387,594 |
||||
|
FINANCE - 1.0% |
|||||
|
Banks - 0.2% |
|||||
|
Bank of Tokyo-Mitsubishi Ltd. 8.4% 4/15/10 |
A3 |
|
70,000 |
70,686 |
|
|
BankBoston Corp. 6.625% 2/1/04 |
A3 |
|
60,000 |
57,821 |
|
|
Capital One Bank: |
|
|
|
|
|
|
6.375% 2/15/03 |
Baa2 |
|
130,000 |
124,651 |
|
|
6.65% 3/15/04 |
Baa3 |
|
260,000 |
249,730 |
|
|
Capital One Financial Corp. 7.125% 8/1/08 |
Baa3 |
|
100,000 |
93,065 |
|
|
Commonwealth Bank of Australia 8.5% 6/1/10 |
A1 |
|
100,000 |
103,774 |
|
|
Den Danske Bank AS 6.375% 6/15/08 (f)(i) |
A1 |
|
170,000 |
156,081 |
|
|
Korea Development Bank 6.625% 11/21/03 |
Baa2 |
|
95,000 |
91,388 |
|
|
Providian National Bank 6.7% 3/15/03 |
Baa3 |
|
100,000 |
95,634 |
|
|
Royal Bank of Scotland Group PLC 9.118% 3/31/49 |
A1 |
|
50,000 |
51,934 |
|
|
|
1,094,764 |
||||
|
Credit & Other Finance - 0.6% |
|||||
|
Ahmanson Capital Trust I 8.36% 12/1/26 (f) |
A3 |
|
125,000 |
113,663 |
|
|
AMRESCO, Inc.: |
|
|
|
|
|
|
9.875% 3/15/05 |
Caa3 |
|
470,000 |
218,550 |
|
|
10% 3/15/04 |
Caa3 |
|
210,000 |
96,600 |
|
|
Countrywide Funding Corp. 6.45% 2/27/03 |
A3 |
|
150,000 |
144,867 |
|
|
Details Capital Corp. 0% 11/15/07 (e) |
Caa1 |
|
85,000 |
56,100 |
|
|
Dobson/Sygnet Communications Co. 12.25% 12/15/08 |
- |
|
140,000 |
148,050 |
|
|
ERP Operating LP: |
|
|
|
|
|
|
6.55% 11/15/01 |
A3 |
|
55,000 |
54,206 |
|
|
7.1% 6/23/04 |
A3 |
|
100,000 |
96,976 |
|
|
Finova Capital Corp.: |
|
|
|
|
|
|
6.11% 2/18/03 |
Baa2 |
|
50,000 |
44,000 |
|
|
7.25% 11/8/04 |
Baa2 |
|
110,000 |
97,900 |
|
|
|
|||||
|
Moody's Ratings (unaudited) (b) |
Principal Amount |
Value |
|||
|
First Security Capital I 8.41% 12/15/26 |
A3 |
|
$ 110,000 |
$ 101,908 |
|
|
Ford Motor Credit Co.: |
|
|
|
|
|
|
6.4513% 7/16/01 (i) |
A2 |
|
400,000 |
400,433 |
|
|
7.5% 3/15/05 |
A2 |
|
140,000 |
138,950 |
|
|
7.875% 6/15/10 |
A2 |
|
400,000 |
400,568 |
|
|
Heller Financial, Inc. 6% 3/19/04 |
A3 |
|
180,000 |
168,451 |
|
|
Macsaver Financial Services, Inc.: |
|
|
|
|
|
|
7.4% 2/15/02 |
Ba2 |
|
280,000 |
182,000 |
|
|
7.6% 8/1/07 |
Ba2 |
|
790,000 |
418,700 |
|
|
7.875% 8/1/03 |
Ba2 |
|
130,000 |
80,600 |
|
|
Newcourt Credit Group, Inc. 6.875% 2/16/05 |
A1 |
|
130,000 |
123,696 |
|
|
Sprint Capital Corp.: |
|
|
|
|
|
|
5.7% 11/15/03 |
Baa1 |
|
40,000 |
37,693 |
|
|
6.875% 11/15/28 |
Baa1 |
|
90,000 |
77,818 |
|
|
The Money Store, Inc. 7.3% 12/1/02 |
A2 |
|
100,000 |
99,063 |
|
|
TXU Eastern Funding: |
|
|
|
|
|
|
6.15% 5/15/02 |
Baa1 |
|
60,000 |
58,267 |
|
|
6.75% 5/15/09 |
Baa1 |
|
90,000 |
80,475 |
|
|
Venetian Casino Resort LLC/Las Vegas Sands, Inc. 12.25% 11/15/04 |
Caa1 |
|
150,000 |
151,500 |
|
|
|
3,591,034 |
||||
|
Savings & Loans - 0.1% |
|||||
|
Chevy Chase Savings Bank FSB 9.25% 12/1/08 |
B1 |
|
80,000 |
71,200 |
|
|
Home Savings of America FSB 6.5% 8/15/04 |
A3 |
|
90,000 |
85,394 |
|
|
Long Island Savings Bank FSB 7% 6/13/02 |
Baa3 |
|
140,000 |
138,011 |
|
|
Sovereign Bancorp, Inc. 6.625% 3/15/01 |
Ba3 |
|
100,000 |
97,625 |
|
|
|
392,230 |
||||
|
Securities Industry - 0.1% |
|||||
|
Amvescap PLC yankee 6.375% 5/15/03 |
A3 |
|
200,000 |
190,872 |
|
|
Goldman Sachs Group LP 6.6338% 7/27/00 (i)(k) |
A1 |
|
400,000 |
399,966 |
|
|
|
590,838 |
||||
|
TOTAL FINANCE |
5,668,866 |
||||
|
HEALTH - 0.1% |
|||||
|
Medical Facilities Management - 0.1% |
|||||
|
Fountain View, Inc. 11.25% 4/15/08 |
Caa1 |
|
460,000 |
112,700 |
|
|
Corporate Bonds - continued |
|||||
|
Moody's Ratings (unaudited) (b) |
Principal Amount |
Value |
|||
|
Nonconvertible Bonds - continued |
|||||
|
HEALTH - continued |
|||||
|
Medical Facilities Management - continued |
|||||
|
Tenet Healthcare Corp. 8.625% 1/15/07 |
Ba3 |
|
$ 330,000 |
$ 313,500 |
|
|
Unilab Corp. 12.75% 10/1/09 |
B3 |
|
150,000 |
154,500 |
|
|
|
580,700 |
||||
|
INDUSTRIAL MACHINERY & EQUIPMENT - 0.6% |
|||||
|
Industrial Machinery & Equipment - 0.2% |
|||||
|
Dunlop Standard Aero Holdings PLC 11.875% 5/15/09 |
B3 |
|
430,000 |
425,700 |
|
|
Roller Bearing Holding, Inc. 0% 6/15/09 (e)(f) |
- |
|
500,000 |
255,000 |
|
|
Tyco International Group SA: |
|
|
|
|
|
|
7% 6/15/28 |
Baa1 |
|
280,000 |
240,696 |
|
|
yankee 6.375% 6/15/05 |
Baa1 |
|
30,000 |
28,618 |
|
|
|
950,014 |
||||
|
Pollution Control - 0.4% |
|||||
|
Allied Waste North America, Inc.: |
|
|
|
|
|
|
7.375% 1/1/04 |
Ba3 |
|
230,000 |
209,300 |
|
|
7.625% 1/1/06 |
Ba2 |
|
195,000 |
169,650 |
|
|
10% 8/1/09 |
B2 |
|
1,795,000 |
1,507,800 |
|
|
Browning-Ferris Industries, Inc. 6.375% 1/15/08 |
Ba3 |
|
220,000 |
169,400 |
|
|
WMX Technologies, Inc.: |
|
|
|
|
|
|
6.25% 10/15/00 |
Ba1 |
|
100,000 |
99,343 |
|
|
7.1% 8/1/26 |
Ba1 |
|
40,000 |
37,649 |
|
|
|
2,193,142 |
||||
|
TOTAL INDUSTRIAL MACHINERY & EQUIPMENT |
3,143,156 |
||||
|
MEDIA & LEISURE - 4.5% |
|||||
|
Broadcasting - 3.6% |
|||||
|
Adelphia Communications Corp. 9.875% 3/1/07 |
B1 |
|
1,230,000 |
1,168,500 |
|
|
AMFM Operating, Inc. 12.625% 10/31/06 pay-in-kind |
- |
|
257,300 |
302,328 |
|
|
Ascent Entertainment Group, Inc. 0% 12/15/04 (e) |
Ba1 |
|
350,000 |
283,500 |
|
|
British Sky Broadcasting Group PLC 8.2% 7/15/09 |
Baa3 |
|
210,000 |
196,442 |
|
|
Callahan Nordrhein Westfalen 14% 7/15/10 (f) |
B3 |
|
770,000 |
770,000 |
|
|
|
|||||
|
Moody's Ratings (unaudited) (b) |
Principal Amount |
Value |
|||
|
Charter Communications Holdings LLC/Charter Communications Holdings Capital Corp. 10% 4/1/09 |
B2 |
|
$ 705,000 |
$ 683,850 |
|
|
Citadel Broadcasting Co.: |
|
|
|
|
|
|
9.25% 11/15/08 |
B3 |
|
210,000 |
203,700 |
|
|
10.25% 7/1/07 |
B3 |
|
1,335,000 |
1,353,356 |
|
|
Clear Channel Communications, Inc.: |
|
|
|
|
|
|
6.875% 6/15/18 |
Baa3 |
|
320,000 |
275,104 |
|
|
7.875% 6/15/05 |
Baa3 |
|
90,000 |
89,577 |
|
|
Comcast UK Cable Partners Ltd. 0% 11/15/07 (e) |
B2 |
|
580,000 |
539,400 |
|
|
CSC Holdings, Inc. 10.5% 5/15/16 |
Ba3 |
|
280,000 |
295,400 |
|
|
Diamond Cable Communications PLC: |
|
|
|
|
|
|
0% 2/15/07 (e) |
B3 |
|
645,000 |
495,038 |
|
|
yankee 0% 12/15/05 (e) |
B3 |
|
300,000 |
280,500 |
|
|
Earthwatch, Inc. 0% 7/15/07 unit (e)(f) |
- |
|
430,000 |
275,200 |
|
|
EchoStar DBS Corp.: |
|
|
|
|
|
|
9.25% 2/1/06 |
B2 |
|
515,000 |
496,975 |
|
|
9.375% 2/1/09 |
B2 |
|
420,000 |
405,300 |
|
|
Fox Family Worldwide, Inc. 0% 11/1/07 (e) |
B1 |
|
100,000 |
62,000 |
|
|
FrontierVision Holdings LP/FrontierVision Holdings Capital Corp. 0% 9/15/07 (e) |
B1 |
|
700,000 |
603,750 |
|
|
FrontierVision Operating Partners LP/ FrontierVision Capital Corp. 11% 10/15/06 |
B1 |
|
340,000 |
340,000 |
|
|
Golden Sky DBS, Inc. 0% 3/1/07 (e) |
Caa1 |
|
590,000 |
396,775 |
|
|
Golden Sky Systems, Inc. 12.375% 8/1/06 |
B3 |
|
180,000 |
196,200 |
|
|
Hearst-Argyle Television, Inc. 7.5% 11/15/27 |
Baa3 |
|
200,000 |
168,718 |
|
|
International Cabletel, Inc. 0% 2/1/06 (e) |
B3 |
|
220,000 |
202,400 |
|
|
Knology Holding, Inc. 0% 10/15/07 (e) |
- |
|
380,000 |
193,800 |
|
|
LIN Holdings Corp. 0% 3/1/08 (e) |
B3 |
|
305,000 |
200,538 |
|
|
Nielsen Media Research, Inc. 7.6% 6/15/09 |
Baa2 |
|
60,000 |
57,251 |
|
|
NorthPoint Communication Holdings, Inc. 12.875% 2/15/10 |
Caa1 |
|
890,000 |
614,100 |
|
|
NTL Communications Corp.: |
|
|
|
|
|
|
0% 10/1/08 (e) |
B3 |
|
875,000 |
562,188 |
|
|
11.5% 10/1/08 |
B3 |
|
690,000 |
695,175 |
|
|
NTL, Inc.: |
|
|
|
|
|
|
0% 4/1/08 (e) |
B3 |
|
1,735,000 |
1,075,700 |
|
|
Corporate Bonds - continued |
|||||
|
Moody's Ratings (unaudited) (b) |
Principal Amount |
Value |
|||
|
Nonconvertible Bonds - continued |
|||||
|
MEDIA & LEISURE - continued |
|||||
|
Broadcasting - continued |
|||||
|
NTL, Inc.: - continued |
|
|
|
|
|
|
10% 2/15/07 |
B3 |
|
$ 240,000 |
$ 228,000 |
|
|
Pegasus Communications Corp. 9.625% 10/15/05 |
B3 |
|
960,000 |
926,400 |
|
|
TCI Communications, Inc. 9.8% 2/1/12 |
A2 |
|
190,000 |
215,865 |
|
|
Telemundo Holdings, Inc. 0% 8/15/08 (e) |
Caa1 |
|
805,000 |
559,475 |
|
|
Telewest Communications PLC: |
|
|
|
|
|
|
0% 4/15/09 (e) |
B1 |
|
620,000 |
341,000 |
|
|
0% 2/1/10 (e)(f) |
B1 |
|
615,000 |
325,950 |
|
|
Telewest PLC: |
|
|
|
|
|
|
yankee 9.625% 10/1/06 |
B1 |
|
110,000 |
103,400 |
|
|
0% 10/1/07 (e) |
B1 |
|
1,330,000 |
1,270,150 |
|
|
Time Warner, Inc. 9.125% 1/15/13 |
Baa3 |
|
155,000 |
169,865 |
|
|
United Pan-Europe Communications NV: |
|
|
|
|
|
|
0% 2/1/10 (e) |
B2 |
|
1,310,000 |
615,700 |
|
|
10.875% 8/1/09 |
B2 |
|
2,057,000 |
1,810,160 |
|
|
USA Networks, Inc./USANi LLC 6.75% 11/15/05 |
Baa3 |
|
35,000 |
33,338 |
|
|
|
20,082,068 |
||||
|
Entertainment - 0.3% |
|||||
|
Bally Total Fitness Holding Corp. 9.875% 10/15/07 |
B3 |
|
418,000 |
380,380 |
|
|
Cinemark USA, Inc. 8.5% 8/1/08 |
B2 |
|
130,000 |
61,100 |
|
|
Paramount Communications, Inc. 7.5% 1/15/02 |
Baa1 |
|
110,000 |
109,640 |
|
|
Premier Parks, Inc. 0% 4/1/08 (e) |
B3 |
|
1,335,000 |
906,131 |
|
|
Viacom, Inc.: |
|
|
|
|
|
|
6.75% 1/15/03 |
Baa1 |
|
110,000 |
108,032 |
|
|
7.75% 6/1/05 |
Baa1 |
|
115,000 |
115,390 |
|
|
|
1,680,673 |
||||
|
Lodging & Gaming - 0.4% |
|||||
|
Florida Panthers Holdings, Inc. 9.875% 4/15/09 |
B2 |
|
410,000 |
383,350 |
|
|
HMH Properties, Inc. 7.875% 8/1/05 |
Ba2 |
|
380,000 |
349,600 |
|
|
Horseshoe Gaming LLC 8.625% 5/15/09 |
B2 |
|
285,000 |
267,900 |
|
|
Host Marriott LP 8.375% 2/15/06 |
Ba2 |
|
630,000 |
589,050 |
|
|
ITT Corp. 7.375% 11/15/15 |
Ba1 |
|
150,000 |
125,625 |
|
|
|
|||||
|
Moody's Ratings (unaudited) (b) |
Principal Amount |
Value |
|||
|
Mohegan Tribal Gaming Authority 8.75% 1/1/09 |
Ba3 |
|
$ 390,000 |
$ 368,550 |
|
|
Station Casinos, Inc. 9.875% 7/1/10 (f) |
B1 |
|
465,000 |
467,325 |
|
|
|
2,551,400 |
||||
|
Publishing - 0.1% |
|||||
|
News America |
|
|
|
|
|
|
7.7% 10/30/25 |
Baa3 |
|
110,000 |
100,177 |
|
|
7.75% 1/20/24 |
Baa3 |
|
70,000 |
63,369 |
|
|
Time Warner Entertainment Co. LP 8.375% 3/15/23 |
Baa2 |
|
325,000 |
329,007 |
|
|
|
492,553 |
||||
|
Restaurants - 0.1% |
|||||
|
Domino's, Inc. 10.375% 1/15/09 |
B3 |
|
300,000 |
278,250 |
|
|
NE Restaurant, Inc. 10.75% 7/15/08 |
B3 |
|
550,000 |
429,000 |
|
|
|
707,250 |
||||
|
TOTAL MEDIA & LEISURE |
25,513,944 |
||||
|
NONDURABLES - 0.2% |
|||||
|
Beverages - 0.1% |
|||||
|
Seagram JE & Sons, Inc.: |
|
|
|
|
|
|
6.4% 12/15/03 |
Baa3 |
|
120,000 |
115,332 |
|
|
6.8% 12/15/08 |
Baa3 |
|
105,000 |
98,472 |
|
|
|
213,804 |
||||
|
Foods - 0.1% |
|||||
|
ConAgra, Inc. 7.125% 10/1/26 |
Baa1 |
|
115,000 |
106,058 |
|
|
Del Monte Foods Co. 0% 12/15/07 (e) |
Caa1 |
|
440,000 |
330,000 |
|
|
|
436,058 |
||||
|
Tobacco - 0.0% |
|||||
|
Philip Morris |
|
|
|
|
|
|
7% 7/15/05 |
A2 |
|
70,000 |
65,942 |
|
|
7.25% 9/15/01 |
A2 |
|
50,000 |
49,184 |
|
|
RJ Reynolds Tobacco Holdings, Inc. 7.375% 5/15/03 |
Baa2 |
|
100,000 |
92,876 |
|
|
|
208,002 |
||||
|
TOTAL NONDURABLES |
857,864 |
||||
|
RETAIL & WHOLESALE - 0.3% |
|||||
|
Drug Stores - 0.0% |
|||||
|
Rite Aid Corp.: |
|
|
|
|
|
|
6.5% 12/15/05 (f) |
Caa1 |
|
100,000 |
51,500 |
|
|
7.125% 1/15/07 |
Caa1 |
|
40,000 |
21,200 |
|
|
|
72,700 |
||||
|
Corporate Bonds - continued |
|||||
|
Moody's Ratings (unaudited) (b) |
Principal Amount |
Value |
|||
|
Nonconvertible Bonds - continued |
|||||
|
RETAIL & WHOLESALE - continued |
|||||
|
General Merchandise Stores - 0.1% |
|||||
|
Dayton Hudson Corp. 7.5% 7/15/06 |
A2 |
|
$ 125,000 |
$ 124,930 |
|
|
Federated Department Stores, Inc.: |
|
|
|
|
|
|
6.79% 7/15/27 |
Baa1 |
|
100,000 |
96,704 |
|
|
8.5% 6/15/03 |
Baa1 |
|
50,000 |
50,459 |
|
|
Kmart Corp. 12.5% 3/1/05 |
Baa3 |
|
510,000 |
553,350 |
|
|
|
825,443 |
||||
|
Grocery Stores - 0.2% |
|||||
|
Kroger Co. 6% 7/1/00 |
Baa3 |
|
110,000 |
109,979 |
|
|
Pathmark Stores, Inc. 9.625% 5/1/03 (d) |
Caa3 |
|
1,230,000 |
848,700 |
|
|
|
958,679 |
||||
|
TOTAL RETAIL & WHOLESALE |
1,856,822 |
||||
|
SERVICES - 0.1% |
|||||
|
Printing - 0.0% |
|||||
|
Sullivan Graphics, Inc. 12.75% 8/1/05 |
Caa1 |
|
210,000 |
211,050 |
|
|
Services - 0.1% |
|||||
|
La Petite Academy, Inc./La Petite Academy Holding Co. 10% 5/15/08 |
B3 |
|
370,000 |
214,600 |
|
|
Medaphis Corp. 9.5% 2/15/05 |
Caa1 |
|
260,000 |
195,000 |
|
|
|
409,600 |
||||
|
TOTAL SERVICES |
620,650 |
||||
|
TECHNOLOGY - 1.2% |
|||||
|
Computer Services & Software - 0.6% |
|||||
|
Amazon.com, Inc. 0% 5/1/08 (e) |
Caa1 |
|
395,000 |
213,300 |
|
|
Concentric Network Corp. 12.75% 12/15/07 |
B- |
|
120,000 |
126,000 |
|
|
Covad Communications Group, Inc.: |
|
|
|
|
|
|
0% 3/15/08 (e) |
B3 |
|
715,000 |
350,350 |
|
|
12% 2/15/10 |
B3 |
|
970,000 |
751,750 |
|
|
12.5% 2/15/09 |
B3 |
|
201,000 |
159,795 |
|
|
Exodus Communications, Inc. 11.25% 7/1/08 |
B- |
|
355,000 |
351,450 |
|
|
Federal Data Corp. 10.125% 8/1/05 |
B3 |
|
690,000 |
448,500 |
|
|
PSINet, Inc. 10.5% 12/1/06 |
B3 |
|
1,115,000 |
1,025,800 |
|
|
Verio, Inc. 10.375% 4/1/05 |
B3 |
|
11,000 |
11,715 |
|
|
|
3,438,660 |
||||
|
|
|||||
|
Moody's Ratings (unaudited) (b) |
Principal Amount |
Value |
|||
|
Computers & Office Equipment - 0.2% |
|||||
|
Comdisco, Inc.: |
|
|
|
|
|
|
6.375% 11/30/01 |
Baa1 |
|
$ 150,000 |
$ 145,139 |
|
|
7.25% 9/1/02 |
Baa1 |
|
125,000 |
120,986 |
|
|
Globix Corp. 12.5% 2/1/10 |
B- |
|
570,000 |
470,250 |
|
|
Sun Microsystems, Inc. 7% 8/15/02 |
Baa1 |
|
35,000 |
34,783 |
|
|
|
771,158 |
||||
|
Electronics - 0.4% |
|||||
|
ChipPAC International Ltd. 12.75% 8/1/09 |
B3 |
|
535,000 |
575,125 |
|
|
Details, Inc. 10% 11/15/05 |
B3 |
|
110,000 |
104,500 |
|
|
Fairchild |
|
|
|
|
|
|
10.125% 3/15/07 |
B2 |
|
100,000 |
101,000 |
|
|
10.375% 10/1/07 |
B3 |
|
310,000 |
316,200 |
|
|
Flextronics International Ltd. 9.875% 7/1/10 (f) |
Ba3 |
|
225,000 |
228,375 |
|
|
Micron Technology, Inc. 6.5% 9/30/05 (k) |
B3 |
|
1,000,000 |
835,000 |
|
|
SCG Holding Corp./Semiconductor Components Industries LLC 12% 8/1/09 |
B2 |
|
230,000 |
245,525 |
|
|
|
2,405,725 |
||||
|
TOTAL TECHNOLOGY |
6,615,543 |
||||
|
TRANSPORTATION - 0.2% |
|||||
|
Air Transportation - 0.1% |
|||||
|
Continental Airlines, Inc. pass thru trust certificates: |
|
|
|
|
|
|
7.434% 3/15/06 |
Baa1 |
|
30,000 |
29,007 |
|
|
7.73% 9/15/12 |
Baa1 |
|
12,553 |
11,989 |
|
|
Delta Air Lines, Inc. 8.3% 12/15/29 |
Baa3 |
|
160,000 |
139,456 |
|
|
Qantas Airways Ltd. 7.75% 6/15/09 (f) |
Baa1 |
|
110,000 |
109,450 |
|
|
US Airways Group, Inc. 10.375% 3/1/13 |
Ba3 |
|
360,000 |
320,400 |
|
|
|
610,302 |
||||
|
Railroads - 0.1% |
|||||
|
Burlington Northern |
Baa2 |
|
150,000 |
133,680 |
|
|
Canadian National Railway Co. 6.9% 7/15/28 |
Baa2 |
|
150,000 |
126,551 |
|
|
CSX Corp.: |
|
|
|
|
|
|
6.25% 10/15/08 |
Baa2 |
|
60,000 |
52,178 |
|
|
6.46% 6/22/05 |
Baa2 |
|
100,000 |
94,039 |
|
|
Corporate Bonds - continued |
|||||
|
Moody's Ratings (unaudited) (b) |
Principal Amount |
Value |
|||
|
Nonconvertible Bonds - continued |
|||||
|
TRANSPORTATION - continued |
|||||
|
Railroads - continued |
|||||
|
Norfolk Southern Corp. 7.05% 5/1/37 |
Baa1 |
|
$ 220,000 |
$ 215,019 |
|
|
Wisconsin Central Transportation Corp. 6.625% 4/15/08 |
Baa2 |
|
100,000 |
88,821 |
|
|
|
710,288 |
||||
|
TOTAL TRANSPORTATION |
1,320,590 |
||||
|
UTILITIES - 3.6% |
|||||
|
Cellular - 1.5% |
|||||
|
Crown Castle International Corp. 0% 5/15/11 (e) |
B3 |
|
525,000 |
320,250 |
|
|
Dobson Communications Corp. 10.875% 7/1/10 (f) |
- |
|
230,000 |
231,725 |
|
|
McCaw International Ltd. 0% 4/15/07 (e) |
Caa1 |
|
1,067,000 |
810,920 |
|
|
Millicom International Cellular SA 0% 6/1/06 (e) |
Caa1 |
|
1,310,000 |
1,113,500 |
|
|
Nextel Communications, Inc. 0% 10/31/07 (e) |
B1 |
|
2,760,000 |
2,056,200 |
|
|
Nextel International, Inc. 0% 4/15/08 (e) |
Caa1 |
|
815,000 |
537,900 |
|
|
Rogers Communications, Inc. 8.875% 7/15/07 |
Ba3 |
|
530,000 |
519,400 |
|
|
TeleCorp PCS, Inc. 0% 4/15/09 (e) |
B3 |
|
595,000 |
391,213 |
|
|
Triton PCS, Inc. 0% 5/1/08 (e) |
B3 |
|
560,000 |
404,600 |
|
|
Vodafone AirTouch PLC 7.625% 2/15/05 (f) |
A2 |
|
105,000 |
104,887 |
|
|
VoiceStream Wireless Corp.: |
|
|
|
|
|
|
0% 11/15/09 (e) |
B2 |
|
255,000 |
170,850 |
|
|
10.375% 11/15/09 |
B2 |
|
1,550,000 |
1,612,000 |
|
|
|
8,273,445 |
||||
|
Electric Utility - 0.1% |
|||||
|
Avon Energy Partners Holdings 6.46% 3/4/08 (f) |
Baa2 |
|
130,000 |
115,788 |
|
|
Dominion Resources, Inc. 8.125% 6/15/10 |
Baa1 |
|
65,000 |
65,439 |
|
|
Hydro-Quebec yankee 8.4% 3/28/25 |
A2 |
|
90,000 |
95,040 |
|
|
Illinois Power Co. 7.5% 6/15/09 |
Baa1 |
|
60,000 |
58,571 |
|
|
Israel Electric Corp. Ltd.: |
|
|
|
|
|
|
7.75% 12/15/27 (f) |
A3 |
|
170,000 |
145,716 |
|
|
yankee 7.875% 12/15/26 (f) |
A3 |
|
80,000 |
70,665 |
|
|
|
|||||
|
Moody's Ratings (unaudited) (b) |
Principal Amount |
Value |
|||
|
Texas Utilities Co. 6.375% 1/1/08 |
Baa3 |
|
$ 40,000 |
$ 36,130 |
|
|
|
587,349 |
||||
|
Gas - 0.0% |
|||||
|
Reliant Energy Resources Corp. 8.125% 7/15/05 (f) |
Baa1 |
|
50,000 |
49,990 |
|
|
Telephone Services - 2.0% |
|||||
|
Allegiance Telecom, Inc.: |
|
|
|
|
|
|
0% 2/15/08 (e) |
B3 |
|
250,000 |
181,875 |
|
|
12.875% 5/15/08 |
B3 |
|
260,000 |
281,450 |
|
|
Cable & Wireless Optus Ltd. 8% 6/22/10 (f) |
Baa1 |
|
100,000 |
99,383 |
|
|
Deutsche Telekom International Finance BV 8.25% 6/15/30 |
Aa2 |
|
260,000 |
264,142 |
|
|
FirstWorld Communications, Inc. 0% 4/15/08 (e) |
- |
|
480,000 |
216,000 |
|
|
Global Crossing Holdings Ltd. 9.125% 11/15/06 |
Ba2 |
|
145,000 |
139,563 |
|
|
Globenet Communication Group Ltd. 13% 7/15/07 |
Caa1 |
|
475,000 |
479,750 |
|
|
ICG Services, Inc. 0% 5/1/08 (e) |
B3 |
|
400,000 |
184,000 |
|
|
Intermedia |
|
|
|
|
|
|
0% 7/15/07 (e) |
B2 |
|
455,000 |
352,625 |
|
|
0% 3/1/09 (e) |
B3 |
|
250,000 |
151,875 |
|
|
Level 3 Communications, Inc. 9.125% 5/1/08 |
B3 |
|
765,000 |
686,588 |
|
|
Logix Communications Enterprises, Inc. 12.25% 6/15/08 |
- |
|
675,000 |
216,000 |
|
|
McLeodUSA, Inc.: |
|
|
|
|
|
|
0% 3/1/07 (e) |
B1 |
|
670,000 |
559,450 |
|
|
9.5% 11/1/08 |
B1 |
|
215,000 |
209,625 |
|
|
Metromedia Fiber Network, Inc. 10% 12/15/09 |
B2 |
|
95,000 |
93,338 |
|
|
NEXTLINK Communications, Inc. 9.625% 10/1/07 |
B2 |
|
540,000 |
506,250 |
|
|
Ono Finance PLC 13% 5/1/09 |
Caa1 |
|
370,000 |
349,650 |
|
|
Pathnet, Inc. 12.25% 4/15/08 |
- |
|
840,000 |
470,400 |
|
|
Rhythms |
|
|
|
|
|
|
0% 5/15/08 (e) |
B3 |
|
1,356,000 |
535,620 |
|
|
12.75% 4/15/09 |
B3 |
|
695,000 |
472,600 |
|
|
Telecomunicaciones de Puerto Rico, Inc. 6.65% 5/15/06 |
Baa2 |
|
140,000 |
130,379 |
|
|
Teleglobe Canada, Inc.: |
|
|
|
|
|
|
7.2% 7/20/09 |
Baa1 |
|
183,000 |
175,104 |
|
|
7.7% 7/20/29 |
Baa1 |
|
160,000 |
150,667 |
|
|
Corporate Bonds - continued |
|||||
|
Moody's Ratings (unaudited) (b) |
Principal Amount |
Value |
|||
|
Nonconvertible Bonds - continued |
|||||
|
UTILITIES - continued |
|||||
|
Telephone Services - continued |
|||||
|
Teligent, Inc.: |
|
|
|
|
|
|
0% 3/1/08 (e) |
Caa1 |
|
$ 770,000 |
$ 354,200 |
|
|
11.5% 12/1/07 |
Caa1 |
|
890,000 |
689,750 |
|
|
WinStar Communications, Inc.: |
|
|
|
|
|
|
0% 4/15/10 (e)(f) |
B3 |
|
2,636,000 |
1,225,740 |
|
|
12.75% 4/15/10 (f) |
B3 |
|
1,961,000 |
1,892,365 |
|
|
WorldCom, Inc. 8.875% 1/15/06 |
A3 |
|
103,000 |
106,797 |
|
|
|
11,175,186 |
||||
|
TOTAL UTILITIES |
20,085,970 |
||||
|
TOTAL NONCONVERTIBLE BONDS |
76,449,169 |
||||
|
TOTAL CORPORATE BONDS (Cost $84,294,396) |
78,365,707 |
||||
|
U.S. Government and Government |
|||||
|
|
|||||
|
U.S. Government Agency Obligations - 1.2% |
|||||
|
Fannie Mae: |
|
|
|
|
|
|
6% 5/15/08 |
Aaa |
|
1,000,000 |
932,570 |
|
|
6.5% 4/29/09 |
Aaa |
|
245,000 |
228,884 |
|
|
7.125% 2/15/05 |
Aaa |
|
255,000 |
256,035 |
|
|
7.25% 5/15/30 |
Aaa |
|
310,000 |
316,310 |
|
|
Federal Home Loan Bank 6.75% 2/1/02 |
Aaa |
|
830,000 |
827,402 |
|
|
Freddie Mac: |
|
|
|
|
|
|
0% 8/17/00 |
- |
|
2,000,000 |
1,983,698 |
|
|
5.5% 5/15/02 |
Aaa |
|
1,000,000 |
975,310 |
|
|
5.75% 3/15/09 |
Aaa |
|
510,000 |
464,498 |
|
|
6.25% 7/15/04 |
Aaa |
|
200,000 |
194,438 |
|
|
6.875% 1/15/05 |
Aaa |
|
85,000 |
84,469 |
|
|
7% 7/15/05 |
Aaa |
|
110,000 |
109,846 |
|
|
7.625% 9/9/09 |
Aaa |
|
85,000 |
83,805 |
|
|
Tennessee Valley Authority 7.125% 5/1/30 |
Aaa |
|
65,000 |
65,273 |
|
|
TOTAL U.S. GOVERNMENT AGENCY OBLIGATIONS |
6,522,538 |
||||
|
U.S. Treasury Obligations - 1.2% |
|||||
|
U.S. Treasury Bills, yield at date of purchase 5.76% 8/24/00 (h) |
- |
|
1,000,000 |
991,983 |
|
|
U.S. Treasury Bonds: |
|
|
|
|
|
|
6.875% 8/15/25 |
Aaa |
|
135,000 |
147,128 |
|
|
8% 11/15/21 |
Aaa |
|
50,000 |
60,446 |
|
|
8.125% 8/15/19 |
Aaa |
|
1,780,000 |
2,151,860 |
|
|
|
|||||
|
Moody's Ratings (unaudited) (b) |
Principal Amount |
Value |
|||
|
8.875% 8/15/17 |
Aaa |
|
$ 219,000 |
$ 279,157 |
|
|
8.875% 2/15/19 |
Aaa |
|
259,000 |
333,341 |
|
|
U.S. Treasury Notes: |
|
|
|
|
|
|
5.875% 10/31/01 |
Aaa |
|
700,000 |
694,533 |
|
|
6.625% 6/30/01 |
Aaa |
|
1,315,000 |
1,316,644 |
|
|
7.25% 8/15/04 |
Aaa |
|
20,000 |
20,678 |
|
|
7.875% 11/15/04 |
Aaa |
|
830,000 |
878,895 |
|
|
TOTAL U.S. TREASURY OBLIGATIONS |
6,874,665 |
||||
|
TOTAL U.S. GOVERNMENT AND GOVERNMENT AGENCY OBLIGATIONS (Cost $13,316,132) |
13,397,203 |
||||
|
U.S. Government Agency - |
|||||
|
|
|||||
|
Fannie Mae - 2.3% |
|||||
|
6% 3/1/11 to 1/1/29 |
Aaa |
|
1,157,618 |
1,100,240 |
|
|
6.5% 2/1/26 to 11/1/29 |
Aaa |
|
3,584,741 |
3,385,228 |
|
|
7% 8/1/25 to 12/1/29 |
Aaa |
|
3,017,374 |
2,921,248 |
|
|
7.5% 5/1/24 to 1/1/30 |
Aaa |
|
2,639,765 |
2,603,005 |
|
|
7.5% 7/1/30 |
Aaa |
|
1,200,000 |
1,182,375 |
|
|
8% 1/1/30 |
Aaa |
|
398,480 |
400,098 |
|
|
8% 7/1/30 (g) |
Aaa |
|
1,155,000 |
1,159,332 |
|
|
TOTAL FANNIE MAE |
12,751,526 |
||||
|
Freddie Mac - 0.0% |
|||||
|
7.5% 8/1/28 |
Aaa |
|
131,845 |
130,404 |
|
|
Government National Mortgage Association - 0.3% |
|||||
|
7% 7/15/28 |
Aaa |
|
847,185 |
823,616 |
|
|
7.5% 1/15/26 to 8/15/28 |
Aaa |
|
775,734 |
770,452 |
|
|
TOTAL GOVERNMENT NATIONAL |
1,594,068 |
||||
|
TOTAL U.S. GOVERNMENT AGENCY - (Cost $14,760,546) |
14,475,998 |
||||
|
Asset-Backed Securities - 0.2% |
|||||
|
|
|||||
|
Airplanes pass through trust 10.875% 3/15/19 |
Ba2 |
|
340,757 |
252,160 |
|
|
BankAmerica Manufacturing Housing Contract Trust V 6.2% 4/10/09 |
Aaa |
|
150,000 |
146,859 |
|
|
Capita Equipment Receivables Trust 6.48% 10/15/06 |
Baa2 |
|
100,000 |
96,797 |
|
|
CIT Marine Trust 5.8% 4/15/10 |
Aaa |
|
120,000 |
115,950 |
|
|
CPS Auto Grantor Trust 6.55% 8/15/02 |
Aaa |
|
18,974 |
18,879 |
|
|
Asset-Backed Securities - continued |
|||||
|
Moody's Ratings (unaudited) (b) |
Principal Amount |
Value |
|||
|
CPS Auto Receivables Trust 6% 8/15/03 |
Aaa |
|
$ 72,514 |
$ 71,517 |
|
|
CSXT Trade Receivables Master Trust 6% 7/25/04 |
Aaa |
|
180,000 |
174,544 |
|
|
Ford Credit Auto |
|
|
|
|
|
|
6.2% 12/15/02 |
Aa2 |
|
90,000 |
88,777 |
|
|
6.4% 12/15/02 |
Aa2 |
|
50,000 |
49,350 |
|
|
7.03% 11/15/03 |
Aaa |
|
24,000 |
23,981 |
|
|
Green Tree Financial Corp. 6.8% 6/15/27 |
Aaa |
|
19,008 |
18,990 |
|
|
Olympic Automobile Receivables Trust 6.7% 3/15/02 |
Aaa |
|
6,288 |
6,286 |
|
|
Petroleum Enhanced Trust Receivables Offering Petroleum Trust 6.125% 2/5/03 (f)(i) |
Baa2 |
|
54,596 |
54,331 |
|
|
Sears Credit Account Master Trust II 7.5% 11/15/07 |
A2 |
|
50,000 |
50,000 |
|
|
UAF Auto Grantor Trust 6.1% 1/15/03 (f) |
Aaa |
|
79,617 |
79,095 |
|
|
TOTAL ASSET-BACKED SECURITIES (Cost $1,381,710) |
1,247,516 |
||||
|
Collateralized Mortgage Obligations - 0.0% |
|||||
|
|
|||||
|
Private Sponsor - 0.0% |
|||||
|
Credit-Based Asset Servicing and Securitization LLC Series 1997-2 Class 2B, 7.1786% 12/29/25 (d)(f)(i) |
Ba3 |
|
167,970 |
80,993 |
|
|
U.S. Government Agency - 0.0% |
|||||
|
Fannie Mae REMIC planned amortization class: |
|
|
|
|
|
|
Series 1999-54 Class PH, 6.5% 11/18/29 |
Aaa |
|
100,000 |
90,016 |
|
|
Series 1999-57 Class PH, 6.5% 12/25/29 |
Aaa |
|
100,000 |
89,859 |
|
|
TOTAL U.S. GOVERNMENT AGENCY |
179,875 |
||||
|
TOTAL COLLATERALIZED MORTGAGE OBLIGATIONS (Cost $268,920) |
260,868 |
||||
|
Commercial Mortgage Securities - 0.7% |
|||||
|
Moody's Ratings (unaudited) (b) |
Principal Amount |
Value |
|||
|
BKB Commercial Mortgage Trust Series 1997-C1 Class D, 7.7606% 2/25/43 (f)(i) |
BBB |
|
$ 36,512 |
$ 36,294 |
|
|
CBM Funding Corp. sequential pay Series 1996-1: |
|
|
|
|
|
|
Class A-3PI, 7.08% 11/1/07 |
AA |
|
100,000 |
98,242 |
|
|
Class B, 7.48% 2/1/08 |
A |
|
80,000 |
78,172 |
|
|
CS First Boston Mortgage Securities Corp.: |
|
|
|
|
|
|
Series 1997-C2 Class D, 7.27% 1/17/35 |
Baa2 |
|
200,000 |
183,859 |
|
|
Series 1998-FL1 Class E, 7.4913% 1/10/13 (f)(i) |
Baa2 |
|
220,000 |
219,020 |
|
|
Deutsche Mortgage & Asset Receiving Corp. Series 1998-C1 Class D, 7.231% 7/15/12 |
Baa2 |
|
140,000 |
125,759 |
|
|
First Chicago/Lennar Trust I Series 1997-CHL1 Class E, 8.0835% 4/1/39 (i) |
- |
|
320,000 |
227,700 |
|
|
FMAC Loan |
|
|
|
|
|
|
Series 1997-A Class E, 8.1104% 4/15/19 (f)(i) |
- |
|
250,000 |
165,234 |
|
|
Series 1997-B Class E, 7.8912% 9/15/19 (f)(i) |
- |
|
100,000 |
38,000 |
|
|
General Motors Acceptance Corp. Commercial Mortgage Securities, Inc. Series 1996-C1 Class F, 7.86% 10/15/28 (f) |
Ba3 |
|
250,000 |
201,055 |
|
|
GS Mortgage Securities Corp. II Series 1998-GLII Class E, 7.1905% 4/13/31 (f)(i) |
Baa3 |
|
180,000 |
155,623 |
|
|
LTC Commercial Mortgage pass through certificates: |
|
|
|
|
|
|
Series 1996-1 Class E, 9.16% 4/15/28 |
BB- |
|
500,000 |
447,500 |
|
|
Series 1998-1 Class A, 6.029% 5/30/30 (f) |
AAA |
|
103,030 |
96,929 |
|
|
Morgan Stanley Capital I, Inc. Series 1996-MBL1 Class E, 8.2633% 5/25/21 (f)(i) |
- |
|
76,623 |
76,204 |
|
|
Nomura Asset Securities Corp. Series 1998-D6 Class A4, 7.6083% 3/17/28 (i) |
Baa2 |
|
140,000 |
127,728 |
|
|
Nomura Depositor Trust floater Series 1998-ST1A Class B2, 10.9013% 1/15/03 (f)(i) |
- |
|
125,000 |
115,762 |
|
|
Commercial Mortgage Securities - continued |
|||||
|
Moody's Ratings (unaudited) (b) |
Principal Amount |
Value |
|||
|
Prudential Securities Secd Financing Corp. Series 2000-C1, Class A2 7.727% 2/15/10 |
Aaa |
|
$ 50,000 |
$ 50,484 |
|
|
Structured Asset Securities Corp.: |
|
|
|
|
|
|
Series 1995-C1 Class E, 7.375% 9/25/24 (f) |
BB |
|
1,000,000 |
921,445 |
|
|
Series 1996-CFL Class E, 7.75% 2/25/28 |
BBB |
|
80,000 |
79,331 |
|
|
Thirteen Affiliates of General Growth Properties, Inc.: |
|
|
|
|
|
|
Series D-2, 6.992% 12/15/10 (f) |
Baa2 |
|
140,000 |
128,827 |
|
|
Series E-2, 7.224% 12/15/10 (f) |
Baa3 |
|
100,000 |
89,828 |
|
|
TOTAL COMMERCIAL MORTGAGE SECURITIES (Cost $3,940,126) |
3,662,996 |
||||
|
Foreign Government and Government |
|||||
|
|
|||||
|
Korean Republic yankee 8.875% 4/15/08 |
Baa2 |
|
46,000 |
47,449 |
|
|
Quebec Province 7.5% 9/15/29 |
A2 |
|
340,000 |
334,019 |
|
|
United Mexican States 9.875% 2/1/10 |
Baa3 |
|
150,000 |
156,750 |
|
|
TOTAL FOREIGN GOVERNMENT AND GOVERNMENT AGENCY OBLIGATIONS (Cost $539,426) |
538,218 |
||||
|
Supranational Obligations - 0.0% |
|||||
|
|
|||||
|
Inter-American Development Bank yankee 6.29% 7/16/27 |
Aaa |
|
150,000 |
142,893 |
|
|
Purchased Bank Debt - 1.6% |
|||||
|
|
|||||
|
American Tower L P term loan 9.53% 12/31/07 (i) |
- |
|
600,000 |
603,000 |
|
|
Charter Communication Operating LLC term loan 8.8% 3/18/08 (i) |
Ba3 |
|
1,000,000 |
993,750 |
|
|
Crown Castle Operating Co. term loan 9.46% 6/15/08 (i) |
Ba3 |
|
800,000 |
802,000 |
|
|
Dynatech LLC term loan 10.03% 9/1/07 (i) |
- |
|
760,000 |
756,200 |
|
|
|
|||||
|
Moody's Ratings (unaudited) (b) |
Principal Amount |
Value |
|||
|
Huntsman ICI Chemicals LLC sr. secured: |
|
|
|
|
|
|
term B loan 9.875% 6/30/07 (i) |
- |
|
$ 341,250 |
$ 342,103 |
|
|
term C loan 9.8128% 6/30/08 (i) |
- |
|
438,920 |
440,017 |
|
|
Lyondell Chemical Co. sr. secured Tranche E term loan 10.5263% 5/17/06 (i) |
- |
|
700,000 |
719,250 |
|
|
McLeodUSA, Inc. term loan 9.69% 5/31/08 (i) |
Ba2 |
|
750,000 |
751,875 |
|
|
Nextel Finance Co. term loan: |
|
|
|
|
|
|
9.6875% 6/30/08 (i) |
Ba2 |
|
500,000 |
501,875 |
|
|
10.375% 12/31/08 (i) |
Ba2 |
|
500,000 |
501,875 |
|
|
Packaging Corp. of America term loan 0% 5/22/07 (i) |
- |
|
500,000 |
501,250 |
|
|
Telemundo Group, Inc. term loan 8.905% 3/31/07 (i) |
B1 |
|
300,000 |
298,125 |
|
|
Tritel Holding Corp. term loan 11.15% 12/31/07 (i) |
B2 |
|
750,000 |
752,813 |
|
|
Voicestream Pcs Holding LLC term loan 9.76% 2/25/09 (i) |
B+ |
|
900,000 |
897,750 |
|
|
Wci Capital Corp. term loan 11.43% 9/30/07 (i) |
B2 |
|
400,000 |
399,000 |
|
|
TOTAL PURCHASED BANK DEBT (Cost $9,276,347) |
9,260,883 |
||||
|
Bank Notes - 0.1% |
||||
|
|
||||
|
Bank One NA 6.29% 8/25/00 |
|
350,000 |
349,447 |
|
|
Certificates of Deposit - 0.1% |
||||
|
|
||||
|
Canadian Imperial Bank of Commerce yankee 7.01% 11/27/00 |
|
350,000 |
350,194 |
|
|
Commercial Paper - 0.3% |
||||
|
|
||||
|
CIT Group, Inc. 6.43% 7/5/00 |
|
350,000 |
349,869 |
|
|
Daimler-Chrysler North America Holding Corp. yankee 6.65% 11/7/00 |
|
350,000 |
341,826 |
|
|
General Motors Acceptance Corp. 6.62% 8/28/00 |
|
380,000 |
376,116 |
|
|
ING America Insurance Holdings, Inc. yankee 6.69% 11/9/00 |
|
350,000 |
341,735 |
|
|
Woolwich PLC yankee 6.21% 7/19/00 |
|
350,000 |
348,969 |
|
|
TOTAL COMMERCIAL PAPER (Cost $1,757,427) |
1,758,515 |
|||
|
Cash Equivalents - 7.6% |
|||
|
Maturity Amount |
Value |
||
|
Investments in repurchase agreements (U.S. Government Obligations), in a joint trading account at 6.83%, dated 6/30/00 due 7/3/00 |
$ 2,216,261 |
$ 2,215,000 |
|
|
Shares |
|
||
|
Central Cash Collateral Fund, 6.71% (c) |
501,400 |
501,400 |
|
|
Taxable Central Cash Fund, 6.59% (c) |
39,965,070 |
39,965,070 |
|
|
TOTAL CASH EQUIVALENTS (Cost $42,681,470) |
42,681,470 |
||
|
TOTAL INVESTMENT PORTFOLIO - 100.1% (Cost $509,744,964) |
565,029,889 |
||
|
NET OTHER ASSETS - (0.1)% |
(325,417) |
||
|
NET ASSETS - 100% |
$ 564,704,472 |
||
|
Futures Contracts |
|||||
|
|
Expiration Date |
Underlying Face Amount at Value |
Unrealized Gain/(Loss) |
||
|
Purchased |
|||||
|
74 S&P 500 Stock Index Contracts |
Sept. 2000 |
$ 27,159,850 |
$ (154,341) |
||
|
The face value of futures purchased as a percentage of net assets - 4.8% |
|
Legend |
|
(a) Non-income producing |
|
(b) S&P credit ratings are used in the absence of a rating by Moody's Investors Service, Inc. |
|
(c) The rate quoted is the annualized seven-day yield of the fund at |
|
(d) Non-income producing - issuer filed for protection under the Federal Bankruptcy Code or is in default of interest payment. |
|
(e) Debt obligation initially issued in zero coupon form which converts to coupon form at a specified rate and date. The rate shown is the rate at period end. |
|
(f) Security exempt from registration under Rule 144A of the Securities Act of 1933. These securities may be resold in transactions exempt from registration, normally to qualified institutional buyers. At the period end, the value of these securities amounted to $10,009,281 or 1.8% of net assets. |
|
(g) Security purchased on a delayed delivery or when-issued basis. |
|
(h) Security or a portion of the security was pledged to cover margin requirements for futures contracts. At the period end, the value of securities pledged amounted to $991,983. |
|
(i) The coupon rate shown on floating or adjustable rate securities represents the rate at period end. |
|
(j) For foreign government obligations not individually rated by S&P or Moody's, the ratings listed have been assigned by FMR, the fund's investment adviser, based principally on S&P and Moody's ratings of the sovereign credit of the issuing government. |
|
(k) Restricted securities - Investment in securities not registered under the Securities Act of 1933. |
|
Additional information on each holding is as follows: |
|
Security |
Acquisition Date |
Acquisition Cost |
|
Goldman Sachs Group LP 6.6338% 7/27/00 |
1/25/99 |
$ 400,000 |
|
Micron Technology, Inc. 6.5% 9/30/05 |
11/1/99 |
$ 787,500 |
|
Other Information |
|
The composition of long-term debt holdings as a percentage of total value of investments in securities, is as follows (ratings are unaudited): |
|
Moody's Ratings |
S&P Ratings |
|||
|
Aaa, Aa, A |
5.4% |
|
AAA, AA, A |
4.6% |
|
Baa |
1.7% |
|
BBB |
1.5% |
|
Ba |
2.1% |
|
BB |
2.3% |
|
B |
8.2% |
|
B |
8.6% |
|
Caa |
1.8% |
|
CCC |
1.2% |
|
Ca, C |
0.0% |
|
CC, C |
0.0% |
|
|
|
|
D |
0.2% |
|
The percentage not rated by Moody's or S&P amounted to 1.1%. FMR has determined that unrated debt securities that are lower quality account for 1.1% of the total value of investment in securities. |
|
Purchases and sales of securities, other than short-term securities, aggregated $410,590,429 and $446,509,326, respectively, of which long-term U.S. government and government agency obligations aggregated $21,640,909 and $29,574,212, respectively. |
|
The market value of futures contracts opened and closed during the period amounted to $42,463,560 and $25,435,756, respectively. |
|
The fund placed a portion of its portfolio transactions with brokerage firms which are affiliates of Fidelity Management & Research Company. The commissions paid to these affiliated firms were $11,215 for the period. |
|
The fund invested in securities that are not registered under the Securities Act of 1933. These securities are subject to legal or contractual restrictions on resale. At the end of the period, restricted securities (excluding Rule 144A issues) amounted to $1,234,966 and 0.2% of net assets. |
|
The fund participated in the security lending program. At period end, the value of securities loaned amounted to $508,362. The fund received cash collateral of $501,400 which was invested in cash equivalents. |
|
Income Tax Information |
|
At June 30, 2000, the aggregate cost of investment securities for income tax purposes was $511,113,364. Net unrealized appreciation aggregated $53,916,525, of which $78,810,087 related to appreciated investment securities and $24,893,562 related to depreciated investment securities. |
See accompanying notes which are an integral part of the financial statements.
Asset Manager: Growth Portfolio
Statement of Assets and Liabilities
|
|
June 30, 2000 (Unaudited) |
|
|
Assets |
|
|
|
Investment in securities, at value (including repurchase agreements of $2,215,000) |
|
$ 565,029,889 |
|
Cash |
|
580,771 |
|
Receivable for investments sold |
|
2,971,635 |
|
Receivable for fund shares sold |
|
144,989 |
|
Dividends receivable |
|
223,283 |
|
Interest receivable |
|
2,250,205 |
|
Receivable for daily variation on futures contracts |
|
128,478 |
|
Other receivables |
|
4,662 |
|
Total assets |
|
571,333,912 |
|
Liabilities |
|
|
|
Payable for investments purchased |
$ 4,480,071 |
|
|
Delayed delivery |
1,156,414 |
|
|
Payable for fund shares redeemed |
103,022 |
|
|
Accrued management fee |
268,525 |
|
|
Distribution fees payable |
1,214 |
|
|
Other payables and |
118,794 |
|
|
Collateral on securities loaned, |
501,400 |
|
|
Total liabilities |
|
6,629,440 |
|
Net Assets |
|
$ 564,704,472 |
|
Net Assets consist of: |
|
|
|
Paid in capital |
|
$ 459,835,599 |
|
Undistributed net investment income |
|
8,042,512 |
|
Accumulated undistributed net realized gain (loss) on investments and foreign currency transactions |
|
41,695,777 |
|
Net unrealized appreciation (depreciation) on investments |
|
55,130,584 |
|
Net Assets |
|
$ 564,704,472 |
|
Initial Class: |
|
$16.26 |
|
Service Class: |
|
$16.16 |
|
Service Class 2: |
|
$16.15 |
Statement of Operations
|
|
Six months ended June 30, 2000 (Unaudited) |
|
|
Investment Income Dividends |
|
$ 2,439,432 |
|
Interest |
|
6,412,593 |
|
Security lending |
|
3,343 |
|
Total income |
|
8,855,368 |
|
Expenses |
|
|
|
Management fee |
$ 1,608,808 |
|
|
Transfer agent fees |
183,381 |
|
|
Distribution fees |
6,175 |
|
|
Accounting and security lending fees |
98,601 |
|
|
Non-interested trustees' compensation |
884 |
|
|
Custodian fees and expenses |
17,239 |
|
|
Registration fees |
246 |
|
|
Audit |
13,564 |
|
|
Legal |
2,214 |
|
|
Miscellaneous |
12,474 |
|
|
Total expenses before reductions |
1,943,586 |
|
|
Expense reductions |
(19,481) |
1,924,105 |
|
Net investment income |
|
6,931,263 |
|
Realized and Unrealized Gain (Loss) Net realized gain (loss) on: |
|
|
|
Investment securities |
41,710,684 |
|
|
Foreign currency transactions |
25 |
|
|
Futures contracts |
303,300 |
42,014,009 |
|
Change in net unrealized appreciation (depreciation) on: |
|
|
|
Investment securities |
(56,540,361) |
|
|
Assets and liabilities in |
(1) |
|
|
Futures contracts |
(189,604) |
(56,729,966) |
|
Net gain (loss) |
|
(14,715,957) |
|
Net increase (decrease) in net assets resulting from operations |
|
$ (7,784,694) |
|
Other Information Expense reductions |
|
$ 16,516 |
|
Custodian credits |
|
2,965 |
|
|
|
$ 19,481 |
See accompanying notes which are an integral part of the financial statements.
Semiannual Report
Fidelity Variable Insurance Products: Asset Manager: Growth Portfolio
Financial Statements - continued
Statement of Changes in Net Assets
|
Increase (Decrease) in Net Assets |
Six months ended |
Year ended |
|
Operations |
$ 6,931,263 |
$ 13,100,308 |
|
Net realized gain (loss) |
42,014,009 |
48,664,911 |
|
Change in net unrealized appreciation (depreciation) |
(56,729,966) |
17,820,079 |
|
Net increase (decrease) in net assets resulting from operations |
(7,784,694) |
79,585,298 |
|
Distributions to shareholders |
(11,727,781) |
(12,766,102) |
|
From net realized gain |
(47,570,525) |
(21,173,047) |
|
Total distributions |
(59,298,306) |
(33,939,149) |
|
Share transactions - net increase (decrease) |
40,407,233 |
13,695,216 |
|
Total increase (decrease) in net assets |
(26,675,767) |
59,341,365 |
|
Net Assets |
|
|
|
Beginning of period |
591,380,239 |
532,038,874 |
|
End of period (including undistributed net investment income of $8,042,512 and $13,084,201, respectively) |
$ 564,704,472 |
$ 591,380,239 |
|
|
|
Other Information: |
|
|
Six months ended June 30, 2000 |
Year ended |
||
|
|
Shares |
Dollars |
Shares |
Dollars |
|
Share transactions |
2,257,146 |
$ 36,909,555 |
3,532,899 |
$ 59,442,839 |
|
Reinvested |
3,619,549 |
58,129,957 |
2,100,108 |
33,706,735 |
|
Redeemed |
(3,600,176) |
(59,212,121) |
(5,095,721) |
(86,190,044) |
|
Net increase (decrease) |
2,276,519 |
$ 35,827,391 |
537,286 |
$ 6,959,530 |
|
Service Class |
224,493 |
$ 3,664,261 |
451,433 |
$ 7,507,627 |
|
Reinvested |
72,504 |
1,157,887 |
14,544 |
232,414 |
|
Redeemed |
(53,879) |
(864,210) |
(60,280) |
(1,004,355) |
|
Net increase (decrease) |
243,118 |
$ 3,957,938 |
405,697 |
$ 6,735,686 |
|
Service Class 2 A |
39,435 |
$ 628,570 |
- |
$ - |
|
Reinvested |
655 |
10,461 |
- |
- |
|
Redeemed |
(1,069) |
(17,127) |
- |
- |
|
Net increase (decrease) |
39,021 |
$ 621,904 |
- |
$ - |
|
Distributions |
|
$ 11,501,649 |
|
$ 12,678,680 |
|
Service Class |
|
224,107 |
|
87,422 |
|
Service Class 2 A |
|
2,025 |
|
- |
|
Total |
|
$ 11,727,781 |
|
$ 12,766,102 |
|
From net realized gain |
|
$ 46,628,308 |
|
$ 21,028,055 |
|
Service Class |
|
933,780 |
|
144,992 |
|
Service Class 2 A |
|
8,437 |
|
- |
|
Total |
|
$ 47,570,525 |
|
$ 21,173,047 |
|
|
|
$ 59,298,306 |
|
$ 33,939,149 |
A Service Class 2 commenced sale of shares January 12, 2000.
See accompanying notes which are an integral part of the financial statements.
Asset Manager: Growth Portfolio
Financial Highlights - Initial Class
|
|
Six months ended |
Years ended December 31, |
||||
|
Selected Per-Share Data |
(Unaudited) |
1999 |
1998 |
1997 |
1996 |
1995 E |
|
Net asset value, beginning of period |
$ 18.38 |
$ 17.03 |
$ 16.36 |
$ 13.10 |
$ 11.77 |
$ 10.00 |
|
Income from Investment Operations |
|
|
|
|
|
|
|
Net investment income |
.20 D |
.40 D |
.41 D |
.36 D |
.21 |
.10 |
|
Net realized and unrealized gain (loss) |
(.45) |
2.04 |
2.19 |
2.92 |
2.08 |
2.20 |
|
Total from investment operations |
(.25) |
2.44 |
2.60 |
3.28 |
2.29 |
2.30 |
|
Less Distributions |
|
|
|
|
|
|
|
From net investment income |
(.37) |
(.41) |
(.34) |
- |
(.21) |
(.11) |
|
From net realized gain |
(1.50) |
(.68) |
(1.59) |
(.02) |
(.75) |
(.42) |
|
Total distributions |
(1.87) |
(1.09) |
(1.93) |
(.02) |
(.96) |
(.53) |
|
Net asset value, end of period |
$ 16.26 |
$ 18.38 |
$ 17.03 |
$ 16.36 |
$ 13.10 |
$ 11.77 |
|
Total Return B, C |
(1.29)% |
15.26% |
17.57% |
25.07% |
20.04% |
23.02% |
|
Ratios and Supplemental Data |
|
|
|
|
|
|
|
Net assets, end of period (000 omitted) |
$ 550,573 |
$ 580,555 |
$ 528,874 |
$ 483,231 |
$ 253,024 |
$ 68,247 |
|
Ratio of expenses to average net assets |
.69% A |
.71% |
.73% |
.77% |
.87% |
1.00% G |
|
Ratio of expenses to average net assets after |
.69% A |
.70% H |
.72% H |
.76% H |
.85% H |
1.00% |
|
Ratio of net investment income to average net assets |
2.48% A |
2.38% |
2.60% |
2.44% |
2.63% |
1.69% |
|
Portfolio turnover |
154% A |
92% |
98% |
90% |
120% |
343% |
Financial Highlights - Service Class
|
|
Six months ended |
Years ended December 31, |
||
|
Selected Per-Share Data |
(Unaudited) |
1999 |
1998 |
1997 F |
|
Net asset value, beginning of period |
$ 18.28 |
$ 16.96 |
$ 16.35 |
$ 15.94 |
|
Income from Investment Operations |
|
|
|
|
|
Net investment income D |
.19 |
.38 |
.40 |
.07 |
|
Net realized and unrealized gain (loss) |
(.45) |
2.03 |
2.14 |
.34 |
|
Total from investment operations |
(.26) |
2.41 |
2.54 |
.41 |
|
Less Distributions |
|
|
|
|
|
From net investment income |
(.36) |
(.41) |
(.34) |
- |
|
From net realized gain |
(1.50) |
(.68) |
(1.59) |
- |
|
Total distributions |
(1.86) |
(1.09) |
(1.93) |
- |
|
Net asset value, end of period |
$ 16.16 |
$ 18.28 |
$ 16.96 |
$ 16.35 |
|
Total Return B, C |
(1.30)% |
15.13% |
17.18% |
2.57% |
|
Ratios and Supplemental Data |
|
|
|
|
|
Net assets, end of period (000 omitted) |
$ 13,502 |
$ 10,825 |
$ 3,165 |
$ 10 |
|
Ratio of expenses to average net assets |
.80% A |
.82% |
.89% |
.87% A |
|
Ratio of expenses to average net assets after expense reductions |
.79% A, H |
.81% H |
.88% H |
.87% A |
|
Ratio of net investment income to average net assets |
2.38% A |
2.27% |
2.65% |
2.70% A |
|
Portfolio turnover |
154% A |
92% |
98% |
90% |
|
A Annualized B Total returns for periods of less than one year are not annualized and do not reflect charges attributable to your insurance company's separate account. Inclusion of these charges would reduce the total returns shown. C The total returns would have been lower had certain expenses not been reduced during the period shown. D Net investment income per share has been calculated based on average shares outstanding during the period. E For the period January 5, 1995 (commencement of sale of Initial Class shares) to December 31, 1995. F For the period November 3, 1997 (commencement of sale of Service Class shares) to December 31, 1997. G FMR agreed to reimburse a portion of the class' expenses during the period. Without this reimbursement, the class' expense ratio would have been higher. H FMR or the fund has entered into varying arrangements with third parties who either paid or reduced a portion of the class' expenses. |
||||
See accompanying notes which are an integral part of the financial statements.
Semiannual Report
Financial Highlights - Service Class 2
|
|
Six months ended |
|
Selected Per-Share Data |
(Unaudited) |
|
Net asset value, beginning of period |
$ 17.78 |
|
Income from Investment Operations |
|
|
Net investment income C |
.16 |
|
Net realized and unrealized gain (loss) |
.07 E |
|
Total from investment operations |
.23 |
|
Less Distributions |
|
|
From net investment income |
(.36) |
|
From net realized gain |
(1.50) |
|
Total distributions |
(1.86) |
|
Net asset value, end of period |
$ 16.15 |
|
Total Return B |
1.41% |
|
Ratios and Supplemental Data |
|
|
Net assets, end of period (000 omitted) |
$ 630 |
|
Ratio of expenses to average net assets |
.94% A |
|
Ratio of net investment income to average net assets |
2.23% A |
|
Portfolio turnover |
154% A |
|
A Annualized B Total returns for periods of less than one year are not annualized and do not reflect charges attributable to your insurance company's separate account. Inclusion of these charges would reduce the total returns shown. C Net investment income per share has been calculated based on average shares outstanding during the period. D For the period January 12, 2000 (commencement of sale of Service Class 2 shares) to June 30, 2000. E The amount shown for a share outstanding does not correspond with the aggregate net loss on investments for the period due to the timing of sales and repurchases of class shares in relation to fluctuating market values of the investments of the fund. |
|
See accompanying notes which are an integral part of the financial statements.
Asset Manager: Growth Portfolio
Performance
There are several ways to evaluate a fund's historical performance. You can look at the total percentage change in value, the average annual percentage change or the growth of a hypothetical $10,000 investment. Total return reflects the change in the value of an investment, assuming reinvestment of the fund's dividend income and capital gains (the profits earned upon the sale of securities that have grown in value). If Fidelity had not reimbursed certain fund expenses, the past 10 years total return would have been lower.
Average Annual Total Returns
|
Periods ended |
Past 1 |
Past 5 |
Past 10 |
|
Fidelity VIP: Asset Manager - |
4.82% |
14.10% |
12.61% |
|
Asset Manager Composite |
6.29% |
14.27% |
11.82% |
|
S&P 500 ® |
7.25% |
23.80% |
17.80% |
|
LB Aggregate Bond |
4.57% |
6.25% |
7.82% |
|
LB 3 Month T-Bill |
5.57% |
5.41% |
5.08% |
Average annual returns take the fund's cumulative return and show you what would have happened if the fund had performed at a constant rate each year.
You can compare the fund's returns to those of the Asset Manager Composite Index, a hypothetical combination of unmanaged indices. The composite index combines the total returns of the Standard & Poor's 500 SM Index, the Lehman Brothers Aggregate Bond Index and the Lehman Brothers 3 Month Treasury Bill Index weighted according to the fund's neutral mix.*
The benchmarks listed in the table above include reinvested dividends and capital gains, if any.
Figures for more than one year assume a steady compounded rate of return and are not the fund's year-by-year results, which fluctuated over the periods shown.
Performance numbers are net of all fund operating expenses, but do not include any insurance charges imposed by your insurance company's separate account. If performance information included the effect of these additional charges, the total returns would have been lower.
Past performance is no guarantee of future results. Principal and investment return will vary and you may have a gain or loss when you withdraw your money.
Understanding Performance
How a fund did yesterday is no guarantee of how it will do tomorrow. The stock market, for example, has a history of long-term growth and short-term volatility. In turn, the share price and return of a fund that invests in stocks will vary. That means if you sell your shares during a market downturn, you might lose money. But if you can ride out the market's ups and downs, you may have a gain.
3$10,000 Over 10 Years
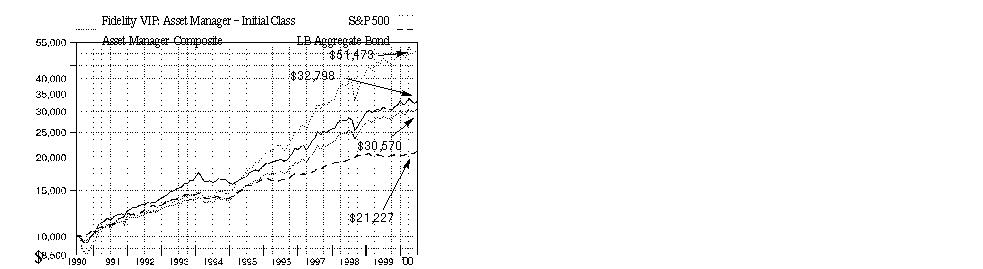
$10,000 Over 10 Years: Let's say hypothetically that $10,000 was invested in Fidelity Variable Insurance Products: Asset Manager Portfolio - Initial Class on June 30, 1990. By June 30, 2000, the value of the investment would have grown to $32,798 - a 227.98% increase. With reinvested dividends and capital gains, if any, a $10,000 investment in the Standard & Poor's 500 Index would have grown to $51,473 over the same period - a 414.73% increase on the initial investment. If $10,000 was invested in the Lehman Brothers Aggregate Bond Index, it would have grown to $21,227 - a 112.27% increase.
You can also look at how the Asset Manager Composite Index did over the same period. With reinvested dividends and capital gains, if any, a $10,000 investment in the index would have grown to $30,570 - a 205.70% increase.
* 50% stocks, 40% bonds and 10% short-term instruments effective January 1, 1997.
Investment Summary
|
Top Five Stocks as of June 30, 2000 |
|
|
|
% of fund's |
|
General Electric Co. |
2.4 |
|
Intel Corp. |
1.8 |
|
Pfizer, Inc. |
1.6 |
|
Cisco Systems, Inc. |
1.6 |
|
Microsoft Corp. |
1.6 |
|
|
9.0 |
|
Top Five Bond Issuers as of June 30, 2000 |
|
|
(with maturities greater than one year) |
% of fund's |
|
Fannie Mae |
9.4 |
|
U.S. Treasury Obligations |
3.8 |
|
Government National Mortgage Association |
1.1 |
|
Federal Home Loan Bank |
1.0 |
|
Freddie Mac |
0.6 |
|
|
15.9 |
|
Asset Allocation as of June 30, 2000 |
|||
|
% of fund's net assets * |
|||
|
Stock class 53.0% |
|
|
|
Bonds class 35.7% |
|
|
|
Short-Term class 11.3% |
|
|
|
* Foreign investments 4.5% |

|
Asset allocation in the pie chart reflects the categorization of assets as defined in the fund's Prospectus. Financial statement categorizations conform to accounting standards and will differ from the pie chart. |
Semiannual Report
(Portfolio Manager photograph)
Note to shareholders: Bart Grenier became Portfolio Manager of Asset Manager Portfolio
on May 1, 2000.
Q. How did the fund perform, Bart?
A. For the six- and 12-month periods that ended June 30, 2000,
the fund trailed the Asset Manager Composite Index, which returned 1.80% and 6.29%, respectively.
Q. How did the fund's asset allocation strategies play out
during the past six months?
A. The fund maintained a modest tilt toward equities, averaging just under 53% for the period. The fund's neutral allocation mix typically calls for 50% to be invested in stocks, 40% in bonds and 10% in short-term and money market instruments. Given the bullish environment for stocks in the first quarter of 2000, the fund's overexposure here garnered it an edge over the composite index early in the period. However, the fund's wins during the period were more than offset by its losses suffered during the sharp, broad market decline of April and May, even though stocks rallied again in June. On the bond front, the fund continued to emphasize investment-grade debt, which helped. However, our exposure to high-yield securities hurt, as this asset class had a particularly difficult period.
Q. What factors influenced performance of the equity subportfolio?
A. Steve Snider kept the fund generally sector neutral relative to the Standard & Poor's 500 Index, choosing instead to focus his efforts on individual stock picking. The fund benefited from owning a number of high-quality tech names that effectively weathered the correction in the spring and delivered strong returns for the period. Texas Instruments, Adobe Systems and ADC Telecommunications led the way, followed by Intel, Corning and Cisco. The fund's exposure to health stocks, particularly Amgen and Pfizer, helped amid a rally in biotechnology shares. Growth-oriented financials, such as Lehman Brothers, and energy stocks, such as BP Amoco, also were meaningful contributors. Conversely, we were caught holding a number of disappointments within tech, including Qualcomm, Motorola and Lucent, which each fell on weak earnings. Neither BP Amoco nor Lucent was held at the close of the period. Poor performance among retail stocks also hurt the fund's return as Wal-Mart, Lowe's and Home Depot all declined. Overall, the equity subportfolio trailed the index slightly during the six-month period, but outperformed it during the past 12 months.
Q. How did the bond portion of the fund fare?
A. High-yield bonds suffered from poor liquidity and declining credit quality. Fred Hoff - who directed the fund's high-yield investments until June 1, 2000, when Mark Notkin took over - helped limit our losses by avoiding the names that fell the furthest amid the period's downtrend. Switching gears, Charlie Morrison and his team did a nice job of positioning the investment-grade component of the fund to benefit from changing market conditions. Following strong performance turned in by the spread sectors - namely corporate bonds and mortgage securities - in the fourth quarter of 1999, we reduced our exposure to these markets, particularly to long-term corporates, in early January. This strategy benefited the fund, as spread-sector performance deteriorated during the period. A driving influence at this time was the U.S. Treasury's announcement in January of its intention to reduce new borrowing and use government surplus proceeds to repurchase outstanding debt. This move sparked a tremendous rally in long-term Treasuries. So, despite the Federal Reserve Board's actions to raise rates during the period, the much improved supply/demand picture painted by the Treasury buybacks led to a positive return for the investment-grade subportfolio.
Q. And the fund's short-term/money market investments?
A. John Todd felt that concerns surrounding Y2K were overblown and, thus, used the opportunity to extend the average maturity of the fund's money-market subportfolio early on to take advantage of a steeply sloped yield curve. Early in 2000, however, the yield curve flattened out dramatically. In response, we let the average maturity roll down, believing that strong economic growth and the risk of rising inflation were likely to set off a protracted period of Fed tightening. Shareholders should note that John may choose to invest in a money market mutual fund rather than invest directly in money market securities in the future.
Q. What's your outlook?
A. It's still unclear as to whether or not the Fed can successfully orchestrate a soft landing, which would be very constructive for stocks. There's a lot of conflicting evidence out there in terms of economic data that will have to get cleared up before we can know for sure if the economy has actually slowed down a couple notches to be considered a soft landing. Until then, I think we'll be in sort of a narrow trading range in terms of the equity market. Security selection in this type of environment will become even more important, which bodes well for us given the strength of Fidelity's research.
The views expressed in this report reflect those of the portfolio manager only through the end of the period of the report as stated on the cover. The manager's views are subject to change at any time based on market or other conditions. For more information, see page 2.
Fund Facts
Goal: high total return with reduced risk over the long term by allocating its assets among stocks, bonds and short-term instruments
Start date: September 6, 1989
Size: as of June 30, 2000, more than $4.5 billion
Manager: Bart Grenier, since May 2000; joined Fidelity in 1991
3Semiannual Report
Fidelity Variable Insurance Products: Asset Manager Portfolio
(Unaudited)
Showing Percentage of Net Assets
|
Common Stocks - 48.5% |
|||
|
Shares |
Value (Note 1) |
||
|
AEROSPACE & DEFENSE - 1.3% |
|||
|
Boeing Co. |
309,600 |
$ 12,945,150 |
|
|
Honeywell International, Inc. |
358,387 |
12,073,162 |
|
|
Northrop Grumman Corp. |
193,300 |
12,806,125 |
|
|
United Technologies Corp. |
362,406 |
21,336,653 |
|
|
|
59,161,090 |
||
|
BASIC INDUSTRIES - 0.5% |
|||
|
Chemicals & Plastics - 0.5% |
|||
|
Eastman Chemical Co. |
150,000 |
7,162,500 |
|
|
Pharmacia Corp. |
200,000 |
10,337,500 |
|
|
Praxair, Inc. |
123,900 |
4,638,506 |
|
|
|
22,138,506 |
||
|
Iron & Steel - 0.0% |
|||
|
Mueller Industries, Inc. |
51,200 |
1,433,600 |
|
|
TOTAL BASIC INDUSTRIES |
23,572,106 |
||
|
DURABLES - 0.7% |
|||
|
Consumer Durables - 0.5% |
|||
|
Minnesota Mining & Manufacturing Co. |
281,200 |
23,199,000 |
|
|
Consumer Electronics - 0.0% |
|||
|
Whirlpool Corp. |
21,000 |
979,125 |
|
|
Textiles & Apparel - 0.2% |
|||
|
Arena Brands Holdings Corp. Class B |
8,445 |
211,125 |
|
|
Liz Claiborne, Inc. |
180,000 |
6,345,000 |
|
|
|
6,556,125 |
||
|
TOTAL DURABLES |
30,734,250 |
||
|
ENERGY - 3.4% |
|||
|
Energy Services - 0.2% |
|||
|
BJ Services Co. (a) |
173,000 |
10,812,500 |
|
|
Oil & Gas - 3.2% |
|||
|
Amerada Hess Corp. |
55,000 |
3,396,250 |
|
|
Apache Corp. |
151,900 |
8,933,619 |
|
|
Chevron Corp. |
448,200 |
38,012,963 |
|
|
EOG Resources, Inc. |
130,000 |
4,355,000 |
|
|
Exxon Mobil Corp. |
809,875 |
63,575,188 |
|
|
Royal Dutch Petroleum Co. (NY Shares) |
450,000 |
27,703,125 |
|
|
|
145,976,145 |
||
|
TOTAL ENERGY |
156,788,645 |
||
|
FINANCE - 6.6% |
|||
|
Banks - 1.9% |
|||
|
Bank of America Corp. |
270,000 |
11,610,000 |
|
|
Chase Manhattan Corp. |
268,050 |
12,347,053 |
|
|
FleetBoston Financial Corp. |
579,905 |
19,716,770 |
|
|
|
|||
|
Shares |
Value (Note 1) |
||
|
J.P. Morgan & Co., Inc. |
154,600 |
$ 17,025,325 |
|
|
Wells Fargo & Co. |
650,000 |
25,187,500 |
|
|
|
85,886,648 |
||
|
Credit & Other Finance - 1.8% |
|||
|
American Express Co. |
292,500 |
15,246,563 |
|
|
Citigroup, Inc. |
975,800 |
58,791,950 |
|
|
Providian Financial Corp. |
85,950 |
7,735,500 |
|
|
|
81,774,013 |
||
|
Insurance - 0.6% |
|||
|
CIGNA Corp. |
60,600 |
5,666,100 |
|
|
Marsh & McLennan Companies, Inc. |
173,600 |
18,130,350 |
|
|
MGIC Investment Corp. |
95,800 |
4,358,900 |
|
|
|
28,155,350 |
||
|
Savings & Loans - 0.4% |
|||
|
Golden West Financial Corp. |
428,700 |
17,496,319 |
|
|
Securities Industry - 1.9% |
|||
|
AXA Financial, Inc. |
15,700 |
533,800 |
|
|
Lehman Brothers Holdings, Inc. |
441,600 |
41,758,800 |
|
|
Merrill Lynch & Co., Inc. |
129,800 |
14,927,000 |
|
|
Morgan Stanley Dean Witter & Co. |
346,800 |
28,871,100 |
|
|
|
86,090,700 |
||
|
TOTAL FINANCE |
299,403,030 |
||
|
HEALTH - 4.8% |
|||
|
Drugs & Pharmaceuticals - 3.5% |
|||
|
Amgen, Inc. |
640,700 |
45,009,175 |
|
|
Forest Laboratories, Inc. (a) |
80,000 |
8,080,000 |
|
|
IVAX Corp. (a) |
120,000 |
4,980,000 |
|
|
Merck & Co., Inc. |
346,000 |
26,512,250 |
|
|
Pfizer, Inc. |
1,577,200 |
75,705,600 |
|
|
|
160,287,025 |
||
|
Medical Equipment & Supplies - 0.7% |
|||
|
Johnson & Johnson |
296,300 |
30,185,563 |
|
|
Millipore Corp. |
34,700 |
2,615,513 |
|
|
|
32,801,076 |
||
|
Medical Facilities Management - 0.6% |
|||
|
HCA - The Healthcare Co. |
170,000 |
5,163,750 |
|
|
UnitedHealth Group, Inc. |
216,800 |
18,590,600 |
|
|
|
23,754,350 |
||
|
TOTAL HEALTH |
216,842,451 |
||
|
INDUSTRIAL MACHINERY & EQUIPMENT - 2.6% |
|||
|
Electrical Equipment - 2.5% |
|||
|
General Electric Co. |
2,048,100 |
108,549,300 |
|
|
Scientific-Atlanta, Inc. |
80,000 |
5,960,000 |
|
|
|
114,509,300 |
||
|
Common Stocks - continued |
|||
|
Shares |
Value (Note 1) |
||
|
INDUSTRIAL MACHINERY & EQUIPMENT - continued |
|||
|
Industrial Machinery & Equipment - 0.1% |
|||
|
Parker-Hannifin Corp. |
69,200 |
$ 2,370,100 |
|
|
TOTAL INDUSTRIAL MACHINERY & EQUIPMENT |
116,879,400 |
||
|
MEDIA & LEISURE - 1.5% |
|||
|
Broadcasting - 0.0% |
|||
|
NTL, Inc. warrants 10/14/08 (a) |
3,742 |
153,422 |
|
|
Entertainment - 0.5% |
|||
|
Viacom, Inc. Class B (non-vtg.) (a) |
85,000 |
5,795,938 |
|
|
Walt Disney Co. |
459,600 |
17,838,225 |
|
|
|
23,634,163 |
||
|
Publishing - 1.0% |
|||
|
Dow Jones & Co., Inc. |
77,100 |
5,647,575 |
|
|
Gannett Co., Inc. |
324,500 |
19,409,156 |
|
|
Knight-Ridder, Inc. |
128,700 |
6,845,231 |
|
|
McGraw-Hill Companies, Inc. |
56,000 |
3,024,000 |
|
|
The New York Times Co. Class A |
219,200 |
8,658,400 |
|
|
|
43,584,362 |
||
|
Restaurants - 0.0% |
|||
|
Darden Restaurants, Inc. |
151,600 |
2,463,500 |
|
|
TOTAL MEDIA & LEISURE |
69,835,447 |
||
|
NONDURABLES - 2.3% |
|||
|
Beverages - 1.2% |
|||
|
Anheuser-Busch Companies, Inc. |
564,200 |
42,138,688 |
|
|
Pepsi Bottling Group, Inc. |
389,800 |
11,377,288 |
|
|
|
53,515,976 |
||
|
Foods - 0.9% |
|||
|
PepsiCo, Inc. |
350,000 |
15,553,125 |
|
|
Quaker Oats Co. |
284,000 |
21,335,500 |
|
|
Sysco Corp. |
140,000 |
5,897,500 |
|
|
|
42,786,125 |
||
|
Household Products - 0.2% |
|||
|
Colgate-Palmolive Co. |
170,000 |
10,178,750 |
|
|
TOTAL NONDURABLES |
106,480,851 |
||
|
RETAIL & WHOLESALE - 3.6% |
|||
|
Apparel Stores - 0.1% |
|||
|
Venator Group, Inc. (a) |
500,000 |
5,125,000 |
|
|
General Merchandise Stores - 1.9% |
|||
|
Sears, Roebuck & Co. |
334,600 |
10,916,325 |
|
|
Target Corp. |
147,500 |
8,555,000 |
|
|
Wal-Mart Stores, Inc. |
1,166,600 |
67,225,325 |
|
|
|
86,696,650 |
||
|
Retail & Wholesale, Miscellaneous - 1.6% |
|||
|
Best Buy Co., Inc. (a) |
249,700 |
15,793,525 |
|
|
Circuit City Stores, Inc. - |
129,900 |
4,311,056 |
|
|
|
|||
|
Shares |
Value (Note 1) |
||
|
Home Depot, Inc. |
624,300 |
$ 31,175,981 |
|
|
Lowe's Companies, Inc. |
358,400 |
14,716,800 |
|
|
Tiffany & Co., Inc. |
77,900 |
5,258,250 |
|
|
|
71,255,612 |
||
|
TOTAL RETAIL & WHOLESALE |
163,077,262 |
||
|
SERVICES - 0.1% |
|||
|
Leasing & Rental - 0.1% |
|||
|
Hertz Corp. Class A |
115,700 |
3,246,831 |
|
|
TECHNOLOGY - 16.9% |
|||
|
Communications Equipment - 3.8% |
|||
|
ADC Telecommunications, Inc. (a) |
433,000 |
36,317,875 |
|
|
Cisco Systems, Inc. (a) |
1,174,000 |
74,622,375 |
|
|
Comverse Technology, Inc. (a) |
312,400 |
29,053,200 |
|
|
Corning, Inc. |
120,000 |
32,385,000 |
|
|
|
172,378,450 |
||
|
Computer Services & Software - 4.0% |
|||
|
Adobe Systems, Inc. |
390,400 |
50,752,000 |
|
|
First Data Corp. |
302,900 |
15,031,413 |
|
|
Microsoft Corp. (a) |
897,700 |
71,816,000 |
|
|
Oracle Corp. (a) |
505,400 |
42,485,188 |
|
|
Sybase, Inc. (a) |
200,000 |
4,600,000 |
|
|
|
184,684,601 |
||
|
Computers & Office Equipment - 2.8% |
|||
|
EMC Corp. (a) |
216,400 |
16,649,275 |
|
|
Hewlett-Packard Co. |
300,000 |
37,462,500 |
|
|
International Business Machines Corp. |
319,400 |
34,994,263 |
|
|
Sun Microsystems, Inc. (a) |
406,100 |
36,929,719 |
|
|
|
126,035,757 |
||
|
Electronic Instruments - 1.2% |
|||
|
Agilent Technologies, Inc. |
53,440 |
3,941,200 |
|
|
Applied Materials, Inc. (a) |
273,600 |
24,795,000 |
|
|
KLA-Tencor Corp. (a) |
80,000 |
4,685,000 |
|
|
LAM Research Corp. (a) |
75,300 |
2,823,750 |
|
|
Teradyne, Inc. (a) |
233,800 |
17,184,300 |
|
|
|
53,429,250 |
||
|
Electronics - 5.1% |
|||
|
Advanced Micro Devices, Inc. (a) |
200,000 |
15,450,000 |
|
|
Analog Devices, Inc. (a) |
49,200 |
3,739,200 |
|
|
Intel Corp. |
601,600 |
80,426,400 |
|
|
LSI Logic Corp. (a) |
303,600 |
16,432,350 |
|
|
Motorola, Inc. |
1,041,051 |
30,255,545 |
|
|
National Semiconductor Corp. (a) |
173,000 |
9,817,750 |
|
|
Texas Instruments, Inc. |
1,040,800 |
71,489,950 |
|
|
Vishay Intertechnology, Inc. (a) |
194,700 |
7,386,431 |
|
|
|
234,997,626 |
||
|
TOTAL TECHNOLOGY |
771,525,684 |
||
|
Common Stocks - continued |
|||
|
Shares |
Value (Note 1) |
||
|
TRANSPORTATION - 0.1% |
|||
|
Air Transportation - 0.1% |
|||
|
AMR Corp. |
100,000 |
$ 2,643,750 |
|
|
Delta Air Lines, Inc. |
75,000 |
3,792,188 |
|
|
|
6,435,938 |
||
|
UTILITIES - 4.1% |
|||
|
Cellular - 0.6% |
|||
|
McCaw International Ltd. warrants 4/16/07 (a)(g) |
8,150 |
20,375 |
|
|
QUALCOMM, Inc. (a) |
346,400 |
20,784,000 |
|
|
Sprint Corp. - PCS Group Series 1 (a) |
100,000 |
5,950,000 |
|
|
|
26,754,375 |
||
|
Electric Utility - 0.8% |
|||
|
Energy East Corp. |
654,000 |
12,466,875 |
|
|
Entergy Corp. |
150,000 |
4,078,125 |
|
|
Northeast Utilities |
129,800 |
2,823,150 |
|
|
PECO Energy Co. |
100,000 |
4,031,250 |
|
|
Pinnacle West Capital Corp. |
112,500 |
3,810,938 |
|
|
PPL Corp. |
128,500 |
2,818,969 |
|
|
Public Service Enterprise Group, Inc. |
170,100 |
5,889,713 |
|
|
|
35,919,020 |
||
|
Gas - 0.6% |
|||
|
Dynegy, Inc. Class A |
90,000 |
6,148,125 |
|
|
Enron Corp. |
319,800 |
20,627,100 |
|
|
|
26,775,225 |
||
|
Telephone Services - 2.1% |
|||
|
BellSouth Corp. |
762,300 |
32,493,038 |
|
|
Ono Finance PLC rights 5/31/09 (a)(g) |
1,740 |
17,400 |
|
|
Pathnet, Inc. warrants 4/15/08 (a)(g) |
4,665 |
46,650 |
|
|
Sprint Corp. - FON Group |
314,900 |
16,059,900 |
|
|
U.S. WEST, Inc. |
375,000 |
32,156,250 |
|
|
WorldCom, Inc. (a) |
324,450 |
14,884,144 |
|
|
|
95,657,382 |
||
|
TOTAL UTILITIES |
185,106,002 |
||
|
TOTAL COMMON STOCKS (Cost $1,639,229,725) |
2,209,088,987 |
||
|
Nonconvertible Preferred Stocks - 1.3% |
|||
|
|
|
|
|
|
CONSTRUCTION & REAL ESTATE - 0.1% |
|||
|
Real Estate Investment Trusts - 0.1% |
|||
|
California Federal Preferred |
156,349 |
3,322,416 |
|
|
FINANCE - 0.0% |
|||
|
Insurance - 0.0% |
|||
|
American Annuity Group Capital Trust II 8.875% |
1,490 |
1,326,490 |
|
|
|
|||
|
Shares |
Value (Note 1) |
||
|
HEALTH - 0.0% |
|||
|
Medical Facilities Management - 0.0% |
|||
|
Fresenius Medical Care Capital Trust II 7.875% |
653 |
$ 595,719 |
|
|
MEDIA & LEISURE - 0.4% |
|||
|
Broadcasting - 0.3% |
|||
|
Adelphia Communications Corp. $13.00 |
15,763 |
1,623,589 |
|
|
CSC Holdings, Inc. 11.125% pay-in-kind |
102,653 |
10,727,239 |
|
|
|
12,350,828 |
||
|
Publishing - 0.1% |
|||
|
PRIMEDIA, Inc.: |
|
|
|
|
$9.20 |
32,995 |
2,862,316 |
|
|
Series D, $10.00 |
15,250 |
1,410,625 |
|
|
|
4,272,941 |
||
|
TOTAL MEDIA & LEISURE |
16,623,769 |
||
|
RETAIL & WHOLESALE - 0.0% |
|||
|
Grocery Stores - 0.0% |
|||
|
Supermarkets General Holdings Corp. $3.52 pay-in-kind |
17,231 |
17,231 |
|
|
UTILITIES - 0.8% |
|||
|
Cellular - 0.4% |
|||
|
Crown Castle International Corp. |
2,079 |
2,120,580 |
|
|
Nextel Communications, Inc. |
14,671 |
14,157,515 |
|
|
|
16,278,095 |
||
|
Telephone Services - 0.4% |
|||
|
Adelphia Business Solution, Inc. |
5,283 |
4,728,285 |
|
|
Intermedia Communications, Inc. |
5,292 |
5,133,240 |
|
|
IXC Communications, Inc. |
1,384 |
1,384,000 |
|
|
NEXTLINK Communications, Inc. |
185,967 |
9,484,317 |
|
|
|
20,729,842 |
||
|
TOTAL UTILITIES |
37,007,937 |
||
|
TOTAL NONCONVERTIBLE PREFERRED STOCKS (Cost $61,177,855) |
58,893,562 |
||
|
Corporate Bonds - 16.9% |
|||||
|
Moody's Ratings (unaudited) (b) |
Principal Amount |
Value |
|||
|
Convertible Bonds - 0.2% |
|||||
|
HEALTH - 0.2% |
|||||
|
Medical Facilities Management - 0.2% |
|||||
|
Tenet Healthcare Corp. |
B1 |
|
$ 7,210,000 |
$ 5,939,238 |
|
|
Total Renal Care Holdings, Inc. 7% 5/15/09 (g) |
B3 |
|
2,940,000 |
1,955,100 |
|
|
|
7,894,338 |
||||
|
MEDIA & LEISURE - 0.0% |
|||||
|
Lodging & Gaming - 0.0% |
|||||
|
Hilton Hotels Corp. |
Ba2 |
|
3,680,000 |
2,907,200 |
|
|
TOTAL CONVERTIBLE BONDS |
10,801,538 |
||||
|
Nonconvertible Bonds - 16.7% |
|||||
|
AEROSPACE & DEFENSE - 0.2% |
|||||
|
Defense Electronics - 0.1% |
|||||
|
Raytheon Co. |
Baa2 |
|
4,500,000 |
4,447,485 |
|
|
Ship Building & Repair - 0.1% |
|||||
|
Newport News Shipbuilding, Inc. |
Ba3 |
|
3,515,000 |
3,515,000 |
|
|
TOTAL AEROSPACE & DEFENSE |
7,962,485 |
||||
|
BASIC INDUSTRIES - 0.7% |
|||||
|
Chemicals & Plastics - 0.4% |
|||||
|
Avecia Group PLC |
B2 |
|
3,440,000 |
3,371,200 |
|
|
Huntsman Corp. |
B2 |
|
3,520,000 |
3,212,000 |
|
|
Huntsman ICI Chemicals LLC 10.125% 7/1/09 |
B2 |
|
625,000 |
625,000 |
|
|
Lyondell Chemical Co.: |
|
|
|
|
|
|
9.875% 5/1/07 |
Ba3 |
|
5,050,000 |
4,999,500 |
|
|
10.875% 5/1/09 |
B2 |
|
2,570,000 |
2,550,725 |
|
|
Sovereign Specialty Chemicals, Inc. |
B3 |
|
1,655,000 |
1,702,581 |
|
|
Sterling Chemicals, Inc. 11.75% 8/15/06 |
Caa3 |
|
1,935,000 |
1,567,350 |
|
|
|
18,028,356 |
||||
|
Metals & Mining - 0.0% |
|||||
|
Kaiser Aluminum & Chemical Corp. |
B3 |
|
1,630,000 |
1,483,300 |
|
|
Packaging & Containers - 0.2% |
|||||
|
Gaylord Container Corp.: |
|
|
|
|
|
|
9.375% 6/15/07 |
Caa1 |
|
2,825,000 |
2,175,250 |
|
|
9.75% 6/15/07 |
Caa1 |
|
3,675,000 |
2,866,500 |
|
|
|
|||||
|
Moody's Ratings (unaudited) (b) |
Principal Amount |
Value |
|||
|
Norampac, Inc. |
B1 |
|
$ 2,100,000 |
$ 2,026,500 |
|
|
Packaging Corp. of America 9.625% 4/1/09 |
B2 |
|
2,020,000 |
1,994,750 |
|
|
|
9,063,000 |
||||
|
Paper & Forest Products - 0.1% |
|||||
|
Potlatch Corp. |
Baa1 |
|
3,320,000 |
3,211,170 |
|
|
Repap New Brunswick, Inc. yankee 10.625% 4/15/05 |
Caa1 |
|
2,035,000 |
1,790,800 |
|
|
|
5,001,970 |
||||
|
TOTAL BASIC INDUSTRIES |
33,576,626 |
||||
|
CONSTRUCTION & REAL ESTATE - 0.4% |
|||||
|
Building Materials - 0.0% |
|||||
|
Numatics, Inc. |
B3 |
|
170,000 |
136,000 |
|
|
Construction - 0.0% |
|||||
|
Blount, Inc. 13% 8/1/09 |
B3 |
|
1,465,000 |
1,490,638 |
|
|
Engineering - 0.0% |
|||||
|
Anteon Corp. |
B3 |
|
980,000 |
882,000 |
|
|
Real Estate - 0.1% |
|||||
|
Duke-Weeks Realty LP 6.875% 3/15/05 |
Baa2 |
|
2,950,000 |
2,801,792 |
|
|
Real Estate Investment Trusts - 0.3% |
|||||
|
CenterPoint Properties Trust: |
|
|
|
|
|
|
6.75% 4/1/05 |
Baa2 |
|
1,590,000 |
1,481,244 |
|
|
7.125% 3/15/04 |
Baa2 |
|
4,200,000 |
4,031,412 |
|
|
Equity Office |
|
|
|
|
|
|
6.375% 2/15/03 |
Baa1 |
|
3,600,000 |
3,460,104 |
|
|
6.75% 2/15/08 |
Baa1 |
|
1,590,000 |
1,456,583 |
|
|
Pinnacle Holdings, Inc. |
B3 |
|
1,510,000 |
1,049,450 |
|
|
|
11,478,793 |
||||
|
TOTAL CONSTRUCTION & REAL ESTATE |
16,789,223 |
||||
|
DURABLES - 0.2% |
|||||
|
Autos, Tires, & Accessories - 0.1% |
|||||
|
TRW, Inc. 6.5% 6/1/02 |
Baa1 |
|
4,520,000 |
4,402,390 |
|
|
Consumer Electronics - 0.0% |
|||||
|
Whirlpool Corp. |
Baa1 |
|
1,390,000 |
1,434,341 |
|
|
Textiles & Apparel - 0.1% |
|||||
|
Jones Apparel Group, Inc. 7.875% 6/15/06 |
Baa2 |
|
5,070,000 |
4,840,430 |
|
|
TOTAL DURABLES |
10,677,161 |
||||
|
Corporate Bonds - continued |
|||||
|
Moody's Ratings (unaudited) (b) |
Principal Amount |
Value |
|||
|
Nonconvertible Bonds - continued |
|||||
|
ENERGY - 0.7% |
|||||
|
Coal - 0.0% |
|||||
|
P&L Coal Holdings Corp. 9.625% 5/15/08 |
B2 |
|
$ 1,890,000 |
$ 1,752,975 |
|
|
Energy Services - 0.2% |
|||||
|
Baker Hughes, Inc. |
A2 |
|
3,980,000 |
3,811,248 |
|
|
R&B Falcon Corp. |
Ba3 |
|
1,785,000 |
1,655,588 |
|
|
RBF Finance Co. |
Ba3 |
|
1,260,000 |
1,348,200 |
|
|
|
6,815,036 |
||||
|
Oil & Gas - 0.5% |
|||||
|
Apache Corp. |
Baa1 |
|
2,970,000 |
2,867,713 |
|
|
Chesapeake Energy Corp. 9.625% 5/1/05 |
B2 |
|
3,710,000 |
3,617,250 |
|
|
Occidental Petroleum Corp. 6.39% 11/9/00 |
Baa3 |
|
1,000,000 |
996,030 |
|
|
Oryx Energy Co.: |
|
|
|
|
|
|
8% 10/15/03 |
Baa1 |
|
3,055,000 |
3,053,839 |
|
|
8.125% 10/15/05 |
Baa1 |
|
4,935,000 |
4,993,727 |
|
|
8.375% 7/15/04 |
Baa1 |
|
2,335,000 |
2,355,875 |
|
|
Petro-Canada |
A3 |
|
1,290,000 |
1,126,428 |
|
|
Phillips Petroleum Co. 8.75% 5/25/10 |
Baa2 |
|
1,880,000 |
1,980,430 |
|
|
|
20,991,292 |
||||
|
TOTAL ENERGY |
29,559,303 |
||||
|
FINANCE - 3.8% |
|||||
|
Banks - 1.3% |
|||||
|
Bank of America Corp. 7.8% 2/15/10 |
Aa3 |
|
1,400,000 |
1,394,246 |
|
|
Bank of Tokyo-Mitsubishi Ltd. 8.4% 4/15/10 |
A3 |
|
2,820,000 |
2,847,636 |
|
|
BankBoston Corp. |
A3 |
|
1,700,000 |
1,638,256 |
|
|
Barclays Bank PLC yankee 5.95% 7/15/01 |
A1 |
|
7,650,000 |
7,595,371 |
|
|
Capital One Bank: |
|
|
|
|
|
|
6.26% 5/7/01 |
Baa2 |
|
3,160,000 |
3,109,503 |
|
|
6.375% 2/15/03 |
Baa2 |
|
3,570,000 |
3,423,095 |
|
|
6.48% 6/28/02 |
Baa2 |
|
1,740,000 |
1,691,454 |
|
|
6.65% 3/15/04 |
Baa3 |
|
2,320,000 |
2,228,360 |
|
|
Capital One Financial Corp. 7.125% 8/1/08 |
Baa3 |
|
5,040,000 |
4,690,476 |
|
|
Commonwealth Bank of Australia 8.5% 6/1/10 |
A1 |
|
1,700,000 |
1,764,158 |
|
|
Den Danske Bank AS 6.375% 6/15/08 (g)(j) |
A1 |
|
8,340,000 |
7,657,163 |
|
|
|
|||||
|
Moody's Ratings (unaudited) (b) |
Principal Amount |
Value |
|||
|
HSBC Finance Nederland BV 7.4% 4/15/03 (g) |
A2 |
|
$ 500,000 |
$ 497,985 |
|
|
Korea Development Bank: |
|
|
|
|
|
|
6.625% 11/21/03 |
Baa2 |
|
4,165,000 |
4,006,647 |
|
|
7.375% 9/17/04 |
Baa2 |
|
615,000 |
595,997 |
|
|
yankee 6.5% 11/15/02 |
Baa2 |
|
665,000 |
643,654 |
|
|
Popular, Inc. 6.2% 4/30/01 |
A3 |
|
1,840,000 |
1,823,035 |
|
|
Providian National Bank 6.7% 3/15/03 |
Baa3 |
|
3,060,000 |
2,926,400 |
|
|
Royal Bank of Scotland Group PLC |
A1 |
|
1,975,000 |
2,051,373 |
|
|
Summit Bancorp |
BBB+ |
|
1,730,000 |
1,751,296 |
|
|
Union Planters National Bank 6.81% 8/20/01 |
A3 |
|
3,500,000 |
3,474,520 |
|
|
|
55,810,625 |
||||
|
Credit & Other Finance - 1.7% |
|||||
|
Ahmanson Capital Trust I 8.36% 12/1/26 (g) |
A3 |
|
4,250,000 |
3,864,525 |
|
|
AMRESCO, Inc.: |
|
|
|
|
|
|
9.875% 3/15/05 |
Caa3 |
|
2,340,000 |
1,088,100 |
|
|
10% 3/15/04 |
Caa3 |
|
1,130,000 |
519,800 |
|
|
CIT Group, Inc. |
A1 |
|
680,000 |
626,797 |
|
|
Countrywide Funding Corp. 6.45% 2/27/03 |
A3 |
|
3,950,000 |
3,814,831 |
|
|
Daimler-Chrysler NA Holding Corp. |
A1 |
|
900,000 |
889,299 |
|
|
Details Capital Corp. |
Caa1 |
|
505,000 |
333,300 |
|
|
Dobson/Sygnet Communications Co. 12.25% 12/15/08 |
- |
|
755,000 |
798,413 |
|
|
ERP Operating LP: |
|
|
|
|
|
|
6.55% 11/15/01 |
A3 |
|
1,500,000 |
1,478,355 |
|
|
7.1% 6/23/04 |
A3 |
|
3,980,000 |
3,859,645 |
|
|
Finova Capital Corp.: |
|
|
|
|
|
|
6.11% 2/18/03 |
Baa2 |
|
5,720,000 |
5,033,600 |
|
|
6.12% 5/28/02 |
Baa2 |
|
2,000,000 |
1,870,000 |
|
|
7.25% 11/8/04 |
Baa2 |
|
3,890,000 |
3,462,100 |
|
|
First Security Capital I 8.41% 12/15/26 |
A3 |
|
1,690,000 |
1,565,684 |
|
|
Ford Motor Credit Co.: |
|
|
|
|
|
|
6.4513% 7/16/01 (j) |
A2 |
|
13,000,000 |
13,014,079 |
|
|
7.5% 3/15/05 |
A2 |
|
3,850,000 |
3,821,125 |
|
|
7.875% 6/15/10 |
A2 |
|
1,690,000 |
1,692,400 |
|
|
GS Escrow Corp. |
Ba1 |
|
2,800,000 |
2,487,352 |
|
|
Heller Financial, Inc. |
A3 |
|
5,050,000 |
4,725,992 |
|
|
HSBC Capital Funding LP 10.176% 12/31/49 (f)(g) |
A1 |
|
2,600,000 |
2,784,210 |
|
|
Corporate Bonds - continued |
|||||
|
Moody's Ratings (unaudited) (b) |
Principal Amount |
Value |
|||
|
Nonconvertible Bonds - continued |
|||||
|
FINANCE - continued |
|||||
|
Credit & Other Finance - continued |
|||||
|
Macsaver Financial Services, Inc.: |
|
|
|
|
|
|
7.4% 2/15/02 |
Ba2 |
|
$ 1,480,000 |
$ 962,000 |
|
|
7.6% 8/1/07 |
Ba2 |
|
4,190,000 |
2,220,700 |
|
|
7.875% 8/1/03 |
Ba2 |
|
690,000 |
427,800 |
|
|
Newcourt Credit Group, Inc. 6.875% 2/16/05 |
A1 |
|
2,865,000 |
2,726,076 |
|
|
PNC Funding Corp. |
A3 |
|
2,020,000 |
1,971,358 |
|
|
Sprint Capital Corp. |
Baa1 |
|
2,905,000 |
2,511,779 |
|
|
The Money Store, Inc. |
A2 |
|
2,550,000 |
2,526,094 |
|
|
TXU Eastern Funding: |
|
|
|
|
|
|
6.15% 5/15/02 |
Baa1 |
|
2,510,000 |
2,437,511 |
|
|
6.75% 5/15/09 |
Baa1 |
|
3,325,000 |
2,973,115 |
|
|
Venetian Casino Resort LLC/Las Vegas Sands, Inc. 12.25% 11/15/04 |
Caa1 |
|
305,000 |
308,050 |
|
|
|
76,794,090 |
||||
|
Savings & Loans - 0.3% |
|||||
|
Chevy Chase Savings Bank FSB 9.25% 12/1/08 |
B1 |
|
730,000 |
649,700 |
|
|
Home Savings of America FSB 6.5% 8/15/04 |
A3 |
|
2,830,000 |
2,685,161 |
|
|
Long Island Savings Bank FSB: |
|
|
|
|
|
|
6.2% 4/2/01 |
Baa3 |
|
3,770,000 |
3,765,815 |
|
|
7% 6/13/02 |
Baa3 |
|
3,400,000 |
3,351,686 |
|
|
Sovereign Bancorp, Inc. 6.625% 3/15/01 |
Ba3 |
|
4,300,000 |
4,197,875 |
|
|
|
14,650,237 |
||||
|
Securities Industry - 0.5% |
|||||
|
Amvescap PLC yankee: |
|
|
|
|
|
|
6.375% 5/15/03 |
A3 |
|
2,200,000 |
2,099,592 |
|
|
6.6% 5/15/05 |
A3 |
|
4,410,000 |
4,108,268 |
|
|
Goldman Sachs Group LP 6.6338% 7/27/00 (j)(l) |
A1 |
|
12,900,000 |
12,898,891 |
|
|
Morgan Stanley |
Aa3 |
|
4,760,000 |
4,725,019 |
|
|
|
23,831,770 |
||||
|
TOTAL FINANCE |
171,086,722 |
||||
|
|
|||||
|
Moody's Ratings (unaudited) (b) |
Principal Amount |
Value |
|||
|
HEALTH - 0.0% |
|||||
|
Medical Facilities Management - 0.0% |
|||||
|
Fountain View, Inc. |
Caa1 |
|
$ 2,330,000 |
$ 570,850 |
|
|
Unilab Corp. |
B3 |
|
725,000 |
746,750 |
|
|
|
1,317,600 |
||||
|
INDUSTRIAL MACHINERY & EQUIPMENT - 0.5% |
|||||
|
Industrial Machinery & Equipment - 0.2% |
|||||
|
Dunlop Standard Aero Holdings PLC |
B3 |
|
2,490,000 |
2,465,100 |
|
|
Roller Bearing Holding, Inc. 0% 6/15/09 (e)(g) |
- |
|
3,550,000 |
1,810,500 |
|
|
Tyco International Group SA: |
|
|
|
|
|
|
7% 6/15/28 |
Baa1 |
|
5,310,000 |
4,564,635 |
|
|
yankee 6.375% 6/15/05 |
Baa1 |
|
830,000 |
791,762 |
|
|
|
9,631,997 |
||||
|
Pollution Control - 0.3% |
|||||
|
Allied Waste |
|
|
|
|
|
|
7.375% 1/1/04 |
Ba3 |
|
1,290,000 |
1,173,900 |
|
|
7.625% 1/1/06 |
Ba2 |
|
1,095,000 |
952,650 |
|
|
10% 8/1/09 |
B2 |
|
9,325,000 |
7,833,000 |
|
|
Browning-Ferris Industries, Inc. 6.375% 1/15/08 |
Ba3 |
|
1,220,000 |
939,400 |
|
|
Envirosource, Inc. Series B, 9.75% 6/15/03 |
Caa3 |
|
50,000 |
22,500 |
|
|
WMX Technologies, Inc.: |
|
|
|
|
|
|
6.25% 10/15/00 |
Ba1 |
|
2,100,000 |
2,086,203 |
|
|
7.1% 8/1/26 |
Ba1 |
|
1,390,000 |
1,308,296 |
|
|
|
14,315,949 |
||||
|
TOTAL INDUSTRIAL MACHINERY & EQUIPMENT |
23,947,946 |
||||
|
MEDIA & LEISURE - 3.9% |
|||||
|
Broadcasting - 2.9% |
|||||
|
Adelphia Communications Corp. 9.875% 3/1/07 |
B1 |
|
4,150,000 |
3,942,500 |
|
|
AMFM Operating, Inc. 12.625% 10/31/06 |
- |
|
1,523,800 |
1,790,465 |
|
|
Ascent Entertainment Group, Inc. |
Ba1 |
|
2,145,000 |
1,737,450 |
|
|
British Sky Broadcasting Group PLC |
Baa3 |
|
6,040,000 |
5,650,058 |
|
|
Callahan |
B3 |
|
4,120,144 |
4,120,144 |
|
|
Corporate Bonds - continued |
|||||
|
Moody's Ratings (unaudited) (b) |
Principal Amount |
Value |
|||
|
Nonconvertible Bonds - continued |
|||||
|
MEDIA & LEISURE - continued |
|||||
|
Broadcasting - continued |
|||||
|
Charter Communications Holdings LLC/Charter Communications Holdings Capital Corp. |
B2 |
|
$ 4,100,000 |
$ 3,977,000 |
|
|
Citadel Broadcasting Co.: |
|
|
|
|
|
|
9.25% 11/15/08 |
B3 |
|
1,165,000 |
1,130,050 |
|
|
10.25% 7/1/07 |
B3 |
|
7,080,000 |
7,177,350 |
|
|
Clear Channel Communications, Inc. 6.875% 6/15/18 |
Baa3 |
|
3,450,000 |
2,965,965 |
|
|
Comcast UK Cable Partners Ltd. 0% 11/15/07 (e) |
B2 |
|
3,360,000 |
3,124,800 |
|
|
Continental |
|
|
|
|
|
|
8.3% 5/15/06 |
A2 |
|
5,125,000 |
5,246,411 |
|
|
8.625% 8/15/03 |
A2 |
|
2,790,000 |
2,869,041 |
|
|
Diamond Cable Communications PLC: |
|
|
|
|
|
|
0% 2/15/07 (e) |
B3 |
|
3,730,000 |
2,862,775 |
|
|
yankee 0% 12/15/05 (e) |
B3 |
|
2,460,000 |
2,300,100 |
|
|
Earthwatch, Inc. 0% 7/15/07 unit (e)(g) |
- |
|
2,530,000 |
1,619,200 |
|
|
EchoStar DBS Corp.: |
|
|
|
|
|
|
9.25% 2/1/06 |
B2 |
|
2,820,000 |
2,721,300 |
|
|
9.375% 2/1/09 |
B2 |
|
2,305,000 |
2,224,325 |
|
|
Fox Family Worldwide, Inc. 0% 11/1/07 (e) |
B1 |
|
555,000 |
344,100 |
|
|
FrontierVision Holdings LP/FrontierVision |
B1 |
|
4,130,000 |
3,562,125 |
|
|
FrontierVision Operating Partners LP/FrontierVision Capital Corp. |
B1 |
|
1,910,000 |
1,910,000 |
|
|
Golden Sky DBS, Inc. |
Caa1 |
|
4,950,000 |
3,328,875 |
|
|
Golden Sky Systems, Inc. 12.375% 8/1/06 |
B3 |
|
950,000 |
1,035,500 |
|
|
Hearst-Argyle Television, Inc. 7.5% 11/15/27 |
Baa3 |
|
3,260,000 |
2,750,103 |
|
|
International Cabletel, Inc. 0% 2/1/06 (e) |
B3 |
|
1,850,000 |
1,702,000 |
|
|
Knology Holding, Inc. |
- |
|
2,220,000 |
1,132,200 |
|
|
LIN Holdings Corp. |
B3 |
|
1,635,000 |
1,075,013 |
|
|
Nielsen Media Research, Inc. 7.6% 6/15/09 |
Baa2 |
|
2,395,000 |
2,285,261 |
|
|
NorthPoint Communication Holdings, Inc. |
Caa1 |
|
5,125,000 |
3,536,250 |
|
|
|
|||||
|
Moody's Ratings (unaudited) (b) |
Principal Amount |
Value |
|||
|
NTL Communications Corp. 11.5% 10/1/08 |
B3 |
|
$ 4,100,000 |
$ 4,130,750 |
|
|
NTL, Inc.: |
|
|
|
|
|
|
0% 4/1/08 (e) |
B3 |
|
9,455,000 |
5,862,100 |
|
|
10% 2/15/07 |
B3 |
|
2,020,000 |
1,919,000 |
|
|
Pegasus Communications Corp. 9.625% 10/15/05 |
B3 |
|
3,365,000 |
3,247,225 |
|
|
TCI Communications, Inc. 9.8% 2/1/12 |
A2 |
|
4,550,000 |
5,169,392 |
|
|
Telemundo Holdings, Inc. |
Caa1 |
|
4,410,000 |
3,064,950 |
|
|
Telewest Communications PLC: |
|
|
|
|
|
|
0% 4/15/09 (e) |
B1 |
|
3,380,000 |
1,859,000 |
|
|
0% 2/1/10 (e)(g) |
B1 |
|
3,335,000 |
1,767,550 |
|
|
Telewest PLC: |
|
|
|
|
|
|
yankee 9.625% 10/1/06 |
B1 |
|
680,000 |
639,200 |
|
|
0% 10/1/07 (e) |
B1 |
|
6,705,000 |
6,403,275 |
|
|
Time Warner, Inc. |
Baa3 |
|
5,355,000 |
5,868,545 |
|
|
United Pan-Europe Communications NV: |
|
|
|
|
|
|
0% 2/1/10 (e) |
B2 |
|
7,545,000 |
3,546,150 |
|
|
10.875% 8/1/09 |
B2 |
|
11,443,000 |
10,069,840 |
|
|
USA Networks, Inc./USANi LLC 6.75% 11/15/05 |
Baa3 |
|
1,935,000 |
1,843,088 |
|
|
|
133,510,426 |
||||
|
Entertainment - 0.3% |
|||||
|
Bally Total Fitness Holding Corp. 9.875% 10/15/07 |
B3 |
|
2,450,000 |
2,229,500 |
|
|
Cinemark USA, Inc. |
B2 |
|
845,000 |
397,150 |
|
|
Paramount Communications, Inc. 7.5% 1/15/02 |
Baa1 |
|
1,785,000 |
1,779,163 |
|
|
Premier Parks, Inc. |
B3 |
|
7,225,000 |
4,903,969 |
|
|
Viacom, Inc.: |
|
|
|
|
|
|
6.75% 1/15/03 |
Baa1 |
|
4,430,000 |
4,350,747 |
|
|
7.75% 6/1/05 |
Baa1 |
|
2,137,000 |
2,144,244 |
|
|
|
15,804,773 |
||||
|
Lodging & Gaming - 0.3% |
|||||
|
Florida Panthers Holdings, Inc. 9.875% 4/15/09 |
B2 |
|
2,225,000 |
2,080,375 |
|
|
HMH Properties, Inc. 7.875% 8/1/05 |
Ba2 |
|
2,120,000 |
1,950,400 |
|
|
Horseshoe Gaming LLC 8.625% 5/15/09 |
B2 |
|
1,525,000 |
1,433,500 |
|
|
Host Marriott LP |
Ba2 |
|
3,000,000 |
2,805,000 |
|
|
ITT Corp. |
Ba1 |
|
810,000 |
678,375 |
|
|
Corporate Bonds - continued |
|||||
|
Moody's Ratings (unaudited) (b) |
Principal Amount |
Value |
|||
|
Nonconvertible Bonds - continued |
|||||
|
MEDIA & LEISURE - continued |
|||||
|
Lodging & Gaming - continued |
|||||
|
Mohegan Tribal Gaming Authority 8.75% 1/1/09 |
Ba3 |
|
$ 2,110,000 |
$ 1,993,950 |
|
|
Station Casinos, Inc. 9.875% 7/1/10 (g) |
B1 |
|
2,490,000 |
2,502,450 |
|
|
|
13,444,050 |
||||
|
Publishing - 0.3% |
|||||
|
News America |
|
|
|
|
|
|
7.7% 10/30/25 |
Baa3 |
|
4,300,000 |
3,916,010 |
|
|
7.75% 1/20/24 |
Baa3 |
|
2,590,000 |
2,344,649 |
|
|
Time Warner Entertainment Co. LP 8.375% 3/15/23 |
Baa2 |
|
5,340,000 |
5,405,842 |
|
|
|
11,666,501 |
||||
|
Restaurants - 0.1% |
|||||
|
Domino's, Inc. |
B3 |
|
1,620,000 |
1,502,550 |
|
|
NE Restaurant, Inc. |
B3 |
|
2,760,000 |
2,152,800 |
|
|
|
3,655,350 |
||||
|
TOTAL MEDIA & LEISURE |
178,081,100 |
||||
|
NONDURABLES - 0.5% |
|||||
|
Beverages - 0.2% |
|||||
|
Seagram JE & Sons, Inc.: |
|
|
|
|
|
|
6.4% 12/15/03 |
Baa3 |
|
5,840,000 |
5,612,824 |
|
|
6.8% 12/15/08 |
Baa3 |
|
3,040,000 |
2,850,994 |
|
|
|
8,463,818 |
||||
|
Foods - 0.1% |
|||||
|
ConAgra, Inc. |
Baa1 |
|
3,200,000 |
2,951,168 |
|
|
Del Monte Foods Co. |
Caa1 |
|
2,390,000 |
1,792,500 |
|
|
|
4,743,668 |
||||
|
Tobacco - 0.2% |
|||||
|
Philip Morris |
|
|
|
|
|
|
7% 7/15/05 |
A2 |
|
3,955,000 |
3,725,729 |
|
|
7.25% 9/15/01 |
A2 |
|
1,450,000 |
1,426,322 |
|
|
RJ Reynolds Tobacco Holdings, Inc. |
Baa2 |
|
3,500,000 |
3,250,660 |
|
|
|
8,402,711 |
||||
|
TOTAL NONDURABLES |
21,610,197 |
||||
|
|
|||||
|
Moody's Ratings (unaudited) (b) |
Principal Amount |
Value |
|||
|
RETAIL & WHOLESALE - 0.5% |
|||||
|
Drug Stores - 0.1% |
|||||
|
Rite Aid Corp.: |
|
|
|
|
|
|
6.5% 12/15/05 (g) |
Caa1 |
|
$ 5,475,000 |
$ 2,819,625 |
|
|
7.125% 1/15/07 |
Caa1 |
|
1,595,000 |
845,350 |
|
|
|
3,664,975 |
||||
|
General Merchandise Stores - 0.2% |
|||||
|
Dayton Hudson Corp. |
A2 |
|
3,500,000 |
3,498,040 |
|
|
Federated Department Stores, Inc.: |
|
|
|
|
|
|
6.79% 7/15/27 |
Baa1 |
|
3,000,000 |
2,901,120 |
|
|
8.5% 6/15/03 |
Baa1 |
|
2,580,000 |
2,603,659 |
|
|
Kmart Corp. 12.5% 3/1/05 |
Baa3 |
|
2,510,000 |
2,723,350 |
|
|
|
11,726,169 |
||||
|
Grocery Stores - 0.2% |
|||||
|
Kroger Co. 6% 7/1/00 |
Baa3 |
|
4,480,000 |
4,479,149 |
|
|
Pathmark Stores, Inc. 9.625% 5/1/03 (d) |
Caa3 |
|
6,150,000 |
4,243,500 |
|
|
|
8,722,649 |
||||
|
TOTAL RETAIL & WHOLESALE |
24,113,793 |
||||
|
SERVICES - 0.1% |
|||||
|
Printing - 0.0% |
|||||
|
Sullivan Graphics, Inc. 12.75% 8/1/05 |
Caa1 |
|
1,430,000 |
1,437,150 |
|
|
Services - 0.1% |
|||||
|
La Petite Academy, Inc./La Petite Academy Holding Co. 10% 5/15/08 |
B3 |
|
2,040,000 |
1,183,200 |
|
|
Medaphis Corp. |
Caa1 |
|
1,770,000 |
1,327,500 |
|
|
|
2,510,700 |
||||
|
TOTAL SERVICES |
3,947,850 |
||||
|
TECHNOLOGY - 1.0% |
|||||
|
Communications Equipment - 0.1% |
|||||
|
Corning, Inc. |
A2 |
|
2,350,000 |
2,102,075 |
|
|
Computer Services & Software - 0.4% |
|||||
|
Amazon.com, Inc. |
Caa1 |
|
2,305,000 |
1,244,700 |
|
|
Concentric Network Corp. 12.75% 12/15/07 |
B- |
|
595,000 |
624,750 |
|
|
Covad Communications Group, Inc.: |
|
|
|
|
|
|
0% 3/15/08 (e) |
B3 |
|
3,885,000 |
1,903,650 |
|
|
12% 2/15/10 |
B3 |
|
5,505,000 |
4,266,375 |
|
|
12.5% 2/15/09 |
B3 |
|
1,091,000 |
867,345 |
|
|
Exodus Communications, Inc. 11.25% 7/1/08 |
B- |
|
1,945,000 |
1,925,550 |
|
|
Corporate Bonds - continued |
|||||
|
Moody's Ratings (unaudited) (b) |
Principal Amount |
Value |
|||
|
Nonconvertible Bonds - continued |
|||||
|
TECHNOLOGY - continued |
|||||
|
Computer Services & Software - continued |
|||||
|
Federal Data Corp. 10.125% 8/1/05 |
B3 |
|
$ 3,720,000 |
$ 2,418,000 |
|
|
PSINet, Inc. |
B3 |
|
5,940,000 |
5,464,800 |
|
|
Verio, Inc. |
B3 |
|
61,000 |
64,965 |
|
|
|
18,780,135 |
||||
|
Computers & Office Equipment - 0.3% |
|||||
|
Comdisco, Inc. |
Baa1 |
|
8,300,000 |
8,030,997 |
|
|
Globix Corp. |
B- |
|
3,270,000 |
2,697,750 |
|
|
Sun Microsystems, Inc. |
Baa1 |
|
1,380,000 |
1,371,444 |
|
|
|
12,100,191 |
||||
|
Electronics - 0.2% |
|||||
|
ChipPAC International Ltd. 12.75% 8/1/09 |
B3 |
|
3,055,000 |
3,284,125 |
|
|
Details, Inc. 10% 11/15/05 |
B3 |
|
520,000 |
494,000 |
|
|
Fairchild |
|
|
|
|
|
|
10.125% 3/15/07 |
B2 |
|
560,000 |
565,600 |
|
|
10.375% 10/1/07 |
B3 |
|
1,660,000 |
1,693,200 |
|
|
Flextronics International Ltd. 9.875% 7/1/10 (g) |
Ba3 |
|
1,210,000 |
1,228,150 |
|
|
Micron Technology, Inc. 6.5% 9/30/05 (l) |
B3 |
|
3,000,000 |
2,505,000 |
|
|
SCG Holding Corp./Semiconductor Components Industries LLC 12% 8/1/09 |
B2 |
|
1,340,000 |
1,430,450 |
|
|
|
11,200,525 |
||||
|
TOTAL TECHNOLOGY |
44,182,926 |
||||
|
TRANSPORTATION - 0.8% |
|||||
|
Air Transportation - 0.2% |
|||||
|
Continental Airlines, Inc. pass thru trust certificates: |
|
|
|
|
|
|
7.434% 3/15/06 |
Baa1 |
|
1,110,000 |
1,073,259 |
|
|
7.73% 9/15/12 |
Baa1 |
|
455,032 |
434,601 |
|
|
Delta Air Lines, Inc. |
Baa3 |
|
4,000,000 |
3,486,400 |
|
|
Qantas Airways Ltd. |
Baa1 |
|
4,370,000 |
4,348,150 |
|
|
US Airways Group, Inc. 10.375% 3/1/13 |
Ba3 |
|
2,480,000 |
2,207,200 |
|
|
|
11,549,610 |
||||
|
|
|||||
|
Moody's Ratings (unaudited) (b) |
Principal Amount |
Value |
|||
|
Railroads - 0.6% |
|||||
|
Burlington Northern |
|
|
|
|
|
|
6.125% 3/15/09 |
Baa2 |
|
$ 6,450,000 |
$ 5,748,240 |
|
|
7.29% 6/1/36 |
Baa2 |
|
3,000,000 |
2,932,170 |
|
|
Canadian National Railway Co. 6.9% 7/15/28 |
Baa2 |
|
3,390,000 |
2,860,041 |
|
|
CSX Corp.: |
|
|
|
|
|
|
6.25% 10/15/08 |
Baa2 |
|
2,385,000 |
2,074,068 |
|
|
6.46% 6/22/05 |
Baa2 |
|
5,120,000 |
4,814,797 |
|
|
Norfolk Southern Corp. 7.05% 5/1/37 |
Baa1 |
|
6,610,000 |
6,460,350 |
|
|
Wisconsin Central Transportation Corp. 6.625% 4/15/08 |
Baa2 |
|
1,810,000 |
1,607,660 |
|
|
|
26,497,326 |
||||
|
TOTAL TRANSPORTATION |
38,046,936 |
||||
|
UTILITIES - 3.4% |
|||||
|
Cellular - 1.0% |
|||||
|
Crown Castle International Corp. 0% 5/15/11 (e) |
B3 |
|
2,830,000 |
1,726,300 |
|
|
Dobson Communications Corp. 10.875% 7/1/10 (g) |
- |
|
1,235,000 |
1,244,263 |
|
|
McCaw International Ltd. 0% 4/15/07 (e) |
Caa1 |
|
8,170,000 |
6,209,200 |
|
|
Millicom International Cellular SA 0% 6/1/06 (e) |
Caa1 |
|
7,300,000 |
6,205,000 |
|
|
Nextel Communications, Inc. 0% 10/31/07 (e) |
B1 |
|
16,310,000 |
12,150,950 |
|
|
Nextel International, Inc. |
Caa1 |
|
1,270,000 |
838,200 |
|
|
Rogers Communications, Inc. 8.875% 7/15/07 |
Ba3 |
|
2,950,000 |
2,891,000 |
|
|
TeleCorp PCS, Inc. |
B3 |
|
3,235,000 |
2,127,013 |
|
|
Triton PCS, Inc. |
B3 |
|
3,030,000 |
2,189,175 |
|
|
Vodafone AirTouch PLC 7.625% 2/15/05 (g) |
A2 |
|
3,040,000 |
3,036,717 |
|
|
VoiceStream Wireless Corp.: |
|
|
|
|
|
|
0% 11/15/09 (e) |
B2 |
|
1,430,000 |
958,100 |
|
|
10.375% 11/15/09 |
B2 |
|
7,905,000 |
8,221,200 |
|
|
|
47,797,118 |
||||
|
Electric Utility - 0.5% |
|||||
|
Avon Energy |
|
|
|
|
|
|
6.46% 3/4/08 (g) |
Baa2 |
|
3,960,000 |
3,527,093 |
|
|
6.73% 12/11/02 (g) |
Baa2 |
|
4,910,000 |
4,783,518 |
|
|
Dominion Resources, Inc. 8.125% 6/15/10 |
Baa1 |
|
2,095,000 |
2,109,162 |
|
|
Hydro-Quebec yankee |
A2 |
|
2,620,000 |
2,766,720 |
|
|
Corporate Bonds - continued |
|||||
|
Moody's Ratings (unaudited) (b) |
Principal Amount |
Value |
|||
|
Nonconvertible Bonds - continued |
|||||
|
UTILITIES - continued |
|||||
|
Electric Utility - continued |
|||||
|
Illinois Power Co. |
Baa1 |
|
$ 1,880,000 |
$ 1,835,218 |
|
|
Israel Electric Corp. Ltd.: |
|
|
|
|
|
|
7.75% 12/15/27 (g) |
A3 |
|
3,920,000 |
3,360,028 |
|
|
yankee 7.875% 12/15/26 (g) |
A3 |
|
1,960,000 |
1,731,288 |
|
|
Texas Utilities Co. |
Baa3 |
|
990,000 |
894,218 |
|
|
|
21,007,245 |
||||
|
Gas - 0.1% |
|||||
|
Reliant Energy |
Baa1 |
|
2,550,000 |
2,549,490 |
|
|
Telephone Services - 1.8% |
|||||
|
Allegiance Telecom, Inc.: |
|
|
|
|
|
|
0% 2/15/08 (e) |
B3 |
|
1,280,000 |
931,200 |
|
|
12.875% 5/15/08 |
B3 |
|
1,390,000 |
1,504,675 |
|
|
Cable & Wireless Optus Ltd. 8% 6/22/10 (g) |
Baa1 |
|
2,520,000 |
2,504,452 |
|
|
Deutsche Telekom International Finance BV 8.25% 6/15/30 |
Aa2 |
|
7,180,000 |
7,294,377 |
|
|
FirstWorld Communications, Inc. 0% 4/15/08 (e) |
- |
|
2,745,000 |
1,235,250 |
|
|
Global Crossing Holdings Ltd. 9.125% 11/15/06 |
Ba2 |
|
840,000 |
808,500 |
|
|
Globenet Communication Group Ltd. 13% 7/15/07 |
Caa1 |
|
2,450,000 |
2,474,500 |
|
|
ICG Services, Inc. |
B3 |
|
2,425,000 |
1,115,500 |
|
|
Intermedia |
|
|
|
|
|
|
0% 7/15/07 (e) |
B2 |
|
1,050,000 |
813,750 |
|
|
0% 3/1/09 (e) |
B3 |
|
1,410,000 |
856,575 |
|
|
Level 3 Communications, Inc. 9.125% 5/1/08 |
B3 |
|
3,885,000 |
3,486,788 |
|
|
Logix Communications Enterprises, Inc. |
- |
|
4,040,000 |
1,292,800 |
|
|
McLeodUSA, Inc.: |
|
|
|
|
|
|
0% 3/1/07 (e) |
B1 |
|
2,485,000 |
2,074,975 |
|
|
9.5% 11/1/08 |
B1 |
|
1,205,000 |
1,174,875 |
|
|
Metromedia Fiber Network, Inc. 10% 12/15/09 |
B2 |
|
580,000 |
569,850 |
|
|
NEXTLINK Communications, Inc. 9.625% 10/1/07 |
B2 |
|
2,870,000 |
2,690,625 |
|
|
Ono Finance PLC |
Caa1 |
|
2,075,000 |
1,960,875 |
|
|
|
|||||
|
Moody's Ratings (unaudited) (b) |
Principal Amount |
Value |
|||
|
Pathnet, Inc. |
- |
|
$ 4,665,000 |
$ 2,612,400 |
|
|
Rhythms |
|
|
|
|
|
|
0% 5/15/08 (e) |
B3 |
|
7,983,000 |
3,153,285 |
|
|
12.75% 4/15/09 |
B3 |
|
2,510,000 |
1,706,800 |
|
|
Telecomunicaciones |
Baa2 |
|
5,540,000 |
5,159,291 |
|
|
Teleglobe Canada, Inc.: |
|
|
|
|
|
|
7.2% 7/20/09 |
Baa1 |
|
6,886,000 |
6,588,869 |
|
|
7.7% 7/20/29 |
Baa1 |
|
6,330,000 |
5,960,771 |
|
|
Teligent, Inc.: |
|
|
|
|
|
|
0% 3/1/08 (e) |
Caa1 |
|
4,445,000 |
2,044,700 |
|
|
11.5% 12/1/07 |
Caa1 |
|
4,295,000 |
3,328,625 |
|
|
WinStar |
|
|
|
|
|
|
0% 4/15/10 (e)(g) |
B3 |
|
12,896,000 |
5,996,640 |
|
|
12.75% 4/15/10 (g) |
B3 |
|
10,487,000 |
10,119,955 |
|
|
WorldCom, Inc. |
A3 |
|
3,139,000 |
3,254,704 |
|
|
|
82,715,607 |
||||
|
TOTAL UTILITIES |
154,069,460 |
||||
|
TOTAL NONCONVERTIBLE BONDS |
758,969,328 |
||||
|
TOTAL CORPORATE BONDS (Cost $818,133,022) |
769,770,866 |
||||
|
U.S. Government and Government |
|||||
|
|
|||||
|
U.S. Government Agency Obligations - 3.4% |
|||||
|
Fannie Mae: |
|
|
|
|
|
|
0% 8/24/00 |
- |
|
30,000,000 |
29,717,460 |
|
|
6% 5/15/08 |
Aaa |
|
12,000,000 |
11,190,840 |
|
|
6.5% 4/29/09 |
Aaa |
|
9,210,000 |
8,604,166 |
|
|
7.125% 2/15/05 |
Aaa |
|
10,045,000 |
10,085,783 |
|
|
7.25% 5/15/30 |
Aaa |
|
12,135,000 |
12,382,020 |
|
|
Farm Credit Systems Financial Assistance Corp. 8.8% 6/10/05 |
Aaa |
|
2,000,000 |
2,141,560 |
|
|
Federal Home Loan Bank: |
|
|
|
|
|
|
5.195% 9/11/01 |
Aaa |
|
4,500,000 |
4,405,770 |
|
|
6.75% 2/1/02 |
Aaa |
|
38,840,000 |
38,718,431 |
|
|
7.59% 3/10/05 |
Aaa |
|
3,850,000 |
3,928,194 |
|
|
Freddie Mac: |
|
|
|
|
|
|
0% 8/17/00 |
- |
|
10,000,000 |
9,918,490 |
|
|
6.25% 7/15/04 |
Aaa |
|
6,200,000 |
6,027,578 |
|
|
6.75% 8/1/05 |
Aaa |
|
2,500,000 |
2,464,850 |
|
|
6.875% 1/15/05 |
Aaa |
|
3,255,000 |
3,234,656 |
|
|
7% 7/15/05 |
Aaa |
|
4,400,000 |
4,393,840 |
|
|
U.S. Government and Government Agency |
|||||
|
Moody's Ratings (unaudited) (b) |
Principal Amount |
Value |
|||
|
U.S. Government Agency Obligations - continued |
|||||
|
Freddie Mac: - continued |
|
|
|
|
|
|
7.625% 9/9/09 |
Aaa |
|
$ 3,415,000 |
$ 3,366,985 |
|
|
Tennessee Valley Authority 7.125% 5/1/30 |
Aaa |
|
2,570,000 |
2,580,794 |
|
|
U.S. Department of Housing and Urban Development government guaranteed participation certificates Series 1996-A, |
Aaa |
|
2,825,000 |
2,879,381 |
|
|
TOTAL U.S. GOVERNMENT AGENCY OBLIGATIONS |
156,040,798 |
||||
|
U.S. Treasury Obligations - 4.0% |
|||||
|
U.S. Treasury Bills, yield |
- |
|
8,000,000 |
7,935,864 |
|
|
U.S. Treasury Bonds: |
|
|
|
|
|
|
5.25% 2/15/29 |
Aaa |
|
750,000 |
665,625 |
|
|
6.875% 8/15/25 |
Aaa |
|
715,000 |
779,236 |
|
|
7.625% 2/15/25 |
Aaa |
|
10,290,000 |
12,167,925 |
|
|
8% 11/15/21 |
Aaa |
|
2,200,000 |
2,659,602 |
|
|
8.125% 8/15/19 |
Aaa |
|
58,400,000 |
70,600,344 |
|
|
8.875% 8/15/17 |
Aaa |
|
4,027,000 |
5,133,177 |
|
|
11.75% 2/15/10 (callable) |
Aaa |
|
15,045,000 |
18,150,438 |
|
|
12% 8/15/13 |
Aaa |
|
3,740,000 |
5,049,000 |
|
|
13.875% 5/15/11 (callable) |
Aaa |
|
21,150,000 |
28,688,072 |
|
|
U.S. Treasury Notes: |
|
|
|
|
|
|
4.75% 11/15/08 |
Aaa |
|
1,665,000 |
1,512,020 |
|
|
6.25% 10/31/01 |
Aaa |
|
820,000 |
817,433 |
|
|
6.625% 6/30/01 |
Aaa |
|
19,110,000 |
19,133,888 |
|
|
7% 7/15/06 |
Aaa |
|
8,695,000 |
9,010,194 |
|
|
7.25% 8/15/04 |
Aaa |
|
1,404,000 |
1,451,610 |
|
|
TOTAL U.S. TREASURY OBLIGATIONS |
183,754,428 |
||||
|
TOTAL U.S. GOVERNMENT AND GOVERNMENT AGENCY OBLIGATIONS (Cost $344,947,217) |
339,795,226 |
||||
|
U.S. Government Agency - |
|||||
|
|
|||||
|
Fannie Mae - 8.4% |
|||||
|
6% 1/1/11 to 1/1/29 |
Aaa |
|
55,576,630 |
51,894,145 |
|
|
6.5% 5/1/14 to 1/1/30 |
Aaa |
|
112,916,299 |
106,742,974 |
|
|
7% 8/1/13 to 12/1/29 |
Aaa |
|
126,273,999 |
122,195,551 |
|
|
7.5% 7/1/16 to 3/1/30 |
Aaa |
|
30,045,234 |
29,660,358 |
|
|
7.5% 7/1/30 (h) |
Aaa |
|
25,600,000 |
25,224,000 |
|
|
|
|||||
|
Moody's Ratings (unaudited) (b) |
Principal Amount |
Value |
|||
|
8% 9/1/26 to 3/1/30 |
Aaa |
|
$ 1,472,835 |
$ 1,478,817 |
|
|
8% 7/1/30 (h) |
Aaa |
|
44,860,000 |
45,028,225 |
|
|
TOTAL FANNIE MAE |
382,224,070 |
||||
|
Freddie Mac - 0.1% |
|||||
|
7.5% 5/1/17 to 7/1/29 |
Aaa |
|
3,977,164 |
3,939,908 |
|
|
8% 7/1/17 to 5/1/27 |
Aaa |
|
616,237 |
621,896 |
|
|
8.5% 7/1/22 to 6/1/23 |
Aaa |
|
23,330 |
23,822 |
|
|
TOTAL FREDDIE MAC |
4,585,626 |
||||
|
Government National Mortgage Association - 1.1% |
|||||
|
6% 12/15/08 to 6/15/09 |
Aaa |
|
2,339,469 |
2,255,515 |
|
|
6.5% 6/15/08 to 7/15/09 |
Aaa |
|
10,988,800 |
10,770,268 |
|
|
7% 7/15/28 |
Aaa |
|
17,866,601 |
17,369,552 |
|
|
7.5% 9/15/22 to 8/15/28 |
Aaa |
|
19,270,248 |
19,157,679 |
|
|
8% 5/15/25 |
Aaa |
|
80,865 |
81,775 |
|
|
8.5% 12/15/16 |
Aaa |
|
25,719 |
26,519 |
|
|
TOTAL GOVERNMENT NATIONAL |
49,661,308 |
||||
|
TOTAL U.S. GOVERNMENT AGENCY - (Cost $444,523,943) |
436,471,004 |
||||
|
Asset-Backed Securities - 0.7% |
|||||
|
|
|||||
|
Airplanes pass through trust 10.875% 3/15/19 |
Ba2 |
|
2,513,697 |
1,860,135 |
|
|
BankAmerica Manufacturing Housing Contract Trust V 6.2% 4/10/09 |
Aaa |
|
3,730,000 |
3,651,903 |
|
|
Capita Equipment Receivables Trust |
Baa2 |
|
2,950,000 |
2,855,508 |
|
|
CIT Marine Trust |
Aaa |
|
5,920,000 |
5,720,200 |
|
|
CPS Auto Grantor Trust 6.55% 8/15/02 |
Aaa |
|
586,472 |
583,539 |
|
|
CPS Auto Receivables Trust 6% 8/15/03 |
Aaa |
|
2,157,284 |
2,127,622 |
|
|
CSXT Trade Receivables Master Trust 6% 7/25/04 |
Aaa |
|
4,600,000 |
4,460,563 |
|
|
Ford Credit Auto |
|
|
|
|
|
|
6.2% 12/15/02 |
Aa2 |
|
2,680,000 |
2,643,569 |
|
|
6.4% 12/15/02 |
Aa2 |
|
1,480,000 |
1,460,760 |
|
|
7.03% 11/15/03 |
Aaa |
|
704,000 |
703,450 |
|
|
Green Tree Financial Corp. 6.8% 6/15/27 |
Aaa |
|
361,150 |
360,810 |
|
|
Asset-Backed Securities - continued |
|||||
|
Moody's Ratings (unaudited) (b) |
Principal Amount |
Value |
|||
|
Olympic Automobile Receivables Trust |
Aaa |
|
$ 193,142 |
$ 193,082 |
|
|
Petroleum Enhanced Trust Receivables Offering Petroleum Trust |
Baa2 |
|
1,549,554 |
1,542,048 |
|
|
Sears Credit Account Master Trust II 7.5% 11/15/07 |
A2 |
|
2,650,000 |
2,650,000 |
|
|
UAF Auto Grantor Trust 6.1% 1/15/03 (g) |
Aaa |
|
2,101,899 |
2,088,106 |
|
|
TOTAL ASSET-BACKED SECURITIES (Cost $34,231,746) |
32,901,295 |
||||
|
Collateralized Mortgage Obligations - 0.3% |
|||||
|
|
|||||
|
Private Sponsor - 0.0% |
|||||
|
Credit-Based Asset Servicing and Securitization LLC Series 1997-2 Class 2B, 7.1786% 12/29/25 (d)(g)(j) |
Ba3 |
|
1,007,822 |
485,959 |
|
|
U.S. Government Agency - 0.3% |
|||||
|
Bank America Mortgage Securities, Inc.: |
|
|
|
|
|
|
Series 1999-3, Class A1 6.25% 5/25/14 |
AAA |
|
6,026,533 |
5,696,016 |
|
|
Series 1999-6, Class A1 6.25% 7/25/14 |
AAA |
|
3,828,300 |
3,614,872 |
|
|
Fannie Mae REMIC planned amortization class: |
|
|
|
|
|
|
Series 1999-54 Class PH, 6.5% 11/18/29 |
Aaa |
|
3,300,000 |
2,970,516 |
|
|
Series 1999-57 Class PH, 6.5% 12/25/29 |
Aaa |
|
2,600,000 |
2,336,344 |
|
|
TOTAL U.S. GOVERNMENT AGENCY |
14,617,748 |
||||
|
TOTAL COLLATERALIZED (Cost $14,957,335) |
15,103,707 |
||||
|
Commercial Mortgage Securities - 1.6% |
|||||
|
|
|||||
|
Bankers Trust REMIC Trust 1998-1 Series 1998-S1A Class G, 8.5632% 11/28/02 (g)(j) |
Baa3 |
|
1,000,000 |
960,625 |
|
|
Berkeley Federal Bank & Trust FSB Series 1994-1 Class B, 7.5003% 8/1/24 (g)(j) |
- |
|
1,900,000 |
1,316,938 |
|
|
BKB Commercial Mortgage Trust Series 1997-C1 Class D, 7.7606% 2/25/43 (g)(j) |
BBB |
|
1,095,356 |
1,088,810 |
|
|
|
|||||
|
Moody's Ratings (unaudited) (b) |
Principal Amount |
Value |
|||
|
CBM Funding Corp. sequential pay |
|
|
|
|
|
|
Class A-3PI, |
AA |
|
$ 3,000,000 |
$ 2,947,266 |
|
|
Class B, 7.48% 2/1/08 |
A |
|
2,320,000 |
2,266,984 |
|
|
CS First Boston Mortgage Securities Corp.: |
|
|
|
|
|
|
Series 1997-C2 Class D, 7.27% 1/17/35 |
Baa2 |
|
5,730,000 |
5,267,572 |
|
|
Series 1998-FL1 Class E, 7.4913% 1/10/13 (g)(j) |
Baa2 |
|
5,490,000 |
5,465,553 |
|
|
Deutsche Mortgage & |
Baa2 |
|
4,260,000 |
3,826,678 |
|
|
Equitable Life Assurance Society of the United States Series 174: |
|
|
|
|
|
|
Class B1, |
Aa2 |
|
3,500,000 |
3,471,152 |
|
|
Class C1, |
A2 |
|
2,300,000 |
2,259,031 |
|
|
Class D1, |
Baa2 |
|
2,200,000 |
2,148,266 |
|
|
First Chicago/Lennar Trust I Series 1997-CHL1 Class E, 8.0835% 4/1/39 (j) |
- |
|
1,600,000 |
1,138,500 |
|
|
First Union-Lehman Brothers Commercial Mortgage Trust sequential pay Series 1997-C2 Class B, |
Aa2 |
|
8,640,000 |
8,073,338 |
|
|
FMAC Loan |
|
|
|
|
|
|
Series 1997-A Class E, 8.1104% 4/15/19 (g)(j) |
- |
|
500,000 |
330,469 |
|
|
Series 1997-B Class E, 7.8912% 9/15/19 (g)(j) |
- |
|
750,000 |
285,000 |
|
|
GAFCO Franchisee Loan Trust Series 1998-1 |
- |
|
1,300,000 |
1,040,813 |
|
|
General Motors Acceptance Corp. Commercial Mortgage Securities, Inc. Series 1996-C1 Class F, 7.86% 10/15/28 (g) |
Ba3 |
|
750,000 |
603,164 |
|
|
GS Mortgage Securities Corp. II Series 1998-GLII Class E, 7.1905% 4/13/31 (g)(j) |
Baa3 |
|
4,930,000 |
4,262,332 |
|
|
LTC Commercial Mortgage pass through certificates Series 1998-1 Class A, 6.029% 5/30/30 (g) |
AAA |
|
2,997,247 |
2,819,754 |
|
|
Morgan Stanley Capital I, Inc. Series 1996-MBL1 Class E, 8.2633% 5/25/21 (g)(j) |
- |
|
1,509,471 |
1,501,216 |
|
|
Commercial Mortgage Securities - continued |
|||||
|
Moody's Ratings (unaudited) (b) |
Principal Amount |
Value |
|||
|
Nomura Asset Securities Corp. Series 1998-D6 Class A4, 7.6083% 3/17/28 (j) |
Baa2 |
|
$ 4,260,000 |
$ 3,886,585 |
|
|
Nomura Depositor Trust floater Series 1998-ST1A Class B2, 10.9013% 1/15/03 (g)(j) |
- |
|
800,000 |
740,875 |
|
|
Penn Mutual Life Insurance Co. (The)/Penn Insurance & Annuity Co. |
|
|
|
|
|
|
Class K, 7.9% 11/15/26 (g) |
- |
|
1,473,000 |
953,768 |
|
|
Class L, 7.9% 11/15/26 (g) |
- |
|
1,133,000 |
595,710 |
|
|
Prudential Securities Secd Financing Corp. Series 2000-C1, Class A2 7.727% 2/15/10 |
Aaa |
|
1,620,000 |
1,635,694 |
|
|
Structured Asset |
|
|
|
|
|
|
Series 1995-C1 Class E, 7.375% 9/25/24 (g) |
BB |
|
1,200,000 |
1,105,734 |
|
|
Series 1996-CFL: |
|
|
|
|
|
|
Class E, |
BBB |
|
2,390,000 |
2,370,021 |
|
|
Class G, |
B+ |
|
1,000,000 |
887,500 |
|
|
Thirteen Affiliates of General Growth Properties, Inc.: |
|
|
|
|
|
|
sequential pay Series 1 Class A2, 6.602% 12/15/10 (g) |
Aaa |
|
4,200,000 |
3,975,234 |
|
|
Series D-2, |
Baa2 |
|
4,120,000 |
3,791,205 |
|
|
Series E-2, |
Baa3 |
|
2,450,000 |
2,200,789 |
|
|
TOTAL COMMERCIAL MORTGAGE SECURITIES (Cost $77,443,303) |
73,216,576 |
||||
|
Foreign Government and Government |
|||||
|
|
|||||
|
Israeli State euro |
A3 |
|
3,350,000 |
3,301,794 |
|
|
Korean Republic yankee: |
|
|
|
|
|
|
8.75% 4/15/03 |
Baa2 |
|
1,340,000 |
1,364,066 |
|
|
8.875% 4/15/08 |
Baa2 |
|
1,868,000 |
1,926,842 |
|
|
Newfoundland Province yankee 11. |
Baa1 |
|
2,000,000 |
2,455,600 |
|
|
Quebec Province |
A2 |
|
7,220,000 |
7,093,000 |
|
|
United Mexican States 9.875% 2/1/10 |
Baa3 |
|
5,110,000 |
5,339,950 |
|
|
TOTAL FOREIGN GOVERNMENT AND GOVERNMENT AGENCY OBLIGATIONS (Cost $21,783,424) |
21,481,252 |
||||
|
Supranational Obligations - 0.1% |
|||||
|
Moody's Ratings (unaudited) (b) |
Principal Amount |
Value |
|||
|
Inter-American Development Bank yankee |
Aaa |
|
$ 4,750,000 |
$ 4,524,945 |
|
|
Purchased Bank Debt - 1.3% |
|||||
|
|
|||||
|
Allied Waste North America, Inc. term loan: |
|
|
|
|
|
|
9.5625% 7/21/06 (j) |
Ba3 |
|
2,272,727 |
2,130,682 |
|
|
9.7542% 7/21/07 (j) |
Ba3 |
|
2,727,273 |
2,556,818 |
|
|
American Tower L P term loan 9.53% 12/31/07 (j) |
- |
|
3,400,000 |
3,417,000 |
|
|
Charter Communication Operating LLC term loan 8.8% 3/18/08 (j) |
Ba3 |
|
6,000,000 |
5,962,500 |
|
|
Crown Castle Operating Co. term loan 9.46% 6/15/08 (j) |
Ba3 |
|
4,200,000 |
4,210,500 |
|
|
Dynatech LLC term loan 10.03% 9/1/07 (j) |
- |
|
4,240,000 |
4,218,800 |
|
|
Huntsman ICI Chemicals LLC sr. secured: |
|
|
|
|
|
|
term B loan |
- |
|
1,837,630 |
1,842,224 |
|
|
term C loan |
- |
|
2,382,200 |
2,388,156 |
|
|
Lyondell Chemical Co. sr. secured Tranche E term loan 10.5263% 5/17/06 (j) |
- |
|
4,300,000 |
4,418,250 |
|
|
McLeodUSA, Inc. term loan 9.69% 5/31/08 (j) |
Ba2 |
|
4,250,000 |
4,260,625 |
|
|
Nextel Finance Co. |
|
|
|
|
|
|
9.6875% 6/30/08 (j) |
Ba2 |
|
3,000,000 |
3,011,250 |
|
|
10.375% 12/31/08 (j) |
Ba2 |
|
3,000,000 |
3,011,250 |
|
|
Packaging Corp. of America term loan 0% 5/22/07 (j) |
- |
|
2,500,000 |
2,506,250 |
|
|
Telemundo Group, Inc. term loan 8.905% 3/31/07 (j) |
B1 |
|
1,665,000 |
1,654,594 |
|
|
Tritel Holding Corp. |
B2 |
|
4,250,000 |
4,265,938 |
|
|
Purchased Bank Debt - continued |
|||||
|
Moody's Ratings (unaudited) (b) |
Principal Amount |
Value |
|||
|
Voicestream Pcs Holding LLC term loan 9.76% 2/25/09 (j) |
B+ |
|
$ 5,100,000 |
$ 5,087,250 |
|
|
Wci Capital Corp. term loan 11.43% 9/30/07 (j) |
B2 |
|
3,600,000 |
3,591,000 |
|
|
TOTAL PURCHASED BANK DEBT (Cost $58,603,499) |
58,533,087 |
||||
|
Bank Notes - 0.2% |
||||
|
|
||||
|
Bank One NA 6.29% 8/25/00 |
|
11,350,000 |
11,332,056 |
|
|
Certificates of Deposit - 0.2% |
||||
|
|
||||
|
Canadian Imperial Bank |
|
11,500,000 |
11,506,374 |
|
|
Commercial Paper - 2.3% |
||||
|
|
||||
|
CIT Group, Inc. 6.43% 7/5/00 |
|
11,000,000 |
10,995,875 |
|
|
Daimler-Chrysler North America Holding Corp. yankee |
|
10,000,000 |
9,766,461 |
|
|
Falcon Asset Securitization Corp. 6.58% 8/10/00 |
|
11,000,000 |
10,923,715 |
|
|
General Motors Acceptance Corp. 6.62% 8/23/00 |
|
10,000,000 |
9,906,925 |
|
|
ING America Insurance Holdings, Inc. yankee 6.69% 11/9/00 |
|
10,000,000 |
9,763,858 |
|
|
Kitty Hawk Funding Corp. |
|
10,000,000 |
9,968,786 |
|
|
Montauk Funding Corp. yankee 6.58% 7/12/00 |
|
11,000,000 |
10,981,575 |
|
|
Preferred Receivables Funding Corp. 6.58% 7/18/00 |
|
11,000,000 |
10,969,475 |
|
|
Windmill Funding Corp. yankee 6.58% 7/20/00 |
|
11,000,000 |
10,965,352 |
|
|
Woolwich PLC yankee |
|
11,400,000 |
11,366,408 |
|
|
TOTAL COMMERCIAL PAPER (Cost $105,548,446) |
105,608,430 |
|||
|
Cash Equivalents - 9.4% |
|||
|
Maturity Amount |
Value |
||
|
Investments in repurchase agreements (U.S. Government Obligations), in a joint trading account at 6.83%, dated 6/30/00 due 7/3/00 |
$ 30,341,270 |
$ 30,324,000 |
|
|
Shares |
|
||
|
Central Cash Collateral Fund, 6.71% (c) |
659,100 |
659,100 |
|
|
Taxable Central Cash Fund, 6.59% (c) |
394,173,790 |
394,173,790 |
|
|
TOTAL CASH EQUIVALENTS (Cost $425,156,890) |
425,156,890 |
||
|
TOTAL INVESTMENT PORTFOLIO - 100.3% (Cost $4,073,306,528) |
4,573,384,257 |
|
|
NET OTHER ASSETS - (0.3)% |
(15,209,059) |
|
|
NET ASSETS - 100% |
$ 4,558,175,198 |
|
|
Futures Contracts |
|||||
|
|
Expiration Date |
Underlying |
Unrealized Gain/(Loss) |
||
|
Purchased |
|||||
|
634 S&P 500 Stock Index Contracts |
Sept. 2000 |
$ 232,693,850 |
$ (1,400,223) |
||
|
The face value of futures purchased as a percentage of net assets - 5.1% |
|
Legend |
|
(a) Non-income producing |
|
(b) S&P credit ratings are used in the absence of a rating by Moody's Investors Service, Inc. |
|
(c) The rate quoted is the annualized seven-day yield of the fund at |
|
(d) Non-income producing - issuer filed for protection under the |
|
(e) Debt obligation initially issued in zero coupon form which converts to coupon form at a specified rate and date. The rate shown is the rate at period end. |
|
(f) Debt obligation initially issued at one coupon which converts to a higher coupon at a specified date. The rate shown is the rate at period end. |
|
(g) Security exempt from registration under Rule 144A of the Securities Act |
|
(h) Security purchased on a delayed delivery or when-issued basis. |
|
(i) Security or a portion of the security was pledged to cover margin requirements for futures contracts. At the period end, the value of securities pledged amounted to $7,935,864. |
|
(j) The coupon rate shown on floating or adjustable rate securities represents the rate at period end. |
|
(k) For foreign government obligations not individually rated by S&P |
|
(l) Restricted securities - Investment in securities not registered under the Securities Act of 1933. |
|
Additional information on each holding is as follows: |
|
Security |
Acquisition Date |
Acquisition Cost |
|
Goldman Sachs Group LP |
1/25/99 |
$ 12,900,000 |
|
Micron Technology, Inc. |
7/15/99 - 4/10/00 |
$ 2,417,500 |
|
Other Information |
|
The composition of long-term debt holdings as a percentage of total value of investments in securities, is as follows (ratings are unaudited): |
|
Moody's Ratings |
S&P Ratings |
|||
|
Aaa, Aa, A |
20.8% |
|
AAA, AA, A |
17.8% |
|
Baa |
6.5% |
|
BBB |
6.0% |
|
Ba |
1.7% |
|
BB |
1.9% |
|
B |
5.3% |
|
B |
5.8% |
|
Caa |
1.3% |
|
CCC |
0.8% |
|
Ca, C |
0.0% |
|
CC, C |
0.0% |
|
|
|
|
D |
0.1% |
|
The percentage not rated by Moody's or S&P amounted to 0.9%. FMR has determined that unrated debt securities that are lower quality account for 0.9% of the total value of investment in securities. |
|
Purchases and sales of securities, other than short-term securities, aggregated $1,703,007,563 and $2,385,422,392, respectively, of which long-term U.S. government and government agency obligations aggregated $703,320,022 and $737,829,262, respectively. |
|
The market value of futures contracts opened and closed during the period amounted to $369,738,823 and $140,715,190, respectively. |
|
The fund placed a portion of its portfolio transactions with brokerage firms which are affiliates of Fidelity Management & Research Company. The commissions paid to these affiliated firms were $30,209 for the period. |
|
The fund invested in securities that are not registered under the Securities Act of 1933. These securities are subject to legal or contractual restrictions on resale. At the end of the period, restricted securities (excluding Rule 144A issues) amounted to $15,403,891 and 0.3% of net assets. |
|
The fund participated in the security lending program. At period end, the value of securities loaned amounted to $659,757. The fund received cash collateral of $659,100 which was invested in cash equivalents. |
|
Income Tax Information |
|
At June 30, 2000, the aggregate cost of investment securities for income tax purposes was $4,073,709,121. Net unrealized appreciation aggregated $499,675,136, of which $646,290,978 related to appreciated investment securities and $146,615,842 related to depreciated investment securities. |
See accompanying notes which are an integral part of the financial statements.
Asset Manager Portfolio
Statement of Assets and Liabilities
|
|
June 30, 2000 (Unaudited) |
|
|
Assets |
|
|
|
Investment in securities, at value (including repurchase agreements of $30,324,000) |
|
$ 4,573,384,257 |
|
Cash |
|
417,051 |
|
Receivable for investments sold |
|
78,404,347 |
|
Receivable for fund shares sold |
|
538,054 |
|
Dividends receivable |
|
1,365,550 |
|
Interest receivable |
|
27,511,966 |
|
Receivable for daily variation on futures contracts |
|
1,131,992 |
|
Other receivables |
|
132,043 |
|
Total assets |
|
4,682,885,260 |
|
Liabilities |
|
|
|
Payable for investments purchased |
$ 73,353,664 |
|
|
Delayed delivery |
44,912,865 |
|
|
Payable for fund shares redeemed |
3,398,939 |
|
|
Accrued management fee |
2,015,725 |
|
|
Distribution fees payable |
2,417 |
|
|
Other payables and |
367,352 |
|
|
Collateral on securities loaned, |
659,100 |
|
|
Total liabilities |
|
124,710,062 |
|
Net Assets |
|
$ 4,558,175,198 |
|
Net Assets consist of: |
|
|
|
Paid in capital |
|
$ 3,894,821,160 |
|
Undistributed net investment income |
|
93,150,596 |
|
Accumulated undistributed net realized gain (loss) on investments and foreign currency transactions |
|
71,519,816 |
|
Net unrealized appreciation (depreciation) on investments |
|
498,683,626 |
|
Net Assets |
|
$ 4,558,175,198 |
|
Initial Class: |
|
$16.55 |
|
Service Class: |
|
$16.46 |
|
Service Class 2: |
|
$16.45 |
Statement of Operations
|
|
Six months ended June 30, 2000 (Unaudited) |
|
|
Investment Income Dividends |
|
$ 16,298,613 |
|
Interest |
|
82,305,154 |
|
Security lending |
|
650 |
|
Total income |
|
98,604,417 |
|
Expenses |
|
|
|
Management fee |
$ 12,350,508 |
|
|
Transfer agent fees |
1,535,078 |
|
|
Distribution fees |
13,162 |
|
|
Accounting and security lending fees |
334,234 |
|
|
Non-interested trustees' compensation |
15,911 |
|
|
Custodian fees and expenses |
55,539 |
|
|
Registration fees |
12,422 |
|
|
Audit |
22,607 |
|
|
Legal |
16,406 |
|
|
Miscellaneous |
30,810 |
|
|
Total expenses before reductions |
14,386,677 |
|
|
Expense reductions |
(144,577) |
14,242,100 |
|
Net investment income |
|
84,362,317 |
|
Realized and Unrealized Gain (Loss) Net realized gain (loss) on: |
|
|
|
Investment securities |
70,050,664 |
|
|
Foreign currency transactions |
(13) |
|
|
Futures contracts |
5,070,440 |
75,121,091 |
|
Change in net unrealized appreciation (depreciation) on: |
|
|
|
Investment securities |
(193,765,715) |
|
|
Assets and liabilities in |
(7) |
|
|
Futures contracts |
(1,400,223) |
(195,165,945) |
|
Net gain (loss) |
|
(120,044,854) |
|
Net increase (decrease) in net assets resulting from operations |
|
$ (35,682,537) |
|
Other Information Expense reductions |
|
$ 134,129 |
|
Custodian credits |
|
10,448 |
|
|
|
$ 144,577 |
See accompanying notes which are an integral part of the financial statements.
Semiannual Report
Fidelity Variable Insurance Products: Asset Manager Portfolio
Financial Statements - continued
Statement of Changes in Net Assets
|
Increase (Decrease) in Net Assets |
Six months ended |
Year ended |
|
Operations |
$ 84,362,317 |
$ 163,666,158 |
|
Net realized gain (loss) |
75,121,091 |
365,307,199 |
|
Change in net unrealized appreciation (depreciation) |
(195,165,945) |
(14,691,723) |
|
Net increase (decrease) in net assets resulting from operations |
(35,682,537) |
514,281,634 |
|
Distributions to shareholders |
(154,095,495) |
(161,497,855) |
|
From net realized gain |
(363,069,869) |
(204,563,949) |
|
Total distributions |
(517,165,364) |
(366,061,804) |
|
Share transactions - net increase (decrease) |
150,420,217 |
(98,885,126) |
|
Total increase (decrease) in net assets |
(402,427,684) |
49,334,704 |
|
Net Assets |
|
|
|
Beginning of period |
4,960,602,882 |
4,911,268,178 |
|
End of period (including undistributed net investment income of $93,150,596 and $163,666,159, respectively) |
$ 4,558,175,198 |
$ 4,960,602,882 |
|
|
|
Other Information: |
|
|
Six months ended June 30, 2000 |
Year ended |
||
|
|
Shares |
Dollars |
Shares |
Dollars |
|
Share transactions |
7,773,047 |
$ 130,415,409 |
18,326,496 |
$ 320,298,483 |
|
Reinvested |
31,454,002 |
514,587,479 |
21,655,706 |
365,548,318 |
|
Redeemed |
(29,837,358) |
(502,371,635) |
(45,749,338) |
(801,281,286) |
|
Net increase (decrease) |
9,389,691 |
$ 142,631,253 |
(5,767,136) |
$ (115,434,485) |
|
Service Class |
388,675 |
$ 6,434,099 |
1,054,578 |
$ 18,334,058 |
|
Reinvested |
157,694 |
2,567,255 |
30,528 |
513,486 |
|
Redeemed |
(118,776) |
(1,991,210) |
(131,705) |
(2,298,185) |
|
Net increase (decrease) |
427,593 |
$ 7,010,144 |
953,401 |
$ 16,549,359 |
|
Service Class 2 A |
49,063 |
$ 817,391 |
- |
$ - |
|
Reinvested |
666 |
10,842 |
- |
- |
|
Redeemed |
(2,997) |
(49,413) |
- |
- |
|
Net increase (decrease) |
46,732 |
$ 778,820 |
- |
$ - |
|
Distributions |
|
$ 153,336,461 |
|
$ 161,271,317 |
|
Service Class |
|
755,842 |
|
226,538 |
|
Service Class 2 A |
|
3,192 |
|
- |
|
Total |
|
$ 154,095,495 |
|
$ 161,497,855 |
|
From net realized gain |
|
$ 361,250,806 |
|
$ 204,277,001 |
|
Service Class |
|
1,811,413 |
|
286,948 |
|
Service Class 2 A |
|
7,650 |
|
- |
|
Total |
|
$ 363,069,869 |
|
$ 204,563,949 |
|
|
|
$ 517,165,364 |
|
$ 366,061,804 |
A Service Class 2 commenced sale of shares January 12, 2000.
See accompanying notes which are an integral part of the financial statements.
Asset Manager Portfolio
Financial Highlights - Initial Class
|
|
Six months ended |
Years ended December 31, |
||||
|
Selected Per-Share Data |
(Unaudited) |
1999 |
1998 |
1997 |
1996 |
1995 |
|
Net asset value, beginning of period |
$ 18.67 |
$ 18.16 |
$ 18.01 |
$ 16.93 |
$ 15.79 |
$ 13.79 |
|
Income from Investment Operations |
|
|
|
|
|
|
|
Net investment income |
.30 D |
.59 D |
.59 D |
.57 D |
.63 |
.30 |
|
Net realized and unrealized gain (loss) |
(.44) |
1.28 |
1.84 |
2.58 |
1.55 |
1.99 |
|
Total from investment operations |
(.14) |
1.87 |
2.43 |
3.15 |
2.18 |
2.29 |
|
Less Distributions |
|
|
|
|
|
|
|
From net investment income |
(.59) |
(.60) |
(.57) |
(.59) |
(.57) |
(.29) |
|
From net realized gain |
(1.39) |
(.76) |
(1.71) |
(1.48) |
(.47) |
- |
|
Total distributions |
(1.98) |
(1.36) |
(2.28) |
(2.07) |
(1.04) |
(.29) |
|
Net asset value, end of period |
$ 16.55 |
$ 18.67 |
$ 18.16 |
$ 18.01 |
$ 16.93 |
$ 15.79 |
|
Total Return B, C |
(.69)% |
11.09% |
15.05% |
20.65% |
14.60% |
16.96% |
|
Ratios and Supplemental Data |
|
|
|
|
|
|
|
Net assets, end of period (000 omitted) |
$ 4,529,402 |
$ 4,936,926 |
$ 4,905,468 |
$ 4,399,937 |
$ 3,641,194 |
$ 3,333,844 |
|
Ratio of expenses to average net assets |
.61% A |
.63% |
.64% |
.65% |
.74% |
.81% |
|
Ratio of expenses to average net assets after |
.61% A |
.62% F |
.63% F |
.64% F |
.73% F |
.79% F |
|
Ratio of net investment income to average net assets |
3.59% A |
3.36% |
3.46% |
3.43% |
3.60% |
3.54% |
|
Portfolio turnover |
78% A |
94% |
113% |
101% |
168% |
256% |
Financial Highlights - Service Class
|
|
Six months ended |
Years ended December 31, |
||
|
Selected Per-Share Data |
(Unaudited) |
1999 |
1998 |
1997 E |
|
Net asset value, beginning of period |
$ 18.59 |
$ 18.10 |
$ 17.99 |
$ 17.60 |
|
Income from Investment Operations |
|
|
|
|
|
Net investment income D |
.29 |
.56 |
.57 |
.10 |
|
Net realized and unrealized gain (loss) |
(.45) |
1.29 |
1.82 |
.29 |
|
Total from investment operations |
(.16) |
1.85 |
2.39 |
.39 |
|
Less Distributions |
|
|
|
|
|
From net investment income |
(.58) |
(.60) |
(.57) |
- |
|
From net realized gain |
(1.39) |
(.76) |
(1.71) |
- |
|
Total distributions |
(1.97) |
(1.36) |
(2.28) |
- |
|
Net asset value, end of period |
$ 16.46 |
$ 18.59 |
$ 18.10 |
$ 17.99 |
|
Total Return B, C |
(.74)% |
11.01% |
14.82% |
2.22% |
|
Ratios and Supplemental Data |
|
|
|
|
|
Net assets, end of period (000 omitted) |
$ 28,005 |
$ 23,677 |
$ 5,801 |
$ 10 |
|
Ratio of expenses to average net assets |
.71% A |
.74% |
.78% |
.75% A |
|
Ratio of expenses to average net assets after expense reductions |
.71% A |
.73% F |
.77% F |
.75% A |
|
Ratio of net investment income to average net assets |
3.49% A |
3.25% |
3.49% |
3.52% A |
|
Portfolio turnover |
78% A |
94% |
113% |
101% |
|
A Annualized B Total returns for periods of less than one year are not annualized and do not reflect charges attributable to your insurance company's separate account. Inclusion of these charges would reduce the total returns shown. C The total returns would have been lower had certain expenses not been reduced during the period shown. D Net investment income per share has been calculated based on average shares outstanding during the period. E For the period November 3, 1997 (commencement of sale of Service Class shares) to December 31, 1997. F FMR or the fund has entered into varying arrangements with third parties who either paid or reduced a portion of the class' expenses. |
||||
See accompanying notes which are an integral part of the financial statements.
Semiannual Report
Financial Highlights - Service Class 2
|
|
Six months ended |
|
Selected Per-Share Data |
(Unaudited) |
|
Net asset value, beginning of period |
$ 18.17 |
|
Income from Investment Operations |
|
|
Net investment income C |
.24 |
|
Net realized and unrealized gain (loss) |
.01 E |
|
Total from investment operations |
.25 |
|
Less Distributions |
|
|
From net investment income |
(.58) |
|
From net realized gain |
(1.39) |
|
Total distributions |
(1.97) |
|
Net asset value, end of period |
$ 16.45 |
|
Total Return B |
1.49% |
|
Ratios and Supplemental Data |
|
|
Net assets, end of period (000 omitted) |
$ 769 |
|
Ratio of expenses to average net assets |
.84% A |
|
Ratio of net investment income to average net assets |
3.36% A |
|
Portfolio turnover |
78% A |
|
A Annualized B Total returns for periods of less than one year are not annualized and do not reflect charges attributable to your insurance company's separate account. Inclusion of these charges would reduce the total returns shown. C Net investment income per share has been calculated based on average shares outstanding during the period. D For the period January 12, 2000 (commencement of sale of Service Class 2 shares) to June 30, 2000. E The amount shown for a share outstanding does not correspond with the aggregate net loss on investments for the period due to the timing of sales and repurchases of class shares in relation to fluctuating market values of the investments of the fund. |
|
See accompanying notes which are an integral part of the financial statements.
Asset Manager Portfolio
Performance
There are several ways to evaluate a fund's historical performance. You can look at the total percentage change in value, the average annual percentage change or the growth of a hypothetical $10,000 investment. Total return reflects the change in the value of an investment, assuming reinvestment of the fund's dividend income and capital gains (the profits earned upon the sale of securities that have grown in value). If Fidelity had not reimbursed certain fund expenses, the past 10 year total returns would have been lower.
Average Annual Total Returns
|
Periods ended |
Past 1 |
Past 5 |
Past 10 |
|
Fidelity VIP: High Income - |
-4.59% |
7.30% |
11.98% |
|
ML High Yield Master II |
-0.97% |
7.03% |
10.83% |
Average annual returns take the fund's cumulative return and show you what would have happened if the fund had performed at a constant rate each year.
You can compare the fund's returns to the performance of the Merrill Lynch High Yield Master II Index - a market value-weighted index of all domestic and yankee high-yield bonds, including deferred interest bonds and payment-in-kind securities. Issues included in the index have maturities of one year or more and have a credit rating lower than BBB-/Baa3, but are not in default. This benchmark reflects the reinvestment of dividends and capital gains, if any.
Figures for more than one year assume a steady compounded rate of return and are not the fund's year-by-year results, which fluctuated over the periods shown.
Performance numbers are net of all fund operating expenses, but do not include any insurance charges imposed by your insurance company's separate account. If performance information included the effect of these additional charges, the total returns would have been lower.
Past performance is no guarantee of future results. Principal and investment return will vary and you may have a gain or loss when you withdraw your money. The fund includes high yielding, lower-rated securities which are subject to greater price volatility and may involve greater risk of default. The market for these securities may be less liquid.
Understanding Performance
How a fund did yesterday is no guarantee of
how it will do tomorrow. Bond prices, for example,
generally move in the opposite direction of interest
rates. In turn, the share price, return and yield of a
fund that invests in bonds will vary. That means if
you sell your shares during a market downturn,
you might lose money. But if you can ride out the
market's ups and downs, you may have a gain.
$10,000 Over 10 Years
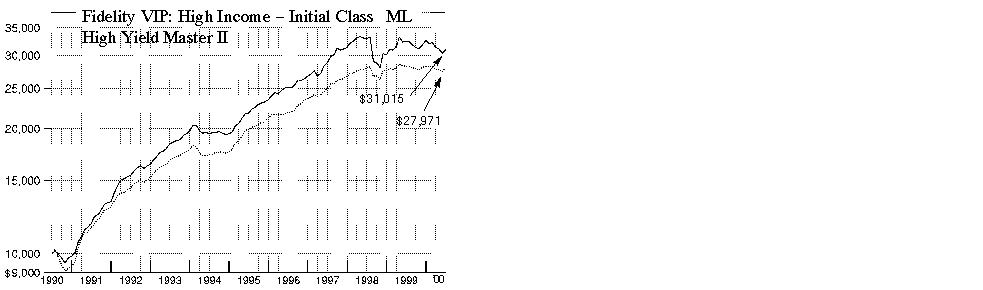
$10,000 Over 10 Years: Let's say hypothetically that $10,000 was invested in Fidelity Variable Insurance Products: High Income Portfolio - Initial Class on June 30, 1990. As the chart shows, by June 30, 2000, the value of the investment would have grown to $31,015 - a 210.15% increase on the initial investment. For comparison, look at how the Merrill Lynch High Yield Master II Index did over the same period. With dividends and capital gains, if any, reinvested, the same $10,000 investment would have grown to $27,971 - a 179.71% increase.
Investment Summary
|
Top Five Holdings as of June 30, 2000 |
|
|
(by issuer, excluding cash equivalents) |
% of fund's |
|
Nextel Communications, Inc. |
5.5 |
|
NEXTLINK Communications, Inc. |
4.4 |
|
WinStar Communications, Inc. |
3.0 |
|
Allied Waste North America, Inc. |
2.7 |
|
ICG Holdings, Inc. |
2.5 |
|
|
18.1 |
|
Top Five Market Sectors as of June 30, 2000 |
|
|
|
% of fund's |
|
Utilities |
31.8 |
|
Media & Leisure |
23.8 |
|
Technology |
8.2 |
|
Basic Industries |
7.8 |
|
Industrial Machinery & Equipment |
5.2 |
|
Quality Diversification as of June 30, 2000 |
|
|
(Moody's Ratings) |
% of fund's |
|
Aaa, Aa, A |
0.0 |
|
Baa |
0.2 |
|
Ba |
4.0 |
|
B |
53.1 |
|
Caa, Ca, C |
13.5 |
|
Not Rated |
7.6 |
|
Table excludes short-term investments. Where Moody's ratings are not available, we have used S&P ratings. Unrated debt securities that are equivalent to Ba and below at June 30, 2000 account for 7.6% of the fund's investments. |
Semiannual Report
(Portfolio Manager photograph)
An interview with Barry Coffman, Portfolio Manager of High Income Portfolio
Q. How did the fund perform, Barry?
A. For the six-month period that ended June 30, 2000, the fund lagged the -1.00% return of the Merrill Lynch High Yield Master Index II. The fund also underperformed the index's -0.97% return for the 12-month period ending June 30, 2000.
Q. What factors drove the high-yield market's performance and how did those factors, in turn, affect the fund's performance?
A. As they did throughout most of 1999, rising interest rates continued to put pressure on high-yield bonds and most other fixed-income investments. From January through June 2000, the Federal Reserve Board raised interest rates three times to cool the economy and the stock market. Compounding the effects of the difficult interest-rate backdrop was the fact that the "technicals" - supply and demand - were unfavorable. While supply had tapered off significantly from the same six-month period a year earlier, demand was quite weak. Furthermore, the default rate - which measures the percentage of high-yield debt that companies are unable or unwilling to honor - continued to rise, which also cooled demand. Those factors conspired to drive the high-yield market and the fund lower.
Q. Why did the fund underperform the Merrill Lynch index?
A. Unfortunately, a small handful of disappointments significantly detracted from the fund's performance. Given the overall negative tone of the high-yield market, investors severely punished companies that had worse-than-expected results. Most of the fund's underperformance can be accounted for by losses in securities of three holdings that defaulted: Sunterra Resorts, Specialty Retailers - the operating subsidiary of Stages Stores, Inc. - and competitive local exchange carrier GST Telecom. Also, continued weakness in the theater industry due to an overbuilding of new movie theaters pressured bonds in that sector.
Q. What holdings held up well against the difficult backdrop?
A. Telecommunications holdings outperformed the overall market. Many of these companies began to see very attractive returns from their network investments as they neared critical mass. Overall demand for telecom services, particularly high-speed data transmission, continued to be very robust. Within telecommunications, the fund benefited from its holdings in WinStar Communications, which refinanced its debt at very favorable terms during the period. Cable companies also performed well. In particular, our holdings in two international cable concerns, UnitedGlobalCom and Telewest both benefited from their investments in advanced networks that allow them to bundle high-speed Internet access and telephony with cable TV. In addition, both companies successfully raised equity during the period. Also, our position in Allied Waste - now the nation's second-largest waste management company - rebounded during the period and was a significant contributor to performance.
Q. What changes did you make over the past six months?
A. One of the most significant changes was that I concentrated more of the fund in larger, more liquid holdings. Historically, I've tried to find value among less-followed small- and mid-tier companies. But it became clear that the market environment was one that overly punished companies in those groups that disappoint. As a result, I focused on the larger-cap companies in the high-yield universe, particularly those with strong operating fundamentals and access to capital. As examples, I added to some of the fund's larger holdings, including telecommunications companies Nextel and NEXTLINK and direct broadcast satellite company Echostar.
Q. What's your outlook?
A. In my view, the relatively cheap valuations of high-yield bonds offer cause for optimism. The average high-yield bond is selling in the low 80s as a percentage of par - or face - value with yields nearing 13%, or twice the absolute level of U.S. Treasury bond yields. We haven't really seen that type of value since 1990 when the U.S. economy was in a recession. Even though the economy may slow in response to higher interest rates, I think the risk of a recession is limited over the near term. Steady economic growth would likely be a positive backdrop for this market. While I can't pinpoint exactly what will be the catalyst for a high-yield market turnaround, I would expect that the end of the Fed's campaign to raise interest rates could provide a significant boost for high-yield and other fixed-income securities as well.
The views expressed in this report reflect those of the portfolio manager only through the end of the period of the report as stated on the cover. The manager's views are subject to change at any time based upon market or other conditions. For more information, see page 2.
Fund Facts
Goal: to seek high current income by investing primarily in all types of income-producing debt securities with an emphasis on lower-quality securities
Start date: September 19, 1985
Size: as of June 30, 2000, more than $2.2 billion
Manager: Barry Coffman, since 1990; joined Fidelity in 1986
3Semiannual Report
Fidelity Variable Insurance Products: High Income Portfolio
(Unaudited)
Showing Percentage of Net Assets
|
Corporate Bonds - 75.4% |
|||||
|
Moody's Ratings (unaudited) (b) |
Principal Amount |
Value |
|||
|
Convertible Bonds - 3.3% |
|||||
|
HEALTH - 0.4% |
|||||
|
Medical Facilities Management - 0.4% |
|||||
|
Total Renal Care Holdings, Inc. 7% 5/15/09 (f) |
B3 |
|
$ 14,680,000 |
$ 9,762,200 |
|
|
MEDIA & LEISURE - 2.2% |
|||||
|
Broadcasting - 2.2% |
|||||
|
EchoStar Communications Corp. 4.875% 1/1/07 (f) |
- |
|
50,665,000 |
48,195,081 |
|
|
UTILITIES - 0.7% |
|||||
|
Cellular - 0.7% |
|||||
|
Nextel |
|
|
|
|
|
|
5.25% 1/15/10 (f) |
B1 |
|
10,000,000 |
10,350,000 |
|
|
5.25% 1/15/10 |
B1 |
|
5,000,000 |
5,175,000 |
|
|
|
15,525,000 |
||||
|
TOTAL CONVERTIBLE BONDS |
73,482,281 |
||||
|
Nonconvertible Bonds - 72.1% |
|||||
|
BASIC INDUSTRIES - 7.7% |
|||||
|
Chemicals & Plastics - 5.0% |
|||||
|
Acetex Corp. yankee 9.75% 10/1/03 |
B3 |
|
3,000,000 |
2,805,000 |
|
|
Avecia Group PLC 11% 7/1/09 |
B2 |
|
7,275,000 |
7,129,500 |
|
|
Foamex LP 13.5% 8/15/05 |
Caa2 |
|
5,000,000 |
4,275,000 |
|
|
Huntsman Corp.: |
|
|
|
|
|
|
9.5% 7/1/07 (f) |
B2 |
|
10,240,000 |
9,344,000 |
|
|
9.5% 7/1/07 (f) |
B2 |
|
32,830,000 |
29,957,375 |
|
|
Huntsman ICI Chemicals LLC 10.125% 7/1/09 |
B2 |
|
12,390,000 |
12,390,000 |
|
|
Huntsman ICI Holdings LLC 0% 12/31/09 |
B3 |
|
34,102,000 |
10,912,640 |
|
|
Lyondell Chemical Co.: |
|
|
|
|
|
|
9.625% 5/1/07 |
Ba3 |
|
3,740,000 |
3,702,600 |
|
|
9.875% 5/1/07 |
Ba3 |
|
9,420,000 |
9,325,800 |
|
|
10.875% 5/1/09 |
B2 |
|
18,455,000 |
18,316,588 |
|
|
Sterling Chemicals, Inc. 11.75% 8/15/06 |
Caa3 |
|
5,030,000 |
4,074,300 |
|
|
|
112,232,803 |
||||
|
Metals & Mining - 0.4% |
|||||
|
Kaiser Aluminum & Chemical Corp.: |
|
|
|
|
|
|
9.875% 2/15/02 |
B1 |
|
2,455,000 |
2,369,075 |
|
|
12.75% 2/1/03 |
B3 |
|
6,958,000 |
6,331,780 |
|
|
|
8,700,855 |
||||
|
|
|||||
|
Moody's Ratings (unaudited) (b) |
Principal Amount |
Value |
|||
|
Packaging & Containers - 1.0% |
|||||
|
Gaylord Container Corp.: |
|
|
|
|
|
|
9.375% 6/15/07 |
Caa1 |
|
$ 14,080,000 |
$ 10,841,600 |
|
|
9.75% 6/15/07 |
Caa1 |
|
5,370,000 |
4,188,600 |
|
|
Packaging Corp. of America 9.625% 4/1/09 |
B2 |
|
7,470,000 |
7,376,625 |
|
|
|
22,406,825 |
||||
|
Paper & Forest Products - 1.3% |
|||||
|
APP China Group Ltd. 14% 3/15/10 unit (f) |
B3 |
|
4,875,000 |
3,071,250 |
|
|
APP Finance II Mauritius Ltd. 12% 3/15/04 |
B3 |
|
4,175,000 |
2,129,250 |
|
|
Container Corp. of America gtd. 9.75% 4/1/03 |
B2 |
|
1,690,000 |
1,681,550 |
|
|
Millar Western Forest Products Ltd. 9.875% 5/15/08 |
B3 |
|
13,115,000 |
12,295,313 |
|
|
Repap New Brunswick, Inc.: |
|
|
|
|
|
|
11.5% 6/1/04 |
B3 |
|
1,795,000 |
1,803,975 |
|
|
yankee 10.625% 4/15/05 |
Caa1 |
|
6,340,000 |
5,579,200 |
|
|
Stone Container Corp. 12.58% 8/1/16 (g) |
B2 |
|
1,150,000 |
1,184,500 |
|
|
|
27,745,038 |
||||
|
TOTAL BASIC INDUSTRIES |
171,085,521 |
||||
|
CONSTRUCTION & REAL ESTATE - 2.0% |
|||||
|
Building Materials - 0.3% |
|||||
|
International Utility Structures, Inc. 10.75% 2/1/08 |
Caa1 |
|
9,200,000 |
7,360,000 |
|
|
Construction - 0.1% |
|||||
|
Great Lakes Dredge & Dock Corp. 11.25% 8/15/08 |
B3 |
|
50,000 |
49,375 |
|
|
Lennar Corp. 9.95% 5/1/10 (f) |
Ba1 |
|
3,010,000 |
2,964,850 |
|
|
|
3,014,225 |
||||
|
Engineering - 0.6% |
|||||
|
360networks, Inc. 13% 5/1/08 (f) |
B3 |
|
12,660,000 |
12,533,400 |
|
|
Real Estate - 0.9% |
|||||
|
LNR Property Corp.: |
|
|
|
|
|
|
9.375% 3/15/08 |
B1 |
|
14,395,000 |
12,523,650 |
|
|
10.5% 1/15/09 |
B1 |
|
7,040,000 |
6,476,800 |
|
|
|
19,000,450 |
||||
|
Real Estate Investment Trusts - 0.1% |
|||||
|
Ocwen Asset Investment Corp. 11.5% 7/1/05 |
- |
|
3,520,000 |
2,710,400 |
|
|
TOTAL CONSTRUCTION & REAL ESTATE |
44,618,475 |
||||
|
Corporate Bonds - continued |
|||||
|
Moody's Ratings (unaudited) (b) |
Principal Amount |
Value |
|||
|
Nonconvertible Bonds - continued |
|||||
|
DURABLES - 0.3% |
|||||
|
Autos, Tires, & Accessories - 0.1% |
|||||
|
Federal-Mogul Corp. 7.5% 1/15/09 |
Ba2 |
|
$ 5,455,000 |
$ 3,600,300 |
|
|
Textiles & Apparel - 0.2% |
|||||
|
Levi Strauss & Co.: |
|
|
|
|
|
|
6.8% 11/1/03 |
Ba3 |
|
3,775,000 |
3,095,500 |
|
|
7% 11/1/06 |
Ba3 |
|
755,000 |
573,800 |
|
|
|
3,669,300 |
||||
|
TOTAL DURABLES |
7,269,600 |
||||
|
ENERGY - 2.0% |
|||||
|
Coal - 0.4% |
|||||
|
P&L Coal Holdings Corp. 9.625% 5/15/08 |
B2 |
|
10,210,000 |
9,469,775 |
|
|
Energy Services - 0.4% |
|||||
|
Cliffs Drilling Co. 10.25% 5/15/03 |
Ba3 |
|
900,000 |
904,500 |
|
|
R&B Falcon Corp.: |
|
|
|
|
|
|
6.5% 4/15/03 |
Ba3 |
|
5,525,000 |
5,124,438 |
|
|
6.75% 4/15/05 |
Ba3 |
|
1,260,000 |
1,137,150 |
|
|
6.95% 4/15/08 |
Ba3 |
|
750,000 |
637,500 |
|
|
9.5% 12/15/08 |
Ba3 |
|
595,000 |
597,975 |
|
|
|
8,401,563 |
||||
|
Oil & Gas - 1.2% |
|||||
|
Chesapeake Energy Corp.: |
|
|
|
|
|
|
7.875% 3/15/04 |
B2 |
|
1,610,000 |
1,493,275 |
|
|
8.5% 3/15/12 |
B2 |
|
1,435,000 |
1,205,400 |
|
|
9.125% 4/15/06 |
B2 |
|
3,565,000 |
3,377,838 |
|
|
Great Lakes Carbon Corp.: |
|
|
|
|
|
|
0% 5/15/09 (d) |
Caa1 |
|
15,215,000 |
6,086,000 |
|
|
10.25% 5/15/08 pay-in-kind |
B3 |
|
8,550,000 |
6,840,000 |
|
|
Plains Resources, Inc.: |
|
|
|
|
|
|
Series B 10.25% 3/15/06 |
B2 |
|
5,860,000 |
5,801,400 |
|
|
Series D 10.25% 3/15/06 |
B2 |
|
2,770,000 |
2,742,300 |
|
|
|
27,546,213 |
||||
|
TOTAL ENERGY |
45,417,551 |
||||
|
FINANCE - 2.2% |
|||||
|
Credit & Other Finance - 2.0% |
|||||
|
AMRESCO, Inc.: |
|
|
|
|
|
|
9.875% 3/15/05 |
Caa3 |
|
14,905,000 |
6,930,825 |
|
|
10% 3/15/04 |
Caa3 |
|
1,824,000 |
839,040 |
|
|
APP Global Finance III 10.7513% 4/17/02 (g) |
Caa1 |
|
2,400,000 |
1,704,000 |
|
|
Delta Financial Corp. 9.5% 8/1/04 |
B3 |
|
1,350,000 |
607,500 |
|
|
|
|||||
|
Moody's Ratings (unaudited) (b) |
Principal Amount |
Value |
|||
|
Imperial Credit Capital Trust I 10.25% 6/14/02 |
B2 |
|
$ 4,870,000 |
$ 4,139,500 |
|
|
Imperial Credit Industries 9.875% 1/15/07 |
B3 |
|
17,470,000 |
12,578,400 |
|
|
Macsaver Financial Services, Inc.: |
|
|
|
|
|
|
7.4% 2/15/02 |
Ba2 |
|
2,720,000 |
1,768,000 |
|
|
7.875% 8/1/03 |
Ba2 |
|
6,900,000 |
4,278,000 |
|
|
Metris Companies, Inc.: |
|
|
|
|
|
|
10% 11/1/04 |
Ba3 |
|
100,000 |
94,000 |
|
|
10.125% 7/15/06 |
Ba3 |
|
1,810,000 |
1,719,500 |
|
|
MFN Financial Corp. 10% 3/23/01 |
- |
|
10,000,000 |
9,600,000 |
|
|
PX Escrow Corp. 0% 2/1/06 (d) |
B3 |
|
3,190,000 |
1,339,800 |
|
|
|
45,598,565 |
||||
|
Insurance - 0.2% |
|||||
|
Willis Corroon Corp. 9% 2/1/09 |
Ba3 |
|
5,500,000 |
4,606,250 |
|
|
TOTAL FINANCE |
50,204,815 |
||||
|
HEALTH - 1.9% |
|||||
|
Drugs & Pharmaceuticals - 0.3% |
|||||
|
Global Health Sciences, Inc. 11% 5/1/08 |
Caa1 |
|
7,970,000 |
1,992,500 |
|
|
Warner Chilcott, Inc. 12.625% 2/15/08 (f) |
B2 |
|
4,815,000 |
4,863,150 |
|
|
|
6,855,650 |
||||
|
Medical Facilities Management - 1.6% |
|||||
|
Express Scripts, Inc. 9.625% 6/15/09 |
Ba2 |
|
9,055,000 |
8,828,625 |
|
|
Fountain View, Inc. 11.25% 4/15/08 |
Caa1 |
|
7,330,000 |
1,795,850 |
|
|
Mariner Post-Acute Network, Inc. 9.5% 11/1/07 (c) |
C |
|
11,630,000 |
1,163 |
|
|
Oxford Health Plans, Inc. 11% 5/15/05 |
B2 |
|
14,465,000 |
14,935,113 |
|
|
Unilab Corp. 12.75% 10/1/09 |
B3 |
|
8,920,000 |
9,187,600 |
|
|
|
34,748,351 |
||||
|
TOTAL HEALTH |
41,604,001 |
||||
|
INDUSTRIAL MACHINERY & EQUIPMENT - 4.3% |
|||||
|
Electrical Equipment - 0.7% |
|||||
|
Loral Space & Communications Ltd. 9.5% 1/15/06 |
B1 |
|
1,185,000 |
865,050 |
|
|
Motors & Gears, Inc. 10.75% 11/15/06 |
B3 |
|
9,170,000 |
8,803,200 |
|
|
Telex Communications, Inc. 10.5% 5/1/07 |
B2 |
|
7,490,000 |
5,018,300 |
|
|
|
14,686,550 |
||||
|
Corporate Bonds - continued |
|||||
|
Moody's Ratings (unaudited) (b) |
Principal Amount |
Value |
|||
|
Nonconvertible Bonds - continued |
|||||
|
INDUSTRIAL MACHINERY & EQUIPMENT - continued |
|||||
|
Industrial Machinery & Equipment - 0.7% |
|||||
|
Tenneco Automotive, Inc. 11.625% 10/15/09 |
B2 |
|
$ 8,500,000 |
$ 7,522,500 |
|
|
Thermadyne Holdings Corp. 0% 6/1/08 (d) |
Caa1 |
|
11,470,000 |
4,129,200 |
|
|
Thermadyne Manufacturing LLC 9.875% 6/1/08 |
B3 |
|
4,470,000 |
3,441,900 |
|
|
Tokheim Corp. 11.375% 8/1/08 |
Ca |
|
9,030,000 |
903,000 |
|
|
|
15,996,600 |
||||
|
Pollution Control - 2.9% |
|||||
|
Allied Waste North America, Inc.: |
|
|
|
|
|
|
7.375% 1/1/04 |
Ba3 |
|
1,870,000 |
1,701,700 |
|
|
7.625% 1/1/06 |
Ba2 |
|
1,185,000 |
1,030,950 |
|
|
7.875% 1/1/09 |
Ba2 |
|
1,965,000 |
1,670,250 |
|
|
10% 8/1/09 |
B2 |
|
65,360,000 |
54,902,400 |
|
|
Envirosource, Inc.: |
|
|
|
|
|
|
Series B, 9.75% 6/15/03 |
Caa3 |
|
4,900,000 |
2,205,000 |
|
|
9.75% 6/15/03 |
Caa3 |
|
7,171,000 |
3,226,950 |
|
|
|
64,737,250 |
||||
|
TOTAL INDUSTRIAL MACHINERY & EQUIPMENT |
95,420,400 |
||||
|
MEDIA & LEISURE - 18.8% |
|||||
|
Broadcasting - 15.2% |
|||||
|
Adelphia |
|
|
|
|
|
|
7.75% 1/15/09 |
B1 |
|
7,000,000 |
5,897,500 |
|
|
9.875% 3/1/05 |
B1 |
|
3,400,000 |
3,315,000 |
|
|
American Mobile Satellite Corp. 12.25% 4/1/08 |
- |
|
3,435,000 |
2,644,950 |
|
|
Charter Communications Holdings LLC/Charter Communications Holdings Capital Corp.: |
|
|
|
|
|
|
8.625% 4/1/09 |
B2 |
|
11,160,000 |
9,848,700 |
|
|
10.25% 1/15/10 |
B2 |
|
4,005,000 |
3,884,850 |
|
|
Diamond Cable Communications PLC: |
|
|
|
|
|
|
0% 2/15/07 (d) |
B3 |
|
11,561,000 |
8,873,068 |
|
|
yankee 0% 12/15/05 (d) |
B3 |
|
9,875,000 |
9,233,125 |
|
|
Earthwatch, Inc. 0% 7/15/07 unit (d)(f) |
- |
|
16,560,000 |
10,598,400 |
|
|
EchoStar DBS Corp. 9.375% 2/1/09 |
B2 |
|
14,860,000 |
14,339,900 |
|
|
Fox Family Worldwide, Inc. 0% 11/1/07 (d) |
B1 |
|
8,050,000 |
4,991,000 |
|
|
|
|||||
|
Moody's Ratings (unaudited) (b) |
Principal Amount |
Value |
|||
|
FrontierVision Holdings LP/FrontierVision Holdings Capital Corp. 0% 9/15/07 (d) |
B1 |
|
$ 210,000 |
$ 181,125 |
|
|
Golden Sky DBS, Inc. 0% 3/1/07 (d) |
Caa1 |
|
10,640,000 |
7,155,400 |
|
|
Impsat Fiber Networks, Inc. 13.75% 2/15/05 (f) |
B3 |
|
6,050,000 |
5,384,500 |
|
|
International Cabletel, Inc. 0% 2/1/06 (d) |
B3 |
|
40,484,000 |
37,245,280 |
|
|
LIN Holdings Corp. 0% 3/1/08 (d) |
B3 |
|
11,678,000 |
7,678,285 |
|
|
NorthPoint Communication Holdings, Inc. 12.875% 2/15/10 |
Caa1 |
|
17,095,000 |
11,795,550 |
|
|
NTL Communications Corp. 11.5% 10/1/08 |
B3 |
|
14,080,000 |
14,185,600 |
|
|
NTL, Inc. 0% 4/1/08 (d) |
B3 |
|
2,380,000 |
1,475,600 |
|
|
Olympus Communications LP/Olympus Capital Corp. 10.625% 11/15/06 |
B1 |
|
7,585,000 |
7,433,300 |
|
|
Satelites Mexicanos SA de CV: |
|
|
|
|
|
|
10.125% 11/1/04 |
B3 |
|
20,460,000 |
13,810,500 |
|
|
11.28% 6/30/04 (f)(g) |
B1 |
|
10,954,000 |
9,968,140 |
|
|
Spectrasite Holdings, Inc. 0% 4/15/09 (d) |
B3 |
|
18,670,000 |
10,781,925 |
|
|
Telewest PLC 0% 10/1/07 (d) |
B1 |
|
26,492,000 |
25,299,860 |
|
|
UIH Australia/Pacific, Inc.: |
|
|
|
|
|
|
Series B 0% 5/15/06 (d) |
B2 |
|
40,240,000 |
37,020,800 |
|
|
Series D 0% 5/15/06 (d) |
B2 |
|
5,620,000 |
5,170,400 |
|
|
United International Holdings, Inc. 0% 2/15/08 (d) |
B3 |
|
49,076,000 |
33,862,440 |
|
|
United Pan-Europe Communications NV: |
|
|
|
|
|
|
0% 2/1/10 (d) |
B2 |
|
28,175,000 |
13,242,250 |
|
|
10.875% 8/1/09 |
B2 |
|
13,240,000 |
11,651,200 |
|
|
11.25% 2/1/10 |
B2 |
|
6,005,000 |
5,404,500 |
|
|
XM Satellite Radio, Inc. 14% 3/15/10 unit (f) |
- |
|
6,055,000 |
5,328,400 |
|
|
|
337,701,548 |
||||
|
Entertainment - 1.5% |
|||||
|
AMC Entertainment, Inc.: |
|
|
|
|
|
|
9.5% 3/15/09 |
Caa3 |
|
4,030,000 |
1,934,400 |
|
|
9.5% 2/1/11 |
Caa3 |
|
5,390,000 |
2,479,400 |
|
|
Hollywood Entertainment Corp. 10.625% 8/15/04 |
B3 |
|
10,690,000 |
9,166,675 |
|
|
MGM Grand, Inc. 9.75% 6/1/07 |
Ba2 |
|
5,940,000 |
6,029,100 |
|
|
Premier Parks, Inc.: |
|
|
|
|
|
|
0% 4/1/08 (d) |
B3 |
|
4,710,000 |
3,196,913 |
|
|
9.25% 4/1/06 |
B3 |
|
4,745,000 |
4,484,025 |
|
|
Corporate Bonds - continued |
|||||
|
Moody's Ratings (unaudited) (b) |
Principal Amount |
Value |
|||
|
Nonconvertible Bonds - continued |
|||||
|
MEDIA & LEISURE - continued |
|||||
|
Entertainment - continued |
|||||
|
Regal Cinemas, Inc.: |
|
|
|
|
|
|
8.875% 12/15/10 |
Ca |
|
$ 2,660,000 |
$ 638,400 |
|
|
9.5% 6/1/08 |
Ca |
|
24,035,000 |
6,008,750 |
|
|
|
33,937,663 |
||||
|
Leisure Durables & Toys - 0.3% |
|||||
|
Marvel Enterprises, Inc. 12% 6/15/09 |
- |
|
8,750,000 |
6,650,000 |
|
|
Lodging & Gaming - 1.2% |
|||||
|
Florida Panthers Holdings, Inc. 9.875% 4/15/09 |
B2 |
|
8,750,000 |
8,181,250 |
|
|
HMH Properties, Inc. 7.875% 8/1/05 |
Ba2 |
|
2,965,000 |
2,727,800 |
|
|
Hollywood Casino Corp. 11.25% 5/1/07 |
B3 |
|
6,210,000 |
6,365,250 |
|
|
ITT Corp. 7.375% 11/15/15 |
Ba1 |
|
4,270,000 |
3,576,125 |
|
|
KSL Recreation Group, Inc. 10.25% 5/1/07 |
B2 |
|
6,060,000 |
5,757,000 |
|
|
|
26,607,425 |
||||
|
Restaurants - 0.6% |
|||||
|
AFC Enterprises, Inc. 10.25% 5/15/07 |
B3 |
|
10,485,000 |
9,960,750 |
|
|
NE Restaurant, Inc. 10.75% 7/15/08 |
B3 |
|
5,135,000 |
4,005,300 |
|
|
|
13,966,050 |
||||
|
TOTAL MEDIA & LEISURE |
418,862,686 |
||||
|
NONDURABLES - 0.4% |
|||||
|
Household Products - 0.4% |
|||||
|
AKI Holding Corp. 0% 7/1/09 (d) |
Caa1 |
|
9,120,000 |
4,286,400 |
|
|
AKI, Inc. 10.5% 7/1/08 |
B2 |
|
6,960,000 |
5,533,200 |
|
|
|
9,819,600 |
||||
|
RETAIL & WHOLESALE - 1.2% |
|||||
|
Apparel Stores - 0.7% |
|||||
|
Mothers Work, Inc. 12.625% 8/1/05 |
B3 |
|
15,320,000 |
14,324,200 |
|
|
Specialty Retailers, Inc. 8.5% 7/15/05 (c) |
Ca |
|
18,870,000 |
188,700 |
|
|
|
14,512,900 |
||||
|
Drug Stores - 0.2% |
|||||
|
Rite Aid Corp.: |
|
|
|
|
|
|
6.5% 12/15/05 (f) |
Caa1 |
|
6,175,000 |
3,180,125 |
|
|
7.125% 1/15/07 |
Caa1 |
|
3,920,000 |
2,077,600 |
|
|
|
5,257,725 |
||||
|
|
|||||
|
Moody's Ratings (unaudited) (b) |
Principal Amount |
Value |
|||
|
Grocery Stores - 0.3% |
|||||
|
Jitney-Jungle Stores |
|
|
|
|
|
|
10.375% 9/15/07 (c) |
C |
|
$ 9,685,000 |
$ 193,700 |
|
|
12% 3/1/06 (c) |
Caa3 |
|
2,590,000 |
323,750 |
|
|
Pathmark Stores, Inc. 9.625% 5/1/03 (c) |
Caa3 |
|
10,127,000 |
6,987,630 |
|
|
|
7,505,080 |
||||
|
TOTAL RETAIL & WHOLESALE |
27,275,705 |
||||
|
SERVICES - 2.1% |
|||||
|
Leasing & Rental - 0.2% |
|||||
|
Rent-A-Center, Inc. 11% 8/15/08 |
B2 |
|
3,980,000 |
3,860,600 |
|
|
Printing - 1.2% |
|||||
|
Sullivan Graphics, Inc. 12.75% 8/1/05 |
Caa1 |
|
21,340,000 |
21,446,700 |
|
|
World Color Press, Inc. 7.75% 2/15/09 |
Baa3 |
|
5,090,000 |
4,644,625 |
|
|
|
26,091,325 |
||||
|
Services - 0.7% |
|||||
|
AP Holdings, Inc. 0% 3/15/08 (d) |
Caa2 |
|
2,470,000 |
247,000 |
|
|
Apcoa, Inc. 9.25% 3/15/08 |
Caa1 |
|
17,070,000 |
5,803,800 |
|
|
Medaphis Corp. 9.5% 2/15/05 |
Caa1 |
|
13,713,000 |
10,284,750 |
|
|
|
16,335,550 |
||||
|
TOTAL SERVICES |
46,287,475 |
||||
|
TECHNOLOGY - 8.1% |
|||||
|
Computer Services & Software - 5.0% |
|||||
|
Amazon.com, Inc. 0% 5/1/08 (d) |
Caa1 |
|
7,070,000 |
3,817,800 |
|
|
Colo.com 13.875% 3/15/10 unit (f) |
- |
|
9,755,000 |
10,340,300 |
|
|
Concentric Network Corp. 12.75% 12/15/07 |
B- |
|
12,760,000 |
13,398,000 |
|
|
Covad Communications Group, Inc.: |
|
|
|
|
|
|
0% 3/15/08 (d) |
B3 |
|
19,440,000 |
9,525,600 |
|
|
12% 2/15/10 |
B3 |
|
15,575,000 |
12,070,625 |
|
|
12.5% 2/15/09 |
B3 |
|
7,684,000 |
6,108,780 |
|
|
Exodus |
|
|
|
|
|
|
10.75% 12/15/09 |
B- |
|
21,765,000 |
21,112,050 |
|
|
11.625% 7/15/10 (f) |
B |
|
9,025,000 |
9,070,125 |
|
|
PSINet, Inc.: |
|
|
|
|
|
|
10% 2/15/05 |
B3 |
|
12,670,000 |
11,688,075 |
|
|
10.5% 12/1/06 |
B3 |
|
6,010,000 |
5,529,200 |
|
|
Corporate Bonds - continued |
|||||
|
Moody's Ratings (unaudited) (b) |
Principal Amount |
Value |
|||
|
Nonconvertible Bonds - continued |
|||||
|
TECHNOLOGY - continued |
|||||
|
Computer Services & Software - continued |
|||||
|
PSINet, Inc.: - continued |
|
|
|
|
|
|
11% 8/1/09 |
B3 |
|
$ 4,790,000 |
$ 4,430,750 |
|
|
11.5% 11/1/08 |
B3 |
|
5,500,000 |
5,183,750 |
|
|
|
112,275,055 |
||||
|
Computers & Office Equipment - 1.0% |
|||||
|
Dictaphone Corp. 11.75% 8/1/05 |
Caa1 |
|
8,516,000 |
8,665,030 |
|
|
Globix Corp. 12.5% 2/1/10 |
B- |
|
14,995,000 |
12,370,875 |
|
|
|
21,035,905 |
||||
|
Electronic Instruments - 0.8% |
|||||
|
Telecommunications Techniques Co. LLC 9.75% 5/15/08 |
B3 |
|
19,385,000 |
17,834,200 |
|
|
Electronics - 1.3% |
|||||
|
ChipPAC International Ltd. 12.75% 8/1/09 |
B3 |
|
3,380,000 |
3,633,500 |
|
|
Details, Inc. 10% 11/15/05 |
B3 |
|
2,040,000 |
1,938,000 |
|
|
Hadco Corp. 9.5% 6/15/08 |
B2 |
|
12,835,000 |
12,867,088 |
|
|
Knowles Electronics, Inc. 13.125% 10/15/09 (f) |
B3 |
|
3,500,000 |
2,992,500 |
|
|
Micron Technology, Inc. 6.5% 9/30/05 (h) |
B3 |
|
10,000,000 |
8,350,000 |
|
|
|
29,781,088 |
||||
|
TOTAL TECHNOLOGY |
180,926,248 |
||||
|
TRANSPORTATION - 0.4% |
|||||
|
Air Transportation - 0.4% |
|||||
|
Atlas Air, Inc. 10.75% 8/1/05 |
B1 |
|
9,225,000 |
9,363,375 |
|
|
UTILITIES - 20.7% |
|||||
|
Cellular - 8.4% |
|||||
|
Cellnet Data Systems, Inc. 0% 10/1/07 (d) |
- |
|
69,670,000 |
5,573,600 |
|
|
Crown Castle International Corp. 10.75% 8/1/11 |
B3 |
|
6,195,000 |
6,287,925 |
|
|
Dobson Communications Corp. 10.875% 7/1/10 (f) |
- |
|
6,585,000 |
6,634,388 |
|
|
McCaw International Ltd. 0% 4/15/07 (d) |
Caa1 |
|
35,735,000 |
27,158,600 |
|
|
Metrocall, Inc.: |
|
|
|
|
|
|
10.375% 10/1/07 |
B3 |
|
10,455,000 |
7,318,500 |
|
|
11% 9/15/08 |
B3 |
|
3,410,000 |
2,404,050 |
|
|
Millicom International Cellular SA 0% 6/1/06 (d) |
Caa1 |
|
43,200,000 |
36,720,000 |
|
|
|
|||||
|
Moody's Ratings (unaudited) (b) |
Principal Amount |
Value |
|||
|
Nextel Communications, Inc. 9.375% 11/15/09 |
B1 |
|
$ 21,110,000 |
$ 20,265,600 |
|
|
Nextel International, Inc. 0% 4/15/08 (d) |
Caa1 |
|
18,480,000 |
12,196,800 |
|
|
Orbital Imaging Corp.: |
|
|
|
|
|
|
11.625% 3/1/05 |
CCC+ |
|
7,110,000 |
2,986,200 |
|
|
11.625% 3/1/05 |
CCC+ |
|
3,680,000 |
1,545,600 |
|
|
Orion Network Systems, Inc.: |
|
|
|
|
|
|
0% 1/15/07 (d) |
B2 |
|
12,460,000 |
4,984,000 |
|
|
11.25% 1/15/07 |
B2 |
|
5,800,000 |
3,393,000 |
|
|
PageMart Nationwide, Inc. 15% 2/1/05 |
B3 |
|
20,235,000 |
19,324,425 |
|
|
Telesystem International Wireless, Inc.: |
|
|
|
|
|
|
0% 6/30/07 (d) |
Caa1 |
|
20,940,000 |
14,658,000 |
|
|
0% 11/1/07 (d) |
Caa1 |
|
25,685,000 |
15,411,000 |
|
|
|
186,861,688 |
||||
|
Telephone Services - 12.3% |
|||||
|
Allegiance Telecom, Inc. 0% 2/15/08 (d) |
B3 |
|
5,387,000 |
3,919,043 |
|
|
Bestel SA de CV 0% 5/15/05 (d) |
- |
|
8,075,000 |
5,733,250 |
|
|
FirstWorld Communications, Inc. 0% 4/15/08 (d) |
- |
|
19,760,000 |
8,892,000 |
|
|
Flag Telecom Holdings Ltd. 11.625% 3/30/10 |
B2 |
|
2,965,000 |
2,816,750 |
|
|
Hyperion Telecommunications, Inc.: |
|
|
|
|
|
|
0% 4/15/03 (d) |
B3 |
|
4,435,000 |
4,124,550 |
|
|
12% 11/1/07 |
Caa1 |
|
3,600,000 |
3,384,000 |
|
|
ICG Holdings, Inc.: |
|
|
|
|
|
|
0% 9/15/05 (d) |
B3 |
|
28,000,000 |
26,880,000 |
|
|
0% 5/1/06 (d) |
B3 |
|
9,255,000 |
7,542,825 |
|
|
ICG Services, Inc.: |
|
|
|
|
|
|
0% 2/15/08 (d) |
B3 |
|
37,500,000 |
18,000,000 |
|
|
0% 5/1/08 (d) |
B3 |
|
2,950,000 |
1,357,000 |
|
|
Intermedia Communications, Inc.: |
|
|
|
|
|
|
0% 5/15/06 (d) |
B2 |
|
145,000 |
137,750 |
|
|
0% 7/15/07 (d) |
B2 |
|
7,835,000 |
6,072,125 |
|
|
KMC Telecom Holdings, Inc.: |
|
|
|
|
|
|
0% 2/15/08 (d) |
Caa2 |
|
19,400,000 |
8,342,000 |
|
|
13.5% 5/15/09 |
Caa2 |
|
6,710,000 |
5,569,300 |
|
|
Logix Communications Enterprises, Inc. 12.25% 6/15/08 |
- |
|
6,970,000 |
2,230,400 |
|
|
Metromedia Fiber Network, Inc. 10% 11/15/08 |
B2 |
|
19,255,000 |
18,918,038 |
|
|
NEXTLINK |
|
|
|
|
|
|
0% 12/1/09 (d) |
B2 |
|
11,215,000 |
6,448,625 |
|
|
10.75% 11/15/08 |
B3 |
|
340,000 |
334,900 |
|
|
10.75% 6/1/09 |
B2 |
|
10,690,000 |
10,529,650 |
|
|
Corporate Bonds - continued |
|||||
|
Moody's Ratings (unaudited) (b) |
Principal Amount |
Value |
|||
|
Nonconvertible Bonds - continued |
|||||
|
UTILITIES - continued |
|||||
|
Telephone Services - continued |
|||||
|
Optel Communications Corp. 15% 12/30/04 (h) |
- |
|
$ 14,907,563 |
$ 14,162,185 |
|
|
Pathnet, Inc. 12.25% 4/15/08 |
- |
|
20,255,000 |
11,342,800 |
|
|
Rhythms |
|
|
|
|
|
|
0% 5/15/08 (d) |
B3 |
|
21,980,000 |
8,682,100 |
|
|
12.75% 4/15/09 |
B3 |
|
7,480,000 |
5,086,400 |
|
|
14% 2/15/10 (f) |
B3 |
|
7,210,000 |
5,191,200 |
|
|
RSL Communications Ltd./RSL Communications PLC 12.25% 11/15/06 |
B2 |
|
6,026,000 |
4,790,670 |
|
|
RSL Communications PLC 9.875% 11/15/09 |
B2 |
|
7,195,000 |
4,676,750 |
|
|
Teligent, Inc. 11.5% 12/1/07 |
Caa1 |
|
4,625,000 |
3,584,375 |
|
|
WinStar |
|
|
|
|
|
|
0% 4/15/10 (d)(f) |
B3 |
|
36,689,000 |
17,060,385 |
|
|
12.5% 4/15/08 (f) |
B3 |
|
17,930,000 |
17,481,750 |
|
|
12.75% 4/15/10 (f) |
B3 |
|
31,418,000 |
30,318,370 |
|
|
Worldwide Fiber, Inc. 12% 8/1/09 |
B3 |
|
11,800,000 |
11,033,000 |
|
|
|
274,642,191 |
||||
|
TOTAL UTILITIES |
461,503,879 |
||||
|
TOTAL NONCONVERTIBLE BONDS |
1,609,659,331 |
||||
|
TOTAL CORPORATE BONDS (Cost $1,951,710,007) |
|
1,683,141,612 |
|||
|
Asset-Backed Securities - 0.1% |
|||||
|
|
|||||
|
Airplanes pass through trust 10.875% 3/15/19 |
Ba2 |
|
2,884,084 |
2,134,222 |
|
|
Commercial Mortgage Securities - 1.3% |
|||||
|
Moody's Ratings (unaudited) (b) |
Principal Amount |
Value |
|||
|
Commercial Mortgage Acceptance Corp. pass through certificates Series 1998-C2 Class F, 5.44% 5/15/13 (f)(g) |
BB+ |
|
$ 4,500,000 |
$ 2,825,860 |
|
|
Commercial Mortgage |
Ba1 |
|
4,750,000 |
3,046,680 |
|
|
Danmall Finance, Inc. |
- |
|
4,890,848 |
4,946,634 |
|
|
LB Multifamily Mortgage Trust Series 1991-4 |
Caa1 |
|
2,313,015 |
1,850,412 |
|
|
Meritor Mortgage Security Corp. Series 1987 1 |
- |
|
1,350,000 |
116,505 |
|
|
Mortgage Capital Funding, Inc. Series 1998-MC3 Class F, 7.3177% 11/18/31 (f)(g) |
Ba1 |
|
4,500,000 |
3,608,190 |
|
|
Nationslink Funding Corp. Commercial Mortgage pass through certificates Series 1998-2 Class F, 7.105% 8/20/30 |
BB |
|
4,500,000 |
3,351,094 |
|
|
Nomura Depositor Trust: |
|
|
|
|
|
|
floater Series 1998-ST1A Class B2, 10.9013% 1/15/03 (f)(g) |
- |
|
2,200,000 |
2,037,406 |
|
|
Series 1998-ST1A |
- |
|
4,000,000 |
3,725,000 |
|
|
Structured Asset |
|
|
|
|
|
|
Series 1994-C1 Class F, 6.87% 8/25/26 |
B |
|
2,600,000 |
2,110,266 |
|
|
Series 1995-C1 Class F, 7.375% 9/25/24 (f) |
- |
|
2,000,000 |
1,588,438 |
|
|
TOTAL COMMERCIAL MORTGAGE SECURITIES (Cost $28,843,213) |
29,206,485 |
||||
|
Common Stocks - 3.2% |
|||
|
Shares |
|
||
|
BASIC INDUSTRIES - 0.1% |
|||
|
Chemicals & Plastics - 0.0% |
|||
|
Sterling Chemicals Holdings, Inc. warrants 8/15/08 (a) |
340 |
4,080 |
|
|
Iron & Steel - 0.0% |
|||
|
AK Steel Holding Corp. |
6,500 |
52,000 |
|
|
Common Stocks - continued |
|||
|
Shares |
Value (Note 1) |
||
|
BASIC INDUSTRIES - continued |
|||
|
Packaging & Containers - 0.1% |
|||
|
Packaging Corp. of America |
150,000 |
$ 1,518,750 |
|
|
TOTAL BASIC INDUSTRIES |
1,574,830 |
||
|
CONSTRUCTION & REAL ESTATE - 0.3% |
|||
|
Building Materials - 0.1% |
|||
|
International Utility Structures, Inc. unit |
2,500 |
1,750,000 |
|
|
Real Estate - 0.2% |
|||
|
LNR Property Corp. |
257,600 |
5,023,200 |
|
|
Real Estate Investment Trusts - 0.0% |
|||
|
Swerdlow Real Estate Group, Inc.: |
|
|
|
|
Class A (h) |
79,800 |
1 |
|
|
Class B (h) |
19,817 |
0 |
|
|
|
1 |
||
|
TOTAL CONSTRUCTION & REAL ESTATE |
6,773,201 |
||
|
DURABLES - 0.2% |
|||
|
Textiles & Apparel - 0.2% |
|||
|
Arena Brands Holdings Corp. Class B |
48,889 |
1,222,225 |
|
|
Polymer Group, Inc. |
426,300 |
3,943,275 |
|
|
|
5,165,500 |
||
|
ENERGY - 0.5% |
|||
|
Oil & Gas - 0.5% |
|||
|
Plains Resources, Inc. (a) |
686,000 |
10,976,000 |
|
|
FINANCE - 0.0% |
|||
|
Credit & Other Finance - 0.0% |
|||
|
Arcadia Financial Ltd. warrants 3/15/07 (a) |
498 |
1 |
|
|
Securities Industry - 0.0% |
|||
|
ECM Corp. LP (f) |
3,000 |
264,000 |
|
|
TOTAL FINANCE |
264,001 |
||
|
HEALTH - 0.0% |
|||
|
Medical Equipment & Supplies - 0.0% |
|||
|
Wright Medical Technology, Inc. |
3,212 |
32 |
|
|
INDUSTRIAL MACHINERY & EQUIPMENT - 0.9% |
|||
|
Industrial Machinery & Equipment - 0.1% |
|||
|
Tenneco Automotive, Inc. |
150,000 |
787,500 |
|
|
Terex Corp. (a) |
50,000 |
706,250 |
|
|
|
1,493,750 |
||
|
Pollution Control - 0.8% |
|||
|
Allied Waste Industries, Inc. (a) |
1,765,000 |
17,650,000 |
|
|
TOTAL INDUSTRIAL MACHINERY & EQUIPMENT |
19,143,750 |
||
|
|
|||
|
Shares |
Value (Note 1) |
||
|
MEDIA & LEISURE - 0.4% |
|||
|
Broadcasting - 0.1% |
|||
|
Benedek Communications Corp. |
57,600 |
$ 115,200 |
|
|
CS Wireless Systems, Inc. (a)(f) |
1,024 |
10 |
|
|
EchoStar Communications Corp. |
3,100 |
102,639 |
|
|
Motient Corp. warrants 4/1/08 (a) |
3,435 |
127,095 |
|
|
UIH Australia/Pacific, Inc. |
26,805 |
804,150 |
|
|
|
1,149,094 |
||
|
Entertainment - 0.3% |
|||
|
Premier Parks, Inc. (a) |
325,000 |
7,393,750 |
|
|
Lodging & Gaming - 0.0% |
|||
|
Motels of America, Inc. (a) |
3,000 |
43,500 |
|
|
TOTAL MEDIA & LEISURE |
8,586,344 |
||
|
RETAIL & WHOLESALE - 0.1% |
|||
|
Apparel Stores - 0.1% |
|||
|
Mothers Work, Inc. (a)(e) |
294,100 |
3,308,625 |
|
|
Mothers Work, Inc. (a)(h) |
2,952 |
33,210 |
|
|
|
3,341,835 |
||
|
TECHNOLOGY - 0.0% |
|||
|
Computer Services & Software - 0.0% |
|||
|
DecisionOne Corp. |
16,846 |
168 |
|
|
DecisionOne Corp.: |
|
|
|
|
Class A warrants 4/18/07 (a) |
9,890 |
1 |
|
|
Class B warrants 4/18/07 (a) |
17,041 |
2 |
|
|
Class C warrants 4/18/07 (a) |
10,108 |
1 |
|
|
|
172 |
||
|
Computers & Office Equipment - 0.0% |
|||
|
Ampex Corp. Class A (a) |
9,600 |
16,200 |
|
|
Electronics - 0.0% |
|||
|
Insilco Corp. warrants 8/15/07 (a) |
7,380 |
7 |
|
|
TOTAL TECHNOLOGY |
16,379 |
||
|
UTILITIES - 0.7% |
|||
|
Cellular - 0.3% |
|||
|
Cellnet Data Systems, Inc. |
18,000 |
180 |
|
|
Loral Orion Network Systems, Inc.: |
|
|
|
|
warrants 1/15/07 (CV ratio .47) (a) |
45,930 |
114,825 |
|
|
warrants 1/15/07 (CV ratio .6) (a) |
5,585 |
23,736 |
|
|
McCaw International Ltd. |
42,305 |
105,763 |
|
|
WebLink Wireless, Inc. Class A (a) |
528,034 |
6,996,451 |
|
|
|
7,240,955 |
||
|
Telephone Services - 0.4% |
|||
|
Bestel SA de CV warrants 5/13/05 (a)(f) |
8,075 |
904,400 |
|
|
Common Stocks - continued |
|||
|
Shares |
Value (Note 1) |
||
|
UTILITIES - continued |
|||
|
Telephone Services - continued |
|||
|
KMC Telecom Holdings, Inc. |
12,650 |
$ 31,625 |
|
|
Optel Communications Corp. |
2,559,515 |
6,718,727 |
|
|
Pathnet, Inc. warrants 4/15/08 (a)(f) |
20,255 |
202,550 |
|
|
|
7,857,302 |
||
|
TOTAL UTILITIES |
15,098,257 |
||
|
TOTAL COMMON STOCKS (Cost $82,503,250) |
70,940,129 |
||
|
Preferred Stocks - 13.5% |
|||
|
|
|
|
|
|
Convertible Preferred Stocks - 0.1% |
|||
|
TECHNOLOGY - 0.1% |
|||
|
Computer Services & Software - 0.1% |
|||
|
PSINet, Inc. $3.50 (f) |
100,000 |
3,400,000 |
|
|
|
|
|
|
|
Nonconvertible Preferred Stocks - 13.4% |
|||
|
CONSTRUCTION & REAL ESTATE - 0.4% |
|||
|
Building Materials - 0.0% |
|||
|
International Utility Structures, Inc. |
713 |
499,100 |
|
|
Real Estate Investment Trusts - 0.4% |
|||
|
Swerdlow Real Estate Group, Inc.: |
|
|
|
|
junior (h) |
19,817 |
0 |
|
|
mezzanine (h) |
79,800 |
28,890 |
|
|
senior (h) |
79,800 |
8,815,611 |
|
|
|
8,844,501 |
||
|
TOTAL CONSTRUCTION & REAL ESTATE |
9,343,601 |
||
|
FINANCE - 0.4% |
|||
|
Insurance - 0.4% |
|||
|
American Annuity Group Capital Trust II 8.875% |
8,910 |
7,932,230 |
|
|
HEALTH - 0.5% |
|||
|
Medical Facilities Management - 0.5% |
|||
|
Fresenius Medical Care Capital Trust II 7.875% |
10,524 |
9,600,845 |
|
|
|
|||
|
Shares |
Value (Note 1) |
||
|
MEDIA & LEISURE - 2.4% |
|||
|
Broadcasting - 2.4% |
|||
|
Citadel Broadcasting Co. Series B, 13.25% pay-in-kind |
54,339 |
$ 5,596,917 |
|
|
CSC Holdings, Inc.: |
|
|
|
|
11.125% pay-in-kind |
197,957 |
20,686,507 |
|
|
Series H, 11.75% pay-in-kind |
200,061 |
21,106,436 |
|
|
Granite Broadcasting Corp. |
7,825 |
6,573,000 |
|
|
|
53,962,860 |
||
|
TECHNOLOGY - 0.0% |
|||
|
Computers & Office Equipment - 0.0% |
|||
|
Ampex Corp. 8% non-cumulative |
422 |
658,320 |
|
|
UTILITIES - 9.7% |
|||
|
Cellular - 3.9% |
|||
|
Nextel Communications, Inc.: |
|
|
|
|
11.125% pay-in-kind |
47,183 |
45,531,595 |
|
|
Series D, 13% pay-in-kind |
38,807 |
40,553,315 |
|
|
|
86,084,910 |
||
|
Telephone Services - 5.8% |
|||
|
Adelphia Business Solution, Inc. |
2,988 |
2,674,260 |
|
|
e.spire Communications, Inc. |
17,801 |
3,204,180 |
|
|
ICG Holdings, Inc. 14.25% pay-in-kind |
26,893 |
21,514,400 |
|
|
Intermedia Communications, Inc. |
22,827 |
22,142,190 |
|
|
NEXTLINK Communications, Inc. |
24,242 |
23,514,740 |
|
|
NEXTLINK Communications, Inc. |
1,125,487 |
57,399,830 |
|
|
|
130,449,600 |
||
|
TOTAL UTILITIES |
216,534,510 |
||
|
TOTAL NONCONVERTIBLE PREFERRED STOCKS |
298,032,366 |
||
|
TOTAL PREFERRED STOCKS (Cost $325,176,740) |
301,432,366 |
||
|
Purchased Bank Debt - 0.6% |
|||||
|
Moody's Ratings (unaudited) (b) |
Principal Amount |
|
|||
|
Dynatech LLC term loan 10.03% 9/1/07 (g) |
- |
|
$ 2,000,000 |
1,990,000 |
|
|
Synthetic Industries, Inc. term loan 14% 12/13/00 (g) |
- |
|
3,600,000 |
3,564,000 |
|
|
Purchased Bank Debt - continued |
|||||
|
Moody's Ratings (unaudited) (b) |
Principal Amount |
Value |
|||
|
Total Renal Care Holdings, Inc. term loan 11.5% 3/31/06 (g) |
Ba2 |
|
$ 2,620,105 |
$ 2,436,697 |
|
|
Voicestream Pcs Holding LLC term loan 9.76% 2/25/09 (g) |
B+ |
|
5,000,000 |
4,987,500 |
|
|
TOTAL PURCHASED BANK DEBT (Cost $12,855,286) |
12,978,197 |
||||
|
Cash Equivalents - 4.7% |
|||
|
Maturity Amount |
|
||
|
Investments in repurchase agreements (U.S. Treasury Obligations), in a joint |
$ 104,520,295 |
104,463,000 |
|
|
TOTAL INVESTMENT PORTFOLIO - 98.8% (Cost $2,508,743,347) |
2,204,296,011 |
||
|
NET OTHER ASSETS - 1.2% |
26,704,251 |
||
|
NET ASSETS - 100% |
$ 2,231,000,262 |
||
|
Legend |
|
(a) Non-income producing |
|
(b) S&P credit ratings are used in the absence of a rating by Moody's Investors Service, Inc. |
|
(c) Non-income producing - issuer filed for protection under the Federal Bankruptcy Code or is in default of interest payment. |
|
(d) Debt obligation initially issued in zero coupon form which converts to coupon form at a specified rate and date. The rate shown is the rate at period end. |
|
(e) Transactions during the period with companies which are or were affiliates are as follows: |
|
Affiliate |
Purchase |
Sales |
Dividend |
Value |
|
Mothers |
$ - |
$ 112,038 |
$ - |
$ 3,308,625 |
|
(f) Security exempt from registration under Rule 144A of the Securities |
|
(g) The coupon rate shown on floating or adjustable rate securities represents the rate at period end. |
|
(h) Restricted securities - Investment in securities not registered under the Securities Act of 1933. |
|
Additional information on each holding is as follows: |
|
Security |
Acquisition Date |
Acquisition Cost |
|
Micron Technology, Inc. |
3/3/99 - 10/7/99 |
$ 7,794,500 |
|
Mothers Work, Inc. |
6/18/98 |
$ 26,172 |
|
Optel Communications Corp. |
12/31/97 |
$ 759,408 |
|
Optel Communications Corp. |
12/31/97 - 12/30/99 |
$ 14,148,203 |
|
Swerdlow Real Estate Group, Inc. |
1/15/99 |
$ 11,132 |
|
Swerdlow Real Estate Group, Inc. |
1/15/99 |
$ 2,760 |
|
Swerdlow Real Estate Group, Inc. |
1/15/99 |
$ 2,760 |
|
Swerdlow Real Estate Group, Inc. |
1/15/99 |
$ 78,520 |
|
Swerdlow Real Estate Group, Inc. |
1/15/99 |
$ 7,618,828 |
|
Other Information |
|
Purchases and sales of securities, other than short-term securities, |
|
The fund placed a portion of its portfolio transactions with brokerage firms which are affiliates of Fidelity Management & Research Company. The commissions paid to these affiliated firms were $7,030 for the period. |
|
The fund invested in securities that are not registered under the Securities Act of 1933. These securities are subject to legal or contractual restrictions on resale. At the end of the period, restricted securities (excluding Rule 144A issues) amounted to $38,108,624 and 1.7% of net assets. |
|
The fund participated in the interfund lending program as a borrower. The average daily loan balance during the period for which loans were outstanding amounted to $10,243,000. The weighted average interest rate was 6.73%. |
|
Distribution of investments by country of issue, as a percentage of total |
|
United States of America |
89.2% |
|
Canada |
3.4 |
|
United Kingdom |
2.4 |
|
Luxembourg |
1.6 |
|
Mexico |
1.5 |
|
Netherlands |
1.4 |
|
Others (individually less than 1%) |
0.5 |
|
|
100.0% |
|
The composition of long-term debt holdings as a percentage of total |
|
Moody's Ratings |
S&P Ratings |
|||
|
Aaa, Aa, A |
0.0% |
|
AAA, AA, A |
0.0% |
|
Baa |
0.2% |
|
BBB |
0.2% |
|
Ba |
3.7% |
|
BB |
3.2% |
|
B |
50.2% |
|
B |
56.1% |
|
Caa |
12.9% |
|
CCC |
7.2% |
|
Ca, C |
0.4% |
|
CC, C |
0.0% |
|
|
|
|
D |
0.4% |
|
The percentage not rated by Moody's or S&P amounted to 7.6%. FMR has determined that unrated debt securities that are lower quality account for 7.6% of the total value of investment in securities. |
|
Income Tax Information |
|
At June 30, 2000, the aggregate cost of investment securities for income tax purposes was $2,510,663,320. Net unrealized depreciation aggregated $306,367,309, of which $36,552,593 related to appreciated investment securities and $342,919,902 related to depreciated investment securities. |
|
At December 31, 1999, the fund had a capital loss carryforward of approximately $78,395,000, all of which will expire on December 31, 2007. |
See accompanying notes which are an integral part of the financial statements.
High Income Portfolio
Statement of Assets and Liabilities
|
|
June 30, 2000 (Unaudited) |
|
|
Assets |
|
|
|
Investment in securities, at value (including repurchase agreements of $104,463,000) |
|
$ 2,204,296,011 |
|
Cash |
|
1,173,022 |
|
Receivable for investments sold |
|
10,237,395 |
|
Receivable for fund shares sold |
|
1,824,525 |
|
Dividends receivable |
|
395,382 |
|
Interest receivable |
|
39,095,601 |
|
Other receivables |
|
551,687 |
|
Total assets |
|
2,257,573,623 |
|
Liabilities |
|
|
|
Payable for investments purchased |
$ 24,668,573 |
|
|
Payable for fund shares redeemed |
630,403 |
|
|
Accrued management fee |
1,052,289 |
|
|
Distribution fees payable |
21,721 |
|
|
Other payables and |
200,375 |
|
|
Total liabilities |
|
26,573,361 |
|
Net Assets |
|
$ 2,231,000,262 |
|
Net Assets consist of: |
|
|
|
Paid in capital |
|
$ 2,569,113,584 |
|
Undistributed net investment income |
|
195,475,174 |
|
Accumulated undistributed |
|
(229,141,160) |
|
Net unrealized appreciation (depreciation) on investments |
|
(304,447,336) |
|
Net Assets |
|
$ 2,231,000,262 |
|
Initial Class : |
|
$10.04 |
|
Service Class : |
|
$10.01 |
|
Service Class 2: |
|
$10.00 |
Statement of Operations
|
|
Six months ended June 30, 2000 (Unaudited) |
|
|
Investment Income Dividends |
|
$ 19,576,105 |
|
Interest |
|
115,899,684 |
|
Total income |
|
135,475,789 |
|
Expenses |
|
|
|
Management fee |
$ 6,594,093 |
|
|
Transfer agent fees |
738,215 |
|
|
Distribution fees |
126,321 |
|
|
Accounting fees and expenses |
306,723 |
|
|
Non-interested trustees' compensation |
6,473 |
|
|
Custodian fees and expenses |
33,438 |
|
|
Registration fees |
4,288 |
|
|
Audit |
22,467 |
|
|
Legal |
10,848 |
|
|
Interest |
5,745 |
|
|
Miscellaneous |
20,986 |
|
|
Total expenses before reductions |
7,869,597 |
|
|
Expense reductions |
(38,341) |
7,831,256 |
|
Net investment income |
|
127,644,533 |
|
Realized and Unrealized Gain (Loss) Net realized gain (loss) on investment securities (including realized loss of $45,477 on sales of investments in affiliated issuers) |
|
(148,333,381) |
|
Change in net unrealized appreciation (depreciation) |
|
(97,254,537) |
|
Net gain (loss) |
|
(245,587,918) |
|
Net increase (decrease) in net assets resulting from operations |
|
$ (117,943,385) |
|
Other Information Expense reductions |
|
|
|
Directed brokerage arrangements |
|
$ 35,786 |
|
Custodian credits |
|
2,555 |
|
|
|
$ 38,341 |
See accompanying notes which are an integral part of the financial statements.
Semiannual Report
Fidelity Variable Insurance Products: High Income Portfolio
Financial Statements - continued
Statement of Changes in Net Assets
|
Increase (Decrease) in Net Assets |
Six months ended |
Year ended |
|
Operations |
$ 127,644,533 |
$ 247,259,596 |
|
Net realized gain (loss) |
(148,333,381) |
(96,179,624) |
|
Change in net unrealized appreciation (depreciation) |
(97,254,537) |
55,361,896 |
|
Net increase (decrease) in net assets resulting from operations |
(117,943,385) |
206,441,868 |
|
Distributions to shareholders |
(160,774,244) |
(232,085,602) |
|
From net realized gain |
- |
(6,657,693) |
|
In excess of net realized gain |
- |
(877,958) |
|
Total distributions |
(160,774,244) |
(239,621,253) |
|
Share transactions - net increase (decrease) |
(1,863,609) |
66,219,533 |
|
Total increase (decrease) in net assets |
(280,581,238) |
33,040,148 |
|
Net Assets |
|
|
|
Beginning of period |
2,511,581,500 |
2,478,541,352 |
|
End of period (including undistributed net investment income |
$ 2,231,000,262 |
$ 2,511,581,500 |
|
Other Information: |
|
|
Six months ended June 30, 2000 |
Year ended |
||
|
|
Shares |
Dollars |
Shares |
Dollars |
|
Share transactions |
34,881,654 |
$ 357,036,731 |
101,971,137 |
$ 1,140,554,728 |
|
Reinvested |
13,813,362 |
144,073,366 |
20,936,841 |
226,536,621 |
|
Redeemed |
(52,613,342) |
(547,562,808) |
(127,141,526) |
(1,424,987,101) |
|
Net increase (decrease) |
(3,918,326) |
$ (46,452,711) |
(4,233,548) |
$ (57,895,752) |
|
Service Class |
7,232,634 |
$ 74,033,462 |
15,936,772 |
$ 177,176,136 |
|
Reinvested |
1,603,673 |
16,694,232 |
1,211,540 |
13,084,632 |
|
Redeemed |
(4,572,624) |
(47,192,023) |
(5,904,384) |
(66,145,483) |
|
Net increase (decrease) |
4,263,683 |
$ 43,535,671 |
11,243,928 |
$ 124,115,285 |
|
Service Class 2 A |
104,183 |
$ 1,046,949 |
- |
$ - |
|
Reinvested |
639 |
6,643 |
- |
- |
|
Redeemed |
(16) |
(161) |
- |
- |
|
Net increase (decrease) |
104,806 |
$ 1,053,431 |
- |
$ - |
|
Distributions |
|
|
|
|
|
From net investment income |
|
$ 144,073,368 |
|
$ 219,412,458 |
|
Service Class |
|
16,694,233 |
|
12,673,144 |
|
Service Class 2 A |
|
6,643 |
|
- |
|
Total |
|
$ 160,774,244 |
|
$ 232,085,602 |
|
From net realized gain |
|
$ - |
|
$ 6,294,147 |
|
Service Class |
|
- |
|
363,546 |
|
Service Class 2 A |
|
- |
|
- |
|
Total |
|
$ - |
|
$ 6,657,693 |
|
In excess of net realized gain |
|
$ - |
|
$ 830,017 |
|
Service Class |
|
- |
|
47,941 |
|
Service Class 2 A |
|
- |
|
- |
|
Total |
|
$ - |
|
$ 877,958 |
|
|
|
$ 160,774,244 |
|
$ 239,621,253 |
A Service Class 2 commenced sale of shares January 12, 2000.
See accompanying notes which are an integral part of the financial statements.
High Income Portfolio
Financial Highlights - Initial Class
|
|
Six months ended |
Years ended December 31, |
||||
|
Selected Per-Share Data |
(Unaudited) |
1999 |
1998 |
1997 |
1996 |
1995 |
|
Net asset value, beginning of period |
$ 11.320 |
$ 11.530 |
$ 13.580 |
$ 12.520 |
$ 12.050 |
$ 10.750 |
|
Income from Investment Operations |
|
|
|
|
|
|
|
Net investment income |
.580 D |
1.095 D |
1.111 D |
1.124 D |
.927 |
.856 |
|
Net realized and unrealized gain (loss) |
(1.110) |
(.195) |
(1.591) |
.936 |
.643 |
1.224 |
|
Total from investment operations |
(.530) |
.900 |
(.480) |
2.060 |
1.570 |
2.080 |
|
Less Distributions |
|
|
|
|
|
|
|
From net investment income |
(.750) |
(1.075) |
(.970) |
(.890) |
(.920) |
(.780) |
|
From net realized gain |
- |
(.030) |
(.600) |
(.110) |
(.180) |
- |
|
In excess of net realized gain |
- |
(.005) |
- |
- |
- |
- |
|
Total distributions |
(.750) |
(1.110) |
(1.570) |
(1.000) |
(1.100) |
(.780) |
|
Net asset value, end of period |
$ 10.040 |
$ 11.320 |
$ 11.530 |
$ 13.580 |
$ 12.520 |
$ 12.050 |
|
Total Return B, C |
(4.93)% |
8.25% |
(4.33)% |
17.67% |
14.03% |
20.72% |
|
Ratios and Supplemental Data |
|
|
|
|
|
|
|
Net assets, end of period (000 omitted) |
$ 1,962,075 |
$ 2,257,610 |
$ 2,348,954 |
$ 2,329,516 |
$ 1,588,822 |
$ 1,040,000 |
|
Ratio of expenses to average net assets |
.68% A |
.69% |
.70% |
.71% |
.71% |
.71% |
|
Ratio of net investment income to average net assets |
11.22% A |
9.80% |
9.14% |
8.88% |
9.09% |
9.32% |
|
Portfolio turnover rate |
71% A |
82% |
92% |
118% |
123% |
132% |
Financial Highlights - Service Class
|
|
Six months ended |
Years ended December 31, |
||
|
Selected Per-Share Data |
(Unaudited) |
1999 |
1998 |
1997 E |
|
Net asset value, beginning of period |
$ 11.290 |
$ 11.520 |
$ 13.570 |
$ 13.380 |
|
Income from Investment Operations |
|
|
|
|
|
Net investment income D |
.570 |
1.074 |
1.082 |
.203 |
|
Net realized and unrealized gain (loss) |
(1.110) |
(.194) |
(1.562) |
(.013) |
|
Total from investment operations |
(.540) |
.880 |
(.480) |
.190 |
|
Less Distributions |
|
|
|
|
|
From net investment income |
(.740) |
(1.075) |
(.970) |
- |
|
From net realized gain |
- |
(.030) |
(.600) |
- |
|
In excess of net realized gain |
- |
(.005) |
- |
- |
|
Total distributions |
(.740) |
(1.110) |
(1.570) |
- |
|
Net asset value, end of period |
$ 10.010 |
$ 11.290 |
$ 11.520 |
$ 13.570 |
|
Total Return B, C |
(5.03)% |
8.08% |
(4.34)% |
1.42% |
|
Ratios and Supplemental Data |
|
|
|
|
|
Net assets, end of period (000 omitted) |
$ 267,878 |
$ 253,972 |
$ 129,587 |
$ 2,919 |
|
Ratio of expenses to average net assets |
.78% A |
.79% |
.82% |
.81% A |
|
Ratio of expenses to average net assets after expense reductions |
.78% A |
.79% |
.82% |
.80% A, F |
|
Ratio of net investment income to average net assets |
11.12% A |
9.69% |
9.51% |
10.75% A |
|
Portfolio turnover rate |
71% A |
82% |
92% |
118% |
|
A Annualized B Total returns for periods of less than one year are not annualized and do not reflect charges attributable to your insurance company's separate account. Inclusion of these charges would reduce the total returns shown. C The total returns would have been lower had certain expenses not been reduced during the periods shown. D Net investment income per share has been calculated based on average shares outstanding during the period. E For the period November 3, 1997 (commencement of sale of Service Class shares) to December 31, 1997. F FMR or the fund has entered into varying arrangements with third parties who either paid or reduced a portion of the class' expenses. |
||||
See accompanying notes which are an integral part of the financial statements.
Semiannual Report
Financial Highlights - Service Class 2
|
|
Six months ended |
|
Selected Per-Share Data |
(Unaudited) |
|
Net asset value, beginning of period |
$ 11.140 |
|
Income from Investment Operations |
|
|
Net investment income D |
.476 |
|
Net realized and unrealized gain (loss) |
(.876) |
|
Total from investment operations |
(.400) |
|
Less Distributions |
|
|
From net investment income |
(.740) |
|
Net asset value, end of period |
$ 10.000 |
|
Total Return B, C |
(3.85)% |
|
Ratios and Supplemental Data |
|
|
Net assets, end of period (000 omitted) |
$ 1,048 |
|
Ratio of expenses to average net assets |
.97% A |
|
Ratio of expenses to average net assets after expense reductions |
.96% A, F |
|
Ratio of net investment income to average net assets |
10.93% A |
|
Portfolio turnover rate |
71% A |
|
A Annualized B Total returns for periods of less than one year are not annualized and do not reflect charges attributable to your insurance company's separate account. Inclusion of these charges would reduce the total returns shown. C The total return would have been lower had certain expenses not been reduced during the period shown. D Net investment income per share has been calculated based on average shares outstanding during the period. E For the period January 12, 2000 (commencement of sale of Service Class 2 shares) to June 30, 2000. F FMR or the fund has entered into varying arrangements with third parties who either paid or reduced a portion of the class' expenses. |
|
See accompanying notes which are an integral part of the financial statements.
High Income Portfolio
Performance
There are several ways to evaluate a fund's historical performance. You can look at the total percentage change in value, the average annual percentage change or the growth of a hypothetical $10,000 investment. Total return reflects the change in the value of an investment, assuming reinvestment of the fund's dividend income and capital gains (the profits earned upon the sale of securities that have grown in value). If Fidelity had not reimbursed certain fund expenses, the past 10 year total returns would have been lower.
Average Annual Total Returns
|
Periods ended June 30, 2000 |
Past 1 |
Past 5 |
Past 10 |
|
Fidelity VIP: Investment Grade Bond - |
4.49% |
5.95% |
7.26% |
|
LB Aggregate Bond |
4.57% |
6.25% |
7.82% |
Average annual returns take the fund's cumulative return and show you what would have happened if the fund had performed at a constant rate each year.
You can compare these figures to the Lehman Brothers Aggregate Bond Index - a market value-weighted index of investment-grade fixed-rate debt issues, including government, corporate, asset-backed, and mortgage-backed securities, with maturities of one year or more. This benchmark includes reinvested dividends and capital gains, if any.
Figures for more than one year assume a steady compounded rate of return and are not the fund's year-by-year results, which fluctuated over the periods shown.
Performance numbers are net of all fund operating expenses, but do not include any insurance charges imposed by your insurance company's separate account. If performance information included the effect of these additional charges, the total returns would have been lower.
Past performance is no guarantee of future results. Principal and investment return will vary and you may have a gain or loss when you withdraw your money.
Understanding Performance
How a fund did yesterday is no guarantee of
how it will do tomorrow. Bond prices, for example,
generally move in the opposite direction of interest
rates. In turn, the share price, return and yield of a
fund that invests in bonds will vary. That means if
you sell your shares during a market downturn,
you might lose money. But if you can ride out the
market's ups and downs, you may have a gain.
$10,000 Over 10 Years
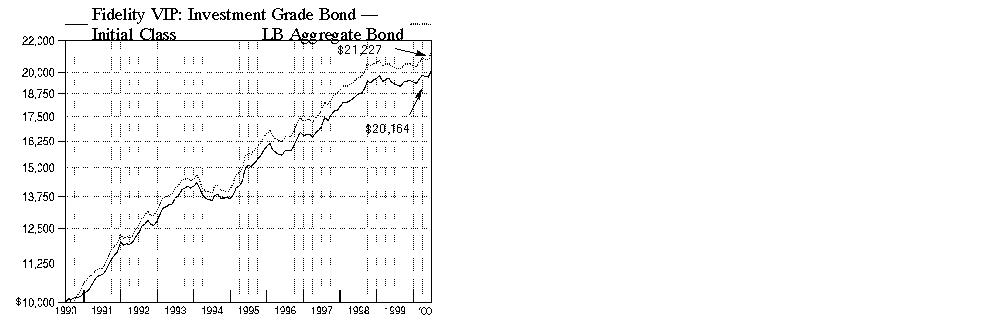
$10,000 Over 10 Years: Let's say hypothetically that $10,000 was invested in Fidelity Variable Insurance Products: Investment Grade Bond Portfolio - Initial Class on June 30, 1990. By June 30, 2000, the value of the investment would have grown to $20,164 - a 101.64% increase on the initial investment. For comparison, look at how the Lehman Brothers Aggregate Bond Index did over the same period. With dividends and capital gains, if any, reinvested, the same $10,000 investment would have grown to $21,227 - a 112.27% increase.
Investment Summary
|
Quality Diversification as of June 30, 2000 |
|
|
(Moody's Ratings) |
% of fund's |
|
Aaa |
60.2 |
|
Aa |
1.9 |
|
A |
11.6 |
|
Baa |
20.3 |
|
Ba and Below |
0.9 |
|
Table excludes short-term investments. Where Moody's ratings are not available, we have used S&P ratings. Securities rated as Ba or below were rated investment grade by other nationally recognized rating agencies or assigned an investment grade rating at the time of acquisition by Fidelity. |
|
Average Years to Maturity as of June 30, 2000 |
|
|
Years |
9.0 |
|
Average years to maturity is based on the average time remaining until principal payments are expected from each of the fund's bonds, weighted by dollar amount. |
|
Top Five Market Sectors as of June 30, 2000 |
|
|
|
% of fund's |
|
Finance |
10.6 |
|
Utilities |
4.8 |
|
Construction & Real Estate |
3.5 |
|
Media & Leisure |
2.7 |
|
Energy |
2.0 |
Semiannual Report
(Portfolio Manager photograph)
An interview with
Kevin Grant, Portfolio Manager of Investment Grade Bond Portfolio
Q. How did the fund perform compared to its benchmark, Kevin?
A. For the six- and 12-month periods that ended June 30, 2000, the fund performed in line with the Lehman Brothers Aggregate Bond Index, which returned 3.99% over the past six months and 4.57% over the past 12 months.
Q. What was the six-month period like for bonds overall?
A. Concerns about the Federal Reserve Board raising short-term interest rates further to cool the economy kept bond performance in check early on. Then came the announcement by the U.S. Treasury in late January of its intention to reduce new borrowing and use government surplus proceeds to buy back outstanding debt. This action sent the prices of long-dated Treasuries soaring. The Fed delivered the first of three rate hikes made during the period in early February, causing an inversion in the yield curve, which occurs when short-term bonds offer higher yields than their longer-dated counterparts. Historically, an inverted yield curve has been a precursor of recession and the yield curve has not been this inverted since 1981. These unique technical factors allowed Treasuries to outperform all comparable-duration spread sectors - namely corporate bonds, mortgage securities and government agency issues - during the period. An increasing prevalence of share buybacks and leveraged buyouts also weighed heavily on corporates during the period. Agencies retreated in response to rumblings in Washington threatening to strip Fannie Mae and Freddie Mac of their implicit government backing.
Q. How did you position the fund in response to this changing environment?
A. We were rewarded for recognizing the impact of the Treasury buybacks on the market and boosting the fund's weighting in higher-coupon Treasuries in response. In terms of the spread sectors, as it became clear to me that the Fed was going to continue to raise interest rates, I decided to scale back a bit on the fund's exposure to corporate bonds, which had enjoyed a strong fourth quarter of 1999. I began by reducing a long-standing overweighting in banks - a posture that worked out beautifully for the fund in the past - because I felt that it would be extremely difficult for bank securities to outperform in a rising rate environment. This strategy paid off as the market proceeded to punish the group during the first half of the period. Overall, I became much more defensive, reducing our risk exposure through increased diversification. Despite the fact that most corporates had a very difficult period, tactical allocations into different subsectors, such as media and telecommunications, aided relative performance. The fund benefited from owning a number of issuers from these groups that were acquired during the period, which sweetened the valuations of their debt securities. Owning Yankee bonds - issues guaranteed by foreign governments - at the expense of banks also helped, as did some good picks in energy, a sector that benefited from a rally in oil prices. On the flip side, having some notably poor performers in electric and gas utilities and consumer nondurables constrained fund returns. In hindsight, I wish I had sold a larger percentage of corporates in exchange for more Treasuries.
Q. How did the fund's mortgage holdings fare?
A. The fund got a lift from my focus on seasoned discount mortgages - ranging from three-to-five years old - which benefited from strong housing turnover fueled by a robust economy. A red-hot housing market meant higher-than-normal prepayment activity, which resulted in a nice, steady windfall for us each month as we got prepaid at par, or face value.
Q. What's your outlook?
A. The Treasury buyback program is a new and very powerful factor in the market that's expected to remain the overriding concern for bond investors going forward. Admittedly, further Fed tightening and a growing budget surplus could continue to impact the Treasury yield curve and increase the volatility of the broader market. However, right now, we feel that the spread sectors are oversold and thus offer compelling value opportunities. Unlike the market, we see little evidence of a recession on the horizon. Since it seems like it will be tougher to make money on Treasuries going forward, we plan to maintain an overweighting in corporate bonds - focusing on the more defensive sectors and adding to the fund's position while valuations remain attractive.
The views expressed in this report reflect those of the portfolio manager only through the end of the period of the report as stated on the cover. The manager's views are subject to change at any time based on market or other conditions. For more information, see page 2.
Fund Facts
Goal: seeks to provide a high rate of income consistent with reasonable risk by investing in a broad range of investment-grade fixed-income securities; in addition, the fund seeks to protect capital
Start date: December 5, 1988
Size: as of June 30, 2000, more than
$620 million
Manager: Kevin Grant, since 1997; joined Fidelity in 1993
3Semiannual Report
Fidelity Variable Insurance Products: Investment Grade Bond Portfolio
(Unaudited)
Showing Percentage of Net Assets
|
Nonconvertible Bonds - 29.7% |
|||||
|
Moody's Ratings |
Principal Amount |
Value |
|||
|
AEROSPACE & DEFENSE - 0.1% |
|||||
|
Defense Electronics - 0.1% |
|||||
|
Raytheon Co. 7.9% 3/1/03 (c) |
Baa2 |
|
$ 705,000 |
$ 706,946 |
|
|
BASIC INDUSTRIES - 0.4% |
|||||
|
Chemicals & Plastics - 0.3% |
|||||
|
Monsanto Co. 5.75% 12/1/05 |
A2 |
|
2,000,000 |
1,866,200 |
|
|
Paper & Forest Products - 0.1% |
|||||
|
Fort James Corp. 6.625% 9/15/04 |
Baa2 |
|
350,000 |
336,574 |
|
|
TOTAL BASIC INDUSTRIES |
2,202,774 |
||||
|
CONSTRUCTION & REAL ESTATE - 3.5% |
|||||
|
Real Estate - 0.5% |
|||||
|
Cabot Industrial Property LP 7.125% 5/1/04 |
Baa2 |
|
1,325,000 |
1,265,110 |
|
|
Duke Realty LP 7.3% 6/30/03 |
Baa1 |
|
1,500,000 |
1,474,050 |
|
|
|
2,739,160 |
||||
|
Real Estate Investment Trusts - 3.0% |
|||||
|
CenterPoint Properties Trust 6.75% 4/1/05 |
Baa2 |
|
510,000 |
475,116 |
|
|
Equity Office Properties Trust: |
|
|
|
|
|
|
6.5% 1/15/04 |
Baa1 |
|
2,885,000 |
2,753,473 |
|
|
6.625% 2/15/05 |
Baa1 |
|
4,500,000 |
4,251,330 |
|
|
6.75% 2/15/08 |
Baa1 |
|
4,020,000 |
3,682,682 |
|
|
ProLogis Trust 6.7% 4/15/04 |
Baa1 |
|
565,000 |
538,163 |
|
|
Spieker Properties LP: |
|
|
|
|
|
|
6.75% 1/15/08 |
Baa2 |
|
7,000,000 |
6,417,880 |
|
|
6.8% 5/1/04 |
Baa2 |
|
705,000 |
675,743 |
|
|
|
18,794,387 |
||||
|
TOTAL CONSTRUCTION & REAL ESTATE |
21,533,547 |
||||
|
DURABLES - 0.1% |
|||||
|
Consumer Electronics - 0.1% |
|||||
|
Whirlpool Corp. 8.6% 5/1/10 |
Baa1 |
|
610,000 |
629,459 |
|
|
ENERGY - 2.0% |
|||||
|
Oil & Gas - 2.0% |
|||||
|
Anadarko Petroleum Corp.: |
|
|
|
|
|
|
7% 11/15/27 |
Baa1 |
|
1,400,000 |
1,248,100 |
|
|
7.2% 3/15/29 |
Baa1 |
|
2,490,000 |
2,271,453 |
|
|
Apache Corp.: |
|
|
|
|
|
|
7.625% 7/1/19 |
Baa1 |
|
210,000 |
202,768 |
|
|
7.7% 3/15/26 |
Baa1 |
|
550,000 |
529,997 |
|
|
Apache Finance Property Ltd. 6.5% 12/15/07 |
Baa1 |
|
940,000 |
853,050 |
|
|
|
|||||
|
Moody's Ratings |
Principal Amount |
Value |
|||
|
Conoco, Inc. 5.9% 4/15/04 |
A3 |
|
$ 850,000 |
$ 811,240 |
|
|
Petro-Canada 7% 11/15/28 |
A3 |
|
1,380,000 |
1,205,016 |
|
|
Phillips Petroleum Co. 8.75% 5/25/10 |
Baa2 |
|
915,000 |
963,879 |
|
|
Ras Laffan Liquid Natural Gas Co. Ltd. yankee 8.294% 3/15/14 (c) |
Baa3 |
|
1,200,000 |
1,131,960 |
|
|
Tosco Corp. 8.125% 2/15/30 |
Baa2 |
|
3,000,000 |
3,007,050 |
|
|
YPF Sociedad Anonima: |
|
|
|
|
|
|
7.75% 8/27/07 |
B1 |
|
55,000 |
51,308 |
|
|
8% 2/15/04 |
B1 |
|
380,000 |
372,776 |
|
|
|
12,648,597 |
||||
|
FINANCE - 10.6% |
|||||
|
Banks - 4.1% |
|||||
|
ABN-Amro Bank NV, Chicago 6.625% 10/31/01 |
A1 |
|
1,000,000 |
988,110 |
|
|
Banc One Corp. 7.25% 8/1/02 |
A1 |
|
1,000,000 |
995,810 |
|
|
Bank of Montreal 6.1% 9/15/05 |
A1 |
|
3,000,000 |
2,789,940 |
|
|
Bank of Tokyo-Mitsubishi Ltd. 8.4% 4/15/10 |
A3 |
|
1,000,000 |
1,009,800 |
|
|
Barclays Bank PLC yankee 5.95% 7/15/01 |
A1 |
|
2,150,000 |
2,134,647 |
|
|
Capital One Bank 6.375% 2/15/03 |
Baa2 |
|
1,130,000 |
1,083,501 |
|
|
Capital One Financial Corp. 7.125% 8/1/08 |
Baa3 |
|
1,290,000 |
1,200,539 |
|
|
Commonwealth Bank of Australia 8.5% 6/1/10 |
A1 |
|
600,000 |
622,644 |
|
|
HSBC Finance Nederland BV 7.4% 4/15/03 (c) |
A2 |
|
250,000 |
248,993 |
|
|
Kansallis-Osake-Pankki (NY Branch) yankee 10% 5/1/02 |
A1 |
|
260,000 |
270,694 |
|
|
Korea Development Bank: |
|
|
|
|
|
|
6.625% 11/21/03 |
Baa2 |
|
1,635,000 |
1,572,837 |
|
|
7.375% 9/17/04 |
Baa2 |
|
1,320,000 |
1,279,212 |
|
|
yankee 6.5% 11/15/02 |
Baa2 |
|
240,000 |
232,296 |
|
|
MBNA Corp.: |
|
|
|
|
|
|
6.34% 6/2/03 |
Baa2 |
|
350,000 |
335,265 |
|
|
6.875% 11/15/02 |
Baa2 |
|
1,750,000 |
1,725,115 |
|
|
Providian National Bank 6.75% 3/15/02 |
Baa3 |
|
3,000,000 |
2,925,030 |
|
|
Sanwa Finance Aruba AEC 8.35% 7/15/09 |
Baa1 |
|
4,700,000 |
4,679,132 |
|
|
Sumitomo Bank International Finance NV 8.5% 6/15/09 |
Baa1 |
|
500,000 |
502,345 |
|
|
Nonconvertible Bonds - continued |
|||||
|
Moody's Ratings |
Principal Amount |
Value |
|||
|
FINANCE - continued |
|||||
|
Banks - continued |
|||||
|
Union Planters Corp. 6.75% 11/1/05 |
Baa2 |
|
$ 400,000 |
$ 381,628 |
|
|
Union Planters National Bank 6.81% 8/20/01 |
A3 |
|
500,000 |
496,360 |
|
|
|
25,473,898 |
||||
|
Credit & Other Finance - 5.9% |
|||||
|
Ahmanson Capital Trust I 8.36% 12/1/26 (c) |
A3 |
|
1,125,000 |
1,022,963 |
|
|
Associates Corp. of North America: |
|
|
|
|
|
|
6% 4/15/03 |
Aa3 |
|
1,150,000 |
1,109,233 |
|
|
6% 7/15/05 |
Aa3 |
|
2,500,000 |
2,336,925 |
|
|
Bell Atlantic Financial Service, Inc. 7.6% 3/15/07 |
A1 |
|
1,100,000 |
1,095,600 |
|
|
Chrysler Financial Corp. 5.69% 11/15/01 |
A1 |
|
4,400,000 |
4,299,460 |
|
|
CIT Group, Inc. 5.5% 2/15/04 |
A1 |
|
500,000 |
460,880 |
|
|
Daimler-Chrysler NA Holding Corp. 6.59% 6/18/02 |
A1 |
|
250,000 |
247,028 |
|
|
ERP Operating LP: |
|
|
|
|
|
|
6.55% 11/15/01 |
A3 |
|
1,150,000 |
1,133,406 |
|
|
7.1% 6/23/04 |
A3 |
|
1,000,000 |
969,760 |
|
|
Finova Capital Corp.: |
|
|
|
|
|
|
6.11% 2/18/03 |
Baa2 |
|
600,000 |
528,000 |
|
|
6.27% 9/29/00 |
Baa2 |
|
400,000 |
388,000 |
|
|
First Security Capital I 8.41% 12/15/26 |
A3 |
|
510,000 |
472,484 |
|
|
Ford Motor Credit Co.: |
|
|
|
|
|
|
6.5% 2/28/02 |
A2 |
|
7,000,000 |
6,889,050 |
|
|
7.875% 6/15/10 |
A2 |
|
700,000 |
700,994 |
|
|
General Motors Acceptance Corp. 7.625% 6/15/04 |
A2 |
|
2,000,000 |
2,002,220 |
|
|
GS Escrow Corp. 7.125% 8/1/05 |
Ba1 |
|
2,825,000 |
2,509,561 |
|
|
Household Finance Corp. 8% 5/9/05 |
A2 |
|
2,000,000 |
2,016,940 |
|
|
HSBC Capital Funding LP 10.176% 12/31/49 (b)(c) |
A1 |
|
485,000 |
519,362 |
|
|
Newcourt Credit Group, Inc. 6.875% 2/16/05 |
A1 |
|
2,120,000 |
2,017,201 |
|
|
Sprint Capital Corp.: |
|
|
|
|
|
|
5.7% 11/15/03 |
Baa1 |
|
1,480,000 |
1,394,648 |
|
|
5.875% 5/1/04 |
Baa1 |
|
3,080,000 |
2,901,483 |
|
|
Trizec Finance Ltd. yankee 10.875% 10/15/05 |
Baa3 |
|
810,000 |
793,800 |
|
|
TXU Eastern Funding 6.75% 5/15/09 |
Baa1 |
|
480,000 |
429,202 |
|
|
|
36,238,200 |
||||
|
|
|||||
|
Moody's Ratings |
Principal Amount |
Value |
|||
|
Insurance - 0.1% |
|||||
|
Executive Risk Capital Trust 8.675% 2/1/27 |
Baa3 |
|
$ 750,000 |
$ 712,095 |
|
|
Savings & Loans - 0.1% |
|||||
|
Long Island Savings Bank FSB 6.2% 4/2/01 |
Baa3 |
|
750,000 |
749,168 |
|
|
Securities Industry - 0.4% |
|||||
|
Amvescap PLC yankee 6.6% 5/15/05 |
A3 |
|
2,900,000 |
2,701,582 |
|
|
TOTAL FINANCE |
65,874,943 |
||||
|
INDUSTRIAL MACHINERY & EQUIPMENT - 0.4% |
|||||
|
Industrial Machinery & Equipment - 0.2% |
|||||
|
Tyco International Group SA yankee 6.875% 1/15/29 |
Baa1 |
|
1,500,000 |
1,267,155 |
|
|
Pollution Control - 0.2% |
|||||
|
WMX Technologies, Inc. 7.1% 8/1/26 |
Ba1 |
|
905,000 |
851,804 |
|
|
TOTAL INDUSTRIAL MACHINERY & EQUIPMENT |
2,118,959 |
||||
|
MEDIA & LEISURE - 2.7% |
|||||
|
Broadcasting - 2.5% |
|||||
|
British Sky Broadcasting Group PLC 8.2% 7/15/09 |
Baa3 |
|
2,100,000 |
1,964,424 |
|
|
Clear Channel Communications, Inc. 7.25% 10/15/27 |
Baa3 |
|
3,000,000 |
2,631,690 |
|
|
Continental Cablevision, Inc. 8.3% 5/15/06 |
A2 |
|
1,260,000 |
1,289,849 |
|
|
Nielsen Media Research, Inc. 7.6% 6/15/09 |
Baa2 |
|
1,190,000 |
1,135,474 |
|
|
TCI Communications, Inc.: |
|
|
|
|
|
|
8.75% 8/1/15 |
A2 |
|
660,000 |
705,712 |
|
|
9.8% 2/1/12 |
A2 |
|
1,915,000 |
2,175,689 |
|
|
TCI Communications Financing III 9.65% 3/31/27 |
A3 |
|
1,500,000 |
1,657,200 |
|
|
Time Warner, Inc. 8.18% 8/15/07 |
Baa3 |
|
1,240,000 |
1,264,416 |
|
|
USA Networks, Inc./USANi LLC 6.75% 11/15/05 |
Baa3 |
|
3,000,000 |
2,857,500 |
|
|
|
15,681,954 |
||||
|
Publishing - 0.2% |
|||||
|
Time Warner Entertainment Co. LP 8.375% 7/15/33 |
Baa2 |
|
1,200,000 |
1,209,780 |
|
|
TOTAL MEDIA & LEISURE |
16,891,734 |
||||
|
NONDURABLES - 1.7% |
|||||
|
Beverages - 1.3% |
|||||
|
Seagram JE & Sons, Inc. 6.625% 12/15/05 |
Baa3 |
|
8,265,000 |
7,899,687 |
|
|
Nonconvertible Bonds - continued |
|||||
|
Moody's Ratings |
Principal Amount |
Value |
|||
|
NONDURABLES - continued |
|||||
|
Foods - 0.2% |
|||||
|
ConAgra, Inc. 7.125% 10/1/26 |
Baa1 |
|
$ 1,270,000 |
$ 1,171,245 |
|
|
Tobacco - 0.2% |
|||||
|
RJ Reynolds Tobacco Holdings, Inc. 7.375% 5/15/03 |
Baa2 |
|
1,800,000 |
1,671,768 |
|
|
TOTAL NONDURABLES |
10,742,700 |
||||
|
RETAIL & WHOLESALE - 0.7% |
|||||
|
Drug Stores - 0.3% |
|||||
|
Rite Aid Corp.: |
|
|
|
|
|
|
6.5% 12/15/05 (c) |
Caa1 |
|
3,360,000 |
1,730,400 |
|
|
7.125% 1/15/07 |
Caa1 |
|
790,000 |
418,700 |
|
|
|
2,149,100 |
||||
|
General Merchandise Stores - 0.3% |
|||||
|
Federated Department Stores, Inc. 8.5% 6/15/03 |
Baa1 |
|
1,700,000 |
1,715,589 |
|
|
Grocery Stores - 0.1% |
|||||
|
Kroger Co. 6% 7/1/00 |
Baa3 |
|
530,000 |
529,899 |
|
|
TOTAL RETAIL & WHOLESALE |
4,394,588 |
||||
|
TECHNOLOGY - 1.6% |
|||||
|
Computers & Office Equipment - 1.6% |
|||||
|
Comdisco, Inc.: |
|
|
|
|
|
|
5.95% 4/30/02 |
Baa1 |
|
3,000,000 |
2,847,630 |
|
|
6.375% 11/30/01 |
Baa1 |
|
3,200,000 |
3,096,288 |
|
|
7.23% 8/16/01 |
Baa1 |
|
3,000,000 |
2,985,450 |
|
|
7.25% 9/1/02 |
Baa1 |
|
1,000,000 |
967,890 |
|
|
|
9,897,258 |
||||
|
TRANSPORTATION - 1.1% |
|||||
|
Air Transportation - 0.4% |
|||||
|
Continental Airlines, Inc. pass thru trust certificates: |
|
|
|
|
|
|
7.434% 3/15/06 |
Baa1 |
|
550,000 |
531,795 |
|
|
7.73% 9/15/12 |
Baa1 |
|
222,809 |
212,805 |
|
|
Delta Air Lines, Inc. equipment trust certificate 8.54% 1/2/07 |
Baa1 |
|
352,386 |
336,077 |
|
|
United Air Lines, Inc. 9% 12/15/03 |
Baa3 |
|
1,100,000 |
1,085,590 |
|
|
|
2,166,267 |
||||
|
|
|||||
|
Moody's Ratings |
Principal Amount |
Value |
|||
|
Railroads - 0.7% |
|||||
|
Burlington Northern Santa Fe Corp. 6.53% 7/15/37 |
Baa2 |
|
$ 3,000,000 |
$ 2,907,330 |
|
|
Norfolk Southern Corp. 7.05% 5/1/37 |
Baa1 |
|
1,700,000 |
1,661,512 |
|
|
|
4,568,842 |
||||
|
TOTAL TRANSPORTATION |
6,735,109 |
||||
|
UTILITIES - 4.8% |
|||||
|
Electric Utility - 1.4% |
|||||
|
Avon Energy Partners Holdings: |
|
|
|
|
|
|
6.46% 3/4/08 (c) |
Baa2 |
|
1,500,000 |
1,336,020 |
|
|
7.05% 12/11/07 (c) |
Baa2 |
|
3,000,000 |
2,775,660 |
|
|
Dominion Resources, Inc. 8.125% 6/15/10 |
Baa1 |
|
1,055,000 |
1,062,132 |
|
|
DR Investments UK PLC yankee 7.1% 5/15/02 (c) |
A2 |
|
1,500,000 |
1,485,960 |
|
|
Israel Electric Corp. Ltd. 7.75% 12/15/27 (c) |
A3 |
|
1,900,000 |
1,628,585 |
|
|
Texas Utilities Co. 6.375% 1/1/08 |
Baa3 |
|
510,000 |
460,658 |
|
|
|
8,749,015 |
||||
|
Gas - 0.7% |
|||||
|
CMS Panhandle Holding Co.: |
|
|
|
|
|
|
6.125% 3/15/04 |
Baa3 |
|
1,350,000 |
1,275,075 |
|
|
7% 7/15/29 |
Baa3 |
|
1,000,000 |
839,200 |
|
|
Reliant Energy Resources Corp. 8.125% 7/15/05 (c) |
Baa1 |
|
1,000,000 |
999,800 |
|
|
Southwest Gas Corp. 9.75% 6/15/02 |
Baa2 |
|
1,000,000 |
1,032,030 |
|
|
|
4,146,105 |
||||
|
Telephone Services - 2.7% |
|||||
|
Cable & Wireless Optus Ltd.: |
|
|
|
|
|
|
8% 6/22/10 (c) |
Baa1 |
|
700,000 |
695,681 |
|
|
8.125% 6/15/09 (c) |
Baa1 |
|
3,000,000 |
3,028,980 |
|
|
Deutsche Telekom International Finance BV 8.25% 6/15/30 |
Aa2 |
|
5,835,000 |
5,927,952 |
|
|
Telecomunicaciones de Puerto Rico, Inc. 6.65% 5/15/06 |
Baa2 |
|
1,730,000 |
1,611,114 |
|
|
Teleglobe Canada, Inc.: |
|
|
|
|
|
|
7.2% 7/20/09 |
Baa1 |
|
3,273,000 |
3,131,770 |
|
|
7.7% 7/20/29 |
Baa1 |
|
2,591,000 |
2,439,867 |
|
|
|
16,835,364 |
||||
|
TOTAL UTILITIES |
29,730,484 |
||||
|
TOTAL NONCONVERTIBLE BONDS (Cost $193,297,122) |
184,107,098 |
||||
|
U.S. Government and Government Agency Obligations - 23.7% |
|||||
|
Moody's Ratings |
Principal Amount |
Value |
|||
|
U.S. Government Agency Obligations - 6.2% |
|||||
|
Fannie Mae: |
|
|
|
|
|
|
6.5% 4/29/09 |
Aaa |
|
$ 8,500,000 |
$ 7,940,870 |
|
|
7.125% 2/15/05 |
Aaa |
|
6,355,000 |
6,380,801 |
|
|
Federal Agricultural Mortgage Corp. 7.01% 2/10/05 |
Aaa |
|
10,000 |
9,981 |
|
|
Federal Home Loan Bank: |
|
|
|
|
|
|
6.75% 2/1/02 |
Aaa |
|
3,490,000 |
3,479,076 |
|
|
7.59% 3/10/05 |
Aaa |
|
10,000 |
10,203 |
|
|
Freddie Mac: |
|
|
|
|
|
|
5.75% 3/15/09 |
Aaa |
|
5,000,000 |
4,553,900 |
|
|
6.25% 7/15/04 |
Aaa |
|
7,765,000 |
7,549,055 |
|
|
6.77% 9/15/02 |
Aaa |
|
150,000 |
149,133 |
|
|
6.875% 1/15/05 |
Aaa |
|
2,045,000 |
2,032,219 |
|
|
7% 7/15/05 |
Aaa |
|
2,800,000 |
2,796,080 |
|
|
Government Loan Trusts (assets of Trust guaranteed by U.S. Government through Agency for International Development) 8.5% 4/1/06 |
Aaa |
|
1,493,771 |
1,556,076 |
|
|
Government Trust Certificates (assets of Trust guaranteed by U.S. Government through Defense Security Assistance Agency): |
|
|
|
|
|
|
Class 1-C, 9.25% 11/15/01 |
Aaa |
|
397,146 |
404,564 |
|
|
Class 2-E, 9.4% 5/15/02 |
Aaa |
|
258,789 |
262,503 |
|
|
Class 3-T, 9.625% 5/15/02 |
Aaa |
|
15,000 |
15,269 |
|
|
Guaranteed Export Trust Certificates (assets of Trust guaranteed by U.S. Government through |
|
|
|
|
|
|
Series 1993-C, 5.2% 10/15/04 |
Aaa |
|
4,000 |
3,842 |
|
|
Series 1993-D, 5.23% 5/15/05 |
Aaa |
|
8,511 |
8,134 |
|
|
Series 1994-A, 7.12% 4/15/06 |
Aaa |
|
6,043 |
6,079 |
|
|
Guaranteed Trade Trust Certificates (assets of Trust guaranteed by U.S. Government through |
Aaa |
|
6,058 |
6,102 |
|
|
|
|||||
|
Moody's Ratings |
Principal Amount |
Value |
|||
|
Israel Export Trust Certificates (assets of |
Aaa |
|
$ 7,059 |
$ 7,044 |
|
|
Overseas Private Investment Corp. U.S. Government guaranteed participation certificate Series 1994-195, 6.08% 8/15/04 (callable) |
Aaa |
|
98,175 |
96,624 |
|
|
Private Export Funding Corp. secured: |
|
|
|
|
|
|
5.65% 3/15/03 |
Aaa |
|
121,500 |
119,296 |
|
|
6.86% 4/30/04 |
Aaa |
|
916,733 |
909,847 |
|
|
TOTAL U.S. GOVERNMENT AGENCY OBLIGATIONS |
38,296,698 |
||||
|
U.S. Treasury Obligations - 17.5% |
|||||
|
U.S. Treasury Bonds: |
|
|
|
|
|
|
6.125% 8/15/29 |
Aaa |
|
15,100,000 |
15,251,000 |
|
|
8.875% 8/15/17 |
Aaa |
|
9,940,000 |
12,670,419 |
|
|
9.875% 11/15/15 |
Aaa |
|
3,810,000 |
5,166,131 |
|
|
14% 11/15/11 |
Aaa |
|
1,465,000 |
2,034,519 |
|
|
U.S. Treasury Notes: |
|
|
|
|
|
|
5.5% 2/15/08 |
Aaa |
|
14,545,000 |
13,922,329 |
|
|
5.625% 9/30/01 |
Aaa |
|
11,500,000 |
11,377,755 |
|
|
5.875% 11/15/04 |
Aaa |
|
6,100,000 |
6,011,367 |
|
|
6.5% 5/31/02 |
Aaa |
|
8,000,000 |
8,010,000 |
|
|
7% 7/15/06 |
Aaa |
|
20,610,000 |
21,357,113 |
|
|
U.S. Treasury Notes - coupon STRIPS 0% 11/15/11 |
Aaa |
|
26,700,000 |
13,250,142 |
|
|
TOTAL U.S. TREASURY OBLIGATIONS |
109,050,775 |
||||
|
TOTAL U.S. GOVERNMENT AND GOVERNMENT AGENCY OBLIGATIONS (Cost $148,365,354) |
147,347,473 |
||||
|
U.S. Government Agency - |
|||||
|
|
|||||
|
Fannie Mae - 28.7% |
|||||
|
6% 2/1/11 to 2/1/29 |
Aaa |
|
12,890,851 |
11,936,164 |
|
|
6.5% 2/1/10 to 7/1/29 |
Aaa |
|
87,169,130 |
82,350,146 |
|
|
7% 12/1/24 to 1/1/30 |
Aaa |
|
29,769,952 |
28,816,016 |
|
|
7.5% 7/1/07 to 7/1/30 |
Aaa |
|
43,393,905 |
42,829,090 |
|
|
8% 3/1/24 to 12/1/29 |
Aaa |
|
1,285,727 |
1,297,033 |
|
|
U.S. Government Agency - |
|||||
|
Moody's Ratings |
Principal Amount |
Value |
|||
|
Fannie Mae - continued |
|||||
|
8% 7/1/30 (d) |
Aaa |
|
$ 10,700,000 |
$ 10,740,125 |
|
|
8.5% 3/1/25 to 6/1/25 |
Aaa |
|
18,047 |
18,386 |
|
|
TOTAL FANNIE MAE |
177,986,960 |
||||
|
Freddie Mac - 0.3% |
|||||
|
8.5% 3/1/20 to 1/1/28 |
Aaa |
|
2,072,159 |
2,116,142 |
|
|
Government National Mortgage Association - 5.2% |
|||||
|
6% 8/15/08 to 5/15/09 |
Aaa |
|
2,721,986 |
2,623,726 |
|
|
6.5% 2/15/28 to 4/15/29 |
Aaa |
|
21,907,350 |
20,796,105 |
|
|
7.5% 3/15/06 to 10/15/28 |
Aaa |
|
8,781,726 |
8,735,756 |
|
|
8% 2/15/17 |
Aaa |
|
120,882 |
123,110 |
|
|
TOTAL GOVERNMENT NATIONAL |
32,278,697 |
||||
|
TOTAL U.S. GOVERNMENT AGENCY - (Cost $219,986,676) |
212,381,799 |
||||
|
Asset-Backed Securities - 3.6% |
|||||
|
|
|||||
|
American Express Credit Account Master Trust 6.1% 12/15/06 |
A1 |
|
1,500,000 |
1,442,227 |
|
|
Capita Equipment Receivables Trust 6.48% 10/15/06 |
Baa2 |
|
880,000 |
851,813 |
|
|
Discover Card Master Trust I 5.85% 11/16/04 |
A2 |
|
4,000,000 |
3,876,875 |
|
|
Ford Credit Auto Owner Trust: |
|
|
|
|
|
|
6.2% 12/15/02 |
Aa2 |
|
830,000 |
818,717 |
|
|
6.4% 12/15/02 |
Aa2 |
|
480,000 |
473,760 |
|
|
7.03% 11/15/03 |
Aaa |
|
209,000 |
208,837 |
|
|
JCPenney Master Credit Card Trust 5.5% 6/15/07 |
Aaa |
|
7,000,000 |
6,618,282 |
|
|
Key Auto Finance Trust: |
|
|
|
|
|
|
6.3% 10/15/03 |
A2 |
|
125,809 |
125,180 |
|
|
6.65% 10/15/03 |
Baa3 |
|
82,161 |
82,058 |
|
|
Premier Auto Trust 5.59% 2/9/04 |
Aaa |
|
6,000,000 |
5,821,860 |
|
|
Railcar Trust 7.75% 6/1/04 |
Aaa |
|
492,380 |
504,685 |
|
|
Sears Credit Account Master Trust II 7.5% 11/15/07 |
A2 |
|
1,300,000 |
1,300,000 |
|
|
TOTAL ASSET-BACKED SECURITIES (Cost $22,844,512) |
22,124,294 |
||||
|
Commercial Mortgage Securities - 2.4% |
|||||
|
Moody's Ratings |
Principal Amount |
Value |
|||
|
CS First Boston Mortgage Securities Corp.: |
|
|
|
|
|
|
Series 1997-C2 Class D, 7.27% 1/17/35 |
Baa2 |
|
$ 1,080,000 |
$ 992,841 |
|
|
Series 1998-FL1: |
|
|
|
|
|
|
Class D, 7.1415% 12/10/00 (c)(e) |
A2 |
|
2,100,000 |
2,096,802 |
|
|
Class E, 7.4913% 1/10/13 (c)(e) |
Baa2 |
|
2,650,000 |
2,638,200 |
|
|
DLJ Commercial Mortgage Corp. 7.62% 5/10/10 |
Aaa |
|
3,000,000 |
3,008,906 |
|
|
Equitable Life Assurance Society of the United States Series 174: |
|
|
|
|
|
|
Class B1, 7.33% 5/15/06 (c) |
Aa2 |
|
500,000 |
495,879 |
|
|
Class C1, 7.52% 5/15/06 (c) |
A2 |
|
500,000 |
491,094 |
|
|
Fannie Mae ACES REMIC sequential pay Series 1996 M5 Class A1, 7.141% 7/25/10 |
Aaa |
|
138,048 |
137,056 |
|
|
GS Mortgage Securities Corp. II Series 1998-GLII Class E, 7.1905% 4/13/31 (c)(e) |
Baa3 |
|
1,000,000 |
864,570 |
|
|
Prudential Securities |
Aaa |
|
2,890,000 |
2,917,997 |
|
|
Thirteen Affiliates of General Growth Properties, Inc. sequential pay Series 1 Class A2, 6.602% 12/15/10 (c) |
Aaa |
|
1,500,000 |
1,419,727 |
|
|
TOTAL COMMERCIAL MORTGAGE SECURITIES (Cost $15,325,912) |
15,063,072 |
||||
|
Foreign Government and Government |
|||||
|
|
|||||
|
British Columbia Province yankee 7% 1/15/03 |
Aa2 |
|
500,000 |
498,260 |
|
|
Korean Republic yankee: |
|
|
|
|
|
|
8.75% 4/15/03 |
Baa2 |
|
775,000 |
788,919 |
|
|
8.875% 4/15/08 |
Baa2 |
|
1,194,000 |
1,231,611 |
|
|
Manitoba Province yankee 6.75% 3/1/03 |
Aa3 |
|
500,000 |
495,780 |
|
|
Quebec Province: |
|
|
|
|
|
|
yankee: |
|
|
|
|
|
|
7.125% 2/9/24 |
A2 |
|
250,000 |
236,145 |
|
|
7.5% 7/15/23 |
A2 |
|
8,550,000 |
8,428,590 |
|
|
7% 1/30/07 |
A2 |
|
1,000,000 |
980,520 |
|
|
Foreign Government and Government |
|||||
|
Moody's Ratings |
Principal Amount |
Value |
|||
|
Quebec Province: - continued |
|
|
|
|
|
|
7.5% 9/15/29 |
A2 |
|
$ 6,480,000 |
$ 6,366,017 |
|
|
United Mexican States 9.875% 2/1/10 |
Baa3 |
|
2,290,000 |
2,393,050 |
|
|
TOTAL FOREIGN GOVERNMENT AND GOVERNMENT AGENCY OBLIGATIONS (Cost $22,550,794) |
21,418,892 |
||||
|
Supranational Obligations - 0.6% |
|||||
|
|
|||||
|
Inter-American Development Bank yankee |
Aaa |
|
4,000,000 |
3,810,480 |
|
|
Cash Equivalents - 5.1% |
|||
|
Maturity Amount |
|
||
|
Investments in repurchase agreements (U.S. Government Obligations), in a joint trading account at 6.83%, dated 6/30/00 due
7/3/00 |
$ 31,637,007 |
31,619,000 |
|
|
TOTAL INVESTMENT PORTFOLIO - 102.7% (Cost $657,964,210) |
637,872,108 |
||
|
NET OTHER ASSETS - (2.7)% |
(16,874,271) |
||
|
NET ASSETS - 100% |
$ 620,997,837 |
||
|
Legend |
|
(a) S&P credit ratings are used in the absence of a rating by Moody's Investors Service, Inc. |
|
(b) Debt obligation initially issued at one coupon which converts to a higher coupon at a specified date. The rate shown is the rate at period end. |
|
(c) Security exempt from registration under Rule 144A of the Securities Act of 1933. These securities may be resold in transactions exempt from registration, normally to qualified institutional buyers. At the period end, the value of these securities amounted to $25,317,582 or 4.1% of net assets. |
|
(d) Security purchased on a delayed delivery or when-issued basis. |
|
(e) The coupon rate shown on floating or adjustable rate securities represents the rate at period end. |
|
(f) For foreign government obligations not individually rated by S&P or Moody's, the ratings listed have been assigned by FMR, the fund's investment adviser, based principally on S&P and Moody's ratings of the sovereign credit of the issuing government. |
|
Other Information |
|
The composition of long-term debt holdings as a percentage of total value of investments in securities, is as follows (ratings are unaudited): |
|
Moody's Ratings |
S&P Ratings |
|||
|
Aaa, Aa, A |
73.7% |
|
AAA, AA, A |
67.0% |
|
Baa |
20.3% |
|
BBB |
18.9% |
|
Ba |
0.5% |
|
BB |
1.6% |
|
B |
0.1% |
|
B |
0.3% |
|
Caa |
0.3% |
|
CCC |
0.0% |
|
Ca, C |
0.0% |
|
CC, C |
0.0% |
|
|
|
|
D |
0.0% |
|
|
|
Purchases and sales of securities, other than short-term securities, aggregated $467,642,183 and $520,876,687, respectively, of which long-term U.S. government and government agency obligations aggregated $384,782,549 and $401,954,052, respectively. |
|
The fund participated in the interfund lending program as a lender. The average daily loan balance during the period for which loans were outstanding amounted to $21,767,000. The weighted average interest rate was 5.86%. Interest earned from the interfund lending program amounted to $21,253 and is included in interest income on the Statement of Operations. |
|
Income Tax Information |
|
At June 30, 2000, the aggregate cost of investment securities for income tax purposes was $658,225,459. Net unrealized depreciation aggregated $20,353,351, of which $1,723,809 related to appreciated investment securities and $22,077,160 related to depreciated investment securities. |
|
At December 31, 1999, the fund had a capital loss carryforward of approximately $11,269,000 all of which will expire on December 31, 2007. |
See accompanying notes which are an integral part of the financial statements.
Investment Grade Bond Portfolio
Statement of Assets and Liabilities
|
|
June 30, 2000 (Unaudited) |
|
|
Assets |
|
|
|
Investment in securities, at value (including repurchase agreements of $31,619,000) |
|
$ 637,872,108 |
|
Cash |
|
106 |
|
Receivable for investments sold |
|
6,380,828 |
|
Receivable for fund shares sold |
|
231,457 |
|
Interest receivable |
|
8,078,601 |
|
Total assets |
|
652,563,100 |
|
Liabilities |
|
|
|
Payable for investments purchased |
$ 20,040,145 |
|
|
Delayed delivery |
10,721,326 |
|
|
Payable for fund shares redeemed |
510,735 |
|
|
Accrued management fee |
223,058 |
|
|
Distribution fees payable |
22 |
|
|
Other payables and accrued expenses |
69,977 |
|
|
Total liabilities |
|
31,565,263 |
|
Net Assets |
|
$ 620,997,837 |
|
Net Assets consist of: |
|
|
|
Paid in capital |
|
$ 641,249,230 |
|
Undistributed net investment income |
|
19,896,010 |
|
Accumulated undistributed net realized gain (loss) on investments and foreign currency transactions |
|
(20,055,301) |
|
Net unrealized appreciation (depreciation) on investments |
|
(20,092,102) |
|
Net Assets |
|
$ 620,997,837 |
|
Initial Class: |
|
$11.75 |
|
Service Class 2: |
|
$11.74 |
Statement of Operations
|
|
Six months ended June 30, 2000 (Unaudited) |
|
|
Investment Income Interest |
|
$ 21,822,522 |
|
Security lending |
|
63,152 |
|
Total income |
|
21,885,674 |
|
Expenses |
|
|
|
Management fee |
$ 1,325,329 |
|
|
Transfer agent fees |
207,178 |
|
|
Distribution fees |
121 |
|
|
Accounting and security lending fees |
89,154 |
|
|
Non-interested trustees' compensation |
1,005 |
|
|
Custodian fees and expenses |
22,606 |
|
|
Audit |
16,173 |
|
|
Legal |
2,425 |
|
|
Miscellaneous |
412 |
|
|
Total expenses before reductions |
1,664,403 |
|
|
Expense reductions |
(1,188) |
1,663,215 |
|
Net investment income |
|
20,222,459 |
|
Realized and Unrealized Gain (Loss) Net realized gain (loss) on investment securities |
|
(8,016,907) |
|
Change in net unrealized appreciation (depreciation) on investment securities |
|
10,456,223 |
|
Net gain (loss) |
|
2,439,316 |
|
Net increase (decrease) in net assets resulting from operations |
|
$ 22,661,775 |
|
Other Information Expense reductions |
|
$ 1,188 |
See accompanying notes which are an integral part of the financial statements.
Semiannual Report
Fidelity Variable Insurance Products: Investment Grade Bond Portfolio
Financial Statements - continued
Statement of Changes in Net Assets
|
Increase (Decrease) in Net Assets |
Six months ended |
Year ended |
|
Operations |
$ 20,222,459 |
$ 43,183,071 |
|
Net realized gain (loss) |
(8,016,907) |
(11,737,244) |
|
Change in net unrealized appreciation (depreciation) |
10,456,223 |
(38,771,648) |
|
Net increase (decrease) in net assets resulting from operations |
22,661,775 |
(7,325,821) |
|
Distributions to shareholders |
(43,339,424) |
(28,513,399) |
|
From net realized gain |
- |
(8,945,380) |
|
Total distributions |
(43,339,424) |
(37,458,779) |
|
Share transactions - net increase (decrease) |
(17,176,281) |
28,823,589 |
|
Total increase (decrease) in net assets |
(37,853,930) |
(15,961,011) |
|
Net Assets |
|
|
|
Beginning of period |
658,851,767 |
674,812,778 |
|
End of period (including undistributed net investment income of $19,896,010 and $42,809,963, respectively) |
$ 620,997,837 |
$ 658,851,767 |
|
|
|
|
|
Other Information: |
Six months ended June 30, 2000 |
Year ended December 31, 1999 |
||
|
|
Shares |
Dollars |
Shares |
Dollars |
|
Share transactions |
6,302,773 |
$ 73,176,423 |
20,833,388 |
$ 258,967,451 |
|
Reinvested |
3,827,956 |
43,332,459 |
3,052,875 |
37,458,779 |
|
Redeemed |
(11,451,016) |
(133,795,101) |
(21,798,580) |
(267,602,641) |
|
Net increase (decrease) |
(1,320,287) |
$ (17,286,219) |
2,087,683 |
$ 28,823,589 |
|
Service Class 2 A |
8,552 |
$ 102,980 |
- |
$ - |
|
Reinvested |
614 |
6,965 |
- |
- |
|
Redeemed |
(1) |
(7) |
- |
- |
|
Net increase (decrease) |
9,165 |
$ 109,938 |
- |
$ - |
|
Distributions |
|
$ 43,332,459 |
|
$ 28,513,399 |
|
Service Class 2 A |
|
6,965 |
|
- |
|
Total |
|
$ 43,339,424 |
|
$ 28,513,399 |
|
From net realized gain |
|
$ - |
|
$ 8,945,380 |
|
Service Class 2 A |
|
- |
|
- |
|
Total |
|
$ - |
|
$ 8,945,380 |
|
|
|
$ 43,339,424 |
|
$ 37,458,779 |
A Service Class 2 commenced sale of shares January 12, 2000.
See accompanying notes which are an integral part of the financial statements.
Investment Grade Bond Portfolio
Financial Highlights - Initial Class
|
|
Six months ended |
Years ended December 31, |
||||
|
Selected Per-Share Data |
(Unaudited) |
1999 |
1998 |
1997 |
1996 |
1995 |
|
Net asset value, beginning of period |
$ 12.160 |
$ 12.960 |
$ 12.560 |
$ 12.240 |
$ 12.480 |
$ 11.020 |
|
Income from Investment Operations Net investment income |
.378C |
.743 C |
.725 C |
.759 C |
.670 |
.320 |
|
Net realized and unrealized gain (loss) |
.052 |
(.873) |
.335 |
.291 |
(.290) |
1.530 |
|
Total from investment operations |
.430 |
(.130) |
1.060 |
1.050 |
.380 |
1.850 |
|
Less Distributions |
|
|
|
|
|
|
|
From net investment income |
(.840) |
(.510) |
(.590) |
(.730) |
(.620) |
(.390) |
|
From net realized gain |
- |
(.160) |
(.070) |
- |
- |
- |
|
Total distributions |
(.840) |
(.670) |
(.660) |
(.730) |
(.620) |
(.390) |
|
Net asset value, end of period |
$ 11.750 |
$ 12.160 |
$ 12.960 |
$ 12.560 |
$ 12.240 |
$ 12.480 |
|
Total ReturnB |
3.80% |
(1.05)% |
8.85% |
9.06% |
3.19% |
17.32% |
|
Ratios and Supplemental Data |
|
|
|
|
|
|
|
Net assets, end of period (000 omitted) |
$ 620,890 |
$ 658,852 |
$ 674,813 |
$ 324,525 |
$ 228,594 |
$ 181,546 |
|
Ratio of expenses to average net assets |
.54% A |
.54% |
.57% |
.58% |
.58% |
.59% |
|
Ratio of net investment income to average net assets |
6.53% A |
6.07% |
5.85% |
6.34% |
6.49% |
6.53% |
|
Portfolio turnover rate |
154% A |
87% |
239% |
191% |
81% |
182% |
|
|
||||||
Financial Highlights - Service Class 2
|
|
Six months ended |
|
Selected Per-Share Data |
(Unaudited) |
|
Net asset value, beginning of period |
$ 12.060 |
|
Income from Investment Operations |
|
|
Net investment income C |
.339 |
|
Net realized and unrealized gain (loss) |
.181 |
|
Total from investment operations |
.520 |
|
Less Distributions |
|
|
From net investment income |
(.840) |
|
Net asset value, end of period |
$ 11.740 |
|
Total ReturnB |
4.56% |
|
Ratios and Supplemental Data |
|
|
Net assets, end of period (000 omitted) |
$ 108 |
|
Ratio of expenses to average net assets |
.80% A |
|
Ratio of net investment income to average net assets |
6.32% A |
|
Portfolio turnover rate |
154%A |
|
A Annualized B Total returns for periods of less than one year are not annualized and do not reflect charges attributable to your insurance company's separate account. Inclusion of these charges would reduce the total returns shown. C Net investment income per share has been calculated based on average shares outstanding during the period. D For the period January 12, 2000 (commencement of sale of Service Class 2 shares) to June 30, 2000. |
|
See accompanying notes which are an integral part of the financial statements.
Semiannual Report
To measure a money market fund's performance, you can look at either total return or yield. Total return reflects the change in value of an investment, assuming reinvestment of the fund's dividend income and capital gains (the profits earned upon the sale of securities that have grown in value). Yield measures the income paid by a fund. Since a money market fund tries to maintain a $1 share price, yield is an important measure of performance.
Average Annual Total Returns
|
Periods ended June 30, 2000 |
Past 1 |
Past 5 |
Past 10 |
|
Fidelity VIP: Money Market - |
5.73% |
5.49% |
5.19% |
Average annual total returns take the fund's cumulative return and show you what would have happened if the fund had achieved that return by performing at a constant rate each year.
Figures for more than one year assume a steady compounded rate of return and are not the fund's year-by-year results, which fluctuated over the periods shown.
Performance numbers are net of all fund operating expenses, but do not include any insurance charges imposed by your insurance company's separate account. If performance information included the effect of these additional charges, the total returns would have been lower.
A money market fund's total returns and yields will vary, and reflect past results rather than predict future performance.
Yield
|
|
6/28/00 |
3/29/00 |
12/29/99 |
9/29/99 |
6/30/99 |
|
|
Fidelity VIP: |
|
|
|
|
|
|
|
|
Money Market - |
|
|
|
|
|
|
|
Initial Class |
6.41% |
5.78% |
5.72% |
5.20% |
4.85% |
|
|
|
|
|
|
|
|
|
MMDA |
2.11% |
2.04% |
2.07% |
2.08% |
2.03% |
|

Yield refers to the income paid by the fund over a given period. Yields for money market funds are usually for seven-day periods, expressed as annual percentage rates. A yield that assumes income earned is reinvested or compounded is called an effective yield. The chart above shows the fund's current seven-day yield at quarterly intervals over the past year. You can compare these yields to the bank money market deposit account (MMDA) average. The MMDA average is supplied by BANK RATE MONITOR.(TM)
Comparing Performance
There are some important differences between a bank money market deposit account (MMDA) and a money market fund. First, the U.S. government neither insures nor guarantees a money market fund. In fact, there is no assurance that a money market fund will maintain a $1 share price. Second, a money market fund returns to its shareholders income earned by the fund's investments after expenses. This is in contrast to banks, which set their MMDA rates periodically based on current interest rates, competitors' rates, and internal criteria.
3Semiannual Report
(Portfolio Manager photograph)
An interview with
Robert Duby,
Portfolio Manager
of Money Market Portfolio
Q. Bob, what was the investment environment like during the six months that ended June 30, 2000?
A. Interest rates rose due to strong economic performance, evidenced by the lowest unemployment rate in approximately 30 years and robust gains in real GDP - gross domestic product adjusted for inflation. Personal consumption, business investment and a strong real estate market fueled growth. The wealth effect created by appreciating equity and real estate markets also boosted consumer spending, a significant component of real GDP. Commodity prices increased due to improving global economic conditions and strong domestic demand.
Q. How did the market react to this backdrop?
A. Market participants expected that the Federal Reserve Board would hike short-term interest rates in order to slow growth and head off inflation. That argument was bolstered by the fact that, in spite of improvements in productivity, consumer and producer prices ultimately rose during the period, sparked mainly by increasing energy prices.
Q. What was the Fed's reaction to these developments?
A. Strong real GDP growth and concerns about the impact of wage pressures within firm labor markets encouraged the Fed to continue its program of interest-rate hikes. During the first half of 2000, the Fed raised the rate banks charge each other for overnight loans - known as the fed funds target rate - three times. Two of these rate hikes - in February and March - came in increments of 0.25 percentage points, but not the last hike, which occurred in May.
Q. What happened in May?
A. Faced with continued strong GDP growth, an increase in the core rate of inflation, a decline in the unemployment rate and a larger-than-expected increase in average hourly earnings, the Fed in May raised the fed funds rate by 0.50 percentage points, the first increase of such magnitude in over five years. However, recent evidence of an economic slowdown prompted the Fed to keep rates unchanged at its June 2000 meeting.
Q. What was your strategy with the fund?
A. During the period, our strategy shifted to capitalize on Fed rate hikes while at the same time maintaining adequate portfolio liquidity to accommodate cash outflows. The fund's average maturity was shortened at times when the market priced in overly optimistic expectations for changes in monetary policy. Conversely, the fund's average maturity was lengthened when the market priced in overly aggressive expectations of Fed rate hikes.
Q. What is your outlook?
A. Recent economic data suggests that Fed monetary policy has begun to dampen economic activity. Fed rate hikes appear to have tempered consumer spending, as evidenced by recent statistics showing slower retail and home sales. As a result, manufacturing activity has softened within interest-rate sensitive sectors, while employment has recently declined from record levels. It's uncertain at this point if the economy is taking a breather or if the Fed has achieved a so-called "soft landing." Market prices currently reflect the belief that the Fed has finished its rate-hike program. However, we believe the Fed might implement at least one more rate hike in the near future.
The views expressed in this report reflect those of the portfolio manager only through the end of the period of the report as stated on the cover. The manager's views are subject to change at any time based upon market or other conditions. For more information, please see page 2.
Fund Facts
Goal: as high a level of current income as is consistent with preservation of capital and liquidity
Start date: April 1, 1982
Size: as of June 30, 2000, more than $2.0 billion
Manager: Robert Duby, since 1997; joined Fidelity in 1982
3Semiannual Report
Fidelity Variable Insurance Products: Money Market Portfolio
(Unaudited)
Showing Percentage of Net Assets
|
Certificates of Deposit - 38.2% |
||||
|
Due Date |
Annualized Yield at Time of Purchase |
Principal Amount |
Value |
|
|
Domestic Certificates Of Deposit - 5.7% |
||||
|
Chase Manhattan Bank USA NA |
||||
|
9/5/00 |
6.70% |
$ 25,000,000 |
$ 25,000,000 |
|
|
Citibank NA, New York |
||||
|
11/15/00 |
7.02 |
30,000,000 |
30,000,000 |
|
|
First Union National Bank, North Carolina |
||||
|
7/20/00 |
6.85 (b) |
25,000,000 |
25,000,000 |
|
|
11/21/00 |
6.48 |
10,000,000 |
10,000,000 |
|
|
5/15/01 |
7.35 |
15,000,000 |
15,000,000 |
|
|
U.S. Bank NA, Minnesota |
||||
|
7/3/00 |
6.72 (b) |
10,000,000 |
10,000,000 |
|
|
|
115,000,000 |
|||
|
London Branch, Eurodollar, Foreign Banks - 15.7% |
||||
|
Abbey National Treasury Services PLC |
||||
|
11/6/00 |
6.75 |
25,000,000 |
25,000,000 |
|
|
11/9/00 |
6.50 |
20,000,000 |
20,000,000 |
|
|
5/17/01 |
7.36 |
25,000,000 |
25,000,000 |
|
|
Barclays Bank PLC |
||||
|
7/28/00 |
5.80 |
9,000,000 |
9,000,000 |
|
|
Bayerische Hypo-und Vereinsbank AG |
||||
|
8/21/00 |
6.76 |
15,000,000 |
15,000,000 |
|
|
10/19/00 |
6.75 |
50,000,000 |
50,000,000 |
|
|
11/20/00 |
7.01 |
25,000,000 |
25,000,000 |
|
|
Deutsche Bank AG |
||||
|
9/19/00 |
6.40 |
31,000,000 |
30,993,318 |
|
|
Dresdner Bank AG |
||||
|
8/3/00 |
6.25 |
25,000,000 |
24,999,976 |
|
|
8/21/00 |
6.75 |
60,000,000 |
59,999,996 |
|
|
Halifax PLC |
||||
|
12/18/00 |
6.51 |
10,000,000 |
10,000,000 |
|
|
RaboBank Nederland Coop. Central |
||||
|
11/6/00 |
6.83 |
25,000,000 |
25,000,000 |
|
|
|
319,993,290 |
|||
|
New York Branch, Yankee Dollar, Foreign Banks - 16.8% |
||||
|
Banque Nationale de Paris (BNP) |
||||
|
8/2/00 |
5.85 |
10,000,000 |
9,999,581 |
|
|
Canadian Imperial Bank of Commerce |
||||
|
7/6/00 |
6.62 (b) |
25,000,000 |
24,986,250 |
|
|
8/17/00 |
6.75 |
10,000,000 |
10,000,000 |
|
|
Commerzbank AG |
||||
|
8/23/00 |
6.65 |
25,000,000 |
25,000,000 |
|
|
Credit Agricole Indosuez |
||||
|
7/3/00 |
6.63 (b) |
25,000,000 |
24,992,398 |
|
|
Deutsche Bank AG |
||||
|
11/16/00 |
7.01 |
25,000,000 |
25,000,000 |
|
|
Dresdner Bank AG |
||||
|
7/23/00 |
6.62 (b) |
20,000,000 |
19,999,510 |
|
|
National Westminster Bank PLC |
||||
|
7/10/00 |
6.58 |
25,000,000 |
25,000,000 |
|
|
|
||||
|
Due Date |
Annualized Yield at Time of Purchase |
Principal Amount |
Value |
|
|
Norddeutsche Landesbank Girozentrale |
||||
|
7/12/00 |
5.76% |
$ 10,000,000 |
$ 9,999,856 |
|
|
2/8/01 |
6.75 |
10,000,000 |
9,997,115 |
|
|
5/8/01 |
7.15 |
25,000,000 |
24,995,975 |
|
|
Royal Bank of Canada |
||||
|
7/3/00 |
6.62 (b) |
25,000,000 |
24,988,249 |
|
|
5/3/01 |
7.10 |
25,000,000 |
24,994,053 |
|
|
Societe Generale |
||||
|
7/10/00 |
6.61 (b) |
15,000,000 |
14,995,612 |
|
|
7/29/00 |
6.67 (b) |
7,000,000 |
6,997,834 |
|
|
Svenska Handelsbanken AB |
||||
|
5/2/01 |
7.00 |
35,000,000 |
34,994,462 |
|
|
UBS AG |
||||
|
12/7/00 |
6.45 |
25,000,000 |
24,963,178 |
|
|
|
341,904,073 |
|||
|
TOTAL CERTIFICATES OF DEPOSIT |
776,897,363 |
|||
|
Commercial Paper - 44.8% |
||||
|
|
||||
|
Aegon Funding Corp. |
||||
|
9/12/00 |
6.38 |
6,000,000 |
5,924,810 |
|
|
Bank of Scotland Treasury Services PLC |
||||
|
9/12/00 |
6.71 |
25,000,000 |
24,665,417 |
|
|
Citibank Credit Card Master Trust I (Dakota Certificate Program) |
||||
|
7/18/00 |
6.67 |
25,000,000 |
24,922,083 |
|
|
8/17/00 |
6.65 |
10,000,000 |
9,914,094 |
|
|
ConAgra, Inc. |
||||
|
7/10/00 |
6.77 |
5,000,000 |
4,991,588 |
|
|
7/25/00 |
6.79 |
8,000,000 |
7,964,000 |
|
|
7/27/00 |
6.80 |
7,000,000 |
6,965,875 |
|
|
Corporate Receivables Corp. |
||||
|
8/22/00 |
6.65 |
25,000,000 |
24,762,750 |
|
|
8/22/00 |
6.75 |
25,000,000 |
24,759,861 |
|
|
Countrywide Home Loans, Inc. |
||||
|
7/17/00 |
6.85 |
5,000,000 |
4,984,822 |
|
|
CXC, Inc. |
||||
|
8/10/00 |
6.75 |
50,000,000 |
49,630,556 |
|
|
Daimler-Chrysler North America Holding Corp. |
||||
|
9/14/00 |
6.72 |
20,000,000 |
19,724,583 |
|
|
Deutsche Bank Financial, Inc. |
||||
|
8/15/00 |
6.76 |
25,000,000 |
24,792,188 |
|
|
Dominion Resources, Inc. |
||||
|
7/19/00 |
6.91 |
5,000,000 |
4,982,850 |
|
|
Falcon Asset Securitization Corp. |
||||
|
7/18/00 |
6.82 |
15,000,000 |
14,951,833 |
|
|
8/9/00 |
6.66 |
29,335,000 |
29,125,573 |
|
|
General Electric Capital Corp. |
||||
|
7/25/00 |
6.65 |
50,000,000 |
49,780,333 |
|
|
8/15/00 |
6.67 |
50,000,000 |
49,588,750 |
|
|
Commercial Paper - continued |
||||
|
Due Date |
Annualized Yield at Time of Purchase |
Principal Amount |
Value |
|
|
General Motors Acceptance Corp. |
||||
|
8/23/00 |
6.74% |
$ 50,000,000 |
$ 49,512,694 |
|
|
8/31/00 |
6.78 |
25,000,000 |
24,718,299 |
|
|
Goldman Sachs Group, Inc. |
||||
|
8/14/00 |
6.66 |
20,000,000 |
19,839,156 |
|
|
8/16/00 |
6.65 |
21,242,000 |
21,063,673 |
|
|
GTE Corp. |
||||
|
8/1/00 |
6.69 |
6,000,000 |
5,965,693 |
|
|
Kitty Hawk Funding Corp. |
||||
|
8/15/00 |
6.27 |
5,000,000 |
4,962,000 |
|
|
9/20/00 |
6.41 |
5,000,000 |
4,930,138 |
|
|
12/1/00 |
7.08 |
10,000,000 |
9,709,725 |
|
|
Lehman Brothers Holdings, Inc. |
||||
|
8/2/00 |
6.54 (b) |
14,000,000 |
14,000,000 |
|
|
Lower Colorado River Auth. Tax Rev. |
||||
|
8/2/00 |
6.59 |
10,000,000 |
10,000,000 |
|
|
Merrill Lynch & Co., Inc. |
||||
|
8/23/00 |
6.78 |
35,000,000 |
34,656,825 |
|
|
New Center Asset Trust |
||||
|
7/17/00 |
6.67 |
25,000,000 |
24,926,667 |
|
|
Newport Funding Corp. |
||||
|
7/6/00 |
6.58 |
25,000,000 |
24,977,257 |
|
|
9/18/00 |
6.35 |
10,000,000 |
9,865,042 |
|
|
Park Avenue Receivables Corp. |
||||
|
7/20/00 |
6.63 |
50,000,000 |
49,825,833 |
|
|
Preferred Receivables Funding Corp. |
||||
|
7/3/00 |
6.65 |
20,000,000 |
19,992,667 |
|
|
Sears Roebuck Acceptance Corp. |
||||
|
7/25/00 |
6.79 |
6,000,000 |
5,973,000 |
|
|
7/26/00 |
6.79 |
5,000,000 |
4,976,563 |
|
|
Societe Generale NA |
||||
|
8/3/00 |
6.25 |
25,000,000 |
24,861,125 |
|
|
Three Rivers Funding Corp. |
||||
|
7/5/00 |
6.59 |
25,000,000 |
24,981,806 |
|
|
7/28/00 |
6.65 |
35,240,000 |
35,065,562 |
|
|
Triple-A One Funding Corp. |
||||
|
7/20/00 |
6.62 |
60,000,000 |
59,791,633 |
|
|
Tyco International Group SA |
||||
|
7/19/00 |
6.92 |
5,000,000 |
4,982,813 |
|
|
7/25/00 |
6.95 |
5,000,000 |
4,977,000 |
|
|
UBS Finance, Inc. |
||||
|
7/5/00 |
7.06 |
4,200,000 |
4,196,710 |
|
|
Ventures Business Trust |
||||
|
7/3/00 |
7.05 |
29,997,000 |
29,985,251 |
|
|
TOTAL COMMERCIAL PAPER |
911,169,098 |
|||
|
Bank Notes - 2.5% |
||||
|
Due Date |
Annualized Yield at Time of Purchase |
Principal Amount |
Value |
|
|
Bank of America NA |
||||
|
11/20/00 |
7.00% |
$ 15,000,000 |
$ 15,000,000 |
|
|
First National Bank, Chicago |
||||
|
7/12/00 |
5.75 |
10,000,000 |
9,999,856 |
|
|
Fleet National Bank |
||||
|
7/3/00 |
6.71 (b) |
25,000,000 |
24,999,607 |
|
|
TOTAL BANK NOTES |
49,999,463 |
|||
|
Master Notes - 3.2% |
||||
|
|
||||
|
Goldman Sachs Group, Inc. |
||||
|
8/22/00 |
6.73 (c) |
50,000,000 |
50,000,000 |
|
|
J.P. Morgan Securities, Inc. |
||||
|
7/7/00 |
6.64 (b) |
15,000,000 |
15,000,000 |
|
|
TOTAL MASTER NOTES |
65,000,000 |
|||
|
Medium-Term Notes - 7.1% |
||||
|
|
||||
|
AT&T Corp. |
||||
|
7/6/00 |
6.67 (b) |
25,000,000 |
25,000,000 |
|
|
CIESCO LP |
||||
|
7/15/00 |
6.63 (b) |
10,000,000 |
9,999,914 |
|
|
CIT Group, Inc. |
||||
|
7/3/00 |
6.61 (b) |
10,000,000 |
9,994,445 |
|
|
7/3/00 |
6.80 (b) |
15,000,000 |
14,996,960 |
|
|
Ford Motor Credit Co. |
||||
|
8/23/00 |
6.80 (b) |
25,000,000 |
24,997,512 |
|
|
GE Life & Annuity Assurance Co. |
||||
|
7/3/00 |
6.76 (b)(c) |
15,000,000 |
15,000,000 |
|
|
General Motors Acceptance Corp. Mortgage Credit |
||||
|
7/3/00 |
6.69 (b) |
10,000,000 |
9,996,305 |
|
|
7/3/00 |
6.71 (b) |
25,000,000 |
24,990,734 |
|
|
Merrill Lynch & Co., Inc. |
||||
|
7/3/00 |
6.63 (b) |
10,000,000 |
9,999,244 |
|
|
TOTAL MEDIUM-TERM NOTES |
144,975,114 |
|||
|
Short-Term Notes - 3.6% |
||||
|
|
||||
|
Jackson National Life Insurance Co. |
||||
|
7/3/00 |
7.00 (b)(c) |
7,000,000 |
7,000,000 |
|
|
Monumental Life Insurance Co. |
||||
|
7/3/00 |
6.78 (b)(c) |
5,000,000 |
5,000,000 |
|
|
7/3/00 |
6.81 (b)(c) |
5,000,000 |
5,000,000 |
|
|
New York Life Insurance Co. |
||||
|
7/3/00 |
6.41 (b)(c) |
4,000,000 |
4,000,000 |
|
|
Short-Term Notes - continued |
||||
|
Due Date |
Annualized Yield at Time of Purchase |
Principal Amount |
Value |
|
|
New York Life Insurance Co. - continued |
||||
|
8/28/00 |
6.96% (b)(c) |
$ 5,000,000 |
$ 5,000,000 |
|
|
RACERS Series 00 10mm, |
||||
|
6/22/01 |
6.67 (a)(b) |
10,000,000 |
10,000,000 |
|
|
Strategic Money Market Trust Series 1999 A6, |
||||
|
7/13/00 |
6.40 (a)(b) |
17,000,000 |
17,000,000 |
|
|
Strategic Money Market Trust Series 2000 B, |
||||
|
9/13/00 |
6.81 (a)(b) |
5,000,000 |
5,000,000 |
|
|
Strategic Money Market Trust Series 2000 E, |
||||
|
7/14/00 |
6.67 (a)(b) |
5,000,000 |
5,000,000 |
|
|
Transamerica Occidental Life Insurance Co. |
||||
|
9/29/00 |
6.56 (b)(c) |
10,000,000 |
10,000,000 |
|
|
TOTAL SHORT-TERM NOTES |
73,000,000 |
|||
|
Repurchase Agreements - 2.5% |
|||
|
Maturity Amount |
|
||
|
In a joint trading account (U.S. Government Obligations) dated 6/30/00 due 7/3/00 At 6.83% |
$ 31,018 |
31,000 |
|
|
With: |
|
|
|
|
Bank of America NA |
30,018,025 |
30,000,000 |
|
|
Deutsche Bank Securities, Inc. |
20,012,017 |
20,000,000 |
|
|
TOTAL REPURCHASE AGREEMENTS |
50,031,000 |
||
|
TOTAL INVESTMENT |
2,071,072,038 |
||
|
NET OTHER ASSETS - (1.9)% |
(37,716,448) |
||
|
NET ASSETS - 100% |
$ 2,033,355,590 |
||
|
Total Cost for Income Tax Purposes $2,071,072,038 |
|
Legend |
|
(a) Security exempt from registration under Rule 144A of the Securities Act of 1933. These securities may be resold in transactions exempt from registration, normally to qualified institutional buyers. At the period end, the value of these securities amounted to $37,000,000 or 1.8% of net assets. |
|
(b) The coupon rate shown on floating or adjustable rate securities represents the rate at period end. The due dates on these types of securities reflects the next interest rate reset date or, when applicable, the final maturity date. |
|
(c) Restricted securities - Investment in securities not registered under the Securities Act of 1933. |
|
Additional information on each holding is as follows: |
|
Security |
Acquisition Date |
Cost |
|
GE Life & Annuity Assurance Co. |
4/6/00 |
$ 15,000,000 |
|
Goldman Sachs Group, Inc. |
6/14/00 |
$ 50,000,000 |
|
Jackson National Life Insurance Co. |
7/6/99 |
$ 7,000,000 |
|
Monumental Life Insurance Co.: |
9/17/98 |
$ 5,000,000 |
|
6.81%, 7/3/00 |
3/12/99 |
$ 5,000,000 |
|
New York Life Insurance Co.: |
12/20/99 |
$ 4,000,000 |
|
6.96%, 8/28/00 |
8/13/99 |
$ 5,000,000 |
|
Transamerica Occidental Life |
4/28/00 |
$ 10,000,000 |
|
Other Information |
|
The fund invested in securities that are not registered under the Securities Act of 1933. These securities are subject to legal or contractual restrictions on resale. At the end of the period, restricted securities (excluding Rule 144A issues) amounted to $101,000,000 or 5.0% of net assets. |
|
The fund participated in the interfund lending program as a lender. The average daily loan balance during the period for which loans were outstanding amounted to $10,351,708. The weighted average interest rate was 6.06%. Interest earned from the interfund lending program amounted to $41,853 and is included in interest income on the Statement of Operations. |
|
Income Tax Information |
|
At December 31, 1999, the fund had a capital loss carryforward of approximately $102,000 of which $1,000, $28,000 and $73,000 will expire on December 31, 2002, 2005 and 2007, respectively. |
See accompanying notes which are an integral part of the financial statements.
Money Market Portfolio
Statement of Assets and Liabilities
|
|
June 30, 2000 (Unaudited) |
|
|
Assets |
|
|
|
Investment in securities, at value (including repurchase |
|
$ 2,071,072,038 |
|
Receivable for fund shares sold |
|
3,301,546 |
|
Interest receivable |
|
11,922,327 |
|
Prepaid expenses |
|
40,981 |
|
Total assets |
|
2,086,336,892 |
|
Liabilities |
|
|
|
Payable to custodian bank |
$ 38,588 |
|
|
Payable for investments purchased |
24,986,250 |
|
|
Payable for fund shares redeemed |
27,396,441 |
|
|
Accrued management fee |
446,877 |
|
|
Other payables and accrued expenses |
113,146 |
|
|
Total liabilities |
|
52,981,302 |
|
Net Assets |
|
$ 2,033,355,590 |
|
Net Assets consist of: |
|
|
|
Paid in capital |
|
$ 2,033,466,514 |
|
Accumulated net realized gain (loss) on investments |
|
(110,924) |
|
Net Assets |
|
$ 2,033,355,590 |
|
Initial Class: |
|
$1.00 |
|
Service Class 2: |
|
$1.00 |
Statement of Operations
|
|
Six months ended June 30, 2000 (Unaudited) |
|
|
Interest Income |
|
$ 63,230,620 |
|
Expenses |
|
|
|
Management fee |
$ 2,332,410 |
|
|
Transfer agent fees |
695,684 |
|
|
Distribution fees |
117 |
|
|
Accounting fees and expenses |
97,285 |
|
|
Non-interested trustees' compensation |
3,231 |
|
|
Custodian fees and expenses |
21,274 |
|
|
Registration fees |
923 |
|
|
Audit |
13,574 |
|
|
Legal |
7,404 |
|
|
Miscellaneous |
71,873 |
|
|
Total expenses before reductions |
3,243,775 |
|
|
Expense reductions |
(217) |
3,243,558 |
|
Net interest income |
|
59,987,062 |
|
Net Realized Gain (Loss) |
|
(8,777) |
|
Net increase in net assets resulting from operations |
|
$ 59,978,285 |
|
Other Information |
|
|
|
Expense reductions |
|
$ 217 |
See accompanying notes which are an integral part of the financial statements.
Semiannual Report
Fidelity Variable Insurance Products: Money Market Portfolio
Financial Statements - continued
Statement of Changes in Net Assets
|
Increase (Decrease) in Net Assets |
Six months ended |
Year ended December 31, 1999 |
|
|
|
|
|
Operations |
$ 59,987,062 |
$ 89,685,301 |
|
Net realized gain (loss) |
(8,777) |
(73,427) |
|
Net increase (decrease) in net assets resulting from operations |
59,978,285 |
89,611,874 |
|
Distributions to shareholders from net interest income |
(59,987,062) |
(89,685,301) |
|
Share transactions - net increase (decrease) |
93,873,698 |
432,074,680 |
|
Total increase (decrease) in net assets |
93,864,921 |
432,001,253 |
|
Net Assets |
|
|
|
Beginning of period |
1,939,490,669 |
1,507,489,416 |
|
End of period |
$ 2,033,355,590 |
$ 1,939,490,669 |
|
Other Information: |
|
|
Six months ended
June 30, 2000 |
Year ended |
|
Share transactions at net asset value of $1.00 per share |
$ 3,072,502,306 |
$ 3,933,097,969 |
|
Reinvestment of distributions from net interest income |
60,021,807 |
88,893,196 |
|
Cost of shares redeemed |
(3,038,753,092) |
(3,589,916,485) |
|
Net increase (decrease) in net assets and shares |
$ 93,771,021 |
$ 432,074,680 |
|
Service Class 2 A |
$ 100,000 |
$ - |
|
Reinvestment of distributions from net interest income |
2,677 |
- |
|
Cost of shares redeemed |
- |
- |
|
Net increase (decrease) in net assets and shares |
$ 102,677 |
$ - |
|
Distributions |
$ (59,984,377) |
$ (89,685,301) |
|
Service Class 2 A |
(2,685) |
- |
|
Total |
$ (59,987,062) |
$ (89,685,301) |
A Service Class 2 commenced sale of shares January 12, 2000.
See accompanying notes which are an integral part of the financial statements.
Money Market Portfolio
Financial Highlights - Initial Class
|
|
Six months ended June 30, 2000 |
Years ended December 31, |
||||
|
|
(Unaudited) |
1999 |
1998 |
1997 |
1996 |
1995 |
|
Selected Per-Share Data |
|
|
|
|
|
|
|
Net asset value, beginning of period |
$ 1.000 |
$ 1.000 |
$ 1.000 |
$ 1.000 |
$ 1.000 |
$ 1.000 |
|
Income from Investment Operations |
.029 |
.050 |
.053 |
.053 |
.052 |
.057 |
|
Less Distributions |
|
|
|
|
|
|
|
From net interest income |
(.029) |
(.050) |
(.053) |
(.053) |
(.052) |
(.057) |
|
Net asset value, end of period |
$ 1.000 |
$ 1.000 |
$ 1.000 |
$ 1.000 |
$ 1.000 |
$ 1.000 |
|
Total Return B |
2.98% |
5.17% |
5.46% |
5.51% |
5.41% |
5.87% |
|
Ratios and Supplemental Data |
|
|
|
|
|
|
|
Net assets, end of period (000 omitted) |
$ 2,033,253 |
$ 1,939,491 |
$ 1,507,489 |
$ 1,020,794 |
$ 1,126,155 |
$ 808,874 |
|
Ratio of expenses to average net assets |
.32% A |
.27% |
.30% |
.31% |
.30% |
.33% |
|
Ratio of net interest income to average net assets |
5.93% A |
5.06% |
5.33% |
5.32% |
5.28% |
5.72% |
Financial Highlights - Service Class 2
|
|
Six months ended June 30, 2000 C |
|
|
(Unaudited) |
|
Selected Per-Share Data |
|
|
Net asset value, beginning of period |
$ 1.000 |
|
Income from Investment Operations |
|
|
Net interest income |
.027 |
|
Less Distributions |
|
|
From net interest income |
(.027) |
|
Net asset value, end of period |
$ 1.000 |
|
Total Return B |
2.71% |
|
Ratios and Supplemental Data |
|
|
Net assets, end of period (000 omitted) |
$ 103 |
|
Ratio of expenses to average net assets |
.57% A |
|
Ratio of net interest income to average net assets |
5.72% A |
A Annualized
B Total returns for periods of less than one year are not annualized and do not reflect charges attributable to your insurance company's separate account. Inclusion of these charges would reduce the total returns shown.
C For the period January 12, 2000 (commencement of sale of Service Class 2 shares) to June 30, 2000.
See accompanying notes which are an integral part of the financial statements.
Semiannual Report
For the period ended June 30, 2000 (Unaudited)
1. Significant Accounting Policies.
The Money Market Portfolio, High Income Portfolio, Equity-Income Portfolio, Growth Portfolio, and Overseas Portfolio (the funds) are funds of Variable Insurance Products Fund. Investment Grade Bond Portfolio, Asset Manager Portfolio, Asset Manager: Growth Portfolio, Index 500 Portfolio, and Contrafund Portfolio (the funds) are funds of Variable Insurance Products Fund II. Balanced Portfolio, Growth & Income Portfolio, Growth Opportunities Portfolio, and Mid Cap Portfolio (the funds) are funds of Variable Insurance Products Fund III. Variable Insurance Products Fund, Variable Insurance Products Fund II and Variable Insurance Products Fund III (the trusts) are registered under the Investment Company Act of 1940, as amended (the 1940 Act), as open-end management investment companies organized as Massachusetts business trusts. Each fund is authorized to issue an unlimited number of shares. Shares of each fund may only be purchased by insurance companies for the purpose of funding variable annuity or variable life insurance contracts. Each fund, except Money Market Portfolio, Index 500 Portfolio and Investment Grade Bond Portfolio, offers three classes of shares: the funds' original class of shares (Initial Class shares), Service Class shares and Service Class 2 shares. Each fund commenced sale of Service Class 2 shares on January 12, 2000. All classes have equal rights and voting privileges, except for matters affecting a single class. Investment income, realized and unrealized capital gains and losses, the common expenses of the fund, and certain fund-level expense reductions, if any, are allocated on a pro rata basis to each class based on the relative net assets of each class to the total net assets of the fund. Each class of shares differs in its respective distribution plan. On April 20, 2000, the Board of Trustees of Money Market Portfolio, Investment Grade Bond Portfolio, and Index 500 Portfolio approved the creation of Service Class, a new class of shares of Money Market Portfolio, Investment Grade Bond Portfolio, and Index 500 Portfolio. The Service Class shares of Money Market Portfolio, Investment Grade Bond Portfolio, and Index 500 Portfolio will be subject to an annual distribution and service fee of .10% of the class' average net assets. These shares are expected to be available on July 14, 2000.
The financial statements have been prepared in conformity with generally accepted accounting principles which require management to make certain estimates and assumptions at the date of the financial statements. The following summarizes the significant accounting policies of the funds:
Security Valuation:
Money Market Portfolio. As permitted under Rule 2a-7 of the 1940 Act, and certain conditions therein, securities are valued initially at cost and thereafter assume a constant amortization to maturity of any discount or premium.
Investment Grade Bond Portfolio. Securities are valued based upon a computerized matrix system and/or appraisals by a pricing service, both of which consider market transactions and dealer-supplied valuations. Securities (including restricted securities) for which market quotations are not readily available are valued at their fair value as determined in good faith under consistently applied procedures under the general supervision of the Board of Trustees. Short-term securities with remaining maturities of sixty days or less for which quotations are not readily available are valued at amortized cost or original cost plus accrued interest, both of which approximate current value.
High Income, Asset Manager and Balanced Portfolios. Equity securities for which quotations are readily available are valued at the last sale price, or if no sale price, at the closing bid price. Foreign equity securities are valued based on quotations from the principal market in which such securities are normally traded. If trading or events occurring in other markets after the close of the principal market in which foreign securities are traded, and before the close of the business of the funds, are expected to materially affect the value of those securities, then they are valued at their fair value taking this trading or these events into account. Fair value is determined in good faith under consistently applied procedures under the general supervision of the Board of Trustees. Debt securities for which quotations are readily available are valued by a pricing service at their market values as determined by their most recent bid prices in the principal market (sales prices if the principal market is an exchange) in which such securities are normally traded. Securities (including restricted securities) for which market quotations are not readily available are valued at their fair value. Short-term securities with remaining maturities of sixty days or less for which quotations are not readily available are valued at amortized cost or original cost plus accrued interest, both of which approximate current value.
Asset Manager: Growth, Equity-Income, Growth & Income, Index 500, Growth Opportunities, Contrafund, Growth and Mid Cap Portfolios. Securities for which exchange quotations are readily available are valued at the last sale price, or if no sale price, at the closing bid price. Foreign securities are valued based on quotations from the principal market in which such securities are normally traded. If trading or events occurring in other markets after the close of the principal market in which foreign securities are traded, and before the close of the business of the funds, are expected to materially affect the value of those securities, then they are valued at their fair value taking this trading or these events into account. Fair value is determined in good faith under consistently applied procedures under the general supervision of the Board of Trustees. Securities (including restricted securities) for which exchange quotations are not readily available (and in certain cases debt securities which trade on an exchange) are valued primarily using dealer-supplied valuations or at their fair value. Short-term securities with remaining maturities of sixty days or less for which quotations are not readily available are valued at amortized cost or original cost plus accrued interest, both of which approximate current value.
Semiannual Report
Notes to Financial Statements (Unaudited) - continued
1. Significant Accounting Policies - continued
Overseas Portfolio. Securities for which quotations are readily available are valued using the official closing price or at the last sale price in the principal market in which they are traded. If the last sale price (on the local exchange) is unavailable, the last evaluated quote or closing bid price normally is used. If trading or events occurring in other markets after the close of the principal market in which securities are traded are expected to materially affect the value of those securities, then they are valued at their fair value taking this trading or these events into account. Fair value is determined in good faith under consistently applied procedures under the general supervision of the Board of Trustees. Securities (including restricted securities) for which quotations are not readily available are valued primarily using dealer-supplied valuations or at their fair value. Short-term securities with remaining maturities of sixty days or less for which quotations are not readily available are valued at amortized cost or original cost plus accrued interest, both of which approximate current value.
Foreign Currency Translation. The accounting records of the funds are maintained in U.S. dollars. Investment securities and other assets and liabilities denominated in a foreign currency are translated into U.S. dollars at the prevailing rates of exchange at period end. Purchases and sales of securities, income receipts and expense payments are translated into U.S. dollars at the prevailing exchange rate on the respective dates of the transactions.
Net realized gains and losses on foreign currency transactions represent net gains and losses from sales and maturities of foreign currency contracts, disposition of foreign currencies, the difference between the amount of net investment income accrued and the U.S. dollar amount actually received, and gains and losses between trade and settlement date on purchases and sales of securities. The effects of changes in foreign currency exchange rates on investments in securities are included with the net realized and unrealized gain or loss on investment securities.
Income Taxes. As a qualified regulated investment company under Subchapter M of the Internal Revenue Code, each fund is not subject to U.S. federal income taxes to the extent that it distributes substantially all of its taxable income for its fiscal year. Each fund may be subject to foreign taxes on income and gains on investments which are accrued based upon each fund's understanding of the tax rules and regulations that exist in the markets in which they invest. Foreign governments may also impose taxes on other payments or transactions with respect to foreign securities. Each fund accrues such taxes as applicable. The schedules of investments include information regarding income taxes under the caption "Income Tax Information."
Investment Income:
Money Market Portfolio. Interest income, which includes amortization of premium and accretion of discount, is accrued as earned.
Investment Grade Bond, High Income, Asset Manager, Balanced, Asset Manager: Growth, Equity-Income, Growth & Income, Index 500, Growth Opportunities, Contrafund, Growth, Mid Cap and Overseas Portfolios. Dividend income is recorded on the ex-dividend date, except certain dividends from foreign securities where the ex-dividend date may have passed, which are recorded as soon as the funds are informed of the ex-dividend date. Non-cash dividends included in dividend income, if any, are recorded at the fair market value of the securities received. Interest income, which includes accretion of original issue discount, is accrued as earned. The funds may place a debt obligation on non-accrual status and reduce related interest income by ceasing current accruals and writing off interest receivables when the collection of all or a portion of interest has become doubtful based on consistently applied procedures, under the general supervision of the Board of Trustees of the funds. A debt obligation is removed from non-accrual status when the issuer resumes interest payments or when collectibility of interest is reasonably assured. Investment income is recorded net of foreign taxes withheld where recovery of such taxes is uncertain.
Expenses. Most expenses of each trust can be directly attributed to a fund. Expenses which cannot be directly attributed are apportioned among the funds in the trust.
Deferred Trustee Compensation. Under a Deferred Compensation Plan (the Plan) non-interested Trustees of certain funds must defer receipt of a portion of, and may elect to defer receipt of an additional portion of, their annual compensation. Deferred amounts are treated as though equivalent dollar amounts had been invested in a cross-section of other Fidelity funds. Deferred amounts remain in the funds until distributed in accordance with the Plan.
Distributions to Shareholders. Dividends are declared daily and paid monthly from net interest income for the Money Market Portfolio. Distributions are recorded on the ex-dividend date for all other funds. Income dividends and capital gain distributions are declared separately for each class.
Income and capital gain distributions are determined in accordance with income tax regulations which may differ from generally accepted accounting principles. These differences, which may result in distribution reclassifications, are primarily due to differing treatments for litigation proceeds, paydown gains/losses on certain securities, futures transactions, foreign currency transactions, passive foreign investment companies (PFIC), market discount, redemptions in kind, partnerships, non-taxable dividends, net operating losses, capital loss carryforwards and losses deferred due to wash sales.
Permanent book and tax basis differences relating to shareholder distributions will result in reclassifications to paid in capital. Undistributed net investment income, distributions in excess of net investment income and accumulated undistributed net realized gain (loss) on investments and foreign currency transactions may include temporary book and tax basis differences which will reverse in a subsequent period. Any taxable income or gain remaining at fiscal year end is distributed in the following year.
Semiannual Report
Notes to Financial Statements (Unaudited) - continued
1. Significant Accounting Policies - continued
Security Transactions. Security transactions are accounted for as of trade date. Gains and losses on securities sold are determined on the basis of identified cost.
2. Operating Policies.
Foreign Currency Contracts. Certain funds use foreign currency contracts to facilitate transactions in foreign-denominated securities. Losses may arise from changes in the value of the foreign currency or if the counterparties do not perform under the contracts' terms. The U.S. dollar value of foreign currency contracts is determined using contractual currency exchange rates established at the time of each trade.
Joint Trading Account. Pursuant to an Exemptive Order issued by the Securities and Exchange Commission (the SEC), certain funds, along with other affiliated entities of Fidelity Management & Research Company (FMR), may transfer uninvested cash balances into one or more joint trading accounts. These balances are invested in one or more repurchase agreements for U.S. Treasury or Federal Agency obligations.
Repurchase Agreements. The underlying U.S. Treasury, Federal Agency, or other obligations found to be satisfactory by FMR are transferred to an account of the funds, or to the Joint Trading Account, at a bank custodian. The securities are marked-to-market daily and maintained at a value at least equal to the principal amount of the repurchase agreement (including accrued interest). FMR, the funds' investment adviser, is responsible for determining that the value of the underlying securities remains in accordance with the market value requirements stated above.
Central Cash Funds. Pursuant to an Exemptive Order issued by the SEC, the funds may invest in the Taxable Central Cash Fund and the Central Cash Collateral Fund (the Cash Funds) managed by Fidelity Investments Money Management, Inc. (FIMM), an affiliate of FMR. The Cash Funds are open-end money market funds available only to investment companies and other accounts managed by FMR and its affiliates. The Cash Funds seek preservation of capital, liquidity, and current income. Income distributions from the Cash Funds are declared daily and paid monthly from net interest income. Income distributions earned by the funds are recorded as either interest income or security lending income in the accompanying financial statements.
Interfund Lending Program. Pursuant to an Exemptive Order issued by the SEC, the funds, along with other registered investment companies having management contracts with FMR, may participate in an interfund lending program. This program provides an alternative credit facility allowing the funds to borrow from, or lend money to, other participating funds. Information
regarding each fund's participation in the program is included under the caption "Other Information" at the end of each applicable fund's schedule of investments.
Delayed Delivery Transactions. Each fund may purchase or sell securities on a delayed delivery basis. Payment and delivery may take place after the customary settlement period for that security. The price of the underlying securities and the date when the securities will be delivered and paid for are fixed at the time the transaction is negotiated. The market values of the securities purchased on a delayed delivery basis are identified as such in each applicable fund's schedule of investments. Each fund may receive compensation for interest forgone in the purchase of a delayed delivery security. With respect to purchase commitments, each fund identifies securities as segregated in its records with a value at least equal to the amount of the commitment. Losses may arise due to changes in the market value of the underlying securities or if the counterparty does not perform under the contract.
Futures Contracts. Certain funds may use futures contracts to manage their exposure to the stock market and to fluctuations in currency values. Buying futures tends to increase a fund's exposure to the underlying instrument, while selling futures tends to decrease a fund's exposure to the underlying instrument or hedge other fund investments. Futures contracts involve, to varying degrees, risk of loss in excess of the futures variation margin reflected in each applicable fund's Statement of Assets and Liabilities. The underlying face amount at value of any open futures contracts at period end is shown in each applicable fund's schedule of investments under the caption "Futures Contracts." This amount reflects each contract's exposure to the underlying instrument at period end. Losses may arise from changes in the value of the underlying instruments or if the counterparties do not perform under the contracts' terms. Gains (losses) are realized upon the expiration or closing of the futures contracts. Futures contracts are valued at the settlement price established each day by the board of trade or exchange on which they are traded.
Restricted Securities. Certain funds are permitted to invest in securities that are subject to legal or contractual restrictions on resale. These securities generally may be resold in transactions exempt from registration or to the public if the securities are registered. Disposal of these securities may involve time-consuming negotiations and expense, and prompt sale at an acceptable price may be difficult. Information regarding restricted securities is included under the caption "Other Information" at the end of each applicable fund's schedule of investments.
Semiannual Report
Notes to Financial Statements (Unaudited) - continued
2. Operating Policies - continued
Loans and Other Direct Debt Instruments. Certain funds are permitted to invest in loans and loan participations, trade claims or other receivables. These investments may include standby financing commitments that obligate the fund to supply additional cash to the borrower on demand. Loan participations involve a risk of insolvency of the lending bank or other financial intermediary. At the end of the period, the following funds held investments in loans or other direct debt instruments:
|
|
|
% of |
|
|
Value |
Net Assets |
|
Asset Manager |
$58,533,087 |
1.3% |
|
Asset Manager: Growth |
$9,260,883 |
1.6% |
|
High Income |
$12,978,197 |
0.6% |
3. Purchases and Sales of Investments.
Information regarding purchases and sales of securities (other than short-term securities) and the market value of future contracts opened and closed, is included under the caption "Other Information" at the end of each applicable fund's schedule of investments.
4. Fees and Other Transactions with Affiliates.
Management Fee. As each fund's investment adviser, FMR receives a monthly fee.
For the Money Market Portfolio, FMR receives a monthly fee that is calculated on the basis of a group fee rate plus a fixed individual fund fee rate applied to the average net assets of the fund and an income-based fee. The group fee rate is the weighted average of a series of rates and is based on the monthly average net assets of all the mutual funds advised by FMR. The rates ranged from .0920% to .3700% for the period. The annual individual fund fee rate is .03%. In the event that these rates were lower than the contractual rates in effect during the period, FMR voluntarily implemented the above rates, as they resulted in the same or a lower management fee. The income-based fee is added only when the fund's gross yield exceeds 5%. At that time the income-based fee would equal 6% of that portion of the fund's gross income that represents a gross yield of more than 5% per year. The maximum income-based component is .24% of average net assets. For the period, the total management fee was equivalent to an annualized rate of .23%. The income-based portion of this fee was equal to $755,805, or an annualized rate of .07% of the fund's average net assets.
For the Index 500 Portfolio, FMR receives a fee that is computed daily at an annual rate of .24% of the fund's average net assets.
For all the other funds, FMR receives a monthly fee that is calculated on the basis of a group fee rate plus a fixed individual fund fee rate applied to the average net assets of each fund. The group fee rate is the weighted average of a series of rates and is based on the monthly average net assets of all the mutual funds advised by FMR. The rates ranged from .0920% to .3700% for the period for the Investment Grade Bond and High Income Portfolios and .2167% to .5200% for the period for the Asset Manager, Balanced, Asset Manager: Growth, Equity-Income, Growth & Income, Growth Opportunities, Contrafund, Growth, Mid Cap and Overseas Portfolios for the period. The annual individual fund fee rate is .30% for Investment Grade Bond, Asset Manager: Growth, Growth Opportunities, Contrafund, Growth, and Mid Cap Portfolios, .45% for High Income and Overseas Portfolios, .25% for Asset Manager Portfolio, .15% for Balanced Portfolio, and .20% for Equity-Income and Growth & Income Portfolios. In the event that these rates were lower than the contractual rates in effect during the period, FMR voluntarily implemented the above rates, as they resulted in the same or a lower management fee.
For the period, each fund's management fee was equivalent to the following annualized rates expressed as a percentage of average net assets:
|
Money Market |
.23% |
|
Investment Grade Bond |
.43% |
|
High Income |
.58% |
|
Asset Manager |
.53% |
|
Balanced |
.43% |
|
Asset Manager: Growth |
.58% |
|
Equity-Income |
.48% |
|
Growth & Income |
.48% |
|
Index 500 |
.24% |
|
Growth Opportunities |
.58% |
|
Contrafund |
.57% |
|
Growth |
.57% |
|
Mid Cap |
.56% |
|
Overseas |
.72% |
Sub-Adviser Fee. As the Money Market and Investment Grade Bond Portfolios' investment sub-adviser, FIMM, a wholly owned subsidiary of FMR, receives a fee from FMR of 50% of the management fee payable to FMR. The fee is paid prior to any voluntary expense reimbursements which may be in effect.
FMR, on behalf of the Overseas Portfolio, entered into sub-advisory agreements with Fidelity Management & Research (U.K.) Inc., Fidelity Management & Research (Far East) Inc., and Fidelity International Investment Advisors (FIIA). Under the sub-advisory arrangements, FMR may receive investment advice and research services and may grant the sub-advisers investment management authority to buy and sell securities. FMR pays its sub-advisers either a portion of its management fee or a fee based on costs incurred for these services.
Semiannual Report
Notes to Financial Statements (Unaudited) - continued
FMR and Index 500 Portfolio entered into a sub-advisory agreement with Bankers Trust Company (Bankers Trust). Bankers Trust receives a sub-advisory fee for providing investment management and custodial services to the fund. For these services, FMR pays Bankers Trust fees at an annual rate of 0.006% of the fund's average net assets.
Semiannual Report
Notes to Financial Statements (Unaudited) - continued
4. Fees and Other Transactions with Affiliates - continued
Sub-Adviser Fee - continued
Under a separate securities lending agreement with Bankers Trust, Index 500 Portfolio receives at least 70% of net income from the securities lending program. Bankers Trust retains no more than 30% of net income under this agreement. For the period, Bankers Trust retained $90,941.
Distribution and Service Plan. In accordance with Rule 12b-1 of the 1940 Act, the Board of Trustees has adopted separate Distribution and Service Plans with respect to each class of shares (collectively referred to as "the Plans"). Under certain of the Plans, the class pays Fidelity Distributors Corporation (FDC), an affiliate of FMR, a 12b-1 fee. For the period, this fee is based on an annual rate of .10% of Service Class' average net assets and .25% of Service Class 2's average net assets. Initial Class shares are not subject to a 12b-1 fee.
For the period, each class paid FDC the following amounts, all of which were reallowed to insurance companies, for the distribution of shares and providing shareholder support services:
|
Money Market |
|
|
Service Class 2 |
$ 117 |
|
Investment Grade Bond |
|
|
Service Class 2 |
121 |
|
High Income |
|
|
Service Class |
126,071 |
|
Service Class 2 |
250 |
|
Asset Manager |
|
|
Service Class |
12,967 |
|
Service Class 2 |
195 |
|
Balanced |
|
|
Service Class |
13,703 |
|
Service Class 2 |
213 |
|
Asset Manager: Growth |
|
|
Service Class |
5,971 |
|
Service Class 2 |
204 |
|
Equity-Income |
|
|
Service Class |
221,204 |
|
Service Class 2 |
4,873 |
|
Index 500 |
|
|
Service Class 2 |
116 |
|
Growth & Income |
|
|
Service Class |
64,293 |
|
Service Class 2 |
492 |
|
Growth Opportunities |
|
|
Service Class |
170,539 |
|
Service Class 2 |
934 |
|
Contrafund |
|
|
Service Class |
472,035 |
|
Service Class 2 |
12,537 |
|
Growth |
|
|
Service Class |
650,795 |
|
Service Class 2 |
1,896 |
|
Mid Cap |
|
|
Service Class |
36,074 |
|
Service Class 2 |
8,716 |
|
Overseas |
|
|
Service Class |
99,503 |
|
Service Class 2 |
583 |
Transfer Agent Fees. Fidelity Investment Institutional Operations Company (FIIOC), an affiliate of FMR, is the funds' transfer, dividend disbursing and shareholder servicing agent. FIIOC receives account fees and asset-based fees that vary according to account size and type of account. FIIOC pays a portion of the expenses related to the typesetting, printing and mailing of shareholder reports, except proxy statements.
For the period, each funds' transfer agent fees were equivalent to the following annualized rates expressed as a percentage of average net assets:
|
MONEY MARKET |
.07% |
|
INVESTMENT GRADE BOND |
.07% |
|
HIGH INCOME |
.07% |
|
ASSET MANAGER |
.07% |
|
BALANCED |
.07% |
|
ASSET MANAGER: GROWTH |
.07% |
|
EQUITY-INCOME |
.07% |
|
GROWTH & INCOME |
.07% |
|
INDEX 500 |
.07% |
|
GROWTH OPPORTUNITIES |
.07% |
|
CONTRAFUND |
.07% |
|
GROWTH |
.07% |
|
MID CAP |
.08% |
|
OVERSEAS |
.07% |
Semiannual Report
Notes to Financial Statements (Unaudited) - continued
4. Fees and Other Transactions with Affiliates - continued
Transfer Agent Fees - continued
For the period, each class paid the following amounts:
|
Money Market |
|
|
Initial Class |
$ 695,651 |
|
Service Class 2 |
33 |
|
Investment Grade Bond |
|
|
Initial Class |
207,145 |
|
Service Class 2 |
33 |
|
High Income |
|
|
Initial Class |
655,017 |
|
Service Class |
83,102 |
|
Service Class 2 |
96 |
|
Asset Manager |
|
|
Initial Class |
1,526,085 |
|
Service Class |
8,951 |
|
Service Class 2 |
42 |
|
Balanced |
|
|
Initial Class |
92,789 |
|
Service Class |
9,127 |
|
Service Class 2 |
55 |
|
Asset Manager: Growth |
|
|
Initial Class |
179,131 |
|
Service Class |
4,189 |
|
Service Class 2 |
61 |
|
Equity-Income |
|
|
Initial Class |
3,206,951 |
|
Service Class |
146,559 |
|
Service Class 2 |
1,525 |
|
Index 500 |
|
|
Initial Class |
1,638,142 |
|
Service Class 2 |
33 |
|
Growth & Income |
|
|
Initial Class |
351,138 |
|
Service Class 2 |
43,630 |
|
Service Class 2 |
132 |
|
Growth Opportunities |
|
|
Initial Class |
417,276 |
|
Service Class |
113,605 |
|
Service Class 2 |
426 |
|
Contrafund |
|
|
Initial Class |
2,952,107 |
|
Service Class |
316,815 |
|
Service Class 2 |
3,771 |
|
Growth |
|
|
Initial Class |
5,897,805 |
|
Service Class |
451,666 |
|
Service Class 2 |
848 |
|
Mid Cap |
|
|
Initial Class |
13,418 |
|
Service Class |
27,121 |
|
Service Class 2 |
2,882 |
|
Overseas |
|
|
Initial Class |
925,813 |
|
Service Class |
69,985 |
|
Service Class 2 |
301 |
Accounting and Security Lending Fees. Fidelity Service Company, Inc. (FSC), an affiliate of FMR, maintains each fund's accounting records and administers the security lending program. The security lending fee is based on the number and duration of lending transactions. The accounting fee is based on the level of average net assets for the month plus out-of-pocket expenses.
Money Market Insurance. Pursuant to an Exemptive Order issued by the the SEC, the Money Market Portfolio, along with other money market funds advised by FMR or its affiliates, has entered into insurance agreements with FIDFUNDS Mutual Limited (FIDFUNDS), an affiliated mutual insurance company. FIDFUNDS provides limited coverage for certain loss events including issuer default as to payment of principal or interest and bankruptcy or insolvency of a credit enhancement provider. The insurance does not cover losses resulting from changes in interest rates, ratings downgrades or other market conditions. The fund may be subject to a special assessment of up to approximately 2.5 times the fund's annual gross premium if covered losses exceed certain levels. During the period, the fund paid premiums of $81,961 for the calendar year 2000 to FIDFUNDS, which are being amortized over one year.
Brokerage Commissions. Certain funds placed a portion of their portfolio transactions with brokerage firms which are affiliates of FMR. The commissions paid to these affiliated firms are shown under the caption "Other Information" at the end of each applicable fund's schedule of investments.
5. Security Lending.
Certain funds lend portfolio securities from time to time in order to earn additional income. Each applicable fund receives collateral (in the form of U.S. Treasury obligations, letters of credit and/or cash) against the loaned securities and maintains collateral in an amount not less than 100% of the market value of the loaned securities during the period of the loan. The market value of the loaned securities is determined at the close of business of the funds and any additional required collateral is delivered to the funds on the next business day. If the borrower defaults on its obligation to return the securities loaned because of insolvency or other reasons, a fund could experience delays and costs in recovering the securities loaned or in gaining access to the collateral. Information regarding the value of securities loaned and the value of collateral at period end is included under the caption "Other Information" at the end of each applicable fund's schedule of investments.
Semiannual Report
Notes to Financial Statements (Unaudited) - continued
6. Bank Borrowings.
Each fund is permitted to have bank borrowings for temporary or emergency purposes to fund shareholder redemptions. Each fund has established borrowing arrangements with certain banks. The interest rate on the borrowings is the bank's base rate, as revised from time to time. Information regarding a fund's participation in the program is included under the caption "Other Information" at the end of each applicable fund's schedule of investments.
7. Expense Reductions.
FMR voluntarily agreed to reimburse Index 500 Portfolio's operating expenses (excluding interest, taxes, brokerage commissions, extraordinary expenses and sub-advisory fees paid by the fund associated with securities lending) above an annualized rate of .28% of average net assets for Initial Class and .53% of average net assets for Service Class 2.
FMR has directed certain portfolio trades to brokers who paid a portion of certain fund's expenses.
In addition, through arrangements with certain funds' custodians, credits realized as a result of uninvested cash balances were used to reduce a portion of each applicable fund's expenses.
For the period, the reductions under these arrangements are shown under the caption "Other Information" on each applicable fund's Statement of Operations.
8. Beneficial Interest.
At the end of the period, Fidelity Investments Life Insurance Company (FILI) and its subsidiaries, affiliates of FMR, were the record owners of more than 5% of the outstanding shares, and certain unaffiliated insurance companies were record owners of 10% or more of the total outstanding shares of the following funds:
|
|
FILI |
UNAFFILIATED INSURANCE COMPANIES |
|
|
FUND |
% OF OWNERSHIP |
# OF |
% OF OWNERSHIP |
|
MONEY MARKET |
64% |
0 |
0% |
|
INVESTMENT GRADE BOND |
31% |
2 |
21% |
|
HIGH INCOME |
11% |
2 |
61% |
|
ASSET MANAGER |
18% |
1 |
22% |
|
BALANCED |
36% |
1 |
52% |
|
ASSET MANAGER: GROWTH |
63% |
1 |
10% |
|
EQUITY-INCOME |
12% |
2 |
39% |
|
GROWTH & INCOME |
40% |
3 |
42% |
|
INDEX 500 |
27% |
1 |
13% |
|
GROWTH OPPORTUNITIES |
15% |
1 |
66% |
|
CONTRAFUND |
20% |
2 |
34% |
|
GROWTH |
13% |
1 |
29% |
|
MID CAP |
44% |
1 |
28% |
|
OVERSEAS |
14% |
1 |
33% |
9. Transactions with Affiliated Companies.
An affiliated company is a company which the fund has ownership of at least 5% of the voting securities. Information regarding transactions with affiliated companies is included under "Legend" at the end of each applicable fund's schedule of investments.
Semiannual Report
Semiannual Report
Investment Adviser
Fidelity Management & Research Company
Boston, MA
Investment Sub-Advisers
Fidelity Investments Money Management, Inc.
Money Market, Asset Manager, Balanced, Investment
Grade Bond and Asset Manager: Growth Portfolios
Fidelity Management & Research (U.K.) Inc.
High Income, Mid Cap, Asset Manager, Asset Manager:
Growth, Contrafund, Balanced, Growth Opportunities,
Growth & Income, and Overseas Portfolios
Fidelity Management & Research (Far East) Inc.
High Income, Mid Cap, Asset Manager, Asset Manager:
Growth, Contrafund, Balanced, Growth Opportunities,
Growth & Income, and Overseas Portfolios
Fidelity International Investment Advisors Overseas Portfolio
Fidelity International Investment Advisors (U.K.) Limited
Overseas Portfolio
Fidelity Investments Japan Limited
High Income, Mid Cap, Asset Manager, Asset Manager:
Growth, Contrafund, Balanced, Growth Opportunities,
Growth & Income, and Overseas Portfolios
Bankers Trust
Index 500 Portfolio
Officers
Edward C. Johnson 3d, President
Robert C. Pozen, Senior Vice President
Abigail P. Johnson, Vice President - Growth, Mid Cap, Contrafund and Growth Opportunities Portfolios
Richard A. Spillane, Jr., Vice President - Equity-Income,
Overseas, Balanced and Growth & Income Portfolios
Dwight D. Churchill, Vice President - Money Market and
Investment Grade Bond Portfolios
Boyce I. Greer, Vice President - Money Market Portfolio
Robert A. Lawrence, Vice President - Index 500, Asset Manager, Asset Manager: Growth and High Income Portfolios
David L. Murphy, Vice President - Investment Grade Bond Portfolio
John Avery, Vice President - Balanced Portfolio
Barry J. Coffman, Vice President - High Income Portfolio
William Danoff, Vice President - Contrafund Portfolio
Robert K. Duby, Vice President - Money Market Portfolio
David Felman, Vice President - Mid Cap Portfolio
Kevin E. Grant, Vice President - Investment Grade Bond
and Balanced Portfolios
Bart A. Grenier, Vice President - Asset Manager
and Asset Manager: Growth Portfolios
Richard R. Mace, Jr., Vice President - Overseas Portfolio
Charles S. Morrison II, Vice President - Asset Manager
and Asset Manager: Growth Portfolios
Stephen R. Petersen, Vice President - Equity-Income Portfolio
John J. Todd, Vice President - Asset Manager
and Asset Manager: Growth Portfolios
Jennifer Uhrig, Vice President - Growth Portfolio
Bettina Doulton, Vice President -
Growth Opportunities Portfolio
Steven J. Snider, Vice President - Asset Manager
and Asset Manager: Growth Portfolios
Jason Weiner, Vice President - Contrafund Portfolio
Eric D. Roiter, Secretary
Robert A. Dwight, Treasurer
Maria F. Dwyer, Deputy Treasurer
Stanley N. Griffith, Assistant Vice President - Money Market and Investment Grade Bond Portfolios
John H. Costello, Assistant Treasurer
Thomas J. Simpson, Assistant Treasurer - Money Market
and Investment Grade Bond Portfolios
Board of Trustees
Ralph F. Cox *
Phyllis Burke Davis *
Robert M. Gates *
Edward C. Johnson 3d
Donald J. Kirk *
Ned C. Lautenbach *
Peter S. Lynch
Marvin L. Mann *
William O. McCoy *
Gerald C. McDonough *
Robert C. Pozen
Thomas R. Williams *
Advisory Board
J. Michael Cook
Marie L. Knowles
General Distributor
Fidelity Distributors Corporation
Boston, MA
Transfer and Shareholder Servicing Agent
Fidelity Investments Institutional Operations Co., Inc.
Boston, MA
Custodian
The Bank of New York, New York, NY
Money Market, Investment Grade Bond and
High Income Portfolios
The Chase Manhattan Bank, New York, NY
Equity-Income, Asset Manager, Asset Manager: Growth,
Growth & Income, Balanced and Overseas Portfolios
Brown Brothers Harriman & Co., Boston, MA
Growth, Growth Opportunities, Mid Cap
and Contrafund Portfolios
Bankers Trust, New York, NY
Index 500 Portfolio
* Independent trustees
VIPIC-SANN-0800 109454
1.705983.102
(2_fidelity_logos)
Overseas Portfolio
Mid Cap Portfolio
Growth Portfolio
Contrafund® Portfolio
Growth Opportunities Portfolio
Growth & Income Portfolio
Equity-Income Portfolio
Balanced Portfolio
Asset Manager: Growth® Portfolio
Asset Manager SM Portfolio
High Income Portfolio
Semiannual Report
June 30, 2000
|
Market Environment |
4 |
A review of what happened in world markets during the past six months. |
|
Overseas Portfolio |
5 |
Performance and Investment Summary |
|
|
6 |
Fund Talk: The Manager's Overview |
|
|
7 |
Investments |
|
|
10 |
Investments |
|
Mid Cap Portfolio |
14 |
Performance and Investment Summary |
|
|
15 |
Fund Talk: The Manager's Overview |
|
|
16 |
Investments |
|
|
22 |
Financial Statements |
|
|
26 |
Proxy Voting Results |
|
Growth Portfolio |
28 |
Performance and Investment Summary |
|
|
29 |
Fund Talk: The Manager's Overview |
|
|
30 |
Investments |
|
|
35 |
Financial Statements |
|
Contrafund Portfolio |
39 |
Performance and Investment Summary |
|
|
40 |
Fund Talk: The Manager's Overview |
|
|
41 |
Investments |
|
|
49 |
Financial Statements |
|
Growth Opportunities Portfolio |
53 |
Performance and Investment Summary |
|
|
54 |
Fund Talk: The Manager's Overview |
|
|
55 |
Investments |
|
|
58 |
Financial Statements |
|
|
62 |
Proxy Voting Results |
|
Growth & Income Portfolio |
64 |
Performance and Investment Summary |
|
|
65 |
Fund Talk: The Manager's Overview |
|
|
66 |
Investments |
|
|
69 |
Financial Statements |
|
|
73 |
Proxy Voting Results |
|
Equity-Income Portfolio |
75 |
Performance and Investment Summary |
|
|
76 |
Fund Talk: The Manager's Overview |
|
|
77 |
Investments |
|
|
84 |
Financial Statements |
|
Balanced Portfolio |
88 |
Performance and Investment Summary |
|
|
89 |
Fund Talk: The Managers' Overview |
|
|
90 |
Investments |
|
|
101 |
Financial Statements |
|
|
105 |
Proxy Voting Results |
|
Asset Manager: Growth Portfolio |
107 |
Performance and Investment Summary |
|
|
108 |
Fund Talk: The Manager's Overview |
|
|
109 |
Investments |
|
|
123 |
Financial Statements |
|
Asset Manager Portfolio |
127 |
Performance and Investment Summary |
|
|
128 |
Fund Talk: The Manager's Overview |
|
|
129 |
Investments |
|
|
144 |
Financial Statements |
|
High Income Portfolio |
148 |
Performance and Investment Summary |
|
|
149 |
Fund Talk: The Manager's Overview |
|
|
150 |
Investments |
|
|
160 |
Financial Statements |
|
Notes to Financial Statements |
164 |
Notes to the Financial Statements |
Fidelity Variable Insurance Products are separate account options which are purchased through a variable insurance contract.
Standard & Poor's, S&P and S&P 500 are registered service marks of The McGraw-Hill Companies, Inc. and have been licensed for use by Fidelity Distributors Corporation.
Other third party marks appearing herein are the property of their respective owners.
All other marks appearing herein are registered or unregistered trademarks or service marks of FMR Corp. or an affiliated company.
(Recycle graphic) This report is printed on recycled paper using soy-based inks.
The views expressed in this report reflect those of each fund's portfolio manager only through the end of the period of the report as stated on the cover and do not necessarily represent the views of Fidelity or any other person in the Fidelity organization. Any such views are subject to change at any time based upon market or other conditions and Fidelity disclaims any responsibility to update such views. These views may not be relied on as investment advice and, because investment decisions for a Fidelity fund are based on numerous factors, may not be relied on as an indication of trading intent on behalf of any Fidelity fund.
This report and the financial statements contained herein are submitted for the general information of the shareholders of the funds. This report is not
authorized for distribution to prospective investors in the funds unless preceded or accompanied by an effective prospectus.
Mutual fund shares are not deposits or obligations of, or guaranteed by, any depository institution. Shares are not insured by the FDIC,
Federal Reserve Board or any other agency, and are subject to investment risks, including possible loss of principal amount invested.
Neither the funds nor Fidelity Distributors Corporation is a bank.
Semiannual Report
After reaching record heights in the first quarter of 2000, several of the most notable U.S. equity market indexes - including the Standard & Poor's 500SM, NASDAQ and Dow Jones Industrial Average - tumbled into negative territory by the end of the second quarter. Leading the market down was the same sector that drove it to new highs just a few months prior: technology. Beginning in mid-March, investors abandoned technology en masse, as concerns about excessive valuations and impending inflation pervaded the market. The ripple effect of the tech sell-off spread rapidly around the world, and international equity markets trended downward in response. As stocks cooled, domestic bond performance heated up, helping many U.S. fixed-income categories outpace their equity counterparts for the overall six-month period. Meanwhile, emerging-market bonds held on to most of their strong first quarter gains, but international developed-market bonds felt the pinch of inflation, as several central banks around the world began to implement interest-rate hikes to slow their respective economies.
At the mid-way point of 2000, the U.S. stock market's unprecedented streak of five consecutive double-digit annual increases appeared to be in jeopardy. The Dow Jones Industrial Average - an index of 30 blue-chip stocks - declined 8.42% during the six-month period ending June 30, 2000. The broad-based S&P 500® and the technology-concentrated NASDAQ index also disappeared below the surface, returning -0.42% and -2.44%, respectively. In a 10-week stretch from March through June, the NASDAQ dropped 33%, making dot-com investors anything but dot-calm as Internet stocks bore the brunt of the decline. As the spectacular growth of the technology sector waned, previously out-of-favor sectors began to lure investors' attention. The consistent, steady growth of the health sector was the primary beneficiary, as it wore the crown of best-performing sector for the first six months of 2000. The natural resources and real-estate sectors were surprising runners-up in the performance derby. But not all was lost for the technology sector. In June, economic reports showed strong evidence that the Federal Reserve Board's series of interest-rate hikes - including three during the first half of this year - were winning the battle against inflation. This news, combined with the Fed's decision to eschew another hike in June, fueled a renewed enthusiasm for tech stocks, as evidenced by the NASDAQ's 16.64% return for the final month of the period.
Reacting similarly to the U.S. stock market - and no doubt largely as a direct result of the U.S. market - most foreign stock markets started the six-month period off on a high note before stumbling in the second quarter. Japan and the Pacific Region in general fell particularly hard. After a stellar 1999, Japanese equities were shaken by their country's economic downturn and an unsteady U.S. market. "New Japan" stocks - Internet, electronic, telecom and software securities - led the
decline. The TOPIX Index, a benchmark of the Japanese market, fell 10.34% during the period. And even the best-performing Pacific Region fund had a negative return, according to Lipper Inc. Weak tech performance in the second quarter also hurt European stock markets, causing the Morgan Stanley Capital International Europe Index to decline 3.10% for the first half of 2000. One of the only non-U.S. stock markets that didn't suffer a negative second quarter was Canada. Often overlooked, the Canadian stock market quietly piled up an impressive six-month return of 21.89% - as measured by the Toronto Stock Exchange (TSE) 300.
Despite being challenged with a series of interest-rate hikes - almost always a detriment to fixed-income offerings - U.S. bond markets still managed to post solid returns relative to equities through the first six months of this year. U.S. government bonds were one of the top performers. In January, the U.S. Treasury announced its intent to repurchase long-term debt and curtail future issuance. Treasury prices soared in response and helped the Lehman Brothers Long-Term Government Bond Index return 8.77% for the period. The Lehman Brothers Aggregate Bond Index, a popular measure of taxable-bond performance, rose 3.99% for the past six months, while tax-free municipals were even more robust, gaining 4.48% according to the Lehman Brothers Municipal Bond Index. Underperformance in the bond market was pretty much limited to the high-yield sector. Faced with a rising interest-rate backdrop and poor technicals - including an unfavorable supply/demand condition and an increased default rate - the high-yield market stumbled to a negative return of 1.00%, as measured by the Merrill Lynch High Yield Master II Index, for the past six months.
International bond investors faced a myriad of negative factors throughout the majority of the six-month period ending June 30, 2000. Strong global economic growth and the threat of rising interest rates, currency fluctuations, and a weakening euro continued to plague global debt issues. Additionally, poor liquidity hampered bond prices in non-U.S. developed markets. Combined, those factors helped drag down the Salomon Brothers Non-U.S. World Government Bond Index, which returned -1.95%. On the bright side, a number of favorable factors propelled demand for emerging-market bonds, which was reflected in the 6.95% return of the J.P. Morgan Emerging Markets Bond Index Global - a popular benchmark of emerging-market debt. Credit momentum, which was driven by improving fundamentals - such as the Russian government's Soviet-era debt restructuring and new political leadership - fostered the rally in emerging-market bonds. Elsewhere, Brazil's better-than-expected economic growth fueled a sharp increase in foreign direct investment. Often large commodity suppliers, emerging-market countries also benefited from a sharp increase in oil prices.
Semiannual Report
Performance
There are several ways to evaluate a fund's historical performance. You can look at the total percentage change in value, the average annual percentage change or the growth of a hypothetical $10,000 investment. Total return reflects the change in the value of an investment, assuming reinvestment of the fund's dividend income and capital gains (the profits earned upon the sale of securities that have grown in value). The initial offering of Service Class shares took place on November 3, 1997. Performance for Service Class shares reflects an asset based distribution fee (12b-1 fee), and returns prior to November 3, 1997 are those of Initial Class and do not include the effects of Service Class' 12b-1 fee. Had Service Class shares' 12b-1 fee been reflected, returns prior to November 3, 1997 would have been lower.
Average Annual Total Returns
|
Periods ended |
Past 1 |
Past 5 |
Past 10 |
|
Fidelity VIP: Overseas - |
25.13% |
15.14% |
9.82% |
|
MSCI EAFE |
17.38% |
11.49% |
8.04% |
Average annual returns take the fund's cumulative return and show you what would have happened if the fund had performed at a constant rate each year.
You can compare the fund's returns to the performance of the Morgan Stanley Capital International Europe, Australasia, Far East (EAFE) Index - a market capitalization-weighted index that is designed to represent the performance of developed stock markets outside the United States and Canada. As of June 30, 2000, the index included 947 equity securities of companies domiciled in 20 countries.
Figures for more than one year assume a steady compounded rate of return and are not the fund's year-by-year results, which fluctuated over the periods shown.
Performance numbers are net of all fund operating expenses, but do not include any insurance charges imposed by your insurance company's separate account. If performance information included the effect of these additional charges, the total returns would have been lower.
Past performance is no guarantee of future results. Principal and investment return will vary and you may have a gain or loss when you withdraw your money. Foreign investments involve greater risks and potential rewards than U.S. investments. These risks include political and economic uncertainties of foreign countries, as well as the risk of currency fluctuations.
Understanding Performance
Many markets around the globe offer the potential for significant growth over time; however, investing in foreign markets means assuming greater risks than investing in the United States. Factors like changes in a country's financial markets, its local political and economic climate, and the fluctuating value of its currency create these risks. For these reasons an international fund's performance may be more volatile than a fund that invests exclusively in the United States.
3$10,000 Over 10 Years
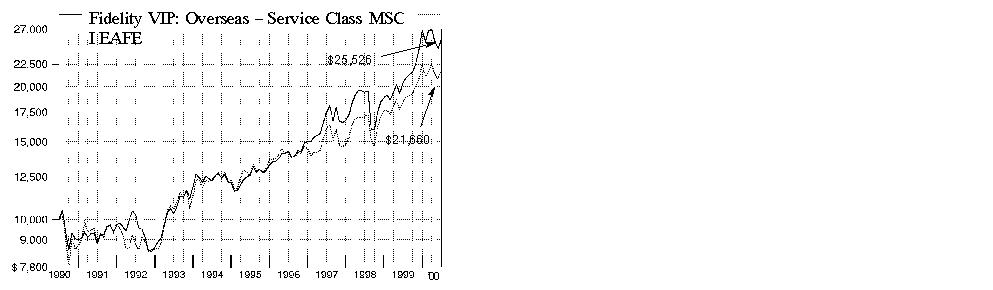
$10,000 Over 10 Years: Let's say hypothetically that $10,000 was invested in Fidelity Variable Insurance Products: Overseas Portfolio - Service Class on June 30, 1990. As the chart shows, by June 30, 2000, the value of the investment would have grown to $25,526 - a 155.26% increase on the initial investment. For comparison, look at how the Morgan Stanley Capital International EAFE Index did over the same period. With dividends and capital gains, if any, reinvested, the same $10,000 investment would have grown to $21,660 - a 116.60% increase.
Investment Summary
|
Top Five Stocks as of June 30, 2000 |
|
|
|
% of fund's |
|
TotalFinaElf SA Class B (France) |
4.7 |
|
Furukawa Electric Co. Ltd. (Japan) |
4.5 |
|
BP Amoco PLC (United Kingdom) |
4.0 |
|
Vodafone AirTouch PLC (United Kingdom) |
3.6 |
|
Samsung Electronics Co. Ltd. (Korea (South)) |
2.9 |
|
|
19.7 |
|
Top Five Market Sectors as of June 30, 2000 |
|
|
|
% of fund's |
|
Technology |
16.4 |
|
Utilities |
15.7 |
|
Energy |
14.3 |
|
Finance |
13.3 |
|
Industrial Machinery & Equipment |
8.8 |
|
Top Five Countries as of June 30, 2000 |
|
|
(excluding cash equivalents) |
% of fund's |
|
Japan |
22.3 |
|
United Kingdom |
16.5 |
|
France |
10.2 |
|
Netherlands |
8.0 |
|
Switzerland |
3.7 |
|
Percentages are adjusted for the effect of open futures contracts, if applicable. |
Semiannual Report
(Portfolio Manager photograph)
An interview with Richard Mace, Portfolio Manager of Overseas Portfolio
Q. How did the fund perform, Rick?
A. For the six months that ended June 30, 2000, the fund lagged the -3.97% return of the Morgan Stanley Capital International EAFE Index, which tracks the performance of stocks in Europe, Australasia and the Far East. For the 12 months that ended June 30, 2000, the fund's return topped the 17.38% return of the EAFE index.
Q. Why did the fund underperform its index during the past six months?
A. The fund's high concentration in Japanese technology and European and Japanese telephone utilities stocks - which were among the most positive sectors for the fund in the prior period - turned out to be the biggest relative detractor from performance this period. This weakness was due to a global correction in both sectors that was fueled by unsustainable valuations, some disappointing earnings reports and concerns about higher interest rates. In January and February, continued strong returns from the fund's positions in selected Japanese technology stocks - such as Kyocera - and Internet-related companies - such as Softbank - were short-lived when technology stocks retreated in March, turning advances in those stocks into detractors from performance for the remainder of the period. Among the utilities stocks that gave up some of their gains from the fourth quarter of 1999 and hurt the fund most were European and Japanese telephone utilities such as Vodafone AirTouch, British Telecommunications, DDI and Nippon Telegraph & Telephone.
Q. There seemed to be an effort to make the fund more concentrated during the period . . .
A. That's true. It was an extremely difficult period. Volatile market conditions created some unusual opportunities to buy more of the fund's most attractive stocks at cheaper prices. Therefore, I eliminated some of the fund's smaller and less attractive holdings to increase our positions in the stocks with the greatest potential for growth. My effort to increase the fund's concentration reduced the total number of stocks in the portfolio by about 27%. Further, the strategy also boosted the weighting of the fund's top-10 positions to 28.1% of the fund's net assets, from 19.7% of net assets six months earlier.
Q. Why did the fund's energy position rise from the prior period? What was your strategy there?
A. The energy sector looked attractive for several reasons. First, OPEC (Organization of Petroleum Exporting Countries) curtailed production during a period of increasing global demand, and this caused oil inventories to fall to very low levels. Second, as demand continued to grow and inventories remained low, I felt that oil prices might remain above the levels most investors were expecting - and that meant energy stocks were cheap as they reflected a $16-$18 per barrel oil price assumption. Third, I thought the earnings estimates for these companies were generally too low. Most were generating substantial cash flow and were benefiting from continuing industry consolidation activity. In this environment, I added to some of the fund's existing positions in oil producers such as TotalFinaElf and BP Amoco, both of which were among the fund's top-five holdings at the end of the period. In addition, I initiated positions in a number of tanker stocks on expectations that OPEC would need to increase production in an effort to ease oil prices. This worked out well as production quotas were eventually raised and prices for tanker stocks - such as fund holding Overseas Shipholding - increased substantially.
Q. What were some of the fund's top performers?
Which stocks disappointed?
A. Furukawa, a Japanese company that provides materials and components used in the manufacturing of electronics equipment such as cell phones, bucked the sell-off in the technology sector and stood out as the fund's top performer. TotalFinaElf, the French oil producer, was the fund's second-biggest contributor as investors reacted positively to its acquisition of Elf Aquitane and the rising demand for oil. On the down side, Kyocera, the fund's largest detractor, and Vodafone AirTouch both suffered from overall weakness in the technology and utilities sectors.
Q. What's your outlook, Rick?
A. I'll continue to look for undervalued companies that have good growth prospects and are consistently reporting strong earnings. In partnership with our team of 100 international research analysts, we'll maintain our global stock selection process using a bottom-up approach, while monitoring country and industry weightings. I expect consolidation to remain a major theme across a variety of sectors as corporate managements seek to cut costs, boost growth and increase their global competitiveness by acquiring competitors.
The views expressed in this report reflect those of the portfolio manager only through the end of the period of the report as stated on the cover. The manager's views are subject to change at any time based upon market or other conditions. For more information, see page 2.
Fund Facts
Goal: seeks long-term growth of capital primarily by investments in foreign securities
Start date: January 28, 1987
Size: as of June 30, 2000, more than $3.0 billion
Manager: Richard Mace, since 1996; joined Fidelity in 1987
Semiannual Report
Fidelity Variable Insurance Products: Overseas Portfolio
(Unaudited)
Showing Percentage of Net Assets
|
Common Stocks - 90.5% |
|||
|
Shares |
Value (Note 1) |
||
|
Australia - 1.1% |
|||
|
Broken Hill Proprietary Co. Ltd. |
676,793 |
$ 7,977,892 |
|
|
Cable & Wireless Optus Ltd. (a) |
2,839,300 |
8,439,288 |
|
|
News Corp. Ltd. |
795,223 |
10,834,913 |
|
|
News Corp. Ltd. sponsored ADR (preferred ltd. vtg.) |
163,800 |
7,780,500 |
|
|
|
35,032,593 |
||
|
Belgium - 0.2% |
|||
|
Electrabel SA |
22,500 |
5,556,997 |
|
|
Brazil - 0.3% |
|||
|
Aracruz Celulose SA sponsored ADR |
212,400 |
4,101,975 |
|
|
Telesp Celular Participacoes SA ADR |
141,800 |
6,363,275 |
|
|
|
10,465,250 |
||
|
Canada - 2.8% |
|||
|
Alberta Energy Co. Ltd. |
189,500 |
7,654,238 |
|
|
Anderson Exploration Ltd. (a) |
355,200 |
6,453,820 |
|
|
BCE, Inc. |
59,000 |
1,398,784 |
|
|
Canada Occidental Petroleum Ltd. |
153,000 |
4,149,240 |
|
|
Canadian Natural Resources Ltd. (a) |
279,600 |
8,120,770 |
|
|
Celestica, Inc. (sub. vtg.) (a) |
199,800 |
9,730,213 |
|
|
Cinar Films, Inc. Class B (ltd. vtg.) (a) |
136,500 |
477,750 |
|
|
Crestar Energy, Inc. (a) |
277,500 |
4,226,697 |
|
|
Mitel Corp. (a) |
112,300 |
2,343,850 |
|
|
Nortel Networks Corp. |
92,652 |
6,427,126 |
|
|
Rio Alto Exploration Ltd. (a) |
257,500 |
4,713,441 |
|
|
Suncor Energy, Inc. |
196,500 |
4,539,210 |
|
|
Talisman Energy, Inc. (a) |
659,100 |
21,836,444 |
|
|
Telesystem International Wireless, Inc. (sub. vtg.) (a) |
213,900 |
3,915,360 |
|
|
|
85,986,943 |
||
|
Denmark - 0.4% |
|||
|
Novo-Nordisk AS (B Shares) (a) |
64,800 |
11,018,365 |
|
|
Finland - 2.8% |
|||
|
Metsa-Serla Oyj Class B Free Shares |
164,200 |
1,213,949 |
|
|
Nokia AB |
770,000 |
38,451,874 |
|
|
Sampo Insurance Co. Ltd. |
131,100 |
5,315,171 |
|
|
Sonera Corp. |
221,200 |
10,075,906 |
|
|
UPM-Kymmene Corp. |
1,284,600 |
31,861,548 |
|
|
|
86,918,448 |
||
|
France - 10.2% |
|||
|
Aventis SA |
166,260 |
12,064,242 |
|
|
AXA SA de CV |
127,026 |
19,994,115 |
|
|
Banque Nationale de Paris (BNP) |
159,240 |
15,312,225 |
|
|
Canal Plus SA |
28,800 |
4,835,382 |
|
|
Castorama Dubois Investissements SA |
34,750 |
8,585,789 |
|
|
Compagnie de St. Gobain |
23,000 |
3,106,824 |
|
|
France Telecom SA |
280,400 |
39,160,182 |
|
|
Rhodia SA |
361,700 |
6,072,769 |
|
|
Sanofi-Synthelabo SA |
193,168 |
9,195,203 |
|
|
Societe Generale Class A |
168,800 |
10,144,686 |
|
|
|
|||
|
Shares |
Value (Note 1) |
||
|
Suez Lyonnaise des Eaux |
33,800 |
$ 5,916,684 |
|
|
Television Francaise 1 SA |
208,940 |
14,550,237 |
|
|
TotalFinaElf SA Class B |
945,444 |
145,598,378 |
|
|
Vivendi SA |
245,500 |
21,651,302 |
|
|
|
316,188,018 |
||
|
Germany - 3.7% |
|||
|
Allianz AG (Reg.) |
47,200 |
16,943,449 |
|
|
BASF AG |
517,700 |
20,791,502 |
|
|
Deutsche Telekom AG |
218,700 |
12,476,006 |
|
|
E.On AG |
159,700 |
7,693,464 |
|
|
Intershop Communication AG (a) |
6,800 |
3,093,584 |
|
|
JUMPtec Industrielle Computertechnik AG |
5,292 |
467,978 |
|
|
Kali Und Salz Beteiligungs AG |
590,850 |
9,018,262 |
|
|
Munich Reinsurance AG (Reg.) |
28,192 |
8,848,047 |
|
|
Siemens AG |
193,500 |
29,165,113 |
|
|
Software AG |
18,200 |
1,684,103 |
|
|
United Internet AG (a) |
21,700 |
2,670,392 |
|
|
|
112,851,900 |
||
|
Hong Kong - 1.4% |
|||
|
China Telecom (Hong Kong) Ltd. (a) |
3,618,000 |
32,166,283 |
|
|
Hutchison Whampoa Ltd. |
578,600 |
7,273,693 |
|
|
Johnson Electric Holdings Ltd. |
480,000 |
4,541,023 |
|
|
|
43,980,999 |
||
|
Ireland - 0.2% |
|||
|
Bank of Ireland, Inc. |
1,151,438 |
7,205,598 |
|
|
Israel - 0.2% |
|||
|
Check Point Software |
24,600 |
5,209,050 |
|
|
Italy - 1.9% |
|||
|
Banca Intesa Spa |
3,138,646 |
14,144,182 |
|
|
Olivetti & Co. Spa |
1,883,500 |
6,856,455 |
|
|
San Paolo Imi Spa |
404,100 |
7,124,648 |
|
|
Telecom Italia Mobile Spa |
1,313,900 |
13,410,072 |
|
|
Telecom Italia Spa |
1,130,524 |
15,551,776 |
|
|
|
57,087,133 |
||
|
Japan - 22.3% |
|||
|
Asahi Chemical Industry Co. Ltd. |
527,000 |
3,728,070 |
|
|
Canon, Inc. |
445,000 |
22,416,876 |
|
|
DDI Corp. |
2,836 |
27,284,664 |
|
|
Fuji Bank Ltd. |
902,000 |
6,857,310 |
|
|
Fujitsu Ltd. |
749,000 |
25,927,468 |
|
|
Furukawa Electric Co. Ltd. |
6,630,000 |
138,515,852 |
|
|
Hitachi Chemical Co. Ltd. |
132,000 |
3,056,593 |
|
|
Hitachi Zosen Corp. (a) |
1,563,000 |
1,415,280 |
|
|
Hoya Corp. |
80,000 |
7,168,459 |
|
|
Ito-Yokado Co. Ltd. |
387,000 |
23,288,626 |
|
|
KDD Corp. |
73,900 |
7,458,310 |
|
|
Kyocera Corp. |
287,200 |
49,344,552 |
|
|
Mitsubishi Electric Corp. |
1,303,000 |
14,109,074 |
|
|
Mitsubishi Estate Co. Ltd. |
646,000 |
7,604,301 |
|
|
Common Stocks - continued |
|||
|
Shares |
Value (Note 1) |
||
|
Japan - continued |
|||
|
Mitsui Fudosan Co. Ltd. |
288,000 |
$ 3,123,939 |
|
|
NEC Corp. |
885,000 |
27,797,115 |
|
|
Net One Systems Co. Ltd. |
159 |
3,659,310 |
|
|
Nikko Securities Co. Ltd. |
4,280,000 |
42,388,230 |
|
|
Nintendo Co. Ltd. |
39,000 |
6,812,677 |
|
|
Nippon Telegraph & Telephone Corp. |
3,306 |
43,967,744 |
|
|
Nomura Securities Co. Ltd. |
2,238,000 |
54,778,440 |
|
|
NTT DoCoMo, Inc. |
365 |
9,880,683 |
|
|
Oki Electric Industry Co. Ltd. (a) |
719,000 |
5,594,935 |
|
|
Omron Corp. |
772,000 |
20,971,138 |
|
|
ORIX Corp. |
57,600 |
8,502,547 |
|
|
Rohm Co. Ltd. |
24,300 |
7,105,263 |
|
|
Sakura Bank Ltd. |
1,052,000 |
7,273,307 |
|
|
Softbank Corp. |
131,700 |
17,887,946 |
|
|
Sony Corp. |
199,600 |
18,824,776 |
|
|
Takeda Chemical Industries Ltd. |
455,000 |
29,869,837 |
|
|
Toko, Inc. |
586,000 |
4,427,335 |
|
|
Tokyo Broadcasting System, Inc. |
136,000 |
5,875,118 |
|
|
Tokyo Seimitsu Co. Ltd. |
128,800 |
17,251,085 |
|
|
Trans Cosmos, Inc. |
31,600 |
4,745,067 |
|
|
Yamanouchi Pharmaceutical Co. Ltd. |
117,000 |
6,389,644 |
|
|
Zeon Corp. |
712,000 |
5,070,364 |
|
|
|
690,371,935 |
||
|
Korea (South) - 3.6% |
|||
|
Kookmin Bank |
228,100 |
2,904,886 |
|
|
Samsung Electro-Mechanics Co. (a) |
152,610 |
9,566,997 |
|
|
Samsung Electronics Co. Ltd. |
271,340 |
89,795,721 |
|
|
SK Telecom Co. Ltd. ADR |
286,100 |
10,389,006 |
|
|
|
112,656,610 |
||
|
Marshall Islands - 0.6% |
|||
|
Teekay Shipping Corp. |
592,500 |
19,478,438 |
|
|
Mexico - 2.8% |
|||
|
Grupo Televisa SA de CV sponsored GDR (a) |
253,400 |
17,468,763 |
|
|
Telefonos de Mexico SA de CV Series L sponsored ADR |
552,800 |
31,578,700 |
|
|
TV Azteca SA de CV sponsored ADR |
1,962,700 |
25,883,106 |
|
|
Wal-Mart de Mexico SA de CV |
5,402,000 |
12,644,151 |
|
|
|
87,574,720 |
||
|
Netherlands - 8.0% |
|||
|
ABN AMRO Holding NV |
404,000 |
9,889,256 |
|
|
Akzo Nobel NV (a) |
312,300 |
13,257,377 |
|
|
Equant NV (NY Shares) (a) |
312,000 |
13,416,000 |
|
|
Heineken NV |
94,600 |
5,753,034 |
|
|
ING Groep NV |
352,462 |
23,805,164 |
|
|
Koninklijke Ahold NV (a) |
711,949 |
20,938,618 |
|
|
Koninklijke KPN NV |
235,600 |
10,529,567 |
|
|
Koninklijke Philips Electronics NV |
1,201,984 |
56,643,652 |
|
|
|
|||
|
Shares |
Value (Note 1) |
||
|
Nutreco Holding NV |
123,833 |
$ 4,725,220 |
|
|
Royal Dutch Petroleum Co. |
801,800 |
49,360,809 |
|
|
STMicroelectronics NV (NY Shares) |
152,700 |
9,801,431 |
|
|
United Pan-Europe Communications NV Class A (a) |
372,200 |
9,725,099 |
|
|
Vendex KBB NV |
496,457 |
8,425,258 |
|
|
VNU NV |
106,700 |
5,506,648 |
|
|
Wolters Kluwer NV |
239,700 |
6,379,665 |
|
|
|
248,156,798 |
||
|
Norway - 1.3% |
|||
|
Bergesen dy ASA: |
|
|
|
|
(A Shares) |
509,100 |
10,433,470 |
|
|
(B Shares) |
489,051 |
9,367,702 |
|
|
DNB Holding ASA |
1,026,200 |
4,253,976 |
|
|
Frontline Ltd. (a) |
769,900 |
9,413,186 |
|
|
TANDBERG ASA (a) |
186,400 |
4,438,664 |
|
|
VMETRO ASA |
121,900 |
1,419,439 |
|
|
|
39,326,437 |
||
|
Russia - 0.0% |
|||
|
Mobile TeleSystems Ojsc sponsored ADR (a) |
21,100 |
472,113 |
|
|
Singapore - 0.8% |
|||
|
Chartered Semiconductor |
196,100 |
17,649,000 |
|
|
Overseas Union Bank Ltd. |
862,296 |
3,342,716 |
|
|
United Overseas Bank Ltd. |
329,472 |
2,154,097 |
|
|
|
23,145,813 |
||
|
Spain - 1.7% |
|||
|
Altadis SA |
245,727 |
3,771,677 |
|
|
Banco Santander Central Hispano SA |
1,538,868 |
16,221,435 |
|
|
Telefonica SA (a) |
1,445,100 |
31,017,446 |
|
|
|
51,010,558 |
||
|
Sweden - 0.1% |
|||
|
Netcom AB (B Shares) (a) |
25,300 |
1,873,808 |
|
|
Switzerland - 3.7% |
|||
|
ABB Ltd. (Reg.) |
60,751 |
7,262,817 |
|
|
Credit Suisse Group (Reg.) |
131,154 |
26,058,947 |
|
|
Gretag Imaging Holding AG (Reg. D) |
6,500 |
1,249,694 |
|
|
Julius Baer Holding AG |
1,792 |
7,077,149 |
|
|
Nestle SA (Reg.) |
21,218 |
42,417,812 |
|
|
The Swatch Group AG (Reg.) |
46,400 |
12,088,660 |
|
|
UBS AG |
109,468 |
16,019,380 |
|
|
Valora Holding AG |
8,500 |
2,357,641 |
|
|
|
114,532,100 |
||
|
Taiwan - 2.4% |
|||
|
Macronix International Co. Ltd. (a) |
1,754,890 |
4,397,934 |
|
|
Taiwan Semiconductor |
6,292,976 |
29,903,157 |
|
|
Common Stocks - continued |
|||
|
Shares |
Value (Note 1) |
||
|
Taiwan - continued |
|||
|
United Microelectronics Corp. |
9,392,400 |
$ 26,136,703 |
|
|
Winbond Electronics Corp. (a) |
4,298,450 |
12,451,165 |
|
|
|
72,888,959 |
||
|
United Kingdom - 16.5% |
|||
|
Amvescap PLC |
871,400 |
14,012,286 |
|
|
BAE SYSTEMS PLC |
1,589,329 |
9,933,370 |
|
|
BP Amoco PLC |
13,057,386 |
123,092,995 |
|
|
Cable & Wireless PLC |
1,959,100 |
33,256,173 |
|
|
Carlton Communications PLC |
1,578,600 |
20,355,258 |
|
|
Diageo PLC |
476,100 |
4,282,905 |
|
|
Granada Group PLC |
715,800 |
7,166,733 |
|
|
HSBC Holdings PLC (Reg.) |
938,894 |
10,879,433 |
|
|
Lloyds TSB Group PLC |
1,473,800 |
13,951,109 |
|
|
Marconi PLC |
639,700 |
8,345,654 |
|
|
Misys PLC |
631,300 |
5,343,866 |
|
|
Prudential Corp. PLC |
454,200 |
6,669,727 |
|
|
Reed International PLC |
537,300 |
4,686,734 |
|
|
Reuters Group PLC |
767,400 |
12,782,007 |
|
|
Rio Tinto PLC (Reg.) |
768,500 |
12,590,797 |
|
|
Royal Bank of Scotland Group PLC |
1,639,500 |
27,507,564 |
|
|
Shell Transport & Trading Co. PLC (Reg.) |
6,057,900 |
50,419,383 |
|
|
SMG PLC |
787,200 |
4,257,260 |
|
|
SmithKline Beecham PLC |
1,620,442 |
21,126,500 |
|
|
SSL International PLC |
96,600 |
1,047,777 |
|
|
Unilever PLC |
363,810 |
2,285,180 |
|
|
Vodafone AirTouch PLC |
26,557,103 |
110,045,894 |
|
|
WPP Group PLC |
465,700 |
6,817,406 |
|
|
|
510,856,011 |
||
|
United States of America - 1.5% |
|||
|
Bristol-Myers Squibb Co. |
151,000 |
8,795,750 |
|
|
Eli Lilly & Co. |
119,500 |
11,935,063 |
|
|
OMI Corp. |
443,100 |
2,409,356 |
|
|
Overseas Shipholding Group, Inc. |
533,300 |
13,132,513 |
|
|
Schering-Plough Corp. |
186,300 |
9,408,150 |
|
|
|
45,680,832 |
||
|
TOTAL COMMON STOCKS (Cost $2,098,252,397) |
2,795,526,426 |
||
|
Investment Companies - 0.1% |
|||
|
|
|
|
|
|
Multi-National - 0.1% |
|||
|
European Warrant Fund, Inc. |
306,000 |
4,475,250 |
|
|
Cash Equivalents - 12.4% |
|||
|
Shares |
Value (Note 1) |
||
|
Central Cash Collateral Fund, 6.71% (b) |
164,583,560 |
$ 164,583,560 |
|
|
Taxable Central Cash Fund, 6.59% (b) |
218,019,162 |
218,019,162 |
|
|
TOTAL CASH EQUIVALENTS (Cost $382,602,722) |
382,602,722 |
||
|
TOTAL INVESTMENT PORTFOLIO - 103.0% (Cost $2,485,876,718) |
3,182,604,398 |
|
|
NET OTHER ASSETS - (3.0)% |
(92,987,924) |
|
|
NET ASSETS - 100% |
$ 3,089,616,474 |
|
|
Legend |
|
(a) Non-income producing |
|
(b) The rate quoted is the annualized seven-day yield of the fund at |
|
Other Information |
|
Purchases and sales of securities, other than short-term securities, aggregated $1,789,627,683 and $1,514,198,966, respectively, of which U.S. government and government agency obligations aggregated $0 and $4,435,324, respectively. |
|
The market value of futures contracts opened and closed during the period amounted to $0 and $16,650,996, respectively. |
|
The fund placed a portion of its portfolio transactions with brokerage firms which are affiliates of Fidelity Management & Research Company. The commissions paid to these affiliated firms were $1,080 for the period. |
|
The fund participated in the security lending program. At the period end, the value of securities loaned amounted to $164,478,909. The fund received cash collateral of $164,583,560 which was invested in cash equivalents and U.S. Treasury Obligations valued at $7,170,000. |
|
Income Tax Information |
|
At June 30, 2000, the aggregate cost of investment securities for income tax purposes was $2,495,276,806. Net unrealized appreciation aggregated $687,327,592, of which $794,595,136 related to appreciated investment securities and $107,267,544 related to depreciated investment securities. |
See accompanying notes which are an integral part of the financial statements.
Overseas Portfolio
Statement of Assets and Liabilities
|
|
June 30, 2000 (Unaudited) |
|
|
Assets |
|
|
|
Investment in securities, at value (cost $2,485,876,718) - |
|
$ 3,182,604,398 |
|
Foreign currency held at value |
|
14,800,284 |
|
Receivable for investments sold |
|
87,398,285 |
|
Receivable for fund shares sold |
|
55,319,628 |
|
Dividends receivable |
|
4,560,497 |
|
Interest receivable |
|
1,166,523 |
|
Other receivables |
|
32,299 |
|
Total assets |
|
3,345,881,914 |
|
Liabilities |
|
|
|
Payable to custodian bank |
$ 24 |
|
|
Payable for investments purchased |
88,348,263 |
|
|
Payable for fund shares redeemed |
755,883 |
|
|
Accrued management fee |
1,845,001 |
|
|
Distribution fees payable |
20,958 |
|
|
Other payables and |
711,751 |
|
|
Collateral on securities loaned, |
164,583,560 |
|
|
Total liabilities |
|
256,265,440 |
|
Net Assets |
|
$ 3,089,616,474 |
|
Net Assets consist of: |
|
|
|
Paid in capital |
|
$ 2,238,651,656 |
|
Undistributed net investment income |
|
6,881,028 |
|
Accumulated undistributed |
|
147,360,600 |
|
Net unrealized appreciation (depreciation) on investments |
|
696,723,190 |
|
Net Assets |
|
$ 3,089,616,474 |
|
Initial Class : |
|
$23.46 |
|
Service Class: |
|
$23.41 |
|
Service Class 2: |
|
$23.38 |
Statement of Operations
|
|
Six months ended June 30, 2000 (Unaudited) |
|
|
Investment Income Dividends |
|
$ 28,919,045 |
|
Interest |
|
5,991,504 |
|
Security lending |
|
369,625 |
|
|
|
35,280,174 |
|
Less foreign taxes withheld |
|
(3,264,911) |
|
Total income |
|
32,015,263 |
|
Expenses |
|
|
|
Management fee |
$ 10,781,118 |
|
|
Transfer agent fees |
996,099 |
|
|
Distribution fees |
100,086 |
|
|
Accounting and security lending fees |
697,742 |
|
|
Non-interested trustees' compensation |
12,169 |
|
|
Custodian fees and expenses |
703,855 |
|
|
Registration fees |
159,039 |
|
|
Audit |
23,591 |
|
|
Legal |
11,063 |
|
|
Miscellaneous |
25,459 |
|
|
Total expenses before reductions |
13,510,221 |
|
|
Expense reductions |
(262,270) |
13,247,951 |
|
Net investment income |
|
18,767,312 |
|
Realized and Unrealized Gain (Loss) Net realized gain (loss) on: |
|
|
|
Investment securities |
157,476,657 |
|
|
Foreign currency transactions |
(157,449) |
|
|
Futures contracts |
966,799 |
158,286,007 |
|
Change in net unrealized appreciation (depreciation) on: |
|
|
|
Investment securities |
(308,240,636) |
|
|
Assets and liabilities in |
(88,785) |
|
|
Futures contracts |
(450,390) |
(308,779,811) |
|
Net gain (loss) |
|
(150,493,804) |
|
Net increase (decrease) in net assets resulting from operations |
|
$ (131,726,492) |
|
Other Information Expense reductions |
|
$ 249,713 |
|
Custodian credits |
|
12,557 |
|
|
|
$ 262,270 |
See accompanying notes which are an integral part of the financial statements.
Semiannual Report
Fidelity Variable Insurance Products: Overseas Portfolio
Financial Statements - continued
Statement of Changes in Net Assets
|
Increase (Decrease) in Net Assets |
Six months ended |
Year ended |
|
Operations |
$ 18,767,312 |
$ 24,385,652 |
|
Net realized gain (loss) |
158,286,007 |
279,081,035 |
|
Change in net unrealized appreciation (depreciation) |
(308,779,811) |
567,840,640 |
|
Net increase (decrease) in net assets resulting from operations |
(131,726,492) |
871,307,327 |
|
Distributions to shareholders |
(29,474,912) |
(31,839,750) |
|
In excess of net investment income |
(12,018,477) |
- |
|
From net realized gain |
(261,723,630) |
(51,354,434) |
|
Total distributions |
(303,217,019) |
(83,194,184) |
|
Share transactions - net increase (decrease) |
643,337,117 |
(16,452,995) |
|
Total increase (decrease) in net assets |
208,393,606 |
771,660,148 |
|
Net Assets |
|
|
|
Beginning of period |
2,881,222,868 |
2,109,562,720 |
|
End of period (including undistributed net investment income of $6,881,028 and $10,707,600, respectively) |
$ 3,089,616,474 |
$ 2,881,222,868 |
|
Other Information: |
|
|
Six months ended June 30, 2000 |
Year ended |
||
|
|
Shares |
Dollars |
Shares |
Dollars |
|
Share transactions |
85,476,599 |
$ 2,061,439,529 |
137,488,784 |
$ 2,927,082,596 |
|
Reinvested |
11,650,005 |
284,959,119 |
4,250,326 |
81,691,268 |
|
Redeemed |
(76,595,523) |
(1,846,989,611) |
(145,444,173) |
(3,101,747,139) |
|
Net increase (decrease) |
20,531,081 |
$ 499,409,037 |
(3,705,063) |
$ (92,973,275) |
|
Service Class |
36,993,399 |
$ 881,191,616 |
18,969,271 |
$ 422,534,083 |
|
Reinvested |
747,240 |
18,247,617 |
78,277 |
1,502,916 |
|
Redeemed |
(31,673,883) |
(757,892,720) |
(15,508,477) |
(347,516,719) |
|
Net increase (decrease) |
6,066,756 |
$ 141,546,513 |
3,539,071 |
$ 76,520,280 |
|
Service Class 2 A |
107,413 |
$ 2,478,164 |
- |
$ - |
|
Reinvested |
421 |
10,283 |
- |
- |
|
Redeemed |
(4,671) |
(106,880) |
- |
- |
|
Net increase (decrease) |
103,163 |
$ 2,381,567 |
- |
$ - |
|
Distributions |
|
$ 27,739,213 |
|
$ 31,264,560 |
|
Service Class |
|
1,734,722 |
|
575,190 |
|
Service Class 2 A |
|
977 |
|
- |
|
Total |
|
$ 29,474,912 |
|
$ 31,839,750 |
|
In excess of net investment income |
|
$ 11,310,740 |
|
$ - |
|
Service Class |
|
707,338 |
|
- |
|
Service Class 2 A |
|
399 |
|
- |
|
Total |
|
$ 12,018,477 |
|
$ - |
|
From net realized gain |
|
$ 245,909,166 |
|
$ 50,426,708 |
|
Service Class |
|
15,805,557 |
|
927,726 |
|
Service Class 2 A |
|
8,907 |
|
- |
|
Total |
|
$ 261,723,630 |
|
$ 51,354,434 |
|
|
|
$ 303,217,019 |
|
$ 83,194,184 |
A Service Class 2 commenced sale of shares January 12, 2000.
See accompanying notes which are an integral part of the financial statements.
Overseas Portfolio
Financial Highlights - Initial Class
|
|
Six months ended |
Years ended December 31, |
||||
|
Selected Per-Share Data |
(Unaudited) |
1999 |
1998 |
1997 |
1996 |
1995 |
|
Net asset value, beginning of period |
$ 27.44 |
$ 20.06 |
$ 19.20 |
$ 18.84 |
$ 17.06 |
$ 15.67 |
|
Income from Investment Operations |
|
|
|
|
|
|
|
Net investment income |
.15 D |
.24 D |
.23 D |
.30 D |
.32 D, E |
.17 |
|
Net realized and unrealized gain (loss) |
(1.43) |
7.95 |
2.13 |
1.70 |
1.88 |
1.34 |
|
Total from investment operations |
(1.28) |
8.19 |
2.36 |
2.00 |
2.20 |
1.51 |
|
Less Distributions |
|
|
|
|
|
|
|
From net investment income |
(.26) |
(.31) |
(.38) |
(.33) |
(.20) |
(.06) |
|
In excess of net investment income |
(.11) |
- |
- |
- |
- |
- |
|
From net realized gain |
(2.33) |
(.50) |
(1.12) |
(1.31) |
(.22) |
(.02) |
|
In excess of net realized gain |
- |
- |
- |
- |
- |
(.04) |
|
Total distributions |
(2.70) |
(.81) |
(1.50) |
(1.64) |
(.42) |
(.12) |
|
Net asset value, end of period |
$ 23.46 |
$ 27.44 |
$ 20.06 |
$ 19.20 |
$ 18.84 |
$ 17.06 |
|
Total Return B, C |
(5.07)% |
42.55% |
12.81% |
11.56% |
13.15% |
9.74% |
|
Ratios and Supplemental Data |
|
|
|
|
|
|
|
Net assets, end of period (000 omitted) |
$ 2,821,728 |
$ 2,736,851 |
$ 2,074,843 |
$ 1,926,322 |
$ 1,667,601 |
$ 1,343,134 |
|
Ratio of expenses to average net assets |
.90% A |
.91% |
.91% |
.92% |
.93% |
.91% |
|
Ratio of expenses to average net assets after expense reductions |
.88% A, G |
.87% G |
.89% G |
.90% G |
.92% G |
.91% |
|
Ratio of net investment income to average net assets |
1.27% A |
1.10% |
1.19% |
1.55% |
1.84% |
1.88% |
|
Portfolio turnover |
110% A |
78% |
84% |
67% |
92% |
50% |
Financial Highlights - Service Class
|
|
Six months ended |
Years ended December 31, |
||
|
Selected Per-Share Data |
(Unaudited) |
1999 |
1998 |
1997 F |
|
Net asset value, beginning of period |
$ 27.39 |
$ 20.04 |
$ 19.20 |
$ 19.36 |
|
Income from Investment Operations |
|
|
|
|
|
Net investment income D |
.14 |
.22 |
.15 |
.01 |
|
Net realized and unrealized gain (loss) |
(1.43) |
7.94 |
2.19 |
(.17) |
|
Total from investment operations |
(1.29) |
8.16 |
2.34 |
(.16) |
|
Less Distributions |
|
|
|
|
|
From net investment income |
(.26) |
(.31) |
(.38) |
- |
|
In excess of net investment income |
(.10) |
- |
- |
- |
|
From net realized gain |
(2.33) |
(.50) |
(1.12) |
- |
|
Total distributions |
(2.69) |
(.81) |
(1.50) |
- |
|
Net asset value, end of period |
$ 23.41 |
$ 27.39 |
$ 20.04 |
$ 19.20 |
|
Total Return B, C |
(5.12)% |
42.44% |
12.69% |
(0.83)% |
|
Ratios and Supplemental Data |
|
|
|
|
|
Net assets, end of period (000 omitted) |
$ 265,477 |
$ 144,371 |
$ 34,720 |
$ 931 |
|
Ratio of expenses to average net assets |
1.00% A |
1.01% |
1.01% |
1.02% A |
|
Ratio of expenses to average net assets after expense reductions |
.99% A, G |
.98% G |
.97% G |
1.01% A, G |
|
Ratio of net investment income to average net assets |
1.17% A |
1.00% |
.80% |
.31% A |
|
Portfolio turnover |
110% A |
78% |
84% |
67% |
|
A Annualized B The total returns would have been lower had certain expenses not been reduced during the periods shown. C Total returns for periods of less than one year are not annualized and do not reflect charges attributable to your insurance company's separate account. Inclusion of these charges would reduce the total returns shown. D Net investment income per share has been calculated based on average shares outstanding during the period. E Investment income per share reflects a special dividend which amounted to $.05 per share. F For the period November 3, 1997 (commencement of sale of Service Class shares) to December 31, 1997. G FMR or the fund has entered into varying arrangements with third parties who either paid or reduced a portion of the class' expenses. |
||||
See accompanying notes which are an integral part of the financial statements.
Semiannual Report
Financial Highlights - Service Class 2
|
|
Six months ended |
|
Selected Per-Share Data |
(Unaudited) |
|
Net asset value, beginning of period |
$ 26.16 |
|
Income from Investment Operations |
|
|
Net investment income D |
.10 |
|
Net realized and unrealized gain (loss) |
(.19) |
|
Total from investment operations |
(.09) |
|
Less Distributions |
|
|
From net investment income |
(.26) |
|
In excess of net investment income |
(.10) |
|
From net realized gain |
(2.33) |
|
Total distributions |
(2.69) |
|
Net asset value, end of period |
$ 23.38 |
|
Total Return B, C |
(0.78)% |
|
Ratios and Supplemental Data |
|
|
Net assets, end of period (000 omitted) |
$ 2,412 |
|
Ratio of expenses to average net assets |
1.20% A |
|
Ratio of expenses to average net assets after expense reductions |
1.18% A, F |
|
Ratio of net investment income to average net assets |
.97% A |
|
Portfolio turnover |
110% A |
|
A Annualized B The total return would have been lower had certain expenses not been reduced during the period shown. C Total returns for periods of less than one year are not annualized and do not reflect charges attributable to your insurance company's separate account. Inclusion of these charges would reduce the total returns shown. D Net investment income per share has been calculated based on average shares outstanding during the period. E For the period January 12, 2000 (commencement of sale of Service Class 2 shares) to June 30, 2000. F FMR or the fund has entered into varying arrangements with third parties who either paid or reduced a portion of the class' expenses. |
|
See accompanying notes which are an integral part of the financial statements.
Overseas Portfolio
Performance
There are several ways to evaluate a fund's historical performance. You can look at the total percentage change in value, the average annual percentage change or the growth of a hypothetical $10,000 investment. Total return reflects the change in the value of an investment, assuming reinvestment of the fund's dividend income and capital gains (the profits earned upon the sale of securities that have grown in value). Performance for Service Class shares reflects an asset based distribution fee (12b-1 fee). If Fidelity had not reimbursed certain fund expenses, the total returns would have been lower.
Average Annual Total Returns
|
Periods ended |
Past 1 |
Life of |
|
Fidelity VIP: Mid Cap - Service Class |
61.43% |
53.10% |
|
S&P MidCap 400 |
16.98% |
20.14% |
Average annual returns take the fund's cumulative return and show you what would have happened if the fund had performed at a constant rate each year.
You can compare the fund's returns to the performance of the Standard & Poor's MidCap 400 Index - a market capitalization-weighted index of 400 medium-capitalization stocks. This benchmark includes reinvested dividends and capital gains, if any.
Figures for more than one year assume a steady compounded rate of return and are not the fund's year-by-year results, which fluctuated over the periods shown. The life of fund figures are from commencement of operations, December 28, 1998.
Performance numbers are net of all fund operating expenses, but do not include any insurance charges imposed by your insurance company's separate account. If performance information included the effect of these additional charges, the total returns would be lower.
Past performance is no guarantee of future results. Principal and investment return will vary and you may have a gain or loss when you withdraw your money.
Understanding Performance
How a fund did yesterday is no guarantee of how it will do tomorrow. The stock market, for example, has a history of long-term growth and short-term volatility. In turn, the share price and return of a fund that invests in stocks will vary. That means if you sell your shares during a market downturn, you might lose money. But if you can ride out the market's ups and downs, you may have a gain.
3$10,000 Over Life of Fund
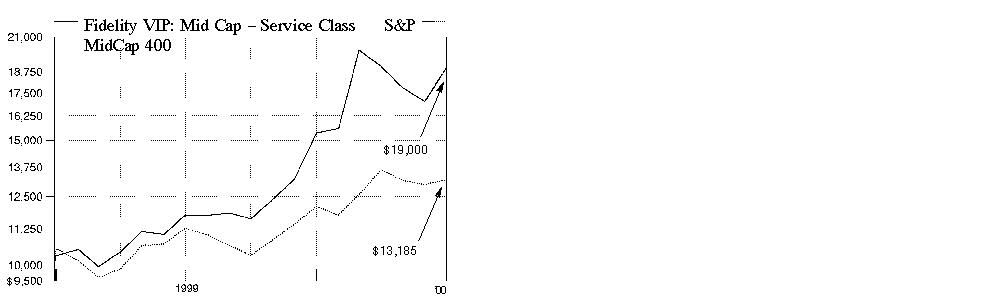
$10,000 Over Life of Fund: Let's say hypothetically that $10,000 was invested in Fidelity Variable Insurance Products: Mid Cap Portfolio - Service Class - on December 28, 1998, when the fund started. As the chart shows, by June 30, 2000, the value of the investment would have grown to $19,000 - a 90.00% increase on the initial investment. For comparison, look at how the Standard & Poor's MidCap 400 Index did over the same period. With dividends and capital gains, if any, reinvested, the same $10,000 investment would have grown to $13,185 - a 31.85% increase.
Investment Summary
|
Top Five Stocks as of June 30, 2000 |
|
|
|
% of fund's |
|
Nextel Communications, Inc. Class A |
2.6 |
|
Kopin Corp. |
1.7 |
|
Calpine Corp. |
1.5 |
|
Freddie Mac |
1.3 |
|
Brocade Communications Systems, Inc. |
1.0 |
|
|
8.1 |
|
Top Five Market Sectors as of June 30, 2000 |
|
|
|
% of fund's |
|
Technology |
31.7 |
|
Health |
13.5 |
|
Energy |
10.8 |
|
Utilities |
8.8 |
|
Finance |
6.5 |
|
Asset Allocation as of June 30, 2000 |
|||
|
% of fund's net assets * |
|||
|
Stocks and |
|
|
|
Short-Term |
|
|
|
* Foreign investments 4.7% |
Semiannual Report
(Portfolio Manager photograph)
An interview with
David Felman,
Portfolio Manager
of Mid Cap Portfolio
Q. How did the fund perform, David?
A. The fund performed very well, substantially exceeding the performance of its benchmark, the Standard & Poor's MidCap 400 Index, which had a total return of 8.97% for the six-month period ending June 30, 2000 and a 16.98% return for the 12-month period.
Q. What factors affected performance?
A. We started the period by continuing a very good run in technology and biotechnology into March. The technology run was driven by excitement about the Internet, with continued bullishness for Internet infrastructure stocks. Enthusiasm for biotechnology stocks was strong due to breakthroughs in genomics, or gene-mapping. In early March, however, things seemed to fall apart for both sectors. The catalyst for biotechnology's decline was a government announcement raising questions about whether patents would be issued for genes. That started a cascade that began in March and lasted until early June. Valuations were so high that anything that possibly could threaten stock values eventually did. In early June, however, stocks in these two sectors started coming back.
Q. What were your principal strategies during this period of volatility?
A. We had a very strong weighting in technology early in the period, exceeding 45% of net assets in late February. This helped the fund greatly in the rally. We did get hit in the correction that began in March, but we practiced prudent risk management, selling some stocks with extremely high valuations, and taking some money off the table. I also reduced our holdings in some Internet stocks when I started to see cracks in Internet usage and a reduction in advertising on the Web. I remained bullish on telecommunications service providers, such as Nextel, as I was still optimistic about the growth potential for wireless communications in the United States. By the end of the period, the technology weighting declined to 31.7% of net assets. Part of this reduction was a result of stock prices losing value and part of it was a result of my decisions to reduce the size of holdings. Throughout the period, I avoided traditional defensive areas such as cyclicals, natural resources and utilities other than telecommunications companies. As a risk-management tactic, I was more comfortable increasing my cash position than investing in these industries. The fund did underperform the S&P MidCap 400 Index from early March through early June, but I thought that was an acceptable price to pay for the very good performance early in the period. Overall, we were well ahead of mid-cap stock indexes for the six-month period.
Q. What were some of the investments that helped performance?
A. Nextel Communications, the fund's largest position at the end of the period, was a big contributor. Kopin, which makes wafers for the amplifiers of wireless handsets, also helped performance. Kopin and Research in Motion, which manufactures two-way pagers with access to the Internet, both benefited from increased wireless usage. Another strong contributor was Veritas Software, whose data protection products were in demand as data storage related to the Internet grew.
Q. What were some of the disappointments?
A. DoubleClick had performed well earlier, but its stock fell as advertising on the Internet declined. DoubleClick is the largest provider of advertising on the Internet. Most of the other detractors from performance, relative to the S&P Mid Cap 400 Index, were companies such as QLogic Corp., which had good performance but which I underweighted. QLogic produces components for fiber-optic communications systems.
Q. What is your outlook for the mid-cap stock market?
A. The rapid growth of wireless communications and increased Internet usage are major long-term trends. However, the stocks that benefited from this growth during the period reached very high valuations and then suffered sharp corrections in March through early June. Investors are wondering what will happen next. I believe that technology will continue to be a driving force for global change, and I think that the growth potential of wireless communications remains very strong in the United States.
The views expressed in this report reflect those of the portfolio manager only through the end of the period of the report as stated on the cover. The manager's views are subject to change at any time based on market or other conditions. For more information, see page 2.
Fund Facts
Goal: long-term growth of capital by investing primarily in common stocks of companies with medium-sized capitalizations
Start date: December 28, 1998
Size: as of June 30, 2000, more than $296 million
Manager: David Felman, since 1999; joined Fidelity in 1993
3Semiannual Report
Fidelity Variable Insurance Products: Mid Cap Portfolio
(Unaudited)
Showing Percentage of Net Assets
|
Common Stocks - 87.3% |
|||
|
Shares |
Value (Note 1) |
||
|
BASIC INDUSTRIES - 1.3% |
|||
|
Chemicals & Plastics - 1.2% |
|||
|
Avery Dennison Corp. |
17,400 |
$ 1,167,975 |
|
|
Dow Chemical Co. |
8,300 |
250,556 |
|
|
Ivex Packaging Corp. (a) |
14,900 |
165,763 |
|
|
Lyondell Chemical Co. |
41,800 |
700,150 |
|
|
M.A. Hanna Co. |
47,300 |
425,700 |
|
|
Sealed Air Corp. (a) |
9,800 |
513,275 |
|
|
Union Carbide Corp. |
4,700 |
232,650 |
|
|
|
3,456,069 |
||
|
Packaging & Containers - 0.0% |
|||
|
Bemis Co., Inc. |
4,800 |
161,400 |
|
|
Paper & Forest Products - 0.1% |
|||
|
Trex Co., Inc. (a) |
6,000 |
300,000 |
|
|
TOTAL BASIC INDUSTRIES |
3,917,469 |
||
|
CONSTRUCTION & REAL ESTATE - 0.4% |
|||
|
Building Materials - 0.1% |
|||
|
Applied Films Corp. (a) |
9,600 |
351,600 |
|
|
Engineering - 0.3% |
|||
|
Bouygues SA |
600 |
400,659 |
|
|
Quanta Services, Inc. (a) |
9,900 |
544,500 |
|
|
|
945,159 |
||
|
TOTAL CONSTRUCTION & REAL ESTATE |
1,296,759 |
||
|
DURABLES - 1.6% |
|||
|
Autos, Tires, & Accessories - 0.5% |
|||
|
SPX Corp. |
11,090 |
1,341,197 |
|
|
Consumer Electronics - 0.7% |
|||
|
Black & Decker Corp. |
3,700 |
145,456 |
|
|
General Motors Corp. Class H (a) |
22,100 |
1,939,275 |
|
|
|
2,084,731 |
||
|
Home Furnishings - 0.0% |
|||
|
Leggett & Platt, Inc. |
6,700 |
110,550 |
|
|
Textiles & Apparel - 0.4% |
|||
|
Jones Apparel Group, Inc. (a) |
11,300 |
265,550 |
|
|
Liz Claiborne, Inc. |
18,670 |
658,118 |
|
|
Timberland Co. Class A (a) |
5,200 |
368,225 |
|
|
|
1,291,893 |
||
|
TOTAL DURABLES |
4,828,371 |
||
|
ENERGY - 10.8% |
|||
|
Energy Services - 6.4% |
|||
|
BJ Services Co. (a) |
28,980 |
1,811,250 |
|
|
Cal Dive International, Inc. (a) |
9,700 |
525,619 |
|
|
Coflexip SA sponsored ADR |
2,300 |
139,150 |
|
|
Diamond Offshore Drilling, Inc. |
15,300 |
537,413 |
|
|
ENSCO International, Inc. |
46,110 |
1,651,314 |
|
|
Global Marine, Inc. |
73,500 |
2,071,781 |
|
|
|
|||
|
Shares |
Value (Note 1) |
||
|
Grey Wolf, Inc. (a) |
162,000 |
$ 810,000 |
|
|
Halliburton Co. |
24,700 |
1,165,531 |
|
|
Hanover Compressor Co. (a) |
23,700 |
900,600 |
|
|
Helmerich & Payne, Inc. |
20,100 |
751,238 |
|
|
Nabors Industries, Inc. (a) |
40,080 |
1,665,825 |
|
|
Noble Drilling Corp. |
43,590 |
1,795,363 |
|
|
Pride International, Inc. (a) |
9,000 |
222,750 |
|
|
R&B Falcon Corp. (a) |
30,800 |
725,725 |
|
|
Rowan Companies, Inc. (a) |
4,300 |
130,613 |
|
|
Smith International, Inc. (a) |
10,400 |
757,250 |
|
|
Tidewater, Inc. |
25,950 |
934,200 |
|
|
Transocean Sedco Forex, Inc. |
14,260 |
762,019 |
|
|
Varco International, Inc. (a) |
30,548 |
710,229 |
|
|
Weatherford International, Inc. |
25,930 |
1,032,338 |
|
|
|
19,100,208 |
||
|
Oil & Gas - 4.4% |
|||
|
Anadarko Petroleum Corp. |
18,100 |
892,556 |
|
|
Apache Corp. |
37,450 |
2,202,528 |
|
|
Burlington Resources, Inc. |
14,700 |
562,275 |
|
|
Cooper Cameron Corp. (a) |
12,560 |
828,960 |
|
|
Devon Energy Corp. |
19,700 |
1,106,894 |
|
|
EOG Resources, Inc. |
9,140 |
306,190 |
|
|
Grant Prideco, Inc. (a) |
8,730 |
218,250 |
|
|
Kerr-McGee Corp. |
2,770 |
163,257 |
|
|
Murphy Oil Corp. |
2,000 |
118,875 |
|
|
Noble Affiliates, Inc. |
14,470 |
539,008 |
|
|
Ocean Energy, Inc. (a) |
39,290 |
557,427 |
|
|
Santa Fe Snyder Corp. (a) |
144,670 |
1,645,621 |
|
|
Tosco Corp. |
23,530 |
666,193 |
|
|
USX - Marathon Group |
7,590 |
190,224 |
|
|
Valero Energy Corp. |
18,700 |
593,725 |
|
|
Vastar Resources, Inc. |
21,640 |
1,777,185 |
|
|
Veritas DGC, Inc. (a) |
22,600 |
587,600 |
|
|
|
12,956,768 |
||
|
TOTAL ENERGY |
32,056,976 |
||
|
FINANCE - 6.5% |
|||
|
Banks - 0.9% |
|||
|
Bank of New York Co., Inc. |
15,300 |
711,450 |
|
|
Bank One Corp. |
39,200 |
1,041,250 |
|
|
PNC Financial Services Group, Inc. |
16,600 |
778,125 |
|
|
|
2,530,825 |
||
|
Credit & Other Finance - 0.5% |
|||
|
Concord EFS, Inc. (a) |
16,500 |
429,000 |
|
|
Household International, Inc. |
14,000 |
581,875 |
|
|
Providian Financial Corp. |
6,700 |
603,000 |
|
|
|
1,613,875 |
||
|
Federal Sponsored Credit - 1.3% |
|||
|
Freddie Mac |
92,410 |
3,742,605 |
|
|
Insurance - 3.7% |
|||
|
Ace Ltd. |
23,200 |
649,600 |
|
|
Common Stocks - continued |
|||
|
Shares |
Value (Note 1) |
||
|
FINANCE - continued |
|||
|
Insurance - continued |
|||
|
AFLAC, Inc. |
8,950 |
$ 411,141 |
|
|
Allmerica Financial Corp. |
12,720 |
666,210 |
|
|
AMBAC Financial Group, Inc. |
24,640 |
1,350,580 |
|
|
American General Corp. |
4,590 |
279,990 |
|
|
Brown & Brown, Inc. |
500 |
26,000 |
|
|
CIGNA Corp. |
25,650 |
2,398,275 |
|
|
First Health Group Corp. (a) |
14,300 |
469,219 |
|
|
Hartford Financial Services Group, Inc. |
6,270 |
350,728 |
|
|
Jefferson-Pilot Corp. |
3,600 |
203,175 |
|
|
MBIA, Inc. |
5,310 |
255,876 |
|
|
MetLife, Inc. |
60,000 |
1,263,750 |
|
|
Protective Life Corp. |
22,780 |
606,518 |
|
|
Reliastar Financial Corp. |
23,939 |
1,255,301 |
|
|
The Chubb Corp. |
4,360 |
268,140 |
|
|
XL Capital Ltd. Class A |
10,400 |
562,900 |
|
|
|
11,017,403 |
||
|
Securities Industry - 0.1% |
|||
|
Lehman Brothers Holdings, Inc. |
3,000 |
283,688 |
|
|
TOTAL FINANCE |
19,188,396 |
||
|
HEALTH - 13.5% |
|||
|
Drugs & Pharmaceuticals - 10.4% |
|||
|
Abgenix, Inc. (a) |
6,100 |
731,142 |
|
|
Alkermes, Inc. (a) |
4,100 |
193,213 |
|
|
Allergan, Inc. |
10,100 |
752,450 |
|
|
ALZA Corp. (a) |
12,200 |
721,325 |
|
|
Aviron (a) |
28,880 |
891,670 |
|
|
Bristol-Myers Squibb Co. |
10,800 |
629,100 |
|
|
Celgene Corp. (a) |
23,550 |
1,386,506 |
|
|
Cephalon, Inc. (a) |
31,540 |
1,888,458 |
|
|
Chiron Corp. (a) |
12,830 |
609,425 |
|
|
COR Therapeutics, Inc. (a) |
28,420 |
2,424,581 |
|
|
Corixa Corp. (a) |
9,500 |
407,906 |
|
|
CV Therapeutics, Inc. (a) |
7,605 |
527,122 |
|
|
Elan Corp. PLC sponsored ADR (a) |
20,200 |
978,438 |
|
|
Eli Lilly & Co. |
7,500 |
749,063 |
|
|
Forest Laboratories, Inc. (a) |
6,370 |
643,370 |
|
|
Gene Logic, Inc. (a) |
10,480 |
374,005 |
|
|
Genentech, Inc. |
3,170 |
545,240 |
|
|
Gilead Sciences, Inc. (a) |
7,010 |
498,586 |
|
|
Human Genome Sciences, Inc. (a) |
620 |
82,693 |
|
|
ImClone Systems, Inc. (a) |
16,400 |
1,253,575 |
|
|
IVAX Corp. (a) |
6,500 |
269,750 |
|
|
Millennium Pharmaceuticals, Inc. (a) |
13,762 |
1,539,624 |
|
|
Myriad Genetics, Inc. (a) |
9,000 |
1,332,703 |
|
|
Noven Pharmaceuticals, Inc. (a) |
1,100 |
33,069 |
|
|
PE Corp. - Celera Genomics Group (a) |
9,300 |
869,550 |
|
|
Protein Design Labs, Inc. (a) |
8,210 |
1,354,265 |
|
|
QLT, Inc. (a) |
21,260 |
1,651,402 |
|
|
Schering-Plough Corp. |
9,700 |
489,850 |
|
|
|
|||
|
Shares |
Value (Note 1) |
||
|
Sepracor, Inc. (a) |
12,560 |
$ 1,515,050 |
|
|
Teva Pharmaceutical Industries Ltd. ADR |
28,200 |
1,563,338 |
|
|
Titan Pharmaceuticals, Inc. (a) |
15,100 |
649,300 |
|
|
United Therapeutics Corp. |
26,100 |
2,828,588 |
|
|
Vertex Pharmaceuticals, Inc. (a) |
5,300 |
558,488 |
|
|
|
30,942,845 |
||
|
Medical Equipment & Supplies - 0.8% |
|||
|
Millipore Corp. |
8,700 |
655,763 |
|
|
MiniMed, Inc. (a) |
3,900 |
460,200 |
|
|
Novoste Corp. (a) |
10,300 |
628,300 |
|
|
Stryker Corp. |
10,800 |
472,500 |
|
|
Sybron International, Inc. (a) |
8,730 |
172,963 |
|
|
|
2,389,726 |
||
|
Medical Facilities Management - 2.3% |
|||
|
Express Scripts, Inc. Class A (a) |
10,800 |
670,950 |
|
|
Laboratory Corp. of America Holdings |
5,700 |
439,613 |
|
|
Quest Diagnostics, Inc. (a) |
24,500 |
1,831,375 |
|
|
Trigon Healthcare, Inc. (a) |
43,170 |
2,225,953 |
|
|
UnitedHealth Group, Inc. |
14,600 |
1,251,950 |
|
|
Wellpoint Health Networks, Inc. (a) |
4,800 |
347,700 |
|
|
|
6,767,541 |
||
|
TOTAL HEALTH |
40,100,112 |
||
|
INDUSTRIAL MACHINERY & EQUIPMENT - 2.8% |
|||
|
Electrical Equipment - 2.2% |
|||
|
Adaptive Broadband Corp. (a) |
21,140 |
776,895 |
|
|
Adtran, Inc. (a) |
16,300 |
975,963 |
|
|
American Power Conversion Corp. (a) |
7,300 |
297,931 |
|
|
ANTEC Corp. (a) |
11,200 |
465,500 |
|
|
California Amplifier, Inc. (a) |
320 |
14,640 |
|
|
Harris Corp. |
5,600 |
183,400 |
|
|
Pace Micro Technology PLC |
88,944 |
1,284,515 |
|
|
Powerwave Technologies, Inc. (a) |
6,700 |
294,800 |
|
|
Scientific-Atlanta, Inc. |
16,840 |
1,254,580 |
|
|
Vyyo, Inc. |
32,600 |
880,200 |
|
|
|
6,428,424 |
||
|
Industrial Machinery & Equipment - 0.6% |
|||
|
Asyst Technologies, Inc. (a) |
21,900 |
750,075 |
|
|
Ingersoll-Rand Co. |
10,100 |
406,525 |
|
|
Varian Semiconductor Equipment Associates, Inc. (a) |
9,400 |
590,438 |
|
|
|
1,747,038 |
||
|
TOTAL INDUSTRIAL MACHINERY & EQUIPMENT |
8,175,462 |
||
|
MEDIA & LEISURE - 3.1% |
|||
|
Broadcasting - 2.4% |
|||
|
EchoStar Communications Corp. |
23,020 |
762,178 |
|
|
Pegasus Communications Corp. (a) |
53,240 |
2,612,088 |
|
|
Radio One, Inc.: |
|
|
|
|
Class A |
6,070 |
179,444 |
|
|
Common Stocks - continued |
|||
|
Shares |
Value (Note 1) |
||
|
MEDIA & LEISURE - continued |
|||
|
Broadcasting - continued |
|||
|
Radio One, Inc.: - continued |
|
|
|
|
Class D (non-vtg.) (a) |
15,140 |
$ 334,026 |
|
|
TiVo, Inc. |
29,200 |
1,022,000 |
|
|
UnitedGlobalCom, Inc. Class A (a) |
5,090 |
237,958 |
|
|
Univision Communications, Inc. |
8,580 |
888,030 |
|
|
USA Networks, Inc. (a) |
43,300 |
936,363 |
|
|
|
6,972,087 |
||
|
Entertainment - 0.7% |
|||
|
Mandalay Resort Group (a) |
18,100 |
362,000 |
|
|
MGM Grand, Inc. |
41,900 |
1,346,038 |
|
|
Park Place Entertainment Corp. (a) |
5,400 |
65,813 |
|
|
Premier Parks, Inc. (a) |
10,400 |
236,600 |
|
|
|
2,010,451 |
||
|
Publishing - 0.0% |
|||
|
Reader's Digest Association, Inc. |
860 |
34,185 |
|
|
Restaurants - 0.0% |
|||
|
Jack in the Box, Inc. (a) |
2,880 |
70,920 |
|
|
TOTAL MEDIA & LEISURE |
9,087,643 |
||
|
NONDURABLES - 1.7% |
|||
|
Agriculture - 0.1% |
|||
|
Nutreco Holding NV |
11,573 |
441,603 |
|
|
Foods - 1.2% |
|||
|
Bestfoods |
4,200 |
290,850 |
|
|
Keebler Foods Co. |
22,840 |
847,935 |
|
|
Nabisco Group Holdings Corp. |
45,910 |
1,190,791 |
|
|
Nabisco Holdings Corp. Class A |
10,800 |
567,000 |
|
|
Quaker Oats Co. |
7,200 |
540,900 |
|
|
|
3,437,476 |
||
|
Household Products - 0.4% |
|||
|
Avon Products, Inc. |
24,610 |
1,095,145 |
|
|
TOTAL NONDURABLES |
4,974,224 |
||
|
PRECIOUS METALS - 0.4% |
|||
|
Agnico-Eagle Mines Ltd. |
8,930 |
56,095 |
|
|
Newmont Mining Corp. |
900 |
19,463 |
|
|
Stillwater Mining Co. (a) |
37,520 |
1,045,870 |
|
|
|
1,121,428 |
||
|
RETAIL & WHOLESALE - 1.1% |
|||
|
Apparel Stores - 0.2% |
|||
|
AnnTaylor Stores Corp. (a) |
21,800 |
722,125 |
|
|
General Merchandise Stores - 0.3% |
|||
|
Consolidated Stores Corp. (a) |
1,900 |
22,800 |
|
|
|
|||
|
Shares |
Value (Note 1) |
||
|
Costco Wholesale Corp. (a) |
13,400 |
$ 442,200 |
|
|
Dollar Tree Stores, Inc. (a) |
7,650 |
302,653 |
|
|
|
767,653 |
||
|
Grocery Stores - 0.3% |
|||
|
Safeway, Inc. (a) |
17,100 |
771,638 |
|
|
Retail & Wholesale, Miscellaneous - 0.3% |
|||
|
Best Buy Co., Inc. (a) |
13,000 |
822,250 |
|
|
Circuit City Stores, Inc. - |
4,600 |
152,663 |
|
|
Ventro Corp. |
3,500 |
66,063 |
|
|
|
1,040,976 |
||
|
TOTAL RETAIL & WHOLESALE |
3,302,392 |
||
|
SERVICES - 2.5% |
|||
|
Advertising - 0.9% |
|||
|
ADVO, Inc. (a) |
20,600 |
865,200 |
|
|
DoubleClick, Inc. (a) |
8,180 |
311,863 |
|
|
TMP Worldwide, Inc. (a) |
19,500 |
1,439,344 |
|
|
|
2,616,407 |
||
|
Printing - 0.0% |
|||
|
Valassis Communications, Inc. (a) |
1,360 |
51,850 |
|
|
Services - 1.6% |
|||
|
ACNielsen Corp. (a) |
23,100 |
508,200 |
|
|
Cintas Corp. |
29,390 |
1,078,246 |
|
|
Convergys Corp. (a) |
9,000 |
466,875 |
|
|
Ecolab, Inc. |
28,939 |
1,130,430 |
|
|
Profit Recovery Group |
21,600 |
359,100 |
|
|
Robert Half International, Inc. (a) |
24,640 |
702,240 |
|
|
True North Communications |
11,400 |
501,600 |
|
|
|
4,746,691 |
||
|
TOTAL SERVICES |
7,414,948 |
||
|
TECHNOLOGY - 31.7% |
|||
|
Communications Equipment - 3.9% |
|||
|
ADC Telecommunications, Inc. (a) |
8,300 |
696,163 |
|
|
Advanced Fibre Communications, Inc. (a) |
2,430 |
110,109 |
|
|
Andrew Corp. (a) |
17,000 |
570,563 |
|
|
Ciena Corp. (a) |
4,790 |
798,433 |
|
|
Comverse Technology, Inc. (a) |
14,850 |
1,381,050 |
|
|
Corning, Inc. |
5,903 |
1,593,072 |
|
|
Ditech Communications Corp. |
900 |
85,106 |
|
|
Efficient Networks, Inc. |
9,800 |
720,913 |
|
|
Jabil Circuit, Inc. (a) |
29,740 |
1,475,848 |
|
|
Metricom, Inc. (a) |
10,230 |
285,161 |
|
|
Natural MicroSystems Corp. (a) |
22,050 |
2,479,247 |
|
|
Tekelec (a) |
7,800 |
375,863 |
|
|
Terayon Communication Systems, Inc. (a) |
1,200 |
77,081 |
|
|
Turnstone Systems, Inc. |
3,200 |
530,150 |
|
|
Common Stocks - continued |
|||
|
Shares |
Value (Note 1) |
||
|
TECHNOLOGY - continued |
|||
|
Communications Equipment - continued |
|||
|
Tut Systems, Inc. (a) |
2,600 |
$ 149,175 |
|
|
Westell Technologies, Inc. Class A (a) |
8,800 |
132,000 |
|
|
|
11,459,934 |
||
|
Computer Services & Software - 8.4% |
|||
|
Active Software, Inc. |
13,500 |
1,048,781 |
|
|
Adobe Systems, Inc. |
10,630 |
1,381,900 |
|
|
Affiliated Computer Services, Inc. |
3,220 |
106,461 |
|
|
Affymetrix, Inc. (a) |
4,300 |
710,038 |
|
|
Amazon.com, Inc. (a) |
24,500 |
889,656 |
|
|
Amdocs Ltd. (a) |
7,947 |
609,932 |
|
|
Ariba, Inc. |
5,000 |
490,234 |
|
|
Autodesk, Inc. |
11,800 |
409,313 |
|
|
BEA Systems, Inc. (a) |
24,520 |
1,212,208 |
|
|
BroadVision, Inc. (a) |
2,300 |
116,869 |
|
|
Business Objects SA sponsored ADR (a) |
4,400 |
387,750 |
|
|
CACI International, Inc. Class A (a) |
12,200 |
237,900 |
|
|
Cadence Design Systems, Inc. (a) |
19,620 |
399,758 |
|
|
Check Point Software |
3,200 |
677,600 |
|
|
Clarent Corp. |
2,500 |
178,750 |
|
|
CNET Networks, Inc. (a) |
23,700 |
582,131 |
|
|
Covad Communications Group, Inc. (a) |
25,200 |
406,350 |
|
|
Digital Insight Corp. |
4,900 |
166,600 |
|
|
Electronic Arts, Inc. (a) |
3,010 |
219,542 |
|
|
Foundry Networks, Inc. |
4,600 |
506,000 |
|
|
Interact Commerce Corp. (a) |
7,080 |
83,632 |
|
|
Internap Network Services Corp. |
3,300 |
137,002 |
|
|
Intuit, Inc. (a) |
7,830 |
323,966 |
|
|
Keynote Systems, Inc. |
6,300 |
444,544 |
|
|
Macromedia, Inc. (a) |
900 |
87,019 |
|
|
Manugistics Group, Inc. (a) |
1,500 |
70,125 |
|
|
Marketwatch.com, Inc. (a) |
200 |
3,763 |
|
|
Mercury Interactive Corp. (a) |
2,700 |
261,225 |
|
|
Metasolv Software, Inc. |
11,330 |
498,520 |
|
|
National Computer Systems, Inc. |
7,200 |
354,600 |
|
|
New Era of Networks, Inc. (a) |
2,370 |
100,725 |
|
|
Opus360 Corp. |
20 |
74 |
|
|
Orbotech Ltd. |
8,400 |
780,150 |
|
|
Pharmacopeia, Inc. (a) |
3,400 |
157,675 |
|
|
Phone.com, Inc. |
4,900 |
319,113 |
|
|
Polycom, Inc. (a) |
13,400 |
1,260,856 |
|
|
Priceline.com, Inc. (a) |
24,500 |
930,617 |
|
|
Puma Technology, Inc. (a) |
4,160 |
111,540 |
|
|
Rational Software Corp. (a) |
14,300 |
1,329,006 |
|
|
Redback Networks, Inc. |
6,320 |
1,132,070 |
|
|
Software.com, Inc. |
2,100 |
272,738 |
|
|
VERITAS Software Corp. (a) |
24,605 |
2,780,749 |
|
|
Vignette Corp. (a) |
10,080 |
524,318 |
|
|
|
|||
|
Shares |
Value (Note 1) |
||
|
Vitria Technology, Inc. |
6,800 |
$ 415,650 |
|
|
webMethods, Inc. |
12,000 |
1,886,250 |
|
|
|
25,003,700 |
||
|
Computers & Office Equipment - 4.7% |
|||
|
Alteon Websystems, Inc. |
5,700 |
570,356 |
|
|
Apple Computer, Inc. (a) |
80 |
4,190 |
|
|
Brocade Communications |
16,860 |
3,093,547 |
|
|
CDW Computer Centers, Inc. (a) |
30,800 |
1,925,000 |
|
|
Comdisco, Inc. |
5,400 |
120,488 |
|
|
Copper Mountain Networks, Inc. |
3,300 |
290,813 |
|
|
Juniper Networks, Inc. |
15,060 |
2,192,171 |
|
|
MMC Networks, Inc. (a) |
21,600 |
1,154,250 |
|
|
MRV Communications, Inc. (a) |
6,100 |
410,225 |
|
|
Network Appliance, Inc. (a) |
24,080 |
1,938,440 |
|
|
ScanSource, Inc. (a) |
7,130 |
277,179 |
|
|
SCI Systems, Inc. (a) |
7,100 |
278,231 |
|
|
Symbol Technologies, Inc. |
9,645 |
520,830 |
|
|
Tech Data Corp. (a) |
25,500 |
1,110,844 |
|
|
|
13,886,564 |
||
|
Electronic Instruments - 4.1% |
|||
|
Aclara Biosciences, Inc. |
6,200 |
315,813 |
|
|
Agilent Technologies, Inc. |
10,350 |
763,313 |
|
|
Aurora Biosciences Corp. (a) |
17,100 |
1,166,006 |
|
|
FEI Co. (a) |
29,700 |
905,850 |
|
|
KLA-Tencor Corp. (a) |
4,820 |
282,271 |
|
|
Kulicke & Soffa Industries, Inc. (a) |
12,100 |
718,438 |
|
|
Novellus Systems, Inc. (a) |
14,950 |
845,609 |
|
|
PE Corp. - Biosystems Group |
7,910 |
521,071 |
|
|
PerkinElmer, Inc. |
36,950 |
2,443,319 |
|
|
Photon Dynamics, Inc. (a) |
18,700 |
1,396,656 |
|
|
Tektronix, Inc. |
13,200 |
976,800 |
|
|
Waters Corp. (a) |
14,910 |
1,860,954 |
|
|
|
12,196,100 |
||
|
Electronics - 10.6% |
|||
|
Altera Corp. (a) |
28,450 |
2,900,122 |
|
|
Analog Devices, Inc. (a) |
7,440 |
565,440 |
|
|
Atmel Corp. (a) |
11,300 |
416,688 |
|
|
Celestica, Inc. (sub. vtg.) (a) |
7,720 |
375,962 |
|
|
Chartered Semiconductor |
3,540 |
318,600 |
|
|
Cypress Semiconductor Corp. (a) |
20,640 |
872,040 |
|
|
Digital Microwave Corp. (a) |
8,300 |
316,438 |
|
|
E Tek Dynamics, Inc. (a) |
3,130 |
825,733 |
|
|
GlobeSpan, Inc. |
12,400 |
1,513,769 |
|
|
Infineon Technologies AG |
5,200 |
408,550 |
|
|
KEMET Corp. (a) |
8,160 |
204,510 |
|
|
Kopin Corp. (a) |
72,470 |
5,018,548 |
|
|
Lattice Semiconductor Corp. (a) |
8,100 |
559,913 |
|
|
Linear Technology Corp. |
20 |
1,279 |
|
|
LSI Logic Corp. (a) |
2,900 |
156,963 |
|
|
Merix Corp. (a) |
9,500 |
446,500 |
|
|
Microchip Technology, Inc. (a) |
14,900 |
868,158 |
|
|
Common Stocks - continued |
|||
|
Shares |
Value (Note 1) |
||
|
TECHNOLOGY - continued |
|||
|
Electronics - continued |
|||
|
Micron Technology, Inc. (a) |
17,140 |
$ 1,509,391 |
|
|
National Semiconductor Corp. (a) |
33,430 |
1,897,153 |
|
|
NVIDIA Corp. (a) |
12,600 |
800,888 |
|
|
Plexus Corp. (a) |
5,000 |
565,000 |
|
|
PMC-Sierra, Inc. (a) |
3,870 |
687,651 |
|
|
Power-One, Inc. (a) |
10,700 |
1,219,131 |
|
|
QLogic Corp. (a) |
7,132 |
471,158 |
|
|
Rambus, Inc. (a) |
14,100 |
1,452,300 |
|
|
S3, Inc. |
34,100 |
502,975 |
|
|
Sanmina Corp. (a) |
33,600 |
2,872,800 |
|
|
SDL, Inc. (a) |
4,400 |
1,254,825 |
|
|
Three-Five Systems, Inc. (a) |
2,704 |
159,536 |
|
|
TriQuint Semiconductor, Inc. |
8,600 |
822,913 |
|
|
Vishay Intertechnology, Inc. (a) |
18,220 |
691,221 |
|
|
Vitesse Semiconductor Corp. (a) |
5,990 |
440,639 |
|
|
Xilinx, Inc. (a) |
3,100 |
255,944 |
|
|
|
31,372,738 |
||
|
TOTAL TECHNOLOGY |
93,919,036 |
||
|
TRANSPORTATION - 1.1% |
|||
|
Air Transportation - 0.2% |
|||
|
Continental Airlines, Inc. Class B (a) |
4,900 |
230,300 |
|
|
Northwest Airlines Corp. Class A (a) |
9,700 |
295,244 |
|
|
Southwest Airlines Co. |
13,350 |
252,816 |
|
|
|
778,360 |
||
|
Railroads - 0.0% |
|||
|
Wabtec Corp. |
296 |
3,071 |
|
|
Shipping - 0.5% |
|||
|
Teekay Shipping Corp. |
45,000 |
1,479,375 |
|
|
Trucking & Freight - 0.4% |
|||
|
Forward Air Corp. (a) |
11,985 |
479,400 |
|
|
Landstar System, Inc. (a) |
10,100 |
601,581 |
|
|
|
1,080,981 |
||
|
TOTAL TRANSPORTATION |
3,341,787 |
||
|
UTILITIES - 8.8% |
|||
|
Cellular - 4.2% |
|||
|
China Telecom (Hong Kong) Ltd. sponsored ADR (a) |
3,400 |
604,563 |
|
|
Clearnet Communications, Inc. |
24,450 |
677,102 |
|
|
Microcell Telecommunications, Inc. |
26,430 |
955,979 |
|
|
Millicom International Cellular SA (a) |
1,430 |
50,050 |
|
|
Nextel Communications, Inc. Class A (a) |
123,420 |
7,551,737 |
|
|
Nextel Partners, Inc. Class A |
6,300 |
205,144 |
|
|
|
|||
|
Shares |
Value (Note 1) |
||
|
Sprint Corp. - PCS Group Series 1 (a) |
37,110 |
$ 2,208,045 |
|
|
VoiceStream Wireless Corp. (a) |
2,790 |
324,468 |
|
|
|
12,577,088 |
||
|
Electric Utility - 2.8% |
|||
|
AES Corp. (a) |
30,960 |
1,412,550 |
|
|
Calpine Corp. (a) |
68,000 |
4,471,000 |
|
|
Constellation Energy Corp. |
8,100 |
263,756 |
|
|
IPALCO Enterprises, Inc. |
15,680 |
315,560 |
|
|
Montana Power Co. |
13,100 |
462,594 |
|
|
NiSource, Inc. |
39,900 |
743,138 |
|
|
Northern States Power Co. |
16,000 |
323,000 |
|
|
NRG Energy, Inc. |
4,500 |
82,125 |
|
|
PECO Energy Co. |
6,000 |
241,875 |
|
|
|
8,315,598 |
||
|
Gas - 1.3% |
|||
|
Columbia Energy Group |
60 |
3,938 |
|
|
Dynegy, Inc. Class A |
28,470 |
1,944,857 |
|
|
Enron Corp. |
8,150 |
525,675 |
|
|
Kinder Morgan, Inc. |
36,580 |
1,264,296 |
|
|
|
3,738,766 |
||
|
Telephone Services - 0.5% |
|||
|
Allegiance Telecom, Inc. (a) |
2,200 |
140,800 |
|
|
CenturyTel, Inc. |
31,400 |
902,750 |
|
|
ITXC Corp. |
14,210 |
503,123 |
|
|
|
1,546,673 |
||
|
TOTAL UTILITIES |
26,178,125 |
||
|
TOTAL COMMON STOCKS (Cost $230,321,148) |
258,903,128 |
||
|
U.S. Treasury Obligations - 0.3% |
|||||
|
Moody's Ratings (unaudited) |
Principal Amount |
|
|||
|
U.S. Treasury Bills, yield at date of purchase 5.59% to 6.03% 7/13/00 to 8/17/00 (c) |
- |
|
$ 925,000 |
919,853 |
|
|
Cash Equivalents - 18.5% |
|||
|
Maturity Amount |
Value |
||
|
Investments in repurchase agreements (U.S. Treasury Obligations), in a joint trading account at 6.58%, dated 6/30/00 due 7/3/00 |
$ 18,919,371 |
$ 18,909,000 |
|
|
Shares |
|
||
|
Central Cash Collateral Fund, 6.71% (b) |
6,731,354 |
6,731,354 |
|
|
Taxable Central Cash Fund, 6.59% (b) |
29,086,263 |
29,086,263 |
|
|
TOTAL CASH EQUIVALENTS (Cost $54,726,617) |
54,726,617 |
|
|
TOTAL INVESTMENT PORTFOLIO - 106.1% (Cost $285,967,116) |
314,549,598 |
|
|
NET OTHER ASSETS - (6.1)% |
(18,181,476) |
|
|
NET ASSETS - 100% |
$ 296,368,122 |
|
|
Futures Contracts |
|||||
|
|
Expiration Date |
Underlying |
Unrealized Gain/(Loss) |
||
|
Purchased |
|||||
|
57 S&P 400 Midcap Index Contracts |
Sept. 2000 |
$ 13,916,550 |
$ (412,213) |
||
|
The face value of futures purchased as a percentage of net assets - 4.7% |
|
Legend |
|
(a) Non-income producing |
|
(b) The rate quoted is the annualized seven-day yield of the fund at |
|
(c) Security or a portion of the security was pledged to cover margin requirements for futures contracts. At the period end, the value of securities pledged amounted to $919,853. |
|
Other Information |
|
Purchases and sales of securities, other than short-term securities, |
|
The market value of futures contracts opened and closed during the |
|
The fund placed a portion of its portfolio transactions with brokerage firms which are affiliates of Fidelity Management & Research Company. The commissions paid to these affiliated firms were $16,684 for the period. |
|
The fund participated in the security lending program. At period end, the value of securities loaned amounted to $6,633,405. The fund received cash collateral of $6,731,354 which was invested in cash equivalents. |
|
Income Tax Information |
|
At June 30, 2000, the aggregate cost of investment securities for income tax purposes was $289,737,660. Net unrealized appreciation aggregated $24,811,938, of which $35,724,103 related to appreciated investment securities and $10,912,165 related to depreciated investment securities. |
See accompanying notes which are an integral part of the financial statements.
Mid Cap Portfolio
Statement of Assets and Liabilities
|
|
June 30, 2000 (Unaudited) |
|
|
Assets |
|
|
|
Investment in securities, at value (including repurchase agreements of $18,909,000) |
|
$ 314,549,598 |
|
Cash |
|
323,420 |
|
Receivable for investments sold |
|
13,596,246 |
|
Receivable for fund shares sold |
|
3,012,314 |
|
Dividends receivable |
|
66,918 |
|
Interest receivable |
|
128,429 |
|
Other receivables |
|
10,808 |
|
Total assets |
|
331,687,733 |
|
Liabilities |
|
|
|
Payable for investments purchased |
$ 27,374,504 |
|
|
Payable for fund shares redeemed |
834,902 |
|
|
Accrued management fee |
115,770 |
|
|
Distribution fees payable |
12,793 |
|
|
Payable for daily variation on |
208,051 |
|
|
Other payables and |
42,237 |
|
|
Collateral on securities loaned, |
6,731,354 |
|
|
Total liabilities |
|
35,319,611 |
|
Net Assets |
|
$ 296,368,122 |
|
Net Assets consist of: |
|
|
|
Paid in capital |
|
$ 271,976,722 |
|
Undistributed net investment income |
|
97,845 |
|
Accumulated undistributed net realized gain (loss) on investments and foreign currency transactions |
|
(3,876,611) |
|
Net unrealized appreciation (depreciation) on investments |
|
28,170,166 |
|
Net Assets |
|
$ 296,368,122 |
|
Initial Class: |
|
$18.82 |
|
Service Class: |
|
$18.80 |
|
Service Class 2: |
|
$18.78 |
Statement of Operations
|
|
Six months ended June 30, 2000 (Unaudited) |
|
|
Investment Income Dividends |
|
$ 177,301 |
|
Interest |
|
380,016 |
|
Security lending |
|
16,068 |
|
Total income |
|
573,385 |
|
Expenses |
|
|
|
Management fee |
$ 306,603 |
|
|
Transfer agent fees |
43,421 |
|
|
Distribution fees |
44,790 |
|
|
Accounting and security lending fees |
32,445 |
|
|
Non-interested trustees' compensation |
111 |
|
|
Custodian fees and expenses |
58,064 |
|
|
Audit |
8,158 |
|
|
Legal |
586 |
|
|
Reports to Shareholders |
236 |
|
|
Miscellaneous |
69 |
|
|
Total expenses before reductions |
494,483 |
|
|
Expense reductions |
(19,437) |
475,046 |
|
Net investment income |
|
98,339 |
|
Realized and Unrealized Gain (Loss) Net realized gain (loss) on: |
|
|
|
Investment securities |
(3,838,305) |
|
|
Foreign currency transactions |
1,931 |
|
|
Futures contracts |
126,879 |
(3,709,495) |
|
Change in net unrealized appreciation (depreciation) on: |
|
|
|
Investment securities |
24,218,897 |
|
|
Assets and liabilities in |
(23) |
|
|
Futures contracts |
(424,407) |
23,794,467 |
|
Net gain (loss) |
|
20,084,972 |
|
Net increase (decrease) in net assets resulting from operations |
|
$ 20,183,311 |
|
Other Information Expense reductions |
|
$ 19,080 |
|
Custodian credits |
|
357 |
|
|
|
$ 19,437 |
See accompanying notes which are an integral part of the financial statements.
Semiannual Report
Variable Insurance Products: Portfolio
Financial Statements - continued
Statement of Changes in Net Assets
|
Increase (Decrease) in Net Assets |
Six months ended |
Year ended |
|
Operations |
$ 98,339 |
$ (3,279) |
|
Net realized gain (loss) |
(3,709,495) |
139,917 |
|
Change in net unrealized appreciation (depreciation) |
23,794,467 |
4,343,490 |
|
Net increase (decrease) in net assets resulting from operations |
20,183,311 |
4,480,128 |
|
Distributions to shareholders |
- |
(139,917) |
|
In excess of net realized gain |
(131,105) |
(32,523) |
|
Total distributions |
(131,105) |
(172,440) |
|
Share transactions - net increase (decrease) |
248,664,126 |
22,312,614 |
|
Total increase (decrease) in net assets |
268,716,332 |
26,620,302 |
|
Net Assets |
|
|
|
Beginning of period |
27,651,790 |
1,031,488 |
|
End of period (including undistributed net investment income of $97,845 and $0, respectively) |
$ 296,368,122 |
$ 27,651,790 |
|
|
|
Other Information: |
|
|
Six months ended |
Year ended December 31, 1999 |
||
|
|
Shares |
Dollars |
Shares |
Dollars |
|
Share transactions |
7,954,588 |
$ 141,197,057 |
67,742 |
$ 873,931 |
|
Reinvested |
507 |
8,466 |
755 |
10,914 |
|
Redeemed |
(130,836) |
(2,260,660) |
(4,140) |
(54,766) |
|
Net increase (decrease) |
7,824,259 |
$ 138,944,863 |
64,357 |
$ 830,079 |
|
Service Class |
5,632,594 |
$ 100,266,360 |
1,749,215 |
$ 22,631,585 |
|
Reinvested |
7,312 |
121,968 |
11,186 |
161,526 |
|
Redeemed |
(474,562) |
(8,379,137) |
(110,484) |
(1,310,576) |
|
Net increase (decrease) |
5,165,344 |
$ 92,009,191 |
1,649,917 |
$ 21,482,535 |
|
Service Class 2 A |
1,052,073 |
$ 19,316,295 |
- |
$ - |
|
Reinvested |
40 |
671 |
- |
- |
|
Redeemed |
(99,362) |
(1,606,894) |
- |
- |
|
Net increase (decrease) |
952,751 |
$ 17,710,072 |
- |
$ - |
|
Distributions |
|
|
|
|
|
From net realized gain |
|
$ - |
|
$ 8,856 |
|
Service Class |
|
- |
|
131,061 |
|
Service Class 2 A |
|
- |
|
- |
|
Total |
|
$ - |
|
$ 139,917 |
|
In excess of net realized gain |
|
$ 8,466 |
|
$ 2,058 |
|
Service Class |
|
121,968 |
|
30,465 |
|
Service Class 2 A |
|
671 |
|
- |
|
Total |
|
$ 131,105 |
|
$ 32,523 |
|
|
|
$ 131,105 |
|
$ 172,440 |
A Service Class 2 commenced sale of shares January 12, 2000.
See accompanying notes which are an integral part of the financial statements.
Mid Cap Portfolio
Financial Highlights - Initial Class
|
|
Six months ended |
Years ended |
|
|
Selected Per-Share Data |
(Unaudited) |
1999 |
1998 E |
|
Net asset value, beginning of period |
$ 15.25 |
$ 10.31 |
$ 10.00 |
|
Income from Investment Operations |
|
|
|
|
Net investment income (loss) D |
.02 |
.00 |
.00 |
|
Net realized and unrealized gain (loss) |
3.60 |
5.05 |
.31 |
|
Total from investment operations |
3.62 |
5.05 |
.31 |
|
Less Distributions |
|
|
|
|
From net realized gain |
- |
(.09) |
- |
|
In excess of net realized gain |
(.05) |
(.02) |
- |
|
Total distributions |
(.05) |
(.11) |
- |
|
Net asset value, end of period |
$ 18.82 |
$ 15.25 |
$ 10.31 |
|
Total Return B, C |
23.78% |
49.04% |
3.10% |
|
Ratios and Supplemental Data |
|
|
|
|
Net assets, end of period (000 omitted) |
$ 149,444 |
$ 1,744 |
$ 516 |
|
Ratio of expenses to average net assets |
.84% A |
1.00% G |
1.00% A, G |
|
Ratio of expenses to average net assets after expense reductions |
.80% A, H |
.97% H |
1.00% A |
|
Ratio of net investment income (loss) to average net assets |
.25% A |
.01% |
(.27)% A |
|
Portfolio turnover |
239% A |
163% |
125% A |
Financial Highlights - Service Class
|
|
Six months ended |
Years ended |
|
|
Selected Per-Share Data |
(Unaudited) |
1999 |
1998 F |
|
Net asset value, beginning of period |
$ 15.24 |
$ 10.31 |
$ 10.00 |
|
Income from Investment Operations |
|
|
|
|
Net investment income (loss) D |
.01 |
(.01) |
.00 |
|
Net realized and unrealized gain (loss) |
3.60 |
5.05 |
.31 |
|
Total from investment operations |
3.61 |
5.04 |
.31 |
|
Less Distributions |
|
|
|
|
From net realized gain |
- |
(.09) |
- |
|
In excess of net realized gain |
(.05) |
(.02) |
- |
|
Total distributions |
(.05) |
(.11) |
- |
|
Net asset value, end of period |
$ 18.80 |
$ 15.24 |
$ 10.31 |
|
Total Return B, C |
23.73% |
48.94% |
3.10% |
|
Ratios and Supplemental Data |
|
|
|
|
Net assets, end of period (000 omitted) |
$ 129,033 |
$ 25,908 |
$ 516 |
|
Ratio of expenses to average net assets |
.92% A |
1.10% G |
1.10% A, G |
|
Ratio of expenses to average net assets after expense reductions |
.88% A, H |
1.07% H |
1.10% A |
|
Ratio of net investment income (loss) to average net assets |
.17% A |
(.09)% |
(.35)% A |
|
Portfolio turnover |
239% A |
163% |
125% A |
|
A Annualized B The total returns would have been lower had certain expenses not been reduced during the periods shown. C Total returns for periods of less than one year are not annualized and do not reflect charges attributable to your insurance company's separate account. Inclusion of these charges would reduce the total returns shown. D Net investment income (loss) per share has been calculated based on average shares outstanding during the period. E For the period December 28, 1998 (commencement of sale of Initial Class shares) to December 31, 1998. F For the period December 28, 1998 (commencement of sale of Service Class shares) to December 31, 1998. G FMR agreed to reimburse a portion of the class' expenses during the period. Without this reimbursement, the class' expense ratio would have been higher. H FMR or the fund has entered into varying arrangements with third parties who either paid or reduced a portion of the class' expenses. |
|||
See accompanying notes which are an integral part of the financial statements.
Semiannual Report
Financial Highlights - Service Class 2
|
|
Six months ended |
|
Selected Per-Share Data |
(Unaudited) |
|
Net asset value, beginning of period |
$ 14.82 |
|
Income from Investment Operations |
|
|
Net investment income D |
.00 |
|
Net realized and unrealized gain (loss) |
4.01 |
|
Total from investment operations |
4.01 |
|
Less Distributions |
|
|
In excess of net realized gain |
(.05) |
|
Net asset value, end of period |
$ 18.78 |
|
Total Return B, C |
27.10% |
|
Ratios and Supplemental Data |
|
|
Net assets, end of period (000 omitted) |
$ 17,891 |
|
Ratio of expenses to average net assets |
1.07% A |
|
Ratio of expenses to average net assets after expense reductions |
1.04% A, F |
|
Ratio of net investment income to average net assets |
.02% A |
|
Portfolio turnover |
239% A |
|
A Annualized B The total returns would have been lower had certain expenses not been reduced during the periods shown. C Total returns for periods of less than one year are not annualized and do not reflect charges attributable to your insurance company's separate account. Inclusion of these charges would reduce the total returns shown. D Net investment income per share has been calculated based on average shares outstanding during the period. E For the period January 12, 2000 (commencement of sale of Service Class 2 shares) to June 30, 2000. F FMR or the fund has entered into varying arrangements with third parties who either paid or reduced a portion of the class' expenses. |
|
See accompanying notes which are an integral part of the financial statements.
Mid Cap Portfolio
A special meeting of the fund's shareholders was held on July 19, 2000. The results of votes taken among shareholders on proposals before them are reported below. Each vote reported represents one dollar of net asset value held on the record date for the meeting.
PROPOSAL 1
To elect as Trustees the following twelve nominees.*
|
|
# of Dollars Voted |
% of Dollars Voted |
Ralph F. Cox
|
Affirmative |
2,995,348,207.84 |
97.862 |
|
Withheld |
65,444,305.52 |
2.138 |
|
TOTAL |
3,060,792,513.36 |
100.000 |
Phyllis Burke Davis
|
Affirmative |
2,995,012,849.06 |
97.851 |
|
Withheld |
65,779,664.30 |
2.149 |
|
TOTAL |
3,060,792,513.36 |
100.000 |
Robert M. Gates
|
Affirmative |
2,994,325,628.16 |
97.828 |
|
Withheld |
66,466,885.20 |
2.172 |
|
TOTAL |
3,060,792,513.36 |
100.000 |
Edward C. Johnson 3d
|
Affirmative |
2,994,212,266.77 |
97.825 |
|
Withheld |
66,580,246.59 |
2.175 |
|
TOTAL |
3,060,792,513.36 |
100.000 |
Donald J. Kirk
|
Affirmative |
2,996,527,468.99 |
97.900 |
|
Withheld |
64,265,044.37 |
2.100 |
|
TOTAL |
3,060,792,513.36 |
100.000 |
Ned C. Lautenbach
|
Affirmative |
2,997,430,896.97 |
97.930 |
|
Withheld |
63,361,616.39 |
2.070 |
|
TOTAL |
3,060,792,513.36 |
100.000 |
|
|
# of Dollars Voted |
% of Dollars Voted |
Peter S. Lynch
|
Affirmative |
2,997,391,112.97 |
97.929 |
|
Withheld |
63,401,400.39 |
2.071 |
|
TOTAL |
3,060,792,513.36 |
100.000 |
William O. McCoy
|
Affirmative |
2,997,364,420.76 |
97.928 |
|
Withheld |
63,428,092.60 |
2.072 |
|
TOTAL |
3,060,792,513.36 |
100.000 |
Gerald C. McDonough
|
Affirmative |
2,992,594,911.89 |
97.772 |
|
Withheld |
68,197,601.47 |
2.228 |
|
TOTAL |
3,060,792,513.36 |
100.000 |
Marvin L. Mann
|
Affirmative |
2,996,491,839.67 |
97.899 |
|
Withheld |
64,300,673.69 |
2.101 |
|
TOTAL |
3,060,792,513.36 |
100.000 |
Robert C. Pozen
|
Affirmative |
2,997,304,419.99 |
97.926 |
|
Withheld |
63,488,093.37 |
2.074 |
|
TOTAL |
3,060,792,513.36 |
100.000 |
Thomas R. Williams
|
Affirmative |
2,993,561,996.24 |
97.803 |
|
Withheld |
67,230,517.12 |
2.197 |
|
TOTAL |
3,060,792,513.36 |
100.000 |
Semiannual Report
PROPOSAL 2
To ratify the selection of PricewaterhouseCoopers LLP as independent accountants of the fund.
|
|
# of Dollars Voted |
% of Dollars Voted |
|
Affirmative |
152,524,752.89 |
95.370 |
|
Against |
1,456,201.90 |
0.911 |
|
Abstain |
5,947,746.88 |
3.719 |
|
TOTAL |
159,928,701.67 |
100.000 |
PROPOSAL 3
To authorize the Trustees to adopt an amended and restated Declaration of Trust.*
|
|
# of Dollars Voted |
% of Dollars Voted |
|
Affirmative |
2,837,267,199.92 |
92.697 |
|
Against |
49,473,422.32 |
1.617 |
|
Abstain |
174,051,891.12 |
5.686 |
|
TOTAL |
3,060,792,513.36 |
100.000 |
PROPOSAL 4
To approve an amended management contract for the fund that would reduce the management fee payable to FMR by the fund as FMR's assets under management increase.
|
|
# of Dollars Voted |
% of Dollars Voted |
|
Affirmative |
149,727,278.77 |
93.621 |
|
Against |
2,405,860.33 |
1.505 |
|
Abstain |
7,795,562.57 |
4.874 |
|
TOTAL |
159,928,701.67 |
100.000 |
PROPOSAL 5
To amend the fundamental limitation concerning underwriting.
|
|
# of Dollars Voted |
% of Dollars Voted |
|
Affirmative |
147,993,847.24 |
92.537 |
|
Against |
3,567,046.24 |
2.231 |
|
Abstain |
8,367,808.19 |
5.232 |
|
TOTAL |
159,928,701.67 |
100.000 |
PROPOSAL 6
To amend the fundamental limitation concerning concentration.
|
|
# of Dollars Voted |
% of Dollars Voted |
|
Affirmative |
147,959,308.60 |
92.516 |
|
Against |
3,629,590.53 |
2.269 |
|
Abstain |
8,339,802.54 |
5.215 |
|
TOTAL |
159,928,701.67 |
100.000 |
* Denotes trust-wide proposals and voting results.
Mid Cap Portfolio
Performance
There are several ways to evaluate a fund's historical performance. You can look at the total percentage change in value, the average annual percentage change or the growth of a hypothetical $10,000 investment. Total return reflects the change in the value of an investment, assuming reinvestment of the fund's dividend income and capital gains (the profits earned upon the sale of securities that have grown in value). The initial offering of Service Class shares took place on November 3, 1997. Performance for Service Class shares reflects an asset based distribution fee (12b-1 fee), and returns prior to November 3, 1997 are those of Initial Class and do not include the effects of Service Class' 12b-1 fee. Had Service Class shares' 12b-1 fee been reflected, returns prior to November 3, 1997 would have been lower.
Average Annual Total Returns
|
Periods ended |
Past 1 |
Past 5 |
Past 10 |
|
Fidelity VIP: Growth - Service Class |
26.12% |
25.50% |
20.05% |
|
Russell 3000 Growth |
25.86% |
27.43% |
19.49% |
Average annual returns take the fund's cumulative return and show you what would have happened if the fund had performed at a constant rate each year.
You can compare the fund's returns to the performance of the Russell 3000 Growth Index - a market capitalization-weighted index of growth-oriented stocks of U.S. domiciled corporations. This benchmark reflects the reinvestment of dividends and capital gains, if any.
Figures for more than one year assume a steady compounded rate of return and are not the fund's year-by-year results, which fluctuated over the periods shown.
Performance numbers are net of all fund operating expenses, but do not include any insurance charges imposed by your insurance company's separate account. If performance information included the effect of these additional charges, the total returns would have been lower.
Past performance is no guarantee of future results. Principal and investment return will vary and you may have a gain or loss when you withdraw your money.
Understanding Performance
How a fund did yesterday is no guarantee of how it will do tomorrow. The stock market, for example, has a history of long-term growth and short-term volatility. In turn, the share price and return of a fund that invests in stocks will vary. That means if you sell your shares during a market downturn, you might lose money. But if you can ride out the market's ups and downs, you may have a gain.
3$10,000 Over 10 Years
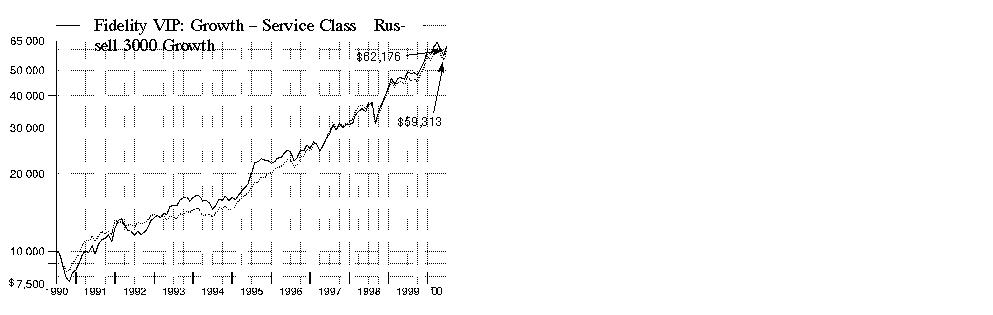
$10,000 Over 10 Years: Let's say hypothetically that $10,000 was invested in Fidelity Variable Insurance Products: Growth Portfolio - Service Class on June 30, 1990. As the chart shows, by June 30, 2000, the value of the investment would have grown to $62,176 - a 521.76% increase on the initial investment. For comparison, look at how the Russell 3000 Growth Index did over the same period. With dividends and capital gains, if any, reinvested, the same $10,000 investment would have grown to $59,313 - a 493.13% increase.
Investment Summary
|
Top Five Stocks as of June 30, 2000 |
|
|
|
% of fund's |
|
Cisco Systems, Inc. |
4.5 |
|
Intel Corp. |
4.4 |
|
Pfizer, Inc. |
3.6 |
|
General Electric Co. |
2.9 |
|
Eli Lilly & Co. |
2.6 |
|
|
18.0 |
|
Top Five Market Sectors as of June 30, 2000 |
|
|
|
% of fund's |
|
Technology |
42.6 |
|
Health |
14.9 |
|
Finance |
8.3 |
|
Media & Leisure |
6.9 |
|
Utilities |
6.5 |
|
Asset Allocation as of June 30, 2000 |
||
|
% of fund's net assets * |
|
Stocks 98.4% |
|
|
|
Short-Term |
|
|
|
* Foreign investments 11.4% |
Semiannual Report
(Portfolio Manager photograph)
An interview with Jennifer Uhrig, Portfolio Manager of Growth Portfolio
Q. How did the fund perform, Jennifer?
A. Pretty well. For the six months that ended June 30, 2000, the fund posted a higher return than the Russell 3000 Growth Index, which returned 4.04%. For the 12 months that ended June 30, 2000, the fund also outperformed the index, which returned 25.86%.
Q. The period was marked by a high degree of volatility within the technology sector. How did this affect the fund?
A. Technology stocks performed well during the first half of the period, but succumbed to investor fears during much of the second as high valuations succumbed to the effects of higher interest rates, and the group suffered a significant downturn. The fund was underweighted in technology stocks relative to the Russell index, but nonetheless had just under 43% of its net assets in the sector at the end of the period. Many of its technology names were of the small-cap variety, and these stocks were among the hardest hit during the technology slide. On the plus side, the fund's positions in communications equipment providers such as Nokia and Ericsson helped. These stocks typically trade in line with technology, so their solid performance during the period was a pleasant surprise.
Q. Despite the volatility, some of the fund's bigger-cap technology names fared well . . .
A. The fund's stakes in market leaders such as Cisco Systems, EMC Corp. and Intel generated nice results. Cisco - the main player in the Internet infrastructure area - performed well on the heels of accelerating earnings and revenue growth. EMC, which specializes in data storage, also enjoyed strong earnings growth, and Intel benefited from a shortage of high-end microprocessors. Microsoft was one big-cap that didn't come through, however, as its performance was hampered by both the ongoing federal government case against it and a slowdown in the company's applications business. Microsoft also was in the process of implementing a new Internet strategy, and its success is yet to be proven.
Q. What other types of stocks contributed positively?
A. The fund's investments in the oil services group - including names such as Baker Hughes, Halliburton and Smith International - performed well. Oil prices remained at relatively high levels during the period, which made the return on exploration quite attractive. In addition, we've seen lower levels of exploration in recent years, indicating that activity will need to pick up in order to meet production estimates. These companies - which sell the equipment used to drill for oil - were in a solid position to benefit from this environment. Finally, the fund's underweighting in consumer nondurables positions worked out well relative to the index.
Q. At just under 15%, health stocks occupied the second-largest position - after technology - in the portfolio. How did this group perform?
A. The fund's health-related investments were spread mostly among drug and biotechnology stocks, and each group performed well. Drug stocks Eli Lilly - which had eight drugs in the latter stages of development - and Warner-Lambert were among the fund's better performers. Biotechnology stocks - particularly those involved in the field of human genomics - fell along with technology in April, but enjoyed a fairly good rebound as we closed the period. The fund's positions in Millennium Pharmaceuticals and Genentech provided a favorable boost.
Q. What's your outlook?
A. Technology has been the key market driver for some time, and the sector has been very unpredictable. Performance has bounced around depending on whether technology stocks have had a good week or a bad week. Earnings growth continues to be strong for technology, so the sector could do well if the economy slows and interest rates stabilize. Outside of technology, the key economic question is whether we're in for a soft landing - in which the economy slows, but in a gradual fashion - or a hard landing, which could translate into a recession. Obviously, a soft landing would be better. More stocks outside of tech could participate, and economically sensitive stocks would stand a chance. If we see a hard landing, I may look to add to the fund's consumer nondurables positions or to the drug stocks, both of which tend to perform well going into a recession.
The views expressed in this report reflect those of the portfolio manager only through the end of the period of the report as stated on the cover. The manager's views are subject to change at any time based on market or other conditions. For more information, see page 2.
Fund Facts
Goal: to increase the value of the fund's shares over the long term by investing in stocks with above-average growth potential
Start date: October 9, 1986
Size: as of June 30, 2000, more than $20.2 billion
Manager: Jennifer Uhrig, since 1997; joined Fidelity in 1987
3Semiannual Report
Fidelity Variable Insurance Products: Growth Portfolio
(Unaudited)
Showing Percentage of Net Assets
|
Common Stocks - 98.4% |
|||
|
Shares |
Value (Note 1) |
||
|
AEROSPACE & DEFENSE - 0.7% |
|||
|
BFGoodrich Co. |
657,900 |
$ 22,409,719 |
|
|
Boeing Co. |
1,827,800 |
76,424,888 |
|
|
Textron, Inc. |
31,600 |
1,716,275 |
|
|
United Technologies Corp. |
822,200 |
48,407,025 |
|
|
|
148,957,907 |
||
|
BASIC INDUSTRIES - 1.3% |
|||
|
Chemicals & Plastics - 0.2% |
|||
|
Cytec Industries, Inc. (a) |
888,200 |
21,927,438 |
|
|
Lyondell Chemical Co. |
1,473,400 |
24,679,450 |
|
|
|
46,606,888 |
||
|
Metals & Mining - 0.4% |
|||
|
CommScope, Inc. (a) |
1,266,100 |
51,910,100 |
|
|
Falconbridge Ltd. |
802,500 |
9,892,351 |
|
|
Inco Ltd. (a) |
1,402,000 |
21,496,386 |
|
|
Martin Marietta Materials, Inc. |
143,900 |
5,818,956 |
|
|
|
89,117,793 |
||
|
Packaging & Containers - 0.2% |
|||
|
Owens-Illinois, Inc. (a) |
3,285,700 |
38,401,619 |
|
|
Paper & Forest Products - 0.5% |
|||
|
Kimberly-Clark Corp. |
1,625,400 |
93,257,325 |
|
|
TOTAL BASIC INDUSTRIES |
267,383,625 |
||
|
CONSTRUCTION & REAL ESTATE - 0.3% |
|||
|
Building Materials - 0.1% |
|||
|
Vulcan Materials Co. |
350,200 |
14,949,163 |
|
|
Engineering - 0.2% |
|||
|
Fluor Corp. |
583,770 |
18,461,726 |
|
|
Stolt Offshore SA (a) |
1,551,600 |
21,916,350 |
|
|
Stolt Offshore SA Class A sponsored ADR (a) |
206,050 |
2,446,844 |
|
|
|
42,824,920 |
||
|
TOTAL CONSTRUCTION & REAL ESTATE |
57,774,083 |
||
|
DURABLES - 0.8% |
|||
|
Consumer Durables - 0.0% |
|||
|
Minnesota Mining & Manufacturing Co. |
55,400 |
4,570,500 |
|
|
Consumer Electronics - 0.7% |
|||
|
Gemstar International Group Ltd. (a) |
872,300 |
53,605,561 |
|
|
Pioneer Corp. |
190,000 |
7,401,434 |
|
|
Sanyo Electric Co. Ltd. |
822,000 |
7,396,605 |
|
|
Sony Corp. |
837,300 |
78,967,860 |
|
|
|
147,371,460 |
||
|
|
|||
|
Shares |
Value (Note 1) |
||
|
Textiles & Apparel - 0.1% |
|||
|
Shaw Industries, Inc. |
1,045,400 |
$ 13,067,500 |
|
|
TOTAL DURABLES |
165,009,460 |
||
|
ENERGY - 3.5% |
|||
|
Energy Services - 2.3% |
|||
|
Baker Hughes, Inc. |
3,032,770 |
97,048,640 |
|
|
BJ Services Co. (a) |
635,700 |
39,731,250 |
|
|
Coflexip SA sponsored ADR |
928,500 |
56,174,250 |
|
|
Global Industries Ltd. (a) |
406,300 |
7,668,913 |
|
|
Halliburton Co. |
2,470,100 |
116,557,844 |
|
|
Smith International, Inc. (a) |
868,950 |
63,270,422 |
|
|
Varco International, Inc. (a) |
1,295,500 |
30,120,375 |
|
|
Weatherford International, Inc. |
1,328,840 |
52,904,443 |
|
|
|
463,476,137 |
||
|
Oil & Gas - 1.2% |
|||
|
Apache Corp. |
679,200 |
39,945,450 |
|
|
Burlington Resources, Inc. |
676,400 |
25,872,300 |
|
|
Grant Prideco, Inc. (a) |
1,328,840 |
33,221,000 |
|
|
National-Oilwell, Inc. (a) |
1,050,000 |
34,518,750 |
|
|
Newfield Exploration Co. (a) |
1,396,300 |
54,630,238 |
|
|
Noble Affiliates, Inc. |
1,435,000 |
53,453,750 |
|
|
|
241,641,488 |
||
|
TOTAL ENERGY |
705,117,625 |
||
|
FINANCE - 8.3% |
|||
|
Banks - 0.9% |
|||
|
Bank One Corp. |
5,755,590 |
152,882,859 |
|
|
Chuo Mitsui Trust & Banking Co. Ltd. |
3,483,000 |
15,177,760 |
|
|
Sumitomo Trust & Banking Ltd. |
2,482,000 |
17,675,062 |
|
|
|
185,735,681 |
||
|
Credit & Other Finance - 1.2% |
|||
|
American Express Co. |
1,696,600 |
88,435,275 |
|
|
Associates First Capital Corp. Class A |
3,188,900 |
71,152,331 |
|
|
Citigroup, Inc. |
1,278,100 |
77,005,525 |
|
|
|
236,593,131 |
||
|
Federal Sponsored Credit - 1.3% |
|||
|
Fannie Mae |
3,578,100 |
186,732,094 |
|
|
Freddie Mac |
1,969,500 |
79,764,750 |
|
|
|
266,496,844 |
||
|
Insurance - 3.3% |
|||
|
Ace Ltd. |
2,117,000 |
59,276,000 |
|
|
AFLAC, Inc. |
881,600 |
40,498,500 |
|
|
Allmerica Financial Corp. |
657,910 |
34,458,036 |
|
|
AMBAC Financial Group, Inc. |
435,400 |
23,865,363 |
|
|
American International Group, Inc. |
1,682,031 |
197,638,643 |
|
|
Everest Re Group Ltd. |
1,198,800 |
39,410,550 |
|
|
Hartford Financial Services Group, Inc. |
143,200 |
8,010,250 |
|
|
Marsh & McLennan Companies, Inc. |
569,600 |
59,487,600 |
|
|
PartnerRe Ltd. |
1,170,500 |
41,479,594 |
|
|
Common Stocks - continued |
|||
|
Shares |
Value (Note 1) |
||
|
FINANCE - continued |
|||
|
Insurance - continued |
|||
|
The Chubb Corp. |
1,051,200 |
$ 64,648,800 |
|
|
XL Capital Ltd. Class A |
1,922,400 |
104,049,900 |
|
|
|
672,823,236 |
||
|
Securities Industry - 1.6% |
|||
|
Charles Schwab Corp. |
3,193,650 |
107,386,481 |
|
|
Daiwa Securities Group, Inc. |
5,334,000 |
70,435,770 |
|
|
Nikko Securities Co. Ltd. |
5,626,000 |
55,718,735 |
|
|
Nomura Securities Co. Ltd. |
3,836,000 |
93,891,911 |
|
|
|
327,432,897 |
||
|
TOTAL FINANCE |
1,689,081,789 |
||
|
HEALTH - 14.9% |
|||
|
Drugs & Pharmaceuticals - 13.3% |
|||
|
Abgenix, Inc. (a) |
466,671 |
55,934,894 |
|
|
Alkermes, Inc. (a) |
1,152,700 |
54,320,988 |
|
|
American Home Products Corp. |
1,349,200 |
79,265,500 |
|
|
Bristol-Myers Squibb Co. |
5,479,300 |
319,169,225 |
|
|
Cambridge Antibody Technology Group PLC (a) |
598,796 |
26,887,857 |
|
|
Elan Corp. PLC sponsored ADR (a) |
2,800,400 |
135,644,375 |
|
|
Eli Lilly & Co. |
5,317,800 |
531,115,275 |
|
|
Exelixis, Inc. |
534,300 |
17,832,263 |
|
|
Genentech, Inc. |
791,300 |
136,103,600 |
|
|
Human Genome Sciences, Inc. (a) |
525,300 |
70,061,888 |
|
|
Medarex, Inc. (a) |
598,600 |
50,581,700 |
|
|
Merck & Co., Inc. |
2,394,800 |
183,501,550 |
|
|
Millennium Pharmaceuticals, Inc. (a) |
913,240 |
102,168,725 |
|
|
Pfizer, Inc. |
15,050,025 |
722,401,200 |
|
|
Protein Design Labs, Inc. (a) |
140,600 |
23,192,409 |
|
|
Schering-Plough Corp. |
3,671,970 |
185,434,485 |
|
|
|
2,693,615,934 |
||
|
Medical Equipment & Supplies - 1.2% |
|||
|
Cardinal Health, Inc. |
1,739,400 |
128,715,600 |
|
|
Johnson & Johnson |
697,400 |
71,047,625 |
|
|
Medtronic, Inc. |
858,600 |
42,769,013 |
|
|
|
242,532,238 |
||
|
Medical Facilities Management - 0.4% |
|||
|
HCA - The Healthcare Co. |
1,859,800 |
56,491,425 |
|
|
HEALTHSOUTH Corp. (a) |
2,273,300 |
16,339,344 |
|
|
|
72,830,769 |
||
|
TOTAL HEALTH |
3,008,978,941 |
||
|
|
|||
|
Shares |
Value (Note 1) |
||
|
INDUSTRIAL MACHINERY & EQUIPMENT - 3.0% |
|||
|
Electrical Equipment - 2.9% |
|||
|
Capstone Turbine Corp. |
11,400 |
$ 513,713 |
|
|
General Electric Co. |
11,108,200 |
588,734,600 |
|
|
|
589,248,313 |
||
|
Industrial Machinery & Equipment - 0.1% |
|||
|
ASM Lithography Holding NV (a) |
255,000 |
11,251,875 |
|
|
TOTAL INDUSTRIAL MACHINERY & EQUIPMENT |
600,500,188 |
||
|
MEDIA & LEISURE - 6.9% |
|||
|
Broadcasting - 4.2% |
|||
|
AT&T Corp. - Liberty Media Group Class A (a) |
2,554,380 |
61,943,715 |
|
|
Clear Channel Communications, Inc. (a) |
1,191,300 |
89,347,500 |
|
|
Comcast Corp. Class A (special) (a) |
2,027,300 |
82,105,650 |
|
|
Cox Communications, Inc. Class A (a) |
1,380,400 |
62,894,475 |
|
|
EchoStar Communications Corp. |
1,538,800 |
50,948,706 |
|
|
Mediacom Communications Corp. |
1,151,200 |
17,699,700 |
|
|
MediaOne Group, Inc. (a) |
2,421,600 |
160,585,377 |
|
|
NTL, Inc. (a) |
647,594 |
38,774,691 |
|
|
Time Warner, Inc. |
2,574,468 |
195,659,568 |
|
|
UnitedGlobalCom, Inc. Class A (a) |
928,200 |
43,393,350 |
|
|
USA Networks, Inc. (a) |
2,526,700 |
54,639,888 |
|
|
|
857,992,620 |
||
|
Entertainment - 0.9% |
|||
|
Viacom, Inc. Class B (non-vtg.) (a) |
1,750,025 |
119,329,830 |
|
|
Walt Disney Co. |
1,500,600 |
58,242,038 |
|
|
|
177,571,868 |
||
|
Leisure Durables & Toys - 0.2% |
|||
|
Harley-Davidson, Inc. |
1,293,100 |
49,784,350 |
|
|
Restaurants - 1.6% |
|||
|
Brinker International, Inc. (a) |
1,974,900 |
57,765,825 |
|
|
Darden Restaurants, Inc. |
2,937,700 |
47,737,625 |
|
|
McDonald's Corp. |
3,556,900 |
117,155,394 |
|
|
Outback Steakhouse, Inc. (a) |
2,031,250 |
59,414,063 |
|
|
Tricon Global Restaurants, Inc. (a) |
834,760 |
23,581,970 |
|
|
Wendy's International, Inc. |
838,100 |
14,928,656 |
|
|
|
320,583,533 |
||
|
TOTAL MEDIA & LEISURE |
1,405,932,371 |
||
|
NONDURABLES - 4.0% |
|||
|
Beverages - 1.4% |
|||
|
Coca-Cola Enterprises, Inc. |
2,170,300 |
35,403,019 |
|
|
Pepsi Bottling Group, Inc. |
2,176,500 |
63,526,594 |
|
|
The Coca-Cola Co. |
3,240,600 |
186,131,963 |
|
|
|
285,061,576 |
||
|
Common Stocks - continued |
|||
|
Shares |
Value (Note 1) |
||
|
NONDURABLES - continued |
|||
|
Foods - 0.4% |
|||
|
American Italian Pasta Co. Class A (a) |
642,000 |
$ 13,281,375 |
|
|
Keebler Foods Co. |
1,651,762 |
61,321,664 |
|
|
|
74,603,039 |
||
|
Household Products - 1.0% |
|||
|
Clorox Co. |
1,788,200 |
80,133,713 |
|
|
Colgate-Palmolive Co. |
578,800 |
34,655,650 |
|
|
Procter & Gamble Co. |
1,701,360 |
97,402,860 |
|
|
|
212,192,223 |
||
|
Tobacco - 1.2% |
|||
|
Philip Morris Companies, Inc. |
9,198,800 |
244,343,125 |
|
|
TOTAL NONDURABLES |
816,199,963 |
||
|
PRECIOUS METALS - 0.4% |
|||
|
Barrick Gold Corp. |
1,434,000 |
25,909,828 |
|
|
Homestake Mining Co. |
2,249,300 |
15,463,938 |
|
|
Newmont Mining Corp. |
1,472,000 |
31,832,000 |
|
|
Placer Dome, Inc. |
1,426,100 |
13,389,254 |
|
|
TOTAL PRECIOUS METALS |
86,595,020 |
||
|
RETAIL & WHOLESALE - 4.2% |
|||
|
Drug Stores - 0.4% |
|||
|
Walgreen Co. |
2,329,560 |
74,982,713 |
|
|
General Merchandise Stores - 1.4% |
|||
|
Kohls Corp. (a) |
1,211,100 |
67,367,438 |
|
|
Wal-Mart Stores, Inc. |
3,864,300 |
222,680,288 |
|
|
|
290,047,726 |
||
|
Grocery Stores - 0.4% |
|||
|
Safeway, Inc. (a) |
1,715,200 |
77,398,400 |
|
|
Retail & Wholesale, Miscellaneous - 2.0% |
|||
|
Best Buy Co., Inc. (a) |
1,651,000 |
104,425,750 |
|
|
Home Depot, Inc. |
4,848,350 |
242,114,478 |
|
|
Tiffany & Co., Inc. |
876,700 |
59,177,250 |
|
|
|
405,717,478 |
||
|
TOTAL RETAIL & WHOLESALE |
848,146,317 |
||
|
SERVICES - 0.3% |
|||
|
Advertising - 0.2% |
|||
|
TMP Worldwide, Inc. (a) |
527,000 |
38,899,188 |
|
|
Services - 0.1% |
|||
|
Media Metrix, Inc. (a) |
453,100 |
11,525,731 |
|
|
Register.com, Inc. |
257,300 |
7,863,731 |
|
|
|
19,389,462 |
||
|
TOTAL SERVICES |
58,288,650 |
||
|
|
|||
|
Shares |
Value (Note 1) |
||
|
TECHNOLOGY - 42.6% |
|||
|
Communications Equipment - 11.0% |
|||
|
ADC Telecommunications, Inc. (a) |
1,574,400 |
$ 132,052,800 |
|
|
Advanced Fibre |
332,100 |
15,048,281 |
|
|
Aspect Communications Corp. (a) |
701,700 |
27,585,581 |
|
|
Ciena Corp. (a) |
674,000 |
112,347,375 |
|
|
Cisco Systems, Inc. (a) |
14,336,200 |
911,244,690 |
|
|
Comverse Technology, Inc. (a) |
742,500 |
69,052,500 |
|
|
Corning, Inc. |
710,900 |
191,854,138 |
|
|
Ditech Communications Corp. |
490,700 |
46,401,819 |
|
|
Lucent Technologies, Inc. |
5,005,635 |
296,583,874 |
|
|
Nokia AB sponsored ADR |
2,526,800 |
126,182,075 |
|
|
Nortel Networks Corp. |
3,470,160 |
240,719,643 |
|
|
Telefonaktiebolaget LM Ericsson sponsored ADR |
3,149,200 |
62,984,000 |
|
|
|
2,232,056,776 |
||
|
Computer Services & Software - 7.3% |
|||
|
Adobe Systems, Inc. |
571,400 |
74,282,000 |
|
|
Affymetrix, Inc. (a) |
324,900 |
53,649,113 |
|
|
Art Technology Group, Inc. |
742,100 |
74,905,719 |
|
|
Automatic Data Processing, Inc. |
1,415,500 |
75,817,719 |
|
|
BEA Systems, Inc. (a) |
1,548,050 |
76,531,722 |
|
|
BroadVision, Inc. (a) |
1,454,300 |
73,896,619 |
|
|
Citrix Systems, Inc. (a) |
32,100 |
607,894 |
|
|
Data Return Corp. |
130,300 |
3,778,700 |
|
|
Digex, Inc. Class A (c) |
1,235,800 |
83,957,163 |
|
|
Electronic Arts, Inc. (a) |
984,000 |
71,770,500 |
|
|
Healtheon/WebMD (a) |
1,039,500 |
15,397,594 |
|
|
Inktomi Corp. (a) |
295,000 |
34,883,750 |
|
|
Intertrust Technologies Corp. |
874,400 |
17,979,850 |
|
|
Intuit, Inc. (a) |
2,675,600 |
110,702,950 |
|
|
Microsoft Corp. (a) |
2,735,523 |
218,841,840 |
|
|
Nuance Communications, Inc. |
219,500 |
18,287,094 |
|
|
Oracle Corp. (a) |
2,368,100 |
199,068,406 |
|
|
PeopleSoft, Inc. (a) |
846,600 |
14,180,550 |
|
|
Razorfish, Inc. Class A (a) |
524,200 |
8,419,963 |
|
|
Software.com, Inc. |
256,900 |
33,364,888 |
|
|
Trans Cosmos, Inc. |
153,800 |
23,094,662 |
|
|
Travelocity.com, Inc. (a) |
466,200 |
7,634,025 |
|
|
Usinternetworking, Inc. (a) |
573,800 |
11,727,038 |
|
|
VeriSign, Inc. (a) |
485,907 |
85,762,586 |
|
|
VERITAS Software Corp. (a) |
558,675 |
63,139,004 |
|
|
Viant Corp. |
179,300 |
5,311,763 |
|
|
Vignette Corp. (a) |
461,800 |
24,020,816 |
|
|
|
1,481,013,928 |
||
|
Computers & Office Equipment - 10.6% |
|||
|
Brocade Communications |
427,500 |
78,439,570 |
|
|
CDW Computer Centers, Inc. (a) |
1,554,400 |
97,150,000 |
|
|
Compaq Computer Corp. |
2,698,000 |
68,967,625 |
|
|
Common Stocks - continued |
|||
|
Shares |
Value (Note 1) |
||
|
TECHNOLOGY - continued |
|||
|
Computers & Office Equipment - continued |
|||
|
Dell Computer Corp. (a) |
6,459,900 |
$ 318,553,819 |
|
|
EMC Corp. (a) |
5,129,740 |
394,669,371 |
|
|
Gateway, Inc. (a) |
1,011,000 |
57,374,250 |
|
|
Hewlett-Packard Co. |
1,720,400 |
214,834,950 |
|
|
International Business Machines Corp. |
2,986,500 |
327,208,406 |
|
|
Lexmark International Group, Inc. |
742,800 |
49,953,300 |
|
|
MRV Communications, Inc. (a) |
1,744,800 |
117,337,800 |
|
|
SCI Systems, Inc. (a) |
1,534,500 |
60,133,219 |
|
|
Softbank Corp. |
429,900 |
58,390,495 |
|
|
Sun Microsystems, Inc. (a) |
3,416,100 |
310,651,594 |
|
|
|
2,153,664,399 |
||
|
Electronic Instruments - 1.1% |
|||
|
Agilent Technologies, Inc. |
1,702,760 |
125,578,550 |
|
|
Applied Materials, Inc. (a) |
736,300 |
66,727,188 |
|
|
Varian, Inc. (a) |
347,700 |
16,037,663 |
|
|
|
208,343,401 |
||
|
Electronics - 12.6% |
|||
|
Advanced Micro Devices, Inc. (a) |
565,000 |
43,646,250 |
|
|
Bookham Technology PLC sponsored ADR |
577,500 |
34,216,875 |
|
|
Broadcom Corp. Class A (a) |
396,000 |
86,699,250 |
|
|
Chartered Semiconductor |
888,500 |
79,965,000 |
|
|
Intel Corp. |
6,712,700 |
897,404,081 |
|
|
JDS Uniphase Corp. (a) |
1,341,200 |
160,776,350 |
|
|
Kyocera Corp. |
351,500 |
60,392,096 |
|
|
LSI Logic Corp. (a) |
1,405,900 |
76,094,338 |
|
|
Marvell Technology Group Ltd. (a) |
7,800 |
444,600 |
|
|
Micron Technology, Inc. (a) |
1,485,400 |
130,808,038 |
|
|
Mitsubishi Electric Corp. |
9,445,000 |
102,271,840 |
|
|
Motorola, Inc. |
3,130,200 |
90,971,438 |
|
|
PMC-Sierra, Inc. (a) |
291,000 |
51,707,063 |
|
|
Samsung Electronics Co. Ltd. |
170,080 |
56,285,311 |
|
|
Sanmina Corp. (a) |
1,014,700 |
86,756,850 |
|
|
SDL, Inc. (a) |
248,800 |
70,954,650 |
|
|
Stratos Lightwave, Inc. (a) |
8,100 |
225,788 |
|
|
Taiwan Semiconductor Manufacturing Co. Ltd. sponsored ADR (a) |
1,796,354 |
69,608,718 |
|
|
|
|||
|
Shares |
Value (Note 1) |
||
|
Texas Instruments, Inc. |
5,659,200 |
$ 388,716,300 |
|
|
Xilinx, Inc. (a) |
857,800 |
70,822,113 |
|
|
|
2,558,766,949 |
||
|
TOTAL TECHNOLOGY |
8,633,845,453 |
||
|
TRANSPORTATION - 0.7% |
|||
|
Air Transportation - 0.2% |
|||
|
Southwest Airlines Co. |
2,211,100 |
41,872,706 |
|
|
Railroads - 0.5% |
|||
|
Burlington Northern Santa Fe Corp. |
1,209,300 |
27,738,319 |
|
|
Canadian National Railway Co. |
1,458,980 |
42,473,514 |
|
|
Union Pacific Corp. |
684,000 |
25,436,250 |
|
|
|
95,648,083 |
||
|
TOTAL TRANSPORTATION |
137,520,789 |
||
|
UTILITIES - 6.5% |
|||
|
Cellular - 3.7% |
|||
|
AT&T Corp. - Wireless Group |
1,172,100 |
32,672,288 |
|
|
China Telecom (Hong Kong) Ltd. sponsored ADR (a) |
723,050 |
128,567,328 |
|
|
China Unicom Ltd. sponsored ADR |
2,673,200 |
56,805,500 |
|
|
Nextel Communications, Inc. Class A (a) |
1,992,200 |
121,897,738 |
|
|
Sprint Corp. - PCS Group Series 1 (a) |
1,787,180 |
106,337,210 |
|
|
Vodafone AirTouch PLC |
32,309,376 |
133,881,853 |
|
|
Vodafone AirTouch PLC sponsored ADR |
1,652,650 |
68,481,684 |
|
|
VoiceStream Wireless Corp. (a) |
874,073 |
101,651,958 |
|
|
|
750,295,559 |
||
|
Electric Utility - 0.8% |
|||
|
AES Corp. (a) |
2,006,000 |
91,523,750 |
|
|
Calpine Corp. (a) |
1,211,900 |
79,682,425 |
|
|
|
171,206,175 |
||
|
Telephone Services - 2.0% |
|||
|
DDI Corp. |
6,392 |
61,496,324 |
|
|
iBasis, Inc. |
468,100 |
20,157,556 |
|
|
McLeodUSA, Inc. Class A (a) |
3,343,800 |
69,174,863 |
|
|
Metromedia Fiber Network, Inc. |
2,442,800 |
96,948,625 |
|
|
NEXTLINK Communications, Inc. Class A |
1,691,593 |
64,174,809 |
|
|
Sprint Corp. - FON Group |
756,000 |
38,556,000 |
|
|
TeraBeam Networks (d) |
60,800 |
228,000 |
|
|
Time Warner Telecom, Inc. Class A |
784,500 |
50,502,188 |
|
|
|
401,238,365 |
||
|
TOTAL UTILITIES |
1,322,740,099 |
||
|
TOTAL COMMON STOCKS (Cost $14,218,076,542) |
19,952,072,280 |
||
|
Cash Equivalents - 3.7% |
|||
|
Shares |
Value (Note 1) |
||
|
Central Cash Collateral Fund, 6.71% (b) |
296,344,139 |
$ 296,344,139 |
|
|
Taxable Central Cash Fund, 6.59% (b) |
454,771,936 |
454,771,936 |
|
|
TOTAL CASH EQUIVALENTS (Cost $751,116,075) |
751,116,075 |
|
|
TOTAL INVESTMENT PORTFOLIO - 102.1% (Cost $14,969,192,617) |
20,703,188,355 |
|
|
NET OTHER ASSETS - (2.1)% |
(422,988,881) |
|
|
NET ASSETS - 100% |
$ 20,280,199,474 |
|
|
Legend |
|
(a) Non-income producing |
|
(b) The rate quoted is the annualized seven-day yield of the fund at |
|
(c) Transactions during the period with companies which are or were affiliates are as follows: |
|
Affiliate |
Purchase |
Sales |
Dividend |
Value |
|
Coflexip SA |
$ - |
$ - |
$ - |
$ - |
|
Digex, Inc. |
313,744 |
- |
- |
83,957,163 |
|
TOTALS |
$ 313,744 |
$ - |
$ - |
$ 83,957,163 |
|
(d) Restricted securities - Investment in securities not registered under the Securities Act of 1933. |
|
Additional information on each holding is as follows: |
|
Security |
Acquisition Date |
Acquisition Cost |
|
TeraBeam Networks |
4/7/00 |
$ 228,000 |
|
Other Information |
|
Purchases and sales of securities, other than short-term securities, aggregated $10,740,018,866 and $9,565,681,575, respectively. |
|
The fund placed a portion of its portfolio transactions with brokerage firms which are affiliates of Fidelity Management & Research Company. The commissions paid to these affiliated firms were $332,074 for the period. |
|
The fund invested in securities that are not registered under the Securities Act of 1933. These securities are subject to legal or contractual restrictions on resale. At the end of the period, restricted securities (excluding Rule 144A issues) amounted to $228,000 or 0.0% of net assets. |
|
The fund participated in the security lending program. At period end, the value of securities loaned amounted to $302,340,051. The fund received cash collateral of $296,344,139 which was invested in cash equivalents. |
|
The fund participated in the interfund lending program as a borrower. |
|
Distribution of investments by country of issue, as a percentage of total |
|
United States of America |
88.6% |
|
Japan |
3.2 |
|
Canada |
1.7 |
|
United Kingdom |
1.3 |
|
Others (individually less than 1%) |
5.2 |
|
|
100.0% |
|
Income Tax Information |
|
At June 30, 2000, the aggregate cost of investment securities for income tax purposes was $15,074,908,308. Net unrealized appreciation aggregated $5,628,280,047, of which $6,454,968,371 related to appreciated investment securities and $826,688,324 related to depreciated investment securities. |
See accompanying notes which are an integral part of the financial statements.
Growth Portfolio
Statement of Assets and Liabilities
|
|
June 30, 2000 (Unaudited) |
|
|
Assets |
|
|
|
Investment in securities, at value (cost $14,969,192,617) - |
|
$ 20,703,188,355 |
|
Receivable for investments sold |
|
154,406,528 |
|
Receivable for fund shares sold |
|
13,515,281 |
|
Dividends receivable |
|
13,538,228 |
|
Interest receivable |
|
1,031,263 |
|
Other receivables |
|
825,472 |
|
Total assets |
|
20,886,505,127 |
|
Liabilities |
|
|
|
Payable for investments purchased |
$ 288,895,972 |
|
|
Payable for fund shares redeemed |
10,484,314 |
|
|
Accrued management fee |
9,499,178 |
|
|
Distribution fees payable |
135,980 |
|
|
Other payables and |
946,070 |
|
|
Collateral on securities loaned, |
296,344,139 |
|
|
Total liabilities |
|
606,305,653 |
|
Net Assets |
|
$ 20,280,199,474 |
|
Net Assets consist of: |
|
|
|
Paid in capital |
|
$ 13,338,505,241 |
|
Distributions in excess of |
|
(3,734,826) |
|
Accumulated undistributed |
|
1,211,401,186 |
|
Net unrealized appreciation (depreciation) on investments |
|
5,734,027,873 |
|
Net Assets |
|
$ 20,280,199,474 |
|
Initial Class: |
|
$51.54 |
|
Service Class: |
|
$51.39 |
|
Service Class 2: |
|
$51.35 |
Statement of Operations
|
|
Six months ended June 30, 2000 (Unaudited) |
|
|
Investment Income Dividends |
|
$ 52,399,181 |
|
Interest |
|
4,779,796 |
|
Security lending |
|
1,284,282 |
|
Total income |
|
58,463,259 |
|
Expenses |
|
|
|
Management fee |
$ 54,947,825 |
|
|
Transfer agent fees |
6,350,319 |
|
|
Distribution fees |
652,691 |
|
|
Accounting and security lending fees |
641,945 |
|
|
Non-interested trustees' compensation |
68,264 |
|
|
Custodian fees and expenses |
339,442 |
|
|
Registration fees |
89,572 |
|
|
Audit |
46,992 |
|
|
Legal |
69,742 |
|
|
Interest |
6,948 |
|
|
Miscellaneous |
83,780 |
|
|
Total expenses before reductions |
63,297,520 |
|
|
Expense reductions |
(1,596,136) |
61,701,384 |
|
Net investment income (loss) |
|
(3,238,125) |
|
Realized and Unrealized Gain (Loss) Net realized gain (loss) on: |
|
|
|
Investment securities |
1,263,186,366 |
|
|
Foreign currency transactions |
270,216 |
1,263,456,582 |
|
Change in net unrealized appreciation (depreciation) on: |
|
|
|
Investment securities |
(303,021,726) |
|
|
Assets and liabilities in |
10,711 |
(303,011,015) |
|
Net gain (loss) |
|
960,445,567 |
|
Net increase (decrease) in net assets resulting from operations |
|
$ 957,207,442 |
|
Other Information Expense reductions |
|
$ 1,592,303 |
|
Custodian credits |
|
3,833 |
|
|
|
$ 1,596,136 |
See accompanying notes which are an integral part of the financial statements.
Semiannual Report
Fidelity Variable Insurance Products: Growth Portfolio
Financial Statements - continued
Statement of Changes in Net Assets
|
Increase (Decrease) in Net Assets |
Six months ended |
Year ended |
|
Operations |
$ (3,238,125) |
$ 19,639,750 |
|
Net realized gain (loss) |
1,263,456,582 |
2,028,922,212 |
|
Change in net unrealized appreciation (depreciation) |
(303,011,015) |
2,640,487,583 |
|
Net increase (decrease) in net assets resulting from operations |
957,207,442 |
4,689,049,545 |
|
Distributions to shareholders |
(20,008,543) |
(20,716,861) |
|
From net realized gain |
(2,010,393,014) |
(1,302,572,634) |
|
Total distributions |
(2,030,401,557) |
(1,323,289,495) |
|
Share transactions - net increase (decrease) |
3,294,652,295 |
3,313,015,561 |
|
Total increase (decrease) in net assets |
2,221,458,180 |
6,678,775,611 |
|
Net Assets |
|
|
|
Beginning of period |
18,058,741,294 |
11,379,965,683 |
|
End of period (including under (over) distribution of net investment income of $(3,734,826) |
$ 20,280,199,474 |
$ 18,058,741,294 |
|
|
|
Other Information: |
|
|
Six months ended June 30, 2000 |
Year ended |
||
|
|
Shares |
Dollars |
Shares |
Dollars |
|
Share transactions |
36,209,385 |
$ 1,867,900,668 |
82,051,942 |
$ 3,738,420,624 |
|
Reinvested |
38,128,847 |
1,912,161,690 |
31,299,165 |
1,303,923,236 |
|
Redeemed |
(26,208,895) |
(1,332,024,693) |
(51,848,071) |
(2,361,030,389) |
|
Net increase (decrease) |
48,129,337 |
$ 2,448,037,665 |
61,503,036 |
$ 2,681,313,471 |
|
Service Class |
14,784,762 |
$ 754,915,605 |
14,009,513 |
$ 648,480,975 |
|
Reinvested |
2,363,626 |
118,228,594 |
465,535 |
19,366,259 |
|
Redeemed |
(703,110) |
(35,750,550) |
(792,556) |
(36,145,144) |
|
Net increase (decrease) |
16,445,278 |
$ 837,393,649 |
13,682,492 |
$ 631,702,090 |
|
Service Class 2 A |
191,871 |
$ 9,432,086 |
- |
$ - |
|
Reinvested |
225 |
11,274 |
- |
- |
|
Redeemed |
(4,542) |
(222,379) |
- |
- |
|
Net increase (decrease) |
187,554 |
$ 9,220,981 |
- |
$ - |
|
Distributions |
|
$ 19,026,484 |
|
$ 20,413,671 |
|
Service Class |
|
981,965 |
|
303,190 |
|
Service Class 2 A |
|
94 |
|
- |
|
Total |
|
$ 20,008,543 |
|
$ 20,716,861 |
|
From net realized gain |
|
$ 1,893,135,205 |
|
$ 1,283,509,565 |
|
Service Class |
|
117,246,629 |
|
19,063,069 |
|
Service Class 2 A |
|
11,180 |
|
- |
|
Total |
|
$ 2,010,393,014 |
|
$ 1,302,572,634 |
|
|
|
$ 2,030,401,557 |
|
$ 1,323,289,495 |
A Service Class 2 commenced sale of shares January 12, 2000.
See accompanying notes which are an integral part of the financial statements.
Growth Portfolio
Financial Highlights - Initial Class
|
|
Six months ended |
Years ended December 31, |
||||
|
Selected Per-Share Data |
(Unaudited) |
1999 |
1998 |
1997 |
1996 |
1995 |
|
Net asset value, beginning of period |
$ 54.93 |
$ 44.87 |
$ 37.10 |
$ 31.14 |
$ 29.20 |
$ 21.69 |
|
Income from Investment Operations |
|
|
|
|
|
|
|
Net investment income (loss) |
(.01) D |
.07 D |
.08 D |
.20 D |
.22 |
.08 |
|
Net realized and unrealized gain (loss) |
2.65 |
15.10 |
12.85 |
6.91 |
3.82 |
7.55 |
|
Total from investment operations |
2.64 |
15.17 |
12.93 |
7.11 |
4.04 |
7.63 |
|
Less Distributions |
|
|
|
|
|
|
|
From net investment income |
(.06) |
(.08) |
(.19) |
(.21) |
(.08) |
(.12) |
|
From net realized gain |
(5.97) |
(5.03) |
(4.97) |
(.94) |
(2.02) |
- |
|
Total distributions |
(6.03) |
(5.11) |
(5.16) |
(1.15) |
(2.10) |
(.12) |
|
Net asset value, end of period |
$ 51.54 |
$ 54.93 |
$ 44.87 |
$ 37.10 |
$ 31.14 |
$ 29.20 |
|
Total Return B, C |
5.11% |
37.44% |
39.49% |
23.48% |
14.71% |
35.36% |
|
Ratios and Supplemental Data |
|
|
|
|
|
|
|
Net assets, end of period (000 omitted) |
$ 18,566,075 |
$ 17,142,411 |
$ 11,243,824 |
$ 7,727,132 |
$ 6,086,424 |
$ 4,162,702 |
|
Ratio of expenses to average net assets |
.65% A |
.66% |
.68% |
.69% |
.69% |
.70% |
|
Ratio of expenses to average net assets after |
.64% A, F |
.65% F |
.66% F |
.67% F |
.67% F |
.70% |
|
Ratio of net investment income (loss) to average net assets |
(.03)% A |
.14% |
.21% |
.58% |
.81% |
.37% |
|
Portfolio turnover |
101% A |
84% |
123% |
113% |
81% |
108% |
Financial Highlights - Service Class
|
|
Six months ended |
Years ended December 31, |
||
|
Selected Per-Share Data |
(Unaudited) |
1999 |
1998 |
1997 E |
|
Net asset value, beginning of period |
$ 54.80 |
$ 44.82 |
$ 37.09 |
$ 36.92 |
|
Income from Investment Operations |
|
|
|
|
|
Net investment income (loss) D |
(.03) |
.02 |
.06 |
.03 |
|
Net realized and unrealized gain (loss) |
2.64 |
15.07 |
12.83 |
.14 |
|
Total from investment operations |
2.61 |
15.09 |
12.89 |
.17 |
|
Less Distributions |
|
|
|
|
|
From net investment income |
(.05) |
(.08) |
(.19) |
- |
|
From net realized gain |
(5.97) |
(5.03) |
(4.97) |
- |
|
Total distributions |
(6.02) |
(5.11) |
(5.16) |
- |
|
Net asset value, end of period |
$ 51.39 |
$ 54.80 |
$ 44.82 |
$ 37.09 |
|
Total Return B, C |
5.06% |
37.29% |
39.38% |
.46% |
|
Ratios and Supplemental Data |
|
|
|
|
|
Net assets, end of period (000 omitted) |
$ 1,704,494 |
$ 916,330 |
$ 136,142 |
$ 2,015 |
|
Ratio of expenses to average net assets |
.76% A |
.77% |
.80% |
.79% A |
|
Ratio of expenses to average net assets after expense reductions |
.74% A, F |
.75% F |
.75% F |
.77% A, F |
|
Ratio of net investment income (loss) to average net assets |
(.13)% A |
.04% |
.15% |
.70% A |
|
Portfolio turnover |
101% A |
84% |
123% |
113% |
|
A Annualized B Total returns for periods of less than one year are not annualized and do not reflect charges attributable to your insurance company's separate account. Inclusion of these charges would reduce the total returns shown. C The total returns would have been lower had certain expenses not been reduced during the periods shown. D Net investment income (loss) per share has been calculated based on average shares outstanding during the period. E For the period November 3, 1997 (commencement of sale of Service Class shares) to December 31, 1997. F FMR or the fund has entered into varying arrangements with third parties who either paid or reduced a portion of the class' expenses. |
||||
See accompanying notes which are an integral part of the financial statements.
Semiannual Report
Financial Highlights - Service Class 2
|
|
Six months ended |
|
Selected Per-Share Data |
(Unaudited) |
|
Net asset value, beginning of period |
$ 53.40 |
|
Income from Investment Operations |
|
|
Net investment income (loss) D |
(.07) |
|
Net realized and unrealized gain (loss) |
4.04 |
|
Total from investment operations |
3.97 |
|
Less Distributions |
|
|
From net investment income |
(.05) |
|
From net realized gain |
(5.97) |
|
Total distributions |
(6.02) |
|
Net asset value, end of period |
$ 51.35 |
|
Total Return B, C |
7.74% |
|
Ratios and Supplemental Data |
|
|
Net assets, end of period (000 omitted) |
$ 9,630 |
|
Ratio of expenses to average net assets |
.94% A |
|
Ratio of expenses to average net assets after expense reductions |
.92% A, F |
|
Ratio of net investment income (loss) to average net assets |
(.31)% A |
|
Portfolio turnover |
101% A |
|
A Annualized B Total returns for periods of less than one year are not annualized and do not reflect charges attributable to your insurance company's separate account. Inclusion of these charges would reduce the total returns shown. C The total returns would have been lower had certain expenses not been reduced during the periods shown. D Net investment income (loss) per share has been calculated based on average shares outstanding during the period. E For the period January 12, 2000 (commencement of sale of Service Class 2 shares) to June 30, 2000. F FMR or the fund has entered into varying arrangements with third parties who either paid or reduced a portion of the class' expenses. |
|
See accompanying notes which are an integral part of the financial statements.
Growth Portfolio
Performance
There are several ways to evaluate a fund's historical performance. You can look at the total percentage change in value, the average annual percentage change or the growth of a hypothetical $10,000 investment. Total return reflects the change in the value of an investment, assuming reinvestment of the fund's dividend income and capital gains (the profits earned upon the sale of securities that have grown in value). The initial offering of Service Class shares took place on November 3, 1997. Performance for Service Class shares reflects an asset based distribution fee (12b-1 fee), and returns prior to November 3, 1997 are those of Initial Class and do not include the effects of Service Class' 12b-1 fee. Had Service Class shares' 12b-1 fee been reflected, returns prior to November 3, 1997 would have been lower.
Average Annual Total Returns
|
Periods ended |
Past 1 |
Past 5 |
Life of |
|
Fidelity VIP: Contrafund - |
10.11% |
21.77% |
24.58% |
|
S&P 500 |
7.25% |
23.80% |
25.60% |
Average annual returns take the fund's cumulative return and show you what would have happened if the fund had performed at a constant rate each year.
You can compare the fund's return to the performance of the Standard & Poor's 500 Index - a market capitalization-weighted index of common stocks. This benchmark reflects the reinvestment of dividends and capital gains, if any.
Figures for more than one year assume a steady compounded rate of return and are not the fund's year-by-year results, which fluctuated over the periods shown. The life of the fund figures are from commencement of operations, January 3, 1995.
Performance numbers are net of all fund operating expenses, but do not include any insurance charges imposed by your insurance company's separate account. If performance information included the effect of these additional charges, the total return would be lower.
Past performance is no guarantee of future results. Principal and investment return will vary and you may have a gain or loss when you withdraw your money.
Understanding Performance
How a fund did yesterday is no guarantee of how it will do tomorrow. The stock market, for example, has a history of long-term growth and short-term volatility. In turn, the share price and return of a fund that invests in stocks will vary. That means if you sell your shares during a market downturn, you might lose money. But if you can ride out the market's ups and downs, you may have a gain.
3$10,000 Over Life of Fund
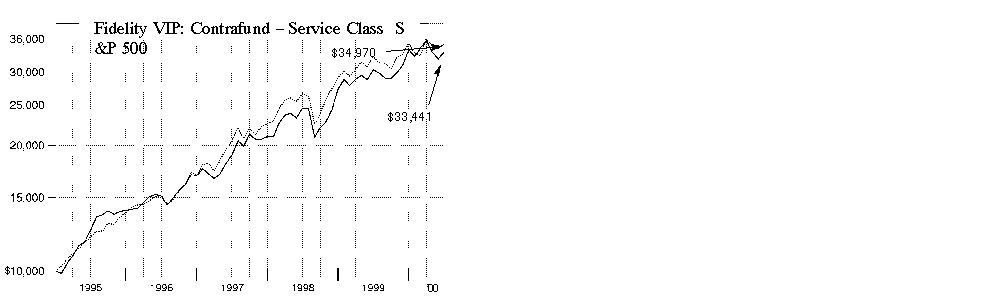
$10,000 Over Life of Fund: Let's say hypothetically that $10,000 was invested in Fidelity Variable Insurance Products: Contrafund Portfolio - Service Class on January 3, 1995, when the fund started. As the chart shows, by June 30, 2000, the value of the investment would have grown to $33,441 - a 234.41% increase on the initial investment. For comparison, look at how the Standard & Poor's 500 Index did over the same period. With dividends and capital gains, if any, reinvested, the same $10,000 investment would have grown to $34,970 - a 249.70% increase.
Investment Summary
|
Top Five Stocks as of June 30, 2000 |
|
|
|
% of fund's |
|
Cisco Systems, Inc. |
4.3 |
|
Viacom, Inc. Class B (non-vtg.) |
4.1 |
|
McDonald's Corp. |
2.9 |
|
BP Amoco PLC sponsored ADR |
1.9 |
|
Exxon Mobil Corp. |
1.8 |
|
|
15.0 |
|
Top Five Market Sectors as of June 30, 2000 |
|
|
|
% of fund's |
|
Technology |
23.9 |
|
Media & Leisure |
13.0 |
|
Finance |
12.0 |
|
Utilities |
9.6 |
|
Energy |
7.1 |
|
Asset Allocation as of June 30, 2000 |
|||
|
% of fund's net assets * |
|||
|
Stocks and |
|
|
|
Bonds 2.3% |
|
|
|
Short-Term Investments |
|
|
|
* Foreign investments 15.5% |
Semiannual Report
(Portfolio Manager photograph)
An interview with Will Danoff, Portfolio Manager of Contrafund
Q. How did the fund perform, Will?
A. Performance was disappointing. For the six months that ended June 30, 2000, the fund trailed the Standard & Poor's 500 Index, which returned -0.42%. For the 12 months that ended June 30, 2000, the fund's performance topped the S&P 500, which returned 7.25%.
Q. What factors influenced the fund's performance during the six-month period?
A. The biggest drag on performance was the fund's low weighting in health stocks relative to the S&P 500. I kept the fund's exposure to the group at around half that of the index because the growth rates for health stocks were slowing. Health stocks rebounded during the period - returning around 25% - and the fund's low weighting ultimately hurt. Technology stocks, which accounted for approximately one-third of the S&P 500 at the end of the period, also played a key role. At the beginning of the period, I was concerned about high valuations and excessive speculation throughout the sector. As a result, I kept the fund underweighted relative to the index, and my decision to do so worked out well as technology stock prices corrected during April and May.
Q. What was your strategy in terms of the fund's technology investments?
A. I firmly believe that the Internet will be a major growth engine of the world economy for years to come. Dot-com stocks had been a major driver behind the market since mid-1998, but many of them were selling at valuations that drastically exceeded their potential earnings growth rates. When Internet stocks declined, the whole sector followed suit. At that time, I upgraded the fund's technology holdings by adding to its positions in leading technology names such as Cisco Systems and Nortel Networks, as well as emerging-but-profitable leaders such as Brocade Communications and Broadcom. These companies were well-positioned to benefit from the continued buildout of the Internet infrastructure. While the fund's investments in semiconductor names such as Micron Technology and Texas Instruments performed well during the period, a higher weighting in technology overall would have helped performance.
Q. The fund's emphasis on media and leisure stocks helped performance. Can you elaborate?
A. I viewed media stocks as beneficiaries of the Internet tidal wave, because I felt the Internet would serve as a significant outlet for media companies' content. Unlike many of the new dot-com companies, traditional media companies were producing positive earnings and cash flow. By investing in these stocks, the fund participated in the Internet investment theme, but with its risk limited by the real earnings and cash flow from these companies. This strategy proved wise, as the fund's investments in Time Warner and Viacom were particularly lucrative during the period. Consolidation also was prevalent throughout the media group, as America Online announced its intent to aquire Time Warner in January, and the Viacom-CBS merger produced better-than-expected results.
Q. Which stocks were disappointing?
A. McDonald's was a disappointment. I was initially attracted to the stock as a turnaround story, but the company's sales during the period were weaker than I had hoped. Rising interest rates hurt the stock of Home Depot, but the company continued to execute well and remained a core holding. Microsoft performed poorly during the period, as the ongoing federal government antitrust suit against the company and slowing revenue growth hurt its stock.
Q. What's your outlook?
A. The market remains extremely expensive. Price-to-earnings (P/E) ratios - which tell investors how much they're paying for a company's earnings power - have risen dramatically during the period and currently stand at almost twice their 75-year average. Corporate earnings thus far in 2000 have been very good - S&P earnings for the first quarter of 2000 were up 29% - but they may slow considering the six interest-rate hikes we've seen over the past year. Inflation is rising, but it remains under control. Against this uncertain backdrop, I'll try to concentrate on finding high-quality companies that are gaining market share, have sustainable competitive advantages and are in growing markets.
The views expressed in this report reflect those of the portfolio manager only through the end of the period of the report as stated on the cover. The manager's views are subject to change at any time based on market or other conditions. For more information, see page 2.
Fund Facts
Goal: long term capital appreciation
Start date: January 3, 1995
Size: as of June 30, 2000, more than
$10.2 billion
Manager: Will Danoff, since inception; joined Fidelity in 1986
3Semiannual Report
Fidelity Variable Insurance Products: Contrafund Portfolio
(Unaudited)
Showing Percentage of Net Assets
|
Common Stocks - 90.0% |
|||
|
Shares |
Value (Note 1) |
||
|
AEROSPACE & DEFENSE - 0.2% |
|||
|
Aerospace & Defense - 0.1% |
|||
|
Boeing Co. |
21,980 |
$ 919,039 |
|
|
Bombardier, Inc. Class B (non-vtg.) |
237,100 |
6,437,974 |
|
|
Northrop Grumman Corp. |
18,600 |
1,232,250 |
|
|
United Technologies Corp. |
21,701 |
1,277,646 |
|
|
|
9,866,909 |
||
|
Ship Building & Repair - 0.1% |
|||
|
General Dynamics Corp. |
186,200 |
9,728,950 |
|
|
TOTAL AEROSPACE & DEFENSE |
19,595,859 |
||
|
BASIC INDUSTRIES - 0.8% |
|||
|
Chemicals & Plastics - 0.6% |
|||
|
Avery Dennison Corp. |
332,400 |
22,312,350 |
|
|
Pharmacia Corp. |
373,500 |
19,305,281 |
|
|
Sealed Air Corp. (a) |
41,900 |
2,194,513 |
|
|
Spartech Corp. |
172,600 |
4,660,200 |
|
|
Valspar Corp. |
404,200 |
13,641,750 |
|
|
|
62,114,094 |
||
|
Metals & Mining - 0.2% |
|||
|
Alcoa, Inc. |
246,200 |
7,139,800 |
|
|
Broken Hill Proprietary Co. Ltd. |
791,982 |
9,335,716 |
|
|
|
16,475,516 |
||
|
Paper & Forest Products - 0.0% |
|||
|
Bowater, Inc. |
6,500 |
286,813 |
|
|
TOTAL BASIC INDUSTRIES |
78,876,423 |
||
|
CONSTRUCTION & REAL ESTATE - 0.5% |
|||
|
Building Materials - 0.1% |
|||
|
Fastenal Co. |
101,600 |
5,143,500 |
|
|
Fortune Brands, Inc. |
230,500 |
5,315,906 |
|
|
|
10,459,406 |
||
|
Construction - 0.1% |
|||
|
Ashtead Group PLC |
24,700 |
35,971 |
|
|
Jacobs Engineering Group, Inc. (a) |
290,530 |
9,496,699 |
|
|
|
9,532,670 |
||
|
Engineering - 0.0% |
|||
|
360networks, Inc. (sub. vtg.) |
220,400 |
3,379,318 |
|
|
Tetra Tech, Inc. (a) |
9,100 |
208,163 |
|
|
|
3,587,481 |
||
|
Real Estate - 0.0% |
|||
|
ResortQuest International, Inc. (a) |
192,100 |
984,513 |
|
|
Real Estate Investment Trusts - 0.3% |
|||
|
Equity Office Properties Trust |
448,600 |
12,364,538 |
|
|
Equity Residential Properties Trust (SBI) |
115,100 |
5,294,600 |
|
|
Glenborough Realty Trust, Inc. |
213,600 |
3,724,650 |
|
|
|
|||
|
Shares |
Value (Note 1) |
||
|
Pinnacle Holdings, Inc. (a) |
93,900 |
$ 5,070,600 |
|
|
Spieker Properties, Inc. |
46,600 |
2,143,600 |
|
|
|
28,597,988 |
||
|
TOTAL CONSTRUCTION & REAL ESTATE |
53,162,058 |
||
|
DURABLES - 3.4% |
|||
|
Autos, Tires, & Accessories - 2.2% |
|||
|
Danaher Corp. |
837,422 |
41,400,050 |
|
|
Gentex Corp. (a) |
172,700 |
4,339,088 |
|
|
Goodyear Tire & Rubber Co. |
22,500 |
450,000 |
|
|
Lear Corp. (a) |
190,800 |
3,816,000 |
|
|
Midas, Inc. |
304,800 |
6,096,000 |
|
|
Sonic Automotive, Inc. Class A (a) |
50,000 |
534,375 |
|
|
SPX Corp. |
1,053,141 |
127,364,240 |
|
|
Toyota Motor Corp. |
305,000 |
13,895,020 |
|
|
TRW, Inc. |
612,500 |
26,567,188 |
|
|
|
224,461,961 |
||
|
Consumer Durables - 0.1% |
|||
|
Blyth, Inc. |
69,000 |
2,035,500 |
|
|
Boyds Collection, Ltd. (a) |
408,500 |
3,472,250 |
|
|
|
5,507,750 |
||
|
Consumer Electronics - 1.1% |
|||
|
General Motors Corp. Class H (a) |
232,100 |
20,366,775 |
|
|
Harman International Industries, Inc. |
461,000 |
28,121,000 |
|
|
Pioneer Corp. |
402,000 |
15,659,876 |
|
|
Sony Corp. |
499,700 |
47,127,958 |
|
|
|
111,275,609 |
||
|
Home Furnishings - 0.0% |
|||
|
Herman Miller, Inc. |
86,900 |
2,248,538 |
|
|
The Bombay Company, Inc. (a) |
429,100 |
1,260,481 |
|
|
|
3,509,019 |
||
|
Textiles & Apparel - 0.0% |
|||
|
Delta Woodside Industries |
88,700 |
194,031 |
|
|
Timberland Co. Class A (a) |
7,600 |
538,175 |
|
|
Warnaco Group, Inc. Class A |
571,100 |
4,426,025 |
|
|
|
5,158,231 |
||
|
TOTAL DURABLES |
349,912,570 |
||
|
ENERGY - 7.1% |
|||
|
Energy Services - 0.5% |
|||
|
Baker Hughes, Inc. |
432,000 |
13,824,000 |
|
|
ENSCO International, Inc. |
107,100 |
3,835,519 |
|
|
Global Marine, Inc. |
117,300 |
3,306,394 |
|
|
Hanover Compressor Co. (a) |
225,100 |
8,553,800 |
|
|
Schlumberger Ltd. (NY Shares) |
286,600 |
21,387,525 |
|
|
|
50,907,238 |
||
|
Oil & Gas - 6.6% |
|||
|
Alberta Energy Co. Ltd. |
1,046,700 |
42,278,055 |
|
|
Common Stocks - continued |
|||
|
Shares |
Value (Note 1) |
||
|
ENERGY - continued |
|||
|
Oil & Gas - continued |
|||
|
Apache Corp. |
402,000 |
$ 23,642,625 |
|
|
BP Amoco PLC sponsored ADR |
3,497,532 |
197,829,154 |
|
|
Canada Occidental Petroleum Ltd. |
559,700 |
15,178,625 |
|
|
Canadian Natural Resources Ltd. (a) |
168,930 |
4,906,444 |
|
|
Chevron Corp. |
408,600 |
34,654,388 |
|
|
Cooper Cameron Corp. (a) |
22,900 |
1,511,400 |
|
|
Devon Energy Corp. |
36,640 |
2,058,710 |
|
|
EOG Resources, Inc. |
416,600 |
13,956,100 |
|
|
Exxon Mobil Corp. |
2,329,171 |
182,839,924 |
|
|
Newfield Exploration Co. (a) |
174,100 |
6,811,663 |
|
|
Royal Dutch Petroleum Co. (NY Shares) |
534,900 |
32,929,781 |
|
|
Santa Fe Snyder Corp. (a) |
257,300 |
2,926,788 |
|
|
Suncor Energy, Inc. |
1,445,940 |
33,401,653 |
|
|
Talisman Energy, Inc. (a) |
186,300 |
6,172,249 |
|
|
Tosco Corp. |
651,000 |
18,431,438 |
|
|
TotalFinaElf SA sponsored ADR |
526,823 |
40,466,592 |
|
|
Vastar Resources, Inc. |
261,200 |
21,451,050 |
|
|
|
681,446,639 |
||
|
TOTAL ENERGY |
732,353,877 |
||
|
FINANCE - 12.0% |
|||
|
Banks - 1.6% |
|||
|
Bank of New York Co., Inc. |
476,900 |
22,175,850 |
|
|
Bank One Corp. |
1,587,400 |
42,165,313 |
|
|
Commerce Bancorp, Inc. |
32,000 |
1,472,000 |
|
|
Fifth Third Bancorp |
250,800 |
15,863,100 |
|
|
Firstar Corp. |
806,100 |
16,978,481 |
|
|
M&T Bank Corp. |
33,230 |
14,953,500 |
|
|
Mellon Financial Corp. |
137,700 |
5,017,444 |
|
|
Northern Trust Corp. |
249,000 |
16,200,563 |
|
|
PNC Financial Services Group, Inc. |
74,400 |
3,487,500 |
|
|
Royal Bank of Scotland Group PLC |
704,573 |
11,821,340 |
|
|
Wells Fargo & Co. |
225,400 |
8,734,250 |
|
|
|
158,869,341 |
||
|
Credit & Other Finance - 3.0% |
|||
|
American Express Co. |
964,700 |
50,284,988 |
|
|
Associates First Capital Corp. Class A |
2,427,604 |
54,165,914 |
|
|
Citigroup, Inc. |
2,820,000 |
169,905,000 |
|
|
Concord EFS, Inc. (a) |
144,500 |
3,757,000 |
|
|
Household International, Inc. |
578,700 |
24,052,219 |
|
|
MBNA Corp. |
93,100 |
2,525,338 |
|
|
|
304,690,459 |
||
|
Federal Sponsored Credit - 0.8% |
|||
|
Fannie Mae |
1,593,000 |
83,134,688 |
|
|
Freddie Mac |
62,800 |
2,543,400 |
|
|
|
85,678,088 |
||
|
Insurance - 4.5% |
|||
|
Ace Ltd. |
170,200 |
4,765,600 |
|
|
AFLAC, Inc. |
211,500 |
9,715,781 |
|
|
|
|||
|
Shares |
Value (Note 1) |
||
|
American International Group, Inc. |
1,303,156 |
$ 153,120,830 |
|
|
Berkshire Hathaway, Inc. Class A (a) |
1,683 |
90,545,400 |
|
|
Canada Life Financial Corp. |
210,300 |
4,275,603 |
|
|
CIGNA Corp. |
187,870 |
17,565,845 |
|
|
Everest Re Group Ltd. |
80,200 |
2,636,575 |
|
|
Hartford Financial Services Group, Inc. |
361,600 |
20,227,000 |
|
|
John Hancock Financial Services, Inc. |
37,600 |
890,650 |
|
|
Marsh & McLennan Companies, Inc. |
175,275 |
18,305,283 |
|
|
MetLife, Inc. |
3,458,700 |
72,848,869 |
|
|
Mutual Risk Management Ltd. |
24,200 |
418,963 |
|
|
PartnerRe Ltd. |
135,300 |
4,794,694 |
|
|
PMI Group, Inc. |
96,900 |
4,602,750 |
|
|
RenaissanceRe Holdings Ltd. |
128,500 |
5,597,781 |
|
|
The Chubb Corp. |
267,300 |
16,438,950 |
|
|
The St. Paul Companies, Inc. |
151,500 |
5,169,938 |
|
|
XL Capital Ltd. Class A |
442,500 |
23,950,313 |
|
|
Zenith National Insurance Corp. |
127,700 |
2,713,625 |
|
|
|
458,584,450 |
||
|
Savings & Loans - 0.5% |
|||
|
Golden West Financial Corp. |
1,330,500 |
54,301,031 |
|
|
TCF Financial Corp. |
55,200 |
1,417,950 |
|
|
|
55,718,981 |
||
|
Securities Industry - 1.6% |
|||
|
AXA Financial, Inc. |
20,600 |
700,400 |
|
|
Daiwa Securities Group, Inc. |
5,186,000 |
68,481,421 |
|
|
Morgan Stanley Dean Witter & Co. |
125,500 |
10,447,875 |
|
|
Nikko Securities Co. Ltd. |
3,741,000 |
37,050,086 |
|
|
Nomura Securities Co. Ltd. |
2,049,000 |
50,152,379 |
|
|
|
166,832,161 |
||
|
TOTAL FINANCE |
1,230,373,480 |
||
|
HEALTH - 7.0% |
|||
|
Drugs & Pharmaceuticals - 4.9% |
|||
|
Accredo Health, Inc. (a) |
6,500 |
224,656 |
|
|
Allergan, Inc. |
68,800 |
5,125,600 |
|
|
ALZA Corp. (a) |
18,700 |
1,105,638 |
|
|
Amgen, Inc. |
73,800 |
5,184,450 |
|
|
Cephalon, Inc. (a) |
41,500 |
2,484,813 |
|
|
COR Therapeutics, Inc. (a) |
18,600 |
1,586,813 |
|
|
Elan Corp. PLC sponsored ADR (a) |
502,000 |
24,315,625 |
|
|
Eli Lilly & Co. |
964,482 |
96,327,640 |
|
|
Forest Laboratories, Inc. (a) |
75,600 |
7,635,600 |
|
|
Genentech, Inc. |
334,460 |
57,527,120 |
|
|
Gilead Sciences, Inc. (a) |
37,200 |
2,645,850 |
|
|
Immunex Corp. (a) |
1,423,770 |
70,387,629 |
|
|
Medimmune, Inc. (a) |
74,700 |
5,527,800 |
|
|
Pfizer, Inc. |
3,194,575 |
153,339,600 |
|
|
Schering-Plough Corp. |
1,426,900 |
72,058,450 |
|
|
|
505,477,284 |
||
|
Common Stocks - continued |
|||
|
Shares |
Value (Note 1) |
||
|
HEALTH - continued |
|||
|
Medical Equipment & Supplies - 1.5% |
|||
|
Boston Scientific Corp. (a) |
132,800 |
$ 2,913,300 |
|
|
Cardinal Health, Inc. |
214,800 |
15,895,200 |
|
|
DENTSPLY International, Inc. |
91,000 |
2,803,938 |
|
|
Edwards Lifesciences Corp. (a) |
4,600 |
85,100 |
|
|
Guidant Corp. (a) |
37,838 |
1,872,981 |
|
|
Medtronic, Inc. |
949,300 |
47,287,006 |
|
|
Millipore Corp. |
130,300 |
9,821,363 |
|
|
MiniMed, Inc. (a) |
98,100 |
11,575,800 |
|
|
Novoste Corp. (a) |
52,800 |
3,220,800 |
|
|
Novoste Corp. (a)(d) |
167,000 |
10,187,000 |
|
|
ORATEC Interventions, Inc. |
67,400 |
2,249,475 |
|
|
Patterson Dental Co. (a) |
470,100 |
23,975,100 |
|
|
Priority Healthcare Corp. (a) |
7,100 |
527,619 |
|
|
Smith & Nephew PLC |
1,658,322 |
6,138,246 |
|
|
Varian Medical Systems, Inc. (a) |
425,500 |
16,647,688 |
|
|
|
155,200,616 |
||
|
Medical Facilities Management - 0.6% |
|||
|
Chronimed, Inc. |
2,100 |
15,488 |
|
|
HCA - The Healthcare Co. |
233,400 |
7,089,525 |
|
|
Health Management Associates, Inc. Class A (a) |
119,800 |
1,564,888 |
|
|
Oxford Health Plans, Inc. (a) |
205,200 |
4,886,325 |
|
|
UnitedHealth Group, Inc. |
484,900 |
41,580,175 |
|
|
Universal Health Services, Inc. |
40,700 |
2,665,850 |
|
|
|
57,802,251 |
||
|
TOTAL HEALTH |
718,480,151 |
||
|
INDUSTRIAL MACHINERY & EQUIPMENT - 1.5% |
|||
|
Electrical Equipment - 1.3% |
|||
|
Alcatel SA sponsored ADR |
617,150 |
41,040,475 |
|
|
Allen Telecom, Inc. (a) |
479,500 |
8,481,156 |
|
|
American Power Conversion Corp. (a) |
16,700 |
681,569 |
|
|
General Electric Co. |
381,300 |
20,208,900 |
|
|
Hutchison Whampoa Ltd. |
993,900 |
12,494,510 |
|
|
Koninklijke Philips Electronics NV |
414,200 |
19,674,500 |
|
|
Littelfuse, Inc. (a) |
3,700 |
181,300 |
|
|
Loral Space & Communications Ltd. (a) |
846,933 |
5,875,598 |
|
|
Pinnacle Systems (a) |
439,700 |
9,886,380 |
|
|
Rayovac Corp. (a) |
553,950 |
12,394,631 |
|
|
Roper Industries, Inc. |
118,700 |
3,041,688 |
|
|
|
133,960,707 |
||
|
Industrial Machinery & Equipment - 0.1% |
|||
|
Exide Corp. |
100 |
800 |
|
|
Mettler-Toledo International, Inc. (a) |
153,700 |
6,148,000 |
|
|
|
|||
|
Shares |
Value (Note 1) |
||
|
MSC Industrial Direct, Inc. (a) |
57,500 |
$ 1,203,906 |
|
|
Sandvik AB |
56,300 |
1,184,960 |
|
|
|
8,537,666 |
||
|
Pollution Control - 0.1% |
|||
|
Waste Management, Inc. |
387,600 |
7,364,400 |
|
|
TOTAL INDUSTRIAL MACHINERY & EQUIPMENT |
149,862,773 |
||
|
MEDIA & LEISURE - 13.0% |
|||
|
Broadcasting - 3.2% |
|||
|
American Tower Corp. Class A (a) |
2,553,250 |
106,438,609 |
|
|
AT&T Corp. - Liberty Media Group |
1,471,816 |
35,691,538 |
|
|
Carlton Communications PLC |
1,628,640 |
21,000,498 |
|
|
Clear Channel Communications, Inc. (a) |
148,700 |
11,152,500 |
|
|
Cox Radio, Inc. Class A (a) |
191,500 |
5,362,000 |
|
|
Grupo Televisa SA de CV |
139,200 |
9,596,100 |
|
|
Infinity Broadcasting Corp. Class A (a) |
2,899,160 |
105,638,143 |
|
|
Time Warner, Inc. |
337,903 |
25,680,628 |
|
|
Westwood One, Inc. |
263,800 |
9,002,175 |
|
|
|
329,562,191 |
||
|
Entertainment - 5.4% |
|||
|
Fox Entertainment Group, Inc. |
533,700 |
16,211,138 |
|
|
MGM Grand, Inc. |
317,200 |
10,190,050 |
|
|
Park Place Entertainment Corp. (a) |
922,700 |
11,245,406 |
|
|
Premier Parks, Inc. (a) |
553,900 |
12,601,225 |
|
|
Viacom, Inc.: |
|
|
|
|
Class A (a) |
475,100 |
32,484,963 |
|
|
Class B (non-vtg.) (a) |
6,230,551 |
424,845,696 |
|
|
Walt Disney Co. |
1,303,620 |
50,596,751 |
|
|
|
558,175,229 |
||
|
Leisure Durables & Toys - 0.5% |
|||
|
Callaway Golf Co. |
622,800 |
10,159,425 |
|
|
Harley-Davidson, Inc. |
794,600 |
30,592,100 |
|
|
Mattel, Inc. |
608,000 |
8,018,000 |
|
|
|
48,769,525 |
||
|
Lodging & Gaming - 0.3% |
|||
|
Aztar Corp. (a) |
57,500 |
891,250 |
|
|
Starwood Hotels & Resorts |
911,100 |
29,667,694 |
|
|
|
30,558,944 |
||
|
Publishing - 0.5% |
|||
|
Harte Hanks Communications, Inc. |
19,500 |
487,500 |
|
|
McGraw-Hill Companies, Inc. |
280,900 |
15,168,600 |
|
|
PRIMEDIA, Inc. (a) |
275,200 |
6,260,800 |
|
|
Reader's Digest Association, Inc. |
653,640 |
25,982,190 |
|
|
United News & Media PLC |
90,900 |
1,310,005 |
|
|
|
49,209,095 |
||
|
Restaurants - 3.1% |
|||
|
CEC Entertainment, Inc. (a) |
196,000 |
5,022,500 |
|
|
Common Stocks - continued |
|||
|
Shares |
Value (Note 1) |
||
|
MEDIA & LEISURE - continued |
|||
|
Restaurants - continued |
|||
|
McDonald's Corp. |
9,129,400 |
$ 300,699,613 |
|
|
Outback Steakhouse, Inc. (a) |
45,350 |
1,326,488 |
|
|
Pizzaexpress PLC |
20,902 |
200,080 |
|
|
PJ America, Inc. (a)(c) |
581,700 |
5,671,575 |
|
|
Ryan's Family Steak Houses, Inc. (a) |
188,500 |
1,590,469 |
|
|
|
314,510,725 |
||
|
TOTAL MEDIA & LEISURE |
1,330,785,709 |
||
|
NONDURABLES - 3.0% |
|||
|
Foods - 1.9% |
|||
|
Booker PLC (a) |
2,151,689 |
4,724,802 |
|
|
Earthgrains Co. |
840,100 |
16,329,444 |
|
|
General Mills, Inc. |
264,200 |
10,105,650 |
|
|
Keebler Foods Co. |
859,200 |
31,897,800 |
|
|
Nestle SA (Reg.) |
7,933 |
15,859,200 |
|
|
PepsiCo, Inc. |
548,700 |
24,382,856 |
|
|
Quaker Oats Co. |
846,000 |
63,555,750 |
|
|
Sysco Corp. |
394,400 |
16,614,100 |
|
|
Wm. Wrigley Jr. Co. |
80,700 |
6,471,131 |
|
|
|
189,940,733 |
||
|
Household Products - 1.1% |
|||
|
Avon Products, Inc. |
1,140,300 |
50,743,350 |
|
|
Colgate-Palmolive Co. |
936,400 |
56,066,950 |
|
|
Estee Lauder Companies, Inc. |
182,400 |
9,017,400 |
|
|
Yankee Candle Co., Inc. |
61,800 |
1,336,425 |
|
|
|
117,164,125 |
||
|
TOTAL NONDURABLES |
307,104,858 |
||
|
PRECIOUS METALS - 0.9% |
|||
|
Barrick Gold Corp. |
2,174,060 |
39,281,395 |
|
|
Franco Nevada Mining Corp. Ltd. |
1,499,464 |
17,319,037 |
|
|
Gold Fields Ltd. |
932,600 |
3,658,873 |
|
|
Newmont Mining Corp. |
773,100 |
16,718,288 |
|
|
Placer Dome, Inc. |
1,698,845 |
15,949,980 |
|
|
|
92,927,573 |
||
|
RETAIL & WHOLESALE - 4.6% |
|||
|
Apparel Stores - 0.8% |
|||
|
Charming Shoppes, Inc. (a) |
1,479,600 |
7,536,713 |
|
|
Claire's Stores, Inc. |
304,800 |
5,867,400 |
|
|
Talbots, Inc. |
344,700 |
18,936,956 |
|
|
The Limited, Inc. |
783,800 |
16,949,675 |
|
|
|
|||
|
Shares |
Value (Note 1) |
||
|
TJX Companies, Inc. |
1,762,400 |
$ 33,045,000 |
|
|
Venator Group, Inc. (a) |
2,300 |
23,575 |
|
|
|
82,359,319 |
||
|
Drug Stores - 1.6% |
|||
|
CVS Corp. |
3,220,202 |
128,808,080 |
|
|
Rite Aid Corp. |
173,400 |
1,137,938 |
|
|
Walgreen Co. |
1,136,600 |
36,584,313 |
|
|
|
166,530,331 |
||
|
General Merchandise Stores - 0.5% |
|||
|
Costco Wholesale Corp. (a) |
415,400 |
13,708,200 |
|
|
Dollar Tree Stores, Inc. (a) |
173,450 |
6,862,116 |
|
|
JCPenney Co., Inc. |
651,700 |
12,015,719 |
|
|
Kohls Corp. (a) |
232,500 |
12,932,813 |
|
|
Michaels Stores, Inc. (a) |
74,300 |
3,403,869 |
|
|
Stein Mart, Inc. (a) |
241,400 |
2,474,350 |
|
|
Tuesday Morning Corp. (a) |
250,900 |
2,634,450 |
|
|
|
54,031,517 |
||
|
Grocery Stores - 0.2% |
|||
|
Fleming Companies, Inc. |
556,356 |
7,267,400 |
|
|
Iceland Group PLC |
470,067 |
1,987,743 |
|
|
Krispy Kreme Doughnuts, Inc. |
6,500 |
477,750 |
|
|
Safeway PLC |
1,616,114 |
6,300,727 |
|
|
|
16,033,620 |
||
|
Retail & Wholesale, Miscellaneous - 1.5% |
|||
|
Bed Bath & Beyond, Inc. (a) |
856,100 |
31,033,625 |
|
|
Best Buy Co., Inc. (a) |
382,400 |
24,186,800 |
|
|
Good Guys, Inc. (a) |
28,700 |
104,038 |
|
|
Guitar Center, Inc. (a) |
18,200 |
191,100 |
|
|
Home Depot, Inc. |
1,625,290 |
81,162,919 |
|
|
Staples, Inc. (a) |
1,420,350 |
21,837,881 |
|
|
|
158,516,363 |
||
|
TOTAL RETAIL & WHOLESALE |
477,471,150 |
||
|
SERVICES - 1.0% |
|||
|
Advertising - 0.5% |
|||
|
Getty Images, Inc. (a) |
48,200 |
1,786,413 |
|
|
Interpublic Group of Companies, Inc. |
55,700 |
2,395,100 |
|
|
Omnicom Group, Inc. |
194,240 |
17,299,500 |
|
|
TMP Worldwide, Inc. (a) |
8,300 |
612,644 |
|
|
Young & Rubicam, Inc. |
499,300 |
28,553,719 |
|
|
|
50,647,376 |
||
|
Educational Services - 0.0% |
|||
|
Apollo Group, Inc. Class A (a) |
70,700 |
1,979,600 |
|
|
Printing - 0.1% |
|||
|
Reynolds & Reynolds Co. Class A |
134,000 |
2,445,500 |
|
|
Valassis Communications, Inc. (a) |
32,700 |
1,246,688 |
|
|
|
3,692,188 |
||
|
Services - 0.4% |
|||
|
Carlisle Holdings Ltd. (a) |
205,500 |
1,509,141 |
|
|
Gartner Group, Inc. Class B (a) |
38,777 |
382,923 |
|
|
Common Stocks - continued |
|||
|
Shares |
Value (Note 1) |
||
|
SERVICES - continued |
|||
|
Services - continued |
|||
|
Learning Tree International, Inc. (a) |
2,800 |
$ 171,500 |
|
|
NOVA Corp. (a) |
312,600 |
8,733,263 |
|
|
Professional Detailing, Inc. (a) |
9,500 |
323,594 |
|
|
Robert Half International, Inc. (a) |
130,000 |
3,705,000 |
|
|
Storagenetworks, Inc. |
5,400 |
487,350 |
|
|
True North Communications |
58,100 |
2,556,400 |
|
|
Viad Corp. |
967,812 |
26,372,877 |
|
|
|
44,242,048 |
||
|
TOTAL SERVICES |
100,561,212 |
||
|
TECHNOLOGY - 23.9% |
|||
|
Communications Equipment - 7.3% |
|||
|
ADC Telecommunications, Inc. (a) |
552,700 |
46,357,713 |
|
|
Advanced Fibre |
24,400 |
1,105,625 |
|
|
Andrew Corp. (a) |
111,000 |
3,725,438 |
|
|
Centillium Communications, Inc. (a) |
14,400 |
993,600 |
|
|
Ciena Corp. (a) |
37,800 |
6,300,788 |
|
|
Cisco Systems, Inc. (a) |
6,866,788 |
436,470,182 |
|
|
Comverse Technology, Inc. (a) |
41,600 |
3,868,800 |
|
|
Corning, Inc. |
275,700 |
74,404,538 |
|
|
Jabil Circuit, Inc. (a) |
73,600 |
3,652,400 |
|
|
NEC Corp. |
210,000 |
6,595,926 |
|
|
Nokia AB sponsored ADR |
1,072,400 |
53,552,975 |
|
|
Nortel Networks Corp. |
1,352,190 |
93,799,333 |
|
|
Plantronics, Inc. (a) |
56,600 |
6,537,300 |
|
|
Tellabs, Inc. (a) |
239,500 |
16,390,781 |
|
|
|
753,755,399 |
||
|
Computer Services & Software - 5.1% |
|||
|
Adobe Systems, Inc. |
1,016,100 |
132,093,000 |
|
|
Amdocs Ltd. (a) |
170,200 |
13,062,850 |
|
|
Art Technology Group, Inc. |
15,700 |
1,584,719 |
|
|
Automatic Data Processing, Inc. |
1,439,900 |
77,124,644 |
|
|
BEA Systems, Inc. (a) |
16,200 |
800,888 |
|
|
Black Box Corp. (a) |
203,600 |
16,119,394 |
|
|
BroadVision, Inc. (a) |
176,500 |
8,968,406 |
|
|
Ceridian Corp. (a) |
101,020 |
2,430,794 |
|
|
Computer Sciences Corp. (a) |
209,200 |
15,624,625 |
|
|
DST Systems, Inc. (a) |
136,700 |
10,406,288 |
|
|
E.piphany, Inc. |
37,200 |
3,987,375 |
|
|
Electronic Data Systems Corp. |
536,100 |
22,114,125 |
|
|
Exodus Communications, Inc. (a) |
107,900 |
4,970,144 |
|
|
Extensity, Inc. |
4,900 |
167,825 |
|
|
Fiserv, Inc. (a) |
101,800 |
4,402,850 |
|
|
Forsoft Ltd. (a)(c) |
831,800 |
6,446,450 |
|
|
Foundry Networks, Inc. |
90,600 |
9,966,000 |
|
|
Go2Net, Inc. (a) |
148,100 |
7,451,281 |
|
|
Infonet Services Corp. Class B |
361,320 |
4,313,258 |
|
|
Macromedia, Inc. (a) |
208,400 |
20,149,675 |
|
|
Mentor Graphics Corp. (a) |
230,400 |
4,579,200 |
|
|
Micromuse, Inc. (a) |
42,000 |
6,950,344 |
|
|
|
|||
|
Shares |
Value (Note 1) |
||
|
Microsoft Corp. (a) |
59,070 |
$ 4,725,600 |
|
|
National Computer Systems, Inc. |
130,500 |
6,427,125 |
|
|
National Instrument Corp. (a) |
28,500 |
1,243,313 |
|
|
Nuance Communications, Inc. |
43,200 |
3,599,100 |
|
|
Oracle Corp. (a) |
298,900 |
25,126,281 |
|
|
Paychex, Inc. |
61,500 |
2,583,000 |
|
|
Polycom, Inc. (a) |
127,250 |
11,973,430 |
|
|
Rational Software Corp. (a) |
413,600 |
38,438,950 |
|
|
SEI Investments Co. |
46,600 |
1,855,263 |
|
|
Siebel Systems, Inc. (a) |
74,900 |
12,250,831 |
|
|
Software.com, Inc. |
48,800 |
6,337,900 |
|
|
The Bisys Group (a) |
58,900 |
3,622,350 |
|
|
Unisys Corp. (a) |
1,682,358 |
24,499,338 |
|
|
VeriSign, Inc. (a) |
14,500 |
2,559,250 |
|
|
Vignette Corp. (a) |
16,900 |
879,064 |
|
|
webMethods, Inc. |
13,200 |
2,074,875 |
|
|
|
521,909,805 |
||
|
Computers & Office Equipment - 4.2% |
|||
|
Apple Computer, Inc. (a) |
199,300 |
10,438,338 |
|
|
Brocade Communications |
520,000 |
95,411,875 |
|
|
Canon, Inc. |
406,000 |
20,452,251 |
|
|
CDW Computer Centers, Inc. (a) |
61,700 |
3,856,250 |
|
|
Copper Mountain Networks, Inc. |
66,100 |
5,825,063 |
|
|
Dell Computer Corp. (a) |
432,100 |
21,307,931 |
|
|
Diebold, Inc. |
346,000 |
9,644,750 |
|
|
EMC Corp. (a) |
249,600 |
19,203,600 |
|
|
Extreme Networks, Inc. (a) |
22,300 |
2,352,650 |
|
|
Handspring, Inc. |
12,700 |
342,900 |
|
|
Hewlett-Packard Co. |
738,050 |
92,163,994 |
|
|
Insight Enterprises, Inc. (a) |
108,800 |
6,453,200 |
|
|
Juniper Networks, Inc. |
77,600 |
11,295,650 |
|
|
Network Appliance, Inc. (a) |
34,500 |
2,777,250 |
|
|
Oak Technology, Inc. (a) |
162,800 |
3,510,375 |
|
|
Palm, Inc. |
318,200 |
10,619,925 |
|
|
RSA Security, Inc. (a) |
82,800 |
5,733,900 |
|
|
Sun Microsystems, Inc. (a) |
851,700 |
77,451,469 |
|
|
Symbol Technologies, Inc. |
510,860 |
27,586,440 |
|
|
|
426,427,811 |
||
|
Electronic Instruments - 1.9% |
|||
|
Agilent Technologies, Inc. |
1,010,574 |
74,529,833 |
|
|
LAM Research Corp. (a) |
200 |
7,500 |
|
|
Lernout & Hauspie Speech |
129,600 |
5,710,500 |
|
|
Novellus Systems, Inc. (a) |
276,300 |
15,628,219 |
|
|
PerkinElmer, Inc. |
48,250 |
3,190,531 |
|
|
Tektronix, Inc. |
82,300 |
6,090,200 |
|
|
Teradyne, Inc. (a) |
143,800 |
10,569,300 |
|
|
Thermo Electron Corp. (a) |
1,149,050 |
24,201,866 |
|
|
Waters Corp. (a) |
480,600 |
59,984,888 |
|
|
|
199,912,837 |
||
|
Electronics - 5.4% |
|||
|
Altera Corp. (a) |
152,900 |
15,586,244 |
|
|
Common Stocks - continued |
|||
|
Shares |
Value (Note 1) |
||
|
TECHNOLOGY - continued |
|||
|
Electronics - continued |
|||
|
Amphenol Corp. Class A (a) |
62,100 |
$ 4,110,244 |
|
|
Analog Devices, Inc. (a) |
224,200 |
17,039,200 |
|
|
Arrow Electronics, Inc. (a) |
52,100 |
1,615,100 |
|
|
Broadcom Corp. Class A (a) |
94,900 |
20,777,169 |
|
|
Conexant Systems, Inc. (a) |
68,500 |
3,330,813 |
|
|
Fairchild Semiconductor |
62,000 |
2,511,000 |
|
|
Flextronics International Ltd. (a) |
178,000 |
12,226,375 |
|
|
Infineon Technologies AG |
561,500 |
44,498,875 |
|
|
Intel Corp. |
24,580 |
3,286,039 |
|
|
Intersil Holding Corp. Class A |
134,400 |
7,266,000 |
|
|
JDS Uniphase Corp. (a) |
50,900 |
6,101,638 |
|
|
Kyocera Corp. |
232,600 |
39,963,589 |
|
|
Linear Technology Corp. |
347,900 |
22,243,856 |
|
|
LSI Logic Corp. (a) |
152,400 |
8,248,650 |
|
|
Merix Corp. (a) |
20,700 |
972,900 |
|
|
Micron Technology, Inc. (a) |
1,457,600 |
128,359,900 |
|
|
Molex, Inc. Class A |
143,200 |
5,012,000 |
|
|
National Semiconductor Corp. (a) |
46,700 |
2,650,225 |
|
|
NVIDIA Corp. (a) |
277,600 |
17,644,950 |
|
|
Power-One, Inc. (a) |
45,500 |
5,184,156 |
|
|
Sanmina Corp. (a) |
130,600 |
11,166,300 |
|
|
STMicroelectronics NV (NY Shares) |
234,600 |
15,058,388 |
|
|
TDK Corp. |
67,000 |
9,631,013 |
|
|
Texas Instruments, Inc. |
1,479,200 |
101,602,550 |
|
|
Vitesse Semiconductor Corp. (a) |
280,800 |
20,656,350 |
|
|
Xilinx, Inc. (a) |
213,500 |
17,627,094 |
|
|
Zoran Corp. (a) |
162,400 |
10,708,250 |
|
|
|
555,078,868 |
||
|
TOTAL TECHNOLOGY |
2,457,084,720 |
||
|
TRANSPORTATION - 1.5% |
|||
|
Air Transportation - 0.5% |
|||
|
Continental Airlines, Inc. Class B (a) |
385,900 |
18,137,300 |
|
|
Ryanair Holdings PLC sponsored ADR (a) |
341,700 |
12,472,050 |
|
|
Southwest Airlines Co. |
1,265,387 |
23,963,266 |
|
|
|
54,572,616 |
||
|
Railroads - 0.1% |
|||
|
Canadian Pacific Ltd. |
245,200 |
6,359,797 |
|
|
Trucking & Freight - 0.9% |
|||
|
C.H. Robinson Worldwide, Inc. |
418,700 |
20,725,650 |
|
|
Expeditors International of |
229,400 |
10,896,500 |
|
|
Forward Air Corp. (a) |
17,200 |
688,000 |
|
|
Ocean Group PLC(OLD) |
1,781,680 |
29,460,613 |
|
|
|
|||
|
Shares |
Value (Note 1) |
||
|
Swift Transportation Co., Inc. (a) |
1,093,300 |
$ 15,306,200 |
|
|
United Parcel Service, Inc. Class B |
281,700 |
16,620,300 |
|
|
|
93,697,263 |
||
|
TOTAL TRANSPORTATION |
154,629,676 |
||
|
UTILITIES - 9.6% |
|||
|
Cellular - 4.8% |
|||
|
AT&T Corp. - Wireless Group |
939,700 |
26,194,138 |
|
|
China Telecom (Hong Kong) Ltd. sponsored ADR (a) |
37,300 |
6,632,406 |
|
|
Crown Castle International Corp. (a) |
494,800 |
18,060,200 |
|
|
Dobson Communications Corp. Class A |
69,600 |
1,339,800 |
|
|
Nextel Communications, Inc. Class A (a) |
1,869,900 |
114,414,506 |
|
|
NTT DoCoMo, Inc. |
1,141 |
30,887,287 |
|
|
Sprint Corp. - PCS Group Series 1 (a) |
2,093,000 |
124,533,500 |
|
|
Triton PCS Holdings, Inc. Class A |
439,730 |
25,394,408 |
|
|
Vodafone AirTouch PLC sponsored ADR |
3,203,400 |
132,740,888 |
|
|
VoiceStream Wireless Corp. (a) |
46,750 |
5,436,879 |
|
|
|
485,634,012 |
||
|
Electric Utility - 0.7% |
|||
|
AES Corp. (a) |
1,018,900 |
46,487,313 |
|
|
Calpine Corp. (a) |
130,700 |
8,593,525 |
|
|
DPL, Inc. |
68,800 |
1,509,300 |
|
|
Duke Energy Corp. |
128,400 |
7,238,550 |
|
|
Northern States Power Co. |
313,400 |
6,326,763 |
|
|
NRG Energy, Inc. |
248,100 |
4,527,825 |
|
|
|
74,683,276 |
||
|
Gas - 0.5% |
|||
|
Dynegy, Inc. Class A |
700,656 |
47,863,563 |
|
|
Enron Corp. |
61,300 |
3,953,850 |
|
|
|
51,817,413 |
||
|
Telephone Services - 3.6% |
|||
|
Allegiance Telecom, Inc. (a) |
231,280 |
14,801,920 |
|
|
BellSouth Corp. |
1,588,200 |
67,697,025 |
|
|
Cable & Wireless PLC sponsored ADR |
734,900 |
36,790,931 |
|
|
DDI Corp. |
2,103 |
20,232,598 |
|
|
Energis PLC (a) |
219,335 |
8,245,079 |
|
|
McLeodUSA, Inc. Class A (a) |
2,005,074 |
41,479,968 |
|
|
Metromedia Fiber Network, Inc. |
56,300 |
2,234,406 |
|
|
NEXTLINK Communications, Inc. Class A |
492,400 |
18,680,425 |
|
|
Nippon Telegraph & Telephone Corp. |
3,410 |
45,350,879 |
|
|
Qwest Communications |
889,944 |
44,219,093 |
|
|
SBC Communications, Inc. |
69,106 |
2,988,835 |
|
|
Common Stocks - continued |
|||
|
Shares |
Value (Note 1) |
||
|
UTILITIES - continued |
|||
|
Telephone Services - continued |
|||
|
Time Warner Telecom, Inc. Class A |
80,203 |
$ 5,163,068 |
|
|
U.S. WEST, Inc. |
730,400 |
62,631,800 |
|
|
|
370,516,027 |
||
|
TOTAL UTILITIES |
982,650,728 |
||
|
TOTAL COMMON STOCKS (Cost $7,454,454,140) |
9,235,832,817 |
||
|
U.S. Treasury Obligations - 2.3% |
|||||
|
Moody's Ratings (unaudited) |
Principal Amount |
|
|||
|
U.S. Treasury Bills, yield at date of purchase 5.6% to 5.62% 8/17/00 (e) |
- |
|
$ 2,000,000 |
1,985,950 |
|
|
U.S. Treasury Bonds: |
|
|
|
|
|
|
5.5% 8/15/28 |
Aaa |
|
22,500,000 |
20,636,775 |
|
|
6.125% 11/15/27 |
Aaa |
|
63,000,000 |
62,862,030 |
|
|
6.375% 8/15/27 |
Aaa |
|
66,000,000 |
67,969,440 |
|
|
6.5% 11/15/26 |
Aaa |
|
20,000,000 |
20,890,600 |
|
|
6.75% 8/15/26 |
Aaa |
|
9,900,000 |
10,653,291 |
|
|
6.875% 8/15/25 |
Aaa |
|
36,500,000 |
39,779,160 |
|
|
7.625% 2/15/25 |
Aaa |
|
9,500,000 |
11,233,750 |
|
|
TOTAL U.S. TREASURY OBLIGATIONS (Cost $235,882,664) |
236,010,996 |
||||
|
Cash Equivalents - 7.4% |
|||
|
Shares |
|
||
|
Central Cash Collateral Fund, 6.71% (b) |
125,228,100 |
125,228,100 |
|
|
Taxable Central Cash Fund, 6.59% (b) |
628,988,088 |
628,988,088 |
|
|
TOTAL CASH EQUIVALENTS (Cost $754,216,188) |
754,216,188 |
||
|
TOTAL INVESTMENT PORTFOLIO - 99.7% (Cost $8,444,552,992) |
10,226,060,001 |
||
|
NET OTHER ASSETS - 0.3% |
32,329,993 |
||
|
NET ASSETS - 100% |
$ 10,258,389,994 |
||
|
Futures Contracts |
|||||
|
|
Expiration Date |
Underlying Face Amount at Value |
Unrealized |
||
|
Purchased |
|||||
|
150 S&P 500 Stock Index Contracts |
Sept. 2000 |
$ 55,053,750 |
$ (206,670) |
||
|
The face value of futures purchased as a percentage of net assets - 0.5% |
|
Legend |
|
(a) Non-income producing |
|
(b) The rate quoted is the annualized seven-day yield of the fund at |
|
(c) Transactions during the period with companies which are or were affiliates are as follows: |
|
Affiliate |
|
Purchase |
|
Sales |
|
Dividend |
|
Value |
|
Forsoft Ltd. |
|
$ - |
|
$ - |
|
$ - |
|
$ 6,446,450 |
|
PJ America, Inc. |
|
- |
|
- |
|
- |
|
5,671,575 |
|
TOTALS |
|
$ - |
|
$ - |
|
$ - |
|
$ 12,118,025 |
|
(d) Security exempt from registration under Rule 144A of the Securities Act |
|
(e) Security or a portion of the security was pledged to cover margin requirements for futures contracts. At the period end, the value of securities pledged amounted to $1,985,950. |
|
Other Information |
|
Purchases and sales of securities, other than short-term securities, aggregated $8,415,238,617 and $8,270,968,679, respectively, of which long-term U.S. government and government agency obligations aggregated $0 and $5,867,969, respectively. |
|
The market value of futures contracts opened and closed during the period amounted to $740,575,595 and $702,738,997, respectively. |
|
The fund placed a portion of its portfolio transactions with brokerage firms which are affiliates of Fidelity Management & Research Company. The commissions paid to these affiliated firms were $336,878 for the period. |
|
The fund participated in the security lending program. At period end, the value of securities loaned amounted to $122,412,563. The fund received cash collateral of $125,228,100 which was invested in cash equivalents. |
|
Distribution of investments by country of issue, as a percentage of total |
|
United States of America |
84.5% |
|
United Kingdom |
4.6 |
|
Japan |
3.9 |
|
Canada |
2.9 |
|
Others (individually less than 1%) |
4.1 |
|
|
100.0% |
|
Income Tax Information |
|
At June 30, 2000, the aggregate cost of investment securities for income |
See accompanying notes which are an integral part of the financial statements.
Contrafund Portfolio
Statement of Assets and Liabilities
|
|
June 30, 2000 (Unaudited) |
|
|
Assets |
|
|
|
Investment in securities, at value |
|
$ 10,226,060,001 |
|
Foreign currency held at value (cost $3,198,136) |
|
3,200,762 |
|
Receivable for investments sold |
|
227,343,121 |
|
Receivable for fund shares sold |
|
5,795,420 |
|
Dividends receivable |
|
6,174,594 |
|
Interest receivable |
|
8,752,007 |
|
Receivable for daily variation on futures contracts |
|
394,650 |
|
Other receivables |
|
1,705,788 |
|
Total assets |
|
10,479,426,343 |
|
Liabilities |
|
|
|
Payable for investments purchased |
$ 88,850,142 |
|
|
Payable for fund shares redeemed |
1,847,512 |
|
|
Accrued management fee |
4,877,662 |
|
|
Distribution fees payable |
94,923 |
|
|
Other payables and |
138,010 |
|
|
Collateral on securities loaned, |
125,228,100 |
|
|
Total liabilities |
|
221,036,349 |
|
Net Assets |
|
$ 10,258,389,994 |
|
Net Assets consist of: |
|
|
|
Paid in capital |
|
$ 8,001,539,614 |
|
Undistributed net |
|
28,658,206 |
|
Accumulated undistributed |
|
446,882,094 |
|
Net unrealized appreciation (depreciation) on investments |
|
1,781,310,080 |
|
Net Assets |
|
$ 10,258,389,994 |
|
Initial Class: |
|
$25.09 |
|
Service Class: |
|
$25.03 |
|
Service Class 2: |
|
$25.02 |
Statement of Operations
|
|
Six months ended June 30, 2000 (Unaudited) |
|
|
Investment Income Dividends |
|
$ 27,621,948 |
|
Interest |
|
31,147,532 |
|
Security lending |
|
1,347,457 |
|
Total income |
|
60,116,937 |
|
Expenses |
|
|
|
Management fee |
$ 28,674,384 |
|
|
Transfer agent fees |
3,272,693 |
|
|
Distribution fees |
484,572 |
|
|
Accounting and security lending fees |
450,247 |
|
|
Non-interested trustees' compensation |
15,815 |
|
|
Custodian fees and expenses |
315,685 |
|
|
Registration fees |
43,475 |
|
|
Audit |
31,520 |
|
|
Legal |
36,304 |
|
|
Miscellaneous |
70,060 |
|
|
Total expenses before reductions |
33,394,755 |
|
|
Expense reductions |
(1,509,996) |
31,884,759 |
|
Net investment income |
|
28,232,178 |
|
Realized and Unrealized Gain (Loss) Net realized gain (loss) on: |
|
|
|
Investment securities |
529,036,819 |
|
|
Foreign currency transactions |
41,699 |
|
|
Futures contracts |
(2,603,401) |
526,475,117 |
|
Change in net unrealized appreciation (depreciation) on: |
|
|
|
Investment securities |
(684,382,795) |
|
|
Assets and liabilities in |
11,087 |
|
|
Futures contracts |
(216,147) |
(684,587,855) |
|
Net gain (loss) |
|
(158,112,738) |
|
Net increase (decrease) in net assets resulting from operations |
|
$ (129,880,560) |
|
Other Information Expense reductions |
|
$ 1,501,131 |
|
Custodian credits |
|
8,865 |
|
|
|
$ 1,509,996 |
See accompanying notes which are an integral part of the financial statements.
Semiannual Report
Variable Insurance Products: Contrafund Portfolio
Financial Statements - continued
Statement of Changes in Net Assets
|
Increase (Decrease) in Net Assets |
Six months ended |
Year ended |
|
Operations |
$ 28,232,178 |
$ 37,064,074 |
|
Net realized gain (loss) |
526,475,117 |
1,238,554,251 |
|
Change in net unrealized appreciation (depreciation) |
(684,587,855) |
533,893,873 |
|
Net increase (decrease) in net assets resulting from operations |
(129,880,560) |
1,809,512,198 |
|
Distributions to shareholders |
(34,082,876) |
(32,779,255) |
|
From net realized gain |
(1,237,208,385) |
(240,381,202) |
|
Total distributions |
(1,271,291,261) |
(273,160,457) |
|
Share transactions - net increase (decrease) |
1,879,217,135 |
1,702,847,259 |
|
Total increase (decrease) in net assets |
478,045,314 |
3,239,199,000 |
|
Net Assets |
|
|
|
Beginning of period |
9,780,344,680 |
6,541,145,680 |
|
End of period (including undistributed net investment income of $28,658,206 and $34,775,260, respectively) |
$ 10,258,389,994 |
$ 9,780,344,680 |
|
|
|
Other Information: |
|
|
Six months ended June 30, 2000 |
Year ended December 31, 1999 |
||
|
|
Shares |
Dollars |
Shares |
Dollars |
|
Share transactions |
31,827,829 |
$ 821,871,536 |
75,689,715 |
$ 1,921,467,155 |
|
Reinvested |
45,653,334 |
1,161,877,344 |
11,119,147 |
266,192,366 |
|
Redeemed |
(22,956,691) |
(590,350,809) |
(39,357,256) |
(1,004,869,657) |
|
Net increase (decrease) |
54,524,472 |
$ 1,393,398,071 |
47,451,606 |
$ 1,182,789,864 |
|
Service Class |
14,727,745 |
$ 380,358,381 |
20,768,738 |
$ 530,250,534 |
|
Reinvested |
4,305,875 |
109,369,238 |
291,308 |
6,968,091 |
|
Redeemed |
(1,309,500) |
(32,733,410) |
(669,866) |
(17,161,230) |
|
Net increase (decrease) |
17,724,120 |
$ 456,994,209 |
20,390,180 |
$ 520,057,395 |
|
Service Class 2 A |
1,156,782 |
$ 29,090,053 |
- |
$ - |
|
Reinvested |
1,759 |
44,679 |
- |
- |
|
Redeemed |
(12,454) |
(309,877) |
- |
- |
|
Net increase (decrease) |
1,146,087 |
$ 28,824,855 |
- |
$ - |
|
Distributions |
|
$ 31,149,527 |
|
$ 31,943,084 |
|
Service Class |
|
2,932,151 |
|
836,171 |
|
Service Class 2 A |
|
1,198 |
|
- |
|
Total |
|
$ 34,082,876 |
|
$ 32,779,255 |
|
From net realized gain |
|
$ 1,130,727,819 |
|
$ 234,249,282 |
|
Service Class |
|
106,437,085 |
|
6,131,920 |
|
Service Class 2 A |
|
43,481 |
|
- |
|
Total |
|
$ 1,237,208,385 |
|
$ 240,381,202 |
|
|
|
$ 1,271,291,261 |
|
$ 273,160,457 |
A Service Class 2 commenced sale of shares January 12, 2000.
See accompanying notes which are an integral part of the financial statements.
Contrafund Portfolio
Financial Highlights - Initial Class
|
|
Six months ended |
Years ended December 31, |
||||
|
Selected Per-Share Data |
(Unaudited) |
1999 |
1998 |
1997 |
1996 |
1995 E |
|
Net asset value, beginning of period |
$ 29.15 |
$ 24.44 |
$ 19.94 |
$ 16.56 |
$ 13.79 |
$ 10.00 |
|
Income from Investment Operations |
|
|
|
|
|
|
|
Net investment income |
.07 C |
.12 C |
.13 C |
.16 C |
.14 |
.06 |
|
Net realized and unrealized gain (loss) |
(.40) |
5.59 |
5.54 |
3.73 |
2.76 |
3.91 |
|
Total from investment operations |
(.33) |
5.71 |
5.67 |
3.89 |
2.90 |
3.97 |
|
Less Distributions |
|
|
|
|
|
|
|
From net investment income |
(.10) |
(.12) |
(.14) |
(.14) |
- |
(.06) |
|
From net realized gain |
(3.63) |
(.88) |
(1.03) |
(.37) |
(.13) |
(.12) |
|
Total distributions |
(3.73) |
(1.00) |
(1.17) |
(.51) |
(.13) |
(.18) |
|
Net asset value, end of period |
$ 25.09 |
$ 29.15 |
$ 24.44 |
$ 19.94 |
$ 16.56 |
$ 13.79 |
|
Total Return B, G |
(1.31)% |
24.25% |
29.98% |
24.14% |
21.22% |
39.72% |
|
Ratios and Supplemental Data |
|
|
|
|
|
|
|
Net assets, end of period (000 omitted) |
$ 9,119,275 |
$ 9,005,129 |
$ 6,388,592 |
$ 4,107,868 |
$ 2,394,103 |
$ 877,000 |
|
Ratio of expenses to average net assets |
.66% A |
.67% |
.70% |
.71% |
.74% |
.72% |
|
Ratio of expenses to average net assets after |
.63% A, F |
.65% F |
.66% F |
.68% F |
.71% F |
.72% |
|
Ratio of net investment income to average net assets |
.58% A |
.48% |
.62% |
.90% |
1.33% |
1.07% |
|
Portfolio turnover |
178% A |
172% |
201% |
142% |
178% |
132% |
Financial Highlights - Service Class
|
|
Six months ended |
Years ended December 31, |
||
|
Selected Per-Share Data |
(Unaudited) |
1999 |
1998 |
1997 D |
|
Net asset value, beginning of period |
$ 29.10 |
$ 24.42 |
$ 19.93 |
$ 19.99 |
|
Income from Investment Operations |
|
|
|
|
|
Net investment income C |
.06 |
.10 |
.11 |
.03 |
|
Net realized and unrealized gain (loss) |
(.40) |
5.58 |
5.55 |
(.09) |
|
Total from investment operations |
(.34) |
5.68 |
5.66 |
(.06) |
|
Less Distributions |
|
|
|
|
|
From net investment income |
(.10) |
(.12) |
(.14) |
- |
|
From net realized gain |
(3.63) |
(.88) |
(1.03) |
- |
|
Total distributions |
(3.73) |
(1.00) |
(1.17) |
- |
|
Net asset value, end of period |
$ 25.03 |
$ 29.10 |
$ 24.42 |
$ 19.93 |
|
Total Return B, G |
(1.36)% |
24.15% |
29.94% |
(0.30)% |
|
Ratios and Supplemental Data |
|
|
|
|
|
Net assets, end of period (000 omitted) |
$ 1,110,439 |
$ 775,216 |
$ 152,553 |
$ 3,722 |
|
Ratio of expenses to average net assets |
.76% A |
.78% |
.80% |
.81% A |
|
Ratio of expenses to average net assets after expense reductions |
.73% A, F |
.75% F |
.75% F |
.78% A, F |
|
Ratio of net investment income to average net assets |
.47% A |
.37% |
.53% |
1.14% A |
|
Portfolio turnover |
178% A |
172% |
201% |
142% |
|
A Annualized B The total returns would have been lower had certain expenses not been reduced during the periods shown. C Net investment income per share has been calculated based on average shares outstanding during the period. D For the period November 3, 1997 (commencement of sale of Service Class shares) to December 31, 1997. E For the period January 3, 1995 (commencement of operations of Initial Class shares) to December 31, 1995. F FMR or the fund has entered into varying arrangements with third parties who either paid or reduced a portion of the class' expenses. G Total returns for periods of less than one year are not annualized and do not reflect charges attributable to your insurance company's separate account. Inclusion of these charges would reduce the total returns shown. |
||||
See accompanying notes which are an integral part of the financial statements.
Semiannual Report
Financial Highlights - Service Class 2
|
|
Six months ended |
|
Selected Per-Share Data |
(Unaudited) |
|
Net asset value, beginning of period |
$ 28.20 |
|
Income from Investment Operations |
|
|
Net investment income C |
.04 |
|
Net realized and unrealized gain (loss) |
.51 G |
|
Total from investment operations |
.55 |
|
Less Distributions |
|
|
From net investment income |
(.10) |
|
From net realized gain |
(3.63) |
|
Total distributions |
(3.73) |
|
Net asset value, end of period |
$ 25.02 |
|
Total Return B, F |
1.75% |
|
Ratios and Supplemental Data |
|
|
Net assets, end of period (000 omitted) |
$ 28,675 |
|
Ratio of expenses to average net assets |
.91% A |
|
Ratio of expenses to average net assets after expense reductions |
.88% A, E |
|
Ratio of net investment income to average net assets |
.32% A |
|
Portfolio turnover |
178% A |
|
A Annualized B The total returns would have been lower had certain expenses not been reduced during the periods shown. C Net investment income per share has been calculated based on average shares outstanding during the period. D For the period January 12, 2000 (commencement of sale of Service Class 2 shares) to June 30, 2000. E FMR or the fund has entered into varying arrangements with third parties who either paid or reduced a portion of the class' expenses. F Total returns for periods of less than one year are not annualized and do not reflect charges attributable to your insurance company's separate account. Inclusion of these charges would reduce the total returns shown. G The amount shown for a share outstanding does not correspond with the aggregate net loss on investments for the period due to the timing of sales and repurchases of class shares in relation to fluctuating |
|
See accompanying notes which are an integral part of the financial statements.
Contrafund Portfolio
Performance
There are several ways to evaluate a fund's historical performance. You can look at the total percentage change in value, the average annual percentage change or the growth of a hypothetical $10,000 investment. Total return reflects the change in the value of an investment, assuming reinvestment of the fund's dividend income and capital gains (the profits earned upon the sale of securities that have grown in value). The initial offering of Service Class shares took place on November 3, 1997. Performance for Service Class shares reflects an asset based distribution fee (12b-1 fee), and returns prior to November 3, 1997 are those of Initial Class and do not include the effects of Service Class' 12b-1 fee. Had Service Class shares' 12b-1 fee been reflected, returns prior to November 3, 1997 would have been lower. If Fidelity had not reimbursed certain fund expenses, the past five year and life of fund total returns would have been lower.
Average Annual Total Returns
|
Periods ended |
Past 1 |
Past 5 |
Life of |
|
Fidelity VIP: Growth Opportunities - |
-5.74% |
16.63% |
18.53% |
|
S&P 500 |
7.25% |
23.80% |
25.60% |
Average annual returns take the fund's cumulative return and show you what would have happened if the fund had performed at a constant rate each year.
You can compare the fund's return to the performance of the Standard & Poor's 500 Index - a market capitalization-weighted index of common stocks. This benchmark reflects the reinvestment of dividends and capital gains, if any.
Figures for more than one year assume a steady compounded rate of return and are not the fund's year-by-year results, which fluctuated over the periods shown. The life of the fund figures are from commencement of operations, January 3, 1995.
Performance numbers are net of all fund operating expenses, but do not include any insurance charges imposed by your insurance company's separate account. If performance information included the effect of these additional charges, the total return would be lower.
Past performance is no guarantee of future results. Principal and investment return will vary and you may have a gain or loss when you withdraw your money.
Understanding Performance
How a fund did yesterday is no guarantee of how it will do tomorrow. The stock market, for example, has a history of long-term growth and short-term volatility. In turn, the share price and return of a fund that invests in stocks will vary. That means if you sell your shares during a market downturn, you might lose money. But if you can ride out the market's ups and downs, you may have a gain.
3$10,000 Over Life of Fund
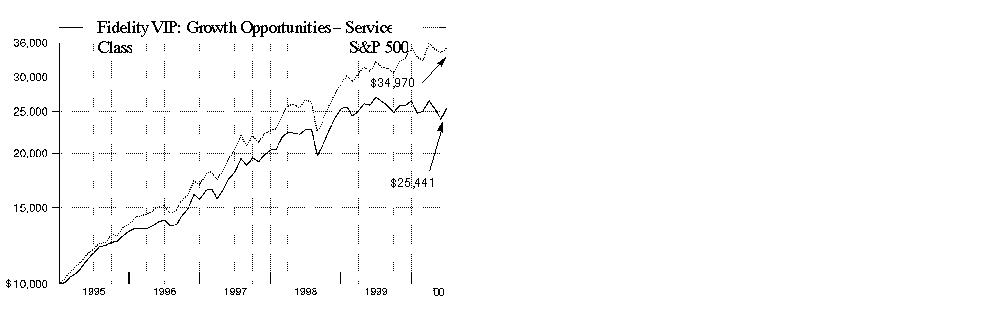
$10,000 Over Life of Fund: Let's say hypothetically that $10,000 was invested in Fidelity Variable Insurance Products: Growth Opportunities Portfolio - Service Class on January 3, 1995, when the fund started. As the chart shows, by June 30, 2000, the value of the investment would have grown to $25,441 - a 154.41% increase on the initial investment. For comparison, look at how the Standard & Poor's 500 Index did over the same period. With dividends and capital gains, if any, reinvested, the same $10,000 investment would have grown to $34,970 - a 249.70% increase.
Investment Summary
|
Top Five Stocks as of June 30, 2000 |
|
|
|
% of fund's |
|
General Electric Co. |
4.2 |
|
Cisco Systems, Inc. |
4.2 |
|
Eli Lilly & Co. |
2.9 |
|
Intel Corp. |
2.7 |
|
Oracle Corp. |
2.4 |
|
|
16.4 |
|
Top Five Market Sectors as of June 30, 2000 |
|
|
|
% of fund's |
|
Technology |
42.8 |
|
Finance |
11.8 |
|
Health |
10.3 |
|
Energy |
6.4 |
|
Utilities |
5.8 |
|
Asset Allocation as of June 30, 2000 |
|||
|
% of fund's net assets* |
|||
|
Stocks 93.6% |
|
|
|
Short-Term Investments |
|
|
|
* Foreign investments 10.0% |
Semiannual Report
(Portfolio Manager photograph)
Note to shareholders: Bettina Doulton became Portfolio Manager of Growth Opportunities Portfolio on February 1, 2000.
Q. How did the fund perform, Bettina?
A. For the six-month period ending June 30, 2000, the fund underperformed the Standard & Poor's 500 Index, which returned -0.42%. For the 12-month period that ended June 30, 2000, the fund also trailed the S&P 500, which returned 7.25%.
Q. Why did the fund underperform its benchmark?
A. Early in the period, the fund was considerably underweighted in technology and telecommunications - the sectors that drove equity markets to record heights. Our lack of exposure here was a big detractor from performance. After taking over the fund in February, I repositioned it to be more in line with expectations - with more of a growth emphasis than a value proposition - and increased the tech position to approximately 43% of net assets at the end of the period, compared to just over 16% six months ago.
Q. Was that strategy successful?
A. On a short-term basis, the repositioning seemed poorly timed. Fund performance was negatively affected by the massive rotation away from technology that began in mid-March and lasted through the end of May. Several factors contributed to the tech sell-off: interest-rate hikes, fears of a slowdown in earnings growth, high valuations and illiquidity. Tech stocks did rebound in June, however, and the fund more than doubled the return of the S&P for the month.
Q. What other changes did you make to the fund since taking over?
A. In light of margin pressures and credit concerns in the finance sector, I reduced the sector's aggregate weighting to 11.8% of net assets compared to 20.6% six months ago. I also shifted the sector's asset allocation, reducing the fund's positions in regional banks, mortgage insurance companies and GSEs - government-sponsored enterprises such as Fannie Mae and Freddie Mac - while adding more capital markets exposure, which was a plus. Two other moves also helped. I reduced the fund's consumer nondurables holdings, largely due to the elimination of the Philip Morris position. I was less enamored with the company's fundamental prospects than my predecessor. I also eliminated the fund's bond position, as I expect to focus largely on equity investments.
Q. Which stocks were among the best absolute contributors?
A. Despite the technology sector's spring decline, six of the fund's 10 best-performing stocks came from that area. Most are very familiar names: Micron Technology, Intel, Oracle, Adobe Systems, Analog Devices and Nortel. All benefited from the growth prospects surrounding the rapid acceleration and penetration of Internet- and wireless-related communications. General Electric, the fund's largest holding at the end of the period, also was a strong contributor. GE experienced an acceleration in revenue and profit growth due to market share gains, acquisitions and strong global economies. Eli Lilly was another winner, benefiting from investor appreciation of its strong product pipeline and increased confidence in the company's earnings growth potential.
Q. Which stocks did not perform as well as you expected?
A. Although I have reduced these positions dramatically since taking over the fund, Fannie Mae and Freddie Mac significantly detracted from performance during the period. Several factors caused the underperformance of these stocks, including the Federal Reserve Board's recent string of interest-rate hikes and increased political bantering about capital ratios and funding requirements. Two other disappointments were retailers Home Depot and Wal-Mart. Despite continuing to deliver strong results, these stocks came under pressure as investors grew increasingly concerned that results would come under pressure due to slowing consumer spending caused by interest-rate increases.
Q. What is your outlook, Bettina?
A. It comes down to whether the technology sector's recent struggle was a short-term rotation or a permanent change in leadership. I believe it was just a violent short-term rotation similar to what we experienced at this time last year. On a medium-term basis, I expect the companies that are the enablers of our networked, communications economy - those that provide servers, data storage, fiber optics, etc. - are going to lead, because we still appear to be in the early stages of the "e-economy" build out.
The views expressed in this report reflect those of the portfolio manager only through the end of the period of the report as stated on the cover. The manager's views are subject to change at any time based on market or other conditions. For more information, see page 2.
Fund Facts
Goal: to provide capital growth by investing primarily in common stocks
Start date: January 3, 1995
Size: as of June 30, 2000, more than
$1.5 billion
Manager: Bettina Doulton, since February 2000; joined Fidelity in 1986
3Semiannual Report
Fidelity Variable Insurance Products: Growth Opportunities Portfolio
(Unaudited)
Showing Percentage of Net Assets
|
Common Stocks - 93.6% |
|||
|
Shares |
Value (Note 1) |
||
|
AEROSPACE & DEFENSE - 1.1% |
|||
|
Boeing Co. |
374,200 |
$ 15,646,238 |
|
|
Textron, Inc. |
30,200 |
1,640,238 |
|
|
|
17,286,476 |
||
|
BASIC INDUSTRIES - 0.3% |
|||
|
Chemicals & Plastics - 0.3% |
|||
|
Praxair, Inc. |
122,000 |
4,567,375 |
|
|
ENERGY - 6.4% |
|||
|
Energy Services - 1.3% |
|||
|
Baker Hughes, Inc. |
36,700 |
1,174,400 |
|
|
Halliburton Co. |
272,200 |
12,844,438 |
|
|
Schlumberger Ltd. (NY Shares) |
92,300 |
6,887,888 |
|
|
|
20,906,726 |
||
|
Oil & Gas - 5.1% |
|||
|
BP Amoco PLC sponsored ADR |
221,190 |
12,511,059 |
|
|
Chevron Corp. |
27,000 |
2,289,938 |
|
|
Conoco, Inc. Class B |
97,868 |
2,403,883 |
|
|
Cooper Cameron Corp. (a) |
72,300 |
4,771,800 |
|
|
Exxon Mobil Corp. |
417,300 |
32,758,050 |
|
|
Royal Dutch Petroleum Co. (NY Shares) |
178,300 |
10,976,594 |
|
|
Tosco Corp. |
257,300 |
7,284,806 |
|
|
TotalFinaElf SA: |
|
|
|
|
Class B |
6,153 |
947,562 |
|
|
sponsored ADR |
94,405 |
7,251,484 |
|
|
|
81,195,176 |
||
|
TOTAL ENERGY |
102,101,902 |
||
|
FINANCE - 11.8% |
|||
|
Banks - 1.1% |
|||
|
Bank of America Corp. |
65,200 |
2,803,600 |
|
|
Bank of Tokyo-Mitsubishi Ltd. |
255,000 |
3,081,070 |
|
|
Bank of Tokyo-Mitsubishi Ltd. ADR |
44,500 |
539,563 |
|
|
Chase Manhattan Corp. |
232,800 |
10,723,350 |
|
|
|
17,147,583 |
||
|
Credit & Other Finance - 2.9% |
|||
|
American Express Co. |
499,400 |
26,031,225 |
|
|
Citigroup, Inc. |
340,200 |
20,497,050 |
|
|
|
46,528,275 |
||
|
Federal Sponsored Credit - 4.1% |
|||
|
Fannie Mae |
712,400 |
37,178,375 |
|
|
Freddie Mac |
688,000 |
27,864,000 |
|
|
|
65,042,375 |
||
|
Insurance - 2.2% |
|||
|
Allmerica Financial Corp. |
41,500 |
2,173,563 |
|
|
American International Group, Inc. |
184,175 |
21,640,563 |
|
|
CIGNA Corp. |
92,812 |
8,677,922 |
|
|
|
|||
|
Shares |
Value (Note 1) |
||
|
Hartford Financial Services Group, Inc. |
13,700 |
$ 766,344 |
|
|
The Chubb Corp. |
37,200 |
2,287,800 |
|
|
|
35,546,192 |
||
|
Securities Industry - 1.5% |
|||
|
Daiwa Securities Group, Inc. |
72,000 |
950,764 |
|
|
Morgan Stanley Dean Witter & Co. |
155,900 |
12,978,675 |
|
|
Nomura Securities Co. Ltd. |
391,000 |
9,570,317 |
|
|
|
23,499,756 |
||
|
TOTAL FINANCE |
187,764,181 |
||
|
HEALTH - 10.3% |
|||
|
Drugs & Pharmaceuticals - 9.0% |
|||
|
American Home Products Corp. |
82,900 |
4,870,375 |
|
|
Amgen, Inc. |
71,300 |
5,008,825 |
|
|
Bristol-Myers Squibb Co. |
373,600 |
21,762,200 |
|
|
Eli Lilly & Co. |
466,400 |
46,581,700 |
|
|
Merck & Co., Inc. |
149,200 |
11,432,450 |
|
|
Pfizer, Inc. |
449,693 |
21,585,264 |
|
|
Schering-Plough Corp. |
650,600 |
32,855,300 |
|
|
|
144,096,114 |
||
|
Medical Equipment & Supplies - 1.3% |
|||
|
Abbott Laboratories |
102,200 |
4,554,288 |
|
|
Johnson & Johnson |
148,300 |
15,108,063 |
|
|
|
19,662,351 |
||
|
TOTAL HEALTH |
163,758,465 |
||
|
INDUSTRIAL MACHINERY & EQUIPMENT - 5.3% |
|||
|
Electrical Equipment - 4.2% |
|||
|
General Electric Co. |
1,269,700 |
67,294,088 |
|
|
Industrial Machinery & Equipment - 1.1% |
|||
|
Deere & Co. |
156,600 |
5,794,200 |
|
|
Ingersoll-Rand Co. |
60,400 |
2,431,100 |
|
|
Tyco International Ltd. |
194,200 |
9,200,225 |
|
|
|
17,425,525 |
||
|
TOTAL INDUSTRIAL MACHINERY & EQUIPMENT |
84,719,613 |
||
|
MEDIA & LEISURE - 4.7% |
|||
|
Broadcasting - 1.9% |
|||
|
AT&T Corp. - Liberty Media Group |
501,244 |
12,155,167 |
|
|
Charter Communications, Inc. |
167,700 |
2,756,569 |
|
|
Comcast Corp. Class A (special) (a) |
77,500 |
3,138,750 |
|
|
Cox Communications, Inc. Class A (a) |
78,213 |
3,563,580 |
|
|
Infinity Broadcasting Corp. Class A (a) |
23,400 |
852,638 |
|
|
Time Warner, Inc. |
89,500 |
6,802,000 |
|
|
Univision Communications, Inc. |
6,100 |
631,350 |
|
|
|
29,900,054 |
||
|
Entertainment - 2.2% |
|||
|
Fox Entertainment Group, Inc. Class A (a) |
239,400 |
7,271,775 |
|
|
Common Stocks - continued |
|||
|
Shares |
Value (Note 1) |
||
|
MEDIA & LEISURE - continued |
|||
|
Entertainment - continued |
|||
|
Viacom, Inc. Class B (non-vtg.) (a) |
328,428 |
$ 22,394,684 |
|
|
Walt Disney Co. |
133,500 |
5,181,469 |
|
|
|
34,847,928 |
||
|
Publishing - 0.1% |
|||
|
McGraw-Hill Companies, Inc. |
35,400 |
1,911,600 |
|
|
Restaurants - 0.5% |
|||
|
McDonald's Corp. |
268,700 |
8,850,306 |
|
|
TOTAL MEDIA & LEISURE |
75,509,888 |
||
|
NONDURABLES - 0.5% |
|||
|
Beverages - 0.1% |
|||
|
The Coca-Cola Co. |
27,300 |
1,568,044 |
|
|
Household Products - 0.4% |
|||
|
Avon Products, Inc. |
16,900 |
752,050 |
|
|
Clorox Co. |
41,700 |
1,868,681 |
|
|
Procter & Gamble Co. |
67,320 |
3,854,070 |
|
|
|
6,474,801 |
||
|
TOTAL NONDURABLES |
8,042,845 |
||
|
RETAIL & WHOLESALE - 4.6% |
|||
|
General Merchandise Stores - 2.5% |
|||
|
Kohls Corp. (a) |
56,400 |
3,137,250 |
|
|
Target Corp. |
119,400 |
6,925,200 |
|
|
Wal-Mart Stores, Inc. |
533,700 |
30,754,463 |
|
|
|
40,816,913 |
||
|
Retail & Wholesale, Miscellaneous - 2.1% |
|||
|
Home Depot, Inc. |
394,000 |
19,675,375 |
|
|
Lowe's Companies, Inc. |
320,900 |
13,176,956 |
|
|
|
32,852,331 |
||
|
TOTAL RETAIL & WHOLESALE |
73,669,244 |
||
|
SERVICES - 0.0% |
|||
|
Advertising - 0.0% |
|||
|
Interpublic Group of Companies, Inc. |
13,800 |
593,400 |
|
|
Services - 0.0% |
|||
|
Gartner Group, Inc. Class B (a) |
106 |
1,047 |
|
|
TOTAL SERVICES |
594,447 |
||
|
TECHNOLOGY - 42.8% |
|||
|
Communications Equipment - 11.1% |
|||
|
Ciena Corp. (a) |
61,700 |
10,284,619 |
|
|
Cisco Systems, Inc. (a) |
1,046,300 |
66,505,444 |
|
|
Corning, Inc. |
50,500 |
13,628,688 |
|
|
Lucent Technologies, Inc. |
226,200 |
13,402,350 |
|
|
Nokia AB sponsored ADR |
533,900 |
26,661,631 |
|
|
|
|||
|
Shares |
Value (Note 1) |
||
|
Nortel Networks Corp. |
481,200 |
$ 33,380,101 |
|
|
Telefonaktiebolaget LM Ericsson sponsored ADR |
665,500 |
13,310,000 |
|
|
|
177,172,833 |
||
|
Computer Services & Software - 9.9% |
|||
|
Adobe Systems, Inc. |
134,700 |
17,511,000 |
|
|
Amazon.com, Inc. (a) |
10,200 |
370,388 |
|
|
America Online, Inc. (a) |
266,600 |
14,063,150 |
|
|
Automatic Data Processing, Inc. |
224,300 |
12,014,069 |
|
|
BEA Systems, Inc. (a) |
75,100 |
3,712,756 |
|
|
BroadVision, Inc. (a) |
111,400 |
5,660,513 |
|
|
Computer Sciences Corp. (a) |
9,700 |
724,469 |
|
|
E.piphany, Inc. |
13,000 |
1,393,438 |
|
|
First Data Corp. |
61,700 |
3,061,863 |
|
|
i2 Technologies, Inc. (a) |
25,800 |
2,690,053 |
|
|
InfoSpace.com, Inc. (a) |
47,000 |
2,596,750 |
|
|
Microsoft Corp. (a) |
242,100 |
19,368,000 |
|
|
Oracle Corp. (a) |
456,600 |
38,382,939 |
|
|
Phone.com, Inc. |
24,100 |
1,569,513 |
|
|
Redback Networks, Inc. |
16,100 |
2,883,913 |
|
|
Siebel Systems, Inc. (a) |
93,500 |
15,293,094 |
|
|
VeriSign, Inc. (a) |
82,537 |
14,567,781 |
|
|
Yahoo!, Inc. (a) |
23,000 |
2,849,125 |
|
|
|
158,712,814 |
||
|
Computers & Office Equipment - 7.2% |
|||
|
Compaq Computer Corp. |
285,500 |
7,298,094 |
|
|
Dell Computer Corp. (a) |
217,200 |
10,710,675 |
|
|
EMC Corp. (a) |
270,500 |
20,811,594 |
|
|
Hewlett-Packard Co. |
76,600 |
9,565,425 |
|
|
International Business Machines Corp. |
34,100 |
3,736,081 |
|
|
Network Appliance, Inc. (a) |
154,700 |
12,453,350 |
|
|
SCI Systems, Inc. (a) |
490,600 |
19,225,388 |
|
|
Sun Microsystems, Inc. (a) |
345,200 |
31,391,625 |
|
|
|
115,192,232 |
||
|
Electronic Instruments - 2.8% |
|||
|
Agilent Technologies, Inc. |
86,915 |
6,409,981 |
|
|
Applied Materials, Inc. (a) |
178,900 |
16,212,813 |
|
|
KLA-Tencor Corp. (a) |
118,600 |
6,945,513 |
|
|
LAM Research Corp. (a) |
404,000 |
15,150,000 |
|
|
|
44,718,307 |
||
|
Electronics - 11.8% |
|||
|
Analog Devices, Inc. (a) |
245,100 |
18,627,600 |
|
|
Broadcom Corp. Class A (a) |
7,100 |
1,554,456 |
|
|
Flextronics International Ltd. (a) |
119,171 |
8,185,558 |
|
|
Intel Corp. |
316,500 |
42,312,094 |
|
|
JDS Uniphase Corp. (a) |
116,200 |
13,929,475 |
|
|
Methode Electronics, Inc. Class A |
4,300 |
166,088 |
|
|
Micron Technology, Inc. (a) |
335,200 |
29,518,550 |
|
|
Molex, Inc. Class A |
145,810 |
5,103,350 |
|
|
Motorola, Inc. |
60,000 |
1,743,750 |
|
|
National Semiconductor Corp. (a) |
228,600 |
12,973,050 |
|
|
Samsung Electronics Co. Ltd. |
2,800 |
926,616 |
|
|
Common Stocks - continued |
|||
|
Shares |
Value (Note 1) |
||
|
TECHNOLOGY - continued |
|||
|
Electronics - continued |
|||
|
Sanmina Corp. (a) |
59,500 |
$ 5,087,250 |
|
|
SDL, Inc. (a) |
13,700 |
3,907,069 |
|
|
Texas Instruments, Inc. |
541,900 |
37,221,756 |
|
|
Xilinx, Inc. (a) |
83,700 |
6,910,481 |
|
|
|
188,167,143 |
||
|
TOTAL TECHNOLOGY |
683,963,329 |
||
|
TRANSPORTATION - 0.0% |
|||
|
Air Transportation - 0.0% |
|||
|
Southwest Airlines Co. |
31,500 |
596,531 |
|
|
UTILITIES - 5.8% |
|||
|
Cellular - 4.5% |
|||
|
China Telecom (Hong Kong) Ltd. sponsored ADR (a) |
34,100 |
6,063,406 |
|
|
Nextel Communications, Inc. Class A (a) |
291,000 |
17,805,563 |
|
|
Nextel Partners, Inc. Class A |
2,500 |
81,406 |
|
|
QUALCOMM, Inc. (a) |
27,800 |
1,668,000 |
|
|
Sprint Corp. - PCS Group Series 1 (a) |
316,800 |
18,849,600 |
|
|
Vodafone AirTouch PLC |
122,991 |
509,643 |
|
|
Vodafone AirTouch PLC sponsored ADR |
378,900 |
15,700,669 |
|
|
VoiceStream Wireless Corp. (a) |
91,800 |
10,676,053 |
|
|
|
71,354,340 |
||
|
Electric Utility - 0.3% |
|||
|
AES Corp. (a) |
113,000 |
5,155,625 |
|
|
Telephone Services - 1.0% |
|||
|
Level 3 Communications, Inc. (a) |
105,100 |
9,248,800 |
|
|
NEXTLINK Communications, Inc. Class A |
132,800 |
5,038,100 |
|
|
U.S. WEST, Inc. |
16,300 |
1,397,725 |
|
|
|
15,684,625 |
||
|
TOTAL UTILITIES |
92,194,590 |
||
|
TOTAL COMMON STOCKS (Cost $1,159,260,000) |
1,494,768,886 |
||
|
Cash Equivalents - 6.9% |
|||
|
Shares |
Value (Note 1) |
||
|
Central Cash Collateral Fund, 6.71% (b) |
1,235,200 |
$ 1,235,200 |
|
|
Taxable Central Cash Fund, 6.59% (b) |
109,058,384 |
109,058,384 |
|
|
TOTAL CASH EQUIVALENTS (Cost $110,293,584) |
110,293,584 |
||
|
TOTAL INVESTMENT PORTFOLIO - 100.5% (Cost $1,269,553,584) |
1,605,062,470 |
|
NET OTHER ASSETS - (0.5)% |
(7,485,639) |
||
|
NET ASSETS - 100% |
$ 1,597,576,831 |
||
|
Legend |
|
(a) Non-income producing |
|
(b) The rate quoted is the annualized seven-day yield of the fund at |
|
Other Information |
|
Purchases and sales of securities, other than short-term securities, aggregated $1,110,429,310 and $1,386,467,463, respectively, of which long-term U.S. government and government agency obligations aggregated $0 and $110,516,388, respectively. |
|
The market value of futures contracts opened and closed during the period amounted to $2,939,068 and $2,727,952, respectively. |
|
The fund placed a portion of its portfolio transactions with brokerage firms which are affiliates of Fidelity Management & Research Company. The commissions paid to these affiliated firms were $41,941 for the period. |
|
The fund participated in the security lending program. At period end, the value of securities loaned amounted to $1,236,406. The fund received cash collateral of $1,235,200 which was invested in cash equivalents. |
|
Distribution of investments by country of issue, as a percentage of total |
|
United States of America |
90.0% |
|
Canada |
2.1 |
|
United Kingdom |
1.8 |
|
Finland |
1.7 |
|
Others (individually less than 1%) |
4.4 |
|
|
100.0% |
|
Income Tax Information |
|
At June 30, 2000, the aggregate cost of investment securities for income tax purposes was $1,270,414,331. Net unrealized appreciation aggregated $334,648,139, of which $383,735,051 related to appreciated investment securities and $49,086,912 related to depreciated investment securities. |
See accompanying notes which are an integral part of the financial statements.
Growth Opportunities Portfolio
Statement of Assets and Liabilities
|
|
June 30, 2000 (Unaudited) |
|
|
Assets |
|
|
|
Investment in securities, at value |
|
$ 1,605,062,470 |
|
Foreign currency held at value |
|
869,422 |
|
Receivable for investments sold |
|
18,787,103 |
|
Receivable for fund shares sold |
|
2,992,234 |
|
Dividends receivable |
|
563,371 |
|
Interest receivable |
|
475,311 |
|
Other receivables |
|
13,116 |
|
Total assets |
|
1,628,763,027 |
|
Liabilities |
|
|
|
Payable to custodian bank |
$ 1,150,566 |
|
|
Payable for investments purchased |
27,237,658 |
|
|
Payable for fund shares redeemed |
663,655 |
|
|
Accrued management fee |
760,615 |
|
|
Distribution fees payable |
30,888 |
|
|
Other payables and |
107,614 |
|
|
Collateral on securities loaned, |
1,235,200 |
|
|
Total liabilities |
|
31,186,196 |
|
Net Assets |
|
$ 1,597,576,831 |
|
Net Assets consist of: |
|
|
|
Paid in capital |
|
$ 1,297,693,607 |
|
Undistributed net |
|
1,554,523 |
|
Accumulated undistributed |
|
(37,177,356) |
|
Net unrealized appreciation (depreciation) on investments |
|
335,506,057 |
|
Net Assets |
|
$ 1,597,576,831 |
|
Initial Class: |
|
$20.61 |
|
Service Class: |
|
$20.58 |
|
Service Class 2: |
|
$20.57 |
Statement of Operations
|
|
Six months ended June 30, 2000 (Unaudited) |
|
|
Investment Income Dividends |
|
$ 4,944,088 |
|
Interest |
|
2,196,303 |
|
Security lending |
|
43,224 |
|
Total income |
|
7,183,615 |
|
Expenses |
|
|
|
Management fee |
$ 4,713,628 |
|
|
Transfer agent fees |
531,307 |
|
|
Distribution fees |
171,473 |
|
|
Accounting and security lending fees |
182,021 |
|
|
Non-interested trustees' compensation |
2,651 |
|
|
Custodian fees and expenses |
44,138 |
|
|
Registration fees |
956 |
|
|
Audit |
17,449 |
|
|
Legal |
7,156 |
|
|
Reports to shareholders |
7,396 |
|
|
Miscellaneous |
395 |
|
|
Total expenses before reductions |
5,678,570 |
|
|
Expense reductions |
(279,920) |
5,398,650 |
|
Net investment income |
|
1,784,965 |
|
Realized and Unrealized Gain (Loss) Net realized gain (loss) on: |
|
|
|
Investment securities |
(31,567,618) |
|
|
Foreign currency transactions |
(17,618) |
|
|
Futures contracts |
(211,116) |
(31,796,352) |
|
Change in net unrealized appreciation (depreciation) on: |
|
|
|
Investment securities |
(41,408,261) |
|
|
Assets and liabilities in |
105 |
(41,408,156) |
|
Net gain (loss) |
|
(73,204,508) |
|
Net increase (decrease) in net assets resulting from operations |
|
$ (71,419,543) |
|
Other Information Expense reductions |
|
$ 276,910 |
|
Custodian credits |
|
3,010 |
|
|
|
$ 279,920 |
See accompanying notes which are an integral part of the financial statements.
Semiannual Report
Fidelity Variable Insurance Products: Growth Opportunities Portfolio
Financial Statements - continued
Statement of Changes in Net Assets
|
Increase (Decrease) in Net Assets |
Six months ended |
Year ended |
|
|
|
|
|
Operations |
$ 1,784,965 |
$ 21,853,752 |
|
Net realized gain (loss) |
(31,796,352) |
109,839,194 |
|
Change in net unrealized appreciation (depreciation) |
(41,408,156) |
(54,923,099) |
|
Net increase (decrease) in net assets resulting from operations |
(71,419,543) |
76,769,847 |
|
Distributions to shareholders |
(21,794,226) |
(17,518,652) |
|
From net realized gain |
(111,302,559) |
(32,887,198) |
|
Total distributions |
(133,096,785) |
(50,405,850) |
|
Share transactions - net increase (decrease) |
(84,271,368) |
140,493,459 |
|
Total increase (decrease) in net assets |
(288,787,696) |
166,857,456 |
|
Net Assets |
|
|
|
Beginning of period |
1,886,364,527 |
1,719,507,071 |
|
End of period (including undistributed net investment income of $1,554,523 and $21,419,780, respectively) |
$ 1,597,576,831 |
$ 1,886,364,527 |
|
|
|
Other Information: |
|
|
Six months ended June 30, 2000 |
Year ended |
||
|
|
Shares |
Dollars |
Shares |
Dollars |
|
Share transactions |
7,804,052 |
$ 162,982,845 |
14,140,894 |
$ 318,792,928 |
|
Reinvested |
5,190,171 |
107,280,842 |
2,116,413 |
45,714,518 |
|
Redeemed |
(20,232,012) |
(422,309,444) |
(18,293,067) |
(412,962,598) |
|
Net increase (decrease) |
(7,237,789) |
$ (152,045,757) |
(2,035,760) |
$ (48,455,152) |
|
Service Class |
3,431,508 |
$ 71,121,191 |
9,385,140 |
$ 211,858,592 |
|
Reinvested |
1,249,806 |
25,808,498 |
217,292 |
4,691,331 |
|
Redeemed |
(1,604,623) |
(33,520,138) |
(1,230,823) |
(27,601,312) |
|
Net increase (decrease) |
3,076,691 |
$ 63,409,551 |
8,371,609 |
$ 188,948,611 |
|
Service Class 2 A |
234,557 |
$ 4,716,010 |
- |
$ - |
|
Reinvested |
361 |
7,445 |
- |
- |
|
Redeemed |
(17,302) |
(358,617) |
- |
- |
|
Net increase (decrease) |
217,616 |
$ 4,364,838 |
- |
$ - |
|
Distributions |
|
$ 17,669,786 |
|
$ 15,930,817 |
|
Service Class |
|
4,123,251 |
|
1,587,835 |
|
Service Class 2 A |
|
1,189 |
|
- |
|
Total |
|
$ 21,794,226 |
|
$ 17,518,652 |
|
From net realized gain |
|
$ 89,611,056 |
|
$ 29,783,702 |
|
Service Class |
|
21,685,247 |
|
3,103,496 |
|
Service Class 2 A |
|
6,256 |
|
- |
|
Total |
|
$ 111,302,559 |
|
$ 32,887,198 |
|
|
|
$ 133,096,785 |
|
$ 50,405,850 |
A Service Class 2 commenced sale of shares January 12, 2000.
See accompanying notes which are an integral part of the financial statements.
Growth Opportunities Portfolio
Financial Highlights - Initial Class
|
|
Six months ended |
Years ended December 31, |
||||
|
Selected Per-Share Data |
(Unaudited) |
1999 |
1998 |
1997 |
1996 |
1995 E |
|
Net asset value, beginning of period |
$ 23.15 |
$ 22.88 |
$ 19.27 |
$ 15.40 |
$ 13.07 |
$ 10.00 |
|
Income from Investment Operations |
|
|
|
|
|
|
|
Net investment income |
.02 D |
.27 D |
.26 D |
.29 D |
.26 |
.11 |
|
Net realized and unrealized gain (loss) |
(.86) |
.66 |
4.29 |
4.18 |
2.12 |
3.14 |
|
Total from investment operations |
(.84) |
.93 |
4.55 |
4.47 |
2.38 |
3.25 |
|
Less Distributions |
|
|
|
|
|
|
|
From net investment income |
(.28) |
(.23) |
(.21) |
(.25) |
- |
(.11) |
|
From net realized gain |
(1.42) |
(.43) |
(.73) |
(.35) |
(.05) |
(.07) |
|
Total distributions |
(1.70) |
(.66) |
(.94) |
(.60) |
(.05) |
(.18) |
|
Net asset value, end of period |
$ 20.61 |
$ 23.15 |
$ 22.88 |
$ 19.27 |
$ 15.40 |
$ 13.07 |
|
Total Return B, C |
(3.65)% |
4.27% |
24.61% |
29.95% |
18.27% |
32.52% |
|
Ratios and Supplemental Data |
|
|
|
|
|
|
|
Net assets, end of period (000 omitted) |
$ 1,222,938 |
$ 1,541,587 |
$ 1,570,011 |
$ 1,025,766 |
$ 383,085 |
$ 164,303 |
|
Ratio of expenses to average net assets |
.67% A |
.69% |
.71% |
.74% |
.77% |
.85% G |
|
Ratio of expenses to average net assets after |
.64% A, H |
.68% H |
.70% H |
.73% H |
.76% H |
.83% H |
|
Ratio of net investment income to average net assets |
.24% A |
1.20% |
1.27% |
1.68% |
2.29% |
2.49% |
|
Portfolio turnover |
138% A |
42% |
29% |
26% |
28% |
38% |
Financial Highlights - Service Class
|
|
Six months ended |
Years ended December 31, |
||
|
Selected Per-Share Data |
(Unaudited) |
1999 |
1998 |
1997 F |
|
Net asset value, beginning of period |
$ 23.12 |
$ 22.86 |
$ 19.27 |
$ 18.50 |
|
Income from Investment Operations |
|
|
|
|
|
Net investment income D |
.01 |
.25 |
.23 |
.04 |
|
Net realized and unrealized gain (loss) |
(.86) |
.66 |
4.30 |
.73 |
|
Total from investment operations |
(.85) |
.91 |
4.53 |
.77 |
|
Less Distributions |
|
|
|
|
|
From net investment income |
(.27) |
(.22) |
(.21) |
- |
|
From net realized gain |
(1.42) |
(.43) |
(.73) |
- |
|
Total distributions |
(1.69) |
(.65) |
(.94) |
- |
|
Net asset value, end of period |
$ 20.58 |
$ 23.12 |
$ 22.86 |
$ 19.27 |
|
Total ReturnB, C |
(3.70)% |
4.18% |
24.51% |
4.16% |
|
Ratios and Supplemental Data |
|
|
|
|
|
Net assets, end of period (000 omitted) |
$ 370,164 |
$ 344,778 |
$ 149,496 |
$ 2,589 |
|
Ratio of expenses to average net assets |
.77% A |
.79% |
.80% |
.84% A |
|
Ratio of expenses to average net assets after expense reductions |
.74% A, H |
.78% H |
.79% H |
.83% A, H |
|
Ratio of net investment income to average net assets |
.14% A |
1.09% |
1.16% |
1.72% A |
|
Portfolio turnover |
138% A |
42% |
29% |
26% |
|
A Annualized B The total returns would have been lower had certain expenses not been reduced during the periods shown. C Total returns for periods of less than one year are not annualized and do not reflect charges attributable to your insurance company's separate account. Inclusion of these charges would reduce the total returns shown. D Net investment income per share has been calculated based on average shares outstanding during the period. E For the period January 3, 1995 (commencement of sale of Initial Class shares) to December 31, 1995. F For the period November 3, 1997 (commencement of sale of Service Class shares) to December 31, 1997. G FMR agreed to reimburse a portion of the class' expenses during the period. Without this reimbursement, the class' expense ratio would have been higher. H FMR or the fund has entered into varying arrangements with third parties who either paid or reduced a portion of the class' expenses. |
||||
See accompanying notes which are an integral part of the financial statements.
Semiannual Report
Financial Highlights - Service Class 2
|
|
Six months ended |
|
Selected Per-Share Data |
(Unaudited) |
|
Net asset value, beginning of period |
$ 22.70 |
|
Income from Investment Operations |
|
|
Net investment income (loss) D |
(.00) |
|
Net realized and unrealized gain (loss) |
(.44) |
|
Total from investment operations |
(.44) |
|
Less Distributions |
|
|
From net investment income |
(.27) |
|
From net realized gain |
(1.42) |
|
Total distributions |
(1.69) |
|
Net asset value, end of period |
$ 20.57 |
|
Total Return B, C |
(1.97)% |
|
Ratios and Supplemental Data |
|
|
Net assets, end of period (000 omitted) |
$ 4,476 |
|
Ratio of expenses to average net assets |
.96% A |
|
Ratio of expenses to average net assets after expense reductions |
.92% A, F |
|
Ratio of net investment income (loss) to average net assets |
(.05)% A |
|
Portfolio turnover |
138% A |
|
A Annualized B The total returns would have been lower had certain expenses not been reduced during the periods shown. C Total returns for periods of less than one year are not annualized and do not reflect charges attributable to your insurance company's separate account. Inclusion of these charges would reduce the total returns shown. D Net investment income (loss) per share has been calculated based on average shares outstanding during the period. E For the period January 12, 2000 (commencement of sale of Service Class 2 shares) to June 30, 2000. F FMR or the fund has entered into varying arrangements with third parties who either paid or reduced a portion of the class' expenses. |
|
See accompanying notes which are an integral part of the financial statements.
Growth Opportunities Portfolio
A special meeting of the fund's shareholders was held on July 19, 2000. The results of votes taken among shareholders on proposals before them are reported below. Each vote reported represents one dollar of net asset value held on the record date for the meeting.
PROPOSAL 1
To elect as Trustees the following twelve nominees.*
|
|
# of Dollars Voted |
% of Dollars Voted |
Ralph F. Cox
|
Affirmative |
2,995,348,207.84 |
97.862 |
|
Withheld |
65,444,305.52 |
2.138 |
|
TOTAL |
3,060,792,513.36 |
100.000 |
Phyllis Burke Davis
|
Affirmative |
2,995,012,849.06 |
97.851 |
|
Withheld |
65,779,664.30 |
2.149 |
|
TOTAL |
3,060,792,513.36 |
100.000 |
Robert M. Gates
|
Affirmative |
2,994,325,628.16 |
97.828 |
|
Withheld |
66,466,885.20 |
2.172 |
|
TOTAL |
3,060,792,513.36 |
100.000 |
Edward C. Johnson 3d
|
Affirmative |
2,994,212,266.77 |
97.825 |
|
Withheld |
66,580,246.59 |
2.175 |
|
TOTAL |
3,060,792,513.36 |
100.000 |
Donald J. Kirk
|
Affirmative |
2,996,527,468.99 |
97.900 |
|
Withheld |
64,265,044.37 |
2.100 |
|
TOTAL |
3,060,792,513.36 |
100.000 |
Ned. C. Lautenbach
|
Affirmative |
2,997,430,896.97 |
97.930 |
|
Withheld |
63,361,616.39 |
2.070 |
|
TOTAL |
3,060,792,513.36 |
100.000 |
|
|
# of Dollars Voted |
% of Dollars Voted |
Peter S. Lynch
|
Affirmative |
2,997,391,112.97 |
97.929 |
|
Withheld |
63,401,400.39 |
2.071 |
|
TOTAL |
3,060,792,513.36 |
100.000 |
William O. McCoy
|
Affirmative |
2,997,364,420.76 |
97.928 |
|
Withheld |
63,428,092.60 |
2.072 |
|
TOTAL |
3,060,792,513.36 |
100.000 |
Gerald C. McDonough
|
Affirmative |
2,992,594,911.89 |
97.772 |
|
Withheld |
68,197,601.47 |
2.228 |
|
TOTAL |
3,060,792,513.36 |
100.000 |
Marvin L. Mann
|
Affirmative |
2,996,491,839.67 |
97.899 |
|
Withheld |
64,300,673.69 |
2.101 |
|
TOTAL |
3,060,792,513.36 |
100.000 |
Robert C. Pozen
|
Affirmative |
2,997,304,419.99 |
97.926 |
|
Withheld |
63,488,093.37 |
2.074 |
|
TOTAL |
3,060,792,513.36 |
100.000 |
Thomas R. Williams
|
Affirmative |
2,993,561,996.24 |
97.803 |
|
Withheld |
67,230,517.12 |
2.197 |
|
TOTAL |
3,060,792,513.36 |
100.000 |
Semiannual Report
Notes to Financial Statements (Unaudited) - continued
PROPOSAL 2
To ratify the selection of Deloitte & Touche LLP as independent accountants of the fund.
|
|
# of Dollars Voted |
% of Dollars Voted |
|
Affirmative |
1,377,496,384.11 |
94.671 |
|
Against |
12,255,144.99 |
0.842 |
|
Abstain |
65,286,057.94 |
4.487 |
|
TOTAL |
1,455,037,587.04 |
100.000 |
PROPOSAL 3
To authorize the Trustees to adopt an amended and restated Declaration of Trust.*
|
|
# of Dollars Voted |
% of Dollars Voted |
|
Affirmative |
2,837,267,199.92 |
92.697 |
|
Against |
49,473,422.32 |
1.617 |
|
Abstain |
174,051,891.12 |
5.686 |
|
TOTAL |
3,060,792,513.36 |
100.000 |
PROPOSAL 6
To approve an amended management contract for the fund that would reduce the management fee payable to FMR by the fund as FMR's assets under management increase.
|
|
# of Dollars Voted |
% of Dollars Voted |
|
Affirmative |
1,340,780,422.20 |
92.147 |
|
Against |
27,115,319.81 |
1.864 |
|
Abstain |
87,141,845.03 |
5.989 |
|
TOTAL |
1,455,037,587.04 |
100.000 |
PROPOSAL 8
To approve an amended sub-advisory agreement with FMR U.K. to provide investment advice and research services or investment management services.
|
|
# of Dollars Voted |
% of Dollars Voted |
|
Affirmative |
1,331,739,032.83 |
91.526 |
|
Against |
27,683,762.48 |
1.903 |
|
Abstain |
95,614,791.73 |
6.571 |
|
TOTAL |
1,455,037,587.04 |
100.000 |
* Denotes trust-wide proposals and voting results.
PROPOSAL 10
To approve an amended sub-advisory agreement with FMR Far East to provide investment advice and research services or investment management services.
|
|
# of Dollars Voted |
% of Dollars Voted |
|
Affirmative |
1,323,899,985.14 |
90.987 |
|
Against |
34,015,265.88 |
2.338 |
|
Abstain |
97,122,336.02 |
6.675 |
|
TOTAL |
1,455,037,587.04 |
100.000 |
PROPOSAL 13
Diversification - To amend the fundamental investment limitation concerning diversification.
|
|
# of Dollars Voted |
% of Dollars Voted |
|
Affirmative |
1,328,921,810.70 |
91.332 |
|
Against |
33,755,864.67 |
2.320 |
|
Abstain |
92,359,911.67 |
6.348 |
|
TOTAL |
1,455,037,587.04 |
100.000 |
PROPOSAL 14
Underwriting - To amend the fundamental limitation concerning underwriting.
|
|
# of Dollars Voted |
% of Dollars Voted |
|
Affirmative |
1,331,436,859.78 |
91.505 |
|
Against |
31,609,505.60 |
2.173 |
|
Abstain |
91,991,221.66 |
6.322 |
|
TOTAL |
1,455,037,587.04 |
100.000 |
PROPOSAL 15
Concentration - To amend the fundamental limitation concerning concentration.
|
|
# of Dollars Voted |
% of Dollars Voted |
|
Affirmative |
1,327,032,945.65 |
91.203 |
|
Against |
34,495,489.11 |
2.370 |
|
Abstain |
93,509,152.28 |
6.427 |
|
TOTAL |
1,455,037,587.04 |
100.000 |
Growth Opportunities Portfolio
Performance
There are several ways to evaluate a fund's historical performance. You can look at the total percentage change in value, the average annual percentage change or the growth of a hypothetical $10,000 investment. Total return reflects the change in the value of an investment, assuming reinvestment of the fund's dividend income and capital gains (the profits earned upon the sale of securities that have grown in value). The initial offering of Service Class shares took place on November 3, 1997. Performance for Service Class shares reflects an asset based distribution fee (12b-1 fee), and returns prior to November 3, 1997 are those of Initial Class and do not include the effects of Service Class' 12b-1 fee. Had Service Class shares' 12b-1 fee been reflected, returns prior to November 3, 1997 would have been lower. If Fidelity had not reimbursed certain fund expenses, the life of fund total return would have been lower.
Average Annual Total Returns
|
Periods ended |
Past 1 |
Life of |
|
Fidelity VIP: Growth & Income - Service Class |
-1.15% |
17.79% |
|
S&P 500 |
7.25% |
22.43% |
Average annual returns take the fund's cumulative return and show you what would have happened if the fund had performed at a constant rate each year.
You can compare the fund's returns to the performance of the Standard & Poor's 500 Index - a market capitalization-weighted index of common stocks. This benchmark includes reinvested dividends and capital gains, if any.
Figures for more than one year assume a steady compounded rate of return and are not the fund's year-by-year results, which fluctuated over the periods shown. The life of fund figures are from commencement of operations, December 31, 1996.
Performance numbers are net of all fund operating expenses, but do not include any insurance charges imposed by your insurance company's separate account. If performance information included the effect of these additional charges, the total returns would be lower.
Past performance is no guarantee of future results. Principal and investment return will vary and you may have a gain or loss when
you withdraw your money.
Understanding Performance
How a fund did yesterday is no guarantee of how it will do tomorrow. The stock market, for example, has a history of long-term growth and short-term volatility. In turn, the share price and return of a fund that invests in stocks will vary. That means if you sell your shares during a market downturn, you might lose money. But if you can ride out the market's ups and downs, you may have a gain.
3$10,000 Over Life of Fund
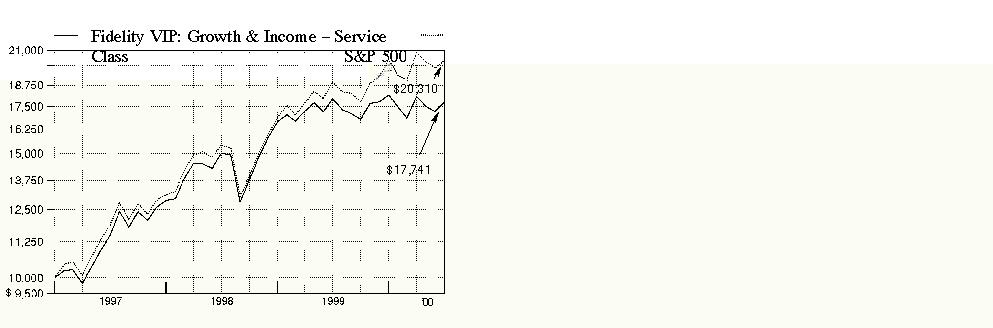
$10,000 Over Life of Fund: Let's say hypothetically that $10,000 was invested in Fidelity Variable Insurance Products: Growth & Income Portfolio - Service Class on December 31, 1996, when the fund started. As the chart shows, by June 30, 2000, the value of the investment would have grown to $17,741 - a 77.41% increase on the initial investment. For comparison, look at how the Standard & Poor's 500 Index did over the same period. With dividends and capital gains, if any, reinvested, the same $10,000 investment would have grown to $20,310 - a 103.10% increase.
Investment Summary
|
Top Five Stocks as of June 30, 2000 |
|
|
|
% of fund's |
|
Microsoft Corp. |
4.3 |
|
Exxon Mobil Corp. |
4.2 |
|
Fannie Mae |
3.9 |
|
Intel Corp. |
3.8 |
|
Cisco Systems, Inc. |
3.7 |
|
|
19.9 |
|
Top Five Market Sectors as of June 30, 2000 |
|
|
|
% of fund's |
|
Technology |
23.2 |
|
Finance |
18.2 |
|
Utilities |
10.0 |
|
Health |
7.0 |
|
Energy |
6.1 |
|
Asset Allocation as of June 30, 2000 |
|||
|
% of fund's net assets* |
|||
|
Stocks and |
|
|
|
Short-Term Investments |
|
|

|
* Foreign investments 6.2% |
Semiannual Report
(Portfolio Manager photograph)
An interview with Louis Salemy, Portfolio Manager of Growth & Income Portfolio
Q. How did the fund perform, Louis?
A. For the six- and 12-month periods that ended June 30, 2000, the fund's returns fell short of the -0.42% and 7.25% returns recorded by the Standard & Poor's 500 Index, respectively.
Q. Why did the fund underperform the index during the past six months?
A. At the beginning of the period, one of the primary difficulties was an underweighting in the technology sector. This time period witnessed a speculative bubble in technology shares that finally burst in the spring of 2000, flattening many formerly high-flying technology stocks that had little or no earnings. The fund's emphasis on growth at a reasonable price prevented it from owning many of the best-performing stocks during this period. An overweighting in the finance sector, which faced a stiff headwind in the form of sharply higher interest rates, also undermined performance. Stock selection in the finance sector hurt as well, as a number of the fund's finance holdings detracted significantly from performance.
Q. The Federal Reserve Board raised short-term interest rates three times during the period. Why did you continue to overweight finance stocks, which tend to do poorly when rates rise?
A. Most of the overweighting was accounted for by two mortgage loan providers: Fannie Mae and Freddie Mac. These government-sponsored enterprises (GSEs) tend to be less sensitive to rising interest rates than banks, which I underweighted. Although the share prices of these two holdings did poorly during the period, they did not accurately reflect the earnings outlook, which remained excellent. Unfortunately, the herd instinct took over, and investors appeared to lump Fannie and Freddie with the rate-sensitive segments of the finance sector. Since the spring correction, however, investors have seemed more willing to evaluate stocks on the basis of earnings and other fundamental factors - a potentially positive development for these two stocks.
Q. What stocks did well for the fund?
A. Intel was one of the better performers. The stock firmed because of a shortage of microprocessors and expectations of improving personal
computer demand in the second half of 2000. Intel also manufactures memory components for the cellular phone market, which experienced robust
growth during the period. Another technology standout, Cisco Systems, has a significant share of the market for the routers used to expand the
Internet. Drug giant Eli Lilly also per-
formed well. The company had a very successful test of Zovant, a new drug for treating sepsis, or blood poisoning. In addition, Lilly benefited from
greater investor interest in drug stocks, which are thought to offer relatively stable earnings streams in a slowing economy.
Q. What stocks were disappointing?
A. The biggest detractor, Microsoft, received an unfavorable ruling in the federal government's antitrust suit against the company. The ruling may, despite the company's appeals, result in splitting Microsoft into two separate companies. In the consumer nondurables sector, Procter & Gamble fell sharply following a warning from the company that its earnings would fall short of analysts' estimates due, in part, to higher raw materials prices. Freddie Mac and Fannie Mae also made the list of stocks that detracted most from performance. This is a case where I felt that investors missed the boat - for the reasons I gave previously. Because of my strong conviction about these stocks, I used weakness in their prices as an opportunity to add to the fund's positions in them.
Q. What's your outlook, Louis?
A. Higher interest rates have begun to slow the economy, and I believe that more slowing can be expected over the next six to 12 months, as the Federal Reserve Board's series of interest-rate hikes percolates through the economy. While a slowing economy should alleviate concerns about inflation, it might also create a lot more earnings risk. With valuations relatively high, we probably will continue to see stocks punished severely when a company fails to meet earnings estimates. Investing in stocks with attractive growth prospects at reasonable prices is the fund's overall strategy, but finding companies that can deliver stable earnings growth under a variety of economic conditions also will be important in the period just ahead.
The views expressed in this report reflect those of the portfolio manager only through the end of the period of the report as stated on the cover. The manager's views are subject to change at any time based on market or other conditions. For more information, see page 2.
Fund Facts
Goal: seeks high total return through a combination of current income and capital appreciation
Start date: December 31, 1996
Size: as of June 30, 2000, more than $1.2 billion
Manager: Louis Salemy, since 1998; manager, Fidelity Growth & Income II, since 1998; various Fidelity Select Portfolios, 1992-1998; joined Fidelity in 1992
3Semiannual Report
Fidelity Variable Insurance Products: Growth & Income Portfolio
(Unaudited)
Showing Percentage of Net Assets
|
Common Stocks - 88.1% |
|||
|
Shares |
Value (Note 1) |
||
|
AEROSPACE & DEFENSE - 0.6% |
|||
|
Boeing Co. |
181,300 |
$ 7,580,606 |
|
|
BASIC INDUSTRIES - 0.4% |
|||
|
Packaging & Containers - 0.4% |
|||
|
Ball Corp. |
165,401 |
5,323,845 |
|
|
CONSTRUCTION & REAL ESTATE - 1.2% |
|||
|
Real Estate Investment Trusts - 1.2% |
|||
|
Equity Office Properties Trust |
263,600 |
7,265,475 |
|
|
Equity Residential Properties Trust (SBI) |
159,000 |
7,314,000 |
|
|
|
14,579,475 |
||
|
DURABLES - 1.8% |
|||
|
Consumer Durables - 0.8% |
|||
|
Minnesota Mining & Manufacturing Co. |
118,700 |
9,792,750 |
|
|
Consumer Electronics - 1.0% |
|||
|
General Motors Corp. Class H (a) |
139,800 |
12,267,450 |
|
|
TOTAL DURABLES |
22,060,200 |
||
|
ENERGY - 6.1% |
|||
|
Energy Services - 0.8% |
|||
|
Schlumberger Ltd. (NY Shares) |
123,700 |
9,231,113 |
|
|
Oil & Gas - 5.3% |
|||
|
BP Amoco PLC sponsored ADR |
232,262 |
13,137,319 |
|
|
Exxon Mobil Corp. |
661,528 |
51,929,948 |
|
|
|
65,067,267 |
||
|
TOTAL ENERGY |
74,298,380 |
||
|
FINANCE - 18.2% |
|||
|
Banks - 4.2% |
|||
|
Bank of New York Co., Inc. |
536,700 |
24,956,550 |
|
|
Mellon Financial Corp. |
316,900 |
11,547,044 |
|
|
Wachovia Corp. |
271,200 |
14,712,600 |
|
|
|
51,216,194 |
||
|
Credit & Other Finance - 3.7% |
|||
|
American Express Co. |
298,600 |
15,564,525 |
|
|
Associates First Capital Corp. Class A |
1,363,000 |
30,411,938 |
|
|
|
45,976,463 |
||
|
Federal Sponsored Credit - 7.3% |
|||
|
Fannie Mae |
918,200 |
47,918,563 |
|
|
Freddie Mac |
1,021,132 |
41,355,846 |
|
|
|
89,274,409 |
||
|
Insurance - 0.9% |
|||
|
American International Group, Inc. |
76,537 |
8,993,098 |
|
|
PMI Group, Inc. |
47,800 |
2,270,500 |
|
|
|
11,263,598 |
||
|
Securities Industry - 2.1% |
|||
|
Charles Schwab Corp. |
218,150 |
7,335,294 |
|
|
|
|||
|
Shares |
Value (Note 1) |
||
|
Merrill Lynch & Co., Inc. |
68,200 |
$ 7,843,000 |
|
|
Morgan Stanley Dean Witter & Co. |
127,200 |
10,589,400 |
|
|
|
25,767,694 |
||
|
TOTAL FINANCE |
223,498,358 |
||
|
HEALTH - 7.0% |
|||
|
Drugs & Pharmaceuticals - 6.4% |
|||
|
Allergan, Inc. |
90,600 |
6,749,700 |
|
|
Bristol-Myers Squibb Co. |
447,100 |
26,043,575 |
|
|
Eli Lilly & Co. |
385,400 |
38,491,825 |
|
|
Merck & Co., Inc. |
91,100 |
6,980,538 |
|
|
|
78,265,638 |
||
|
Medical Equipment & Supplies - 0.6% |
|||
|
Baxter International, Inc. |
109,500 |
7,699,219 |
|
|
TOTAL HEALTH |
85,964,857 |
||
|
INDUSTRIAL MACHINERY & EQUIPMENT - 4.5% |
|||
|
Electrical Equipment - 2.6% |
|||
|
General Electric Co. |
599,700 |
31,784,100 |
|
|
Industrial Machinery & Equipment - 1.9% |
|||
|
Caterpillar, Inc. |
144,700 |
4,901,713 |
|
|
Ingersoll-Rand Co. |
132,400 |
5,329,100 |
|
|
Tyco International Ltd. |
266,720 |
12,635,860 |
|
|
|
22,866,673 |
||
|
TOTAL INDUSTRIAL MACHINERY & EQUIPMENT |
54,650,773 |
||
|
MEDIA & LEISURE - 5.8% |
|||
|
Broadcasting - 4.0% |
|||
|
Comcast Corp. Class A (special) (a) |
230,500 |
9,335,250 |
|
|
EchoStar Communications Corp. |
327,800 |
10,853,253 |
|
|
Infinity Broadcasting Corp. Class A (a) |
408,825 |
14,896,561 |
|
|
Pegasus Communications Corp. (a) |
282,900 |
13,879,781 |
|
|
|
48,964,845 |
||
|
Entertainment - 0.7% |
|||
|
Walt Disney Co. |
217,800 |
8,453,363 |
|
|
Publishing - 1.1% |
|||
|
McGraw-Hill Companies, Inc. |
256,500 |
13,851,000 |
|
|
TOTAL MEDIA & LEISURE |
71,269,208 |
||
|
NONDURABLES - 3.4% |
|||
|
Foods - 1.1% |
|||
|
Bestfoods |
166,700 |
11,543,975 |
|
|
Nabisco Holdings Corp. Class A |
43,800 |
2,299,500 |
|
|
|
13,843,475 |
||
|
Household Products - 0.2% |
|||
|
Procter & Gamble Co. |
40,300 |
2,307,175 |
|
|
Common Stocks - continued |
|||
|
Shares |
Value (Note 1) |
||
|
NONDURABLES - continued |
|||
|
Tobacco - 2.1% |
|||
|
Philip Morris Companies, Inc. |
941,760 |
$ 25,015,500 |
|
|
TOTAL NONDURABLES |
41,166,150 |
||
|
RETAIL & WHOLESALE - 5.6% |
|||
|
Drug Stores - 0.9% |
|||
|
Walgreen Co. |
322,500 |
10,380,469 |
|
|
General Merchandise Stores - 2.5% |
|||
|
Wal-Mart Stores, Inc. |
539,800 |
31,105,975 |
|
|
Retail & Wholesale, Miscellaneous - 2.2% |
|||
|
Bed Bath & Beyond, Inc. (a) |
233,900 |
8,478,875 |
|
|
Home Depot, Inc. |
374,000 |
18,676,625 |
|
|
|
27,155,500 |
||
|
TOTAL RETAIL & WHOLESALE |
68,641,944 |
||
|
SERVICES - 0.3% |
|||
|
Advertising - 0.3% |
|||
|
Omnicom Group, Inc. |
35,100 |
3,126,094 |
|
|
TECHNOLOGY - 23.2% |
|||
|
Communications Equipment - 6.5% |
|||
|
Cisco Systems, Inc. (a) |
715,300 |
45,466,256 |
|
|
Lucent Technologies, Inc. |
72,000 |
4,266,000 |
|
|
Nokia AB sponsored ADR |
260,700 |
13,018,706 |
|
|
Nortel Networks Corp. |
246,000 |
17,064,640 |
|
|
|
79,815,602 |
||
|
Computer Services & Software - 6.8% |
|||
|
Adobe Systems, Inc. |
53,400 |
6,942,000 |
|
|
IMS Health, Inc. |
595,000 |
10,710,000 |
|
|
Intuit, Inc. (a) |
99,800 |
4,129,225 |
|
|
Microsoft Corp. (a) |
659,100 |
52,727,994 |
|
|
VERITAS Software Corp. (a) |
73,800 |
8,340,553 |
|
|
|
82,849,772 |
||
|
Computers & Office Equipment - 3.9% |
|||
|
Compaq Computer Corp. |
630,900 |
16,127,381 |
|
|
EMC Corp. (a) |
249,300 |
19,180,519 |
|
|
Pitney Bowes, Inc. |
301,400 |
12,056,000 |
|
|
|
47,363,900 |
||
|
Electronics - 6.0% |
|||
|
Intel Corp. |
345,500 |
46,189,031 |
|
|
LSI Logic Corp. (a) |
90,600 |
4,903,725 |
|
|
Micron Technology, Inc. (a) |
81,400 |
7,168,288 |
|
|
Texas Instruments, Inc. |
226,200 |
15,537,113 |
|
|
|
73,798,157 |
||
|
TOTAL TECHNOLOGY |
283,827,431 |
||
|
|
|||
|
Shares |
Value (Note 1) |
||
|
UTILITIES - 10.0% |
|||
|
Cellular - 3.6% |
|||
|
Nextel Communications, Inc. |
374,500 |
$ 22,914,719 |
|
|
Vodafone AirTouch PLC sponsored ADR |
524,900 |
21,750,544 |
|
|
|
44,665,263 |
||
|
Electric Utility - 0.5% |
|||
|
IPALCO Enterprises, Inc. |
302,800 |
6,093,850 |
|
|
Telephone Services - 5.9% |
|||
|
Allegiance Telecom, Inc. (a) |
119,400 |
7,641,600 |
|
|
AT&T Corp. |
235,450 |
7,446,106 |
|
|
BellSouth Corp. |
248,200 |
10,579,525 |
|
|
NEXTLINK Communications, Inc. |
203,800 |
7,731,663 |
|
|
Qwest Communications |
137,700 |
6,841,969 |
|
|
SBC Communications, Inc. |
728,530 |
31,508,923 |
|
|
WorldCom, Inc. (a) |
1 |
23 |
|
|
|
71,749,809 |
||
|
TOTAL UTILITIES |
122,508,922 |
||
|
TOTAL COMMON STOCKS (Cost $974,550,110) |
1,078,496,243 |
||
|
U.S. Treasury Obligations - 0.1% |
||||
|
|
Principal Amount |
|
||
|
U.S. Treasury Bills, yield at date of purchase 5.57% 8/17/00 (c) |
|
$ 1,500,000 |
1,489,463 |
|
|
Cash Equivalents - 11.9% |
|||
|
Shares |
|
||
|
Central Cash Collateral Fund, 6.71% (b) |
5,919,200 |
5,919,200 |
|
|
Taxable Central Cash Fund, 6.59% (b) |
140,027,095 |
140,027,095 |
|
|
TOTAL CASH EQUIVALENTS (Cost $145,946,295) |
145,946,295 |
||
|
TOTAL INVESTMENT PORTFOLIO - 100.1% (Cost $1,121,985,345) |
1,225,932,001 |
||
|
NET OTHER ASSETS - (0.1)% |
(717,905) |
||
|
NET ASSETS - 100% |
$ 1,225,214,096 |
||
|
Futures Contracts |
|||||
|
|
Expiration Date |
Underlying |
Unrealized Gain/(Loss) |
||
|
Purchased |
|||||
|
70 S&P 500 Stock Index Contracts |
Sept. 2000 |
$ 25,691,750 |
$ (194,795) |
||
|
The face value of futures purchased as a percentage of net assets - 2.1% |
|
Legend |
|
(a) Non-income producing |
|
(b) The rate quoted is the annualized seven-day yield of the fund at |
|
(c) Security or a portion of the security was pledged to cover margin requirements for futures contracts. At the period end, the value of securities pledged amounted to $1,489,463. |
|
Other Information |
|
Purchases and sales of securities, other than short-term securities, aggregated $339,324,728 and $468,732,226, respectively. |
|
The market value of futures contracts opened and closed during the period amounted to $73,545,687 and $48,716,990, respectively. |
|
The fund placed a portion of its portfolio transactions with brokerage firms which are affiliates of Fidelity Management & Research Company. The commissions paid to these affiliated firms were $27,856 for the period. |
|
The fund participated in the security lending program. At period end, the value of securities loaned amounted to $6,002,310. The fund received cash collateral of $5,919,200 which was invested in cash equivalents. |
|
Income Tax Information |
|
At June 30, 2000, the aggregate cost of investment securities for income tax purposes was $1,123,779,759. Net unrealized appreciation aggregated $102,152,242, of which $210,748,476 related to appreciated investment securities and $108,596,234 related to depreciated investment securities. |
See accompanying notes which are an integral part of the financial statements.
Growth & Income Portfolio
Statement of Assets and Liabilities
|
|
June 30, 2000 (Unaudited) |
|
|
Assets |
|
|
|
Investment in securities, at value (cost $1,121,985,345) - |
|
$ 1,225,932,001 |
|
Receivable for investments sold |
|
9,778,991 |
|
Receivable for fund shares sold |
|
972,216 |
|
Dividends receivable |
|
979,605 |
|
Interest receivable |
|
739,383 |
|
Receivable for daily variation |
|
176,750 |
|
Other receivables |
|
15,747 |
|
Total assets |
|
1,238,594,693 |
|
Liabilities |
|
|
|
Payable for investments purchased |
$ 5,986,196 |
|
|
Payable for fund shares redeemed |
898,008 |
|
|
Accrued management fee |
485,655 |
|
|
Distribution fees payable |
13,646 |
|
|
Other payables and |
77,892 |
|
|
Collateral on securities loaned, |
5,919,200 |
|
|
Total liabilities |
|
13,380,597 |
|
Net Assets |
|
$ 1,225,214,096 |
|
Net Assets consist of: |
|
|
|
Paid in capital |
|
$ 1,061,452,605 |
|
Undistributed net investment income |
|
6,495,495 |
|
Accumulated undistributed |
|
53,514,137 |
|
Net unrealized appreciation (depreciation) on investments |
|
103,751,859 |
|
Net Assets |
|
$ 1,225,214,096 |
|
Initial Class: |
|
$15.48 |
|
Service Class: |
|
$15.41 |
|
Service Class 2: |
|
$15.40 |
Statement of Operations
|
|
Six months ended June 30, 2000 (Unaudited) |
|
|
Investment Income Dividends |
|
$ 6,835,962 |
|
Interest |
|
2,943,179 |
|
Security lending |
|
86,077 |
|
Total income |
|
9,865,218 |
|
Expenses |
|
|
|
Management fee |
$ 2,904,405 |
|
|
Transfer agent fees |
394,900 |
|
|
Distribution fees |
64,785 |
|
|
Accounting and security lending fees |
148,951 |
|
|
Non-interested trustees' compensation |
1,956 |
|
|
Custodian fees and expenses |
12,206 |
|
|
Audit |
12,783 |
|
|
Legal |
5,249 |
|
|
Reports to shareholders |
4,672 |
|
|
Miscellaneous |
303 |
|
|
Total expenses before reductions |
3,550,210 |
|
|
Expense reductions |
(82,248) |
3,467,962 |
|
Net investment income |
|
6,397,256 |
|
Realized and Unrealized Gain (Loss) Net realized gain (loss) on: |
|
|
|
Investment securities |
54,093,706 |
|
|
Foreign currency transactions |
8,989 |
|
|
Futures contracts |
1,057,848 |
55,160,543 |
|
Change in net unrealized appreciation (depreciation) on: |
|
|
|
Investment securities |
(94,278,054) |
|
|
Assets and liabilities in |
(2) |
|
|
Futures contracts |
(194,795) |
(94,472,851) |
|
Net gain (loss) |
|
(39,312,308) |
|
Net increase (decrease) in net assets resulting from operations |
|
$ (32,915,052) |
|
Other Information Expense reductions |
|
$ 81,894 |
|
Custodian credits |
|
354 |
|
|
|
$ 82,248 |
See accompanying notes which are an integral part of the financial statements.
Semiannual Report
Fidelity Variable Insurance Products: Growth & Income Portfolio
Financial Statements - continued
Statement of Changes in Net Assets
|
Increase (Decrease) in Net Assets |
Six months ended |
Year ended |
|
Operations |
$ 6,397,256 |
$ 14,349,137 |
|
Net realized gain (loss) |
55,160,543 |
94,527,839 |
|
Change in net unrealized appreciation (depreciation) |
(94,472,851) |
5,576,047 |
|
Net increase (decrease) in net assets resulting from operations |
(32,915,052) |
114,453,023 |
|
Distributions to shareholders |
(14,244,194) |
(7,463,706) |
|
From net realized gain |
(92,962,107) |
(14,927,412) |
|
Total distributions |
(107,206,301) |
(22,391,118) |
|
Share transactions - net increase (decrease) |
10,338,716 |
102,753,346 |
|
Total increase (decrease) in net assets |
(129,782,637) |
194,815,251 |
|
Net Assets |
|
|
|
Beginning of period |
1,354,996,733 |
1,160,181,482 |
|
End of period (including undistributed net investment income of $6,495,495 and $14,353,340, respectively) |
$ 1,225,214,096 |
$ 1,354,996,733 |
|
|
|
Other Information: |
|
|
Six months ended June 30, 2000 |
Year ended |
||
|
|
Shares |
Dollars |
Shares |
Dollars |
|
Share transactions |
4,848,084 |
$ 75,165,202 |
16,149,212 |
$ 265,569,682 |
|
Reinvested |
6,348,551 |
97,958,146 |
1,401,034 |
21,996,237 |
|
Redeemed |
(15,652,464) |
(244,802,304) |
(15,445,916) |
(257,900,936) |
|
Net increase (decrease) |
(4,455,829) |
$ (71,678,956) |
2,104,330 |
$ 29,664,983 |
|
Service Class |
4,709,059 |
$ 72,777,536 |
4,435,269 |
$ 73,604,463 |
|
Reinvested |
601,152 |
9,239,713 |
25,216 |
394,881 |
|
Redeemed |
(148,738) |
(2,281,362) |
(55,277) |
(910,981) |
|
Net increase (decrease) |
5,161,473 |
$ 79,735,887 |
4,405,208 |
$ 73,088,363 |
|
Service Class 2 A |
149,950 |
$ 2,273,384 |
- |
$ - |
|
Reinvested |
550 |
8,442 |
- |
- |
|
Redeemed |
(3) |
(41) |
- |
- |
|
Net increase (decrease) |
150,497 |
$ 2,281,785 |
- |
$ - |
|
Distributions Initial Class |
|
$ 13,015,418 |
|
$ 7,332,079 |
|
Service Class |
|
1,227,654 |
|
131,627 |
|
Service Class 2 A |
|
1,122 |
|
- |
|
Total |
|
$ 14,244,194 |
|
$ 7,463,706 |
|
From net realized gain Initial Class |
|
$ 84,942,728 |
|
$ 14,664,158 |
|
Service Class |
|
8,012,059 |
|
263,254 |
|
Service Class 2 A |
|
7,320 |
|
- |
|
Total |
|
$ 92,962,107 |
|
$ 14,927,412 |
|
|
|
$ 107,206,301 |
|
$ 22,391,118 |
A Service Class 2 commenced sale of shares January 12, 2000.
See accompanying notes which are an integral part of the financial statements.
Growth & Income Portfolio
Financial Highlights - Initial Class
|
|
Six months ended |
Years ended December 31, |
|||
|
Selected Per-Share Data |
(Unaudited) |
1999 |
1998 |
1997 |
1996 H |
|
Net asset value, beginning of period |
$ 17.30 |
$ 16.15 |
$ 12.53 |
$ 9.90 |
$ 10.00 |
|
Income from Investment Operations |
|
|
|
|
|
|
Net investment income |
.08 D |
.18 D |
.15 D |
.13 D |
.00 |
|
Net realized and unrealized gain (loss) |
(.47) |
1.27 |
3.54 |
2.84 |
(.10) |
|
Total from investment operations |
(.39) |
1.45 |
3.69 |
2.97 |
(.10) |
|
Less Distributions |
|
|
|
|
|
|
From net investment income |
(.19) |
(.10) |
- |
(.08) |
- |
|
From net realized gain |
(1.24) |
(.20) |
(.07) |
(.26) |
- |
|
Total distributions |
(1.43) |
(.30) |
(.07) |
(.34) |
- |
|
Net asset value, end of period |
$ 15.48 |
$ 17.30 |
$ 16.15 |
$ 12.53 |
$ 9.90 |
|
Total Return B, C |
(2.23)% |
9.17% |
29.59% |
30.09% |
(1.00)% |
|
Ratios and Supplemental Data |
|
|
|
|
|
|
Net assets, end of period (000 omitted) |
$ 1,057,884 |
$ 1,259,396 |
$ 1,141,806 |
$ 345,287 |
$ 990 |
|
Ratio of expenses to average net assets |
.57% A |
.60% |
.61% |
.70% |
1.00% A, F |
|
Ratio of expenses to average net assets after expense reductions |
.56% A, G |
.59% G |
.60% G |
.70% |
1.00% A |
|
Ratio of net investment income to average net assets |
1.06% A |
1.08% |
1.08% |
1.14% |
3.89% A |
|
Portfolio turnover |
60% A |
58% |
66% |
81% |
0% A |
Financial Highlights - Service Class
|
|
Six months ended |
Years ended December 31, |
||
|
Selected Per-Share Data |
(Unaudited) |
1999 |
1998 |
1997 E |
|
Net asset value, beginning of period |
$ 17.24 |
$ 16.11 |
$ 12.53 |
$ 12.35 |
|
Income from Investment Operations |
|
|
|
|
|
Net investment income D |
.07 |
.16 |
.15 |
.03 |
|
Net realized and unrealized gain (loss) |
(.47) |
1.27 |
3.50 |
.49 |
|
Total from investment operations |
(.40) |
1.43 |
3.65 |
.52 |
|
Less Distributions |
|
|
|
|
|
From net investment income |
(.19) |
(.10) |
- |
(.08) |
|
From net realized gain |
(1.24) |
(.20) |
(.07) |
(.26) |
|
Total distributions |
(1.43) |
(.30) |
(.07) |
(.34) |
|
Net asset value, end of period |
$ 15.41 |
$ 17.24 |
$ 16.11 |
$ 12.53 |
|
Total Return B, C |
(2.30)% |
9.06% |
29.27% |
4.29% |
|
Ratios and Supplemental Data |
|
|
|
|
|
Net assets, end of period (000 omitted) |
$ 165,012 |
$ 95,600 |
$ 18,375 |
$ 10 |
|
Ratio of expenses to average net assets |
.67% A |
.70% |
.71% |
.80% A |
|
Ratio of expenses to average net assets after expense reductions |
.66% A, G |
.69% G |
.70% G |
.80% A |
|
Ratio of net investment income to average net assets |
.96% A |
.98% |
1.05% |
1.24% A |
|
Portfolio turnover |
60% A |
58% |
66% |
81% |
|
A Annualized B The total returns would have been lower had certain expenses not been reduced during the periods shown. C Total returns for periods of less than one year are not annualized and do not reflect charges attributable to your insurance company's separate account. Inclusion of these charges would reduce the total returns shown. D Net investment income per share has been calculated based on average shares outstanding during the period. E For the period November 3, 1997 (commencement of sale of Service Class shares) to December 31, 1997. F FMR agreed to reimburse a portion of the class' expenses during the period. Without this reimbursement, the class' expense ratio would have been higher. G FMR or the fund has entered into varying arrangements with third parties who either paid or reduced a portion of the class' expenses. H For the period December 31, 1996 (commencement of operations of Initial Class shares). |
||||
See accompanying notes which are an integral part of the financial statements.
Semiannual Report
Financial Highlights - Service Class 2
|
|
Six months ended |
|
Selected Per-Share Data |
(Unaudited) |
|
Net asset value, beginning of period |
$ 16.94 |
|
Income from Investment Operations |
|
|
Net investment income D |
.05 |
|
Net realized and unrealized gain (loss) |
(.16) |
|
Total from investment operations |
(.11) |
|
Less Distributions |
|
|
From net investment income |
(.19) |
|
From net realized gain |
(1.24) |
|
Total distributions |
(1.43) |
|
Net asset value, end of period |
$ 15.40 |
|
Total Return B, C |
(0.63)% |
|
Ratios and Supplemental Data |
|
|
Net assets, end of period (000 omitted) |
$ 2,318 |
|
Ratio of expenses to average net assets |
.81% A |
|
Ratio of expenses to average net assets after expense reductions |
.80% A, E |
|
Ratio of net investment income to average net assets |
.82% A |
|
Portfolio turnover |
60% A |
|
A Annualized B The total returns would have been lower had certain expenses not been reduced during the periods shown. C Total returns for periods of less than one year are not annualized and do not reflect charges attributable to your insurance company's separate account. Inclusion of these charges would reduce the total returns shown. D Net investment income per share has been calculated based on average shares outstanding during the period. E FMR or the fund has entered into varying arrangements with third parties who either paid or reduced a portion of the class' expenses. F For the period January 12, 2000 (commencement of sale of Service Class 2 shares) to June 30, 2000. |
|
See accompanying notes which are an integral part of the financial statements.
Growth & Income Portfolio
A special meeting of the fund's shareholders was held on July 19, 2000. The results of votes taken among shareholders on proposals before them are reported below. Each vote reported represents one dollar of net asset value held on the record date for the meeting.
PROPOSAL 1
To elect as Trustees the following twelve nominees.*
|
|
# of Dollars Voted |
% of Dollars Voted |
Ralph F. Cox
|
Affirmative |
2,995,348,207.84 |
97.862 |
|
Withheld |
65,444,305.52 |
2.138 |
|
TOTAL |
3,060,792,513.36 |
100.000 |
Phyllis Burke Davis
|
Affirmative |
2,995,012,849.06 |
97.851 |
|
Withheld |
65,779,664.30 |
2.149 |
|
TOTAL |
3,060,792,513.36 |
100.000 |
Robert M. Gates
|
Affirmative |
2,994,325,628.16 |
97.828 |
|
Withheld |
66,466,885.20 |
2.172 |
|
TOTAL |
3,060,792,513.36 |
100.000 |
Edward C. Johnson 3d
|
Affirmative |
2,994,212,266.77 |
97.825 |
|
Withheld |
66,580,246.59 |
2.175 |
|
TOTAL |
3,060,792,513.36 |
100.000 |
Donald J. Kirk
|
Affirmative |
2,996,527,468.99 |
97.900 |
|
Withheld |
64,265,044.37 |
2.100 |
|
TOTAL |
3,060,792,513.36 |
100.000 |
Ned C. Lautenbach
|
Affirmative |
2,997,430,896.97 |
97.930 |
|
Withheld |
63,361,616.39 |
2.070 |
|
TOTAL |
3,060,792,513.36 |
100.000 |
Peter S. Lynch
|
Affirmative |
2,997,391,112.97 |
97.929 |
|
Withheld |
63,401,400.39 |
2.071 |
|
TOTAL |
3,060,792,513.36 |
100.000 |
|
|
# of Dollars Voted |
% of Dollars Voted |
William O. McCoy
|
Affirmative |
2,997,364,420.76 |
97.928 |
|
Withheld |
63,428,092.60 |
2.072 |
|
TOTAL |
3,060,792,513.36 |
100.000 |
Gerald C. McDonough
|
Affirmative |
2,992,594,911.89 |
97.772 |
|
Withheld |
68,197,601.47 |
2.228 |
|
TOTAL |
3,060,792,513.36 |
100.000 |
Marvin L. Mann
|
Affirmative |
2,996,491,839.67 |
97.899 |
|
Withheld |
64,300,673.69 |
2.101 |
|
TOTAL |
3,060,792,513.36 |
100.000 |
Robert C. Pozen
|
Affirmative |
2,997,304,419.99 |
97.926 |
|
Withheld |
63,488,093.37 |
2.074 |
|
TOTAL |
3,060,792,513.36 |
100.000 |
Thomas R. Williams
|
Affirmative |
2,993,561,996.24 |
97.803 |
|
Withheld |
67,230,517.12 |
2.197 |
|
TOTAL |
3,060,792,513.36 |
100.000 |
Semiannual Report
Proxy Voting Results - continued
PROPOSAL 2
To ratify the selection of Deloitte & Touche LLP as independent accountants of the fund.
|
|
# of Dollars Voted |
% of Dollars Voted |
|
Affirmative |
1,094,741,303.86 |
94.882 |
|
Against |
8,150,336.78 |
0.707 |
|
Abstain |
50,895,725.39 |
4.411 |
|
TOTAL |
1,153,787,366.03 |
100.000 |
PROPOSAL 3
To authorize the Trustees to adopt an Amended and Restated Declaration of Trust.*
|
|
# of Dollars Voted |
% of Dollars Voted |
|
Affirmative |
2,837,267,199.92 |
92.697 |
|
Against |
49,473,422.32 |
1.617 |
|
Abstain |
174,051,891.12 |
5.686 |
|
TOTAL |
3,060,792,513.36 |
100.000 |
PROPOSAL 4
To approve an amended management contract for the fund that would reduce the management fee payable to FMR by the fund as FMR's assets under management increase.
|
|
# of Dollars Voted |
% of Dollars Voted |
|
Affirmative |
1,065,660,945.04 |
92.362 |
|
Against |
14,930,318.61 |
1.294 |
|
Abstain |
73,196,102.38 |
6.344 |
|
TOTAL |
1,153,787,366.03 |
100.000 |
PROPOSAL 5
To approve an amended sub-advisory agreement with FMR U.K. to provide investment advice and research services or investment management services.
|
|
# of Dollars Voted |
% of Dollars Voted |
|
Affirmative |
1,052,012,765.56 |
91.179 |
|
Against |
14,716,021.72 |
1.276 |
|
Abstain |
87,058,578.75 |
7.545 |
|
TOTAL |
1,153,787,366.03 |
100.000 |
PROPOSAL 6
To approve an amended sub-advisory agreement with FMR Far East to provide investment advice and research services or investment management services.
|
|
# of Dollars Voted |
% of Dollars Voted |
|
Affirmative |
1,047,279,358.30 |
90.769 |
|
Against |
18,168,639.12 |
1.575 |
|
Abstain |
88,339,368.61 |
7.656 |
|
TOTAL |
1,153,787,366.03 |
100.000 |
PROPOSAL 7
To amend the fundamental investment limitation concerning diversification.
|
|
# of Dollars Voted |
% of Dollars Voted |
|
Affirmative |
1,045,547,591.12 |
90.619 |
|
Against |
27,126,923.06 |
2.351 |
|
Abstain |
81,112,851.85 |
7.030 |
|
TOTAL |
1,153,787,366.03 |
100.000 |
PROPOSAL 8
To amend the fundamental limitation concerning underwriting.
|
|
# of Dollars Voted |
% of Dollars Voted |
|
Affirmative |
1,041,821,757.51 |
90.296 |
|
Against |
27,809,789.09 |
2.410 |
|
Abstain |
84,155,819.43 |
7.294 |
|
TOTAL |
1,153,787,366.03 |
100.000 |
PROPOSAL 9
To amend the fundamental limitation concerning concentration.
|
|
# of Dollars Voted |
% of Dollars Voted |
|
Affirmative |
1,042,706,287.48 |
90.372 |
|
Against |
26,973,368.78 |
2.338 |
|
Abstain |
84,107,709.77 |
7.290 |
|
TOTAL |
1,153,787,366.03 |
100.000 |
* Denotes trust-wide proposals and voting results.
Growth & Income Portfolio
Performance
There are several ways to evaluate a fund's historical performance. You can look at the total percentage change in value, the average annual percentage change or the growth of a hypothetical $10,000 investment. Total return reflects the change in the value of an investment, assuming reinvestment of the fund's dividend income and capital gains (the profits earned upon the sale of securities that have grown in value). The initial offering of Service Class shares took place on November 3, 1997. Performance for Service Class shares reflects an asset based distribution fee (12b-1 fee), and returns prior to November 3, 1997 are those of Initial Class and do not include the effects of Service Class' 12b-1 fee. Had Service Class 2's 12b-1 fee been reflected, returns prior to November 3, 1997 would have been lower.
Average Annual Total Returns
|
Periods ended |
Past 1 |
Past 5 |
Past 10 |
|
Fidelity VIP: Equity-Income - |
-8.26% |
14.24% |
14.65% |
|
Russell 3000 Value |
-8.38% |
17.20% |
15.03% |
Average annual returns take the fund's cumulative return and show you what would have happened if the fund had performed at a constant rate each year.
You can compare the fund's returns to the performance of the Russell 3000 Value Index - a market capitalization-weighted index of value-oriented stocks of U.S. domiciled corporations. This benchmark reflects the reinvestment of dividends and capital gains, if any.
Figures for more than one year assume a steady compounded rate of return and are not the fund's year-by-year results, which fluctuated over the periods shown.
Performance numbers are net of all fund operating expenses, but do not include any insurance charges imposed by your insurance company's separate account. If performance information included the effect of these additional charges, the total returns would have been lower.
Past performance is no guarantee of future results. Principal and investment return will vary and you may have a gain or loss when
you withdraw your money.
Understanding Performance
How a fund did yesterday is no guarantee of how it will do tomorrow. The stock market, for example, has a history of long-term growth and short-term volatility. In turn, the share price and return of a fund that invests in stocks will vary. That means if you sell your shares during a market downturn, you might lose money. But if you can ride out the market's ups and downs, you may have a gain.
3$10,000 Over 10 Years
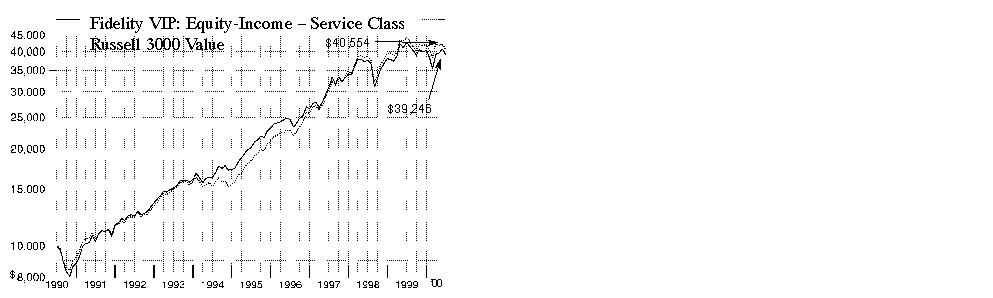
$10,000 Over 10 Years: Let's say hypothetically that $10,000 was invested in Fidelity Variable Insurance Products: Equity-Income Portfolio - Service Class on June 30, 1990. As the chart shows, by June 30, 2000, the value of the investment would have grown to $39,246 - a 292.46% increase on the initial investment. For comparison, look at how the Russell 3000 Value Index did over the same period. With dividends and capital gains, if any, reinvested, the same $10,000 investment would have grown to $40,554 - a 305.54% increase.
Investment Summary
|
Top Five Stocks as of June 30, 2000 |
|
|
|
% of fund's |
|
General Electric Co. |
3.8 |
|
Citigroup, Inc. |
3.6 |
|
Exxon Mobil Corp. |
3.4 |
|
BP Amoco PLC sponsored ADR |
2.6 |
|
Viacom, Inc. Class B (non-vtg.) |
2.4 |
|
|
15.8 |
|
Top Five Market Sectors as of June 30, 2000 |
|
|
|
% of fund's |
|
Finance |
24.2 |
|
Energy |
15.9 |
|
Utilities |
10.3 |
|
Health |
7.8 |
|
Industrial Machinery & Equipment |
7.6 |
|
Asset Allocation as of June 30, 2000 |
|||
|
% of fund's net assets* |
|||
|
Stocks 96.5% |
|
|
|
Bonds 2.1% |
|
|
|
Short-Term Investments |
|
|

|
* Foreign investments 9.7% |
Semiannual Report
(Portfolio Manager photograph)
An interview with
Steve Petersen,
Portfolio Manager of
Equity-Income Portfolio
Q. How did the fund perform, Steve?
A. For the six-month period ending June 30, 2000, the fund outperformed the Russell 3000 Value Index, which returned -3.56%. The fund also outperformed the Russell index's 12-month return of -8.38% for the one-year period ending June 30, 2000.
Q. What helped the fund outperform its benchmark?
A. The most important aspect of the fund's performance relative to the index was the huge swing in technology stock prices and the impact it had. From the beginning of the year through mid-March, technology stocks led the market. That came to an end as the NASDAQ plummeted and was still struggling to recover at the end of the period. The Russell 3000 Value Index, which focuses on companies with value characteristics, closely reflects the fund's investment strategy. However, with a lower weighting in technology stocks than the Russell index, the fund was not as exposed to these wild swings. Consequently, the underweighting in technology stocks helped the fund's relative performance.
Q. How did financial stocks - the fund's largest sector weighting - do?
A. Their performance was mixed. Although fund holding American Express' fundamentals were good, the company, which focuses on high-end travel and entertainment spending, was hurt by the perception of a slowing economy, and its high valuation added to concern about a possible decline in its earnings momentum. Fannie Mae continued to be plagued by Congress' current debate about whether the U.S. government should continue to implicitly guarantee its debt. Fannie Mae also was hurt by higher interest rates. On the positive side, financial companies that earned a higher percentage of their revenues from transactions or asset management businesses did well during the period. Fund holding Citigroup benefited from subsidiary Salomon Smith Barney's strong revenues, and Bank of New York's growing revenues from its successful custody business helped its performance.
Q. Pharmaceutical stocks appeared to come back from their slump last year . . .
A. Yes, they were disappointments last year. The U.S. government had considered providing coverage to Medicare patients for prescription drugs, potentially cutting drug companies' profits. This year, however, an evolving perception of a slowing economy helped pharmaceutical stocks, which are considered to be defensive, to come back strongly. As a result, the fund's pharmaceutical holdings performed very well. Eli Lilly was one example of a strong pharmaceutical stock. The company's performance was boosted by its development of a drug to treat sepsis, an often fatal condition resulting from severe infections. This drug could be a possible source of significant revenues for the company. The company's stock soared following the reports of promising clinical test results. Schering-Plough was another beneficiary of the general recovery in pharmaceutical stock prices.
Q. Which stocks were disappointments?
A. Along with many other companies, AT&T was hurt by announcements that its earnings growth would be lower than expected. Its core business - consumer long-distance telephone service - has been rather flat over the past few years. Prices have declined while competition has increased. Honeywell's expectations for earnings growth also slipped. This multi-industry company saw a softening in a couple of its business lines, and its performance slumped. SBC Communications, a telephone company specializing in local service, also announced slower-than-expected earnings growth, and its stock performance suffered.
Q. What's your near-term outlook, Steve?
A. The big question is how much the economy will slow. If it strengthens once again, showing the last couple of months to be an anomaly, it would cause more worry about increasingly drastic steps the Federal Reserve Board could take - such as increasing interest rates significantly - to slow the economy, potentially causing a recession. On the other hand, if the Fed's tightening moves have been sufficient to slow the economy and reduce expectations for growth, perhaps even causing a bit of a correction in technology stocks, the market would probably perceive that as a very positive scenario. No matter what scenario evolves, I will continue to invest in what I believe to be the cheapest part of the market. I'm focusing on finding very solid companies, looking for good value and strong dividend yields. Although this area could remain out of favor for some time, there are still some terrific opportunities in this universe, and I'll continue to search for them.
The views expressed in this report reflect those of the portfolio manager only through the end of the period of the report as stated on the cover. The manager's views are subject to change at any time based upon market or other conditions. For more information, see page 2.
Fund Facts
Goal: seeks reasonable income while maintaining a yield that exceeds the composite dividend yield of the S&P 500; also considers the potential for capital appreciation
Start date: October 9, 1986
Size: as of June 30, 2000, more than $9.9 billion
Manager: Stephen Petersen, since 1997; joined Fidelity in 1980
3Semiannual Report
Fidelity Variable Insurance Products: Equity-Income Portfolio
(Unaudited)
Showing Percentage of Net Assets
|
Common Stocks - 93.5% |
|||
|
Shares |
Value (Note 1) |
||
|
AEROSPACE & DEFENSE - 3.5% |
|||
|
Aerospace & Defense - 3.2% |
|||
|
Boeing Co. |
1,678,000 |
$ 70,161,375 |
|
|
Honeywell International, Inc. |
1,758,825 |
59,250,417 |
|
|
Rockwell International Corp. |
592,100 |
18,651,150 |
|
|
Textron, Inc. |
1,515,000 |
82,283,438 |
|
|
United Technologies Corp. |
1,466,300 |
86,328,413 |
|
|
|
316,674,793 |
||
|
Ship Building & Repair - 0.3% |
|||
|
General Dynamics Corp. |
505,700 |
26,422,825 |
|
|
TOTAL AEROSPACE & DEFENSE |
343,097,618 |
||
|
BASIC INDUSTRIES - 4.7% |
|||
|
Chemicals & Plastics - 2.5% |
|||
|
Arch Chemicals, Inc. |
292,600 |
6,400,625 |
|
|
Celanese AG |
151,110 |
2,911,858 |
|
|
Crompton Corp. |
1,090,651 |
13,360,475 |
|
|
Dow Chemical Co. |
820,200 |
24,759,788 |
|
|
E.I. du Pont de Nemours and Co. |
609,449 |
26,663,394 |
|
|
Engelhard Corp. |
557,500 |
9,512,344 |
|
|
Great Lakes Chemical Corp. |
1,060,100 |
33,393,150 |
|
|
Hercules Trust II unit |
15,700 |
8,713,500 |
|
|
Hercules, Inc. |
856,100 |
12,038,906 |
|
|
IMC Global, Inc. |
1,626,800 |
21,148,400 |
|
|
M.A. Hanna Co. |
979,200 |
8,812,800 |
|
|
Millennium Chemicals, Inc. |
749,200 |
12,736,400 |
|
|
Olin Corp. |
712,700 |
11,759,550 |
|
|
Praxair, Inc. |
446,900 |
16,730,819 |
|
|
Rohm & Haas Co. |
122,300 |
4,219,350 |
|
|
Solutia, Inc. |
1,249,300 |
17,177,875 |
|
|
Union Carbide Corp. |
376,200 |
18,621,900 |
|
|
|
248,961,134 |
||
|
Iron & Steel - 0.5% |
|||
|
Allegheny Technologies, Inc. |
782,050 |
14,076,900 |
|
|
Dofasco, Inc. |
749,800 |
12,332,070 |
|
|
Nucor Corp. |
628,100 |
20,845,069 |
|
|
|
47,254,039 |
||
|
Metals & Mining - 0.9% |
|||
|
Alcoa, Inc. |
2,308,216 |
66,938,264 |
|
|
Phelps Dodge Corp. |
556,500 |
20,694,844 |
|
|
Ryerson Tull, Inc. |
753,323 |
7,815,726 |
|
|
|
95,448,834 |
||
|
Packaging & Containers - 0.2% |
|||
|
Ball Corp. |
387,075 |
12,458,977 |
|
|
Owens-Illinois, Inc. (a) |
700,700 |
8,189,431 |
|
|
|
20,648,408 |
||
|
Paper & Forest Products - 0.6% |
|||
|
Bowater, Inc. |
798,600 |
35,238,225 |
|
|
International Paper Co. |
165,910 |
4,946,192 |
|
|
|
|||
|
Shares |
Value (Note 1) |
||
|
Pentair, Inc. |
236,600 |
$ 8,399,300 |
|
|
Smurfit-Stone Container Corp. (a) |
755,400 |
9,725,775 |
|
|
|
58,309,492 |
||
|
TOTAL BASIC INDUSTRIES |
470,621,907 |
||
|
CONSTRUCTION & REAL ESTATE - 1.4% |
|||
|
Building Materials - 0.4% |
|||
|
Fortune Brands, Inc. |
805,700 |
18,581,456 |
|
|
Masco Corp. |
1,265,800 |
22,863,513 |
|
|
|
41,444,969 |
||
|
Real Estate Investment Trusts - 1.0% |
|||
|
Alexandria Real Estate Equities, Inc. |
109,600 |
3,760,650 |
|
|
Crescent Real Estate Equities Co. |
810,400 |
16,613,200 |
|
|
Duke-Weeks Realty Corp. |
434,622 |
9,724,667 |
|
|
Equity Office Properties Trust |
524,500 |
14,456,531 |
|
|
Equity Residential Properties Trust (SBI) |
649,500 |
29,877,000 |
|
|
Public Storage, Inc. |
609,700 |
14,289,844 |
|
|
Spieker Properties, Inc. |
277,000 |
12,742,000 |
|
|
|
101,463,892 |
||
|
TOTAL CONSTRUCTION & REAL ESTATE |
142,908,861 |
||
|
DURABLES - 2.4% |
|||
|
Autos, Tires, & Accessories - 1.2% |
|||
|
AutoNation, Inc. |
642,800 |
4,539,775 |
|
|
Eaton Corp. |
428,300 |
28,696,100 |
|
|
Goodyear Tire & Rubber Co. |
407,100 |
8,142,000 |
|
|
Johnson Controls, Inc. |
333,600 |
17,117,850 |
|
|
Meritor Automotive, Inc. |
408,600 |
4,494,600 |
|
|
Navistar International Corp. (a) |
387,600 |
12,039,825 |
|
|
Pep Boys-Manny, Moe & Jack |
662,100 |
3,972,600 |
|
|
TRW, Inc. |
801,700 |
34,773,738 |
|
|
|
113,776,488 |
||
|
Consumer Durables - 0.9% |
|||
|
Minnesota Mining & Manufacturing Co. |
682,500 |
56,306,250 |
|
|
Snap-On, Inc. |
1,102,000 |
29,340,750 |
|
|
|
85,647,000 |
||
|
Consumer Electronics - 0.1% |
|||
|
Black & Decker Corp. |
252,600 |
9,930,338 |
|
|
General Motors Corp. Class H (a) |
43,086 |
3,780,797 |
|
|
|
13,711,135 |
||
|
Home Furnishings - 0.2% |
|||
|
Newell Rubbermaid, Inc. |
822,067 |
21,168,225 |
|
|
Textiles & Apparel - 0.0% |
|||
|
Kellwood Co. |
85,800 |
1,812,525 |
|
|
TOTAL DURABLES |
236,115,373 |
||
|
ENERGY - 15.7% |
|||
|
Energy Services - 2.3% |
|||
|
Baker Hughes, Inc. |
1,817,400 |
58,156,800 |
|
|
Common Stocks - continued |
|||
|
Shares |
Value (Note 1) |
||
|
ENERGY - continued |
|||
|
Energy Services - continued |
|||
|
Halliburton Co. |
2,882,900 |
$ 136,036,844 |
|
|
Schlumberger Ltd. (NY Shares) |
409,500 |
30,558,938 |
|
|
|
224,752,582 |
||
|
Oil & Gas - 13.4% |
|||
|
Amerada Hess Corp. |
246,500 |
15,221,375 |
|
|
Anadarko Petroleum Corp. |
587,900 |
28,990,819 |
|
|
BP Amoco PLC sponsored ADR |
4,538,242 |
256,694,313 |
|
|
Burlington Resources, Inc. |
1,192,100 |
45,597,825 |
|
|
Chevron Corp. |
1,280,171 |
108,574,503 |
|
|
Conoco, Inc.: |
|
|
|
|
Class A |
721,200 |
15,866,400 |
|
|
Class B |
1,931,915 |
47,452,662 |
|
|
Exxon Mobil Corp. |
4,334,118 |
340,228,263 |
|
|
Occidental Petroleum Corp. |
985,000 |
20,746,563 |
|
|
Royal Dutch Petroleum Co. (NY Shares) |
1,968,600 |
121,191,938 |
|
|
Santa Fe Snyder Corp. (a) |
1,336,203 |
15,199,309 |
|
|
Tosco Corp. |
449,800 |
12,734,963 |
|
|
TotalFinaElf SA: |
|
|
|
|
Class B |
448,000 |
68,992,001 |
|
|
sponsored ADR |
2,183,396 |
167,712,105 |
|
|
Ultramar Diamond Shamrock Corp. |
713,600 |
17,706,200 |
|
|
Union Pacific Resources Group, Inc. |
645,500 |
14,201,000 |
|
|
USX - Marathon Group |
1,621,100 |
40,628,819 |
|
|
|
1,337,739,058 |
||
|
TOTAL ENERGY |
1,562,491,640 |
||
|
FINANCE - 23.5% |
|||
|
Banks - 10.2% |
|||
|
Bank of America Corp. |
2,935,590 |
126,230,370 |
|
|
Bank of New York Co., Inc. |
4,579,000 |
212,923,500 |
|
|
Bank One Corp. |
1,119,438 |
29,735,072 |
|
|
Chase Manhattan Corp. |
2,924,450 |
134,707,478 |
|
|
Comerica, Inc. |
1,601,800 |
71,880,775 |
|
|
Firstar Corp. |
138,900 |
2,925,581 |
|
|
FleetBoston Financial Corp. |
2,006,200 |
68,210,800 |
|
|
Mellon Financial Corp. |
2,266,900 |
82,600,169 |
|
|
National Bank of Canada |
2,476,636 |
36,969,710 |
|
|
PNC Financial Services Group, Inc. |
233,000 |
10,921,875 |
|
|
U.S. Bancorp |
2,928,094 |
56,365,810 |
|
|
Wachovia Corp. |
442,500 |
24,005,625 |
|
|
Wells Fargo & Co. |
3,967,200 |
153,729,000 |
|
|
|
1,011,205,765 |
||
|
Credit & Other Finance - 7.2% |
|||
|
American Express Co. |
3,251,616 |
169,490,484 |
|
|
Associates First Capital Corp. Class A |
3,623,656 |
80,852,825 |
|
|
|
|||
|
Shares |
Value (Note 1) |
||
|
Citigroup, Inc. |
5,969,898 |
$ 359,686,355 |
|
|
Household International, Inc. |
2,527,647 |
105,055,328 |
|
|
|
715,084,992 |
||
|
Federal Sponsored Credit - 2.7% |
|||
|
Fannie Mae |
4,308,800 |
224,865,500 |
|
|
Freddie Mac |
762,900 |
30,897,450 |
|
|
SLM Holding Corp. |
412,700 |
15,450,456 |
|
|
|
271,213,406 |
||
|
Insurance - 2.5% |
|||
|
Ace Ltd. |
1,474,100 |
41,274,800 |
|
|
American International Group, Inc. |
315,900 |
37,118,250 |
|
|
Everest Re Group Ltd. |
96,800 |
3,182,300 |
|
|
Hartford Financial Services Group, Inc. |
1,691,600 |
94,623,875 |
|
|
Highlands Insurance Group, Inc. (a) |
371,100 |
3,479,063 |
|
|
Protective Life Corp. |
180,700 |
4,811,138 |
|
|
The Chubb Corp. |
382,500 |
23,523,750 |
|
|
The St. Paul Companies, Inc. |
374,200 |
12,769,575 |
|
|
UnumProvident Corp. |
1,063,700 |
21,340,481 |
|
|
XL Capital Ltd. Class A |
180,700 |
9,780,388 |
|
|
|
251,903,620 |
||
|
Savings & Loans - 0.2% |
|||
|
TCF Financial Corp. |
573,000 |
14,718,938 |
|
|
Securities Industry - 0.7% |
|||
|
Franklin Resources, Inc. |
243,700 |
7,402,388 |
|
|
Morgan Stanley Dean Witter & Co. |
410,600 |
34,182,450 |
|
|
Nomura Securities Co. Ltd. |
1,061,000 |
25,969,582 |
|
|
Waddell & Reed Financial, Inc. Class B |
94,498 |
2,746,348 |
|
|
|
70,300,768 |
||
|
TOTAL FINANCE |
2,334,427,489 |
||
|
HEALTH - 7.8% |
|||
|
Drugs & Pharmaceuticals - 5.8% |
|||
|
Bristol-Myers Squibb Co. |
2,457,400 |
143,143,550 |
|
|
Eli Lilly & Co. |
2,053,000 |
205,043,375 |
|
|
Merck & Co., Inc. |
1,595,700 |
122,270,513 |
|
|
Schering-Plough Corp. |
2,129,530 |
107,541,265 |
|
|
|
577,998,703 |
||
|
Medical Equipment & Supplies - 1.3% |
|||
|
Abbott Laboratories |
1,616,600 |
72,039,738 |
|
|
Becton, Dickinson & Co. |
680,800 |
19,530,450 |
|
|
Cardinal Health, Inc. |
481,100 |
35,601,400 |
|
|
|
127,171,588 |
||
|
Medical Facilities Management - 0.7% |
|||
|
HCA - The Healthcare Co. |
2,259,150 |
68,621,681 |
|
|
TOTAL HEALTH |
773,791,972 |
||
|
Common Stocks - continued |
|||
|
Shares |
Value (Note 1) |
||
|
INDUSTRIAL MACHINERY & EQUIPMENT - 7.4% |
|||
|
Electrical Equipment - 4.2% |
|||
|
General Electric Co. |
7,160,900 |
$ 379,527,680 |
|
|
Siemens AG |
253,900 |
38,268,849 |
|
|
|
417,796,529 |
||
|
Industrial Machinery & Equipment - 3.2% |
|||
|
Caterpillar, Inc. |
1,009,800 |
34,206,975 |
|
|
CNH Global NV |
506,200 |
4,682,350 |
|
|
Deere & Co. |
1,258,250 |
46,555,250 |
|
|
Ingersoll-Rand Co. |
799,500 |
32,179,875 |
|
|
ITT Industries, Inc. |
218,600 |
6,639,975 |
|
|
Kennametal, Inc. |
500,708 |
10,733,928 |
|
|
Parker-Hannifin Corp. |
641,100 |
21,957,675 |
|
|
The Stanley Works |
293,700 |
6,975,375 |
|
|
Tyco International Ltd. |
3,208,246 |
151,990,654 |
|
|
|
315,922,057 |
||
|
Pollution Control - 0.0% |
|||
|
Republic Services, Inc. Class A (a) |
341,200 |
5,459,200 |
|
|
TOTAL INDUSTRIAL MACHINERY & EQUIPMENT |
739,177,786 |
||
|
MEDIA & LEISURE - 5.8% |
|||
|
Broadcasting - 1.4% |
|||
|
Clear Channel Communications, Inc. (a) |
123,500 |
9,262,500 |
|
|
MediaOne Group, Inc. (a) |
636,110 |
42,182,840 |
|
|
Time Warner, Inc. |
1,167,754 |
88,749,334 |
|
|
|
140,194,674 |
||
|
Entertainment - 2.9% |
|||
|
Fox Entertainment Group, Inc. |
721,700 |
21,921,638 |
|
|
Mandalay Resort Group (a) |
534,500 |
10,690,000 |
|
|
Viacom, Inc. Class B (non-vtg.) (a) |
3,482,118 |
237,436,921 |
|
|
Walt Disney Co. |
586,900 |
22,779,056 |
|
|
|
292,827,615 |
||
|
Lodging & Gaming - 0.6% |
|||
|
Harrah's Entertainment, Inc. (a) |
424,500 |
8,887,969 |
|
|
Starwood Hotels & Resorts |
1,465,981 |
47,736,006 |
|
|
|
56,623,975 |
||
|
Publishing - 0.4% |
|||
|
Reader's Digest Association, Inc. |
953,200 |
37,889,700 |
|
|
Restaurants - 0.5% |
|||
|
McDonald's Corp. |
1,562,400 |
51,461,550 |
|
|
TOTAL MEDIA & LEISURE |
578,997,514 |
||
|
NONDURABLES - 3.6% |
|||
|
Beverages - 0.1% |
|||
|
Brown-Forman Corp. Class B (non-vtg.) |
147,800 |
7,944,250 |
|
|
|
|||
|
Shares |
Value (Note 1) |
||
|
Foods - 0.7% |
|||
|
Nabisco Group Holdings Corp. |
967,700 |
$ 25,099,719 |
|
|
Nabisco Holdings Corp. Class A |
779,200 |
40,908,000 |
|
|
|
66,007,719 |
||
|
Household Products - 1.8% |
|||
|
Avon Products, Inc. |
915,600 |
40,744,200 |
|
|
Clorox Co. |
649,300 |
29,096,756 |
|
|
Dial Corp. |
624,300 |
6,477,113 |
|
|
Gillette Co. |
769,200 |
26,873,925 |
|
|
International Flavors & Fragrances, Inc. |
244,600 |
7,383,863 |
|
|
Procter & Gamble Co. |
438,400 |
25,098,400 |
|
|
Unilever NV (NY Shares) |
241,485 |
10,383,855 |
|
|
Unilever PLC |
6,090,714 |
38,257,265 |
|
|
|
184,315,377 |
||
|
Tobacco - 1.0% |
|||
|
Philip Morris Companies, Inc. |
3,741,200 |
99,375,625 |
|
|
TOTAL NONDURABLES |
357,642,971 |
||
|
RETAIL & WHOLESALE - 2.5% |
|||
|
Apparel Stores - 0.9% |
|||
|
Charming Shoppes, Inc. (a) |
612,800 |
3,121,450 |
|
|
Footstar, Inc. (a) |
206,300 |
6,859,475 |
|
|
The Limited, Inc. |
2,635,400 |
56,990,525 |
|
|
TJX Companies, Inc. |
1,362,300 |
25,543,125 |
|
|
Venator Group, Inc. (a) |
221,300 |
2,268,325 |
|
|
|
94,782,900 |
||
|
General Merchandise Stores - 1.6% |
|||
|
Ames Department Stores, Inc. |
203,500 |
1,577,125 |
|
|
Consolidated Stores Corp. (a) |
2,020,156 |
24,241,875 |
|
|
Federated Department Stores, Inc. (a) |
1,102,700 |
37,216,125 |
|
|
Hudson's Bay Co. (e) |
302,500 |
3,207,869 |
|
|
JCPenney Co., Inc. |
328,100 |
6,049,344 |
|
|
Target Corp. |
870,700 |
50,500,600 |
|
|
Wal-Mart Stores, Inc. |
608,600 |
35,070,575 |
|
|
|
157,863,513 |
||
|
TOTAL RETAIL & WHOLESALE |
252,646,413 |
||
|
SERVICES - 1.3% |
|||
|
Printing - 0.2% |
|||
|
New England Business Service, Inc. |
207,200 |
3,367,000 |
|
|
R.R. Donnelley & Sons Co. |
535,300 |
12,077,706 |
|
|
|
15,444,706 |
||
|
Services - 1.1% |
|||
|
ACNielsen Corp. (a) |
750,100 |
16,502,200 |
|
|
Brascan Corp. Class A (ltd. vtg.) |
2,699,800 |
31,730,172 |
|
|
Dun & Bradstreet Corp. |
134,300 |
3,844,338 |
|
|
H&R Block, Inc. |
1,073,800 |
34,764,275 |
|
|
Per-Se Technologies, Inc. (a) |
9,540 |
89,438 |
|
|
Common Stocks - continued |
|||
|
Shares |
Value (Note 1) |
||
|
SERVICES - continued |
|||
|
Services - continued |
|||
|
Per-Se Technologies, Inc. warrants 7/8/03 (a) |
12,807 |
$ 0 |
|
|
Viad Corp. |
775,800 |
21,140,550 |
|
|
|
108,070,973 |
||
|
TOTAL SERVICES |
123,515,679 |
||
|
TECHNOLOGY - 3.5% |
|||
|
Communications Equipment - 0.1% |
|||
|
Nortel Networks Corp. |
122,804 |
8,518,724 |
|
|
Computer Services & Software - 0.9% |
|||
|
IMS Health, Inc. |
891,500 |
16,047,000 |
|
|
Microsoft Corp. (a) |
196,400 |
15,712,000 |
|
|
NCR Corp. (a) |
683,800 |
26,625,463 |
|
|
Sabre Holdings Corp. Class A |
145,116 |
4,135,806 |
|
|
Unisys Corp. (a) |
2,059,717 |
29,994,629 |
|
|
|
92,514,898 |
||
|
Computers & Office Equipment - 2.1% |
|||
|
Compaq Computer Corp. |
2,037,300 |
52,078,481 |
|
|
Hewlett-Packard Co. |
157,800 |
19,705,275 |
|
|
International Business Machines Corp. |
567,400 |
62,165,763 |
|
|
Pitney Bowes, Inc. |
1,582,000 |
63,280,000 |
|
|
Xerox Corp. |
463,100 |
9,609,325 |
|
|
|
206,838,844 |
||
|
Electronic Instruments - 0.3% |
|||
|
Thermo Electron Corp. (a) |
1,295,400 |
27,284,363 |
|
|
Photographic Equipment - 0.1% |
|||
|
Eastman Kodak Co. |
257,200 |
15,303,400 |
|
|
TOTAL TECHNOLOGY |
350,460,229 |
||
|
TRANSPORTATION - 1.2% |
|||
|
Air Transportation - 0.2% |
|||
|
AMR Corp. |
371,000 |
9,808,313 |
|
|
Southwest Airlines Co. |
435,000 |
8,237,813 |
|
|
|
18,046,126 |
||
|
Railroads - 1.0% |
|||
|
Burlington Northern Santa Fe Corp. |
2,998,700 |
68,782,681 |
|
|
CSX Corp. |
559,200 |
11,848,050 |
|
|
Union Pacific Corp. |
409,400 |
15,224,563 |
|
|
|
95,855,294 |
||
|
TOTAL TRANSPORTATION |
113,901,420 |
||
|
UTILITIES - 9.2% |
|||
|
Cellular - 0.1% |
|||
|
AT&T Corp. - Wireless Group |
453,300 |
12,635,738 |
|
|
Electric Utility - 2.4% |
|||
|
Allegheny Energy, Inc. |
1,148,700 |
31,445,663 |
|
|
|
|||
|
Shares |
Value (Note 1) |
||
|
American Electric Power Co., Inc. |
997,100 |
$ 29,539,088 |
|
|
Cinergy Corp. |
415,000 |
10,556,563 |
|
|
DPL, Inc. |
168,354 |
3,693,266 |
|
|
Entergy Corp. |
3,187,300 |
86,654,719 |
|
|
IPALCO Enterprises, Inc. |
431,500 |
8,683,938 |
|
|
Niagara Mohawk Holdings, Inc. (a) |
1,682,100 |
23,444,269 |
|
|
NRG Energy, Inc. |
308,800 |
5,635,600 |
|
|
PG&E Corp. |
1,551,878 |
38,214,996 |
|
|
|
237,868,102 |
||
|
Telephone Services - 6.7% |
|||
|
AT&T Corp. |
4,236,400 |
133,976,150 |
|
|
Bell Atlantic Corp. |
1,266,240 |
64,340,820 |
|
|
BellSouth Corp. |
2,151,399 |
91,703,382 |
|
|
GTE Corp. |
1,087,100 |
67,671,975 |
|
|
Pathnet, Inc. warrants 4/15/08 (a)(e) |
510 |
5,100 |
|
|
SBC Communications, Inc. |
5,353,193 |
231,525,597 |
|
|
U.S. WEST, Inc. |
189,300 |
16,232,475 |
|
|
WorldCom, Inc. (a) |
1,309,716 |
60,083,199 |
|
|
|
665,538,698 |
||
|
TOTAL UTILITIES |
916,042,538 |
||
|
TOTAL COMMON STOCKS (Cost $7,320,124,457) |
9,295,839,410 |
||
|
Preferred Stocks - 3.0% |
|||
|
|
|
|
|
|
Convertible Preferred Stocks - 3.0% |
|||
|
BASIC INDUSTRIES - 0.2% |
|||
|
Chemicals & Plastics - 0.1% |
|||
|
Monsanto Co. $1.625 ACES |
283,800 |
12,966,113 |
|
|
Paper & Forest Products - 0.1% |
|||
|
Georgia-Pacific Corp. $3.75 PEPS |
314,100 |
9,854,888 |
|
|
TOTAL BASIC INDUSTRIES |
22,821,001 |
||
|
ENERGY - 0.2% |
|||
|
Oil & Gas - 0.2% |
|||
|
Apache Corp. $2.015 ACES |
183,100 |
9,349,635 |
|
|
The Coastal Corp. $1.20 PRIDES |
368,900 |
11,938,711 |
|
|
|
21,288,346 |
||
|
FINANCE - 0.7% |
|||
|
Credit & Other Finance - 0.4% |
|||
|
Federal-Mogul Financing Trust $3.50 |
490,300 |
10,725,313 |
|
|
Union Pacific Capital Trust: |
|
|
|
|
$3.125 |
403,200 |
15,926,400 |
|
|
$3.125 TIDES (e) |
384,500 |
15,187,750 |
|
|
|
41,839,463 |
||
|
Preferred Stocks - continued |
|||
|
Shares |
Value (Note 1) |
||
|
Convertible Preferred Stocks - continued |
|||
|
FINANCE - continued |
|||
|
Insurance - 0.3% |
|||
|
Ace Ltd. $4.125 PRIDES |
225,800 |
$ 14,126,725 |
|
|
MetLife, Inc. $4.00 |
225,800 |
15,523,750 |
|
|
|
29,650,475 |
||
|
TOTAL FINANCE |
71,489,938 |
||
|
INDUSTRIAL MACHINERY & EQUIPMENT - 0.2% |
|||
|
Electrical Equipment - 0.1% |
|||
|
Loral Space & Communications Ltd. Series C: |
|
|
|
|
$3.00 (e) |
183,200 |
4,122,000 |
|
|
$3.00 |
208,700 |
4,695,750 |
|
|
|
8,817,750 |
||
|
Industrial Machinery & Equipment - 0.1% |
|||
|
Ingersoll Rand Co./Ingersoll Rand Finance $1.68 Growth PRIDES |
530,100 |
10,188,522 |
|
|
TOTAL INDUSTRIAL MACHINERY & EQUIPMENT |
19,006,272 |
||
|
MEDIA & LEISURE - 0.9% |
|||
|
Broadcasting - 0.6% |
|||
|
Cox Communications, Inc.: |
|
|
|
|
$2.27 PRIDES |
159,500 |
9,884,215 |
|
|
$6.858 PRIZES |
146,000 |
16,078,250 |
|
|
MediaOne Group, Inc. |
|
|
|
|
$3.04 PIES |
317,100 |
12,763,275 |
|
|
$3.63 PIES |
249,900 |
22,491,000 |
|
|
|
61,216,740 |
||
|
Entertainment - 0.1% |
|||
|
Premier Parks, Inc. $4.05 PIES |
273,300 |
11,956,875 |
|
|
Publishing - 0.2% |
|||
|
Readers Digest Automatic Common Exchange Securities Trust $1.93 TRACES |
464,700 |
16,409,951 |
|
|
TOTAL MEDIA & LEISURE |
89,583,566 |
||
|
NONDURABLES - 0.3% |
|||
|
Beverages - 0.3% |
|||
|
Seagram Co. Ltd. $3.76 ACES |
473,400 |
25,001,674 |
|
|
RETAIL & WHOLESALE - 0.0% |
|||
|
General Merchandise Stores - 0.0% |
|||
|
Kmart Financing I $3.875 |
100,000 |
3,643,750 |
|
|
UTILITIES - 0.5% |
|||
|
Electric Utility - 0.3% |
|||
|
Alliant Energy Resources, Inc. $4.91 (e) |
52,700 |
3,642,888 |
|
|
|
|||
|
Shares |
Value (Note 1) |
||
|
NiSource, Inc. $3.875 PIES |
299,300 |
$ 11,148,925 |
|
|
TXU Corp. $1.6575 PRIDES |
398,400 |
13,844,400 |
|
|
|
28,636,213 |
||
|
Gas - 0.2% |
|||
|
Enron Corp. (EOG Resources, Inc.) $1.5575 ACES |
484,900 |
14,910,675 |
|
|
TOTAL UTILITIES |
43,546,888 |
||
|
TOTAL CONVERTIBLE PREFERRED STOCKS |
296,381,435 |
||
|
Nonconvertible Preferred Stocks - 0.0% |
|||
|
CONSTRUCTION & REAL ESTATE - 0.0% |
|||
|
Real Estate Investment Trusts - 0.0% |
|||
|
California Federal Preferred |
31,590 |
671,288 |
|
|
MEDIA & LEISURE - 0.0% |
|||
|
Broadcasting - 0.0% |
|||
|
CSC Holdings, Inc. 11.125% pay-in-kind |
23,622 |
2,468,499 |
|
|
Publishing - 0.0% |
|||
|
PRIMEDIA, Inc. 8.625% |
6,123 |
520,455 |
|
|
TOTAL MEDIA & LEISURE |
2,988,954 |
||
|
TOTAL NONCONVERTIBLE PREFERRED STOCKS |
3,660,242 |
||
|
TOTAL PREFERRED STOCKS (Cost $317,222,517) |
300,041,677 |
||
|
Corporate Bonds - 2.1% |
|||||
|
Moody's Ratings (unaudited) (b) |
Principal Amount |
|
|||
|
Convertible Bonds - 1.7% |
|||||
|
CONSTRUCTION & REAL ESTATE - 0.4% |
|||||
|
Real Estate Investment Trusts - 0.4% |
|||||
|
Liberty Property LP |
Ba2 |
|
$ 27,985,000 |
36,363,009 |
|
|
DURABLES - 0.1% |
|||||
|
Consumer Electronics - 0.1% |
|||||
|
Sunbeam Corp. |
Caa2 |
|
60,290,000 |
9,344,950 |
|
|
FINANCE - 0.0% |
|||||
|
Insurance - 0.0% |
|||||
|
Loews Corp. |
A2 |
|
4,320,000 |
3,591,000 |
|
|
MEDIA & LEISURE - 0.6% |
|||||
|
Broadcasting - 0.1% |
|||||
|
Cox Communications, Inc. 1% 4/19/20 |
Baa3 |
|
26,600,000 |
13,815,508 |
|
|
Corporate Bonds - continued |
|||||
|
Moody's Ratings (unaudited) (b) |
Principal Amount |
Value |
|||
|
Convertible Bonds - continued |
|||||
|
Publishing - 0.5% |
|||||
|
News America Holdings, Inc. liquid yield option notes 0% 3/11/13 |
Baa3 |
|
$ 42,720,000 |
$ 47,448,250 |
|
|
TOTAL MEDIA & LEISURE |
61,263,758 |
||||
|
NONDURABLES - 0.0% |
|||||
|
Foods - 0.0% |
|||||
|
Chiquita Brands International, Inc. |
B3 |
|
820,000 |
721,600 |
|
|
TECHNOLOGY - 0.2% |
|||||
|
Computer Services & Software - 0.0% |
|||||
|
Softkey International, Inc. 5.5% 11/1/00 (e) |
- |
|
1,340,000 |
1,313,200 |
|
|
Computers & Office Equipment - 0.1% |
|||||
|
Quantum Corp. |
B2 |
|
7,730,000 |
6,097,038 |
|
|
Electronics - 0.1% |
|||||
|
Solectron Corp. |
BBB |
|
13,410,000 |
8,548,875 |
|
|
Vitesse Semiconductor Corp. 4% 3/15/05 (e) |
B2 |
|
7,770,000 |
7,187,250 |
|
|
|
15,736,125 |
||||
|
TOTAL TECHNOLOGY |
23,146,363 |
||||
|
UTILITIES - 0.4% |
|||||
|
Cellular - 0.1% |
|||||
|
Nextel Communications, Inc. 5.25% 1/15/10 (e) |
B1 |
|
13,390,000 |
13,858,650 |
|
|
Telephone Services - 0.3% |
|||||
|
Level 3 Communications, Inc. 6% 3/15/10 |
Caa1 |
|
13,380,000 |
12,117,263 |
|
|
Telefonos de Mexico SA de CV 4.25% 6/15/04 |
Baa3 |
|
9,430,000 |
12,659,775 |
|
|
|
24,777,038 |
||||
|
TOTAL UTILITIES |
38,635,688 |
||||
|
TOTAL CONVERTIBLE BONDS |
173,066,368 |
||||
|
Nonconvertible Bonds - 0.4% |
|||||
|
BASIC INDUSTRIES - 0.0% |
|||||
|
Chemicals & Plastics - 0.0% |
|||||
|
Lyondell Chemical Co. 9.875% 5/1/07 |
Ba3 |
|
1,340,000 |
1,326,600 |
|
|
Corporate Bonds - continued |
|||||
|
Moody's Ratings (unaudited) (b) |
Principal Amount |
Value |
|||
|
Nonconvertible Bonds - continued |
|||||
|
ENERGY - 0.0% |
|||||
|
Energy Services - 0.0% |
|||||
|
RBF Finance Co. |
Ba3 |
|
$ 1,520,000 |
$ 1,641,600 |
|
|
FINANCE - 0.0% |
|||||
|
Credit & Other Finance - 0.0% |
|||||
|
Macsaver Financial Services, Inc. |
Ba2 |
|
1,000,000 |
620,000 |
|
|
HEALTH - 0.0% |
|||||
|
Medical Facilities Management - 0.0% |
|||||
|
Tenet Healthcare Corp. 8.125% 12/1/08 |
Ba3 |
|
1,550,000 |
1,418,250 |
|
|
INDUSTRIAL MACHINERY & EQUIPMENT - 0.0% |
|||||
|
Pollution Control - 0.0% |
|||||
|
Allied Waste |
|
|
|
|
|
|
7.625% 1/1/06 |
Ba2 |
|
950,000 |
826,500 |
|
|
7.875% 1/1/09 |
Ba2 |
|
1,065,000 |
905,250 |
|
|
|
1,731,750 |
||||
|
MEDIA & LEISURE - 0.2% |
|||||
|
Broadcasting - 0.2% |
|||||
|
Adelphia Communications Corp. 9.875% 3/1/07 |
B1 |
|
2,425,000 |
2,303,750 |
|
|
Century Communications Corp. Series B, |
B1 |
|
440,000 |
180,400 |
|
|
Charter Communications Holdings LLC/Charter Communications Holdings Capital Corp. 8.625% 4/1/09 |
B2 |
|
1,340,000 |
1,182,550 |
|
|
NTL Communications Corp. 11.5% 10/1/08 |
B3 |
|
4,140,000 |
4,171,050 |
|
|
Telewest PLC 0% 10/1/07 (d) |
B1 |
|
2,265,000 |
2,163,075 |
|
|
United Pan-Europe Communications NV 10.875% 11/1/07 |
B2 |
|
2,380,000 |
2,142,000 |
|
|
|
12,142,825 |
||||
|
Entertainment - 0.0% |
|||||
|
Regal Cinemas, Inc. 8.875% 12/15/10 |
Ca |
|
2,340,000 |
561,600 |
|
|
Lodging & Gaming - 0.0% |
|||||
|
HMH Properties, Inc. 7.875% 8/1/08 |
Ba2 |
|
230,000 |
205,275 |
|
|
Restaurants - 0.0% |
|||||
|
Domino's, Inc. |
B3 |
|
1,020,000 |
946,050 |
|
|
TOTAL MEDIA & LEISURE |
13,855,750 |
||||
|
Corporate Bonds - continued |
|||||
|
Moody's Ratings (unaudited) (b) |
Principal Amount |
Value |
|||
|
Nonconvertible Bonds - continued |
|||||
|
TECHNOLOGY - 0.0% |
|||||
|
Computer Services & Software - 0.0% |
|||||
|
PSINet, Inc. |
B3 |
|
$ 1,335,000 |
$ 1,228,200 |
|
|
UTILITIES - 0.2% |
|||||
|
Cellular - 0.1% |
|||||
|
Nextel |
|
|
|
|
|
|
0% 10/31/07 (d) |
B1 |
|
3,765,000 |
2,804,925 |
|
|
12% 11/1/08 |
B1 |
|
1,410,000 |
1,505,175 |
|
|
|
4,310,100 |
||||
|
Telephone Services - 0.1% |
|||||
|
Global Crossing Holdings Ltd. 9.625% 5/15/08 |
Ba2 |
|
1,335,000 |
1,308,300 |
|
|
McLeodUSA, Inc. |
B1 |
|
910,000 |
887,250 |
|
|
NEXTLINK Communications, Inc. 9.625% 10/1/07 |
B2 |
|
2,780,000 |
2,606,250 |
|
|
Pathnet, Inc. |
- |
|
510,000 |
285,600 |
|
|
Rhythms NetConnections, Inc. 12.75% 4/15/09 |
B3 |
|
1,670,000 |
1,135,600 |
|
|
WinStar |
|
|
|
|
|
|
0% 4/15/10 (d)(e) |
B3 |
|
1,449,000 |
673,785 |
|
|
12.75% 4/15/10 (e) |
B3 |
|
4,031,000 |
3,889,915 |
|
|
|
10,786,700 |
||||
|
TOTAL UTILITIES |
15,096,800 |
||||
|
TOTAL NONCONVERTIBLE BONDS |
36,918,950 |
||||
|
TOTAL CORPORATE BONDS (Cost $193,683,286) |
209,985,318 |
||||
|
Cash Equivalents - 1.0% |
|||
|
Shares |
|
||
|
Central Cash Collateral Fund, 6.71% (c) |
1,698,015 |
1,698,015 |
|
|
Taxable Central Cash Fund, 6.59% (c) |
94,619,327 |
94,619,327 |
|
|
TOTAL CASH EQUIVALENTS (Cost $96,317,342) |
96,317,342 |
||
|
TOTAL INVESTMENT PORTFOLIO - 99.6% (Cost $7,927,347,602) |
9,902,183,747 |
||
|
NET OTHER ASSETS - 0.4% |
41,016,147 |
||
|
NET ASSETS - 100% |
$ 9,943,199,894 |
||
|
Security Type Abbreviations |
||
|
ACES |
- |
Automatic Common Exchange Securities |
|
PEPS |
- |
Participating Equity Preferred Shares/Premium Exchangeable Participating Shares |
|
PIES |
- |
Premium Income Equity Securities |
|
PRIDES |
- |
Preferred Redeemable Increased Dividend |
|
PRIZES |
- |
Participating Redeemable Indexed Zero-Premium Exchangeable Securities |
|
TIDES |
- |
Term Income Deferred Equity Securities |
|
TRACES |
- |
Trust Automatic Common Exchange Securities |
|
Legend |
|
(a) Non-income producing |
|
(b) S&P credit ratings are used in the absence of a rating by Moody's Investors Service, Inc. |
|
(c) The rate quoted is the annualized seven-day yield of the fund at |
|
(d) Debt obligation initially issued in zero coupon form which converts to coupon form at a specified rate and date. The rate shown is the rate at period end. |
|
(e) Security exempt from registration under Rule 144A of the Securities |
|
Other Information |
|
Purchases and sales of securities, other than short-term securities, |
|
The fund placed a portion of its portfolio transactions with brokerage |
|
The fund participated in the security lending program. At period end, the value of securities loaned amounted to $1,591,025. The fund received cash collateral of $1,698,015 which was invested in cash equivalents. |
|
The fund participated in the interfund lending program as a borrower. |
|
The fund participated in the bank borrowing program. The average daily loan balance during the period for which loans were outstanding amounted to $13,171,318. The weighted average interest rate was 6.09%. Interest expense includes $49,044 paid under the bank borrowing program. |
|
Income Tax Information |
|
At June 30, 2000, the aggregate cost of investment securities for income tax purposes was $7,931,739,825. Net unrealized appreciation aggregated $1,970,443,922, of which $2,830,722,007 related to appreciated investment securities and $860,278,085 related to depreciated investment securities. |
See accompanying notes which are an integral part of the financial statements.
Equity-Income Portfolio
Statement of Assets and Liabilities
|
|
June 30, 2000 (Unaudited) |
|
|
Assets |
|
|
|
Investment in securities, at value |
|
$ 9,902,183,747 |
|
Cash |
|
80,267 |
|
Receivable for investments sold |
|
46,351,579 |
|
Receivable for fund shares sold |
|
3,306,224 |
|
Dividends receivable |
|
18,707,830 |
|
Interest receivable |
|
3,548,270 |
|
Other receivables |
|
639,455 |
|
Total assets |
|
9,974,817,372 |
|
Liabilities |
|
|
|
Payable for investments purchased |
$ 16,883,268 |
|
|
Payable for fund shares redeemed |
8,328,602 |
|
|
Accrued management fee |
4,071,933 |
|
|
Distribution fees payable |
43,292 |
|
|
Other payables and |
592,368 |
|
|
Collateral on securities loaned, |
1,698,015 |
|
|
Total liabilities |
|
31,617,478 |
|
Net Assets |
|
$ 9,943,199,894 |
|
Net Assets consist of: |
|
|
|
Paid in capital |
|
$ 7,592,710,655 |
|
Undistributed net investment income |
|
94,996,781 |
|
Accumulated undistributed net realized gain (loss) on investments and foreign currency transactions |
|
280,716,353 |
|
Net unrealized appreciation (depreciation) on investments |
|
1,974,776,105 |
|
Net Assets |
|
$ 9,943,199,894 |
|
Initial Class: |
|
$22.91 |
|
Service Class: |
|
$22.86 |
|
Service Class 2: |
|
$22.84 |
Statement of Operations
|
|
Six months ended June 30, 2000 (Unaudited) |
|
|
Investment Income Dividends |
|
$ 114,821,549 |
|
Interest |
|
7,423,512 |
|
Security lending |
|
109,307 |
|
Total income |
|
122,354,368 |
|
Expenses |
|
|
|
Management fee |
$ 24,432,214 |
|
|
Transfer agent fees |
3,355,035 |
|
|
Distribution fees |
226,077 |
|
|
Accounting and security lending fees |
443,177 |
|
|
Non-interested trustees' compensation |
25,855 |
|
|
Custodian fees and expenses |
117,627 |
|
|
Registration fees |
1,500 |
|
|
Audit |
39,228 |
|
|
Legal |
42,473 |
|
|
Interest |
220,630 |
|
|
Miscellaneous |
59,950 |
|
|
Total expenses before reductions |
28,963,766 |
|
|
Expense reductions |
(585,247) |
28,378,519 |
|
Net investment income |
|
93,975,849 |
|
Realized and Unrealized Gain (Loss) Net realized gain (loss) on: |
|
|
|
Investment securities |
290,121,682 |
|
|
Foreign currency transactions |
(169,714) |
289,951,968 |
|
Change in net unrealized appreciation (depreciation) on: |
|
|
|
Investment securities |
(725,820,111) |
|
|
Assets and liabilities in |
(72,517) |
(725,892,628) |
|
Net gain (loss) |
|
(435,940,660) |
|
Net increase (decrease) in net assets resulting from operations |
|
$ (341,964,811) |
|
Other Information Expense reductions |
|
$ 583,627 |
|
Custodian credits |
|
1,620 |
|
|
|
$ 585,247 |
See accompanying notes which are an integral part of the financial statements.
Semiannual Report
Fidelity Variable Insurance Products: Equity-Income Portfolio
Financial Statements - continued
Statement of Changes in Net Assets
|
|
Six months ended June 30, 2000 (Unaudited) |
Year ended
December 31, |
|
Increase (Decrease) in Net Assets |
|
|
|
Operations |
$ 93,975,849 |
$ 185,905,580 |
|
Net realized gain (loss) |
289,951,968 |
697,598,663 |
|
Change in net unrealized appreciation (depreciation) |
(725,892,628) |
(178,860,281) |
|
Net increase (decrease) in net assets resulting from operations |
(341,964,811) |
704,643,962 |
|
Distributions to shareholders |
(185,023,672) |
(170,985,891) |
|
From net realized gain |
(697,715,914) |
(377,968,784) |
|
Total distributions |
(882,739,586) |
(548,954,675) |
|
Share transactions - net increase (decrease) |
(283,718,779) |
(339,122,770) |
|
Total increase (decrease) in net assets |
(1,508,423,176) |
(183,433,483) |
|
Net Assets |
|
|
|
Beginning of period |
11,451,623,070 |
11,635,056,553 |
|
End of period (including undistributed net investment income of $94,996,781 and $185,982,649, respectively) |
$ 9,943,199,894 |
$ 11,451,623,070 |
|
|
||||
|
Other Information: |
||||
|
|
Six months ended June 30, 2000 |
Year ended December 31, 1999 |
||
|
|
Shares |
Dollars |
Shares |
Dollars |
|
Share transactions |
20,194,962 |
$ 468,135,483 |
41,506,315 |
$ 1,076,558,536 |
|
Reinvested |
38,143,294 |
847,544,035 |
22,601,688 |
537,468,103 |
|
Redeemed |
(74,517,854) |
(1,710,461,582) |
(84,630,671) |
(2,163,179,248) |
|
Net increase (decrease) |
(16,179,598) |
$ (394,782,064) |
(20,522,668) |
$ (549,152,609) |
|
Service Class |
4,641,894 |
107,791,908 |
8,201,124 |
211,555,674 |
|
Reinvested |
1,585,963 |
35,176,653 |
483,645 |
11,486,572 |
|
Redeemed |
(1,892,879) |
(43,575,460) |
(507,589) |
(13,012,407) |
|
Net increase (decrease) |
4,334,978 |
$ 99,393,101 |
8,177,180 |
$ 210,029,839 |
|
Service Class 2 A |
523,075 |
$ 11,931,422 |
- |
$ - |
|
Reinvested |
852 |
18,898 |
- |
- |
|
Redeemed |
(11,973) |
(280,136) |
- |
- |
|
Net increase (decrease) |
511,954 |
$ 11,670,184 |
- |
$ - |
|
Distributions |
|
$ 177,777,529 |
|
$ 167,408,106 |
|
Service Class |
|
7,242,252 |
|
3,577,785 |
|
Service Class 2 A |
|
3,891 |
|
- |
|
Total |
|
$ 185,023,672 |
|
$ 170,985,891 |
|
From net realized gain |
|
$ 669,766,506 |
|
$ 370,059,997 |
|
Service Class |
|
27,934,401 |
|
7,908,787 |
|
Service Class 2 A |
|
15,007 |
|
- |
|
Total |
|
$ 697,715,914 |
|
$ 377,968,784 |
|
|
|
$ 882,739,586 |
|
$ 548,954,675 |
A Service Class 2 commenced sale of shares January 12, 2000.
See accompanying notes which are an integral part of the financial statements.
Equity-Income Portfolio
Financial Highlights - Initial Class
|
|
Six months ended |
Years ended December 31, |
||||
|
Selected Per-Share Data |
(Unaudited) |
1999 |
1998 |
1997 |
1996 |
1995 |
|
Net asset value, beginning of period |
$ 25.71 |
$ 25.42 |
$ 24.28 |
$ 21.03 |
$ 19.27 |
$ 15.35 |
|
Income from Investment Operations |
|
|
|
|
|
|
|
Net investment income |
.21 D |
.41 D |
.38 D |
.36 D |
.35 |
.41 |
|
Net realized and unrealized gain (loss) |
(.96) |
1.10 |
2.31 |
5.06 |
2.30 |
4.69 |
|
Total from investment operations |
(.75) |
1.51 |
2.69 |
5.42 |
2.65 |
5.10 |
|
Less Distributions |
|
|
|
|
|
|
|
From net investment income |
(.43) |
(.38) |
(.34) |
(.36) |
(.03) |
(.40) |
|
From net realized gain |
(1.62) |
(.84) |
(1.21) |
(1.81) |
(.86) |
(.78) |
|
Total distributions |
(2.05) |
(1.22) |
(1.55) |
(2.17) |
(.89) |
(1.18) |
|
Net asset value, end of period |
$ 22.91 |
$ 25.71 |
$ 25.42 |
$ 24.28 |
$ 21.03 |
$ 19.27 |
|
Total Return B, C |
(2.67)% |
6.33% |
11.63% |
28.11% |
14.28% |
35.09% |
|
Ratios and Supplemental Data |
|
|
|
|
|
|
|
Net assets, end of period (000 omitted) |
$ 9,442,871 |
$ 11,014,291 |
$ 11,409,912 |
$ 10,106,742 |
$ 6,961,090 |
$ 4,879,435 |
|
Ratio of expenses to average net assets |
.56% A |
.57% |
.58% |
.58% |
.58% |
.61% |
|
Ratio of expenses to average net assets after |
.55% A, F |
.56% F |
.57% F |
.57% F |
.56% F |
.61% |
|
Ratio of net investment income to average net assets |
1.83% A |
1.57% |
1.58% |
1.65% |
1.97% |
2.56% |
|
Portfolio turnover |
19% A |
27% |
28% |
44% |
186% |
87% |
Financial Highlights - Service Class
|
|
Six months ended |
Years ended December 31, |
||
|
Selected Per-Share Data |
(Unaudited) |
1999 |
1998 |
1997 E |
|
Net asset value, beginning of period |
$ 25.66 |
$ 25.39 |
$ 24.27 |
$ 23.44 |
|
Income from Investment Operations |
|
|
|
|
|
Net investment income D |
.20 |
.38 |
.36 |
.05 |
|
Net realized and unrealized gain (loss) |
(.96) |
1.11 |
2.31 |
.78 |
|
Total from investment operations |
(.76) |
1.49 |
2.67 |
.83 |
|
Less Distributions |
|
|
|
|
|
From net investment income |
(.42) |
(.38) |
(.34) |
- |
|
From net realized gain |
(1.62) |
(.84) |
(1.21) |
- |
|
Total distributions |
(2.04) |
(1.22) |
(1.55) |
- |
|
Net asset value, end of period |
$ 22.86 |
$ 25.66 |
$ 25.39 |
$ 24.27 |
|
Total Return B, C |
(2.72)% |
6.25% |
11.54% |
3.54% |
|
Ratios and Supplemental Data |
|
|
|
|
|
Net assets, end of period (000 omitted) |
$ 488,635 |
$ 437,332 |
$ 225,145 |
$ 5,328 |
|
Ratio of expenses to average net assets |
.66% A |
.67% |
.68% |
.68% A |
|
Ratio of expenses to average net assets after expense reductions |
.65% A, F |
.66% F |
.67% F |
.65% A, F |
|
Ratio of net investment income to average net assets |
1.73% A |
1.47% |
1.51% |
1.63% A |
|
Portfolio turnover |
19% A |
27% |
28% |
44% |
|
A Annualized B Total returns for periods of less than one year are not annualized and do not reflect charges attributable to your insurance company's separate account. Inclusion of these charges would reduce the total returns shown. C The total returns would have been lower had certain expenses not been reduced during the periods shown. D Net investment income per share has been calculated based on average shares outstanding during the period. E For the period November 3, 1997 (commencement of sale of Service Class shares) to December 31, 1997. F FMR or the fund has entered into varying arrangements with third parties who either paid or reduced a portion of the class' expenses. |
||||
See accompanying notes which are an integral part of the financial statements.
Semiannual Report
Financial Highlights - Service Class 2
|
|
Six months ended |
|
Selected Per-Share Data |
(Unaudited) |
|
Net asset value, beginning of period |
$ 25.18 |
|
Income from Investment Operations |
|
|
Net investment income D |
.17 |
|
Net realized and unrealized gain (loss) |
(.47) |
|
Total from investment operations |
(.30) |
|
Less Distributions |
|
|
From net investment income |
(.42) |
|
From net realized gain |
(1.62) |
|
Total distributions |
(2.04) |
|
Net asset value, end of period |
$ 22.84 |
|
Total Return B, C |
(0.95)% |
|
Ratios and Supplemental Data |
|
|
Net assets, end of period (000 omitted) |
$ 11,694 |
|
Ratio of expenses to average net assets |
.82% A |
|
Ratio of expenses to average net assets after expense reductions |
.80% A, F |
|
Ratio of net investment income to average net assets |
1.58% A |
|
Portfolio turnover |
19% A |
|
A Annualized B Total returns for periods of less than one year are not annualized and do not reflect charges attributable to your insurance company's separate account. Inclusion of these charges would reduce the total returns shown. C The total return would have been lower had certain expenses not been reduced during the period shown. D Net investment income per share has been calculated based on average shares outstanding during the period. E For the period January 12, 2000 (commencement of sale of Service Class 2 shares) to June 30, 2000. F FMR or the fund has entered into varying arrangements with third parties who either paid or reduced a portion of the class' expenses. |
|
See accompanying notes which are an integral part of the financial statements.
Equity-Income Portfolio
Performance
There are several ways to evaluate a fund's historical performance. You can look at the total percentage change in value, the average annual percentage change or the growth of a hypothetical $10,000 investment. Total return reflects the change in the value of an investment, assuming reinvestment of the fund's dividend income and capital gains (the profits earned upon the sale of securities that have grown in value). The initial offering of Service Class shares took place on November 3, 1997. Performance for Service Class shares reflects an asset based distribution fee (12b-1 fee), and returns prior to November 3, 1997 are those of Initial Class and do not include the effects of Service Class' 12b-1 fee. Had Service Class shares' 12b-1 fee been reflected, returns prior to November 3, 1997 would have been lower. If Fidelity had not reimbursed certain fund expenses, the past five years and life of fund total returns would have been lower.
Average Annual Total Returns
|
Periods ended |
Past 1 |
Past 5 |
Life of |
|
Fidelity VIP: Balanced - |
-0.57% |
11.77% |
12.11% |
|
Fidelity Balanced 60/40 Composite |
6.44% |
16.78% |
18.45% |
|
S&P 500 |
7.25% |
23.80% |
25.60% |
|
LB Aggregate Bond |
4.57% |
6.25% |
7.81% |
Average annual total returns take the fund's cumulative return and show what would have happened if the fund had performed at a constant rate each year.
You can compare the fund's returns to the performance of the Fidelity Balanced 60/40 Composite Index - a hypothetical combination of unmanaged indices using a weighting of 60% equity and 40% bond. The composite index combines the total returns of the Standard & Poor's 500 Index and the Lehman Brothers Aggregate Bond Index.
Figures for more than one year assume a steady compounded rate of return and are not the fund's year-by-year results, which fluctuated over the periods shown. The life of fund figures are from commencement of operations, January 3, 1995.
Performance numbers are net of all fund operating expenses, but do not include any insurance charges imposed by your insurance company's separate account. If performance information included the effect of these additional charges, the total returns would have been lower.
Past performance is no guarantee of future results. Principal and investment return will vary and you may have a gain or loss when you withdraw your money.
Understanding Performance
How a fund did yesterday is no guarantee of how it will do tomorrow. The stock market, for example, has a history of long-term growth and short-term volatility. In turn, the share price and return of a fund that invests in stocks will vary. That means if you sell your shares during a market downturn, you might lose money. But if you can ride out the market's ups and downs, you may have a gain.
3$10,000 Over Life of Fund

$10,000 Over Life of Fund: Let's say hypothetically that $10,000 was invested in Fidelity Variable Insurance Products: Balanced Portfolio - Service Class on January 3, 1995, when the fund started. As the chart shows, by June 30, 2000, the value of the investment would have grown to $18,735 - an 87.35% increase on the initial investment. For comparison, look at how both the Standard & Poor's 500 Index, a market capitalization-weighted index of common stocks, and the Lehman Brothers Aggregate Bond Index, a market value-weighted index of investment-grade fixed-rate debt issues, including government, corporate, asset-backed, and mortgage-backed securities, with maturities of one year or more, did over the same period. With dividends and capital gains, if any, reinvested, the same $10,000 investment in the Standard & Poor's 500 Index would have grown to $34,970 - a 249.70% increase. If $10,000 was invested in the Lehman Brothers Aggregate Bond Index, it would have grown to $15,114 - a 51.14% increase. You can also look at how the Fidelity Balanced 60/40 Composite Index did over the same period. With dividends and interest, if any, reinvested, the same $10,000 would have grown to $25,352 - a 153.52% increase.
Investment Summary
|
Top Five Stocks as of June 30, 2000 |
|
|
|
% of fund's |
|
General Electric Co. |
3.6 |
|
Cisco Systems, Inc. |
2.3 |
|
Intel Corp. |
1.7 |
|
Exxon Mobil Corp. |
1.4 |
|
Pfizer, Inc. |
1.3 |
|
|
10.3 |
|
Top Five Market Sectors as of June 30, 2000 |
|
|
|
% of fund's |
|
Technology |
20.0 |
|
Finance |
10.4 |
|
Utilities |
9.2 |
|
Media & Leisure |
7.8 |
|
Health |
6.4 |
|
Asset Allocation as of June 30, 2000 |
|||
|
% of fund's net assets * |
|||
|
Stocks 57.2% |
|
|
|
Bonds 40.7% |
|
|
|
Short-Term Investments |
|
|

|
* Foreign investments 6.4% |
Semiannual Report
(Portfolio Manager photographs)
An interview with John Avery (right), Lead Portfolio Manager of Balanced Portfolio, and Kevin Grant, manager for fixed-income investments
Q. How did the fund perform, John?
J.A. For the six- and 12-month periods that ended June 30, 2000, the fund underperformed the Fidelity Balanced 60/40 Composite Index, which returned 1.45% and 6.44%, respectively, during these time frames.
Q. Why did the fund trail its benchmark during the
six-month period?
J.A. Having an average underweighting in technology hurt during the sector's impressive run-up early in the period. The fund's underexposure to tech was double trouble in the sense that most other areas of the market in which the fund was invested had a difficult period. So, even though the technology group corrected sharply in the spring - as the market turned elsewhere for growth - it was up so much in the first half that, for all intents and purposes, our fate was sealed.
Q. What were some of your strategies and how did they influence performance?
J.A. I maintained an emphasis on equities during the market's upturn, adding convertible securities in lieu of pure stocks. I used convertibles as an indirect, less volatile way to participate in some of the growth stories I liked within the technology sector. This strategy helped provide some nice yield and afforded us the added benefit of downside protection, as convertible securities gave back less than their pure stock equivalents during the correction. When things started to fall apart for tech, I took advantage of the opportunity to increase the fund's concentration in large, high-quality companies, many of which had dropped sharply from their highs of the period. However, the fund was hurt for not owning enough of the period's top performers along the way, namely Oracle and Intel. On a more positive note, the fund's healthy exposure to large drug companies such as Warner-Lambert and Eli Lilly helped, as the group rallied behind renewed enthusiasm for strong new product pipelines. Warner-Lambert merged with Pfizer - another fund holding - just prior to the close of the period. The fund's lack of exposure to a generally weak consumer nondurables sector, and some good picks in media stocks such as Viacom, further aided relative performance.
Q. What other stocks performed well for the fund? Which disappointed?
J.A. A number of the fund's financial holdings performed well - most notably Bank of New York and Morgan Stanley Dean Witter - benefiting from strong capital markets activity. Tech stocks we did own, including Texas Instruments, EMC and Micron Technology, also added meaningfully to performance. Conversely, those that weren't so hot included Motorola, Alltel and Lucent. Motorola was, by far, the fund's worst performer, slipping on execution problems and narrowing margins in its cellular handset business. Traditional telecommunications providers AT&T and WorldCom fell prey to increased competition and falling prices.
Q. Turning to you, Kevin, how did the fund's bond investments fare?
K.G. The investment-grade portion of the fund performed well during the six-month period, benefiting from its exposure to a strong rally in the government market. An announcement by the U.S. Treasury in January of its intent to repurchase long-term debt and reduce future issuance sent the price of the long bond higher and its yield lower. This action, coupled with rising short-term interest rates, induced an inverted yield curve, which occurs when short-term issues provide a higher yield than their longer-term counterparts. This inversion hurt the spread sectors - most notably corporate bonds and mortgage securities - with yield spreads widening out significantly relative to comparable duration Treasuries. The fund was well-positioned for these changes, as we responded to the buybacks by reducing our exposure to long-term corporates in exchange for more Treasuries, which worked out beautifully. This strategy helped the fund's bond subportfolio outperform the Lehman Brothers Aggregate Bond Index during the period. So, despite the Federal Reserve Board's efforts to raise rates during the period, the supply/demand imbalance spurred by the Treasury buybacks helped ensure our success.
Q. John, what's your outlook?
J.A. I'm bullish overall, as business remains strong in many areas of the economy, although I temper that enthusiasm with concern about interest rates rising further. In this uncertain environment, I believe the market will begin to focus more on revenues and earnings. As such, the companies capable of delivering robust top-line growth and strong bottom-line earnings should be the ones to reap the rewards. Given the extent to which technology and the Internet have transformed the global landscape, I expect we'll see strong performance from this sector going forward.
The views expressed in this report reflect those of the portfolio managers only through the end of the period of the report as stated on the cover. The managers' views are subject to change at any time based on market or other conditions. For more information, see page 2.
Fund Facts
Goal: seeks income and capital growth consistent with reasonable risk by investing in a diversified portfolio of stocks and bonds
Start date: January 3, 1995
Size: as of June 30, 2000, more than $304 million
Manager: John Avery, since 1998, and
Kevin Grant, since 1996; John Avery joined
Fidelity in 1995; Kevin Grant joined Fidelity in 1993
Semiannual Report
Fidelity Variable Insurance Products: Balanced Portfolio
(Unaudited)
Showing Percentage of Net Assets
|
Common Stocks - 56.8% |
|||
|
Shares |
Value (Note 1) |
||
|
AEROSPACE & DEFENSE - 0.4% |
|||
|
Aerospace & Defense - 0.2% |
|||
|
Boeing Co. |
13,700 |
$ 572,831 |
|
|
Textron, Inc. |
4,200 |
228,113 |
|
|
|
800,944 |
||
|
Ship Building & Repair - 0.2% |
|||
|
General Dynamics Corp. |
9,700 |
506,825 |
|
|
TOTAL AEROSPACE & DEFENSE |
1,307,769 |
||
|
BASIC INDUSTRIES - 0.5% |
|||
|
Chemicals & Plastics - 0.4% |
|||
|
E.I. du Pont de Nemours and Co. |
14,104 |
617,050 |
|
|
Praxair, Inc. |
16,100 |
602,744 |
|
|
|
1,219,794 |
||
|
Metals & Mining - 0.1% |
|||
|
Alcoa, Inc. |
13,000 |
377,000 |
|
|
TOTAL BASIC INDUSTRIES |
1,596,794 |
||
|
DURABLES - 0.3% |
|||
|
Autos, Tires, & Accessories - 0.2% |
|||
|
AutoNation, Inc. |
3,700 |
26,131 |
|
|
Danaher Corp. |
9,600 |
474,600 |
|
|
|
500,731 |
||
|
Consumer Electronics - 0.1% |
|||
|
General Motors Corp. Class H (a) |
5,400 |
473,850 |
|
|
TOTAL DURABLES |
974,581 |
||
|
ENERGY - 3.7% |
|||
|
Energy Services - 0.8% |
|||
|
Diamond Offshore Drilling, Inc. |
15,200 |
533,900 |
|
|
Halliburton Co. |
12,900 |
608,719 |
|
|
Nabors Industries, Inc. (a) |
16,800 |
698,250 |
|
|
Schlumberger Ltd. (NY Shares) |
9,000 |
671,625 |
|
|
|
2,512,494 |
||
|
Oil & Gas - 2.9% |
|||
|
BP Amoco PLC |
63,962 |
602,975 |
|
|
Burlington Resources, Inc. |
15,000 |
573,750 |
|
|
Chevron Corp. |
10,000 |
848,125 |
|
|
Conoco, Inc. Class B |
50,800 |
1,247,775 |
|
|
Exxon Mobil Corp. |
53,366 |
4,189,231 |
|
|
Royal Dutch Petroleum Co. (NY Shares) |
21,400 |
1,317,438 |
|
|
|
8,779,294 |
||
|
TOTAL ENERGY |
11,291,788 |
||
|
FINANCE - 7.4% |
|||
|
Banks - 1.0% |
|||
|
Bank of America Corp. |
15,100 |
649,300 |
|
|
|
|||
|
Shares |
Value (Note 1) |
||
|
Bank of New York Co., Inc. |
41,700 |
$ 1,939,050 |
|
|
Chase Manhattan Corp. |
10,500 |
483,656 |
|
|
|
3,072,006 |
||
|
Credit & Other Finance - 2.3% |
|||
|
American Express Co. |
70,900 |
3,695,663 |
|
|
Citigroup, Inc. |
56,325 |
3,393,581 |
|
|
|
7,089,244 |
||
|
Federal Sponsored Credit - 1.2% |
|||
|
Fannie Mae |
32,400 |
1,690,875 |
|
|
Freddie Mac |
45,300 |
1,834,650 |
|
|
|
3,525,525 |
||
|
Insurance - 1.5% |
|||
|
AFLAC, Inc. |
9,300 |
427,219 |
|
|
American International Group, Inc. |
30,300 |
3,560,250 |
|
|
Hartford Financial Services Group, Inc. |
8,400 |
469,875 |
|
|
|
4,457,344 |
||
|
Securities Industry - 1.4% |
|||
|
Charles Schwab Corp. |
25,150 |
845,669 |
|
|
Merrill Lynch & Co., Inc. |
7,500 |
862,500 |
|
|
Morgan Stanley Dean Witter & Co. |
31,900 |
2,655,675 |
|
|
|
4,363,844 |
||
|
TOTAL FINANCE |
22,507,963 |
||
|
HEALTH - 5.9% |
|||
|
Drugs & Pharmaceuticals - 5.6% |
|||
|
American Home Products Corp. |
15,900 |
934,125 |
|
|
Amgen, Inc. |
11,600 |
814,900 |
|
|
Bristol-Myers Squibb Co. |
48,200 |
2,807,650 |
|
|
Eli Lilly & Co. |
39,000 |
3,895,125 |
|
|
Merck & Co., Inc. |
11,300 |
865,863 |
|
|
Pfizer, Inc. |
84,700 |
4,065,600 |
|
|
Schering-Plough Corp. |
72,400 |
3,656,200 |
|
|
|
17,039,463 |
||
|
Medical Equipment & Supplies - 0.3% |
|||
|
Johnson & Johnson |
4,600 |
468,625 |
|
|
Medtronic, Inc. |
10,000 |
498,125 |
|
|
|
966,750 |
||
|
TOTAL HEALTH |
18,006,213 |
||
|
INDUSTRIAL MACHINERY & EQUIPMENT - 4.4% |
|||
|
Electrical Equipment - 3.6% |
|||
|
General Electric Co. |
206,400 |
10,939,184 |
|
|
Industrial Machinery & Equipment - 0.8% |
|||
|
Tyco International Ltd. |
53,870 |
2,552,091 |
|
|
TOTAL INDUSTRIAL MACHINERY & EQUIPMENT |
13,491,275 |
||
|
Common Stocks - continued |
|||
|
Shares |
Value (Note 1) |
||
|
MEDIA & LEISURE - 4.3% |
|||
|
Broadcasting - 1.6% |
|||
|
AT&T Corp. - Liberty Media Group |
44,000 |
$ 1,067,000 |
|
|
Cable Satisfaction International, Inc. warrants 3/1/10 (a) |
200 |
540 |
|
|
Clear Channel Communications, Inc. (a) |
15,400 |
1,155,000 |
|
|
Infinity Broadcasting Corp. Class A (a) |
29,600 |
1,078,550 |
|
|
NTL, Inc. warrants 10/14/08 (a) |
199 |
8,159 |
|
|
Time Warner, Inc. |
20,208 |
1,535,808 |
|
|
UIH Australia/Pacific, Inc. warrants 5/15/06 (a) |
150 |
4,500 |
|
|
|
4,849,557 |
||
|
Entertainment - 1.8% |
|||
|
MGM Grand, Inc. |
12,500 |
401,563 |
|
|
Viacom, Inc. Class B (non-vtg.) (a) |
56,389 |
3,845,025 |
|
|
Walt Disney Co. |
29,100 |
1,129,444 |
|
|
|
5,376,032 |
||
|
Publishing - 0.7% |
|||
|
McGraw-Hill Companies, Inc. |
42,100 |
2,273,400 |
|
|
Restaurants - 0.2% |
|||
|
McDonald's Corp. |
20,500 |
675,219 |
|
|
TOTAL MEDIA & LEISURE |
13,174,208 |
||
|
NONDURABLES - 1.6% |
|||
|
Beverages - 0.9% |
|||
|
Anheuser-Busch Companies, Inc. |
16,700 |
1,247,281 |
|
|
Seagram Co. Ltd. |
6,100 |
358,460 |
|
|
The Coca-Cola Co. |
19,300 |
1,108,544 |
|
|
|
2,714,285 |
||
|
Household Products - 0.5% |
|||
|
Clorox Co. |
14,700 |
658,744 |
|
|
Colgate-Palmolive Co. |
12,100 |
724,488 |
|
|
|
1,383,232 |
||
|
Tobacco - 0.2% |
|||
|
Philip Morris Companies, Inc. |
22,400 |
595,000 |
|
|
TOTAL NONDURABLES |
4,692,517 |
||
|
RETAIL & WHOLESALE - 2.9% |
|||
|
Apparel Stores - 0.2% |
|||
|
Mothers Work, Inc. (a)(k) |
3 |
34 |
|
|
The Limited, Inc. |
26,800 |
579,550 |
|
|
|
579,584 |
||
|
General Merchandise Stores - 1.6% |
|||
|
Kohls Corp. (a) |
9,300 |
517,313 |
|
|
Target Corp. |
21,400 |
1,241,200 |
|
|
Wal-Mart Stores, Inc. |
54,900 |
3,163,613 |
|
|
|
4,922,126 |
||
|
Retail & Wholesale, Miscellaneous - 1.1% |
|||
|
Best Buy Co., Inc. (a) |
800 |
50,600 |
|
|
|
|||
|
Shares |
Value (Note 1) |
||
|
Home Depot, Inc. |
53,550 |
$ 2,674,153 |
|
|
Lowe's Companies, Inc. |
11,100 |
455,794 |
|
|
|
3,180,547 |
||
|
TOTAL RETAIL & WHOLESALE |
8,682,257 |
||
|
SERVICES - 0.7% |
|||
|
Advertising - 0.5% |
|||
|
Omnicom Group, Inc. |
17,200 |
1,531,875 |
|
|
Services - 0.2% |
|||
|
Ecolab, Inc. |
18,100 |
707,031 |
|
|
TOTAL SERVICES |
2,238,906 |
||
|
TECHNOLOGY - 19.0% |
|||
|
Communications Equipment - 5.3% |
|||
|
Cisco Systems, Inc. (a) |
111,000 |
7,055,438 |
|
|
Comverse Technology, Inc. (a) |
8,100 |
753,300 |
|
|
Corning, Inc. |
4,000 |
1,079,500 |
|
|
Lucent Technologies, Inc. |
30,200 |
1,789,350 |
|
|
Nokia AB sponsored ADR |
34,200 |
1,707,863 |
|
|
Nortel Networks Corp. |
53,100 |
3,683,465 |
|
|
|
16,068,916 |
||
|
Computer Services & Software - 3.4% |
|||
|
America Online, Inc. (a) |
25,950 |
1,368,863 |
|
|
BEA Systems, Inc. (a) |
14,100 |
697,069 |
|
|
DecisionOne Corp. |
583 |
6 |
|
|
DecisionOne Corp.: |
|
|
|
|
Class A warrants 4/18/07 (a) |
342 |
0 |
|
|
Class B warrants 4/18/07 (a) |
590 |
0 |
|
|
Class C warrants 4/18/07 (a) |
350 |
0 |
|
|
Inktomi Corp. (a) |
3,400 |
402,050 |
|
|
Microsoft Corp. (a) |
40,400 |
3,232,000 |
|
|
Oracle Corp. (a) |
38,700 |
3,253,219 |
|
|
VeriSign, Inc. (a) |
4,392 |
775,188 |
|
|
Yahoo!, Inc. (a) |
6,200 |
768,025 |
|
|
|
10,496,420 |
||
|
Computers & Office Equipment - 4.5% |
|||
|
Compaq Computer Corp. |
33,600 |
858,900 |
|
|
Dell Computer Corp. (a) |
42,700 |
2,105,644 |
|
|
EMC Corp. (a) |
50,100 |
3,854,569 |
|
|
Hewlett-Packard Co. |
8,400 |
1,048,950 |
|
|
International Business Machines Corp. |
24,000 |
2,629,500 |
|
|
Network Appliance, Inc. (a) |
8,300 |
668,150 |
|
|
Pitney Bowes, Inc. |
11,000 |
440,000 |
|
|
Sun Microsystems, Inc. (a) |
22,800 |
2,073,375 |
|
|
|
13,679,088 |
||
|
Electronic Instruments - 0.5% |
|||
|
Applied Materials, Inc. (a) |
10,400 |
942,500 |
|
|
KLA-Tencor Corp. (a) |
8,400 |
491,925 |
|
|
|
1,434,425 |
||
|
Common Stocks - continued |
|||
|
Shares |
Value (Note 1) |
||
|
TECHNOLOGY - continued |
|||
|
Electronics - 5.3% |
|||
|
Analog Devices, Inc. (a) |
12,900 |
$ 980,400 |
|
|
Broadcom Corp. Class A (a) |
4,200 |
919,538 |
|
|
Flextronics International Ltd. (a) |
6,500 |
446,469 |
|
|
Insilco Corp. warrants 8/15/07 (a) |
60 |
0 |
|
|
Intel Corp. |
39,300 |
5,253,919 |
|
|
JDS Uniphase Corp. (a) |
12,200 |
1,462,475 |
|
|
Micron Technology, Inc. (a) |
20,400 |
1,796,475 |
|
|
Motorola, Inc. |
32,900 |
956,156 |
|
|
Sanmina Corp. (a) |
7,900 |
675,450 |
|
|
Texas Instruments, Inc. |
55,100 |
3,784,681 |
|
|
|
16,275,563 |
||
|
TOTAL TECHNOLOGY |
57,954,412 |
||
|
UTILITIES - 5.7% |
|||
|
Cellular - 2.5% |
|||
|
China Telecom (Hong Kong) Ltd. (a) |
90,000 |
800,156 |
|
|
Leap Wireless International, Inc.: |
|
|
|
|
warrants 4/15/10 (a)(g) |
75 |
0 |
|
|
warrants 4/15/10 (a) |
65 |
0 |
|
|
Loral Orion Network Systems, Inc.: |
|
|
|
|
warrants 1/15/07 (CV ratio .47) (a) |
290 |
725 |
|
|
warrants 1/15/07 (CV ratio .6) (a) |
50 |
213 |
|
|
McCaw International Ltd. warrants 4/16/07 (a)(g) |
290 |
725 |
|
|
Nextel Communications, Inc. Class A (a) |
23,400 |
1,431,788 |
|
|
Sprint Corp. - PCS Group Series 1 (a) |
35,100 |
2,088,450 |
|
|
Vodafone AirTouch PLC sponsored ADR |
37,800 |
1,566,338 |
|
|
VoiceStream Wireless Corp. (a) |
14,700 |
1,709,564 |
|
|
|
7,597,959 |
||
|
Electric Utility - 0.3% |
|||
|
AES Corp. (a) |
21,800 |
994,625 |
|
|
Gas - 0.5% |
|||
|
Dynegy, Inc. Class A |
11,600 |
792,425 |
|
|
Enron Corp. |
9,200 |
593,400 |
|
|
|
1,385,825 |
||
|
Telephone Services - 2.4% |
|||
|
Allegiance Telecom, Inc. (a) |
6,900 |
441,600 |
|
|
AT&T Corp. |
16,604 |
525,102 |
|
|
BellSouth Corp. |
32,000 |
1,364,000 |
|
|
KMC Telecom Holdings, Inc. warrants 4/15/08 (a)(g) |
70 |
175 |
|
|
Level 3 Communications, Inc. (a) |
5,400 |
475,200 |
|
|
McLeodUSA, Inc. Class A (a) |
37,600 |
777,850 |
|
|
Ono Finance PLC rights 5/31/09 (a)(g) |
210 |
2,100 |
|
|
Qwest Communications |
13,600 |
675,750 |
|
|
SBC Communications, Inc. |
37,170 |
1,607,603 |
|
|
|
|||
|
Shares |
Value (Note 1) |
||
|
Sprint Corp. - FON Group |
12,300 |
$ 627,300 |
|
|
WorldCom, Inc. (a) |
19,489 |
894,058 |
|
|
|
7,390,738 |
||
|
TOTAL UTILITIES |
17,369,147 |
||
|
TOTAL COMMON STOCKS (Cost $133,038,091) |
173,287,830 |
||
|
Preferred Stocks - 0.4% |
|||
|
|
|
|
|
|
Convertible Preferred Stocks - 0.2% |
|||
|
MEDIA & LEISURE - 0.2% |
|||
|
Broadcasting - 0.2% |
|||
|
MediaOne Group, Inc. |
4,700 |
423,000 |
|
|
Nonconvertible Preferred Stocks - 0.2% |
|||
|
ENERGY - 0.0% |
|||
|
Energy Services - 0.0% |
|||
|
R&B Falcon Corp. 13.875% |
113 |
128,255 |
|
|
FINANCE - 0.0% |
|||
|
Insurance - 0.0% |
|||
|
American Annuity Group Capital |
50 |
44,513 |
|
|
HEALTH - 0.1% |
|||
|
Medical Facilities Management - 0.1% |
|||
|
Fresenius Medical Care Capital |
190 |
173,333 |
|
|
MEDIA & LEISURE - 0.1% |
|||
|
Broadcasting - 0.1% |
|||
|
CSC Holdings, Inc. 11.125% pay-in-kind |
2,136 |
223,212 |
|
|
Publishing - 0.0% |
|||
|
PRIMEDIA, Inc. Series D, $10.00 |
600 |
55,500 |
|
|
TOTAL MEDIA & LEISURE |
278,712 |
||
|
TOTAL NONCONVERTIBLE PREFERRED STOCKS |
624,813 |
||
|
TOTAL PREFERRED STOCKS (Cost $970,382) |
1,047,813 |
||
|
Corporate Bonds - 15.2% |
|||||
|
Moody's Ratings (unaudited) (b) |
Principal Amount |
|
|||
|
Convertible Bonds - 1.1% |
|||||
|
HEALTH - 0.4% |
|||||
|
Drugs & Pharmaceuticals - 0.4% |
|||||
|
Roche Holdings, Inc. |
- |
|
$ 1,261,000 |
1,153,815 |
|
|
Corporate Bonds - continued |
|||||
|
Moody's Ratings (unaudited) (b) |
Principal Amount |
Value |
|||
|
Convertible Bonds - continued |
|||||
|
MEDIA & LEISURE - 0.2% |
|||||
|
Broadcasting - 0.2% |
|||||
|
Liberty Media Corp. |
Baa3 |
|
$ 481,000 |
$ 521,885 |
|
|
TECHNOLOGY - 0.4% |
|||||
|
Computers & Office Equipment - 0.4% |
|||||
|
Juniper Networks, Inc. 4.75% 3/15/07 |
B- |
|
1,220,000 |
1,349,625 |
|
|
UTILITIES - 0.1% |
|||||
|
Cellular - 0.1% |
|||||
|
Nextel Communications, Inc. 5.25% 1/15/10 (g) |
B1 |
|
308,000 |
318,780 |
|
|
Telephone Services - 0.0% |
|||||
|
Level 3 Communications, Inc. 6% 3/15/10 |
Caa1 |
|
203,000 |
183,842 |
|
|
TOTAL UTILITIES |
502,622 |
||||
|
TOTAL CONVERTIBLE BONDS |
3,527,947 |
||||
|
Nonconvertible Bonds - 14.1% |
|||||
|
AEROSPACE & DEFENSE - 0.1% |
|||||
|
Defense Electronics - 0.1% |
|||||
|
Raytheon Co. |
Baa2 |
|
240,000 |
240,662 |
|
|
BASIC INDUSTRIES - 0.4% |
|||||
|
Chemicals & Plastics - 0.2% |
|||||
|
Huntsman Corp. |
B2 |
|
370,000 |
337,625 |
|
|
Lyondell Chemical Co. 10.875% 5/1/09 |
B2 |
|
340,000 |
337,450 |
|
|
|
675,075 |
||||
|
Metals & Mining - 0.0% |
|||||
|
Kaiser Aluminum & Chemical Corp. |
B3 |
|
160,000 |
145,600 |
|
|
Packaging & Containers - 0.1% |
|||||
|
Gaylord Container Corp. 9.75% 6/15/07 |
Caa1 |
|
210,000 |
163,800 |
|
|
Paper & Forest Products - 0.1% |
|||||
|
APP China Group Ltd. |
B3 |
|
150,000 |
94,500 |
|
|
|
|||||
|
Moody's Ratings (unaudited) (b) |
Principal Amount |
Value |
|||
|
Fort James Corp. |
Baa2 |
|
$ 45,000 |
$ 43,274 |
|
|
Repap New Brunswick, Inc. yankee 10.625% 4/15/05 |
Caa1 |
|
230,000 |
202,400 |
|
|
|
340,174 |
||||
|
TOTAL BASIC INDUSTRIES |
1,324,649 |
||||
|
CONSTRUCTION & REAL ESTATE - 1.1% |
|||||
|
Building Materials - 0.1% |
|||||
|
Dayton Superior Corp. |
B3 |
|
160,000 |
158,400 |
|
|
Construction - 0.0% |
|||||
|
Lennar Corp. |
Ba1 |
|
25,000 |
24,625 |
|
|
Real Estate - 0.2% |
|||||
|
Duke Realty LP |
Baa1 |
|
500,000 |
491,350 |
|
|
LNR Property Corp. |
B1 |
|
160,000 |
139,200 |
|
|
|
630,550 |
||||
|
Real Estate Investment Trusts - 0.8% |
|||||
|
CenterPoint Properties Trust 6.75% 4/1/05 |
Baa2 |
|
100,000 |
93,160 |
|
|
Equity Office |
|
|
|
|
|
|
6.5% 1/15/04 |
Baa1 |
|
1,000,000 |
954,410 |
|
|
6.625% 2/15/05 |
Baa1 |
|
200,000 |
188,948 |
|
|
6.75% 2/15/08 |
Baa1 |
|
100,000 |
91,609 |
|
|
Ocwen Asset Investment Corp. 11.5% 7/1/05 |
- |
|
120,000 |
92,400 |
|
|
ProLogis Trust |
Baa1 |
|
70,000 |
66,675 |
|
|
Spieker Properties LP: |
|
|
|
|
|
|
6.8% 5/1/04 |
Baa2 |
|
90,000 |
86,265 |
|
|
6.875% 2/1/05 |
Baa2 |
|
1,000,000 |
956,150 |
|
|
|
2,529,617 |
||||
|
TOTAL CONSTRUCTION & REAL ESTATE |
3,343,192 |
||||
|
ENERGY - 0.6% |
|||||
|
Coal - 0.0% |
|||||
|
P&L Coal Holdings Corp. 9.625% 5/15/08 |
B2 |
|
135,000 |
125,213 |
|
|
Energy Services - 0.0% |
|||||
|
R&B Falcon Corp. |
Ba3 |
|
100,000 |
109,000 |
|
|
Oil & Gas - 0.6% |
|||||
|
Anadarko Petroleum Corp. 7.2% 3/15/29 |
Baa1 |
|
385,000 |
351,209 |
|
|
Apache Corp.: |
|
|
|
|
|
|
7.625% 7/1/19 |
Baa1 |
|
155,000 |
149,662 |
|
|
7.7% 3/15/26 |
Baa1 |
|
65,000 |
62,636 |
|
|
Corporate Bonds - continued |
|||||
|
Moody's Ratings (unaudited) (b) |
Principal Amount |
Value |
|||
|
Nonconvertible Bonds - continued |
|||||
|
ENERGY - continued |
|||||
|
Oil & Gas - continued |
|||||
|
Apache Finance Property Ltd. 6.5% 12/15/07 |
Baa1 |
|
$ 100,000 |
$ 90,750 |
|
|
Chesapeake Energy Corp. 9.625% 5/1/05 |
B2 |
|
250,000 |
243,750 |
|
|
Conoco, Inc. |
A3 |
|
125,000 |
119,300 |
|
|
Ocean Energy, Inc. |
Ba1 |
|
190,000 |
179,550 |
|
|
Phillips Petroleum Co. 6.375% 3/30/09 |
Baa2 |
|
250,000 |
225,868 |
|
|
Plains Resources, Inc. Series B 10.25% 3/15/06 |
B2 |
|
200,000 |
198,000 |
|
|
YPF Sociedad Anonima |
B1 |
|
50,000 |
49,050 |
|
|
|
1,669,775 |
||||
|
TOTAL ENERGY |
1,903,988 |
||||
|
FINANCE - 3.0% |
|||||
|
Banks - 1.1% |
|||||
|
ABN-Amro Bank NV, Chicago 6.625% 10/31/01 |
A1 |
|
500,000 |
494,055 |
|
|
Bank of Tokyo-Mitsubishi Ltd. 8.4% 4/15/10 |
A3 |
|
200,000 |
201,960 |
|
|
BankBoston Corp. |
A3 |
|
200,000 |
192,736 |
|
|
Barclays Bank PLC yankee 5.95% 7/15/01 |
A1 |
|
350,000 |
347,501 |
|
|
Capital One Bank |
Baa2 |
|
250,000 |
239,713 |
|
|
Capital One Financial Corp. 7.125% 8/1/08 |
Baa3 |
|
210,000 |
195,437 |
|
|
Commonwealth Bank of Australia 8.5% 6/1/10 |
A1 |
|
100,000 |
103,774 |
|
|
Korea Development Bank: |
|
|
|
|
|
|
6.625% 11/21/03 |
Baa2 |
|
170,000 |
163,537 |
|
|
7.375% 9/17/04 |
Baa2 |
|
160,000 |
155,056 |
|
|
MBNA Corp.: |
|
|
|
|
|
|
6.34% 6/2/03 |
Baa2 |
|
100,000 |
95,790 |
|
|
6.875% 11/15/02 |
Baa2 |
|
300,000 |
295,734 |
|
|
Sanwa Finance Aruba AEC 8.35% 7/15/09 |
Baa1 |
|
600,000 |
597,336 |
|
|
Sumitomo Bank International Finance NV 8.5% 6/15/09 |
Baa1 |
|
100,000 |
100,469 |
|
|
Summit Bancorp |
BBB+ |
|
100,000 |
101,231 |
|
|
|
3,284,329 |
||||
|
|
|||||
|
Moody's Ratings (unaudited) (b) |
Principal Amount |
Value |
|||
|
Credit & Other Finance - 1.8% |
|||||
|
Ahmanson Capital Trust I 8.36% 12/1/26 (g) |
A3 |
|
$ 250,000 |
$ 227,325 |
|
|
AMRESCO, Inc. |
Caa3 |
|
220,000 |
102,300 |
|
|
Associates Corp. of North America 6% 7/15/05 |
Aa3 |
|
250,000 |
233,693 |
|
|
Bellsouth Capital Funding Corp. 7.75% 2/15/10 |
Aa3 |
|
160,000 |
160,006 |
|
|
Daimler-Chrysler NA Holding Corp. |
A1 |
|
100,000 |
98,811 |
|
|
ERP Operating LP: |
|
|
|
|
|
|
6.55% 11/15/01 |
A3 |
|
50,000 |
49,279 |
|
|
7.1% 6/23/04 |
A3 |
|
200,000 |
193,952 |
|
|
Finova Capital Corp.: |
|
|
|
|
|
|
6.11% 2/18/03 |
Baa2 |
|
200,000 |
176,000 |
|
|
7.25% 11/8/04 |
Baa2 |
|
100,000 |
89,000 |
|
|
Ford Motor Credit Co.: |
|
|
|
|
|
|
6.5% 2/28/02 |
A2 |
|
1,000,000 |
984,150 |
|
|
7.875% 6/15/10 |
A2 |
|
1,040,000 |
1,041,477 |
|
|
Household Finance Corp. 8% 5/9/05 |
A2 |
|
300,000 |
302,541 |
|
|
Imperial Credit Capital Trust I 10.25% 6/14/02 |
B2 |
|
20,000 |
17,000 |
|
|
Imperial Credit Industries 9.875% 1/15/07 |
B3 |
|
330,000 |
237,600 |
|
|
Newcourt Credit Group, Inc. 6.875% 2/16/05 |
A1 |
|
340,000 |
323,513 |
|
|
Sprint Capital Corp.: |
|
|
|
|
|
|
5.875% 5/1/04 |
Baa1 |
|
375,000 |
353,265 |
|
|
6.875% 11/15/28 |
Baa1 |
|
735,000 |
635,510 |
|
|
Trizec Finance Ltd. yankee 10.875% 10/15/05 |
Baa3 |
|
100,000 |
98,000 |
|
|
TXU Eastern Funding 6.75% 5/15/09 |
Baa1 |
|
100,000 |
89,417 |
|
|
U.S. West Capital Funding, Inc. 6.875% 7/15/28 |
Baa1 |
|
60,000 |
51,537 |
|
|
|
5,464,376 |
||||
|
Savings & Loans - 0.1% |
|||||
|
Long Island Savings Bank FSB 6.2% 4/2/01 |
Baa3 |
|
500,000 |
499,445 |
|
|
TOTAL FINANCE |
9,248,150 |
||||
|
HEALTH - 0.0% |
|||||
|
Medical Facilities Management - 0.0% |
|||||
|
Unilab Corp. |
B3 |
|
70,000 |
72,100 |
|
|
INDUSTRIAL MACHINERY & EQUIPMENT - 0.4% |
|||||
|
Industrial Machinery & Equipment - 0.3% |
|||||
|
Tyco International Group SA yankee 6.875% 1/15/29 |
Baa1 |
|
1,000,000 |
844,770 |
|
|
Corporate Bonds - continued |
|||||
|
Moody's Ratings (unaudited) (b) |
Principal Amount |
Value |
|||
|
Nonconvertible Bonds - continued |
|||||
|
INDUSTRIAL MACHINERY & EQUIPMENT - continued |
|||||
|
Pollution Control - 0.1% |
|||||
|
Allied Waste |
|
|
|
|
|
|
7.625% 1/1/06 |
Ba2 |
|
$ 155,000 |
$ 134,850 |
|
|
7.875% 1/1/09 |
Ba2 |
|
170,000 |
144,500 |
|
|
WMX Technologies, Inc. 7.1% 8/1/26 |
Ba1 |
|
120,000 |
112,946 |
|
|
|
392,296 |
||||
|
TOTAL INDUSTRIAL MACHINERY & EQUIPMENT |
1,237,066 |
||||
|
MEDIA & LEISURE - 3.0% |
|||||
|
Broadcasting - 2.6% |
|||||
|
ACME Television LLC/ACME Financial Corp. 0% 9/30/04 (e) |
B3 |
|
200,000 |
191,000 |
|
|
Adelphia Communications Corp. 9.875% 3/1/05 |
B1 |
|
150,000 |
146,250 |
|
|
Ascent Entertainment Group, Inc. 0% 12/15/04 (e) |
Ba1 |
|
230,000 |
186,300 |
|
|
British Sky Broadcasting Group PLC 8.2% 7/15/09 |
Baa3 |
|
650,000 |
608,036 |
|
|
Cable Satisfaction International, Inc. 12.75% 3/1/10 |
Caa1 |
|
200,000 |
194,500 |
|
|
Callahan Nordrhein Westfalen 14% 7/15/10 (g) |
B3 |
|
250,000 |
250,000 |
|
|
CapStar Broadcasting Partners, Inc. |
B2 |
|
190,000 |
173,375 |
|
|
Charter Communications Holdings LLC/Charter Communications Holdings Capital Corp.: |
|
|
|
|
|
|
0% 1/15/10 (e) |
B2 |
|
320,000 |
181,600 |
|
|
8.25% 4/1/07 |
B2 |
|
180,000 |
159,300 |
|
|
8.625% 4/1/09 |
B2 |
|
180,000 |
158,850 |
|
|
Continental Cablevision, Inc. 8.3% 5/15/06 |
A2 |
|
215,000 |
220,093 |
|
|
Diamond Cable Communications PLC |
B3 |
|
210,000 |
161,175 |
|
|
Earthwatch, Inc. 0% 7/15/07 unit (e)(g) |
- |
|
130,000 |
83,200 |
|
|
EchoStar DBS Corp. 9.375% 2/1/09 |
B2 |
|
260,000 |
250,900 |
|
|
Impsat Fiber Networks, Inc. 13.75% 2/15/05 (g) |
B3 |
|
195,000 |
173,550 |
|
|
International Cabletel, Inc. 0% 2/1/06 (e) |
B3 |
|
250,000 |
230,000 |
|
|
LIN Holdings Corp. |
B3 |
|
270,000 |
177,525 |
|
|
|
|||||
|
Moody's Ratings (unaudited) (b) |
Principal Amount |
Value |
|||
|
Nielsen Media Research, Inc. 7.6% 6/15/09 |
Baa2 |
|
$ 150,000 |
$ 143,127 |
|
|
NorthPoint Communication Holdings, Inc. 12.875% 2/15/10 |
Caa1 |
|
150,000 |
103,500 |
|
|
NTL, Inc. 0% 4/1/08 (e) |
B3 |
|
560,000 |
347,200 |
|
|
Olympus Communications LP/Olympus Capital Corp. 10.625% 11/15/06 |
B1 |
|
170,000 |
166,600 |
|
|
Satelites Mexicanos SA de CV 11.28% 6/30/04 (g)(i) |
B1 |
|
74,000 |
67,340 |
|
|
Shaw Communications, Inc. 8.25% 4/11/10 |
Baa2 |
|
140,000 |
141,135 |
|
|
Spectrasite Holdings, Inc.: |
|
|
|
|
|
|
0% 3/15/10 (e) |
B3 |
|
65,000 |
34,938 |
|
|
10.75% 3/15/10 |
B3 |
|
25,000 |
24,875 |
|
|
TCI Communications Financing III |
A3 |
|
180,000 |
198,864 |
|
|
Telewest PLC 0% 10/1/07 (e) |
B1 |
|
270,000 |
257,850 |
|
|
Time Warner, Inc. |
Baa3 |
|
910,000 |
927,918 |
|
|
UIH Australia/Pacific, Inc.: |
|
|
|
|
|
|
Series B 0% 5/15/06 (e) |
B2 |
|
380,000 |
349,600 |
|
|
Series D 0% 5/15/06 (e) |
B2 |
|
30,000 |
27,600 |
|
|
United Pan-Europe Communications NV: |
|
|
|
|
|
|
0% 8/1/09 (e) |
B2 |
|
230,000 |
115,000 |
|
|
0% 2/1/10 (e) |
B2 |
|
270,000 |
126,900 |
|
|
10.875% 11/1/07 |
B2 |
|
480,000 |
432,000 |
|
|
10.875% 8/1/09 |
B2 |
|
275,000 |
242,000 |
|
|
11.25% 11/1/09 |
B2 |
|
15,000 |
13,125 |
|
|
USA Networks, Inc./USANi LLC |
Baa3 |
|
580,000 |
552,450 |
|
|
|
7,817,676 |
||||
|
Entertainment - 0.0% |
|||||
|
Regal Cinemas, Inc. 9.5% 6/1/08 |
Ca |
|
355,000 |
88,750 |
|
|
Lodging & Gaming - 0.0% |
|||||
|
Horseshoe Gaming LLC 8.625% 5/15/09 |
B2 |
|
70,000 |
65,800 |
|
|
KSL Recreation Group, Inc. 10.25% 5/1/07 |
B2 |
|
90,000 |
85,500 |
|
|
|
151,300 |
||||
|
Publishing - 0.3% |
|||||
|
News America Holdings, Inc. 7.375% 10/17/08 |
Baa3 |
|
500,000 |
480,685 |
|
|
News America, Inc.: |
|
|
|
|
|
|
7.125% 4/8/28 |
Baa3 |
|
80,000 |
66,850 |
|
|
7.28% 6/30/28 |
Baa3 |
|
200,000 |
172,432 |
|
|
7.3% 4/30/28 |
Baa3 |
|
170,000 |
145,143 |
|
|
|
865,110 |
||||
|
Corporate Bonds - continued |
|||||
|
Moody's Ratings (unaudited) (b) |
Principal Amount |
Value |
|||
|
Nonconvertible Bonds - continued |
|||||
|
MEDIA & LEISURE - continued |
|||||
|
Restaurants - 0.1% |
|||||
|
AFC Enterprises, Inc. 10.25% 5/15/07 |
B3 |
|
$ 170,000 |
$ 161,500 |
|
|
TOTAL MEDIA & LEISURE |
9,084,336 |
||||
|
NONDURABLES - 0.2% |
|||||
|
Beverages - 0.1% |
|||||
|
Seagram JE & Sons, Inc.: |
|
|
|
|
|
|
6.625% 12/15/05 |
Baa3 |
|
150,000 |
143,370 |
|
|
6.8% 12/15/08 |
Baa3 |
|
200,000 |
187,565 |
|
|
|
330,935 |
||||
|
Tobacco - 0.1% |
|||||
|
RJ Reynolds Tobacco Holdings, Inc. |
Baa2 |
|
200,000 |
185,752 |
|
|
TOTAL NONDURABLES |
516,687 |
||||
|
RETAIL & WHOLESALE - 0.3% |
|||||
|
Drug Stores - 0.1% |
|||||
|
Rite Aid Corp.: |
|
|
|
|
|
|
6.5% 12/15/05 (g) |
Caa1 |
|
420,000 |
216,300 |
|
|
7.125% 1/15/07 |
Caa1 |
|
110,000 |
58,300 |
|
|
|
274,600 |
||||
|
General Merchandise Stores - 0.1% |
|||||
|
Federated Department Stores, Inc. |
Baa1 |
|
500,000 |
483,520 |
|
|
Grocery Stores - 0.1% |
|||||
|
Jitney-Jungle Stores |
|
|
|
|
|
|
10.375% 9/15/07 (d) |
C |
|
450,000 |
9,000 |
|
|
12% 3/1/06 (d) |
Caa3 |
|
10,000 |
1,250 |
|
|
Kroger Co. 6% 7/1/00 |
Baa3 |
|
200,000 |
199,962 |
|
|
|
210,212 |
||||
|
TOTAL RETAIL & WHOLESALE |
968,332 |
||||
|
SERVICES - 0.1% |
|||||
|
Printing - 0.0% |
|||||
|
Sullivan Graphics, Inc. 12.75% 8/1/05 |
Caa1 |
|
40,000 |
40,200 |
|
|
Services - 0.1% |
|||||
|
SITEL Corp. |
B3 |
|
250,000 |
220,000 |
|
|
TOTAL SERVICES |
260,200 |
||||
|
|
|||||
|
Moody's Ratings (unaudited) (b) |
Principal Amount |
Value |
|||
|
TECHNOLOGY - 0.6% |
|||||
|
Computer Services & Software - 0.3% |
|||||
|
Concentric Network Corp. 12.75% 12/15/07 |
B- |
|
$ 50,000 |
$ 52,500 |
|
|
Covad Communications Group, Inc. |
B3 |
|
355,000 |
275,125 |
|
|
Exodus Communications, Inc. 11.625% 7/15/10 (g) |
B |
|
280,000 |
281,400 |
|
|
PSINet, Inc. |
B3 |
|
260,000 |
239,200 |
|
|
|
848,225 |
||||
|
Computers & Office Equipment - 0.2% |
|||||
|
Comdisco, Inc.: |
|
|
|
|
|
|
5.95% 4/30/02 |
Baa1 |
|
300,000 |
284,763 |
|
|
7.25% 9/1/02 |
Baa1 |
|
250,000 |
241,973 |
|
|
Globix Corp. |
B- |
|
95,000 |
78,375 |
|
|
|
605,111 |
||||
|
Electronic Instruments - 0.0% |
|||||
|
Telecommunications Techniques Co. LLC 9.75% 5/15/08 |
B3 |
|
80,000 |
73,600 |
|
|
Electronics - 0.1% |
|||||
|
ChipPAC International Ltd. 12.75% 8/1/09 |
B3 |
|
40,000 |
43,000 |
|
|
Hadco Corp. |
B2 |
|
140,000 |
140,350 |
|
|
SCG Holding Corp./Semiconductor Components Industries LLC 12% 8/1/09 |
B2 |
|
52,000 |
55,510 |
|
|
|
238,860 |
||||
|
TOTAL TECHNOLOGY |
1,765,796 |
||||
|
TRANSPORTATION - 0.9% |
|||||
|
Air Transportation - 0.4% |
|||||
|
Atlas Air, Inc.: |
|
|
|
|
|
|
8.77% 1/2/11 |
Ba1 |
|
86,129 |
83,115 |
|
|
9.375% 11/15/06 |
B3 |
|
220,000 |
213,400 |
|
|
Continental Airlines, Inc. pass thru trust certificates: |
|
|
|
|
|
|
7.434% 3/15/06 |
Baa1 |
|
70,000 |
67,683 |
|
|
7.73% 9/15/12 |
Baa1 |
|
28,243 |
26,975 |
|
|
Delta Air Lines, Inc. |
Baa3 |
|
500,000 |
464,750 |
|
|
US Air, Inc. |
B3 |
|
430,000 |
425,700 |
|
|
|
1,281,623 |
||||
|
Railroads - 0.5% |
|||||
|
Burlington Northern |
|
|
|
|
|
|
6.875% 12/1/27 |
Baa2 |
|
1,000,000 |
860,780 |
|
|
Corporate Bonds - continued |
|||||
|
Moody's Ratings (unaudited) (b) |
Principal Amount |
Value |
|||
|
Nonconvertible Bonds - continued |
|||||
|
TRANSPORTATION - continued |
|||||
|
Railroads - continued |
|||||
|
Burlington Northern |
|
|
|
|
|
|
7.29% 6/1/36 |
Baa2 |
|
$ 150,000 |
$ 146,609 |
|
|
Norfolk Southern Corp. 7.05% 5/1/37 |
Baa1 |
|
340,000 |
332,302 |
|
|
|
1,339,691 |
||||
|
TOTAL TRANSPORTATION |
2,621,314 |
||||
|
UTILITIES - 3.4% |
|||||
|
Cellular - 0.5% |
|||||
|
Cellnet Data Systems, Inc. 0% 10/1/07 (e) |
- |
|
300,000 |
24,000 |
|
|
Clearnet Communications, Inc. yankee 0% 12/15/05 (e) |
B3 |
|
200,000 |
206,000 |
|
|
Crown Castle International Corp. 10.75% 8/1/11 |
B3 |
|
45,000 |
45,675 |
|
|
Dobson Communications Corp. 10.875% 7/1/10 (g) |
- |
|
50,000 |
50,375 |
|
|
Leap Wireless International, Inc.: |
|
|
|
|
|
|
0% 4/15/10 (e)(g) |
- |
|
65,000 |
27,300 |
|
|
12.5% 4/15/10 (g) |
Caa2 |
|
75,000 |
66,000 |
|
|
McCaw International Ltd. 0% 4/15/07 (e) |
Caa1 |
|
270,000 |
205,200 |
|
|
Millicom International Cellular SA |
Caa1 |
|
241,000 |
204,850 |
|
|
Nextel |
|
|
|
|
|
|
0% 10/31/07 (e) |
B1 |
|
420,000 |
312,900 |
|
|
9.375% 11/15/09 |
B1 |
|
170,000 |
163,200 |
|
|
VoiceStream |
|
|
|
|
|
|
0% 11/15/09 (e) |
B2 |
|
295,000 |
197,650 |
|
|
10.375% 11/15/09 |
B2 |
|
170,000 |
176,800 |
|
|
|
1,679,950 |
||||
|
Electric Utility - 0.4% |
|||||
|
Avon Energy Partners Holdings 6.46% 3/4/08 (g) |
Baa2 |
|
300,000 |
267,204 |
|
|
Dominion Resources, Inc. 8.125% 6/15/10 |
Baa1 |
|
165,000 |
166,115 |
|
|
Illinois Power Co. |
Baa1 |
|
150,000 |
146,427 |
|
|
Israel Electric Corp. Ltd. 7.75% 12/15/27 (g) |
A3 |
|
545,000 |
467,147 |
|
|
|
|||||
|
Moody's Ratings (unaudited) (b) |
Principal Amount |
Value |
|||
|
Niagara Mohawk Power Corp. 8.875% 5/15/07 |
Baa3 |
|
$ 75,000 |
$ 77,640 |
|
|
Texas Utilities Co. |
Baa3 |
|
100,000 |
90,325 |
|
|
|
1,214,858 |
||||
|
Gas - 0.3% |
|||||
|
CMS Panhandle |
|
|
|
|
|
|
6.125% 3/15/04 |
Baa3 |
|
150,000 |
141,675 |
|
|
7% 7/15/29 |
Baa3 |
|
150,000 |
125,880 |
|
|
Reliant Energy Resources Corp. 8.125% 7/15/05 (g) |
Baa1 |
|
500,000 |
499,900 |
|
|
|
767,455 |
||||
|
Telephone Services - 2.2% |
|||||
|
Allegiance Telecom, Inc. 12.875% 5/15/08 |
B3 |
|
200,000 |
216,500 |
|
|
Cable & Wireless Optus Ltd. 8% 6/22/10 (g) |
Baa1 |
|
700,000 |
695,681 |
|
|
Deutsche Telekom International Finance BV 8.25% 6/15/30 |
Aa2 |
|
935,000 |
949,895 |
|
|
Esat Telecom Group PLC 0% 2/1/07 (e) |
Aa1 |
|
230,000 |
213,900 |
|
|
Global Crossing Holdings Ltd. 9.625% 5/15/08 |
Ba2 |
|
180,000 |
176,400 |
|
|
Global TeleSystems Group, Inc. 9.875% 2/15/05 |
Caa1 |
|
330,000 |
227,700 |
|
|
Globenet Communication Group Ltd. |
Caa1 |
|
560,000 |
565,600 |
|
|
Hermes Europe Railtel BV 11.5% 8/15/07 |
B3 |
|
150,000 |
125,250 |
|
|
ICG Holdings, Inc. |
B3 |
|
260,000 |
249,600 |
|
|
Intermedia Communications, Inc. |
B3 |
|
330,000 |
200,475 |
|
|
KMC Telecom Holdings, Inc. 13.5% 5/15/09 |
Caa2 |
|
170,000 |
141,100 |
|
|
NEXTLINK Communications, Inc. |
B2 |
|
500,000 |
287,500 |
|
|
Ono Finance PLC |
Caa1 |
|
215,000 |
203,175 |
|
|
Rhythms NetConnections, Inc. 14% 2/15/10 (g) |
B3 |
|
200,000 |
144,000 |
|
|
Telecomunicaciones de Puerto Rico, Inc. |
Baa2 |
|
220,000 |
204,882 |
|
|
Teleglobe Canada, Inc.: |
|
|
|
|
|
|
7.2% 7/20/09 |
Baa1 |
|
449,000 |
429,626 |
|
|
7.7% 7/20/29 |
Baa1 |
|
666,000 |
627,152 |
|
|
Versatel Telecom |
B3 |
|
150,000 |
152,250 |
|
|
Viatel, Inc. 11.25% 4/15/08 |
B3 |
|
250,000 |
187,500 |
|
|
Corporate Bonds - continued |
|||||
|
Moody's Ratings (unaudited) (b) |
Principal Amount |
Value |
|||
|
Nonconvertible Bonds - continued |
|||||
|
UTILITIES - continued |
|||||
|
Telephone Services - continued |
|||||
|
WinStar Communications, Inc. 12.75% 4/15/10 (g) |
B3 |
|
$ 450,000 |
$ 434,250 |
|
|
WorldCom, Inc. |
A3 |
|
184,000 |
190,782 |
|
|
|
6,623,218 |
||||
|
TOTAL UTILITIES |
10,285,481 |
||||
|
TOTAL NONCONVERTIBLE BONDS |
42,871,953 |
||||
|
TOTAL CORPORATE BONDS (Cost $48,683,174) |
46,399,900 |
||||
|
U.S. Government and Government |
|||||
|
|
|||||
|
U.S. Government Agency Obligations - 1.7% |
|||||
|
Fannie Mae: |
|
|
|
|
|
|
6.5% 4/29/09 |
Aaa |
|
1,600,000 |
1,494,752 |
|
|
7.125% 2/15/05 |
Aaa |
|
1,315,000 |
1,320,339 |
|
|
7.25% 5/15/30 |
Aaa |
|
660,000 |
673,435 |
|
|
Federal Home Loan Bank 7.59% 3/10/05 |
Aaa |
|
190,000 |
193,859 |
|
|
Freddie Mac: |
|
|
|
|
|
|
5.75% 3/15/09 |
Aaa |
|
800,000 |
728,624 |
|
|
6.25% 7/15/04 |
Aaa |
|
310,000 |
301,379 |
|
|
6.875% 1/15/05 |
Aaa |
|
185,000 |
183,844 |
|
|
7% 7/15/05 |
Aaa |
|
250,000 |
249,650 |
|
|
Government Trust Certificates (assets of Trust guaranteed by U.S. Government through Defense Security Assistance Agency) Class 2-E, 9.4% 5/15/02 |
Aaa |
|
34,670 |
35,168 |
|
|
Tennessee Valley Authority 7.125% 5/1/30 |
Aaa |
|
140,000 |
140,588 |
|
|
TOTAL U.S. GOVERNMENT AGENCY OBLIGATIONS |
5,321,638 |
||||
|
U.S. Treasury Obligations - 8.7% |
|||||
|
U.S. Treasury Bonds: |
|
|
|
|
|
|
6.125% 8/15/29 |
Aaa |
|
1,660,000 |
1,676,600 |
|
|
8.875% 8/15/17 |
Aaa |
|
3,805,000 |
4,850,195 |
|
|
9.875% 11/15/15 |
Aaa |
|
625,000 |
847,463 |
|
|
14% 11/15/11 |
Aaa |
|
490,000 |
680,488 |
|
|
U.S. Treasury Notes: |
|
|
|
|
|
|
5.5% 5/31/03 |
Aaa |
|
6,000,000 |
5,861,220 |
|
|
5.5% 2/15/08 |
Aaa |
|
100,000 |
95,719 |
|
|
5.625% 9/30/01 |
Aaa |
|
140,000 |
138,512 |
|
|
|
|||||
|
Moody's Ratings (unaudited) (b) |
Principal Amount |
Value |
|||
|
5.875% 10/31/01 |
Aaa |
|
$ 1,950,000 |
$ 1,934,771 |
|
|
5.875% 11/15/04 |
Aaa |
|
2,850,000 |
2,808,590 |
|
|
6.5% 5/31/02 |
Aaa |
|
3,010,000 |
3,013,763 |
|
|
7% 7/15/06 |
Aaa |
|
3,750,000 |
3,885,938 |
|
|
U.S. Treasury Notes - |
Aaa |
|
1,430,000 |
709,652 |
|
|
TOTAL U.S. TREASURY OBLIGATIONS |
26,502,911 |
||||
|
TOTAL U.S. GOVERNMENT AND GOVERNMENT AGENCY OBLIGATIONS (Cost $31,715,419) |
31,824,549 |
||||
|
U.S. Government Agency - |
|||||
|
|
|||||
|
Fannie Mae - 9.1% |
|||||
|
5.5% 2/1/11 |
Aaa |
|
156,534 |
145,429 |
|
|
6% 4/1/09 to 1/1/29 |
Aaa |
|
1,860,194 |
1,734,133 |
|
|
6.5% 11/1/25 to 7/1/29 |
Aaa |
|
11,136,937 |
10,514,432 |
|
|
6.5% 7/1/30 (h) |
Aaa |
|
3,500,000 |
3,298,750 |
|
|
7% 12/1/24 to 9/1/28 |
Aaa |
|
3,344,454 |
3,236,903 |
|
|
7.5% 5/1/15 to 1/1/30 |
Aaa |
|
8,490,673 |
8,375,883 |
|
|
8% 12/1/29 |
Aaa |
|
499,027 |
501,053 |
|
|
TOTAL FANNIE MAE |
27,806,583 |
||||
|
Freddie Mac - 0.1% |
|||||
|
7.5% 1/1/27 |
Aaa |
|
367,456 |
363,782 |
|
|
Government National Mortgage Association - 3.8% |
|||||
|
6.5% 4/15/28 to 4/15/29 |
Aaa |
|
10,337,543 |
9,813,560 |
|
|
7% 1/15/28 to 12/15/28 |
Aaa |
|
636,734 |
619,020 |
|
|
7.5% 6/15/27 to 3/15/28 |
Aaa |
|
1,153,223 |
1,145,846 |
|
|
TOTAL GOVERNMENT NATIONAL |
11,578,426 |
||||
|
TOTAL U.S. GOVERNMENT AGENCY - (Cost $41,146,234) |
39,748,791 |
||||
|
Asset-Backed Securities - 0.8% |
|||||
|
|
|||||
|
American Express Credit Account Master Trust |
A1 |
|
200,000 |
192,297 |
|
|
Ford Credit Auto |
|
|
|
|
|
|
6.2% 12/15/02 |
Aa2 |
|
510,000 |
503,067 |
|
|
6.4% 12/15/02 |
Aa2 |
|
80,000 |
78,960 |
|
|
7.03% 11/15/03 |
Aaa |
|
145,000 |
144,887 |
|
|
Key Auto Finance Trust: |
|
|
|
|
|
|
6.3% 10/15/03 |
A2 |
|
197,699 |
196,711 |
|
|
6.65% 10/15/03 |
Baa3 |
|
59,053 |
58,979 |
|
|
Asset-Backed Securities - continued |
|||||
|
Moody's Ratings (unaudited) (b) |
Principal Amount |
Value |
|||
|
Premier Auto Trust |
Aaa |
|
$ 1,000,000 |
$ 970,310 |
|
|
Sears Credit Account Master Trust II |
A2 |
|
200,000 |
200,000 |
|
|
TOTAL ASSET-BACKED SECURITIES (Cost $2,390,044) |
2,345,211 |
||||
|
Commercial Mortgage Securities - 0.9% |
|||||
|
|
|||||
|
CS First Boston Mortgage Securities Corp.: |
|
|
|
|
|
|
Series 1997-C2 Class D, 7.27% 1/17/35 |
Baa2 |
|
220,000 |
202,245 |
|
|
Series 1998-FL1: |
|
|
|
|
|
|
Class D, 7.1415% 12/10/00 (g)(i) |
A2 |
|
300,000 |
299,543 |
|
|
Class E, 7.4913% 1/10/13 (g)(i) |
Baa2 |
|
420,000 |
418,130 |
|
|
DLJ Commercial Mortgage Corp. 7.62% 5/10/10 |
Aaa |
|
500,000 |
501,484 |
|
|
GS Mortgage Securities Corp. II Series 1998-GLII Class E, 7.1905% 4/13/31 (g)(i) |
Baa3 |
|
500,000 |
432,285 |
|
|
Prudential Securities Secd Financing Corp. Series 2000-C1, Class A2 7.727% 2/15/10 |
Aaa |
|
450,000 |
454,359 |
|
|
Thirteen Affiliates of General Growth Properties, Inc. sequential pay Series 1 Class A2, 6.602% 12/15/10 (g) |
Aaa |
|
500,000 |
473,242 |
|
|
TOTAL COMMERCIAL MORTGAGE SECURITIES (Cost $2,876,556) |
2,781,288 |
||||
|
Foreign Government and Government |
|||||
|
|
|||||
|
Korean Republic yankee: |
|
|
|
|
|
|
8.75% 4/15/03 |
Baa2 |
|
80,000 |
81,437 |
|
|
8.875% 4/15/08 |
Baa2 |
|
116,000 |
119,654 |
|
|
Quebec Province yankee: |
|
|
|
|
|
|
6.86% 4/15/26 (f) |
A2 |
|
250,000 |
240,255 |
|
|
7.125% 2/9/24 |
A2 |
|
30,000 |
28,337 |
|
|
7.5% 7/15/23 |
A2 |
|
30,000 |
29,574 |
|
|
United Mexican States 9.875% 2/1/10 |
Baa3 |
|
200,000 |
209,000 |
|
|
TOTAL FOREIGN GOVERNMENT AND GOVERNMENT AGENCY OBLIGATIONS (Cost $727,451) |
708,257 |
||||
|
Supranational Obligations - 0.2% |
|||||
|
Moody's Ratings (unaudited) (b) |
Principal Amount |
Value |
|||
|
Inter-American Development Bank yankee 6.29% 7/16/27 |
Aaa |
|
$ 500,000 |
$ 476,310 |
|
|
Cash Equivalents - 3.0% |
|||
|
Shares |
|
||
|
Taxable Central Cash Fund, |
9,219,794 |
9,219,794 |
|
|
TOTAL INVESTMENT PORTFOLIO - 100.9% (Cost $271,264,000) |
307,839,743 |
||
|
NET OTHER ASSETS - (0.9)% |
(2,855,046) |
||
|
NET ASSETS - 100% |
$ 304,984,697 |
||
|
Security Type Abbreviations |
||
|
PIES |
- |
Premium Income Equity Securities |
|
Legend |
|
(a) Non-income producing |
|
(b) S&P credit ratings are used in the absence of a rating by Moody's Investors Service, Inc. |
|
(c) The rate quoted is the annualized seven-day yield of the fund at |
|
(d) Non-income producing - issuer filed for protection under the |
|
(e) Debt obligation initially issued in zero coupon form which converts to coupon form at a specified rate and date. The rate shown is the rate at period end. |
|
(f) Debt obligation initially issued at one coupon which converts to a higher coupon at a specified date. The rate shown is the rate at period end. |
|
(g) Security exempt from registration under Rule 144A of the Securities Act |
|
(h) Security purchased on a delayed delivery or when-issued basis. |
|
(i) The coupon rate shown on floating or adjustable rate securities represents the rate at period end. |
|
(j) For foreign government obligations not individually rated by S&P |
|
(k) Restricted securities - Investment in securities not registered under the Securities Act of 1933. |
|
Additional information on each holding is as follows: |
|
Security |
Acquisition Date |
Acquisition Cost |
|
Mothers Work, Inc. |
6/18/98 |
$ 18 |
|
Other Information |
|
The composition of long-term debt holdings as a percentage of total value |
|
Moody's Ratings |
S&P Ratings |
|||
|
Aaa, Aa, A |
27.2% |
|
AAA, AA, A |
25.5% |
|
Baa |
6.9% |
|
BBB |
5.9% |
|
Ba |
0.4% |
|
BB |
0.6% |
|
B |
3.9% |
|
B |
4.7% |
|
Caa |
0.9% |
|
CCC |
0.7% |
|
Ca, C |
0.0% |
|
CC, C |
0.0% |
|
|
|
|
D |
0.0% |
|
The percentage not rated by Moody's or S&P amounted to 0.5%. FMR has determined that unrated debt securities that are lower quality account for 0.5% of the total value of investment in securities. |
|
Purchases and sales of securities, other than short-term securities, aggregated $224,411,074 and $262,292,592, respectively, of which long-term U.S. government and government agency obligations aggregated $59,871,450 and $60,369,656, respectively. |
|
The fund placed a portion of its portfolio transactions with brokerage firms which are affiliates of Fidelity Management & Research Company. The commissions paid to these affiliated firms were $8,986 for the period. |
|
The fund invested in securities that are not registered under the Securities Act of 1933. These securities are subject to legal or contractual restrictions on resale. At the end of the period, restricted securities (excluding Rule 144A issues) amounted to $34 and 0% of net assets. |
|
Income Tax Information |
|
At June 30, 2000, the aggregate cost of investment securities for income tax purposes was $266,299,649. Net unrealized appreciation aggregated $41,540,094, of which $50,485,729 related to appreciated investment securities and $8,945,635 related to depreciated investment securities. |
See accompanying notes which are an integral part of the financial statements.
Balanced Portfolio
Statement of Assets and Liabilities
|
|
June 30, 2000 (Unaudited) |
|
|
Assets |
|
|
|
Investment in securities, at value |
|
$ 307,839,743 |
|
Commitment to sell securities on a delayed delivery basis |
$ (5,690,625) |
|
|
Receivable for securities sold on a delayed delivery basis |
5,685,000 |
(5,625) |
|
Receivable for investments sold, regular delivery |
|
3,535,259 |
|
Cash |
|
23,298 |
|
Receivable for fund shares sold |
|
242,446 |
|
Dividends receivable |
|
49,966 |
|
Interest receivable |
|
1,666,464 |
|
Other receivables |
|
44,424 |
|
Total assets |
|
313,395,975 |
|
Liabilities |
|
|
|
Payable for investments purchased |
4,592,826 |
|
|
Delayed delivery |
3,294,642 |
|
|
Payable for fund shares redeemed |
376,552 |
|
|
Accrued management fee |
108,417 |
|
|
Distribution fees payable |
2,544 |
|
|
Other payables and |
36,297 |
|
|
Total liabilities |
|
8,411,278 |
|
Net Assets |
|
$ 304,984,697 |
|
Net Assets consist of: |
|
|
|
Paid in capital |
|
$ 259,384,219 |
|
Undistributed net investment income |
|
5,026,674 |
|
Accumulated undistributed net realized gain (loss) on investments and foreign currency transactions |
|
4,004,148 |
|
Net unrealized appreciation (depreciation) on investments |
|
36,569,656 |
|
Net Assets |
|
$ 304,984,697 |
|
Initial Class: |
|
$15.09 |
|
Service Class: |
|
$15.03 |
|
Service Class 2: |
|
$15.02 |
Statement of Operations
|
|
Six months ended June 30, 2000 (Unaudited) |
|
|
Investment Income Dividends |
|
$ 1,026,288 |
|
Interest |
|
4,833,980 |
|
Security lending |
|
131 |
|
Total income |
|
5,860,399 |
|
Expenses |
|
|
|
Management fee |
$ 667,765 |
|
|
Transfer agent fees |
101,971 |
|
|
Distribution fees |
13,916 |
|
|
Accounting and security lending fees |
59,780 |
|
|
Non-interested trustees' compensation |
506 |
|
|
Custodian fees and expenses |
13,860 |
|
|
Audit |
14,098 |
|
|
Legal |
1,823 |
|
|
Reports to shareholders |
309 |
|
|
Miscellaneous |
137 |
|
|
Total expenses before reductions |
874,165 |
|
|
Expense reductions |
(26,193) |
847,972 |
|
Net investment income |
|
5,012,427 |
|
Realized and Unrealized Gain (Loss) Net realized gain (loss) on: |
|
|
|
Investment securities |
4,969,880 |
|
|
Foreign currency transactions |
(4,097) |
4,965,783 |
|
Change in net unrealized appreciation (depreciation) on: |
|
|
|
Investment securities |
(11,411,603) |
|
|
Assets and liabilities in |
(1,569) |
|
|
Delayed delivery commitments |
(5,625) |
(11,418,797) |
|
Net gain (loss) |
|
(6,453,014) |
|
Net increase (decrease) in net assets resulting from operations |
|
$ (1,440,587) |
|
Other Information Expense reductions |
|
$ 25,816 |
|
Custodian credits |
|
377 |
|
|
|
$ 26,193 |
See accompanying notes which are an integral part of the financial statements.
Semiannual Report
Fidelity Variable Insurance Products: Balanced Portfolio
Financial Statements - continued
Statement of Changes in Net Assets
|
Increase (Decrease) in Net Assets |
Six months ended |
Year ended |
|
Operations |
$ 5,012,427 |
$ 10,132,202 |
|
Net realized gain (loss) |
4,965,783 |
7,580,954 |
|
Change in net unrealized appreciation (depreciation) |
(11,418,797) |
(2,525,268) |
|
Net increase (decrease) in net assets resulting from operations |
(1,440,587) |
15,187,888 |
|
Distributions to shareholders |
(10,025,969) |
(7,479,403) |
|
From net realized gain |
(8,369,238) |
(8,692,279) |
|
Total distributions |
(18,395,207) |
(16,171,682) |
|
Share transactions - net increase (decrease) |
(27,604,335) |
36,165,081 |
|
Total increase (decrease) in net assets |
(47,440,129) |
35,181,287 |
|
Net Assets |
|
|
|
Beginning of period |
352,424,826 |
317,243,539 |
|
End of period (including undistributed net investment income of $5,026,674 and $10,132,202, respectively) |
$ 304,984,697 |
$ 352,424,826 |
|
|
|
Other Information: |
|
|
Six months ended June 30, 2000 |
Year ended |
||
|
|
Shares |
Dollars |
Shares |
Dollars |
|
Share transactions |
800,778 |
$ 11,898,820 |
4,444,110 |
$ 70,037,773 |
|
Reinvested |
1,146,173 |
16,906,054 |
1,027,536 |
15,608,277 |
|
Redeemed |
(4,066,967) |
(61,054,219) |
(4,234,242) |
(66,752,172) |
|
Net increase (decrease) |
(2,120,016) |
$ (32,249,345) |
1,237,404 |
$ 18,893,878 |
|
Service Class |
289,094 |
$ 4,329,594 |
1,108,300 |
$ 17,387,242 |
|
Reinvested |
100,855 |
1,483,571 |
37,189 |
563,405 |
|
Redeemed |
(125,685) |
(1,874,764) |
(43,583) |
(679,444) |
|
Net increase (decrease) |
264,264 |
$ 3,938,401 |
1,101,906 |
$ 17,271,203 |
|
Service Class 2 A |
47,040 |
$ 701,059 |
- |
$ - |
|
Reinvested |
380 |
5,581 |
- |
- |
|
Redeemed |
(2) |
(31) |
- |
- |
|
Net increase (decrease) |
47,418 |
$ 706,609 |
- |
$ - |
|
Distributions |
|
$ 9,221,484 |
|
$ 7,218,828 |
|
Service Class |
|
801,470 |
|
260,575 |
|
Service Class 2 A |
|
3,015 |
|
- |
|
Total |
|
$ 10,025,969 |
|
$ 7,479,403 |
|
From net realized gain |
|
$ 7,684,570 |
|
$ 8,389,449 |
|
Service Class |
|
682,102 |
|
302,830 |
|
Service Class 2 A |
|
2,566 |
|
- |
|
Total |
|
$ 8,369,238 |
|
$ 8,692,279 |
|
|
|
$ 18,395,207 |
|
$ 16,171,682 |
A Service Class 2 commenced sale of shares January 12, 2000.
See accompanying notes which are an integral part of the financial statements.
Balanced Portfolio
Financial Highlights - Initial Class
|
|
Six months ended |
Years ended December 31, |
||||
|
Selected Per-Share Data |
(Unaudited) |
1999 |
1998 |
1997 |
1996 |
1995 H |
|
Net asset value, beginning of period |
$ 16.00 |
$ 16.11 |
$ 14.58 |
$ 12.23 |
$ 11.17 |
$ 10.00 |
|
Income from Investment Operations |
|
|
|
|
|
|
|
Net investment income |
.24 D |
.45 D |
.44 D |
.44 D |
.33 |
.14 |
|
Net realized and unrealized gain (loss) |
(.27) |
.24 |
2.00 |
2.22 |
.78 |
1.25 |
|
Total from investment operations |
(.03) |
.69 |
2.44 |
2.66 |
1.11 |
1.39 |
|
Less Distributions |
|
|
|
|
|
|
|
From net investment income |
(.48) |
(.37) |
(.36) |
(.31) |
(.01) |
(.14) |
|
From net realized gain |
(.40) |
(.43) |
(.55) |
- |
(.04) |
(.08) |
|
Total distributions |
(.88) |
(.80) |
(.91) |
(.31) |
(.05) |
(.22) |
|
Net asset value, end of period |
$ 15.09 |
$ 16.00 |
$ 16.11 |
$ 14.58 |
$ 12.23 |
$ 11.17 |
|
Total Return B, C |
(0.06)% |
4.55% |
17.64% |
22.18% |
9.98% |
13.92% |
|
Ratios and Supplemental Data |
|
|
|
|
|
|
|
Net assets, end of period (000 omitted) |
$ 274,792 |
$ 325,371 |
$ 307,681 |
$ 214,538 |
$ 103,110 |
$ 43,155 |
|
Ratio of expenses to average net assets |
.55% A |
.57% |
.59% |
.61% |
.72% |
1.42% F |
|
Ratio of expenses to average net assets after |
.53% A, G |
.55% G |
.58% G |
.60% G |
.71% G |
1.42% |
|
Ratio of net investment income to average net assets |
3.20% A |
2.87% |
2.94% |
3.28% |
3.63% |
3.56% |
|
Portfolio turnover |
148% A |
108% |
94% |
98% |
163% |
248% |
Financial Highlights - Service Class
|
|
Six months ended |
Years ended December 31, |
||
|
Selected Per-Share Data |
(Unaudited) |
1999 |
1998 |
1997 E |
|
Net asset value, beginning of period |
$ 15.94 |
$ 16.07 |
$ 14.59 |
$ 14.16 |
|
Income from Investment Operations |
|
|
|
|
|
Net investment income D |
.23 |
.43 |
.41 |
.08 |
|
Net realized and unrealized gain (loss) |
(.27) |
.24 |
1.98 |
.35 |
|
Total from investment operations |
(.04) |
.67 |
2.39 |
.43 |
|
Less Distributions |
|
|
|
|
|
From net investment income |
(.47) |
(.37) |
(.36) |
- |
|
From net realized gain |
(.40) |
(.43) |
(.55) |
- |
|
Total distributions |
(.87) |
(.80) |
(.91) |
- |
|
Net asset value, end of period |
$ 15.03 |
$ 15.94 |
$ 16.07 |
$ 14.59 |
|
Total Return B, C |
(0.13)% |
4.43% |
17.27% |
3.04% |
|
Ratios and Supplemental Data |
|
|
|
|
|
Net assets, end of period (000 omitted) |
$ 29,480 |
$ 27,054 |
$ 9,562 |
$ 10 |
|
Ratio of expenses to average net assets |
.65% A |
.67% |
.70% |
.71% A |
|
Ratio of expenses to average net assets after expense reductions |
.63% A, G |
.66% G |
.69% G |
.71% A |
|
Ratio of net investment income to average net assets |
3.10% A |
2.77% |
2.79% |
3.43% A |
|
Portfolio turnover |
148% A |
108% |
94% |
98% |
|
A Annualized B The total returns would have been lower had certain expenses not been reduced during the periods shown. C Total returns for periods of less than one year are not annualized and do not reflect charges attributable to your insurance company's separate account. Inclusion of these charges would reduce the total returns shown. D Net investment income per share has been calculated based on average shares outstanding during the period. E For the period November 3, 1997 (commencement of sale of Service Class shares) to December 31, 1997. F FMR agreed to reimburse a portion of the class' expenses during the period. Without this reimbursement, the class' expense ratio would have been higher. G FMR or the fund has entered into varying arrangements with third parties who either paid or reduced a portion of the class' expenses. H For the period January 3, 1995 (commencement of operations of Initial Class shares) to December 31, 1995. |
||||
See accompanying notes which are an integral part of the financial statements.
Semiannual Report
Financial Highlights - Service Class 2
|
|
Six months ended |
|
Selected Per-Share Data |
(Unaudited) |
|
Net asset value, beginning of period |
$ 15.59 |
|
Income from Investment Operations |
|
|
Net investment income D |
.20 |
|
Net realized and unrealized gain (loss) |
.10 G |
|
Total from investment operations |
.30 |
|
Less Distributions |
|
|
From net investment income |
(.47) |
|
From net realized gain |
(.40) |
|
Total distributions |
(.87) |
|
Net asset value, end of period |
$ 15.02 |
|
Total Return B, C |
2.05% |
|
Ratios and Supplemental Data |
|
|
Net assets, end of period (000 omitted) |
$ 712 |
|
Ratio of expenses to average net assets |
.79% A |
|
Ratio of expenses to average net assets after expense reductions |
.77% A, F |
|
Ratio of net investment income to average net assets |
2.96% A |
|
Portfolio turnover |
148% A |
|
A Annualized B The total returns would have been lower had certain expenses not been reduced during the periods shown. C Total returns for periods of less than one year are not annualized and do not reflect charges attributable to your insurance company's separate account. Inclusion of these charges would reduce the total returns shown. D Net investment income per share has been calculated based on average shares outstanding during the period. E For the period January 12, 2000 (commencement of sale of Service Class 2 shares) to June 30, 2000. F FMR or the fund has entered into varying arrangements with third parties who either paid or reduced a portion of the class' expenses. G The amount shown for a share outstanding does not correspond with the aggregate net loss on investments for the period due to the timing of sales and repurchases of class shares in relation to fluctuating market values of the investments of the fund. |
|
See accompanying notes which are an integral part of the financial statements.
Balanced Portfolio
A special meeting of the fund's shareholders was held on July 19, 2000. The results of votes taken among shareholders on proposals before them are reported below. Each vote reported represents one dollar of net asset value held on the record date for the meeting.
PROPOSAL 1
To elect as Trustees the following twelve nominees.*
|
|
# of Dollars Voted |
% of Dollars Voted |
Ralph F. Cox
|
Affirmative |
2,995,348,207.84 |
97.862 |
|
Withheld |
65,444,305.52 |
2.138 |
|
TOTAL |
3,060,792,513.36 |
100.000 |
Phyllis Burke Davis
|
Affirmative |
2,995,012,849.06 |
97.851 |
|
Withheld |
65,779,664.30 |
2.149 |
|
TOTAL |
3,060,792,513.36 |
100.000 |
Robert M. Gates
|
Affirmative |
2,994,325,628.16 |
97.828 |
|
Withheld |
66,466,885.20 |
2.172 |
|
TOTAL |
3,060,792,513.36 |
100.000 |
Edward C. Johnson 3d
|
Affirmative |
2,994,212,266.77 |
97.825 |
|
Withheld |
66,580,246.59 |
2.175 |
|
TOTAL |
3,060,792,513.36 |
100.000 |
Donald J. Kirk
|
Affirmative |
2,996,527,468.99 |
97.900 |
|
Withheld |
64,265,044.37 |
2.100 |
|
TOTAL |
3,060,792,513.36 |
100.000 |
Ned C. Lautenbach
|
Affirmative |
2,997,430,896.97 |
97.930 |
|
Withheld |
63,361,616.39 |
2.070 |
|
TOTAL |
3,060,792,513.36 |
100.000 |
|
|
# of Dollars Voted |
% of Dollars Voted |
Peter S. Lynch
|
Affirmative |
2,997,391,112.97 |
97.929 |
|
Withheld |
63,401,400.39 |
2.071 |
|
TOTAL |
3,060,792,513.36 |
100.000 |
William O. McCoy
|
Affirmative |
2,997,364,420.76 |
97.928 |
|
Withheld |
63,428,092.60 |
2.072 |
|
TOTAL |
3,060,792,513.36 |
100.000 |
Gerald C. McDonough
|
Affirmative |
2,992,594,911.89 |
97.772 |
|
Withheld |
68,197,601.47 |
2.228 |
|
TOTAL |
3,060,792,513.36 |
100.000 |
Marvin L. Mann
|
Affirmative |
2,996,491,839.67 |
97.899 |
|
Withheld |
64,300,673.69 |
2.101 |
|
TOTAL |
3,060,792,513.36 |
100.000 |
Robert C. Pozen
|
Affirmative |
2,997,304,419.99 |
97.926 |
|
Withheld |
63,488,093.37 |
2.074 |
|
TOTAL |
3,060,792,513.36 |
100.000 |
Thomas R. Williams
|
Affirmative |
2,993,561,996.24 |
97.803 |
|
Withheld |
67,230,517.12 |
2.197 |
|
TOTAL |
3,060,792,513.36 |
100.000 |
Semiannual Report
Proxy Voting Results - continued
PROPOSAL 2
To ratify the selection of Deloitte & Touche LLP as independent accountants of the fund.
|
|
# of Dollars Voted |
% of Dollars Voted |
|
Affirmative |
276,319,488.69 |
94.617 |
|
Against |
4,151,739.32 |
1.422 |
|
Abstain |
11,567,630.61 |
3.961 |
|
TOTAL |
292,038,858.62 |
100.000 |
PROPOSAL 3
To authorize the Trustees to adopt an Amended and Restated Declaration of Trust.*
|
|
# of Dollars Voted |
% of Dollars Voted |
|
Affirmative |
2,837,267,199.92 |
92.697 |
|
Against |
49,473,422.32 |
1.617 |
|
Abstain |
174,051,891.12 |
5.686 |
|
TOTAL |
3,060,792,513.36 |
100.000 |
PROPOSAL 4
To approve an amended management contract for the fund that would reduce the management fee payable to FMR by the fund as FMR's assets under management increase.
|
|
# of Dollars Voted |
% of Dollars Voted |
|
Affirmative |
272,189,750.93 |
93.203 |
|
Against |
4,507,278.92 |
1.544 |
|
Abstain |
15,341,828.77 |
5.253 |
|
TOTAL |
292,038,858.62 |
100.000 |
PROPOSAL 5
To approve an amended sub-advisory agreement with FMR U.K. to provide investment advice and research services or investment management services.
|
|
# of Dollars Voted |
% of Dollars Voted |
|
Affirmative |
268,161,500.09 |
91.824 |
|
Against |
5,337,639.43 |
1.828 |
|
Abstain |
18,539,719.10 |
6.348 |
|
TOTAL |
292,038,858.62 |
100.000 |
PROPOSAL 6
To approve an amended sub-advisory agreement with FMR Far East to provide investment advice and research services or investment management services.
|
|
# of Dollars Voted |
% of Dollars Voted |
|
Affirmative |
267,614,072.73 |
91.636 |
|
Against |
5,806,227.04 |
1.989 |
|
Abstain |
18,618,558.85 |
6.375 |
|
TOTAL |
292,038,858.62 |
100.000 |
PROPOSAL 7
To modify the fund's fundamental investment objective and eliminate a fundamental investment policy of the fund.
|
Affirmative |
267,914,892.06 |
91.739 |
|
Against |
7,333,491.83 |
2.512 |
|
Abstain |
16,790,474.73 |
5.749 |
|
TOTAL |
292,038,858.62 |
100.000 |
PROPOSAL 8
To amend the fundamental investment limitation concerning diversification.
|
Affirmative |
267,037,890.43 |
91.439 |
|
Against |
7,842,324.91 |
2.686 |
|
Abstain |
17,158,643.28 |
5.875 |
|
TOTAL |
292,038,858.62 |
100.000 |
PROPOSAL 9
To amend the fundamental investment limitation concerning underwriting.
|
|
# of Dollars Voted |
% of Dollars Voted |
|
Affirmative |
266,860,588.67 |
91.378 |
|
Against |
8,492,005.75 |
2.908 |
|
Abstain |
16,686,264.20 |
5.714 |
|
TOTAL |
292,038,858.62 |
100.000 |
PROPOSAL 10
To amend the fundamental investment limitation concerning concentration.
|
|
# of Dollars Voted |
% of Dollars Voted |
|
Affirmative |
267,900,537.74 |
91.735 |
|
Against |
7,342,176.47 |
2.514 |
|
Abstain |
16,796,144.41 |
5.751 |
|
TOTAL |
292,038,858.62 |
100.000 |
* Denotes trust-wide proposals and voting results.
Balanced Portfolio
Performance
There are several ways to evaluate a fund's historical performance. You can look at the total percentage change in value, the average annual percentage change or the growth of a hypothetical $10,000 investment. Total return reflects the change in the value of an investment, assuming reinvestment of the fund's dividend income and capital gains (the profits earned upon the sale of securities that have grown in value). The initial offering of Service Class shares took place on November 3, 1997. Performance for Service Class shares reflects an asset based distribution fee (12b-1 fee), and returns prior to November 3, 1997 are those of Initial Class and do not include the effects of Service Class' 12b-1 fee. Had Service Class shares' 12b-1 fee been reflected, returns prior to November 3, 1997 would have been lower. If Fidelity had not reimbursed certain fund expenses, the past five year and life of fund total returns would have been lower.
Average Annual Total Returns
|
Periods ended |
Past 1 |
Past 5 |
Life of |
|
Fidelity VIP: Asset Mgr: Growth - |
5.69% |
17.10% |
17.79% |
|
Asset Manager: Growth Composite |
6.73% |
18.15% |
15.37% |
|
S&P 500 |
7.25% |
23.80% |
25.60% |
|
LB Aggregate Bond |
4.57% |
6.25% |
7.81% |
|
LB 3 Month T-Bill |
5.57% |
5.41% |
n/a* |
Average annual returns take the fund's cumulative return and show you what would have happened if the fund had performed at a constant rate each year.
You can compare the fund's returns to those of the Asset Manager: Growth Composite Index - a hypothetical combination of unmanaged indices. The composite index combines the total returns of the Standard & Poor's 500 Index, the Lehman Brothers Aggregate Bond Index and the Lehman Brothers 3 Month Treasury Bill Index weighted according to the fund's neutral mix.**
The benchmarks listed in the table above include reinvested dividends and capital gains, if any.
Figures for more than one year assume a steady compounded rate of return and are not the fund's year-by-year results, which fluctuated over the periods shown. The life of fund figures are from commencement of operations, January 3, 1995.
Performance numbers are net of all fund operating expenses, but do not include any insurance charges imposed by your insurance company's separate account. If performance information included the effect of these additional charges, the total return would have been lower.
Past performance is no guarantee of future results. Principal and investment return will vary and you may have a gain or loss when you withdraw your money.
* not available
** 70% stocks, 25% bonds and 5% short-term instruments effective January 1, 1997.
Understanding Performance
How a fund did yesterday is no guarantee of how it will do tomorrow. The stock market, for example, has a history of long-term growth and short-term volatility. In turn, the share price and return of a fund that invests in stocks will vary. That means if you sell your shares during a market downturn, you might lose money. But if you can ride out the market's ups and downs, you may have a gain.
3$10,000 Over Life of Fund
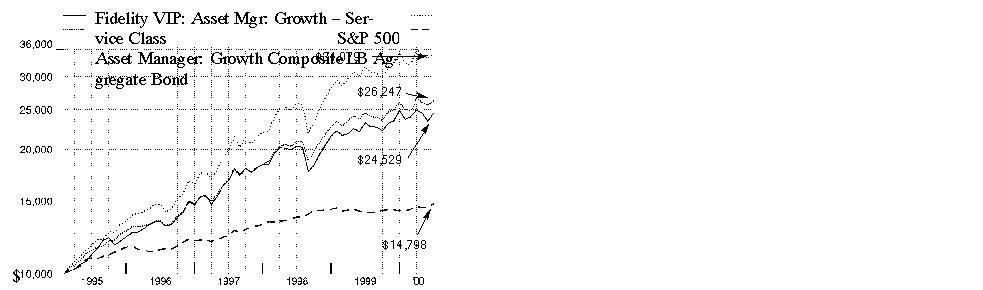
$10,000 Over Life of Fund: Let's say hypothetically that $10,000 was invested in Fidelity Variable Insurance Products: Asset Manager: Growth Portfolio -
Service Class on January 31, 1995, shortly after the fund started. As the chart shows, by June 30, 2000, the value of the investment would have grown to $24,529 -
a 145.29% increase. With reinvested dividends and capital gains, if any, a $10,000 investment in the Standard & Poor's 500 Index would have grown to $34,079 over
the same period - a 240.79% increase. If $10,000 was invested in the Lehman Brothers Aggregate
Bond Index, it would have grown to $14,798 - a 47.98% increase.
You can also look at how the Asset Manager: Growth Composite Index did over the same period. With reinvested dividends and capital gains, if any, a $10,000
investment in the index would have grown to $26,247 - a 162.47% increase.
Investment Summary
|
Top Five Stocks as of June 30, 2000 |
|
|
|
% of fund's |
|
General Electric Co. |
2.8 |
|
Intel Corp. |
2.4 |
|
Cisco Systems, Inc. |
2.4 |
|
Microsoft Corp. |
2.3 |
|
Pfizer, Inc. |
1.6 |
|
|
11.5 |
|
Top Five Market Sectors as of June 30, 2000 |
|
|
(stocks only) |
% of fund's |
|
Technology |
29.1 |
|
Health |
9.3 |
|
Finance |
6.4 |
|
Utilities |
6.0 |
|
Energy |
4.5 |
|
Asset Allocation as of June 30, 2000 |
|||
|
% of fund's net assets * |
|||
|
Stock Class 73.4% |
|
|
|
Bond Class 20.6% |
|
|
|
Short-Term Class 6.0% |
|
|
|
* Foreign |
|
|
Asset allocations in the pie charts reflect the categorization of assets as defined in the fund's prospectus. Financial Statement categorizations conform to accounting standards and will differ from the pie chart.
Semiannual Report
(Portfolio Manager photograph)
Note to shareholders: Bart Grenier became Portfolio Manager of Asset Manager: Growth Portfolio on May 1, 2000.
Q. How did the fund perform, Bart?
A. For the six- and 12-month periods that ended June 30, 2000, the fund trailed the Asset Manager: Growth Composite Index, which returned 0.95% and 6.73%, respectively.
Q. What asset allocation strategies did you pursue during the six-month period?
A. The fund continued to slightly emphasize equities, with just over 71% of its assets on average invested in this class during the period. The fund's neutral allocation mix typically calls for 70% to be invested in stocks, 25% in bonds and 5% in short-term and money market instruments. Given the bullish environment for stocks in the first quarter of 2000, the fund's overexposure here garnered it an advantage over the composite index early in the period. However, even with the equity rally in June, the fund's gains during the period were more than offset by its losses suffered during the sharp, broad market decline of April and May. On the bond side, the fund focused on high-yield securities, which hurt, although our exposure to investment-grade debt did help offset some of those losses.
Q. What factors influenced performance of the equity subportfolio?
A. Steve Snider maintained the fund's tilt toward the sectors of the economy with a high growth orientation. The fund's overweighting in technology aided performance, as we were able to uncover several large, high-quality tech names that effectively weathered the correction in the spring and posted big numbers for the period. We also took advantage of several good growth stories among some smaller-cap companies that fared extremely well. Our best tech picks overall included Texas Instruments, LSI Logic, Integrated Device Technology and Comverse. The fund's exposure to health stocks, particularly IVAX, Techne and Pfizer, helped amid a rally in biotechnology shares. Growth-oriented financials, including mutual fund distributor Waddell & Reed and insurer American International Group, were meaningful contributors. Conversely, we were caught holding a handful of disappointments within the tech sector, notably Microsoft, Lucent Technologies, QLogic and Harmonic. Steve sold off fund positions in Waddell & Reed, QLogic and Harmonic prior to the close of the period. The decline in retail stocks during the period dragged down fund holdings Wal-Mart and Home Depot. Poorly performing utility stocks, most notably Qualcomm and AT&T, also weighed on performance. Overall, the equity subportfolio trailed the Standard & Poor's 500 Index slightly during the six-month period, but outperformed it during the past 12 months.
Q. How did the fund's bond subportfolio fare?
A. Charlie Morrison and his team did a nice job of positioning the investment-grade component of the fund to benefit from changing market conditions. The decision to reduce the fund's exposure to long-term corporate bonds was a good one, as the performance of these securities deteriorated along side all other spread sectors during the period. A driving influence at this time was the U.S. Treasury's announcement in January of its intention to reduce new borrowing and use government surplus proceeds to repurchase outstanding debt. This move sparked a tremendous rally in long-term Treasuries. So, despite the Federal Reserve Board's actions to raise rates during the period, the much improved supply/demand picture painted by the Treasury buybacks led to a positive return for the investment-grade subportfolio. On the other hand, high-yield bonds suffered from poor liquidity and declining credit quality. Fred Hoff - who directed the fund's high-yield investments until June 1, 2000, when Mark Notkin took over - helped limit our losses by avoiding the names that fell the furthest amid the period's downtrend.
Q. And the fund's short-term/money market investments?
A. John Todd felt that concerns surrounding Y2K were overblown and, thus, used the opportunity to extend the average maturity of the fund's money-market subportfolio early on to take advantage of a steeply sloped yield curve. Early in 2000, however, the yield curve flattened out dramatically. In response, we let the average maturity roll down, believing that strong economic growth and the risk of rising inflation were likely to set off a protracted period of Fed tightening. Shareholders should note that John may choose to invest in a money market mutual fund rather than invest directly in money market securities in the future.
Q. What's your outlook?
A. It's still unclear as to whether or not the Fed can successfully orchestrate a soft landing, which would be very constructive for stocks. There's a lot of conflicting evidence out there in terms of economic data that will have to get cleared up before we can know for sure if the economy has actually slowed down a couple notches to be considered a soft landing. Until then, I think we'll be in sort of a narrow trading range in terms of the equity market. Security selection in this type of environment will become even more important, which bodes well for us given the strength of Fidelity's research.
The views expressed in this report reflect those of the portfolio manager only through the end of the period of the report as stated on the cover. The manager's views are subject to change at any time based on market or other conditions. For more information, see page 2.
Fund Facts
Goal: maximize total return over the long term by allocating its assets among stocks, bonds and short-term instruments
Start date: January 3, 1995
Size: as of June 30, 2000, more than
$564 million
Manager: Bart Grenier, since May 2000; joined Fidelity in 1991
3Semiannual Report
Fidelity Variable Insurance Products: Asset Manager: Growth Portfolio
(Unaudited)
Showing Percentage of Net Assets
|
Common Stocks - 68.7% |
|||
|
Shares |
Value (Note 1) |
||
|
AEROSPACE & DEFENSE - 0.3% |
|||
|
Northrop Grumman Corp. |
8,400 |
$ 556,500 |
|
|
Textron, Inc. |
16,700 |
907,019 |
|
|
|
1,463,519 |
||
|
BASIC INDUSTRIES - 0.8% |
|||
|
Chemicals & Plastics - 0.6% |
|||
|
Eastman Chemical Co. |
8,600 |
410,650 |
|
|
Engelhard Corp. |
24,200 |
412,913 |
|
|
Pharmacia Corp. |
38,700 |
2,000,306 |
|
|
Praxair, Inc. |
11,500 |
430,531 |
|
|
W.R. Grace & Co. (a) |
37,300 |
452,263 |
|
|
|
3,706,663 |
||
|
Paper & Forest Products - 0.2% |
|||
|
Westvaco Corp. |
39,800 |
987,538 |
|
|
TOTAL BASIC INDUSTRIES |
4,694,201 |
||
|
CONSTRUCTION & REAL ESTATE - 0.1% |
|||
|
Engineering - 0.1% |
|||
|
MasTec, Inc. (a) |
20,100 |
767,569 |
|
|
DURABLES - 0.2% |
|||
|
Consumer Durables - 0.1% |
|||
|
Minnesota Mining & Manufacturing Co. |
5,500 |
453,750 |
|
|
Consumer Electronics - 0.1% |
|||
|
Whirlpool Corp. |
8,300 |
386,988 |
|
|
Textiles & Apparel - 0.0% |
|||
|
Liz Claiborne, Inc. |
10,400 |
366,600 |
|
|
TOTAL DURABLES |
1,207,338 |
||
|
ENERGY - 4.5% |
|||
|
Energy Services - 0.1% |
|||
|
BJ Services Co. (a) |
11,900 |
743,750 |
|
|
Oil & Gas - 4.4% |
|||
|
Amerada Hess Corp. |
28,000 |
1,729,000 |
|
|
EOG Resources, Inc. |
25,400 |
850,900 |
|
|
Exxon Mobil Corp. |
106,800 |
8,383,800 |
|
|
Murphy Oil Corp. |
28,200 |
1,676,138 |
|
|
Noble Affiliates, Inc. |
21,300 |
793,425 |
|
|
Occidental Petroleum Corp. |
89,600 |
1,887,200 |
|
|
Ocean Energy, Inc. (a) |
136,900 |
1,942,269 |
|
|
Royal Dutch Petroleum Co. (NY Shares) |
66,300 |
4,081,594 |
|
|
Tosco Corp. |
26,600 |
753,113 |
|
|
Valero Energy Corp. |
54,400 |
1,727,200 |
|
|
Vintage Petroleum, Inc. |
35,800 |
807,738 |
|
|
|
24,632,377 |
||
|
TOTAL ENERGY |
25,376,127 |
||
|
|
|||
|
Shares |
Value (Note 1) |
||
|
FINANCE - 6.4% |
|||
|
Banks - 1.1% |
|||
|
Bank of America Corp. |
50,800 |
$ 2,184,400 |
|
|
Northern Trust Corp. |
10,100 |
657,131 |
|
|
Silicon Valley Bancshares (a) |
36,600 |
1,560,075 |
|
|
Wells Fargo & Co. |
51,000 |
1,976,250 |
|
|
|
6,377,856 |
||
|
Credit & Other Finance - 1.7% |
|||
|
American Express Co. |
41,400 |
2,157,975 |
|
|
Citigroup, Inc. |
125,700 |
7,573,425 |
|
|
|
9,731,400 |
||
|
Insurance - 1.9% |
|||
|
American International Group, Inc. |
47,100 |
5,534,250 |
|
|
CIGNA Corp. |
22,300 |
2,085,050 |
|
|
First Health Group Corp. (a) |
23,500 |
771,094 |
|
|
Hartford Financial Services Group, Inc. |
13,500 |
755,156 |
|
|
Marsh & McLennan Companies, Inc. |
7,100 |
741,506 |
|
|
PMI Group, Inc. |
13,200 |
627,000 |
|
|
|
10,514,056 |
||
|
Savings & Loans - 0.2% |
|||
|
Dime Bancorp, Inc. |
37,000 |
582,750 |
|
|
Golden West Financial Corp. |
17,300 |
706,056 |
|
|
|
1,288,806 |
||
|
Securities Industry - 1.5% |
|||
|
Bear Stearns Companies, Inc. |
33,900 |
1,411,088 |
|
|
Eaton Vance Corp. (non-vtg.) |
19,100 |
883,375 |
|
|
Lehman Brothers Holdings, Inc. |
16,700 |
1,579,194 |
|
|
Merrill Lynch & Co., Inc. |
14,600 |
1,679,000 |
|
|
Morgan Stanley Dean Witter & Co. |
35,200 |
2,930,400 |
|
|
|
8,483,057 |
||
|
TOTAL FINANCE |
36,395,175 |
||
|
HEALTH - 9.2% |
|||
|
Drugs & Pharmaceuticals - 6.2% |
|||
|
American Home Products Corp. |
40,400 |
2,373,500 |
|
|
Amgen, Inc. |
31,600 |
2,219,900 |
|
|
Andrx Corp. (a) |
14,700 |
939,652 |
|
|
Bristol-Myers Squibb Co. |
61,300 |
3,570,725 |
|
|
Eli Lilly & Co. |
33,700 |
3,365,788 |
|
|
Forest Laboratories, Inc. (a) |
9,400 |
949,400 |
|
|
IVAX Corp. (a) |
63,500 |
2,635,250 |
|
|
Jones Pharma, Inc. |
41,100 |
1,641,431 |
|
|
Merck & Co., Inc. |
70,700 |
5,417,388 |
|
|
Pfizer, Inc. |
192,675 |
9,248,400 |
|
|
Schering-Plough Corp. |
45,400 |
2,292,700 |
|
|
|
34,654,134 |
||
|
Medical Equipment & Supplies - 2.0% |
|||
|
Abbott Laboratories |
47,000 |
2,094,438 |
|
|
Johnson & Johnson |
43,000 |
4,380,625 |
|
|
Millipore Corp. |
15,300 |
1,153,238 |
|
|
Common Stocks - continued |
|||
|
Shares |
Value (Note 1) |
||
|
HEALTH - continued |
|||
|
Medical Equipment & Supplies - continued |
|||
|
Techne Corp. (a) |
22,400 |
$ 2,912,000 |
|
|
Varian Medical Systems, Inc. (a) |
19,000 |
743,375 |
|
|
|
11,283,676 |
||
|
Medical Facilities Management - 1.0% |
|||
|
Quest Diagnostics, Inc. (a) |
14,100 |
1,053,975 |
|
|
Trigon Healthcare, Inc. (a) |
20,300 |
1,046,719 |
|
|
UnitedHealth Group, Inc. |
32,400 |
2,778,300 |
|
|
Universal Health Services, Inc. Class B (a) |
14,100 |
923,550 |
|
|
|
5,802,544 |
||
|
TOTAL HEALTH |
51,740,354 |
||
|
INDUSTRIAL MACHINERY & EQUIPMENT - 4.4% |
|||
|
Electrical Equipment - 3.5% |
|||
|
Adtran, Inc. (a) |
25,300 |
1,514,838 |
|
|
General Electric Co. |
304,600 |
16,143,777 |
|
|
Scientific-Atlanta, Inc. |
30,600 |
2,279,700 |
|
|
|
19,938,315 |
||
|
Industrial Machinery & Equipment - 0.9% |
|||
|
Asyst Technologies, Inc. (a) |
37,800 |
1,294,650 |
|
|
Deere & Co. |
34,400 |
1,272,800 |
|
|
Tyco International Ltd. |
52,300 |
2,477,713 |
|
|
|
5,045,163 |
||
|
TOTAL INDUSTRIAL MACHINERY & EQUIPMENT |
24,983,478 |
||
|
MEDIA & LEISURE - 2.7% |
|||
|
Broadcasting - 0.5% |
|||
|
NTL, Inc. warrants 10/14/08 (a) |
427 |
17,507 |
|
|
Time Warner, Inc. |
39,800 |
3,024,800 |
|
|
|
3,042,307 |
||
|
Entertainment - 1.3% |
|||
|
Mandalay Resort Group (a) |
65,300 |
1,306,000 |
|
|
Viacom, Inc. Class B (non-vtg.) (a) |
47,100 |
3,211,631 |
|
|
Walt Disney Co. |
64,000 |
2,484,000 |
|
|
|
7,001,631 |
||
|
Leisure Durables & Toys - 0.2% |
|||
|
Brunswick Corp. |
30,300 |
501,844 |
|
|
Callaway Golf Co. |
30,700 |
500,794 |
|
|
|
1,002,638 |
||
|
Publishing - 0.6% |
|||
|
Dow Jones & Co., Inc. |
18,400 |
1,347,800 |
|
|
Gannett Co., Inc. |
7,100 |
424,669 |
|
|
McGraw-Hill Companies, Inc. |
25,600 |
1,382,400 |
|
|
The New York Times Co. Class A |
11,200 |
442,400 |
|
|
|
3,597,269 |
||
|
|
|||
|
Shares |
Value (Note 1) |
||
|
Restaurants - 0.1% |
|||
|
Brinker International, Inc. (a) |
18,300 |
$ 535,275 |
|
|
TOTAL MEDIA & LEISURE |
15,179,120 |
||
|
NONDURABLES - 2.4% |
|||
|
Beverages - 1.4% |
|||
|
Anheuser-Busch Companies, Inc. |
13,500 |
1,008,281 |
|
|
Pepsi Bottling Group, Inc. |
84,200 |
2,457,588 |
|
|
The Coca-Cola Co. |
76,400 |
4,388,225 |
|
|
|
7,854,094 |
||
|
Foods - 0.6% |
|||
|
Quaker Oats Co. |
14,100 |
1,059,263 |
|
|
Sysco Corp. |
49,400 |
2,080,975 |
|
|
|
3,140,238 |
||
|
Household Products - 0.4% |
|||
|
Procter & Gamble Co. |
40,700 |
2,330,075 |
|
|
TOTAL NONDURABLES |
13,324,407 |
||
|
PRECIOUS METALS - 0.0% |
|||
|
Placer Dome, Inc. |
11,500 |
107,970 |
|
|
RETAIL & WHOLESALE - 3.2% |
|||
|
Apparel Stores - 0.6% |
|||
|
Talbots, Inc. |
30,000 |
1,648,125 |
|
|
The Limited, Inc. |
45,600 |
986,100 |
|
|
Venator Group, Inc. (a) |
79,600 |
815,900 |
|
|
|
3,450,125 |
||
|
General Merchandise Stores - 1.7% |
|||
|
BJ's Wholesale Club, Inc. (a) |
49,600 |
1,636,800 |
|
|
Wal-Mart Stores, Inc. |
137,800 |
7,940,725 |
|
|
|
9,577,525 |
||
|
Retail & Wholesale, Miscellaneous - 0.9% |
|||
|
Home Depot, Inc. |
71,200 |
3,555,550 |
|
|
Tiffany & Co., Inc. |
24,300 |
1,640,250 |
|
|
|
5,195,800 |
||
|
TOTAL RETAIL & WHOLESALE |
18,223,450 |
||
|
SERVICES - 0.5% |
|||
|
Advertising - 0.2% |
|||
|
TMP Worldwide, Inc. (a) |
12,100 |
893,131 |
|
|
Services - 0.3% |
|||
|
Manpower, Inc. |
6,600 |
211,200 |
|
|
Robert Half International, Inc. (a) |
25,200 |
718,200 |
|
|
Teletech Holdings, Inc. (a) |
25,900 |
804,519 |
|
|
|
1,733,919 |
||
|
TOTAL SERVICES |
2,627,050 |
||
|
Common Stocks - continued |
|||
|
Shares |
Value (Note 1) |
||
|
TECHNOLOGY - 29.1% |
|||
|
Communications Equipment - 6.2% |
|||
|
ADC Telecommunications, Inc. (a) |
11,300 |
$ 947,788 |
|
|
Cable Design Technologies Corp. (a) |
40,800 |
1,366,800 |
|
|
Cisco Systems, Inc. (a) |
213,700 |
13,583,306 |
|
|
Comverse Technology, Inc. (a) |
17,700 |
1,646,100 |
|
|
Corning, Inc. |
8,500 |
2,293,938 |
|
|
Lucent Technologies, Inc. |
102,100 |
6,049,425 |
|
|
Nokia AB sponsored ADR |
14,300 |
714,106 |
|
|
Nortel Networks Corp. |
102,500 |
7,110,267 |
|
|
Tollgrade Communications, Inc. (a) |
11,200 |
1,484,000 |
|
|
|
35,195,730 |
||
|
Computer Services & Software - 6.2% |
|||
|
Adobe Systems, Inc. |
4,000 |
520,000 |
|
|
Amdocs Ltd. (a) |
10,300 |
790,525 |
|
|
America Online, Inc. (a) |
70,600 |
3,724,150 |
|
|
BEA Systems, Inc. (a) |
19,200 |
949,200 |
|
|
BroadVision, Inc. (a) |
10,800 |
548,775 |
|
|
Microsoft Corp. (a) |
161,000 |
12,880,000 |
|
|
Oracle Corp. (a) |
108,600 |
9,129,188 |
|
|
Remedy Corp. (a) |
16,100 |
897,575 |
|
|
Siebel Systems, Inc. (a) |
5,800 |
948,663 |
|
|
Sybase, Inc. (a) |
88,500 |
2,035,500 |
|
|
Symantec Corp. (a) |
11,300 |
609,494 |
|
|
Yahoo!, Inc. (a) |
16,800 |
2,081,100 |
|
|
|
35,114,170 |
||
|
Computers & Office Equipment - 4.6% |
|||
|
Apple Computer, Inc. (a) |
13,000 |
680,875 |
|
|
Dell Computer Corp. (a) |
79,300 |
3,910,481 |
|
|
EMC Corp. (a) |
66,800 |
5,139,425 |
|
|
Hewlett-Packard Co. |
37,800 |
4,720,275 |
|
|
International Business Machines Corp. |
53,700 |
5,883,506 |
|
|
Maxtor Corp. (a) |
55,900 |
590,444 |
|
|
Sun Microsystems, Inc. (a) |
57,500 |
5,228,906 |
|
|
|
26,153,912 |
||
|
Electronic Instruments - 2.5% |
|||
|
Applied Materials, Inc. (a) |
33,700 |
3,054,063 |
|
|
Credence Systems Corp. (a) |
30,200 |
1,666,663 |
|
|
Electro Scientific Industries, Inc. (a) |
29,600 |
1,303,325 |
|
|
KLA-Tencor Corp. (a) |
10,500 |
614,906 |
|
|
Kulicke & Soffa Industries, Inc. (a) |
13,700 |
813,438 |
|
|
LAM Research Corp. (a) |
39,100 |
1,466,250 |
|
|
LTX Corp. (a) |
19,700 |
688,269 |
|
|
Meade Instruments Corp. (a) |
64,400 |
1,618,050 |
|
|
Teradyne, Inc. (a) |
23,000 |
1,690,500 |
|
|
Trimble Navigation Ltd. (a) |
17,300 |
844,456 |
|
|
|
13,759,920 |
||
|
Electronics - 9.6% |
|||
|
Advanced Micro Devices, Inc. (a) |
27,200 |
2,101,200 |
|
|
Altera Corp. (a) |
20,300 |
2,069,331 |
|
|
Amkor Technology, Inc. (a) |
16,900 |
596,781 |
|
|
Amphenol Corp. Class A (a) |
39,600 |
2,621,025 |
|
|
|
|||
|
Shares |
Value (Note 1) |
||
|
Analog Devices, Inc. (a) |
22,500 |
$ 1,710,000 |
|
|
Arrow Electronics, Inc. (a) |
14,900 |
461,900 |
|
|
Atmel Corp. (a) |
36,700 |
1,353,313 |
|
|
AVX Corp. |
50,000 |
1,146,875 |
|
|
Burr-Brown Corp. (a) |
30,700 |
2,661,306 |
|
|
Cypress Semiconductor Corp. (a) |
38,900 |
1,643,525 |
|
|
Integrated Device Technology, Inc. (a) |
45,700 |
2,736,288 |
|
|
Intel Corp. |
103,400 |
13,823,288 |
|
|
International Rectifier Corp. (a) |
41,800 |
2,340,800 |
|
|
KEMET Corp. (a) |
49,800 |
1,248,113 |
|
|
LSI Logic Corp. (a) |
10,400 |
562,900 |
|
|
Microchip Technology, Inc. (a) |
10,800 |
629,269 |
|
|
Motorola, Inc. |
65,697 |
1,909,319 |
|
|
National Semiconductor Corp. (a) |
7,600 |
431,300 |
|
|
PMC-Sierra, Inc. (a) |
3,800 |
675,213 |
|
|
SDL, Inc. (a) |
3,900 |
1,112,231 |
|
|
Semtech Corp. (a) |
28,400 |
2,172,156 |
|
|
Technitrol, Inc. |
5,600 |
542,500 |
|
|
Texas Instruments, Inc. |
72,000 |
4,945,500 |
|
|
Three-Five Systems, Inc. (a) |
11,000 |
649,000 |
|
|
Vishay Intertechnology, Inc. (a) |
51,000 |
1,934,813 |
|
|
Xilinx, Inc. (a) |
24,100 |
1,989,756 |
|
|
|
54,067,702 |
||
|
TOTAL TECHNOLOGY |
164,291,434 |
||
|
TRANSPORTATION - 0.1% |
|||
|
Air Transportation - 0.0% |
|||
|
Delta Air Lines, Inc. |
4,600 |
232,588 |
|
|
Trucking & Freight - 0.1% |
|||
|
C.H. Robinson Worldwide, Inc. |
5,000 |
247,500 |
|
|
TOTAL TRANSPORTATION |
480,088 |
||
|
UTILITIES - 4.8% |
|||
|
Cellular - 0.2% |
|||
|
McCaw International Ltd. warrants 4/16/07 (a)(f) |
910 |
2,275 |
|
|
QUALCOMM, Inc. (a) |
5,500 |
330,000 |
|
|
Sprint Corp. - PCS Group Series 1 (a) |
13,500 |
803,250 |
|
|
|
1,135,525 |
||
|
Electric Utility - 1.0% |
|||
|
Calpine Corp. (a) |
29,400 |
1,933,050 |
|
|
Entergy Corp. |
26,400 |
717,750 |
|
|
PECO Energy Co. |
18,000 |
725,625 |
|
|
PPL Corp. |
30,900 |
677,869 |
|
|
Public Service Enterprise Group, Inc. |
24,800 |
858,700 |
|
|
TXU Corp. |
26,700 |
787,650 |
|
|
|
5,700,644 |
||
|
Gas - 0.3% |
|||
|
Columbia Energy Group |
12,000 |
787,500 |
|
|
Enron Corp. |
11,200 |
722,400 |
|
|
|
1,509,900 |
||
|
Common Stocks - continued |
|||
|
Shares |
Value (Note 1) |
||
|
UTILITIES - continued |
|||
|
Telephone Services - 3.3% |
|||
|
AT&T Corp. |
114,800 |
$ 3,630,550 |
|
|
Bell Atlantic Corp. |
48,000 |
2,439,000 |
|
|
BellSouth Corp. |
58,200 |
2,480,775 |
|
|
GTE Corp. |
29,800 |
1,855,050 |
|
|
Ono Finance PLC rights 5/31/09 (a)(f) |
310 |
3,100 |
|
|
Pathnet, Inc. warrants 4/15/08 (a)(f) |
840 |
8,400 |
|
|
SBC Communications, Inc. |
105,500 |
4,562,875 |
|
|
WorldCom, Inc. (a) |
87,800 |
4,027,825 |
|
|
|
19,007,575 |
||
|
TOTAL UTILITIES |
27,353,644 |
||
|
TOTAL COMMON STOCKS (Cost $325,944,798) |
388,214,924 |
||
|
Nonconvertible Preferred Stocks - 1.8% |
|||
|
|
|
|
|
|
CONSTRUCTION & REAL ESTATE - 0.1% |
|||
|
Real Estate Investment Trusts - 0.1% |
|||
|
California Federal Preferred Capital Corp. $2.2812 |
30,171 |
641,134 |
|
|
FINANCE - 0.0% |
|||
|
Insurance - 0.0% |
|||
|
American Annuity Group Capital Trust II 8.875% |
160 |
142,442 |
|
|
HEALTH - 0.1% |
|||
|
Medical Facilities Management - 0.1% |
|||
|
Fresenius Medical Care Capital Trust II 7.875% |
386 |
352,140 |
|
|
MEDIA & LEISURE - 0.4% |
|||
|
Broadcasting - 0.3% |
|||
|
Adelphia Communications Corp. $13.00 |
2,183 |
224,849 |
|
|
CSC Holdings, Inc. 11.125% pay-in-kind |
14,567 |
1,522,252 |
|
|
|
1,747,101 |
||
|
Publishing - 0.1% |
|||
|
PRIMEDIA, Inc.: |
|
|
|
|
$9.20 |
4,338 |
376,322 |
|
|
Series D, $10.00 |
4,544 |
420,320 |
|
|
|
796,642 |
||
|
TOTAL MEDIA & LEISURE |
2,543,743 |
||
|
|
|||
|
Shares |
Value (Note 1) |
||
|
UTILITIES - 1.2% |
|||
|
Cellular - 0.6% |
|||
|
Crown Castle International Corp. 12.75% pay-in-kind |
358 |
$ 365,160 |
|
|
Nextel Communications, Inc. 11.125% pay-in-kind |
2,851 |
2,751,215 |
|
|
|
3,116,375 |
||
|
Telephone Services - 0.6% |
|||
|
Adelphia Business Solution, Inc. 12.875% pay-in-kind |
873 |
781,335 |
|
|
Intermedia Communications, Inc. 13.5% pay-in-kind |
820 |
795,400 |
|
|
IXC Communications, Inc. 12.5% pay-in-kind |
263 |
263,000 |
|
|
NEXTLINK Communications, Inc. 14% pay-in-kind |
33,088 |
1,687,488 |
|
|
|
3,527,223 |
||
|
TOTAL UTILITIES |
6,643,598 |
||
|
TOTAL NONCONVERTIBLE (Cost $10,734,609) |
10,323,057 |
||
|
Corporate Bonds - 13.9% |
|||||
|
Moody's Ratings (unaudited) (b) |
Principal Amount |
|
|||
|
Convertible Bonds - 0.4% |
|||||
|
HEALTH - 0.3% |
|||||
|
Medical Facilities Management - 0.3% |
|||||
|
Tenet Healthcare Corp. 6% 12/1/05 |
B1 |
|
$ 1,290,000 |
1,062,638 |
|
|
Total Renal Care Holdings, Inc. 7% 5/15/09 (f) |
B3 |
|
500,000 |
332,500 |
|
|
|
1,395,138 |
||||
|
MEDIA & LEISURE - 0.1% |
|||||
|
Lodging & Gaming - 0.1% |
|||||
|
Hilton Hotels Corp. 5% 5/15/06 |
Ba2 |
|
660,000 |
521,400 |
|
|
TOTAL CONVERTIBLE BONDS |
1,916,538 |
||||
|
Nonconvertible Bonds - 13.5% |
|||||
|
AEROSPACE & DEFENSE - 0.1% |
|||||
|
Ship Building & Repair - 0.1% |
|||||
|
Newport News Shipbuilding, Inc. 9.25% 12/1/06 |
Ba3 |
|
652,000 |
652,000 |
|
|
BASIC INDUSTRIES - 1.0% |
|||||
|
Chemicals & Plastics - 0.6% |
|||||
|
Avecia Group PLC 11% 7/1/09 |
B2 |
|
635,000 |
622,300 |
|
|
Corporate Bonds - continued |
|||||
|
Moody's Ratings (unaudited) (b) |
Principal Amount |
Value |
|||
|
Nonconvertible Bonds - continued |
|||||
|
BASIC INDUSTRIES - continued |
|||||
|
Chemicals & Plastics - continued |
|||||
|
Huntsman Corp. 9.5% 7/1/07 (f) |
B2 |
|
$ 565,000 |
$ 515,563 |
|
|
Huntsman ICI Chemicals LLC 10.125% 7/1/09 |
B2 |
|
200,000 |
200,000 |
|
|
Lyondell Chemical Co.: |
|
|
|
|
|
|
9.875% 5/1/07 |
Ba3 |
|
890,000 |
881,100 |
|
|
10.875% 5/1/09 |
B2 |
|
440,000 |
436,700 |
|
|
Sovereign Specialty Chemicals, Inc. 11.875% 3/15/10 |
B3 |
|
305,000 |
313,769 |
|
|
Sterling Chemicals, Inc. 11.75% 8/15/06 |
Caa3 |
|
470,000 |
380,700 |
|
|
|
3,350,132 |
||||
|
Metals & Mining - 0.0% |
|||||
|
Kaiser Aluminum & Chemical Corp. 12.75% 2/1/03 |
B3 |
|
305,000 |
277,550 |
|
|
Packaging & Containers - 0.3% |
|||||
|
Gaylord Container Corp.: |
|
|
|
|
|
|
9.375% 6/15/07 |
Caa1 |
|
560,000 |
431,200 |
|
|
9.75% 6/15/07 |
Caa1 |
|
660,000 |
514,800 |
|
|
Norampac, Inc. 9.5% 2/1/08 |
B1 |
|
390,000 |
376,350 |
|
|
Packaging Corp. of America 9.625% 4/1/09 |
B2 |
|
370,000 |
365,375 |
|
|
|
1,687,725 |
||||
|
Paper & Forest Products - 0.1% |
|||||
|
Potlatch Corp. 6.25% 3/15/02 |
Baa1 |
|
80,000 |
77,378 |
|
|
Repap New Brunswick, Inc. yankee 10.625% 4/15/05 |
Caa1 |
|
380,000 |
334,400 |
|
|
|
411,778 |
||||
|
TOTAL BASIC INDUSTRIES |
5,727,185 |
||||
|
CONSTRUCTION & REAL ESTATE - 0.2% |
|||||
|
Building Materials - 0.0% |
|||||
|
Numatics, Inc. 9.625% 4/1/08 |
B3 |
|
30,000 |
24,000 |
|
|
Construction - 0.1% |
|||||
|
Blount, Inc. 13% 8/1/09 |
B3 |
|
270,000 |
274,725 |
|
|
Engineering - 0.0% |
|||||
|
Anteon Corp. 12% 5/15/09 |
B3 |
|
170,000 |
153,000 |
|
|
Real Estate - 0.0% |
|||||
|
Duke-Weeks Realty LP 6.875% 3/15/05 |
Baa2 |
|
100,000 |
94,976 |
|
|
|
|||||
|
Moody's Ratings (unaudited) (b) |
Principal Amount |
Value |
|||
|
Real Estate Investment Trusts - 0.1% |
|||||
|
CenterPoint Properties Trust: |
|
|
|
|
|
|
6.75% 4/1/05 |
Baa2 |
|
$ 100,000 |
$ 93,160 |
|
|
7.125% 3/15/04 |
Baa2 |
|
110,000 |
105,585 |
|
|
Equity Office Properties Trust: |
|
|
|
|
|
|
6.375% 2/15/03 |
Baa1 |
|
100,000 |
96,114 |
|
|
6.75% 2/15/08 |
Baa1 |
|
100,000 |
91,609 |
|
|
Pinnacle Holdings, Inc. 0% 3/15/08 (e) |
B3 |
|
285,000 |
198,075 |
|
|
|
584,543 |
||||
|
TOTAL CONSTRUCTION & REAL ESTATE |
1,131,244 |
||||
|
DURABLES - 0.0% |
|||||
|
Autos, Tires, & Accessories - 0.0% |
|||||
|
TRW, Inc. 6.5% 6/1/02 |
Baa1 |
|
120,000 |
116,878 |
|
|
Consumer Electronics - 0.0% |
|||||
|
Whirlpool Corp. 8.6% 5/1/10 |
Baa1 |
|
40,000 |
41,276 |
|
|
Textiles & Apparel - 0.0% |
|||||
|
Jones Apparel Group, Inc. 7.875% 6/15/06 |
Baa2 |
|
135,000 |
128,887 |
|
|
TOTAL DURABLES |
287,041 |
||||
|
ENERGY - 0.4% |
|||||
|
Coal - 0.1% |
|||||
|
P&L Coal Holdings Corp. 9.625% 5/15/08 |
B2 |
|
330,000 |
306,075 |
|
|
Energy Services - 0.1% |
|||||
|
Baker Hughes, Inc. 5.8% 2/15/03 |
A2 |
|
90,000 |
86,184 |
|
|
R&B Falcon Corp. 6.5% 4/15/03 |
Ba3 |
|
320,000 |
296,800 |
|
|
RBF Finance Co. 11% 3/15/06 |
Ba3 |
|
300,000 |
321,000 |
|
|
|
703,984 |
||||
|
Oil & Gas - 0.2% |
|||||
|
Apache Corp. 7.625% 7/1/19 |
Baa1 |
|
75,000 |
72,417 |
|
|
Chesapeake Energy Corp. 9.625% 5/1/05 |
B2 |
|
680,000 |
663,000 |
|
|
Occidental Petroleum Corp. 9.75% 6/15/01 |
Baa3 |
|
100,000 |
101,880 |
|
|
Oryx Energy Co.: |
|
|
|
|
|
|
8% 10/15/03 |
Baa1 |
|
95,000 |
94,964 |
|
|
8.125% 10/15/05 |
Baa1 |
|
140,000 |
141,666 |
|
|
8.375% 7/15/04 |
Baa1 |
|
195,000 |
196,743 |
|
|
Corporate Bonds - continued |
|||||
|
Moody's Ratings (unaudited) (b) |
Principal Amount |
Value |
|||
|
Nonconvertible Bonds - continued |
|||||
|
ENERGY - continued |
|||||
|
Oil & Gas - continued |
|||||
|
Petro-Canada 7% 11/15/28 |
A3 |
|
$ 50,000 |
$ 43,660 |
|
|
Phillips Petroleum Co. 8.75% 5/25/10 |
Baa2 |
|
60,000 |
63,205 |
|
|
|
1,377,535 |
||||
|
TOTAL ENERGY |
2,387,594 |
||||
|
FINANCE - 1.0% |
|||||
|
Banks - 0.2% |
|||||
|
Bank of Tokyo-Mitsubishi Ltd. 8.4% 4/15/10 |
A3 |
|
70,000 |
70,686 |
|
|
BankBoston Corp. 6.625% 2/1/04 |
A3 |
|
60,000 |
57,821 |
|
|
Capital One Bank: |
|
|
|
|
|
|
6.375% 2/15/03 |
Baa2 |
|
130,000 |
124,651 |
|
|
6.65% 3/15/04 |
Baa3 |
|
260,000 |
249,730 |
|
|
Capital One Financial Corp. 7.125% 8/1/08 |
Baa3 |
|
100,000 |
93,065 |
|
|
Commonwealth Bank of Australia 8.5% 6/1/10 |
A1 |
|
100,000 |
103,774 |
|
|
Den Danske Bank AS 6.375% 6/15/08 (f)(i) |
A1 |
|
170,000 |
156,081 |
|
|
Korea Development Bank 6.625% 11/21/03 |
Baa2 |
|
95,000 |
91,388 |
|
|
Providian National Bank 6.7% 3/15/03 |
Baa3 |
|
100,000 |
95,634 |
|
|
Royal Bank of Scotland Group PLC 9.118% 3/31/49 |
A1 |
|
50,000 |
51,934 |
|
|
|
1,094,764 |
||||
|
Credit & Other Finance - 0.6% |
|||||
|
Ahmanson Capital Trust I 8.36% 12/1/26 (f) |
A3 |
|
125,000 |
113,663 |
|
|
AMRESCO, Inc.: |
|
|
|
|
|
|
9.875% 3/15/05 |
Caa3 |
|
470,000 |
218,550 |
|
|
10% 3/15/04 |
Caa3 |
|
210,000 |
96,600 |
|
|
Countrywide Funding Corp. 6.45% 2/27/03 |
A3 |
|
150,000 |
144,867 |
|
|
Details Capital Corp. 0% 11/15/07 (e) |
Caa1 |
|
85,000 |
56,100 |
|
|
Dobson/Sygnet Communications Co. 12.25% 12/15/08 |
- |
|
140,000 |
148,050 |
|
|
ERP Operating LP: |
|
|
|
|
|
|
6.55% 11/15/01 |
A3 |
|
55,000 |
54,206 |
|
|
7.1% 6/23/04 |
A3 |
|
100,000 |
96,976 |
|
|
Finova Capital Corp.: |
|
|
|
|
|
|
6.11% 2/18/03 |
Baa2 |
|
50,000 |
44,000 |
|
|
7.25% 11/8/04 |
Baa2 |
|
110,000 |
97,900 |
|
|
|
|||||
|
Moody's Ratings (unaudited) (b) |
Principal Amount |
Value |
|||
|
First Security Capital I 8.41% 12/15/26 |
A3 |
|
$ 110,000 |
$ 101,908 |
|
|
Ford Motor Credit Co.: |
|
|
|
|
|
|
6.4513% 7/16/01 (i) |
A2 |
|
400,000 |
400,433 |
|
|
7.5% 3/15/05 |
A2 |
|
140,000 |
138,950 |
|
|
7.875% 6/15/10 |
A2 |
|
400,000 |
400,568 |
|
|
Heller Financial, Inc. 6% 3/19/04 |
A3 |
|
180,000 |
168,451 |
|
|
Macsaver Financial Services, Inc.: |
|
|
|
|
|
|
7.4% 2/15/02 |
Ba2 |
|
280,000 |
182,000 |
|
|
7.6% 8/1/07 |
Ba2 |
|
790,000 |
418,700 |
|
|
7.875% 8/1/03 |
Ba2 |
|
130,000 |
80,600 |
|
|
Newcourt Credit Group, Inc. 6.875% 2/16/05 |
A1 |
|
130,000 |
123,696 |
|
|
Sprint Capital Corp.: |
|
|
|
|
|
|
5.7% 11/15/03 |
Baa1 |
|
40,000 |
37,693 |
|
|
6.875% 11/15/28 |
Baa1 |
|
90,000 |
77,818 |
|
|
The Money Store, Inc. 7.3% 12/1/02 |
A2 |
|
100,000 |
99,063 |
|
|
TXU Eastern Funding: |
|
|
|
|
|
|
6.15% 5/15/02 |
Baa1 |
|
60,000 |
58,267 |
|
|
6.75% 5/15/09 |
Baa1 |
|
90,000 |
80,475 |
|
|
Venetian Casino Resort LLC/Las Vegas Sands, Inc. 12.25% 11/15/04 |
Caa1 |
|
150,000 |
151,500 |
|
|
|
3,591,034 |
||||
|
Savings & Loans - 0.1% |
|||||
|
Chevy Chase Savings Bank FSB 9.25% 12/1/08 |
B1 |
|
80,000 |
71,200 |
|
|
Home Savings of America FSB 6.5% 8/15/04 |
A3 |
|
90,000 |
85,394 |
|
|
Long Island Savings Bank FSB 7% 6/13/02 |
Baa3 |
|
140,000 |
138,011 |
|
|
Sovereign Bancorp, Inc. 6.625% 3/15/01 |
Ba3 |
|
100,000 |
97,625 |
|
|
|
392,230 |
||||
|
Securities Industry - 0.1% |
|||||
|
Amvescap PLC yankee 6.375% 5/15/03 |
A3 |
|
200,000 |
190,872 |
|
|
Goldman Sachs Group LP 6.6338% 7/27/00 (i)(k) |
A1 |
|
400,000 |
399,966 |
|
|
|
590,838 |
||||
|
TOTAL FINANCE |
5,668,866 |
||||
|
HEALTH - 0.1% |
|||||
|
Medical Facilities Management - 0.1% |
|||||
|
Fountain View, Inc. 11.25% 4/15/08 |
Caa1 |
|
460,000 |
112,700 |
|
|
Corporate Bonds - continued |
|||||
|
Moody's Ratings (unaudited) (b) |
Principal Amount |
Value |
|||
|
Nonconvertible Bonds - continued |
|||||
|
HEALTH - continued |
|||||
|
Medical Facilities Management - continued |
|||||
|
Tenet Healthcare Corp. 8.625% 1/15/07 |
Ba3 |
|
$ 330,000 |
$ 313,500 |
|
|
Unilab Corp. 12.75% 10/1/09 |
B3 |
|
150,000 |
154,500 |
|
|
|
580,700 |
||||
|
INDUSTRIAL MACHINERY & EQUIPMENT - 0.6% |
|||||
|
Industrial Machinery & Equipment - 0.2% |
|||||
|
Dunlop Standard Aero Holdings PLC 11.875% 5/15/09 |
B3 |
|
430,000 |
425,700 |
|
|
Roller Bearing Holding, Inc. 0% 6/15/09 (e)(f) |
- |
|
500,000 |
255,000 |
|
|
Tyco International Group SA: |
|
|
|
|
|
|
7% 6/15/28 |
Baa1 |
|
280,000 |
240,696 |
|
|
yankee 6.375% 6/15/05 |
Baa1 |
|
30,000 |
28,618 |
|
|
|
950,014 |
||||
|
Pollution Control - 0.4% |
|||||
|
Allied Waste North America, Inc.: |
|
|
|
|
|
|
7.375% 1/1/04 |
Ba3 |
|
230,000 |
209,300 |
|
|
7.625% 1/1/06 |
Ba2 |
|
195,000 |
169,650 |
|
|
10% 8/1/09 |
B2 |
|
1,795,000 |
1,507,800 |
|
|
Browning-Ferris Industries, Inc. 6.375% 1/15/08 |
Ba3 |
|
220,000 |
169,400 |
|
|
WMX Technologies, Inc.: |
|
|
|
|
|
|
6.25% 10/15/00 |
Ba1 |
|
100,000 |
99,343 |
|
|
7.1% 8/1/26 |
Ba1 |
|
40,000 |
37,649 |
|
|
|
2,193,142 |
||||
|
TOTAL INDUSTRIAL MACHINERY & EQUIPMENT |
3,143,156 |
||||
|
MEDIA & LEISURE - 4.5% |
|||||
|
Broadcasting - 3.6% |
|||||
|
Adelphia Communications Corp. 9.875% 3/1/07 |
B1 |
|
1,230,000 |
1,168,500 |
|
|
AMFM Operating, Inc. 12.625% 10/31/06 pay-in-kind |
- |
|
257,300 |
302,328 |
|
|
Ascent Entertainment Group, Inc. 0% 12/15/04 (e) |
Ba1 |
|
350,000 |
283,500 |
|
|
British Sky Broadcasting Group PLC 8.2% 7/15/09 |
Baa3 |
|
210,000 |
196,442 |
|
|
Callahan Nordrhein Westfalen 14% 7/15/10 (f) |
B3 |
|
770,000 |
770,000 |
|
|
|
|||||
|
Moody's Ratings (unaudited) (b) |
Principal Amount |
Value |
|||
|
Charter Communications Holdings LLC/Charter Communications Holdings Capital Corp. 10% 4/1/09 |
B2 |
|
$ 705,000 |
$ 683,850 |
|
|
Citadel Broadcasting Co.: |
|
|
|
|
|
|
9.25% 11/15/08 |
B3 |
|
210,000 |
203,700 |
|
|
10.25% 7/1/07 |
B3 |
|
1,335,000 |
1,353,356 |
|
|
Clear Channel Communications, Inc.: |
|
|
|
|
|
|
6.875% 6/15/18 |
Baa3 |
|
320,000 |
275,104 |
|
|
7.875% 6/15/05 |
Baa3 |
|
90,000 |
89,577 |
|
|
Comcast UK Cable Partners Ltd. 0% 11/15/07 (e) |
B2 |
|
580,000 |
539,400 |
|
|
CSC Holdings, Inc. 10.5% 5/15/16 |
Ba3 |
|
280,000 |
295,400 |
|
|
Diamond Cable Communications PLC: |
|
|
|
|
|
|
0% 2/15/07 (e) |
B3 |
|
645,000 |
495,038 |
|
|
yankee 0% 12/15/05 (e) |
B3 |
|
300,000 |
280,500 |
|
|
Earthwatch, Inc. 0% 7/15/07 unit (e)(f) |
- |
|
430,000 |
275,200 |
|
|
EchoStar DBS Corp.: |
|
|
|
|
|
|
9.25% 2/1/06 |
B2 |
|
515,000 |
496,975 |
|
|
9.375% 2/1/09 |
B2 |
|
420,000 |
405,300 |
|
|
Fox Family Worldwide, Inc. 0% 11/1/07 (e) |
B1 |
|
100,000 |
62,000 |
|
|
FrontierVision Holdings LP/FrontierVision Holdings Capital Corp. 0% 9/15/07 (e) |
B1 |
|
700,000 |
603,750 |
|
|
FrontierVision Operating Partners LP/ FrontierVision Capital Corp. 11% 10/15/06 |
B1 |
|
340,000 |
340,000 |
|
|
Golden Sky DBS, Inc. 0% 3/1/07 (e) |
Caa1 |
|
590,000 |
396,775 |
|
|
Golden Sky Systems, Inc. 12.375% 8/1/06 |
B3 |
|
180,000 |
196,200 |
|
|
Hearst-Argyle Television, Inc. 7.5% 11/15/27 |
Baa3 |
|
200,000 |
168,718 |
|
|
International Cabletel, Inc. 0% 2/1/06 (e) |
B3 |
|
220,000 |
202,400 |
|
|
Knology Holding, Inc. 0% 10/15/07 (e) |
- |
|
380,000 |
193,800 |
|
|
LIN Holdings Corp. 0% 3/1/08 (e) |
B3 |
|
305,000 |
200,538 |
|
|
Nielsen Media Research, Inc. 7.6% 6/15/09 |
Baa2 |
|
60,000 |
57,251 |
|
|
NorthPoint Communication Holdings, Inc. 12.875% 2/15/10 |
Caa1 |
|
890,000 |
614,100 |
|
|
NTL Communications Corp.: |
|
|
|
|
|
|
0% 10/1/08 (e) |
B3 |
|
875,000 |
562,188 |
|
|
11.5% 10/1/08 |
B3 |
|
690,000 |
695,175 |
|
|
NTL, Inc.: |
|
|
|
|
|
|
0% 4/1/08 (e) |
B3 |
|
1,735,000 |
1,075,700 |
|
|
Corporate Bonds - continued |
|||||
|
Moody's Ratings (unaudited) (b) |
Principal Amount |
Value |
|||
|
Nonconvertible Bonds - continued |
|||||
|
MEDIA & LEISURE - continued |
|||||
|
Broadcasting - continued |
|||||
|
NTL, Inc.: - continued |
|
|
|
|
|
|
10% 2/15/07 |
B3 |
|
$ 240,000 |
$ 228,000 |
|
|
Pegasus Communications Corp. 9.625% 10/15/05 |
B3 |
|
960,000 |
926,400 |
|
|
TCI Communications, Inc. 9.8% 2/1/12 |
A2 |
|
190,000 |
215,865 |
|
|
Telemundo Holdings, Inc. 0% 8/15/08 (e) |
Caa1 |
|
805,000 |
559,475 |
|
|
Telewest Communications PLC: |
|
|
|
|
|
|
0% 4/15/09 (e) |
B1 |
|
620,000 |
341,000 |
|
|
0% 2/1/10 (e)(f) |
B1 |
|
615,000 |
325,950 |
|
|
Telewest PLC: |
|
|
|
|
|
|
yankee 9.625% 10/1/06 |
B1 |
|
110,000 |
103,400 |
|
|
0% 10/1/07 (e) |
B1 |
|
1,330,000 |
1,270,150 |
|
|
Time Warner, Inc. 9.125% 1/15/13 |
Baa3 |
|
155,000 |
169,865 |
|
|
United Pan-Europe Communications NV: |
|
|
|
|
|
|
0% 2/1/10 (e) |
B2 |
|
1,310,000 |
615,700 |
|
|
10.875% 8/1/09 |
B2 |
|
2,057,000 |
1,810,160 |
|
|
USA Networks, Inc./USANi LLC 6.75% 11/15/05 |
Baa3 |
|
35,000 |
33,338 |
|
|
|
20,082,068 |
||||
|
Entertainment - 0.3% |
|||||
|
Bally Total Fitness Holding Corp. 9.875% 10/15/07 |
B3 |
|
418,000 |
380,380 |
|
|
Cinemark USA, Inc. 8.5% 8/1/08 |
B2 |
|
130,000 |
61,100 |
|
|
Paramount Communications, Inc. 7.5% 1/15/02 |
Baa1 |
|
110,000 |
109,640 |
|
|
Premier Parks, Inc. 0% 4/1/08 (e) |
B3 |
|
1,335,000 |
906,131 |
|
|
Viacom, Inc.: |
|
|
|
|
|
|
6.75% 1/15/03 |
Baa1 |
|
110,000 |
108,032 |
|
|
7.75% 6/1/05 |
Baa1 |
|
115,000 |
115,390 |
|
|
|
1,680,673 |
||||
|
Lodging & Gaming - 0.4% |
|||||
|
Florida Panthers Holdings, Inc. 9.875% 4/15/09 |
B2 |
|
410,000 |
383,350 |
|
|
HMH Properties, Inc. 7.875% 8/1/05 |
Ba2 |
|
380,000 |
349,600 |
|
|
Horseshoe Gaming LLC 8.625% 5/15/09 |
B2 |
|
285,000 |
267,900 |
|
|
Host Marriott LP 8.375% 2/15/06 |
Ba2 |
|
630,000 |
589,050 |
|
|
ITT Corp. 7.375% 11/15/15 |
Ba1 |
|
150,000 |
125,625 |
|
|
|
|||||
|
Moody's Ratings (unaudited) (b) |
Principal Amount |
Value |
|||
|
Mohegan Tribal Gaming Authority 8.75% 1/1/09 |
Ba3 |
|
$ 390,000 |
$ 368,550 |
|
|
Station Casinos, Inc. 9.875% 7/1/10 (f) |
B1 |
|
465,000 |
467,325 |
|
|
|
2,551,400 |
||||
|
Publishing - 0.1% |
|||||
|
News America |
|
|
|
|
|
|
7.7% 10/30/25 |
Baa3 |
|
110,000 |
100,177 |
|
|
7.75% 1/20/24 |
Baa3 |
|
70,000 |
63,369 |
|
|
Time Warner Entertainment Co. LP 8.375% 3/15/23 |
Baa2 |
|
325,000 |
329,007 |
|
|
|
492,553 |
||||
|
Restaurants - 0.1% |
|||||
|
Domino's, Inc. 10.375% 1/15/09 |
B3 |
|
300,000 |
278,250 |
|
|
NE Restaurant, Inc. 10.75% 7/15/08 |
B3 |
|
550,000 |
429,000 |
|
|
|
707,250 |
||||
|
TOTAL MEDIA & LEISURE |
25,513,944 |
||||
|
NONDURABLES - 0.2% |
|||||
|
Beverages - 0.1% |
|||||
|
Seagram JE & Sons, Inc.: |
|
|
|
|
|
|
6.4% 12/15/03 |
Baa3 |
|
120,000 |
115,332 |
|
|
6.8% 12/15/08 |
Baa3 |
|
105,000 |
98,472 |
|
|
|
213,804 |
||||
|
Foods - 0.1% |
|||||
|
ConAgra, Inc. 7.125% 10/1/26 |
Baa1 |
|
115,000 |
106,058 |
|
|
Del Monte Foods Co. 0% 12/15/07 (e) |
Caa1 |
|
440,000 |
330,000 |
|
|
|
436,058 |
||||
|
Tobacco - 0.0% |
|||||
|
Philip Morris |
|
|
|
|
|
|
7% 7/15/05 |
A2 |
|
70,000 |
65,942 |
|
|
7.25% 9/15/01 |
A2 |
|
50,000 |
49,184 |
|
|
RJ Reynolds Tobacco Holdings, Inc. 7.375% 5/15/03 |
Baa2 |
|
100,000 |
92,876 |
|
|
|
208,002 |
||||
|
TOTAL NONDURABLES |
857,864 |
||||
|
RETAIL & WHOLESALE - 0.3% |
|||||
|
Drug Stores - 0.0% |
|||||
|
Rite Aid Corp.: |
|
|
|
|
|
|
6.5% 12/15/05 (f) |
Caa1 |
|
100,000 |
51,500 |
|
|
7.125% 1/15/07 |
Caa1 |
|
40,000 |
21,200 |
|
|
|
72,700 |
||||
|
Corporate Bonds - continued |
|||||
|
Moody's Ratings (unaudited) (b) |
Principal Amount |
Value |
|||
|
Nonconvertible Bonds - continued |
|||||
|
RETAIL & WHOLESALE - continued |
|||||
|
General Merchandise Stores - 0.1% |
|||||
|
Dayton Hudson Corp. 7.5% 7/15/06 |
A2 |
|
$ 125,000 |
$ 124,930 |
|
|
Federated Department Stores, Inc.: |
|
|
|
|
|
|
6.79% 7/15/27 |
Baa1 |
|
100,000 |
96,704 |
|
|
8.5% 6/15/03 |
Baa1 |
|
50,000 |
50,459 |
|
|
Kmart Corp. 12.5% 3/1/05 |
Baa3 |
|
510,000 |
553,350 |
|
|
|
825,443 |
||||
|
Grocery Stores - 0.2% |
|||||
|
Kroger Co. 6% 7/1/00 |
Baa3 |
|
110,000 |
109,979 |
|
|
Pathmark Stores, Inc. 9.625% 5/1/03 (d) |
Caa3 |
|
1,230,000 |
848,700 |
|
|
|
958,679 |
||||
|
TOTAL RETAIL & WHOLESALE |
1,856,822 |
||||
|
SERVICES - 0.1% |
|||||
|
Printing - 0.0% |
|||||
|
Sullivan Graphics, Inc. 12.75% 8/1/05 |
Caa1 |
|
210,000 |
211,050 |
|
|
Services - 0.1% |
|||||
|
La Petite Academy, Inc./La Petite Academy Holding Co. 10% 5/15/08 |
B3 |
|
370,000 |
214,600 |
|
|
Medaphis Corp. 9.5% 2/15/05 |
Caa1 |
|
260,000 |
195,000 |
|
|
|
409,600 |
||||
|
TOTAL SERVICES |
620,650 |
||||
|
TECHNOLOGY - 1.2% |
|||||
|
Computer Services & Software - 0.6% |
|||||
|
Amazon.com, Inc. 0% 5/1/08 (e) |
Caa1 |
|
395,000 |
213,300 |
|
|
Concentric Network Corp. 12.75% 12/15/07 |
B- |
|
120,000 |
126,000 |
|
|
Covad Communications Group, Inc.: |
|
|
|
|
|
|
0% 3/15/08 (e) |
B3 |
|
715,000 |
350,350 |
|
|
12% 2/15/10 |
B3 |
|
970,000 |
751,750 |
|
|
12.5% 2/15/09 |
B3 |
|
201,000 |
159,795 |
|
|
Exodus Communications, Inc. 11.25% 7/1/08 |
B- |
|
355,000 |
351,450 |
|
|
Federal Data Corp. 10.125% 8/1/05 |
B3 |
|
690,000 |
448,500 |
|
|
PSINet, Inc. 10.5% 12/1/06 |
B3 |
|
1,115,000 |
1,025,800 |
|
|
Verio, Inc. 10.375% 4/1/05 |
B3 |
|
11,000 |
11,715 |
|
|
|
3,438,660 |
||||
|
|
|||||
|
Moody's Ratings (unaudited) (b) |
Principal Amount |
Value |
|||
|
Computers & Office Equipment - 0.2% |
|||||
|
Comdisco, Inc.: |
|
|
|
|
|
|
6.375% 11/30/01 |
Baa1 |
|
$ 150,000 |
$ 145,139 |
|
|
7.25% 9/1/02 |
Baa1 |
|
125,000 |
120,986 |
|
|
Globix Corp. 12.5% 2/1/10 |
B- |
|
570,000 |
470,250 |
|
|
Sun Microsystems, Inc. 7% 8/15/02 |
Baa1 |
|
35,000 |
34,783 |
|
|
|
771,158 |
||||
|
Electronics - 0.4% |
|||||
|
ChipPAC International Ltd. 12.75% 8/1/09 |
B3 |
|
535,000 |
575,125 |
|
|
Details, Inc. 10% 11/15/05 |
B3 |
|
110,000 |
104,500 |
|
|
Fairchild |
|
|
|
|
|
|
10.125% 3/15/07 |
B2 |
|
100,000 |
101,000 |
|
|
10.375% 10/1/07 |
B3 |
|
310,000 |
316,200 |
|
|
Flextronics International Ltd. 9.875% 7/1/10 (f) |
Ba3 |
|
225,000 |
228,375 |
|
|
Micron Technology, Inc. 6.5% 9/30/05 (k) |
B3 |
|
1,000,000 |
835,000 |
|
|
SCG Holding Corp./Semiconductor Components Industries LLC 12% 8/1/09 |
B2 |
|
230,000 |
245,525 |
|
|
|
2,405,725 |
||||
|
TOTAL TECHNOLOGY |
6,615,543 |
||||
|
TRANSPORTATION - 0.2% |
|||||
|
Air Transportation - 0.1% |
|||||
|
Continental Airlines, Inc. pass thru trust certificates: |
|
|
|
|
|
|
7.434% 3/15/06 |
Baa1 |
|
30,000 |
29,007 |
|
|
7.73% 9/15/12 |
Baa1 |
|
12,553 |
11,989 |
|
|
Delta Air Lines, Inc. 8.3% 12/15/29 |
Baa3 |
|
160,000 |
139,456 |
|
|
Qantas Airways Ltd. 7.75% 6/15/09 (f) |
Baa1 |
|
110,000 |
109,450 |
|
|
US Airways Group, Inc. 10.375% 3/1/13 |
Ba3 |
|
360,000 |
320,400 |
|
|
|
610,302 |
||||
|
Railroads - 0.1% |
|||||
|
Burlington Northern |
Baa2 |
|
150,000 |
133,680 |
|
|
Canadian National Railway Co. 6.9% 7/15/28 |
Baa2 |
|
150,000 |
126,551 |
|
|
CSX Corp.: |
|
|
|
|
|
|
6.25% 10/15/08 |
Baa2 |
|
60,000 |
52,178 |
|
|
6.46% 6/22/05 |
Baa2 |
|
100,000 |
94,039 |
|
|
Corporate Bonds - continued |
|||||
|
Moody's Ratings (unaudited) (b) |
Principal Amount |
Value |
|||
|
Nonconvertible Bonds - continued |
|||||
|
TRANSPORTATION - continued |
|||||
|
Railroads - continued |
|||||
|
Norfolk Southern Corp. 7.05% 5/1/37 |
Baa1 |
|
$ 220,000 |
$ 215,019 |
|
|
Wisconsin Central Transportation Corp. 6.625% 4/15/08 |
Baa2 |
|
100,000 |
88,821 |
|
|
|
710,288 |
||||
|
TOTAL TRANSPORTATION |
1,320,590 |
||||
|
UTILITIES - 3.6% |
|||||
|
Cellular - 1.5% |
|||||
|
Crown Castle International Corp. 0% 5/15/11 (e) |
B3 |
|
525,000 |
320,250 |
|
|
Dobson Communications Corp. 10.875% 7/1/10 (f) |
- |
|
230,000 |
231,725 |
|
|
McCaw International Ltd. 0% 4/15/07 (e) |
Caa1 |
|
1,067,000 |
810,920 |
|
|
Millicom International Cellular SA 0% 6/1/06 (e) |
Caa1 |
|
1,310,000 |
1,113,500 |
|
|
Nextel Communications, Inc. 0% 10/31/07 (e) |
B1 |
|
2,760,000 |
2,056,200 |
|
|
Nextel International, Inc. 0% 4/15/08 (e) |
Caa1 |
|
815,000 |
537,900 |
|
|
Rogers Communications, Inc. 8.875% 7/15/07 |
Ba3 |
|
530,000 |
519,400 |
|
|
TeleCorp PCS, Inc. 0% 4/15/09 (e) |
B3 |
|
595,000 |
391,213 |
|
|
Triton PCS, Inc. 0% 5/1/08 (e) |
B3 |
|
560,000 |
404,600 |
|
|
Vodafone AirTouch PLC 7.625% 2/15/05 (f) |
A2 |
|
105,000 |
104,887 |
|
|
VoiceStream Wireless Corp.: |
|
|
|
|
|
|
0% 11/15/09 (e) |
B2 |
|
255,000 |
170,850 |
|
|
10.375% 11/15/09 |
B2 |
|
1,550,000 |
1,612,000 |
|
|
|
8,273,445 |
||||
|
Electric Utility - 0.1% |
|||||
|
Avon Energy Partners Holdings 6.46% 3/4/08 (f) |
Baa2 |
|
130,000 |
115,788 |
|
|
Dominion Resources, Inc. 8.125% 6/15/10 |
Baa1 |
|
65,000 |
65,439 |
|
|
Hydro-Quebec yankee 8.4% 3/28/25 |
A2 |
|
90,000 |
95,040 |
|
|
Illinois Power Co. 7.5% 6/15/09 |
Baa1 |
|
60,000 |
58,571 |
|
|
Israel Electric Corp. Ltd.: |
|
|
|
|
|
|
7.75% 12/15/27 (f) |
A3 |
|
170,000 |
145,716 |
|
|
yankee 7.875% 12/15/26 (f) |
A3 |
|
80,000 |
70,665 |
|
|
|
|||||
|
Moody's Ratings (unaudited) (b) |
Principal Amount |
Value |
|||
|
Texas Utilities Co. 6.375% 1/1/08 |
Baa3 |
|
$ 40,000 |
$ 36,130 |
|
|
|
587,349 |
||||
|
Gas - 0.0% |
|||||
|
Reliant Energy Resources Corp. 8.125% 7/15/05 (f) |
Baa1 |
|
50,000 |
49,990 |
|
|
Telephone Services - 2.0% |
|||||
|
Allegiance Telecom, Inc.: |
|
|
|
|
|
|
0% 2/15/08 (e) |
B3 |
|
250,000 |
181,875 |
|
|
12.875% 5/15/08 |
B3 |
|
260,000 |
281,450 |
|
|
Cable & Wireless Optus Ltd. 8% 6/22/10 (f) |
Baa1 |
|
100,000 |
99,383 |
|
|
Deutsche Telekom International Finance BV 8.25% 6/15/30 |
Aa2 |
|
260,000 |
264,142 |
|
|
FirstWorld Communications, Inc. 0% 4/15/08 (e) |
- |
|
480,000 |
216,000 |
|
|
Global Crossing Holdings Ltd. 9.125% 11/15/06 |
Ba2 |
|
145,000 |
139,563 |
|
|
Globenet Communication Group Ltd. 13% 7/15/07 |
Caa1 |
|
475,000 |
479,750 |
|
|
ICG Services, Inc. 0% 5/1/08 (e) |
B3 |
|
400,000 |
184,000 |
|
|
Intermedia |
|
|
|
|
|
|
0% 7/15/07 (e) |
B2 |
|
455,000 |
352,625 |
|
|
0% 3/1/09 (e) |
B3 |
|
250,000 |
151,875 |
|
|
Level 3 Communications, Inc. 9.125% 5/1/08 |
B3 |
|
765,000 |
686,588 |
|
|
Logix Communications Enterprises, Inc. 12.25% 6/15/08 |
- |
|
675,000 |
216,000 |
|
|
McLeodUSA, Inc.: |
|
|
|
|
|
|
0% 3/1/07 (e) |
B1 |
|
670,000 |
559,450 |
|
|
9.5% 11/1/08 |
B1 |
|
215,000 |
209,625 |
|
|
Metromedia Fiber Network, Inc. 10% 12/15/09 |
B2 |
|
95,000 |
93,338 |
|
|
NEXTLINK Communications, Inc. 9.625% 10/1/07 |
B2 |
|
540,000 |
506,250 |
|
|
Ono Finance PLC 13% 5/1/09 |
Caa1 |
|
370,000 |
349,650 |
|
|
Pathnet, Inc. 12.25% 4/15/08 |
- |
|
840,000 |
470,400 |
|
|
Rhythms |
|
|
|
|
|
|
0% 5/15/08 (e) |
B3 |
|
1,356,000 |
535,620 |
|
|
12.75% 4/15/09 |
B3 |
|
695,000 |
472,600 |
|
|
Telecomunicaciones de Puerto Rico, Inc. 6.65% 5/15/06 |
Baa2 |
|
140,000 |
130,379 |
|
|
Teleglobe Canada, Inc.: |
|
|
|
|
|
|
7.2% 7/20/09 |
Baa1 |
|
183,000 |
175,104 |
|
|
7.7% 7/20/29 |
Baa1 |
|
160,000 |
150,667 |
|
|
Corporate Bonds - continued |
|||||
|
Moody's Ratings (unaudited) (b) |
Principal Amount |
Value |
|||
|
Nonconvertible Bonds - continued |
|||||
|
UTILITIES - continued |
|||||
|
Telephone Services - continued |
|||||
|
Teligent, Inc.: |
|
|
|
|
|
|
0% 3/1/08 (e) |
Caa1 |
|
$ 770,000 |
$ 354,200 |
|
|
11.5% 12/1/07 |
Caa1 |
|
890,000 |
689,750 |
|
|
WinStar Communications, Inc.: |
|
|
|
|
|
|
0% 4/15/10 (e)(f) |
B3 |
|
2,636,000 |
1,225,740 |
|
|
12.75% 4/15/10 (f) |
B3 |
|
1,961,000 |
1,892,365 |
|
|
WorldCom, Inc. 8.875% 1/15/06 |
A3 |
|
103,000 |
106,797 |
|
|
|
11,175,186 |
||||
|
TOTAL UTILITIES |
20,085,970 |
||||
|
TOTAL NONCONVERTIBLE BONDS |
76,449,169 |
||||
|
TOTAL CORPORATE BONDS (Cost $84,294,396) |
78,365,707 |
||||
|
U.S. Government and Government |
|||||
|
|
|||||
|
U.S. Government Agency Obligations - 1.2% |
|||||
|
Fannie Mae: |
|
|
|
|
|
|
6% 5/15/08 |
Aaa |
|
1,000,000 |
932,570 |
|
|
6.5% 4/29/09 |
Aaa |
|
245,000 |
228,884 |
|
|
7.125% 2/15/05 |
Aaa |
|
255,000 |
256,035 |
|
|
7.25% 5/15/30 |
Aaa |
|
310,000 |
316,310 |
|
|
Federal Home Loan Bank 6.75% 2/1/02 |
Aaa |
|
830,000 |
827,402 |
|
|
Freddie Mac: |
|
|
|
|
|
|
0% 8/17/00 |
- |
|
2,000,000 |
1,983,698 |
|
|
5.5% 5/15/02 |
Aaa |
|
1,000,000 |
975,310 |
|
|
5.75% 3/15/09 |
Aaa |
|
510,000 |
464,498 |
|
|
6.25% 7/15/04 |
Aaa |
|
200,000 |
194,438 |
|
|
6.875% 1/15/05 |
Aaa |
|
85,000 |
84,469 |
|
|
7% 7/15/05 |
Aaa |
|
110,000 |
109,846 |
|
|
7.625% 9/9/09 |
Aaa |
|
85,000 |
83,805 |
|
|
Tennessee Valley Authority 7.125% 5/1/30 |
Aaa |
|
65,000 |
65,273 |
|
|
TOTAL U.S. GOVERNMENT AGENCY OBLIGATIONS |
6,522,538 |
||||
|
U.S. Treasury Obligations - 1.2% |
|||||
|
U.S. Treasury Bills, yield at date of purchase 5.76% 8/24/00 (h) |
- |
|
1,000,000 |
991,983 |
|
|
U.S. Treasury Bonds: |
|
|
|
|
|
|
6.875% 8/15/25 |
Aaa |
|
135,000 |
147,128 |
|
|
8% 11/15/21 |
Aaa |
|
50,000 |
60,446 |
|
|
8.125% 8/15/19 |
Aaa |
|
1,780,000 |
2,151,860 |
|
|
|
|||||
|
Moody's Ratings (unaudited) (b) |
Principal Amount |
Value |
|||
|
8.875% 8/15/17 |
Aaa |
|
$ 219,000 |
$ 279,157 |
|
|
8.875% 2/15/19 |
Aaa |
|
259,000 |
333,341 |
|
|
U.S. Treasury Notes: |
|
|
|
|
|
|
5.875% 10/31/01 |
Aaa |
|
700,000 |
694,533 |
|
|
6.625% 6/30/01 |
Aaa |
|
1,315,000 |
1,316,644 |
|
|
7.25% 8/15/04 |
Aaa |
|
20,000 |
20,678 |
|
|
7.875% 11/15/04 |
Aaa |
|
830,000 |
878,895 |
|
|
TOTAL U.S. TREASURY OBLIGATIONS |
6,874,665 |
||||
|
TOTAL U.S. GOVERNMENT AND GOVERNMENT AGENCY OBLIGATIONS (Cost $13,316,132) |
13,397,203 |
||||
|
U.S. Government Agency - |
|||||
|
|
|||||
|
Fannie Mae - 2.3% |
|||||
|
6% 3/1/11 to 1/1/29 |
Aaa |
|
1,157,618 |
1,100,240 |
|
|
6.5% 2/1/26 to 11/1/29 |
Aaa |
|
3,584,741 |
3,385,228 |
|
|
7% 8/1/25 to 12/1/29 |
Aaa |
|
3,017,374 |
2,921,248 |
|
|
7.5% 5/1/24 to 1/1/30 |
Aaa |
|
2,639,765 |
2,603,005 |
|
|
7.5% 7/1/30 |
Aaa |
|
1,200,000 |
1,182,375 |
|
|
8% 1/1/30 |
Aaa |
|
398,480 |
400,098 |
|
|
8% 7/1/30 (g) |
Aaa |
|
1,155,000 |
1,159,332 |
|
|
TOTAL FANNIE MAE |
12,751,526 |
||||
|
Freddie Mac - 0.0% |
|||||
|
7.5% 8/1/28 |
Aaa |
|
131,845 |
130,404 |
|
|
Government National Mortgage Association - 0.3% |
|||||
|
7% 7/15/28 |
Aaa |
|
847,185 |
823,616 |
|
|
7.5% 1/15/26 to 8/15/28 |
Aaa |
|
775,734 |
770,452 |
|
|
TOTAL GOVERNMENT NATIONAL |
1,594,068 |
||||
|
TOTAL U.S. GOVERNMENT AGENCY - (Cost $14,760,546) |
14,475,998 |
||||
|
Asset-Backed Securities - 0.2% |
|||||
|
|
|||||
|
Airplanes pass through trust 10.875% 3/15/19 |
Ba2 |
|
340,757 |
252,160 |
|
|
BankAmerica Manufacturing Housing Contract Trust V 6.2% 4/10/09 |
Aaa |
|
150,000 |
146,859 |
|
|
Capita Equipment Receivables Trust 6.48% 10/15/06 |
Baa2 |
|
100,000 |
96,797 |
|
|
CIT Marine Trust 5.8% 4/15/10 |
Aaa |
|
120,000 |
115,950 |
|
|
CPS Auto Grantor Trust 6.55% 8/15/02 |
Aaa |
|
18,974 |
18,879 |
|
|
Asset-Backed Securities - continued |
|||||
|
Moody's Ratings (unaudited) (b) |
Principal Amount |
Value |
|||
|
CPS Auto Receivables Trust 6% 8/15/03 |
Aaa |
|
$ 72,514 |
$ 71,517 |
|
|
CSXT Trade Receivables Master Trust 6% 7/25/04 |
Aaa |
|
180,000 |
174,544 |
|
|
Ford Credit Auto |
|
|
|
|
|
|
6.2% 12/15/02 |
Aa2 |
|
90,000 |
88,777 |
|
|
6.4% 12/15/02 |
Aa2 |
|
50,000 |
49,350 |
|
|
7.03% 11/15/03 |
Aaa |
|
24,000 |
23,981 |
|
|
Green Tree Financial Corp. 6.8% 6/15/27 |
Aaa |
|
19,008 |
18,990 |
|
|
Olympic Automobile Receivables Trust 6.7% 3/15/02 |
Aaa |
|
6,288 |
6,286 |
|
|
Petroleum Enhanced Trust Receivables Offering Petroleum Trust 6.125% 2/5/03 (f)(i) |
Baa2 |
|
54,596 |
54,331 |
|
|
Sears Credit Account Master Trust II 7.5% 11/15/07 |
A2 |
|
50,000 |
50,000 |
|
|
UAF Auto Grantor Trust 6.1% 1/15/03 (f) |
Aaa |
|
79,617 |
79,095 |
|
|
TOTAL ASSET-BACKED SECURITIES (Cost $1,381,710) |
1,247,516 |
||||
|
Collateralized Mortgage Obligations - 0.0% |
|||||
|
|
|||||
|
Private Sponsor - 0.0% |
|||||
|
Credit-Based Asset Servicing and Securitization LLC Series 1997-2 Class 2B, 7.1786% 12/29/25 (d)(f)(i) |
Ba3 |
|
167,970 |
80,993 |
|
|
U.S. Government Agency - 0.0% |
|||||
|
Fannie Mae REMIC planned amortization class: |
|
|
|
|
|
|
Series 1999-54 Class PH, 6.5% 11/18/29 |
Aaa |
|
100,000 |
90,016 |
|
|
Series 1999-57 Class PH, 6.5% 12/25/29 |
Aaa |
|
100,000 |
89,859 |
|
|
TOTAL U.S. GOVERNMENT AGENCY |
179,875 |
||||
|
TOTAL COLLATERALIZED MORTGAGE OBLIGATIONS (Cost $268,920) |
260,868 |
||||
|
Commercial Mortgage Securities - 0.7% |
|||||
|
Moody's Ratings (unaudited) (b) |
Principal Amount |
Value |
|||
|
BKB Commercial Mortgage Trust Series 1997-C1 Class D, 7.7606% 2/25/43 (f)(i) |
BBB |
|
$ 36,512 |
$ 36,294 |
|
|
CBM Funding Corp. sequential pay Series 1996-1: |
|
|
|
|
|
|
Class A-3PI, 7.08% 11/1/07 |
AA |
|
100,000 |
98,242 |
|
|
Class B, 7.48% 2/1/08 |
A |
|
80,000 |
78,172 |
|
|
CS First Boston Mortgage Securities Corp.: |
|
|
|
|
|
|
Series 1997-C2 Class D, 7.27% 1/17/35 |
Baa2 |
|
200,000 |
183,859 |
|
|
Series 1998-FL1 Class E, 7.4913% 1/10/13 (f)(i) |
Baa2 |
|
220,000 |
219,020 |
|
|
Deutsche Mortgage & Asset Receiving Corp. Series 1998-C1 Class D, 7.231% 7/15/12 |
Baa2 |
|
140,000 |
125,759 |
|
|
First Chicago/Lennar Trust I Series 1997-CHL1 Class E, 8.0835% 4/1/39 (i) |
- |
|
320,000 |
227,700 |
|
|
FMAC Loan |
|
|
|
|
|
|
Series 1997-A Class E, 8.1104% 4/15/19 (f)(i) |
- |
|
250,000 |
165,234 |
|
|
Series 1997-B Class E, 7.8912% 9/15/19 (f)(i) |
- |
|
100,000 |
38,000 |
|
|
General Motors Acceptance Corp. Commercial Mortgage Securities, Inc. Series 1996-C1 Class F, 7.86% 10/15/28 (f) |
Ba3 |
|
250,000 |
201,055 |
|
|
GS Mortgage Securities Corp. II Series 1998-GLII Class E, 7.1905% 4/13/31 (f)(i) |
Baa3 |
|
180,000 |
155,623 |
|
|
LTC Commercial Mortgage pass through certificates: |
|
|
|
|
|
|
Series 1996-1 Class E, 9.16% 4/15/28 |
BB- |
|
500,000 |
447,500 |
|
|
Series 1998-1 Class A, 6.029% 5/30/30 (f) |
AAA |
|
103,030 |
96,929 |
|
|
Morgan Stanley Capital I, Inc. Series 1996-MBL1 Class E, 8.2633% 5/25/21 (f)(i) |
- |
|
76,623 |
76,204 |
|
|
Nomura Asset Securities Corp. Series 1998-D6 Class A4, 7.6083% 3/17/28 (i) |
Baa2 |
|
140,000 |
127,728 |
|
|
Nomura Depositor Trust floater Series 1998-ST1A Class B2, 10.9013% 1/15/03 (f)(i) |
- |
|
125,000 |
115,762 |
|
|
Commercial Mortgage Securities - continued |
|||||
|
Moody's Ratings (unaudited) (b) |
Principal Amount |
Value |
|||
|
Prudential Securities Secd Financing Corp. Series 2000-C1, Class A2 7.727% 2/15/10 |
Aaa |
|
$ 50,000 |
$ 50,484 |
|
|
Structured Asset Securities Corp.: |
|
|
|
|
|
|
Series 1995-C1 Class E, 7.375% 9/25/24 (f) |
BB |
|
1,000,000 |
921,445 |
|
|
Series 1996-CFL Class E, 7.75% 2/25/28 |
BBB |
|
80,000 |
79,331 |
|
|
Thirteen Affiliates of General Growth Properties, Inc.: |
|
|
|
|
|
|
Series D-2, 6.992% 12/15/10 (f) |
Baa2 |
|
140,000 |
128,827 |
|
|
Series E-2, 7.224% 12/15/10 (f) |
Baa3 |
|
100,000 |
89,828 |
|
|
TOTAL COMMERCIAL MORTGAGE SECURITIES (Cost $3,940,126) |
3,662,996 |
||||
|
Foreign Government and Government |
|||||
|
|
|||||
|
Korean Republic yankee 8.875% 4/15/08 |
Baa2 |
|
46,000 |
47,449 |
|
|
Quebec Province 7.5% 9/15/29 |
A2 |
|
340,000 |
334,019 |
|
|
United Mexican States 9.875% 2/1/10 |
Baa3 |
|
150,000 |
156,750 |
|
|
TOTAL FOREIGN GOVERNMENT AND GOVERNMENT AGENCY OBLIGATIONS (Cost $539,426) |
538,218 |
||||
|
Supranational Obligations - 0.0% |
|||||
|
|
|||||
|
Inter-American Development Bank yankee 6.29% 7/16/27 |
Aaa |
|
150,000 |
142,893 |
|
|
Purchased Bank Debt - 1.6% |
|||||
|
|
|||||
|
American Tower L P term loan 9.53% 12/31/07 (i) |
- |
|
600,000 |
603,000 |
|
|
Charter Communication Operating LLC term loan 8.8% 3/18/08 (i) |
Ba3 |
|
1,000,000 |
993,750 |
|
|
Crown Castle Operating Co. term loan 9.46% 6/15/08 (i) |
Ba3 |
|
800,000 |
802,000 |
|
|
Dynatech LLC term loan 10.03% 9/1/07 (i) |
- |
|
760,000 |
756,200 |
|
|
|
|||||
|
Moody's Ratings (unaudited) (b) |
Principal Amount |
Value |
|||
|
Huntsman ICI Chemicals LLC sr. secured: |
|
|
|
|
|
|
term B loan 9.875% 6/30/07 (i) |
- |
|
$ 341,250 |
$ 342,103 |
|
|
term C loan 9.8128% 6/30/08 (i) |
- |
|
438,920 |
440,017 |
|
|
Lyondell Chemical Co. sr. secured Tranche E term loan 10.5263% 5/17/06 (i) |
- |
|
700,000 |
719,250 |
|
|
McLeodUSA, Inc. term loan 9.69% 5/31/08 (i) |
Ba2 |
|
750,000 |
751,875 |
|
|
Nextel Finance Co. term loan: |
|
|
|
|
|
|
9.6875% 6/30/08 (i) |
Ba2 |
|
500,000 |
501,875 |
|
|
10.375% 12/31/08 (i) |
Ba2 |
|
500,000 |
501,875 |
|
|
Packaging Corp. of America term loan 0% 5/22/07 (i) |
- |
|
500,000 |
501,250 |
|
|
Telemundo Group, Inc. term loan 8.905% 3/31/07 (i) |
B1 |
|
300,000 |
298,125 |
|
|
Tritel Holding Corp. term loan 11.15% 12/31/07 (i) |
B2 |
|
750,000 |
752,813 |
|
|
Voicestream Pcs Holding LLC term loan 9.76% 2/25/09 (i) |
B+ |
|
900,000 |
897,750 |
|
|
Wci Capital Corp. term loan 11.43% 9/30/07 (i) |
B2 |
|
400,000 |
399,000 |
|
|
TOTAL PURCHASED BANK DEBT (Cost $9,276,347) |
9,260,883 |
||||
|
Bank Notes - 0.1% |
||||
|
|
||||
|
Bank One NA 6.29% 8/25/00 |
|
350,000 |
349,447 |
|
|
Certificates of Deposit - 0.1% |
||||
|
|
||||
|
Canadian Imperial Bank of Commerce yankee 7.01% 11/27/00 |
|
350,000 |
350,194 |
|
|
Commercial Paper - 0.3% |
||||
|
|
||||
|
CIT Group, Inc. 6.43% 7/5/00 |
|
350,000 |
349,869 |
|
|
Daimler-Chrysler North America Holding Corp. yankee 6.65% 11/7/00 |
|
350,000 |
341,826 |
|
|
General Motors Acceptance Corp. 6.62% 8/28/00 |
|
380,000 |
376,116 |
|
|
ING America Insurance Holdings, Inc. yankee 6.69% 11/9/00 |
|
350,000 |
341,735 |
|
|
Woolwich PLC yankee 6.21% 7/19/00 |
|
350,000 |
348,969 |
|
|
TOTAL COMMERCIAL PAPER (Cost $1,757,427) |
1,758,515 |
|||
|
Cash Equivalents - 7.6% |
|||
|
Maturity Amount |
Value |
||
|
Investments in repurchase agreements (U.S. Government Obligations), in a joint trading account at 6.83%, dated 6/30/00 due 7/3/00 |
$ 2,216,261 |
$ 2,215,000 |
|
|
Shares |
|
||
|
Central Cash Collateral Fund, 6.71% (c) |
501,400 |
501,400 |
|
|
Taxable Central Cash Fund, 6.59% (c) |
39,965,070 |
39,965,070 |
|
|
TOTAL CASH EQUIVALENTS (Cost $42,681,470) |
42,681,470 |
||
|
TOTAL INVESTMENT PORTFOLIO - 100.1% (Cost $509,744,964) |
565,029,889 |
||
|
NET OTHER ASSETS - (0.1)% |
(325,417) |
||
|
NET ASSETS - 100% |
$ 564,704,472 |
||
|
Futures Contracts |
|||||
|
|
Expiration Date |
Underlying Face Amount at Value |
Unrealized Gain/(Loss) |
||
|
Purchased |
|||||
|
74 S&P 500 Stock Index Contracts |
Sept. 2000 |
$ 27,159,850 |
$ (154,341) |
||
|
The face value of futures purchased as a percentage of net assets - 4.8% |
|
Legend |
|
(a) Non-income producing |
|
(b) S&P credit ratings are used in the absence of a rating by Moody's Investors Service, Inc. |
|
(c) The rate quoted is the annualized seven-day yield of the fund at |
|
(d) Non-income producing - issuer filed for protection under the Federal Bankruptcy Code or is in default of interest payment. |
|
(e) Debt obligation initially issued in zero coupon form which converts to coupon form at a specified rate and date. The rate shown is the rate at period end. |
|
(f) Security exempt from registration under Rule 144A of the Securities Act of 1933. These securities may be resold in transactions exempt from registration, normally to qualified institutional buyers. At the period end, the value of these securities amounted to $10,009,281 or 1.8% of net assets. |
|
(g) Security purchased on a delayed delivery or when-issued basis. |
|
(h) Security or a portion of the security was pledged to cover margin requirements for futures contracts. At the period end, the value of securities pledged amounted to $991,983. |
|
(i) The coupon rate shown on floating or adjustable rate securities represents the rate at period end. |
|
(j) For foreign government obligations not individually rated by S&P or Moody's, the ratings listed have been assigned by FMR, the fund's investment adviser, based principally on S&P and Moody's ratings of the sovereign credit of the issuing government. |
|
(k) Restricted securities - Investment in securities not registered under the Securities Act of 1933. |
|
Additional information on each holding is as follows: |
|
Security |
Acquisition Date |
Acquisition Cost |
|
Goldman Sachs Group LP 6.6338% 7/27/00 |
1/25/99 |
$ 400,000 |
|
Micron Technology, Inc. 6.5% 9/30/05 |
11/1/99 |
$ 787,500 |
|
Other Information |
|
The composition of long-term debt holdings as a percentage of total value of investments in securities, is as follows (ratings are unaudited): |
|
Moody's Ratings |
S&P Ratings |
|||
|
Aaa, Aa, A |
5.4% |
|
AAA, AA, A |
4.6% |
|
Baa |
1.7% |
|
BBB |
1.5% |
|
Ba |
2.1% |
|
BB |
2.3% |
|
B |
8.2% |
|
B |
8.6% |
|
Caa |
1.8% |
|
CCC |
1.2% |
|
Ca, C |
0.0% |
|
CC, C |
0.0% |
|
|
|
|
D |
0.2% |
|
The percentage not rated by Moody's or S&P amounted to 1.1%. FMR has determined that unrated debt securities that are lower quality account for 1.1% of the total value of investment in securities. |
|
Purchases and sales of securities, other than short-term securities, aggregated $410,590,429 and $446,509,326, respectively, of which long-term U.S. government and government agency obligations aggregated $21,640,909 and $29,574,212, respectively. |
|
The market value of futures contracts opened and closed during the period amounted to $42,463,560 and $25,435,756, respectively. |
|
The fund placed a portion of its portfolio transactions with brokerage firms which are affiliates of Fidelity Management & Research Company. The commissions paid to these affiliated firms were $11,215 for the period. |
|
The fund invested in securities that are not registered under the Securities Act of 1933. These securities are subject to legal or contractual restrictions on resale. At the end of the period, restricted securities (excluding Rule 144A issues) amounted to $1,234,966 and 0.2% of net assets. |
|
The fund participated in the security lending program. At period end, the value of securities loaned amounted to $508,362. The fund received cash collateral of $501,400 which was invested in cash equivalents. |
|
Income Tax Information |
|
At June 30, 2000, the aggregate cost of investment securities for income tax purposes was $511,113,364. Net unrealized appreciation aggregated $53,916,525, of which $78,810,087 related to appreciated investment securities and $24,893,562 related to depreciated investment securities. |
See accompanying notes which are an integral part of the financial statements.
Asset Manager: Growth Portfolio
Statement of Assets and Liabilities
|
|
June 30, 2000 (Unaudited) |
|
|
Assets |
|
|
|
Investment in securities, at value (including repurchase agreements of $2,215,000) |
|
$ 565,029,889 |
|
Cash |
|
580,771 |
|
Receivable for investments sold |
|
2,971,635 |
|
Receivable for fund shares sold |
|
144,989 |
|
Dividends receivable |
|
223,283 |
|
Interest receivable |
|
2,250,205 |
|
Receivable for daily variation on futures contracts |
|
128,478 |
|
Other receivables |
|
4,662 |
|
Total assets |
|
571,333,912 |
|
Liabilities |
|
|
|
Payable for investments purchased |
$ 4,480,071 |
|
|
Delayed delivery |
1,156,414 |
|
|
Payable for fund shares redeemed |
103,022 |
|
|
Accrued management fee |
268,525 |
|
|
Distribution fees payable |
1,214 |
|
|
Other payables and |
118,794 |
|
|
Collateral on securities loaned, |
501,400 |
|
|
Total liabilities |
|
6,629,440 |
|
Net Assets |
|
$ 564,704,472 |
|
Net Assets consist of: |
|
|
|
Paid in capital |
|
$ 459,835,599 |
|
Undistributed net investment income |
|
8,042,512 |
|
Accumulated undistributed net realized gain (loss) on investments and foreign currency transactions |
|
41,695,777 |
|
Net unrealized appreciation (depreciation) on investments |
|
55,130,584 |
|
Net Assets |
|
$ 564,704,472 |
|
Initial Class: |
|
$16.26 |
|
Service Class: |
|
$16.16 |
|
Service Class 2: |
|
$16.15 |
Statement of Operations
|
|
Six months ended June 30, 2000 (Unaudited) |
|
|
Investment Income Dividends |
|
$ 2,439,432 |
|
Interest |
|
6,412,593 |
|
Security lending |
|
3,343 |
|
Total income |
|
8,855,368 |
|
Expenses |
|
|
|
Management fee |
$ 1,608,808 |
|
|
Transfer agent fees |
183,381 |
|
|
Distribution fees |
6,175 |
|
|
Accounting and security lending fees |
98,601 |
|
|
Non-interested trustees' compensation |
884 |
|
|
Custodian fees and expenses |
17,239 |
|
|
Registration fees |
246 |
|
|
Audit |
13,564 |
|
|
Legal |
2,214 |
|
|
Miscellaneous |
12,474 |
|
|
Total expenses before reductions |
1,943,586 |
|
|
Expense reductions |
(19,481) |
1,924,105 |
|
Net investment income |
|
6,931,263 |
|
Realized and Unrealized Gain (Loss) Net realized gain (loss) on: |
|
|
|
Investment securities |
41,710,684 |
|
|
Foreign currency transactions |
25 |
|
|
Futures contracts |
303,300 |
42,014,009 |
|
Change in net unrealized appreciation (depreciation) on: |
|
|
|
Investment securities |
(56,540,361) |
|
|
Assets and liabilities in |
(1) |
|
|
Futures contracts |
(189,604) |
(56,729,966) |
|
Net gain (loss) |
|
(14,715,957) |
|
Net increase (decrease) in net assets resulting from operations |
|
$ (7,784,694) |
|
Other Information Expense reductions |
|
$ 16,516 |
|
Custodian credits |
|
2,965 |
|
|
|
$ 19,481 |
See accompanying notes which are an integral part of the financial statements.
Semiannual Report
Fidelity Variable Insurance Products: Asset Manager: Growth Portfolio
Financial Statements - continued
Statement of Changes in Net Assets
|
Increase (Decrease) in Net Assets |
Six months ended |
Year ended |
|
Operations |
$ 6,931,263 |
$ 13,100,308 |
|
Net realized gain (loss) |
42,014,009 |
48,664,911 |
|
Change in net unrealized appreciation (depreciation) |
(56,729,966) |
17,820,079 |
|
Net increase (decrease) in net assets resulting from operations |
(7,784,694) |
79,585,298 |
|
Distributions to shareholders |
(11,727,781) |
(12,766,102) |
|
From net realized gain |
(47,570,525) |
(21,173,047) |
|
Total distributions |
(59,298,306) |
(33,939,149) |
|
Share transactions - net increase (decrease) |
40,407,233 |
13,695,216 |
|
Total increase (decrease) in net assets |
(26,675,767) |
59,341,365 |
|
Net Assets |
|
|
|
Beginning of period |
591,380,239 |
532,038,874 |
|
End of period (including undistributed net investment income of $8,042,512 and $13,084,201, respectively) |
$ 564,704,472 |
$ 591,380,239 |
|
|
|
Other Information: |
|
|
Six months ended June 30, 2000 |
Year ended |
||
|
|
Shares |
Dollars |
Shares |
Dollars |
|
Share transactions |
2,257,146 |
$ 36,909,555 |
3,532,899 |
$ 59,442,839 |
|
Reinvested |
3,619,549 |
58,129,957 |
2,100,108 |
33,706,735 |
|
Redeemed |
(3,600,176) |
(59,212,121) |
(5,095,721) |
(86,190,044) |
|
Net increase (decrease) |
2,276,519 |
$ 35,827,391 |
537,286 |
$ 6,959,530 |
|
Service Class |
224,493 |
$ 3,664,261 |
451,433 |
$ 7,507,627 |
|
Reinvested |
72,504 |
1,157,887 |
14,544 |
232,414 |
|
Redeemed |
(53,879) |
(864,210) |
(60,280) |
(1,004,355) |
|
Net increase (decrease) |
243,118 |
$ 3,957,938 |
405,697 |
$ 6,735,686 |
|
Service Class 2 A |
39,435 |
$ 628,570 |
- |
$ - |
|
Reinvested |
655 |
10,461 |
- |
- |
|
Redeemed |
(1,069) |
(17,127) |
- |
- |
|
Net increase (decrease) |
39,021 |
$ 621,904 |
- |
$ - |
|
Distributions |
|
$ 11,501,649 |
|
$ 12,678,680 |
|
Service Class |
|
224,107 |
|
87,422 |
|
Service Class 2 A |
|
2,025 |
|
- |
|
Total |
|
$ 11,727,781 |
|
$ 12,766,102 |
|
From net realized gain |
|
$ 46,628,308 |
|
$ 21,028,055 |
|
Service Class |
|
933,780 |
|
144,992 |
|
Service Class 2 A |
|
8,437 |
|
- |
|
Total |
|
$ 47,570,525 |
|
$ 21,173,047 |
|
|
|
$ 59,298,306 |
|
$ 33,939,149 |
A Service Class 2 commenced sale of shares January 12, 2000.
See accompanying notes which are an integral part of the financial statements.
Asset Manager: Growth Portfolio
Financial Highlights - Initial Class
|
|
Six months ended |
Years ended December 31, |
||||
|
Selected Per-Share Data |
(Unaudited) |
1999 |
1998 |
1997 |
1996 |
1995 E |
|
Net asset value, beginning of period |
$ 18.38 |
$ 17.03 |
$ 16.36 |
$ 13.10 |
$ 11.77 |
$ 10.00 |
|
Income from Investment Operations |
|
|
|
|
|
|
|
Net investment income |
.20 D |
.40 D |
.41 D |
.36 D |
.21 |
.10 |
|
Net realized and unrealized gain (loss) |
(.45) |
2.04 |
2.19 |
2.92 |
2.08 |
2.20 |
|
Total from investment operations |
(.25) |
2.44 |
2.60 |
3.28 |
2.29 |
2.30 |
|
Less Distributions |
|
|
|
|
|
|
|
From net investment income |
(.37) |
(.41) |
(.34) |
- |
(.21) |
(.11) |
|
From net realized gain |
(1.50) |
(.68) |
(1.59) |
(.02) |
(.75) |
(.42) |
|
Total distributions |
(1.87) |
(1.09) |
(1.93) |
(.02) |
(.96) |
(.53) |
|
Net asset value, end of period |
$ 16.26 |
$ 18.38 |
$ 17.03 |
$ 16.36 |
$ 13.10 |
$ 11.77 |
|
Total Return B, C |
(1.29)% |
15.26% |
17.57% |
25.07% |
20.04% |
23.02% |
|
Ratios and Supplemental Data |
|
|
|
|
|
|
|
Net assets, end of period (000 omitted) |
$ 550,573 |
$ 580,555 |
$ 528,874 |
$ 483,231 |
$ 253,024 |
$ 68,247 |
|
Ratio of expenses to average net assets |
.69% A |
.71% |
.73% |
.77% |
.87% |
1.00% G |
|
Ratio of expenses to average net assets after |
.69% A |
.70% H |
.72% H |
.76% H |
.85% H |
1.00% |
|
Ratio of net investment income to average net assets |
2.48% A |
2.38% |
2.60% |
2.44% |
2.63% |
1.69% |
|
Portfolio turnover |
154% A |
92% |
98% |
90% |
120% |
343% |
Financial Highlights - Service Class
|
|
Six months ended |
Years ended December 31, |
||
|
Selected Per-Share Data |
(Unaudited) |
1999 |
1998 |
1997 F |
|
Net asset value, beginning of period |
$ 18.28 |
$ 16.96 |
$ 16.35 |
$ 15.94 |
|
Income from Investment Operations |
|
|
|
|
|
Net investment income D |
.19 |
.38 |
.40 |
.07 |
|
Net realized and unrealized gain (loss) |
(.45) |
2.03 |
2.14 |
.34 |
|
Total from investment operations |
(.26) |
2.41 |
2.54 |
.41 |
|
Less Distributions |
|
|
|
|
|
From net investment income |
(.36) |
(.41) |
(.34) |
- |
|
From net realized gain |
(1.50) |
(.68) |
(1.59) |
- |
|
Total distributions |
(1.86) |
(1.09) |
(1.93) |
- |
|
Net asset value, end of period |
$ 16.16 |
$ 18.28 |
$ 16.96 |
$ 16.35 |
|
Total Return B, C |
(1.30)% |
15.13% |
17.18% |
2.57% |
|
Ratios and Supplemental Data |
|
|
|
|
|
Net assets, end of period (000 omitted) |
$ 13,502 |
$ 10,825 |
$ 3,165 |
$ 10 |
|
Ratio of expenses to average net assets |
.80% A |
.82% |
.89% |
.87% A |
|
Ratio of expenses to average net assets after expense reductions |
.79% A, H |
.81% H |
.88% H |
.87% A |
|
Ratio of net investment income to average net assets |
2.38% A |
2.27% |
2.65% |
2.70% A |
|
Portfolio turnover |
154% A |
92% |
98% |
90% |
|
A Annualized B Total returns for periods of less than one year are not annualized and do not reflect charges attributable to your insurance company's separate account. Inclusion of these charges would reduce the total returns shown. C The total returns would have been lower had certain expenses not been reduced during the period shown. D Net investment income per share has been calculated based on average shares outstanding during the period. E For the period January 5, 1995 (commencement of sale of Initial Class shares) to December 31, 1995. F For the period November 3, 1997 (commencement of sale of Service Class shares) to December 31, 1997. G FMR agreed to reimburse a portion of the class' expenses during the period. Without this reimbursement, the class' expense ratio would have been higher. H FMR or the fund has entered into varying arrangements with third parties who either paid or reduced a portion of the class' expenses. |
||||
See accompanying notes which are an integral part of the financial statements.
Semiannual Report
Financial Highlights - Service Class 2
|
|
Six months ended |
|
Selected Per-Share Data |
(Unaudited) |
|
Net asset value, beginning of period |
$ 17.78 |
|
Income from Investment Operations |
|
|
Net investment income C |
.16 |
|
Net realized and unrealized gain (loss) |
.07 E |
|
Total from investment operations |
.23 |
|
Less Distributions |
|
|
From net investment income |
(.36) |
|
From net realized gain |
(1.50) |
|
Total distributions |
(1.86) |
|
Net asset value, end of period |
$ 16.15 |
|
Total Return B |
1.41% |
|
Ratios and Supplemental Data |
|
|
Net assets, end of period (000 omitted) |
$ 630 |
|
Ratio of expenses to average net assets |
.94% A |
|
Ratio of net investment income to average net assets |
2.23% A |
|
Portfolio turnover |
154% A |
|
A Annualized B Total returns for periods of less than one year are not annualized and do not reflect charges attributable to your insurance company's separate account. Inclusion of these charges would reduce the total returns shown. C Net investment income per share has been calculated based on average shares outstanding during the period. D For the period January 12, 2000 (commencement of sale of Service Class 2 shares) to June 30, 2000. E The amount shown for a share outstanding does not correspond with the aggregate net loss on investments for the period due to the timing of sales and repurchases of class shares in relation to fluctuating market values of the investments of the fund. |
|
See accompanying notes which are an integral part of the financial statements.
Asset Manager: Growth Portfolio
Performance
There are several ways to evaluate a fund's historical performance. You can look at the total percentage change in value, the average annual percentage change or the growth of a hypothetical $10,000 investment. Total return reflects the change in the value of an investment, assuming reinvestment of the fund's dividend income and capital gains (the profits earned upon the sale of securities that have grown in value). The initial offering of Service Class shares took place on November 3, 1997. Performance for Service Class shares reflects an asset based distribution fee (12b-1 fee), and returns prior to November 3, 1997 are those of Initial Class and do not include the effects of Service Class' 12b-1 fee. Had Service Class shares' 12b-1 fee been reflected, returns prior to November 3, 1997 would have been lower. If Fidelity had not reimbursed certain fund expenses, the past 10 years total return would have been lower.
Average Annual Total Returns
|
Periods ended |
Past 1 |
Past 5 |
Past 10 |
|
Fidelity VIP: Asset Manager - |
4.72% |
14.00% |
12.56% |
|
Asset Manager Composite |
6.29% |
14.27% |
11.82% |
|
S&P 500 |
7.25% |
23.80% |
17.80% |
|
LB Aggregate Bond |
4.57% |
6.25% |
7.82% |
|
LB 3 Month T-Bill |
5.57% |
5.41% |
5.08% |
Average annual returns take the fund's cumulative return and show you what would have happened if the fund had performed at a constant rate each year.
You can compare the fund's returns to those of the Asset Manager Composite Index, a hypothetical combination of unmanaged indices. The composite index combines the total returns of the Standard & Poor's 500 Index, the Lehman Brothers Aggregate Bond Index and the Lehman Brothers 3 Month Treasury Bill Index weighted according to the fund's neutral mix.*
The benchmarks listed in the table above include reinvested dividends and capital gains, if any.
Figures for more than one year assume a steady compounded rate of return and are not the fund's year-by-year results, which fluctuated over the periods shown.
Performance numbers are net of all fund operating expenses, but do not include any insurance charges imposed by your insurance company's separate account. If performance information included the effect of these additional charges, the total returns would have been lower.
Past performance is no guarantee of future results. Principal and investment return will vary and you may have a gain or loss when you withdraw your money.
Understanding Performance
How a fund did yesterday is no guarantee of how it will do tomorrow. The stock market, for example, has a history of long-term growth and short-term volatility. In turn, the share price and return of a fund that invests in stocks will vary. That means if you sell your shares during a market downturn, you might lose money. But if you can ride out the market's ups and downs, you may have a gain.
$10,000 Over 10 Years
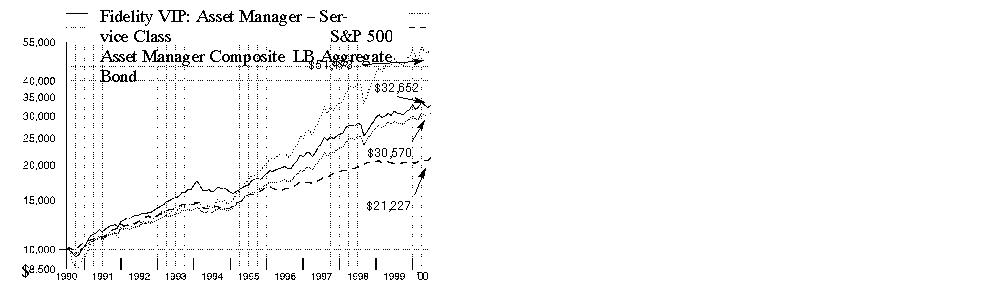
$10,000 Over 10 Years: Let's say hypothetically that $10,000 was invested in Fidelity Variable Insurance Products: Asset Manager Portfolio - Service Class on June 30, 1990. By June 30, 2000, the value of the investment would have grown to $32,652 - a 226.52% increase. With reinvested dividends and capital gains, if any, a $10,000 investment in the Standard & Poor's 500 Index would have grown to $51,473 over the same period - a 414.73% increase on the initial investment. If $10,000 was invested in the Lehman Brothers Aggregate Bond Index, it would have grown to $21,227 - a 112.27% increase. You can also look at how the Asset Manager Composite Index did over the same period. With reinvested dividends and capital gains, if any, a $10,000 investment in the index would have grown to $30,570 - a 205.70% increase.
* 50% stocks, 40% bonds and 10% short-term instruments effective January 1, 1997.
Investment Summary
|
Top Five Stocks as of June 30, 2000 |
|
|
|
% of fund's |
|
General Electric Co. |
2.4 |
|
Intel Corp. |
1.8 |
|
Pfizer, Inc. |
1.6 |
|
Cisco Systems, Inc. |
1.6 |
|
Microsoft Corp. |
1.6 |
|
|
9.0 |
|
Top Five Bond Issuers as of June 30, 2000 |
|
|
(with maturities greater than one year) |
% of fund's |
|
Fannie Mae |
9.4 |
|
U.S. Treasury Obligations |
3.8 |
|
Government National Mortgage Association |
1.1 |
|
Federal Home Loan Bank |
1.0 |
|
Freddie Mac |
0.6 |
|
|
15.9 |
|
Asset Allocation as of June 30, 2000 |
|||
|
% of fund's net assets * |
|||
|
Stock class 53.0% |
|
|
|
Bonds class 35.7% |
|
|
|
Short-Term class 11.3% |
|
|
|
* Foreign investments 4.5% |
|
Asset allocation in the pie chart reflects the categorization of assets as defined in the fund's Prospectus. Financial statement categorizations conform to accounting standards and will differ from the pie chart. |
Semiannual Report
(Portfolio Manager photograph)
Note to shareholders: Bart Grenier became Portfolio Manager of Asset Manager Portfolio
on May 1, 2000.
Q. How did the fund perform, Bart?
A. For the six- and 12-month periods that ended June 30, 2000,
the fund trailed the Asset Manager Composite Index, which returned 1.80% and 6.29%, respectively.
Q. How did the fund's asset allocation strategies play out
during the past six months?
A. The fund maintained a modest tilt toward equities, averaging just under 53% for the period. The fund's neutral allocation mix typically calls for 50% to be invested in stocks, 40% in bonds and 10% in short-term and money market instruments. Given the bullish environment for stocks in the first quarter of 2000, the fund's overexposure here garnered it an edge over the composite index early in the period. However, the fund's wins during the period were more than offset by its losses suffered during the sharp, broad market decline of April and May, even though stocks rallied again in June. On the bond front, the fund continued to emphasize investment-grade debt, which helped. However, our exposure to high-yield securities hurt, as this asset class had a particularly difficult period.
Q. What factors influenced performance of the equity subportfolio?
A. Steve Snider kept the fund generally sector neutral relative to the Standard & Poor's 500 Index, choosing instead to focus his efforts on individual stock picking. The fund benefited from owning a number of high-quality tech names that effectively weathered the correction in the spring and delivered strong returns for the period. Texas Instruments, Adobe Systems and ADC Telecommunications led the way, followed by Intel, Corning and Cisco. The fund's exposure to health stocks, particularly Amgen and Pfizer, helped amid a rally in biotechnology shares. Growth-oriented financials, such as Lehman Brothers, and energy stocks, such as BP Amoco, also were meaningful contributors. Conversely, we were caught holding a number of disappointments within tech, including Qualcomm, Motorola and Lucent, which each fell on weak earnings. Neither BP Amoco nor Lucent was held at the close of the period. Poor performance among retail stocks also hurt the fund's return as Wal-Mart, Lowe's and Home Depot all declined. Overall, the equity subportfolio trailed the index slightly during the six-month period, but outperformed it during the past 12 months.
Q. How did the bond portion of the fund fare?
A. High-yield bonds suffered from poor liquidity and declining credit quality. Fred Hoff - who directed the fund's high-yield investments until June 1, 2000, when Mark Notkin took over - helped limit our losses by avoiding the names that fell the furthest amid the period's downtrend. Switching gears, Charlie Morrison and his team did a nice job of positioning the investment-grade component of the fund to benefit from changing market conditions. Following strong performance turned in by the spread sectors - namely corporate bonds and mortgage securities - in the fourth quarter of 1999, we reduced our exposure to these markets, particularly to long-term corporates, in early January. This strategy benefited the fund, as spread-sector performance deteriorated during the period. A driving influence at this time was the U.S. Treasury's announcement in January of its intention to reduce new borrowing and use government surplus proceeds to repurchase outstanding debt. This move sparked a tremendous rally in long-term Treasuries. So, despite the Federal Reserve Board's actions to raise rates during the period, the much improved supply/demand picture painted by the Treasury buybacks led to a positive return for the investment-grade subportfolio.
Q. And the fund's short-term/money market investments?
A. John Todd felt that concerns surrounding Y2K were overblown and, thus, used the opportunity to extend the average maturity of the fund's money-market subportfolio early on to take advantage of a steeply sloped yield curve. Early in 2000, however, the yield curve flattened out dramatically. In response, we let the average maturity roll down, believing that strong economic growth and the risk of rising inflation were likely to set off a protracted period of Fed tightening. Shareholders should note that John may choose to invest in a money market mutual fund rather than invest directly in money market securities in the future.
Q. What's your outlook?
A. It's still unclear as to whether or not the Fed can successfully orchestrate a soft landing, which would be very constructive for stocks. There's a lot of conflicting evidence out there in terms of economic data that will have to get cleared up before we can know for sure if the economy has actually slowed down a couple notches to be considered a soft landing. Until then, I think we'll be in sort of a narrow trading range in terms of the equity market. Security selection in this type of environment will become even more important, which bodes well for us given the strength of Fidelity's research.
The views expressed in this report reflect those of the portfolio manager only through the end of the period of the report as stated on the cover. The manager's views are subject to change at any time based on market or other conditions. For more information, see page 2.
Fund Facts
Goal: high total return with reduced risk over the long term by allocating its assets among stocks, bonds and short-term instruments
Start date: September 6, 1989
Size: as of June 30, 2000, more than $4.5 billion
Manager: Bart Grenier, since May 2000; joined Fidelity in 1991
3Semiannual Report
Fidelity Variable Insurance Products: Asset Manager Portfolio
(Unaudited)
Showing Percentage of Net Assets
|
Common Stocks - 48.5% |
|||
|
Shares |
Value (Note 1) |
||
|
AEROSPACE & DEFENSE - 1.3% |
|||
|
Boeing Co. |
309,600 |
$ 12,945,150 |
|
|
Honeywell International, Inc. |
358,387 |
12,073,162 |
|
|
Northrop Grumman Corp. |
193,300 |
12,806,125 |
|
|
United Technologies Corp. |
362,406 |
21,336,653 |
|
|
|
59,161,090 |
||
|
BASIC INDUSTRIES - 0.5% |
|||
|
Chemicals & Plastics - 0.5% |
|||
|
Eastman Chemical Co. |
150,000 |
7,162,500 |
|
|
Pharmacia Corp. |
200,000 |
10,337,500 |
|
|
Praxair, Inc. |
123,900 |
4,638,506 |
|
|
|
22,138,506 |
||
|
Iron & Steel - 0.0% |
|||
|
Mueller Industries, Inc. |
51,200 |
1,433,600 |
|
|
TOTAL BASIC INDUSTRIES |
23,572,106 |
||
|
DURABLES - 0.7% |
|||
|
Consumer Durables - 0.5% |
|||
|
Minnesota Mining & Manufacturing Co. |
281,200 |
23,199,000 |
|
|
Consumer Electronics - 0.0% |
|||
|
Whirlpool Corp. |
21,000 |
979,125 |
|
|
Textiles & Apparel - 0.2% |
|||
|
Arena Brands Holdings Corp. Class B |
8,445 |
211,125 |
|
|
Liz Claiborne, Inc. |
180,000 |
6,345,000 |
|
|
|
6,556,125 |
||
|
TOTAL DURABLES |
30,734,250 |
||
|
ENERGY - 3.4% |
|||
|
Energy Services - 0.2% |
|||
|
BJ Services Co. (a) |
173,000 |
10,812,500 |
|
|
Oil & Gas - 3.2% |
|||
|
Amerada Hess Corp. |
55,000 |
3,396,250 |
|
|
Apache Corp. |
151,900 |
8,933,619 |
|
|
Chevron Corp. |
448,200 |
38,012,963 |
|
|
EOG Resources, Inc. |
130,000 |
4,355,000 |
|
|
Exxon Mobil Corp. |
809,875 |
63,575,188 |
|
|
Royal Dutch Petroleum Co. (NY Shares) |
450,000 |
27,703,125 |
|
|
|
145,976,145 |
||
|
TOTAL ENERGY |
156,788,645 |
||
|
FINANCE - 6.6% |
|||
|
Banks - 1.9% |
|||
|
Bank of America Corp. |
270,000 |
11,610,000 |
|
|
Chase Manhattan Corp. |
268,050 |
12,347,053 |
|
|
FleetBoston Financial Corp. |
579,905 |
19,716,770 |
|
|
|
|||
|
Shares |
Value (Note 1) |
||
|
J.P. Morgan & Co., Inc. |
154,600 |
$ 17,025,325 |
|
|
Wells Fargo & Co. |
650,000 |
25,187,500 |
|
|
|
85,886,648 |
||
|
Credit & Other Finance - 1.8% |
|||
|
American Express Co. |
292,500 |
15,246,563 |
|
|
Citigroup, Inc. |
975,800 |
58,791,950 |
|
|
Providian Financial Corp. |
85,950 |
7,735,500 |
|
|
|
81,774,013 |
||
|
Insurance - 0.6% |
|||
|
CIGNA Corp. |
60,600 |
5,666,100 |
|
|
Marsh & McLennan Companies, Inc. |
173,600 |
18,130,350 |
|
|
MGIC Investment Corp. |
95,800 |
4,358,900 |
|
|
|
28,155,350 |
||
|
Savings & Loans - 0.4% |
|||
|
Golden West Financial Corp. |
428,700 |
17,496,319 |
|
|
Securities Industry - 1.9% |
|||
|
AXA Financial, Inc. |
15,700 |
533,800 |
|
|
Lehman Brothers Holdings, Inc. |
441,600 |
41,758,800 |
|
|
Merrill Lynch & Co., Inc. |
129,800 |
14,927,000 |
|
|
Morgan Stanley Dean Witter & Co. |
346,800 |
28,871,100 |
|
|
|
86,090,700 |
||
|
TOTAL FINANCE |
299,403,030 |
||
|
HEALTH - 4.8% |
|||
|
Drugs & Pharmaceuticals - 3.5% |
|||
|
Amgen, Inc. |
640,700 |
45,009,175 |
|
|
Forest Laboratories, Inc. (a) |
80,000 |
8,080,000 |
|
|
IVAX Corp. (a) |
120,000 |
4,980,000 |
|
|
Merck & Co., Inc. |
346,000 |
26,512,250 |
|
|
Pfizer, Inc. |
1,577,200 |
75,705,600 |
|
|
|
160,287,025 |
||
|
Medical Equipment & Supplies - 0.7% |
|||
|
Johnson & Johnson |
296,300 |
30,185,563 |
|
|
Millipore Corp. |
34,700 |
2,615,513 |
|
|
|
32,801,076 |
||
|
Medical Facilities Management - 0.6% |
|||
|
HCA - The Healthcare Co. |
170,000 |
5,163,750 |
|
|
UnitedHealth Group, Inc. |
216,800 |
18,590,600 |
|
|
|
23,754,350 |
||
|
TOTAL HEALTH |
216,842,451 |
||
|
INDUSTRIAL MACHINERY & EQUIPMENT - 2.6% |
|||
|
Electrical Equipment - 2.5% |
|||
|
General Electric Co. |
2,048,100 |
108,549,300 |
|
|
Scientific-Atlanta, Inc. |
80,000 |
5,960,000 |
|
|
|
114,509,300 |
||
|
Common Stocks - continued |
|||
|
Shares |
Value (Note 1) |
||
|
INDUSTRIAL MACHINERY & EQUIPMENT - continued |
|||
|
Industrial Machinery & Equipment - 0.1% |
|||
|
Parker-Hannifin Corp. |
69,200 |
$ 2,370,100 |
|
|
TOTAL INDUSTRIAL MACHINERY & EQUIPMENT |
116,879,400 |
||
|
MEDIA & LEISURE - 1.5% |
|||
|
Broadcasting - 0.0% |
|||
|
NTL, Inc. warrants 10/14/08 (a) |
3,742 |
153,422 |
|
|
Entertainment - 0.5% |
|||
|
Viacom, Inc. Class B (non-vtg.) (a) |
85,000 |
5,795,938 |
|
|
Walt Disney Co. |
459,600 |
17,838,225 |
|
|
|
23,634,163 |
||
|
Publishing - 1.0% |
|||
|
Dow Jones & Co., Inc. |
77,100 |
5,647,575 |
|
|
Gannett Co., Inc. |
324,500 |
19,409,156 |
|
|
Knight-Ridder, Inc. |
128,700 |
6,845,231 |
|
|
McGraw-Hill Companies, Inc. |
56,000 |
3,024,000 |
|
|
The New York Times Co. Class A |
219,200 |
8,658,400 |
|
|
|
43,584,362 |
||
|
Restaurants - 0.0% |
|||
|
Darden Restaurants, Inc. |
151,600 |
2,463,500 |
|
|
TOTAL MEDIA & LEISURE |
69,835,447 |
||
|
NONDURABLES - 2.3% |
|||
|
Beverages - 1.2% |
|||
|
Anheuser-Busch Companies, Inc. |
564,200 |
42,138,688 |
|
|
Pepsi Bottling Group, Inc. |
389,800 |
11,377,288 |
|
|
|
53,515,976 |
||
|
Foods - 0.9% |
|||
|
PepsiCo, Inc. |
350,000 |
15,553,125 |
|
|
Quaker Oats Co. |
284,000 |
21,335,500 |
|
|
Sysco Corp. |
140,000 |
5,897,500 |
|
|
|
42,786,125 |
||
|
Household Products - 0.2% |
|||
|
Colgate-Palmolive Co. |
170,000 |
10,178,750 |
|
|
TOTAL NONDURABLES |
106,480,851 |
||
|
RETAIL & WHOLESALE - 3.6% |
|||
|
Apparel Stores - 0.1% |
|||
|
Venator Group, Inc. (a) |
500,000 |
5,125,000 |
|
|
General Merchandise Stores - 1.9% |
|||
|
Sears, Roebuck & Co. |
334,600 |
10,916,325 |
|
|
Target Corp. |
147,500 |
8,555,000 |
|
|
Wal-Mart Stores, Inc. |
1,166,600 |
67,225,325 |
|
|
|
86,696,650 |
||
|
Retail & Wholesale, Miscellaneous - 1.6% |
|||
|
Best Buy Co., Inc. (a) |
249,700 |
15,793,525 |
|
|
Circuit City Stores, Inc. - |
129,900 |
4,311,056 |
|
|
|
|||
|
Shares |
Value (Note 1) |
||
|
Home Depot, Inc. |
624,300 |
$ 31,175,981 |
|
|
Lowe's Companies, Inc. |
358,400 |
14,716,800 |
|
|
Tiffany & Co., Inc. |
77,900 |
5,258,250 |
|
|
|
71,255,612 |
||
|
TOTAL RETAIL & WHOLESALE |
163,077,262 |
||
|
SERVICES - 0.1% |
|||
|
Leasing & Rental - 0.1% |
|||
|
Hertz Corp. Class A |
115,700 |
3,246,831 |
|
|
TECHNOLOGY - 16.9% |
|||
|
Communications Equipment - 3.8% |
|||
|
ADC Telecommunications, Inc. (a) |
433,000 |
36,317,875 |
|
|
Cisco Systems, Inc. (a) |
1,174,000 |
74,622,375 |
|
|
Comverse Technology, Inc. (a) |
312,400 |
29,053,200 |
|
|
Corning, Inc. |
120,000 |
32,385,000 |
|
|
|
172,378,450 |
||
|
Computer Services & Software - 4.0% |
|||
|
Adobe Systems, Inc. |
390,400 |
50,752,000 |
|
|
First Data Corp. |
302,900 |
15,031,413 |
|
|
Microsoft Corp. (a) |
897,700 |
71,816,000 |
|
|
Oracle Corp. (a) |
505,400 |
42,485,188 |
|
|
Sybase, Inc. (a) |
200,000 |
4,600,000 |
|
|
|
184,684,601 |
||
|
Computers & Office Equipment - 2.8% |
|||
|
EMC Corp. (a) |
216,400 |
16,649,275 |
|
|
Hewlett-Packard Co. |
300,000 |
37,462,500 |
|
|
International Business Machines Corp. |
319,400 |
34,994,263 |
|
|
Sun Microsystems, Inc. (a) |
406,100 |
36,929,719 |
|
|
|
126,035,757 |
||
|
Electronic Instruments - 1.2% |
|||
|
Agilent Technologies, Inc. |
53,440 |
3,941,200 |
|
|
Applied Materials, Inc. (a) |
273,600 |
24,795,000 |
|
|
KLA-Tencor Corp. (a) |
80,000 |
4,685,000 |
|
|
LAM Research Corp. (a) |
75,300 |
2,823,750 |
|
|
Teradyne, Inc. (a) |
233,800 |
17,184,300 |
|
|
|
53,429,250 |
||
|
Electronics - 5.1% |
|||
|
Advanced Micro Devices, Inc. (a) |
200,000 |
15,450,000 |
|
|
Analog Devices, Inc. (a) |
49,200 |
3,739,200 |
|
|
Intel Corp. |
601,600 |
80,426,400 |
|
|
LSI Logic Corp. (a) |
303,600 |
16,432,350 |
|
|
Motorola, Inc. |
1,041,051 |
30,255,545 |
|
|
National Semiconductor Corp. (a) |
173,000 |
9,817,750 |
|
|
Texas Instruments, Inc. |
1,040,800 |
71,489,950 |
|
|
Vishay Intertechnology, Inc. (a) |
194,700 |
7,386,431 |
|
|
|
234,997,626 |
||
|
TOTAL TECHNOLOGY |
771,525,684 |
||
|
Common Stocks - continued |
|||
|
Shares |
Value (Note 1) |
||
|
TRANSPORTATION - 0.1% |
|||
|
Air Transportation - 0.1% |
|||
|
AMR Corp. |
100,000 |
$ 2,643,750 |
|
|
Delta Air Lines, Inc. |
75,000 |
3,792,188 |
|
|
|
6,435,938 |
||
|
UTILITIES - 4.1% |
|||
|
Cellular - 0.6% |
|||
|
McCaw International Ltd. warrants 4/16/07 (a)(g) |
8,150 |
20,375 |
|
|
QUALCOMM, Inc. (a) |
346,400 |
20,784,000 |
|
|
Sprint Corp. - PCS Group Series 1 (a) |
100,000 |
5,950,000 |
|
|
|
26,754,375 |
||
|
Electric Utility - 0.8% |
|||
|
Energy East Corp. |
654,000 |
12,466,875 |
|
|
Entergy Corp. |
150,000 |
4,078,125 |
|
|
Northeast Utilities |
129,800 |
2,823,150 |
|
|
PECO Energy Co. |
100,000 |
4,031,250 |
|
|
Pinnacle West Capital Corp. |
112,500 |
3,810,938 |
|
|
PPL Corp. |
128,500 |
2,818,969 |
|
|
Public Service Enterprise Group, Inc. |
170,100 |
5,889,713 |
|
|
|
35,919,020 |
||
|
Gas - 0.6% |
|||
|
Dynegy, Inc. Class A |
90,000 |
6,148,125 |
|
|
Enron Corp. |
319,800 |
20,627,100 |
|
|
|
26,775,225 |
||
|
Telephone Services - 2.1% |
|||
|
BellSouth Corp. |
762,300 |
32,493,038 |
|
|
Ono Finance PLC rights 5/31/09 (a)(g) |
1,740 |
17,400 |
|
|
Pathnet, Inc. warrants 4/15/08 (a)(g) |
4,665 |
46,650 |
|
|
Sprint Corp. - FON Group |
314,900 |
16,059,900 |
|
|
U.S. WEST, Inc. |
375,000 |
32,156,250 |
|
|
WorldCom, Inc. (a) |
324,450 |
14,884,144 |
|
|
|
95,657,382 |
||
|
TOTAL UTILITIES |
185,106,002 |
||
|
TOTAL COMMON STOCKS (Cost $1,639,229,725) |
2,209,088,987 |
||
|
Nonconvertible Preferred Stocks - 1.3% |
|||
|
|
|
|
|
|
CONSTRUCTION & REAL ESTATE - 0.1% |
|||
|
Real Estate Investment Trusts - 0.1% |
|||
|
California Federal Preferred |
156,349 |
3,322,416 |
|
|
FINANCE - 0.0% |
|||
|
Insurance - 0.0% |
|||
|
American Annuity Group Capital Trust II 8.875% |
1,490 |
1,326,490 |
|
|
|
|||
|
Shares |
Value (Note 1) |
||
|
HEALTH - 0.0% |
|||
|
Medical Facilities Management - 0.0% |
|||
|
Fresenius Medical Care Capital Trust II 7.875% |
653 |
$ 595,719 |
|
|
MEDIA & LEISURE - 0.4% |
|||
|
Broadcasting - 0.3% |
|||
|
Adelphia Communications Corp. $13.00 |
15,763 |
1,623,589 |
|
|
CSC Holdings, Inc. 11.125% pay-in-kind |
102,653 |
10,727,239 |
|
|
|
12,350,828 |
||
|
Publishing - 0.1% |
|||
|
PRIMEDIA, Inc.: |
|
|
|
|
$9.20 |
32,995 |
2,862,316 |
|
|
Series D, $10.00 |
15,250 |
1,410,625 |
|
|
|
4,272,941 |
||
|
TOTAL MEDIA & LEISURE |
16,623,769 |
||
|
RETAIL & WHOLESALE - 0.0% |
|||
|
Grocery Stores - 0.0% |
|||
|
Supermarkets General Holdings Corp. $3.52 pay-in-kind |
17,231 |
17,231 |
|
|
UTILITIES - 0.8% |
|||
|
Cellular - 0.4% |
|||
|
Crown Castle International Corp. |
2,079 |
2,120,580 |
|
|
Nextel Communications, Inc. |
14,671 |
14,157,515 |
|
|
|
16,278,095 |
||
|
Telephone Services - 0.4% |
|||
|
Adelphia Business Solution, Inc. |
5,283 |
4,728,285 |
|
|
Intermedia Communications, Inc. |
5,292 |
5,133,240 |
|
|
IXC Communications, Inc. |
1,384 |
1,384,000 |
|
|
NEXTLINK Communications, Inc. |
185,967 |
9,484,317 |
|
|
|
20,729,842 |
||
|
TOTAL UTILITIES |
37,007,937 |
||
|
TOTAL NONCONVERTIBLE PREFERRED STOCKS (Cost $61,177,855) |
58,893,562 |
||
|
Corporate Bonds - 16.9% |
|||||
|
Moody's Ratings (unaudited) (b) |
Principal Amount |
Value |
|||
|
Convertible Bonds - 0.2% |
|||||
|
HEALTH - 0.2% |
|||||
|
Medical Facilities Management - 0.2% |
|||||
|
Tenet Healthcare Corp. |
B1 |
|
$ 7,210,000 |
$ 5,939,238 |
|
|
Total Renal Care Holdings, Inc. 7% 5/15/09 (g) |
B3 |
|
2,940,000 |
1,955,100 |
|
|
|
7,894,338 |
||||
|
MEDIA & LEISURE - 0.0% |
|||||
|
Lodging & Gaming - 0.0% |
|||||
|
Hilton Hotels Corp. |
Ba2 |
|
3,680,000 |
2,907,200 |
|
|
TOTAL CONVERTIBLE BONDS |
10,801,538 |
||||
|
Nonconvertible Bonds - 16.7% |
|||||
|
AEROSPACE & DEFENSE - 0.2% |
|||||
|
Defense Electronics - 0.1% |
|||||
|
Raytheon Co. |
Baa2 |
|
4,500,000 |
4,447,485 |
|
|
Ship Building & Repair - 0.1% |
|||||
|
Newport News Shipbuilding, Inc. |
Ba3 |
|
3,515,000 |
3,515,000 |
|
|
TOTAL AEROSPACE & DEFENSE |
7,962,485 |
||||
|
BASIC INDUSTRIES - 0.7% |
|||||
|
Chemicals & Plastics - 0.4% |
|||||
|
Avecia Group PLC |
B2 |
|
3,440,000 |
3,371,200 |
|
|
Huntsman Corp. |
B2 |
|
3,520,000 |
3,212,000 |
|
|
Huntsman ICI Chemicals LLC 10.125% 7/1/09 |
B2 |
|
625,000 |
625,000 |
|
|
Lyondell Chemical Co.: |
|
|
|
|
|
|
9.875% 5/1/07 |
Ba3 |
|
5,050,000 |
4,999,500 |
|
|
10.875% 5/1/09 |
B2 |
|
2,570,000 |
2,550,725 |
|
|
Sovereign Specialty Chemicals, Inc. |
B3 |
|
1,655,000 |
1,702,581 |
|
|
Sterling Chemicals, Inc. 11.75% 8/15/06 |
Caa3 |
|
1,935,000 |
1,567,350 |
|
|
|
18,028,356 |
||||
|
Metals & Mining - 0.0% |
|||||
|
Kaiser Aluminum & Chemical Corp. |
B3 |
|
1,630,000 |
1,483,300 |
|
|
Packaging & Containers - 0.2% |
|||||
|
Gaylord Container Corp.: |
|
|
|
|
|
|
9.375% 6/15/07 |
Caa1 |
|
2,825,000 |
2,175,250 |
|
|
9.75% 6/15/07 |
Caa1 |
|
3,675,000 |
2,866,500 |
|
|
|
|||||
|
Moody's Ratings (unaudited) (b) |
Principal Amount |
Value |
|||
|
Norampac, Inc. |
B1 |
|
$ 2,100,000 |
$ 2,026,500 |
|
|
Packaging Corp. of America 9.625% 4/1/09 |
B2 |
|
2,020,000 |
1,994,750 |
|
|
|
9,063,000 |
||||
|
Paper & Forest Products - 0.1% |
|||||
|
Potlatch Corp. |
Baa1 |
|
3,320,000 |
3,211,170 |
|
|
Repap New Brunswick, Inc. yankee 10.625% 4/15/05 |
Caa1 |
|
2,035,000 |
1,790,800 |
|
|
|
5,001,970 |
||||
|
TOTAL BASIC INDUSTRIES |
33,576,626 |
||||
|
CONSTRUCTION & REAL ESTATE - 0.4% |
|||||
|
Building Materials - 0.0% |
|||||
|
Numatics, Inc. |
B3 |
|
170,000 |
136,000 |
|
|
Construction - 0.0% |
|||||
|
Blount, Inc. 13% 8/1/09 |
B3 |
|
1,465,000 |
1,490,638 |
|
|
Engineering - 0.0% |
|||||
|
Anteon Corp. |
B3 |
|
980,000 |
882,000 |
|
|
Real Estate - 0.1% |
|||||
|
Duke-Weeks Realty LP 6.875% 3/15/05 |
Baa2 |
|
2,950,000 |
2,801,792 |
|
|
Real Estate Investment Trusts - 0.3% |
|||||
|
CenterPoint Properties Trust: |
|
|
|
|
|
|
6.75% 4/1/05 |
Baa2 |
|
1,590,000 |
1,481,244 |
|
|
7.125% 3/15/04 |
Baa2 |
|
4,200,000 |
4,031,412 |
|
|
Equity Office |
|
|
|
|
|
|
6.375% 2/15/03 |
Baa1 |
|
3,600,000 |
3,460,104 |
|
|
6.75% 2/15/08 |
Baa1 |
|
1,590,000 |
1,456,583 |
|
|
Pinnacle Holdings, Inc. |
B3 |
|
1,510,000 |
1,049,450 |
|
|
|
11,478,793 |
||||
|
TOTAL CONSTRUCTION & REAL ESTATE |
16,789,223 |
||||
|
DURABLES - 0.2% |
|||||
|
Autos, Tires, & Accessories - 0.1% |
|||||
|
TRW, Inc. 6.5% 6/1/02 |
Baa1 |
|
4,520,000 |
4,402,390 |
|
|
Consumer Electronics - 0.0% |
|||||
|
Whirlpool Corp. |
Baa1 |
|
1,390,000 |
1,434,341 |
|
|
Textiles & Apparel - 0.1% |
|||||
|
Jones Apparel Group, Inc. 7.875% 6/15/06 |
Baa2 |
|
5,070,000 |
4,840,430 |
|
|
TOTAL DURABLES |
10,677,161 |
||||
|
Corporate Bonds - continued |
|||||
|
Moody's Ratings (unaudited) (b) |
Principal Amount |
Value |
|||
|
Nonconvertible Bonds - continued |
|||||
|
ENERGY - 0.7% |
|||||
|
Coal - 0.0% |
|||||
|
P&L Coal Holdings Corp. 9.625% 5/15/08 |
B2 |
|
$ 1,890,000 |
$ 1,752,975 |
|
|
Energy Services - 0.2% |
|||||
|
Baker Hughes, Inc. |
A2 |
|
3,980,000 |
3,811,248 |
|
|
R&B Falcon Corp. |
Ba3 |
|
1,785,000 |
1,655,588 |
|
|
RBF Finance Co. |
Ba3 |
|
1,260,000 |
1,348,200 |
|
|
|
6,815,036 |
||||
|
Oil & Gas - 0.5% |
|||||
|
Apache Corp. |
Baa1 |
|
2,970,000 |
2,867,713 |
|
|
Chesapeake Energy Corp. 9.625% 5/1/05 |
B2 |
|
3,710,000 |
3,617,250 |
|
|
Occidental Petroleum Corp. 6.39% 11/9/00 |
Baa3 |
|
1,000,000 |
996,030 |
|
|
Oryx Energy Co.: |
|
|
|
|
|
|
8% 10/15/03 |
Baa1 |
|
3,055,000 |
3,053,839 |
|
|
8.125% 10/15/05 |
Baa1 |
|
4,935,000 |
4,993,727 |
|
|
8.375% 7/15/04 |
Baa1 |
|
2,335,000 |
2,355,875 |
|
|
Petro-Canada |
A3 |
|
1,290,000 |
1,126,428 |
|
|
Phillips Petroleum Co. 8.75% 5/25/10 |
Baa2 |
|
1,880,000 |
1,980,430 |
|
|
|
20,991,292 |
||||
|
TOTAL ENERGY |
29,559,303 |
||||
|
FINANCE - 3.8% |
|||||
|
Banks - 1.3% |
|||||
|
Bank of America Corp. 7.8% 2/15/10 |
Aa3 |
|
1,400,000 |
1,394,246 |
|
|
Bank of Tokyo-Mitsubishi Ltd. 8.4% 4/15/10 |
A3 |
|
2,820,000 |
2,847,636 |
|
|
BankBoston Corp. |
A3 |
|
1,700,000 |
1,638,256 |
|
|
Barclays Bank PLC yankee 5.95% 7/15/01 |
A1 |
|
7,650,000 |
7,595,371 |
|
|
Capital One Bank: |
|
|
|
|
|
|
6.26% 5/7/01 |
Baa2 |
|
3,160,000 |
3,109,503 |
|
|
6.375% 2/15/03 |
Baa2 |
|
3,570,000 |
3,423,095 |
|
|
6.48% 6/28/02 |
Baa2 |
|
1,740,000 |
1,691,454 |
|
|
6.65% 3/15/04 |
Baa3 |
|
2,320,000 |
2,228,360 |
|
|
Capital One Financial Corp. 7.125% 8/1/08 |
Baa3 |
|
5,040,000 |
4,690,476 |
|
|
Commonwealth Bank of Australia 8.5% 6/1/10 |
A1 |
|
1,700,000 |
1,764,158 |
|
|
Den Danske Bank AS 6.375% 6/15/08 (g)(j) |
A1 |
|
8,340,000 |
7,657,163 |
|
|
|
|||||
|
Moody's Ratings (unaudited) (b) |
Principal Amount |
Value |
|||
|
HSBC Finance Nederland BV 7.4% 4/15/03 (g) |
A2 |
|
$ 500,000 |
$ 497,985 |
|
|
Korea Development Bank: |
|
|
|
|
|
|
6.625% 11/21/03 |
Baa2 |
|
4,165,000 |
4,006,647 |
|
|
7.375% 9/17/04 |
Baa2 |
|
615,000 |
595,997 |
|
|
yankee 6.5% 11/15/02 |
Baa2 |
|
665,000 |
643,654 |
|
|
Popular, Inc. 6.2% 4/30/01 |
A3 |
|
1,840,000 |
1,823,035 |
|
|
Providian National Bank 6.7% 3/15/03 |
Baa3 |
|
3,060,000 |
2,926,400 |
|
|
Royal Bank of Scotland Group PLC |
A1 |
|
1,975,000 |
2,051,373 |
|
|
Summit Bancorp |
BBB+ |
|
1,730,000 |
1,751,296 |
|
|
Union Planters National Bank 6.81% 8/20/01 |
A3 |
|
3,500,000 |
3,474,520 |
|
|
|
55,810,625 |
||||
|
Credit & Other Finance - 1.7% |
|||||
|
Ahmanson Capital Trust I 8.36% 12/1/26 (g) |
A3 |
|
4,250,000 |
3,864,525 |
|
|
AMRESCO, Inc.: |
|
|
|
|
|
|
9.875% 3/15/05 |
Caa3 |
|
2,340,000 |
1,088,100 |
|
|
10% 3/15/04 |
Caa3 |
|
1,130,000 |
519,800 |
|
|
CIT Group, Inc. |
A1 |
|
680,000 |
626,797 |
|
|
Countrywide Funding Corp. 6.45% 2/27/03 |
A3 |
|
3,950,000 |
3,814,831 |
|
|
Daimler-Chrysler NA Holding Corp. |
A1 |
|
900,000 |
889,299 |
|
|
Details Capital Corp. |
Caa1 |
|
505,000 |
333,300 |
|
|
Dobson/Sygnet Communications Co. 12.25% 12/15/08 |
- |
|
755,000 |
798,413 |
|
|
ERP Operating LP: |
|
|
|
|
|
|
6.55% 11/15/01 |
A3 |
|
1,500,000 |
1,478,355 |
|
|
7.1% 6/23/04 |
A3 |
|
3,980,000 |
3,859,645 |
|
|
Finova Capital Corp.: |
|
|
|
|
|
|
6.11% 2/18/03 |
Baa2 |
|
5,720,000 |
5,033,600 |
|
|
6.12% 5/28/02 |
Baa2 |
|
2,000,000 |
1,870,000 |
|
|
7.25% 11/8/04 |
Baa2 |
|
3,890,000 |
3,462,100 |
|
|
First Security Capital I 8.41% 12/15/26 |
A3 |
|
1,690,000 |
1,565,684 |
|
|
Ford Motor Credit Co.: |
|
|
|
|
|
|
6.4513% 7/16/01 (j) |
A2 |
|
13,000,000 |
13,014,079 |
|
|
7.5% 3/15/05 |
A2 |
|
3,850,000 |
3,821,125 |
|
|
7.875% 6/15/10 |
A2 |
|
1,690,000 |
1,692,400 |
|
|
GS Escrow Corp. |
Ba1 |
|
2,800,000 |
2,487,352 |
|
|
Heller Financial, Inc. |
A3 |
|
5,050,000 |
4,725,992 |
|
|
HSBC Capital Funding LP 10.176% 12/31/49 (f)(g) |
A1 |
|
2,600,000 |
2,784,210 |
|
|
Corporate Bonds - continued |
|||||
|
Moody's Ratings (unaudited) (b) |
Principal Amount |
Value |
|||
|
Nonconvertible Bonds - continued |
|||||
|
FINANCE - continued |
|||||
|
Credit & Other Finance - continued |
|||||
|
Macsaver Financial Services, Inc.: |
|
|
|
|
|
|
7.4% 2/15/02 |
Ba2 |
|
$ 1,480,000 |
$ 962,000 |
|
|
7.6% 8/1/07 |
Ba2 |
|
4,190,000 |
2,220,700 |
|
|
7.875% 8/1/03 |
Ba2 |
|
690,000 |
427,800 |
|
|
Newcourt Credit Group, Inc. 6.875% 2/16/05 |
A1 |
|
2,865,000 |
2,726,076 |
|
|
PNC Funding Corp. |
A3 |
|
2,020,000 |
1,971,358 |
|
|
Sprint Capital Corp. |
Baa1 |
|
2,905,000 |
2,511,779 |
|
|
The Money Store, Inc. |
A2 |
|
2,550,000 |
2,526,094 |
|
|
TXU Eastern Funding: |
|
|
|
|
|
|
6.15% 5/15/02 |
Baa1 |
|
2,510,000 |
2,437,511 |
|
|
6.75% 5/15/09 |
Baa1 |
|
3,325,000 |
2,973,115 |
|
|
Venetian Casino Resort LLC/Las Vegas Sands, Inc. 12.25% 11/15/04 |
Caa1 |
|
305,000 |
308,050 |
|
|
|
76,794,090 |
||||
|
Savings & Loans - 0.3% |
|||||
|
Chevy Chase Savings Bank FSB 9.25% 12/1/08 |
B1 |
|
730,000 |
649,700 |
|
|
Home Savings of America FSB 6.5% 8/15/04 |
A3 |
|
2,830,000 |
2,685,161 |
|
|
Long Island Savings Bank FSB: |
|
|
|
|
|
|
6.2% 4/2/01 |
Baa3 |
|
3,770,000 |
3,765,815 |
|
|
7% 6/13/02 |
Baa3 |
|
3,400,000 |
3,351,686 |
|
|
Sovereign Bancorp, Inc. 6.625% 3/15/01 |
Ba3 |
|
4,300,000 |
4,197,875 |
|
|
|
14,650,237 |
||||
|
Securities Industry - 0.5% |
|||||
|
Amvescap PLC yankee: |
|
|
|
|
|
|
6.375% 5/15/03 |
A3 |
|
2,200,000 |
2,099,592 |
|
|
6.6% 5/15/05 |
A3 |
|
4,410,000 |
4,108,268 |
|
|
Goldman Sachs Group LP 6.6338% 7/27/00 (j)(l) |
A1 |
|
12,900,000 |
12,898,891 |
|
|
Morgan Stanley |
Aa3 |
|
4,760,000 |
4,725,019 |
|
|
|
23,831,770 |
||||
|
TOTAL FINANCE |
171,086,722 |
||||
|
|
|||||
|
Moody's Ratings (unaudited) (b) |
Principal Amount |
Value |
|||
|
HEALTH - 0.0% |
|||||
|
Medical Facilities Management - 0.0% |
|||||
|
Fountain View, Inc. |
Caa1 |
|
$ 2,330,000 |
$ 570,850 |
|
|
Unilab Corp. |
B3 |
|
725,000 |
746,750 |
|
|
|
1,317,600 |
||||
|
INDUSTRIAL MACHINERY & EQUIPMENT - 0.5% |
|||||
|
Industrial Machinery & Equipment - 0.2% |
|||||
|
Dunlop Standard Aero Holdings PLC |
B3 |
|
2,490,000 |
2,465,100 |
|
|
Roller Bearing Holding, Inc. 0% 6/15/09 (e)(g) |
- |
|
3,550,000 |
1,810,500 |
|
|
Tyco International Group SA: |
|
|
|
|
|
|
7% 6/15/28 |
Baa1 |
|
5,310,000 |
4,564,635 |
|
|
yankee 6.375% 6/15/05 |
Baa1 |
|
830,000 |
791,762 |
|
|
|
9,631,997 |
||||
|
Pollution Control - 0.3% |
|||||
|
Allied Waste |
|
|
|
|
|
|
7.375% 1/1/04 |
Ba3 |
|
1,290,000 |
1,173,900 |
|
|
7.625% 1/1/06 |
Ba2 |
|
1,095,000 |
952,650 |
|
|
10% 8/1/09 |
B2 |
|
9,325,000 |
7,833,000 |
|
|
Browning-Ferris Industries, Inc. 6.375% 1/15/08 |
Ba3 |
|
1,220,000 |
939,400 |
|
|
Envirosource, Inc. Series B, 9.75% 6/15/03 |
Caa3 |
|
50,000 |
22,500 |
|
|
WMX Technologies, Inc.: |
|
|
|
|
|
|
6.25% 10/15/00 |
Ba1 |
|
2,100,000 |
2,086,203 |
|
|
7.1% 8/1/26 |
Ba1 |
|
1,390,000 |
1,308,296 |
|
|
|
14,315,949 |
||||
|
TOTAL INDUSTRIAL MACHINERY & EQUIPMENT |
23,947,946 |
||||
|
MEDIA & LEISURE - 3.9% |
|||||
|
Broadcasting - 2.9% |
|||||
|
Adelphia Communications Corp. 9.875% 3/1/07 |
B1 |
|
4,150,000 |
3,942,500 |
|
|
AMFM Operating, Inc. 12.625% 10/31/06 |
- |
|
1,523,800 |
1,790,465 |
|
|
Ascent Entertainment Group, Inc. |
Ba1 |
|
2,145,000 |
1,737,450 |
|
|
British Sky Broadcasting Group PLC |
Baa3 |
|
6,040,000 |
5,650,058 |
|
|
Callahan |
B3 |
|
4,120,144 |
4,120,144 |
|
|
Corporate Bonds - continued |
|||||
|
Moody's Ratings (unaudited) (b) |
Principal Amount |
Value |
|||
|
Nonconvertible Bonds - continued |
|||||
|
MEDIA & LEISURE - continued |
|||||
|
Broadcasting - continued |
|||||
|
Charter Communications Holdings LLC/Charter Communications Holdings Capital Corp. |
B2 |
|
$ 4,100,000 |
$ 3,977,000 |
|
|
Citadel Broadcasting Co.: |
|
|
|
|
|
|
9.25% 11/15/08 |
B3 |
|
1,165,000 |
1,130,050 |
|
|
10.25% 7/1/07 |
B3 |
|
7,080,000 |
7,177,350 |
|
|
Clear Channel Communications, Inc. 6.875% 6/15/18 |
Baa3 |
|
3,450,000 |
2,965,965 |
|
|
Comcast UK Cable Partners Ltd. 0% 11/15/07 (e) |
B2 |
|
3,360,000 |
3,124,800 |
|
|
Continental |
|
|
|
|
|
|
8.3% 5/15/06 |
A2 |
|
5,125,000 |
5,246,411 |
|
|
8.625% 8/15/03 |
A2 |
|
2,790,000 |
2,869,041 |
|
|
Diamond Cable Communications PLC: |
|
|
|
|
|
|
0% 2/15/07 (e) |
B3 |
|
3,730,000 |
2,862,775 |
|
|
yankee 0% 12/15/05 (e) |
B3 |
|
2,460,000 |
2,300,100 |
|
|
Earthwatch, Inc. 0% 7/15/07 unit (e)(g) |
- |
|
2,530,000 |
1,619,200 |
|
|
EchoStar DBS Corp.: |
|
|
|
|
|
|
9.25% 2/1/06 |
B2 |
|
2,820,000 |
2,721,300 |
|
|
9.375% 2/1/09 |
B2 |
|
2,305,000 |
2,224,325 |
|
|
Fox Family Worldwide, Inc. 0% 11/1/07 (e) |
B1 |
|
555,000 |
344,100 |
|
|
FrontierVision Holdings LP/FrontierVision |
B1 |
|
4,130,000 |
3,562,125 |
|
|
FrontierVision Operating Partners LP/FrontierVision Capital Corp. |
B1 |
|
1,910,000 |
1,910,000 |
|
|
Golden Sky DBS, Inc. |
Caa1 |
|
4,950,000 |
3,328,875 |
|
|
Golden Sky Systems, Inc. 12.375% 8/1/06 |
B3 |
|
950,000 |
1,035,500 |
|
|
Hearst-Argyle Television, Inc. 7.5% 11/15/27 |
Baa3 |
|
3,260,000 |
2,750,103 |
|
|
International Cabletel, Inc. 0% 2/1/06 (e) |
B3 |
|
1,850,000 |
1,702,000 |
|
|
Knology Holding, Inc. |
- |
|
2,220,000 |
1,132,200 |
|
|
LIN Holdings Corp. |
B3 |
|
1,635,000 |
1,075,013 |
|
|
Nielsen Media Research, Inc. 7.6% 6/15/09 |
Baa2 |
|
2,395,000 |
2,285,261 |
|
|
NorthPoint Communication Holdings, Inc. |
Caa1 |
|
5,125,000 |
3,536,250 |
|
|
|
|||||
|
Moody's Ratings (unaudited) (b) |
Principal Amount |
Value |
|||
|
NTL Communications Corp. 11.5% 10/1/08 |
B3 |
|
$ 4,100,000 |
$ 4,130,750 |
|
|
NTL, Inc.: |
|
|
|
|
|
|
0% 4/1/08 (e) |
B3 |
|
9,455,000 |
5,862,100 |
|
|
10% 2/15/07 |
B3 |
|
2,020,000 |
1,919,000 |
|
|
Pegasus Communications Corp. 9.625% 10/15/05 |
B3 |
|
3,365,000 |
3,247,225 |
|
|
TCI Communications, Inc. 9.8% 2/1/12 |
A2 |
|
4,550,000 |
5,169,392 |
|
|
Telemundo Holdings, Inc. |
Caa1 |
|
4,410,000 |
3,064,950 |
|
|
Telewest Communications PLC: |
|
|
|
|
|
|
0% 4/15/09 (e) |
B1 |
|
3,380,000 |
1,859,000 |
|
|
0% 2/1/10 (e)(g) |
B1 |
|
3,335,000 |
1,767,550 |
|
|
Telewest PLC: |
|
|
|
|
|
|
yankee 9.625% 10/1/06 |
B1 |
|
680,000 |
639,200 |
|
|
0% 10/1/07 (e) |
B1 |
|
6,705,000 |
6,403,275 |
|
|
Time Warner, Inc. |
Baa3 |
|
5,355,000 |
5,868,545 |
|
|
United Pan-Europe Communications NV: |
|
|
|
|
|
|
0% 2/1/10 (e) |
B2 |
|
7,545,000 |
3,546,150 |
|
|
10.875% 8/1/09 |
B2 |
|
11,443,000 |
10,069,840 |
|
|
USA Networks, Inc./USANi LLC 6.75% 11/15/05 |
Baa3 |
|
1,935,000 |
1,843,088 |
|
|
|
133,510,426 |
||||
|
Entertainment - 0.3% |
|||||
|
Bally Total Fitness Holding Corp. 9.875% 10/15/07 |
B3 |
|
2,450,000 |
2,229,500 |
|
|
Cinemark USA, Inc. |
B2 |
|
845,000 |
397,150 |
|
|
Paramount Communications, Inc. 7.5% 1/15/02 |
Baa1 |
|
1,785,000 |
1,779,163 |
|
|
Premier Parks, Inc. |
B3 |
|
7,225,000 |
4,903,969 |
|
|
Viacom, Inc.: |
|
|
|
|
|
|
6.75% 1/15/03 |
Baa1 |
|
4,430,000 |
4,350,747 |
|
|
7.75% 6/1/05 |
Baa1 |
|
2,137,000 |
2,144,244 |
|
|
|
15,804,773 |
||||
|
Lodging & Gaming - 0.3% |
|||||
|
Florida Panthers Holdings, Inc. 9.875% 4/15/09 |
B2 |
|
2,225,000 |
2,080,375 |
|
|
HMH Properties, Inc. 7.875% 8/1/05 |
Ba2 |
|
2,120,000 |
1,950,400 |
|
|
Horseshoe Gaming LLC 8.625% 5/15/09 |
B2 |
|
1,525,000 |
1,433,500 |
|
|
Host Marriott LP |
Ba2 |
|
3,000,000 |
2,805,000 |
|
|
ITT Corp. |
Ba1 |
|
810,000 |
678,375 |
|
|
Corporate Bonds - continued |
|||||
|
Moody's Ratings (unaudited) (b) |
Principal Amount |
Value |
|||
|
Nonconvertible Bonds - continued |
|||||
|
MEDIA & LEISURE - continued |
|||||
|
Lodging & Gaming - continued |
|||||
|
Mohegan Tribal Gaming Authority 8.75% 1/1/09 |
Ba3 |
|
$ 2,110,000 |
$ 1,993,950 |
|
|
Station Casinos, Inc. 9.875% 7/1/10 (g) |
B1 |
|
2,490,000 |
2,502,450 |
|
|
|
13,444,050 |
||||
|
Publishing - 0.3% |
|||||
|
News America |
|
|
|
|
|
|
7.7% 10/30/25 |
Baa3 |
|
4,300,000 |
3,916,010 |
|
|
7.75% 1/20/24 |
Baa3 |
|
2,590,000 |
2,344,649 |
|
|
Time Warner Entertainment Co. LP 8.375% 3/15/23 |
Baa2 |
|
5,340,000 |
5,405,842 |
|
|
|
11,666,501 |
||||
|
Restaurants - 0.1% |
|||||
|
Domino's, Inc. |
B3 |
|
1,620,000 |
1,502,550 |
|
|
NE Restaurant, Inc. |
B3 |
|
2,760,000 |
2,152,800 |
|
|
|
3,655,350 |
||||
|
TOTAL MEDIA & LEISURE |
178,081,100 |
||||
|
NONDURABLES - 0.5% |
|||||
|
Beverages - 0.2% |
|||||
|
Seagram JE & Sons, Inc.: |
|
|
|
|
|
|
6.4% 12/15/03 |
Baa3 |
|
5,840,000 |
5,612,824 |
|
|
6.8% 12/15/08 |
Baa3 |
|
3,040,000 |
2,850,994 |
|
|
|
8,463,818 |
||||
|
Foods - 0.1% |
|||||
|
ConAgra, Inc. |
Baa1 |
|
3,200,000 |
2,951,168 |
|
|
Del Monte Foods Co. |
Caa1 |
|
2,390,000 |
1,792,500 |
|
|
|
4,743,668 |
||||
|
Tobacco - 0.2% |
|||||
|
Philip Morris |
|
|
|
|
|
|
7% 7/15/05 |
A2 |
|
3,955,000 |
3,725,729 |
|
|
7.25% 9/15/01 |
A2 |
|
1,450,000 |
1,426,322 |
|
|
RJ Reynolds Tobacco Holdings, Inc. |
Baa2 |
|
3,500,000 |
3,250,660 |
|
|
|
8,402,711 |
||||
|
TOTAL NONDURABLES |
21,610,197 |
||||
|
|
|||||
|
Moody's Ratings (unaudited) (b) |
Principal Amount |
Value |
|||
|
RETAIL & WHOLESALE - 0.5% |
|||||
|
Drug Stores - 0.1% |
|||||
|
Rite Aid Corp.: |
|
|
|
|
|
|
6.5% 12/15/05 (g) |
Caa1 |
|
$ 5,475,000 |
$ 2,819,625 |
|
|
7.125% 1/15/07 |
Caa1 |
|
1,595,000 |
845,350 |
|
|
|
3,664,975 |
||||
|
General Merchandise Stores - 0.2% |
|||||
|
Dayton Hudson Corp. |
A2 |
|
3,500,000 |
3,498,040 |
|
|
Federated Department Stores, Inc.: |
|
|
|
|
|
|
6.79% 7/15/27 |
Baa1 |
|
3,000,000 |
2,901,120 |
|
|
8.5% 6/15/03 |
Baa1 |
|
2,580,000 |
2,603,659 |
|
|
Kmart Corp. 12.5% 3/1/05 |
Baa3 |
|
2,510,000 |
2,723,350 |
|
|
|
11,726,169 |
||||
|
Grocery Stores - 0.2% |
|||||
|
Kroger Co. 6% 7/1/00 |
Baa3 |
|
4,480,000 |
4,479,149 |
|
|
Pathmark Stores, Inc. 9.625% 5/1/03 (d) |
Caa3 |
|
6,150,000 |
4,243,500 |
|
|
|
8,722,649 |
||||
|
TOTAL RETAIL & WHOLESALE |
24,113,793 |
||||
|
SERVICES - 0.1% |
|||||
|
Printing - 0.0% |
|||||
|
Sullivan Graphics, Inc. 12.75% 8/1/05 |
Caa1 |
|
1,430,000 |
1,437,150 |
|
|
Services - 0.1% |
|||||
|
La Petite Academy, Inc./La Petite Academy Holding Co. 10% 5/15/08 |
B3 |
|
2,040,000 |
1,183,200 |
|
|
Medaphis Corp. |
Caa1 |
|
1,770,000 |
1,327,500 |
|
|
|
2,510,700 |
||||
|
TOTAL SERVICES |
3,947,850 |
||||
|
TECHNOLOGY - 1.0% |
|||||
|
Communications Equipment - 0.1% |
|||||
|
Corning, Inc. |
A2 |
|
2,350,000 |
2,102,075 |
|
|
Computer Services & Software - 0.4% |
|||||
|
Amazon.com, Inc. |
Caa1 |
|
2,305,000 |
1,244,700 |
|
|
Concentric Network Corp. 12.75% 12/15/07 |
B- |
|
595,000 |
624,750 |
|
|
Covad Communications Group, Inc.: |
|
|
|
|
|
|
0% 3/15/08 (e) |
B3 |
|
3,885,000 |
1,903,650 |
|
|
12% 2/15/10 |
B3 |
|
5,505,000 |
4,266,375 |
|
|
12.5% 2/15/09 |
B3 |
|
1,091,000 |
867,345 |
|
|
Exodus Communications, Inc. 11.25% 7/1/08 |
B- |
|
1,945,000 |
1,925,550 |
|
|
Corporate Bonds - continued |
|||||
|
Moody's Ratings (unaudited) (b) |
Principal Amount |
Value |
|||
|
Nonconvertible Bonds - continued |
|||||
|
TECHNOLOGY - continued |
|||||
|
Computer Services & Software - continued |
|||||
|
Federal Data Corp. 10.125% 8/1/05 |
B3 |
|
$ 3,720,000 |
$ 2,418,000 |
|
|
PSINet, Inc. |
B3 |
|
5,940,000 |
5,464,800 |
|
|
Verio, Inc. |
B3 |
|
61,000 |
64,965 |
|
|
|
18,780,135 |
||||
|
Computers & Office Equipment - 0.3% |
|||||
|
Comdisco, Inc. |
Baa1 |
|
8,300,000 |
8,030,997 |
|
|
Globix Corp. |
B- |
|
3,270,000 |
2,697,750 |
|
|
Sun Microsystems, Inc. |
Baa1 |
|
1,380,000 |
1,371,444 |
|
|
|
12,100,191 |
||||
|
Electronics - 0.2% |
|||||
|
ChipPAC International Ltd. 12.75% 8/1/09 |
B3 |
|
3,055,000 |
3,284,125 |
|
|
Details, Inc. 10% 11/15/05 |
B3 |
|
520,000 |
494,000 |
|
|
Fairchild |
|
|
|
|
|
|
10.125% 3/15/07 |
B2 |
|
560,000 |
565,600 |
|
|
10.375% 10/1/07 |
B3 |
|
1,660,000 |
1,693,200 |
|
|
Flextronics International Ltd. 9.875% 7/1/10 (g) |
Ba3 |
|
1,210,000 |
1,228,150 |
|
|
Micron Technology, Inc. 6.5% 9/30/05 (l) |
B3 |
|
3,000,000 |
2,505,000 |
|
|
SCG Holding Corp./Semiconductor Components Industries LLC 12% 8/1/09 |
B2 |
|
1,340,000 |
1,430,450 |
|
|
|
11,200,525 |
||||
|
TOTAL TECHNOLOGY |
44,182,926 |
||||
|
TRANSPORTATION - 0.8% |
|||||
|
Air Transportation - 0.2% |
|||||
|
Continental Airlines, Inc. pass thru trust certificates: |
|
|
|
|
|
|
7.434% 3/15/06 |
Baa1 |
|
1,110,000 |
1,073,259 |
|
|
7.73% 9/15/12 |
Baa1 |
|
455,032 |
434,601 |
|
|
Delta Air Lines, Inc. |
Baa3 |
|
4,000,000 |
3,486,400 |
|
|
Qantas Airways Ltd. |
Baa1 |
|
4,370,000 |
4,348,150 |
|
|
US Airways Group, Inc. 10.375% 3/1/13 |
Ba3 |
|
2,480,000 |
2,207,200 |
|
|
|
11,549,610 |
||||
|
|
|||||
|
Moody's Ratings (unaudited) (b) |
Principal Amount |
Value |
|||
|
Railroads - 0.6% |
|||||
|
Burlington Northern |
|
|
|
|
|
|
6.125% 3/15/09 |
Baa2 |
|
$ 6,450,000 |
$ 5,748,240 |
|
|
7.29% 6/1/36 |
Baa2 |
|
3,000,000 |
2,932,170 |
|
|
Canadian National Railway Co. 6.9% 7/15/28 |
Baa2 |
|
3,390,000 |
2,860,041 |
|
|
CSX Corp.: |
|
|
|
|
|
|
6.25% 10/15/08 |
Baa2 |
|
2,385,000 |
2,074,068 |
|
|
6.46% 6/22/05 |
Baa2 |
|
5,120,000 |
4,814,797 |
|
|
Norfolk Southern Corp. 7.05% 5/1/37 |
Baa1 |
|
6,610,000 |
6,460,350 |
|
|
Wisconsin Central Transportation Corp. 6.625% 4/15/08 |
Baa2 |
|
1,810,000 |
1,607,660 |
|
|
|
26,497,326 |
||||
|
TOTAL TRANSPORTATION |
38,046,936 |
||||
|
UTILITIES - 3.4% |
|||||
|
Cellular - 1.0% |
|||||
|
Crown Castle International Corp. 0% 5/15/11 (e) |
B3 |
|
2,830,000 |
1,726,300 |
|
|
Dobson Communications Corp. 10.875% 7/1/10 (g) |
- |
|
1,235,000 |
1,244,263 |
|
|
McCaw International Ltd. 0% 4/15/07 (e) |
Caa1 |
|
8,170,000 |
6,209,200 |
|
|
Millicom International Cellular SA 0% 6/1/06 (e) |
Caa1 |
|
7,300,000 |
6,205,000 |
|
|
Nextel Communications, Inc. 0% 10/31/07 (e) |
B1 |
|
16,310,000 |
12,150,950 |
|
|
Nextel International, Inc. |
Caa1 |
|
1,270,000 |
838,200 |
|
|
Rogers Communications, Inc. 8.875% 7/15/07 |
Ba3 |
|
2,950,000 |
2,891,000 |
|
|
TeleCorp PCS, Inc. |
B3 |
|
3,235,000 |
2,127,013 |
|
|
Triton PCS, Inc. |
B3 |
|
3,030,000 |
2,189,175 |
|
|
Vodafone AirTouch PLC 7.625% 2/15/05 (g) |
A2 |
|
3,040,000 |
3,036,717 |
|
|
VoiceStream Wireless Corp.: |
|
|
|
|
|
|
0% 11/15/09 (e) |
B2 |
|
1,430,000 |
958,100 |
|
|
10.375% 11/15/09 |
B2 |
|
7,905,000 |
8,221,200 |
|
|
|
47,797,118 |
||||
|
Electric Utility - 0.5% |
|||||
|
Avon Energy |
|
|
|
|
|
|
6.46% 3/4/08 (g) |
Baa2 |
|
3,960,000 |
3,527,093 |
|
|
6.73% 12/11/02 (g) |
Baa2 |
|
4,910,000 |
4,783,518 |
|
|
Dominion Resources, Inc. 8.125% 6/15/10 |
Baa1 |
|
2,095,000 |
2,109,162 |
|
|
Hydro-Quebec yankee |
A2 |
|
2,620,000 |
2,766,720 |
|
|
Corporate Bonds - continued |
|||||
|
Moody's Ratings (unaudited) (b) |
Principal Amount |
Value |
|||
|
Nonconvertible Bonds - continued |
|||||
|
UTILITIES - continued |
|||||
|
Electric Utility - continued |
|||||
|
Illinois Power Co. |
Baa1 |
|
$ 1,880,000 |
$ 1,835,218 |
|
|
Israel Electric Corp. Ltd.: |
|
|
|
|
|
|
7.75% 12/15/27 (g) |
A3 |
|
3,920,000 |
3,360,028 |
|
|
yankee 7.875% 12/15/26 (g) |
A3 |
|
1,960,000 |
1,731,288 |
|
|
Texas Utilities Co. |
Baa3 |
|
990,000 |
894,218 |
|
|
|
21,007,245 |
||||
|
Gas - 0.1% |
|||||
|
Reliant Energy |
Baa1 |
|
2,550,000 |
2,549,490 |
|
|
Telephone Services - 1.8% |
|||||
|
Allegiance Telecom, Inc.: |
|
|
|
|
|
|
0% 2/15/08 (e) |
B3 |
|
1,280,000 |
931,200 |
|
|
12.875% 5/15/08 |
B3 |
|
1,390,000 |
1,504,675 |
|
|
Cable & Wireless Optus Ltd. 8% 6/22/10 (g) |
Baa1 |
|
2,520,000 |
2,504,452 |
|
|
Deutsche Telekom International Finance BV 8.25% 6/15/30 |
Aa2 |
|
7,180,000 |
7,294,377 |
|
|
FirstWorld Communications, Inc. 0% 4/15/08 (e) |
- |
|
2,745,000 |
1,235,250 |
|
|
Global Crossing Holdings Ltd. 9.125% 11/15/06 |
Ba2 |
|
840,000 |
808,500 |
|
|
Globenet Communication Group Ltd. 13% 7/15/07 |
Caa1 |
|
2,450,000 |
2,474,500 |
|
|
ICG Services, Inc. |
B3 |
|
2,425,000 |
1,115,500 |
|
|
Intermedia |
|
|
|
|
|
|
0% 7/15/07 (e) |
B2 |
|
1,050,000 |
813,750 |
|
|
0% 3/1/09 (e) |
B3 |
|
1,410,000 |
856,575 |
|
|
Level 3 Communications, Inc. 9.125% 5/1/08 |
B3 |
|
3,885,000 |
3,486,788 |
|
|
Logix Communications Enterprises, Inc. |
- |
|
4,040,000 |
1,292,800 |
|
|
McLeodUSA, Inc.: |
|
|
|
|
|
|
0% 3/1/07 (e) |
B1 |
|
2,485,000 |
2,074,975 |
|
|
9.5% 11/1/08 |
B1 |
|
1,205,000 |
1,174,875 |
|
|
Metromedia Fiber Network, Inc. 10% 12/15/09 |
B2 |
|
580,000 |
569,850 |
|
|
NEXTLINK Communications, Inc. 9.625% 10/1/07 |
B2 |
|
2,870,000 |
2,690,625 |
|
|
Ono Finance PLC |
Caa1 |
|
2,075,000 |
1,960,875 |
|
|
|
|||||
|
Moody's Ratings (unaudited) (b) |
Principal Amount |
Value |
|||
|
Pathnet, Inc. |
- |
|
$ 4,665,000 |
$ 2,612,400 |
|
|
Rhythms |
|
|
|
|
|
|
0% 5/15/08 (e) |
B3 |
|
7,983,000 |
3,153,285 |
|
|
12.75% 4/15/09 |
B3 |
|
2,510,000 |
1,706,800 |
|
|
Telecomunicaciones |
Baa2 |
|
5,540,000 |
5,159,291 |
|
|
Teleglobe Canada, Inc.: |
|
|
|
|
|
|
7.2% 7/20/09 |
Baa1 |
|
6,886,000 |
6,588,869 |
|
|
7.7% 7/20/29 |
Baa1 |
|
6,330,000 |
5,960,771 |
|
|
Teligent, Inc.: |
|
|
|
|
|
|
0% 3/1/08 (e) |
Caa1 |
|
4,445,000 |
2,044,700 |
|
|
11.5% 12/1/07 |
Caa1 |
|
4,295,000 |
3,328,625 |
|
|
WinStar |
|
|
|
|
|
|
0% 4/15/10 (e)(g) |
B3 |
|
12,896,000 |
5,996,640 |
|
|
12.75% 4/15/10 (g) |
B3 |
|
10,487,000 |
10,119,955 |
|
|
WorldCom, Inc. |
A3 |
|
3,139,000 |
3,254,704 |
|
|
|
82,715,607 |
||||
|
TOTAL UTILITIES |
154,069,460 |
||||
|
TOTAL NONCONVERTIBLE BONDS |
758,969,328 |
||||
|
TOTAL CORPORATE BONDS (Cost $818,133,022) |
769,770,866 |
||||
|
U.S. Government and Government |
|||||
|
|
|||||
|
U.S. Government Agency Obligations - 3.4% |
|||||
|
Fannie Mae: |
|
|
|
|
|
|
0% 8/24/00 |
- |
|
30,000,000 |
29,717,460 |
|
|
6% 5/15/08 |
Aaa |
|
12,000,000 |
11,190,840 |
|
|
6.5% 4/29/09 |
Aaa |
|
9,210,000 |
8,604,166 |
|
|
7.125% 2/15/05 |
Aaa |
|
10,045,000 |
10,085,783 |
|
|
7.25% 5/15/30 |
Aaa |
|
12,135,000 |
12,382,020 |
|
|
Farm Credit Systems Financial Assistance Corp. 8.8% 6/10/05 |
Aaa |
|
2,000,000 |
2,141,560 |
|
|
Federal Home Loan Bank: |
|
|
|
|
|
|
5.195% 9/11/01 |
Aaa |
|
4,500,000 |
4,405,770 |
|
|
6.75% 2/1/02 |
Aaa |
|
38,840,000 |
38,718,431 |
|
|
7.59% 3/10/05 |
Aaa |
|
3,850,000 |
3,928,194 |
|
|
Freddie Mac: |
|
|
|
|
|
|
0% 8/17/00 |
- |
|
10,000,000 |
9,918,490 |
|
|
6.25% 7/15/04 |
Aaa |
|
6,200,000 |
6,027,578 |
|
|
6.75% 8/1/05 |
Aaa |
|
2,500,000 |
2,464,850 |
|
|
6.875% 1/15/05 |
Aaa |
|
3,255,000 |
3,234,656 |
|
|
7% 7/15/05 |
Aaa |
|
4,400,000 |
4,393,840 |
|
|
U.S. Government and Government Agency |
|||||
|
Moody's Ratings (unaudited) (b) |
Principal Amount |
Value |
|||
|
U.S. Government Agency Obligations - continued |
|||||
|
Freddie Mac: - continued |
|
|
|
|
|
|
7.625% 9/9/09 |
Aaa |
|
$ 3,415,000 |
$ 3,366,985 |
|
|
Tennessee Valley Authority 7.125% 5/1/30 |
Aaa |
|
2,570,000 |
2,580,794 |
|
|
U.S. Department of Housing and Urban Development government guaranteed participation certificates Series 1996-A, |
Aaa |
|
2,825,000 |
2,879,381 |
|
|
TOTAL U.S. GOVERNMENT AGENCY OBLIGATIONS |
156,040,798 |
||||
|
U.S. Treasury Obligations - 4.0% |
|||||
|
U.S. Treasury Bills, yield |
- |
|
8,000,000 |
7,935,864 |
|
|
U.S. Treasury Bonds: |
|
|
|
|
|
|
5.25% 2/15/29 |
Aaa |
|
750,000 |
665,625 |
|
|
6.875% 8/15/25 |
Aaa |
|
715,000 |
779,236 |
|
|
7.625% 2/15/25 |
Aaa |
|
10,290,000 |
12,167,925 |
|
|
8% 11/15/21 |
Aaa |
|
2,200,000 |
2,659,602 |
|
|
8.125% 8/15/19 |
Aaa |
|
58,400,000 |
70,600,344 |
|
|
8.875% 8/15/17 |
Aaa |
|
4,027,000 |
5,133,177 |
|
|
11.75% 2/15/10 (callable) |
Aaa |
|
15,045,000 |
18,150,438 |
|
|
12% 8/15/13 |
Aaa |
|
3,740,000 |
5,049,000 |
|
|
13.875% 5/15/11 (callable) |
Aaa |
|
21,150,000 |
28,688,072 |
|
|
U.S. Treasury Notes: |
|
|
|
|
|
|
4.75% 11/15/08 |
Aaa |
|
1,665,000 |
1,512,020 |
|
|
6.25% 10/31/01 |
Aaa |
|
820,000 |
817,433 |
|
|
6.625% 6/30/01 |
Aaa |
|
19,110,000 |
19,133,888 |
|
|
7% 7/15/06 |
Aaa |
|
8,695,000 |
9,010,194 |
|
|
7.25% 8/15/04 |
Aaa |
|
1,404,000 |
1,451,610 |
|
|
TOTAL U.S. TREASURY OBLIGATIONS |
183,754,428 |
||||
|
TOTAL U.S. GOVERNMENT AND GOVERNMENT AGENCY OBLIGATIONS (Cost $344,947,217) |
339,795,226 |
||||
|
U.S. Government Agency - |
|||||
|
|
|||||
|
Fannie Mae - 8.4% |
|||||
|
6% 1/1/11 to 1/1/29 |
Aaa |
|
55,576,630 |
51,894,145 |
|
|
6.5% 5/1/14 to 1/1/30 |
Aaa |
|
112,916,299 |
106,742,974 |
|
|
7% 8/1/13 to 12/1/29 |
Aaa |
|
126,273,999 |
122,195,551 |
|
|
7.5% 7/1/16 to 3/1/30 |
Aaa |
|
30,045,234 |
29,660,358 |
|
|
7.5% 7/1/30 (h) |
Aaa |
|
25,600,000 |
25,224,000 |
|
|
|
|||||
|
Moody's Ratings (unaudited) (b) |
Principal Amount |
Value |
|||
|
8% 9/1/26 to 3/1/30 |
Aaa |
|
$ 1,472,835 |
$ 1,478,817 |
|
|
8% 7/1/30 (h) |
Aaa |
|
44,860,000 |
45,028,225 |
|
|
TOTAL FANNIE MAE |
382,224,070 |
||||
|
Freddie Mac - 0.1% |
|||||
|
7.5% 5/1/17 to 7/1/29 |
Aaa |
|
3,977,164 |
3,939,908 |
|
|
8% 7/1/17 to 5/1/27 |
Aaa |
|
616,237 |
621,896 |
|
|
8.5% 7/1/22 to 6/1/23 |
Aaa |
|
23,330 |
23,822 |
|
|
TOTAL FREDDIE MAC |
4,585,626 |
||||
|
Government National Mortgage Association - 1.1% |
|||||
|
6% 12/15/08 to 6/15/09 |
Aaa |
|
2,339,469 |
2,255,515 |
|
|
6.5% 6/15/08 to 7/15/09 |
Aaa |
|
10,988,800 |
10,770,268 |
|
|
7% 7/15/28 |
Aaa |
|
17,866,601 |
17,369,552 |
|
|
7.5% 9/15/22 to 8/15/28 |
Aaa |
|
19,270,248 |
19,157,679 |
|
|
8% 5/15/25 |
Aaa |
|
80,865 |
81,775 |
|
|
8.5% 12/15/16 |
Aaa |
|
25,719 |
26,519 |
|
|
TOTAL GOVERNMENT NATIONAL |
49,661,308 |
||||
|
TOTAL U.S. GOVERNMENT AGENCY - (Cost $444,523,943) |
436,471,004 |
||||
|
Asset-Backed Securities - 0.7% |
|||||
|
|
|||||
|
Airplanes pass through trust 10.875% 3/15/19 |
Ba2 |
|
2,513,697 |
1,860,135 |
|
|
BankAmerica Manufacturing Housing Contract Trust V 6.2% 4/10/09 |
Aaa |
|
3,730,000 |
3,651,903 |
|
|
Capita Equipment Receivables Trust |
Baa2 |
|
2,950,000 |
2,855,508 |
|
|
CIT Marine Trust |
Aaa |
|
5,920,000 |
5,720,200 |
|
|
CPS Auto Grantor Trust 6.55% 8/15/02 |
Aaa |
|
586,472 |
583,539 |
|
|
CPS Auto Receivables Trust 6% 8/15/03 |
Aaa |
|
2,157,284 |
2,127,622 |
|
|
CSXT Trade Receivables Master Trust 6% 7/25/04 |
Aaa |
|
4,600,000 |
4,460,563 |
|
|
Ford Credit Auto |
|
|
|
|
|
|
6.2% 12/15/02 |
Aa2 |
|
2,680,000 |
2,643,569 |
|
|
6.4% 12/15/02 |
Aa2 |
|
1,480,000 |
1,460,760 |
|
|
7.03% 11/15/03 |
Aaa |
|
704,000 |
703,450 |
|
|
Green Tree Financial Corp. 6.8% 6/15/27 |
Aaa |
|
361,150 |
360,810 |
|
|
Asset-Backed Securities - continued |
|||||
|
Moody's Ratings (unaudited) (b) |
Principal Amount |
Value |
|||
|
Olympic Automobile Receivables Trust |
Aaa |
|
$ 193,142 |
$ 193,082 |
|
|
Petroleum Enhanced Trust Receivables Offering Petroleum Trust |
Baa2 |
|
1,549,554 |
1,542,048 |
|
|
Sears Credit Account Master Trust II 7.5% 11/15/07 |
A2 |
|
2,650,000 |
2,650,000 |
|
|
UAF Auto Grantor Trust 6.1% 1/15/03 (g) |
Aaa |
|
2,101,899 |
2,088,106 |
|
|
TOTAL ASSET-BACKED SECURITIES (Cost $34,231,746) |
32,901,295 |
||||
|
Collateralized Mortgage Obligations - 0.3% |
|||||
|
|
|||||
|
Private Sponsor - 0.0% |
|||||
|
Credit-Based Asset Servicing and Securitization LLC Series 1997-2 Class 2B, 7.1786% 12/29/25 (d)(g)(j) |
Ba3 |
|
1,007,822 |
485,959 |
|
|
U.S. Government Agency - 0.3% |
|||||
|
Bank America Mortgage Securities, Inc.: |
|
|
|
|
|
|
Series 1999-3, Class A1 6.25% 5/25/14 |
AAA |
|
6,026,533 |
5,696,016 |
|
|
Series 1999-6, Class A1 6.25% 7/25/14 |
AAA |
|
3,828,300 |
3,614,872 |
|
|
Fannie Mae REMIC planned amortization class: |
|
|
|
|
|
|
Series 1999-54 Class PH, 6.5% 11/18/29 |
Aaa |
|
3,300,000 |
2,970,516 |
|
|
Series 1999-57 Class PH, 6.5% 12/25/29 |
Aaa |
|
2,600,000 |
2,336,344 |
|
|
TOTAL U.S. GOVERNMENT AGENCY |
14,617,748 |
||||
|
TOTAL COLLATERALIZED (Cost $14,957,335) |
15,103,707 |
||||
|
Commercial Mortgage Securities - 1.6% |
|||||
|
|
|||||
|
Bankers Trust REMIC Trust 1998-1 Series 1998-S1A Class G, 8.5632% 11/28/02 (g)(j) |
Baa3 |
|
1,000,000 |
960,625 |
|
|
Berkeley Federal Bank & Trust FSB Series 1994-1 Class B, 7.5003% 8/1/24 (g)(j) |
- |
|
1,900,000 |
1,316,938 |
|
|
BKB Commercial Mortgage Trust Series 1997-C1 Class D, 7.7606% 2/25/43 (g)(j) |
BBB |
|
1,095,356 |
1,088,810 |
|
|
|
|||||
|
Moody's Ratings (unaudited) (b) |
Principal Amount |
Value |
|||
|
CBM Funding Corp. sequential pay |
|
|
|
|
|
|
Class A-3PI, |
AA |
|
$ 3,000,000 |
$ 2,947,266 |
|
|
Class B, 7.48% 2/1/08 |
A |
|
2,320,000 |
2,266,984 |
|
|
CS First Boston Mortgage Securities Corp.: |
|
|
|
|
|
|
Series 1997-C2 Class D, 7.27% 1/17/35 |
Baa2 |
|
5,730,000 |
5,267,572 |
|
|
Series 1998-FL1 Class E, 7.4913% 1/10/13 (g)(j) |
Baa2 |
|
5,490,000 |
5,465,553 |
|
|
Deutsche Mortgage & |
Baa2 |
|
4,260,000 |
3,826,678 |
|
|
Equitable Life Assurance Society of the United States Series 174: |
|
|
|
|
|
|
Class B1, |
Aa2 |
|
3,500,000 |
3,471,152 |
|
|
Class C1, |
A2 |
|
2,300,000 |
2,259,031 |
|
|
Class D1, |
Baa2 |
|
2,200,000 |
2,148,266 |
|
|
First Chicago/Lennar Trust I Series 1997-CHL1 Class E, 8.0835% 4/1/39 (j) |
- |
|
1,600,000 |
1,138,500 |
|
|
First Union-Lehman Brothers Commercial Mortgage Trust sequential pay Series 1997-C2 Class B, |
Aa2 |
|
8,640,000 |
8,073,338 |
|
|
FMAC Loan |
|
|
|
|
|
|
Series 1997-A Class E, 8.1104% 4/15/19 (g)(j) |
- |
|
500,000 |
330,469 |
|
|
Series 1997-B Class E, 7.8912% 9/15/19 (g)(j) |
- |
|
750,000 |
285,000 |
|
|
GAFCO Franchisee Loan Trust Series 1998-1 |
- |
|
1,300,000 |
1,040,813 |
|
|
General Motors Acceptance Corp. Commercial Mortgage Securities, Inc. Series 1996-C1 Class F, 7.86% 10/15/28 (g) |
Ba3 |
|
750,000 |
603,164 |
|
|
GS Mortgage Securities Corp. II Series 1998-GLII Class E, 7.1905% 4/13/31 (g)(j) |
Baa3 |
|
4,930,000 |
4,262,332 |
|
|
LTC Commercial Mortgage pass through certificates Series 1998-1 Class A, 6.029% 5/30/30 (g) |
AAA |
|
2,997,247 |
2,819,754 |
|
|
Morgan Stanley Capital I, Inc. Series 1996-MBL1 Class E, 8.2633% 5/25/21 (g)(j) |
- |
|
1,509,471 |
1,501,216 |
|
|
Commercial Mortgage Securities - continued |
|||||
|
Moody's Ratings (unaudited) (b) |
Principal Amount |
Value |
|||
|
Nomura Asset Securities Corp. Series 1998-D6 Class A4, 7.6083% 3/17/28 (j) |
Baa2 |
|
$ 4,260,000 |
$ 3,886,585 |
|
|
Nomura Depositor Trust floater Series 1998-ST1A Class B2, 10.9013% 1/15/03 (g)(j) |
- |
|
800,000 |
740,875 |
|
|
Penn Mutual Life Insurance Co. (The)/Penn Insurance & Annuity Co. |
|
|
|
|
|
|
Class K, 7.9% 11/15/26 (g) |
- |
|
1,473,000 |
953,768 |
|
|
Class L, 7.9% 11/15/26 (g) |
- |
|
1,133,000 |
595,710 |
|
|
Prudential Securities Secd Financing Corp. Series 2000-C1, Class A2 7.727% 2/15/10 |
Aaa |
|
1,620,000 |
1,635,694 |
|
|
Structured Asset |
|
|
|
|
|
|
Series 1995-C1 Class E, 7.375% 9/25/24 (g) |
BB |
|
1,200,000 |
1,105,734 |
|
|
Series 1996-CFL: |
|
|
|
|
|
|
Class E, |
BBB |
|
2,390,000 |
2,370,021 |
|
|
Class G, |
B+ |
|
1,000,000 |
887,500 |
|
|
Thirteen Affiliates of General Growth Properties, Inc.: |
|
|
|
|
|
|
sequential pay Series 1 Class A2, 6.602% 12/15/10 (g) |
Aaa |
|
4,200,000 |
3,975,234 |
|
|
Series D-2, |
Baa2 |
|
4,120,000 |
3,791,205 |
|
|
Series E-2, |
Baa3 |
|
2,450,000 |
2,200,789 |
|
|
TOTAL COMMERCIAL MORTGAGE SECURITIES (Cost $77,443,303) |
73,216,576 |
||||
|
Foreign Government and Government |
|||||
|
|
|||||
|
Israeli State euro |
A3 |
|
3,350,000 |
3,301,794 |
|
|
Korean Republic yankee: |
|
|
|
|
|
|
8.75% 4/15/03 |
Baa2 |
|
1,340,000 |
1,364,066 |
|
|
8.875% 4/15/08 |
Baa2 |
|
1,868,000 |
1,926,842 |
|
|
Newfoundland Province yankee 11. |
Baa1 |
|
2,000,000 |
2,455,600 |
|
|
Quebec Province |
A2 |
|
7,220,000 |
7,093,000 |
|
|
United Mexican States 9.875% 2/1/10 |
Baa3 |
|
5,110,000 |
5,339,950 |
|
|
TOTAL FOREIGN GOVERNMENT AND GOVERNMENT AGENCY OBLIGATIONS (Cost $21,783,424) |
21,481,252 |
||||
|
Supranational Obligations - 0.1% |
|||||
|
Moody's Ratings (unaudited) (b) |
Principal Amount |
Value |
|||
|
Inter-American Development Bank yankee |
Aaa |
|
$ 4,750,000 |
$ 4,524,945 |
|
|
Purchased Bank Debt - 1.3% |
|||||
|
|
|||||
|
Allied Waste North America, Inc. term loan: |
|
|
|
|
|
|
9.5625% 7/21/06 (j) |
Ba3 |
|
2,272,727 |
2,130,682 |
|
|
9.7542% 7/21/07 (j) |
Ba3 |
|
2,727,273 |
2,556,818 |
|
|
American Tower L P term loan 9.53% 12/31/07 (j) |
- |
|
3,400,000 |
3,417,000 |
|
|
Charter Communication Operating LLC term loan 8.8% 3/18/08 (j) |
Ba3 |
|
6,000,000 |
5,962,500 |
|
|
Crown Castle Operating Co. term loan 9.46% 6/15/08 (j) |
Ba3 |
|
4,200,000 |
4,210,500 |
|
|
Dynatech LLC term loan 10.03% 9/1/07 (j) |
- |
|
4,240,000 |
4,218,800 |
|
|
Huntsman ICI Chemicals LLC sr. secured: |
|
|
|
|
|
|
term B loan |
- |
|
1,837,630 |
1,842,224 |
|
|
term C loan |
- |
|
2,382,200 |
2,388,156 |
|
|
Lyondell Chemical Co. sr. secured Tranche E term loan 10.5263% 5/17/06 (j) |
- |
|
4,300,000 |
4,418,250 |
|
|
McLeodUSA, Inc. term loan 9.69% 5/31/08 (j) |
Ba2 |
|
4,250,000 |
4,260,625 |
|
|
Nextel Finance Co. |
|
|
|
|
|
|
9.6875% 6/30/08 (j) |
Ba2 |
|
3,000,000 |
3,011,250 |
|
|
10.375% 12/31/08 (j) |
Ba2 |
|
3,000,000 |
3,011,250 |
|
|
Packaging Corp. of America term loan 0% 5/22/07 (j) |
- |
|
2,500,000 |
2,506,250 |
|
|
Telemundo Group, Inc. term loan 8.905% 3/31/07 (j) |
B1 |
|
1,665,000 |
1,654,594 |
|
|
Tritel Holding Corp. |
B2 |
|
4,250,000 |
4,265,938 |
|
|
Purchased Bank Debt - continued |
|||||
|
Moody's Ratings (unaudited) (b) |
Principal Amount |
Value |
|||
|
Voicestream Pcs Holding LLC term loan 9.76% 2/25/09 (j) |
B+ |
|
$ 5,100,000 |
$ 5,087,250 |
|
|
Wci Capital Corp. term loan 11.43% 9/30/07 (j) |
B2 |
|
3,600,000 |
3,591,000 |
|
|
TOTAL PURCHASED BANK DEBT (Cost $58,603,499) |
58,533,087 |
||||
|
Bank Notes - 0.2% |
||||
|
|
||||
|
Bank One NA 6.29% 8/25/00 |
|
11,350,000 |
11,332,056 |
|
|
Certificates of Deposit - 0.2% |
||||
|
|
||||
|
Canadian Imperial Bank |
|
11,500,000 |
11,506,374 |
|
|
Commercial Paper - 2.3% |
||||
|
|
||||
|
CIT Group, Inc. 6.43% 7/5/00 |
|
11,000,000 |
10,995,875 |
|
|
Daimler-Chrysler North America Holding Corp. yankee |
|
10,000,000 |
9,766,461 |
|
|
Falcon Asset Securitization Corp. 6.58% 8/10/00 |
|
11,000,000 |
10,923,715 |
|
|
General Motors Acceptance Corp. 6.62% 8/23/00 |
|
10,000,000 |
9,906,925 |
|
|
ING America Insurance Holdings, Inc. yankee 6.69% 11/9/00 |
|
10,000,000 |
9,763,858 |
|
|
Kitty Hawk Funding Corp. |
|
10,000,000 |
9,968,786 |
|
|
Montauk Funding Corp. yankee 6.58% 7/12/00 |
|
11,000,000 |
10,981,575 |
|
|
Preferred Receivables Funding Corp. 6.58% 7/18/00 |
|
11,000,000 |
10,969,475 |
|
|
Windmill Funding Corp. yankee 6.58% 7/20/00 |
|
11,000,000 |
10,965,352 |
|
|
Woolwich PLC yankee |
|
11,400,000 |
11,366,408 |
|
|
TOTAL COMMERCIAL PAPER (Cost $105,548,446) |
105,608,430 |
|||
|
Cash Equivalents - 9.4% |
|||
|
Maturity Amount |
Value |
||
|
Investments in repurchase agreements (U.S. Government Obligations), in a joint trading account at 6.83%, dated 6/30/00 due 7/3/00 |
$ 30,341,270 |
$ 30,324,000 |
|
|
Shares |
|
||
|
Central Cash Collateral Fund, 6.71% (c) |
659,100 |
659,100 |
|
|
Taxable Central Cash Fund, 6.59% (c) |
394,173,790 |
394,173,790 |
|
|
TOTAL CASH EQUIVALENTS (Cost $425,156,890) |
425,156,890 |
||
|
TOTAL INVESTMENT PORTFOLIO - 100.3% (Cost $4,073,306,528) |
4,573,384,257 |
|
|
NET OTHER ASSETS - (0.3)% |
(15,209,059) |
|
|
NET ASSETS - 100% |
$ 4,558,175,198 |
|
|
Futures Contracts |
|||||
|
|
Expiration Date |
Underlying |
Unrealized Gain/(Loss) |
||
|
Purchased |
|||||
|
634 S&P 500 Stock Index Contracts |
Sept. 2000 |
$ 232,693,850 |
$ (1,400,223) |
||
|
The face value of futures purchased as a percentage of net assets - 5.1% |
|
Legend |
|
(a) Non-income producing |
|
(b) S&P credit ratings are used in the absence of a rating by Moody's Investors Service, Inc. |
|
(c) The rate quoted is the annualized seven-day yield of the fund at |
|
(d) Non-income producing - issuer filed for protection under the |
|
(e) Debt obligation initially issued in zero coupon form which converts to coupon form at a specified rate and date. The rate shown is the rate at period end. |
|
(f) Debt obligation initially issued at one coupon which converts to a higher coupon at a specified date. The rate shown is the rate at period end. |
|
(g) Security exempt from registration under Rule 144A of the Securities Act |
|
(h) Security purchased on a delayed delivery or when-issued basis. |
|
(i) Security or a portion of the security was pledged to cover margin requirements for futures contracts. At the period end, the value of securities pledged amounted to $7,935,864. |
|
(j) The coupon rate shown on floating or adjustable rate securities represents the rate at period end. |
|
(k) For foreign government obligations not individually rated by S&P |
|
(l) Restricted securities - Investment in securities not registered under the Securities Act of 1933. |
|
Additional information on each holding is as follows: |
|
Security |
Acquisition Date |
Acquisition Cost |
|
Goldman Sachs Group LP |
1/25/99 |
$ 12,900,000 |
|
Micron Technology, Inc. |
7/15/99 - 4/10/00 |
$ 2,417,500 |
|
Other Information |
|
The composition of long-term debt holdings as a percentage of total value of investments in securities, is as follows (ratings are unaudited): |
|
Moody's Ratings |
S&P Ratings |
|||
|
Aaa, Aa, A |
20.8% |
|
AAA, AA, A |
17.8% |
|
Baa |
6.5% |
|
BBB |
6.0% |
|
Ba |
1.7% |
|
BB |
1.9% |
|
B |
5.3% |
|
B |
5.8% |
|
Caa |
1.3% |
|
CCC |
0.8% |
|
Ca, C |
0.0% |
|
CC, C |
0.0% |
|
|
|
|
D |
0.1% |
|
The percentage not rated by Moody's or S&P amounted to 0.9%. FMR has determined that unrated debt securities that are lower quality account for 0.9% of the total value of investment in securities. |
|
Purchases and sales of securities, other than short-term securities, aggregated $1,703,007,563 and $2,385,422,392, respectively, of which long-term U.S. government and government agency obligations aggregated $703,320,022 and $737,829,262, respectively. |
|
The market value of futures contracts opened and closed during the period amounted to $369,738,823 and $140,715,190, respectively. |
|
The fund placed a portion of its portfolio transactions with brokerage firms which are affiliates of Fidelity Management & Research Company. The commissions paid to these affiliated firms were $30,209 for the period. |
|
The fund invested in securities that are not registered under the Securities Act of 1933. These securities are subject to legal or contractual restrictions on resale. At the end of the period, restricted securities (excluding Rule 144A issues) amounted to $15,403,891 and 0.3% of net assets. |
|
The fund participated in the security lending program. At period end, the value of securities loaned amounted to $659,757. The fund received cash collateral of $659,100 which was invested in cash equivalents. |
|
Income Tax Information |
|
At June 30, 2000, the aggregate cost of investment securities for income tax purposes was $4,073,709,121. Net unrealized appreciation aggregated $499,675,136, of which $646,290,978 related to appreciated investment securities and $146,615,842 related to depreciated investment securities. |
See accompanying notes which are an integral part of the financial statements.
Asset Manager Portfolio
Statement of Assets and Liabilities
|
|
June 30, 2000 (Unaudited) |
|
|
Assets |
|
|
|
Investment in securities, at value (including repurchase agreements of $30,324,000) |
|
$ 4,573,384,257 |
|
Cash |
|
417,051 |
|
Receivable for investments sold |
|
78,404,347 |
|
Receivable for fund shares sold |
|
538,054 |
|
Dividends receivable |
|
1,365,550 |
|
Interest receivable |
|
27,511,966 |
|
Receivable for daily variation on futures contracts |
|
1,131,992 |
|
Other receivables |
|
132,043 |
|
Total assets |
|
4,682,885,260 |
|
Liabilities |
|
|
|
Payable for investments purchased |
$ 73,353,664 |
|
|
Delayed delivery |
44,912,865 |
|
|
Payable for fund shares redeemed |
3,398,939 |
|
|
Accrued management fee |
2,015,725 |
|
|
Distribution fees payable |
2,417 |
|
|
Other payables and |
367,352 |
|
|
Collateral on securities loaned, |
659,100 |
|
|
Total liabilities |
|
124,710,062 |
|
Net Assets |
|
$ 4,558,175,198 |
|
Net Assets consist of: |
|
|
|
Paid in capital |
|
$ 3,894,821,160 |
|
Undistributed net investment income |
|
93,150,596 |
|
Accumulated undistributed net realized gain (loss) on investments and foreign currency transactions |
|
71,519,816 |
|
Net unrealized appreciation (depreciation) on investments |
|
498,683,626 |
|
Net Assets |
|
$ 4,558,175,198 |
|
Initial Class: |
|
$16.55 |
|
Service Class: |
|
$16.46 |
|
Service Class 2: |
|
$16.45 |
Statement of Operations
|
|
Six months ended June 30, 2000 (Unaudited) |
|
|
Investment Income Dividends |
|
$ 16,298,613 |
|
Interest |
|
82,305,154 |
|
Security lending |
|
650 |
|
Total income |
|
98,604,417 |
|
Expenses |
|
|
|
Management fee |
$ 12,350,508 |
|
|
Transfer agent fees |
1,535,078 |
|
|
Distribution fees |
13,162 |
|
|
Accounting and security lending fees |
334,234 |
|
|
Non-interested trustees' compensation |
15,911 |
|
|
Custodian fees and expenses |
55,539 |
|
|
Registration fees |
12,422 |
|
|
Audit |
22,607 |
|
|
Legal |
16,406 |
|
|
Miscellaneous |
30,810 |
|
|
Total expenses before reductions |
14,386,677 |
|
|
Expense reductions |
(144,577) |
14,242,100 |
|
Net investment income |
|
84,362,317 |
|
Realized and Unrealized Gain (Loss) Net realized gain (loss) on: |
|
|
|
Investment securities |
70,050,664 |
|
|
Foreign currency transactions |
(13) |
|
|
Futures contracts |
5,070,440 |
75,121,091 |
|
Change in net unrealized appreciation (depreciation) on: |
|
|
|
Investment securities |
(193,765,715) |
|
|
Assets and liabilities in |
(7) |
|
|
Futures contracts |
(1,400,223) |
(195,165,945) |
|
Net gain (loss) |
|
(120,044,854) |
|
Net increase (decrease) in net assets resulting from operations |
|
$ (35,682,537) |
|
Other Information Expense reductions |
|
$ 134,129 |
|
Custodian credits |
|
10,448 |
|
|
|
$ 144,577 |
See accompanying notes which are an integral part of the financial statements.
Semiannual Report
Fidelity Variable Insurance Products: Asset Manager Portfolio
Financial Statements - continued
Statement of Changes in Net Assets
|
Increase (Decrease) in Net Assets |
Six months ended |
Year ended |
|
Operations |
$ 84,362,317 |
$ 163,666,158 |
|
Net realized gain (loss) |
75,121,091 |
365,307,199 |
|
Change in net unrealized appreciation (depreciation) |
(195,165,945) |
(14,691,723) |
|
Net increase (decrease) in net assets resulting from operations |
(35,682,537) |
514,281,634 |
|
Distributions to shareholders |
(154,095,495) |
(161,497,855) |
|
From net realized gain |
(363,069,869) |
(204,563,949) |
|
Total distributions |
(517,165,364) |
(366,061,804) |
|
Share transactions - net increase (decrease) |
150,420,217 |
(98,885,126) |
|
Total increase (decrease) in net assets |
(402,427,684) |
49,334,704 |
|
Net Assets |
|
|
|
Beginning of period |
4,960,602,882 |
4,911,268,178 |
|
End of period (including undistributed net investment income of $93,150,596 and $163,666,159, respectively) |
$ 4,558,175,198 |
$ 4,960,602,882 |
|
|
|
Other Information: |
|
|
Six months ended June 30, 2000 |
Year ended |
||
|
|
Shares |
Dollars |
Shares |
Dollars |
|
Share transactions |
7,773,047 |
$ 130,415,409 |
18,326,496 |
$ 320,298,483 |
|
Reinvested |
31,454,002 |
514,587,479 |
21,655,706 |
365,548,318 |
|
Redeemed |
(29,837,358) |
(502,371,635) |
(45,749,338) |
(801,281,286) |
|
Net increase (decrease) |
9,389,691 |
$ 142,631,253 |
(5,767,136) |
$ (115,434,485) |
|
Service Class |
388,675 |
$ 6,434,099 |
1,054,578 |
$ 18,334,058 |
|
Reinvested |
157,694 |
2,567,255 |
30,528 |
513,486 |
|
Redeemed |
(118,776) |
(1,991,210) |
(131,705) |
(2,298,185) |
|
Net increase (decrease) |
427,593 |
$ 7,010,144 |
953,401 |
$ 16,549,359 |
|
Service Class 2 A |
49,063 |
$ 817,391 |
- |
$ - |
|
Reinvested |
666 |
10,842 |
- |
- |
|
Redeemed |
(2,997) |
(49,413) |
- |
- |
|
Net increase (decrease) |
46,732 |
$ 778,820 |
- |
$ - |
|
Distributions |
|
$ 153,336,461 |
|
$ 161,271,317 |
|
Service Class |
|
755,842 |
|
226,538 |
|
Service Class 2 A |
|
3,192 |
|
- |
|
Total |
|
$ 154,095,495 |
|
$ 161,497,855 |
|
From net realized gain |
|
$ 361,250,806 |
|
$ 204,277,001 |
|
Service Class |
|
1,811,413 |
|
286,948 |
|
Service Class 2 A |
|
7,650 |
|
- |
|
Total |
|
$ 363,069,869 |
|
$ 204,563,949 |
|
|
|
$ 517,165,364 |
|
$ 366,061,804 |
A Service Class 2 commenced sale of shares January 12, 2000.
See accompanying notes which are an integral part of the financial statements.
Asset Manager Portfolio
Financial Highlights - Initial Class
|
|
Six months ended |
Years ended December 31, |
||||
|
Selected Per-Share Data |
(Unaudited) |
1999 |
1998 |
1997 |
1996 |
1995 |
|
Net asset value, beginning of period |
$ 18.67 |
$ 18.16 |
$ 18.01 |
$ 16.93 |
$ 15.79 |
$ 13.79 |
|
Income from Investment Operations |
|
|
|
|
|
|
|
Net investment income |
.30 D |
.59 D |
.59 D |
.57 D |
.63 |
.30 |
|
Net realized and unrealized gain (loss) |
(.44) |
1.28 |
1.84 |
2.58 |
1.55 |
1.99 |
|
Total from investment operations |
(.14) |
1.87 |
2.43 |
3.15 |
2.18 |
2.29 |
|
Less Distributions |
|
|
|
|
|
|
|
From net investment income |
(.59) |
(.60) |
(.57) |
(.59) |
(.57) |
(.29) |
|
From net realized gain |
(1.39) |
(.76) |
(1.71) |
(1.48) |
(.47) |
- |
|
Total distributions |
(1.98) |
(1.36) |
(2.28) |
(2.07) |
(1.04) |
(.29) |
|
Net asset value, end of period |
$ 16.55 |
$ 18.67 |
$ 18.16 |
$ 18.01 |
$ 16.93 |
$ 15.79 |
|
Total Return B, C |
(.69)% |
11.09% |
15.05% |
20.65% |
14.60% |
16.96% |
|
Ratios and Supplemental Data |
|
|
|
|
|
|
|
Net assets, end of period (000 omitted) |
$ 4,529,402 |
$ 4,936,926 |
$ 4,905,468 |
$ 4,399,937 |
$ 3,641,194 |
$ 3,333,844 |
|
Ratio of expenses to average net assets |
.61% A |
.63% |
.64% |
.65% |
.74% |
.81% |
|
Ratio of expenses to average net assets after |
.61% A |
.62% F |
.63% F |
.64% F |
.73% F |
.79% F |
|
Ratio of net investment income to average net assets |
3.59% A |
3.36% |
3.46% |
3.43% |
3.60% |
3.54% |
|
Portfolio turnover |
78% A |
94% |
113% |
101% |
168% |
256% |
Financial Highlights - Service Class
|
|
Six months ended |
Years ended December 31, |
||
|
Selected Per-Share Data |
(Unaudited) |
1999 |
1998 |
1997 E |
|
Net asset value, beginning of period |
$ 18.59 |
$ 18.10 |
$ 17.99 |
$ 17.60 |
|
Income from Investment Operations |
|
|
|
|
|
Net investment income D |
.29 |
.56 |
.57 |
.10 |
|
Net realized and unrealized gain (loss) |
(.45) |
1.29 |
1.82 |
.29 |
|
Total from investment operations |
(.16) |
1.85 |
2.39 |
.39 |
|
Less Distributions |
|
|
|
|
|
From net investment income |
(.58) |
(.60) |
(.57) |
- |
|
From net realized gain |
(1.39) |
(.76) |
(1.71) |
- |
|
Total distributions |
(1.97) |
(1.36) |
(2.28) |
- |
|
Net asset value, end of period |
$ 16.46 |
$ 18.59 |
$ 18.10 |
$ 17.99 |
|
Total Return B, C |
(.74)% |
11.01% |
14.82% |
2.22% |
|
Ratios and Supplemental Data |
|
|
|
|
|
Net assets, end of period (000 omitted) |
$ 28,005 |
$ 23,677 |
$ 5,801 |
$ 10 |
|
Ratio of expenses to average net assets |
.71% A |
.74% |
.78% |
.75% A |
|
Ratio of expenses to average net assets after expense reductions |
.71% A |
.73% F |
.77% F |
.75% A |
|
Ratio of net investment income to average net assets |
3.49% A |
3.25% |
3.49% |
3.52% A |
|
Portfolio turnover |
78% A |
94% |
113% |
101% |
|
A Annualized B Total returns for periods of less than one year are not annualized and do not reflect charges attributable to your insurance company's separate account. Inclusion of these charges would reduce the total returns shown. C The total returns would have been lower had certain expenses not been reduced during the period shown. D Net investment income per share has been calculated based on average shares outstanding during the period. E For the period November 3, 1997 (commencement of sale of Service Class shares) to December 31, 1997. F FMR or the fund has entered into varying arrangements with third parties who either paid or reduced a portion of the class' expenses. |
||||
See accompanying notes which are an integral part of the financial statements.
Semiannual Report
Financial Highlights - Service Class 2
|
|
Six months ended |
|
Selected Per-Share Data |
(Unaudited) |
|
Net asset value, beginning of period |
$ 18.17 |
|
Income from Investment Operations |
|
|
Net investment income C |
.24 |
|
Net realized and unrealized gain (loss) |
.01 E |
|
Total from investment operations |
.25 |
|
Less Distributions |
|
|
From net investment income |
(.58) |
|
From net realized gain |
(1.39) |
|
Total distributions |
(1.97) |
|
Net asset value, end of period |
$ 16.45 |
|
Total Return B |
1.49% |
|
Ratios and Supplemental Data |
|
|
Net assets, end of period (000 omitted) |
$ 769 |
|
Ratio of expenses to average net assets |
.84% A |
|
Ratio of net investment income to average net assets |
3.36% A |
|
Portfolio turnover |
78% A |
|
A Annualized B Total returns for periods of less than one year are not annualized and do not reflect charges attributable to your insurance company's separate account. Inclusion of these charges would reduce the total returns shown. C Net investment income per share has been calculated based on average shares outstanding during the period. D For the period January 12, 2000 (commencement of sale of Service Class 2 shares) to June 30, 2000. E The amount shown for a share outstanding does not correspond with the aggregate net loss on investments for the period due to the timing of sales and repurchases of class shares in relation to fluctuating market values of the investments of the fund. |
|
See accompanying notes which are an integral part of the financial statements.
Asset Manager Portfolio
Performance
There are several ways to evaluate a fund's historical performance. You can look at the total percentage change in value, the average annual percentage change or the growth of a hypothetical $10,000 investment. Total return reflects the change in the value of an investment, assuming reinvestment of the fund's dividend income and capital gains (the profits earned upon the sale of securities that have grown in value). The initial offering of Service Class shares took place on November 3, 1997. Performance for Service Class shares reflects an asset based distribution fee (12b-1 fee), and returns prior to November 3, 1997 are those of Initial Class and do not include the effects of Service Class' 12b-1 fee. Had Service Class shares' 12b-1 fee been reflected, returns prior to November 3, 1997 would have been lower. If Fidelity had not reimbursed certain fund expenses, the past 10 year total return would have been lower.
Average Annual Total Returns
|
Periods ended |
Past 1 |
Past 5 |
Past 10 |
|
Fidelity VIP: High Income - |
-4.78% |
7.23% |
11.94% |
|
ML High Yield Master II |
-0.97% |
7.03% |
10.83% |
Average annual returns take the fund's cumulative return and show you what would have happened if the fund had performed at a constant rate each year.
You can compare the fund's returns to the performance of the Merrill Lynch High Yield Master II Index - a market value-weighted index of all domestic and yankee high-yield bonds, including deferred interest bonds and payment-in-kind securities. Issues included in the index have maturities of one year or more and have a credit rating lower than BBB-/Baa3, but are not in default. This benchmark reflects the reinvestment of dividends and capital gains, if any.
Figures for more than one year assume a steady compounded rate of return and are not the fund's year-by-year results, which fluctuated over the periods shown.
Performance numbers are net of all fund operating expenses, but do not include any insurance charges imposed by your insurance company's separate account. If performance information included the effect of these additional charges, the total returns would have been lower.
Past performance is no guarantee of future results. Principal and investment return will vary and you may have a gain or loss when you withdraw your money. The fund includes high yielding, lower-rated securities which are subject to greater price volatility and may involve greater risk of default. The market for these securities may be less liquid.
Understanding Performance
How a fund did yesterday is no guarantee of
how it will do tomorrow. Bond prices, for example,
generally move in the opposite direction of interest
rates. In turn, the share price, return and yield of a
fund that invests in bonds will vary. That means if
you sell your shares during a market downturn,
you might lose money. But if you can ride out the
market's ups and downs, you may have a gain.
$10,000 Over 10 Years
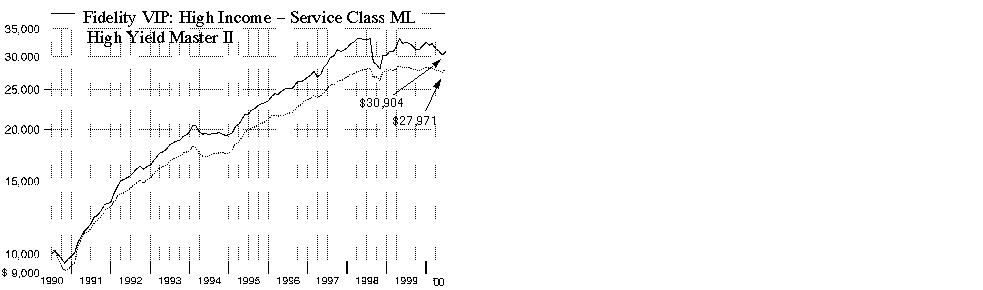
$10,000 Over 10 Years: Let's say hypothetically that $10,000 was invested in Fidelity Variable Insurance Products: High Income Portfolio - Service Class on June 30, 1990. As the chart shows, by June 30, 2000, the value of the investment would have grown to $30,904 - a 209.04% increase on the initial investment. For comparison, look at how the Merrill Lynch High Yield Master II Index did over the same period. With dividends and capital gains, if any, reinvested, the same $10,000 investment would have grown to $27,971 - a 179.71% increase.
Investment Summary
|
Top Five Holdings as of June 30, 2000 |
|
|
(by issuer, excluding cash equivalents) |
% of fund's |
|
Nextel Communications, Inc. |
5.5 |
|
NEXTLINK Communications, Inc. |
4.4 |
|
WinStar Communications, Inc. |
3.0 |
|
Allied Waste North America, Inc. |
2.7 |
|
ICG Holdings, Inc. |
2.5 |
|
|
18.1 |
|
Top Five Market Sectors as of June 30, 2000 |
|
|
|
% of fund's |
|
Utilities |
31.8 |
|
Media & Leisure |
23.8 |
|
Technology |
8.2 |
|
Basic Industries |
7.8 |
|
Industrial Machinery & Equipment |
5.2 |
|
Quality Diversification as of June 30, 2000 |
|
|
(Moody's Ratings) |
% of fund's |
|
Aaa, Aa, A |
0.0 |
|
Baa |
0.2 |
|
Ba |
4.0 |
|
B |
53.1 |
|
Caa, Ca, C |
13.5 |
|
Not Rated |
7.6 |
|
Table excludes short-term investments. Where Moody's ratings are not available, we have used S&P ratings. Unrated debt securities that are equivalent to Ba and below at June 30, 2000 account for 7.6% of the fund's investments. |
Semiannual Report
(Portfolio Manager photograph)
An interview with Barry Coffman, Portfolio Manager of High Income Portfolio
Q. How did the fund perform, Barry?
A. For the six-month period that ended June 30, 2000, the fund lagged the -1.00% return of the Merrill Lynch High Yield Master Index II. The fund also underperformed the index's -0.97% return for the 12-month period ending June 30, 2000.
Q. What factors drove the high-yield market's performance and how did those factors, in turn, affect the fund's performance?
A. As they did throughout most of 1999, rising interest rates continued to put pressure on high-yield bonds and most other fixed-income investments. From January through June 2000, the Federal Reserve Board raised interest rates three times to cool the economy and the stock market. Compounding the effects of the difficult interest-rate backdrop was the fact that the "technicals" - supply and demand - were unfavorable. While supply had tapered off significantly from the same six-month period a year earlier, demand was quite weak. Furthermore, the default rate - which measures the percentage of high-yield debt that companies are unable or unwilling to honor - continued to rise, which also cooled demand. Those factors conspired to drive the high-yield market and the fund lower.
Q. Why did the fund underperform the Merrill Lynch index?
A. Unfortunately, a small handful of disappointments significantly detracted from the fund's performance. Given the overall negative tone of the high-yield market, investors severely punished companies that had worse-than-expected results. Most of the fund's underperformance can be accounted for by losses in securities of three holdings that defaulted: Sunterra Resorts, Specialty Retailers - the operating subsidiary of Stages Stores, Inc. - and competitive local exchange carrier GST Telecom. Also, continued weakness in the theater industry due to an overbuilding of new movie theaters pressured bonds in that sector.
Q. What holdings held up well against the difficult backdrop?
A. Telecommunications holdings outperformed the overall market. Many of these companies began to see very attractive returns from their network investments as they neared critical mass. Overall demand for telecom services, particularly high-speed data transmission, continued to be very robust. Within telecommunications, the fund benefited from its holdings in WinStar Communications, which refinanced its debt at very favorable terms during the period. Cable companies also performed well. In particular, our holdings in two international cable concerns, UnitedGlobalCom and Telewest both benefited from their investments in advanced networks that allow them to bundle high-speed Internet access and telephony with cable TV. In addition, both companies successfully raised equity during the period. Also, our position in Allied Waste - now the nation's second-largest waste management company - rebounded during the period and was a significant contributor to performance.
Q. What changes did you make over the past six months?
A. One of the most significant changes was that I concentrated more of the fund in larger, more liquid holdings. Historically, I've tried to find value among less-followed small- and mid-tier companies. But it became clear that the market environment was one that overly punished companies in those groups that disappoint. As a result, I focused on the larger-cap companies in the high-yield universe, particularly those with strong operating fundamentals and access to capital. As examples, I added to some of the fund's larger holdings, including telecommunications companies Nextel and NEXTLINK and direct broadcast satellite company Echostar.
Q. What's your outlook?
A. In my view, the relatively cheap valuations of high-yield bonds offer cause for optimism. The average high-yield bond is selling in the low 80s as a percentage of par - or face - value with yields nearing 13%, or twice the absolute level of U.S. Treasury bond yields. We haven't really seen that type of value since 1990 when the U.S. economy was in a recession. Even though the economy may slow in response to higher interest rates, I think the risk of a recession is limited over the near term. Steady economic growth would likely be a positive backdrop for this market. While I can't pinpoint exactly what will be the catalyst for a high-yield market turnaround, I would expect that the end of the Fed's campaign to raise interest rates could provide a significant boost for high-yield and other fixed-income securities as well.
The views expressed in this report reflect those of the portfolio manager only through the end of the period of the report as stated on the cover. The manager's views are subject to change at any time based upon market or other conditions. For more information, see page 2.
Fund Facts
Goal: to seek high current income by investing primarily in all types of income-producing debt securities with an emphasis on lower-quality securities
Start date: September 19, 1985
Size: as of June 30, 2000, more than $2.2 billion
Manager: Barry Coffman, since 1990; joined Fidelity in 1986
3Semiannual Report
Fidelity Variable Insurance Products: High Income Portfolio
(Unaudited)
Showing Percentage of Net Assets
|
Corporate Bonds - 75.4% |
|||||
|
Moody's Ratings (unaudited) (b) |
Principal Amount |
Value |
|||
|
Convertible Bonds - 3.3% |
|||||
|
HEALTH - 0.4% |
|||||
|
Medical Facilities Management - 0.4% |
|||||
|
Total Renal Care Holdings, Inc. 7% 5/15/09 (f) |
B3 |
|
$ 14,680,000 |
$ 9,762,200 |
|
|
MEDIA & LEISURE - 2.2% |
|||||
|
Broadcasting - 2.2% |
|||||
|
EchoStar Communications Corp. 4.875% 1/1/07 (f) |
- |
|
50,665,000 |
48,195,081 |
|
|
UTILITIES - 0.7% |
|||||
|
Cellular - 0.7% |
|||||
|
Nextel |
|
|
|
|
|
|
5.25% 1/15/10 (f) |
B1 |
|
10,000,000 |
10,350,000 |
|
|
5.25% 1/15/10 |
B1 |
|
5,000,000 |
5,175,000 |
|
|
|
15,525,000 |
||||
|
TOTAL CONVERTIBLE BONDS |
73,482,281 |
||||
|
Nonconvertible Bonds - 72.1% |
|||||
|
BASIC INDUSTRIES - 7.7% |
|||||
|
Chemicals & Plastics - 5.0% |
|||||
|
Acetex Corp. yankee 9.75% 10/1/03 |
B3 |
|
3,000,000 |
2,805,000 |
|
|
Avecia Group PLC 11% 7/1/09 |
B2 |
|
7,275,000 |
7,129,500 |
|
|
Foamex LP 13.5% 8/15/05 |
Caa2 |
|
5,000,000 |
4,275,000 |
|
|
Huntsman Corp.: |
|
|
|
|
|
|
9.5% 7/1/07 (f) |
B2 |
|
10,240,000 |
9,344,000 |
|
|
9.5% 7/1/07 (f) |
B2 |
|
32,830,000 |
29,957,375 |
|
|
Huntsman ICI Chemicals LLC 10.125% 7/1/09 |
B2 |
|
12,390,000 |
12,390,000 |
|
|
Huntsman ICI Holdings LLC 0% 12/31/09 |
B3 |
|
34,102,000 |
10,912,640 |
|
|
Lyondell Chemical Co.: |
|
|
|
|
|
|
9.625% 5/1/07 |
Ba3 |
|
3,740,000 |
3,702,600 |
|
|
9.875% 5/1/07 |
Ba3 |
|
9,420,000 |
9,325,800 |
|
|
10.875% 5/1/09 |
B2 |
|
18,455,000 |
18,316,588 |
|
|
Sterling Chemicals, Inc. 11.75% 8/15/06 |
Caa3 |
|
5,030,000 |
4,074,300 |
|
|
|
112,232,803 |
||||
|
Metals & Mining - 0.4% |
|||||
|
Kaiser Aluminum & Chemical Corp.: |
|
|
|
|
|
|
9.875% 2/15/02 |
B1 |
|
2,455,000 |
2,369,075 |
|
|
12.75% 2/1/03 |
B3 |
|
6,958,000 |
6,331,780 |
|
|
|
8,700,855 |
||||
|
|
|||||
|
Moody's Ratings (unaudited) (b) |
Principal Amount |
Value |
|||
|
Packaging & Containers - 1.0% |
|||||
|
Gaylord Container Corp.: |
|
|
|
|
|
|
9.375% 6/15/07 |
Caa1 |
|
$ 14,080,000 |
$ 10,841,600 |
|
|
9.75% 6/15/07 |
Caa1 |
|
5,370,000 |
4,188,600 |
|
|
Packaging Corp. of America 9.625% 4/1/09 |
B2 |
|
7,470,000 |
7,376,625 |
|
|
|
22,406,825 |
||||
|
Paper & Forest Products - 1.3% |
|||||
|
APP China Group Ltd. 14% 3/15/10 unit (f) |
B3 |
|
4,875,000 |
3,071,250 |
|
|
APP Finance II Mauritius Ltd. 12% 3/15/04 |
B3 |
|
4,175,000 |
2,129,250 |
|
|
Container Corp. of America gtd. 9.75% 4/1/03 |
B2 |
|
1,690,000 |
1,681,550 |
|
|
Millar Western Forest Products Ltd. 9.875% 5/15/08 |
B3 |
|
13,115,000 |
12,295,313 |
|
|
Repap New Brunswick, Inc.: |
|
|
|
|
|
|
11.5% 6/1/04 |
B3 |
|
1,795,000 |
1,803,975 |
|
|
yankee 10.625% 4/15/05 |
Caa1 |
|
6,340,000 |
5,579,200 |
|
|
Stone Container Corp. 12.58% 8/1/16 (g) |
B2 |
|
1,150,000 |
1,184,500 |
|
|
|
27,745,038 |
||||
|
TOTAL BASIC INDUSTRIES |
171,085,521 |
||||
|
CONSTRUCTION & REAL ESTATE - 2.0% |
|||||
|
Building Materials - 0.3% |
|||||
|
International Utility Structures, Inc. 10.75% 2/1/08 |
Caa1 |
|
9,200,000 |
7,360,000 |
|
|
Construction - 0.1% |
|||||
|
Great Lakes Dredge & Dock Corp. 11.25% 8/15/08 |
B3 |
|
50,000 |
49,375 |
|
|
Lennar Corp. 9.95% 5/1/10 (f) |
Ba1 |
|
3,010,000 |
2,964,850 |
|
|
|
3,014,225 |
||||
|
Engineering - 0.6% |
|||||
|
360networks, Inc. 13% 5/1/08 (f) |
B3 |
|
12,660,000 |
12,533,400 |
|
|
Real Estate - 0.9% |
|||||
|
LNR Property Corp.: |
|
|
|
|
|
|
9.375% 3/15/08 |
B1 |
|
14,395,000 |
12,523,650 |
|
|
10.5% 1/15/09 |
B1 |
|
7,040,000 |
6,476,800 |
|
|
|
19,000,450 |
||||
|
Real Estate Investment Trusts - 0.1% |
|||||
|
Ocwen Asset Investment Corp. 11.5% 7/1/05 |
- |
|
3,520,000 |
2,710,400 |
|
|
TOTAL CONSTRUCTION & REAL ESTATE |
44,618,475 |
||||
|
Corporate Bonds - continued |
|||||
|
Moody's Ratings (unaudited) (b) |
Principal Amount |
Value |
|||
|
Nonconvertible Bonds - continued |
|||||
|
DURABLES - 0.3% |
|||||
|
Autos, Tires, & Accessories - 0.1% |
|||||
|
Federal-Mogul Corp. 7.5% 1/15/09 |
Ba2 |
|
$ 5,455,000 |
$ 3,600,300 |
|
|
Textiles & Apparel - 0.2% |
|||||
|
Levi Strauss & Co.: |
|
|
|
|
|
|
6.8% 11/1/03 |
Ba3 |
|
3,775,000 |
3,095,500 |
|
|
7% 11/1/06 |
Ba3 |
|
755,000 |
573,800 |
|
|
|
3,669,300 |
||||
|
TOTAL DURABLES |
7,269,600 |
||||
|
ENERGY - 2.0% |
|||||
|
Coal - 0.4% |
|||||
|
P&L Coal Holdings Corp. 9.625% 5/15/08 |
B2 |
|
10,210,000 |
9,469,775 |
|
|
Energy Services - 0.4% |
|||||
|
Cliffs Drilling Co. 10.25% 5/15/03 |
Ba3 |
|
900,000 |
904,500 |
|
|
R&B Falcon Corp.: |
|
|
|
|
|
|
6.5% 4/15/03 |
Ba3 |
|
5,525,000 |
5,124,438 |
|
|
6.75% 4/15/05 |
Ba3 |
|
1,260,000 |
1,137,150 |
|
|
6.95% 4/15/08 |
Ba3 |
|
750,000 |
637,500 |
|
|
9.5% 12/15/08 |
Ba3 |
|
595,000 |
597,975 |
|
|
|
8,401,563 |
||||
|
Oil & Gas - 1.2% |
|||||
|
Chesapeake Energy Corp.: |
|
|
|
|
|
|
7.875% 3/15/04 |
B2 |
|
1,610,000 |
1,493,275 |
|
|
8.5% 3/15/12 |
B2 |
|
1,435,000 |
1,205,400 |
|
|
9.125% 4/15/06 |
B2 |
|
3,565,000 |
3,377,838 |
|
|
Great Lakes Carbon Corp.: |
|
|
|
|
|
|
0% 5/15/09 (d) |
Caa1 |
|
15,215,000 |
6,086,000 |
|
|
10.25% 5/15/08 pay-in-kind |
B3 |
|
8,550,000 |
6,840,000 |
|
|
Plains Resources, Inc.: |
|
|
|
|
|
|
Series B 10.25% 3/15/06 |
B2 |
|
5,860,000 |
5,801,400 |
|
|
Series D 10.25% 3/15/06 |
B2 |
|
2,770,000 |
2,742,300 |
|
|
|
27,546,213 |
||||
|
TOTAL ENERGY |
45,417,551 |
||||
|
FINANCE - 2.2% |
|||||
|
Credit & Other Finance - 2.0% |
|||||
|
AMRESCO, Inc.: |
|
|
|
|
|
|
9.875% 3/15/05 |
Caa3 |
|
14,905,000 |
6,930,825 |
|
|
10% 3/15/04 |
Caa3 |
|
1,824,000 |
839,040 |
|
|
APP Global Finance III 10.7513% 4/17/02 (g) |
Caa1 |
|
2,400,000 |
1,704,000 |
|
|
Delta Financial Corp. 9.5% 8/1/04 |
B3 |
|
1,350,000 |
607,500 |
|
|
|
|||||
|
Moody's Ratings (unaudited) (b) |
Principal Amount |
Value |
|||
|
Imperial Credit Capital Trust I 10.25% 6/14/02 |
B2 |
|
$ 4,870,000 |
$ 4,139,500 |
|
|
Imperial Credit Industries 9.875% 1/15/07 |
B3 |
|
17,470,000 |
12,578,400 |
|
|
Macsaver Financial Services, Inc.: |
|
|
|
|
|
|
7.4% 2/15/02 |
Ba2 |
|
2,720,000 |
1,768,000 |
|
|
7.875% 8/1/03 |
Ba2 |
|
6,900,000 |
4,278,000 |
|
|
Metris Companies, Inc.: |
|
|
|
|
|
|
10% 11/1/04 |
Ba3 |
|
100,000 |
94,000 |
|
|
10.125% 7/15/06 |
Ba3 |
|
1,810,000 |
1,719,500 |
|
|
MFN Financial Corp. 10% 3/23/01 |
- |
|
10,000,000 |
9,600,000 |
|
|
PX Escrow Corp. 0% 2/1/06 (d) |
B3 |
|
3,190,000 |
1,339,800 |
|
|
|
45,598,565 |
||||
|
Insurance - 0.2% |
|||||
|
Willis Corroon Corp. 9% 2/1/09 |
Ba3 |
|
5,500,000 |
4,606,250 |
|
|
TOTAL FINANCE |
50,204,815 |
||||
|
HEALTH - 1.9% |
|||||
|
Drugs & Pharmaceuticals - 0.3% |
|||||
|
Global Health Sciences, Inc. 11% 5/1/08 |
Caa1 |
|
7,970,000 |
1,992,500 |
|
|
Warner Chilcott, Inc. 12.625% 2/15/08 (f) |
B2 |
|
4,815,000 |
4,863,150 |
|
|
|
6,855,650 |
||||
|
Medical Facilities Management - 1.6% |
|||||
|
Express Scripts, Inc. 9.625% 6/15/09 |
Ba2 |
|
9,055,000 |
8,828,625 |
|
|
Fountain View, Inc. 11.25% 4/15/08 |
Caa1 |
|
7,330,000 |
1,795,850 |
|
|
Mariner Post-Acute Network, Inc. 9.5% 11/1/07 (c) |
C |
|
11,630,000 |
1,163 |
|
|
Oxford Health Plans, Inc. 11% 5/15/05 |
B2 |
|
14,465,000 |
14,935,113 |
|
|
Unilab Corp. 12.75% 10/1/09 |
B3 |
|
8,920,000 |
9,187,600 |
|
|
|
34,748,351 |
||||
|
TOTAL HEALTH |
41,604,001 |
||||
|
INDUSTRIAL MACHINERY & EQUIPMENT - 4.3% |
|||||
|
Electrical Equipment - 0.7% |
|||||
|
Loral Space & Communications Ltd. 9.5% 1/15/06 |
B1 |
|
1,185,000 |
865,050 |
|
|
Motors & Gears, Inc. 10.75% 11/15/06 |
B3 |
|
9,170,000 |
8,803,200 |
|
|
Telex Communications, Inc. 10.5% 5/1/07 |
B2 |
|
7,490,000 |
5,018,300 |
|
|
|
14,686,550 |
||||
|
Corporate Bonds - continued |
|||||
|
Moody's Ratings (unaudited) (b) |
Principal Amount |
Value |
|||
|
Nonconvertible Bonds - continued |
|||||
|
INDUSTRIAL MACHINERY & EQUIPMENT - continued |
|||||
|
Industrial Machinery & Equipment - 0.7% |
|||||
|
Tenneco Automotive, Inc. 11.625% 10/15/09 |
B2 |
|
$ 8,500,000 |
$ 7,522,500 |
|
|
Thermadyne Holdings Corp. 0% 6/1/08 (d) |
Caa1 |
|
11,470,000 |
4,129,200 |
|
|
Thermadyne Manufacturing LLC 9.875% 6/1/08 |
B3 |
|
4,470,000 |
3,441,900 |
|
|
Tokheim Corp. 11.375% 8/1/08 |
Ca |
|
9,030,000 |
903,000 |
|
|
|
15,996,600 |
||||
|
Pollution Control - 2.9% |
|||||
|
Allied Waste North America, Inc.: |
|
|
|
|
|
|
7.375% 1/1/04 |
Ba3 |
|
1,870,000 |
1,701,700 |
|
|
7.625% 1/1/06 |
Ba2 |
|
1,185,000 |
1,030,950 |
|
|
7.875% 1/1/09 |
Ba2 |
|
1,965,000 |
1,670,250 |
|
|
10% 8/1/09 |
B2 |
|
65,360,000 |
54,902,400 |
|
|
Envirosource, Inc.: |
|
|
|
|
|
|
Series B, 9.75% 6/15/03 |
Caa3 |
|
4,900,000 |
2,205,000 |
|
|
9.75% 6/15/03 |
Caa3 |
|
7,171,000 |
3,226,950 |
|
|
|
64,737,250 |
||||
|
TOTAL INDUSTRIAL MACHINERY & EQUIPMENT |
95,420,400 |
||||
|
MEDIA & LEISURE - 18.8% |
|||||
|
Broadcasting - 15.2% |
|||||
|
Adelphia |
|
|
|
|
|
|
7.75% 1/15/09 |
B1 |
|
7,000,000 |
5,897,500 |
|
|
9.875% 3/1/05 |
B1 |
|
3,400,000 |
3,315,000 |
|
|
American Mobile Satellite Corp. 12.25% 4/1/08 |
- |
|
3,435,000 |
2,644,950 |
|
|
Charter Communications Holdings LLC/Charter Communications Holdings Capital Corp.: |
|
|
|
|
|
|
8.625% 4/1/09 |
B2 |
|
11,160,000 |
9,848,700 |
|
|
10.25% 1/15/10 |
B2 |
|
4,005,000 |
3,884,850 |
|
|
Diamond Cable Communications PLC: |
|
|
|
|
|
|
0% 2/15/07 (d) |
B3 |
|
11,561,000 |
8,873,068 |
|
|
yankee 0% 12/15/05 (d) |
B3 |
|
9,875,000 |
9,233,125 |
|
|
Earthwatch, Inc. 0% 7/15/07 unit (d)(f) |
- |
|
16,560,000 |
10,598,400 |
|
|
EchoStar DBS Corp. 9.375% 2/1/09 |
B2 |
|
14,860,000 |
14,339,900 |
|
|
Fox Family Worldwide, Inc. 0% 11/1/07 (d) |
B1 |
|
8,050,000 |
4,991,000 |
|
|
|
|||||
|
Moody's Ratings (unaudited) (b) |
Principal Amount |
Value |
|||
|
FrontierVision Holdings LP/FrontierVision Holdings Capital Corp. 0% 9/15/07 (d) |
B1 |
|
$ 210,000 |
$ 181,125 |
|
|
Golden Sky DBS, Inc. 0% 3/1/07 (d) |
Caa1 |
|
10,640,000 |
7,155,400 |
|
|
Impsat Fiber Networks, Inc. 13.75% 2/15/05 (f) |
B3 |
|
6,050,000 |
5,384,500 |
|
|
International Cabletel, Inc. 0% 2/1/06 (d) |
B3 |
|
40,484,000 |
37,245,280 |
|
|
LIN Holdings Corp. 0% 3/1/08 (d) |
B3 |
|
11,678,000 |
7,678,285 |
|
|
NorthPoint Communication Holdings, Inc. 12.875% 2/15/10 |
Caa1 |
|
17,095,000 |
11,795,550 |
|
|
NTL Communications Corp. 11.5% 10/1/08 |
B3 |
|
14,080,000 |
14,185,600 |
|
|
NTL, Inc. 0% 4/1/08 (d) |
B3 |
|
2,380,000 |
1,475,600 |
|
|
Olympus Communications LP/Olympus Capital Corp. 10.625% 11/15/06 |
B1 |
|
7,585,000 |
7,433,300 |
|
|
Satelites Mexicanos SA de CV: |
|
|
|
|
|
|
10.125% 11/1/04 |
B3 |
|
20,460,000 |
13,810,500 |
|
|
11.28% 6/30/04 (f)(g) |
B1 |
|
10,954,000 |
9,968,140 |
|
|
Spectrasite Holdings, Inc. 0% 4/15/09 (d) |
B3 |
|
18,670,000 |
10,781,925 |
|
|
Telewest PLC 0% 10/1/07 (d) |
B1 |
|
26,492,000 |
25,299,860 |
|
|
UIH Australia/Pacific, Inc.: |
|
|
|
|
|
|
Series B 0% 5/15/06 (d) |
B2 |
|
40,240,000 |
37,020,800 |
|
|
Series D 0% 5/15/06 (d) |
B2 |
|
5,620,000 |
5,170,400 |
|
|
United International Holdings, Inc. 0% 2/15/08 (d) |
B3 |
|
49,076,000 |
33,862,440 |
|
|
United Pan-Europe Communications NV: |
|
|
|
|
|
|
0% 2/1/10 (d) |
B2 |
|
28,175,000 |
13,242,250 |
|
|
10.875% 8/1/09 |
B2 |
|
13,240,000 |
11,651,200 |
|
|
11.25% 2/1/10 |
B2 |
|
6,005,000 |
5,404,500 |
|
|
XM Satellite Radio, Inc. 14% 3/15/10 unit (f) |
- |
|
6,055,000 |
5,328,400 |
|
|
|
337,701,548 |
||||
|
Entertainment - 1.5% |
|||||
|
AMC Entertainment, Inc.: |
|
|
|
|
|
|
9.5% 3/15/09 |
Caa3 |
|
4,030,000 |
1,934,400 |
|
|
9.5% 2/1/11 |
Caa3 |
|
5,390,000 |
2,479,400 |
|
|
Hollywood Entertainment Corp. 10.625% 8/15/04 |
B3 |
|
10,690,000 |
9,166,675 |
|
|
MGM Grand, Inc. 9.75% 6/1/07 |
Ba2 |
|
5,940,000 |
6,029,100 |
|
|
Premier Parks, Inc.: |
|
|
|
|
|
|
0% 4/1/08 (d) |
B3 |
|
4,710,000 |
3,196,913 |
|
|
9.25% 4/1/06 |
B3 |
|
4,745,000 |
4,484,025 |
|
|
Corporate Bonds - continued |
|||||
|
Moody's Ratings (unaudited) (b) |
Principal Amount |
Value |
|||
|
Nonconvertible Bonds - continued |
|||||
|
MEDIA & LEISURE - continued |
|||||
|
Entertainment - continued |
|||||
|
Regal Cinemas, Inc.: |
|
|
|
|
|
|
8.875% 12/15/10 |
Ca |
|
$ 2,660,000 |
$ 638,400 |
|
|
9.5% 6/1/08 |
Ca |
|
24,035,000 |
6,008,750 |
|
|
|
33,937,663 |
||||
|
Leisure Durables & Toys - 0.3% |
|||||
|
Marvel Enterprises, Inc. 12% 6/15/09 |
- |
|
8,750,000 |
6,650,000 |
|
|
Lodging & Gaming - 1.2% |
|||||
|
Florida Panthers Holdings, Inc. 9.875% 4/15/09 |
B2 |
|
8,750,000 |
8,181,250 |
|
|
HMH Properties, Inc. 7.875% 8/1/05 |
Ba2 |
|
2,965,000 |
2,727,800 |
|
|
Hollywood Casino Corp. 11.25% 5/1/07 |
B3 |
|
6,210,000 |
6,365,250 |
|
|
ITT Corp. 7.375% 11/15/15 |
Ba1 |
|
4,270,000 |
3,576,125 |
|
|
KSL Recreation Group, Inc. 10.25% 5/1/07 |
B2 |
|
6,060,000 |
5,757,000 |
|
|
|
26,607,425 |
||||
|
Restaurants - 0.6% |
|||||
|
AFC Enterprises, Inc. 10.25% 5/15/07 |
B3 |
|
10,485,000 |
9,960,750 |
|
|
NE Restaurant, Inc. 10.75% 7/15/08 |
B3 |
|
5,135,000 |
4,005,300 |
|
|
|
13,966,050 |
||||
|
TOTAL MEDIA & LEISURE |
418,862,686 |
||||
|
NONDURABLES - 0.4% |
|||||
|
Household Products - 0.4% |
|||||
|
AKI Holding Corp. 0% 7/1/09 (d) |
Caa1 |
|
9,120,000 |
4,286,400 |
|
|
AKI, Inc. 10.5% 7/1/08 |
B2 |
|
6,960,000 |
5,533,200 |
|
|
|
9,819,600 |
||||
|
RETAIL & WHOLESALE - 1.2% |
|||||
|
Apparel Stores - 0.7% |
|||||
|
Mothers Work, Inc. 12.625% 8/1/05 |
B3 |
|
15,320,000 |
14,324,200 |
|
|
Specialty Retailers, Inc. 8.5% 7/15/05 (c) |
Ca |
|
18,870,000 |
188,700 |
|
|
|
14,512,900 |
||||
|
Drug Stores - 0.2% |
|||||
|
Rite Aid Corp.: |
|
|
|
|
|
|
6.5% 12/15/05 (f) |
Caa1 |
|
6,175,000 |
3,180,125 |
|
|
7.125% 1/15/07 |
Caa1 |
|
3,920,000 |
2,077,600 |
|
|
|
5,257,725 |
||||
|
|
|||||
|
Moody's Ratings (unaudited) (b) |
Principal Amount |
Value |
|||
|
Grocery Stores - 0.3% |
|||||
|
Jitney-Jungle Stores |
|
|
|
|
|
|
10.375% 9/15/07 (c) |
C |
|
$ 9,685,000 |
$ 193,700 |
|
|
12% 3/1/06 (c) |
Caa3 |
|
2,590,000 |
323,750 |
|
|
Pathmark Stores, Inc. 9.625% 5/1/03 (c) |
Caa3 |
|
10,127,000 |
6,987,630 |
|
|
|
7,505,080 |
||||
|
TOTAL RETAIL & WHOLESALE |
27,275,705 |
||||
|
SERVICES - 2.1% |
|||||
|
Leasing & Rental - 0.2% |
|||||
|
Rent-A-Center, Inc. 11% 8/15/08 |
B2 |
|
3,980,000 |
3,860,600 |
|
|
Printing - 1.2% |
|||||
|
Sullivan Graphics, Inc. 12.75% 8/1/05 |
Caa1 |
|
21,340,000 |
21,446,700 |
|
|
World Color Press, Inc. 7.75% 2/15/09 |
Baa3 |
|
5,090,000 |
4,644,625 |
|
|
|
26,091,325 |
||||
|
Services - 0.7% |
|||||
|
AP Holdings, Inc. 0% 3/15/08 (d) |
Caa2 |
|
2,470,000 |
247,000 |
|
|
Apcoa, Inc. 9.25% 3/15/08 |
Caa1 |
|
17,070,000 |
5,803,800 |
|
|
Medaphis Corp. 9.5% 2/15/05 |
Caa1 |
|
13,713,000 |
10,284,750 |
|
|
|
16,335,550 |
||||
|
TOTAL SERVICES |
46,287,475 |
||||
|
TECHNOLOGY - 8.1% |
|||||
|
Computer Services & Software - 5.0% |
|||||
|
Amazon.com, Inc. 0% 5/1/08 (d) |
Caa1 |
|
7,070,000 |
3,817,800 |
|
|
Colo.com 13.875% 3/15/10 unit (f) |
- |
|
9,755,000 |
10,340,300 |
|
|
Concentric Network Corp. 12.75% 12/15/07 |
B- |
|
12,760,000 |
13,398,000 |
|
|
Covad Communications Group, Inc.: |
|
|
|
|
|
|
0% 3/15/08 (d) |
B3 |
|
19,440,000 |
9,525,600 |
|
|
12% 2/15/10 |
B3 |
|
15,575,000 |
12,070,625 |
|
|
12.5% 2/15/09 |
B3 |
|
7,684,000 |
6,108,780 |
|
|
Exodus |
|
|
|
|
|
|
10.75% 12/15/09 |
B- |
|
21,765,000 |
21,112,050 |
|
|
11.625% 7/15/10 (f) |
B |
|
9,025,000 |
9,070,125 |
|
|
PSINet, Inc.: |
|
|
|
|
|
|
10% 2/15/05 |
B3 |
|
12,670,000 |
11,688,075 |
|
|
10.5% 12/1/06 |
B3 |
|
6,010,000 |
5,529,200 |
|
|
Corporate Bonds - continued |
|||||
|
Moody's Ratings (unaudited) (b) |
Principal Amount |
Value |
|||
|
Nonconvertible Bonds - continued |
|||||
|
TECHNOLOGY - continued |
|||||
|
Computer Services & Software - continued |
|||||
|
PSINet, Inc.: - continued |
|
|
|
|
|
|
11% 8/1/09 |
B3 |
|
$ 4,790,000 |
$ 4,430,750 |
|
|
11.5% 11/1/08 |
B3 |
|
5,500,000 |
5,183,750 |
|
|
|
112,275,055 |
||||
|
Computers & Office Equipment - 1.0% |
|||||
|
Dictaphone Corp. 11.75% 8/1/05 |
Caa1 |
|
8,516,000 |
8,665,030 |
|
|
Globix Corp. 12.5% 2/1/10 |
B- |
|
14,995,000 |
12,370,875 |
|
|
|
21,035,905 |
||||
|
Electronic Instruments - 0.8% |
|||||
|
Telecommunications Techniques Co. LLC 9.75% 5/15/08 |
B3 |
|
19,385,000 |
17,834,200 |
|
|
Electronics - 1.3% |
|||||
|
ChipPAC International Ltd. 12.75% 8/1/09 |
B3 |
|
3,380,000 |
3,633,500 |
|
|
Details, Inc. 10% 11/15/05 |
B3 |
|
2,040,000 |
1,938,000 |
|
|
Hadco Corp. 9.5% 6/15/08 |
B2 |
|
12,835,000 |
12,867,088 |
|
|
Knowles Electronics, Inc. 13.125% 10/15/09 (f) |
B3 |
|
3,500,000 |
2,992,500 |
|
|
Micron Technology, Inc. 6.5% 9/30/05 (h) |
B3 |
|
10,000,000 |
8,350,000 |
|
|
|
29,781,088 |
||||
|
TOTAL TECHNOLOGY |
180,926,248 |
||||
|
TRANSPORTATION - 0.4% |
|||||
|
Air Transportation - 0.4% |
|||||
|
Atlas Air, Inc. 10.75% 8/1/05 |
B1 |
|
9,225,000 |
9,363,375 |
|
|
UTILITIES - 20.7% |
|||||
|
Cellular - 8.4% |
|||||
|
Cellnet Data Systems, Inc. 0% 10/1/07 (d) |
- |
|
69,670,000 |
5,573,600 |
|
|
Crown Castle International Corp. 10.75% 8/1/11 |
B3 |
|
6,195,000 |
6,287,925 |
|
|
Dobson Communications Corp. 10.875% 7/1/10 (f) |
- |
|
6,585,000 |
6,634,388 |
|
|
McCaw International Ltd. 0% 4/15/07 (d) |
Caa1 |
|
35,735,000 |
27,158,600 |
|
|
Metrocall, Inc.: |
|
|
|
|
|
|
10.375% 10/1/07 |
B3 |
|
10,455,000 |
7,318,500 |
|
|
11% 9/15/08 |
B3 |
|
3,410,000 |
2,404,050 |
|
|
Millicom International Cellular SA 0% 6/1/06 (d) |
Caa1 |
|
43,200,000 |
36,720,000 |
|
|
|
|||||
|
Moody's Ratings (unaudited) (b) |
Principal Amount |
Value |
|||
|
Nextel Communications, Inc. 9.375% 11/15/09 |
B1 |
|
$ 21,110,000 |
$ 20,265,600 |
|
|
Nextel International, Inc. 0% 4/15/08 (d) |
Caa1 |
|
18,480,000 |
12,196,800 |
|
|
Orbital Imaging Corp.: |
|
|
|
|
|
|
11.625% 3/1/05 |
CCC+ |
|
7,110,000 |
2,986,200 |
|
|
11.625% 3/1/05 |
CCC+ |
|
3,680,000 |
1,545,600 |
|
|
Orion Network Systems, Inc.: |
|
|
|
|
|
|
0% 1/15/07 (d) |
B2 |
|
12,460,000 |
4,984,000 |
|
|
11.25% 1/15/07 |
B2 |
|
5,800,000 |
3,393,000 |
|
|
PageMart Nationwide, Inc. 15% 2/1/05 |
B3 |
|
20,235,000 |
19,324,425 |
|
|
Telesystem International Wireless, Inc.: |
|
|
|
|
|
|
0% 6/30/07 (d) |
Caa1 |
|
20,940,000 |
14,658,000 |
|
|
0% 11/1/07 (d) |
Caa1 |
|
25,685,000 |
15,411,000 |
|
|
|
186,861,688 |
||||
|
Telephone Services - 12.3% |
|||||
|
Allegiance Telecom, Inc. 0% 2/15/08 (d) |
B3 |
|
5,387,000 |
3,919,043 |
|
|
Bestel SA de CV 0% 5/15/05 (d) |
- |
|
8,075,000 |
5,733,250 |
|
|
FirstWorld Communications, Inc. 0% 4/15/08 (d) |
- |
|
19,760,000 |
8,892,000 |
|
|
Flag Telecom Holdings Ltd. 11.625% 3/30/10 |
B2 |
|
2,965,000 |
2,816,750 |
|
|
Hyperion Telecommunications, Inc.: |
|
|
|
|
|
|
0% 4/15/03 (d) |
B3 |
|
4,435,000 |
4,124,550 |
|
|
12% 11/1/07 |
Caa1 |
|
3,600,000 |
3,384,000 |
|
|
ICG Holdings, Inc.: |
|
|
|
|
|
|
0% 9/15/05 (d) |
B3 |
|
28,000,000 |
26,880,000 |
|
|
0% 5/1/06 (d) |
B3 |
|
9,255,000 |
7,542,825 |
|
|
ICG Services, Inc.: |
|
|
|
|
|
|
0% 2/15/08 (d) |
B3 |
|
37,500,000 |
18,000,000 |
|
|
0% 5/1/08 (d) |
B3 |
|
2,950,000 |
1,357,000 |
|
|
Intermedia Communications, Inc.: |
|
|
|
|
|
|
0% 5/15/06 (d) |
B2 |
|
145,000 |
137,750 |
|
|
0% 7/15/07 (d) |
B2 |
|
7,835,000 |
6,072,125 |
|
|
KMC Telecom Holdings, Inc.: |
|
|
|
|
|
|
0% 2/15/08 (d) |
Caa2 |
|
19,400,000 |
8,342,000 |
|
|
13.5% 5/15/09 |
Caa2 |
|
6,710,000 |
5,569,300 |
|
|
Logix Communications Enterprises, Inc. 12.25% 6/15/08 |
- |
|
6,970,000 |
2,230,400 |
|
|
Metromedia Fiber Network, Inc. 10% 11/15/08 |
B2 |
|
19,255,000 |
18,918,038 |
|
|
NEXTLINK |
|
|
|
|
|
|
0% 12/1/09 (d) |
B2 |
|
11,215,000 |
6,448,625 |
|
|
10.75% 11/15/08 |
B3 |
|
340,000 |
334,900 |
|
|
10.75% 6/1/09 |
B2 |
|
10,690,000 |
10,529,650 |
|
|
Corporate Bonds - continued |
|||||
|
Moody's Ratings (unaudited) (b) |
Principal Amount |
Value |
|||
|
Nonconvertible Bonds - continued |
|||||
|
UTILITIES - continued |
|||||
|
Telephone Services - continued |
|||||
|
Optel Communications Corp. 15% 12/30/04 (h) |
- |
|
$ 14,907,563 |
$ 14,162,185 |
|
|
Pathnet, Inc. 12.25% 4/15/08 |
- |
|
20,255,000 |
11,342,800 |
|
|
Rhythms |
|
|
|
|
|
|
0% 5/15/08 (d) |
B3 |
|
21,980,000 |
8,682,100 |
|
|
12.75% 4/15/09 |
B3 |
|
7,480,000 |
5,086,400 |
|
|
14% 2/15/10 (f) |
B3 |
|
7,210,000 |
5,191,200 |
|
|
RSL Communications Ltd./RSL Communications PLC 12.25% 11/15/06 |
B2 |
|
6,026,000 |
4,790,670 |
|
|
RSL Communications PLC 9.875% 11/15/09 |
B2 |
|
7,195,000 |
4,676,750 |
|
|
Teligent, Inc. 11.5% 12/1/07 |
Caa1 |
|
4,625,000 |
3,584,375 |
|
|
WinStar |
|
|
|
|
|
|
0% 4/15/10 (d)(f) |
B3 |
|
36,689,000 |
17,060,385 |
|
|
12.5% 4/15/08 (f) |
B3 |
|
17,930,000 |
17,481,750 |
|
|
12.75% 4/15/10 (f) |
B3 |
|
31,418,000 |
30,318,370 |
|
|
Worldwide Fiber, Inc. 12% 8/1/09 |
B3 |
|
11,800,000 |
11,033,000 |
|
|
|
274,642,191 |
||||
|
TOTAL UTILITIES |
461,503,879 |
||||
|
TOTAL NONCONVERTIBLE BONDS |
1,609,659,331 |
||||
|
TOTAL CORPORATE BONDS (Cost $1,951,710,007) |
|
1,683,141,612 |
|||
|
Asset-Backed Securities - 0.1% |
|||||
|
|
|||||
|
Airplanes pass through trust 10.875% 3/15/19 |
Ba2 |
|
2,884,084 |
2,134,222 |
|
|
Commercial Mortgage Securities - 1.3% |
|||||
|
Moody's Ratings (unaudited) (b) |
Principal Amount |
Value |
|||
|
Commercial Mortgage Acceptance Corp. pass through certificates Series 1998-C2 Class F, 5.44% 5/15/13 (f)(g) |
BB+ |
|
$ 4,500,000 |
$ 2,825,860 |
|
|
Commercial Mortgage |
Ba1 |
|
4,750,000 |
3,046,680 |
|
|
Danmall Finance, Inc. |
- |
|
4,890,848 |
4,946,634 |
|
|
LB Multifamily Mortgage Trust Series 1991-4 |
Caa1 |
|
2,313,015 |
1,850,412 |
|
|
Meritor Mortgage Security Corp. Series 1987 1 |
- |
|
1,350,000 |
116,505 |
|
|
Mortgage Capital Funding, Inc. Series 1998-MC3 Class F, 7.3177% 11/18/31 (f)(g) |
Ba1 |
|
4,500,000 |
3,608,190 |
|
|
Nationslink Funding Corp. Commercial Mortgage pass through certificates Series 1998-2 Class F, 7.105% 8/20/30 |
BB |
|
4,500,000 |
3,351,094 |
|
|
Nomura Depositor Trust: |
|
|
|
|
|
|
floater Series 1998-ST1A Class B2, 10.9013% 1/15/03 (f)(g) |
- |
|
2,200,000 |
2,037,406 |
|
|
Series 1998-ST1A |
- |
|
4,000,000 |
3,725,000 |
|
|
Structured Asset |
|
|
|
|
|
|
Series 1994-C1 Class F, 6.87% 8/25/26 |
B |
|
2,600,000 |
2,110,266 |
|
|
Series 1995-C1 Class F, 7.375% 9/25/24 (f) |
- |
|
2,000,000 |
1,588,438 |
|
|
TOTAL COMMERCIAL MORTGAGE SECURITIES (Cost $28,843,213) |
29,206,485 |
||||
|
Common Stocks - 3.2% |
|||
|
Shares |
|
||
|
BASIC INDUSTRIES - 0.1% |
|||
|
Chemicals & Plastics - 0.0% |
|||
|
Sterling Chemicals Holdings, Inc. warrants 8/15/08 (a) |
340 |
4,080 |
|
|
Iron & Steel - 0.0% |
|||
|
AK Steel Holding Corp. |
6,500 |
52,000 |
|
|
Common Stocks - continued |
|||
|
Shares |
Value (Note 1) |
||
|
BASIC INDUSTRIES - continued |
|||
|
Packaging & Containers - 0.1% |
|||
|
Packaging Corp. of America |
150,000 |
$ 1,518,750 |
|
|
TOTAL BASIC INDUSTRIES |
1,574,830 |
||
|
CONSTRUCTION & REAL ESTATE - 0.3% |
|||
|
Building Materials - 0.1% |
|||
|
International Utility Structures, Inc. unit |
2,500 |
1,750,000 |
|
|
Real Estate - 0.2% |
|||
|
LNR Property Corp. |
257,600 |
5,023,200 |
|
|
Real Estate Investment Trusts - 0.0% |
|||
|
Swerdlow Real Estate Group, Inc.: |
|
|
|
|
Class A (h) |
79,800 |
1 |
|
|
Class B (h) |
19,817 |
0 |
|
|
|
1 |
||
|
TOTAL CONSTRUCTION & REAL ESTATE |
6,773,201 |
||
|
DURABLES - 0.2% |
|||
|
Textiles & Apparel - 0.2% |
|||
|
Arena Brands Holdings Corp. Class B |
48,889 |
1,222,225 |
|
|
Polymer Group, Inc. |
426,300 |
3,943,275 |
|
|
|
5,165,500 |
||
|
ENERGY - 0.5% |
|||
|
Oil & Gas - 0.5% |
|||
|
Plains Resources, Inc. (a) |
686,000 |
10,976,000 |
|
|
FINANCE - 0.0% |
|||
|
Credit & Other Finance - 0.0% |
|||
|
Arcadia Financial Ltd. warrants 3/15/07 (a) |
498 |
1 |
|
|
Securities Industry - 0.0% |
|||
|
ECM Corp. LP (f) |
3,000 |
264,000 |
|
|
TOTAL FINANCE |
264,001 |
||
|
HEALTH - 0.0% |
|||
|
Medical Equipment & Supplies - 0.0% |
|||
|
Wright Medical Technology, Inc. |
3,212 |
32 |
|
|
INDUSTRIAL MACHINERY & EQUIPMENT - 0.9% |
|||
|
Industrial Machinery & Equipment - 0.1% |
|||
|
Tenneco Automotive, Inc. |
150,000 |
787,500 |
|
|
Terex Corp. (a) |
50,000 |
706,250 |
|
|
|
1,493,750 |
||
|
Pollution Control - 0.8% |
|||
|
Allied Waste Industries, Inc. (a) |
1,765,000 |
17,650,000 |
|
|
TOTAL INDUSTRIAL MACHINERY & EQUIPMENT |
19,143,750 |
||
|
|
|||
|
Shares |
Value (Note 1) |
||
|
MEDIA & LEISURE - 0.4% |
|||
|
Broadcasting - 0.1% |
|||
|
Benedek Communications Corp. |
57,600 |
$ 115,200 |
|
|
CS Wireless Systems, Inc. (a)(f) |
1,024 |
10 |
|
|
EchoStar Communications Corp. |
3,100 |
102,639 |
|
|
Motient Corp. warrants 4/1/08 (a) |
3,435 |
127,095 |
|
|
UIH Australia/Pacific, Inc. |
26,805 |
804,150 |
|
|
|
1,149,094 |
||
|
Entertainment - 0.3% |
|||
|
Premier Parks, Inc. (a) |
325,000 |
7,393,750 |
|
|
Lodging & Gaming - 0.0% |
|||
|
Motels of America, Inc. (a) |
3,000 |
43,500 |
|
|
TOTAL MEDIA & LEISURE |
8,586,344 |
||
|
RETAIL & WHOLESALE - 0.1% |
|||
|
Apparel Stores - 0.1% |
|||
|
Mothers Work, Inc. (a)(e) |
294,100 |
3,308,625 |
|
|
Mothers Work, Inc. (a)(h) |
2,952 |
33,210 |
|
|
|
3,341,835 |
||
|
TECHNOLOGY - 0.0% |
|||
|
Computer Services & Software - 0.0% |
|||
|
DecisionOne Corp. |
16,846 |
168 |
|
|
DecisionOne Corp.: |
|
|
|
|
Class A warrants 4/18/07 (a) |
9,890 |
1 |
|
|
Class B warrants 4/18/07 (a) |
17,041 |
2 |
|
|
Class C warrants 4/18/07 (a) |
10,108 |
1 |
|
|
|
172 |
||
|
Computers & Office Equipment - 0.0% |
|||
|
Ampex Corp. Class A (a) |
9,600 |
16,200 |
|
|
Electronics - 0.0% |
|||
|
Insilco Corp. warrants 8/15/07 (a) |
7,380 |
7 |
|
|
TOTAL TECHNOLOGY |
16,379 |
||
|
UTILITIES - 0.7% |
|||
|
Cellular - 0.3% |
|||
|
Cellnet Data Systems, Inc. |
18,000 |
180 |
|
|
Loral Orion Network Systems, Inc.: |
|
|
|
|
warrants 1/15/07 (CV ratio .47) (a) |
45,930 |
114,825 |
|
|
warrants 1/15/07 (CV ratio .6) (a) |
5,585 |
23,736 |
|
|
McCaw International Ltd. |
42,305 |
105,763 |
|
|
WebLink Wireless, Inc. Class A (a) |
528,034 |
6,996,451 |
|
|
|
7,240,955 |
||
|
Telephone Services - 0.4% |
|||
|
Bestel SA de CV warrants 5/13/05 (a)(f) |
8,075 |
904,400 |
|
|
Common Stocks - continued |
|||
|
Shares |
Value (Note 1) |
||
|
UTILITIES - continued |
|||
|
Telephone Services - continued |
|||
|
KMC Telecom Holdings, Inc. |
12,650 |
$ 31,625 |
|
|
Optel Communications Corp. |
2,559,515 |
6,718,727 |
|
|
Pathnet, Inc. warrants 4/15/08 (a)(f) |
20,255 |
202,550 |
|
|
|
7,857,302 |
||
|
TOTAL UTILITIES |
15,098,257 |
||
|
TOTAL COMMON STOCKS (Cost $82,503,250) |
70,940,129 |
||
|
Preferred Stocks - 13.5% |
|||
|
|
|
|
|
|
Convertible Preferred Stocks - 0.1% |
|||
|
TECHNOLOGY - 0.1% |
|||
|
Computer Services & Software - 0.1% |
|||
|
PSINet, Inc. $3.50 (f) |
100,000 |
3,400,000 |
|
|
|
|
|
|
|
Nonconvertible Preferred Stocks - 13.4% |
|||
|
CONSTRUCTION & REAL ESTATE - 0.4% |
|||
|
Building Materials - 0.0% |
|||
|
International Utility Structures, Inc. |
713 |
499,100 |
|
|
Real Estate Investment Trusts - 0.4% |
|||
|
Swerdlow Real Estate Group, Inc.: |
|
|
|
|
junior (h) |
19,817 |
0 |
|
|
mezzanine (h) |
79,800 |
28,890 |
|
|
senior (h) |
79,800 |
8,815,611 |
|
|
|
8,844,501 |
||
|
TOTAL CONSTRUCTION & REAL ESTATE |
9,343,601 |
||
|
FINANCE - 0.4% |
|||
|
Insurance - 0.4% |
|||
|
American Annuity Group Capital Trust II 8.875% |
8,910 |
7,932,230 |
|
|
HEALTH - 0.5% |
|||
|
Medical Facilities Management - 0.5% |
|||
|
Fresenius Medical Care Capital Trust II 7.875% |
10,524 |
9,600,845 |
|
|
|
|||
|
Shares |
Value (Note 1) |
||
|
MEDIA & LEISURE - 2.4% |
|||
|
Broadcasting - 2.4% |
|||
|
Citadel Broadcasting Co. Series B, 13.25% pay-in-kind |
54,339 |
$ 5,596,917 |
|
|
CSC Holdings, Inc.: |
|
|
|
|
11.125% pay-in-kind |
197,957 |
20,686,507 |
|
|
Series H, 11.75% pay-in-kind |
200,061 |
21,106,436 |
|
|
Granite Broadcasting Corp. |
7,825 |
6,573,000 |
|
|
|
53,962,860 |
||
|
TECHNOLOGY - 0.0% |
|||
|
Computers & Office Equipment - 0.0% |
|||
|
Ampex Corp. 8% non-cumulative |
422 |
658,320 |
|
|
UTILITIES - 9.7% |
|||
|
Cellular - 3.9% |
|||
|
Nextel Communications, Inc.: |
|
|
|
|
11.125% pay-in-kind |
47,183 |
45,531,595 |
|
|
Series D, 13% pay-in-kind |
38,807 |
40,553,315 |
|
|
|
86,084,910 |
||
|
Telephone Services - 5.8% |
|||
|
Adelphia Business Solution, Inc. |
2,988 |
2,674,260 |
|
|
e.spire Communications, Inc. |
17,801 |
3,204,180 |
|
|
ICG Holdings, Inc. 14.25% pay-in-kind |
26,893 |
21,514,400 |
|
|
Intermedia Communications, Inc. |
22,827 |
22,142,190 |
|
|
NEXTLINK Communications, Inc. |
24,242 |
23,514,740 |
|
|
NEXTLINK Communications, Inc. |
1,125,487 |
57,399,830 |
|
|
|
130,449,600 |
||
|
TOTAL UTILITIES |
216,534,510 |
||
|
TOTAL NONCONVERTIBLE PREFERRED STOCKS |
298,032,366 |
||
|
TOTAL PREFERRED STOCKS (Cost $325,176,740) |
301,432,366 |
||
|
Purchased Bank Debt - 0.6% |
|||||
|
Moody's Ratings (unaudited) (b) |
Principal Amount |
|
|||
|
Dynatech LLC term loan 10.03% 9/1/07 (g) |
- |
|
$ 2,000,000 |
1,990,000 |
|
|
Synthetic Industries, Inc. term loan 14% 12/13/00 (g) |
- |
|
3,600,000 |
3,564,000 |
|
|
Purchased Bank Debt - continued |
|||||
|
Moody's Ratings (unaudited) (b) |
Principal Amount |
Value |
|||
|
Total Renal Care Holdings, Inc. term loan 11.5% 3/31/06 (g) |
Ba2 |
|
$ 2,620,105 |
$ 2,436,697 |
|
|
Voicestream Pcs Holding LLC term loan 9.76% 2/25/09 (g) |
B+ |
|
5,000,000 |
4,987,500 |
|
|
TOTAL PURCHASED BANK DEBT (Cost $12,855,286) |
12,978,197 |
||||
|
Cash Equivalents - 4.7% |
|||
|
Maturity Amount |
|
||
|
Investments in repurchase agreements (U.S. Treasury Obligations), in a joint |
$ 104,520,295 |
104,463,000 |
|
|
TOTAL INVESTMENT PORTFOLIO - 98.8% (Cost $2,508,743,347) |
2,204,296,011 |
||
|
NET OTHER ASSETS - 1.2% |
26,704,251 |
||
|
NET ASSETS - 100% |
$ 2,231,000,262 |
||
|
Legend |
|
(a) Non-income producing |
|
(b) S&P credit ratings are used in the absence of a rating by Moody's Investors Service, Inc. |
|
(c) Non-income producing - issuer filed for protection under the Federal Bankruptcy Code or is in default of interest payment. |
|
(d) Debt obligation initially issued in zero coupon form which converts to coupon form at a specified rate and date. The rate shown is the rate at period end. |
|
(e) Transactions during the period with companies which are or were affiliates are as follows: |
|
Affiliate |
Purchase |
Sales |
Dividend |
Value |
|
Mothers |
$ - |
$ 112,038 |
$ - |
$ 3,308,625 |
|
(f) Security exempt from registration under Rule 144A of the Securities |
|
(g) The coupon rate shown on floating or adjustable rate securities represents the rate at period end. |
|
(h) Restricted securities - Investment in securities not registered under the Securities Act of 1933. |
|
Additional information on each holding is as follows: |
|
Security |
Acquisition Date |
Acquisition Cost |
|
Micron Technology, Inc. |
3/3/99 - 10/7/99 |
$ 7,794,500 |
|
Mothers Work, Inc. |
6/18/98 |
$ 26,172 |
|
Optel Communications Corp. |
12/31/97 |
$ 759,408 |
|
Optel Communications Corp. |
12/31/97 - 12/30/99 |
$ 14,148,203 |
|
Swerdlow Real Estate Group, Inc. |
1/15/99 |
$ 11,132 |
|
Swerdlow Real Estate Group, Inc. |
1/15/99 |
$ 2,760 |
|
Swerdlow Real Estate Group, Inc. |
1/15/99 |
$ 2,760 |
|
Swerdlow Real Estate Group, Inc. |
1/15/99 |
$ 78,520 |
|
Swerdlow Real Estate Group, Inc. |
1/15/99 |
$ 7,618,828 |
|
Other Information |
|
Purchases and sales of securities, other than short-term securities, |
|
The fund placed a portion of its portfolio transactions with brokerage firms which are affiliates of Fidelity Management & Research Company. The commissions paid to these affiliated firms were $7,030 for the period. |
|
The fund invested in securities that are not registered under the Securities Act of 1933. These securities are subject to legal or contractual restrictions on resale. At the end of the period, restricted securities (excluding Rule 144A issues) amounted to $38,108,624 and 1.7% of net assets. |
|
The fund participated in the interfund lending program as a borrower. The average daily loan balance during the period for which loans were outstanding amounted to $10,243,000. The weighted average interest rate was 6.73%. |
|
Distribution of investments by country of issue, as a percentage of total |
|
United States of America |
89.2% |
|
Canada |
3.4 |
|
United Kingdom |
2.4 |
|
Luxembourg |
1.6 |
|
Mexico |
1.5 |
|
Netherlands |
1.4 |
|
Others (individually less than 1%) |
0.5 |
|
|
100.0% |
|
The composition of long-term debt holdings as a percentage of total |
|
Moody's Ratings |
S&P Ratings |
|||
|
Aaa, Aa, A |
0.0% |
|
AAA, AA, A |
0.0% |
|
Baa |
0.2% |
|
BBB |
0.2% |
|
Ba |
3.7% |
|
BB |
3.2% |
|
B |
50.2% |
|
B |
56.1% |
|
Caa |
12.9% |
|
CCC |
7.2% |
|
Ca, C |
0.4% |
|
CC, C |
0.0% |
|
|
|
|
D |
0.4% |
|
The percentage not rated by Moody's or S&P amounted to 7.6%. FMR has determined that unrated debt securities that are lower quality account for 7.6% of the total value of investment in securities. |
|
Income Tax Information |
|
At June 30, 2000, the aggregate cost of investment securities for income tax purposes was $2,510,663,320. Net unrealized depreciation aggregated $306,367,309, of which $36,552,593 related to appreciated investment securities and $342,919,902 related to depreciated investment securities. |
|
At December 31, 1999, the fund had a capital loss carryforward of approximately $78,395,000, all of which will expire on December 31, 2007. |
See accompanying notes which are an integral part of the financial statements.
High Income Portfolio
Statement of Assets and Liabilities
|
|
June 30, 2000 (Unaudited) |
|
|
Assets |
|
|
|
Investment in securities, at value (including repurchase agreements of $104,463,000) |
|
$ 2,204,296,011 |
|
Cash |
|
1,173,022 |
|
Receivable for investments sold |
|
10,237,395 |
|
Receivable for fund shares sold |
|
1,824,525 |
|
Dividends receivable |
|
395,382 |
|
Interest receivable |
|
39,095,601 |
|
Other receivables |
|
551,687 |
|
Total assets |
|
2,257,573,623 |
|
Liabilities |
|
|
|
Payable for investments purchased |
$ 24,668,573 |
|
|
Payable for fund shares redeemed |
630,403 |
|
|
Accrued management fee |
1,052,289 |
|
|
Distribution fees payable |
21,721 |
|
|
Other payables and |
200,375 |
|
|
Total liabilities |
|
26,573,361 |
|
Net Assets |
|
$ 2,231,000,262 |
|
Net Assets consist of: |
|
|
|
Paid in capital |
|
$ 2,569,113,584 |
|
Undistributed net investment income |
|
195,475,174 |
|
Accumulated undistributed |
|
(229,141,160) |
|
Net unrealized appreciation (depreciation) on investments |
|
(304,447,336) |
|
Net Assets |
|
$ 2,231,000,262 |
|
Initial Class : |
|
$10.04 |
|
Service Class : |
|
$10.01 |
|
Service Class 2: |
|
$10.00 |
Statement of Operations
|
|
Six months ended June 30, 2000 (Unaudited) |
|
|
Investment Income Dividends |
|
$ 19,576,105 |
|
Interest |
|
115,899,684 |
|
Total income |
|
135,475,789 |
|
Expenses |
|
|
|
Management fee |
$ 6,594,093 |
|
|
Transfer agent fees |
738,215 |
|
|
Distribution fees |
126,321 |
|
|
Accounting fees and expenses |
306,723 |
|
|
Non-interested trustees' compensation |
6,473 |
|
|
Custodian fees and expenses |
33,438 |
|
|
Registration fees |
4,288 |
|
|
Audit |
22,467 |
|
|
Legal |
10,848 |
|
|
Interest |
5,745 |
|
|
Miscellaneous |
20,986 |
|
|
Total expenses before reductions |
7,869,597 |
|
|
Expense reductions |
(38,341) |
7,831,256 |
|
Net investment income |
|
127,644,533 |
|
Realized and Unrealized Gain (Loss) Net realized gain (loss) on investment securities (including realized loss of $45,477 on sales of investments in affiliated issuers) |
|
(148,333,381) |
|
Change in net unrealized appreciation (depreciation) |
|
(97,254,537) |
|
Net gain (loss) |
|
(245,587,918) |
|
Net increase (decrease) in net assets resulting from operations |
|
$ (117,943,385) |
|
Other Information Expense reductions |
|
|
|
Directed brokerage arrangements |
|
$ 35,786 |
|
Custodian credits |
|
2,555 |
|
|
|
$ 38,341 |
See accompanying notes which are an integral part of the financial statements.
Semiannual Report
Fidelity Variable Insurance Products: High Income Portfolio
Financial Statements - continued
Statement of Changes in Net Assets
|
Increase (Decrease) in Net Assets |
Six months ended |
Year ended |
|
Operations |
$ 127,644,533 |
$ 247,259,596 |
|
Net realized gain (loss) |
(148,333,381) |
(96,179,624) |
|
Change in net unrealized appreciation (depreciation) |
(97,254,537) |
55,361,896 |
|
Net increase (decrease) in net assets resulting from operations |
(117,943,385) |
206,441,868 |
|
Distributions to shareholders |
(160,774,244) |
(232,085,602) |
|
From net realized gain |
- |
(6,657,693) |
|
In excess of net realized gain |
- |
(877,958) |
|
Total distributions |
(160,774,244) |
(239,621,253) |
|
Share transactions - net increase (decrease) |
(1,863,609) |
66,219,533 |
|
Total increase (decrease) in net assets |
(280,581,238) |
33,040,148 |
|
Net Assets |
|
|
|
Beginning of period |
2,511,581,500 |
2,478,541,352 |
|
End of period (including undistributed net investment income |
$ 2,231,000,262 |
$ 2,511,581,500 |
|
Other Information: |
|
|
Six months ended June 30, 2000 |
Year ended |
||
|
|
Shares |
Dollars |
Shares |
Dollars |
|
Share transactions |
34,881,654 |
$ 357,036,731 |
101,971,137 |
$ 1,140,554,728 |
|
Reinvested |
13,813,362 |
144,073,366 |
20,936,841 |
226,536,621 |
|
Redeemed |
(52,613,342) |
(547,562,808) |
(127,141,526) |
(1,424,987,101) |
|
Net increase (decrease) |
(3,918,326) |
$ (46,452,711) |
(4,233,548) |
$ (57,895,752) |
|
Service Class |
7,232,634 |
$ 74,033,462 |
15,936,772 |
$ 177,176,136 |
|
Reinvested |
1,603,673 |
16,694,232 |
1,211,540 |
13,084,632 |
|
Redeemed |
(4,572,624) |
(47,192,023) |
(5,904,384) |
(66,145,483) |
|
Net increase (decrease) |
4,263,683 |
$ 43,535,671 |
11,243,928 |
$ 124,115,285 |
|
Service Class 2 A |
104,183 |
$ 1,046,949 |
- |
$ - |
|
Reinvested |
639 |
6,643 |
- |
- |
|
Redeemed |
(16) |
(161) |
- |
- |
|
Net increase (decrease) |
104,806 |
$ 1,053,431 |
- |
$ - |
|
Distributions |
|
|
|
|
|
From net investment income |
|
$ 144,073,368 |
|
$ 219,412,458 |
|
Service Class |
|
16,694,233 |
|
12,673,144 |
|
Service Class 2 A |
|
6,643 |
|
- |
|
Total |
|
$ 160,774,244 |
|
$ 232,085,602 |
|
From net realized gain |
|
$ - |
|
$ 6,294,147 |
|
Service Class |
|
- |
|
363,546 |
|
Service Class 2 A |
|
- |
|
- |
|
Total |
|
$ - |
|
$ 6,657,693 |
|
In excess of net realized gain |
|
$ - |
|
$ 830,017 |
|
Service Class |
|
- |
|
47,941 |
|
Service Class 2 A |
|
- |
|
- |
|
Total |
|
$ - |
|
$ 877,958 |
|
|
|
$ 160,774,244 |
|
$ 239,621,253 |
A Service Class 2 commenced sale of shares January 12, 2000.
See accompanying notes which are an integral part of the financial statements.
High Income Portfolio
Financial Highlights - Initial Class
|
|
Six months ended |
Years ended December 31, |
||||
|
Selected Per-Share Data |
(Unaudited) |
1999 |
1998 |
1997 |
1996 |
1995 |
|
Net asset value, beginning of period |
$ 11.320 |
$ 11.530 |
$ 13.580 |
$ 12.520 |
$ 12.050 |
$ 10.750 |
|
Income from Investment Operations |
|
|
|
|
|
|
|
Net investment income |
.580 D |
1.095 D |
1.111 D |
1.124 D |
.927 |
.856 |
|
Net realized and unrealized gain (loss) |
(1.110) |
(.195) |
(1.591) |
.936 |
.643 |
1.224 |
|
Total from investment operations |
(.530) |
.900 |
(.480) |
2.060 |
1.570 |
2.080 |
|
Less Distributions |
|
|
|
|
|
|
|
From net investment income |
(.750) |
(1.075) |
(.970) |
(.890) |
(.920) |
(.780) |
|
From net realized gain |
- |
(.030) |
(.600) |
(.110) |
(.180) |
- |
|
In excess of net realized gain |
- |
(.005) |
- |
- |
- |
- |
|
Total distributions |
(.750) |
(1.110) |
(1.570) |
(1.000) |
(1.100) |
(.780) |
|
Net asset value, end of period |
$ 10.040 |
$ 11.320 |
$ 11.530 |
$ 13.580 |
$ 12.520 |
$ 12.050 |
|
Total Return B, C |
(4.93)% |
8.25% |
(4.33)% |
17.67% |
14.03% |
20.72% |
|
Ratios and Supplemental Data |
|
|
|
|
|
|
|
Net assets, end of period (000 omitted) |
$ 1,962,075 |
$ 2,257,610 |
$ 2,348,954 |
$ 2,329,516 |
$ 1,588,822 |
$ 1,040,000 |
|
Ratio of expenses to average net assets |
.68% A |
.69% |
.70% |
.71% |
.71% |
.71% |
|
Ratio of net investment income to average net assets |
11.22% A |
9.80% |
9.14% |
8.88% |
9.09% |
9.32% |
|
Portfolio turnover rate |
71% A |
82% |
92% |
118% |
123% |
132% |
Financial Highlights - Service Class
|
|
Six months ended |
Years ended December 31, |
||
|
Selected Per-Share Data |
(Unaudited) |
1999 |
1998 |
1997 E |
|
Net asset value, beginning of period |
$ 11.290 |
$ 11.520 |
$ 13.570 |
$ 13.380 |
|
Income from Investment Operations |
|
|
|
|
|
Net investment income D |
.570 |
1.074 |
1.082 |
.203 |
|
Net realized and unrealized gain (loss) |
(1.110) |
(.194) |
(1.562) |
(.013) |
|
Total from investment operations |
(.540) |
.880 |
(.480) |
.190 |
|
Less Distributions |
|
|
|
|
|
From net investment income |
(.740) |
(1.075) |
(.970) |
- |
|
From net realized gain |
- |
(.030) |
(.600) |
- |
|
In excess of net realized gain |
- |
(.005) |
- |
- |
|
Total distributions |
(.740) |
(1.110) |
(1.570) |
- |
|
Net asset value, end of period |
$ 10.010 |
$ 11.290 |
$ 11.520 |
$ 13.570 |
|
Total Return B, C |
(5.03)% |
8.08% |
(4.34)% |
1.42% |
|
Ratios and Supplemental Data |
|
|
|
|
|
Net assets, end of period (000 omitted) |
$ 267,878 |
$ 253,972 |
$ 129,587 |
$ 2,919 |
|
Ratio of expenses to average net assets |
.78% A |
.79% |
.82% |
.81% A |
|
Ratio of expenses to average net assets after expense reductions |
.78% A |
.79% |
.82% |
.80% A, F |
|
Ratio of net investment income to average net assets |
11.12% A |
9.69% |
9.51% |
10.75% A |
|
Portfolio turnover rate |
71% A |
82% |
92% |
118% |
|
A Annualized B Total returns for periods of less than one year are not annualized and do not reflect charges attributable to your insurance company's separate account. Inclusion of these charges would reduce the total returns shown. C The total returns would have been lower had certain expenses not been reduced during the periods shown. D Net investment income per share has been calculated based on average shares outstanding during the period. E For the period November 3, 1997 (commencement of sale of Service Class shares) to December 31, 1997. F FMR or the fund has entered into varying arrangements with third parties who either paid or reduced a portion of the class' expenses. |
||||
See accompanying notes which are an integral part of the financial statements.
Semiannual Report
Financial Highlights - Service Class 2
|
|
Six months ended |
|
Selected Per-Share Data |
(Unaudited) |
|
Net asset value, beginning of period |
$ 11.140 |
|
Income from Investment Operations |
|
|
Net investment income D |
.476 |
|
Net realized and unrealized gain (loss) |
(.876) |
|
Total from investment operations |
(.400) |
|
Less Distributions |
|
|
From net investment income |
(.740) |
|
Net asset value, end of period |
$ 10.000 |
|
Total Return B, C |
(3.85)% |
|
Ratios and Supplemental Data |
|
|
Net assets, end of period (000 omitted) |
$ 1,048 |
|
Ratio of expenses to average net assets |
.97% A |
|
Ratio of expenses to average net assets after expense reductions |
.96% A, F |
|
Ratio of net investment income to average net assets |
10.93% A |
|
Portfolio turnover rate |
71% A |
|
A Annualized B Total returns for periods of less than one year are not annualized and do not reflect charges attributable to your insurance company's separate account. Inclusion of these charges would reduce the total returns shown. C The total return would have been lower had certain expenses not been reduced during the period shown. D Net investment income per share has been calculated based on average shares outstanding during the period. E For the period January 12, 2000 (commencement of sale of Service Class 2 shares) to June 30, 2000. F FMR or the fund has entered into varying arrangements with third parties who either paid or reduced a portion of the class' expenses. |
|
See accompanying notes which are an integral part of the financial statements.
High Income Portfolio
For the period ended June 30, 2000 (Unaudited)
1. Significant Accounting Policies.
The High Income Portfolio, Equity-Income Portfolio, Growth Portfolio, and Overseas Portfolio (the funds) are funds of Variable Insurance Products Fund. Asset Manager Portfolio, Asset Manager: Growth Portfolio, and Contrafund Portfolio (the funds) are funds of Variable Insurance Products Fund II. Balanced Portfolio, Growth & Income Portfolio, Growth Opportunities Portfolio, and Mid Cap Portfolio (the funds) are funds of Variable Insurance Products Fund III. Variable Insurance Products Fund, Variable Insurance Products Fund II and Variable Insurance Products Fund III (the trusts) are registered under the Investment Company Act of 1940, as amended (the 1940 Act), as open-end management investment companies organized as Massachusetts business trusts. Each fund is authorized to issue an unlimited number of shares. Shares of each fund may only be purchased by insurance companies for the purpose of funding variable annuity or variable life insurance contracts. Each fund offers three classes of shares: the funds' original class of shares (Initial Class shares), Service Class shares and Service Class 2 shares. Each fund commenced sale of Service Class 2 shares on January 12, 2000. All classes have equal rights and voting privileges, except for matters affecting a single class. Investment income, realized and unrealized capital gains and losses, the common expenses of the fund, and certain fund-level expense reductions, if any, are allocated on a pro rata basis to each class based on the relative net assets of each class to the total net assets of the fund. Each class of shares differs in its respective distribution plan.
The financial statements have been prepared in conformity with generally accepted accounting principles which require management to make certain estimates and assumptions at the date of the financial statements. The following summarizes the significant accounting policies of the funds:
Security Valuation:
High Income, Asset Manager and Balanced Portfolios. Equity securities for which quotations are readily available are valued at the last sale price, or if no sale price, at the closing bid price. Foreign equity securities are valued based on quotations from the principal market in which such securities are normally traded. If trading or events occurring in other markets after the close of the principal market in which foreign securities are traded, and before the close of the business of the funds, are expected to materially affect the value of those securities, then they are valued at their fair value taking this trading or these events into account. Fair value is determined in good faith under consistently applied procedures under the general supervision of the Board of Trustees. Debt securities for which quotations are readily available are valued by a pricing service at their market values as determined by their most recent bid prices in the principal market (sales prices if the principal market is an exchange) in which such securities are normally traded. Securities (including restricted securities) for which market quotations are not readily available are valued at their fair value. Short-term securities with remaining maturities of sixty days or less for which quotations are not readily available are valued at amortized cost or original cost plus accrued interest, both of which approximate current value.
Asset Manager: Growth, Equity-Income, Growth & Income, Growth Opportunities, Contrafund, Growth
and Mid Cap Portfolios. Securities for which exchange quotations are readily available are valued at the last sale price,
or if no sale price, at the closing bid price. Foreign securities are valued based on quotations from the principal market in which such securities
are normally traded. If trading or events occurring in other markets after the close of the principal market in which foreign securities are traded,
and before the close of the business of the funds, are expected to materially affect the value of those securities, then they are valued at their fair
value taking this trading or these events into account. Fair value is determined in good faith under consistently applied procedures under the
general supervision of the Board of Trustees. Securities (including restricted securities) for which exchange quotations are not readily
available (and in certain cases debt securities which trade on an exchange) are valued primarily using dealer-supplied valuations or at their fair
value. Short-term securities with remaining maturities of sixty days or less for which quotations are not readily available are valued at
amortized cost or original cost plus accrued interest, both of which approximate current value.
Overseas Portfolio. Securities for which quotations are readily available are valued using the official closing price or at the last sale price in the principal market in which they are traded. If the last sale price (on the local exchange) is unavailable, the last evaluated quote or closing bid price normally is used. If trading or events occurring in other markets after the close of the principal market in which securities are traded are expected to materially affect the value of those securities, then they are valued at their fair value taking this trading or these events into account. Fair value is determined in good faith under consistently applied procedures under the general supervision of the Board of Trustees. Securities (including restricted securities) for which quotations are not readily available are valued primarily using dealer-supplied valuations or at their fair value. Short-term securities with remaining maturities of sixty days or less for which quotations are not readily available are valued at amortized cost or original cost plus accrued interest, both of which approximate current value.
Foreign Currency Translation. The accounting records of the funds are maintained in U.S. dollars. Investment securities and other assets and liabilities denominated in a foreign currency are translated into U.S. dollars at the prevailing rates of exchange at period end. Purchases and sales of securities, income receipts and expense payments are translated into U.S. dollars at the prevailing exchange rate on the respective dates of the transactions.
Semiannual Report
Notes to Financial Statements (Unaudited) - continued
1. Significant Accounting Policies - continued
Foreign Currency Translation - continued
Net realized gains and losses on foreign currency transactions represent net gains and losses from sales and maturities of foreign currency contracts, disposition of foreign currencies, the difference between the amount of net investment income accrued and the U.S. dollar amount actually received, and gains and losses between trade and settlement date on purchases and sales of securities. The effects of changes in foreign currency exchange rates on investments in securities are included with the net realized and unrealized gain or loss on investment securities.
Income Taxes. As a qualified regulated investment company under Subchapter M of the Internal Revenue Code, each fund is not subject to U.S. federal income taxes to the extent that it distributes substantially all of its taxable income for its fiscal year. Each fund may be subject to foreign taxes on income and gains on investments which are accrued based upon each fund's understanding of the tax rules and regulations that exist in the markets in which they invest. Foreign governments may also impose taxes on other payments or transactions with respect to foreign securities. Each fund accrues such taxes as applicable. The schedules of investments include information regarding income taxes under the caption "Income Tax Information."
Investment Income. Dividend income is recorded on the ex-dividend date, except certain dividends from foreign securities where the ex-dividend date may have passed, which are recorded as soon as the funds are informed of the ex-dividend date. Non-cash dividends included in dividend income, if any, are recorded at the fair market value of the securities received. Interest income, which includes accretion of original issue discount, is accrued as earned. The funds may place a debt obligation on non-accrual status and reduce related interest income by ceasing current accruals and writing off interest receivables when the collection of all or a portion of interest has become doubtful based on consistently applied procedures, under the general supervision of the Board of Trustees of the funds. A debt obligation is removed from non-accrual status when the issuer resumes interest payments or when collectibility of interest is reasonably assured. Investment income is recorded net of foreign taxes withheld where recovery of such taxes is uncertain.
Expenses. Most expenses of each trust can be directly attributed to a fund. Expenses which cannot be directly attributed are apportioned among the funds in the trust.
Deferred Trustee Compensation. Under a Deferred Compensation Plan (the Plan) non-interested Trustees of certain funds must defer receipt of a portion of, and may elect to defer receipt of an additional portion of, their annual compensation. Deferred amounts are treated as though equivalent dollar amounts had been invested in a cross-section of other Fidelity funds. Deferred amounts remain in the funds until distributed in accordance with the Plan.
Distributions to Shareholders. Distributions are recorded on the ex-dividend date. Income dividends and capital gain distributions are declared separately for each class.
Income and capital gain distributions are determined in accordance with income tax regulations which may differ from generally accepted accounting principles. These differences, which may result in distribution reclassifications, are primarily due to differing treatments for litigation proceeds, paydown gains/losses on certain securities, futures transactions, foreign currency transactions, passive foreign investment companies (PFIC), market discount, partnerships, non-taxable dividends, net operating losses, capital loss carryforwards and losses deferred due to wash sales.
Permanent book and tax basis differences relating to shareholder distributions will result in reclassifications to paid in capital. Undistributed net investment income, distributions in excess of net investment income and accumulated undistributed net realized gain (loss) on investments and foreign currency transactions may include temporary book and tax basis differences which will reverse in a subsequent period. Any taxable income or gain remaining at fiscal year end is distributed in the following year.
Security Transactions. Security transactions are accounted for as of trade date. Gains and losses on securities sold are determined on the basis of identified cost.
2. Operating Policies.
Foreign Currency Contracts. Certain funds use foreign currency contracts to facilitate transactions in foreign-denominated securities. Losses may arise from changes in the value of the foreign currency or if the counterparties do not perform under the contracts' terms. The U.S. dollar value of foreign currency contracts is determined using contractual currency exchange rates established at the time of each trade.
Joint Trading Account. Pursuant to an Exemptive Order issued by the Securities and Exchange Commission (the SEC), certain funds, along with other affiliated entities of Fidelity Management & Research Company (FMR), may transfer uninvested cash balances into one or more joint trading accounts. These balances are invested in one or more repurchase agreements for U.S. Treasury or Federal Agency obligations.
Repurchase Agreements. The underlying U.S. Treasury, Federal Agency, or other obligations found to be satisfactory by FMR are transferred to an account of the funds, or to the Joint Trading Account, at a bank custodian. The securities are marked-to-market daily and maintained at a value at least equal to the principal amount of the repurchase agreement (including accrued interest). FMR, the funds' investment adviser, is responsible for determining that the value of the underlying securities remains in accordance with the market value requirements stated above.
Central Cash Funds. Pursuant to an Exemptive Order issued by the SEC, the funds may invest in the Taxable Central Cash Fund and the Central Cash Collateral Fund (the Cash Funds) managed by Fidelity Investments Money Management, Inc.
Semiannual Report
Notes to Financial Statements (Unaudited) - continued
2. Operating Policies - continued
Central Cash Funds - continued
(FIMM), an affiliate of FMR. The Cash Funds are open-end money market funds available only to investment companies and other accounts managed by FMR and its affiliates. The Cash Funds seek preservation of capital, liquidity, and current income. Income distributions from the Cash Funds are declared daily and paid monthly from net interest income. Income distributions earned by the funds are recorded as either interest income or security lending income in the accompanying financial statements.
Interfund Lending Program. Pursuant to an Exemptive Order issued by the SEC, the funds, along with other registered investment companies having management contracts with FMR, may participate in an interfund lending program. This program provides an alternative credit facility allowing the funds to borrow from, or lend money to, other participating funds. Information regarding each fund's participation in the program is included under the caption "Other Information" at the end of each applicable fund's schedule of investments.
Delayed Delivery Transactions. Each fund may purchase or sell securities on a delayed delivery basis. Payment and delivery may take place after the customary settlement period for that security. The price of the underlying securities and the date when the securities will be delivered and paid for are fixed at the time the transaction is negotiated. The market values of the securities purchased on a delayed delivery basis are identified as such in each applicable fund's schedule of investments. Each fund may receive compensation for interest forgone in the purchase of a delayed delivery security. With respect to purchase commitments, each fund identifies securities as segregated in its records with a value at least equal to the amount of the commitment. Losses may arise due to changes in the market value of the underlying securities or if the counterparty does not perform under the contract.
Futures Contracts. Certain funds may use futures contracts to manage their exposure to the stock market and to fluctuations in currency values. Buying futures tends to increase a fund's exposure to the underlying instrument, while selling futures tends to decrease a fund's exposure to the underlying instrument or hedge other fund investments. Futures contracts involve, to varying degrees, risk of loss in excess of the futures variation margin reflected in each applicable fund's Statement of Assets and Liabilities. The underlying face amount at value of any open futures contracts at period end is shown in each applicable fund's schedule of investments under the caption "Futures Contracts." This amount reflects each contract's exposure to the underlying instrument at period end. Losses may arise from changes in the value of the underlying instruments or if the counterparties do not perform under the contracts' terms. Gains (losses) are realized upon the expiration or closing of the futures contracts. Futures contracts are valued at the settlement price established each day by the board of trade or exchange on which they are traded.
Restricted Securities. Certain funds are permitted to invest in securities that are subject to legal or contractual restrictions on resale. These securities generally may be resold in transactions exempt from registration or to the public if the securities are registered. Disposal of these securities may involve time-consuming negotiations and expense, and prompt sale at an acceptable price may be difficult. Information regarding restricted securities is included under the caption "Other Information" at the end of each applicable fund's schedule of investments.
Loans and Other Direct Debt Instruments. Certain funds are permitted to invest in loans and loan participations, trade claims or other receivables. These investments may include standby financing commitments that obligate the fund to supply additional cash to the borrower on demand. Loan participations involve a risk of insolvency of the lending bank or other financial intermediary. At the end of the period, the following funds held investments in loans or other direct debt instruments:
|
|
Value |
% of Net Assets |
|
Asset Manager. |
$58,533,087 |
1.3% |
|
Asset Manager: Growth |
$9,260,883 |
1.6% |
|
High Income |
$12,978,197 |
0.6% |
Purchases and Sales of Investments.
Information regarding purchases and sales of securities (other than short-term securities) and the market value of future contracts opened and closed, is included under the caption "Other Information" at the end of each applicable fund's schedule of investments.
3. Fees and Other Transactions with Affiliates.
Management Fee. As each fund's investment adviser, FMR receives a monthly fee that is calculated on the basis of a group fee rate plus a fixed individual fund fee rate applied to the average net assets of each fund. The group fee rate is the weighted average of a series of rates and is based on the monthly average net assets of all the mutual funds advised by FMR. The rates ranged from .0920% to .3700% for the period for the High Income Portfolio and .2167% to .5200% for the period for the Asset Manager, Balanced, Asset Manager: Growth, Equity-Income, Growth & Income, Growth Opportunities, Contrafund, Growth, Mid Cap and Overseas Portfolios for the period. The annual individual fund fee rate is .30% for Asset Manager: Growth, Growth Opportunities, Contrafund, Growth, and Mid Cap Portfolios, .45% for High Income and Overseas Portfolios, .25% for Asset Manager Portfolio, .15% for Balanced Portfolio, and .20% for Equity-Income and Growth & Income Portfolios. In the event that these rates were lower than the contractual rates in effect during the period, FMR voluntarily implemented the above rates, as they resulted in the same or a lower management fee.
Semiannual Report
Notes to Financial Statements (Unaudited) - continued
4. Fees and Other Transactions with Affiliates - continued
Management Fee - continued
For the period, each fund's management fee was equivalent to the following annualized rates expressed as a percentage of average net assets:
|
High Income |
.58% |
|
Asset Manager |
.53% |
|
Balanced |
.43% |
|
Asset Manager: Growth |
.58% |
|
Equity-Income |
.48% |
|
Growth & Income |
.48% |
|
Growth Opportunities |
.58% |
|
Contrafund |
.57% |
|
Growth |
.57% |
|
Mid Cap |
.56% |
|
Overseas |
.72% |
Sub-Adviser Fee.FMR, on behalf of the Overseas Portfolio, entered into sub-advisory agreements with Fidelity Management & Research (U.K.) Inc., Fidelity Management & Research (Far East) Inc., and Fidelity International Investment Advisors (FIIA). Under the sub-advisory arrangements, FMR may receive investment advice and research services and may grant the sub-advisers investment management authority to buy and sell securities. FMR pays its sub-advisers either a portion of its management fee or a fee based on costs incurred for these services.
Distribution and Service Plan. In accordance with Rule 12b-1 of the 1940 Act, the Board of Trustees has adopted separate Distribution and Service Plans with respect to each class of shares (collectively referred to as "the Plans"). Under certain of the Plans, the class pays Fidelity Distributors Corporation (FDC), an affiliate of FMR, a 12b-1 fee. For the period, this fee is based on an annual rate of .10% of Service Class' average net assets and .25% of Service Class 2's average net assets. Initial Class shares are not subject to a 12b-1 fee.
For the period, each class paid FDC the following amounts, all of which were reallowed to insurance companies, for the distribution of shares and providing shareholder support services:
|
High Income |
|
|
Service Class |
126,071 |
|
Service Class 2 |
250 |
|
Asset Manager |
|
|
Service Class |
12,967 |
|
Service Class 2 |
195 |
|
Balanced |
|
|
Service Class |
13,703 |
|
Service Class 2 |
213 |
|
Asset Manager: Growth |
|
|
Service Class |
5,971 |
|
Service Class 2 |
204 |
|
Equity-Income |
|
|
Service Class |
221,204 |
|
Service Class 2 |
4,873 |
|
Growth & Income |
|
|
Service Class |
64,293 |
|
Service Class 2 |
492 |
|
Growth Opportunities |
|
|
Service Class |
170,539 |
|
Service Class 2 |
934 |
|
Contrafund |
|
|
Service Class |
472,035 |
|
Service Class 2 |
12,537 |
|
Growth |
|
|
Service Class |
650,795 |
|
Service Class 2 |
1,896 |
|
Mid Cap |
|
|
Service Class |
36,074 |
|
Service Class 2 |
8,716 |
|
Overseas |
|
|
Service Class |
99,503 |
|
Service Class 2 |
583 |
Transfer Agent Fees. Fidelity Investment Institutional Operations Company (FIIOC), an affiliate of FMR, is the funds' transfer, dividend disbursing and shareholder servicing agent. FIIOC receives account fees and asset-based fees that vary according to account size and type of account. FIIOC pays a portion of the expenses related to the typesetting, printing and mailing of shareholder reports, except proxy statements.
Semiannual Report
Notes to Financial Statements (Unaudited) - continued
4. Fees and Other Transactions with Affiliates - continued
Transfer Agent Fees - continued
For the period, each funds' transfer agent fees were equivalent to the following annualized rates expressed as a percentage of average net assets:
|
HIGH INCOME |
.07% |
|
ASSET MANAGER |
.07% |
|
BALANCED |
.07% |
|
ASSET MANAGER: GROWTH |
.07% |
|
EQUITY-INCOME |
.07% |
|
GROWTH & INCOME |
.07% |
|
GROWTH OPPORTUNITIES |
.07% |
|
CONTRAFUND |
.07% |
|
GROWTH |
.07% |
|
MID CAP |
.08% |
|
OVERSEAS |
.07% |
For the period, each class paid the following amounts:
|
High Income |
|
|
Initial Class |
655,017 |
|
Service Class |
83,102 |
|
Service Class 2 |
96 |
|
Asset Manager |
|
|
Initial Class |
1,526,085 |
|
Service Class |
8,951 |
|
Service Class 2 |
42 |
|
Balanced |
|
|
Initial Class |
92,789 |
|
Service Class |
9,127 |
|
Service Class 2 |
55 |
|
Asset Manager: Growth |
|
|
Initial Class |
179,131 |
|
Service Class |
4,189 |
|
Service Class 2 |
61 |
|
Equity-Income |
|
|
Initial Class |
3,206,951 |
|
Service Class |
146,559 |
|
Service Class 2 |
1,525 |
|
Growth & Income |
|
|
Initial Class |
351,138 |
|
Service Class 2 |
43,630 |
|
Service Class 2 |
132 |
|
Growth Opportunities |
|
|
Initial Class |
417,276 |
|
Service Class |
113,605 |
|
Service Class 2 |
426 |
|
Contrafund |
|
|
Initial Class |
2,952,107 |
|
Service Class |
316,815 |
|
Service Class 2 |
3,771 |
|
Growth |
|
|
Initial Class |
5,897,805 |
|
Service Class |
451,666 |
|
Service Class 2 |
848 |
|
Mid Cap |
|
|
Initial Class |
13,418 |
|
Service Class |
27,121 |
|
Service Class 2 |
2,882 |
|
Overseas |
|
|
Initial Class |
925,813 |
|
Service Class |
69,985 |
|
Service Class 2 |
301 |
Accounting and Security Lending Fees. Fidelity Service Company, Inc. (FSC), an affiliate of FMR, maintains each fund's accounting records and administers the security lending program. The security lending fee is based on the number and duration of lending transactions. The accounting fee is based on the level of average net assets for the month plus out-of-pocket expenses.
Brokerage Commissions. Certain funds placed a portion of their portfolio transactions with brokerage firms which are affiliates of FMR. The commissions paid to these affiliated firms are shown under the caption "Other Information" at the end of each applicable fund's schedule of investments.
4. Security Lending.
Certain funds lend portfolio securities from time to time in order to earn additional income. Each applicable fund receives collateral (in the form of U.S. Treasury obligations, letters of credit and/or cash) against the loaned securities and maintains collateral in an amount not less than 100% of the market value of the loaned securities during the period of the loan. The market value of the loaned securities is determined at the close of business of the funds and any additional required collateral is delivered to the funds on the next business day. If the borrower defaults on its obligation to return the securities loaned because of insolvency or other reasons, a fund could experience delays and costs in recovering the securities loaned or in gaining access to the collateral. Information regarding the value of securities loaned and the value of collateral at period end is included under the caption "Other Information" at the end of each applicable fund's schedule of investments.
5. Bank Borrowings.
Each fund is permitted to have bank borrowings for temporary or emergency purposes to fund shareholder redemptions. Each fund has established borrowing arrangements with certain banks. The interest rate on the borrowings is the bank's base rate, as revised from time to time. Information regarding a fund's participation in the program is included under the caption "Other Information" at the end of each applicable fund's schedule of investments.
Semiannual Report
Notes to Financial Statements (Unaudited) - continued
6. Expense Reductions.
FMR has directed certain portfolio trades to brokers who paid a portion of certain fund's expenses.
In addition, through arrangements with certain funds' custodians, credits realized as a result of uninvested cash balances were used to reduce a portion of each applicable fund's expenses.
For the period, the reductions under these arrangements are shown under the caption "Other Information" on each applicable fund's Statement of Operations.
7. Beneficial Interest.
At the end of the period, Fidelity Investments Life Insurance Company (FILI) and its subsidiaries, affiliates of FMR, were the record owners of more than 5% of the outstanding shares, and certain unaffiliated insurance companies were record owners of 10% or more of the total outstanding shares of the following funds:
|
|
FILI |
UNAFFILIATED INSURANCE COMPANIES |
|
|
FUND |
% OF OWERNISP |
# OF |
% OF OWNERSHIP |
|
HIGH INCOME |
11% |
2 |
61% |
|
ASSET MANAGER |
18% |
1 |
22% |
|
BALANCED |
36% |
1 |
52% |
|
ASSET MANAGER: GROWTH |
63% |
1 |
10% |
|
EQUITY-INCOME |
12% |
2 |
39% |
|
GROWTH & INCOME |
40% |
3 |
42% |
|
GROWTH OPPORTUNITIES |
15% |
1 |
66% |
|
CONTRAFUND |
20% |
2 |
34% |
|
GROWTH |
13% |
1 |
29% |
|
MID CAP |
44% |
1 |
28% |
|
OVERSEAS |
14% |
1 |
33% |
8. Transactions with Affiliated Companies.
An affiliated company is a company which the fund has ownership of at least 5% of the voting securities. Information regarding transactions with affiliated companies is included under "Legend" at the end of each applicable fund's schedule of investments.
Semiannual Report
Semiannual Report
Semiannual Report
Investment Adviser
Fidelity Management & Research Company
Boston, MA
Investment Sub-Advisers
Fidelity Investments Money Management, Inc.
Asset Manager, Balanced, and Asset Manager: Growth Portfolios
Fidelity Management & Research (U.K.) Inc.
High Income, Mid Cap, Asset Manager, Asset Manager:
Growth, Contrafund, Balanced, Growth Opportunities,
Growth & Income, and Overseas Portfolios
Fidelity Management & Research (Far East) Inc.
High Income, Mid Cap, Asset Manager, Asset Manager:
Growth, Contrafund, Balanced, Growth Opportunities,
Growth & Income, and Overseas Portfolios
Fidelity International Investment Advisors
Overseas Portfolio
Fidelity International Investment Advisors (U.K.) Limited
Overseas Portfolio
Fidelity Investments Japan Limited
High Income, Mid Cap, Asset Manager, Asset Manager:
Growth, Contrafund, Balanced, Growth Opportunities,
Growth & Income, and Overseas Portfolios
Officers
Edward C. Johnson 3d, President
Robert C. Pozen, Senior Vice President
Abigail P. Johnson, Vice President - Growth, Mid Cap,
Contrafund and Growth Opportunities Portfolios
Richard A. Spillane, Jr., Vice President - Equity-Income,
Overseas, Balanced and Growth & Income Portfolios
Robert A. Lawrence, Vice President - Asset Manager,
High Income and Asset Manager: Growth Portfolios
John Avery, Vice President - Balanced Portfolio
Barry J. Coffman, Vice President - High Income Portfolio
William Danoff, Vice President - Contrafund Portfolio
David Felman, Vice President - Mid Cap Portfolio
Kevin E. Grant, Vice President - Balanced Portfolio
Bart A. Grenier, Vice President - Asset Manager
and Asset Manager: Growth Portfolios
Richard R. Mace, Jr., Vice President - Overseas Portfolio
Charles S. Morrison II, Vice President - Asset Manager
and Asset Manager: Growth Portfolios
Stephen R. Petersen, Vice President - Equity-Income Portfolio
John J. Todd, Vice President - Asset Manager
and Asset Manager: Growth Portfolios
Jennifer Uhrig, Vice President - Growth Portfolio
Bettina Doulton, Vice President -
Growth Opportunities Portfolio
Steven J. Snider, Vice President - Asset Manager
and Asset Manager: Growth Portfolios
Jason L. Weiner, Vice President - Contrafund Portfolio
Eric D. Roiter, Secretary
Robert A. Dwight, Treasurer
Maria F. Dwyer, Deputy Treasurer
John H. Costello, Assistant Treasurer
Board of Trustees
Ralph F. Cox *
Phyllis Burke Davis *
Robert M. Gates *
Edward C. Johnson 3d
Donald J. Kirk *
Ned C. Lautenbach *
Peter S. Lynch
Marvin L. Mann *
William O. McCoy *
Gerald C. McDonough *
Robert C. Pozen
Thomas R. Williams *
Advisory Board
J. Michael Cook
Marie L. Knowles
General Distributor
Fidelity Distributors Corporation
Boston, MA
Transfer and Shareholder Servicing Agent
Fidelity Investments Institutional Operations Co., Inc.
Boston, MA
Custodian
The Bank of New York, New York, NY
High Income Portfolio
The Chase Manhattan Bank, New York, NY
Equity-Income, Asset Manager, Asset Manager: Growth,
Growth & Income, Balanced and Overseas Portfolios
Brown Brothers Harriman & Co., Boston, MA
Growth, Growth Opportunities, Mid Cap
and Contrafund Portfolios
* Independent trustees
VIPSC-SANN-0800 109455
1.744746.100
(2_fidelity_logos)
Overseas Portfolio
Mid Cap Portfolio
Growth Portfolio
Contrafund® Portfolio
Growth Opportunities Portfolio
Index 500 Portfolio
Growth & Income Portfolio
Equity-Income Portfolio
Balanced Portfolio
Asset Manager: Growth® Portfolio
Asset Manager SM Portfolio
High Income Portfolio
Investment Grade Bond Portfolio
Money Market Portfolio
Semiannual Report
June 30, 2000
|
Market Environment |
4 |
A review of what happened in world markets during the past six months. |
|
Overseas Portfolio |
5 |
Performance and Investment Summary
|
|
Mid Cap Portfolio |
14 |
Performance and Investment Summary
|
|
Growth Portfolio |
28 |
Performance and Investment Summary
|
|
Contrafund Portfolio |
39 |
Performance and Investment Summary
|
|
Growth Opportunities Portfolio |
53 |
Performance and Investment Summary
|
|
Index 500 Portfolio |
64 |
Performance and Investment Summary
|
|
Growth & Income Portfolio |
77 |
Performance and Investment Summary
|
|
Equity-Income Portfolio |
88 |
Performance and Investment Summary
|
|
Balanced Portfolio |
101 |
Performance and Investment Summary
|
|
Asset Manager: Growth Portfolio |
120 |
Performance and Investment Summary
|
|
Asset Manager Portfolio |
140 |
Performance and Investment Summary
|
|
High Income Portfolio |
161 |
Performance and Investment Summary
|
|
Investment Grade Bond Portfolio |
177 |
Performance and Investment Summary
|
|
Money Market Portfolio |
188 |
Performance
|
|
Notes to Financial Statements |
196 |
Notes to the Financial Statements |
Fidelity Variable Insurance Products are separate account options which are purchased through a variable insurance contract.
Standard & Poor's, S&P and S&P 500 are registered service marks of The McGraw-Hill Companies, Inc. and have been licensed for use by Fidelity Distributors Corporation.
Other third party marks appearing herein are the property of their respective owners.
All other marks appearing herein are registered or unregistered trademarks or service marks of FMR Corp. or an affiliated company.
(Recycle graphic) This report is printed on recycled paper using soy-based inks.
The views expressed in this report reflect those of each fund's portfolio manager only through the end of the period of the report as stated on the cover and do not necessarily represent the views of Fidelity or any other person in the Fidelity organization. Any such views are subject to change at any time based upon market or other conditions and Fidelity disclaims any responsibility to update such views. These views may not be relied on as investment advice and, because investment decisions for a Fidelity fund are based on numerous factors, may not be relied on as an indication of trading intent on behalf of any Fidelity fund.
This report and the financial statements contained herein are submitted for the general information of the shareholders of the funds. This report is not
authorized for distribution to prospective investors in the funds unless preceded or accompanied by an effective prospectus.
Mutual fund shares are not deposits or obligations of, or guaranteed by, any depository institution. Shares are not insured by the FDIC,
Federal Reserve Board or any other agency, and are subject to investment risks, including possible loss of principal amount invested.
Neither the funds nor Fidelity Distributors Corporation is a bank.
Semiannual Report
After reaching record heights in the first quarter of 2000, several of the most notable U.S. equity market indexes - including the Standard & Poor's 500SM, NASDAQ and Dow Jones Industrial Average - tumbled into negative territory by the end of the second quarter. Leading the market down was the same sector that drove it to new highs just a few months prior: technology. Beginning in mid-March, investors abandoned technology en masse, as concerns about excessive valuations and impending inflation pervaded the market. The ripple effect of the tech sell-off spread rapidly around the world, and international equity markets trended downward in response. As stocks cooled, domestic bond performance heated up, helping many U.S. fixed-income categories outpace their equity counterparts for the overall six-month period. Meanwhile, emerging-market bonds held on to most of their strong first quarter gains, but international developed-market bonds felt the pinch of inflation, as several central banks around the world began to implement interest-rate hikes to slow their respective economies.
At the mid-way point of 2000, the U.S. stock market's unprecedented streak of five consecutive double-digit annual increases appeared to be in jeopardy. The Dow Jones Industrial Average - an index of 30 blue-chip stocks - declined 8.42% during the six-month period ending June 30, 2000. The broad-based S&P 500® and the technology-concentrated NASDAQ index also disappeared below the surface, returning -0.42% and -2.44%, respectively. In a 10-week stretch from March through June, the NASDAQ dropped 33%, making dot-com investors anything but dot-calm as Internet stocks bore the brunt of the decline. As the spectacular growth of the technology sector waned, previously out-of-favor sectors began to lure investors' attention. The consistent, steady growth of the health sector was the primary beneficiary, as it wore the crown of best-performing sector for the first six months of 2000. The natural resources and real-estate sectors were surprising runners-up in the performance derby. But not all was lost for the technology sector. In June, economic reports showed strong evidence that the Federal Reserve Board's series of interest-rate hikes - including three during the first half of this year - were winning the battle against inflation. This news, combined with the Fed's decision to eschew another hike in June, fueled a renewed enthusiasm for tech stocks, as evidenced by the NASDAQ's 16.64% return for the final month of the period.
Reacting similarly to the U.S. stock market - and no doubt largely as a direct result of the U.S. market - most foreign stock markets started the six-month period off on a high note before stumbling in the second quarter. Japan and the Pacific Region in general fell particularly hard. After a stellar 1999, Japanese equities were shaken by their country's economic downturn and an unsteady U.S. market. "New Japan" stocks - Internet, electronic, telecom and software securities - led the
decline. The TOPIX Index, a benchmark of the Japanese market, fell 10.34% during the period. And even the best-performing Pacific Region fund had a negative return, according to Lipper Inc. Weak tech performance in the second quarter also hurt European stock markets, causing the Morgan Stanley Capital International Europe Index to decline 3.10% for the first half of 2000. One of the only non-U.S. stock markets that didn't suffer a negative second quarter was Canada. Often overlooked, the Canadian stock market quietly piled up an impressive six-month return of 21.89% - as measured by the Toronto Stock Exchange (TSE) 300.
Despite being challenged with a series of interest-rate hikes - almost always a detriment to fixed-income offerings - U.S. bond markets still managed to post solid returns relative to equities through the first six months of this year. U.S. government bonds were one of the top performers. In January, the U.S. Treasury announced its intent to repurchase long-term debt and curtail future issuance. Treasury prices soared in response and helped the Lehman Brothers Long-Term Government Bond Index return 8.77% for the period. The Lehman Brothers Aggregate Bond Index, a popular measure of taxable-bond performance, rose 3.99% for the past six months, while tax-free municipals were even more robust, gaining 4.48% according to the Lehman Brothers Municipal Bond Index. Underperformance in the bond market was pretty much limited to the high-yield sector. Faced with a rising interest-rate backdrop and poor technicals - including an unfavorable supply/demand condition and an increased default rate - the high-yield market stumbled to a negative return of 1.00%, as measured by the Merrill Lynch High Yield Master II Index, for the past six months.
International bond investors faced a myriad of negative factors throughout the majority of the six-month period ending June 30, 2000. Strong global economic growth and the threat of rising interest rates, currency fluctuations, and a weakening euro continued to plague global debt issues. Additionally, poor liquidity hampered bond prices in non-U.S. developed markets. Combined, those factors helped drag down the Salomon Brothers Non-U.S. World Government Bond Index, which returned -1.95%. On the bright side, a number of favorable factors propelled demand for emerging-market bonds, which was reflected in the 6.95% return of the J.P. Morgan Emerging Markets Bond Index Global - a popular benchmark of emerging-market debt. Credit momentum, which was driven by improving fundamentals - such as the Russian government's Soviet-era debt restructuring and new political leadership - fostered the rally in emerging-market bonds. Elsewhere, Brazil's better-than-expected economic growth fueled a sharp increase in foreign direct investment. Often large commodity suppliers, emerging-market countries also benefited from a sharp increase in oil prices.
Semiannual Report
Performance
There are several ways to evaluate a fund's historical performance. You can look at the total percentage change in value, the average annual percentage change or the growth of a hypothetical $10,000 investment. Total return reflects the change in the value of an investment, assuming reinvestment of the fund's dividend income and capital gains (the profits earned upon the sale of securities that have grown in value). The initial offering of Service Class 2 shares took place on January 12, 2000. Performance for Service Class 2 shares reflects an asset based distribution fee (12b-1 fee). Returns from November 3, 1997 to January 12, 2000 are those of Service Class which reflect a different 12b-1 fee. Service Class 2 returns prior to November 3, 1997 are those of Initial Class, and do not include the effects of a 12b-1 fee. Had Service Class 2 shares' 12b-1 fee been reflected, returns prior to January 12, 2000 would have been lower.
Average Annual Total Returns
|
Periods ended |
Past 1 |
Past 5 |
Past 10 |
|
Fidelity VIP: Overseas - |
24.97% |
15.11% |
9.81% |
|
MSCI EAFE |
17.38% |
11.49% |
8.04% |
Average annual returns take the fund's cumulative return and show you what would have happened if the fund had performed at a constant rate each year.
You can compare the fund's returns to the performance of the Morgan Stanley Capital International Europe, Australasia, Far East (EAFE) Index - a market capitalization-weighted index that is designed to represent the performance of developed stock markets outside the United States and Canada. As of June 30, 2000, the index included 947 equity securities of companies domiciled in 20 countries.
Figures for more than one year assume a steady compounded rate of return and are not the fund's year-by-year results, which fluctuated over the periods shown.
Performance numbers are net of all fund operating expenses, but do not include any insurance charges imposed by your insurance company's separate account. If performance information included the effect of these additional charges, the total returns would have been lower.
Past performance is no guarantee of future results. Principal and investment return will vary and you may have a gain or loss when you withdraw your money. Foreign investments involve greater risks and potential rewards than U.S. investments. These risks include political and economic uncertainties of foreign countries, as well as the risk of currency fluctuations.
Understanding Performance
Many markets around the globe offer the potential for significant growth over time; however, investing in foreign markets means assuming greater risks than investing in the United States. Factors like changes in a country's financial markets, its local political and economic climate, and the fluctuating value of its currency create these risks. For these reasons an international fund's performance may be more volatile than a fund that invests exclusively in the United States.
3$10,000 Over 10 Years
$10,000 Over 10 Years: Let's say hypothetically that $10,000 was invested in Fidelity Variable Insurance Products: Overseas Portfolio - Service Class 2 on June 30, 1990. As the chart shows, by June 30, 2000, the value of the investment would have grown to $25,494 - a 154.94% increase on the initial investment. For comparison, look at how the Morgan Stanley Capital International EAFE Index did over the same period. With dividends and capital gains, if any, reinvested, the same $10,000 investment would have grown to $21,660 - a 116.60% increase.
Investment Summary
|
Top Five Stocks as of June 30, 2000 |
|
|
|
% of fund's |
|
TotalFinaElf SA Class B (France) |
4.7 |
|
Furukawa Electric Co. Ltd. (Japan) |
4.5 |
|
BP Amoco PLC (United Kingdom) |
4.0 |
|
Vodafone AirTouch PLC (United Kingdom) |
3.6 |
|
Samsung Electronics Co. Ltd. (Korea (South)) |
2.9 |
|
|
19.7 |
|
Top Five Market Sectors as of June 30, 2000 |
|
|
|
% of fund's |
|
Technology |
16.4 |
|
Utilities |
15.7 |
|
Energy |
14.3 |
|
Finance |
13.3 |
|
Industrial Machinery & Equipment |
8.8 |
|
Top Five Countries as of June 30, 2000 |
|
|
(excluding cash equivalents) |
% of fund's |
|
Japan |
22.3 |
|
United Kingdom |
16.5 |
|
France |
10.2 |
|
Netherlands |
8.0 |
|
Switzerland |
3.7 |
|
Percentages are adjusted for the effect of open futures contracts, if applicable. |
Semiannual Report
(Portfolio Manager photograph)
An interview with Richard Mace, Portfolio Manager of Overseas Portfolio
Q. How did the fund perform, Rick?
A. For the six months that ended June 30, 2000, the fund lagged the -3.97% return of the Morgan Stanley Capital International EAFE Index, which tracks the performance of stocks in Europe, Australasia and the Far East. For the 12 months that ended June 30, 2000, the fund's return topped the 17.38% return of the EAFE index.
Q. Why did the fund underperform its index during the past six months?
A. The fund's high concentration in Japanese technology and European and Japanese telephone utilities stocks - which were among the most positive sectors for the fund in the prior period - turned out to be the biggest relative detractor from performance this period. This weakness was due to a global correction in both sectors that was fueled by unsustainable valuations, some disappointing earnings reports and concerns about higher interest rates. In January and February, continued strong returns from the fund's positions in selected Japanese technology stocks - such as Kyocera - and Internet-related companies - such as Softbank - were short-lived when technology stocks retreated in March, turning advances in those stocks into detractors from performance for the remainder of the period. Among the utilities stocks that gave up some of their gains from the fourth quarter of 1999 and hurt the fund most were European and Japanese telephone utilities such as Vodafone AirTouch, British Telecommunications, DDI and Nippon Telegraph & Telephone.
Q. There seemed to be an effort to make the fund more concentrated during the period . . .
A. That's true. It was an extremely difficult period. Volatile market conditions created some unusual opportunities to buy more of the fund's most attractive stocks at cheaper prices. Therefore, I eliminated some of the fund's smaller and less attractive holdings to increase our positions in the stocks with the greatest potential for growth. My effort to increase the fund's concentration reduced the total number of stocks in the portfolio by about 27%. Further, the strategy also boosted the weighting of the fund's top-10 positions to 28.1% of the fund's net assets, from 19.7% of net assets six months earlier.
Q. Why did the fund's energy position rise from the prior period? What was your strategy there?
A. The energy sector looked attractive for several reasons. First, OPEC (Organization of Petroleum Exporting Countries) curtailed production during a period of increasing global demand, and this caused oil inventories to fall to very low levels. Second, as demand continued to grow and inventories remained low, I felt that oil prices might remain above the levels most investors were expecting - and that meant energy stocks were cheap as they reflected a $16-$18 per barrel oil price assumption. Third, I thought the earnings estimates for these companies were generally too low. Most were generating substantial cash flow and were benefiting from continuing industry consolidation activity. In this environment, I added to some of the fund's existing positions in oil producers such as TotalFinaElf and BP Amoco, both of which were among the fund's top-five holdings at the end of the period. In addition, I initiated positions in a number of tanker stocks on expectations that OPEC would need to increase production in an effort to ease oil prices. This worked out well as production quotas were eventually raised and prices for tanker stocks - such as fund holding Overseas Shipholding - increased substantially.
Q. What were some of the fund's top performers?
Which stocks disappointed?
A. Furukawa, a Japanese company that provides materials and components used in the manufacturing of electronics equipment such as cell phones, bucked the sell-off in the technology sector and stood out as the fund's top performer. TotalFinaElf, the French oil producer, was the fund's second-biggest contributor as investors reacted positively to its acquisition of Elf Aquitane and the rising demand for oil. On the down side, Kyocera, the fund's largest detractor, and Vodafone AirTouch both suffered from overall weakness in the technology and utilities sectors.
Q. What's your outlook, Rick?
A. I'll continue to look for undervalued companies that have good growth prospects and are consistently reporting strong earnings. In partnership with our team of 100 international research analysts, we'll maintain our global stock selection process using a bottom-up approach, while monitoring country and industry weightings. I expect consolidation to remain a major theme across a variety of sectors as corporate managements seek to cut costs, boost growth and increase their global competitiveness by acquiring competitors.
The views expressed in this report reflect those of the portfolio manager only through the end of the period of the report as stated on the cover. The manager's views are subject to change at any time based upon market or other conditions. For more information, see page 2.
Fund Facts
Goal: seeks long-term growth of capital primarily by investments in foreign securities
Start date: January 28, 1987
Size: as of June 30, 2000, more than $3.0 billion
Manager: Richard Mace, since 1996; joined Fidelity in 1987
3Semiannual Report
Fidelity Variable Insurance Products: Overseas Portfolio
(Unaudited)
Showing Percentage of Net Assets
|
Common Stocks - 90.5% |
|||
|
Shares |
Value (Note 1) |
||
|
Australia - 1.1% |
|||
|
Broken Hill Proprietary Co. Ltd. |
676,793 |
$ 7,977,892 |
|
|
Cable & Wireless Optus Ltd. (a) |
2,839,300 |
8,439,288 |
|
|
News Corp. Ltd. |
795,223 |
10,834,913 |
|
|
News Corp. Ltd. sponsored ADR (preferred ltd. vtg.) |
163,800 |
7,780,500 |
|
|
|
35,032,593 |
||
|
Belgium - 0.2% |
|||
|
Electrabel SA |
22,500 |
5,556,997 |
|
|
Brazil - 0.3% |
|||
|
Aracruz Celulose SA sponsored ADR |
212,400 |
4,101,975 |
|
|
Telesp Celular Participacoes SA ADR |
141,800 |
6,363,275 |
|
|
|
10,465,250 |
||
|
Canada - 2.8% |
|||
|
Alberta Energy Co. Ltd. |
189,500 |
7,654,238 |
|
|
Anderson Exploration Ltd. (a) |
355,200 |
6,453,820 |
|
|
BCE, Inc. |
59,000 |
1,398,784 |
|
|
Canada Occidental Petroleum Ltd. |
153,000 |
4,149,240 |
|
|
Canadian Natural Resources Ltd. (a) |
279,600 |
8,120,770 |
|
|
Celestica, Inc. (sub. vtg.) (a) |
199,800 |
9,730,213 |
|
|
Cinar Films, Inc. Class B (ltd. vtg.) (a) |
136,500 |
477,750 |
|
|
Crestar Energy, Inc. (a) |
277,500 |
4,226,697 |
|
|
Mitel Corp. (a) |
112,300 |
2,343,850 |
|
|
Nortel Networks Corp. |
92,652 |
6,427,126 |
|
|
Rio Alto Exploration Ltd. (a) |
257,500 |
4,713,441 |
|
|
Suncor Energy, Inc. |
196,500 |
4,539,210 |
|
|
Talisman Energy, Inc. (a) |
659,100 |
21,836,444 |
|
|
Telesystem International Wireless, Inc. (sub. vtg.) (a) |
213,900 |
3,915,360 |
|
|
|
85,986,943 |
||
|
Denmark - 0.4% |
|||
|
Novo-Nordisk AS (B Shares) (a) |
64,800 |
11,018,365 |
|
|
Finland - 2.8% |
|||
|
Metsa-Serla Oyj Class B Free Shares |
164,200 |
1,213,949 |
|
|
Nokia AB |
770,000 |
38,451,874 |
|
|
Sampo Insurance Co. Ltd. |
131,100 |
5,315,171 |
|
|
Sonera Corp. |
221,200 |
10,075,906 |
|
|
UPM-Kymmene Corp. |
1,284,600 |
31,861,548 |
|
|
|
86,918,448 |
||
|
France - 10.2% |
|||
|
Aventis SA |
166,260 |
12,064,242 |
|
|
AXA SA de CV |
127,026 |
19,994,115 |
|
|
Banque Nationale de Paris (BNP) |
159,240 |
15,312,225 |
|
|
Canal Plus SA |
28,800 |
4,835,382 |
|
|
Castorama Dubois Investissements SA |
34,750 |
8,585,789 |
|
|
Compagnie de St. Gobain |
23,000 |
3,106,824 |
|
|
France Telecom SA |
280,400 |
39,160,182 |
|
|
Rhodia SA |
361,700 |
6,072,769 |
|
|
Sanofi-Synthelabo SA |
193,168 |
9,195,203 |
|
|
Societe Generale Class A |
168,800 |
10,144,686 |
|
|
|
|||
|
Shares |
Value (Note 1) |
||
|
Suez Lyonnaise des Eaux |
33,800 |
$ 5,916,684 |
|
|
Television Francaise 1 SA |
208,940 |
14,550,237 |
|
|
TotalFinaElf SA Class B |
945,444 |
145,598,378 |
|
|
Vivendi SA |
245,500 |
21,651,302 |
|
|
|
316,188,018 |
||
|
Germany - 3.7% |
|||
|
Allianz AG (Reg.) |
47,200 |
16,943,449 |
|
|
BASF AG |
517,700 |
20,791,502 |
|
|
Deutsche Telekom AG |
218,700 |
12,476,006 |
|
|
E.On AG |
159,700 |
7,693,464 |
|
|
Intershop Communication AG (a) |
6,800 |
3,093,584 |
|
|
JUMPtec Industrielle Computertechnik AG |
5,292 |
467,978 |
|
|
Kali Und Salz Beteiligungs AG |
590,850 |
9,018,262 |
|
|
Munich Reinsurance AG (Reg.) |
28,192 |
8,848,047 |
|
|
Siemens AG |
193,500 |
29,165,113 |
|
|
Software AG |
18,200 |
1,684,103 |
|
|
United Internet AG (a) |
21,700 |
2,670,392 |
|
|
|
112,851,900 |
||
|
Hong Kong - 1.4% |
|||
|
China Telecom (Hong Kong) Ltd. (a) |
3,618,000 |
32,166,283 |
|
|
Hutchison Whampoa Ltd. |
578,600 |
7,273,693 |
|
|
Johnson Electric Holdings Ltd. |
480,000 |
4,541,023 |
|
|
|
43,980,999 |
||
|
Ireland - 0.2% |
|||
|
Bank of Ireland, Inc. |
1,151,438 |
7,205,598 |
|
|
Israel - 0.2% |
|||
|
Check Point Software |
24,600 |
5,209,050 |
|
|
Italy - 1.9% |
|||
|
Banca Intesa Spa |
3,138,646 |
14,144,182 |
|
|
Olivetti & Co. Spa |
1,883,500 |
6,856,455 |
|
|
San Paolo Imi Spa |
404,100 |
7,124,648 |
|
|
Telecom Italia Mobile Spa |
1,313,900 |
13,410,072 |
|
|
Telecom Italia Spa |
1,130,524 |
15,551,776 |
|
|
|
57,087,133 |
||
|
Japan - 22.3% |
|||
|
Asahi Chemical Industry Co. Ltd. |
527,000 |
3,728,070 |
|
|
Canon, Inc. |
445,000 |
22,416,876 |
|
|
DDI Corp. |
2,836 |
27,284,664 |
|
|
Fuji Bank Ltd. |
902,000 |
6,857,310 |
|
|
Fujitsu Ltd. |
749,000 |
25,927,468 |
|
|
Furukawa Electric Co. Ltd. |
6,630,000 |
138,515,852 |
|
|
Hitachi Chemical Co. Ltd. |
132,000 |
3,056,593 |
|
|
Hitachi Zosen Corp. (a) |
1,563,000 |
1,415,280 |
|
|
Hoya Corp. |
80,000 |
7,168,459 |
|
|
Ito-Yokado Co. Ltd. |
387,000 |
23,288,626 |
|
|
KDD Corp. |
73,900 |
7,458,310 |
|
|
Kyocera Corp. |
287,200 |
49,344,552 |
|
|
Mitsubishi Electric Corp. |
1,303,000 |
14,109,074 |
|
|
Mitsubishi Estate Co. Ltd. |
646,000 |
7,604,301 |
|
|
Common Stocks - continued |
|||
|
Shares |
Value (Note 1) |
||
|
Japan - continued |
|||
|
Mitsui Fudosan Co. Ltd. |
288,000 |
$ 3,123,939 |
|
|
NEC Corp. |
885,000 |
27,797,115 |
|
|
Net One Systems Co. Ltd. |
159 |
3,659,310 |
|
|
Nikko Securities Co. Ltd. |
4,280,000 |
42,388,230 |
|
|
Nintendo Co. Ltd. |
39,000 |
6,812,677 |
|
|
Nippon Telegraph & Telephone Corp. |
3,306 |
43,967,744 |
|
|
Nomura Securities Co. Ltd. |
2,238,000 |
54,778,440 |
|
|
NTT DoCoMo, Inc. |
365 |
9,880,683 |
|
|
Oki Electric Industry Co. Ltd. (a) |
719,000 |
5,594,935 |
|
|
Omron Corp. |
772,000 |
20,971,138 |
|
|
ORIX Corp. |
57,600 |
8,502,547 |
|
|
Rohm Co. Ltd. |
24,300 |
7,105,263 |
|
|
Sakura Bank Ltd. |
1,052,000 |
7,273,307 |
|
|
Softbank Corp. |
131,700 |
17,887,946 |
|
|
Sony Corp. |
199,600 |
18,824,776 |
|
|
Takeda Chemical Industries Ltd. |
455,000 |
29,869,837 |
|
|
Toko, Inc. |
586,000 |
4,427,335 |
|
|
Tokyo Broadcasting System, Inc. |
136,000 |
5,875,118 |
|
|
Tokyo Seimitsu Co. Ltd. |
128,800 |
17,251,085 |
|
|
Trans Cosmos, Inc. |
31,600 |
4,745,067 |
|
|
Yamanouchi Pharmaceutical Co. Ltd. |
117,000 |
6,389,644 |
|
|
Zeon Corp. |
712,000 |
5,070,364 |
|
|
|
690,371,935 |
||
|
Korea (South) - 3.6% |
|||
|
Kookmin Bank |
228,100 |
2,904,886 |
|
|
Samsung Electro-Mechanics Co. (a) |
152,610 |
9,566,997 |
|
|
Samsung Electronics Co. Ltd. |
271,340 |
89,795,721 |
|
|
SK Telecom Co. Ltd. ADR |
286,100 |
10,389,006 |
|
|
|
112,656,610 |
||
|
Marshall Islands - 0.6% |
|||
|
Teekay Shipping Corp. |
592,500 |
19,478,438 |
|
|
Mexico - 2.8% |
|||
|
Grupo Televisa SA de CV sponsored GDR (a) |
253,400 |
17,468,763 |
|
|
Telefonos de Mexico SA de CV Series L sponsored ADR |
552,800 |
31,578,700 |
|
|
TV Azteca SA de CV sponsored ADR |
1,962,700 |
25,883,106 |
|
|
Wal-Mart de Mexico SA de CV |
5,402,000 |
12,644,151 |
|
|
|
87,574,720 |
||
|
Netherlands - 8.0% |
|||
|
ABN AMRO Holding NV |
404,000 |
9,889,256 |
|
|
Akzo Nobel NV (a) |
312,300 |
13,257,377 |
|
|
Equant NV (NY Shares) (a) |
312,000 |
13,416,000 |
|
|
Heineken NV |
94,600 |
5,753,034 |
|
|
ING Groep NV |
352,462 |
23,805,164 |
|
|
Koninklijke Ahold NV (a) |
711,949 |
20,938,618 |
|
|
Koninklijke KPN NV |
235,600 |
10,529,567 |
|
|
Koninklijke Philips Electronics NV |
1,201,984 |
56,643,652 |
|
|
|
|||
|
Shares |
Value (Note 1) |
||
|
Nutreco Holding NV |
123,833 |
$ 4,725,220 |
|
|
Royal Dutch Petroleum Co. |
801,800 |
49,360,809 |
|
|
STMicroelectronics NV (NY Shares) |
152,700 |
9,801,431 |
|
|
United Pan-Europe Communications NV Class A (a) |
372,200 |
9,725,099 |
|
|
Vendex KBB NV |
496,457 |
8,425,258 |
|
|
VNU NV |
106,700 |
5,506,648 |
|
|
Wolters Kluwer NV |
239,700 |
6,379,665 |
|
|
|
248,156,798 |
||
|
Norway - 1.3% |
|||
|
Bergesen dy ASA: |
|
|
|
|
(A Shares) |
509,100 |
10,433,470 |
|
|
(B Shares) |
489,051 |
9,367,702 |
|
|
DNB Holding ASA |
1,026,200 |
4,253,976 |
|
|
Frontline Ltd. (a) |
769,900 |
9,413,186 |
|
|
TANDBERG ASA (a) |
186,400 |
4,438,664 |
|
|
VMETRO ASA |
121,900 |
1,419,439 |
|
|
|
39,326,437 |
||
|
Russia - 0.0% |
|||
|
Mobile TeleSystems Ojsc sponsored ADR (a) |
21,100 |
472,113 |
|
|
Singapore - 0.8% |
|||
|
Chartered Semiconductor |
196,100 |
17,649,000 |
|
|
Overseas Union Bank Ltd. |
862,296 |
3,342,716 |
|
|
United Overseas Bank Ltd. |
329,472 |
2,154,097 |
|
|
|
23,145,813 |
||
|
Spain - 1.7% |
|||
|
Altadis SA |
245,727 |
3,771,677 |
|
|
Banco Santander Central Hispano SA |
1,538,868 |
16,221,435 |
|
|
Telefonica SA (a) |
1,445,100 |
31,017,446 |
|
|
|
51,010,558 |
||
|
Sweden - 0.1% |
|||
|
Netcom AB (B Shares) (a) |
25,300 |
1,873,808 |
|
|
Switzerland - 3.7% |
|||
|
ABB Ltd. (Reg.) |
60,751 |
7,262,817 |
|
|
Credit Suisse Group (Reg.) |
131,154 |
26,058,947 |
|
|
Gretag Imaging Holding AG (Reg. D) |
6,500 |
1,249,694 |
|
|
Julius Baer Holding AG |
1,792 |
7,077,149 |
|
|
Nestle SA (Reg.) |
21,218 |
42,417,812 |
|
|
The Swatch Group AG (Reg.) |
46,400 |
12,088,660 |
|
|
UBS AG |
109,468 |
16,019,380 |
|
|
Valora Holding AG |
8,500 |
2,357,641 |
|
|
|
114,532,100 |
||
|
Taiwan - 2.4% |
|||
|
Macronix International Co. Ltd. (a) |
1,754,890 |
4,397,934 |
|
|
Taiwan Semiconductor |
6,292,976 |
29,903,157 |
|
|
Common Stocks - continued |
|||
|
Shares |
Value (Note 1) |
||
|
Taiwan - continued |
|||
|
United Microelectronics Corp. |
9,392,400 |
$ 26,136,703 |
|
|
Winbond Electronics Corp. (a) |
4,298,450 |
12,451,165 |
|
|
|
72,888,959 |
||
|
United Kingdom - 16.5% |
|||
|
Amvescap PLC |
871,400 |
14,012,286 |
|
|
BAE SYSTEMS PLC |
1,589,329 |
9,933,370 |
|
|
BP Amoco PLC |
13,057,386 |
123,092,995 |
|
|
Cable & Wireless PLC |
1,959,100 |
33,256,173 |
|
|
Carlton Communications PLC |
1,578,600 |
20,355,258 |
|
|
Diageo PLC |
476,100 |
4,282,905 |
|
|
Granada Group PLC |
715,800 |
7,166,733 |
|
|
HSBC Holdings PLC (Reg.) |
938,894 |
10,879,433 |
|
|
Lloyds TSB Group PLC |
1,473,800 |
13,951,109 |
|
|
Marconi PLC |
639,700 |
8,345,654 |
|
|
Misys PLC |
631,300 |
5,343,866 |
|
|
Prudential Corp. PLC |
454,200 |
6,669,727 |
|
|
Reed International PLC |
537,300 |
4,686,734 |
|
|
Reuters Group PLC |
767,400 |
12,782,007 |
|
|
Rio Tinto PLC (Reg.) |
768,500 |
12,590,797 |
|
|
Royal Bank of Scotland Group PLC |
1,639,500 |
27,507,564 |
|
|
Shell Transport & Trading Co. PLC (Reg.) |
6,057,900 |
50,419,383 |
|
|
SMG PLC |
787,200 |
4,257,260 |
|
|
SmithKline Beecham PLC |
1,620,442 |
21,126,500 |
|
|
SSL International PLC |
96,600 |
1,047,777 |
|
|
Unilever PLC |
363,810 |
2,285,180 |
|
|
Vodafone AirTouch PLC |
26,557,103 |
110,045,894 |
|
|
WPP Group PLC |
465,700 |
6,817,406 |
|
|
|
510,856,011 |
||
|
United States of America - 1.5% |
|||
|
Bristol-Myers Squibb Co. |
151,000 |
8,795,750 |
|
|
Eli Lilly & Co. |
119,500 |
11,935,063 |
|
|
OMI Corp. |
443,100 |
2,409,356 |
|
|
Overseas Shipholding Group, Inc. |
533,300 |
13,132,513 |
|
|
Schering-Plough Corp. |
186,300 |
9,408,150 |
|
|
|
45,680,832 |
||
|
TOTAL COMMON STOCKS (Cost $2,098,252,397) |
2,795,526,426 |
||
|
Investment Companies - 0.1% |
|||
|
|
|
|
|
|
Multi-National - 0.1% |
|||
|
European Warrant Fund, Inc. |
306,000 |
4,475,250 |
|
|
Cash Equivalents - 12.4% |
|||
|
Shares |
Value (Note 1) |
||
|
Central Cash Collateral Fund, 6.71% (b) |
164,583,560 |
$ 164,583,560 |
|
|
Taxable Central Cash Fund, 6.59% (b) |
218,019,162 |
218,019,162 |
|
|
TOTAL CASH EQUIVALENTS (Cost $382,602,722) |
382,602,722 |
||
|
TOTAL INVESTMENT PORTFOLIO - 103.0% (Cost $2,485,876,718) |
3,182,604,398 |
|
|
NET OTHER ASSETS - (3.0)% |
(92,987,924) |
|
|
NET ASSETS - 100% |
$ 3,089,616,474 |
|
|
Legend |
|
(a) Non-income producing |
|
(b) The rate quoted is the annualized seven-day yield of the fund at |
|
Other Information |
|
Purchases and sales of securities, other than short-term securities, aggregated $1,789,627,683 and $1,514,198,966, respectively, of which U.S. government and government agency obligations aggregated $0 and $4,435,324, respectively. |
|
The market value of futures contracts opened and closed during the period amounted to $0 and $16,650,996, respectively. |
|
The fund placed a portion of its portfolio transactions with brokerage firms which are affiliates of Fidelity Management & Research Company. The commissions paid to these affiliated firms were $1,080 for the period. |
|
The fund participated in the security lending program. At the period end, the value of securities loaned amounted to $164,478,909. The fund received cash collateral of $164,583,560 which was invested in cash equivalents and U.S. Treasury Obligations valued at $7,170,000. |
|
Income Tax Information |
|
At June 30, 2000, the aggregate cost of investment securities for income tax purposes was $2,495,276,806. Net unrealized appreciation aggregated $687,327,592, of which $794,595,136 related to appreciated investment securities and $107,267,544 related to depreciated investment securities. |
Overseas Portfolio
See accompanying notes which are an integral part of the financial statements.
Statement of Assets and Liabilities
|
|
June 30, 2000 (Unaudited) |
|
|
Assets |
|
|
|
Investment in securities, at value (cost $2,485,876,718) - |
|
$ 3,182,604,398 |
|
Foreign currency held at value |
|
14,800,284 |
|
Receivable for investments sold |
|
87,398,285 |
|
Receivable for fund shares sold |
|
55,319,628 |
|
Dividends receivable |
|
4,560,497 |
|
Interest receivable |
|
1,166,523 |
|
Other receivables |
|
32,299 |
|
Total assets |
|
3,345,881,914 |
|
Liabilities |
|
|
|
Payable to custodian bank |
$ 24 |
|
|
Payable for investments purchased |
88,348,263 |
|
|
Payable for fund shares redeemed |
755,883 |
|
|
Accrued management fee |
1,845,001 |
|
|
Distribution fees payable |
20,958 |
|
|
Other payables and |
711,751 |
|
|
Collateral on securities loaned, |
164,583,560 |
|
|
Total liabilities |
|
256,265,440 |
|
Net Assets |
|
$ 3,089,616,474 |
|
Net Assets consist of: |
|
|
|
Paid in capital |
|
$ 2,238,651,656 |
|
Undistributed net investment income |
|
6,881,028 |
|
Accumulated undistributed |
|
147,360,600 |
|
Net unrealized appreciation (depreciation) on investments |
|
696,723,190 |
|
Net Assets |
|
$ 3,089,616,474 |
|
Initial Class : |
|
$23.46 |
|
Service Class: |
|
$23.41 |
|
Service Class 2: |
|
$23.38 |
Statement of Operations
|
|
Six months ended June 30, 2000 (Unaudited) |
|
|
Investment Income Dividends |
|
$ 28,919,045 |
|
Interest |
|
5,991,504 |
|
Security lending |
|
369,625 |
|
|
|
35,280,174 |
|
Less foreign taxes withheld |
|
(3,264,911) |
|
Total income |
|
32,015,263 |
|
Expenses |
|
|
|
Management fee |
$ 10,781,118 |
|
|
Transfer agent fees |
996,099 |
|
|
Distribution fees |
100,086 |
|
|
Accounting and security lending fees |
697,742 |
|
|
Non-interested trustees' compensation |
12,169 |
|
|
Custodian fees and expenses |
703,855 |
|
|
Registration fees |
159,039 |
|
|
Audit |
23,591 |
|
|
Legal |
11,063 |
|
|
Miscellaneous |
25,459 |
|
|
Total expenses before reductions |
13,510,221 |
|
|
Expense reductions |
(262,270) |
13,247,951 |
|
Net investment income |
|
18,767,312 |
|
Realized and Unrealized Gain (Loss) Net realized gain (loss) on: |
|
|
|
Investment securities |
157,476,657 |
|
|
Foreign currency transactions |
(157,449) |
|
|
Futures contracts |
966,799 |
158,286,007 |
|
Change in net unrealized appreciation (depreciation) on: |
|
|
|
Investment securities |
(308,240,636) |
|
|
Assets and liabilities in |
(88,785) |
|
|
Futures contracts |
(450,390) |
(308,779,811) |
|
Net gain (loss) |
|
(150,493,804) |
|
Net increase (decrease) in net assets resulting from operations |
|
$ (131,726,492) |
|
Other Information Expense reductions |
|
$ 249,713 |
|
Custodian credits |
|
12,557 |
|
|
|
$ 262,270 |
See accompanying notes which are an integral part of the financial statements.
Semiannual Report
Fidelity Variable Insurance Products: Overseas Portfolio
Financial Statements - continued
Statement of Changes in Net Assets
|
Increase (Decrease) in Net Assets |
Six months ended |
Year ended |
|
Operations |
$ 18,767,312 |
$ 24,385,652 |
|
Net realized gain (loss) |
158,286,007 |
279,081,035 |
|
Change in net unrealized appreciation (depreciation) |
(308,779,811) |
567,840,640 |
|
Net increase (decrease) in net assets resulting from operations |
(131,726,492) |
871,307,327 |
|
Distributions to shareholders |
(29,474,912) |
(31,839,750) |
|
In excess of net investment income |
(12,018,477) |
- |
|
From net realized gain |
(261,723,630) |
(51,354,434) |
|
Total distributions |
(303,217,019) |
(83,194,184) |
|
Share transactions - net increase (decrease) |
643,337,117 |
(16,452,995) |
|
Total increase (decrease) in net assets |
208,393,606 |
771,660,148 |
|
Net Assets |
|
|
|
Beginning of period |
2,881,222,868 |
2,109,562,720 |
|
End of period (including undistributed net investment income of $6,881,028 and $10,707,600, respectively) |
$ 3,089,616,474 |
$ 2,881,222,868 |
|
Other Information: |
|
|
Six months ended June 30, 2000 |
Year ended |
||
|
|
Shares |
Dollars |
Shares |
Dollars |
|
Share transactions |
85,476,599 |
$ 2,061,439,529 |
137,488,784 |
$ 2,927,082,596 |
|
Reinvested |
11,650,005 |
284,959,119 |
4,250,326 |
81,691,268 |
|
Redeemed |
(76,595,523) |
(1,846,989,611) |
(145,444,173) |
(3,101,747,139) |
|
Net increase (decrease) |
20,531,081 |
$ 499,409,037 |
(3,705,063) |
$ (92,973,275) |
|
Service Class |
36,993,399 |
$ 881,191,616 |
18,969,271 |
$ 422,534,083 |
|
Reinvested |
747,240 |
18,247,617 |
78,277 |
1,502,916 |
|
Redeemed |
(31,673,883) |
(757,892,720) |
(15,508,477) |
(347,516,719) |
|
Net increase (decrease) |
6,066,756 |
$ 141,546,513 |
3,539,071 |
$ 76,520,280 |
|
Service Class 2 A |
107,413 |
$ 2,478,164 |
- |
$ - |
|
Reinvested |
421 |
10,283 |
- |
- |
|
Redeemed |
(4,671) |
(106,880) |
- |
- |
|
Net increase (decrease) |
103,163 |
$ 2,381,567 |
- |
$ - |
|
Distributions |
|
$ 27,739,213 |
|
$ 31,264,560 |
|
Service Class |
|
1,734,722 |
|
575,190 |
|
Service Class 2 A |
|
977 |
|
- |
|
Total |
|
$ 29,474,912 |
|
$ 31,839,750 |
|
In excess of net investment income |
|
$ 11,310,740 |
|
$ - |
|
Service Class |
|
707,338 |
|
- |
|
Service Class 2 A |
|
399 |
|
- |
|
Total |
|
$ 12,018,477 |
|
$ - |
|
From net realized gain |
|
$ 245,909,166 |
|
$ 50,426,708 |
|
Service Class |
|
15,805,557 |
|
927,726 |
|
Service Class 2 A |
|
8,907 |
|
- |
|
Total |
|
$ 261,723,630 |
|
$ 51,354,434 |
|
|
|
$ 303,217,019 |
|
$ 83,194,184 |
D Service Class 2 commenced sale of shares January 12, 2000.
See accompanying notes which are an integral part of the financial statements.
Overseas Portfolio
Financial Highlights - Initial Class
|
|
Six months ended |
Years ended December 31, |
||||
|
Selected Per-Share Data |
(Unaudited) |
1999 |
1998 |
1997 |
1996 |
1995 |
|
Net asset value, beginning of period |
$ 27.44 |
$ 20.06 |
$ 19.20 |
$ 18.84 |
$ 17.06 |
$ 15.67 |
|
Income from Investment Operations |
|
|
|
|
|
|
|
Net investment income |
.15 D |
.24 D |
.23 D |
.30 D |
.32 D, E |
.17 |
|
Net realized and unrealized gain (loss) |
(1.43) |
7.95 |
2.13 |
1.70 |
1.88 |
1.34 |
|
Total from investment operations |
(1.28) |
8.19 |
2.36 |
2.00 |
2.20 |
1.51 |
|
Less Distributions |
|
|
|
|
|
|
|
From net investment income |
(.26) |
(.31) |
(.38) |
(.33) |
(.20) |
(.06) |
|
In excess of net investment income |
(.11) |
- |
- |
- |
- |
- |
|
From net realized gain |
(2.33) |
(.50) |
(1.12) |
(1.31) |
(.22) |
(.02) |
|
In excess of net realized gain |
- |
- |
- |
- |
- |
(.04) |
|
Total distributions |
(2.70) |
(.81) |
(1.50) |
(1.64) |
(.42) |
(.12) |
|
Net asset value, end of period |
$ 23.46 |
$ 27.44 |
$ 20.06 |
$ 19.20 |
$ 18.84 |
$ 17.06 |
|
Total Return B, C |
(5.07)% |
42.55% |
12.81% |
11.56% |
13.15% |
9.74% |
|
Ratios and Supplemental Data |
|
|
|
|
|
|
|
Net assets, end of period (000 omitted) |
$ 2,821,728 |
$ 2,736,851 |
$ 2,074,843 |
$ 1,926,322 |
$ 1,667,601 |
$ 1,343,134 |
|
Ratio of expenses to average net assets |
.90% A |
.91% |
.91% |
.92% |
.93% |
.91% |
|
Ratio of expenses to average net assets after expense reductions |
.88% A, G |
.87% G |
.89% G |
.90% G |
.92% G |
.91% |
|
Ratio of net investment income to average net assets |
1.27% A |
1.10% |
1.19% |
1.55% |
1.84% |
1.88% |
|
Portfolio turnover |
110% A |
78% |
84% |
67% |
92% |
50% |
Financial Highlights - Service Class
|
|
Six months ended |
Years ended December 31, |
||
|
Selected Per-Share Data |
(Unaudited) |
1999 |
1998 |
1997 F |
|
Net asset value, beginning of period |
$ 27.39 |
$ 20.04 |
$ 19.20 |
$ 19.36 |
|
Income from Investment Operations |
|
|
|
|
|
Net investment income D |
.14 |
.22 |
.15 |
.01 |
|
Net realized and unrealized gain (loss) |
(1.43) |
7.94 |
2.19 |
(.17) |
|
Total from investment operations |
(1.29) |
8.16 |
2.34 |
(.16) |
|
Less Distributions |
|
|
|
|
|
From net investment income |
(.26) |
(.31) |
(.38) |
- |
|
In excess of net investment income |
(.10) |
- |
- |
- |
|
From net realized gain |
(2.33) |
(.50) |
(1.12) |
- |
|
Total distributions |
(2.69) |
(.81) |
(1.50) |
- |
|
Net asset value, end of period |
$ 23.41 |
$ 27.39 |
$ 20.04 |
$ 19.20 |
|
Total Return B, C |
(5.12)% |
42.44% |
12.69% |
(0.83)% |
|
Ratios and Supplemental Data |
|
|
|
|
|
Net assets, end of period (000 omitted) |
$ 265,477 |
$ 144,371 |
$ 34,720 |
$ 931 |
|
Ratio of expenses to average net assets |
1.00% A |
1.01% |
1.01% |
1.02% A |
|
Ratio of expenses to average net assets after expense reductions |
.99% A, G |
.98% G |
.97% G |
1.01% A, G |
|
Ratio of net investment income to average net assets |
1.17% A |
1.00% |
.80% |
.31% A |
|
Portfolio turnover |
110% A |
78% |
84% |
67% |
|
A Annualized B The total returns would have been lower had certain expenses not been reduced during the periods shown. C Total returns for periods of less than one year are not annualized and do not reflect charges attributable to your insurance company's separate account. Inclusion of these charges would reduce the total returns shown. D Net investment income per share has been calculated based on average shares outstanding during the period. E Investment income per share reflects a special dividend which amounted to $.05 per share. F For the period November 3, 1997 (commencement of sale of Service Class shares) to December 31, 1997. G FMR or the fund has entered into varying arrangements with third parties who either paid or reduced a portion of the class' expenses. |
||||
See accompanying notes which are an integral part of the financial statements.
Semiannual Report
Financial Highlights - Service Class 2
|
|
Six months ended |
|
Selected Per-Share Data |
(Unaudited) |
|
Net asset value, beginning of period |
$ 26.16 |
|
Income from Investment Operations |
|
|
Net investment income D |
.10 |
|
Net realized and unrealized gain (loss) |
(.19) |
|
Total from investment operations |
(.09) |
|
Less Distributions |
|
|
From net investment income |
(.26) |
|
In excess of net investment income |
(.10) |
|
From net realized gain |
(2.33) |
|
Total distributions |
(2.69) |
|
Net asset value, end of period |
$ 23.38 |
|
Total Return B, C |
(0.78)% |
|
Ratios and Supplemental Data |
|
|
Net assets, end of period (000 omitted) |
$ 2,412 |
|
Ratio of expenses to average net assets |
1.20% A |
|
Ratio of expenses to average net assets after expense reductions |
1.18% A, F |
|
Ratio of net investment income to average net assets |
.97% A |
|
Portfolio turnover |
110% A |
|
A Annualized B The total return would have been lower had certain expenses not been reduced during the period shown. C Total returns for periods of less than one year are not annualized and do not reflect charges attributable to your insurance company's separate account. Inclusion of these charges would reduce the total returns shown. D Net investment income per share has been calculated based on average shares outstanding during the period. E For the period January 12, 2000 (commencement of sale of Service Class 2 shares) to June 30, 2000. F FMR or the fund has entered into varying arrangements with third parties who either paid or reduced a portion of the class' expenses. |
|
See accompanying notes which are an integral part of the financial statements.
Overseas Portfolio
Performance
There are several ways to evaluate a fund's historical performance. You can look at the total percentage change in value, the average annual percentage change or the growth of a hypothetical $10,000 investment. Total return reflects the change in the value of an investment, assuming reinvestment of the fund's dividend income and capital gains (the profits earned upon the sale of securities that have grown in value). The initial offering of Service Class 2 shares took place January 12, 2000. Performance for Service Class 2 shares reflects an asset based distribution fee (12b-1 fee). Returns from December 28, 1998 to January 12, 2000 are those of Service Class which reflect a different 12b-1 fee. Had Service Class 2's 12b-1 fee been reflected, returns prior to January 12, 2000 would have been lower. If Fidelity had not reimbursed certain fund expenses, the total returns would have been lower.
Average Annual Total Returns
|
Periods ended |
Past 1 |
Life of |
|
Fidelity VIP: Mid Cap - Service Class 2 |
61.26% |
52.99% |
|
S&P MidCap 400 |
16.98% |
20.14% |
Average annual returns take the fund's cumulative return and show you what would have happened if the fund had performed at a constant rate each year.
You can compare the fund's returns to the performance of the Standard & Poor's MidCap 400 Index - a market capitalization-weighted index of 400 medium-capitalization stocks. This benchmark includes reinvested dividends and capital gains, if any.
Figures for more than one year assume a steady compounded rate of return and are not the fund's year-by-year results, which fluctuated over the periods shown. The life of fund figures are from commencement of operations, December 28, 1998.
Performance numbers are net of all fund operating expenses, but do not include any insurance charges imposed by your insurance company's separate account. If performance information included the effect of these additional charges, the total returns would be lower.
Past performance is no guarantee of future results. Principal and investment return will vary and you may have a gain or loss when you withdraw your money.
Understanding Performance
How a fund did yesterday is no guarantee of how it will do tomorrow. The stock market, for example, has a history of long-term growth and short-term volatility. In turn, the share price and return of a fund that invests in stocks will vary. That means if you sell your shares during a market downturn, you might lose money. But if you can ride out the market's ups and downs, you may have a gain.
3$10,000 Over Life of Fund
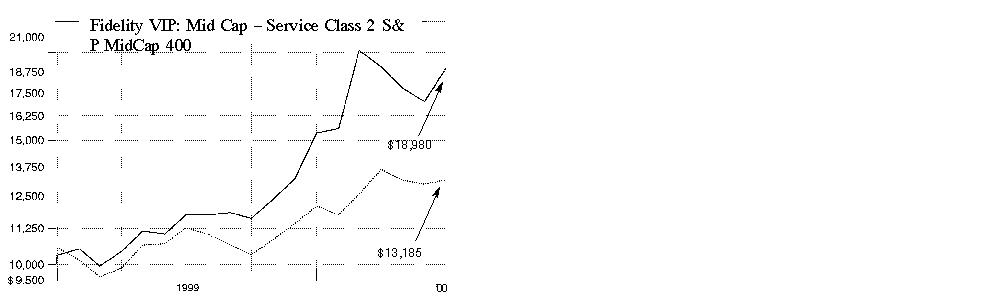
$10,000 Over Life of Fund: Let's say hypothetically that $10,000 was invested in Fidelity Variable Insurance Products: Mid Cap Portfolio - Service Class 2 - on December 28, 1998, when the fund started. As the chart shows, by June 30, 2000, the value of the investment would have grown to $18,980 - an 89.80% increase on the initial investment. For comparison, look at how the Standard & Poor's MidCap 400 Index did over the same period. With dividends and capital gains, if any, reinvested, the same $10,000 investment would have grown to $13,185 - a 31.85% increase.
Investment Summary
|
Top Five Stocks as of June 30, 2000 |
|
|
|
% of fund's |
|
Nextel Communications, Inc. Class A |
2.6 |
|
Kopin Corp. |
1.7 |
|
Calpine Corp. |
1.5 |
|
Freddie Mac |
1.3 |
|
Brocade Communications Systems, Inc. |
1.0 |
|
|
8.1 |
|
Top Five Market Sectors as of June 30, 2000 |
|
|
|
% of fund's |
|
Technology |
31.7 |
|
Health |
13.5 |
|
Energy |
10.8 |
|
Utilities |
8.8 |
|
Finance |
6.5 |
|
Asset Allocation as of June 30, 2000 |
|||
|
% of fund's net assets * |
|||
 |
Stocks and |
|
|
 |
Short-Term |
|
|
|
* Foreign investments 4.7% |
Semiannual Report
(Portfolio Manager photograph)
An interview with
David Felman,
Portfolio Manager
of Mid Cap Portfolio
Q. How did the fund perform, David?
A. The fund performed very well, substantially exceeding the performance of its benchmark, the Standard & Poor's MidCap 400 Index, which had a total return of 8.97% for the six-month period ending June 30, 2000 and a 16.98% return for the 12-month period.
Q. What factors affected performance?
A. We started the period by continuing a very good run in technology and biotechnology into March. The technology run was driven by excitement about the Internet, with continued bullishness for Internet infrastructure stocks. Enthusiasm for biotechnology stocks was strong due to breakthroughs in genomics, or gene-mapping. In early March, however, things seemed to fall apart for both sectors. The catalyst for biotechnology's decline was a government announcement raising questions about whether patents would be issued for genes. That started a cascade that began in March and lasted until early June. Valuations were so high that anything that possibly could threaten stock values eventually did. In early June, however, stocks in these two sectors started coming back.
Q. What were your principal strategies during this period of volatility?
A. We had a very strong weighting in technology early in the period, exceeding 45% of net assets in late February. This helped the fund greatly in the rally. We did get hit in the correction that began in March, but we practiced prudent risk management, selling some stocks with extremely high valuations, and taking some money off the table. I also reduced our holdings in some Internet stocks when I started to see cracks in Internet usage and a reduction in advertising on the Web. I remained bullish on telecommunications service providers, such as Nextel, as I was still optimistic about the growth potential for wireless communications in the United States. By the end of the period, the technology weighting declined to 31.7% of net assets. Part of this reduction was a result of stock prices losing value and part of it was a result of my decisions to reduce the size of holdings. Throughout the period, I avoided traditional defensive areas such as cyclicals, natural resources and utilities other than telecommunications companies. As a risk-management tactic, I was more comfortable increasing my cash position than investing in these industries. The fund did underperform the S&P MidCap 400 Index from early March through early June, but I thought that was an acceptable price to pay for the very good performance early in the period. Overall, we were well ahead of mid-cap stock indexes for the six-month period.
Q. What were some of the investments that helped performance?
A. Nextel Communications, the fund's largest position at the end of the period, was a big contributor. Kopin, which makes wafers for the amplifiers of wireless handsets, also helped performance. Kopin and Research in Motion, which manufactures two-way pagers with access to the Internet, both benefited from increased wireless usage. Another strong contributor was Veritas Software, whose data protection products were in demand as data storage related to the Internet grew.
Q. What were some of the disappointments?
A. DoubleClick had performed well earlier, but its stock fell as advertising on the Internet declined. DoubleClick is the largest provider of advertising on the Internet. Most of the other detractors from performance, relative to the S&P Mid Cap 400 Index, were companies such as QLogic Corp., which had good performance but which I underweighted. QLogic produces components for fiber-optic communications systems.
Q. What is your outlook for the mid-cap stock market?
A. The rapid growth of wireless communications and increased Internet usage are major long-term trends. However, the stocks that benefited from this growth during the period reached very high valuations and then suffered sharp corrections in March through early June. Investors are wondering what will happen next. I believe that technology will continue to be a driving force for global change, and I think that the growth potential of wireless communications remains very strong in the United States.
The views expressed in this report reflect those of the portfolio manager only through the end of the period of the report as stated on the cover. The manager's views are subject to change at any time based on market or other conditions. For more information, see page 2.
Fund Facts
Goal: long-term growth of capital by investing primarily in common stocks of companies with medium-sized capitalizations
Start date: December 28, 1998
Size: as of June 30, 2000, more than $296 million
Manager: David Felman, since 1999; joined Fidelity in 1993
3Semiannual Report
Fidelity Variable Insurance Products: Mid Cap Portfolio
(Unaudited)
Showing Percentage of Net Assets
|
Common Stocks - 87.3% |
|||
|
Shares |
Value (Note 1) |
||
|
BASIC INDUSTRIES - 1.3% |
|||
|
Chemicals & Plastics - 1.2% |
|||
|
Avery Dennison Corp. |
17,400 |
$ 1,167,975 |
|
|
Dow Chemical Co. |
8,300 |
250,556 |
|
|
Ivex Packaging Corp. (a) |
14,900 |
165,763 |
|
|
Lyondell Chemical Co. |
41,800 |
700,150 |
|
|
M.A. Hanna Co. |
47,300 |
425,700 |
|
|
Sealed Air Corp. (a) |
9,800 |
513,275 |
|
|
Union Carbide Corp. |
4,700 |
232,650 |
|
|
|
3,456,069 |
||
|
Packaging & Containers - 0.0% |
|||
|
Bemis Co., Inc. |
4,800 |
161,400 |
|
|
Paper & Forest Products - 0.1% |
|||
|
Trex Co., Inc. (a) |
6,000 |
300,000 |
|
|
TOTAL BASIC INDUSTRIES |
3,917,469 |
||
|
CONSTRUCTION & REAL ESTATE - 0.4% |
|||
|
Building Materials - 0.1% |
|||
|
Applied Films Corp. (a) |
9,600 |
351,600 |
|
|
Engineering - 0.3% |
|||
|
Bouygues SA |
600 |
400,659 |
|
|
Quanta Services, Inc. (a) |
9,900 |
544,500 |
|
|
|
945,159 |
||
|
TOTAL CONSTRUCTION & REAL ESTATE |
1,296,759 |
||
|
DURABLES - 1.6% |
|||
|
Autos, Tires, & Accessories - 0.5% |
|||
|
SPX Corp. |
11,090 |
1,341,197 |
|
|
Consumer Electronics - 0.7% |
|||
|
Black & Decker Corp. |
3,700 |
145,456 |
|
|
General Motors Corp. Class H (a) |
22,100 |
1,939,275 |
|
|
|
2,084,731 |
||
|
Home Furnishings - 0.0% |
|||
|
Leggett & Platt, Inc. |
6,700 |
110,550 |
|
|
Textiles & Apparel - 0.4% |
|||
|
Jones Apparel Group, Inc. (a) |
11,300 |
265,550 |
|
|
Liz Claiborne, Inc. |
18,670 |
658,118 |
|
|
Timberland Co. Class A (a) |
5,200 |
368,225 |
|
|
|
1,291,893 |
||
|
TOTAL DURABLES |
4,828,371 |
||
|
ENERGY - 10.8% |
|||
|
Energy Services - 6.4% |
|||
|
BJ Services Co. (a) |
28,980 |
1,811,250 |
|
|
Cal Dive International, Inc. (a) |
9,700 |
525,619 |
|
|
Coflexip SA sponsored ADR |
2,300 |
139,150 |
|
|
Diamond Offshore Drilling, Inc. |
15,300 |
537,413 |
|
|
ENSCO International, Inc. |
46,110 |
1,651,314 |
|
|
Global Marine, Inc. |
73,500 |
2,071,781 |
|
|
|
|||
|
Shares |
Value (Note 1) |
||
|
Grey Wolf, Inc. (a) |
162,000 |
$ 810,000 |
|
|
Halliburton Co. |
24,700 |
1,165,531 |
|
|
Hanover Compressor Co. (a) |
23,700 |
900,600 |
|
|
Helmerich & Payne, Inc. |
20,100 |
751,238 |
|
|
Nabors Industries, Inc. (a) |
40,080 |
1,665,825 |
|
|
Noble Drilling Corp. |
43,590 |
1,795,363 |
|
|
Pride International, Inc. (a) |
9,000 |
222,750 |
|
|
R&B Falcon Corp. (a) |
30,800 |
725,725 |
|
|
Rowan Companies, Inc. (a) |
4,300 |
130,613 |
|
|
Smith International, Inc. (a) |
10,400 |
757,250 |
|
|
Tidewater, Inc. |
25,950 |
934,200 |
|
|
Transocean Sedco Forex, Inc. |
14,260 |
762,019 |
|
|
Varco International, Inc. (a) |
30,548 |
710,229 |
|
|
Weatherford International, Inc. |
25,930 |
1,032,338 |
|
|
|
19,100,208 |
||
|
Oil & Gas - 4.4% |
|||
|
Anadarko Petroleum Corp. |
18,100 |
892,556 |
|
|
Apache Corp. |
37,450 |
2,202,528 |
|
|
Burlington Resources, Inc. |
14,700 |
562,275 |
|
|
Cooper Cameron Corp. (a) |
12,560 |
828,960 |
|
|
Devon Energy Corp. |
19,700 |
1,106,894 |
|
|
EOG Resources, Inc. |
9,140 |
306,190 |
|
|
Grant Prideco, Inc. (a) |
8,730 |
218,250 |
|
|
Kerr-McGee Corp. |
2,770 |
163,257 |
|
|
Murphy Oil Corp. |
2,000 |
118,875 |
|
|
Noble Affiliates, Inc. |
14,470 |
539,008 |
|
|
Ocean Energy, Inc. (a) |
39,290 |
557,427 |
|
|
Santa Fe Snyder Corp. (a) |
144,670 |
1,645,621 |
|
|
Tosco Corp. |
23,530 |
666,193 |
|
|
USX - Marathon Group |
7,590 |
190,224 |
|
|
Valero Energy Corp. |
18,700 |
593,725 |
|
|
Vastar Resources, Inc. |
21,640 |
1,777,185 |
|
|
Veritas DGC, Inc. (a) |
22,600 |
587,600 |
|
|
|
12,956,768 |
||
|
TOTAL ENERGY |
32,056,976 |
||
|
FINANCE - 6.5% |
|||
|
Banks - 0.9% |
|||
|
Bank of New York Co., Inc. |
15,300 |
711,450 |
|
|
Bank One Corp. |
39,200 |
1,041,250 |
|
|
PNC Financial Services Group, Inc. |
16,600 |
778,125 |
|
|
|
2,530,825 |
||
|
Credit & Other Finance - 0.5% |
|||
|
Concord EFS, Inc. (a) |
16,500 |
429,000 |
|
|
Household International, Inc. |
14,000 |
581,875 |
|
|
Providian Financial Corp. |
6,700 |
603,000 |
|
|
|
1,613,875 |
||
|
Federal Sponsored Credit - 1.3% |
|||
|
Freddie Mac |
92,410 |
3,742,605 |
|
|
Insurance - 3.7% |
|||
|
Ace Ltd. |
23,200 |
649,600 |
|
|
Common Stocks - continued |
|||
|
Shares |
Value (Note 1) |
||
|
FINANCE - continued |
|||
|
Insurance - continued |
|||
|
AFLAC, Inc. |
8,950 |
$ 411,141 |
|
|
Allmerica Financial Corp. |
12,720 |
666,210 |
|
|
AMBAC Financial Group, Inc. |
24,640 |
1,350,580 |
|
|
American General Corp. |
4,590 |
279,990 |
|
|
Brown & Brown, Inc. |
500 |
26,000 |
|
|
CIGNA Corp. |
25,650 |
2,398,275 |
|
|
First Health Group Corp. (a) |
14,300 |
469,219 |
|
|
Hartford Financial Services Group, Inc. |
6,270 |
350,728 |
|
|
Jefferson-Pilot Corp. |
3,600 |
203,175 |
|
|
MBIA, Inc. |
5,310 |
255,876 |
|
|
MetLife, Inc. |
60,000 |
1,263,750 |
|
|
Protective Life Corp. |
22,780 |
606,518 |
|
|
Reliastar Financial Corp. |
23,939 |
1,255,301 |
|
|
The Chubb Corp. |
4,360 |
268,140 |
|
|
XL Capital Ltd. Class A |
10,400 |
562,900 |
|
|
|
11,017,403 |
||
|
Securities Industry - 0.1% |
|||
|
Lehman Brothers Holdings, Inc. |
3,000 |
283,688 |
|
|
TOTAL FINANCE |
19,188,396 |
||
|
HEALTH - 13.5% |
|||
|
Drugs & Pharmaceuticals - 10.4% |
|||
|
Abgenix, Inc. (a) |
6,100 |
731,142 |
|
|
Alkermes, Inc. (a) |
4,100 |
193,213 |
|
|
Allergan, Inc. |
10,100 |
752,450 |
|
|
ALZA Corp. (a) |
12,200 |
721,325 |
|
|
Aviron (a) |
28,880 |
891,670 |
|
|
Bristol-Myers Squibb Co. |
10,800 |
629,100 |
|
|
Celgene Corp. (a) |
23,550 |
1,386,506 |
|
|
Cephalon, Inc. (a) |
31,540 |
1,888,458 |
|
|
Chiron Corp. (a) |
12,830 |
609,425 |
|
|
COR Therapeutics, Inc. (a) |
28,420 |
2,424,581 |
|
|
Corixa Corp. (a) |
9,500 |
407,906 |
|
|
CV Therapeutics, Inc. (a) |
7,605 |
527,122 |
|
|
Elan Corp. PLC sponsored ADR (a) |
20,200 |
978,438 |
|
|
Eli Lilly & Co. |
7,500 |
749,063 |
|
|
Forest Laboratories, Inc. (a) |
6,370 |
643,370 |
|
|
Gene Logic, Inc. (a) |
10,480 |
374,005 |
|
|
Genentech, Inc. |
3,170 |
545,240 |
|
|
Gilead Sciences, Inc. (a) |
7,010 |
498,586 |
|
|
Human Genome Sciences, Inc. (a) |
620 |
82,693 |
|
|
ImClone Systems, Inc. (a) |
16,400 |
1,253,575 |
|
|
IVAX Corp. (a) |
6,500 |
269,750 |
|
|
Millennium Pharmaceuticals, Inc. (a) |
13,762 |
1,539,624 |
|
|
Myriad Genetics, Inc. (a) |
9,000 |
1,332,703 |
|
|
Noven Pharmaceuticals, Inc. (a) |
1,100 |
33,069 |
|
|
PE Corp. - Celera Genomics Group (a) |
9,300 |
869,550 |
|
|
Protein Design Labs, Inc. (a) |
8,210 |
1,354,265 |
|
|
QLT, Inc. (a) |
21,260 |
1,651,402 |
|
|
Schering-Plough Corp. |
9,700 |
489,850 |
|
|
|
|||
|
Shares |
Value (Note 1) |
||
|
Sepracor, Inc. (a) |
12,560 |
$ 1,515,050 |
|
|
Teva Pharmaceutical Industries Ltd. ADR |
28,200 |
1,563,338 |
|
|
Titan Pharmaceuticals, Inc. (a) |
15,100 |
649,300 |
|
|
United Therapeutics Corp. |
26,100 |
2,828,588 |
|
|
Vertex Pharmaceuticals, Inc. (a) |
5,300 |
558,488 |
|
|
|
30,942,845 |
||
|
Medical Equipment & Supplies - 0.8% |
|||
|
Millipore Corp. |
8,700 |
655,763 |
|
|
MiniMed, Inc. (a) |
3,900 |
460,200 |
|
|
Novoste Corp. (a) |
10,300 |
628,300 |
|
|
Stryker Corp. |
10,800 |
472,500 |
|
|
Sybron International, Inc. (a) |
8,730 |
172,963 |
|
|
|
2,389,726 |
||
|
Medical Facilities Management - 2.3% |
|||
|
Express Scripts, Inc. Class A (a) |
10,800 |
670,950 |
|
|
Laboratory Corp. of America Holdings |
5,700 |
439,613 |
|
|
Quest Diagnostics, Inc. (a) |
24,500 |
1,831,375 |
|
|
Trigon Healthcare, Inc. (a) |
43,170 |
2,225,953 |
|
|
UnitedHealth Group, Inc. |
14,600 |
1,251,950 |
|
|
Wellpoint Health Networks, Inc. (a) |
4,800 |
347,700 |
|
|
|
6,767,541 |
||
|
TOTAL HEALTH |
40,100,112 |
||
|
INDUSTRIAL MACHINERY & EQUIPMENT - 2.8% |
|||
|
Electrical Equipment - 2.2% |
|||
|
Adaptive Broadband Corp. (a) |
21,140 |
776,895 |
|
|
Adtran, Inc. (a) |
16,300 |
975,963 |
|
|
American Power Conversion Corp. (a) |
7,300 |
297,931 |
|
|
ANTEC Corp. (a) |
11,200 |
465,500 |
|
|
California Amplifier, Inc. (a) |
320 |
14,640 |
|
|
Harris Corp. |
5,600 |
183,400 |
|
|
Pace Micro Technology PLC |
88,944 |
1,284,515 |
|
|
Powerwave Technologies, Inc. (a) |
6,700 |
294,800 |
|
|
Scientific-Atlanta, Inc. |
16,840 |
1,254,580 |
|
|
Vyyo, Inc. |
32,600 |
880,200 |
|
|
|
6,428,424 |
||
|
Industrial Machinery & Equipment - 0.6% |
|||
|
Asyst Technologies, Inc. (a) |
21,900 |
750,075 |
|
|
Ingersoll-Rand Co. |
10,100 |
406,525 |
|
|
Varian Semiconductor Equipment Associates, Inc. (a) |
9,400 |
590,438 |
|
|
|
1,747,038 |
||
|
TOTAL INDUSTRIAL MACHINERY & EQUIPMENT |
8,175,462 |
||
|
MEDIA & LEISURE - 3.1% |
|||
|
Broadcasting - 2.4% |
|||
|
EchoStar Communications Corp. |
23,020 |
762,178 |
|
|
Pegasus Communications Corp. (a) |
53,240 |
2,612,088 |
|
|
Radio One, Inc.: |
|
|
|
|
Class A |
6,070 |
179,444 |
|
|
Common Stocks - continued |
|||
|
Shares |
Value (Note 1) |
||
|
MEDIA & LEISURE - continued |
|||
|
Broadcasting - continued |
|||
|
Radio One, Inc.: - continued |
|
|
|
|
Class D (non-vtg.) (a) |
15,140 |
$ 334,026 |
|
|
TiVo, Inc. |
29,200 |
1,022,000 |
|
|
UnitedGlobalCom, Inc. Class A (a) |
5,090 |
237,958 |
|
|
Univision Communications, Inc. |
8,580 |
888,030 |
|
|
USA Networks, Inc. (a) |
43,300 |
936,363 |
|
|
|
6,972,087 |
||
|
Entertainment - 0.7% |
|||
|
Mandalay Resort Group (a) |
18,100 |
362,000 |
|
|
MGM Grand, Inc. |
41,900 |
1,346,038 |
|
|
Park Place Entertainment Corp. (a) |
5,400 |
65,813 |
|
|
Premier Parks, Inc. (a) |
10,400 |
236,600 |
|
|
|
2,010,451 |
||
|
Publishing - 0.0% |
|||
|
Reader's Digest Association, Inc. |
860 |
34,185 |
|
|
Restaurants - 0.0% |
|||
|
Jack in the Box, Inc. (a) |
2,880 |
70,920 |
|
|
TOTAL MEDIA & LEISURE |
9,087,643 |
||
|
NONDURABLES - 1.7% |
|||
|
Agriculture - 0.1% |
|||
|
Nutreco Holding NV |
11,573 |
441,603 |
|
|
Foods - 1.2% |
|||
|
Bestfoods |
4,200 |
290,850 |
|
|
Keebler Foods Co. |
22,840 |
847,935 |
|
|
Nabisco Group Holdings Corp. |
45,910 |
1,190,791 |
|
|
Nabisco Holdings Corp. Class A |
10,800 |
567,000 |
|
|
Quaker Oats Co. |
7,200 |
540,900 |
|
|
|
3,437,476 |
||
|
Household Products - 0.4% |
|||
|
Avon Products, Inc. |
24,610 |
1,095,145 |
|
|
TOTAL NONDURABLES |
4,974,224 |
||
|
PRECIOUS METALS - 0.4% |
|||
|
Agnico-Eagle Mines Ltd. |
8,930 |
56,095 |
|
|
Newmont Mining Corp. |
900 |
19,463 |
|
|
Stillwater Mining Co. (a) |
37,520 |
1,045,870 |
|
|
|
1,121,428 |
||
|
RETAIL & WHOLESALE - 1.1% |
|||
|
Apparel Stores - 0.2% |
|||
|
AnnTaylor Stores Corp. (a) |
21,800 |
722,125 |
|
|
General Merchandise Stores - 0.3% |
|||
|
Consolidated Stores Corp. (a) |
1,900 |
22,800 |
|
|
|
|||
|
Shares |
Value (Note 1) |
||
|
Costco Wholesale Corp. (a) |
13,400 |
$ 442,200 |
|
|
Dollar Tree Stores, Inc. (a) |
7,650 |
302,653 |
|
|
|
767,653 |
||
|
Grocery Stores - 0.3% |
|||
|
Safeway, Inc. (a) |
17,100 |
771,638 |
|
|
Retail & Wholesale, Miscellaneous - 0.3% |
|||
|
Best Buy Co., Inc. (a) |
13,000 |
822,250 |
|
|
Circuit City Stores, Inc. - |
4,600 |
152,663 |
|
|
Ventro Corp. |
3,500 |
66,063 |
|
|
|
1,040,976 |
||
|
TOTAL RETAIL & WHOLESALE |
3,302,392 |
||
|
SERVICES - 2.5% |
|||
|
Advertising - 0.9% |
|||
|
ADVO, Inc. (a) |
20,600 |
865,200 |
|
|
DoubleClick, Inc. (a) |
8,180 |
311,863 |
|
|
TMP Worldwide, Inc. (a) |
19,500 |
1,439,344 |
|
|
|
2,616,407 |
||
|
Printing - 0.0% |
|||
|
Valassis Communications, Inc. (a) |
1,360 |
51,850 |
|
|
Services - 1.6% |
|||
|
ACNielsen Corp. (a) |
23,100 |
508,200 |
|
|
Cintas Corp. |
29,390 |
1,078,246 |
|
|
Convergys Corp. (a) |
9,000 |
466,875 |
|
|
Ecolab, Inc. |
28,939 |
1,130,430 |
|
|
Profit Recovery Group |
21,600 |
359,100 |
|
|
Robert Half International, Inc. (a) |
24,640 |
702,240 |
|
|
True North Communications |
11,400 |
501,600 |
|
|
|
4,746,691 |
||
|
TOTAL SERVICES |
7,414,948 |
||
|
TECHNOLOGY - 31.7% |
|||
|
Communications Equipment - 3.9% |
|||
|
ADC Telecommunications, Inc. (a) |
8,300 |
696,163 |
|
|
Advanced Fibre Communications, Inc. (a) |
2,430 |
110,109 |
|
|
Andrew Corp. (a) |
17,000 |
570,563 |
|
|
Ciena Corp. (a) |
4,790 |
798,433 |
|
|
Comverse Technology, Inc. (a) |
14,850 |
1,381,050 |
|
|
Corning, Inc. |
5,903 |
1,593,072 |
|
|
Ditech Communications Corp. |
900 |
85,106 |
|
|
Efficient Networks, Inc. |
9,800 |
720,913 |
|
|
Jabil Circuit, Inc. (a) |
29,740 |
1,475,848 |
|
|
Metricom, Inc. (a) |
10,230 |
285,161 |
|
|
Natural MicroSystems Corp. (a) |
22,050 |
2,479,247 |
|
|
Tekelec (a) |
7,800 |
375,863 |
|
|
Terayon Communication Systems, Inc. (a) |
1,200 |
77,081 |
|
|
Turnstone Systems, Inc. |
3,200 |
530,150 |
|
|
Common Stocks - continued |
|||
|
Shares |
Value (Note 1) |
||
|
TECHNOLOGY - continued |
|||
|
Communications Equipment - continued |
|||
|
Tut Systems, Inc. (a) |
2,600 |
$ 149,175 |
|
|
Westell Technologies, Inc. Class A (a) |
8,800 |
132,000 |
|
|
|
11,459,934 |
||
|
Computer Services & Software - 8.4% |
|||
|
Active Software, Inc. |
13,500 |
1,048,781 |
|
|
Adobe Systems, Inc. |
10,630 |
1,381,900 |
|
|
Affiliated Computer Services, Inc. |
3,220 |
106,461 |
|
|
Affymetrix, Inc. (a) |
4,300 |
710,038 |
|
|
Amazon.com, Inc. (a) |
24,500 |
889,656 |
|
|
Amdocs Ltd. (a) |
7,947 |
609,932 |
|
|
Ariba, Inc. |
5,000 |
490,234 |
|
|
Autodesk, Inc. |
11,800 |
409,313 |
|
|
BEA Systems, Inc. (a) |
24,520 |
1,212,208 |
|
|
BroadVision, Inc. (a) |
2,300 |
116,869 |
|
|
Business Objects SA sponsored ADR (a) |
4,400 |
387,750 |
|
|
CACI International, Inc. Class A (a) |
12,200 |
237,900 |
|
|
Cadence Design Systems, Inc. (a) |
19,620 |
399,758 |
|
|
Check Point Software |
3,200 |
677,600 |
|
|
Clarent Corp. |
2,500 |
178,750 |
|
|
CNET Networks, Inc. (a) |
23,700 |
582,131 |
|
|
Covad Communications Group, Inc. (a) |
25,200 |
406,350 |
|
|
Digital Insight Corp. |
4,900 |
166,600 |
|
|
Electronic Arts, Inc. (a) |
3,010 |
219,542 |
|
|
Foundry Networks, Inc. |
4,600 |
506,000 |
|
|
Interact Commerce Corp. (a) |
7,080 |
83,632 |
|
|
Internap Network Services Corp. |
3,300 |
137,002 |
|
|
Intuit, Inc. (a) |
7,830 |
323,966 |
|
|
Keynote Systems, Inc. |
6,300 |
444,544 |
|
|
Macromedia, Inc. (a) |
900 |
87,019 |
|
|
Manugistics Group, Inc. (a) |
1,500 |
70,125 |
|
|
Marketwatch.com, Inc. (a) |
200 |
3,763 |
|
|
Mercury Interactive Corp. (a) |
2,700 |
261,225 |
|
|
Metasolv Software, Inc. |
11,330 |
498,520 |
|
|
National Computer Systems, Inc. |
7,200 |
354,600 |
|
|
New Era of Networks, Inc. (a) |
2,370 |
100,725 |
|
|
Opus360 Corp. |
20 |
74 |
|
|
Orbotech Ltd. |
8,400 |
780,150 |
|
|
Pharmacopeia, Inc. (a) |
3,400 |
157,675 |
|
|
Phone.com, Inc. |
4,900 |
319,113 |
|
|
Polycom, Inc. (a) |
13,400 |
1,260,856 |
|
|
Priceline.com, Inc. (a) |
24,500 |
930,617 |
|
|
Puma Technology, Inc. (a) |
4,160 |
111,540 |
|
|
Rational Software Corp. (a) |
14,300 |
1,329,006 |
|
|
Redback Networks, Inc. |
6,320 |
1,132,070 |
|
|
Software.com, Inc. |
2,100 |
272,738 |
|
|
VERITAS Software Corp. (a) |
24,605 |
2,780,749 |
|
|
Vignette Corp. (a) |
10,080 |
524,318 |
|
|
|
|||
|
Shares |
Value (Note 1) |
||
|
Vitria Technology, Inc. |
6,800 |
$ 415,650 |
|
|
webMethods, Inc. |
12,000 |
1,886,250 |
|
|
|
25,003,700 |
||
|
Computers & Office Equipment - 4.7% |
|||
|
Alteon Websystems, Inc. |
5,700 |
570,356 |
|
|
Apple Computer, Inc. (a) |
80 |
4,190 |
|
|
Brocade Communications |
16,860 |
3,093,547 |
|
|
CDW Computer Centers, Inc. (a) |
30,800 |
1,925,000 |
|
|
Comdisco, Inc. |
5,400 |
120,488 |
|
|
Copper Mountain Networks, Inc. |
3,300 |
290,813 |
|
|
Juniper Networks, Inc. |
15,060 |
2,192,171 |
|
|
MMC Networks, Inc. (a) |
21,600 |
1,154,250 |
|
|
MRV Communications, Inc. (a) |
6,100 |
410,225 |
|
|
Network Appliance, Inc. (a) |
24,080 |
1,938,440 |
|
|
ScanSource, Inc. (a) |
7,130 |
277,179 |
|
|
SCI Systems, Inc. (a) |
7,100 |
278,231 |
|
|
Symbol Technologies, Inc. |
9,645 |
520,830 |
|
|
Tech Data Corp. (a) |
25,500 |
1,110,844 |
|
|
|
13,886,564 |
||
|
Electronic Instruments - 4.1% |
|||
|
Aclara Biosciences, Inc. |
6,200 |
315,813 |
|
|
Agilent Technologies, Inc. |
10,350 |
763,313 |
|
|
Aurora Biosciences Corp. (a) |
17,100 |
1,166,006 |
|
|
FEI Co. (a) |
29,700 |
905,850 |
|
|
KLA-Tencor Corp. (a) |
4,820 |
282,271 |
|
|
Kulicke & Soffa Industries, Inc. (a) |
12,100 |
718,438 |
|
|
Novellus Systems, Inc. (a) |
14,950 |
845,609 |
|
|
PE Corp. - Biosystems Group |
7,910 |
521,071 |
|
|
PerkinElmer, Inc. |
36,950 |
2,443,319 |
|
|
Photon Dynamics, Inc. (a) |
18,700 |
1,396,656 |
|
|
Tektronix, Inc. |
13,200 |
976,800 |
|
|
Waters Corp. (a) |
14,910 |
1,860,954 |
|
|
|
12,196,100 |
||
|
Electronics - 10.6% |
|||
|
Altera Corp. (a) |
28,450 |
2,900,122 |
|
|
Analog Devices, Inc. (a) |
7,440 |
565,440 |
|
|
Atmel Corp. (a) |
11,300 |
416,688 |
|
|
Celestica, Inc. (sub. vtg.) (a) |
7,720 |
375,962 |
|
|
Chartered Semiconductor |
3,540 |
318,600 |
|
|
Cypress Semiconductor Corp. (a) |
20,640 |
872,040 |
|
|
Digital Microwave Corp. (a) |
8,300 |
316,438 |
|
|
E Tek Dynamics, Inc. (a) |
3,130 |
825,733 |
|
|
GlobeSpan, Inc. |
12,400 |
1,513,769 |
|
|
Infineon Technologies AG |
5,200 |
408,550 |
|
|
KEMET Corp. (a) |
8,160 |
204,510 |
|
|
Kopin Corp. (a) |
72,470 |
5,018,548 |
|
|
Lattice Semiconductor Corp. (a) |
8,100 |
559,913 |
|
|
Linear Technology Corp. |
20 |
1,279 |
|
|
LSI Logic Corp. (a) |
2,900 |
156,963 |
|
|
Merix Corp. (a) |
9,500 |
446,500 |
|
|
Microchip Technology, Inc. (a) |
14,900 |
868,158 |
|
|
Common Stocks - continued |
|||
|
Shares |
Value (Note 1) |
||
|
TECHNOLOGY - continued |
|||
|
Electronics - continued |
|||
|
Micron Technology, Inc. (a) |
17,140 |
$ 1,509,391 |
|
|
National Semiconductor Corp. (a) |
33,430 |
1,897,153 |
|
|
NVIDIA Corp. (a) |
12,600 |
800,888 |
|
|
Plexus Corp. (a) |
5,000 |
565,000 |
|
|
PMC-Sierra, Inc. (a) |
3,870 |
687,651 |
|
|
Power-One, Inc. (a) |
10,700 |
1,219,131 |
|
|
QLogic Corp. (a) |
7,132 |
471,158 |
|
|
Rambus, Inc. (a) |
14,100 |
1,452,300 |
|
|
S3, Inc. |
34,100 |
502,975 |
|
|
Sanmina Corp. (a) |
33,600 |
2,872,800 |
|
|
SDL, Inc. (a) |
4,400 |
1,254,825 |
|
|
Three-Five Systems, Inc. (a) |
2,704 |
159,536 |
|
|
TriQuint Semiconductor, Inc. |
8,600 |
822,913 |
|
|
Vishay Intertechnology, Inc. (a) |
18,220 |
691,221 |
|
|
Vitesse Semiconductor Corp. (a) |
5,990 |
440,639 |
|
|
Xilinx, Inc. (a) |
3,100 |
255,944 |
|
|
|
31,372,738 |
||
|
TOTAL TECHNOLOGY |
93,919,036 |
||
|
TRANSPORTATION - 1.1% |
|||
|
Air Transportation - 0.2% |
|||
|
Continental Airlines, Inc. Class B (a) |
4,900 |
230,300 |
|
|
Northwest Airlines Corp. Class A (a) |
9,700 |
295,244 |
|
|
Southwest Airlines Co. |
13,350 |
252,816 |
|
|
|
778,360 |
||
|
Railroads - 0.0% |
|||
|
Wabtec Corp. |
296 |
3,071 |
|
|
Shipping - 0.5% |
|||
|
Teekay Shipping Corp. |
45,000 |
1,479,375 |
|
|
Trucking & Freight - 0.4% |
|||
|
Forward Air Corp. (a) |
11,985 |
479,400 |
|
|
Landstar System, Inc. (a) |
10,100 |
601,581 |
|
|
|
1,080,981 |
||
|
TOTAL TRANSPORTATION |
3,341,787 |
||
|
UTILITIES - 8.8% |
|||
|
Cellular - 4.2% |
|||
|
China Telecom (Hong Kong) Ltd. sponsored ADR (a) |
3,400 |
604,563 |
|
|
Clearnet Communications, Inc. |
24,450 |
677,102 |
|
|
Microcell Telecommunications, Inc. |
26,430 |
955,979 |
|
|
Millicom International Cellular SA (a) |
1,430 |
50,050 |
|
|
Nextel Communications, Inc. Class A (a) |
123,420 |
7,551,737 |
|
|
Nextel Partners, Inc. Class A |
6,300 |
205,144 |
|
|
|
|||
|
Shares |
Value (Note 1) |
||
|
Sprint Corp. - PCS Group Series 1 (a) |
37,110 |
$ 2,208,045 |
|
|
VoiceStream Wireless Corp. (a) |
2,790 |
324,468 |
|
|
|
12,577,088 |
||
|
Electric Utility - 2.8% |
|||
|
AES Corp. (a) |
30,960 |
1,412,550 |
|
|
Calpine Corp. (a) |
68,000 |
4,471,000 |
|
|
Constellation Energy Corp. |
8,100 |
263,756 |
|
|
IPALCO Enterprises, Inc. |
15,680 |
315,560 |
|
|
Montana Power Co. |
13,100 |
462,594 |
|
|
NiSource, Inc. |
39,900 |
743,138 |
|
|
Northern States Power Co. |
16,000 |
323,000 |
|
|
NRG Energy, Inc. |
4,500 |
82,125 |
|
|
PECO Energy Co. |
6,000 |
241,875 |
|
|
|
8,315,598 |
||
|
Gas - 1.3% |
|||
|
Columbia Energy Group |
60 |
3,938 |
|
|
Dynegy, Inc. Class A |
28,470 |
1,944,857 |
|
|
Enron Corp. |
8,150 |
525,675 |
|
|
Kinder Morgan, Inc. |
36,580 |
1,264,296 |
|
|
|
3,738,766 |
||
|
Telephone Services - 0.5% |
|||
|
Allegiance Telecom, Inc. (a) |
2,200 |
140,800 |
|
|
CenturyTel, Inc. |
31,400 |
902,750 |
|
|
ITXC Corp. |
14,210 |
503,123 |
|
|
|
1,546,673 |
||
|
TOTAL UTILITIES |
26,178,125 |
||
|
TOTAL COMMON STOCKS (Cost $230,321,148) |
258,903,128 |
||
|
U.S. Treasury Obligations - 0.3% |
|||||
|
Moody's Ratings (unaudited) |
Principal Amount |
|
|||
|
U.S. Treasury Bills, yield at date of purchase 5.59% to 6.03% 7/13/00 to 8/17/00 (c) |
- |
|
$ 925,000 |
919,853 |
|
|
Cash Equivalents - 18.5% |
|||
|
Maturity Amount |
Value |
||
|
Investments in repurchase agreements (U.S. Treasury Obligations), in a joint trading account at 6.58%, dated 6/30/00 due 7/3/00 |
$ 18,919,371 |
$ 18,909,000 |
|
|
Shares |
|
||
|
Central Cash Collateral Fund, 6.71% (b) |
6,731,354 |
6,731,354 |
|
|
Taxable Central Cash Fund, 6.59% (b) |
29,086,263 |
29,086,263 |
|
|
TOTAL CASH EQUIVALENTS (Cost $54,726,617) |
54,726,617 |
|
|
TOTAL INVESTMENT PORTFOLIO - 106.1% (Cost $285,967,116) |
314,549,598 |
|
|
NET OTHER ASSETS - (6.1)% |
(18,181,476) |
|
|
NET ASSETS - 100% |
$ 296,368,122 |
|
|
Futures Contracts |
|||||
|
|
Expiration Date |
Underlying |
Unrealized Gain/(Loss) |
||
|
Purchased |
|||||
|
57 S&P 400 Midcap Index Contracts |
Sept. 2000 |
$ 13,916,550 |
$ (412,213) |
||
|
The face value of futures purchased as a percentage of net assets - 4.7% |
|
Legend |
|
(a) Non-income producing |
|
(b) The rate quoted is the annualized seven-day yield of the fund at |
|
(c) Security or a portion of the security was pledged to cover margin requirements for futures contracts. At the period end, the value of securities pledged amounted to $919,853. |
|
Other Information |
|
Purchases and sales of securities, other than short-term securities, |
|
The market value of futures contracts opened and closed during the |
|
The fund placed a portion of its portfolio transactions with brokerage firms which are affiliates of Fidelity Management & Research Company. The commissions paid to these affiliated firms were $16,684 for the period. |
|
The fund participated in the security lending program. At period end, the value of securities loaned amounted to $6,633,405. The fund received cash collateral of $6,731,354 which was invested in cash equivalents. |
|
Income Tax Information |
|
At June 30, 2000, the aggregate cost of investment securities for income tax purposes was $289,737,660. Net unrealized appreciation aggregated $24,811,938, of which $35,724,103 related to appreciated investment securities and $10,912,165 related to depreciated investment securities. |
See accompanying notes which are an integral part of the financial statements.
Mid Cap Portfolio
Statement of Assets and Liabilities
|
|
June 30, 2000 (Unaudited) |
|
|
Assets |
|
|
|
Investment in securities, at value (including repurchase agreements of $18,909,000) |
|
$ 314,549,598 |
|
Cash |
|
323,420 |
|
Receivable for investments sold |
|
13,596,246 |
|
Receivable for fund shares sold |
|
3,012,314 |
|
Dividends receivable |
|
66,918 |
|
Interest receivable |
|
128,429 |
|
Other receivables |
|
10,808 |
|
Total assets |
|
331,687,733 |
|
Liabilities |
|
|
|
Payable for investments purchased |
$ 27,374,504 |
|
|
Payable for fund shares redeemed |
834,902 |
|
|
Accrued management fee |
115,770 |
|
|
Distribution fees payable |
12,793 |
|
|
Payable for daily variation on |
208,051 |
|
|
Other payables and |
42,237 |
|
|
Collateral on securities loaned, |
6,731,354 |
|
|
Total liabilities |
|
35,319,611 |
|
Net Assets |
|
$ 296,368,122 |
|
Net Assets consist of: |
|
|
|
Paid in capital |
|
$ 271,976,722 |
|
Undistributed net investment income |
|
97,845 |
|
Accumulated undistributed net realized gain (loss) on investments and foreign currency transactions |
|
(3,876,611) |
|
Net unrealized appreciation (depreciation) on investments |
|
28,170,166 |
|
Net Assets |
|
$ 296,368,122 |
|
Initial Class: |
|
$18.82 |
|
Service Class: |
|
$18.80 |
|
Service Class 2: |
|
$18.78 |
Statement of Operations
|
|
Six months ended June 30, 2000 (Unaudited) |
|
|
Investment Income Dividends |
|
$ 177,301 |
|
Interest |
|
380,016 |
|
Security lending |
|
16,068 |
|
Total income |
|
573,385 |
|
Expenses |
|
|
|
Management fee |
$ 306,603 |
|
|
Transfer agent fees |
43,421 |
|
|
Distribution fees |
44,790 |
|
|
Accounting and security lending fees |
32,445 |
|
|
Non-interested trustees' compensation |
111 |
|
|
Custodian fees and expenses |
58,064 |
|
|
Audit |
8,158 |
|
|
Legal |
586 |
|
|
Reports to Shareholders |
236 |
|
|
Miscellaneous |
69 |
|
|
Total expenses before reductions |
494,483 |
|
|
Expense reductions |
(19,437) |
475,046 |
|
Net investment income |
|
98,339 |
|
Realized and Unrealized Gain (Loss) Net realized gain (loss) on: |
|
|
|
Investment securities |
(3,838,305) |
|
|
Foreign currency transactions |
1,931 |
|
|
Futures contracts |
126,879 |
(3,709,495) |
|
Change in net unrealized appreciation (depreciation) on: |
|
|
|
Investment securities |
24,218,897 |
|
|
Assets and liabilities in |
(23) |
|
|
Futures contracts |
(424,407) |
23,794,467 |
|
Net gain (loss) |
|
20,084,972 |
|
Net increase (decrease) in net assets resulting from operations |
|
$ 20,183,311 |
|
Other Information Expense reductions |
|
$ 19,080 |
|
Custodian credits |
|
357 |
|
|
|
$ 19,437 |
See accompanying notes which are an integral part of the financial statements.
Semiannual Report
Variable Insurance Products: Portfolio
Financial Statements - continued
Statement of Changes in Net Assets
|
Increase (Decrease) in Net Assets |
Six months ended |
Year ended |
|
Operations |
$ 98,339 |
$ (3,279) |
|
Net realized gain (loss) |
(3,709,495) |
139,917 |
|
Change in net unrealized appreciation (depreciation) |
23,794,467 |
4,343,490 |
|
Net increase (decrease) in net assets resulting from operations |
20,183,311 |
4,480,128 |
|
Distributions to shareholders |
- |
(139,917) |
|
In excess of net realized gain |
(131,105) |
(32,523) |
|
Total distributions |
(131,105) |
(172,440) |
|
Share transactions - net increase (decrease) |
248,664,126 |
22,312,614 |
|
Total increase (decrease) in net assets |
268,716,332 |
26,620,302 |
|
Net Assets |
|
|
|
Beginning of period |
27,651,790 |
1,031,488 |
|
End of period (including undistributed net investment income of $97,845 and $0, respectively) |
$ 296,368,122 |
$ 27,651,790 |
|
|
|
Other Information: |
|
|
Six months ended |
Year ended December 31, 1999 |
||
|
|
Shares |
Dollars |
Shares |
Dollars |
|
Share transactions |
7,954,588 |
$ 141,197,057 |
67,742 |
$ 873,931 |
|
Reinvested |
507 |
8,466 |
755 |
10,914 |
|
Redeemed |
(130,836) |
(2,260,660) |
(4,140) |
(54,766) |
|
Net increase (decrease) |
7,824,259 |
$ 138,944,863 |
64,357 |
$ 830,079 |
|
Service Class |
5,632,594 |
$ 100,266,360 |
1,749,215 |
$ 22,631,585 |
|
Reinvested |
7,312 |
121,968 |
11,186 |
161,526 |
|
Redeemed |
(474,562) |
(8,379,137) |
(110,484) |
(1,310,576) |
|
Net increase (decrease) |
5,165,344 |
$ 92,009,191 |
1,649,917 |
$ 21,482,535 |
|
Service Class 2 A |
1,052,073 |
$ 19,316,295 |
- |
$ - |
|
Reinvested |
40 |
671 |
- |
- |
|
Redeemed |
(99,362) |
(1,606,894) |
- |
- |
|
Net increase (decrease) |
952,751 |
$ 17,710,072 |
- |
$ - |
|
Distributions |
|
|
|
|
|
From net realized gain |
|
$ - |
|
$ 8,856 |
|
Service Class |
|
- |
|
131,061 |
|
Service Class 2 A |
|
- |
|
- |
|
Total |
|
$ - |
|
$ 139,917 |
|
In excess of net realized gain |
|
$ 8,466 |
|
$ 2,058 |
|
Service Class |
|
121,968 |
|
30,465 |
|
Service Class 2 A |
|
671 |
|
- |
|
Total |
|
$ 131,105 |
|
$ 32,523 |
|
|
|
$ 131,105 |
|
$ 172,440 |
A Service Class 2 commenced sale of shares January 12, 2000.
See accompanying notes which are an integral part of the financial statements.
Mid Cap Portfolio
Financial Highlights - Initial Class
|
|
Six months ended |
Years ended |
|
|
Selected Per-Share Data |
(Unaudited) |
1999 |
1998 E |
|
Net asset value, beginning of period |
$ 15.25 |
$ 10.31 |
$ 10.00 |
|
Income from Investment Operations |
|
|
|
|
Net investment income (loss) D |
.02 |
.00 |
.00 |
|
Net realized and unrealized gain (loss) |
3.60 |
5.05 |
.31 |
|
Total from investment operations |
3.62 |
5.05 |
.31 |
|
Less Distributions |
|
|
|
|
From net realized gain |
- |
(.09) |
- |
|
In excess of net realized gain |
(.05) |
(.02) |
- |
|
Total distributions |
(.05) |
(.11) |
- |
|
Net asset value, end of period |
$ 18.82 |
$ 15.25 |
$ 10.31 |
|
Total Return B, C |
23.78% |
49.04% |
3.10% |
|
Ratios and Supplemental Data |
|
|
|
|
Net assets, end of period (000 omitted) |
$ 149,444 |
$ 1,744 |
$ 516 |
|
Ratio of expenses to average net assets |
.84% A |
1.00% G |
1.00% A, G |
|
Ratio of expenses to average net assets after expense reductions |
.80% A, H |
.97% H |
1.00% A |
|
Ratio of net investment income (loss) to average net assets |
.25% A |
.01% |
(.27)% A |
|
Portfolio turnover |
239% A |
163% |
125% A |
Financial Highlights - Service Class
|
|
Six months ended |
Years ended |
|
|
Selected Per-Share Data |
(Unaudited) |
1999 |
1998 F |
|
Net asset value, beginning of period |
$ 15.24 |
$ 10.31 |
$ 10.00 |
|
Income from Investment Operations |
|
|
|
|
Net investment income (loss) D |
.01 |
(.01) |
.00 |
|
Net realized and unrealized gain (loss) |
3.60 |
5.05 |
.31 |
|
Total from investment operations |
3.61 |
5.04 |
.31 |
|
Less Distributions |
|
|
|
|
From net realized gain |
- |
(.09) |
- |
|
In excess of net realized gain |
(.05) |
(.02) |
- |
|
Total distributions |
(.05) |
(.11) |
- |
|
Net asset value, end of period |
$ 18.80 |
$ 15.24 |
$ 10.31 |
|
Total Return B, C |
23.73% |
48.94% |
3.10% |
|
Ratios and Supplemental Data |
|
|
|
|
Net assets, end of period (000 omitted) |
$ 129,033 |
$ 25,908 |
$ 516 |
|
Ratio of expenses to average net assets |
.92% A |
1.10% G |
1.10% A, G |
|
Ratio of expenses to average net assets after expense reductions |
.88% A, H |
1.07% H |
1.10% A |
|
Ratio of net investment income (loss) to average net assets |
.17% A |
(.09)% |
(.35)% A |
|
Portfolio turnover |
239% A |
163% |
125% A |
|
A Annualized B The total returns would have been lower had certain expenses not been reduced during the periods shown. C Total returns for periods of less than one year are not annualized and do not reflect charges attributable to your insurance company's separate account. Inclusion of these charges would reduce the total returns shown. D Net investment income (loss) per share has been calculated based on average shares outstanding during the period. E For the period December 28, 1998 (commencement of sale of Initial Class shares) to December 31, 1998. F For the period December 28, 1998 (commencement of sale of Service Class shares) to December 31, 1998. G FMR agreed to reimburse a portion of the class' expenses during the period. Without this reimbursement, the class' expense ratio would have been higher. H FMR or the fund has entered into varying arrangements with third parties who either paid or reduced a portion of the class' expenses. |
|||
See accompanying notes which are an integral part of the financial statements.
Semiannual Report
Financial Highlights - Service Class 2
|
|
Six months ended |
|
Selected Per-Share Data |
(Unaudited) |
|
Net asset value, beginning of period |
$ 14.82 |
|
Income from Investment Operations |
|
|
Net investment income D |
.00 |
|
Net realized and unrealized gain (loss) |
4.01 |
|
Total from investment operations |
4.01 |
|
Less Distributions |
|
|
In excess of net realized gain |
(.05) |
|
Net asset value, end of period |
$ 18.78 |
|
Total Return B, C |
27.10% |
|
Ratios and Supplemental Data |
|
|
Net assets, end of period (000 omitted) |
$ 17,891 |
|
Ratio of expenses to average net assets |
1.07% A |
|
Ratio of expenses to average net assets after expense reductions |
1.04% A, F |
|
Ratio of net investment income to average net assets |
.02% A |
|
Portfolio turnover |
239% A |
|
A Annualized B The total returns would have been lower had certain expenses not been reduced during the periods shown. C Total returns for periods of less than one year are not annualized and do not reflect charges attributable to your insurance company's separate account. Inclusion of these charges would reduce the total returns shown. D Net investment income per share has been calculated based on average shares outstanding during the period. E For the period January 12, 2000 (commencement of sale of Service Class 2 shares) to June 30, 2000. F FMR or the fund has entered into varying arrangements with third parties who either paid or reduced a portion of the class' expenses. |
|
See accompanying notes which are an integral part of the financial statements.
Mid Cap Portfolio
A special meeting of the fund's shareholders was held on July 19, 2000. The results of votes taken among shareholders on proposals before them are reported below. Each vote reported represents one dollar of net asset value held on the record date for the meeting.
PROPOSAL 1
To elect as Trustees the following twelve nominees.*
|
|
# of Dollars Voted |
% of Dollars Voted |
Ralph F. Cox
|
Affirmative |
2,995,348,207.84 |
97.862 |
|
Withheld |
65,444,305.52 |
2.138 |
|
TOTAL |
3,060,792,513.36 |
100.000 |
Phyllis Burke Davis
|
Affirmative |
2,995,012,849.06 |
97.851 |
|
Withheld |
65,779,664.30 |
2.149 |
|
TOTAL |
3,060,792,513.36 |
100.000 |
Robert M. Gates
|
Affirmative |
2,994,325,628.16 |
97.828 |
|
Withheld |
66,466,885.20 |
2.172 |
|
TOTAL |
3,060,792,513.36 |
100.000 |
Edward C. Johnson 3d
|
Affirmative |
2,994,212,266.77 |
97.825 |
|
Withheld |
66,580,246.59 |
2.175 |
|
TOTAL |
3,060,792,513.36 |
100.000 |
Donald J. Kirk
|
Affirmative |
2,996,527,468.99 |
97.900 |
|
Withheld |
64,265,044.37 |
2.100 |
|
TOTAL |
3,060,792,513.36 |
100.000 |
Ned C. Lautenbach
|
Affirmative |
2,997,430,896.97 |
97.930 |
|
Withheld |
63,361,616.39 |
2.070 |
|
TOTAL |
3,060,792,513.36 |
100.000 |
|
|
# of Dollars Voted |
% of Dollars Voted |
Peter S. Lynch
|
Affirmative |
2,997,391,112.97 |
97.929 |
|
Withheld |
63,401,400.39 |
2.071 |
|
TOTAL |
3,060,792,513.36 |
100.000 |
William O. McCoy
|
Affirmative |
2,997,364,420.76 |
97.928 |
|
Withheld |
63,428,092.60 |
2.072 |
|
TOTAL |
3,060,792,513.36 |
100.000 |
Gerald C. McDonough
|
Affirmative |
2,992,594,911.89 |
97.772 |
|
Withheld |
68,197,601.47 |
2.228 |
|
TOTAL |
3,060,792,513.36 |
100.000 |
Marvin L. Mann
|
Affirmative |
2,996,491,839.67 |
97.899 |
|
Withheld |
64,300,673.69 |
2.101 |
|
TOTAL |
3,060,792,513.36 |
100.000 |
Robert C. Pozen
|
Affirmative |
2,997,304,419.99 |
97.926 |
|
Withheld |
63,488,093.37 |
2.074 |
|
TOTAL |
3,060,792,513.36 |
100.000 |
Thomas R. Williams
|
Affirmative |
2,993,561,996.24 |
97.803 |
|
Withheld |
67,230,517.12 |
2.197 |
|
TOTAL |
3,060,792,513.36 |
100.000 |
Semiannual Report
PROPOSAL 2
To ratify the selection of PricewaterhouseCoopers LLP as independent accountants of the fund.
|
|
# of Dollars Voted |
% of Dollars Voted |
|
Affirmative |
152,524,752.89 |
95.370 |
|
Against |
1,456,201.90 |
0.911 |
|
Abstain |
5,947,746.88 |
3.719 |
|
TOTAL |
159,928,701.67 |
100.000 |
PROPOSAL 3
To authorize the Trustees to adopt an amended and restated Declaration of Trust.*
|
|
# of Dollars Voted |
% of Dollars Voted |
|
Affirmative |
2,837,267,199.92 |
92.697 |
|
Against |
49,473,422.32 |
1.617 |
|
Abstain |
174,051,891.12 |
5.686 |
|
TOTAL |
3,060,792,513.36 |
100.000 |
PROPOSAL 4
To approve an amended management contract for the fund that would reduce the management fee payable to FMR by the fund as FMR's assets under management increase.
|
|
# of Dollars Voted |
% of Dollars Voted |
|
Affirmative |
149,727,278.77 |
93.621 |
|
Against |
2,405,860.33 |
1.505 |
|
Abstain |
7,795,562.57 |
4.874 |
|
TOTAL |
159,928,701.67 |
100.000 |
PROPOSAL 5
To amend the fundamental limitation concerning underwriting.
|
|
# of Dollars Voted |
% of Dollars Voted |
|
Affirmative |
147,993,847.24 |
92.537 |
|
Against |
3,567,046.24 |
2.231 |
|
Abstain |
8,367,808.19 |
5.232 |
|
TOTAL |
159,928,701.67 |
100.000 |
PROPOSAL 6
To amend the fundamental limitation concerning concentration.
|
|
# of Dollars Voted |
% of Dollars Voted |
|
Affirmative |
147,959,308.60 |
92.516 |
|
Against |
3,629,590.53 |
2.269 |
|
Abstain |
8,339,802.54 |
5.215 |
|
TOTAL |
159,928,701.67 |
100.000 |
* Denotes trust-wide proposals and voting results.
Mid Cap Portfolio
Performance
There are several ways to evaluate a fund's historical performance. You can look at the total percentage change in value, the average annual percentage change or the growth of a hypothetical $10,000 investment. Total return reflects the change in the value of an investment, assuming reinvestment of the fund's dividend income and capital gains (the profits earned upon the sale of securities that have grown in value). The initial offering of Service Class 2 shares took place on January 12, 2000. Performance for Service Class 2 shares reflects an asset based distribution fee (12b-1 fee). Returns from November 3, 1997 through January 12, 2000 are those of Service Class which reflect a different 12b-1 fee. Service Class 2 returns prior to November 3, 1997 are those of Initial Class, and do not include the effects of a 12b-1 fee. Had Service Class 2's 12b-1 fee been reflected, returns prior to January 12, 2000 would have been lower.
Average Annual Total Returns
|
Periods ended |
Past 1 |
Past 5 |
Past 10 |
|
Fidelity VIP: Growth - Service Class 2 |
26.03% |
25.48% |
20.04% |
|
Russell 3000 Growth |
25.86% |
27.43% |
19.49% |
Average annual returns take the fund's cumulative return and show you what would have happened if the fund had performed at a constant rate each year.
You can compare the fund's returns to the performance of the Russell 3000 Growth Index - a market capitalization-weighted index of growth-oriented stocks of U.S. domiciled corporations.
Figures for more than one year assume a steady compounded rate of return and are not the fund's year-by-year results, which fluctuated over the periods shown.
Performance numbers are net of all fund operating expenses, but do not include any insurance charges imposed by your insurance company's separate account. If performance information included the effect of these additional charges, the total returns would have been lower.
Past performance is no guarantee of future results. Principal and investment return will vary and you may have a gain or loss when you withdraw your money.
Understanding Performance
How a fund did yesterday is no guarantee of how it will do tomorrow. The stock market, for example, has a history of long-term growth and short-term volatility. In turn, the share price and return of a fund that invests in stocks will vary. That means if you sell your shares during a market downturn, you might lose money. But if you can ride out the market's ups and downs, you may have a gain.
3$10,000 Over 10 Years
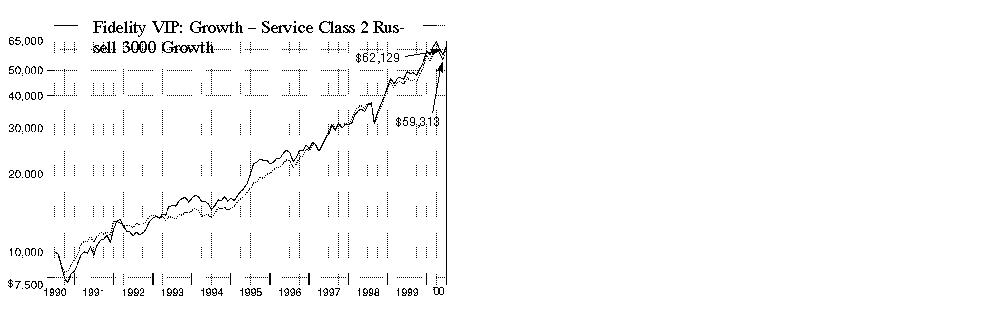
$10,000 Over 10 Years: Let's say hypothetically that $10,000 was invested in Fidelity Variable Insurance Products: Growth Portfolio - Service Class 2 on June 30, 1990. As the chart shows, by June 30, 2000, the value of the investment would have grown to $62,129 - a 521.29% increase on the initial investment. For comparison, look at how the Russell 3000 Growth Index did over the same period. With dividends and capital gains, if any, reinvested, the same $10,000 investment would have grown to $59,313 - a 493.13% increase.
Investment Summary
|
Top Five Stocks as of June 30, 2000 |
|
|
|
% of fund's |
|
Cisco Systems, Inc. |
4.5 |
|
Intel Corp. |
4.4 |
|
Pfizer, Inc. |
3.6 |
|
General Electric Co. |
2.9 |
|
Eli Lilly & Co. |
2.6 |
|
|
18.0 |
|
Top Five Market Sectors as of June 30, 2000 |
|
|
|
% of fund's |
|
Technology |
42.6 |
|
Health |
14.9 |
|
Finance |
8.3 |
|
Media & Leisure |
6.9 |
|
Utilities |
6.5 |
|
Asset Allocation as of June 30, 2000 |
||
|
% of fund's net assets * |
|
Stocks 98.4% |
|
|
|
Short-Term |
|
|
|
* Foreign investments 11.4% |
Semiannual Report
(Portfolio Manager photograph)
An interview with Jennifer Uhrig, Portfolio Manager of Growth Portfolio
Q. How did the fund perform, Jennifer?
A. Pretty well. For the six months that ended June 30, 2000, the fund posted a higher return than the Russell 3000 Growth Index, which returned 4.04%. For the 12 months that ended June 30, 2000, the fund also outperformed the index, which returned 25.86%.
Q. The period was marked by a high degree of volatility within the technology sector. How did this affect the fund?
A. Technology stocks performed well during the first half of the period, but succumbed to investor fears during much of the second as high valuations succumbed to the effects of higher interest rates, and the group suffered a significant downturn. The fund was underweighted in technology stocks relative to the Russell index, but nonetheless had just under 43% of its net assets in the sector at the end of the period. Many of its technology names were of the small-cap variety, and these stocks were among the hardest hit during the technology slide. On the plus side, the fund's positions in communications equipment providers such as Nokia and Ericsson helped. These stocks typically trade in line with technology, so their solid performance during the period was a pleasant surprise.
Q. Despite the volatility, some of the fund's bigger-cap technology names fared well . . .
A. The fund's stakes in market leaders such as Cisco Systems, EMC Corp. and Intel generated nice results. Cisco - the main player in the Internet infrastructure area - performed well on the heels of accelerating earnings and revenue growth. EMC, which specializes in data storage, also enjoyed strong earnings growth, and Intel benefited from a shortage of high-end microprocessors. Microsoft was one big-cap that didn't come through, however, as its performance was hampered by both the ongoing federal government case against it and a slowdown in the company's applications business. Microsoft also was in the process of implementing a new Internet strategy, and its success is yet to be proven.
Q. What other types of stocks contributed positively?
A. The fund's investments in the oil services group - including names such as Baker Hughes, Halliburton and Smith International - performed well. Oil prices remained at relatively high levels during the period, which made the return on exploration quite attractive. In addition, we've seen lower levels of exploration in recent years, indicating that activity will need to pick up in order to meet production estimates. These companies - which sell the equipment used to drill for oil - were in a solid position to benefit from this environment. Finally, the fund's underweighting in consumer nondurables positions worked out well relative to the index.
Q. At just under 15%, health stocks occupied the second-largest position - after technology - in the portfolio. How did this group perform?
A. The fund's health-related investments were spread mostly among drug and biotechnology stocks, and each group performed well. Drug stocks Eli Lilly - which had eight drugs in the latter stages of development - and Warner-Lambert were among the fund's better performers. Biotechnology stocks - particularly those involved in the field of human genomics - fell along with technology in April, but enjoyed a fairly good rebound as we closed the period. The fund's positions in Millennium Pharmaceuticals and Genentech provided a favorable boost.
Q. What's your outlook?
A. Technology has been the key market driver for some time, and the sector has been very unpredictable. Performance has bounced around depending on whether technology stocks have had a good week or a bad week. Earnings growth continues to be strong for technology, so the sector could do well if the economy slows and interest rates stabilize. Outside of technology, the key economic question is whether we're in for a soft landing - in which the economy slows, but in a gradual fashion - or a hard landing, which could translate into a recession. Obviously, a soft landing would be better. More stocks outside of tech could participate, and economically sensitive stocks would stand a chance. If we see a hard landing, I may look to add to the fund's consumer nondurables positions or to the drug stocks, both of which tend to perform well going into a recession.
The views expressed in this report reflect those of the portfolio manager only through the end of the period of the report as stated on the cover. The manager's views are subject to change at any time based on market or other conditions. For more information, see page 2.
Fund Facts
Goal: to increase the value of the fund's shares over the long term by investing in stocks with above-average growth potential
Start date: October 9, 1986
Size: as of June 30, 2000, more than $20.2 billion
Manager: Jennifer Uhrig, since 1997; joined Fidelity in 1987
3Semiannual Report
Fidelity Variable Insurance Products: Growth Portfolio
(Unaudited)
Showing Percentage of Net Assets
|
Common Stocks - 98.4% |
|||
|
Shares |
Value (Note 1) |
||
|
AEROSPACE & DEFENSE - 0.7% |
|||
|
BFGoodrich Co. |
657,900 |
$ 22,409,719 |
|
|
Boeing Co. |
1,827,800 |
76,424,888 |
|
|
Textron, Inc. |
31,600 |
1,716,275 |
|
|
United Technologies Corp. |
822,200 |
48,407,025 |
|
|
|
148,957,907 |
||
|
BASIC INDUSTRIES - 1.3% |
|||
|
Chemicals & Plastics - 0.2% |
|||
|
Cytec Industries, Inc. (a) |
888,200 |
21,927,438 |
|
|
Lyondell Chemical Co. |
1,473,400 |
24,679,450 |
|
|
|
46,606,888 |
||
|
Metals & Mining - 0.4% |
|||
|
CommScope, Inc. (a) |
1,266,100 |
51,910,100 |
|
|
Falconbridge Ltd. |
802,500 |
9,892,351 |
|
|
Inco Ltd. (a) |
1,402,000 |
21,496,386 |
|
|
Martin Marietta Materials, Inc. |
143,900 |
5,818,956 |
|
|
|
89,117,793 |
||
|
Packaging & Containers - 0.2% |
|||
|
Owens-Illinois, Inc. (a) |
3,285,700 |
38,401,619 |
|
|
Paper & Forest Products - 0.5% |
|||
|
Kimberly-Clark Corp. |
1,625,400 |
93,257,325 |
|
|
TOTAL BASIC INDUSTRIES |
267,383,625 |
||
|
CONSTRUCTION & REAL ESTATE - 0.3% |
|||
|
Building Materials - 0.1% |
|||
|
Vulcan Materials Co. |
350,200 |
14,949,163 |
|
|
Engineering - 0.2% |
|||
|
Fluor Corp. |
583,770 |
18,461,726 |
|
|
Stolt Offshore SA (a) |
1,551,600 |
21,916,350 |
|
|
Stolt Offshore SA Class A sponsored ADR (a) |
206,050 |
2,446,844 |
|
|
|
42,824,920 |
||
|
TOTAL CONSTRUCTION & REAL ESTATE |
57,774,083 |
||
|
DURABLES - 0.8% |
|||
|
Consumer Durables - 0.0% |
|||
|
Minnesota Mining & Manufacturing Co. |
55,400 |
4,570,500 |
|
|
Consumer Electronics - 0.7% |
|||
|
Gemstar International Group Ltd. (a) |
872,300 |
53,605,561 |
|
|
Pioneer Corp. |
190,000 |
7,401,434 |
|
|
Sanyo Electric Co. Ltd. |
822,000 |
7,396,605 |
|
|
Sony Corp. |
837,300 |
78,967,860 |
|
|
|
147,371,460 |
||
|
|
|||
|
Shares |
Value (Note 1) |
||
|
Textiles & Apparel - 0.1% |
|||
|
Shaw Industries, Inc. |
1,045,400 |
$ 13,067,500 |
|
|
TOTAL DURABLES |
165,009,460 |
||
|
ENERGY - 3.5% |
|||
|
Energy Services - 2.3% |
|||
|
Baker Hughes, Inc. |
3,032,770 |
97,048,640 |
|
|
BJ Services Co. (a) |
635,700 |
39,731,250 |
|
|
Coflexip SA sponsored ADR |
928,500 |
56,174,250 |
|
|
Global Industries Ltd. (a) |
406,300 |
7,668,913 |
|
|
Halliburton Co. |
2,470,100 |
116,557,844 |
|
|
Smith International, Inc. (a) |
868,950 |
63,270,422 |
|
|
Varco International, Inc. (a) |
1,295,500 |
30,120,375 |
|
|
Weatherford International, Inc. |
1,328,840 |
52,904,443 |
|
|
|
463,476,137 |
||
|
Oil & Gas - 1.2% |
|||
|
Apache Corp. |
679,200 |
39,945,450 |
|
|
Burlington Resources, Inc. |
676,400 |
25,872,300 |
|
|
Grant Prideco, Inc. (a) |
1,328,840 |
33,221,000 |
|
|
National-Oilwell, Inc. (a) |
1,050,000 |
34,518,750 |
|
|
Newfield Exploration Co. (a) |
1,396,300 |
54,630,238 |
|
|
Noble Affiliates, Inc. |
1,435,000 |
53,453,750 |
|
|
|
241,641,488 |
||
|
TOTAL ENERGY |
705,117,625 |
||
|
FINANCE - 8.3% |
|||
|
Banks - 0.9% |
|||
|
Bank One Corp. |
5,755,590 |
152,882,859 |
|
|
Chuo Mitsui Trust & Banking Co. Ltd. |
3,483,000 |
15,177,760 |
|
|
Sumitomo Trust & Banking Ltd. |
2,482,000 |
17,675,062 |
|
|
|
185,735,681 |
||
|
Credit & Other Finance - 1.2% |
|||
|
American Express Co. |
1,696,600 |
88,435,275 |
|
|
Associates First Capital Corp. Class A |
3,188,900 |
71,152,331 |
|
|
Citigroup, Inc. |
1,278,100 |
77,005,525 |
|
|
|
236,593,131 |
||
|
Federal Sponsored Credit - 1.3% |
|||
|
Fannie Mae |
3,578,100 |
186,732,094 |
|
|
Freddie Mac |
1,969,500 |
79,764,750 |
|
|
|
266,496,844 |
||
|
Insurance - 3.3% |
|||
|
Ace Ltd. |
2,117,000 |
59,276,000 |
|
|
AFLAC, Inc. |
881,600 |
40,498,500 |
|
|
Allmerica Financial Corp. |
657,910 |
34,458,036 |
|
|
AMBAC Financial Group, Inc. |
435,400 |
23,865,363 |
|
|
American International Group, Inc. |
1,682,031 |
197,638,643 |
|
|
Everest Re Group Ltd. |
1,198,800 |
39,410,550 |
|
|
Hartford Financial Services Group, Inc. |
143,200 |
8,010,250 |
|
|
Marsh & McLennan Companies, Inc. |
569,600 |
59,487,600 |
|
|
PartnerRe Ltd. |
1,170,500 |
41,479,594 |
|
|
Common Stocks - continued |
|||
|
Shares |
Value (Note 1) |
||
|
FINANCE - continued |
|||
|
Insurance - continued |
|||
|
The Chubb Corp. |
1,051,200 |
$ 64,648,800 |
|
|
XL Capital Ltd. Class A |
1,922,400 |
104,049,900 |
|
|
|
672,823,236 |
||
|
Securities Industry - 1.6% |
|||
|
Charles Schwab Corp. |
3,193,650 |
107,386,481 |
|
|
Daiwa Securities Group, Inc. |
5,334,000 |
70,435,770 |
|
|
Nikko Securities Co. Ltd. |
5,626,000 |
55,718,735 |
|
|
Nomura Securities Co. Ltd. |
3,836,000 |
93,891,911 |
|
|
|
327,432,897 |
||
|
TOTAL FINANCE |
1,689,081,789 |
||
|
HEALTH - 14.9% |
|||
|
Drugs & Pharmaceuticals - 13.3% |
|||
|
Abgenix, Inc. (a) |
466,671 |
55,934,894 |
|
|
Alkermes, Inc. (a) |
1,152,700 |
54,320,988 |
|
|
American Home Products Corp. |
1,349,200 |
79,265,500 |
|
|
Bristol-Myers Squibb Co. |
5,479,300 |
319,169,225 |
|
|
Cambridge Antibody Technology Group PLC (a) |
598,796 |
26,887,857 |
|
|
Elan Corp. PLC sponsored ADR (a) |
2,800,400 |
135,644,375 |
|
|
Eli Lilly & Co. |
5,317,800 |
531,115,275 |
|
|
Exelixis, Inc. |
534,300 |
17,832,263 |
|
|
Genentech, Inc. |
791,300 |
136,103,600 |
|
|
Human Genome Sciences, Inc. (a) |
525,300 |
70,061,888 |
|
|
Medarex, Inc. (a) |
598,600 |
50,581,700 |
|
|
Merck & Co., Inc. |
2,394,800 |
183,501,550 |
|
|
Millennium Pharmaceuticals, Inc. (a) |
913,240 |
102,168,725 |
|
|
Pfizer, Inc. |
15,050,025 |
722,401,200 |
|
|
Protein Design Labs, Inc. (a) |
140,600 |
23,192,409 |
|
|
Schering-Plough Corp. |
3,671,970 |
185,434,485 |
|
|
|
2,693,615,934 |
||
|
Medical Equipment & Supplies - 1.2% |
|||
|
Cardinal Health, Inc. |
1,739,400 |
128,715,600 |
|
|
Johnson & Johnson |
697,400 |
71,047,625 |
|
|
Medtronic, Inc. |
858,600 |
42,769,013 |
|
|
|
242,532,238 |
||
|
Medical Facilities Management - 0.4% |
|||
|
HCA - The Healthcare Co. |
1,859,800 |
56,491,425 |
|
|
HEALTHSOUTH Corp. (a) |
2,273,300 |
16,339,344 |
|
|
|
72,830,769 |
||
|
TOTAL HEALTH |
3,008,978,941 |
||
|
|
|||
|
Shares |
Value (Note 1) |
||
|
INDUSTRIAL MACHINERY & EQUIPMENT - 3.0% |
|||
|
Electrical Equipment - 2.9% |
|||
|
Capstone Turbine Corp. |
11,400 |
$ 513,713 |
|
|
General Electric Co. |
11,108,200 |
588,734,600 |
|
|
|
589,248,313 |
||
|
Industrial Machinery & Equipment - 0.1% |
|||
|
ASM Lithography Holding NV (a) |
255,000 |
11,251,875 |
|
|
TOTAL INDUSTRIAL MACHINERY & EQUIPMENT |
600,500,188 |
||
|
MEDIA & LEISURE - 6.9% |
|||
|
Broadcasting - 4.2% |
|||
|
AT&T Corp. - Liberty Media Group Class A (a) |
2,554,380 |
61,943,715 |
|
|
Clear Channel Communications, Inc. (a) |
1,191,300 |
89,347,500 |
|
|
Comcast Corp. Class A (special) (a) |
2,027,300 |
82,105,650 |
|
|
Cox Communications, Inc. Class A (a) |
1,380,400 |
62,894,475 |
|
|
EchoStar Communications Corp. |
1,538,800 |
50,948,706 |
|
|
Mediacom Communications Corp. |
1,151,200 |
17,699,700 |
|
|
MediaOne Group, Inc. (a) |
2,421,600 |
160,585,377 |
|
|
NTL, Inc. (a) |
647,594 |
38,774,691 |
|
|
Time Warner, Inc. |
2,574,468 |
195,659,568 |
|
|
UnitedGlobalCom, Inc. Class A (a) |
928,200 |
43,393,350 |
|
|
USA Networks, Inc. (a) |
2,526,700 |
54,639,888 |
|
|
|
857,992,620 |
||
|
Entertainment - 0.9% |
|||
|
Viacom, Inc. Class B (non-vtg.) (a) |
1,750,025 |
119,329,830 |
|
|
Walt Disney Co. |
1,500,600 |
58,242,038 |
|
|
|
177,571,868 |
||
|
Leisure Durables & Toys - 0.2% |
|||
|
Harley-Davidson, Inc. |
1,293,100 |
49,784,350 |
|
|
Restaurants - 1.6% |
|||
|
Brinker International, Inc. (a) |
1,974,900 |
57,765,825 |
|
|
Darden Restaurants, Inc. |
2,937,700 |
47,737,625 |
|
|
McDonald's Corp. |
3,556,900 |
117,155,394 |
|
|
Outback Steakhouse, Inc. (a) |
2,031,250 |
59,414,063 |
|
|
Tricon Global Restaurants, Inc. (a) |
834,760 |
23,581,970 |
|
|
Wendy's International, Inc. |
838,100 |
14,928,656 |
|
|
|
320,583,533 |
||
|
TOTAL MEDIA & LEISURE |
1,405,932,371 |
||
|
NONDURABLES - 4.0% |
|||
|
Beverages - 1.4% |
|||
|
Coca-Cola Enterprises, Inc. |
2,170,300 |
35,403,019 |
|
|
Pepsi Bottling Group, Inc. |
2,176,500 |
63,526,594 |
|
|
The Coca-Cola Co. |
3,240,600 |
186,131,963 |
|
|
|
285,061,576 |
||
|
Common Stocks - continued |
|||
|
Shares |
Value (Note 1) |
||
|
NONDURABLES - continued |
|||
|
Foods - 0.4% |
|||
|
American Italian Pasta Co. Class A (a) |
642,000 |
$ 13,281,375 |
|
|
Keebler Foods Co. |
1,651,762 |
61,321,664 |
|
|
|
74,603,039 |
||
|
Household Products - 1.0% |
|||
|
Clorox Co. |
1,788,200 |
80,133,713 |
|
|
Colgate-Palmolive Co. |
578,800 |
34,655,650 |
|
|
Procter & Gamble Co. |
1,701,360 |
97,402,860 |
|
|
|
212,192,223 |
||
|
Tobacco - 1.2% |
|||
|
Philip Morris Companies, Inc. |
9,198,800 |
244,343,125 |
|
|
TOTAL NONDURABLES |
816,199,963 |
||
|
PRECIOUS METALS - 0.4% |
|||
|
Barrick Gold Corp. |
1,434,000 |
25,909,828 |
|
|
Homestake Mining Co. |
2,249,300 |
15,463,938 |
|
|
Newmont Mining Corp. |
1,472,000 |
31,832,000 |
|
|
Placer Dome, Inc. |
1,426,100 |
13,389,254 |
|
|
TOTAL PRECIOUS METALS |
86,595,020 |
||
|
RETAIL & WHOLESALE - 4.2% |
|||
|
Drug Stores - 0.4% |
|||
|
Walgreen Co. |
2,329,560 |
74,982,713 |
|
|
General Merchandise Stores - 1.4% |
|||
|
Kohls Corp. (a) |
1,211,100 |
67,367,438 |
|
|
Wal-Mart Stores, Inc. |
3,864,300 |
222,680,288 |
|
|
|
290,047,726 |
||
|
Grocery Stores - 0.4% |
|||
|
Safeway, Inc. (a) |
1,715,200 |
77,398,400 |
|
|
Retail & Wholesale, Miscellaneous - 2.0% |
|||
|
Best Buy Co., Inc. (a) |
1,651,000 |
104,425,750 |
|
|
Home Depot, Inc. |
4,848,350 |
242,114,478 |
|
|
Tiffany & Co., Inc. |
876,700 |
59,177,250 |
|
|
|
405,717,478 |
||
|
TOTAL RETAIL & WHOLESALE |
848,146,317 |
||
|
SERVICES - 0.3% |
|||
|
Advertising - 0.2% |
|||
|
TMP Worldwide, Inc. (a) |
527,000 |
38,899,188 |
|
|
Services - 0.1% |
|||
|
Media Metrix, Inc. (a) |
453,100 |
11,525,731 |
|
|
Register.com, Inc. |
257,300 |
7,863,731 |
|
|
|
19,389,462 |
||
|
TOTAL SERVICES |
58,288,650 |
||
|
|
|||
|
Shares |
Value (Note 1) |
||
|
TECHNOLOGY - 42.6% |
|||
|
Communications Equipment - 11.0% |
|||
|
ADC Telecommunications, Inc. (a) |
1,574,400 |
$ 132,052,800 |
|
|
Advanced Fibre |
332,100 |
15,048,281 |
|
|
Aspect Communications Corp. (a) |
701,700 |
27,585,581 |
|
|
Ciena Corp. (a) |
674,000 |
112,347,375 |
|
|
Cisco Systems, Inc. (a) |
14,336,200 |
911,244,690 |
|
|
Comverse Technology, Inc. (a) |
742,500 |
69,052,500 |
|
|
Corning, Inc. |
710,900 |
191,854,138 |
|
|
Ditech Communications Corp. |
490,700 |
46,401,819 |
|
|
Lucent Technologies, Inc. |
5,005,635 |
296,583,874 |
|
|
Nokia AB sponsored ADR |
2,526,800 |
126,182,075 |
|
|
Nortel Networks Corp. |
3,470,160 |
240,719,643 |
|
|
Telefonaktiebolaget LM Ericsson sponsored ADR |
3,149,200 |
62,984,000 |
|
|
|
2,232,056,776 |
||
|
Computer Services & Software - 7.3% |
|||
|
Adobe Systems, Inc. |
571,400 |
74,282,000 |
|
|
Affymetrix, Inc. (a) |
324,900 |
53,649,113 |
|
|
Art Technology Group, Inc. |
742,100 |
74,905,719 |
|
|
Automatic Data Processing, Inc. |
1,415,500 |
75,817,719 |
|
|
BEA Systems, Inc. (a) |
1,548,050 |
76,531,722 |
|
|
BroadVision, Inc. (a) |
1,454,300 |
73,896,619 |
|
|
Citrix Systems, Inc. (a) |
32,100 |
607,894 |
|
|
Data Return Corp. |
130,300 |
3,778,700 |
|
|
Digex, Inc. Class A (c) |
1,235,800 |
83,957,163 |
|
|
Electronic Arts, Inc. (a) |
984,000 |
71,770,500 |
|
|
Healtheon/WebMD (a) |
1,039,500 |
15,397,594 |
|
|
Inktomi Corp. (a) |
295,000 |
34,883,750 |
|
|
Intertrust Technologies Corp. |
874,400 |
17,979,850 |
|
|
Intuit, Inc. (a) |
2,675,600 |
110,702,950 |
|
|
Microsoft Corp. (a) |
2,735,523 |
218,841,840 |
|
|
Nuance Communications, Inc. |
219,500 |
18,287,094 |
|
|
Oracle Corp. (a) |
2,368,100 |
199,068,406 |
|
|
PeopleSoft, Inc. (a) |
846,600 |
14,180,550 |
|
|
Razorfish, Inc. Class A (a) |
524,200 |
8,419,963 |
|
|
Software.com, Inc. |
256,900 |
33,364,888 |
|
|
Trans Cosmos, Inc. |
153,800 |
23,094,662 |
|
|
Travelocity.com, Inc. (a) |
466,200 |
7,634,025 |
|
|
Usinternetworking, Inc. (a) |
573,800 |
11,727,038 |
|
|
VeriSign, Inc. (a) |
485,907 |
85,762,586 |
|
|
VERITAS Software Corp. (a) |
558,675 |
63,139,004 |
|
|
Viant Corp. |
179,300 |
5,311,763 |
|
|
Vignette Corp. (a) |
461,800 |
24,020,816 |
|
|
|
1,481,013,928 |
||
|
Computers & Office Equipment - 10.6% |
|||
|
Brocade Communications |
427,500 |
78,439,570 |
|
|
CDW Computer Centers, Inc. (a) |
1,554,400 |
97,150,000 |
|
|
Compaq Computer Corp. |
2,698,000 |
68,967,625 |
|
|
Common Stocks - continued |
|||
|
Shares |
Value (Note 1) |
||
|
TECHNOLOGY - continued |
|||
|
Computers & Office Equipment - continued |
|||
|
Dell Computer Corp. (a) |
6,459,900 |
$ 318,553,819 |
|
|
EMC Corp. (a) |
5,129,740 |
394,669,371 |
|
|
Gateway, Inc. (a) |
1,011,000 |
57,374,250 |
|
|
Hewlett-Packard Co. |
1,720,400 |
214,834,950 |
|
|
International Business Machines Corp. |
2,986,500 |
327,208,406 |
|
|
Lexmark International Group, Inc. |
742,800 |
49,953,300 |
|
|
MRV Communications, Inc. (a) |
1,744,800 |
117,337,800 |
|
|
SCI Systems, Inc. (a) |
1,534,500 |
60,133,219 |
|
|
Softbank Corp. |
429,900 |
58,390,495 |
|
|
Sun Microsystems, Inc. (a) |
3,416,100 |
310,651,594 |
|
|
|
2,153,664,399 |
||
|
Electronic Instruments - 1.1% |
|||
|
Agilent Technologies, Inc. |
1,702,760 |
125,578,550 |
|
|
Applied Materials, Inc. (a) |
736,300 |
66,727,188 |
|
|
Varian, Inc. (a) |
347,700 |
16,037,663 |
|
|
|
208,343,401 |
||
|
Electronics - 12.6% |
|||
|
Advanced Micro Devices, Inc. (a) |
565,000 |
43,646,250 |
|
|
Bookham Technology PLC sponsored ADR |
577,500 |
34,216,875 |
|
|
Broadcom Corp. Class A (a) |
396,000 |
86,699,250 |
|
|
Chartered Semiconductor |
888,500 |
79,965,000 |
|
|
Intel Corp. |
6,712,700 |
897,404,081 |
|
|
JDS Uniphase Corp. (a) |
1,341,200 |
160,776,350 |
|
|
Kyocera Corp. |
351,500 |
60,392,096 |
|
|
LSI Logic Corp. (a) |
1,405,900 |
76,094,338 |
|
|
Marvell Technology Group Ltd. (a) |
7,800 |
444,600 |
|
|
Micron Technology, Inc. (a) |
1,485,400 |
130,808,038 |
|
|
Mitsubishi Electric Corp. |
9,445,000 |
102,271,840 |
|
|
Motorola, Inc. |
3,130,200 |
90,971,438 |
|
|
PMC-Sierra, Inc. (a) |
291,000 |
51,707,063 |
|
|
Samsung Electronics Co. Ltd. |
170,080 |
56,285,311 |
|
|
Sanmina Corp. (a) |
1,014,700 |
86,756,850 |
|
|
SDL, Inc. (a) |
248,800 |
70,954,650 |
|
|
Stratos Lightwave, Inc. (a) |
8,100 |
225,788 |
|
|
Taiwan Semiconductor Manufacturing Co. Ltd. sponsored ADR (a) |
1,796,354 |
69,608,718 |
|
|
|
|||
|
Shares |
Value (Note 1) |
||
|
Texas Instruments, Inc. |
5,659,200 |
$ 388,716,300 |
|
|
Xilinx, Inc. (a) |
857,800 |
70,822,113 |
|
|
|
2,558,766,949 |
||
|
TOTAL TECHNOLOGY |
8,633,845,453 |
||
|
TRANSPORTATION - 0.7% |
|||
|
Air Transportation - 0.2% |
|||
|
Southwest Airlines Co. |
2,211,100 |
41,872,706 |
|
|
Railroads - 0.5% |
|||
|
Burlington Northern Santa Fe Corp. |
1,209,300 |
27,738,319 |
|
|
Canadian National Railway Co. |
1,458,980 |
42,473,514 |
|
|
Union Pacific Corp. |
684,000 |
25,436,250 |
|
|
|
95,648,083 |
||
|
TOTAL TRANSPORTATION |
137,520,789 |
||
|
UTILITIES - 6.5% |
|||
|
Cellular - 3.7% |
|||
|
AT&T Corp. - Wireless Group |
1,172,100 |
32,672,288 |
|
|
China Telecom (Hong Kong) Ltd. sponsored ADR (a) |
723,050 |
128,567,328 |
|
|
China Unicom Ltd. sponsored ADR |
2,673,200 |
56,805,500 |
|
|
Nextel Communications, Inc. Class A (a) |
1,992,200 |
121,897,738 |
|
|
Sprint Corp. - PCS Group Series 1 (a) |
1,787,180 |
106,337,210 |
|
|
Vodafone AirTouch PLC |
32,309,376 |
133,881,853 |
|
|
Vodafone AirTouch PLC sponsored ADR |
1,652,650 |
68,481,684 |
|
|
VoiceStream Wireless Corp. (a) |
874,073 |
101,651,958 |
|
|
|
750,295,559 |
||
|
Electric Utility - 0.8% |
|||
|
AES Corp. (a) |
2,006,000 |
91,523,750 |
|
|
Calpine Corp. (a) |
1,211,900 |
79,682,425 |
|
|
|
171,206,175 |
||
|
Telephone Services - 2.0% |
|||
|
DDI Corp. |
6,392 |
61,496,324 |
|
|
iBasis, Inc. |
468,100 |
20,157,556 |
|
|
McLeodUSA, Inc. Class A (a) |
3,343,800 |
69,174,863 |
|
|
Metromedia Fiber Network, Inc. |
2,442,800 |
96,948,625 |
|
|
NEXTLINK Communications, Inc. Class A |
1,691,593 |
64,174,809 |
|
|
Sprint Corp. - FON Group |
756,000 |
38,556,000 |
|
|
TeraBeam Networks (d) |
60,800 |
228,000 |
|
|
Time Warner Telecom, Inc. Class A |
784,500 |
50,502,188 |
|
|
|
401,238,365 |
||
|
TOTAL UTILITIES |
1,322,740,099 |
||
|
TOTAL COMMON STOCKS (Cost $14,218,076,542) |
19,952,072,280 |
||
|
Cash Equivalents - 3.7% |
|||
|
Shares |
Value (Note 1) |
||
|
Central Cash Collateral Fund, 6.71% (b) |
296,344,139 |
$ 296,344,139 |
|
|
Taxable Central Cash Fund, 6.59% (b) |
454,771,936 |
454,771,936 |
|
|
TOTAL CASH EQUIVALENTS (Cost $751,116,075) |
751,116,075 |
|
|
TOTAL INVESTMENT PORTFOLIO - 102.1% (Cost $14,969,192,617) |
20,703,188,355 |
|
|
NET OTHER ASSETS - (2.1)% |
(422,988,881) |
|
|
NET ASSETS - 100% |
$ 20,280,199,474 |
|
|
Legend |
|
(a) Non-income producing |
|
(b) The rate quoted is the annualized seven-day yield of the fund at |
|
(c) Transactions during the period with companies which are or were affiliates are as follows: |
|
Affiliate |
Purchase |
Sales |
Dividend |
Value |
|
Coflexip SA |
$ - |
$ - |
$ - |
$ - |
|
Digex, Inc. |
313,744 |
- |
- |
83,957,163 |
|
TOTALS |
$ 313,744 |
$ - |
$ - |
$ 83,957,163 |
|
(d) Restricted securities - Investment in securities not registered under the Securities Act of 1933. |
|
Additional information on each holding is as follows: |
|
Security |
Acquisition Date |
Acquisition Cost |
|
TeraBeam Networks |
4/7/00 |
$ 228,000 |
|
Other Information |
|
Purchases and sales of securities, other than short-term securities, aggregated $10,740,018,866 and $9,565,681,575, respectively. |
|
The fund placed a portion of its portfolio transactions with brokerage firms which are affiliates of Fidelity Management & Research Company. The commissions paid to these affiliated firms were $332,074 for the period. |
|
The fund invested in securities that are not registered under the Securities Act of 1933. These securities are subject to legal or contractual restrictions on resale. At the end of the period, restricted securities (excluding Rule 144A issues) amounted to $228,000 or 0.0% of net assets. |
|
The fund participated in the security lending program. At period end, the value of securities loaned amounted to $302,340,051. The fund received cash collateral of $296,344,139 which was invested in cash equivalents. |
|
The fund participated in the interfund lending program as a borrower. |
|
Distribution of investments by country of issue, as a percentage of total |
|
United States of America |
88.6% |
|
Japan |
3.2 |
|
Canada |
1.7 |
|
United Kingdom |
1.3 |
|
Others (individually less than 1%) |
5.2 |
|
|
100.0% |
|
Income Tax Information |
|
At June 30, 2000, the aggregate cost of investment securities for income tax purposes was $15,074,908,308. Net unrealized appreciation aggregated $5,628,280,047, of which $6,454,968,371 related to appreciated investment securities and $826,688,324 related to depreciated investment securities. |
See accompanying notes which are an integral part of the financial statements.
Growth Portfolio
Statement of Assets and Liabilities
|
|
June 30, 2000 (Unaudited) |
|
|
Assets |
|
|
|
Investment in securities, at value (cost $14,969,192,617) - |
|
$ 20,703,188,355 |
|
Receivable for investments sold |
|
154,406,528 |
|
Receivable for fund shares sold |
|
13,515,281 |
|
Dividends receivable |
|
13,538,228 |
|
Interest receivable |
|
1,031,263 |
|
Other receivables |
|
825,472 |
|
Total assets |
|
20,886,505,127 |
|
Liabilities |
|
|
|
Payable for investments purchased |
$ 288,895,972 |
|
|
Payable for fund shares redeemed |
10,484,314 |
|
|
Accrued management fee |
9,499,178 |
|
|
Distribution fees payable |
135,980 |
|
|
Other payables and |
946,070 |
|
|
Collateral on securities loaned, |
296,344,139 |
|
|
Total liabilities |
|
606,305,653 |
|
Net Assets |
|
$ 20,280,199,474 |
|
Net Assets consist of: |
|
|
|
Paid in capital |
|
$ 13,338,505,241 |
|
Distributions in excess of |
|
(3,734,826) |
|
Accumulated undistributed |
|
1,211,401,186 |
|
Net unrealized appreciation (depreciation) on investments |
|
5,734,027,873 |
|
Net Assets |
|
$ 20,280,199,474 |
|
Initial Class: |
|
$51.54 |
|
Service Class: |
|
$51.39 |
|
Service Class 2: |
|
$51.35 |
Statement of Operations
|
|
Six months ended June 30, 2000 (Unaudited) |
|
|
Investment Income Dividends |
|
$ 52,399,181 |
|
Interest |
|
4,779,796 |
|
Security lending |
|
1,284,282 |
|
Total income |
|
58,463,259 |
|
Expenses |
|
|
|
Management fee |
$ 54,947,825 |
|
|
Transfer agent fees |
6,350,319 |
|
|
Distribution fees |
652,691 |
|
|
Accounting and security lending fees |
641,945 |
|
|
Non-interested trustees' compensation |
68,264 |
|
|
Custodian fees and expenses |
339,442 |
|
|
Registration fees |
89,572 |
|
|
Audit |
46,992 |
|
|
Legal |
69,742 |
|
|
Interest |
6,948 |
|
|
Miscellaneous |
83,780 |
|
|
Total expenses before reductions |
63,297,520 |
|
|
Expense reductions |
(1,596,136) |
61,701,384 |
|
Net investment income (loss) |
|
(3,238,125) |
|
Realized and Unrealized Gain (Loss) Net realized gain (loss) on: |
|
|
|
Investment securities |
1,263,186,366 |
|
|
Foreign currency transactions |
270,216 |
1,263,456,582 |
|
Change in net unrealized appreciation (depreciation) on: |
|
|
|
Investment securities |
(303,021,726) |
|
|
Assets and liabilities in |
10,711 |
(303,011,015) |
|
Net gain (loss) |
|
960,445,567 |
|
Net increase (decrease) in net assets resulting from operations |
|
$ 957,207,442 |
|
Other Information Expense reductions |
|
$ 1,592,303 |
|
Custodian credits |
|
3,833 |
|
|
|
$ 1,596,136 |
See accompanying notes which are an integral part of the financial statements.
Semiannual Report
Fidelity Variable Insurance Products: Growth Portfolio
Financial Statements - continued
Statement of Changes in Net Assets
|
Increase (Decrease) in Net Assets |
Six months ended |
Year ended |
|
Operations |
$ (3,238,125) |
$ 19,639,750 |
|
Net realized gain (loss) |
1,263,456,582 |
2,028,922,212 |
|
Change in net unrealized appreciation (depreciation) |
(303,011,015) |
2,640,487,583 |
|
Net increase (decrease) in net assets resulting from operations |
957,207,442 |
4,689,049,545 |
|
Distributions to shareholders |
(20,008,543) |
(20,716,861) |
|
From net realized gain |
(2,010,393,014) |
(1,302,572,634) |
|
Total distributions |
(2,030,401,557) |
(1,323,289,495) |
|
Share transactions - net increase (decrease) |
3,294,652,295 |
3,313,015,561 |
|
Total increase (decrease) in net assets |
2,221,458,180 |
6,678,775,611 |
|
Net Assets |
|
|
|
Beginning of period |
18,058,741,294 |
11,379,965,683 |
|
End of period (including under (over) distribution of net investment income of $(3,734,826) |
$ 20,280,199,474 |
$ 18,058,741,294 |
|
|
|
Other Information: |
|
|
Six months ended June 30, 2000 |
Year ended |
||
|
|
Shares |
Dollars |
Shares |
Dollars |
|
Share transactions |
36,209,385 |
$ 1,867,900,668 |
82,051,942 |
$ 3,738,420,624 |
|
Reinvested |
38,128,847 |
1,912,161,690 |
31,299,165 |
1,303,923,236 |
|
Redeemed |
(26,208,895) |
(1,332,024,693) |
(51,848,071) |
(2,361,030,389) |
|
Net increase (decrease) |
48,129,337 |
$ 2,448,037,665 |
61,503,036 |
$ 2,681,313,471 |
|
Service Class |
14,784,762 |
$ 754,915,605 |
14,009,513 |
$ 648,480,975 |
|
Reinvested |
2,363,626 |
118,228,594 |
465,535 |
19,366,259 |
|
Redeemed |
(703,110) |
(35,750,550) |
(792,556) |
(36,145,144) |
|
Net increase (decrease) |
16,445,278 |
$ 837,393,649 |
13,682,492 |
$ 631,702,090 |
|
Service Class 2 A |
191,871 |
$ 9,432,086 |
- |
$ - |
|
Reinvested |
225 |
11,274 |
- |
- |
|
Redeemed |
(4,542) |
(222,379) |
- |
- |
|
Net increase (decrease) |
187,554 |
$ 9,220,981 |
- |
$ - |
|
Distributions |
|
$ 19,026,484 |
|
$ 20,413,671 |
|
Service Class |
|
981,965 |
|
303,190 |
|
Service Class 2 A |
|
94 |
|
- |
|
Total |
|
$ 20,008,543 |
|
$ 20,716,861 |
|
From net realized gain |
|
$ 1,893,135,205 |
|
$ 1,283,509,565 |
|
Service Class |
|
117,246,629 |
|
19,063,069 |
|
Service Class 2 A |
|
11,180 |
|
- |
|
Total |
|
$ 2,010,393,014 |
|
$ 1,302,572,634 |
|
|
|
$ 2,030,401,557 |
|
$ 1,323,289,495 |
A Service Class 2 commenced sale of shares January 12, 2000.
See accompanying notes which are an integral part of the financial statements.
Growth Portfolio
Financial Highlights - Initial Class
|
|
Six months ended |
Years ended December 31, |
||||
|
Selected Per-Share Data |
(Unaudited) |
1999 |
1998 |
1997 |
1996 |
1995 |
|
Net asset value, beginning of period |
$ 54.93 |
$ 44.87 |
$ 37.10 |
$ 31.14 |
$ 29.20 |
$ 21.69 |
|
Income from Investment Operations |
|
|
|
|
|
|
|
Net investment income (loss) |
(.01) D |
.07 D |
.08 D |
.20 D |
.22 |
.08 |
|
Net realized and unrealized gain (loss) |
2.65 |
15.10 |
12.85 |
6.91 |
3.82 |
7.55 |
|
Total from investment operations |
2.64 |
15.17 |
12.93 |
7.11 |
4.04 |
7.63 |
|
Less Distributions |
|
|
|
|
|
|
|
From net investment income |
(.06) |
(.08) |
(.19) |
(.21) |
(.08) |
(.12) |
|
From net realized gain |
(5.97) |
(5.03) |
(4.97) |
(.94) |
(2.02) |
- |
|
Total distributions |
(6.03) |
(5.11) |
(5.16) |
(1.15) |
(2.10) |
(.12) |
|
Net asset value, end of period |
$ 51.54 |
$ 54.93 |
$ 44.87 |
$ 37.10 |
$ 31.14 |
$ 29.20 |
|
Total Return B, C |
5.11% |
37.44% |
39.49% |
23.48% |
14.71% |
35.36% |
|
Ratios and Supplemental Data |
|
|
|
|
|
|
|
Net assets, end of period (000 omitted) |
$ 18,566,075 |
$ 17,142,411 |
$ 11,243,824 |
$ 7,727,132 |
$ 6,086,424 |
$ 4,162,702 |
|
Ratio of expenses to average net assets |
.65% A |
.66% |
.68% |
.69% |
.69% |
.70% |
|
Ratio of expenses to average net assets after |
.64% A, F |
.65% F |
.66% F |
.67% F |
.67% F |
.70% |
|
Ratio of net investment income (loss) to average net assets |
(.03)% A |
.14% |
.21% |
.58% |
.81% |
.37% |
|
Portfolio turnover |
101% A |
84% |
123% |
113% |
81% |
108% |
Financial Highlights - Service Class
|
|
Six months ended |
Years ended December 31, |
||
|
Selected Per-Share Data |
(Unaudited) |
1999 |
1998 |
1997 E |
|
Net asset value, beginning of period |
$ 54.80 |
$ 44.82 |
$ 37.09 |
$ 36.92 |
|
Income from Investment Operations |
|
|
|
|
|
Net investment income (loss) D |
(.03) |
.02 |
.06 |
.03 |
|
Net realized and unrealized gain (loss) |
2.64 |
15.07 |
12.83 |
.14 |
|
Total from investment operations |
2.61 |
15.09 |
12.89 |
.17 |
|
Less Distributions |
|
|
|
|
|
From net investment income |
(.05) |
(.08) |
(.19) |
- |
|
From net realized gain |
(5.97) |
(5.03) |
(4.97) |
- |
|
Total distributions |
(6.02) |
(5.11) |
(5.16) |
- |
|
Net asset value, end of period |
$ 51.39 |
$ 54.80 |
$ 44.82 |
$ 37.09 |
|
Total Return B, C |
5.06% |
37.29% |
39.38% |
.46% |
|
Ratios and Supplemental Data |
|
|
|
|
|
Net assets, end of period (000 omitted) |
$ 1,704,494 |
$ 916,330 |
$ 136,142 |
$ 2,015 |
|
Ratio of expenses to average net assets |
.76% A |
.77% |
.80% |
.79% A |
|
Ratio of expenses to average net assets after expense reductions |
.74% A, F |
.75% F |
.75% F |
.77% A, F |
|
Ratio of net investment income (loss) to average net assets |
(.13)% A |
.04% |
.15% |
.70% A |
|
Portfolio turnover |
101% A |
84% |
123% |
113% |
|
A Annualized B Total returns for periods of less than one year are not annualized and do not reflect charges attributable to your insurance company's separate account. Inclusion of these charges would reduce the total returns shown. C The total returns would have been lower had certain expenses not been reduced during the periods shown. D Net investment income (loss) per share has been calculated based on average shares outstanding during the period. E For the period November 3, 1997 (commencement of sale of Service Class shares) to December 31, 1997. F FMR or the fund has entered into varying arrangements with third parties who either paid or reduced a portion of the class' expenses. |
||||
See accompanying notes which are an integral part of the financial statements.
Semiannual Report
Financial Highlights - Service Class 2
|
|
Six months ended |
|
Selected Per-Share Data |
(Unaudited) |
|
Net asset value, beginning of period |
$ 53.40 |
|
Income from Investment Operations |
|
|
Net investment income (loss) D |
(.07) |
|
Net realized and unrealized gain (loss) |
4.04 |
|
Total from investment operations |
3.97 |
|
Less Distributions |
|
|
From net investment income |
(.05) |
|
From net realized gain |
(5.97) |
|
Total distributions |
(6.02) |
|
Net asset value, end of period |
$ 51.35 |
|
Total Return B, C |
7.74% |
|
Ratios and Supplemental Data |
|
|
Net assets, end of period (000 omitted) |
$ 9,630 |
|
Ratio of expenses to average net assets |
.94% A |
|
Ratio of expenses to average net assets after expense reductions |
.92% A, F |
|
Ratio of net investment income (loss) to average net assets |
(.31)% A |
|
Portfolio turnover |
101% A |
|
A Annualized B Total returns for periods of less than one year are not annualized and do not reflect charges attributable to your insurance company's separate account. Inclusion of these charges would reduce the total returns shown. C The total returns would have been lower had certain expenses not been reduced during the periods shown. D Net investment income (loss) per share has been calculated based on average shares outstanding during the period. E For the period January 12, 2000 (commencement of sale of Service Class 2 shares) to June 30, 2000. F FMR or the fund has entered into varying arrangements with third parties who either paid or reduced a portion of the class' expenses. |
|
See accompanying notes which are an integral part of the financial statements.
Growth Portfolio
Performance
There are several ways to evaluate a fund's historical performance. You can look at the total percentage change in value, the average annual percentage change or the growth of a hypothetical $10,000 investment. Total return reflects the change in the value of an investment, assuming reinvestment of the fund's dividend income and capital gains (the profits earned upon the sale of securities that have grown in value). The initial offering of Service Class 2 shares took place on January 12, 2000. Performance for Service Class 2 shares reflects an asset based distribution fee (12b-1 fee). Returns from November 3, 1997 through January 12, 2000 are those of Service Class which reflect a different 12b-1 fee. Service Class 2 returns prior to November 3, 1997 are those of Initial Class, and do not include the effects of a 12b-1 fee. Had Service Class 2's 12b-1 fee been reflected, returns prior to January 12, 2000 would have been lower.
Average Annual Total Returns
|
Periods ended |
Past 1 |
Past 5 |
Life of |
|
Fidelity VIP: Contrafund - |
10.07% |
21.76% |
24.57% |
|
S&P 500 |
7.25% |
23.80% |
25.60% |
Average annual returns take the fund's cumulative return and show you what would have happened if the fund had performed at a constant rate each year.
You can compare the fund's return to the performance of the Standard & Poor's 500 Index - a market capitalization-weighted index of common stocks. This benchmark reflects the reinvestment of dividends and capital gains, if any.
Figures for more than one year assume a steady compounded rate of return and are not the fund's year-by-year results, which fluctuated over the periods shown. The life of the fund figures are from commencement of operations, January 3, 1995.
Performance numbers are net of all fund operating expenses, but do not include any insurance charges imposed by your insurance company's separate account. If performance information included the effect of these additional charges, the total return would be lower.
Past performance is no guarantee of future results. Principal and investment return will vary and you may have a gain or loss when you withdraw your money.
Understanding Performance
How a fund did yesterday is no guarantee of how it will do tomorrow. The stock market, for example, has a history of long-term growth and short-term volatility. In turn, the share price and return of a fund that invests in stocks will vary. That means if you sell your shares during a market downturn, you might lose money. But if you can ride out the market's ups and downs, you may have a gain.
3$10,000 Over Life of Fund
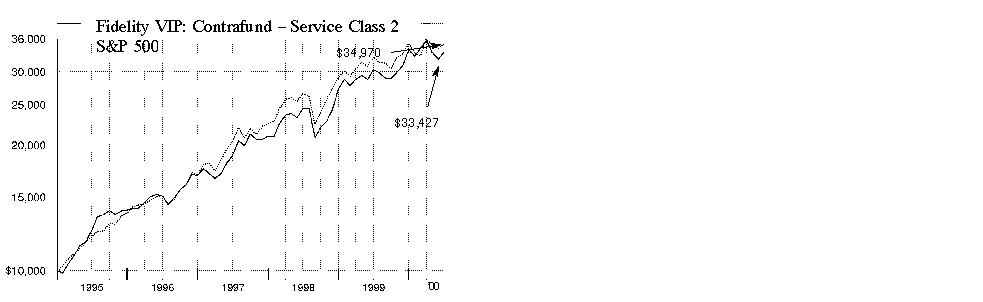
$10,000 Over Life of Fund: Let's say hypothetically that $10,000 was invested in Fidelity Variable Insurance Products: Contrafund Portfolio - Service Class 2 on January 3, 1995, when the fund started. As the chart shows, by June 30, 2000, the value of the investment would have grown to $33,427 - a 234.27% increase on the initial investment. For comparison, look at how the Standard & Poor's 500 Index did over the same period. With dividends and capital gains, if any, reinvested, the same $10,000 investment would have grown to $34,970 - a 249.70% increase.
Investment Summary
|
Top Five Stocks as of June 30, 2000 |
|
|
|
% of fund's |
|
Cisco Systems, Inc. |
4.3 |
|
Viacom, Inc. Class B (non-vtg.) |
4.1 |
|
McDonald's Corp. |
2.9 |
|
BP Amoco PLC sponsored ADR |
1.9 |
|
Exxon Mobil Corp. |
1.8 |
|
|
15.0 |
|
Top Five Market Sectors as of June 30, 2000 |
|
|
|
% of fund's |
|
Technology |
23.9 |
|
Media & Leisure |
13.0 |
|
Finance |
12.0 |
|
Utilities |
9.6 |
|
Energy |
7.1 |
|
Asset Allocation as of June 30, 2000 |
|||
|
% of fund's net assets * |
|||
|
Stocks and |
|
|
|
Bonds 2.3% |
|
|
|
Short-Term Investments |
|
|

|
* Foreign investments 15.5% |
Semiannual Report
(Portfolio Manager photograph)
An interview with Will Danoff, Portfolio Manager of Contrafund
Q. How did the fund perform, Will?
A. Performance was disappointing. For the six months that ended June 30, 2000, the fund trailed the Standard & Poor's 500 Index, which returned -0.42%. For the 12 months that ended June 30, 2000, the fund's performance topped the S&P 500, which returned 7.25%.
Q. What factors influenced the fund's performance during the six-month period?
A. The biggest drag on performance was the fund's low weighting in health stocks relative to the S&P 500. I kept the fund's exposure to the group at around half that of the index because the growth rates for health stocks were slowing. Health stocks rebounded during the period - returning around 25% - and the fund's low weighting ultimately hurt. Technology stocks, which accounted for approximately one-third of the S&P 500 at the end of the period, also played a key role. At the beginning of the period, I was concerned about high valuations and excessive speculation throughout the sector. As a result, I kept the fund underweighted relative to the index, and my decision to do so worked out well as technology stock prices corrected during April and May.
Q. What was your strategy in terms of the fund's technology investments?
A. I firmly believe that the Internet will be a major growth engine of the world economy for years to come. Dot-com stocks had been a major driver behind the market since mid-1998, but many of them were selling at valuations that drastically exceeded their potential earnings growth rates. When Internet stocks declined, the whole sector followed suit. At that time, I upgraded the fund's technology holdings by adding to its positions in leading technology names such as Cisco Systems and Nortel Networks, as well as emerging-but-profitable leaders such as Brocade Communications and Broadcom. These companies were well-positioned to benefit from the continued buildout of the Internet infrastructure. While the fund's investments in semiconductor names such as Micron Technology and Texas Instruments performed well during the period, a higher weighting in technology overall would have helped performance.
Q. The fund's emphasis on media and leisure stocks helped performance. Can you elaborate?
A. I viewed media stocks as beneficiaries of the Internet tidal wave, because I felt the Internet would serve as a significant outlet for media companies' content. Unlike many of the new dot-com companies, traditional media companies were producing positive earnings and cash flow. By investing in these stocks, the fund participated in the Internet investment theme, but with its risk limited by the real earnings and cash flow from these companies. This strategy proved wise, as the fund's investments in Time Warner and Viacom were particularly lucrative during the period. Consolidation also was prevalent throughout the media group, as America Online announced its intent to aquire Time Warner in January, and the Viacom-CBS merger produced better-than-expected results.
Q. Which stocks were disappointing?
A. McDonald's was a disappointment. I was initially attracted to the stock as a turnaround story, but the company's sales during the period were weaker than I had hoped. Rising interest rates hurt the stock of Home Depot, but the company continued to execute well and remained a core holding. Microsoft performed poorly during the period, as the ongoing federal government antitrust suit against the company and slowing revenue growth hurt its stock.
Q. What's your outlook?
A. The market remains extremely expensive. Price-to-earnings (P/E) ratios - which tell investors how much they're paying for a company's earnings power - have risen dramatically during the period and currently stand at almost twice their 75-year average. Corporate earnings thus far in 2000 have been very good - S&P earnings for the first quarter of 2000 were up 29% - but they may slow considering the six interest-rate hikes we've seen over the past year. Inflation is rising, but it remains under control. Against this uncertain backdrop, I'll try to concentrate on finding high-quality companies that are gaining market share, have sustainable competitive advantages and are in growing markets.
The views expressed in this report reflect those of the portfolio manager only through the end of the period of the report as stated on the cover. The manager's views are subject to change at any time based on market or other conditions. For more information, see page 2.
Fund Facts
Goal: long term capital appreciation
Start date: January 3, 1995
Size: as of June 30, 2000, more than
$10.2 billion
Manager: Will Danoff, since inception; joined Fidelity in 1986
3Semiannual Report
Fidelity Variable Insurance Products: Contrafund Portfolio
(Unaudited)
Showing Percentage of Net Assets
|
Common Stocks - 90.0% |
|||
|
Shares |
Value (Note 1) |
||
|
AEROSPACE & DEFENSE - 0.2% |
|||
|
Aerospace & Defense - 0.1% |
|||
|
Boeing Co. |
21,980 |
$ 919,039 |
|
|
Bombardier, Inc. Class B (non-vtg.) |
237,100 |
6,437,974 |
|
|
Northrop Grumman Corp. |
18,600 |
1,232,250 |
|
|
United Technologies Corp. |
21,701 |
1,277,646 |
|
|
|
9,866,909 |
||
|
Ship Building & Repair - 0.1% |
|||
|
General Dynamics Corp. |
186,200 |
9,728,950 |
|
|
TOTAL AEROSPACE & DEFENSE |
19,595,859 |
||
|
BASIC INDUSTRIES - 0.8% |
|||
|
Chemicals & Plastics - 0.6% |
|||
|
Avery Dennison Corp. |
332,400 |
22,312,350 |
|
|
Pharmacia Corp. |
373,500 |
19,305,281 |
|
|
Sealed Air Corp. (a) |
41,900 |
2,194,513 |
|
|
Spartech Corp. |
172,600 |
4,660,200 |
|
|
Valspar Corp. |
404,200 |
13,641,750 |
|
|
|
62,114,094 |
||
|
Metals & Mining - 0.2% |
|||
|
Alcoa, Inc. |
246,200 |
7,139,800 |
|
|
Broken Hill Proprietary Co. Ltd. |
791,982 |
9,335,716 |
|
|
|
16,475,516 |
||
|
Paper & Forest Products - 0.0% |
|||
|
Bowater, Inc. |
6,500 |
286,813 |
|
|
TOTAL BASIC INDUSTRIES |
78,876,423 |
||
|
CONSTRUCTION & REAL ESTATE - 0.5% |
|||
|
Building Materials - 0.1% |
|||
|
Fastenal Co. |
101,600 |
5,143,500 |
|
|
Fortune Brands, Inc. |
230,500 |
5,315,906 |
|
|
|
10,459,406 |
||
|
Construction - 0.1% |
|||
|
Ashtead Group PLC |
24,700 |
35,971 |
|
|
Jacobs Engineering Group, Inc. (a) |
290,530 |
9,496,699 |
|
|
|
9,532,670 |
||
|
Engineering - 0.0% |
|||
|
360networks, Inc. (sub. vtg.) |
220,400 |
3,379,318 |
|
|
Tetra Tech, Inc. (a) |
9,100 |
208,163 |
|
|
|
3,587,481 |
||
|
Real Estate - 0.0% |
|||
|
ResortQuest International, Inc. (a) |
192,100 |
984,513 |
|
|
Real Estate Investment Trusts - 0.3% |
|||
|
Equity Office Properties Trust |
448,600 |
12,364,538 |
|
|
Equity Residential Properties Trust (SBI) |
115,100 |
5,294,600 |
|
|
Glenborough Realty Trust, Inc. |
213,600 |
3,724,650 |
|
|
|
|||
|
Shares |
Value (Note 1) |
||
|
Pinnacle Holdings, Inc. (a) |
93,900 |
$ 5,070,600 |
|
|
Spieker Properties, Inc. |
46,600 |
2,143,600 |
|
|
|
28,597,988 |
||
|
TOTAL CONSTRUCTION & REAL ESTATE |
53,162,058 |
||
|
DURABLES - 3.4% |
|||
|
Autos, Tires, & Accessories - 2.2% |
|||
|
Danaher Corp. |
837,422 |
41,400,050 |
|
|
Gentex Corp. (a) |
172,700 |
4,339,088 |
|
|
Goodyear Tire & Rubber Co. |
22,500 |
450,000 |
|
|
Lear Corp. (a) |
190,800 |
3,816,000 |
|
|
Midas, Inc. |
304,800 |
6,096,000 |
|
|
Sonic Automotive, Inc. Class A (a) |
50,000 |
534,375 |
|
|
SPX Corp. |
1,053,141 |
127,364,240 |
|
|
Toyota Motor Corp. |
305,000 |
13,895,020 |
|
|
TRW, Inc. |
612,500 |
26,567,188 |
|
|
|
224,461,961 |
||
|
Consumer Durables - 0.1% |
|||
|
Blyth, Inc. |
69,000 |
2,035,500 |
|
|
Boyds Collection, Ltd. (a) |
408,500 |
3,472,250 |
|
|
|
5,507,750 |
||
|
Consumer Electronics - 1.1% |
|||
|
General Motors Corp. Class H (a) |
232,100 |
20,366,775 |
|
|
Harman International Industries, Inc. |
461,000 |
28,121,000 |
|
|
Pioneer Corp. |
402,000 |
15,659,876 |
|
|
Sony Corp. |
499,700 |
47,127,958 |
|
|
|
111,275,609 |
||
|
Home Furnishings - 0.0% |
|||
|
Herman Miller, Inc. |
86,900 |
2,248,538 |
|
|
The Bombay Company, Inc. (a) |
429,100 |
1,260,481 |
|
|
|
3,509,019 |
||
|
Textiles & Apparel - 0.0% |
|||
|
Delta Woodside Industries |
88,700 |
194,031 |
|
|
Timberland Co. Class A (a) |
7,600 |
538,175 |
|
|
Warnaco Group, Inc. Class A |
571,100 |
4,426,025 |
|
|
|
5,158,231 |
||
|
TOTAL DURABLES |
349,912,570 |
||
|
ENERGY - 7.1% |
|||
|
Energy Services - 0.5% |
|||
|
Baker Hughes, Inc. |
432,000 |
13,824,000 |
|
|
ENSCO International, Inc. |
107,100 |
3,835,519 |
|
|
Global Marine, Inc. |
117,300 |
3,306,394 |
|
|
Hanover Compressor Co. (a) |
225,100 |
8,553,800 |
|
|
Schlumberger Ltd. (NY Shares) |
286,600 |
21,387,525 |
|
|
|
50,907,238 |
||
|
Oil & Gas - 6.6% |
|||
|
Alberta Energy Co. Ltd. |
1,046,700 |
42,278,055 |
|
|
Common Stocks - continued |
|||
|
Shares |
Value (Note 1) |
||
|
ENERGY - continued |
|||
|
Oil & Gas - continued |
|||
|
Apache Corp. |
402,000 |
$ 23,642,625 |
|
|
BP Amoco PLC sponsored ADR |
3,497,532 |
197,829,154 |
|
|
Canada Occidental Petroleum Ltd. |
559,700 |
15,178,625 |
|
|
Canadian Natural Resources Ltd. (a) |
168,930 |
4,906,444 |
|
|
Chevron Corp. |
408,600 |
34,654,388 |
|
|
Cooper Cameron Corp. (a) |
22,900 |
1,511,400 |
|
|
Devon Energy Corp. |
36,640 |
2,058,710 |
|
|
EOG Resources, Inc. |
416,600 |
13,956,100 |
|
|
Exxon Mobil Corp. |
2,329,171 |
182,839,924 |
|
|
Newfield Exploration Co. (a) |
174,100 |
6,811,663 |
|
|
Royal Dutch Petroleum Co. (NY Shares) |
534,900 |
32,929,781 |
|
|
Santa Fe Snyder Corp. (a) |
257,300 |
2,926,788 |
|
|
Suncor Energy, Inc. |
1,445,940 |
33,401,653 |
|
|
Talisman Energy, Inc. (a) |
186,300 |
6,172,249 |
|
|
Tosco Corp. |
651,000 |
18,431,438 |
|
|
TotalFinaElf SA sponsored ADR |
526,823 |
40,466,592 |
|
|
Vastar Resources, Inc. |
261,200 |
21,451,050 |
|
|
|
681,446,639 |
||
|
TOTAL ENERGY |
732,353,877 |
||
|
FINANCE - 12.0% |
|||
|
Banks - 1.6% |
|||
|
Bank of New York Co., Inc. |
476,900 |
22,175,850 |
|
|
Bank One Corp. |
1,587,400 |
42,165,313 |
|
|
Commerce Bancorp, Inc. |
32,000 |
1,472,000 |
|
|
Fifth Third Bancorp |
250,800 |
15,863,100 |
|
|
Firstar Corp. |
806,100 |
16,978,481 |
|
|
M&T Bank Corp. |
33,230 |
14,953,500 |
|
|
Mellon Financial Corp. |
137,700 |
5,017,444 |
|
|
Northern Trust Corp. |
249,000 |
16,200,563 |
|
|
PNC Financial Services Group, Inc. |
74,400 |
3,487,500 |
|
|
Royal Bank of Scotland Group PLC |
704,573 |
11,821,340 |
|
|
Wells Fargo & Co. |
225,400 |
8,734,250 |
|
|
|
158,869,341 |
||
|
Credit & Other Finance - 3.0% |
|||
|
American Express Co. |
964,700 |
50,284,988 |
|
|
Associates First Capital Corp. Class A |
2,427,604 |
54,165,914 |
|
|
Citigroup, Inc. |
2,820,000 |
169,905,000 |
|
|
Concord EFS, Inc. (a) |
144,500 |
3,757,000 |
|
|
Household International, Inc. |
578,700 |
24,052,219 |
|
|
MBNA Corp. |
93,100 |
2,525,338 |
|
|
|
304,690,459 |
||
|
Federal Sponsored Credit - 0.8% |
|||
|
Fannie Mae |
1,593,000 |
83,134,688 |
|
|
Freddie Mac |
62,800 |
2,543,400 |
|
|
|
85,678,088 |
||
|
Insurance - 4.5% |
|||
|
Ace Ltd. |
170,200 |
4,765,600 |
|
|
AFLAC, Inc. |
211,500 |
9,715,781 |
|
|
|
|||
|
Shares |
Value (Note 1) |
||
|
American International Group, Inc. |
1,303,156 |
$ 153,120,830 |
|
|
Berkshire Hathaway, Inc. Class A (a) |
1,683 |
90,545,400 |
|
|
Canada Life Financial Corp. |
210,300 |
4,275,603 |
|
|
CIGNA Corp. |
187,870 |
17,565,845 |
|
|
Everest Re Group Ltd. |
80,200 |
2,636,575 |
|
|
Hartford Financial Services Group, Inc. |
361,600 |
20,227,000 |
|
|
John Hancock Financial Services, Inc. |
37,600 |
890,650 |
|
|
Marsh & McLennan Companies, Inc. |
175,275 |
18,305,283 |
|
|
MetLife, Inc. |
3,458,700 |
72,848,869 |
|
|
Mutual Risk Management Ltd. |
24,200 |
418,963 |
|
|
PartnerRe Ltd. |
135,300 |
4,794,694 |
|
|
PMI Group, Inc. |
96,900 |
4,602,750 |
|
|
RenaissanceRe Holdings Ltd. |
128,500 |
5,597,781 |
|
|
The Chubb Corp. |
267,300 |
16,438,950 |
|
|
The St. Paul Companies, Inc. |
151,500 |
5,169,938 |
|
|
XL Capital Ltd. Class A |
442,500 |
23,950,313 |
|
|
Zenith National Insurance Corp. |
127,700 |
2,713,625 |
|
|
|
458,584,450 |
||
|
Savings & Loans - 0.5% |
|||
|
Golden West Financial Corp. |
1,330,500 |
54,301,031 |
|
|
TCF Financial Corp. |
55,200 |
1,417,950 |
|
|
|
55,718,981 |
||
|
Securities Industry - 1.6% |
|||
|
AXA Financial, Inc. |
20,600 |
700,400 |
|
|
Daiwa Securities Group, Inc. |
5,186,000 |
68,481,421 |
|
|
Morgan Stanley Dean Witter & Co. |
125,500 |
10,447,875 |
|
|
Nikko Securities Co. Ltd. |
3,741,000 |
37,050,086 |
|
|
Nomura Securities Co. Ltd. |
2,049,000 |
50,152,379 |
|
|
|
166,832,161 |
||
|
TOTAL FINANCE |
1,230,373,480 |
||
|
HEALTH - 7.0% |
|||
|
Drugs & Pharmaceuticals - 4.9% |
|||
|
Accredo Health, Inc. (a) |
6,500 |
224,656 |
|
|
Allergan, Inc. |
68,800 |
5,125,600 |
|
|
ALZA Corp. (a) |
18,700 |
1,105,638 |
|
|
Amgen, Inc. |
73,800 |
5,184,450 |
|
|
Cephalon, Inc. (a) |
41,500 |
2,484,813 |
|
|
COR Therapeutics, Inc. (a) |
18,600 |
1,586,813 |
|
|
Elan Corp. PLC sponsored ADR (a) |
502,000 |
24,315,625 |
|
|
Eli Lilly & Co. |
964,482 |
96,327,640 |
|
|
Forest Laboratories, Inc. (a) |
75,600 |
7,635,600 |
|
|
Genentech, Inc. |
334,460 |
57,527,120 |
|
|
Gilead Sciences, Inc. (a) |
37,200 |
2,645,850 |
|
|
Immunex Corp. (a) |
1,423,770 |
70,387,629 |
|
|
Medimmune, Inc. (a) |
74,700 |
5,527,800 |
|
|
Pfizer, Inc. |
3,194,575 |
153,339,600 |
|
|
Schering-Plough Corp. |
1,426,900 |
72,058,450 |
|
|
|
505,477,284 |
||
|
Common Stocks - continued |
|||
|
Shares |
Value (Note 1) |
||
|
HEALTH - continued |
|||
|
Medical Equipment & Supplies - 1.5% |
|||
|
Boston Scientific Corp. (a) |
132,800 |
$ 2,913,300 |
|
|
Cardinal Health, Inc. |
214,800 |
15,895,200 |
|
|
DENTSPLY International, Inc. |
91,000 |
2,803,938 |
|
|
Edwards Lifesciences Corp. (a) |
4,600 |
85,100 |
|
|
Guidant Corp. (a) |
37,838 |
1,872,981 |
|
|
Medtronic, Inc. |
949,300 |
47,287,006 |
|
|
Millipore Corp. |
130,300 |
9,821,363 |
|
|
MiniMed, Inc. (a) |
98,100 |
11,575,800 |
|
|
Novoste Corp. (a) |
52,800 |
3,220,800 |
|
|
Novoste Corp. (a)(d) |
167,000 |
10,187,000 |
|
|
ORATEC Interventions, Inc. |
67,400 |
2,249,475 |
|
|
Patterson Dental Co. (a) |
470,100 |
23,975,100 |
|
|
Priority Healthcare Corp. (a) |
7,100 |
527,619 |
|
|
Smith & Nephew PLC |
1,658,322 |
6,138,246 |
|
|
Varian Medical Systems, Inc. (a) |
425,500 |
16,647,688 |
|
|
|
155,200,616 |
||
|
Medical Facilities Management - 0.6% |
|||
|
Chronimed, Inc. |
2,100 |
15,488 |
|
|
HCA - The Healthcare Co. |
233,400 |
7,089,525 |
|
|
Health Management Associates, Inc. Class A (a) |
119,800 |
1,564,888 |
|
|
Oxford Health Plans, Inc. (a) |
205,200 |
4,886,325 |
|
|
UnitedHealth Group, Inc. |
484,900 |
41,580,175 |
|
|
Universal Health Services, Inc. |
40,700 |
2,665,850 |
|
|
|
57,802,251 |
||
|
TOTAL HEALTH |
718,480,151 |
||
|
INDUSTRIAL MACHINERY & EQUIPMENT - 1.5% |
|||
|
Electrical Equipment - 1.3% |
|||
|
Alcatel SA sponsored ADR |
617,150 |
41,040,475 |
|
|
Allen Telecom, Inc. (a) |
479,500 |
8,481,156 |
|
|
American Power Conversion Corp. (a) |
16,700 |
681,569 |
|
|
General Electric Co. |
381,300 |
20,208,900 |
|
|
Hutchison Whampoa Ltd. |
993,900 |
12,494,510 |
|
|
Koninklijke Philips Electronics NV |
414,200 |
19,674,500 |
|
|
Littelfuse, Inc. (a) |
3,700 |
181,300 |
|
|
Loral Space & Communications Ltd. (a) |
846,933 |
5,875,598 |
|
|
Pinnacle Systems (a) |
439,700 |
9,886,380 |
|
|
Rayovac Corp. (a) |
553,950 |
12,394,631 |
|
|
Roper Industries, Inc. |
118,700 |
3,041,688 |
|
|
|
133,960,707 |
||
|
Industrial Machinery & Equipment - 0.1% |
|||
|
Exide Corp. |
100 |
800 |
|
|
Mettler-Toledo International, Inc. (a) |
153,700 |
6,148,000 |
|
|
|
|||
|
Shares |
Value (Note 1) |
||
|
MSC Industrial Direct, Inc. (a) |
57,500 |
$ 1,203,906 |
|
|
Sandvik AB |
56,300 |
1,184,960 |
|
|
|
8,537,666 |
||
|
Pollution Control - 0.1% |
|||
|
Waste Management, Inc. |
387,600 |
7,364,400 |
|
|
TOTAL INDUSTRIAL MACHINERY & EQUIPMENT |
149,862,773 |
||
|
MEDIA & LEISURE - 13.0% |
|||
|
Broadcasting - 3.2% |
|||
|
American Tower Corp. Class A (a) |
2,553,250 |
106,438,609 |
|
|
AT&T Corp. - Liberty Media Group |
1,471,816 |
35,691,538 |
|
|
Carlton Communications PLC |
1,628,640 |
21,000,498 |
|
|
Clear Channel Communications, Inc. (a) |
148,700 |
11,152,500 |
|
|
Cox Radio, Inc. Class A (a) |
191,500 |
5,362,000 |
|
|
Grupo Televisa SA de CV |
139,200 |
9,596,100 |
|
|
Infinity Broadcasting Corp. Class A (a) |
2,899,160 |
105,638,143 |
|
|
Time Warner, Inc. |
337,903 |
25,680,628 |
|
|
Westwood One, Inc. |
263,800 |
9,002,175 |
|
|
|
329,562,191 |
||
|
Entertainment - 5.4% |
|||
|
Fox Entertainment Group, Inc. |
533,700 |
16,211,138 |
|
|
MGM Grand, Inc. |
317,200 |
10,190,050 |
|
|
Park Place Entertainment Corp. (a) |
922,700 |
11,245,406 |
|
|
Premier Parks, Inc. (a) |
553,900 |
12,601,225 |
|
|
Viacom, Inc.: |
|
|
|
|
Class A (a) |
475,100 |
32,484,963 |
|
|
Class B (non-vtg.) (a) |
6,230,551 |
424,845,696 |
|
|
Walt Disney Co. |
1,303,620 |
50,596,751 |
|
|
|
558,175,229 |
||
|
Leisure Durables & Toys - 0.5% |
|||
|
Callaway Golf Co. |
622,800 |
10,159,425 |
|
|
Harley-Davidson, Inc. |
794,600 |
30,592,100 |
|
|
Mattel, Inc. |
608,000 |
8,018,000 |
|
|
|
48,769,525 |
||
|
Lodging & Gaming - 0.3% |
|||
|
Aztar Corp. (a) |
57,500 |
891,250 |
|
|
Starwood Hotels & Resorts |
911,100 |
29,667,694 |
|
|
|
30,558,944 |
||
|
Publishing - 0.5% |
|||
|
Harte Hanks Communications, Inc. |
19,500 |
487,500 |
|
|
McGraw-Hill Companies, Inc. |
280,900 |
15,168,600 |
|
|
PRIMEDIA, Inc. (a) |
275,200 |
6,260,800 |
|
|
Reader's Digest Association, Inc. |
653,640 |
25,982,190 |
|
|
United News & Media PLC |
90,900 |
1,310,005 |
|
|
|
49,209,095 |
||
|
Restaurants - 3.1% |
|||
|
CEC Entertainment, Inc. (a) |
196,000 |
5,022,500 |
|
|
Common Stocks - continued |
|||
|
Shares |
Value (Note 1) |
||
|
MEDIA & LEISURE - continued |
|||
|
Restaurants - continued |
|||
|
McDonald's Corp. |
9,129,400 |
$ 300,699,613 |
|
|
Outback Steakhouse, Inc. (a) |
45,350 |
1,326,488 |
|
|
Pizzaexpress PLC |
20,902 |
200,080 |
|
|
PJ America, Inc. (a)(c) |
581,700 |
5,671,575 |
|
|
Ryan's Family Steak Houses, Inc. (a) |
188,500 |
1,590,469 |
|
|
|
314,510,725 |
||
|
TOTAL MEDIA & LEISURE |
1,330,785,709 |
||
|
NONDURABLES - 3.0% |
|||
|
Foods - 1.9% |
|||
|
Booker PLC (a) |
2,151,689 |
4,724,802 |
|
|
Earthgrains Co. |
840,100 |
16,329,444 |
|
|
General Mills, Inc. |
264,200 |
10,105,650 |
|
|
Keebler Foods Co. |
859,200 |
31,897,800 |
|
|
Nestle SA (Reg.) |
7,933 |
15,859,200 |
|
|
PepsiCo, Inc. |
548,700 |
24,382,856 |
|
|
Quaker Oats Co. |
846,000 |
63,555,750 |
|
|
Sysco Corp. |
394,400 |
16,614,100 |
|
|
Wm. Wrigley Jr. Co. |
80,700 |
6,471,131 |
|
|
|
189,940,733 |
||
|
Household Products - 1.1% |
|||
|
Avon Products, Inc. |
1,140,300 |
50,743,350 |
|
|
Colgate-Palmolive Co. |
936,400 |
56,066,950 |
|
|
Estee Lauder Companies, Inc. |
182,400 |
9,017,400 |
|
|
Yankee Candle Co., Inc. |
61,800 |
1,336,425 |
|
|
|
117,164,125 |
||
|
TOTAL NONDURABLES |
307,104,858 |
||
|
PRECIOUS METALS - 0.9% |
|||
|
Barrick Gold Corp. |
2,174,060 |
39,281,395 |
|
|
Franco Nevada Mining Corp. Ltd. |
1,499,464 |
17,319,037 |
|
|
Gold Fields Ltd. |
932,600 |
3,658,873 |
|
|
Newmont Mining Corp. |
773,100 |
16,718,288 |
|
|
Placer Dome, Inc. |
1,698,845 |
15,949,980 |
|
|
|
92,927,573 |
||
|
RETAIL & WHOLESALE - 4.6% |
|||
|
Apparel Stores - 0.8% |
|||
|
Charming Shoppes, Inc. (a) |
1,479,600 |
7,536,713 |
|
|
Claire's Stores, Inc. |
304,800 |
5,867,400 |
|
|
Talbots, Inc. |
344,700 |
18,936,956 |
|
|
The Limited, Inc. |
783,800 |
16,949,675 |
|
|
|
|||
|
Shares |
Value (Note 1) |
||
|
TJX Companies, Inc. |
1,762,400 |
$ 33,045,000 |
|
|
Venator Group, Inc. (a) |
2,300 |
23,575 |
|
|
|
82,359,319 |
||
|
Drug Stores - 1.6% |
|||
|
CVS Corp. |
3,220,202 |
128,808,080 |
|
|
Rite Aid Corp. |
173,400 |
1,137,938 |
|
|
Walgreen Co. |
1,136,600 |
36,584,313 |
|
|
|
166,530,331 |
||
|
General Merchandise Stores - 0.5% |
|||
|
Costco Wholesale Corp. (a) |
415,400 |
13,708,200 |
|
|
Dollar Tree Stores, Inc. (a) |
173,450 |
6,862,116 |
|
|
JCPenney Co., Inc. |
651,700 |
12,015,719 |
|
|
Kohls Corp. (a) |
232,500 |
12,932,813 |
|
|
Michaels Stores, Inc. (a) |
74,300 |
3,403,869 |
|
|
Stein Mart, Inc. (a) |
241,400 |
2,474,350 |
|
|
Tuesday Morning Corp. (a) |
250,900 |
2,634,450 |
|
|
|
54,031,517 |
||
|
Grocery Stores - 0.2% |
|||
|
Fleming Companies, Inc. |
556,356 |
7,267,400 |
|
|
Iceland Group PLC |
470,067 |
1,987,743 |
|
|
Krispy Kreme Doughnuts, Inc. |
6,500 |
477,750 |
|
|
Safeway PLC |
1,616,114 |
6,300,727 |
|
|
|
16,033,620 |
||
|
Retail & Wholesale, Miscellaneous - 1.5% |
|||
|
Bed Bath & Beyond, Inc. (a) |
856,100 |
31,033,625 |
|
|
Best Buy Co., Inc. (a) |
382,400 |
24,186,800 |
|
|
Good Guys, Inc. (a) |
28,700 |
104,038 |
|
|
Guitar Center, Inc. (a) |
18,200 |
191,100 |
|
|
Home Depot, Inc. |
1,625,290 |
81,162,919 |
|
|
Staples, Inc. (a) |
1,420,350 |
21,837,881 |
|
|
|
158,516,363 |
||
|
TOTAL RETAIL & WHOLESALE |
477,471,150 |
||
|
SERVICES - 1.0% |
|||
|
Advertising - 0.5% |
|||
|
Getty Images, Inc. (a) |
48,200 |
1,786,413 |
|
|
Interpublic Group of Companies, Inc. |
55,700 |
2,395,100 |
|
|
Omnicom Group, Inc. |
194,240 |
17,299,500 |
|
|
TMP Worldwide, Inc. (a) |
8,300 |
612,644 |
|
|
Young & Rubicam, Inc. |
499,300 |
28,553,719 |
|
|
|
50,647,376 |
||
|
Educational Services - 0.0% |
|||
|
Apollo Group, Inc. Class A (a) |
70,700 |
1,979,600 |
|
|
Printing - 0.1% |
|||
|
Reynolds & Reynolds Co. Class A |
134,000 |
2,445,500 |
|
|
Valassis Communications, Inc. (a) |
32,700 |
1,246,688 |
|
|
|
3,692,188 |
||
|
Services - 0.4% |
|||
|
Carlisle Holdings Ltd. (a) |
205,500 |
1,509,141 |
|
|
Gartner Group, Inc. Class B (a) |
38,777 |
382,923 |
|
|
Common Stocks - continued |
|||
|
Shares |
Value (Note 1) |
||
|
SERVICES - continued |
|||
|
Services - continued |
|||
|
Learning Tree International, Inc. (a) |
2,800 |
$ 171,500 |
|
|
NOVA Corp. (a) |
312,600 |
8,733,263 |
|
|
Professional Detailing, Inc. (a) |
9,500 |
323,594 |
|
|
Robert Half International, Inc. (a) |
130,000 |
3,705,000 |
|
|
Storagenetworks, Inc. |
5,400 |
487,350 |
|
|
True North Communications |
58,100 |
2,556,400 |
|
|
Viad Corp. |
967,812 |
26,372,877 |
|
|
|
44,242,048 |
||
|
TOTAL SERVICES |
100,561,212 |
||
|
TECHNOLOGY - 23.9% |
|||
|
Communications Equipment - 7.3% |
|||
|
ADC Telecommunications, Inc. (a) |
552,700 |
46,357,713 |
|
|
Advanced Fibre |
24,400 |
1,105,625 |
|
|
Andrew Corp. (a) |
111,000 |
3,725,438 |
|
|
Centillium Communications, Inc. (a) |
14,400 |
993,600 |
|
|
Ciena Corp. (a) |
37,800 |
6,300,788 |
|
|
Cisco Systems, Inc. (a) |
6,866,788 |
436,470,182 |
|
|
Comverse Technology, Inc. (a) |
41,600 |
3,868,800 |
|
|
Corning, Inc. |
275,700 |
74,404,538 |
|
|
Jabil Circuit, Inc. (a) |
73,600 |
3,652,400 |
|
|
NEC Corp. |
210,000 |
6,595,926 |
|
|
Nokia AB sponsored ADR |
1,072,400 |
53,552,975 |
|
|
Nortel Networks Corp. |
1,352,190 |
93,799,333 |
|
|
Plantronics, Inc. (a) |
56,600 |
6,537,300 |
|
|
Tellabs, Inc. (a) |
239,500 |
16,390,781 |
|
|
|
753,755,399 |
||
|
Computer Services & Software - 5.1% |
|||
|
Adobe Systems, Inc. |
1,016,100 |
132,093,000 |
|
|
Amdocs Ltd. (a) |
170,200 |
13,062,850 |
|
|
Art Technology Group, Inc. |
15,700 |
1,584,719 |
|
|
Automatic Data Processing, Inc. |
1,439,900 |
77,124,644 |
|
|
BEA Systems, Inc. (a) |
16,200 |
800,888 |
|
|
Black Box Corp. (a) |
203,600 |
16,119,394 |
|
|
BroadVision, Inc. (a) |
176,500 |
8,968,406 |
|
|
Ceridian Corp. (a) |
101,020 |
2,430,794 |
|
|
Computer Sciences Corp. (a) |
209,200 |
15,624,625 |
|
|
DST Systems, Inc. (a) |
136,700 |
10,406,288 |
|
|
E.piphany, Inc. |
37,200 |
3,987,375 |
|
|
Electronic Data Systems Corp. |
536,100 |
22,114,125 |
|
|
Exodus Communications, Inc. (a) |
107,900 |
4,970,144 |
|
|
Extensity, Inc. |
4,900 |
167,825 |
|
|
Fiserv, Inc. (a) |
101,800 |
4,402,850 |
|
|
Forsoft Ltd. (a)(c) |
831,800 |
6,446,450 |
|
|
Foundry Networks, Inc. |
90,600 |
9,966,000 |
|
|
Go2Net, Inc. (a) |
148,100 |
7,451,281 |
|
|
Infonet Services Corp. Class B |
361,320 |
4,313,258 |
|
|
Macromedia, Inc. (a) |
208,400 |
20,149,675 |
|
|
Mentor Graphics Corp. (a) |
230,400 |
4,579,200 |
|
|
Micromuse, Inc. (a) |
42,000 |
6,950,344 |
|
|
|
|||
|
Shares |
Value (Note 1) |
||
|
Microsoft Corp. (a) |
59,070 |
$ 4,725,600 |
|
|
National Computer Systems, Inc. |
130,500 |
6,427,125 |
|
|
National Instrument Corp. (a) |
28,500 |
1,243,313 |
|
|
Nuance Communications, Inc. |
43,200 |
3,599,100 |
|
|
Oracle Corp. (a) |
298,900 |
25,126,281 |
|
|
Paychex, Inc. |
61,500 |
2,583,000 |
|
|
Polycom, Inc. (a) |
127,250 |
11,973,430 |
|
|
Rational Software Corp. (a) |
413,600 |
38,438,950 |
|
|
SEI Investments Co. |
46,600 |
1,855,263 |
|
|
Siebel Systems, Inc. (a) |
74,900 |
12,250,831 |
|
|
Software.com, Inc. |
48,800 |
6,337,900 |
|
|
The Bisys Group (a) |
58,900 |
3,622,350 |
|
|
Unisys Corp. (a) |
1,682,358 |
24,499,338 |
|
|
VeriSign, Inc. (a) |
14,500 |
2,559,250 |
|
|
Vignette Corp. (a) |
16,900 |
879,064 |
|
|
webMethods, Inc. |
13,200 |
2,074,875 |
|
|
|
521,909,805 |
||
|
Computers & Office Equipment - 4.2% |
|||
|
Apple Computer, Inc. (a) |
199,300 |
10,438,338 |
|
|
Brocade Communications |
520,000 |
95,411,875 |
|
|
Canon, Inc. |
406,000 |
20,452,251 |
|
|
CDW Computer Centers, Inc. (a) |
61,700 |
3,856,250 |
|
|
Copper Mountain Networks, Inc. |
66,100 |
5,825,063 |
|
|
Dell Computer Corp. (a) |
432,100 |
21,307,931 |
|
|
Diebold, Inc. |
346,000 |
9,644,750 |
|
|
EMC Corp. (a) |
249,600 |
19,203,600 |
|
|
Extreme Networks, Inc. (a) |
22,300 |
2,352,650 |
|
|
Handspring, Inc. |
12,700 |
342,900 |
|
|
Hewlett-Packard Co. |
738,050 |
92,163,994 |
|
|
Insight Enterprises, Inc. (a) |
108,800 |
6,453,200 |
|
|
Juniper Networks, Inc. |
77,600 |
11,295,650 |
|
|
Network Appliance, Inc. (a) |
34,500 |
2,777,250 |
|
|
Oak Technology, Inc. (a) |
162,800 |
3,510,375 |
|
|
Palm, Inc. |
318,200 |
10,619,925 |
|
|
RSA Security, Inc. (a) |
82,800 |
5,733,900 |
|
|
Sun Microsystems, Inc. (a) |
851,700 |
77,451,469 |
|
|
Symbol Technologies, Inc. |
510,860 |
27,586,440 |
|
|
|
426,427,811 |
||
|
Electronic Instruments - 1.9% |
|||
|
Agilent Technologies, Inc. |
1,010,574 |
74,529,833 |
|
|
LAM Research Corp. (a) |
200 |
7,500 |
|
|
Lernout & Hauspie Speech |
129,600 |
5,710,500 |
|
|
Novellus Systems, Inc. (a) |
276,300 |
15,628,219 |
|
|
PerkinElmer, Inc. |
48,250 |
3,190,531 |
|
|
Tektronix, Inc. |
82,300 |
6,090,200 |
|
|
Teradyne, Inc. (a) |
143,800 |
10,569,300 |
|
|
Thermo Electron Corp. (a) |
1,149,050 |
24,201,866 |
|
|
Waters Corp. (a) |
480,600 |
59,984,888 |
|
|
|
199,912,837 |
||
|
Electronics - 5.4% |
|||
|
Altera Corp. (a) |
152,900 |
15,586,244 |
|
|
Common Stocks - continued |
|||
|
Shares |
Value (Note 1) |
||
|
TECHNOLOGY - continued |
|||
|
Electronics - continued |
|||
|
Amphenol Corp. Class A (a) |
62,100 |
$ 4,110,244 |
|
|
Analog Devices, Inc. (a) |
224,200 |
17,039,200 |
|
|
Arrow Electronics, Inc. (a) |
52,100 |
1,615,100 |
|
|
Broadcom Corp. Class A (a) |
94,900 |
20,777,169 |
|
|
Conexant Systems, Inc. (a) |
68,500 |
3,330,813 |
|
|
Fairchild Semiconductor |
62,000 |
2,511,000 |
|
|
Flextronics International Ltd. (a) |
178,000 |
12,226,375 |
|
|
Infineon Technologies AG |
561,500 |
44,498,875 |
|
|
Intel Corp. |
24,580 |
3,286,039 |
|
|
Intersil Holding Corp. Class A |
134,400 |
7,266,000 |
|
|
JDS Uniphase Corp. (a) |
50,900 |
6,101,638 |
|
|
Kyocera Corp. |
232,600 |
39,963,589 |
|
|
Linear Technology Corp. |
347,900 |
22,243,856 |
|
|
LSI Logic Corp. (a) |
152,400 |
8,248,650 |
|
|
Merix Corp. (a) |
20,700 |
972,900 |
|
|
Micron Technology, Inc. (a) |
1,457,600 |
128,359,900 |
|
|
Molex, Inc. Class A |
143,200 |
5,012,000 |
|
|
National Semiconductor Corp. (a) |
46,700 |
2,650,225 |
|
|
NVIDIA Corp. (a) |
277,600 |
17,644,950 |
|
|
Power-One, Inc. (a) |
45,500 |
5,184,156 |
|
|
Sanmina Corp. (a) |
130,600 |
11,166,300 |
|
|
STMicroelectronics NV (NY Shares) |
234,600 |
15,058,388 |
|
|
TDK Corp. |
67,000 |
9,631,013 |
|
|
Texas Instruments, Inc. |
1,479,200 |
101,602,550 |
|
|
Vitesse Semiconductor Corp. (a) |
280,800 |
20,656,350 |
|
|
Xilinx, Inc. (a) |
213,500 |
17,627,094 |
|
|
Zoran Corp. (a) |
162,400 |
10,708,250 |
|
|
|
555,078,868 |
||
|
TOTAL TECHNOLOGY |
2,457,084,720 |
||
|
TRANSPORTATION - 1.5% |
|||
|
Air Transportation - 0.5% |
|||
|
Continental Airlines, Inc. Class B (a) |
385,900 |
18,137,300 |
|
|
Ryanair Holdings PLC sponsored ADR (a) |
341,700 |
12,472,050 |
|
|
Southwest Airlines Co. |
1,265,387 |
23,963,266 |
|
|
|
54,572,616 |
||
|
Railroads - 0.1% |
|||
|
Canadian Pacific Ltd. |
245,200 |
6,359,797 |
|
|
Trucking & Freight - 0.9% |
|||
|
C.H. Robinson Worldwide, Inc. |
418,700 |
20,725,650 |
|
|
Expeditors International of |
229,400 |
10,896,500 |
|
|
Forward Air Corp. (a) |
17,200 |
688,000 |
|
|
Ocean Group PLC(OLD) |
1,781,680 |
29,460,613 |
|
|
|
|||
|
Shares |
Value (Note 1) |
||
|
Swift Transportation Co., Inc. (a) |
1,093,300 |
$ 15,306,200 |
|
|
United Parcel Service, Inc. Class B |
281,700 |
16,620,300 |
|
|
|
93,697,263 |
||
|
TOTAL TRANSPORTATION |
154,629,676 |
||
|
UTILITIES - 9.6% |
|||
|
Cellular - 4.8% |
|||
|
AT&T Corp. - Wireless Group |
939,700 |
26,194,138 |
|
|
China Telecom (Hong Kong) Ltd. sponsored ADR (a) |
37,300 |
6,632,406 |
|
|
Crown Castle International Corp. (a) |
494,800 |
18,060,200 |
|
|
Dobson Communications Corp. Class A |
69,600 |
1,339,800 |
|
|
Nextel Communications, Inc. Class A (a) |
1,869,900 |
114,414,506 |
|
|
NTT DoCoMo, Inc. |
1,141 |
30,887,287 |
|
|
Sprint Corp. - PCS Group Series 1 (a) |
2,093,000 |
124,533,500 |
|
|
Triton PCS Holdings, Inc. Class A |
439,730 |
25,394,408 |
|
|
Vodafone AirTouch PLC sponsored ADR |
3,203,400 |
132,740,888 |
|
|
VoiceStream Wireless Corp. (a) |
46,750 |
5,436,879 |
|
|
|
485,634,012 |
||
|
Electric Utility - 0.7% |
|||
|
AES Corp. (a) |
1,018,900 |
46,487,313 |
|
|
Calpine Corp. (a) |
130,700 |
8,593,525 |
|
|
DPL, Inc. |
68,800 |
1,509,300 |
|
|
Duke Energy Corp. |
128,400 |
7,238,550 |
|
|
Northern States Power Co. |
313,400 |
6,326,763 |
|
|
NRG Energy, Inc. |
248,100 |
4,527,825 |
|
|
|
74,683,276 |
||
|
Gas - 0.5% |
|||
|
Dynegy, Inc. Class A |
700,656 |
47,863,563 |
|
|
Enron Corp. |
61,300 |
3,953,850 |
|
|
|
51,817,413 |
||
|
Telephone Services - 3.6% |
|||
|
Allegiance Telecom, Inc. (a) |
231,280 |
14,801,920 |
|
|
BellSouth Corp. |
1,588,200 |
67,697,025 |
|
|
Cable & Wireless PLC sponsored ADR |
734,900 |
36,790,931 |
|
|
DDI Corp. |
2,103 |
20,232,598 |
|
|
Energis PLC (a) |
219,335 |
8,245,079 |
|
|
McLeodUSA, Inc. Class A (a) |
2,005,074 |
41,479,968 |
|
|
Metromedia Fiber Network, Inc. |
56,300 |
2,234,406 |
|
|
NEXTLINK Communications, Inc. Class A |
492,400 |
18,680,425 |
|
|
Nippon Telegraph & Telephone Corp. |
3,410 |
45,350,879 |
|
|
Qwest Communications |
889,944 |
44,219,093 |
|
|
SBC Communications, Inc. |
69,106 |
2,988,835 |
|
|
Common Stocks - continued |
|||
|
Shares |
Value (Note 1) |
||
|
UTILITIES - continued |
|||
|
Telephone Services - continued |
|||
|
Time Warner Telecom, Inc. Class A |
80,203 |
$ 5,163,068 |
|
|
U.S. WEST, Inc. |
730,400 |
62,631,800 |
|
|
|
370,516,027 |
||
|
TOTAL UTILITIES |
982,650,728 |
||
|
TOTAL COMMON STOCKS (Cost $7,454,454,140) |
9,235,832,817 |
||
|
U.S. Treasury Obligations - 2.3% |
|||||
|
Moody's Ratings (unaudited) |
Principal Amount |
|
|||
|
U.S. Treasury Bills, yield at date of purchase 5.6% to 5.62% 8/17/00 (e) |
- |
|
$ 2,000,000 |
1,985,950 |
|
|
U.S. Treasury Bonds: |
|
|
|
|
|
|
5.5% 8/15/28 |
Aaa |
|
22,500,000 |
20,636,775 |
|
|
6.125% 11/15/27 |
Aaa |
|
63,000,000 |
62,862,030 |
|
|
6.375% 8/15/27 |
Aaa |
|
66,000,000 |
67,969,440 |
|
|
6.5% 11/15/26 |
Aaa |
|
20,000,000 |
20,890,600 |
|
|
6.75% 8/15/26 |
Aaa |
|
9,900,000 |
10,653,291 |
|
|
6.875% 8/15/25 |
Aaa |
|
36,500,000 |
39,779,160 |
|
|
7.625% 2/15/25 |
Aaa |
|
9,500,000 |
11,233,750 |
|
|
TOTAL U.S. TREASURY OBLIGATIONS (Cost $235,882,664) |
236,010,996 |
||||
|
Cash Equivalents - 7.4% |
|||
|
Shares |
|
||
|
Central Cash Collateral Fund, 6.71% (b) |
125,228,100 |
125,228,100 |
|
|
Taxable Central Cash Fund, 6.59% (b) |
628,988,088 |
628,988,088 |
|
|
TOTAL CASH EQUIVALENTS (Cost $754,216,188) |
754,216,188 |
||
|
TOTAL INVESTMENT PORTFOLIO - 99.7% (Cost $8,444,552,992) |
10,226,060,001 |
||
|
NET OTHER ASSETS - 0.3% |
32,329,993 |
||
|
NET ASSETS - 100% |
$ 10,258,389,994 |
||
|
Futures Contracts |
|||||
|
|
Expiration Date |
Underlying Face Amount at Value |
Unrealized |
||
|
Purchased |
|||||
|
150 S&P 500 Stock Index Contracts |
Sept. 2000 |
$ 55,053,750 |
$ (206,670) |
||
|
The face value of futures purchased as a percentage of net assets - 0.5% |
|
Legend |
|
(a) Non-income producing |
|
(b) The rate quoted is the annualized seven-day yield of the fund at |
|
(c) Transactions during the period with companies which are or were affiliates are as follows: |
|
Affiliate |
|
Purchase |
|
Sales |
|
Dividend |
|
Value |
|
Forsoft Ltd. |
|
$ - |
|
$ - |
|
$ - |
|
$ 6,446,450 |
|
PJ America, Inc. |
|
- |
|
- |
|
- |
|
5,671,575 |
|
TOTALS |
|
$ - |
|
$ - |
|
$ - |
|
$ 12,118,025 |
|
(d) Security exempt from registration under Rule 144A of the Securities Act |
|
(e) Security or a portion of the security was pledged to cover margin requirements for futures contracts. At the period end, the value of securities pledged amounted to $1,985,950. |
|
Other Information |
|
Purchases and sales of securities, other than short-term securities, aggregated $8,415,238,617 and $8,270,968,679, respectively, of which long-term U.S. government and government agency obligations aggregated $0 and $5,867,969, respectively. |
|
The market value of futures contracts opened and closed during the period amounted to $740,575,595 and $702,738,997, respectively. |
|
The fund placed a portion of its portfolio transactions with brokerage firms which are affiliates of Fidelity Management & Research Company. The commissions paid to these affiliated firms were $336,878 for the period. |
|
The fund participated in the security lending program. At period end, the value of securities loaned amounted to $122,412,563. The fund received cash collateral of $125,228,100 which was invested in cash equivalents. |
|
Distribution of investments by country of issue, as a percentage of total |
|
United States of America |
84.5% |
|
United Kingdom |
4.6 |
|
Japan |
3.9 |
|
Canada |
2.9 |
|
Others (individually less than 1%) |
4.1 |
|
|
100.0% |
|
Income Tax Information |
|
At June 30, 2000, the aggregate cost of investment securities for income |
See accompanying notes which are an integral part of the financial statements.
Contrafund Portfolio
Statement of Assets and Liabilities
|
June 30, 2000 (Unaudited) |
||
|
Assets |
|
|
|
Investment in securities, at value |
|
$ 10,226,060,001 |
|
Foreign currency held at value (cost $3,198,136) |
|
3,200,762 |
|
Receivable for investments sold |
|
227,343,121 |
|
Receivable for fund shares sold |
|
5,795,420 |
|
Dividends receivable |
|
6,174,594 |
|
Interest receivable |
|
8,752,007 |
|
Receivable for daily variation on futures contracts |
|
394,650 |
|
Other receivables |
|
1,705,788 |
|
Total assets |
|
10,479,426,343 |
|
Liabilities |
|
|
|
Payable for investments purchased |
$ 88,850,142 |
|
|
Payable for fund shares redeemed |
1,847,512 |
|
|
Accrued management fee |
4,877,662 |
|
|
Distribution fees payable |
94,923 |
|
|
Other payables and |
138,010 |
|
|
Collateral on securities loaned, |
125,228,100 |
|
|
Total liabilities |
|
221,036,349 |
|
Net Assets |
|
$ 10,258,389,994 |
|
Net Assets consist of: |
|
|
|
Paid in capital |
|
$ 8,001,539,614 |
|
Undistributed net |
|
28,658,206 |
|
Accumulated undistributed |
|
446,882,094 |
|
Net unrealized appreciation (depreciation) on investments |
|
1,781,310,080 |
|
Net Assets |
|
$ 10,258,389,994 |
|
Initial Class: |
|
$25.09 |
|
Service Class: |
|
$25.03 |
|
Service Class 2: |
|
$25.02 |
Statement of Operations
|
Six months ended June 30, 2000 (Unaudited) |
||
|
Investment Income Dividends |
|
$ 27,621,948 |
|
Interest |
|
31,147,532 |
|
Security lending |
|
1,347,457 |
|
Total income |
|
60,116,937 |
|
Expenses |
|
|
|
Management fee |
$ 28,674,384 |
|
|
Transfer agent fees |
3,272,693 |
|
|
Distribution fees |
484,572 |
|
|
Accounting and security lending fees |
450,247 |
|
|
Non-interested trustees' compensation |
15,815 |
|
|
Custodian fees and expenses |
315,685 |
|
|
Registration fees |
43,475 |
|
|
Audit |
31,520 |
|
|
Legal |
36,304 |
|
|
Miscellaneous |
70,060 |
|
|
Total expenses before reductions |
33,394,755 |
|
|
Expense reductions |
(1,509,996) |
31,884,759 |
|
Net investment income |
|
28,232,178 |
|
Realized and Unrealized Gain (Loss) Net realized gain (loss) on: |
|
|
|
Investment securities |
529,036,819 |
|
|
Foreign currency transactions |
41,699 |
|
|
Futures contracts |
(2,603,401) |
526,475,117 |
|
Change in net unrealized appreciation (depreciation) on: |
|
|
|
Investment securities |
(684,382,795) |
|
|
Assets and liabilities in |
11,087 |
|
|
Futures contracts |
(216,147) |
(684,587,855) |
|
Net gain (loss) |
|
(158,112,738) |
|
Net increase (decrease) in net assets resulting from operations |
|
$ (129,880,560) |
|
Other Information Expense reductions |
|
$ 1,501,131 |
|
Custodian credits |
|
8,865 |
|
|
|
$ 1,509,996 |
See accompanying notes which are an integral part of the financial statements.
Semiannual Report
Variable Insurance Products: Contrafund Portfolio
Financial Statements - continued
Statement of Changes in Net Assets
|
Increase (Decrease) in Net Assets |
Six months ended |
Year ended |
|
Operations |
$ 28,232,178 |
$ 37,064,074 |
|
Net realized gain (loss) |
526,475,117 |
1,238,554,251 |
|
Change in net unrealized appreciation (depreciation) |
(684,587,855) |
533,893,873 |
|
Net increase (decrease) in net assets resulting from operations |
(129,880,560) |
1,809,512,198 |
|
Distributions to shareholders |
(34,082,876) |
(32,779,255) |
|
From net realized gain |
(1,237,208,385) |
(240,381,202) |
|
Total distributions |
(1,271,291,261) |
(273,160,457) |
|
Share transactions - net increase (decrease) |
1,879,217,135 |
1,702,847,259 |
|
Total increase (decrease) in net assets |
478,045,314 |
3,239,199,000 |
|
Net Assets |
|
|
|
Beginning of period |
9,780,344,680 |
6,541,145,680 |
|
End of period (including undistributed net investment income of $28,658,206 and $34,775,260, respectively) |
$ 10,258,389,994 |
$ 9,780,344,680 |
|
|
|
Other Information: |
|
|
Six months ended June 30, 2000 |
Year ended December 31, 1999 |
||
|
|
Shares |
Dollars |
Shares |
Dollars |
|
Share transactions |
31,827,829 |
$ 821,871,536 |
75,689,715 |
$ 1,921,467,155 |
|
Reinvested |
45,653,334 |
1,161,877,344 |
11,119,147 |
266,192,366 |
|
Redeemed |
(22,956,691) |
(590,350,809) |
(39,357,256) |
(1,004,869,657) |
|
Net increase (decrease) |
54,524,472 |
$ 1,393,398,071 |
47,451,606 |
$ 1,182,789,864 |
|
Service Class |
14,727,745 |
$ 380,358,381 |
20,768,738 |
$ 530,250,534 |
|
Reinvested |
4,305,875 |
109,369,238 |
291,308 |
6,968,091 |
|
Redeemed |
(1,309,500) |
(32,733,410) |
(669,866) |
(17,161,230) |
|
Net increase (decrease) |
17,724,120 |
$ 456,994,209 |
20,390,180 |
$ 520,057,395 |
|
Service Class 2 A |
1,156,782 |
$ 29,090,053 |
- |
$ - |
|
Reinvested |
1,759 |
44,679 |
- |
- |
|
Redeemed |
(12,454) |
(309,877) |
- |
- |
|
Net increase (decrease) |
1,146,087 |
$ 28,824,855 |
- |
$ - |
|
Distributions |
|
$ 31,149,527 |
|
$ 31,943,084 |
|
Service Class |
|
2,932,151 |
|
836,171 |
|
Service Class 2 A |
|
1,198 |
|
- |
|
Total |
|
$ 34,082,876 |
|
$ 32,779,255 |
|
From net realized gain |
|
$ 1,130,727,819 |
|
$ 234,249,282 |
|
Service Class |
|
106,437,085 |
|
6,131,920 |
|
Service Class 2 A |
|
43,481 |
|
- |
|
Total |
|
$ 1,237,208,385 |
|
$ 240,381,202 |
|
|
|
$ 1,271,291,261 |
|
$ 273,160,457 |
A Service Class 2 commenced sale of shares January 12, 2000.
See accompanying notes which are an integral part of the financial statements.
Contrafund Portfolio
Financial Highlights - Initial Class
|
|
Six months ended |
Years ended December 31, |
||||
|
Selected Per-Share Data |
(Unaudited) |
1999 |
1998 |
1997 |
1996 |
1995 E |
|
Net asset value, beginning of period |
$ 29.15 |
$ 24.44 |
$ 19.94 |
$ 16.56 |
$ 13.79 |
$ 10.00 |
|
Income from Investment Operations |
|
|
|
|
|
|
|
Net investment income |
.07 C |
.12 C |
.13 C |
.16 C |
.14 |
.06 |
|
Net realized and unrealized gain (loss) |
(.40) |
5.59 |
5.54 |
3.73 |
2.76 |
3.91 |
|
Total from investment operations |
(.33) |
5.71 |
5.67 |
3.89 |
2.90 |
3.97 |
|
Less Distributions |
|
|
|
|
|
|
|
From net investment income |
(.10) |
(.12) |
(.14) |
(.14) |
- |
(.06) |
|
From net realized gain |
(3.63) |
(.88) |
(1.03) |
(.37) |
(.13) |
(.12) |
|
Total distributions |
(3.73) |
(1.00) |
(1.17) |
(.51) |
(.13) |
(.18) |
|
Net asset value, end of period |
$ 25.09 |
$ 29.15 |
$ 24.44 |
$ 19.94 |
$ 16.56 |
$ 13.79 |
|
Total Return B, G |
(1.31)% |
24.25% |
29.98% |
24.14% |
21.22% |
39.72% |
|
Ratios and Supplemental Data |
|
|
|
|
|
|
|
Net assets, end of period (000 omitted) |
$ 9,119,275 |
$ 9,005,129 |
$ 6,388,592 |
$ 4,107,868 |
$ 2,394,103 |
$ 877,000 |
|
Ratio of expenses to average net assets |
.66% A |
.67% |
.70% |
.71% |
.74% |
.72% |
|
Ratio of expenses to average net assets after |
.63% A, F |
.65% F |
.66% F |
.68% F |
.71% F |
.72% |
|
Ratio of net investment income to average net assets |
.58% A |
.48% |
.62% |
.90% |
1.33% |
1.07% |
|
Portfolio turnover |
178% A |
172% |
201% |
142% |
178% |
132% |
Financial Highlights - Service Class
|
|
Six months ended |
Years ended December 31, |
||
|
Selected Per-Share Data |
(Unaudited) |
1999 |
1998 |
1997 D |
|
Net asset value, beginning of period |
$ 29.10 |
$ 24.42 |
$ 19.93 |
$ 19.99 |
|
Income from Investment Operations |
|
|
|
|
|
Net investment income C |
.06 |
.10 |
.11 |
.03 |
|
Net realized and unrealized gain (loss) |
(.40) |
5.58 |
5.55 |
(.09) |
|
Total from investment operations |
(.34) |
5.68 |
5.66 |
(.06) |
|
Less Distributions |
|
|
|
|
|
From net investment income |
(.10) |
(.12) |
(.14) |
- |
|
From net realized gain |
(3.63) |
(.88) |
(1.03) |
- |
|
Total distributions |
(3.73) |
(1.00) |
(1.17) |
- |
|
Net asset value, end of period |
$ 25.03 |
$ 29.10 |
$ 24.42 |
$ 19.93 |
|
Total Return B, G |
(1.36)% |
24.15% |
29.94% |
(0.30)% |
|
Ratios and Supplemental Data |
|
|
|
|
|
Net assets, end of period (000 omitted) |
$ 1,110,439 |
$ 775,216 |
$ 152,553 |
$ 3,722 |
|
Ratio of expenses to average net assets |
.76% A |
.78% |
.80% |
.81% A |
|
Ratio of expenses to average net assets after expense reductions |
.73% A, F |
.75% F |
.75% F |
.78% A, F |
|
Ratio of net investment income to average net assets |
.47% A |
.37% |
.53% |
1.14% A |
|
Portfolio turnover |
178% A |
172% |
201% |
142% |
|
A Annualized B The total returns would have been lower had certain expenses not been reduced during the periods shown. C Net investment income per share has been calculated based on average shares outstanding during the period. D For the period November 3, 1997 (commencement of sale of Service Class shares) to December 31, 1997. E For the period January 3, 1995 (commencement of operations of Initial Class shares) to December 31, 1995. F FMR or the fund has entered into varying arrangements with third parties who either paid or reduced a portion of the class' expenses. G Total returns for periods of less than one year are not annualized and do not reflect charges attributable to your insurance company's separate account. Inclusion of these charges would reduce the total returns shown. |
||||
See accompanying notes which are an integral part of the financial statements.
Semiannual Report
Financial Highlights - Service Class 2
|
|
Six months ended |
|
Selected Per-Share Data |
(Unaudited) |
|
Net asset value, beginning of period |
$ 28.20 |
|
Income from Investment Operations |
|
|
Net investment income C |
.04 |
|
Net realized and unrealized gain (loss) |
.51 G |
|
Total from investment operations |
.55 |
|
Less Distributions |
|
|
From net investment income |
(.10) |
|
From net realized gain |
(3.63) |
|
Total distributions |
(3.73) |
|
Net asset value, end of period |
$ 25.02 |
|
Total Return B, F |
1.75% |
|
Ratios and Supplemental Data |
|
|
Net assets, end of period (000 omitted) |
$ 28,675 |
|
Ratio of expenses to average net assets |
.91% A |
|
Ratio of expenses to average net assets after expense reductions |
.88% A, E |
|
Ratio of net investment income to average net assets |
.32% A |
|
Portfolio turnover |
178% A |
|
A Annualized B The total returns would have been lower had certain expenses not been reduced during the periods shown. C Net investment income per share has been calculated based on average shares outstanding during the period. D For the period January 12, 2000 (commencement of sale of Service Class 2 shares) to June 30, 2000. E FMR or the fund has entered into varying arrangements with third parties who either paid or reduced a portion of the class' expenses. F Total returns for periods of less than one year are not annualized and do not reflect charges attributable to your insurance company's separate account. Inclusion of these charges would reduce the total returns shown. G The amount shown for a share outstanding does not correspond with the aggregate net loss on investments for the period due to the timing of sales and repurchases of class shares in relation to fluctuating |
|
See accompanying notes which are an integral part of the financial statements.
Contrafund Portfolio
Performance
There are several ways to evaluate a fund's historical performance. You can look at the total percentage change in value, the average annual percentage change or the growth of a hypothetical $10,000 investment. Total return reflects the change in the value of an investment, assuming reinvestment of the fund's dividend income and capital gains (the profits earned upon the sale of securities that have grown in value). The initial offering of Service Class 2 shares took place on January 12, 2000. Performance for Service Class 2 shares reflects an asset based distribution fee (12b-1 fee). Returns from November 3, 1997 to January 12, 2000 are those of Service Class which reflect a different 12b-1 fee. Service Class 2 returns prior to November 3, 1997 are those of Initial Class and do not include the effects of a 12b-1 fee. Had Service Class 2's 12b-1 fee been reflected, returns prior to January 12, 2000 would have been lower. If Fidelity had not reimbursed certain fund expenses, the past five year and life of fund total returns would have been lower.
Average Annual Total Returns
|
Periods ended |
Past 1 |
Past 5 |
Life of |
|
Fidelity VIP: Growth Opportunities - |
-5.79% |
16.62% |
18.52% |
|
S&P 500 |
7.25% |
23.80% |
25.60% |
Average annual returns take the fund's cumulative return and show you what would have happened if the fund had performed at a constant rate each year.
You can compare the fund's return to the performance of the Standard & Poor's 500 Index - a market capitalization-weighted index of common stocks. This benchmark reflects the reinvestment of dividends and capital gains, if any.
Figures for more than one year assume a steady compounded rate of return and are not the fund's year-by-year results, which fluctuated over the periods shown. The life of the fund figures are from commencement of operations, January 3, 1995.
Performance numbers are net of all fund operating expenses, but do not include any insurance charges imposed by your insurance company's separate account. If performance information included the effect of these additional charges, the total return would be lower.
Past performance is no guarantee of future results. Principal and investment return will vary and you may have a gain or loss when you withdraw your money.
Understanding Performance
How a fund did yesterday is no guarantee of how it will do tomorrow. The stock market, for example, has a history of long-term growth and short-term volatility. In turn, the share price and return of a fund that invests in stocks will vary. That means if you sell your shares during a market downturn, you might lose money. But if you can ride out the market's ups and downs, you may have a gain.
3$10,000 Over Life of Fund
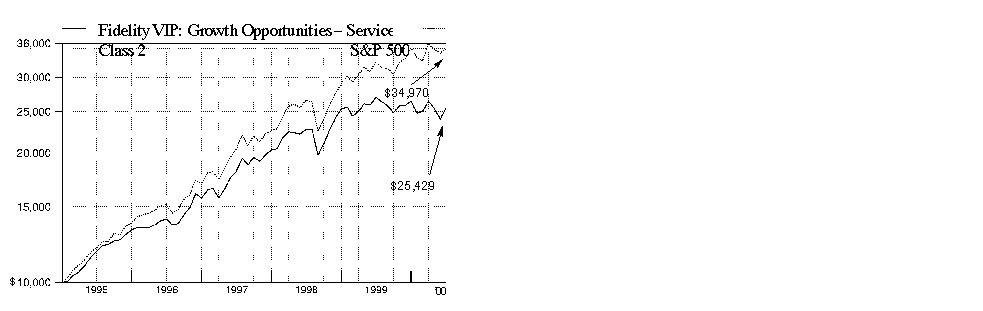
$10,000 Over Life of Fund: Let's say hypothetically that $10,000 was invested in Fidelity Variable Insurance Products: Growth Opportunities Portfolio - Service Class 2 on January 3, 1995, when the fund started. As the chart shows, by June 30, 2000, the value of the investment would have grown to $25,429 - a 154.29% increase on the initial investment. For comparison, look at how the Standard & Poor's 500 Index did over the same period. With dividends and capital gains, if any, reinvested, the same $10,000 investment would have grown to $34,970 - a 249.70% increase.
Investment Summary
|
Top Five Stocks as of June 30, 2000 |
|
|
|
% of fund's |
|
General Electric Co. |
4.2 |
|
Cisco Systems, Inc. |
4.2 |
|
Eli Lilly & Co. |
2.9 |
|
Intel Corp. |
2.7 |
|
Oracle Corp. |
2.4 |
|
|
16.4 |
|
Top Five Market Sectors as of June 30, 2000 |
|
|
|
% of fund's |
|
Technology |
42.8 |
|
Finance |
11.8 |
|
Health |
10.3 |
|
Energy |
6.4 |
|
Utilities |
5.8 |
|
Asset Allocation as of June 30, 2000 |
|||
|
% of fund's net assets* |
|||
|
Stocks 93.6% |
|
|
|
Short-Term Investments |
|
|
|
* Foreign investments 10.0% |
Semiannual Report
(Portfolio Manager photograph)
Note to shareholders: Bettina Doulton became Portfolio Manager of Growth Opportunities Portfolio on February 1, 2000.
Q. How did the fund perform, Bettina?
A. For the six-month period ending June 30, 2000, the fund underperformed the Standard & Poor's 500 Index, which returned -0.42%. For the 12-month period that ended June 30, 2000, the fund also trailed the S&P 500, which returned 7.25%.
Q. Why did the fund underperform its benchmark?
A. Early in the period, the fund was considerably underweighted in technology and telecommunications - the sectors that drove equity markets to record heights. Our lack of exposure here was a big detractor from performance. After taking over the fund in February, I repositioned it to be more in line with expectations - with more of a growth emphasis than a value proposition - and increased the tech position to approximately 43% of net assets at the end of the period, compared to just over 16% six months ago.
Q. Was that strategy successful?
A. On a short-term basis, the repositioning seemed poorly timed. Fund performance was negatively affected by the massive rotation away from technology that began in mid-March and lasted through the end of May. Several factors contributed to the tech sell-off: interest-rate hikes, fears of a slowdown in earnings growth, high valuations and illiquidity. Tech stocks did rebound in June, however, and the fund more than doubled the return of the S&P for the month.
Q. What other changes did you make to the fund since taking over?
A. In light of margin pressures and credit concerns in the finance sector, I reduced the sector's aggregate weighting to 11.8% of net assets compared to 20.6% six months ago. I also shifted the sector's asset allocation, reducing the fund's positions in regional banks, mortgage insurance companies and GSEs - government-sponsored enterprises such as Fannie Mae and Freddie Mac - while adding more capital markets exposure, which was a plus. Two other moves also helped. I reduced the fund's consumer nondurables holdings, largely due to the elimination of the Philip Morris position. I was less enamored with the company's fundamental prospects than my predecessor. I also eliminated the fund's bond position, as I expect to focus largely on equity investments.
Q. Which stocks were among the best absolute contributors?
A. Despite the technology sector's spring decline, six of the fund's 10 best-performing stocks came from that area. Most are very familiar names: Micron Technology, Intel, Oracle, Adobe Systems, Analog Devices and Nortel. All benefited from the growth prospects surrounding the rapid acceleration and penetration of Internet- and wireless-related communications. General Electric, the fund's largest holding at the end of the period, also was a strong contributor. GE experienced an acceleration in revenue and profit growth due to market share gains, acquisitions and strong global economies. Eli Lilly was another winner, benefiting from investor appreciation of its strong product pipeline and increased confidence in the company's earnings growth potential.
Q. Which stocks did not perform as well as you expected?
A. Although I have reduced these positions dramatically since taking over the fund, Fannie Mae and Freddie Mac significantly detracted from performance during the period. Several factors caused the underperformance of these stocks, including the Federal Reserve Board's recent string of interest-rate hikes and increased political bantering about capital ratios and funding requirements. Two other disappointments were retailers Home Depot and Wal-Mart. Despite continuing to deliver strong results, these stocks came under pressure as investors grew increasingly concerned that results would come under pressure due to slowing consumer spending caused by interest-rate increases.
Q. What is your outlook, Bettina?
A. It comes down to whether the technology sector's recent struggle was a short-term rotation or a permanent change in leadership. I believe it was just a violent short-term rotation similar to what we experienced at this time last year. On a medium-term basis, I expect the companies that are the enablers of our networked, communications economy - those that provide servers, data storage, fiber optics, etc. - are going to lead, because we still appear to be in the early stages of the "e-economy" build out.
The views expressed in this report reflect those of the portfolio manager only through the end of the period of the report as stated on the cover. The manager's views are subject to change at any time based on market or other conditions. For more information, see page 2.
Fund Facts
Goal: to provide capital growth by investing primarily in common stocks
Start date: January 3, 1995
Size: as of June 30, 2000, more than
$1.5 billion
Manager: Bettina Doulton, since February 2000; joined Fidelity in 1986
3Semiannual Report
Fidelity Variable Insurance Products: Growth Opportunities Portfolio
(Unaudited)
Showing Percentage of Net Assets
|
Common Stocks - 93.6% |
|||
|
Shares |
Value (Note 1) |
||
|
AEROSPACE & DEFENSE - 1.1% |
|||
|
Boeing Co. |
374,200 |
$ 15,646,238 |
|
|
Textron, Inc. |
30,200 |
1,640,238 |
|
|
|
17,286,476 |
||
|
BASIC INDUSTRIES - 0.3% |
|||
|
Chemicals & Plastics - 0.3% |
|||
|
Praxair, Inc. |
122,000 |
4,567,375 |
|
|
ENERGY - 6.4% |
|||
|
Energy Services - 1.3% |
|||
|
Baker Hughes, Inc. |
36,700 |
1,174,400 |
|
|
Halliburton Co. |
272,200 |
12,844,438 |
|
|
Schlumberger Ltd. (NY Shares) |
92,300 |
6,887,888 |
|
|
|
20,906,726 |
||
|
Oil & Gas - 5.1% |
|||
|
BP Amoco PLC sponsored ADR |
221,190 |
12,511,059 |
|
|
Chevron Corp. |
27,000 |
2,289,938 |
|
|
Conoco, Inc. Class B |
97,868 |
2,403,883 |
|
|
Cooper Cameron Corp. (a) |
72,300 |
4,771,800 |
|
|
Exxon Mobil Corp. |
417,300 |
32,758,050 |
|
|
Royal Dutch Petroleum Co. (NY Shares) |
178,300 |
10,976,594 |
|
|
Tosco Corp. |
257,300 |
7,284,806 |
|
|
TotalFinaElf SA: |
|
|
|
|
Class B |
6,153 |
947,562 |
|
|
sponsored ADR |
94,405 |
7,251,484 |
|
|
|
81,195,176 |
||
|
TOTAL ENERGY |
102,101,902 |
||
|
FINANCE - 11.8% |
|||
|
Banks - 1.1% |
|||
|
Bank of America Corp. |
65,200 |
2,803,600 |
|
|
Bank of Tokyo-Mitsubishi Ltd. |
255,000 |
3,081,070 |
|
|
Bank of Tokyo-Mitsubishi Ltd. ADR |
44,500 |
539,563 |
|
|
Chase Manhattan Corp. |
232,800 |
10,723,350 |
|
|
|
17,147,583 |
||
|
Credit & Other Finance - 2.9% |
|||
|
American Express Co. |
499,400 |
26,031,225 |
|
|
Citigroup, Inc. |
340,200 |
20,497,050 |
|
|
|
46,528,275 |
||
|
Federal Sponsored Credit - 4.1% |
|||
|
Fannie Mae |
712,400 |
37,178,375 |
|
|
Freddie Mac |
688,000 |
27,864,000 |
|
|
|
65,042,375 |
||
|
Insurance - 2.2% |
|||
|
Allmerica Financial Corp. |
41,500 |
2,173,563 |
|
|
American International Group, Inc. |
184,175 |
21,640,563 |
|
|
CIGNA Corp. |
92,812 |
8,677,922 |
|
|
|
|||
|
Shares |
Value (Note 1) |
||
|
Hartford Financial Services Group, Inc. |
13,700 |
$ 766,344 |
|
|
The Chubb Corp. |
37,200 |
2,287,800 |
|
|
|
35,546,192 |
||
|
Securities Industry - 1.5% |
|||
|
Daiwa Securities Group, Inc. |
72,000 |
950,764 |
|
|
Morgan Stanley Dean Witter & Co. |
155,900 |
12,978,675 |
|
|
Nomura Securities Co. Ltd. |
391,000 |
9,570,317 |
|
|
|
23,499,756 |
||
|
TOTAL FINANCE |
187,764,181 |
||
|
HEALTH - 10.3% |
|||
|
Drugs & Pharmaceuticals - 9.0% |
|||
|
American Home Products Corp. |
82,900 |
4,870,375 |
|
|
Amgen, Inc. |
71,300 |
5,008,825 |
|
|
Bristol-Myers Squibb Co. |
373,600 |
21,762,200 |
|
|
Eli Lilly & Co. |
466,400 |
46,581,700 |
|
|
Merck & Co., Inc. |
149,200 |
11,432,450 |
|
|
Pfizer, Inc. |
449,693 |
21,585,264 |
|
|
Schering-Plough Corp. |
650,600 |
32,855,300 |
|
|
|
144,096,114 |
||
|
Medical Equipment & Supplies - 1.3% |
|||
|
Abbott Laboratories |
102,200 |
4,554,288 |
|
|
Johnson & Johnson |
148,300 |
15,108,063 |
|
|
|
19,662,351 |
||
|
TOTAL HEALTH |
163,758,465 |
||
|
INDUSTRIAL MACHINERY & EQUIPMENT - 5.3% |
|||
|
Electrical Equipment - 4.2% |
|||
|
General Electric Co. |
1,269,700 |
67,294,088 |
|
|
Industrial Machinery & Equipment - 1.1% |
|||
|
Deere & Co. |
156,600 |
5,794,200 |
|
|
Ingersoll-Rand Co. |
60,400 |
2,431,100 |
|
|
Tyco International Ltd. |
194,200 |
9,200,225 |
|
|
|
17,425,525 |
||
|
TOTAL INDUSTRIAL MACHINERY & EQUIPMENT |
84,719,613 |
||
|
MEDIA & LEISURE - 4.7% |
|||
|
Broadcasting - 1.9% |
|||
|
AT&T Corp. - Liberty Media Group |
501,244 |
12,155,167 |
|
|
Charter Communications, Inc. |
167,700 |
2,756,569 |
|
|
Comcast Corp. Class A (special) (a) |
77,500 |
3,138,750 |
|
|
Cox Communications, Inc. Class A (a) |
78,213 |
3,563,580 |
|
|
Infinity Broadcasting Corp. Class A (a) |
23,400 |
852,638 |
|
|
Time Warner, Inc. |
89,500 |
6,802,000 |
|
|
Univision Communications, Inc. |
6,100 |
631,350 |
|
|
|
29,900,054 |
||
|
Entertainment - 2.2% |
|||
|
Fox Entertainment Group, Inc. Class A (a) |
239,400 |
7,271,775 |
|
|
Common Stocks - continued |
|||
|
Shares |
Value (Note 1) |
||
|
MEDIA & LEISURE - continued |
|||
|
Entertainment - continued |
|||
|
Viacom, Inc. Class B (non-vtg.) (a) |
328,428 |
$ 22,394,684 |
|
|
Walt Disney Co. |
133,500 |
5,181,469 |
|
|
|
34,847,928 |
||
|
Publishing - 0.1% |
|||
|
McGraw-Hill Companies, Inc. |
35,400 |
1,911,600 |
|
|
Restaurants - 0.5% |
|||
|
McDonald's Corp. |
268,700 |
8,850,306 |
|
|
TOTAL MEDIA & LEISURE |
75,509,888 |
||
|
NONDURABLES - 0.5% |
|||
|
Beverages - 0.1% |
|||
|
The Coca-Cola Co. |
27,300 |
1,568,044 |
|
|
Household Products - 0.4% |
|||
|
Avon Products, Inc. |
16,900 |
752,050 |
|
|
Clorox Co. |
41,700 |
1,868,681 |
|
|
Procter & Gamble Co. |
67,320 |
3,854,070 |
|
|
|
6,474,801 |
||
|
TOTAL NONDURABLES |
8,042,845 |
||
|
RETAIL & WHOLESALE - 4.6% |
|||
|
General Merchandise Stores - 2.5% |
|||
|
Kohls Corp. (a) |
56,400 |
3,137,250 |
|
|
Target Corp. |
119,400 |
6,925,200 |
|
|
Wal-Mart Stores, Inc. |
533,700 |
30,754,463 |
|
|
|
40,816,913 |
||
|
Retail & Wholesale, Miscellaneous - 2.1% |
|||
|
Home Depot, Inc. |
394,000 |
19,675,375 |
|
|
Lowe's Companies, Inc. |
320,900 |
13,176,956 |
|
|
|
32,852,331 |
||
|
TOTAL RETAIL & WHOLESALE |
73,669,244 |
||
|
SERVICES - 0.0% |
|||
|
Advertising - 0.0% |
|||
|
Interpublic Group of Companies, Inc. |
13,800 |
593,400 |
|
|
Services - 0.0% |
|||
|
Gartner Group, Inc. Class B (a) |
106 |
1,047 |
|
|
TOTAL SERVICES |
594,447 |
||
|
TECHNOLOGY - 42.8% |
|||
|
Communications Equipment - 11.1% |
|||
|
Ciena Corp. (a) |
61,700 |
10,284,619 |
|
|
Cisco Systems, Inc. (a) |
1,046,300 |
66,505,444 |
|
|
Corning, Inc. |
50,500 |
13,628,688 |
|
|
Lucent Technologies, Inc. |
226,200 |
13,402,350 |
|
|
Nokia AB sponsored ADR |
533,900 |
26,661,631 |
|
|
|
|||
|
Shares |
Value (Note 1) |
||
|
Nortel Networks Corp. |
481,200 |
$ 33,380,101 |
|
|
Telefonaktiebolaget LM Ericsson sponsored ADR |
665,500 |
13,310,000 |
|
|
|
177,172,833 |
||
|
Computer Services & Software - 9.9% |
|||
|
Adobe Systems, Inc. |
134,700 |
17,511,000 |
|
|
Amazon.com, Inc. (a) |
10,200 |
370,388 |
|
|
America Online, Inc. (a) |
266,600 |
14,063,150 |
|
|
Automatic Data Processing, Inc. |
224,300 |
12,014,069 |
|
|
BEA Systems, Inc. (a) |
75,100 |
3,712,756 |
|
|
BroadVision, Inc. (a) |
111,400 |
5,660,513 |
|
|
Computer Sciences Corp. (a) |
9,700 |
724,469 |
|
|
E.piphany, Inc. |
13,000 |
1,393,438 |
|
|
First Data Corp. |
61,700 |
3,061,863 |
|
|
i2 Technologies, Inc. (a) |
25,800 |
2,690,053 |
|
|
InfoSpace.com, Inc. (a) |
47,000 |
2,596,750 |
|
|
Microsoft Corp. (a) |
242,100 |
19,368,000 |
|
|
Oracle Corp. (a) |
456,600 |
38,382,939 |
|
|
Phone.com, Inc. |
24,100 |
1,569,513 |
|
|
Redback Networks, Inc. |
16,100 |
2,883,913 |
|
|
Siebel Systems, Inc. (a) |
93,500 |
15,293,094 |
|
|
VeriSign, Inc. (a) |
82,537 |
14,567,781 |
|
|
Yahoo!, Inc. (a) |
23,000 |
2,849,125 |
|
|
|
158,712,814 |
||
|
Computers & Office Equipment - 7.2% |
|||
|
Compaq Computer Corp. |
285,500 |
7,298,094 |
|
|
Dell Computer Corp. (a) |
217,200 |
10,710,675 |
|
|
EMC Corp. (a) |
270,500 |
20,811,594 |
|
|
Hewlett-Packard Co. |
76,600 |
9,565,425 |
|
|
International Business Machines Corp. |
34,100 |
3,736,081 |
|
|
Network Appliance, Inc. (a) |
154,700 |
12,453,350 |
|
|
SCI Systems, Inc. (a) |
490,600 |
19,225,388 |
|
|
Sun Microsystems, Inc. (a) |
345,200 |
31,391,625 |
|
|
|
115,192,232 |
||
|
Electronic Instruments - 2.8% |
|||
|
Agilent Technologies, Inc. |
86,915 |
6,409,981 |
|
|
Applied Materials, Inc. (a) |
178,900 |
16,212,813 |
|
|
KLA-Tencor Corp. (a) |
118,600 |
6,945,513 |
|
|
LAM Research Corp. (a) |
404,000 |
15,150,000 |
|
|
|
44,718,307 |
||
|
Electronics - 11.8% |
|||
|
Analog Devices, Inc. (a) |
245,100 |
18,627,600 |
|
|
Broadcom Corp. Class A (a) |
7,100 |
1,554,456 |
|
|
Flextronics International Ltd. (a) |
119,171 |
8,185,558 |
|
|
Intel Corp. |
316,500 |
42,312,094 |
|
|
JDS Uniphase Corp. (a) |
116,200 |
13,929,475 |
|
|
Methode Electronics, Inc. Class A |
4,300 |
166,088 |
|
|
Micron Technology, Inc. (a) |
335,200 |
29,518,550 |
|
|
Molex, Inc. Class A |
145,810 |
5,103,350 |
|
|
Motorola, Inc. |
60,000 |
1,743,750 |
|
|
National Semiconductor Corp. (a) |
228,600 |
12,973,050 |
|
|
Samsung Electronics Co. Ltd. |
2,800 |
926,616 |
|
|
Common Stocks - continued |
|||
|
Shares |
Value (Note 1) |
||
|
TECHNOLOGY - continued |
|||
|
Electronics - continued |
|||
|
Sanmina Corp. (a) |
59,500 |
$ 5,087,250 |
|
|
SDL, Inc. (a) |
13,700 |
3,907,069 |
|
|
Texas Instruments, Inc. |
541,900 |
37,221,756 |
|
|
Xilinx, Inc. (a) |
83,700 |
6,910,481 |
|
|
|
188,167,143 |
||
|
TOTAL TECHNOLOGY |
683,963,329 |
||
|
TRANSPORTATION - 0.0% |
|||
|
Air Transportation - 0.0% |
|||
|
Southwest Airlines Co. |
31,500 |
596,531 |
|
|
UTILITIES - 5.8% |
|||
|
Cellular - 4.5% |
|||
|
China Telecom (Hong Kong) Ltd. sponsored ADR (a) |
34,100 |
6,063,406 |
|
|
Nextel Communications, Inc. Class A (a) |
291,000 |
17,805,563 |
|
|
Nextel Partners, Inc. Class A |
2,500 |
81,406 |
|
|
QUALCOMM, Inc. (a) |
27,800 |
1,668,000 |
|
|
Sprint Corp. - PCS Group Series 1 (a) |
316,800 |
18,849,600 |
|
|
Vodafone AirTouch PLC |
122,991 |
509,643 |
|
|
Vodafone AirTouch PLC sponsored ADR |
378,900 |
15,700,669 |
|
|
VoiceStream Wireless Corp. (a) |
91,800 |
10,676,053 |
|
|
|
71,354,340 |
||
|
Electric Utility - 0.3% |
|||
|
AES Corp. (a) |
113,000 |
5,155,625 |
|
|
Telephone Services - 1.0% |
|||
|
Level 3 Communications, Inc. (a) |
105,100 |
9,248,800 |
|
|
NEXTLINK Communications, Inc. Class A |
132,800 |
5,038,100 |
|
|
U.S. WEST, Inc. |
16,300 |
1,397,725 |
|
|
|
15,684,625 |
||
|
TOTAL UTILITIES |
92,194,590 |
||
|
TOTAL COMMON STOCKS (Cost $1,159,260,000) |
1,494,768,886 |
||
|
Cash Equivalents - 6.9% |
|||
|
Shares |
Value (Note 1) |
||
|
Central Cash Collateral Fund, 6.71% (b) |
1,235,200 |
$ 1,235,200 |
|
|
Taxable Central Cash Fund, 6.59% (b) |
109,058,384 |
109,058,384 |
|
|
TOTAL CASH EQUIVALENTS (Cost $110,293,584) |
110,293,584 |
||
|
TOTAL INVESTMENT PORTFOLIO - 100.5% (Cost $1,269,553,584) |
1,605,062,470 |
|
NET OTHER ASSETS - (0.5)% |
(7,485,639) |
||
|
NET ASSETS - 100% |
$ 1,597,576,831 |
||
|
Legend |
|
(a) Non-income producing |
|
(b) The rate quoted is the annualized seven-day yield of the fund at |
|
Other Information |
|
Purchases and sales of securities, other than short-term securities, aggregated $1,110,429,310 and $1,386,467,463, respectively, of which long-term U.S. government and government agency obligations aggregated $0 and $110,516,388, respectively. |
|
The market value of futures contracts opened and closed during the period amounted to $2,939,068 and $2,727,952, respectively. |
|
The fund placed a portion of its portfolio transactions with brokerage firms which are affiliates of Fidelity Management & Research Company. The commissions paid to these affiliated firms were $41,941 for the period. |
|
The fund participated in the security lending program. At period end, the value of securities loaned amounted to $1,236,406. The fund received cash collateral of $1,235,200 which was invested in cash equivalents. |
|
Distribution of investments by country of issue, as a percentage of total |
|
United States of America |
90.0% |
|
Canada |
2.1 |
|
United Kingdom |
1.8 |
|
Finland |
1.7 |
|
Others (individually less than 1%) |
4.4 |
|
|
100.0% |
|
Income Tax Information |
|
At June 30, 2000, the aggregate cost of investment securities for income tax purposes was $1,270,414,331. Net unrealized appreciation aggregated $334,648,139, of which $383,735,051 related to appreciated investment securities and $49,086,912 related to depreciated investment securities. |
See accompanying notes which are an integral part of the financial statements.
Growth Opportunities Portfolio
Statement of Assets and Liabilities
|
|
June 30, 2000 (Unaudited) |
|
|
Assets |
|
|
|
Investment in securities, at value |
|
$ 1,605,062,470 |
|
Foreign currency held at value |
|
869,422 |
|
Receivable for investments sold |
|
18,787,103 |
|
Receivable for fund shares sold |
|
2,992,234 |
|
Dividends receivable |
|
563,371 |
|
Interest receivable |
|
475,311 |
|
Other receivables |
|
13,116 |
|
Total assets |
|
1,628,763,027 |
|
Liabilities |
|
|
|
Payable to custodian bank |
$ 1,150,566 |
|
|
Payable for investments purchased |
27,237,658 |
|
|
Payable for fund shares redeemed |
663,655 |
|
|
Accrued management fee |
760,615 |
|
|
Distribution fees payable |
30,888 |
|
|
Other payables and |
107,614 |
|
|
Collateral on securities loaned, |
1,235,200 |
|
|
Total liabilities |
|
31,186,196 |
|
Net Assets |
|
$ 1,597,576,831 |
|
Net Assets consist of: |
|
|
|
Paid in capital |
|
$ 1,297,693,607 |
|
Undistributed net |
|
1,554,523 |
|
Accumulated undistributed |
|
(37,177,356) |
|
Net unrealized appreciation (depreciation) on investments |
|
335,506,057 |
|
Net Assets |
|
$ 1,597,576,831 |
|
Initial Class: |
|
$20.61 |
|
Service Class: |
|
$20.58 |
|
Service Class 2: |
|
$20.57 |
Statement of Operations
|
|
Six months ended June 30, 2000 (Unaudited) |
|
|
Investment Income Dividends |
|
$ 4,944,088 |
|
Interest |
|
2,196,303 |
|
Security lending |
|
43,224 |
|
Total income |
|
7,183,615 |
|
Expenses |
|
|
|
Management fee |
$ 4,713,628 |
|
|
Transfer agent fees |
531,307 |
|
|
Distribution fees |
171,473 |
|
|
Accounting and security lending fees |
182,021 |
|
|
Non-interested trustees' compensation |
2,651 |
|
|
Custodian fees and expenses |
44,138 |
|
|
Registration fees |
956 |
|
|
Audit |
17,449 |
|
|
Legal |
7,156 |
|
|
Reports to shareholders |
7,396 |
|
|
Miscellaneous |
395 |
|
|
Total expenses before reductions |
5,678,570 |
|
|
Expense reductions |
(279,920) |
5,398,650 |
|
Net investment income |
|
1,784,965 |
|
Realized and Unrealized Gain (Loss) Net realized gain (loss) on: |
|
|
|
Investment securities |
(31,567,618) |
|
|
Foreign currency transactions |
(17,618) |
|
|
Futures contracts |
(211,116) |
(31,796,352) |
|
Change in net unrealized appreciation (depreciation) on: |
|
|
|
Investment securities |
(41,408,261) |
|
|
Assets and liabilities in |
105 |
(41,408,156) |
|
Net gain (loss) |
|
(73,204,508) |
|
Net increase (decrease) in net assets resulting from operations |
|
$ (71,419,543) |
|
Other Information Expense reductions |
|
$ 276,910 |
|
Custodian credits |
|
3,010 |
|
|
|
$ 279,920 |
See accompanying notes which are an integral part of the financial statements.
Semiannual Report
Fidelity Variable Insurance Products: Growth Opportunities Portfolio
Financial Statements - continued
Statement of Changes in Net Assets
|
Increase (Decrease) in Net Assets |
Six months ended |
Year ended |
|
|
|
|
|
Operations |
$ 1,784,965 |
$ 21,853,752 |
|
Net realized gain (loss) |
(31,796,352) |
109,839,194 |
|
Change in net unrealized appreciation (depreciation) |
(41,408,156) |
(54,923,099) |
|
Net increase (decrease) in net assets resulting from operations |
(71,419,543) |
76,769,847 |
|
Distributions to shareholders |
(21,794,226) |
(17,518,652) |
|
From net realized gain |
(111,302,559) |
(32,887,198) |
|
Total distributions |
(133,096,785) |
(50,405,850) |
|
Share transactions - net increase (decrease) |
(84,271,368) |
140,493,459 |
|
Total increase (decrease) in net assets |
(288,787,696) |
166,857,456 |
|
Net Assets |
|
|
|
Beginning of period |
1,886,364,527 |
1,719,507,071 |
|
End of period (including undistributed net investment income of $1,554,523 and $21,419,780, respectively) |
$ 1,597,576,831 |
$ 1,886,364,527 |
|
|
|
Other Information: |
|
|
Six months ended June 30, 2000 |
Year ended |
||
|
|
Shares |
Dollars |
Shares |
Dollars |
|
Share transactions |
7,804,052 |
$ 162,982,845 |
14,140,894 |
$ 318,792,928 |
|
Reinvested |
5,190,171 |
107,280,842 |
2,116,413 |
45,714,518 |
|
Redeemed |
(20,232,012) |
(422,309,444) |
(18,293,067) |
(412,962,598) |
|
Net increase (decrease) |
(7,237,789) |
$ (152,045,757) |
(2,035,760) |
$ (48,455,152) |
|
Service Class |
3,431,508 |
$ 71,121,191 |
9,385,140 |
$ 211,858,592 |
|
Reinvested |
1,249,806 |
25,808,498 |
217,292 |
4,691,331 |
|
Redeemed |
(1,604,623) |
(33,520,138) |
(1,230,823) |
(27,601,312) |
|
Net increase (decrease) |
3,076,691 |
$ 63,409,551 |
8,371,609 |
$ 188,948,611 |
|
Service Class 2 A |
234,557 |
$ 4,716,010 |
- |
$ - |
|
Reinvested |
361 |
7,445 |
- |
- |
|
Redeemed |
(17,302) |
(358,617) |
- |
- |
|
Net increase (decrease) |
217,616 |
$ 4,364,838 |
- |
$ - |
|
Distributions |
|
$ 17,669,786 |
|
$ 15,930,817 |
|
Service Class |
|
4,123,251 |
|
1,587,835 |
|
Service Class 2 A |
|
1,189 |
|
- |
|
Total |
|
$ 21,794,226 |
|
$ 17,518,652 |
|
From net realized gain |
|
$ 89,611,056 |
|
$ 29,783,702 |
|
Service Class |
|
21,685,247 |
|
3,103,496 |
|
Service Class 2 A |
|
6,256 |
|
- |
|
Total |
|
$ 111,302,559 |
|
$ 32,887,198 |
|
|
|
$ 133,096,785 |
|
$ 50,405,850 |
A Service Class 2 commenced sale of shares January 12, 2000.
See accompanying notes which are an integral part of the financial statements.
Growth Opportunities Portfolio
Financial Highlights - Initial Class
|
|
Six months ended |
Years ended December 31, |
||||
|
Selected Per-Share Data |
(Unaudited) |
1999 |
1998 |
1997 |
1996 |
1995 E |
|
Net asset value, beginning of period |
$ 23.15 |
$ 22.88 |
$ 19.27 |
$ 15.40 |
$ 13.07 |
$ 10.00 |
|
Income from Investment Operations |
|
|
|
|
|
|
|
Net investment income |
.02 D |
.27 D |
.26 D |
.29 D |
.26 |
.11 |
|
Net realized and unrealized gain (loss) |
(.86) |
.66 |
4.29 |
4.18 |
2.12 |
3.14 |
|
Total from investment operations |
(.84) |
.93 |
4.55 |
4.47 |
2.38 |
3.25 |
|
Less Distributions |
|
|
|
|
|
|
|
From net investment income |
(.28) |
(.23) |
(.21) |
(.25) |
- |
(.11) |
|
From net realized gain |
(1.42) |
(.43) |
(.73) |
(.35) |
(.05) |
(.07) |
|
Total distributions |
(1.70) |
(.66) |
(.94) |
(.60) |
(.05) |
(.18) |
|
Net asset value, end of period |
$ 20.61 |
$ 23.15 |
$ 22.88 |
$ 19.27 |
$ 15.40 |
$ 13.07 |
|
Total Return B, C |
(3.65)% |
4.27% |
24.61% |
29.95% |
18.27% |
32.52% |
|
Ratios and Supplemental Data |
|
|
|
|
|
|
|
Net assets, end of period (000 omitted) |
$ 1,222,938 |
$ 1,541,587 |
$ 1,570,011 |
$ 1,025,766 |
$ 383,085 |
$ 164,303 |
|
Ratio of expenses to average net assets |
.67% A |
.69% |
.71% |
.74% |
.77% |
.85% G |
|
Ratio of expenses to average net assets after |
.64% A, H |
.68% H |
.70% H |
.73% H |
.76% H |
.83% H |
|
Ratio of net investment income to average net assets |
.24% A |
1.20% |
1.27% |
1.68% |
2.29% |
2.49% |
|
Portfolio turnover |
138% A |
42% |
29% |
26% |
28% |
38% |
Financial Highlights - Service Class
|
|
Six months ended |
Years ended December 31, |
||
|
Selected Per-Share Data |
(Unaudited) |
1999 |
1998 |
1997 F |
|
Net asset value, beginning of period |
$ 23.12 |
$ 22.86 |
$ 19.27 |
$ 18.50 |
|
Income from Investment Operations |
|
|
|
|
|
Net investment income D |
.01 |
.25 |
.23 |
.04 |
|
Net realized and unrealized gain (loss) |
(.86) |
.66 |
4.30 |
.73 |
|
Total from investment operations |
(.85) |
.91 |
4.53 |
.77 |
|
Less Distributions |
|
|
|
|
|
From net investment income |
(.27) |
(.22) |
(.21) |
- |
|
From net realized gain |
(1.42) |
(.43) |
(.73) |
- |
|
Total distributions |
(1.69) |
(.65) |
(.94) |
- |
|
Net asset value, end of period |
$ 20.58 |
$ 23.12 |
$ 22.86 |
$ 19.27 |
|
Total ReturnB, C |
(3.70)% |
4.18% |
24.51% |
4.16% |
|
Ratios and Supplemental Data |
|
|
|
|
|
Net assets, end of period (000 omitted) |
$ 370,164 |
$ 344,778 |
$ 149,496 |
$ 2,589 |
|
Ratio of expenses to average net assets |
.77% A |
.79% |
.80% |
.84% A |
|
Ratio of expenses to average net assets after expense reductions |
.74% A, H |
.78% H |
.79% H |
.83% A, H |
|
Ratio of net investment income to average net assets |
.14% A |
1.09% |
1.16% |
1.72% A |
|
Portfolio turnover |
138% A |
42% |
29% |
26% |
|
A Annualized B The total returns would have been lower had certain expenses not been reduced during the periods shown. C Total returns for periods of less than one year are not annualized and do not reflect charges attributable to your insurance company's separate account. Inclusion of these charges would reduce the total returns shown. D Net investment income per share has been calculated based on average shares outstanding during the period. E For the period January 3, 1995 (commencement of sale of Initial Class shares) to December 31, 1995. F For the period November 3, 1997 (commencement of sale of Service Class shares) to December 31, 1997. G FMR agreed to reimburse a portion of the class' expenses during the period. Without this reimbursement, the class' expense ratio would have been higher. H FMR or the fund has entered into varying arrangements with third parties who either paid or reduced a portion of the class' expenses. |
||||
See accompanying notes which are an integral part of the financial statements.
Semiannual Report
Financial Highlights - Service Class 2
|
|
Six months ended |
|
Selected Per-Share Data |
(Unaudited) |
|
Net asset value, beginning of period |
$ 22.70 |
|
Income from Investment Operations |
|
|
Net investment income (loss) D |
(.00) |
|
Net realized and unrealized gain (loss) |
(.44) |
|
Total from investment operations |
(.44) |
|
Less Distributions |
|
|
From net investment income |
(.27) |
|
From net realized gain |
(1.42) |
|
Total distributions |
(1.69) |
|
Net asset value, end of period |
$ 20.57 |
|
Total Return B, C |
(1.97)% |
|
Ratios and Supplemental Data |
|
|
Net assets, end of period (000 omitted) |
$ 4,476 |
|
Ratio of expenses to average net assets |
.96% A |
|
Ratio of expenses to average net assets after expense reductions |
.92% A, F |
|
Ratio of net investment income (loss) to average net assets |
(.05)% A |
|
Portfolio turnover |
138% A |
|
A Annualized B The total returns would have been lower had certain expenses not been reduced during the periods shown. C Total returns for periods of less than one year are not annualized and do not reflect charges attributable to your insurance company's separate account. Inclusion of these charges would reduce the total returns shown. D Net investment income (loss) per share has been calculated based on average shares outstanding during the period. E For the period January 12, 2000 (commencement of sale of Service Class 2 shares) to June 30, 2000. F FMR or the fund has entered into varying arrangements with third parties who either paid or reduced a portion of the class' expenses. |
|
See accompanying notes which are an integral part of the financial statements.
Growth Opportunities Portfolio
A special meeting of the fund's shareholders was held on July 19, 2000. The results of votes taken among shareholders on proposals before them are reported below. Each vote reported represents one dollar of net asset value held on the record date for the meeting.
PROPOSAL 1
To elect as Trustees the following twelve nominees.*
|
|
# of Dollars Voted |
% of Dollars Voted |
Ralph F. Cox
|
Affirmative |
2,995,348,207.84 |
97.862 |
|
Withheld |
65,444,305.52 |
2.138 |
|
TOTAL |
3,060,792,513.36 |
100.000 |
Phyllis Burke Davis
|
Affirmative |
2,995,012,849.06 |
97.851 |
|
Withheld |
65,779,664.30 |
2.149 |
|
TOTAL |
3,060,792,513.36 |
100.000 |
Robert M. Gates
|
Affirmative |
2,994,325,628.16 |
97.828 |
|
Withheld |
66,466,885.20 |
2.172 |
|
TOTAL |
3,060,792,513.36 |
100.000 |
Edward C. Johnson 3d
|
Affirmative |
2,994,212,266.77 |
97.825 |
|
Withheld |
66,580,246.59 |
2.175 |
|
TOTAL |
3,060,792,513.36 |
100.000 |
Donald J. Kirk
|
Affirmative |
2,996,527,468.99 |
97.900 |
|
Withheld |
64,265,044.37 |
2.100 |
|
TOTAL |
3,060,792,513.36 |
100.000 |
Ned. C. Lautenbach
|
Affirmative |
2,997,430,896.97 |
97.930 |
|
Withheld |
63,361,616.39 |
2.070 |
|
TOTAL |
3,060,792,513.36 |
100.000 |
|
|
# of Dollars Voted |
% of Dollars Voted |
Peter S. Lynch
|
Affirmative |
2,997,391,112.97 |
97.929 |
|
Withheld |
63,401,400.39 |
2.071 |
|
TOTAL |
3,060,792,513.36 |
100.000 |
William O. McCoy
|
Affirmative |
2,997,364,420.76 |
97.928 |
|
Withheld |
63,428,092.60 |
2.072 |
|
TOTAL |
3,060,792,513.36 |
100.000 |
Gerald C. McDonough
|
Affirmative |
2,992,594,911.89 |
97.772 |
|
Withheld |
68,197,601.47 |
2.228 |
|
TOTAL |
3,060,792,513.36 |
100.000 |
Marvin L. Mann
|
Affirmative |
2,996,491,839.67 |
97.899 |
|
Withheld |
64,300,673.69 |
2.101 |
|
TOTAL |
3,060,792,513.36 |
100.000 |
Robert C. Pozen
|
Affirmative |
2,997,304,419.99 |
97.926 |
|
Withheld |
63,488,093.37 |
2.074 |
|
TOTAL |
3,060,792,513.36 |
100.000 |
Thomas R. Williams
|
Affirmative |
2,993,561,996.24 |
97.803 |
|
Withheld |
67,230,517.12 |
2.197 |
|
TOTAL |
3,060,792,513.36 |
100.000 |
Semiannual Report
Notes to Financial Statements (Unaudited) - continued
PROPOSAL 2
To ratify the selection of Deloitte & Touche LLP as independent accountants of the fund.
|
|
# of Dollars Voted |
% of Dollars Voted |
|
Affirmative |
1,377,496,384.11 |
94.671 |
|
Against |
12,255,144.99 |
0.842 |
|
Abstain |
65,286,057.94 |
4.487 |
|
TOTAL |
1,455,037,587.04 |
100.000 |
PROPOSAL 3
To authorize the Trustees to adopt an amended and restated Declaration of Trust.*
|
|
# of Dollars Voted |
% of Dollars Voted |
|
Affirmative |
2,837,267,199.92 |
92.697 |
|
Against |
49,473,422.32 |
1.617 |
|
Abstain |
174,051,891.12 |
5.686 |
|
TOTAL |
3,060,792,513.36 |
100.000 |
PROPOSAL 6
To approve an amended management contract for the fund that would reduce the management fee payable to FMR by the fund as FMR's assets under management increase.
|
|
# of Dollars Voted |
% of Dollars Voted |
|
Affirmative |
1,340,780,422.20 |
92.147 |
|
Against |
27,115,319.81 |
1.864 |
|
Abstain |
87,141,845.03 |
5.989 |
|
TOTAL |
1,455,037,587.04 |
100.000 |
PROPOSAL 8
To approve an amended sub-advisory agreement with FMR U.K. to provide investment advice and research services or investment management services.
|
|
# of Dollars Voted |
% of Dollars Voted |
|
Affirmative |
1,331,739,032.83 |
91.526 |
|
Against |
27,683,762.48 |
1.903 |
|
Abstain |
95,614,791.73 |
6.571 |
|
TOTAL |
1,455,037,587.04 |
100.000 |
* Denotes trust-wide proposals and voting results.
PROPOSAL 10
To approve an amended sub-advisory agreement with FMR Far East to provide investment advice and research services or investment management services.
|
|
# of Dollars Voted |
% of Dollars Voted |
|
Affirmative |
1,323,899,985.14 |
90.987 |
|
Against |
34,015,265.88 |
2.338 |
|
Abstain |
97,122,336.02 |
6.675 |
|
TOTAL |
1,455,037,587.04 |
100.000 |
PROPOSAL 13
Diversification - To amend the fundamental investment limitation concerning diversification.
|
|
# of Dollars Voted |
% of Dollars Voted |
|
Affirmative |
1,328,921,810.70 |
91.332 |
|
Against |
33,755,864.67 |
2.320 |
|
Abstain |
92,359,911.67 |
6.348 |
|
TOTAL |
1,455,037,587.04 |
100.000 |
PROPOSAL 14
Underwriting - To amend the fundamental limitation concerning underwriting.
|
|
# of Dollars Voted |
% of Dollars Voted |
|
Affirmative |
1,331,436,859.78 |
91.505 |
|
Against |
31,609,505.60 |
2.173 |
|
Abstain |
91,991,221.66 |
6.322 |
|
TOTAL |
1,455,037,587.04 |
100.000 |
PROPOSAL 15
Concentration - To amend the fundamental limitation concerning concentration.
|
|
# of Dollars Voted |
% of Dollars Voted |
|
Affirmative |
1,327,032,945.65 |
91.203 |
|
Against |
34,495,489.11 |
2.370 |
|
Abstain |
93,509,152.28 |
6.427 |
|
TOTAL |
1,455,037,587.04 |
100.000 |
Growth Opportunities Portfolio
Performance
There are several ways to evaluate a fund's historical performance. You can look at the total percentage change in value, the average annual percentage change or the growth of a hypothetical $10,000 investment. Total return reflects the change in the value of an investment, assuming reinvestment of the fund's dividend income and capital gains (the profits earned upon the sale of securities that have grown in value). The initial offering of Service Class 2 shares took place on January 12, 2000. Performance for Service Class 2 shares reflects an asset based distribution fee (12b-1 fee), and returns prior to January 12, 2000 are those of Initial Class, and do not include the effects of a 12b-1 fee. Had Service Class 2's 12b-1 fee been reflected, returns prior to January 12, 2000 would have been lower. If Fidelity had not reimbursed certain fund expenses, the total returns would have been lower.
Average Annual Total Returns
|
Periods ended |
Past 1 |
Past 5 |
Life of |
|
Fidelity VIP: Index 500 - |
6.81% |
23.39% |
19.50% |
|
S&P 500 |
7.25% |
23.80% |
19.89% |
Average annual returns take the fund's cumulative return and show you what would have happened if the fund had performed at a constant rate each year.
You can compare the fund's returns to the performance of the Standard & Poor's 500 Index - a market capitalization-weighted index of common stocks. This benchmark includes reinvested dividends and capital gains, if any.
Figures for more than one year assume a steady compounded rate of return and are not the fund's year-by-year results, which fluctuated over the periods shown. The life of fund figures are from commencement of operations, August 27, 1992.
Performance numbers are net of all fund operating expenses, but do not include any insurance charges imposed by your insurance company's separate account. If performance information included the effect of these additional charges, the total returns would be lower.
Past performance is no guarantee of future results. Principal and investment return will vary and you may have a gain or loss when you withdraw your money.
Understanding Performance
How a fund did yesterday is no guarantee of how it will do tomorrow. The stock market, for example, has a history of long-term growth and short-term volatility. In turn, the share price and return of a fund that invests in stocks will vary. That means if you sell your shares during a market downturn, you might lose money. But if you can ride out the market's ups and downs, you may have a gain.
3$10,000 Over Life of Fund

$10,000 Over Life of Fund: Let's say hypothetically that $10,000 was invested in Fidelity Variable Insurance Products: Index 500 Portfolio - Service Class 2 on August 27, 1992, when the fund started. As the chart shows, by June 30, 2000 the value of the investment would have grown to $40,474 - a 304.74% increase on the initial investment. For comparison, look at how the Standard & Poor's 500 Index did over the same period. With dividends and capital gains, if any, reinvested, the same $10,000 investment would have grown to $41,515 - a 315.15% increase.
Investment Summary
|
Top Ten Stocks as of June 30, 2000 |
|
|
|
% of fund's |
|
General Electric Co. |
4.1 |
|
Intel Corp. |
3.5 |
|
Cisco Systems, Inc. |
3.4 |
|
Microsoft Corp. |
3.3 |
|
Pfizer, Inc. |
2.4 |
|
Exxon Mobil Corp. |
2.1 |
|
Wal-Mart Stores, Inc. |
2.0 |
|
Oracle Corp. |
1.9 |
|
Nortel Networks Corp. |
1.6 |
|
Citigroup, Inc. |
1.6 |
|
|
25.9 |
|
Top Ten Market Sectors as of June 30, 2000 |
|
|
|
% of fund's |
|
Technology |
32.4 |
|
Finance |
12.4 |
|
Health |
10.9 |
|
Utilities |
9.1 |
|
Industrial Machinery & Equipment |
5.7 |
|
Retail & Wholesale |
5.4 |
|
Nondurables |
5.4 |
|
Energy |
5.3 |
|
Media & Leisure |
4.4 |
|
Basic Industries |
2.6 |
Semiannual Report
(Portfolio Manager photograph)
An interview with Dean Barr, who oversees the Index 500 Portfolio's investment management personnel as Managing Director for Bankers Trust, sub-adviser of the fund
Q. How did the fund perform, Dean?
A. For the six-month period that ended June 30, 2000, the fund closely tracked the -0.42% return of the Standard & Poor's 500 Index. For the 12 months that ended June 30, 2000, fund performance also fell in line with the index, which returned 7.25%.
Q. What was the market environment like over the past six months?
A. It was a grueling round trip. The stock market battled through one of the most volatile periods on record, yet had very little to show for its efforts. Technology-enabled productivity gains helped keep the lid on inflation, allowing the economy to advance at a feverish pace. In this high-growth environment, speculative investors rallied seemingly indiscriminately around smaller-sized tech stocks expected to give shape to the new economy. Amid the tech rush, the broader market retreated into bear territory. A quarter-point interest-rate hike levied by the Federal Reserve Board in February, expected to slow the advances of new economy stocks, had the opposite effect of pushing old economy stocks lower, further widening the performance disparity between the two groups. In late March, however, the tables turned on tech stocks.
Q. What sparked this reversal of fortune?
A. Concerns about seemingly overstretched valuations and further Fed tightening spurred a flight to safety, with jittery investors fleeing smaller-cap tech stocks en masse for the predictability found in large, value-oriented companies. The S&P 500 - home to many of these well-known stocks - benefited from this migration, although the party was short-lived. Another quarter-point hike on March 24, coupled with expectations for an even bigger increase in May, pulled the entire market into a steep decline, culminating in a 5.8% drop in the index on April 14. Stocks forged a recovery later in the month, only to turn back again in May when the Fed dropped a half-point bomb on them. Investors - seeing signs of a slowdown and sensing the smoke was clearing on the rate front - eased their way back into the market, focusing on seasoned growth companies with actual revenues and earnings.
Q. What areas of technology survived the tumult, and which didn't?
A. Not surprisingly, semiconductors - providing the lifeblood for the digital age - led the way, posting impressive gains during the six-month period. Chips were in high demand thanks to growing usage of personal computers and wireless communications devices worldwide. Index standouts Intel, Micron Technology, Texas Instruments and Altera were the big winners here. Not far behind were the providers of networking equipment - central to the development of broadband services - most notably Corning, Nortel, Cisco and Network Appliance. Conversely, Internet stocks - namely AOL and Yahoo! - lost ground, as did Microsoft, which was plagued by antitrust litigation.
Q. How did other sectors of the market fare?
A. Health stocks rode the biotech wave to a strong turnaround during the period. Most biotech and genomics stocks fell sharply in the spring, but recovered nicely in June behind investors' renewed enthusiasm for the sector when researchers reported a successful mapping of the human genome. PE Corp. and Amgen were notable contributors. Drug stocks, such as Eli Lilly and Pfizer, rallied as exciting new product pipelines overcame concerns that presidential campaign rhetoric would dominate the investment landscape. Among financials, banks got a bounce out of the rotation in April and May, but ended up generally flat to down thanks to rising rates. Investment management firms and brokerage houses, however, did quite well, benefiting from robust capital markets activity. Lehman Brothers was one of the stars here. Energy stocks, particularly companies engaged in oil services, such as Baker Hughes, got a lift from the rebound in oil prices. On the downside, retailers such as Wal-Mart and Home Depot suffered from the fear of a slowdown in consumer spending. Utilities also underperformed due to the poor performance of traditional telecommunications providers, such as AT&T and WorldCom, which slipped on increased competition and pricing pressures in their long-distance businesses.
Q. What's your outlook?
A. In choosing not to raise rates further on June 28, the Fed acknowledged that the economy appears to be cooling, for now at least. More evidence of a slowdown will be needed before we can be sure that the Fed will stop tightening. Strong technology-related spending should continue to fuel productivity growth, which, hopefully, will dampen inflationary pressures and keep corporate profits rising. If so, growth stocks could prosper and continue to outperform in the coming months.
The views expressed in this report reflect those of Bankers Trust only through the end of the period of the report as stated on the cover. Any such views are subject to change at any time based on market or other conditions. For more information, see page 2.
Fund Facts
Goal: to provide returns that correspond to those of the S&P 500 index
Start date: August 27, 1992
Size: as of June 30, 2000, more than
$4.8 billion
Manager: Bankers Trust, since 1997
3Semiannual Report
Fidelity Variable Insurance Products: Index 500 Portfolio
(Unaudited)
Showing Percentage of Net Assets
|
Common Stocks - 97.8% |
|||
|
Shares |
Value (Note 1) |
||
|
AEROSPACE & DEFENSE - 1.1% |
|||
|
Aerospace & Defense - 1.0% |
|||
|
BFGoodrich Co. |
41,200 |
$ 1,403,375 |
|
|
Boeing Co. |
324,668 |
13,575,181 |
|
|
Honeywell International, Inc. |
295,662 |
9,960,114 |
|
|
Lockheed Martin Corp. |
147,986 |
3,671,903 |
|
|
Northrop Grumman Corp. |
26,000 |
1,722,500 |
|
|
Rockwell International Corp. |
70,900 |
2,233,350 |
|
|
Textron, Inc. |
55,600 |
3,019,775 |
|
|
United Technologies Corp. |
177,600 |
10,456,200 |
|
|
|
46,042,398 |
||
|
Defense Electronics - 0.0% |
|||
|
Raytheon Co. Class B |
126,400 |
2,433,200 |
|
|
Ship Building & Repair - 0.1% |
|||
|
General Dynamics Corp. |
75,100 |
3,923,975 |
|
|
TOTAL AEROSPACE & DEFENSE |
52,399,573 |
||
|
BASIC INDUSTRIES - 2.6% |
|||
|
Chemicals & Plastics - 1.5% |
|||
|
Air Products & Chemicals, Inc. |
83,500 |
2,572,844 |
|
|
Armstrong Holdings, Inc. |
14,900 |
228,156 |
|
|
Ashland, Inc. |
26,700 |
936,169 |
|
|
Avery Dennison Corp. |
42,200 |
2,832,675 |
|
|
Dow Chemical Co. |
246,000 |
7,426,125 |
|
|
E.I. du Pont de Nemours and Co. |
390,379 |
17,079,081 |
|
|
Eastman Chemical Co. |
29,375 |
1,402,656 |
|
|
Engelhard Corp. |
47,300 |
807,056 |
|
|
FMC Corp. |
11,500 |
667,000 |
|
|
Great Lakes Chemical Corp. |
21,600 |
680,400 |
|
|
Hercules, Inc. |
39,500 |
555,469 |
|
|
Pharmacia Corp. |
473,423 |
24,470,051 |
|
|
PPG Industries, Inc. |
65,100 |
2,884,744 |
|
|
Praxair, Inc. |
59,500 |
2,227,531 |
|
|
Rohm & Haas Co. |
81,936 |
2,826,792 |
|
|
Sealed Air Corp. (a) |
31,260 |
1,637,243 |
|
|
Union Carbide Corp. |
50,100 |
2,479,950 |
|
|
W.R. Grace & Co. (a) |
26,800 |
324,950 |
|
|
|
72,038,892 |
||
|
Iron & Steel - 0.1% |
|||
|
Allegheny Technologies, Inc. |
34,492 |
620,856 |
|
|
Bethlehem Steel Corp. (a) |
45,000 |
160,313 |
|
|
Crane Co. |
24,300 |
590,794 |
|
|
Nucor Corp. |
34,900 |
1,158,244 |
|
|
USX - U.S. Steel Group |
35,600 |
660,825 |
|
|
Worthington Industries, Inc. |
32,550 |
341,775 |
|
|
|
3,532,807 |
||
|
Metals & Mining - 0.3% |
|||
|
Alcan Aluminium Ltd. |
85,157 |
2,645,878 |
|
|
Alcoa, Inc. |
322,504 |
9,352,616 |
|
|
Freeport-McMoRan Copper & Gold, Inc. Class B (a) |
59,500 |
550,375 |
|
|
|
|||
|
Shares |
Value (Note 1) |
||
|
Inco Ltd. (a) |
69,436 |
$ 1,064,638 |
|
|
Phelps Dodge Corp. |
31,157 |
1,158,651 |
|
|
|
14,772,158 |
||
|
Packaging & Containers - 0.1% |
|||
|
Ball Corp. |
10,730 |
345,372 |
|
|
Bemis Co., Inc. |
16,500 |
554,813 |
|
|
Crown Cork & Seal Co., Inc. |
45,800 |
687,000 |
|
|
Owens-Illinois, Inc. (a) |
54,800 |
640,475 |
|
|
Tupperware Corp. |
20,900 |
459,800 |
|
|
|
2,687,460 |
||
|
Paper & Forest Products - 0.6% |
|||
|
Boise Cascade Corp. |
20,700 |
535,613 |
|
|
Fort James Corp. |
83,400 |
1,928,625 |
|
|
Georgia-Pacific Corp. |
64,400 |
1,690,500 |
|
|
International Paper Co. |
182,336 |
5,435,892 |
|
|
Kimberly-Clark Corp. |
205,632 |
11,798,136 |
|
|
Louisiana-Pacific Corp. |
43,800 |
476,325 |
|
|
Mead Corp. |
37,900 |
956,975 |
|
|
Pactiv Corp. (a) |
70,200 |
552,825 |
|
|
Potlatch Corp. |
12,100 |
400,813 |
|
|
Temple-Inland, Inc. |
20,900 |
877,800 |
|
|
Westvaco Corp. |
33,450 |
829,978 |
|
|
Weyerhaeuser Co. |
86,900 |
3,736,700 |
|
|
Willamette Industries, Inc. |
38,800 |
1,057,300 |
|
|
|
30,277,482 |
||
|
TOTAL BASIC INDUSTRIES |
123,308,799 |
||
|
CONSTRUCTION & REAL ESTATE - 0.2% |
|||
|
Building Materials - 0.2% |
|||
|
Fortune Brands, Inc. |
61,300 |
1,413,731 |
|
|
Masco Corp. |
167,000 |
3,016,438 |
|
|
Owens Corning |
20,400 |
188,700 |
|
|
Sherwin-Williams Co. |
62,300 |
1,319,981 |
|
|
Vulcan Materials Co. |
37,500 |
1,600,781 |
|
|
|
7,539,631 |
||
|
Construction - 0.0% |
|||
|
Centex Corp. |
22,200 |
521,700 |
|
|
Kaufman & Broad Home Corp. |
17,700 |
350,681 |
|
|
Pulte Corp. |
16,100 |
348,163 |
|
|
|
1,220,544 |
||
|
Engineering - 0.0% |
|||
|
Fluor Corp. |
28,300 |
894,988 |
|
|
TOTAL CONSTRUCTION & REAL ESTATE |
9,655,163 |
||
|
DURABLES - 1.6% |
|||
|
Autos, Tires, & Accessories - 1.0% |
|||
|
AutoZone, Inc. (a) |
52,050 |
1,145,100 |
|
|
Cooper Tire & Rubber Co. |
30,300 |
337,088 |
|
|
Cummins Engine Co., Inc. |
15,500 |
422,375 |
|
|
Dana Corp. |
62,466 |
1,323,498 |
|
|
Common Stocks - continued |
|||
|
Shares |
Value (Note 1) |
||
|
DURABLES - continued |
|||
|
Autos, Tires, & Accessories - continued |
|||
|
Danaher Corp. |
53,200 |
$ 2,630,075 |
|
|
Delphi Automotive Systems Corp. |
213,335 |
3,106,691 |
|
|
Eaton Corp. |
27,300 |
1,829,100 |
|
|
Ford Motor Co. |
452,100 |
19,440,300 |
|
|
General Motors Corp. |
199,878 |
11,605,416 |
|
|
Genuine Parts Co. |
66,550 |
1,331,000 |
|
|
Goodyear Tire & Rubber Co. |
58,700 |
1,174,000 |
|
|
Johnson Controls, Inc. |
31,700 |
1,626,606 |
|
|
Navistar International Corp. (a) |
24,570 |
763,206 |
|
|
PACCAR, Inc. |
30,090 |
1,194,197 |
|
|
TRW, Inc. |
45,400 |
1,969,225 |
|
|
Visteon Corp. (a) |
59,194 |
717,727 |
|
|
|
50,615,604 |
||
|
Consumer Durables - 0.3% |
|||
|
Minnesota Mining & Manufacturing Co. |
149,200 |
12,309,000 |
|
|
Snap-On, Inc. |
21,900 |
583,088 |
|
|
|
12,892,088 |
||
|
Consumer Electronics - 0.1% |
|||
|
Black & Decker Corp. |
32,700 |
1,285,519 |
|
|
Maytag Corp. |
33,100 |
1,220,563 |
|
|
Whirlpool Corp. |
25,500 |
1,188,938 |
|
|
|
3,695,020 |
||
|
Home Furnishings - 0.1% |
|||
|
Leggett & Platt, Inc. |
73,900 |
1,219,350 |
|
|
Newell Rubbermaid, Inc. |
105,493 |
2,716,445 |
|
|
|
3,935,795 |
||
|
Textiles & Apparel - 0.1% |
|||
|
Liz Claiborne, Inc. |
23,600 |
831,900 |
|
|
NIKE, Inc. Class B |
105,900 |
4,216,144 |
|
|
Reebok International Ltd. (a) |
21,300 |
339,469 |
|
|
Russell Corp. |
13,000 |
260,000 |
|
|
Springs Industries, Inc. Class A |
6,700 |
214,400 |
|
|
VF Corp. |
44,500 |
1,059,656 |
|
|
|
6,921,569 |
||
|
TOTAL DURABLES |
78,060,076 |
||
|
ENERGY - 5.3% |
|||
|
Energy Services - 0.7% |
|||
|
Baker Hughes, Inc. |
122,230 |
3,911,360 |
|
|
Halliburton Co. |
166,700 |
7,866,156 |
|
|
McDermott International, Inc. |
20,700 |
182,419 |
|
|
Rowan Companies, Inc. (a) |
31,000 |
941,625 |
|
|
Schlumberger Ltd. (NY Shares) |
207,200 |
15,462,300 |
|
|
Transocean Sedco Forex, Inc. |
68,606 |
3,666,133 |
|
|
|
32,029,993 |
||
|
Oil & Gas - 4.6% |
|||
|
Amerada Hess Corp. |
34,600 |
2,136,550 |
|
|
Anadarko Petroleum Corp. |
47,100 |
2,322,619 |
|
|
|
|||
|
Shares |
Value (Note 1) |
||
|
Apache Corp. |
42,300 |
$ 2,487,769 |
|
|
Burlington Resources, Inc. |
81,557 |
3,119,555 |
|
|
Chevron Corp. |
245,700 |
20,838,431 |
|
|
Conoco, Inc. Class B |
234,031 |
5,748,386 |
|
|
Exxon Mobil Corp. |
1,290,933 |
101,338,241 |
|
|
Kerr-McGee Corp. |
34,894 |
2,056,565 |
|
|
Occidental Petroleum Corp. |
137,900 |
2,904,519 |
|
|
Phillips Petroleum Co. |
95,500 |
4,840,656 |
|
|
Royal Dutch Petroleum Co. (NY Shares) |
801,975 |
49,371,586 |
|
|
Sunoco, Inc. |
33,700 |
992,044 |
|
|
Texaco, Inc. |
206,700 |
11,006,775 |
|
|
The Coastal Corp. |
79,800 |
4,857,825 |
|
|
Tosco Corp. |
55,300 |
1,565,681 |
|
|
Union Pacific Resources Group, Inc. |
91,912 |
2,022,064 |
|
|
Unocal Corp. |
90,850 |
3,009,406 |
|
|
USX - Marathon Group |
116,100 |
2,909,756 |
|
|
|
223,528,428 |
||
|
TOTAL ENERGY |
255,558,421 |
||
|
FINANCE - 12.4% |
|||
|
Banks - 4.2% |
|||
|
AmSouth Bancorp. |
143,900 |
2,266,425 |
|
|
Bank of America Corp. |
619,240 |
26,627,320 |
|
|
Bank of New York Co., Inc. |
275,700 |
12,820,050 |
|
|
Bank One Corp. |
429,199 |
11,400,598 |
|
|
BB&T Corp. |
129,300 |
3,087,038 |
|
|
Capital One Financial Corp. |
74,800 |
3,337,950 |
|
|
Chase Manhattan Corp. |
462,669 |
21,311,691 |
|
|
Comerica, Inc. |
59,000 |
2,647,625 |
|
|
Fifth Third Bancorp |
115,725 |
7,319,606 |
|
|
First Union Corp. |
369,645 |
9,171,816 |
|
|
Firstar Corp. |
367,142 |
7,732,928 |
|
|
FleetBoston Financial Corp. |
336,783 |
11,450,622 |
|
|
Huntington Bancshares, Inc. |
84,104 |
1,329,895 |
|
|
J.P. Morgan & Co., Inc. |
60,700 |
6,684,588 |
|
|
KeyCorp |
168,214 |
2,964,772 |
|
|
Mellon Financial Corp. |
183,500 |
6,686,281 |
|
|
National City Corp. |
231,442 |
3,948,979 |
|
|
Northern Trust Corp. |
83,500 |
5,432,719 |
|
|
PNC Financial Services Group, Inc. |
110,400 |
5,175,000 |
|
|
Regions Financial Corp. |
79,800 |
1,586,025 |
|
|
SouthTrust Corp. |
63,600 |
1,438,950 |
|
|
State Street Corp. |
60,000 |
6,363,750 |
|
|
Summit Bancorp |
66,100 |
1,627,713 |
|
|
SunTrust Banks, Inc. |
113,000 |
5,162,688 |
|
|
Synovus Finanical Corp. |
101,700 |
1,792,463 |
|
|
U.S. Bancorp |
275,551 |
5,304,357 |
|
|
Union Planters Corp. |
51,100 |
1,427,606 |
|
|
Wachovia Corp. |
76,200 |
4,133,850 |
|
|
Wells Fargo & Co. |
602,100 |
23,331,375 |
|
|
|
203,564,680 |
||
|
Common Stocks - continued |
|||
|
Shares |
Value (Note 1) |
||
|
FINANCE - continued |
|||
|
Credit & Other Finance - 2.7% |
|||
|
American Express Co. |
503,037 |
$ 26,220,804 |
|
|
Associates First Capital Corp. Class A |
274,748 |
6,130,315 |
|
|
Citigroup, Inc. |
1,254,329 |
75,573,322 |
|
|
Countrywide Credit Industries, Inc. |
42,300 |
1,282,219 |
|
|
Household International, Inc. |
177,082 |
7,359,971 |
|
|
MBNA Corp. |
301,725 |
8,184,291 |
|
|
Old Kent Financial Corp. |
47,775 |
1,277,981 |
|
|
Providian Financial Corp. |
53,700 |
4,833,000 |
|
|
|
130,861,903 |
||
|
Federal Sponsored Credit - 0.7% |
|||
|
Fannie Mae |
376,500 |
19,648,594 |
|
|
Freddie Mac |
260,900 |
10,566,450 |
|
|
SLM Holding Corp. |
60,100 |
2,249,994 |
|
|
|
32,465,038 |
||
|
Insurance - 2.9% |
|||
|
Aetna, Inc. |
53,400 |
3,427,613 |
|
|
AFLAC, Inc. |
99,400 |
4,566,188 |
|
|
Allstate Corp. |
278,242 |
6,190,885 |
|
|
American General Corp. |
92,352 |
5,633,472 |
|
|
American International Group, Inc. |
576,012 |
67,681,410 |
|
|
Aon Corp. |
92,525 |
2,874,058 |
|
|
CIGNA Corp. |
63,000 |
5,890,500 |
|
|
Cincinnati Financial Corp. |
60,300 |
1,895,681 |
|
|
Conseco, Inc. |
122,116 |
1,190,631 |
|
|
Hartford Financial Services Group, Inc. |
84,400 |
4,721,125 |
|
|
Jefferson-Pilot Corp. |
39,700 |
2,240,569 |
|
|
Lincoln National Corp. |
73,100 |
2,640,738 |
|
|
Loews Corp. |
39,100 |
2,346,000 |
|
|
Marsh & McLennan Companies, Inc. |
100,250 |
10,469,859 |
|
|
MBIA, Inc. |
36,300 |
1,749,206 |
|
|
MGIC Investment Corp. |
39,700 |
1,806,350 |
|
|
Progressive Corp. |
26,600 |
1,968,400 |
|
|
SAFECO Corp. |
49,400 |
981,825 |
|
|
The Chubb Corp. |
68,400 |
4,206,600 |
|
|
The St. Paul Companies, Inc. |
79,192 |
2,702,427 |
|
|
Torchmark Corp. |
49,100 |
1,212,156 |
|
|
UnumProvident Corp. |
89,638 |
1,798,362 |
|
|
|
138,194,055 |
||
|
Savings & Loans - 0.2% |
|||
|
Charter One Financial, Inc. |
78,400 |
1,803,200 |
|
|
Golden West Financial Corp. |
60,800 |
2,481,400 |
|
|
Washington Mutual, Inc. |
204,662 |
5,909,615 |
|
|
|
10,194,215 |
||
|
Securities Industry - 1.7% |
|||
|
Bear Stearns Companies, Inc. |
42,397 |
1,764,775 |
|
|
Charles Schwab Corp. |
498,000 |
16,745,250 |
|
|
Franklin Resources, Inc. |
92,900 |
2,821,838 |
|
|
Lehman Brothers Holdings, Inc. |
44,700 |
4,226,944 |
|
|
Merrill Lynch & Co., Inc. |
138,500 |
15,927,500 |
|
|
Morgan Stanley Dean Witter & Co. |
422,912 |
35,207,424 |
|
|
|
|||
|
Shares |
Value (Note 1) |
||
|
PaineWebber Group, Inc. |
53,300 |
$ 2,425,150 |
|
|
T. Rowe Price Associates, Inc. |
44,700 |
1,899,750 |
|
|
|
81,018,631 |
||
|
TOTAL FINANCE |
596,298,522 |
||
|
HEALTH - 10.9% |
|||
|
Drugs & Pharmaceuticals - 7.7% |
|||
|
Allergan, Inc. |
49,500 |
3,687,750 |
|
|
ALZA Corp. (a) |
44,300 |
2,619,238 |
|
|
American Home Products Corp. |
488,400 |
28,693,500 |
|
|
Amgen, Inc. |
390,200 |
27,411,550 |
|
|
Bausch & Lomb, Inc. |
20,100 |
1,555,238 |
|
|
Biogen, Inc. (a) |
56,600 |
3,650,700 |
|
|
Bristol-Myers Squibb Co. |
737,100 |
42,936,075 |
|
|
Eli Lilly & Co. |
420,892 |
42,036,589 |
|
|
Medimmune, Inc. (a) |
72,800 |
5,387,200 |
|
|
Merck & Co., Inc. |
859,700 |
65,874,513 |
|
|
Pfizer, Inc. |
2,363,825 |
113,463,600 |
|
|
Quintiles Transnational Corp. (a) |
42,900 |
605,963 |
|
|
Schering-Plough Corp. |
549,900 |
27,769,950 |
|
|
Sigma-Aldrich Corp. |
37,500 |
1,096,875 |
|
|
Watson Pharmaceuticals, Inc. (a) |
35,900 |
1,929,625 |
|
|
|
368,718,366 |
||
|
Medical Equipment & Supplies - 2.8% |
|||
|
Abbott Laboratories |
575,300 |
25,636,806 |
|
|
Baxter International, Inc. |
109,200 |
7,678,125 |
|
|
Becton, Dickinson & Co. |
94,400 |
2,708,100 |
|
|
Biomet, Inc. |
42,700 |
1,641,281 |
|
|
Boston Scientific Corp. (a) |
156,400 |
3,431,025 |
|
|
C.R. Bard, Inc. |
19,500 |
938,438 |
|
|
Cardinal Health, Inc. |
105,650 |
7,818,100 |
|
|
Guidant Corp. (a) |
115,400 |
5,712,300 |
|
|
Johnson & Johnson |
520,400 |
53,015,750 |
|
|
Mallinckrodt, Inc. |
25,900 |
1,125,031 |
|
|
McKesson HBOC, Inc. |
105,748 |
2,214,099 |
|
|
Medtronic, Inc. |
446,800 |
22,256,225 |
|
|
Millipore Corp. |
16,100 |
1,213,538 |
|
|
St. Jude Medical, Inc. (a) |
29,329 |
1,345,468 |
|
|
|
136,734,286 |
||
|
Medical Facilities Management - 0.4% |
|||
|
HCA - The Healthcare Co. |
210,412 |
6,391,265 |
|
|
HEALTHSOUTH Corp. (a) |
144,300 |
1,037,156 |
|
|
Humana, Inc. (a) |
60,500 |
294,938 |
|
|
Manor Care, Inc. (a) |
38,600 |
270,200 |
|
|
Tenet Healthcare Corp. |
112,300 |
3,032,100 |
|
|
UnitedHealth Group, Inc. |
63,400 |
5,436,550 |
|
|
Wellpoint Health Networks, Inc. (a) |
23,800 |
1,724,013 |
|
|
|
18,186,222 |
||
|
TOTAL HEALTH |
523,638,874 |
||
|
Common Stocks - continued |
|||
|
Shares |
Value (Note 1) |
||
|
INDUSTRIAL MACHINERY & EQUIPMENT - 5.7% |
|||
|
Electrical Equipment - 4.4% |
|||
|
American Power Conversion Corp. (a) |
64,000 |
$ 2,612,000 |
|
|
Emerson Electric Co. |
161,100 |
9,726,413 |
|
|
General Electric Co. |
3,687,400 |
195,432,166 |
|
|
Scientific-Atlanta, Inc. |
59,900 |
4,462,550 |
|
|
Thomas & Betts Corp. |
21,600 |
413,100 |
|
|
W.W. Grainger, Inc. |
34,600 |
1,066,113 |
|
|
|
213,712,342 |
||
|
Industrial Machinery & Equipment - 1.2% |
|||
|
Briggs & Stratton Corp. |
8,600 |
294,550 |
|
|
Caterpillar, Inc. |
132,800 |
4,498,600 |
|
|
Cooper Industries, Inc. |
35,146 |
1,144,442 |
|
|
Deere & Co. |
88,500 |
3,274,500 |
|
|
Dover Corp. |
77,800 |
3,155,763 |
|
|
Illinois Tool Works, Inc. |
112,300 |
6,401,100 |
|
|
Ingersoll-Rand Co. |
61,200 |
2,463,300 |
|
|
ITT Industries, Inc. |
35,500 |
1,078,313 |
|
|
Pall Corp. |
46,500 |
860,250 |
|
|
Parker-Hannifin Corp. |
41,925 |
1,435,931 |
|
|
The Stanley Works |
33,500 |
795,625 |
|
|
Timken Co. |
22,584 |
420,627 |
|
|
Tyco International Ltd. |
631,842 |
29,933,515 |
|
|
|
55,756,516 |
||
|
Pollution Control - 0.1% |
|||
|
Allied Waste Industries, Inc. (a) |
64,500 |
645,000 |
|
|
Waste Management, Inc. |
242,209 |
4,601,971 |
|
|
|
5,246,971 |
||
|
TOTAL INDUSTRIAL MACHINERY & EQUIPMENT |
274,715,829 |
||
|
MEDIA & LEISURE - 4.4% |
|||
|
Broadcasting - 1.6% |
|||
|
Clear Channel Communications, Inc. (a) |
127,200 |
9,540,000 |
|
|
Comcast Corp. Class A (special) (a) |
337,300 |
13,660,650 |
|
|
MediaOne Group, Inc. (a) |
229,200 |
15,199,111 |
|
|
Time Warner, Inc. |
490,440 |
37,273,440 |
|
|
|
75,673,201 |
||
|
Entertainment - 1.5% |
|||
|
Carnival Corp. |
230,800 |
4,500,600 |
|
|
Viacom, Inc. Class B (non-vtg.) (a) |
571,393 |
38,961,860 |
|
|
Walt Disney Co. |
774,700 |
30,068,044 |
|
|
|
73,530,504 |
||
|
Leisure Durables & Toys - 0.2% |
|||
|
Brunswick Corp. |
34,100 |
564,781 |
|
|
Harley-Davidson, Inc. |
113,200 |
4,358,200 |
|
|
Hasbro, Inc. |
66,804 |
1,006,235 |
|
|
Mattel, Inc. |
157,176 |
2,072,759 |
|
|
|
8,001,975 |
||
|
Lodging & Gaming - 0.1% |
|||
|
Harrah's Entertainment, Inc. (a) |
39,500 |
827,031 |
|
|
|
|||
|
Shares |
Value (Note 1) |
||
|
Hilton Hotels Corp. |
137,800 |
$ 1,291,875 |
|
|
Marriott International, Inc. Class A |
92,900 |
3,350,206 |
|
|
|
5,469,112 |
||
|
Publishing - 0.5% |
|||
|
American Greetings Corp. Class A |
26,200 |
497,800 |
|
|
Dow Jones & Co., Inc. |
29,700 |
2,175,525 |
|
|
Gannett Co., Inc. |
99,600 |
5,957,325 |
|
|
Harcourt General, Inc. |
22,400 |
1,218,000 |
|
|
Knight-Ridder, Inc. |
32,300 |
1,717,956 |
|
|
McGraw-Hill Companies, Inc. |
74,100 |
4,001,400 |
|
|
Meredith Corp. |
19,200 |
648,000 |
|
|
The New York Times Co. Class A |
65,300 |
2,579,350 |
|
|
Tribune Co. |
116,747 |
4,086,145 |
|
|
|
22,881,501 |
||
|
Restaurants - 0.5% |
|||
|
Darden Restaurants, Inc. |
50,600 |
822,250 |
|
|
McDonald's Corp. |
499,300 |
16,445,694 |
|
|
Starbucks Corp. (a) |
68,500 |
2,615,844 |
|
|
Tricon Global Restaurants, Inc. (a) |
58,910 |
1,664,208 |
|
|
Wendy's International, Inc. |
46,000 |
819,375 |
|
|
|
22,367,371 |
||
|
TOTAL MEDIA & LEISURE |
207,923,664 |
||
|
NONDURABLES - 5.4% |
|||
|
Beverages - 1.7% |
|||
|
Adolph Coors Co. Class B |
13,200 |
798,600 |
|
|
Anheuser-Busch Companies, Inc. |
168,800 |
12,607,250 |
|
|
Brown-Forman Corp. Class B (non-vtg.) |
22,700 |
1,220,125 |
|
|
Coca-Cola Enterprises, Inc. |
159,300 |
2,598,581 |
|
|
Seagram Co. Ltd. |
165,400 |
9,719,554 |
|
|
The Coca-Cola Co. |
923,900 |
53,066,506 |
|
|
|
80,010,616 |
||
|
Foods - 1.7% |
|||
|
Archer-Daniels-Midland Co. |
224,928 |
2,207,106 |
|
|
Bestfoods |
105,300 |
7,292,025 |
|
|
Campbell Soup Co. |
159,900 |
4,657,088 |
|
|
ConAgra, Inc. |
183,100 |
3,490,344 |
|
|
General Mills, Inc. |
113,800 |
4,352,850 |
|
|
H.J. Heinz Co. |
133,850 |
5,855,938 |
|
|
Hershey Foods Corp. |
50,700 |
2,458,950 |
|
|
Kellogg Co. |
150,400 |
4,474,400 |
|
|
Nabisco Group Holdings Corp. |
126,500 |
3,281,094 |
|
|
PepsiCo, Inc. |
538,500 |
23,929,594 |
|
|
Quaker Oats Co. |
50,800 |
3,816,350 |
|
|
Ralston Purina Co. |
112,800 |
2,248,950 |
|
|
Sara Lee Corp. |
330,900 |
6,390,506 |
|
|
Sysco Corp. |
124,500 |
5,244,563 |
|
|
Wm. Wrigley Jr. Co. |
43,900 |
3,520,231 |
|
|
|
83,219,989 |
||
|
Household Products - 1.5% |
|||
|
Avon Products, Inc. |
90,500 |
4,027,250 |
|
|
Common Stocks - continued |
|||
|
Shares |
Value (Note 1) |
||
|
NONDURABLES - continued |
|||
|
Household Products - continued |
|||
|
Clorox Co. |
87,700 |
$ 3,930,056 |
|
|
Colgate-Palmolive Co. |
217,700 |
13,034,788 |
|
|
Gillette Co. |
390,100 |
13,629,119 |
|
|
International Flavors & Fragrances, Inc. |
39,100 |
1,180,331 |
|
|
Procter & Gamble Co. |
491,600 |
28,144,100 |
|
|
Unilever NV (NY Shares) |
214,452 |
9,221,436 |
|
|
|
73,167,080 |
||
|
Tobacco - 0.5% |
|||
|
Philip Morris Companies, Inc. |
854,500 |
22,697,656 |
|
|
UST, Inc. |
63,900 |
938,531 |
|
|
|
23,636,187 |
||
|
TOTAL NONDURABLES |
260,033,872 |
||
|
PRECIOUS METALS - 0.1% |
|||
|
Barrick Gold Corp. |
147,700 |
2,668,676 |
|
|
Homestake Mining Co. |
92,200 |
633,875 |
|
|
Newmont Mining Corp. |
63,065 |
1,363,781 |
|
|
Placer Dome, Inc. |
122,500 |
1,150,118 |
|
|
|
5,816,450 |
||
|
RETAIL & WHOLESALE - 5.4% |
|||
|
Apparel Stores - 0.3% |
|||
|
Gap, Inc. |
318,475 |
9,952,344 |
|
|
The Limited, Inc. |
161,480 |
3,492,005 |
|
|
TJX Companies, Inc. |
116,600 |
2,186,250 |
|
|
|
15,630,599 |
||
|
Drug Stores - 0.4% |
|||
|
CVS Corp. |
146,700 |
5,868,000 |
|
|
Longs Drug Stores Corp. |
14,100 |
306,675 |
|
|
Rite Aid Corp. |
98,700 |
647,719 |
|
|
Walgreen Co. |
376,400 |
12,115,375 |
|
|
|
18,937,769 |
||
|
General Merchandise Stores - 2.8% |
|||
|
Consolidated Stores Corp. (a) |
39,700 |
476,400 |
|
|
Costco Wholesale Corp. (a) |
167,078 |
5,513,574 |
|
|
Dillards, Inc. Class A |
37,600 |
460,600 |
|
|
Dollar General Corp. |
111,616 |
2,176,512 |
|
|
Federated Department Stores, Inc. (a) |
76,400 |
2,578,500 |
|
|
JCPenney Co., Inc. |
95,500 |
1,760,781 |
|
|
Kmart Corp. (a) |
178,800 |
1,218,075 |
|
|
Kohls Corp. (a) |
122,700 |
6,825,188 |
|
|
Nordstrom, Inc. |
51,200 |
1,235,200 |
|
|
Sears, Roebuck & Co. |
131,700 |
4,296,713 |
|
|
Target Corp. |
164,300 |
9,529,400 |
|
|
The May Department Stores Co. |
125,800 |
3,019,200 |
|
|
Wal-Mart Stores, Inc. |
1,664,900 |
95,939,863 |
|
|
|
135,030,006 |
||
|
|
|||
|
Shares |
Value (Note 1) |
||
|
Grocery Stores - 0.5% |
|||
|
Albertson's, Inc. |
160,681 |
$ 5,342,643 |
|
|
Great Atlantic & Pacific Tea, Inc. |
13,900 |
231,088 |
|
|
Kroger Co. (a) |
314,900 |
6,947,481 |
|
|
Safeway, Inc. (a) |
185,500 |
8,370,688 |
|
|
SUPERVALU, Inc. |
47,600 |
907,375 |
|
|
Winn-Dixie Stores, Inc. |
53,600 |
767,150 |
|
|
|
22,566,425 |
||
|
Retail & Wholesale, Miscellaneous - 1.4% |
|||
|
Alberto-Culver Co. Class B |
19,900 |
608,194 |
|
|
Bed Bath & Beyond, Inc. (a) |
51,700 |
1,874,125 |
|
|
Best Buy Co., Inc. (a) |
76,400 |
4,832,300 |
|
|
Circuit City Stores, Inc. - Circuit City Group |
76,300 |
2,532,206 |
|
|
Home Depot, Inc. |
860,450 |
42,968,722 |
|
|
Lowe's Companies, Inc. |
143,100 |
5,876,044 |
|
|
Office Depot, Inc. (a) |
124,000 |
775,000 |
|
|
RadioShack Corp. |
71,700 |
3,396,788 |
|
|
Staples, Inc. (a) |
176,150 |
2,708,306 |
|
|
Tiffany & Co., Inc. |
22,500 |
1,518,750 |
|
|
Toys 'R' Us, Inc. (a) |
90,500 |
1,317,906 |
|
|
|
68,408,341 |
||
|
TOTAL RETAIL & WHOLESALE |
260,573,140 |
||
|
SERVICES - 0.6% |
|||
|
Advertising - 0.3% |
|||
|
Interpublic Group of Companies, Inc. |
104,900 |
4,510,700 |
|
|
Omnicom Group, Inc. |
66,300 |
5,904,844 |
|
|
Young & Rubicam, Inc. |
26,000 |
1,486,875 |
|
|
|
11,902,419 |
||
|
Leasing & Rental - 0.0% |
|||
|
Ryder System, Inc. |
28,700 |
543,506 |
|
|
Printing - 0.0% |
|||
|
Deluxe Corp. |
28,900 |
680,956 |
|
|
R.R. Donnelley & Sons Co. |
49,100 |
1,107,819 |
|
|
|
1,788,775 |
||
|
Services - 0.3% |
|||
|
Cendant Corp. (a) |
260,441 |
3,646,174 |
|
|
Convergys Corp. (a) |
57,700 |
2,993,188 |
|
|
Dun & Bradstreet Corp. |
60,100 |
1,720,363 |
|
|
Ecolab, Inc. |
48,600 |
1,898,438 |
|
|
H&R Block, Inc. |
38,000 |
1,230,250 |
|
|
National Service Industries, Inc. |
15,200 |
296,400 |
|
|
|
11,784,813 |
||
|
TOTAL SERVICES |
26,019,513 |
||
|
TECHNOLOGY - 32.4% |
|||
|
Communications Equipment - 7.9% |
|||
|
3Com Corp. |
129,500 |
7,462,438 |
|
|
ADC Telecommunications, Inc. (a) |
113,000 |
9,477,875 |
|
|
Common Stocks - continued |
|||
|
Shares |
Value (Note 1) |
||
|
TECHNOLOGY - continued |
|||
|
Communications Equipment - continued |
|||
|
Andrew Corp. (a) |
33,212 |
$ 1,114,678 |
|
|
Cabletron Systems, Inc. (a) |
67,900 |
1,714,475 |
|
|
Cisco Systems, Inc. (a) |
2,593,900 |
164,874,769 |
|
|
Comverse Technology, Inc. (a) |
54,900 |
5,105,700 |
|
|
Corning, Inc. |
104,600 |
28,228,925 |
|
|
Lucent Technologies, Inc. |
1,224,406 |
72,546,056 |
|
|
Nortel Networks Corp. |
1,103,580 |
76,553,641 |
|
|
Tellabs, Inc. (a) |
151,600 |
10,375,125 |
|
|
|
377,453,682 |
||
|
Computer Services & Software - 8.9% |
|||
|
Adobe Systems, Inc. |
46,800 |
6,084,000 |
|
|
America Online, Inc. (a) |
858,300 |
45,275,325 |
|
|
Autodesk, Inc. |
22,700 |
787,406 |
|
|
Automatic Data Processing, Inc. |
235,300 |
12,603,256 |
|
|
BMC Software, Inc. (a) |
91,200 |
3,327,375 |
|
|
Ceridian Corp. (a) |
52,400 |
1,260,875 |
|
|
Citrix Systems, Inc. (a) |
67,500 |
1,278,281 |
|
|
Computer Associates International, Inc. |
213,312 |
10,918,908 |
|
|
Computer Sciences Corp. (a) |
62,600 |
4,675,438 |
|
|
Compuware Corp. (a) |
134,700 |
1,397,513 |
|
|
Electronic Data Systems Corp. |
175,900 |
7,255,875 |
|
|
Equifax, Inc. |
52,200 |
1,370,250 |
|
|
First Data Corp. |
156,600 |
7,771,275 |
|
|
IMS Health, Inc. |
115,100 |
2,071,800 |
|
|
Mercury Interactive Corp. (a) |
26,200 |
2,534,850 |
|
|
Microsoft Corp. (a) |
1,961,200 |
156,896,000 |
|
|
NCR Corp. (a) |
36,300 |
1,413,431 |
|
|
Novell, Inc. (a) |
124,300 |
1,149,775 |
|
|
Oracle Corp. (a) |
1,064,550 |
89,488,734 |
|
|
Parametric Technology Corp. (a) |
101,300 |
1,114,300 |
|
|
Paychex, Inc. |
138,525 |
5,818,050 |
|
|
PeopleSoft, Inc. (a) |
101,000 |
1,691,750 |
|
|
Sabre Holdings Corp. Class A |
52,664 |
1,500,924 |
|
|
Sapient Corp. (a) |
21,400 |
2,288,463 |
|
|
Shared Medical Systems Corp. |
9,500 |
692,906 |
|
|
Siebel Systems, Inc. (a) |
76,200 |
12,463,463 |
|
|
Unisys Corp. (a) |
116,600 |
1,697,988 |
|
|
VERITAS Software Corp. (a) |
148,600 |
16,794,122 |
|
|
Yahoo!, Inc. (a) |
201,500 |
24,960,813 |
|
|
|
426,583,146 |
||
|
Computers & Office Equipment - 7.1% |
|||
|
Adaptec, Inc. (a) |
38,500 |
875,875 |
|
|
Apple Computer, Inc. (a) |
128,000 |
6,704,000 |
|
|
Compaq Computer Corp. |
647,762 |
16,558,416 |
|
|
Dell Computer Corp. (a) |
956,200 |
47,152,613 |
|
|
EMC Corp. (a) |
810,750 |
62,377,078 |
|
|
Gateway, Inc. (a) |
119,100 |
6,758,925 |
|
|
Hewlett-Packard Co. |
373,700 |
46,665,788 |
|
|
International Business Machines Corp. |
662,500 |
72,585,156 |
|
|
|
|||
|
Shares |
Value (Note 1) |
||
|
Lexmark International Group, Inc. |
48,100 |
$ 3,234,725 |
|
|
Network Appliance, Inc. (a) |
116,300 |
9,362,150 |
|
|
Pitney Bowes, Inc. |
99,800 |
3,992,000 |
|
|
Seagate Technology, Inc. (a) |
78,400 |
4,312,000 |
|
|
Sun Microsystems, Inc. (a) |
596,700 |
54,262,406 |
|
|
Xerox Corp. |
250,000 |
5,187,500 |
|
|
|
340,028,632 |
||
|
Electronic Instruments - 1.2% |
|||
|
Agilent Technologies, Inc. |
169,020 |
12,465,225 |
|
|
Applied Materials, Inc. (a) |
297,800 |
26,988,125 |
|
|
KLA-Tencor Corp. (a) |
68,000 |
3,982,250 |
|
|
Novellus Systems, Inc. (a) |
43,001 |
2,432,244 |
|
|
PE Corp. - Biosystems Group |
78,000 |
5,138,250 |
|
|
PerkinElmer, Inc. |
18,400 |
1,216,700 |
|
|
Tektronix, Inc. |
17,050 |
1,261,700 |
|
|
Teradyne, Inc. (a) |
64,900 |
4,770,150 |
|
|
Thermo Electron Corp. (a) |
57,200 |
1,204,775 |
|
|
|
59,459,419 |
||
|
Electronics - 7.2% |
|||
|
Advanced Micro Devices, Inc. (a) |
60,200 |
4,650,450 |
|
|
Altera Corp. (a) |
76,200 |
7,767,638 |
|
|
Analog Devices, Inc. (a) |
131,200 |
9,971,200 |
|
|
Broadcom Corp. Class A (a) |
79,300 |
17,361,744 |
|
|
Conexant Systems, Inc. (a) |
81,900 |
3,982,388 |
|
|
Intel Corp. |
1,252,400 |
167,430,225 |
|
|
Linear Technology Corp. |
116,400 |
7,442,325 |
|
|
LSI Logic Corp. (a) |
111,900 |
6,056,588 |
|
|
Maxim Integrated Products, Inc. (a) |
103,800 |
7,051,913 |
|
|
Micron Technology, Inc. (a) |
210,800 |
18,563,575 |
|
|
Molex, Inc. |
73,700 |
3,546,813 |
|
|
Motorola, Inc. |
796,515 |
23,148,717 |
|
|
National Semiconductor Corp. (a) |
64,500 |
3,660,375 |
|
|
Sanmina Corp. (a) |
48,200 |
4,121,100 |
|
|
Solectron Corp. (a) |
222,400 |
9,313,000 |
|
|
Texas Instruments, Inc. |
616,700 |
42,359,581 |
|
|
Xilinx, Inc. (a) |
120,000 |
9,907,500 |
|
|
|
346,335,132 |
||
|
Photographic Equipment - 0.1% |
|||
|
Eastman Kodak Co. |
118,000 |
7,021,000 |
|
|
Polaroid Corp. |
16,700 |
301,644 |
|
|
|
7,322,644 |
||
|
TOTAL TECHNOLOGY |
1,557,182,655 |
||
|
TRANSPORTATION - 0.6% |
|||
|
Air Transportation - 0.2% |
|||
|
AMR Corp. |
55,300 |
1,461,994 |
|
|
Delta Air Lines, Inc. |
48,200 |
2,437,113 |
|
|
Southwest Airlines Co. |
183,575 |
3,476,452 |
|
|
US Airways Group, Inc. (a) |
26,700 |
1,041,300 |
|
|
|
8,416,859 |
||
|
Common Stocks - continued |
|||
|
Shares |
Value (Note 1) |
||
|
TRANSPORTATION - continued |
|||
|
Railroads - 0.3% |
|||
|
Burlington Northern Santa Fe Corp. |
160,054 |
$ 3,671,239 |
|
|
CSX Corp. |
81,638 |
1,729,705 |
|
|
Kansas City Southern Industries, Inc. |
39,800 |
3,529,763 |
|
|
Norfolk Southern Corp. |
138,500 |
2,060,188 |
|
|
Union Pacific Corp. |
92,900 |
3,454,719 |
|
|
|
14,445,614 |
||
|
Trucking & Freight - 0.1% |
|||
|
FedEx Corp. (a) |
109,140 |
4,147,320 |
|
|
TOTAL TRANSPORTATION |
27,009,793 |
||
|
UTILITIES - 9.1% |
|||
|
Cellular - 1.3% |
|||
|
ALLTEL Corp. |
117,300 |
7,265,269 |
|
|
Nextel Communications, Inc. Class A (a) |
283,000 |
17,316,063 |
|
|
QUALCOMM, Inc. (a) |
279,800 |
16,788,000 |
|
|
Sprint Corp. - PCS Group Series 1 (a) |
341,400 |
20,313,300 |
|
|
|
61,682,632 |
||
|
Electric Utility - 1.6% |
|||
|
AES Corp. (a) |
154,400 |
7,044,500 |
|
|
Ameren Corp. |
46,700 |
1,576,125 |
|
|
American Electric Power Co., Inc. |
121,837 |
3,609,421 |
|
|
Cinergy Corp. |
53,613 |
1,363,781 |
|
|
CMS Energy Corp. |
42,800 |
946,950 |
|
|
Consolidated Edison, Inc. |
84,900 |
2,515,163 |
|
|
Constellation Energy Corp. |
51,200 |
1,667,200 |
|
|
CP&L Energy, Inc. |
50,400 |
1,609,650 |
|
|
Dominion Resources, Inc. |
89,557 |
3,839,756 |
|
|
DTE Energy Co. |
57,100 |
1,745,119 |
|
|
Duke Energy Corp. |
140,707 |
7,932,357 |
|
|
Edison International |
124,200 |
2,546,100 |
|
|
Entergy Corp. |
86,000 |
2,338,125 |
|
|
FirstEnergy Corp. |
78,900 |
1,844,288 |
|
|
Florida Progress Corp. |
37,100 |
1,739,063 |
|
|
FPL Group, Inc. |
67,700 |
3,351,150 |
|
|
GPU, Inc. |
40,900 |
1,106,856 |
|
|
New Century Energies, Inc. |
37,800 |
1,134,000 |
|
|
Niagara Mohawk Holdings, Inc. (a) |
67,500 |
940,781 |
|
|
Northern States Power Co. |
46,900 |
946,794 |
|
|
PECO Energy Co. |
63,400 |
2,555,813 |
|
|
PG&E Corp. |
144,000 |
3,546,000 |
|
|
Pinnacle West Capital Corp. |
32,400 |
1,097,550 |
|
|
PPL Corp. |
50,640 |
1,110,915 |
|
|
Public Service Enterprise Group, Inc. |
81,300 |
2,815,013 |
|
|
Reliant Energy, Inc. |
102,322 |
3,024,894 |
|
|
Southern Co. |
242,400 |
5,650,950 |
|
|
|
|||
|
Shares |
Value (Note 1) |
||
|
TXU Corp. |
98,500 |
$ 2,905,750 |
|
|
Unicom Corp. |
66,400 |
2,568,850 |
|
|
|
75,072,914 |
||
|
Gas - 0.7% |
|||
|
Columbia Energy Group |
30,400 |
1,995,000 |
|
|
Eastern Enterprises Co. |
10,100 |
636,300 |
|
|
El Paso Energy Corp. |
85,300 |
4,344,969 |
|
|
Enron Corp. |
278,100 |
17,937,450 |
|
|
NICOR, Inc. |
17,600 |
574,200 |
|
|
ONEOK, Inc. |
11,506 |
298,437 |
|
|
Peoples Energy Corp. |
13,300 |
430,588 |
|
|
Sempra Energy |
75,141 |
1,277,397 |
|
|
Williams Companies, Inc. |
162,400 |
6,770,050 |
|
|
|
34,264,391 |
||
|
Telephone Services - 5.5% |
|||
|
AT&T Corp. |
1,175,405 |
37,172,183 |
|
|
Bell Atlantic Corp. |
577,578 |
29,348,182 |
|
|
BellSouth Corp. |
704,500 |
30,029,313 |
|
|
CenturyTel, Inc. |
52,300 |
1,503,625 |
|
|
Global Crossing Ltd. (a) |
318,725 |
8,386,452 |
|
|
GTE Corp. |
359,800 |
22,397,550 |
|
|
Qwest Communications International, Inc. (a) |
9,947 |
494,242 |
|
|
SBC Communications, Inc. |
1,275,870 |
55,181,378 |
|
|
Sprint Corp. - FON Group |
326,600 |
16,656,600 |
|
|
U.S. WEST, Inc. |
189,492 |
16,248,939 |
|
|
WorldCom, Inc. (a) |
1,074,655 |
49,299,798 |
|
|
|
266,718,262 |
||
|
TOTAL UTILITIES |
437,738,199 |
||
|
TOTAL COMMON STOCKS (Cost $2,899,268,000) |
4,695,932,543 |
||
|
U.S. Treasury Obligations - 2.4% |
||||
|
Moody's Ratings (unaudited) |
Principal Amount |
|
||
|
U.S. Treasury Bills, yield at date of purchase 5.68% |
- |
$ 116,450,000 |
114,682,780 |
|
|
Cash Equivalents - 0.8% |
||||
|
|
Shares |
|
||
|
Bankers Trust Institutional Daily |
39,754,793 |
39,754,793 |
||
|
TOTAL INVESTMENT PORTFOLIO - 101.0% (Cost $3,053,627,367) |
4,850,370,116 |
||
|
NET OTHER ASSETS - (1.0)% |
(46,355,055) |
||
|
NET ASSETS - 100% |
$ 4,804,015,061 |
||
|
Futures Contracts |
|||||
|
|
Expiration Date |
Underlying Face Amount at Value |
Unrealized Gain/Loss |
||
|
Purchased |
|||||
|
274 S&P 500 Stock Index Contracts |
Sept. 2000 |
$ 100,564,851 |
$ (654,705) |
||
|
The face value of futures purchased as a percentage of net assets - 2.1% |
|
Legend |
|
(a) Non-income producing |
|
(b) Security or a portion of the security was pledged to cover margin requirements for futures contracts. At the period end, the value of securities pledged amounted to $7,127,769. |
|
(c) The rate quoted is the annualized daily yield of the fund at |
|
Other Information |
|
Purchases of securities, other than short-term securities aggregated $222,776,885. Sales of securities, other than short-term securities, aggregated $923,876,945, of which $766,371,542 represents the value of securities delivered in redemption of fund shares. The realized gain (loss) of $35,507,297 on securities delivered in redemption of fund shares is not taxable to the fund. |
|
The market value of futures contracts opened and closed during the period amounted to $600,789,704 and $561,095,562, respectively. |
|
The fund placed a portion of its portfolio transactions with brokerage firms which are affiliates of Fidelity Management & Research Company or Bankers Trust Company. The commissions paid to these affiliated firms were $0 and $19,320, respectively, for the period. |
|
The fund participated in the security lending program. At period end, the value of securities loaned amounted to $38,752,243. The fund received |
|
Income Tax Information |
|
At June 30, 2000, the aggregate cost of investment securities for income |
See accompanying notes which are an integral part of the financial statements.
Index 500 Portfolio
Statement of Assets and Liabilities
|
|
June 30, 2000 (Unaudited) |
|
|
Assets |
|
|
|
Investment in securities, at value |
|
$ 4,850,370,116 |
|
Cash |
|
810,569 |
|
Receivable for investments sold |
|
1,449,070 |
|
Receivable for fund shares sold |
|
13,222,207 |
|
Dividends receivable |
|
3,661,604 |
|
Interest receivable |
|
4,847 |
|
Receivable for daily variation on futures contracts |
|
802,951 |
|
Total assets |
|
4,870,321,364 |
|
Liabilities |
|
|
|
Payable for investments purchased |
$ 21,169,951 |
|
|
Payable for fund shares redeemed |
4,225,085 |
|
|
Accrued management fee |
799,398 |
|
|
Other payables and |
357,076 |
|
|
Collateral on securities loaned, |
39,754,793 |
|
|
Total liabilities |
|
66,306,303 |
|
Net Assets |
|
$ 4,804,015,061 |
|
Net Assets consist of: |
|
|
|
Paid in capital |
|
$ 2,966,769,627 |
|
Undistributed net investment income |
|
23,406,752 |
|
Accumulated undistributed net realized gain (loss) on investments and foreign currency transactions |
|
17,750,423 |
|
Net unrealized appreciation (depreciation) on investments |
|
1,796,088,259 |
|
Net Assets |
|
$ 4,804,015,061 |
|
Initial Class: |
|
$163.92 |
|
Service Class 2: |
|
$163.72 |
Statement of Operations
|
|
Six months ended June 30, 2000 (Unaudited) |
|
|
Investment Income Dividends |
|
$ 27,728,094 |
|
Interest |
|
2,374,504 |
|
Security lending |
|
273,278 |
|
Total income |
|
30,375,876 |
|
Expenses |
|
|
|
Management fee |
$ 6,002,485 |
|
|
Transfer agent fees |
1,638,175 |
|
|
Distribution fees |
116 |
|
|
Accounting fees |
331,008 |
|
|
Non-interested trustees' compensation |
8,015 |
|
|
Registration fees |
59,131 |
|
|
Audit |
33,825 |
|
|
Legal |
17,261 |
|
|
Miscellaneous |
37,818 |
|
|
Total expenses before reductions |
8,127,834 |
|
|
Expense reductions |
(1,159,409) |
6,968,425 |
|
Net investment income |
|
23,407,451 |
|
Realized and Unrealized Gain (Loss) Net realized gain (loss) on: |
|
|
|
Investment securities |
30,967,239 |
|
|
Foreign currency transactions |
53 |
|
|
Futures contracts |
(7,060,446) |
23,906,846 |
|
Change in net unrealized appreciation (depreciation) on: |
|
|
|
Investment securities |
(91,497,383) |
|
|
Assets and liabilities in |
215 |
|
|
Futures contracts |
(1,826,245) |
(93,323,413) |
|
Net gain (loss) |
|
(69,416,567) |
|
Net increase (decrease) in net assets resulting from operations |
|
$ (46,009,116) |
|
Other Information Expense reductions |
|
|
|
Initial Class |
|
$ 1,138,105 |
|
Service Class 2 |
|
22 |
|
Custodian credits |
|
21,282 |
|
|
|
$ 1,159,409 |
See accompanying notes which are an integral part of the financial statements.
Semiannual Report
Fidelity Variable Insurance Products: Index 500 Portfolio
Financial Statements - continued
Statement of Changes in Net Assets
|
Increase (Decrease) in Net Assets |
Six months ended |
Year ended |
|
Operations |
$ 23,407,451 |
$ 51,674,088 |
|
Net realized gain (loss) |
23,906,846 |
9,155,111 |
|
Change in net unrealized appreciation (depreciation) |
(93,323,413) |
832,662,055 |
|
Net increase (decrease) in net assets resulting from operations |
(46,009,116) |
893,491,254 |
|
Distributions to shareholders |
(51,736,686) |
(39,106,912) |
|
From net realized gain |
(22,615,438) |
(26,536,833) |
|
Total distributions |
(74,352,124) |
(65,643,745) |
|
Share transactions - net increase (decrease) |
(614,358,389) |
938,819,660 |
|
Total increase (decrease) in net assets |
(734,719,629) |
1,766,667,169 |
|
Net Assets |
|
|
|
Beginning of period |
5,538,734,690 |
3,772,067,521 |
|
End of period (including undistributed net investment income of $23,406,752 and $51,598,237, respectively) |
$ 4,804,015,061 |
$ 5,538,734,690 |
|
|
|
Other Information: |
|
|
Six months ended June 30, 2000 |
Year ended |
||
|
|
Shares |
Dollars |
Shares |
Dollars |
|
Share transactions |
4,611,791 |
$ 746,908,804 |
12,455,112 |
$ 1,868,929,324 |
|
Reinvested |
477,249 |
74,350,653 |
468,884 |
65,643,745 |
|
Redeemed |
(8,866,876) |
(1,435,720,785) |
(6,545,615) |
(995,753,409) |
|
Net increase (decrease) |
(3,777,836) |
$ (614,461,328) |
6,378,381 |
$ 938,819,660 |
|
Service Class 2 A |
612 |
$ 101,469 |
- |
$ - |
|
Reinvested |
10 |
1,470 |
- |
- |
|
Redeemed |
- |
- |
- |
- |
|
Net increase (decrease) |
622 |
$ 102,939 |
- |
$ - |
|
Distributions |
|
$ 51,735,663 |
|
$ 39,106,912 |
|
Service Class 2 A |
|
1,023 |
|
- |
|
Total |
|
$ 51,736,686 |
|
$ 39,106,912 |
|
From net realized gain |
|
$ 22,614,991 |
|
$ 26,536,833 |
|
Service Class 2 A |
|
447 |
|
- |
|
Total |
|
$ 22,615,438 |
|
$ 26,536,833 |
|
|
|
$ 74,352,124 |
|
$ 65,643,745 |
A Service Class 2 commenced sale of shares January 12, 2000.
See accompanying notes which are an integral part of the financial statements.
Index 500 Portfolio
Financial Highlights - Initial Class
|
|
Six months ended |
Years ended December 31, |
||||
|
Selected Per-Share Data |
(Unaudited) |
1999 |
1998 |
1997 |
1996 |
1995 |
|
Net asset value, beginning of period |
$ 167.41 |
$ 141.24 |
$ 114.40 |
$ 89.05 |
$ 75.71 |
$ 56.22 |
|
Income from Investment Operations |
|
|
|
|
|
|
|
Net investment income |
.76 D |
1.64 D |
1.65 D |
1.80 D |
1.04 |
.85 |
|
Net realized and unrealized gain (loss) |
(1.85) |
26.88 |
29.70 |
26.67 |
15.55 |
19.72 |
|
Total from investment operations |
(1.09) |
28.52 |
31.35 |
28.47 |
16.59 |
20.57 |
|
Less Distributions |
|
|
|
|
|
|
|
From net investment income |
(1.67) |
(1.40) |
(1.36) |
(1.03) |
(.91) |
(.95) |
|
From net realized gain |
(.73) |
(.95) |
(3.15) |
(2.09) |
(2.34) |
(.11) |
|
In excess of net realized gain |
- |
- |
- |
- |
- |
(.02) |
|
Total distributions |
(2.40) |
(2.35) |
(4.51) |
(3.12) |
(3.25) |
(1.08) |
|
Net asset value, end of period |
$ 163.92 |
$ 167.41 |
$ 141.24 |
$ 114.40 |
$ 89.05 |
$ 75.71 |
|
Total Return B, C |
(0.58)% |
20.52% |
28.31% |
32.83% |
22.71% |
37.19% |
|
Ratios and Supplemental Data |
|
|
|
|
|
|
|
Net assets, end of period (000 omitted) |
$ 4,803,913 |
$ 5,538,735 |
$ 3,772,068 |
$ 2,098,042 |
$ 823,243 |
$ 245,700 |
|
Ratio of expenses to average net assets |
.28% A, F |
.28% F |
.28% F |
.28% F |
.28% F |
.28% F |
|
Ratio of net investment income to average net assets |
.94% A |
1.09% |
1.33% |
1.74% |
2.26% |
2.70% |
|
Portfolio turnover |
9% A |
8% |
4% |
9% |
14% |
16% |
Financial Highlights - Service Class 2
|
|
Six months ended |
|
Selected Per-Share Data |
(Unaudited) |
|
Net asset value, beginning of period |
$ 163.25 |
|
Income from Investment Operations |
|
|
Net investment income D |
.52 |
|
Net realized and unrealized gain (loss) |
2.35 G |
|
Total from investment operations |
2.87 |
|
Less Distributions |
|
|
From net investment income |
(1.67) |
|
From net realized gain |
(.73) |
|
Total distributions |
(2.40) |
|
Net asset value, end of period |
$ 163.72 |
|
Total Return B, C |
1.83% |
|
Ratios and Supplemental Data |
|
|
Net assets, end of period (000 omitted) |
$ 102 |
|
Ratio of expenses to average net assets |
.53% A, F |
|
Ratio of net investment income to average net assets |
.69% A |
|
Portfolio turnover |
9% A |
|
A Annualized B Total returns for periods of less than one year are not annualized and do not reflect charges attributable to your insurance company's separate account. Inclusion of these charges would reduce the total returns shown. C The total returns would have been lower had certain expenses not been reduced during the periods shown. D Net investment income per share has been calculated based on average shares outstanding during the period. E For the period January 12, 2000 (commencement of sale of Service Class 2 shares) to June 30, 2000. F FMR agreed to reimburse a portion of the class' expenses during the period. Without this reimbursement, the class' expense ratio would have been higher. G The amount shown for a share outstanding does not correspond with the aggregate net loss on investments for the period due to the timing of sales and repurchases of class shares in relation to fluctuating market values of the investments of the fund. |
|
See accompanying notes which are an integral part of the financial statements.
Semiannual Report
Performance
There are several ways to evaluate a fund's historical performance. You can look at the total percentage change in value, the average annual percentage change or the growth of a hypothetical $10,000 investment. Total return reflects the change in the value of an investment, assuming reinvestment of the fund's dividend income and capital gains (the profits earned upon the sale of securities that have grown in value). The initial offering of Service Class 2 shares took place on January 12, 2000. Performance for Service Class 2 shares reflects an asset based distribution fee (12b-1 fee). Returns from November 3, 1997 to January 12, 2000 are those of Service Class which reflect a different 12b-1 fee. Service Class 2 returns prior to November 3, 1997 are those of Initial Class and do not include the effects of a 12b-1 fee. Had Service Class 2's 12b-1 fee been reflected, returns prior to January 12, 2000 would have been lower. If Fidelity had not reimbursed certain fund expenses, the life of fund total return would have been lower.
Average Annual Total Returns
|
Periods ended |
Past 1 |
Life of |
|
Fidelity VIP: Growth & Income - Service Class 2 |
-1.21% |
17.77% |
|
S&P 500 |
7.25% |
22.43% |
Average annual returns take the fund's cumulative return and show you what would have happened if the fund had performed at a constant rate each year.
You can compare the fund's returns to the performance of the Standard & Poor's 500 Index - a market capitalization-weighted index of common stocks. This benchmark includes reinvested dividends and capital gains, if any.
Figures for more than one year assume a steady compounded rate of return and are not the fund's year-by-year results, which fluctuated over the periods shown. The life of fund figures are from commencement of operations, December 31, 1996.
Performance numbers are net of all fund operating expenses, but do not include any insurance charges imposed by your insurance company's separate account. If performance information included the effect of these additional charges, the total returns would be lower.
Past performance is no guarantee of future results. Principal and investment return will vary and you may have a gain or loss when
you withdraw your money.
Understanding Performance
How a fund did yesterday is no guarantee of how it will do tomorrow. The stock market, for example, has a history of long-term growth and short-term volatility. In turn, the share price and return of a fund that invests in stocks will vary. That means if you sell your shares during a market downturn, you might lose money. But if you can ride out the market's ups and downs, you may have a gain.
3$10,000 Over Life of Fund
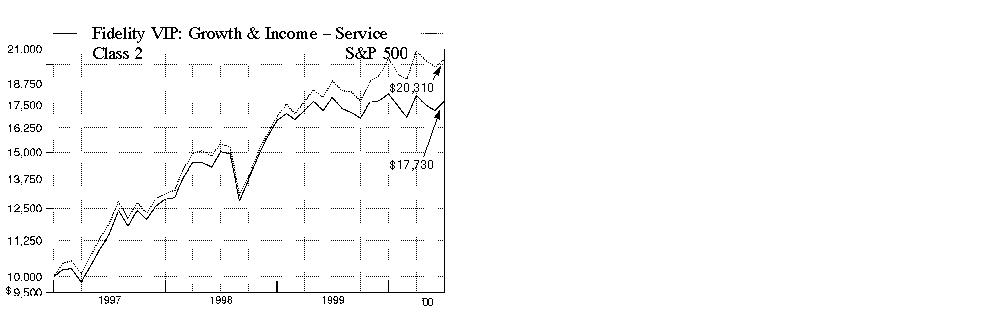
$10,000 Over Life of Fund: Let's say hypothetically that $10,000 was invested in Fidelity Variable Insurance Products: Growth & Income Portfolio -
Service Class 2 on December 31, 1996, when the fund started. As the chart shows, by June 30, 2000, the value of the investment would have grown to $17,730
- a 77.30% increase on the initial investment. For comparison, look at how the Standard & Poor's 500 Index did over the same period. With dividends and
capital gains, if any, reinvested,
the same $10,000 investment would have grown to $20,310 - a
103.10% increase.
Investment Summary
|
Top Five Stocks as of June 30, 2000 |
|
|
|
% of fund's |
|
Microsoft Corp. |
4.3 |
|
Exxon Mobil Corp. |
4.2 |
|
Fannie Mae |
3.9 |
|
Intel Corp. |
3.8 |
|
Cisco Systems, Inc. |
3.7 |
|
|
19.9 |
|
Top Five Market Sectors as of June 30, 2000 |
|
|
|
% of fund's |
|
Technology |
23.2 |
|
Finance |
18.2 |
|
Utilities |
10.0 |
|
Health |
7.0 |
|
Energy |
6.1 |
|
Asset Allocation as of June 30, 2000 |
|||
|
% of fund's net assets* |
|||
|
Stocks and |
|
|
|
Short-Term Investments |
|
|
|
* Foreign investments 6.2% |
Semiannual Report
(Portfolio Manager photograph)
An interview with Louis Salemy, Portfolio Manager of Growth & Income Portfolio
Q. How did the fund perform, Louis?
A. For the six- and 12-month periods that ended June 30, 2000, the fund's returns fell short of the -0.42% and 7.25% returns recorded by the Standard & Poor's 500 Index, respectively.
Q. Why did the fund underperform the index during the past six months?
A. At the beginning of the period, one of the primary difficulties was an underweighting in the technology sector. This time period witnessed a speculative bubble in technology shares that finally burst in the spring of 2000, flattening many formerly high-flying technology stocks that had little or no earnings. The fund's emphasis on growth at a reasonable price prevented it from owning many of the best-performing stocks during this period. An overweighting in the finance sector, which faced a stiff headwind in the form of sharply higher interest rates, also undermined performance. Stock selection in the finance sector hurt as well, as a number of the fund's finance holdings detracted significantly from performance.
Q. The Federal Reserve Board raised short-term interest rates three times during the period. Why did you continue to overweight finance stocks, which tend to do poorly when rates rise?
A. Most of the overweighting was accounted for by two mortgage loan providers: Fannie Mae and Freddie Mac. These government-sponsored enterprises (GSEs) tend to be less sensitive to rising interest rates than banks, which I underweighted. Although the share prices of these two holdings did poorly during the period, they did not accurately reflect the earnings outlook, which remained excellent. Unfortunately, the herd instinct took over, and investors appeared to lump Fannie and Freddie with the rate-sensitive segments of the finance sector. Since the spring correction, however, investors have seemed more willing to evaluate stocks on the basis of earnings and other fundamental factors - a potentially positive development for these two stocks.
Q. What stocks did well for the fund?
A. Intel was one of the better performers. The stock firmed because of a shortage of microprocessors and expectations of improving personal
computer demand in the second half of 2000. Intel also manufactures memory components for the cellular phone market, which experienced robust
growth during the period. Another technology standout, Cisco Systems, has a significant share of the market for the routers used to expand the
Internet. Drug giant Eli Lilly also per-
formed well. The company had a very successful test of Zovant, a new drug for treating sepsis, or blood poisoning. In addition, Lilly benefited from
greater investor interest in drug stocks, which are thought to offer relatively stable earnings streams in a slowing economy.
Q. What stocks were disappointing?
A. The biggest detractor, Microsoft, received an unfavorable ruling in the federal government's antitrust suit against the company. The ruling may, despite the company's appeals, result in splitting Microsoft into two separate companies. In the consumer nondurables sector, Procter & Gamble fell sharply following a warning from the company that its earnings would fall short of analysts' estimates due, in part, to higher raw materials prices. Freddie Mac and Fannie Mae also made the list of stocks that detracted most from performance. This is a case where I felt that investors missed the boat - for the reasons I gave previously. Because of my strong conviction about these stocks, I used weakness in their prices as an opportunity to add to the fund's positions in them.
Q. What's your outlook, Louis?
A. Higher interest rates have begun to slow the economy, and I believe that more slowing can be expected over the next six to 12 months, as the Federal Reserve Board's series of interest-rate hikes percolates through the economy. While a slowing economy should alleviate concerns about inflation, it might also create a lot more earnings risk. With valuations relatively high, we probably will continue to see stocks punished severely when a company fails to meet earnings estimates. Investing in stocks with attractive growth prospects at reasonable prices is the fund's overall strategy, but finding companies that can deliver stable earnings growth under a variety of economic conditions also will be important in the period just ahead.
The views expressed in this report reflect those of the portfolio manager only through the end of the period of the report as stated on the cover. The manager's views are subject to change at any time based on market or other conditions. For more information, see page 2.
Fund Facts
Goal: seeks high total return through a combination of current income and capital appreciation
Start date: December 31, 1996
Size: as of June 30, 2000, more than $1.2 billion
Manager: Louis Salemy, since 1998; manager, Fidelity Growth & Income II, since 1998; various Fidelity Select Portfolios, 1992-1998; joined Fidelity in 1992
3Semiannual Report
Fidelity Variable Insurance Products: Growth & Income Portfolio
(Unaudited)
Showing Percentage of Net Assets
|
Common Stocks - 88.1% |
|||
|
Shares |
Value (Note 1) |
||
|
AEROSPACE & DEFENSE - 0.6% |
|||
|
Boeing Co. |
181,300 |
$ 7,580,606 |
|
|
BASIC INDUSTRIES - 0.4% |
|||
|
Packaging & Containers - 0.4% |
|||
|
Ball Corp. |
165,401 |
5,323,845 |
|
|
CONSTRUCTION & REAL ESTATE - 1.2% |
|||
|
Real Estate Investment Trusts - 1.2% |
|||
|
Equity Office Properties Trust |
263,600 |
7,265,475 |
|
|
Equity Residential Properties Trust (SBI) |
159,000 |
7,314,000 |
|
|
|
14,579,475 |
||
|
DURABLES - 1.8% |
|||
|
Consumer Durables - 0.8% |
|||
|
Minnesota Mining & Manufacturing Co. |
118,700 |
9,792,750 |
|
|
Consumer Electronics - 1.0% |
|||
|
General Motors Corp. Class H (a) |
139,800 |
12,267,450 |
|
|
TOTAL DURABLES |
22,060,200 |
||
|
ENERGY - 6.1% |
|||
|
Energy Services - 0.8% |
|||
|
Schlumberger Ltd. (NY Shares) |
123,700 |
9,231,113 |
|
|
Oil & Gas - 5.3% |
|||
|
BP Amoco PLC sponsored ADR |
232,262 |
13,137,319 |
|
|
Exxon Mobil Corp. |
661,528 |
51,929,948 |
|
|
|
65,067,267 |
||
|
TOTAL ENERGY |
74,298,380 |
||
|
FINANCE - 18.2% |
|||
|
Banks - 4.2% |
|||
|
Bank of New York Co., Inc. |
536,700 |
24,956,550 |
|
|
Mellon Financial Corp. |
316,900 |
11,547,044 |
|
|
Wachovia Corp. |
271,200 |
14,712,600 |
|
|
|
51,216,194 |
||
|
Credit & Other Finance - 3.7% |
|||
|
American Express Co. |
298,600 |
15,564,525 |
|
|
Associates First Capital Corp. Class A |
1,363,000 |
30,411,938 |
|
|
|
45,976,463 |
||
|
Federal Sponsored Credit - 7.3% |
|||
|
Fannie Mae |
918,200 |
47,918,563 |
|
|
Freddie Mac |
1,021,132 |
41,355,846 |
|
|
|
89,274,409 |
||
|
Insurance - 0.9% |
|||
|
American International Group, Inc. |
76,537 |
8,993,098 |
|
|
PMI Group, Inc. |
47,800 |
2,270,500 |
|
|
|
11,263,598 |
||
|
Securities Industry - 2.1% |
|||
|
Charles Schwab Corp. |
218,150 |
7,335,294 |
|
|
|
|||
|
Shares |
Value (Note 1) |
||
|
Merrill Lynch & Co., Inc. |
68,200 |
$ 7,843,000 |
|
|
Morgan Stanley Dean Witter & Co. |
127,200 |
10,589,400 |
|
|
|
25,767,694 |
||
|
TOTAL FINANCE |
223,498,358 |
||
|
HEALTH - 7.0% |
|||
|
Drugs & Pharmaceuticals - 6.4% |
|||
|
Allergan, Inc. |
90,600 |
6,749,700 |
|
|
Bristol-Myers Squibb Co. |
447,100 |
26,043,575 |
|
|
Eli Lilly & Co. |
385,400 |
38,491,825 |
|
|
Merck & Co., Inc. |
91,100 |
6,980,538 |
|
|
|
78,265,638 |
||
|
Medical Equipment & Supplies - 0.6% |
|||
|
Baxter International, Inc. |
109,500 |
7,699,219 |
|
|
TOTAL HEALTH |
85,964,857 |
||
|
INDUSTRIAL MACHINERY & EQUIPMENT - 4.5% |
|||
|
Electrical Equipment - 2.6% |
|||
|
General Electric Co. |
599,700 |
31,784,100 |
|
|
Industrial Machinery & Equipment - 1.9% |
|||
|
Caterpillar, Inc. |
144,700 |
4,901,713 |
|
|
Ingersoll-Rand Co. |
132,400 |
5,329,100 |
|
|
Tyco International Ltd. |
266,720 |
12,635,860 |
|
|
|
22,866,673 |
||
|
TOTAL INDUSTRIAL MACHINERY & EQUIPMENT |
54,650,773 |
||
|
MEDIA & LEISURE - 5.8% |
|||
|
Broadcasting - 4.0% |
|||
|
Comcast Corp. Class A (special) (a) |
230,500 |
9,335,250 |
|
|
EchoStar Communications Corp. |
327,800 |
10,853,253 |
|
|
Infinity Broadcasting Corp. Class A (a) |
408,825 |
14,896,561 |
|
|
Pegasus Communications Corp. (a) |
282,900 |
13,879,781 |
|
|
|
48,964,845 |
||
|
Entertainment - 0.7% |
|||
|
Walt Disney Co. |
217,800 |
8,453,363 |
|
|
Publishing - 1.1% |
|||
|
McGraw-Hill Companies, Inc. |
256,500 |
13,851,000 |
|
|
TOTAL MEDIA & LEISURE |
71,269,208 |
||
|
NONDURABLES - 3.4% |
|||
|
Foods - 1.1% |
|||
|
Bestfoods |
166,700 |
11,543,975 |
|
|
Nabisco Holdings Corp. Class A |
43,800 |
2,299,500 |
|
|
|
13,843,475 |
||
|
Household Products - 0.2% |
|||
|
Procter & Gamble Co. |
40,300 |
2,307,175 |
|
|
Common Stocks - continued |
|||
|
Shares |
Value (Note 1) |
||
|
NONDURABLES - continued |
|||
|
Tobacco - 2.1% |
|||
|
Philip Morris Companies, Inc. |
941,760 |
$ 25,015,500 |
|
|
TOTAL NONDURABLES |
41,166,150 |
||
|
RETAIL & WHOLESALE - 5.6% |
|||
|
Drug Stores - 0.9% |
|||
|
Walgreen Co. |
322,500 |
10,380,469 |
|
|
General Merchandise Stores - 2.5% |
|||
|
Wal-Mart Stores, Inc. |
539,800 |
31,105,975 |
|
|
Retail & Wholesale, Miscellaneous - 2.2% |
|||
|
Bed Bath & Beyond, Inc. (a) |
233,900 |
8,478,875 |
|
|
Home Depot, Inc. |
374,000 |
18,676,625 |
|
|
|
27,155,500 |
||
|
TOTAL RETAIL & WHOLESALE |
68,641,944 |
||
|
SERVICES - 0.3% |
|||
|
Advertising - 0.3% |
|||
|
Omnicom Group, Inc. |
35,100 |
3,126,094 |
|
|
TECHNOLOGY - 23.2% |
|||
|
Communications Equipment - 6.5% |
|||
|
Cisco Systems, Inc. (a) |
715,300 |
45,466,256 |
|
|
Lucent Technologies, Inc. |
72,000 |
4,266,000 |
|
|
Nokia AB sponsored ADR |
260,700 |
13,018,706 |
|
|
Nortel Networks Corp. |
246,000 |
17,064,640 |
|
|
|
79,815,602 |
||
|
Computer Services & Software - 6.8% |
|||
|
Adobe Systems, Inc. |
53,400 |
6,942,000 |
|
|
IMS Health, Inc. |
595,000 |
10,710,000 |
|
|
Intuit, Inc. (a) |
99,800 |
4,129,225 |
|
|
Microsoft Corp. (a) |
659,100 |
52,727,994 |
|
|
VERITAS Software Corp. (a) |
73,800 |
8,340,553 |
|
|
|
82,849,772 |
||
|
Computers & Office Equipment - 3.9% |
|||
|
Compaq Computer Corp. |
630,900 |
16,127,381 |
|
|
EMC Corp. (a) |
249,300 |
19,180,519 |
|
|
Pitney Bowes, Inc. |
301,400 |
12,056,000 |
|
|
|
47,363,900 |
||
|
Electronics - 6.0% |
|||
|
Intel Corp. |
345,500 |
46,189,031 |
|
|
LSI Logic Corp. (a) |
90,600 |
4,903,725 |
|
|
Micron Technology, Inc. (a) |
81,400 |
7,168,288 |
|
|
Texas Instruments, Inc. |
226,200 |
15,537,113 |
|
|
|
73,798,157 |
||
|
TOTAL TECHNOLOGY |
283,827,431 |
||
|
|
|||
|
Shares |
Value (Note 1) |
||
|
UTILITIES - 10.0% |
|||
|
Cellular - 3.6% |
|||
|
Nextel Communications, Inc. |
374,500 |
$ 22,914,719 |
|
|
Vodafone AirTouch PLC sponsored ADR |
524,900 |
21,750,544 |
|
|
|
44,665,263 |
||
|
Electric Utility - 0.5% |
|||
|
IPALCO Enterprises, Inc. |
302,800 |
6,093,850 |
|
|
Telephone Services - 5.9% |
|||
|
Allegiance Telecom, Inc. (a) |
119,400 |
7,641,600 |
|
|
AT&T Corp. |
235,450 |
7,446,106 |
|
|
BellSouth Corp. |
248,200 |
10,579,525 |
|
|
NEXTLINK Communications, Inc. |
203,800 |
7,731,663 |
|
|
Qwest Communications |
137,700 |
6,841,969 |
|
|
SBC Communications, Inc. |
728,530 |
31,508,923 |
|
|
WorldCom, Inc. (a) |
1 |
23 |
|
|
|
71,749,809 |
||
|
TOTAL UTILITIES |
122,508,922 |
||
|
TOTAL COMMON STOCKS (Cost $974,550,110) |
1,078,496,243 |
||
|
U.S. Treasury Obligations - 0.1% |
||||
|
|
Principal Amount |
|
||
|
U.S. Treasury Bills, yield at date of purchase 5.57% 8/17/00 (c) |
|
$ 1,500,000 |
1,489,463 |
|
|
Cash Equivalents - 11.9% |
|||
|
Shares |
|
||
|
Central Cash Collateral Fund, 6.71% (b) |
5,919,200 |
5,919,200 |
|
|
Taxable Central Cash Fund, 6.59% (b) |
140,027,095 |
140,027,095 |
|
|
TOTAL CASH EQUIVALENTS (Cost $145,946,295) |
145,946,295 |
||
|
TOTAL INVESTMENT PORTFOLIO - 100.1% (Cost $1,121,985,345) |
1,225,932,001 |
||
|
NET OTHER ASSETS - (0.1)% |
(717,905) |
||
|
NET ASSETS - 100% |
$ 1,225,214,096 |
||
|
Futures Contracts |
|||||
|
|
Expiration Date |
Underlying |
Unrealized Gain/(Loss) |
||
|
Purchased |
|||||
|
70 S&P 500 Stock Index Contracts |
Sept. 2000 |
$ 25,691,750 |
$ (194,795) |
||
|
The face value of futures purchased as a percentage of net assets - 2.1% |
|
Legend |
|
(a) Non-income producing |
|
(b) The rate quoted is the annualized seven-day yield of the fund at |
|
(c) Security or a portion of the security was pledged to cover margin requirements for futures contracts. At the period end, the value of securities pledged amounted to $1,489,463. |
|
Other Information |
|
Purchases and sales of securities, other than short-term securities, aggregated $339,324,728 and $468,732,226, respectively. |
|
The market value of futures contracts opened and closed during the period amounted to $73,545,687 and $48,716,990, respectively. |
|
The fund placed a portion of its portfolio transactions with brokerage firms which are affiliates of Fidelity Management & Research Company. The commissions paid to these affiliated firms were $27,856 for the period. |
|
The fund participated in the security lending program. At period end, the value of securities loaned amounted to $6,002,310. The fund received cash collateral of $5,919,200 which was invested in cash equivalents. |
|
Income Tax Information |
|
At June 30, 2000, the aggregate cost of investment securities for income tax purposes was $1,123,779,759. Net unrealized appreciation aggregated $102,152,242, of which $210,748,476 related to appreciated investment securities and $108,596,234 related to depreciated investment securities. |
See accompanying notes which are an integral part of the financial statements.
Growth & Income Portfolio
Statement of Assets and Liabilities
|
|
June 30, 2000 (Unaudited) |
|
|
Assets |
|
|
|
Investment in securities, at value (cost $1,121,985,345) - |
|
$ 1,225,932,001 |
|
Receivable for investments sold |
|
9,778,991 |
|
Receivable for fund shares sold |
|
972,216 |
|
Dividends receivable |
|
979,605 |
|
Interest receivable |
|
739,383 |
|
Receivable for daily variation |
|
176,750 |
|
Other receivables |
|
15,747 |
|
Total assets |
|
1,238,594,693 |
|
Liabilities |
|
|
|
Payable for investments purchased |
$ 5,986,196 |
|
|
Payable for fund shares redeemed |
898,008 |
|
|
Accrued management fee |
485,655 |
|
|
Distribution fees payable |
13,646 |
|
|
Other payables and |
77,892 |
|
|
Collateral on securities loaned, |
5,919,200 |
|
|
Total liabilities |
|
13,380,597 |
|
Net Assets |
|
$ 1,225,214,096 |
|
Net Assets consist of: |
|
|
|
Paid in capital |
|
$ 1,061,452,605 |
|
Undistributed net investment income |
|
6,495,495 |
|
Accumulated undistributed |
|
53,514,137 |
|
Net unrealized appreciation (depreciation) on investments |
|
103,751,859 |
|
Net Assets |
|
$ 1,225,214,096 |
|
Initial Class: |
|
$15.48 |
|
Service Class: |
|
$15.41 |
|
Service Class 2: |
|
$15.40 |
Statement of Operations
|
|
Six months ended June 30, 2000 (Unaudited) |
|
|
Investment Income Dividends |
|
$ 6,835,962 |
|
Interest |
|
2,943,179 |
|
Security lending |
|
86,077 |
|
Total income |
|
9,865,218 |
|
Expenses |
|
|
|
Management fee |
$ 2,904,405 |
|
|
Transfer agent fees |
394,900 |
|
|
Distribution fees |
64,785 |
|
|
Accounting and security lending fees |
148,951 |
|
|
Non-interested trustees' compensation |
1,956 |
|
|
Custodian fees and expenses |
12,206 |
|
|
Audit |
12,783 |
|
|
Legal |
5,249 |
|
|
Reports to shareholders |
4,672 |
|
|
Miscellaneous |
303 |
|
|
Total expenses before reductions |
3,550,210 |
|
|
Expense reductions |
(82,248) |
3,467,962 |
|
Net investment income |
|
6,397,256 |
|
Realized and Unrealized Gain (Loss) Net realized gain (loss) on: |
|
|
|
Investment securities |
54,093,706 |
|
|
Foreign currency transactions |
8,989 |
|
|
Futures contracts |
1,057,848 |
55,160,543 |
|
Change in net unrealized appreciation (depreciation) on: |
|
|
|
Investment securities |
(94,278,054) |
|
|
Assets and liabilities in |
(2) |
|
|
Futures contracts |
(194,795) |
(94,472,851) |
|
Net gain (loss) |
|
(39,312,308) |
|
Net increase (decrease) in net assets resulting from operations |
|
$ (32,915,052) |
|
Other Information Expense reductions |
|
$ 81,894 |
|
Custodian credits |
|
354 |
|
|
|
$ 82,248 |
See accompanying notes which are an integral part of the financial statements.
Semiannual Report
Fidelity Variable Insurance Products: Growth & Income Portfolio
Financial Statements - continued
Statement of Changes in Net Assets
|
Increase (Decrease) in Net Assets |
Six months ended |
Year ended |
|
Operations |
$ 6,397,256 |
$ 14,349,137 |
|
Net realized gain (loss) |
55,160,543 |
94,527,839 |
|
Change in net unrealized appreciation (depreciation) |
(94,472,851) |
5,576,047 |
|
Net increase (decrease) in net assets resulting from operations |
(32,915,052) |
114,453,023 |
|
Distributions to shareholders |
(14,244,194) |
(7,463,706) |
|
From net realized gain |
(92,962,107) |
(14,927,412) |
|
Total distributions |
(107,206,301) |
(22,391,118) |
|
Share transactions - net increase (decrease) |
10,338,716 |
102,753,346 |
|
Total increase (decrease) in net assets |
(129,782,637) |
194,815,251 |
|
Net Assets |
|
|
|
Beginning of period |
1,354,996,733 |
1,160,181,482 |
|
End of period (including undistributed net investment income of $6,495,495 and $14,353,340, respectively) |
$ 1,225,214,096 |
$ 1,354,996,733 |
|
|
|
Other Information: |
|
|
Six months ended June 30, 2000 |
Year ended |
||
|
|
Shares |
Dollars |
Shares |
Dollars |
|
Share transactions |
4,848,084 |
$ 75,165,202 |
16,149,212 |
$ 265,569,682 |
|
Reinvested |
6,348,551 |
97,958,146 |
1,401,034 |
21,996,237 |
|
Redeemed |
(15,652,464) |
(244,802,304) |
(15,445,916) |
(257,900,936) |
|
Net increase (decrease) |
(4,455,829) |
$ (71,678,956) |
2,104,330 |
$ 29,664,983 |
|
Service Class |
4,709,059 |
$ 72,777,536 |
4,435,269 |
$ 73,604,463 |
|
Reinvested |
601,152 |
9,239,713 |
25,216 |
394,881 |
|
Redeemed |
(148,738) |
(2,281,362) |
(55,277) |
(910,981) |
|
Net increase (decrease) |
5,161,473 |
$ 79,735,887 |
4,405,208 |
$ 73,088,363 |
|
Service Class 2 A |
149,950 |
$ 2,273,384 |
- |
$ - |
|
Reinvested |
550 |
8,442 |
- |
- |
|
Redeemed |
(3) |
(41) |
- |
- |
|
Net increase (decrease) |
150,497 |
$ 2,281,785 |
- |
$ - |
|
Distributions Initial Class |
|
$ 13,015,418 |
|
$ 7,332,079 |
|
Service Class |
|
1,227,654 |
|
131,627 |
|
Service Class 2 A |
|
1,122 |
|
- |
|
Total |
|
$ 14,244,194 |
|
$ 7,463,706 |
|
From net realized gain Initial Class |
|
$ 84,942,728 |
|
$ 14,664,158 |
|
Service Class |
|
8,012,059 |
|
263,254 |
|
Service Class 2 A |
|
7,320 |
|
- |
|
Total |
|
$ 92,962,107 |
|
$ 14,927,412 |
|
|
|
$ 107,206,301 |
|
$ 22,391,118 |
A Service Class 2 commenced sale of shares January 12, 2000.
See accompanying notes which are an integral part of the financial statements.
Growth & Income Portfolio
Financial Highlights - Initial Class
|
|
Six months ended |
Years ended December 31, |
|||
|
Selected Per-Share Data |
(Unaudited) |
1999 |
1998 |
1997 |
1996 H |
|
Net asset value, beginning of period |
$ 17.30 |
$ 16.15 |
$ 12.53 |
$ 9.90 |
$ 10.00 |
|
Income from Investment Operations |
|
|
|
|
|
|
Net investment income |
.08 D |
.18 D |
.15 D |
.13 D |
.00 |
|
Net realized and unrealized gain (loss) |
(.47) |
1.27 |
3.54 |
2.84 |
(.10) |
|
Total from investment operations |
(.39) |
1.45 |
3.69 |
2.97 |
(.10) |
|
Less Distributions |
|
|
|
|
|
|
From net investment income |
(.19) |
(.10) |
- |
(.08) |
- |
|
From net realized gain |
(1.24) |
(.20) |
(.07) |
(.26) |
- |
|
Total distributions |
(1.43) |
(.30) |
(.07) |
(.34) |
- |
|
Net asset value, end of period |
$ 15.48 |
$ 17.30 |
$ 16.15 |
$ 12.53 |
$ 9.90 |
|
Total Return B, C |
(2.23)% |
9.17% |
29.59% |
30.09% |
(1.00)% |
|
Ratios and Supplemental Data |
|
|
|
|
|
|
Net assets, end of period (000 omitted) |
$ 1,057,884 |
$ 1,259,396 |
$ 1,141,806 |
$ 345,287 |
$ 990 |
|
Ratio of expenses to average net assets |
.57% A |
.60% |
.61% |
.70% |
1.00% A, F |
|
Ratio of expenses to average net assets after expense reductions |
.56% A, G |
.59% G |
.60% G |
.70% |
1.00% A |
|
Ratio of net investment income to average net assets |
1.06% A |
1.08% |
1.08% |
1.14% |
3.89% A |
|
Portfolio turnover |
60% A |
58% |
66% |
81% |
0% A |
Financial Highlights - Service Class
|
|
Six months ended |
Years ended December 31, |
||
|
Selected Per-Share Data |
(Unaudited) |
1999 |
1998 |
1997 E |
|
Net asset value, beginning of period |
$ 17.24 |
$ 16.11 |
$ 12.53 |
$ 12.35 |
|
Income from Investment Operations |
|
|
|
|
|
Net investment income D |
.07 |
.16 |
.15 |
.03 |
|
Net realized and unrealized gain (loss) |
(.47) |
1.27 |
3.50 |
.49 |
|
Total from investment operations |
(.40) |
1.43 |
3.65 |
.52 |
|
Less Distributions |
|
|
|
|
|
From net investment income |
(.19) |
(.10) |
- |
(.08) |
|
From net realized gain |
(1.24) |
(.20) |
(.07) |
(.26) |
|
Total distributions |
(1.43) |
(.30) |
(.07) |
(.34) |
|
Net asset value, end of period |
$ 15.41 |
$ 17.24 |
$ 16.11 |
$ 12.53 |
|
Total Return B, C |
(2.30)% |
9.06% |
29.27% |
4.29% |
|
Ratios and Supplemental Data |
|
|
|
|
|
Net assets, end of period (000 omitted) |
$ 165,012 |
$ 95,600 |
$ 18,375 |
$ 10 |
|
Ratio of expenses to average net assets |
.67% A |
.70% |
.71% |
.80% A |
|
Ratio of expenses to average net assets after expense reductions |
.66% A, G |
.69% G |
.70% G |
.80% A |
|
Ratio of net investment income to average net assets |
.96% A |
.98% |
1.05% |
1.24% A |
|
Portfolio turnover |
60% A |
58% |
66% |
81% |
|
A Annualized B The total returns would have been lower had certain expenses not been reduced during the periods shown. C Total returns for periods of less than one year are not annualized and do not reflect charges attributable to your insurance company's separate account. Inclusion of these charges would reduce the total returns shown. D Net investment income per share has been calculated based on average shares outstanding during the period. E For the period November 3, 1997 (commencement of sale of Service Class shares) to December 31, 1997. F FMR agreed to reimburse a portion of the class' expenses during the period. Without this reimbursement, the class' expense ratio would have been higher. G FMR or the fund has entered into varying arrangements with third parties who either paid or reduced a portion of the class' expenses. H For the period December 31, 1996 (commencement of operations of Initial Class shares). |
||||
See accompanying notes which are an integral part of the financial statements.
Semiannual Report
Financial Highlights - Service Class 2
|
|
Six months ended |
|
Selected Per-Share Data |
(Unaudited) |
|
Net asset value, beginning of period |
$ 16.94 |
|
Income from Investment Operations |
|
|
Net investment income D |
.05 |
|
Net realized and unrealized gain (loss) |
(.16) |
|
Total from investment operations |
(.11) |
|
Less Distributions |
|
|
From net investment income |
(.19) |
|
From net realized gain |
(1.24) |
|
Total distributions |
(1.43) |
|
Net asset value, end of period |
$ 15.40 |
|
Total Return B, C |
(0.63)% |
|
Ratios and Supplemental Data |
|
|
Net assets, end of period (000 omitted) |
$ 2,318 |
|
Ratio of expenses to average net assets |
.81% A |
|
Ratio of expenses to average net assets after expense reductions |
.80% A, E |
|
Ratio of net investment income to average net assets |
.82% A |
|
Portfolio turnover |
60% A |
|
A Annualized B The total returns would have been lower had certain expenses not been reduced during the periods shown. C Total returns for periods of less than one year are not annualized and do not reflect charges attributable to your insurance company's separate account. Inclusion of these charges would reduce the total returns shown. D Net investment income per share has been calculated based on average shares outstanding during the period. E FMR or the fund has entered into varying arrangements with third parties who either paid or reduced a portion of the class' expenses. F For the period January 12, 2000 (commencement of sale of Service Class 2 shares) to June 30, 2000. |
|
See accompanying notes which are an integral part of the financial statements.
Growth & Income Portfolio
A special meeting of the fund's shareholders was held on July 19, 2000. The results of votes taken among shareholders on proposals before them are reported below. Each vote reported represents one dollar of net asset value held on the record date for the meeting.
PROPOSAL 1
To elect as Trustees the following twelve nominees.*
|
|
# of Dollars Voted |
% of Dollars Voted |
Ralph F. Cox
|
Affirmative |
2,995,348,207.84 |
97.862 |
|
Withheld |
65,444,305.52 |
2.138 |
|
TOTAL |
3,060,792,513.36 |
100.000 |
Phyllis Burke Davis
|
Affirmative |
2,995,012,849.06 |
97.851 |
|
Withheld |
65,779,664.30 |
2.149 |
|
TOTAL |
3,060,792,513.36 |
100.000 |
Robert M. Gates
|
Affirmative |
2,994,325,628.16 |
97.828 |
|
Withheld |
66,466,885.20 |
2.172 |
|
TOTAL |
3,060,792,513.36 |
100.000 |
Edward C. Johnson 3d
|
Affirmative |
2,994,212,266.77 |
97.825 |
|
Withheld |
66,580,246.59 |
2.175 |
|
TOTAL |
3,060,792,513.36 |
100.000 |
Donald J. Kirk
|
Affirmative |
2,996,527,468.99 |
97.900 |
|
Withheld |
64,265,044.37 |
2.100 |
|
TOTAL |
3,060,792,513.36 |
100.000 |
Ned C. Lautenbach
|
Affirmative |
2,997,430,896.97 |
97.930 |
|
Withheld |
63,361,616.39 |
2.070 |
|
TOTAL |
3,060,792,513.36 |
100.000 |
Peter S. Lynch
|
Affirmative |
2,997,391,112.97 |
97.929 |
|
Withheld |
63,401,400.39 |
2.071 |
|
TOTAL |
3,060,792,513.36 |
100.000 |
|
|
# of Dollars Voted |
% of Dollars Voted |
William O. McCoy
|
Affirmative |
2,997,364,420.76 |
97.928 |
|
Withheld |
63,428,092.60 |
2.072 |
|
TOTAL |
3,060,792,513.36 |
100.000 |
Gerald C. McDonough
|
Affirmative |
2,992,594,911.89 |
97.772 |
|
Withheld |
68,197,601.47 |
2.228 |
|
TOTAL |
3,060,792,513.36 |
100.000 |
Marvin L. Mann
|
Affirmative |
2,996,491,839.67 |
97.899 |
|
Withheld |
64,300,673.69 |
2.101 |
|
TOTAL |
3,060,792,513.36 |
100.000 |
Robert C. Pozen
|
Affirmative |
2,997,304,419.99 |
97.926 |
|
Withheld |
63,488,093.37 |
2.074 |
|
TOTAL |
3,060,792,513.36 |
100.000 |
Thomas R. Williams
|
Affirmative |
2,993,561,996.24 |
97.803 |
|
Withheld |
67,230,517.12 |
2.197 |
|
TOTAL |
3,060,792,513.36 |
100.000 |
Semiannual Report
Proxy Voting Results - continued
PROPOSAL 2
To ratify the selection of Deloitte & Touche LLP as independent accountants of the fund.
|
|
# of Dollars Voted |
% of Dollars Voted |
|
Affirmative |
1,094,741,303.86 |
94.882 |
|
Against |
8,150,336.78 |
0.707 |
|
Abstain |
50,895,725.39 |
4.411 |
|
TOTAL |
1,153,787,366.03 |
100.000 |
PROPOSAL 3
To authorize the Trustees to adopt an Amended and Restated Declaration of Trust.*
|
|
# of Dollars Voted |
% of Dollars Voted |
|
Affirmative |
2,837,267,199.92 |
92.697 |
|
Against |
49,473,422.32 |
1.617 |
|
Abstain |
174,051,891.12 |
5.686 |
|
TOTAL |
3,060,792,513.36 |
100.000 |
PROPOSAL 4
To approve an amended management contract for the fund that would reduce the management fee payable to FMR by the fund as FMR's assets under management increase.
|
|
# of Dollars Voted |
% of Dollars Voted |
|
Affirmative |
1,065,660,945.04 |
92.362 |
|
Against |
14,930,318.61 |
1.294 |
|
Abstain |
73,196,102.38 |
6.344 |
|
TOTAL |
1,153,787,366.03 |
100.000 |
PROPOSAL 5
To approve an amended sub-advisory agreement with FMR U.K. to provide investment advice and research services or investment management services.
|
|
# of Dollars Voted |
% of Dollars Voted |
|
Affirmative |
1,052,012,765.56 |
91.179 |
|
Against |
14,716,021.72 |
1.276 |
|
Abstain |
87,058,578.75 |
7.545 |
|
TOTAL |
1,153,787,366.03 |
100.000 |
PROPOSAL 6
To approve an amended sub-advisory agreement with FMR Far East to provide investment advice and research services or investment management services.
|
|
# of Dollars Voted |
% of Dollars Voted |
|
Affirmative |
1,047,279,358.30 |
90.769 |
|
Against |
18,168,639.12 |
1.575 |
|
Abstain |
88,339,368.61 |
7.656 |
|
TOTAL |
1,153,787,366.03 |
100.000 |
PROPOSAL 7
To amend the fundamental investment limitation concerning diversification.
|
|
# of Dollars Voted |
% of Dollars Voted |
|
Affirmative |
1,045,547,591.12 |
90.619 |
|
Against |
27,126,923.06 |
2.351 |
|
Abstain |
81,112,851.85 |
7.030 |
|
TOTAL |
1,153,787,366.03 |
100.000 |
PROPOSAL 8
To amend the fundamental limitation concerning underwriting.
|
|
# of Dollars Voted |
% of Dollars Voted |
|
Affirmative |
1,041,821,757.51 |
90.296 |
|
Against |
27,809,789.09 |
2.410 |
|
Abstain |
84,155,819.43 |
7.294 |
|
TOTAL |
1,153,787,366.03 |
100.000 |
PROPOSAL 9
To amend the fundamental limitation concerning concentration.
|
|
# of Dollars Voted |
% of Dollars Voted |
|
Affirmative |
1,042,706,287.48 |
90.372 |
|
Against |
26,973,368.78 |
2.338 |
|
Abstain |
84,107,709.77 |
7.290 |
|
TOTAL |
1,153,787,366.03 |
100.000 |
* Denotes trust-wide proposals and voting results.
Growth & Income Portfolio
Performance
There are several ways to evaluate a fund's historical performance. You can look at the total percentage change in value, the average annual percentage change or the growth of a hypothetical $10,000 investment. Total return reflects the change in the value of an investment, assuming reinvestment of the fund's dividend income and capital gains (the profits earned upon the sale of securities that have grown in value). The initial offering of Service Class 2 shares took place on January 12, 2000. Performance for Service Class 2 shares reflects an asset based distribution fee (12b-1 fee). Returns from November 3, 1997 to January 12, 2000 are those of Service Class which reflect a different 12b-1 fee. Service Class 2 returns prior to November 3, 1997 are those of Initial Class, and do not include the effects of a 12b-1 fee. Had Service Class 2 shares' 12b-1 fee been reflected, returns prior to January 12, 2000 would have been lower.
Average Annual Total Returns
|
Periods ended |
Past 1 |
Past 5 |
Past 10 |
|
Fidelity VIP: Equity-Income - |
-8.34% |
14.22% |
14.64% |
|
Russell 3000 Value |
-8.38% |
17.20% |
15.03% |
Average annual returns take the fund's cumulative return and show you what would have happened if the fund had performed at a constant rate each year.
You can compare the fund's returns to the performance of the Russell 3000 Value Index - a market capitalization-weighted index of value-oriented stocks of U.S. domiciled corporations. This benchmark reflects the reinvestment of dividends and capital gains, if any.
Figures for more than one year assume a steady compounded rate of return and are not the fund's year-by-year results, which fluctuated over the periods shown.
Performance numbers are net of all fund operating expenses, but do not include any insurance charges imposed by your insurance company's separate account. If performance information included the effect of these additional charges, the total returns would have been lower.
Past performance is no guarantee of future results. Principal and investment return will vary and you may have a gain or loss when
you withdraw your money.
Understanding Performance
How a fund did yesterday is no guarantee of how it will do tomorrow. The stock market, for example, has a history of long-term growth and short-term volatility. In turn, the share price and return of a fund that invests in stocks will vary. That means if you sell your shares during a market downturn, you might lose money. But if you can ride out the market's ups and downs, you may have a gain.
3$10,000 Over 10 Years

$10,000 Over 10 Years: Let's say hypothetically that $10,000 was invested in Fidelity Variable Insurance Products: Equity-Income Portfolio - Service Class 2 on June 30, 1990. As the chart shows, by June 30, 2000, the value of the investment would have grown to $39,212 - a 292.12% increase on the initial investment. For comparison, look at how the Russell 3000 Value Index did over the same period. With dividends and capital gains, if any, reinvested, the same $10,000 investment would have grown to $40,554 - a 305.54% increase.
Investment Summary
|
Top Five Stocks as of June 30, 2000 |
|
|
|
% of fund's |
|
General Electric Co. |
3.8 |
|
Citigroup, Inc. |
3.6 |
|
Exxon Mobil Corp. |
3.4 |
|
BP Amoco PLC sponsored ADR |
2.6 |
|
Viacom, Inc. Class B (non-vtg.) |
2.4 |
|
|
15.8 |
|
Top Five Market Sectors as of June 30, 2000 |
|
|
|
% of fund's |
|
Finance |
24.2 |
|
Energy |
15.9 |
|
Utilities |
10.3 |
|
Health |
7.8 |
|
Industrial Machinery & Equipment |
7.6 |
|
Asset Allocation as of June 30, 2000 |
|||
|
% of fund's net assets* |
|||
|
Stocks 96.5% |
|
|
|
Bonds 2.1% |
|
|
|
Short-Term Investments |
|
|
|
* Foreign investments 9.7% |
Semiannual Report
(Portfolio Manager photograph)
An interview with
Steve Petersen,
Portfolio Manager of
Equity-Income Portfolio
Q. How did the fund perform, Steve?
A. For the six-month period ending June 30, 2000, the fund outperformed the Russell 3000 Value Index, which returned -3.56%. The fund also outperformed the Russell index's 12-month return of -8.38% for the one-year period ending June 30, 2000.
Q. What helped the fund outperform its benchmark?
A. The most important aspect of the fund's performance relative to the index was the huge swing in technology stock prices and the impact it had. From the beginning of the year through mid-March, technology stocks led the market. That came to an end as the NASDAQ plummeted and was still struggling to recover at the end of the period. The Russell 3000 Value Index, which focuses on companies with value characteristics, closely reflects the fund's investment strategy. However, with a lower weighting in technology stocks than the Russell index, the fund was not as exposed to these wild swings. Consequently, the underweighting in technology stocks helped the fund's relative performance.
Q. How did financial stocks - the fund's largest sector weighting - do?
A. Their performance was mixed. Although fund holding American Express' fundamentals were good, the company, which focuses on high-end travel and entertainment spending, was hurt by the perception of a slowing economy, and its high valuation added to concern about a possible decline in its earnings momentum. Fannie Mae continued to be plagued by Congress' current debate about whether the U.S. government should continue to implicitly guarantee its debt. Fannie Mae also was hurt by higher interest rates. On the positive side, financial companies that earned a higher percentage of their revenues from transactions or asset management businesses did well during the period. Fund holding Citigroup benefited from subsidiary Salomon Smith Barney's strong revenues, and Bank of New York's growing revenues from its successful custody business helped its performance.
Q. Pharmaceutical stocks appeared to come back from their slump last year . . .
A. Yes, they were disappointments last year. The U.S. government had considered providing coverage to Medicare patients for prescription drugs, potentially cutting drug companies' profits. This year, however, an evolving perception of a slowing economy helped pharmaceutical stocks, which are considered to be defensive, to come back strongly. As a result, the fund's pharmaceutical holdings performed very well. Eli Lilly was one example of a strong pharmaceutical stock. The company's performance was boosted by its development of a drug to treat sepsis, an often fatal condition resulting from severe infections. This drug could be a possible source of significant revenues for the company. The company's stock soared following the reports of promising clinical test results. Schering-Plough was another beneficiary of the general recovery in pharmaceutical stock prices.
Q. Which stocks were disappointments?
A. Along with many other companies, AT&T was hurt by announcements that its earnings growth would be lower than expected. Its core business - consumer long-distance telephone service - has been rather flat over the past few years. Prices have declined while competition has increased. Honeywell's expectations for earnings growth also slipped. This multi-industry company saw a softening in a couple of its business lines, and its performance slumped. SBC Communications, a telephone company specializing in local service, also announced slower-than-expected earnings growth, and its stock performance suffered.
Q. What's your near-term outlook, Steve?
A. The big question is how much the economy will slow. If it strengthens once again, showing the last couple of months to be an anomaly, it would cause more worry about increasingly drastic steps the Federal Reserve Board could take - such as increasing interest rates significantly - to slow the economy, potentially causing a recession. On the other hand, if the Fed's tightening moves have been sufficient to slow the economy and reduce expectations for growth, perhaps even causing a bit of a correction in technology stocks, the market would probably perceive that as a very positive scenario. No matter what scenario evolves, I will continue to invest in what I believe to be the cheapest part of the market. I'm focusing on finding very solid companies, looking for good value and strong dividend yields. Although this area could remain out of favor for some time, there are still some terrific opportunities in this universe, and I'll continue to search for them.
The views expressed in this report reflect those of the portfolio manager only through the end of the period of the report as stated on the cover. The manager's views are subject to change at any time based upon market or other conditions. For more information, see page 2.
Fund Facts
Goal: seeks reasonable income while maintaining a yield that exceeds the composite dividend yield of the S&P 500; also considers the potential for capital appreciation
Start date: October 9, 1986
Size: as of June 30, 2000, more than $9.9 billion
Manager: Stephen Petersen, since 1997; joined Fidelity in 1980
3Semiannual Report
Fidelity Variable Insurance Products: Equity-Income Portfolio
(Unaudited)
Showing Percentage of Net Assets
|
Common Stocks - 93.5% |
|||
|
Shares |
Value (Note 1) |
||
|
AEROSPACE & DEFENSE - 3.5% |
|||
|
Aerospace & Defense - 3.2% |
|||
|
Boeing Co. |
1,678,000 |
$ 70,161,375 |
|
|
Honeywell International, Inc. |
1,758,825 |
59,250,417 |
|
|
Rockwell International Corp. |
592,100 |
18,651,150 |
|
|
Textron, Inc. |
1,515,000 |
82,283,438 |
|
|
United Technologies Corp. |
1,466,300 |
86,328,413 |
|
|
|
316,674,793 |
||
|
Ship Building & Repair - 0.3% |
|||
|
General Dynamics Corp. |
505,700 |
26,422,825 |
|
|
TOTAL AEROSPACE & DEFENSE |
343,097,618 |
||
|
BASIC INDUSTRIES - 4.7% |
|||
|
Chemicals & Plastics - 2.5% |
|||
|
Arch Chemicals, Inc. |
292,600 |
6,400,625 |
|
|
Celanese AG |
151,110 |
2,911,858 |
|
|
Crompton Corp. |
1,090,651 |
13,360,475 |
|
|
Dow Chemical Co. |
820,200 |
24,759,788 |
|
|
E.I. du Pont de Nemours and Co. |
609,449 |
26,663,394 |
|
|
Engelhard Corp. |
557,500 |
9,512,344 |
|
|
Great Lakes Chemical Corp. |
1,060,100 |
33,393,150 |
|
|
Hercules Trust II unit |
15,700 |
8,713,500 |
|
|
Hercules, Inc. |
856,100 |
12,038,906 |
|
|
IMC Global, Inc. |
1,626,800 |
21,148,400 |
|
|
M.A. Hanna Co. |
979,200 |
8,812,800 |
|
|
Millennium Chemicals, Inc. |
749,200 |
12,736,400 |
|
|
Olin Corp. |
712,700 |
11,759,550 |
|
|
Praxair, Inc. |
446,900 |
16,730,819 |
|
|
Rohm & Haas Co. |
122,300 |
4,219,350 |
|
|
Solutia, Inc. |
1,249,300 |
17,177,875 |
|
|
Union Carbide Corp. |
376,200 |
18,621,900 |
|
|
|
248,961,134 |
||
|
Iron & Steel - 0.5% |
|||
|
Allegheny Technologies, Inc. |
782,050 |
14,076,900 |
|
|
Dofasco, Inc. |
749,800 |
12,332,070 |
|
|
Nucor Corp. |
628,100 |
20,845,069 |
|
|
|
47,254,039 |
||
|
Metals & Mining - 0.9% |
|||
|
Alcoa, Inc. |
2,308,216 |
66,938,264 |
|
|
Phelps Dodge Corp. |
556,500 |
20,694,844 |
|
|
Ryerson Tull, Inc. |
753,323 |
7,815,726 |
|
|
|
95,448,834 |
||
|
Packaging & Containers - 0.2% |
|||
|
Ball Corp. |
387,075 |
12,458,977 |
|
|
Owens-Illinois, Inc. (a) |
700,700 |
8,189,431 |
|
|
|
20,648,408 |
||
|
Paper & Forest Products - 0.6% |
|||
|
Bowater, Inc. |
798,600 |
35,238,225 |
|
|
International Paper Co. |
165,910 |
4,946,192 |
|
|
|
|||
|
Shares |
Value (Note 1) |
||
|
Pentair, Inc. |
236,600 |
$ 8,399,300 |
|
|
Smurfit-Stone Container Corp. (a) |
755,400 |
9,725,775 |
|
|
|
58,309,492 |
||
|
TOTAL BASIC INDUSTRIES |
470,621,907 |
||
|
CONSTRUCTION & REAL ESTATE - 1.4% |
|||
|
Building Materials - 0.4% |
|||
|
Fortune Brands, Inc. |
805,700 |
18,581,456 |
|
|
Masco Corp. |
1,265,800 |
22,863,513 |
|
|
|
41,444,969 |
||
|
Real Estate Investment Trusts - 1.0% |
|||
|
Alexandria Real Estate Equities, Inc. |
109,600 |
3,760,650 |
|
|
Crescent Real Estate Equities Co. |
810,400 |
16,613,200 |
|
|
Duke-Weeks Realty Corp. |
434,622 |
9,724,667 |
|
|
Equity Office Properties Trust |
524,500 |
14,456,531 |
|
|
Equity Residential Properties Trust (SBI) |
649,500 |
29,877,000 |
|
|
Public Storage, Inc. |
609,700 |
14,289,844 |
|
|
Spieker Properties, Inc. |
277,000 |
12,742,000 |
|
|
|
101,463,892 |
||
|
TOTAL CONSTRUCTION & REAL ESTATE |
142,908,861 |
||
|
DURABLES - 2.4% |
|||
|
Autos, Tires, & Accessories - 1.2% |
|||
|
AutoNation, Inc. |
642,800 |
4,539,775 |
|
|
Eaton Corp. |
428,300 |
28,696,100 |
|
|
Goodyear Tire & Rubber Co. |
407,100 |
8,142,000 |
|
|
Johnson Controls, Inc. |
333,600 |
17,117,850 |
|
|
Meritor Automotive, Inc. |
408,600 |
4,494,600 |
|
|
Navistar International Corp. (a) |
387,600 |
12,039,825 |
|
|
Pep Boys-Manny, Moe & Jack |
662,100 |
3,972,600 |
|
|
TRW, Inc. |
801,700 |
34,773,738 |
|
|
|
113,776,488 |
||
|
Consumer Durables - 0.9% |
|||
|
Minnesota Mining & Manufacturing Co. |
682,500 |
56,306,250 |
|
|
Snap-On, Inc. |
1,102,000 |
29,340,750 |
|
|
|
85,647,000 |
||
|
Consumer Electronics - 0.1% |
|||
|
Black & Decker Corp. |
252,600 |
9,930,338 |
|
|
General Motors Corp. Class H (a) |
43,086 |
3,780,797 |
|
|
|
13,711,135 |
||
|
Home Furnishings - 0.2% |
|||
|
Newell Rubbermaid, Inc. |
822,067 |
21,168,225 |
|
|
Textiles & Apparel - 0.0% |
|||
|
Kellwood Co. |
85,800 |
1,812,525 |
|
|
TOTAL DURABLES |
236,115,373 |
||
|
ENERGY - 15.7% |
|||
|
Energy Services - 2.3% |
|||
|
Baker Hughes, Inc. |
1,817,400 |
58,156,800 |
|
|
Common Stocks - continued |
|||
|
Shares |
Value (Note 1) |
||
|
ENERGY - continued |
|||
|
Energy Services - continued |
|||
|
Halliburton Co. |
2,882,900 |
$ 136,036,844 |
|
|
Schlumberger Ltd. (NY Shares) |
409,500 |
30,558,938 |
|
|
|
224,752,582 |
||
|
Oil & Gas - 13.4% |
|||
|
Amerada Hess Corp. |
246,500 |
15,221,375 |
|
|
Anadarko Petroleum Corp. |
587,900 |
28,990,819 |
|
|
BP Amoco PLC sponsored ADR |
4,538,242 |
256,694,313 |
|
|
Burlington Resources, Inc. |
1,192,100 |
45,597,825 |
|
|
Chevron Corp. |
1,280,171 |
108,574,503 |
|
|
Conoco, Inc.: |
|
|
|
|
Class A |
721,200 |
15,866,400 |
|
|
Class B |
1,931,915 |
47,452,662 |
|
|
Exxon Mobil Corp. |
4,334,118 |
340,228,263 |
|
|
Occidental Petroleum Corp. |
985,000 |
20,746,563 |
|
|
Royal Dutch Petroleum Co. (NY Shares) |
1,968,600 |
121,191,938 |
|
|
Santa Fe Snyder Corp. (a) |
1,336,203 |
15,199,309 |
|
|
Tosco Corp. |
449,800 |
12,734,963 |
|
|
TotalFinaElf SA: |
|
|
|
|
Class B |
448,000 |
68,992,001 |
|
|
sponsored ADR |
2,183,396 |
167,712,105 |
|
|
Ultramar Diamond Shamrock Corp. |
713,600 |
17,706,200 |
|
|
Union Pacific Resources Group, Inc. |
645,500 |
14,201,000 |
|
|
USX - Marathon Group |
1,621,100 |
40,628,819 |
|
|
|
1,337,739,058 |
||
|
TOTAL ENERGY |
1,562,491,640 |
||
|
FINANCE - 23.5% |
|||
|
Banks - 10.2% |
|||
|
Bank of America Corp. |
2,935,590 |
126,230,370 |
|
|
Bank of New York Co., Inc. |
4,579,000 |
212,923,500 |
|
|
Bank One Corp. |
1,119,438 |
29,735,072 |
|
|
Chase Manhattan Corp. |
2,924,450 |
134,707,478 |
|
|
Comerica, Inc. |
1,601,800 |
71,880,775 |
|
|
Firstar Corp. |
138,900 |
2,925,581 |
|
|
FleetBoston Financial Corp. |
2,006,200 |
68,210,800 |
|
|
Mellon Financial Corp. |
2,266,900 |
82,600,169 |
|
|
National Bank of Canada |
2,476,636 |
36,969,710 |
|
|
PNC Financial Services Group, Inc. |
233,000 |
10,921,875 |
|
|
U.S. Bancorp |
2,928,094 |
56,365,810 |
|
|
Wachovia Corp. |
442,500 |
24,005,625 |
|
|
Wells Fargo & Co. |
3,967,200 |
153,729,000 |
|
|
|
1,011,205,765 |
||
|
Credit & Other Finance - 7.2% |
|||
|
American Express Co. |
3,251,616 |
169,490,484 |
|
|
Associates First Capital Corp. Class A |
3,623,656 |
80,852,825 |
|
|
|
|||
|
Shares |
Value (Note 1) |
||
|
Citigroup, Inc. |
5,969,898 |
$ 359,686,355 |
|
|
Household International, Inc. |
2,527,647 |
105,055,328 |
|
|
|
715,084,992 |
||
|
Federal Sponsored Credit - 2.7% |
|||
|
Fannie Mae |
4,308,800 |
224,865,500 |
|
|
Freddie Mac |
762,900 |
30,897,450 |
|
|
SLM Holding Corp. |
412,700 |
15,450,456 |
|
|
|
271,213,406 |
||
|
Insurance - 2.5% |
|||
|
Ace Ltd. |
1,474,100 |
41,274,800 |
|
|
American International Group, Inc. |
315,900 |
37,118,250 |
|
|
Everest Re Group Ltd. |
96,800 |
3,182,300 |
|
|
Hartford Financial Services Group, Inc. |
1,691,600 |
94,623,875 |
|
|
Highlands Insurance Group, Inc. (a) |
371,100 |
3,479,063 |
|
|
Protective Life Corp. |
180,700 |
4,811,138 |
|
|
The Chubb Corp. |
382,500 |
23,523,750 |
|
|
The St. Paul Companies, Inc. |
374,200 |
12,769,575 |
|
|
UnumProvident Corp. |
1,063,700 |
21,340,481 |
|
|
XL Capital Ltd. Class A |
180,700 |
9,780,388 |
|
|
|
251,903,620 |
||
|
Savings & Loans - 0.2% |
|||
|
TCF Financial Corp. |
573,000 |
14,718,938 |
|
|
Securities Industry - 0.7% |
|||
|
Franklin Resources, Inc. |
243,700 |
7,402,388 |
|
|
Morgan Stanley Dean Witter & Co. |
410,600 |
34,182,450 |
|
|
Nomura Securities Co. Ltd. |
1,061,000 |
25,969,582 |
|
|
Waddell & Reed Financial, Inc. Class B |
94,498 |
2,746,348 |
|
|
|
70,300,768 |
||
|
TOTAL FINANCE |
2,334,427,489 |
||
|
HEALTH - 7.8% |
|||
|
Drugs & Pharmaceuticals - 5.8% |
|||
|
Bristol-Myers Squibb Co. |
2,457,400 |
143,143,550 |
|
|
Eli Lilly & Co. |
2,053,000 |
205,043,375 |
|
|
Merck & Co., Inc. |
1,595,700 |
122,270,513 |
|
|
Schering-Plough Corp. |
2,129,530 |
107,541,265 |
|
|
|
577,998,703 |
||
|
Medical Equipment & Supplies - 1.3% |
|||
|
Abbott Laboratories |
1,616,600 |
72,039,738 |
|
|
Becton, Dickinson & Co. |
680,800 |
19,530,450 |
|
|
Cardinal Health, Inc. |
481,100 |
35,601,400 |
|
|
|
127,171,588 |
||
|
Medical Facilities Management - 0.7% |
|||
|
HCA - The Healthcare Co. |
2,259,150 |
68,621,681 |
|
|
TOTAL HEALTH |
773,791,972 |
||
|
Common Stocks - continued |
|||
|
Shares |
Value (Note 1) |
||
|
INDUSTRIAL MACHINERY & EQUIPMENT - 7.4% |
|||
|
Electrical Equipment - 4.2% |
|||
|
General Electric Co. |
7,160,900 |
$ 379,527,680 |
|
|
Siemens AG |
253,900 |
38,268,849 |
|
|
|
417,796,529 |
||
|
Industrial Machinery & Equipment - 3.2% |
|||
|
Caterpillar, Inc. |
1,009,800 |
34,206,975 |
|
|
CNH Global NV |
506,200 |
4,682,350 |
|
|
Deere & Co. |
1,258,250 |
46,555,250 |
|
|
Ingersoll-Rand Co. |
799,500 |
32,179,875 |
|
|
ITT Industries, Inc. |
218,600 |
6,639,975 |
|
|
Kennametal, Inc. |
500,708 |
10,733,928 |
|
|
Parker-Hannifin Corp. |
641,100 |
21,957,675 |
|
|
The Stanley Works |
293,700 |
6,975,375 |
|
|
Tyco International Ltd. |
3,208,246 |
151,990,654 |
|
|
|
315,922,057 |
||
|
Pollution Control - 0.0% |
|||
|
Republic Services, Inc. Class A (a) |
341,200 |
5,459,200 |
|
|
TOTAL INDUSTRIAL MACHINERY & EQUIPMENT |
739,177,786 |
||
|
MEDIA & LEISURE - 5.8% |
|||
|
Broadcasting - 1.4% |
|||
|
Clear Channel Communications, Inc. (a) |
123,500 |
9,262,500 |
|
|
MediaOne Group, Inc. (a) |
636,110 |
42,182,840 |
|
|
Time Warner, Inc. |
1,167,754 |
88,749,334 |
|
|
|
140,194,674 |
||
|
Entertainment - 2.9% |
|||
|
Fox Entertainment Group, Inc. |
721,700 |
21,921,638 |
|
|
Mandalay Resort Group (a) |
534,500 |
10,690,000 |
|
|
Viacom, Inc. Class B (non-vtg.) (a) |
3,482,118 |
237,436,921 |
|
|
Walt Disney Co. |
586,900 |
22,779,056 |
|
|
|
292,827,615 |
||
|
Lodging & Gaming - 0.6% |
|||
|
Harrah's Entertainment, Inc. (a) |
424,500 |
8,887,969 |
|
|
Starwood Hotels & Resorts |
1,465,981 |
47,736,006 |
|
|
|
56,623,975 |
||
|
Publishing - 0.4% |
|||
|
Reader's Digest Association, Inc. |
953,200 |
37,889,700 |
|
|
Restaurants - 0.5% |
|||
|
McDonald's Corp. |
1,562,400 |
51,461,550 |
|
|
TOTAL MEDIA & LEISURE |
578,997,514 |
||
|
NONDURABLES - 3.6% |
|||
|
Beverages - 0.1% |
|||
|
Brown-Forman Corp. Class B (non-vtg.) |
147,800 |
7,944,250 |
|
|
|
|||
|
Shares |
Value (Note 1) |
||
|
Foods - 0.7% |
|||
|
Nabisco Group Holdings Corp. |
967,700 |
$ 25,099,719 |
|
|
Nabisco Holdings Corp. Class A |
779,200 |
40,908,000 |
|
|
|
66,007,719 |
||
|
Household Products - 1.8% |
|||
|
Avon Products, Inc. |
915,600 |
40,744,200 |
|
|
Clorox Co. |
649,300 |
29,096,756 |
|
|
Dial Corp. |
624,300 |
6,477,113 |
|
|
Gillette Co. |
769,200 |
26,873,925 |
|
|
International Flavors & Fragrances, Inc. |
244,600 |
7,383,863 |
|
|
Procter & Gamble Co. |
438,400 |
25,098,400 |
|
|
Unilever NV (NY Shares) |
241,485 |
10,383,855 |
|
|
Unilever PLC |
6,090,714 |
38,257,265 |
|
|
|
184,315,377 |
||
|
Tobacco - 1.0% |
|||
|
Philip Morris Companies, Inc. |
3,741,200 |
99,375,625 |
|
|
TOTAL NONDURABLES |
357,642,971 |
||
|
RETAIL & WHOLESALE - 2.5% |
|||
|
Apparel Stores - 0.9% |
|||
|
Charming Shoppes, Inc. (a) |
612,800 |
3,121,450 |
|
|
Footstar, Inc. (a) |
206,300 |
6,859,475 |
|
|
The Limited, Inc. |
2,635,400 |
56,990,525 |
|
|
TJX Companies, Inc. |
1,362,300 |
25,543,125 |
|
|
Venator Group, Inc. (a) |
221,300 |
2,268,325 |
|
|
|
94,782,900 |
||
|
General Merchandise Stores - 1.6% |
|||
|
Ames Department Stores, Inc. |
203,500 |
1,577,125 |
|
|
Consolidated Stores Corp. (a) |
2,020,156 |
24,241,875 |
|
|
Federated Department Stores, Inc. (a) |
1,102,700 |
37,216,125 |
|
|
Hudson's Bay Co. (e) |
302,500 |
3,207,869 |
|
|
JCPenney Co., Inc. |
328,100 |
6,049,344 |
|
|
Target Corp. |
870,700 |
50,500,600 |
|
|
Wal-Mart Stores, Inc. |
608,600 |
35,070,575 |
|
|
|
157,863,513 |
||
|
TOTAL RETAIL & WHOLESALE |
252,646,413 |
||
|
SERVICES - 1.3% |
|||
|
Printing - 0.2% |
|||
|
New England Business Service, Inc. |
207,200 |
3,367,000 |
|
|
R.R. Donnelley & Sons Co. |
535,300 |
12,077,706 |
|
|
|
15,444,706 |
||
|
Services - 1.1% |
|||
|
ACNielsen Corp. (a) |
750,100 |
16,502,200 |
|
|
Brascan Corp. Class A (ltd. vtg.) |
2,699,800 |
31,730,172 |
|
|
Dun & Bradstreet Corp. |
134,300 |
3,844,338 |
|
|
H&R Block, Inc. |
1,073,800 |
34,764,275 |
|
|
Per-Se Technologies, Inc. (a) |
9,540 |
89,438 |
|
|
Common Stocks - continued |
|||
|
Shares |
Value (Note 1) |
||
|
SERVICES - continued |
|||
|
Services - continued |
|||
|
Per-Se Technologies, Inc. warrants 7/8/03 (a) |
12,807 |
$ 0 |
|
|
Viad Corp. |
775,800 |
21,140,550 |
|
|
|
108,070,973 |
||
|
TOTAL SERVICES |
123,515,679 |
||
|
TECHNOLOGY - 3.5% |
|||
|
Communications Equipment - 0.1% |
|||
|
Nortel Networks Corp. |
122,804 |
8,518,724 |
|
|
Computer Services & Software - 0.9% |
|||
|
IMS Health, Inc. |
891,500 |
16,047,000 |
|
|
Microsoft Corp. (a) |
196,400 |
15,712,000 |
|
|
NCR Corp. (a) |
683,800 |
26,625,463 |
|
|
Sabre Holdings Corp. Class A |
145,116 |
4,135,806 |
|
|
Unisys Corp. (a) |
2,059,717 |
29,994,629 |
|
|
|
92,514,898 |
||
|
Computers & Office Equipment - 2.1% |
|||
|
Compaq Computer Corp. |
2,037,300 |
52,078,481 |
|
|
Hewlett-Packard Co. |
157,800 |
19,705,275 |
|
|
International Business Machines Corp. |
567,400 |
62,165,763 |
|
|
Pitney Bowes, Inc. |
1,582,000 |
63,280,000 |
|
|
Xerox Corp. |
463,100 |
9,609,325 |
|
|
|
206,838,844 |
||
|
Electronic Instruments - 0.3% |
|||
|
Thermo Electron Corp. (a) |
1,295,400 |
27,284,363 |
|
|
Photographic Equipment - 0.1% |
|||
|
Eastman Kodak Co. |
257,200 |
15,303,400 |
|
|
TOTAL TECHNOLOGY |
350,460,229 |
||
|
TRANSPORTATION - 1.2% |
|||
|
Air Transportation - 0.2% |
|||
|
AMR Corp. |
371,000 |
9,808,313 |
|
|
Southwest Airlines Co. |
435,000 |
8,237,813 |
|
|
|
18,046,126 |
||
|
Railroads - 1.0% |
|||
|
Burlington Northern Santa Fe Corp. |
2,998,700 |
68,782,681 |
|
|
CSX Corp. |
559,200 |
11,848,050 |
|
|
Union Pacific Corp. |
409,400 |
15,224,563 |
|
|
|
95,855,294 |
||
|
TOTAL TRANSPORTATION |
113,901,420 |
||
|
UTILITIES - 9.2% |
|||
|
Cellular - 0.1% |
|||
|
AT&T Corp. - Wireless Group |
453,300 |
12,635,738 |
|
|
Electric Utility - 2.4% |
|||
|
Allegheny Energy, Inc. |
1,148,700 |
31,445,663 |
|
|
|
|||
|
Shares |
Value (Note 1) |
||
|
American Electric Power Co., Inc. |
997,100 |
$ 29,539,088 |
|
|
Cinergy Corp. |
415,000 |
10,556,563 |
|
|
DPL, Inc. |
168,354 |
3,693,266 |
|
|
Entergy Corp. |
3,187,300 |
86,654,719 |
|
|
IPALCO Enterprises, Inc. |
431,500 |
8,683,938 |
|
|
Niagara Mohawk Holdings, Inc. (a) |
1,682,100 |
23,444,269 |
|
|
NRG Energy, Inc. |
308,800 |
5,635,600 |
|
|
PG&E Corp. |
1,551,878 |
38,214,996 |
|
|
|
237,868,102 |
||
|
Telephone Services - 6.7% |
|||
|
AT&T Corp. |
4,236,400 |
133,976,150 |
|
|
Bell Atlantic Corp. |
1,266,240 |
64,340,820 |
|
|
BellSouth Corp. |
2,151,399 |
91,703,382 |
|
|
GTE Corp. |
1,087,100 |
67,671,975 |
|
|
Pathnet, Inc. warrants 4/15/08 (a)(e) |
510 |
5,100 |
|
|
SBC Communications, Inc. |
5,353,193 |
231,525,597 |
|
|
U.S. WEST, Inc. |
189,300 |
16,232,475 |
|
|
WorldCom, Inc. (a) |
1,309,716 |
60,083,199 |
|
|
|
665,538,698 |
||
|
TOTAL UTILITIES |
916,042,538 |
||
|
TOTAL COMMON STOCKS (Cost $7,320,124,457) |
9,295,839,410 |
||
|
Preferred Stocks - 3.0% |
|||
|
|
|
|
|
|
Convertible Preferred Stocks - 3.0% |
|||
|
BASIC INDUSTRIES - 0.2% |
|||
|
Chemicals & Plastics - 0.1% |
|||
|
Monsanto Co. $1.625 ACES |
283,800 |
12,966,113 |
|
|
Paper & Forest Products - 0.1% |
|||
|
Georgia-Pacific Corp. $3.75 PEPS |
314,100 |
9,854,888 |
|
|
TOTAL BASIC INDUSTRIES |
22,821,001 |
||
|
ENERGY - 0.2% |
|||
|
Oil & Gas - 0.2% |
|||
|
Apache Corp. $2.015 ACES |
183,100 |
9,349,635 |
|
|
The Coastal Corp. $1.20 PRIDES |
368,900 |
11,938,711 |
|
|
|
21,288,346 |
||
|
FINANCE - 0.7% |
|||
|
Credit & Other Finance - 0.4% |
|||
|
Federal-Mogul Financing Trust $3.50 |
490,300 |
10,725,313 |
|
|
Union Pacific Capital Trust: |
|
|
|
|
$3.125 |
403,200 |
15,926,400 |
|
|
$3.125 TIDES (e) |
384,500 |
15,187,750 |
|
|
|
41,839,463 |
||
|
Preferred Stocks - continued |
|||
|
Shares |
Value (Note 1) |
||
|
Convertible Preferred Stocks - continued |
|||
|
FINANCE - continued |
|||
|
Insurance - 0.3% |
|||
|
Ace Ltd. $4.125 PRIDES |
225,800 |
$ 14,126,725 |
|
|
MetLife, Inc. $4.00 |
225,800 |
15,523,750 |
|
|
|
29,650,475 |
||
|
TOTAL FINANCE |
71,489,938 |
||
|
INDUSTRIAL MACHINERY & EQUIPMENT - 0.2% |
|||
|
Electrical Equipment - 0.1% |
|||
|
Loral Space & Communications Ltd. Series C: |
|
|
|
|
$3.00 (e) |
183,200 |
4,122,000 |
|
|
$3.00 |
208,700 |
4,695,750 |
|
|
|
8,817,750 |
||
|
Industrial Machinery & Equipment - 0.1% |
|||
|
Ingersoll Rand Co./Ingersoll Rand Finance $1.68 Growth PRIDES |
530,100 |
10,188,522 |
|
|
TOTAL INDUSTRIAL MACHINERY & EQUIPMENT |
19,006,272 |
||
|
MEDIA & LEISURE - 0.9% |
|||
|
Broadcasting - 0.6% |
|||
|
Cox Communications, Inc.: |
|
|
|
|
$2.27 PRIDES |
159,500 |
9,884,215 |
|
|
$6.858 PRIZES |
146,000 |
16,078,250 |
|
|
MediaOne Group, Inc. |
|
|
|
|
$3.04 PIES |
317,100 |
12,763,275 |
|
|
$3.63 PIES |
249,900 |
22,491,000 |
|
|
|
61,216,740 |
||
|
Entertainment - 0.1% |
|||
|
Premier Parks, Inc. $4.05 PIES |
273,300 |
11,956,875 |
|
|
Publishing - 0.2% |
|||
|
Readers Digest Automatic Common Exchange Securities Trust $1.93 TRACES |
464,700 |
16,409,951 |
|
|
TOTAL MEDIA & LEISURE |
89,583,566 |
||
|
NONDURABLES - 0.3% |
|||
|
Beverages - 0.3% |
|||
|
Seagram Co. Ltd. $3.76 ACES |
473,400 |
25,001,674 |
|
|
RETAIL & WHOLESALE - 0.0% |
|||
|
General Merchandise Stores - 0.0% |
|||
|
Kmart Financing I $3.875 |
100,000 |
3,643,750 |
|
|
UTILITIES - 0.5% |
|||
|
Electric Utility - 0.3% |
|||
|
Alliant Energy Resources, Inc. $4.91 (e) |
52,700 |
3,642,888 |
|
|
|
|||
|
Shares |
Value (Note 1) |
||
|
NiSource, Inc. $3.875 PIES |
299,300 |
$ 11,148,925 |
|
|
TXU Corp. $1.6575 PRIDES |
398,400 |
13,844,400 |
|
|
|
28,636,213 |
||
|
Gas - 0.2% |
|||
|
Enron Corp. (EOG Resources, Inc.) $1.5575 ACES |
484,900 |
14,910,675 |
|
|
TOTAL UTILITIES |
43,546,888 |
||
|
TOTAL CONVERTIBLE PREFERRED STOCKS |
296,381,435 |
||
|
Nonconvertible Preferred Stocks - 0.0% |
|||
|
CONSTRUCTION & REAL ESTATE - 0.0% |
|||
|
Real Estate Investment Trusts - 0.0% |
|||
|
California Federal Preferred |
31,590 |
671,288 |
|
|
MEDIA & LEISURE - 0.0% |
|||
|
Broadcasting - 0.0% |
|||
|
CSC Holdings, Inc. 11.125% pay-in-kind |
23,622 |
2,468,499 |
|
|
Publishing - 0.0% |
|||
|
PRIMEDIA, Inc. 8.625% |
6,123 |
520,455 |
|
|
TOTAL MEDIA & LEISURE |
2,988,954 |
||
|
TOTAL NONCONVERTIBLE PREFERRED STOCKS |
3,660,242 |
||
|
TOTAL PREFERRED STOCKS (Cost $317,222,517) |
300,041,677 |
||
|
Corporate Bonds - 2.1% |
|||||
|
Moody's Ratings (unaudited) (b) |
Principal Amount |
|
|||
|
Convertible Bonds - 1.7% |
|||||
|
CONSTRUCTION & REAL ESTATE - 0.4% |
|||||
|
Real Estate Investment Trusts - 0.4% |
|||||
|
Liberty Property LP |
Ba2 |
|
$ 27,985,000 |
36,363,009 |
|
|
DURABLES - 0.1% |
|||||
|
Consumer Electronics - 0.1% |
|||||
|
Sunbeam Corp. |
Caa2 |
|
60,290,000 |
9,344,950 |
|
|
FINANCE - 0.0% |
|||||
|
Insurance - 0.0% |
|||||
|
Loews Corp. |
A2 |
|
4,320,000 |
3,591,000 |
|
|
MEDIA & LEISURE - 0.6% |
|||||
|
Broadcasting - 0.1% |
|||||
|
Cox Communications, Inc. 1% 4/19/20 |
Baa3 |
|
26,600,000 |
13,815,508 |
|
|
Corporate Bonds - continued |
|||||
|
Moody's Ratings (unaudited) (b) |
Principal Amount |
Value |
|||
|
Convertible Bonds - continued |
|||||
|
Publishing - 0.5% |
|||||
|
News America Holdings, Inc. liquid yield option notes 0% 3/11/13 |
Baa3 |
|
$ 42,720,000 |
$ 47,448,250 |
|
|
TOTAL MEDIA & LEISURE |
61,263,758 |
||||
|
NONDURABLES - 0.0% |
|||||
|
Foods - 0.0% |
|||||
|
Chiquita Brands International, Inc. |
B3 |
|
820,000 |
721,600 |
|
|
TECHNOLOGY - 0.2% |
|||||
|
Computer Services & Software - 0.0% |
|||||
|
Softkey International, Inc. 5.5% 11/1/00 (e) |
- |
|
1,340,000 |
1,313,200 |
|
|
Computers & Office Equipment - 0.1% |
|||||
|
Quantum Corp. |
B2 |
|
7,730,000 |
6,097,038 |
|
|
Electronics - 0.1% |
|||||
|
Solectron Corp. |
BBB |
|
13,410,000 |
8,548,875 |
|
|
Vitesse Semiconductor Corp. 4% 3/15/05 (e) |
B2 |
|
7,770,000 |
7,187,250 |
|
|
|
15,736,125 |
||||
|
TOTAL TECHNOLOGY |
23,146,363 |
||||
|
UTILITIES - 0.4% |
|||||
|
Cellular - 0.1% |
|||||
|
Nextel Communications, Inc. 5.25% 1/15/10 (e) |
B1 |
|
13,390,000 |
13,858,650 |
|
|
Telephone Services - 0.3% |
|||||
|
Level 3 Communications, Inc. 6% 3/15/10 |
Caa1 |
|
13,380,000 |
12,117,263 |
|
|
Telefonos de Mexico SA de CV 4.25% 6/15/04 |
Baa3 |
|
9,430,000 |
12,659,775 |
|
|
|
24,777,038 |
||||
|
TOTAL UTILITIES |
38,635,688 |
||||
|
TOTAL CONVERTIBLE BONDS |
173,066,368 |
||||
|
Nonconvertible Bonds - 0.4% |
|||||
|
BASIC INDUSTRIES - 0.0% |
|||||
|
Chemicals & Plastics - 0.0% |
|||||
|
Lyondell Chemical Co. 9.875% 5/1/07 |
Ba3 |
|
1,340,000 |
1,326,600 |
|
|
Corporate Bonds - continued |
|||||
|
Moody's Ratings (unaudited) (b) |
Principal Amount |
Value |
|||
|
Nonconvertible Bonds - continued |
|||||
|
ENERGY - 0.0% |
|||||
|
Energy Services - 0.0% |
|||||
|
RBF Finance Co. |
Ba3 |
|
$ 1,520,000 |
$ 1,641,600 |
|
|
FINANCE - 0.0% |
|||||
|
Credit & Other Finance - 0.0% |
|||||
|
Macsaver Financial Services, Inc. |
Ba2 |
|
1,000,000 |
620,000 |
|
|
HEALTH - 0.0% |
|||||
|
Medical Facilities Management - 0.0% |
|||||
|
Tenet Healthcare Corp. 8.125% 12/1/08 |
Ba3 |
|
1,550,000 |
1,418,250 |
|
|
INDUSTRIAL MACHINERY & EQUIPMENT - 0.0% |
|||||
|
Pollution Control - 0.0% |
|||||
|
Allied Waste |
|
|
|
|
|
|
7.625% 1/1/06 |
Ba2 |
|
950,000 |
826,500 |
|
|
7.875% 1/1/09 |
Ba2 |
|
1,065,000 |
905,250 |
|
|
|
1,731,750 |
||||
|
MEDIA & LEISURE - 0.2% |
|||||
|
Broadcasting - 0.2% |
|||||
|
Adelphia Communications Corp. 9.875% 3/1/07 |
B1 |
|
2,425,000 |
2,303,750 |
|
|
Century Communications Corp. Series B, |
B1 |
|
440,000 |
180,400 |
|
|
Charter Communications Holdings LLC/Charter Communications Holdings Capital Corp. 8.625% 4/1/09 |
B2 |
|
1,340,000 |
1,182,550 |
|
|
NTL Communications Corp. 11.5% 10/1/08 |
B3 |
|
4,140,000 |
4,171,050 |
|
|
Telewest PLC 0% 10/1/07 (d) |
B1 |
|
2,265,000 |
2,163,075 |
|
|
United Pan-Europe Communications NV 10.875% 11/1/07 |
B2 |
|
2,380,000 |
2,142,000 |
|
|
|
12,142,825 |
||||
|
Entertainment - 0.0% |
|||||
|
Regal Cinemas, Inc. 8.875% 12/15/10 |
Ca |
|
2,340,000 |
561,600 |
|
|
Lodging & Gaming - 0.0% |
|||||
|
HMH Properties, Inc. 7.875% 8/1/08 |
Ba2 |
|
230,000 |
205,275 |
|
|
Restaurants - 0.0% |
|||||
|
Domino's, Inc. |
B3 |
|
1,020,000 |
946,050 |
|
|
TOTAL MEDIA & LEISURE |
13,855,750 |
||||
|
Corporate Bonds - continued |
|||||
|
Moody's Ratings (unaudited) (b) |
Principal Amount |
Value |
|||
|
Nonconvertible Bonds - continued |
|||||
|
TECHNOLOGY - 0.0% |
|||||
|
Computer Services & Software - 0.0% |
|||||
|
PSINet, Inc. |
B3 |
|
$ 1,335,000 |
$ 1,228,200 |
|
|
UTILITIES - 0.2% |
|||||
|
Cellular - 0.1% |
|||||
|
Nextel |
|
|
|
|
|
|
0% 10/31/07 (d) |
B1 |
|
3,765,000 |
2,804,925 |
|
|
12% 11/1/08 |
B1 |
|
1,410,000 |
1,505,175 |
|
|
|
4,310,100 |
||||
|
Telephone Services - 0.1% |
|||||
|
Global Crossing Holdings Ltd. 9.625% 5/15/08 |
Ba2 |
|
1,335,000 |
1,308,300 |
|
|
McLeodUSA, Inc. |
B1 |
|
910,000 |
887,250 |
|
|
NEXTLINK Communications, Inc. 9.625% 10/1/07 |
B2 |
|
2,780,000 |
2,606,250 |
|
|
Pathnet, Inc. |
- |
|
510,000 |
285,600 |
|
|
Rhythms NetConnections, Inc. 12.75% 4/15/09 |
B3 |
|
1,670,000 |
1,135,600 |
|
|
WinStar |
|
|
|
|
|
|
0% 4/15/10 (d)(e) |
B3 |
|
1,449,000 |
673,785 |
|
|
12.75% 4/15/10 (e) |
B3 |
|
4,031,000 |
3,889,915 |
|
|
|
10,786,700 |
||||
|
TOTAL UTILITIES |
15,096,800 |
||||
|
TOTAL NONCONVERTIBLE BONDS |
36,918,950 |
||||
|
TOTAL CORPORATE BONDS (Cost $193,683,286) |
209,985,318 |
||||
|
Cash Equivalents - 1.0% |
|||
|
Shares |
|
||
|
Central Cash Collateral Fund, 6.71% (c) |
1,698,015 |
1,698,015 |
|
|
Taxable Central Cash Fund, 6.59% (c) |
94,619,327 |
94,619,327 |
|
|
TOTAL CASH EQUIVALENTS (Cost $96,317,342) |
96,317,342 |
||
|
TOTAL INVESTMENT PORTFOLIO - 99.6% (Cost $7,927,347,602) |
9,902,183,747 |
||
|
NET OTHER ASSETS - 0.4% |
41,016,147 |
||
|
NET ASSETS - 100% |
$ 9,943,199,894 |
||
|
Security Type Abbreviations |
||
|
ACES |
- |
Automatic Common Exchange Securities |
|
PEPS |
- |
Participating Equity Preferred Shares/Premium Exchangeable Participating Shares |
|
PIES |
- |
Premium Income Equity Securities |
|
PRIDES |
- |
Preferred Redeemable Increased Dividend |
|
PRIZES |
- |
Participating Redeemable Indexed Zero-Premium Exchangeable Securities |
|
TIDES |
- |
Term Income Deferred Equity Securities |
|
TRACES |
- |
Trust Automatic Common Exchange Securities |
|
Legend |
|
(a) Non-income producing |
|
(b) S&P credit ratings are used in the absence of a rating by Moody's Investors Service, Inc. |
|
(c) The rate quoted is the annualized seven-day yield of the fund at |
|
(d) Debt obligation initially issued in zero coupon form which converts to coupon form at a specified rate and date. The rate shown is the rate at period end. |
|
(e) Security exempt from registration under Rule 144A of the Securities |
|
Other Information |
|
Purchases and sales of securities, other than short-term securities, |
|
The fund placed a portion of its portfolio transactions with brokerage |
|
The fund participated in the security lending program. At period end, the value of securities loaned amounted to $1,591,025. The fund received cash collateral of $1,698,015 which was invested in cash equivalents. |
|
The fund participated in the interfund lending program as a borrower. |
|
The fund participated in the bank borrowing program. The average daily loan balance during the period for which loans were outstanding amounted to $13,171,318. The weighted average interest rate was 6.09%. Interest expense includes $49,044 paid under the bank borrowing program. |
|
Income Tax Information |
|
At June 30, 2000, the aggregate cost of investment securities for income tax purposes was $7,931,739,825. Net unrealized appreciation aggregated $1,970,443,922, of which $2,830,722,007 related to appreciated investment securities and $860,278,085 related to depreciated investment securities. |
See accompanying notes which are an integral part of the financial statements.
Equity-Income Portfolio
Statement of Assets and Liabilities
|
|
June 30, 2000 (Unaudited) |
|
|
Assets |
|
|
|
Investment in securities, at value |
|
$ 9,902,183,747 |
|
Cash |
|
80,267 |
|
Receivable for investments sold |
|
46,351,579 |
|
Receivable for fund shares sold |
|
3,306,224 |
|
Dividends receivable |
|
18,707,830 |
|
Interest receivable |
|
3,548,270 |
|
Other receivables |
|
639,455 |
|
Total assets |
|
9,974,817,372 |
|
Liabilities |
|
|
|
Payable for investments purchased |
$ 16,883,268 |
|
|
Payable for fund shares redeemed |
8,328,602 |
|
|
Accrued management fee |
4,071,933 |
|
|
Distribution fees payable |
43,292 |
|
|
Other payables and |
592,368 |
|
|
Collateral on securities loaned, |
1,698,015 |
|
|
Total liabilities |
|
31,617,478 |
|
Net Assets |
|
$ 9,943,199,894 |
|
Net Assets consist of: |
|
|
|
Paid in capital |
|
$ 7,592,710,655 |
|
Undistributed net investment income |
|
94,996,781 |
|
Accumulated undistributed net realized gain (loss) on investments and foreign currency transactions |
|
280,716,353 |
|
Net unrealized appreciation (depreciation) on investments |
|
1,974,776,105 |
|
Net Assets |
|
$ 9,943,199,894 |
|
Initial Class: |
|
$22.91 |
|
Service Class: |
|
$22.86 |
|
Service Class 2: |
|
$22.84 |
Statement of Operations
|
|
Six months ended June 30, 2000 (Unaudited) |
|
|
Investment Income Dividends |
|
$ 114,821,549 |
|
Interest |
|
7,423,512 |
|
Security lending |
|
109,307 |
|
Total income |
|
122,354,368 |
|
Expenses |
|
|
|
Management fee |
$ 24,432,214 |
|
|
Transfer agent fees |
3,355,035 |
|
|
Distribution fees |
226,077 |
|
|
Accounting and security lending fees |
443,177 |
|
|
Non-interested trustees' compensation |
25,855 |
|
|
Custodian fees and expenses |
117,627 |
|
|
Registration fees |
1,500 |
|
|
Audit |
39,228 |
|
|
Legal |
42,473 |
|
|
Interest |
220,630 |
|
|
Miscellaneous |
59,950 |
|
|
Total expenses before reductions |
28,963,766 |
|
|
Expense reductions |
(585,247) |
28,378,519 |
|
Net investment income |
|
93,975,849 |
|
Realized and Unrealized Gain (Loss) Net realized gain (loss) on: |
|
|
|
Investment securities |
290,121,682 |
|
|
Foreign currency transactions |
(169,714) |
289,951,968 |
|
Change in net unrealized appreciation (depreciation) on: |
|
|
|
Investment securities |
(725,820,111) |
|
|
Assets and liabilities in |
(72,517) |
(725,892,628) |
|
Net gain (loss) |
|
(435,940,660) |
|
Net increase (decrease) in net assets resulting from operations |
|
$ (341,964,811) |
|
Other Information Expense reductions |
|
$ 583,627 |
|
Custodian credits |
|
1,620 |
|
|
|
$ 585,247 |
See accompanying notes which are an integral part of the financial statements.
Semiannual Report
Fidelity Variable Insurance Products: Equity-Income Portfolio
Financial Statements - continued
Statement of Changes in Net Assets
|
|
Six months ended June 30, 2000 (Unaudited) |
Year ended
December 31, |
|
Increase (Decrease) in Net Assets |
|
|
|
Operations |
$ 93,975,849 |
$ 185,905,580 |
|
Net realized gain (loss) |
289,951,968 |
697,598,663 |
|
Change in net unrealized appreciation (depreciation) |
(725,892,628) |
(178,860,281) |
|
Net increase (decrease) in net assets resulting from operations |
(341,964,811) |
704,643,962 |
|
Distributions to shareholders |
(185,023,672) |
(170,985,891) |
|
From net realized gain |
(697,715,914) |
(377,968,784) |
|
Total distributions |
(882,739,586) |
(548,954,675) |
|
Share transactions - net increase (decrease) |
(283,718,779) |
(339,122,770) |
|
Total increase (decrease) in net assets |
(1,508,423,176) |
(183,433,483) |
|
Net Assets |
|
|
|
Beginning of period |
11,451,623,070 |
11,635,056,553 |
|
End of period (including undistributed net investment income of $94,996,781 and $185,982,649, respectively) |
$ 9,943,199,894 |
$ 11,451,623,070 |
|
|
||||
|
Other Information: |
||||
|
|
Six months ended June 30, 2000 |
Year ended December 31, 1999 |
||
|
|
Shares |
Dollars |
Shares |
Dollars |
|
Share transactions |
20,194,962 |
$ 468,135,483 |
41,506,315 |
$ 1,076,558,536 |
|
Reinvested |
38,143,294 |
847,544,035 |
22,601,688 |
537,468,103 |
|
Redeemed |
(74,517,854) |
(1,710,461,582) |
(84,630,671) |
(2,163,179,248) |
|
Net increase (decrease) |
(16,179,598) |
$ (394,782,064) |
(20,522,668) |
$ (549,152,609) |
|
Service Class |
4,641,894 |
107,791,908 |
8,201,124 |
211,555,674 |
|
Reinvested |
1,585,963 |
35,176,653 |
483,645 |
11,486,572 |
|
Redeemed |
(1,892,879) |
(43,575,460) |
(507,589) |
(13,012,407) |
|
Net increase (decrease) |
4,334,978 |
$ 99,393,101 |
8,177,180 |
$ 210,029,839 |
|
Service Class 2 A |
523,075 |
$ 11,931,422 |
- |
$ - |
|
Reinvested |
852 |
18,898 |
- |
- |
|
Redeemed |
(11,973) |
(280,136) |
- |
- |
|
Net increase (decrease) |
511,954 |
$ 11,670,184 |
- |
$ - |
|
Distributions |
|
$ 177,777,529 |
|
$ 167,408,106 |
|
Service Class |
|
7,242,252 |
|
3,577,785 |
|
Service Class 2 A |
|
3,891 |
|
- |
|
Total |
|
$ 185,023,672 |
|
$ 170,985,891 |
|
From net realized gain |
|
$ 669,766,506 |
|
$ 370,059,997 |
|
Service Class |
|
27,934,401 |
|
7,908,787 |
|
Service Class 2 A |
|
15,007 |
|
- |
|
Total |
|
$ 697,715,914 |
|
$ 377,968,784 |
|
|
|
$ 882,739,586 |
|
$ 548,954,675 |
A Service Class 2 commenced sale of shares January 12, 2000.
See accompanying notes which are an integral part of the financial statements.
Equity-Income Portfolio
Financial Highlights - Initial Class
|
|
Six months ended |
Years ended December 31, |
||||
|
Selected Per-Share Data |
(Unaudited) |
1999 |
1998 |
1997 |
1996 |
1995 |
|
Net asset value, beginning of period |
$ 25.71 |
$ 25.42 |
$ 24.28 |
$ 21.03 |
$ 19.27 |
$ 15.35 |
|
Income from Investment Operations |
|
|
|
|
|
|
|
Net investment income |
.21 D |
.41 D |
.38 D |
.36 D |
.35 |
.41 |
|
Net realized and unrealized gain (loss) |
(.96) |
1.10 |
2.31 |
5.06 |
2.30 |
4.69 |
|
Total from investment operations |
(.75) |
1.51 |
2.69 |
5.42 |
2.65 |
5.10 |
|
Less Distributions |
|
|
|
|
|
|
|
From net investment income |
(.43) |
(.38) |
(.34) |
(.36) |
(.03) |
(.40) |
|
From net realized gain |
(1.62) |
(.84) |
(1.21) |
(1.81) |
(.86) |
(.78) |
|
Total distributions |
(2.05) |
(1.22) |
(1.55) |
(2.17) |
(.89) |
(1.18) |
|
Net asset value, end of period |
$ 22.91 |
$ 25.71 |
$ 25.42 |
$ 24.28 |
$ 21.03 |
$ 19.27 |
|
Total Return B, C |
(2.67)% |
6.33% |
11.63% |
28.11% |
14.28% |
35.09% |
|
Ratios and Supplemental Data |
|
|
|
|
|
|
|
Net assets, end of period (000 omitted) |
$ 9,442,871 |
$ 11,014,291 |
$ 11,409,912 |
$ 10,106,742 |
$ 6,961,090 |
$ 4,879,435 |
|
Ratio of expenses to average net assets |
.56% A |
.57% |
.58% |
.58% |
.58% |
.61% |
|
Ratio of expenses to average net assets after |
.55% A, F |
.56% F |
.57% F |
.57% F |
.56% F |
.61% |
|
Ratio of net investment income to average net assets |
1.83% A |
1.57% |
1.58% |
1.65% |
1.97% |
2.56% |
|
Portfolio turnover |
19% A |
27% |
28% |
44% |
186% |
87% |
Financial Highlights - Service Class
|
|
Six months ended |
Years ended December 31, |
||
|
Selected Per-Share Data |
(Unaudited) |
1999 |
1998 |
1997 E |
|
Net asset value, beginning of period |
$ 25.66 |
$ 25.39 |
$ 24.27 |
$ 23.44 |
|
Income from Investment Operations |
|
|
|
|
|
Net investment income D |
.20 |
.38 |
.36 |
.05 |
|
Net realized and unrealized gain (loss) |
(.96) |
1.11 |
2.31 |
.78 |
|
Total from investment operations |
(.76) |
1.49 |
2.67 |
.83 |
|
Less Distributions |
|
|
|
|
|
From net investment income |
(.42) |
(.38) |
(.34) |
- |
|
From net realized gain |
(1.62) |
(.84) |
(1.21) |
- |
|
Total distributions |
(2.04) |
(1.22) |
(1.55) |
- |
|
Net asset value, end of period |
$ 22.86 |
$ 25.66 |
$ 25.39 |
$ 24.27 |
|
Total Return B, C |
(2.72)% |
6.25% |
11.54% |
3.54% |
|
Ratios and Supplemental Data |
|
|
|
|
|
Net assets, end of period (000 omitted) |
$ 488,635 |
$ 437,332 |
$ 225,145 |
$ 5,328 |
|
Ratio of expenses to average net assets |
.66% A |
.67% |
.68% |
.68% A |
|
Ratio of expenses to average net assets after expense reductions |
.65% A, F |
.66% F |
.67% F |
.65% A, F |
|
Ratio of net investment income to average net assets |
1.73% A |
1.47% |
1.51% |
1.63% A |
|
Portfolio turnover |
19% A |
27% |
28% |
44% |
|
A Annualized B Total returns for periods of less than one year are not annualized and do not reflect charges attributable to your insurance company's separate account. Inclusion of these charges would reduce the total returns shown. C The total returns would have been lower had certain expenses not been reduced during the periods shown. D Net investment income per share has been calculated based on average shares outstanding during the period. E For the period November 3, 1997 (commencement of sale of Service Class shares) to December 31, 1997. F FMR or the fund has entered into varying arrangements with third parties who either paid or reduced a portion of the class' expenses. |
||||
See accompanying notes which are an integral part of the financial statements.
Semiannual Report
Financial Highlights - Service Class 2
|
|
Six months ended |
|
Selected Per-Share Data |
(Unaudited) |
|
Net asset value, beginning of period |
$ 25.18 |
|
Income from Investment Operations |
|
|
Net investment income D |
.17 |
|
Net realized and unrealized gain (loss) |
(.47) |
|
Total from investment operations |
(.30) |
|
Less Distributions |
|
|
From net investment income |
(.42) |
|
From net realized gain |
(1.62) |
|
Total distributions |
(2.04) |
|
Net asset value, end of period |
$ 22.84 |
|
Total Return B, C |
(0.95)% |
|
Ratios and Supplemental Data |
|
|
Net assets, end of period (000 omitted) |
$ 11,694 |
|
Ratio of expenses to average net assets |
.82% A |
|
Ratio of expenses to average net assets after expense reductions |
.80% A, F |
|
Ratio of net investment income to average net assets |
1.58% A |
|
Portfolio turnover |
19% A |
|
A Annualized B Total returns for periods of less than one year are not annualized and do not reflect charges attributable to your insurance company's separate account. Inclusion of these charges would reduce the total returns shown. C The total return would have been lower had certain expenses not been reduced during the period shown. D Net investment income per share has been calculated based on average shares outstanding during the period. E For the period January 12, 2000 (commencement of sale of Service Class 2 shares) to June 30, 2000. F FMR or the fund has entered into varying arrangements with third parties who either paid or reduced a portion of the class' expenses. |
|
See accompanying notes which are an integral part of the financial statements.
Equity-Income Portfolio
Performance
There are several ways to evaluate a fund's historical performance. You can look at the total percentage change in value, the average annual percentage change or the growth of a hypothetical $10,000 investment. Total return reflects the change in the value of an investment, assuming reinvestment of the fund's dividend income and capital gains (the profits earned upon the sale of securities that have grown in value). The initial offering of Service Class 2 shares took place on January 12, 2000. Performance for Service Class 2 shares reflects an asset based distribution fee (12b-1 fee). Returns from November 3, 1997 through January 12, 2000 are those of Service Class which reflects a different 12b-1 fee. Service Class 2 returns prior to November 3, 1997 are those of Initial Class, and do not include the effects of a 12b-1 fee. Had Service Class 2's 12b-1 fee been reflected, returns prior to January 12, 2000 would have been lower. If Fidelity had not reimbursed certain fund expenses, the past five years and life of fund total returns would have been lower.
Average Annual Total Returns
|
Periods ended |
Past 1 |
Past 5 |
Life of |
|
Fidelity VIP: Balanced - |
-0.63% |
11.76% |
12.09% |
|
Fidelity Balanced 60/40 Composite |
6.44% |
16.78% |
18.45% |
|
S&P 500 |
7.25% |
23.80% |
25.60% |
|
LB Aggregate Bond |
4.57% |
6.25% |
7.81% |
Average annual total returns take the fund's cumulative return and show what would have happened if the fund had performed at a constant rate each year.
You can compare the fund's returns to the performance of the Fidelity Balanced 60/40 Composite Index - a hypothetical combination of unmanaged indices using a weighting of 60% equity and 40% bond. The composite index combines the total returns of the Standard & Poor's 500 Index and the Lehman Brothers Aggregate Bond Index.
Figures for more than one year assume a steady compounded rate of return and are not the fund's year-by-year results, which fluctuated over the periods shown. The life of fund figures are from commencement of operations, January 3, 1995.
Performance numbers are net of all fund operating expenses, but do not include any insurance charges imposed by your insurance company's separate account. If performance information included the effect of these additional charges, the total returns would have been lower.
Past performance is no guarantee of future results. Principal and investment return will vary and you may have a gain or loss when you withdraw your money.
Understanding Performance
How a fund did yesterday is no guarantee of how it will do tomorrow. The stock market, for example, has a history of long-term growth and short-term volatility. In turn, the share price and return of a fund that invests in stocks will vary. That means if you sell your shares during a market downturn, you might lose money. But if you can ride out the market's ups and downs, you may have a gain.
3$10,000 Over Life of Fund
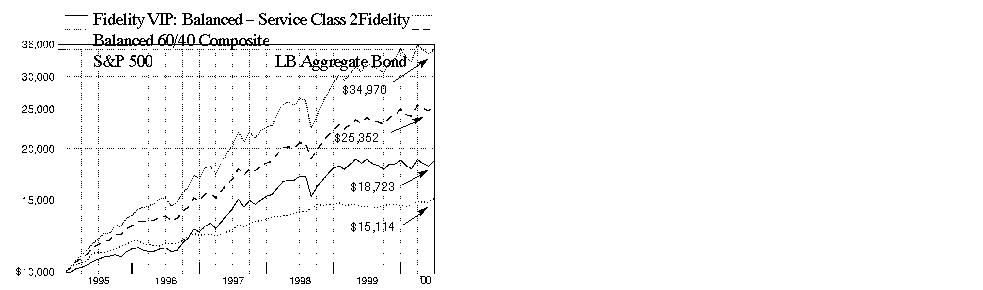
$10,000 Over Life of Fund: Let's say hypothetically that $10,000 was invested in Fidelity Variable Insurance Products: Balanced Portfolio - Service Class 2 on January 3, 1995, when the fund started. As the chart shows, by June 30, 2000, the value of the investment would have grown to $18,723 - an 87.23% increase on the initial investment. For comparison, look at how both the Standard & Poor's 500 Index, a market capitalization-weighted index of common stocks, and the Lehman Brothers Aggregate Bond Index, a market value-weighted index of investment-grade fixed-rate debt issues, including government, corporate, asset-backed, and mortgage-backed securities, with maturities of one year or more, did over the same period. With dividends and capital gains, if any, reinvested, the same $10,000 investment in the Standard & Poor's 500 Index would have grown to $34,970 - a 249.70% increase. If $10,000 was invested in the Lehman Brothers Aggregate Bond Index, it would have grown to $15,114 - a 51.14% increase. You can also look at how the Fidelity Balanced 60/40 Composite Index did over the same period. With dividends and interest, if any, reinvested, the same $10,000 would have grown to $25,352 - a 153.52% increase.
Investment Summary
|
Top Five Stocks as of June 30, 2000 |
|
|
|
% of fund's |
|
General Electric Co. |
3.6 |
|
Cisco Systems, Inc. |
2.3 |
|
Intel Corp. |
1.7 |
|
Exxon Mobil Corp. |
1.4 |
|
Pfizer, Inc. |
1.3 |
|
|
10.3 |
|
Top Five Market Sectors as of June 30, 2000 |
|
|
|
% of fund's |
|
Technology |
20.0 |
|
Finance |
10.4 |
|
Utilities |
9.2 |
|
Media & Leisure |
7.8 |
|
Health |
6.4 |
|
Asset Allocation as of June 30, 2000 |
|||
|
% of fund's net assets * |
|||
|
Stocks 57.2% |
|
|
 |
Bonds 40.7% |
|
|
|
Short-Term Investments |
|
|
|
* Foreign investments 6.4% |
Semiannual Report
(automated graphic) (automated graphic)
An interview with John Avery (right), Lead Portfolio Manager of Balanced Portfolio, and Kevin Grant, manager for fixed-income investments
Q. How did the fund perform, John?
J.A. For the six- and 12-month periods that ended June 30, 2000, the fund underperformed the Fidelity Balanced 60/40 Composite Index, which returned 1.45% and 6.44%, respectively, during these time frames.
Q. Why did the fund trail its benchmark during the
six-month period?
J.A. Having an average underweighting in technology hurt during the sector's impressive run-up early in the period. The fund's underexposure to tech was double trouble in the sense that most other areas of the market in which the fund was invested had a difficult period. So, even though the technology group corrected sharply in the spring - as the market turned elsewhere for growth - it was up so much in the first half that, for all intents and purposes, our fate was sealed.
Q. What were some of your strategies and how did they influence performance?
J.A. I maintained an emphasis on equities during the market's upturn, adding convertible securities in lieu of pure stocks. I used convertibles as an indirect, less volatile way to participate in some of the growth stories I liked within the technology sector. This strategy helped provide some nice yield and afforded us the added benefit of downside protection, as convertible securities gave back less than their pure stock equivalents during the correction. When things started to fall apart for tech, I took advantage of the opportunity to increase the fund's concentration in large, high-quality companies, many of which had dropped sharply from their highs of the period. However, the fund was hurt for not owning enough of the period's top performers along the way, namely Oracle and Intel. On a more positive note, the fund's healthy exposure to large drug companies such as Warner-Lambert and Eli Lilly helped, as the group rallied behind renewed enthusiasm for strong new product pipelines. Warner-Lambert merged with Pfizer - another fund holding - just prior to the close of the period. The fund's lack of exposure to a generally weak consumer nondurables sector, and some good picks in media stocks such as Viacom, further aided relative performance.
Q. What other stocks performed well for the fund? Which disappointed?
J.A. A number of the fund's financial holdings performed well - most notably Bank of New York and Morgan Stanley Dean Witter - benefiting from strong capital markets activity. Tech stocks we did own, including Texas Instruments, EMC and Micron Technology, also added meaningfully to performance. Conversely, those that weren't so hot included Motorola, Alltel and Lucent. Motorola was, by far, the fund's worst performer, slipping on execution problems and narrowing margins in its cellular handset business. Traditional telecommunications providers AT&T and WorldCom fell prey to increased competition and falling prices.
Q. Turning to you, Kevin, how did the fund's bond investments fare?
K.G. The investment-grade portion of the fund performed well during the six-month period, benefiting from its exposure to a strong rally in the government market. An announcement by the U.S. Treasury in January of its intent to repurchase long-term debt and reduce future issuance sent the price of the long bond higher and its yield lower. This action, coupled with rising short-term interest rates, induced an inverted yield curve, which occurs when short-term issues provide a higher yield than their longer-term counterparts. This inversion hurt the spread sectors - most notably corporate bonds and mortgage securities - with yield spreads widening out significantly relative to comparable duration Treasuries. The fund was well-positioned for these changes, as we responded to the buybacks by reducing our exposure to long-term corporates in exchange for more Treasuries, which worked out beautifully. This strategy helped the fund's bond subportfolio outperform the Lehman Brothers Aggregate Bond Index during the period. So, despite the Federal Reserve Board's efforts to raise rates during the period, the supply/demand imbalance spurred by the Treasury buybacks helped ensure our success.
Q. John, what's your outlook?
J.A. I'm bullish overall, as business remains strong in many areas of the economy, although I temper that enthusiasm with concern about interest rates rising further. In this uncertain environment, I believe the market will begin to focus more on revenues and earnings. As such, the companies capable of delivering robust top-line growth and strong bottom-line earnings should be the ones to reap the rewards. Given the extent to which technology and the Internet have transformed the global landscape, I expect we'll see strong performance from this sector going forward.
The views expressed in this report reflect those of the portfolio managers only through the end of the period of the report as stated on the cover. The managers' views are subject to change at any time based on market or other conditions. For more information, see page 2.
Fund Facts
Goal: seeks income and capital growth consistent with reasonable risk by investing in a diversified portfolio of stocks and bonds
Start date: January 3, 1995
Size: as of June 30, 2000, more than $304 million
Manager: John Avery, since 1998, and
Kevin Grant, since 1996; John Avery joined
Fidelity in 1995; Kevin Grant joined Fidelity in 1993
Semiannual Report
Fidelity Variable Insurance Products: Balanced Portfolio
(Unaudited)
Showing Percentage of Net Assets
|
Common Stocks - 56.8% |
|||
|
Shares |
Value (Note 1) |
||
|
AEROSPACE & DEFENSE - 0.4% |
|||
|
Aerospace & Defense - 0.2% |
|||
|
Boeing Co. |
13,700 |
$ 572,831 |
|
|
Textron, Inc. |
4,200 |
228,113 |
|
|
|
800,944 |
||
|
Ship Building & Repair - 0.2% |
|||
|
General Dynamics Corp. |
9,700 |
506,825 |
|
|
TOTAL AEROSPACE & DEFENSE |
1,307,769 |
||
|
BASIC INDUSTRIES - 0.5% |
|||
|
Chemicals & Plastics - 0.4% |
|||
|
E.I. du Pont de Nemours and Co. |
14,104 |
617,050 |
|
|
Praxair, Inc. |
16,100 |
602,744 |
|
|
|
1,219,794 |
||
|
Metals & Mining - 0.1% |
|||
|
Alcoa, Inc. |
13,000 |
377,000 |
|
|
TOTAL BASIC INDUSTRIES |
1,596,794 |
||
|
DURABLES - 0.3% |
|||
|
Autos, Tires, & Accessories - 0.2% |
|||
|
AutoNation, Inc. |
3,700 |
26,131 |
|
|
Danaher Corp. |
9,600 |
474,600 |
|
|
|
500,731 |
||
|
Consumer Electronics - 0.1% |
|||
|
General Motors Corp. Class H (a) |
5,400 |
473,850 |
|
|
TOTAL DURABLES |
974,581 |
||
|
ENERGY - 3.7% |
|||
|
Energy Services - 0.8% |
|||
|
Diamond Offshore Drilling, Inc. |
15,200 |
533,900 |
|
|
Halliburton Co. |
12,900 |
608,719 |
|
|
Nabors Industries, Inc. (a) |
16,800 |
698,250 |
|
|
Schlumberger Ltd. (NY Shares) |
9,000 |
671,625 |
|
|
|
2,512,494 |
||
|
Oil & Gas - 2.9% |
|||
|
BP Amoco PLC |
63,962 |
602,975 |
|
|
Burlington Resources, Inc. |
15,000 |
573,750 |
|
|
Chevron Corp. |
10,000 |
848,125 |
|
|
Conoco, Inc. Class B |
50,800 |
1,247,775 |
|
|
Exxon Mobil Corp. |
53,366 |
4,189,231 |
|
|
Royal Dutch Petroleum Co. (NY Shares) |
21,400 |
1,317,438 |
|
|
|
8,779,294 |
||
|
TOTAL ENERGY |
11,291,788 |
||
|
FINANCE - 7.4% |
|||
|
Banks - 1.0% |
|||
|
Bank of America Corp. |
15,100 |
649,300 |
|
|
|
|||
|
Shares |
Value (Note 1) |
||
|
Bank of New York Co., Inc. |
41,700 |
$ 1,939,050 |
|
|
Chase Manhattan Corp. |
10,500 |
483,656 |
|
|
|
3,072,006 |
||
|
Credit & Other Finance - 2.3% |
|||
|
American Express Co. |
70,900 |
3,695,663 |
|
|
Citigroup, Inc. |
56,325 |
3,393,581 |
|
|
|
7,089,244 |
||
|
Federal Sponsored Credit - 1.2% |
|||
|
Fannie Mae |
32,400 |
1,690,875 |
|
|
Freddie Mac |
45,300 |
1,834,650 |
|
|
|
3,525,525 |
||
|
Insurance - 1.5% |
|||
|
AFLAC, Inc. |
9,300 |
427,219 |
|
|
American International Group, Inc. |
30,300 |
3,560,250 |
|
|
Hartford Financial Services Group, Inc. |
8,400 |
469,875 |
|
|
|
4,457,344 |
||
|
Securities Industry - 1.4% |
|||
|
Charles Schwab Corp. |
25,150 |
845,669 |
|
|
Merrill Lynch & Co., Inc. |
7,500 |
862,500 |
|
|
Morgan Stanley Dean Witter & Co. |
31,900 |
2,655,675 |
|
|
|
4,363,844 |
||
|
TOTAL FINANCE |
22,507,963 |
||
|
HEALTH - 5.9% |
|||
|
Drugs & Pharmaceuticals - 5.6% |
|||
|
American Home Products Corp. |
15,900 |
934,125 |
|
|
Amgen, Inc. |
11,600 |
814,900 |
|
|
Bristol-Myers Squibb Co. |
48,200 |
2,807,650 |
|
|
Eli Lilly & Co. |
39,000 |
3,895,125 |
|
|
Merck & Co., Inc. |
11,300 |
865,863 |
|
|
Pfizer, Inc. |
84,700 |
4,065,600 |
|
|
Schering-Plough Corp. |
72,400 |
3,656,200 |
|
|
|
17,039,463 |
||
|
Medical Equipment & Supplies - 0.3% |
|||
|
Johnson & Johnson |
4,600 |
468,625 |
|
|
Medtronic, Inc. |
10,000 |
498,125 |
|
|
|
966,750 |
||
|
TOTAL HEALTH |
18,006,213 |
||
|
INDUSTRIAL MACHINERY & EQUIPMENT - 4.4% |
|||
|
Electrical Equipment - 3.6% |
|||
|
General Electric Co. |
206,400 |
10,939,184 |
|
|
Industrial Machinery & Equipment - 0.8% |
|||
|
Tyco International Ltd. |
53,870 |
2,552,091 |
|
|
TOTAL INDUSTRIAL MACHINERY & EQUIPMENT |
13,491,275 |
||
|
Common Stocks - continued |
|||
|
Shares |
Value (Note 1) |
||
|
MEDIA & LEISURE - 4.3% |
|||
|
Broadcasting - 1.6% |
|||
|
AT&T Corp. - Liberty Media Group |
44,000 |
$ 1,067,000 |
|
|
Cable Satisfaction International, Inc. warrants 3/1/10 (a) |
200 |
540 |
|
|
Clear Channel Communications, Inc. (a) |
15,400 |
1,155,000 |
|
|
Infinity Broadcasting Corp. Class A (a) |
29,600 |
1,078,550 |
|
|
NTL, Inc. warrants 10/14/08 (a) |
199 |
8,159 |
|
|
Time Warner, Inc. |
20,208 |
1,535,808 |
|
|
UIH Australia/Pacific, Inc. warrants 5/15/06 (a) |
150 |
4,500 |
|
|
|
4,849,557 |
||
|
Entertainment - 1.8% |
|||
|
MGM Grand, Inc. |
12,500 |
401,563 |
|
|
Viacom, Inc. Class B (non-vtg.) (a) |
56,389 |
3,845,025 |
|
|
Walt Disney Co. |
29,100 |
1,129,444 |
|
|
|
5,376,032 |
||
|
Publishing - 0.7% |
|||
|
McGraw-Hill Companies, Inc. |
42,100 |
2,273,400 |
|
|
Restaurants - 0.2% |
|||
|
McDonald's Corp. |
20,500 |
675,219 |
|
|
TOTAL MEDIA & LEISURE |
13,174,208 |
||
|
NONDURABLES - 1.6% |
|||
|
Beverages - 0.9% |
|||
|
Anheuser-Busch Companies, Inc. |
16,700 |
1,247,281 |
|
|
Seagram Co. Ltd. |
6,100 |
358,460 |
|
|
The Coca-Cola Co. |
19,300 |
1,108,544 |
|
|
|
2,714,285 |
||
|
Household Products - 0.5% |
|||
|
Clorox Co. |
14,700 |
658,744 |
|
|
Colgate-Palmolive Co. |
12,100 |
724,488 |
|
|
|
1,383,232 |
||
|
Tobacco - 0.2% |
|||
|
Philip Morris Companies, Inc. |
22,400 |
595,000 |
|
|
TOTAL NONDURABLES |
4,692,517 |
||
|
RETAIL & WHOLESALE - 2.9% |
|||
|
Apparel Stores - 0.2% |
|||
|
Mothers Work, Inc. (a)(k) |
3 |
34 |
|
|
The Limited, Inc. |
26,800 |
579,550 |
|
|
|
579,584 |
||
|
General Merchandise Stores - 1.6% |
|||
|
Kohls Corp. (a) |
9,300 |
517,313 |
|
|
Target Corp. |
21,400 |
1,241,200 |
|
|
Wal-Mart Stores, Inc. |
54,900 |
3,163,613 |
|
|
|
4,922,126 |
||
|
Retail & Wholesale, Miscellaneous - 1.1% |
|||
|
Best Buy Co., Inc. (a) |
800 |
50,600 |
|
|
|
|||
|
Shares |
Value (Note 1) |
||
|
Home Depot, Inc. |
53,550 |
$ 2,674,153 |
|
|
Lowe's Companies, Inc. |
11,100 |
455,794 |
|
|
|
3,180,547 |
||
|
TOTAL RETAIL & WHOLESALE |
8,682,257 |
||
|
SERVICES - 0.7% |
|||
|
Advertising - 0.5% |
|||
|
Omnicom Group, Inc. |
17,200 |
1,531,875 |
|
|
Services - 0.2% |
|||
|
Ecolab, Inc. |
18,100 |
707,031 |
|
|
TOTAL SERVICES |
2,238,906 |
||
|
TECHNOLOGY - 19.0% |
|||
|
Communications Equipment - 5.3% |
|||
|
Cisco Systems, Inc. (a) |
111,000 |
7,055,438 |
|
|
Comverse Technology, Inc. (a) |
8,100 |
753,300 |
|
|
Corning, Inc. |
4,000 |
1,079,500 |
|
|
Lucent Technologies, Inc. |
30,200 |
1,789,350 |
|
|
Nokia AB sponsored ADR |
34,200 |
1,707,863 |
|
|
Nortel Networks Corp. |
53,100 |
3,683,465 |
|
|
|
16,068,916 |
||
|
Computer Services & Software - 3.4% |
|||
|
America Online, Inc. (a) |
25,950 |
1,368,863 |
|
|
BEA Systems, Inc. (a) |
14,100 |
697,069 |
|
|
DecisionOne Corp. |
583 |
6 |
|
|
DecisionOne Corp.: |
|
|
|
|
Class A warrants 4/18/07 (a) |
342 |
0 |
|
|
Class B warrants 4/18/07 (a) |
590 |
0 |
|
|
Class C warrants 4/18/07 (a) |
350 |
0 |
|
|
Inktomi Corp. (a) |
3,400 |
402,050 |
|
|
Microsoft Corp. (a) |
40,400 |
3,232,000 |
|
|
Oracle Corp. (a) |
38,700 |
3,253,219 |
|
|
VeriSign, Inc. (a) |
4,392 |
775,188 |
|
|
Yahoo!, Inc. (a) |
6,200 |
768,025 |
|
|
|
10,496,420 |
||
|
Computers & Office Equipment - 4.5% |
|||
|
Compaq Computer Corp. |
33,600 |
858,900 |
|
|
Dell Computer Corp. (a) |
42,700 |
2,105,644 |
|
|
EMC Corp. (a) |
50,100 |
3,854,569 |
|
|
Hewlett-Packard Co. |
8,400 |
1,048,950 |
|
|
International Business Machines Corp. |
24,000 |
2,629,500 |
|
|
Network Appliance, Inc. (a) |
8,300 |
668,150 |
|
|
Pitney Bowes, Inc. |
11,000 |
440,000 |
|
|
Sun Microsystems, Inc. (a) |
22,800 |
2,073,375 |
|
|
|
13,679,088 |
||
|
Electronic Instruments - 0.5% |
|||
|
Applied Materials, Inc. (a) |
10,400 |
942,500 |
|
|
KLA-Tencor Corp. (a) |
8,400 |
491,925 |
|
|
|
1,434,425 |
||
|
Common Stocks - continued |
|||
|
Shares |
Value (Note 1) |
||
|
TECHNOLOGY - continued |
|||
|
Electronics - 5.3% |
|||
|
Analog Devices, Inc. (a) |
12,900 |
$ 980,400 |
|
|
Broadcom Corp. Class A (a) |
4,200 |
919,538 |
|
|
Flextronics International Ltd. (a) |
6,500 |
446,469 |
|
|
Insilco Corp. warrants 8/15/07 (a) |
60 |
0 |
|
|
Intel Corp. |
39,300 |
5,253,919 |
|
|
JDS Uniphase Corp. (a) |
12,200 |
1,462,475 |
|
|
Micron Technology, Inc. (a) |
20,400 |
1,796,475 |
|
|
Motorola, Inc. |
32,900 |
956,156 |
|
|
Sanmina Corp. (a) |
7,900 |
675,450 |
|
|
Texas Instruments, Inc. |
55,100 |
3,784,681 |
|
|
|
16,275,563 |
||
|
TOTAL TECHNOLOGY |
57,954,412 |
||
|
UTILITIES - 5.7% |
|||
|
Cellular - 2.5% |
|||
|
China Telecom (Hong Kong) Ltd. (a) |
90,000 |
800,156 |
|
|
Leap Wireless International, Inc.: |
|
|
|
|
warrants 4/15/10 (a)(g) |
75 |
0 |
|
|
warrants 4/15/10 (a) |
65 |
0 |
|
|
Loral Orion Network Systems, Inc.: |
|
|
|
|
warrants 1/15/07 (CV ratio .47) (a) |
290 |
725 |
|
|
warrants 1/15/07 (CV ratio .6) (a) |
50 |
213 |
|
|
McCaw International Ltd. warrants 4/16/07 (a)(g) |
290 |
725 |
|
|
Nextel Communications, Inc. Class A (a) |
23,400 |
1,431,788 |
|
|
Sprint Corp. - PCS Group Series 1 (a) |
35,100 |
2,088,450 |
|
|
Vodafone AirTouch PLC sponsored ADR |
37,800 |
1,566,338 |
|
|
VoiceStream Wireless Corp. (a) |
14,700 |
1,709,564 |
|
|
|
7,597,959 |
||
|
Electric Utility - 0.3% |
|||
|
AES Corp. (a) |
21,800 |
994,625 |
|
|
Gas - 0.5% |
|||
|
Dynegy, Inc. Class A |
11,600 |
792,425 |
|
|
Enron Corp. |
9,200 |
593,400 |
|
|
|
1,385,825 |
||
|
Telephone Services - 2.4% |
|||
|
Allegiance Telecom, Inc. (a) |
6,900 |
441,600 |
|
|
AT&T Corp. |
16,604 |
525,102 |
|
|
BellSouth Corp. |
32,000 |
1,364,000 |
|
|
KMC Telecom Holdings, Inc. warrants 4/15/08 (a)(g) |
70 |
175 |
|
|
Level 3 Communications, Inc. (a) |
5,400 |
475,200 |
|
|
McLeodUSA, Inc. Class A (a) |
37,600 |
777,850 |
|
|
Ono Finance PLC rights 5/31/09 (a)(g) |
210 |
2,100 |
|
|
Qwest Communications |
13,600 |
675,750 |
|
|
SBC Communications, Inc. |
37,170 |
1,607,603 |
|
|
|
|||
|
Shares |
Value (Note 1) |
||
|
Sprint Corp. - FON Group |
12,300 |
$ 627,300 |
|
|
WorldCom, Inc. (a) |
19,489 |
894,058 |
|
|
|
7,390,738 |
||
|
TOTAL UTILITIES |
17,369,147 |
||
|
TOTAL COMMON STOCKS (Cost $133,038,091) |
173,287,830 |
||
|
Preferred Stocks - 0.4% |
|||
|
|
|
|
|
|
Convertible Preferred Stocks - 0.2% |
|||
|
MEDIA & LEISURE - 0.2% |
|||
|
Broadcasting - 0.2% |
|||
|
MediaOne Group, Inc. |
4,700 |
423,000 |
|
|
Nonconvertible Preferred Stocks - 0.2% |
|||
|
ENERGY - 0.0% |
|||
|
Energy Services - 0.0% |
|||
|
R&B Falcon Corp. 13.875% |
113 |
128,255 |
|
|
FINANCE - 0.0% |
|||
|
Insurance - 0.0% |
|||
|
American Annuity Group Capital |
50 |
44,513 |
|
|
HEALTH - 0.1% |
|||
|
Medical Facilities Management - 0.1% |
|||
|
Fresenius Medical Care Capital |
190 |
173,333 |
|
|
MEDIA & LEISURE - 0.1% |
|||
|
Broadcasting - 0.1% |
|||
|
CSC Holdings, Inc. 11.125% pay-in-kind |
2,136 |
223,212 |
|
|
Publishing - 0.0% |
|||
|
PRIMEDIA, Inc. Series D, $10.00 |
600 |
55,500 |
|
|
TOTAL MEDIA & LEISURE |
278,712 |
||
|
TOTAL NONCONVERTIBLE PREFERRED STOCKS |
624,813 |
||
|
TOTAL PREFERRED STOCKS (Cost $970,382) |
1,047,813 |
||
|
Corporate Bonds - 15.2% |
|||||
|
Moody's Ratings (unaudited) (b) |
Principal Amount |
|
|||
|
Convertible Bonds - 1.1% |
|||||
|
HEALTH - 0.4% |
|||||
|
Drugs & Pharmaceuticals - 0.4% |
|||||
|
Roche Holdings, Inc. |
- |
|
$ 1,261,000 |
1,153,815 |
|
|
Corporate Bonds - continued |
|||||
|
Moody's Ratings (unaudited) (b) |
Principal Amount |
Value |
|||
|
Convertible Bonds - continued |
|||||
|
MEDIA & LEISURE - 0.2% |
|||||
|
Broadcasting - 0.2% |
|||||
|
Liberty Media Corp. |
Baa3 |
|
$ 481,000 |
$ 521,885 |
|
|
TECHNOLOGY - 0.4% |
|||||
|
Computers & Office Equipment - 0.4% |
|||||
|
Juniper Networks, Inc. 4.75% 3/15/07 |
B- |
|
1,220,000 |
1,349,625 |
|
|
UTILITIES - 0.1% |
|||||
|
Cellular - 0.1% |
|||||
|
Nextel Communications, Inc. 5.25% 1/15/10 (g) |
B1 |
|
308,000 |
318,780 |
|
|
Telephone Services - 0.0% |
|||||
|
Level 3 Communications, Inc. 6% 3/15/10 |
Caa1 |
|
203,000 |
183,842 |
|
|
TOTAL UTILITIES |
502,622 |
||||
|
TOTAL CONVERTIBLE BONDS |
3,527,947 |
||||
|
Nonconvertible Bonds - 14.1% |
|||||
|
AEROSPACE & DEFENSE - 0.1% |
|||||
|
Defense Electronics - 0.1% |
|||||
|
Raytheon Co. |
Baa2 |
|
240,000 |
240,662 |
|
|
BASIC INDUSTRIES - 0.4% |
|||||
|
Chemicals & Plastics - 0.2% |
|||||
|
Huntsman Corp. |
B2 |
|
370,000 |
337,625 |
|
|
Lyondell Chemical Co. 10.875% 5/1/09 |
B2 |
|
340,000 |
337,450 |
|
|
|
675,075 |
||||
|
Metals & Mining - 0.0% |
|||||
|
Kaiser Aluminum & Chemical Corp. |
B3 |
|
160,000 |
145,600 |
|
|
Packaging & Containers - 0.1% |
|||||
|
Gaylord Container Corp. 9.75% 6/15/07 |
Caa1 |
|
210,000 |
163,800 |
|
|
Paper & Forest Products - 0.1% |
|||||
|
APP China Group Ltd. |
B3 |
|
150,000 |
94,500 |
|
|
|
|||||
|
Moody's Ratings (unaudited) (b) |
Principal Amount |
Value |
|||
|
Fort James Corp. |
Baa2 |
|
$ 45,000 |
$ 43,274 |
|
|
Repap New Brunswick, Inc. yankee 10.625% 4/15/05 |
Caa1 |
|
230,000 |
202,400 |
|
|
|
340,174 |
||||
|
TOTAL BASIC INDUSTRIES |
1,324,649 |
||||
|
CONSTRUCTION & REAL ESTATE - 1.1% |
|||||
|
Building Materials - 0.1% |
|||||
|
Dayton Superior Corp. |
B3 |
|
160,000 |
158,400 |
|
|
Construction - 0.0% |
|||||
|
Lennar Corp. |
Ba1 |
|
25,000 |
24,625 |
|
|
Real Estate - 0.2% |
|||||
|
Duke Realty LP |
Baa1 |
|
500,000 |
491,350 |
|
|
LNR Property Corp. |
B1 |
|
160,000 |
139,200 |
|
|
|
630,550 |
||||
|
Real Estate Investment Trusts - 0.8% |
|||||
|
CenterPoint Properties Trust 6.75% 4/1/05 |
Baa2 |
|
100,000 |
93,160 |
|
|
Equity Office |
|
|
|
|
|
|
6.5% 1/15/04 |
Baa1 |
|
1,000,000 |
954,410 |
|
|
6.625% 2/15/05 |
Baa1 |
|
200,000 |
188,948 |
|
|
6.75% 2/15/08 |
Baa1 |
|
100,000 |
91,609 |
|
|
Ocwen Asset Investment Corp. 11.5% 7/1/05 |
- |
|
120,000 |
92,400 |
|
|
ProLogis Trust |
Baa1 |
|
70,000 |
66,675 |
|
|
Spieker Properties LP: |
|
|
|
|
|
|
6.8% 5/1/04 |
Baa2 |
|
90,000 |
86,265 |
|
|
6.875% 2/1/05 |
Baa2 |
|
1,000,000 |
956,150 |
|
|
|
2,529,617 |
||||
|
TOTAL CONSTRUCTION & REAL ESTATE |
3,343,192 |
||||
|
ENERGY - 0.6% |
|||||
|
Coal - 0.0% |
|||||
|
P&L Coal Holdings Corp. 9.625% 5/15/08 |
B2 |
|
135,000 |
125,213 |
|
|
Energy Services - 0.0% |
|||||
|
R&B Falcon Corp. |
Ba3 |
|
100,000 |
109,000 |
|
|
Oil & Gas - 0.6% |
|||||
|
Anadarko Petroleum Corp. 7.2% 3/15/29 |
Baa1 |
|
385,000 |
351,209 |
|
|
Apache Corp.: |
|
|
|
|
|
|
7.625% 7/1/19 |
Baa1 |
|
155,000 |
149,662 |
|
|
7.7% 3/15/26 |
Baa1 |
|
65,000 |
62,636 |
|
|
Corporate Bonds - continued |
|||||
|
Moody's Ratings (unaudited) (b) |
Principal Amount |
Value |
|||
|
Nonconvertible Bonds - continued |
|||||
|
ENERGY - continued |
|||||
|
Oil & Gas - continued |
|||||
|
Apache Finance Property Ltd. 6.5% 12/15/07 |
Baa1 |
|
$ 100,000 |
$ 90,750 |
|
|
Chesapeake Energy Corp. 9.625% 5/1/05 |
B2 |
|
250,000 |
243,750 |
|
|
Conoco, Inc. |
A3 |
|
125,000 |
119,300 |
|
|
Ocean Energy, Inc. |
Ba1 |
|
190,000 |
179,550 |
|
|
Phillips Petroleum Co. 6.375% 3/30/09 |
Baa2 |
|
250,000 |
225,868 |
|
|
Plains Resources, Inc. Series B 10.25% 3/15/06 |
B2 |
|
200,000 |
198,000 |
|
|
YPF Sociedad Anonima |
B1 |
|
50,000 |
49,050 |
|
|
|
1,669,775 |
||||
|
TOTAL ENERGY |
1,903,988 |
||||
|
FINANCE - 3.0% |
|||||
|
Banks - 1.1% |
|||||
|
ABN-Amro Bank NV, Chicago 6.625% 10/31/01 |
A1 |
|
500,000 |
494,055 |
|
|
Bank of Tokyo-Mitsubishi Ltd. 8.4% 4/15/10 |
A3 |
|
200,000 |
201,960 |
|
|
BankBoston Corp. |
A3 |
|
200,000 |
192,736 |
|
|
Barclays Bank PLC yankee 5.95% 7/15/01 |
A1 |
|
350,000 |
347,501 |
|
|
Capital One Bank |
Baa2 |
|
250,000 |
239,713 |
|
|
Capital One Financial Corp. 7.125% 8/1/08 |
Baa3 |
|
210,000 |
195,437 |
|
|
Commonwealth Bank of Australia 8.5% 6/1/10 |
A1 |
|
100,000 |
103,774 |
|
|
Korea Development Bank: |
|
|
|
|
|
|
6.625% 11/21/03 |
Baa2 |
|
170,000 |
163,537 |
|
|
7.375% 9/17/04 |
Baa2 |
|
160,000 |
155,056 |
|
|
MBNA Corp.: |
|
|
|
|
|
|
6.34% 6/2/03 |
Baa2 |
|
100,000 |
95,790 |
|
|
6.875% 11/15/02 |
Baa2 |
|
300,000 |
295,734 |
|
|
Sanwa Finance Aruba AEC 8.35% 7/15/09 |
Baa1 |
|
600,000 |
597,336 |
|
|
Sumitomo Bank International Finance NV 8.5% 6/15/09 |
Baa1 |
|
100,000 |
100,469 |
|
|
Summit Bancorp |
BBB+ |
|
100,000 |
101,231 |
|
|
|
3,284,329 |
||||
|
|
|||||
|
Moody's Ratings (unaudited) (b) |
Principal Amount |
Value |
|||
|
Credit & Other Finance - 1.8% |
|||||
|
Ahmanson Capital Trust I 8.36% 12/1/26 (g) |
A3 |
|
$ 250,000 |
$ 227,325 |
|
|
AMRESCO, Inc. |
Caa3 |
|
220,000 |
102,300 |
|
|
Associates Corp. of North America 6% 7/15/05 |
Aa3 |
|
250,000 |
233,693 |
|
|
Bellsouth Capital Funding Corp. 7.75% 2/15/10 |
Aa3 |
|
160,000 |
160,006 |
|
|
Daimler-Chrysler NA Holding Corp. |
A1 |
|
100,000 |
98,811 |
|
|
ERP Operating LP: |
|
|
|
|
|
|
6.55% 11/15/01 |
A3 |
|
50,000 |
49,279 |
|
|
7.1% 6/23/04 |
A3 |
|
200,000 |
193,952 |
|
|
Finova Capital Corp.: |
|
|
|
|
|
|
6.11% 2/18/03 |
Baa2 |
|
200,000 |
176,000 |
|
|
7.25% 11/8/04 |
Baa2 |
|
100,000 |
89,000 |
|
|
Ford Motor Credit Co.: |
|
|
|
|
|
|
6.5% 2/28/02 |
A2 |
|
1,000,000 |
984,150 |
|
|
7.875% 6/15/10 |
A2 |
|
1,040,000 |
1,041,477 |
|
|
Household Finance Corp. 8% 5/9/05 |
A2 |
|
300,000 |
302,541 |
|
|
Imperial Credit Capital Trust I 10.25% 6/14/02 |
B2 |
|
20,000 |
17,000 |
|
|
Imperial Credit Industries 9.875% 1/15/07 |
B3 |
|
330,000 |
237,600 |
|
|
Newcourt Credit Group, Inc. 6.875% 2/16/05 |
A1 |
|
340,000 |
323,513 |
|
|
Sprint Capital Corp.: |
|
|
|
|
|
|
5.875% 5/1/04 |
Baa1 |
|
375,000 |
353,265 |
|
|
6.875% 11/15/28 |
Baa1 |
|
735,000 |
635,510 |
|
|
Trizec Finance Ltd. yankee 10.875% 10/15/05 |
Baa3 |
|
100,000 |
98,000 |
|
|
TXU Eastern Funding 6.75% 5/15/09 |
Baa1 |
|
100,000 |
89,417 |
|
|
U.S. West Capital Funding, Inc. 6.875% 7/15/28 |
Baa1 |
|
60,000 |
51,537 |
|
|
|
5,464,376 |
||||
|
Savings & Loans - 0.1% |
|||||
|
Long Island Savings Bank FSB 6.2% 4/2/01 |
Baa3 |
|
500,000 |
499,445 |
|
|
TOTAL FINANCE |
9,248,150 |
||||
|
HEALTH - 0.0% |
|||||
|
Medical Facilities Management - 0.0% |
|||||
|
Unilab Corp. |
B3 |
|
70,000 |
72,100 |
|
|
INDUSTRIAL MACHINERY & EQUIPMENT - 0.4% |
|||||
|
Industrial Machinery & Equipment - 0.3% |
|||||
|
Tyco International Group SA yankee 6.875% 1/15/29 |
Baa1 |
|
1,000,000 |
844,770 |
|
|
Corporate Bonds - continued |
|||||
|
Moody's Ratings (unaudited) (b) |
Principal Amount |
Value |
|||
|
Nonconvertible Bonds - continued |
|||||
|
INDUSTRIAL MACHINERY & EQUIPMENT - continued |
|||||
|
Pollution Control - 0.1% |
|||||
|
Allied Waste |
|
|
|
|
|
|
7.625% 1/1/06 |
Ba2 |
|
$ 155,000 |
$ 134,850 |
|
|
7.875% 1/1/09 |
Ba2 |
|
170,000 |
144,500 |
|
|
WMX Technologies, Inc. 7.1% 8/1/26 |
Ba1 |
|
120,000 |
112,946 |
|
|
|
392,296 |
||||
|
TOTAL INDUSTRIAL MACHINERY & EQUIPMENT |
1,237,066 |
||||
|
MEDIA & LEISURE - 3.0% |
|||||
|
Broadcasting - 2.6% |
|||||
|
ACME Television LLC/ACME Financial Corp. 0% 9/30/04 (e) |
B3 |
|
200,000 |
191,000 |
|
|
Adelphia Communications Corp. 9.875% 3/1/05 |
B1 |
|
150,000 |
146,250 |
|
|
Ascent Entertainment Group, Inc. 0% 12/15/04 (e) |
Ba1 |
|
230,000 |
186,300 |
|
|
British Sky Broadcasting Group PLC 8.2% 7/15/09 |
Baa3 |
|
650,000 |
608,036 |
|
|
Cable Satisfaction International, Inc. 12.75% 3/1/10 |
Caa1 |
|
200,000 |
194,500 |
|
|
Callahan Nordrhein Westfalen 14% 7/15/10 (g) |
B3 |
|
250,000 |
250,000 |
|
|
CapStar Broadcasting Partners, Inc. |
B2 |
|
190,000 |
173,375 |
|
|
Charter Communications Holdings LLC/Charter Communications Holdings Capital Corp.: |
|
|
|
|
|
|
0% 1/15/10 (e) |
B2 |
|
320,000 |
181,600 |
|
|
8.25% 4/1/07 |
B2 |
|
180,000 |
159,300 |
|
|
8.625% 4/1/09 |
B2 |
|
180,000 |
158,850 |
|
|
Continental Cablevision, Inc. 8.3% 5/15/06 |
A2 |
|
215,000 |
220,093 |
|
|
Diamond Cable Communications PLC |
B3 |
|
210,000 |
161,175 |
|
|
Earthwatch, Inc. 0% 7/15/07 unit (e)(g) |
- |
|
130,000 |
83,200 |
|
|
EchoStar DBS Corp. 9.375% 2/1/09 |
B2 |
|
260,000 |
250,900 |
|
|
Impsat Fiber Networks, Inc. 13.75% 2/15/05 (g) |
B3 |
|
195,000 |
173,550 |
|
|
International Cabletel, Inc. 0% 2/1/06 (e) |
B3 |
|
250,000 |
230,000 |
|
|
LIN Holdings Corp. |
B3 |
|
270,000 |
177,525 |
|
|
|
|||||
|
Moody's Ratings (unaudited) (b) |
Principal Amount |
Value |
|||
|
Nielsen Media Research, Inc. 7.6% 6/15/09 |
Baa2 |
|
$ 150,000 |
$ 143,127 |
|
|
NorthPoint Communication Holdings, Inc. 12.875% 2/15/10 |
Caa1 |
|
150,000 |
103,500 |
|
|
NTL, Inc. 0% 4/1/08 (e) |
B3 |
|
560,000 |
347,200 |
|
|
Olympus Communications LP/Olympus Capital Corp. 10.625% 11/15/06 |
B1 |
|
170,000 |
166,600 |
|
|
Satelites Mexicanos SA de CV 11.28% 6/30/04 (g)(i) |
B1 |
|
74,000 |
67,340 |
|
|
Shaw Communications, Inc. 8.25% 4/11/10 |
Baa2 |
|
140,000 |
141,135 |
|
|
Spectrasite Holdings, Inc.: |
|
|
|
|
|
|
0% 3/15/10 (e) |
B3 |
|
65,000 |
34,938 |
|
|
10.75% 3/15/10 |
B3 |
|
25,000 |
24,875 |
|
|
TCI Communications Financing III |
A3 |
|
180,000 |
198,864 |
|
|
Telewest PLC 0% 10/1/07 (e) |
B1 |
|
270,000 |
257,850 |
|
|
Time Warner, Inc. |
Baa3 |
|
910,000 |
927,918 |
|
|
UIH Australia/Pacific, Inc.: |
|
|
|
|
|
|
Series B 0% 5/15/06 (e) |
B2 |
|
380,000 |
349,600 |
|
|
Series D 0% 5/15/06 (e) |
B2 |
|
30,000 |
27,600 |
|
|
United Pan-Europe Communications NV: |
|
|
|
|
|
|
0% 8/1/09 (e) |
B2 |
|
230,000 |
115,000 |
|
|
0% 2/1/10 (e) |
B2 |
|
270,000 |
126,900 |
|
|
10.875% 11/1/07 |
B2 |
|
480,000 |
432,000 |
|
|
10.875% 8/1/09 |
B2 |
|
275,000 |
242,000 |
|
|
11.25% 11/1/09 |
B2 |
|
15,000 |
13,125 |
|
|
USA Networks, Inc./USANi LLC |
Baa3 |
|
580,000 |
552,450 |
|
|
|
7,817,676 |
||||
|
Entertainment - 0.0% |
|||||
|
Regal Cinemas, Inc. 9.5% 6/1/08 |
Ca |
|
355,000 |
88,750 |
|
|
Lodging & Gaming - 0.0% |
|||||
|
Horseshoe Gaming LLC 8.625% 5/15/09 |
B2 |
|
70,000 |
65,800 |
|
|
KSL Recreation Group, Inc. 10.25% 5/1/07 |
B2 |
|
90,000 |
85,500 |
|
|
|
151,300 |
||||
|
Publishing - 0.3% |
|||||
|
News America Holdings, Inc. 7.375% 10/17/08 |
Baa3 |
|
500,000 |
480,685 |
|
|
News America, Inc.: |
|
|
|
|
|
|
7.125% 4/8/28 |
Baa3 |
|
80,000 |
66,850 |
|
|
7.28% 6/30/28 |
Baa3 |
|
200,000 |
172,432 |
|
|
7.3% 4/30/28 |
Baa3 |
|
170,000 |
145,143 |
|
|
|
865,110 |
||||
|
Corporate Bonds - continued |
|||||
|
Moody's Ratings (unaudited) (b) |
Principal Amount |
Value |
|||
|
Nonconvertible Bonds - continued |
|||||
|
MEDIA & LEISURE - continued |
|||||
|
Restaurants - 0.1% |
|||||
|
AFC Enterprises, Inc. 10.25% 5/15/07 |
B3 |
|
$ 170,000 |
$ 161,500 |
|
|
TOTAL MEDIA & LEISURE |
9,084,336 |
||||
|
NONDURABLES - 0.2% |
|||||
|
Beverages - 0.1% |
|||||
|
Seagram JE & Sons, Inc.: |
|
|
|
|
|
|
6.625% 12/15/05 |
Baa3 |
|
150,000 |
143,370 |
|
|
6.8% 12/15/08 |
Baa3 |
|
200,000 |
187,565 |
|
|
|
330,935 |
||||
|
Tobacco - 0.1% |
|||||
|
RJ Reynolds Tobacco Holdings, Inc. |
Baa2 |
|
200,000 |
185,752 |
|
|
TOTAL NONDURABLES |
516,687 |
||||
|
RETAIL & WHOLESALE - 0.3% |
|||||
|
Drug Stores - 0.1% |
|||||
|
Rite Aid Corp.: |
|
|
|
|
|
|
6.5% 12/15/05 (g) |
Caa1 |
|
420,000 |
216,300 |
|
|
7.125% 1/15/07 |
Caa1 |
|
110,000 |
58,300 |
|
|
|
274,600 |
||||
|
General Merchandise Stores - 0.1% |
|||||
|
Federated Department Stores, Inc. |
Baa1 |
|
500,000 |
483,520 |
|
|
Grocery Stores - 0.1% |
|||||
|
Jitney-Jungle Stores |
|
|
|
|
|
|
10.375% 9/15/07 (d) |
C |
|
450,000 |
9,000 |
|
|
12% 3/1/06 (d) |
Caa3 |
|
10,000 |
1,250 |
|
|
Kroger Co. 6% 7/1/00 |
Baa3 |
|
200,000 |
199,962 |
|
|
|
210,212 |
||||
|
TOTAL RETAIL & WHOLESALE |
968,332 |
||||
|
SERVICES - 0.1% |
|||||
|
Printing - 0.0% |
|||||
|
Sullivan Graphics, Inc. 12.75% 8/1/05 |
Caa1 |
|
40,000 |
40,200 |
|
|
Services - 0.1% |
|||||
|
SITEL Corp. |
B3 |
|
250,000 |
220,000 |
|
|
TOTAL SERVICES |
260,200 |
||||
|
|
|||||
|
Moody's Ratings (unaudited) (b) |
Principal Amount |
Value |
|||
|
TECHNOLOGY - 0.6% |
|||||
|
Computer Services & Software - 0.3% |
|||||
|
Concentric Network Corp. 12.75% 12/15/07 |
B- |
|
$ 50,000 |
$ 52,500 |
|
|
Covad Communications Group, Inc. |
B3 |
|
355,000 |
275,125 |
|
|
Exodus Communications, Inc. 11.625% 7/15/10 (g) |
B |
|
280,000 |
281,400 |
|
|
PSINet, Inc. |
B3 |
|
260,000 |
239,200 |
|
|
|
848,225 |
||||
|
Computers & Office Equipment - 0.2% |
|||||
|
Comdisco, Inc.: |
|
|
|
|
|
|
5.95% 4/30/02 |
Baa1 |
|
300,000 |
284,763 |
|
|
7.25% 9/1/02 |
Baa1 |
|
250,000 |
241,973 |
|
|
Globix Corp. |
B- |
|
95,000 |
78,375 |
|
|
|
605,111 |
||||
|
Electronic Instruments - 0.0% |
|||||
|
Telecommunications Techniques Co. LLC 9.75% 5/15/08 |
B3 |
|
80,000 |
73,600 |
|
|
Electronics - 0.1% |
|||||
|
ChipPAC International Ltd. 12.75% 8/1/09 |
B3 |
|
40,000 |
43,000 |
|
|
Hadco Corp. |
B2 |
|
140,000 |
140,350 |
|
|
SCG Holding Corp./Semiconductor Components Industries LLC 12% 8/1/09 |
B2 |
|
52,000 |
55,510 |
|
|
|
238,860 |
||||
|
TOTAL TECHNOLOGY |
1,765,796 |
||||
|
TRANSPORTATION - 0.9% |
|||||
|
Air Transportation - 0.4% |
|||||
|
Atlas Air, Inc.: |
|
|
|
|
|
|
8.77% 1/2/11 |
Ba1 |
|
86,129 |
83,115 |
|
|
9.375% 11/15/06 |
B3 |
|
220,000 |
213,400 |
|
|
Continental Airlines, Inc. pass thru trust certificates: |
|
|
|
|
|
|
7.434% 3/15/06 |
Baa1 |
|
70,000 |
67,683 |
|
|
7.73% 9/15/12 |
Baa1 |
|
28,243 |
26,975 |
|
|
Delta Air Lines, Inc. |
Baa3 |
|
500,000 |
464,750 |
|
|
US Air, Inc. |
B3 |
|
430,000 |
425,700 |
|
|
|
1,281,623 |
||||
|
Railroads - 0.5% |
|||||
|
Burlington Northern |
|
|
|
|
|
|
6.875% 12/1/27 |
Baa2 |
|
1,000,000 |
860,780 |
|
|
Corporate Bonds - continued |
|||||
|
Moody's Ratings (unaudited) (b) |
Principal Amount |
Value |
|||
|
Nonconvertible Bonds - continued |
|||||
|
TRANSPORTATION - continued |
|||||
|
Railroads - continued |
|||||
|
Burlington Northern |
|
|
|
|
|
|
7.29% 6/1/36 |
Baa2 |
|
$ 150,000 |
$ 146,609 |
|
|
Norfolk Southern Corp. 7.05% 5/1/37 |
Baa1 |
|
340,000 |
332,302 |
|
|
|
1,339,691 |
||||
|
TOTAL TRANSPORTATION |
2,621,314 |
||||
|
UTILITIES - 3.4% |
|||||
|
Cellular - 0.5% |
|||||
|
Cellnet Data Systems, Inc. 0% 10/1/07 (e) |
- |
|
300,000 |
24,000 |
|
|
Clearnet Communications, Inc. yankee 0% 12/15/05 (e) |
B3 |
|
200,000 |
206,000 |
|
|
Crown Castle International Corp. 10.75% 8/1/11 |
B3 |
|
45,000 |
45,675 |
|
|
Dobson Communications Corp. 10.875% 7/1/10 (g) |
- |
|
50,000 |
50,375 |
|
|
Leap Wireless International, Inc.: |
|
|
|
|
|
|
0% 4/15/10 (e)(g) |
- |
|
65,000 |
27,300 |
|
|
12.5% 4/15/10 (g) |
Caa2 |
|
75,000 |
66,000 |
|
|
McCaw International Ltd. 0% 4/15/07 (e) |
Caa1 |
|
270,000 |
205,200 |
|
|
Millicom International Cellular SA |
Caa1 |
|
241,000 |
204,850 |
|
|
Nextel |
|
|
|
|
|
|
0% 10/31/07 (e) |
B1 |
|
420,000 |
312,900 |
|
|
9.375% 11/15/09 |
B1 |
|
170,000 |
163,200 |
|
|
VoiceStream |
|
|
|
|
|
|
0% 11/15/09 (e) |
B2 |
|
295,000 |
197,650 |
|
|
10.375% 11/15/09 |
B2 |
|
170,000 |
176,800 |
|
|
|
1,679,950 |
||||
|
Electric Utility - 0.4% |
|||||
|
Avon Energy Partners Holdings 6.46% 3/4/08 (g) |
Baa2 |
|
300,000 |
267,204 |
|
|
Dominion Resources, Inc. 8.125% 6/15/10 |
Baa1 |
|
165,000 |
166,115 |
|
|
Illinois Power Co. |
Baa1 |
|
150,000 |
146,427 |
|
|
Israel Electric Corp. Ltd. 7.75% 12/15/27 (g) |
A3 |
|
545,000 |
467,147 |
|
|
|
|||||
|
Moody's Ratings (unaudited) (b) |
Principal Amount |
Value |
|||
|
Niagara Mohawk Power Corp. 8.875% 5/15/07 |
Baa3 |
|
$ 75,000 |
$ 77,640 |
|
|
Texas Utilities Co. |
Baa3 |
|
100,000 |
90,325 |
|
|
|
1,214,858 |
||||
|
Gas - 0.3% |
|||||
|
CMS Panhandle |
|
|
|
|
|
|
6.125% 3/15/04 |
Baa3 |
|
150,000 |
141,675 |
|
|
7% 7/15/29 |
Baa3 |
|
150,000 |
125,880 |
|
|
Reliant Energy Resources Corp. 8.125% 7/15/05 (g) |
Baa1 |
|
500,000 |
499,900 |
|
|
|
767,455 |
||||
|
Telephone Services - 2.2% |
|||||
|
Allegiance Telecom, Inc. 12.875% 5/15/08 |
B3 |
|
200,000 |
216,500 |
|
|
Cable & Wireless Optus Ltd. 8% 6/22/10 (g) |
Baa1 |
|
700,000 |
695,681 |
|
|
Deutsche Telekom International Finance BV 8.25% 6/15/30 |
Aa2 |
|
935,000 |
949,895 |
|
|
Esat Telecom Group PLC 0% 2/1/07 (e) |
Aa1 |
|
230,000 |
213,900 |
|
|
Global Crossing Holdings Ltd. 9.625% 5/15/08 |
Ba2 |
|
180,000 |
176,400 |
|
|
Global TeleSystems Group, Inc. 9.875% 2/15/05 |
Caa1 |
|
330,000 |
227,700 |
|
|
Globenet Communication Group Ltd. |
Caa1 |
|
560,000 |
565,600 |
|
|
Hermes Europe Railtel BV 11.5% 8/15/07 |
B3 |
|
150,000 |
125,250 |
|
|
ICG Holdings, Inc. |
B3 |
|
260,000 |
249,600 |
|
|
Intermedia Communications, Inc. |
B3 |
|
330,000 |
200,475 |
|
|
KMC Telecom Holdings, Inc. 13.5% 5/15/09 |
Caa2 |
|
170,000 |
141,100 |
|
|
NEXTLINK Communications, Inc. |
B2 |
|
500,000 |
287,500 |
|
|
Ono Finance PLC |
Caa1 |
|
215,000 |
203,175 |
|
|
Rhythms NetConnections, Inc. 14% 2/15/10 (g) |
B3 |
|
200,000 |
144,000 |
|
|
Telecomunicaciones de Puerto Rico, Inc. |
Baa2 |
|
220,000 |
204,882 |
|
|
Teleglobe Canada, Inc.: |
|
|
|
|
|
|
7.2% 7/20/09 |
Baa1 |
|
449,000 |
429,626 |
|
|
7.7% 7/20/29 |
Baa1 |
|
666,000 |
627,152 |
|
|
Versatel Telecom |
B3 |
|
150,000 |
152,250 |
|
|
Viatel, Inc. 11.25% 4/15/08 |
B3 |
|
250,000 |
187,500 |
|
|
Corporate Bonds - continued |
|||||
|
Moody's Ratings (unaudited) (b) |
Principal Amount |
Value |
|||
|
Nonconvertible Bonds - continued |
|||||
|
UTILITIES - continued |
|||||
|
Telephone Services - continued |
|||||
|
WinStar Communications, Inc. 12.75% 4/15/10 (g) |
B3 |
|
$ 450,000 |
$ 434,250 |
|
|
WorldCom, Inc. |
A3 |
|
184,000 |
190,782 |
|
|
|
6,623,218 |
||||
|
TOTAL UTILITIES |
10,285,481 |
||||
|
TOTAL NONCONVERTIBLE BONDS |
42,871,953 |
||||
|
TOTAL CORPORATE BONDS (Cost $48,683,174) |
46,399,900 |
||||
|
U.S. Government and Government |
|||||
|
|
|||||
|
U.S. Government Agency Obligations - 1.7% |
|||||
|
Fannie Mae: |
|
|
|
|
|
|
6.5% 4/29/09 |
Aaa |
|
1,600,000 |
1,494,752 |
|
|
7.125% 2/15/05 |
Aaa |
|
1,315,000 |
1,320,339 |
|
|
7.25% 5/15/30 |
Aaa |
|
660,000 |
673,435 |
|
|
Federal Home Loan Bank 7.59% 3/10/05 |
Aaa |
|
190,000 |
193,859 |
|
|
Freddie Mac: |
|
|
|
|
|
|
5.75% 3/15/09 |
Aaa |
|
800,000 |
728,624 |
|
|
6.25% 7/15/04 |
Aaa |
|
310,000 |
301,379 |
|
|
6.875% 1/15/05 |
Aaa |
|
185,000 |
183,844 |
|
|
7% 7/15/05 |
Aaa |
|
250,000 |
249,650 |
|
|
Government Trust Certificates (assets of Trust guaranteed by U.S. Government through Defense Security Assistance Agency) Class 2-E, 9.4% 5/15/02 |
Aaa |
|
34,670 |
35,168 |
|
|
Tennessee Valley Authority 7.125% 5/1/30 |
Aaa |
|
140,000 |
140,588 |
|
|
TOTAL U.S. GOVERNMENT AGENCY OBLIGATIONS |
5,321,638 |
||||
|
U.S. Treasury Obligations - 8.7% |
|||||
|
U.S. Treasury Bonds: |
|
|
|
|
|
|
6.125% 8/15/29 |
Aaa |
|
1,660,000 |
1,676,600 |
|
|
8.875% 8/15/17 |
Aaa |
|
3,805,000 |
4,850,195 |
|
|
9.875% 11/15/15 |
Aaa |
|
625,000 |
847,463 |
|
|
14% 11/15/11 |
Aaa |
|
490,000 |
680,488 |
|
|
U.S. Treasury Notes: |
|
|
|
|
|
|
5.5% 5/31/03 |
Aaa |
|
6,000,000 |
5,861,220 |
|
|
5.5% 2/15/08 |
Aaa |
|
100,000 |
95,719 |
|
|
5.625% 9/30/01 |
Aaa |
|
140,000 |
138,512 |
|
|
|
|||||
|
Moody's Ratings (unaudited) (b) |
Principal Amount |
Value |
|||
|
5.875% 10/31/01 |
Aaa |
|
$ 1,950,000 |
$ 1,934,771 |
|
|
5.875% 11/15/04 |
Aaa |
|
2,850,000 |
2,808,590 |
|
|
6.5% 5/31/02 |
Aaa |
|
3,010,000 |
3,013,763 |
|
|
7% 7/15/06 |
Aaa |
|
3,750,000 |
3,885,938 |
|
|
U.S. Treasury Notes - |
Aaa |
|
1,430,000 |
709,652 |
|
|
TOTAL U.S. TREASURY OBLIGATIONS |
26,502,911 |
||||
|
TOTAL U.S. GOVERNMENT AND GOVERNMENT AGENCY OBLIGATIONS (Cost $31,715,419) |
31,824,549 |
||||
|
U.S. Government Agency - |
|||||
|
|
|||||
|
Fannie Mae - 9.1% |
|||||
|
5.5% 2/1/11 |
Aaa |
|
156,534 |
145,429 |
|
|
6% 4/1/09 to 1/1/29 |
Aaa |
|
1,860,194 |
1,734,133 |
|
|
6.5% 11/1/25 to 7/1/29 |
Aaa |
|
11,136,937 |
10,514,432 |
|
|
6.5% 7/1/30 (h) |
Aaa |
|
3,500,000 |
3,298,750 |
|
|
7% 12/1/24 to 9/1/28 |
Aaa |
|
3,344,454 |
3,236,903 |
|
|
7.5% 5/1/15 to 1/1/30 |
Aaa |
|
8,490,673 |
8,375,883 |
|
|
8% 12/1/29 |
Aaa |
|
499,027 |
501,053 |
|
|
TOTAL FANNIE MAE |
27,806,583 |
||||
|
Freddie Mac - 0.1% |
|||||
|
7.5% 1/1/27 |
Aaa |
|
367,456 |
363,782 |
|
|
Government National Mortgage Association - 3.8% |
|||||
|
6.5% 4/15/28 to 4/15/29 |
Aaa |
|
10,337,543 |
9,813,560 |
|
|
7% 1/15/28 to 12/15/28 |
Aaa |
|
636,734 |
619,020 |
|
|
7.5% 6/15/27 to 3/15/28 |
Aaa |
|
1,153,223 |
1,145,846 |
|
|
TOTAL GOVERNMENT NATIONAL |
11,578,426 |
||||
|
TOTAL U.S. GOVERNMENT AGENCY - (Cost $41,146,234) |
39,748,791 |
||||
|
Asset-Backed Securities - 0.8% |
|||||
|
|
|||||
|
American Express Credit Account Master Trust |
A1 |
|
200,000 |
192,297 |
|
|
Ford Credit Auto |
|
|
|
|
|
|
6.2% 12/15/02 |
Aa2 |
|
510,000 |
503,067 |
|
|
6.4% 12/15/02 |
Aa2 |
|
80,000 |
78,960 |
|
|
7.03% 11/15/03 |
Aaa |
|
145,000 |
144,887 |
|
|
Key Auto Finance Trust: |
|
|
|
|
|
|
6.3% 10/15/03 |
A2 |
|
197,699 |
196,711 |
|
|
6.65% 10/15/03 |
Baa3 |
|
59,053 |
58,979 |
|
|
Asset-Backed Securities - continued |
|||||
|
Moody's Ratings (unaudited) (b) |
Principal Amount |
Value |
|||
|
Premier Auto Trust |
Aaa |
|
$ 1,000,000 |
$ 970,310 |
|
|
Sears Credit Account Master Trust II |
A2 |
|
200,000 |
200,000 |
|
|
TOTAL ASSET-BACKED SECURITIES (Cost $2,390,044) |
2,345,211 |
||||
|
Commercial Mortgage Securities - 0.9% |
|||||
|
|
|||||
|
CS First Boston Mortgage Securities Corp.: |
|
|
|
|
|
|
Series 1997-C2 Class D, 7.27% 1/17/35 |
Baa2 |
|
220,000 |
202,245 |
|
|
Series 1998-FL1: |
|
|
|
|
|
|
Class D, 7.1415% 12/10/00 (g)(i) |
A2 |
|
300,000 |
299,543 |
|
|
Class E, 7.4913% 1/10/13 (g)(i) |
Baa2 |
|
420,000 |
418,130 |
|
|
DLJ Commercial Mortgage Corp. 7.62% 5/10/10 |
Aaa |
|
500,000 |
501,484 |
|
|
GS Mortgage Securities Corp. II Series 1998-GLII Class E, 7.1905% 4/13/31 (g)(i) |
Baa3 |
|
500,000 |
432,285 |
|
|
Prudential Securities Secd Financing Corp. Series 2000-C1, Class A2 7.727% 2/15/10 |
Aaa |
|
450,000 |
454,359 |
|
|
Thirteen Affiliates of General Growth Properties, Inc. sequential pay Series 1 Class A2, 6.602% 12/15/10 (g) |
Aaa |
|
500,000 |
473,242 |
|
|
TOTAL COMMERCIAL MORTGAGE SECURITIES (Cost $2,876,556) |
2,781,288 |
||||
|
Foreign Government and Government |
|||||
|
|
|||||
|
Korean Republic yankee: |
|
|
|
|
|
|
8.75% 4/15/03 |
Baa2 |
|
80,000 |
81,437 |
|
|
8.875% 4/15/08 |
Baa2 |
|
116,000 |
119,654 |
|
|
Quebec Province yankee: |
|
|
|
|
|
|
6.86% 4/15/26 (f) |
A2 |
|
250,000 |
240,255 |
|
|
7.125% 2/9/24 |
A2 |
|
30,000 |
28,337 |
|
|
7.5% 7/15/23 |
A2 |
|
30,000 |
29,574 |
|
|
United Mexican States 9.875% 2/1/10 |
Baa3 |
|
200,000 |
209,000 |
|
|
TOTAL FOREIGN GOVERNMENT AND GOVERNMENT AGENCY OBLIGATIONS (Cost $727,451) |
708,257 |
||||
|
Supranational Obligations - 0.2% |
|||||
|
Moody's Ratings (unaudited) (b) |
Principal Amount |
Value |
|||
|
Inter-American Development Bank yankee 6.29% 7/16/27 |
Aaa |
|
$ 500,000 |
$ 476,310 |
|
|
Cash Equivalents - 3.0% |
|||
|
Shares |
|
||
|
Taxable Central Cash Fund, |
9,219,794 |
9,219,794 |
|
|
TOTAL INVESTMENT PORTFOLIO - 100.9% (Cost $271,264,000) |
307,839,743 |
||
|
NET OTHER ASSETS - (0.9)% |
(2,855,046) |
||
|
NET ASSETS - 100% |
$ 304,984,697 |
||
|
Security Type Abbreviations |
||
|
PIES |
- |
Premium Income Equity Securities |
|
Legend |
|
(a) Non-income producing |
|
(b) S&P credit ratings are used in the absence of a rating by Moody's Investors Service, Inc. |
|
(c) The rate quoted is the annualized seven-day yield of the fund at |
|
(d) Non-income producing - issuer filed for protection under the |
|
(e) Debt obligation initially issued in zero coupon form which converts to coupon form at a specified rate and date. The rate shown is the rate at period end. |
|
(f) Debt obligation initially issued at one coupon which converts to a higher coupon at a specified date. The rate shown is the rate at period end. |
|
(g) Security exempt from registration under Rule 144A of the Securities Act |
|
(h) Security purchased on a delayed delivery or when-issued basis. |
|
(i) The coupon rate shown on floating or adjustable rate securities represents the rate at period end. |
|
(j) For foreign government obligations not individually rated by S&P |
|
(k) Restricted securities - Investment in securities not registered under the Securities Act of 1933. |
|
Additional information on each holding is as follows: |
|
Security |
Acquisition Date |
Acquisition Cost |
|
Mothers Work, Inc. |
6/18/98 |
$ 18 |
|
Other Information |
|
The composition of long-term debt holdings as a percentage of total value |
|
Moody's Ratings |
S&P Ratings |
|||
|
Aaa, Aa, A |
27.2% |
|
AAA, AA, A |
25.5% |
|
Baa |
6.9% |
|
BBB |
5.9% |
|
Ba |
0.4% |
|
BB |
0.6% |
|
B |
3.9% |
|
B |
4.7% |
|
Caa |
0.9% |
|
CCC |
0.7% |
|
Ca, C |
0.0% |
|
CC, C |
0.0% |
|
|
|
|
D |
0.0% |
|
The percentage not rated by Moody's or S&P amounted to 0.5%. FMR has determined that unrated debt securities that are lower quality account for 0.5% of the total value of investment in securities. |
|
Purchases and sales of securities, other than short-term securities, aggregated $224,411,074 and $262,292,592, respectively, of which long-term U.S. government and government agency obligations aggregated $59,871,450 and $60,369,656, respectively. |
|
The fund placed a portion of its portfolio transactions with brokerage firms which are affiliates of Fidelity Management & Research Company. The commissions paid to these affiliated firms were $8,986 for the period. |
|
The fund invested in securities that are not registered under the Securities Act of 1933. These securities are subject to legal or contractual restrictions on resale. At the end of the period, restricted securities (excluding Rule 144A issues) amounted to $34 and 0% of net assets. |
|
Income Tax Information |
|
At June 30, 2000, the aggregate cost of investment securities for income tax purposes was $266,299,649. Net unrealized appreciation aggregated $41,540,094, of which $50,485,729 related to appreciated investment securities and $8,945,635 related to depreciated investment securities. |
See accompanying notes which are an integral part of the financial statements.
Balanced Portfolio
Statement of Assets and Liabilities
|
|
June 30, 2000 (Unaudited) |
|
|
Assets |
|
|
|
Investment in securities, at value |
|
$ 307,839,743 |
|
Commitment to sell securities on a delayed delivery basis |
$ (5,690,625) |
|
|
Receivable for securities sold on a delayed delivery basis |
5,685,000 |
(5,625) |
|
Receivable for investments sold, regular delivery |
|
3,535,259 |
|
Cash |
|
23,298 |
|
Receivable for fund shares sold |
|
242,446 |
|
Dividends receivable |
|
49,966 |
|
Interest receivable |
|
1,666,464 |
|
Other receivables |
|
44,424 |
|
Total assets |
|
313,395,975 |
|
Liabilities |
|
|
|
Payable for investments purchased |
4,592,826 |
|
|
Delayed delivery |
3,294,642 |
|
|
Payable for fund shares redeemed |
376,552 |
|
|
Accrued management fee |
108,417 |
|
|
Distribution fees payable |
2,544 |
|
|
Other payables and |
36,297 |
|
|
Total liabilities |
|
8,411,278 |
|
Net Assets |
|
$ 304,984,697 |
|
Net Assets consist of: |
|
|
|
Paid in capital |
|
$ 259,384,219 |
|
Undistributed net investment income |
|
5,026,674 |
|
Accumulated undistributed net realized gain (loss) on investments and foreign currency transactions |
|
4,004,148 |
|
Net unrealized appreciation (depreciation) on investments |
|
36,569,656 |
|
Net Assets |
|
$ 304,984,697 |
|
Initial Class: |
|
$15.09 |
|
Service Class: |
|
$15.03 |
|
Service Class 2: |
|
$15.02 |
Statement of Operations
|
|
Six months ended June 30, 2000 (Unaudited) |
|
|
Investment Income Dividends |
|
$ 1,026,288 |
|
Interest |
|
4,833,980 |
|
Security lending |
|
131 |
|
Total income |
|
5,860,399 |
|
Expenses |
|
|
|
Management fee |
$ 667,765 |
|
|
Transfer agent fees |
101,971 |
|
|
Distribution fees |
13,916 |
|
|
Accounting and security lending fees |
59,780 |
|
|
Non-interested trustees' compensation |
506 |
|
|
Custodian fees and expenses |
13,860 |
|
|
Audit |
14,098 |
|
|
Legal |
1,823 |
|
|
Reports to shareholders |
309 |
|
|
Miscellaneous |
137 |
|
|
Total expenses before reductions |
874,165 |
|
|
Expense reductions |
(26,193) |
847,972 |
|
Net investment income |
|
5,012,427 |
|
Realized and Unrealized Gain (Loss) Net realized gain (loss) on: |
|
|
|
Investment securities |
4,969,880 |
|
|
Foreign currency transactions |
(4,097) |
4,965,783 |
|
Change in net unrealized appreciation (depreciation) on: |
|
|
|
Investment securities |
(11,411,603) |
|
|
Assets and liabilities in |
(1,569) |
|
|
Delayed delivery commitments |
(5,625) |
(11,418,797) |
|
Net gain (loss) |
|
(6,453,014) |
|
Net increase (decrease) in net assets resulting from operations |
|
$ (1,440,587) |
|
Other Information Expense reductions |
|
$ 25,816 |
|
Custodian credits |
|
377 |
|
|
|
$ 26,193 |
See accompanying notes which are an integral part of the financial statements.
Semiannual Report
Fidelity Variable Insurance Products: Balanced Portfolio
Financial Statements - continued
Statement of Changes in Net Assets
|
Increase (Decrease) in Net Assets |
Six months ended |
Year ended |
|
Operations |
$ 5,012,427 |
$ 10,132,202 |
|
Net realized gain (loss) |
4,965,783 |
7,580,954 |
|
Change in net unrealized appreciation (depreciation) |
(11,418,797) |
(2,525,268) |
|
Net increase (decrease) in net assets resulting from operations |
(1,440,587) |
15,187,888 |
|
Distributions to shareholders |
(10,025,969) |
(7,479,403) |
|
From net realized gain |
(8,369,238) |
(8,692,279) |
|
Total distributions |
(18,395,207) |
(16,171,682) |
|
Share transactions - net increase (decrease) |
(27,604,335) |
36,165,081 |
|
Total increase (decrease) in net assets |
(47,440,129) |
35,181,287 |
|
Net Assets |
|
|
|
Beginning of period |
352,424,826 |
317,243,539 |
|
End of period (including undistributed net investment income of $5,026,674 and $10,132,202, respectively) |
$ 304,984,697 |
$ 352,424,826 |
|
|
|
Other Information: |
|
|
Six months ended June 30, 2000 |
Year ended |
||
|
|
Shares |
Dollars |
Shares |
Dollars |
|
Share transactions |
800,778 |
$ 11,898,820 |
4,444,110 |
$ 70,037,773 |
|
Reinvested |
1,146,173 |
16,906,054 |
1,027,536 |
15,608,277 |
|
Redeemed |
(4,066,967) |
(61,054,219) |
(4,234,242) |
(66,752,172) |
|
Net increase (decrease) |
(2,120,016) |
$ (32,249,345) |
1,237,404 |
$ 18,893,878 |
|
Service Class |
289,094 |
$ 4,329,594 |
1,108,300 |
$ 17,387,242 |
|
Reinvested |
100,855 |
1,483,571 |
37,189 |
563,405 |
|
Redeemed |
(125,685) |
(1,874,764) |
(43,583) |
(679,444) |
|
Net increase (decrease) |
264,264 |
$ 3,938,401 |
1,101,906 |
$ 17,271,203 |
|
Service Class 2 A |
47,040 |
$ 701,059 |
- |
$ - |
|
Reinvested |
380 |
5,581 |
- |
- |
|
Redeemed |
(2) |
(31) |
- |
- |
|
Net increase (decrease) |
47,418 |
$ 706,609 |
- |
$ - |
|
Distributions |
|
$ 9,221,484 |
|
$ 7,218,828 |
|
Service Class |
|
801,470 |
|
260,575 |
|
Service Class 2 A |
|
3,015 |
|
- |
|
Total |
|
$ 10,025,969 |
|
$ 7,479,403 |
|
From net realized gain |
|
$ 7,684,570 |
|
$ 8,389,449 |
|
Service Class |
|
682,102 |
|
302,830 |
|
Service Class 2 A |
|
2,566 |
|
- |
|
Total |
|
$ 8,369,238 |
|
$ 8,692,279 |
|
|
|
$ 18,395,207 |
|
$ 16,171,682 |
A Service Class 2 commenced sale of shares January 12, 2000.
See accompanying notes which are an integral part of the financial statements.
Balanced Portfolio
Financial Highlights - Initial Class
|
|
Six months ended |
Years ended December 31, |
||||
|
Selected Per-Share Data |
(Unaudited) |
1999 |
1998 |
1997 |
1996 |
1995 H |
|
Net asset value, beginning of period |
$ 16.00 |
$ 16.11 |
$ 14.58 |
$ 12.23 |
$ 11.17 |
$ 10.00 |
|
Income from Investment Operations |
|
|
|
|
|
|
|
Net investment income |
.24 D |
.45 D |
.44 D |
.44 D |
.33 |
.14 |
|
Net realized and unrealized gain (loss) |
(.27) |
.24 |
2.00 |
2.22 |
.78 |
1.25 |
|
Total from investment operations |
(.03) |
.69 |
2.44 |
2.66 |
1.11 |
1.39 |
|
Less Distributions |
|
|
|
|
|
|
|
From net investment income |
(.48) |
(.37) |
(.36) |
(.31) |
(.01) |
(.14) |
|
From net realized gain |
(.40) |
(.43) |
(.55) |
- |
(.04) |
(.08) |
|
Total distributions |
(.88) |
(.80) |
(.91) |
(.31) |
(.05) |
(.22) |
|
Net asset value, end of period |
$ 15.09 |
$ 16.00 |
$ 16.11 |
$ 14.58 |
$ 12.23 |
$ 11.17 |
|
Total Return B, C |
(0.06)% |
4.55% |
17.64% |
22.18% |
9.98% |
13.92% |
|
Ratios and Supplemental Data |
|
|
|
|
|
|
|
Net assets, end of period (000 omitted) |
$ 274,792 |
$ 325,371 |
$ 307,681 |
$ 214,538 |
$ 103,110 |
$ 43,155 |
|
Ratio of expenses to average net assets |
.55% A |
.57% |
.59% |
.61% |
.72% |
1.42% F |
|
Ratio of expenses to average net assets after |
.53% A, G |
.55% G |
.58% G |
.60% G |
.71% G |
1.42% |
|
Ratio of net investment income to average net assets |
3.20% A |
2.87% |
2.94% |
3.28% |
3.63% |
3.56% |
|
Portfolio turnover |
148% A |
108% |
94% |
98% |
163% |
248% |
Financial Highlights - Service Class
|
|
Six months ended |
Years ended December 31, |
||
|
Selected Per-Share Data |
(Unaudited) |
1999 |
1998 |
1997 E |
|
Net asset value, beginning of period |
$ 15.94 |
$ 16.07 |
$ 14.59 |
$ 14.16 |
|
Income from Investment Operations |
|
|
|
|
|
Net investment income D |
.23 |
.43 |
.41 |
.08 |
|
Net realized and unrealized gain (loss) |
(.27) |
.24 |
1.98 |
.35 |
|
Total from investment operations |
(.04) |
.67 |
2.39 |
.43 |
|
Less Distributions |
|
|
|
|
|
From net investment income |
(.47) |
(.37) |
(.36) |
- |
|
From net realized gain |
(.40) |
(.43) |
(.55) |
- |
|
Total distributions |
(.87) |
(.80) |
(.91) |
- |
|
Net asset value, end of period |
$ 15.03 |
$ 15.94 |
$ 16.07 |
$ 14.59 |
|
Total Return B, C |
(0.13)% |
4.43% |
17.27% |
3.04% |
|
Ratios and Supplemental Data |
|
|
|
|
|
Net assets, end of period (000 omitted) |
$ 29,480 |
$ 27,054 |
$ 9,562 |
$ 10 |
|
Ratio of expenses to average net assets |
.65% A |
.67% |
.70% |
.71% A |
|
Ratio of expenses to average net assets after expense reductions |
.63% A, G |
.66% G |
.69% G |
.71% A |
|
Ratio of net investment income to average net assets |
3.10% A |
2.77% |
2.79% |
3.43% A |
|
Portfolio turnover |
148% A |
108% |
94% |
98% |
|
A Annualized B The total returns would have been lower had certain expenses not been reduced during the periods shown. C Total returns for periods of less than one year are not annualized and do not reflect charges attributable to your insurance company's separate account. Inclusion of these charges would reduce the total returns shown. D Net investment income per share has been calculated based on average shares outstanding during the period. E For the period November 3, 1997 (commencement of sale of Service Class shares) to December 31, 1997. F FMR agreed to reimburse a portion of the class' expenses during the period. Without this reimbursement, the class' expense ratio would have been higher. G FMR or the fund has entered into varying arrangements with third parties who either paid or reduced a portion of the class' expenses. H For the period January 3, 1995 (commencement of operations of Initial Class shares) to December 31, 1995. |
||||
See accompanying notes which are an integral part of the financial statements.
Semiannual Report
Financial Highlights - Service Class 2
|
|
Six months ended |
|
Selected Per-Share Data |
(Unaudited) |
|
Net asset value, beginning of period |
$ 15.59 |
|
Income from Investment Operations |
|
|
Net investment income D |
.20 |
|
Net realized and unrealized gain (loss) |
.10 G |
|
Total from investment operations |
.30 |
|
Less Distributions |
|
|
From net investment income |
(.47) |
|
From net realized gain |
(.40) |
|
Total distributions |
(.87) |
|
Net asset value, end of period |
$ 15.02 |
|
Total Return B, C |
2.05% |
|
Ratios and Supplemental Data |
|
|
Net assets, end of period (000 omitted) |
$ 712 |
|
Ratio of expenses to average net assets |
.79% A |
|
Ratio of expenses to average net assets after expense reductions |
.77% A, F |
|
Ratio of net investment income to average net assets |
2.96% A |
|
Portfolio turnover |
148% A |
|
A Annualized B The total returns would have been lower had certain expenses not been reduced during the periods shown. C Total returns for periods of less than one year are not annualized and do not reflect charges attributable to your insurance company's separate account. Inclusion of these charges would reduce the total returns shown. D Net investment income per share has been calculated based on average shares outstanding during the period. E For the period January 12, 2000 (commencement of sale of Service Class 2 shares) to June 30, 2000. F FMR or the fund has entered into varying arrangements with third parties who either paid or reduced a portion of the class' expenses. G The amount shown for a share outstanding does not correspond with the aggregate net loss on investments for the period due to the timing of sales and repurchases of class shares in relation to fluctuating market values of the investments of the fund. |
|
See accompanying notes which are an integral part of the financial statements.
Balanced Portfolio
A special meeting of the fund's shareholders was held on July 19, 2000. The results of votes taken among shareholders on proposals before them are reported below. Each vote reported represents one dollar of net asset value held on the record date for the meeting.
PROPOSAL 1
To elect as Trustees the following twelve nominees.*
|
|
# of Dollars Voted |
% of Dollars Voted |
Ralph F. Cox
|
Affirmative |
2,995,348,207.84 |
97.862 |
|
Withheld |
65,444,305.52 |
2.138 |
|
TOTAL |
3,060,792,513.36 |
100.000 |
Phyllis Burke Davis
|
Affirmative |
2,995,012,849.06 |
97.851 |
|
Withheld |
65,779,664.30 |
2.149 |
|
TOTAL |
3,060,792,513.36 |
100.000 |
Robert M. Gates
|
Affirmative |
2,994,325,628.16 |
97.828 |
|
Withheld |
66,466,885.20 |
2.172 |
|
TOTAL |
3,060,792,513.36 |
100.000 |
Edward C. Johnson 3d
|
Affirmative |
2,994,212,266.77 |
97.825 |
|
Withheld |
66,580,246.59 |
2.175 |
|
TOTAL |
3,060,792,513.36 |
100.000 |
Donald J. Kirk
|
Affirmative |
2,996,527,468.99 |
97.900 |
|
Withheld |
64,265,044.37 |
2.100 |
|
TOTAL |
3,060,792,513.36 |
100.000 |
Ned C. Lautenbach
|
Affirmative |
2,997,430,896.97 |
97.930 |
|
Withheld |
63,361,616.39 |
2.070 |
|
TOTAL |
3,060,792,513.36 |
100.000 |
|
|
# of Dollars Voted |
% of Dollars Voted |
Peter S. Lynch
|
Affirmative |
2,997,391,112.97 |
97.929 |
|
Withheld |
63,401,400.39 |
2.071 |
|
TOTAL |
3,060,792,513.36 |
100.000 |
William O. McCoy
|
Affirmative |
2,997,364,420.76 |
97.928 |
|
Withheld |
63,428,092.60 |
2.072 |
|
TOTAL |
3,060,792,513.36 |
100.000 |
Gerald C. McDonough
|
Affirmative |
2,992,594,911.89 |
97.772 |
|
Withheld |
68,197,601.47 |
2.228 |
|
TOTAL |
3,060,792,513.36 |
100.000 |
Marvin L. Mann
|
Affirmative |
2,996,491,839.67 |
97.899 |
|
Withheld |
64,300,673.69 |
2.101 |
|
TOTAL |
3,060,792,513.36 |
100.000 |
Robert C. Pozen
|
Affirmative |
2,997,304,419.99 |
97.926 |
|
Withheld |
63,488,093.37 |
2.074 |
|
TOTAL |
3,060,792,513.36 |
100.000 |
Thomas R. Williams
|
Affirmative |
2,993,561,996.24 |
97.803 |
|
Withheld |
67,230,517.12 |
2.197 |
|
TOTAL |
3,060,792,513.36 |
100.000 |
Semiannual Report
Proxy Voting Results - continued
PROPOSAL 2
To ratify the selection of Deloitte & Touche LLP as independent accountants of the fund.
|
|
# of Dollars Voted |
% of Dollars Voted |
|
Affirmative |
276,319,488.69 |
94.617 |
|
Against |
4,151,739.32 |
1.422 |
|
Abstain |
11,567,630.61 |
3.961 |
|
TOTAL |
292,038,858.62 |
100.000 |
PROPOSAL 3
To authorize the Trustees to adopt an Amended and Restated Declaration of Trust.*
|
|
# of Dollars Voted |
% of Dollars Voted |
|
Affirmative |
2,837,267,199.92 |
92.697 |
|
Against |
49,473,422.32 |
1.617 |
|
Abstain |
174,051,891.12 |
5.686 |
|
TOTAL |
3,060,792,513.36 |
100.000 |
PROPOSAL 4
To approve an amended management contract for the fund that would reduce the management fee payable to FMR by the fund as FMR's assets under management increase.
|
|
# of Dollars Voted |
% of Dollars Voted |
|
Affirmative |
272,189,750.93 |
93.203 |
|
Against |
4,507,278.92 |
1.544 |
|
Abstain |
15,341,828.77 |
5.253 |
|
TOTAL |
292,038,858.62 |
100.000 |
PROPOSAL 5
To approve an amended sub-advisory agreement with FMR U.K. to provide investment advice and research services or investment management services.
|
|
# of Dollars Voted |
% of Dollars Voted |
|
Affirmative |
268,161,500.09 |
91.824 |
|
Against |
5,337,639.43 |
1.828 |
|
Abstain |
18,539,719.10 |
6.348 |
|
TOTAL |
292,038,858.62 |
100.000 |
PROPOSAL 6
To approve an amended sub-advisory agreement with FMR Far East to provide investment advice and research services or investment management services.
|
|
# of Dollars Voted |
% of Dollars Voted |
|
Affirmative |
267,614,072.73 |
91.636 |
|
Against |
5,806,227.04 |
1.989 |
|
Abstain |
18,618,558.85 |
6.375 |
|
TOTAL |
292,038,858.62 |
100.000 |
PROPOSAL 7
To modify the fund's fundamental investment objective and eliminate a fundamental investment policy of the fund.
|
Affirmative |
267,914,892.06 |
91.739 |
|
Against |
7,333,491.83 |
2.512 |
|
Abstain |
16,790,474.73 |
5.749 |
|
TOTAL |
292,038,858.62 |
100.000 |
PROPOSAL 8
To amend the fundamental investment limitation concerning diversification.
|
Affirmative |
267,037,890.43 |
91.439 |
|
Against |
7,842,324.91 |
2.686 |
|
Abstain |
17,158,643.28 |
5.875 |
|
TOTAL |
292,038,858.62 |
100.000 |
PROPOSAL 9
To amend the fundamental investment limitation concerning underwriting.
|
|
# of Dollars Voted |
% of Dollars Voted |
|
Affirmative |
266,860,588.67 |
91.378 |
|
Against |
8,492,005.75 |
2.908 |
|
Abstain |
16,686,264.20 |
5.714 |
|
TOTAL |
292,038,858.62 |
100.000 |
PROPOSAL 10
To amend the fundamental investment limitation concerning concentration.
|
|
# of Dollars Voted |
% of Dollars Voted |
|
Affirmative |
267,900,537.74 |
91.735 |
|
Against |
7,342,176.47 |
2.514 |
|
Abstain |
16,796,144.41 |
5.751 |
|
TOTAL |
292,038,858.62 |
100.000 |
* Denotes trust-wide proposals and voting results.
Balanced Portfolio
Performance
There are several ways to evaluate a fund's historical performance. You can look at the total percentage change in value, the average annual percentage change or the growth of a hypothetical $10,000 investment. Total return reflects the change in the value of an investment, assuming reinvestment of the fund's dividend income and capital gains (the profits earned upon the sale of securities that have grown in value). The initial offering of Service Class 2 shares took place on January 12, 2000. Performance for Service Class 2 shares reflects an asset based distribution fee (12b-1 fee). Returns from November 3, 1997 to January 12, 2000 are those of Service Class which reflect a different 12b-1 fee. Service Class 2 returns prior to November 3, 1997 are those of Initial Class and do not include the effects of a 12b-1 fee. Had Service Class 2's 12b-1 fee been reflected, returns prior to January 12, 2000 would have been lower. If Fidelity had not reimbursed certain fund expenses, the past five year and life of fund total returns would have been lower.
Average Annual Total Returns
|
Periods ended |
Past 1 |
Past 5 |
Life of |
|
Fidelity VIP: Asset Mgr: Growth - |
5.63% |
17.09% |
17.77% |
|
Asset Manager: Growth Composite |
6.73% |
18.15% |
15.37% |
|
S&P 500 |
7.25% |
23.80% |
25.60% |
|
LB Aggregate Bond |
4.57% |
6.25% |
7.81% |
|
LB 3 Month T-Bill |
5.57% |
5.41% |
n/a* |
Average annual returns take the fund's cumulative return and show you what would have happened if the fund had performed at a constant rate each year.
You can compare the fund's returns to those of the Asset Manager: Growth Composite Index - a hypothetical combination of unmanaged indices. The composite index combines the total returns of the Standard & Poor's 500 Index, the Lehman Brothers Aggregate Bond Index and the Lehman Brothers 3 Month Treasury Bill Index weighted according to the fund's neutral mix.**
The benchmarks listed in the table above include reinvested dividends and capital gains, if any.
Figures for more than one year assume a steady compounded rate of return and are not the fund's year-by-year results, which fluctuated over the periods shown. The life of fund figures are from commencement of operations, January 3, 1995.
Performance numbers are net of all fund operating expenses, but do not include any insurance charges imposed by your insurance company's separate account. If performance information included the effect of these additional charges, the total return would have been lower.
Past performance is no guarantee of future results. Principal and investment return will vary and you may have a gain or loss when
you withdraw your money.
* not available
** 70% stocks, 25% bonds and 5% short-term instruments effective January 1, 1997.
Understanding Performance
How a fund did yesterday is no guarantee of how it will do tomorrow. The stock market, for example, has a history of long-term growth and short-term volatility. In turn, the share price and return of a fund that invests in stocks will vary. That means if you sell your shares during a market downturn, you might lose money. But if you can ride out the market's ups and downs, you may have a gain.
3$10,000 Over Life of Fund
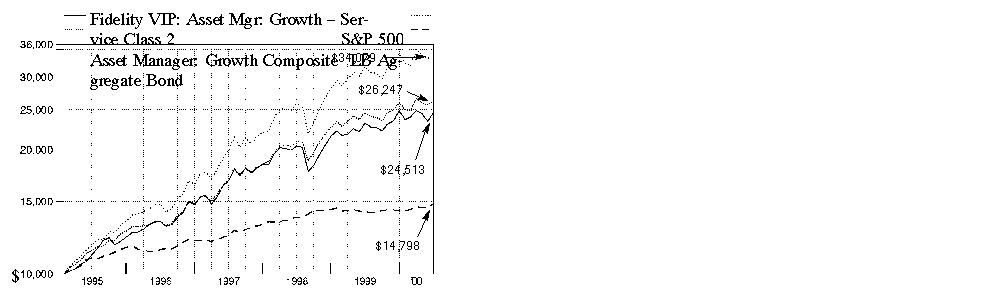
$10,000 Over Life of Fund: Let's say hypothetically that $10,000 was invested in Fidelity Variable Insurance Products: Asset Manager: Growth Portfolio -
Service Class 2 on January 31, 1995, shortly after the fund started. As the chart shows, by June 30, 2000, the value of the investment would have grown to $24,513
- a 145.13% increase. With reinvested dividends and capital gains, if any, a $10,000 investment in the Standard & Poor's 500 Index would have grown to $34,079
over the same period - a 240.79% increase. If $10,000 was invested in the Lehman Brothers Aggregate Bond Index, it would have grown to $14,798 - a 47.98%
increase.
You can also look at how the Asset Manager: Growth Composite Index did over the same period. With reinvested dividends and capital gains, if any, a $10,000
investment in the index would have grown to $26,247 - a 162.47% increase.
Investment Summary
|
Top Five Stocks as of June 30, 2000 |
|
|
|
% of fund's |
|
General Electric Co. |
2.8 |
|
Intel Corp. |
2.4 |
|
Cisco Systems, Inc. |
2.4 |
|
Microsoft Corp. |
2.3 |
|
Pfizer, Inc. |
1.6 |
|
|
11.5 |
|
Top Five Market Sectors as of June 30, 2000 |
|
|
(stocks only) |
% of fund's |
|
Technology |
29.1 |
|
Health |
9.3 |
|
Finance |
6.4 |
|
Utilities |
6.0 |
|
Energy |
4.5 |
|
Asset Allocation as of June 30, 2000 |
|||
|
% of fund's net assets * |
|||
|
Stock Class 73.4% |
|
|
|
Bond Class 20.6% |
|
|
|
Short-Term Class 6.0% |
|
|
|
* Foreign |
|
|
Asset allocations in the pie charts reflect the categorization of assets as defined in the fund's prospectus. Financial Statement categorizations conform to accounting standards and will differ from the pie chart.
Semiannual Report
(Portfolio Manager photograph)
Note to shareholders: Bart Grenier became Portfolio Manager of Asset Manager: Growth Portfolio on May 1, 2000.
Q. How did the fund perform, Bart?
A. For the six- and 12-month periods that ended June 30, 2000, the fund trailed the Asset Manager: Growth Composite Index, which returned 0.95% and 6.73%, respectively.
Q. What asset allocation strategies did you pursue during the six-month period?
A. The fund continued to slightly emphasize equities, with just over 71% of its assets on average invested in this class during the period. The fund's neutral allocation mix typically calls for 70% to be invested in stocks, 25% in bonds and 5% in short-term and money market instruments. Given the bullish environment for stocks in the first quarter of 2000, the fund's overexposure here garnered it an advantage over the composite index early in the period. However, even with the equity rally in June, the fund's gains during the period were more than offset by its losses suffered during the sharp, broad market decline of April and May. On the bond side, the fund focused on high-yield securities, which hurt, although our exposure to investment-grade debt did help offset some of those losses.
Q. What factors influenced performance of the equity subportfolio?
A. Steve Snider maintained the fund's tilt toward the sectors of the economy with a high growth orientation. The fund's overweighting in technology aided performance, as we were able to uncover several large, high-quality tech names that effectively weathered the correction in the spring and posted big numbers for the period. We also took advantage of several good growth stories among some smaller-cap companies that fared extremely well. Our best tech picks overall included Texas Instruments, LSI Logic, Integrated Device Technology and Comverse. The fund's exposure to health stocks, particularly IVAX, Techne and Pfizer, helped amid a rally in biotechnology shares. Growth-oriented financials, including mutual fund distributor Waddell & Reed and insurer American International Group, were meaningful contributors. Conversely, we were caught holding a handful of disappointments within the tech sector, notably Microsoft, Lucent Technologies, QLogic and Harmonic. Steve sold off fund positions in Waddell & Reed, QLogic and Harmonic prior to the close of the period. The decline in retail stocks during the period dragged down fund holdings Wal-Mart and Home Depot. Poorly performing utility stocks, most notably Qualcomm and AT&T, also weighed on performance. Overall, the equity subportfolio trailed the Standard & Poor's 500 Index slightly during the six-month period, but outperformed it during the past 12 months.
Q. How did the fund's bond subportfolio fare?
A. Charlie Morrison and his team did a nice job of positioning the investment-grade component of the fund to benefit from changing market conditions. The decision to reduce the fund's exposure to long-term corporate bonds was a good one, as the performance of these securities deteriorated along side all other spread sectors during the period. A driving influence at this time was the U.S. Treasury's announcement in January of its intention to reduce new borrowing and use government surplus proceeds to repurchase outstanding debt. This move sparked a tremendous rally in long-term Treasuries. So, despite the Federal Reserve Board's actions to raise rates during the period, the much improved supply/demand picture painted by the Treasury buybacks led to a positive return for the investment-grade subportfolio. On the other hand, high-yield bonds suffered from poor liquidity and declining credit quality. Fred Hoff - who directed the fund's high-yield investments until June 1, 2000, when Mark Notkin took over - helped limit our losses by avoiding the names that fell the furthest amid the period's downtrend.
Q. And the fund's short-term/money market investments?
A. John Todd felt that concerns surrounding Y2K were overblown and, thus, used the opportunity to extend the average maturity of the fund's money-market subportfolio early on to take advantage of a steeply sloped yield curve. Early in 2000, however, the yield curve flattened out dramatically. In response, we let the average maturity roll down, believing that strong economic growth and the risk of rising inflation were likely to set off a protracted period of Fed tightening. Shareholders should note that John may choose to invest in a money market mutual fund rather than invest directly in money market securities in the future.
Q. What's your outlook?
A. It's still unclear as to whether or not the Fed can successfully orchestrate a soft landing, which would be very constructive for stocks. There's a lot of conflicting evidence out there in terms of economic data that will have to get cleared up before we can know for sure if the economy has actually slowed down a couple notches to be considered a soft landing. Until then, I think we'll be in sort of a narrow trading range in terms of the equity market. Security selection in this type of environment will become even more important, which bodes well for us given the strength of Fidelity's research.
The views expressed in this report reflect those of the portfolio manager only through the end of the period of the report as stated on the cover. The manager's views are subject to change at any time based on market or other conditions. For more information, see page 2.
Fund Facts
Goal: maximize total return over the long term by allocating its assets among stocks, bonds and short-term instruments
Start date: January 3, 1995
Size: as of June 30, 2000, more than
$564 million
Manager: Bart Grenier, since May 2000; joined Fidelity in 1991
3Semiannual Report
Fidelity Variable Insurance Products: Asset Manager: Growth Portfolio
(Unaudited)
Showing Percentage of Net Assets
|
Common Stocks - 68.7% |
|||
|
Shares |
Value (Note 1) |
||
|
AEROSPACE & DEFENSE - 0.3% |
|||
|
Northrop Grumman Corp. |
8,400 |
$ 556,500 |
|
|
Textron, Inc. |
16,700 |
907,019 |
|
|
|
1,463,519 |
||
|
BASIC INDUSTRIES - 0.8% |
|||
|
Chemicals & Plastics - 0.6% |
|||
|
Eastman Chemical Co. |
8,600 |
410,650 |
|
|
Engelhard Corp. |
24,200 |
412,913 |
|
|
Pharmacia Corp. |
38,700 |
2,000,306 |
|
|
Praxair, Inc. |
11,500 |
430,531 |
|
|
W.R. Grace & Co. (a) |
37,300 |
452,263 |
|
|
|
3,706,663 |
||
|
Paper & Forest Products - 0.2% |
|||
|
Westvaco Corp. |
39,800 |
987,538 |
|
|
TOTAL BASIC INDUSTRIES |
4,694,201 |
||
|
CONSTRUCTION & REAL ESTATE - 0.1% |
|||
|
Engineering - 0.1% |
|||
|
MasTec, Inc. (a) |
20,100 |
767,569 |
|
|
DURABLES - 0.2% |
|||
|
Consumer Durables - 0.1% |
|||
|
Minnesota Mining & Manufacturing Co. |
5,500 |
453,750 |
|
|
Consumer Electronics - 0.1% |
|||
|
Whirlpool Corp. |
8,300 |
386,988 |
|
|
Textiles & Apparel - 0.0% |
|||
|
Liz Claiborne, Inc. |
10,400 |
366,600 |
|
|
TOTAL DURABLES |
1,207,338 |
||
|
ENERGY - 4.5% |
|||
|
Energy Services - 0.1% |
|||
|
BJ Services Co. (a) |
11,900 |
743,750 |
|
|
Oil & Gas - 4.4% |
|||
|
Amerada Hess Corp. |
28,000 |
1,729,000 |
|
|
EOG Resources, Inc. |
25,400 |
850,900 |
|
|
Exxon Mobil Corp. |
106,800 |
8,383,800 |
|
|
Murphy Oil Corp. |
28,200 |
1,676,138 |
|
|
Noble Affiliates, Inc. |
21,300 |
793,425 |
|
|
Occidental Petroleum Corp. |
89,600 |
1,887,200 |
|
|
Ocean Energy, Inc. (a) |
136,900 |
1,942,269 |
|
|
Royal Dutch Petroleum Co. (NY Shares) |
66,300 |
4,081,594 |
|
|
Tosco Corp. |
26,600 |
753,113 |
|
|
Valero Energy Corp. |
54,400 |
1,727,200 |
|
|
Vintage Petroleum, Inc. |
35,800 |
807,738 |
|
|
|
24,632,377 |
||
|
TOTAL ENERGY |
25,376,127 |
||
|
|
|||
|
Shares |
Value (Note 1) |
||
|
FINANCE - 6.4% |
|||
|
Banks - 1.1% |
|||
|
Bank of America Corp. |
50,800 |
$ 2,184,400 |
|
|
Northern Trust Corp. |
10,100 |
657,131 |
|
|
Silicon Valley Bancshares (a) |
36,600 |
1,560,075 |
|
|
Wells Fargo & Co. |
51,000 |
1,976,250 |
|
|
|
6,377,856 |
||
|
Credit & Other Finance - 1.7% |
|||
|
American Express Co. |
41,400 |
2,157,975 |
|
|
Citigroup, Inc. |
125,700 |
7,573,425 |
|
|
|
9,731,400 |
||
|
Insurance - 1.9% |
|||
|
American International Group, Inc. |
47,100 |
5,534,250 |
|
|
CIGNA Corp. |
22,300 |
2,085,050 |
|
|
First Health Group Corp. (a) |
23,500 |
771,094 |
|
|
Hartford Financial Services Group, Inc. |
13,500 |
755,156 |
|
|
Marsh & McLennan Companies, Inc. |
7,100 |
741,506 |
|
|
PMI Group, Inc. |
13,200 |
627,000 |
|
|
|
10,514,056 |
||
|
Savings & Loans - 0.2% |
|||
|
Dime Bancorp, Inc. |
37,000 |
582,750 |
|
|
Golden West Financial Corp. |
17,300 |
706,056 |
|
|
|
1,288,806 |
||
|
Securities Industry - 1.5% |
|||
|
Bear Stearns Companies, Inc. |
33,900 |
1,411,088 |
|
|
Eaton Vance Corp. (non-vtg.) |
19,100 |
883,375 |
|
|
Lehman Brothers Holdings, Inc. |
16,700 |
1,579,194 |
|
|
Merrill Lynch & Co., Inc. |
14,600 |
1,679,000 |
|
|
Morgan Stanley Dean Witter & Co. |
35,200 |
2,930,400 |
|
|
|
8,483,057 |
||
|
TOTAL FINANCE |
36,395,175 |
||
|
HEALTH - 9.2% |
|||
|
Drugs & Pharmaceuticals - 6.2% |
|||
|
American Home Products Corp. |
40,400 |
2,373,500 |
|
|
Amgen, Inc. |
31,600 |
2,219,900 |
|
|
Andrx Corp. (a) |
14,700 |
939,652 |
|
|
Bristol-Myers Squibb Co. |
61,300 |
3,570,725 |
|
|
Eli Lilly & Co. |
33,700 |
3,365,788 |
|
|
Forest Laboratories, Inc. (a) |
9,400 |
949,400 |
|
|
IVAX Corp. (a) |
63,500 |
2,635,250 |
|
|
Jones Pharma, Inc. |
41,100 |
1,641,431 |
|
|
Merck & Co., Inc. |
70,700 |
5,417,388 |
|
|
Pfizer, Inc. |
192,675 |
9,248,400 |
|
|
Schering-Plough Corp. |
45,400 |
2,292,700 |
|
|
|
34,654,134 |
||
|
Medical Equipment & Supplies - 2.0% |
|||
|
Abbott Laboratories |
47,000 |
2,094,438 |
|
|
Johnson & Johnson |
43,000 |
4,380,625 |
|
|
Millipore Corp. |
15,300 |
1,153,238 |
|
|
Common Stocks - continued |
|||
|
Shares |
Value (Note 1) |
||
|
HEALTH - continued |
|||
|
Medical Equipment & Supplies - continued |
|||
|
Techne Corp. (a) |
22,400 |
$ 2,912,000 |
|
|
Varian Medical Systems, Inc. (a) |
19,000 |
743,375 |
|
|
|
11,283,676 |
||
|
Medical Facilities Management - 1.0% |
|||
|
Quest Diagnostics, Inc. (a) |
14,100 |
1,053,975 |
|
|
Trigon Healthcare, Inc. (a) |
20,300 |
1,046,719 |
|
|
UnitedHealth Group, Inc. |
32,400 |
2,778,300 |
|
|
Universal Health Services, Inc. Class B (a) |
14,100 |
923,550 |
|
|
|
5,802,544 |
||
|
TOTAL HEALTH |
51,740,354 |
||
|
INDUSTRIAL MACHINERY & EQUIPMENT - 4.4% |
|||
|
Electrical Equipment - 3.5% |
|||
|
Adtran, Inc. (a) |
25,300 |
1,514,838 |
|
|
General Electric Co. |
304,600 |
16,143,777 |
|
|
Scientific-Atlanta, Inc. |
30,600 |
2,279,700 |
|
|
|
19,938,315 |
||
|
Industrial Machinery & Equipment - 0.9% |
|||
|
Asyst Technologies, Inc. (a) |
37,800 |
1,294,650 |
|
|
Deere & Co. |
34,400 |
1,272,800 |
|
|
Tyco International Ltd. |
52,300 |
2,477,713 |
|
|
|
5,045,163 |
||
|
TOTAL INDUSTRIAL MACHINERY & EQUIPMENT |
24,983,478 |
||
|
MEDIA & LEISURE - 2.7% |
|||
|
Broadcasting - 0.5% |
|||
|
NTL, Inc. warrants 10/14/08 (a) |
427 |
17,507 |
|
|
Time Warner, Inc. |
39,800 |
3,024,800 |
|
|
|
3,042,307 |
||
|
Entertainment - 1.3% |
|||
|
Mandalay Resort Group (a) |
65,300 |
1,306,000 |
|
|
Viacom, Inc. Class B (non-vtg.) (a) |
47,100 |
3,211,631 |
|
|
Walt Disney Co. |
64,000 |
2,484,000 |
|
|
|
7,001,631 |
||
|
Leisure Durables & Toys - 0.2% |
|||
|
Brunswick Corp. |
30,300 |
501,844 |
|
|
Callaway Golf Co. |
30,700 |
500,794 |
|
|
|
1,002,638 |
||
|
Publishing - 0.6% |
|||
|
Dow Jones & Co., Inc. |
18,400 |
1,347,800 |
|
|
Gannett Co., Inc. |
7,100 |
424,669 |
|
|
McGraw-Hill Companies, Inc. |
25,600 |
1,382,400 |
|
|
The New York Times Co. Class A |
11,200 |
442,400 |
|
|
|
3,597,269 |
||
|
|
|||
|
Shares |
Value (Note 1) |
||
|
Restaurants - 0.1% |
|||
|
Brinker International, Inc. (a) |
18,300 |
$ 535,275 |
|
|
TOTAL MEDIA & LEISURE |
15,179,120 |
||
|
NONDURABLES - 2.4% |
|||
|
Beverages - 1.4% |
|||
|
Anheuser-Busch Companies, Inc. |
13,500 |
1,008,281 |
|
|
Pepsi Bottling Group, Inc. |
84,200 |
2,457,588 |
|
|
The Coca-Cola Co. |
76,400 |
4,388,225 |
|
|
|
7,854,094 |
||
|
Foods - 0.6% |
|||
|
Quaker Oats Co. |
14,100 |
1,059,263 |
|
|
Sysco Corp. |
49,400 |
2,080,975 |
|
|
|
3,140,238 |
||
|
Household Products - 0.4% |
|||
|
Procter & Gamble Co. |
40,700 |
2,330,075 |
|
|
TOTAL NONDURABLES |
13,324,407 |
||
|
PRECIOUS METALS - 0.0% |
|||
|
Placer Dome, Inc. |
11,500 |
107,970 |
|
|
RETAIL & WHOLESALE - 3.2% |
|||
|
Apparel Stores - 0.6% |
|||
|
Talbots, Inc. |
30,000 |
1,648,125 |
|
|
The Limited, Inc. |
45,600 |
986,100 |
|
|
Venator Group, Inc. (a) |
79,600 |
815,900 |
|
|
|
3,450,125 |
||
|
General Merchandise Stores - 1.7% |
|||
|
BJ's Wholesale Club, Inc. (a) |
49,600 |
1,636,800 |
|
|
Wal-Mart Stores, Inc. |
137,800 |
7,940,725 |
|
|
|
9,577,525 |
||
|
Retail & Wholesale, Miscellaneous - 0.9% |
|||
|
Home Depot, Inc. |
71,200 |
3,555,550 |
|
|
Tiffany & Co., Inc. |
24,300 |
1,640,250 |
|
|
|
5,195,800 |
||
|
TOTAL RETAIL & WHOLESALE |
18,223,450 |
||
|
SERVICES - 0.5% |
|||
|
Advertising - 0.2% |
|||
|
TMP Worldwide, Inc. (a) |
12,100 |
893,131 |
|
|
Services - 0.3% |
|||
|
Manpower, Inc. |
6,600 |
211,200 |
|
|
Robert Half International, Inc. (a) |
25,200 |
718,200 |
|
|
Teletech Holdings, Inc. (a) |
25,900 |
804,519 |
|
|
|
1,733,919 |
||
|
TOTAL SERVICES |
2,627,050 |
||
|
Common Stocks - continued |
|||
|
Shares |
Value (Note 1) |
||
|
TECHNOLOGY - 29.1% |
|||
|
Communications Equipment - 6.2% |
|||
|
ADC Telecommunications, Inc. (a) |
11,300 |
$ 947,788 |
|
|
Cable Design Technologies Corp. (a) |
40,800 |
1,366,800 |
|
|
Cisco Systems, Inc. (a) |
213,700 |
13,583,306 |
|
|
Comverse Technology, Inc. (a) |
17,700 |
1,646,100 |
|
|
Corning, Inc. |
8,500 |
2,293,938 |
|
|
Lucent Technologies, Inc. |
102,100 |
6,049,425 |
|
|
Nokia AB sponsored ADR |
14,300 |
714,106 |
|
|
Nortel Networks Corp. |
102,500 |
7,110,267 |
|
|
Tollgrade Communications, Inc. (a) |
11,200 |
1,484,000 |
|
|
|
35,195,730 |
||
|
Computer Services & Software - 6.2% |
|||
|
Adobe Systems, Inc. |
4,000 |
520,000 |
|
|
Amdocs Ltd. (a) |
10,300 |
790,525 |
|
|
America Online, Inc. (a) |
70,600 |
3,724,150 |
|
|
BEA Systems, Inc. (a) |
19,200 |
949,200 |
|
|
BroadVision, Inc. (a) |
10,800 |
548,775 |
|
|
Microsoft Corp. (a) |
161,000 |
12,880,000 |
|
|
Oracle Corp. (a) |
108,600 |
9,129,188 |
|
|
Remedy Corp. (a) |
16,100 |
897,575 |
|
|
Siebel Systems, Inc. (a) |
5,800 |
948,663 |
|
|
Sybase, Inc. (a) |
88,500 |
2,035,500 |
|
|
Symantec Corp. (a) |
11,300 |
609,494 |
|
|
Yahoo!, Inc. (a) |
16,800 |
2,081,100 |
|
|
|
35,114,170 |
||
|
Computers & Office Equipment - 4.6% |
|||
|
Apple Computer, Inc. (a) |
13,000 |
680,875 |
|
|
Dell Computer Corp. (a) |
79,300 |
3,910,481 |
|
|
EMC Corp. (a) |
66,800 |
5,139,425 |
|
|
Hewlett-Packard Co. |
37,800 |
4,720,275 |
|
|
International Business Machines Corp. |
53,700 |
5,883,506 |
|
|
Maxtor Corp. (a) |
55,900 |
590,444 |
|
|
Sun Microsystems, Inc. (a) |
57,500 |
5,228,906 |
|
|
|
26,153,912 |
||
|
Electronic Instruments - 2.5% |
|||
|
Applied Materials, Inc. (a) |
33,700 |
3,054,063 |
|
|
Credence Systems Corp. (a) |
30,200 |
1,666,663 |
|
|
Electro Scientific Industries, Inc. (a) |
29,600 |
1,303,325 |
|
|
KLA-Tencor Corp. (a) |
10,500 |
614,906 |
|
|
Kulicke & Soffa Industries, Inc. (a) |
13,700 |
813,438 |
|
|
LAM Research Corp. (a) |
39,100 |
1,466,250 |
|
|
LTX Corp. (a) |
19,700 |
688,269 |
|
|
Meade Instruments Corp. (a) |
64,400 |
1,618,050 |
|
|
Teradyne, Inc. (a) |
23,000 |
1,690,500 |
|
|
Trimble Navigation Ltd. (a) |
17,300 |
844,456 |
|
|
|
13,759,920 |
||
|
Electronics - 9.6% |
|||
|
Advanced Micro Devices, Inc. (a) |
27,200 |
2,101,200 |
|
|
Altera Corp. (a) |
20,300 |
2,069,331 |
|
|
Amkor Technology, Inc. (a) |
16,900 |
596,781 |
|
|
Amphenol Corp. Class A (a) |
39,600 |
2,621,025 |
|
|
|
|||
|
Shares |
Value (Note 1) |
||
|
Analog Devices, Inc. (a) |
22,500 |
$ 1,710,000 |
|
|
Arrow Electronics, Inc. (a) |
14,900 |
461,900 |
|
|
Atmel Corp. (a) |
36,700 |
1,353,313 |
|
|
AVX Corp. |
50,000 |
1,146,875 |
|
|
Burr-Brown Corp. (a) |
30,700 |
2,661,306 |
|
|
Cypress Semiconductor Corp. (a) |
38,900 |
1,643,525 |
|
|
Integrated Device Technology, Inc. (a) |
45,700 |
2,736,288 |
|
|
Intel Corp. |
103,400 |
13,823,288 |
|
|
International Rectifier Corp. (a) |
41,800 |
2,340,800 |
|
|
KEMET Corp. (a) |
49,800 |
1,248,113 |
|
|
LSI Logic Corp. (a) |
10,400 |
562,900 |
|
|
Microchip Technology, Inc. (a) |
10,800 |
629,269 |
|
|
Motorola, Inc. |
65,697 |
1,909,319 |
|
|
National Semiconductor Corp. (a) |
7,600 |
431,300 |
|
|
PMC-Sierra, Inc. (a) |
3,800 |
675,213 |
|
|
SDL, Inc. (a) |
3,900 |
1,112,231 |
|
|
Semtech Corp. (a) |
28,400 |
2,172,156 |
|
|
Technitrol, Inc. |
5,600 |
542,500 |
|
|
Texas Instruments, Inc. |
72,000 |
4,945,500 |
|
|
Three-Five Systems, Inc. (a) |
11,000 |
649,000 |
|
|
Vishay Intertechnology, Inc. (a) |
51,000 |
1,934,813 |
|
|
Xilinx, Inc. (a) |
24,100 |
1,989,756 |
|
|
|
54,067,702 |
||
|
TOTAL TECHNOLOGY |
164,291,434 |
||
|
TRANSPORTATION - 0.1% |
|||
|
Air Transportation - 0.0% |
|||
|
Delta Air Lines, Inc. |
4,600 |
232,588 |
|
|
Trucking & Freight - 0.1% |
|||
|
C.H. Robinson Worldwide, Inc. |
5,000 |
247,500 |
|
|
TOTAL TRANSPORTATION |
480,088 |
||
|
UTILITIES - 4.8% |
|||
|
Cellular - 0.2% |
|||
|
McCaw International Ltd. warrants 4/16/07 (a)(f) |
910 |
2,275 |
|
|
QUALCOMM, Inc. (a) |
5,500 |
330,000 |
|
|
Sprint Corp. - PCS Group Series 1 (a) |
13,500 |
803,250 |
|
|
|
1,135,525 |
||
|
Electric Utility - 1.0% |
|||
|
Calpine Corp. (a) |
29,400 |
1,933,050 |
|
|
Entergy Corp. |
26,400 |
717,750 |
|
|
PECO Energy Co. |
18,000 |
725,625 |
|
|
PPL Corp. |
30,900 |
677,869 |
|
|
Public Service Enterprise Group, Inc. |
24,800 |
858,700 |
|
|
TXU Corp. |
26,700 |
787,650 |
|
|
|
5,700,644 |
||
|
Gas - 0.3% |
|||
|
Columbia Energy Group |
12,000 |
787,500 |
|
|
Enron Corp. |
11,200 |
722,400 |
|
|
|
1,509,900 |
||
|
Common Stocks - continued |
|||
|
Shares |
Value (Note 1) |
||
|
UTILITIES - continued |
|||
|
Telephone Services - 3.3% |
|||
|
AT&T Corp. |
114,800 |
$ 3,630,550 |
|
|
Bell Atlantic Corp. |
48,000 |
2,439,000 |
|
|
BellSouth Corp. |
58,200 |
2,480,775 |
|
|
GTE Corp. |
29,800 |
1,855,050 |
|
|
Ono Finance PLC rights 5/31/09 (a)(f) |
310 |
3,100 |
|
|
Pathnet, Inc. warrants 4/15/08 (a)(f) |
840 |
8,400 |
|
|
SBC Communications, Inc. |
105,500 |
4,562,875 |
|
|
WorldCom, Inc. (a) |
87,800 |
4,027,825 |
|
|
|
19,007,575 |
||
|
TOTAL UTILITIES |
27,353,644 |
||
|
TOTAL COMMON STOCKS (Cost $325,944,798) |
388,214,924 |
||
|
Nonconvertible Preferred Stocks - 1.8% |
|||
|
|
|
|
|
|
CONSTRUCTION & REAL ESTATE - 0.1% |
|||
|
Real Estate Investment Trusts - 0.1% |
|||
|
California Federal Preferred Capital Corp. $2.2812 |
30,171 |
641,134 |
|
|
FINANCE - 0.0% |
|||
|
Insurance - 0.0% |
|||
|
American Annuity Group Capital Trust II 8.875% |
160 |
142,442 |
|
|
HEALTH - 0.1% |
|||
|
Medical Facilities Management - 0.1% |
|||
|
Fresenius Medical Care Capital Trust II 7.875% |
386 |
352,140 |
|
|
MEDIA & LEISURE - 0.4% |
|||
|
Broadcasting - 0.3% |
|||
|
Adelphia Communications Corp. $13.00 |
2,183 |
224,849 |
|
|
CSC Holdings, Inc. 11.125% pay-in-kind |
14,567 |
1,522,252 |
|
|
|
1,747,101 |
||
|
Publishing - 0.1% |
|||
|
PRIMEDIA, Inc.: |
|
|
|
|
$9.20 |
4,338 |
376,322 |
|
|
Series D, $10.00 |
4,544 |
420,320 |
|
|
|
796,642 |
||
|
TOTAL MEDIA & LEISURE |
2,543,743 |
||
|
|
|||
|
Shares |
Value (Note 1) |
||
|
UTILITIES - 1.2% |
|||
|
Cellular - 0.6% |
|||
|
Crown Castle International Corp. 12.75% pay-in-kind |
358 |
$ 365,160 |
|
|
Nextel Communications, Inc. 11.125% pay-in-kind |
2,851 |
2,751,215 |
|
|
|
3,116,375 |
||
|
Telephone Services - 0.6% |
|||
|
Adelphia Business Solution, Inc. 12.875% pay-in-kind |
873 |
781,335 |
|
|
Intermedia Communications, Inc. 13.5% pay-in-kind |
820 |
795,400 |
|
|
IXC Communications, Inc. 12.5% pay-in-kind |
263 |
263,000 |
|
|
NEXTLINK Communications, Inc. 14% pay-in-kind |
33,088 |
1,687,488 |
|
|
|
3,527,223 |
||
|
TOTAL UTILITIES |
6,643,598 |
||
|
TOTAL NONCONVERTIBLE (Cost $10,734,609) |
10,323,057 |
||
|
Corporate Bonds - 13.9% |
|||||
|
Moody's Ratings (unaudited) (b) |
Principal Amount |
|
|||
|
Convertible Bonds - 0.4% |
|||||
|
HEALTH - 0.3% |
|||||
|
Medical Facilities Management - 0.3% |
|||||
|
Tenet Healthcare Corp. 6% 12/1/05 |
B1 |
|
$ 1,290,000 |
1,062,638 |
|
|
Total Renal Care Holdings, Inc. 7% 5/15/09 (f) |
B3 |
|
500,000 |
332,500 |
|
|
|
1,395,138 |
||||
|
MEDIA & LEISURE - 0.1% |
|||||
|
Lodging & Gaming - 0.1% |
|||||
|
Hilton Hotels Corp. 5% 5/15/06 |
Ba2 |
|
660,000 |
521,400 |
|
|
TOTAL CONVERTIBLE BONDS |
1,916,538 |
||||
|
Nonconvertible Bonds - 13.5% |
|||||
|
AEROSPACE & DEFENSE - 0.1% |
|||||
|
Ship Building & Repair - 0.1% |
|||||
|
Newport News Shipbuilding, Inc. 9.25% 12/1/06 |
Ba3 |
|
652,000 |
652,000 |
|
|
BASIC INDUSTRIES - 1.0% |
|||||
|
Chemicals & Plastics - 0.6% |
|||||
|
Avecia Group PLC 11% 7/1/09 |
B2 |
|
635,000 |
622,300 |
|
|
Corporate Bonds - continued |
|||||
|
Moody's Ratings (unaudited) (b) |
Principal Amount |
Value |
|||
|
Nonconvertible Bonds - continued |
|||||
|
BASIC INDUSTRIES - continued |
|||||
|
Chemicals & Plastics - continued |
|||||
|
Huntsman Corp. 9.5% 7/1/07 (f) |
B2 |
|
$ 565,000 |
$ 515,563 |
|
|
Huntsman ICI Chemicals LLC 10.125% 7/1/09 |
B2 |
|
200,000 |
200,000 |
|
|
Lyondell Chemical Co.: |
|
|
|
|
|
|
9.875% 5/1/07 |
Ba3 |
|
890,000 |
881,100 |
|
|
10.875% 5/1/09 |
B2 |
|
440,000 |
436,700 |
|
|
Sovereign Specialty Chemicals, Inc. 11.875% 3/15/10 |
B3 |
|
305,000 |
313,769 |
|
|
Sterling Chemicals, Inc. 11.75% 8/15/06 |
Caa3 |
|
470,000 |
380,700 |
|
|
|
3,350,132 |
||||
|
Metals & Mining - 0.0% |
|||||
|
Kaiser Aluminum & Chemical Corp. 12.75% 2/1/03 |
B3 |
|
305,000 |
277,550 |
|
|
Packaging & Containers - 0.3% |
|||||
|
Gaylord Container Corp.: |
|
|
|
|
|
|
9.375% 6/15/07 |
Caa1 |
|
560,000 |
431,200 |
|
|
9.75% 6/15/07 |
Caa1 |
|
660,000 |
514,800 |
|
|
Norampac, Inc. 9.5% 2/1/08 |
B1 |
|
390,000 |
376,350 |
|
|
Packaging Corp. of America 9.625% 4/1/09 |
B2 |
|
370,000 |
365,375 |
|
|
|
1,687,725 |
||||
|
Paper & Forest Products - 0.1% |
|||||
|
Potlatch Corp. 6.25% 3/15/02 |
Baa1 |
|
80,000 |
77,378 |
|
|
Repap New Brunswick, Inc. yankee 10.625% 4/15/05 |
Caa1 |
|
380,000 |
334,400 |
|
|
|
411,778 |
||||
|
TOTAL BASIC INDUSTRIES |
5,727,185 |
||||
|
CONSTRUCTION & REAL ESTATE - 0.2% |
|||||
|
Building Materials - 0.0% |
|||||
|
Numatics, Inc. 9.625% 4/1/08 |
B3 |
|
30,000 |
24,000 |
|
|
Construction - 0.1% |
|||||
|
Blount, Inc. 13% 8/1/09 |
B3 |
|
270,000 |
274,725 |
|
|
Engineering - 0.0% |
|||||
|
Anteon Corp. 12% 5/15/09 |
B3 |
|
170,000 |
153,000 |
|
|
Real Estate - 0.0% |
|||||
|
Duke-Weeks Realty LP 6.875% 3/15/05 |
Baa2 |
|
100,000 |
94,976 |
|
|
|
|||||
|
Moody's Ratings (unaudited) (b) |
Principal Amount |
Value |
|||
|
Real Estate Investment Trusts - 0.1% |
|||||
|
CenterPoint Properties Trust: |
|
|
|
|
|
|
6.75% 4/1/05 |
Baa2 |
|
$ 100,000 |
$ 93,160 |
|
|
7.125% 3/15/04 |
Baa2 |
|
110,000 |
105,585 |
|
|
Equity Office Properties Trust: |
|
|
|
|
|
|
6.375% 2/15/03 |
Baa1 |
|
100,000 |
96,114 |
|
|
6.75% 2/15/08 |
Baa1 |
|
100,000 |
91,609 |
|
|
Pinnacle Holdings, Inc. 0% 3/15/08 (e) |
B3 |
|
285,000 |
198,075 |
|
|
|
584,543 |
||||
|
TOTAL CONSTRUCTION & REAL ESTATE |
1,131,244 |
||||
|
DURABLES - 0.0% |
|||||
|
Autos, Tires, & Accessories - 0.0% |
|||||
|
TRW, Inc. 6.5% 6/1/02 |
Baa1 |
|
120,000 |
116,878 |
|
|
Consumer Electronics - 0.0% |
|||||
|
Whirlpool Corp. 8.6% 5/1/10 |
Baa1 |
|
40,000 |
41,276 |
|
|
Textiles & Apparel - 0.0% |
|||||
|
Jones Apparel Group, Inc. 7.875% 6/15/06 |
Baa2 |
|
135,000 |
128,887 |
|
|
TOTAL DURABLES |
287,041 |
||||
|
ENERGY - 0.4% |
|||||
|
Coal - 0.1% |
|||||
|
P&L Coal Holdings Corp. 9.625% 5/15/08 |
B2 |
|
330,000 |
306,075 |
|
|
Energy Services - 0.1% |
|||||
|
Baker Hughes, Inc. 5.8% 2/15/03 |
A2 |
|
90,000 |
86,184 |
|
|
R&B Falcon Corp. 6.5% 4/15/03 |
Ba3 |
|
320,000 |
296,800 |
|
|
RBF Finance Co. 11% 3/15/06 |
Ba3 |
|
300,000 |
321,000 |
|
|
|
703,984 |
||||
|
Oil & Gas - 0.2% |
|||||
|
Apache Corp. 7.625% 7/1/19 |
Baa1 |
|
75,000 |
72,417 |
|
|
Chesapeake Energy Corp. 9.625% 5/1/05 |
B2 |
|
680,000 |
663,000 |
|
|
Occidental Petroleum Corp. 9.75% 6/15/01 |
Baa3 |
|
100,000 |
101,880 |
|
|
Oryx Energy Co.: |
|
|
|
|
|
|
8% 10/15/03 |
Baa1 |
|
95,000 |
94,964 |
|
|
8.125% 10/15/05 |
Baa1 |
|
140,000 |
141,666 |
|
|
8.375% 7/15/04 |
Baa1 |
|
195,000 |
196,743 |
|
|
Corporate Bonds - continued |
|||||
|
Moody's Ratings (unaudited) (b) |
Principal Amount |
Value |
|||
|
Nonconvertible Bonds - continued |
|||||
|
ENERGY - continued |
|||||
|
Oil & Gas - continued |
|||||
|
Petro-Canada 7% 11/15/28 |
A3 |
|
$ 50,000 |
$ 43,660 |
|
|
Phillips Petroleum Co. 8.75% 5/25/10 |
Baa2 |
|
60,000 |
63,205 |
|
|
|
1,377,535 |
||||
|
TOTAL ENERGY |
2,387,594 |
||||
|
FINANCE - 1.0% |
|||||
|
Banks - 0.2% |
|||||
|
Bank of Tokyo-Mitsubishi Ltd. 8.4% 4/15/10 |
A3 |
|
70,000 |
70,686 |
|
|
BankBoston Corp. 6.625% 2/1/04 |
A3 |
|
60,000 |
57,821 |
|
|
Capital One Bank: |
|
|
|
|
|
|
6.375% 2/15/03 |
Baa2 |
|
130,000 |
124,651 |
|
|
6.65% 3/15/04 |
Baa3 |
|
260,000 |
249,730 |
|
|
Capital One Financial Corp. 7.125% 8/1/08 |
Baa3 |
|
100,000 |
93,065 |
|
|
Commonwealth Bank of Australia 8.5% 6/1/10 |
A1 |
|
100,000 |
103,774 |
|
|
Den Danske Bank AS 6.375% 6/15/08 (f)(i) |
A1 |
|
170,000 |
156,081 |
|
|
Korea Development Bank 6.625% 11/21/03 |
Baa2 |
|
95,000 |
91,388 |
|
|
Providian National Bank 6.7% 3/15/03 |
Baa3 |
|
100,000 |
95,634 |
|
|
Royal Bank of Scotland Group PLC 9.118% 3/31/49 |
A1 |
|
50,000 |
51,934 |
|
|
|
1,094,764 |
||||
|
Credit & Other Finance - 0.6% |
|||||
|
Ahmanson Capital Trust I 8.36% 12/1/26 (f) |
A3 |
|
125,000 |
113,663 |
|
|
AMRESCO, Inc.: |
|
|
|
|
|
|
9.875% 3/15/05 |
Caa3 |
|
470,000 |
218,550 |
|
|
10% 3/15/04 |
Caa3 |
|
210,000 |
96,600 |
|
|
Countrywide Funding Corp. 6.45% 2/27/03 |
A3 |
|
150,000 |
144,867 |
|
|
Details Capital Corp. 0% 11/15/07 (e) |
Caa1 |
|
85,000 |
56,100 |
|
|
Dobson/Sygnet Communications Co. 12.25% 12/15/08 |
- |
|
140,000 |
148,050 |
|
|
ERP Operating LP: |
|
|
|
|
|
|
6.55% 11/15/01 |
A3 |
|
55,000 |
54,206 |
|
|
7.1% 6/23/04 |
A3 |
|
100,000 |
96,976 |
|
|
Finova Capital Corp.: |
|
|
|
|
|
|
6.11% 2/18/03 |
Baa2 |
|
50,000 |
44,000 |
|
|
7.25% 11/8/04 |
Baa2 |
|
110,000 |
97,900 |
|
|
|
|||||
|
Moody's Ratings (unaudited) (b) |
Principal Amount |
Value |
|||
|
First Security Capital I 8.41% 12/15/26 |
A3 |
|
$ 110,000 |
$ 101,908 |
|
|
Ford Motor Credit Co.: |
|
|
|
|
|
|
6.4513% 7/16/01 (i) |
A2 |
|
400,000 |
400,433 |
|
|
7.5% 3/15/05 |
A2 |
|
140,000 |
138,950 |
|
|
7.875% 6/15/10 |
A2 |
|
400,000 |
400,568 |
|
|
Heller Financial, Inc. 6% 3/19/04 |
A3 |
|
180,000 |
168,451 |
|
|
Macsaver Financial Services, Inc.: |
|
|
|
|
|
|
7.4% 2/15/02 |
Ba2 |
|
280,000 |
182,000 |
|
|
7.6% 8/1/07 |
Ba2 |
|
790,000 |
418,700 |
|
|
7.875% 8/1/03 |
Ba2 |
|
130,000 |
80,600 |
|
|
Newcourt Credit Group, Inc. 6.875% 2/16/05 |
A1 |
|
130,000 |
123,696 |
|
|
Sprint Capital Corp.: |
|
|
|
|
|
|
5.7% 11/15/03 |
Baa1 |
|
40,000 |
37,693 |
|
|
6.875% 11/15/28 |
Baa1 |
|
90,000 |
77,818 |
|
|
The Money Store, Inc. 7.3% 12/1/02 |
A2 |
|
100,000 |
99,063 |
|
|
TXU Eastern Funding: |
|
|
|
|
|
|
6.15% 5/15/02 |
Baa1 |
|
60,000 |
58,267 |
|
|
6.75% 5/15/09 |
Baa1 |
|
90,000 |
80,475 |
|
|
Venetian Casino Resort LLC/Las Vegas Sands, Inc. 12.25% 11/15/04 |
Caa1 |
|
150,000 |
151,500 |
|
|
|
3,591,034 |
||||
|
Savings & Loans - 0.1% |
|||||
|
Chevy Chase Savings Bank FSB 9.25% 12/1/08 |
B1 |
|
80,000 |
71,200 |
|
|
Home Savings of America FSB 6.5% 8/15/04 |
A3 |
|
90,000 |
85,394 |
|
|
Long Island Savings Bank FSB 7% 6/13/02 |
Baa3 |
|
140,000 |
138,011 |
|
|
Sovereign Bancorp, Inc. 6.625% 3/15/01 |
Ba3 |
|
100,000 |
97,625 |
|
|
|
392,230 |
||||
|
Securities Industry - 0.1% |
|||||
|
Amvescap PLC yankee 6.375% 5/15/03 |
A3 |
|
200,000 |
190,872 |
|
|
Goldman Sachs Group LP 6.6338% 7/27/00 (i)(k) |
A1 |
|
400,000 |
399,966 |
|
|
|
590,838 |
||||
|
TOTAL FINANCE |
5,668,866 |
||||
|
HEALTH - 0.1% |
|||||
|
Medical Facilities Management - 0.1% |
|||||
|
Fountain View, Inc. 11.25% 4/15/08 |
Caa1 |
|
460,000 |
112,700 |
|
|
Corporate Bonds - continued |
|||||
|
Moody's Ratings (unaudited) (b) |
Principal Amount |
Value |
|||
|
Nonconvertible Bonds - continued |
|||||
|
HEALTH - continued |
|||||
|
Medical Facilities Management - continued |
|||||
|
Tenet Healthcare Corp. 8.625% 1/15/07 |
Ba3 |
|
$ 330,000 |
$ 313,500 |
|
|
Unilab Corp. 12.75% 10/1/09 |
B3 |
|
150,000 |
154,500 |
|
|
|
580,700 |
||||
|
INDUSTRIAL MACHINERY & EQUIPMENT - 0.6% |
|||||
|
Industrial Machinery & Equipment - 0.2% |
|||||
|
Dunlop Standard Aero Holdings PLC 11.875% 5/15/09 |
B3 |
|
430,000 |
425,700 |
|
|
Roller Bearing Holding, Inc. 0% 6/15/09 (e)(f) |
- |
|
500,000 |
255,000 |
|
|
Tyco International Group SA: |
|
|
|
|
|
|
7% 6/15/28 |
Baa1 |
|
280,000 |
240,696 |
|
|
yankee 6.375% 6/15/05 |
Baa1 |
|
30,000 |
28,618 |
|
|
|
950,014 |
||||
|
Pollution Control - 0.4% |
|||||
|
Allied Waste North America, Inc.: |
|
|
|
|
|
|
7.375% 1/1/04 |
Ba3 |
|
230,000 |
209,300 |
|
|
7.625% 1/1/06 |
Ba2 |
|
195,000 |
169,650 |
|
|
10% 8/1/09 |
B2 |
|
1,795,000 |
1,507,800 |
|
|
Browning-Ferris Industries, Inc. 6.375% 1/15/08 |
Ba3 |
|
220,000 |
169,400 |
|
|
WMX Technologies, Inc.: |
|
|
|
|
|
|
6.25% 10/15/00 |
Ba1 |
|
100,000 |
99,343 |
|
|
7.1% 8/1/26 |
Ba1 |
|
40,000 |
37,649 |
|
|
|
2,193,142 |
||||
|
TOTAL INDUSTRIAL MACHINERY & EQUIPMENT |
3,143,156 |
||||
|
MEDIA & LEISURE - 4.5% |
|||||
|
Broadcasting - 3.6% |
|||||
|
Adelphia Communications Corp. 9.875% 3/1/07 |
B1 |
|
1,230,000 |
1,168,500 |
|
|
AMFM Operating, Inc. 12.625% 10/31/06 pay-in-kind |
- |
|
257,300 |
302,328 |
|
|
Ascent Entertainment Group, Inc. 0% 12/15/04 (e) |
Ba1 |
|
350,000 |
283,500 |
|
|
British Sky Broadcasting Group PLC 8.2% 7/15/09 |
Baa3 |
|
210,000 |
196,442 |
|
|
Callahan Nordrhein Westfalen 14% 7/15/10 (f) |
B3 |
|
770,000 |
770,000 |
|
|
|
|||||
|
Moody's Ratings (unaudited) (b) |
Principal Amount |
Value |
|||
|
Charter Communications Holdings LLC/Charter Communications Holdings Capital Corp. 10% 4/1/09 |
B2 |
|
$ 705,000 |
$ 683,850 |
|
|
Citadel Broadcasting Co.: |
|
|
|
|
|
|
9.25% 11/15/08 |
B3 |
|
210,000 |
203,700 |
|
|
10.25% 7/1/07 |
B3 |
|
1,335,000 |
1,353,356 |
|
|
Clear Channel Communications, Inc.: |
|
|
|
|
|
|
6.875% 6/15/18 |
Baa3 |
|
320,000 |
275,104 |
|
|
7.875% 6/15/05 |
Baa3 |
|
90,000 |
89,577 |
|
|
Comcast UK Cable Partners Ltd. 0% 11/15/07 (e) |
B2 |
|
580,000 |
539,400 |
|
|
CSC Holdings, Inc. 10.5% 5/15/16 |
Ba3 |
|
280,000 |
295,400 |
|
|
Diamond Cable Communications PLC: |
|
|
|
|
|
|
0% 2/15/07 (e) |
B3 |
|
645,000 |
495,038 |
|
|
yankee 0% 12/15/05 (e) |
B3 |
|
300,000 |
280,500 |
|
|
Earthwatch, Inc. 0% 7/15/07 unit (e)(f) |
- |
|
430,000 |
275,200 |
|
|
EchoStar DBS Corp.: |
|
|
|
|
|
|
9.25% 2/1/06 |
B2 |
|
515,000 |
496,975 |
|
|
9.375% 2/1/09 |
B2 |
|
420,000 |
405,300 |
|
|
Fox Family Worldwide, Inc. 0% 11/1/07 (e) |
B1 |
|
100,000 |
62,000 |
|
|
FrontierVision Holdings LP/FrontierVision Holdings Capital Corp. 0% 9/15/07 (e) |
B1 |
|
700,000 |
603,750 |
|
|
FrontierVision Operating Partners LP/ FrontierVision Capital Corp. 11% 10/15/06 |
B1 |
|
340,000 |
340,000 |
|
|
Golden Sky DBS, Inc. 0% 3/1/07 (e) |
Caa1 |
|
590,000 |
396,775 |
|
|
Golden Sky Systems, Inc. 12.375% 8/1/06 |
B3 |
|
180,000 |
196,200 |
|
|
Hearst-Argyle Television, Inc. 7.5% 11/15/27 |
Baa3 |
|
200,000 |
168,718 |
|
|
International Cabletel, Inc. 0% 2/1/06 (e) |
B3 |
|
220,000 |
202,400 |
|
|
Knology Holding, Inc. 0% 10/15/07 (e) |
- |
|
380,000 |
193,800 |
|
|
LIN Holdings Corp. 0% 3/1/08 (e) |
B3 |
|
305,000 |
200,538 |
|
|
Nielsen Media Research, Inc. 7.6% 6/15/09 |
Baa2 |
|
60,000 |
57,251 |
|
|
NorthPoint Communication Holdings, Inc. 12.875% 2/15/10 |
Caa1 |
|
890,000 |
614,100 |
|
|
NTL Communications Corp.: |
|
|
|
|
|
|
0% 10/1/08 (e) |
B3 |
|
875,000 |
562,188 |
|
|
11.5% 10/1/08 |
B3 |
|
690,000 |
695,175 |
|
|
NTL, Inc.: |
|
|
|
|
|
|
0% 4/1/08 (e) |
B3 |
|
1,735,000 |
1,075,700 |
|
|
Corporate Bonds - continued |
|||||
|
Moody's Ratings (unaudited) (b) |
Principal Amount |
Value |
|||
|
Nonconvertible Bonds - continued |
|||||
|
MEDIA & LEISURE - continued |
|||||
|
Broadcasting - continued |
|||||
|
NTL, Inc.: - continued |
|
|
|
|
|
|
10% 2/15/07 |
B3 |
|
$ 240,000 |
$ 228,000 |
|
|
Pegasus Communications Corp. 9.625% 10/15/05 |
B3 |
|
960,000 |
926,400 |
|
|
TCI Communications, Inc. 9.8% 2/1/12 |
A2 |
|
190,000 |
215,865 |
|
|
Telemundo Holdings, Inc. 0% 8/15/08 (e) |
Caa1 |
|
805,000 |
559,475 |
|
|
Telewest Communications PLC: |
|
|
|
|
|
|
0% 4/15/09 (e) |
B1 |
|
620,000 |
341,000 |
|
|
0% 2/1/10 (e)(f) |
B1 |
|
615,000 |
325,950 |
|
|
Telewest PLC: |
|
|
|
|
|
|
yankee 9.625% 10/1/06 |
B1 |
|
110,000 |
103,400 |
|
|
0% 10/1/07 (e) |
B1 |
|
1,330,000 |
1,270,150 |
|
|
Time Warner, Inc. 9.125% 1/15/13 |
Baa3 |
|
155,000 |
169,865 |
|
|
United Pan-Europe Communications NV: |
|
|
|
|
|
|
0% 2/1/10 (e) |
B2 |
|
1,310,000 |
615,700 |
|
|
10.875% 8/1/09 |
B2 |
|
2,057,000 |
1,810,160 |
|
|
USA Networks, Inc./USANi LLC 6.75% 11/15/05 |
Baa3 |
|
35,000 |
33,338 |
|
|
|
20,082,068 |
||||
|
Entertainment - 0.3% |
|||||
|
Bally Total Fitness Holding Corp. 9.875% 10/15/07 |
B3 |
|
418,000 |
380,380 |
|
|
Cinemark USA, Inc. 8.5% 8/1/08 |
B2 |
|
130,000 |
61,100 |
|
|
Paramount Communications, Inc. 7.5% 1/15/02 |
Baa1 |
|
110,000 |
109,640 |
|
|
Premier Parks, Inc. 0% 4/1/08 (e) |
B3 |
|
1,335,000 |
906,131 |
|
|
Viacom, Inc.: |
|
|
|
|
|
|
6.75% 1/15/03 |
Baa1 |
|
110,000 |
108,032 |
|
|
7.75% 6/1/05 |
Baa1 |
|
115,000 |
115,390 |
|
|
|
1,680,673 |
||||
|
Lodging & Gaming - 0.4% |
|||||
|
Florida Panthers Holdings, Inc. 9.875% 4/15/09 |
B2 |
|
410,000 |
383,350 |
|
|
HMH Properties, Inc. 7.875% 8/1/05 |
Ba2 |
|
380,000 |
349,600 |
|
|
Horseshoe Gaming LLC 8.625% 5/15/09 |
B2 |
|
285,000 |
267,900 |
|
|
Host Marriott LP 8.375% 2/15/06 |
Ba2 |
|
630,000 |
589,050 |
|
|
ITT Corp. 7.375% 11/15/15 |
Ba1 |
|
150,000 |
125,625 |
|
|
|
|||||
|
Moody's Ratings (unaudited) (b) |
Principal Amount |
Value |
|||
|
Mohegan Tribal Gaming Authority 8.75% 1/1/09 |
Ba3 |
|
$ 390,000 |
$ 368,550 |
|
|
Station Casinos, Inc. 9.875% 7/1/10 (f) |
B1 |
|
465,000 |
467,325 |
|
|
|
2,551,400 |
||||
|
Publishing - 0.1% |
|||||
|
News America |
|
|
|
|
|
|
7.7% 10/30/25 |
Baa3 |
|
110,000 |
100,177 |
|
|
7.75% 1/20/24 |
Baa3 |
|
70,000 |
63,369 |
|
|
Time Warner Entertainment Co. LP 8.375% 3/15/23 |
Baa2 |
|
325,000 |
329,007 |
|
|
|
492,553 |
||||
|
Restaurants - 0.1% |
|||||
|
Domino's, Inc. 10.375% 1/15/09 |
B3 |
|
300,000 |
278,250 |
|
|
NE Restaurant, Inc. 10.75% 7/15/08 |
B3 |
|
550,000 |
429,000 |
|
|
|
707,250 |
||||
|
TOTAL MEDIA & LEISURE |
25,513,944 |
||||
|
NONDURABLES - 0.2% |
|||||
|
Beverages - 0.1% |
|||||
|
Seagram JE & Sons, Inc.: |
|
|
|
|
|
|
6.4% 12/15/03 |
Baa3 |
|
120,000 |
115,332 |
|
|
6.8% 12/15/08 |
Baa3 |
|
105,000 |
98,472 |
|
|
|
213,804 |
||||
|
Foods - 0.1% |
|||||
|
ConAgra, Inc. 7.125% 10/1/26 |
Baa1 |
|
115,000 |
106,058 |
|
|
Del Monte Foods Co. 0% 12/15/07 (e) |
Caa1 |
|
440,000 |
330,000 |
|
|
|
436,058 |
||||
|
Tobacco - 0.0% |
|||||
|
Philip Morris |
|
|
|
|
|
|
7% 7/15/05 |
A2 |
|
70,000 |
65,942 |
|
|
7.25% 9/15/01 |
A2 |
|
50,000 |
49,184 |
|
|
RJ Reynolds Tobacco Holdings, Inc. 7.375% 5/15/03 |
Baa2 |
|
100,000 |
92,876 |
|
|
|
208,002 |
||||
|
TOTAL NONDURABLES |
857,864 |
||||
|
RETAIL & WHOLESALE - 0.3% |
|||||
|
Drug Stores - 0.0% |
|||||
|
Rite Aid Corp.: |
|
|
|
|
|
|
6.5% 12/15/05 (f) |
Caa1 |
|
100,000 |
51,500 |
|
|
7.125% 1/15/07 |
Caa1 |
|
40,000 |
21,200 |
|
|
|
72,700 |
||||
|
Corporate Bonds - continued |
|||||
|
Moody's Ratings (unaudited) (b) |
Principal Amount |
Value |
|||
|
Nonconvertible Bonds - continued |
|||||
|
RETAIL & WHOLESALE - continued |
|||||
|
General Merchandise Stores - 0.1% |
|||||
|
Dayton Hudson Corp. 7.5% 7/15/06 |
A2 |
|
$ 125,000 |
$ 124,930 |
|
|
Federated Department Stores, Inc.: |
|
|
|
|
|
|
6.79% 7/15/27 |
Baa1 |
|
100,000 |
96,704 |
|
|
8.5% 6/15/03 |
Baa1 |
|
50,000 |
50,459 |
|
|
Kmart Corp. 12.5% 3/1/05 |
Baa3 |
|
510,000 |
553,350 |
|
|
|
825,443 |
||||
|
Grocery Stores - 0.2% |
|||||
|
Kroger Co. 6% 7/1/00 |
Baa3 |
|
110,000 |
109,979 |
|
|
Pathmark Stores, Inc. 9.625% 5/1/03 (d) |
Caa3 |
|
1,230,000 |
848,700 |
|
|
|
958,679 |
||||
|
TOTAL RETAIL & WHOLESALE |
1,856,822 |
||||
|
SERVICES - 0.1% |
|||||
|
Printing - 0.0% |
|||||
|
Sullivan Graphics, Inc. 12.75% 8/1/05 |
Caa1 |
|
210,000 |
211,050 |
|
|
Services - 0.1% |
|||||
|
La Petite Academy, Inc./La Petite Academy Holding Co. 10% 5/15/08 |
B3 |
|
370,000 |
214,600 |
|
|
Medaphis Corp. 9.5% 2/15/05 |
Caa1 |
|
260,000 |
195,000 |
|
|
|
409,600 |
||||
|
TOTAL SERVICES |
620,650 |
||||
|
TECHNOLOGY - 1.2% |
|||||
|
Computer Services & Software - 0.6% |
|||||
|
Amazon.com, Inc. 0% 5/1/08 (e) |
Caa1 |
|
395,000 |
213,300 |
|
|
Concentric Network Corp. 12.75% 12/15/07 |
B- |
|
120,000 |
126,000 |
|
|
Covad Communications Group, Inc.: |
|
|
|
|
|
|
0% 3/15/08 (e) |
B3 |
|
715,000 |
350,350 |
|
|
12% 2/15/10 |
B3 |
|
970,000 |
751,750 |
|
|
12.5% 2/15/09 |
B3 |
|
201,000 |
159,795 |
|
|
Exodus Communications, Inc. 11.25% 7/1/08 |
B- |
|
355,000 |
351,450 |
|
|
Federal Data Corp. 10.125% 8/1/05 |
B3 |
|
690,000 |
448,500 |
|
|
PSINet, Inc. 10.5% 12/1/06 |
B3 |
|
1,115,000 |
1,025,800 |
|
|
Verio, Inc. 10.375% 4/1/05 |
B3 |
|
11,000 |
11,715 |
|
|
|
3,438,660 |
||||
|
|
|||||
|
Moody's Ratings (unaudited) (b) |
Principal Amount |
Value |
|||
|
Computers & Office Equipment - 0.2% |
|||||
|
Comdisco, Inc.: |
|
|
|
|
|
|
6.375% 11/30/01 |
Baa1 |
|
$ 150,000 |
$ 145,139 |
|
|
7.25% 9/1/02 |
Baa1 |
|
125,000 |
120,986 |
|
|
Globix Corp. 12.5% 2/1/10 |
B- |
|
570,000 |
470,250 |
|
|
Sun Microsystems, Inc. 7% 8/15/02 |
Baa1 |
|
35,000 |
34,783 |
|
|
|
771,158 |
||||
|
Electronics - 0.4% |
|||||
|
ChipPAC International Ltd. 12.75% 8/1/09 |
B3 |
|
535,000 |
575,125 |
|
|
Details, Inc. 10% 11/15/05 |
B3 |
|
110,000 |
104,500 |
|
|
Fairchild |
|
|
|
|
|
|
10.125% 3/15/07 |
B2 |
|
100,000 |
101,000 |
|
|
10.375% 10/1/07 |
B3 |
|
310,000 |
316,200 |
|
|
Flextronics International Ltd. 9.875% 7/1/10 (f) |
Ba3 |
|
225,000 |
228,375 |
|
|
Micron Technology, Inc. 6.5% 9/30/05 (k) |
B3 |
|
1,000,000 |
835,000 |
|
|
SCG Holding Corp./Semiconductor Components Industries LLC 12% 8/1/09 |
B2 |
|
230,000 |
245,525 |
|
|
|
2,405,725 |
||||
|
TOTAL TECHNOLOGY |
6,615,543 |
||||
|
TRANSPORTATION - 0.2% |
|||||
|
Air Transportation - 0.1% |
|||||
|
Continental Airlines, Inc. pass thru trust certificates: |
|
|
|
|
|
|
7.434% 3/15/06 |
Baa1 |
|
30,000 |
29,007 |
|
|
7.73% 9/15/12 |
Baa1 |
|
12,553 |
11,989 |
|
|
Delta Air Lines, Inc. 8.3% 12/15/29 |
Baa3 |
|
160,000 |
139,456 |
|
|
Qantas Airways Ltd. 7.75% 6/15/09 (f) |
Baa1 |
|
110,000 |
109,450 |
|
|
US Airways Group, Inc. 10.375% 3/1/13 |
Ba3 |
|
360,000 |
320,400 |
|
|
|
610,302 |
||||
|
Railroads - 0.1% |
|||||
|
Burlington Northern |
Baa2 |
|
150,000 |
133,680 |
|
|
Canadian National Railway Co. 6.9% 7/15/28 |
Baa2 |
|
150,000 |
126,551 |
|
|
CSX Corp.: |
|
|
|
|
|
|
6.25% 10/15/08 |
Baa2 |
|
60,000 |
52,178 |
|
|
6.46% 6/22/05 |
Baa2 |
|
100,000 |
94,039 |
|
|
Corporate Bonds - continued |
|||||
|
Moody's Ratings (unaudited) (b) |
Principal Amount |
Value |
|||
|
Nonconvertible Bonds - continued |
|||||
|
TRANSPORTATION - continued |
|||||
|
Railroads - continued |
|||||
|
Norfolk Southern Corp. 7.05% 5/1/37 |
Baa1 |
|
$ 220,000 |
$ 215,019 |
|
|
Wisconsin Central Transportation Corp. 6.625% 4/15/08 |
Baa2 |
|
100,000 |
88,821 |
|
|
|
710,288 |
||||
|
TOTAL TRANSPORTATION |
1,320,590 |
||||
|
UTILITIES - 3.6% |
|||||
|
Cellular - 1.5% |
|||||
|
Crown Castle International Corp. 0% 5/15/11 (e) |
B3 |
|
525,000 |
320,250 |
|
|
Dobson Communications Corp. 10.875% 7/1/10 (f) |
- |
|
230,000 |
231,725 |
|
|
McCaw International Ltd. 0% 4/15/07 (e) |
Caa1 |
|
1,067,000 |
810,920 |
|
|
Millicom International Cellular SA 0% 6/1/06 (e) |
Caa1 |
|
1,310,000 |
1,113,500 |
|
|
Nextel Communications, Inc. 0% 10/31/07 (e) |
B1 |
|
2,760,000 |
2,056,200 |
|
|
Nextel International, Inc. 0% 4/15/08 (e) |
Caa1 |
|
815,000 |
537,900 |
|
|
Rogers Communications, Inc. 8.875% 7/15/07 |
Ba3 |
|
530,000 |
519,400 |
|
|
TeleCorp PCS, Inc. 0% 4/15/09 (e) |
B3 |
|
595,000 |
391,213 |
|
|
Triton PCS, Inc. 0% 5/1/08 (e) |
B3 |
|
560,000 |
404,600 |
|
|
Vodafone AirTouch PLC 7.625% 2/15/05 (f) |
A2 |
|
105,000 |
104,887 |
|
|
VoiceStream Wireless Corp.: |
|
|
|
|
|
|
0% 11/15/09 (e) |
B2 |
|
255,000 |
170,850 |
|
|
10.375% 11/15/09 |
B2 |
|
1,550,000 |
1,612,000 |
|
|
|
8,273,445 |
||||
|
Electric Utility - 0.1% |
|||||
|
Avon Energy Partners Holdings 6.46% 3/4/08 (f) |
Baa2 |
|
130,000 |
115,788 |
|
|
Dominion Resources, Inc. 8.125% 6/15/10 |
Baa1 |
|
65,000 |
65,439 |
|
|
Hydro-Quebec yankee 8.4% 3/28/25 |
A2 |
|
90,000 |
95,040 |
|
|
Illinois Power Co. 7.5% 6/15/09 |
Baa1 |
|
60,000 |
58,571 |
|
|
Israel Electric Corp. Ltd.: |
|
|
|
|
|
|
7.75% 12/15/27 (f) |
A3 |
|
170,000 |
145,716 |
|
|
yankee 7.875% 12/15/26 (f) |
A3 |
|
80,000 |
70,665 |
|
|
|
|||||
|
Moody's Ratings (unaudited) (b) |
Principal Amount |
Value |
|||
|
Texas Utilities Co. 6.375% 1/1/08 |
Baa3 |
|
$ 40,000 |
$ 36,130 |
|
|
|
587,349 |
||||
|
Gas - 0.0% |
|||||
|
Reliant Energy Resources Corp. 8.125% 7/15/05 (f) |
Baa1 |
|
50,000 |
49,990 |
|
|
Telephone Services - 2.0% |
|||||
|
Allegiance Telecom, Inc.: |
|
|
|
|
|
|
0% 2/15/08 (e) |
B3 |
|
250,000 |
181,875 |
|
|
12.875% 5/15/08 |
B3 |
|
260,000 |
281,450 |
|
|
Cable & Wireless Optus Ltd. 8% 6/22/10 (f) |
Baa1 |
|
100,000 |
99,383 |
|
|
Deutsche Telekom International Finance BV 8.25% 6/15/30 |
Aa2 |
|
260,000 |
264,142 |
|
|
FirstWorld Communications, Inc. 0% 4/15/08 (e) |
- |
|
480,000 |
216,000 |
|
|
Global Crossing Holdings Ltd. 9.125% 11/15/06 |
Ba2 |
|
145,000 |
139,563 |
|
|
Globenet Communication Group Ltd. 13% 7/15/07 |
Caa1 |
|
475,000 |
479,750 |
|
|
ICG Services, Inc. 0% 5/1/08 (e) |
B3 |
|
400,000 |
184,000 |
|
|
Intermedia |
|
|
|
|
|
|
0% 7/15/07 (e) |
B2 |
|
455,000 |
352,625 |
|
|
0% 3/1/09 (e) |
B3 |
|
250,000 |
151,875 |
|
|
Level 3 Communications, Inc. 9.125% 5/1/08 |
B3 |
|
765,000 |
686,588 |
|
|
Logix Communications Enterprises, Inc. 12.25% 6/15/08 |
- |
|
675,000 |
216,000 |
|
|
McLeodUSA, Inc.: |
|
|
|
|
|
|
0% 3/1/07 (e) |
B1 |
|
670,000 |
559,450 |
|
|
9.5% 11/1/08 |
B1 |
|
215,000 |
209,625 |
|
|
Metromedia Fiber Network, Inc. 10% 12/15/09 |
B2 |
|
95,000 |
93,338 |
|
|
NEXTLINK Communications, Inc. 9.625% 10/1/07 |
B2 |
|
540,000 |
506,250 |
|
|
Ono Finance PLC 13% 5/1/09 |
Caa1 |
|
370,000 |
349,650 |
|
|
Pathnet, Inc. 12.25% 4/15/08 |
- |
|
840,000 |
470,400 |
|
|
Rhythms |
|
|
|
|
|
|
0% 5/15/08 (e) |
B3 |
|
1,356,000 |
535,620 |
|
|
12.75% 4/15/09 |
B3 |
|
695,000 |
472,600 |
|
|
Telecomunicaciones de Puerto Rico, Inc. 6.65% 5/15/06 |
Baa2 |
|
140,000 |
130,379 |
|
|
Teleglobe Canada, Inc.: |
|
|
|
|
|
|
7.2% 7/20/09 |
Baa1 |
|
183,000 |
175,104 |
|
|
7.7% 7/20/29 |
Baa1 |
|
160,000 |
150,667 |
|
|
Corporate Bonds - continued |
|||||
|
Moody's Ratings (unaudited) (b) |
Principal Amount |
Value |
|||
|
Nonconvertible Bonds - continued |
|||||
|
UTILITIES - continued |
|||||
|
Telephone Services - continued |
|||||
|
Teligent, Inc.: |
|
|
|
|
|
|
0% 3/1/08 (e) |
Caa1 |
|
$ 770,000 |
$ 354,200 |
|
|
11.5% 12/1/07 |
Caa1 |
|
890,000 |
689,750 |
|
|
WinStar Communications, Inc.: |
|
|
|
|
|
|
0% 4/15/10 (e)(f) |
B3 |
|
2,636,000 |
1,225,740 |
|
|
12.75% 4/15/10 (f) |
B3 |
|
1,961,000 |
1,892,365 |
|
|
WorldCom, Inc. 8.875% 1/15/06 |
A3 |
|
103,000 |
106,797 |
|
|
|
11,175,186 |
||||
|
TOTAL UTILITIES |
20,085,970 |
||||
|
TOTAL NONCONVERTIBLE BONDS |
76,449,169 |
||||
|
TOTAL CORPORATE BONDS (Cost $84,294,396) |
78,365,707 |
||||
|
U.S. Government and Government |
|||||
|
|
|||||
|
U.S. Government Agency Obligations - 1.2% |
|||||
|
Fannie Mae: |
|
|
|
|
|
|
6% 5/15/08 |
Aaa |
|
1,000,000 |
932,570 |
|
|
6.5% 4/29/09 |
Aaa |
|
245,000 |
228,884 |
|
|
7.125% 2/15/05 |
Aaa |
|
255,000 |
256,035 |
|
|
7.25% 5/15/30 |
Aaa |
|
310,000 |
316,310 |
|
|
Federal Home Loan Bank 6.75% 2/1/02 |
Aaa |
|
830,000 |
827,402 |
|
|
Freddie Mac: |
|
|
|
|
|
|
0% 8/17/00 |
- |
|
2,000,000 |
1,983,698 |
|
|
5.5% 5/15/02 |
Aaa |
|
1,000,000 |
975,310 |
|
|
5.75% 3/15/09 |
Aaa |
|
510,000 |
464,498 |
|
|
6.25% 7/15/04 |
Aaa |
|
200,000 |
194,438 |
|
|
6.875% 1/15/05 |
Aaa |
|
85,000 |
84,469 |
|
|
7% 7/15/05 |
Aaa |
|
110,000 |
109,846 |
|
|
7.625% 9/9/09 |
Aaa |
|
85,000 |
83,805 |
|
|
Tennessee Valley Authority 7.125% 5/1/30 |
Aaa |
|
65,000 |
65,273 |
|
|
TOTAL U.S. GOVERNMENT AGENCY OBLIGATIONS |
6,522,538 |
||||
|
U.S. Treasury Obligations - 1.2% |
|||||
|
U.S. Treasury Bills, yield at date of purchase 5.76% 8/24/00 (h) |
- |
|
1,000,000 |
991,983 |
|
|
U.S. Treasury Bonds: |
|
|
|
|
|
|
6.875% 8/15/25 |
Aaa |
|
135,000 |
147,128 |
|
|
8% 11/15/21 |
Aaa |
|
50,000 |
60,446 |
|
|
8.125% 8/15/19 |
Aaa |
|
1,780,000 |
2,151,860 |
|
|
|
|||||
|
Moody's Ratings (unaudited) (b) |
Principal Amount |
Value |
|||
|
8.875% 8/15/17 |
Aaa |
|
$ 219,000 |
$ 279,157 |
|
|
8.875% 2/15/19 |
Aaa |
|
259,000 |
333,341 |
|
|
U.S. Treasury Notes: |
|
|
|
|
|
|
5.875% 10/31/01 |
Aaa |
|
700,000 |
694,533 |
|
|
6.625% 6/30/01 |
Aaa |
|
1,315,000 |
1,316,644 |
|
|
7.25% 8/15/04 |
Aaa |
|
20,000 |
20,678 |
|
|
7.875% 11/15/04 |
Aaa |
|
830,000 |
878,895 |
|
|
TOTAL U.S. TREASURY OBLIGATIONS |
6,874,665 |
||||
|
TOTAL U.S. GOVERNMENT AND GOVERNMENT AGENCY OBLIGATIONS (Cost $13,316,132) |
13,397,203 |
||||
|
U.S. Government Agency - |
|||||
|
|
|||||
|
Fannie Mae - 2.3% |
|||||
|
6% 3/1/11 to 1/1/29 |
Aaa |
|
1,157,618 |
1,100,240 |
|
|
6.5% 2/1/26 to 11/1/29 |
Aaa |
|
3,584,741 |
3,385,228 |
|
|
7% 8/1/25 to 12/1/29 |
Aaa |
|
3,017,374 |
2,921,248 |
|
|
7.5% 5/1/24 to 1/1/30 |
Aaa |
|
2,639,765 |
2,603,005 |
|
|
7.5% 7/1/30 |
Aaa |
|
1,200,000 |
1,182,375 |
|
|
8% 1/1/30 |
Aaa |
|
398,480 |
400,098 |
|
|
8% 7/1/30 (g) |
Aaa |
|
1,155,000 |
1,159,332 |
|
|
TOTAL FANNIE MAE |
12,751,526 |
||||
|
Freddie Mac - 0.0% |
|||||
|
7.5% 8/1/28 |
Aaa |
|
131,845 |
130,404 |
|
|
Government National Mortgage Association - 0.3% |
|||||
|
7% 7/15/28 |
Aaa |
|
847,185 |
823,616 |
|
|
7.5% 1/15/26 to 8/15/28 |
Aaa |
|
775,734 |
770,452 |
|
|
TOTAL GOVERNMENT NATIONAL |
1,594,068 |
||||
|
TOTAL U.S. GOVERNMENT AGENCY - (Cost $14,760,546) |
14,475,998 |
||||
|
Asset-Backed Securities - 0.2% |
|||||
|
|
|||||
|
Airplanes pass through trust 10.875% 3/15/19 |
Ba2 |
|
340,757 |
252,160 |
|
|
BankAmerica Manufacturing Housing Contract Trust V 6.2% 4/10/09 |
Aaa |
|
150,000 |
146,859 |
|
|
Capita Equipment Receivables Trust 6.48% 10/15/06 |
Baa2 |
|
100,000 |
96,797 |
|
|
CIT Marine Trust 5.8% 4/15/10 |
Aaa |
|
120,000 |
115,950 |
|
|
CPS Auto Grantor Trust 6.55% 8/15/02 |
Aaa |
|
18,974 |
18,879 |
|
|
Asset-Backed Securities - continued |
|||||
|
Moody's Ratings (unaudited) (b) |
Principal Amount |
Value |
|||
|
CPS Auto Receivables Trust 6% 8/15/03 |
Aaa |
|
$ 72,514 |
$ 71,517 |
|
|
CSXT Trade Receivables Master Trust 6% 7/25/04 |
Aaa |
|
180,000 |
174,544 |
|
|
Ford Credit Auto |
|
|
|
|
|
|
6.2% 12/15/02 |
Aa2 |
|
90,000 |
88,777 |
|
|
6.4% 12/15/02 |
Aa2 |
|
50,000 |
49,350 |
|
|
7.03% 11/15/03 |
Aaa |
|
24,000 |
23,981 |
|
|
Green Tree Financial Corp. 6.8% 6/15/27 |
Aaa |
|
19,008 |
18,990 |
|
|
Olympic Automobile Receivables Trust 6.7% 3/15/02 |
Aaa |
|
6,288 |
6,286 |
|
|
Petroleum Enhanced Trust Receivables Offering Petroleum Trust 6.125% 2/5/03 (f)(i) |
Baa2 |
|
54,596 |
54,331 |
|
|
Sears Credit Account Master Trust II 7.5% 11/15/07 |
A2 |
|
50,000 |
50,000 |
|
|
UAF Auto Grantor Trust 6.1% 1/15/03 (f) |
Aaa |
|
79,617 |
79,095 |
|
|
TOTAL ASSET-BACKED SECURITIES (Cost $1,381,710) |
1,247,516 |
||||
|
Collateralized Mortgage Obligations - 0.0% |
|||||
|
|
|||||
|
Private Sponsor - 0.0% |
|||||
|
Credit-Based Asset Servicing and Securitization LLC Series 1997-2 Class 2B, 7.1786% 12/29/25 (d)(f)(i) |
Ba3 |
|
167,970 |
80,993 |
|
|
U.S. Government Agency - 0.0% |
|||||
|
Fannie Mae REMIC planned amortization class: |
|
|
|
|
|
|
Series 1999-54 Class PH, 6.5% 11/18/29 |
Aaa |
|
100,000 |
90,016 |
|
|
Series 1999-57 Class PH, 6.5% 12/25/29 |
Aaa |
|
100,000 |
89,859 |
|
|
TOTAL U.S. GOVERNMENT AGENCY |
179,875 |
||||
|
TOTAL COLLATERALIZED MORTGAGE OBLIGATIONS (Cost $268,920) |
260,868 |
||||
|
Commercial Mortgage Securities - 0.7% |
|||||
|
Moody's Ratings (unaudited) (b) |
Principal Amount |
Value |
|||
|
BKB Commercial Mortgage Trust Series 1997-C1 Class D, 7.7606% 2/25/43 (f)(i) |
BBB |
|
$ 36,512 |
$ 36,294 |
|
|
CBM Funding Corp. sequential pay Series 1996-1: |
|
|
|
|
|
|
Class A-3PI, 7.08% 11/1/07 |
AA |
|
100,000 |
98,242 |
|
|
Class B, 7.48% 2/1/08 |
A |
|
80,000 |
78,172 |
|
|
CS First Boston Mortgage Securities Corp.: |
|
|
|
|
|
|
Series 1997-C2 Class D, 7.27% 1/17/35 |
Baa2 |
|
200,000 |
183,859 |
|
|
Series 1998-FL1 Class E, 7.4913% 1/10/13 (f)(i) |
Baa2 |
|
220,000 |
219,020 |
|
|
Deutsche Mortgage & Asset Receiving Corp. Series 1998-C1 Class D, 7.231% 7/15/12 |
Baa2 |
|
140,000 |
125,759 |
|
|
First Chicago/Lennar Trust I Series 1997-CHL1 Class E, 8.0835% 4/1/39 (i) |
- |
|
320,000 |
227,700 |
|
|
FMAC Loan |
|
|
|
|
|
|
Series 1997-A Class E, 8.1104% 4/15/19 (f)(i) |
- |
|
250,000 |
165,234 |
|
|
Series 1997-B Class E, 7.8912% 9/15/19 (f)(i) |
- |
|
100,000 |
38,000 |
|
|
General Motors Acceptance Corp. Commercial Mortgage Securities, Inc. Series 1996-C1 Class F, 7.86% 10/15/28 (f) |
Ba3 |
|
250,000 |
201,055 |
|
|
GS Mortgage Securities Corp. II Series 1998-GLII Class E, 7.1905% 4/13/31 (f)(i) |
Baa3 |
|
180,000 |
155,623 |
|
|
LTC Commercial Mortgage pass through certificates: |
|
|
|
|
|
|
Series 1996-1 Class E, 9.16% 4/15/28 |
BB- |
|
500,000 |
447,500 |
|
|
Series 1998-1 Class A, 6.029% 5/30/30 (f) |
AAA |
|
103,030 |
96,929 |
|
|
Morgan Stanley Capital I, Inc. Series 1996-MBL1 Class E, 8.2633% 5/25/21 (f)(i) |
- |
|
76,623 |
76,204 |
|
|
Nomura Asset Securities Corp. Series 1998-D6 Class A4, 7.6083% 3/17/28 (i) |
Baa2 |
|
140,000 |
127,728 |
|
|
Nomura Depositor Trust floater Series 1998-ST1A Class B2, 10.9013% 1/15/03 (f)(i) |
- |
|
125,000 |
115,762 |
|
|
Commercial Mortgage Securities - continued |
|||||
|
Moody's Ratings (unaudited) (b) |
Principal Amount |
Value |
|||
|
Prudential Securities Secd Financing Corp. Series 2000-C1, Class A2 7.727% 2/15/10 |
Aaa |
|
$ 50,000 |
$ 50,484 |
|
|
Structured Asset Securities Corp.: |
|
|
|
|
|
|
Series 1995-C1 Class E, 7.375% 9/25/24 (f) |
BB |
|
1,000,000 |
921,445 |
|
|
Series 1996-CFL Class E, 7.75% 2/25/28 |
BBB |
|
80,000 |
79,331 |
|
|
Thirteen Affiliates of General Growth Properties, Inc.: |
|
|
|
|
|
|
Series D-2, 6.992% 12/15/10 (f) |
Baa2 |
|
140,000 |
128,827 |
|
|
Series E-2, 7.224% 12/15/10 (f) |
Baa3 |
|
100,000 |
89,828 |
|
|
TOTAL COMMERCIAL MORTGAGE SECURITIES (Cost $3,940,126) |
3,662,996 |
||||
|
Foreign Government and Government |
|||||
|
|
|||||
|
Korean Republic yankee 8.875% 4/15/08 |
Baa2 |
|
46,000 |
47,449 |
|
|
Quebec Province 7.5% 9/15/29 |
A2 |
|
340,000 |
334,019 |
|
|
United Mexican States 9.875% 2/1/10 |
Baa3 |
|
150,000 |
156,750 |
|
|
TOTAL FOREIGN GOVERNMENT AND GOVERNMENT AGENCY OBLIGATIONS (Cost $539,426) |
538,218 |
||||
|
Supranational Obligations - 0.0% |
|||||
|
|
|||||
|
Inter-American Development Bank yankee 6.29% 7/16/27 |
Aaa |
|
150,000 |
142,893 |
|
|
Purchased Bank Debt - 1.6% |
|||||
|
|
|||||
|
American Tower L P term loan 9.53% 12/31/07 (i) |
- |
|
600,000 |
603,000 |
|
|
Charter Communication Operating LLC term loan 8.8% 3/18/08 (i) |
Ba3 |
|
1,000,000 |
993,750 |
|
|
Crown Castle Operating Co. term loan 9.46% 6/15/08 (i) |
Ba3 |
|
800,000 |
802,000 |
|
|
Dynatech LLC term loan 10.03% 9/1/07 (i) |
- |
|
760,000 |
756,200 |
|
|
|
|||||
|
Moody's Ratings (unaudited) (b) |
Principal Amount |
Value |
|||
|
Huntsman ICI Chemicals LLC sr. secured: |
|
|
|
|
|
|
term B loan 9.875% 6/30/07 (i) |
- |
|
$ 341,250 |
$ 342,103 |
|
|
term C loan 9.8128% 6/30/08 (i) |
- |
|
438,920 |
440,017 |
|
|
Lyondell Chemical Co. sr. secured Tranche E term loan 10.5263% 5/17/06 (i) |
- |
|
700,000 |
719,250 |
|
|
McLeodUSA, Inc. term loan 9.69% 5/31/08 (i) |
Ba2 |
|
750,000 |
751,875 |
|
|
Nextel Finance Co. term loan: |
|
|
|
|
|
|
9.6875% 6/30/08 (i) |
Ba2 |
|
500,000 |
501,875 |
|
|
10.375% 12/31/08 (i) |
Ba2 |
|
500,000 |
501,875 |
|
|
Packaging Corp. of America term loan 0% 5/22/07 (i) |
- |
|
500,000 |
501,250 |
|
|
Telemundo Group, Inc. term loan 8.905% 3/31/07 (i) |
B1 |
|
300,000 |
298,125 |
|
|
Tritel Holding Corp. term loan 11.15% 12/31/07 (i) |
B2 |
|
750,000 |
752,813 |
|
|
Voicestream Pcs Holding LLC term loan 9.76% 2/25/09 (i) |
B+ |
|
900,000 |
897,750 |
|
|
Wci Capital Corp. term loan 11.43% 9/30/07 (i) |
B2 |
|
400,000 |
399,000 |
|
|
TOTAL PURCHASED BANK DEBT (Cost $9,276,347) |
9,260,883 |
||||
|
Bank Notes - 0.1% |
||||
|
|
||||
|
Bank One NA 6.29% 8/25/00 |
|
350,000 |
349,447 |
|
|
Certificates of Deposit - 0.1% |
||||
|
|
||||
|
Canadian Imperial Bank of Commerce yankee 7.01% 11/27/00 |
|
350,000 |
350,194 |
|
|
Commercial Paper - 0.3% |
||||
|
|
||||
|
CIT Group, Inc. 6.43% 7/5/00 |
|
350,000 |
349,869 |
|
|
Daimler-Chrysler North America Holding Corp. yankee 6.65% 11/7/00 |
|
350,000 |
341,826 |
|
|
General Motors Acceptance Corp. 6.62% 8/28/00 |
|
380,000 |
376,116 |
|
|
ING America Insurance Holdings, Inc. yankee 6.69% 11/9/00 |
|
350,000 |
341,735 |
|
|
Woolwich PLC yankee 6.21% 7/19/00 |
|
350,000 |
348,969 |
|
|
TOTAL COMMERCIAL PAPER (Cost $1,757,427) |
1,758,515 |
|||
|
Cash Equivalents - 7.6% |
|||
|
Maturity Amount |
Value |
||
|
Investments in repurchase agreements (U.S. Government Obligations), in a joint trading account at 6.83%, dated 6/30/00 due 7/3/00 |
$ 2,216,261 |
$ 2,215,000 |
|
|
Shares |
|
||
|
Central Cash Collateral Fund, 6.71% (c) |
501,400 |
501,400 |
|
|
Taxable Central Cash Fund, 6.59% (c) |
39,965,070 |
39,965,070 |
|
|
TOTAL CASH EQUIVALENTS (Cost $42,681,470) |
42,681,470 |
||
|
TOTAL INVESTMENT PORTFOLIO - 100.1% (Cost $509,744,964) |
565,029,889 |
||
|
NET OTHER ASSETS - (0.1)% |
(325,417) |
||
|
NET ASSETS - 100% |
$ 564,704,472 |
||
|
Futures Contracts |
|||||
|
|
Expiration Date |
Underlying Face Amount at Value |
Unrealized Gain/(Loss) |
||
|
Purchased |
|||||
|
74 S&P 500 Stock Index Contracts |
Sept. 2000 |
$ 27,159,850 |
$ (154,341) |
||
|
The face value of futures purchased as a percentage of net assets - 4.8% |
|
Legend |
|
(a) Non-income producing |
|
(b) S&P credit ratings are used in the absence of a rating by Moody's Investors Service, Inc. |
|
(c) The rate quoted is the annualized seven-day yield of the fund at |
|
(d) Non-income producing - issuer filed for protection under the Federal Bankruptcy Code or is in default of interest payment. |
|
(e) Debt obligation initially issued in zero coupon form which converts to coupon form at a specified rate and date. The rate shown is the rate at period end. |
|
(f) Security exempt from registration under Rule 144A of the Securities Act of 1933. These securities may be resold in transactions exempt from registration, normally to qualified institutional buyers. At the period end, the value of these securities amounted to $10,009,281 or 1.8% of net assets. |
|
(g) Security purchased on a delayed delivery or when-issued basis. |
|
(h) Security or a portion of the security was pledged to cover margin requirements for futures contracts. At the period end, the value of securities pledged amounted to $991,983. |
|
(i) The coupon rate shown on floating or adjustable rate securities represents the rate at period end. |
|
(j) For foreign government obligations not individually rated by S&P or Moody's, the ratings listed have been assigned by FMR, the fund's investment adviser, based principally on S&P and Moody's ratings of the sovereign credit of the issuing government. |
|
(k) Restricted securities - Investment in securities not registered under the Securities Act of 1933. |
|
Additional information on each holding is as follows: |
|
Security |
Acquisition Date |
Acquisition Cost |
|
Goldman Sachs Group LP 6.6338% 7/27/00 |
1/25/99 |
$ 400,000 |
|
Micron Technology, Inc. 6.5% 9/30/05 |
11/1/99 |
$ 787,500 |
|
Other Information |
|
The composition of long-term debt holdings as a percentage of total value of investments in securities, is as follows (ratings are unaudited): |
|
Moody's Ratings |
S&P Ratings |
|||
|
Aaa, Aa, A |
5.4% |
|
AAA, AA, A |
4.6% |
|
Baa |
1.7% |
|
BBB |
1.5% |
|
Ba |
2.1% |
|
BB |
2.3% |
|
B |
8.2% |
|
B |
8.6% |
|
Caa |
1.8% |
|
CCC |
1.2% |
|
Ca, C |
0.0% |
|
CC, C |
0.0% |
|
|
|
|
D |
0.2% |
|
The percentage not rated by Moody's or S&P amounted to 1.1%. FMR has determined that unrated debt securities that are lower quality account for 1.1% of the total value of investment in securities. |
|
Purchases and sales of securities, other than short-term securities, aggregated $410,590,429 and $446,509,326, respectively, of which long-term U.S. government and government agency obligations aggregated $21,640,909 and $29,574,212, respectively. |
|
The market value of futures contracts opened and closed during the period amounted to $42,463,560 and $25,435,756, respectively. |
|
The fund placed a portion of its portfolio transactions with brokerage firms which are affiliates of Fidelity Management & Research Company. The commissions paid to these affiliated firms were $11,215 for the period. |
|
The fund invested in securities that are not registered under the Securities Act of 1933. These securities are subject to legal or contractual restrictions on resale. At the end of the period, restricted securities (excluding Rule 144A issues) amounted to $1,234,966 and 0.2% of net assets. |
|
The fund participated in the security lending program. At period end, the value of securities loaned amounted to $508,362. The fund received cash collateral of $501,400 which was invested in cash equivalents. |
|
Income Tax Information |
|
At June 30, 2000, the aggregate cost of investment securities for income tax purposes was $511,113,364. Net unrealized appreciation aggregated $53,916,525, of which $78,810,087 related to appreciated investment securities and $24,893,562 related to depreciated investment securities. |
See accompanying notes which are an integral part of the financial statements.
Asset Manager: Growth Portfolio
Statement of Assets and Liabilities
|
|
June 30, 2000 (Unaudited) |
|
|
Assets |
|
|
|
Investment in securities, at value (including repurchase agreements of $2,215,000) |
|
$ 565,029,889 |
|
Cash |
|
580,771 |
|
Receivable for investments sold |
|
2,971,635 |
|
Receivable for fund shares sold |
|
144,989 |
|
Dividends receivable |
|
223,283 |
|
Interest receivable |
|
2,250,205 |
|
Receivable for daily variation on futures contracts |
|
128,478 |
|
Other receivables |
|
4,662 |
|
Total assets |
|
571,333,912 |
|
Liabilities |
|
|
|
Payable for investments purchased |
$ 4,480,071 |
|
|
Delayed delivery |
1,156,414 |
|
|
Payable for fund shares redeemed |
103,022 |
|
|
Accrued management fee |
268,525 |
|
|
Distribution fees payable |
1,214 |
|
|
Other payables and |
118,794 |
|
|
Collateral on securities loaned, |
501,400 |
|
|
Total liabilities |
|
6,629,440 |
|
Net Assets |
|
$ 564,704,472 |
|
Net Assets consist of: |
|
|
|
Paid in capital |
|
$ 459,835,599 |
|
Undistributed net investment income |
|
8,042,512 |
|
Accumulated undistributed net realized gain (loss) on investments and foreign currency transactions |
|
41,695,777 |
|
Net unrealized appreciation (depreciation) on investments |
|
55,130,584 |
|
Net Assets |
|
$ 564,704,472 |
|
Initial Class: |
|
$16.26 |
|
Service Class: |
|
$16.16 |
|
Service Class 2: |
|
$16.15 |
Statement of Operations
|
|
Six months ended June 30, 2000 (Unaudited) |
|
|
Investment Income Dividends |
|
$ 2,439,432 |
|
Interest |
|
6,412,593 |
|
Security lending |
|
3,343 |
|
Total income |
|
8,855,368 |
|
Expenses |
|
|
|
Management fee |
$ 1,608,808 |
|
|
Transfer agent fees |
183,381 |
|
|
Distribution fees |
6,175 |
|
|
Accounting and security lending fees |
98,601 |
|
|
Non-interested trustees' compensation |
884 |
|
|
Custodian fees and expenses |
17,239 |
|
|
Registration fees |
246 |
|
|
Audit |
13,564 |
|
|
Legal |
2,214 |
|
|
Miscellaneous |
12,474 |
|
|
Total expenses before reductions |
1,943,586 |
|
|
Expense reductions |
(19,481) |
1,924,105 |
|
Net investment income |
|
6,931,263 |
|
Realized and Unrealized Gain (Loss) Net realized gain (loss) on: |
|
|
|
Investment securities |
41,710,684 |
|
|
Foreign currency transactions |
25 |
|
|
Futures contracts |
303,300 |
42,014,009 |
|
Change in net unrealized appreciation (depreciation) on: |
|
|
|
Investment securities |
(56,540,361) |
|
|
Assets and liabilities in |
(1) |
|
|
Futures contracts |
(189,604) |
(56,729,966) |
|
Net gain (loss) |
|
(14,715,957) |
|
Net increase (decrease) in net assets resulting from operations |
|
$ (7,784,694) |
|
Other Information Expense reductions |
|
$ 16,516 |
|
Custodian credits |
|
2,965 |
|
|
|
$ 19,481 |
See accompanying notes which are an integral part of the financial statements.
Semiannual Report
Fidelity Variable Insurance Products: Asset Manager: Growth Portfolio
Financial Statements - continued
Statement of Changes in Net Assets
|
Increase (Decrease) in Net Assets |
Six months ended |
Year ended |
|
Operations |
$ 6,931,263 |
$ 13,100,308 |
|
Net realized gain (loss) |
42,014,009 |
48,664,911 |
|
Change in net unrealized appreciation (depreciation) |
(56,729,966) |
17,820,079 |
|
Net increase (decrease) in net assets resulting from operations |
(7,784,694) |
79,585,298 |
|
Distributions to shareholders |
(11,727,781) |
(12,766,102) |
|
From net realized gain |
(47,570,525) |
(21,173,047) |
|
Total distributions |
(59,298,306) |
(33,939,149) |
|
Share transactions - net increase (decrease) |
40,407,233 |
13,695,216 |
|
Total increase (decrease) in net assets |
(26,675,767) |
59,341,365 |
|
Net Assets |
|
|
|
Beginning of period |
591,380,239 |
532,038,874 |
|
End of period (including undistributed net investment income of $8,042,512 and $13,084,201, respectively) |
$ 564,704,472 |
$ 591,380,239 |
|
|
|
Other Information: |
|
|
Six months ended June 30, 2000 |
Year ended |
||
|
|
Shares |
Dollars |
Shares |
Dollars |
|
Share transactions |
2,257,146 |
$ 36,909,555 |
3,532,899 |
$ 59,442,839 |
|
Reinvested |
3,619,549 |
58,129,957 |
2,100,108 |
33,706,735 |
|
Redeemed |
(3,600,176) |
(59,212,121) |
(5,095,721) |
(86,190,044) |
|
Net increase (decrease) |
2,276,519 |
$ 35,827,391 |
537,286 |
$ 6,959,530 |
|
Service Class |
224,493 |
$ 3,664,261 |
451,433 |
$ 7,507,627 |
|
Reinvested |
72,504 |
1,157,887 |
14,544 |
232,414 |
|
Redeemed |
(53,879) |
(864,210) |
(60,280) |
(1,004,355) |
|
Net increase (decrease) |
243,118 |
$ 3,957,938 |
405,697 |
$ 6,735,686 |
|
Service Class 2 A |
39,435 |
$ 628,570 |
- |
$ - |
|
Reinvested |
655 |
10,461 |
- |
- |
|
Redeemed |
(1,069) |
(17,127) |
- |
- |
|
Net increase (decrease) |
39,021 |
$ 621,904 |
- |
$ - |
|
Distributions |
|
$ 11,501,649 |
|
$ 12,678,680 |
|
Service Class |
|
224,107 |
|
87,422 |
|
Service Class 2 A |
|
2,025 |
|
- |
|
Total |
|
$ 11,727,781 |
|
$ 12,766,102 |
|
From net realized gain |
|
$ 46,628,308 |
|
$ 21,028,055 |
|
Service Class |
|
933,780 |
|
144,992 |
|
Service Class 2 A |
|
8,437 |
|
- |
|
Total |
|
$ 47,570,525 |
|
$ 21,173,047 |
|
|
|
$ 59,298,306 |
|
$ 33,939,149 |
A Service Class 2 commenced sale of shares January 12, 2000.
See accompanying notes which are an integral part of the financial statements.
Asset Manager: Growth Portfolio
Financial Highlights - Initial Class
|
|
Six months ended |
Years ended December 31, |
||||
|
Selected Per-Share Data |
(Unaudited) |
1999 |
1998 |
1997 |
1996 |
1995 E |
|
Net asset value, beginning of period |
$ 18.38 |
$ 17.03 |
$ 16.36 |
$ 13.10 |
$ 11.77 |
$ 10.00 |
|
Income from Investment Operations |
|
|
|
|
|
|
|
Net investment income |
.20 D |
.40 D |
.41 D |
.36 D |
.21 |
.10 |
|
Net realized and unrealized gain (loss) |
(.45) |
2.04 |
2.19 |
2.92 |
2.08 |
2.20 |
|
Total from investment operations |
(.25) |
2.44 |
2.60 |
3.28 |
2.29 |
2.30 |
|
Less Distributions |
|
|
|
|
|
|
|
From net investment income |
(.37) |
(.41) |
(.34) |
- |
(.21) |
(.11) |
|
From net realized gain |
(1.50) |
(.68) |
(1.59) |
(.02) |
(.75) |
(.42) |
|
Total distributions |
(1.87) |
(1.09) |
(1.93) |
(.02) |
(.96) |
(.53) |
|
Net asset value, end of period |
$ 16.26 |
$ 18.38 |
$ 17.03 |
$ 16.36 |
$ 13.10 |
$ 11.77 |
|
Total Return B, C |
(1.29)% |
15.26% |
17.57% |
25.07% |
20.04% |
23.02% |
|
Ratios and Supplemental Data |
|
|
|
|
|
|
|
Net assets, end of period (000 omitted) |
$ 550,573 |
$ 580,555 |
$ 528,874 |
$ 483,231 |
$ 253,024 |
$ 68,247 |
|
Ratio of expenses to average net assets |
.69% A |
.71% |
.73% |
.77% |
.87% |
1.00% G |
|
Ratio of expenses to average net assets after |
.69% A |
.70% H |
.72% H |
.76% H |
.85% H |
1.00% |
|
Ratio of net investment income to average net assets |
2.48% A |
2.38% |
2.60% |
2.44% |
2.63% |
1.69% |
|
Portfolio turnover |
154% A |
92% |
98% |
90% |
120% |
343% |
Financial Highlights - Service Class
|
|
Six months ended |
Years ended December 31, |
||
|
Selected Per-Share Data |
(Unaudited) |
1999 |
1998 |
1997 F |
|
Net asset value, beginning of period |
$ 18.28 |
$ 16.96 |
$ 16.35 |
$ 15.94 |
|
Income from Investment Operations |
|
|
|
|
|
Net investment income D |
.19 |
.38 |
.40 |
.07 |
|
Net realized and unrealized gain (loss) |
(.45) |
2.03 |
2.14 |
.34 |
|
Total from investment operations |
(.26) |
2.41 |
2.54 |
.41 |
|
Less Distributions |
|
|
|
|
|
From net investment income |
(.36) |
(.41) |
(.34) |
- |
|
From net realized gain |
(1.50) |
(.68) |
(1.59) |
- |
|
Total distributions |
(1.86) |
(1.09) |
(1.93) |
- |
|
Net asset value, end of period |
$ 16.16 |
$ 18.28 |
$ 16.96 |
$ 16.35 |
|
Total Return B, C |
(1.30)% |
15.13% |
17.18% |
2.57% |
|
Ratios and Supplemental Data |
|
|
|
|
|
Net assets, end of period (000 omitted) |
$ 13,502 |
$ 10,825 |
$ 3,165 |
$ 10 |
|
Ratio of expenses to average net assets |
.80% A |
.82% |
.89% |
.87% A |
|
Ratio of expenses to average net assets after expense reductions |
.79% A, H |
.81% H |
.88% H |
.87% A |
|
Ratio of net investment income to average net assets |
2.38% A |
2.27% |
2.65% |
2.70% A |
|
Portfolio turnover |
154% A |
92% |
98% |
90% |
|
A Annualized B Total returns for periods of less than one year are not annualized and do not reflect charges attributable to your insurance company's separate account. Inclusion of these charges would reduce the total returns shown. C The total returns would have been lower had certain expenses not been reduced during the period shown. D Net investment income per share has been calculated based on average shares outstanding during the period. E For the period January 5, 1995 (commencement of sale of Initial Class shares) to December 31, 1995. F For the period November 3, 1997 (commencement of sale of Service Class shares) to December 31, 1997. G FMR agreed to reimburse a portion of the class' expenses during the period. Without this reimbursement, the class' expense ratio would have been higher. H FMR or the fund has entered into varying arrangements with third parties who either paid or reduced a portion of the class' expenses. |
||||
See accompanying notes which are an integral part of the financial statements.
Semiannual Report
Financial Highlights - Service Class 2
|
|
Six months ended |
|
Selected Per-Share Data |
(Unaudited) |
|
Net asset value, beginning of period |
$ 17.78 |
|
Income from Investment Operations |
|
|
Net investment income C |
.16 |
|
Net realized and unrealized gain (loss) |
.07 E |
|
Total from investment operations |
.23 |
|
Less Distributions |
|
|
From net investment income |
(.36) |
|
From net realized gain |
(1.50) |
|
Total distributions |
(1.86) |
|
Net asset value, end of period |
$ 16.15 |
|
Total Return B |
1.41% |
|
Ratios and Supplemental Data |
|
|
Net assets, end of period (000 omitted) |
$ 630 |
|
Ratio of expenses to average net assets |
.94% A |
|
Ratio of net investment income to average net assets |
2.23% A |
|
Portfolio turnover |
154% A |
|
A Annualized B Total returns for periods of less than one year are not annualized and do not reflect charges attributable to your insurance company's separate account. Inclusion of these charges would reduce the total returns shown. C Net investment income per share has been calculated based on average shares outstanding during the period. D For the period January 12, 2000 (commencement of sale of Service Class 2 shares) to June 30, 2000. E The amount shown for a share outstanding does not correspond with the aggregate net loss on investments for the period due to the timing of sales and repurchases of class shares in relation to fluctuating market values of the investments of the fund. |
|
See accompanying notes which are an integral part of the financial statements.
Asset Manager: Growth Portfolio
Performance
There are several ways to evaluate a fund's historical performance. You can look at the total percentage change in value, the average annual percentage change or the growth of a hypothetical $10,000 investment. Total return reflects the change in the value of an investment, assuming reinvestment of the fund's dividend income and capital gains (the profits earned upon the sale of securities that have grown in value). The initial offering of Service Class 2 shares took place on January 12, 2000. Performance for Service Class 2 shares reflects an asset based distribution fee (12b-1 fee). Returns from November 3, 1997 to January 12, 2000 are those of Service Class which reflect a different 12b-1 fee. Service Class 2 returns prior to November 3, 1997 are those of Initial Class and do not include the effects of a 12b-1 fee. Had Service Class 2's 12b-1 fee been reflected, returns prior to January 12, 2000 would have been lower. If Fidelity had not reimbursed certain fund expenses, the past 10 years total return would have been lower.
Average Annual Total Returns
|
Periods ended |
Past 1 |
Past 5 |
Past 10 years |
|
Fidelity VIP: Asset Manager - |
4.66% |
13.99% |
12.56% |
|
Asset Manager Composite |
6.29% |
14.27% |
11.82% |
|
S&P 500 |
7.25% |
23.80% |
17.80% |
|
LB Aggregate Bond |
4.57% |
6.25% |
7.82% |
|
LB 3 Month T-Bill |
5.57% |
5.41% |
5.08% |
Average annual returns take the fund's cumulative return and show you what would have happened if the fund had performed at a constant rate each year.
You can compare the fund's returns to those of the Asset Manager Composite Index, a hypothetical combination of unmanaged indices. The composite index combines the total returns of the Standard & Poor's 500 Index, the Lehman Brothers Aggregate Bond Index and the Lehman Brothers 3 Month Treasury Bill Index weighted according to the fund's neutral mix.*
The benchmarks listed in the table above include reinvested dividends and capital gains, if any.
Figures for more than one year assume a steady compounded rate of return and are not the fund's year-by-year results, which fluctuated over the periods shown.
Performance numbers are net of all fund operating expenses, but do not include any insurance charges imposed by your insurance company's separate account. If performance information included the effect of these additional charges, the total returns would have been lower.
Past performance is no guarantee of future results. Principal and investment return will vary and you may have a gain or loss when you withdraw your money.
Understanding Performance
How a fund did yesterday is no guarantee of how it will do tomorrow. The stock market, for example, has a history of long-term growth and short-term volatility. In turn, the share price and return of a fund that invests in stocks will vary. That means if you sell your shares during a market downturn, you might lose money. But if you can ride out the market's ups and downs, you may have a gain.
3$10,000 Over 10 Years
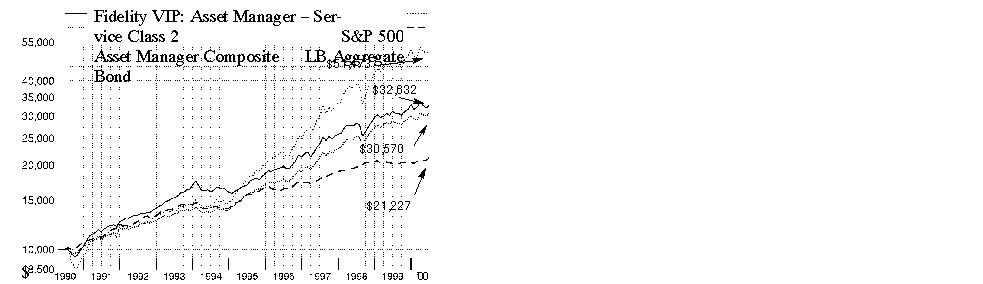
$10,000 Over 10 Years: Let's say hypothetically that $10,000 was invested in Fidelity Variable Insurance Products: Asset Manager Portfolio - Service Class 2 on June 30, 1990. By June 30, 2000, the value of the investment would have grown to $32,632 - a 226.32% increase. With reinvested dividends and capital gains, if any, a $10,000 investment in the Standard & Poor's 500 Index would have grown to $51,473 over the same period - a 414.73% increase on the initial investment. If $10,000 was invested in the Lehman Brothers Aggregate Bond Index, it would have grown to $21,227 - a 112.27% increase. You can also look at how the Asset Manager Composite Index did over the same period. With reinvested dividends and capital gains, if any, a $10,000 investment in the index would have grown to $30,570 - a 205.70% increase.
* 50% stocks, 40% bonds and 10% short-term instruments effective January 1, 1997.
Investment Summary
|
Top Five Stocks as of June 30, 2000 |
|
|
|
% of fund's |
|
General Electric Co. |
2.4 |
|
Intel Corp. |
1.8 |
|
Pfizer, Inc. |
1.6 |
|
Cisco Systems, Inc. |
1.6 |
|
Microsoft Corp. |
1.6 |
|
|
9.0 |
|
Top Five Bond Issuers as of June 30, 2000 |
|
|
(with maturities greater than one year) |
% of fund's |
|
Fannie Mae |
9.4 |
|
U.S. Treasury Obligations |
3.8 |
|
Government National Mortgage Association |
1.1 |
|
Federal Home Loan Bank |
1.0 |
|
Freddie Mac |
0.6 |
|
|
15.9 |
|
Asset Allocation as of June 30, 2000 |
|||
|
% of fund's net assets * |
|||
|
Stock class 53.0% |
|
|
|
Bonds class 35.7% |
|
|
|
Short-Term class 11.3% |
|
|
|
* Foreign investments 4.5% |
|
Asset allocation in the pie chart reflects the categorization of assets as defined in the fund's Prospectus. Financial statement categorizations conform to accounting standards and will differ from the pie chart. |
Semiannual Report
(Portfolio Manager photograph)
Note to shareholders: Bart Grenier became Portfolio Manager of Asset Manager Portfolio
on May 1, 2000.
Q. How did the fund perform, Bart?
A. For the six- and 12-month periods that ended June 30, 2000,
the fund trailed the Asset Manager Composite Index, which returned 1.80% and 6.29%, respectively.
Q. How did the fund's asset allocation strategies play out
during the past six months?
A. The fund maintained a modest tilt toward equities, averaging just under 53% for the period. The fund's neutral allocation mix typically calls for 50% to be invested in stocks, 40% in bonds and 10% in short-term and money market instruments. Given the bullish environment for stocks in the first quarter of 2000, the fund's overexposure here garnered it an edge over the composite index early in the period. However, the fund's wins during the period were more than offset by its losses suffered during the sharp, broad market decline of April and May, even though stocks rallied again in June. On the bond front, the fund continued to emphasize investment-grade debt, which helped. However, our exposure to high-yield securities hurt, as this asset class had a particularly difficult period.
Q. What factors influenced performance of the equity subportfolio?
A. Steve Snider kept the fund generally sector neutral relative to the Standard & Poor's 500 Index, choosing instead to focus his efforts on individual stock picking. The fund benefited from owning a number of high-quality tech names that effectively weathered the correction in the spring and delivered strong returns for the period. Texas Instruments, Adobe Systems and ADC Telecommunications led the way, followed by Intel, Corning and Cisco. The fund's exposure to health stocks, particularly Amgen and Pfizer, helped amid a rally in biotechnology shares. Growth-oriented financials, such as Lehman Brothers, and energy stocks, such as BP Amoco, also were meaningful contributors. Conversely, we were caught holding a number of disappointments within tech, including Qualcomm, Motorola and Lucent, which each fell on weak earnings. Neither BP Amoco nor Lucent was held at the close of the period. Poor performance among retail stocks also hurt the fund's return as Wal-Mart, Lowe's and Home Depot all declined. Overall, the equity subportfolio trailed the index slightly during the six-month period, but outperformed it during the past 12 months.
Q. How did the bond portion of the fund fare?
A. High-yield bonds suffered from poor liquidity and declining credit quality. Fred Hoff - who directed the fund's high-yield investments until June 1, 2000, when Mark Notkin took over - helped limit our losses by avoiding the names that fell the furthest amid the period's downtrend. Switching gears, Charlie Morrison and his team did a nice job of positioning the investment-grade component of the fund to benefit from changing market conditions. Following strong performance turned in by the spread sectors - namely corporate bonds and mortgage securities - in the fourth quarter of 1999, we reduced our exposure to these markets, particularly to long-term corporates, in early January. This strategy benefited the fund, as spread-sector performance deteriorated during the period. A driving influence at this time was the U.S. Treasury's announcement in January of its intention to reduce new borrowing and use government surplus proceeds to repurchase outstanding debt. This move sparked a tremendous rally in long-term Treasuries. So, despite the Federal Reserve Board's actions to raise rates during the period, the much improved supply/demand picture painted by the Treasury buybacks led to a positive return for the investment-grade subportfolio.
Q. And the fund's short-term/money market investments?
A. John Todd felt that concerns surrounding Y2K were overblown and, thus, used the opportunity to extend the average maturity of the fund's money-market subportfolio early on to take advantage of a steeply sloped yield curve. Early in 2000, however, the yield curve flattened out dramatically. In response, we let the average maturity roll down, believing that strong economic growth and the risk of rising inflation were likely to set off a protracted period of Fed tightening. Shareholders should note that John may choose to invest in a money market mutual fund rather than invest directly in money market securities in the future.
Q. What's your outlook?
A. It's still unclear as to whether or not the Fed can successfully orchestrate a soft landing, which would be very constructive for stocks. There's a lot of conflicting evidence out there in terms of economic data that will have to get cleared up before we can know for sure if the economy has actually slowed down a couple notches to be considered a soft landing. Until then, I think we'll be in sort of a narrow trading range in terms of the equity market. Security selection in this type of environment will become even more important, which bodes well for us given the strength of Fidelity's research.
The views expressed in this report reflect those of the portfolio manager only through the end of the period of the report as stated on the cover. The manager's views are subject to change at any time based on market or other conditions. For more information, see page 2.
Fund Facts
Goal: high total return with reduced risk over the long term by allocating its assets among stocks, bonds and short-term instruments
Start date: September 6, 1989
Size: as of June 30, 2000, more than $4.5 billion
Manager: Bart Grenier, since May 2000; joined Fidelity in 1991
3Semiannual Report
Fidelity Variable Insurance Products: Asset Manager Portfolio
(Unaudited)
Showing Percentage of Net Assets
|
Common Stocks - 48.5% |
|||
|
Shares |
Value (Note 1) |
||
|
AEROSPACE & DEFENSE - 1.3% |
|||
|
Boeing Co. |
309,600 |
$ 12,945,150 |
|
|
Honeywell International, Inc. |
358,387 |
12,073,162 |
|
|
Northrop Grumman Corp. |
193,300 |
12,806,125 |
|
|
United Technologies Corp. |
362,406 |
21,336,653 |
|
|
|
59,161,090 |
||
|
BASIC INDUSTRIES - 0.5% |
|||
|
Chemicals & Plastics - 0.5% |
|||
|
Eastman Chemical Co. |
150,000 |
7,162,500 |
|
|
Pharmacia Corp. |
200,000 |
10,337,500 |
|
|
Praxair, Inc. |
123,900 |
4,638,506 |
|
|
|
22,138,506 |
||
|
Iron & Steel - 0.0% |
|||
|
Mueller Industries, Inc. |
51,200 |
1,433,600 |
|
|
TOTAL BASIC INDUSTRIES |
23,572,106 |
||
|
DURABLES - 0.7% |
|||
|
Consumer Durables - 0.5% |
|||
|
Minnesota Mining & Manufacturing Co. |
281,200 |
23,199,000 |
|
|
Consumer Electronics - 0.0% |
|||
|
Whirlpool Corp. |
21,000 |
979,125 |
|
|
Textiles & Apparel - 0.2% |
|||
|
Arena Brands Holdings Corp. Class B |
8,445 |
211,125 |
|
|
Liz Claiborne, Inc. |
180,000 |
6,345,000 |
|
|
|
6,556,125 |
||
|
TOTAL DURABLES |
30,734,250 |
||
|
ENERGY - 3.4% |
|||
|
Energy Services - 0.2% |
|||
|
BJ Services Co. (a) |
173,000 |
10,812,500 |
|
|
Oil & Gas - 3.2% |
|||
|
Amerada Hess Corp. |
55,000 |
3,396,250 |
|
|
Apache Corp. |
151,900 |
8,933,619 |
|
|
Chevron Corp. |
448,200 |
38,012,963 |
|
|
EOG Resources, Inc. |
130,000 |
4,355,000 |
|
|
Exxon Mobil Corp. |
809,875 |
63,575,188 |
|
|
Royal Dutch Petroleum Co. (NY Shares) |
450,000 |
27,703,125 |
|
|
|
145,976,145 |
||
|
TOTAL ENERGY |
156,788,645 |
||
|
FINANCE - 6.6% |
|||
|
Banks - 1.9% |
|||
|
Bank of America Corp. |
270,000 |
11,610,000 |
|
|
Chase Manhattan Corp. |
268,050 |
12,347,053 |
|
|
FleetBoston Financial Corp. |
579,905 |
19,716,770 |
|
|
|
|||
|
Shares |
Value (Note 1) |
||
|
J.P. Morgan & Co., Inc. |
154,600 |
$ 17,025,325 |
|
|
Wells Fargo & Co. |
650,000 |
25,187,500 |
|
|
|
85,886,648 |
||
|
Credit & Other Finance - 1.8% |
|||
|
American Express Co. |
292,500 |
15,246,563 |
|
|
Citigroup, Inc. |
975,800 |
58,791,950 |
|
|
Providian Financial Corp. |
85,950 |
7,735,500 |
|
|
|
81,774,013 |
||
|
Insurance - 0.6% |
|||
|
CIGNA Corp. |
60,600 |
5,666,100 |
|
|
Marsh & McLennan Companies, Inc. |
173,600 |
18,130,350 |
|
|
MGIC Investment Corp. |
95,800 |
4,358,900 |
|
|
|
28,155,350 |
||
|
Savings & Loans - 0.4% |
|||
|
Golden West Financial Corp. |
428,700 |
17,496,319 |
|
|
Securities Industry - 1.9% |
|||
|
AXA Financial, Inc. |
15,700 |
533,800 |
|
|
Lehman Brothers Holdings, Inc. |
441,600 |
41,758,800 |
|
|
Merrill Lynch & Co., Inc. |
129,800 |
14,927,000 |
|
|
Morgan Stanley Dean Witter & Co. |
346,800 |
28,871,100 |
|
|
|
86,090,700 |
||
|
TOTAL FINANCE |
299,403,030 |
||
|
HEALTH - 4.8% |
|||
|
Drugs & Pharmaceuticals - 3.5% |
|||
|
Amgen, Inc. |
640,700 |
45,009,175 |
|
|
Forest Laboratories, Inc. (a) |
80,000 |
8,080,000 |
|
|
IVAX Corp. (a) |
120,000 |
4,980,000 |
|
|
Merck & Co., Inc. |
346,000 |
26,512,250 |
|
|
Pfizer, Inc. |
1,577,200 |
75,705,600 |
|
|
|
160,287,025 |
||
|
Medical Equipment & Supplies - 0.7% |
|||
|
Johnson & Johnson |
296,300 |
30,185,563 |
|
|
Millipore Corp. |
34,700 |
2,615,513 |
|
|
|
32,801,076 |
||
|
Medical Facilities Management - 0.6% |
|||
|
HCA - The Healthcare Co. |
170,000 |
5,163,750 |
|
|
UnitedHealth Group, Inc. |
216,800 |
18,590,600 |
|
|
|
23,754,350 |
||
|
TOTAL HEALTH |
216,842,451 |
||
|
INDUSTRIAL MACHINERY & EQUIPMENT - 2.6% |
|||
|
Electrical Equipment - 2.5% |
|||
|
General Electric Co. |
2,048,100 |
108,549,300 |
|
|
Scientific-Atlanta, Inc. |
80,000 |
5,960,000 |
|
|
|
114,509,300 |
||
|
Common Stocks - continued |
|||
|
Shares |
Value (Note 1) |
||
|
INDUSTRIAL MACHINERY & EQUIPMENT - continued |
|||
|
Industrial Machinery & Equipment - 0.1% |
|||
|
Parker-Hannifin Corp. |
69,200 |
$ 2,370,100 |
|
|
TOTAL INDUSTRIAL MACHINERY & EQUIPMENT |
116,879,400 |
||
|
MEDIA & LEISURE - 1.5% |
|||
|
Broadcasting - 0.0% |
|||
|
NTL, Inc. warrants 10/14/08 (a) |
3,742 |
153,422 |
|
|
Entertainment - 0.5% |
|||
|
Viacom, Inc. Class B (non-vtg.) (a) |
85,000 |
5,795,938 |
|
|
Walt Disney Co. |
459,600 |
17,838,225 |
|
|
|
23,634,163 |
||
|
Publishing - 1.0% |
|||
|
Dow Jones & Co., Inc. |
77,100 |
5,647,575 |
|
|
Gannett Co., Inc. |
324,500 |
19,409,156 |
|
|
Knight-Ridder, Inc. |
128,700 |
6,845,231 |
|
|
McGraw-Hill Companies, Inc. |
56,000 |
3,024,000 |
|
|
The New York Times Co. Class A |
219,200 |
8,658,400 |
|
|
|
43,584,362 |
||
|
Restaurants - 0.0% |
|||
|
Darden Restaurants, Inc. |
151,600 |
2,463,500 |
|
|
TOTAL MEDIA & LEISURE |
69,835,447 |
||
|
NONDURABLES - 2.3% |
|||
|
Beverages - 1.2% |
|||
|
Anheuser-Busch Companies, Inc. |
564,200 |
42,138,688 |
|
|
Pepsi Bottling Group, Inc. |
389,800 |
11,377,288 |
|
|
|
53,515,976 |
||
|
Foods - 0.9% |
|||
|
PepsiCo, Inc. |
350,000 |
15,553,125 |
|
|
Quaker Oats Co. |
284,000 |
21,335,500 |
|
|
Sysco Corp. |
140,000 |
5,897,500 |
|
|
|
42,786,125 |
||
|
Household Products - 0.2% |
|||
|
Colgate-Palmolive Co. |
170,000 |
10,178,750 |
|
|
TOTAL NONDURABLES |
106,480,851 |
||
|
RETAIL & WHOLESALE - 3.6% |
|||
|
Apparel Stores - 0.1% |
|||
|
Venator Group, Inc. (a) |
500,000 |
5,125,000 |
|
|
General Merchandise Stores - 1.9% |
|||
|
Sears, Roebuck & Co. |
334,600 |
10,916,325 |
|
|
Target Corp. |
147,500 |
8,555,000 |
|
|
Wal-Mart Stores, Inc. |
1,166,600 |
67,225,325 |
|
|
|
86,696,650 |
||
|
Retail & Wholesale, Miscellaneous - 1.6% |
|||
|
Best Buy Co., Inc. (a) |
249,700 |
15,793,525 |
|
|
Circuit City Stores, Inc. - |
129,900 |
4,311,056 |
|
|
|
|||
|
Shares |
Value (Note 1) |
||
|
Home Depot, Inc. |
624,300 |
$ 31,175,981 |
|
|
Lowe's Companies, Inc. |
358,400 |
14,716,800 |
|
|
Tiffany & Co., Inc. |
77,900 |
5,258,250 |
|
|
|
71,255,612 |
||
|
TOTAL RETAIL & WHOLESALE |
163,077,262 |
||
|
SERVICES - 0.1% |
|||
|
Leasing & Rental - 0.1% |
|||
|
Hertz Corp. Class A |
115,700 |
3,246,831 |
|
|
TECHNOLOGY - 16.9% |
|||
|
Communications Equipment - 3.8% |
|||
|
ADC Telecommunications, Inc. (a) |
433,000 |
36,317,875 |
|
|
Cisco Systems, Inc. (a) |
1,174,000 |
74,622,375 |
|
|
Comverse Technology, Inc. (a) |
312,400 |
29,053,200 |
|
|
Corning, Inc. |
120,000 |
32,385,000 |
|
|
|
172,378,450 |
||
|
Computer Services & Software - 4.0% |
|||
|
Adobe Systems, Inc. |
390,400 |
50,752,000 |
|
|
First Data Corp. |
302,900 |
15,031,413 |
|
|
Microsoft Corp. (a) |
897,700 |
71,816,000 |
|
|
Oracle Corp. (a) |
505,400 |
42,485,188 |
|
|
Sybase, Inc. (a) |
200,000 |
4,600,000 |
|
|
|
184,684,601 |
||
|
Computers & Office Equipment - 2.8% |
|||
|
EMC Corp. (a) |
216,400 |
16,649,275 |
|
|
Hewlett-Packard Co. |
300,000 |
37,462,500 |
|
|
International Business Machines Corp. |
319,400 |
34,994,263 |
|
|
Sun Microsystems, Inc. (a) |
406,100 |
36,929,719 |
|
|
|
126,035,757 |
||
|
Electronic Instruments - 1.2% |
|||
|
Agilent Technologies, Inc. |
53,440 |
3,941,200 |
|
|
Applied Materials, Inc. (a) |
273,600 |
24,795,000 |
|
|
KLA-Tencor Corp. (a) |
80,000 |
4,685,000 |
|
|
LAM Research Corp. (a) |
75,300 |
2,823,750 |
|
|
Teradyne, Inc. (a) |
233,800 |
17,184,300 |
|
|
|
53,429,250 |
||
|
Electronics - 5.1% |
|||
|
Advanced Micro Devices, Inc. (a) |
200,000 |
15,450,000 |
|
|
Analog Devices, Inc. (a) |
49,200 |
3,739,200 |
|
|
Intel Corp. |
601,600 |
80,426,400 |
|
|
LSI Logic Corp. (a) |
303,600 |
16,432,350 |
|
|
Motorola, Inc. |
1,041,051 |
30,255,545 |
|
|
National Semiconductor Corp. (a) |
173,000 |
9,817,750 |
|
|
Texas Instruments, Inc. |
1,040,800 |
71,489,950 |
|
|
Vishay Intertechnology, Inc. (a) |
194,700 |
7,386,431 |
|
|
|
234,997,626 |
||
|
TOTAL TECHNOLOGY |
771,525,684 |
||
|
Common Stocks - continued |
|||
|
Shares |
Value (Note 1) |
||
|
TRANSPORTATION - 0.1% |
|||
|
Air Transportation - 0.1% |
|||
|
AMR Corp. |
100,000 |
$ 2,643,750 |
|
|
Delta Air Lines, Inc. |
75,000 |
3,792,188 |
|
|
|
6,435,938 |
||
|
UTILITIES - 4.1% |
|||
|
Cellular - 0.6% |
|||
|
McCaw International Ltd. warrants 4/16/07 (a)(g) |
8,150 |
20,375 |
|
|
QUALCOMM, Inc. (a) |
346,400 |
20,784,000 |
|
|
Sprint Corp. - PCS Group Series 1 (a) |
100,000 |
5,950,000 |
|
|
|
26,754,375 |
||
|
Electric Utility - 0.8% |
|||
|
Energy East Corp. |
654,000 |
12,466,875 |
|
|
Entergy Corp. |
150,000 |
4,078,125 |
|
|
Northeast Utilities |
129,800 |
2,823,150 |
|
|
PECO Energy Co. |
100,000 |
4,031,250 |
|
|
Pinnacle West Capital Corp. |
112,500 |
3,810,938 |
|
|
PPL Corp. |
128,500 |
2,818,969 |
|
|
Public Service Enterprise Group, Inc. |
170,100 |
5,889,713 |
|
|
|
35,919,020 |
||
|
Gas - 0.6% |
|||
|
Dynegy, Inc. Class A |
90,000 |
6,148,125 |
|
|
Enron Corp. |
319,800 |
20,627,100 |
|
|
|
26,775,225 |
||
|
Telephone Services - 2.1% |
|||
|
BellSouth Corp. |
762,300 |
32,493,038 |
|
|
Ono Finance PLC rights 5/31/09 (a)(g) |
1,740 |
17,400 |
|
|
Pathnet, Inc. warrants 4/15/08 (a)(g) |
4,665 |
46,650 |
|
|
Sprint Corp. - FON Group |
314,900 |
16,059,900 |
|
|
U.S. WEST, Inc. |
375,000 |
32,156,250 |
|
|
WorldCom, Inc. (a) |
324,450 |
14,884,144 |
|
|
|
95,657,382 |
||
|
TOTAL UTILITIES |
185,106,002 |
||
|
TOTAL COMMON STOCKS (Cost $1,639,229,725) |
2,209,088,987 |
||
|
Nonconvertible Preferred Stocks - 1.3% |
|||
|
|
|
|
|
|
CONSTRUCTION & REAL ESTATE - 0.1% |
|||
|
Real Estate Investment Trusts - 0.1% |
|||
|
California Federal Preferred |
156,349 |
3,322,416 |
|
|
FINANCE - 0.0% |
|||
|
Insurance - 0.0% |
|||
|
American Annuity Group Capital Trust II 8.875% |
1,490 |
1,326,490 |
|
|
|
|||
|
Shares |
Value (Note 1) |
||
|
HEALTH - 0.0% |
|||
|
Medical Facilities Management - 0.0% |
|||
|
Fresenius Medical Care Capital Trust II 7.875% |
653 |
$ 595,719 |
|
|
MEDIA & LEISURE - 0.4% |
|||
|
Broadcasting - 0.3% |
|||
|
Adelphia Communications Corp. $13.00 |
15,763 |
1,623,589 |
|
|
CSC Holdings, Inc. 11.125% pay-in-kind |
102,653 |
10,727,239 |
|
|
|
12,350,828 |
||
|
Publishing - 0.1% |
|||
|
PRIMEDIA, Inc.: |
|
|
|
|
$9.20 |
32,995 |
2,862,316 |
|
|
Series D, $10.00 |
15,250 |
1,410,625 |
|
|
|
4,272,941 |
||
|
TOTAL MEDIA & LEISURE |
16,623,769 |
||
|
RETAIL & WHOLESALE - 0.0% |
|||
|
Grocery Stores - 0.0% |
|||
|
Supermarkets General Holdings Corp. $3.52 pay-in-kind |
17,231 |
17,231 |
|
|
UTILITIES - 0.8% |
|||
|
Cellular - 0.4% |
|||
|
Crown Castle International Corp. |
2,079 |
2,120,580 |
|
|
Nextel Communications, Inc. |
14,671 |
14,157,515 |
|
|
|
16,278,095 |
||
|
Telephone Services - 0.4% |
|||
|
Adelphia Business Solution, Inc. |
5,283 |
4,728,285 |
|
|
Intermedia Communications, Inc. |
5,292 |
5,133,240 |
|
|
IXC Communications, Inc. |
1,384 |
1,384,000 |
|
|
NEXTLINK Communications, Inc. |
185,967 |
9,484,317 |
|
|
|
20,729,842 |
||
|
TOTAL UTILITIES |
37,007,937 |
||
|
TOTAL NONCONVERTIBLE PREFERRED STOCKS (Cost $61,177,855) |
58,893,562 |
||
|
Corporate Bonds - 16.9% |
|||||
|
Moody's Ratings (unaudited) (b) |
Principal Amount |
Value |
|||
|
Convertible Bonds - 0.2% |
|||||
|
HEALTH - 0.2% |
|||||
|
Medical Facilities Management - 0.2% |
|||||
|
Tenet Healthcare Corp. |
B1 |
|
$ 7,210,000 |
$ 5,939,238 |
|
|
Total Renal Care Holdings, Inc. 7% 5/15/09 (g) |
B3 |
|
2,940,000 |
1,955,100 |
|
|
|
7,894,338 |
||||
|
MEDIA & LEISURE - 0.0% |
|||||
|
Lodging & Gaming - 0.0% |
|||||
|
Hilton Hotels Corp. |
Ba2 |
|
3,680,000 |
2,907,200 |
|
|
TOTAL CONVERTIBLE BONDS |
10,801,538 |
||||
|
Nonconvertible Bonds - 16.7% |
|||||
|
AEROSPACE & DEFENSE - 0.2% |
|||||
|
Defense Electronics - 0.1% |
|||||
|
Raytheon Co. |
Baa2 |
|
4,500,000 |
4,447,485 |
|
|
Ship Building & Repair - 0.1% |
|||||
|
Newport News Shipbuilding, Inc. |
Ba3 |
|
3,515,000 |
3,515,000 |
|
|
TOTAL AEROSPACE & DEFENSE |
7,962,485 |
||||
|
BASIC INDUSTRIES - 0.7% |
|||||
|
Chemicals & Plastics - 0.4% |
|||||
|
Avecia Group PLC |
B2 |
|
3,440,000 |
3,371,200 |
|
|
Huntsman Corp. |
B2 |
|
3,520,000 |
3,212,000 |
|
|
Huntsman ICI Chemicals LLC 10.125% 7/1/09 |
B2 |
|
625,000 |
625,000 |
|
|
Lyondell Chemical Co.: |
|
|
|
|
|
|
9.875% 5/1/07 |
Ba3 |
|
5,050,000 |
4,999,500 |
|
|
10.875% 5/1/09 |
B2 |
|
2,570,000 |
2,550,725 |
|
|
Sovereign Specialty Chemicals, Inc. |
B3 |
|
1,655,000 |
1,702,581 |
|
|
Sterling Chemicals, Inc. 11.75% 8/15/06 |
Caa3 |
|
1,935,000 |
1,567,350 |
|
|
|
18,028,356 |
||||
|
Metals & Mining - 0.0% |
|||||
|
Kaiser Aluminum & Chemical Corp. |
B3 |
|
1,630,000 |
1,483,300 |
|
|
Packaging & Containers - 0.2% |
|||||
|
Gaylord Container Corp.: |
|
|
|
|
|
|
9.375% 6/15/07 |
Caa1 |
|
2,825,000 |
2,175,250 |
|
|
9.75% 6/15/07 |
Caa1 |
|
3,675,000 |
2,866,500 |
|
|
|
|||||
|
Moody's Ratings (unaudited) (b) |
Principal Amount |
Value |
|||
|
Norampac, Inc. |
B1 |
|
$ 2,100,000 |
$ 2,026,500 |
|
|
Packaging Corp. of America 9.625% 4/1/09 |
B2 |
|
2,020,000 |
1,994,750 |
|
|
|
9,063,000 |
||||
|
Paper & Forest Products - 0.1% |
|||||
|
Potlatch Corp. |
Baa1 |
|
3,320,000 |
3,211,170 |
|
|
Repap New Brunswick, Inc. yankee 10.625% 4/15/05 |
Caa1 |
|
2,035,000 |
1,790,800 |
|
|
|
5,001,970 |
||||
|
TOTAL BASIC INDUSTRIES |
33,576,626 |
||||
|
CONSTRUCTION & REAL ESTATE - 0.4% |
|||||
|
Building Materials - 0.0% |
|||||
|
Numatics, Inc. |
B3 |
|
170,000 |
136,000 |
|
|
Construction - 0.0% |
|||||
|
Blount, Inc. 13% 8/1/09 |
B3 |
|
1,465,000 |
1,490,638 |
|
|
Engineering - 0.0% |
|||||
|
Anteon Corp. |
B3 |
|
980,000 |
882,000 |
|
|
Real Estate - 0.1% |
|||||
|
Duke-Weeks Realty LP 6.875% 3/15/05 |
Baa2 |
|
2,950,000 |
2,801,792 |
|
|
Real Estate Investment Trusts - 0.3% |
|||||
|
CenterPoint Properties Trust: |
|
|
|
|
|
|
6.75% 4/1/05 |
Baa2 |
|
1,590,000 |
1,481,244 |
|
|
7.125% 3/15/04 |
Baa2 |
|
4,200,000 |
4,031,412 |
|
|
Equity Office |
|
|
|
|
|
|
6.375% 2/15/03 |
Baa1 |
|
3,600,000 |
3,460,104 |
|
|
6.75% 2/15/08 |
Baa1 |
|
1,590,000 |
1,456,583 |
|
|
Pinnacle Holdings, Inc. |
B3 |
|
1,510,000 |
1,049,450 |
|
|
|
11,478,793 |
||||
|
TOTAL CONSTRUCTION & REAL ESTATE |
16,789,223 |
||||
|
DURABLES - 0.2% |
|||||
|
Autos, Tires, & Accessories - 0.1% |
|||||
|
TRW, Inc. 6.5% 6/1/02 |
Baa1 |
|
4,520,000 |
4,402,390 |
|
|
Consumer Electronics - 0.0% |
|||||
|
Whirlpool Corp. |
Baa1 |
|
1,390,000 |
1,434,341 |
|
|
Textiles & Apparel - 0.1% |
|||||
|
Jones Apparel Group, Inc. 7.875% 6/15/06 |
Baa2 |
|
5,070,000 |
4,840,430 |
|
|
TOTAL DURABLES |
10,677,161 |
||||
|
Corporate Bonds - continued |
|||||
|
Moody's Ratings (unaudited) (b) |
Principal Amount |
Value |
|||
|
Nonconvertible Bonds - continued |
|||||
|
ENERGY - 0.7% |
|||||
|
Coal - 0.0% |
|||||
|
P&L Coal Holdings Corp. 9.625% 5/15/08 |
B2 |
|
$ 1,890,000 |
$ 1,752,975 |
|
|
Energy Services - 0.2% |
|||||
|
Baker Hughes, Inc. |
A2 |
|
3,980,000 |
3,811,248 |
|
|
R&B Falcon Corp. |
Ba3 |
|
1,785,000 |
1,655,588 |
|
|
RBF Finance Co. |
Ba3 |
|
1,260,000 |
1,348,200 |
|
|
|
6,815,036 |
||||
|
Oil & Gas - 0.5% |
|||||
|
Apache Corp. |
Baa1 |
|
2,970,000 |
2,867,713 |
|
|
Chesapeake Energy Corp. 9.625% 5/1/05 |
B2 |
|
3,710,000 |
3,617,250 |
|
|
Occidental Petroleum Corp. 6.39% 11/9/00 |
Baa3 |
|
1,000,000 |
996,030 |
|
|
Oryx Energy Co.: |
|
|
|
|
|
|
8% 10/15/03 |
Baa1 |
|
3,055,000 |
3,053,839 |
|
|
8.125% 10/15/05 |
Baa1 |
|
4,935,000 |
4,993,727 |
|
|
8.375% 7/15/04 |
Baa1 |
|
2,335,000 |
2,355,875 |
|
|
Petro-Canada |
A3 |
|
1,290,000 |
1,126,428 |
|
|
Phillips Petroleum Co. 8.75% 5/25/10 |
Baa2 |
|
1,880,000 |
1,980,430 |
|
|
|
20,991,292 |
||||
|
TOTAL ENERGY |
29,559,303 |
||||
|
FINANCE - 3.8% |
|||||
|
Banks - 1.3% |
|||||
|
Bank of America Corp. 7.8% 2/15/10 |
Aa3 |
|
1,400,000 |
1,394,246 |
|
|
Bank of Tokyo-Mitsubishi Ltd. 8.4% 4/15/10 |
A3 |
|
2,820,000 |
2,847,636 |
|
|
BankBoston Corp. |
A3 |
|
1,700,000 |
1,638,256 |
|
|
Barclays Bank PLC yankee 5.95% 7/15/01 |
A1 |
|
7,650,000 |
7,595,371 |
|
|
Capital One Bank: |
|
|
|
|
|
|
6.26% 5/7/01 |
Baa2 |
|
3,160,000 |
3,109,503 |
|
|
6.375% 2/15/03 |
Baa2 |
|
3,570,000 |
3,423,095 |
|
|
6.48% 6/28/02 |
Baa2 |
|
1,740,000 |
1,691,454 |
|
|
6.65% 3/15/04 |
Baa3 |
|
2,320,000 |
2,228,360 |
|
|
Capital One Financial Corp. 7.125% 8/1/08 |
Baa3 |
|
5,040,000 |
4,690,476 |
|
|
Commonwealth Bank of Australia 8.5% 6/1/10 |
A1 |
|
1,700,000 |
1,764,158 |
|
|
Den Danske Bank AS 6.375% 6/15/08 (g)(j) |
A1 |
|
8,340,000 |
7,657,163 |
|
|
|
|||||
|
Moody's Ratings (unaudited) (b) |
Principal Amount |
Value |
|||
|
HSBC Finance Nederland BV 7.4% 4/15/03 (g) |
A2 |
|
$ 500,000 |
$ 497,985 |
|
|
Korea Development Bank: |
|
|
|
|
|
|
6.625% 11/21/03 |
Baa2 |
|
4,165,000 |
4,006,647 |
|
|
7.375% 9/17/04 |
Baa2 |
|
615,000 |
595,997 |
|
|
yankee 6.5% 11/15/02 |
Baa2 |
|
665,000 |
643,654 |
|
|
Popular, Inc. 6.2% 4/30/01 |
A3 |
|
1,840,000 |
1,823,035 |
|
|
Providian National Bank 6.7% 3/15/03 |
Baa3 |
|
3,060,000 |
2,926,400 |
|
|
Royal Bank of Scotland Group PLC |
A1 |
|
1,975,000 |
2,051,373 |
|
|
Summit Bancorp |
BBB+ |
|
1,730,000 |
1,751,296 |
|
|
Union Planters National Bank 6.81% 8/20/01 |
A3 |
|
3,500,000 |
3,474,520 |
|
|
|
55,810,625 |
||||
|
Credit & Other Finance - 1.7% |
|||||
|
Ahmanson Capital Trust I 8.36% 12/1/26 (g) |
A3 |
|
4,250,000 |
3,864,525 |
|
|
AMRESCO, Inc.: |
|
|
|
|
|
|
9.875% 3/15/05 |
Caa3 |
|
2,340,000 |
1,088,100 |
|
|
10% 3/15/04 |
Caa3 |
|
1,130,000 |
519,800 |
|
|
CIT Group, Inc. |
A1 |
|
680,000 |
626,797 |
|
|
Countrywide Funding Corp. 6.45% 2/27/03 |
A3 |
|
3,950,000 |
3,814,831 |
|
|
Daimler-Chrysler NA Holding Corp. |
A1 |
|
900,000 |
889,299 |
|
|
Details Capital Corp. |
Caa1 |
|
505,000 |
333,300 |
|
|
Dobson/Sygnet Communications Co. 12.25% 12/15/08 |
- |
|
755,000 |
798,413 |
|
|
ERP Operating LP: |
|
|
|
|
|
|
6.55% 11/15/01 |
A3 |
|
1,500,000 |
1,478,355 |
|
|
7.1% 6/23/04 |
A3 |
|
3,980,000 |
3,859,645 |
|
|
Finova Capital Corp.: |
|
|
|
|
|
|
6.11% 2/18/03 |
Baa2 |
|
5,720,000 |
5,033,600 |
|
|
6.12% 5/28/02 |
Baa2 |
|
2,000,000 |
1,870,000 |
|
|
7.25% 11/8/04 |
Baa2 |
|
3,890,000 |
3,462,100 |
|
|
First Security Capital I 8.41% 12/15/26 |
A3 |
|
1,690,000 |
1,565,684 |
|
|
Ford Motor Credit Co.: |
|
|
|
|
|
|
6.4513% 7/16/01 (j) |
A2 |
|
13,000,000 |
13,014,079 |
|
|
7.5% 3/15/05 |
A2 |
|
3,850,000 |
3,821,125 |
|
|
7.875% 6/15/10 |
A2 |
|
1,690,000 |
1,692,400 |
|
|
GS Escrow Corp. |
Ba1 |
|
2,800,000 |
2,487,352 |
|
|
Heller Financial, Inc. |
A3 |
|
5,050,000 |
4,725,992 |
|
|
HSBC Capital Funding LP 10.176% 12/31/49 (f)(g) |
A1 |
|
2,600,000 |
2,784,210 |
|
|
Corporate Bonds - continued |
|||||
|
Moody's Ratings (unaudited) (b) |
Principal Amount |
Value |
|||
|
Nonconvertible Bonds - continued |
|||||
|
FINANCE - continued |
|||||
|
Credit & Other Finance - continued |
|||||
|
Macsaver Financial Services, Inc.: |
|
|
|
|
|
|
7.4% 2/15/02 |
Ba2 |
|
$ 1,480,000 |
$ 962,000 |
|
|
7.6% 8/1/07 |
Ba2 |
|
4,190,000 |
2,220,700 |
|
|
7.875% 8/1/03 |
Ba2 |
|
690,000 |
427,800 |
|
|
Newcourt Credit Group, Inc. 6.875% 2/16/05 |
A1 |
|
2,865,000 |
2,726,076 |
|
|
PNC Funding Corp. |
A3 |
|
2,020,000 |
1,971,358 |
|
|
Sprint Capital Corp. |
Baa1 |
|
2,905,000 |
2,511,779 |
|
|
The Money Store, Inc. |
A2 |
|
2,550,000 |
2,526,094 |
|
|
TXU Eastern Funding: |
|
|
|
|
|
|
6.15% 5/15/02 |
Baa1 |
|
2,510,000 |
2,437,511 |
|
|
6.75% 5/15/09 |
Baa1 |
|
3,325,000 |
2,973,115 |
|
|
Venetian Casino Resort LLC/Las Vegas Sands, Inc. 12.25% 11/15/04 |
Caa1 |
|
305,000 |
308,050 |
|
|
|
76,794,090 |
||||
|
Savings & Loans - 0.3% |
|||||
|
Chevy Chase Savings Bank FSB 9.25% 12/1/08 |
B1 |
|
730,000 |
649,700 |
|
|
Home Savings of America FSB 6.5% 8/15/04 |
A3 |
|
2,830,000 |
2,685,161 |
|
|
Long Island Savings Bank FSB: |
|
|
|
|
|
|
6.2% 4/2/01 |
Baa3 |
|
3,770,000 |
3,765,815 |
|
|
7% 6/13/02 |
Baa3 |
|
3,400,000 |
3,351,686 |
|
|
Sovereign Bancorp, Inc. 6.625% 3/15/01 |
Ba3 |
|
4,300,000 |
4,197,875 |
|
|
|
14,650,237 |
||||
|
Securities Industry - 0.5% |
|||||
|
Amvescap PLC yankee: |
|
|
|
|
|
|
6.375% 5/15/03 |
A3 |
|
2,200,000 |
2,099,592 |
|
|
6.6% 5/15/05 |
A3 |
|
4,410,000 |
4,108,268 |
|
|
Goldman Sachs Group LP 6.6338% 7/27/00 (j)(l) |
A1 |
|
12,900,000 |
12,898,891 |
|
|
Morgan Stanley |
Aa3 |
|
4,760,000 |
4,725,019 |
|
|
|
23,831,770 |
||||
|
TOTAL FINANCE |
171,086,722 |
||||
|
|
|||||
|
Moody's Ratings (unaudited) (b) |
Principal Amount |
Value |
|||
|
HEALTH - 0.0% |
|||||
|
Medical Facilities Management - 0.0% |
|||||
|
Fountain View, Inc. |
Caa1 |
|
$ 2,330,000 |
$ 570,850 |
|
|
Unilab Corp. |
B3 |
|
725,000 |
746,750 |
|
|
|
1,317,600 |
||||
|
INDUSTRIAL MACHINERY & EQUIPMENT - 0.5% |
|||||
|
Industrial Machinery & Equipment - 0.2% |
|||||
|
Dunlop Standard Aero Holdings PLC |
B3 |
|
2,490,000 |
2,465,100 |
|
|
Roller Bearing Holding, Inc. 0% 6/15/09 (e)(g) |
- |
|
3,550,000 |
1,810,500 |
|
|
Tyco International Group SA: |
|
|
|
|
|
|
7% 6/15/28 |
Baa1 |
|
5,310,000 |
4,564,635 |
|
|
yankee 6.375% 6/15/05 |
Baa1 |
|
830,000 |
791,762 |
|
|
|
9,631,997 |
||||
|
Pollution Control - 0.3% |
|||||
|
Allied Waste |
|
|
|
|
|
|
7.375% 1/1/04 |
Ba3 |
|
1,290,000 |
1,173,900 |
|
|
7.625% 1/1/06 |
Ba2 |
|
1,095,000 |
952,650 |
|
|
10% 8/1/09 |
B2 |
|
9,325,000 |
7,833,000 |
|
|
Browning-Ferris Industries, Inc. 6.375% 1/15/08 |
Ba3 |
|
1,220,000 |
939,400 |
|
|
Envirosource, Inc. Series B, 9.75% 6/15/03 |
Caa3 |
|
50,000 |
22,500 |
|
|
WMX Technologies, Inc.: |
|
|
|
|
|
|
6.25% 10/15/00 |
Ba1 |
|
2,100,000 |
2,086,203 |
|
|
7.1% 8/1/26 |
Ba1 |
|
1,390,000 |
1,308,296 |
|
|
|
14,315,949 |
||||
|
TOTAL INDUSTRIAL MACHINERY & EQUIPMENT |
23,947,946 |
||||
|
MEDIA & LEISURE - 3.9% |
|||||
|
Broadcasting - 2.9% |
|||||
|
Adelphia Communications Corp. 9.875% 3/1/07 |
B1 |
|
4,150,000 |
3,942,500 |
|
|
AMFM Operating, Inc. 12.625% 10/31/06 |
- |
|
1,523,800 |
1,790,465 |
|
|
Ascent Entertainment Group, Inc. |
Ba1 |
|
2,145,000 |
1,737,450 |
|
|
British Sky Broadcasting Group PLC |
Baa3 |
|
6,040,000 |
5,650,058 |
|
|
Callahan |
B3 |
|
4,120,144 |
4,120,144 |
|
|
Corporate Bonds - continued |
|||||
|
Moody's Ratings (unaudited) (b) |
Principal Amount |
Value |
|||
|
Nonconvertible Bonds - continued |
|||||
|
MEDIA & LEISURE - continued |
|||||
|
Broadcasting - continued |
|||||
|
Charter Communications Holdings LLC/Charter Communications Holdings Capital Corp. |
B2 |
|
$ 4,100,000 |
$ 3,977,000 |
|
|
Citadel Broadcasting Co.: |
|
|
|
|
|
|
9.25% 11/15/08 |
B3 |
|
1,165,000 |
1,130,050 |
|
|
10.25% 7/1/07 |
B3 |
|
7,080,000 |
7,177,350 |
|
|
Clear Channel Communications, Inc. 6.875% 6/15/18 |
Baa3 |
|
3,450,000 |
2,965,965 |
|
|
Comcast UK Cable Partners Ltd. 0% 11/15/07 (e) |
B2 |
|
3,360,000 |
3,124,800 |
|
|
Continental |
|
|
|
|
|
|
8.3% 5/15/06 |
A2 |
|
5,125,000 |
5,246,411 |
|
|
8.625% 8/15/03 |
A2 |
|
2,790,000 |
2,869,041 |
|
|
Diamond Cable Communications PLC: |
|
|
|
|
|
|
0% 2/15/07 (e) |
B3 |
|
3,730,000 |
2,862,775 |
|
|
yankee 0% 12/15/05 (e) |
B3 |
|
2,460,000 |
2,300,100 |
|
|
Earthwatch, Inc. 0% 7/15/07 unit (e)(g) |
- |
|
2,530,000 |
1,619,200 |
|
|
EchoStar DBS Corp.: |
|
|
|
|
|
|
9.25% 2/1/06 |
B2 |
|
2,820,000 |
2,721,300 |
|
|
9.375% 2/1/09 |
B2 |
|
2,305,000 |
2,224,325 |
|
|
Fox Family Worldwide, Inc. 0% 11/1/07 (e) |
B1 |
|
555,000 |
344,100 |
|
|
FrontierVision Holdings LP/FrontierVision |
B1 |
|
4,130,000 |
3,562,125 |
|
|
FrontierVision Operating Partners LP/FrontierVision Capital Corp. |
B1 |
|
1,910,000 |
1,910,000 |
|
|
Golden Sky DBS, Inc. |
Caa1 |
|
4,950,000 |
3,328,875 |
|
|
Golden Sky Systems, Inc. 12.375% 8/1/06 |
B3 |
|
950,000 |
1,035,500 |
|
|
Hearst-Argyle Television, Inc. 7.5% 11/15/27 |
Baa3 |
|
3,260,000 |
2,750,103 |
|
|
International Cabletel, Inc. 0% 2/1/06 (e) |
B3 |
|
1,850,000 |
1,702,000 |
|
|
Knology Holding, Inc. |
- |
|
2,220,000 |
1,132,200 |
|
|
LIN Holdings Corp. |
B3 |
|
1,635,000 |
1,075,013 |
|
|
Nielsen Media Research, Inc. 7.6% 6/15/09 |
Baa2 |
|
2,395,000 |
2,285,261 |
|
|
NorthPoint Communication Holdings, Inc. |
Caa1 |
|
5,125,000 |
3,536,250 |
|
|
|
|||||
|
Moody's Ratings (unaudited) (b) |
Principal Amount |
Value |
|||
|
NTL Communications Corp. 11.5% 10/1/08 |
B3 |
|
$ 4,100,000 |
$ 4,130,750 |
|
|
NTL, Inc.: |
|
|
|
|
|
|
0% 4/1/08 (e) |
B3 |
|
9,455,000 |
5,862,100 |
|
|
10% 2/15/07 |
B3 |
|
2,020,000 |
1,919,000 |
|
|
Pegasus Communications Corp. 9.625% 10/15/05 |
B3 |
|
3,365,000 |
3,247,225 |
|
|
TCI Communications, Inc. 9.8% 2/1/12 |
A2 |
|
4,550,000 |
5,169,392 |
|
|
Telemundo Holdings, Inc. |
Caa1 |
|
4,410,000 |
3,064,950 |
|
|
Telewest Communications PLC: |
|
|
|
|
|
|
0% 4/15/09 (e) |
B1 |
|
3,380,000 |
1,859,000 |
|
|
0% 2/1/10 (e)(g) |
B1 |
|
3,335,000 |
1,767,550 |
|
|
Telewest PLC: |
|
|
|
|
|
|
yankee 9.625% 10/1/06 |
B1 |
|
680,000 |
639,200 |
|
|
0% 10/1/07 (e) |
B1 |
|
6,705,000 |
6,403,275 |
|
|
Time Warner, Inc. |
Baa3 |
|
5,355,000 |
5,868,545 |
|
|
United Pan-Europe Communications NV: |
|
|
|
|
|
|
0% 2/1/10 (e) |
B2 |
|
7,545,000 |
3,546,150 |
|
|
10.875% 8/1/09 |
B2 |
|
11,443,000 |
10,069,840 |
|
|
USA Networks, Inc./USANi LLC 6.75% 11/15/05 |
Baa3 |
|
1,935,000 |
1,843,088 |
|
|
|
133,510,426 |
||||
|
Entertainment - 0.3% |
|||||
|
Bally Total Fitness Holding Corp. 9.875% 10/15/07 |
B3 |
|
2,450,000 |
2,229,500 |
|
|
Cinemark USA, Inc. |
B2 |
|
845,000 |
397,150 |
|
|
Paramount Communications, Inc. 7.5% 1/15/02 |
Baa1 |
|
1,785,000 |
1,779,163 |
|
|
Premier Parks, Inc. |
B3 |
|
7,225,000 |
4,903,969 |
|
|
Viacom, Inc.: |
|
|
|
|
|
|
6.75% 1/15/03 |
Baa1 |
|
4,430,000 |
4,350,747 |
|
|
7.75% 6/1/05 |
Baa1 |
|
2,137,000 |
2,144,244 |
|
|
|
15,804,773 |
||||
|
Lodging & Gaming - 0.3% |
|||||
|
Florida Panthers Holdings, Inc. 9.875% 4/15/09 |
B2 |
|
2,225,000 |
2,080,375 |
|
|
HMH Properties, Inc. 7.875% 8/1/05 |
Ba2 |
|
2,120,000 |
1,950,400 |
|
|
Horseshoe Gaming LLC 8.625% 5/15/09 |
B2 |
|
1,525,000 |
1,433,500 |
|
|
Host Marriott LP |
Ba2 |
|
3,000,000 |
2,805,000 |
|
|
ITT Corp. |
Ba1 |
|
810,000 |
678,375 |
|
|
Corporate Bonds - continued |
|||||
|
Moody's Ratings (unaudited) (b) |
Principal Amount |
Value |
|||
|
Nonconvertible Bonds - continued |
|||||
|
MEDIA & LEISURE - continued |
|||||
|
Lodging & Gaming - continued |
|||||
|
Mohegan Tribal Gaming Authority 8.75% 1/1/09 |
Ba3 |
|
$ 2,110,000 |
$ 1,993,950 |
|
|
Station Casinos, Inc. 9.875% 7/1/10 (g) |
B1 |
|
2,490,000 |
2,502,450 |
|
|
|
13,444,050 |
||||
|
Publishing - 0.3% |
|||||
|
News America |
|
|
|
|
|
|
7.7% 10/30/25 |
Baa3 |
|
4,300,000 |
3,916,010 |
|
|
7.75% 1/20/24 |
Baa3 |
|
2,590,000 |
2,344,649 |
|
|
Time Warner Entertainment Co. LP 8.375% 3/15/23 |
Baa2 |
|
5,340,000 |
5,405,842 |
|
|
|
11,666,501 |
||||
|
Restaurants - 0.1% |
|||||
|
Domino's, Inc. |
B3 |
|
1,620,000 |
1,502,550 |
|
|
NE Restaurant, Inc. |
B3 |
|
2,760,000 |
2,152,800 |
|
|
|
3,655,350 |
||||
|
TOTAL MEDIA & LEISURE |
178,081,100 |
||||
|
NONDURABLES - 0.5% |
|||||
|
Beverages - 0.2% |
|||||
|
Seagram JE & Sons, Inc.: |
|
|
|
|
|
|
6.4% 12/15/03 |
Baa3 |
|
5,840,000 |
5,612,824 |
|
|
6.8% 12/15/08 |
Baa3 |
|
3,040,000 |
2,850,994 |
|
|
|
8,463,818 |
||||
|
Foods - 0.1% |
|||||
|
ConAgra, Inc. |
Baa1 |
|
3,200,000 |
2,951,168 |
|
|
Del Monte Foods Co. |
Caa1 |
|
2,390,000 |
1,792,500 |
|
|
|
4,743,668 |
||||
|
Tobacco - 0.2% |
|||||
|
Philip Morris |
|
|
|
|
|
|
7% 7/15/05 |
A2 |
|
3,955,000 |
3,725,729 |
|
|
7.25% 9/15/01 |
A2 |
|
1,450,000 |
1,426,322 |
|
|
RJ Reynolds Tobacco Holdings, Inc. |
Baa2 |
|
3,500,000 |
3,250,660 |
|
|
|
8,402,711 |
||||
|
TOTAL NONDURABLES |
21,610,197 |
||||
|
|
|||||
|
Moody's Ratings (unaudited) (b) |
Principal Amount |
Value |
|||
|
RETAIL & WHOLESALE - 0.5% |
|||||
|
Drug Stores - 0.1% |
|||||
|
Rite Aid Corp.: |
|
|
|
|
|
|
6.5% 12/15/05 (g) |
Caa1 |
|
$ 5,475,000 |
$ 2,819,625 |
|
|
7.125% 1/15/07 |
Caa1 |
|
1,595,000 |
845,350 |
|
|
|
3,664,975 |
||||
|
General Merchandise Stores - 0.2% |
|||||
|
Dayton Hudson Corp. |
A2 |
|
3,500,000 |
3,498,040 |
|
|
Federated Department Stores, Inc.: |
|
|
|
|
|
|
6.79% 7/15/27 |
Baa1 |
|
3,000,000 |
2,901,120 |
|
|
8.5% 6/15/03 |
Baa1 |
|
2,580,000 |
2,603,659 |
|
|
Kmart Corp. 12.5% 3/1/05 |
Baa3 |
|
2,510,000 |
2,723,350 |
|
|
|
11,726,169 |
||||
|
Grocery Stores - 0.2% |
|||||
|
Kroger Co. 6% 7/1/00 |
Baa3 |
|
4,480,000 |
4,479,149 |
|
|
Pathmark Stores, Inc. 9.625% 5/1/03 (d) |
Caa3 |
|
6,150,000 |
4,243,500 |
|
|
|
8,722,649 |
||||
|
TOTAL RETAIL & WHOLESALE |
24,113,793 |
||||
|
SERVICES - 0.1% |
|||||
|
Printing - 0.0% |
|||||
|
Sullivan Graphics, Inc. 12.75% 8/1/05 |
Caa1 |
|
1,430,000 |
1,437,150 |
|
|
Services - 0.1% |
|||||
|
La Petite Academy, Inc./La Petite Academy Holding Co. 10% 5/15/08 |
B3 |
|
2,040,000 |
1,183,200 |
|
|
Medaphis Corp. |
Caa1 |
|
1,770,000 |
1,327,500 |
|
|
|
2,510,700 |
||||
|
TOTAL SERVICES |
3,947,850 |
||||
|
TECHNOLOGY - 1.0% |
|||||
|
Communications Equipment - 0.1% |
|||||
|
Corning, Inc. |
A2 |
|
2,350,000 |
2,102,075 |
|
|
Computer Services & Software - 0.4% |
|||||
|
Amazon.com, Inc. |
Caa1 |
|
2,305,000 |
1,244,700 |
|
|
Concentric Network Corp. 12.75% 12/15/07 |
B- |
|
595,000 |
624,750 |
|
|
Covad Communications Group, Inc.: |
|
|
|
|
|
|
0% 3/15/08 (e) |
B3 |
|
3,885,000 |
1,903,650 |
|
|
12% 2/15/10 |
B3 |
|
5,505,000 |
4,266,375 |
|
|
12.5% 2/15/09 |
B3 |
|
1,091,000 |
867,345 |
|
|
Exodus Communications, Inc. 11.25% 7/1/08 |
B- |
|
1,945,000 |
1,925,550 |
|
|
Corporate Bonds - continued |
|||||
|
Moody's Ratings (unaudited) (b) |
Principal Amount |
Value |
|||
|
Nonconvertible Bonds - continued |
|||||
|
TECHNOLOGY - continued |
|||||
|
Computer Services & Software - continued |
|||||
|
Federal Data Corp. 10.125% 8/1/05 |
B3 |
|
$ 3,720,000 |
$ 2,418,000 |
|
|
PSINet, Inc. |
B3 |
|
5,940,000 |
5,464,800 |
|
|
Verio, Inc. |
B3 |
|
61,000 |
64,965 |
|
|
|
18,780,135 |
||||
|
Computers & Office Equipment - 0.3% |
|||||
|
Comdisco, Inc. |
Baa1 |
|
8,300,000 |
8,030,997 |
|
|
Globix Corp. |
B- |
|
3,270,000 |
2,697,750 |
|
|
Sun Microsystems, Inc. |
Baa1 |
|
1,380,000 |
1,371,444 |
|
|
|
12,100,191 |
||||
|
Electronics - 0.2% |
|||||
|
ChipPAC International Ltd. 12.75% 8/1/09 |
B3 |
|
3,055,000 |
3,284,125 |
|
|
Details, Inc. 10% 11/15/05 |
B3 |
|
520,000 |
494,000 |
|
|
Fairchild |
|
|
|
|
|
|
10.125% 3/15/07 |
B2 |
|
560,000 |
565,600 |
|
|
10.375% 10/1/07 |
B3 |
|
1,660,000 |
1,693,200 |
|
|
Flextronics International Ltd. 9.875% 7/1/10 (g) |
Ba3 |
|
1,210,000 |
1,228,150 |
|
|
Micron Technology, Inc. 6.5% 9/30/05 (l) |
B3 |
|
3,000,000 |
2,505,000 |
|
|
SCG Holding Corp./Semiconductor Components Industries LLC 12% 8/1/09 |
B2 |
|
1,340,000 |
1,430,450 |
|
|
|
11,200,525 |
||||
|
TOTAL TECHNOLOGY |
44,182,926 |
||||
|
TRANSPORTATION - 0.8% |
|||||
|
Air Transportation - 0.2% |
|||||
|
Continental Airlines, Inc. pass thru trust certificates: |
|
|
|
|
|
|
7.434% 3/15/06 |
Baa1 |
|
1,110,000 |
1,073,259 |
|
|
7.73% 9/15/12 |
Baa1 |
|
455,032 |
434,601 |
|
|
Delta Air Lines, Inc. |
Baa3 |
|
4,000,000 |
3,486,400 |
|
|
Qantas Airways Ltd. |
Baa1 |
|
4,370,000 |
4,348,150 |
|
|
US Airways Group, Inc. 10.375% 3/1/13 |
Ba3 |
|
2,480,000 |
2,207,200 |
|
|
|
11,549,610 |
||||
|
|
|||||
|
Moody's Ratings (unaudited) (b) |
Principal Amount |
Value |
|||
|
Railroads - 0.6% |
|||||
|
Burlington Northern |
|
|
|
|
|
|
6.125% 3/15/09 |
Baa2 |
|
$ 6,450,000 |
$ 5,748,240 |
|
|
7.29% 6/1/36 |
Baa2 |
|
3,000,000 |
2,932,170 |
|
|
Canadian National Railway Co. 6.9% 7/15/28 |
Baa2 |
|
3,390,000 |
2,860,041 |
|
|
CSX Corp.: |
|
|
|
|
|
|
6.25% 10/15/08 |
Baa2 |
|
2,385,000 |
2,074,068 |
|
|
6.46% 6/22/05 |
Baa2 |
|
5,120,000 |
4,814,797 |
|
|
Norfolk Southern Corp. 7.05% 5/1/37 |
Baa1 |
|
6,610,000 |
6,460,350 |
|
|
Wisconsin Central Transportation Corp. 6.625% 4/15/08 |
Baa2 |
|
1,810,000 |
1,607,660 |
|
|
|
26,497,326 |
||||
|
TOTAL TRANSPORTATION |
38,046,936 |
||||
|
UTILITIES - 3.4% |
|||||
|
Cellular - 1.0% |
|||||
|
Crown Castle International Corp. 0% 5/15/11 (e) |
B3 |
|
2,830,000 |
1,726,300 |
|
|
Dobson Communications Corp. 10.875% 7/1/10 (g) |
- |
|
1,235,000 |
1,244,263 |
|
|
McCaw International Ltd. 0% 4/15/07 (e) |
Caa1 |
|
8,170,000 |
6,209,200 |
|
|
Millicom International Cellular SA 0% 6/1/06 (e) |
Caa1 |
|
7,300,000 |
6,205,000 |
|
|
Nextel Communications, Inc. 0% 10/31/07 (e) |
B1 |
|
16,310,000 |
12,150,950 |
|
|
Nextel International, Inc. |
Caa1 |
|
1,270,000 |
838,200 |
|
|
Rogers Communications, Inc. 8.875% 7/15/07 |
Ba3 |
|
2,950,000 |
2,891,000 |
|
|
TeleCorp PCS, Inc. |
B3 |
|
3,235,000 |
2,127,013 |
|
|
Triton PCS, Inc. |
B3 |
|
3,030,000 |
2,189,175 |
|
|
Vodafone AirTouch PLC 7.625% 2/15/05 (g) |
A2 |
|
3,040,000 |
3,036,717 |
|
|
VoiceStream Wireless Corp.: |
|
|
|
|
|
|
0% 11/15/09 (e) |
B2 |
|
1,430,000 |
958,100 |
|
|
10.375% 11/15/09 |
B2 |
|
7,905,000 |
8,221,200 |
|
|
|
47,797,118 |
||||
|
Electric Utility - 0.5% |
|||||
|
Avon Energy |
|
|
|
|
|
|
6.46% 3/4/08 (g) |
Baa2 |
|
3,960,000 |
3,527,093 |
|
|
6.73% 12/11/02 (g) |
Baa2 |
|
4,910,000 |
4,783,518 |
|
|
Dominion Resources, Inc. 8.125% 6/15/10 |
Baa1 |
|
2,095,000 |
2,109,162 |
|
|
Hydro-Quebec yankee |
A2 |
|
2,620,000 |
2,766,720 |
|
|
Corporate Bonds - continued |
|||||
|
Moody's Ratings (unaudited) (b) |
Principal Amount |
Value |
|||
|
Nonconvertible Bonds - continued |
|||||
|
UTILITIES - continued |
|||||
|
Electric Utility - continued |
|||||
|
Illinois Power Co. |
Baa1 |
|
$ 1,880,000 |
$ 1,835,218 |
|
|
Israel Electric Corp. Ltd.: |
|
|
|
|
|
|
7.75% 12/15/27 (g) |
A3 |
|
3,920,000 |
3,360,028 |
|
|
yankee 7.875% 12/15/26 (g) |
A3 |
|
1,960,000 |
1,731,288 |
|
|
Texas Utilities Co. |
Baa3 |
|
990,000 |
894,218 |
|
|
|
21,007,245 |
||||
|
Gas - 0.1% |
|||||
|
Reliant Energy |
Baa1 |
|
2,550,000 |
2,549,490 |
|
|
Telephone Services - 1.8% |
|||||
|
Allegiance Telecom, Inc.: |
|
|
|
|
|
|
0% 2/15/08 (e) |
B3 |
|
1,280,000 |
931,200 |
|
|
12.875% 5/15/08 |
B3 |
|
1,390,000 |
1,504,675 |
|
|
Cable & Wireless Optus Ltd. 8% 6/22/10 (g) |
Baa1 |
|
2,520,000 |
2,504,452 |
|
|
Deutsche Telekom International Finance BV 8.25% 6/15/30 |
Aa2 |
|
7,180,000 |
7,294,377 |
|
|
FirstWorld Communications, Inc. 0% 4/15/08 (e) |
- |
|
2,745,000 |
1,235,250 |
|
|
Global Crossing Holdings Ltd. 9.125% 11/15/06 |
Ba2 |
|
840,000 |
808,500 |
|
|
Globenet Communication Group Ltd. 13% 7/15/07 |
Caa1 |
|
2,450,000 |
2,474,500 |
|
|
ICG Services, Inc. |
B3 |
|
2,425,000 |
1,115,500 |
|
|
Intermedia |
|
|
|
|
|
|
0% 7/15/07 (e) |
B2 |
|
1,050,000 |
813,750 |
|
|
0% 3/1/09 (e) |
B3 |
|
1,410,000 |
856,575 |
|
|
Level 3 Communications, Inc. 9.125% 5/1/08 |
B3 |
|
3,885,000 |
3,486,788 |
|
|
Logix Communications Enterprises, Inc. |
- |
|
4,040,000 |
1,292,800 |
|
|
McLeodUSA, Inc.: |
|
|
|
|
|
|
0% 3/1/07 (e) |
B1 |
|
2,485,000 |
2,074,975 |
|
|
9.5% 11/1/08 |
B1 |
|
1,205,000 |
1,174,875 |
|
|
Metromedia Fiber Network, Inc. 10% 12/15/09 |
B2 |
|
580,000 |
569,850 |
|
|
NEXTLINK Communications, Inc. 9.625% 10/1/07 |
B2 |
|
2,870,000 |
2,690,625 |
|
|
Ono Finance PLC |
Caa1 |
|
2,075,000 |
1,960,875 |
|
|
|
|||||
|
Moody's Ratings (unaudited) (b) |
Principal Amount |
Value |
|||
|
Pathnet, Inc. |
- |
|
$ 4,665,000 |
$ 2,612,400 |
|
|
Rhythms |
|
|
|
|
|
|
0% 5/15/08 (e) |
B3 |
|
7,983,000 |
3,153,285 |
|
|
12.75% 4/15/09 |
B3 |
|
2,510,000 |
1,706,800 |
|
|
Telecomunicaciones |
Baa2 |
|
5,540,000 |
5,159,291 |
|
|
Teleglobe Canada, Inc.: |
|
|
|
|
|
|
7.2% 7/20/09 |
Baa1 |
|
6,886,000 |
6,588,869 |
|
|
7.7% 7/20/29 |
Baa1 |
|
6,330,000 |
5,960,771 |
|
|
Teligent, Inc.: |
|
|
|
|
|
|
0% 3/1/08 (e) |
Caa1 |
|
4,445,000 |
2,044,700 |
|
|
11.5% 12/1/07 |
Caa1 |
|
4,295,000 |
3,328,625 |
|
|
WinStar |
|
|
|
|
|
|
0% 4/15/10 (e)(g) |
B3 |
|
12,896,000 |
5,996,640 |
|
|
12.75% 4/15/10 (g) |
B3 |
|
10,487,000 |
10,119,955 |
|
|
WorldCom, Inc. |
A3 |
|
3,139,000 |
3,254,704 |
|
|
|
82,715,607 |
||||
|
TOTAL UTILITIES |
154,069,460 |
||||
|
TOTAL NONCONVERTIBLE BONDS |
758,969,328 |
||||
|
TOTAL CORPORATE BONDS (Cost $818,133,022) |
769,770,866 |
||||
|
U.S. Government and Government |
|||||
|
|
|||||
|
U.S. Government Agency Obligations - 3.4% |
|||||
|
Fannie Mae: |
|
|
|
|
|
|
0% 8/24/00 |
- |
|
30,000,000 |
29,717,460 |
|
|
6% 5/15/08 |
Aaa |
|
12,000,000 |
11,190,840 |
|
|
6.5% 4/29/09 |
Aaa |
|
9,210,000 |
8,604,166 |
|
|
7.125% 2/15/05 |
Aaa |
|
10,045,000 |
10,085,783 |
|
|
7.25% 5/15/30 |
Aaa |
|
12,135,000 |
12,382,020 |
|
|
Farm Credit Systems Financial Assistance Corp. 8.8% 6/10/05 |
Aaa |
|
2,000,000 |
2,141,560 |
|
|
Federal Home Loan Bank: |
|
|
|
|
|
|
5.195% 9/11/01 |
Aaa |
|
4,500,000 |
4,405,770 |
|
|
6.75% 2/1/02 |
Aaa |
|
38,840,000 |
38,718,431 |
|
|
7.59% 3/10/05 |
Aaa |
|
3,850,000 |
3,928,194 |
|
|
Freddie Mac: |
|
|
|
|
|
|
0% 8/17/00 |
- |
|
10,000,000 |
9,918,490 |
|
|
6.25% 7/15/04 |
Aaa |
|
6,200,000 |
6,027,578 |
|
|
6.75% 8/1/05 |
Aaa |
|
2,500,000 |
2,464,850 |
|
|
6.875% 1/15/05 |
Aaa |
|
3,255,000 |
3,234,656 |
|
|
7% 7/15/05 |
Aaa |
|
4,400,000 |
4,393,840 |
|
|
U.S. Government and Government Agency |
|||||
|
Moody's Ratings (unaudited) (b) |
Principal Amount |
Value |
|||
|
U.S. Government Agency Obligations - continued |
|||||
|
Freddie Mac: - continued |
|
|
|
|
|
|
7.625% 9/9/09 |
Aaa |
|
$ 3,415,000 |
$ 3,366,985 |
|
|
Tennessee Valley Authority 7.125% 5/1/30 |
Aaa |
|
2,570,000 |
2,580,794 |
|
|
U.S. Department of Housing and Urban Development government guaranteed participation certificates Series 1996-A, |
Aaa |
|
2,825,000 |
2,879,381 |
|
|
TOTAL U.S. GOVERNMENT AGENCY OBLIGATIONS |
156,040,798 |
||||
|
U.S. Treasury Obligations - 4.0% |
|||||
|
U.S. Treasury Bills, yield |
- |
|
8,000,000 |
7,935,864 |
|
|
U.S. Treasury Bonds: |
|
|
|
|
|
|
5.25% 2/15/29 |
Aaa |
|
750,000 |
665,625 |
|
|
6.875% 8/15/25 |
Aaa |
|
715,000 |
779,236 |
|
|
7.625% 2/15/25 |
Aaa |
|
10,290,000 |
12,167,925 |
|
|
8% 11/15/21 |
Aaa |
|
2,200,000 |
2,659,602 |
|
|
8.125% 8/15/19 |
Aaa |
|
58,400,000 |
70,600,344 |
|
|
8.875% 8/15/17 |
Aaa |
|
4,027,000 |
5,133,177 |
|
|
11.75% 2/15/10 (callable) |
Aaa |
|
15,045,000 |
18,150,438 |
|
|
12% 8/15/13 |
Aaa |
|
3,740,000 |
5,049,000 |
|
|
13.875% 5/15/11 (callable) |
Aaa |
|
21,150,000 |
28,688,072 |
|
|
U.S. Treasury Notes: |
|
|
|
|
|
|
4.75% 11/15/08 |
Aaa |
|
1,665,000 |
1,512,020 |
|
|
6.25% 10/31/01 |
Aaa |
|
820,000 |
817,433 |
|
|
6.625% 6/30/01 |
Aaa |
|
19,110,000 |
19,133,888 |
|
|
7% 7/15/06 |
Aaa |
|
8,695,000 |
9,010,194 |
|
|
7.25% 8/15/04 |
Aaa |
|
1,404,000 |
1,451,610 |
|
|
TOTAL U.S. TREASURY OBLIGATIONS |
183,754,428 |
||||
|
TOTAL U.S. GOVERNMENT AND GOVERNMENT AGENCY OBLIGATIONS (Cost $344,947,217) |
339,795,226 |
||||
|
U.S. Government Agency - |
|||||
|
|
|||||
|
Fannie Mae - 8.4% |
|||||
|
6% 1/1/11 to 1/1/29 |
Aaa |
|
55,576,630 |
51,894,145 |
|
|
6.5% 5/1/14 to 1/1/30 |
Aaa |
|
112,916,299 |
106,742,974 |
|
|
7% 8/1/13 to 12/1/29 |
Aaa |
|
126,273,999 |
122,195,551 |
|
|
7.5% 7/1/16 to 3/1/30 |
Aaa |
|
30,045,234 |
29,660,358 |
|
|
7.5% 7/1/30 (h) |
Aaa |
|
25,600,000 |
25,224,000 |
|
|
|
|||||
|
Moody's Ratings (unaudited) (b) |
Principal Amount |
Value |
|||
|
8% 9/1/26 to 3/1/30 |
Aaa |
|
$ 1,472,835 |
$ 1,478,817 |
|
|
8% 7/1/30 (h) |
Aaa |
|
44,860,000 |
45,028,225 |
|
|
TOTAL FANNIE MAE |
382,224,070 |
||||
|
Freddie Mac - 0.1% |
|||||
|
7.5% 5/1/17 to 7/1/29 |
Aaa |
|
3,977,164 |
3,939,908 |
|
|
8% 7/1/17 to 5/1/27 |
Aaa |
|
616,237 |
621,896 |
|
|
8.5% 7/1/22 to 6/1/23 |
Aaa |
|
23,330 |
23,822 |
|
|
TOTAL FREDDIE MAC |
4,585,626 |
||||
|
Government National Mortgage Association - 1.1% |
|||||
|
6% 12/15/08 to 6/15/09 |
Aaa |
|
2,339,469 |
2,255,515 |
|
|
6.5% 6/15/08 to 7/15/09 |
Aaa |
|
10,988,800 |
10,770,268 |
|
|
7% 7/15/28 |
Aaa |
|
17,866,601 |
17,369,552 |
|
|
7.5% 9/15/22 to 8/15/28 |
Aaa |
|
19,270,248 |
19,157,679 |
|
|
8% 5/15/25 |
Aaa |
|
80,865 |
81,775 |
|
|
8.5% 12/15/16 |
Aaa |
|
25,719 |
26,519 |
|
|
TOTAL GOVERNMENT NATIONAL |
49,661,308 |
||||
|
TOTAL U.S. GOVERNMENT AGENCY - (Cost $444,523,943) |
436,471,004 |
||||
|
Asset-Backed Securities - 0.7% |
|||||
|
|
|||||
|
Airplanes pass through trust 10.875% 3/15/19 |
Ba2 |
|
2,513,697 |
1,860,135 |
|
|
BankAmerica Manufacturing Housing Contract Trust V 6.2% 4/10/09 |
Aaa |
|
3,730,000 |
3,651,903 |
|
|
Capita Equipment Receivables Trust |
Baa2 |
|
2,950,000 |
2,855,508 |
|
|
CIT Marine Trust |
Aaa |
|
5,920,000 |
5,720,200 |
|
|
CPS Auto Grantor Trust 6.55% 8/15/02 |
Aaa |
|
586,472 |
583,539 |
|
|
CPS Auto Receivables Trust 6% 8/15/03 |
Aaa |
|
2,157,284 |
2,127,622 |
|
|
CSXT Trade Receivables Master Trust 6% 7/25/04 |
Aaa |
|
4,600,000 |
4,460,563 |
|
|
Ford Credit Auto |
|
|
|
|
|
|
6.2% 12/15/02 |
Aa2 |
|
2,680,000 |
2,643,569 |
|
|
6.4% 12/15/02 |
Aa2 |
|
1,480,000 |
1,460,760 |
|
|
7.03% 11/15/03 |
Aaa |
|
704,000 |
703,450 |
|
|
Green Tree Financial Corp. 6.8% 6/15/27 |
Aaa |
|
361,150 |
360,810 |
|
|
Asset-Backed Securities - continued |
|||||
|
Moody's Ratings (unaudited) (b) |
Principal Amount |
Value |
|||
|
Olympic Automobile Receivables Trust |
Aaa |
|
$ 193,142 |
$ 193,082 |
|
|
Petroleum Enhanced Trust Receivables Offering Petroleum Trust |
Baa2 |
|
1,549,554 |
1,542,048 |
|
|
Sears Credit Account Master Trust II 7.5% 11/15/07 |
A2 |
|
2,650,000 |
2,650,000 |
|
|
UAF Auto Grantor Trust 6.1% 1/15/03 (g) |
Aaa |
|
2,101,899 |
2,088,106 |
|
|
TOTAL ASSET-BACKED SECURITIES (Cost $34,231,746) |
32,901,295 |
||||
|
Collateralized Mortgage Obligations - 0.3% |
|||||
|
|
|||||
|
Private Sponsor - 0.0% |
|||||
|
Credit-Based Asset Servicing and Securitization LLC Series 1997-2 Class 2B, 7.1786% 12/29/25 (d)(g)(j) |
Ba3 |
|
1,007,822 |
485,959 |
|
|
U.S. Government Agency - 0.3% |
|||||
|
Bank America Mortgage Securities, Inc.: |
|
|
|
|
|
|
Series 1999-3, Class A1 6.25% 5/25/14 |
AAA |
|
6,026,533 |
5,696,016 |
|
|
Series 1999-6, Class A1 6.25% 7/25/14 |
AAA |
|
3,828,300 |
3,614,872 |
|
|
Fannie Mae REMIC planned amortization class: |
|
|
|
|
|
|
Series 1999-54 Class PH, 6.5% 11/18/29 |
Aaa |
|
3,300,000 |
2,970,516 |
|
|
Series 1999-57 Class PH, 6.5% 12/25/29 |
Aaa |
|
2,600,000 |
2,336,344 |
|
|
TOTAL U.S. GOVERNMENT AGENCY |
14,617,748 |
||||
|
TOTAL COLLATERALIZED (Cost $14,957,335) |
15,103,707 |
||||
|
Commercial Mortgage Securities - 1.6% |
|||||
|
|
|||||
|
Bankers Trust REMIC Trust 1998-1 Series 1998-S1A Class G, 8.5632% 11/28/02 (g)(j) |
Baa3 |
|
1,000,000 |
960,625 |
|
|
Berkeley Federal Bank & Trust FSB Series 1994-1 Class B, 7.5003% 8/1/24 (g)(j) |
- |
|
1,900,000 |
1,316,938 |
|
|
BKB Commercial Mortgage Trust Series 1997-C1 Class D, 7.7606% 2/25/43 (g)(j) |
BBB |
|
1,095,356 |
1,088,810 |
|
|
|
|||||
|
Moody's Ratings (unaudited) (b) |
Principal Amount |
Value |
|||
|
CBM Funding Corp. sequential pay |
|
|
|
|
|
|
Class A-3PI, |
AA |
|
$ 3,000,000 |
$ 2,947,266 |
|
|
Class B, 7.48% 2/1/08 |
A |
|
2,320,000 |
2,266,984 |
|
|
CS First Boston Mortgage Securities Corp.: |
|
|
|
|
|
|
Series 1997-C2 Class D, 7.27% 1/17/35 |
Baa2 |
|
5,730,000 |
5,267,572 |
|
|
Series 1998-FL1 Class E, 7.4913% 1/10/13 (g)(j) |
Baa2 |
|
5,490,000 |
5,465,553 |
|
|
Deutsche Mortgage & |
Baa2 |
|
4,260,000 |
3,826,678 |
|
|
Equitable Life Assurance Society of the United States Series 174: |
|
|
|
|
|
|
Class B1, |
Aa2 |
|
3,500,000 |
3,471,152 |
|
|
Class C1, |
A2 |
|
2,300,000 |
2,259,031 |
|
|
Class D1, |
Baa2 |
|
2,200,000 |
2,148,266 |
|
|
First Chicago/Lennar Trust I Series 1997-CHL1 Class E, 8.0835% 4/1/39 (j) |
- |
|
1,600,000 |
1,138,500 |
|
|
First Union-Lehman Brothers Commercial Mortgage Trust sequential pay Series 1997-C2 Class B, |
Aa2 |
|
8,640,000 |
8,073,338 |
|
|
FMAC Loan |
|
|
|
|
|
|
Series 1997-A Class E, 8.1104% 4/15/19 (g)(j) |
- |
|
500,000 |
330,469 |
|
|
Series 1997-B Class E, 7.8912% 9/15/19 (g)(j) |
- |
|
750,000 |
285,000 |
|
|
GAFCO Franchisee Loan Trust Series 1998-1 |
- |
|
1,300,000 |
1,040,813 |
|
|
General Motors Acceptance Corp. Commercial Mortgage Securities, Inc. Series 1996-C1 Class F, 7.86% 10/15/28 (g) |
Ba3 |
|
750,000 |
603,164 |
|
|
GS Mortgage Securities Corp. II Series 1998-GLII Class E, 7.1905% 4/13/31 (g)(j) |
Baa3 |
|
4,930,000 |
4,262,332 |
|
|
LTC Commercial Mortgage pass through certificates Series 1998-1 Class A, 6.029% 5/30/30 (g) |
AAA |
|
2,997,247 |
2,819,754 |
|
|
Morgan Stanley Capital I, Inc. Series 1996-MBL1 Class E, 8.2633% 5/25/21 (g)(j) |
- |
|
1,509,471 |
1,501,216 |
|
|
Commercial Mortgage Securities - continued |
|||||
|
Moody's Ratings (unaudited) (b) |
Principal Amount |
Value |
|||
|
Nomura Asset Securities Corp. Series 1998-D6 Class A4, 7.6083% 3/17/28 (j) |
Baa2 |
|
$ 4,260,000 |
$ 3,886,585 |
|
|
Nomura Depositor Trust floater Series 1998-ST1A Class B2, 10.9013% 1/15/03 (g)(j) |
- |
|
800,000 |
740,875 |
|
|
Penn Mutual Life Insurance Co. (The)/Penn Insurance & Annuity Co. |
|
|
|
|
|
|
Class K, 7.9% 11/15/26 (g) |
- |
|
1,473,000 |
953,768 |
|
|
Class L, 7.9% 11/15/26 (g) |
- |
|
1,133,000 |
595,710 |
|
|
Prudential Securities Secd Financing Corp. Series 2000-C1, Class A2 7.727% 2/15/10 |
Aaa |
|
1,620,000 |
1,635,694 |
|
|
Structured Asset |
|
|
|
|
|
|
Series 1995-C1 Class E, 7.375% 9/25/24 (g) |
BB |
|
1,200,000 |
1,105,734 |
|
|
Series 1996-CFL: |
|
|
|
|
|
|
Class E, |
BBB |
|
2,390,000 |
2,370,021 |
|
|
Class G, |
B+ |
|
1,000,000 |
887,500 |
|
|
Thirteen Affiliates of General Growth Properties, Inc.: |
|
|
|
|
|
|
sequential pay Series 1 Class A2, 6.602% 12/15/10 (g) |
Aaa |
|
4,200,000 |
3,975,234 |
|
|
Series D-2, |
Baa2 |
|
4,120,000 |
3,791,205 |
|
|
Series E-2, |
Baa3 |
|
2,450,000 |
2,200,789 |
|
|
TOTAL COMMERCIAL MORTGAGE SECURITIES (Cost $77,443,303) |
73,216,576 |
||||
|
Foreign Government and Government |
|||||
|
|
|||||
|
Israeli State euro |
A3 |
|
3,350,000 |
3,301,794 |
|
|
Korean Republic yankee: |
|
|
|
|
|
|
8.75% 4/15/03 |
Baa2 |
|
1,340,000 |
1,364,066 |
|
|
8.875% 4/15/08 |
Baa2 |
|
1,868,000 |
1,926,842 |
|
|
Newfoundland Province yankee 11. |
Baa1 |
|
2,000,000 |
2,455,600 |
|
|
Quebec Province |
A2 |
|
7,220,000 |
7,093,000 |
|
|
United Mexican States 9.875% 2/1/10 |
Baa3 |
|
5,110,000 |
5,339,950 |
|
|
TOTAL FOREIGN GOVERNMENT AND GOVERNMENT AGENCY OBLIGATIONS (Cost $21,783,424) |
21,481,252 |
||||
|
Supranational Obligations - 0.1% |
|||||
|
Moody's Ratings (unaudited) (b) |
Principal Amount |
Value |
|||
|
Inter-American Development Bank yankee |
Aaa |
|
$ 4,750,000 |
$ 4,524,945 |
|
|
Purchased Bank Debt - 1.3% |
|||||
|
|
|||||
|
Allied Waste North America, Inc. term loan: |
|
|
|
|
|
|
9.5625% 7/21/06 (j) |
Ba3 |
|
2,272,727 |
2,130,682 |
|
|
9.7542% 7/21/07 (j) |
Ba3 |
|
2,727,273 |
2,556,818 |
|
|
American Tower L P term loan 9.53% 12/31/07 (j) |
- |
|
3,400,000 |
3,417,000 |
|
|
Charter Communication Operating LLC term loan 8.8% 3/18/08 (j) |
Ba3 |
|
6,000,000 |
5,962,500 |
|
|
Crown Castle Operating Co. term loan 9.46% 6/15/08 (j) |
Ba3 |
|
4,200,000 |
4,210,500 |
|
|
Dynatech LLC term loan 10.03% 9/1/07 (j) |
- |
|
4,240,000 |
4,218,800 |
|
|
Huntsman ICI Chemicals LLC sr. secured: |
|
|
|
|
|
|
term B loan |
- |
|
1,837,630 |
1,842,224 |
|
|
term C loan |
- |
|
2,382,200 |
2,388,156 |
|
|
Lyondell Chemical Co. sr. secured Tranche E term loan 10.5263% 5/17/06 (j) |
- |
|
4,300,000 |
4,418,250 |
|
|
McLeodUSA, Inc. term loan 9.69% 5/31/08 (j) |
Ba2 |
|
4,250,000 |
4,260,625 |
|
|
Nextel Finance Co. |
|
|
|
|
|
|
9.6875% 6/30/08 (j) |
Ba2 |
|
3,000,000 |
3,011,250 |
|
|
10.375% 12/31/08 (j) |
Ba2 |
|
3,000,000 |
3,011,250 |
|
|
Packaging Corp. of America term loan 0% 5/22/07 (j) |
- |
|
2,500,000 |
2,506,250 |
|
|
Telemundo Group, Inc. term loan 8.905% 3/31/07 (j) |
B1 |
|
1,665,000 |
1,654,594 |
|
|
Tritel Holding Corp. |
B2 |
|
4,250,000 |
4,265,938 |
|
|
Purchased Bank Debt - continued |
|||||
|
Moody's Ratings (unaudited) (b) |
Principal Amount |
Value |
|||
|
Voicestream Pcs Holding LLC term loan 9.76% 2/25/09 (j) |
B+ |
|
$ 5,100,000 |
$ 5,087,250 |
|
|
Wci Capital Corp. term loan 11.43% 9/30/07 (j) |
B2 |
|
3,600,000 |
3,591,000 |
|
|
TOTAL PURCHASED BANK DEBT (Cost $58,603,499) |
58,533,087 |
||||
|
Bank Notes - 0.2% |
||||
|
|
||||
|
Bank One NA 6.29% 8/25/00 |
|
11,350,000 |
11,332,056 |
|
|
Certificates of Deposit - 0.2% |
||||
|
|
||||
|
Canadian Imperial Bank |
|
11,500,000 |
11,506,374 |
|
|
Commercial Paper - 2.3% |
||||
|
|
||||
|
CIT Group, Inc. 6.43% 7/5/00 |
|
11,000,000 |
10,995,875 |
|
|
Daimler-Chrysler North America Holding Corp. yankee |
|
10,000,000 |
9,766,461 |
|
|
Falcon Asset Securitization Corp. 6.58% 8/10/00 |
|
11,000,000 |
10,923,715 |
|
|
General Motors Acceptance Corp. 6.62% 8/23/00 |
|
10,000,000 |
9,906,925 |
|
|
ING America Insurance Holdings, Inc. yankee 6.69% 11/9/00 |
|
10,000,000 |
9,763,858 |
|
|
Kitty Hawk Funding Corp. |
|
10,000,000 |
9,968,786 |
|
|
Montauk Funding Corp. yankee 6.58% 7/12/00 |
|
11,000,000 |
10,981,575 |
|
|
Preferred Receivables Funding Corp. 6.58% 7/18/00 |
|
11,000,000 |
10,969,475 |
|
|
Windmill Funding Corp. yankee 6.58% 7/20/00 |
|
11,000,000 |
10,965,352 |
|
|
Woolwich PLC yankee |
|
11,400,000 |
11,366,408 |
|
|
TOTAL COMMERCIAL PAPER (Cost $105,548,446) |
105,608,430 |
|||
|
Cash Equivalents - 9.4% |
|||
|
Maturity Amount |
Value |
||
|
Investments in repurchase agreements (U.S. Government Obligations), in a joint trading account at 6.83%, dated 6/30/00 due 7/3/00 |
$ 30,341,270 |
$ 30,324,000 |
|
|
Shares |
|
||
|
Central Cash Collateral Fund, 6.71% (c) |
659,100 |
659,100 |
|
|
Taxable Central Cash Fund, 6.59% (c) |
394,173,790 |
394,173,790 |
|
|
TOTAL CASH EQUIVALENTS (Cost $425,156,890) |
425,156,890 |
||
|
TOTAL INVESTMENT PORTFOLIO - 100.3% (Cost $4,073,306,528) |
4,573,384,257 |
|
|
NET OTHER ASSETS - (0.3)% |
(15,209,059) |
|
|
NET ASSETS - 100% |
$ 4,558,175,198 |
|
|
Futures Contracts |
|||||
|
|
Expiration Date |
Underlying |
Unrealized Gain/(Loss) |
||
|
Purchased |
|||||
|
634 S&P 500 Stock Index Contracts |
Sept. 2000 |
$ 232,693,850 |
$ (1,400,223) |
||
|
The face value of futures purchased as a percentage of net assets - 5.1% |
|
Legend |
|
(a) Non-income producing |
|
(b) S&P credit ratings are used in the absence of a rating by Moody's Investors Service, Inc. |
|
(c) The rate quoted is the annualized seven-day yield of the fund at |
|
(d) Non-income producing - issuer filed for protection under the |
|
(e) Debt obligation initially issued in zero coupon form which converts to coupon form at a specified rate and date. The rate shown is the rate at period end. |
|
(f) Debt obligation initially issued at one coupon which converts to a higher coupon at a specified date. The rate shown is the rate at period end. |
|
(g) Security exempt from registration under Rule 144A of the Securities Act |
|
(h) Security purchased on a delayed delivery or when-issued basis. |
|
(i) Security or a portion of the security was pledged to cover margin requirements for futures contracts. At the period end, the value of securities pledged amounted to $7,935,864. |
|
(j) The coupon rate shown on floating or adjustable rate securities represents the rate at period end. |
|
(k) For foreign government obligations not individually rated by S&P |
|
(l) Restricted securities - Investment in securities not registered under the Securities Act of 1933. |
|
Additional information on each holding is as follows: |
|
Security |
Acquisition Date |
Acquisition Cost |
|
Goldman Sachs Group LP |
1/25/99 |
$ 12,900,000 |
|
Micron Technology, Inc. |
7/15/99 - 4/10/00 |
$ 2,417,500 |
|
Other Information |
|
The composition of long-term debt holdings as a percentage of total value of investments in securities, is as follows (ratings are unaudited): |
|
Moody's Ratings |
S&P Ratings |
|||
|
Aaa, Aa, A |
20.8% |
|
AAA, AA, A |
17.8% |
|
Baa |
6.5% |
|
BBB |
6.0% |
|
Ba |
1.7% |
|
BB |
1.9% |
|
B |
5.3% |
|
B |
5.8% |
|
Caa |
1.3% |
|
CCC |
0.8% |
|
Ca, C |
0.0% |
|
CC, C |
0.0% |
|
|
|
|
D |
0.1% |
|
The percentage not rated by Moody's or S&P amounted to 0.9%. FMR has determined that unrated debt securities that are lower quality account for 0.9% of the total value of investment in securities. |
|
Purchases and sales of securities, other than short-term securities, aggregated $1,703,007,563 and $2,385,422,392, respectively, of which long-term U.S. government and government agency obligations aggregated $703,320,022 and $737,829,262, respectively. |
|
The market value of futures contracts opened and closed during the period amounted to $369,738,823 and $140,715,190, respectively. |
|
The fund placed a portion of its portfolio transactions with brokerage firms which are affiliates of Fidelity Management & Research Company. The commissions paid to these affiliated firms were $30,209 for the period. |
|
The fund invested in securities that are not registered under the Securities Act of 1933. These securities are subject to legal or contractual restrictions on resale. At the end of the period, restricted securities (excluding Rule 144A issues) amounted to $15,403,891 and 0.3% of net assets. |
|
The fund participated in the security lending program. At period end, the value of securities loaned amounted to $659,757. The fund received cash collateral of $659,100 which was invested in cash equivalents. |
|
Income Tax Information |
|
At June 30, 2000, the aggregate cost of investment securities for income tax purposes was $4,073,709,121. Net unrealized appreciation aggregated $499,675,136, of which $646,290,978 related to appreciated investment securities and $146,615,842 related to depreciated investment securities. |
See accompanying notes which are an integral part of the financial statements.
Asset Manager Portfolio
Statement of Assets and Liabilities
|
|
June 30, 2000 (Unaudited) |
|
|
Assets |
|
|
|
Investment in securities, at value (including repurchase agreements of $30,324,000) |
|
$ 4,573,384,257 |
|
Cash |
|
417,051 |
|
Receivable for investments sold |
|
78,404,347 |
|
Receivable for fund shares sold |
|
538,054 |
|
Dividends receivable |
|
1,365,550 |
|
Interest receivable |
|
27,511,966 |
|
Receivable for daily variation on futures contracts |
|
1,131,992 |
|
Other receivables |
|
132,043 |
|
Total assets |
|
4,682,885,260 |
|
Liabilities |
|
|
|
Payable for investments purchased |
$ 73,353,664 |
|
|
Delayed delivery |
44,912,865 |
|
|
Payable for fund shares redeemed |
3,398,939 |
|
|
Accrued management fee |
2,015,725 |
|
|
Distribution fees payable |
2,417 |
|
|
Other payables and |
367,352 |
|
|
Collateral on securities loaned, |
659,100 |
|
|
Total liabilities |
|
124,710,062 |
|
Net Assets |
|
$ 4,558,175,198 |
|
Net Assets consist of: |
|
|
|
Paid in capital |
|
$ 3,894,821,160 |
|
Undistributed net investment income |
|
93,150,596 |
|
Accumulated undistributed net realized gain (loss) on investments and foreign currency transactions |
|
71,519,816 |
|
Net unrealized appreciation (depreciation) on investments |
|
498,683,626 |
|
Net Assets |
|
$ 4,558,175,198 |
|
Initial Class: |
|
$16.55 |
|
Service Class: |
|
$16.46 |
|
Service Class 2: |
|
$16.45 |
Statement of Operations
|
|
Six months ended June 30, 2000 (Unaudited) |
|
|
Investment Income Dividends |
|
$ 16,298,613 |
|
Interest |
|
82,305,154 |
|
Security lending |
|
650 |
|
Total income |
|
98,604,417 |
|
Expenses |
|
|
|
Management fee |
$ 12,350,508 |
|
|
Transfer agent fees |
1,535,078 |
|
|
Distribution fees |
13,162 |
|
|
Accounting and security lending fees |
334,234 |
|
|
Non-interested trustees' compensation |
15,911 |
|
|
Custodian fees and expenses |
55,539 |
|
|
Registration fees |
12,422 |
|
|
Audit |
22,607 |
|
|
Legal |
16,406 |
|
|
Miscellaneous |
30,810 |
|
|
Total expenses before reductions |
14,386,677 |
|
|
Expense reductions |
(144,577) |
14,242,100 |
|
Net investment income |
|
84,362,317 |
|
Realized and Unrealized Gain (Loss) Net realized gain (loss) on: |
|
|
|
Investment securities |
70,050,664 |
|
|
Foreign currency transactions |
(13) |
|
|
Futures contracts |
5,070,440 |
75,121,091 |
|
Change in net unrealized appreciation (depreciation) on: |
|
|
|
Investment securities |
(193,765,715) |
|
|
Assets and liabilities in |
(7) |
|
|
Futures contracts |
(1,400,223) |
(195,165,945) |
|
Net gain (loss) |
|
(120,044,854) |
|
Net increase (decrease) in net assets resulting from operations |
|
$ (35,682,537) |
|
Other Information Expense reductions |
|
$ 134,129 |
|
Custodian credits |
|
10,448 |
|
|
|
$ 144,577 |
See accompanying notes which are an integral part of the financial statements.
Semiannual Report
Fidelity Variable Insurance Products: Asset Manager Portfolio
Financial Statements - continued
Statement of Changes in Net Assets
|
Increase (Decrease) in Net Assets |
Six months ended |
Year ended |
|
Operations |
$ 84,362,317 |
$ 163,666,158 |
|
Net realized gain (loss) |
75,121,091 |
365,307,199 |
|
Change in net unrealized appreciation (depreciation) |
(195,165,945) |
(14,691,723) |
|
Net increase (decrease) in net assets resulting from operations |
(35,682,537) |
514,281,634 |
|
Distributions to shareholders |
(154,095,495) |
(161,497,855) |
|
From net realized gain |
(363,069,869) |
(204,563,949) |
|
Total distributions |
(517,165,364) |
(366,061,804) |
|
Share transactions - net increase (decrease) |
150,420,217 |
(98,885,126) |
|
Total increase (decrease) in net assets |
(402,427,684) |
49,334,704 |
|
Net Assets |
|
|
|
Beginning of period |
4,960,602,882 |
4,911,268,178 |
|
End of period (including undistributed net investment income of $93,150,596 and $163,666,159, respectively) |
$ 4,558,175,198 |
$ 4,960,602,882 |
|
|
|
Other Information: |
|
|
Six months ended June 30, 2000 |
Year ended |
||
|
|
Shares |
Dollars |
Shares |
Dollars |
|
Share transactions |
7,773,047 |
$ 130,415,409 |
18,326,496 |
$ 320,298,483 |
|
Reinvested |
31,454,002 |
514,587,479 |
21,655,706 |
365,548,318 |
|
Redeemed |
(29,837,358) |
(502,371,635) |
(45,749,338) |
(801,281,286) |
|
Net increase (decrease) |
9,389,691 |
$ 142,631,253 |
(5,767,136) |
$ (115,434,485) |
|
Service Class |
388,675 |
$ 6,434,099 |
1,054,578 |
$ 18,334,058 |
|
Reinvested |
157,694 |
2,567,255 |
30,528 |
513,486 |
|
Redeemed |
(118,776) |
(1,991,210) |
(131,705) |
(2,298,185) |
|
Net increase (decrease) |
427,593 |
$ 7,010,144 |
953,401 |
$ 16,549,359 |
|
Service Class 2 A |
49,063 |
$ 817,391 |
- |
$ - |
|
Reinvested |
666 |
10,842 |
- |
- |
|
Redeemed |
(2,997) |
(49,413) |
- |
- |
|
Net increase (decrease) |
46,732 |
$ 778,820 |
- |
$ - |
|
Distributions |
|
$ 153,336,461 |
|
$ 161,271,317 |
|
Service Class |
|
755,842 |
|
226,538 |
|
Service Class 2 A |
|
3,192 |
|
- |
|
Total |
|
$ 154,095,495 |
|
$ 161,497,855 |
|
From net realized gain |
|
$ 361,250,806 |
|
$ 204,277,001 |
|
Service Class |
|
1,811,413 |
|
286,948 |
|
Service Class 2 A |
|
7,650 |
|
- |
|
Total |
|
$ 363,069,869 |
|
$ 204,563,949 |
|
|
|
$ 517,165,364 |
|
$ 366,061,804 |
A Service Class 2 commenced sale of shares January 12, 2000.
See accompanying notes which are an integral part of the financial statements.
Asset Manager Portfolio
Financial Highlights - Initial Class
|
|
Six months ended |
Years ended December 31, |
||||
|
Selected Per-Share Data |
(Unaudited) |
1999 |
1998 |
1997 |
1996 |
1995 |
|
Net asset value, beginning of period |
$ 18.67 |
$ 18.16 |
$ 18.01 |
$ 16.93 |
$ 15.79 |
$ 13.79 |
|
Income from Investment Operations |
|
|
|
|
|
|
|
Net investment income |
.30 D |
.59 D |
.59 D |
.57 D |
.63 |
.30 |
|
Net realized and unrealized gain (loss) |
(.44) |
1.28 |
1.84 |
2.58 |
1.55 |
1.99 |
|
Total from investment operations |
(.14) |
1.87 |
2.43 |
3.15 |
2.18 |
2.29 |
|
Less Distributions |
|
|
|
|
|
|
|
From net investment income |
(.59) |
(.60) |
(.57) |
(.59) |
(.57) |
(.29) |
|
From net realized gain |
(1.39) |
(.76) |
(1.71) |
(1.48) |
(.47) |
- |
|
Total distributions |
(1.98) |
(1.36) |
(2.28) |
(2.07) |
(1.04) |
(.29) |
|
Net asset value, end of period |
$ 16.55 |
$ 18.67 |
$ 18.16 |
$ 18.01 |
$ 16.93 |
$ 15.79 |
|
Total Return B, C |
(.69)% |
11.09% |
15.05% |
20.65% |
14.60% |
16.96% |
|
Ratios and Supplemental Data |
|
|
|
|
|
|
|
Net assets, end of period (000 omitted) |
$ 4,529,402 |
$ 4,936,926 |
$ 4,905,468 |
$ 4,399,937 |
$ 3,641,194 |
$ 3,333,844 |
|
Ratio of expenses to average net assets |
.61% A |
.63% |
.64% |
.65% |
.74% |
.81% |
|
Ratio of expenses to average net assets after |
.61% A |
.62% F |
.63% F |
.64% F |
.73% F |
.79% F |
|
Ratio of net investment income to average net assets |
3.59% A |
3.36% |
3.46% |
3.43% |
3.60% |
3.54% |
|
Portfolio turnover |
78% A |
94% |
113% |
101% |
168% |
256% |
Financial Highlights - Service Class
|
|
Six months ended |
Years ended December 31, |
||
|
Selected Per-Share Data |
(Unaudited) |
1999 |
1998 |
1997 E |
|
Net asset value, beginning of period |
$ 18.59 |
$ 18.10 |
$ 17.99 |
$ 17.60 |
|
Income from Investment Operations |
|
|
|
|
|
Net investment income D |
.29 |
.56 |
.57 |
.10 |
|
Net realized and unrealized gain (loss) |
(.45) |
1.29 |
1.82 |
.29 |
|
Total from investment operations |
(.16) |
1.85 |
2.39 |
.39 |
|
Less Distributions |
|
|
|
|
|
From net investment income |
(.58) |
(.60) |
(.57) |
- |
|
From net realized gain |
(1.39) |
(.76) |
(1.71) |
- |
|
Total distributions |
(1.97) |
(1.36) |
(2.28) |
- |
|
Net asset value, end of period |
$ 16.46 |
$ 18.59 |
$ 18.10 |
$ 17.99 |
|
Total Return B, C |
(.74)% |
11.01% |
14.82% |
2.22% |
|
Ratios and Supplemental Data |
|
|
|
|
|
Net assets, end of period (000 omitted) |
$ 28,005 |
$ 23,677 |
$ 5,801 |
$ 10 |
|
Ratio of expenses to average net assets |
.71% A |
.74% |
.78% |
.75% A |
|
Ratio of expenses to average net assets after expense reductions |
.71% A |
.73% F |
.77% F |
.75% A |
|
Ratio of net investment income to average net assets |
3.49% A |
3.25% |
3.49% |
3.52% A |
|
Portfolio turnover |
78% A |
94% |
113% |
101% |
|
A Annualized B Total returns for periods of less than one year are not annualized and do not reflect charges attributable to your insurance company's separate account. Inclusion of these charges would reduce the total returns shown. C The total returns would have been lower had certain expenses not been reduced during the period shown. D Net investment income per share has been calculated based on average shares outstanding during the period. E For the period November 3, 1997 (commencement of sale of Service Class shares) to December 31, 1997. F FMR or the fund has entered into varying arrangements with third parties who either paid or reduced a portion of the class' expenses. |
||||
See accompanying notes which are an integral part of the financial statements.
Semiannual Report
Financial Highlights - Service Class 2
|
|
Six months ended |
|
Selected Per-Share Data |
(Unaudited) |
|
Net asset value, beginning of period |
$ 18.17 |
|
Income from Investment Operations |
|
|
Net investment income C |
.24 |
|
Net realized and unrealized gain (loss) |
.01 E |
|
Total from investment operations |
.25 |
|
Less Distributions |
|
|
From net investment income |
(.58) |
|
From net realized gain |
(1.39) |
|
Total distributions |
(1.97) |
|
Net asset value, end of period |
$ 16.45 |
|
Total Return B |
1.49% |
|
Ratios and Supplemental Data |
|
|
Net assets, end of period (000 omitted) |
$ 769 |
|
Ratio of expenses to average net assets |
.84% A |
|
Ratio of net investment income to average net assets |
3.36% A |
|
Portfolio turnover |
78% A |
|
A Annualized B Total returns for periods of less than one year are not annualized and do not reflect charges attributable to your insurance company's separate account. Inclusion of these charges would reduce the total returns shown. C Net investment income per share has been calculated based on average shares outstanding during the period. D For the period January 12, 2000 (commencement of sale of Service Class 2 shares) to June 30, 2000. E The amount shown for a share outstanding does not correspond with the aggregate net loss on investments for the period due to the timing of sales and repurchases of class shares in relation to fluctuating market values of the investments of the fund. |
|
See accompanying notes which are an integral part of the financial statements.
Asset Manager Portfolio
Performance
There are several ways to evaluate a fund's historical performance. You can look at the total percentage change in value, the average annual percentage change or the growth of a hypothetical $10,000 investment. Total return reflects the change in the value of an investment, assuming reinvestment of the fund's dividend income and capital gains (the profits earned upon the sale of securities that have grown in value). The initial offering of Service Class 2 shares took place on January 12, 2000. Performance for Service Class 2 shares reflects an asset based distribution fee (12b-1 fee). Returns from November 3, 1997 to January 12, 2000 are those of Service Class which reflect a different 12b-1 fee. Service Class 2 returns prior to November 3, 1997 are those of Initial Class and do not include the effects of a 12b-1 fee. Had Service Class 2's 12b-1 fee been reflected, returns prior to January 12, 2000 would have been lower. If Fidelity had not reimbursed certain fund expenses, the past 10 year total return would have been lower.
Average Annual Total Returns
|
Periods ended |
Past 1 |
Past 5 |
Past 10 |
|
Fidelity VIP: High Income - |
-4.87% |
7.21% |
11.93% |
|
ML High Yield Master II |
-0.97% |
7.03% |
10.83% |
Average annual returns take the fund's cumulative return and show you what would have happened if the fund had performed at a constant rate each year.
You can compare the fund's returns to the performance of the Merrill Lynch High Yield Master II Index - a market value-weighted index of all domestic and yankee high-yield bonds, including deferred interest bonds and payment-in-kind securities. Issues included in the index have maturities of one year or more and have a credit rating lower than BBB-/Baa3, but are not in default. This benchmark reflects the reinvestment of dividends and capital gains, if any.
Figures for more than one year assume a steady compounded rate of return and are not the fund's year-by-year results, which fluctuated over the periods shown.
Performance numbers are net of all fund operating expenses, but do not include any insurance charges imposed by your insurance company's separate account. If performance information included the effect of these additional charges, the total returns would have been lower.
Past performance is no guarantee of future results. Principal and investment return will vary and you may have a gain or loss when you withdraw your money. The fund includes high yielding, lower-rated securities which are subject to greater price volatility and may involve greater risk of default. The market for these securities may be less liquid.
Understanding Performance
How a fund did yesterday is no guarantee of
how it will do tomorrow. Bond prices, for example,
generally move in the opposite direction of interest
rates. In turn, the share price, return and yield of a
fund that invests in bonds will vary. That means if
you sell your shares during a market downturn,
you might lose money. But if you can ride out the
market's ups and downs, you may have a gain.
$10,000 Over 10 Years
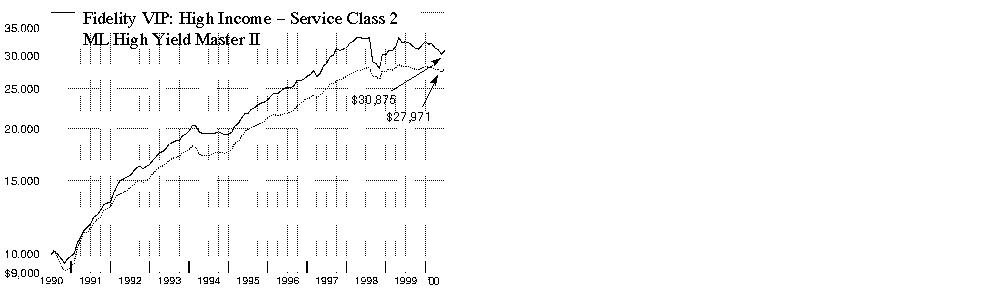
$10,000 Over 10 Years: Let's say hypothetically that $10,000 was invested in Fidelity Variable Insurance Products: High Income Portfolio - Service Class 2 on June 30, 1990. As the chart shows, by June 30, 2000, the value of the investment would have grown to $30,875 - a 208.75% increase on the initial investment. For comparison, look at how the Merrill Lynch High Yield Master II Index did over the same period. With dividends and capital gains, if any, reinvested, the same $10,000 investment would have grown to $27,971 - a 179.71% increase.
Investment Summary
|
Top Five Holdings as of June 30, 2000 |
|
|
(by issuer, excluding cash equivalents) |
% of fund's |
|
Nextel Communications, Inc. |
5.5 |
|
NEXTLINK Communications, Inc. |
4.4 |
|
WinStar Communications, Inc. |
3.0 |
|
Allied Waste North America, Inc. |
2.7 |
|
ICG Holdings, Inc |
2.5 |
|
|
18.1 |
|
Top Five Market Sectors as of June 30, 2000 |
|
|
|
% of fund's |
|
Utilities |
31.8 |
|
Media & Leisure |
23.8 |
|
Technology |
8.2 |
|
Basic Industries |
7.8 |
|
Industrial Machinery & Equipment |
5.2 |
|
Quality Diversification as of June 30, 2000 |
|
|
(Moody's Ratings) |
% of fund's |
|
Aaa, Aa, A |
0.0 |
|
Baa |
0.2 |
|
Ba |
4.0 |
|
B |
53.1 |
|
Caa, Ca, C |
13.5 |
|
Not Rated |
7.6 |
|
Table excludes short-term investments. Where Moody's ratings are not available, we have used S&P ratings. Unrated debt securities that are equivalent to Ba and below at June 30, 2000 account for 7.6% of the fund's investments. |
Semiannual Report
(Portfolio Manager photograph)
An interview with Barry Coffman, Portfolio Manager of High Income Portfolio
Q. How did the fund perform, Barry?
A. For the six-month period that ended June 30, 2000, the fund lagged the -1.00% return of the Merrill Lynch High Yield Master Index II. The fund also underperformed the index's -0.97% return for the 12-month period ending June 30, 2000.
Q. What factors drove the high-yield market's performance and how did those factors, in turn, affect the fund's performance?
A. As they did throughout most of 1999, rising interest rates continued to put pressure on high-yield bonds and most other fixed-income investments. From January through June 2000, the Federal Reserve Board raised interest rates three times to cool the economy and the stock market. Compounding the effects of the difficult interest-rate backdrop was the fact that the "technicals" - supply and demand - were unfavorable. While supply had tapered off significantly from the same six-month period a year earlier, demand was quite weak. Furthermore, the default rate - which measures the percentage of high-yield debt that companies are unable or unwilling to honor - continued to rise, which also cooled demand. Those factors conspired to drive the high-yield market and the fund lower.
Q. Why did the fund underperform the Merrill Lynch index?
A. Unfortunately, a small handful of disappointments significantly detracted from the fund's performance. Given the overall negative tone of the high-yield market, investors severely punished companies that had worse-than-expected results. Most of the fund's underperformance can be accounted for by losses in securities of three holdings that defaulted: Sunterra Resorts, Specialty Retailers - the operating subsidiary of Stages Stores, Inc. - and competitive local exchange carrier GST Telecom. Also, continued weakness in the theater industry due to an overbuilding of new movie theaters pressured bonds in that sector.
Q. What holdings held up well against the difficult backdrop?
A. Telecommunications holdings outperformed the overall market. Many of these companies began to see very attractive returns from their network investments as they neared critical mass. Overall demand for telecom services, particularly high-speed data transmission, continued to be very robust. Within telecommunications, the fund benefited from its holdings in WinStar Communications, which refinanced its debt at very favorable terms during the period. Cable companies also performed well. In particular, our holdings in two international cable concerns, UnitedGlobalCom and Telewest both benefited from their investments in advanced networks that allow them to bundle high-speed Internet access and telephony with cable TV. In addition, both companies successfully raised equity during the period. Also, our position in Allied Waste - now the nation's second-largest waste management company - rebounded during the period and was a significant contributor to performance.
Q. What changes did you make over the past six months?
A. One of the most significant changes was that I concentrated more of the fund in larger, more liquid holdings. Historically, I've tried to find value among less-followed small- and mid-tier companies. But it became clear that the market environment was one that overly punished companies in those groups that disappoint. As a result, I focused on the larger-cap companies in the high-yield universe, particularly those with strong operating fundamentals and access to capital. As examples, I added to some of the fund's larger holdings, including telecommunications companies Nextel and NEXTLINK and direct broadcast satellite company Echostar.
Q. What's your outlook?
A. In my view, the relatively cheap valuations of high-yield bonds offer cause for optimism. The average high-yield bond is selling in the low 80s as a percentage of par - or face - value with yields nearing 13%, or twice the absolute level of U.S. Treasury bond yields. We haven't really seen that type of value since 1990 when the U.S. economy was in a recession. Even though the economy may slow in response to higher interest rates, I think the risk of a recession is limited over the near term. Steady economic growth would likely be a positive backdrop for this market. While I can't pinpoint exactly what will be the catalyst for a high-yield market turnaround, I would expect that the end of the Fed's campaign to raise interest rates could provide a significant boost for high-yield and other fixed-income securities as well.
The views expressed in this report reflect those of the portfolio manager only through the end of the period of the report as stated on the cover. The manager's views are subject to change at any time based upon market or other conditions. For more information, see page 2.
Fund Facts
Goal: to seek high current income by investing primarily in all types of income-producing debt securities with an emphasis on lower-quality securities
Start date: September 19, 1985
Size: as of June 30, 2000, more than $2.2 billion
Manager: Barry Coffman, since 1990; joined Fidelity in 1986
3Semiannual Report
Fidelity Variable Insurance Products: High Income Portfolio
(Unaudited)
Showing Percentage of Net Assets
|
Corporate Bonds - 75.4% |
|||||
|
Moody's Ratings (unaudited) (b) |
Principal Amount |
Value |
|||
|
Convertible Bonds - 3.3% |
|||||
|
HEALTH - 0.4% |
|||||
|
Medical Facilities Management - 0.4% |
|||||
|
Total Renal Care Holdings, Inc. 7% 5/15/09 (f) |
B3 |
|
$ 14,680,000 |
$ 9,762,200 |
|
|
MEDIA & LEISURE - 2.2% |
|||||
|
Broadcasting - 2.2% |
|||||
|
EchoStar Communications Corp. 4.875% 1/1/07 (f) |
- |
|
50,665,000 |
48,195,081 |
|
|
UTILITIES - 0.7% |
|||||
|
Cellular - 0.7% |
|||||
|
Nextel |
|
|
|
|
|
|
5.25% 1/15/10 (f) |
B1 |
|
10,000,000 |
10,350,000 |
|
|
5.25% 1/15/10 |
B1 |
|
5,000,000 |
5,175,000 |
|
|
|
15,525,000 |
||||
|
TOTAL CONVERTIBLE BONDS |
73,482,281 |
||||
|
Nonconvertible Bonds - 72.1% |
|||||
|
BASIC INDUSTRIES - 7.7% |
|||||
|
Chemicals & Plastics - 5.0% |
|||||
|
Acetex Corp. yankee 9.75% 10/1/03 |
B3 |
|
3,000,000 |
2,805,000 |
|
|
Avecia Group PLC 11% 7/1/09 |
B2 |
|
7,275,000 |
7,129,500 |
|
|
Foamex LP 13.5% 8/15/05 |
Caa2 |
|
5,000,000 |
4,275,000 |
|
|
Huntsman Corp.: |
|
|
|
|
|
|
9.5% 7/1/07 (f) |
B2 |
|
10,240,000 |
9,344,000 |
|
|
9.5% 7/1/07 (f) |
B2 |
|
32,830,000 |
29,957,375 |
|
|
Huntsman ICI Chemicals LLC 10.125% 7/1/09 |
B2 |
|
12,390,000 |
12,390,000 |
|
|
Huntsman ICI Holdings LLC 0% 12/31/09 |
B3 |
|
34,102,000 |
10,912,640 |
|
|
Lyondell Chemical Co.: |
|
|
|
|
|
|
9.625% 5/1/07 |
Ba3 |
|
3,740,000 |
3,702,600 |
|
|
9.875% 5/1/07 |
Ba3 |
|
9,420,000 |
9,325,800 |
|
|
10.875% 5/1/09 |
B2 |
|
18,455,000 |
18,316,588 |
|
|
Sterling Chemicals, Inc. 11.75% 8/15/06 |
Caa3 |
|
5,030,000 |
4,074,300 |
|
|
|
112,232,803 |
||||
|
Metals & Mining - 0.4% |
|||||
|
Kaiser Aluminum & Chemical Corp.: |
|
|
|
|
|
|
9.875% 2/15/02 |
B1 |
|
2,455,000 |
2,369,075 |
|
|
12.75% 2/1/03 |
B3 |
|
6,958,000 |
6,331,780 |
|
|
|
8,700,855 |
||||
|
|
|||||
|
Moody's Ratings (unaudited) (b) |
Principal Amount |
Value |
|||
|
Packaging & Containers - 1.0% |
|||||
|
Gaylord Container Corp.: |
|
|
|
|
|
|
9.375% 6/15/07 |
Caa1 |
|
$ 14,080,000 |
$ 10,841,600 |
|
|
9.75% 6/15/07 |
Caa1 |
|
5,370,000 |
4,188,600 |
|
|
Packaging Corp. of America 9.625% 4/1/09 |
B2 |
|
7,470,000 |
7,376,625 |
|
|
|
22,406,825 |
||||
|
Paper & Forest Products - 1.3% |
|||||
|
APP China Group Ltd. 14% 3/15/10 unit (f) |
B3 |
|
4,875,000 |
3,071,250 |
|
|
APP Finance II Mauritius Ltd. 12% 3/15/04 |
B3 |
|
4,175,000 |
2,129,250 |
|
|
Container Corp. of America gtd. 9.75% 4/1/03 |
B2 |
|
1,690,000 |
1,681,550 |
|
|
Millar Western Forest Products Ltd. 9.875% 5/15/08 |
B3 |
|
13,115,000 |
12,295,313 |
|
|
Repap New Brunswick, Inc.: |
|
|
|
|
|
|
11.5% 6/1/04 |
B3 |
|
1,795,000 |
1,803,975 |
|
|
yankee 10.625% 4/15/05 |
Caa1 |
|
6,340,000 |
5,579,200 |
|
|
Stone Container Corp. 12.58% 8/1/16 (g) |
B2 |
|
1,150,000 |
1,184,500 |
|
|
|
27,745,038 |
||||
|
TOTAL BASIC INDUSTRIES |
171,085,521 |
||||
|
CONSTRUCTION & REAL ESTATE - 2.0% |
|||||
|
Building Materials - 0.3% |
|||||
|
International Utility Structures, Inc. 10.75% 2/1/08 |
Caa1 |
|
9,200,000 |
7,360,000 |
|
|
Construction - 0.1% |
|||||
|
Great Lakes Dredge & Dock Corp. 11.25% 8/15/08 |
B3 |
|
50,000 |
49,375 |
|
|
Lennar Corp. 9.95% 5/1/10 (f) |
Ba1 |
|
3,010,000 |
2,964,850 |
|
|
|
3,014,225 |
||||
|
Engineering - 0.6% |
|||||
|
360networks, Inc. 13% 5/1/08 (f) |
B3 |
|
12,660,000 |
12,533,400 |
|
|
Real Estate - 0.9% |
|||||
|
LNR Property Corp.: |
|
|
|
|
|
|
9.375% 3/15/08 |
B1 |
|
14,395,000 |
12,523,650 |
|
|
10.5% 1/15/09 |
B1 |
|
7,040,000 |
6,476,800 |
|
|
|
19,000,450 |
||||
|
Real Estate Investment Trusts - 0.1% |
|||||
|
Ocwen Asset Investment Corp. 11.5% 7/1/05 |
- |
|
3,520,000 |
2,710,400 |
|
|
TOTAL CONSTRUCTION & REAL ESTATE |
44,618,475 |
||||
|
Corporate Bonds - continued |
|||||
|
Moody's Ratings (unaudited) (b) |
Principal Amount |
Value |
|||
|
Nonconvertible Bonds - continued |
|||||
|
DURABLES - 0.3% |
|||||
|
Autos, Tires, & Accessories - 0.1% |
|||||
|
Federal-Mogul Corp. 7.5% 1/15/09 |
Ba2 |
|
$ 5,455,000 |
$ 3,600,300 |
|
|
Textiles & Apparel - 0.2% |
|||||
|
Levi Strauss & Co.: |
|
|
|
|
|
|
6.8% 11/1/03 |
Ba3 |
|
3,775,000 |
3,095,500 |
|
|
7% 11/1/06 |
Ba3 |
|
755,000 |
573,800 |
|
|
|
3,669,300 |
||||
|
TOTAL DURABLES |
7,269,600 |
||||
|
ENERGY - 2.0% |
|||||
|
Coal - 0.4% |
|||||
|
P&L Coal Holdings Corp. 9.625% 5/15/08 |
B2 |
|
10,210,000 |
9,469,775 |
|
|
Energy Services - 0.4% |
|||||
|
Cliffs Drilling Co. 10.25% 5/15/03 |
Ba3 |
|
900,000 |
904,500 |
|
|
R&B Falcon Corp.: |
|
|
|
|
|
|
6.5% 4/15/03 |
Ba3 |
|
5,525,000 |
5,124,438 |
|
|
6.75% 4/15/05 |
Ba3 |
|
1,260,000 |
1,137,150 |
|
|
6.95% 4/15/08 |
Ba3 |
|
750,000 |
637,500 |
|
|
9.5% 12/15/08 |
Ba3 |
|
595,000 |
597,975 |
|
|
|
8,401,563 |
||||
|
Oil & Gas - 1.2% |
|||||
|
Chesapeake Energy Corp.: |
|
|
|
|
|
|
7.875% 3/15/04 |
B2 |
|
1,610,000 |
1,493,275 |
|
|
8.5% 3/15/12 |
B2 |
|
1,435,000 |
1,205,400 |
|
|
9.125% 4/15/06 |
B2 |
|
3,565,000 |
3,377,838 |
|
|
Great Lakes Carbon Corp.: |
|
|
|
|
|
|
0% 5/15/09 (d) |
Caa1 |
|
15,215,000 |
6,086,000 |
|
|
10.25% 5/15/08 pay-in-kind |
B3 |
|
8,550,000 |
6,840,000 |
|
|
Plains Resources, Inc.: |
|
|
|
|
|
|
Series B 10.25% 3/15/06 |
B2 |
|
5,860,000 |
5,801,400 |
|
|
Series D 10.25% 3/15/06 |
B2 |
|
2,770,000 |
2,742,300 |
|
|
|
27,546,213 |
||||
|
TOTAL ENERGY |
45,417,551 |
||||
|
FINANCE - 2.2% |
|||||
|
Credit & Other Finance - 2.0% |
|||||
|
AMRESCO, Inc.: |
|
|
|
|
|
|
9.875% 3/15/05 |
Caa3 |
|
14,905,000 |
6,930,825 |
|
|
10% 3/15/04 |
Caa3 |
|
1,824,000 |
839,040 |
|
|
APP Global Finance III 10.7513% 4/17/02 (g) |
Caa1 |
|
2,400,000 |
1,704,000 |
|
|
Delta Financial Corp. 9.5% 8/1/04 |
B3 |
|
1,350,000 |
607,500 |
|
|
|
|||||
|
Moody's Ratings (unaudited) (b) |
Principal Amount |
Value |
|||
|
Imperial Credit Capital Trust I 10.25% 6/14/02 |
B2 |
|
$ 4,870,000 |
$ 4,139,500 |
|
|
Imperial Credit Industries 9.875% 1/15/07 |
B3 |
|
17,470,000 |
12,578,400 |
|
|
Macsaver Financial Services, Inc.: |
|
|
|
|
|
|
7.4% 2/15/02 |
Ba2 |
|
2,720,000 |
1,768,000 |
|
|
7.875% 8/1/03 |
Ba2 |
|
6,900,000 |
4,278,000 |
|
|
Metris Companies, Inc.: |
|
|
|
|
|
|
10% 11/1/04 |
Ba3 |
|
100,000 |
94,000 |
|
|
10.125% 7/15/06 |
Ba3 |
|
1,810,000 |
1,719,500 |
|
|
MFN Financial Corp. 10% 3/23/01 |
- |
|
10,000,000 |
9,600,000 |
|
|
PX Escrow Corp. 0% 2/1/06 (d) |
B3 |
|
3,190,000 |
1,339,800 |
|
|
|
45,598,565 |
||||
|
Insurance - 0.2% |
|||||
|
Willis Corroon Corp. 9% 2/1/09 |
Ba3 |
|
5,500,000 |
4,606,250 |
|
|
TOTAL FINANCE |
50,204,815 |
||||
|
HEALTH - 1.9% |
|||||
|
Drugs & Pharmaceuticals - 0.3% |
|||||
|
Global Health Sciences, Inc. 11% 5/1/08 |
Caa1 |
|
7,970,000 |
1,992,500 |
|
|
Warner Chilcott, Inc. 12.625% 2/15/08 (f) |
B2 |
|
4,815,000 |
4,863,150 |
|
|
|
6,855,650 |
||||
|
Medical Facilities Management - 1.6% |
|||||
|
Express Scripts, Inc. 9.625% 6/15/09 |
Ba2 |
|
9,055,000 |
8,828,625 |
|
|
Fountain View, Inc. 11.25% 4/15/08 |
Caa1 |
|
7,330,000 |
1,795,850 |
|
|
Mariner Post-Acute Network, Inc. 9.5% 11/1/07 (c) |
C |
|
11,630,000 |
1,163 |
|
|
Oxford Health Plans, Inc. 11% 5/15/05 |
B2 |
|
14,465,000 |
14,935,113 |
|
|
Unilab Corp. 12.75% 10/1/09 |
B3 |
|
8,920,000 |
9,187,600 |
|
|
|
34,748,351 |
||||
|
TOTAL HEALTH |
41,604,001 |
||||
|
INDUSTRIAL MACHINERY & EQUIPMENT - 4.3% |
|||||
|
Electrical Equipment - 0.7% |
|||||
|
Loral Space & Communications Ltd. 9.5% 1/15/06 |
B1 |
|
1,185,000 |
865,050 |
|
|
Motors & Gears, Inc. 10.75% 11/15/06 |
B3 |
|
9,170,000 |
8,803,200 |
|
|
Telex Communications, Inc. 10.5% 5/1/07 |
B2 |
|
7,490,000 |
5,018,300 |
|
|
|
14,686,550 |
||||
|
Corporate Bonds - continued |
|||||
|
Moody's Ratings (unaudited) (b) |
Principal Amount |
Value |
|||
|
Nonconvertible Bonds - continued |
|||||
|
INDUSTRIAL MACHINERY & EQUIPMENT - continued |
|||||
|
Industrial Machinery & Equipment - 0.7% |
|||||
|
Tenneco Automotive, Inc. 11.625% 10/15/09 |
B2 |
|
$ 8,500,000 |
$ 7,522,500 |
|
|
Thermadyne Holdings Corp. 0% 6/1/08 (d) |
Caa1 |
|
11,470,000 |
4,129,200 |
|
|
Thermadyne Manufacturing LLC 9.875% 6/1/08 |
B3 |
|
4,470,000 |
3,441,900 |
|
|
Tokheim Corp. 11.375% 8/1/08 |
Ca |
|
9,030,000 |
903,000 |
|
|
|
15,996,600 |
||||
|
Pollution Control - 2.9% |
|||||
|
Allied Waste North America, Inc.: |
|
|
|
|
|
|
7.375% 1/1/04 |
Ba3 |
|
1,870,000 |
1,701,700 |
|
|
7.625% 1/1/06 |
Ba2 |
|
1,185,000 |
1,030,950 |
|
|
7.875% 1/1/09 |
Ba2 |
|
1,965,000 |
1,670,250 |
|
|
10% 8/1/09 |
B2 |
|
65,360,000 |
54,902,400 |
|
|
Envirosource, Inc.: |
|
|
|
|
|
|
Series B, 9.75% 6/15/03 |
Caa3 |
|
4,900,000 |
2,205,000 |
|
|
9.75% 6/15/03 |
Caa3 |
|
7,171,000 |
3,226,950 |
|
|
|
64,737,250 |
||||
|
TOTAL INDUSTRIAL MACHINERY & EQUIPMENT |
95,420,400 |
||||
|
MEDIA & LEISURE - 18.8% |
|||||
|
Broadcasting - 15.2% |
|||||
|
Adelphia |
|
|
|
|
|
|
7.75% 1/15/09 |
B1 |
|
7,000,000 |
5,897,500 |
|
|
9.875% 3/1/05 |
B1 |
|
3,400,000 |
3,315,000 |
|
|
American Mobile Satellite Corp. 12.25% 4/1/08 |
- |
|
3,435,000 |
2,644,950 |
|
|
Charter Communications Holdings LLC/Charter Communications Holdings Capital Corp.: |
|
|
|
|
|
|
8.625% 4/1/09 |
B2 |
|
11,160,000 |
9,848,700 |
|
|
10.25% 1/15/10 |
B2 |
|
4,005,000 |
3,884,850 |
|
|
Diamond Cable Communications PLC: |
|
|
|
|
|
|
0% 2/15/07 (d) |
B3 |
|
11,561,000 |
8,873,068 |
|
|
yankee 0% 12/15/05 (d) |
B3 |
|
9,875,000 |
9,233,125 |
|
|
Earthwatch, Inc. 0% 7/15/07 unit (d)(f) |
- |
|
16,560,000 |
10,598,400 |
|
|
EchoStar DBS Corp. 9.375% 2/1/09 |
B2 |
|
14,860,000 |
14,339,900 |
|
|
Fox Family Worldwide, Inc. 0% 11/1/07 (d) |
B1 |
|
8,050,000 |
4,991,000 |
|
|
|
|||||
|
Moody's Ratings (unaudited) (b) |
Principal Amount |
Value |
|||
|
FrontierVision Holdings LP/FrontierVision Holdings Capital Corp. 0% 9/15/07 (d) |
B1 |
|
$ 210,000 |
$ 181,125 |
|
|
Golden Sky DBS, Inc. 0% 3/1/07 (d) |
Caa1 |
|
10,640,000 |
7,155,400 |
|
|
Impsat Fiber Networks, Inc. 13.75% 2/15/05 (f) |
B3 |
|
6,050,000 |
5,384,500 |
|
|
International Cabletel, Inc. 0% 2/1/06 (d) |
B3 |
|
40,484,000 |
37,245,280 |
|
|
LIN Holdings Corp. 0% 3/1/08 (d) |
B3 |
|
11,678,000 |
7,678,285 |
|
|
NorthPoint Communication Holdings, Inc. 12.875% 2/15/10 |
Caa1 |
|
17,095,000 |
11,795,550 |
|
|
NTL Communications Corp. 11.5% 10/1/08 |
B3 |
|
14,080,000 |
14,185,600 |
|
|
NTL, Inc. 0% 4/1/08 (d) |
B3 |
|
2,380,000 |
1,475,600 |
|
|
Olympus Communications LP/Olympus Capital Corp. 10.625% 11/15/06 |
B1 |
|
7,585,000 |
7,433,300 |
|
|
Satelites Mexicanos SA de CV: |
|
|
|
|
|
|
10.125% 11/1/04 |
B3 |
|
20,460,000 |
13,810,500 |
|
|
11.28% 6/30/04 (f)(g) |
B1 |
|
10,954,000 |
9,968,140 |
|
|
Spectrasite Holdings, Inc. 0% 4/15/09 (d) |
B3 |
|
18,670,000 |
10,781,925 |
|
|
Telewest PLC 0% 10/1/07 (d) |
B1 |
|
26,492,000 |
25,299,860 |
|
|
UIH Australia/Pacific, Inc.: |
|
|
|
|
|
|
Series B 0% 5/15/06 (d) |
B2 |
|
40,240,000 |
37,020,800 |
|
|
Series D 0% 5/15/06 (d) |
B2 |
|
5,620,000 |
5,170,400 |
|
|
United International Holdings, Inc. 0% 2/15/08 (d) |
B3 |
|
49,076,000 |
33,862,440 |
|
|
United Pan-Europe Communications NV: |
|
|
|
|
|
|
0% 2/1/10 (d) |
B2 |
|
28,175,000 |
13,242,250 |
|
|
10.875% 8/1/09 |
B2 |
|
13,240,000 |
11,651,200 |
|
|
11.25% 2/1/10 |
B2 |
|
6,005,000 |
5,404,500 |
|
|
XM Satellite Radio, Inc. 14% 3/15/10 unit (f) |
- |
|
6,055,000 |
5,328,400 |
|
|
|
337,701,548 |
||||
|
Entertainment - 1.5% |
|||||
|
AMC Entertainment, Inc.: |
|
|
|
|
|
|
9.5% 3/15/09 |
Caa3 |
|
4,030,000 |
1,934,400 |
|
|
9.5% 2/1/11 |
Caa3 |
|
5,390,000 |
2,479,400 |
|
|
Hollywood Entertainment Corp. 10.625% 8/15/04 |
B3 |
|
10,690,000 |
9,166,675 |
|
|
MGM Grand, Inc. 9.75% 6/1/07 |
Ba2 |
|
5,940,000 |
6,029,100 |
|
|
Premier Parks, Inc.: |
|
|
|
|
|
|
0% 4/1/08 (d) |
B3 |
|
4,710,000 |
3,196,913 |
|
|
9.25% 4/1/06 |
B3 |
|
4,745,000 |
4,484,025 |
|
|
Corporate Bonds - continued |
|||||
|
Moody's Ratings (unaudited) (b) |
Principal Amount |
Value |
|||
|
Nonconvertible Bonds - continued |
|||||
|
MEDIA & LEISURE - continued |
|||||
|
Entertainment - continued |
|||||
|
Regal Cinemas, Inc.: |
|
|
|
|
|
|
8.875% 12/15/10 |
Ca |
|
$ 2,660,000 |
$ 638,400 |
|
|
9.5% 6/1/08 |
Ca |
|
24,035,000 |
6,008,750 |
|
|
|
33,937,663 |
||||
|
Leisure Durables & Toys - 0.3% |
|||||
|
Marvel Enterprises, Inc. 12% 6/15/09 |
- |
|
8,750,000 |
6,650,000 |
|
|
Lodging & Gaming - 1.2% |
|||||
|
Florida Panthers Holdings, Inc. 9.875% 4/15/09 |
B2 |
|
8,750,000 |
8,181,250 |
|
|
HMH Properties, Inc. 7.875% 8/1/05 |
Ba2 |
|
2,965,000 |
2,727,800 |
|
|
Hollywood Casino Corp. 11.25% 5/1/07 |
B3 |
|
6,210,000 |
6,365,250 |
|
|
ITT Corp. 7.375% 11/15/15 |
Ba1 |
|
4,270,000 |
3,576,125 |
|
|
KSL Recreation Group, Inc. 10.25% 5/1/07 |
B2 |
|
6,060,000 |
5,757,000 |
|
|
|
26,607,425 |
||||
|
Restaurants - 0.6% |
|||||
|
AFC Enterprises, Inc. 10.25% 5/15/07 |
B3 |
|
10,485,000 |
9,960,750 |
|
|
NE Restaurant, Inc. 10.75% 7/15/08 |
B3 |
|
5,135,000 |
4,005,300 |
|
|
|
13,966,050 |
||||
|
TOTAL MEDIA & LEISURE |
418,862,686 |
||||
|
NONDURABLES - 0.4% |
|||||
|
Household Products - 0.4% |
|||||
|
AKI Holding Corp. 0% 7/1/09 (d) |
Caa1 |
|
9,120,000 |
4,286,400 |
|
|
AKI, Inc. 10.5% 7/1/08 |
B2 |
|
6,960,000 |
5,533,200 |
|
|
|
9,819,600 |
||||
|
RETAIL & WHOLESALE - 1.2% |
|||||
|
Apparel Stores - 0.7% |
|||||
|
Mothers Work, Inc. 12.625% 8/1/05 |
B3 |
|
15,320,000 |
14,324,200 |
|
|
Specialty Retailers, Inc. 8.5% 7/15/05 (c) |
Ca |
|
18,870,000 |
188,700 |
|
|
|
14,512,900 |
||||
|
Drug Stores - 0.2% |
|||||
|
Rite Aid Corp.: |
|
|
|
|
|
|
6.5% 12/15/05 (f) |
Caa1 |
|
6,175,000 |
3,180,125 |
|
|
7.125% 1/15/07 |
Caa1 |
|
3,920,000 |
2,077,600 |
|
|
|
5,257,725 |
||||
|
|
|||||
|
Moody's Ratings (unaudited) (b) |
Principal Amount |
Value |
|||
|
Grocery Stores - 0.3% |
|||||
|
Jitney-Jungle Stores |
|
|
|
|
|
|
10.375% 9/15/07 (c) |
C |
|
$ 9,685,000 |
$ 193,700 |
|
|
12% 3/1/06 (c) |
Caa3 |
|
2,590,000 |
323,750 |
|
|
Pathmark Stores, Inc. 9.625% 5/1/03 (c) |
Caa3 |
|
10,127,000 |
6,987,630 |
|
|
|
7,505,080 |
||||
|
TOTAL RETAIL & WHOLESALE |
27,275,705 |
||||
|
SERVICES - 2.1% |
|||||
|
Leasing & Rental - 0.2% |
|||||
|
Rent-A-Center, Inc. 11% 8/15/08 |
B2 |
|
3,980,000 |
3,860,600 |
|
|
Printing - 1.2% |
|||||
|
Sullivan Graphics, Inc. 12.75% 8/1/05 |
Caa1 |
|
21,340,000 |
21,446,700 |
|
|
World Color Press, Inc. 7.75% 2/15/09 |
Baa3 |
|
5,090,000 |
4,644,625 |
|
|
|
26,091,325 |
||||
|
Services - 0.7% |
|||||
|
AP Holdings, Inc. 0% 3/15/08 (d) |
Caa2 |
|
2,470,000 |
247,000 |
|
|
Apcoa, Inc. 9.25% 3/15/08 |
Caa1 |
|
17,070,000 |
5,803,800 |
|
|
Medaphis Corp. 9.5% 2/15/05 |
Caa1 |
|
13,713,000 |
10,284,750 |
|
|
|
16,335,550 |
||||
|
TOTAL SERVICES |
46,287,475 |
||||
|
TECHNOLOGY - 8.1% |
|||||
|
Computer Services & Software - 5.0% |
|||||
|
Amazon.com, Inc. 0% 5/1/08 (d) |
Caa1 |
|
7,070,000 |
3,817,800 |
|
|
Colo.com 13.875% 3/15/10 unit (f) |
- |
|
9,755,000 |
10,340,300 |
|
|
Concentric Network Corp. 12.75% 12/15/07 |
B- |
|
12,760,000 |
13,398,000 |
|
|
Covad Communications Group, Inc.: |
|
|
|
|
|
|
0% 3/15/08 (d) |
B3 |
|
19,440,000 |
9,525,600 |
|
|
12% 2/15/10 |
B3 |
|
15,575,000 |
12,070,625 |
|
|
12.5% 2/15/09 |
B3 |
|
7,684,000 |
6,108,780 |
|
|
Exodus |
|
|
|
|
|
|
10.75% 12/15/09 |
B- |
|
21,765,000 |
21,112,050 |
|
|
11.625% 7/15/10 (f) |
B |
|
9,025,000 |
9,070,125 |
|
|
PSINet, Inc.: |
|
|
|
|
|
|
10% 2/15/05 |
B3 |
|
12,670,000 |
11,688,075 |
|
|
10.5% 12/1/06 |
B3 |
|
6,010,000 |
5,529,200 |
|
|
Corporate Bonds - continued |
|||||
|
Moody's Ratings (unaudited) (b) |
Principal Amount |
Value |
|||
|
Nonconvertible Bonds - continued |
|||||
|
TECHNOLOGY - continued |
|||||
|
Computer Services & Software - continued |
|||||
|
PSINet, Inc.: - continued |
|
|
|
|
|
|
11% 8/1/09 |
B3 |
|
$ 4,790,000 |
$ 4,430,750 |
|
|
11.5% 11/1/08 |
B3 |
|
5,500,000 |
5,183,750 |
|
|
|
112,275,055 |
||||
|
Computers & Office Equipment - 1.0% |
|||||
|
Dictaphone Corp. 11.75% 8/1/05 |
Caa1 |
|
8,516,000 |
8,665,030 |
|
|
Globix Corp. 12.5% 2/1/10 |
B- |
|
14,995,000 |
12,370,875 |
|
|
|
21,035,905 |
||||
|
Electronic Instruments - 0.8% |
|||||
|
Telecommunications Techniques Co. LLC 9.75% 5/15/08 |
B3 |
|
19,385,000 |
17,834,200 |
|
|
Electronics - 1.3% |
|||||
|
ChipPAC International Ltd. 12.75% 8/1/09 |
B3 |
|
3,380,000 |
3,633,500 |
|
|
Details, Inc. 10% 11/15/05 |
B3 |
|
2,040,000 |
1,938,000 |
|
|
Hadco Corp. 9.5% 6/15/08 |
B2 |
|
12,835,000 |
12,867,088 |
|
|
Knowles Electronics, Inc. 13.125% 10/15/09 (f) |
B3 |
|
3,500,000 |
2,992,500 |
|
|
Micron Technology, Inc. 6.5% 9/30/05 (h) |
B3 |
|
10,000,000 |
8,350,000 |
|
|
|
29,781,088 |
||||
|
TOTAL TECHNOLOGY |
180,926,248 |
||||
|
TRANSPORTATION - 0.4% |
|||||
|
Air Transportation - 0.4% |
|||||
|
Atlas Air, Inc. 10.75% 8/1/05 |
B1 |
|
9,225,000 |
9,363,375 |
|
|
UTILITIES - 20.7% |
|||||
|
Cellular - 8.4% |
|||||
|
Cellnet Data Systems, Inc. 0% 10/1/07 (d) |
- |
|
69,670,000 |
5,573,600 |
|
|
Crown Castle International Corp. 10.75% 8/1/11 |
B3 |
|
6,195,000 |
6,287,925 |
|
|
Dobson Communications Corp. 10.875% 7/1/10 (f) |
- |
|
6,585,000 |
6,634,388 |
|
|
McCaw International Ltd. 0% 4/15/07 (d) |
Caa1 |
|
35,735,000 |
27,158,600 |
|
|
Metrocall, Inc.: |
|
|
|
|
|
|
10.375% 10/1/07 |
B3 |
|
10,455,000 |
7,318,500 |
|
|
11% 9/15/08 |
B3 |
|
3,410,000 |
2,404,050 |
|
|
Millicom International Cellular SA 0% 6/1/06 (d) |
Caa1 |
|
43,200,000 |
36,720,000 |
|
|
|
|||||
|
Moody's Ratings (unaudited) (b) |
Principal Amount |
Value |
|||
|
Nextel Communications, Inc. 9.375% 11/15/09 |
B1 |
|
$ 21,110,000 |
$ 20,265,600 |
|
|
Nextel International, Inc. 0% 4/15/08 (d) |
Caa1 |
|
18,480,000 |
12,196,800 |
|
|
Orbital Imaging Corp.: |
|
|
|
|
|
|
11.625% 3/1/05 |
CCC+ |
|
7,110,000 |
2,986,200 |
|
|
11.625% 3/1/05 |
CCC+ |
|
3,680,000 |
1,545,600 |
|
|
Orion Network Systems, Inc.: |
|
|
|
|
|
|
0% 1/15/07 (d) |
B2 |
|
12,460,000 |
4,984,000 |
|
|
11.25% 1/15/07 |
B2 |
|
5,800,000 |
3,393,000 |
|
|
PageMart Nationwide, Inc. 15% 2/1/05 |
B3 |
|
20,235,000 |
19,324,425 |
|
|
Telesystem International Wireless, Inc.: |
|
|
|
|
|
|
0% 6/30/07 (d) |
Caa1 |
|
20,940,000 |
14,658,000 |
|
|
0% 11/1/07 (d) |
Caa1 |
|
25,685,000 |
15,411,000 |
|
|
|
186,861,688 |
||||
|
Telephone Services - 12.3% |
|||||
|
Allegiance Telecom, Inc. 0% 2/15/08 (d) |
B3 |
|
5,387,000 |
3,919,043 |
|
|
Bestel SA de CV 0% 5/15/05 (d) |
- |
|
8,075,000 |
5,733,250 |
|
|
FirstWorld Communications, Inc. 0% 4/15/08 (d) |
- |
|
19,760,000 |
8,892,000 |
|
|
Flag Telecom Holdings Ltd. 11.625% 3/30/10 |
B2 |
|
2,965,000 |
2,816,750 |
|
|
Hyperion Telecommunications, Inc.: |
|
|
|
|
|
|
0% 4/15/03 (d) |
B3 |
|
4,435,000 |
4,124,550 |
|
|
12% 11/1/07 |
Caa1 |
|
3,600,000 |
3,384,000 |
|
|
ICG Holdings, Inc.: |
|
|
|
|
|
|
0% 9/15/05 (d) |
B3 |
|
28,000,000 |
26,880,000 |
|
|
0% 5/1/06 (d) |
B3 |
|
9,255,000 |
7,542,825 |
|
|
ICG Services, Inc.: |
|
|
|
|
|
|
0% 2/15/08 (d) |
B3 |
|
37,500,000 |
18,000,000 |
|
|
0% 5/1/08 (d) |
B3 |
|
2,950,000 |
1,357,000 |
|
|
Intermedia Communications, Inc.: |
|
|
|
|
|
|
0% 5/15/06 (d) |
B2 |
|
145,000 |
137,750 |
|
|
0% 7/15/07 (d) |
B2 |
|
7,835,000 |
6,072,125 |
|
|
KMC Telecom Holdings, Inc.: |
|
|
|
|
|
|
0% 2/15/08 (d) |
Caa2 |
|
19,400,000 |
8,342,000 |
|
|
13.5% 5/15/09 |
Caa2 |
|
6,710,000 |
5,569,300 |
|
|
Logix Communications Enterprises, Inc. 12.25% 6/15/08 |
- |
|
6,970,000 |
2,230,400 |
|
|
Metromedia Fiber Network, Inc. 10% 11/15/08 |
B2 |
|
19,255,000 |
18,918,038 |
|
|
NEXTLINK |
|
|
|
|
|
|
0% 12/1/09 (d) |
B2 |
|
11,215,000 |
6,448,625 |
|
|
10.75% 11/15/08 |
B3 |
|
340,000 |
334,900 |
|
|
10.75% 6/1/09 |
B2 |
|
10,690,000 |
10,529,650 |
|
|
Corporate Bonds - continued |
|||||
|
Moody's Ratings (unaudited) (b) |
Principal Amount |
Value |
|||
|
Nonconvertible Bonds - continued |
|||||
|
UTILITIES - continued |
|||||
|
Telephone Services - continued |
|||||
|
Optel Communications Corp. 15% 12/30/04 (h) |
- |
|
$ 14,907,563 |
$ 14,162,185 |
|
|
Pathnet, Inc. 12.25% 4/15/08 |
- |
|
20,255,000 |
11,342,800 |
|
|
Rhythms |
|
|
|
|
|
|
0% 5/15/08 (d) |
B3 |
|
21,980,000 |
8,682,100 |
|
|
12.75% 4/15/09 |
B3 |
|
7,480,000 |
5,086,400 |
|
|
14% 2/15/10 (f) |
B3 |
|
7,210,000 |
5,191,200 |
|
|
RSL Communications Ltd./RSL Communications PLC 12.25% 11/15/06 |
B2 |
|
6,026,000 |
4,790,670 |
|
|
RSL Communications PLC 9.875% 11/15/09 |
B2 |
|
7,195,000 |
4,676,750 |
|
|
Teligent, Inc. 11.5% 12/1/07 |
Caa1 |
|
4,625,000 |
3,584,375 |
|
|
WinStar |
|
|
|
|
|
|
0% 4/15/10 (d)(f) |
B3 |
|
36,689,000 |
17,060,385 |
|
|
12.5% 4/15/08 (f) |
B3 |
|
17,930,000 |
17,481,750 |
|
|
12.75% 4/15/10 (f) |
B3 |
|
31,418,000 |
30,318,370 |
|
|
Worldwide Fiber, Inc. 12% 8/1/09 |
B3 |
|
11,800,000 |
11,033,000 |
|
|
|
274,642,191 |
||||
|
TOTAL UTILITIES |
461,503,879 |
||||
|
TOTAL NONCONVERTIBLE BONDS |
1,609,659,331 |
||||
|
TOTAL CORPORATE BONDS (Cost $1,951,710,007) |
|
1,683,141,612 |
|||
|
Asset-Backed Securities - 0.1% |
|||||
|
|
|||||
|
Airplanes pass through trust 10.875% 3/15/19 |
Ba2 |
|
2,884,084 |
2,134,222 |
|
|
Commercial Mortgage Securities - 1.3% |
|||||
|
Moody's Ratings (unaudited) (b) |
Principal Amount |
Value |
|||
|
Commercial Mortgage Acceptance Corp. pass through certificates Series 1998-C2 Class F, 5.44% 5/15/13 (f)(g) |
BB+ |
|
$ 4,500,000 |
$ 2,825,860 |
|
|
Commercial Mortgage |
Ba1 |
|
4,750,000 |
3,046,680 |
|
|
Danmall Finance, Inc. |
- |
|
4,890,848 |
4,946,634 |
|
|
LB Multifamily Mortgage Trust Series 1991-4 |
Caa1 |
|
2,313,015 |
1,850,412 |
|
|
Meritor Mortgage Security Corp. Series 1987 1 |
- |
|
1,350,000 |
116,505 |
|
|
Mortgage Capital Funding, Inc. Series 1998-MC3 Class F, 7.3177% 11/18/31 (f)(g) |
Ba1 |
|
4,500,000 |
3,608,190 |
|
|
Nationslink Funding Corp. Commercial Mortgage pass through certificates Series 1998-2 Class F, 7.105% 8/20/30 |
BB |
|
4,500,000 |
3,351,094 |
|
|
Nomura Depositor Trust: |
|
|
|
|
|
|
floater Series 1998-ST1A Class B2, 10.9013% 1/15/03 (f)(g) |
- |
|
2,200,000 |
2,037,406 |
|
|
Series 1998-ST1A |
- |
|
4,000,000 |
3,725,000 |
|
|
Structured Asset |
|
|
|
|
|
|
Series 1994-C1 Class F, 6.87% 8/25/26 |
B |
|
2,600,000 |
2,110,266 |
|
|
Series 1995-C1 Class F, 7.375% 9/25/24 (f) |
- |
|
2,000,000 |
1,588,438 |
|
|
TOTAL COMMERCIAL MORTGAGE SECURITIES (Cost $28,843,213) |
29,206,485 |
||||
|
Common Stocks - 3.2% |
|||
|
Shares |
|
||
|
BASIC INDUSTRIES - 0.1% |
|||
|
Chemicals & Plastics - 0.0% |
|||
|
Sterling Chemicals Holdings, Inc. warrants 8/15/08 (a) |
340 |
4,080 |
|
|
Iron & Steel - 0.0% |
|||
|
AK Steel Holding Corp. |
6,500 |
52,000 |
|
|
Common Stocks - continued |
|||
|
Shares |
Value (Note 1) |
||
|
BASIC INDUSTRIES - continued |
|||
|
Packaging & Containers - 0.1% |
|||
|
Packaging Corp. of America |
150,000 |
$ 1,518,750 |
|
|
TOTAL BASIC INDUSTRIES |
1,574,830 |
||
|
CONSTRUCTION & REAL ESTATE - 0.3% |
|||
|
Building Materials - 0.1% |
|||
|
International Utility Structures, Inc. unit |
2,500 |
1,750,000 |
|
|
Real Estate - 0.2% |
|||
|
LNR Property Corp. |
257,600 |
5,023,200 |
|
|
Real Estate Investment Trusts - 0.0% |
|||
|
Swerdlow Real Estate Group, Inc.: |
|
|
|
|
Class A (h) |
79,800 |
1 |
|
|
Class B (h) |
19,817 |
0 |
|
|
|
1 |
||
|
TOTAL CONSTRUCTION & REAL ESTATE |
6,773,201 |
||
|
DURABLES - 0.2% |
|||
|
Textiles & Apparel - 0.2% |
|||
|
Arena Brands Holdings Corp. Class B |
48,889 |
1,222,225 |
|
|
Polymer Group, Inc. |
426,300 |
3,943,275 |
|
|
|
5,165,500 |
||
|
ENERGY - 0.5% |
|||
|
Oil & Gas - 0.5% |
|||
|
Plains Resources, Inc. (a) |
686,000 |
10,976,000 |
|
|
FINANCE - 0.0% |
|||
|
Credit & Other Finance - 0.0% |
|||
|
Arcadia Financial Ltd. warrants 3/15/07 (a) |
498 |
1 |
|
|
Securities Industry - 0.0% |
|||
|
ECM Corp. LP (f) |
3,000 |
264,000 |
|
|
TOTAL FINANCE |
264,001 |
||
|
HEALTH - 0.0% |
|||
|
Medical Equipment & Supplies - 0.0% |
|||
|
Wright Medical Technology, Inc. |
3,212 |
32 |
|
|
INDUSTRIAL MACHINERY & EQUIPMENT - 0.9% |
|||
|
Industrial Machinery & Equipment - 0.1% |
|||
|
Tenneco Automotive, Inc. |
150,000 |
787,500 |
|
|
Terex Corp. (a) |
50,000 |
706,250 |
|
|
|
1,493,750 |
||
|
Pollution Control - 0.8% |
|||
|
Allied Waste Industries, Inc. (a) |
1,765,000 |
17,650,000 |
|
|
TOTAL INDUSTRIAL MACHINERY & EQUIPMENT |
19,143,750 |
||
|
|
|||
|
Shares |
Value (Note 1) |
||
|
MEDIA & LEISURE - 0.4% |
|||
|
Broadcasting - 0.1% |
|||
|
Benedek Communications Corp. |
57,600 |
$ 115,200 |
|
|
CS Wireless Systems, Inc. (a)(f) |
1,024 |
10 |
|
|
EchoStar Communications Corp. |
3,100 |
102,639 |
|
|
Motient Corp. warrants 4/1/08 (a) |
3,435 |
127,095 |
|
|
UIH Australia/Pacific, Inc. |
26,805 |
804,150 |
|
|
|
1,149,094 |
||
|
Entertainment - 0.3% |
|||
|
Premier Parks, Inc. (a) |
325,000 |
7,393,750 |
|
|
Lodging & Gaming - 0.0% |
|||
|
Motels of America, Inc. (a) |
3,000 |
43,500 |
|
|
TOTAL MEDIA & LEISURE |
8,586,344 |
||
|
RETAIL & WHOLESALE - 0.1% |
|||
|
Apparel Stores - 0.1% |
|||
|
Mothers Work, Inc. (a)(e) |
294,100 |
3,308,625 |
|
|
Mothers Work, Inc. (a)(h) |
2,952 |
33,210 |
|
|
|
3,341,835 |
||
|
TECHNOLOGY - 0.0% |
|||
|
Computer Services & Software - 0.0% |
|||
|
DecisionOne Corp. |
16,846 |
168 |
|
|
DecisionOne Corp.: |
|
|
|
|
Class A warrants 4/18/07 (a) |
9,890 |
1 |
|
|
Class B warrants 4/18/07 (a) |
17,041 |
2 |
|
|
Class C warrants 4/18/07 (a) |
10,108 |
1 |
|
|
|
172 |
||
|
Computers & Office Equipment - 0.0% |
|||
|
Ampex Corp. Class A (a) |
9,600 |
16,200 |
|
|
Electronics - 0.0% |
|||
|
Insilco Corp. warrants 8/15/07 (a) |
7,380 |
7 |
|
|
TOTAL TECHNOLOGY |
16,379 |
||
|
UTILITIES - 0.7% |
|||
|
Cellular - 0.3% |
|||
|
Cellnet Data Systems, Inc. |
18,000 |
180 |
|
|
Loral Orion Network Systems, Inc.: |
|
|
|
|
warrants 1/15/07 (CV ratio .47) (a) |
45,930 |
114,825 |
|
|
warrants 1/15/07 (CV ratio .6) (a) |
5,585 |
23,736 |
|
|
McCaw International Ltd. |
42,305 |
105,763 |
|
|
WebLink Wireless, Inc. Class A (a) |
528,034 |
6,996,451 |
|
|
|
7,240,955 |
||
|
Telephone Services - 0.4% |
|||
|
Bestel SA de CV warrants 5/13/05 (a)(f) |
8,075 |
904,400 |
|
|
Common Stocks - continued |
|||
|
Shares |
Value (Note 1) |
||
|
UTILITIES - continued |
|||
|
Telephone Services - continued |
|||
|
KMC Telecom Holdings, Inc. |
12,650 |
$ 31,625 |
|
|
Optel Communications Corp. |
2,559,515 |
6,718,727 |
|
|
Pathnet, Inc. warrants 4/15/08 (a)(f) |
20,255 |
202,550 |
|
|
|
7,857,302 |
||
|
TOTAL UTILITIES |
15,098,257 |
||
|
TOTAL COMMON STOCKS (Cost $82,503,250) |
70,940,129 |
||
|
Preferred Stocks - 13.5% |
|||
|
|
|
|
|
|
Convertible Preferred Stocks - 0.1% |
|||
|
TECHNOLOGY - 0.1% |
|||
|
Computer Services & Software - 0.1% |
|||
|
PSINet, Inc. $3.50 (f) |
100,000 |
3,400,000 |
|
|
|
|
|
|
|
Nonconvertible Preferred Stocks - 13.4% |
|||
|
CONSTRUCTION & REAL ESTATE - 0.4% |
|||
|
Building Materials - 0.0% |
|||
|
International Utility Structures, Inc. |
713 |
499,100 |
|
|
Real Estate Investment Trusts - 0.4% |
|||
|
Swerdlow Real Estate Group, Inc.: |
|
|
|
|
junior (h) |
19,817 |
0 |
|
|
mezzanine (h) |
79,800 |
28,890 |
|
|
senior (h) |
79,800 |
8,815,611 |
|
|
|
8,844,501 |
||
|
TOTAL CONSTRUCTION & REAL ESTATE |
9,343,601 |
||
|
FINANCE - 0.4% |
|||
|
Insurance - 0.4% |
|||
|
American Annuity Group Capital Trust II 8.875% |
8,910 |
7,932,230 |
|
|
HEALTH - 0.5% |
|||
|
Medical Facilities Management - 0.5% |
|||
|
Fresenius Medical Care Capital Trust II 7.875% |
10,524 |
9,600,845 |
|
|
|
|||
|
Shares |
Value (Note 1) |
||
|
MEDIA & LEISURE - 2.4% |
|||
|
Broadcasting - 2.4% |
|||
|
Citadel Broadcasting Co. Series B, 13.25% pay-in-kind |
54,339 |
$ 5,596,917 |
|
|
CSC Holdings, Inc.: |
|
|
|
|
11.125% pay-in-kind |
197,957 |
20,686,507 |
|
|
Series H, 11.75% pay-in-kind |
200,061 |
21,106,436 |
|
|
Granite Broadcasting Corp. |
7,825 |
6,573,000 |
|
|
|
53,962,860 |
||
|
TECHNOLOGY - 0.0% |
|||
|
Computers & Office Equipment - 0.0% |
|||
|
Ampex Corp. 8% non-cumulative |
422 |
658,320 |
|
|
UTILITIES - 9.7% |
|||
|
Cellular - 3.9% |
|||
|
Nextel Communications, Inc.: |
|
|
|
|
11.125% pay-in-kind |
47,183 |
45,531,595 |
|
|
Series D, 13% pay-in-kind |
38,807 |
40,553,315 |
|
|
|
86,084,910 |
||
|
Telephone Services - 5.8% |
|||
|
Adelphia Business Solution, Inc. |
2,988 |
2,674,260 |
|
|
e.spire Communications, Inc. |
17,801 |
3,204,180 |
|
|
ICG Holdings, Inc. 14.25% pay-in-kind |
26,893 |
21,514,400 |
|
|
Intermedia Communications, Inc. |
22,827 |
22,142,190 |
|
|
NEXTLINK Communications, Inc. |
24,242 |
23,514,740 |
|
|
NEXTLINK Communications, Inc. |
1,125,487 |
57,399,830 |
|
|
|
130,449,600 |
||
|
TOTAL UTILITIES |
216,534,510 |
||
|
TOTAL NONCONVERTIBLE PREFERRED STOCKS |
298,032,366 |
||
|
TOTAL PREFERRED STOCKS (Cost $325,176,740) |
301,432,366 |
||
|
Purchased Bank Debt - 0.6% |
|||||
|
Moody's Ratings (unaudited) (b) |
Principal Amount |
|
|||
|
Dynatech LLC term loan 10.03% 9/1/07 (g) |
- |
|
$ 2,000,000 |
1,990,000 |
|
|
Synthetic Industries, Inc. term loan 14% 12/13/00 (g) |
- |
|
3,600,000 |
3,564,000 |
|
|
Purchased Bank Debt - continued |
|||||
|
Moody's Ratings (unaudited) (b) |
Principal Amount |
Value |
|||
|
Total Renal Care Holdings, Inc. term loan 11.5% 3/31/06 (g) |
Ba2 |
|
$ 2,620,105 |
$ 2,436,697 |
|
|
Voicestream Pcs Holding LLC term loan 9.76% 2/25/09 (g) |
B+ |
|
5,000,000 |
4,987,500 |
|
|
TOTAL PURCHASED BANK DEBT (Cost $12,855,286) |
12,978,197 |
||||
|
Cash Equivalents - 4.7% |
|||
|
Maturity Amount |
|
||
|
Investments in repurchase agreements (U.S. Treasury Obligations), in a joint |
$ 104,520,295 |
104,463,000 |
|
|
TOTAL INVESTMENT PORTFOLIO - 98.8% (Cost $2,508,743,347) |
2,204,296,011 |
||
|
NET OTHER ASSETS - 1.2% |
26,704,251 |
||
|
NET ASSETS - 100% |
$ 2,231,000,262 |
||
|
Legend |
|
(a) Non-income producing |
|
(b) S&P credit ratings are used in the absence of a rating by Moody's Investors Service, Inc. |
|
(c) Non-income producing - issuer filed for protection under the Federal Bankruptcy Code or is in default of interest payment. |
|
(d) Debt obligation initially issued in zero coupon form which converts to coupon form at a specified rate and date. The rate shown is the rate at period end. |
|
(e) Transactions during the period with companies which are or were affiliates are as follows: |
|
Affiliate |
Purchase |
Sales |
Dividend |
Value |
|
Mothers |
$ - |
$ 112,038 |
$ - |
$ 3,308,625 |
|
(f) Security exempt from registration under Rule 144A of the Securities |
|
(g) The coupon rate shown on floating or adjustable rate securities represents the rate at period end. |
|
(h) Restricted securities - Investment in securities not registered under the Securities Act of 1933. |
|
Additional information on each holding is as follows: |
|
Security |
Acquisition Date |
Acquisition Cost |
|
Micron Technology, Inc. |
3/3/99 - 10/7/99 |
$ 7,794,500 |
|
Mothers Work, Inc. |
6/18/98 |
$ 26,172 |
|
Optel Communications Corp. |
12/31/97 |
$ 759,408 |
|
Optel Communications Corp. |
12/31/97 - 12/30/99 |
$ 14,148,203 |
|
Swerdlow Real Estate Group, Inc. |
1/15/99 |
$ 11,132 |
|
Swerdlow Real Estate Group, Inc. |
1/15/99 |
$ 2,760 |
|
Swerdlow Real Estate Group, Inc. |
1/15/99 |
$ 2,760 |
|
Swerdlow Real Estate Group, Inc. |
1/15/99 |
$ 78,520 |
|
Swerdlow Real Estate Group, Inc. |
1/15/99 |
$ 7,618,828 |
|
Other Information |
|
Purchases and sales of securities, other than short-term securities, |
|
The fund placed a portion of its portfolio transactions with brokerage firms which are affiliates of Fidelity Management & Research Company. The commissions paid to these affiliated firms were $7,030 for the period. |
|
The fund invested in securities that are not registered under the Securities Act of 1933. These securities are subject to legal or contractual restrictions on resale. At the end of the period, restricted securities (excluding Rule 144A issues) amounted to $38,108,624 and 1.7% of net assets. |
|
The fund participated in the interfund lending program as a borrower. The average daily loan balance during the period for which loans were outstanding amounted to $10,243,000. The weighted average interest rate was 6.73%. |
|
Distribution of investments by country of issue, as a percentage of total |
|
United States of America |
89.2% |
|
Canada |
3.4 |
|
United Kingdom |
2.4 |
|
Luxembourg |
1.6 |
|
Mexico |
1.5 |
|
Netherlands |
1.4 |
|
Others (individually less than 1%) |
0.5 |
|
|
100.0% |
|
The composition of long-term debt holdings as a percentage of total |
|
Moody's Ratings |
S&P Ratings |
|||
|
Aaa, Aa, A |
0.0% |
|
AAA, AA, A |
0.0% |
|
Baa |
0.2% |
|
BBB |
0.2% |
|
Ba |
3.7% |
|
BB |
3.2% |
|
B |
50.2% |
|
B |
56.1% |
|
Caa |
12.9% |
|
CCC |
7.2% |
|
Ca, C |
0.4% |
|
CC, C |
0.0% |
|
|
|
|
D |
0.4% |
|
The percentage not rated by Moody's or S&P amounted to 7.6%. FMR has determined that unrated debt securities that are lower quality account for 7.6% of the total value of investment in securities. |
|
Income Tax Information |
|
At June 30, 2000, the aggregate cost of investment securities for income tax purposes was $2,510,663,320. Net unrealized depreciation aggregated $306,367,309, of which $36,552,593 related to appreciated investment securities and $342,919,902 related to depreciated investment securities. |
|
At December 31, 1999, the fund had a capital loss carryforward of approximately $78,395,000, all of which will expire on December 31, 2007. |
See accompanying notes which are an integral part of the financial statements.
High Income Portfolio
Statement of Assets and Liabilities
|
|
June 30, 2000 (Unaudited) |
|
|
Assets |
|
|
|
Investment in securities, at value (including repurchase agreements of $104,463,000) |
|
$ 2,204,296,011 |
|
Cash |
|
1,173,022 |
|
Receivable for investments sold |
|
10,237,395 |
|
Receivable for fund shares sold |
|
1,824,525 |
|
Dividends receivable |
|
395,382 |
|
Interest receivable |
|
39,095,601 |
|
Other receivables |
|
551,687 |
|
Total assets |
|
2,257,573,623 |
|
Liabilities |
|
|
|
Payable for investments purchased |
$ 24,668,573 |
|
|
Payable for fund shares redeemed |
630,403 |
|
|
Accrued management fee |
1,052,289 |
|
|
Distribution fees payable |
21,721 |
|
|
Other payables and |
200,375 |
|
|
Total liabilities |
|
26,573,361 |
|
Net Assets |
|
$ 2,231,000,262 |
|
Net Assets consist of: |
|
|
|
Paid in capital |
|
$ 2,569,113,584 |
|
Undistributed net investment income |
|
195,475,174 |
|
Accumulated undistributed |
|
(229,141,160) |
|
Net unrealized appreciation (depreciation) on investments |
|
(304,447,336) |
|
Net Assets |
|
$ 2,231,000,262 |
|
Initial Class : |
|
$10.04 |
|
Service Class : |
|
$10.01 |
|
Service Class 2: |
|
$10.00 |
Statement of Operations
|
|
Six months ended June 30, 2000 (Unaudited) |
|
|
Investment Income Dividends |
|
$ 19,576,105 |
|
Interest |
|
115,899,684 |
|
Total income |
|
135,475,789 |
|
Expenses |
|
|
|
Management fee |
$ 6,594,093 |
|
|
Transfer agent fees |
738,215 |
|
|
Distribution fees |
126,321 |
|
|
Accounting fees and expenses |
306,723 |
|
|
Non-interested trustees' compensation |
6,473 |
|
|
Custodian fees and expenses |
33,438 |
|
|
Registration fees |
4,288 |
|
|
Audit |
22,467 |
|
|
Legal |
10,848 |
|
|
Interest |
5,745 |
|
|
Miscellaneous |
20,986 |
|
|
Total expenses before reductions |
7,869,597 |
|
|
Expense reductions |
(38,341) |
7,831,256 |
|
Net investment income |
|
127,644,533 |
|
Realized and Unrealized Gain (Loss) Net realized gain (loss) on investment securities (including realized loss of $45,477 on sales of investments in affiliated issuers) |
|
(148,333,381) |
|
Change in net unrealized appreciation (depreciation) |
|
(97,254,537) |
|
Net gain (loss) |
|
(245,587,918) |
|
Net increase (decrease) in net assets resulting from operations |
|
$ (117,943,385) |
|
Other Information Expense reductions |
|
|
|
Directed brokerage arrangements |
|
$ 35,786 |
|
Custodian credits |
|
2,555 |
|
|
|
$ 38,341 |
See accompanying notes which are an integral part of the financial statements.
Semiannual Report
Fidelity Variable Insurance Products: High Income Portfolio
Financial Statements - continued
Statement of Changes in Net Assets
|
Increase (Decrease) in Net Assets |
Six months ended |
Year ended |
|
Operations |
$ 127,644,533 |
$ 247,259,596 |
|
Net realized gain (loss) |
(148,333,381) |
(96,179,624) |
|
Change in net unrealized appreciation (depreciation) |
(97,254,537) |
55,361,896 |
|
Net increase (decrease) in net assets resulting from operations |
(117,943,385) |
206,441,868 |
|
Distributions to shareholders |
(160,774,244) |
(232,085,602) |
|
From net realized gain |
- |
(6,657,693) |
|
In excess of net realized gain |
- |
(877,958) |
|
Total distributions |
(160,774,244) |
(239,621,253) |
|
Share transactions - net increase (decrease) |
(1,863,609) |
66,219,533 |
|
Total increase (decrease) in net assets |
(280,581,238) |
33,040,148 |
|
Net Assets |
|
|
|
Beginning of period |
2,511,581,500 |
2,478,541,352 |
|
End of period (including undistributed net investment income |
$ 2,231,000,262 |
$ 2,511,581,500 |
|
Other Information: |
|
|
Six months ended June 30, 2000 |
Year ended |
||
|
|
Shares |
Dollars |
Shares |
Dollars |
|
Share transactions |
34,881,654 |
$ 357,036,731 |
101,971,137 |
$ 1,140,554,728 |
|
Reinvested |
13,813,362 |
144,073,366 |
20,936,841 |
226,536,621 |
|
Redeemed |
(52,613,342) |
(547,562,808) |
(127,141,526) |
(1,424,987,101) |
|
Net increase (decrease) |
(3,918,326) |
$ (46,452,711) |
(4,233,548) |
$ (57,895,752) |
|
Service Class |
7,232,634 |
$ 74,033,462 |
15,936,772 |
$ 177,176,136 |
|
Reinvested |
1,603,673 |
16,694,232 |
1,211,540 |
13,084,632 |
|
Redeemed |
(4,572,624) |
(47,192,023) |
(5,904,384) |
(66,145,483) |
|
Net increase (decrease) |
4,263,683 |
$ 43,535,671 |
11,243,928 |
$ 124,115,285 |
|
Service Class 2 A |
104,183 |
$ 1,046,949 |
- |
$ - |
|
Reinvested |
639 |
6,643 |
- |
- |
|
Redeemed |
(16) |
(161) |
- |
- |
|
Net increase (decrease) |
104,806 |
$ 1,053,431 |
- |
$ - |
|
Distributions |
|
|
|
|
|
From net investment income |
|
$ 144,073,368 |
|
$ 219,412,458 |
|
Service Class |
|
16,694,233 |
|
12,673,144 |
|
Service Class 2 A |
|
6,643 |
|
- |
|
Total |
|
$ 160,774,244 |
|
$ 232,085,602 |
|
From net realized gain |
|
$ - |
|
$ 6,294,147 |
|
Service Class |
|
- |
|
363,546 |
|
Service Class 2 A |
|
- |
|
- |
|
Total |
|
$ - |
|
$ 6,657,693 |
|
In excess of net realized gain |
|
$ - |
|
$ 830,017 |
|
Service Class |
|
- |
|
47,941 |
|
Service Class 2 A |
|
- |
|
- |
|
Total |
|
$ - |
|
$ 877,958 |
|
|
|
$ 160,774,244 |
|
$ 239,621,253 |
A Service Class 2 commenced sale of shares January 12, 2000.
See accompanying notes which are an integral part of the financial statements.
High Income Portfolio
Financial Highlights - Initial Class
|
|
Six months ended |
Years ended December 31, |
||||
|
Selected Per-Share Data |
(Unaudited) |
1999 |
1998 |
1997 |
1996 |
1995 |
|
Net asset value, beginning of period |
$ 11.320 |
$ 11.530 |
$ 13.580 |
$ 12.520 |
$ 12.050 |
$ 10.750 |
|
Income from Investment Operations |
|
|
|
|
|
|
|
Net investment income |
.580 D |
1.095 D |
1.111 D |
1.124 D |
.927 |
.856 |
|
Net realized and unrealized gain (loss) |
(1.110) |
(.195) |
(1.591) |
.936 |
.643 |
1.224 |
|
Total from investment operations |
(.530) |
.900 |
(.480) |
2.060 |
1.570 |
2.080 |
|
Less Distributions |
|
|
|
|
|
|
|
From net investment income |
(.750) |
(1.075) |
(.970) |
(.890) |
(.920) |
(.780) |
|
From net realized gain |
- |
(.030) |
(.600) |
(.110) |
(.180) |
- |
|
In excess of net realized gain |
- |
(.005) |
- |
- |
- |
- |
|
Total distributions |
(.750) |
(1.110) |
(1.570) |
(1.000) |
(1.100) |
(.780) |
|
Net asset value, end of period |
$ 10.040 |
$ 11.320 |
$ 11.530 |
$ 13.580 |
$ 12.520 |
$ 12.050 |
|
Total Return B, C |
(4.93)% |
8.25% |
(4.33)% |
17.67% |
14.03% |
20.72% |
|
Ratios and Supplemental Data |
|
|
|
|
|
|
|
Net assets, end of period (000 omitted) |
$ 1,962,075 |
$ 2,257,610 |
$ 2,348,954 |
$ 2,329,516 |
$ 1,588,822 |
$ 1,040,000 |
|
Ratio of expenses to average net assets |
.68% A |
.69% |
.70% |
.71% |
.71% |
.71% |
|
Ratio of net investment income to average net assets |
11.22% A |
9.80% |
9.14% |
8.88% |
9.09% |
9.32% |
|
Portfolio turnover rate |
71% A |
82% |
92% |
118% |
123% |
132% |
Financial Highlights - Service Class
|
|
Six months ended |
Years ended December 31, |
||
|
Selected Per-Share Data |
(Unaudited) |
1999 |
1998 |
1997 E |
|
Net asset value, beginning of period |
$ 11.290 |
$ 11.520 |
$ 13.570 |
$ 13.380 |
|
Income from Investment Operations |
|
|
|
|
|
Net investment income D |
.570 |
1.074 |
1.082 |
.203 |
|
Net realized and unrealized gain (loss) |
(1.110) |
(.194) |
(1.562) |
(.013) |
|
Total from investment operations |
(.540) |
.880 |
(.480) |
.190 |
|
Less Distributions |
|
|
|
|
|
From net investment income |
(.740) |
(1.075) |
(.970) |
- |
|
From net realized gain |
- |
(.030) |
(.600) |
- |
|
In excess of net realized gain |
- |
(.005) |
- |
- |
|
Total distributions |
(.740) |
(1.110) |
(1.570) |
- |
|
Net asset value, end of period |
$ 10.010 |
$ 11.290 |
$ 11.520 |
$ 13.570 |
|
Total Return B, C |
(5.03)% |
8.08% |
(4.34)% |
1.42% |
|
Ratios and Supplemental Data |
|
|
|
|
|
Net assets, end of period (000 omitted) |
$ 267,878 |
$ 253,972 |
$ 129,587 |
$ 2,919 |
|
Ratio of expenses to average net assets |
.78% A |
.79% |
.82% |
.81% A |
|
Ratio of expenses to average net assets after expense reductions |
.78% A |
.79% |
.82% |
.80% A, F |
|
Ratio of net investment income to average net assets |
11.12% A |
9.69% |
9.51% |
10.75% A |
|
Portfolio turnover rate |
71% A |
82% |
92% |
118% |
|
A Annualized B Total returns for periods of less than one year are not annualized and do not reflect charges attributable to your insurance company's separate account. Inclusion of these charges would reduce the total returns shown. C The total returns would have been lower had certain expenses not been reduced during the periods shown. D Net investment income per share has been calculated based on average shares outstanding during the period. E For the period November 3, 1997 (commencement of sale of Service Class shares) to December 31, 1997. F FMR or the fund has entered into varying arrangements with third parties who either paid or reduced a portion of the class' expenses. |
||||
See accompanying notes which are an integral part of the financial statements.
Semiannual Report
Financial Highlights - Service Class 2
|
|
Six months ended |
|
Selected Per-Share Data |
(Unaudited) |
|
Net asset value, beginning of period |
$ 11.140 |
|
Income from Investment Operations |
|
|
Net investment income D |
.476 |
|
Net realized and unrealized gain (loss) |
(.876) |
|
Total from investment operations |
(.400) |
|
Less Distributions |
|
|
From net investment income |
(.740) |
|
Net asset value, end of period |
$ 10.000 |
|
Total Return B, C |
(3.85)% |
|
Ratios and Supplemental Data |
|
|
Net assets, end of period (000 omitted) |
$ 1,048 |
|
Ratio of expenses to average net assets |
.97% A |
|
Ratio of expenses to average net assets after expense reductions |
.96% A, F |
|
Ratio of net investment income to average net assets |
10.93% A |
|
Portfolio turnover rate |
71% A |
|
A Annualized B Total returns for periods of less than one year are not annualized and do not reflect charges attributable to your insurance company's separate account. Inclusion of these charges would reduce the total returns shown. C The total return would have been lower had certain expenses not been reduced during the period shown. D Net investment income per share has been calculated based on average shares outstanding during the period. E For the period January 12, 2000 (commencement of sale of Service Class 2 shares) to June 30, 2000. F FMR or the fund has entered into varying arrangements with third parties who either paid or reduced a portion of the class' expenses. |
|
See accompanying notes which are an integral part of the financial statements.
High Income Portfolio
Performance
There are several ways to evaluate a fund's historical performance. You can look at the total percentage change in value, the average annual percentage change or the growth of a hypothetical $10,000 investment. Total return reflects the change in the value of an investment, assuming reinvestment of the fund's dividend income and capital gains (the profits earned upon the sale of securities that have grown in value). The initial offering of Service Class 2 shares took place on January 12, 2000. Performance for Service Class 2 shares reflects an asset based distribution fee (12b-1 fee), and returns prior to January 12, 2000 are those of Initial Class and do not include the effects of Service Class 2's 12b-1 fee. Had Service Class 2's 12b-1 fee been reflected, returns prior to January 12, 2000 would have been lower. If Fidelity had not reimbursed certain fund expenses, the past 10 year total returns would have been lower.
Average Annual Total Returns
|
Periods ended June 30, 2000 |
Past 1 |
Past 5 |
Past 10 years |
|
Fidelity VIP: Investment Grade Bond - |
4.39% |
5.93% |
7.25% |
|
LB Aggregate Bond |
4.57% |
6.25% |
7.82% |
Average annual returns take the fund's cumulative return and show you what would have happened if the fund had performed at a constant rate each year.
You can compare these figures to the Lehman Brothers Aggregate Bond Index - a market value-weighted index of investment-grade fixed-rate debt issues, including government, corporate, asset-backed, and mortgage-backed securities, with maturities of one year or more. This benchmark includes reinvested dividends and capital gains, if any.
Figures for more than one year assume a steady compounded rate of return and are not the fund's year-by-year results, which fluctuated over the periods shown.
Performance numbers are net of all fund operating expenses, but do not include any insurance charges imposed by your insurance company's separate account. If performance information included the effect of these additional charges, the total returns would have been lower.
Past performance is no guarantee of future results. Principal and investment return will vary and you may have a gain or loss when you withdraw your money.
Understanding Performance
How a fund did yesterday is no guarantee of
how it will do tomorrow. Bond prices, for example,
generally move in the opposite direction of interest
rates. In turn, the share price, return and yield of a
fund that invests in bonds will vary. That means if
you sell your shares during a market downturn,
you might lose money. But if you can ride out the
market's ups and downs, you may have a gain.
$10,000 Over 10 Years
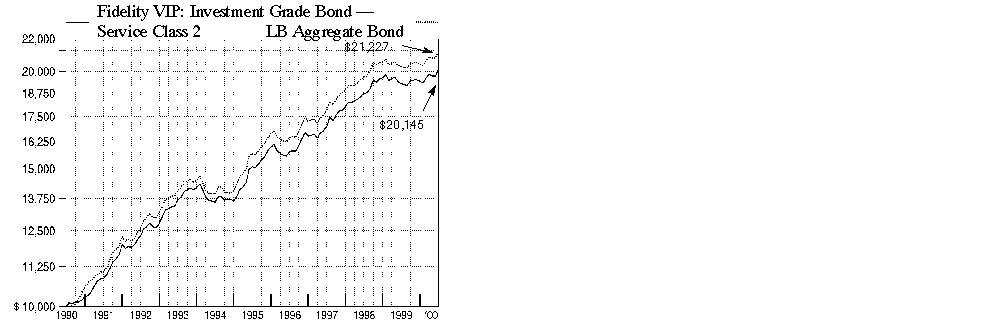
$10,000 Over 10 Years: Let's say hypothetically that $10,000 was invested in Fidelity Variable Insurance Products: Investment Grade Bond Portfolio - Service Class 2 on June 30, 1990. By June 30, 2000, the value of the investment would have grown to $20,145 - a 101.45% increase on the initial investment. For comparison, look at how the Lehman Brothers Aggregate Bond Index did over the same period. With dividends and capital gains, if any, reinvested, the same $10,000 investment would have grown to $21,227 - a 112.27% increase.
Investment Summary
|
Quality Diversification as of June 30, 2000 |
|
|
(Moody's Ratings) |
% of fund's |
|
Aaa |
60.2 |
|
Aa |
1.9 |
|
A |
11.6 |
|
Baa |
20.3 |
|
Ba and Below |
0.9 |
|
Table excludes short-term investments. Where Moody's ratings are not available, we have used S&P ratings. Securities rated as Ba or below were rated investment grade by other nationally recognized rating agencies or assigned an investment grade rating at the time of acquisition by Fidelity. |
|
Average Years to Maturity as of June 30, 2000 |
|
|
Years |
9.0 |
|
Average years to maturity is based on the average time remaining until principal payments are expected from each of the fund's bonds, weighted by dollar amount. |
|
Top Five Market Sectors as of June 30, 2000 |
|
|
|
% of fund's |
|
Finance |
10.6 |
|
Utilities |
4.8 |
|
Construction & Real Estate |
3.5 |
|
Media & Leisure |
2.7 |
|
Energy |
2.0 |
Semiannual Report
(Portfolio Manager photograph)
An interview with
Kevin Grant, Portfolio Manager of Investment Grade Bond Portfolio
Q. How did the fund perform compared to its benchmark, Kevin?
A. For the six- and 12-month periods that ended June 30, 2000, the fund performed in line with the Lehman Brothers Aggregate Bond Index, which returned 3.99% over the past six months and 4.57% over the past 12 months.
Q. What was the six-month period like for bonds overall?
A. Concerns about the Federal Reserve Board raising short-term interest rates further to cool the economy kept bond performance in check early on. Then came the announcement by the U.S. Treasury in late January of its intention to reduce new borrowing and use government surplus proceeds to buy back outstanding debt. This action sent the prices of long-dated Treasuries soaring. The Fed delivered the first of three rate hikes made during the period in early February, causing an inversion in the yield curve, which occurs when short-term bonds offer higher yields than their longer-dated counterparts. Historically, an inverted yield curve has been a precursor of recession and the yield curve has not been this inverted since 1981. These unique technical factors allowed Treasuries to outperform all comparable-duration spread sectors - namely corporate bonds, mortgage securities and government agency issues - during the period. An increasing prevalence of share buybacks and leveraged buyouts also weighed heavily on corporates during the period. Agencies retreated in response to rumblings in Washington threatening to strip Fannie Mae and Freddie Mac of their implicit government backing.
Q. How did you position the fund in response to this changing environment?
A. We were rewarded for recognizing the impact of the Treasury buybacks on the market and boosting the fund's weighting in higher-coupon Treasuries in response. In terms of the spread sectors, as it became clear to me that the Fed was going to continue to raise interest rates, I decided to scale back a bit on the fund's exposure to corporate bonds, which had enjoyed a strong fourth quarter of 1999. I began by reducing a long-standing overweighting in banks - a posture that worked out beautifully for the fund in the past - because I felt that it would be extremely difficult for bank securities to outperform in a rising rate environment. This strategy paid off as the market proceeded to punish the group during the first half of the period. Overall, I became much more defensive, reducing our risk exposure through increased diversification. Despite the fact that most corporates had a very difficult period, tactical allocations into different subsectors, such as media and telecommunications, aided relative performance. The fund benefited from owning a number of issuers from these groups that were acquired during the period, which sweetened the valuations of their debt securities. Owning Yankee bonds - issues guaranteed by foreign governments - at the expense of banks also helped, as did some good picks in energy, a sector that benefited from a rally in oil prices. On the flip side, having some notably poor performers in electric and gas utilities and consumer nondurables constrained fund returns. In hindsight, I wish I had sold a larger percentage of corporates in exchange for more Treasuries.
Q. How did the fund's mortgage holdings fare?
A. The fund got a lift from my focus on seasoned discount mortgages - ranging from three-to-five years old - which benefited from strong housing turnover fueled by a robust economy. A red-hot housing market meant higher-than-normal prepayment activity, which resulted in a nice, steady windfall for us each month as we got prepaid at par, or face value.
Q. What's your outlook?
A. The Treasury buyback program is a new and very powerful factor in the market that's expected to remain the overriding concern for bond investors going forward. Admittedly, further Fed tightening and a growing budget surplus could continue to impact the Treasury yield curve and increase the volatility of the broader market. However, right now, we feel that the spread sectors are oversold and thus offer compelling value opportunities. Unlike the market, we see little evidence of a recession on the horizon. Since it seems like it will be tougher to make money on Treasuries going forward, we plan to maintain an overweighting in corporate bonds - focusing on the more defensive sectors and adding to the fund's position while valuations remain attractive.
The views expressed in this report reflect those of the portfolio manager only through the end of the period of the report as stated on the cover. The manager's views are subject to change at any time based on market or other conditions. For more information, see page 2.
Fund Facts
Goal: seeks to provide a high rate of income consistent with reasonable risk by investing in a broad range of investment-grade fixed-income securities; in addition, the fund seeks to protect capital
Start date: December 5, 1988
Size: as of June 30, 2000, more than
$620 million
Manager: Kevin Grant, since 1997; joined Fidelity in 1993
3Semiannual Report
Fidelity Variable Insurance Products: Investment Grade Bond Portfolio
(Unaudited)
Showing Percentage of Net Assets
|
Nonconvertible Bonds - 29.7% |
|||||
|
Moody's Ratings |
Principal Amount |
Value |
|||
|
AEROSPACE & DEFENSE - 0.1% |
|||||
|
Defense Electronics - 0.1% |
|||||
|
Raytheon Co. 7.9% 3/1/03 (c) |
Baa2 |
|
$ 705,000 |
$ 706,946 |
|
|
BASIC INDUSTRIES - 0.4% |
|||||
|
Chemicals & Plastics - 0.3% |
|||||
|
Monsanto Co. 5.75% 12/1/05 |
A2 |
|
2,000,000 |
1,866,200 |
|
|
Paper & Forest Products - 0.1% |
|||||
|
Fort James Corp. 6.625% 9/15/04 |
Baa2 |
|
350,000 |
336,574 |
|
|
TOTAL BASIC INDUSTRIES |
2,202,774 |
||||
|
CONSTRUCTION & REAL ESTATE - 3.5% |
|||||
|
Real Estate - 0.5% |
|||||
|
Cabot Industrial Property LP 7.125% 5/1/04 |
Baa2 |
|
1,325,000 |
1,265,110 |
|
|
Duke Realty LP 7.3% 6/30/03 |
Baa1 |
|
1,500,000 |
1,474,050 |
|
|
|
2,739,160 |
||||
|
Real Estate Investment Trusts - 3.0% |
|||||
|
CenterPoint Properties Trust 6.75% 4/1/05 |
Baa2 |
|
510,000 |
475,116 |
|
|
Equity Office Properties Trust: |
|
|
|
|
|
|
6.5% 1/15/04 |
Baa1 |
|
2,885,000 |
2,753,473 |
|
|
6.625% 2/15/05 |
Baa1 |
|
4,500,000 |
4,251,330 |
|
|
6.75% 2/15/08 |
Baa1 |
|
4,020,000 |
3,682,682 |
|
|
ProLogis Trust 6.7% 4/15/04 |
Baa1 |
|
565,000 |
538,163 |
|
|
Spieker Properties LP: |
|
|
|
|
|
|
6.75% 1/15/08 |
Baa2 |
|
7,000,000 |
6,417,880 |
|
|
6.8% 5/1/04 |
Baa2 |
|
705,000 |
675,743 |
|
|
|
18,794,387 |
||||
|
TOTAL CONSTRUCTION & REAL ESTATE |
21,533,547 |
||||
|
DURABLES - 0.1% |
|||||
|
Consumer Electronics - 0.1% |
|||||
|
Whirlpool Corp. 8.6% 5/1/10 |
Baa1 |
|
610,000 |
629,459 |
|
|
ENERGY - 2.0% |
|||||
|
Oil & Gas - 2.0% |
|||||
|
Anadarko Petroleum Corp.: |
|
|
|
|
|
|
7% 11/15/27 |
Baa1 |
|
1,400,000 |
1,248,100 |
|
|
7.2% 3/15/29 |
Baa1 |
|
2,490,000 |
2,271,453 |
|
|
Apache Corp.: |
|
|
|
|
|
|
7.625% 7/1/19 |
Baa1 |
|
210,000 |
202,768 |
|
|
7.7% 3/15/26 |
Baa1 |
|
550,000 |
529,997 |
|
|
Apache Finance Property Ltd. 6.5% 12/15/07 |
Baa1 |
|
940,000 |
853,050 |
|
|
|
|||||
|
Moody's Ratings |
Principal Amount |
Value |
|||
|
Conoco, Inc. 5.9% 4/15/04 |
A3 |
|
$ 850,000 |
$ 811,240 |
|
|
Petro-Canada 7% 11/15/28 |
A3 |
|
1,380,000 |
1,205,016 |
|
|
Phillips Petroleum Co. 8.75% 5/25/10 |
Baa2 |
|
915,000 |
963,879 |
|
|
Ras Laffan Liquid Natural Gas Co. Ltd. yankee 8.294% 3/15/14 (c) |
Baa3 |
|
1,200,000 |
1,131,960 |
|
|
Tosco Corp. 8.125% 2/15/30 |
Baa2 |
|
3,000,000 |
3,007,050 |
|
|
YPF Sociedad Anonima: |
|
|
|
|
|
|
7.75% 8/27/07 |
B1 |
|
55,000 |
51,308 |
|
|
8% 2/15/04 |
B1 |
|
380,000 |
372,776 |
|
|
|
12,648,597 |
||||
|
FINANCE - 10.6% |
|||||
|
Banks - 4.1% |
|||||
|
ABN-Amro Bank NV, Chicago 6.625% 10/31/01 |
A1 |
|
1,000,000 |
988,110 |
|
|
Banc One Corp. 7.25% 8/1/02 |
A1 |
|
1,000,000 |
995,810 |
|
|
Bank of Montreal 6.1% 9/15/05 |
A1 |
|
3,000,000 |
2,789,940 |
|
|
Bank of Tokyo-Mitsubishi Ltd. 8.4% 4/15/10 |
A3 |
|
1,000,000 |
1,009,800 |
|
|
Barclays Bank PLC yankee 5.95% 7/15/01 |
A1 |
|
2,150,000 |
2,134,647 |
|
|
Capital One Bank 6.375% 2/15/03 |
Baa2 |
|
1,130,000 |
1,083,501 |
|
|
Capital One Financial Corp. 7.125% 8/1/08 |
Baa3 |
|
1,290,000 |
1,200,539 |
|
|
Commonwealth Bank of Australia 8.5% 6/1/10 |
A1 |
|
600,000 |
622,644 |
|
|
HSBC Finance Nederland BV 7.4% 4/15/03 (c) |
A2 |
|
250,000 |
248,993 |
|
|
Kansallis-Osake-Pankki (NY Branch) yankee 10% 5/1/02 |
A1 |
|
260,000 |
270,694 |
|
|
Korea Development Bank: |
|
|
|
|
|
|
6.625% 11/21/03 |
Baa2 |
|
1,635,000 |
1,572,837 |
|
|
7.375% 9/17/04 |
Baa2 |
|
1,320,000 |
1,279,212 |
|
|
yankee 6.5% 11/15/02 |
Baa2 |
|
240,000 |
232,296 |
|
|
MBNA Corp.: |
|
|
|
|
|
|
6.34% 6/2/03 |
Baa2 |
|
350,000 |
335,265 |
|
|
6.875% 11/15/02 |
Baa2 |
|
1,750,000 |
1,725,115 |
|
|
Providian National Bank 6.75% 3/15/02 |
Baa3 |
|
3,000,000 |
2,925,030 |
|
|
Sanwa Finance Aruba AEC 8.35% 7/15/09 |
Baa1 |
|
4,700,000 |
4,679,132 |
|
|
Sumitomo Bank International Finance NV 8.5% 6/15/09 |
Baa1 |
|
500,000 |
502,345 |
|
|
Nonconvertible Bonds - continued |
|||||
|
Moody's Ratings |
Principal Amount |
Value |
|||
|
FINANCE - continued |
|||||
|
Banks - continued |
|||||
|
Union Planters Corp. 6.75% 11/1/05 |
Baa2 |
|
$ 400,000 |
$ 381,628 |
|
|
Union Planters National Bank 6.81% 8/20/01 |
A3 |
|
500,000 |
496,360 |
|
|
|
25,473,898 |
||||
|
Credit & Other Finance - 5.9% |
|||||
|
Ahmanson Capital Trust I 8.36% 12/1/26 (c) |
A3 |
|
1,125,000 |
1,022,963 |
|
|
Associates Corp. of North America: |
|
|
|
|
|
|
6% 4/15/03 |
Aa3 |
|
1,150,000 |
1,109,233 |
|
|
6% 7/15/05 |
Aa3 |
|
2,500,000 |
2,336,925 |
|
|
Bell Atlantic Financial Service, Inc. 7.6% 3/15/07 |
A1 |
|
1,100,000 |
1,095,600 |
|
|
Chrysler Financial Corp. 5.69% 11/15/01 |
A1 |
|
4,400,000 |
4,299,460 |
|
|
CIT Group, Inc. 5.5% 2/15/04 |
A1 |
|
500,000 |
460,880 |
|
|
Daimler-Chrysler NA Holding Corp. 6.59% 6/18/02 |
A1 |
|
250,000 |
247,028 |
|
|
ERP Operating LP: |
|
|
|
|
|
|
6.55% 11/15/01 |
A3 |
|
1,150,000 |
1,133,406 |
|
|
7.1% 6/23/04 |
A3 |
|
1,000,000 |
969,760 |
|
|
Finova Capital Corp.: |
|
|
|
|
|
|
6.11% 2/18/03 |
Baa2 |
|
600,000 |
528,000 |
|
|
6.27% 9/29/00 |
Baa2 |
|
400,000 |
388,000 |
|
|
First Security Capital I 8.41% 12/15/26 |
A3 |
|
510,000 |
472,484 |
|
|
Ford Motor Credit Co.: |
|
|
|
|
|
|
6.5% 2/28/02 |
A2 |
|
7,000,000 |
6,889,050 |
|
|
7.875% 6/15/10 |
A2 |
|
700,000 |
700,994 |
|
|
General Motors Acceptance Corp. 7.625% 6/15/04 |
A2 |
|
2,000,000 |
2,002,220 |
|
|
GS Escrow Corp. 7.125% 8/1/05 |
Ba1 |
|
2,825,000 |
2,509,561 |
|
|
Household Finance Corp. 8% 5/9/05 |
A2 |
|
2,000,000 |
2,016,940 |
|
|
HSBC Capital Funding LP 10.176% 12/31/49 (b)(c) |
A1 |
|
485,000 |
519,362 |
|
|
Newcourt Credit Group, Inc. 6.875% 2/16/05 |
A1 |
|
2,120,000 |
2,017,201 |
|
|
Sprint Capital Corp.: |
|
|
|
|
|
|
5.7% 11/15/03 |
Baa1 |
|
1,480,000 |
1,394,648 |
|
|
5.875% 5/1/04 |
Baa1 |
|
3,080,000 |
2,901,483 |
|
|
Trizec Finance Ltd. yankee 10.875% 10/15/05 |
Baa3 |
|
810,000 |
793,800 |
|
|
TXU Eastern Funding 6.75% 5/15/09 |
Baa1 |
|
480,000 |
429,202 |
|
|
|
36,238,200 |
||||
|
|
|||||
|
Moody's Ratings |
Principal Amount |
Value |
|||
|
Insurance - 0.1% |
|||||
|
Executive Risk Capital Trust 8.675% 2/1/27 |
Baa3 |
|
$ 750,000 |
$ 712,095 |
|
|
Savings & Loans - 0.1% |
|||||
|
Long Island Savings Bank FSB 6.2% 4/2/01 |
Baa3 |
|
750,000 |
749,168 |
|
|
Securities Industry - 0.4% |
|||||
|
Amvescap PLC yankee 6.6% 5/15/05 |
A3 |
|
2,900,000 |
2,701,582 |
|
|
TOTAL FINANCE |
65,874,943 |
||||
|
INDUSTRIAL MACHINERY & EQUIPMENT - 0.4% |
|||||
|
Industrial Machinery & Equipment - 0.2% |
|||||
|
Tyco International Group SA yankee 6.875% 1/15/29 |
Baa1 |
|
1,500,000 |
1,267,155 |
|
|
Pollution Control - 0.2% |
|||||
|
WMX Technologies, Inc. 7.1% 8/1/26 |
Ba1 |
|
905,000 |
851,804 |
|
|
TOTAL INDUSTRIAL MACHINERY & EQUIPMENT |
2,118,959 |
||||
|
MEDIA & LEISURE - 2.7% |
|||||
|
Broadcasting - 2.5% |
|||||
|
British Sky Broadcasting Group PLC 8.2% 7/15/09 |
Baa3 |
|
2,100,000 |
1,964,424 |
|
|
Clear Channel Communications, Inc. 7.25% 10/15/27 |
Baa3 |
|
3,000,000 |
2,631,690 |
|
|
Continental Cablevision, Inc. 8.3% 5/15/06 |
A2 |
|
1,260,000 |
1,289,849 |
|
|
Nielsen Media Research, Inc. 7.6% 6/15/09 |
Baa2 |
|
1,190,000 |
1,135,474 |
|
|
TCI Communications, Inc.: |
|
|
|
|
|
|
8.75% 8/1/15 |
A2 |
|
660,000 |
705,712 |
|
|
9.8% 2/1/12 |
A2 |
|
1,915,000 |
2,175,689 |
|
|
TCI Communications Financing III 9.65% 3/31/27 |
A3 |
|
1,500,000 |
1,657,200 |
|
|
Time Warner, Inc. 8.18% 8/15/07 |
Baa3 |
|
1,240,000 |
1,264,416 |
|
|
USA Networks, Inc./USANi LLC 6.75% 11/15/05 |
Baa3 |
|
3,000,000 |
2,857,500 |
|
|
|
15,681,954 |
||||
|
Publishing - 0.2% |
|||||
|
Time Warner Entertainment Co. LP 8.375% 7/15/33 |
Baa2 |
|
1,200,000 |
1,209,780 |
|
|
TOTAL MEDIA & LEISURE |
16,891,734 |
||||
|
NONDURABLES - 1.7% |
|||||
|
Beverages - 1.3% |
|||||
|
Seagram JE & Sons, Inc. 6.625% 12/15/05 |
Baa3 |
|
8,265,000 |
7,899,687 |
|
|
Nonconvertible Bonds - continued |
|||||
|
Moody's Ratings |
Principal Amount |
Value |
|||
|
NONDURABLES - continued |
|||||
|
Foods - 0.2% |
|||||
|
ConAgra, Inc. 7.125% 10/1/26 |
Baa1 |
|
$ 1,270,000 |
$ 1,171,245 |
|
|
Tobacco - 0.2% |
|||||
|
RJ Reynolds Tobacco Holdings, Inc. 7.375% 5/15/03 |
Baa2 |
|
1,800,000 |
1,671,768 |
|
|
TOTAL NONDURABLES |
10,742,700 |
||||
|
RETAIL & WHOLESALE - 0.7% |
|||||
|
Drug Stores - 0.3% |
|||||
|
Rite Aid Corp.: |
|
|
|
|
|
|
6.5% 12/15/05 (c) |
Caa1 |
|
3,360,000 |
1,730,400 |
|
|
7.125% 1/15/07 |
Caa1 |
|
790,000 |
418,700 |
|
|
|
2,149,100 |
||||
|
General Merchandise Stores - 0.3% |
|||||
|
Federated Department Stores, Inc. 8.5% 6/15/03 |
Baa1 |
|
1,700,000 |
1,715,589 |
|
|
Grocery Stores - 0.1% |
|||||
|
Kroger Co. 6% 7/1/00 |
Baa3 |
|
530,000 |
529,899 |
|
|
TOTAL RETAIL & WHOLESALE |
4,394,588 |
||||
|
TECHNOLOGY - 1.6% |
|||||
|
Computers & Office Equipment - 1.6% |
|||||
|
Comdisco, Inc.: |
|
|
|
|
|
|
5.95% 4/30/02 |
Baa1 |
|
3,000,000 |
2,847,630 |
|
|
6.375% 11/30/01 |
Baa1 |
|
3,200,000 |
3,096,288 |
|
|
7.23% 8/16/01 |
Baa1 |
|
3,000,000 |
2,985,450 |
|
|
7.25% 9/1/02 |
Baa1 |
|
1,000,000 |
967,890 |
|
|
|
9,897,258 |
||||
|
TRANSPORTATION - 1.1% |
|||||
|
Air Transportation - 0.4% |
|||||
|
Continental Airlines, Inc. pass thru trust certificates: |
|
|
|
|
|
|
7.434% 3/15/06 |
Baa1 |
|
550,000 |
531,795 |
|
|
7.73% 9/15/12 |
Baa1 |
|
222,809 |
212,805 |
|
|
Delta Air Lines, Inc. equipment trust certificate 8.54% 1/2/07 |
Baa1 |
|
352,386 |
336,077 |
|
|
United Air Lines, Inc. 9% 12/15/03 |
Baa3 |
|
1,100,000 |
1,085,590 |
|
|
|
2,166,267 |
||||
|
|
|||||
|
Moody's Ratings |
Principal Amount |
Value |
|||
|
Railroads - 0.7% |
|||||
|
Burlington Northern Santa Fe Corp. 6.53% 7/15/37 |
Baa2 |
|
$ 3,000,000 |
$ 2,907,330 |
|
|
Norfolk Southern Corp. 7.05% 5/1/37 |
Baa1 |
|
1,700,000 |
1,661,512 |
|
|
|
4,568,842 |
||||
|
TOTAL TRANSPORTATION |
6,735,109 |
||||
|
UTILITIES - 4.8% |
|||||
|
Electric Utility - 1.4% |
|||||
|
Avon Energy Partners Holdings: |
|
|
|
|
|
|
6.46% 3/4/08 (c) |
Baa2 |
|
1,500,000 |
1,336,020 |
|
|
7.05% 12/11/07 (c) |
Baa2 |
|
3,000,000 |
2,775,660 |
|
|
Dominion Resources, Inc. 8.125% 6/15/10 |
Baa1 |
|
1,055,000 |
1,062,132 |
|
|
DR Investments UK PLC yankee 7.1% 5/15/02 (c) |
A2 |
|
1,500,000 |
1,485,960 |
|
|
Israel Electric Corp. Ltd. 7.75% 12/15/27 (c) |
A3 |
|
1,900,000 |
1,628,585 |
|
|
Texas Utilities Co. 6.375% 1/1/08 |
Baa3 |
|
510,000 |
460,658 |
|
|
|
8,749,015 |
||||
|
Gas - 0.7% |
|||||
|
CMS Panhandle Holding Co.: |
|
|
|
|
|
|
6.125% 3/15/04 |
Baa3 |
|
1,350,000 |
1,275,075 |
|
|
7% 7/15/29 |
Baa3 |
|
1,000,000 |
839,200 |
|
|
Reliant Energy Resources Corp. 8.125% 7/15/05 (c) |
Baa1 |
|
1,000,000 |
999,800 |
|
|
Southwest Gas Corp. 9.75% 6/15/02 |
Baa2 |
|
1,000,000 |
1,032,030 |
|
|
|
4,146,105 |
||||
|
Telephone Services - 2.7% |
|||||
|
Cable & Wireless Optus Ltd.: |
|
|
|
|
|
|
8% 6/22/10 (c) |
Baa1 |
|
700,000 |
695,681 |
|
|
8.125% 6/15/09 (c) |
Baa1 |
|
3,000,000 |
3,028,980 |
|
|
Deutsche Telekom International Finance BV 8.25% 6/15/30 |
Aa2 |
|
5,835,000 |
5,927,952 |
|
|
Telecomunicaciones de Puerto Rico, Inc. 6.65% 5/15/06 |
Baa2 |
|
1,730,000 |
1,611,114 |
|
|
Teleglobe Canada, Inc.: |
|
|
|
|
|
|
7.2% 7/20/09 |
Baa1 |
|
3,273,000 |
3,131,770 |
|
|
7.7% 7/20/29 |
Baa1 |
|
2,591,000 |
2,439,867 |
|
|
|
16,835,364 |
||||
|
TOTAL UTILITIES |
29,730,484 |
||||
|
TOTAL NONCONVERTIBLE BONDS (Cost $193,297,122) |
184,107,098 |
||||
|
U.S. Government and Government Agency Obligations - 23.7% |
|||||
|
Moody's Ratings |
Principal Amount |
Value |
|||
|
U.S. Government Agency Obligations - 6.2% |
|||||
|
Fannie Mae: |
|
|
|
|
|
|
6.5% 4/29/09 |
Aaa |
|
$ 8,500,000 |
$ 7,940,870 |
|
|
7.125% 2/15/05 |
Aaa |
|
6,355,000 |
6,380,801 |
|
|
Federal Agricultural Mortgage Corp. 7.01% 2/10/05 |
Aaa |
|
10,000 |
9,981 |
|
|
Federal Home Loan Bank: |
|
|
|
|
|
|
6.75% 2/1/02 |
Aaa |
|
3,490,000 |
3,479,076 |
|
|
7.59% 3/10/05 |
Aaa |
|
10,000 |
10,203 |
|
|
Freddie Mac: |
|
|
|
|
|
|
5.75% 3/15/09 |
Aaa |
|
5,000,000 |
4,553,900 |
|
|
6.25% 7/15/04 |
Aaa |
|
7,765,000 |
7,549,055 |
|
|
6.77% 9/15/02 |
Aaa |
|
150,000 |
149,133 |
|
|
6.875% 1/15/05 |
Aaa |
|
2,045,000 |
2,032,219 |
|
|
7% 7/15/05 |
Aaa |
|
2,800,000 |
2,796,080 |
|
|
Government Loan Trusts (assets of Trust guaranteed by U.S. Government through Agency for International Development) 8.5% 4/1/06 |
Aaa |
|
1,493,771 |
1,556,076 |
|
|
Government Trust Certificates (assets of Trust guaranteed by U.S. Government through Defense Security Assistance Agency): |
|
|
|
|
|
|
Class 1-C, 9.25% 11/15/01 |
Aaa |
|
397,146 |
404,564 |
|
|
Class 2-E, 9.4% 5/15/02 |
Aaa |
|
258,789 |
262,503 |
|
|
Class 3-T, 9.625% 5/15/02 |
Aaa |
|
15,000 |
15,269 |
|
|
Guaranteed Export Trust Certificates (assets of Trust guaranteed by U.S. Government through |
|
|
|
|
|
|
Series 1993-C, 5.2% 10/15/04 |
Aaa |
|
4,000 |
3,842 |
|
|
Series 1993-D, 5.23% 5/15/05 |
Aaa |
|
8,511 |
8,134 |
|
|
Series 1994-A, 7.12% 4/15/06 |
Aaa |
|
6,043 |
6,079 |
|
|
Guaranteed Trade Trust Certificates (assets of Trust guaranteed by U.S. Government through |
Aaa |
|
6,058 |
6,102 |
|
|
|
|||||
|
Moody's Ratings |
Principal Amount |
Value |
|||
|
Israel Export Trust Certificates (assets of |
Aaa |
|
$ 7,059 |
$ 7,044 |
|
|
Overseas Private Investment Corp. U.S. Government guaranteed participation certificate Series 1994-195, 6.08% 8/15/04 (callable) |
Aaa |
|
98,175 |
96,624 |
|
|
Private Export Funding Corp. secured: |
|
|
|
|
|
|
5.65% 3/15/03 |
Aaa |
|
121,500 |
119,296 |
|
|
6.86% 4/30/04 |
Aaa |
|
916,733 |
909,847 |
|
|
TOTAL U.S. GOVERNMENT AGENCY OBLIGATIONS |
38,296,698 |
||||
|
U.S. Treasury Obligations - 17.5% |
|||||
|
U.S. Treasury Bonds: |
|
|
|
|
|
|
6.125% 8/15/29 |
Aaa |
|
15,100,000 |
15,251,000 |
|
|
8.875% 8/15/17 |
Aaa |
|
9,940,000 |
12,670,419 |
|
|
9.875% 11/15/15 |
Aaa |
|
3,810,000 |
5,166,131 |
|
|
14% 11/15/11 |
Aaa |
|
1,465,000 |
2,034,519 |
|
|
U.S. Treasury Notes: |
|
|
|
|
|
|
5.5% 2/15/08 |
Aaa |
|
14,545,000 |
13,922,329 |
|
|
5.625% 9/30/01 |
Aaa |
|
11,500,000 |
11,377,755 |
|
|
5.875% 11/15/04 |
Aaa |
|
6,100,000 |
6,011,367 |
|
|
6.5% 5/31/02 |
Aaa |
|
8,000,000 |
8,010,000 |
|
|
7% 7/15/06 |
Aaa |
|
20,610,000 |
21,357,113 |
|
|
U.S. Treasury Notes - coupon STRIPS 0% 11/15/11 |
Aaa |
|
26,700,000 |
13,250,142 |
|
|
TOTAL U.S. TREASURY OBLIGATIONS |
109,050,775 |
||||
|
TOTAL U.S. GOVERNMENT AND GOVERNMENT AGENCY OBLIGATIONS (Cost $148,365,354) |
147,347,473 |
||||
|
U.S. Government Agency - |
|||||
|
|
|||||
|
Fannie Mae - 28.7% |
|||||
|
6% 2/1/11 to 2/1/29 |
Aaa |
|
12,890,851 |
11,936,164 |
|
|
6.5% 2/1/10 to 7/1/29 |
Aaa |
|
87,169,130 |
82,350,146 |
|
|
7% 12/1/24 to 1/1/30 |
Aaa |
|
29,769,952 |
28,816,016 |
|
|
7.5% 7/1/07 to 7/1/30 |
Aaa |
|
43,393,905 |
42,829,090 |
|
|
8% 3/1/24 to 12/1/29 |
Aaa |
|
1,285,727 |
1,297,033 |
|
|
U.S. Government Agency - |
|||||
|
Moody's Ratings |
Principal Amount |
Value |
|||
|
Fannie Mae - continued |
|||||
|
8% 7/1/30 (d) |
Aaa |
|
$ 10,700,000 |
$ 10,740,125 |
|
|
8.5% 3/1/25 to 6/1/25 |
Aaa |
|
18,047 |
18,386 |
|
|
TOTAL FANNIE MAE |
177,986,960 |
||||
|
Freddie Mac - 0.3% |
|||||
|
8.5% 3/1/20 to 1/1/28 |
Aaa |
|
2,072,159 |
2,116,142 |
|
|
Government National Mortgage Association - 5.2% |
|||||
|
6% 8/15/08 to 5/15/09 |
Aaa |
|
2,721,986 |
2,623,726 |
|
|
6.5% 2/15/28 to 4/15/29 |
Aaa |
|
21,907,350 |
20,796,105 |
|
|
7.5% 3/15/06 to 10/15/28 |
Aaa |
|
8,781,726 |
8,735,756 |
|
|
8% 2/15/17 |
Aaa |
|
120,882 |
123,110 |
|
|
TOTAL GOVERNMENT NATIONAL |
32,278,697 |
||||
|
TOTAL U.S. GOVERNMENT AGENCY - (Cost $219,986,676) |
212,381,799 |
||||
|
Asset-Backed Securities - 3.6% |
|||||
|
|
|||||
|
American Express Credit Account Master Trust 6.1% 12/15/06 |
A1 |
|
1,500,000 |
1,442,227 |
|
|
Capita Equipment Receivables Trust 6.48% 10/15/06 |
Baa2 |
|
880,000 |
851,813 |
|
|
Discover Card Master Trust I 5.85% 11/16/04 |
A2 |
|
4,000,000 |
3,876,875 |
|
|
Ford Credit Auto Owner Trust: |
|
|
|
|
|
|
6.2% 12/15/02 |
Aa2 |
|
830,000 |
818,717 |
|
|
6.4% 12/15/02 |
Aa2 |
|
480,000 |
473,760 |
|
|
7.03% 11/15/03 |
Aaa |
|
209,000 |
208,837 |
|
|
JCPenney Master Credit Card Trust 5.5% 6/15/07 |
Aaa |
|
7,000,000 |
6,618,282 |
|
|
Key Auto Finance Trust: |
|
|
|
|
|
|
6.3% 10/15/03 |
A2 |
|
125,809 |
125,180 |
|
|
6.65% 10/15/03 |
Baa3 |
|
82,161 |
82,058 |
|
|
Premier Auto Trust 5.59% 2/9/04 |
Aaa |
|
6,000,000 |
5,821,860 |
|
|
Railcar Trust 7.75% 6/1/04 |
Aaa |
|
492,380 |
504,685 |
|
|
Sears Credit Account Master Trust II 7.5% 11/15/07 |
A2 |
|
1,300,000 |
1,300,000 |
|
|
TOTAL ASSET-BACKED SECURITIES (Cost $22,844,512) |
22,124,294 |
||||
|
Commercial Mortgage Securities - 2.4% |
|||||
|
Moody's Ratings |
Principal Amount |
Value |
|||
|
CS First Boston Mortgage Securities Corp.: |
|
|
|
|
|
|
Series 1997-C2 Class D, 7.27% 1/17/35 |
Baa2 |
|
$ 1,080,000 |
$ 992,841 |
|
|
Series 1998-FL1: |
|
|
|
|
|
|
Class D, 7.1415% 12/10/00 (c)(e) |
A2 |
|
2,100,000 |
2,096,802 |
|
|
Class E, 7.4913% 1/10/13 (c)(e) |
Baa2 |
|
2,650,000 |
2,638,200 |
|
|
DLJ Commercial Mortgage Corp. 7.62% 5/10/10 |
Aaa |
|
3,000,000 |
3,008,906 |
|
|
Equitable Life Assurance Society of the United States Series 174: |
|
|
|
|
|
|
Class B1, 7.33% 5/15/06 (c) |
Aa2 |
|
500,000 |
495,879 |
|
|
Class C1, 7.52% 5/15/06 (c) |
A2 |
|
500,000 |
491,094 |
|
|
Fannie Mae ACES REMIC sequential pay Series 1996 M5 Class A1, 7.141% 7/25/10 |
Aaa |
|
138,048 |
137,056 |
|
|
GS Mortgage Securities Corp. II Series 1998-GLII Class E, 7.1905% 4/13/31 (c)(e) |
Baa3 |
|
1,000,000 |
864,570 |
|
|
Prudential Securities |
Aaa |
|
2,890,000 |
2,917,997 |
|
|
Thirteen Affiliates of General Growth Properties, Inc. sequential pay Series 1 Class A2, 6.602% 12/15/10 (c) |
Aaa |
|
1,500,000 |
1,419,727 |
|
|
TOTAL COMMERCIAL MORTGAGE SECURITIES (Cost $15,325,912) |
15,063,072 |
||||
|
Foreign Government and Government |
|||||
|
|
|||||
|
British Columbia Province yankee 7% 1/15/03 |
Aa2 |
|
500,000 |
498,260 |
|
|
Korean Republic yankee: |
|
|
|
|
|
|
8.75% 4/15/03 |
Baa2 |
|
775,000 |
788,919 |
|
|
8.875% 4/15/08 |
Baa2 |
|
1,194,000 |
1,231,611 |
|
|
Manitoba Province yankee 6.75% 3/1/03 |
Aa3 |
|
500,000 |
495,780 |
|
|
Quebec Province: |
|
|
|
|
|
|
yankee: |
|
|
|
|
|
|
7.125% 2/9/24 |
A2 |
|
250,000 |
236,145 |
|
|
7.5% 7/15/23 |
A2 |
|
8,550,000 |
8,428,590 |
|
|
7% 1/30/07 |
A2 |
|
1,000,000 |
980,520 |
|
|
Foreign Government and Government |
|||||
|
Moody's Ratings |
Principal Amount |
Value |
|||
|
Quebec Province: - continued |
|
|
|
|
|
|
7.5% 9/15/29 |
A2 |
|
$ 6,480,000 |
$ 6,366,017 |
|
|
United Mexican States 9.875% 2/1/10 |
Baa3 |
|
2,290,000 |
2,393,050 |
|
|
TOTAL FOREIGN GOVERNMENT AND GOVERNMENT AGENCY OBLIGATIONS (Cost $22,550,794) |
21,418,892 |
||||
|
Supranational Obligations - 0.6% |
|||||
|
|
|||||
|
Inter-American Development Bank yankee |
Aaa |
|
4,000,000 |
3,810,480 |
|
|
Cash Equivalents - 5.1% |
|||
|
Maturity Amount |
|
||
|
Investments in repurchase agreements (U.S. Government Obligations), in a joint trading account at 6.83%, dated 6/30/00 due
7/3/00 |
$ 31,637,007 |
31,619,000 |
|
|
TOTAL INVESTMENT PORTFOLIO - 102.7% (Cost $657,964,210) |
637,872,108 |
||
|
NET OTHER ASSETS - (2.7)% |
(16,874,271) |
||
|
NET ASSETS - 100% |
$ 620,997,837 |
||
|
Legend |
|
(a) S&P credit ratings are used in the absence of a rating by Moody's Investors Service, Inc. |
|
(b) Debt obligation initially issued at one coupon which converts to a higher coupon at a specified date. The rate shown is the rate at period end. |
|
(c) Security exempt from registration under Rule 144A of the Securities Act of 1933. These securities may be resold in transactions exempt from registration, normally to qualified institutional buyers. At the period end, the value of these securities amounted to $25,317,582 or 4.1% of net assets. |
|
(d) Security purchased on a delayed delivery or when-issued basis. |
|
(e) The coupon rate shown on floating or adjustable rate securities represents the rate at period end. |
|
(f) For foreign government obligations not individually rated by S&P or Moody's, the ratings listed have been assigned by FMR, the fund's investment adviser, based principally on S&P and Moody's ratings of the sovereign credit of the issuing government. |
|
Other Information |
|
The composition of long-term debt holdings as a percentage of total value of investments in securities, is as follows (ratings are unaudited): |
|
Moody's Ratings |
S&P Ratings |
|||
|
Aaa, Aa, A |
73.7% |
|
AAA, AA, A |
67.0% |
|
Baa |
20.3% |
|
BBB |
18.9% |
|
Ba |
0.5% |
|
BB |
1.6% |
|
B |
0.1% |
|
B |
0.3% |
|
Caa |
0.3% |
|
CCC |
0.0% |
|
Ca, C |
0.0% |
|
CC, C |
0.0% |
|
|
|
|
D |
0.0% |
|
|
|
Purchases and sales of securities, other than short-term securities, aggregated $467,642,183 and $520,876,687, respectively, of which long-term U.S. government and government agency obligations aggregated $384,782,549 and $401,954,052, respectively. |
|
The fund participated in the interfund lending program as a lender. The average daily loan balance during the period for which loans were outstanding amounted to $21,767,000. The weighted average interest rate was 5.86%. Interest earned from the interfund lending program amounted to $21,253 and is included in interest income on the Statement of Operations. |
|
Income Tax Information |
|
At June 30, 2000, the aggregate cost of investment securities for income tax purposes was $658,225,459. Net unrealized depreciation aggregated $20,353,351, of which $1,723,809 related to appreciated investment securities and $22,077,160 related to depreciated investment securities. |
|
At December 31, 1999, the fund had a capital loss carryforward of approximately $11,269,000 all of which will expire on December 31, 2007. |
See accompanying notes which are an integral part of the financial statements.
Investment Grade Bond Portfolio
Statement of Assets and Liabilities
|
|
June 30, 2000 (Unaudited) |
|
|
Assets |
|
|
|
Investment in securities, at value (including repurchase agreements of $31,619,000) |
|
$ 637,872,108 |
|
Cash |
|
106 |
|
Receivable for investments sold |
|
6,380,828 |
|
Receivable for fund shares sold |
|
231,457 |
|
Interest receivable |
|
8,078,601 |
|
Total assets |
|
652,563,100 |
|
Liabilities |
|
|
|
Payable for investments purchased |
$ 20,040,145 |
|
|
Delayed delivery |
10,721,326 |
|
|
Payable for fund shares redeemed |
510,735 |
|
|
Accrued management fee |
223,058 |
|
|
Distribution fees payable |
22 |
|
|
Other payables and accrued expenses |
69,977 |
|
|
Total liabilities |
|
31,565,263 |
|
Net Assets |
|
$ 620,997,837 |
|
Net Assets consist of: |
|
|
|
Paid in capital |
|
$ 641,249,230 |
|
Undistributed net investment income |
|
19,896,010 |
|
Accumulated undistributed net realized gain (loss) on investments and foreign currency transactions |
|
(20,055,301) |
|
Net unrealized appreciation (depreciation) on investments |
|
(20,092,102) |
|
Net Assets |
|
$ 620,997,837 |
|
Initial Class: |
|
$11.75 |
|
Service Class 2: |
|
$11.74 |
Statement of Operations
|
|
Six months ended June 30, 2000 (Unaudited) |
|
|
Investment Income Interest |
|
$ 21,822,522 |
|
Security lending |
|
63,152 |
|
Total income |
|
21,885,674 |
|
Expenses |
|
|
|
Management fee |
$ 1,325,329 |
|
|
Transfer agent fees |
207,178 |
|
|
Distribution fees |
121 |
|
|
Accounting and security lending fees |
89,154 |
|
|
Non-interested trustees' compensation |
1,005 |
|
|
Custodian fees and expenses |
22,606 |
|
|
Audit |
16,173 |
|
|
Legal |
2,425 |
|
|
Miscellaneous |
412 |
|
|
Total expenses before reductions |
1,664,403 |
|
|
Expense reductions |
(1,188) |
1,663,215 |
|
Net investment income |
|
20,222,459 |
|
Realized and Unrealized Gain (Loss) Net realized gain (loss) on investment securities |
|
(8,016,907) |
|
Change in net unrealized appreciation (depreciation) on investment securities |
|
10,456,223 |
|
Net gain (loss) |
|
2,439,316 |
|
Net increase (decrease) in net assets resulting from operations |
|
$ 22,661,775 |
|
Other Information Expense reductions |
|
$ 1,188 |
See accompanying notes which are an integral part of the financial statements.
Semiannual Report
Fidelity Variable Insurance Products: Investment Grade Bond Portfolio
Financial Statements - continued
Statement of Changes in Net Assets
|
Increase (Decrease) in Net Assets |
Six months ended |
Year ended |
|
Operations |
$ 20,222,459 |
$ 43,183,071 |
|
Net realized gain (loss) |
(8,016,907) |
(11,737,244) |
|
Change in net unrealized appreciation (depreciation) |
10,456,223 |
(38,771,648) |
|
Net increase (decrease) in net assets resulting from operations |
22,661,775 |
(7,325,821) |
|
Distributions to shareholders |
(43,339,424) |
(28,513,399) |
|
From net realized gain |
- |
(8,945,380) |
|
Total distributions |
(43,339,424) |
(37,458,779) |
|
Share transactions - net increase (decrease) |
(17,176,281) |
28,823,589 |
|
Total increase (decrease) in net assets |
(37,853,930) |
(15,961,011) |
|
Net Assets |
|
|
|
Beginning of period |
658,851,767 |
674,812,778 |
|
End of period (including undistributed net investment income of $19,896,010 and $42,809,963, respectively) |
$ 620,997,837 |
$ 658,851,767 |
|
|
|
|
|
Other Information: |
Six months ended June 30, 2000 |
Year ended December 31, 1999 |
||
|
|
Shares |
Dollars |
Shares |
Dollars |
|
Share transactions |
6,302,773 |
$ 73,176,423 |
20,833,388 |
$ 258,967,451 |
|
Reinvested |
3,827,956 |
43,332,459 |
3,052,875 |
37,458,779 |
|
Redeemed |
(11,451,016) |
(133,795,101) |
(21,798,580) |
(267,602,641) |
|
Net increase (decrease) |
(1,320,287) |
$ (17,286,219) |
2,087,683 |
$ 28,823,589 |
|
Service Class 2 A |
8,552 |
$ 102,980 |
- |
$ - |
|
Reinvested |
614 |
6,965 |
- |
- |
|
Redeemed |
(1) |
(7) |
- |
- |
|
Net increase (decrease) |
9,165 |
$ 109,938 |
- |
$ - |
|
Distributions |
|
$ 43,332,459 |
|
$ 28,513,399 |
|
Service Class 2 A |
|
6,965 |
|
- |
|
Total |
|
$ 43,339,424 |
|
$ 28,513,399 |
|
From net realized gain |
|
$ - |
|
$ 8,945,380 |
|
Service Class 2 A |
|
- |
|
- |
|
Total |
|
$ - |
|
$ 8,945,380 |
|
|
|
$ 43,339,424 |
|
$ 37,458,779 |
A Service Class 2 commenced sale of shares January 12, 2000.
See accompanying notes which are an integral part of the financial statements.
Investment Grade Bond Portfolio
Financial Highlights - Initial Class
|
|
Six months ended |
Years ended December 31, |
||||
|
Selected Per-Share Data |
(Unaudited) |
1999 |
1998 |
1997 |
1996 |
1995 |
|
Net asset value, beginning of period |
$ 12.160 |
$ 12.960 |
$ 12.560 |
$ 12.240 |
$ 12.480 |
$ 11.020 |
|
Income from Investment Operations Net investment income |
.378C |
.743 C |
.725 C |
.759 C |
.670 |
.320 |
|
Net realized and unrealized gain (loss) |
.052 |
(.873) |
.335 |
.291 |
(.290) |
1.530 |
|
Total from investment operations |
.430 |
(.130) |
1.060 |
1.050 |
.380 |
1.850 |
|
Less Distributions |
|
|
|
|
|
|
|
From net investment income |
(.840) |
(.510) |
(.590) |
(.730) |
(.620) |
(.390) |
|
From net realized gain |
- |
(.160) |
(.070) |
- |
- |
- |
|
Total distributions |
(.840) |
(.670) |
(.660) |
(.730) |
(.620) |
(.390) |
|
Net asset value, end of period |
$ 11.750 |
$ 12.160 |
$ 12.960 |
$ 12.560 |
$ 12.240 |
$ 12.480 |
|
Total ReturnB |
3.80% |
(1.05)% |
8.85% |
9.06% |
3.19% |
17.32% |
|
Ratios and Supplemental Data |
|
|
|
|
|
|
|
Net assets, end of period (000 omitted) |
$ 620,890 |
$ 658,852 |
$ 674,813 |
$ 324,525 |
$ 228,594 |
$ 181,546 |
|
Ratio of expenses to average net assets |
.54% A |
.54% |
.57% |
.58% |
.58% |
.59% |
|
Ratio of net investment income to average net assets |
6.53% A |
6.07% |
5.85% |
6.34% |
6.49% |
6.53% |
|
Portfolio turnover rate |
154% A |
87% |
239% |
191% |
81% |
182% |
|
|
||||||
Financial Highlights - Service Class 2
|
|
Six months ended |
|
Selected Per-Share Data |
(Unaudited) |
|
Net asset value, beginning of period |
$ 12.060 |
|
Income from Investment Operations |
|
|
Net investment income C |
.339 |
|
Net realized and unrealized gain (loss) |
.181 |
|
Total from investment operations |
.520 |
|
Less Distributions |
|
|
From net investment income |
(.840) |
|
Net asset value, end of period |
$ 11.740 |
|
Total ReturnB |
4.56% |
|
Ratios and Supplemental Data |
|
|
Net assets, end of period (000 omitted) |
$ 108 |
|
Ratio of expenses to average net assets |
.80% A |
|
Ratio of net investment income to average net assets |
6.32% A |
|
Portfolio turnover rate |
154%A |
|
A Annualized B Total returns for periods of less than one year are not annualized and do not reflect charges attributable to your insurance company's separate account. Inclusion of these charges would reduce the total returns shown. C Net investment income per share has been calculated based on average shares outstanding during the period. D For the period January 12, 2000 (commencement of sale of Service Class 2 shares) to June 30, 2000. |
|
See accompanying notes which are an integral part of the financial statements.
Semiannual Report
To measure a money market fund's performance, you can look at either total return or yield. Total return reflects the change in value of an investment, assuming reinvestment of the fund's dividend income and capital gains (the profits earned upon the sale of securities that have grown in value). Yield measures the income paid by a fund. Since a money market fund tries to maintain a $1 share price, yield is an important measure of performance. The initial offering of Service Class 2 shares took place on January 12, 2000. Performance for Service Class 2 shares reflects an asset based distribution fee (12b-1 fee), and returns prior to January 12, 2000 are those of Initial Class and do not include the effects of a 12b-1 fee. Had Service Class 2's 12b-1 fee been reflected, returns and yields prior to January 12, 2000 would have been lower.
Average Annual Total Returns
|
Periods ended June 30, 2000 |
Past 1 |
Past 5 |
Past 10 |
|
Fidelity VIP: Money Market - |
5.47% |
5.44% |
5.16% |
Average annual total returns take the fund's cumulative return and show you what would have happened if the fund had achieved that return by performing at a constant rate each year.
Figures for more than one year assume a steady compounded rate of return and are not the fund's year-by-year results, which fluctuated over the periods shown.
Performance numbers are net of all fund operating expenses, but do not include any insurance charges imposed by your insurance company's separate account. If performance information included the effect of these additional charges, the total returns would have been lower.
A money market fund's total returns and yields will vary, and reflect past results rather than predict future performance.
Semiannual Report
Yield
|
|
6/28/00 |
3/29/00 |
12/29/99 |
9/29/99 |
6/30/99 |
|
|
Fidelity VIP: |
|
|
|
|
|
|
|
|
Money Market - |
|
|
|
|
|
|
|
Service Class 2 |
6.16% |
5.51% |
5.72% |
5.20% |
4.85% |
|
MMDA |
2.11% |
2.04% |
2.07% |
2.08% |
2.03% |
|

Yield refers to the income paid by the fund over a given period. Yields for money market funds are usually for seven-day periods, expressed as annual percentage rates. A yield that assumes income earned is reinvested or compounded is called an effective yield. The chart above shows the fund's current seven-day yield at quarterly intervals over the past year. You can compare these yields to the bank money market deposit account (MMDA) average. The MMDA average is supplied by BANK RATE MONITOR.(TM)
Comparing Performance
There are some important differences between a bank money market deposit account (MMDA) and a money market fund. First, the U.S. government neither insures nor guarantees a money market fund. In fact, there is no assurance that a money market fund will maintain a $1 share price. Second, a money market fund returns to its shareholders income earned by the fund's investments after expenses. This is in contrast to banks, which set their MMDA rates periodically based on current interest rates, competitors' rates, and internal criteria.
3Money Market Portfolio
(Portfolio Manager photograph)
An interview with
Robert Duby,
Portfolio Manager
of Money Market Portfolio
Q. Bob, what was the investment environment like during the six months that ended June 30, 2000?
A. Interest rates rose due to strong economic performance, evidenced by the lowest unemployment rate in approximately 30 years and robust gains in real GDP - gross domestic product adjusted for inflation. Personal consumption, business investment and a strong real estate market fueled growth. The wealth effect created by appreciating equity and real estate markets also boosted consumer spending, a significant component of real GDP. Commodity prices increased due to improving global economic conditions and strong domestic demand.
Q. How did the market react to this backdrop?
A. Market participants expected that the Federal Reserve Board would hike short-term interest rates in order to slow growth and head off inflation. That argument was bolstered by the fact that, in spite of improvements in productivity, consumer and producer prices ultimately rose during the period, sparked mainly by increasing energy prices.
Q. What was the Fed's reaction to these developments?
A. Strong real GDP growth and concerns about the impact of wage pressures within firm labor markets encouraged the Fed to continue its program of interest-rate hikes. During the first half of 2000, the Fed raised the rate banks charge each other for overnight loans - known as the fed funds target rate - three times. Two of these rate hikes - in February and March - came in increments of 0.25 percentage points, but not the last hike, which occurred in May.
Q. What happened in May?
A. Faced with continued strong GDP growth, an increase in the core rate of inflation, a decline in the unemployment rate and a larger-than-expected increase in average hourly earnings, the Fed in May raised the fed funds rate by 0.50 percentage points, the first increase of such magnitude in over five years. However, recent evidence of an economic slowdown prompted the Fed to keep rates unchanged at its June 2000 meeting.
Q. What was your strategy with the fund?
A. During the period, our strategy shifted to capitalize on Fed rate hikes while at the same time maintaining adequate portfolio liquidity to accommodate cash outflows. The fund's average maturity was shortened at times when the market priced in overly optimistic expectations for changes in monetary policy. Conversely, the fund's average maturity was lengthened when the market priced in overly aggressive expectations of Fed rate hikes.
Q. What is your outlook?
A. Recent economic data suggests that Fed monetary policy has begun to dampen economic activity. Fed rate hikes appear to have tempered consumer spending, as evidenced by recent statistics showing slower retail and home sales. As a result, manufacturing activity has softened within interest-rate sensitive sectors, while employment has recently declined from record levels. It's uncertain at this point if the economy is taking a breather or if the Fed has achieved a so-called "soft landing." Market prices currently reflect the belief that the Fed has finished its rate-hike program. However, we believe the Fed might implement at least one more rate hike in the near future.
The views expressed in this report reflect those of the portfolio manager only through the end of the period of the report as stated on the cover. The manager's views are subject to change at any time based upon market or other conditions. For more information, please see page 2.
Fund Facts
Goal: as high a level of current income as is consistent with preservation of capital and liquidity
Start date: April 1, 1982
Size: as of June 30, 2000, more than $2.0 billion
Manager: Robert Duby, since 1997; joined Fidelity in 1982
3Semiannual Report
Fidelity Variable Insurance Products: Money Market Portfolio
(Unaudited)
Showing Percentage of Net Assets
|
Certificates of Deposit - 38.2% |
||||
|
Due Date |
Annualized Yield at Time of Purchase |
Principal Amount |
Value |
|
|
Domestic Certificates Of Deposit - 5.7% |
||||
|
Chase Manhattan Bank USA NA |
||||
|
9/5/00 |
6.70% |
$ 25,000,000 |
$ 25,000,000 |
|
|
Citibank NA, New York |
||||
|
11/15/00 |
7.02 |
30,000,000 |
30,000,000 |
|
|
First Union National Bank, North Carolina |
||||
|
7/20/00 |
6.85 (b) |
25,000,000 |
25,000,000 |
|
|
11/21/00 |
6.48 |
10,000,000 |
10,000,000 |
|
|
5/15/01 |
7.35 |
15,000,000 |
15,000,000 |
|
|
U.S. Bank NA, Minnesota |
||||
|
7/3/00 |
6.72 (b) |
10,000,000 |
10,000,000 |
|
|
|
115,000,000 |
|||
|
London Branch, Eurodollar, Foreign Banks - 15.7% |
||||
|
Abbey National Treasury Services PLC |
||||
|
11/6/00 |
6.75 |
25,000,000 |
25,000,000 |
|
|
11/9/00 |
6.50 |
20,000,000 |
20,000,000 |
|
|
5/17/01 |
7.36 |
25,000,000 |
25,000,000 |
|
|
Barclays Bank PLC |
||||
|
7/28/00 |
5.80 |
9,000,000 |
9,000,000 |
|
|
Bayerische Hypo-und Vereinsbank AG |
||||
|
8/21/00 |
6.76 |
15,000,000 |
15,000,000 |
|
|
10/19/00 |
6.75 |
50,000,000 |
50,000,000 |
|
|
11/20/00 |
7.01 |
25,000,000 |
25,000,000 |
|
|
Deutsche Bank AG |
||||
|
9/19/00 |
6.40 |
31,000,000 |
30,993,318 |
|
|
Dresdner Bank AG |
||||
|
8/3/00 |
6.25 |
25,000,000 |
24,999,976 |
|
|
8/21/00 |
6.75 |
60,000,000 |
59,999,996 |
|
|
Halifax PLC |
||||
|
12/18/00 |
6.51 |
10,000,000 |
10,000,000 |
|
|
RaboBank Nederland Coop. Central |
||||
|
11/6/00 |
6.83 |
25,000,000 |
25,000,000 |
|
|
|
319,993,290 |
|||
|
New York Branch, Yankee Dollar, Foreign Banks - 16.8% |
||||
|
Banque Nationale de Paris (BNP) |
||||
|
8/2/00 |
5.85 |
10,000,000 |
9,999,581 |
|
|
Canadian Imperial Bank of Commerce |
||||
|
7/6/00 |
6.62 (b) |
25,000,000 |
24,986,250 |
|
|
8/17/00 |
6.75 |
10,000,000 |
10,000,000 |
|
|
Commerzbank AG |
||||
|
8/23/00 |
6.65 |
25,000,000 |
25,000,000 |
|
|
Credit Agricole Indosuez |
||||
|
7/3/00 |
6.63 (b) |
25,000,000 |
24,992,398 |
|
|
Deutsche Bank AG |
||||
|
11/16/00 |
7.01 |
25,000,000 |
25,000,000 |
|
|
Dresdner Bank AG |
||||
|
7/23/00 |
6.62 (b) |
20,000,000 |
19,999,510 |
|
|
National Westminster Bank PLC |
||||
|
7/10/00 |
6.58 |
25,000,000 |
25,000,000 |
|
|
|
||||
|
Due Date |
Annualized Yield at Time of Purchase |
Principal Amount |
Value |
|
|
Norddeutsche Landesbank Girozentrale |
||||
|
7/12/00 |
5.76% |
$ 10,000,000 |
$ 9,999,856 |
|
|
2/8/01 |
6.75 |
10,000,000 |
9,997,115 |
|
|
5/8/01 |
7.15 |
25,000,000 |
24,995,975 |
|
|
Royal Bank of Canada |
||||
|
7/3/00 |
6.62 (b) |
25,000,000 |
24,988,249 |
|
|
5/3/01 |
7.10 |
25,000,000 |
24,994,053 |
|
|
Societe Generale |
||||
|
7/10/00 |
6.61 (b) |
15,000,000 |
14,995,612 |
|
|
7/29/00 |
6.67 (b) |
7,000,000 |
6,997,834 |
|
|
Svenska Handelsbanken AB |
||||
|
5/2/01 |
7.00 |
35,000,000 |
34,994,462 |
|
|
UBS AG |
||||
|
12/7/00 |
6.45 |
25,000,000 |
24,963,178 |
|
|
|
341,904,073 |
|||
|
TOTAL CERTIFICATES OF DEPOSIT |
776,897,363 |
|||
|
Commercial Paper - 44.8% |
||||
|
|
||||
|
Aegon Funding Corp. |
||||
|
9/12/00 |
6.38 |
6,000,000 |
5,924,810 |
|
|
Bank of Scotland Treasury Services PLC |
||||
|
9/12/00 |
6.71 |
25,000,000 |
24,665,417 |
|
|
Citibank Credit Card Master Trust I (Dakota Certificate Program) |
||||
|
7/18/00 |
6.67 |
25,000,000 |
24,922,083 |
|
|
8/17/00 |
6.65 |
10,000,000 |
9,914,094 |
|
|
ConAgra, Inc. |
||||
|
7/10/00 |
6.77 |
5,000,000 |
4,991,588 |
|
|
7/25/00 |
6.79 |
8,000,000 |
7,964,000 |
|
|
7/27/00 |
6.80 |
7,000,000 |
6,965,875 |
|
|
Corporate Receivables Corp. |
||||
|
8/22/00 |
6.65 |
25,000,000 |
24,762,750 |
|
|
8/22/00 |
6.75 |
25,000,000 |
24,759,861 |
|
|
Countrywide Home Loans, Inc. |
||||
|
7/17/00 |
6.85 |
5,000,000 |
4,984,822 |
|
|
CXC, Inc. |
||||
|
8/10/00 |
6.75 |
50,000,000 |
49,630,556 |
|
|
Daimler-Chrysler North America Holding Corp. |
||||
|
9/14/00 |
6.72 |
20,000,000 |
19,724,583 |
|
|
Deutsche Bank Financial, Inc. |
||||
|
8/15/00 |
6.76 |
25,000,000 |
24,792,188 |
|
|
Dominion Resources, Inc. |
||||
|
7/19/00 |
6.91 |
5,000,000 |
4,982,850 |
|
|
Falcon Asset Securitization Corp. |
||||
|
7/18/00 |
6.82 |
15,000,000 |
14,951,833 |
|
|
8/9/00 |
6.66 |
29,335,000 |
29,125,573 |
|
|
General Electric Capital Corp. |
||||
|
7/25/00 |
6.65 |
50,000,000 |
49,780,333 |
|
|
8/15/00 |
6.67 |
50,000,000 |
49,588,750 |
|
|
Commercial Paper - continued |
||||
|
Due Date |
Annualized Yield at Time of Purchase |
Principal Amount |
Value |
|
|
General Motors Acceptance Corp. |
||||
|
8/23/00 |
6.74% |
$ 50,000,000 |
$ 49,512,694 |
|
|
8/31/00 |
6.78 |
25,000,000 |
24,718,299 |
|
|
Goldman Sachs Group, Inc. |
||||
|
8/14/00 |
6.66 |
20,000,000 |
19,839,156 |
|
|
8/16/00 |
6.65 |
21,242,000 |
21,063,673 |
|
|
GTE Corp. |
||||
|
8/1/00 |
6.69 |
6,000,000 |
5,965,693 |
|
|
Kitty Hawk Funding Corp. |
||||
|
8/15/00 |
6.27 |
5,000,000 |
4,962,000 |
|
|
9/20/00 |
6.41 |
5,000,000 |
4,930,138 |
|
|
12/1/00 |
7.08 |
10,000,000 |
9,709,725 |
|
|
Lehman Brothers Holdings, Inc. |
||||
|
8/2/00 |
6.54 (b) |
14,000,000 |
14,000,000 |
|
|
Lower Colorado River Auth. Tax Rev. |
||||
|
8/2/00 |
6.59 |
10,000,000 |
10,000,000 |
|
|
Merrill Lynch & Co., Inc. |
||||
|
8/23/00 |
6.78 |
35,000,000 |
34,656,825 |
|
|
New Center Asset Trust |
||||
|
7/17/00 |
6.67 |
25,000,000 |
24,926,667 |
|
|
Newport Funding Corp. |
||||
|
7/6/00 |
6.58 |
25,000,000 |
24,977,257 |
|
|
9/18/00 |
6.35 |
10,000,000 |
9,865,042 |
|
|
Park Avenue Receivables Corp. |
||||
|
7/20/00 |
6.63 |
50,000,000 |
49,825,833 |
|
|
Preferred Receivables Funding Corp. |
||||
|
7/3/00 |
6.65 |
20,000,000 |
19,992,667 |
|
|
Sears Roebuck Acceptance Corp. |
||||
|
7/25/00 |
6.79 |
6,000,000 |
5,973,000 |
|
|
7/26/00 |
6.79 |
5,000,000 |
4,976,563 |
|
|
Societe Generale NA |
||||
|
8/3/00 |
6.25 |
25,000,000 |
24,861,125 |
|
|
Three Rivers Funding Corp. |
||||
|
7/5/00 |
6.59 |
25,000,000 |
24,981,806 |
|
|
7/28/00 |
6.65 |
35,240,000 |
35,065,562 |
|
|
Triple-A One Funding Corp. |
||||
|
7/20/00 |
6.62 |
60,000,000 |
59,791,633 |
|
|
Tyco International Group SA |
||||
|
7/19/00 |
6.92 |
5,000,000 |
4,982,813 |
|
|
7/25/00 |
6.95 |
5,000,000 |
4,977,000 |
|
|
UBS Finance, Inc. |
||||
|
7/5/00 |
7.06 |
4,200,000 |
4,196,710 |
|
|
Ventures Business Trust |
||||
|
7/3/00 |
7.05 |
29,997,000 |
29,985,251 |
|
|
TOTAL COMMERCIAL PAPER |
911,169,098 |
|||
|
Bank Notes - 2.5% |
||||
|
Due Date |
Annualized Yield at Time of Purchase |
Principal Amount |
Value |
|
|
Bank of America NA |
||||
|
11/20/00 |
7.00% |
$ 15,000,000 |
$ 15,000,000 |
|
|
First National Bank, Chicago |
||||
|
7/12/00 |
5.75 |
10,000,000 |
9,999,856 |
|
|
Fleet National Bank |
||||
|
7/3/00 |
6.71 (b) |
25,000,000 |
24,999,607 |
|
|
TOTAL BANK NOTES |
49,999,463 |
|||
|
Master Notes - 3.2% |
||||
|
|
||||
|
Goldman Sachs Group, Inc. |
||||
|
8/22/00 |
6.73 (c) |
50,000,000 |
50,000,000 |
|
|
J.P. Morgan Securities, Inc. |
||||
|
7/7/00 |
6.64 (b) |
15,000,000 |
15,000,000 |
|
|
TOTAL MASTER NOTES |
65,000,000 |
|||
|
Medium-Term Notes - 7.1% |
||||
|
|
||||
|
AT&T Corp. |
||||
|
7/6/00 |
6.67 (b) |
25,000,000 |
25,000,000 |
|
|
CIESCO LP |
||||
|
7/15/00 |
6.63 (b) |
10,000,000 |
9,999,914 |
|
|
CIT Group, Inc. |
||||
|
7/3/00 |
6.61 (b) |
10,000,000 |
9,994,445 |
|
|
7/3/00 |
6.80 (b) |
15,000,000 |
14,996,960 |
|
|
Ford Motor Credit Co. |
||||
|
8/23/00 |
6.80 (b) |
25,000,000 |
24,997,512 |
|
|
GE Life & Annuity Assurance Co. |
||||
|
7/3/00 |
6.76 (b)(c) |
15,000,000 |
15,000,000 |
|
|
General Motors Acceptance Corp. Mortgage Credit |
||||
|
7/3/00 |
6.69 (b) |
10,000,000 |
9,996,305 |
|
|
7/3/00 |
6.71 (b) |
25,000,000 |
24,990,734 |
|
|
Merrill Lynch & Co., Inc. |
||||
|
7/3/00 |
6.63 (b) |
10,000,000 |
9,999,244 |
|
|
TOTAL MEDIUM-TERM NOTES |
144,975,114 |
|||
|
Short-Term Notes - 3.6% |
||||
|
|
||||
|
Jackson National Life Insurance Co. |
||||
|
7/3/00 |
7.00 (b)(c) |
7,000,000 |
7,000,000 |
|
|
Monumental Life Insurance Co. |
||||
|
7/3/00 |
6.78 (b)(c) |
5,000,000 |
5,000,000 |
|
|
7/3/00 |
6.81 (b)(c) |
5,000,000 |
5,000,000 |
|
|
New York Life Insurance Co. |
||||
|
7/3/00 |
6.41 (b)(c) |
4,000,000 |
4,000,000 |
|
|
Short-Term Notes - continued |
||||
|
Due Date |
Annualized Yield at Time of Purchase |
Principal Amount |
Value |
|
|
New York Life Insurance Co. - continued |
||||
|
8/28/00 |
6.96% (b)(c) |
$ 5,000,000 |
$ 5,000,000 |
|
|
RACERS Series 00 10mm, |
||||
|
6/22/01 |
6.67 (a)(b) |
10,000,000 |
10,000,000 |
|
|
Strategic Money Market Trust Series 1999 A6, |
||||
|
7/13/00 |
6.40 (a)(b) |
17,000,000 |
17,000,000 |
|
|
Strategic Money Market Trust Series 2000 B, |
||||
|
9/13/00 |
6.81 (a)(b) |
5,000,000 |
5,000,000 |
|
|
Strategic Money Market Trust Series 2000 E, |
||||
|
7/14/00 |
6.67 (a)(b) |
5,000,000 |
5,000,000 |
|
|
Transamerica Occidental Life Insurance Co. |
||||
|
9/29/00 |
6.56 (b)(c) |
10,000,000 |
10,000,000 |
|
|
TOTAL SHORT-TERM NOTES |
73,000,000 |
|||
|
Repurchase Agreements - 2.5% |
|||
|
Maturity Amount |
|
||
|
In a joint trading account (U.S. Government Obligations) dated 6/30/00 due 7/3/00 At 6.83% |
$ 31,018 |
31,000 |
|
|
With: |
|
|
|
|
Bank of America NA |
30,018,025 |
30,000,000 |
|
|
Deutsche Bank Securities, Inc. |
20,012,017 |
20,000,000 |
|
|
TOTAL REPURCHASE AGREEMENTS |
50,031,000 |
||
|
TOTAL INVESTMENT |
2,071,072,038 |
||
|
NET OTHER ASSETS - (1.9)% |
(37,716,448) |
||
|
NET ASSETS - 100% |
$ 2,033,355,590 |
||
|
Total Cost for Income Tax Purposes $2,071,072,038 |
|
Legend |
|
(a) Security exempt from registration under Rule 144A of the Securities Act of 1933. These securities may be resold in transactions exempt from registration, normally to qualified institutional buyers. At the period end, the value of these securities amounted to $37,000,000 or 1.8% of net assets. |
|
(b) The coupon rate shown on floating or adjustable rate securities represents the rate at period end. The due dates on these types of securities reflects the next interest rate reset date or, when applicable, the final maturity date. |
|
(c) Restricted securities - Investment in securities not registered under the Securities Act of 1933. |
|
Additional information on each holding is as follows: |
|
Security |
Acquisition Date |
Cost |
|
GE Life & Annuity Assurance Co. |
4/6/00 |
$ 15,000,000 |
|
Goldman Sachs Group, Inc. |
6/14/00 |
$ 50,000,000 |
|
Jackson National Life Insurance Co. |
7/6/99 |
$ 7,000,000 |
|
Monumental Life Insurance Co.: |
9/17/98 |
$ 5,000,000 |
|
6.81%, 7/3/00 |
3/12/99 |
$ 5,000,000 |
|
New York Life Insurance Co.: |
12/20/99 |
$ 4,000,000 |
|
6.96%, 8/28/00 |
8/13/99 |
$ 5,000,000 |
|
Transamerica Occidental Life |
4/28/00 |
$ 10,000,000 |
|
Other Information |
|
The fund invested in securities that are not registered under the Securities Act of 1933. These securities are subject to legal or contractual restrictions on resale. At the end of the period, restricted securities (excluding Rule 144A issues) amounted to $101,000,000 or 5.0% of net assets. |
|
The fund participated in the interfund lending program as a lender. The average daily loan balance during the period for which loans were outstanding amounted to $10,351,708. The weighted average interest rate was 6.06%. Interest earned from the interfund lending program amounted to $41,853 and is included in interest income on the Statement of Operations. |
|
Income Tax Information |
|
At December 31, 1999, the fund had a capital loss carryforward of approximately $102,000 of which $1,000, $28,000 and $73,000 will expire on December 31, 2002, 2005 and 2007, respectively. |
See accompanying notes which are an integral part of the financial statements.
Money Market Portfolio
Statement of Assets and Liabilities
|
|
June 30, 2000 (Unaudited) |
|
|
Assets |
|
|
|
Investment in securities, at value (including repurchase |
|
$ 2,071,072,038 |
|
Receivable for fund shares sold |
|
3,301,546 |
|
Interest receivable |
|
11,922,327 |
|
Prepaid expenses |
|
40,981 |
|
Total assets |
|
2,086,336,892 |
|
Liabilities |
|
|
|
Payable to custodian bank |
$ 38,588 |
|
|
Payable for investments purchased |
24,986,250 |
|
|
Payable for fund shares redeemed |
27,396,441 |
|
|
Accrued management fee |
446,877 |
|
|
Other payables and accrued expenses |
113,146 |
|
|
Total liabilities |
|
52,981,302 |
|
Net Assets |
|
$ 2,033,355,590 |
|
Net Assets consist of: |
|
|
|
Paid in capital |
|
$ 2,033,466,514 |
|
Accumulated net realized gain (loss) on investments |
|
(110,924) |
|
Net Assets |
|
$ 2,033,355,590 |
|
Initial Class: |
|
$1.00 |
|
Service Class 2: |
|
$1.00 |
Statement of Operations
|
|
Six months ended June 30, 2000 (Unaudited) |
|
|
Interest Income |
|
$ 63,230,620 |
|
Expenses |
|
|
|
Management fee |
$ 2,332,410 |
|
|
Transfer agent fees |
695,684 |
|
|
Distribution fees |
117 |
|
|
Accounting fees and expenses |
97,285 |
|
|
Non-interested trustees' compensation |
3,231 |
|
|
Custodian fees and expenses |
21,274 |
|
|
Registration fees |
923 |
|
|
Audit |
13,574 |
|
|
Legal |
7,404 |
|
|
Miscellaneous |
71,873 |
|
|
Total expenses before reductions |
3,243,775 |
|
|
Expense reductions |
(217) |
3,243,558 |
|
Net interest income |
|
59,987,062 |
|
Net Realized Gain (Loss) |
|
(8,777) |
|
Net increase in net assets resulting from operations |
|
$ 59,978,285 |
|
Other Information |
|
|
|
Expense reductions |
|
$ 217 |
See accompanying notes which are an integral part of the financial statements.
Semiannual Report
Fidelity Variable Insurance Products: Money Market Portfolio
Financial Statements - continued
Statement of Changes in Net Assets
|
Increase (Decrease) in Net Assets |
Six months ended |
Year ended December 31, 1999 |
|
|
|
|
|
Operations |
$ 59,987,062 |
$ 89,685,301 |
|
Net realized gain (loss) |
(8,777) |
(73,427) |
|
Net increase (decrease) in net assets resulting from operations |
59,978,285 |
89,611,874 |
|
Distributions to shareholders from net interest income |
(59,987,062) |
(89,685,301) |
|
Share transactions - net increase (decrease) |
93,873,698 |
432,074,680 |
|
Total increase (decrease) in net assets |
93,864,921 |
432,001,253 |
|
Net Assets |
|
|
|
Beginning of period |
1,939,490,669 |
1,507,489,416 |
|
End of period |
$ 2,033,355,590 |
$ 1,939,490,669 |
|
Other Information: |
|
|
Six months ended
June 30, 2000 |
Year ended |
|
Share transactions at net asset value of $1.00 per share |
$ 3,072,502,306 |
$ 3,933,097,969 |
|
Reinvestment of distributions from net interest income |
60,021,807 |
88,893,196 |
|
Cost of shares redeemed |
(3,038,753,092) |
(3,589,916,485) |
|
Net increase (decrease) in net assets and shares |
$ 93,771,021 |
$ 432,074,680 |
|
Service Class 2 A |
$ 100,000 |
$ - |
|
Reinvestment of distributions from net interest income |
2,677 |
- |
|
Cost of shares redeemed |
- |
- |
|
Net increase (decrease) in net assets and shares |
$ 102,677 |
$ - |
|
Distributions |
$ (59,984,377) |
$ (89,685,301) |
|
Service Class 2 A |
(2,685) |
- |
|
Total |
$ (59,987,062) |
$ (89,685,301) |
A Service Class 2 commenced sale of shares January 12, 2000.
See accompanying notes which are an integral part of the financial statements.
Money Market Portfolio
Financial Highlights - Initial Class
|
|
Six months ended June 30, 2000 |
Years ended December 31, |
||||
|
|
(Unaudited) |
1999 |
1998 |
1997 |
1996 |
1995 |
|
Selected Per-Share Data |
|
|
|
|
|
|
|
Net asset value, beginning of period |
$ 1.000 |
$ 1.000 |
$ 1.000 |
$ 1.000 |
$ 1.000 |
$ 1.000 |
|
Income from Investment Operations |
.029 |
.050 |
.053 |
.053 |
.052 |
.057 |
|
Less Distributions |
|
|
|
|
|
|
|
From net interest income |
(.029) |
(.050) |
(.053) |
(.053) |
(.052) |
(.057) |
|
Net asset value, end of period |
$ 1.000 |
$ 1.000 |
$ 1.000 |
$ 1.000 |
$ 1.000 |
$ 1.000 |
|
Total Return B |
2.98% |
5.17% |
5.46% |
5.51% |
5.41% |
5.87% |
|
Ratios and Supplemental Data |
|
|
|
|
|
|
|
Net assets, end of period (000 omitted) |
$ 2,033,253 |
$ 1,939,491 |
$ 1,507,489 |
$ 1,020,794 |
$ 1,126,155 |
$ 808,874 |
|
Ratio of expenses to average net assets |
.32% A |
.27% |
.30% |
.31% |
.30% |
.33% |
|
Ratio of net interest income to average net assets |
5.93% A |
5.06% |
5.33% |
5.32% |
5.28% |
5.72% |
Financial Highlights - Service Class 2
|
|
Six months ended June 30, 2000 C |
|
|
(Unaudited) |
|
Selected Per-Share Data |
|
|
Net asset value, beginning of period |
$ 1.000 |
|
Income from Investment Operations |
|
|
Net interest income |
.027 |
|
Less Distributions |
|
|
From net interest income |
(.027) |
|
Net asset value, end of period |
$ 1.000 |
|
Total Return B |
2.71% |
|
Ratios and Supplemental Data |
|
|
Net assets, end of period (000 omitted) |
$ 103 |
|
Ratio of expenses to average net assets |
.57% A |
|
Ratio of net interest income to average net assets |
5.72% A |
A Annualized
B Total returns for periods of less than one year are not annualized and do not reflect charges attributable to your insurance company's separate account. Inclusion of these charges would reduce the total returns shown.
C For the period January 12, 2000 (commencement of sale of Service Class 2 shares) to June 30, 2000.
See accompanying notes which are an integral part of the financial statements.
Semiannual Report
For the period ended June 30, 2000 (Unaudited)
1. Significant Accounting Policies.
The Money Market Portfolio, High Income Portfolio, Equity-Income Portfolio, Growth Portfolio, and Overseas Portfolio (the funds) are funds of Variable Insurance Products Fund. Investment Grade Bond Portfolio, Asset Manager Portfolio, Asset Manager: Growth Portfolio, Index 500 Portfolio, and Contrafund Portfolio (the funds) are funds of Variable Insurance Products Fund II. Balanced Portfolio, Growth & Income Portfolio, Growth Opportunities Portfolio, and Mid Cap Portfolio (the funds) are funds of Variable Insurance Products Fund III. Variable Insurance Products Fund, Variable Insurance Products Fund II and Variable Insurance Products Fund III (the trusts) are registered under the Investment Company Act of 1940, as amended (the 1940 Act), as open-end management investment companies organized as Massachusetts business trusts. Each fund is authorized to issue an unlimited number of shares. Shares of each fund may only be purchased by insurance companies for the purpose of funding variable annuity or variable life insurance contracts. Each fund, except Money Market Portfolio, Index 500 Portfolio and Investment Grade Bond Portfolio, offers three classes of shares: the funds' original class of shares (Initial Class shares), Service Class shares and Service Class 2 shares. Each fund commenced sale of Service Class 2 shares on January 12, 2000. All classes have equal rights and voting privileges, except for matters affecting a single class. Investment income, realized and unrealized capital gains and losses, the common expenses of the fund, and certain fund-level expense reductions, if any, are allocated on a pro rata basis to each class based on the relative net assets of each class to the total net assets of the fund. Each class of shares differs in its respective distribution plan. On April 20, 2000, the Board of Trustees of Money Market Portfolio, Investment Grade Bond Portfolio, and Index 500 Portfolio approved the creation of Service Class, a new class of shares of Money Market Portfolio, Investment Grade Bond Portfolio, and Index 500 Portfolio. The Service Class shares of Money Market Portfolio, Investment Grade Bond Portfolio, and Index 500 Portfolio will be subject to an annual distribution and service fee of .10% of the class' average net assets. These shares are expected to be available on July 14, 2000.
The financial statements have been prepared in conformity with generally accepted accounting principles which require management to make certain estimates and assumptions at the date of the financial statements. The following summarizes the significant accounting policies of the funds:
Security Valuation:
Money Market Portfolio. As permitted under Rule 2a-7 of the 1940 Act, and certain conditions therein, securities are valued initially at cost and thereafter assume a constant amortization to maturity of any discount or premium.
Investment Grade Bond Portfolio. Securities are valued based upon a computerized matrix system and/or appraisals by a pricing service, both of which consider market transactions and dealer-supplied valuations. Securities (including restricted securities) for which market quotations are not readily available are valued at their fair value as determined in good faith under consistently applied procedures under the general supervision of the Board of Trustees. Short-term securities with remaining maturities of sixty days or less for which quotations are not readily available are valued at amortized cost or original cost plus accrued interest, both of which approximate current value.
High Income, Asset Manager and Balanced Portfolios. Equity securities for which quotations are readily available are valued at the last sale price, or if no sale price, at the closing bid price. Foreign equity securities are valued based on quotations from the principal market in which such securities are normally traded. If trading or events occurring in other markets after the close of the principal market in which foreign securities are traded, and before the close of the business of the funds, are expected to materially affect the value of those securities, then they are valued at their fair value taking this trading or these events into account. Fair value is determined in good faith under consistently applied procedures under the general supervision of the Board of Trustees. Debt securities for which quotations are readily available are valued by a pricing service at their market values as determined by their most recent bid prices in the principal market (sales prices if the principal market is an exchange) in which such securities are normally traded. Securities (including restricted securities) for which market quotations are not readily available are valued at their fair value. Short-term securities with remaining maturities of sixty days or less for which quotations are not readily available are valued at amortized cost or original cost plus accrued interest, both of which approximate current value.
Asset Manager: Growth, Equity-Income, Growth & Income, Index 500, Growth Opportunities, Contrafund, Growth and Mid Cap Portfolios. Securities for which exchange quotations are readily available are valued at the last sale price, or if no sale price, at the closing bid price. Foreign securities are valued based on quotations from the principal market in which such securities are normally traded. If trading or events occurring in other markets after the close of the principal market in which foreign securities are traded, and before the close of the business of the funds, are expected to materially affect the value of those securities, then they are valued at their fair value taking this trading or these events into account. Fair value is determined in good faith under consistently applied procedures under the general supervision of the Board of Trustees. Securities (including restricted securities) for which exchange quotations are not readily available (and in certain cases debt securities which trade on an exchange) are valued primarily using dealer-supplied valuations or at their fair value. Short-term securities with remaining maturities of sixty days or less for which quotations are not readily available are valued at amortized cost or original cost plus accrued interest, both of which approximate current value.
Semiannual Report
Notes to Financial Statements (Unaudited) - continued
1. Significant Accounting Policies - continued
Overseas Portfolio. Securities for which quotations are readily available are valued using the official closing price or at the last sale price in the principal market in which they are traded. If the last sale price (on the local exchange) is unavailable, the last evaluated quote or closing bid price normally is used. If trading or events occurring in other markets after the close of the principal market in which securities are traded are expected to materially affect the value of those securities, then they are valued at their fair value taking this trading or these events into account. Fair value is determined in good faith under consistently applied procedures under the general supervision of the Board of Trustees. Securities (including restricted securities) for which quotations are not readily available are valued primarily using dealer-supplied valuations or at their fair value. Short-term securities with remaining maturities of sixty days or less for which quotations are not readily available are valued at amortized cost or original cost plus accrued interest, both of which approximate current value.
Foreign Currency Translation. The accounting records of the funds are maintained in U.S. dollars. Investment securities and other assets and liabilities denominated in a foreign currency are translated into U.S. dollars at the prevailing rates of exchange at period end. Purchases and sales of securities, income receipts and expense payments are translated into U.S. dollars at the prevailing exchange rate on the respective dates of the transactions.
Net realized gains and losses on foreign currency transactions represent net gains and losses from sales and maturities of foreign currency contracts, disposition of foreign currencies, the difference between the amount of net investment income accrued and the U.S. dollar amount actually received, and gains and losses between trade and settlement date on purchases and sales of securities. The effects of changes in foreign currency exchange rates on investments in securities are included with the net realized and unrealized gain or loss on investment securities.
Income Taxes. As a qualified regulated investment company under Subchapter M of the Internal Revenue Code, each fund is not subject to U.S. federal income taxes to the extent that it distributes substantially all of its taxable income for its fiscal year. Each fund may be subject to foreign taxes on income and gains on investments which are accrued based upon each fund's understanding of the tax rules and regulations that exist in the markets in which they invest. Foreign governments may also impose taxes on other payments or transactions with respect to foreign securities. Each fund accrues such taxes as applicable. The schedules of investments include information regarding income taxes under the caption "Income Tax Information."
Investment Income:
Money Market Portfolio. Interest income, which includes amortization of premium and accretion of discount, is accrued as earned.
Investment Grade Bond, High Income, Asset Manager, Balanced, Asset Manager: Growth, Equity-Income, Growth & Income, Index 500, Growth Opportunities, Contrafund, Growth, Mid Cap and Overseas Portfolios. Dividend income is recorded on the ex-dividend date, except certain dividends from foreign securities where the ex-dividend date may have passed, which are recorded as soon as the funds are informed of the ex-dividend date. Non-cash dividends included in dividend income, if any, are recorded at the fair market value of the securities received. Interest income, which includes accretion of original issue discount, is accrued as earned. The funds may place a debt obligation on non-accrual status and reduce related interest income by ceasing current accruals and writing off interest receivables when the collection of all or a portion of interest has become doubtful based on consistently applied procedures, under the general supervision of the Board of Trustees of the funds. A debt obligation is removed from non-accrual status when the issuer resumes interest payments or when collectibility of interest is reasonably assured. Investment income is recorded net of foreign taxes withheld where recovery of such taxes is uncertain.
Expenses. Most expenses of each trust can be directly attributed to a fund. Expenses which cannot be directly attributed are apportioned among the funds in the trust.
Deferred Trustee Compensation. Under a Deferred Compensation Plan (the Plan) non-interested Trustees of certain funds must defer receipt of a portion of, and may elect to defer receipt of an additional portion of, their annual compensation. Deferred amounts are treated as though equivalent dollar amounts had been invested in a cross-section of other Fidelity funds. Deferred amounts remain in the funds until distributed in accordance with the Plan.
Distributions to Shareholders. Dividends are declared daily and paid monthly from net interest income for the Money Market Portfolio. Distributions are recorded on the ex-dividend date for all other funds. Income dividends and capital gain distributions are declared separately for each class.
Income and capital gain distributions are determined in accordance with income tax regulations which may differ from generally accepted accounting principles. These differences, which may result in distribution reclassifications, are primarily due to differing treatments for litigation proceeds, paydown gains/losses on certain securities, futures transactions, foreign currency transactions, passive foreign investment companies (PFIC), market discount, redemptions in kind, partnerships, non-taxable dividends, net operating losses, capital loss carryforwards and losses deferred due to wash sales.
Permanent book and tax basis differences relating to shareholder distributions will result in reclassifications to paid in capital. Undistributed net investment income, distributions in excess of net investment income and accumulated undistributed net realized gain (loss) on investments and foreign currency transactions may include temporary book and tax basis differences which will reverse in a subsequent period. Any taxable income or gain remaining at fiscal year end is distributed in the following year.
Semiannual Report
Notes to Financial Statements (Unaudited) - continued
1. Significant Accounting Policies - continued
Security Transactions. Security transactions are accounted for as of trade date. Gains and losses on securities sold are determined on the basis of identified cost.
2. Operating Policies.
Foreign Currency Contracts. Certain funds use foreign currency contracts to facilitate transactions in foreign-denominated securities. Losses may arise from changes in the value of the foreign currency or if the counterparties do not perform under the contracts' terms. The U.S. dollar value of foreign currency contracts is determined using contractual currency exchange rates established at the time of each trade.
Joint Trading Account. Pursuant to an Exemptive Order issued by the Securities and Exchange Commission (the SEC), certain funds, along with other affiliated entities of Fidelity Management & Research Company (FMR), may transfer uninvested cash balances into one or more joint trading accounts. These balances are invested in one or more repurchase agreements for U.S. Treasury or Federal Agency obligations.
Repurchase Agreements. The underlying U.S. Treasury, Federal Agency, or other obligations found to be satisfactory by FMR are transferred to an account of the funds, or to the Joint Trading Account, at a bank custodian. The securities are marked-to-market daily and maintained at a value at least equal to the principal amount of the repurchase agreement (including accrued interest). FMR, the funds' investment adviser, is responsible for determining that the value of the underlying securities remains in accordance with the market value requirements stated above.
Central Cash Funds. Pursuant to an Exemptive Order issued by the SEC, the funds may invest in the Taxable Central Cash Fund and the Central Cash Collateral Fund (the Cash Funds) managed by Fidelity Investments Money Management, Inc. (FIMM), an affiliate of FMR. The Cash Funds are open-end money market funds available only to investment companies and other accounts managed by FMR and its affiliates. The Cash Funds seek preservation of capital, liquidity, and current income. Income distributions from the Cash Funds are declared daily and paid monthly from net interest income. Income distributions earned by the funds are recorded as either interest income or security lending income in the accompanying financial statements.
Interfund Lending Program. Pursuant to an Exemptive Order issued by the SEC, the funds, along with other registered investment companies having management contracts with FMR, may participate in an interfund lending program. This program provides an alternative credit facility allowing the funds to borrow from, or lend money to, other participating funds. Information
regarding each fund's participation in the program is included under the caption "Other Information" at the end of each applicable fund's schedule of investments.
Delayed Delivery Transactions. Each fund may purchase or sell securities on a delayed delivery basis. Payment and delivery may take place after the customary settlement period for that security. The price of the underlying securities and the date when the securities will be delivered and paid for are fixed at the time the transaction is negotiated. The market values of the securities purchased on a delayed delivery basis are identified as such in each applicable fund's schedule of investments. Each fund may receive compensation for interest forgone in the purchase of a delayed delivery security. With respect to purchase commitments, each fund identifies securities as segregated in its records with a value at least equal to the amount of the commitment. Losses may arise due to changes in the market value of the underlying securities or if the counterparty does not perform under the contract.
Futures Contracts. Certain funds may use futures contracts to manage their exposure to the stock market and to fluctuations in currency values. Buying futures tends to increase a fund's exposure to the underlying instrument, while selling futures tends to decrease a fund's exposure to the underlying instrument or hedge other fund investments. Futures contracts involve, to varying degrees, risk of loss in excess of the futures variation margin reflected in each applicable fund's Statement of Assets and Liabilities. The underlying face amount at value of any open futures contracts at period end is shown in each applicable fund's schedule of investments under the caption "Futures Contracts." This amount reflects each contract's exposure to the underlying instrument at period end. Losses may arise from changes in the value of the underlying instruments or if the counterparties do not perform under the contracts' terms. Gains (losses) are realized upon the expiration or closing of the futures contracts. Futures contracts are valued at the settlement price established each day by the board of trade or exchange on which they are traded.
Restricted Securities. Certain funds are permitted to invest in securities that are subject to legal or contractual restrictions on resale. These securities generally may be resold in transactions exempt from registration or to the public if the securities are registered. Disposal of these securities may involve time-consuming negotiations and expense, and prompt sale at an acceptable price may be difficult. Information regarding restricted securities is included under the caption "Other Information" at the end of each applicable fund's schedule of investments.
Semiannual Report
Notes to Financial Statements (Unaudited) - continued
2. Operating Policies - continued
Loans and Other Direct Debt Instruments. Certain funds are permitted to invest in loans and loan participations, trade claims or other receivables. These investments may include standby financing commitments that obligate the fund to supply additional cash to the borrower on demand. Loan participations involve a risk of insolvency of the lending bank or other financial intermediary. At the end of the period, the following funds held investments in loans or other direct debt instruments:
|
|
Value |
% of Net Assets |
|
Asset Manager |
$58,533,087 |
1.3% |
|
Asset Manager: Growth |
$9,260,883 |
1.6% |
|
High Income |
$12,978,197 |
0.6% |
3. Purchases and Sales of Investments.
Information regarding purchases and sales of securities (other than short-term securities) and the market value of future contracts opened and closed, is included under the caption "Other Information" at the end of each applicable fund's schedule of investments.
4. Fees and Other Transactions with Affiliates.
Management Fee. As each fund's investment adviser, FMR receives a monthly fee.
For the Money Market Portfolio, FMR receives a monthly fee that is calculated on the basis of a group fee rate plus a fixed individual fund fee rate applied to the average net assets of the fund and an income-based fee. The group fee rate is the weighted average of a series of rates and is based on the monthly average net assets of all the mutual funds advised by FMR. The rates ranged from .0920% to .3700% for the period. The annual individual fund fee rate is .03%. In the event that these rates were lower than the contractual rates in effect during the period, FMR voluntarily implemented the above rates, as they resulted in the same or a lower management fee. The income-based fee is added only when the fund's gross yield exceeds 5%. At that time the income-based fee would equal 6% of that portion of the fund's gross income that represents a gross yield of more than 5% per year. The maximum income-based component is .24% of average net assets. For the period, the total management fee was equivalent to an annualized rate of .23%. The income-based portion of this fee was equal to $755,805, or an annualized rate of .07% of the fund's average net assets.
For the Index 500 Portfolio, FMR receives a fee that is computed daily at an annual rate of .24% of the fund's average net assets.
For all the other funds, FMR receives a monthly fee that is calculated on the basis of a group fee rate plus a fixed individual fund fee rate applied to the average net assets of each fund. The group fee rate is the weighted average of a series of rates and is based on the monthly average net assets of all the mutual funds advised by FMR. The rates ranged from .0920% to .3700% for the period for the Investment Grade Bond and High Income Portfolios and .2167% to .5200% for the period for the Asset Manager, Balanced, Asset Manager: Growth, Equity-Income, Growth & Income, Growth Opportunities, Contrafund, Growth, Mid Cap and Overseas Portfolios for the period. The annual individual fund fee rate is .30% for Investment Grade Bond, Asset Manager: Growth, Growth Opportunities, Contrafund, Growth, and Mid Cap Portfolios, .45% for High Income and Overseas Portfolios, .25% for Asset Manager Portfolio, .15% for Balanced Portfolio, and .20% for Equity-Income and Growth & Income Portfolios. In the event that these rates were lower than the contractual rates in effect during the period, FMR voluntarily implemented the above rates, as they resulted in the same or a lower management fee.
For the period, each fund's management fee was equivalent to the following annualized rates expressed as a percentage of average net assets:
|
Money Market |
.23% |
|
Investment Grade Bond |
.43% |
|
High Income |
.58% |
|
Asset Manager |
.53% |
|
Balanced |
.43% |
|
Asset Manager: Growth |
.58% |
|
Equity-Income |
.48% |
|
Growth & Income |
.48% |
|
Index 500 |
.24% |
|
Growth Opportunities |
.58% |
|
Contrafund |
.57% |
|
Growth |
.57% |
|
Mid Cap |
.56% |
|
Overseas |
.72% |
Sub-Adviser Fee. As the Money Market and Investment Grade Bond Portfolios' investment sub-adviser, FIMM, a wholly owned subsidiary of FMR, receives a fee from FMR of 50% of the management fee payable to FMR. The fee is paid prior to any voluntary expense reimbursements which may be in effect.
FMR, on behalf of the Overseas Portfolio, entered into sub-advisory agreements with Fidelity Management & Research (U.K.) Inc., Fidelity Management & Research (Far East) Inc., and Fidelity International Investment Advisors (FIIA). Under the sub-advisory arrangements, FMR may receive investment advice and research services and may grant the sub-advisers investment management authority to buy and sell securities. FMR pays its sub-advisers either a portion of its management fee or a fee based on costs incurred for these services.
Semiannual Report
Notes to Financial Statements (Unaudited) - continued
FMR and Index 500 Portfolio entered into a sub-advisory agreement with Bankers Trust Company (Bankers Trust). Bankers Trust receives a sub-advisory fee for providing investment management and custodial services to the fund. For these services, FMR pays Bankers Trust fees at an annual rate of 0.006% of the fund's average net assets.
Semiannual Report
Notes to Financial Statements (Unaudited) - continued
4. Fees and Other Transactions with Affiliates - continued
Sub-Adviser Fee - continued
Under a separate securities lending agreement with Bankers Trust, Index 500 Portfolio receives at least 70% of net income from the securities lending program. Bankers Trust retains no more than 30% of net income under this agreement. For the period, Bankers Trust retained $90,941.
Distribution and Service Plan. In accordance with Rule 12b-1 of the 1940 Act, the Board of Trustees has adopted separate Distribution and Service Plans with respect to each class of shares (collectively referred to as "the Plans"). Under certain of the Plans, the class pays Fidelity Distributors Corporation (FDC), an affiliate of FMR, a 12b-1 fee. For the period, this fee is based on an annual rate of .10% of Service Class' average net assets and .25% of Service Class 2's average net assets. Initial Class shares are not subject to a 12b-1 fee.
For the period, each class paid FDC the following amounts, all of which were reallowed to insurance companies, for the distribution of shares and providing shareholder support services:
|
Money Market |
|
|
Service Class 2 |
$ 117 |
|
Investment Grade Bond |
|
|
Service Class 2 |
121 |
|
High Income |
|
|
Service Class |
126,071 |
|
Service Class 2 |
250 |
|
Asset Manager |
|
|
Service Class |
12,967 |
|
Service Class 2 |
195 |
|
Balanced |
|
|
Service Class |
13,703 |
|
Service Class 2 |
213 |
|
Asset Manager: Growth |
|
|
Service Class |
5,971 |
|
Service Class 2 |
204 |
|
Equity-Income |
|
|
Service Class |
221,204 |
|
Service Class 2 |
4,873 |
|
Index 500 |
|
|
Service Class 2 |
116 |
|
Growth & Income |
|
|
Service Class |
64,293 |
|
Service Class 2 |
492 |
|
Growth Opportunities |
|
|
Service Class |
170,539 |
|
Service Class 2 |
934 |
|
Contrafund |
|
|
Service Class |
472,035 |
|
Service Class 2 |
12,537 |
|
Growth |
|
|
Service Class |
650,795 |
|
Service Class 2 |
1,896 |
|
Mid Cap |
|
|
Service Class |
36,074 |
|
Service Class 2 |
8,716 |
|
Overseas |
|
|
Service Class |
99,503 |
|
Service Class 2 |
583 |
Transfer Agent Fees. Fidelity Investment Institutional Operations Company (FIIOC), an affiliate of FMR, is the funds' transfer, dividend disbursing and shareholder servicing agent. FIIOC receives account fees and asset-based fees that vary according to account size and type of account. FIIOC pays a portion of the expenses related to the typesetting, printing and mailing of shareholder reports, except proxy statements.
For the period, each funds' transfer agent fees were equivalent to the following annualized rates expressed as a percentage of average net assets:
|
MONEY MARKET |
.07% |
|
INVESTMENT GRADE BOND |
.07% |
|
HIGH INCOME |
.07% |
|
ASSET MANAGER |
.07% |
|
BALANCED |
.07% |
|
ASSET MANAGER: GROWTH |
.07% |
|
EQUITY-INCOME |
.07% |
|
GROWTH & INCOME |
.07% |
|
INDEX 500 |
.07% |
|
GROWTH OPPORTUNITIES |
.07% |
|
CONTRAFUND |
.07% |
|
GROWTH |
.07% |
|
MID CAP |
.08% |
|
OVERSEAS |
.07% |
Semiannual Report
Notes to Financial Statements (Unaudited) - continued
4. Fees and Other Transactions with Affiliates - continued
Transfer Agent Fees - continued
For the period, each class paid the following amounts:
|
Money Market |
|
|
Initial Class |
$ 695,651 |
|
Service Class 2 |
33 |
|
Investment Grade Bond |
|
|
Initial Class |
207,145 |
|
Service Class 2 |
33 |
|
High Income |
|
|
Initial Class |
655,017 |
|
Service Class |
83,102 |
|
Service Class 2 |
96 |
|
Asset Manager |
|
|
Initial Class |
1,526,085 |
|
Service Class |
8,951 |
|
Service Class 2 |
42 |
|
Balanced |
|
|
Initial Class |
92,789 |
|
Service Class |
9,127 |
|
Service Class 2 |
55 |
|
Asset Manager: Growth |
|
|
Initial Class |
179,131 |
|
Service Class |
4,189 |
|
Service Class 2 |
61 |
|
Equity-Income |
|
|
Initial Class |
3,206,951 |
|
Service Class |
146,559 |
|
Service Class 2 |
1,525 |
|
Index 500 |
|
|
Initial Class |
1,638,142 |
|
Service Class 2 |
33 |
|
Growth & Income |
|
|
Initial Class |
351,138 |
|
Service Class 2 |
43,630 |
|
Service Class 2 |
132 |
|
Growth Opportunities |
|
|
Initial Class |
417,276 |
|
Service Class |
113,605 |
|
Service Class 2 |
426 |
|
Contrafund |
|
|
Initial Class |
2,952,107 |
|
Service Class |
316,815 |
|
Service Class 2 |
3,771 |
|
Growth |
|
|
Initial Class |
5,897,805 |
|
Service Class |
451,666 |
|
Service Class 2 |
848 |
|
Mid Cap |
|
|
Initial Class |
13,418 |
|
Service Class |
27,121 |
|
Service Class 2 |
2,882 |
|
Overseas |
|
|
Initial Class |
925,813 |
|
Service Class |
69,985 |
|
Service Class 2 |
301 |
Accounting and Security Lending Fees. Fidelity Service Company, Inc. (FSC), an affiliate of FMR, maintains each fund's accounting records and administers the security lending program. The security lending fee is based on the number and duration of lending transactions. The accounting fee is based on the level of average net assets for the month plus out-of-pocket expenses.
Money Market Insurance. Pursuant to an Exemptive Order issued by the the SEC, the Money Market Portfolio, along with other money market funds advised by FMR or its affiliates, has entered into insurance agreements with FIDFUNDS Mutual Limited (FIDFUNDS), an affiliated mutual insurance company. FIDFUNDS provides limited coverage for certain loss events including issuer default as to payment of principal or interest and bankruptcy or insolvency of a credit enhancement provider. The insurance does not cover losses resulting from changes in interest rates, ratings downgrades or other market conditions. The fund may be subject to a special assessment of up to approximately 2.5 times the fund's annual gross premium if covered losses exceed certain levels. During the period, the fund paid premiums of $81,961 for the calendar year 2000 to FIDFUNDS, which are being amortized over one year.
Brokerage Commissions. Certain funds placed a portion of their portfolio transactions with brokerage firms which are affiliates of FMR. The commissions paid to these affiliated firms are shown under the caption "Other Information" at the end of each applicable fund's schedule of investments.
5. Security Lending.
Certain funds lend portfolio securities from time to time in order to earn additional income. Each applicable fund receives collateral (in the form of U.S. Treasury obligations, letters of credit and/or cash) against the loaned securities and maintains collateral in an amount not less than 100% of the market value of the loaned securities during the period of the loan. The market value of the loaned securities is determined at the close of business of the funds and any additional required collateral is delivered to the funds on the next business day. If the borrower defaults on its obligation to return the securities loaned because of insolvency or other reasons, a fund could experience delays and costs in recovering the securities loaned or in gaining access to the collateral. Information regarding the value of securities loaned and the value of collateral at period end is included under the caption "Other Information" at the end of each applicable fund's schedule of investments.
Semiannual Report
Notes to Financial Statements (Unaudited) - continued
6. Bank Borrowings.
Each fund is permitted to have bank borrowings for temporary or emergency purposes to fund shareholder redemptions. Each fund has established borrowing arrangements with certain banks. The interest rate on the borrowings is the bank's base rate, as revised from time to time. Information regarding a fund's participation in the program is included under the caption "Other Information" at the end of each applicable fund's schedule of investments.
7. Expense Reductions.
FMR voluntarily agreed to reimburse Index 500 Portfolio's operating expenses (excluding interest, taxes, brokerage commissions, extraordinary expenses and sub-advisory fees paid by the fund associated with securities lending) above an annualized rate of .28% of average net assets for Initial Class and .53% of average net assets for Service Class 2.
FMR has directed certain portfolio trades to brokers who paid a portion of certain fund's expenses.
In addition, through arrangements with certain funds' custodians, credits realized as a result of uninvested cash balances were used to reduce a portion of each applicable fund's expenses.
For the period, the reductions under these arrangements are shown under the caption "Other Information" on each applicable fund's Statement of Operations.
8. Beneficial Interest.
At the end of the period, Fidelity Investments Life Insurance Company (FILI) and its subsidiaries, affiliates of FMR, were the record owners of more than 5% of the outstanding shares, and certain unaffiliated insurance companies were record owners of 10% or more of the total outstanding shares of the following funds:
|
|
FILI |
UNAFFILIATED INSURANCE COMPANIES |
|
|
FUND |
% OF OWNERSHIP |
# OF |
% OF OWNERSHIP |
|
MONEY MARKET |
64% |
0 |
0% |
|
INVESTMENT GRADE BOND |
31% |
2 |
21% |
|
HIGH INCOME |
11% |
2 |
61% |
|
ASSET MANAGER |
18% |
1 |
22% |
|
BALANCED |
36% |
1 |
52% |
|
ASSET MANAGER: GROWTH |
63% |
1 |
10% |
|
EQUITY-INCOME |
12% |
2 |
39% |
|
GROWTH & INCOME |
40% |
3 |
42% |
|
INDEX 500 |
27% |
1 |
13% |
|
GROWTH OPPORTUNITIES |
15% |
1 |
66% |
|
CONTRAFUND |
20% |
2 |
34% |
|
GROWTH |
13% |
1 |
29% |
|
MID CAP |
44% |
1 |
28% |
|
OVERSEAS |
14% |
1 |
33% |
9. Transactions with Affiliated Companies.
An affiliated company is a company which the fund has ownership of at least 5% of the voting securities. Information regarding transactions with affiliated companies is included under "Legend" at the end of each applicable fund's schedule of investments.
Semiannual Report
Semiannual Report
Investment Adviser
Fidelity Management & Research Company
Boston, MA
Investment Sub-Advisers
Fidelity Investments Money Management, Inc.
Money Market, Asset Manager, Balanced, Investment
Grade Bond and Asset Manager: Growth Portfolios
Fidelity Management & Research (U.K.) Inc.
High Income, Mid Cap, Asset Manager, Asset Manager:
Growth, Contrafund, Balanced, Growth Opportunities,
Growth & Income, and Overseas Portfolios
Fidelity Management & Research (Far East) Inc.
High Income, Mid Cap, Asset Manager, Asset Manager:
Growth, Contrafund, Balanced, Growth Opportunities,
Growth & Income, and Overseas Portfolios
Fidelity International Investment Advisors
Overseas Portfolio
Fidelity International Investment Advisors (U.K.) Limited
Overseas Portfolio
Fidelity Investments Japan Limited
High Income, Mid Cap, Asset Manager, Asset Manager:
Growth, Contrafund, Balanced, Growth Opportunities,
Growth & Income, and Overseas Portfolios
Bankers Trust
Index 500 Portfolio
Officers
Edward C. Johnson 3d, President
Robert C. Pozen, Senior Vice President
Abigail P. Johnson, Vice President - Growth, Mid Cap,
Contrafund and Growth Opportunities Portfolios
Richard A. Spillane, Jr., Vice President - Equity-Income,
Overseas, Balanced and Growth & Income Portfolios
Dwight D. Churchill, Vice President -
Money Market and Investment Grade Bond Portfolios
Boyce I. Greer, Vice President - Money Market Portfolio
Robert A. Lawrence, Vice President - Index 500, Asset Manager, Asset Manager: Growth and High Income Portfolios
David L. Murphy, Vice President - Investment Grade Bond Portfolio
John Avery, Vice President - Balanced Portfolio
Barry J. Coffman, Vice President - High Income Portfolio
William Danoff, Vice President - Contrafund Portfolio
Robert K. Duby, Vice President - Money Market Portfolio
David Felman, Vice President - Mid Cap Portfolio
Kevin E. Grant, Vice President - Investment Grade Bond
and Balanced Portfolios
Bart A. Grenier, Vice President - Asset Manager
and Asset Manager: Growth Portfolios
Richard R. Mace, Jr., Vice President - Overseas Portfolio
Charles S. Morrison II, Vice President - Asset Manager
and Asset Manager: Growth Portfolios
Stephen R. Petersen, Vice President - Equity-Income Portfolio
John J. Todd, Vice President - Asset Manager
and Asset Manager: Growth Portfolios
Jennifer Uhrig, Vice President - Growth Portfolio
Bettina Doulton, Vice President -
Growth Opportunities Portfolio
Steven J. Snider, Vice President - Asset Manager
and Asset Manager: Growth Portfolios
Jason L. Weiner, Vice President - Contrafund Portfolio
Eric D. Roiter, Secretary
Robert A Dwight, Treasurer
Maria F. Dwyer, Deputy Treasurer
Stanley N. Griffith, Assistant Vice President - Money Market
and Investment Grade Bond Portfolios
John H. Costello, Assistant Treasurer
Thomas J. Simpson, Assistant Treasurer - Money Market
and Investment Grade Bond Portfolios
Board of Trustees
Ralph F. Cox *
Phyllis Burke Davis *
Robert M. Gates *
Edward C. Johnson 3d
Donald J. Kirk *
Ned C. Lautenbach *
Peter S. Lynch
Marvin L. Mann *
William O. McCoy *
Gerald C. McDonough *
Robert C. Pozen
Thomas R. Williams *
Advisory Board
J. Michael Cook
Marie L. Knowles
General Distributor
Fidelity Distributors Corporation
Boston, MA
Transfer and Shareholder Servicing Agent
Fidelity Investments Institutional Operations Co., Inc.
Boston, MA
Custodian
The Bank of New York, New York, NY
Money Market, Investment Grade Bond and
High Income Portfolios
The Chase Manhattan Bank, New York, NY
Equity-Income, Asset Manager, Asset Manager: Growth,
Growth & Income, Balanced and Overseas Portfolios
Brown Brothers Harriman & Co., Boston, MA
Growth, Growth Opportunities, Mid Cap
and Contrafund Portfolios
Bankers Trust, New York, NY
Index 500 Portfolio
* Independent trustees
VIPSC2-SANN-0800 109456
1.744747.100
|
|