
|
|
|
|
|
|
|
|
|
(2_fidelity_logos)Fidelity®
Semiannual Report
June 30, 2000
REHIFII-SANN-0800 108625
1.723907.101
|
Performance |
3 |
How the fund has done over time. |
|
Fund Talk |
4 |
The manager's review of fund performance, strategy and outlook. |
|
Investments |
5 |
A complete list of the fund's investments with their market values. |
|
Financial Statements |
9 |
Statements of assets and liabilities, operations, and changes in net assets, as well as financial highlights. |
|
Notes |
11 |
Notes to the financial statements. |
|
|
|
|
Standard & Poor's, S&P and S&P 500 are registered service marks of The McGraw-Hill Companies, Inc. and have been licensed for use by Fidelity Distributors Corporation.
Other third party marks appearing herein are the property of their respective owners.
All other marks appearing herein are registered or unregistered trademarks or service marks of FMR Corp. or an affiliated company.
(Recycle graphic) This report is printed on recycled paper using soy-based inks.
This report and the financial statements contained herein are submitted for the general information of the shareholders of the fund. This report is not authorized for distribution to prospective investors in the fund unless preceded or accompanied by an effective prospectus.
Mutual fund shares are not deposits or obligations of, or guaranteed by, any depository institution. Shares are not insured by the FDIC, Federal Reserve Board or any other agency, and are subject to investment risks, including possible loss of principal amount invested.
Neither the fund nor Fidelity Distributors Corporation is a bank.
For more information on the fund, including charges and expenses, call Jeff Gandel at 617-563-6414 for a free prospectus. Read it carefully before you invest or send money.
Semiannual Report
There are several ways to evaluate a fund's historical performance. You can look at the total percentage change in value, the average annual percentage change or the growth of a hypothetical $100,000 investment. Total return reflects the change in the value of an investment, assuming reinvestment of the fund's dividend income and capital gains (the profits earned upon the sale of securities that have grown in value).
Cumulative Total Returns
|
Periods ended June 30, 2000 |
Past 6 |
Past 1 |
Life of |
|
Fidelity Real Estate High Income II |
13.27% |
4.90% |
36.11% |
|
ML High Yield Master |
-1.19% |
-1.37% |
22.13% |
|
NAREIT Index |
13.04% |
0.74% |
n/a* |
|
Real Estate Funds Average |
12.66% |
2.10% |
n/a* |
Cumulative total returns show the fund's performance in percentage terms over a set period - in this case, six months, one year or since the fund started on September 27, 1996. For example, if you had invested $1,000 in a fund that had a 5% return over the past year, the value of your investment would be $1,050. You can compare the fund's return to the performance of the Merrill Lynch High Yield Master Index - a market value-weighted index of all domestic and yankee high-yield bonds. Issues included in the index have maturities of one year or more and have a credit rating lower than BBB-/Baa3, but are not in default. You can also compare the fund's returns to the performance of the National Association of Real Estate Investment Trusts (NAREIT) Index - a market capitalization-weighted index that tracks the common shares of all tax-qualified Real Estate Investment Trusts listed on the New York Stock Exchange, American Stock Exchange, and NASDAQ. To measure how the fund's performance stacked up against its peers, you can compare it to the real estate funds average, which reflects the performance of mutual funds with similar objectives tracked by Lipper Inc. The past six months average represents a peer group of 144 mutual funds. These benchmarks include reinvested dividends and capital gains, if any, and exclude the effect of sales charges.
Average Annual Total Returns
|
Periods ended June 30, 2000 |
Past 1 |
Life of |
|
Fidelity Real Estate High Income II |
4.90% |
8.55% |
|
ML High Yield Master |
-1.37% |
5.46% |
|
NAREIT Index |
0.74% |
n/a* |
|
Real Estate Funds Average |
2.10% |
n/a* |
Average annual total returns take the fund's cumulative return and show you what would have happened if the fund had performed at a constant rate each year. (Note: Lipper calculates average annual total returns by annualizing each fund's total return, then taking an arithmetic average. This may produce a different figure than that obtained by averaging the cumulative total returns and annualizing the result.)
* Not available
$100,000 Over Life of Fund
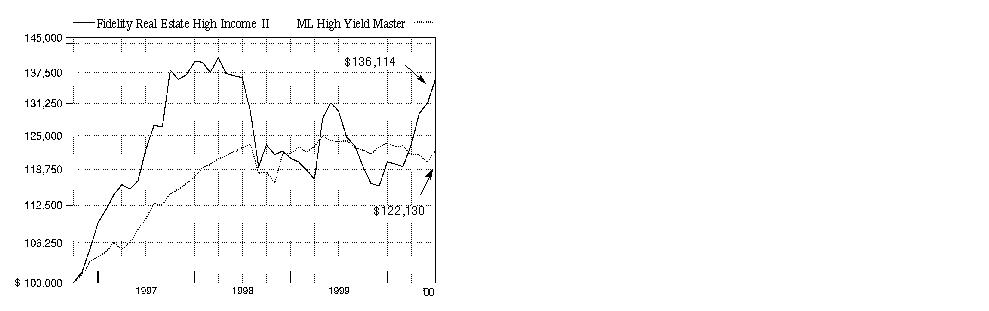
$100,000 Over Life of Fund: Let's say hypothetically that $100,000 was invested in Fidelity Real Estate High Income Fund II on September 27, 1996, when the fund started. As the chart shows, by June 30, 2000, the value of the investment would have grown to $136,114 - a 36.11% increase on the initial investment. For comparison, look at how the Merrill Lynch High Yield Master Index did over the same period. With dividends reinvested, the same $100,000 investment would have grown to $122,130 - a 22.13% increase.
Understanding Performance
How a fund did yesterday is no guarantee of how it will do tomorrow. The stock market, for example, has a history of long-term growth and short-term volatility. In turn, the share price and return of a fund that invests in stocks or bonds will vary. That means if you sell your shares during a market downturn, you might lose money. But if you can ride out the market's ups and downs, you may have a gain.
3Semiannual Report
An interview with Mark Snyderman, Portfolio Manager of Fidelity Real Estate High Income Fund II
Q. How did the fund perform, Mark?
A. For the six months that ended June 30, 2000, the fund returned 13.27%. During the same period, the NAREIT Index, maintained by the National Association of Real Estate Investment Trusts, returned 13.04%, while the real estate funds average returned 12.66% according to Lipper Inc. The fund also outpaced the Merrill Lynch High Yield Master Index, a broad measure of the high-yield bond market, which returned -1.19%. For the 12-month period that ended June 30, 2000, the fund returned 4.90%, while the NAREIT Index, Lipper real estate funds average and Merrill Lynch index returned 0.74%, 2.10% and -1.37%, respectively.
Q. What factors helped the fund perform in line with the NAREIT Index and outperform the Lipper average and Merrill Lynch index during the past six months?
A. A rebound in the real estate investment trust (REIT) market benefited the fund given its heavy concentration in this sector. The fund's focus on larger REITs with strong dividend growth prospects and good management helped keep it on par with the performance of the NAREIT Index during the period. REITs had been beaten up pretty badly during 1998 and 1999, but bounced back during the past six months, in part due to a significant correction in much-loved technology stocks beginning in March that sent investors to more attractively valued areas of the marketplace. This cool-down in the technology sector helped boost demand for REITs, which generally had been trading at big discounts relative to the price of their underlying assets. The fund's underweighting in retail properties - which typically suffer during a rising interest rate/slowing growth environment - probably contributed to its better performance than the Lipper average. Compared to the Merrill Lynch index, the fund's significant exposure to better-performing REITs and commercial mortgage-backed securities (CMBS) helped it outperform.
Q. What were some of the other components of your investment strategy?
A. I continued to carry a modest overweighting in apartment REITs and a significant underweighting in retail REITs. I think apartments perform better in an economy of rising interest rates - an environment that creates more demand for apartments as home mortgages get less affordable. Similarly, retail REITs tend to perform worse in a less-buoyant environment due to less consumer spending. I also gradually increased my weighting in health-care facility companies. These REITs have very high yields and I expect them to recover a bit in price in the future as their business environment improves.
Q. How did the fund's holdings in CMBS contribute to performance?
A. The fund benefited from steady spreads for high-yield CMBS, participating in several "credit wins"- owning several bonds where the credit improved appreciably - and a favorable environment for real estate-related securities in general. Though spreads for high-yield CMBS did not tighten during the period, they performed better than the broader high-income benchmark because of the overall weakness in high-yield corporate bonds. A continued scarcity of issuance in the CMBS market - due to rising interest rates - helped spreads remain at stable levels, which played to our strengths of credit analysis and property evaluation.
Q. What specific holdings helped boost performance? Which disappointed?
A. The fund's position in large, well-managed companies with strong earnings growth - such as Equity Office, Starwood Hotels & Resorts and Apartment Investment & Management - led the way, as the fundamentals of these companies turned out better than people had expected. Turning to CMBS, one of the top performers was RTC91 M2 A3, a security backed by a southern California multi-family dwelling that we bought some time ago when people doubted its good credit. We sold it at a good price after its cash flows bounced back up and its credit turned out to be better than expected. On the down side, Canadian apartment company Boardwalk Equities hurt the fund, as rents didn't grow quite as fast as the market expected. Additionally, the fund's holdings in health care REITs, such as LTC Properties, underperformed due to the rising cost of nursing labor, and because the reimbursement scheme for Medicare switched, creating margin pressure for the operators.
Q. What's your outlook?
A. I'm optimistic that the growth we've seen in the fund's real estate-related investments during the past six months was warranted by the fundamentals. In my view, there could be another 10%-20% jump in REIT stock prices going forward before they are fairly valued. However, that growth could be tempered by any significant drop in the Standard & Poor's 500SM Index. In the REIT sector, I will continue to focus on companies with better-than-average earnings growth prospects and increasing dividend yields. In terms of CMBS, I think spreads will remain stable, allowing us to capitalize on our credit analysis and obtain our share of credit wins over time.
The views expressed in this report reflect those of the portfolio manager only through the end of the period of the report as stated on the cover and do not necessarily represent the views of Fidelity or any other person in the Fidelity organization. Any such views are subject to change at any time based upon market or other conditions and Fidelity disclaims any responsibility to update such views. These views may not be relied on as investment advice and, because investment decisions for a Fidelity fund are based on numerous factors, may not be relied on as an indication of trading intent on behalf of any Fidelity fund.
Fund Facts
Goal: to provide high current income by investing primarily in commercial mortgage-backed securities and real estate investment trusts
Start date: September 27, 1996
Size: as of June 30, 2000, more than
$369 million
Manager: Mark Snyderman, since inception; joined Fidelity in 1994
3Semiannual Report
Fidelity Real Estate High Income Fund II
(Unaudited)
Showing Percentage of Net Assets
|
Corporate Bonds - 0.3% |
|||||
|
Moody's Ratings (unaudited) (b) |
Principal Amount |
Value |
|||
|
Convertible Bonds - 0.2% |
|||||
|
CONSTRUCTION & REAL ESTATE - 0.2% |
|||||
|
Real Estate Investment Trusts - 0.2% |
|||||
|
Rockefeller Center Properties, Inc. 0% 12/31/00 |
- |
|
$ 1,000,000 |
$ 850,000 |
|
|
Nonconvertible Bonds - 0.1% |
|||||
|
MEDIA & LEISURE - 0.1% |
|||||
|
Lodging & Gaming - 0.1% |
|||||
|
ShoLodge, Inc.: |
|
|
|
|
|
|
9.55% 9/1/07 |
Caa2 |
|
80,000 |
52,000 |
|
|
9.75% 11/1/06 |
Caa2 |
|
515,000 |
334,750 |
|
|
|
386,750 |
||||
|
TOTAL CORPORATE BONDS (Cost $1,405,847) |
1,236,750 |
||||
|
Asset-Backed Securities - 0.2% |
|||||
|
|
|||||
|
Saxon Asset Securities Trust: |
|
|
|
|
|
|
8% 12/25/27 (d) |
BB |
|
400,000 |
349,063 |
|
|
8.6% 12/25/27 (d) |
B |
|
345,000 |
286,454 |
|
|
TOTAL ASSET-BACKED SECURITIES (Cost $573,925) |
635,517 |
||||
|
Collateralized Mortgage Obligations - 0.3% |
|||||
|
|
|||||
|
Private Sponsor - 0.3% |
|||||
|
Credit-Based Asset Servicing and Securitization LLC Series 1997-2: |
|
|
|
|
|
|
Class 2B, 7.1786% 12/29/25 (c)(d)(e) |
Ba3 |
|
671,881 |
323,973 |
|
|
Class 2C, 7.1786% 12/29/25 (c)(d)(e) |
B3 |
|
2,550,000 |
698,859 |
|
|
TOTAL COLLATERALIZED (Cost $1,095,452) |
1,022,832 |
||||
|
Commercial Mortgage Securities - 6.5% |
|||||
|
|
|||||
|
Artesia Mortgage CMBS, Inc. Series 1998 C1: |
|
|
|
|
|
|
Class G, 6.871% 10/25/31 (d)(e) |
- |
|
999,248 |
561,257 |
|
|
Class NR, 6.423% 10/25/31 (d)(e) |
- |
|
1,499,623 |
397,459 |
|
|
|
|||||
|
Moody's Ratings (unaudited) (b) |
Principal Amount |
Value |
|||
|
BKB Commercial Mortgage Trust Series 1997-C1: |
|
|
|
|
|
|
Class G, 7.7606% 4/27/09 (d)(e) |
CCC |
|
$ 1,790,500 |
$ 1,145,920 |
|
|
Class H, 3.3388% 10/25/22 (d)(e) |
- |
|
1,803,572 |
360,714 |
|
|
Blaylock Mortgage Capital Corp. Series 1997-A: |
|
|
|
|
|
|
Class B5, 6.425% 10/15/03 (d) |
B- |
|
250,000 |
178,438 |
|
|
Class B6, 6.425% 10/15/03 (d) |
CCC |
|
250,000 |
138,438 |
|
|
Class B7, 6.425% 10/15/03 (d) |
- |
|
335,000 |
138,606 |
|
|
DLJ Mortgage Acceptance Corp. Series 1994-MF4 Class C, 8.5% 4/18/01 (d) |
- |
|
1,046,000 |
962,320 |
|
|
First Chicago/Lennar Trust I Series 1997-CHL1 Class E, 8.0835% 4/1/39 (e) |
- |
|
4,000,000 |
2,846,250 |
|
|
FMAC Loan Receivables Trust: |
|
|
|
|
|
|
Series 1997-A Class F, 8.1104% 4/15/19 (d)(e) |
- |
|
919,984 |
581,027 |
|
|
Series 1998-A Class E, 7.9315% 9/15/20 (d)(e) |
BB |
|
2,500,000 |
1,025,000 |
|
|
General Motors Acceptance Corp. Commercial Mortgage Securities, Inc. Series 1996-C1 Class F, 7.86% 10/15/28 (d) |
Ba3 |
|
1,000,000 |
804,219 |
|
|
Kidder Peabody Acceptance Corp. I Series 1994-M1 Class D, 8.1284% 7/25/01 (d)(e) |
- |
|
1,914,000 |
1,557,518 |
|
|
LB Multifamily Mortgage Trust Series 1991-4 Class A1, 8.125% 4/25/21 (e) |
Caa1 |
|
374,791 |
299,833 |
|
|
Meritor Mortgage Security Corp. Series 1987 1 Class B, 9.4% 2/1/10 (c)(d) |
- |
|
12,919,000 |
1,114,910 |
|
|
Morgan (JP) Commercial Mortgage Finance Corp. Series 1997 C4 Class NR, 7.38% 12/26/28 (d) |
- |
|
4,885,341 |
1,438,886 |
|
|
Nomura Depositor Trust floater Series 1998-ST1A Class B2, 10.9013% 1/15/03 (d)(e) |
- |
|
2,500,000 |
2,315,235 |
|
|
Resolution Trust Corp.: |
|
|
|
|
|
|
floater Series 1991-M2 Class A1, 7.7372% 9/25/20 (e) |
Baa3 |
|
196,949 |
169,376 |
|
|
Series 1991-M2 Class A2, 7.132% 9/25/20 (e) |
Baa3 |
|
1,186,501 |
996,661 |
|
|
Structured Asset Securities Corp.: |
|
|
|
|
|
|
Series 1995-C1 Class F, 7.375% 9/25/24 (d) |
- |
|
3,000,000 |
2,382,656 |
|
|
Commercial Mortgage Securities - continued |
|||||
|
Moody's Ratings (unaudited) (b) |
Principal Amount |
Value |
|||
|
Structured Asset Securities Corp.: - continued |
|
|
|
|
|
|
Series 1996-CFL: |
|
|
|
|
|
|
Class G, 7.75% 2/25/28 (d) |
B+ |
|
$ 3,250,000 |
$ 2,884,375 |
|
|
Class H, 7.75% 2/25/28 (d) |
B- |
|
1,500,000 |
981,094 |
|
|
Structured Mortgage Trust weighted average coupon Series 1997-2: |
|
|
|
|
|
|
Class C, 7.41% 1/30/06 (d) |
- |
|
569,275 |
414,681 |
|
|
Class D, 7.41% 1/30/06 (d) |
- |
|
700,646 |
437,904 |
|
|
TOTAL COMMERCIAL MORTGAGE SECURITIES (Cost $23,853,866) |
24,132,777 |
||||
|
Complex Mortgage Securities - 0.1% |
|||||
|
|
|||||
|
Interest Only - 0.0% |
|||||
|
BKB Commercial Mortgage Trust Series 1997-C1 Class X1, 0.1966% 12/26/01 (d)(e)(f) |
BBB |
|
4,471,001 |
2,096 |
|
|
Principal Only - 0.1% |
|||||
|
Structured Asset Securities Corp. Series 1996-CFL Class P, 0% 2/25/28 (d)(g) |
- |
|
546,357 |
245,860 |
|
|
TOTAL COMPLEX MORTGAGE SECURITIES (Cost $221,181) |
247,956 |
||||
|
Common Stocks - 88.8% |
|||
|
Shares |
|
||
|
CONSTRUCTION & REAL ESTATE - 84.2% |
|||
|
Real Estate - 3.9% |
|||
|
Boardwalk Equities, Inc. (a) |
592,400 |
5,601,891 |
|
|
Catellus Development Corp. (a) |
101,900 |
1,528,500 |
|
|
Excel Legacy Corp. (a) |
1,005,400 |
2,702,013 |
|
|
LNR Property Corp. |
21,400 |
417,300 |
|
|
Oxford Properties Group, Inc. (a) |
164,300 |
1,881,044 |
|
|
Trammell Crow Co. (a) |
170,000 |
1,827,500 |
|
|
Vornado Operating Co. (a) |
27,100 |
210,025 |
|
|
|
14,168,273 |
||
|
Real Estate Investment Trusts - 80.3% |
|||
|
Alexandria Real Estate Equities, Inc. |
61,300 |
2,103,356 |
|
|
AMB Property Corp. |
492,800 |
11,242,000 |
|
|
AMRESCO Capital Trust, Inc. |
265,000 |
2,683,125 |
|
|
Apartment Investment & Management Co. Class A |
529,515 |
22,901,524 |
|
|
Archstone Communities Trust |
223,500 |
4,707,469 |
|
|
Arden Realty Group, Inc. |
221,300 |
5,200,550 |
|
|
|
|||
|
Shares |
Value |
||
|
Asset Investors Corp. |
276,500 |
$ 3,266,156 |
|
|
Avalonbay Communities, Inc. |
272,900 |
11,393,575 |
|
|
Boston Properties, Inc. |
115,200 |
4,449,600 |
|
|
Bradley Real Estate, Inc. (SBI) |
164,200 |
3,499,513 |
|
|
CBL & Associates Properties, Inc. |
70,400 |
1,755,600 |
|
|
CenterPoint Properties Trust |
244,600 |
9,967,450 |
|
|
Clarion Commercial Holdings, Inc. |
23,500 |
126,313 |
|
|
Commercial Assets, Inc. |
16,100 |
80,500 |
|
|
Cousins Properties, Inc. |
151,200 |
5,821,200 |
|
|
Crescent Real Estate Equities Co. |
565,200 |
11,586,600 |
|
|
Crown American Realty Trust |
97,000 |
521,375 |
|
|
Duke-Weeks Realty Corp. |
373,500 |
8,357,063 |
|
|
Eastgroup Properties, Inc. |
142,200 |
2,995,088 |
|
|
Equity Office Properties Trust |
943,439 |
26,003,528 |
|
|
Equity Residential Properties Trust (SBI) |
321,639 |
14,795,394 |
|
|
Essex Property Trust, Inc. |
30,000 |
1,260,000 |
|
|
First Washington Realty Trust, Inc. |
71,200 |
1,570,850 |
|
|
Fortress Investment Corp. (d) |
175,930 |
2,265,099 |
|
|
Franchise Finance Corp. of America |
69,200 |
1,591,600 |
|
|
General Growth Properties, Inc. |
314,900 |
9,998,075 |
|
|
Glenborough Realty Trust, Inc. |
320,900 |
5,595,694 |
|
|
Golf Trust of America, Inc. |
354,200 |
5,622,925 |
|
|
Healthcare Realty Trust, Inc. |
296,300 |
5,055,619 |
|
|
Highwoods Properties, Inc. |
49,600 |
1,190,400 |
|
|
Home Properties of New York, Inc. |
235,400 |
7,062,000 |
|
|
Host Marriott Corp. |
94,400 |
885,000 |
|
|
HRPT Properties Trust |
43,100 |
263,988 |
|
|
Innkeepers USA Trust |
360,900 |
3,293,213 |
|
|
Kimco Realty Corp. |
185,400 |
7,601,400 |
|
|
Liberty Property Trust (SBI) |
188,200 |
4,881,438 |
|
|
LTC Properties, Inc. |
205,700 |
1,221,344 |
|
|
Macerich Co. |
60,700 |
1,339,194 |
|
|
Mack-Cali Realty Corp. |
147,350 |
3,785,053 |
|
|
Manufactured Home Communities, Inc. |
42,100 |
1,007,769 |
|
|
MeriStar Hospitality Corp. |
100,600 |
2,112,600 |
|
|
Nationwide Health Properties, Inc. |
45,300 |
631,369 |
|
|
Northstar Capital Investment Corp. (d) |
85,000 |
1,200,625 |
|
|
Philips International Realty Corp. |
135,300 |
2,350,838 |
|
|
Pinnacle Holdings, Inc. (a) |
72,500 |
3,915,000 |
|
|
Plum Creek Timber Co., Inc. |
220,600 |
5,735,600 |
|
|
Post Properties, Inc. |
21,500 |
946,000 |
|
|
ProLogis Trust |
80,800 |
1,722,050 |
|
|
Public Storage, Inc. |
544,800 |
12,768,750 |
|
|
Reckson Associates Realty Corp. |
391,900 |
9,307,625 |
|
|
Senior Housing Properties Trust |
177,000 |
1,294,313 |
|
|
Simon Property Group, Inc. |
218,800 |
4,854,625 |
|
|
SL Green Realty Corp. |
158,400 |
4,237,200 |
|
|
Spieker Properties, Inc. |
141,600 |
6,513,600 |
|
|
Sun Communities, Inc. |
94,800 |
3,169,875 |
|
|
Taubman Centers, Inc. |
139,300 |
1,532,300 |
|
|
Common Stocks - continued |
|||
|
Shares |
Value |
||
|
CONSTRUCTION & REAL ESTATE - continued |
|||
|
Real Estate Investment Trusts - continued |
|||
|
Ventas, Inc. (a) |
693,000 |
$ 2,208,938 |
|
|
Vornado Realty Trust |
381,300 |
13,250,175 |
|
|
|
296,699,123 |
||
|
TOTAL CONSTRUCTION & REAL ESTATE |
310,867,396 |
||
|
FINANCE - 0.7% |
|||
|
Securities Industry - 0.7% |
|||
|
Capstead Mortgage Corp. |
317,800 |
2,661,575 |
|
|
MEDIA & LEISURE - 3.6% |
|||
|
Lodging & Gaming - 3.6% |
|||
|
MeriStar Hotels & Resorts, Inc. (a) |
705,000 |
2,026,875 |
|
|
Prime Hospitality Corp. (a) |
184,300 |
1,739,331 |
|
|
Starwood Hotels & Resorts Worldwide, Inc. unit |
295,950 |
9,636,872 |
|
|
|
13,403,078 |
||
|
TECHNOLOGY - 0.3% |
|||
|
Computer Services & Software - 0.3% |
|||
|
Homestore.com, Inc. |
35,000 |
1,021,563 |
|
|
TOTAL COMMON STOCKS (Cost $311,524,992) |
327,953,612 |
||
|
Preferred Stocks - 0.5% |
|||
|
|
|
|
|
|
Convertible Preferred Stocks - 0.2% |
|||
|
CONSTRUCTION & REAL ESTATE - 0.2% |
|||
|
Real Estate Investment Trusts - 0.2% |
|||
|
Innkeepers USA Trust Series A, $2.16 |
40,000 |
660,000 |
|
|
Nonconvertible Preferred Stocks - 0.3% |
|||
|
CONSTRUCTION & REAL ESTATE - 0.3% |
|||
|
Real Estate Investment Trusts - 0.3% |
|||
|
Crown American Realty Trust Series A, $5.50 |
35,200 |
1,328,800 |
|
|
TOTAL PREFERRED STOCKS (Cost $2,760,000) |
1,988,800 |
||
|
Cash Equivalents - 2.8% |
||||
|
Maturity Amount |
Value |
|||
|
Investments in repurchase agreements (U.S. Treasury Obligations), in a joint trading account at 6.58%, dated 6/30/00 due 7/3/00 |
$ 10,317,656 |
|
$ 10,312,000 |
|
|
TOTAL INVESTMENT PORTFOLIO - 99.5% (Cost $351,747,263) |
367,530,244 |
||
|
NET OTHER ASSETS - 0.5% |
1,883,024 |
||
|
NET ASSETS - 100% |
$ 369,413,268 |
|
Legend |
|
(a) Non-income producing |
|
(b) S&P ® credit ratings are used in the absence of a rating by Moody's Investors Service, Inc. |
|
(c) Non-income producing - issuer filed for protection under the Federal Bankruptcy Code or is in default of interest payment. |
|
(d) Security exempt from registration under Rule 144A of the Securities Act of 1933. These securities may be resold in transactions exempt from registration, normally to qualified institutional buyers. At the period end, the value of these securities amounted to $25,192,686 or 6.8% of net assets. |
|
(e) The coupon rate shown on floating or adjustable rate securities represents the rate at period end. |
|
(f) Security represents right to receive monthly interest payments on an underlying pool of mortgages. Principal shown is the par amount of the mortgage pool. |
|
(g) Principal Only Strips represent the right to receive the monthly principal payments on an underlying pool of mortgage loans. |
|
Other Information |
|
The composition of long-term debt holdings as a percentage of total value of investments in securities, is as follows (ratings are unaudited): |
|
Moody's Ratings |
S&P Ratings |
|||
|
Aaa, Aa, A |
0.0% |
|
AAA, AA, A |
0.0% |
|
Baa |
0.3% |
|
BBB |
0.0% |
|
Ba |
0.3% |
|
BB |
0.6% |
|
B |
0.2% |
|
B |
1.5% |
|
Caa |
0.2% |
|
CCC |
0.5% |
|
Ca, C |
0.0% |
|
CC, C |
0.0% |
|
|
|
|
D |
0.1% |
|
The percentage not rated by Moody's or S&P amounted to 4.5%. FMR has determined that unrated debt securities that are lower quality account for 4.5% of the total value of investment in securities. |
|
Income Tax Information |
|
At June 30, 2000, the aggregate cost of investment securities for income tax purposes was $352,751,358. Net unrealized appreciation aggregated $14,778,886, of which $31,398,928 related to appreciated investment securities and $16,620,042 related to depreciated investment securities. |
|
At December 31, 1999, the fund had a capital loss carryforward of approximately $14,653,000 of which $4,711,000 and $9,942,000 |
|
The fund intends to elect to defer to its fiscal year ending December 31, 2000 approximately $4,698,000 of losses recognized during the period November 1, 1999 to December 31, 1999. |
See accompanying notes which are an integral part of the financial statements.
Semiannual Report
Statement of Assets and Liabilities
|
|
June 30, 2000 (Unaudited) |
|
|
Assets |
|
|
|
Investment in securities, at |
|
$ 367,530,244 |
|
Cash |
|
1,125,511 |
|
Receivable for investments sold |
|
327,109 |
|
Receivable for fund shares sold |
|
83,852 |
|
Dividends receivable |
|
2,064,261 |
|
Interest receivable |
|
333,249 |
|
Total assets |
|
371,464,226 |
|
Liabilities |
|
|
|
Payable for investments purchased |
$ 1,735,881 |
|
|
Distributions payable |
56,376 |
|
|
Accrued management fee |
221,450 |
|
|
Other payables and accrued expenses |
37,251 |
|
|
Total liabilities |
|
2,050,958 |
|
Net Assets |
|
$ 369,413,268 |
|
Net Assets consist of: |
|
|
|
Paid in capital |
|
$ 369,491,038 |
|
Undistributed net investment income |
|
9,432,233 |
|
Accumulated undistributed net realized gain (loss) on investments and foreign currency transactions |
|
(25,292,984) |
|
Net unrealized appreciation (depreciation) on investments |
|
15,782,981 |
|
Net Assets, for 34,657,221 |
|
$ 369,413,268 |
|
Net Asset Value, offering price |
|
$10.66 |
Statement of Operations
|
|
Six months ended June 30, 2000 (Unaudited) |
|
|
Investment Income Dividends |
|
$ 8,133,579 |
|
Interest |
|
1,909,144 |
|
Total income |
|
10,042,723 |
|
Expenses |
|
|
|
Management fee |
$ 1,222,235 |
|
|
Transfer agent fees |
39,009 |
|
|
Accounting fees and expenses |
84,561 |
|
|
Non-interested trustees' compensation |
515 |
|
|
Custodian fees and expenses |
8,428 |
|
|
Registration fees |
2,606 |
|
|
Audit |
9,761 |
|
|
Legal |
56,517 |
|
|
Miscellaneous |
79 |
|
|
Total expenses before reductions |
1,423,711 |
|
|
Expense reductions |
(41,129) |
1,382,582 |
|
Net investment income |
|
8,660,141 |
|
Realized and Unrealized Gain (Loss) Net realized gain (loss) on: |
|
|
|
Investment securities |
(4,918,011) |
|
|
Foreign currency transactions |
(820) |
(4,918,831) |
|
Change in net unrealized appreciation (depreciation) on investment securities |
|
38,634,823 |
|
Net gain (loss) |
|
33,715,992 |
|
Net increase (decrease) in net assets resulting from operations |
|
$ 42,376,133 |
See accompanying notes which are an integral part of the financial statements.
Semiannual Report
Fidelity Real Estate High Income Fund II
Financial Statements - continued
Statement of Changes in Net Assets
|
|
Six months ended
June 30, 2000 |
Year ended
December 31, |
|
Increase (Decrease) in Net Assets |
|
|
|
Operations |
$ 8,660,141 |
$ 21,015,581 |
|
Net realized gain (loss) |
(4,918,831) |
(10,726,634) |
|
Change in net unrealized appreciation (depreciation) |
38,634,823 |
(14,244,415) |
|
Net increase (decrease) in net assets resulting from operations |
42,376,133 |
(3,955,468) |
|
Distributions to shareholders from net investment income |
(686,731) |
(20,070,792) |
|
Share transactions |
13,461,442 |
157,809,888 |
|
Reinvestment of distributions |
325,815 |
20,070,792 |
|
Cost of shares redeemed |
(7,704,000) |
(24,684,352) |
|
Net increase (decrease) in net assets resulting from share transactions |
6,083,257 |
153,196,328 |
|
Total increase (decrease) in net assets |
47,772,659 |
129,170,068 |
|
Net Assets |
|
|
|
Beginning of period |
321,640,609 |
192,470,541 |
|
End of period (including undistributed net investment income of $9,432,233 and $1,458,823, respectively) |
$ 369,413,268 |
$ 321,640,609 |
|
Other Information Shares |
|
|
|
Sold |
1,324,397 |
15,428,030 |
|
Issued in reinvestment of distributions |
32,936 |
2,106,648 |
|
Redeemed |
(815,794) |
(2,434,910) |
|
Net increase (decrease) |
541,539 |
15,099,768 |
Financial Highlights
|
|
Six months ended June 30, 2000 |
Years ended December 31, |
|||
|
|
(Unaudited) |
1999 |
1998 |
1997 |
1996 E |
|
|
|
|
|
|
|
|
Selected Per-Share Data |
|
|
|
|
|
|
Net asset value, beginning of period |
$ 9.430 |
$ 10.120 |
$ 12.380 |
$ 10.730 |
$ 10.000 |
|
Income from Investment Operations |
.253 D |
.761 D |
.786 D |
.823 D |
.214 |
|
Net realized and unrealized gain (loss) |
.997 |
(.806) |
(2.454) |
2.073 |
.732 |
|
Total from investment operations |
1.250 |
(.045) |
(1.668) |
2.896 |
.946 |
|
Less Distributions |
|
|
|
|
|
|
From net investment income |
(.020) |
(.645) |
(.592) |
(.721) |
(.216) |
|
In excess of net investment income |
- |
- |
- |
(.085) |
- |
|
From net realized gain |
- |
- |
- |
(.440) |
- |
|
Total distributions |
(.020) |
(.645) |
(.592) |
(1.246) |
(.216) |
|
Net asset value, end of period |
$ 10.660 |
$ 9.430 |
$ 10.120 |
$ 12.380 |
$ 10.730 |
|
Total Return B, C |
13.27% |
(.46)% |
(13.66)% |
27.67% |
9.52% |
|
Ratios and Supplemental Data |
|
|
|
|
|
|
Net assets, end of period (000 omitted) |
$ 369,413 |
$ 321,641 |
$ 192,471 |
$ 109,785 |
$ 52,951 |
|
Ratio of expenses to average net assets |
.85% A |
.85% |
.89% |
.97% |
1.42% A |
|
Ratio of expenses to average net assets after expense reductions |
.83% A, F |
.79% F |
.83% F |
.94% F |
1.42% A |
|
Ratio of net investment income to average net assets |
5.17% A |
7.57% |
7.08% |
6.90% |
9.90% A |
|
Portfolio turnover rate |
31% A |
41% |
65% |
64% |
11% A |
A Annualized
B Total returns for periods of less than one year are not annualized.
C The total returns would have been lower had certain expenses not been reduced during the periods shown.
D Net investment income per share has been calculated based on average shares outstanding during the period.
E For the period September 27, 1996 (commencement of operations) to December 31, 1996.
F FMR or the fund has entered into varying arrangements with third parties who either paid or reduced a portion of the fund's expenses.
See accompanying notes which are an integral part of the financial statements.
Semiannual Report
For the period ended June 30, 2000 (Unaudited)
1. Significant Accounting Policies.
Fidelity Real Estate High Income Fund II (the fund) is a fund of Fidelity Covington Trust (the trust) and is authorized to issue an unlimited number of shares. The trust is registered under the Investment Company Act of 1940, as amended, as an open-end management investment company organized as a Massachusetts business trust. The financial statements have been prepared in conformity with generally accepted accounting principles which require management to make certain estimates and assumptions at the date of the financial statements. The following summarizes the significant accounting policies of the fund:
Security Valuation. Equity securities for which quotations are readily available are valued at the last sale price, or if no sale price, at the closing bid price. Foreign equity securities are valued based on quotations from the principal market in which such securities are normally traded. If trading or events occurring in other markets after the close of the principal market in which foreign securities are traded, and before the close of the business of the fund, are expected to materially affect the value of those securities, then they are valued at their fair value taking this trading or these events into account. Fair value is determined in good faith under consistently applied procedures under the general supervision of the Board of Trustees. Debt securities for which quotations are readily available are valued by a pricing service at their market values as determined by their most recent bid prices in the principal market (sales prices if the principal market is an exchange) in which such securities are normally traded. Securities (including restricted securities) for which market quotations are not readily available are valued at their fair value. Short-term securities with remaining maturities of sixty days or less for which quotations are not readily available are valued at amortized cost or original cost plus accrued interest, both of which approximate current value.
Foreign Currency Translation. The accounting records of the fund are maintained in U.S. dollars. Investment securities and other assets and liabilities denominated in a foreign currency are translated into U.S. dollars at the prevailing rates of exchange at period end. Purchases and sales of securities, income receipts and expense payments are translated into U.S. dollars at the prevailing exchange rate on the respective dates of the transactions.
Net realized gains and losses on foreign currency transactions represent net gains and losses from sales and maturities of foreign currency contracts , disposition of foreign currencies, the difference between the amount of net investment income accrued and the U.S. dollar amount actually received, and gains and losses between trade and settlement date on purchases and sales of securities. The effects of changes in foreign currency exchange rates on investments in securities are included with the net realized and unrealized gain or loss on investment securities.
Income Taxes. As a qualified regulated investment company under Subchapter M of the Internal Revenue Code, the fund is not subject to income taxes to the extent that it distributes substantially all of its taxable income for its fiscal year. The schedule of investments includes information regarding income taxes under the caption "Income Tax Information."
Investment Income. Dividend income is recorded on the ex-dividend date, except certain dividends from foreign securities where the ex-dividend date may have passed, are recorded as soon as the fund is informed of the ex-dividend date. Non-cash dividends included in dividend income, if any, are recorded at the fair market value of the securities received. Interest income, which includes accretion of original issue discount, is accrued as earned. Investment income is recorded net of foreign taxes withheld where recovery of such taxes is uncertain. The fund may place a debt obligation on non-accrual status and reduce related interest income by ceasing current accruals and writing off interest receivables when the collection of all or a portion of interest has become doubtful based on consistently applied procedures, under the general supervision of the Board of Trustees of the fund. A debt obligation is removed from non-accrual status when the issuer resumes interest payments or when collectibility of interest is reasonably assured.
Distributions to Shareholders. Distributions are declared daily and paid monthly from net investment income. Distributions from realized gains, if any, are recorded on the ex-dividend date.
Income and capital gain distributions are determined in accordance with income tax regulations which may differ from generally accepted accounting principles. These differences, which may result in distribution reclassifications, are primarily due to differing treatments for paydown gains/losses on certain securities, foreign currency transactions, market discount, non-taxable dividends, capital loss carryforwards and losses deferred due to wash sales and excise tax regulations.
Permanent book and tax basis differences relating to shareholder distributions will result in reclassifications to paid in capital. Undistributed net investment income and accumulated undistributed net realized gain (loss) on investments and foreign currency transactions may include temporary book and tax basis differences which will reverse in a subsequent period. Any taxable income or gain remaining at fiscal year end is distributed in the following year.
Security Transactions. Security transactions are accounted for as of trade date. Gains and losses on securities sold are determined on the basis of identified cost.
2. Operating Policies.
Foreign Currency Contracts. The fund generally uses foreign currency contracts to facilitate transactions in foreign-denominated securities. Losses may arise from changes in the value of the foreign currency or if the counterparties do not perform under the contracts' terms. The U.S. dollar value of foreign currency contracts is determined using contractual currency exchange rates established at the time of each trade.
Semiannual Report
Notes to Financial Statements (Unaudited) - continued
2. Operating Policies - continued
Joint Trading Account. Pursuant to an Exemptive Order issued by the Securities and Exchange Commission, the fund, along with other affiliated entities of Fidelity Management & Research Company (FMR), may transfer uninvested cash balances into one or more joint trading accounts. These balances are invested in one or more repurchase agreements for U.S. Treasury or Federal Agency obligations.
Repurchase Agreements. The underlying U.S. Treasury, Federal Agency, or other obligations found to be satisfactory by FMR are transferred to an account of the fund, or to the Joint Trading Account, at a bank custodian. The securities are marked-to-market daily and maintained at a value at least equal to the principal amount of the repurchase agreement (including accrued interest). FMR, the fund's investment adviser, is responsible for determining that the value of the underlying securities remains in accordance with the market value requirements stated above.
Restricted Securities. The fund is permitted to invest in securities that are subject to legal or contractual restrictions on resale. These securities generally may be resold in transactions exempt from registration or to the public if the securities are registered. Disposal of these securities may involve time-consuming negotiations and expense, and prompt sale at an acceptable price may be difficult. At the end of the period, the fund had no investments in restricted securities (excluding 144A issues).
3. Purchases and Sales of Investments.
Purchases and sales of securities, other than short-term securities, aggregated $61,038,043 and $50,306,892, respectively.
4. Fees and Other Transactions with Affiliates.
Management Fee. As the fund's investment adviser, FMR receives a monthly fee that is calculated on the basis of a group fee rate plus a fixed individual fund fee rate applied to the average net assets of the fund. The group fee rate is the weighted average of a series of rates and is based on the monthly average net assets of all the mutual funds advised by FMR. The rates ranged from .0920% to .3700% for the period. The annual individual fund fee rate is .60%. In the event that these rates were lower than the contractual rates in effect during the period, FMR voluntarily implemented the above rates, as they resulted in the same or a lower management fee. For the period, the management fee was equivalent to an annualized rate of .73% of average net assets.
Transfer Agent Fees. Fidelity Investments Institutional Operations Company, Inc. (FIIOC), an affiliate of FMR, is the fund's transfer, dividend disbursing and shareholder servicing agent. FIIOC receives account fees and asset-based fees that vary according to account size and type of account. FIIOC pays for typesetting, printing and mailing of all shareholder reports, except proxy statements. For the period, the transfer agent fees were equivalent to an annualized rate of .02% of average net assets.
Accounting Fees. Fidelity Service Company, Inc., an affiliate of FMR, maintains the fund's accounting records. The fee is based on the level of average net assets for the month plus out-of-pocket expenses.
Brokerage Commissions. The fund placed a portion of its portfolio transactions with brokerage firms which are affiliates of FMR. The commissions paid to these affiliated firms were $6,224 for the period.
5. Expense Reductions.
FMR has directed certain portfolio trades to brokers who paid a portion of the fund's expenses. For the period, the fund's expenses were reduced by $33,106 under this arrangement.
In addition, through arrangements with the fund's custodian and transfer agent, credits realized as a result of uninvested cash balances were used to reduce a portion of the fund's expenses. During the period, the fund's custodian and transfer agent fees were reduced by $4,344, and $3,679, respectively, under these arrangements.
6. Beneficial Interest.
At the end of the period, FMR and its affiliates were record owners of approximately 71% of the total outstanding shares of the fund. In addition, one unaffiliated shareholder was record owner of approximately 29% of the total outstanding shares of the fund.
Semiannual Report
Investment Adviser
Fidelity Management & Research Company
Boston, MA
Officers
Edward C. Johnson 3d, President
Robert C. Pozen, Senior Vice President
Robert A. Lawrence, Vice President
Mark P. Snyderman, Vice President
Eric D. Roiter, Secretary
Robert A. Dwight, Treasurer
Maria F. Dwyer, Deputy Treasurer
John H. Costello, Assistant Treasurer
Board of Trustees
Ralph F. Cox *
Phyllis Burke Davis *
Robert M. Gates *
Edward C. Johnson 3d
Donald J. Kirk *
Ned C. Lautenbach *
Peter S. Lynch
Marvin L. Mann *
William O. McCoy *
Gerald C. McDonough *
Robert C. Pozen
Thomas R. Williams *
Advisory Board
J. Michael Cook
Abigail P. Johnson
Marie L. Knowles
General Distributor
Fidelity Distributors Corporation
Boston, MA
Transfer and Shareholder Servicing Agent
Fidelity Investments Institutional Operations Company, Inc.
Boston, MA
Custodian
The Bank of New York
New York, NY
* Independent trustees
|
|