
|
|
|
|
|
|
|
|
|
|
Previous: VARIAN MEDICAL SYSTEMS INC, DEF 14A, 2000-12-19 |
Next: TAURUS ENTERTAINMENT COMPANIES INC, 10KSB, 2000-12-19 |
Fidelity®
Fund
Semiannual Report
October 31, 2000
(2_fidelity_logos)(Registered_Trademark)
|
President's Message |
Ned Johnson on investing strategies. |
|
|
Performance |
How the fund has done over time. |
|
|
Fund Talk |
The manager's review of fund performance, strategy and outlook. |
|
|
Investment Changes |
A summary of major shifts in the fund's investments over the past six months. |
|
|
Investments |
A complete list of the fund's investments with their market values. |
|
|
Financial Statements |
Statements of assets and liabilities,
operations, and changes in net assets, |
|
|
Notes |
Notes to the financial statements. |
|
|
|
|
|
To reduce expenses, only one copy of most financial reports and prospectuses may be mailed to households, even if more than one person in the household has an account in the fund. Call Fidelity at 1-800-544-8544 if you need additional copies of financial reports or prospectuses. If you do not want the mailing of these documents to be combined with those for other members of your household, contact Fidelity in writing at P.O. Box 5000, Cincinnati, OH 45273-8692.
Standard & Poor's, S&P and S&P 500 are registered service marks of The McGraw-Hill Companies, Inc. and have been licensed for use by Fidelity Distributors Corporation.
Other third party marks appearing herein are the property of their respective owners.
All other marks appearing herein are registered or unregistered trademarks or service marks of FMR Corp. or an affiliated company.
(Recycle graphic) This report is printed on recycled paper using soy-based inks.
This report and the financial statements contained herein are submitted for the general information of the shareholders of the fund. This report is not authorized for distribution to prospective investors in the fund unless preceded or accompanied by an effective prospectus.
Mutual fund shares are not deposits or obligations of, or guaranteed by, any depository institution. Shares are not insured by the FDIC, Federal Reserve Board or any other agency, and are subject to investment risks, including possible loss of principal amount invested.
Neither the fund nor Fidelity Distributors Corporation is a bank.
For more information on any Fidelity fund, including charges and expenses, call 1-800-544-6666 for a free prospectus. Read it carefully before you invest or send money.
Semiannual Report
(photo_of_Edward_C_Johnson_3d)
Dear Shareholder:
A sixth-straight year of double-digit positive returns for the Dow Jones Industrial Average, NASDAQ and S&P 500® could be in jeopardy unless the U.S. stock market shows marked improvement in the final two months of 2000. Through October, all three indexes had negative year-to-date returns. On the other hand, most fixed-income sectors were solidly in the black. Treasuries and other long-term government securities led the way, returning nearly 14%.
While it's impossible to predict the future direction of the markets with any degree of certainty, there are certain basic principles that can help investors plan for their future needs.
The longer your investment time frame, the less likely it is that you will be affected by short-term market volatility. A 10-year investment horizon appropriate for saving for a college education, for example, enables you to weather market cycles in a long-term fund, which may have a higher risk potential, but also has a higher potential rate of return.
An intermediate-length fund could make sense if your investment horizon is two to four years, while a short-term bond fund could be the right choice if you need your money in one or two years.
If your time horizon is less than a year, you might want to consider moving some of your bond investment into a money market fund. These funds seek income and a stable share price by investing in high-quality, short-term investments. Of course, it's important to remember that an investment in a money market fund is not insured or guaranteed by the Federal Deposit Insurance Corporation or any other government agency. Although money market funds seek to preserve the value of your investment at $1.00 per share, it is possible to lose money by investing in these types of funds.
Finally, no matter what your time horizon or portfolio diversity, it makes good sense to follow a regular investment plan, investing a certain amount of money in a fund at the same time each month or quarter and periodically reviewing your overall portfolio. By doing so, you won't get caught up in the excitement of a rapidly rising market, nor will you buy all your shares at market highs. While this strategy - known as dollar cost averaging - won't assure a profit or protect you from a loss in a declining market, it should help you lower the average cost of your purchases. Of course, you should consider your financial ability to continue your purchases through periods of low price levels before undertaking such a strategy.
If you have questions, please call us at 1-800-544-6666, or visit our web site at www.fidelity.com. We are available 24 hours a day, seven days a week to provide you the information you need to make the investments that are right for you.
Best regards,
/s/Edward C. Johnson 3d
Edward C. Johnson 3d
Semiannual Report
There are several ways to evaluate a fund's historical performance. You can look at the total percentage change in value, the average annual percentage change or the growth of a hypothetical $10,000 investment. Total return reflects the change in the value of an investment, assuming reinvestment of the fund's dividend income and capital gains (the profits earned upon the sale of securities that have grown in value). You can also look at the fund's income, as reflected in the fund's yield, to measure performance. If Fidelity had not reimbursed certain fund expenses, the past 10 year total returns would have been lower.
Cumulative Total Returns
|
Periods ended October 31, 2000 |
Past 6 |
Past 1 |
Past 5 |
Past 10 |
|
Fidelity Intermediate Bond |
5.13% |
6.57% |
31.51% |
99.07% |
|
LB Int Govt/Credit Bond |
5.34% |
6.46% |
33.43% |
102.72% |
|
Short-Intermediate Investment Grade Debt Funds Average |
4.34% |
5.69% |
29.18% |
89.40% |
Cumulative total returns show the fund's performance in percentage terms over a set period - in this case, six months, one year, five years or 10 years. For example, if you had invested $1,000 in a fund that had a 5% return over the past year, the value of your investment would be $1,050. You can compare the fund's returns to the performance of the Lehman Brothers Intermediate Government/Credit Bond Index - a market value-weighted index of government and investment-grade corporate fixed-rate debt issues with maturities between one and 10 years. To measure how the fund's performance stacked up against its peers, you can compare it to the short-intermediate investment grade debt funds average, which reflects the performance of mutual funds with similar objectives tracked by Lipper Inc. The past six months average represents a peer group of 128 mutual funds. These benchmarks reflect reinvestment of dividends and capital gains, if any, and exclude the effect of sales charges.
Average Annual Total Returns
|
Periods ended October 31, 2000 |
Past 1 |
Past 5 |
Past 10 |
|
Fidelity Intermediate Bond |
6.57% |
5.63% |
7.13% |
|
LB Int Govt/Credit Bond |
6.46% |
5.94% |
7.32% |
|
Short-Intermediate Investment Grade Debt |
5.69% |
5.25% |
6.59% |
Average annual total returns take the fund's cumulative return and show you what would have happened if the fund had performed at a constant rate each year. (Note: Lipper calculates average annual total returns by annualizing each fund's total return, then taking an arithmetic average. This may produce a different figure than that obtained by averaging the cumulative total returns and annualizing the result.)
Semiannual Report
Performance - continued
$10,000 Over 10 Years
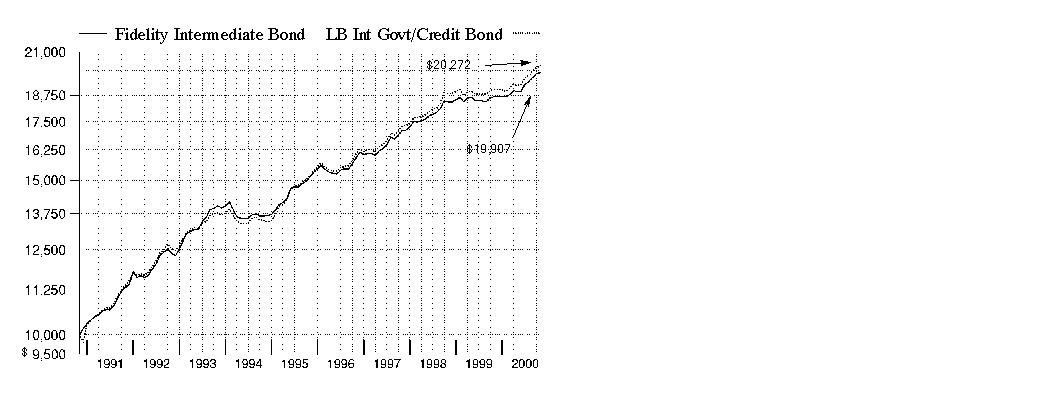
$10,000 Over 10 Years: Let's say hypothetically that $10,000 was invested in Fidelity Intermediate Bond Fund on October 31, 1990. As the chart shows, by October 31, 2000, the value of the investment would have grown to $19,907 - a 99.07% increase on the initial investment. For comparison, look at how the Lehman Brothers Intermediate Government/Credit Bond Index did over the same period. With dividends and capital gains, if any, reinvested, the same $10,000 would have grown to $20,272 - a 102.72% increase.
Understanding
Performance
How a fund did yesterday is no guarantee of how it will do tomorrow. Bond prices, for example, generally move in the opposite direction of interest rates. In turn, the share price, return and yield of a fund that invests in bonds will vary. That means if you sell your shares during a market downturn, you might lose money. But if you can ride out the market's ups and downs, you may have a gain.
3Semiannual Report
Performance - continued
Total Return Components
|
|
Six months ended October 31, |
Years ended April 30, |
||||
|
|
2000 |
2000 |
1999 |
1998 |
1997 |
1996 |
|
Dividend returns |
3.37% |
6.17% |
6.13% |
6.69% |
6.61% |
6.65% |
|
Capital returns |
1.76% |
-4.73% |
-0.10% |
2.01% |
-0.59% |
0.20% |
|
Total returns |
5.13% |
1.44% |
6.03% |
8.70% |
6.02% |
6.85% |
Total return components include both dividend returns and capital returns. A dividend return reflects the actual dividends paid by the fund. A capital return reflects both the amount paid by the fund to shareholders as capital gain distributions and changes in the fund's share price. Both returns assume the dividends or capital gains, if any, paid by the fund are reinvested.
Dividends and Yield
|
Periods ended October 31, 2000 |
Past 1 |
Past 6 |
Past 1 |
|
Dividends per share |
5.41¢ |
31.96¢ |
63.24¢ |
|
Annualized dividend rate |
6.46% |
6.50% |
6.48% |
|
30-day annualized yield |
6.69% |
- |
- |
Dividends per share show the income paid by the fund for a set period. If you annualize this number, based on an average share price of $9.86 over the past one month, $9.76 over the past six months and $9.76 over the past one year, you can compare the fund's income over these three periods. The 30-day annualized yield is a standard formula for all bond funds based on the yields of the bonds in the fund, averaged over the past 30 days. This figure shows you the yield characteristics of the fund's investments at the end of the period. It also helps you compare funds from different companies on an equal basis.
Semiannual Report
Market Recap
Strong technical factors in the market helped most investment-grade bonds overcome unusually volatile market conditions, enabling them to handily outperform most major U.S. equity indexes during the six-month period that ended October 31, 2000. The Lehman Brothers Aggregate Bond Index - a popular measure of taxable-bond performance - returned 5.80% during this time frame. Treasuries continued their hot streak from the beginning of 2000 thanks to a swelling federal surplus and the U.S. government's decision to buy back increasingly larger amounts of outstanding long-term debt. Anticipation that the Fed was finished raising interest rates following a half-point hike in May, combined with persistent flights-to-safety from risk-averse investors concerned about volatility in equity markets, further bolstered the long bond, helping the Lehman Brothers Treasury Index return 5.50% during the period. Mortgage and agency securities rallied back from their period lows in May to post formidable six-month returns. Discount mortgages were boosted by higher-than-normal prepayment activity supported by a strong housing market. Agencies staged a comeback behind reduced political risk surrounding government-sponsored enterprises. During the past six months, the Lehman Brothers Mortgage-Backed Securities and U.S. Agency indexes returned 6.24% and 6.08%, respectively. The corporate sector was the worst-performing segment of the market, plagued by deteriorating credit conditions and growing supply pressures. The Lehman Brothers Credit Bond Index posted a 5.37% return during the six-month period.
(Portfolio Manager photograph)
An interview with Ford O'Neil, Portfolio Manager of Fidelity Intermediate Bond Fund
Q. How did the fund perform, Ford?
A. For the six-month period that ended October 31, 2000, the fund posted a total return of 5.13%, topping the intermediate investment grade debt funds average tracked by Lipper Inc., which returned 4.34%. The Lehman Brothers Intermediate Government/Credit Bond Index returned 5.34% during the same period. For the 12 months that ended October 31, 2000, the fund returned 6.57%, outpacing both the Lipper average and Lehman Brothers index, which returned 5.69% and 6.46%, respectively.
Q. What factors influenced the fund's performance during the six-month period?
A. Favorable sector allocation and security selection were the biggest factors. Assuming a more defensive posture by way of further diversification was a key strategy given the extreme volatility that plagued the bond market during the past six months. With "negative event risk" threatening the credit quality of many corporate bonds during the period, I chose to reposition the fund in higher-quality, shorter-term issues, which suffered the least. This move helped mitigate the effects of our overweighting in corporates relative to the index. While we were able to avoid most of the major blow-ups in the sector during the period, the exposure we did have detracted from relative performance. Although underweighted in Treasuries, we owned longer-dated securities than the Lehman Brothers benchmark, which helped as the prices of these issues jumped in response to the U.S. Treasury's decision to reduce both outstanding and new issue supply of long-term debt. We also benefited by owning some callable Treasuries, which offered us the combination of a higher yield, as well as some price appreciation when the government surprisingly included these bonds in its buyback campaign. Unfortunately, much of what we gained in Treasuries, we gave back by underweighting agencies, a sector that rebounded nicely during the period. The political risk faced by dominant issuers Fannie Mae and Freddie Mac potentially losing their implicit government backing weighed heavily on the sector early on. Since we had little insight into how that outcome would be decided, I felt it prudent to remain underweighted in agencies, while pursuing more attractive opportunities elsewhere.
Semiannual Report
Fund Talk: The Manager's Overview - continued
Q. What was behind the fund's success relative to its peers?
A. A combination of factors led to the fund's success relative to its peers. First off, I believe many of our peers were more highly concentrated in some of the benchmark's largest issuers, which left them more heavily exposed to some of the enormous credit blowups that marked the six-month period. Second, the fund had an insignificant amount of poorly performing non-investment-grade debt, which also boosted relative returns. Finally, having a slightly longer duration - a measure of how sensitive the fund's share price is to changing interest rates - than some of our competitors helped in light of the unique technical backdrop painted by the Treasury buybacks. Under normal circumstances when the Federal Reserve Board is raising interest rates, it's appropriate to be shorter than the index. So basically, anyone who followed conventional wisdom got hurt.
Q. How did some of your other strategies play out for the fund?
A. Having exposure to a few of the bright spots within corporates, namely energy, entertainment and even tobacco, helped offset some of our losses. Although we were heavily invested in telecommunications, our strategy of overweighting strong performing European issuers at the expense of U.S. carriers paid off. An out-of-benchmark position in discount mortgages also worked out nicely for us, as we benefited from a pick-up in prepayment activity related to strong housing turnover. Allocating some assets to high-quality asset-backed and commercial mortgage-backed securities provided the fund with some stability, which was important in a declining credit environment. Their yield spreads widened somewhat during the period, but not enough to fully neutralize the yield advantage they offered relative to Treasuries.
Q. What's your outlook?
A. I remain cautious. We're at a crossroads in that the debt markets are anticipating a significant economic downturn, which is not supported by current economic data. So, given this uncertainty, I believe it's prudent to err on the side of caution, which leads to a very diversified portfolio in terms of sectors as well as individual names. I feel the fund should remain overweighted in the spread sectors, which currently offer historically attractive value opportunities, but it should remain defensively positioned.
Semiannual Report
Fund Talk: The Manager's Overview - continued
The views expressed in this report reflect those of the portfolio manager only through the end of the period of the report as stated on the cover and do not necessarily represent the views of Fidelity or any other person in the Fidelity organization. Any such views are subject to change at any time based upon market or other conditions and Fidelity disclaims any responsibility to update such views. These views may not be relied on as investment advice and, because investment decisions for a Fidelity fund are based on numerous factors, may not be relied on as an indication of trading intent on behalf of any Fidelity fund.
Fund Facts
Goal: high current income by investing mainly in investment-grade debt securities while normally maintaining an average maturity between three and 10 years
Fund number: 032
Trading symbol: FTHRX
Start date: May 23, 1975
Size: as of October 31, 2000, more than $3.3 billion
Manager: Ford O'Neil, since 1998; manager, various Fidelity bond funds; joined Fidelity in 1990
3Ford O'Neil on compelling value in today's credit markets:
"The spread sectors are as cheap as they've ever been, especially in light of today's strong economic environment. To begin with, corporates are an extraordinarily cheap sector, with the widest spreads seen in over a decade - double the levels we had at the height of the global economic crisis in 1998. Again, since we feel the economy, although slowing, is not heading toward a severe economic recession, corporates are all the more attractive on a historical basis. Turning to mortgages, one would think that with spreads where they are today, we'd be seeing a refinancing wave coming around the corner. Maybe so, but I certainly don't see that happening any time soon, particularly given the fact that mortgage rates remain approximately 1% above the yield levels that triggered the refinancing wave that hit toward the end of 1998 and beginning of 1999. Finally, agency yield spreads relative to Treasuries hit their widest levels in May at the height of the political controversy surrounding government-sponsored enterprises (GSEs), such as Fannie Mae and Freddie Mac. Although agency spreads tightened a bit toward the end of the six-month period when legislation stalled, they still remain attractive, albeit less so than the corporate and mortgage markets. After the presidential election, legislation could pick up again, which could cause problems for agencies in their quest to possibly replace Treasuries as the benchmark issue. Even though I still view agencies as a core position, I intend to maintain a slight underweighting in the sector overall."
Semiannual Report
|
Quality Diversification as of October 31, 2000 |
||
|
(Moody's Ratings) |
% of fund's investments |
% of fund's investments |
|
Aaa |
38.3 |
38.2 |
|
Aa |
8.2 |
5.6 |
|
A |
22.2 |
22.6 |
|
Baa |
25.3 |
29.8 |
|
Ba and Below |
0.6 |
1.0 |
|
Not Rated |
1.0 |
1.1 |
|
Table excludes short-term investments. Where Moody's ratings are not available, we have used S&P ® ratings. |
|
Average Years to Maturity as of October 31, 2000 |
||
|
|
|
6 months ago |
|
Years |
6.1 |
5.6 |
|
Average years to maturity is based on the average time remaining until principal payments are expected from each of the fund's bonds, weighted by dollar amount. |
|
Duration as of October 31, 2000 |
||
|
|
|
6 months ago |
|
Years |
3.5 |
3.5 |
|
Duration shows how much a bond fund's price fluctuates with changes in comparable interest rates. If rates rise 1%, for example, a fund with a five-year duration is likely to lose about 5% of its value. Other factors also can influence a bond fund's performance and share price. Accordingly, a bond fund's actual performance may differ from this example. |
|
Asset Allocation (% of fund's net assets) |
|||||||
|
As of October 31, 2000 * |
As of April 30, 2000 ** |
||||||
 |
Corporate Bonds 49.7% |
|
|
Corporate Bonds 51.8% |
|
||
 |
U.S. Government and Government Agency Obligations 28.7% |
|
|
U.S. Government and Government Agency Obligations 29.3% |
|
||
 |
Asset-Backed |
|
|
Asset-Backed |
|
||
 |
CMOs and Other Mortgage Related Securities 5.0% |
|
|
CMOs and Other Mortgage Related Securities 4.0% |
|
||
 |
Other Investments 4.4% |
|
|
Other Investments 4.3% |
|
||
 |
Short-Term |
|
|
Short-Term |
|
||
|
* Foreign investments |
15.2% |
|
** Foreign investments |
13.8% |
|
||

Semiannual Report
(Unaudited)
Showing Percentage of Net Assets
|
Nonconvertible Bonds - 49.7% |
|||||
|
Moody's Ratings |
Principal Amount (000s) |
Value (Note 1) (000s) |
|||
|
AEROSPACE & DEFENSE - 0.3% |
|||||
|
Defense Electronics - 0.3% |
|||||
|
Raytheon Co. 7.9% 3/1/03 |
Baa2 |
|
$ 10,000 |
$ 10,116 |
|
|
BASIC INDUSTRIES - 1.3% |
|||||
|
Chemicals & Plastics - 0.5% |
|||||
|
Pharmacia Corp. 5.75% 12/1/05 |
A1 |
|
16,000 |
15,149 |
|
|
Paper & Forest Products - 0.8% |
|||||
|
Abitibi-Consolidated, Inc. yankee: |
|
|
|
|
|
|
8.3% 8/1/05 |
Baa3 |
|
3,380 |
3,417 |
|
|
8.55% 8/1/10 |
Baa3 |
|
12,285 |
12,114 |
|
|
Fort James Corp.: |
|
|
|
|
|
|
6.5% 9/15/02 |
Baa2 |
|
11,950 |
11,767 |
|
|
6.625% 9/15/04 |
Baa2 |
|
525 |
500 |
|
|
|
27,798 |
||||
|
TOTAL BASIC INDUSTRIES |
42,947 |
||||
|
CONSTRUCTION & REAL ESTATE - 1.7% |
|||||
|
Real Estate - 0.7% |
|||||
|
Arden Realty LP 8.875% 3/1/05 |
Baa3 |
|
4,365 |
4,446 |
|
|
Cabot Industrial Property LP 7.125% 5/1/04 |
Baa2 |
|
6,060 |
5,885 |
|
|
Duke-Weeks Realty LP 6.875% 3/15/05 |
Baa2 |
|
11,700 |
11,422 |
|
|
|
21,753 |
||||
|
Real Estate Investment Trusts - 1.0% |
|||||
|
Avalonbay Communities, Inc.: |
|
|
|
|
|
|
6.58% 2/15/04 |
Baa1 |
|
6,635 |
6,465 |
|
|
8.25% 7/15/08 |
Baa1 |
|
6,500 |
6,605 |
|
|
CenterPoint Properties Trust 7.125% 3/15/04 |
Baa2 |
|
9,000 |
8,768 |
|
|
Equity Office Properties Trust: |
|
|
|
|
|
|
6.5% 1/15/04 |
Baa1 |
|
3,125 |
3,030 |
|
|
6.763% 6/15/07 |
Baa1 |
|
4,700 |
4,410 |
|
|
Spieker Properties LP 6.8% 5/1/04 |
Baa2 |
|
4,705 |
4,575 |
|
|
|
33,853 |
||||
|
TOTAL CONSTRUCTION & REAL ESTATE |
55,606 |
||||
|
Nonconvertible Bonds - continued |
|||||
|
Moody's Ratings |
Principal Amount (000s) |
Value (Note 1) (000s) |
|||
|
DURABLES - 1.2% |
|||||
|
Autos, Tires, & Accessories - 0.7% |
|||||
|
Daimler-Chrysler North America Holding Corp. 7.4% 1/20/05 |
A1 |
|
$ 12,500 |
$ 12,535 |
|
|
Enron Corp. Series A, 8.375% 5/23/05 |
Baa1 |
|
8,915 |
9,273 |
|
|
|
21,808 |
||||
|
Textiles & Apparel - 0.5% |
|||||
|
Jones Apparel Group, Inc./Jones Apparel Group Hldgs., Inc./Jones Apparel Group USA, Inc. 6.25% 10/1/01 |
Baa2 |
|
5,500 |
5,384 |
|
|
Jones Apparel Group, Inc. 7.875% 6/15/06 |
Baa2 |
|
12,580 |
11,617 |
|
|
|
17,001 |
||||
|
TOTAL DURABLES |
38,809 |
||||
|
ENERGY - 2.0% |
|||||
|
Energy Services - 0.5% |
|||||
|
Baker Hughes, Inc. 5.8% 2/15/03 |
A2 |
|
7,800 |
7,583 |
|
|
Petroliam Nasional BHD (Petronas) yankee 7.125% 10/18/06 (c) |
Baa2 |
|
9,300 |
8,868 |
|
|
|
16,451 |
||||
|
Oil & Gas - 1.5% |
|||||
|
Canada Occidental Petroleum Ltd. 7.125% 2/4/04 |
Baa2 |
|
13,450 |
13,279 |
|
|
Occidental Petroleum Corp. 6.35% 11/9/00 |
Baa3 |
|
5,000 |
5,000 |
|
|
Phillips Petroleum Co. 8.5% 5/25/05 |
Baa2 |
|
3,500 |
3,688 |
|
|
Ras Laffan Liquid Natural Gas Co. Ltd. yankee 8.294% 3/15/14 (c) |
Baa3 |
|
9,700 |
9,291 |
|
|
The Coastal Corp. 6.2% 5/15/04 |
Baa2 |
|
8,500 |
8,251 |
|
|
Union Pacific Resources Group, Inc. 7% 10/15/06 |
Baa1 |
|
10,000 |
9,918 |
|
|
|
49,427 |
||||
|
TOTAL ENERGY |
65,878 |
||||
|
FINANCE - 25.9% |
|||||
|
Banks - 10.2% |
|||||
|
Australia & New Zealand Banking Group Ltd. yankee 6.25% 2/1/04 |
A1 |
|
15,995 |
15,569 |
|
|
Banc One Corp. 7.6% 5/1/07 |
A1 |
|
10,000 |
9,944 |
|
|
Bank of America Corp. 7.875% 5/16/05 |
Aa2 |
|
8,750 |
8,986 |
|
|
Bank of Montreal 6.1% 9/15/05 |
A1 |
|
3,000 |
2,857 |
|
|
Nonconvertible Bonds - continued |
|||||
|
Moody's Ratings |
Principal Amount (000s) |
Value (Note 1) (000s) |
|||
|
FINANCE - continued |
|||||
|
Banks - continued |
|||||
|
Bank of New York Co., Inc. 6.625% 6/15/03 |
A1 |
|
$ 7,200 |
$ 7,152 |
|
|
Bank One Capital III 8.75% 9/1/30 |
Aa3 |
|
12,000 |
11,717 |
|
|
Bank One Corp. 7.625% 8/1/05 |
Aa3 |
|
2,000 |
2,023 |
|
|
BankAmerica Corp. 5.75% 3/1/04 |
Aa2 |
|
5,000 |
4,807 |
|
|
BanPonce Financial Corp. 6.75% 8/9/01 |
A3 |
|
3,850 |
3,839 |
|
|
Barclays Bank PLC yankee 8.55% |
Aa2 |
|
6,000 |
6,041 |
|
|
Capital One Bank: |
|
|
|
|
|
|
6.375% 2/15/03 |
Baa2 |
|
9,860 |
9,568 |
|
|
6.48% 6/28/02 |
Baa2 |
|
7,975 |
7,778 |
|
|
6.65% 3/15/04 |
Baa3 |
|
12,500 |
11,983 |
|
|
Chase Manhattan Corp.: |
|
|
|
|
|
|
5.75% 4/15/04 |
Aa3 |
|
7,200 |
6,912 |
|
|
6.375% 4/1/08 |
A1 |
|
3,500 |
3,286 |
|
|
7.25% 6/1/07 |
A1 |
|
6,303 |
6,266 |
|
|
Crestar Finanical Corp. 8.75% 11/15/04 |
A2 |
|
7,100 |
7,453 |
|
|
Den Danske Bank AS 6.375% 6/15/08 (c)(d) |
A1 |
|
15,800 |
15,089 |
|
|
First Chicago Corp. 6.3% 11/1/01 |
Aa3 |
|
2,000 |
1,989 |
|
|
First National Boston Corp. 7.375% 9/15/06 |
A2 |
|
4,950 |
4,950 |
|
|
First Security Corp.: |
|
|
|
|
|
|
5.875% 11/1/03 |
Aa2 |
|
1,750 |
1,686 |
|
|
7.5% 9/1/02 |
Aa3 |
|
5,300 |
5,300 |
|
|
First Tennessee National Corp. 6.75% |
A3 |
|
7,020 |
6,839 |
|
|
Firstar Bank, Milwaukee 6.25% 12/1/02 |
Aa3 |
|
2,500 |
2,462 |
|
|
FleetBoston Financial Corp. 7.25% 9/15/05 |
A2 |
|
8,450 |
8,468 |
|
|
Kansallis-Osake-Pankki (NY Branch) yankee |
A1 |
|
17,415 |
18,083 |
|
|
Key Bank NA 5.8% 4/1/04 |
Aa3 |
|
7,000 |
6,669 |
|
|
Korea Development Bank 7.375% 9/17/04 |
Baa2 |
|
7,890 |
7,705 |
|
|
MBNA Corp. 6.34% 6/2/03 |
Baa2 |
|
2,900 |
2,800 |
|
|
Mellon Financial Co. 9.25% 8/15/01 |
A2 |
|
4,000 |
4,059 |
|
|
Merita Bank Ltd. yankee 6.5% 1/15/06 |
A1 |
|
12,000 |
11,531 |
|
|
Midland Bank PLC 8.625% 12/15/04 |
Aa3 |
|
9,750 |
10,275 |
|
|
National Australia Bank Ltd.: |
|
|
|
|
|
|
yankee 6.4% 12/10/07 (d) |
A1 |
|
9,875 |
9,585 |
|
|
yankee 6.6% 12/10/07 |
A1 |
|
10,000 |
9,428 |
|
|
NationsBank Corp. 6.5% 8/15/03 |
Aa3 |
|
4,000 |
3,953 |
|
|
Norwest Corp. 6.5% 6/1/05 |
Aa2 |
|
5,000 |
4,870 |
|
|
Popular, Inc. 6.2% 4/30/01 |
A3 |
|
7,545 |
7,504 |
|
|
Nonconvertible Bonds - continued |
|||||
|
Moody's Ratings |
Principal Amount (000s) |
Value (Note 1) (000s) |
|||
|
FINANCE - continued |
|||||
|
Banks - continued |
|||||
|
Providian National Bank: |
|
|
|
|
|
|
6.25% 5/7/01 |
Baa3 |
|
$ 8,875 |
$ 8,814 |
|
|
6.75% 3/15/02 |
Baa3 |
|
3,425 |
3,380 |
|
|
Royal Bank of Scotland Group PLC 9.118% 3/31/49 |
A1 |
|
20,205 |
21,046 |
|
|
State Street Corp. 7.65% 6/15/10 |
A1 |
|
3,000 |
3,059 |
|
|
Swiss Bank Corp. 6.75% 7/15/05 |
Aa2 |
|
4,000 |
3,933 |
|
|
Union Planters Corp. 6.75% 11/1/05 |
Baa2 |
|
9,000 |
8,661 |
|
|
Wachovia Corp. 6.925% 10/15/03 |
Aa3 |
|
17,750 |
17,717 |
|
|
Wells Fargo & Co. 7.2% 5/1/03 |
Aa2 |
|
2,250 |
2,265 |
|
|
|
338,301 |
||||
|
Credit & Other Finance - 10.2% |
|||||
|
Abbey National Capital Trust I 8.963% 12/29/49 (d) |
Aa3 |
|
4,050 |
4,034 |
|
|
Aristar, Inc. 6% 5/15/02 |
A3 |
|
11,200 |
11,010 |
|
|
Associates Corp. of North America: |
|
|
|
|
|
|
5.8% 4/20/04 |
A1 |
|
6,750 |
6,484 |
|
|
6% 4/15/03 |
A1 |
|
6,910 |
6,758 |
|
|
CIT Group Holdings, Inc. 6.5% 6/14/02 |
A1 |
|
6,100 |
6,005 |
|
|
CIT Group, Inc. 7.375% 3/15/03 |
A1 |
|
1,700 |
1,703 |
|
|
Citigroup, Inc.: |
|
|
|
|
|
|
7.25% 10/1/10 |
Aa3 |
|
15,000 |
14,881 |
|
|
9.5% 3/1/02 |
Aa2 |
|
2,000 |
2,065 |
|
|
Countrywide Funding Corp. 6.45% 2/27/03 |
A3 |
|
15,900 |
15,682 |
|
|
Duke Capital Corp. 7.5% 10/1/09 |
A3 |
|
14,500 |
14,582 |
|
|
Edison Mission Energy Funding Corp. 6.77% 9/15/03 (c) |
Baa1 |
|
10,258 |
9,964 |
|
|
ERP Operating LP 6.55% 11/15/01 |
A3 |
|
3,150 |
3,125 |
|
|
Ford Motor Credit Co.: |
|
|
|
|
|
|
7.5% 3/15/05 |
A2 |
|
3,500 |
3,511 |
|
|
7.6% 8/1/05 |
A2 |
|
10,000 |
10,053 |
|
|
7.875% 6/15/10 |
A2 |
|
10,000 |
10,028 |
|
|
General Motors Acceptance Corp.: |
|
|
|
|
|
|
5.5% 1/14/02 |
A2 |
|
7,500 |
7,361 |
|
|
5.75% 11/10/03 |
A2 |
|
6,000 |
5,791 |
|
|
7.625% 6/15/04 |
A2 |
|
8,500 |
8,637 |
|
|
9% 10/15/02 |
A2 |
|
9,000 |
9,333 |
|
|
GS Escrow Corp. 7.125% 8/1/05 |
Ba1 |
|
2,500 |
2,293 |
|
|
Heller Financial, Inc. 6.5% 7/22/02 |
A3 |
|
8,200 |
8,083 |
|
|
Household Finance Corp. 8% 5/9/05 |
A2 |
|
6,000 |
6,136 |
|
|
Nonconvertible Bonds - continued |
|||||
|
Moody's Ratings |
Principal Amount (000s) |
Value (Note 1) (000s) |
|||
|
FINANCE - continued |
|||||
|
Credit & Other Finance - continued |
|||||
|
HSBC Capital Funding LP 9.547% 12/31/49 (b)(c) |
A1 |
|
$ 10,000 |
$ 10,520 |
|
|
Norwest Financial, Inc. 5.375% 9/30/03 |
Aa2 |
|
7,050 |
6,747 |
|
|
PNC Funding Corp. 6.95% 9/1/02 |
A2 |
|
12,500 |
12,506 |
|
|
Popular North America, Inc.: |
|
|
|
|
|
|
6.625% 10/27/02 |
A3 |
|
5,000 |
4,958 |
|
|
7.375% 9/15/01 |
A3 |
|
8,420 |
8,404 |
|
|
Qwest Capital Funding, Inc. 7.75% 8/15/06 (c) |
Baa1 |
|
4,000 |
4,056 |
|
|
Scotland International Finance No. 2 BV yankee: |
|
|
|
|
|
|
7.7% 8/15/10 (c) |
A1 |
|
8,000 |
7,938 |
|
|
8.8% 1/27/04 (c) |
A1 |
|
5,250 |
5,449 |
|
|
Sears Roebuck Acceptance Corp.: |
|
|
|
|
|
|
6% 3/20/03 |
A3 |
|
3,425 |
3,338 |
|
|
6.95% 5/15/02 |
A3 |
|
1,730 |
1,723 |
|
|
Spear, Leeds & Kellogg LP/SLK Capital Corp. 8.25% 8/15/05 (c) |
A3 |
|
9,000 |
9,316 |
|
|
Sprint Capital Corp. 6.875% 11/15/28 |
Baa1 |
|
11,500 |
9,394 |
|
|
Textron Financial Corp. 7.125% 12/9/04 |
A2 |
|
12,675 |
12,675 |
|
|
Trizec Finance Ltd. yankee 10.875% 10/15/05 |
Baa3 |
|
14,146 |
14,287 |
|
|
TXU Eastern Funding: |
|
|
|
|
|
|
6.15% 5/15/02 |
Baa1 |
|
12,000 |
11,744 |
|
|
6.75% 5/15/09 |
Baa1 |
|
13,500 |
12,153 |
|
|
U.S. West Capital Funding, Inc. 6.375% 7/15/08 |
Baa1 |
|
15,800 |
14,708 |
|
|
UBS Preferred Funding Trust 1 8.622% 12/29/49 |
Aa2 |
|
7,900 |
7,979 |
|
|
Unicredito Italiano Capital Trust II yankee 9.2% 10/29/49 (b)(c) |
A1 |
|
3,500 |
3,478 |
|
|
Unilever Capital Corp. 6.75% 11/1/03 |
A1 |
|
10,000 |
9,951 |
|
|
|
338,843 |
||||
|
Insurance - 1.6% |
|||||
|
American General Corp. 6.25% 3/15/03 |
A2 |
|
11,000 |
10,787 |
|
|
Metropolitan Life Insurance Co.: |
|
|
|
|
|
|
6.3% 11/1/03 (c) |
A1 |
|
4,500 |
4,404 |
|
|
7% 11/1/05 (c) |
A1 |
|
5,000 |
4,903 |
|
|
New York Life Insurance Co. 6.4% 12/15/03 (c) |
Aa3 |
|
10,000 |
9,808 |
|
|
The Saint Paul Companies, Inc. 7.875% 4/15/05 |
A1 |
|
6,500 |
6,662 |
|
|
Western National Corp. 7.125% 2/15/04 |
A2 |
|
18,430 |
18,320 |
|
|
|
54,884 |
||||
|
Nonconvertible Bonds - continued |
|||||
|
Moody's Ratings |
Principal Amount (000s) |
Value (Note 1) (000s) |
|||
|
FINANCE - continued |
|||||
|
Savings & Loans - 1.4% |
|||||
|
H.F. Ahmanson & Co.: |
|
|
|
|
|
|
7.875% 9/1/04 |
Baa1 |
|
$ 1,250 |
$ 1,262 |
|
|
8.25% 10/1/02 |
A3 |
|
6,400 |
6,520 |
|
|
Home Savings of America FSB 6.5% 8/15/04 |
A3 |
|
9,550 |
9,248 |
|
|
Long Island Savings Bank FSB: |
|
|
|
|
|
|
6.2% 4/2/01 |
Baa3 |
|
7,030 |
6,982 |
|
|
7% 6/13/02 |
Baa3 |
|
10,700 |
10,627 |
|
|
Sovereign Bancorp, Inc. 6.625% 3/15/01 |
Ba3 |
|
10,500 |
10,418 |
|
|
|
45,057 |
||||
|
Securities Industry - 2.5% |
|||||
|
Amvescap PLC yankee: |
|
|
|
|
|
|
6.375% 5/15/03 |
A2 |
|
15,650 |
15,163 |
|
|
6.6% 5/15/05 |
A2 |
|
10,785 |
10,308 |
|
|
Goldman Sachs Group LP: |
|
|
|
|
|
|
6.6% 7/15/02 (c) |
A1 |
|
4,200 |
4,140 |
|
|
7.875% 1/15/03 (c) |
A1 |
|
3,000 |
3,041 |
|
|
Goldman Sachs Group, Inc. 7.625% 8/17/05 |
A1 |
|
4,000 |
4,048 |
|
|
Lehman Brothers Holdings 7% 5/15/03 |
A3 |
|
10,000 |
9,956 |
|
|
Merrill Lynch & Co., Inc. 5.71% 1/15/02 |
Aa3 |
|
15,250 |
15,000 |
|
|
Morgan Stanley Dean Witter & Co. 7.125% 1/15/03 |
Aa3 |
|
12,250 |
12,297 |
|
|
Salomon Smith Barney Holdings, Inc. 7.3% 5/15/02 |
Aa3 |
|
8,000 |
8,037 |
|
|
|
81,990 |
||||
|
TOTAL FINANCE |
859,075 |
||||
|
INDUSTRIAL MACHINERY & EQUIPMENT - 0.9% |
|||||
|
Tyco International Group SA: |
|
|
|
|
|
|
6.875% 9/5/02 |
Baa1 |
|
5,500 |
5,458 |
|
|
yankee: |
|
|
|
|
|
|
6.125% 6/15/01 |
Baa1 |
|
5,250 |
5,203 |
|
|
6.375% 6/15/05 |
Baa1 |
|
19,600 |
18,896 |
|
|
TOTAL INDUSTRIAL MACHINERY & EQUIPMENT |
29,557 |
||||
|
MEDIA & LEISURE - 2.1% |
|||||
|
Broadcasting - 1.2% |
|||||
|
British Sky Broadcasting Group PLC 7.3% 10/15/06 |
Ba1 |
|
9,050 |
8,211 |
|
|
Nonconvertible Bonds - continued |
|||||
|
Moody's Ratings |
Principal Amount (000s) |
Value (Note 1) (000s) |
|||
|
MEDIA & LEISURE - continued |
|||||
|
Broadcasting - continued |
|||||
|
Clear Channel Communications, Inc. 7.875% 6/15/05 |
Baa3 |
|
$ 5,880 |
$ 5,926 |
|
|
Continental Cablevision, Inc. 8.3% 5/15/06 |
A2 |
|
11,501 |
11,779 |
|
|
Cox Communications, Inc. 6.5% 11/15/02 |
Baa2 |
|
1,500 |
1,479 |
|
|
Hearst-Argyle Television, Inc. 7% 11/15/07 |
Baa3 |
|
6,500 |
6,167 |
|
|
TCI Communications, Inc.: |
|
|
|
|
|
|
8% 8/1/05 |
A2 |
|
2,748 |
2,783 |
|
|
8.65% 9/15/04 |
A2 |
|
2,000 |
2,073 |
|
|
|
38,418 |
||||
|
Entertainment - 0.4% |
|||||
|
Viacom, Inc. 6.75% 1/15/03 |
Baa1 |
|
14,398 |
14,295 |
|
|
Publishing - 0.5% |
|||||
|
News America Holdings, Inc. 8.625% 2/1/03 |
Baa3 |
|
4,000 |
4,087 |
|
|
Time Warner Entertainment Co. LP 8.375% 3/15/23 |
Baa2 |
|
11,500 |
11,998 |
|
|
|
16,085 |
||||
|
TOTAL MEDIA & LEISURE |
68,798 |
||||
|
NONDURABLES - 2.3% |
|||||
|
Beverages - 0.2% |
|||||
|
Seagram JE & Sons, Inc. 6.625% 12/15/05 |
Baa3 |
|
5,650 |
5,689 |
|
|
Foods - 0.9% |
|||||
|
ConAgra Foods, Inc.: |
|
|
|
|
|
|
5.5% 10/15/02 |
Baa1 |
|
12,000 |
11,636 |
|
|
7.875% 9/15/10 |
Baa1 |
|
11,750 |
11,924 |
|
|
Nabisco, Inc. 6.85% 6/15/05 |
Baa2 |
|
8,750 |
8,388 |
|
|
|
31,948 |
||||
|
Tobacco - 1.2% |
|||||
|
Imperial Tobacco Overseas Bv 7.125% 4/1/09 |
Baa2 |
|
9,500 |
8,719 |
|
|
Philip Morris Companies, Inc.: |
|
|
|
|
|
|
6.8% 12/1/03 |
A2 |
|
13,370 |
12,973 |
|
|
7% 7/15/05 |
A2 |
|
3,000 |
2,885 |
|
|
7.625% 5/15/02 |
A2 |
|
3,000 |
2,987 |
|
|
Nonconvertible Bonds - continued |
|||||
|
Moody's Ratings |
Principal Amount (000s) |
Value (Note 1) (000s) |
|||
|
NONDURABLES - continued |
|||||
|
Tobacco - continued |
|||||
|
RJ Reynolds Tobacco Holdings, Inc.: |
|
|
|
|
|
|
7.375% 5/15/03 |
Baa2 |
|
$ 5,125 |
$ 4,850 |
|
|
7.75% 5/15/06 |
Baa2 |
|
9,000 |
8,209 |
|
|
|
40,623 |
||||
|
TOTAL NONDURABLES |
78,260 |
||||
|
RETAIL & WHOLESALE - 1.0% |
|||||
|
General Merchandise Stores - 0.8% |
|||||
|
Dayton Hudson Corp. 9.75% 7/1/02 |
A2 |
|
2,200 |
2,288 |
|
|
Federated Department Stores, Inc.: |
|
|
|
|
|
|
6.79% 7/15/27 |
Baa1 |
|
9,300 |
8,746 |
|
|
8.125% 10/15/02 |
Baa1 |
|
6,535 |
6,510 |
|
|
8.5% 6/15/03 |
Baa1 |
|
8,905 |
8,842 |
|
|
|
26,386 |
||||
|
Grocery Stores - 0.2% |
|||||
|
Safeway, Inc. 7% 9/15/02 |
Baa2 |
|
7,500 |
7,483 |
|
|
TOTAL RETAIL & WHOLESALE |
33,869 |
||||
|
TECHNOLOGY - 1.1% |
|||||
|
Communications Equipment - 0.3% |
|||||
|
Marconi PLC yankee 8.375% 9/15/30 |
A3 |
|
11,000 |
10,441 |
|
|
Computers & Office Equipment - 0.8% |
|||||
|
Comdisco, Inc.: |
|
|
|
|
|
|
6% 1/30/02 |
Baa2 |
|
11,850 |
8,769 |
|
|
6.65% 11/13/01 |
Baa2 |
|
3,000 |
2,370 |
|
|
7.25% 9/1/02 |
Baa2 |
|
7,500 |
5,475 |
|
|
Compaq Computer Corp. 7.45% 8/1/02 |
Baa2 |
|
9,200 |
9,186 |
|
|
|
25,800 |
||||
|
TOTAL TECHNOLOGY |
36,241 |
||||
|
TRANSPORTATION - 2.8% |
|||||
|
Air Transportation - 0.9% |
|||||
|
Continental Airlines, Inc. pass thru trust certificates: |
|
|
|
|
|
|
7.42% 10/1/08 |
Baa1 |
|
7,545 |
7,447 |
|
|
7.434% 3/15/06 |
Baa1 |
|
2,665 |
2,614 |
|
|
Nonconvertible Bonds - continued |
|||||
|
Moody's Ratings |
Principal Amount (000s) |
Value (Note 1) (000s) |
|||
|
TRANSPORTATION - continued |
|||||
|
Air Transportation - continued |
|||||
|
Continental Airlines, Inc. pass thru trust certificates: - continued |
|
|
|
|
|
|
7.73% 9/15/12 |
Baa1 |
|
$ 981 |
$ 958 |
|
|
Delta Air Lines, Inc. 7.7% 12/15/05 |
Baa3 |
|
10,500 |
10,139 |
|
|
Qantas Airways Ltd. 7.75% 6/15/09 (c) |
Baa1 |
|
8,500 |
8,557 |
|
|
|
29,715 |
||||
|
Railroads - 1.9% |
|||||
|
Burlington Northern Santa Fe Corp. 6.53% 7/15/37 |
Baa2 |
|
19,000 |
18,668 |
|
|
Canadian National Railway Co. yankee 6.625% 5/15/03 |
Baa2 |
|
8,000 |
7,868 |
|
|
CSX Corp.: |
|
|
|
|
|
|
6.46% 6/22/05 |
Baa2 |
|
5,000 |
4,788 |
|
|
7.05% 5/1/02 |
Baa2 |
|
5,000 |
4,973 |
|
|
7.25% 5/1/04 |
Baa2 |
|
6,000 |
5,978 |
|
|
Union Pacific 6.34% 11/25/03 |
Baa3 |
|
10,300 |
10,021 |
|
|
Wisconsin Central Transportation Corp. 6.625% 4/15/08 |
Baa2 |
|
11,070 |
9,991 |
|
|
|
62,287 |
||||
|
TOTAL TRANSPORTATION |
92,002 |
||||
|
UTILITIES - 7.1% |
|||||
|
Cellular - 0.6% |
|||||
|
Vodafone AirTouch PLC: |
|
|
|
|
|
|
7.625% 2/15/05 (c) |
A2 |
|
7,500 |
7,609 |
|
|
7.75% 2/15/10 (c) |
A2 |
|
13,000 |
13,199 |
|
|
|
20,808 |
||||
|
Electric Utility - 2.4% |
|||||
|
Avon Energy Partners Holdings 6.73% 12/11/02 (c) |
Baa2 |
|
18,500 |
18,072 |
|
|
Commonwealth Edison Co. 7.375% 9/15/02 |
Baa1 |
|
7,500 |
7,533 |
|
|
Dominion Resources, Inc.: |
|
|
|
|
|
|
7.6% 7/15/03 |
Baa1 |
|
5,000 |
5,066 |
|
|
8.125% 6/15/10 |
Baa1 |
|
5,395 |
5,563 |
|
|
Illinois Power Co. 6.25% 7/15/02 |
Baa1 |
|
5,000 |
4,929 |
|
|
Niagara Mohawk Power Corp.: |
|
|
|
|
|
|
5.875% 9/1/02 |
Baa2 |
|
4,800 |
4,690 |
|
|
7.375% 8/1/03 |
Baa2 |
|
2,500 |
2,523 |
|
|
Nonconvertible Bonds - continued |
|||||
|
Moody's Ratings |
Principal Amount (000s) |
Value (Note 1) (000s) |
|||
|
UTILITIES - continued |
|||||
|
Electric Utility - continued |
|||||
|
Niagara Mohawk Power Corp.: - continued |
|
|
|
|
|
|
8% 6/1/04 |
Baa2 |
|
$ 4,269 |
$ 4,375 |
|
|
8.875% 5/15/07 |
Baa3 |
|
2,485 |
2,612 |
|
|
Philadelphia Electric Co.: |
|
|
|
|
|
|
6.5% 5/1/03 |
Baa1 |
|
4,800 |
4,719 |
|
|
6.625% 3/1/03 |
Baa1 |
|
8,980 |
8,861 |
|
|
Public Service Electric & Gas Co. 6.125% 8/1/02 |
A3 |
|
5,800 |
5,705 |
|
|
Texas Utilities Electric Co. 8.125% 2/1/02 |
A3 |
|
6,000 |
6,061 |
|
|
|
80,709 |
||||
|
Gas - 1.3% |
|||||
|
CMS Panhandle Holding Co. 6.125% |
Baa3 |
|
6,250 |
5,897 |
|
|
Consolidated Natural Gas Co. 7.375% |
A2 |
|
5,750 |
5,774 |
|
|
Enserch Corp. 6.25% 1/1/03 |
Baa2 |
|
4,000 |
3,922 |
|
|
Kern River Funding Corp. 6.42% 3/31/01 (c) |
A2 |
|
1,858 |
1,849 |
|
|
Reliant Energy Resources Corp. 8.125% 7/15/05 (c) |
Baa1 |
|
8,000 |
8,096 |
|
|
Sempra Energy 7.95% 3/1/10 |
A2 |
|
10,000 |
10,090 |
|
|
Sonat, Inc. 6.875% 6/1/05 |
Baa2 |
|
2,755 |
2,713 |
|
|
Southwest Gas Corp. 9.75% 6/15/02 |
Baa2 |
|
3,840 |
3,957 |
|
|
|
42,298 |
||||
|
Telephone Services - 2.8% |
|||||
|
Cable & Wireless Optus Ltd. 8% 6/22/10 (c) |
Baa1 |
|
7,900 |
8,158 |
|
|
Deutsche Telekom International Finance BV 8.25% 6/15/30 |
A2 |
|
6,890 |
7,031 |
|
|
Telecomunicaciones de Puerto Rico, Inc.: |
|
|
|
|
|
|
6.15% 5/15/02 |
Baa2 |
|
10,345 |
10,157 |
|
|
6.65% 5/15/06 |
Baa2 |
|
9,110 |
8,658 |
|
|
Telefonica Europe BV: |
|
|
|
|
|
|
7.35% 9/15/05 |
A2 |
|
8,200 |
8,235 |
|
|
8.25% 9/15/30 |
A2 |
|
8,600 |
8,855 |
|
|
Teleglobe Canada, Inc.: |
|
|
|
|
|
|
7.2% 7/20/09 |
Baa1 |
|
19,519 |
18,709 |
|
|
7.7% 7/20/29 |
Baa1 |
|
8,000 |
7,548 |
|
|
Nonconvertible Bonds - continued |
|||||
|
Moody's Ratings |
Principal Amount (000s) |
Value (Note 1) (000s) |
|||
|
UTILITIES - continued |
|||||
|
Telephone Services - continued |
|||||
|
WorldCom, Inc.: |
|
|
|
|
|
|
6.125% 8/15/01 |
A3 |
|
$ 2,345 |
$ 2,322 |
|
|
7.75% 4/1/07 |
A3 |
|
1,950 |
1,973 |
|
|
8.875% 1/15/06 |
A3 |
|
11,326 |
11,687 |
|
|
|
93,333 |
||||
|
TOTAL UTILITIES |
237,148 |
||||
|
TOTAL NONCONVERTIBLE BONDS (Cost $1,672,659) |
1,648,306 |
||||
|
U.S. Government and Government Agency Obligations - 21.3% |
|||||
|
|
|||||
|
U.S. Government Agency Obligations - 8.3% |
|||||
|
Fannie Mae: |
|
|
|
|
|
|
5.125% 2/13/04 |
Aaa |
|
34,720 |
33,320 |
|
|
6.375% 10/15/02 |
Aaa |
|
15,000 |
14,993 |
|
|
6.5% 8/15/04 |
Aaa |
|
43,415 |
43,388 |
|
|
7% 7/15/05 |
Aaa |
|
9,500 |
9,680 |
|
|
Federal Farm Credit Bank 5.54% 9/10/03 |
Aaa |
|
1,000 |
974 |
|
|
Federal Home Loan Bank: |
|
|
|
|
|
|
5.125% 9/15/03 |
Aaa |
|
4,885 |
4,715 |
|
|
6.5% 8/15/07 |
Aaa |
|
20,000 |
19,791 |
|
|
Financing Corp. - coupon STRIPS: |
|
|
|
|
|
|
0% 12/6/03 |
Aaa |
|
2,168 |
1,773 |
|
|
0% 10/5/05 |
Aaa |
|
1,000 |
727 |
|
|
Freddie Mac: |
|
|
|
|
|
|
5.85% 2/21/06 |
Aaa |
|
2,425 |
2,342 |
|
|
6.875% 1/15/05 |
Aaa |
|
6,330 |
6,411 |
|
|
7% 7/15/05 |
Aaa |
|
14,595 |
14,869 |
|
|
Guaranteed Export Trust Certificates (assets of Trust guaranteed by U.S. Government through Export-Import Bank): |
|
|
|
|
|
|
Series 1993-C, 5.2% 10/15/04 |
Aaa |
|
2,973 |
2,886 |
|
|
Series 1993-D, 5.23% 5/15/05 |
Aaa |
|
2,357 |
2,284 |
|
|
Series 1995-A, 6.28% 6/15/04 |
Aaa |
|
16,007 |
15,870 |
|
|
Series 1996-A, 6.55% 6/15/04 |
Aaa |
|
8,212 |
8,180 |
|
|
U.S. Government and Government Agency Obligations - continued |
|||||
|
Moody's Ratings |
Principal Amount (000s) |
Value (Note 1) (000s) |
|||
|
U.S. Government Agency Obligations - continued |
|||||
|
Guaranteed Trade Trust Certificates (assets of Trust guaranteed by U.S. Government through Export-Import Bank): |
|
|
|
|
|
|
Series 1994-B, 7.5% 1/26/06 |
Aaa |
|
$ 2,015 |
$ 2,054 |
|
|
Series 1997-A, 6.104% 7/15/03 |
Aaa |
|
10,000 |
9,915 |
|
|
Overseas Private Investment Corp. U.S. Government guaranteed participation certificate: |
|
|
|
|
|
|
Series 1994-195, 6.08% 8/15/04 (callable) |
Aaa |
|
6,640 |
6,600 |
|
|
Series 1996-A1, 6.726% 9/15/10 (callable) |
- |
|
14,783 |
14,979 |
|
|
Series 1998-196A, 5.926% 6/15/05 (callable) |
- |
|
7,964 |
7,834 |
|
|
Private Export Funding Corp. secured: |
|
|
|
|
|
|
5.31% 11/15/03 (c) |
Aaa |
|
8,115 |
7,821 |
|
|
5.8% 2/1/04 |
Aaa |
|
11,900 |
11,692 |
|
|
6.62% 10/1/05 |
Aaa |
|
10,000 |
10,061 |
|
|
State of Israel (guaranteed by U.S. Government through Agency for International Development): |
|
|
|
|
|
|
5.89% 8/15/05 |
Aaa |
|
2,917 |
2,860 |
|
|
6.625% 8/15/03 |
Aaa |
|
15,800 |
15,848 |
|
|
U.S. Department of Housing and Urban
Development government guaranteed
participation certificates Series 1996-A, |
Aaa |
|
3,715 |
3,711 |
|
|
TOTAL U.S. GOVERNMENT AGENCY OBLIGATIONS |
275,578 |
||||
|
U.S. Treasury Obligations - 13.0% |
|||||
|
U.S. Treasury Bonds: |
|
|
|
|
|
|
10.75% 5/15/03 |
Aaa |
|
42,525 |
47,170 |
|
|
12% 8/15/13 |
Aaa |
|
115,350 |
157,648 |
|
|
14% 11/15/11 |
Aaa |
|
62,800 |
87,861 |
|
|
U.S. Treasury Notes: |
|
|
|
|
|
|
5.5% 2/15/08 |
Aaa |
|
123,675 |
121,047 |
|
|
7% 7/15/06 |
Aaa |
|
15,000 |
15,812 |
|
|
TOTAL U.S. TREASURY OBLIGATIONS |
429,538 |
||||
|
TOTAL U.S. GOVERNMENT AND (Cost $719,312) |
705,116 |
||||
|
U.S. Government Agency - Mortgage Securities - 7.4% |
|||||
|
Moody's Ratings |
Principal Amount (000s) |
Value (Note 1) (000s) |
|||
|
Fannie Mae - 5.5% |
|||||
|
6.5% 3/1/13 to 10/1/30 |
Aaa |
|
$ 67,800 |
$ 65,778 |
|
|
7% 7/1/25 to 11/1/30 |
Aaa |
|
26,551 |
26,030 |
|
|
7.5% 8/1/13 to 8/1/30 |
Aaa |
|
84,362 |
84,289 |
|
|
8% 7/1/30 to 8/1/30 |
Aaa |
|
6,874 |
6,958 |
|
|
12.5% 4/1/14 to 8/1/15 |
Aaa |
|
131 |
148 |
|
|
TOTAL FANNIE MAE |
183,203 |
||||
|
Freddie Mac - 0.8% |
|||||
|
7.5% 9/1/30 to 10/1/30 |
Aaa |
|
26,009 |
25,993 |
|
|
8.5% 6/1/13 |
Aaa |
|
25 |
25 |
|
|
TOTAL FREDDIE MAC |
26,018 |
||||
|
Government National Mortgage Association - 1.1% |
|||||
|
7.5% 3/15/28 to 11/1/30 |
Aaa |
|
533 |
535 |
|
|
8% 7/15/17 to 5/15/22 |
Aaa |
|
35,388 |
36,217 |
|
|
TOTAL GOVERNMENT NATIONAL MORTGAGE ASSOCIATION |
36,752 |
||||
|
TOTAL U.S. GOVERNMENT AGENCY - MORTGAGE SECURITIES (Cost $245,734) |
245,973 |
||||
|
Asset-Backed Securities - 9.1% |
|||||
|
|
|||||
|
American Express Master Trust 5.9% 5/15/03 |
Aaa |
|
12,000 |
11,786 |
|
|
Americredit Automobile Receivables Trust 7.02% 12/15/05 |
Aaa |
|
8,000 |
8,044 |
|
|
ANRC Auto Owner Trust 6.75% 12/15/03 |
Aaa |
|
13,000 |
13,000 |
|
|
BankAmerica Manufacturing Housing Contract Trust V: |
|
|
|
|
|
|
6.11% 1/10/08 |
Aaa |
|
10,500 |
10,438 |
|
|
6.2% 4/10/09 |
Aaa |
|
7,930 |
7,838 |
|
|
Capita Equipment Receivables Trust 6.45% 8/15/02 |
Aa3 |
|
12,420 |
12,342 |
|
|
Caterpillar Financial Asset Trust 6.2% 4/25/04 |
Aaa |
|
6,185 |
6,154 |
|
|
Chase Manhattan Grantor Trust 6.76% 9/15/02 |
A3 |
|
350 |
350 |
|
|
Chevy Chase Auto Receivables Trust 6.2% 3/20/04 |
Aaa |
|
2,907 |
2,885 |
|
|
CIT Marine Trust 5.8% 4/15/10 |
Aaa |
|
6,000 |
5,904 |
|
|
CPS Auto Grantor Trust 6.55% 8/15/02 |
Aaa |
|
1,170 |
1,168 |
|
|
CS First Boston Mortgage Securities Corp. 7% 3/15/27 |
Aaa |
|
2,156 |
2,154 |
|
|
Asset-Backed Securities - continued |
|||||
|
Moody's Ratings |
Principal Amount (000s) |
Value (Note 1) (000s) |
|||
|
Dayton Hudson Credit Card Master Trust 5.9% 5/25/06 |
Aaa |
|
$ 4,500 |
$ 4,415 |
|
|
Discover Card Master Trust I 5.6% 5/15/06 |
Aaa |
|
12,760 |
12,349 |
|
|
Fidelity Funding Auto Trust 6.99% 11/15/02 (c) |
Aaa |
|
573 |
573 |
|
|
Ford Credit Auto Owner Trust: |
|
|
|
|
|
|
6.2% 12/15/02 |
Aa2 |
|
7,080 |
7,017 |
|
|
6.4% 12/15/02 |
Aa2 |
|
3,810 |
3,791 |
|
|
7.03% 11/15/03 |
Aaa |
|
8,612 |
8,681 |
|
|
7.09% 11/17/03 |
Aaa |
|
10,000 |
10,050 |
|
|
Green Tree Financial Corp.: |
|
|
|
|
|
|
6.68% 1/15/29 |
AAA |
|
21,000 |
20,849 |
|
|
7.15% 7/15/27 |
Aaa |
|
542 |
541 |
|
|
Key Auto Finance Trust 6.65% 10/15/03 |
Baa3 |
|
638 |
636 |
|
|
MBNA Master Credit Card Trust II: |
|
|
|
|
|
|
6.4% 1/18/05 |
Aaa |
|
7,000 |
6,976 |
|
|
6.55% 1/15/07 |
Aaa |
|
8,400 |
8,342 |
|
|
6.9% 1/15/08 |
Aaa |
|
8,065 |
8,122 |
|
|
Navistar Financial Owner Trust 7.2% 5/17/04 |
Aaa |
|
7,500 |
7,552 |
|
|
Olympic Automobile Receivables Trust 6.125% 11/15/04 |
Aaa |
|
1,611 |
1,595 |
|
|
Petroleum Enhanced Trust Receivables Offering Petroleum Trust 7.12% 2/5/03 (c)(d) |
Baa2 |
|
5,626 |
5,608 |
|
|
PP&L Transition Bonds LLC: |
|
|
|
|
|
|
Series 1991-1 Class A3, 6.6% 3/25/05 |
Aaa |
|
4,900 |
4,888 |
|
|
Series 1999-1 Class A4, 6.72% 12/26/05 |
Aaa |
|
17,000 |
16,989 |
|
|
Railcar Trust 7.75% 6/1/04 |
Aaa |
|
7,205 |
7,329 |
|
|
Reliance Auto Receivables Corp., Inc. 6.1% 7/15/02 (c) |
Aaa |
|
63 |
63 |
|
|
Sears Credit Account Master Trust II 7% 7/15/08 |
Aaa |
|
26,750 |
26,925 |
|
|
SLMA Student Loan Trust 6.835% 4/25/08 (d) |
Aaa |
|
22,505 |
22,505 |
|
|
Tranex Auto Receivables Owner Trust 6.334% 8/15/03 (c) |
Aaa |
|
2,588 |
2,578 |
|
|
Triad Auto Receivables Owner Trust 5.98% 9/17/05 |
Aaa |
|
3,720 |
3,675 |
|
|
West Penn Funding LLC 6.63% 12/26/05 |
Aaa |
|
4,000 |
3,992 |
|
|
WFS Financial Owner Trust: |
|
|
|
|
|
|
5.7% 11/20/03 |
Aaa |
|
15,500 |
15,224 |
|
|
7.75% 11/20/04 |
Aaa |
|
7,000 |
7,079 |
|
|
TOTAL ASSET-BACKED SECURITIES (Cost $300,717) |
300,407 |
||||
|
Collateralized Mortgage Obligations - 0.3% |
|||||
|
Moody's Ratings |
Principal Amount (000s) |
Value (Note 1) (000s) |
|||
|
U.S. Government Agency - 0.3% |
|||||
|
Freddie Mac sequential pay Series 2122 Class L,
6% 11/15/26 |
Aaa |
|
$ 9,035 |
$ 8,600 |
|
|
Commercial Mortgage Securities - 4.7% |
|||||
|
|
|||||
|
Allied Capital Commercial Mortgage Trust sequential pay Series 1998-1 Class A, 6.31% 1/25/28 (c) |
Aaa |
|
3,788 |
3,750 |
|
|
Bankers Trust II Series 1999-S1A Class D, 8.81% 2/28/14 (c)(d) |
Baa2 |
|
11,499 |
11,524 |
|
|
Commercial Mortgage Asset Trust sequential pay Series 1999-C1 Class A3, 6.64% 9/17/10 |
Aaa |
|
7,500 |
7,394 |
|
|
CS First Boston Mortgage Securities Corp.: |
|
|
|
|
|
|
sequential pay Series 1997-SPICE: |
|
|
|
|
|
|
Class A, 6.653% 8/20/36 (c) |
- |
|
2,712 |
2,701 |
|
|
Class D, 7.332% 4/20/08 |
- |
|
7,500 |
7,377 |
|
|
sequential pay Series 2000-C1 Class A1, 7.325% 4/15/62 |
AAA |
|
9,885 |
10,016 |
|
|
Series 1995-WF1 Class A2, 6.648% 12/21/27 |
AAA |
|
7,268 |
7,166 |
|
|
Series 1998-FL1: |
|
|
|
|
|
|
Class D, 7.1188% 12/10/00 (c)(d) |
Aa1 |
|
10,200 |
10,199 |
|
|
Class E, 7.4688% 1/10/13 (c)(d) |
Baa1 |
|
15,000 |
15,266 |
|
|
Deutsche Mortgage & Asset Receiving Corp. Series 1998-C1 Class D, 7.231% 7/15/12 |
Baa2 |
|
10,000 |
9,247 |
|
|
Federal Deposit Insurance Corp. REMIC Trust sequential pay Series 1996-C1 Class 1A, 6.75% 7/25/26 |
Aaa |
|
5,336 |
5,283 |
|
|
FMAC Loan Receivables Trust sequential pay Series 1998-C Class A1, 5.99% 9/15/20 (c) |
Aaa |
|
3,640 |
3,531 |
|
|
Host Marriot Pool Trust sequential pay Series 1999-HMTA Class A, 6.98% 8/1/15 |
Aaa |
|
7,802 |
7,786 |
|
|
JP Morgan Commercial Mortgage Finance Corp. Series 2000-C10 Class A1, 7.1075% 8/15/32 |
Aaa |
|
7,604 |
7,642 |
|
|
LTC Commercial Mortgage pass through certificates Series 1998-1 Class A, 6.029% 5/30/30 (c) |
AAA |
|
9,290 |
8,818 |
|
|
Midland Realty Acceptance Corp. sequential pay Series 1997-C1 Class A1, 7.315% 4/25/03 |
Aaa |
|
2,293 |
2,287 |
|
|
Prudential Securities Secured Financing Corp. Series 2000-C1 Class A2, 7.727% 2/15/10 |
Aaa |
|
8,000 |
8,345 |
|
|
Commercial Mortgage Securities - continued |
|||||
|
Moody's Ratings |
Principal Amount (000s) |
Value (Note 1) (000s) |
|||
|
Resolution Trust Corp. Series 1995-C2 Class D, 7% 5/25/27 |
Baa2 |
|
$ 2,569 |
$ 2,537 |
|
|
Thirteen Affiliates of General Growth Properties, Inc.: |
|
|
|
|
|
|
sequential pay Series 1 Class A2, 6.602% 12/15/10 (c) |
Aaa |
|
5,000 |
4,922 |
|
|
Series 1 Class C1, 6.762% 12/15/07 (c) |
A2 |
|
20,000 |
19,606 |
|
|
TOTAL COMMERCIAL MORTGAGE SECURITIES (Cost $155,562) |
155,397 |
||||
|
Foreign Government and Government Agency Obligations (e) - 4.4% |
|||||
|
|
|||||
|
Alberta Province 4.875% 10/29/03 |
Aa1 |
|
7,500 |
7,135 |
|
|
Chile Republic 6.875% 4/28/09 |
Baa1 |
|
13,800 |
12,751 |
|
|
Korean Republic yankee 8.875% 4/15/08 |
Baa2 |
|
10,500 |
10,920 |
|
|
Manitoba Province yankee 6.875% 9/15/02 |
Aa3 |
|
26,500 |
26,621 |
|
|
Nova Scotia Province yankee 9.375% 7/15/02 |
A3 |
|
12,033 |
12,494 |
|
|
Ontario Province yankee: |
|
|
|
|
|
|
7.375% 1/27/03 |
Aa3 |
|
7,500 |
7,608 |
|
|
7.75% 6/4/02 |
Aa3 |
|
12,050 |
12,225 |
|
|
Ontario Province 7%, 8/4/05 |
Aa3 |
|
6,000 |
6,071 |
|
|
Quebec Province: |
|
|
|
|
|
|
7% 1/30/07 |
A2 |
|
9,500 |
9,477 |
|
|
yankee 6.5% 1/17/06 |
A2 |
|
10,000 |
9,810 |
|
|
State of Israel (guaranteed by U.S. Government through Agency for International Development) yankee 7.25% 12/15/28 |
A2 |
|
16,000 |
13,336 |
|
|
United Mexican States: |
|
|
|
|
|
|
8.5% 2/1/06 |
Baa3 |
|
11,750 |
11,715 |
|
|
9.875% 2/1/10 |
Baa3 |
|
6,850 |
7,107 |
|
|
TOTAL FOREIGN GOVERNMENT AND (Cost $152,633) |
147,270 |
||||
|
Commercial Paper - 0.7% |
||||
|
|
||||
|
British Telecom PLC 6.8525% 10/9/01 (c)(d) |
|
25,000 |
24,954 |
|
|
Cash Equivalents - 3.7% |
|||
|
Maturity Amount (000s) |
Value (Note 1) (000s) |
||
|
Investments in repurchase agreements: |
|
|
|
|
(U.S. Government Obligations), in a joint trading account at 6.62%, dated 10/31/00 due 11/1/00 |
$ 119,232 |
$ 119,210 |
|
|
(U.S. Treasury Obligations), in a joint trading account at 6.55%, dated 10/31/00 due 11/1/00 |
2,598 |
2,598 |
|
|
TOTAL CASH EQUIVALENTS (Cost $121,808) |
121,808 |
||
|
TOTAL INVESTMENT PORTFOLIO - 101.3% (Cost $3,402,013) |
3,357,831 |
||
|
|
|
|
|
|
NET OTHER ASSETS - (1.3)% |
(44,471) |
||
|
NET ASSETS - 100% |
$ 3,313,360 |
||
|
Legend |
|
(a) S&P credit ratings are used in the absence of a rating by Moody's Investors Service, Inc. |
|
(b) Debt obligation initially issued at one coupon which converts to a higher coupon at a specified date. The rate shown is the rate at period end. |
|
(c) Security exempt from registration under Rule 144A of the Securities Act of 1933. These securities may be resold in transactions exempt from registration, normally to qualified institutional buyers. At the period end, the value of these securities amounted to $303,760,000 or 9.2% of net assets. |
|
(d) The coupon rate shown on floating or adjustable rate securities represents the rate at period end. |
|
(e) For foreign government obligations not individually rated by S&P or Moody's, the ratings listed have been assigned by FMR, the fund's investment adviser, based principally on S&P and Moody's ratings of the sovereign credit of the issuing government. |
|
Other Information |
|
The composition of long-term debt holdings as a percentage of total value of investments in securities, is as follows (ratings are unaudited): |
|
Moody's Ratings |
S&P Ratings |
|||
|
Aaa, Aa, A |
67.3% |
|
AAA, AA, A |
61.1% |
|
Baa |
25.3% |
|
BBB |
24.5% |
|
Ba |
0.6% |
|
BB |
1.6% |
|
B |
0.0% |
|
B |
0.0% |
|
Caa |
0.0% |
|
CCC |
0.0% |
|
Ca, C |
0.0% |
|
CC, C |
0.0% |
|
|
|
|
D |
0.0% |
|
The percentage not rated by Moody's or S&P amounted to 1.0%. |
|
Distribution of investments by country of issue, as a percentage of total net assets, is as follows: |
|
United States of America |
84.8% |
|
United Kingdom |
4.6 |
|
Canada |
4.4 |
|
Australia |
1.1 |
|
Others (individually less than 1%) |
5.1 |
|
|
100.0% |
|
Income Tax Information |
|
At October 31, 2000, the aggregate cost of investment securities for income tax purposes was $3,402,194,000. Net unrealized depreciation aggregated $44,363,000, of which $20,567,000 related to appreciated investment securities and $64,930,000 related to depreciated investment securities. |
|
At April 30, 2000, the fund had a capital loss carryforward of approximately $36,798,000 of which $7,401,000, $5,813,000 and $23,584,000 will expire on April 30, 2005, 2006 and 2008, respectively. |
See accompanying notes which are an integral part of the financial statements.
Semiannual Report
Statement of Assets and Liabilities
|
Amounts in thousands (except per-share amount) |
October 31, 2000 (Unaudited) |
|
|
Assets |
|
|
|
Investment in securities, at value (including repurchase agreements of $121,808) (cost $3,402,013) - |
|
$ 3,357,831 |
|
Cash |
|
88 |
|
Receivable for investments sold |
|
12,794 |
|
Receivable for fund shares sold |
|
5,543 |
|
Interest receivable |
|
52,713 |
|
Other receivables |
|
8 |
|
Total assets |
|
3,428,977 |
|
Liabilities |
|
|
|
Payable for investments purchased |
$ 107,731 |
|
|
Payable for fund shares redeemed |
5,482 |
|
|
Distributions payable |
564 |
|
|
Accrued management fee |
1,170 |
|
|
Other payables and accrued expenses |
670 |
|
|
Total liabilities |
|
115,617 |
|
Net Assets |
|
$ 3,313,360 |
|
Net Assets consist of: |
|
|
|
Paid in capital |
|
$ 3,442,053 |
|
Distributions in excess of net investment income |
|
(1,225) |
|
Accumulated undistributed net realized gain (loss) |
|
(83,286) |
|
Net unrealized appreciation (depreciation) on investments |
|
(44,182) |
|
Net Assets, for 336,838 shares outstanding |
|
$ 3,313,360 |
|
Net Asset Value, offering price and redemption price |
|
$9.84 |
See accompanying notes which are an integral part of the financial statements.
Semiannual Report
Financial Statements - continued
Statement of Operations
|
Amounts in thousands |
Six months ended October 31, 2000 (Unaudited) |
|
|
Investment Income Interest |
|
$ 116,951 |
|
Security lending |
|
29 |
|
Total Income |
|
116,980 |
|
Expenses |
|
|
|
Management fee |
$ 6,856 |
|
|
Transfer agent fees |
3,200 |
|
|
Accounting and security lending fees |
297 |
|
|
Non-interested trustees' compensation |
6 |
|
|
Custodian fees and expenses |
59 |
|
|
Registration fees |
43 |
|
|
Audit |
17 |
|
|
Legal |
7 |
|
|
Miscellaneous |
2 |
|
|
Total expenses before reductions |
10,487 |
|
|
Expense reductions |
(242) |
10,245 |
|
Net investment income |
|
106,735 |
|
Realized and Unrealized Gain (Loss) Net realized gain (loss) on investment securities |
|
(19,954) |
|
Change in net unrealized appreciation (depreciation) |
|
72,133 |
|
Net gain (loss) |
|
52,179 |
|
Net increase (decrease) in net assets resulting |
|
$ 158,914 |
See accompanying notes which are an integral part of the financial statements.
Semiannual Report
Financial Statements - continued
Statement of Changes in Net Assets
|
Amounts in thousands |
Six months ended |
Year ended |
|
Increase (Decrease) in Net Assets |
|
|
|
Operations |
$ 106,735 |
$ 205,419 |
|
Net realized gain (loss) |
(19,954) |
(48,278) |
|
Change in net unrealized appreciation (depreciation) |
72,133 |
(113,100) |
|
Net increase (decrease) in net assets resulting |
158,914 |
44,041 |
|
Distributions to shareholders from net investment income |
(105,481) |
(203,842) |
|
Share transactions |
596,413 |
1,868,049 |
|
Reinvestment of distributions |
101,261 |
195,263 |
|
Cost of shares redeemed |
(637,119) |
(2,218,983) |
|
Net increase (decrease) in net assets resulting |
60,555 |
(155,671) |
|
Total increase (decrease) in net assets |
113,988 |
(315,472) |
|
Net Assets |
|
|
|
Beginning of period |
3,199,372 |
3,514,844 |
|
End of period (including distributions in excess of net investment income of $1,225 and $2,479, respectively) |
$ 3,313,360 |
$ 3,199,372 |
|
Other Information Shares |
|
|
|
Sold |
61,055 |
189,673 |
|
Issued in reinvestment of distributions |
10,356 |
19,885 |
|
Redeemed |
(65,284) |
(225,183) |
|
Net increase (decrease) |
6,127 |
(15,625) |
See accompanying notes which are an integral part of the financial statements.
Semiannual Report
Financial Highlights
|
|
Six months ended October 31, 2000 |
Years ended April 30, |
||||
|
|
(Unaudited) |
2000 |
1999 |
1998 |
1997 |
1996 |
|
Selected Per-Share Data |
|
|
|
|
|
|
|
Net asset value, beginning of period |
$ 9.670 |
$ 10.150 |
$ 10.160 |
$ 9.960 |
$ 10.050 |
$ 10.030 |
|
Income from Investment
Operations |
.323 D |
.623 D |
.613 D |
.646 D |
.647 D |
.684 |
|
Net realized |
.167 |
(.485) |
(.013) |
.200 |
(.060) |
(.004) |
|
Total from investment operations |
.490 |
.138 |
.600 |
.846 |
.587 |
.680 |
|
Less Distributions |
|
|
|
|
|
|
|
From net investment income |
(.320) |
(.618) |
(.610) |
(.646) |
(.647) |
(.660) |
|
From net |
- |
- |
- |
- |
(.030) |
- |
|
Total distributions |
(.320) |
(.618) |
(.610) |
(.646) |
(.677) |
(.660) |
|
Net asset value, |
$ 9.840 |
$ 9.670 |
$ 10.150 |
$ 10.160 |
$ 9.960 |
$ 10.050 |
|
Total Return B, C |
5.13% |
1.44% |
6.03% |
8.70% |
6.02% |
6.85% |
|
Ratios and Supplemental Data |
|
|
|
|
|
|
|
Net assets, end of period (in millions) |
$ 3,313 |
$ 3,199 |
$ 3,515 |
$ 3,092 |
$ 3,083 |
$ 2,881 |
|
Ratio of expenses to average net assets |
.65% A |
.67% |
.66% |
.66% |
.71% |
.73% |
|
Ratio of expenses to average net assets after expense reductions |
.63% A, E |
.66% E |
.65% E |
.65% E |
.69% E |
.71% E |
|
Ratio of net investment income to average net assets |
6.57% A |
6.32% |
6.00% |
6.37% |
6.46% |
6.48% |
|
Portfolio turnover rate |
99% A |
102% |
108% |
90% |
116% |
169% |
A Annualized
B Total returns for periods of less than one year are not annualized.
C The total returns would have been lower had certain expenses not been reduced during the periods shown.
D Net investment income per share has been calculated based on average shares outstanding during the period.
E FMR or the fund has entered into varying arrangements with third parties who either paid or reduced a portion of the fund's expenses.
See accompanying notes which are an integral part of the financial statements.
Semiannual Report
For the period ended October 31, 2000 (Unaudited)
1. Significant Accounting Policies.
Fidelity Intermediate Bond Fund (the fund) is a fund of Fidelity Commonwealth Trust (the trust) and is authorized to issue an unlimited number of shares. The trust is registered under the Investment Company Act of 1940, as amended, as an open-end management investment company organized as a Massachusetts business trust. The financial statements have been prepared in conformity with generally accepted accounting principles which require management to make certain estimates and assumptions at the date of the financial statements. The following summarizes the significant accounting policies of the fund:
Security Valuation. Securities are valued based upon a computerized matrix system and/or appraisals by a pricing service, both of which consider market transactions and dealer-supplied valuations. Securities (including restricted securities) for which market quotations are not readily available are valued at their fair value as determined in good faith under consistently applied procedures under the general supervision of the Board of Trustees. Short-term securities with remaining maturities of sixty days or less for which quotations are not readily available are valued at amortized cost or original cost plus accrued interest, both of which approximate current value. Investments in open-end investment companies are valued at their net asset value each business day.
Foreign Currency Translation. The accounting records of the fund are maintained in U.S. dollars. Investment securities and other assets and liabilities denominated in a foreign currency are translated into U.S. dollars at the prevailing rates of exchange at period end. Purchases and sales of securities, income receipts and expense payments are translated into U.S. dollars at the prevailing exchange rate on the respective dates of the transactions.
Net realized gains and losses on foreign currency transactions represent net gains and losses from sales and maturities of foreign currency contracts, disposition of foreign currencies, the difference between the amount of net investment income accrued and the U.S. dollar amount actually received, and gains and losses between trade and settlement date on purchases and sales of securities. The effects of changes in foreign currency exchange rates on investments in securities are included with the net realized and unrealized gain or loss on investment securities.
Income Taxes. As a qualified regulated investment company under Subchapter M of the Internal Revenue Code, the fund is not subject to income taxes to the extent that it distributes substantially all of its taxable income for its fiscal year. The schedule of investments includes information regarding income taxes under the caption "Income Tax Information."
Investment Income. Interest income, which includes accretion of original issue discount, is accrued as earned.
Semiannual Report
Notes to Financial Statements (Unaudited) - continued
1. Significant Accounting Policies -continued
Expenses. Most expenses of the trust can be directly attributed to a fund. Expenses which cannot be directly attributed are apportioned among the funds in the trust.
Deferred Trustee Compensation. Under a Deferred Compensation Plan (the Plan) non-interested Trustees must defer receipt of a portion of, and may elect to defer receipt of an additional portion of, their annual compensation. Deferred amounts are treated as though equivalent dollar amounts had been invested in a cross-section of other Fidelity funds. Deferred amounts remain in the fund until distributed in accordance with the Plan.
Distributions to Shareholders. Dividends are declared daily and paid monthly from net investment income. Distributions to shareholders from realized capital gains on investments, if any, are recorded on the ex-dividend date.
Income and capital gain distributions are determined in accordance with income tax regulations which may differ from generally accepted accounting principles. These differences, which may result in distribution reclassifications, are primarily due to differing treatments for paydown gains/losses on certain securities, market discount, capital loss carryforwards, and losses deferred due to wash sales and excise tax regulations.
Permanent book and tax basis differences relating to shareholder distributions will result in reclassifications to paid in capital. Distributions in excess of net investment income and accumulated undistributed net realized gain (loss) on investments and foreign currency transactions may include temporary book and tax basis differences which will reverse in a subsequent period. Any taxable income or gain remaining at fiscal year end is distributed in the following year.
Security Transactions. Security transactions are accounted for as of trade date. Gains and losses on securities sold are determined on the basis of identified cost.
2. Operating Policies.
Joint Trading Account. Pursuant to an Exemptive Order issued by the Securities and Exchange Commission (the SEC), the fund, along with other affiliated entities of Fidelity Management & Research Company (FMR), may transfer uninvested cash balances into one or more joint trading accounts. These balances are invested in one or more repurchase agreements for U.S. Treasury or Federal Agency obligations.
Repurchase Agreements. The underlying U.S. Treasury, Federal Agency, or other obligations found to be satisfactory by FMR are transferred to an account of the fund, or to the Joint Trading Account, at a custodian bank. The securities are marked-to-market daily and maintained at a value at least equal to the principal amount of the repurchase agreement (including accrued interest). FMR, the fund's investment adviser, is responsible for determining that the value of the underlying securities remains in accordance with the market value requirements stated above.
Semiannual Report
Notes to Financial Statements (Unaudited) - continued
2. Operating Policies - continued
Interfund Lending Program. Pursuant to an Exemptive Order issued by the SEC, the fund, along with other registered investment companies having management contracts with FMR, may participate in an interfund lending program. This program provides an alternative credit facility allowing the fund to borrow from, or lend money to, other participating funds.
Delayed Delivery Transactions. The fund may purchase or sell securities on a delayed delivery basis. Payment and delivery may take place after the customary settlement period for that security. The price of the underlying securities and the date when the securities will be delivered and paid for are fixed at the time the transaction is negotiated. The fund may receive compensation for interest forgone in the purchase of a delayed delivery security. With respect to purchase commitments, the fund identifies securities as segregated in its records with a value at least equal to the amount of the commitment. Losses may arise due to changes in the market value of the underlying securities or if the counterparty does not perform under the contract.
Restricted Securities. The fund is permitted to invest in securities that are subject to legal or contractual restrictions on resale. These securities generally may be resold in transactions exempt from registration or to the public if the securities
are registered. Disposal of these securities may involve time-consuming negotiations and expense, and prompt sale at an acceptable price may be difficult. At the end of the period, the fund had no investments in restricted securities (excluding 144A issues).
3. Purchases and Sales of Investments.
Purchases and sales of securities, other than short-term securities, aggregated $1,565,748,000 and $1,564,894,000, respectively, of which U.S. government and government agency obligations aggregated $809,990,000 and $815,751,000, respectively.
4. Fees and Other Transactions with Affiliates.
Management Fee. As the fund's investment adviser, FMR receives a monthly fee that is calculated on the basis of a group fee rate plus a fixed individual fund fee rate applied to the average net assets of the fund. The group fee rate is the weighted average of a series of rates and is based on the monthly average net assets of all the mutual funds advised by FMR. The rates ranged from .0920% to .3700% for the period. The annual individual fund fee rate is .30%. In the event that these rates were lower than the contractual rates in effect during the period, FMR voluntarily implemented the above rates, as they resulted in the same or a lower management fee. For the period, the management fee was equivalent to an annualized rate of .43% of average net assets.
Semiannual Report
Notes to Financial Statements (Unaudited) - continued
4. Fees and Other Transactions with Affiliates - continued
Sub-Adviser Fee. FMR, on behalf of the fund, has entered into a sub-advisory agreement with Fidelity Investments Money Management, Inc. (FIMM), a wholly owned subsidiary of FMR. For its services, FIMM receives a fee from FMR of 50% of the management fee payable to FMR. The fee is paid prior to any voluntary expense reimbursements which may be in effect.
Transfer Agent Fees. Fidelity Service Company, Inc. (FSC), an affiliate of FMR, is the fund's transfer, dividend disbursing and shareholder servicing agent. FSC receives account fees and asset-based fees that vary according to account size and type of account. FSC pays for typesetting, printing and mailing of all shareholder reports, except proxy statements. For the period, the transfer agent fees were equivalent to an annualized rate of .20% of average net assets.
Accounting and Security Lending Fees. FSC maintains the fund's accounting records and administers the security lending program. The security lending fee is based on the number and duration of lending transactions. The accounting fee is based on the level of average net assets for the month plus out-of-pocket expenses.
5. Interfund Lending Program.
The fund participated in the interfund lending program as a lender. The average daily loan balance during the period for which the loan was outstanding amounted to $ 9,106,000. The weighted average interest rate was 6.66%. Interest earned from the interfund lending program amounted to $5,000 and is included in interest income on the Statement of Operations. At period end there were no interfund loans outstanding.
6. Security Lending.
The fund lends portfolio securities from time to time in order to earn additional income. The fund receives collateral in the form of U.S. Treasury obligations, letters of credit, and/or cash against the loaned securities, and maintains collateral in an amount not less than 100% of the market value of the loaned securities during the period of the loan. The market value of the loaned securities is determined at the close of business of the fund and any additional required collateral is delivered to the fund on the next business day. If the borrower defaults on its obligation to return the securities loaned because of insolvency or other reasons, the fund could experience delays and costs in recovering the securities loaned or in gaining access to the collateral. At period end there were no security loans outstanding.
7. Expense Reductions.
Through arrangements with the fund's custodian and transfer agent, credits realized as a result of uninvested cash balances were used to reduce a portion of the fund's expenses. During the period, the fund's custodian and transfer agent fees were reduced by $11,000 and $231,000, respectively, under these arrangements.
Semiannual Report
Fidelity offers several ways to conveniently manage your personal investments via your telephone or PC. You can access your account information, conduct trades and research your investments 24 hours a day.
By Phone
Fidelity Automated Service Telephone provides a single toll-free number to access account balances, positions, quotes and trading. It's easy to navigate the service, and on your first call, the system will help you create a personal identification number (PIN) for security.
(phone_graphic)
Fidelity Automated
Service Telephone (FAST®)
1-800-544-5555
Press
1 For mutual fund and brokerage trading.
2 For quotes.*
3 For account balances and holdings.
4 To review orders and mutual
fund activity.
5 To change your PIN.
*0 To speak to a Fidelity representative.
By PC
Fidelity's web site on the Internet provides a wide range of information, including daily financial news, fund performance, interactive planning tools and news about Fidelity products and services.
(computer_graphic)
Fidelity's Web Site
www.fidelity.com
If you are not currently on the Internet, call EarthLink Sprint at 1-800-288-2967, and be sure to ask for registration number SMD004 to receive a special Fidelity package that includes 30 days of free Internet access. EarthLink is North America's #1 independent Internet access provider.
(computer_graphic)
Fidelity On-line Xpress+®
Fidelity On-line Xpress+ software for Windows combines comprehensive portfolio management capabilities, securities trading and access to research and analysis tools . . . all on your desktop. Call Fidelity at 1-800-544-0240 or visit our web site for more information on how to manage your investments via your PC.
* When you call the quotes line, please remember that a fund's yield and return will vary and, except for money market funds, share price will also vary. This means that you may have a gain or loss when you sell your shares. There is no assurance that money market funds will be able to maintain a stable $1 share price; an investment in a money market fund is not insured or guaranteed by the U.S. government. Total returns are historical and include changes in share price, reinvestment of dividends and capital gains, and the effects of any sales charges.
Semiannual Report
For directions and hours,
please call 1-800-544-9797.
Arizona
7373 N. Scottsdale Road
Scottsdale, AZ
California
815 East Birch Street
Brea, CA
851 East Hamilton Avenue
Campbell, CA
527 North Brand Boulevard
Glendale, CA
19200 Von Karman Avenue
Irvine, CA
10100 Santa Monica Blvd.
Los Angeles, CA
251 University Avenue
Palo Alto, CA
1760 Challenge Way
Sacramento, CA
7676 Hazard Center Drive
San Diego, CA
8 Montgomery Street
San Francisco, CA
950 Northgate Drive
San Rafael, CA
1400 Civic Drive
Walnut Creek, CA
6300 Canoga Avenue
Woodland Hills, CA
Colorado
1625 Broadway
Denver, CO
Connecticut
48 West Putnam Avenue
Greenwich, CT
265 Church Street
New Haven, CT
300 Atlantic Street
Stamford, CT
29 South Main Street
West Hartford, CT
Delaware
222 Delaware Avenue
Wilmington, DE
Florida
4400 N. Federal Highway
Boca Raton, FL
90 Alhambra Plaza
Coral Gables, FL
4090 N. Ocean Boulevard
Ft. Lauderdale, FL
1907 West State Road 434
Longwood, FL
8880 Tamiami Trail, North
Naples, FL
2401 PGA Boulevard
Palm Beach Gardens, FL
8065 Beneva Road
Sarasota, FL
1502 N. Westshore Blvd.
Tampa, FL
Georgia
3445 Peachtree Road, N.E.
Atlanta, GA
1000 Abernathy Road
Atlanta, GA
Illinois
One North Franklin Street
Chicago, IL
1415 West 22nd Street
Oak Brook, IL
1700 East Golf Road
Schaumburg, IL
3232 Lake Avenue
Wilmette, IL
Indiana
4729 East 82nd Street
Indianapolis, IN
Maine
Three Canal Plaza
Portland, ME
Maryland
7401 Wisconsin Avenue
Bethesda, MD
One W. Pennsylvania Ave.
Towson, MD
Massachusetts
801 Boylston Street
Boston, MA
155 Congress Street
Boston, MA
25 State Street
Boston, MA
300 Granite Street
Braintree, MA
44 Mall Road
Burlington, MA
416 Belmont Street
Worcester, MA
Semiannual Report
Michigan
280 Old N. Woodward Ave.
Birmingham, MI
29155 Northwestern Hwy.
Southfield, MI
Minnesota
7600 France Avenue South
Edina, MN
Missouri
700 West 47th Street
Kansas City, MO
8885 Ladue Road
Ladue, MO
New Jersey
150 Essex Street
Millburn, NJ
56 South Street
Morristown, NJ
501 Route 17, South
Paramus, NJ
New York
1055 Franklin Avenue
Garden City, NY
999 Walt Whitman Road
Melville, L.I., NY
1271 Avenue of the Americas
New York, NY
71 Broadway
New York, NY
350 Park Avenue
New York, NY
North Carolina
4611 Sharon Road
Charlotte, NC
Ohio
600 Vine Street
Cincinnati, OH
28699 Chagrin Boulevard
Woodmere Village, OH
Oregon
16850 SW 72nd Avenue
Tigard, OR
Pennsylvania
1735 Market Street
Philadelphia, PA
439 Fifth Avenue
Pittsburgh, PA
Rhode Island
47 Providence Place
Providence, RI
Tennessee
6150 Poplar Avenue
Memphis, TN
Texas
10000 Research Boulevard
Austin, TX
4017 Northwest Parkway
Dallas, TX
1155 Dairy Ashford Street
Houston, TX
2701 Drexel Drive
Houston, TX
400 East Las Colinas Blvd.
Irving, TX
14100 San Pedro
San Antonio, TX
19740 IH 45 North
Spring, TX
Utah
215 South State Street
Salt Lake City, UT
Virginia
1861 International Drive
McLean, VA
Washington
411 108th Avenue, N.E.
Bellevue, WA
511 Pine Street
Seattle, WA
Washington, DC
1900 K Street, N.W.
Washington, DC
Wisconsin
595 North Barker Road
Brookfield, WI
Fidelity Brokerage Services, Inc., 100 Summer St., Boston, MA 02110 Member NYSE/SIPC
Semiannual Report
Investment Adviser
Fidelity Management & Research
Company
Boston, MA
Investment Sub-Advisers
Fidelity Management & Research
(U.K.) Inc.
Fidelity Management & Research
(Far East) Inc.
Fidelity Investments Japan Limited
Fidelity Investments Money
Management, Inc.
Officers
Edward C. Johnson 3d, President
Robert C. Pozen, Senior Vice President
Dwight D. Churchill, Vice President
David L. Murphy, Vice President
Ford E. O'Neil, Vice President
Stanley N. Griffith, Assistant Vice President
Eric D. Roiter, Secretary
Robert A. Dwight, Treasurer
Maria F. Dwyer, Deputy Treasurer
John H. Costello, Assistant Treasurer
Thomas J. Simpson, Assistant Treasurer
Board of Trustees
Ralph F. Cox *
Phyllis Burke Davis *
Robert M. Gates *
Edward C. Johnson 3d
Donald J. Kirk *
Ned C. Lautenbach *
Peter S. Lynch
Marvin L. Mann *
William O. McCoy *
Gerald C. McDonough *
Robert C. Pozen
Thomas R. Williams *
Advisory Board
J. Michael Cook
Marie L. Knowles
* Independent trustees
General Distributor
Fidelity Distributors Corporation
Boston, MA
Transfer and Shareholder
Servicing Agent
Fidelity Service Company, Inc.
Boston, MA
Custodian
The Bank of New York
New York, NY
Fidelity's Taxable Bond Funds
Capital & Income
Ginnie Mae
Government Income
High Income
Intermediate Bond
Intermediate Government Income
International Bond
Investment Grade Bond
New Markets Income
Short-Term Bond
Spartan® Government Income
Spartan Investment Grade Bond
Strategic Income
Target TimelineSM 2001 & 2003
The Fidelity Telephone Connection
Mutual Fund 24-Hour Service
Exchanges/Redemptions
and Account Assistance 1-800-544-6666
Product Information 1-800-544-6666
Retirement Accounts 1-800-544-4774
(8 a.m. - 9 p.m.)
TDD Service 1-800-544-0118
for the deaf and hearing impaired
(9 a.m. - 9 p.m. Eastern time)
Fidelity Automated Service
Telephone (FAST®) (automated graphic) 1-800-544-5555
(automated graphic) Automated line for quickest service
IBF-SANN-1200 118990
1.538685.103
(Fidelity Investment logo)(registered trademark)
Corporate Headquarters
82 Devonshire St., Boston, MA 02109
www.fidelity.com
|
|