
|
|
|
|
|
|
|
|
|
| MML Emerging Growth Fund – Letter to Shareholders
|

| |
| MassMutual Expands Fund Offerings
|
| I’d like to announce some exciting additions to the MML Series Investment Fund. Through our comprehensive due diligence
process, we’ve uncovered significant investor demand for a number of fund types and managers that were not previously addressed by our selections. As a result, we’ve added three new funds, listed as follows, with their managers (sub-advisers) in
parentheses: Large Cap Value (Davis Selected Advisers), OTC 100 (Deutsche Asset Management/Bankers Trust Company), and Emerging Growth (RS Investment Management). These new choices span a broad range of investment styles and market sectors—value vs.
growth, active vs. indexed, and large-cap vs. emerging growth. All of our new managers have produced excellent long-term track records, and have passed through our extensive selection process. We will continue to monitor all of our funds carefully so that
you can be assured of access to top-flight investment management talent.
|

Ÿ
|
seek long-term growth of capital
|
Ÿ
|
invest primarily in a diversified portfolio of equity securities of smaller, emerging growth companies
|
Ÿ
|
utilize a growth-oriented strategy in making investment decisions
|
Ÿ
|
utilize fundamental analysis to identify companies which
|
| -are of high investment quality or possess a unique product, market position or operating characteristics
|
| -offer above-average levels of profitability or superior growth potential
|
| |
What is your outlook?
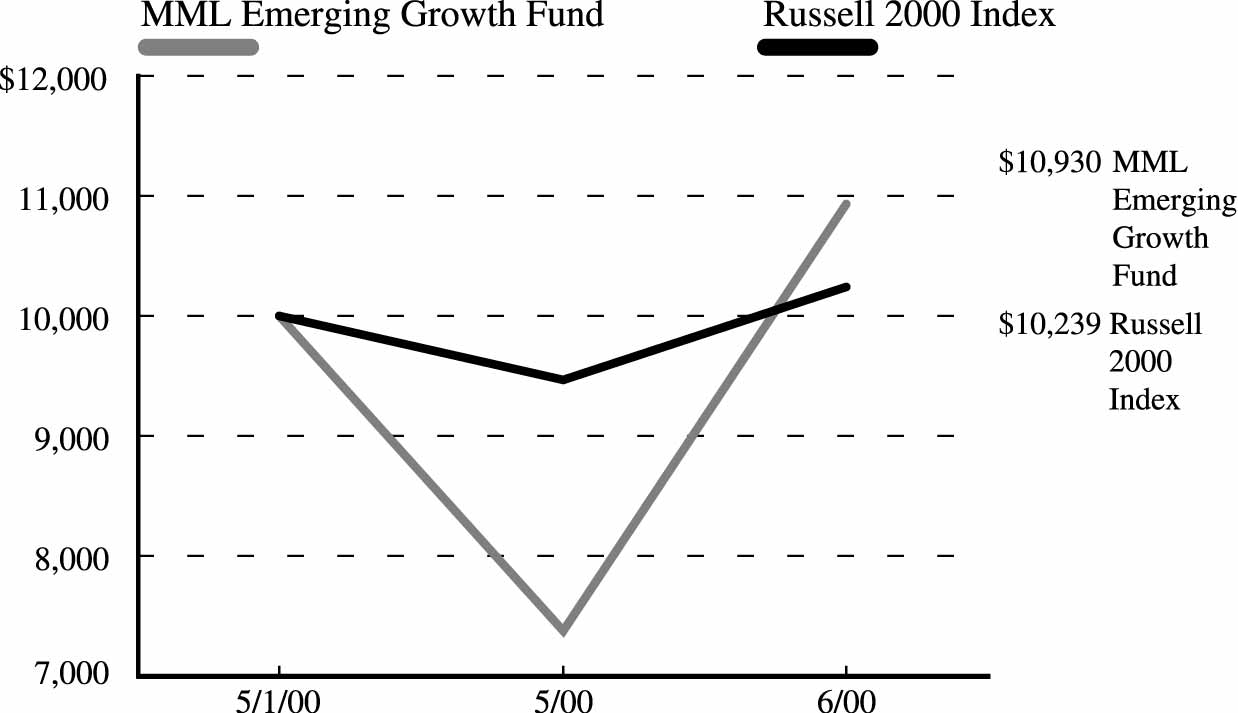
Despite the recent volatility, we continue to see great opportunities in many segments of the market, including wireless, broadband access, the continued build-out of the Internet, and Internet content delivery. We are not surprised that many online retailers are encountering difficulties—we have been pessimistic about that group’s prospects for quite a while—but we believe that those difficulties should not have a meaningful long-term impact on the high-growth sectors just mentioned. While we are optimistic at the individual company level, however, higher interest rates and the likelihood of a slowing economy raise the very real possibility of further market volatility as the second half progresses. We view our role as stock-pickers and not market timers. Therefore, our best defense against volatility is to position the Fund in the very best emerging growth stocks we can find and, should the market provide us with further opportunities to implement the upgrading strategy outlined earlier, we will certainly do so.| Since Inception | |||
|---|---|---|---|
| 5/1/00 - 6/30/00 | |||
| MML Emerging Growth Fund | 9.30% | ||
| Russell 2000 Index | 2.39% | ||
| ASSETS: | |||
| Investments, at value (cost $9,765,356) (Note 2) | $10,808,366 | ||
| Short-term investments, at amortized cost (Note 2) | 660,546 | ||
| Total investments | 11,468,912 | ||
| Receivables from: | |||
| Investments sold | 32,184 | ||
| Interest and dividends | 176 | ||
| Investment adviser (Note 3) | 6,611 | ||
| Total assets | 11,507,883 | ||
| LIABILITIES: | |||
| Payables for: | |||
| Investments purchased | 4,300 | ||
| Directors’ fees and expenses (Note 3) | 2,174 | ||
| Affiliates (Note 3): | |||
| Investment management fees | 8,884 | ||
| Accrued expenses and other liabilities | 13,112 | ||
| Total liabilities | 28,470 | ||
| NET ASSETS | $11,479,413 | ||
| Net assets consist of: | |||
| Paid-in capital | $10,484,259 | ||
| Undistributed net investment loss | (9,402 | ) | |
| Accumulated net realized loss on investments | (38,454 | ) | |
| Net unrealized appreciation on investments | 1,043,010 | ||
| $11,479,413 | |||
| Shares outstanding: | 1,050,092 | ||
| Net asset value, offering price and redemption price per share: | $ 10.93 | ||
| Investment income: (Note 2) | |||
| Interest | $ 9,099 | ||
| Total investment income | 9,099 | ||
| Expenses: (Note 3) | |||
| Investment management fees (Note 3) | 16,769 | ||
| Custody fees | 10,155 | ||
| Directors’ fees (Note 3) | 2,174 | ||
| Audit and legal fees | 1,464 | ||
| Other expenses | 1,494 | ||
| Total expenses | 32,056 | ||
| Expenses reimbursed (Note 3) | (13,555 | ) | |
| Net expenses | 18,501 | ||
| Net investment loss | (9,402 | ) | |
| Realized and unrealized gain (loss): | |||
| Net realized loss on investment transactions | (38,454 | ) | |
| Net change in unrealized appreciation (depreciation) on investments | 1,043,010 | ||
| Net realized and unrealized gain | 1,004,556 | ||
| Net increase in net assets resulting from operations | $ 995,154 | ||
| Increase (Decrease) in Net Assets: | |||
| Operations: | |||
| Net investment loss | $ (9,402 | ) | |
| Net realized loss on investment transactions | (38,454 | ) | |
| Net change in unrealized appreciation (depreciation) on investments | 1,043,010 | ||
| Net increase in net assets resulting from operations | 995,154 | ||
| Net fund share transactions (Note 5) | 10,484,259 | ||
| Total increase in net assets | 11,479,413 | ||
| NET ASSETS: | |||
| Beginning of period | - | ||
| End of period (including undistributed net investment loss of $9,402) | $11,479,413 | ||
| Net asset value, beginning of period | $ 10.00 | ||
| Income (loss) from investment operations: | |||
| Net investment loss | (0.01 | )*** | |
| Net realized and unrealized gain (loss) on investments | 0.94 | ||
| Total income (loss) from investment operations | 0.93 | ||
| Net asset value, end of period | $ 10.93 | ||
| Total Return @ | 9.30% | ** | |
| Ratios/Supplemental Data: | |||
| Net assets, end of period (000’s) | $11,479 | ||
| Ratio of expenses to average daily net assets: | |||
| Before expense waiver | 2.01% | * | |
| After expense waiver | 1.16% | * | |
| Net investment loss to average daily net assets | (0.59% | )* | |
| Portfolio turnover rate | 14% | ** | |
*
|
Annualized
|
**
|
Percentage represents results for the period and are not annualized.
|
***
|
Per share amount calculated on the average shares method.
|
@
|
Total return information shown in the Financial Highlights tables does not reflect expenses that apply at the separate account level or to
related insurance products. Inclusion of these charges would reduce the total return figures for all periods shown.
|
| Number
of Shares |
Market Value |
|||
|---|---|---|---|---|
| EQUITIES - 94.2% | ||||
| Advertising - 3.3% | ||||
| Lamar Advertising Co.* | 1,000 | $ 43,312 | ||
| MyPoints.com, Inc.* | 9,500 | 180,054 | ||
| NetCreations, Inc.* | 1,200 | 54,975 | ||
| TMP Worldwide, Inc.* | 1,300 | 95,956 | ||
| 374,297 | ||||
| Banking, Savings & Loans - 0.7% | ||||
| Financial Federal Corp.* | 4,500 | 78,187 | ||
| Broadcasting, Publishing & Printing - 1.1% | ||||
| COX Radio, Inc. Cl. A* | 3,200 | 89,600 | ||
| Hispanic Broadcasting Corp.* | 1,200 | 39,750 | ||
| 129,350 | ||||
| Commercial Services - 4.2% | ||||
| Critical Path, Inc.* | 900 | 52,481 | ||
| Ebenx, Inc.* | 100 | 2,119 | ||
| Netcentives, Inc.* | 8,300 | 154,587 | ||
| On Assignment, Inc.* | 1,400 | 42,700 | ||
| Professional Detailing, Inc.* | 5,600 | 190,750 | ||
| Teletech Holdings, Inc.* | 1,400 | 43,487 | ||
| 486,124 | ||||
| Communications - 10.8% | ||||
| Allegiance Telecom, Inc.* | 2,100 | 134,400 | ||
| American Tower Corp. Cl. A* | 3,200 | 133,400 | ||
| AudioCodes Ltd.* | 1,400 | 168,000 | ||
| CapRock Communications
Corp.* |
150 | 2,925 | ||
| Ciena Corp.* | 500 | 83,344 | ||
| Copper Mountain Networks,
Inc.* |
1,050 | 92,531 | ||
| DSL.Net, Inc.* | 8,400 | 86,625 | ||
| Echostar Communications
Corp.* |
2,850 | 94,362 | ||
| Exfo Electro Optical
Engineering, Inc.* |
50 | 2,194 | ||
| LifeMinders, Inc.* | 3,400 | 100,512 | ||
| McleodUSA, Inc.* | 6,000 | 124,125 | ||
| Powerwave Technologies,
Inc.* |
600 | 26,400 | ||
| Turnstone Systems, Inc.* | 800 | 132,538 | ||
| Westell Technologies, Inc.
Cl. A* |
3,900 | 58,500 | ||
| 1,239,856 | ||||
| Number
of Shares |
Market Value |
|||
|---|---|---|---|---|
| Computer Integrated Systems Design - 3.4% | ||||
| Exchange Applications, Inc.* | 5,600 | $ 149,100 | ||
| Software.com, Inc.* | 1,900 | 246,762 | ||
| 395,862 | ||||
| Computer Programming Services - 3.6% | ||||
| Macromedia, Inc.* | 1,700 | 164,369 | ||
| Portal Software* | 1,800 | 114,975 | ||
| RealNetworks, Inc.* | 900 | 45,506 | ||
| Viant Corp.* | 3,000 | 88,875 | ||
| 413,725 | ||||
| Computer Related Services - 5.0% | ||||
| Acxiom Corp.* | 2,500 | 68,125 | ||
| Espeed, Inc. Cl. A* | 1,500 | 65,156 | ||
| Keynote Systems, Inc.* | 1,600 | 112,900 | ||
| Lante Corp.* | 1,900 | 38,831 | ||
| NaviSite, Inc.* | 3,250 | 135,891 | ||
| Register.com* | 2,700 | 82,519 | ||
| Scient Corp.* | 1,500 | 66,187 | ||
| 569,609 | ||||
| Computers & Information - 4.7% | ||||
| Extreme Networks* | 1,300 | 137,150 | ||
| Foundry Networks, Inc.* | 1,650 | 181,500 | ||
| Immersion Corporation* | 1,200 | 36,000 | ||
| Interlink Electronics, Inc.* | 1,500 | 62,812 | ||
| Paradyne Networks* | 3,700 | 120,481 | ||
| 537,943 | ||||
| Data Processing and Preparation - 1.0% | ||||
| Homestore.com, Inc.* | 3,900 | 113,831 | ||
| Electrical Equipment & Electronics - 12.6% | ||||
| Alpha Industries* | 800 | 35,250 | ||
| Anaren Microwave, Inc.* | 1,350 | 177,166 | ||
| Applied Micro Circuits Corp.* | 500 | 49,375 | ||
| Avanex Corp.* | 500 | 47,750 | ||
| Cobalt Networks, Inc.* | 2,500 | 144,687 | ||
| Cree, Inc.* | 1,050 | 140,175 | ||
| Exar Corp.* | 1,000 | 87,187 | ||
| Globespan, Inc.* | 500 | 61,039 | ||
| Intersil Holding Corp.* | 3,000 | 162,188 | ||
| Manufacturers Services Ltd.* | 100 | 2,056 | ||
| Microsemi Corp.* | 1,500 | 50,906 | ||
| Next Level Communications,
Inc.* |
1,900 | 162,925 | ||
| Number
of Shares |
Market Value |
|||
|---|---|---|---|---|
| Electrical Equipment & Electronics (Continued) | ||||
| Nvidia Corp.* | 1,000 | $ 63,563 | ||
| PLX Technology, Inc.* | 4,550 | 188,825 | ||
| Power Integrations, Inc.* | 3,300 | 77,756 | ||
| 1,450,848 | ||||
| Entertainment & Leisure - 0.8% | ||||
| Macrovision Corp.* | 1,500 | 95,883 | ||
| Financial Services - 3.7% | ||||
| Knight Trading Group, Inc.* | 1,200 | 35,775 | ||
| NextCard, Inc.* | 17,600 | 149,600 | ||
| Pinnacle Holdings, Inc.* | 2,700 | 145,800 | ||
| Waddell & Reed Financial,
Inc. Cl. A |
3,000 | 98,438 | ||
| 429,613 | ||||
| Healthcare - 1.7% | ||||
| Community Health Systems,
Inc.* |
150 | 2,428 | ||
| Province Healthcare Co.* | 2,900 | 104,763 | ||
| Sunrise Assisted Living, Inc.* | 4,800 | 88,800 | ||
| 195,991 | ||||
| Information Retrieval Services - 0.7% | ||||
| Psinet, Inc.* | 3,200 | 80,400 | ||
| Internet Content - 1.3% | ||||
| BEA Systems, Inc.* | 3,000 | 148,313 | ||
| Internet Software - 3.5% | ||||
| Firepond, Inc.* | 8,900 | 320,400 | ||
| Webmethods, Inc.* | 500 | 78,594 | ||
| 398,994 | ||||
| Lodging - 0.8% | ||||
| Four Seasons Hotels, Inc. | 1,400 | 87,063 | ||
| Medical Supplies - 4.0% | ||||
| Cytyc Corp.* | 3,200 | 170,800 | ||
| LTX Corp.* | 1,100 | 38,431 | ||
| Resmed, Inc.* | 4,800 | 128,400 | ||
| Techne Corp.* | 900 | 117,000 | ||
| 454,631 | ||||
| Number
of Shares |
Market Value |
|||
|---|---|---|---|---|
| Pharmaceuticals - 3.9% | ||||
| Abgenix, Inc.* | 900 | $ 107,873 | ||
| Albany Molecular Research,
Inc.* |
1,600 | 87,100 | ||
| Charles River Laboratories
International, Inc.* |
50 | 1,109 | ||
| Protein Design Labs, Inc.* | 1,500 | 247,430 | ||
| 443,512 | ||||
| Prepackaged Software - 16.6% | ||||
| Art Technology Group, Inc.* | 1,400 | 141,313 | ||
| Digex, Inc.* | 1,900 | 129,081 | ||
| Informatica Corp.* | 1,700 | 139,294 | ||
| ISS Group, Inc.* | 1,650 | 162,912 | ||
| NETIQ Corp.* | 4,100 | 244,463 | ||
| Netopia, Inc.* | 2,000 | 80,500 | ||
| Ondisplay, Inc.* | 1,400 | 114,013 | ||
| Peregrine Systems, Inc.* | 3,400 | 117,938 | ||
| Proxicom, Inc.* | 4,100 | 196,288 | ||
| SonicWall, Inc.* | 2,500 | 220,156 | ||
| Tibco Software, Inc.* | 1,700 | 182,298 | ||
| Vitria Technology, Inc.* | 2,100 | 128,363 | ||
| WatchGuard Technologies* | 900 | 49,444 | ||
| 1,906,063 | ||||
| Retail - 0.8% | ||||
| Bed Bath & Beyond, Inc.* | 2,400 | 87,000 | ||
| Telephone Utilities - 5.7% | ||||
| Dobson Communications
Corp. Cl. A* |
3,100 | 59,675 | ||
| Metrocall, Inc.* | 12,500 | 112,500 | ||
| Metromedia Fiber Network,
Inc.* |
4,900 | 194,469 | ||
| Nextlink Communications* | 4,439 | 168,405 | ||
| WebLink Wireless, Inc.* | 3,900 | 51,675 | ||
| West Teleservices Corp.* | 2,550 | 64,547 | ||
| 651,271 | ||||
| Transportation - 0.3% | ||||
| Forward Air Corporation* | 1,000 | 40,000 | ||
| TOTAL EQUITIES
(Cost $9,765,356) |
10,808,366 | |||
|
Principal Amount |
Market Value |
|||
|---|---|---|---|---|
| SHORT-TERM INVESTMENTS - 5.7% | ||||
| Repurchase Agreement | ||||
| Investors Bank & Trust
Company Repurchase Agreement, dated 06/30/00, 6.03%, due 07/03/00 (a) |
$ 660,546 | $ 660,546 | ||
| TOTAL SHORT-TERM INVESTMENTS
(At Amortized Cost) |
660,546 | |||
| TOTAL INVESTMENTS - 99.9%
(Cost $10,425,902)** |
11,468,912 | |||
| Other Assets/(Liabilities) - 0.1% | 10,501 | |||
| NET ASSETS - 100.0% | $ 11,479,413 | |||
*
|
Non-income producing security.
|
**
|
Aggregate cost for Federal tax purposes. (Note 7).
|
(a)
|
Maturity value of $660,878. Collateralized by U.S. Government Agency obligation with a rate of 7.647%, maturity date of 09/01/2023, and
aggregate market value, including accrued interest, of $693,617.
|
| 1. The Fund | MML Emerging Growth Fund (the “Fund”), which commenced operations on May 1, 2000, is a diversified series of the MML
Series Investment Fund (“MML Trust”), a no-load, open-end management investment company registered under the Investment Company Act of 1940, as amended (the “1940 Act”). The MML Trust, which has eleven separate series of shares, is
organized under the laws of the Commonwealth of Massachusetts as a Massachusetts business trust pursuant to an Agreement and Declaration of Trust dated December 19, 1984, as amended.
|
| The MML Trust was established by Massachusetts Mutual Life Insurance Company (“MassMutual”) for the purpose of providing
vehicles for the investment assets of various separate investment accounts established by MassMutual and by life insurance companies which are subsidiaries of MassMutual. Shares of the MML Trust are not offered to the general public.
|
| 2. Significant
Accounting Policies |
The following is a summary of significant accounting policies followed consistently by the Fund in the preparation of the
financial statements in conformity with generally accepted accounting principles. The preparation of the financial statements in accordance with generally accepted accounting principles requires management to make estimates and assumptions that affect the
reported amounts and disclosures in the financial statements. Actual results could differ from those estimates.
|
| Investment
Valuation |
Equity securities are valued on the basis of valuations furnished by a pricing service, authorized by the Board of Trustees (“
Trustees”), which provides the last reported sale price for securities listed on a national securities exchange or on the NASDAQ National Market System, or in the case of over-the-counter securities not so listed, the last reported bid price. Debt
securities (other than short-term obligations with a remaining maturity of sixty days or less) are valued on the basis of valuations furnished by a pricing service, authorized by the Trustees, which determines valuations taking into account appropriate
factors such as institutional-size trading in similar groups of securities, yield, quality, coupon rate, maturity, type of issue, trading characteristics and other market data. Money market obligations with a remaining maturity of sixty days or less are
valued at either amortized cost or at original cost plus accrued interest, whichever approximates current market value. All other securities and other assets are valued at fair value in accordance with procedures approved by and determined in good faith
by the Trustees, although the actual calculation may be done by others.
|
| Portfolio securities traded on more than one national securities exchange are valued at the last price on the business day as of
which such value is being determined at the close of the exchange representing the principal market for such securities. All assets and liabilities expressed in foreign currencies will be converted into U.S. dollars at the mean between the buying and
selling rates of such currencies against U.S. dollars last quoted by any major bank. If such quotations are not available, the rate of exchange will be determined in accordance with policies established by the Trustees.
|
| Accounting for
Investments |
Investment transactions are accounted for on the trade date. Realized gains and losses on sales of investments and unrealized
appreciation and depreciation of investments are computed on the specific identification cost method. Interest income, adjusted for amortization of discounts and premiums on investments, is earned from the settlement date and is recorded on the accrual
basis. Dividend income is recorded on the ex-dividend date.
|
| Federal Income
Tax |
It is the Fund’s intent to continue to comply with the provisions of subchapter M of the Internal Revenue Code of 1986, as
amended (the “Code”), applicable to a regulated investment company. Under such provisions, the Fund will not be subject to federal income taxes on its ordinary income and net realized capital gains to the extent they are distributed or deemed to
have been distributed to its shareholders. Therefore, no Federal income tax provision is required.
|
|
Dividends and
|
Dividends from net investment income and distributions of any net realized capital gains of the Fund are declared and paid
annually and at other times as may be required to satisfy tax or regulatory requirements. Distributions to shareholders are recorded on the ex-dividend date. Income and capital gain distributions are determined in accordance with income tax regulations
which may differ from generally accepted accounting principles. These differences are primarily due to investments in forward contracts, passive foreign investment companies and the deferral of wash sale losses. As a result, net investment income and net
realized gains on investment transactions for a reporting period may differ significantly from distributions during such period. Accordingly, the Fund may periodically make reclassifications among certain of its capital accounts without impacting the net
asset value of the Fund.
|
| Foreign Currency
Translation |
The books and records of the Fund are maintained in U.S. dollars. The market values of foreign currencies, foreign securities and
other assets and liabilities denominated in foreign currencies are translated into U.S. dollars at the mean of the buying and selling rates of such currencies against the U.S. dollar at the end of each business day. Purchases and sales of foreign
securities and income and expense items are translated at the rates of exchange prevailing on the respective dates of such transactions. The Fund does not isolate that portion of the results of operations arising from changes in the exchange rates from
that portion arising from changes in the market prices of securities.
|
| Net realized foreign currency gains and losses resulting from changes in exchange rates include foreign currency gains and losses
between trade date and settlement date on investment securities transactions, foreign currency transactions and the difference between the amounts of dividends recorded on the books of the Fund and the amounts actually received.
|
| Securities Lending
|
The Fund may make loans of portfolio securities; however, securities lending can not exceed 33% of its total assets taken at
current value. The loans are collateralized at all times with cash or securities with a market value at least equal to 100% of the market value of the securities on loan. As with other extensions of credit, the Fund may bear the risk of delay in recovery
or even loss of rights in the collateral should the borrower of the securities fail financially. The Fund receives compensation for lending its securities. At June 30, 2000, the Fund did not have any loaned securities.
|
| Forward Foreign
Currency Contracts |
The Fund may enter into forward foreign currency contracts in order to convert foreign denominated securities or obligations to
U.S. dollar denominated investments. A forward foreign currency contract is an agreement between two parties to buy and sell a currency at a set price on a future date. The market value of a forward currency contract fluctuates with changes in forward
foreign currency exchange rates. Forward foreign currency contracts are marked to market daily and the change in their value is recorded by the Fund as an unrealized gain or loss. When a forward foreign currency contract is extinguished, through delivery
or offset by entering into another forward foreign currency contract, the Fund records a realized gain or loss equal to the difference between the value of the contract at the time it was opened and the value of the contract at the time it was
extinguished or offset.
|
| Forward foreign currency contracts involve a risk of loss from the potential inability of counterparties to meet the terms of
their contracts and from unanticipated movements in foreign currency values and interest rates.
|
| The notional or contractual amounts of these instruments represent the investments the Fund has in particular classes of financial
instruments and do not necessarily represent the amounts potentially subject to risk. The measurement of the risk associated with these instruments is meaningful only when all related and offsetting transactions are considered.
|
| There were no outstanding forward foreign currency contracts at June 30, 2000.
|
| Forward
Commitments |
The Fund may purchase or sell securities on a “when issued,” delayed delivery or forward commitment basis. The Fund uses
forward commitments to manage interest rate exposure or as a temporary substitute for purchasing or selling particular debt securities. Delivery and payment for securities purchased on a forward commitment basis can take place a month or more after the
date of the transaction. The Fund instructs the custodian to segregate assets in a separate account with a current market value at least equal to the amount of its forward purchase commitments. The price of the underlying security and the date when the
securities will be delivered and paid for are fixed at the time the transaction is negotiated. The value of the forward commitment is determined by management using a commonly accepted pricing model and fluctuates based upon changes in the value of the
underlying security and market repurchase rates. Such rates equate the counterparty’s cost to purchase and finance the underlying security to the earnings received on the security and forward delivery proceeds. The Fund records on a daily basis the
unrealized appreciation/depreciation based upon changes in the value of the forward commitment. When a forward commitment contract is closed, the Fund records a realized gain or loss equal to the difference between the value of the contract at the time it
was opened and the value of the contract at the time it was extinguished. Forward commitments involve a risk of loss if the value of the security to be purchased declines prior to the settlement date. The Fund could also be exposed to loss if it cannot
close out its forward commitments because of an illiquid secondary market, or the inability of counterparties to perform. The Fund monitors exposure to ensure counterparties are creditworthy and concentration of exposure is minimized. At June 30, 2000,
the Fund had no open forward commitments.
|
| Financial Futures
Contracts |
The Fund may purchase or sell financial futures contracts and options on such futures contracts for the purpose of hedging the
market risk on existing securities or the intended purchase of securities. Futures contracts are contracts for delayed delivery of securities at a specific future date and at a specific price or yield. Upon entering into a contract, the Fund deposits and
maintains as collateral such initial margin as required by the exchange on which the transaction is effected. Pursuant to the contract, the Fund agrees to receive from or pay to the broker an amount of cash equal to the daily fluctuation in value of the
contract. Such receipts or payments are known as variation margin and are recorded by the Fund as unrealized gains or losses. When the contract is closed, the Fund records a realized gain or loss equal to the difference between the value of the contract
at the time it was opened and the value at the time it was closed. At June 30, 2000, the Fund had no open financial futures contracts.
|
| Investment
Management Fee |
MassMutual serves as investment adviser to the Fund and provides administrative services as needed by the Fund. For acting as
such, MassMutual receives a fee from the Fund at the annual rate, payable monthly, of 1.05% of the first $200,000,000, 1.00% on the next $200,000,000 and 0.95% on assets over $400,000,000, of the average daily net asset value of the Fund.
|
| MassMutual has entered into an investment sub-advisory agreement with RS Investment Management L.P. (“RS”) pursuant to
which RS serves as investment sub-adviser to the Fund. MassMutual pays RS a monthly fee based upon the aggregate net assets under management at the annual rate of 0.65% of the first $200,000,000 of aggregate net assets, 0.60% of the next $200,000,000 of
assets and 0.55% of assets over $400,000,000.
|
| MassMutual has agreed, at least through April 30, 2001, to bear the expenses of the Fund to the extent that the aggregate expenses
(excluding the Fund’s management fee, interest, taxes, brokerage commissions and extraordinary expenses) incurred during the Fund’s fiscal year exceed 0.11% of the average daily net assets of the Fund for such year.
|
| Other
|
Certain officers and trustees of the Fund are also officers of MassMutual. The compensation of unaffiliated directors of the Fund
is borne by the Fund.
|
| 4. Purchases and
Sales of Investments
|
Cost of purchases and proceeds from sales of investment securities (excluding short-term investments) for the period from May 1,
2000 (commencement of operations) through June 30, 2000, were as follows:
|
| Purchases
|
| Equities | $10,654,007 | |
| Sales
|
| Equities | $ 850,197 |
| 5. Capital Share
Transactions |
The Fund is authorized to issue an unlimited number of shares, with no par value. The change in shares outstanding for the period
May 1, 2000 (commencement of operations) through June 30, 2000 is as follows:
|
| Shares
|
| Sales of shares | 1,051,267 | ||
| Redemptions of shares | (1,175 | ) | |
| |
|||
| Net increase | 1,050,092 | ||
| |
|||
| Shares
|
| Sales of shares | $10,496,318 | ||
| Redemptions of shares | (12,059 | ) | |
| |
|||
| Net increase | $10,484,259 | ||
| |
| 6. Foreign
Securities |
The Fund may also invest in foreign securities, subject to certain percentage restrictions. Investing in securities of foreign
companies and foreign governments involves special risks and considerations not typically associated with investing in securities issued by U.S. companies and the U.S. Government. These risks include revaluation of currencies and future adverse political
and economic developments. Moreover, securities of many foreign companies and foreign governments and their markets may be less liquid and their prices more volatile than those of securities of comparable U.S. companies and the U.S. Government.
|
| 7. Federal Income
Tax Information |
At June 30, 2000, the cost of securities and the unrealized appreciation (depreciation) in the value of investments owned by the
Fund, as computed on a Federal income tax basis, are as follows:
|
| Federal
Income Tax Cost |
Tax Basis
Unrealized Appreciation |
Tax Basis
Unrealized Depreciation |
Net Unrealized
Appreciation |
|||
|---|---|---|---|---|---|---|
| $10,425,902 | $1,714,025 | $671,015 | $1,043,010 |
|
|