
|
|
|
|
|
|
|
|
|
|
Previous: MML SERIES INVESTMENT FUND, N-30D, 2000-08-23 |
Next: MML SERIES INVESTMENT FUND, N-30D, 2000-08-23 |
| MML Equity Index Fund – Letter to Shareholders
|
| |
| MassMutual Expands Fund Offerings
|
| I’d like to announce some exciting additions to the MML Series Investment Fund. Through our comprehensive due diligence
process, we’ve uncovered significant investor demand for a number of fund types and managers that were not previously addressed by our selections. As a result, we’ve added three new funds, listed as follows, with their managers (sub-advisers) in
parentheses: Large Cap Value (Davis Selected Advisers), OTC 100 (Deutsche Asset Management/Bankers Trust Company), and Emerging Growth (RS Investment Management). These new choices span a broad range of investment styles and market sectors—value vs.
growth, active vs. indexed, and large-cap vs. emerging growth. All of our new managers have produced excellent long-term track records, and have passed through our extensive selection process. We will continue to monitor all of our funds carefully so that
you can be assured of access to top-flight investment management talent.
|
What are the investment objectives and policies for the MML Equity Index Fund?
The objective and policies of the Fund are to:
Ÿ achieve long-term growth of capital through performance that closely tracks that of the Standard & Poor’s 500 Index
Ÿ invest in a portfolio of equity securities mirroring the composition and sector weightings of the Standard & Poor’s 500 Index
How did the Fund perform during the first half of 2000?
For the six months ended June 30, 2000, the Fund’s shares returned -0.65%, slightly trailing the -0.42% return of the Standard & Poor’s 500 Index, a market cap italization-weighted, unmanaged index of 500 common stocks. The Fund’s return reflects changes in the net asset value per share without the deduction of any product charges. The inclusion of these charges would have reduced the performance shown here. Past performance is no indication of future results.
What factors influenced performance during the period?
It was an extremely volatile six-month period. After backing and filling during January and February, the Index surged 9.78% in March, closing at its peak of 1,527.57 on March 24. Strength came primarily from the new economy sectors of technology, media, the telecommunications segment of the utilities sector, and the biotechnology component of health care. Investors bid particularly aggressively for any stock related to the Internet, regardless of the earnings prospects, and the valuations of many shares reached unsustainably high levels.
Which stocks and sectors were most helpful or detrimental to performance?
As investors began to take seriously the possibility of an economic slowdown later in the year, money began to flow into defensive market sectors—that is, those that tend to outperform the overall market during periods of slower economic growth. Two of the best-performing defensive sectors were health care and consumer staples, with respective returns of 25.7% and 9.0%. These sectors benefited from the perception that people tend to buy items such as razor blades, toothpaste and drugs in a somewhat predictable fashion unless the economy is absolutely terrible. Utilities also did well, with a 9.4% return. The weakest sectors were basic materials, communication services, and consumer cyclicals, with returns of -11.8%, -11.3%, and -8.4%, respectively. Turning to individual holdings, the strongest performers were Nabisco Group, St. Jude Medical, and Reebok International, which finished the period with respective returns of 115%, 77%, and 72%. On the negative side, the Fund’s performance was hurt by weakness in Citrix Systems -71%, Novell -67%, and Qualcomm -59%. In addition, during the quarter there were 16 additions or deletions to the Index, as well as 13 share increases and 7 share decreases, resulting in higher-than-normal turnover costs.
| There is little question in our minds that the Fed’s aggressive tightening of monetary policy will have some slowing effect
on the U.S. economy, along with a decrease in the rate of earnings growth. Thus, in the short term, new economy stocks could experience further volatility since they depend on above-average earnings growth to propel their stock prices higher. In addition,
with valuations still relatively high, investors are likely to be unforgiving of those companies that fail to meet their earnings estimates. On the positive side, spending for information technology is increasing all over the world and is estimated to
reach 5% of gross domestic product in the United States this year. A lot of that spending is likely to benefit companies in the S&P 500®, many of which are leaders in their respective industries.
|
| Furthermore, in the past few years changing market conditions have often resulted in investors shifting their money among
different sectors rather than withdrawing funds from the market. If technology and other new economy sectors temporarily fall from favor, therefore, sector rotation may result in new leadership for the market. Being modeled on a broadly based index like
the S&P 500®, the Fund is well positioned to benefit from this kind of scenario.
|
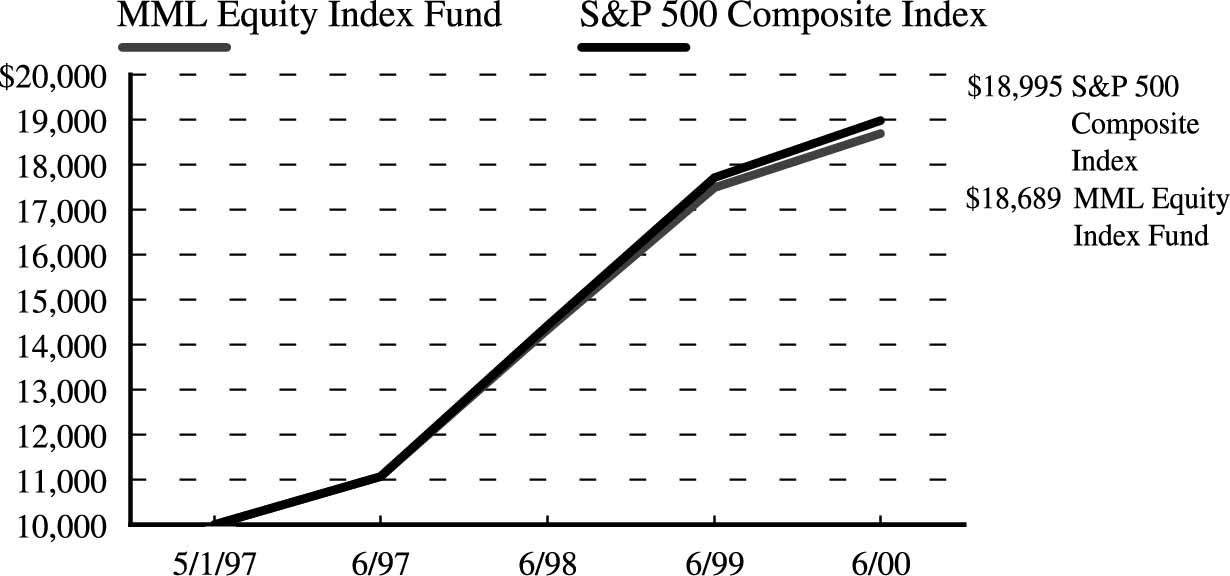
| Year to
Date |
One Year | Since Inception
Average Annual |
|||||
|---|---|---|---|---|---|---|---|
| 1/1/00 - 6/30/00 | 7/1/99 - 6/30/00 | 5/1/97 - 6/30/00 | |||||
| MML Equity Index Fund | -0.65% | 6.80% | 21.79% | ||||
| S&P’s 500 Composite Index | -0.42% | 7.25% | 22.46% | ||||
GROWTH OF A $10,000 INVESTMENT SINCE INCEPTION
| ASSETS: | ||
| Investments, at value (cost $114,761,652) (Note 2) | $136,168,041 | |
| Short-term investments, at amortized cost (Note 2) | 12,862,579 | |
| Total investments | 149,030,620 | |
| Cash | 2,996,559 | |
| Receivables from investments sold | 7,493 | |
| Interest and dividends | 143,770 | |
| Foreign taxes withheld | 1,886 | |
| Variation margin on open futures contracts (Note 1) | 106,050 | |
| Reimbursement receivable | 5,391 | |
| Total assets | 152,291,769 | |
| LIABILITIES: | ||
| Payables for investments purchased | 75,559 | |
| Directors’ fees and expenses (Note 3) | 4,258 | |
| Affiliates (Note 3): | ||
| Investment management fees | 12,062 | ||
| Administration fees | 21,787 | ||
| Accrued expenses and other liabilities | 43,783 | ||
| Total liabilities | 157,449 | ||
| NET ASSETS | $152,134,320 | ||
| Net assets consist of: | |||
| Paid-in capital | $130,584,902 | ||
| Undistributed net investment income | 284,814 | ||
| Accumulated net realized loss on investments and futures contracts | (36,683 | ) | |
| Net unrealized appreciation on investments and futures contracts | 21,301,287 | ||
| $152,134,320 | |||
| Net assets: | |||
| Class I | $ 74,505,928 | ||
| Class II | $ 40,239,850 | ||
| Class III | $ 37,388,542 | ||
| Shares outstanding: | |||
| Class I | 4,147,055 | ||
| Class II | 2,240,325 | ||
| Class III | 2,081,081 | ||
| Net asset value, offering price and redemption price per share: | |||
| Class I | $ 17.97 | ||
| Class II | $ 17.96 | ||
| Class III | $ 17.97 | ||
| Investment income: (Note 2) | ||
| Dividends (net of withholding tax of $3,627) | $ 657,759 | |
| Interest | 172,031 | |
| Total investment income | 829,790 | |
| Expenses: (Note 2) | ||
| Investment management fees (Note 3) | 170,330 | ||
| Custody fees | 15,009 | ||
| Audit and legal fees | 12,292 | ||
| Directors’ fees (Note 3) | 7,175 | ||
| Other expenses | 3,213 | ||
| 208,019 | |||
| Expenses reimbursed (Note 3) | (10,442 | ) | |
| 197,577 | |||
| Administration fees (Note 3): | |||
| Class I | 32,763 | ||
| Class II* | 12,045 | ||
| Class II fees waived* | (3,315 | ) | |
| 8,730 | |||
| Class III* | 3,078 | ||
| Class III fees waived* | (3,078 | ) | |
| - | |||
| Net expenses | 239,070 | ||
| Net investment income | 590,720 | ||
| Realized and unrealized gain (loss): | |||
| Net realized gain (loss) on: | |||
| Investment transactions | 71,460 | ||
| Closed futures contracts | (25,433 | ) | |
| Net realized gain | 46,027 | ||
| Net change in unrealized appreciation (depreciation) on: | |||
| Investments | (282,678 | ) | |
| Open futures contracts | (173,062 | ) | |
| Net unrealized loss | (455,740 | ) | |
| Net realized and unrealized loss | (409,713 | ) | |
| Net increase in net assets resulting from operations | $ 181,007 | ||
*
|
For the period from May 1, 2000 (commencement of operations) through June 30, 2000.
|
| Six months ended
June 30, 2000 (Unaudited) |
Year ended
December 31, 1999 |
|||||
|---|---|---|---|---|---|---|
| Increase (Decrease) in Net Assets: | ||||||
| Operations: | ||||||
| Net investment income | $ 590,720 | $ 489,013 | ||||
| Net realized gain on investment and futures transactions | 46,027 | 581,500 | ||||
| Net change in unrealized appreciation (depreciation) on investments and futures contracts | (455,740 | ) | 10,753,807 | |||
| Net increase in net assets resulting from operations | 181,007 | 11,824,320 | ||||
| Distributions to shareholders (Note 2): | ||||||
| From net investment income: | ||||||
| Class I | (134,560 | ) | (491,028 | ) | ||
| Class II* | (85,970 | ) | - | |||
| Class III* | (85,376 | ) | - | |||
| Total distributions from net investment income | (305,906 | ) | (491,028 | ) | ||
| From net realized gains: | ||||||
| Class I | - | (686,989 | ) | |||
| Total distributions from net realized gains | - | (686,989 | ) | |||
| Net fund share transactions (Note 5): | ||||||
| Class I | (20,356,906 | ) | 48,333,681 | |||
| Class II* | 40,192,701 | - | ||||
| Class III* | 37,374,163 | - | ||||
| Increase in net assets from net fund share transactions | 57,209,958 | 48,333,681 | ||||
| Total increase in net assets | 57,085,059 | 58,979,984 | ||||
| NET ASSETS: | ||||||
| Beginning of period | 95,049,261 | 36,069,277 | ||||
| End of period (including undistributed net investment income of $284,814 and $0, respectively) | $ 152,134,320 | $ 95,049,261 | ||||
| * For the period from May 1, 2000 (commencement of operations) through June 30, 2000.
|
| Class I |
||||||||||||
|---|---|---|---|---|---|---|---|---|---|---|---|---|
| Six months ended
6/30/00 (Unaudited) |
Year ended
12/31/99 |
Year ended
12/31/98 |
Period ended
12/31/97† |
|||||||||
| Net asset value, beginning of period | $ 18.13 | $ 15.26 | $ 12.08 | $ 10.00 | ||||||||
| Income (loss) from investment operations: | ||||||||||||
| Net investment income | 0.11 | 0.09 | 0.13 | 0.09 | ||||||||
| Net realized and unrealized gain (loss) on investments | (0.23 | ) | 3.01 | 3.28 | 2.10 | |||||||
| Total income (loss) from investment operations | (0.12 | ) | 3.10 | 3.41 | 2.19 | |||||||
| Less distributions to shareholders: | ||||||||||||
| From net investment income | (0.04 | ) | (0.09 | ) | (0.13 | ) | (0.09 | ) | ||||
| From net realized gains | - | (0.14 | ) | (0.10 | ) | (0.02 | ) | |||||
| Total distributions | (0.04 | ) | (0.23 | ) | (0.23 | ) | (0.11 | ) | ||||
| Net asset value, end of period | $ 17.97 | $ 18.13 | $ 15.26 | $ 12.08 | ||||||||
| Total Return @ | (0.65% | )** | 20.32% | 28.22% | 21.39% | ** | ||||||
| Ratios / Supplemental Data: | ||||||||||||
| Net assets, end of period (000’s) | $74,506 | $95,050 | $36,069 | $24,202 | ||||||||
| Ratio of net expenses to average daily net assets: | ||||||||||||
| Before expense waiver | 0.46% | * | 0.50% | 0.60% | 0.43% | ** | ||||||
| After expense waiver # | 0.45% | * | N/A | 0.50% | N/A | |||||||
| Net investment income to average daily net assets | 0.89% | * | 0.92% | 0.91% | 0.80% | ** | ||||||
| Portfolio turnover rate | 1% | ** | 3% | 5% | 2% | ** | ||||||
| Class II |
Class III |
|||||||||||
| Period ended
6/30/00†† (Unaudited) |
Period ended
6/30/00†† (Unaudited) |
|||||||||||
| Net asset value, beginning of period | $ 17.96 | $ 17.96 | ||||||||||
| Income (loss) from investment operations: | ||||||||||||
| Net investment income | 0.04 | 0.04 | ||||||||||
| Net realized and unrealized gain (loss) on investments | - | 0.01 | ||||||||||
| Total income (loss) from investment operations | 0.04 | 0.05 | ||||||||||
| Less distributions to shareholders: | ||||||||||||
| From net investment income | (0.04 | ) | (0.04 | ) | ||||||||
| Net asset value, end of period | $ 17.96 | $ 17.97 | ||||||||||
| Total Return @ | 0.23% | ** | 0.27% | ** | ||||||||
| Ratios / Supplemental Data: | ||||||||||||
| Net assets, end of period (000’s) | $40,240 | $37,389 | ||||||||||
| Ratio of net expenses to average daily net assets: | ||||||||||||
| Before expense waiver | 0.34% | * | 0.20% | * | ||||||||
| After expense waiver | 0.29% | * | 0.15% | * | ||||||||
| Net investment income to average daily net assets | 1.26% | * | 1.40% | * | ||||||||
| Portfolio turnover rate | 1% | ** | 1% | ** | ||||||||
| *
|
Annualized
|
**
|
Percentage represents results for the period and are not annualized.
|
| †
|
For the period from May 1, 1997 (commencement of operations) through December 31, 1997.
|
††
|
For the period from May 1, 2000 (commencement of operations) through June 30, 2000.
|
| #
|
Computed after giving effect to an agreement by MassMutual to waive certain fees and expenses of the Fund for the year ended December 31,
1998 and the period ended June 30, 2000.
|
| @
|
Total return information shown in the Financial Highlights tables does not reflect expenses that apply at the separate account level or
to related insurance products. Inclusion of these charges would reduce the total return figures for all periods shown.
|
| Number
of Shares |
Market Value |
||||||||
|---|---|---|---|---|---|---|---|---|---|
| EQUITIES - 89.5% | |||||||||
| Advertising - 0.2% | |||||||||
| Interpublic Group Cos., Inc. | 3,100 | $ 133,300 | |||||||
| Omnicom Group | 1,900 | 169,219 | |||||||
| Young & Rubicam, Inc. | 700 | 40,031 | |||||||
| 342,550 | |||||||||
| Aerospace & Defense - 0.7% | |||||||||
| Boeing Co. | 9,410 | 393,456 | |||||||
| General Dynamics Corp. | 2,200 | 114,950 | |||||||
| Goodrich (B.F.) Co. | 1,200 | 40,875 | |||||||
| Honeywell International, Inc. | 8,687 | 292,643 | |||||||
| Lockheed Martin Corporation | 4,300 | 106,694 | |||||||
| Northrop Grumman Corp. | 700 | 46,375 | |||||||
| Raytheon Co. Cl. B | 3,700 | 71,225 | |||||||
| TRW, Inc. | 1,400 | 60,725 | |||||||
| 1,126,943 | |||||||||
| Air Transportation - 0.2% | |||||||||
| AMR Corp./Del* | 1,600 | 42,300 | |||||||
| Delta Air Lines, Inc. | 1,400 | 70,787 | |||||||
| Southwest Airlines | 5,537 | 104,857 | |||||||
| US Airways Group, Inc.* | 700 | 27,300 | |||||||
| 245,244 | |||||||||
| Apparel, Textiles & Shoes - 0.4% | |||||||||
| Gap, Inc. | 9,287 | 290,219 | |||||||
| LIZ Claiborne, Inc. | 600 | 21,150 | |||||||
| Limited, Inc. | 4,600 | 99,475 | |||||||
| Nike, Inc. Cl. B | 3,000 | 119,437 | |||||||
| Nordstrom, Inc. | 1,500 | 36,187 | |||||||
| Reebok International Ltd.* | 600 | 9,562 | |||||||
| Russell Corp. | 300 | 6,000 | |||||||
| Springs Industries, Inc. Cl. A | 200 | 6,400 | |||||||
| VF Corporation | 1,300 | 30,956 | |||||||
| 619,386 | |||||||||
| Automotive & Parts - 0.8% | |||||||||
| Cooper Tire & Rubber
Company |
700 | 7,787 | |||||||
| Dana Corp. | 1,785 | 37,820 | |||||||
| Number
of Shares |
Market Value |
||||||||
|---|---|---|---|---|---|---|---|---|---|
| Automotive & Parts (Continued) | |||||||||
| Delphi Automotive Systems
Corporation |
6,117 | $ 89,079 | |||||||
| Ford Motor Company | 13,100 | 563,300 | |||||||
| General Motors Corp. | 6,377 | 370,265 | |||||||
| Genuine Parts Co. | 1,900 | 38,000 | |||||||
| Goodyear Tire & Rubber
Company |
1,700 | 34,000 | |||||||
| Navistar International* | 700 | 21,744 | |||||||
| Paccar, Inc. | 800 | 31,750 | |||||||
| Visteon Corp.* | 1,715 | 20,797 | |||||||
| 1,214,542 | |||||||||
| Banking, Savings & Loans - 5.8% | |||||||||
| Amsouth Bancorporation | 4,250 | 66,937 | |||||||
| Bank of America Corp. | 18,627 | 800,961 | |||||||
| The Bank of New York
Company, Incorporated |
8,100 | 376,650 | |||||||
| Bank One Corp. | 12,510 | 332,297 | |||||||
| BB&T Corporation | 3,800 | 90,725 | |||||||
| Capital One Financial Corp. | 2,100 | 93,712 | |||||||
| Charter One Financial, Inc. | 2,400 | 55,200 | |||||||
| Chase Manhattan Corp. | 13,500 | 621,844 | |||||||
| Citigroup, Inc. | 36,767 | 2,215,212 | |||||||
| Comerica, Incorporated | 1,750 | 78,531 | |||||||
| Fifth Third Bancorp | 3,375 | 213,469 | |||||||
| First Union Corp. | 10,796 | 267,876 | |||||||
| Firstar Corporation | 10,672 | 224,779 | |||||||
| Fleet Boston Financial Corp. | 9,995 | 339,830 | |||||||
| Federal Home Loan
Mortgage Corp. |
7,600 | 307,800 | |||||||
| Golden West Financial Corp. | 1,800 | 73,462 | |||||||
| Huntington Bancshares | 2,436 | 38,519 | |||||||
| KeyCorp | 4,900 | 86,362 | |||||||
| Mellon Financial Corp. | 5,500 | 200,406 | |||||||
| National City Corp. | 6,700 | 114,319 | |||||||
| Northern Trust Corp. | 2,400 | 156,150 | |||||||
| Old Kent Financial Corp. | 1,575 | 42,131 | |||||||
| PNC Financial Services
Group |
3,200 | 150,000 | |||||||
| Providian Financial Corp. | 1,550 | 139,500 | |||||||
| Regions Financial Corp. | 2,400 | 47,700 | |||||||
| SouthTrust Corp. | 1,800 | 40,725 | |||||||
| State Street Corp. | 1,700 | 180,306 | |||||||
| Summit Bancorp | 1,900 | 46,787 | |||||||
| Number
of Shares |
Market Value |
||||||||
|---|---|---|---|---|---|---|---|---|---|
| Banking, Savings & Loans (Continued) | |||||||||
| Suntrust Banks, Inc. | 3,500 | $ 159,906 | |||||||
| Synovus Financial Corp. | 3,100 | 54,637 | |||||||
| U.S. Bancorp | 8,231 | 158,447 | |||||||
| Union Planters Corp. | 1,600 | 44,700 | |||||||
| Wachovia Corp. | 2,200 | 119,350 | |||||||
| Washington Mutual, Inc. | 6,312 | 182,259 | |||||||
| Wells Fargo & Company | 18,000 | 697,500 | |||||||
| 8,818,989 | |||||||||
| Beverages - 1.8% | |||||||||
| Anheuser-Busch Companies,
Inc. |
5,100 | 380,906 | |||||||
| Brown-Forman Corporation
Cl. B |
700 | 37,625 | |||||||
| Coca-Cola Company, The | 26,900 | 1,545,069 | |||||||
| Coca-Cola Enterprises | 4,700 | 76,669 | |||||||
| Coors (Adolph) Cl. B | 400 | 24,200 | |||||||
| Pepsico, Inc. | 15,900 | 706,556 | |||||||
| 2,771,025 | |||||||||
| Broadcasting, Publishing & Printing - 2.0% | |||||||||
| American Greetings Cl. A | 700 | 13,300 | |||||||
| Clear Channel
Communications* |
3,700 | 277,500 | |||||||
| Comcast Corp. Cl. A* | 10,100 | 409,050 | |||||||
| Dow Jones & Co., Inc. | 1,000 | 73,250 | |||||||
| Gannett Co., Inc. | 3,100 | 185,419 | |||||||
| Harcourt General, Inc. | 700 | 38,062 | |||||||
| Knight Ridder, Inc. | 900 | 47,869 | |||||||
| The McGraw-Hill
Companies, Inc. |
2,100 | 113,400 | |||||||
| MediaOne Group, Inc.* | 6,700 | 444,302 | |||||||
| Meredith Corp. | 500 | 16,875 | |||||||
| New York Times Co. Cl. A | 1,900 | 75,050 | |||||||
| Times Mirror Company Cl. A | 600 | 52,500 | |||||||
| Tribune Co. | 2,500 | 87,500 | |||||||
| Viacom, Inc. Cl. B* | 16,568 | 1,129,730 | |||||||
| 2,963,807 | |||||||||
| Building Materials & Construction - 1.1% | |||||||||
| Centex Corp. | 600 | 14,100 | |||||||
| Home Depot, Inc. | 25,050 | 1,250,934 | |||||||
| Number
of Shares |
Market Value |
|||
|---|---|---|---|---|
| Building Materials & Construction (Continued) | ||||
| Kaufman & Broad Home
Corp. |
500 | $ 9,906 | ||
| Louisiana-Pacific Corp. | 1,100 | 11,962 | ||
| Lowe’s Companies | 4,100 | 168,356 | ||
| Masco Corp. | 4,900 | 88,506 | ||
| Owens Corning | 600 | 5,550 | ||
| Vulcan Materials Co. | 1,100 | 46,956 | ||
| 1,596,270 | ||||
| Chemicals - 0.9% | ||||
| Air Products and Chemicals,
Inc. |
2,500 | 77,031 | ||
| Ashland, Inc. | 700 | 24,544 | ||
| Dow Chemical Company | 7,500 | 226,406 | ||
| E. I. du Pont de Nemours
and Company |
11,375 | 497,656 | ||
| Eastman Chemical Company | 800 | 38,200 | ||
| Engelhard Corporation | 1,400 | 23,887 | ||
| FMC Corp.* | 300 | 17,400 | ||
| Great Lakes Chemical Corp. | 600 | 18,900 | ||
| Hercules, Inc. | 1,200 | 16,875 | ||
| International Flavors &
Fragrances |
1,200 | 36,225 | ||
| PPG Industries, Inc. | 1,900 | 84,194 | ||
| Praxair, Inc. | 1,700 | 63,644 | ||
| Rohm & Haas Company | 2,384 | 82,248 | ||
| Union Carbide Corp. | 1,500 | 74,250 | ||
| W.R. Grace & Company* | 700 | 8,487 | ||
| 1,289,947 | ||||
| Commercial Services - 0.5% | ||||
| Allied Waste Industries, Inc.* | 2,000 | 20,000 | ||
| Block H & R, Inc. | 1,100 | 35,612 | ||
| Cendant Corporation | 7,661 | 107,254 | ||
| Convergys Corporation* | 1,700 | 88,187 | ||
| Donnelley (R.R.) & Sons Co. | 1,400 | 31,587 | ||
| Dun & Bradstreet Corp. | 1,800 | 51,525 | ||
| Ecolab, Inc. | 1,400 | 54,687 | ||
| Equifax, Inc. | 1,600 | 42,000 | ||
| Fluor Corporation | 800 | 25,300 | ||
| Ikon Office Solutions, Inc. | 1,187 | 4,600 | ||
| Paychex, Inc. | 3,950 | 165,900 | ||
| PerkinElmer, Inc. | 500 | 33,062 | ||
| Quintiles Transnational
Corp.* |
1,200 | 16,950 | ||
| Number
of Shares |
Market Value |
||||||||
|---|---|---|---|---|---|---|---|---|---|
| Commercial Services (Continued) | |||||||||
| Ryder System, Inc. | 600 | $ 11,362 | |||||||
| Waste Management, Inc. | 6,732 | 127,908 | |||||||
| 815,934 | |||||||||
| Communications - 5.7% | |||||||||
| ADC Telecommunications,
Inc.* |
3,300 | 276,787 | |||||||
| Andrew Corp.* | 800 | 26,850 | |||||||
| Global Crossing Ltd.* | 9,245 | 243,259 | |||||||
| GTE Corporation | 10,600 | 659,850 | |||||||
| Lucent Technologies Inc. | 34,785 | 2,061,011 | |||||||
| Network Appliance, Inc.* | 3,300 | 265,650 | |||||||
| Nextel Communications, Inc.
Cl. A* |
8,000 | 489,500 | |||||||
| Nortel Networks Corporation | 31,520 | 2,151,240 | |||||||
| Qualcomm, Inc.* | 8,100 | 486,000 | |||||||
| SBC Communications, Inc. | 37,264 | 1,611,668 | |||||||
| Scientific-Atlanta, Inc. | 1,700 | 126,650 | |||||||
| Tellabs, Inc.* | 4,300 | 294,281 | |||||||
| 8,692,746 | |||||||||
| Computer Integrated Systems Design - 1.5% | |||||||||
| 3com Corp.* | 3,700 | 213,212 | |||||||
| Autodesk, Inc. | 600 | 20,812 | |||||||
| Cabletron Systems* | 2,000 | 50,500 | |||||||
| Computer Sciences Corp.* | 1,800 | 134,437 | |||||||
| Parametric Technology
Corp.* |
2,900 | 31,900 | |||||||
| Sapient Corp.* | 600 | 64,162 | |||||||
| Shared Medical Systems
Corp. |
300 | 21,881 | |||||||
| Sun Microsystems, Inc.* | 17,200 | 1,564,125 | |||||||
| Teradyne, Inc.* | 1,900 | 139,650 | |||||||
| Unisys Corporation* | 3,400 | 49,512 | |||||||
| 2,290,191 | |||||||||
| Computer Programming Services - 0.1% | |||||||||
| Mercury Interactive Corp.* | 800 | 77,400 | |||||||
| Computers & Information - 6.1% | |||||||||
| Apple Computer, Inc.* | 3,600 | 188,550 | |||||||
| Cisco Systems, Inc.* | 74,600 | 4,741,762 | |||||||
| Compaq Computer Corp. | 18,392 | 470,145 | |||||||
| Comverse Technology, Inc.* | 1,700 | 158,100 | |||||||
| Dell Computer Corp.* | 28,000 | 1,380,750 | |||||||
| EMC Corp.* | 22,200 | 1,708,012 | |||||||
| Number
of Shares |
Market Value |
||||||||
|---|---|---|---|---|---|---|---|---|---|
| Computers & Information (Continued) | |||||||||
| Gateway, Inc.* | 3,500 | $ 198,625 | |||||||
| Lexmark International Group,
Inc.* |
1,400 | 94,150 | |||||||
| Seagate Technology, Inc.* | 2,300 | 126,500 | |||||||
| Solectron Corp.* | 6,500 | 272,187 | |||||||
| 9,338,781 | |||||||||
| Computers & Office Equipment - 2.6% | |||||||||
| Electronic Data Systems
Corporation |
5,100 | 210,375 | |||||||
| Hewlett-Packard Company | 10,900 | 1,361,137 | |||||||
| International Business
Machines Corporation |
19,700 | 2,158,381 | |||||||
| Pitney Bowes, Inc. | 2,900 | 116,000 | |||||||
| Xerox Corp. | 7,200 | 149,400 | |||||||
| 3,995,293 | |||||||||
| Containers - 0.1% | |||||||||
| Ball Corp. | 300 | 9,656 | |||||||
| Bemis Company, Inc. | 500 | 16,812 | |||||||
| Crown Cork & Seal
Company, Inc. |
1,400 | 21,000 | |||||||
| Owens-Illinois, Inc.* | 1,600 | 18,700 | |||||||
| Pactiv Corporation* | 1,800 | 14,175 | |||||||
| Sealed Air Corp.* | 1,007 | 52,742 | |||||||
| Temple-Inland, Inc. | 600 | 25,200 | |||||||
| 158,285 | |||||||||
| Cosmetics & Personal Care - 1.4% | |||||||||
| Alberto-Culver Co. Cl. B | 600 | 18,337 | |||||||
| Avon Products | 2,600 | 115,700 | |||||||
| Colgate-Palmolive Company | 6,400 | 383,200 | |||||||
| Gillette Company | 11,700 | 408,769 | |||||||
| Kimberly-Clark Corporation | 6,000 | 344,250 | |||||||
| The Procter & Gamble
Company |
14,300 | 818,675 | |||||||
| 2,088,931 | |||||||||
| Data Processing and Preparation - 0.5% | |||||||||
| Automatic Data Processing,
Inc. |
6,900 | 369,581 | |||||||
| Ceridian Corp.* | 1,600 | 38,500 | |||||||
| Deluxe Corp. | 800 | 18,850 | |||||||
| First Data Corp. | 4,600 | 228,275 | |||||||
| Number
of Shares |
Market Value |
||||||||
|---|---|---|---|---|---|---|---|---|---|
| Data Processing and Preparation (Continued) | |||||||||
| IMS Health, Inc. | 3,400 | $ 61,200 | |||||||
| NCR Corporation* | 1,100 | 42,831 | |||||||
| 759,237 | |||||||||
| Electric Utilities - 1.5% | |||||||||
| AES Corp.* | 4,400 | 200,750 | |||||||
| Ameren Corporation | 1,500 | 50,625 | |||||||
| American Electric Power
Company |
3,480 | 103,095 | |||||||
| C P & L Energy, Inc. | 1,700 | 54,294 | |||||||
| Cinergy Corp. | 1,700 | 43,244 | |||||||
| CMS Energy Corp. | 1,300 | 28,762 | |||||||
| Consolidated Edison, Inc. | 2,400 | 71,100 | |||||||
| Constellation Energy Group,
Inc. |
1,600 | 52,100 | |||||||
| Dominion Resources, Inc. | 2,568 | 110,103 | |||||||
| DTE Energy Company | 1,600 | 48,900 | |||||||
| Duke Energy Corporation | 3,922 | 221,103 | |||||||
| Edison International | 3,800 | 77,900 | |||||||
| Entergy Corp. | 2,700 | 73,406 | |||||||
| FirstEnergy Corporation | 2,500 | 58,437 | |||||||
| Florida Progress Corp. | 1,100 | 51,562 | |||||||
| FPL Group, Inc. | 1,900 | 94,050 | |||||||
| GPU, Inc. | 1,400 | 37,887 | |||||||
| New Century Energies, Inc. | 1,300 | 39,000 | |||||||
| Niagara Mohawk Holdings,
Inc.* |
1,800 | 25,087 | |||||||
| Northern States Power
Company |
1,700 | 34,319 | |||||||
| PECO Energy Co. | 2,000 | 80,625 | |||||||
| PG&E Corp. | 4,200 | 103,425 | |||||||
| Pinnacle West Capital
Corporation |
1,000 | 33,875 | |||||||
| PPL Corporation | 1,600 | 35,100 | |||||||
| Public Service Enterprise
Group |
2,400 | 83,100 | |||||||
| Reliant Energy, Inc. | 3,199 | 94,570 | |||||||
| Southern Co. | 7,300 | 170,181 | |||||||
| TXU Corporation | 3,045 | 89,827 | |||||||
| Unicom Corporation | 2,300 | 88,981 | |||||||
| 2,255,408 | |||||||||
| Electrical Equipment & Electronics - 10.4% | |||||||||
| Adaptec, Inc.* | 1,200 | 27,300 | |||||||
| Advanced Micro Devices* | 1,600 | 123,600 | |||||||
| Number
of Shares |
Market Value |
|||
|---|---|---|---|---|
| Electrical Equipment & Electronics (Continued) | ||||
| Altera Corp.* | 2,200 | $ 224,125 | ||
| American Power Conversion
Corporation* |
1,700 | 69,381 | ||
| Analog Devices, Inc.* | 3,800 | 288,800 | ||
| Conexant Systems, Inc.* | 2,300 | 111,837 | ||
| Emerson Electric Co. | 4,700 | 283,762 | ||
| General Electric Company | 107,500 | 5,697,500 | ||
| Intel Corp. | 36,500 | 4,879,594 | ||
| Johnson Controls, Inc. | 1,000 | 51,312 | ||
| Kla-Tencor Corp.* | 2,000 | 117,125 | ||
| Linear Technology Corp. | 3,400 | 217,387 | ||
| LSI Logic Corp.* | 3,300 | 178,612 | ||
| Maxim Intergrated Products* | 3,600 | 244,575 | ||
| Micron Technology, Inc.* | 5,900 | 519,569 | ||
| MIPS Technologies, Inc. Cl. B* | 263 | 10,137 | ||
| Molex, Inc. | 2,150 | 103,469 | ||
| Motorola, Inc. | 23,115 | 671,780 | ||
| National Semiconductor
Corp.* |
1,900 | 107,825 | ||
| Novellus Systems, Inc.* | 1,300 | 73,531 | ||
| PE Corp.-PE Biosystems
Group |
2,200 | 144,925 | ||
| Rockwell International Corp. | 2,100 | 66,150 | ||
| Sanmina Corp.* | 1,500 | 128,250 | ||
| Texas Instruments, Inc. | 17,800 | 1,222,637 | ||
| Thomas & Betts Corp. | 600 | 11,475 | ||
| Xilinx, Inc.* | 3,500 | 288,969 | ||
| 15,863,627 | ||||
| Energy - 5.5% | ||||
| Amerada Hess Corp. | 1,000 | 61,750 | ||
| Anadarko Petroleum Corp. | 1,400 | 69,037 | ||
| Apache Corporation | 1,300 | 76,456 | ||
| Burlington Resources, Inc. | 2,352 | 89,964 | ||
| Chevron Corporation | 7,200 | 610,650 | ||
| Coastal Corp. | 2,300 | 140,012 | ||
| Columbia Energy Group | 900 | 59,063 | ||
| Conoco, Inc. Cl. B | 6,868 | 168,695 | ||
| Eastern Enterprises | 300 | 18,900 | ||
| EL Paso Energy Corporation | 2,500 | 127,344 | ||
| Enron Corp. | 7,800 | 503,100 | ||
| Exxon Mobil Corp. | 37,628 | 2,953,798 | ||
| Halliburton Co. | 4,800 | 226,500 | ||
| Kerr-McGee Corp. | 1,047 | 61,708 | ||
| Nicor, Inc. | 500 | 16,313 | ||
| Number
of Shares |
Market Value |
||||||||
|---|---|---|---|---|---|---|---|---|---|
| Energy (Continued) | |||||||||
| Occidental Petroleum Corp. | 4,000 | $ 84,250 | |||||||
| Oneok, Inc. | 300 | 7,781 | |||||||
| Peoples Energy Corp. | 400 | 12,950 | |||||||
| Phillips Petroleum Co. | 2,800 | 141,925 | |||||||
| Rowan Cos., Inc.* | 1,000 | 30,375 | |||||||
| Royal Dutch Petroleum
Company NY Shares |
23,400 | 1,440,563 | |||||||
| Schlumberger Ltd. | 6,000 | 447,750 | |||||||
| Sempra Energy | 2,251 | 38,267 | |||||||
| Sunoco, Inc. | 1,000 | 29,438 | |||||||
| Texaco, Inc. | 6,000 | 319,500 | |||||||
| Tosco Corp. | 1,600 | 45,300 | |||||||
| Transocean Sedco Forex,
Inc. |
2,300 | 122,906 | |||||||
| Union Pacific Resources
Group |
2,800 | 61,600 | |||||||
| Unocal Corporation | 2,600 | 86,125 | |||||||
| USX-Marathon Group | 3,400 | 85,213 | |||||||
| The Williams Companies,
Inc. |
4,800 | 200,100 | |||||||
| 8,337,333 | |||||||||
| Entertainment & Leisure – 1.4% | |||||||||
| Brunswick Corp. | 1,000 | 16,563 | |||||||
| Harley-Davidson, Inc. | 3,300 | 127,050 | |||||||
| Harrah’s Entertainment Inc.* | 1,400 | 29,313 | |||||||
| Polaroid Corp. | 500 | 9,031 | |||||||
| Time Warner, Inc. | 14,000 | 1,064,000 | |||||||
| Walt Disney Company, The | 22,600 | 877,163 | |||||||
| 2,123,120 | |||||||||
| Financial Services – 3.1% | |||||||||
| American Express Company | 14,600 | 761,025 | |||||||
| American General
Corporation |
2,710 | 165,310 | |||||||
| Associates First Capital
Corp. Cl. A |
7,896 | 176,180 | |||||||
| Bear Stearns Companies,
Inc. |
1,256 | 52,281 | |||||||
| Countrywide Credit
Industries, Inc. |
1,300 | 39,406 | |||||||
| Federal National Mortgage
Association |
11,200 | 584,500 | |||||||
| Franklin Resources, Inc. | 2,800 | 85,050 | |||||||
| Number
of Shares |
Market Value |
||||||||
|---|---|---|---|---|---|---|---|---|---|
| Financial Services (Continued) | |||||||||
| Household International, Inc. | 5,113 | $ 212,509 | |||||||
| Lehman Brothers Holdings,
Inc. |
1,300 | 122,931 | |||||||
| MBNA Corp. | 8,775 | 238,022 | |||||||
| Merrill Lynch & Co. Inc. | 4,000 | 460,000 | |||||||
| J.P. Morgan & Company | 1,900 | 209,238 | |||||||
| Morgan Stanley Dean Witter &
Co. |
12,450 | 1,036,463 | |||||||
| Paine Webber Group, Inc. | 1,600 | 72,800 | |||||||
| Price (T. Rowe) Associates | 1,300 | 55,250 | |||||||
| Schwab (Charles) Corp. | 13,175 | 443,009 | |||||||
| SLM Holding Corp. | 1,700 | 63,644 | |||||||
| 4,777,618 | |||||||||
| Foods - 1.5% | |||||||||
| Archer-Daniels-Midland | 6,623 | 64,988 | |||||||
| Bestfoods | 3,100 | 214,675 | |||||||
| Campbell Soup Company | 4,700 | 136,888 | |||||||
| ConAgra, Inc. | 5,400 | 102,938 | |||||||
| General Mills, Inc. | 3,300 | 126,225 | |||||||
| Great Atlantic & Pacific
TEA Co. |
400 | 6,650 | |||||||
| Heinz (H. J.) Company | 3,900 | 170,625 | |||||||
| Hershey Foods Corp. | 1,500 | 72,750 | |||||||
| Kellogg Co. | 4,500 | 133,875 | |||||||
| The Kroger Co.* | 9,100 | 200,769 | |||||||
| Nabisco Group Holdings Corp. | 3,600 | 93,375 | |||||||
| Quaker Oats Co. | 1,500 | 112,688 | |||||||
| Ralston-Ralston Purina Group | 3,300 | 65,794 | |||||||
| Safeway, Inc.* | 5,500 | 248,188 | |||||||
| Sara Lee Corp. | 10,000 | 193,125 | |||||||
| Starbucks Corp.* | 2,000 | 76,375 | |||||||
| SuperValu, Inc. | 1,500 | 28,594 | |||||||
| Sysco Corp. | 3,600 | 151,650 | |||||||
| Wrigley (WM.) JR Co. | 1,300 | 104,244 | |||||||
| 2,304,416 | |||||||||
| Forest Products & Paper - 0.3% | |||||||||
| Boise Cascade Corp. | 600 | 15,525 | |||||||
| Fort James Corporation | 2,300 | 53,188 | |||||||
| Georgia-Pacific Group | 1,900 | 49,875 | |||||||
| International Paper Company | 5,323 | 158,692 | |||||||
| Mead Corp. | 1,200 | 30,300 | |||||||
| Potlatch Corp. | 300 | 9,938 | |||||||
| Westvaco Corporation | 1,100 | 27,294 | |||||||
| Number
of Shares |
Market Value |
||||||||
|---|---|---|---|---|---|---|---|---|---|
| Forest Products & Paper (Continued) | |||||||||
| Weyerhaeuser Company | 2,500 | $ 107,500 | |||||||
| Willamette Industries | 1,200 | 32,700 | |||||||
| 485,012 | |||||||||
| Healthcare - 1.8% | |||||||||
| Becton, Dickinson and
Company |
2,800 | 80,325 | |||||||
| Bristol-Myers Squibb Company | 21,600 | 1,258,200 | |||||||
| The Healthcare Company | 6,100 | 185,288 | |||||||
| Healthsouth Corp.* | 4,200 | 30,188 | |||||||
| Humana, Inc.* | 1,800 | 8,775 | |||||||
| Manor Care, Inc.* | 1,100 | 7,700 | |||||||
| Schering-Plough Corp. | 16,000 | 808,000 | |||||||
| Tenet Healthcare Corporation | 3,400 | 91,800 | |||||||
| UnitedHealth Group
Incorporated |
1,800 | 154,350 | |||||||
| Wellpoint Health Networks* | 700 | 50,706 | |||||||
| 2,675,332 | |||||||||
| Holding Company-Diversified - 0.2% | |||||||||
| Seagram Co. Ltd. | 4,800 | 278,400 | |||||||
| Home Construction, Furnishings &
Appliances - 0.1% |
|||||||||
| Armstrong Holdings, Inc. | 400 | 6,125 | |||||||
| Leggett & Platt, Inc. | 2,100 | 34,650 | |||||||
| Maytag Corp. | 1,000 | 36,875 | |||||||
| Pulte Corp. | 400 | 8,650 | |||||||
| Whirlpool Corp. | 800 | 37,300 | |||||||
| 123,600 | |||||||||
| Household Products - 0.8% | |||||||||
| The Clorox Company | 2,500 | 112,031 | |||||||
| Corning, Incorporated | 3,000 | 809,625 | |||||||
| Snap-On, Inc. | 600 | 15,975 | |||||||
| Tupperware Corp. | 600 | 13,200 | |||||||
| Unilever NV NY Shares | 6,332 | 272,276 | |||||||
| 1,223,107 | |||||||||
| Industrial - Distribution - 0.0% | |||||||||
| W.W. Grainger, Inc. | 1,100 | 33,894 | |||||||
| Industrial - Diversified - 0.7% | |||||||||
| Illinois Tool Works, Inc. | 3,300 | 188,100 | |||||||
| McDermott International, Inc. | 600 | 5,288 | |||||||
| Tyco International Ltd. | 18,368 | 870,184 | |||||||
| 1,063,572 | |||||||||
| Number
of Shares |
Market Value |
||||||||
|---|---|---|---|---|---|---|---|---|---|
| Information Retrieval Services - 1.3% | |||||||||
| America Online, Inc.* | 24,900 | $ 1,313,475 | |||||||
| Yahoo!, Inc.* | 5,700 | 706,088 | |||||||
| 2,019,563 | |||||||||
| Insurance - 2.6% | |||||||||
| Aetna, Inc. | 1,600 | 102,700 | |||||||
| Aflac, Inc. | 2,900 | 133,219 | |||||||
| Allstate Corp. | 8,800 | 195,800 | |||||||
| American International Group,
Inc. |
16,973 | 1,994,328 | |||||||
| AON Corp. | 2,850 | 88,528 | |||||||
| Chubb Corp. | 1,900 | 116,850 | |||||||
| CIGNA Corporation | 1,800 | 168,300 | |||||||
| Cincinnati Financial Corp. | 1,800 | 56,588 | |||||||
| Conseco, Inc. | 3,458 | 33,716 | |||||||
| The Hartford Financial
Services Group, Inc. |
2,400 | 134,250 | |||||||
| Jefferson-Pilot Corporation | 1,200 | 67,725 | |||||||
| Lincoln National Corp. | 2,100 | 75,863 | |||||||
| Loews Corp. | 1,200 | 72,000 | |||||||
| Marsh & McLennan
Companies, Inc. |
2,900 | 302,869 | |||||||
| MBIA, Inc. | 1,100 | 53,006 | |||||||
| MGIC Investment Corp. | 1,200 | 54,600 | |||||||
| Progressive Corp. | 900 | 66,600 | |||||||
| Safeco Corp. | 1,400 | 27,825 | |||||||
| St. Paul Companies | 2,424 | 82,719 | |||||||
| Torchmark Corp. | 1,500 | 37,031 | |||||||
| UnumProvident Corp. | 2,538 | 50,919 | |||||||
| 3,915,436 | |||||||||
| Lodging - 0.1% | |||||||||
| Hilton Hotels Corp. | 3,800 | 35,625 | |||||||
| Marriott International, Inc.
Cl. A |
2,800 | 100,975 | |||||||
| 136,600 | |||||||||
| Machinery & Components - 1.2% | |||||||||
| Applied Materials, Inc.* | 8,400 | 761,250 | |||||||
| Baker Hughes, Inc. | 3,540 | 113,280 | |||||||
| Black & Decker Corporation | 1,000 | 39,313 | |||||||
| Briggs & Stratton | 200 | 6,850 | |||||||
| Caterpillar, Inc. | 3,900 | 132,113 | |||||||
| Cummins Engine | 400 | 10,900 | |||||||
| Number
of Shares |
Market Value |
||||||||
|---|---|---|---|---|---|---|---|---|---|
| Machinery & Components (Continued) | |||||||||
| Danaher Corporation | 1,600 | $ 79,100 | |||||||
| Deere & Co. | 2,500 | 92,500 | |||||||
| Dover Corporation | 2,200 | 89,238 | |||||||
| Ingersoll-Rand Co. | 1,800 | 72,450 | |||||||
| Pall Corporation | 1,400 | 25,900 | |||||||
| Parker-Hannifin Corporation | 1,300 | 44,525 | |||||||
| The Stanley Works | 1,000 | 23,750 | |||||||
| Timken Co. | 600 | 11,175 | |||||||
| United Technologies Corp. | 5,200 | 306,150 | |||||||
| 1,808,494 | |||||||||
| Manufacturing - 0.0% | |||||||||
| Millipore Corp. | 500 | 37,688 | |||||||
| Manufacturing - Diversified - 0.1% | |||||||||
| Cooper Industries, Inc. | 1,100 | 35,819 | |||||||
| Eaton Corp. | 800 | 53,600 | |||||||
| ITT Industries, Inc. | 1,000 | 30,375 | |||||||
| National Service Industries,
Inc. |
400 | 7,800 | |||||||
| Textron, Inc. | 1,600 | 86,900 | |||||||
| 214,494 | |||||||||
| Medical Supplies - 1.2% | |||||||||
| Agilent Technologies, Inc.* | 4,957 | 365,579 | |||||||
| Allergan, Inc. | 1,500 | 111,750 | |||||||
| Bard (C.R.), Inc. | 500 | 24,063 | |||||||
| Bausch & Lomb, Inc. | 600 | 46,425 | |||||||
| Baxter International, Inc. | 3,200 | 225,000 | |||||||
| Biomet, Inc. | 1,300 | 49,969 | |||||||
| Boston Scientific Corp.* | 4,600 | 100,913 | |||||||
| Guidant Corp.* | 3,400 | 168,300 | |||||||
| Mallinckrodt Group, Inc. | 700 | 30,406 | |||||||
| Medtronic, Inc. | 13,000 | 647,563 | |||||||
| St. Jude Medical, Inc.* | 1,000 | 45,875 | |||||||
| Tektronix, Inc. | 450 | 33,300 | |||||||
| Thermo Electron Corp.* | 1,700 | 35,806 | |||||||
| 1,884,949 | |||||||||
| Metals & Mining - 0.5% | |||||||||
| Alcan Aluminium Ltd. | 2,400 | 74,400 | |||||||
| Alcoa, Inc. | 9,684 | 280,836 | |||||||
| Allegheny Technologies, Inc. | 1,100 | 19,800 | |||||||
| Barrick Gold Corp. | 4,300 | 78,206 | |||||||
| Number
of Shares |
Market Value |
|||
|---|---|---|---|---|
| Metals & Mining (Continued) | ||||
| Bethlehem Steel Corp.* | 1,400 | $ 4,988 | ||
| Crane Co. | 700 | 17,019 | ||
| Freeport-McMoran Copper &
Gold, Inc. Cl. B* |
1,700 | 15,725 | ||
| Homestake Mining Company | 2,800 | 19,250 | ||
| Inco Ltd.* | 2,100 | 32,288 | ||
| Newmont Mining Corp. | 1,872 | 40,482 | ||
| Nucor Corp. | 1,000 | 33,188 | ||
| Phelps Dodge Corp. | 960 | 35,700 | ||
| Placer Dome, Inc. | 3,600 | 34,425 | ||
| USX-U.S. Steel Group, Inc. | 1,000 | 18,563 | ||
| Worthington Industries | 1,000 | 10,500 | ||
| 715,370 | ||||
| Miscellaneous - 0.3% | |||||
| Avery-Dennison Corp. | 1,300 | 87,263 | |||
| Minnesota Mining &
Manufacturing Company |
4,400 | 363,000 | |||
| 450,263 | |||||
| Pharmaceuticals - 7.7% | |||||
| Abbott Laboratories | 16,700 | 744,194 | |||
| Alza Corp.* | 1,200 | 70,950 | |||
| American Home Products
Corporation |
14,200 | 834,250 | |||
| Amgen, Inc.* | 11,100 | 779,775 | |||
| Biogen, Inc.* | 1,600 | 103,200 | |||
| Cardinal Health, Inc. | 3,050 | 225,700 | |||
| Eli Lilly & Co. | 11,900 | 1,188,513 | |||
| Johnson & Johnson | 15,200 | 1,548,500 | |||
| Mckesson HBOC, Inc. | 3,092 | 64,739 | |||
| Medimmune, Inc.* | 2,100 | 155,400 | |||
| Merck & Co., Inc. | 25,500 | 1,953,938 | |||
| Pfizer, Inc. | 67,775 | 3,253,200 | |||
| Pharmacia Corp. | 13,731 | 709,721 | |||
| Sigma-Aldrich | 1,100 | 32,175 | |||
| Watson Pharmaceutical,
Inc.* |
1,100 | 59,125 | |||
| 11,723,380 | |||||
| Photography Equipment/Supplies - 0.1% | |||||
| Eastman Kodak Co. | 3,400 | 202,300 | |||
| Number
of Shares |
Market Value |
||||||||
|---|---|---|---|---|---|---|---|---|---|
| Prepackaged Software - 5.7% | |||||||||
| Adobe Systems, Inc. | 1,300 | $ 169,000 | |||||||
| BMC Software, Inc.* | 2,700 | 98,508 | |||||||
| Citrix Systems, Inc.* | 1,900 | 35,981 | |||||||
| Computer Associates
Internationational, Inc. |
6,450 | 330,159 | |||||||
| Compuware Corp.* | 3,800 | 39,425 | |||||||
| Microsoft Corp.* | 56,800 | 4,544,000 | |||||||
| Novell, Inc.* | 3,600 | 33,300 | |||||||
| Oracle Corporation* | 30,700 | 2,580,719 | |||||||
| Peoplesoft, Inc.* | 3,000 | 50,250 | |||||||
| Siebel Systems, Inc.* | 2,100 | 343,481 | |||||||
| Veritas Software Corp.* | 4,300 | 485,967 | |||||||
| 8,710,790 | |||||||||
| Restaurants - 0.4% | |||||||||
| Darden Restaurants, Inc. | 1,400 | 22,750 | |||||||
| McDonald’s Corp. | 14,700 | 484,181 | |||||||
| Tricon Global Restaurants,
Inc.* |
1,690 | 47,743 | |||||||
| Wendy’s International, Inc. | 1,300 | 23,156 | |||||||
| 577,830 | |||||||||
| Retail - 3.4% | |||||||||
| Autozone, Inc.* | 1,500 | 33,000 | |||||||
| Bed Bath & Beyond, Inc.* | 1,500 | 54,375 | |||||||
| Best Buy Co., Inc.* | 2,200 | 139,150 | |||||||
| Circuit City Stores | 2,200 | 73,013 | |||||||
| Cons Stores Corp.* | 1,200 | 14,400 | |||||||
| Costco Wholesale Corp.* | 4,900 | 161,700 | |||||||
| CVS Corporation | 4,200 | 168,000 | |||||||
| Dillards, Inc. Cl. A | 1,100 | 13,475 | |||||||
| Dollar General Corp. | 3,621 | 70,610 | |||||||
| Federated Department
Stores* |
2,300 | 77,625 | |||||||
| K Mart Corp.* | 5,300 | 36,106 | |||||||
| Kohls Corp.* | 3,600 | 200,250 | |||||||
| Longs Drug Stores, Inc. | 400 | 8,700 | |||||||
| The May Department Stores
Company |
3,650 | 87,600 | |||||||
| Newell Rubbermaid, Inc. | 3,072 | 79,104 | |||||||
| Office Depot, Inc.* | 3,600 | 22,500 | |||||||
| J.C. Penney Co., Inc. | 2,800 | 51,625 | |||||||
| RadioShack Corporation | 2,000 | 94,750 | |||||||
| Rite Aid Corp. | 2,800 | 18,375 | |||||||
| Number
of Shares |
Market Value |
||||||||
|---|---|---|---|---|---|---|---|---|---|
| Retail (Continued) | |||||||||
| Sears Roebuck and Co. | 4,100 | $ 133,763 | |||||||
| Sherwin-Williams Co. | 1,800 | 38,138 | |||||||
| Staples, Inc.* | 5,150 | 79,181 | |||||||
| Target Corporation | 4,800 | 278,400 | |||||||
| Tiffany & Co. | 700 | 47,250 | |||||||
| TJX Companies, Inc. | 3,400 | 63,750 | |||||||
| Toys R US, Inc.* | 2,500 | 36,406 | |||||||
| Walgreen Co. | 11,000 | 354,063 | |||||||
| Wal-Mart Stores, Inc. | 48,600 | 2,800,575 | |||||||
| 5,235,884 | |||||||||
| Retail-Grocery - 0.1% | |||||||||
| Albertson’s, Inc. | 4,693 | 156,042 | |||||||
| Winn-Dixie Stores, Inc. | 1,600 | 22,900 | |||||||
| 178,942 | |||||||||
| Telephone Utilities - 4.0% | |||||||||
| Alltel Corp. | 3,400 | 210,588 | |||||||
| AT&T Corp. | 34,876 | 1,102,954 | |||||||
| Bell Atlantic Corp. | 16,950 | 861,272 | |||||||
| BellSouth Corporation | 20,600 | 878,075 | |||||||
| CenturyTel, Inc. | 1,500 | 43,125 | |||||||
| Sprint Corp. (FON Group) | 9,500 | 484,500 | |||||||
| Sprint Corp. (PCS Group)* | 9,400 | 559,300 | |||||||
| US West, Inc. | 5,454 | 467,681 | |||||||
| Worldcom, Inc.* | 30,977 | 1,421,070 | |||||||
| 6,028,565 | |||||||||
| Tobacco - 0.5% | |||||||||
| Fortune Brands, Inc. | 1,800 | 41,513 | |||||||
| Philip Morris Companies,
Inc. |
25,900 | 687,969 | |||||||
| UST, Inc. | 1,900 | 27,906 | |||||||
| 757,388 | |||||||||
| Toys, Games - 0.1% | |||||||||
| Hasbro, Inc. | 1,950 | 29,372 | |||||||
| Mattel, Inc. | 4,600 | 60,663 | |||||||
| 90,035 | |||||||||
| Number
of Shares |
Market Value |
||||||||
|---|---|---|---|---|---|---|---|---|---|
| Transportation - 0.5% | |||||||||
| Burlington Northern Santa
Fe Corp. |
5,000 | $ 114,688 | |||||||
| Carnival Corp. | 6,800 | 132,600 | |||||||
| CSX Corp. | 2,300 | 48,731 | |||||||
| FedEx Corporation* | 3,220 | 122,360 | |||||||
| Kansas City Southern
Industries, Inc. |
1,200 | 106,425 | |||||||
| Norfolk Southern
Corporation |
4,100 | 60,988 | |||||||
| Union Pacific Corp. | 2,800 | 104,125 | |||||||
| 689,917 | |||||||||
| Travel - 0.0% | |||||||||
| Sabre Holdings Corp. | 1,411 | 40,213 | |||||||
| TOTAL EQUITIES | |||||||||
| (Cost $114,761,652) | 136,168,041 | ||||||||
| Principal
Amount |
|||||||||
| SHORT-TERM INVESTMENTS - 8.5% | |||||||||
| Repurchase Agreement - 7.9% | |||||||||
| Investors Bank & Trust
Company Repurchase Agreement, dated 06/30/00, 6.03%, due 07/03/00 (a) |
$12,014,071 | 12,014,071 | |||||||
| U.S. Treasury Obligations - 0.6% | |||||||||
| US Treasury Bill
5.000-5.560%, 07/13/2000 |
850,000 | 848,508 | |||||||
| TOTAL SHORT-TERM INVESTMENTS | |||||||||
| (At Amortized Cost) | 12,862,579 | ||||||||
| TOTAL INVESTMENTS - 98.0%
(Cost $127,624,231)** |
$ 149,030,620 | ||||||||
| Other Assets/(Liabilities) - 2.0% | 3,103,700 | ||||||||
| NET ASSETS - 100.0% | $ 152,134,320 | ||||||||
| Notes to Portfolio of Investments | ||
| * | Non-income producing security. | |
| ** | Aggregate cost for Federal tax purposes. (Note 7). | |
| (a) | Maturity value of $12,020,108. Collateralized by U.S. Government Agency obligation with a rate of 6.217%, maturity date of 05/01/2030, and aggregate market value, including accrued interest, of $12,615,150. | |
| 1. The Fund | MML Equity Index Fund (the “Fund”) is a non-diversified series of the MML Series Investment fund (“MML Trust”
). The MML Trust is registered under the Investment Company Act of 1940, as amended (the “1940 Act”), as a no-load, registered open-end, management investment company. The MML Trust, which has eleven separate series of shares, is organized under
the laws of the Commonwealth of Massachusetts as a Massachusetts business trust pursuant to an Agreement and Declaration of Trust dated December 19, 1984, as amended. On May 1, 1997, the Fund commenced operations.
|
| The MML Trust was established by Massachusetts Mutual Life Insurance Company (“MassMutual”) for the purpose of providing
vehicles for the investment assets of various separate investment accounts established by MassMutual and by life insurance companies which are subsidiaries of MassMutual. Shares of the MML Trust are not offered to the general public.
|
| Effective May 1, 2000, the Fund began to offer three classes of shares: Class I, Class II and Class III. Each share class invests
in the same portfolio of expenses. The principal economic difference among the classes is the level of service and administration fees borne by the classes. Because each class will have different fees and expenses, performance and share prices among the
classes will vary. The classes of shares are offered to different types of investors, as outlined in the Fund’s Prospectus. Class I shares are a redesignation of the shares of the Fund existing prior to May 1, 2000. Class II and Class III commenced
operations on May 1, 2000.
|
| 2. Significant
Accounting Policies |
The following is a summary of significant accounting policies followed consistently by the Fund in the preparation of the
financial statement in conformity with generally accepted accounting principles. The preparation of the financial statement in accordance with generally accepted accounting principles requires management to make estimates and assumptions that affect the
reported amounts and disclosures in the financial statements. Actual results could differ from those estimates.
|
| Investment
Valuation |
Equity securities are valued on the basis of valuations furnished by a pricing service, authorized by the Board of Trustees (“
Trustees”), which provides the last reported sale price for securities listed on a national securities exchange or on the NASDAQ National Market System, or in the case of over-the-counter securities not so listed, the last reported bid price. Debt
securities (other than short-term obligations with a remaining maturity of sixty days or less) are valued on the basis of valuations furnished by a pricing service, authorized by the Trustees, which determines valuations taking into account appropriate
factors such as institutional-size trading in similar groups of securities, yield, quality, coupon rate, maturity, type of issue, trading characteristics and other market data. Money market obligations with a remaining maturity of sixty days or less are
valued at either amortized cost or at original cost plus accrued interest, which ever approximates current market value. All other securities and other assets are valued at fair value in accordance with procedures approved by and determined in good faith
by the Trustees, although the actual calculation may be done by others.
|
| Portfolio securities traded on more than one national securities exchange are valued at the last price on the business day as of
which such value is being determined at the close of the exchange representing the principal market for such securities. All assets and liabilities expressed in foreign currencies will be converted into U.S. dollars at the mean between the buying and
selling rates of such currencies against U.S. dollars last quoted by any major bank. If such quotations are not available, the rate of exchange will be determined in accordance with policies established by the Trustees.
|
| Accounting for
Investments |
Investment transactions are accounted for on the trade date. Realized gains and losses on sales of investments and unrealized
appreciation and depreciation of investments are computed on the specific identification cost method. Interest income, adjusted for amortization of discounts and premiums on investments, is earned from the settlement date and is recorded on the accrual
basis. Dividend income is recorded on the ex-dividend date.
|
| Federal Income Tax
|
It is the Fund’s intent to continue to comply with the provisions of subchapter M of the Internal Revenue Code of 1986, as
amended (the “Code”), applicable to a regulated investment company. Under such provisions, the Fund will not be subject to federal income taxes on their ordinary income and net realized capital gains to the extent they are distributed or deemed
to have been distributed to their shareholders. Therefore, no Federal income tax provision is required.
|
| Dividends and
Distributions to Shareholders |
Dividends from net investment income and distributions of any net realized capital gains of the Fund are declared and paid
annually and at other times as may be required to satisfy tax or regulatory requirements. Distributions to shareholders are recorded on the ex-dividend date. Income and capital gain distributions are determined in accordance with income tax regulations
which may differ from generally accepted accounting principles. These differences are primarily due to investments in forward contracts, passive foreign investment companies and the deferral of wash sale losses. As a result, net investment income and net
realized gains on investment transactions for a reporting period may differ significantly from distributions during such period. Accordingly, the Fund may periodically make reclassifications among certain of its capital accounts without impacting the net
asset value of the Fund.
|
| Foreign Currency
Translation |
The books and records of the Fund are maintained in U.S. dollars. The market values of foreign currencies, foreign securities and
other assets and liabilities denominated in foreign currencies are translated into U.S. dollars at the mean of the buying and selling rates of such currencies against the U.S. dollar at the end of each business day. Purchases and sales of foreign
securities and income and expense items are translated at the rates of exchange prevailing on the respective dates of such transactions. The Fund does not isolate that portion of the results of operations arising from changes in the exchange rates from
that portion arising from changes in the market price of securities.
|
| Net realized foreign currency gains and losses resulting from changes in exchange rates include foreign currency gains and losses
between trade date and settlement date on investment securities transactions, foreign currency transactions and the difference between the amounts of dividend recorded on the books of the Fund and the amount actually received.
|
| Securities Lending
|
The Fund may make loans of portfolio securities; however, securities lending can not exceed 33% of its total assets taken at
current value. The loans are collateralized at all times with cash or securities with a market value at least equal to 100% of the market value of the securities on loan. As with other extensions of credit, the Fund may bear the risk of delay in recovery
or even loss of rights in the collateral should the borrower of the securities fail financially. The Fund receives compensation for lending its securities. At June 30, 2000, the Fund did not have any loaned securities.
|
| Forward Foreign
Currency Contracts |
The Fund may enter into forward foreign currency contracts in order to convert foreign denominated securities or obligations to
U.S. dollar denominated investments. A forward foreign currency contract is an agreement between two parties to buy and sell a currency at a set price on a future date. The market value of a forward currency contract fluctuates with changes in forward
foreign currency exchange rates. Forward foreign currency contracts are marked to market daily and the change in their value is recorded by the Fund as an unrealized gain or loss. When a forward foreign currency contract is extinguished, through delivery
or offset by entering into another forward foreign currency contract, the Fund records a realized gain or loss equal to the difference between the value of the contract at the time it was opened and the value of the contract at the time it was
extinguished or offset.
|
| Forward foreign currency contracts involve a risk of loss from the potential inability of counterparties to meet the terms of
their contracts and from unanticipated movements in foreign currency values and interest rates.
|
| The notional or contractual amounts of these instruments represent the investments the Fund has in particular classes of
financial instruments and do not necessarily represent the amounts potentially subject to risk. The measurement of the risk associated with these instruments is meaningful only when all related and offsetting transactions are considered.
|
| There were no outstanding forward foreign currency contracts at June 30, 2000.
|
| Forward
Commitments |
The Fund may purchase or sell securities on a “when issued,” delayed delivery or forward commitment basis. The Fund uses
forward commitments to manage interest rate exposure or as a temporary substitute for purchasing or selling particular debt securities. Delivery and payment for securities purchased on a forward commitment basis can take place a month or more after the
date of the transaction. The Fund instructs the custodian to segregate assets in a separate account with a current market value at least equal to the amount of its forward purchase commitments. The price of the underlying security and the date when the
securities will be delivered and paid for are fixed at the time the transaction is negotiated. The value of the forward commitment is determined by management using a commonly accepted pricing model and fluctuates based upon changes in the value of the
underlying security and market repurchase rates. Such rates equate the counterparty’s cost to purchase and finance the underlying security to the earnings received on the security and forward delivery proceeds. The Fund records on a daily basis the
unrealized appreciation/depreciation based upon changes in the value of the forward commitment. When a forward commitment contract is closed, the Fund records a realized gain or loss equal to the difference between the value of the contract at the time it
was opened and the value of the contract at the time it was extinguished. Forward commitments involve a risk of loss if the value of the security to be purchased declines prior to the settlement date. The Fund could also be exposed to loss if they cannot
close out its forward commitments because of an illiquid secondary market, or the inability of counterparties to perform. The Fund monitors exposure to ensure counterparties are creditworthy and concentration of exposure is minimized. At June 30, 2000,
the Fund had no open forward commitments.
|
| Financial Futures
Contracts |
The Fund may purchase or sell financial futures contracts and options on such futures contracts for the purpose of hedging the
market risk on existing securities or the intended purchase of securities. Futures contracts are contracts for delayed delivery of securities at a specific future date and at a specific price or yield. Upon entering into a contract, the Fund deposits and
maintains as collateral such initial margin as required by the exchange on which the transaction is effected. Pursuant to the contract, the Fund agrees to receive from or pay to the broker an amount of cash equal to the daily fluctuation in value of the
contract. Such receipts or payments are known as variation margin and are recorded by the Fund as unrealized gains or losses. When the contract is closed, the Fund records a realized gain or loss equal to the difference between the value of the contract
at the time it was opened and the value at the time it was closed.
|
| Number of Contracts |
Type |
Expiration
Date |
Contract
Value |
Net
Unrealized Depreciation |
||||
|---|---|---|---|---|---|---|---|---|
| Buys | ||||||||
| 42 | S&P 500® | 09/15/00 | $15,415,050 | $105,102 |
| Allocation of
Operating Activity |
In maintaining the records for the Funds, the income and expense accounts are allocated to each class of shares. Investment
income, unrealized and realized gains or losses are prorated among the classes of shares based on the relative net assets of each. Expenses are allocated to each class of shares depending on the nature of the expenditures. Administration and service fees,
which are directly attributable to a class of shares, are charged to that class’ operations. Expenses of the Fund not directly attributable to the operations of any class of shares or Fund are prorated among the Funds and classes to which the expense
relates based on the relative net assets of each.
|
| 3. Management
|
| Investment
Management Fee |
MassMutual serves as investment adviser to the Fund and provides administrative services needed by the Fund. For acting as such,
MassMutual receives a monthly fee from the Fund at the annual rate of 0.10% of the average daily net asset value of the Fund. Prior to May 1, 2000, MassMutual received a quarterly fee from the Fund at the annual rate of 0.40% of the first $100,000,000,
0.38% of the next $150,000,000, and 0.36% of any excess over $250,000,000 of the average daily net asset value of the Fund.
|
| Effective May 1, 2000, MassMutual has entered into an investment sub-advisory agreement with Bankers Trust Company under the
marketing name Deutsche Asset Management (“DAM”), pursuant to which DAM serves as the Fund’s sub-adviser. The agreement provides that DAM provide investment sub-advisory services with respect to the assets of the Fund. MassMutual pays DAM a
monthly fee equal to an annual rate of 0.01% of the first $1 billion of aggregate net assets under management and 0.0075% of aggregate net assets over $1 billion. Prior to May 1, 2000, Mellon Equity Associates (“Mellon Equity”) served as the
Fund’s sub-adviser.
|
| Administration &
Shareholder Service Fees |
Under a separate administrative and shareholder services agreement between the Fund and MassMutual effective May 1, 2000,
MassMutual provides certain administrative and shareholder services and bears some class specific administrative expenses. In return for these services, MassMutual receives an administrative services fee monthly based upon the average daily net assets of
the applicable class of shares of the Fund at the following annual rates: 0.30% on the first $100,000,000, 0.28% on the next $150,000,000 and 0.26% on assets in excess of $250,000,000 of Class I shares of the Fund, 0.19% of the average daily net assets of
Class II shares of the Fund, and for Class III shares, an amount not to exceed 0.05% of the average daily net assets of the Fund.
|
| Expense Waivers
|
MassMutual has agreed, at least through April 30, 2001, to absorb the expenses of the Fund, to the extent that the aggregate
expenses (excluding the Fund’s management and administrative fees, interest, taxes, brokerage commissions and extraordinary expenses) incurred during the Fund’s fiscal year exceed 0.05% of the average daily net assets of the Fund for such year.
|
| MassMutual has agreed to waive administrative and shareholder service fees incurred during the Fund’s fiscal year for Class
II and Class III shares in the amount of 0.05% of the average daily net assets of the respective classes.
|
| Other
|
Certain officers and trustees of the Fund are also officers of MassMutual. The compensation of unaffiliated directors of the Fund
is borne by the Fund.
|
| 4. Purchases and
Sales of Investments |
Cost of purchases and proceeds from sales of investment securities (excluding short-term investments) for the six months ended
June 30, 2000, were as follows:
|
| Purchases
|
| Equities | $46,002,991 |
| Sales
|
| Equities | $ 1,732,046 |
5.
|
Capital Share Transactions
|
| The Fund is authorized to issue an unlimited number of shares, with no par value. The change in shares outstanding for the Fund is
as follows:
|
| Class I
Six months ended June 30, 2000 |
Class II
For the Period May 1, 2000 (Commencement of Operations) through June 30, 2000 |
Class III
For the Period May 1, 2000 (Commencement of Operations) through June 30, 2000 |
|||||||
|---|---|---|---|---|---|---|---|---|---|
| Shares
|
|||||||||
| Reinvestment of shares | 70,012 | 4,901 | 4,868 | ||||||
| Sales of shares | 3,272,393 | 2,354,908 | 2,076,213 | ||||||
| Redemptions of shares | (4,437,730 | ) | (119,484 | ) | — | ||||
| |
|
|
|||||||
| Net increase (decrease) | (1,095,325 | ) | 2,240,325 | 2,081,081 | |||||
| |
|
|
|||||||
| Amount
|
|||||||||
| Reinvestment of shares | $ 1,264,870 | $ 85,970 | $ 85,376 | ||||||
| Sales of shares | 57,940,856 | 42,242,992 | 37,288,787 | ||||||
| Redemptions of shares | (79,562,632 | ) | (2,136,261 | ) | — | ||||
| |
|
|
|||||||
| Net increase (decrease) | $ (20,356,906 | ) | $ 40,192,701 | $ 37,374,163 | |||||
| |
|
|
|||||||
| For the Year ended
December 31, 1999 |
|||||||||
| Shares
|
|||||||||
| Reinvestment of shares | 2,846 | ||||||||
| Sales of shares | 3,612,656 | ||||||||
| Redemptions of shares | (736,879 | ) | |||||||
| |
|||||||||
| Net increase | 2,878,623 | ||||||||
| |
|||||||||
| Amount
|
|||||||||
| Reinvestment of shares | $ 47,708 | ||||||||
| Sales of shares | 60,273,099 | ||||||||
| Redemptions of shares | (11,987,126 | ) | |||||||
| |
|||||||||
| Net increase | $ 48,333,681 | ||||||||
| |
|||||||||
| 6. Foreign
Securities |
The Fund may also invest in foreign securities, subject to certain percentage restrictions. Investing in securities of foreign
companies and foreign governments involves special risks and considerations not typically associated with investing in securities issued by U.S. companies and the U.S. Government. These risks include revaluation of currencies and future adverse political
and economic developments. Moreover, securities of many foreign companies and foreign governments and their markets may be less liquid and their prices more volatile than those of securities of comparable U.S. companies and the U.S. Government.
|
| 7. Federal Income
Tax Information |
At June 30, 2000, the cost of securities and the unrealized appreciation (depreciation) in the value of investments owned by the
Fund, as computed on a Federal income tax basis, is as follows:
|
| Federal
Income Tax Cost |
Tax Basis
Unrealized Appreciation |
Tax Basis
Unrealized Depreciation |
Net Unrealized
Appreciation |
|||
|---|---|---|---|---|---|---|
| $127,624,231 | $28,334,276 | $7,032,989 | $21,301,287 |
| 8. Investment Risk
and Consideration |
Since the Fund is non-diversified and a relatively high percentage of the Fund’s assets may be invested in the securities of
a limited number of issuers, some of which may be in the same economic sector, the Fund’s portfolio may be more sensitive to changes in market value of a single issuer or industry.
|
|
|