
|
|
|
|
|
|
|
|
|
|
Previous: MML SERIES INVESTMENT FUND, N-30D, 2000-08-23 |
Next: MML SERIES INVESTMENT FUND, N-30D, 2000-08-23 |
| MML Growth Equity Fund – Letter to Shareholders
|

| |
| MassMutual Expands Fund Offerings
|
| I’d like to announce some exciting additions to the MML Series Investment Fund. Through our comprehensive due diligence
process, we’ve uncovered significant investor demand for a number of fund types and managers that were not previously addressed by our selections. As a result, we’ve added three new funds, listed as follows, with their managers (sub-advisers) in
parentheses: Large Cap Value (Davis Selected Advisers), OTC 100 (Deutsche Asset Management/Bankers Trust Company), and Emerging Growth (RS Investment Management). These new choices span a broad range of investment styles and market sectors—value vs.
growth, active vs. indexed, and large-cap vs. emerging growth. All of our new managers have produced excellent long-term track records, and have passed through our extensive selection process. We will continue to monitor all of our funds carefully so that
you can be assured of access to top-flight investment management talent.
|

What are the investment objectives and policies for the MML Growth Equity Fund?
The objective and policies of the Fund are to:
| -are of high investment quality or possess a unique product, market position or operating characteristics | |
| -offer above-average levels of profitability or superior growth potential |
How did the Fund perform during the first half of 2000?
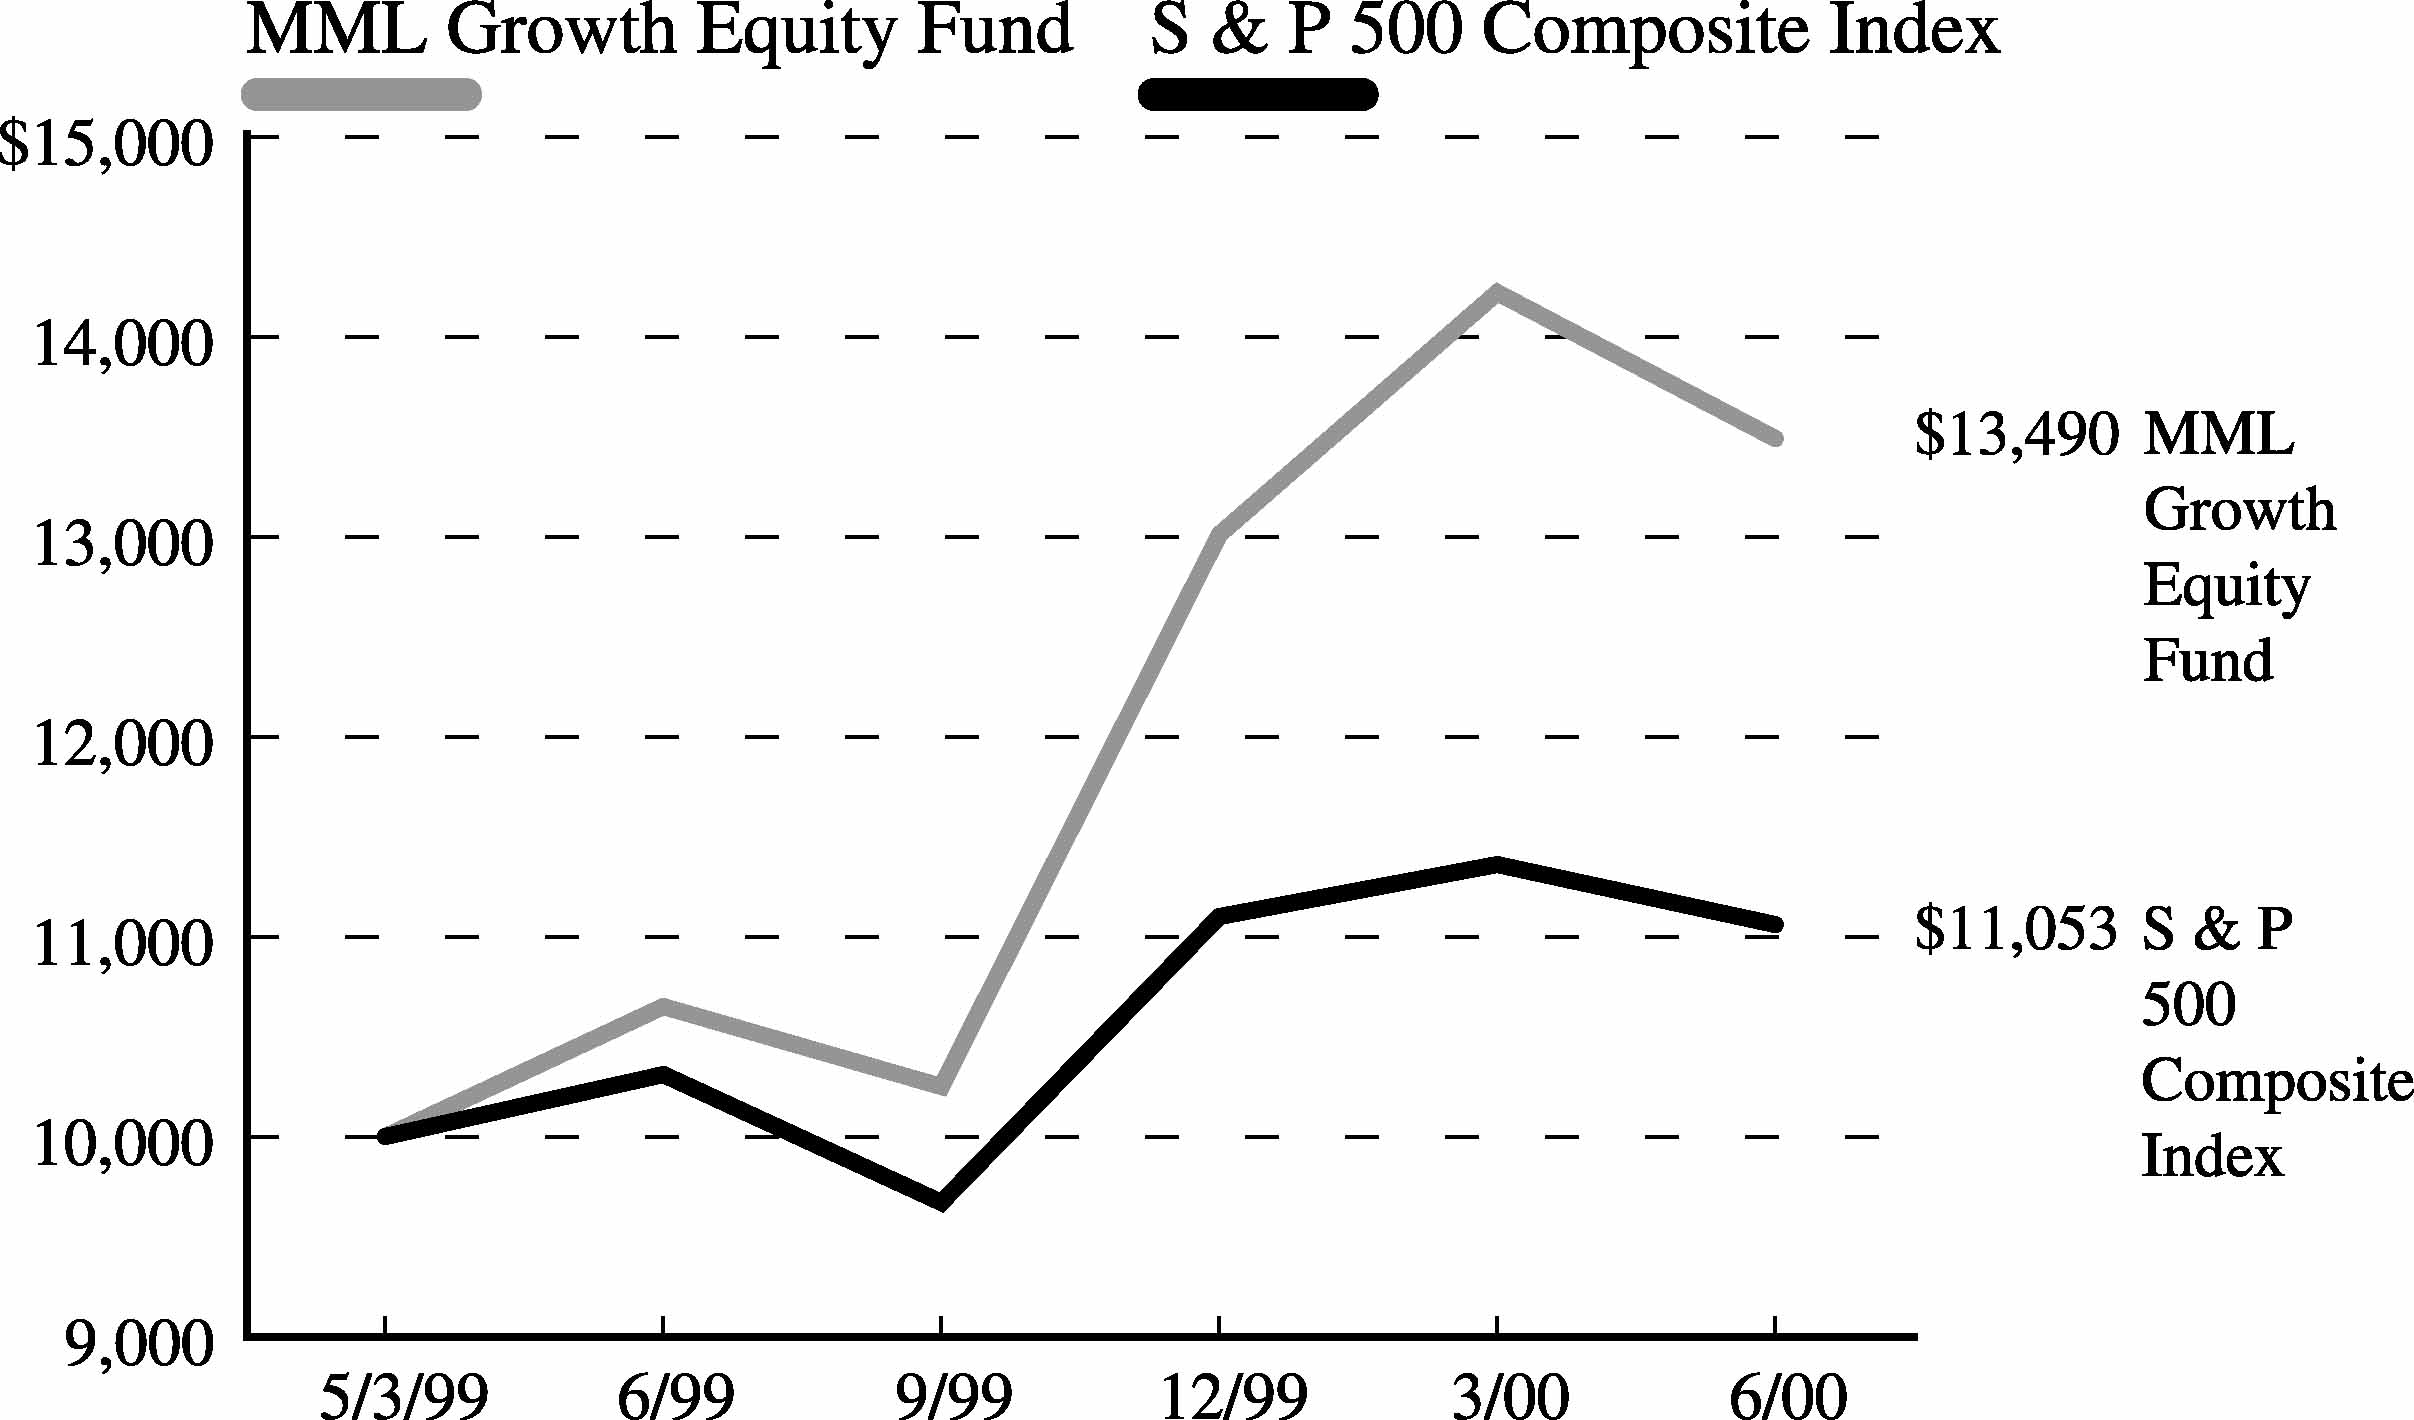
Absolute returns were modest but relative performance was strong. For the six months that ended June 30, 2000, the Fund’ s shares returned 3.69%, compared to the -0.42% return of the Standard & Poor’s 500 Index over the same period. The Fund’s return reflects changes in the net asset value per share without the deduction of any product charges. The inclusion of these charges would have reduced the performance shown here. Past performance is no indication of future results.
What enabled the Fund to beat the index during a period that included a dramatic market correction?
There were several reasons. First, we keep the Fund well diversified across companies and sectors, and we try to avoid very large positions in any individual holding. Spreading risk helps to cushion the Fund in down markets.
Performance was also helped by the fact that we used the correction as an opportunity to add to our positions in high-quality technology companies at what we thought were bargain-basement prices. This decision paid off in the latter half of May and June because those shares rebounded nicely, with the NASDAQ cutting its losses by about half.
What caused the correction?
Higher interest rates were the main culprit. After raising short-term interest rates three times in the last 7 months of 1999, the Federal Reserve Board hiked rates three more times during the first six months of 2000. The Fed implemented 0.25% increases in February and March, while May saw an increase of 0.50%. Rising rates were prompted by a strong U.S. economy, which experienced 5.5% growth of gross domestic product in the first quarter and ongoing tightness in its labor markets. The Fed was also motivated by strengthening economies in Europe and Asia, as well as higher crude oil prices. Rising interest rates tend to have the most negative impact on stocks with high price-to-earnings ratios, which accounted for the dramatic pullback in technology shares.
What other changes occurred in the Fund’s holdings?
Higher interest rates tend to have a slowing effect on the economy, making it likely that we’ll see a slowdown in corporate earnings growth. We therefore added to the Fund’s holdings in two sectors, health care and business services that tend to be less sensitive to the general level of economic activity. In health care, we added to positions in pharmaceutical stocks such as Pharmacia and American Home Products. While pharmaceutical stocks have been hurt by political rhetoric about health care regulation, such rhetoric is common in the first half of the year—especially during presidential election season—and we felt that the favorable long-term outlook for those companies remained intact.
What is your outlook?
| Since Inception | |||||||
|---|---|---|---|---|---|---|---|
| Year to Date | One Year | Average Annual | |||||
| 1/1/00 - 6/30/00 | 7/1/99 - 6/30/00 | 5/3/99 - 6/30/00 | |||||
| MML Growth Equity Fund | 3.69% | 26.67% | 29.32% | ||||
| S&P 500 Composite Index | -0.42% | 7.25% | 8.96% | ||||
| The investment return and principal value of shares of the Fund will fluctuate with market conditions so that shares of the
Fund, when redeemed, may be worth more or less than their original cost. Investors should note that the Fund is a professionally managed mutual fund, while the S&P 500 Composite Index is unmanaged and does not incur expenses, and cannot be purchased
directly by investors. The Fund’s return reflects changes in the net asset value per share without the deduction of any product charges. The inclusion of these charges would have reduced the performance shown here. Past performance is no indication
of future results.
|
| ASSETS: | |||
| Investments, at value (cost $43,394,596) (Note 2) | $46,932,484 | ||
| Short-term investments, at amortized cost (Note 2) | 6,330,196 | ||
| |
|||
| Total investments | 53,262,680 | ||
| Receivables from: | |||
| Investments sold | 653,688 | ||
| Interest and dividends | 19,733 | ||
| Foreign taxes withheld | 471 | ||
| Investment adviser (Note 3) | 4,582 | ||
| |
|||
| Total assets | 53,941,154 | ||
| |
|||
| LIABILITIES: | |||
| Payables for: | |||
| Investments purchased | 824,386 | ||
| Securities on loan (Note 2) | 3,566,638 | ||
| Directors’ fees and expenses (Note 3) | 648 | ||
| Open forward foreign currency contracts (Note 2) | 167 | ||
| Affiliates (Note 3): | |||
| Investment management fees | 31,778 | ||
| Due to custodian | 18,377 | ||
| Accrued expenses and other liabilities | 24,020 | ||
| |
|||
| Total liabilities | 4,466,014 | ||
| |
|||
| NET ASSETS | $49,475,140 | ||
| |
|||
| Net assets consist of: | |||
| Paid-in capital | $39,264,288 | ||
| Undistributed net investment loss | (39,283 | ) | |
| Accumulated net realized gain on investments and foreign currency translations | 6,712,569 | ||
| Net unrealized appreciation on investments, foreign currency and other assets and liabilities | 3,537,566 | ||
| |
|||
| $49,475,140 | |||
| |
|||
| Shares outstanding: | 3,668,040 | ||
| |
|||
| Net asset value, offering price and redemption price per share: | $ 13.49 | ||
| |
|||
| Investment income: (Note 2) | |||
| Dividends (net of withholding tax of $1,007) | $ 88,792 | ||
| Interest (including securities lending income of $3,171) | 75,677 | ||
| |
|||
| Total investment income | 164,469 | ||
| |
|||
| Expenses: (Note 3) | |||
| Investment management fees (Note 3) | 177,049 | ||
| Custody fees | 32,695 | ||
| Audit and legal fees | 10,752 | ||
| Directors’ fees (Note 3) | 8,128 | ||
| Other expenses | 3,276 | ||
| |
|||
| Total expenses | 231,900 | ||
| Expenses reimbursed (Note 3) | (30,507 | ) | |
| |
|||
| Net expenses | 201,393 | ||
| |
|||
| Net investment loss | (36,924 | ) | |
| |
|||
| Realized and unrealized gain (loss): | |||
| Net realized gain (loss) on: | |||
| Investment transactions | 5,875,679 | ||
| Foreign currency transactions | (9,406 | ) | |
| |
|||
| Net realized gain | 5,866,273 | ||
| |
|||
| Net change in unrealized appreciation (depreciation) on: | |||
| Investments | (4,257,372 | ) | |
| Translation of assets and liabilities in foreign currencies | (314 | ) | |
| |
|||
| Net unrealized loss | (4,257,686 | ) | |
| |
|||
| Net realized and unrealized gain | 1,608,587 | ||
| |
|||
| Net increase in net assets resulting from operations | $1,571,663 | ||
| |
|||
| Six months ended
June 30, 2000 (Unaudited) |
Period ended
December 31, 1999* |
|||||
|---|---|---|---|---|---|---|
| Increase (decrease) in net assets: | ||||||
| Operations: | ||||||
| Net investment loss | $ (36,924 | ) | $ (12,827 | ) | ||
| Net realized gain on investment and foreign currency transactions | 5,866,273 | 856,764 | ||||
| Net change in unrealized appreciation (depreciation) on investments and translation of assets and liabilities in foreign currencies | (4,257,686 | ) | 7,795,252 | |||
| Net increase in net assets resulting from operations | 1,571,663 | 8,639,189 | ||||
| Net fund share transactions (Note 5) | 8,416,871 | 30,847,417 | ||||
| Total increase in net assets | 9,988,534 | 39,486,606 | ||||
| NET ASSETS: | ||||||
| Beginning of period | 39,486,606 | - | ||||
| End of period (including undistributed net investment loss of $39,283 and $2,359, respectively) | $49,475,140 | $39,486,606 | ||||
*
|
For the period from May 3, 1999 (commencement of operations) through December 31, 1999.
|
| Six months ended
6/30/00 (Unaudited) |
Period ended
12/31/99† |
|||||
|---|---|---|---|---|---|---|
| Net asset value: Beginning of period | $ 13.01 | $ 10.00 | ||||
| Income (loss) from investment operations: | ||||||
| Net investment loss | (0.01 | ) | (0.00 | )*** | ||
| Net realized and unrealized gain (loss) on investments | 0.49 | 3.01 | ||||
| Total income (loss) from investment operations | 0.48 | 3.01 | ||||
| Net asset value: End of period | $ 13.49 | $ 13.01 | ||||
| Total Return @ | 3.69% | ** | 30.10% | ** | ||
| Ratios/Supplemental Data: | ||||||
| Net assets, end of period (000’s) | $49,475 | $39,487 | ||||
| Ratio of expenses to average daily net assets: | ||||||
| Before expense waiver | 1.05% | * | 0.77% | ** | ||
| After expense waiver | 0.91% | * | 0.61% | ** | ||
| Net investment loss to average daily net assets | (0.17%) | * | (0.04%) | ** | ||
| Portfolio turnover rate | 131% | ** | 106% | ** | ||
| * | Annualized | ||
| ** | Percentage represents results for the period and are not annualized. | ||
| *** | Net investment loss is less than $0.01 per share. | ||
| † | For the period from May 3, 1999 (commencement of operations) through December 31, 1999. | ||
| @ | Total return information shown in the Financial Highlights tables does not reflect expenses that apply at the separate account level or to related insurance products. Inclusion of these charges would reduce the total return figures for all periods shown. |
| Number
of Shares |
Market Value |
|||
|---|---|---|---|---|
| EQUITIES - 94.9% | ||||
| Apparel, Textiles & Shoes - 0.6% | ||||
| Fast Retailing Company | 700 | $ 293,758 | ||
| Banking, Savings & Loans - 3.1% | ||||
| Citigroup, Inc. | 8,860 | 533,815 | ||
| Federal Home Loan Mortgage
Corp. |
10,000 | 405,000 | ||
| Providian Financial Corp. | 2,860 | 257,400 | ||
| State Street Corp. | 3,290 | 348,946 | ||
| 1,545,161 | ||||
| Beverages - 1.9% | ||||
| Anheuser-Busch Companies,
Inc. |
6,300 | 470,531 | ||
| Coca-Cola Company, The | 8,400 | 482,475 | ||
| 953,006 | ||||
| Broadcasting, Publishing & Printing - 4.0% | ||||
| Comcast Corp. Cl. A* | 12,400 | 502,200 | ||
| Infinity Broadasting Corp.* | 6,400 | 233,200 | ||
| UnitedGlobalCom, Inc. Cl. A* | 2,200 | 102,850 | ||
| Univision Communications, Inc.* | 2,350 | 243,225 | ||
| USA Networks, Inc.* | 12,700 | 274,637 | ||
| Viacom, Inc. Cl. B* | 8,974 | 611,915 | ||
| 1,968,027 | ||||
| Communications - 8.1% | ||||
| American Tower Corp. Cl. A* | 12,200 | 508,587 | ||
| China Unicom Limited*† | 150 | 3,187 | ||
| Ericsson (LM ) CL. B | 4,000 | 79,583 | ||
| Global Crossing Ltd.* | 18,800 | 494,675 | ||
| Juniper Networks, Inc.* | 600 | 87,337 | ||
| Nextel Communications, Inc.
Cl. A* |
4,700 | 287,581 | ||
| Nortel Networks Corporation | 19,340 | 1,319,955 | ||
| NTL Incorporated* | 5,625 | 336,797 | ||
| Tellabs, Inc.* | 3,600 | 246,375 | ||
| Vodafone AirTouch PLC | 161,423 | 652,488 | ||
| 4,016,565 | ||||
| Computer Integrated Systems Design - 3.3% | ||||
| Cabletron Systems* | 4,000 | 101,000 | ||
| Cadence Design Systems, Inc.* | 17,000 | 346,375 | ||
| Computer Sciences Corp.* | 8,180 | 610,944 | ||
| Sun Microsystems, Inc.* | 6,200 | 563,812 | ||
| 1,622,131 | ||||
| Number
of Shares |
Market Value |
|||
|---|---|---|---|---|
| Computer Programming Services - 2.3% | ||||
| Mercury Interactive Corp.* | 1,300 | $ 125,775 | ||
| VeriSign, Inc.* | 5,732 | 1,011,698 | ||
| 1,137,473 | ||||
| Computers & Information - 7.6% | ||||
| Cisco Systems, Inc.* | 22,860 | 1,453,039 | ||
| Compaq Computer Corp. | 6,300 | 161,044 | ||
| Comverse Technology, Inc.* | 3,600 | 334,800 | ||
| Dell Computer Corp.* | 13,600 | 670,650 | ||
| EMC Corp.* | 9,060 | 697,054 | ||
| Foundry Networks, Inc.* | 500 | 55,000 | ||
| Seagate Technology, Inc.* | 7,500 | 412,500 | ||
| 3,784,087 | ||||
| Data Processing and Preparation - 2.6% | ||||
| Automatic Data Processing, Inc. | 11,900 | 637,394 | ||
| The BISYS Group, Inc.* | 3,000 | 184,500 | ||
| First Data Corp. | 7,770 | 385,586 | ||
| Fiserv, Inc.* | 1,400 | 60,550 | ||
| 1,268,030 | ||||
| Electric Utilities - 1.8% | ||||
| AES Corp.* | 19,680 | 897,900 | ||
| Electrical Equipment & Electronics - 12.5% | ||||
| Altera Corp.* | 2,500 | 254,844 | ||
| Analog Devices, Inc.* | 2,940 | 223,440 | ||
| Atmel Corp.* | 3,260 | 120,212 | ||
| Capstone Turbine Corporation* | 50 | 2,253 | ||
| Emerson Electric Co. | 3,500 | 211,312 | ||
| Flextronics International Ltd.* | 7,864 | 540,159 | ||
| General Electric Company | 17,360 | 920,080 | ||
| Intel Corp. | 9,150 | 1,223,241 | ||
| LSI Logic Corp.* | 8,480 | 458,980 | ||
| Micron Technology, Inc.* | 14,500 | 1,276,906 | ||
| Motorola, Inc. | 8,212 | 238,661 | ||
| National Semiconductor Corp.* | 7,110 | 403,492 | ||
| PE Corp.-PE Biosystems Group | 4,800 | 316,200 | ||
| Stratos Lightwave, Inc.* | 50 | 1,394 | ||
| 6,191,174 | ||||
| Energy - 5.0% | ||||
| Apache Corporation | 1,200 | 70,575 | ||
| Coastal Corp. | 5,200 | 316,550 | ||
| Dynegy, Inc. | 2,100 | 143,456 | ||
| Enron Corp. | 1,600 | 103,200 | ||
| Global Marine, Inc.* | 8,400 | 236,775 | ||
| Number
of Shares |
Market Value |
|||
|---|---|---|---|---|
| Energy (Continued) | ||||
| Halliburton Co. | 8,000 | $ 377,500 | ||
| Noble Drilling Corp.* | 5,820 | 239,711 | ||
| Royal Dutch Petroleum
Company |
9,900 | 617,802 | ||
| Transocean Sedco Forex, Inc. | 6,800 | 363,375 | ||
| 2,468,944 | ||||
| Entertainment & Leisure - 1.5% | ||||
| AT&T-Liberty Media Group* | 13,940 | 338,045 | ||
| Time Warner, Inc. | 5,200 | 395,200 | ||
| 733,245 | ||||
| Financial Services - 1.0% | ||||
| American Express Company | 2,820 | 146,992 | ||
| Associates First Capital Corp.
Cl. A |
10,500 | 234,281 | ||
| HSBC Holdings PLC | 10,100 | 115,519 | ||
| 496,792 | ||||
| Foods - 2.2% | ||||
| The Kroger Co.* | 9,500 | 209,594 | ||
| Safeway, Inc.* | 19,260 | 869,107 | ||
| 1,078,701 | ||||
| Healthcare - 1.5% | ||||
| Bristol-Myers Squibb Company | 8,400 | 489,300 | ||
| The Healthcare Company | 8,300 | 252,112 | ||
| 741,412 | ||||
| Household Products - 2.3% | ||||
| The Clorox Company | 2,800 | 125,475 | ||
| Corning, Incorporated | 3,700 | 998,537 | ||
| 1,124,012 | ||||
| Industrial—Diversified - 2.4% | ||||
| Tyco International Ltd. | 25,240 | 1,195,745 | ||
| Insurance - 3.9% | ||||
| American International Group,
Inc. |
6,775 | 796,062 | ||
| AXA Financial, Inc. | 11,000 | 374,000 | ||
| The Hartford Financial Services
Group, Inc. |
9,300 | 520,219 | ||
| Marsh & McLennan Companies,
Inc. |
2,400 | 250,650 | ||
| 1,940,931 | ||||
| Number
of Shares |
Market Value |
|||
|---|---|---|---|---|
| Internet Content - 0.1% | ||||
| BEA Systems, Inc.* | 1,500 | $ 74,156 | ||
| Internet Software - 0.1% | ||||
| Vignette Corp.* | 600 | 31,209 | ||
| Machinery & Components - 2.2% | ||||
| Applied Materials, Inc.* | 1,300 | 117,812 | ||
| Baker Hughes, Inc. | 14,100 | 451,200 | ||
| Deere & Co. | 5,700 | 210,900 | ||
| Lam Research Corp.* | 8,500 | 318,750 | ||
| 1,098,662 | ||||
| Medical Supplies - 1.7% | ||||
| Bausch & Lomb, Inc. | 3,970 | 307,179 | ||
| Waters Corp.* | 4,130 | 515,476 | ||
| 822,655 | ||||
| Pharmaceuticals - 7.4% | ||||
| Abbott Laboratories | 14,400 | 641,700 | ||
| Alza Corp.* | 2,100 | 124,163 | ||
| American Home Products
Corporation |
14,870 | 873,613 | ||
| Genzyme Corporation* | 900 | 53,494 | ||
| Pfizer, Inc. | 20,092 | 964,416 | ||
| Pharmacia Corp. | 15,821 | 817,748 | ||
| Sepracor, Inc.* | 1,400 | 168,875 | ||
| 3,644,009 | ||||
| Prepackaged Software - 8.4% | ||||
| Art Technology Group, Inc.* | 500 | 50,469 | ||
| BMC Software, Inc.* | 7,600 | 277,281 | ||
| Check Point Software Tech* | 1,900 | 402,325 | ||
| Commerce One, Inc.* | 1,100 | 49,913 | ||
| Computer Associates
Internationational, Inc. |
9,030 | 462,223 | ||
| E. Piphany, Inc.* | 1,000 | 107,188 | ||
| I2 Technologies, Inc.* | 200 | 20,853 | ||
| Microsoft Corp.* | 18,700 | 1,496,000 | ||
| Oracle Corporation* | 7,700 | 647,281 | ||
| Rational Software Corp.* | 4,900 | 455,394 | ||
| Siebel Systems, Inc.* | 1,060 | 173,376 | ||
| Veritas Software Corp.* | 200 | 22,603 | ||
| 4,164,906 | ||||
| Retail - 2.4% | ||||
| CVS Corporation | 16,780 | 671,200 | ||
| Office Depot, Inc.* | 4,520 | 28,250 | ||
| Number
of Shares |
Market Value |
|||
|---|---|---|---|---|
| Retail (Continued) | ||||
| RadioShack Corporation | 7,600 | $ 360,050 | ||
| Wal-Mart Stores, Inc. | 1,900 | 109,488 | ||
| 1,168,988 | ||||
| Telephone Utilities - 4.7% | ||||
| Alltel Corp. | 2,100 | 130,069 | ||
| Amdocs Ltd.* | 2,425 | 186,119 | ||
| Metromedia Fiber Network,
Inc.* |
14,200 | 563,563 | ||
| Nextlink Communications* | 6,900 | 261,769 | ||
| Sprint Corp. (PCS Group)* | 11,000 | 654,500 | ||
| VoiceStream Wireless
Corporation* |
1,000 | 116,297 | ||
| Worldcom, Inc.* | 8,700 | 399,113 | ||
| 2,311,430 | ||||
| Tobacco - 0.3% | ||||
| Philip Morris Companies, Inc. | 6,000 | 159,375 | ||
| TOTAL EQUITIES
(Cost $43,394,596) |
46,932,484 | |||
| Principal
Amount |
Market Value |
|||
| SHORT-TERM INVESTMENTS - 12.8% | ||||
| Cash Equivalents - 7.2% | ||||
| Bank of America Bank Note**
6.670% 03/22/2001 |
$ 76,413 | $ 76,413 | ||
| Bank of Montreal Bank Note**
6.630% 08/16/2000 |
127,354 | 127,354 | ||
| Bank of Nova Scotia
Eurodollar Time Deposit** 7.000% 07/03/2000 |
152,826 | 152,826 | ||
| Credit Agricole Bank
Eurodollar Time Deposit** 6.750% 07/06/2000 |
509,421 | 509,421 | ||
| Credit Agricole Bank
Eurodollar Time Deposit** 6.750% 07/07/2000 |
76,414 | 76,414 | ||
| Den Danske Bank Eurodollar
Time Deposit** 6.810% 07/05/2000 |
280,181 | 280,181 | ||
| First Union Bank Note**
6.900% 05/09/2001 |
76,413 | 76,413 | ||
| Fleet National Bank
Eurodollar Time Deposit** 7.260% 10/31/2000 |
474,455 | 474,455 | ||
|
Principal Amount |
Market Value |
|||||||
|---|---|---|---|---|---|---|---|---|
| Cash Equivalents (Continued) | ||||||||
| HypoVereinsbank Eurodollar
Time Deposit** 6.750% 07/05/2000 |
$ 636,776 | $ 636,776 | ||||||
| Merrimac Money Market
Fund** 6.440% 07/03/2000 |
799,790 | 799,790 | ||||||
| Morgan Stanley Dean Witter
& Co.** 6.910% 11/22/2000 |
50,943 | 50,943 | ||||||
| Paribas Bank Eurodollar
Time Deposit** 6.750% 07/05/2000 |
305,652 | 305,652 | ||||||
| 3,566,638 | ||||||||
| Repurchase Agreement - 5.6% | ||||||||
| Investors Bank & Trust
Company Repurchase Agreement, dated 06/30/00, 6.03%, due 07/03/00 (a) |
2,763,558 | 2,763,558 | ||||||
| TOTAL SHORT-TERM
INVESTMENTS |
||||||||
| (At Amortized Cost) | 6,330,196 | |||||||
| TOTAL INVESTMENTS - 107.7% | ||||||||
| (Cost $49,724,792)*** | $ 53,262,680 | |||||||
| Other Assets/
(Liabilities) - (7.7%) |
(3,787,540 | ) | ||||||
| NET ASSETS - 100.0% | $ 49,475,140 | |||||||
*
|
Non-income producing security.
|
**
|
Represents investment of security lending collateral. (Note 2).
|
***
|
Aggregate cost for Federal tax purposes. (Note 7).
|
†
|
American Depository Receipt.
|
(a)
|
Maturity value of $2,764,946. Collateralized by U.S. Government Agency obligation with a rate of 7.161%, maturity date of 10/01/2023, and
aggregate market value, including accrued interest, of $2,902,007.
|
| 1. The Fund
|
| MML Growth Equity Fund (the “Fund”), which commenced operations on May 3, 1999, is a diversified series of the MML
Series Investment Fund (“MML Trust”), a no-load, open-end management investment company registered under the Investment Company Act of 1940, as amended (the “1940 Act”). The MML Trust, which has eleven separate series of shares, is
organized under the laws of the Commonwealth of Massachusetts as a Massachusetts business trust pursuant to an Agreement and Declaration of Trust dated December 19, 1984, as amended.
|
| The MML Trust was established by Massachusetts Mutual Life Insurance Company (“MassMutual”) for the purpose of providing
vehicles for the investment assets of various separate investment accounts established by MassMutual and by life insurance companies which are subsidiaries of MassMutual. Shares of the MML Trust are not offered to the general public.
|
| 2. Significant
Accounting Policies |
The following is a summary of significant accounting policies followed consistently by the Fund in the preparation of the
financial statements in conformity with generally accepted accounting principles. The preparation of the financial statements in accordance with generally accepted accounting principles requires management to make estimates and assumptions that affect the
reported amounts and disclosures in the financial statements. Actual results could differ from those estimates.
|
| Investment
Valuation |
Equity securities are valued on the basis of valuations furnished by a pricing service, authorized by the Board of Trustees (“
Trustees”), which provides the last reported sale price for securities listed on a national securities exchange or on the NASDAQ National Market System, or in the case of over-the-counter securities not so listed, the last reported bid price. Debt
securities (other than short-term obligations with a remaining maturity of sixty days or less) are valued on the basis of valuations furnished by a pricing service, authorized by the Trustees, which determines valuations taking into account appropriate
factors such as institutional-size trading in similar groups of securities, yield, quality, coupon rate, maturity, type of issue, trading characteristics and other market data. Money market obligations with a remaining maturity of sixty days or less are
valued at either amortized cost or at original cost plus accrued interest, whichever approximates current market value. All other securities and other assets are valued at fair value in accordance with procedures approved by and determined in good faith
by the Trustees, although the actual calculation may be done by others.
|
| Portfolio securities traded on more than one national securities exchange are valued at the last price on the business day as of
which such value is being determined at the close of the exchange representing the principal market for such securities. All assets and liabilities expressed in foreign currencies will be converted into U.S. dollars at the mean between the buying and
selling rates of such currencies against U.S. dollars last quoted by any major bank. If such quotations are not available, the rate of exchange will be determined in accordance with policies established by the Trustees.
|
| Accounting for
Investments |
Investment transactions are accounted for on the trade date. Realized gains and losses on sales of investments and unrealized
appreciation and depreciation of investments are computed on the specific identification cost method. Interest income, adjusted for amortization of discounts and premiums on investments, is earned from the settlement date and is recorded on the accrual
basis. Dividend income is recorded on the ex-dividend date.
|
| Federal Income
Tax |
It is the Fund’s intent to continue to comply with the provisions of subchapter M of the Internal Revenue Code of 1986, as
amended (the “Code”), applicable to a regulated investment company. Under such provisions, the Fund will not be subject to federal income taxes on its ordinary income and net realized capital gains to the extent they are distributed or deemed to
have been distributed to its shareholders. Therefore, no Federal income tax provision is required.
|
| Dividends and
Distributions to Shareholders |
Dividends from net investment income and distributions of any net realized capital gains of the Fund are declared and paid
annually and at other times as may be required to satisfy tax or regulatory requirements. Distributions to shareholders are recorded on the ex-dividend date. Income and capital gain distributions are determined in accordance with income tax regulations
which may differ from generally accepted accounting principles. These differences are primarily due to investments in forward contracts, passive foreign investment companies and the deferral of wash sale losses. As a result, net investment income and net
realized gains on investment transactions for a reporting period may differ significantly from distributions during such period. Accordingly, the Fund may periodically make reclassifications among certain of its capital accounts without impacting the net
asset value of the Fund.
|
| Foreign Currency
Translation |
The books and records of the Fund are maintained in U.S. dollars. The market values of foreign currencies, foreign securities and
other assets and liabilities denominated in foreign currencies are translated into U.S. dollars at the mean of the buying and selling rates of such currencies against the U.S. dollar at the end of each business day. Purchases and sales of foreign
securities and income and expense items are translated at the rates of exchange prevailing on the respective dates of such transactions. The Fund does not isolate that portion of the results of operations arising from changes in the exchange rates from
that portion arising from changes in the market prices of securities.
|
| Net realized foreign currency gains and losses resulting from changes in exchange rates include foreign currency gains and losses
between trade date and settlement date on investment securities transactions, foreign currency transactions and the difference between the amounts of dividends recorded on the books of the Fund and the amounts actually received.
|
| Securities
Lending |
The Fund may make loans of portfolio securities; however, securities lending can not exceed 33% of its total assets taken at
current value. The loans are collateralized at all times with cash or securities with a market value at least equal to 100% of the market value of the securities on loan. As with other extensions of credit, the Fund may bear the risk of delay in recovery
or even loss of rights in the collateral should the borrower of the securities fail financially. The Fund receives compensation for lending its securities. At June 30, 2000, the Fund loaned securities having a market value of $3,460,428, collateralized
cash in the amount of $3,566,638, which was invested in short-term instruments.
|
| Forward Foreign
Currency Contracts |
The Fund may enter into forward foreign currency contracts in order to convert foreign denominated securities or obligations to
U.S. dollar denominated investments. A forward foreign currency contract is an agreement between two parties to buy and sell a currency at a set price on a future date. The market value of a forward currency contract fluctuates with changes in forward
foreign currency exchange rates. Forward foreign currency contracts are marked to market daily and the change in their value is recorded by the Fund as an unrealized gain or loss. When a forward foreign currency contract is extinguished, through delivery
or offset by entering into another forward foreign currency contract, the Fund records a realized gain or loss equal to the difference between the value of the contract at the time it was opened and the value of the contract at the time it was
extinguished or offset.
|
| Forward foreign currency contracts involve a risk of loss from the potential inability of counterparties to meet the terms of
their contracts and from unanticipated movements in foreign currency values and interest rates.
|
| The notional or contractual amounts of these instruments represent the investments the Fund has in particular classes of financial
instruments and do not necessarily represent the amounts potentially subject to risk. The measurement of the risk associated with these instruments is meaningful only when all related and offsetting transactions are considered.
|
| The following forward foreign currency contracts were open as of June 30, 2000:
|
| Settlement
Date |
Contracts to
Deliver/Receive |
Units of
Currency |
In Exchange
for U.S. Dollars |
Contracts
at Value |
Unrealized
Appreciation (Depreciation) |
||||||
|---|---|---|---|---|---|---|---|---|---|---|---|
| BUY | |||||||||||
| 07/03/00 | Euro | 32,821 | $31,256 | $31,463 | $207 | ||||||
| SELL | |||||||||||
| 07/06/00 | British Pound | 25,120 | $38,132 | $38,032 | $100 | ||||||
| SELL | |||||||||||
| 07/06/00 | Swedish Krona | 501,880 | $56,748 | $57,222 | $(474 | ) | |||||
| Forward
Commitments |
The Fund may purchase or sell securities on a “when issued,” delayed delivery or forward commitment basis. The Fund uses
forward commitments to manage interest rate exposure or as a temporary substitute for purchasing or selling particular debt securities. Delivery and payment for securities purchased on a forward commitment basis can take place a month or more after the
date of the transaction. The Fund instructs the custodian to segregate assets in a separate account with a current market value at least equal to the amount of its forward purchase commitments. The price of the underlying security and the date when the
securities will be delivered and paid for are fixed at the time the transaction is negotiated. The value of the forward commitment is determined by management using a commonly accepted pricing model and fluctuates based upon changes in the value of the
underlying security and market repurchase rates. Such rates equate the counterparty’s cost to purchase and finance the underlying security to the earnings received on the security and forward delivery proceeds. The Fund records on a daily basis the
unrealized appreciation/depreciation based upon changes in the value of the forward commitment. When a forward commitment contract is closed, the Fund records a realized gain or loss equal to the difference between the value of the contract at the time it
was opened and the value of the contract at the time it was extinguished. Forward commitments involve a risk of loss if the value of the security to be purchased declines prior to the settlement date. The Fund could also be exposed to loss if it cannot
close out its forward commitments because of an illiquid secondary market, or the inability of counterparties to perform. The Fund monitors exposure to ensure counterparties are creditworthy and concentration of exposure is minimized. At June 30, 2000,
the Fund had no open forward commitments.
|
| Financial Futures
Contracts |
The Fund may purchase or sell financial futures contracts and options on such futures contracts for the purpose of hedging the
market risk on existing securities or the intended purchase of securities. Futures contracts are contracts for delayed delivery of securities at a specific future date and at a specific price or yield. Upon entering into a contract, the Fund deposits and
maintains as collateral such initial margin as required by the exchange on which the transaction is effected. Pursuant to the contract, the Fund agrees to receive from or pay to the broker an amount of cash equal to the daily fluctuation in value of the
contract. Such receipts or payments are known as variation margin and are recorded by the Fund as unrealized gains or losses. When the contract is closed, the Fund records a realized gain or loss equal to the difference between the value of the contract
at the time it was opened and the value at the time it was closed. At June 30, 2000, the Fund had no open financial futures contracts.
|
| 3. Management
Fees and Other Transactions with Affiliates |
| Investment
Management Fee |
MassMutual serves as investment adviser to the Fund and provides administrative services as needed by the Fund. For acting as
such, MassMutual receives a fee from the Fund at the annual rate, payable monthly, of 0.80% of the first $300,000,000, 0.77% of the next $300,000,000, 0.75% of the next
$300,000,000, 0.72% of the next $600,000,000 and 0.65% of assets over $1.5 billion, of the average daily net asset value of the Fund.
|
| MassMutual has entered into an investment sub-advisory agreement with Massachusetts Financial Services Company (“MFS”)
pursuant to which MFS serves as the Fund’s sub-adviser, providing day-to-day management of the Fund’s investments. MassMutual pays MFS a monthly fee based upon the aggregate net assets under management at the annual rate of 0.40% of the first
$300,000,000, 0.37% of the next $300,000,000, 0.35% of the next $300,000,000, 0.32% of the next $600,000,000 and 0.25% of assets over $1.5 billion.
|
| MassMutual has agreed, at least through April 30, 2001, to bear the expenses of the Fund to the extent that the aggregate expenses
(excluding the Fund’s management fee, interest, taxes, brokerage commissions and extraordinary expenses) incurred during the Fund’s fiscal year exceed 0.11% of the average daily net assets of the Fund for such year.
|
| Other
|
Certain officers and trustees of the Fund are also officers of MassMutual. The compensation of unaffiliated directors of the Fund
is borne by the Fund.
|
| 4. Purchases and
Sales of Investments |
Cost of purchases and proceeds from sales of investment securities (excluding short-term investments) for the six months ended
June 30, 2000, were as follows:
|
| Purchases
|
| Equities | $64,233,928 |
| Sales
|
| Equities | $54,749,966 | |
| 5. Capital Share
Transactions |
The Fund is authorized to issue an unlimited number of shares, with no par value. The change in shares outstanding for the Fund is
as follows:
|
| For the Six
months ended June 30, 2000 |
|||
|---|---|---|---|
| Shares
|
| Sales of shares | 691,513 | ||
| Redemptions of shares | (59,078 | ) | |
| |
|||
| Net increase | 632,435 | ||
| |
| Amount
|
| Sales of shares | $9,196,219 | ||
| Redemptions of shares | (779,348 | ) | |
| |
|||
| Net increase | $8,416,871 | ||
| |
| For the Period
May 3, 1999 (commencement of operations) through December 31, 1999 |
|||
|---|---|---|---|
| Shares
|
| Sales of shares | 3,084,916 | ||
| Redemptions of shares | (49,311 | ) | |
| |
|||
| Net increase | 3,035,605 | ||
| |
| Amount
|
| Sales of shares | $31,389,266 | ||
| Redemptions of shares | (541,849 | ) | |
| |
|||
| Net increase | $30,847,417 | ||
| |
| 6. Foreign
Securities |
The Fund may also invest in foreign securities, subject to certain percentage restrictions. Investing in securities of foreign
companies and foreign governments involves special risks and considerations not typically associated with investing in securities issued by U.S. companies and the U.S. Government. These risks include revaluation of currencies and future adverse political
and economic developments. Moreover, securities of many foreign companies and foreign governments and their markets may be less liquid and their prices more volatile than those of securities of comparable U.S. companies and the U.S. Government.
|
| 7. Federal Income
Tax Information |
At June 30, 2000, the cost of securities and the unrealized appreciation (depreciation) in the value of investments owned by the
Fund, as computed on a Federal income tax basis, are as follows:
|
| Federal
Income Tax Cost |
Tax Basis
Unrealized Appreciation |
Tax Basis
Unrealized Depreciation |
Net Unrealized
Appreciation |
|||
|---|---|---|---|---|---|---|
| $49,724,792 | $4,954,390 | $1,416,824 | $3,537,566 |
| The Fund has elected to defer to January 1, 2000 post-October currency losses of $2,359.
|
|
|