
|
|
|
|
|
|
|
|
|
Fidelity's
Funds
Fidelity® Global Balanced Fund
Fidelity International Growth & Income Fund
Fidelity Diversified International Fund
Fidelity Aggressive International Fund
Fidelity Overseas Fund
Fidelity Worldwide Fund
Annual Report
for the year ending
October 31, 2000
and
Prospectus
dated December 29, 2000
(2_fidelity_logos)(registered_trademark)
|
Market Recap |
A-3 |
A review of what happened in world markets |
|
Global Balanced Fund |
A-4 |
Performance |
|
|
A-5 |
Fund Talk: The Manager's Overview |
|
|
A-7 |
Investment Changes |
|
|
A-8 |
Investments |
|
|
A-15 |
Financial Statements |
|
International Growth & Income Fund |
A-17 |
Performance |
|
|
A-18 |
Fund Talk: The Manager's Overview |
|
|
A-20 |
Investment Changes |
|
|
A-21 |
Investments |
|
|
A-25 |
Financial Statements |
|
Diversified International Fund |
A-27 |
Performance |
|
|
A-28 |
Fund Talk: The Manager's Overview |
|
|
A-30 |
Investment Changes |
|
|
A-31 |
Investments |
|
|
A-39 |
Financial Statements |
|
Aggressive International Fund |
A-41 |
Performance |
|
|
A-42 |
Fund Talk: The Manager's Overview |
|
|
A-44 |
Investment Changes |
|
|
A-45 |
Investments |
|
|
A-47 |
Financial Statements |
|
Overseas Fund |
A-49 |
Performance |
|
|
A-5 |
Fund Talk: The Manager's Overview |
|
|
A-7 |
Investment Changes |
|
|
A-8 |
Investments |
|
|
A-15 |
Financial Statements |
|
Worldwide Fund |
A-58 |
Performance |
|
|
A-59 |
Fund Talk: The Manager's Overview |
|
|
A-61 |
Investment Changes |
|
|
A-62 |
Investments |
|
|
A-67 |
Financial Statements |
|
Notes to Financial Statements |
A-69 |
Notes to the Financial Statements |
|
Report of Independent Accountants |
A-73 |
|
|
Independent Auditors' Report |
A-74 |
|
|
Distributions |
A-75 |
|
Standard & Poor's, S&P and S&P 500 are registered service marks of The McGraw-Hill Companies, Inc. and have been licensed for use by
Fidelity Distributors Corporation.
Third party marks appearing herein are the property of their respective owners.
All other marks appearing herein are registered or unregistered trademarks or service marks of FMR Corp. or an affiliated company.
(Recycle graphic) This report is printed on recycled paper using soy-based inks.
This report and the financial statements contained herein are submitted for the general information of the shareholders of the funds. This report is not authorized for distribution to prospective investors in the funds unless preceded or accompanied by an effective prospectus.
Mutual fund shares are not deposits or obligations of, or guaranteed by, any depository institution. Shares are not insured by the FDIC, Federal Reserve Board or any other agency, and are subject to investment risks, including possible loss of principal amount invested.
Neither the funds nor Fidelity Distributors Corporation is a bank. For more information on any Fidelity fund, including charges and expenses, call 1-800-544-6666 for a free prospectus. Read it carefully before you invest or send money.
Annual Report
The 12-month period that ended October 31, 2000, marked an incredible display of synchronization among global equity markets. Many of the similarities came from the parallel performance of technology stocks in the U.S. and TMT stocks - those in the technology, media and telecommunications areas - overseas. In a nutshell, investors who took any form of risk during the first half of the period were rewarded; those who took risks from April on were firmly punished for their bravado. Rising interest rates, uncertainty over energy prices and the continued dominance of the dollar over other world currencies also played key roles.
Europe: Just as technology stocks propelled the U.S. market to extraordinary heights in 1999 and early 2000, new economy stocks - particularly those in the wireless communications and Internet groups - were responsible for much of Europe's lofty gains. Unfortunately, the old saying "what goes up must come down" was validated in April, when U.S. technology stocks crashed amid concerns over extended valuations. The decline sent shock waves across all oceans of the world, hitting home particularly hard for many of Europe's leading telecommunications stocks. Rising oil and gas prices, meanwhile, made it difficult for Europe's manufacturing industries, and the euro - the underachieving uniform currency for 11 European nations - continued to weaken. For the period, the Morgan Stanley Capital International (MSCI) Europe Index returned 1.16%.
Emerging Markets: Call it guilt by association, but with risk-taking appetites low from April through October, most emerging markets weren't the best place to be during the period. The worldwide technology decline hurt everything from semiconductor stocks in Taiwan to broadcasting stocks in Mexico. Asian semiconductor companies also had to grapple with weak global demand for PCs and cellular handsets. For the period, the MSCI All Country Asia Free ex-Japan Index was down 20.11%. Judging by the 14.24% return of the MSCI Emerging Markets Free-Latin America Index, performance was much better in Latin America. Mexico was a clear winner, as investors reacted positively to the government's repayment of debt to the International Monetary Fund, as well as to the election of the country's new president, who was widely seen as business-friendly.
Japan and the Far East: After flirting with investors throughout 1999, the Japanese market fell back to earth. Initial euphoria over economic progress gave way to the actual corporate restructuring work that needed to be done, and many high-flying technology stocks tumbled. To compound matters, the Japanese yen continued to dip relative to the dollar. The Tokyo Stock Exchange Index - also known as TOPIX - fell 15.16% during the period. Hong Kong and China continued to perform well, as the Hang Seng Index returned 14.26% during the 12 months. Both regions continued to benefit from fast-improving economies, as well as from China's pending admission to the World Trade Organization.
U.S. and Canada: The technology correction, higher interest rates and soaring oil and gas prices eroded much of the U.S. market's gains during the period. The NASDAQ Composite Index gave back much of its previous advance, finishing the period up 13.81%. The Standard & Poor's 500SM Index - a barometer of large-cap stock performance - was up 6.09% during the period, but was in negative territory from January through the end of October. The Russell 2000® Index - which tracks smaller stocks - returned 17.41%, mostly from strong first-half performance. America's neighbor to the north, meanwhile, continued to perform well. Canadian stocks enjoyed a very nice run, mostly aided by the phenomenal performance of telecommunications and technology stocks. Natural resource-related stocks also fared well. For the period, the Toronto Stock Exchange 300 gained 29.44%.
Bonds: For the most part, U.S. fixed-income investments shrugged off rising interest rates and the increased volatility in the equity markets. Many investors, in fact, gravitated to bonds as a safer haven following the technology correction. The Lehman Brothers Aggregate Bond Index - which tracks the performance of U.S. taxable bonds - returned 7.30% during the period. Treasury issues were a strong sector, particularly after the Treasury announced in January that it would be buying back debt and limiting the amount of new borrowings. The Lehman Brothers Long Term Government Bond Index climbed 11.33% during the period. Foreign government bonds couldn't match the U.S.' performance, however, as the Salomon Brothers Non-U.S. World Government Bond Index fell 9.70%. Emerging-markets bonds enjoyed a very strong 12-month showing. The J.P. Morgan Emerging Markets Bond Index returned 19.37%.
[BAR GRAPH]
Standard & Poor's 500 Index Morgan Stanley Capital International
Europe, Australasia, Far East Index
Row: 1, Col: 1, Value: nil
Row: 1, Col: 2, Value: nil
Row: 2, Col: 1, Value: 6.1
Row: 2, Col: 2, Value: 7.38
Row: 3, Col: 1, Value: 31.57
Row: 3, Col: 2, Value: 56.16
Row: 4, Col: 1, Value: 18.56
Row: 4, Col: 2, Value: 69.44000000000001
Row: 5, Col: 1, Value: 5.1
Row: 5, Col: 2, Value: 24.63
Row: 6, Col: 1, Value: 16.61
Row: 6, Col: 2, Value: 28.27
Row: 7, Col: 1, Value: 31.69
Row: 7, Col: 2, Value: 10.53
Row: 8, Col: 1, Value: -3.1
Row: 8, Col: 2, Value: -23.45
Row: 9, Col: 1, Value: 30.47
Row: 9, Col: 2, Value: 12.13
Row: 10, Col: 1, Value: 7.619999999999999
Row: 10, Col: 2, Value: -12.17
Row: 11, Col: 1, Value: 10.08
Row: 11, Col: 2, Value: 32.56
Row: 12, Col: 1, Value: 1.32
Row: 12, Col: 2, Value: 7.78
Row: 13, Col: 1, Value: 37.58
Row: 13, Col: 2, Value: 11.21
Row: 14, Col: 1, Value: 22.96
Row: 14, Col: 2, Value: 6.05
Row: 15, Col: 1, Value: 32.11
Row: 15, Col: 2, Value: 4.819999999999999
Row: 16, Col: 1, Value: 28.58
Row: 16, Col: 2, Value: 20.27
Row: 17, Col: 1, Value: 21.04
Row: 17, Col: 2, Value: 27.22
Row: 18, Col: 1, Value: -1.81
Row: 18, Col: 2, Value: -13.75
%
* YEAR TO DATE THROUGH OCTOBER 31, 2000.
Annual Report
There are several ways to evaluate a fund's historical performance. You can look at the total percentage change in value, the average annual percentage change or the growth of a hypothetical $10,000 investment. Total return reflects the change in the value of an investment, assuming reinvestment of the fund's dividend income and capital gains (the profits earned upon the sale of securities that have grown in value).
Cumulative Total Returns
|
Periods ended October 31, 2000 |
Past 1 |
Past 5 |
Life of |
|
Fidelity Global Balanced |
4.45% |
72.91% |
125.25% |
|
Fidelity Global Balanced |
-1.22% |
60.03% |
n/a* |
|
MSCI World |
1.09% |
97.65% |
187.02% |
|
SSB World Govt Bond |
-5.08% |
12.67% |
n/a* |
|
Global Flexible Portfolio |
7.65% |
78.30% |
n/a* |
Cumulative total returns show the fund's performance in percentage terms over a set period - in this case, one year, five years or since the fund started on February 1, 1993. For example, if you had invested $1,000 in a fund that had a 5% return over the past year, the value of your investment would be $1,050. You can compare the fund's returns to the performance of the Fidelity Global Balanced Composite Index - a hypothetical combination of unmanaged indices, combining the total returns of the Morgan Stanley Capital International World (MSCI) Index and the Salomon Smith Barney World Government Bond Index using a weighting of 60% to 40%, respectively. To measure how the fund's performance stacked up against its peers, you can compare it to the global flexible portfolio funds average, which reflects the performance of mutual funds with similar objectives tracked by Lipper Inc. The past one year average represents a peer group of 94 mutual funds. These benchmarks include reinvested dividends and capital gains, if any, and exclude the effect of sales charges.
Average Annual Total Returns
|
Periods ended October 31, 2000 |
Past 1 |
Past 5 |
Life of |
|
Fidelity Global Balanced |
4.45% |
11.57% |
11.04% |
|
Fidelity Global Balanced Composite |
-1.22% |
9.86% |
n/a* |
Average annual total returns take the fund's cumulative return and show you what would have happened if the fund had performed at a constant rate each year.
* Not available
$10,000 Over Life of Fund

$10,000 Over Life of Fund: Let's say hypothetically that $10,000 was invested in Fidelity Global Balanced Fund on February 26, 1993, shortly after the fund started. As the chart shows, by October 31, 2000, the value of the investment would have grown to $21,473 - a 114.73% increase on the initial investment. For comparison, look at how both the Morgan Stanley Capital International World Index and Salomon Smith Barney World Government Bond Index did over the same period. With dividends and capital gains, if any, reinvested, the same $10,000 investment in the Morgan Stanley Capital International World Index would have grown to $28,107 - a 181.07% increase and the Salomon Smith Barney World Government Bond Index would have grown to $14,665 - a 46.65% increase. You can also look at how the Fidelity Global Balanced Composite Index did over the same period. The composite index combines the total returns of the Morgan Stanley Capital International World (MSCI) Index and the Salomon Smith Barney World Government Bond Index, and assumes monthly rebalancing of the mix. With dividends and interest, if any, reinvested, the same $10,000 would have grown to $22,027 - a 120.27% increase.
Understanding Performance
Many markets around the globe offer the potential for significant growth over time; however, investing in foreign markets means assuming greater risks than investing in the United States. Factors like changes in a country's financial markets, its local political and economic climate, and the fluctuating value of its currency create these risks. For these reasons an international fund's performance may be more volatile than a fund that invests exclusively in the United States. Past performance is no guarantee of future results and you may have a gain or loss when you sell your shares.
3Annual Report
(Portfolio Manager photograph)
An interview with
Rick Mace, Portfolio
Manager of Fidelity
Global Balanced Fund
Q. How did the fund perform, Rick?
A. For the 12-month period that ended October 31, 2000, the fund returned 4.45%. In comparison, the fund outperformed the Fidelity Global Balanced Composite Index - a 60%/40% blend of the Morgan Stanley Capital International World Index and the Salomon Smith Barney World Government Bond Index - which fell 1.22%. However, the fund lagged the 7.65% return of the global flexible portfolio funds average tracked by Lipper Inc.
Q. What factors helped the fund outperform its composite index during the period?
A. The fund's equity component outperformed largely because of favorable stock selection in the telephone utilities and technology sectors. Specifically, the fund's underweighting in underperforming telephone stocks such as Lucent Technologies, AT&T, WorldCom and Nippon Telegraph and Telephone provided a boost to relative performance. At the same time, holding an out-of-benchmark position in Dynegy, an energy and communications company that was rewarded for its acquisition of utilities holding company Illinova and an expansion into the European broadband telecommunications industry, helped the fund. Turning to technology, holding an out-of-benchmark position in U.K.-based Autonomy and an overweighted stake in Furukawa Electric, a Japanese optic-fiber manufacturer, were highlights of our stock selection in the sector, as each stock performed well. Additionally, the fund's performance got a boost from holding several small positions in strong-performing U.S. technology stocks, such as Exodus Communications, Juniper Networks, Redback Networks and Agilent Technologies. The fund no longer held several of these stocks at the period's end.
Q. How did the fund's bond component perform?
A. An overweighting in U.S. Treasury bonds and an underweighting in Japanese bonds worked well, particularly during the first half of the period. During the latter half of the period, the fund's overall performance was hindered by an underweighting in fixed-income securities as bonds generally outperformed equities. The European bond component of the fund, in particular, detracted from performance as interest-rate concerns and a weakening euro depressed prices.
Q. The fund's equity holdings in the financial services sector rose to 11.7% from 8.9% six months ago. What did you like about this sector?
A. The reasons varied according to the economic and market conditions in different countries. In the U.S., a slowdown in the economy put the brakes on further interest-rate hikes by the Federal Reserve Board, which chose to leave rates unchanged on three consecutive occasions - June, August and October - after raising rates six consecutive times since mid-1999. Historically, the stabilization of interest rates has benefited financial stocks. Elsewhere, the fund has owned significant positions in a handful of Japanese financial services companies, such as Nomura Securities, for some time. But I increased our positions in those stocks because I believed that Japanese investors using the securities markets for wealth building is only the initial stage of a long-term growth trend. With the recent deregulation of financial services in Japan, these stocks could benefit going forward. Furthermore, I opportunistically added to the fund's holdings in other selected financial services stocks as the period progressed. In the United Kingdom, the prices and valuations of several banks reached such low levels that I couldn't ignore them, and I added to our holdings in such names as Lloyds TSB Group.
Q. The fund's position in another sector - health care - also increased since the last shareholder report . . .
A. That's right, and it was part of an overall strategy to steer the fund toward the most undervalued companies in the market. As I did with financial stocks, I increased the fund's holdings in many European health stocks because I was attracted to their relative earnings growth. Drug and pharmaceutical companies had been out of favor for some time and appeared to be positioned to benefit from a broadening of global markets. I thought these stocks could benefit from a stable interest-rate environment in the U.S. and declining rates in other countries.
Q. What specific stocks or strategies delivered disappointing results?
A. Within our equity component, our underweighting in several leading U.S. technology companies that performed well, such as Oracle, Cisco Systems and Hewlett-Packard, hurt overall performance. These companies were hurt by the correction in U.S. technology stocks during the spring, but recovered faster than expected in the following months as investors gravitated toward those technology companies with a history of consistent earnings growth. Similarly, holding an underweighted position in U.S. optical component producer Corning, which soared during the period on demand for its products, was a significant detractor. Meanwhile, overweighted positions in Hikari Tsushin, DDI and Telewest Communications also hampered the fund's gain.
Annual Report
Global Balanced
Fund Talk: The Manager's Overview - continued
Q. What's your outlook, Rick?
A. I think we'll continue to see more of the global volatility that we've witnessed during the past six months. Several factors - such as the declining value of the euro, historically high oil prices and slowing demand for products in the technology sectors - have recently shown little evidence of reversing course. As a result, this volatility should present compelling trading opportunities going forward. I will continue to position the fund in a broad range of industries and countries, harnessing the in-depth research capabilities of Fidelity's international team of analysts.
The views expressed in this report reflect those of the portfolio manager only through the end of the period of the report as stated on the cover and do not necessarily represent the views of Fidelity or any other person in the Fidelity organization. Any such views are subject to change at any time based upon market or other conditions and Fidelity disclaims any responsibility to update such views. These views may not be relied on as investment advice and, because investment decisions for a Fidelity fund are based on numerous factors, may not be relied on as an indication of trading intent on behalf of any Fidelity fund.
Fund Facts
Goal: seeks income and capital growth with reasonable risk by investing in a broadly diversified portfolio of high-yielding equity and debt securities issued anywhere in the world
Fund number: 334
Trading symbol: FGBLX
Start date: February 1, 1993
Size: as of October 31, 2000, more than $104 million
Manager: Richard Mace, since 1996; manager, Fidelity Overseas Fund, since 1996; Fidelity Aggressive International Fund, 1994-1999; group leader, Fidelity international funds; joined Fidelity in 1987
3Rick Mace on the recent volatility in global markets:
"As we've seen during the past six months, volatility in the equity markets - both domestically and internationally - has increased this year. I believe it is here to stay for awhile.
"It's important to realize that volatility is truly global, influenced a great deal by economic conditions in the United States. When the U.S. economy cools down, the rest of the world freezes. When U.S. markets warm up, the rest of the world catches fire. Part of the reason volatility is global is that merger and acquisition activity is sweeping the world, with companies buying one another not just within their own geographic markets, but on a global basis. This acquisition activity suggests that industries are consolidating around the world.
"Turning to individual markets, I think we will see the European and Japanese economies sputter along in the short term. However, looking with a longer perspective, the corporate culture in both Europe and Japan is changing - for the better. For example, an increasing number of companies are offering stock options to senior employees, a move that should improve bottom lines and add value for shareholders. Additionally, the increase in merger and acquisition activity is driving efficiency into companies and improving returns for shareholders. In the emerging markets, the outlook is mixed. Although Southeast Asian economies have stabilized, the rise in oil costs could hinder future short-term growth. There is a slightly better outlook in Latin America, because a number of countries are self-sufficient in energy production.
"Understandably, most people fear volatility. But in my opinion, volatility can be a good thing, because it creates great opportunities to buy and sell."
Annual Report
|
Geographic Diversification (% of fund's net assets) |
|||
|
As of October 31, 2000 |
|||
 |
United States of America |
51.3% |
|
 |
Japan |
11.8% |
|
 |
United Kingdom |
9.6% |
|
 |
Germany |
7.4% |
|
 |
France |
5.6% |
|
 |
Netherlands |
2.2% |
|
 |
Switzerland |
1.8% |
|
 |
Italy |
1.8% |
|
 |
Spain |
1.5% |
|
 |
Other |
7.0% |
|

|
|
|||
|
As of April 30, 2000 |
|||
|
United States of America |
51.0% |
|
 |
Japan |
11.4% |
|
|
United Kingdom |
10.5% |
|
|
France |
7.1% |
|
|
Germany |
6.1% |
|
|
Switzerland |
1.8% |
|
|
Spain |
1.6% |
|
|
Italy |
1.6% |
|
|
Sweden |
1.5% |
|
|
Other |
7.4% |
|

|
Percentages are adjusted for the effect of futures contracts, if applicable. |
|
Asset Allocation |
||
|
|
% of fund's |
% of fund's net assets |
|
Stocks |
64.3 |
63.8 |
|
Bonds |
28.1 |
27.9 |
|
Short-Term Investments |
7.6 |
8.3 |
|
Top Five Stocks as of October 31, 2000 |
||
|
|
% of fund's |
% of fund's net assets |
|
General Electric Co. |
1.3 |
1.2 |
|
Cisco Systems, Inc. |
1.2 |
1.2 |
|
EMC Corp. |
0.9 |
0.7 |
|
Exxon Mobil Corp. |
0.9 |
0.7 |
|
Vodafone Group PLC |
0.9 |
0.9 |
|
|
5.2 |
4.7 |
|
Top Five Bond Issuers as of October 31, 2000 |
||
|
(with maturities greater than |
% of fund's |
% of fund's net assets |
|
U.S. Treasury Obligations |
8.7 |
8.3 |
|
Federal Home Loan Bank |
4.8 |
4.4 |
|
United Kingdom, Great Britain & Northern Ireland |
4.3 |
4.3 |
|
Germany Federal Republic |
4.2 |
2.7 |
|
French Government |
1.8 |
3.3 |
|
|
23.8 |
23.0 |
|
Top Ten Market Sectors as of October 31, 2000 |
||
|
|
% of fund's |
% of fund's net assets |
|
Technology |
11.8 |
16.3 |
|
Finance |
11.7 |
8.9 |
|
Utilities |
6.9 |
11.0 |
|
Health |
5.9 |
4.4 |
|
Retail & Wholesale |
4.3 |
3.0 |
|
Industrial Machinery & Equipment |
4.1 |
3.5 |
|
Nondurables |
3.9 |
2.4 |
|
Media & Leisure |
3.8 |
3.6 |
|
Durables |
3.2 |
2.1 |
|
Energy |
3.1 |
3.5 |
Annual Report
Global Balanced
Showing Percentage of Net Assets
|
Common Stocks - 64.1% |
|||
|
Shares |
Value (Note 1) |
||
|
Australia - 0.7% |
|||
|
AMP Ltd. |
4,500 |
$ 40,704 |
|
|
Australia & New Zealand Banking |
2,438 |
18,071 |
|
|
Australian Gas Light Co. |
1,946 |
11,768 |
|
|
Australian Stock Exchange Ltd. |
1,700 |
10,425 |
|
|
BHP Ltd. |
5,904 |
57,427 |
|
|
Billabong International Ltd. (a) |
6,600 |
14,178 |
|
|
Brambles Industries Ltd. |
800 |
20,814 |
|
|
Cable & Wireless Optus Ltd. (a) |
9,800 |
20,828 |
|
|
Coles Myer Ltd. |
2,381 |
8,657 |
|
|
Commonwealth Bank of Australia |
2,223 |
33,196 |
|
|
Fosters Brewing Group Ltd. |
9,600 |
21,821 |
|
|
Harvey Norman Holdings Ltd. |
6,300 |
13,927 |
|
|
Leighton Holdings Ltd. |
3,000 |
10,441 |
|
|
Lend Lease Corp. Ltd. |
748 |
8,787 |
|
|
Lion Nathan Ltd. |
3,900 |
7,539 |
|
|
Macquarie Bank Ltd. |
800 |
11,631 |
|
|
National Australia Bank Ltd. |
6,900 |
96,186 |
|
|
News Corp. Ltd. |
13,725 |
147,544 |
|
|
Rio Tinto Ltd. |
1,000 |
13,775 |
|
|
Tabcorp Holdings Ltd. |
2,500 |
13,638 |
|
|
Telstra Corp. Ltd. |
20,400 |
66,807 |
|
|
Telstra Corp. Ltd. (installment receipt) (e) |
5,800 |
9,793 |
|
|
Wesfarmers Ltd. |
1,345 |
10,304 |
|
|
Westfield Holdings Ltd. |
2,700 |
17,485 |
|
|
Westpac Banking Corp. |
3,300 |
22,613 |
|
|
WMC Ltd. |
3,600 |
13,810 |
|
|
Woodside Petroleum Ltd. (a) |
800 |
5,867 |
|
|
Woolworths Ltd. |
3,800 |
15,192 |
|
|
TOTAL AUSTRALIA |
743,228 |
||
|
Bermuda - 0.2% |
|||
|
ACE Ltd. |
4,000 |
157,000 |
|
|
Brazil - 0.5% |
|||
|
Banco Itau SA |
787,000 |
61,510 |
|
|
Companhia de Bebidas das Americas (AmBev) sponsored ADR |
4,600 |
103,787 |
|
|
Embratel Participacoes SA ADR |
4,400 |
71,225 |
|
|
Petrobras SA (PN) |
4,935 |
131,453 |
|
|
Telesp Celular Participacoes SA ADR |
2,700 |
85,388 |
|
|
Votorantim Celulose e Papel SA |
1,466,000 |
49,227 |
|
|
TOTAL BRAZIL |
502,590 |
||
|
Canada - 1.4% |
|||
|
Abitibi-Consolidated, Inc. |
1,260 |
11,048 |
|
|
Agrium, Inc. |
890 |
9,178 |
|
|
Alberta Energy Co. Ltd. |
930 |
34,360 |
|
|
Alcan Aluminium Ltd. |
650 |
20,514 |
|
|
Anderson Exploration Ltd. (a) |
320 |
5,885 |
|
|
Ballard Power Systems, Inc. (a) |
400 |
43,087 |
|
|
Bank of Montreal |
590 |
27,320 |
|
|
Bank of Nova Scotia |
1,200 |
34,286 |
|
|
|
|||
|
Shares |
Value (Note 1) |
||
|
BCE, Inc. |
1,730 |
$ 46,588 |
|
|
Biovail Corp. (a) |
615 |
26,256 |
|
|
Bombardier, Inc. Class B (sub. vtg.) |
3,770 |
59,305 |
|
|
Bro-X Minerals Ltd. (a) |
600 |
0 |
|
|
C.I. Fund Management, Inc. |
600 |
12,552 |
|
|
Canada Occidental Petroleum Ltd. |
340 |
8,185 |
|
|
Canadian Hunter Exploration Ltd. (a) |
570 |
11,980 |
|
|
Canadian Imperial Bank of Commerce |
760 |
24,160 |
|
|
Canadian Natural Resources Ltd. (a) |
420 |
12,414 |
|
|
Canadian Pacific Ltd. |
2,390 |
69,463 |
|
|
Celestica, Inc. (sub. vtg.) (a) |
535 |
38,232 |
|
|
Cognos, Inc. (a) |
230 |
9,668 |
|
|
Enbridge, Inc. |
1,790 |
48,204 |
|
|
Gulf Canada Resources Ltd. (a) |
2,080 |
8,948 |
|
|
Imperial Oil Ltd. |
320 |
8,092 |
|
|
Inco Ltd. (a) |
300 |
4,670 |
|
|
Loblaw Companies Ltd. |
800 |
27,429 |
|
|
Mackenzie Financial Corp. |
310 |
4,174 |
|
|
Magna International, Inc. Class A |
270 |
12,112 |
|
|
Manulife Financial Corp. |
1,370 |
35,634 |
|
|
Molson, Inc. Class A |
160 |
4,041 |
|
|
National Bank of Canada |
660 |
10,816 |
|
|
Nortel Networks Corp. |
8,409 |
382,610 |
|
|
Petro-Canada |
730 |
15,343 |
|
|
Potash Corp. of Saskatchewan |
340 |
20,154 |
|
|
Power Corp. of Canada |
510 |
11,557 |
|
|
Precision Drilling Corp. (a) |
140 |
4,005 |
|
|
Rogers Communications, Inc. |
560 |
10,887 |
|
|
Royal Bank of Canada |
2,660 |
84,386 |
|
|
Seagram Co. Ltd. |
1,120 |
63,980 |
|
|
Sun Life Financial Services Canada, Inc. |
1,550 |
32,069 |
|
|
Suncor Energy, Inc. |
1,820 |
35,563 |
|
|
Talisman Energy, Inc. (a) |
770 |
24,251 |
|
|
Thomson Corp. |
1,340 |
54,128 |
|
|
Westcoast Energy, Inc. |
320 |
7,146 |
|
|
TOTAL CANADA |
1,414,680 |
||
|
China - 0.0% |
|||
|
China Petroleum & Chemical Corp. |
46,000 |
9,025 |
|
|
Denmark - 0.2% |
|||
|
Novo-Nordisk AS Series B (a) |
950 |
201,592 |
|
|
Finland - 0.7% |
|||
|
Nokia AB |
13,240 |
566,010 |
|
|
UPM-Kymmene Corp. |
7,500 |
212,306 |
|
|
TOTAL FINLAND |
778,316 |
||
|
France - 3.8% |
|||
|
Alcatel SA (RFD) (a) |
3,800 |
237,025 |
|
|
Aventis SA |
2,400 |
172,950 |
|
|
AXA SA de CV |
1,800 |
238,343 |
|
|
BNP Paribas SA |
2,175 |
187,568 |
|
|
BNP Paribas SA warrants 7/1/02 (a) |
286 |
1,372 |
|
|
Common Stocks - continued |
|||
|
Shares |
Value (Note 1) |
||
|
France - continued |
|||
|
Castorama Dubois Investissements SA |
2,265 |
$ 460,639 |
|
|
Clarins SA (a) |
1,015 |
78,486 |
|
|
Clarins SA rights 12/29/00 (a) |
1,015 |
10,700 |
|
|
Groupe Danone (a) |
662 |
92,602 |
|
|
ILOG SA sponsored ADR (a) |
8,500 |
255,000 |
|
|
Integra SA (a) |
7,400 |
59,985 |
|
|
Pernod-Ricard |
2,600 |
119,172 |
|
|
Remy Cointreau SA (RFD) (a) |
59 |
1,973 |
|
|
Royal Canin SA |
1,600 |
144,636 |
|
|
Sanofi-Synthelabo SA |
3,350 |
176,296 |
|
|
Societe Generale Class A (a) |
720 |
40,885 |
|
|
Suez Lyonnaise des Eaux |
1,790 |
273,179 |
|
|
Television Francaise 1 SA (a) |
2,180 |
118,980 |
|
|
TotalFinaElf SA Class B |
5,846 |
837,440 |
|
|
Vivendi Environment (a) |
5,600 |
209,144 |
|
|
Vivendi SA |
3,902 |
280,528 |
|
|
TOTAL FRANCE |
3,996,903 |
||
|
Germany - 1.9% |
|||
|
ACG AG |
2,100 |
110,514 |
|
|
Allianz AG (Reg.) |
895 |
303,529 |
|
|
Arxes Information Design AG (a) |
2,700 |
35,064 |
|
|
DaimlerChrysler AG (Reg.) |
3 |
138 |
|
|
Deutsche Lufthansa AG (Reg.) |
8,400 |
163,988 |
|
|
Douglas Holding AG |
6,700 |
199,612 |
|
|
Fresenius Medical Care AG |
1,300 |
103,470 |
|
|
Kali Und Salz Beteiligungs AG |
5,520 |
79,651 |
|
|
Karstadt Quelle AG |
8,100 |
264,423 |
|
|
Moebel Walther AG |
23,300 |
235,545 |
|
|
Muenchener Ruckversicherungs-Gesellschaft AG (Reg.) |
550 |
172,964 |
|
|
Software AG |
1,000 |
71,639 |
|
|
United Internet AG (a) |
10,000 |
64,339 |
|
|
Wella AG |
4,000 |
152,105 |
|
|
TOTAL GERMANY |
1,956,981 |
||
|
Greece - 0.2% |
|||
|
Antenna TV SA sponsored ADR (a) |
10,800 |
213,300 |
|
|
Hong Kong - 0.7% |
|||
|
Asat Holdings Ltd. sponsored ADR |
700 |
4,638 |
|
|
Cathay Pacific Airways Ltd. |
13,000 |
23,590 |
|
|
Cheung Kong Holdings Ltd. |
6,000 |
66,364 |
|
|
China Mobile (Hong Kong) Ltd. (a) |
2,000 |
12,250 |
|
|
China Unicom Ltd. |
10,000 |
20,069 |
|
|
CLP Holdings Ltd. |
6,000 |
28,007 |
|
|
Dairy Farm International Holdings Ltd. |
22,500 |
9,225 |
|
|
Dao Heng Bank Group Ltd. |
3,000 |
15,158 |
|
|
Great Eagle Holdings Ltd. |
8,129 |
11,675 |
|
|
Hang Seng Bank Ltd. |
2,900 |
34,121 |
|
|
Henderson Land Development Co. Ltd. |
5,000 |
21,544 |
|
|
Hong Kong & China Gas Co. Ltd. |
21,137 |
26,699 |
|
|
Hongkong Land Holdings Ltd. |
6,000 |
11,100 |
|
|
|
|||
|
Shares |
Value (Note 1) |
||
|
Hutchison Whampoa Ltd. |
15,400 |
$ 191,069 |
|
|
JCG Holdings Ltd. |
26,000 |
13,837 |
|
|
Johnson Electric Holdings Ltd. |
24,000 |
47,705 |
|
|
Li & Fung Ltd. |
20,000 |
37,189 |
|
|
Pacific Century Cyberworks Ltd. (a) |
21,355 |
16,431 |
|
|
Pacific Century Cyberworks Ltd. |
641 |
0 |
|
|
Sun Hung Kai Properties Ltd. |
10,000 |
82,714 |
|
|
Swire Pacific Ltd. (A Shares) |
5,000 |
30,841 |
|
|
Wharf Holdings Ltd. |
10,000 |
20,390 |
|
|
Wing Hang Bank Ltd. |
6,000 |
18,313 |
|
|
TOTAL HONG KONG |
742,929 |
||
|
Ireland - 0.1% |
|||
|
Bank of Ireland, Inc. |
10,480 |
80,770 |
|
|
Israel - 0.0% |
|||
|
Orad Hi-Tech Systems Ltd. |
1,700 |
51,009 |
|
|
Italy - 0.8% |
|||
|
Alleanza Assicurazioni Spa |
18,500 |
244,430 |
|
|
Banca Intesa Spa |
35,900 |
150,074 |
|
|
Banca Nazionale del Lavoro (BNL) |
38,450 |
124,018 |
|
|
Beni Stabili Spa |
10,760 |
4,740 |
|
|
Eni Spa |
12,280 |
66,396 |
|
|
Telecom Italia Mobile Spa |
22,900 |
194,861 |
|
|
Telecom Italia Spa |
5,700 |
66,975 |
|
|
TOTAL ITALY |
851,494 |
||
|
Japan - 11.8% |
|||
|
Asahi Glass Co. Ltd. |
8,000 |
82,119 |
|
|
Asahi Techno Glass Corp. |
10,000 |
79,736 |
|
|
Bank of Tokyo-Mitsubishi Ltd. |
11,000 |
131,968 |
|
|
Canon, Inc. |
6,000 |
243,375 |
|
|
Chiba Bank |
13,000 |
53,973 |
|
|
Chubu Electric Power Co., Inc. |
5,000 |
82,486 |
|
|
Coca-Cola West Japan Co. Ltd. |
32 |
1,091 |
|
|
Credit Saison Co. Ltd. |
6,000 |
127,028 |
|
|
Daito Trust Construction Co. |
5,000 |
84,319 |
|
|
Daiwa Securities Group, Inc. |
17,000 |
188,370 |
|
|
DDI Corp. |
20 |
93,850 |
|
|
Fast Retailing Co. Ltd. |
900 |
221,474 |
|
|
Fuji Coca-Cola Bottling Co. Ltd. |
3,000 |
23,508 |
|
|
Fuji Heavy Industries Ltd. |
20,000 |
139,309 |
|
|
Fuji Photo Film Co. Ltd. |
4,000 |
148,474 |
|
|
Fujikura Ltd. |
19,000 |
167,519 |
|
|
Fujisawa Pharmaceutical Co. Ltd. |
2,000 |
62,872 |
|
|
Fujitsu Ltd. |
13,000 |
231,619 |
|
|
Furukawa Co. Ltd. |
25,000 |
51,324 |
|
|
Furukawa Electric Co. Ltd. |
21,000 |
552,378 |
|
|
Gunze Ltd. |
15,000 |
49,904 |
|
|
Hirose Electric Co. Ltd. |
500 |
57,740 |
|
|
Hitachi Chemical Co. Ltd. |
6,000 |
150,674 |
|
|
Hitachi Information Systems Co. Ltd. |
3,000 |
117,679 |
|
|
Honda Motor Co. Ltd. (a) |
4,000 |
138,375 |
|
|
Hosiden Corp. |
2,000 |
63,789 |
|
|
Common Stocks - continued |
|||
|
Shares |
Value (Note 1) |
||
|
Japan - continued |
|||
|
Ines Corp. |
7,000 |
$ 87,508 |
|
|
Japan Medical Dynamic Marketing, Inc. |
4,500 |
148,886 |
|
|
Kaneka Corp. |
6,000 |
58,290 |
|
|
Kansai Electric Power Co., Inc. |
6,000 |
98,268 |
|
|
Kao Corp. |
5,000 |
149,849 |
|
|
Kappa Create Co. Ltd. |
4,000 |
130,144 |
|
|
Komatsu Ltd. |
26,000 |
115,333 |
|
|
Konami Co. Ltd. |
1,300 |
109,614 |
|
|
Konica Corp. (a) |
10,000 |
77,261 |
|
|
Kyocera Corp. |
1,000 |
133,750 |
|
|
Matsushita Electric Industrial Co. Ltd. |
11,000 |
321,475 |
|
|
Mitsumi Electric Co. Ltd. |
2,000 |
65,988 |
|
|
Mizuho Holdings, Inc. |
25 |
192,237 |
|
|
Mkc-Stat Corp. |
4,000 |
65,988 |
|
|
Nakanishi, Inc. |
4,000 |
68,555 |
|
|
NEC Corp. |
6,000 |
114,380 |
|
|
NGK Insulators Ltd. |
15,000 |
198,653 |
|
|
Nichicon Corp. |
6,000 |
107,176 |
|
|
Nintendo Co. Ltd. |
800 |
132,344 |
|
|
Nippon Computer Systems Corp. |
5,000 |
96,233 |
|
|
Nippon Paper Industries Co. Ltd. |
14,000 |
79,809 |
|
|
Nippon Sheet Glass Co. Ltd. |
5,000 |
76,070 |
|
|
Nippon Telegraph & Telephone Corp. |
75 |
682,568 |
|
|
Nippon Thompson Co. Ltd. |
10,000 |
98,524 |
|
|
Nitto Denko Corp. |
3,000 |
101,457 |
|
|
Nomura Securities Co. Ltd. |
10,000 |
212,171 |
|
|
NTT DoCoMo, Inc. (d) |
7 |
172,578 |
|
|
Oki Electric Industry Co. Ltd. (a) |
18,000 |
107,066 |
|
|
Omron Corp. |
6,000 |
147,924 |
|
|
ORIX Corp. |
2,000 |
209,880 |
|
|
Ricoh Co. Ltd. |
5,000 |
76,987 |
|
|
Saizeriya Co. Ltd. |
1,900 |
106,223 |
|
|
Sakura Bank Ltd. |
25,000 |
182,156 |
|
|
Sanyo Electric Co. Ltd. |
10,000 |
76,070 |
|
|
Secom Co. Ltd. |
1,000 |
71,304 |
|
|
Shin-Etsu Chemical Co. Ltd. |
2,000 |
82,119 |
|
|
SKY Perfect Communications, Inc. (a) |
25 |
46,054 |
|
|
Softbank Corp. |
1,200 |
72,037 |
|
|
Sony Corp. |
6,500 |
539,500 |
|
|
Sumitomo Electric Industries Ltd. |
6,000 |
110,806 |
|
|
Sumitomo Trust & Banking Ltd. |
20,000 |
153,973 |
|
|
Takeda Chemical Industries Ltd. |
5,000 |
329,484 |
|
|
The Suruga Bank Ltd. |
6,000 |
82,376 |
|
|
THK Co. Ltd. |
2,000 |
49,491 |
|
|
Toko, Inc. |
15,000 |
78,361 |
|
|
Tokyo Broadcasting System, Inc. |
2,000 |
78,270 |
|
|
Tokyo Electric Power Co. |
5,000 |
121,437 |
|
|
Tokyo Tomin Bank Ltd. |
5,000 |
139,767 |
|
|
Tokyu Corp. |
7,000 |
36,184 |
|
|
Toto Ltd. |
20,000 |
151,773 |
|
|
Toyoda Gosei Co. Ltd. |
4,000 |
244,890 |
|
|
Toyota Motor Corp. |
20,000 |
799,193 |
|
|
|
|||
|
Shares |
Value (Note 1) |
||
|
Trans Cosmos, Inc. |
1,000 |
$ 72,312 |
|
|
Tsubaki Nakashima Co. Ltd. |
6,000 |
75,172 |
|
|
Yakult Honsha Co. Ltd. |
19,000 |
216,625 |
|
|
Yamada Denki Co. Ltd. |
2,400 |
211,163 |
|
|
Yamanouchi Pharmaceutical Co. Ltd. |
4,000 |
181,102 |
|
|
Yokogawa Electric Corp. |
7,000 |
54,917 |
|
|
Yoshinoya D&C Co. Ltd. |
60 |
112,730 |
|
|
Zeon Corp. |
20,000 |
86,701 |
|
|
TOTAL JAPAN |
12,344,109 |
||
|
Luxembourg - 0.1% |
|||
|
Societe Europeen Des Satellite unit |
600 |
79,957 |
|
|
Mexico - 0.6% |
|||
|
Banacci SA de CV Series O (a) |
60,000 |
93,181 |
|
|
Grupo Iusacell SA de CV |
6,000 |
78,000 |
|
|
Grupo Televisa SA de CV |
1,700 |
92,013 |
|
|
Telefonos de Mexico SA de CV Series L sponsored ADR |
3,790 |
204,423 |
|
|
TV Azteca SA de CV sponsored ADR |
5,425 |
67,813 |
|
|
Wal-Mart de Mexico SA de CV |
50,000 |
113,132 |
|
|
TOTAL MEXICO |
648,562 |
||
|
Netherlands - 2.2% |
|||
|
Aegon NV |
3,120 |
123,938 |
|
|
Hunter Douglas NV |
7,700 |
220,909 |
|
|
ING Groep NV (Certificaten Van Aandelen) |
6,664 |
457,716 |
|
|
Koninklijke Ahold NV |
12,526 |
363,936 |
|
|
Koninklijke KPN NV |
3,020 |
61,188 |
|
|
Koninklijke Philips Electronics NV |
3,880 |
152,515 |
|
|
Numico NV |
4,846 |
226,642 |
|
|
Nutreco Holding NV |
8,620 |
371,686 |
|
|
Oce NV |
12,000 |
178,757 |
|
|
United Pan-Europe Communications NV Class A (a) |
2,400 |
42,067 |
|
|
Vendex KBB NV |
4,970 |
62,350 |
|
|
TOTAL NETHERLANDS |
2,261,704 |
||
|
Netherlands Antilles - 0.1% |
|||
|
Schlumberger Ltd. (NY Shares) |
800 |
60,900 |
|
|
New Zealand - 0.0% |
|||
|
Air New Zealand Ltd. Class B |
9,000 |
8,071 |
|
|
Telecom Corp. of New Zealand Ltd. |
5,000 |
11,120 |
|
|
TOTAL NEW ZEALAND |
19,191 |
||
|
Norway - 0.8% |
|||
|
Bergesen dy ASA (A Shares) |
7,500 |
149,322 |
|
|
Norsk Hydro AS (a) |
4,900 |
194,587 |
|
|
TANDBERG ASA (a) |
14,300 |
378,584 |
|
|
VMETRO ASA |
8,200 |
95,308 |
|
|
TOTAL NORWAY |
817,801 |
||
|
Common Stocks - continued |
|||
|
Shares |
Value (Note 1) |
||
|
Papua New Guinea - 0.0% |
|||
|
Oil Search Ltd. (a) |
6,800 |
$ 5,482 |
|
|
Singapore - 0.3% |
|||
|
Chartered Semiconductor |
5,000 |
21,659 |
|
|
City Developments Ltd. |
3,000 |
13,850 |
|
|
Datacraft Asia Ltd. |
2,000 |
13,700 |
|
|
DBS Group Holdings Ltd. |
3,652 |
43,087 |
|
|
DBS Land Ltd. |
5,000 |
7,609 |
|
|
Oversea-Chinese Banking Corp. Ltd. |
4,300 |
27,449 |
|
|
Overseas Union Bank Ltd. |
4,281 |
20,740 |
|
|
Singapore Airlines Ltd. |
4,000 |
40,125 |
|
|
Singapore Press Holdings Ltd. |
2,000 |
28,612 |
|
|
Singapore Technologies Engineering Ltd. |
13,000 |
20,969 |
|
|
Singapore Telecommunications Ltd. |
16,000 |
26,537 |
|
|
United Overseas Bank Ltd. |
5,280 |
39,122 |
|
|
Venture Manufacturing Singapore Ltd. |
3,000 |
29,068 |
|
|
TOTAL SINGAPORE |
332,527 |
||
|
Spain - 0.7% |
|||
|
Aldeasa SA |
2,900 |
54,892 |
|
|
Banco Santander Central Hispano SA |
17,988 |
174,363 |
|
|
Cortefiel SA |
10,880 |
195,319 |
|
|
Sogecable SA (a) |
1,500 |
36,668 |
|
|
Telefonica SA (a) |
16,560 |
315,841 |
|
|
TOTAL SPAIN |
777,083 |
||
|
Sweden - 0.4% |
|||
|
Tele1 Europe Holding AB (a) |
12,200 |
93,968 |
|
|
Telefonaktiebolaget LM Ericsson |
20,920 |
290,265 |
|
|
TV 4 AB (A Shares) |
1,700 |
51,695 |
|
|
TOTAL SWEDEN |
435,928 |
||
|
Switzerland - 1.8% |
|||
|
Credit Suisse Group (Reg.) |
1,219 |
228,541 |
|
|
Givaudan AG (a) |
19 |
4,556 |
|
|
Gretag Imaging Holding AG (Reg. D) |
300 |
53,908 |
|
|
Julius Baer Holding AG |
26 |
128,734 |
|
|
Nestle SA (Reg.) |
154 |
319,138 |
|
|
Novartis AG (Reg.) |
163 |
247,288 |
|
|
PubliGroupe SA (Reg.) |
21 |
12,325 |
|
|
Richemont Compagnie Financier |
51 |
141,864 |
|
|
The Swatch Group AG (Bearer) |
200 |
264,812 |
|
|
Zurich Financial Services Group AG |
1,042 |
504,334 |
|
|
TOTAL SWITZERLAND |
1,905,500 |
||
|
United Kingdom - 5.3% |
|||
|
3i Group PLC |
5,500 |
124,783 |
|
|
Amvescap PLC |
11,530 |
257,412 |
|
|
AstraZeneca Group PLC (Sweden) |
583 |
27,526 |
|
|
Barclays PLC |
3,500 |
100,058 |
|
|
Boots Co. PLC |
43,100 |
343,651 |
|
|
|
|||
|
Shares |
Value (Note 1) |
||
|
British Land Co. PLC |
15,400 |
$ 91,981 |
|
|
Diageo PLC |
21,450 |
202,280 |
|
|
HSBC Holdings PLC: |
|
|
|
|
(Hong Kong) (Reg.) |
1,468 |
21,169 |
|
|
(United Kingdom) (Reg.) |
7,374 |
106,333 |
|
|
Lloyds TSB Group PLC |
38,279 |
389,561 |
|
|
Marconi PLC |
3,400 |
42,882 |
|
|
Misys PLC |
9,100 |
94,720 |
|
|
Reed International PLC |
15,000 |
138,519 |
|
|
Reuters Group PLC |
18,500 |
363,448 |
|
|
Shell Transport & Trading Co. PLC (Reg.) |
56,590 |
463,920 |
|
|
SMG PLC |
105,360 |
412,399 |
|
|
Smith & Nephew PLC |
80,476 |
330,165 |
|
|
SmithKline Beecham PLC |
18,414 |
240,073 |
|
|
Somerfield PLC |
196,900 |
219,793 |
|
|
SSL International PLC |
41,631 |
484,329 |
|
|
Telewest Communications PLC (a) |
100,289 |
165,743 |
|
|
Vodafone Group PLC |
210,175 |
894,557 |
|
|
WPP Group PLC |
6,580 |
88,236 |
|
|
TOTAL UNITED KINGDOM |
5,603,538 |
||
|
United States of America - 28.8% |
|||
|
Abbott Laboratories |
3,100 |
163,719 |
|
|
ADC Telecommunications, Inc. (a) |
3,600 |
76,950 |
|
|
AES Corp. (a) |
1,800 |
101,700 |
|
|
Affiliated Computer Services, Inc. |
1,800 |
100,238 |
|
|
AFLAC, Inc. |
2,300 |
168,044 |
|
|
Alcoa, Inc. |
4,028 |
115,553 |
|
|
AMBAC Financial Group, Inc. |
2,300 |
183,569 |
|
|
American Express Co. |
4,900 |
294,000 |
|
|
American Home Products Corp. |
2,000 |
127,000 |
|
|
American International Group, Inc. |
8,588 |
841,575 |
|
|
Anadarko Petroleum Corp. |
409 |
26,196 |
|
|
Associates First Capital Corp. Class A |
5,548 |
205,970 |
|
|
AT&T Corp. |
6,262 |
145,200 |
|
|
AT&T Corp. - Wireless Group |
3,400 |
84,788 |
|
|
Avery Dennison Corp. |
1,500 |
75,750 |
|
|
Avon Products, Inc. |
6,000 |
291,000 |
|
|
Baker Hughes, Inc. |
1,600 |
55,000 |
|
|
Bank of New York Co., Inc. |
11,200 |
644,700 |
|
|
Bank One Corp. |
5,000 |
182,500 |
|
|
Baxter International, Inc. |
1,800 |
147,938 |
|
|
Bed Bath & Beyond, Inc. (a) |
2,800 |
72,275 |
|
|
BellSouth Corp. |
7,000 |
338,188 |
|
|
BFGoodrich Co. |
3,000 |
122,813 |
|
|
Biomet, Inc. |
2,100 |
75,994 |
|
|
Black & Decker Corp. |
3,000 |
112,875 |
|
|
Boeing Co. |
1,800 |
122,063 |
|
|
Bristol-Myers Squibb Co. |
11,400 |
694,688 |
|
|
Broadcom Corp. Class A (a) |
200 |
44,475 |
|
|
Burlington Northern Santa Fe Corp. |
5,700 |
151,406 |
|
|
Calpine Corp. (a) |
500 |
39,469 |
|
|
Cardinal Health, Inc. |
900 |
85,275 |
|
|
Common Stocks - continued |
|||
|
Shares |
Value (Note 1) |
||
|
United States of America - continued |
|||
|
Ceridian Corp. (a) |
4,000 |
$ 100,000 |
|
|
Charles Schwab Corp. |
3,000 |
105,375 |
|
|
Ciena Corp. (a) |
4,000 |
420,500 |
|
|
Cisco Systems, Inc. (a) |
22,800 |
1,228,350 |
|
|
Citigroup, Inc. |
15,300 |
805,163 |
|
|
Clear Channel Communications, Inc. (a) |
11,996 |
720,510 |
|
|
Comstock Resources, Inc. (a) |
6,200 |
64,325 |
|
|
Conoco, Inc. Class B |
6,000 |
163,125 |
|
|
Corning, Inc. |
1,500 |
114,750 |
|
|
Crown Castle International Corp. (a) |
3,500 |
106,094 |
|
|
Danaher Corp. |
2,000 |
126,250 |
|
|
Dell Computer Corp. (a) |
16,200 |
477,900 |
|
|
Devon Energy Corp. |
1,500 |
75,600 |
|
|
Dynegy, Inc. Class A |
5,848 |
270,836 |
|
|
EchoStar Communications Corp. |
4,000 |
181,000 |
|
|
Eli Lilly & Co. |
7,200 |
643,500 |
|
|
EMC Corp. (a) |
11,000 |
979,688 |
|
|
Exxon Mobil Corp. |
10,876 |
970,003 |
|
|
Fannie Mae |
7,000 |
539,000 |
|
|
Firstar Corp. |
9,000 |
177,188 |
|
|
Forcenergy, Inc. (a) |
3,000 |
65,250 |
|
|
Freddie Mac |
4,600 |
276,000 |
|
|
Gap, Inc. |
7,000 |
180,688 |
|
|
Gateway, Inc. (a) |
3,000 |
154,830 |
|
|
General Electric Co. |
24,900 |
1,364,831 |
|
|
General Motors Corp. Class H |
4,500 |
145,800 |
|
|
Georgia-Pacific Corp. |
3,000 |
80,625 |
|
|
Halliburton Co. |
2,600 |
96,363 |
|
|
Harrah's Entertainment, Inc. (a) |
5,000 |
143,125 |
|
|
Home Depot, Inc. |
10,350 |
445,050 |
|
|
Household International, Inc. |
3,093 |
155,617 |
|
|
Ingersoll-Rand Co. |
1,800 |
67,950 |
|
|
Intel Corp. |
17,400 |
783,000 |
|
|
International Business Machines Corp. |
1,000 |
98,500 |
|
|
International Paper Co. |
3,000 |
109,875 |
|
|
JDS Uniphase Corp. (a) |
600 |
48,863 |
|
|
Juniper Networks, Inc. (a) |
1,000 |
195,000 |
|
|
Kohls Corp. (a) |
1,200 |
65,025 |
|
|
Leggett & Platt, Inc. |
7,700 |
126,088 |
|
|
Lexmark International Group, Inc. |
3,500 |
143,500 |
|
|
Mandalay Resort Group (a) |
3,000 |
62,438 |
|
|
MBIA, Inc. |
2,000 |
145,375 |
|
|
Merck & Co., Inc. |
3,000 |
269,813 |
|
|
Meredith Corp. |
1,800 |
57,150 |
|
|
Merrill Lynch & Co., Inc. |
2,400 |
168,000 |
|
|
Metromedia Fiber Network, Inc. |
1,500 |
28,500 |
|
|
Micron Technology, Inc. (a) |
2,000 |
69,500 |
|
|
Microsoft Corp. (a) |
5,500 |
378,813 |
|
|
Nabisco Group Holdings Corp. |
4,000 |
115,500 |
|
|
Nabisco Holdings Corp. Class A |
1,800 |
97,313 |
|
|
|
|||
|
Shares |
Value (Note 1) |
||
|
Navistar International Corp. (a) |
1,000 |
$ 33,063 |
|
|
Network Appliance, Inc. (a) |
800 |
95,200 |
|
|
Nextel Communications, Inc. Class A (a) |
8,200 |
315,188 |
|
|
Noble Drilling Corp. (a) |
800 |
33,250 |
|
|
NRG Energy, Inc. |
3,500 |
91,000 |
|
|
Omnicom Group, Inc. |
3,800 |
350,550 |
|
|
Oracle Corp. (a) |
6,000 |
198,000 |
|
|
Parker-Hannifin Corp. |
3,300 |
136,538 |
|
|
Patina Oil & Gas Corp. |
2,000 |
35,125 |
|
|
Pfizer, Inc. |
18,325 |
791,411 |
|
|
Pharmacia Corp. |
5,000 |
275,000 |
|
|
Philip Morris Companies, Inc. |
2,500 |
91,563 |
|
|
Phone.com, Inc. (a) |
2,000 |
185,125 |
|
|
Praxair, Inc. |
2,500 |
93,125 |
|
|
Procter & Gamble Co. |
5,600 |
400,050 |
|
|
Quaker Oats Co. |
2,000 |
163,125 |
|
|
Redback Networks, Inc. (a) |
800 |
85,150 |
|
|
Safeway, Inc. (a) |
1,700 |
92,969 |
|
|
SBA Communications Corp. Class A (a) |
4,000 |
200,500 |
|
|
SBC Communications, Inc. |
12,580 |
725,709 |
|
|
Schering-Plough Corp. |
10,300 |
532,381 |
|
|
Shaw Industries, Inc. |
6,000 |
111,375 |
|
|
Sprint Corp. - PCS Group Series 1 (a) |
4,800 |
183,000 |
|
|
Sun Microsystems, Inc. (a) |
6,500 |
720,688 |
|
|
Texas Instruments, Inc. |
4,300 |
210,969 |
|
|
The Chubb Corp. |
2,800 |
236,425 |
|
|
The Coca-Cola Co. |
9,300 |
561,488 |
|
|
Thermo Electron Corp. (a) |
4,000 |
116,000 |
|
|
Time Warner, Inc. |
2,404 |
182,488 |
|
|
Tyco International Ltd. |
6,900 |
391,144 |
|
|
Unisys Corp. (a) |
4,300 |
54,825 |
|
|
United Technologies Corp. |
2,800 |
195,475 |
|
|
VeriSign, Inc. (a) |
1,000 |
132,000 |
|
|
Viacom, Inc. Class B (non-vtg.) (a) |
6,791 |
386,238 |
|
|
VoiceStream Wireless Corp. (a) |
2,400 |
315,600 |
|
|
Wal-Mart Stores, Inc. |
10,000 |
453,750 |
|
|
Walgreen Co. |
8,800 |
401,500 |
|
|
Walt Disney Co. |
2,000 |
71,625 |
|
|
Washington Mutual, Inc. |
2,000 |
88,000 |
|
|
Waters Corp. (a) |
1,000 |
72,563 |
|
|
WorldCom, Inc. (a) |
2,956 |
70,205 |
|
|
TOTAL UNITED STATES OF AMERICA |
30,177,830 |
||
|
TOTAL COMMON STOCKS (Cost $55,823,397) |
67,169,929 |
||
|
Preferred Stocks - 0.2% |
|||
|
|
|
|
|
|
Convertible Preferred Stocks - 0.0% |
|||
|
Australia - 0.0% |
|||
|
WBK STRYPES Trust (Westpac Banking Corp.) $3.135 |
1,100 |
34,032 |
|
|
Preferred Stocks - continued |
|||
|
Shares |
Value (Note 1) |
||
|
Nonconvertible Preferred Stocks - 0.2% |
|||
|
Germany - 0.2% |
|||
|
Wella AG |
4,384 |
$ 175,824 |
|
|
TOTAL PREFERRED STOCKS (Cost $153,359) |
209,856 |
||
|
Nonconvertible Bonds - 0.0% |
|||||
|
Moody's Ratings (unaudited) |
Principal Amount (c) |
|
|||
|
United Kingdom - 0.0% |
|||||
|
BAE Systems PLC 7.45% 11/30/03 |
- |
GBP |
1,137 |
1,599 |
|
|
Government Obligations (f) - 28.1% |
|||||
|
|
|||||
|
France - 1.8% |
|||||
|
French Government OAT 5.5% 4/25/04 |
Aaa |
EUR |
2,200,000 |
1,886,967 |
|
|
Germany - 5.3% |
|||||
|
Germany Federal Republic: |
|
|
|
|
|
|
3.75% 1/4/09 |
Aaa |
EUR |
800,000 |
613,581 |
|
|
4.5% 3/15/02 |
Aaa |
EUR |
1,200,000 |
1,009,597 |
|
|
4.5% 5/17/02 |
Aaa |
EUR |
1,550,000 |
1,303,405 |
|
|
6.25% 1/4/30 |
Aaa |
EUR |
320,000 |
296,686 |
|
|
7.375% 1/3/05 |
Aaa |
EUR |
1,225,000 |
1,123,274 |
|
|
Treuhandanstalt: |
|
|
|
|
|
|
6.625% 7/9/03 |
Aaa |
EUR |
877,507 |
770,897 |
|
|
7.5% 9/9/04 |
Aaa |
EUR |
500,000 |
457,715 |
|
|
TOTAL GERMANY |
5,575,155 |
||||
|
Italy - 1.0% |
|||||
|
Italian Republic: |
|
|
|
|
|
|
6.75% 2/1/07 |
Aa3 |
EUR |
700,000 |
635,751 |
|
|
10.5% 9/1/05 |
Aa3 |
EUR |
361,519 |
372,034 |
|
|
TOTAL ITALY |
1,007,785 |
||||
|
Spain - 0.8% |
|||||
|
Spanish Kingdom 4.5% 7/30/04 |
Aa2 |
EUR |
1,000,000 |
826,222 |
|
|
United Kingdom - 4.3% |
|||||
|
United Kingdom, Great Britain & Northern Ireland: |
|
|
|
|
|
|
5% 6/7/04 |
Aaa |
GBP |
650,000 |
922,328 |
|
|
9% 10/13/08 |
Aaa |
GBP |
2,000,000 |
3,573,786 |
|
|
TOTAL UNITED KINGDOM |
4,496,114 |
||||
|
United States of America - 14.9% |
|||||
|
Federal Home Loan Bank: |
|
|
|
|
|
|
4.875% 1/22/02 |
Aaa |
|
1,500,000 |
1,471,635 |
|
|
|
|||||
|
Moody's Ratings (unaudited) |
Principal Amount (c) |
Value (Note 1) |
|||
|
5.125% 9/15/03 |
Aaa |
|
$ 1,495,000 |
$ 1,442,914 |
|
|
5.19% 10/20/03 |
Aaa |
|
650,000 |
626,438 |
|
|
5.28% 1/6/04 |
Aaa |
|
1,515,000 |
1,460,081 |
|
|
Freddie Mac 5.75% 7/15/03 |
Aaa |
|
1,480,000 |
1,454,840 |
|
|
U.S. Treasury Bonds: |
|
|
|
|
|
|
7.125% 2/15/23 |
Aaa |
|
1,350,000 |
1,536,044 |
|
|
8% 11/15/21 |
Aaa |
|
1,700,000 |
2,101,098 |
|
|
8.125% 8/15/19 |
Aaa |
|
1,300,000 |
1,606,306 |
|
|
12.75% 11/15/10 (callable) |
Aaa |
|
880,000 |
1,133,546 |
|
|
13.875% 5/15/11 (callable) |
Aaa |
|
980,000 |
1,337,857 |
|
|
U.S. Treasury Notes: |
|
|
|
|
|
|
5.5% 1/31/03 |
Aaa |
|
640,000 |
634,099 |
|
|
6.5% 10/15/06 |
Aaa |
|
400,000 |
412,436 |
|
|
7% 7/15/06 |
Aaa |
|
425,000 |
448,020 |
|
|
TOTAL UNITED STATES OF AMERICA |
15,665,314 |
||||
|
TOTAL GOVERNMENT OBLIGATIONS (Cost $33,407,609) |
29,457,557 |
||||
|
Cash Equivalents - 6.8% |
|||
|
Shares |
|
||
|
Fidelity Cash Central Fund, 6.61% (b) |
7,150,069 |
7,150,069 |
|
|
Fidelity Securities Lending Cash Central Fund, 6.66% (b) |
26,709 |
26,709 |
|
|
TOTAL CASH EQUIVALENTS (Cost $7,176,778) |
7,176,778 |
||
|
TOTAL INVESTMENT PORTFOLIO - 99.2% (Cost $96,562,482) |
104,015,719 |
||
|
NET OTHER ASSETS - 0.8% |
804,372 |
||
|
NET ASSETS - 100% |
$ 104,820,091 |
||
|
Security Type Abbreviations |
||
|
STRYPES |
- |
Structured Yield Product Exchangeable |
|
Currency Abbreviations |
||
|
AUD |
- |
Australian dollar |
|
EUR |
- |
European Monetary Unit |
|
GBP |
- |
British pound |
|
Legend |
|
(a) Non-income producing |
|
(b) The rate quoted is the annualized seven-day yield of the fund at period end. A complete listing of the fund's holdings as of its most recent fiscal year end is available upon request. |
|
(c) Principal amount is stated in United States dollars unless otherwise noted. |
|
(d) Security exempt from registration under Rule 144A of the Securities Act |
|
(e) Purchased on an installment basis. Market value reflects only those payments made through October 31, 2000. The remaining installments aggregating AUD 17,690 are due November 2, 2000. |
|
(f) For foreign government obligations not individually rated by S&P |
|
Other Information |
|
Purchases and sales of securities, other than short-term securities, |
|
The fund placed a portion of its portfolio transactions with brokerage firms which are affiliates of Fidelity Management & Research Company. The commissions paid to these affiliated firms were $1,124 for the period. |
|
The fund participated in the security lending program. At period end, the value of securities loaned amounted to $24,643. The fund received cash collateral of $26,709 which was invested in cash equivalents. |
|
The composition of long-term debt holdings as a percentage of total value of investments in securities, is as follows (ratings are unaudited): |
|
Moody's Ratings |
S&P Ratings |
|||
|
Aaa, Aa, A |
28.3% |
|
AAA, AA, A |
24.1% |
|
Baa |
0.0% |
|
BBB |
0.0% |
|
Ba |
0.0% |
|
BB |
0.0% |
|
B |
0.0% |
|
B |
0.0% |
|
Caa |
0.0% |
|
CCC |
0.0% |
|
Ca, C |
0.0% |
|
CC, C |
0.0% |
|
|
|
|
D |
0.0% |
|
Income Tax Information |
|
At October 31, 2000, the aggregate cost of investment securities for income tax purposes was $96,699,139. Net unrealized appreciation aggregated $7,316,580, of which $15,673,233 related to appreciated investment securities and $8,356,653 related to depreciated investment securities. |
|
The fund hereby designates approximately $1,904,000 as a capital gain dividend for the purpose of the dividend paid deduction. |
See accompanying notes which are an integral part of the financial statements.
Annual Report
Global Balanced
Statement of Assets and Liabilities
|
|
October 31, 2000 |
|
|
Assets |
|
|
|
Investment in securities, at value |
|
$ 104,015,719 |
|
Foreign currency held at value |
|
83,786 |
|
Receivable for investments sold |
|
956,868 |
|
Receivable for fund shares sold |
|
105,216 |
|
Dividends receivable |
|
95,625 |
|
Interest receivable |
|
634,625 |
|
Other receivables |
|
815 |
|
Total assets |
|
105,892,654 |
|
Liabilities |
|
|
|
Payable for investments purchased |
$ 818,831 |
|
|
Payable for fund shares redeemed |
65,020 |
|
|
Accrued management fee |
63,330 |
|
|
Other payables and |
98,673 |
|
|
Collateral on securities loaned, |
26,709 |
|
|
Total liabilities |
|
1,072,563 |
|
Net Assets |
|
$ 104,820,091 |
|
Net Assets consist of: |
|
|
|
Paid in capital |
|
$ 88,741,140 |
|
Undistributed net investment income |
|
1,149,212 |
|
Accumulated undistributed net realized gain (loss) on investments and foreign currency transactions |
|
7,483,063 |
|
Net unrealized appreciation (depreciation) on investments |
|
7,446,676 |
|
Net Assets, for 5,486,881 |
|
$ 104,820,091 |
|
Net Asset Value, offering price |
|
$19.10 |
Statement of Operations
|
|
Year ended October 31, 2000 |
|
|
Investment Income Dividends |
|
$ 768,099 |
|
Special dividend from BCE, Inc. |
|
206,945 |
|
Interest |
|
2,403,620 |
|
Security lending |
|
1,218 |
|
|
|
3,379,882 |
|
Less foreign taxes withheld |
|
(64,905) |
|
Total income |
|
3,314,977 |
|
Expenses |
|
|
|
Management fee |
$ 788,156 |
|
|
Transfer agent fees |
273,375 |
|
|
Accounting and security lending fees |
66,171 |
|
|
Non-interested trustees' compensation |
458 |
|
|
Custodian fees and expenses |
132,142 |
|
|
Registration fees |
36,521 |
|
|
Audit |
59,285 |
|
|
Legal |
3,152 |
|
|
Miscellaneous |
5,076 |
|
|
Total expenses before reductions |
1,364,336 |
|
|
Expense reductions |
(10,378) |
1,353,958 |
|
Net investment income |
|
1,961,019 |
|
Realized and Unrealized Gain (Loss) Net realized gain (loss) on: |
|
|
|
Investment securities |
7,514,054 |
|
|
Foreign currency transactions |
(88,402) |
7,425,652 |
|
Change in net unrealized appreciation (depreciation) on: |
|
|
|
Investment securities |
(5,198,528) |
|
|
Assets and liabilities in |
(6,243) |
(5,204,771) |
|
Net gain (loss) |
|
2,220,881 |
|
Net increase (decrease) in net assets resulting from operations |
|
$ 4,181,900 |
|
Other Information |
|
|
|
Expense reductions |
|
|
|
Directed brokerage arrangements |
|
$ 6,792 |
|
Transfer agent credits |
|
3,586 |
|
|
|
$ 10,378 |
See accompanying notes which are an integral part of the financial statements.
Annual Report
Global Balanced
Financial Statements - continued
Statement of Changes in Net Assets
|
Increase (Decrease) in Net Assets |
Year ended
October 31, |
Three months |
Year ended |
|
Operations |
$ 1,961,019 |
$ 451,563 |
$ 1,727,776 |
|
Net realized gain (loss) |
7,425,652 |
3,699,763 |
4,660,042 |
|
Change in net unrealized appreciation (depreciation) |
(5,204,771) |
403,420 |
2,979,683 |
|
Net increase (decrease) in net assets resulting from operations |
4,181,900 |
4,554,746 |
9,367,501 |
|
Distributions to shareholders |
(772,133) |
(973,940) |
(1,574,612) |
|
From net realized gain |
(1,286,888) |
- |
- |
|
Total distributions |
(2,059,021) |
(973,940) |
(1,574,612) |
|
Share transactions |
49,159,358 |
12,762,394 |
45,697,691 |
|
Reinvestment of distributions |
1,935,066 |
910,684 |
1,484,276 |
|
Cost of shares redeemed |
(45,867,790) |
(21,541,440) |
(48,179,432) |
|
Net increase (decrease) in net assets resulting from share transactions |
5,226,634 |
(7,868,362) |
(997,465) |
|
Redemption fees |
2,197 |
- |
- |
|
Total increase (decrease) in net assets |
7,351,710 |
(4,287,556) |
6,795,424 |
|
Net Assets |
|
|
|
|
Beginning of period |
97,468,381 |
101,755,937 |
94,960,513 |
|
End of period (including undistributed net investment income of $1,149,212, $403,390, and $989,733, respectively) |
$ 104,820,091 |
$ 97,468,381 |
$ 101,755,937 |
|
Other Information |
|
|
|
|
Sold |
2,485,806 |
703,403 |
2,735,365 |
|
Issued in reinvestment of distributions |
101,685 |
49,710 |
95,920 |
|
Redeemed |
(2,321,324) |
(1,180,075) |
(2,898,880) |
|
Net increase (decrease) |
266,167 |
(426,962) |
(67,595) |
Financial Highlights
|
|
Year ended |
Three months
ended |
Years ended July 31, |
|||
|
|
2000 |
1999 |
1999 |
1998 |
1997 |
1996 |
|
Selected Per-Share Data |
|
|
|
|
|
|
|
Net asset value, beginning of period |
$ 18.67 |
$ 18.02 |
$ 16.62 |
$ 15.45 |
$ 12.91 |
$ 12.40 |
|
Income from Investment Operations |
|
|
|
|
|
|
|
Net investment income |
.36 D, F |
.08 D |
.31 D |
.30 D |
.31 D |
.31 |
|
Net realized and unrealized gain (loss) |
.47 |
.74 |
1.37 |
1.27 |
2.68 |
.25 |
|
Total from investment operations |
.83 |
.82 |
1.68 |
1.57 |
2.99 |
.56 |
|
Less Distributions |
|
|
|
|
|
|
|
From net investment income |
(.15) |
(.17) |
(.28) |
(.40) |
(.45) |
(.05) |
|
From net realized gain |
(.25) |
- |
- |
- |
- |
- |
|
Total distributions |
(.40) |
(.17) |
(.28) |
(.40) |
(.45) |
(.05) |
|
Net asset value, end of period |
$ 19.10 |
$ 18.67 |
$ 18.02 |
$ 16.62 |
$ 15.45 |
$ 12.91 |
|
Total Return B, C |
4.45% |
4.57% |
10.39% |
10.53% |
23.93% |
4.52% |
|
Ratios and Supplemental Data |
|
|
|
|
|
|
|
Net assets, end of period (000 omitted) |
$ 104,820 |
$ 97,468 |
$ 101,756 |
$ 94,961 |
$ 74,619 |
$ 87,785 |
|
Ratio of expenses to average net assets |
1.26% |
1.20% A |
1.32% |
1.39% |
1.51% |
1.39% |
|
Ratio of expenses to average net assets after |
1.25% E |
1.19% A, E |
1.30% E |
1.37% E |
1.49% E |
1.36% E |
|
Ratio of net investment income to average net assets |
1.81% |
1.74% A |
1.83% |
1.95% |
2.28% |
2.94% |
|
Portfolio turnover rate |
62% |
80% A |
100% |
81% |
57% |
189% |
|
A Annualized B Total returns for periods of less than one year are not annualized. C The total returns would have been lower had certain expenses not been reduced during the periods shown. D Net investment income (loss) per share has been calculated based on average shares outstanding during the period. E FMR or the fund has entered into varying arrangements with third parties who either paid or reduced a portion of the fund's expenses. F Investment income per share reflects a special dividend (from BCE, Inc.) which amounted to $.04 per share. |
See accompanying notes which are an integral part of the financial statements.
Annual Report
There are several ways to evaluate a fund's historical performance. You can look at the total percentage change in value, the average annual percentage change or the growth of a hypothetical $10,000 investment. Total return reflects the change in the value of an investment, assuming reinvestment of the fund's dividend income and capital gains (the profits earned upon the sale of securities that have grown in value).
Cumulative Total Returns
|
Periods ended October 31, 2000 |
Past 1 |
Past 5 |
Past 10 |
|
Fidelity Intl Growth & Income |
9.57% |
88.34% |
172.70% |
|
MSCI EAFE |
-2.72% |
52.63% |
113.59% |
|
International Funds Average |
2.70% |
62.88% |
149.02% |
Cumulative total returns show the fund's performance in percentage terms over a set period - in this case, one year, five years or 10 years. For example, if you had invested $1,000 in a fund that had a 5% return over the past year, the value of your investment would be $1,050. You can compare the fund's returns to the performance of the Morgan Stanley Capital International Europe, Australasia and Far East (EAFE) Index - a market capitalization-weighted index that is designed to represent the performance of developed stock markets outside the United States and Canada. As of October 31, 2000, the index included over 841 equity securities of countries domiciled in 20 countries. To measure how the fund's performance stacked up against its peers, you can compare it to the international funds average, which reflects the performance of mutual funds with similar objectives tracked by Lipper Inc. The past one year average represents a peer group of 666 mutual funds. These benchmarks include reinvested dividends and capital gains, if any, and exclude the effect of sales charges.
Average Annual Total Returns
|
Periods ended October 31, 2000 |
Past 1 |
Past 5 |
Past 10 |
|
Fidelity Intl Growth & Income |
9.57% |
13.50% |
10.55% |
|
MSCI EAFE |
-2.72% |
8.82% |
7.88% |
|
International Funds Average |
2.70% |
9.93% |
9.30% |
Average annual total returns take the fund's cumulative return and show you what would have happened if the fund had performed at a constant rate each year.
$10,000 Over 10 Years

$10,000 Over 10 Years: Let's say hypothetically that $10,000 was invested in Fidelity International Growth & Income Fund on October 31, 1990. As the chart shows, by October 31, 2000, the value of the investment would have grown to $27,270 - a 172.70% increase on the initial investment. For comparison, look at how the Morgan Stanley Capital International EAFE Index did over the same period. With dividends and capital gains, if any, reinvested, the same $10,000 would have grown to $21,359 - a 113.59% increase.
Understanding Performance
Many markets around the globe offer the potential for significant growth over time; however, investing in foreign markets means assuming greater risks than investing in the United States. Factors like changes in a country's financial markets, its local political and economic climate, and the fluctuating value of its currency create these risks. For these reasons an international fund's performance may be more volatile than a fund that invests exclusively in the United States. Past performance is no guarantee of future results and you may have a gain or loss when you sell your shares.
3Annual Report
(Portfolio Manager photograph)
An interview with Bill Bower, Portfolio Manager of Fidelity International Growth & Income Fund
Q. How did the fund perform, Bill?
A. It did well relative to its benchmark index and its peers. For the 12-month period that ended October 31, 2000, the fund posted a total return of 9.57%. This compares with a return of -2.72% for the Morgan Stanley Capital International (MSCI) Europe, Australasia and Far East (EAFE) Index and a return of 2.70% for the international funds average, as tracked by Lipper Inc.
Q. What factors helped the fund outperform both its benchmark index and its peer group?
A. It was a downward trending market for virtually the entire second half of the period, which detracted from overall performance on an absolute basis. Yet, on a relative basis, the fund was able to beat the benchmark index and the peer group average, mainly as a result of favorable stock picking. For example, I found good performance from some holdings in the industrial components sector, particularly those whose businesses were aligned with the growing global demand for increased telecommunications bandwidth. The fund also was helped by selective stock picks in the financial services sector and by strength in the shipping sector, which benefited from growing worldwide demand for oil and an undersupply of shipping capacity. Positive performance also was aided by the fund's underweighted position in the telecommunications sector, which helped protect the fund from the full effect of the market sell-off that began in the late spring. On the negative side, the fund was hurt by poorer-than-expected performance in the electrical components sector - especially among manufacturers of dynamic random access memory (DRAM), whose earnings suffered as a result of lower than expected personal computer sales. Performance also was hurt by not owning enough in the pharmaceuticals sector, which generally performed quite well. But the biggest drag on overall performance came from some of the big positive contributors of the recent past - many of them in the technology and the business and public services sectors - which were underperformers during the market's sell-off beginning late last spring.
Q. What strategy adjustments did you make to accommodate this changing market environment?
A. I made some adjustments to make the fund a bit more defensive against a downward trending market. Back in June, when I visited a number of electronic component manufacturers in Japan - companies making parts for handsets and PCs - it became apparent that their businesses had slowed. On that trip, I dramatically cut the fund's exposure to Japanese electronic component makers and got a lot of money off the table before the industry slowed significantly. I didn't do much to the fund's already underweighted position in the telecommunications sector, but I did eliminate some positions in technology-related and software companies. I also began looking more closely at mid-sized European pharmaceutical companies whose valuations seemed reasonable, and I picked up positions in the financial services sector, including some strong-performing financial services companies. There was no significant change in the fund's geographical distribution, although my concentration in Japan came down a bit as I pared exposure to electronic components; it also came down in the U.K. where I sold some oil company positions.
Q. Which individual stocks did the most to help overall fund performance?
A. The biggest contribution came from Furukawa Electric, which was the fund's largest holding at the end of the period. Furukawa makes optical components for the telecommunications industry and has been beating earnings estimates handily based on strong demand for increased bandwidth, especially in the U.S. Although I was generally underweighted in traditional banking companies in Europe, I found strength in a number of other financial services companies there. Among them were three asset managers - Amvescap in the U.K. and two Swiss money managers, Bank Sarasin and Julius Baer. All three stocks showed great performance based on robust cash inflows, strong fund performance and better-than-expected earnings. Van der Moolen, a Dutch equity market maker with seats on the New York Stock Exchange and major European exchanges, was an attractively priced stock that also performed well during the period. Another stock I should mention is Vivendi Environment, which was sold in an initial public offering by its parent company, Vivendi, S.A., in an effort to raise capital for its acquisition of Seagram. The IPO of Vivendi Environment was overlooked by many because investors were discouraged by recent corporate actions of the parent company. Still, I liked the fundamentals and bought a sizable position in this water services and waste management company in the offering. Later, when investors started looking for more defensive positions, Vivendi Environment was one of the places they came. The stock price subsequently appreciated by more than 25%.
Q. Which holdings were disappointments?
A. I mentioned earlier the poorer-than-expected results from DRAM manufacturers. Two companies that I owned in this sector were particularly hard hit - Samsung Electronics and Hyundai Electronics - both of them South Korean companies that overestimated demand for PCs and saw their pricing collapse in the late summer when PC demand slackened. There also were a number of companies in various other industry sectors that missed earnings estimates and were subsequently punished by the unforgiving markets. Two names that come to mind are ComputaCenter and Exact Holdings in the technology and software areas, respectively. I sold both of these positions during the period.
Annual Report
International Growth & Income
Fund Talk: The Manager's Overview - continued
Q. What's your near-term outlook, Bill? How will you approach managing the fund over the next six months?
A. My feeling is that the market's extreme pessimism is creating some excellent buying opportunities. I also believe that when we talk six to 12 months from now - after the election and assuming that interest rates start to ease off - stocks may well be higher. Meantime, since the fund is invested in equities, that's where I'll look for value. What I'm doing now is really focusing on good company names that I believe will continue to show growth. But I'm also very cognizant of valuations: There are some incredibly low-priced stocks out there. So I may start coming back to some of the technology-related names where valuations have fallen a great deal or it could be in another sector that's been sold off. The bottom line is that I'm looking to buy growth at a reasonable price, and wherever I can find it, that's where I'll go. The market has broadened out from where it has been. It's looking for new leadership, and I believe it's possible to make money in sectors that the markets have been ignoring of late.
The views expressed in this report reflect those of the portfolio manager only through the end of the period of the report as stated on the cover and do not necessarily represent the views of Fidelity or any other person in the Fidelity organization. Any such views are subject to change at any time based upon market or other conditions and Fidelity disclaims any responsibility to update such views. These views may not be relied on as investment advice and, because investment decisions for a Fidelity fund are based on numerous factors, may not be relied on as an indication of trading intent on behalf of any Fidelity fund.
Fund Facts
Goal: growth of capital and current income by investing mainly in foreign stocks
Fund number: 305
Trading symbol: FIGRX
Start date: December 31, 1986
Size: as of October 31, 2000, more than $1.2 billion
Manager: Bill Bower, since 1998; international equity analyst, 1996-1998; manager, Fidelity Select Construction & Housing Portfolio, 1994-1996; joined Fidelity in 1994
3Bill Bower comments on seeking out long-term value in a turbulent market environment:
"It's said that when you are being mauled by a bear, the best thing to do is play dead and hope for the best. And just like I can't overpower or outrun a bear, I can't totally sidestep a financial market correction. My job is to be fully invested in equities and outperform the MSCI EAFE index. I constantly monitor the risk and reward of the fund's underlying equities so that if a correction occurs, I can still position the fund to perform relatively well versus the index. But the fund can't sidestep a market sell-off entirely unless I take greater risk - like trying to time the market - and that's not the way we manage money at Fidelity.
"During the markets' recent sell-off, some of the corrections in various names were so fast and furious, it became almost a panic situation. It was a real test of one's mettle not to get caught up in this frenzy, and I tried to be very careful not to overreact to the volatility because it's very easy to make bad, emotionally based investment decisions in this kind of environment, particularly on the sell-side.
"So what I've been trying to do is to step back and take the longer-term view. I try to assess which of the fund's individual holdings I think will be good names to own over the next 12 to 18 months, and for those stories that I like over the longer term, I'm likely to add to the names where I have a great deal of confidence in their fundamentals. On the other hand, in cases where I think a particular stock's story is done - where the valuation didn't make sense or where I don't see an upside even in the long term - then I'm very likely to exit that name.
"I try not to make dramatic restructuring moves in the portfolio because the liquidity and volatility in the equity markets right now is just too extreme. If all goes well, I expect to have a great deal less of the fund's assets invested in cash at the bottom of the market correction than it had at the start of it."
Annual Report
International Growth & Income
|
Geographic Diversification (% of fund's net assets) |
|||
|
As of October 31, 2000 |
|||
|
Japan |
20.0% |
|
|
United Kingdom |
13.9% |
|
|
United States of America |
10.7% |
|
|
France |
9.3% |
|
|
Netherlands |
7.8% |
|
|
Switzerland |
6.9% |
|
|
Canada |
4.0% |
|
|
Germany |
3.6% |
|
|
Spain |
2.9% |
|
|
Other |
20.9% |
|

|
|
|||
|
As of April 30, 2000 |
|||
|
Japan |
21.6% |
|
|
United Kingdom |
15.9% |
|
|
United States of America |
9.8% |
|
|
France |
9.1% |
|
|
Netherlands |
5.9% |
|
|
Germany |
5.3% |
|
|
Sweden |
4.5% |
|
|
Switzerland |
3.9% |
|
|
Finland |
3.0% |
|
|
Other |
21.0% |
|

|
Percentages are adjusted for the effect of futures contracts, if applicable. |
|
Asset Allocation |
||
|
|
% of fund's |
% of fund's net assets |
|
Stocks |
94.7 |
92.9 |
|
Bonds |
0.3 |
0.3 |
|
Short-Term Investments |
5.0 |
6.8 |
|
Top Ten Stocks as of October 31, 2000 |
||
|
|
% of fund's |
% of fund's net assets |
|
Furukawa Electric Co. Ltd. (Japan, Electrical Equipment) |
3.9 |
1.9 |
|
Vodafone Group PLC |
2.4 |
3.6 |
|
TotalFinaElf SA |
2.3 |
2.4 |
|
Nippon Telegraph & Telephone Corp. (Japan, Telephone Services) |
1.7 |
0.0 |
|
Shell Transport & Trading Co. PLC (Reg.) (United Kingdom, |
1.6 |
1.0 |
|
Nokia AB (Finland, Communications Equipment) |
1.4 |
3.0 |
|
Sony Corp. (Japan, Consumer Electronics) |
1.4 |
0.4 |
|
ING Groep NV (Certificaten |
1.3 |
0.9 |
|
Vivendi SA (France, Water) |
1.3 |
1.2 |
|
Nestle SA (Reg.) |
1.2 |
0.9 |
|
|
18.5 |
15.3 |
|
Top Ten Market Sectors as of October 31, 2000 |
||
|
|
% of fund's |
% of fund's net assets |
|
Finance |
20.4 |
12.9 |
|
Technology |
11.6 |
22.8 |
|
Utilities |
11.0 |
16.2 |
|
Industrial Machinery & Equipment |
9.8 |
7.7 |
|
Health |
8.9 |
6.2 |
|
Energy |
7.2 |
5.1 |
|
Media & Leisure |
6.0 |
7.4 |
|
Durables |
5.9 |
3.8 |
|
Nondurables |
3.3 |
1.7 |
|
Retail & Wholesale |
3.2 |
2.5 |
Annual Report
International Growth & Income
Showing Percentage of Net Assets
|
Common Stocks - 94.5% |
|||
|
Shares |
Value (Note 1) |
||
|
Australia - 1.0% |
|||
|
Cochlear Ltd. |
100,000 |
$ 1,409,607 |
|
|
News Corp. Ltd. sponsored ADR |
177,500 |
7,632,500 |
|
|
Perpetual Trustees Australia Ltd. |
187,800 |
3,360,335 |
|
|
TOTAL AUSTRALIA |
12,402,442 |
||
|
Austria - 0.1% |
|||
|
Plaut AG |
100,000 |
1,867,360 |
|
|
Belgium - 0.3% |
|||
|
Telindus Group NV |
190,000 |
3,717,320 |
|
|
Brazil - 0.1% |
|||
|
Telesp Celular Participacoes SA ADR |
42,900 |
1,356,713 |
|
|
Canada - 4.0% |
|||
|
Alberta Energy Co. Ltd. |
97,700 |
3,609,606 |
|
|
BCE, Inc. |
143,900 |
3,875,140 |
|
|
Bracknell Corp. (a) |
583,800 |
3,987,862 |
|
|
C-Mac Industries, Inc. (a) |
45,300 |
2,558,818 |
|
|
Canadian Crude Separators, Inc. (a) |
329,800 |
1,104,749 |
|
|
Canadian Natural Resources Ltd. (a) |
132,900 |
3,928,079 |
|
|
Celestica, Inc. (sub. vtg.) (a) |
75,800 |
5,416,775 |
|
|
Cinar Films, Inc. Class B (ltd. vtg.) (a) |
304,400 |
989,300 |
|
|
Ensign Resource Service Group, Inc. |
210,200 |
5,660,558 |
|
|
Peak Energy Services Ltd. (a) |
1,000,000 |
1,642,036 |
|
|
Precision Drilling Corp. (a) |
137,700 |
3,938,808 |
|
|
Rio Alto Exploration Ltd. (a) |
209,400 |
3,562,207 |
|
|
Royal Bank of Canada |
73,400 |
2,328,552 |
|
|
Shaw Industries Ltd. Class A |
110,000 |
1,054,844 |
|
|
Talisman Energy, Inc. (a) |
122,900 |
3,870,644 |
|
|
Toronto Dominion Bank |
74,300 |
2,047,215 |
|
|
TOTAL CANADA |
49,575,193 |
||
|
Denmark - 1.0% |
|||
|
2M Invest AS (a) |
132,000 |
2,138,444 |
|
|
Coloplast AS (B Shares) |
56,300 |
2,505,006 |
|
|
Group 4 Falck AS |
14,000 |
1,709,021 |
|
|
Novo-Nordisk AS Series B (a) |
27,700 |
5,877,984 |
|
|
TOTAL DENMARK |
12,230,455 |
||
|
Finland - 2.0% |
|||
|
Nokia AB |
184,900 |
7,904,475 |
|
|
Nokia AB sponsored ADR |
232,000 |
9,918,000 |
|
|
Sonera Corp. |
56,000 |
1,233,951 |
|
|
TietoEnator Oyj (a) |
42,857 |
818,814 |
|
|
UPM-Kymmene Corp. |
175,000 |
4,953,809 |
|
|
TOTAL FINLAND |
24,829,049 |
||
|
France - 9.3% |
|||
|
Alcatel SA sponsored ADR |
99,000 |
6,175,125 |
|
|
AXA SA de CV |
76,200 |
10,089,855 |
|
|
BNP Paribas SA |
122,815 |
10,591,330 |
|
|
Castorama Dubois Investissements SA |
17,500 |
3,559,018 |
|
|
Elior SA (a) |
396,700 |
4,171,948 |
|
|
Integra SA (a) |
575,000 |
4,660,973 |
|
|
|
|||
|
Shares |
Value (Note 1) |
||
|
NRJ Group (a) |
108,035 |
$ 3,576,304 |
|
|
Riber SA (c) |
116,000 |
2,479,243 |
|
|
Sanofi-Synthelabo SA |
129,600 |
6,820,278 |
|
|
Suez Lyonnaise des Eaux (France) |
26,100 |
3,983,232 |
|
|
Television Francaise 1 SA (a) |
75,840 |
4,139,183 |
|
|
TotalFinaElf SA: |
|
|
|
|
Class B |
168,244 |
24,100,953 |
|
|
sponsored ADR |
68,400 |
4,899,150 |
|
|
Vivendi Environment (a) |
310,000 |
11,577,632 |
|
|
Vivendi SA |
217,454 |
15,633,499 |
|
|
TOTAL FRANCE |
116,457,723 |
||
|
Germany - 3.1% |
|||
|
Aachener & Muenchener |
26,100 |
2,348,290 |
|
|
Altana AG |
67,000 |
8,070,934 |
|
|
Consors Discount Broker AG (a) |
20,000 |
1,646,672 |
|
|
Deutsche Bank AG |
116,300 |
9,524,066 |
|
|
Hugo Boss AG |
19,690 |
4,178,218 |
|
|
Siemens AG |
88,400 |
11,258,840 |
|
|
Software AG |
19,000 |
1,361,136 |
|
|
United Internet AG (a) |
70,823 |
455,668 |
|
|
Wella AG |
10,000 |
380,262 |
|
|
TOTAL GERMANY |
39,224,086 |
||
|
Hong Kong - 2.8% |
|||
|
Cheung Kong Holdings Ltd. |
274,000 |
3,030,604 |
|
|
China Mobile (Hong Kong) Ltd. sponsored ADR (a) |
187,700 |
5,748,313 |
|
|
Hutchison Whampoa Ltd. |
595,100 |
7,383,469 |
|
|
Johnson Electric Holdings Ltd. |
3,702,400 |
7,359,268 |
|
|
Legend Holdings Ltd. |
5,000,000 |
4,231,881 |
|
|
Li & Fung Ltd. |
2,640,000 |
4,908,982 |
|
|
Peak International Ltd. (a) |
17,500 |
134,531 |
|
|
Yue Yuen Industrial Holdings Ltd. |
1,224,000 |
2,268,135 |
|
|
TOTAL HONG KONG |
35,065,183 |
||
|
India - 0.3% |
|||
|
Dr. Reddy's Laboratories Ltd. |
33,800 |
1,011,511 |
|
|
Hughes Software Systems Ltd. |
51,000 |
1,152,658 |
|
|
Infosys Technologies Ltd. |
7,400 |
1,132,534 |
|
|
TOTAL INDIA |
3,296,703 |
||
|
Ireland - 1.0% |
|||
|
Bank of Ireland, Inc. |
819,300 |
6,314,430 |
|
|
Elan Corp. PLC sponsored ADR (a) |
113,600 |
5,900,100 |
|
|
TOTAL IRELAND |
12,214,530 |
||
|
Israel - 0.6% |
|||
|
Check Point Software |
35,000 |
5,543,125 |
|
|
Teva Pharmaceutical Industries Ltd. ADR |
42,800 |
2,530,550 |
|
|
TOTAL ISRAEL |
8,073,675 |
||
|
Common Stocks - continued |
|||
|
Shares |
Value (Note 1) |
||
|
Italy - 2.4% |
|||
|
Luxottica Group Spa sponsored ADR |
475,000 |
$ 6,857,813 |
|
|
Olivetti Spa |
4,050,116 |
12,327,730 |
|
|
Parmalat Finanziaria Spa |
1,099,200 |
1,589,834 |
|
|
San Paolo IMI Spa |
178,300 |
2,871,848 |
|
|
Telecom Italia Mobile Spa |
418,800 |
3,563,661 |
|
|
Unicredito Italiano Spa |
566,500 |
2,894,207 |
|
|
TOTAL ITALY |
30,105,093 |
||
|
Japan - 20.0% |
|||
|
Aeon Credit Service Ltd. |
97,700 |
5,480,011 |
|
|
Canon, Inc. |
154,000 |
6,246,625 |
|
|
Crosswave Communications, Inc. ADR (a) |
153,000 |
1,415,250 |
|
|
Daiwa Securities Group, Inc. |
975,000 |
10,803,547 |
|
|
Dentsu Tec, Inc. |
13,500 |
1,163,046 |
|
|
Fujitsu Ltd. |
305,000 |
5,434,149 |
|
|
Furukawa Electric Co. Ltd. |
1,854,000 |
48,767,116 |
|
|
Hitachi Chemical Co. Ltd. |
136,000 |
3,415,269 |
|
|
Hitachi Zosen Corp. (a) |
3,000,000 |
2,282,101 |
|
|
Hoya Corp. |
59,000 |
4,877,463 |
|
|
JAFCO Co. Ltd. |
8,000 |
850,518 |
|
|
Japan Medical Dynamic Marketing, Inc. |
21,200 |
701,421 |
|
|
Kappa Create Co. Ltd. |
48,000 |
1,561,727 |
|
|
Mitsui Engineering & |
3,000,000 |
3,051,966 |
|
|
Mitsumi Electric Co. Ltd. |
57,000 |
1,880,671 |
|
|
NEC Corp. |
419,000 |
7,987,536 |
|
|
Nichicon Corp. |
235,000 |
4,197,736 |
|
|
Nikko Securities Co. Ltd. |
1,239,000 |
10,696,893 |
|
|
Nippon Telegraph & Telephone Corp. |
2,297 |
20,904,785 |
|
|
Nomura Securities Co. Ltd. |
526,000 |
11,160,206 |
|
|
Omron Corp. |
327,000 |
8,061,864 |
|
|
ORIX Corp. |
31,300 |
3,284,621 |
|
|
Sanyo Electric Co. Ltd. |
917,000 |
6,975,621 |
|
|
Secom Co. Ltd. |
46,000 |
3,279,993 |
|
|
SKY Perfect Communications, Inc. (a) |
111 |
204,482 |
|
|
Skylark Co. Ltd. |
53,000 |
1,870,131 |
|
|
Softbank Corp. |
25,000 |
1,500,779 |
|
|
Sony Corp. |
210,000 |
17,430,000 |
|
|
Takeda Chemical Industries Ltd. |
200,000 |
13,179,361 |
|
|
Tokai Corp. |
300,000 |
1,990,652 |
|
|
Toko, Inc. |
700,000 |
3,656,860 |
|
|
Tokyo Broadcasting System, Inc. |
95,000 |
3,717,808 |
|
|
Tokyo Seimitsu Co. Ltd. |
21,500 |
1,517,276 |
|
|
Tokyo Tomin Bank Ltd. |
200,000 |
5,590,688 |
|
|
Toshiba Corp. |
791,000 |
5,654,661 |
|
|
Toyoda Gosei Co. Ltd. |
82,000 |
5,020,255 |
|
|
Toyota Motor Corp. |
144,000 |
5,754,193 |
|
|
Union Tool Co. (a) |
25,000 |
1,718,449 |
|
|
Yakult Honsha Co. Ltd. |
161,000 |
1,835,615 |
|
|
Yamada Denki Co. Ltd. |
30,000 |
2,639,538 |
|
|
Yokogawa Electric Corp. |
397,000 |
3,114,582 |
|
|
TOTAL JAPAN |
250,875,465 |
||
|
|
|||
|
Shares |
Value (Note 1) |
||
|
Korea (South) - 0.5% |
|||
|
Hyundai Electronics Industries Co. Ltd. (a) |
361,100 |
$ 2,218,980 |
|
|
Samsung Electronics Co. Ltd. |
32,727 |
4,099,866 |
|
|
TOTAL KOREA (SOUTH) |
6,318,846 |
||
|
Luxembourg - 0.8% |
|||
|
RTL Group |
20,725 |
1,794,321 |
|
|
Societe Europeen Des Satellite unit |
14,000 |
1,865,662 |
|
|
Stolt Offshore SA (a) |
496,770 |
5,930,192 |
|
|
TOTAL LUXEMBOURG |
9,590,175 |
||
|
Marshall Islands - 0.3% |
|||
|
Teekay Shipping Corp. |
107,900 |
4,032,763 |
|
|
Mexico - 2.3% |
|||
|
Grupo Radio Centro SA de CV sponsored ADR |
297,600 |
2,845,800 |
|
|
Grupo Televisa SA de CV |
74,200 |
4,016,075 |
|
|
Telefonos de Mexico SA de CV Series L sponsored ADR |
135,000 |
7,281,563 |
|
|
Tubos de Acero de Mexico SA |
100,000 |
1,521,000 |
|
|
TV Azteca SA de CV sponsored ADR |
1,009,900 |
12,623,750 |
|
|
TOTAL MEXICO |
28,288,188 |
||
|
Netherlands - 7.8% |
|||
|
ABN AMRO Holding NV |
200,900 |
4,655,303 |
|
|
Akzo Nobel NV |
111,500 |
5,077,500 |
|
|
Draka Holding NV |
120,919 |
7,076,755 |
|
|
Fugro NV |
60,300 |
3,554,634 |
|
|
Gucci Group NV (NY Shares) |
50,000 |
4,887,500 |
|
|
Hunter Douglas NV |
100,000 |
2,868,944 |
|
|
ICT Automatisering NV |
26,200 |
967,377 |
|
|
ING Groep NV (Certificaten |
234,222 |
16,087,514 |
|
|
Koninklijke Ahold NV |
464,527 |
13,496,564 |
|
|
Koninklijke Philips Electronics NV sponsored ADR New |
314,595 |
12,564,138 |
|
|
Numico NV |
111,000 |
5,191,346 |
|
|
Nutreco Holding NV |
118,800 |
5,122,542 |
|
|
Unit 4 NV (a) |
100,300 |
4,129,030 |
|
|
United Pan-Europe Communications NV Class A (a) |
34,900 |
611,717 |
|
|
Van der Moolen Holding NV |
100,000 |
8,084,820 |
|
|
VNU NV |
62,700 |
2,972,324 |
|
|
TOTAL NETHERLANDS |
97,348,008 |
||
|
Norway - 1.3% |
|||
|
DNB Holding ASA |
1,014,700 |
4,400,819 |
|
|
Eltek ASA |
62,600 |
2,351,205 |
|
|
Frontline Ltd. (a) |
381,900 |
6,288,280 |
|
|
Opticom ASA (a) |
9,400 |
1,596,341 |
|
|
VMETRO ASA |
137,200 |
1,594,662 |
|
|
TOTAL NORWAY |
16,231,307 |
||
|
Common Stocks - continued |
|||
|
Shares |
Value (Note 1) |
||
|
Singapore - 0.9% |
|||
|
Chartered Semiconductor |
60,000 |
$ 2,790,000 |
|
|
Datacraft Asia Ltd. |
462,000 |
3,164,700 |
|
|
Oversea-Chinese Banking Corp. Ltd. |
136,500 |
871,359 |
|
|
Overseas Union Bank Ltd. |
494,959 |
2,397,920 |
|
|
United Overseas Bank Ltd. |
285,168 |
2,112,958 |
|
|
TOTAL SINGAPORE |
11,336,937 |
||
|
South Africa - 0.5% |
|||
|
Impala Platinum Holdings Ltd. |
135,500 |
5,807,143 |
|
|
Spain - 2.9% |
|||
|
Banco Santander Central Hispano SA |
866,560 |
8,399,823 |
|
|
Cortefiel SA |
392,900 |
7,053,388 |
|
|
NH Hoteles SA |
204,750 |
2,311,431 |
|
|
Telefonica SA (a) |
587,812 |
11,211,066 |
|
|
Telefonica SA sponsored ADR |
103,265 |
5,982,916 |
|
|
Transportes Azkar SA |
331,248 |
2,024,376 |
|
|
TOTAL SPAIN |
36,983,000 |
||
|
Sweden - 2.0% |
|||
|
Adcore AB (a) |
409,500 |
1,683,550 |
|
|
Eniro AB (a) |
22,100 |
207,802 |
|
|
Nobel Biocare AB |
136,700 |
3,076,673 |
|
|
Securitas AB (B Shares) |
293,500 |
6,253,426 |
|
|
Svenska Handelsbanken AB (A Shares) |
211,600 |
3,323,117 |
|
|
Telefonaktiebolaget LM Ericsson |
480,600 |
6,668,325 |
|
|
TV 4 AB (A Shares) |
122,600 |
3,728,158 |
|
|
TOTAL SWEDEN |
24,941,051 |
||
|
Switzerland - 6.9% |
|||
|
Bank Sarasin & Compagnie |
2,281 |
7,360,111 |
|
|
Credit Suisse Group (Reg.) |
64,100 |
12,017,636 |
|
|
Julius Baer Holding AG |
1,236 |
6,119,833 |
|
|
Nestle SA (Reg.) |
7,276 |
15,078,220 |
|
|
Swiss Reinsurance Co. (Reg.) |
4,116 |
8,117,508 |
|
|
Tecan Group AG |
6,200 |
6,657,024 |
|
|
The Swatch Group AG: |
|
|
|
|
(Bearer) |
1,081 |
1,431,310 |
|
|
(Reg.) |
45,600 |
12,405,229 |
|
|
Valora Holding AG |
18,800 |
3,822,754 |
|
|
Zurich Financial Services Group AG |
27,471 |
13,296,117 |
|
|
TOTAL SWITZERLAND |
86,305,742 |
||
|
Taiwan - 0.7% |
|||
|
Taiwan Semiconductor |
2,163,960 |
6,565,575 |
|
|
United Microelectronics Corp. (a) |
1,361,200 |
2,402,118 |
|
|
TOTAL TAIWAN |
8,967,693 |
||
|
United Kingdom - 13.9% |
|||
|
Amvescap PLC |
460,800 |
10,287,535 |
|
|
|
|||
|
Shares |
Value (Note 1) |
||
|
Ashtead Group PLC |
1,727,100 |
$ 2,954,457 |
|
|
BBA Group PLC |
1,211,700 |
6,648,737 |
|
|
BP Amoco PLC |
1,430,174 |
12,141,588 |
|
|
British Telecommunications PLC |
480,000 |
5,711,997 |
|
|
Carlton Communications PLC |
698,500 |
5,620,016 |
|
|
Enterprise Inns PLC |
400,000 |
1,907,805 |
|
|
Geest PLC |
245,700 |
1,941,243 |
|
|
Glaxo Wellcome PLC |
221,200 |
6,435,538 |
|
|
Granada Compass PLC (a) |
309,351 |
2,663,889 |
|
|
Iceland Group PLC |
1,137,000 |
5,398,212 |
|
|
International Quantum Epitaxy PLC (a) |
200,000 |
1,185,855 |
|
|
Jazztel PLC sponsored ADR |
70,000 |
1,238,125 |
|
|
Lloyds TSB Group PLC |
933,000 |
9,495,042 |
|
|
Reuters Group PLC |
400,000 |
7,858,331 |
|
|
Royal & Sun Alliance Insurance |
769,300 |
5,470,322 |
|
|
Royal Bank of Scotland Group PLC |
620,550 |
13,916,987 |
|
|
Safeway PLC |
314,100 |
1,304,580 |
|
|
Scottish Radio Holdings PLC |
200,000 |
3,580,759 |
|
|
Shell Transport & Trading Co. PLC (Reg.) |
2,380,500 |
19,515,156 |
|
|
SmithKline Beecham PLC |
472,300 |
6,157,611 |
|
|
SSL International PLC |
661,900 |
7,700,440 |
|
|
United News & Media PLC |
137,200 |
1,715,502 |
|
|
Vodafone Group PLC |
7,063,181 |
30,062,641 |
|
|
Williams PLC Class L |
801,100 |
3,832,470 |
|
|
TOTAL UNITED KINGDOM |
174,744,838 |
||
|
United States of America - 5.7% |
|||
|
AES Corp. (a) |
100,000 |
5,650,000 |
|
|
AFLAC, Inc. |
140,900 |
10,294,506 |
|
|
Armstrong Holdings, Inc. |
100,000 |
287,500 |
|
|
Avon Products, Inc. |
75,000 |
3,637,500 |
|
|
Bristol-Myers Squibb Co. |
120,000 |
7,312,500 |
|
|
DENTSPLY International, Inc. |
100,000 |
3,468,750 |
|
|
FMC Corp. (a) |
50,000 |
3,800,000 |
|
|
Pfizer, Inc. |
192,500 |
8,313,594 |
|
|
Schering-Plough Corp. |
172,000 |
8,890,250 |
|
|
Synthes-Stratec, Inc. (c) |
5,466 |
3,482,594 |
|
|
TeraBeam Networks (d) |
4,400 |
16,500 |
|
|
Trikon Technologies, Inc. (a) |
230,900 |
3,795,419 |
|
|
VoiceStream Wireless Corp. (a) |
100,000 |
13,150,000 |
|
|
TOTAL UNITED STATES OF AMERICA |
72,099,113 |
||
|
TOTAL COMMON STOCKS (Cost $1,013,778,936) |
1,184,285,794 |
||
|
Nonconvertible Preferred Stocks - 0.2% |
|||
|
|
|
|
|
|
Germany - 0.2% |
|||
|
ProSieben Sat.1 Media AG (a) |
80,000 |
2,519,238 |
|
|
Nonconvertible Bonds - 0.3% |
|||||
|
Moody's Ratings (unaudited) |
Principal Amount (e) |
Value |
|||
|
Germany - 0.3% |
|||||
|
Brokat AG euro 11.5% 3/31/10 |
B2 |
EUR |
5,000,000 |
$ 3,781,404 |
|
|
Cash Equivalents - 9.1% |
|||
|
Shares |
|
||
|
Fidelity Cash Central Fund, 6.61% (b) |
76,049,178 |
76,049,178 |
|
|
Fidelity Securities Lending Cash Central Fund, 6.66% (b) |
37,413,339 |
37,413,339 |
|
|
TOTAL CASH EQUIVALENTS (Cost $113,462,517) |
113,462,517 |
||
|
TOTAL INVESTMENT PORTFOLIO - 104.1% (Cost $1,134,914,481) |
1,304,048,953 |
||
|
NET OTHER ASSETS - (4.1)% |
(51,465,120) |
||
|
NET ASSETS - 100% |
$ 1,252,583,833 |
||
|
Currency Abbreviations |
||
|
EUR |
- |
European Monetary Unit |
|
Legend |
|
(a) Non-income producing |
|
(b) The rate quoted is the annualized seven-day yield of the fund at period end. A complete listing of the fund's holdings as of its most recent fiscal year end is available upon request. |
|
(c) Security exempt from registration under Rule 144A of the Securities Act of 1933. These securities may be resold in transactions exempt from registration, normally to qualified institutional buyers. At the period end, the value of these securities amounted to $5,961,837 or 0.5% of net assets. |
|
(d) Restricted securities - Investment in securities not registered under the Securities Act of 1933. |
|
Additional information on each holding is as follows: |
|
Security |
Acquisition Date |
Acquisition Cost |
|
TeraBeam Networks |
4/7/00 |
$ 16,500 |
|
(e) Principal amount is stated in United States dollars unless otherwise noted. |
|
Other Information |
|
Purchases and sales of securities, other than short-term securities, |
|
The fund placed a portion of its portfolio transactions with brokerage firms which are affiliates of Fidelity Management & Research Company. The commissions paid to these affiliated firms were $40,013 for the period. |
|
The fund participated in the security lending program. At period end, the value of securities loaned amounted to $40,120,404. The fund received cash collateral of $37,413,339 which was invested in cash equivalents and U.S. Treasury Obligations valued at $5,221,890. Cash collateral includes $1,190,000 received for unsettled security loans. |
|
The fund invested in securities that are not registered under the Securities Act of 1933. These securities are subject to legal or contractual restrictions on resale. At the end of the period, restricted securities (excluding Rule 144A issues) amounted to $16,500 or 0% of net assets. |
|
The fund participated in the bank borrowing program. The average daily loan balance during the period for which loans were outstanding amounted to $5,794,000. The weighted average interest rate was 7.1%. |
|
Income Tax Information |
|
At October 31, 2000, the aggregate cost of investment securities for income tax purposes was $1,137,134,514. Net unrealized appreciation aggregated $166,914,439, of which $262,261,978 related to appreciated investment securities and $95,347,539 related to depreciated investment securities. |
|
The fund hereby designates approximately $71,309,000 as a capital gain dividend for the purpose of the dividend paid deduction. |
See accompanying notes which are an integral part of the financial statements.
Annual Report
International Growth & Income
Statement of Assets and Liabilities
|
|
October 31, 2000 |
|
|
Assets |
|
|
|
Investment in securities, at value |
|
$ 1,304,048,953 |
|
Receivable for investments sold |
|
3,912,293 |
|
Receivable for fund shares sold |
|
2,482,672 |
|
Dividends receivable |
|
1,584,078 |
|
Interest receivable |
|
540,845 |
|
Redemption fees receivable |
|
125 |
|
Other receivables |
|
27,653 |
|
Total assets |
|
1,312,596,619 |
|
Liabilities |
|
|
|
Payable for investments purchased |
$ 15,890,214 |
|
|
Payable for fund shares redeemed |
5,417,398 |
|
|
Accrued management fee |
774,676 |
|
|
Other payables and |
517,159 |
|
|
Collateral on securities loaned, |
37,413,339 |
|
|
Total liabilities |
|
60,012,786 |
|
Net Assets |
|
$ 1,252,583,833 |
|
Net Assets consist of: |
|
|
|
Paid in capital |
|
$ 934,262,905 |
|
Undistributed net investment income |
|
20,921,855 |
|
Accumulated undistributed net realized gain (loss) on investments and foreign currency transactions |
|
128,364,803 |
|
Net unrealized appreciation (depreciation) on investments |
|
169,034,270 |
|
Net Assets, for 46,910,086 shares outstanding |
|
$ 1,252,583,833 |
|
Net Asset Value, offering price |
|
$26.70 |
Statement of Operations
|
|
Year ended October 31, 2000 |
|
|
Investment Income Dividends |
|
$ 16,402,863 |
|
Special dividend from BCE, Inc. |
|
3,340,426 |
|
Interest |
|
4,739,988 |
|
Security lending |
|
455,050 |
|
|
|
24,938,327 |
|
Less foreign taxes withheld |
|
(1,908,193) |
|
Total income |
|
23,030,134 |
|
Expenses |
|
|
|
Management fee |
$ 9,963,674 |
|
|
Transfer agent fees |
3,315,398 |
|
|
Accounting and security lending fees |
688,252 |
|
|
Non-interested trustees' compensation |
5,665 |
|
|
Custodian fees and expenses |
608,212 |
|
|
Registration fees |
94,320 |
|
|
Audit |
54,725 |
|
|
Legal |
23,196 |
|
|
Interest |
1,137 |
|
|
Miscellaneous |
6,433 |
|
|
Total expenses before reductions |
14,761,012 |
|
|
Expense reductions |
(318,541) |
14,442,471 |
|
Net investment income |
|
8,587,663 |
|
Realized and Unrealized Gain (Loss) Net realized gain (loss) on: |
|
|
|
Investment securities |
150,136,824 |
|
|
Foreign currency transactions |
(1,000,561) |
149,136,263 |
|
Change in net unrealized appreciation (depreciation) on: |
|
|
|
Investment securities |
(61,410,245) |
|
|
Assets and liabilities in |
80,159 |
(61,330,086) |
|
Net gain (loss) |
|
87,806,177 |
|
Net increase (decrease) in net assets resulting from operations |
|
$ 96,393,840 |
|
Other Information |
|
|
|
Deferred sales charges withheld |
|
$ 4,266 |
|
Expense reductions |
|
|
|
Directed brokerage arrangements |
|
$ 209,419 |
|
Custodian credits |
|
3,997 |
|
Transfer agent credits |
|
105,125 |
|
|
|
$ 318,541 |
See accompanying notes which are an integral part of the financial statements.
Annual Report
International Growth & Income
Financial Statements - continued
Statement of Changes in Net Assets
|
Increase (Decrease) in Net Assets |
Year ended
October 31, |
Year ended
October 31, |
|
Operations |
$ 8,587,663 |
$ 6,176,575 |
|
Net realized gain (loss) |
149,136,263 |
93,532,876 |
|
Change in net unrealized appreciation (depreciation) |
(61,330,086) |
185,705,690 |
|
Net increase (decrease) in net assets resulting from operations |
96,393,840 |
285,415,141 |
|
Distributions to shareholders |
(14,140,690) |
(3,606,738) |
|
From net realized gain |
(64,276,865) |
(25,246,859) |
|
Total distributions |
(78,417,555) |
(28,853,597) |
|
Share transactions |
1,130,305,448 |
1,147,448,319 |
|
Reinvestment of distributions |
75,636,074 |
27,912,115 |
|
Cost of shares redeemed |
(1,051,490,302) |
(1,169,631,401) |
|
Net increase (decrease) in net assets resulting from share transactions |
154,451,220 |
5,729,033 |
|
Redemption fees |
100,992 |
- |
|
Total increase (decrease) in net assets |
172,528,497 |
262,290,577 |
|
Net Assets |
|
|
|
Beginning of period |
1,080,055,336 |
817,764,759 |
|
End of period (including undistributed net investment income of $20,921,855 and $12,563,275, respectively) |
$ 1,252,583,833 |
$ 1,080,055,336 |
|
Other Information Shares |
|
|
|
Sold |
38,897,822 |
51,495,526 |
|
Issued in reinvestment of distributions |
2,801,337 |
1,401,210 |
|
Redeemed |
(36,304,525) |
(52,786,044) |
|
Net increase (decrease) |
5,394,634 |
110,692 |
Financial Highlights
|
Years ended October 31, |
2000 |
1999 |
1998 |
1997 |
1996 |
|
Selected Per-Share Data |
|
|
|
|
|
|
Net asset value, beginning of period |
$ 26.02 |
$ 19.75 |
$ 20.88 |
$ 19.09 |
$ 17.83 |
|
Income from Investment Operations |
|
|
|
|
|
|
Net investment income |
.18 B, E |
.15 B |
.34 B |
.48 B, C |
.54 |
|
Net realized and unrealized gain (loss) |
2.33 |
6.84 |
(.22) |
1.97 |
1.32 |
|
Total from investment operations |
2.51 |
6.99 |
.12 |
2.45 |
1.86 |
|
Less Distributions |
|
|
|
|
|
|
From net investment income |
(.33) |
(.09) |
(.37) |
(.29) |
(.60) |
|
From net realized gain |
(1.50) |
(.63) |
(.88) |
(.37) |
- |
|
Total distributions |
(1.83) |
(.72) |
(1.25) |
(.66) |
(.60) |
|
Net asset value, end of period |
$ 26.70 |
$ 26.02 |
$ 19.75 |
$ 20.88 |
$ 19.09 |
|
Total Return A |
9.57% |
36.51% |
.55% |
13.17% |
10.66% |
|
Ratios and Supplemental Data |
|
|
|
|
|
|
Net assets, end of period (000 omitted) |
$ 1,252,584 |
$ 1,080,055 |
$ 817,765 |
$ 1,067,169 |
$ 1,007,076 |
|
Ratio of expenses to average net assets |
1.07% |
1.13% |
1.17% |
1.17% |
1.16% |
|
Ratio of expenses to average net assets after expense reductions |
1.05% D |
1.10% D |
1.13% D |
1.15% D |
1.14% D |
|
Ratio of net investment income to average net assets |
.63% |
.69% |
1.62% |
2.33% |
2.76% |
|
Portfolio turnover rate |
104% |
94% |
143% |
70% |
95% |
|
A The total returns would have been lower had certain expenses not been reduced during the periods shown. B Net investment income per share has been calculated based on average shares outstanding during the period. C Investment income per share reflects a special dividend which amounted to $.05 per share. D FMR or the fund has entered into varying arrangements with third parties who either paid or reduced a portion of the fund's expenses. E Investment income per share reflects a special dividend (from BCE, Inc.) which amounted to $.07 per share. |
|||||
See accompanying notes which are an integral part of the financial statements.
Annual Report
There are several ways to evaluate a fund's historical performance. You can look at the total percentage change in value, the average annual percentage change or the growth of a hypothetical $10,000 investment. Total return reflects the change in the value of an investment, assuming reinvestment of the fund's dividend income and capital gains (the profits earned upon the sale of securities that have grown in value). If Fidelity had not reimbursed certain fund expenses, the life of fund total returns would have been lower.
Cumulative Total Returns
|
Periods ended October 31, 2000 |
Past 1 |
Past 5 |
Life of |
|
Fidelity Diversified International |
12.20% |
120.93% |
198.16% |
|
MSCI EAFE |
-2.72% |
52.63% |
103.98% |
|
International Funds Average |
2.70% |
62.88% |
n/a* |
Cumulative total returns show the fund's performance in percentage terms over a set period - in this case, one year, five years or since the fund started on December 27, 1991. For example, if you invested $1,000 in a fund that had a 5% return over the past year, the value of your investment would be $1,050. You can compare the fund's returns to the performance of the Morgan Stanley Capital International Europe, Australasia and Far East (EAFE) Index - a market capitalization-weighted index that is designed to represent the performance of developed stock markets outside the United States and Canada. As of October 31, 2000, the index included over 841 equity securities of companies domiciled in 20 countries. To measure how the fund's performance stacked up against its peers, you can compare it to the international funds average, which reflects the performance of mutual funds with similar objectives tracked by Lipper Inc. The past one year average represents a peer group of 666 mutual funds. These benchmarks include reinvested dividends and capital gains, if any, and exclude the effect of sales charges.
Average Annual Total Returns
|
Periods ended October 31, 2000 |
Past 1 |
Past 5 |
Life of |
|
Fidelity Diversified International |
12.20% |
17.18% |
13.14% |
|
MSCI EAFE |
-2.72% |
8.82% |
8.39% |
|
International Funds Average |
2.70% |
9.93% |
n/a* |
Average annual total returns take the fund's cumulative return and show you what would have happened if the fund had performed at a constant rate each year.
* Not available
$10,000 Over Life of Fund
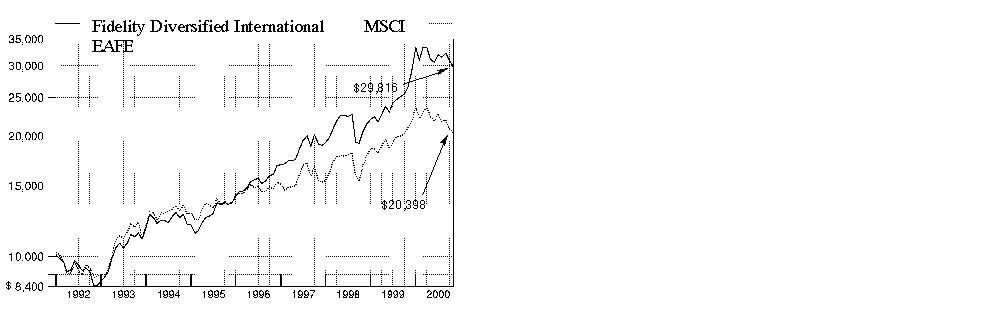
$10,000 Over Life of Fund: Let's say hypothetically that $10,000 was invested in Fidelity Diversified International Fund on December 27, 1991, when the fund started. As the chart shows, by October 31, 2000, the value of the investment would have grown to $29,816 - a 198.16% increase on the initial investment. For comparison, look at how the Morgan Stanley Capital International EAFE Index did over the same period. With dividends and capital gains, if any, reinvested, the same $10,000 would have grown to $20,398 - a 103.98% increase.
Understanding Performance
Many markets around the globe offer the potential for significant growth over time; however, investing in foreign markets means assuming greater risks than investing in the United States. Factors like changes in a country's financial markets, its local political and economic climate, and the fluctuating value of its currency create these risks. For these reasons an international fund's performance may be more volatile than a fund that invests exclusively in the United States. Past performance is no guarantee of future results and you may have a gain or loss when you sell your shares.
3Annual Report
(Portfolio Manager photograph)
An interview with
Greg Fraser, Portfolio
Manager of Fidelity Diversified International Fund
Q. How did the fund perform, Greg?
A. For the 12-month period that ended October 31, 2000, the fund returned 12.20%. For the same period, the capitalization-weighted Morgan Stanley Capital International EAFE Index - a broad measure of stock performance in Europe, Australasia and the Far East - fell 2.72%. The fund also compares its performance against the Lipper Inc. international funds average, which was up 2.70% during the past 12 months.
Q. The fund significantly outperformed its index and Lipper peer group during the past year. What factors contributed to this strong relative performance?
A. Our underweighted position in Japan and favorable stock selection within the Japanese markets made the largest contribution to the fund's strong performance relative to the index. Despite a sell-off in Japanese technology and telecommunications stocks that began in the second quarter of 2000, the strong relative performance of our holdings in those sectors helped the fund. For example, rising demand from telecommunications companies eager to build out optical networks boosted the performance of Furukawa Electric. Additionally, our out-of-benchmark stake in Canadian stocks proved beneficial, as did our stock selection in the financial services and energy industries. Compared to its Lipper peers, I probably reduced the fund's weightings in the technology and telecommunications sectors more quickly and aggressively than other funds - a move that enhanced relative performance as those areas were battered throughout the summer.
Q. Can you describe the international market environment during the period?
A. During the first half of the period, the fund had the wind at its back due to strong economic growth in many countries and improving corporate earnings. That positive environment was altered significantly during the past six months, as a couple of key factors put heavy downward pressure on the prices of international equities. First, a rising interest-rate environment worldwide - particularly in European countries - contributed to slowing demand for products and services and began to hurt corporate profits. Specifically, there were growing concerns about slowing demand for certain technology products, such as personal computers and semiconductors, which hurt stocks in the sector. Meanwhile, an increase in energy prices to near historically high levels was seen as a detriment to the economies in many countries such as South Korea, which imports nearly 100% of its oil.
Q. Why did the net asset value (NAV) of the fund's shares fall during the past six months?
A. As I mentioned, securities markets around the world declined during the second half of the period. When prices in most of the markets are falling, this fund is very likely to lose value as well. While the fund's performance was strong on a relative basis, it is important to understand that there are risks associated with international equity investing. Individual investors can lose a percentage of their assets if they are too aggressive. I believe many investors may have unrealistic performance expectations as a result of the strong fund returns generated by the U.S. equity markets during the past few years, which have been much higher than historical norms.
Q. Could you highlight some of the fund's more important individual contributors?
A. Sure. In the consumer products industry, diversified companies such as Diageo and Nestle performed well as investors retreated from the technology sector. Most pharmaceutical companies did reasonably well during the period, including fund holdings Smithkline Beecham and Glaxo Wellcome. Additionally, energy companies, such as European holdings TotalFinaElf and Eni, as well as Canadian Natural Resources and Alberta Energy in Canada, did well given the growing demand for oil and the shortage of supply, which moved prices sharply higher.
Q. Which stocks disappointed?
A. There were several disappointments in the telecommunications sector, which suffered from global pricing pressures, higher-than-expected licensing costs for the next generation of wireless communications, called 3G, and slowing economic growth worldwide. Among these detractors were Nippon Telegraph, Vodafone Group, NTT DoCoMo, DDI and China Mobile. Additionally, Japanese electronics manufacturer Hikari Tsushin and United Internet were hurt by the global correction in Internet-related stocks. I sold the fund's holdings in both Hikari Tsushin and DDI during the period.
Q. Did the weakening of the European currency have any effect on fund performance?
A. It did. Since the fund generally does not hedge foreign currency exposure, currency movements will be reflected in the fund's share price. A drop in the value of the euro will generally affect the fund in two ways. First, there is an immediate currency translation impact. Shares of companies owned by the fund that are priced in euros will be worth fewer dollars if the euro is weak - assuming the share price as measured in euros stayed the same - a scenario that hurt fund performance this period. However, there is a silver lining in the cloud of weak currencies. For companies that export a large percentage of their products, a weak local currency can increase export competitiveness, leading to increases in expected earnings. As a result, the longer-term business impact of a weak euro can, in some cases, offset the immediate negative impact of currency translation - at least for companies heavily involved in exports.
Annual Report
Diversified International
Fund Talk: The Manager's Overview - continued
Q. Greg, what is your outlook for the fund?
A. After the sharp decline of telecommunications and technology stocks during the past six months, there haven't been any areas of the market that have demonstrated clear leadership. Nevertheless, I will continue to look for reasonably valued stocks with improving fundamentals. I have increasing concerns about the funding environment for emerging companies. Many newer companies appear to have substantial capital needs and, if those needs become too difficult or too expensive to meet, the equities of those companies could fall dramatically in value. In this environment, shareholders should expect that companies with strong balance sheets and those that have demonstrated an ability to generate good cash flow could become a larger part of the portfolio.
The views expressed in this report reflect those of the portfolio manager only through the end of the period of the report as stated on the cover and do not necessarily represent the views of Fidelity or any other person in the Fidelity organization. Any such views are subject to change at any time based upon market or other conditions and Fidelity disclaims any responsibility to update such views. These views may not be relied on as investment advice and, because investment decisions for a Fidelity fund are based on numerous factors, may not be relied on as an indication of trading intent on behalf of any Fidelity fund.
Fund Facts
Goal: long-term growth by investing primarily in foreign equity securities that are determined, mainly through both quantitative and fundamental analysis, to be undervalued compared to others in their industries and countries
Fund number: 325
Trading symbol: FDIVX
Start date: December 27, 1991
Size: as of October 31, 2000, more than $6.2 billion
Manager: Greg Fraser, since 1991; manager, Fidelity Select Environmental Services Portfolio, 1991; Fidelity Select Defense and Aerospace Portfolio, 1989-1990; joined Fidelity in 1986
3Greg Fraser discusses the possibility of a global bear market:
"The returns of U.S. equities during the past few years have not been normal by historical standards. The broader U.S. markets have been typified by substantially higher-than-average returns, as well as spectacular returns among some specific sectors, such as technology - until March of 2000. Additionally, many investors who participated in initial public offerings (IPOs) for the first time experienced tremendous results. Because of this positive experience and through media influence, investors have been taught to buy more stocks on every dip in the market.
"It is important, therefore, to recognize that we might now either be in a global bear market - a period of generally decreasing stock prices - or we soon could be in one. It's one thing to stay the course when equities quickly recover; it's quite another to actually stay the course if one's monthly statements show greater losses month after month. Investors need to recognize that they could potentially lose a substantial percentage of their investment portfolio during bear markets - even in well-managed international equity funds. In these difficult periods, it is debatable how much international diversification can benefit investors. History has shown that truly global bear markets leave few stocks unscathed.
"While I'm not certain whether or not we're in a bear market yet, shareholders should re-examine their portfolio allocations, making sure they don't have short-term investment money overexposed to these risks. Meanwhile, there is some evidence that for periods of 10 years and longer, investing in an appropriate percentage of international equities can provide an added layer of diversification that could enhance portfolio performance. Further, international equities have been shown to deliver superior returns to bonds or money market investments over the long term. If it turns out we are in a bear market, there could still be some very profitable investments to be made. Going forward, I'll strive to ensure that Diversified International Fund gets more than its share of these opportunities."
Annual Report
Diversified International
|
Geographic Diversification (% of fund's net assets) |
|||
|
As of October 31, 2000 |
|||
|
Japan |
14.7% |
|
|
United Kingdom |
12.0% |
|
|
United States of America |
9.6% |
|
|
Canada |
9.1% |
|
|
Switzerland |
8.4% |
|
|
France |
7.4% |
|
|
Germany |
7.0% |
|
|
Netherlands |
6.5% |
|
|
Sweden |
3.3% |
|
|
Other |
22.0% |
|

|
|
|||
|
As of April 30, 2000 |
|||
|
Japan |
21.4% |
|
|
United Kingdom |
10.4% |
|
|
France |
8.2% |
|
|
United States of America |
7.7% |
|
|
Switzerland |
7.6% |
|
|
Germany |
7.3% |
|
|
Netherlands |
5.6% |
|
|
Sweden |
4.2% |
|
|
Canada |
4.1% |
|
|
Other |
23.5% |
|

|
Percentages are adjusted for the effect of futures contracts, if applicable. |
|
Asset Allocation |
||
|
|
% of fund's |
% of fund's net assets |
|
Stocks and Investment Companies |
91.1 |
93.0 |
|
Bonds |
0.1 |
0.3 |
|
Short-Term Investments |
8.8 |
6.7 |
|
Top Ten Stocks as of October 31, 2000 |
||
|
|
% of fund's |
% of fund's net assets |
|
Furukawa Electric Co. Ltd. |
1.7 |
1.5 |
|
Nippon Telegraph & Telephone Corp. (Japan, Telephone Services) |
1.6 |
2.0 |
|
Shell Transport & Trading Co. PLC (Reg.) (United Kingdom, |
1.6 |
1.1 |
|
Nokia AB (Finland, Communications Equipment) |
1.6 |
2.2 |
|
TotalFinaElf SA |
1.5 |
2.0 |
|
Vodafone Group PLC |
1.5 |
2.0 |
|
Nestle SA (Reg.) |
1.3 |
0.9 |
|
ING Groep NV (Certificaten |
1.1 |
1.0 |
|
Telefonica SA |
0.9 |
1.1 |
|
BP Amoco PLC |
0.9 |
0.9 |
|
|
13.7 |
14.7 |
|
Top Ten Market Sectors as of October 31, 2000 |
||
|
|
% of fund's |
% of fund's net assets |
|
Finance |
20.0 |
11.5 |
|
Utilities |
9.6 |
17.3 |
|
Technology |
9.4 |
13.4 |
|
Health |
8.8 |
6.6 |
|
Energy |
8.1 |
8.0 |
|
Industrial Machinery & Equipment |
5.4 |
6.8 |
|
Basic Industries |
5.4 |
5.9 |
|
Durables |
4.8 |
5.9 |
|
Nondurables |
4.7 |
3.2 |
|
Media & Leisure |
3.6 |
4.8 |
Annual Report
Diversified International
Showing Percentage of Net Assets
|
Common Stocks - 88.1% |
|||
|
Shares |
Value (Note 1) |
||
|
Australia - 2.2% |
|||
|
Australian Gas Light Co. |
860,000 |
$ 5,200,647 |
|
|
Australian Stock Exchange Ltd. |
365,100 |
2,239,001 |
|
|
AXA Asia Pacific Holdings Ltd. |
3,330,000 |
4,971,126 |
|
|
BHP Ltd. |
600,000 |
5,836,083 |
|
|
BMCMedia.com Ltd. (a) |
3,792,000 |
542,412 |
|
|
Cable & Wireless Optus Ltd. (a) |
3,000,000 |
6,375,999 |
|
|
Commonwealth Bank of Australia |
1,600,000 |
23,892,778 |
|
|
E*TRADE Australia Ltd. (a) |
1,200,000 |
1,248,360 |
|
|
F. H. Faulding & Co. Ltd. |
812,672 |
4,311,656 |
|
|
ISIS Communications Ltd. (a)(c) |
4,999,939 |
767,212 |
|
|
John Fairfax Holdings Ltd. |
1,500,000 |
3,417,385 |
|
|
National Australia Bank Ltd. |
600,000 |
8,364,012 |
|
|
News Corp. Ltd. sponsored ADR (preferred ltd. vtg.) |
875,000 |
31,664,063 |
|
|
Orbital Engine Co. Ltd. |
50,000 |
440,625 |
|
|
Securenet Ltd. (a) |
2,000,000 |
8,686,505 |
|
|
Westpac Banking Corp. |
1,100,000 |
7,537,702 |
|
|
WMC Ltd. |
6,500,000 |
24,934,691 |
|
|
TOTAL AUSTRALIA |
140,430,257 |
||
|
Austria - 0.2% |
|||
|
Bank Austria AG |
100,000 |
5,411,100 |
|
|
Flughafen Wien AG |
50,000 |
1,824,496 |
|
|
RHI AG |
237,000 |
5,029,140 |
|
|
TOTAL AUSTRIA |
12,264,736 |
||
|
Belgium - 0.2% |
|||
|
Telindus Group NV |
750,000 |
14,673,630 |
|
|
Telindus Group NV (strip VVPR) (a) |
11,111 |
94 |
|
|
TOTAL BELGIUM |
14,673,724 |
||
|
Bermuda - 0.6% |
|||
|
ACE Ltd. |
125,000 |
4,906,250 |
|
|
Aquarius Platinum Ltd. (a) |
1,380,500 |
5,744,537 |
|
|
Asia Global Crossing Ltd. Class A |
700,000 |
4,900,000 |
|
|
Global Crossing Ltd. (a) |
250,000 |
5,906,250 |
|
|
Knightsbridge Tankers Ltd. |
314,400 |
6,779,250 |
|
|
RenaissanceRe Holdings Ltd. |
100,000 |
7,256,250 |
|
|
TOTAL BERMUDA |
35,492,537 |
||
|
Brazil - 0.3% |
|||
|
Banco Itau SA |
70,000,000 |
5,471,053 |
|
|
Companhia de Bebidas das |
|
|
|
|
warrants 4/30/03 (a) |
188,529 |
39,690 |
|
|
sponsored ADR |
25,000 |
564,063 |
|
|
Telebras sponsored ADR (pfd holder) |
125,000 |
9,156,250 |
|
|
Telecomunicacoes de Sao Paulo SA sponsored ADR |
50,000 |
712,500 |
|
|
TOTAL BRAZIL |
15,943,556 |
||
|
Canada - 8.9% |
|||
|
Alberta Energy Co. Ltd. |
750,000 |
27,709,360 |
|
|
Bank of Montreal |
350,000 |
16,206,897 |
|
|
|
|||
|
Shares |
Value (Note 1) |
||
|
Bank of Nova Scotia |
1,000,000 |
$ 28,571,429 |
|
|
Barrick Gold Corp. |
250,000 |
3,325,123 |
|
|
BCE, Inc. |
1,600,000 |
43,087,028 |
|
|
Canada Life Financial Corp. |
350,000 |
8,183,908 |
|
|
Canadian Imperial Bank of Commerce |
1,050,000 |
33,379,310 |
|
|
Canadian National Railway Co. |
700,000 |
22,068,966 |
|
|
Canadian Natural Resources Ltd. (a) |
900,000 |
26,600,985 |
|
|
Canadian Pacific Ltd. |
1,550,000 |
45,049,261 |
|
|
Celestica, Inc. (sub. vtg.) (a) |
250,000 |
17,865,353 |
|
|
COM DEV International Ltd. (a) |
200,000 |
2,266,010 |
|
|
Encal Energy Ltd. (a) |
100,000 |
607,553 |
|
|
Fairfax Financial Holdings Ltd. (a) |
175,000 |
23,333,333 |
|
|
Fletcher Challenge Canada Ltd. |
2,300,000 |
24,170,772 |
|
|
Gulf Canada Resources Ltd. (a) |
2,300,000 |
9,894,910 |
|
|
Harrowston, Inc. Class A (a)(c) |
1,352,800 |
3,776,289 |
|
|
Industrial Alliance Life Insurance Co. (a) |
100,000 |
2,216,749 |
|
|
Manulife Financial Corp. |
100,000 |
2,600,985 |
|
|
Marsulex, Inc. (a) |
160,000 |
320,525 |
|
|
Metro, Inc. Class A |
285,300 |
3,897,695 |
|
|
National Bank of Canada |
600,000 |
9,832,512 |
|
|
Noranda, Inc. |
350,000 |
3,436,782 |
|
|
Nortel Networks Corp. |
200,000 |
9,100,000 |
|
|
Onex Corp. |
500,000 |
7,947,455 |
|
|
OZ Optics Ltd. unit (f) |
102,000 |
1,504,500 |
|
|
Pancanadian Petroleum Ltd. |
254,000 |
5,922,496 |
|
|
Petro-Canada |
1,000,000 |
21,018,062 |
|
|
Placer Dome, Inc. |
300,000 |
2,492,611 |
|
|
Power Corp. of Canada |
550,000 |
12,463,054 |
|
|
Research in Motion Ltd. (a) |
50,000 |
4,991,790 |
|
|
Rio Alto Exploration Ltd. (a) |
300,000 |
5,103,448 |
|
|
Royal Bank of Canada |
1,050,000 |
33,310,345 |
|
|
Sun Life Financial Services Canada, Inc. |
1,000,000 |
20,689,655 |
|
|
Suncor Energy, Inc. |
1,050,000 |
20,517,241 |
|
|
Talisman Energy, Inc. (a) |
300,000 |
9,448,276 |
|
|
TimberWest Forest Corp. unit |
1,300,000 |
9,008,210 |
|
|
Toronto Dominion Bank |
1,300,000 |
35,819,376 |
|
|
Trizec Hahn Corp. (sub. vtg.) (a) |
200,000 |
3,001,642 |
|
|
TOTAL CANADA |
560,739,896 |
||
|
Denmark - 1.6% |
|||
|
Danske Bank AS |
50,000 |
7,244,517 |
|
|
GN Store Nordic AS |
1,150,000 |
22,303,984 |
|
|
Group 4 Falck AS |
125,000 |
15,259,120 |
|
|
NKT Holding AS |
25,000 |
5,918,257 |
|
|
Novo-Nordisk AS Series B (a) |
225,000 |
47,745,358 |
|
|
RTX Telecom AS |
52,183 |
2,202,756 |
|
|
TK Development AS |
28,790 |
952,523 |
|
|
TOTAL DENMARK |
101,626,515 |
||
|
Finland - 2.9% |
|||
|
Elisa Communications Corp. (A Shares) |
304,300 |
8,446,078 |
|
|
F-Secure Oyj (a) |
100,000 |
568,696 |
|
|
Fortum Oyj |
500,000 |
1,655,160 |
|
|
KCI Konecranes |
200,000 |
4,666,702 |
|
|
Common Stocks - continued |
|||
|
Shares |
Value (Note 1) |
||
|
Finland - continued |
|||
|
Kone Corp. |
100,000 |
$ 5,856,720 |
|
|
Metsa Tissue Oyj |
701,000 |
7,140,106 |
|
|
Metsa-Serla Oyj (B Shares) |
500,000 |
3,140,560 |
|
|
Metso Oyj |
600,000 |
4,583,520 |
|
|
Nokia AB sponsored ADR |
2,300,000 |
98,325,000 |
|
|
Sampo Insurance Co. Ltd. (A Shares) |
850,000 |
34,631,040 |
|
|
Sanoma-WSOY Oyj (B Shares) |
181,800 |
2,484,421 |
|
|
Sonera Corp. |
200,000 |
4,406,970 |
|
|
UPM-Kymmene Corp. |
250,000 |
7,076,870 |
|
|
TOTAL FINLAND |
182,981,843 |
||
|
France - 7.2% |
|||
|
Aventis SA (France) |
500,000 |
36,031,250 |
|
|
AXA SA de CV |
250,000 |
33,103,200 |
|
|
BNP Paribas SA |
400,000 |
34,495,232 |
|
|
Carbone Lorraine Group |
202,600 |
8,649,934 |
|
|
Castorama Dubois Investissements SA |
50,000 |
10,168,624 |
|
|
Christian Dior SA |
560,000 |
28,472,147 |
|
|
CNP Assurances |
550,000 |
17,081,676 |
|
|
Compagnie de St. Gobain |
25,000 |
3,308,198 |
|
|
Compagnie Generale d'Industrie et de Participations (CGIP) |
100,000 |
4,193,072 |
|
|
Compagnie Generale de Geophysique SA sponsored ADR (a) |
147,367 |
1,768,404 |
|
|
Eurafrance (Societe) |
28,350 |
17,048,976 |
|
|
Eurotunnel SA unit (a) |
1,000,000 |
908,216 |
|
|
France Telecom SA |
350,000 |
36,600,256 |
|
|
HighWave Optical Technologies |
50,000 |
7,634,956 |
|
|
Isis SA |
75,000 |
5,156,460 |
|
|
L'Oreal SA (a) |
40,000 |
3,055,680 |
|
|
Louis Vuitton Moet Hennessy (LVMH) |
100,000 |
7,299,680 |
|
|
Remy Cointreau SA |
60,000 |
2,006,563 |
|
|
Remy Cointreau SA (RFD) (a) |
1,424 |
47,622 |
|
|
Riber SA (d) |
300,000 |
6,411,835 |
|
|
Sanofi-Synthelabo SA |
500,000 |
26,312,800 |
|
|
Schneider Electric SA |
50,000 |
3,257,270 |
|
|
Silicon On Insulator TEChnologies SA (SOITEC) (a) |
200,000 |
4,532,592 |
|
|
Societe Generale Class A (a) |
400,000 |
22,713,888 |
|
|
TotalFinaElf SA: |
|
|
|
|
Class B |
300,000 |
42,974,999 |
|
|
sponsored ADR |
725,000 |
51,928,125 |
|
|
UBI Soft Entertainment (a) |
8,356 |
360,303 |
|
|
Vivendi Environment (a) |
500,000 |
18,673,600 |
|
|
Vivendi SA |
200,000 |
14,378,672 |
|
|
Wavecom SA sponsored ADR (a) |
25,000 |
2,175,000 |
|
|
TOTAL FRANCE |
450,749,230 |
||
|
Germany - 6.5% |
|||
|
Aachener & Muenchener Beteiligungs AG (AMB) |
50,000 |
4,498,640 |
|
|
ACG AG |
35,311 |
1,858,263 |
|
|
Aixtron AG |
2,086 |
286,483 |
|
|
|
|||
|
Shares |
Value (Note 1) |
||
|
Allianz AG (Reg.) |
80,000 |
$ 27,131,043 |
|
|
Altana AG |
265,000 |
31,922,349 |
|
|
Axel Springer Verlag |
6,400 |
5,160,704 |
|
|
Bayer AG |
690,000 |
29,957,123 |
|
|
Bayerische Motoren Werke AG (BMW) |
50,000 |
1,656,009 |
|
|
Beiersdorf AG |
125,000 |
11,989,300 |
|
|
Buderus AG |
400,000 |
7,581,482 |
|
|
Cybio AG |
60,000 |
7,229,230 |
|
|
Deutsche Bank AG |
400,000 |
32,756,890 |
|
|
Deutsche Lufthansa AG (Reg.) |
600,000 |
11,713,440 |
|
|
Deutsche Telekom AG |
600,000 |
22,535,640 |
|
|
DIS Deutscher Industrie Service AG (a) |
450,000 |
18,811,530 |
|
|
E.On AG |
200,000 |
10,165,229 |
|
|
Epcos AG |
50,000 |
3,790,741 |
|
|
ERGO Versicherungs Gruppe AG |
50,000 |
6,917,720 |
|
|
Fresenius Medical Care AG |
500,000 |
13,312,500 |
|
|
Hannover Rueckversicherungs AG |
110,000 |
9,252,769 |
|
|
Heidelberger Druckmaschinen AG |
350,000 |
18,493,230 |
|
|
Infineon Technologies AG |
100,000 |
4,287,500 |
|
|
Lion Bioscience AG sponsored ADR |
25,000 |
1,926,563 |
|
|
Muenchener Ruckversicherungs-Gesellschaft |
25,000 |
7,862,010 |
|
|
Pfeiffer Vacuum Technology AG |
75,000 |
2,960,190 |
|
|
Schering AG (a) |
625,000 |
35,013,000 |
|
|
SGL Carbon AG (a) |
200,000 |
12,224,418 |
|
|
Siemens AG |
170,000 |
21,651,615 |
|
|
Stinnes AG |
400,000 |
9,472,608 |
|
|
Suess MicroTec AG (a) |
100,000 |
2,818,016 |
|
|
Techem AG |
765,650 |
18,814,134 |
|
|
United Internet AG (a) |
352,834 |
2,270,100 |
|
|
WEB.DE AG |
200,000 |
3,106,608 |
|
|
Wella AG |
154,600 |
5,878,857 |
|
|
Winkler & Dunnebier AG |
160,000 |
2,009,958 |
|
|
TOTAL GERMANY |
407,315,892 |
||
|
Hong Kong - 1.0% |
|||
|
Asat Holdings Ltd. sponsored ADR |
385,000 |
2,550,625 |
|
|
Cathay Pacific Airways Ltd. |
1,000,000 |
1,814,579 |
|
|
China Mobile Ltd. (a) |
1,800,000 |
11,024,999 |
|
|
China Mobile Ltd. sponsored ADR (a) |
1,250,000 |
38,281,250 |
|
|
Hutchison Whampoa Ltd. |
550,000 |
6,823,909 |
|
|
Techpacific.com Ltd. |
2,000,000 |
74,379 |
|
|
TOTAL HONG KONG |
60,569,741 |
||
|
Indonesia - 0.0% |
|||
|
Gulf Indonesia Resources Ltd. (a) |
50,000 |
543,750 |
|
|
Ireland - 0.9% |
|||
|
Allied Irish Banks PLC |
500,000 |
5,092,800 |
|
|
Anglo-Irish Bank Corp. PLC |
2,000,000 |
4,639,040 |
|
|
Bank of Ireland, Inc. |
1,000,000 |
7,707,104 |
|
|
Elan Corp. PLC sponsored ADR (a) |
275,000 |
14,282,813 |
|
|
Common Stocks - continued |
|||
|
Shares |
Value (Note 1) |
||
|
Ireland - continued |
|||
|
Independent Newspapers PLC (Ireland) |
2,000,000 |
$ 6,196,240 |
|
|
Irish Life & Permanent PLC |
1,100,000 |
11,026,761 |
|
|
Ryanair Holdings PLC sponsored ADR (a) |
200,000 |
8,062,500 |
|
|
TOTAL IRELAND |
57,007,258 |
||
|
Israel - 0.3% |
|||
|
AudioCodes Ltd. (a) |
75,000 |
2,967,188 |
|
|
BackWeb Technologies Ltd. (a) |
50,000 |
446,875 |
|
|
BATM Advanced Communications Ltd. |
50,000 |
371,848 |
|
|
Lanoptics Ltd. (a) |
50,000 |
1,181,250 |
|
|
Teva Pharmaceutical Industries Ltd. ADR |
250,000 |
14,781,250 |
|
|
TOTAL ISRAEL |
19,748,411 |
||
|
Italy - 2.1% |
|||
|
Alleanza Assicurazioni Spa |
200,000 |
2,642,484 |
|
|
Assicurazioni Generali Spa |
148,000 |
4,870,380 |
|
|
De Rigo Spa ADR (a) |
100,000 |
818,750 |
|
|
Ducati Motor Holding Spa (a) |
4,000,000 |
8,640,784 |
|
|
Enel Spa |
200,000 |
740,323 |
|
|
Eni Spa sponsored ADR |
800,000 |
43,300,000 |
|
|
Finmeccanica Spa (a) |
10,000,000 |
11,467,288 |
|
|
Industrie Natuzzi Spa ADR |
100,000 |
1,187,500 |
|
|
Luxottica Group Spa sponsored ADR |
450,000 |
6,496,875 |
|
|
SAES Getters Spa sponsored ADR |
300,000 |
2,700,000 |
|
|
San Paolo IMI Spa |
400,000 |
6,442,732 |
|
|
Telecom Italia Mobile Spa |
1,200,000 |
10,211,064 |
|
|
Telecom Italia Spa |
1,500,000 |
17,624,997 |
|
|
Unicredito Italiano Spa |
3,500,000 |
17,881,245 |
|
|
TOTAL ITALY |
135,024,422 |
||
|
Japan - 14.7% |
|||
|
Advantest Corp. |
50,000 |
6,520,942 |
|
|
Air Liquide Japan Ltd. |
200,000 |
949,501 |
|
|
Anritsu Corp. |
400,000 |
8,798,460 |
|
|
Canon, Inc. ADR |
178,000 |
7,220,125 |
|
|
Citizen Watch Co. Ltd. |
1,000,000 |
9,815,782 |
|
|
Daiichi Pharmaceutical Co. Ltd. |
200,000 |
5,682,339 |
|
|
Dainippon Pharmaceutical Co. |
200,000 |
2,564,385 |
|
|
Fanuc Ltd. |
75,000 |
6,736,321 |
|
|
Fuji Coca-Cola Bottling Co. Ltd. |
489,000 |
3,831,867 |
|
|
Fuji Heavy Industries Ltd. |
1,000,000 |
6,965,448 |
|
|
Fuji Photo Film Co. Ltd. |
150,000 |
5,567,776 |
|
|
Fujikura Ltd. |
800,000 |
7,053,432 |
|
|
Fujisawa Pharmaceutical Co. Ltd. |
300,000 |
9,430,850 |
|
|
Fujitsu Ltd. |
800,000 |
14,253,506 |
|
|
Furukawa Electric Co. Ltd. |
4,000,000 |
105,214,900 |
|
|
Hakuto Co. Ltd. |
78,000 |
1,722,849 |
|
|
Hitachi Chemical Co. Ltd. |
100,000 |
2,511,227 |
|
|
Hokkaido Coca-Cola Bottling Co. Ltd. |
347,000 |
2,862,249 |
|
|
Hoya Corp. |
200,000 |
16,533,774 |
|
|
JAFCO Co. Ltd. |
10,000 |
1,063,147 |
|
|
Japan Airlines Co. Ltd. |
1,000,000 |
4,005,133 |
|
|
Japan Aviation Electronics Industries (a) |
300,000 |
2,122,629 |
|
|
|
|||
|
Shares |
Value (Note 1) |
||
|
Kao Corp. |
350,000 |
$ 10,489,415 |
|
|
Konica Corp. (a) |
1,400,000 |
10,816,607 |
|
|
Kyocera Corp. |
240,000 |
32,100,001 |
|
|
Maruichi Steel Tube Ltd. |
100,000 |
1,419,668 |
|
|
Matsushita Communication |
50,000 |
6,553,020 |
|
|
Matsushita Electric Industrial Co. Ltd. |
1,400,000 |
40,915,001 |
|
|
Mikasa Coca Cola Bottling Co. |
150,000 |
1,161,672 |
|
|
Mikuni Coca Cola Bottling Co. |
200,000 |
2,197,782 |
|
|
Mitsubishi Electric Corp. |
1,000,000 |
7,185,409 |
|
|
Mitsubishi Estate Co. Ltd. (a) |
500,000 |
5,315,737 |
|
|
Mitsubishi Rayon Co. Ltd. |
500,000 |
1,782,605 |
|
|
Mitsui Fudosan Co. Ltd. |
500,000 |
6,058,107 |
|
|
NEC Corp. |
1,600,000 |
30,501,330 |
|
|
Nichicon Corp. |
500,000 |
8,931,354 |
|
|
Nikko Securities Co. Ltd. |
1,000,000 |
8,633,489 |
|
|
Nintendo Co. Ltd. |
60,000 |
9,925,763 |
|
|
Nippon Electric Glass Co. Ltd. |
200,000 |
4,655,852 |
|
|
Nippon Sheet Glass Co. Ltd. |
500,000 |
7,607,002 |
|
|
Nippon Telegraph & Telephone Corp. |
11,000 |
100,109,983 |
|
|
Nissan Motor Co. Ltd. (a) |
1,500,000 |
10,500,000 |
|
|
Nitto Denko Corp. |
150,000 |
5,072,862 |
|
|
NOK Corp. |
100,000 |
955,000 |
|
|
Nomura Securities Co. Ltd. |
1,200,000 |
25,460,545 |
|
|
North Pacific Bank Ltd. |
100,000 |
651,636 |
|
|
NTT DoCoMo, Inc. |
600 |
14,792,412 |
|
|
Olympus Optical Co. Ltd. |
400,000 |
5,528,366 |
|
|
Omron Corp. |
1,400,000 |
34,515,627 |
|
|
ORIX Corp. |
225,000 |
23,611,494 |
|
|
Osaka Gas Co. Ltd. |
1,000,000 |
2,465,402 |
|
|
Pioneer Corp. |
900,000 |
27,880,122 |
|
|
Rohm Co. Ltd. |
75,000 |
18,909,816 |
|
|
Sanyo Electric Co. Ltd. |
6,000,000 |
45,642,014 |
|
|
Sharp Corp. |
300,000 |
3,821,831 |
|
|
Shikoku Coca-Cola Bottling Co. Ltd. |
353,400 |
2,882,651 |
|
|
SKY Perfect Communications, Inc. (a) |
1,500 |
2,763,266 |
|
|
Softbank Corp. |
50,000 |
3,001,558 |
|
|
Sony Corp. |
125,000 |
10,375,000 |
|
|
Sony Corp. sponsored ADR |
150,000 |
12,450,000 |
|
|
Stanley Electric Co. Ltd. |
200,000 |
2,071,304 |
|
|
Sumitomo Electric Industries Ltd. |
1,000,000 |
18,467,602 |
|
|
Sumitomo Realty & Development Co. Ltd. |
100,000 |
573,733 |
|
|
Suzuken Co. Ltd. |
100,000 |
3,546,879 |
|
|
Takeda Chemical Industries Ltd. |
500,000 |
32,948,401 |
|
|
TDK Corp. |
100,000 |
10,081,569 |
|
|
Teikoku Hormone Manufacturing Co. Ltd. |
250,000 |
1,571,808 |
|
|
Tokyo Gas Co. Ltd. |
1,000,000 |
2,612,043 |
|
|
Tokyo Seimitsu Co. Ltd. |
100,000 |
7,057,099 |
|
|
Toshiba Corp. |
1,200,000 |
8,578,499 |
|
|
Toyo Corp. |
100,000 |
2,694,529 |
|
|
Toyoda Automatic Loom Works Ltd. |
800,000 |
14,480,800 |
|
|
Toyoda Machine Works Ltd. |
180,000 |
1,309,871 |
|
|
Toyota Motor Corp. |
900,000 |
35,963,707 |
|
|
Common Stocks - continued |
|||
|
Shares |
Value (Note 1) |
||
|
Japan - continued |
|||
|
West Japan Railway Co. |
500 |
$ 2,052,974 |
|
|
Yokogawa Electric Corp. |
300,000 |
2,353,588 |
|
|
TOTAL JAPAN |
925,430,447 |
||
|
Korea (South) - 0.3% |
|||
|
Samsung Electronics Co. Ltd. |
150,000 |
18,791,211 |
|
|
Luxembourg - 0.3% |
|||
|
Espirito Santo Financial Holding SA ADR |
500,000 |
9,437,500 |
|
|
Metro International SA Swedish Depository Receipt (A shares) (a) |
100,000 |
1,030,309 |
|
|
Quilmes Industrial SA sponsored ADR |
350,000 |
2,887,500 |
|
|
RTL Group |
49,608 |
4,294,942 |
|
|
TOTAL LUXEMBOURG |
17,650,251 |
||
|
Mexico - 0.8% |
|||
|
Coca-Cola Femsa SA de CV ADR |
100,000 |
1,918,750 |
|
|
Elamex SA de CV (a)(c) |
596,100 |
1,769,672 |
|
|
Grupo Radio Centro SA de CV sponsored ADR |
328,300 |
3,139,369 |
|
|
Telefonos de Mexico SA de CV Series L sponsored ADR |
400,000 |
21,575,000 |
|
|
Transport Maritima Mexicana SA de CV: |
|
|
|
|
sponsored ADR (a) |
1,000,000 |
8,437,500 |
|
|
Series L sponsored ADR (a) |
609,400 |
5,941,650 |
|
|
Wal-Mart de Mexico SA de CV |
3,000,000 |
6,787,898 |
|
|
TOTAL MEXICO |
49,569,839 |
||
|
Netherlands - 6.5% |
|||
|
ABN AMRO Holding NV |
1,800,000 |
41,710,032 |
|
|
Akzo Nobel NV |
550,000 |
25,045,966 |
|
|
ASM Lithography Holding NV (a) |
25,000 |
695,313 |
|
|
Buhrmann NV |
300,000 |
8,199,408 |
|
|
De Telegraaf Holding NV |
650,000 |
12,910,248 |
|
|
Draka Holding NV |
100,000 |
5,852,476 |
|
|
Elsevier NV |
1,000,000 |
12,774,440 |
|
|
Fugro NV |
160,000 |
9,431,866 |
|
|
Heineken Holding NV (A Shares) |
700,000 |
24,954,720 |
|
|
Hollandsche Beton Groep NV |
100,000 |
870,020 |
|
|
Hunter Douglas NV |
650,000 |
18,648,136 |
|
|
IHC Caland NV |
205,405 |
9,066,084 |
|
|
ING Groep NV (Certificaten |
1,000,000 |
68,684,896 |
|
|
Jomed NV (a) |
494,800 |
30,279,833 |
|
|
KLM Royal Dutch Airlines NV (a) |
121,100 |
2,209,978 |
|
|
Koninklijke Ahold NV |
317,852 |
9,235,007 |
|
|
Koninklijke Boskalis Westminster NV |
300,000 |
7,129,920 |
|
|
Koninklijke Philips Electronics NV |
1,000,000 |
39,307,928 |
|
|
Koninklijke Wessanen NV |
200,000 |
2,334,200 |
|
|
KPNQwest NV |
50,000 |
1,231,250 |
|
|
New Skies Satellites NV (a) |
817,000 |
7,350,778 |
|
|
Numico NV |
150,000 |
7,015,332 |
|
|
Petroplus International NV |
545,500 |
7,269,420 |
|
|
|
|||
|
Shares |
Value (Note 1) |
||
|
Rodamco Asia NV |
180,952 |
$ 2,157,968 |
|
|
Rodamco North America NV |
205,263 |
7,491,771 |
|
|
Smit International NV (Certificaten |
50,000 |
959,144 |
|
|
STMicroelectronics NV (NY Shares) |
250,000 |
12,984,375 |
|
|
Unilever NV (NY Shares) |
200,000 |
10,162,500 |
|
|
United Pan-Europe Communications NV sponsored ADR (a) |
250,000 |
4,562,500 |
|
|
Van der Moolen Holding NV |
50,000 |
4,042,410 |
|
|
Van Melle NV (Certificaten |
177,264 |
4,325,773 |
|
|
Vendex KBB NV |
500,000 |
6,272,632 |
|
|
Vopak NV |
100,000 |
1,909,800 |
|
|
TOTAL NETHERLANDS |
407,076,124 |
||
|
New Zealand - 0.4% |
|||
|
Brierley Investments Ltd. |
7,000,000 |
948,549 |
|
|
Contact Energy Ltd. |
5,000,000 |
5,539,845 |
|
|
Fletcher Challenge Ltd.: |
|
|
|
|
Building Division |
6,200,000 |
4,447,818 |
|
|
Forestry Division |
27,235,000 |
4,016,168 |
|
|
Frucor Beverages Group Ltd. (a) |
4,221,400 |
3,314,405 |
|
|
Sky City Ltd. |
1,952,640 |
5,712,169 |
|
|
TOTAL NEW ZEALAND |
23,978,954 |
||
|
Norway - 2.1% |
|||
|
Bergesen dy ASA (A Shares) |
600,000 |
11,945,760 |
|
|
DNB Holding ASA |
5,200,000 |
22,552,734 |
|
|
Eltek ASA |
104,000 |
3,906,156 |
|
|
Frontline Ltd. (a) |
1,000,000 |
16,465,777 |
|
|
Norsk Hydro AS (a) |
700,000 |
27,798,106 |
|
|
Opticom ASA (a) |
25,000 |
4,245,588 |
|
|
Orkla-Borregaard AS |
200,000 |
3,605,252 |
|
|
PhotoCure ASA (a) |
103,600 |
1,304,477 |
|
|
ProSafe ASA (a) |
588,000 |
9,365,476 |
|
|
Schibsted AS (B Shares) |
500,000 |
7,587,172 |
|
|
Smedvig ASA (A Shares) |
500,000 |
4,681,446 |
|
|
Sparebanken NOR (primary |
300,000 |
7,587,172 |
|
|
TANDBERG ASA (a) |
183,000 |
4,844,813 |
|
|
TANDBERG Television ASA (a) |
300,000 |
3,034,869 |
|
|
TOTAL NORWAY |
128,924,798 |
||
|
Panama - 0.3% |
|||
|
Banco Latin Americano de Exporaciones SA (BLADEX) Series E |
800,000 |
20,050,000 |
|
|
Papua New Guinea - 0.0% |
|||
|
Oil Search Ltd. (a) |
1,500,000 |
1,209,349 |
|
|
Poland - 0.1% |
|||
|
Agora SA unit (a) |
250,000 |
4,562,500 |
|
|
Portugal - 0.1% |
|||
|
Electricidade de Portugal SA |
1,250,000 |
3,395,200 |
|
|
Portugal Telecom SA |
650,000 |
5,793,060 |
|
|
TOTAL PORTUGAL |
9,188,260 |
||
|
Common Stocks - continued |
|||
|
Shares |
Value (Note 1) |
||
|
Singapore - 0.2% |
|||
|
Chartered Semiconductor Manufacturing Ltd. ADR |
50,000 |
$ 2,325,000 |
|
|
Flextronics International Ltd. (a) |
300,000 |
11,400,000 |
|
|
Singapore Airlines Ltd. |
200,000 |
2,006,270 |
|
|
TOTAL SINGAPORE |
15,731,270 |
||
|
South Africa - 0.6% |
|||
|
Anglo American Platinum Corp. Ltd. |
500,000 |
19,510,582 |
|
|
Gold Fields Ltd. |
1,086,900 |
3,234,821 |
|
|
Impala Platinum Holdings Ltd. |
260,000 |
11,142,857 |
|
|
Sasol Ltd. |
200,000 |
1,531,746 |
|
|
TOTAL SOUTH AFRICA |
35,420,006 |
||
|
Spain - 2.3% |
|||
|
Altadis SA |
800,000 |
11,985,056 |
|
|
Banco Santander Central |
3,590,000 |
36,573,125 |
|
|
Endesa SA |
360,000 |
5,866,906 |
|
|
Grupo Auxiliar Metalurgico SA (Gamesa) (a) |
133,200 |
2,456,797 |
|
|
Prosegur Comp Securidad SA |
500,000 |
4,923,040 |
|
|
Repsol YPF SA sponsored ADR |
1,200,000 |
19,125,000 |
|
|
Telefonica SA sponsored ADR |
1,000,000 |
57,937,500 |
|
|
Union Electrica Fenosa SA |
300,000 |
5,548,606 |
|
|
TOTAL SPAIN |
144,416,030 |
||
|
Sweden - 3.3% |
|||
|
Artimplant AB (B Shares) (a)(c) |
420,000 |
5,545,664 |
|
|
AssiDoman AB |
500,000 |
8,477,543 |
|
|
AssiDoman AB rights 11/16/00 (a) |
300,000 |
94,528 |
|
|
Atle AB |
435,000 |
6,004,801 |
|
|
AU-System AB (a)(d) |
1,035,800 |
6,682,915 |
|
|
Biacore International AB (a) |
90,300 |
3,829,869 |
|
|
Bure Equity AB |
1,100,000 |
6,712,014 |
|
|
Capio AB (a) |
550,000 |
3,466,040 |
|
|
Enea Data AB |
900,000 |
4,366,310 |
|
|
Gambro AB (A Shares) |
300,000 |
2,355,707 |
|
|
HIQ International AB |
500,000 |
4,051,215 |
|
|
Investor AB (B Shares) |
2,300,000 |
30,369,111 |
|
|
Kinnevik Investment AB (B Shares) (a) |
350,000 |
7,597,279 |
|
|
Kungsleden AB |
200,000 |
1,750,525 |
|
|
LGP Telecom Holding AB |
300,000 |
7,502,251 |
|
|
Micronic Laser Systems AB (a) |
50,000 |
1,490,447 |
|
|
Nobel Biocare AB |
168,100 |
3,783,385 |
|
|
Nordic Baltic Holding AB |
700,000 |
5,251,575 |
|
|
Partnertech AB |
126,400 |
1,921,857 |
|
|
Scandic Hotels AB |
300,000 |
3,060,918 |
|
|
Skandinaviska Enskilda Banken |
600,000 |
7,082,125 |
|
|
Svenska Cellulosa AB (SCA) (B Shares) |
1,000,000 |
20,506,152 |
|
|
Svenska Handelsbanken AB (A Shares) |
1,500,000 |
23,557,067 |
|
|
SwitchCore AB (a) |
100,000 |
495,149 |
|
|
Tele1 Europe Holding AB (a) |
400,000 |
3,080,924 |
|
|
|
|||
|
Shares |
Value (Note 1) |
||
|
Telefonaktiebolaget LM Ericsson sponsored ADR |
2,500,000 |
$ 34,687,500 |
|
|
TV 4 AB (A Shares) |
105,520 |
3,208,771 |
|
|
TOTAL SWEDEN |
206,931,642 |
||
|
Switzerland - 8.3% |
|||
|
ABB Ltd. (Switzerland) (Reg.) |
100,000 |
8,887,344 |
|
|
Adecco SA |
13,000 |
8,989,708 |
|
|
Baloise Holdings AG |
15,000 |
14,845,619 |
|
|
Bank for International Settlements (BIS) |
1,000 |
8,734,353 |
|
|
Credit Suisse Group (Reg.) |
175,000 |
32,809,458 |
|
|
Disetronic Holding AG |
9,600 |
8,336,912 |
|
|
Edipresse SA (Bearer) |
40,000 |
16,133,519 |
|
|
Gretag Imaging Holding AG (Reg. D) |
41,000 |
7,367,455 |
|
|
Holderbank Financiere Glarus |
8,000 |
8,407,232 |
|
|
Julius Baer Holding AG |
2,000 |
9,902,643 |
|
|
Leica Geosystems AG |
17,400 |
4,936,857 |
|
|
Mikron Holding AG |
10,000 |
5,618,915 |
|
|
Nestle SA (Reg.) |
39,000 |
80,820,584 |
|
|
Novartis AG (Reg.) |
27,000 |
40,961,892 |
|
|
PubliGroupe SA (Reg.) |
30,000 |
17,607,789 |
|
|
Richemont Compagnie Financier |
18,000 |
50,069,541 |
|
|
Roche Holding AG participation certificates |
2,000 |
18,269,819 |
|
|
Schindler Holding AG |
3,000 |
4,557,997 |
|
|
Serono SA sponsored ADR (a) |
150,000 |
3,393,750 |
|
|
Societe Generale de Surveillance Holding SA (SGS) (Bearer) |
5,000 |
6,119,611 |
|
|
Sulzer Medica AG (Reg.) |
91,900 |
23,262,587 |
|
|
Swiss Life |
12,000 |
9,332,962 |
|
|
Swiss Reinsurance Co. (Reg.) |
5,000 |
9,860,918 |
|
|
Tamedia AG (a) |
17,190 |
2,137,394 |
|
|
The Swatch Group AG (Reg.) |
150,000 |
40,806,676 |
|
|
UBS AG |
275,000 |
38,094,576 |
|
|
Zurich Financial Services Group AG |
81,531 |
39,461,458 |
|
|
TOTAL SWITZERLAND |
519,727,569 |
||
|
Taiwan - 0.1% |
|||
|
D-Link Corp. |
862,500 |
1,142,879 |
|
|
Taiwan Semiconductor Manufacturing Co. Ltd. (a) |
1,694,000 |
5,139,690 |
|
|
TOTAL TAIWAN |
6,282,569 |
||
|
United Kingdom - 12.0% |
|||
|
Aggreko PLC |
500,000 |
2,645,703 |
|
|
Allied Domecq PLC |
4,500,000 |
23,240,503 |
|
|
Antofagasta Holdings PLC |
1,000,000 |
5,924,924 |
|
|
ARM Holdings PLC sponsored ADR (a) |
125,000 |
3,750,000 |
|
|
AstraZeneca Group PLC sponsored ADR |
250,000 |
11,921,875 |
|
|
Avis Europe PLC |
900,000 |
2,348,514 |
|
|
BAA PLC |
300,000 |
2,492,034 |
|
|
Baltimore Technologies PLC |
100,000 |
1,600,000 |
|
|
Common Stocks - continued |
|||
|
Shares |
Value (Note 1) |
||
|
United Kingdom - continued |
|||
|
Barclays PLC |
450,000 |
$ 12,864,638 |
|
|
Bass PLC |
1,200,000 |
11,733,872 |
|
|
Billiton PLC |
2,200,000 |
8,387,964 |
|
|
BP Amoco PLC sponsored ADR |
1,100,000 |
56,031,250 |
|
|
British Energy PLC |
3,500,000 |
9,133,110 |
|
|
Cable & Wireless PLC |
300,000 |
4,240,373 |
|
|
Cambridge Antibody Technology |
150,000 |
9,350,565 |
|
|
Carlton Communications PLC |
800,000 |
6,436,668 |
|
|
Centrica PLC |
2,000,000 |
6,871,578 |
|
|
Chloride Group PLC |
700,000 |
2,080,320 |
|
|
Close Brothers Group PLC |
100,000 |
1,674,404 |
|
|
Diageo PLC |
2,800,000 |
26,404,836 |
|
|
Diageo PLC sponsored ADR |
350,000 |
13,168,750 |
|
|
Electronics Boutique PLC |
1,000,000 |
898,814 |
|
|
Glaxo Wellcome PLC sponsored ADR |
725,000 |
42,185,938 |
|
|
Guardian IT PLC |
500,000 |
6,704,862 |
|
|
Guinness Peat Group PLC |
3,500,000 |
2,148,185 |
|
|
Hanson PLC |
1,000,000 |
5,250,002 |
|
|
House of Fraser PLC |
2,000,000 |
1,304,730 |
|
|
HSBC Holdings PLC: |
|
|
|
|
(France) |
650,000 |
9,285,448 |
|
|
(United Kingdom) (Reg.) |
2,319,261 |
33,443,759 |
|
|
Intec Telecom Systems PLC (a) |
500,000 |
5,023,211 |
|
|
Johnson Matthey PLC |
1,000,000 |
15,584,275 |
|
|
Lloyds TSB Group PLC |
2,200,000 |
22,389,167 |
|
|
Logica PLC |
150,000 |
4,433,907 |
|
|
Logica PLC New |
15,000 |
430,561 |
|
|
Lonmin PLC |
350,000 |
4,312,858 |
|
|
Nycomed Amersham PLC |
800,000 |
7,155,719 |
|
|
Oxford Glycosciences PLC (a) |
97,000 |
3,543,647 |
|
|
Professional Staff PLC |
831,000 |
4,466,625 |
|
|
Provident Financial Group PLC |
600,000 |
7,645,718 |
|
|
Reckitt Benckiser PLC |
800,000 |
10,507,426 |
|
|
Rentokil Initial PLC |
5,000,000 |
11,525,115 |
|
|
Rexam PLC |
1,500,000 |
5,066,701 |
|
|
Ricardo PLC |
250,000 |
1,812,125 |
|
|
Rio Tinto PLC (Reg. D) |
1,000,000 |
16,164,155 |
|
|
Royal Bank of Scotland Group PLC |
1,000,000 |
22,426,859 |
|
|
Safeway PLC |
3,500,000 |
14,536,867 |
|
|
Shell Transport & Trading Co. PLC (Reg.) |
12,000,000 |
98,375,076 |
|
|
Smith & Nephew PLC |
999,999 |
4,102,647 |
|
|
SmithKline Beecham PLC sponsored ADR |
479,000 |
31,224,813 |
|
|
South African Breweries PLC |
1,100,000 |
6,591,270 |
|
|
Spirent PLC |
200,000 |
1,852,717 |
|
|
SSL International PLC |
1,000,000 |
11,633,843 |
|
|
Tesco PLC |
3,000,000 |
11,427,260 |
|
|
United News & Media PLC |
800,000 |
10,002,930 |
|
|
United Utilities PLC |
600,000 |
6,027,853 |
|
|
Vodafone Group PLC |
10,000,000 |
42,562,467 |
|
|
|
|||
|
Shares |
Value (Note 1) |
||
|
Vodafone Group PLC sponsored ADR |
1,200,000 |
$ 51,075,000 |
|
|
Zen Research PLC (a)(d) |
596,800 |
1,756,317 |
|
|
TOTAL UNITED KINGDOM |
757,180,748 |
||
|
United States of America - 0.8% |
|||
|
Entravision Communications Corp. |
22,000 |
389,125 |
|
|
Hollinger International, Inc. Class A |
850,000 |
13,121,875 |
|
|
Impsat Fiber Networks, Inc. |
100,000 |
1,200,000 |
|
|
JDS Uniphase Corp. (a) |
25,000 |
2,035,938 |
|
|
Medicines Co. |
14,100 |
424,763 |
|
|
OMI Corp. (a) |
883,600 |
6,129,975 |
|
|
Orthofix International NV (a) |
627,300 |
13,173,300 |
|
|
Pharmacia Corp. |
125,000 |
6,875,000 |
|
|
TeraBeam Networks (f) |
17,600 |
66,000 |
|
|
UnitedGlobalCom, Inc. Class A (a) |
200,000 |
6,362,500 |
|
|
TOTAL UNITED STATES OF AMERICA |
49,778,476 |
||
|
TOTAL COMMON STOCKS (Cost $4,998,081,397) |
5,537,011,811 |
||
|
Preferred Stocks - 0.6% |
|||
|
|
|
|
|
|
Convertible Preferred Stocks - 0.1% |
|||
|
Canada - 0.1% |
|||
|
ITF Optical Technologies, Inc. (f) |
19,047 |
1,999,935 |
|
|
Metrophotonics, Inc. Series 2 (f) |
198,000 |
1,980,000 |
|
|
TOTAL CANADA |
3,979,935 |
||
|
Nonconvertible Preferred Stocks - 0.5% |
|||
|
Germany - 0.5% |
|||
|
Marschollek Lautenschlaeger |
100,000 |
13,538,360 |
|
|
ProSieben Sat.1 Media AG (a) |
600,000 |
18,894,288 |
|
|
Rhoen Klinikum AG |
25,000 |
1,387,788 |
|
|
TOTAL GERMANY |
33,820,436 |
||
|
TOTAL PREFERRED STOCKS (Cost $26,059,320) |
37,800,371 |
||
|
Investment Companies - 2.4% |
|||
|
|
|
|
|
|
Argentina - 0.0% |
|||
|
Argentina Fund, Inc. |
250,000 |
2,609,375 |
|
|
Brazil - 0.1% |
|||
|
Brazil Fund, Inc. |
360,000 |
5,760,000 |
|
|
Canada - 0.1% |
|||
|
Economic Investment Trust Ltd. |
63,696 |
3,943,086 |
|
|
United Corporations Ltd. |
91,071 |
2,587,074 |
|
|
TOTAL CANADA |
6,530,160 |
||
|
Chile - 0.1% |
|||
|
Chile Fund, Inc. |
420,000 |
3,648,750 |
|
|
Investment Companies - continued |
|||
|
Shares |
Value (Note 1) |
||
|
Chile - continued |
|||
|
Five Arrows Chile Investment Trust Ltd. |
1,710,000 |
$ 2,650,500 |
|
|
Genesis Chile Fund |
35,000 |
931,875 |
|
|
TOTAL CHILE |
7,231,125 |
||
|
China - 0.1% |
|||
|
China Fund, Inc. |
300,000 |
2,681,250 |
|
|
Jardine Fleming China Region Fund, Inc. |
200,000 |
1,500,000 |
|
|
Templeton China World Fund, Inc. |
50,000 |
356,250 |
|
|
TOTAL CHINA |
4,537,500 |
||
|
Emerging Markets - 0.3% |
|||
|
Asia Tigers Fund, Inc. |
525,000 |
3,707,813 |
|
|
Central European Equity Fund, Inc. |
250,000 |
2,968,750 |
|
|
Emerging Markets Infrastructure |
141,377 |
1,263,557 |
|
|
Emerging Markets Telecommunication Fund, Inc. |
250,000 |
2,218,750 |
|
|
Southern Africa Fund, Inc. |
46,631 |
568,315 |
|
|
Templeton Dragon Fund, Inc. |
1,100,000 |
8,318,750 |
|
|
TOTAL EMERGING MARKETS |
19,045,935 |
||
|
France - 0.1% |
|||
|
France Growth Fund, Inc. |
325,000 |
3,635,938 |
|
|
Hong Kong - 0.1% |
|||
|
Asia Pacific Fund, Inc. |
500,000 |
4,062,500 |
|
|
Greater China Fund, Inc. |
350,000 |
2,887,500 |
|
|
TOTAL HONG KONG |
6,950,000 |
||
|
India - 0.3% |
|||
|
India Fund |
800,000 |
8,550,000 |
|
|
India Growth Fund (a) |
294,900 |
3,004,294 |
|
|
Jardine Fleming India Fund, Inc. (a) |
211,693 |
1,918,468 |
|
|
Morgan Stanley Dean Witter India Investment Fund, Inc. |
250,000 |
2,640,625 |
|
|
TOTAL INDIA |
16,113,387 |
||
|
Italy - 0.0% |
|||
|
Italy Fund, Inc. (The) |
148,800 |
2,529,600 |
|
|
Korea (South) - 0.2% |
|||
|
Korea Fund, Inc. (The) |
800,000 |
8,808,000 |
|
|
Korean Investment Fund, Inc. |
100,000 |
462,500 |
|
|
TOTAL KOREA (SOUTH) |
9,270,500 |
||
|
Mexico - 0.3% |
|||
|
Mexico Fund, Inc. (The) |
1,100,000 |
17,393,750 |
|
|
Multi-National - 0.6% |
|||
|
Blackrock North American Government Income Trust, Inc. |
350,000 |
3,412,500 |
|
|
|
|||
|
Shares |
Value (Note 1) |
||
|
Kemper International Research Fund Class A |
78,553 |
$ 1,025,905 |
|
|
Latin America Equity Fund, Inc. |
250,000 |
2,890,625 |
|
|
Latin American Discovery Fund, Inc. |
200,000 |
2,000,000 |
|
|
Latin American Investment Fund, Inc. |
237,700 |
3,060,388 |
|
|
MFS Government Markets Income Trust |
1,000,000 |
6,187,500 |
|
|
Morgan Stanley Dean Witter Africa Investment Fund, Inc. |
84,346 |
643,138 |
|
|
Morgan Stanley Dean Witter Asia-Pacific Fund, Inc. |
900,000 |
7,987,500 |
|
|
RCM Strategic Global Government |
100,000 |
968,750 |
|
|
Strategic Global Income Fund, Inc. |
550,000 |
5,637,500 |
|
|
Templeton Global Income Fund, Inc. |
550,000 |
3,300,000 |
|
|
TOTAL MULTI-NATIONAL |
37,113,806 |
||
|
Portugal - 0.0% |
|||
|
Portugal Fund, Inc. |
158,900 |
1,579,069 |
|
|
Singapore - 0.0% |
|||
|
Singapore Fund, Inc. |
275,000 |
1,753,125 |
|
|
Switzerland - 0.1% |
|||
|
Swiss Helvetia Fund, Inc. |
400,000 |
5,700,000 |
|
|
Taiwan - 0.0% |
|||
|
R.O.C. Taiwan Fund (SBI) |
100,000 |
587,500 |
|
|
Thailand - 0.0% |
|||
|
Thai Euro Fund Ltd. (a) |
50,000 |
200,000 |
|
|
Thai Prime Fund |
200,000 |
520,000 |
|
|
TOTAL THAILAND |
720,000 |
||
|
TOTAL INVESTMENT COMPANIES (Cost $157,831,114) |
149,060,770 |
||
|
Corporate Bonds - 0.1% |
|||||
|
Moody's Ratings (unaudited) |
Principal Amount (g) |
|
|||
|
Convertible Bonds - 0.0% |
|||||
|
Israel - 0.0% |
|||||
|
Tecnomatix Tech Ltd. 5.25% 8/15/04 |
- |
|
$ 4,121,000 |
2,379,878 |
|
|
United Kingdom - 0.0% |
|||||
|
Royal Bank of Scotland Group PLC euro 0% 12/1/03 (Reg. S) (e) |
- |
GBP |
948,000 |
1,120,067 |
|
|
TOTAL CONVERTIBLE BONDS |
3,499,945 |
||||
|
Corporate Bonds - continued |
|||||
|
Moody's Ratings (unaudited) |
Principal Amount |
Value |
|||
|
Nonconvertible Bonds - 0.1% |
|||||
|
France - 0.1% |
|||||
|
Eurotunnel Finance Ltd. euro: |
|
|
|
|
|
|
0% 4/30/40 (e) |
- |
EUR |
5,306 |
$ 5,854,853 |
|
|
0% 4/30/40 (e) |
- |
EUR |
200 |
220,688 |
|
|
TOTAL FRANCE |
6,075,541 |
||||
|
TOTAL CORPORATE BONDS (Cost $11,772,890) |
9,575,486 |
||||
|
Cash Equivalents - 9.9% |
|||
|
Maturity Amount |
|
||
|
Investments in repurchase agreements (U.S. Treasury Obligations), in a joint trading account at 6.55%, dated 10/31/00 due 11/1/00 |
$ 2,252,410 |
2,252,000 |
|
|
Shares |
|
||
|
Fidelity Cash Central Fund, 6.61% (b) |
560,931,372 |
560,931,372 |
|
|
Fidelity Securities Lending Cash |
59,538,378 |
59,538,378 |
|
|
TOTAL CASH EQUIVALENTS (Cost $622,721,750) |
622,721,750 |
||
|
TOTAL INVESTMENT PORTFOLIO - 101.1% (Cost $5,816,466,471) |
6,356,170,188 |
||
|
NET OTHER ASSETS - (1.1)% |
(68,501,277) |
||
|
NET ASSETS - 100% |
$ 6,287,668,911 |
||
|
Currency Abbreviations |
||
|
EUR |
- |
European Monetary Unit |
|
GBP |
- |
British pound |
|
Legend |
|
(a) Non-income producing |
|
(b) The rate quoted is the annualized seven-day yield of the fund at period end. A complete listing of the fund's holdings as of its most recent fiscal year end is available upon request. |
|
(c) Affiliated company |
|
(d) Security exempt from registration under Rule 144A of the Securities Act of 1933. These securities may be resold in transactions exempt from registration, normally to qualified institutional buyers. At the period end, the value of these securities amounted to $14,851,067 or 0.2% of net assets. |
|
(e) The coupon rate shown on floating or adjustable rate securities represents the rate at period end. |
|
(f) Restricted securities - Investment in securities not registered under the Securities Act of 1933. |
|
Additional information on each holding is as follows: |
|
Security |
Acquisition Date |
Acquisition Cost |
|
ITF Optical Technologies, Inc. |
10/11/00 |
$ 1,999,935 |
|
Metrophotonics, Inc. Series 2 |
9/29/00 |
$ 1,980,000 |
|
OZ Optics Ltd. unit |
8/18/00 |
$ 1,505,520 |
|
TeraBeam Networks |
4/7/00 |
$ 66,000 |
|
(g) Principal amount is stated in United States dollars unless otherwise noted. |
|
Other Information |
|
Purchases and sales of securities, other than short-term securities, aggregated $7,036,269,329 and $4,802,441,925, respectively. |
|
The fund placed a portion of its portfolio transactions with brokerage firms which are affiliates of Fidelity Management & Research Company. The commissions paid to these affiliated firms were $172,191 for the period. |
|
The fund participated in the security lending program. At period end, the value of securities loaned amounted to $58,661,450. The fund received cash collateral of $59,538,378 which was invested in cash equivalents. |
|
The fund invested in securities that are not registered under the Securities Act of 1933. These securities are subject to legal or contractual restrictions on resale. At the end of the period, restricted securities (excluding Rule 144A issues) amounted to $5,550,435 or 0.1% of net assets. |
|
The fund participated in the bank borrowing program. The average daily loan balance during the period for which loans were outstanding amounted to $7,688,000. The weighted average interest rate was 7%. |
Transactions during the period with companies which are or were affiliates are as follows:
|
Affiliate |
Purchase |
Sales |
Dividend |
Value |
|
Artimplant AB |
$ - |
$ - |
$ - |
$ 5,545,664 |
|
Elamex SA |
721,943 |
287,430 |
- |
1,769,672 |
|
Harrowston, Inc. Class A |
322 |
- |
- |
3,776,289 |
|
ISIS Communications Ltd. |
2,885,233 |
2,983,996 |
- |
767,212 |
|
Professional |
135,000 |
- |
- |
4,466,625 |
|
TOTALS |
$ 3,742,498 |
$ 3,271,426 |
$ - |
$ 16,325,462 |
|
Income Tax Information |
|
At October 31, 2000, the aggregate cost of investment securities for income tax purposes was $5,836,905,271. Net unrealized appreciation aggregated $519,264,917, of which $920,571,106 related to appreciated investment securities and $401,306,189 related to depreciated investment securities. |
|
The fund hereby designates approximately $123,255,000 as a capital gain dividend for the purpose of the dividend paid deduction. |
See accompanying notes which are an integral part of the financial statements.
Annual Report
Diversified International
Statement of Assets and Liabilities
|
|
October 31, 2000 |
|
|
Assets |
|
|
|
Investment in securities, at value (including repurchase agreements of $2,252,000) |
|
$ 6,356,170,188 |
|
Cash |
|
169 |
|
Foreign currency held at value |
|
109,569 |
|
Receivable for investments sold |
|
85,179,934 |
|
Receivable for fund shares sold |
|
16,736,441 |
|
Dividends receivable |
|
8,672,242 |
|
Interest receivable |
|
3,248,172 |
|
Redemption fees receivable |
|
2,487 |
|
Other receivables |
|
76,323 |
|
Total assets |
|
6,470,195,525 |
|
Liabilities |
|
|
|
Payable for investments purchased |
$ 108,248,316 |
|
|
Payable for fund shares redeemed |
7,780,613 |
|
|
Accrued management fee |
4,346,284 |
|
|
Other payables and |
2,613,023 |
|
|
Collateral on securities loaned, |
59,538,378 |
|
|
Total liabilities |
|
182,526,614 |
|
Net Assets |
|
$ 6,287,668,911 |
|
Net Assets consist of: |
|
|
|
Paid in capital |
|
$ 5,384,084,975 |
|
Undistributed net investment income |
|
150,904,935 |
|
Accumulated undistributed net realized gain (loss) on investments and foreign currency transactions |
|
213,430,327 |
|
Net unrealized appreciation (depreciation) on investments |
|
539,248,674 |
|
Net Assets, for 273,618,124 |
|
$ 6,287,668,911 |
|
Net Asset Value, offering price |
|
$22.98 |
Statement of Operations
|
|
Year ended October 31, 2000 |
|
|
Investment Income Dividends |
|
$ 88,301,261 |
|
Special dividend from BCE, Inc. |
|
44,420,940 |
|
Interest |
|
28,368,321 |
|
Security lending |
|
2,551,337 |
|
|
|
163,641,859 |
|
Less foreign taxes withheld |
|
(10,258,050) |
|
Total income |
|
153,383,809 |
|
Expenses |
|
|
|
Management fee |
$ 40,549,796 |
|
|
Performance adjustment |
5,244,390 |
|
|
Transfer agent fees |
13,208,692 |
|
|
Accounting and security lending fees |
1,480,607 |
|
|
Non-interested trustees' compensation |
17,518 |
|
|
Custodian fees and expenses |
2,037,517 |
|
|
Registration fees |
1,127,518 |
|
|
Audit |
45,201 |
|
|
Legal |
67,435 |
|
|
Interest |
1,495 |
|
|
Miscellaneous |
144,444 |
|
|
Total expenses before reductions |
63,924,613 |
|
|
Expense reductions |
(1,357,096) |
62,567,517 |
|
Net investment income |
|
90,816,292 |
|
Realized and Unrealized Gain (Loss) Net realized gain (loss) on: |
|
|
|
Investment securities |
302,282,435 |
|
|
Foreign currency transactions |
(419,971) |
301,862,464 |
|
Change in net unrealized appreciation (depreciation) on: |
|
|
|
Investment securities |
(96,707,827) |
|
|
Assets and liabilities in |
(473,624) |
(97,181,451) |
|
Net gain (loss) |
|
204,681,013 |
|
Net increase (decrease) in net assets resulting from operations |
|
$ 295,497,305 |
|
Other Information |
|
|
|
Expense reductions |
|
|
|
Directed brokerage arrangements |
|
$ 816,826 |
|
Custodian credits |
|
18,152 |
|
Transfer agent credits |
|
522,118 |
|
|
|
$ 1,357,096 |
See accompanying notes which are an integral part of the financial statements.
Annual Report
Diversified International
Financial Statements - continued
Statement of Changes in Net Assets
|
Increase (Decrease) in Net Assets |
Year ended
October 31, |
Year ended
October 31, |
|
Operations |
$ 90,816,292 |
$ 24,528,912 |
|
Net realized gain (loss) |
301,862,464 |
167,836,519 |
|
Change in net unrealized appreciation (depreciation) |
(97,181,451) |
481,618,726 |
|
Net increase (decrease) in net assets resulting from operations |
295,497,305 |
673,984,157 |
|
Distributions to shareholders |
(44,030,882) |
(26,414,796) |
|
From net realized gain |
(123,282,466) |
(53,970,908) |
|
Total distributions |
(167,313,348) |
(80,385,704) |
|
Share transactions |
5,428,317,406 |
2,707,434,686 |
|
Reinvestment of distributions |
158,001,060 |
75,587,611 |
|
Cost of shares redeemed |
(3,006,674,649) |
(1,741,849,904) |
|
Net increase (decrease) in net assets resulting from share transactions |
2,579,643,817 |
1,041,172,393 |
|
Redemption fees |
255,120 |
- |
|
Total increase (decrease) in net assets |
2,708,082,894 |
1,634,770,846 |
|
Net Assets |
|
|
|
Beginning of period |
3,579,586,017 |
1,944,815,171 |
|
End of period (including undistributed net investment income of $150,904,935 and $28,734,752, respectively) |
$ 6,287,668,911 |
$ 3,579,586,017 |
|
Other Information Shares |
|
|
|
Sold |
221,857,784 |
142,411,837 |
|
Issued in reinvestment of distributions |
6,975,761 |
4,456,615 |
|
Redeemed |
(122,971,213) |
(92,138,799) |
|
Net increase (decrease) |
105,862,332 |
54,729,653 |
Financial Highlights
|
Years ended October 31, |
2000 |
1999 |
1998 |
1997 |
1996 |
|
Selected Per-Share Data |
|
|
|
|
|
|
Net asset value, beginning of period |
$ 21.34 |
$ 17.21 |
$ 16.57 |
$ 14.38 |
$ 12.73 |
|
Income from Investment Operations |
|
|
|
|
|
|
Net investment income |
.39 B, E |
.18 B |
.26 B |
.24 B, C |
.15 |
|
Net realized and unrealized gain (loss) |
2.20 |
4.65 |
.98 |
2.46 |
2.13 |
|
Total from investment operations |
2.59 |
4.83 |
1.24 |
2.70 |
2.28 |
|
Less Distributions |
|
|
|
|
|
|
From net investment income |
(.25) |
(.23) |
(.19) |
(.15) |
(.22) |
|
From net realized gain |
(.70) |
(.47) |
(.41) |
(.36) |
(.41) |
|
Total distributions |
(.95) |
(.70) |
(.60) |
(.51) |
(.63) |
|
Net asset value, end of period |
$ 22.98 |
$ 21.34 |
$ 17.21 |
$ 16.57 |
$ 14.38 |
|
Total Return A |
12.20% |
29.12% |
7.72% |
19.30% |
18.66% |
|
Ratios and Supplemental Data |
|
|
|
|
|
|
Net assets, end of period (000 omitted) |
$ 6,287,669 |
$ 3,579,586 |
$ 1,944,815 |
$ 1,514,327 |
$ 665,492 |
|
Ratio of expenses to average net assets |
1.14% |
1.21% |
1.22% |
1.25% |
1.29% |
|
Ratio of expenses to average net assets after expense reductions |
1.12% D |
1.18% D |
1.19% D |
1.23% D |
1.27% D |
|
Ratio of net investment income to average net assets |
1.62% |
.94% |
1.46% |
1.49% |
1.53% |
|
Portfolio turnover rate |
94% |
73% |
95% |
81% |
94% |
|
A The total returns would have been lower had certain expenses not been reduced during the periods shown. B Net investment income per share has been calculated based on average shares outstanding during the period. C Investment income per share reflects a special dividend which amounted to $.05 per share. D FMR or the fund has entered into varying arrangements with third parties who either paid or reduced a portion of the fund's expenses. E Investment income per share reflects a special dividend (from BCE, Inc.) which amounted to $.19 per share. |
|||||
See accompanying notes which are an integral part of the financial statements.
Annual Report
There are several ways to evaluate a fund's historical performance. You can look at the total percentage change in value, the average annual percentage change or the growth of a hypothetical $10,000 investment. Total return reflects the change in the value of an investment, assuming reinvestment of the fund's dividend income and capital gains (the profits earned upon the sale of securities that have grown in value).
Cumulative Total Returns
|
Periods ended October 31, 2000 |
Past 1 |
Past 5 |
Life of |
|
Fidelity Aggressive International |
-4.66% |
63.43% |
73.72% |
|
MSCI EAFE |
-2.72% |
52.63% |
52.28% |
|
International Funds Average |
2.70% |
62.88% |
n/a* |
Cumulative total returns show the fund's performance in percentage terms over a set period - in this case, one year, five years or since the fund started on November 1, 1994. For example, if you had invested $1,000 in a fund that had a 5% return over the past year, the value of your investment would be $1,050. You can compare the fund's returns to the performance of the Morgan Stanley Capital International Europe, Australasia and Far East (EAFE) Index - a market capitalization-weighted index that is designed to represent the performance of developed stock markets outside the United States and Canada. As of October 31, 2000, the index included over 841 equity securities of countries domiciled in 20 countries. To measure how the fund's performance stacked up against its peers, you can compare it to the international funds average, which reflects the performance of mutual funds with similar objectives tracked by Lipper Inc. The past one year average represents a peer group of 666 mutual funds. These benchmarks include reinvested dividends and capital gains, if any, and exclude the effect of sales charges.
Average Annual Total Returns
|
Periods ended October 31, 2000 |
Past 1 |
Past 5 |
Life of |
|
Fidelity Aggressive International |
-4.66% |
10.32% |
9.64% |
|
MSCI EAFE |
-2.72% |
8.82% |
7.26% |
|
International Funds Average |
2.70% |
9.93% |
n/a* |
Average annual total returns take the fund's cumulative return and show you what would have happened if the fund had performed at a constant rate each year.
* Not available
$10,000 Over Life of Fund

$10,000 Over Life of Fund: Let's say hypothetically that $10,000 was invested in Fidelity Aggressive International Fund on November 1, 1994, when the fund started. As the chart shows, by October 31, 2000, the value of the investment would have grown to $17,372 - a 73.72% increase on the initial investment. For comparison, look at how the Morgan Stanley Capital International EAFE Index did over the same period. With dividends and capital gains, if any, reinvested, the same $10,000 would have grown to $15,228 - a 52.28% increase.
Understanding Performance
Many markets around the globe offer the potential for significant growth over time; however, investing in foreign markets means assuming greater risks than investing in the United States. Factors like changes in a country's financial markets, its local political and economic climate, and the fluctuating value of its currency create these risks. For these reasons an international fund's performance may be more volatile than a fund that invests exclusively in the United States. Past performance is no guarantee of future results and you may have a gain or loss when you sell your shares.
3Annual Report
(Portfolio Manager photograph)
An interview with
Kevin McCarey, Portfolio
Manager of Fidelity Aggressive International Fund
Q. How did the fund perform, Kevin?
A. The fund returned -4.66% for the 12-month period that ended October 31, 2000. This trailed both the Morgan Stanley Capital International (MSCI) Europe, Australasia and Far East (EAFE) Index - which fell 2.72% during the period - and the international funds average, which returned 2.70% according to Lipper Inc.
Q. Why did the fund trail its benchmark and its peers during the period?
A. The fund was punished for not owning enough new economy stocks early in the period, and for owning too many as the period went on. When the period began, I was still in the process of transitioning the fund from a value-oriented approach to a growth-oriented approach. At the same time, new economy stocks - namely, those in the technology, media and telecommunications (TMT) areas - rose dramatically and the fund was unable to take full advantage. I built up the fund's new economy positions gradually and, when the market corrected in March, many of these holdings declined. The fund's technology weighting fell from around 33% six months ago to just over 24% at the end of the period, mostly due to depreciation. The fund also was hurt by its limited exposure to pharmaceutical and food stocks, many of which performed better as investors sought refuge during the technology slide.
Q. During the past six months, you lowered the fund's Japanese weighting from approximately 25% to around 18%. Why?
A. The honeymoon was basically over. The Japanese market performed extraordinarily well through most of 1999, mostly on the heels of a modest economic recovery and the blistering performance of many technology stocks. As the period progressed, though, a couple of things became clear. First, Japanese stock prices - not unlike dot-coms in the U.S. - had gotten too far ahead of themselves, and companies were going to have a hard time meeting overly optimistic growth rates. Also, the initial euphoria over signs of a strengthening economy gave way to the actual corporate restructuring work that needed to be done to sustain the recovery. This shift spelled trouble for several tech-related names that had helped the fund, most notably venture capital firms Softbank and Jafco. On the plus side, my stock picking in Japan was pretty good. The fund's two best individual performers during the period were Furukawa Electric - a leading maker of fiber-optic components - and Kyocera, which makes ceramic parts for electronic equipment.
Q. What was the story in Europe?
A. The big story in Europe was the fall from grace of the major telecommunications stocks. This group - including names such as Vodafone, Deutsche Telekom, France Telecom and Spain's Telefonica - had performed exceptionally well during the past few years, but fell hard when TMT stocks tumbled. Some of these companies had spun out separate Internet service provider divisions, and their stock prices had already been overextended prior to the new-economy decline. Many telecom stocks also paid dearly for the new cellular licenses in Europe, commonly known as 3G licenses. I reduced the fund's telecom investments gradually, but some exposure still hurt the fund. On the plus side, I did find some pretty good stocks elsewhere in Europe. The fund's stake in German hair-care company Wella AG performed very well, as did its positions in Swiss watchmaker Swatch and Philips Electronics.
Q. What was your strategy with respect to the fund's emerging-markets investments?
A. Emerging markets weren't the best place to be, but the fund did get good returns from its investments in Mexican television stocks TV Azteca and Grupo Televisa early in the period. I also steered some money away from Japanese technology stocks to several Asian technology names, including Taiwan Semiconductor and South Korea's Samsung Electronics. Though weak global demand for semiconductors hurt these stocks down the stretch, I still felt they were positioned better globally than many of their Japanese counterparts.
Q. Where did you look for opportunities after TMT stocks fell?
A. I added to the fund's retail-related investments during the second half of the period, focusing mostly on names with minimal exposure to the Internet, good growth prospects and attractive valuations. Examples included Bulgari, an Italian retailer of high-end jewelry, Ahold, a Dutch foodservice retailer that made several strong supermarket acquisitions, and Boots Co., a drug-store chain in the United Kingdom that has shown slow but steady growth. The fund's retail weighting at the end of the period was 12.3%, up from 3.2% at the end of April.
Q. One of the fund's larger positions at the end of the period was China Mobile. Was this stock immune from the troubles that dragged down the telecommunications group during the period?
A. It certainly wasn't immune - China Mobile's stock price fell 40% from its peak in March - but I did see some very good growth signs for the company. Cellular penetration is much lower in China than in most developed nations, but it's growing at a rapid pace. Approximately 5% of the Chinese population has a cell phone, compared to around 40%-45% in the U.S. I felt the company had the potential to achieve strong earnings growth, so I added to the fund's stake, particularly during the latter stages of the period.
Annual Report
Fund Name
Fund Talk: The Manager's Overview - continued
Q. Which other stocks performed well? Which were disappointing?
A. Amvescap, a leading asset manager based in the U.K., performed well, as did French software maker ILOG. Disappointments included Hikari Tsushin, a Japanese cellular phone retailer, and Jazztel, a Spanish telecommunications company.
Q. What's your outlook?
A. The biggest challenge I face in the next few months is to maintain enough exposure to aggressive growth stocks, so that when the market does turn around, the fund can take advantage. Even though risk-taking fell out of favor during the period, my strategy remains the same - to find the fastest-growing companies in the world. Many of these opportunities may reside in the new economy area, and I'm confident that our far-reaching global research network will help uncover the best stories.
The views expressed in this report reflect those of the portfolio manager only through the end of the period of the report as stated on the cover and do not necessarily represent the views of Fidelity or any other person in the Fidelity organization. Any such views are subject to change at any time based upon market or other conditions and Fidelity disclaims any responsibility to update such views. These views may not be relied on as investment advice and, because investment decisions for a Fidelity fund are based on numerous factors, may not be relied on as an indication of trading intent on behalf of any Fidelity fund.
Fund Facts
Goal: seeks growth of capital primarily through investments in foreign securities
Fund number: 335
Trading symbol: FIVFX
Start date: November 1, 1994
Size: as of October 31, 2000, more than $459 million
Manager: Kevin McCarey, since 1999; manager, Fidelity Europe Capital Appreciation Fund, 1993-1999; several Fidelity Select Portfolios, 1986-1990; joined Fidelity in 1985
3Kevin McCarey covers more bases:
The falling euro: "The euro continued to fall in value versus the dollar, but I think that was more a reflection of the amazing resiliency of the U.S. economy than of any weakness in Europe. In terms of the fund, the weak euro didn't have much of an impact on overall stock picking. I tend to look at stock values in terms of local currencies."
Rising oil and gas prices: "The dramatically higher prices didn't really influence the fund's performance. Europe relies on natural gas shipped in from Russia and Eastern Europe, so it's not as dependent on oil price swings. One stock that did benefit from the higher prices was TotalFinaElf, the giant French energy conglomerate."
Broadcasting stocks: "Going into March, the fund had made a nice profit from its positions in several European broadcasting stocks, including Television Francaise 1 (TF1) in France. Much of that strong performance came from an increase in advertising revenues, partly from new economy companies. When new economy stocks stumbled, I moved out of these stocks, realizing that expectations for advertising budgets would probably be lowered."
Japanese savings accounts: "For years, Japanese citizens have been saving money through postal savings accounts. These accounts - which operate much like certificates of deposit in the U.S. - have specified maturity dates when the saver is required to take the money out. I felt many people would be looking for new, higher-yielding places in which to park their money, so I added to the fund's positions in Japanese asset managers, including Nikko Securities and Nomura Securities."
France's own Home Depot: "The fund's biggest single position at the end of the period was Castorama Dubois, a leading do-it-yourself, home improvement retailer with operations in both France and the U.K. I liked Castorama's growth prospects, and also felt it was in one of the few retail areas that would be largely unaffected by increased Internet competition."
Annual Report
Aggressive International
|
Geographic Diversification (% of fund's net assets) |
|||
|
As of October 31, 2000 |
|||
|
Japan |
17.8% |
|
|
United Kingdom |
14.2% |
|
|
Germany |
9.2% |
|
|
France |
8.6% |
|
|
Hong Kong |
6.5% |
|
|
Netherlands |
6.3% |
|
|
Switzerland |
6.3% |
|
|
Canada |
5.5% |
|
|
Taiwan |
3.9% |
|
|
Other |
21.7% |
|

|
|
|||
|
As of April 30, 2000 |
|||
|
Japan |
24.9% |
|
|
United Kingdom |
10.7% |
|
|
France |
9.3% |
|
|
Netherlands |
7.9% |
|
|
Finland |
7.4% |
|
|
United States of America |
7.4% |
|
|
Mexico |
4.6% |
|
|
Switzerland |
4.3% |
|
|
Germany |
3.5% |
|
|
Other |
20.0% |
|

|
Percentages are adjusted for the effect of futures contracts, if applicable. |
|
Asset Allocation |
||
|
|
% of fund's |
% of fund's net assets |
|
Stocks and Investment Companies |
97.5 |
93.2 |
|
Short-Term Investments |
2.5 |
6.8 |
|
Top Ten Stocks as of October 31, 2000 |
||
|
|
% of fund's |
% of fund's net assets |
|
Castorama Dubois Investissements SA (France, Retail & Wholesale, Miscellaneous) |
4.9 |
0.3 |
|
China Mobile (Hong Kong) Ltd. (Hong Kong, Cellular) |
4.8 |
0.0 |
|
Furukawa Electric Co. Ltd. |
4.3 |
2.6 |
|
Nikko Securities Co. Ltd. |
4.0 |
1.2 |
|
Nomura Securities Co. Ltd. (Japan, Securities Industry) |
3.8 |
1.0 |
|
Wella AG (Germany, |
2.9 |
0.0 |
|
Taiwan Semiconductor Manufacturing Co. Ltd. |
2.6 |
3.1 |
|
Lloyds TSB Group PLC |
2.6 |
0.0 |
|
Credit Suisse Group (Reg.) (Switzerland, Banks) |
2.6 |
1.0 |
|
Telefonaktiebolaget LM Ericsson |
2.5 |
3.3 |
|
|
35.0 |
12.5 |
|
Top Ten Market Sectors as of October 31, 2000 |
||
|
|
% of fund's |
% of fund's net assets |
|
Technology |
24.1 |
33.0 |
|
Finance |
23.6 |
10.3 |
|
Retail & Wholesale |
12.3 |
3.2 |
|
Industrial Machinery & Equipment |
9.4 |
11.9 |
|
Utilities |
6.1 |
16.1 |
|
Energy |
4.4 |
6.1 |
|
Nondurables |
4.3 |
0.4 |
|
Media & Leisure |
3.8 |
7.6 |
|
Durables |
3.6 |
3.4 |
|
Services |
1.5 |
0.7 |
Annual Report
Aggressive International
Showing Percentage of Net Assets
|
Common Stocks - 94.6% |
|||
|
Shares |
Value (Note 1) |
||
|
Belgium - 0.7% |
|||
|
Fortis B |
97,200 |
$ 2,978,371 |
|
|
Canada - 5.5% |
|||
|
Canadian Natural Resources Ltd. (a) |
266,800 |
7,885,714 |
|
|
Nortel Networks Corp. |
207,200 |
9,427,600 |
|
|
Talisman Energy, Inc. (a) |
245,600 |
7,734,989 |
|
|
TOTAL CANADA |
25,048,303 |
||
|
Finland - 1.6% |
|||
|
JOT Automation Group Oyj |
1,014,100 |
3,529,149 |
|
|
TietoEnator Oyj |
208,600 |
4,010,402 |
|
|
TOTAL FINLAND |
7,539,551 |
||
|
France - 8.6% |
|||
|
Activcard SA (a) |
177,100 |
4,524,905 |
|
|
Castorama Dubois Investissements SA |
110,600 |
22,492,995 |
|
|
ILOG SA sponsored ADR (a) |
33,900 |
1,017,000 |
|
|
Integra SA (a) |
1,395,586 |
11,312,676 |
|
|
TOTAL FRANCE |
39,347,576 |
||
|
Germany - 6.3% |
|||
|
Beiersdorf AG |
33,600 |
3,222,724 |
|
|
Deutsche Lufthansa AG (Reg.) |
298,700 |
5,831,341 |
|
|
Hannover Rueckversicherungs AG |
76,200 |
6,409,645 |
|
|
Karstadt Quelle AG |
85,200 |
2,781,341 |
|
|
Software AG |
123,300 |
8,833,054 |
|
|
United Internet AG (a) |
298,900 |
1,923,094 |
|
|
TOTAL GERMANY |
29,001,199 |
||
|
Hong Kong - 6.5% |
|||
|
China Mobile (Hong Kong) Ltd. (a) |
3,561,500 |
21,814,186 |
|
|
Johnson Electric Holdings Ltd. |
3,202,000 |
6,364,621 |
|
|
Li & Fung Ltd. |
800,000 |
1,487,570 |
|
|
TOTAL HONG KONG |
29,666,377 |
||
|
India - 3.3% |
|||
|
Housing Development Finance Corp. Ltd. |
22,850 |
229,671 |
|
|
Infosys Technologies Ltd. |
58,400 |
8,937,837 |
|
|
Wipro Ltd. sponsored ADR |
114,000 |
5,999,250 |
|
|
TOTAL INDIA |
15,166,758 |
||
|
Ireland - 1.8% |
|||
|
Bank of Ireland, Inc. |
519,500 |
4,003,841 |
|
|
Irish Life & Permanent PLC |
427,300 |
4,283,395 |
|
|
TOTAL IRELAND |
8,287,236 |
||
|
Israel - 0.6% |
|||
|
Orad Hi-Tech Systems Ltd. |
92,932 |
2,788,432 |
|
|
Italy - 3.2% |
|||
|
Banca Nazionale del Lavoro (BNL) |
1,818,200 |
5,864,495 |
|
|
Bulgari Spa |
594,000 |
6,975,430 |
|
|
Luxottica Group Spa sponsored ADR |
127,900 |
1,846,556 |
|
|
TOTAL ITALY |
14,686,481 |
||
|
|
|||
|
Shares |
Value (Note 1) |
||
|
Japan - 17.8% |
|||
|
DDI Corp. |
92 |
$ 431,711 |
|
|
Furukawa Electric Co. Ltd. |
750,000 |
19,727,798 |
|
|
Nikko Securities Co. Ltd. |
2,120,000 |
18,302,997 |
|
|
Nomura Securities Co. Ltd. |
816,000 |
17,313,171 |
|
|
Omron Corp. |
267,000 |
6,582,623 |
|
|
Sanyo Electric Co. Ltd. |
440,000 |
3,347,081 |
|
|
Shinko Securities Co. Ltd. |
3,020,000 |
9,189,259 |
|
|
Sony Corp. |
29,000 |
2,407,000 |
|
|
Yakult Honsha Co. Ltd. |
401,000 |
4,571,937 |
|
|
TOTAL JAPAN |
81,873,577 |
||
|
Korea (South) - 0.6% |
|||
|
Kookmin Bank |
256,000 |
2,925,715 |
|
|
Mexico - 1.4% |
|||
|
TV Azteca SA de CV sponsored ADR |
530,500 |
6,631,250 |
|
|
Netherlands - 6.3% |
|||
|
Draka Holding NV |
23,700 |
1,387,037 |
|
|
IHC Caland NV |
105,500 |
4,656,517 |
|
|
Koninklijke Ahold NV |
233,932 |
6,796,760 |
|
|
Koninklijke Philips Electronics NV |
269,233 |
10,582,991 |
|
|
VNU NV |
117,000 |
5,546,441 |
|
|
TOTAL NETHERLANDS |
28,969,746 |
||
|
Spain - 2.6% |
|||
|
Banco Santander Central Hispano SA |
678,100 |
6,573,024 |
|
|
Telefonica SA (a) |
290,900 |
5,548,201 |
|
|
TOTAL SPAIN |
12,121,225 |
||
|
Sweden - 3.4% |
|||
|
Adcore AB (a) |
965,100 |
3,967,751 |
|
|
Telefonaktiebolaget LM Ericsson (B Shares) |
827,700 |
11,484,338 |
|
|
TOTAL SWEDEN |
15,452,089 |
||
|
Switzerland - 6.3% |
|||
|
Credit Suisse Group (Reg.) |
62,700 |
11,755,160 |
|
|
Swiss Reinsurance Co. (Reg.) |
3,150 |
6,212,378 |
|
|
The Swatch Group AG (Bearer) |
8,233 |
10,900,996 |
|
|
TOTAL SWITZERLAND |
28,868,534 |
||
|
Taiwan - 3.9% |
|||
|
Taiwan Semiconductor |
4,000,000 |
12,136,223 |
|
|
United Microelectronics Corp. (a) |
3,330,000 |
5,876,471 |
|
|
TOTAL TAIWAN |
18,012,694 |
||
|
United Kingdom - 14.2% |
|||
|
Autonomy Corp. PLC (a) |
134,800 |
6,917,852 |
|
|
BAE Systems PLC |
761,600 |
4,322,518 |
|
|
Boots Co. PLC |
1,361,500 |
10,855,716 |
|
|
Carlton Communications PLC |
359,700 |
2,894,087 |
|
|
Dimension Data Holdings PLC (a) |
1,008,200 |
8,827,989 |
|
|
Filtronic PLC |
122,943 |
1,399,109 |
|
|
Common Stocks - continued |
|||
|
Shares |
Value (Note 1) |
||
|
United Kingdom - continued |
|||
|
Hilton Group PLC |
1,016,800 |
$ 2,822,815 |
|
|
Lloyds TSB Group PLC |
1,162,600 |
11,831,657 |
|
|
Reuters Group PLC |
251,000 |
4,931,103 |
|
|
Somerfield PLC |
4,691,700 |
5,237,199 |
|
|
SSL International PLC |
444,500 |
5,171,243 |
|
|
TOTAL UNITED KINGDOM |
65,211,288 |
||
|
TOTAL COMMON STOCKS (Cost $448,486,318) |
434,576,402 |
||
|
Nonconvertible Preferred Stocks - 2.9% |
|||
|
|
|
|
|
|
Germany - 2.9% |
|||
|
Wella AG |
325,100 |
13,038,396 |
|
|
Cash Equivalents - 5.8% |
|||
|
|
|
|
|
|
Fidelity Cash Central Fund, 6.61% (b) |
26,359,537 |
26,359,537 |
|
|
Fidelity Securities Lending Cash |
377,500 |
377,500 |
|
|
TOTAL CASH EQUIVALENTS (Cost $26,737,037) |
26,737,037 |
||
|
TOTAL INVESTMENT PORTFOLIO - 103.3% (Cost $485,935,022) |
474,351,835 |
||
|
NET OTHER ASSETS - (3.3)% |
(15,129,548) |
||
|
NET ASSETS - 100% |
$ 459,222,287 |
||
|
Legend |
|
(a) Non-income producing |
|
(b) The rate quoted is the annualized seven-day yield of the fund at period end. A complete listing of the fund's holdings as of its most recent fiscal year end is available upon request. |
|
Other Information |
|
Purchases and sales of securities, other than short-term securities, aggregated $2,129,297,981 and $2,128,917,681, respectively, of which long-term U.S. government and government agency obligations aggregated $0 and $2,097,504, respectively. |
|
The market value of futures contracts opened and closed during the period amounted to $15,292,769 and $30,480,200, respectively. |
|
The fund placed a portion of its portfolio transactions with brokerage firms which are affiliates of Fidelity Management & Research Company. The commissions paid to these affiliated firms were $44,454 for the period. |
|
The fund participated in the security lending program. At period end, the value of securities loaned amounted to $366,995. The fund received cash collateral of $377,500 which was invested in cash equivalents. |
|
The fund participated in the bank borrowing program. The average daily loan balance during the period for which loans were outstanding amounted to $3,152,000. The weighted average interest rate was 6.1%. |
|
Income Tax Information |
|
At October 31, 2000, the aggregate cost of investment securities for income tax purposes was $498,007,418. Net unrealized depreciation aggregated $23,655,583, of which $37,826,229 related to appreciated investment securities and $61,481,812 related to depreciated investment securities. |
|
The fund hereby designates approximately $69,830,000 as a capital gain dividend for the purpose of the dividend paid deduction. |
See accompanying notes which are an integral part of the financial statements.
Annual Report
Aggressive International
Statement of Assets and Liabilities
|
|
October 31, 2000 |
|
|
Assets |
|
|
|
Investment in securities, at value |
|
$ 474,351,835 |
|
Foreign currency held at value |
|
85,407 |
|
Receivable for investments sold |
|
28,303,980 |
|
Receivable for fund shares sold |
|
489,100 |
|
Dividends receivable |
|
721,138 |
|
Interest receivable |
|
118,979 |
|
Redemption fees receivable |
|
115 |
|
Other receivables |
|
3,581 |
|
Total assets |
|
504,074,135 |
|
Liabilities |
|
|
|
Payable for investments purchased |
$ 34,663,881 |
|
|
Payable for fund shares redeemed |
9,238,582 |
|
|
Accrued management fee |
322,781 |
|
|
Other payables and |
249,104 |
|
|
Collateral on securities loaned, |
377,500 |
|
|
Total liabilities |
|
44,851,848 |
|
Net Assets |
|
$ 459,222,287 |
|
Net Assets consist of: |
|
|
|
Paid in capital |
|
$ 409,603,013 |
|
Undistributed net investment income |
|
16,468,989 |
|
Accumulated undistributed net realized gain (loss) on investments and foreign currency transactions |
|
44,796,875 |
|
Net unrealized appreciation (depreciation) on investments |
|
(11,646,590) |
|
Net Assets, for 30,454,541 |
|
$ 459,222,287 |
|
Net Asset Value, offering price |
|
$15.08 |
Statement of Operations
|
|
Year ended October 31, 2000 |
|
|
Investment Income Dividends |
|
$ 6,446,416 |
|
Interest |
|
2,819,745 |
|
Security lending |
|
210,613 |
|
|
|
9,476,774 |
|
Less foreign taxes withheld |
|
(829,675) |
|
Total income |
|
8,647,099 |
|
Expenses |
|
|
|
Management fee |
|
|
|
Basic fee |
$ 4,926,824 |
|
|
Performance adjustment |
856,156 |
|
|
Transfer agent fees |
1,410,186 |
|
|
Accounting and security lending fees |
380,114 |
|
|
Non-interested trustees' compensation |
2,142 |
|
|
Custodian fees and expenses |
429,554 |
|
|
Registration fees |
103,913 |
|
|
Audit |
28,067 |
|
|
Legal |
9,679 |
|
|
Interest |
1,068 |
|
|
Miscellaneous |
56,882 |
|
|
Total expenses before reductions |
8,204,585 |
|
|
Expense reductions |
(351,510) |
7,853,075 |
|
Net investment income |
|
794,024 |
|
Realized and Unrealized Gain (Loss) Net realized gain (loss) on: |
|
|
|
Investment securities |
62,256,892 |
|
|
Foreign currency transactions |
(1,066,208) |
|
|
Futures contracts |
1,088,180 |
62,278,864 |
|
Change in net unrealized appreciation (depreciation) on: |
|
|
|
Investment securities |
(98,081,814) |
|
|
Assets and liabilities in |
(97,271) |
|
|
Futures contracts |
(455,349) |
(98,634,434) |
|
Net gain (loss) |
|
(36,355,570) |
|
Net increase (decrease) in net assets resulting from operations |
|
$ (35,561,546) |
|
Other Information |
|
|
|
Expense reductions |
|
|
|
Directed brokerage arrangements |
|
$ 306,326 |
|
Custodian credits |
|
35,445 |
|
Transfer agents credits |
|
9,739 |
|
|
|
$ 351,510 |
See accompanying notes which are an integral part of the financial statements.
Annual Report
Aggressive International
Financial Statements - continued
Statement of Changes in Net Assets
|
Increase (Decrease) in Net Assets |
Year ended
October 31, |
Year ended
October 31, |
|
Operations |
$ 794,024 |
$ 3,313,941 |
|
Net realized gain (loss) |
62,278,864 |
65,475,957 |
|
Change in net unrealized appreciation (depreciation) |
(98,634,434) |
68,197,613 |
|
Net increase (decrease) in net assets resulting from operations |
(35,561,546) |
136,987,511 |
|
Distributions to shareholders |
(2,527,179) |
(1,595,857) |
|
From net realized gain |
(28,430,654) |
- |
|
Total distributions |
(30,957,833) |
(1,595,857) |
|
Share transactions |
1,555,838,319 |
690,679,399 |
|
Reinvestment of distributions |
29,282,792 |
1,458,882 |
|
Cost of shares redeemed |
(1,595,548,556) |
(700,344,477) |
|
Net increase (decrease) in net assets resulting from share transactions |
(10,427,445) |
(8,206,196) |
|
Redemption fees |
228,607 |
- |
|
Total increase (decrease) in net assets |
(76,718,217) |
127,185,458 |
|
Net Assets |
|
|
|
Beginning of period |
535,940,504 |
408,755,046 |
|
End of period (including undistributed net investment income of $16,468,989 and $3,735,473, respectively) |
$ 459,222,287 |
$ 535,940,504 |
|
Other Information Shares |
|
|
|
Sold |
81,409,975 |
47,825,870 |
|
Issued in reinvestment of distributions |
1,629,538 |
112,655 |
|
Redeemed |
(84,708,103) |
(48,889,094) |
|
Net increase (decrease) |
(1,668,590) |
(950,569) |
Financial Highlights
|
Years ended October 31, |
2000 |
1999 |
1998 |
1997 |
1996 |
|
Selected Per-Share Data |
|
|
|
|
|
|
Net asset value, beginning of period |
$ 16.68 |
$ 12.36 |
$ 12.47 |
$ 11.33 |
$ 10.63 |
|
Income from Investment Operations |
|
|
|
|
|
|
Net investment income |
.02 B |
.11 B |
.09 B |
.13 B |
.16 C |
|
Net realized and unrealized gain (loss) |
(.65) |
4.26 |
.14 |
1.33 |
.85 |
|
Total from investment operations |
(.63) |
4.37 |
.23 |
1.46 |
1.01 |
|
Less Distributions |
|
|
|
|
|
|
From net investment income |
(.08) |
(.05) |
(.06) |
(.10) |
(.01) |
|
From net realized gain |
(.90) |
- |
(.28) |
(.22) |
(.30) |
|
Total distributions |
(.98) |
(.05) |
(.34) |
(.32) |
(.31) |
|
Redemption fees added to paid in capital |
.01 |
- |
- |
- |
- |
|
Net asset value, end of period |
$ 15.08 |
$ 16.68 |
$ 12.36 |
$ 12.47 |
$ 11.33 |
|
Total Return A |
(4.66)% |
35.47% |
1.95% |
13.20% |
9.64% |
|
Ratios and Supplemental Data |
|
|
|
|
|
|
Net assets, end of period (000 omitted) |
$ 459,222 |
$ 535,941 |
$ 408,755 |
$ 402,747 |
$ 270,865 |
|
Ratio of expenses to average net assets |
1.21% |
1.21% |
1.23% |
1.30% |
1.28% |
|
Ratio of expenses to average net assets after expense reductions |
1.16% D |
1.14% D |
1.21% D |
1.28% D |
1.26% D |
|
Ratio of net investment income to average net assets |
.12% |
.75% |
.71% |
1.03% |
1.74% |
|
Portfolio turnover rate |
344% |
173% |
137% |
86% |
71% |
|
A The total returns would have been lower had certain expenses not been reduced during the periods shown. B Net investment income per share has been calculated based on average shares outstanding during the period. C Investment income per share reflects a special dividend which amounted to $.04 per share. D FMR or the fund has entered into varying arrangements with third parties who either paid or reduced a portion of the fund's expenses. |
|||||
See accompanying notes which are an integral part of the financial statements.
Annual Report
There are several ways to evaluate a fund's historical performance. You can look at the total percentage change in value, the average annual percentage change or the growth of a hypothetical $10,000 investment. Total return reflects the change in the value of an investment, assuming reinvestment of the fund's dividend income and capital gains (the profits earned upon the sale of securities that have grown in value).
Cumulative Total Returns
|
Periods ended October 31, 2000 |
Past 1 |
Past 5 |
Past 10 |
|
Fidelity Overseas |
1.78% |
78.77% |
144.67% |
|
MSCI EAFE |
-2.72% |
52.63% |
113.59% |
|
International Funds Average |
2.70% |
62.88% |
149.02% |
Cumulative total returns show the fund's performance in percentage terms over a set period - in this case, one year, five years or 10 years. For example, if you had invested $1,000 in a fund that had a 5% return over the past year, the value of your investment would be $1,050. You can compare the fund's returns to the performance of the Morgan Stanley Capital International Europe, Australasia and Far East (EAFE) Index - a market capitalization-weighted index that is designed to represent the performance of developed stock markets outside the United States and Canada. As of October 31, 2000, the index included over 841 equity securities of companies domiciled in 20 countries. To measure how the fund's performance stacked up against its peers, you can compare it to the international funds average, which reflects the performance of mutual funds with similar objectives tracked by Lipper Inc. The past one year average represents a peer group of 666 mutual funds. These benchmarks include reinvested dividends and capital gains, if any, and exclude the effect of sales charges.
Average Annual Total Returns
|
Periods ended October 31, 2000 |
Past 1 |
Past 5 |
Past 10 |
|
Fidelity Overseas |
1.78% |
12.32% |
9.36% |
|
MSCI EAFE |
-2.72% |
8.82% |
7.88% |
|
International Funds Average |
2.70% |
9.93% |
9.30% |
Average annual total returns take the fund's cumulative return and show you what would have happened if the fund had performed at a constant rate each year.
$10,000 Over 10 Years

$10,000 Over 10 Years: Let's say hypothetically that $10,000 was invested in Fidelity Overseas Fund on October 31, 1990. As the chart shows, by October 31, 2000, the value of the investment would have grown to $24,467 - a 144.67% increase on the initial investment. For comparison, look at how the Morgan Stanley Capital International EAFE Index did over the period. With dividends and capital gains, if any, reinvested, the same $10,000 investment would have grown to $21,359 - a 113.59% increase.
Understanding Performance
Many markets around the globe offer the potential for significant growth over time; however, investing in foreign markets means assuming greater risks than investing in the United States. Factors like changes in a country's financial markets, its local political and economic climate, and the fluctuating value of its currency create these risks. For these reasons an international fund's performance may be more volatile than a fund that invests exclusively in the United States. Past performance is no guarantee of future results and you may have a gain or loss when you sell your shares.
3Annual Report
(Portfolio Manager photograph)
An interview with
Rick Mace, Portfolio
Manager of Fidelity
Overseas Fund
Q. How did the fund perform, Rick?
A. For the 12 months that ended October 31, 2000, the fund returned 1.78%. The Morgan Stanley Capital International EAFE Index - a broad measure of stock performance in Europe, Australasia and the Far East - declined 2.72% during that time frame, while the international funds average, as tracked by Lipper Inc., returned 2.70%.
Q. What factors helped the fund outperform its index during the 12-month period?
A. Overweightings and favorable stock selection in the industrial machinery, telecommunications, and transportation and shipping industries were the major factors. More specifically, our positions in Furukawa Electric, a company that manufactures optic fiber used in high-capacity telecommunications networks, and Kyocera, a producer of internal components for cellular handsets, provided a significant boost to performance. Many telephone utility holdings also aided performance, such as our positions in Mannesmann and China Telecom, which were particular standouts. The fund also benefited from an early entrance into transportation and shipping stocks - such as Teekay Shipping and Overseas Shipholding - which rose sharply on an increase in worldwide demand for oil. Among energy stocks, French producer TotalFinaElf and several smaller Canadian holdings, such as Talisman, made strong contributions. From a country perspective, being slightly underweighted in the poor-performing Japanese market, particularly during the past six months, proved helpful. Meanwhile, holding significant out-of-benchmark stakes in the relatively strong-performing markets in Canada, Mexico and the U.S. fueled the fund's overall performance.
Q. How would you characterize the overseas equity market environment since the last report to shareholders six months ago?
A. It was one of the most challenging periods in years. Due to the volatility, there weren't many areas of the market that worked particularly well. A series of negative factors collectively hindered performance: the declining value of the euro; a sharp rise in fuel costs; and slowing demand for PCs, semiconductors and handsets.
Q. Given those obstacles, what investment strategies did you employ?
A. During the past year, the fund became more concentrated. I reduced the total number of stocks to focus more on the positions I felt offered the best value and potential for growth. This strategy increased the fund's top-10 holdings to roughly 26% of the fund's net assets, from more than 15% a year ago. During the past six months, I also pared back the fund's telecommunications positions, particularly in equipment manufacturers where competitive pricing pressures and weakening handset demand threatened to hurt profits. Similarly, I cut back on a number of telephone holdings on rising concern over the prices that some of these companies were paying for recent acquisitions. I also was concerned by the high prices that many of these companies were bidding for G3 spectrum licenses to accommodate the next generation of wireless communications. Additionally, I generally took some profits across the board among our energy holdings due to less favorable projections of supply and demand.
Q. Where did you seek to reallocate assets from those industry reductions?
A. I increased the fund's exposure to pharmaceuticals because of the sector's defensive characteristics and relatively stable earnings growth. I consider all major pharmaceutical companies to be global businesses regardless of where they are based. Accordingly, my focus recently has been on U.S. companies that appeared to be cheap relative to their European-based peers. I also increased my positions in European consumer stocks such as Nestle. Like the drug companies, these businesses have relatively steady and predictable growth rates and they appeared to be fairly priced.
Q. The fund's financial services weighting rose to 18.3% from 13.5% six months ago. What was your strategy there?
A. The fund has owned significant positions in a handful of Japanese financial services companies, such as Nomura Securities and Nikko Securities, for some time. But I increased our positions in those stocks because I believed the trend of Japanese investors using the securities markets for wealth building was only in the initial stages of a long-term growth trend. With the recent deregulation of financial services in Japan, these stocks could benefit going forward. As the period progressed, I opportunistically added to the fund's holdings in other selected financial services stocks as well. The prices and valuations of several financial services companies in the United Kingdom - such as Royal Bank of Scotland and Lloyd's TSB Group - reached such low levels that I added them to the fund's holdings.
Q. What were some of the fund's top performers?
A. Our positions in telecommunications equipment manufacturers Furukawa and Kyocera were the fund's top contributors. Elsewhere, our position in German telecom provider Mannesmann benefited from a buyout by U.K.-based Vodafone Group. Despite a profit warning at the end of the period, Nokia, the Finnish cellular handset manufacturer, was rewarded for its industry leadership position. In addition, TotalFinaElf performed well as a result of the rising global demand for oil.
Q. What stocks disappointed?
A. Asian semiconductor holdings were among the fund's biggest disappointments as the price of main memory chips slid to a three-month low in September and investors feared that the industry leaders might miss earnings forecasts. South Korea's Samsung Electronics and Hyundai Electronics were among the fund's biggest detractors, as was Taiwan Semiconductor. Much of the decline in those stocks came after Intel, the world's largest chipmaker, announced that third-quarter sales would lag forecasts because of declining demand in Europe.
Annual Report
Overseas
Fund Talk: The Manager's Overview - continued
Q. What's your outlook for the next six months, Rick?
A. I expect the volatility we've experienced in the markets during the past six months to continue. The euro has shown little evidence of strengthening, and slowing global economies could hinder corporate profits. Global demand for PCs, handsets and other hardware appears to be slower than previously expected while at the same time, there is an oversupply of internal components in the marketplace. Given these factors, I believe the performance of overseas stocks going forward will be closely tied to corporate earnings and fundamentals.
The views expressed in this report reflect those of the portfolio manager only through the end of the period of the report as stated on the cover and do not necessarily represent the views of Fidelity or any other person in the Fidelity organization. Any such views are subject to change at any time based upon market or other conditions and Fidelity disclaims any responsibility to update such views. These views may not be relied on as investment advice and, because investment decisions for a Fidelity fund are based on numerous factors, may not be relied on as an indication of trading intent on behalf of any Fidelity fund.
Fund Facts
Goal: seeks growth of capital primarily through investments in foreign securities
Fund number: 094
Trading symbol: FOSFX
Start date: December 4, 1984
Size: as of October 31, 2000, more than $4.8 billion
Manager: Richard Mace, since 1996; manager,
Fidelity Global Balanced Fund, since 1996;
Fidelity Aggressive International Fund, 1994-
1999; group leader, Fidelity international
funds, since 1996; joined Fidelity in 1987
Rick Mace on the recent volatility in global markets:
"As we've seen during the past six months, volatility in the equity markets - both domestically and internationally - has increased this year. I believe it is here to stay for a while.
"It's important to realize that volatility is truly global, influenced a great deal by economic conditions in the United States. When the U.S. economy cools down, the rest of the world freezes. When U.S. markets warm up, the rest of the world catches fire. Part of the reason volatility is global is that merger and acquisition activity is sweeping the world, with companies buying one another not just within their own geographic markets, but on a global basis. This acquisition activity suggests that industries are consolidating around the world.
"Turning to individual markets, I think we will see the European and Japanese economies sputter along in the short term. However, looking with a longer perspective, the corporate culture in both Europe and Japan is changing - for the better. For example, an increasing number of companies are offering stock options to senior employees, a move that should improve bottom lines and add value for shareholders. Additionally, the increase in merger and acquisition activity is driving efficiency into companies and improving returns for shareholders. In the emerging markets, the outlook is mixed. Although Southeast Asian economies have stabilized, the rise in oil costs could hinder future short-term growth. There is a slightly better outlook in Latin America, because a number of countries are self-sufficient in energy production.
"Understandably, most people fear volatility. But in my opinion, volatility can be a good thing, because it creates great opportunities to buy and sell."
Annual Report
Overseas
|
Geographic Diversification (% of fund's net assets) |
|||
|
As of October 31, 2000 |
|||
|
Japan |
23.4% |
|
|
United Kingdom |
14.5% |
|
|
France |
10.4% |
|
|
United States of America |
10.3% |
|
|
Finland |
7.1% |
|
|
Switzerland |
6.2% |
|
|
Netherlands |
5.6% |
|
|
Korea (South) |
2.8% |
|
|
Spain |
2.5% |
|
|
Other |
17.2% |
|

|
|
|||
|
As of April 30, 2000 |
|||
|
Japan |
24.2% |
|
|
United Kingdom |
15.6% |
|
|
France |
10.4% |
|
|
Netherlands |
7.5% |
|
|
United States of America |
7.3% |
|
|
Germany |
5.3% |
|
|
Finland |
4.7% |
|
|
Switzerland |
3.7% |
|
|
Mexico |
2.7% |
|
|
Other |
18.6% |
|

|
Percentages are adjusted for the effect of futures contracts, if applicable. |
|
Asset Allocation |
||
|
|
% of fund's |
% of fund's net assets |
|
Stocks, Investment Companies |
93.0 |
94.2 |
|
Bonds |
0.2 |
0.2 |
|
Short-Term Investments |
6.8 |
5.6 |
|
Top Ten Stocks as of October 31, 2000 |
||
|
|
% of fund's |
% of fund's net assets |
|
Nokia AB (Finland, Communications Equipment) |
5.1 |
3.6 |
|
Vodafone Group PLC (United Kingdom, Cellular) |
3.7 |
3.9 |
|
TotalFinaElf SA Class B |
3.6 |
3.8 |
|
Sony Corp. |
2.2 |
0.7 |
|
Nippon Telegraph & Telephone Corp. (Japan, Telephone Services) |
2.1 |
1.1 |
|
Nestle SA (Reg.) |
2.1 |
0.9 |
|
Nomura Securities Co. Ltd. (Japan, Securities Industry) |
2.0 |
0.9 |
|
Nikko Securities Co. Ltd. |
1.9 |
0.8 |
|
Samsung Electronics Co. Ltd. (Korea (South), Electronics) |
1.8 |
1.0 |
|
UPM-Kymmene Corp. (Finland, Paper & Forest Products) |
1.6 |
0.5 |
|
|
26.1 |
17.2 |
|
Top Ten Market Sectors as of October 31, 2000 |
||
|
|
% of fund's |
% of fund's net assets |
|
Finance |
18.3 |
13.5 |
|
Technology |
15.5 |
20.7 |
|
Utilities |
15.0 |
19.9 |
|
Energy |
6.7 |
8.5 |
|
Health |
6.7 |
4.0 |
|
Basic Industries |
5.2 |
2.8 |
|
Industrial Machinery & Equipment |
5.0 |
8.3 |
|
Durables |
5.1 |
2.0 |
|
Media & Leisure |
4.0 |
5.4 |
|
Nondurables |
3.5 |
2.1 |
Annual Report
Overseas
Showing Percentage of Net Assets
|
Common Stocks - 92.6% |
|||
|
Shares |
Value (Note 1) |
||
|
Australia - 1.0% |
|||
|
BHP Ltd. |
1,236,486 |
$ 12,027,058 |
|
|
Cable & Wireless Optus Ltd. (a) |
5,278,600 |
11,218,782 |
|
|
News Corp. Ltd. |
1,472,826 |
15,832,883 |
|
|
News Corp. Ltd. sponsored ADR (preferred ltd. vtg.) |
312,800 |
11,319,450 |
|
|
TOTAL AUSTRALIA |
50,398,173 |
||
|
Brazil - 0.2% |
|||
|
Telesp Celular Participacoes SA ADR |
258,400 |
8,171,900 |
|
|
Canada - 2.4% |
|||
|
Alberta Energy Co. Ltd. |
362,190 |
13,381,404 |
|
|
Alcan Aluminium Ltd. |
329,800 |
10,408,466 |
|
|
BCE, Inc. |
362,300 |
9,756,519 |
|
|
Canadian Natural Resources Ltd. (a) |
830,700 |
24,552,709 |
|
|
Ensign Resource Service Group, Inc. |
56,900 |
1,532,282 |
|
|
Nortel Networks Corp. |
175,726 |
7,995,533 |
|
|
Rio Alto Exploration Ltd. (a) |
1,110,200 |
18,886,161 |
|
|
Suncor Energy, Inc. |
38,900 |
760,115 |
|
|
Talisman Energy, Inc. (a) |
1,015,100 |
31,969,816 |
|
|
TOTAL CANADA |
119,243,005 |
||
|
Finland - 7.1% |
|||
|
Nokia AB |
5,754,200 |
245,992,045 |
|
|
Sampo Insurance Co. Ltd. (A Shares) |
239,400 |
9,753,731 |
|
|
Sonera Corp. |
399,300 |
8,798,515 |
|
|
UPM-Kymmene Corp. |
2,802,800 |
79,340,205 |
|
|
TOTAL FINLAND |
343,884,496 |
||
|
France - 10.4% |
|||
|
Alcatel SA (RFD) (a) |
539,900 |
33,676,263 |
|
|
Aventis SA (France) |
371,375 |
26,762,211 |
|
|
AXA SA de CV |
296,165 |
39,216,037 |
|
|
BNP Paribas SA |
295,610 |
25,492,839 |
|
|
Canal Plus SA |
53,300 |
7,713,597 |
|
|
Castorama Dubois Investissements SA |
216,385 |
44,006,754 |
|
|
France Telecom SA |
303,600 |
31,748,108 |
|
|
Sanofi-Synthelabo SA |
472,500 |
24,865,596 |
|
|
Suez Lyonnaise des Eaux (France) |
87,800 |
13,399,530 |
|
|
Television Francaise 1 SA (a) |
205,950 |
11,240,306 |
|
|
TotalFinaElf SA Class B |
1,232,710 |
176,585,705 |
|
|
Vivendi Environment (a) |
884,100 |
33,018,660 |
|
|
Vivendi SA |
507,100 |
36,457,123 |
|
|
TOTAL FRANCE |
504,182,729 |
||
|
Germany - 2.5% |
|||
|
Allianz AG (Reg.) |
96,400 |
32,692,907 |
|
|
BASF AG |
955,100 |
37,453,826 |
|
|
Bayerische Hypo-und Vereinsbank AG |
201,400 |
11,068,904 |
|
|
Deutsche Lufthansa AG (Reg.) |
365,000 |
7,125,676 |
|
|
Kali Und Salz Beteiligungs AG |
945,768 |
13,647,054 |
|
|
|
|||
|
Shares |
Value (Note 1) |
||
|
Muenchener Ruckversicherungs-Gesellschaft |
49,800 |
$ 15,661,124 |
|
|
United Internet AG (a) |
403,000 |
2,592,863 |
|
|
TOTAL GERMANY |
120,242,354 |
||
|
Hong Kong - 2.2% |
|||
|
China Mobile (Hong Kong) Ltd. (a) |
10,952,000 |
67,080,995 |
|
|
Hutchison Whampoa Ltd. |
2,275,800 |
28,236,094 |
|
|
Johnson Electric Holdings Ltd. |
6,202,000 |
12,327,727 |
|
|
TOTAL HONG KONG |
107,644,816 |
||
|
Ireland - 0.4% |
|||
|
Bank of Ireland, Inc. |
2,456,598 |
18,933,256 |
|
|
Italy - 1.4% |
|||
|
Banca Intesa Spa |
3,700,537 |
15,469,503 |
|
|
Olivetti Spa |
3,512,700 |
10,691,945 |
|
|
San Paolo IMI Spa |
878,500 |
14,149,849 |
|
|
Telecom Italia Spa |
2,509,870 |
29,490,967 |
|
|
TOTAL ITALY |
69,802,264 |
||
|
Japan - 23.1% |
|||
|
Advantest Corp. |
67,900 |
8,855,440 |
|
|
Asahi Chemical Industry Co. Ltd. (a) |
974,000 |
6,034,497 |
|
|
Canon, Inc. |
599,000 |
24,296,938 |
|
|
Daiwa Securities Group, Inc. |
3,630,000 |
40,222,437 |
|
|
DDI Corp. |
1,097 |
5,147,686 |
|
|
Fujitsu Ltd. |
1,147,000 |
20,435,964 |
|
|
Furukawa Electric Co. Ltd. |
2,830,000 |
74,439,558 |
|
|
Hitachi Chemical Co. Ltd. |
243,000 |
6,102,282 |
|
|
Hitachi Zosen Corp. (a) |
7,571,000 |
5,759,261 |
|
|
Ito-Yokado Co. Ltd. |
677,000 |
30,589,406 |
|
|
Kyocera Corp. |
194,100 |
25,960,876 |
|
|
Matsushita Electric Industrial Co. Ltd. |
930,000 |
27,179,251 |
|
|
Mitsubishi Electric Corp. |
1,227,000 |
8,816,497 |
|
|
Mitsubishi Estate Co. Ltd. (a) |
1,153,000 |
12,258,088 |
|
|
Mitsui Fudosan Co. Ltd. |
515,000 |
6,239,850 |
|
|
NEC Corp. |
2,146,000 |
40,909,908 |
|
|
Net One Systems Co. Ltd. |
287 |
8,522,409 |
|
|
NGK Insulators Ltd. |
657,000 |
8,700,990 |
|
|
Nikko Securities Co. Ltd. |
10,434,000 |
90,081,828 |
|
|
Nikon Corp. |
608,000 |
8,837,760 |
|
|
Nintendo Co. Ltd. |
73,100 |
12,092,888 |
|
|
Nippon Telegraph & Telephone Corp. |
11,289 |
102,740,145 |
|
|
Nomura Securities Co. Ltd. |
4,475,000 |
94,946,616 |
|
|
NTT DoCoMo, Inc. |
1,843 |
45,437,358 |
|
|
Oki Electric Industry Co. Ltd. (a) |
1,354,000 |
8,053,762 |
|
|
Omron Corp. |
1,400,000 |
34,515,627 |
|
|
ORIX Corp. |
147,800 |
15,510,128 |
|
|
Rohm Co. Ltd. |
45,300 |
11,421,529 |
|
|
Softbank Corp. |
573,100 |
34,403,859 |
|
|
Sony Corp. |
1,280,800 |
106,306,403 |
|
|
Takeda Chemical Industries Ltd. |
859,000 |
56,605,354 |
|
|
Toko, Inc. |
1,113,000 |
5,814,408 |
|
|
Common Stocks - continued |
|||
|
Shares |
Value (Note 1) |
||
|
Japan - continued |
|||
|
Tokyo Broadcasting System, Inc. |
256,000 |
$ 10,018,514 |
|
|
Tokyo Electron Ltd. |
114,700 |
8,977,527 |
|
|
Toshiba Corp. |
3,533,000 |
25,256,531 |
|
|
Toyota Motor Corp. |
1,952,100 |
78,005,281 |
|
|
Trans Cosmos, Inc. |
29,500 |
2,133,214 |
|
|
Yamanouchi Pharmaceutical Co. Ltd. |
221,000 |
10,005,866 |
|
|
TOTAL JAPAN |
1,121,635,936 |
||
|
Korea (South) - 2.8% |
|||
|
Hyundai Electronics Industries Co. Ltd. (a) |
3,936,920 |
24,192,593 |
|
|
Kookmin Bank |
819,210 |
9,362,401 |
|
|
Samsung Electronics Co. Ltd. |
695,800 |
87,166,166 |
|
|
Samsung Heavy Industries Ltd. (a) |
1,231,700 |
3,833,159 |
|
|
SK Telecom Co. Ltd. sponsored ADR |
461,700 |
11,571,356 |
|
|
TOTAL KOREA (SOUTH) |
136,125,675 |
||
|
Marshall Islands - 0.7% |
|||
|
Teekay Shipping Corp. |
856,200 |
32,000,475 |
|
|
Mexico - 1.8% |
|||
|
Grupo Televisa SA de CV |
216,400 |
11,712,650 |
|
|
Telefonos de Mexico SA de CV Series L sponsored ADR |
647,980 |
34,950,421 |
|
|
TV Azteca SA de CV sponsored ADR |
3,109,600 |
38,870,000 |
|
|
TOTAL MEXICO |
85,533,071 |
||
|
Netherlands - 5.6% |
|||
|
ABN AMRO Holding NV |
761,500 |
17,645,661 |
|
|
Akzo Nobel NV |
464,200 |
21,138,795 |
|
|
Heineken NV |
176,200 |
9,571,748 |
|
|
ING Groep NV (Certificaten |
797,382 |
54,768,100 |
|
|
Koninklijke Ahold NV |
1,578,519 |
45,862,960 |
|
|
Koninklijke Philips Electronics NV |
407,803 |
16,029,891 |
|
|
Nutreco Holding NV |
235,122 |
10,138,235 |
|
|
Royal Dutch Petroleum Co. |
403,300 |
23,945,939 |
|
|
Unilever NV (Certificaten |
606,300 |
30,414,482 |
|
|
United Pan-Europe Communications NV Class A (a) |
678,500 |
11,892,558 |
|
|
Vendex KBB NV |
1,087,600 |
13,644,229 |
|
|
VNU NV |
204,300 |
9,684,940 |
|
|
Wolters Kluwer NV (Certificaten |
445,700 |
10,032,785 |
|
|
TOTAL NETHERLANDS |
274,770,323 |
||
|
Norway - 1.8% |
|||
|
Bergesen dy ASA: |
|
|
|
|
(A Shares) |
1,232,850 |
24,545,550 |
|
|
(B Shares) |
1,021,450 |
18,687,742 |
|
|
|
|||
|
Shares |
Value (Note 1) |
||
|
DNB Holding ASA |
3,850,282 |
$ 16,698,920 |
|
|
Frontline Ltd. (a) |
1,651,500 |
27,193,231 |
|
|
TOTAL NORWAY |
87,125,443 |
||
|
Singapore - 0.3% |
|||
|
Overseas Union Bank Ltd. |
1,616,771 |
7,832,746 |
|
|
United Overseas Bank Ltd. |
962,368 |
7,130,683 |
|
|
TOTAL SINGAPORE |
14,963,429 |
||
|
Spain - 2.5% |
|||
|
Altadis SA |
461,007 |
6,906,493 |
|
|
Banco Santander Central Hispano SA |
4,463,216 |
43,263,274 |
|
|
Telefonica SA (a) |
3,736,400 |
71,262,624 |
|
|
TOTAL SPAIN |
121,432,391 |
||
|
Sweden - 1.5% |
|||
|
Telefonaktiebolaget LM Ericsson |
5,115,000 |
70,970,628 |
|
|
Switzerland - 6.2% |
|||
|
Credit Suisse Group (Reg.) |
327,110 |
61,327,438 |
|
|
Julius Baer Holding AG |
2,282 |
11,298,915 |
|
|
Nestle SA (Reg.) |
49,460 |
102,497,079 |
|
|
Novartis AG (Reg.) |
17,164 |
26,039,626 |
|
|
The Swatch Group AG (Reg.) |
100,500 |
27,340,473 |
|
|
UBS AG |
196,522 |
27,223,354 |
|
|
Zurich Financial Services Group AG |
90,246 |
43,679,566 |
|
|
TOTAL SWITZERLAND |
299,406,451 |
||
|
Taiwan - 0.7% |
|||
|
Taiwan Semiconductor Manufacturing Co. Ltd. (a) |
7,043,152 |
21,369,315 |
|
|
United Microelectronics Corp. (a) |
8,501,800 |
15,003,176 |
|
|
TOTAL TAIWAN |
36,372,491 |
||
|
United Kingdom - 14.5% |
|||
|
Amvescap PLC |
999,100 |
22,305,287 |
|
|
AstraZeneca Group PLC |
250,400 |
11,940,951 |
|
|
BAE Systems PLC |
2,998,274 |
17,016,930 |
|
|
Barclays PLC |
483,500 |
13,822,339 |
|
|
BBA Group PLC |
1,067,400 |
5,856,946 |
|
|
Billiton PLC |
3,108,100 |
11,850,287 |
|
|
BP Amoco PLC |
4,865,564 |
41,306,635 |
|
|
British Telecommunications PLC |
2,312,600 |
27,519,924 |
|
|
Cable & Wireless PLC |
923,000 |
13,046,213 |
|
|
Carlton Communications PLC |
1,919,103 |
15,440,786 |
|
|
Diageo PLC |
1,142,200 |
10,771,287 |
|
|
Glaxo Wellcome PLC |
1,075,800 |
31,299,060 |
|
|
Granada Compass PLC (a) |
1,001,260 |
8,622,068 |
|
|
HSBC Holdings PLC (Reg.) |
1,803,688 |
26,009,193 |
|
|
Lloyds TSB Group PLC |
4,413,400 |
44,914,704 |
|
|
Marconi PLC |
638,300 |
8,050,489 |
|
|
Misys PLC |
1,377,500 |
14,338,185 |
|
|
Reed International PLC |
1,007,800 |
9,306,619 |
|
|
Common Stocks - continued |
|||
|
Shares |
Value (Note 1) |
||
|
United Kingdom - continued |
|||
|
Reuters Group PLC |
1,712,400 |
$ 33,641,514 |
|
|
Rio Tinto PLC (Reg. D) |
1,735,400 |
28,051,275 |
|
|
Royal Bank of Scotland Group PLC |
2,540,900 |
56,984,406 |
|
|
SMG PLC |
1,480,800 |
5,796,133 |
|
|
SmithKline Beecham PLC |
3,332,744 |
43,450,650 |
|
|
SSL International PLC |
842,715 |
9,804,014 |
|
|
Unilever PLC |
499,600 |
3,481,588 |
|
|
Vodafone Group PLC |
42,480,503 |
180,807,501 |
|
|
WPP Group PLC |
836,900 |
11,222,599 |
|
|
TOTAL UNITED KINGDOM |
706,657,583 |
||
|
United States of America - 3.5% |
|||
|
Bristol-Myers Squibb Co. |
620,500 |
37,811,719 |
|
|
Eli Lilly & Co. |
219,900 |
19,653,563 |
|
|
OMI Corp. (a) |
1,067,600 |
7,406,475 |
|
|
Overseas Shipholding Group, Inc. |
955,100 |
22,922,400 |
|
|
Pfizer, Inc. |
554,000 |
23,925,875 |
|
|
Schering-Plough Corp. |
620,500 |
32,072,094 |
|
|
VoiceStream Wireless Corp. (a) |
187,200 |
24,616,800 |
|
|
TOTAL UNITED STATES OF AMERICA |
168,408,926 |
||
|
TOTAL COMMON STOCKS (Cost $3,984,796,573) |
4,497,905,815 |
||
|
Investment Companies - 0.1% |
|||
|
|
|
|
|
|
Multi-National - 0.1% |
|||
|
European Warrant Fund, Inc. |
358,800 |
4,798,950 |
|
|
Convertible Bonds - 0.2% |
|||||
|
Moody's Ratings (unaudited) |
Principal Amount |
|
|||
|
Hong Kong - 0.2% |
|||||
|
China Mobile (Hong Kong) Ltd. 2.25% 11/3/05 |
Baa2 |
|
$ 8,437,000 |
8,437,000 |
|
|
Government Obligations - 0.0% |
|||||
|
|
|||||
|
United States of America - 0.0% |
|||||
|
U.S. Treasury Bills, yield at date of purchase 6.14% to 6.16% 11/9/00 to 1/11/01 (c) |
- |
|
1,350,000 |
1,336,303 |
|
|
Cash Equivalents - 8.7% |
|||
|
Shares |
Value (Note 1) |
||
|
Fidelity Cash Central Fund, 6.61% (b) |
334,659,993 |
$ 334,659,993 |
|
|
Fidelity Securities Lending Cash Central Fund, 6.66% (b) |
90,530,960 |
90,530,960 |
|
|
TOTAL CASH EQUIVALENTS (Cost $425,190,953) |
425,190,953 |
||
|
TOTAL INVESTMENT PORTFOLIO - 101.6% (Cost $4,425,510,997) |
4,937,669,021 |
||
|
NET OTHER ASSETS - (1.6)% |
(78,796,689) |
||
|
NET ASSETS - 100% |
$ 4,858,872,332 |
||
|
Futures Contracts |
|||||
|
|
Expiration Date |
Underlying Face Amount at Value |
Unrealized Gain/(Loss) |
||
|
Purchased |
|||||
|
229 Nikkei 225 Index Contracts (Japan) |
Dec. 2000 |
$ 16,894,475 |
$ (1,919,249) |
||
|
|
|
The face value of futures purchased as a percentage of net assets - 0.3% |
|
Legend |
|
(a) Non-income producing |
|
(b) The rate quoted is the annualized seven-day yield of the fund at period end. A complete listing of the fund's holdings as of its most recent fiscal year end is available upon request. |
|
(c) Security or a portion of the security was pledged to cover margin requirements for futures contracts. At the period end, the value of securities pledged amounted to $1,236,977. |
|
Other Information |
|
Purchases and sales of securities, other than short-term securities, aggregated $6,886,877,600 and $6,481,927,910, respectively, of which long-term U.S. government and government agency obligations aggregated $0 and $8,889,972, respectively. |
|
The market value of futures contracts opened and closed during the period amounted to $68,814,959 and $79,501,955, respectively. |
|
The fund placed a portion of its portfolio transactions with brokerage firms which are affiliates of Fidelity Management & Research Company. The commissions paid to these affiliated firms were $50,036 for the period. |
|
The fund participated in the security lending program. At period end, the value of securities loaned amounted to $87,616,366. The fund received cash collateral of $90,530,960 which was invested in cash equivalents. |
|
Income Tax Information |
|
At October 31, 2000, the aggregate cost of investment securities for income tax purposes was $4,483,799,578. Net unrealized appreciation aggregated $453,869,443, of which $899,770,634 related to appreciated investment securities and $445,901,191 related to depreciated investment securities. |
|
The fund hereby designates approximately $211,373,000 as a capital gain dividend for the purpose of the dividend paid deduction. |
See accompanying notes which are an integral part of the financial statements.
Annual Report
Overseas
Statement of Assets and Liabilities
|
|
October 31, 2000 |
|
|
Assets |
|
|
|
Investment in securities, at value |
|
$ 4,937,669,021 |
|
Cash |
|
819,841 |
|
Foreign currency held at value |
|
1,499,580 |
|
Receivable for investments sold |
|
137,465,801 |
|
Receivable for fund shares sold |
|
6,146,634 |
|
Dividends receivable |
|
6,933,601 |
|
Interest receivable |
|
2,112,459 |
|
Redemption fees receivable |
|
424 |
|
Receivable for daily variation |
|
257,625 |
|
Other receivables |
|
73,507 |
|
Total assets |
|
5,092,978,493 |
|
Liabilities |
|
|
|
Payable for investments purchased |
$ 67,424,405 |
|
|
Payable for fund shares redeemed |
71,073,598 |
|
|
Accrued management fee |
3,391,167 |
|
|
Other payables and |
1,686,031 |
|
|
Collateral on securities loaned, |
90,530,960 |
|
|
Total liabilities |
|
234,106,161 |
|
Net Assets |
|
$ 4,858,872,332 |
|
Net Assets consist of: |
|
|
|
Paid in capital |
|
$ 3,738,870,928 |
|
Undistributed net investment income |
|
173,948,754 |
|
Accumulated undistributed net realized gain (loss) on investments and foreign currency transactions |
|
436,266,548 |
|
Net unrealized appreciation (depreciation) on investments |
|
509,786,102 |
|
Net Assets, for 119,332,718 |
|
$ 4,858,872,332 |
|
Net Asset Value, offering price |
|
$40.72 |
Statement of Operations
|
|
Year ended October 31, 2000 |
|
|
Investment Income Dividends |
|
$ 65,342,578 |
|
Special dividend from BCE, Inc. |
|
9,941,395 |
|
Interest |
|
22,911,579 |
|
Security lending |
|
1,099,571 |
|
|
|
99,295,123 |
|
Less foreign taxes withheld |
|
(8,093,645) |
|
Total income |
|
91,201,478 |
|
Expenses |
|
|
|
Management fee |
$ 38,664,401 |
|
|
Performance adjustment |
7,690,792 |
|
|
Transfer agent fees |
12,536,330 |
|
|
Accounting and security lending fees |
1,470,005 |
|
|
Non-interested trustees' compensation |
22,808 |
|
|
Custodian fees and expenses |
2,356,616 |
|
|
Registration fees |
546,385 |
|
|
Audit |
80,388 |
|
|
Legal |
84,741 |
|
|
Miscellaneous |
13,905 |
|
|
Total expenses before reductions |
63,466,371 |
|
|
Expense reductions |
(1,476,835) |
61,989,536 |
|
Net investment income |
|
29,211,942 |
|
Realized and Unrealized Gain (Loss) Net realized gain (loss) on: |
|
|
|
Investment securities |
615,283,655 |
|
|
Foreign currency transactions |
(2,865,909) |
|
|
Futures contracts |
3,568,967 |
615,986,713 |
|
Change in net unrealized appreciation (depreciation) on: |
|
|
|
Investment securities |
(601,229,336) |
|
|
Assets and liabilities in |
(607,103) |
|
|
Futures contracts |
(2,899,547) |
(604,735,986) |
|
Net gain (loss) |
|
11,250,727 |
|
Net increase (decrease) in net assets resulting from operations |
|
$ 40,462,669 |
|
Other Information |
|
|
|
Expense reductions |
|
|
|
Directed brokerage arrangements |
|
$ 1,005,254 |
|
Custodian credits |
|
11,270 |
|
Transfer agent credits |
|
460,311 |
|
|
|
$ 1,476,835 |
See accompanying notes which are an integral part of the financial statements.
Annual Report
Overseas
Financial Statements - continued
Statement of Changes in Net Assets
|
Increase (Decrease) in Net Assets |
Year ended
October 31, |
Year ended
October 31, |
|
Operations |
$ 29,211,942 |
$ 33,841,819 |
|
Net realized gain (loss) |
615,986,713 |
434,643,138 |
|
Change in net unrealized appreciation (depreciation) |
(604,735,986) |
551,091,234 |
|
Net increase (decrease) in net assets resulting from operations |
40,462,669 |
1,019,576,191 |
|
Distributions to shareholders |
(47,126,436) |
(20,938,368) |
|
From net realized gain |
(278,387,415) |
(53,392,648) |
|
Total distributions |
(325,513,851) |
(74,331,016) |
|
Share transactions |
4,212,606,710 |
4,000,168,797 |
|
Reinvestment of distributions |
314,528,983 |
71,180,520 |
|
Cost of shares redeemed |
(3,865,639,267) |
(4,137,892,605) |
|
Net increase (decrease) in net assets resulting from share transactions |
661,496,426 |
(66,543,288) |
|
Redemption fees |
382,953 |
- |
|
Total increase (decrease) in net assets |
376,828,197 |
878,701,887 |
|
Net Assets |
|
|
|
Beginning of period |
4,482,044,135 |
3,603,342,248 |
|
End of period (including undistributed net investment income of $173,948,754 and $45,498,123, respectively) |
$ 4,858,872,332 |
$ 4,482,044,135 |
|
Other Information Shares |
|
|
|
Sold |
92,180,970 |
105,210,288 |
|
Issued in reinvestment of distributions |
7,233,877 |
2,054,834 |
|
Redeemed |
(84,695,977) |
(108,778,783) |
|
Net increase (decrease) |
14,718,870 |
(1,513,661) |
Financial Highlights
|
Years ended October 31, |
2000 |
1999 |
1998 |
1997 |
1996 |
|
Selected Per-Share Data |
|
|
|
|
|
|
Net asset value, beginning of period |
$ 42.84 |
$ 33.95 |
$ 34.12 |
$ 31.08 |
$ 28.57 |
|
Income from Investment Operations |
|
|
|
|
|
|
Net investment income |
.25 B, E |
.32 B |
.29 B |
.43 B |
.48 C |
|
Net realized and unrealized gain (loss) |
.71 |
9.28 |
1.22 |
4.61 |
2.72 |
|
Total from investment operations |
.96 |
9.60 |
1.51 |
5.04 |
3.20 |
|
Less Distributions |
|
|
|
|
|
|
From net investment income |
(.45) F |
(.20) |
(.34) |
(.37) |
(.34) |
|
From net realized gain |
(2.63) F |
(.51) |
(1.34) |
(1.63) |
(.35) |
|
Total distributions |
(3.08) |
(.71) |
(1.68) |
(2.00) |
(.69) |
|
Net asset value, end of period |
$ 40.72 |
$ 42.84 |
$ 33.95 |
$ 34.12 |
$ 31.08 |
|
Total Return A |
1.78% |
28.77% |
4.60% |
17.03% |
11.41% |
|
Ratios and Supplemental Data |
|
|
|
|
|
|
Net assets, end of period (000 omitted) |
$ 4,858,872 |
$ 4,482,044 |
$ 3,603,342 |
$ 3,777,452 |
$ 3,114,625 |
|
Ratio of expenses to average net assets |
1.19% |
1.27% |
1.26% |
1.23% |
1.14% |
|
Ratio of expenses to average net assets after expense reductions |
1.16% D |
1.23% D |
1.24% D |
1.20% D |
1.12% D |
|
Ratio of net investment income to average net assets |
.55% |
.85% |
.82% |
1.28% |
1.74% |
|
Portfolio turnover rate |
132% |
85% |
69% |
68% |
82% |
|
A The total returns would have been lower had certain expenses not been reduced during the periods shown. B Net investment income per share has been calculated based on average shares outstanding during the period. C Investment income per share reflects a special dividend which amounted to $.08 per share. D FMR or the fund has entered into varying arrangements with third parties who either paid or reduced a portion of the fund's expenses. E Investment income per share reflects a special dividend (from BCE, Inc.) which amounted to $.08 per share. F The amounts shown reflect reclassifications related to book to tax differences. |
|||||
See accompanying notes which are an integral part of the financial statements.
Annual Report
There are several ways to evaluate a fund's historical performance. You can look at the total percentage change in value, the average annual percentage change or the growth of a hypothetical $10,000 investment. Total return reflects the change in the value of an investment, assuming reinvestment of the fund's dividend income and capital gains (the profits earned upon the sale of securities that have grown in value).
Cumulative Total Returns
|
Periods ended October 31, 2000 |
Past 1 |
Past 5 |
Past 10 |
|
Fidelity Worldwide |
9.80% |
82.40% |
206.85% |
|
MSCI World |
1.09% |
97.65% |
224.56% |
|
Global Funds Average |
10.26% |
103.97% |
232.76% |
Cumulative total returns show the fund's performance in percentage terms over a set period - in this case, one year, five years or 10 years. For example, if you had invested $1,000 in a fund that had a 5% return over the past year, the value of your investment would be $1,050. You can compare the fund's returns to the performance of the Morgan Stanley Capital International World Index - a market capitalization-weighted index that is designed to represent the performance of developed stock markets throughout the world. As of October 31, 2000, the index included over 1,320 equity securities of companies domiciled in 22 countries. To measure how the fund's performance stacked up against its peers, you can compare it to the global funds average, which reflects the performance of mutual funds with similar objectives tracked by Lipper Inc. The past one year average represents a peer group of 261 mutual funds. These benchmarks include reinvested dividends and capital gains, if any, and exclude the effect of sales charges.
Average Annual Total Returns
|
Periods ended October 31, 2000 |
Past 1 |
Past 5 |
Past 10 |
|
Fidelity Worldwide |
9.80% |
12.77% |
11.86% |
|
MSCI World |
1.09% |
14.60% |
12.49% |
|
Global Funds Average |
10.26% |
14.81% |
12.49% |
Average annual total returns take the fund's cumulative return and show you what would have happened if the fund had performed at a constant rate each year.
$10,000 Over 10 Years

$10,000 Over 10 Years: Let's say hypothetically that $10,000 was invested in Fidelity Worldwide Fund on October 31, 1990. As the chart shows, by October 31, 2000, the value of the investment would have grown to $30,685 - a 206.85% increase on the initial investment. For comparison, look at how the Morgan Stanley Capital International World Index did over the same period. With dividends and capital gains, if any, reinvested, the same $10,000 would have grown to $32,456 - a 224.56% increase.
Understanding Performance
Many markets around the globe offer the potential for significant growth over time; however, investing in foreign markets means assuming greater risks than investing in the United States. Factors like changes in a country's financial markets, its local political and economic climate, and the fluctuating value of its currency create these risks. For these reasons an international fund's performance may be more volatile than a fund that invests exclusively in the United States. Past performance is no guarantee of future results and you may have a gain or loss when you sell your shares.
3Annual Report
(Portfolio Manager photograph)
(Portfolio Manager photograph)
An interview with Penny Dobkin (right), Lead Portfolio Manager of Fidelity Worldwide Fund, and Doug Chase, Manager of the fund's U.S. equity subportfolio
Q. How did the fund perform, Penny?
P.D. For the 12 months that ended October 31, 2000, the fund returned 9.80%, well ahead of the 1.09% return of the Morgan Stanley Capital International World Index but slightly trailing the 10.26% return of the global funds average monitored by Lipper Inc.
Q. What helped the fund outperform its benchmark index?
P.D. From November through February, a modest overweighting in technology helped the fund outperform the index, as did favorable stock selection in the U.S., Japan and Germany. During this time, technology, media and telecommunications (TMT) stocks staged a strong but extremely narrow rally during which valuations in those sectors reached unsustainable levels. Many of the fund's peers carried heavier weightings of TMT stocks than the fund did, causing it to fall behind the Lipper average. A completely different market emerged following the bursting of the speculative TMT bubble. Investors refocused their attention on fundamental factors such as earnings growth potential. During the second half of the period, the fund's overweightings in health care, energy services and consumer nondurables proved helpful, as did stock selection in the telecommunications and media sectors. On a country basis, the fund's increasing weighting in U.S. stocks was helpful, as was underweighting the weak Japanese market. From April through October, the fund gained ground on the Lipper average but not enough to overtake it for the entire 12-month period.
Q. Can you explain further about adjustments you made during the second half of the period?
P.D. Following the Federal Reserve Board's series of interest-rate hikes, which ended in May, investors began to sense that the U.S. economy would slow. A slowing economy is perceived to be bad for growth stocks, so we witnessed a rotation out of technology and into defensive market sectors - health care, consumer nondurables and the like. This rotation occurred abroad as well as in the U.S. I had begun to increase the fund's non-U.S. health care exposure around the beginning of the year and continued to do so as opportunities presented themselves - primarily through investments in pharmaceutical and medical equipment stocks. Energy services was another sector in which I increased the fund's allocation. My rationale in that case was that higher energy prices would continue to stimulate healthy demand for drilling and other services offered by energy services companies. Finally, I responded to the relatively favorable valuations for U.S. stocks by raising the fund's U.S. exposure and reducing its allocations of European and Japanese stocks.
Q. Turning to you, Doug, how did you manage the fund's U.S. holdings?
D.C. My strategy mirrored Penny's. The market's narrow emphasis on TMT stocks early in the period created some incredible bargains in other sectors. Although broadly based measures of market activity such as the Standard & Poor's 500 Index have moved in a broad trading range since April, we saw some clear winners and losers in individual sectors. For the most part the winners were the defensive sectors, and those are the sectors in which I increased the fund's exposure during the period. To give you some idea of how skewed the valuations were early in the period, the technology-heavy NASDAQ Composite Index had an average price-to-earnings ratio (P/E) of over 100 when the market peaked last March. On the other hand, the median P/E for the S&P 500 ® - that is, the P/E in the middle of the range of P/E's for S&P 500 stocks - declined from around 20 in July 1999 to approximately 12 in March 2000. Investors wanted technology stocks but spurned almost everything else. That couldn't last indefinitely, and it didn't.
Q. Penny, what stocks performed well for the fund?
P.D. Furukawa Electric was one of the fund's top performers, as it was six months ago. With its expertise in wave division multiplexing (WDM), this Japanese company benefited from the enormous increase in spending by telecommunications companies to upgrade to fiber-optics networks, which employ WDM. WDM is seen as a key method of enabling telecommunications carriers to accommodate the surging volume of data communications. U.S.-based Avon Products, a household products and personal care stock that was virtually abandoned during the headlong rush into technology, bounced back nicely when investors realized that the company's earnings were growing at roughly 15%, compared with a modest P/E of about 12. Cardinal Health, a U.S. distributor of wholesale drugs and health care products, rebounded after declining in sympathy with other companies in its group that had less favorable prospects. Finally, French television broadcasting stock TF1 was helped by increased advertising revenues due in part to higher-quality programming.
Q. What stocks turned in disappointing performances?
P.D. The list of worst-performing stocks reads much the way it did six months ago. Heading the list was U.S. firm Healtheon/WebMD, an online medical processing firm and the operator of a consumer-oriented Web portal. The company's vision of being a clearinghouse for processing medical insurance claims did not develop as quickly as anticipated, due in part to resistance from HMOs and other health care providers. Another U.S. technology company, Web-hosting provider Navisite, failed to see growth materialize as expected. Pinnacle Systems, a U.S. creator of video broadcast content for professional and consumer audiences, fell in response to more intense competitive pressures and the resulting loss of pricing power. U.K cellular provider Vodafone Group - formerly Vodafone Airtouch - reflected the downward pressure on telecommunications stocks worldwide and concerns over the huge sums paid for third-generation(3G) cellular licenses.
Annual Report
Worldwide
Fund Talk: The Managers' Overview - continued
Q. What's your outlook, Penny?
P.D. I believe that the pessimism permeating the markets during the last two months of the period may have been overdone. Admittedly, a number of U.S. companies announced slower-than-expected third-quarter earnings growth or guided analysts to lower expectations for future quarters. However, most indications still point to moderate slowing with no recession in the U.S. In Europe, economic growth is respectable, and Japan appears to be continuing on its path of restructuring and renewal, albeit slowly. Worldwide demand for personal computers and cellular phones seems to be picking up again after weakening briefly. Overall, investors appear to be anticipating some fairly serious economic problems. If those problems don't materialize, we could see global stock markets snap back strongly.
The views expressed in this report reflect those of the portfolio managers only through the end of the period of the report as stated on the cover and do not necessarily represent the views of Fidelity or any other person in the Fidelity organization. Any such views are subject to change at any time based upon market or other conditions and Fidelity disclaims any responsibility to update such views. These views may not be relied on as investment advice and, because investment decisions for a Fidelity fund are based on numerous factors, may not be relied on as an indication of trading intent on behalf of any Fidelity fund.
Fund Facts
Goal: to provide long-term growth of capital by investing mainly in common stocks from around the world
Fund number: 318
Trading symbol: FWWFX
Start date: May 30, 1990
Size: as of October 31, 2000, more than $984 million
Managers: Penelope Dobkin, since inception; manager, Fidelity Europe Fund, 1986-1990; Fidelity United Kingdom Fund, 1987-1989; Fidelity Select Financial Services Portfolio, 1983-1986; joined Fidelity in 1980; Doug Chase, since 1999; manager, Fidelity Export and Multinational Fund, since February 2000; Fidelity Advisor Consumer Industries Fund, 1997-1999; several Fidelity Select Portfolios, 1994-1999; joined Fidelity in 1992
3Penny Dobkin on the relative valuations of U.S. and foreign stocks:
"The conventional wisdom is that investing abroad is desirable because the rest of the world is behind the U.S. in the percentage of individuals' net worth that is invested in the stock market. The theory is that as this discrepancy narrows over time and individuals in other countries embrace stocks as a long-term investment, as appears to be happening, foreign stocks will benefit relative to U.S. shares. Foreign stocks are therefore thought to be somewhat undervalued as a group compared with their U.S. counterparts. Indeed, that has frequently proven to be the case in recent years.
"During the past 12 months, however, Doug and I began to notice a higher-than-normal number of undervalued U.S. stocks in a variety of groups - pharmaceuticals, food, autos, retail and banks, among others. Part of the reason for this might be that many of these groups had been out of favor until recently, and the U.S. custom of reporting earnings on a quarterly basis - compared with the semiannual reporting schedule overseas - tends to sharpen the contrast between strong and weak companies. It could also be that U.S. investors are more short-term in their investment horizons and therefore less patient with out-of-favor stocks and more prone to chase those considered to be ´hot' at the moment.
"Whatever the explanation, I made the decision earlier in the year to raise the U.S. component of the fund. However, around the same time, U.S. stocks began outperforming their counterparts in other countries, thereby increasing the U.S. weighting in the fund's benchmark, the Morgan Stanley Capital International World Index. In fact, the percentage of U.S. stocks in the index rose sharply in the five months from June through October from around 47% to approximately 55%. As a result, merely keeping up with the index weighting was difficult. However, I did manage to maintain approximately a market weighting of U.S. stocks, and year to date this has been a positive influence on the fund's returns relative to its peers in the Lipper average."
Annual Report
Worldwide
|
Geographic Diversification (% of fund's net assets) |
|||
|
As of October 31, 2000 |
|||
|
United States of America |
55.2% |
|
|
Japan |
10.2% |
|
|
United Kingdom |
9.1% |
|
|
France |
6.0% |
|
|
Germany |
2.9% |
|
|
Netherlands |
2.7% |
|
|
Italy |
2.2% |
|
|
Hong Kong |
2.0% |
|
|
Finland |
1.8% |
|
|
Other |
7.9% |
|

|
|
|||
|
As of April 30, 2000 |
|||
|
United States of America |
51.1% |
|
|
Japan |
12.2% |
|
|
United Kingdom |
8.3% |
|
|
France |
6.1% |
|
|
Germany |
3.6% |
|
|
Netherlands |
2.7% |
|
|
Sweden |
2.4% |
|
|
Switzerland |
2.1% |
|
|
Italy |
1.7% |
|
|
Other |
9.8% |
|

|
Percentages are adjusted for the effect of futures contracts, if applicable. |
|
Asset Allocation |
||
|
|
% of fund's |
% of fund's net assets |
|
Stocks and Investment Companies |
96.5 |
88.1 |
|
Short-Term Investments |
3.5 |
11.9 |
|
Top Ten Stocks as of October 31, 2000 |
||
|
|
% of fund's |
% of fund's net assets |
|
Vodafone Group PLC |
3.0 |
2.9 |
|
Cisco Systems, Inc. |
2.8 |
0.7 |
|
Cardinal Health, Inc. (United States of America, Medical Equipment & Supplies) |
2.5 |
1.0 |
|
Bristol-Myers Squibb Co. |
2.3 |
0.9 |
|
General Electric Co. |
2.3 |
0.0 |
|
Pfizer, Inc. |
2.1 |
0.0 |
|
Avon Products, Inc. |
1.9 |
2.5 |
|
Compaq Computer Corp. |
1.7 |
0.8 |
|
Sonic Automotive, Inc. Class A (United States of America, Autos, Tires, & Accessories) |
1.4 |
1.4 |
|
Dell Computer Corp. |
1.3 |
0.0 |
|
|
21.3 |
10.2 |
|
Top Ten Market Sectors as of October 31, 2000 |
||
|
|
% of fund's |
% of fund's net assets |
|
Technology |
20.6 |
16.3 |
|
Finance |
15.5 |
9.2 |
|
Health |
13.8 |
8.2 |
|
Utilities |
9.4 |
12.9 |
|
Industrial Machinery & Equipment |
7.9 |
6.3 |
|
Nondurables |
7.1 |
8.3 |
|
Energy |
5.1 |
8.0 |
|
Durables |
4.0 |
4.9 |
|
Media & Leisure |
2.6 |
4.2 |
|
Basic Industries |
2.5 |
3.3 |
Annual Report
Worldwide
Showing Percentage of Net Assets
|
Common Stocks - 96.2% |
|||
|
Shares |
Value (Note 1) |
||
|
Australia - 0.1% |
|||
|
Cable & Wireless Optus Ltd. (a) |
292,300 |
$ 621,235 |
|
|
Publishing & Broadcasting Ltd. |
101,100 |
692,573 |
|
|
TOTAL AUSTRALIA |
1,313,808 |
||
|
Belgium - 0.1% |
|||
|
Electrabel SA |
3,500 |
760,228 |
|
|
Bermuda - 0.0% |
|||
|
Flag Telecom Holdings Ltd. |
10,000 |
116,250 |
|
|
Brazil - 0.5% |
|||
|
Companhia de Bebidas das Americas (AmBev) sponsored ADR |
204,500 |
4,614,031 |
|
|
Canada - 0.4% |
|||
|
Anderson Exploration Ltd. (a) |
5,200 |
95,632 |
|
|
Canadian National Railway Co. |
66,600 |
2,099,704 |
|
|
GT Group Telecom, Inc. Class B (non-vtg.) |
7,000 |
68,276 |
|
|
Sun Life Financial Services Canada, Inc. |
85,000 |
1,758,621 |
|
|
TOTAL CANADA |
4,022,233 |
||
|
Denmark - 0.1% |
|||
|
Sophus Berendsen AS (A Shares) |
36,200 |
681,441 |
|
|
Finland - 1.8% |
|||
|
Metsa-Serla Oyj (B Shares) |
191,900 |
1,205,347 |
|
|
Metso Oyj |
70,800 |
540,855 |
|
|
Nokia AB sponsored ADR |
211,200 |
9,028,800 |
|
|
Sampo Insurance Co. Ltd. (A Shares) |
116,800 |
4,758,712 |
|
|
UPM-Kymmene Corp. |
80,500 |
2,278,752 |
|
|
TOTAL FINLAND |
17,812,466 |
||
|
France - 6.0% |
|||
|
Access Commerce SA |
7,100 |
142,225 |
|
|
Alcatel SA sponsored ADR |
94,000 |
5,863,250 |
|
|
Aventis SA (France) |
50,000 |
3,603,125 |
|
|
AXA SA de CV |
40,500 |
5,362,718 |
|
|
BNP Paribas SA |
47,685 |
4,112,263 |
|
|
France Telecom SA |
52,000 |
5,437,752 |
|
|
Havas Advertising SA (a) |
36,000 |
580,274 |
|
|
Pernod-Ricard |
54,300 |
2,488,851 |
|
|
Rhodia SA |
149,800 |
1,874,195 |
|
|
Sanofi-Synthelabo SA |
44,280 |
2,330,262 |
|
|
Societe Generale Class A (a) |
28,800 |
1,635,400 |
|
|
TotalFinaElf SA Class B |
80,037 |
11,465,300 |
|
|
Transiciel SA (a) |
26,400 |
1,294,080 |
|
|
Vivendi Environment (a) |
275,000 |
10,270,480 |
|
|
Vivendi SA |
40,000 |
2,875,734 |
|
|
TOTAL FRANCE |
59,335,909 |
||
|
Germany - 2.7% |
|||
|
BASF AG |
59,500 |
2,333,266 |
|
|
Bayerische Hypo-und Vereinsbank AG |
50,600 |
2,780,966 |
|
|
Deutsche Telekom AG |
114,200 |
4,289,283 |
|
|
Fresenius Medical Care AG |
36,200 |
2,881,230 |
|
|
Hannover Rueckversicherungs AG |
20,100 |
1,690,733 |
|
|
|
|||
|
Shares |
Value (Note 1) |
||
|
Kali Und Salz Beteiligungs AG |
106,000 |
$ 1,529,538 |
|
|
Moebel Walther AG |
34,000 |
343,713 |
|
|
Muenchener Ruckversicherungs-Gesellschaft AG (Reg.) |
9,600 |
3,019,012 |
|
|
Primacom AG (a) |
29,000 |
568,365 |
|
|
SAP AG sponsored ADR |
47,700 |
2,432,700 |
|
|
Schering AG (a) |
10,100 |
565,810 |
|
|
Siemens AG |
19,800 |
2,521,776 |
|
|
Software AG |
10,500 |
752,207 |
|
|
United Internet AG (a) |
32,882 |
211,560 |
|
|
WEB.DE AG |
54,500 |
846,551 |
|
|
TOTAL GERMANY |
26,766,710 |
||
|
Hong Kong - 2.0% |
|||
|
Asat Holdings Ltd. sponsored ADR |
190,600 |
1,262,725 |
|
|
Cathay Pacific Airways Ltd. |
436,000 |
791,157 |
|
|
China Mobile (Hong Kong) Ltd. (a) |
504,000 |
3,087,000 |
|
|
China Mobile (Hong Kong) Ltd. sponsored ADR (a) |
25,000 |
765,625 |
|
|
China Unicom Ltd. sponsored ADR (a) |
275,000 |
5,637,500 |
|
|
Citic Pacific Ltd. |
276,000 |
1,107,830 |
|
|
Hutchison Whampoa Ltd. |
444,000 |
5,508,755 |
|
|
Sun Hung Kai Properties Ltd. |
198,000 |
1,637,738 |
|
|
TOTAL HONG KONG |
19,798,330 |
||
|
Ireland - 0.2% |
|||
|
Bank of Ireland, Inc. |
192,400 |
1,482,847 |
|
|
Riverdeep Group PLC sponsored ADR |
5,600 |
124,600 |
|
|
TOTAL IRELAND |
1,607,447 |
||
|
Italy - 2.1% |
|||
|
Alleanza Assicurazioni Spa |
71,100 |
939,403 |
|
|
Banca Intesa Spa |
876,200 |
3,662,814 |
|
|
Banca Nazionale del Lavoro (BNL) |
317,200 |
1,023,110 |
|
|
Banca Popolare di Verona |
78,700 |
873,284 |
|
|
Luxottica Group Spa sponsored ADR |
119,800 |
1,729,613 |
|
|
Marzotto Spa |
136,900 |
1,328,407 |
|
|
Parmalat Finanziaria Spa |
1,601,800 |
2,316,772 |
|
|
Telecom Italia Mobile Spa |
119,100 |
1,013,448 |
|
|
Telecom Italia Spa |
703,500 |
8,266,123 |
|
|
TOTAL ITALY |
21,152,974 |
||
|
Japan - 10.2% |
|||
|
Advan Co. Ltd. |
51,800 |
712,125 |
|
|
Bank of Tokyo-Mitsubishi Ltd. |
33,000 |
395,903 |
|
|
Chukyo Coca-Cola Bottling Co. Ltd. |
44,000 |
363,340 |
|
|
Dainippon Pharmaceutical Co. |
64,000 |
820,603 |
|
|
Daiwa Securities Group, Inc. |
89,000 |
986,170 |
|
|
Fujikura Ltd. |
153,000 |
1,348,969 |
|
|
Fujitsu Ltd. |
146,000 |
2,601,265 |
|
|
Furukawa Electric Co. Ltd. |
305,000 |
8,022,638 |
|
|
Hitachi Chemical Co. Ltd. |
47,000 |
1,180,277 |
|
|
Hitachi Zosen Corp. (a) |
1,509,000 |
1,147,897 |
|
|
Hogy Medical Co. |
15,800 |
1,013,656 |
|
|
Common Stocks - continued |
|||
|
Shares |
Value (Note 1) |
||
|
Japan - continued |
|||
|
Hokkaido Coca-Cola Bottling Co. Ltd. |
57,000 |
$ 470,168 |
|
|
Japan Medical Dynamic Marketing, Inc. |
37,000 |
1,224,177 |
|
|
Koa Corp. |
58,000 |
1,302,355 |
|
|
Kokusai Securities Co. Ltd. |
35,000 |
295,115 |
|
|
Konica Corp. (a) |
508,000 |
3,924,883 |
|
|
Kyocera Corp. |
70,000 |
9,362,500 |
|
|
Mikasa Coca Cola Bottling Co. |
74,000 |
573,091 |
|
|
Minolta Co. Ltd. |
412,000 |
1,827,587 |
|
|
Mitsubishi Electric Corp. |
220,000 |
1,580,790 |
|
|
Mitsubishi Estate Co. Ltd. (a) |
127,000 |
1,350,197 |
|
|
Mitsui Fudosan Co. Ltd. |
63,000 |
763,321 |
|
|
Mitsumi Electric Co. Ltd. |
109,000 |
3,596,371 |
|
|
Mizuho Holdings, Inc. |
271 |
2,083,851 |
|
|
Murata Manufacturing Co. Ltd. |
17,100 |
2,046,797 |
|
|
Namco Ltd. |
51,400 |
1,328,458 |
|
|
NEC Corp. |
94,000 |
1,791,953 |
|
|
Nichicon Corp. |
115,000 |
2,054,211 |
|
|
Nikko Securities Co. Ltd. |
255,000 |
2,201,540 |
|
|
Nikon Corp. |
62,000 |
901,219 |
|
|
Nippon Telegraph & Telephone Corp. |
392 |
3,567,556 |
|
|
Nippon Thompson Co. Ltd. |
135,000 |
1,330,080 |
|
|
Nomura Securities Co. Ltd. |
70,000 |
1,485,198 |
|
|
Oki Electric Industry Co. Ltd. (a) |
272,000 |
1,617,890 |
|
|
Omron Corp. |
59,000 |
1,454,587 |
|
|
ORIX Corp. |
17,400 |
1,825,956 |
|
|
Pioneer Corp. |
39,000 |
1,208,139 |
|
|
Sakura Bank Ltd. |
200,000 |
1,457,245 |
|
|
Sanwa Bank Ltd. |
109,000 |
969,022 |
|
|
Shikoku Coca-Cola Bottling Co. Ltd. |
50,000 |
407,845 |
|
|
Shinko Securities Co. Ltd. |
397,000 |
1,207,992 |
|
|
SKY Perfect Communications, Inc. (a) |
41 |
75,529 |
|
|
Softbank Corp. |
22,200 |
1,332,692 |
|
|
Sony Corp. |
56,000 |
4,648,000 |
|
|
Sumitomo Electric Industries Ltd. |
87,000 |
1,606,681 |
|
|
Takeda Chemical Industries Ltd. |
90,000 |
5,930,712 |
|
|
Tokyo Broadcasting System, Inc. |
40,000 |
1,565,393 |
|
|
Tokyo Electron Ltd. |
28,100 |
2,199,377 |
|
|
Toyota Motor Corp. |
23,000 |
919,073 |
|
|
Trans Cosmos, Inc. |
800 |
57,850 |
|
|
Tsubaki Nakashima Co. Ltd. |
27,000 |
338,273 |
|
|
Yakult Honsha Co. Ltd. |
128,000 |
1,459,371 |
|
|
Yamada Denki Co. Ltd. |
27,000 |
2,375,584 |
|
|
Yamanouchi Pharmaceutical Co. Ltd. |
60,000 |
2,716,525 |
|
|
Yokogawa Electric Corp. |
158,000 |
1,239,556 |
|
|
TOTAL JAPAN |
100,267,553 |
||
|
Korea (South) - 0.5% |
|||
|
Hyundai Electronics Industries Co. Ltd. (a) |
158,000 |
970,919 |
|
|
Samsung Electronics Co. Ltd. |
29,120 |
3,648,001 |
|
|
TOTAL KOREA (SOUTH) |
4,618,920 |
||
|
|
|||
|
Shares |
Value (Note 1) |
||
|
Luxembourg - 0.3% |
|||
|
Metro International SA: |
|
|
|
|
Swedish Depositary Receipt (A Shares) (a) |
10,500 |
$ 108,182 |
|
|
Swedish Depositary Receipt (B Shares) (a) |
24,500 |
296,539 |
|
|
RTL Group |
24,400 |
2,112,493 |
|
|
Stolt Offshore SA (a) |
75,000 |
895,313 |
|
|
TOTAL LUXEMBOURG |
3,412,527 |
||
|
Marshall Islands - 0.1% |
|||
|
Teekay Shipping Corp. |
35,300 |
1,319,338 |
|
|
Mexico - 0.6% |
|||
|
Grupo Televisa SA de CV |
23,400 |
1,266,525 |
|
|
Telefonos de Mexico SA de CV Series L sponsored ADR |
52,000 |
2,804,750 |
|
|
Tubos de Acero de Mexico SA |
68,100 |
1,035,801 |
|
|
Wal-Mart de Mexico SA de CV |
444,000 |
1,004,609 |
|
|
TOTAL MEXICO |
6,111,685 |
||
|
Netherlands - 2.7% |
|||
|
Akzo Nobel NV |
9,300 |
423,505 |
|
|
ASM Lithography Holding NV (a) |
75,000 |
2,085,938 |
|
|
Draka Holding NV |
9,200 |
538,428 |
|
|
IHC Caland NV |
38,100 |
1,681,643 |
|
|
ING Groep NV (Certificaten Van Aandelen) |
67,900 |
4,663,704 |
|
|
Koninklijke Ahold NV |
184,611 |
5,363,766 |
|
|
Koninklijke Philips Electronics NV |
171,108 |
6,725,901 |
|
|
Royal Dutch Petroleum Co. (NY Shares) |
42,600 |
2,529,375 |
|
|
United Pan-Europe Communications NV Class A (a) |
63,000 |
1,104,246 |
|
|
Vendex KBB NV |
103,800 |
1,302,198 |
|
|
Wegener NV |
14,200 |
167,536 |
|
|
TOTAL NETHERLANDS |
26,586,240 |
||
|
Norway - 1.0% |
|||
|
Bergesen dy ASA (A Shares) |
130,400 |
2,596,212 |
|
|
DNB Holding ASA |
746,900 |
3,239,353 |
|
|
Frontline Ltd. (a) |
67,600 |
1,113,087 |
|
|
Petroleum Geo-Services ASA (a) |
103,300 |
1,422,988 |
|
|
TANDBERG ASA (a) |
51,700 |
1,368,726 |
|
|
TOTAL NORWAY |
9,740,366 |
||
|
Singapore - 0.8% |
|||
|
Chartered Semiconductor Manufacturing Ltd. ADR |
27,500 |
1,278,750 |
|
|
Keppel Land Ltd. |
677,000 |
1,010,966 |
|
|
Overseas Union Bank Ltd. |
206,800 |
1,001,881 |
|
|
Parkway Holdings Ltd. |
621,000 |
1,274,209 |
|
|
United Overseas Bank Ltd. |
455,000 |
3,371,331 |
|
|
TOTAL SINGAPORE |
7,937,137 |
||
|
Common Stocks - continued |
|||
|
Shares |
Value (Note 1) |
||
|
Spain - 0.7% |
|||
|
Banco Santander Central Hispano SA |
187,400 |
$ 1,816,524 |
|
|
Telefonica SA (a) |
252,084 |
4,807,881 |
|
|
TOTAL SPAIN |
6,624,405 |
||
|
Sweden - 0.6% |
|||
|
Modern Times Group AB (MTG) (B Shares) (a) |
35,000 |
892,768 |
|
|
Securitas AB (B Shares) |
45,400 |
967,310 |
|
|
Telefonaktiebolaget LM Ericsson sponsored ADR |
260,000 |
3,607,500 |
|
|
TOTAL SWEDEN |
5,467,578 |
||
|
Switzerland - 1.2% |
|||
|
Credit Suisse Group (Reg.) |
13,500 |
2,531,015 |
|
|
Nestle SA (Reg.) |
927 |
1,921,043 |
|
|
UBS AG |
9,000 |
1,246,732 |
|
|
Valora Holding AG |
7,475 |
1,519,951 |
|
|
Zurich Financial Services Group AG |
9,730 |
4,709,374 |
|
|
TOTAL SWITZERLAND |
11,928,115 |
||
|
Taiwan - 0.6% |
|||
|
Siliconware Precision |
1,089,840 |
830,033 |
|
|
Taiwan Semiconductor |
1,116,560 |
3,387,705 |
|
|
United Microelectronics Corp. (a) |
1,101,600 |
1,944,000 |
|
|
TOTAL TAIWAN |
6,161,738 |
||
|
Turkey - 0.1% |
|||
|
Yapi ve Kredi Bankasi AS (a) |
108,049,700 |
934,565 |
|
|
United Kingdom - 9.1% |
|||
|
Amvescap PLC |
50,000 |
1,116,269 |
|
|
Antofagasta Holdings PLC |
87,800 |
520,208 |
|
|
BAE Systems PLC |
379,200 |
2,152,178 |
|
|
Bank of Scotland |
286,500 |
2,670,630 |
|
|
Barclays PLC |
45,800 |
1,309,334 |
|
|
BBA Group PLC |
310,000 |
1,701,005 |
|
|
Billiton PLC |
470,500 |
1,793,881 |
|
|
BP Amoco PLC sponsored ADR |
147,032 |
7,489,443 |
|
|
Carlton Communications PLC |
39,700 |
319,420 |
|
|
Glaxo Wellcome PLC |
140,000 |
4,073,126 |
|
|
HSBC Holdings PLC |
297,900 |
4,295,720 |
|
|
Iceland Group PLC |
278,147 |
1,320,577 |
|
|
Jazztel PLC sponsored ADR |
12,900 |
228,169 |
|
|
Kelda Group PLC |
92,300 |
494,418 |
|
|
Lloyds TSB Group PLC |
384,900 |
3,917,087 |
|
|
Lonmin PLC |
61,300 |
755,366 |
|
|
Misys PLC |
8,000 |
83,271 |
|
|
Pearson PLC |
72,700 |
1,948,720 |
|
|
Persimmon PLC |
252,300 |
822,958 |
|
|
Rentokil Initial PLC |
778,000 |
1,793,308 |
|
|
Reuters Group PLC sponsored ADR |
9,500 |
1,119,813 |
|
|
|
|||
|
Shares |
Value (Note 1) |
||
|
Royal & Sun Alliance Insurance |
75,400 |
$ 536,153 |
|
|
Royal Bank of Scotland Group PLC |
136,896 |
3,070,147 |
|
|
Severn Trent PLC |
79,000 |
841,768 |
|
|
Shell Transport & Trading Co. PLC (Reg.) |
313,400 |
2,569,229 |
|
|
SMG PLC |
105,334 |
412,297 |
|
|
SmithKline Beecham PLC sponsored ADR |
21,000 |
1,368,938 |
|
|
Somerfield PLC |
2,169,800 |
2,422,080 |
|
|
SSL International PLC |
287,100 |
3,340,076 |
|
|
Trinity Mirror PLC |
71,800 |
469,959 |
|
|
Vodafone Group PLC |
1,939,935 |
8,256,842 |
|
|
Vodafone Group PLC sponsored ADR |
503,000 |
21,408,938 |
|
|
W.H. Smith PLC |
460,000 |
2,700,791 |
|
|
WPP Group PLC sponsored ADR |
26,500 |
1,772,188 |
|
|
TOTAL UNITED KINGDOM |
89,094,307 |
||
|
United States of America - 51.7% |
|||
|
Advanced Digital Information Corp. (a) |
70,600 |
917,800 |
|
|
AES Corp. (a) |
29,000 |
1,638,500 |
|
|
Affiliated Computer Services, Inc. |
79,700 |
4,438,294 |
|
|
AMBAC Financial Group, Inc. |
87,500 |
6,983,594 |
|
|
Apple Computer, Inc. (a) |
467,500 |
9,145,469 |
|
|
AutoNation, Inc. |
1,804,200 |
12,178,350 |
|
|
Avon Products, Inc. |
383,269 |
18,588,547 |
|
|
Ball Corp. |
145,731 |
5,118,801 |
|
|
BFGoodrich Co. |
27,900 |
1,142,156 |
|
|
Biomet, Inc. |
185,500 |
6,712,781 |
|
|
Brinker International, Inc. (a) |
27,800 |
1,091,150 |
|
|
Bristol-Myers Squibb Co. |
372,172 |
22,679,231 |
|
|
Burlington Northern Santa Fe Corp. |
117,200 |
3,113,125 |
|
|
Cadence Design Systems, Inc. (a) |
88,500 |
2,273,344 |
|
|
Cardinal Health, Inc. |
259,200 |
24,559,200 |
|
|
Ciena Corp. (a) |
21,600 |
2,270,700 |
|
|
CIGNA Corp. |
53,700 |
6,548,715 |
|
|
CIMA Labs, Inc. (a) |
11,200 |
616,000 |
|
|
Cisco Systems, Inc. (a) |
520,300 |
28,031,150 |
|
|
Clear Channel Communications, Inc. (a) |
38,100 |
2,288,381 |
|
|
Compaq Computer Corp. |
545,400 |
16,585,614 |
|
|
Computer Associates International, Inc. |
61,000 |
1,944,375 |
|
|
Corning, Inc. |
22,300 |
1,705,950 |
|
|
Dell Computer Corp. (a) |
440,800 |
13,003,600 |
|
|
DENTSPLY International, Inc. |
58,800 |
2,039,625 |
|
|
Ditech Communications Corp. (a) |
143,582 |
4,944,605 |
|
|
Dynegy, Inc. Class A |
25,400 |
1,176,338 |
|
|
Earthgrains Co. |
68,200 |
1,381,050 |
|
|
Eli Lilly & Co. |
41,272 |
3,688,685 |
|
|
EMC Corp. (a) |
90,200 |
8,033,438 |
|
|
Equity Office Properties Trust |
26,500 |
798,313 |
|
|
Estee Lauder Companies, Inc. Class A |
26,600 |
1,235,238 |
|
|
Fannie Mae |
91,700 |
7,060,900 |
|
|
Freddie Mac |
182,400 |
10,944,000 |
|
|
General Dynamics Corp. |
66,600 |
4,766,063 |
|
|
General Electric Co. |
413,300 |
22,654,006 |
|
|
Common Stocks - continued |
|||
|
Shares |
Value (Note 1) |
||
|
United States of America - continued |
|||
|
General Motors Corp. Class H |
90,700 |
$ 2,938,680 |
|
|
Gillette Co. |
127,900 |
4,460,513 |
|
|
Global Industries Ltd. (a) |
374,200 |
3,929,100 |
|
|
Grant Prideco, Inc. (a) |
178,300 |
3,309,694 |
|
|
H&R Block, Inc. |
58,695 |
2,094,678 |
|
|
Hartford Financial Services Group, Inc. |
88,000 |
6,550,500 |
|
|
HCA - The Healthcare Co. |
83,800 |
3,346,763 |
|
|
Honeywell International, Inc. |
57,700 |
3,104,981 |
|
|
Houghton Mifflin Co. |
58,600 |
2,157,213 |
|
|
Immunex Corp. (a) |
36,300 |
1,545,019 |
|
|
Information Resources, Inc. (a) |
74,800 |
397,375 |
|
|
Insurance Auto Auctions, Inc. (a) |
33,000 |
396,000 |
|
|
Intel Corp. |
154,200 |
6,939,000 |
|
|
J.D. Edwards & Co. (a) |
181,800 |
4,704,075 |
|
|
Manpower, Inc. |
61,600 |
2,144,450 |
|
|
MapInfo Corp. (a) |
50,075 |
1,636,827 |
|
|
Marsh & McLennan Companies, Inc. |
18,000 |
2,353,500 |
|
|
MBIA, Inc. |
60,600 |
4,404,863 |
|
|
Medtronic, Inc. |
58,500 |
3,177,281 |
|
|
Merrill Lynch & Co., Inc. |
22,100 |
1,547,000 |
|
|
MetLife, Inc. |
247,400 |
6,834,425 |
|
|
Microsoft Corp. (a) |
127,300 |
8,767,788 |
|
|
MRV Communications, Inc. (a) |
104,000 |
4,108,000 |
|
|
Nabors Industries, Inc. (a) |
188,000 |
9,569,200 |
|
|
National-Oilwell, Inc. (a) |
38,200 |
1,117,350 |
|
|
Novoste Corp. (a) |
74,800 |
1,888,700 |
|
|
NRG Energy, Inc. |
58,000 |
1,508,000 |
|
|
Overseas Shipholding Group, Inc. |
73,800 |
1,771,200 |
|
|
Papa John's International, Inc. (a) |
34,200 |
859,275 |
|
|
Park Place Entertainment Corp. (a) |
214,700 |
2,737,425 |
|
|
Pfizer, Inc. |
473,401 |
20,445,006 |
|
|
Pinnacle Systems (a) |
133,192 |
1,681,549 |
|
|
Procter & Gamble Co. |
87,500 |
6,250,781 |
|
|
Protective Life Corp. |
63,800 |
1,475,375 |
|
|
Quaker Oats Co. |
38,300 |
3,123,844 |
|
|
Quixote Corp. |
2,400 |
39,300 |
|
|
Qwest Communications |
60,600 |
2,946,675 |
|
|
Radio One, Inc.: |
|
|
|
|
Class A (a) |
79,000 |
627,063 |
|
|
Class D (non-vtg.) (a) |
39,600 |
317,419 |
|
|
Reckson Associates Realty Corp. |
30,600 |
692,325 |
|
|
Reinsurance Group of America, Inc. |
42,700 |
1,595,913 |
|
|
Republic Services, Inc. (a) |
80,200 |
1,077,688 |
|
|
Robert Half International, Inc. (a) |
28,900 |
881,450 |
|
|
SBA Communications Corp. Class A (a) |
73,500 |
3,684,188 |
|
|
Schering-Plough Corp. |
205,300 |
10,611,444 |
|
|
SCM Microsystems, Inc. (a) |
1,900 |
72,200 |
|
|
Siebel Systems, Inc. (a) |
10,600 |
1,112,338 |
|
|
Solutia, Inc. |
59,900 |
763,725 |
|
|
Sonic Automotive, Inc. Class A (a)(c) |
1,554,100 |
13,889,769 |
|
|
Staples, Inc. (a) |
220,700 |
3,144,975 |
|
|
|
|||
|
Shares |
Value (Note 1) |
||
|
Stilwell Financial, Inc. |
36,200 |
$ 1,622,213 |
|
|
Sun Microsystems, Inc. (a) |
113,500 |
12,584,313 |
|
|
Superior Energy Services, Inc. (a) |
312,800 |
2,815,200 |
|
|
Sysco Corp. |
140,000 |
7,306,250 |
|
|
Technology Solutions, Inc. |
209,600 |
497,800 |
|
|
Tenet Healthcare Corp. |
201,600 |
7,925,400 |
|
|
The Chubb Corp. |
59,500 |
5,024,031 |
|
|
The Coca-Cola Co. |
176,400 |
10,650,150 |
|
|
Thermo Electron Corp. (a) |
62,700 |
1,818,300 |
|
|
Tyco International Ltd. |
29,300 |
1,660,944 |
|
|
Union Pacific Corp. |
56,680 |
2,656,875 |
|
|
VeriSign, Inc. (a) |
5,400 |
712,800 |
|
|
Viad Corp. |
232,589 |
4,971,590 |
|
|
ViaSat, Inc. (a) |
48,800 |
1,073,600 |
|
|
VoiceStream Wireless Corp. (a) |
43,500 |
5,720,250 |
|
|
Walgreen Co. |
87,200 |
3,978,500 |
|
|
Wendy's International, Inc. |
39,400 |
856,950 |
|
|
TOTAL UNITED STATES OF AMERICA |
508,904,156 |
||
|
TOTAL COMMON STOCKS (Cost $875,028,176) |
947,090,457 |
||
|
Nonconvertible Preferred Stocks - 0.3% |
|||
|
|
|
|
|
|
Germany - 0.2% |
|||
|
ProSieben Sat.1 Media AG (a) |
61,200 |
1,927,217 |
|
|
Italy - 0.1% |
|||
|
Alleanza Assicurazioni Spa |
188,900 |
1,453,948 |
|
|
TOTAL NONCONVERTIBLE (Cost $3,375,409) |
3,381,165 |
||
|
Cash Equivalents - 5.6% |
|||
|
|
|
|
|
|
Fidelity Cash Central Fund, 6.61% (b) |
40,333,910 |
40,333,910 |
|
|
Fidelity Securities Lending Cash |
14,324,270 |
14,324,270 |
|
|
TOTAL CASH EQUIVALENTS (Cost $54,658,180) |
54,658,180 |
||
|
TOTAL INVESTMENT PORTFOLIO - 102.1% (Cost $933,061,765) |
1,005,129,802 |
||
|
NET OTHER ASSETS - (2.1)% |
(21,092,113) |
||
|
NET ASSETS - 100% |
$ 984,037,689 |
||
|
Legend |
|
(a) Non-income producing |
|
(b) The rate quoted is the annualized seven-day yield of the fund at period end. A complete listing of the fund's holdings as of its most recent fiscal year end is available upon request. |
|
(c) Affiliated company |
|
Other Information |
|
Purchases and sales of securities, other than short-term securities, |
|
The fund placed a portion of its portfolio transactions with brokerage firms which are affiliates of Fidelity Management & Research Company. The commissions paid to these affiliated firms were $107,880 for the period. |
|
The fund participated in the security lending program. At period end, the value of securities loaned amounted to $13,896,216. The fund received cash collateral of $14,324,270 which was invested in cash equivalents. |
Transactions during the period with companies which are or were affiliates are as follows:
|
Affiliate |
Purchase |
Sales |
Dividend |
Value |
|
Sonic |
$ - |
$ - |
$ - |
$ 13,889,769 |
|
Income Tax Information |
|
At October 31, 2000, the aggregate cost of investment securities for income tax purposes was $940,019,839. Net unrealized appreciation aggregated $65,109,963, of which $140,210,727 related to appreciated investment securities and $75,100,764 related to depreciated investment securities. |
|
The fund hereby designates approximately $85,082,000 as a capital gain dividend for the purpose of the dividend paid deduction. |
See accompanying notes which are an integral part of the financial statements.
Annual Report
Worldwide
Statement of Assets and Liabilities
|
|
October 31, 2000 |
|
|
Assets |
|
|
|
Investment in securities, at value |
|
$ 1,005,129,802 |
|
Cash |
|
277,763 |
|
Foreign currency held at value |
|
15 |
|
Receivable for investments sold |
|
21,689,576 |
|
Receivable for fund shares sold |
|
658,252 |
|
Dividends receivable |
|
1,181,243 |
|
Interest receivable |
|
270,903 |
|
Redemption fees receivable |
|
19 |
|
Other receivables |
|
262,699 |
|
Total assets |
|
1,029,470,272 |
|
Liabilities |
|
|
|
Payable for investments purchased |
$ 28,597,932 |
|
|
Payable for fund shares redeemed |
1,586,848 |
|
|
Accrued management fee |
585,408 |
|
|
Other payables and |
338,125 |
|
|
Collateral on securities loaned, |
14,324,270 |
|
|
Total liabilities |
|
45,432,583 |
|
Net Assets |
|
$ 984,037,689 |
|
Net Assets consist of: |
|
|
|
Paid in capital |
|
$ 761,810,419 |
|
Undistributed net investment income |
|
18,751,926 |
|
Accumulated undistributed net realized gain (loss) on investments and foreign currency transactions |
|
131,511,334 |
|
Net unrealized appreciation (depreciation) on investments |
|
71,964,010 |
|
Net Assets, for 51,592,565 |
|
$ 984,037,689 |
|
Net Asset Value, offering price |
|
$19.07 |
Statement of Operations
|
|
Year ended October 31, 2000 |
|
|
Investment Income Dividends |
|
$ 14,331,487 |
|
Interest |
|
2,882,854 |
|
Security lending |
|
223,925 |
|
|
|
17,438,266 |
|
Less foreign taxes withheld |
|
(1,169,006) |
|
Total income |
|
16,269,260 |
|
Expenses |
|
|
|
Management fee |
$ 7,781,379 |
|
|
Transfer agent fees |
2,873,477 |
|
|
Accounting and security lending fees |
553,522 |
|
|
Non-interested trustees' compensation |
3,896 |
|
|
Custodian fees and expenses |
331,743 |
|
|
Registration fees |
46,130 |
|
|
Audit |
34,223 |
|
|
Legal |
22,390 |
|
|
Miscellaneous |
7,172 |
|
|
Total expenses before reductions |
11,653,932 |
|
|
Expense reductions |
(538,132) |
11,115,800 |
|
Net investment income |
|
5,153,460 |
|
Realized and Unrealized Gain (Loss) Net realized gain (loss) on: |
|
|
|
Investment securities |
151,115,096 |
|
|
Foreign currency transactions |
(597,351) |
150,517,745 |
|
Change in net unrealized appreciation (depreciation) on: |
|
|
|
Investment securities |
(56,042,328) |
|
|
Assets and liabilities in |
(103,979) |
(56,146,307) |
|
Net gain (loss) |
|
94,371,438 |
|
Net increase (decrease) in net assets resulting from operations |
|
$ 99,524,898 |
|
Other Information |
|
|
|
Expense reductions |
|
|
|
Directed brokerage arrangements |
|
$ 442,086 |
|
Custodian credits |
|
8,376 |
|
Transfer agent credits |
|
87,670 |
|
|
|
$ 538,132 |
See accompanying notes which are an integral part of the financial statements.
Annual Report
Worldwide
Financial Statements - continued
Statement of Changes in Net Assets
|
Increase (Decrease) in Net Assets |
Year ended
October 31, |
Year ended
October 31, |
|
Operations |
$ 5,153,460 |
$ 4,529,623 |
|
Net realized gain (loss) |
150,517,745 |
93,684,754 |
|
Change in net unrealized appreciation (depreciation) |
(56,146,307) |
120,565,932 |
|
Net increase (decrease) in net assets resulting from operations |
99,524,898 |
218,780,309 |
|
Distributions to shareholders |
(5,173,955) |
(6,008,790) |
|
From net realized gain |
(78,632,691) |
(26,442,347) |
|
Total distributions |
(83,806,646) |
(32,451,137) |
|
Share transactions |
491,738,430 |
565,425,727 |
|
Reinvestment of distributions |
81,442,448 |
31,563,831 |
|
Cost of shares redeemed |
(585,754,192) |
(774,588,535) |
|
Net increase (decrease) in net assets resulting from share transactions |
(12,573,314) |
(177,598,977) |
|
Redemption fees |
57,759 |
- |
|
Total increase (decrease) in net assets |
3,202,697 |
8,730,195 |
|
Net Assets |
|
|
|
Beginning of period |
980,834,992 |
972,104,797 |
|
End of period (including undistributed net investment income of $18,751,926 and $4,445,154, respectively) |
$ 984,037,689 |
$ 980,834,992 |
|
Other Information Shares |
|
|
|
Sold |
25,038,202 |
32,894,318 |
|
Issued in reinvestment of distributions |
4,348,233 |
2,000,226 |
|
Redeemed |
(29,771,984) |
(45,257,975) |
|
Net increase (decrease) |
(385,549) |
(10,363,431) |
Financial Highlights
|
Years ended October 31, |
2000 |
1999 |
1998 |
1997 |
1996 |
|
Selected Per-Share Data |
|
|
|
|
|
|
Net asset value, beginning of period |
$ 18.87 |
$ 15.59 |
$ 17.27 |
$ 15.18 |
$ 13.32 |
|
Income from Investment Operations |
|
|
|
|
|
|
Net investment income |
.09 B |
.08 B |
.16 B |
.21 B, D |
.22 |
|
Net realized and unrealized gain (loss) |
1.73 |
3.74 |
(.57) |
2.43 |
1.79 |
|
Total from investment operations |
1.82 |
3.82 |
(.41) |
2.64 |
2.01 |
|
Less Distributions |
|
|
|
|
|
|
From net investment income |
(.10) |
(.10) |
(.11) |
(.17) |
(.15) |
|
From net realized gain |
(1.52) |
(.44) |
(1.16) |
(.38) |
- |
|
Total distributions |
(1.62) |
(.54) |
(1.27) |
(.55) |
(.15) |
|
Net asset value, end of period |
$ 19.07 |
$ 18.87 |
$ 15.59 |
$ 17.27 |
$ 15.18 |
|
Total Return A |
9.80% |
25.18% |
(2.38)% |
17.95% |
15.25% |
|
Ratios and Supplemental Data |
|
|
|
|
|
|
Net assets, end of period (000 omitted) |
$ 984,038 |
$ 980,835 |
$ 972,105 |
$ 1,161,191 |
$ 877,218 |
|
Ratio of expenses to average net assets |
1.09% |
1.12% |
1.15% |
1.18% |
1.19% |
|
Ratio of expenses to average net assets after expense reductions |
1.04% C |
1.07% C |
1.12% C |
1.16% C |
1.18% C |
|
Ratio of net investment income to average net assets |
.48% |
.47% |
.91% |
1.24% |
1.71% |
|
Portfolio turnover rate |
235% |
164% |
100% |
85% |
49% |
|
A The total returns would have been lower had certain expenses not been reduced during the periods shown. B Net investment income per share has been calculated based on average shares outstanding during the period. C FMR or the fund has entered into varying arrangements with third parties who either paid or reduced a portion of the fund's expenses. D Investment income per share reflects a special dividend which amounted to $.06 per share. |
|||||
See accompanying notes which are an integral part of the financial statements.
Annual Report
For the period ended October 31, 2000
1. Significant Accounting Policies.
Fidelity Global Balanced Fund, Fidelity International Growth & Income Fund, Fidelity Diversified International Fund, Fidelity Aggressive International Fund (formerly Fidelity International Value Fund), Fidelity Overseas Fund and Fidelity Worldwide Fund (the funds) are funds of Fidelity Investment Trust (the trust). The trust is registered under the Investment Company Act of 1940, as amended (the 1940 Act), as an open-end management investment company organized as a Massachusetts business trust. Each fund is authorized to issue an unlimited number of shares. The funds' investments in emerging markets can be subject to social, economic, regulatory, and political uncertainties and can be extremely volatile. The financial statements have been prepared in conformity with generally accepted accounting principles which require management to make certain estimates and assumptions at the date of the financial statements. The following summarizes the significant accounting policies of the funds:
Security Valuation. Securities for which quotations are readily available are valued using the official closing price or at the last sale price in the principal market in which they are traded. If the last sale price (on the local exchange) is unavailable, the last evaluated quote or closing bid price normally is used. If trading or events occurring in other markets after the close of the principal market in which securities are traded are expected to materially affect the value of those securities, then they are valued at their fair value taking this trading or these events into account. Fair value is determined in good faith under consistently applied procedures under the general supervision of the Board of Trustees. Securities (including restricted securities) for which quotations are not readily available are valued primarily using dealer-supplied valuations or at their fair value. Short-term securities with remaining maturities of sixty days or less for which quotations are not readily available are valued at amortized cost or original cost plus accrued interest, both of which approximate current value. Investments in open-end investment companies are valued at their net asset value each business day.
Foreign Currency Translation. The accounting records of the funds are maintained in U.S. dollars. Investment securities and other assets and liabilities denominated in a foreign currency are translated into U.S. dollars at the prevailing rates of exchange at period end. Purchases and sales of securities, income receipts and expense payments are translated into U.S. dollars at the prevailing exchange rate on the respective dates of the transactions.
Net realized gains and losses on foreign currency transactions represent net gains and losses from sales and maturities of foreign currency contracts, disposition of foreign currencies, the difference between the amount of net investment income accrued and the U.S. dollar amount actually received, and gains and losses between trade and settlement date on purchases and sales of securities. The effects of changes in foreign currency exchange rates on investments in securities are included with the net realized and unrealized gain or loss on investment securities.
Income Taxes. As a qualified regulated investment company under Subchapter M of the Internal Revenue Code, each fund is not subject to U.S. federal income taxes to the extent that it distributes substantially all of its taxable income for its fiscal year. Each fund may be subject to foreign taxes on income and gains on investments which are accrued based upon each fund's understanding of the tax rules and regulations that exist in the markets in which they invest. Foreign governments may also impose taxes on other payments or transactions with respect to foreign securities. Each fund accrues such taxes as applicable. The schedules of investments include information regarding income taxes under the caption "Income Tax Information."
Investment Income. Dividend income is recorded on the ex-dividend date, except certain dividends from foreign securities where the ex-dividend date may have passed, are recorded as soon as the funds are informed of the ex-dividend date. Non-cash dividends included in dividend income, if any, are recorded at the fair market value of the securities received. Interest income, which includes accretion of original issue discount, is accrued as earned. Investment income is recorded net of foreign taxes withheld where recovery of such taxes is uncertain.
Expenses. Most expenses of the trust can be directly attributed to a fund. Expenses which cannot be directly attributed are apportioned among the funds in the trust.
Deferred Trustee Compensation. Under a Deferred Compensation Plan (the Plan) non-interested Trustees must defer receipt of a portion of, and may elect to defer receipt of an additional portion of, their annual compensation. Deferred amounts are treated as though equivalent dollar amounts had been invested in shares of the fund or are invested in a cross-section of other Fidelity funds. Deferred amounts remain in the fund until distributed in accordance with the Plan.
Distributions to Shareholders. Distributions are recorded on the ex-dividend date.
Income and capital gain distributions are determined in accordance with income tax regulations which may differ from generally accepted accounting principles. These differences, which may result in distribution reclassifications, are primarily due to differing treatments for litigation proceeds, futures transactions, foreign currency transactions, certain foreign taxes, passive foreign investment companies (PFIC), market discount, non-taxable dividends and losses deferred due to wash sales. Certain funds also utilized earnings and profits distributed to shareholders on redemption of shares as a part of the dividends paid deduction for income tax purposes.
Permanent book and tax basis differences relating to shareholder distributions will result in reclassifications to paid in capital. Undistributed net investment income, distributions in excess of net investment income and accumulated undistributed net realized gain (loss) on investments and foreign currency transactions may include temporary book and tax basis differences which will
Annual Report
Notes to Financial Statements - continued
1. Significant Accounting Policies - continued
Distributions to Shareholders - continued
reverse in a subsequent period. Any taxable income or gain remaining at fiscal year end is distributed in the following year.
Short-Term Trading (Redemption) Fees. Shares held in the funds less than 30 days will be subject to a short-term trading fee equal to 1% of the proceeds of the redeemed shares, effective May 31, 2000. The fee, which is retained by the fund, is accounted for as an addition to paid in capital.
Security Transactions. Security transactions are accounted for as of trade date. Gains and losses on securities sold are determined on the basis of identified cost.
2. Operating Policies.
Foreign Currency Contracts. Certain funds use foreign currency contracts to facilitate transactions in foreign-denominated securities. Losses may arise from changes in the value of the foreign currency or if the counterparties do not perform under the contracts' terms. The U.S. dollar value of foreign currency contracts is determined using contractual currency exchange rates established at the time of each trade.
Joint Trading Account. Pursuant to an Exemptive Order issued by the Securities and Exchange Commission (the SEC), the funds, along with other affiliated entities of Fidelity Management & Research Company (FMR), may transfer uninvested cash balances into one or more joint trading accounts. These balances are invested in one or more repurchase agreements for U.S. Treasury or Federal Agency obligations.
Repurchase Agreements. The underlying U.S. Treasury, Federal Agency, or other obligations found to be satisfactory by FMR are transferred to an account of the funds, or to the Joint Trading Account, at a custodian bank. The securities are marked-to-market daily and maintained at a value at least equal to the principal amount of the repurchase agreement (including accrued interest). FMR, the funds' investment adviser, is responsible for determining that the value of the underlying securities remains in accordance with the market value requirements stated above.
When-Issued Securities. Each fund may purchase or sell securities on a when-issued basis. Payment and delivery may take place after the customary settlement period for that security. The price of the underlying securities is fixed at the time the transaction is negotiated. The market values of the securities purchased on a when-issued or forward commitment basis are identified as such in each applicable fund's schedule of investments. Each fund may receive compensation for interest forgone in the purchase of a when-issued security. With respect to purchase commitments, each fund identifies securities as segregated in its records with a value at least equal to the amount of the commitment. Losses may arise due to changes in the market value of the underlying securities, if the counterparty does not perform under the contract, or if the issuer does not issue the securities due to political, economic, or other factors.
Futures Contracts. Certain funds may use futures contracts to manage their exposure to the stock market and to fluctuations in currency values. Buying futures tends to increase a fund's exposure to the underlying instrument, while selling futures tends to decrease a fund's exposure to the underlying instrument or hedge other fund investments. Futures contracts involve, to varying degrees, risk of loss in excess of the futures variation margin reflected in each applicable fund's Statement of Assets and Liabilities. The underlying face amount at value of any open futures contracts at period end is shown in each applicable fund's schedule of investments under the caption "Futures Contracts." This amount reflects each contract's exposure to the underlying instrument at period end. Losses may arise from changes in the value of the underlying instruments or if the counterparties do not perform under the contracts' terms. Gains (losses) are realized upon the expiration or closing of the futures contracts. Futures contracts are valued at the settlement price established each day by the board of trade or exchange on which they are traded.
Restricted Securities. Certain funds are permitted to invest in securities that are subject to legal or contractual restrictions on resale. These securities generally may be resold in transactions exempt from registration or to the public if the securities are registered. Disposal of these securities may involve time-consuming negotiations and expense, and prompt sale at an acceptable price may be difficult. Information regarding restricted securities is included under the caption "Other Information" at the end of each applicable fund's schedule of investments.
3. Purchases and Sales of Investments.
Information regarding purchases and sales of securities (other than short-term securities), and the market value of future contracts opened and closed, is included under the caption "Other Information" at the end of each applicable fund's schedule of investments.
4. Fees and Other Transactions with Affiliates.
Management Fee. As each fund's investment adviser, FMR receives a monthly basic fee that is calculated on the basis of a group fee rate plus a fixed individual fund fee rate applied to the average net assets of each fund. The group fee rate is the weighted average of a series of rates and is based on the monthly average net assets of all the mutual funds advised by FMR. The rates ranged from .2167% to .5200% for the period. The annual individual fund fee rate is .45%. In the event that these rates were lower than the contractual rates in effect during the period, FMR voluntarily implemented the above rates, as they resulted in the same or a lower management fee. The basic fee for Diversified International, Aggressive International and Overseas is subject to a performance adjustment (up to a maximum of ±.20% of the fund's average net assets over the performance period) based on
Annual Report
Notes to Financial Statements - continued
4. Fees and Other Transactions with Affiliates - continued
Management Fee - continued
each fund's investment performance as compared to the appropriate index over a specified period of time. For the period, the management fees were equivalent to the following annual rates expressed as a percentage of average net assets after the performance adjustment, if applicable:
|
Global Balanced |
.73% |
|
International Growth & Income |
.73% |
|
Diversified International |
.82% |
|
Aggressive International |
.85% |
|
Overseas |
.87% |
|
Worldwide |
.73% |
Sub-Adviser Fee. FMR, on behalf of the funds, entered into sub-advisory agreements with Fidelity Management & Research (U.K.) Inc., Fidelity Management & Research (Far East) Inc., and Fidelity International Investment Advisors (FIIA). Under the sub-advisory arrangements, FMR may receive investment advice and research services and may grant the sub-advisers investment management authority to buy and sell securities. FMR pays its sub-advisers either a portion of its management fee or a fee based on costs incurred for these services. Beginning January 1, 2001, FMR Co. (FMRC) will serve as sub-adviser for the funds. FMRC may provide investment research and advice and may also provide investment advisory services for the funds.
Sales Load. Fidelity Distributors Corporation (FDC), an affiliate of FMR, is the general distributor of the fund. Shares of International Growth & Income purchased prior to October 12, 1990, are subject to a 1% deferred sales charge upon redemption. The amounts received by FDC for deferred sales charges are shown under the caption "Other Information" on the fund's Statement of Operations.
Transfer Agent Fees. Fidelity Service Company, Inc. (FSC), an affiliate of FMR, is the funds' transfer, dividend disbursing and shareholder servicing agent. FSC receives account fees and asset-based fees that vary according to account size and type of account. FSC pays for typesetting, printing and mailing of all shareholder reports, except proxy statements. For the period, the transfer agent fees were equivalent to an annual rate expressed as a percentage of average net assets:
|
Global Balanced |
.25% |
|
International Growth & Income |
.24% |
|
Diversified International |
.24% |
|
Aggressive International |
.21% |
|
Overseas |
.24% |
|
Worldwide |
.27% |
Accounting and Security Lending Fees. FSC maintains each fund's accounting records and administers the security lending program. The security lending fee is based on the number and duration of lending transactions. The accounting fee is based on the level of average net assets for the month plus out-of-pocket expenses.
Cash Central Funds. Pursuant to an Exemptive Order issued by the SEC, the funds may invest in the Fidelity Cash Central Fund and the Fidelity Securities Lending Cash Central Fund (the Cash Funds) managed by Fidelity Investments Money Management, Inc., an affiliate of FMR. The Cash Funds are open-end money market funds available only to investment companies and other accounts managed by FMR and its affiliates. The Cash Funds seek preservation of capital, liquidity, and current income. Income distributions from the Cash Funds are declared daily and paid monthly from net investment income. Income distributions earned by the funds are recorded as either interest income or security lending income in the accompanying financial statements.
Brokerage Commissions. Certain funds placed a portion of their portfolio transactions with brokerage firms which are affiliates of FMR. The commissions paid to these affiliated firms are shown under the caption "Other Information" at the end of each applicable fund's schedule of investments.
5. Security Lending.
Certain funds lend portfolio securities from time to time in order to earn additional income. Each applicable fund receives collateral (in the form of U.S. Treasury obligations, letters of credit and/or cash) against the loaned securities and maintains collateral in an amount not less than 100% of the market value of the loaned securities during the period of the loan. The market value of the loaned securities is determined at the close of business of the funds and any additional required collateral is delivered to the funds on the next business day. If the borrower defaults on its obligation to return the securities loaned because of insolvency or other reasons, a fund could experience delays and costs in recovering the securities loaned or in gaining access to the collateral. Information regarding the value of securities loaned and the value of collateral at period end is included under the caption "Other Information" at the end of each applicable fund's schedule of investments.
Annual Report
Notes to Financial Statements - continued
6. Bank Borrowings.
Each fund is permitted to have bank borrowings for temporary or emergency purposes to fund shareholder redemptions. Each fund has established borrowing arrangements with certain banks. The interest rate on the borrowings is the bank's base rate, as revised from time to time. Information regarding a fund's participation in the program is included under the caption "Other Information" at the end of each applicable fund's schedule of investments.
7. Expense Reductions.
FMR has directed certain portfolio trades to brokers who paid a portion of certain funds' expenses.
In addition through arrangements with certain fund's custodian and transfer agent, credits realized as a result of uninvested cash balances were used to reduce a portion of each applicable fund's expenses.
For the period, the reductions under these arrangements are shown under the caption "Other Information" on each applicable fund's Statement of Operations.
8. Transactions with Affiliated Companies.
An affiliated company is a company which the fund has ownership of at least 5% of the voting securities. Information regarding transactions with affiliated companies is included in "Other Information" at the end of each applicable fund's schedule of investments.
Annual Report
To the Trustees of Fidelity Investment Trust and the Shareholders of Fidelity Global Balanced Fund, Fidelity International Growth & Income Fund and Fidelity Overseas Fund:
In our opinion, the accompanying statements of assets and liabilities, including the schedules of investments, and the related statements of operations and of changes in net assets and the financial highlights present fairly, in all material respects, the financial position of Fidelity Global Balanced Fund, Fidelity International Growth & Income Fund and Fidelity Overseas Fund (funds of Fidelity Investment Trust) at October 31, 2000, and the results of their operations, the changes in their net assets and the financial highlights for the periods indicated, in conformity with accounting principles generally accepted in the United States of America. These financial statements and financial highlights (hereafter referred to as "financial statements") are the responsibility of the Fidelity Investment Trust's management; our responsibility is to express an opinion on these financial statements based on our audits. We conducted our audits of these financial statements in accordance with auditing standards generally accepted in the United States of America which require that we plan and perform the audit to obtain reasonable assurance about whether the financial statements are free of material misstatement. An audit includes examining, on a test basis, evidence supporting the amounts and disclosures in the financial statements, assessing the accounting principles used and significant estimates made by management, and evaluating the overall financial statement presentation. We believe that our audits, which included confirmation of securities at October 31, 2000 by correspondence with the custodian and brokers, provide a reasonable basis for our opinion.
/s/PricewaterhouseCoopers LLP
PricewaterhouseCoopers LLP
Boston, Massachusetts
December 15, 2000
Annual Report
To the Trustees of Fidelity Investment Trust and Shareholders of Fidelity Diversified International Fund, Fidelity Aggressive International Fund and Fidelity Worldwide Fund:
We have audited the accompanying statements of assets and liabilities of Fidelity Diversified International Fund, Fidelity Aggressive International Fund and Fidelity Worldwide Fund, (the Funds), funds of Fidelity Investment Trust (the Trust), including the portfolios of investments, as of October 31, 2000, and the related statements of operations for the year then ended, the statements of changes in net assets for each of the two years in the period then ended (one year ended October 31, 2000, for Fidelity Aggressive International Fund), and the financial highlights for each of the five years in the period then ended (one year ended October 31, 2000, for Fidelity Aggressive International Fund). These financial statements and financial highlights are the responsibility of the Funds' management. Our responsibility is to express an opinion on these financial statements and financial highlights based on our audits. The statement of changes in net assets for the year ended October 31, 1999, and the financial highlights for each of the four years in the period then ended for Fidelity Aggressive International Fund, were audited by other auditors whose report, dated December 15, 1999, expressed an unqualified opinion on the statements and financial highlights.
We conducted our audits in accordance with auditing standards generally accepted in the United States of America. Those standards require that we plan and perform our audits to obtain reasonable assurance about whether the financial statements and financial highlights are free of material misstatement. An audit includes examining, on a test basis, evidence supporting the amounts and disclosures in the financial statements. Our procedures included confirmation of securities owned as of October 31, 2000, by correspondence with the custodian and brokers; where replies were not received from brokers, we performed other auditing procedures. An audit also includes assessing the accounting principles used and significant estimates made by management, as well as evaluating the overall financial statement presentation. We believe that our audits provide a reasonable basis for our opinion.
In our opinion, the financial statements and financial highlights referred to above present fairly, in all material respects, the financial position of Fidelity Diversified International Fund, Fidelity Aggressive International Fund and Fidelity Worldwide Fund as of October 31, 2000, the results of their operations for the year then ended, the changes in their net assets for each of the two years in the period then ended (one year ended October 31, 2000, for Fidelity Aggressive International Fund), and their financial highlights for each of the five years in the period then ended (one year ended October 31, 2000, for Fidelity Aggressive International Fund), in conformity with accounting principles generally accepted in the United States of America.
/s/DELOITTE & TOUCHE LLP
DELOITTE & TOUCHE LLP
Boston, Massachusetts
December 8, 2000
Annual Report
The Board of Trustees of Fidelity Investment Trust voted to pay to shareholders of record at the opening of business on record date, the following distributions per share derived from capital gains realized from sales of portfolio securities, and dividends derived from net investment income:
|
Fund |
Pay Date |
\\\\\\ |
Record Date |
\\\\\\ |
Dividends |
\\\\\\ |
Capital Gains |
|
Fidelity Global Balanced Fund |
12/11/00 |
|
12/08/00 |
|
$.32 |
|
$1.24 |
|
Fidelity International Growth & Income Fund |
12/11/00 |
|
12/08/00 |
|
$.51 |
|
$2.66 |
|
Fidelity Diversified International Fund |
12/11/00 |
|
12/08/00 |
|
$.55 |
|
$.81 |
|
Fidelity Aggressive International Fund |
12/18/00 |
|
12/15/00 |
|
$.02 |
|
$.70 |
|
Fidelity Overseas Fund |
12/11/00 |
|
12/08/00 |
|
$.86 |
|
$4.12 |
|
Fidelity Worldwide Fund |
12/18/00 |
|
12/15/00 |
|
$.40 |
|
$2.25 |
Each fund hereby designates 100% of the long-term capital gain dividends distributed during the fiscal year as 20%-rate capital gain dividends.
A percentage of the dividends distributed during the fiscal year for the following funds was derived from interest on U.S. Government securities which is generally exempt from state income tax:
|
Fidelity Global Balanced Fund |
34.03% |
A percentage of the dividends distributed during the fiscal year for the following funds qualifies for the dividends-received deduction for corporate shareholders:
|
FIDELITY GLOBAL BALANCED FUND |
12% |
|
FIDELITY WORLDWIDE FUND |
29% |
The amounts per share which represent income derived from sources within, and taxes paid to, foreign countries or possessions of the United States are as follows:
|
Fund |
Pay Date |
\\\\\\ |
Income |
\\\\\\ |
Taxes |
|
FIDELITY GLOBAL BALANCED FUND |
12/06/99 |
|
$.023 |
|
$.003 |
|
FIDELITY INTERNATIONAL GROWTH & INCOME FUND |
12/06/99 |
|
$.356 |
|
$ .041 |
|
FIDELITY DIVERSIFIED INTERNATIONAL FUND |
12/06/99 |
|
$.572 |
|
$ .032 |
|
FIDELITY AGGRESSIVE INTERNATIONAL FUND |
12/13/99 |
|
$.184 |
|
$.024 |
|
FIDELITY OVERSEAS FUND |
12/06/99 |
|
$.657 |
|
$ .082 |
|
FIDELITY WORLDWIDE FUND |
12/13/99 |
|
$.167 |
|
$.020 |
The funds will notify shareholders in January 2001 of amounts for use in preparing 2000 income tax returns.
Annual Report
Annual Report
Investment Adviser
Fidelity Management & Research Company
Boston, MA
Investment Sub-Advisers
Fidelity Management & Research (U.K.) Inc.
Fidelity Management & Research (Far East) Inc.
Fidelity International Investment Advisors
Fidelity International Investment Advisors
(U.K.) Limited
Fidelity Investments Japan Limited
Officers
Edward C. Johnson 3d, President
Robert C. Pozen, Senior Vice President
Robert Lawrence, Vice President, Diversified International Fund
Richard Spillane Jr., Vice President, International Growth &
Income Fund, Aggressive International Fund, Overseas Fund,
Worldwide Fund
Penelope A. Dobkin, Vice President, Worldwide Fund
Gregory Fraser, Vice President, Diversified International Fund
Richard Mace Jr., Vice President, Aggressive International Fund,
Overseas Fund
Eric D. Roiter, Secretary
Robert A. Dwight, Treasurer
Maria F. Dwyer, Deputy Treasurer
John H. Costello, Assistant Treasurer
Board of Trustees
Ralph F. Cox *
Phyllis Burke Davis *
Robert M. Gates *
Edward C. Johnson 3d
Donald J. Kirk *
Ned C. Lautenbach *
Peter S. Lynch
Marvin L. Mann *
William O. McCoy *
Gerald C. McDonough *
Robert C. Pozen
Thomas R. Williams *
Advisory Board
J. Michael Cook
Abigail P. Johnson
Marie L. Knowles
General Distributor
Fidelity Distributors Corporation
Boston, MA
* Independent trustees
Transfer and Shareholder
Servicing Agent
Fidelity Service Company, Inc.
Boston, MA
Custodian
Chase Manhattan Bank, N.A.
New York, NY
Fidelity's International Equity Funds
Aggressive International Fund
Canada Fund
China Region Fund
Diversified International Fund
Emerging Markets Fund
Europe Fund
Europe Capital Appreciation Fund
Global Balanced Fund
International Growth & Income Fund
Japan Fund
Japan Smaller Companies Fund
Latin America Fund
Nordic Fund
Overseas Fund
Pacific Basin Fund
Southeast Asia Fund
Worldwide Fund
Corporate Headquarters
82 Devonshire Street
Boston, MA 02109
1-800-544-8888
The Fidelity Telephone Connection
Mutual Fund 24-Hour Service
Exchanges/Redemptions
and Account Assistance 1-800-544-6666
Product Information 1-800-544-6666
Retirement Accounts 1-800-544-4774
(8 a.m. - 9 p.m.)
TDD Service 1-800-544-0118
for the deaf and hearing impaired
(9 a.m. - 9 p.m. Eastern time)
Fidelity Automated Service
Telephone (FAST®) (automated graphic) 1-800-544-5555
(automated graphic) Automated line for quickest service

Printed on Recycled Paper
IBD-ANN-1200 118647
1.538565.103
|
|