
|
|
|
|
|
|
|
|
|
|
Previous: AVANT IMMUNOTHERAPEUTICS INC, S-3, EX-99.2, 2000-12-26 |
Next: FIDELITY INVESTMENT TRUST, N-30D, 2000-12-26 |
Fidelity's
Funds®
Fidelity® Canada Fund
Fidelity China Region Fund (formerly Fidelity Hong Kong & China Fund)
Fidelity Emerging Markets Fund
Fidelity Europe Fund
Fidelity Europe Capital Appreciation Fund
Fidelity Japan Fund
Fidelity Japan Smaller Companies Fund
Fidelity Latin America Fund
Fidelity Nordic Fund
Fidelity Pacific Basin Fund
Fidelity Southeast Asia Fund
Annual Report
for the year ending
October 31, 2000
and
Prospectus
dated December 29, 2000
(2_fidelity_logos)(registered_trademark)
|
Market Recap |
A-4 |
A review of what happened in world markets |
|
Canada Fund |
A-5 |
Performance |
|
|
A-6 |
Fund Talk: The Manager's Overview |
|
|
A-7 |
Investment Changes |
|
|
A-8 |
Investments |
|
|
A-11 |
Financial Statements |
|
China Region Fund |
A-13 |
Performance |
|
|
A-14 |
Fund Talk: The Manager's Overview |
|
|
A-15 |
Investment Changes |
|
|
A-16 |
Investments |
|
|
A-18 |
Financial Statements |
|
Emerging Markets Fund |
A-20 |
Performance |
|
|
A-21 |
Fund Talk: The Manager's Overview |
|
|
A-22 |
Investment Changes |
|
|
A-23 |
Investments |
|
|
A-26 |
Financial Statements |
|
Europe Fund |
A-28 |
Performance |
|
|
A-29 |
Fund Talk: The Manager's Overview |
|
|
A-30 |
Investment Changes |
|
|
A-31 |
Investments |
|
|
A-34 |
Financial Statements |
|
Europe Capital Appreciation Fund |
A-36 |
Performance |
|
|
A-37 |
Fund Talk: The Manager's Overview |
|
|
A-38 |
Investment Changes |
|
|
A-39 |
Investments |
|
|
A-41 |
Financial Statements |
|
Japan Fund |
A-43 |
Performance |
|
|
A-44 |
Fund Talk: The Manager's Overview |
|
|
A-45 |
Investment Changes |
|
|
A-46 |
Investments |
|
|
A-49 |
Financial Statements |
|
Japan Smaller Companies Fund |
A-51 |
Performance |
|
|
A-52 |
Fund Talk: The Manager's Overview |
|
|
A-53 |
Investment Changes |
|
|
A-54 |
Investments |
|
|
A-57 |
Financial Statements |
|
Latin America Fund |
A-59 |
Performance |
|
|
A-60 |
Fund Talk: The Manager's Overview |
|
|
A-61 |
Investment Changes |
|
|
A-62 |
Investments |
|
|
A-64 |
Financial Statements |
|
Nordic Fund |
A-66 |
Performance |
|
|
A-67 |
Fund Talk: The Manager's Overview |
|
|
A-68 |
Investment Changes |
|
|
A-69 |
Investments |
|
|
A-71 |
Financial Statements |
|
Pacific Basin Fund |
A-73 |
Performance |
|
|
A-74 |
Fund Talk: The Manager's Overview |
|
|
A-75 |
Investment Changes |
|
|
A-76 |
Investments |
|
|
A-79 |
Financial Statements |
|
Southeast Asia Fund |
A-81 |
Performance |
|
|
A-82 |
Fund Talk: The Manager's Overview |
|
|
A-83 |
Investment Changes |
|
|
A-84 |
Investments |
|
|
A-86 |
Financial Statements |
|
Notes to Financial Statements |
A-88 |
Notes to the Financial Statements |
|
Report of Independent Accountants |
A-92 |
The auditors' opinion. |
|
Independent Auditors' Report |
A-93 |
The auditors' opinion. |
|
Distributions |
A-94 |
|
Standard & Poor's, S&P and S&P 500 are registered service marks of The McGraw-Hill Companies, Inc. and have been licensed for use by
Fidelity Distributors Corporation.
Third party marks appearing herein are the property of their respective owners.
All other marks appearing herein are registered or unregistered trademarks or service marks of FMR Corp. or an affiliated company.
(Recycle graphic) This report is printed on recycled paper using soy-based inks.
The views expressed in this report reflect those of each fund's portfolio manager only through the end of the period of the report as stated on the cover and do not necessarily represent the views of Fidelity or any other person in the Fidelity organization. Any such views are subject to change at any time based upon market or other conditions and Fidelity disclaims any responsibility to update such views. These views may not be relied on as investment advice and, because investment decisions for a Fidelity fund are based on numerous factors, may not be relied on as an indication of trading intent on behalf of any Fidelity fund.
This report and the financial statements contained herein are submitted for the general information of the shareholders of the funds. This report is not authorized for distribution to prospective investors in the funds unless preceded or accompanied by an effective prospectus.
Mutual fund shares are not deposits or obligations of, or guaranteed by, any depository institution. Shares are not insured by the FDIC, Federal Reserve Board or any other agency, and are subject to investment risks, including possible loss of principal amount invested.
Neither the funds nor Fidelity Distributors Corporation is a bank. For more information on any Fidelity fund, including charges and expenses, call 1-800-544-6666 for a free prospectus. Read it carefully before you invest or send money.
Annual Report
The 12-month period that ended October 31, 2000, marked an incredible display of synchronization among global equity markets. Many of the similarities came from the parallel performance of technology stocks in the U.S. and TMT stocks - those in the technology, media and telecommunications areas - overseas. In a nutshell, investors who took any form of risk during the first half of the period were rewarded; those who took risks from April on were firmly punished for their bravado. Rising interest rates, uncertainty over energy prices and the continued dominance of the dollar over other world currencies also played key roles.
Europe: Just as technology stocks propelled the U.S. market to extraordinary heights in 1999 and early 2000, new economy stocks - particularly those in the wireless communications and Internet groups - were responsible for much of Europe's lofty gains. Unfortunately, the old saying "what goes up must come down" was validated in April, when U.S. technology stocks crashed amid concerns over extended valuations. The decline sent shock waves across all oceans of the world, hitting home particularly hard for many of Europe's leading telecommunications stocks. Rising oil and gas prices, meanwhile, made it difficult for Europe's manufacturing industries, and the euro - the underachieving uniform currency for 11 European nations - continued to weaken. For the period, the Morgan Stanley Capital International (MSCI) Europe Index returned 1.16%.
Emerging Markets: Call it guilt by association, but with risk-taking appetites low from April through October, most emerging markets weren't the best place to be during the period. The worldwide technology decline hurt everything from semiconductor stocks in Taiwan to broadcasting stocks in Mexico. Asian semiconductor companies also had to grapple with weak global demand for PCs and cellular handsets. For the period, the MSCI All Country Asia Free ex-Japan Index was down 20.11%. Judging by the 14.24% return of the MSCI Emerging Markets Free-Latin America Index, performance was much better in Latin America. Mexico was a clear winner, as investors reacted positively to the government's repayment of debt to the International Monetary Fund, as well as to the election of the country's new president, who was widely seen as business-friendly.
Japan and the Far East: After flirting with investors throughout 1999, the Japanese market fell back to earth. Initial euphoria over economic progress gave way to the actual corporate restructuring work that needed to be done, and many high-flying technology stocks tumbled. To compound matters, the Japanese yen continued to dip relative to the dollar. The Tokyo Stock Exchange Index - also known as TOPIX - fell 15.16% during the period. Hong Kong and China continued to perform well, as the Hang Seng Index returned 14.26% during the 12 months. Both regions continued to benefit from fast-improving economies, as well as from China's pending admission to the World Trade Organization.
U.S. and Canada: The technology correction, higher interest rates and soaring oil and gas prices eroded much of the U.S. market's gains during the period. The NASDAQ Composite Index gave back much of its previous advance, finishing the period up 13.81%. The Standard & Poor's 500SM Index - a barometer of large-cap stock performance - was up 6.09% during the period, but was in negative territory from January through the end of October. The Russell 2000® Index - which tracks smaller stocks - returned 17.41%, mostly from strong first-half performance. America's neighbor to the north, meanwhile, continued to perform well. Canadian stocks enjoyed a very nice run, mostly aided by the phenomenal performance of telecommunications and technology stocks. Natural resource-related stocks also fared well. For the period, the Toronto Stock Exchange 300 gained 29.44%.
Bonds: For the most part, U.S. fixed-income investments shrugged off rising interest rates and the increased volatility in the equity markets. Many investors, in fact, gravitated to bonds as a safer haven following the technology correction. The Lehman Brothers Aggregate Bond Index - which tracks the performance of U.S. taxable bonds - returned 7.30% during the period. Treasury issues were a strong sector, particularly after the Treasury announced in January that it would be buying back debt and limiting the amount of new borrowings. The Lehman Brothers Long Term Government Bond Index climbed 11.33% during the period. Foreign government bonds couldn't match the U.S.' performance, however, as the Salomon Brothers Non-U.S. World Government Bond Index fell 9.70%. Emerging-markets bonds enjoyed a very strong 12-month showing. The J.P. Morgan Emerging Markets Bond Index returned 19.37%.
[BAR GRAPH]
Standard & Poor's 500 Index Morgan Stanley Capital International
Europe, Australasia, Far East Index
Row: 1, Col: 1, Value: nil
Row: 1, Col: 2, Value: nil
Row: 2, Col: 1, Value: 6.1
Row: 2, Col: 2, Value: 7.38
Row: 3, Col: 1, Value: 31.57
Row: 3, Col: 2, Value: 56.16
Row: 4, Col: 1, Value: 18.56
Row: 4, Col: 2, Value: 69.44000000000001
Row: 5, Col: 1, Value: 5.1
Row: 5, Col: 2, Value: 24.63
Row: 6, Col: 1, Value: 16.61
Row: 6, Col: 2, Value: 28.27
Row: 7, Col: 1, Value: 31.69
Row: 7, Col: 2, Value: 10.53
Row: 8, Col: 1, Value: -3.1
Row: 8, Col: 2, Value: -23.45
Row: 9, Col: 1, Value: 30.47
Row: 9, Col: 2, Value: 12.13
Row: 10, Col: 1, Value: 7.619999999999999
Row: 10, Col: 2, Value: -12.17
Row: 11, Col: 1, Value: 10.08
Row: 11, Col: 2, Value: 32.56
Row: 12, Col: 1, Value: 1.32
Row: 12, Col: 2, Value: 7.78
Row: 13, Col: 1, Value: 37.58
Row: 13, Col: 2, Value: 11.21
Row: 14, Col: 1, Value: 22.96
Row: 14, Col: 2, Value: 6.05
Row: 15, Col: 1, Value: 32.11
Row: 15, Col: 2, Value: 4.819999999999999
Row: 16, Col: 1, Value: 28.58
Row: 16, Col: 2, Value: 20.27
Row: 17, Col: 1, Value: 21.04
Row: 17, Col: 2, Value: 27.22
Row: 18, Col: 1, Value: -1.81
Row: 18, Col: 2, Value: -13.75
%
* YEAR TO DATE THROUGH OCTOBER 31, 2000.
Annual Report
There are several ways to evaluate a fund's historical performance. You can look at the total percentage change in value, the average annual percentage change or the growth of a hypothetical $10,000 investment. Total return reflects the change in the value of an investment, assuming reinvestment of the fund's dividend income and capital gains (the profits earned upon the sale of securities that have grown in value). If Fidelity had not reimbursed certain fund expenses, the past 10 year total return would have been lower.
Cumulative Total Returns
|
Periods ended |
|
Past 1 |
Past 5 |
Past 10 |
|
Fidelity Canada |
|
40.22% |
81.71% |
167.91% |
|
Fidelity Canada |
|
36.01% |
76.26% |
159.88% |
|
Toronto Stock Exchange 300 |
|
29.44% |
106.85% |
201.16% |
Cumulative total returns show the fund's performance in percentage terms over a set period - in this case, one year, five years or 10 years. For example, if you had invested $1,000 in a fund that had a 5% return over the past year, the value of your investment would be $1,050. You can compare the fund's returns to the performance of the Toronto Stock Exchange (TSE) 300 Index - a market capitalization-weighted index of 300 stocks traded in the Canadian market.
Average Annual Total Returns
|
Periods ended |
Past 1 |
Past 5 |
Past 10 |
|
Fidelity Canada |
40.22% |
12.69% |
10.36% |
|
Fidelity Canada |
36.01% |
12.00% |
10.02% |
|
Toronto Stock Exchange 300 |
29.44% |
15.65% |
11.66% |
Average annual total returns take the fund's cumulative return and show you what would have happened if the fund had performed at a constant rate each year.
$10,000 Over 10 Years
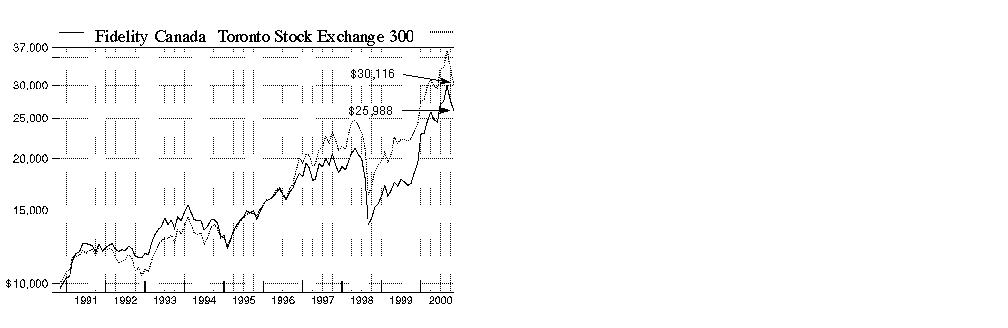
$10,000 Over 10 Years: Let's say hypothetically that $10,000 was invested in Fidelity Canada Fund on October 31, 1990, and the current 3.00% sales charge was paid. As the chart shows, by October 31, 2000, the value of the investment would have grown to $25,988 - a 159.88% increase on the initial investment. For comparison, look at how the Toronto Stock Exchange 300 Index did over the same period. With dividends and capital gains, if any, reinvested, the same $10,000 would have grown to $30,116 - a 201.16% increase.
Understanding Performance
Many markets around the globe offer the potential for significant growth over time; however, investing in foreign markets means assuming greater risks than investing in the United States. Factors like changes in a country's financial markets, its local political and economic climate, and the fluctuating value of its currency create these risks. For these reasons an international fund's performance may be more volatile than a fund that invests exclusively in the United States. Past performance is no guarantee of future results and you may have a gain or loss when you sell your shares.
3Annual Report
(Portfolio Manager photograph)
An interview with
Stephen Binder,
Portfolio Manager
of Fidelity Canada Fund
Q. How did the fund perform, Stephen?
A. Very well. For the 12 months that ended October 31, 2000, the fund returned 40.22%, outpacing the Toronto Stock Exchange (TSE) 300, which returned 29.44% during the same time frame.
Q. What factors helped the fund outpace its benchmark during the 12-month period?
A. Good stock picking and favorable industry positioning allowed us to maintain a healthy lead over the index during the period. A majority of our gains came by way of the technology and telecommunications- heavy utilities sectors. Investors rallied around top firms engaged in the rollout of next-generation communications networks. Fortunately, we had ample exposure to many of the winners in this space, most notably market giants BCE and Nortel Networks, the fund's top holding. Shares of Nortel - the leading supplier of optical networking equipment in North America - rode investor enthusiasm sharply higher during the period, only to give most of its gains back in the fall amid the global tech correction. We couldn't own enough of the stock early on, which hurt relative performance given that its share of the overall stock market exceeded 35% at its peak in July. However, we more than made up for this shortfall by overweighting BCE - Canada's largest telecom company and a major shareholder in Nortel - relative to the TSE 300 index. BCE's announcement in January of its intention to spin off its holdings in Nortel further boosted BCE's stock and helped narrow the discount it was trading at relative to the aggregate value of its underlying businesses and investments. Following the spin-off in May, I reduced our stake in BCE, but still remained underweighted in Nortel, a posture that hurt relative performance during the summer, but which helped when the stock suffered precipitous declines late in the period.
Q. Why did the Canadian market perform so well during this volatile period?
A. Canada's economy continued to expand steadily behind low inflation, a healthy fiscal policy and rising exports particularly to the U.S., its top trading partner. Despite unusually high levels of volatility, fundamentals remained reasonably strong for tech stocks overall thanks to a boom in tech-related spending triggered by companies worldwide looking to stay ahead by improving productivity. For much of the period, this environment favored firms such as Nortel, which had a weighty influence on the direction of the Toronto market.
Q. Could you mention some of your other strategies that worked?
A. Sure. Increasing our exposure to a handful of key tech names that posted triple-digit returns during the period, such as C-Mac and Celestica, helped quite a bit. These firms are electronics manufacturers that benefited from the growing trend of outsourcing the manufacturing of commodity components by telecom equipment carriers such as Nortel. Holding a sizable position in JDS Uniphase - a leading maker of optical components - also paid off nicely for the fund, as did many of our financial holdings. I liquidated our stake in JDS Uniphase prior to the close of the period. Banks enjoyed a strong period, driven in large part by stronger-than-expected earnings as well as optimism about potential consolidation activity. Royal Bank of Canada was a top contributor here. We also were handsomely rewarded for participating in several IPOs involving mutual life insurance companies, namely Sun Life and Industrial Alliance, whose share prices shot up after being issued at particularly attractive valuations. Our investments in the energy sector capitalized on strengthening oil and gas prices, further bolstering relative performance. Canadian Pacific and Tidewater were standouts here.
Q. What moves didn't pan out?
A. Although 11 out of 14 sectors in the market gained ground during the period, even being slightly overexposed to two of the three laggards - metals and minerals, and paper and forest products - hurt. Lack of investor interest in most natural resources stocks, coupled with concerns about a slowing economy late in the period, felled paper and mining stocks such as Domtar and Falconbridge, respectively. Domtar was no longer held at the close of the period. Poor positioning among media stocks further detracted from relative returns.
Q. What's your outlook?
A. I remain optimistic about the prospects for oil and gas stocks, given my belief in the sustainability of higher energy prices. I feel that tech stocks will continue to be volatile in the coming months, as market fears about a slowing global economy have begun to put pressure on sector fundamentals. However, it's possible that a slowdown could result in lower interest rates, which could provide some support for a volatile market. I'm considering raising our exposure a bit to beaten-up cyclical stocks, which currently present extremely attractive value opportunities.
The views expressed in this report reflect those of the portfolio manager only through the end of the period of the report as stated on the cover. The manager's views are subject to change at any time based on market or other conditions. For more information, see page A-3.
Fund Facts
Goal: long-term growth of capital by investing mainly in equity securities of Canadian issuers
Fund number: 309
Trading symbol: FICDX
Start date: November 17, 1987
Size: as of October 31, 2000, more than $163 million
Manager: Stephen Binder, since 1999; associate portfolio manager, Fidelity Canada Fund, 1998-1999; manager, several Fidelity Select Portfolios, 1990-1997; research analyst, 1989-1999; joined Fidelity in 1989
3Annual Report
Canada
|
Geographic Diversification (% of fund's net assets) |
|||
|
As of October 31, 2000 |
|||
 |
Canada |
94.7% |
|
 |
United States of America |
5.3% |
|

|
|
|||
|
As of April 30, 2000 |
|||
|
Canada |
89.2% |
|
 |
United States of America |
10.3% |
|
 |
Cayman Islands |
0.2% |
|
 |
Finland |
0.2% |
|
|
Bermuda |
0.1% |
|

|
Percentages are adjusted for the effect of futures contracts, if applicable. |
|
Asset Allocation |
||
|
|
% of fund's |
% of fund's net assets |
|
Stocks |
98.0 |
97.7 |
|
Short-Term Investments |
2.0 |
2.3 |
|
Top Ten Stocks as of October 31, 2000 |
||
|
|
% of fund's |
% of fund's net assets |
|
Nortel Networks Corp. (Communications Equipment) |
15.0 |
11.2 |
|
C-Mac Industries, Inc. (Electronics) |
5.0 |
3.5 |
|
Royal Bank of Canada (Banks) |
4.6 |
3.1 |
|
BCE, Inc. (Telephone Services) |
3.3 |
14.9 |
|
Toronto Dominion Bank (Banks) |
3.2 |
3.3 |
|
Bombardier, Inc. Class B (sub. vtg.) (Aerospace & Defense) |
3.0 |
2.4 |
|
Canadian Pacific Ltd. (Railroads) |
3.0 |
1.5 |
|
Celestica, Inc. (sub. vtg.) (Electronics) |
2.6 |
1.6 |
|
Canadian Imperial Bank of Commerce (Banks) |
2.5 |
1.9 |
|
Sun Life Financial Services Canada, Inc. (Insurance) |
2.3 |
1.2 |
|
|
44.5 |
44.6 |
|
Top Ten Market Sectors as of October 31, 2000 |
||
|
|
% of fund's |
% of fund's net assets |
|
Technology |
23.6 |
20.7 |
|
Finance |
22.6 |
15.0 |
|
Energy |
13.8 |
10.4 |
|
Utilities |
9.3 |
19.4 |
|
Transportation |
5.5 |
2.9 |
|
Basic Industries |
5.2 |
7.4 |
|
Retail & Wholesale |
4.9 |
4.8 |
|
Aerospace & Defense |
3.0 |
2.8 |
|
Nondurables |
2.9 |
3.8 |
|
Media & Leisure |
1.8 |
1.8 |
Annual Report
Canada
Showing Percentage of Net Assets
|
Common Stocks - 98.0% |
|||
|
Shares |
Value (Note 1) |
||
|
AEROSPACE & DEFENSE - 3.0% |
|||
|
Bombardier, Inc. Class B (sub. vtg.) |
310,000 |
$ 4,876,519 |
|
|
BASIC INDUSTRIES - 5.2% |
|||
|
Chemicals & Plastics - 1.6% |
|||
|
NOVA Chemicals Corp. |
49,000 |
1,010,575 |
|
|
Potash Corp. of Saskatchewan |
27,700 |
1,641,987 |
|
|
|
2,652,562 |
||
|
Iron & Steel - 0.2% |
|||
|
Dofasco, Inc. |
21,000 |
291,724 |
|
|
Metals & Mining - 2.3% |
|||
|
Alcoa, Inc. |
70,000 |
2,008,125 |
|
|
Falconbridge Ltd. |
66,040 |
785,106 |
|
|
Inco Ltd. (a) |
68,000 |
1,058,522 |
|
|
|
3,851,753 |
||
|
Paper & Forest Products - 1.1% |
|||
|
Abitibi-Consolidated, Inc. |
120,000 |
1,052,217 |
|
|
Tembec, Inc. Class A (a) |
79,100 |
698,782 |
|
|
|
1,750,999 |
||
|
TOTAL BASIC INDUSTRIES |
8,547,038 |
||
|
CONSTRUCTION & REAL ESTATE - 0.2% |
|||
|
Building Materials - 0.2% |
|||
|
Richelieu Hardware Ltd. (a) |
30,800 |
273,103 |
|
|
DURABLES - 1.4% |
|||
|
Home Furnishings - 0.3% |
|||
|
Teknion Corp. (sub. vtg.) (a) |
46,000 |
546,864 |
|
|
Textiles & Apparel - 1.1% |
|||
|
Gildan Activewear, Inc. Class A (a) |
49,000 |
1,702,750 |
|
|
TOTAL DURABLES |
2,249,614 |
||
|
ENERGY - 13.8% |
|||
|
Energy Services - 3.4% |
|||
|
Ensign Resource Service Group, Inc. |
113,000 |
3,043,021 |
|
|
Santa Fe International Corp. |
25,500 |
930,750 |
|
|
Tidewater, Inc. |
29,000 |
1,339,438 |
|
|
Trican Well Service Ltd. (a) |
39,400 |
297,603 |
|
|
|
5,610,812 |
||
|
Oil & Gas - 10.4% |
|||
|
Alberta Energy Co. Ltd. |
16,900 |
624,384 |
|
|
Anderson Exploration Ltd. (a) |
36,000 |
662,069 |
|
|
Baytex Energy Ltd. (a) |
74,800 |
564,992 |
|
|
Bonavista Petroleum Ltd. (a) |
27,000 |
478,818 |
|
|
Canada Occidental Petroleum Ltd. |
74,400 |
1,790,975 |
|
|
Canadian Hunter Exploration Ltd. (a) |
47,500 |
998,358 |
|
|
Canadian Natural Resources Ltd. (a) |
66,600 |
1,968,473 |
|
|
Crestar Energy, Inc. (a) |
92,000 |
1,489,524 |
|
|
Rio Alto Exploration Ltd. (a) |
149,400 |
2,541,517 |
|
|
|
|||
|
Shares |
Value (Note 1) |
||
|
Suncor Energy, Inc. |
178,000 |
$ 3,478,161 |
|
|
Talisman Energy, Inc. (a) |
73,000 |
2,299,080 |
|
|
|
16,896,351 |
||
|
TOTAL ENERGY |
22,507,163 |
||
|
FINANCE - 22.6% |
|||
|
Banks - 13.3% |
|||
|
Bank of Montreal |
44,000 |
2,037,438 |
|
|
Bank of Nova Scotia |
85,000 |
2,428,571 |
|
|
Canadian Imperial Bank of Commerce |
127,000 |
4,037,307 |
|
|
Laurentian Bank |
26,000 |
418,391 |
|
|
Royal Bank of Canada |
236,000 |
7,486,897 |
|
|
Toronto Dominion Bank |
192,000 |
5,290,246 |
|
|
|
21,698,850 |
||
|
Credit & Other Finance - 0.4% |
|||
|
Home Capital Group Class B (sub. vtg.) |
176,700 |
696,355 |
|
|
Insurance - 6.7% |
|||
|
Canada Life Financial Corp. |
42,000 |
982,069 |
|
|
Fairfax Financial Holdings Ltd. (a) |
4,800 |
640,000 |
|
|
Industrial Alliance Life Insurance Co. (a) |
96,900 |
2,148,030 |
|
|
Kingsway Financial Services, Inc. (a) |
136,000 |
468,966 |
|
|
Manulife Financial Corp. |
114,000 |
2,965,123 |
|
|
Sun Life Financial Services Canada, Inc. |
176,000 |
3,641,379 |
|
|
|
10,845,567 |
||
|
Securities Industry - 2.2% |
|||
|
AGF Management Ltd. Class B (non-vtg.) |
108,000 |
1,801,773 |
|
|
C.I. Fund Management, Inc. |
61,000 |
1,276,092 |
|
|
Mackenzie Financial Corp. |
29,100 |
391,823 |
|
|
Maverick Tube Canada Ltd. (a) |
7,644 |
117,484 |
|
|
|
3,587,172 |
||
|
TOTAL FINANCE |
36,827,944 |
||
|
HEALTH - 1.2% |
|||
|
Drugs & Pharmaceuticals - 1.2% |
|||
|
Biovail Corp. (a) |
36,000 |
1,536,946 |
|
|
QLT, Inc. (a) |
9,100 |
454,253 |
|
|
|
1,991,199 |
||
|
INDUSTRIAL MACHINERY & EQUIPMENT - 1.3% |
|||
|
Ballard Power Systems, Inc. (a) |
15,600 |
1,680,394 |
|
|
GSI Lumonics, Inc. (a) |
36,300 |
469,695 |
|
|
TOTAL INDUSTRIAL MACHINERY & EQUIPMENT |
2,150,089 |
||
|
MEDIA & LEISURE - 1.8% |
|||
|
Broadcasting - 0.2% |
|||
|
Cogeco, Inc. (sub. vtg.) |
17,200 |
359,816 |
|
|
Common Stocks - continued |
|||
|
Shares |
Value (Note 1) |
||
|
MEDIA & LEISURE - continued |
|||
|
Entertainment - 0.7% |
|||
|
Alliance Atlantis Communications Corp. Class B (non-vtg.) (a) |
25,800 |
$ 389,754 |
|
|
Astral Media, Inc. Class A (non-vtg.) |
28,800 |
782,187 |
|
|
|
1,171,941 |
||
|
Publishing - 0.8% |
|||
|
Thomson Corp. |
33,000 |
1,333,005 |
|
|
Restaurants - 0.1% |
|||
|
Sportscene Restaurants, Inc. Class A |
20,000 |
85,386 |
|
|
TOTAL MEDIA & LEISURE |
2,950,148 |
||
|
NONDURABLES - 2.9% |
|||
|
Beverages - 2.6% |
|||
|
Molson, Inc. Class A |
22,700 |
573,277 |
|
|
Seagram Co. Ltd. |
54,600 |
3,119,025 |
|
|
The Coca-Cola Co. |
8,100 |
489,038 |
|
|
|
4,181,340 |
||
|
Household Products - 0.3% |
|||
|
Procter & Gamble Co. |
7,000 |
500,063 |
|
|
TOTAL NONDURABLES |
4,681,403 |
||
|
PRECIOUS METALS - 1.0% |
|||
|
Barrick Gold Corp. |
58,000 |
771,429 |
|
|
Goldcorp, Inc. Class A (a) |
51,000 |
306,502 |
|
|
Meridian Gold, Inc. (a) |
36,200 |
183,080 |
|
|
Placer Dome, Inc. |
39,300 |
326,532 |
|
|
TOTAL PRECIOUS METALS |
1,587,543 |
||
|
RETAIL & WHOLESALE - 4.9% |
|||
|
Grocery Stores - 4.2% |
|||
|
Loblaw Companies Ltd. |
53,000 |
1,817,143 |
|
|
Onex Corp. |
176,400 |
2,803,862 |
|
|
Weston George Ltd. |
47,000 |
2,343,054 |
|
|
|
6,964,059 |
||
|
Retail & Wholesale, Miscellaneous - 0.7% |
|||
|
Future Shop Ltd. (a) |
209,000 |
1,098,194 |
|
|
TOTAL RETAIL & WHOLESALE |
8,062,253 |
||
|
SERVICES - 0.3% |
|||
|
Mosaic Group, Inc. (a) |
65,000 |
490,969 |
|
|
|
|||
|
Shares |
Value (Note 1) |
||
|
TECHNOLOGY - 23.6% |
|||
|
Communications Equipment - 15.1% |
|||
|
Ciena Corp. (a) |
2,000 |
$ 210,250 |
|
|
Nortel Networks Corp. |
538,017 |
24,479,773 |
|
|
|
24,690,023 |
||
|
Computer Services & Software - 0.9% |
|||
|
Cognos, Inc. (a) |
22,700 |
954,220 |
|
|
Open Text Corp. (a) |
19,000 |
474,220 |
|
|
|
1,428,440 |
||
|
Electronics - 7.6% |
|||
|
C-Mac Industries, Inc. (a) |
144,000 |
8,133,990 |
|
|
Celestica, Inc. (sub. vtg.) (a) |
59,000 |
4,216,223 |
|
|
|
12,350,213 |
||
|
TOTAL TECHNOLOGY |
38,468,676 |
||
|
TRANSPORTATION - 5.5% |
|||
|
Air Transportation - 1.0% |
|||
|
Air Canada (a) |
21,543 |
234,886 |
|
|
Air Canada Class A (non-vtg.) (a) |
7,300 |
69,284 |
|
|
CHC Helicopter Corp. Class A (a) |
125,000 |
923,645 |
|
|
WestJet Airlines Ltd. (a) |
23,600 |
384,420 |
|
|
|
1,612,235 |
||
|
Railroads - 4.5% |
|||
|
Canadian National Railway Co. |
81,000 |
2,553,695 |
|
|
Canadian Pacific Ltd. |
167,000 |
4,853,695 |
|
|
|
7,407,390 |
||
|
TOTAL TRANSPORTATION |
9,019,625 |
||
|
UTILITIES - 9.3% |
|||
|
Cellular - 0.3% |
|||
|
Rogers Communications, Inc. |
25,300 |
491,875 |
|
|
Gas - 3.4% |
|||
|
ATCO Ltd. Class I (non-vtg.) |
118,000 |
2,980,033 |
|
|
Canadian Utilities Ltd. Class A (non-vtg.) |
1,200 |
34,483 |
|
|
Enbridge, Inc. |
52,950 |
1,425,911 |
|
|
Westcoast Energy, Inc. |
48,000 |
1,071,921 |
|
|
|
5,512,348 |
||
|
Telephone Services - 5.6% |
|||
|
BCE, Inc. |
200,000 |
5,385,878 |
|
|
Manitoba Telecom Services, Inc. |
115,000 |
2,379,310 |
|
|
TELUS Corp. (non-vtg.) |
51,000 |
1,306,404 |
|
|
|
9,071,592 |
||
|
TOTAL UTILITIES |
15,075,815 |
||
|
TOTAL COMMON STOCKS (Cost $153,315,955) |
159,759,101 |
||
|
Cash Equivalents - 4.7% |
|||
|
Shares |
Value (Note 1) |
||
|
Fidelity Cash Central Fund, 6.61% (b) |
2,906,933 |
$ 2,906,933 |
|
|
Fidelity Securities Lending Cash Central Fund, 6.66% (b) |
4,693,013 |
4,693,013 |
|
|
TOTAL CASH EQUIVALENTS (Cost $7,599,946) |
7,599,946 |
||
|
TOTAL INVESTMENT PORTFOLIO - 102.7% (Cost $160,915,901) |
167,359,047 |
||
|
NET OTHER ASSETS - (2.7)% |
(4,333,820) |
||
|
NET ASSETS - 100% |
$ 163,025,227 |
||
|
Legend |
|
(a) Non-income producing |
|
(b) The rate quoted is the annualized seven-day yield of the fund at period end. A complete listing of the fund's holdings as of its most recent fiscal year end is available upon request. |
|
Other Information |
|
Purchases and sales of securities, other than short-term securities, aggregated $202,994,766 and $86,651,035, respectively. |
|
The fund placed a portion of its portfolio transactions with brokerage firms which are affiliates of Fidelity Management & Research Company. The commissions paid to these affiliated firms were $3,465 for the period. |
|
The fund participated in the security lending program. At period end, the value of securities loaned amounted to $5,321,970. The fund received cash collateral of $4,693,013 which was invested in cash equivalents. |
|
Income Tax Information |
|
At October 31, 2000, the aggregate cost of investment securities for income tax purposes was $161,760,126. Net unrealized appreciation aggregated $5,598,921, of which $20,250,969 related to appreciated investment securities and $14,652,048 related to depreciated investment securities. |
|
At October 31, 2000, the fund had a capital loss carryforward of approximately $3,354,000, all of which will expire on October 31, 2006. |
See accompanying notes which are an integral part of the financial statements.
Annual Report
Canada
Statement of Assets and Liabilities
|
|
October 31, 2000 |
|
|
Assets |
|
|
|
Investment in securities, at value |
|
$ 167,359,047 |
|
Receivable for investments sold |
|
3,352,825 |
|
Receivable for fund shares sold |
|
579,757 |
|
Dividends receivable |
|
101,158 |
|
Interest receivable |
|
31,295 |
|
Redemption fees receivable |
|
2,860 |
|
Other receivables |
|
13,613 |
|
Total assets |
|
171,440,555 |
|
Liabilities |
|
|
|
Payable for investments purchased |
$ 2,887,985 |
|
|
Payable for fund shares redeemed |
640,450 |
|
|
Accrued management fee |
101,049 |
|
|
Other payables and |
92,831 |
|
|
Collateral on securities loaned, |
4,693,013 |
|
|
Total liabilities |
|
8,415,328 |
|
Net Assets |
|
$ 163,025,227 |
|
Net Assets consist of: |
|
|
|
Paid in capital |
|
$ 152,433,665 |
|
Undistributed net investment income |
|
8,350,012 |
|
Accumulated undistributed net realized gain (loss) on investments and foreign currency transactions |
|
(4,196,973) |
|
Net unrealized appreciation (depreciation) on investments |
|
6,438,523 |
|
Net Assets, for 7,319,715 |
|
$ 163,025,227 |
|
Net Asset Value and redemption price per share ($163,025,227 ÷ 7,319,715 shares) |
|
$22.27 |
|
Maximum offering price per share (100/97.00 of $22.27) |
|
$22.96 |
Statement of Operations
|
|
Year ended October 31, 2000 |
|
|
Investment Income Dividends |
|
$ 813,038 |
|
Special dividend from BCE, Inc. |
|
8,288,947 |
|
Interest |
|
311,060 |
|
Security lending |
|
42,007 |
|
|
|
9,455,052 |
|
Less foreign taxes withheld |
|
(120,145) |
|
Total income |
|
9,334,907 |
|
Expenses |
|
|
|
Management fee |
$ 671,144 |
|
|
Performance adjustment |
(127,562) |
|
|
Transfer agent fees |
252,860 |
|
|
Accounting and security lending fees |
70,172 |
|
|
Non-interested trustees' compensation |
468 |
|
|
Custodian fees and expenses |
64,778 |
|
|
Registration fees |
44,501 |
|
|
Audit |
35,588 |
|
|
Legal |
969 |
|
|
Miscellaneous |
182 |
|
|
Total expenses before reductions |
1,013,100 |
|
|
Expense reductions |
(28,738) |
984,362 |
|
Net investment income |
|
8,350,545 |
|
Realized and Unrealized Gain (Loss) Net realized gain (loss) on: |
|
|
|
Investment securities |
510,655 |
|
|
Foreign currency transactions |
19,177 |
529,832 |
|
Change in net unrealized appreciation (depreciation) on: |
|
|
|
Investment securities |
320,096 |
|
|
Assets and liabilities in |
(3,754) |
316,342 |
|
Net gain (loss) |
|
846,174 |
|
Net increase (decrease) in net assets resulting from operations |
|
$ 9,196,719 |
|
Other Information |
|
$ 183,657 |
|
Sales charges - Retained by FDC |
|
$ 183,657 |
|
Deferred sales charges withheld |
|
$ 1,233 |
|
Expense reductions |
|
|
|
Directed brokerage arrangements |
|
$ 22,808 |
|
Custodian credits |
|
3,629 |
|
Transfer agent credits |
|
2,301 |
|
|
|
$ 28,738 |
See accompanying notes which are an integral part of the financial statements.
Annual Report
Canada
Financial Statements - continued
Statement of Changes in Net Assets
|
Increase (Decrease) in Net Assets |
Year ended
October 31, |
Year ended
October 31, |
|
Operations |
$ 8,350,545 |
$ 116,686 |
|
Net realized gain (loss) |
529,832 |
3,321,252 |
|
Change in net unrealized appreciation (depreciation) |
316,342 |
5,467,083 |
|
Net increase (decrease) in net assets resulting from operations |
9,196,719 |
8,905,021 |
|
Distributions to shareholders from net investment income |
(85,857) |
(248,416) |
|
Share transactions |
160,756,968 |
10,888,952 |
|
Reinvestment of distributions |
82,250 |
237,716 |
|
Cost of shares redeemed |
(51,055,541) |
(23,488,113) |
|
Net increase (decrease) in net assets resulting from share transactions |
109,783,677 |
(12,361,445) |
|
Redemption fees |
360,425 |
53,318 |
|
Total increase (decrease) in net assets |
119,254,964 |
(3,651,522) |
|
Net Assets |
|
|
|
Beginning of period |
43,770,263 |
47,421,785 |
|
End of period (including undistributed net investment income of $8,350,012 and $66,029, respectively) |
$ 163,025,227 |
$ 43,770,263 |
|
Other Information Shares |
|
|
|
Sold |
6,834,177 |
743,930 |
|
Issued in reinvestment of distributions |
4,754 |
17,767 |
|
Redeemed |
(2,270,606) |
(1,618,570) |
|
Net increase (decrease) |
4,568,325 |
(856,873) |
Financial Highlights
|
Years ended October 31, |
2000 |
1999 |
1998 |
1997 |
1996 |
|
Selected Per-Share Data |
|
|
|
|
|
|
Net asset value, beginning of period |
$ 15.91 |
$ 13.14 |
$ 18.88 |
$ 21.84 |
$ 17.55 |
|
Income from Investment Operations |
|
|
|
|
|
|
Net investment income C |
1.98 E |
.04 |
.09 |
.03 |
.08 |
|
Net realized and unrealized gain (loss) |
4.32 F |
2.78 |
(3.70) |
1.39 |
4.27 |
|
Total from investment operations |
6.30 |
2.82 |
(3.61) |
1.42 |
4.35 |
|
Less Distributions |
|
|
|
|
|
|
From net investment income |
(.03) |
(.07) |
(.05) |
(.13) |
(.08) |
|
From net realized gain |
- |
- |
(2.08) |
(4.29) |
- |
|
Total distributions |
(.03) |
(.07) |
(2.13) |
(4.42) |
(.08) |
|
Redemption fees added to paid in capital |
.09 |
.02 |
- |
.04 |
.02 |
|
Net asset value, end of period |
$ 22.27 |
$ 15.91 |
$ 13.14 |
$ 18.88 |
$ 21.84 |
|
Total Return A, B |
40.22% |
21.71% |
(21.27)% |
8.21% |
24.99% |
|
Ratios and Supplemental Data |
|
|
|
|
|
|
Net assets, end of period (000 omitted) |
$ 163,025 |
$ 43,770 |
$ 47,422 |
$ 96,458 |
$ 129,671 |
|
Ratio of expenses to average net assets |
1.09% |
1.22% |
.94% |
.93% |
1.01% |
|
Ratio of expenses to average net assets after expense reductions |
1.06% D |
1.06% D |
.80% D |
.92% D |
.98% D |
|
Ratio of net investment income to average net assets |
9.00% |
.26% |
.57% |
.18% |
.40% |
|
Portfolio turnover rate |
97% |
286% |
215% |
139% |
139% |
|
A The total returns would have been lower had certain expenses not been reduced during the periods shown. B Total returns do not include the one time sales charge. C Net investment income per share has been calculated based on average shares outstanding during the period. D FMR or the fund has entered into varying arrangements with third parties who either paid or reduced a portion of the fund's expenses. E Investment income per share reflects a special dividend (from BCE, Inc.) which amounted to $1.97 per share. F The amount shown for a share outstanding does not correspond with the aggregate net gain on investments for the period due to the timing of sales and repurchases of |
|||||
See accompanying notes which are an integral part of the financial statements.
Annual Report
There are several ways to evaluate a fund's historical performance. You can look at the total percentage change in value, the average annual percentage change or the growth of a hypothetical $10,000 investment. Total return reflects the change in the value of an investment, assuming reinvestment of the fund's dividend income and capital gains (the profits earned upon the sale of securities that have grown in value).
Cumulative Total Returns
|
Periods ended |
|
Past 1 |
Life of |
|
Fidelity China Region |
|
6.77% |
59.35% |
|
Fidelity China Region |
|
3.57% |
54.57% |
|
Hang Seng |
|
14.26% |
75.62% |
|
Fidelity China Region Fund Linked Index |
|
11.00% |
70.62% |
|
China Region Funds Average |
|
13.44% |
n/a* |
Cumulative total returns show the fund's performance in percentage terms over a set period - in this case, one year or since the fund started on November 1, 1995. For example, if you had invested $1,000 in a fund that had a 5% return over the past year, the value of your investment would be $1,050. You can compare the fund's returns to the performance of the Hang Seng Index - a market capitalization-weighted index of the stocks of the 33 largest companies in the Hong Kong market and to the performance of the Fidelity China Region Fund Linked Index - an index which links the returns of the Hang Seng Index from the commencement of the fund on November 1, 1995 through September 1, 2000, and the MSCI Golden Dragon Plus Index beginning September 1, 2000. It is designed to represent the equity markets of Hong Kong through September 1, 2000 and the equity markets of Hong Kong, Taiwan, and China beginning September 1, 2000. You can also compare the fund's performance to the China region funds average, which reflects the performance of mutual funds with similar objectives tracked by Lipper Inc. The past one year average represents a peer group of 22 mutual funds. These benchmarks include reinvested dividends and capital gains, if any, and exclude the effect of sales charges.
Average Annual Total Returns
|
Periods ended |
Past 1 |
Life of |
|
Fidelity China Region |
6.77% |
9.76% |
|
Fidelity China Region |
3.57% |
9.09% |
|
Hang Seng |
14.26% |
11.91% |
|
Fidelity China Region Fund Linked Index |
11.00% |
11.27% |
|
China Region Funds Average |
13.44% |
n/a* |
Average annual total returns take the fund's cumulative return and show you what would have happened if the fund had performed at a constant rate each year.
* Not available
$10,000 Over Life of Fund
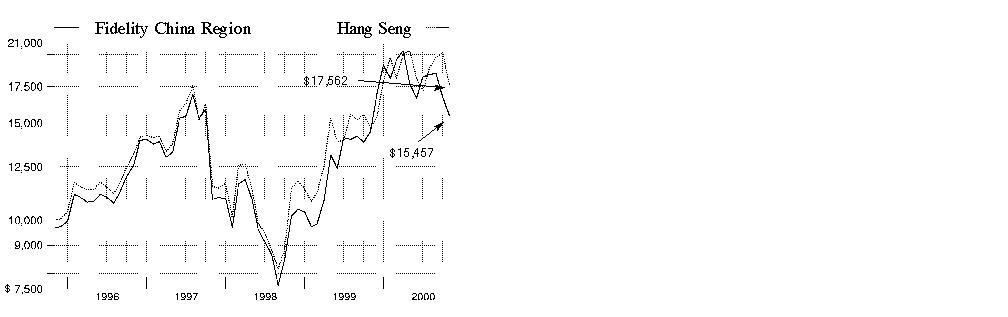
$10,000 Over Life of Fund: Let's say hypothetically that $10,000 was invested in Fidelity China Region Fund on November 1, 1995, when the fund started, and the current 3.00% sales charge was paid. As the chart shows, by October 31, 2000, the value of the investment would have grown to $15,457 - a 54.57% increase on the initial investment. For comparison, look at how the Hang Seng Index did over the same period. With dividends and capital gains, if any, reinvested, the same $10,000 would have grown to $17,562 - a 75.62% increase.
Understanding Performance
Many markets around the globe offer the potential for significant growth over time; however, investing in foreign markets means assuming greater risks than investing in the United States. Factors like changes in a country's financial markets, its local political and economic climate, and the fluctuating value of its currency create these risks. For these reasons an international fund's performance may be more volatile than a fund that invests exclusively in the United States. Past performance is no guarantee of future results and you may have a gain or loss when you sell your shares.
3Annual Report
(Portfolio Manager photograph)
An interview with
Joseph Tse, Portfolio
Manager of Fidelity
China Region Fund
Q. How did the fund perform, Joseph?
A. For the 12 months that ended October 31, 2000, the fund returned 6.77%, trailing the Hang Seng Index, which returned 14.26%. The fund also compares its performance to the Fidelity China Region Fund Linked Index - a measure of the performance of the Hong Kong, Taiwanese and Chinese markets - which returned 11.00%, while the China region funds average tracked by Lipper Inc. returned 13.44%.
Q. What factors helped set the stage for market performance in the region during the 12-month period?
A. Hong Kong, similar to many countries in the region, enjoyed a period of economic expansion, fueled in large part by strong exporting to the U.S. and China. Stocks moved sharply higher early on, riding the worldwide enthusiasm for the so-called TMT - or technology, media and telecommunications - sectors. However, growing concerns about a slowdown in global demand - particularly in the U.S. - during the second half of the period spawned persistent volatility that shook much of the speculative excess out of stock prices. The Taiwanese market - a hotbed of PC and semiconductor manufacturing - was the hardest hit by this global sectoral shift away from technology.
Q. Why did the fund underperform both the Hang Seng Index and the Lipper peer group during this time frame?
A. The fund's positioning in Taiwan led us to underperform the Hang Seng during the period. In particular, chip manufacturers Taiwan Semiconductor and United Microelectronics hurt relative performance. Seeing a downturn coming for TMT stocks in March, I took profits in several lower-quality dot-com type names and invested the proceeds in chip stocks, the only area of the new economy I felt would outlast a correction. Unfortunately, I was wrong and, in hindsight, I wish I had moved more money into more defensive areas of the market. Although many of our peers also had exposure to Taiwan, they were more heavily invested in China on average, specifically in old economy stocks that held up better amid the period's volatility.
Q. On September 1, 2000, the fund's name changed, along with its investment policies. What prompted these changes?
A. We wanted to broaden the fund's investment policies to include Taiwan as one of its primary markets for investment. The policy changes give the fund more flexibility to invest in Taiwan, which is a market that has grown in size and importance, as well as more flexibility relative to the fund's peers. We also added an additional performance comparison for the fund - the Fidelity China Region Linked Index, which blends the Hang Seng Index and the MSCI Golden Dragon Plus Index.
Q. How did some of your other strategies work out for the fund?
A. Underweighting telecom was a plus. The decision to hold fewer traditional telecom providers, such as Cable & Wireless HKT, than the Hang Seng index paid off, as these stocks wilted in response to increased competition. Even more important was our underweighting in Internet investment company Pacific Century CyberWorks, which merged with Cable & Wireless in August. Shares of Pacific Century swooned - as did those of tech firms worldwide that lacked a clear path to profitability - following a series of failed joint ventures and several write-downs in the company's collection of assets. I sold off Pacific Century prior to the close of the period. However, not owning enough of the market's top performers - China Mobile (formerly China Telecom) and conglomerate Hutchison Whampoa - which together accounted for over 25% of the index on average, detracted from relative performance. In the summer, continuing the shift away from new economy TMT stocks, I boosted the fund's weighting in banks, a group that was poised to benefit from peaking U.S. interest rates. Adding more Hang Seng Bank and HSBC, the fund's largest holding, helped, as did heavily underweighting the same two stocks earlier in the period.
Q. What's your outlook?
A. I'm still rather cautious and believe that we should be selling on strength and switching from growth to value, TMT to non-TMT and global to local - that is, more of an emphasis on domestic economy plays given the uncertainty surrounding large multinational companies. I may look to prudently increase our China exposure during the next 12 months as more companies from the finance and telecom sectors move toward privatization. I'm still bullish on chip stocks over the long term, so I plan to watch Taiwan closely in the coming months, looking for a signal that it's time to invest some more money there.
Note to shareholders: Fidelity China Region Fund may invest up to 35% of its total assets in any industry that represents more than 20% of the Hong Kong and Chinese market. As of October 31, 2000, the fund did not have more than 25% of its total assets invested in any one industry.
The views expressed in this report reflect those of the portfolio manager only through the end of the period of the report as stated on the cover. The manager's views are subject to change at any time based on market or other conditions. For more information, see page A-3.
Fund Facts
Goal: long-term growth of capital by investing mainly in equity securities of Hong Kong, Taiwanese and Chinese issuers
Fund number: 352
Trading symbol: FHKCX
Start date: November 1, 1995
Size: as of October 31, 2000, more than $179 million
Manager: Joseph Tse, since inception; director of research, Fidelity Investments Management (Hong Kong), since 1994; manager, Asian portion of various global equity funds, since 1993; joined Fidelity in 1990
3
Annual Report
China Region
|
Geographic Diversification (% of fund's net assets) |
|||
|
As of October 31, 2000 |
|||
|
Hong Kong |
71.7% |
|
 |
United Kingdom |
14.8% |
|
|
Taiwan |
8.3% |
|
|
United States of America |
3.6% |
|
 |
China |
1.2% |
|
 |
Cayman Islands |
0.3% |
|
|
Canada |
0.1% |
|

|
|
|||
|
As of April 30, 2000 |
|||
|
Hong Kong |
79.6% |
|
|
Taiwan |
8.3% |
|
|
United Kingdom |
8.2% |
|
|
United States of America |
3.3% |
|
|
China |
0.3% |
|
|
Bermuda |
0.1% |
|
|
Cayman Islands |
0.1% |
|
|
Singapore |
0.1% |
|
|
Percentages are adjusted for the effect of futures contracts, if applicable. |

|
Asset Allocation |
||
|
|
% of fund's |
% of fund's net assets |
|
Stocks |
96.4 |
97.1 |
|
Short-Term Investments |
3.6 |
2.9 |
|
Top Ten Stocks as of October 31, 2000 |
||
|
|
% of fund's |
% of fund's net assets |
|
HSBC Holdings PLC (Hong Kong) (Reg.) (Banks) |
14.4 |
7.2 |
|
China Mobile (Hong Kong) Ltd. (Cellular) |
11.3 |
14.8 |
|
Cheung Kong Holdings Ltd. |
10.8 |
8.5 |
|
Hutchison Whampoa Ltd. (Electrical Equipment) |
8.9 |
10.9 |
|
Sun Hung Kai Properties Ltd. |
5.0 |
4.8 |
|
Hang Seng Bank Ltd. (Banks) |
4.9 |
1.2 |
|
Johnson Electric Holdings Ltd. (Electrical Equipment) |
3.9 |
3.2 |
|
Taiwan Semiconductor Manufacturing Co. Ltd. (Electronics) |
3.4 |
1.5 |
|
United Microelectronics Corp. (Electronics) |
3.1 |
1.8 |
|
Li & Fung Ltd. |
3.0 |
3.6 |
|
|
68.7 |
57.5 |
|
Top Ten Market Sectors as of October 31, 2000 |
||
|
|
% of fund's |
% of fund's net assets |
|
Finance |
21.8 |
12.0 |
|
Utilities |
19.5 |
19.1 |
|
Construction & Real Estate |
18.5 |
16.8 |
|
Industrial Machinery & Equipment |
13.3 |
15.4 |
|
Technology |
9.4 |
11.5 |
|
Media & Leisure |
4.4 |
5.9 |
|
Retail & Wholesale |
3.4 |
6.4 |
|
Transportation |
3.1 |
2.5 |
|
Durables |
1.4 |
1.1 |
|
Energy |
1.1 |
0.0 |
Annual Report
China Region
Showing Percentage of Net Assets
|
Common Stocks - 96.4% |
|||
|
Shares |
Value (Note 1) |
||
|
BASIC INDUSTRIES - 0.2% |
|||
|
Chemicals & Plastics - 0.2% |
|||
|
China Agrotech Holdings Ltd. |
1,886,000 |
$ 205,580 |
|
|
Yizheng Chemical Fibre Co. Ltd. |
1,036,000 |
188,655 |
|
|
|
394,235 |
||
|
CONSTRUCTION & REAL ESTATE - 18.5% |
|||
|
Real Estate - 18.5% |
|||
|
Amoy Properties Ltd. |
818,000 |
744,785 |
|
|
Cheung Kong Holdings Ltd. |
1,745,000 |
19,300,746 |
|
|
Great Eagle Holdings Ltd. |
511,457 |
734,593 |
|
|
Henderson Land Development Co. Ltd. |
731,000 |
3,149,751 |
|
|
New World Development Co. Ltd. |
6,738 |
7,993 |
|
|
Sun Hung Kai Properties Ltd. |
1,095,021 |
9,057,362 |
|
|
Wharf Holdings Ltd. |
118,485 |
241,591 |
|
|
|
33,236,821 |
||
|
DURABLES - 1.4% |
|||
|
Textiles & Apparel - 1.4% |
|||
|
Glorious Sun Enterprises Ltd. |
5,820,000 |
873,230 |
|
|
Yue Yuen Industrial Holdings Ltd. |
830,000 |
1,538,032 |
|
|
|
2,411,262 |
||
|
ENERGY - 1.1% |
|||
|
Oil & Gas - 1.1% |
|||
|
PetroChina Co. Ltd. (H Shares) |
9,638,000 |
2,026,984 |
|
|
FINANCE - 21.8% |
|||
|
Banks - 21.4% |
|||
|
Citic Ka Wah Bank Ltd. |
1,892,000 |
576,241 |
|
|
Dao Heng Bank Group Ltd. |
316,000 |
1,596,625 |
|
|
Hang Seng Bank Ltd. |
747,500 |
8,795,020 |
|
|
HSBC Holdings PLC (Hong Kong) (Reg.) |
1,789,182 |
25,800,001 |
|
|
Liu Chong Hing Bank Ltd. |
647,000 |
622,279 |
|
|
Standard Chartered PLC |
51,357 |
740,055 |
|
|
Wing Hang Bank Ltd. |
116,000 |
354,042 |
|
|
|
38,484,263 |
||
|
Credit & Other Finance - 0.3% |
|||
|
Aeon Credit Service (ASIA) Co. Ltd. |
1,623,600 |
541,342 |
|
|
Insurance - 0.1% |
|||
|
Manulife Financial Corp. |
8,000 |
194,923 |
|
|
TOTAL FINANCE |
39,220,528 |
||
|
INDUSTRIAL MACHINERY & EQUIPMENT - 13.3% |
|||
|
Electrical Equipment - 13.3% |
|||
|
Chen Hsong Holdings Ltd. |
3,870,000 |
476,433 |
|
|
Delta Electronics, Inc. |
112,000 |
357,152 |
|
|
Hutchison Whampoa Ltd. |
1,285,500 |
15,949,336 |
|
|
Johnson Electric Holdings Ltd. |
3,578,320 |
7,112,633 |
|
|
|
23,895,554 |
||
|
|
|||
|
Shares |
Value (Note 1) |
||
|
MEDIA & LEISURE - 4.4% |
|||
|
Broadcasting - 2.3% |
|||
|
Asia Satellite Telecommunications Holdings Ltd. |
526,500 |
$ 1,066,780 |
|
|
Television Broadcasts Ltd. |
549,000 |
3,006,213 |
|
|
|
4,072,993 |
||
|
Lodging & Gaming - 0.6% |
|||
|
Mandarin Oriental International Ltd. |
342,000 |
218,880 |
|
|
Shangri-La Asia Ltd. |
828,000 |
817,600 |
|
|
|
1,036,480 |
||
|
Restaurants - 1.5% |
|||
|
Cafe de Coral Holdings Ltd. |
7,498,000 |
2,788,451 |
|
|
TOTAL MEDIA & LEISURE |
7,897,924 |
||
|
NONDURABLES - 0.3% |
|||
|
Beverages - 0.3% |
|||
|
Vitasoy International Holdings Ltd. |
3,496,500 |
502,194 |
|
|
RETAIL & WHOLESALE - 3.4% |
|||
|
General Merchandise Stores - 0.4% |
|||
|
China Everbright Ltd. |
808,000 |
735,681 |
|
|
Trading Companies - 3.0% |
|||
|
Li & Fung Ltd. |
2,890,000 |
5,373,848 |
|
|
TOTAL RETAIL & WHOLESALE |
6,109,529 |
||
|
TECHNOLOGY - 9.4% |
|||
|
Computer Services & Software - 0.6% |
|||
|
Prosten Technology Holdings Ltd. |
3,197,000 |
471,477 |
|
|
SINA.com (a) |
89,300 |
622,309 |
|
|
|
1,093,786 |
||
|
Computers & Office Equipment - 0.6% |
|||
|
Asustek Computer, Inc. (a) |
92,000 |
458,576 |
|
|
Quanta Computer, Inc. |
80,000 |
272,446 |
|
|
Stark Technology, Inc. |
40,000 |
245,201 |
|
|
|
976,223 |
||
|
Electronic Instruments - 0.1% |
|||
|
Group Sense International Ltd. |
5,136,000 |
220,643 |
|
|
Electronics - 8.1% |
|||
|
Asat Holdings Ltd. sponsored ADR |
113,400 |
751,275 |
|
|
Compeq Manufacturing Co. Ltd. (a) |
120,000 |
453,251 |
|
|
Hon Hai Precision Industries Co. Ltd. (a) |
158,800 |
830,873 |
|
|
Nanya Technology Corp. |
280,000 |
214,985 |
|
|
Realtek Semiconductor Corp. |
200 |
746 |
|
|
Taiwan Semiconductor |
2,020,308 |
6,129,727 |
|
|
United Microelectronics Corp. (a) |
3,108,600 |
5,485,765 |
|
|
Common Stocks - continued |
|||
|
Shares |
Value (Note 1) |
||
|
TECHNOLOGY - continued |
|||
|
Electronics - continued |
|||
|
Varitronix International Ltd. |
336,000 |
$ 385,640 |
|
|
Winbond Electronics Corp. (a) |
319,310 |
309,424 |
|
|
|
14,561,686 |
||
|
TOTAL TECHNOLOGY |
16,852,338 |
||
|
TRANSPORTATION - 3.1% |
|||
|
Air Transportation - 2.2% |
|||
|
Cathay Pacific Airways Ltd. |
1,682,000 |
3,052,123 |
|
|
Swire Pacific Ltd. (A Shares) |
150,000 |
925,243 |
|
|
|
3,977,366 |
||
|
Railroads - 0.7% |
|||
|
MTR Corp. Ltd. |
843,000 |
1,248,617 |
|
|
Shipping - 0.1% |
|||
|
IMC Holdings Ltd. (a) |
1,823,000 |
147,281 |
|
|
Trucking & Freight - 0.1% |
|||
|
New World Infrastructure Ltd. |
296,000 |
269,507 |
|
|
TOTAL TRANSPORTATION |
5,642,771 |
||
|
UTILITIES - 19.5% |
|||
|
Cellular - 14.2% |
|||
|
China Mobile (Hong Kong) Ltd. (a) |
3,316,500 |
20,313,561 |
|
|
China Unicom Ltd. |
2,596,000 |
5,210,010 |
|
|
|
25,523,571 |
||
|
Electric Utility - 3.5% |
|||
|
CLP Holdings Ltd. |
891,500 |
4,161,427 |
|
|
Hong Kong Electric Holdings Ltd. |
672,000 |
2,219,045 |
|
|
|
6,380,472 |
||
|
Gas - 1.8% |
|||
|
Hong Kong & China Gas Co. Ltd. |
2,508,380 |
3,168,466 |
|
|
TOTAL UTILITIES |
35,072,509 |
||
|
TOTAL COMMON STOCKS (Cost $135,592,736) |
173,262,649 |
||
|
Convertible Bonds - 0.0% |
|||||
|
Moody's Ratings (unaudited) |
Principal Amount |
|
|||
|
MEDIA & LEISURE - 0.0% |
|||||
|
Lodging & Gaming - 0.0% |
|||||
|
Mandarin Oriental International Ltd. 6.75% 3/23/05 |
- |
|
$ 5 |
25,750 |
|
|
Cash Equivalents - 6.0% |
|||
|
Shares |
Value (Note 1) |
||
|
Fidelity Cash Central Fund, 6.61% (b) |
9,878,200 |
$ 9,878,200 |
|
|
Fidelity Securities Lending Cash |
877,800 |
877,800 |
|
|
TOTAL CASH EQUIVALENTS (Cost $10,756,000) |
10,756,000 |
||
|
TOTAL INVESTMENT PORTFOLIO - 102.4% (Cost $146,373,736) |
184,044,399 |
||
|
NET OTHER ASSETS - (2.4)% |
(4,335,701) |
||
|
NET ASSETS - 100% |
$ 179,708,698 |
||
|
Legend |
|
(a) Non-income producing |
|
(b) The rate quoted is the annualized seven-day yield of the fund at period end. A complete listing of the fund's holdings as of its most recent fiscal year end is available upon request. |
|
Other Information |
|
Purchases and sales of securities, other than short-term securities, aggregated $230,453,968 and $227,132,957, respectively. |
|
The fund participated in the security lending program. At period end, the value of securities loaned amounted to $847,174. The fund received cash collateral of $877,800 which was invested in cash equivalents. |
|
The fund participated in the bank borrowing program. The average daily loan balance during the period for which loans were outstanding amounted to $2,104,500. The weighted average interest rate was 6.85%. |
|
Income Tax Information |
|
At October 31, 2000, the aggregate cost of investment securities for income tax purposes was $147,483,654. Net unrealized appreciation aggregated $36,560,745, of which $48,874,600 related to appreciated investment securities and $12,313,855 related to depreciated investment securities. |
|
At October 31, 2000, the fund had a capital loss carryforward of approximately $40,369,000, all of which will expire on October 31, 2006. |
See accompanying notes which are an integral part of the financial statements.
Annual Report
China Region
Statement of Assets and Liabilities
|
|
October 31, 2000 |
|
|
Assets |
|
|
|
Investment in securities, at value |
|
$ 184,044,399 |
|
Cash |
|
242,989 |
|
Foreign currency held at value |
|
3,164,309 |
|
Receivable for investments sold |
|
403,619 |
|
Receivable for fund shares sold |
|
275,982 |
|
Dividends receivable |
|
8,829 |
|
Interest receivable |
|
36,807 |
|
Redemption fees receivable |
|
167 |
|
Other receivables |
|
1,257 |
|
Total assets |
|
188,178,358 |
|
Liabilities |
|
|
|
Payable for investments purchased |
$ 6,911,519 |
|
|
Payable for fund shares redeemed |
414,043 |
|
|
Accrued management fee |
113,560 |
|
|
Other payables and |
152,738 |
|
|
Collateral on securities loaned, |
877,800 |
|
|
Total liabilities |
|
8,469,660 |
|
Net Assets |
|
$ 179,708,698 |
|
Net Assets consist of: |
|
|
|
Paid in capital |
|
$ 178,478,276 |
|
Undistributed net investment income |
|
6,212,134 |
|
Accumulated undistributed net realized gain (loss) on investments and foreign currency transactions |
|
(42,634,885) |
|
Net unrealized appreciation (depreciation) on investments |
|
37,653,173 |
|
Net Assets, for 12,012,618 |
|
$ 179,708,698 |
|
Net Asset Value and redemption price per share ($179,708,698 ÷ 12,012,618 shares) |
|
$14.96 |
|
Maximum offering price per share (100/97.00 of $14.96) |
|
$15.42 |
Statement of Operations
|
|
Year ended October 31, 2000 |
|
|
Investment Income Dividends |
|
$ 3,741,235 |
|
Interest |
|
396,758 |
|
Security lending |
|
1,272 |
|
|
|
4,139,265 |
|
Less foreign taxes withheld |
|
(6,274) |
|
Total income |
|
4,132,991 |
|
Expenses |
|
|
|
Management fee |
$ 1,699,464 |
|
|
Transfer agent fees |
676,307 |
|
|
Accounting and security lending fees |
140,064 |
|
|
Non-interested trustees' compensation |
733 |
|
|
Custodian fees and expenses |
220,507 |
|
|
Registration fees |
67,950 |
|
|
Audit |
36,384 |
|
|
Legal |
3,489 |
|
|
Interest |
1,603 |
|
|
Reports to shareholders |
10,465 |
|
|
Miscellaneous |
3,851 |
|
|
Total expenses before reductions |
2,860,817 |
|
|
Expense reductions |
(24,581) |
2,836,236 |
|
Net investment income |
|
1,296,755 |
|
Realized and Unrealized Gain (Loss) Net realized gain (loss) on: |
|
|
|
Investment securities |
16,231,680 |
|
|
Foreign currency transactions |
(156,061) |
16,075,619 |
|
Change in net unrealized appreciation (depreciation) on: |
|
|
|
Investment securities |
(5,924,680) |
|
|
Assets and liabilities in |
(17,764) |
(5,942,444) |
|
Net gain (loss) |
|
10,133,175 |
|
Net increase (decrease) in net assets resulting from operations |
|
$ 11,429,930 |
|
Other Information |
|
$ 477,585 |
|
Sales charges - Retained by FDC |
|
$ 477,585 |
|
Expense reductions |
|
|
|
Directed brokerage arrangements |
|
$ 21,189 |
|
Transfer agent credits |
|
3,392 |
|
|
|
$ 24,581 |
See accompanying notes which are an integral part of the financial statements.
Annual Report
China Region
Financial Statements - continued
Statement of Changes in Net Assets
|
Increase (Decrease) in Net Assets |
Year ended
October 31, |
Year ended
October 31, |
|
Operations |
$ 1,296,755 |
$ 2,362,496 |
|
Net realized gain (loss) |
16,075,619 |
9,831,552 |
|
Change in net unrealized appreciation (depreciation) |
(5,942,444) |
35,812,522 |
|
Net increase (decrease) in net assets resulting from operations |
11,429,930 |
48,006,570 |
|
Distributions to shareholders from net investment income |
(2,289,574) |
(4,312,427) |
|
Share transactions |
183,395,667 |
89,140,338 |
|
Reinvestment of distributions |
2,213,416 |
4,182,802 |
|
Cost of shares redeemed |
(177,672,782) |
(116,955,228) |
|
Net increase (decrease) in net assets resulting from share transactions |
7,936,301 |
(23,632,088) |
|
Redemption fees |
1,114,437 |
631,730 |
|
Total increase (decrease) in net assets |
18,191,094 |
20,693,785 |
|
Net Assets |
|
|
|
Beginning of period |
161,517,604 |
140,823,819 |
|
End of period (including undistributed net investment income of $6,212,134 and $1,848,938, respectively) |
$ 179,708,698 |
$ 161,517,604 |
|
Other Information Shares |
|
|
|
Sold |
10,586,910 |
7,169,572 |
|
Issued in reinvestment of distributions |
129,289 |
415,738 |
|
Redeemed |
(10,118,064) |
(9,914,200) |
|
Net increase (decrease) |
598,135 |
(2,328,890) |
Financial Highlights
|
Years ended October 31, |
2000 |
1999 |
1998 |
1997 |
1996 E |
|
Selected Per-Share Data |
|
|
|
|
|
|
Net asset value, beginning of period |
$ 14.15 |
$ 10.25 |
$ 11.06 |
$ 12.97 |
$ 10.00 |
|
Income from Investment Operations |
|
|
|
|
|
|
Net investment income C |
.10 |
.19 |
.31 |
.17 |
.29 |
|
Net realized and unrealized gain (loss) |
.80 |
3.98 |
(1.10) |
(1.95) |
2.64 |
|
Total from investment operations |
.90 |
4.17 |
(.79) |
(1.78) |
2.93 |
|
Less Distributions |
|
|
|
|
|
|
From net investment income |
(.17) |
(.32) |
(.06) |
(.14) |
(.01) |
|
From net realized gain |
- |
- |
- |
(.08) |
- |
|
Total distributions |
(.17) |
(.32) |
(.06) |
(.22) |
(.01) |
|
Redemption fees added to paid in capital |
.08 |
.05 |
.04 |
.09 |
.05 |
|
Net asset value, end of period |
$ 14.96 |
$ 14.15 |
$ 10.25 |
$ 11.06 |
$ 12.97 |
|
Total Return A, B |
6.77% |
42.44% |
(6.85)% |
(13.36)% |
29.83% |
|
Ratios and Supplemental Data |
|
|
|
|
|
|
Net assets, end of period (000 omitted) |
$ 179,709 |
$ 161,518 |
$ 140,824 |
$ 177,416 |
$ 109,880 |
|
Ratio of expenses to average net assets |
1.22% |
1.34% |
1.41% |
1.31% |
1.62% |
|
Ratio of expenses to average net assets after expense reductions |
1.21% D |
1.32% D |
1.40% D |
1.31% |
1.62% |
|
Ratio of net investment income to average net assets |
.55% |
1.59% |
3.07% |
1.18% |
2.53% |
|
Portfolio turnover rate |
103% |
84% |
109% |
174% |
118% |
|
A The total returns would have been lower had certain expenses not been reduced during the periods shown. B Total returns do not include the one time sales charge. C Net investment income per share has been calculated based on average shares outstanding during the period. D FMR or the fund has entered into varying arrangements with third parties who either paid or reduced a portion of the fund's expenses. E For the period November 1, 1995 (commencement of operations) to October 31, 1996. |
|||||
See accompanying notes which are an integral part of the financial statements.
Annual Report
There are several ways to evaluate a fund's historical performance. You can look at the total percentage change in value, the average annual percentage change or the growth of a hypothetical $10,000 investment. Total return reflects the change in the value of an investment, assuming reinvestment of the fund's dividend income and capital gains (the profits earned upon the sale of securities that have grown in value). Prior to February 19, 1993, Emerging Markets operated under certain different investment policies. Accordingly, the fund's historical performance may not represent its current investment policies.
Cumulative Total Returns
|
Periods ended |
|
Past 1 |
Past 5 |
Life of |
|
Fidelity Emerging Markets |
|
-6.84% |
-39.03% |
-2.77% |
|
Fidelity Emerging Markets |
|
-9.64% |
-40.86% |
-5.68% |
|
MSCI Emerging |
|
-8.81% |
-11.30% |
134.54% |
|
Emerging Markets |
|
-2.65% |
-2.88% |
n/a* |
Cumulative total returns show the fund's performance in percentage terms over a set period - in this case, one year, five years or since the fund started on November 1, 1990. For example, if you had invested $1,000 in a fund that had a 5% return over the past year, the value of your investment would be $1,050. You can compare the fund's returns to the performance of the Morgan Stanley Capital International (MSCI) Emerging Markets Free Index - a market capitalization-weighted index that is designed to represent the performance of emerging stock markets throughout the world. As of October 31, 2000, the index included over 498 equity securities of companies domiciled in 27 countries. However, to measure how the fund's performance stacked up against its peers, you can compare it to the emerging markets funds average, which reflects the performance of mutual funds with similar objectives tracked by Lipper Inc. The past one year average represents a peer group of 189 mutual funds. These benchmarks include reinvested dividends and capital gains, if any, and exclude the effect of sales charges.
Average Annual Total Returns
|
Periods ended |
Past 1 |
Past 5 |
Life of |
|
Fidelity Emerging Markets |
-6.84% |
-9.42% |
-0.28% |
|
Fidelity Emerging Markets |
-9.64% |
-9.97% |
-0.58% |
|
MSCI Emerging |
-8.81% |
-2.37% |
8.89% |
|
Emerging Markets |
-2.65% |
-0.88% |
n/a* |
Average annual total returns take the fund's cumulative return and show you what would have happened if the fund had performed at a constant rate each year.
* Not available
$10,000 Over Life of Fund
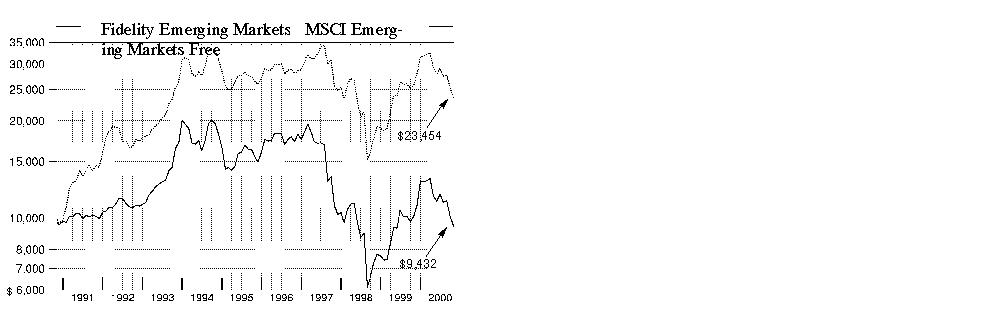
$10,000 Over Life of Fund: Let's say hypothetically that $10,000 was invested in Fidelity Emerging Markets Fund on November 1, 1990, when the fund started, and the current 3.00% sales charge was paid. As the chart shows, by October 31, 2000, the value of the investment would have been $9,432 - a 5.68% decrease on the initial investment. For comparison, look at how the Morgan Stanley Capital International Emerging Markets Free Index did over the same period. With dividends and capital gains, if any, reinvested, the same $10,000 would have grown to $23,454 - a 134.54% increase.
Understanding Performance
Many markets around the globe offer the potential for significant growth over time; however, investing in foreign markets means assuming greater risks than investing in the United States. Factors like changes in a country's financial markets, its local political and economic climate, and the fluctuating value of its currency create these risks. For these reasons an international fund's performance may be more volatile than a fund that invests exclusively in the United States. Past performance is no guarantee of future results and you may have a gain or loss when you sell your shares.
3Annual Report
(Portfolio Manager photograph)
An interview with
Patti Satterthwaite, Portfolio Manager of Fidelity
Emerging Markets Fund
Q. How did the fund perform, Patti?
A. For the 12-month period that ended October 31, 2000, the fund returned -6.84%, topping the Morgan Stanley Capital International Emerging Markets Free Index, which returned -8.81%. The emerging markets funds average tracked by Lipper Inc. returned -2.65% during this same time frame.
Q. What factors drove the performance of emerging markets during the past year?
A. The effects of a sharp falloff in U.S. tech stocks during the second half of the period were amplified throughout most emerging markets, which tend to be more affected by share price volatility than developed ones. Concerns about further rising interest rates in the U.S., persistently high energy prices and a protracted slowdown in global demand further fueled the downside momentum. After a long period of outstanding performance, a shift away from technology, media and telecommunications (TMT) stocks in the U.S. reverberated worldwide, particularly among markets in the Pacific Rim - most notably South Korea and Taiwan - home to many of the world's top semiconductor manufacturers. Weakness in the prices of memory chips, coupled with political uncertainty in the region, further accentuated investors' fears in that region. However, the volatility wasn't enough to stop Latin America from posting positive relative returns during the period. Mexico enjoyed broad market strength as it forged ahead with its economic recovery and had the added advantage of receiving a credit rating upgrade during the period. Brazil also benefited from Mexico's good fortune. Performance was generally negative among smaller emerging markets, although Turkey, Israel and Russia stood out as notable exceptions.
Q. Why did the fund outpace its index, yet trail its Lipper peers?
A. Remaining underweighted in Greece was one of the keys to outperforming the index over the 12-month period. Profit taking pervaded the Greek market as investors chose to part ways with stocks that had climbed unusually high in response to news that the country would join the European Monetary Union. Stock selection and timely trading in Turkey was another big plus for the fund. The Turkish market rallied around a strengthening economy, which produced some of the period's top relative performers, including holding companies Dogan Sirketler and Sabanci. Some good picks and an overweighted position in Mexico further bolstered returns. Telecom giant Telefonos de Mexico (Telmex) - the fund's largest holding - and broadcaster TV Azteca, turned in strong returns despite the period's volatility. Bank stocks such as Grupo Financiero BBVA Bancomer also performed extremely well, riding improved fundamentals. I have since sold BBVA Bancomer, as well as the fund's stake in Sabanci. The reason why we trailed our peer group had a lot to do with our underexposure to TMT sectors earlier in the year.
Q. What other factors influenced performance?
A. The fund's holdings in Russia were up over 100% as a group, thanks in large part to higher energy prices. Overweighting top Russian stocks Unified Energy and Lukoil Oil helped us extend our lead over the index. Additionally, we had some success with Brazilian beverage stocks such as Brahma Cervejaria, which merged with another local company in the summer to form the world's third-largest brewer - AmBev. Finding the right names in South Africa, such as Johnnic Holdings, also boosted returns. On the other hand, we did have our share of disappointments. Choosing not to hold Check Point - an Israeli network-security firm and one of the index's key constituents - early on backfired on us, as the stock proceeded to climb over 400% during the period. Software stocks generally held up better than most other tech stocks during the correction. Some good picks in South Korea helped limit our downside during this difficult period; however, we weren't as lucky with our positioning in Taiwan, where we paid the price for overweighting poorly performing chip stocks. An out-of-benchmark position in Egypt also dragged on performance.
Q. What's your outlook?
A. Emerging markets tend to have a tough time when the developed world is experiencing an economic deceleration. However, if the slowdown triggers a move toward lowering interest rates, emerging markets may have the catalyst they need to begin outperforming. Since I'm not convinced we've seen the end of the volatility for tech stocks, I intend to maintain a neutral-to-underweighted stance there for the time being. I may continue to add some exposure to smaller markets that I feel have been left by the wayside since the crisis of 1997 and have become really cheap despite improving fundamentals, such as Indonesia.
The views expressed in this report reflect those of the portfolio manager only through the end of the period of the report as stated on the cover. The manager's views are subject to change at any time based on market or other conditions. For more information, see page A-3 .
Fund Facts
Goal: capital appreciation by investing mainly in equity securities of emerging market issuers
Fund number: 322
Trading symbol: FEMKX
Start date: November 1, 1990
Size: as of October 31, 2000, more than $304 million
Manager: Patti Satterthwaite, since April 2000; manager, Fidelity Advisor Latin America Fund, since 1998; Fidelity Latin America Fund, since 1993; securities and Latin American analyst, 1986-1990; joined Fidelity in 1986
3
Annual Report
Emerging Markets
|
Geographic Diversification (% of fund's net assets) |
|||
|
As of October 31, 2000 |
|||
|
Mexico |
11.8% |
|
|
Brazil |
11.6% |
|
 |
Taiwan |
9.6% |
|
|
Korea (South) |
9.2% |
|
 |
India |
7.4% |
|
|
Malaysia |
6.9% |
|
 |
South Africa |
6.2% |
|
|
Hong Kong |
6.1% |
|
|
Russia |
4.7% |
|
|
Other |
26.5% |
|

|
|
|||
|
As of April 30, 2000 |
|||
|
Korea (South) |
13.5% |
|
|
Taiwan |
13.4% |
|
|
Mexico |
11.8% |
|
|
Brazil |
9.4% |
|
|
India |
7.6% |
|
|
South Africa |
7.4% |
|
|
Hong Kong |
4.9% |
|
|
Malaysia |
4.2% |
|
|
Russia |
4.1% |
|
|
Other |
23.7% |
|

|
Percentages are adjusted for the effect of futures contracts, if applicable. |
|
Asset Allocation |
||
|
|
% of fund's |
% of fund's net assets |
|
Stocks |
97.6 |
97.4 |
|
Short-Term Investments |
2.4 |
2.6 |
|
Top Ten Stocks as of October 31, 2000 |
||
|
|
% of fund's |
% of fund's net assets |
|
Telefonos de Mexico SA de CV Series L sponsored ADR (Mexico, Telephone Services) |
4.4 |
4.9 |
|
China Mobile (Hong Kong) Ltd. (Hong Kong, Cellular) |
3.9 |
2.5 |
|
Taiwan Semiconductor Manufacturing Co. Ltd. |
3.0 |
3.1 |
|
Petrobras SA (PN) |
2.7 |
1.5 |
|
Wal-Mart de Mexico SA de CV Series C (Mexico, General Merchandise Stores) |
2.6 |
1.9 |
|
Korea Electric Power Corp. |
2.6 |
1.5 |
|
Lukoil Oil Co. sponsored ADR (Russia, Oil & Gas) |
2.3 |
1.8 |
|
Companhia de Bebidas das Americas (AmBev) sponsored ADR (Brazil, Beverages) |
2.2 |
1.1 |
|
Grupo Televisa SA de CV sponsored GDR (Mexico, Broadcasting) |
2.2 |
1.9 |
|
Unified Energy Systems sponsored ADR (Russia, Electric Utility) |
2.1 |
2.3 |
|
|
28.0 |
22.5 |
|
Top Ten Market Sectors as of October 31, 2000 |
||
|
|
% of fund's |
% of fund's net assets |
|
Utilities |
27.1 |
23.5 |
|
Finance |
17.6 |
13.3 |
|
Technology |
12.8 |
21.8 |
|
Nondurables |
7.9 |
3.2 |
|
Energy |
7.1 |
5.0 |
|
Basic Industries |
6.9 |
11.6 |
|
Media & Leisure |
4.9 |
4.2 |
|
Retail & Wholesale |
3.9 |
2.7 |
|
Health |
2.7 |
1.5 |
|
Holding Companies |
2.7 |
1.4 |
Annual Report
Emerging Markets
Showing Percentage of Net Assets
|
Common Stocks - 97.5% |
|||
|
Shares |
Value (Note 1) |
||
|
Argentina - 0.4% |
|||
|
Perez Companc SA sponsored ADR |
81,659 |
$ 1,173,848 |
|
|
Brazil - 11.6% |
|||
|
Banco Bradesco SA (PN) |
301,497,000 |
1,872,455 |
|
|
Banco Itau SA |
43,061,000 |
3,365,557 |
|
|
Companhia Brasileira de Distribuicao Grupo Pao de Acucar sponsored ADR |
49,900 |
1,777,688 |
|
|
Companhia de Bebidas das Americas (AmBev) sponsored ADR |
300,882 |
6,788,650 |
|
|
Embratel Participacoes SA ADR |
83,600 |
1,353,275 |
|
|
Petrobras SA: |
|
|
|
|
(PN) |
283,500 |
7,551,545 |
|
|
sponsored ADR (a) |
23,700 |
688,781 |
|
|
Tele Norte Leste Participacoes SA ADR |
129,609 |
2,867,599 |
|
|
Telesp Celular Participacoes SA ADR |
192,900 |
6,100,463 |
|
|
Votorantim Celulose e Papel SA |
84,748,000 |
2,845,749 |
|
|
TOTAL BRAZIL |
35,211,762 |
||
|
British Virgin Islands - 0.0% |
|||
|
El Sitio, Inc. |
3,600 |
12,038 |
|
|
Chile - 1.0% |
|||
|
Banco Santiago SA sponsored ADR |
51,000 |
1,007,250 |
|
|
Distribucion Y Servicio D&S SA sponsored ADR |
114,900 |
2,053,838 |
|
|
TOTAL CHILE |
3,061,088 |
||
|
China - 2.9% |
|||
|
China Petroleum & Chemical Corp. |
7,758,000 |
1,522,162 |
|
|
Huaneng Power International, Inc. sponsored ADR |
240,700 |
3,670,675 |
|
|
PetroChina Co. Ltd. (H Shares) |
17,082,000 |
3,592,544 |
|
|
TOTAL CHINA |
8,785,381 |
||
|
Croatia - 0.3% |
|||
|
Pliva D.D.: |
|
|
|
|
GDR (c) |
55,300 |
575,120 |
|
|
unit |
34,800 |
361,920 |
|
|
TOTAL CROATIA |
937,040 |
||
|
Egypt - 1.6% |
|||
|
Commercial International Bank Ltd. |
374,080 |
3,278,174 |
|
|
Egyptian Co. for Mobile Services (MobiNil) (a) |
75,600 |
1,486,666 |
|
|
TOTAL EGYPT |
4,764,840 |
||
|
Greece - 1.3% |
|||
|
Alpha Bank AE |
54,200 |
2,002,440 |
|
|
Hellenic Telecommunication Organization SA (OTE) |
116,800 |
2,039,365 |
|
|
TOTAL GREECE |
4,041,805 |
||
|
|
|||
|
Shares |
Value (Note 1) |
||
|
Hong Kong - 6.1% |
|||
|
China Mobile (Hong Kong) Ltd. (a) |
1,939,000 |
$ 11,876,374 |
|
|
China Unicom Ltd. |
1,544,000 |
3,098,712 |
|
|
Hutchison Whampoa Ltd. |
279,100 |
3,462,824 |
|
|
TOTAL HONG KONG |
18,437,910 |
||
|
Hungary - 1.8% |
|||
|
Matav Rt. sponsored ADR |
142,500 |
3,348,750 |
|
|
OTP Bank Rt. |
45,700 |
2,119,006 |
|
|
TOTAL HUNGARY |
5,467,756 |
||
|
India - 7.4% |
|||
|
Dr. Reddy's Laboratories Ltd. |
83,800 |
2,507,828 |
|
|
Hindustan Lever Ltd. |
917,100 |
3,479,870 |
|
|
Housing Development Finance Corp. Ltd. |
317,300 |
3,189,256 |
|
|
Hughes Software Systems Ltd. |
48,800 |
1,102,935 |
|
|
ICICI Bank Ltd. sponsored ADR |
202,700 |
962,825 |
|
|
Infosys Technologies Ltd. |
31,176 |
4,771,335 |
|
|
Ranbaxy Laboratories Ltd. |
182,000 |
2,709,506 |
|
|
Reliance Industries Ltd. |
607,368 |
3,930,486 |
|
|
Tata Engineering & Locomotive Co. Ltd. |
150 |
225 |
|
|
TOTAL INDIA |
22,654,266 |
||
|
Indonesia - 2.0% |
|||
|
Gudang Garam PT Perusahaan |
586,000 |
630,037 |
|
|
PT Bank PAN Indonesia Tbk (a) |
15,990,000 |
419,099 |
|
|
PT Indofood Sukses Makmur (a) |
19,263,000 |
1,597,086 |
|
|
Sampoerna, Hanjaya Mandala |
3,026,500 |
3,561,525 |
|
|
TOTAL INDONESIA |
6,207,747 |
||
|
Israel - 4.7% |
|||
|
Bank Leumi le-Israel BM |
1,551,808 |
3,048,127 |
|
|
Bezeq Israeli Telecommunication |
497,300 |
2,488,302 |
|
|
Check Point Software |
10,500 |
1,662,938 |
|
|
Orbotech Ltd. |
85,350 |
4,518,216 |
|
|
Teva Pharmaceutical Industries Ltd. ADR |
36,800 |
2,175,800 |
|
|
VocalTec Communications Ltd. (a) |
38,900 |
330,650 |
|
|
TOTAL ISRAEL |
14,224,033 |
||
|
Korea (South) - 9.2% |
|||
|
Hyundai Motor Co. Ltd. |
253,980 |
2,902,629 |
|
|
Kookmin Bank |
414,365 |
4,735,601 |
|
|
Kookmin Credit Card Co. Ltd. |
28,950 |
631,174 |
|
|
Korea Electric Power Corp. |
349,440 |
7,802,881 |
|
|
Pohang Iron & Steel Co. Ltd. |
25,400 |
1,475,991 |
|
|
Samsung Electronics Co. Ltd. |
34,995 |
4,383,990 |
|
|
SK Telecom Co. Ltd. |
28,440 |
6,063,034 |
|
|
TOTAL KOREA (SOUTH) |
27,995,300 |
||
|
Malaysia - 6.9% |
|||
|
AMMB Holdings BHD |
2,484,000 |
2,784,695 |
|
|
Amway (Malaysia) Holdings BHD |
1,100,000 |
1,968,421 |
|
|
Berjaya Sports Toto BHD |
1,081,000 |
1,422,368 |
|
|
Common Stocks - continued |
|||
|
Shares |
Value (Note 1) |
||
|
Malaysia - continued |
|||
|
British American Tobacco BHD (Malaysia) |
409,000 |
$ 3,740,197 |
|
|
Genting BHD |
562,000 |
1,434,579 |
|
|
Malayan Banking BHD |
904,000 |
3,616,000 |
|
|
Tanjong PLC |
684,000 |
1,278,000 |
|
|
Technology Resources Industries BHD (a) |
3,575,000 |
2,897,632 |
|
|
Tenaga Nasional BHD |
544,000 |
1,760,842 |
|
|
TOTAL MALAYSIA |
20,902,734 |
||
|
Mexico - 11.8% |
|||
|
Banacci SA de CV Series O (a) |
2,592,000 |
4,025,408 |
|
|
Grupo Iusacell SA de CV sponsored ADR (a) |
86,700 |
1,127,100 |
|
|
Grupo Televisa SA de CV |
123,075 |
6,661,434 |
|
|
Telefonos de Mexico SA de CV Series L sponsored ADR |
249,400 |
13,452,010 |
|
|
TV Azteca SA de CV sponsored ADR |
212,200 |
2,652,500 |
|
|
Wal-Mart de Mexico SA de CV |
3,575,300 |
8,089,590 |
|
|
TOTAL MEXICO |
36,008,042 |
||
|
Pakistan - 0.0% |
|||
|
Dandot Cement Co. Ltd. |
93,750 |
6,661 |
|
|
Peru - 0.4% |
|||
|
Compania de Minas Buenaventura SA Series B sponsored ADR |
104,300 |
1,342,863 |
|
|
Philippines - 0.1% |
|||
|
Manila Electric Co. Class B |
322,200 |
264,563 |
|
|
Poland - 0.4% |
|||
|
Agora SA unit (a) |
72,400 |
1,321,300 |
|
|
Russia - 4.7% |
|||
|
Lukoil Oil Co. sponsored ADR |
131,200 |
7,084,800 |
|
|
Mobile TeleSystems Ojsc sponsored ADR (a) |
27,500 |
759,688 |
|
|
Unified Energy Systems sponsored ADR |
513,400 |
6,479,108 |
|
|
TOTAL RUSSIA |
14,323,596 |
||
|
South Africa - 6.2% |
|||
|
Anglo American Platinum Corp. Ltd. |
70,300 |
2,743,188 |
|
|
De Beers Consolidated Mines |
122,200 |
3,362,116 |
|
|
Impala Platinum Holdings Ltd. |
74,100 |
3,175,714 |
|
|
Johnnic Holdings Ltd. |
217,147 |
2,470,191 |
|
|
Liberty Life Association of Africa Ltd. |
84,200 |
642,638 |
|
|
Nedcor Ltd. |
152,200 |
2,858,783 |
|
|
|
|||
|
Shares |
Value (Note 1) |
||
|
Sappi Ltd. |
186,300 |
$ 1,276,500 |
|
|
Sasol Ltd. |
288,700 |
2,211,075 |
|
|
TOTAL SOUTH AFRICA |
18,740,205 |
||
|
Taiwan - 9.6% |
|||
|
Bank Sinopac (a) |
5,678,090 |
2,364,406 |
|
|
ChinaTrust Commercial Bank (a) |
5,960,155 |
3,782,761 |
|
|
Far Eastern Textile Ltd. |
766,420 |
631,169 |
|
|
GigaMedia Ltd. |
259,100 |
1,263,113 |
|
|
Hon Hai Precision Industries Co. Ltd. (a) |
338,520 |
1,771,204 |
|
|
Macronix International Co. Ltd. (a) |
931,780 |
1,326,993 |
|
|
Siliconware Precision |
1,889,760 |
1,439,260 |
|
|
Taishin International Bank (a) |
3,067,000 |
1,433,799 |
|
|
Taiwan Semiconductor |
3,047,467 |
9,246,185 |
|
|
United Microelectronics Corp. (a) |
3,420,000 |
6,035,294 |
|
|
TOTAL TAIWAN |
29,294,184 |
||
|
Thailand - 0.7% |
|||
|
Advanced Info Service PCL |
251,300 |
2,073,404 |
|
|
Turkey - 4.0% |
|||
|
Anadolu Efes Biracilk Ve Malt |
54,435,775 |
3,192,114 |
|
|
Dogan Sirketler Grubu Holding AS |
137,375,624 |
2,366,364 |
|
|
Koytas Tekstil Sanayi ve Ticaret AS (a) |
26,770,000 |
4 |
|
|
Turkcell Iletisim Hizmet AS |
108,700 |
1,188,906 |
|
|
Turkiye Garanti Bankasi AS (a) |
153,956,700 |
1,579,904 |
|
|
Yapi ve Kredi Bankasi AS (a) |
439,799,556 |
3,804,002 |
|
|
TOTAL TURKEY |
12,131,294 |
||
|
United Kingdom - 1.9% |
|||
|
Dimension Data Holdings PLC (a) |
111,860 |
963,239 |
|
|
South African Breweries PLC |
791,500 |
4,742,718 |
|
|
TOTAL UNITED KINGDOM |
5,705,957 |
||
|
Venezuela - 0.5% |
|||
|
Compania Anonima Nacional Telefono de Venezuela sponsored ADR |
88,200 |
1,675,800 |
|
|
TOTAL COMMON STOCKS (Cost $280,362,468) |
296,765,417 |
||
|
Convertible Preferred Stocks - 0.1% |
|||
|
|
|
|
|
|
Philippines - 0.1% |
|||
|
First E Bank Corp. (a) |
22,521,380 |
348,718 |
|
|
Cash Equivalents - 3.3% |
|||
|
Shares |
Value (Note 1) |
||
|
Fidelity Cash Central Fund, 6.61% (b) |
3,964,705 |
$ 3,964,705 |
|
|
Fidelity Securities Lending Cash Central Fund, 6.66% (b) |
6,239,170 |
6,239,170 |
|
|
TOTAL CASH EQUIVALENTS (Cost $10,203,875) |
10,203,875 |
||
|
TOTAL INVESTMENT PORTFOLIO - 100.9% (Cost $291,425,839) |
307,318,010 |
||
|
NET OTHER ASSETS - (0.9)% |
(2,873,044) |
||
|
NET ASSETS - 100% |
$ 304,444,966 |
||
|
Legend |
|
(a) Non-income producing |
|
(b) The rate quoted is the annualized seven-day yield of the fund at period end. A complete listing of the fund's holdings as of its most recent fiscal year end is available upon request. |
|
(c) Security exempt from registration under Rule 144A of the Securities Act of 1933. These securities may be resold in transactions exempt from registration, normally to qualified institutional buyers. At the period end, the value of these securities amounted to $575,120 or 0.2% of net assets. |
|
Other Information |
|
Purchases and sales of securities, other than short-term securities, aggregated $452,951,222 and $516,567,144, respectively. |
|
The fund participated in the security lending program. At period end, the value of securities loaned amounted to $6,372,851. The fund received cash collateral of $6,239,170 which was invested in cash equivalents. |
|
The fund participated in the interfund lending program as a borrower. The average daily loan balance during the period for which loans were outstanding amounted to $7,254,250. The weighted average interest rate was 6.75%. Interest expense includes $10,874 paid under the interfund lending program. |
|
The fund participated in the bank borrowing program. The average daily loan balance during the period for which loans were outstanding amounted to $4,016,000. The weighted average interest rate was 6.85%. Interest expense includes $764 paid under the bank borrowing program. |
|
Income Tax Information |
|
At October 31, 2000, the aggregate cost of investment securities for income tax purposes was $292,533,050. Net unrealized appreciation aggregated $14,784,960, of which $59,313,510 related to appreciated investment securities and $44,528,550 related to depreciated investment securities. |
|
At October 31, 2000, the fund had a capital loss carryforward of approximately $471,797,000 of which $97,014,000, $19,326,000, $309,416,000 and $46,041,000 will expire on September 30, 2004, 2006, 2007 and 2008, respectively. |
|
The fund intends to elect to defer to its fiscal year ending September 30, 2001 approximately $1,782,000 of losses recognized during the period November 1, 1999 to September 30, 2000. |
See accompanying notes which are an integral part of the financial statements.
Annual Report
Emerging Markets
Statement of Assets and Liabilities
|
|
October 31, 2000 |
|
|
Assets |
|
|
|
Investment in securities, at value |
|
$ 307,318,010 |
|
Foreign currency held at value |
|
3,165,608 |
|
Receivable for investments sold |
|
4,391,744 |
|
Receivable for fund shares sold |
|
179,925 |
|
Dividends receivable |
|
266,008 |
|
Interest receivable |
|
21,881 |
|
Redemption fees receivable |
|
401 |
|
Other receivables |
|
6,701 |
|
Total assets |
|
315,350,278 |
|
Liabilities |
|
|
|
Payable for investments purchased |
$ 3,218,175 |
|
|
Payable for fund shares redeemed |
924,588 |
|
|
Accrued management fee |
190,937 |
|
|
Other payables and |
332,442 |
|
|
Collateral on securities loaned, |
6,239,170 |
|
|
Total liabilities |
|
10,905,312 |
|
Net Assets |
|
$ 304,444,966 |
|
Net Assets consist of: |
|
|
|
Paid in capital |
|
$ 762,751,403 |
|
Undistributed |
|
617,777 |
|
Accumulated undistributed |
|
(474,787,613) |
|
Net unrealized appreciation (depreciation) on investments |
|
15,863,399 |
|
Net Assets, for 34,939,720 |
|
$ 304,444,966 |
|
Net Asset Value and redemption price per share ($304,444,966 ÷ 34,939,720 shares) |
|
$8.71 |
|
Maximum offering price per share (100/97.00 of $8.71) |
|
$8.98 |
Statement of Operations
|
|
Year ended October 31, 2000 |
|
|
Investment Income Dividends |
|
$ 6,252,157 |
|
Special dividend from BOE LTD. |
|
701,230 |
|
Interest |
|
674,791 |
|
Security lending |
|
65,222 |
|
|
|
7,693,400 |
|
Less foreign taxes withheld |
|
(557,606) |
|
Total income |
|
7,135,794 |
|
Expenses |
|
|
|
Management fee |
$ 3,474,978 |
|
|
Transfer agent fees |
1,708,499 |
|
|
Accounting and security lending fees |
282,007 |
|
|
Non-interested trustees' compensation |
1,529 |
|
|
Custodian fees and expenses |
870,235 |
|
|
Registration fees |
53,575 |
|
|
Audit |
69,782 |
|
|
Legal |
11,456 |
|
|
Interest |
11,638 |
|
|
Miscellaneous |
145,683 |
|
|
Total expenses before reductions |
6,629,382 |
|
|
Expense reductions |
(193,415) |
6,435,967 |
|
Net investment income |
|
699,827 |
|
Realized and Unrealized Gain (Loss) Net realized gain (loss) on: |
|
|
|
Investment securities |
1,998,271 |
|
|
Foreign currency transactions |
(1,234,632) |
763,639 |
|
Change in net unrealized appreciation (depreciation) on: |
|
|
|
Investment securities |
(20,583,658) |
|
|
Assets and liabilities in |
(7,832) |
(20,591,490) |
|
Net gain (loss) |
|
(19,827,851) |
|
Net increase (decrease) in net assets resulting from operations |
|
$ (19,128,024) |
|
Other Information |
|
$ 334,985 |
|
Sales charges - Retained by FDC |
|
$ 334,985 |
|
Expense reductions |
|
|
|
Directed brokerage arrangements |
|
$ 161,437 |
|
Custody credits |
|
7,724 |
|
Transfer agent credits |
|
24,254 |
|
|
|
$ 193,415 |
See accompanying notes which are an integral part of the financial statements.
Annual Report
Emerging Markets
Financial Statements - continued
Statement of Changes in Net Assets
|
Increase (Decrease) in Net Assets |
Year ended
October 31, |
Year ended
October 31, |
|
Operations |
$ 699,827 |
$ 3,080,027 |
|
Net realized gain (loss) |
763,639 |
(46,961,437) |
|
Change in net unrealized appreciation (depreciation) |
(20,591,490) |
141,289,128 |
|
Net increase (decrease) in net assets resulting from operations |
(19,128,024) |
97,407,718 |
|
Share transactions |
213,407,205 |
186,390,654 |
|
Cost of shares redeemed |
(292,885,323) |
(152,695,597) |
|
Net increase (decrease) in net assets resulting from share transactions |
(79,478,118) |
33,695,057 |
|
Redemption fees |
658,998 |
580,285 |
|
Total increase (decrease) in net assets |
(97,947,144) |
131,683,060 |
|
Net Assets |
|
|
|
Beginning of period |
402,392,110 |
270,709,050 |
|
End of period (including undistributed net investment income (loss) of $617,777 and $(864,668), respectively) |
$ 304,444,966 |
$ 402,392,110 |
|
Other Information Shares |
|
|
|
Sold |
18,237,804 |
21,355,004 |
|
Redeemed |
(26,333,184) |
(18,514,233) |
|
Net increase (decrease) |
(8,095,380) |
2,840,771 |
Financial Highlights
|
Years ended October 31, |
2000 |
1999 |
1998 |
1997 |
1996 |
|
Selected Per-Share Data |
|
|
|
|
|
|
Net asset value, beginning of period |
$ 9.35 |
$ 6.74 |
$ 10.35 |
$ 16.61 |
$ 15.14 |
|
Income from Investment Operations |
|
|
|
|
|
|
Net investment income C |
.02 D |
.07 |
.09 |
.15 |
.12 |
|
Net realized and unrealized gain (loss) |
(.68) |
2.53 |
(3.47) |
(6.17) |
1.60 |
|
Total from investment operations |
(.66) |
2.60 |
(3.38) |
(6.02) |
1.72 |
|
Less Distributions |
|
|
|
|
|
|
From net investment income |
- |
- |
(.08) |
(.13) |
(.18) |
|
In excess of net investment income |
- |
- |
(.15) |
(.12) |
(.09) |
|
Total distributions |
- |
- |
(.23) |
(.25) |
(.27) |
|
Redemption fees added to paid in capital |
.02 |
.01 |
- |
.01 |
.02 |
|
Net asset value, end of period |
$ 8.71 |
$ 9.35 |
$ 6.74 |
$ 10.35 |
$ 16.61 |
|
Total Return A, B |
(6.84)% |
38.72% |
(33.23)% |
(36.74)% |
11.69% |
|
Ratios and Supplemental Data |
|
|
|
|
|
|
Net assets, end of period (000 omitted) |
$ 304,445 |
$ 402,392 |
$ 270,709 |
$ 499,168 |
$ 1,263,164 |
|
Ratio of expenses to average net assets |
1.39% |
1.45% |
1.59% |
1.36% |
1.30% |
|
Ratio of expenses to average net assets after expense reductions |
1.35% E |
1.42% E |
1.56% E |
1.35% E |
1.29% E |
|
Ratio of net investment income to average net assets |
.15% |
.90% |
1.01% |
.89% |
.74% |
|
Portfolio turnover rate |
100% |
94% |
87% |
69% |
77% |
|
A The total returns would have been lower had certain expenses not been reduced during the periods shown. B Total returns do not include the one time sales charge C Net investment income per share has been calculated based on average shares outstanding during the period. D Investment income per share reflects a special dividend from BOE Limited which amounted to $.02 per share. E FMR or the fund has entered into varying arrangements with third parties who either paid or reduced a portion of the fund's expenses. |
|||||
See accompanying notes which are an integral part of the financial statements.
Annual Report
There are several ways to evaluate a fund's historical performance. You can look at the total percentage change in value, the average annual percentage change or the growth of a hypothetical $10,000 investment. Total return reflects the change in the value of an investment, assuming reinvestment of the fund's dividend income and capital gains (the profits earned upon the sale of securities that have grown in value). If Fidelity had not reimbursed certain fund expenses, the past 10 year total returns would have been lower. Total returns do not include the effect of the 3.00% sales load which was eliminated as of March 1, 2000.
Cumulative Total Returns
|
Periods ended |
|
Past 1 |
Past 5 |
Past 10 |
|
Fidelity Europe |
|
8.51% |
108.24% |
230.84% |
|
MSCI Europe |
|
1.16% |
108.88% |
246.90% |
|
European Region |
|
12.53% |
102.14% |
210.00% |
Cumulative total returns show the fund's performance in percentage terms over a set period - in this case, one year, five years or 10 years. For example, if you had invested $1,000 in a fund that had a 5% return over the past year, the value of your investment would be $1,050. You can compare the fund's returns to the performance of the Morgan Stanley Capital International (MSCI) Europe Index - a market capitalization-weighted index that is designed to represent the performance of developed stock markets in Europe. As of October 31, 2000, the index included over 435 equity securities of companies domiciled in 15 European countries. To measure how the fund's performance stacked up against its peers, you can compare it to the European region funds average, which reflects the performance of mutual funds with similar objectives tracked by Lipper Inc. The past one year average represents a peer group of 151 mutual funds. These benchmarks include reinvested dividends and capital gains, if any, and exclude the effect of sales charges.
Average Annual Total Returns
|
Periods ended |
Past 1 |
Past 5 |
Past 10 |
|
Fidelity Europe |
8.51% |
15.80% |
12.71% |
|
MSCI Europe |
1.16% |
15.87% |
13.25% |
|
European Region |
12.53% |
14.93% |
11.69% |
Average annual total returns take the fund's cumulative return and show you what would have happened if the fund had performed at a constant rate each year.
$10,000 Over 10 Years
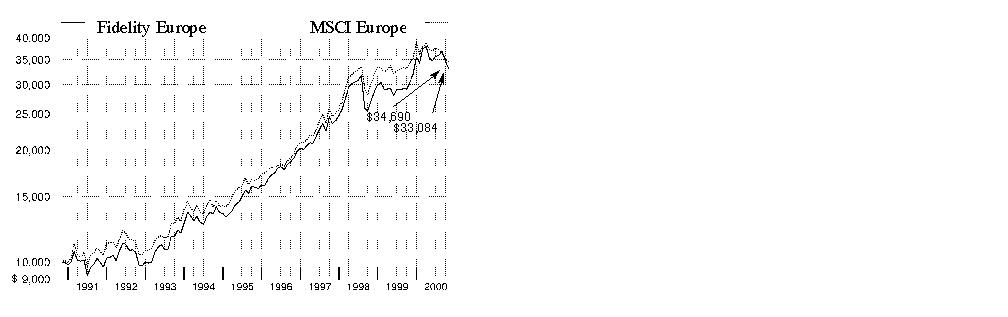
$10,000 Over 10 Years: Let's say hypothetically that $10,000 was invested in Fidelity Europe Fund on October 31, 1990. As the chart shows, by October 31, 2000, the value of the investment would have grown to $33,084 - a 230.84% increase on the initial investment. For comparison, look at how the Morgan Stanley Capital International Europe Index did over the same period. With dividends and capital gains, if any, reinvested, the same $10,000 would have grown to $34,690 - a 246.90% increase.
Understanding Performance
Many markets around the globe offer the potential for significant growth over time; however, investing in foreign markets means assuming greater risks than investing in the United States. Factors like changes in a country's financial markets, its local political and economic climate, and the fluctuating value of its currency create these risks. For these reasons an international fund's performance may be more volatile than a fund that invests exclusively in the United States. Past performance is no guarantee of future results and you may have a gain or loss when you sell your shares.
3Annual Report
(Portfolio Manager photograph)
An interview with
Thierry Serero,
Portfolio Manager
of Fidelity Europe Fund
Q. How did the fund perform, Thierry?
A. For the 12 months ending October 31, 2000, the fund returned 8.51%, while the Morgan Stanley Capital International Europe Index returned 1.16%. Meanwhile, the European region funds average, as tracked by Lipper Inc., returned 12.53%.
Q. What factors influenced the performance of European stock markets during the past 12 months?
A. Stock markets advanced strongly between October 1999 and February 2000, led by demand for technology, media and telecommunications (TMT) stocks. However, in the spring, investors began to doubt that fundamentals justified the high valuations of TMT companies. Investor sentiment also was affected by the high prices that winning telecommunications companies agreed to pay at government auctions for third-generation mobile phone licenses. These factors resulted in a shift in focus toward more-defensive "old economy" stocks. Market volatility since April prevented European markets from making much headway. In the U.K., a smaller proportion of the market is made up of TMT stocks than in continental Europe. Therefore, the U.K. market declined during the 12 months through the end of October as it failed to fully participate in the strong advance around the start of the year, while also suffering from the subsequent volatility. In general, returns in Europe for U.S.-based investors were adversely affected by the weakening of the euro and British sterling. The currencies depreciated by 19% and 13%, respectively, against the dollar.
Q. The fund outperformed its benchmark index but trailed its peer group. Why?
A. Up to March 2000, the fund benefited from its bias toward growth stocks when compared with the benchmark index. My investment style favors growth rather than value, and that contributed significantly to performance during the period. Since the spring, the fund performed in line with the benchmark index. Relative to the peer group, the fund underperformed during the first six months because, on average, the group was more aggressively positioned in TMT stocks. The fund outperformed during the second half, however, because it was more defensively positioned compared to its peers.
Q. Which fund holdings performed particularly well?
A. Kudelski, a maker of a card access system for pay TV, was the largest single contributor to relative performance, closely followed by Marschollek, a German financial services company that focuses on young professional clients. Other contributors included Synthes-Stratec, a manufacturer of orthopedic devices for trauma patients, and Luxottica, an Italian maker of frames and lenses for spectacles and sunglasses with a range of well-known brand names, including Ray-Ban.
Q. Were there any disappointments?
A. The fund's largest holding, U.K. mobile phone operator Vodafone Group, detracted from performance. Vodafone's share price was affected by concerns about the integration of its takeover target, Mannesmann, and about the high bids Vodafone and other telecommunication companies put in for third-generation mobile phone licenses in the U.K. and other European countries. Relative performance also was hurt by the fund's lack of exposure to some large pharmaceutical companies, such as SmithKline Beecham and Glaxo Wellcome, which benefited from investors' interest in more-defensive stocks in the period since March.
Q. What's your outlook for the European market?
A. Stock market volatility has persisted in Europe and the U.K. for much of this year. One result of this volatility is that investors appear to be focusing more on the underlying strength of businesses, which I view as positive. While the short-term outlook for Europe's stock markets remains uncertain, over the medium term a number of factors are likely to be positive for equities. Economic expansion and continued restructuring should improve the outlook for corporate profits. Merger and acquisition activity is continuing. Furthermore, the economic background in Europe remains favorable, although there are some indications that Europe's expansion may have peaked. I'm finding a number of attractive investment opportunities among smaller and medium-sized companies in particular, and I believe that the stock picking environment has improved compared with the beginning of 2000.
The views expressed in this report reflect those of the portfolio manager only through the end of the period of the report as stated on the cover. The manager's views are subject to change at any time based on market or other conditions. For more information, see page <Click Here>.
Fund Facts
Goal: long-term growth of capital by investing mainly in equity securities of European issuers
Fund number: 301
Trading symbol: FIEUX
Start date: October 1, 1986
Size: as of October 31, 2000, more than $1.4 billion
Manager: Thierry Serero, since 1998; manager, several funds for Fidelity International Limited, since 1994; research analyst, Fidelity International Services Limited, 1991-1994; joined Fidelity in 1991
3Annual Report
Europe
|
Geographic Diversification (% of fund's net assets) |
|||
|
As of October 31, 2000 |
|||
|
United Kingdom |
26.9% |
|
|
Germany |
13.6% |
|
|
France |
12.5% |
|
|
Switzerland |
10.7% |
|
|
Italy |
8.5% |
|
|
Sweden |
7.8% |
|
|
United States of America |
6.6% |
|
|
Netherlands |
4.3% |
|
|
Spain |
2.7% |
|
|
Other |
6.4% |
|

|
|
|||
|
As of April 30, 2000 |
|||
|
United Kingdom |
32.7% |
|
|
France |
16.0% |
|
|
Germany |
10.7% |
|
|
Switzerland |
8.8% |
|
|
Sweden |
6.4% |
|
|
United States of America |
5.8% |
|
|
Finland |
5.4% |
|
|
Italy |
4.2% |
|
|
Netherlands |
3.2% |
|
|
Other |
6.8% |
|

|
Percentages are adjusted for the effect of futures contracts, if applicable. |
|
Asset Allocation |
||
|
|
% of fund's |
% of fund's net assets |
|
Stocks |
97.5 |
92.8 |
|
Bonds |
1.1 |
4.1 |
|
Short-Term Investments |
1.4 |
3.1 |
|
Top Ten Stocks as of October 31, 2000 |
||
|
|
% of fund's |
% of fund's net assets |
|
Vodafone Group PLC |
5.0 |
4.2 |
|
Marschollek Lautenschlaeger |
3.7 |
3.2 |
|
Telefonaktiebolaget LM Ericsson |
3.4 |
2.7 |
|
Kudelski SA (Switzerland, Electronic Instruments) |
2.9 |
2.0 |
|
VoiceStream Wireless Corp. (United States of America, Cellular) |
2.9 |
0.0 |
|
Bayer AG (Germany, |
2.7 |
0.0 |
|
BP Amoco PLC |
2.4 |
3.4 |
|
Novartis AG (Reg.) (Switzerland, Drugs & Pharmaceuticals) |
2.3 |
1.6 |
|
Luxottica Group Spa sponsored ADR (Italy, Household Products) |
2.3 |
0.9 |
|
TotalFinaElf SA Class B |
2.2 |
3.0 |
|
|
29.8 |
21.0 |
|
Top Ten Market Sectors as of October 31, 2000 |
||
|
|
% of fund's |
% of fund's net assets |
|
Finance |
20.5 |
22.0 |
|
Technology |
20.3 |
19.8 |
|
Utilities |
11.5 |
13.6 |
|
Energy |
7.3 |
9.8 |
|
Nondurables |
6.5 |
2.8 |
|
Health |
6.4 |
4.5 |
|
Construction & Real Estate |
5.9 |
4.7 |
|
Retail & Wholesale |
5.5 |
3.4 |
|
Media & Leisure |
4.4 |
4.9 |
|
Services |
3.7 |
3.6 |
Annual Report
Europe
Showing Percentage of Net Assets
|
Common Stocks - 90.4% |
|||
|
Shares |
Value (Note 1) |
||
|
Belgium - 0.5% |
|||
|
Integrated Production & Test |
77,200 |
$ 1,866,219 |
|
|
Telindus Group NV |
193,805 |
3,791,764 |
|
|
Telindus Group NV (strip VVPR) (a) |
28,500 |
242 |
|
|
Ubizen NV (a)(e) |
62,800 |
1,308,629 |
|
|
TOTAL BELGIUM |
6,966,854 |
||
|
Denmark - 0.1% |
|||
|
William Demant Holding AS |
27,100 |
1,298,537 |
|
|
Finland - 2.0% |
|||
|
Elisa Communications Corp. (A Shares) |
171,306 |
4,754,728 |
|
|
Nokia AB |
540,600 |
23,110,649 |
|
|
TOTAL FINLAND |
27,865,377 |
||
|
France - 12.1% |
|||
|
Activcard SA (a) |
329,100 |
8,408,505 |
|
|
ALTEN (a) |
2,200 |
271,514 |
|
|
BNP Paribas SA |
172,513 |
14,877,190 |
|
|
Business Objects SA (a) |
369,300 |
28,525,027 |
|
|
Business Objects SA sponsored ADR (a) |
30,000 |
2,363,906 |
|
|
CEGID SA |
7,795 |
624,919 |
|
|
Dassault Systemes SA |
208,745 |
15,919,871 |
|
|
L'Oreal SA (a) |
182,100 |
13,910,983 |
|
|
Neopost SA (a) |
382,664 |
7,343,846 |
|
|
Oberthur Card Systems (a) |
309,243 |
6,273,402 |
|
|
Sodexho Alliance SA |
5,700 |
892,641 |
|
|
Technip SA |
117,600 |
15,052,687 |
|
|
TotalFinaElf SA Class B |
216,227 |
30,974,517 |
|
|
TRANSGENE SA sponsored ADR (a)(d) |
366,500 |
3,115,250 |
|
|
Unibail |
179,008 |
23,854,892 |
|
|
Usinor |
56,100 |
611,887 |
|
|
TOTAL FRANCE |
173,021,037 |
||
|
Germany - 8.3% |
|||
|
ACG AG |
19,520 |
1,027,252 |
|
|
Articon Integralis AG (a) |
23,100 |
1,548,975 |
|
|
Bayer AG |
877,600 |
38,101,987 |
|
|
Bewag AG Series A |
248,500 |
2,383,473 |
|
|
Brokat AG (a) |
316,480 |
14,105,668 |
|
|
Dresdner Bank AG |
728,100 |
30,344,354 |
|
|
Intershop Communications AG (a) |
297,020 |
13,109,750 |
|
|
Karstadt Quelle AG |
478,940 |
15,634,924 |
|
|
Telegate AG (a) |
40,600 |
2,498,443 |
|
|
TOTAL GERMANY |
118,754,826 |
||
|
Greece - 0.2% |
|||
|
Antenna TV SA sponsored ADR (a) |
156,000 |
3,081,000 |
|
|
Ireland - 2.1% |
|||
|
Allied Irish Banks PLC |
761,400 |
7,755,316 |
|
|
Bank of Ireland, Inc. |
558,100 |
4,301,335 |
|
|
Irish Life & Permanent PLC |
1,548,747 |
15,525,148 |
|
|
|
|||
|
Shares |
Value (Note 1) |
||
|
IWP International PLC |
568,270 |
$ 782,630 |
|
|
Riverdeep Group PLC sponsored ADR |
79,500 |
1,768,875 |
|
|
TOTAL IRELAND |
30,133,304 |
||
|
Israel - 0.1% |
|||
|
Card Guard Scientific Survival Ltd. |
23,280 |
1,401,981 |
|
|
Italy - 6.7% |
|||
|
Fila Holding Spa sponsored ADR (a) |
576,000 |
5,220,000 |
|
|
Luxottica Group Spa sponsored ADR |
2,242,060 |
32,369,741 |
|
|
Mediolanum Spa |
479,200 |
7,024,079 |
|
|
Saipem Spa |
2,476,200 |
13,012,235 |
|
|
San Paolo IMI Spa |
1,097,070 |
17,670,319 |
|
|
Unicredito Italiano Spa |
3,859,000 |
19,715,350 |
|
|
TOTAL ITALY |
95,011,724 |
||
|
Luxembourg - 0.2% |
|||
|
Stolt Offshore SA (a) |
240,800 |
2,746,965 |
|
|
Netherlands - 4.3% |
|||
|
Buhrmann NV |
555,800 |
15,190,770 |
|
|
Heineken Holding NV (A Shares) |
326,450 |
11,637,812 |
|
|
IHC Caland NV |
130,000 |
5,737,888 |
|
|
Royal Dutch Petroleum Co. |
487,900 |
28,969,064 |
|
|
TOTAL NETHERLANDS |
61,535,534 |
||
|
Norway - 0.7% |
|||
|
DNB Holding ASA |
2,180,010 |
9,454,843 |
|
|
Poland - 0.3% |
|||
|
Agora SA unit (a) |
247,730 |
4,521,073 |
|
|
Russia - 0.0% |
|||
|
Mobile TeleSystems Ojsc sponsored ADR (a) |
20,900 |
577,363 |
|
|
Spain - 2.7% |
|||
|
Centros Comerciales Carrefour SA |
1,364,213 |
17,288,104 |
|
|
NH Hoteles SA |
1,812,560 |
20,462,062 |
|
|
TOTAL SPAIN |
37,750,166 |
||
|
Sweden - 7.8% |
|||
|
Adcore AB (a) |
599,400 |
2,464,273 |
|
|
Industri-Matematik International Corp. (a) |
1,078,780 |
3,371,188 |
|
|
Investor AB (B Shares) |
1,042,520 |
13,765,394 |
|
|
Nobel Biocare AB |
344,700 |
7,758,077 |
|
|
Nordic Baltic Holding AB |
2,432,100 |
18,246,224 |
|
|
OM Gruppen AB |
14,400 |
514,234 |
|
|
Securitas AB (B Shares) |
723,981 |
15,425,423 |
|
|
Tele1 Europe Holding AB (a) |
214,400 |
1,651,375 |
|
|
Telefonaktiebolaget LM Ericsson |
3,481,165 |
48,301,166 |
|
|
TOTAL SWEDEN |
111,497,354 |
||
|
Switzerland - 10.7% |
|||
|
Fantastic Corp. (a) |
267,570 |
715,407 |
|
|
Common Stocks - continued |
|||
|
Shares |
Value (Note 1) |
||
|
Switzerland - continued |
|||
|
Geberit International AG |
13,900 |
$ 3,325,174 |
|
|
Kudelski SA (a) |
30,550 |
41,129,903 |
|
|
Leica Geosystems AG |
4,300 |
1,220,028 |
|
|
Lindt & Spruengli AG |
22,614 |
10,945,302 |
|
|
Miracle Holding AG |
8,028 |
44,662 |
|
|
Novartis AG (Reg.) |
21,758 |
33,009,216 |
|
|
Richemont Compagnie Financier |
5,829 |
16,214,186 |
|
|
Straumann Holding AG |
2,140 |
4,625,257 |
|
|
Tecan Group AG |
12,963 |
13,918,548 |
|
|
Zurich Financial Services Group AG |
55,840 |
27,026,871 |
|
|
TOTAL SWITZERLAND |
152,174,554 |
||
|
Turkey - 0.2% |
|||
|
Yapi ve Kredi Bankasi AS (a) |
332,572,600 |
2,876,553 |
|
|
United Kingdom - 26.2% |
|||
|
Amdocs Ltd. (a) |
69,100 |
4,478,544 |
|
|
Axis Shield PLC (a) |
827,583 |
7,786,359 |
|
|
Babcock International Group PLC |
2,275,930 |
3,794,328 |
|
|
Baltimore Technologies PLC (a) |
3,201,700 |
24,623,181 |
|
|
BP Amoco PLC |
3,988,057 |
33,856,962 |
|
|
British Land Co. PLC |
4,205,571 |
25,118,883 |
|
|
Capita Group PLC |
1,981,535 |
15,081,314 |
|
|
Corus Group PLC |
4,288,900 |
3,854,923 |
|
|
E-Capital Investments PLC (a) |
8,303,450 |
592,246 |
|
|
EGG PLC (a) |
3,243,800 |
5,349,136 |
|
|
EGG PLC (e) |
442,400 |
729,533 |
|
|
Energis PLC (a) |
2,414,250 |
20,632,136 |
|
|
Exel PLC |
1,853 |
31,671 |
|
|
Expro International Group PLC |
558,000 |
4,085,110 |
|
|
Granada Compass PLC (a) |
2,383,375 |
20,523,762 |
|
|
Jazztel PLC sponsored ADR |
240,600 |
4,255,613 |
|
|
Misys PLC |
245,116 |
2,551,375 |
|
|
NDS Group PLC sponsored ADR |
317,400 |
23,805,000 |
|
|
Prudential PLC |
1,572,813 |
21,136,592 |
|
|
Regus PLC (a) |
516,700 |
2,346,056 |
|
|
Safeway PLC |
7,251,125 |
30,116,754 |
|
|
Sema Group PLC |
450,800 |
5,685,665 |
|
|
Serco Group PLC |
2,068,302 |
19,039,951 |
|
|
Smith & Nephew PLC |
2,958,030 |
12,135,765 |
|
|
United News & Media PLC |
895,120 |
11,192,278 |
|
|
Vodafone Group PLC |
16,709,547 |
71,119,952 |
|
|
TOTAL UNITED KINGDOM |
373,923,089 |
||
|
|
|||
|
Shares |
Value (Note 1) |
||
|
United States of America - 5.2% |
|||
|
Infonet Services Corp. Class B |
1,276,370 |
$ 8,296,405 |
|
|
SCM Microsystems, Inc. (a) |
35,500 |
1,361,984 |
|
|
Synthes-Stratec, Inc. |
36,731 |
23,397,494 |
|
|
VoiceStream Wireless Corp. (a) |
310,700 |
40,857,050 |
|
|
TOTAL UNITED STATES OF AMERICA |
73,912,933 |
||
|
TOTAL COMMON STOCKS (Cost $1,194,444,873) |
1,288,505,067 |
|
|
Nonconvertible Preferred Stocks - 7.1% |
|||
|
|
|
|
|
|
Germany - 5.3% |
|||
|
Marschollek Lautenschlaeger |
385,644 |
52,209,873 |
|
|
ProSieben Sat.1 Media AG (a) |
742,708 |
23,388,231 |
|
|
TOTAL GERMANY |
75,598,104 |
||
|
Italy - 1.8% |
|||
|
Alleanza Assicurazioni Spa |
1,861,200 |
14,325,505 |
|
|
Telecom Italia Spa Risp |
2,115,900 |
11,544,533 |
|
|
TOTAL ITALY |
25,870,038 |
||
|
TOTAL NONCONVERTIBLE (Cost $71,664,643) |
101,468,142 |
||
|
Corporate Bonds - 1.1% |
|||||
|
Moody's Ratings (unaudited) |
Principal Amount (c) |
|
|||
|
Convertible Bonds - 0.1% |
|||||
|
United Kingdom - 0.1% |
|||||
|
Royal Bank of Scotland Group PLC euro 0% 12/1/03 (Reg. S) (f) |
- |
GBP |
1,462,563 |
1,728,026 |
|
|
Nonconvertible Bonds - 1.0% |
|||||
|
France - 0.4% |
|||||
|
Eurotunnel Finance Ltd. euro: |
|
|
|
|
|
|
0% 4/30/40 (f) |
- |
EUR |
1,355 |
1,495,161 |
|
|
0% 4/30/40 (f) |
- |
EUR |
3,885 |
4,286,864 |
|
|
TOTAL FRANCE |
5,782,025 |
||||
|
United Kingdom - 0.6% |
|||||
|
Credit Linked & Structured Securities Ltd. euro: |
|
|
|
|
|
|
5.14% 12/31/50 (f) |
- |
FRF |
63,000,000 |
2,772,708 |
|
|
6.89% 12/31/50 (f) |
- |
GBP |
11,400,000 |
5,619,037 |
|
|
TOTAL UNITED KINGDOM |
8,391,745 |
||||
|
TOTAL NONCONVERTIBLE BONDS |
14,173,770 |
||||
|
TOTAL CORPORATE BONDS (Cost $19,483,754) |
15,901,796 |
||||
|
Cash Equivalents - 5.5% |
|||
|
Shares |
Value (Note 1) |
||
|
Fidelity Cash Central Fund, 6.61% (b) |
30,293,573 |
$ 30,293,573 |
|
|
Fidelity Securities Lending Cash Central Fund, 6.66% (b) |
47,830,784 |
47,830,784 |
|
|
TOTAL CASH EQUIVALENTS (Cost $78,124,357) |
78,124,357 |
||
|
TOTAL INVESTMENT PORTFOLIO - 104.1% (Cost $1,363,717,627) |
1,483,999,362 |
||
|
NET OTHER ASSETS - (4.1)% |
(58,906,871) |
||
|
NET ASSETS - 100% |
$ 1,425,092,491 |
||
|
Currency Abbreviations |
||
|
EUR |
- |
European Monetary Unit |
|
FRF |
- |
French franc |
|
GBP |
- |
British pound |
|
Legend |
|
(a) Non-income producing |
|
(b) The rate quoted is the annualized seven-day yield of the fund at period end. A complete listing of the fund's holdings as of its most recent fiscal year end is available upon request. |
|
(c) Principal amount is stated in United States dollars unless otherwise noted. |
|
(d) Affiliated company |
|
(e) Security exempt from registration under Rule 144A of the Securities Act of 1933. These securities may be resold in transactions exempt from registration, normally to qualified institutional buyers. At the period end, the value of these securities amounted to $2,038,162 or 0.1% of net assets. |
|
(f) The coupon rate shown on floating or adjustable rate securities represents the rate at period end. |
|
Other Information |
|
Purchases and sales of securities, other than short-term securities, aggregated $2,104,998,187 and $2,166,594,408, respectively. |
|
The fund participated in the security lending program. At period end, the value of securities loaned amounted to $46,125,351. The fund received cash collateral of $47,830,784 which was invested in cash equivalents, and U.S. Treasury obligations valued at $1,750,000. Cash collateral includes $560,000 received for unsettled security loans. |
|
The fund participated in the interfund lending program as a borrower. The average daily loan balance during the period for which loans were outstanding amounted to $13,396,034. The weighted average interest rate was 5.78%. Interest expense includes $126,820 paid under the interfund lending program. |
|
The fund participated in the bank borrowing program. The average daily loan balance during the period for which loans were outstanding amounted to $5,164,400. The weighted average interest rate was 6.18%. Interest expense includes $8,868 paid under the bank borrowing program. |
|
Transactions during the period with companies which are or were affiliates are as follows: |
|
|
Purchase |
Sales |
Dividend |
Value |
|
Affiliate |
Cost |
Cost |
Income |
|
|
TRANSGENE SA |
$ - |
$ 642,421 |
- |
$ 3,115,250 |
|
Income Tax Information |
|
At October 31, 2000, the aggregate cost of investment securities for income tax purposes was $1,366,239,037. Net unrealized appreciation aggregated $117,760,325, of which $273,687,048 related to appreciated investment securities and $155,926,723 related to depreciated investment securities. |
|
The fund hereby designates approximately $118,903,000 as a capital gain dividend for the purpose of the dividend paid deduction. |
|
At October 31, 2000, the fund had a capital loss carryforward of approximately $252,000 all of which will expire on October 31, 2006. All of the capital loss carryforward was acquired in the merger of Fidelity Germany Fund and is available to offset future capital gains of the fund to the extent provided by regulations (see Note 11 of the Notes to Financial Statements). |
See accompanying notes which are an integral part of the financial statements.
Annual Report
Europe
Statement of Assets and Liabilities
|
|
October 31, 2000 |
|
|
Assets |
|
|
|
Investment in securities, at value |
|
$ 1,483,999,362 |
|
Cash |
|
14,000 |
|
Receivable for investments sold |
|
30,299,023 |
|
Receivable for fund shares sold |
|
1,622,549 |
|
Dividends receivable |
|
2,146,528 |
|
Interest receivable |
|
472,739 |
|
Redemption fees receivable |
|
119 |
|
Other receivables |
|
66,593 |
|
Total assets |
|
1,518,620,913 |
|
Liabilities |
|
|
|
Payable for investments purchased |
$ 41,969,598 |
|
|
Payable for fund shares redeemed |
2,226,776 |
|
|
Accrued management fee |
862,271 |
|
|
Other payables and |
638,993 |
|
|
Collateral on securities loaned, |
47,830,784 |
|
|
Total liabilities |
|
93,528,422 |
|
Net Assets |
|
$ 1,425,092,491 |
|
Net Assets consist of: |
|
|
|
Paid in capital |
|
$ 1,088,156,121 |
|
Undistributed net investment income |
|
5,821,770 |
|
Accumulated undistributed net realized gain (loss) on investments and foreign currency transactions |
|
211,074,088 |
|
Net unrealized appreciation (depreciation) on investments |
|
120,040,512 |
|
Net Assets, for 40,855,070 |
|
$ 1,425,092,491 |
|
Net Asset Value, offering price |
|
$34.88 |
Statement of Operations
|
|
Year ended October 31, 2000 |
|
|
Investment Income Dividends |
|
$ 23,527,748 |
|
Interest |
|
2,722,343 |
|
Security lending |
|
891,625 |
|
|
|
27,141,716 |
|
Less foreign taxes withheld |
|
(2,996,347) |
|
Total income |
|
24,145,369 |
|
Expenses |
|
|
|
Management fee |
$ 10,952,530 |
|
|
Performance adjustment |
70,824 |
|
|
Transfer agent fees |
3,573,472 |
|
|
Accounting and security lending fees |
751,132 |
|
|
Non-interested trustees' compensation |
5,956 |
|
|
Custodian fees and expenses |
726,686 |
|
|
Registration fees |
88,902 |
|
|
Audit |
52,222 |
|
|
Legal |
23,906 |
|
|
Interest |
135,688 |
|
|
Miscellaneous |
9,995 |
|
|
Total expenses before reductions |
16,391,313 |
|
|
Expense reductions |
(475,213) |
15,916,100 |
|
Net investment income |
|
8,229,269 |
|
Realized and Unrealized Gain (Loss) Net realized gain (loss) on: |
|
|
|
Investment securities (including realized gain (loss) of $420,893 |
213,344,622 |
|
|
Foreign currency transactions |
(119,683) |
213,224,939 |
|
Change in net unrealized appreciation (depreciation) on: |
|
|
|
Investment securities |
(118,134,639) |
|
|
Assets and liabilities in |
(217,600) |
(118,352,239) |
|
Net gain (loss) |
|
94,872,700 |
|
Net increase (decrease) in net assets resulting from operations |
|
$ 103,101,969 |
|
Other Information |
|
$ 325,135 |
|
Sales charges - Retained by FDC |
|
$ 324,575 |
|
Deferred sales charges withheld |
|
$ 39,990 |
|
Expense reductions |
|
|
|
Directed brokerage arrangements |
|
$ 392,080 |
|
Custodian credits |
|
10,167 |
|
Transfer agent credits |
|
72,966 |
|
|
|
$ 475,213 |
See accompanying notes which are an integral part of the financial statements.
Annual Report
Europe
Financial Statements - continued
Statement of Changes in Net Assets
|
Increase (Decrease) in Net Assets |
Year ended
October 31, |
Year ended
October 31, |
|
Operations |
$ 8,229,269 |
$ 11,174,103 |
|
Net realized gain (loss) |
213,224,939 |
103,624,552 |
|
Change in net unrealized appreciation (depreciation) |
(118,352,239) |
59,284,576 |
|
Net increase (decrease) in net assets resulting from operations |
103,101,969 |
174,083,231 |
|
Distributions to shareholders |
(6,915,223) |
(13,415,761) |
|
From net realized gain |
(74,504,729) |
(107,821,453) |
|
Total distributions |
(81,419,952) |
(121,237,214) |
|
Share transactions |
475,580,031 |
350,466,714 |
|
Net asset value of shares issued in exchange for the net assets of Fidelity France Fund, |
62,774,350 |
- |
|
Reinvestment of distributions |
79,434,126 |
118,737,898 |
|
Cost of shares redeemed |
(532,039,104) |
(791,339,602) |
|
Net increase (decrease) in net assets resulting from share transactions |
85,749,403 |
(322,134,990) |
|
Redemption fees |
258,937 |
333,409 |
|
Total increase (decrease) in net assets |
107,690,357 |
(268,955,564) |
|
Net Assets |
|
|
|
Beginning of period |
1,317,402,134 |
1,586,357,698 |
|
End of period (including undistributed net investment income of $5,821,770 and $9,182,220, respectively) |
$ 1,425,092,491 |
$ 1,317,402,134 |
|
Other Information Shares |
|
|
|
Sold |
12,610,973 |
10,550,858 |
|
Issued in exchange for the shares of Fidelity France Fund, Fidelity Germany Fund and Fidelity |
1,625,579 |
- |
|
Issued in reinvestment of distributions |
2,266,303 |
3,755,163 |
|
Redeemed |
(14,288,890) |
(23,998,640) |
|
Net increase (decrease) |
2,213,965 |
(9,692,619) |
Financial Highlights
|
Years ended October 31, |
2000 |
1999 |
1998 |
1997 |
1996 |
|
Selected Per-Share Data |
|
|
|
|
|
|
Net asset value, beginning of period |
$ 34.09 |
$ 32.82 |
$ 31.05 |
$ 27.12 |
$ 23.51 |
|
Income from Investment Operations |
|
|
|
|
|
|
Net investment income C |
.20 |
.25 |
.39 |
.44 |
.30 |
|
Net realized and unrealized gain (loss) |
2.70 |
3.54 |
4.10 |
5.44 |
4.23 |
|
Total from investment operations |
2.90 |
3.79 |
4.49 |
5.88 |
4.53 |
|
Less Distributions |
|
|
|
|
|
|
From net investment income |
(.18) |
(.28) |
(.39) |
(.24) |
(.12) |
|
From net realized gain |
(1.94) |
(2.25) |
(2.35) |
(1.73) |
(.81) |
|
Total distributions |
(2.12) |
(2.53) |
(2.74) |
(1.97) |
(.93) |
|
Redemption fees added to paid in capital |
.01 |
.01 |
.02 |
.02 |
.01 |
|
Net asset value, end of period |
$ 34.88 |
$ 34.09 |
$ 32.82 |
$ 31.05 |
$ 27.12 |
|
Total Return A, B |
8.51% |
12.18% |
15.45% |
23.35% |
20.14% |
|
Ratios and Supplemental Data |
|
|
|
|
|
|
Net assets, end of period (000 omitted) |
$ 1,425,092 |
$ 1,317,402 |
$ 1,586,358 |
$ 916,108 |
$ 691,762 |
|
Ratio of expenses to average net assets |
1.09% |
.96% |
1.10% |
1.19% |
1.27% |
|
Ratio of expenses to average net assets after expense reductions |
1.05% D |
.89% D |
1.09% D |
1.18% D |
1.27% |
|
Ratio of net investment income to average net assets |
.54% |
.76% |
1.15% |
1.53% |
1.20% |
|
Portfolio turnover rate |
144% E |
106% |
114% |
57% |
45% |
|
A The total returns would have been lower had certain expenses not been reduced during the periods shown. B Total returns do not include the former one time sales charge. C Net investment income per share has been calculated based on average shares outstanding during the period. D FMR or the fund has entered into varying arrangements with third parties who either paid or reduced a portion of the fund's expenses. E The portfolio turnover rate does not include the assets acquired in the merger. |
|||||
See accompanying notes which are an integral part of the financial statements.
Annual Report
There are several ways to evaluate a fund's historical performance. You can look at the total percentage change in value, the average annual percentage change or the growth of a hypothetical $10,000 investment. Total return reflects the change in the value of an investment, assuming reinvestment of the fund's dividend income and capital gains (the profits earned upon the sale of securities that have grown in value). Total returns do not include the effect of the 3.00% sales load which was eliminated as of March 1, 2000.
Cumulative Total Returns
|
Periods ended |
Past 1 |
Past 5 |
Life of |
|
|
Fidelity Europe Capital App |
8.19% |
119.96% |
165.71% |
|
|
MSCI Europe |
1.16% |
108.88% |
152.27% |
|
|
European Region Funds Average |
12.53% |
102.14% |
n/a* |
|
Cumulative total returns show the fund's performance in percentage terms over a set period - in this case, one year, five years or since the fund started on December 21, 1993. For example, if you had invested $1,000 in a fund that had a 5% return over the past year, the value of your investment would be $1,050. You can compare the fund's returns to the performance of the Morgan Stanley Capital International (MSCI) Europe Index - a market capitalization-weighted index that is designed to represent the performance of developed stock markets in Europe. As of October 31, 2000, the index included over 435 equity securities of companies domiciled in 15 European countries. To measure how the fund's performance stacked up against its peers, you can compare it to the European region funds average, which reflects the performance of mutual funds with similar objectives tracked by Lipper Inc. The past one year average represents a peer group of 151 mutual funds. These benchmarks include reinvested dividends and capital gains, if any, and exclude the effect of sales charges.
Average Annual Total Returns
|
Periods ended |
Past 1 |
Past 5 |
Life of |
|
Fidelity Europe Capital App |
8.19% |
17.08% |
15.30% |
|
MSCI Europe |
1.16% |
15.87% |
14.43% |
|
European Region Funds Average |
12.53% |
14.93% |
n/a* |
Average annual total returns take the fund's cumulative return and show you what would have happened if the fund had performed at a constant rate each year.
* Not available
$10,000 Over Life of Fund
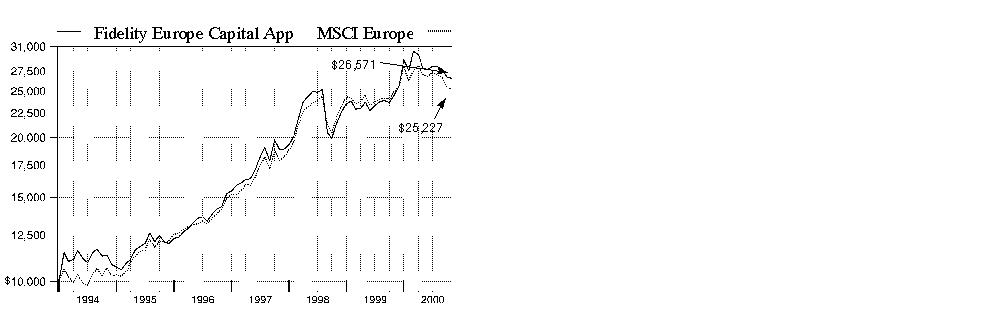
$10,000 Over Life of Fund: Let's say hypothetically that $10,000 was invested in Fidelity Europe Capital Appreciation Fund on December 21, 1993, when the fund started. As the chart shows, by October 31, 2000, the value of the investment would have grown to $26,571 - a 165.71% increase on the initial investment. For comparison, look at how the Morgan Stanley Capital International Europe Index did over the same period. With dividends and capital gains, if any, reinvested, the same $10,000 would have grown to $25,227 - a 152.27% increase.
Understanding Performance
Many markets around the globe offer the potential for significant growth over time; however, investing in foreign markets means assuming greater risks than investing in the United States. Factors like changes in a country's financial markets, its local political and economic climate, and the fluctuating value of its currency create these risks. For these reasons an international fund's performance may be more volatile than a fund that invests exclusively in the United States. Past performance is no guarantee of future results and you may have a gain or loss when you sell your shares.
3Annual Report
(Portfolio Manager photograph)
An interview with
Ian Hart, Portfolio Manager of Fidelity Europe Capital
Appreciation Fund
Q. How did the fund perform, Ian?
A. It did reasonably well. For the 12 months that ended October 31, 2000, the fund returned 8.19%, outperforming the Morgan Stanley Capital International Europe Index, which had a 1.16% return for the same 12-month period. The fund also compares its performance to the European region funds average, as tracked by Lipper Inc., which returned 12.53%.
Q. What were the major factors that influenced this performance?
A. The fund lost some of its earlier gains during the second half of the period. This came as a result of the major downward correction that began in U.S. markets at mid-year and led to downward momentum in Europe and elsewhere. The bubble burst for many of the technology, media and telecommunications (TMT) names that had contributed so greatly to performance in the past couple of years and, by underweighting the fund's exposure to these sectors, it missed some of the downside. The markets remained volatile, and there really were no clear sector themes driving performance. The fund was able to beat the index almost entirely because of favorable stock picking. I found positive company stories in a variety of sectors, including financial services, pharmaceuticals, consumer goods and even in technology. The markets were very unforgiving of companies that missed their earnings projections, so with assistance from Fidelity's European research team based in London, I focused even more intently on owning attractively priced companies that I felt were not going to disappoint on their numbers. The fund lagged the Lipper average, which was more aggressively positioned in the high-growth sectors that drove performance early in the period.
Q. What else did you do to position the fund for this period of market correction and volatility?
A. I became for the most part sector-agnostic and focused on companies that I believed would deliver growth at a reasonable price. However, as mentioned earlier, I did reduce the fund's overall exposure to the TMT sectors, where it previously was overweighted, and I also reduced its positions in the energy sector. At the same time, I increased holdings in the retail and financial services sectors, but did so on the basis of company-specific stories, rather than part of any broad sector themes.
Q. Which individual holdings did the most to help performance during the period?
A. Swatch, the Swiss watch manufacturer, made a strong contribution as the company continued to deliver earnings that exceeded the market's expectations. Nutreco, a Dutch fish farming and animal foods company, also showed surprisingly attractive earnings growth, and its stock price rose as the market began to recognize the company's growth potential. Wella, a German hair care company, was able to benefit from internal improvements that helped drive attractive earnings growth and was rewarded with robust stock price appreciation. Amvescap, a U.K.-based fund manager with significant business in the U.S., also did extremely well as its profitability improved.
Q. What holdings were disappointments - especially in the latter part of the period?
A. The U.K.'s Vodafone Group and Germany's Deutsche Telekom, which I've since sold, were two telecommunications concerns that were caught in the second-half's downdraft. Of course, many of the high-flying stocks in the TMT sectors have come down quite a lot from their recent historical highs. Valuations for many of these companies were quite high, but when the growth assumptions that supported those valuations began to be downgraded, the bubble finally burst. As I said earlier, companies that missed their earnings targets were punished severely.
Q. What's your outlook for the next six months, Ian?
A. Despite the likelihood of continued volatility in the broad market, I think there still are plenty of attractive investment opportunities in Europe. I'll remain focused on bottom-up stock picking, looking for ideas across a wide range of industry sectors. I'm greatly assisted in this task by Fidelity's European research team in London. This invaluable research asset gives me many more feet on the ground in Europe, kicking the tires and providing the necessary due diligence that allows me to both keep on top of existing stocks and generate new stock ideas.
The views expressed in this report reflect those of the portfolio manager only through the end of the period of the report as stated on the cover. The manager's views are subject to change at any time based on market or other conditions. For more information, see page A-3.
Fund Facts
Goal: long-term capital appreciation by investing mainly in equity securities of European issuers
Fund number: 341
Trading symbol: FECAX
Start date: December 21, 1993
Size: as of October 31, 2000, more than $643 million
Manager: Ian Hart, since April 2000; international equity analyst, 1997-2000; European equity analyst in U.K., 1994-1997; joined Fidelity in 1994
3Annual Report
Europe Capital Appreciation
|
Geographic Diversification (% of fund's net assets) |
|||
|
As of October 31, 2000 |
|||
|
United Kingdom |
25.1% |
|
|
France |
21.4% |
|
|
Netherlands |
10.9% |
|
|
Switzerland |
9.3% |
|
|
Germany |
8.7% |
|
|
Spain |
5.6% |
|
|
Italy |
5.6% |
|
|
Finland |
3.8% |
|
|
United States of America |
2.1% |
|
|
Other |
7.5% |
|

|
|
|||
|
As of April 30, 2000 |
|||
|
United Kingdom |
28.5% |
|
|
France |
20.5% |
|
|
Germany |
10.1% |
|
|
Netherlands |
9.6% |
|
|
United States of America |
7.1% |
|
|
Switzerland |
6.5% |
|
|
Spain |
4.7% |
|
|
Sweden |
3.9% |
|
|
Finland |
3.2% |
|
|
Other |
5.9% |
|

|
Percentages are adjusted for the effect of futures contracts, if applicable. |
|
Asset Allocation |
||
|
|
% of fund's |
% of fund's net assets |
|
Stocks |
98.5 |
94.5 |
|
Short-Term Investments |
1.5 |
5.5 |
|
Top Ten Stocks as of October 31, 2000 |
||
|
|
% of fund's |
% of fund's net assets |
|
TotalFinaElf SA Class B |
5.0 |
5.2 |
|
Vodafone Group PLC |
4.8 |
5.0 |
|
Royal Dutch Petroleum Co. |
3.6 |
2.3 |
|
Nokia AB (Finland, Communications Equipment) |
3.3 |
3.2 |
|
Castorama Dubois Investissements SA (France, Retail & Wholesale, Miscellaneous) |
3.2 |
1.1 |
|
Zurich Financial Services Group AG (Switzerland, Insurance) |
2.5 |
0.0 |
|
ING Groep NV (Certificaten |
2.3 |
1.5 |
|
Lloyds TSB Group PLC |
2.2 |
0.7 |
|
Karstadt Quelle AG (Germany, General Merchandise Stores) |
2.0 |
0.5 |
|
Telefonica SA |
1.9 |
1.9 |
|
|
30.8 |
21.4 |
|
Top Ten Market Sectors as of October 31, 2000 |
||
|
|
% of fund's |
% of fund's net assets |
|
Finance |
25.9 |
17.0 |
|
Utilities |
11.7 |
20.4 |
|
Retail & Wholesale |
11.0 |
3.3 |
|
Energy |
9.3 |
10.9 |
|
Technology |
8.5 |
13.5 |
|
Nondurables |
7.9 |
5.9 |
|
Health |
7.6 |
7.8 |
|
Media & Leisure |
4.2 |
6.0 |
|
Industrial Machinery & Equipment |
3.4 |
3.9 |
|
Services |
3.0 |
2.3 |
Annual Report
Europe Capital Appreciation
Showing Percentage of Net Assets
|
Common Stocks - 98.1% |
|||
|
Shares |
Value (Note 1) |
||
|
Belgium - 0.5% |
|||
|
KBC Bancassurance Holding NV |
72,600 |
$ 3,007,197 |
|
|
Denmark - 1.7% |
|||
|
Bang & Olufsen Holding AS |
73,680 |
3,597,734 |
|
|
Carlsberg AS Series B |
10,200 |
427,073 |
|
|
Novo-Nordisk AS Series B (a) |
31,200 |
6,620,690 |
|
|
TOTAL DENMARK |
10,645,497 |
||
|
Finland - 3.8% |
|||
|
Nokia AB |
493,500 |
21,097,124 |
|
|
UPM-Kymmene Corp. |
114,000 |
3,227,053 |
|
|
TOTAL FINLAND |
24,324,177 |
||
|
France - 21.4% |
|||
|
Alcatel SA (RFD) (a) |
157,060 |
9,796,618 |
|
|
Aventis SA (France) |
105,797 |
7,623,996 |
|
|
AXA SA de CV |
79,398 |
10,513,311 |
|
|
BNP Paribas SA |
108,100 |
9,322,336 |
|
|
Castorama Dubois Investissements SA |
100,355 |
20,409,445 |
|
|
Groupe Danone (a) |
22,000 |
3,077,409 |
|
|
ILOG SA sponsored ADR (a) |
101,900 |
3,057,000 |
|
|
Integra SA (a) |
178,200 |
1,444,496 |
|
|
Pernod-Ricard |
68,114 |
3,122,019 |
|
|
Royal Canin SA |
34,000 |
3,073,505 |
|
|
Sanofi-Synthelabo SA |
139,800 |
7,357,059 |
|
|
Societe Generale Class A (a) |
51,600 |
2,930,092 |
|
|
Suez Lyonnaise des Eaux (France) |
40,239 |
6,141,044 |
|
|
Television Francaise 1 SA (a) |
41,920 |
2,287,903 |
|
|
TotalFinaElf SA Class B |
224,900 |
32,216,928 |
|
|
Vivendi Environment (a) |
195,600 |
7,305,112 |
|
|
Vivendi SA |
109,943 |
7,904,172 |
|
|
TOTAL FRANCE |
137,582,445 |
||
|
Germany - 8.3% |
|||
|
ACG AG |
29,200 |
1,536,668 |
|
|
Allianz AG (Reg.) |
20,071 |
6,806,840 |
|
|
Deutsche Lufthansa AG (Reg.) |
292,300 |
5,706,398 |
|
|
Douglas Holding AG |
67,700 |
2,016,978 |
|
|
Fresenius Medical Care AG |
61,200 |
4,871,029 |
|
|
Karstadt Quelle AG |
392,700 |
12,819,632 |
|
|
Muenchener Ruckversicherungs-Gesellschaft AG (Reg.) |
22,507 |
7,078,010 |
|
|
Software AG |
41,200 |
2,951,515 |
|
|
United Internet AG (a) |
73,000 |
469,675 |
|
|
Wella AG |
233,835 |
8,891,866 |
|
|
TOTAL GERMANY |
53,148,611 |
||
|
Greece - 0.7% |
|||
|
Antenna TV SA sponsored ADR (a) |
228,200 |
4,506,950 |
|
|
Ireland - 0.8% |
|||
|
Irish Life & Permanent PLC |
511,100 |
5,123,434 |
|
|
Israel - 0.3% |
|||
|
Orad Hi-Tech Systems Ltd. |
71,800 |
2,154,365 |
|
|
|
|||
|
Shares |
Value (Note 1) |
||
|
Italy - 5.6% |
|||
|
Alleanza Assicurazioni Spa |
796,400 |
$ 10,522,372 |
|
|
Banca Intesa Spa |
1,723,800 |
7,206,070 |
|
|
Banca Nazionale del Lavoro (BNL) |
1,093,100 |
3,525,728 |
|
|
Saipem Spa |
439,400 |
2,309,012 |
|
|
Telecom Italia Mobile Spa |
835,300 |
7,107,751 |
|
|
Telecom Italia Spa |
450,900 |
5,298,074 |
|
|
TOTAL ITALY |
35,969,007 |
||
|
Netherlands - 10.9% |
|||
|
Hunter Douglas NV |
83,500 |
2,395,568 |
|
|
ING Groep NV (Certificaten |
215,049 |
14,770,618 |
|
|
Koninklijke Ahold NV |
386,130 |
11,218,785 |
|
|
Koninklijke Philips Electronics NV |
70,086 |
2,754,935 |
|
|
Numico NV |
92,300 |
4,316,768 |
|
|
Nutreco Holding NV |
166,900 |
7,196,568 |
|
|
Oce NV |
285,600 |
4,254,423 |
|
|
Royal Dutch Petroleum Co. |
390,600 |
23,191,876 |
|
|
TOTAL NETHERLANDS |
70,099,541 |
||
|
Norway - 2.0% |
|||
|
Bergesen dy ASA (A Shares) |
143,000 |
2,847,073 |
|
|
Norsk Hydro AS (a) |
111,500 |
4,427,841 |
|
|
TANDBERG ASA (a) |
207,000 |
5,480,198 |
|
|
TOTAL NORWAY |
12,755,112 |
||
|
Spain - 5.6% |
|||
|
Aldeasa SA |
59,500 |
1,126,230 |
|
|
Altadis SA |
395,600 |
5,926,610 |
|
|
Banco Santander Central Hispano SA |
1,219,800 |
11,823,882 |
|
|
Cortefiel SA |
172,900 |
3,103,922 |
|
|
Sogecable SA (a) |
76,300 |
1,865,187 |
|
|
Telefonica SA (a) |
652,793 |
12,450,418 |
|
|
TOTAL SPAIN |
36,296,249 |
||
|
Sweden - 1.5% |
|||
|
Tele1 Europe Holding AB (a) |
265,300 |
2,043,423 |
|
|
Telefonaktiebolaget LM Ericsson |
569,172 |
7,897,262 |
|
|
TOTAL SWEDEN |
9,940,685 |
||
|
Switzerland - 9.3% |
|||
|
Credit Suisse Group (Reg.) |
57,387 |
10,759,065 |
|
|
Gretag Imaging Holding AG (Reg. D) |
10,187 |
1,830,543 |
|
|
Julius Baer Holding AG |
1,474 |
7,298,248 |
|
|
Nestle SA (Reg.) |
2,168 |
4,492,796 |
|
|
Novartis AG (Reg.) |
3,338 |
5,064,103 |
|
|
PubliGroupe SA (Reg.) |
1,067 |
626,250 |
|
|
The Swatch Group AG (Bearer) |
4,986 |
6,601,769 |
|
|
UBS AG |
51,249 |
7,099,305 |
|
|
Zurich Financial Services Group AG |
32,576 |
15,766,965 |
|
|
TOTAL SWITZERLAND |
59,539,044 |
||
|
Common Stocks - continued |
|||
|
Shares |
Value (Note 1) |
||
|
United Kingdom - 25.1% |
|||
|
3i Group PLC |
267,200 |
$ 6,062,182 |
|
|
Amvescap PLC |
375,700 |
8,387,645 |
|
|
AstraZeneca Group PLC (United Kingdom) |
106,000 |
5,054,875 |
|
|
Barclays PLC |
147,500 |
4,216,742 |
|
|
Boots Co. PLC |
1,313,580 |
10,473,633 |
|
|
British Land Co. PLC |
617,552 |
3,688,492 |
|
|
British Telecommunications PLC |
446,500 |
5,313,347 |
|
|
Cable & Wireless PLC |
359,200 |
5,077,139 |
|
|
Carlton Communications PLC |
347,000 |
2,791,905 |
|
|
Diageo PLC |
1,011,500 |
9,538,747 |
|
|
Lloyds TSB Group PLC |
1,366,100 |
13,902,655 |
|
|
Marconi PLC |
177,100 |
2,233,654 |
|
|
Rank Group PLC Class L |
1,006,200 |
2,494,357 |
|
|
Reuters Group PLC |
331,300 |
6,508,662 |
|
|
SMG PLC |
2,117,666 |
8,288,947 |
|
|
Smith & Nephew PLC |
767,900 |
3,150,426 |
|
|
SmithKline Beecham PLC |
655,600 |
8,547,385 |
|
|
Somerfield PLC |
2,954,100 |
3,297,570 |
|
|
SSL International PLC |
765,500 |
8,905,706 |
|
|
Telewest Communications PLC (a) |
1,304,300 |
2,155,562 |
|
|
Vodafone Group PLC |
7,315,791 |
31,137,811 |
|
|
W.H. Smith PLC |
1,147,100 |
6,734,951 |
|
|
WPP Group PLC |
279,500 |
3,748,018 |
|
|
TOTAL UNITED KINGDOM |
161,710,411 |
||
|
United States of America - 0.6% |
|||
|
Jupiter Media Metrix, Inc. (a) |
104,600 |
1,425,175 |
|
|
Scientific-Atlanta, Inc. |
35,700 |
2,443,219 |
|
|
TOTAL UNITED STATES OF AMERICA |
3,868,394 |
||
|
TOTAL COMMON STOCKS (Cost $575,913,514) |
630,671,119 |
||
|
Nonconvertible Preferred Stocks - 0.4% |
|||
|
|
|
|
|
|
Germany - 0.4% |
|||
|
ProSieben Sat.1 Media AG (a) |
91,600 |
2,884,528 |
|
|
Cash Equivalents - 4.1% |
|||
|
Shares |
Value (Note 1) |
||
|
Fidelity Cash Central Fund, 6.61% (b) |
730,964 |
$ 730,964 |
|
|
Fidelity Securities Lending Cash |
25,502,695 |
25,502,695 |
|
|
TOTAL CASH EQUIVALENTS (Cost $26,233,659) |
26,233,659 |
||
|
TOTAL INVESTMENT PORTFOLIO - 102.6% (Cost $605,313,198) |
659,789,306 |
||
|
NET OTHER ASSETS - (2.6)% |
(16,639,205) |
||
|
NET ASSETS - 100% |
$ 643,150,101 |
||
|
Legend |
|
(a) Non-income producing |
|
(b) The rate quoted is the annualized seven-day yield of the fund at period end. A complete listing of the fund's holdings as of its most recent fiscal year end is available upon request. |
|
Other Information |
|
Purchases and sales of securities, other than short-term securities, aggregated $1,241,435,296 and $1,089,683,471, respectively. |
|
The fund placed a portion of its portfolio transactions with brokerage firms which are affiliates of Fidelity Management & Research Company. The commissions paid to these affiliated firms were $2,335 for the period. |
|
The fund participated in the security lending program. At period end, the value of securities loaned amounted to $25,039,667. The fund received cash collateral of $25,502,695 which was invested in cash equivalents, and U.S. Treasury obligations valued at $406,722. |
|
The fund participated in the interfund lending program as a borrower. The average daily loan balance during the period for which loans were outstanding amounted to $9,495,000. The weighted average interest rate was 6.80%. Interest expense includes $1,793 paid under the interfund lending program. |
|
The fund participated in the bank borrowing program. The average daily loan balance during the period for which loans were outstanding amounted to $3,846,250. The weighted average interest rate was 6.87%. Interest expense includes $2,935 paid under the bank borrowing program. |
|
Income Tax Information |
|
At October 31, 2000, the aggregate cost of investment securities for income tax purposes was $606,708,312. Net unrealized appreciation aggregated $53,080,994, of which $98,445,456 related to appreciated investment securities and $45,364,462 related to depreciated investment securities. |
|
The fund hereby designates approximately $29,702,000 as a capital gain dividend for the purpose of the dividend paid deduction. |
See accompanying notes which are an integral part of the financial statements.
Annual Report
Europe Capital Appreciation
Statement of Assets and Liabilities
|
|
October 31, 2000 |
|
|
Assets |
|
|
|
Investment in securities, at value |
|
$ 659,789,306 |
|
Foreign currency held at value |
|
801,667 |
|
Receivable for investments sold |
|
20,289,979 |
|
Receivable for fund shares sold |
|
788,644 |
|
Dividends receivable |
|
1,303,964 |
|
Interest receivable |
|
87,927 |
|
Redemption fees receivable |
|
667 |
|
Other receivables |
|
18,103 |
|
Total assets |
|
683,080,257 |
|
Liabilities |
|
|
|
Payable for fund shares redeemed |
$ 13,772,376 |
|
|
Accrued management fee |
427,323 |
|
|
Other payables and |
227,762 |
|
|
Collateral on securities loaned, |
25,502,695 |
|
|
Total liabilities |
|
39,930,156 |
|
Net Assets |
|
$ 643,150,101 |
|
Net Assets consist of: |
|
|
|
Paid in capital |
|
$ 543,885,302 |
|
Undistributed net investment income |
|
4,793,720 |
|
Accumulated undistributed net realized gain (loss) on investments and foreign currency transactions |
|
40,093,095 |
|
Net unrealized appreciation (depreciation) on investments |
|
54,377,984 |
|
Net Assets, for 32,851,431 |
|
$ 643,150,101 |
|
Net Asset Value, offering price |
|
$19.58 |
Statement of Operations
|
|
Year ended October 31, 2000 |
|
|
Investment Income Dividends |
|
$ 11,490,512 |
|
Interest |
|
2,845,652 |
|
Security lending |
|
296,918 |
|
|
|
14,633,082 |
|
Less foreign taxes withheld |
|
(1,545,423) |
|
Total income |
|
13,087,659 |
|
Expenses |
|
|
|
Management fee |
$ 5,511,849 |
|
|
Performance adjustment |
111,277 |
|
|
Transfer agent fees |
1,687,886 |
|
|
Accounting and security lending fees |
417,831 |
|
|
Non-interested trustees' compensation |
2,506 |
|
|
Custodian fees and expenses |
414,514 |
|
|
Registration fees |
68,854 |
|
|
Audit |
34,295 |
|
|
Legal |
9,906 |
|
|
Interest |
4,728 |
|
|
Miscellaneous |
1,196 |
|
|
Total expenses before reductions |
8,264,842 |
|
|
Expense reductions |
(376,045) |
7,888,797 |
|
Net investment income |
|
5,198,862 |
|
Realized and Unrealized Gain (Loss) Net realized gain (loss) on: |
|
|
|
Investment securities |
42,009,206 |
|
|
Foreign currency transactions |
(405,871) |
41,603,335 |
|
Change in net unrealized appreciation (depreciation) on: |
|
|
|
Investment securities |
(22,759,319) |
|
|
Assets and liabilities in |
(85,840) |
(22,845,159) |
|
Net gain (loss) |
|
18,758,176 |
|
Net increase (decrease) in net assets resulting from operations |
|
$ 23,957,038 |
|
Other Information |
|
$ 1,050,752 |
|
Sales charges - Retained by FDC |
|
$ 1,050,752 |
|
Expense reductions |
|
|
|
Directed brokerage arrangements |
|
$ 365,375 |
|
Transfer agent credits |
|
10,670 |
|
|
|
$ 376,045 |
See accompanying notes which are an integral part of the financial statements.
Annual Report
Europe Capital Appreciation
Financial Statements - continued
Statement of Changes in Net Assets
|
Increase (Decrease) in Net Assets |
Year ended
October 31, |
Year ended
October 31, |
|
Operations |
$ 5,198,862 |
$ 4,874,467 |
|
Net realized gain (loss) |
41,603,335 |
38,149,941 |
|
Change in net unrealized appreciation (depreciation) |
(22,845,159) |
35,596,084 |
|
Net increase (decrease) in net assets resulting from operations |
23,957,038 |
78,620,492 |
|
Distributions to shareholders |
(4,070,674) |
- |
|
From net realized gain |
(14,717,039) |
- |
|
Total distributions |
(18,787,713) |
- |
|
Share transactions |
512,276,940 |
134,939,446 |
|
Reinvestment of distributions |
18,063,088 |
- |
|
Cost of shares redeemed |
(367,338,080) |
(389,794,618) |
|
Net increase (decrease) in net assets resulting from share transactions |
163,001,948 |
(254,855,172) |
|
Redemption fees |
224,285 |
182,122 |
|
Total increase (decrease) in net assets |
168,395,558 |
(176,052,558) |
|
Net Assets |
|
|
|
Beginning of period |
474,754,543 |
650,807,101 |
|
End of period (including undistributed net investment income of $4,793,720 and $4,567,063, respectively) |
$ 643,150,101 |
$ 474,754,543 |
|
Other Information Shares |
|
|
|
Sold |
24,808,262 |
7,566,679 |
|
Issued in reinvestment of distributions |
903,170 |
- |
|
Redeemed |
(18,336,200) |
(22,059,597) |
|
Net increase (decrease) |
7,375,232 |
(14,492,918) |
Financial Highlights
|
Years ended October 31, |
2000 |
1999 |
1998 |
1997 |
1996 |
|
Selected Per-Share Data |
|
|
|
|
|
|
Net asset value, beginning of period |
$ 18.64 |
$ 16.28 |
$ 16.57 |
$ 14.07 |
$ 12.08 |
|
Income from Investment Operations |
|
|
|
|
|
|
Net investment income |
.14 C |
.15 C |
.15 C |
.20 C |
.22 D |
|
Net realized and unrealized gain (loss) |
1.39 |
2.20 |
1.79 |
3.81 |
2.00 |
|
Total from investment operations |
1.53 |
2.35 |
1.94 |
4.01 |
2.22 |
|
Less Distributions |
|
|
|
|
|
|
From net investment income |
(.13) |
- |
(.17) |
(.23) |
(.23) |
|
From net realized gain |
(.47) |
- |
(2.08) |
(1.29) |
- |
|
Total distributions |
(.60) |
- |
(2.25) |
(1.52) |
(.23) |
|
Redemption fees added to paid in capital |
.01 |
.01 |
.02 |
.01 |
- |
|
Net asset value, end of period |
$ 19.58 |
$ 18.64 |
$ 16.28 |
$ 16.57 |
$ 14.07 |
|
Total Return A, B |
8.19% |
14.50% |
13.65% |
31.57% |
18.74% |
|
Ratios and Supplemental Data |
|
|
|
|
|
|
Net assets, end of period (000 omitted) |
$ 643,150 |
$ 474,755 |
$ 650,807 |
$ 372,049 |
$ 170,192 |
|
Ratio of expenses to average net assets |
1.09% |
1.07% |
1.12% |
1.10% |
1.33% |
|
Ratio of expenses to average net assets after expense reductions |
1.04% E |
.97% E |
1.08% E |
1.07% E |
1.30% E |
|
Ratio of net investment income to average net assets |
.68% |
.86% |
.89% |
1.33% |
1.66% |
|
Portfolio turnover rate |
156% |
150% |
179% |
189% |
155% |
|
A The total returns would have been lower had certain expenses not been reduced during the periods shown. B Total returns do not include the former one time sales charge. C Net investment income per share has been calculated based on average shares outstanding during the period. D Investment income per share reflects a special dividend which amounted to $.04 per share. E FMR or the fund has entered into varying arrangements with third parties who either paid or reduced a portion of the fund's expenses. |
|||||
See accompanying notes which are an integral part of the financial statements.
Annual Report
There are several ways to evaluate a fund's historical performance. You can look at the total percentage change in value, the average annual percentage change or the growth of a hypothetical $10,000 investment. Total return reflects the change in the value of an investment, assuming reinvestment of the fund's dividend income and capital gains (the profits earned upon the sale of securities that have grown in value). If Fidelity had not reimbursed certain fund expenses, the life of fund total returns would have been lower.
Cumulative Total Returns
|
Periods ended |
|
Past 1 |
Past 5 |
Life of |
|
Fidelity Japan |
|
-4.35% |
76.01% |
125.91% |
|
Fidelity Japan |
|
-7.21% |
70.73% |
119.13% |
|
TOPIX |
|
-15.16% |
-4.84% |
20.99% |
|
Japanese Funds Average |
|
-16.10% |
19.81% |
n/a* |
Cumulative total returns show the fund's performance in percentage terms over a set period - in this case, one year, five years or since the fund started on September 15, 1992. For example, if you had invested $1,000 in a fund that had a 5% return over the past year, the value of your investment would be $1,050. You can compare the fund's returns to the performance of the Tokyo Stock Exchange Index (TOPIX) - a market capitalization-weighted index of over 1,300 stocks traded in the Japanese market. To measure how the fund's performance stacked up against its peers, you can compare it to the Japanese funds average, which reflects the performance of mutual funds with similar objectives tracked by Lipper Inc. The past one year average represents a peer group of 48 mutual funds. These benchmarks include reinvested dividends and capital gains, if any, and exclude the effect of sales charges.
Average Annual Total Returns
|
Periods ended |
Past 1 |
Past 5 |
Life of |
|
Fidelity Japan |
-4.35% |
11.97% |
10.54% |
|
Fidelity Japan |
-7.21% |
11.29% |
10.13% |
|
TOPIX |
-15.16% |
-0.99% |
2.37% |
|
Japanese Funds Average |
-16.10% |
2.92% |
n/a* |
Average annual total returns take the fund's cumulative return and show you what would have happened if the fund had performed at a constant rate each year.
* Not available
$10,000 Over Life of Fund
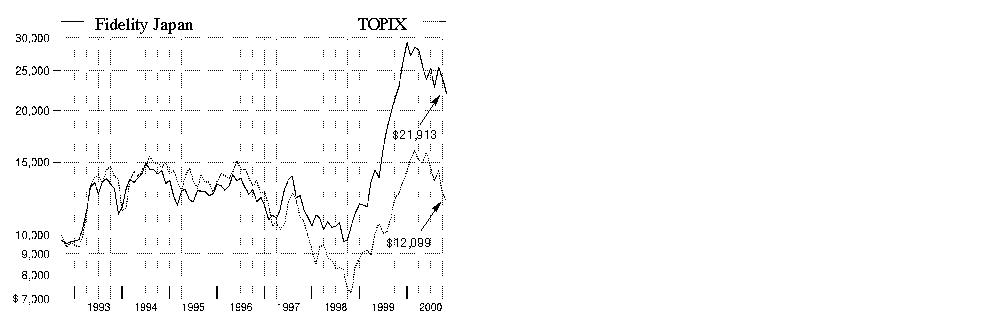
$10,000 Over Life of Fund: Let's say hypothetically that $10,000 was invested in Fidelity Japan Fund on September 15, 1992, when the fund started, and the current 3.00% sales charge was paid. As the chart shows, by October 31, 2000, the value of the investment would have grown to $21,913 - a 119.13% increase on the initial investment. For comparison, look at how the Tokyo Stock Exchange Index did over the same period. With dividends and capital gains, if any, reinvested, the same $10,000 would have been $12,099 - a 20.99% increase.
Understanding Performance
Many markets around the globe offer the potential for significant growth over time; however, investing in foreign markets means assuming greater risks than investing in the United States. Factors like changes in a country's financial markets, its local political and economic climate, and the fluctuating value of its currency create these risks. For these reasons an international fund's performance may be more volatile than a fund that invests exclusively in the United States. Past performance is no guarantee of future results and you may have a gain or loss when you sell your shares.
3Annual Report
(Portfolio Manager photograph)
Note to shareholders:
Yoko Ishibashi became
Portfolio Manager of
Fidelity Japan Fund on
June 16, 2000.
Q. How did the fund perform, Yoko?
A. The fund had a small negative return, although it outperformed its benchmarks by substantial margins. For the 12 months that ended October 31, 2000, the fund returned -4.35%, well ahead of the Tokyo Stock Exchange Index (TOPIX) and the Japanese funds average tracked by Lipper Inc., which returned -15.16% and -16.10%, respectively.
Q. What factors affected the fund's returns?
A. It was a volatile period, with a strong rally in the first four and one-half months that culminated in a sharp correction, especially among market-leading sectors such as technology and telecommunications. During the rally, the fund's strong stock selection and overweighted positions in the favored sectors enabled it to outperform the index and the average. When the markets corrected from March through May, the fund maintained its overweighted exposure to technology, hurting relative performance. After May a broadening of earnings growth across a variety of sectors triggered numerous rotations among defensive, cyclical and new economy stocks. Since taking over management of the fund in June, I maintained the overweighting in selected technology-related businesses, including optical component makers and electronic material producers. This strategy contributed to the outperformance of the fund during that time.
Q. What is your management philosophy?
A. I try to invest in companies offering strong earnings growth at reasonable valuations. I do not, as a rule, invest in companies whose earnings growth is driven only by the economic cycle or by cost-cutting. I want to see sustainable earnings growth resulting from competitive products or services and profit-oriented, return-driven management. The key to finding this kind of company is to get the earnings estimates right. Fidelity analysts and fund managers in Tokyo work closely with their colleagues in Boston, London and Hong Kong to maximize the added value of bottom-up research in each region. My strategy as a fund manager is to translate that research into performance by identifying and investing in shares that I believe are undervalued relative to their future earnings.
Q. What stocks did well for the fund?
A. Furukawa Electric, mentioned in the report to shareholders six months ago, again topped the list of stocks that helped performance. The company has expertise in WDM (wave division multiplexing) - a technology that increases the capacity of the fiber-optic networks used to accommodate the explosive growth in Internet usage worldwide. In addition, the company continued to make progress in restructuring its lower-growth business lines. Another solid performer, Konami, transformed itself from a developer of consumer game software, susceptible to the timing of hardware launches and game cycles, to a more diversified, first-class entertainment company with multiple profit engines. At the same time, the company's growing presence in overseas markets contributed to Konami's strong performance.
Q. What stocks detracted from the fund's performance?
A. One detractor was NTT DoCoMo. Earlier in the year the fund carried an underweighted position in DoCoMo on concerns over high valuations and increasing competitive pressures. DoCoMo's expansion overseas, the possibility of new equity issuance and a period of increasing uncertainty about telecom stocks in general also factored into that decision. Later in the period I overweighted the position, picking up shares at lower prices. NEC also hurt the fund's performance. The stock declined in recent months because of worries about a downturn in semiconductor demand. However, I maintained the position in the belief that the company's competitive edges in its information technology solution and network businesses would drive strong earnings growth over the medium to long term.
Q. What's your outlook, Yoko?
A. Although the Japanese economy is still fragile, I continue to see many positive changes at the company level. Restructuring is no longer focused on merely trying to cut costs in existing businesses, but increasingly involves comprehensive, strategic rethinking of a company's business portfolio. I will continue to carefully screen which companies are able to deliver sustained improvement in shareholder value and which are lagging behind in their proposed restructuring strategies. In this environment, I think individual stock selection based on thorough company research will continue to be the key to investment success in the Japanese market.
The views expressed in this report reflect those of the portfolio manager only through the end of the period of the report as stated on the cover. The manager's views are subject to change at any time based on market or other conditions. For more information, see page A-3 .
Fund Facts
Goal: long-term growth of capital by investing mainly in equity securities of Japanese issuers
Fund number: 350
Trading symbol: FJPNX
Start date: September 15, 1992
Size: as of October 31, 2000, more than $623 million
Manager: Yoko Ishibashi, since June 2000; analyst, various industries, 1994-2000; joined Fidelity in 1994
3
Annual Report
Japan
|
Geographic Diversification (% of fund's net assets) |
|||
|
As of October 31, 2000 |
|||
|
Japan |
98.9% |
|
|
United States of America |
1.1% |
|

|
|
|||
|
As of April 30, 2000 |
|||
|
Japan |
95.1% |
|
|
United States of America |
4.9% |
|

|
Percentages are adjusted for the effect of futures contracts, if applicable. |
|
Asset Allocation |
||
|
|
% of fund's |
% of fund's net assets |
|
Stocks |
98.9 |
95.1 |
|
Short-Term Investments |
1.1 |
4.9 |
|
Top Ten Stocks as of October 31, 2000 |
||
|
|
% of fund's |
% of fund's net assets |
|
Konami Co. Ltd. |
5.4 |
0.3 |
|
NTT DoCoMo, Inc. (Cellular) |
5.2 |
6.4 |
|
Furukawa Electric Co. Ltd. (Electrical Equipment) |
4.7 |
3.0 |
|
Takeda Chemical Industries Ltd. (Drugs & Pharmaceuticals) |
4.1 |
2.6 |
|
Toyota Motor Corp. |
3.6 |
4.2 |
|
Toyoda Gosei Co. Ltd. |
3.3 |
1.4 |
|
Nissan Motor Co. Ltd. |
2.8 |
0.0 |
|
NGK Spark Plug Co. Ltd. |
2.8 |
0.0 |
|
Stanley Electric Co. Ltd. |
2.6 |
0.0 |
|
NEC Corp. |
2.6 |
0.7 |
|
|
37.1 |
18.6 |
|
Top Ten Market Sectors as of October 31, 2000 |
||
|
|
% of fund's |
% of fund's net assets |
|
Technology |
23.1 |
23.2 |
|
Durables |
21.2 |
12.3 |
|
Industrial Machinery & Equipment |
13.3 |
9.7 |
|
Finance |
9.5 |
9.1 |
|
Utilities |
7.9 |
12.4 |
|
Construction & Real Estate |
5.9 |
2.0 |
|
Health |
5.3 |
8.3 |
|
Basic Industries |
4.9 |
5.7 |
|
Retail & Wholesale |
4.5 |
2.3 |
|
Media & Leisure |
1.7 |
4.3 |
Annual Report
Japan
Showing Percentage of Net Assets
|
Common Stocks - 98.9% |
|||
|
Shares |
Value (Note 1) |
||
|
BASIC INDUSTRIES - 4.9% |
|||
|
Chemicals & Plastics - 4.5% |
|||
|
Asahi Chemical Industry Co. Ltd. (a) |
136,000 |
$ 842,599 |
|
|
Hitachi Chemical Co. Ltd. |
568,500 |
14,276,327 |
|
|
JSR Corp. |
116,000 |
776,098 |
|
|
Nissan Chemical Industries Co. Ltd. |
704,000 |
5,194,025 |
|
|
Shin-Etsu Chemical Co. Ltd. |
156,000 |
6,405,279 |
|
|
Zeon Corp. |
103,000 |
446,513 |
|
|
|
27,940,841 |
||
|
Metals & Mining - 0.4% |
|||
|
Mitsubishi Materials Corp. |
887,000 |
2,609,541 |
|
|
TOTAL BASIC INDUSTRIES |
30,550,382 |
||
|
CONSTRUCTION & REAL ESTATE - 5.9% |
|||
|
Building Materials - 4.2% |
|||
|
Nippon Paint Co. Ltd. |
817,000 |
2,411,090 |
|
|
Nippon Sheet Glass Co. Ltd. |
945,000 |
14,377,234 |
|
|
Sumitomo Osaka Cement Co. Ltd. |
1,324,000 |
5,642,563 |
|
|
Toto Ltd. |
505,000 |
3,832,279 |
|
|
|
26,263,166 |
||
|
Construction - 0.4% |
|||
|
HUNET, Inc. |
329,000 |
2,774,081 |
|
|
Real Estate - 1.3% |
|||
|
Mitsubishi Estate Co. Ltd. (a) |
574,000 |
6,102,466 |
|
|
Mitsui Fudosan Co. Ltd. |
140,000 |
1,696,270 |
|
|
|
7,798,736 |
||
|
TOTAL CONSTRUCTION & REAL ESTATE |
36,835,983 |
||
|
DURABLES - 21.2% |
|||
|
Autos, Tires, & Accessories - 14.6% |
|||
|
Denso Corp. |
472,000 |
10,771,515 |
|
|
Fuji Heavy Industries Ltd. |
210,000 |
1,462,744 |
|
|
Honda Motor Co. Ltd. (a) |
19,000 |
657,281 |
|
|
NGK Spark Plug Co. Ltd. |
1,135,000 |
17,465,540 |
|
|
Nissan Motor Co. Ltd. (a) |
2,524,000 |
17,668,000 |
|
|
Toyoda Gosei Co. Ltd. |
339,000 |
20,754,468 |
|
|
Toyota Motor Corp. |
559,800 |
22,369,426 |
|
|
|
91,148,974 |
||
|
Consumer Durables - 0.6% |
|||
|
Asahi Techno Glass Corp. |
495,000 |
3,946,934 |
|
|
Consumer Electronics - 6.0% |
|||
|
Funai Electric Co. Ltd. |
10,200 |
770,305 |
|
|
Pioneer Corp. |
263,000 |
8,147,191 |
|
|
Sanyo Electric Co. Ltd. |
1,836,000 |
13,966,456 |
|
|
Sony Corp. |
172,600 |
14,325,800 |
|
|
|
37,209,752 |
||
|
TOTAL DURABLES |
132,305,660 |
||
|
|
|||
|
Shares |
Value (Note 1) |
||
|
FINANCE - 9.5% |
|||
|
Banks - 5.8% |
|||
|
Bank of Tokyo-Mitsubishi Ltd. |
208,000 |
$ 2,495,390 |
|
|
Mitsubishi Trust & Banking Corp. |
140,000 |
1,135,551 |
|
|
Mizuho Holdings, Inc. |
1,856 |
14,271,689 |
|
|
Sakura Bank Ltd. |
1,313,000 |
9,566,814 |
|
|
Sanwa Bank Ltd. |
137,000 |
1,217,945 |
|
|
Sumitomo Bank Ltd. |
262,000 |
3,181,652 |
|
|
The Suruga Bank Ltd. |
314,000 |
4,310,989 |
|
|
|
36,180,030 |
||
|
Credit & Other Finance - 0.4% |
|||
|
ORIX Corp. |
21,000 |
2,203,739 |
|
|
Securities Industry - 3.3% |
|||
|
Daiwa Securities Group, Inc. |
907,000 |
10,050,069 |
|
|
Nomura Securities Co. Ltd. |
506,000 |
10,735,863 |
|
|
|
20,785,932 |
||
|
TOTAL FINANCE |
59,169,701 |
||
|
HEALTH - 5.3% |
|||
|
Drugs & Pharmaceuticals - 4.8% |
|||
|
Takeda Chemical Industries Ltd. |
384,000 |
25,304,372 |
|
|
Yamanouchi Pharmaceutical Co. Ltd. |
103,000 |
4,663,367 |
|
|
|
29,967,739 |
||
|
Medical Equipment & Supplies - 0.5% |
|||
|
Hoya Corp. |
34,800 |
2,876,877 |
|
|
TOTAL HEALTH |
32,844,616 |
||
|
INDUSTRIAL MACHINERY & EQUIPMENT - 13.3% |
|||
|
Electrical Equipment - 12.1% |
|||
|
Furukawa Electric Co. Ltd. |
1,102,000 |
28,986,711 |
|
|
Hitachi Cable Ltd. |
841,000 |
9,912,254 |
|
|
Murata Manufacturing Co. Ltd. |
15,900 |
1,903,162 |
|
|
Omron Corp. |
508,000 |
12,524,242 |
|
|
Stanley Electric Co. Ltd. |
1,573,000 |
16,290,808 |
|
|
Sumitomo Electric Industries Ltd. |
143,000 |
2,640,867 |
|
|
Yokogawa Electric Corp. |
399,000 |
3,130,272 |
|
|
|
75,388,316 |
||
|
Industrial Machinery & Equipment - 1.2% |
|||
|
SMC Corp. |
10,500 |
1,485,840 |
|
|
THK Co. Ltd. |
186,300 |
4,610,118 |
|
|
Union Tool Co. (a) |
22,800 |
1,567,226 |
|
|
|
7,663,184 |
||
|
TOTAL INDUSTRIAL MACHINERY & EQUIPMENT |
83,051,500 |
||
|
MEDIA & LEISURE - 1.7% |
|||
|
Leisure Durables & Toys - 1.7% |
|||
|
Bandai Co. Ltd. |
175,200 |
5,780,589 |
|
|
Nintendo Co. Ltd. |
28,200 |
4,665,109 |
|
|
|
10,445,698 |
||
|
Common Stocks - continued |
|||
|
Shares |
Value (Note 1) |
||
|
NONDURABLES - 1.6% |
|||
|
Beverages - 0.5% |
|||
|
Ito En Ltd. |
43,300 |
$ 3,115,251 |
|
|
Foods - 1.1% |
|||
|
Ajinomoto Co., Inc. |
61,000 |
682,064 |
|
|
Meiji Seika Kaisha Ltd. (a) |
1,101,000 |
6,407,616 |
|
|
|
7,089,680 |
||
|
TOTAL NONDURABLES |
10,204,931 |
||
|
RETAIL & WHOLESALE - 4.5% |
|||
|
Apparel Stores - 1.7% |
|||
|
Fast Retailing Co. Ltd. |
38,200 |
9,400,330 |
|
|
Shimamura Co. Ltd. |
7,200 |
546,384 |
|
|
World Co. Ltd. |
19,100 |
710,714 |
|
|
|
10,657,428 |
||
|
General Merchandise Stores - 0.7% |
|||
|
Ryohin Keikaku Co. Ltd. |
13,400 |
680,378 |
|
|
Seven Eleven Japan Co. Ltd. |
53,000 |
3,448,813 |
|
|
|
4,129,191 |
||
|
Retail & Wholesale, Miscellaneous - 2.1% |
|||
|
Macnica, Inc. |
10,000 |
1,131,885 |
|
|
Yamada Denki Co. Ltd. |
137,700 |
12,115,480 |
|
|
|
13,247,365 |
||
|
TOTAL RETAIL & WHOLESALE |
28,033,984 |
||
|
TECHNOLOGY - 23.1% |
|||
|
Communications Equipment - 2.6% |
|||
|
NEC Corp. |
838,000 |
15,975,071 |
|
|
Computer Services & Software - 6.3% |
|||
|
Capcom Co. Ltd. |
122,500 |
4,737,879 |
|
|
Fujitsu Ltd. |
17,000 |
302,887 |
|
|
Konami Co. Ltd. |
399,400 |
33,676,844 |
|
|
Net One Systems Co. Ltd. |
23 |
682,980 |
|
|
|
39,400,590 |
||
|
Computers & Office Equipment - 4.3% |
|||
|
Canon, Inc. |
120,000 |
4,867,500 |
|
|
Oki Electric Industry Co. Ltd. (a) |
2,148,000 |
12,776,574 |
|
|
Ricoh Co. Ltd. |
578,000 |
8,899,643 |
|
|
Softbank Corp. |
8,500 |
510,265 |
|
|
|
27,053,982 |
||
|
Electronic Instruments - 3.2% |
|||
|
Anritsu Corp. |
576,000 |
12,669,783 |
|
|
Tokyo Seimitsu Co. Ltd. |
99,600 |
7,028,870 |
|
|
|
19,698,653 |
||
|
Electronics - 6.3% |
|||
|
Hirose Electric Co. Ltd. |
5,200 |
600,495 |
|
|
Kyocera Corp. |
89,700 |
11,997,375 |
|
|
Mitsubishi Electric Corp. |
1,783,000 |
12,811,585 |
|
|
Mitsumi Electric Co. Ltd. |
175,000 |
5,773,990 |
|
|
|
|||
|
Shares |
Value (Note 1) |
||
|
Nichicon Corp. |
31,000 |
$ 553,744 |
|
|
Nidec Copal Corp. |
89,000 |
1,336,101 |
|
|
Nidec Corp. |
9,800 |
600,880 |
|
|
Nitto Denko Corp. |
17,200 |
581,688 |
|
|
Rohm Co. Ltd. |
5,200 |
1,311,081 |
|
|
Seikoh Giken Co. Ltd. |
12,300 |
3,934,287 |
|
|
|
39,501,226 |
||
|
Photographic Equipment - 0.4% |
|||
|
Konica Corp. (a) |
315,000 |
2,433,737 |
|
|
TOTAL TECHNOLOGY |
144,063,259 |
||
|
UTILITIES - 7.9% |
|||
|
Cellular - 7.0% |
|||
|
NTT DoCoMo, Inc. |
1,310 |
32,296,766 |
|
|
NTT DoCoMo, Inc. (c) |
472 |
11,636,697 |
|
|
|
43,933,463 |
||
|
Telephone Services - 0.9% |
|||
|
DDI Corp. |
238 |
1,116,818 |
|
|
Japan Telecom Co. Ltd. |
34 |
685,547 |
|
|
Nippon Telegraph & Telephone Corp. |
401 |
3,649,464 |
|
|
|
5,451,829 |
||
|
TOTAL UTILITIES |
49,385,292 |
||
|
TOTAL COMMON STOCKS (Cost $511,283,319) |
616,891,006 |
||
|
Cash Equivalents - 9.8% |
|||
|
|
|
|
|
|
Fidelity Cash Central Fund, 6.61% (b) |
6,236,080 |
6,236,080 |
|
|
Fidelity Securities Lending Cash |
55,030,581 |
55,030,581 |
|
|
TOTAL CASH EQUIVALENTS (Cost $61,266,661) |
61,266,661 |
||
|
TOTAL INVESTMENT PORTFOLIO - 108.7% (Cost $572,549,980) |
678,157,667 |
||
|
NET OTHER ASSETS - (8.7)% |
(54,207,606) |
||
|
NET ASSETS - 100% |
$ 623,950,061 |
||
|
Legend |
|
(a) Non-income producing |
|
(b) The rate quoted is the annualized seven-day yield of the fund at period end. A complete listing of the fund's holdings as of its most recent fiscal year end is available upon request. |
|
(c) Security exempt from registration under Rule 144A of the Securities Act of 1933. These securities may be resold in transactions exempt from registration, normally to qualified institutional buyers. At the period end, the value of these securities amounted to $11,636,697 or 1.9% of net assets. |
|
Other Information |
|
Purchases and sales of securities, other than short-term securities, aggregated $1,092,566,588 and $1,327,942,721. |
|
The fund placed a portion of its portfolio transactions with brokerage firms which are affiliates of Fidelity Management & Research Company. The commissions paid to these affiliated firms were $44,303 for the period. |
|
The fund participated in the security lending program. At period end, the value of securities loaned amounted to $50,967,289. The fund received cash collateral of $55,030,581 which was invested in cash equivalents and U.S. Treasury Obligations valued at $279,109. Cash collateral includes $1,007,000 received for unsettled security loans. |
|
The fund participated in the interfund lending program as a borrower. The average daily loan balance during the period for which loans were outstanding amounted to $10,334,867. The weighted average interest rate was 6.34%. Interest expense includes $27,300 paid under the interfund lending program. |
|
The fund participated in the bank borrowing program. The average daily loan balance during the period for which loans were outstanding amounted to $4,399,600. The weighted average interest rate was 6.04%. Interest expense includes $3,694 paid under the bank borrowing program. |
|
Income Tax Information |
|
At October 31, 2000, the aggregate cost of investment securities for income tax purposes was $574,254,317. Net unrealized appreciation aggregated $103,903,350, of which $147,772,575 related to appreciated investment securities and $43,869,225 related to depreciated investment securities. |
|
The fund hereby designates approximately $39,124,000 as a capital gain dividend for the purpose of the dividend paid deduction. |
See accompanying notes which are an integral part of the financial statements.
Annual Report
Japan
Statement of Assets and Liabilities
|
|
October 31, 2000 |
|
|
Assets |
|
|
|
Investment in securities, at value |
|
$ 678,157,667 |
|
Receivable for investments sold |
|
12,177,945 |
|
Receivable for fund shares sold |
|
575,822 |
|
Dividends receivable |
|
1,075,687 |
|
Interest receivable |
|
63,403 |
|
Redemption fees receivable |
|
805 |
|
Other receivables |
|
82,971 |
|
Total assets |
|
692,134,300 |
|
Liabilities |
|
|
|
Payable for investments purchased |
$ 11,020,168 |
|
|
Payable for fund shares redeemed |
1,381,319 |
|
|
Accrued management fee |
503,444 |
|
|
Other payables and |
248,727 |
|
|
Collateral on securities loaned, |
55,030,581 |
|
|
Total liabilities |
|
68,184,239 |
|
Net Assets |
|
$ 623,950,061 |
|
Net Assets consist of: |
|
|
|
Paid in capital |
|
$ 368,160,488 |
|
Undistributed net investment income |
|
23,182,613 |
|
Accumulated undistributed net realized gain (loss) on investments and foreign currency transactions |
|
127,017,106 |
|
Net unrealized appreciation (depreciation) on investments |
|
105,589,854 |
|
Net Assets, for 30,541,165 |
|
$ 623,950,061 |
|
Net Asset Value and redemption price per share ($623,950,061 ÷ 30,541,165 shares) |
|
$20.43 |
|
Maximum offering price per share (100/97.00 of $20.43) |
|
$21.06 |
Statement of Operations
|
|
Year ended October 31, 2000 |
|
|
Investment Income Dividends |
|
$ 3,466,895 |
|
Interest |
|
1,671,069 |
|
Security lending |
|
641,254 |
|
|
|
5,779,218 |
|
Less foreign taxes withheld |
|
(519,718) |
|
Total income |
|
5,259,500 |
|
Expenses |
|
|
|
Management fee |
$ 6,623,169 |
|
|
Performance adjustment |
911,895 |
|
|
Transfer agent fees |
2,031,437 |
|
|
Accounting and security lending fees |
486,305 |
|
|
Non-interested trustees' compensation |
3,230 |
|
|
Custodian fees and expenses |
336,588 |
|
|
Registration fees |
164,984 |
|
|
Audit |
45,965 |
|
|
Legal |
15,402 |
|
|
Interest |
30,994 |
|
|
Miscellaneous |
1,552 |
|
|
Total expenses before reductions |
10,651,521 |
|
|
Expense reductions |
(123,054) |
10,528,467 |
|
Net investment income (loss) |
|
(5,268,967) |
|
Realized and Unrealized Gain (Loss) Net realized gain (loss) on: |
|
|
|
Investment securities |
207,957,567 |
|
|
Foreign currency transactions |
(199,763) |
207,757,804 |
|
Change in net unrealized appreciation (depreciation) on: |
|
|
|
Investment securities |
(206,823,287) |
|
|
Assets and liabilities in |
9,787 |
(206,813,500) |
|
Net gain (loss) |
|
944,304 |
|
Net increase (decrease) in net assets resulting from operations |
|
$ (4,324,663) |
|
Other Information |
|
$ 1,748,864 |
|
Sales charges - Retained by FDC |
|
$ 1,748,363 |
|
Expense reductions |
|
|
|
Directed brokerage arrangements |
|
$ 107,698 |
|
Custodian credits |
|
106 |
|
Transfer agent credits |
|
15,250 |
|
|
|
$ 123,054 |
See accompanying notes which are an integral part of the financial statements.
Annual Report
Japan
Financial Statements - continued
Statement of Changes in Net Assets
|
Increase (Decrease) in Net Assets |
Year ended
October 31, |
Year ended
October 31, |
|
Operations |
$ (5,268,967) |
$ (2,120,158) |
|
Net realized gain (loss) |
207,757,804 |
63,006,754 |
|
Change in net unrealized appreciation (depreciation) |
(206,813,500) |
308,966,890 |
|
Net increase (decrease) in net assets resulting from operations |
(4,324,663) |
369,853,486 |
|
Distributions to shareholders |
(13,253,040) |
- |
|
In excess of net investment income |
(7,139,053) |
(833,682) |
|
Total distributions |
(20,392,093) |
(833,682) |
|
Share transactions |
541,936,015 |
547,523,917 |
|
Reinvestment of distributions |
19,730,662 |
804,286 |
|
Cost of shares redeemed |
(806,715,842) |
(292,716,488) |
|
Net increase (decrease) in net assets resulting from share transactions |
(245,049,165) |
255,611,715 |
|
Redemption fees |
2,474,935 |
1,215,013 |
|
Total increase (decrease) in net assets |
(267,290,986) |
625,846,532 |
|
Net Assets |
|
|
|
Beginning of period |
891,241,047 |
265,394,515 |
|
End of period (including undistributed net investment income of $23,182,613 and $13,253,040, respectively) |
$ 623,950,061 |
$ 891,241,047 |
|
Other Information Shares |
|
|
|
Sold |
22,194,873 |
34,652,174 |
|
Issued in reinvestment of distributions |
825,192 |
73,856 |
|
Redeemed |
(33,425,489) |
(20,092,286) |
|
Net increase (decrease) |
(10,405,424) |
14,633,744 |
Financial Highlights
|
Years ended October 31, |
2000 |
1999 |
1998 |
1997 |
1996 |
|
Selected Per-Share Data |
|
|
|
|
|
|
Net asset value, beginning of period |
$ 21.77 |
$ 10.09 |
$ 11.10 |
$ 11.68 |
$ 12.08 |
|
Income from Investment Operations |
|
|
|
|
|
|
Net investment income (loss) C |
(.14) |
(.07) |
(.04) |
(.06) |
(.02) |
|
Net realized and unrealized gain (loss) |
(.81) E |
11.74 |
(.81) |
(.55) |
(.40) |
|
Total from investment operations |
(.95) |
11.67 |
(.85) |
(.61) |
(.42) |
|
Less Distributions |
|
|
|
|
|
|
From net investment income |
(.30) |
- |
- |
- |
- |
|
In excess of net investment income |
(.16) |
(.03) |
(.18) |
(.01) |
- |
|
Total distributions |
(.46) |
(.03) |
(.18) |
(.01) |
- |
|
Redemption fees added to paid in capital |
.07 |
.04 |
.02 |
.04 |
.02 |
|
Net asset value, end of period |
$ 20.43 |
$ 21.77 |
$ 10.09 |
$ 11.10 |
$ 11.68 |
|
Total Return A, B |
(4.35)% |
116.35% |
(7.52)% |
(4.89)% |
(3.31)% |
|
Ratios and Supplemental Data |
|
|
|
|
|
|
Net assets, end of period (000 omitted) |
$ 623,950 |
$ 891,241 |
$ 265,395 |
$ 255,555 |
$ 290,495 |
|
Ratio of expenses to average net assets |
1.17% |
1.24% |
1.49% |
1.42% |
1.15% |
|
Ratio of expenses to average net assets after expense reductions |
1.16% D |
1.23% D |
1.48% D |
1.40% D |
1.14% D |
|
Ratio of net investment income (loss) to average net assets |
(.58)% |
(.47)% |
(.37)% |
(.54)% |
(.12)% |
|
Portfolio turnover rate |
124% |
79% |
62% |
70% |
83% |
|
A The total returns would have been lower had certain expenses not been reduced during the periods shown. B Total returns do not include the one time sales charge. C Net investment income (loss) per share has been calculated based on average shares outstanding during the period. D FMR or the fund has entered into varying arrangements with third parties who either paid or reduced a portion of the fund's expenses. E The amount shown for a share outstanding does not correspond with the aggregate net gain on investments for the period due to the timing of sales and repurchases of fund shares in relation to fluctuating
market |
|||||
See accompanying notes which are an integral part of the financial statements.
Annual Report
There are several ways to evaluate a fund's historical performance. You can look at the total percentage change in value, the average annual percentage change or the growth of a hypothetical $10,000 investment. Total return reflects the change in the value of an investment, assuming reinvestment of the fund's dividend income and capital gains (the profits earned upon the sale of securities that have grown in value).
Cumulative Total Returns
|
Periods ended |
|
Past 1 |
Life of |
|
Fidelity Japan Smaller Companies |
|
-30.24% |
44.38% |
|
Fidelity Japan Smaller Companies |
|
-32.33% |
40.05% |
|
TOPIX Second Section |
|
-24.39% |
2.74% |
|
Japanese Funds Average |
|
-16.10% |
n/a* |
Cumulative total returns show the fund's performance in percentage terms over a set period - in this case, one year or since the fund started on November 1, 1995. For example, if you had invested $1,000 in a fund that had a 5% return over the past year, the value of your investment would be $1,050. You can compare the fund's returns to the performance of the Tokyo Stock Exchange Second Section Stock Price Index (TOPIX Second Section) - a market capitalization-weighted index that reflects the performance of the smaller, less established and newly listed companies of the Tokyo Stock Exchange. To measure how the fund's performance stacked up against its peers, you can compare the fund's performance to the Japanese funds average, which reflects the performance of mutual funds with similar objectives tracked by Lipper Inc. The past one year average represents a peer group of 48 mutual funds. These benchmarks include reinvested dividends and capital gains, if any, and exclude the effect of sales charges.
Average Annual Total Returns
|
Periods ended |
|
Past 1 |
Life of |
|
Fidelity Japan Smaller Companies |
|
-30.24% |
7.62% |
|
Fidelity Japan Smaller Companies (incl. 3.00% sales charge) |
|
-32.33% |
6.96% |
|
TOPIX Second Section |
|
-24.39% |
0.54% |
|
Japanese Funds Average |
|
-16.10% |
n/a* |
Average annual total returns take the fund's cumulative return and show you what would have happened if the fund had performed at a constant rate each year.
* Not available
$10,000 Over Life of Fund
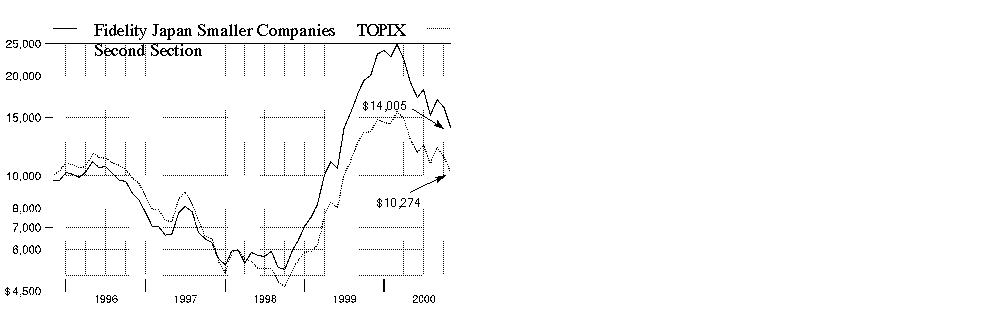
$10,000 Over Life of Fund: Let's say hypothetically that $10,000 was invested in Fidelity Japan Smaller Companies Fund on November 1, 1995, when the fund started, and the current 3.00% sales charge was paid. As the chart shows, by October 31, 2000, the value of the investment would have grown to $14,005 - a 40.05% increase on the initial investment. For comparison, look at how the Tokyo Stock Exchange Second Section Stock Price Index did over the same period. With dividends and capital gains, if any, reinvested, the same $10,000 would have grown to $10,274 - a 2.74% increase.
Understanding Performance
Many markets around the globe offer the potential for significant growth over time; however, investing in foreign markets means assuming greater risks than investing in the United States. Factors like changes in a country's financial markets, its local political and economic climate, and the fluctuating value of its currency create these risks. For these reasons an international fund's performance may be more volatile than a fund that invests exclusively in the United States. Past performance is no guarantee of future results and you may have a gain or loss when you sell your shares.
3Annual Report
(Portfolio Manager photograph)
An interview with
Kenichi Mizushita, Portfolio Manager of Fidelity Japan Smaller Companies Fund
Q. How did the fund perform, Kenichi?
A. For the 12 months that ended October 31, 2000, the fund returned -30.24%. By comparison, the Tokyo Stock Exchange Second Section Stock Price Index (TOPIX Second Section) returned -24.39%, and the Japanese funds average as monitored by Lipper Inc. returned -16.10% for the same time period.
Q. Why did the fund underperform the TOPIX index and its peer group?
A. Following the NASDAQ correction in the U.S. in March, Japanese small-cap stocks took a severe tumble. Japanese Internet stocks - with high valuations like their counterparts in the U.S. - were hit particularly hard. Throughout the latter part of the period, the Japanese stock market was more susceptible to the fluctuations of the U.S. stock market, particularly by the price volatility of high-tech stocks. The fund, which had increased its focus in the technology sector, was hurt more than the index or its counterparts. The fund also was underweighted in telecommunications stocks, which generally performed well during the early stages of the 12-month period, further hurting the fund's relative performance.
Q. What was your strategy in this difficult environment?
A. I continued to focus on finding companies with good medium- to long-term growth potential. Early in the year, I took profits from high-valuation technology stocks, buying more reasonably priced issues in the sector. I also shifted away from cyclical semiconductor companies into cellular handset-related companies, because I believed they had good long-term growth potential. I added optical-related companies within the cable and wire sector, expecting greater investment to be made in the overall information technology infrastructure. I also increased the fund's exposure to manufacturing companies. Although these strategies all helped the fund's performance, they could not offset the negative effect of the drop in technology stock prices.
Q. Which stocks performed well?
A. Oracle Japan performed well, benefiting from the growth in demand for its Internet database products. The company also was helped by its move to the Tokyo Stock Exchange First Section from the OTC exchange. Since Oracle accounts for nearly two percent of the Exchange, index-type funds must hold it in their portfolios, and this boosted demand for the stock. I sold the stock to lock in profits. Toyoda Gosei saw tremendous growth from its blue LED production. The LED market expanded rapidly due to an increase in the demand for lights for cellular phone handsets and for high-brightness blue LEDs. Yamada Denki, the fastest-growing retailer of home appliances, also did well. The company steadily expanded its number of stores and increased market share, while continuing to maintain the highest efficiency rates in the industry.
Q. Which stocks detracted from the fund's performance?
A. Q'Sai, Japan's top maker and distributor of a popular vegetable juice, expanded rapidly by increasing its sales force but, facing a shortage of key ingredients, used other vegetables in its juice. Consumer and investor confidence in the product declined, leading to a significant drop in the company's share price. Hikari Tsushin, a wholesaler of cellular handsets, profited from commissions by mobile telephone carriers. However, the company's rapid expansion led to problems with its distribution channels and, after missing its earnings targets, Hikari's share price declined significantly. I sold Q'Sai and Hikari Tsushin. Cosmetics company Fancl grew successfully through its mail order business. Following its initial public offering, the company expanded into such distribution channels as convenience stores and its own retail shops. However, an increase in competition and problems with new product launches led to a slowdown in the company's underlying profit growth, which hurt its stock price.
Q. What's your outlook?
A. The Japanese stock market's current valuation level is near the lows of 1998 - rather close to the level where the market previously began to show a significant recovery. If we factor in the current levels of potential profit growth, the Japanese market is very attractively valued now. I believe that corporate profits will continue to improve and lead to a gradual recovery in the Japanese economy. In the future, I see some very good opportunities to buy low-valuation companies for the fund. I will continue to pursue my strategy of finding and selecting successful companies, one at a time, regardless of industry or sector trends.
The views expressed in this report reflect those of the portfolio manager only through the end of the period of the report as stated on the cover. The manager's views are subject to change at any time based on market or other conditions. For more information, see page A-3 .
Fund Facts
Goal: long-term growth of capital by investing mainly in equity securities of Japanese issuers with smaller market capitalizations
Fund number: 360
Trading symbol: FJSCX
Start date: November 1, 1995
Size: as of October 31, 2000, more than $559 million
Manager: Kenichi Mizushita, since 1996; manager, several Fidelity Investments Japan, Limited and institutional funds; joined Fidelity in 1985
3
Annual Report
Japan Smaller Companies
|
Geographic Diversification (% of fund's net assets) |
|||
|
As of October 31, 2000 |
|||
|
Japan |
98.6% |
|
|
United States of America |
1.4% |
|

|
|
|||
|
As of April 30, 2000 |
|||
|
Japan |
98.2% |
|
|
United States of America |
1.8% |
|

|
Percentages are adjusted for the effect of futures contracts, if applicable. |
|
Asset Allocation |
||
|
|
% of fund's |
% of fund's net assets |
|
Stocks |
98.6 |
98.2 |
|
Short-Term Investments |
1.4 |
1.8 |
|
Top Ten Stocks as of October 31, 2000 |
||
|
|
% of fund's |
% of fund's net assets |
|
Toyoda Gosei Co. Ltd. |
5.0 |
3.4 |
|
Hogy Medical Co. |
5.0 |
3.4 |
|
Yamada Denki Co. Ltd. (Retail & Wholesale, Miscellaneous) |
4.4 |
2.7 |
|
Cosel Co. Ltd. |
4.2 |
3.1 |
|
Sumida Corp. (Electronics) |
3.0 |
2.0 |
|
Misumi Corp. (Industrial Machinery & Equipment) |
2.9 |
2.9 |
|
Fujimi, Inc. (Building Materials) |
2.7 |
2.1 |
|
Japan Medical Dynamic Marketing, Inc. (Medical Equipment & Supplies) |
2.6 |
1.1 |
|
Tokyo Denpa Co. Ltd. (Electronics) |
2.4 |
2.7 |
|
Nitto Kohki Co. Ltd. (Industrial Machinery & Equipment) |
2.4 |
1.2 |
|
|
34.6 |
24.6 |
|
Top Ten Market Sectors as of October 31, 2000 |
||
|
|
% of fund's |
% of fund's net assets |
|
Technology |
23.2 |
26.2 |
|
Industrial Machinery & Equipment |
22.2 |
15.4 |
|
Durables |
11.0 |
12.2 |
|
Retail & Wholesale |
10.7 |
15.3 |
|
Health |
7.9 |
4.8 |
|
Construction & Real Estate |
5.8 |
4.2 |
|
Media & Leisure |
4.4 |
5.8 |
|
Basic Industries |
4.3 |
0.0 |
|
Nondurables |
4.1 |
7.4 |
|
Finance |
2.4 |
1.1 |
Annual Report
Japan Smaller Companies
Showing Percentage of Net Assets
|
Common Stocks - 98.6% |
|||
|
Shares |
Value (Note 1) |
||
|
AEROSPACE & DEFENSE - 0.0% |
|||
|
Ship Building & Repair - 0.0% |
|||
|
Mitsui Engineering & Shipbuilding Co. (a) |
40,000 |
$ 40,693 |
|
|
BASIC INDUSTRIES - 4.3% |
|||
|
Chemicals & Plastics - 1.8% |
|||
|
Enplas Corp. |
200,000 |
8,450,188 |
|
|
Fujimori Kogyo Co. Ltd. |
2,000 |
12,840 |
|
|
Hagihara Industries, Inc. |
10,000 |
72,404 |
|
|
Nippon Sanso KK |
400,000 |
1,459,078 |
|
|
|
9,994,510 |
||
|
Iron & Steel - 0.2% |
|||
|
Hakudo Co. Ltd. |
78,000 |
1,115,205 |
|
|
Metals & Mining - 1.9% |
|||
|
Fujikura Ltd. |
1,089,000 |
9,601,485 |
|
|
Hitachi Powdered Metal |
150,000 |
1,362,387 |
|
|
|
10,963,872 |
||
|
Paper & Forest Products - 0.4% |
|||
|
Nippon Paper Industries Co. Ltd. |
382,000 |
2,177,656 |
|
|
TOTAL BASIC INDUSTRIES |
24,251,243 |
||
|
CONSTRUCTION & REAL ESTATE - 5.8% |
|||
|
Building Materials - 5.8% |
|||
|
Arc Land Sakamoto Co. Ltd. |
650,000 |
7,744,478 |
|
|
Fujimi, Inc. |
480,000 |
15,177,344 |
|
|
Hitachi Metals Techno Ltd. |
265,000 |
1,279,947 |
|
|
Nippon Electric Glass Co. Ltd. |
353,000 |
8,217,579 |
|
|
|
32,419,348 |
||
|
DURABLES - 11.0% |
|||
|
Autos, Tires, & Accessories - 6.9% |
|||
|
Jac Holdings Co. Ltd. |
65,200 |
1,260,856 |
|
|
NGK Spark Plug Co. Ltd. |
326,000 |
5,016,534 |
|
|
Nissin Kogyo Co. Ltd. |
25,000 |
412,428 |
|
|
Ohashi Technica, Inc. |
210,000 |
3,849,326 |
|
|
Toyoda Gosei Co. Ltd. |
460,000 |
28,162,408 |
|
|
|
38,701,552 |
||
|
Consumer Durables - 0.7% |
|||
|
Sammy Corp. |
176,600 |
3,722,665 |
|
|
Consumer Electronics - 3.2% |
|||
|
Funai Electric Co. Ltd. |
154,000 |
11,630,098 |
|
|
Ono Sangyo Co. Ltd. |
42,000 |
284,850 |
|
|
Sony Corp. |
64,000 |
5,312,000 |
|
|
Tohoku Pioneer Corp. |
20,000 |
714,875 |
|
|
|
17,941,823 |
||
|
Home Furnishings - 0.2% |
|||
|
Takano Co. Ltd. |
100,000 |
1,218,953 |
|
|
TOTAL DURABLES |
61,584,993 |
||
|
|
|||
|
Shares |
Value (Note 1) |
||
|
FINANCE - 2.4% |
|||
|
Banks - 0.9% |
|||
|
Tokyo Tomin Bank Ltd. |
173,000 |
$ 4,835,946 |
|
|
Credit & Other Finance - 0.3% |
|||
|
JAFCO Co. Ltd. |
16,000 |
1,701,036 |
|
|
Venture Link Co. Ltd. |
1,000 |
57,740 |
|
|
|
1,758,776 |
||
|
Securities Industry - 1.2% |
|||
|
F&M Co. Ltd. |
221 |
6,684,080 |
|
|
TOTAL FINANCE |
13,278,802 |
||
|
HEALTH - 7.9% |
|||
|
Drugs & Pharmaceuticals - 0.3% |
|||
|
JCR Pharmaceuticals Co. Ltd. |
294,000 |
1,832,279 |
|
|
Medical Equipment & Supplies - 7.6% |
|||
|
Hogy Medical Co. |
434,000 |
27,843,461 |
|
|
Japan Medical Dynamic Marketing, Inc. |
429,500 |
14,210,384 |
|
|
Nakanishi, Inc. |
8,000 |
137,109 |
|
|
|
42,190,954 |
||
|
TOTAL HEALTH |
44,023,233 |
||
|
INDUSTRIAL MACHINERY & EQUIPMENT - 22.2% |
|||
|
Electrical Equipment - 7.3% |
|||
|
Furukawa Electric Co. Ltd. |
300,000 |
7,891,119 |
|
|
Hakuto Co. Ltd. |
355,000 |
7,841,170 |
|
|
Idec Izumi Corp. |
1,050,500 |
10,157,433 |
|
|
Juki Corp. |
1,750,000 |
6,142,883 |
|
|
NGK Insulators Ltd. |
600,000 |
7,946,110 |
|
|
Nichiden Corp. |
34,000 |
470,534 |
|
|
USC Corp. |
45,000 |
519,659 |
|
|
|
40,968,908 |
||
|
Industrial Machinery & Equipment - 14.9% |
|||
|
Chiyoda Integre Co. Ltd. |
70,000 |
898,176 |
|
|
CKD Corp. |
870,000 |
6,362,937 |
|
|
Iuchi Seieido Co. Ltd. |
131,000 |
1,884,979 |
|
|
Kitagawa Seiki Co. Ltd. |
140,000 |
622,308 |
|
|
Mars Engineering Corp. |
40,000 |
1,363,761 |
|
|
Misumi Corp. |
192,000 |
16,312,346 |
|
|
Naito & Co. Ltd. |
30,800 |
254,902 |
|
|
Nissei Plastic Industrial Co. Ltd. |
104,000 |
905,508 |
|
|
Nitto Kohki Co. Ltd. |
521,000 |
13,369,994 |
|
|
Star Micronics Co. Ltd. |
716,000 |
9,416,736 |
|
|
THK Co. Ltd. |
402,000 |
9,947,759 |
|
|
Toba, Inc. |
59,000 |
465,576 |
|
|
Tsubaki Nakashima Co. Ltd. |
868,000 |
10,874,860 |
|
|
Union Tool Co. (a) |
156,000 |
10,723,124 |
|
|
|
83,402,966 |
||
|
TOTAL INDUSTRIAL MACHINERY & EQUIPMENT |
124,371,874 |
||
|
Common Stocks - continued |
|||
|
Shares |
Value (Note 1) |
||
|
MEDIA & LEISURE - 4.4% |
|||
|
Publishing - 1.9% |
|||
|
Asia Securities Printing Co. Ltd. |
694,000 |
$ 7,626,304 |
|
|
Takara Printing Co. Ltd. |
359,000 |
3,109,293 |
|
|
|
10,735,597 |
||
|
Restaurants - 2.5% |
|||
|
Anrakutei Co. Ltd. |
42,000 |
288,700 |
|
|
Kappa Create Co. Ltd. |
375,000 |
12,200,990 |
|
|
Zensho Co. Ltd. |
187,500 |
1,606,750 |
|
|
|
14,096,440 |
||
|
TOTAL MEDIA & LEISURE |
24,832,037 |
||
|
NONDURABLES - 4.1% |
|||
|
Foods - 3.0% |
|||
|
Ariake Japan Co. Ltd. |
168,400 |
10,726,606 |
|
|
Bourbon Corp. |
108,000 |
691,889 |
|
|
Rock Field Co. Ltd. |
114,500 |
5,152,553 |
|
|
|
16,571,048 |
||
|
Household Products - 1.1% |
|||
|
Fancl Corp. |
96,000 |
6,070,938 |
|
|
TOTAL NONDURABLES |
22,641,986 |
||
|
RETAIL & WHOLESALE - 10.7% |
|||
|
Apparel Stores - 0.7% |
|||
|
International Trading Corp. |
38,000 |
1,149,299 |
|
|
Kyoto Kimono Yuzen Co. Ltd. |
418 |
2,451,838 |
|
|
|
3,601,137 |
||
|
Drug Stores - 0.0% |
|||
|
Terashima Co. Ltd. |
10,000 |
116,396 |
|
|
General Merchandise Stores - 1.3% |
|||
|
Mitta Co. Ltd. |
300,000 |
6,461,369 |
|
|
Thanks Japan Corp. |
46,000 |
526,991 |
|
|
|
6,988,360 |
||
|
Grocery Stores - 0.9% |
|||
|
C Two-Network Co. Ltd. |
55,000 |
3,402,530 |
|
|
C Two-Network Co. Ltd. New |
27,500 |
1,701,265 |
|
|
Ozeki Co. Ltd. |
4,000 |
150,307 |
|
|
|
5,254,102 |
||
|
Retail & Wholesale, Miscellaneous - 7.8% |
|||
|
Don Quijote Co. Ltd. |
81,500 |
6,386,445 |
|
|
Macnica, Inc. |
23,000 |
2,603,336 |
|
|
Shaddy Co. Ltd. |
641,900 |
9,942,361 |
|
|
Yamada Denki Co. Ltd. |
283,000 |
24,899,643 |
|
|
|
43,831,785 |
||
|
TOTAL RETAIL & WHOLESALE |
59,791,780 |
||
|
SERVICES - 2.0% |
|||
|
BellSystem24, Inc. |
2,750 |
987,994 |
|
|
|
|||
|
Shares |
Value (Note 1) |
||
|
H.I.S. Co. Ltd. |
14,100 |
$ 200,302 |
|
|
Kansai Maintenance Corp. |
159,000 |
798,570 |
|
|
NIC Corp. |
87,000 |
1,546,879 |
|
|
Nippon System Development Co. Ltd. |
68,000 |
7,372,743 |
|
|
OZU Corp. |
10,000 |
98,983 |
|
|
TOTAL SERVICES |
11,005,471 |
||
|
TECHNOLOGY - 23.2% |
|||
|
Computer Services & Software - 1.0% |
|||
|
Hitachi Information Systems Co. Ltd. |
10,000 |
392,265 |
|
|
Mkc-Stat Corp. |
10,000 |
164,971 |
|
|
NextCom K.K. (a) |
3 |
225,461 |
|
|
Sakura KCS Corp. |
37,000 |
267,556 |
|
|
Trend Micro, Inc. (a) |
16,000 |
1,510,402 |
|
|
USS Co. Ltd. |
72,000 |
2,144,625 |
|
|
XNET Corp. |
25 |
623,224 |
|
|
|
5,328,504 |
||
|
Computers & Office Equipment - 3.1% |
|||
|
Fujitsu Support & Service, Inc. (FSAS) |
40,000 |
4,861,149 |
|
|
Melco Inc. |
100,000 |
2,795,344 |
|
|
Oki Electric Industry Co. Ltd. (a) |
878,000 |
5,222,455 |
|
|
Pulstec Industrial Co. Ltd. |
25,000 |
448,401 |
|
|
Sotec Co. Ltd. (a) |
300 |
4,179,269 |
|
|
|
17,506,618 |
||
|
Electronic Instruments - 7.4% |
|||
|
Anritsu Corp. |
100,000 |
2,199,615 |
|
|
Cosel Co. Ltd. |
725,000 |
23,389,241 |
|
|
Nagano Keiki Co. Ltd. |
220,000 |
4,335,075 |
|
|
Tamron Co. Ltd. |
100,000 |
925,671 |
|
|
Tokyo Seimitsu Co. Ltd. |
146,000 |
10,303,364 |
|
|
Unipulse Corp. |
23,000 |
548,071 |
|
|
|
41,701,037 |
||
|
Electronics - 11.3% |
|||
|
Citizen Electronics Co. Ltd. |
96,300 |
7,016,635 |
|
|
Daito Electron Co. Ltd. |
71,000 |
1,952,158 |
|
|
Koa Corp. |
105,000 |
2,357,712 |
|
|
Kyocera Corp. |
34,000 |
4,547,500 |
|
|
Nidec Corp. |
109,000 |
6,683,256 |
|
|
Nippon Ceramic Co. Ltd. |
100,000 |
1,650,628 |
|
|
Nippon Foundry, Inc. (a) |
225 |
2,002,337 |
|
|
Noda Screen Co. Ltd. |
50 |
1,787,187 |
|
|
Sanshin Electronic Co. Ltd. |
10,000 |
59,665 |
|
|
Seikoh Giken Co. Ltd. |
6,000 |
1,919,164 |
|
|
Sumida Corp. |
369,000 |
16,943,360 |
|
|
Techno Quartz, Inc. |
70,000 |
949,501 |
|
|
TESEC Corp. |
60,000 |
1,622,216 |
|
|
Tokyo Denpa Co. Ltd. |
363,500 |
13,692,467 |
|
|
Vitec Co. Ltd. (a) |
10,000 |
146,641 |
|
|
|
63,330,427 |
||
|
Common Stocks - continued |
|||
|
Shares |
Value (Note 1) |
||
|
TECHNOLOGY - continued |
|||
|
Photographic Equipment - 0.4% |
|||
|
Daito Chemix Corp. |
379,000 |
$ 1,997,296 |
|
|
TOTAL TECHNOLOGY |
129,863,882 |
||
|
TRANSPORTATION - 0.6% |
|||
|
Air Transportation - 0.6% |
|||
|
Skymark Airlines Co. Ltd. (a) |
2,286 |
3,561,727 |
|
|
TOTAL COMMON STOCKS (Cost $444,317,530) |
551,667,069 |
||
|
Cash Equivalents - 11.5% |
|||
|
|
|
|
|
|
Fidelity Cash Central Fund, 6.61% (b) |
9,609,705 |
9,609,705 |
|
|
Fidelity Securities Lending Cash Central Fund, 6.66% (b) |
54,644,865 |
54,644,865 |
|
|
TOTAL CASH EQUIVALENTS (Cost $64,254,570) |
64,254,570 |
||
|
TOTAL INVESTMENT PORTFOLIO - 110.1% (Cost $508,572,100) |
615,921,639 |
||
|
NET OTHER ASSETS - (10.1)% |
(56,344,440) |
||
|
NET ASSETS - 100% |
$ 559,577,199 |
||
|
Legend |
|
(a) Non-income producing |
|
(b) The rate quoted is the annualized seven-day yield of the fund at period end. A complete listing of the fund's holdings as of its most recent fiscal year end is available upon request. |
|
Other Information |
|
Purchases and sales of securities, other than short-term securities, aggregated $480,293,313 and $1,355,606,874, respectively. |
|
The fund placed a portion of its portfolio transactions with brokerage firms which are affiliates of Fidelity Management & Research Company. The commissions paid to these affiliated firms were $64,711 for the period. |
|
The fund participated in the security lending program. At period end, the value of securities loaned amounted to $51,228,695. The fund received cash collateral of $54,644,865 which was invested in cash equivalents. Cash collateral includes $530,250 received for unsettled security loans. |
|
The fund participated in the interfund lending program as a borrower. The average daily loan balance during the period for which loans were outstanding amounted to $18,821,918. The weighted average interest rate was 5.98%. Interest expense includes $153,328 paid under the interfund lending program. |
|
The fund participated in the bank borrowing program. The average daily loan balance during the period for which loans were outstanding amounted to $3,164,286. The weighted average interest rate was 6.81%. Interest expense includes $4,188 paid under the bank borrowing program. |
Transactions during the period with companies which are or were affiliates are as follows:
|
Affiliate |
Purchase |
Sales |
Dividend |
Value |
|
Kappa Create |
$ 164,266 |
$ 737,320 |
$ 46,659 |
$ - |
|
Tokyo Denpa |
2,580,694 |
2,800,988 |
83,615 |
- |
|
TOTALS |
$ 2,744,960 |
$ 3,538,308 |
$ 130,274 |
$ - |
|
Income Tax Information |
|
At October 31, 2000, the aggregate cost of investment securities for income tax purposes was $508,973,118. Net unrealized appreciation aggregated $106,948,521, of which $163,183,978 related to appreciated investment securities and $56,235,457 related to depreciated investment securities. |
|
The fund hereby designates approximately $58,920,000 as a capital gain dividend for the purpose of the dividend paid deduction. |
See accompanying notes which are an integral part of the financial statements.
Annual Report
Japan Smaller Companies
Statement of Assets and Liabilities
|
|
October 31, 2000 |
|
|
Assets |
|
|
|
Investment in securities, at value |
|
$ 615,921,639 |
|
Foreign currency held at value |
|
1,826 |
|
Receivable for investments sold |
|
4,844,427 |
|
Receivable for fund shares sold |
|
1,338,991 |
|
Dividends receivable |
|
1,021,715 |
|
Interest receivable |
|
53,029 |
|
Redemption fees receivable |
|
580 |
|
Other receivables |
|
56,066 |
|
Total assets |
|
623,238,273 |
|
Liabilities |
|
|
|
Payable for investments purchased |
$ 5,552,001 |
|
|
Payable for fund shares redeemed |
2,760,875 |
|
|
Accrued management fee |
385,471 |
|
|
Other payables and |
317,862 |
|
|
Collateral on securities loaned, |
54,644,865 |
|
|
Total liabilities |
|
63,661,074 |
|
Net Assets |
|
$ 559,577,199 |
|
Net Assets consist of: |
|
|
|
Paid in capital |
|
$ 157,870,584 |
|
Distributions in excess of |
|
(655,391) |
|
Accumulated undistributed net realized gain (loss) on investments and foreign currency transactions |
|
295,027,013 |
|
Net unrealized appreciation (depreciation) on investments |
|
107,334,993 |
|
Net Assets, for 39,269,939 |
|
$ 559,577,199 |
|
Net Asset Value and redemption price per share ($559,577,199 ÷ 39,269,939 shares) |
|
$14.25 |
|
Maximum offering price per share (100/97.00 of $14.25) |
|
$14.69 |
Statement of Operations
|
|
Year ended October 31, 2000 |
|
|
Investment Income Dividends (including $130,274 received from affiliated issuers) |
|
$ 4,122,700 |
|
Interest |
|
1,780,731 |
|
Security lending |
|
873,222 |
|
|
|
6,776,653 |
|
Less foreign taxes withheld |
|
(618,463) |
|
Total income |
|
6,158,190 |
|
Expenses |
|
|
|
Management fee |
$ 9,181,763 |
|
|
Transfer agent fees |
2,823,279 |
|
|
Accounting and security lending fees |
675,469 |
|
|
Non-interested trustees' compensation |
4,198 |
|
|
Custodian fees and expenses |
419,701 |
|
|
Registration fees |
171,195 |
|
|
Audit |
61,395 |
|
|
Legal |
29,430 |
|
|
Interest |
157,516 |
|
|
Miscellaneous |
10,036 |
|
|
Total expenses before reductions |
13,533,982 |
|
|
Expense reductions |
(131,797) |
13,402,185 |
|
Net investment income (loss) |
|
(7,243,995) |
|
Realized and Unrealized Gain (Loss) Net realized gain (loss) on: |
|
|
|
Investment securities (including |
342,128,289 |
|
|
Foreign currency transactions |
407,913 |
342,536,202 |
|
Change in net unrealized appreciation (depreciation) on: |
|
|
|
Investment securities |
(590,123,665) |
|
|
Assets and liabilities in |
(39,491) |
(590,163,156) |
|
Net gain (loss) |
|
(247,626,954) |
|
Net increase (decrease) in net assets resulting from operations |
|
$ (254,870,949) |
|
Other Information |
|
$ 3,582,851 |
|
Sales charges - Retained by FDC |
|
$ 3,580,660 |
|
Expense reductions |
|
|
|
Directed brokerage arrangements |
|
$ 112,135 |
|
Transfer agent credits |
|
19,662 |
|
|
|
$ 131,797 |
See accompanying notes which are an integral part of the financial statements.
Annual Report
Japan Smaller Companies
Financial Statements - continued
Statement of Changes in Net Assets
|
Increase (Decrease) in Net Assets |
Year ended
October 31, |
Year ended
October 31, |
|
Operations |
$ (7,243,995) |
$ (1,439,814) |
|
Net realized gain (loss) |
342,536,202 |
28,685,691 |
|
Change in net unrealized appreciation (depreciation) |
(590,163,156) |
699,993,638 |
|
Net increase (decrease) in net assets resulting from operations |
(254,870,949) |
727,239,515 |
|
Distributions to shareholders in excess of net investment income |
(13,572,554) |
- |
|
Share transactions |
877,121,325 |
1,641,046,368 |
|
Reinvestment of distributions |
13,197,729 |
- |
|
Cost of shares redeemed |
(1,847,897,526) |
(694,218,114) |
|
Net increase (decrease) in net assets resulting from share transactions |
(957,578,472) |
946,828,254 |
|
Redemption fees |
5,586,856 |
5,957,410 |
|
Total increase (decrease) in net assets |
(1,220,435,119) |
1,680,025,179 |
|
Net Assets |
|
|
|
Beginning of period |
1,780,012,318 |
99,987,139 |
|
End of period (including distributions in excess of net investment income of $655,391 |
$ 559,577,199 |
$ 1,780,012,318 |
|
Other Information Shares |
|
|
|
Sold |
39,903,223 |
112,923,444 |
|
Issued in reinvestment of distributions |
575,817 |
- |
|
Redeemed |
(87,766,609) |
(43,003,282) |
|
Net increase (decrease) |
(47,287,569) |
69,920,162 |
Financial Highlights
|
Years ended October 31, |
2000 |
1999 |
1998 |
1997 |
1996 D |
|
Selected Per-Share Data |
|
|
|
|
|
|
Net asset value, beginning of period |
$ 20.56 |
$ 6.01 |
$ 6.47 |
$ 9.13 |
$ 10.00 |
|
Income from Investment Operations |
|
|
|
|
|
|
Net investment income (loss) C |
(.12) |
(.03) |
(.01) |
(.03) |
(.03) |
|
Net realized and unrealized gain (loss) |
(6.13) |
14.45 |
(.45) |
(2.63) |
(.87) |
|
Total from investment operations |
(6.25) |
14.42 |
(.46) |
(2.66) |
(.90) |
|
Less Distributions |
|
|
|
|
|
|
In excess of net investment income |
(.15) |
- |
(.01) |
(.01) |
- |
|
From net realized gain |
- |
- |
- |
(.03) |
- |
|
Total distributions |
(.15) |
- |
(.01) |
(.04) |
- |
|
Redemption fees added to paid in capital |
.09 |
.13 |
.01 |
.04 |
.03 |
|
Net asset value, end of period |
$ 14.25 |
$ 20.56 |
$ 6.01 |
$ 6.47 |
$ 9.13 |
|
Total Return A, B |
(30.24)% |
242.10% |
(6.94)% |
(28.80)% |
(8.70)% |
|
Ratios and Supplemental Data |
|
|
|
|
|
|
Net assets, end of period (000 omitted) |
$ 559,577 |
$ 1,780,012 |
$ 99,987 |
$ 84,274 |
$ 105,664 |
|
Ratio of expenses to average net assets |
1.07% |
1.07% |
1.23% |
1.35% |
1.34% |
|
Ratio of expenses to average net assets after expense reductions |
1.06% E |
1.07% |
1.23% |
1.34% E |
1.34% |
|
Ratio of net investment income (loss) to average net assets |
(.57)% |
(.22)% |
(.20)% |
(.46)% |
(.32)% |
|
Portfolio turnover rate |
39% |
39% |
39% |
101% |
66% |
|
A The total returns would have been lower had certain expenses not been reduced during the periods shown. B Total returns do not include the one time sales charge. C Net investment income (loss) per share has been calculated based on average shares outstanding during the period. D For the period November 1, 1995 (commencement of operations) to October 31, 1996. E FMR or the fund has entered into varying arrangements with third parties who either paid or reduced a portion of the fund's expenses. |
|||||
See accompanying notes which are an integral part of the financial statements.
Annual Report
There are several ways to evaluate a fund's historical performance. You can look at the total percentage change in value, the average annual percentage change or the growth of a hypothetical $10,000 investment. Total return reflects the change in the value of an investment, assuming reinvestment of the fund's dividend income and capital gains (the profits earned upon the sale of securities that have grown in value).
Cumulative Total Returns
|
Periods ended |
|
Past 1 |
Past 5 |
Life of |
|
Fidelity Latin America |
|
13.76% |
53.28% |
50.46% |
|
Fidelity Latin America |
|
10.35% |
48.69% |
45.95% |
|
MSCI EMF - Latin America |
|
14.24% |
52.50% |
89.77% |
|
Latin American Funds Average |
|
20.19% |
47.03% |
n/a* |
Cumulative total returns show the fund's performance in percentage terms over a set period - in this case, one year, five years or since the fund started on April 19, 1993. For example, if you had invested $1,000 in a fund that had a 5% return over the past year, the value of your investment would be $1,050. You can compare the fund's returns to the performance of the Morgan Stanley Capital International (MSCI) Emerging Markets Free-Latin America Index - a market capitalization-weighted index of over 140 stocks traded in seven Latin American markets. To measure how the fund's performance stacked up against its peers, you can compare it to the Latin American funds average, which reflects the performance of mutual funds with similar objectives tracked by Lipper Inc. The past one year average represents a peer group of 42 mutual funds. These benchmarks include reinvested dividends and capital gains, if any, and exclude the effect of sales charges.
Average Annual Total Returns
|
Periods ended |
Past 1 |
Past 5 |
Life of |
|
Fidelity Latin America |
13.76% |
8.92% |
5.57% |
|
Fidelity Latin America |
10.35% |
8.26% |
5.14% |
|
MSCI EMF - Latin America |
14.24% |
8.81% |
8.87% |
|
Latin American Funds Average |
20.19% |
7.65% |
n/a* |
Average annual total returns take the fund's cumulative return and show you what would have happened if the fund had performed at a constant rate each year.
* Not available
$10,000 Over Life of Fund

$10,000 Over Life of Fund: Let's say hypothetically that $10,000 was invested in Fidelity Latin America Fund on April 19, 1993, when the fund started, and the current 3.00% sales charge was paid. As the chart shows, by October 31, 2000, the value of the investment would have grown to $14,595 - a 45.95% increase on the initial investment. For comparison, look at how the Morgan Stanley Capital International Emerging Markets Free-Latin America Index did over the same period. With dividends and capital gains, if any, reinvested, the same $10,000 would have grown to $18,977 - an 89.77% increase.
Understanding Performance
Many markets around the globe offer the potential for significant growth over time; however, investing in foreign markets means assuming greater risks than investing in the United States. Factors like changes in a country's financial markets, its local political and economic climate, and the fluctuating value of its currency create these risks. For these reasons an international fund's performance may be more volatile than a fund that invests exclusively in the United States. Past performance is no guarantee of future results and you may have a gain or loss when you sell your shares.
3Annual Report
(Portfolio Manager photograph)
An interview with
Patti Satterthwaite,
Portfolio Manager of
Fidelity Latin America Fund
Q. How did the fund perform, Patti?
A. For the 12 months that ended October 31, 2000, the fund returned 13.76%, trailing the Morgan Stanley Capital International Emerging Markets Free - Latin America Index, which returned 14.24%. For the same period, the Latin America funds average tracked by Lipper Inc. returned 20.19%.
Q. What was the investment climate like in Latin America during the past 12 months?
A. Recovery among major Latin American economies progressed, albeit at varying speeds. Mexico was the brightest star in the region, spurred by higher oil prices, strong export growth and rising consumer demand. The country also received an important credit rating upgrade from Moody's Investors Services in March, which was followed by a successful democratic presidential election in July. Mexico pretty much had everything going for it during the 12-month period. Brazil - the largest economy in the Latin American region - directly benefited from Mexico's good fortune, though its recovery was hampered by concerns about inflation and declining confidence in Brazil's currency, the real. Still, Brazil remained an attractive value play due to cheap stock prices. Meanwhile, Argentina struggled to emerge from last year's recession, while Chile enjoyed some economic expansion, though weak consumer spending slowed its recovery efforts. Latin American markets tracked the movements of U.S. stocks for much of the period, albeit with less drama. Telecom and media stocks rose sharply early on, only to reverse course following the end of the global tech rally. Investors flocked to less volatile areas of the market, namely banks, consumer stocks and some utilities. Concerns about interest rates rising further in the U.S., persistently high energy prices and a protracted slowdown in the global economy kept Latin American markets off balance during the second half of the period.
Q. What factors helped shape fund performance during the period?
A. Strong stock picking in Mexico was a big positive for the fund relative to the index. Having ample exposure to banks proved particularly beneficial. Reaching the end of a five-year restructuring period, banks turned their attention to such key business drivers as loan growth, which is critical in a strengthening economy. Investors, drawn to the industry's improving fundamentals, pushed the prices of holdings such as Grupo Financiero BBVA Bancomer and Banacci sharply higher during the period. The fund further benefited from overweighting a handful of media stocks that did well, namely TV Azteca and Grupo Televisa. We also were rewarded for holding a sizable stake in Telefonos de Mexico (Telmex) - the fund's largest holding - which was up more than 28% despite the downside volatility that plagued most telecom stocks worldwide during the latter half of the period. Focusing on the downside, industrial holding company Grupo Carso headed south, which hurt. A major reason why we trailed our Lipper peers is that we owned some "new economy" stocks that detracted from performance, including Impsat Fiber Networks, an emerging telecommunications company with operations throughout the region, and Internet portal El Sitio. Remaining generally market-weighted in Brazil relative to the index, we focused our energy on finding the best names. We had some success with beverage stocks such as Brahma Cervejaria, which merged with another local company in the summer to form the world's third largest brewer - AmBev. Our results in the telecom sector were mixed, although we tended to own more losers than winners. Fixed-line provider Tele Norte Leste helped, while Telesp Celular hurt.
Q. What was your approach to countries other than Mexico and Brazil?
A. I continued to underweight the rest of the region - which represented only about 25% of the index on average during the period - primarily on liquidity concerns. Specifically, I kept the fund underexposed to Chile because I felt that its status as a safe haven had been slightly obscured by Mexico's credit rating upgrade. This strategy paid off for us during the period.
Q. What's your outlook?
A. I'm generally positive overall. I feel that valuations remain extremely attractive relative to the rest of the world, given that economic recovery is expected to lead to stronger earnings growth throughout Latin America. Despite positive fundamentals, however, stocks in the region remain extremely vulnerable to global market volatility and further deceleration in the U.S. economy.
Note to shareholders: Fidelity Latin America Fund may invest up to 35% of its total assets in any industry that represents more than 20% of the Latin American market. As of October 31, 2000, 26% of the fund's total assets were invested in telephone service companies, which accounted for approximately 23% of the Latin American market as of October 31, 2000, as represented by the Morgan Stanley Capital International (MSCI) Emerging Markets Free - Latin America Index.
The views expressed in this report reflect those of the portfolio manager only through the end of the period of the report as stated on the cover. The manager's views are subject to change at any time based on market or other conditions. For more information, see page A-3 .3
Fund Facts
Goal: seeks high total investment return
Fund number: 349
Trading symbol: FLATX
Start date: April 19, 1993
Size: as of October 31, 2000, more than $297 million
Manager: Patti Satterthwaite, since inception; manager, Fidelity Emerging Markets Fund, since April 2000; Fidelity Advisor Latin America Fund, since 1998; joined Fidelity in 1986
Annual Report
Latin America
|
Geographic Diversification (% of fund's net assets) |
|||
|
As of October 31, 2000 |
|||
|
Mexico |
44.1% |
|
|
Brazil |
39.7% |
|
|
Chile |
4.5% |
|
|
Argentina |
3.4% |
|
|
United States of America |
3.0% |
|
|
Venezuela |
1.8% |
|
|
Panama |
1.4% |
|
|
Luxembourg |
0.9% |
|
|
Peru |
0.7% |
|
|
Other |
0.5% |
|

|
|
|||
|
As of April 30, 2000 |
|||
|
Mexico |
43.8% |
|
|
Brazil |
35.1% |
|
|
Chile |
4.9% |
|
|
Peru |
4.4% |
|
|
United States of America |
3.1% |
|
|
Venezuela |
2.9% |
|
|
Argentina |
2.7% |
|
|
Panama |
1.3% |
|
|
Luxembourg |
0.9% |
|
|
Other |
0.9% |
|

|
Percentages are adjusted for the effect of futures contracts, if applicable. |
|
Asset Allocation |
||
|
|
% of fund's |
% of fund's net assets |
|
Stocks |
97.7 |
98.1 |
|
Short-Term Investments |
2.3 |
1.9 |
|
Top Ten Stocks as of October 31, 2000 |
||
|
|
% of fund's |
% of fund's net assets |
|
Telefonos de Mexico SA de CV Series L sponsored ADR (Mexico, Telephone Services) |
16.6 |
18.3 |
|
Companhia de Bebidas das Americas (AmBev) sponsored ADR (Brazil, Beverages) |
7.1 |
4.2 |
|
Wal-Mart de Mexico SA de CV Series C (Mexico, General Merchandise Stores) |
6.6 |
6.1 |
|
Petrobras SA (PN) |
6.0 |
5.0 |
|
Grupo Televisa SA de CV sponsored GDR (Mexico, Broadcasting) |
5.3 |
5.4 |
|
Telesp Celular Participacoes SA ADR (Brazil, Cellular) |
5.1 |
4.8 |
|
Banacci SA de CV Series O (Mexico, Banks) |
5.0 |
2.8 |
|
TV Azteca SA de CV sponsored ADR (Mexico, Broadcasting) |
4.1 |
2.7 |
|
Tele Norte Leste Participacoes SA ADR (Brazil, Telephone Services) |
3.5 |
2.8 |
|
Banco Itau SA (Brazil, Banks) |
3.1 |
1.7 |
|
|
62.4 |
53.8 |
|
Top Ten Market Sectors as of October 31, 2000 |
||
|
|
% of fund's |
% of fund's net assets |
|
Utilities |
33.6 |
38.8 |
|
Nondurables |
15.5 |
13.3 |
|
Finance |
12.6 |
9.6 |
|
Media & Leisure |
10.7 |
9.7 |
|
Retail & Wholesale |
10.1 |
7.7 |
|
Energy |
7.8 |
6.9 |
|
Basic Industries |
5.9 |
8.4 |
|
Precious Metals |
0.7 |
2.1 |
|
Holding Companies |
0.4 |
0.5 |
|
Construction & Real Estate |
0.3 |
0.6 |
Annual Report
Latin America
Showing Percentage of Net Assets
|
Common Stocks - 97.7% |
|||
|
Shares |
Value (Note 1) |
||
|
Argentina - 3.4% |
|||
|
Inversiones y Representacions SA sponsored GDR (a) |
27,997 |
$ 582,688 |
|
|
Perez Companc SA sponsored ADR |
369,754 |
5,315,214 |
|
|
Telecom Argentina Stet-France Telecom SA sponsored ADR Class B |
249,700 |
4,291,719 |
|
|
TOTAL ARGENTINA |
10,189,621 |
||
|
Brazil - 39.7% |
|||
|
Banco Bradesco SA (PN) |
967,646,000 |
6,009,591 |
|
|
Banco Itau SA |
118,392,000 |
9,253,269 |
|
|
Companhia Brasileira de Distribuicao Grupo Pao de Acucar sponsored ADR |
125,500 |
4,470,938 |
|
|
Companhia de Bebidas das Americas (AmBev) (a) |
589,135 |
117,827 |
|
|
Companhia de Bebidas das Americas (AmBev): |
|
|
|
|
warrants 4/30/03 (a) |
1,895,770 |
399,109 |
|
|
sponsored ADR |
936,426 |
21,128,112 |
|
|
Companhia Siderurgica Nacional ADR |
85,900 |
2,378,356 |
|
|
Companhia Vale do Rio Doce (PN-A) |
333,200 |
7,716,211 |
|
|
Compania Cimento Portland Itau (PN) |
2,500,000 |
400,000 |
|
|
Compania Energertica Minas Gerais |
166,929,329 |
2,546,112 |
|
|
Embratel Participacoes SA ADR |
418,600 |
6,776,088 |
|
|
Encorpar Redito e Participa SA (a) |
11,465,310 |
28,965 |
|
|
Perdigao SA (PN) |
158,507 |
1,101,207 |
|
|
Petrobras SA (PN) |
673,970 |
17,952,432 |
|
|
Souza Cruz Industria Comerico |
392,500 |
1,917,053 |
|
|
Tele Norte Leste Participacoes SA ADR |
474,208 |
10,491,852 |
|
|
Telesp Celular Participacoes SA ADR |
482,200 |
15,249,575 |
|
|
Uniao de Bancos Brasileiros SA (Unibanco) GDR |
102,000 |
2,575,500 |
|
|
Votorantim Celulose e Papel SA |
223,992,499 |
7,521,432 |
|
|
TOTAL BRAZIL |
118,033,629 |
||
|
British Virgin Islands - 0.1% |
|||
|
El Sitio, Inc. |
49,200 |
164,513 |
|
|
Chile - 4.5% |
|||
|
Banco Santander Chile sponsored ADR |
112,200 |
1,507,688 |
|
|
Banco Santiago SA sponsored ADR |
98,700 |
1,949,325 |
|
|
Distribucion Y Servicio D&S SA sponsored ADR |
327,100 |
5,846,913 |
|
|
|
|||
|
Shares |
Value (Note 1) |
||
|
Embotelladora Andina sponsored ADR Class A |
175,900 |
$ 2,110,800 |
|
|
Vina Concha Stet y Toro SA |
53,200 |
2,041,550 |
|
|
TOTAL CHILE |
13,456,276 |
||
|
Colombia - 0.4% |
|||
|
Suramericana de Inversiones SA |
1,761,400 |
1,071,512 |
|
|
Luxembourg - 0.9% |
|||
|
Quilmes Industrial SA sponsored ADR |
322,900 |
2,663,925 |
|
|
Mexico - 44.1% |
|||
|
Banacci SA de CV Series O (a) |
9,570,000 |
14,862,330 |
|
|
Corporacion Interamericana de Entretenimiento SA de CV Series B (a) |
378,588 |
1,701,341 |
|
|
Fomento Economico Mexicano SA |
92,400 |
3,528,525 |
|
|
Grupo Carso SA de CV Series A1 (a) |
1,964,100 |
6,116,965 |
|
|
Grupo Financiero BBVA Bancomer SA de CV (GFB) (a) |
1,675,700 |
1,036,750 |
|
|
Grupo Iusacell SA de CV |
459,700 |
5,976,100 |
|
|
Grupo Modelo SA de CV Series C |
305,200 |
814,951 |
|
|
Grupo Televisa SA de CV |
293,100 |
15,864,038 |
|
|
Telefonos de Mexico SA de CV Series L sponsored ADR |
916,800 |
49,449,896 |
|
|
TV Azteca SA de CV sponsored ADR |
979,800 |
12,247,500 |
|
|
Wal-Mart de Mexico SA de CV |
8,640,200 |
19,549,598 |
|
|
TOTAL MEXICO |
131,147,994 |
||
|
Panama - 1.4% |
|||
|
Banco Latin Americano de Exporaciones SA (BLADEX) Series E |
24,700 |
619,044 |
|
|
Panamerican Beverages, Inc. Class A |
217,000 |
3,580,500 |
|
|
TOTAL PANAMA |
4,199,544 |
||
|
Peru - 0.7% |
|||
|
Compania de Minas Buenaventura SA: |
|
|
|
|
Series B |
232,618 |
1,511,884 |
|
|
Series B sponsored ADR |
54,300 |
699,113 |
|
|
TOTAL PERU |
2,210,997 |
||
|
United States of America - 0.7% |
|||
|
Impsat Fiber Networks, Inc. |
175,800 |
2,109,600 |
|
|
Venezuela - 1.8% |
|||
|
Compania Anonima Nacional Telefono de Venezuela sponsored ADR |
279,000 |
5,301,000 |
|
|
TOTAL COMMON STOCKS (Cost $233,956,760) |
290,548,611 |
||
|
Nonconvertible Bonds - 0.0% |
|||||
|
Moody's Ratings (unaudited) |
Principal Amount |
Value |
|||
|
Brazil - 0.0% |
|||||
|
Companhia Vale do Rio Doce 0% 11/19/01 |
- |
BRL |
290,000 |
$ 0 |
|
|
Cash Equivalents - 6.9% |
|||
|
Shares |
|
||
|
Fidelity Cash Central Fund, 6.61% (b) |
3,920,106 |
3,920,106 |
|
|
Fidelity Securities Lending Cash Central Fund, 6.66% (b) |
16,460,100 |
16,460,100 |
|
|
TOTAL CASH EQUIVALENTS (Cost $20,380,206) |
20,380,206 |
||
|
TOTAL INVESTMENT PORTFOLIO - 104.6% (Cost $254,336,966) |
310,928,817 |
||
|
NET OTHER ASSETS - (4.6)% |
(13,664,245) |
||
|
NET ASSETS - 100% |
$ 297,264,572 |
||
|
Currency Abbreviations |
||
|
BRL |
- |
Brazilian real |
|
Legend |
|
(a) Non-income producing |
|
(b) The rate quoted is the annualized seven-day yield of the fund at period end. A complete listing of the fund's holdings as of its most recent fiscal year end is available upon request. |
|
Other Information |
|
Purchases and sales of securities, other than short-term securities, aggregated $177,607,694 and $228,427,636, respectively. |
|
The fund participated in the security lending program. At period end, the value of securities loaned amounted to $16,411,669. The fund received cash collateral of $16,460,100 which was invested in cash equivalents. |
|
Income Tax Information |
|
At October 31, 2000, the aggregate cost of investment securities for income tax purposes was $254,414,805. Net unrealized appreciation aggregated $56,514,012, of which $95,302,161 related to appreciated investment securities and $38,788,149 related to depreciated investment securities. |
|
At October 31, 2000, the fund had a capital loss carryforward of approximately $108,322,000 of which $36,899,000, $37,615,000, $22,657,000 and $11,151,000 will expire on October 31, 2003, 2004, 2007 and 2008, respectively. |
See accompanying notes which are an integral part of the financial statements.
Annual Report
Latin America
Statement of Assets and Liabilities
|
|
October 31, 2000 |
|
|
Assets |
|
|
|
Investment in securities, at value |
|
$ 310,928,817 |
|
Receivable for investments sold |
|
4,599,171 |
|
Receivable for fund shares sold |
|
89,919 |
|
Dividends receivable |
|
535,216 |
|
Interest receivable |
|
25,461 |
|
Redemption fees receivable |
|
61 |
|
Other receivables |
|
7,895 |
|
Total assets |
|
316,186,540 |
|
Liabilities |
|
|
|
Payable for investments purchased |
$ 1,467,790 |
|
|
Payable for fund shares redeemed |
616,126 |
|
|
Accrued management fee |
177,804 |
|
|
Other payables and |
200,148 |
|
|
Collateral on securities loaned, |
16,460,100 |
|
|
Total liabilities |
|
18,921,968 |
|
Net Assets |
|
$ 297,264,572 |
|
Net Assets consist of: |
|
|
|
Paid in capital |
|
$ 348,633,159 |
|
Undistributed net investment income |
|
470,807 |
|
Accumulated undistributed net realized gain (loss) on investments and foreign currency transactions |
|
(108,393,984) |
|
Net unrealized appreciation (depreciation) on investments |
|
56,554,590 |
|
Net Assets, for 21,431,277 |
|
$ 297,264,572 |
|
Net Asset Value and redemption price per share ($297,264,572 ÷ 21,431,277 shares) |
|
$13.87 |
|
Maximum offering price per share (100/97.00 of $13.87) |
|
$14.30 |
Statement of Operations
|
|
Year ended October 31, 2000 |
|
|
Investment Income Dividends |
|
$ 5,819,100 |
|
Interest |
|
544,798 |
|
Security lending |
|
161,352 |
|
|
|
6,525,250 |
|
Less foreign taxes withheld |
|
(479,990) |
|
Total income |
|
6,045,260 |
|
Expenses |
|
|
|
Management fee |
$ 2,639,528 |
|
|
Transfer agent fees |
1,101,668 |
|
|
Accounting and security lending fees |
219,168 |
|
|
Non-interested trustees' compensation |
1,641 |
|
|
Custodian fees and expenses |
259,809 |
|
|
Registration fees |
38,546 |
|
|
Audit |
58,256 |
|
|
Legal |
6,068 |
|
|
Foreign tax expense |
198,047 |
|
|
Reports to shareholders |
26,156 |
|
|
Miscellaneous |
405 |
|
|
Total expenses before reductions |
4,549,292 |
|
|
Expense reductions |
(93,563) |
4,455,729 |
|
Net investment income |
|
1,589,531 |
|
Realized and Unrealized Gain (Loss) Net realized gain (loss) on: |
|
|
|
Investment securities |
(10,364,974) |
|
|
Foreign currency transactions |
(394,978) |
(10,759,952) |
|
Change in net unrealized appreciation (depreciation) on: |
|
|
|
Investment securities |
56,622,782 |
|
|
Assets and liabilities in |
230,382 |
56,853,164 |
|
Net gain (loss) |
|
46,093,212 |
|
Net increase (decrease) in net assets resulting from operations |
|
$ 47,682,743 |
|
Other Information |
|
$ 283,593 |
|
Sales charges - Retained by FDC |
|
$ 283,593 |
|
Expense reductions |
|
|
|
Directed brokerage arrangements |
|
$ 84,941 |
|
Custodian credits |
|
3,477 |
|
Transfer agent credits |
|
5,145 |
|
|
|
$ 93,563 |
Annual Report
Statement of Changes in Net Assets
|
Increase (Decrease) in Net Assets |
Year ended
October 31, |
Year ended
October 31, |
|
Operations |
$ 1,589,531 |
$ 5,099,283 |
|
Net realized gain (loss) |
(10,759,952) |
(23,809,899) |
|
Change in net unrealized appreciation (depreciation) |
56,853,164 |
59,451,166 |
|
Net increase (decrease) in net assets resulting from operations |
47,682,743 |
40,740,550 |
|
Distributions to shareholders from net investment income |
(3,622,710) |
(7,666,729) |
|
Share transactions |
112,558,413 |
152,034,795 |
|
Reinvestment of distributions |
3,485,627 |
7,377,095 |
|
Cost of shares redeemed |
(170,586,236) |
(218,494,512) |
|
Net increase (decrease) in net assets resulting from share transactions |
(54,542,196) |
(59,082,622) |
|
Redemption fees |
410,300 |
1,105,692 |
|
Total increase (decrease) in net assets |
(10,071,863) |
(24,903,109) |
|
Net Assets |
|
|
|
Beginning of period |
307,336,435 |
332,239,544 |
|
End of period (including undistributed net investment income of $470,807 and $2,896,477, respectively) |
$ 297,264,572 |
$ 307,336,435 |
|
Other Information Shares |
|
|
|
Sold |
7,397,655 |
12,312,091 |
|
Issued in reinvestment of distributions |
239,890 |
701,738 |
|
Redeemed |
(11,177,420) |
(19,009,646) |
|
Net increase (decrease) |
(3,539,875) |
(5,995,817) |
Financial Highlights
|
Years ended October 31, |
2000 |
1999 |
1998 |
1997 |
1996 |
|
Selected Per-Share Data |
|
|
|
|
|
|
Net asset value, beginning of period |
$ 12.31 |
$ 10.73 |
$ 15.51 |
$ 12.59 |
$ 9.75 |
|
Income from Investment Operations |
|
|
|
|
|
|
Net investment income |
.07 C |
.18 C |
.22 C, D |
.20 C |
.22 |
|
Net realized and unrealized gain (loss) |
1.61 |
1.61 |
(4.81) |
2.92 |
2.72 |
|
Total from investment operations |
1.68 |
1.79 |
(4.59) |
3.12 |
2.94 |
|
Less Distributions from net investment income |
(.14) |
(.25) |
(.20) |
(.23) |
(.12) |
|
Redemption fees added to paid in capital |
.02 |
.04 |
.01 |
.03 |
.02 |
|
Net asset value, end of period |
$ 13.87 |
$ 12.31 |
$ 10.73 |
$ 15.51 |
$ 12.59 |
|
Total Return A, B |
13.76% |
17.46% |
(30.01)% |
25.42% |
30.69% |
|
Ratios and Supplemental Data |
|
|
|
|
|
|
Net assets, end of period (000 omitted) |
$ 297,265 |
$ 307,336 |
$ 332,240 |
$ 808,542 |
$ 557,889 |
|
Ratio of expenses to average net assets |
1.25% |
1.32% |
1.34% |
1.30% |
1.32% |
|
Ratio of expenses to average net assets after expense reductions |
1.23% E |
1.30% E |
1.33% E |
1.29% E |
1.32% |
|
Ratio of net investment income to average net assets |
.44% |
1.55% |
1.49% |
1.19% |
1.48% |
|
Portfolio turnover rate |
51% |
49% |
31% |
64% |
70% |
|
A The total returns would have been lower had certain expenses not been reduced during the periods shown. B Total returns do not include the one time sales charge. C Net investment income per share has been calculated based on average shares outstanding during the period. D Investment income per share reflects a special dividend which amounted to $.06 per share. E FMR or the fund has entered into varying arrangements with third parties who either paid or reduced a portion of the fund's expenses. |
|||||
Annual Report
There are several ways to evaluate a fund's historical performance. You can look at the total percentage change in value, the average annual percentage change or the growth of a hypothetical $10,000 investment. Total return reflects the change in the value of an investment, assuming reinvestment of the fund's dividend income and capital gains (the profits earned upon the sale of securities that have grown in value). If Fidelity had not reimbursed certain fund expenses, the life of fund total returns would have been lower.
Cumulative Total Returns
|
Periods ended |
|
Past 1 |
Life of |
|
Fidelity Nordic |
|
23.21% |
204.91% |
|
Fidelity Nordic |
|
19.52% |
195.76% |
|
FT/S&P-Actuaries World Nordic |
|
16.86% |
191.33% |
|
European Region Funds Average |
|
12.53% |
n/a* |
Cumulative total returns show the fund's performance in percentage terms over a set period - in this case, one year or since the fund started on November 1, 1995. For example, if you had invested $1,000 in a fund that had a 5% return over the past year, the value of your investment would be $1,050. You can compare the fund's returns to the performance of the FT/S&P-Actuaries World Nordic Index - a market capitalization-weighted index of over 95 stocks traded in four Scandinavian markets. To measure how the fund's performance stacked up against its peers, you can compare the fund's performance to the European region funds average, which reflects the performance of mutual funds with similar objectives tracked by Lipper Inc. The past one year average represents a peer group of 151 mutual funds. These benchmarks include reinvested dividends and capital gains, if any, and exclude the effect of sales charges.
Average Annual Total Returns
|
Periods ended |
|
Past 1 |
Life of |
|
Fidelity Nordic |
|
23.21% |
24.96% |
|
Fidelity Nordic |
|
19.52% |
24.20% |
|
FT/S&P-Actuaries World Nordic |
|
16.86% |
23.83% |
|
European Region Funds Average |
|
12.53% |
n/a* |
Average annual total returns take the fund's cumulative return and show you what would have happened if the fund had performed at a constant rate each year.
* Not available
$10,000 Over Life of Fund
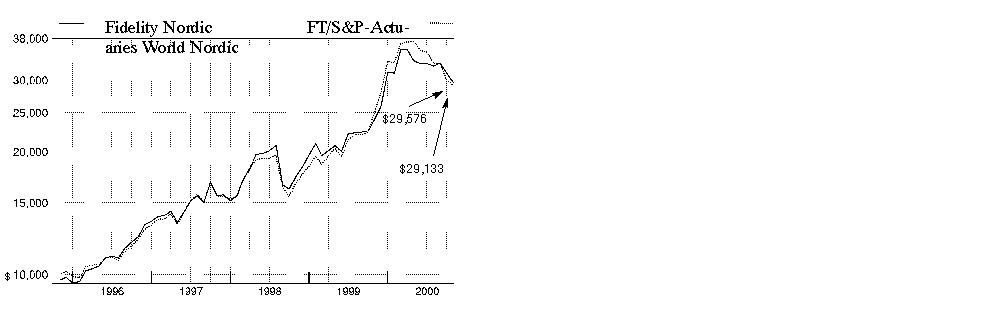
$10,000 Over Life of Fund: Let's say hypothetically that $10,000 was invested in Fidelity Nordic Fund on November 1, 1995, when the fund started, and the current 3.00% sales charge was paid. As the chart shows, by October 31, 2000, the value of the investment would have grown to $29,576 - a 195.76% increase on the initial investment. For comparison, look at how the FT/S&P-Actuaries World Nordic Index did over the same period. With dividends and capital gains, if any, reinvested, the same $10,000 investment would have grown to $29,133 - a 191.33% increase.
Understanding Performance
Many markets around the globe offer the potential for significant growth over time; however, investing in foreign markets means assuming greater risks than investing in the United States. Factors like changes in a country's financial markets, its local political and economic climate, and the fluctuating value of its currency create these risks. For these reasons an international fund's performance may be more volatile than a fund that invests exclusively in the United States. Past performance is no guarantee of future results and you may have a gain or loss when you sell your shares.
3Annual Report
(Portfolio Manager photograph)
An interview with
Trygve Toraasen,
Portfolio Manager
of Fidelity Nordic Fund
Q. How did the fund perform, Trygve?
A. For the 12 months that ended October 31, 2000, the fund returned 23.21%. This topped the 16.86% return of the FT/S&P-Actuaries World Nordic Index during the same period as well as the 12.53% return of the European region funds average, as tracked by Lipper Inc.
Q. What factors helped the fund beat both its index and its peers during the period?
A. The majority of the fund's outperformance came during the first six months of the period when TMT stocks - those in the technology, media and telecommunications areas - performed exceptionally well. However, when the U.S. technology market corrected in April, TMT stocks - many of which had valuations that were hard to justify - followed suit. This resulted in a very difficult environment for telecommunications stocks, and the fund's stakes in Nokia and Ericsson declined. The fund did benefit from selective stock picking within the TMT group, as well as from good stock selection within the banking sector. Several of the fund's investments in Denmark also performed well.
Q. Finance and health stocks accounted for almost one-third of the fund's investments at the end of the period. How did these groups do?
A. Banks were a pleasant story. I increased the fund's exposure to this group early in the period, mostly because I felt interest rates were peaking, valuations were attractive and the potential for solid earnings growth was strong. The fund's investments in Nordic Baltic Holding and Svenska Handelsbanken generated good returns. Swedish life insurance company Skandia Foersaekrings also performed well, as the company benefited from increased demand for savings vehicles such as variable annuity plans and mutual funds. On the health side, several of the fund's pharmaceutical stocks did well, most notably Denmark's Novo-Nordisk.
Q. You increased the fund's exposure to Denmark during the period? Why?
A. Actually, much of that bump came from pure stock appreciation. The fund's best performer for the period was Vestas Wind Systems, a company that makes wind turbines. GN Store Nordic - a technology conglomerate involved in cellular and optical networking equipment - also performed well. When I'm looking at a stock, I look first and foremost at its individual characteristics. I don't pay a lot of attention to the region in which that company is based.
Q. Which other stocks performed well? Which were disappointing?
A. Eltek, a Norwegian company that makes power supplies for mobile communications devices, was a very strong performer, as was Tandberg, a Norwegian firm specializing in videoconferencing. In terms of disappointments, Nokia was hurt both by weaker-than-expected earnings results and the troubles in the telecom sector. Another disappointment was cruise line operator Royal Caribbean, which fell on concerns over decreased consumer spending and increased competition.
Q. What's your outlook?
A. I think we may just have to get used to volatility for awhile. TMT stocks will most likely continue to move in tandem with U.S. technology stocks. Of course, the flip side to increased volatility is that it puts a premium on thorough research and good stock picking, the two main drivers behind the fund's performance at the end of every day. I'll continue to search all over Scandinavia for the best individual stories I can find.
Note to shareholders: The Nordic Fund may invest up to 35% of its total assets in any industry that represents more than 20% of the Nordic market. As of October 31, 2000, the fund did not have more than 25% of its total assets invested in any one industry.
The views expressed in this report reflect those of the portfolio manager only through the end of the period of the report as stated on the cover. The manager's views are subject to change at any time based on market or other conditions. For more information, see page A-3 .
Fund Facts
Goal: long-term growth of capital by investing mainly in equity securities of issuers in Denmark, Finland, Norway and Sweden
Fund number: 342
Trading symbol: FNORX
Start date: November 1, 1995
Size: as of October 31, 2000, more than $200 million
Manager: Trygve Toraasen, since 1998; associate portfolio manager, Fidelity Nordic Fund, 1997-1998; research analyst, 1994-1998; joined Fidelity in 1994
3
Annual Report
Nordic
|
Geographic Diversification (% of fund's net assets) |
|||
|
As of October 31, 2000 |
|||
|
Sweden |
38.3% |
|
|
Denmark |
25.2% |
|
|
Finland |
19.6% |
|
|
Norway |
13.1% |
|
|
United States of America |
3.1% |
|
|
Luxembourg |
0.7% |
|

|
|
|||
|
As of April 30, 2000 |
|||
|
Sweden |
45.2% |
|
|
Finland |
25.2% |
|
|
Denmark |
15.0% |
|
|
Norway |
9.0% |
|
|
United States of America |
5.3% |
|
|
Luxembourg |
0.3% |
|

|
Percentages are adjusted for the effect of futures contracts, if applicable. |
|
Asset Allocation |
||
|
|
% of fund's |
% of fund's net assets |
|
Stocks |
99.6 |
95.9 |
|
Short-Term Investments |
0.4 |
4.1 |
|
Top Ten Stocks as of October 31, 2000 |
||
|
|
% of fund's |
% of fund's net assets |
|
Nokia AB (Finland, Communications Equipment) |
12.0 |
14.3 |
|
Telefonaktiebolaget LM Ericsson (B Shares) (Sweden, Communications Equipment) |
6.9 |
11.5 |
|
Vestas Wind Systems AS (Denmark, Industrial Machinery & Equipment) |
5.1 |
2.6 |
|
Nordic Baltic Holding AB (Sweden, Banks) |
4.8 |
1.6 |
|
Novo-Nordisk AS Series B (Denmark, Drugs & Pharmaceuticals) |
3.6 |
1.6 |
|
Svenska Handelsbanken AB (A Shares) (Sweden, Banks) |
3.5 |
2.1 |
|
Skandia Foersaekrings AB (Sweden, Insurance) |
3.1 |
4.8 |
|
TANDBERG ASA (Norway, Communications Equipment) |
3.0 |
1.4 |
|
William Demant Holding AS (Denmark, Medical Equipment |
2.7 |
0.5 |
|
GN Store Nordic AS (Denmark, Communications Equipment) |
2.6 |
2.2 |
|
|
47.3 |
42.6 |
|
Top Ten Market Sectors as of October 31, 2000 |
||
|
|
% of fund's |
% of fund's net assets |
|
Technology |
33.2 |
36.6 |
|
Finance |
21.4 |
15.6 |
|
Health |
8.4 |
3.3 |
|
Services |
8.3 |
5.3 |
|
Industrial Machinery & Equipment |
7.5 |
6.1 |
|
Utilities |
7.0 |
10.6 |
|
Basic Industries |
4.5 |
6.3 |
|
Energy |
2.7 |
1.2 |
|
Media & Leisure |
2.4 |
2.2 |
|
Nondurables |
1.5 |
1.1 |
Annual Report
Nordic
Showing Percentage of Net Assets
|
Common Stocks - 99.6% |
|||
|
Shares |
Value (Note 1) |
||
|
Denmark - 25.2% |
|||
|
2M Invest AS (a) |
90,000 |
$ 1,458,030 |
|
|
Bang & Olufsen Holding AS |
21,200 |
1,035,179 |
|
|
Coloplast AS (B Shares) |
60,000 |
2,669,633 |
|
|
Danske Bank AS |
19,600 |
2,839,851 |
|
|
GN Store Nordic AS |
269,700 |
5,230,769 |
|
|
Group 4 Falck AS |
28,860 |
3,523,026 |
|
|
ISS AS (a) |
33,500 |
2,063,832 |
|
|
Kobenhaven Lufthave AS |
3,300 |
252,246 |
|
|
NEG Micon AS (a) |
66,700 |
3,462,366 |
|
|
Novo-Nordisk AS Series B (a) |
33,689 |
7,148,859 |
|
|
RTX Telecom AS |
15,800 |
666,952 |
|
|
Sydbank AS |
21,730 |
793,315 |
|
|
Tele Danmark AS Series B |
82,400 |
3,901,315 |
|
|
Vestas Wind Systems AS |
188,000 |
10,187,958 |
|
|
William Demant Holding AS |
112,800 |
5,404,980 |
|
|
TOTAL DENMARK |
50,638,311 |
||
|
Finland - 19.6% |
|||
|
Aldata Solutions Oyj (a) |
133,000 |
936,990 |
|
|
Amer Group PLC (A Shares) |
57,800 |
1,285,389 |
|
|
Comptel Oyj |
63,200 |
874,400 |
|
|
Elisa Communications Corp. (A Shares) |
71,347 |
1,980,290 |
|
|
Keski-Suomen Puhelin Oyj (KSP) |
66,500 |
553,163 |
|
|
Nokia AB |
561,800 |
24,016,947 |
|
|
Novo Group Oyj |
96,500 |
318,627 |
|
|
Okobank (A Shares) |
23,180 |
267,583 |
|
|
Pohjola Group Insurance Corp. |
12,400 |
450,580 |
|
|
Sampo Insurance Co. Ltd. (A Shares) |
11,210 |
456,722 |
|
|
Sonera Corp. |
111,100 |
2,448,072 |
|
|
Stora Enso Oyj (R Shares) |
147,170 |
1,511,507 |
|
|
Teleste Oyj |
37,300 |
1,108,108 |
|
|
TJ Group Oyj (a) |
31,400 |
53,838 |
|
|
UPM-Kymmene Corp. |
108,500 |
3,071,362 |
|
|
TOTAL FINLAND |
39,333,578 |
||
|
Luxembourg - 0.7% |
|||
|
Metro International SA Swedish Depository Receipt: |
|
|
|
|
(A Shares) (a) |
16,230 |
167,219 |
|
|
(B Shares) (a) |
37,870 |
458,365 |
|
|
Stolt Offshore SA (a) |
62,600 |
714,120 |
|
|
TOTAL LUXEMBOURG |
1,339,704 |
||
|
Norway - 13.1% |
|||
|
DNB Holding ASA |
901,900 |
3,911,598 |
|
|
Eltek ASA |
63,200 |
2,373,741 |
|
|
Orkla-Borregaard AS |
169,300 |
3,051,846 |
|
|
Petroleum Geo-Services ASA (a) |
74,800 |
1,030,392 |
|
|
ProSafe ASA (a) |
107,000 |
1,704,262 |
|
|
|
|||
|
Shares |
Value (Note 1) |
||
|
Schibsted AS (B Shares) |
40,900 |
$ 620,631 |
|
|
Smedvig ASA (A Shares) |
142,200 |
1,331,403 |
|
|
Sparebanken NOR (primary shares certificates) |
23,400 |
591,799 |
|
|
TANDBERG ASA (a) |
226,700 |
6,001,743 |
|
|
TANDBERG Television ASA (a) |
134,400 |
1,359,621 |
|
|
TGS Nopec Geophysical Co. ASA (a) |
109,300 |
1,388,011 |
|
|
VMETRO ASA |
259,400 |
3,014,981 |
|
|
TOTAL NORWAY |
26,380,028 |
||
|
Sweden - 38.3% |
|||
|
Assa Abloy AB (B Shares) |
149,692 |
2,755,159 |
|
|
Enlight Interactive AB (a) |
37,300 |
179,094 |
|
|
Europolitan Holdings AB |
175,200 |
1,577,273 |
|
|
Forenings Sparbanken AB (A Shares) |
172,175 |
2,471,453 |
|
|
Gunnebo AB |
46,500 |
469,791 |
|
|
HQ.SE Holding AB |
79,100 |
221,546 |
|
|
Industrial & Financial Systems AB (IFS) (a) |
74,400 |
584,215 |
|
|
International Business Systems AB (IBS) |
133,700 |
256,781 |
|
|
Investor AB (B Shares) |
213,700 |
2,821,687 |
|
|
JM AB (B Shares) |
10,200 |
232,630 |
|
|
LGP Telecom Holding AB |
89,200 |
2,230,669 |
|
|
Micronic Laser Systems AB (a) |
92,900 |
2,769,251 |
|
|
Modern Times Group AB (MTG) |
54,100 |
1,379,964 |
|
|
Munters AB |
50,850 |
717,200 |
|
|
Munters AB (c) |
8,300 |
117,065 |
|
|
Netcom AB (B Shares) (a) |
47,300 |
2,219,036 |
|
|
Netwise AB (B Shares) (a) |
33,700 |
117,985 |
|
|
Nobel Biocare AB |
56,320 |
1,267,580 |
|
|
Nordic Baltic Holding AB |
1,273,000 |
9,550,365 |
|
|
Observer AB (B Shares) |
164,576 |
2,156,593 |
|
|
OM Gruppen AB |
116,500 |
4,160,298 |
|
|
POOLiA AB (B Shares) (c) |
7,800 |
327,698 |
|
|
Proffice AB (B Shares) |
51,900 |
1,713,214 |
|
|
Q-Medical AB (a) |
26,900 |
470,891 |
|
|
Readsoft AB (B Shares) (a) |
284,100 |
1,875,623 |
|
|
Resco AB (B Shares) (a) |
22,100 |
24,096 |
|
|
Securitas AB (B Shares) |
183,100 |
3,901,200 |
|
|
Skandia Foersaekrings AB |
369,100 |
6,258,122 |
|
|
Skanska AB (B Shares) |
23,500 |
930,879 |
|
|
Svenska Cellulosa AB (SCA) (B Shares) |
24,400 |
500,350 |
|
|
Svenska Handelsbanken AB (A Shares) |
448,896 |
7,049,782 |
|
|
SwitchCore AB (a) |
42,750 |
211,676 |
|
|
Tele1 Europe Holding AB (a) |
77,400 |
596,159 |
|
|
Telefonaktiebolaget LM Ericsson |
1,002,400 |
13,908,300 |
|
|
Telelogic AB (a) |
70,000 |
462,139 |
|
|
Teligent AB (a) |
34,100 |
385,446 |
|
|
TV 4 AB (A Shares) |
2,300 |
69,941 |
|
|
TOTAL SWEDEN |
76,941,151 |
||
|
Common Stocks - continued |
|||
|
Shares |
Value (Note 1) |
||
|
United States of America - 2.7% |
|||
|
InFocus Corp. (a) |
43,000 |
$ 1,900,063 |
|
|
Pharmacia Corp. unit |
26,894 |
1,444,641 |
|
|
Royal Caribbean Cruises Ltd. |
100,900 |
2,171,761 |
|
|
TOTAL UNITED STATES OF AMERICA |
5,516,465 |
||
|
TOTAL COMMON STOCKS (Cost $152,285,788) |
200,149,237 |
||
|
Cash Equivalents - 2.8% |
|||
|
|
|
|
|
|
Fidelity Cash Central Fund, 6.61% (b) |
3,871,531 |
3,871,531 |
|
|
Fidelity Securities Lending Cash |
1,751,190 |
1,751,190 |
|
|
TOTAL CASH EQUIVALENTS (Cost $5,622,721) |
5,622,721 |
||
|
TOTAL INVESTMENT PORTFOLIO - 102.4% (Cost $157,908,509) |
205,771,958 |
||
|
NET OTHER ASSETS - (2.4)% |
(4,899,576) |
||
|
NET ASSETS - 100% |
$ 200,872,382 |
||
|
Legend |
|
(a) Non-income producing |
|
(b) The rate quoted is the annualized seven-day yield of the fund at period end. A complete listing of the fund's holdings as of its most recent fiscal year end is available upon request. |
|
(c) Security exempt from registration under Rule 144A of the Securities Act of 1933. These securities may be resold in transactions exempt from registration, normally to qualified institutional buyers. At the period end, the value of these securities amounted to $444,763 or 0.2% of net assets. |
|
Other Information |
|
Purchases and sales of securities, other than short-term securities, aggregated $245,873,220 and $161,576,421, respectively. |
|
The fund participated in the security lending program. At period end, the value of securities loaned amounted to $1,560,082. The fund received cash collateral of $1,751,190 which was invested in cash equivalents. Cash collateral includes $120,000 received for unsettled security loans. |
|
The fund participated in the interfund lending program as a borrower. The average daily loan balance during the period for which loans were outstanding amounted to $3,702,000. The weighted average interest rate was 6.26%. Interest expense includes $2,574 paid under the interfund lending program. |
|
The fund participated in the bank borrowing program. The average daily loan balance during the period for which loans were outstanding amounted to $1,706,667. The weighted average interest rate was 6.87%. Interest expense includes $1,954 paid under the bank borrowing program. |
|
Income Tax Information |
|
At October 31, 2000, the aggregate cost of investment securities for income tax purposes was $159,285,320. Net unrealized appreciation aggregated $46,486,638, of which $66,366,165 related to appreciated investment securities and $19,879,527 related to depreciated investment securities. |
|
The fund hereby designates approximately $3,198,000 as a capital gain dividend for the purpose of the dividend paid deduction. |
See accompanying notes which are an integral part of the financial statements.
Annual Report
Nordic
Statement of Assets and Liabilities
|
|
October 31, 2000 |
|
|
Assets |
|
|
|
Investment in securities, at value |
|
$ 205,771,958 |
|
Receivable for investments sold |
|
736,822 |
|
Receivable for fund shares sold |
|
237,848 |
|
Dividends receivable |
|
124,514 |
|
Interest receivable |
|
13,853 |
|
Redemption fees receivable |
|
5 |
|
Other receivables |
|
9,734 |
|
Total assets |
|
206,894,734 |
|
Liabilities |
|
|
|
Payable for investments purchased |
$ 3,801,922 |
|
|
Payable for fund shares redeemed |
195,134 |
|
|
Accrued management fee |
122,991 |
|
|
Other payables and |
151,115 |
|
|
Collateral on securities loaned, |
1,751,190 |
|
|
Total liabilities |
|
6,022,352 |
|
Net Assets |
|
$ 200,872,382 |
|
Net Assets consist of: |
|
|
|
Paid in capital |
|
$ 151,649,304 |
|
Undistributed net investment income |
|
274,249 |
|
Accumulated undistributed net realized gain (loss) on investments and foreign currency transactions |
|
1,084,131 |
|
Net unrealized appreciation (depreciation) on investments |
|
47,864,698 |
|
Net Assets, for 7,387,348 |
|
$ 200,872,382 |
|
Net Asset Value, offering price |
|
$27.19 |
|
Maximum offering price per share (100/97.00 of $27.19) |
|
$28.03 |
Statement of Operations
|
|
Year ended October 31, 2000 |
|
|
Investment Income Dividends |
|
$ 2,592,100 |
|
Interest |
|
490,491 |
|
Security lending |
|
149,338 |
|
|
|
3,231,929 |
|
Less foreign taxes withheld |
|
(382,395) |
|
Total income |
|
2,849,534 |
|
Expenses |
|
|
|
Management fee |
$ 1,558,616 |
|
|
Transfer agent fees |
523,140 |
|
|
Accounting and security lending fees |
129,999 |
|
|
Non-interested trustees' compensation |
659 |
|
|
Custodian fees and expenses |
197,251 |
|
|
Registration fees |
62,766 |
|
|
Audit |
31,117 |
|
|
Legal |
2,276 |
|
|
Interest |
4,528 |
|
|
Miscellaneous |
5,776 |
|
|
Total expenses before reductions |
2,516,128 |
|
|
Expense reductions |
(49,718) |
2,466,410 |
|
Net investment income |
|
383,124 |
|
Realized and Unrealized Gain (Loss) Net realized gain (loss) on: |
|
|
|
Investment securities |
1,804,800 |
|
|
Foreign currency transactions |
(108,840) |
1,695,960 |
|
Change in net unrealized appreciation (depreciation) on: |
|
|
|
Investment securities |
14,252,087 |
|
|
Assets and liabilities in |
5,264 |
14,257,351 |
|
Net gain (loss) |
|
15,953,311 |
|
Net increase (decrease) in net assets resulting from operations |
|
$ 16,336,435 |
|
Other Information |
|
$ 516,774 |
|
Sales charges - Retained by FDC |
|
$ 516,774 |
|
Expense reductions |
|
|
|
Directed brokerage arrangements |
|
$ 42,012 |
|
Custodian credits |
|
3,353 |
|
Transfer agent credits |
|
4,353 |
|
|
|
$ 49,718 |
See accompanying notes which are an integral part of the financial statements.
Annual Report
Nordic
Financial Statements - continued
Statement of Changes in Net Assets
|
Increase (Decrease) in Net Assets |
Year ended
October 31, |
Year ended
October 31, |
|
Operations |
$ 383,124 |
$ 386,363 |
|
Net realized gain (loss) |
1,695,960 |
11,006,071 |
|
Change in net unrealized appreciation (depreciation) |
14,257,351 |
21,507,135 |
|
Net increase (decrease) in net assets resulting from operations |
16,336,435 |
32,899,569 |
|
Distributions to shareholders |
(328,657) |
- |
|
From net realized gain |
(2,464,859) |
- |
|
Total distributions |
(2,793,516) |
- |
|
Share transactions |
173,779,022 |
41,593,918 |
|
Reinvestment of distributions |
2,711,386 |
- |
|
Cost of shares redeemed |
(100,985,399) |
(65,061,644) |
|
Net increase (decrease) in net assets resulting from share transactions |
75,505,009 |
(23,467,726) |
|
Redemption fees |
436,839 |
97,415 |
|
Total increase (decrease) in net assets |
89,484,767 |
9,529,258 |
|
Net Assets |
|
|
|
Beginning of period |
111,387,615 |
101,858,357 |
|
End of period (including undistributed net investment income of $274,249 and $367,863, respectively) |
$ 200,872,382 |
$ 111,387,615 |
|
Other Information Shares |
|
|
|
Sold |
5,701,728 |
2,122,892 |
|
Issued in reinvestment of distributions |
101,817 |
- |
|
Redeemed |
(3,368,571) |
(3,436,188) |
|
Net increase (decrease) |
2,434,974 |
(1,313,296) |
Financial Highlights
|
Years ended October 31, |
2000 |
1999 |
1998 |
1997 |
1996 E |
|
Selected Per-Share Data |
|
|
|
|
|
|
Net asset value, beginning of period |
$ 22.49 |
$ 16.26 |
$ 15.94 |
$ 12.77 |
$ 10.00 |
|
Income from Investment Operations |
|
|
|
|
|
|
Net investment income C |
.05 |
.07 |
.03 |
.10 |
.17 D |
|
Net realized and unrealized gain (loss) |
5.10 |
6.14 |
1.46 |
3.19 |
2.57 |
|
Total from investment operations |
5.15 |
6.21 |
1.49 |
3.29 |
2.74 |
|
Less Distributions |
|
|
|
|
|
|
From net investment income |
(.06) |
- |
(.07) |
(.05) |
- |
|
From net realized gain |
(.45) |
- |
(1.18) |
(.10) |
- |
|
Total distributions |
(.51) |
- |
(1.25) |
(.15) |
- |
|
Redemption fees added to paid in capital |
.06 |
.02 |
.08 |
.03 |
.03 |
|
Net asset value, end of period |
$ 27.19 |
$ 22.49 |
$ 16.26 |
$ 15.94 |
$ 12.77 |
|
Total Return A, B |
23.21% |
38.31% |
10.99% |
26.24% |
27.70% |
|
Ratios and Supplemental Data |
|
|
|
|
|
|
Net assets, end of period (000 omitted) |
$ 200,872 |
$ 111,388 |
$ 101,858 |
$ 73,278 |
$ 30,871 |
|
Ratio of expenses to average net assets |
1.17% |
1.27% |
1.35% |
1.42% |
2.00% F |
|
Ratio of expenses to average net assets after expense reductions |
1.15% G |
1.23% G |
1.35% |
1.42% |
2.00% |
|
Ratio of net investment income to average net assets |
.18% |
.37% |
.20% |
.67% |
1.52% |
|
Portfolio turnover rate |
80% |
70% |
69% |
74% |
35% |
|
A The total returns would have been lower had certain expenses not been reduced during the periods shown. B Total returns do not include the one time sales charge. C Net investment income per share has been calculated based on average shares outstanding during the period. D Investment income per share reflects a special dividend which amounted to $.16 per share. E For the period November 1, 1995 (commencement of operations) to October 31, 1996. F FMR agreed to reimburse a portion of the fund's expenses during the period. Without this reimbursement, the fund's expense ratio would have been higher. G FMR or the fund has entered into varying arrangements with third parties who either paid or reduced a portion of the fund's expenses. |
|||||
See accompanying notes which are an integral part of the financial statements.
Annual Report
There are several ways to evaluate a fund's historical performance. You can look at the total percentage change in value, the average annual percentage change or the growth of a hypothetical $10,000 investment. Total return reflects the change in the value of an investment, assuming reinvestment of the fund's dividend income and capital gains (the profits earned upon the sale of securities that have grown in value). If Fidelity had not reimbursed certain fund expenses, the past 10 year total return would have been lower.
Cumulative Total Returns
|
Periods ended |
|
Past 1 |
Past 5 |
Past 10 |
|
Fidelity Pacific Basin |
|
-8.61% |
41.87% |
93.53% |
|
Fidelity Pacific Basin |
|
-11.36% |
37.62% |
87.72% |
|
MSCI Pacific |
|
-10.41% |
-2.71% |
17.14% |
|
Pacific Region Funds Average |
|
-11.67% |
-4.56% |
63.97% |
Cumulative total returns show the fund's performance in percentage terms over a set period - in this case, one year, five years or 10 years. For example, if you had invested $1,000 in a fund that had a 5% return over the past year, the value of your investment would be $1,050. You can compare the fund's returns to the performance of the Morgan Stanley Capital International (MSCI) Pacific Index - a market capitalization-weighted index of approximately 406 stocks traded in five Pacific-region markets. To measure how the fund's performance stacked up against its peers, you can compare it to the Pacific region funds average, which reflects the performance of mutual funds with similar objectives tracked by Lipper Inc. The past one year average represents a peer group of 60 mutual funds. These benchmarks include reinvested dividends and capital gains, if any, and exclude the effect of sales charges.
Average Annual Total Returns
|
Periods ended |
Past 1 |
Past 5 |
Past 10 |
|
Fidelity Pacific Basin |
-8.61% |
7.25% |
6.83% |
|
Fidelity Pacific Basin |
-11.36% |
6.59% |
6.50% |
|
MSCI Pacific |
-10.41% |
-0.55% |
1.59% |
|
Pacific Region Funds Average |
-11.67% |
-1.59% |
4.59% |
Average annual total returns take the fund's cumulative return and show you what would have happened if the fund had performed at a constant rate each year.
$10,000 Over 10 Years
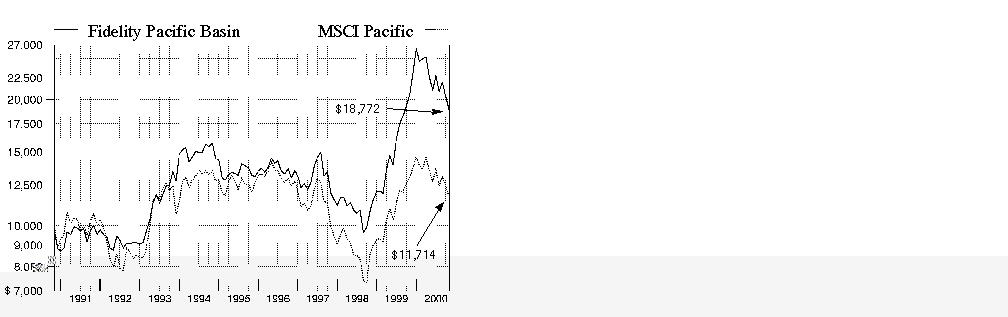
$10,000 Over 10 Years: Let's say hypothetically that $10,000 was invested in Fidelity Pacific Basin Fund on October 31, 1990, and the current 3.00% sales charge was paid. As the chart shows, by October 31, 2000, the value of the investment would have grown to $18,772 - an 87.72% increase on the initial investment. For comparison, look at how the Morgan Stanley Capital International Pacific Index did over the same period. With dividends and capital gains, if any, reinvested, the same $10,000 would have grown to $11,714 - a 17.14% increase.
Understanding Performance
Many markets around the globe offer the potential for significant growth over time; however, investing in foreign markets means assuming greater risks than investing in the United States. Factors like changes in a country's financial markets, its local political and economic climate, and the fluctuating value of its currency create these risks. For these reasons an international fund's performance may be more volatile than a fund that invests exclusively in the United States. Past performance is no guarantee of future results and you may have a gain or loss when you sell your shares.
3Annual Report
(Portfolio Manager photograph)
An interview with
William Kennedy, Portfolio
Manager of Fidelity
Pacific Basin Fund
Q. How did the fund perform, Bill?
A. Absolute performance was negative, but the fund beat both of its benchmarks. For the 12 months that ended October 31, 2000, the fund returned -8.61%, compared with -10.41% and -11.67% for the Morgan Stanley Capital International Pacific Index and the Pacific Region funds average monitored by Lipper Inc., respectively.
Q. What factors influenced the fund's performance?
A. It was a volatile 12 months. From November through mid-March, Pacific Basin technology and telecommunications stocks mirrored their U.S. counterparts by staging a strong rally that was followed by a sharp correction until the third week of May. After a reprieve during the summer, when many technology and telecom stocks made respectable recoveries, those sectors once again took it on the chin during September and October as investors became concerned about a slowing U.S. economy and slackening demand for personal computers, semiconductors and other technology products and services. The fund outperformed the Morgan Stanley index and the Lipper average through strong stock selection, especially in the fiber-optics component industry, and by scaling back its technology exposure substantially.
Q. Where did you invest as you reduced the fund's technology weighting?
A. I placed more emphasis on companies that derive most of their revenues from the domestic Pacific Basin economies rather than on the large, multinational companies that dominated the fund's holdings previously. Most of this money went into banks and real estate companies in Hong Kong and Singapore. With stable interest rates and the possibility of further slowing in the U.S. economy, I thought that banks and real estate stocks would be the likely beneficiaries. In particular, Hong Kong interest rates are pegged to those in the U.S., so interest-rate-sensitive stocks there seemed a good bet when U.S. rates appeared to peak last May. Furthermore, the Hong Kong economy was enjoying good growth, but property prices had not recovered much from the lows reached during the Asian financial crisis of several years ago. Consequently, there seemed to be good upside potential in real estate stocks.
Q. What stocks helped the fund's performance?
A. The fund's best performer, and also one of its largest holdings during the period, was Furukawa Electric. This Japanese company's businesses in fiber-optic cable and wave division multiplexing (WDM) - that is, using lasers and mirrors to split light into its component parts and increase the capacity of fiber-optic pathways - benefited from robust demand. Another strong Japanese performer, Nippon Sheet Glass, experienced rapid growth in its division that manufactures the lenses used in fiber-optic equipment.
Q. What stocks detracted from performance?
A. Japanese holding Nippon Telegraph & Telephone (NTT) was a significant detractor during the period. Like many incumbent telephone service companies worldwide, NTT faced increasing competitive threats to its core long-distance and local-service businesses. Another underperforming holding was Samsung Electronics, a South Korean manufacturer of dynamic random access memory (DRAM). This stock sold off sharply near the end of the period when it became apparent that DRAM demand for the fourth quarter would be much weaker than expected a few months earlier. Finally, Fuji Bank was a negative influence on performance. Although I underweighted Japanese banks due to my concerns about nonperforming loans and weak balance sheets, Fuji Bank appeared to be one of the stronger stocks in the group. However, the company suffered from uncertainty surrounding its merger with Daichi Kanyo Bank and Industrial Bank of Japan. The fund no longer holds Fuji Bank.
Q. What's your outlook, Bill?
A. Given the uncertainty of the earnings outlook for many of the large, multinational growth companies in the region, I foresee continued emphasis on domestic economy plays. We have to remember that what pulled Asia out of its recession in 1997 and 1998 was the extremely strong U.S. economy. Now that U.S. growth is decelerating, the outlook for many export-driven Pacific Basin companies is questionable. On the positive side, if U.S. growth stabilizes without much delay, a lot of investors' uncertainty could quickly disappear. In addition, most Southeast Asian growth stocks didn't get nearly as expensive as their global peers when the markets were advancing, so they could offer more downside protection in a less favorable investment environment.
The views expressed in this report reflect those of the portfolio manager only through the end of the period of the report as stated on the cover. The manager's views are subject to change at any time based on market or other conditions. For more information, see page A-3 .
Fund Facts
Goal: long-term growth of capital by investing mainly in equity securities of Pacific Basin issuers
Fund number: 302
Trading symbol: FPBFX
Start date: October 1, 1986
Size: as of October 31, 2000, more than $516 million
Manager: William Kennedy, since 1998; manager, Fidelity Advisor Japan Fund, since June 2000; Hong Kong research director, 1996-1998; analyst, regional power sector and Indian companies, 1994-1996; joined Fidelity in 1994
3
Annual Report
Pacific Basin
|
Geographic Diversification (% of fund's net assets) |
|||
|
As of October 31, 2000 |
|||
|
Japan |
60.1% |
|
|
Hong Kong |
11.0% |
|
|
Australia |
8.7% |
|
|
United States of America |
7.9% |
|
|
Singapore |
4.1% |
|
|
Korea (South) |
3.1% |
|
|
Taiwan |
1.9% |
|
|
India |
1.6% |
|
|
Malaysia |
0.7% |
|
|
Other |
0.9% |
|

|
|
|||
|
As of April 30, 2000 |
|||
|
Japan |
61.3% |
|
|
Hong Kong |
9.3% |
|
|
Australia |
6.8% |
|
|
Taiwan |
6.8% |
|
|
Korea (South) |
5.1% |
|
|
Singapore |
4.1% |
|
|
United States of America |
3.4% |
|
|
India |
1.6% |
|
|
Thailand |
0.6% |
|
|
Other |
1.0% |
|
|
Percentages are adjusted for the effect of futures contracts, if applicable. |

|
Asset Allocation |
||
|
|
% of fund's |
% of fund's net assets |
|
Stocks |
92.1 |
96.6 |
|
Short-Term Investments |
7.9 |
3.4 |
|
Top Ten Stocks as of October 31, 2000 |
||
|
|
% of fund's |
% of fund's net assets |
|
Toyota Motor Corp. (Japan, Autos, Tires, & Accessories) |
4.2 |
4.1 |
|
Takeda Chemical Industries Ltd. (Japan, Drugs & Pharmaceuticals) |
3.2 |
2.1 |
|
Sony Corp. |
3.2 |
4.3 |
|
Toyoda Gosei Co. Ltd. (Japan, Autos, Tires, & Accessories) |
2.4 |
0.8 |
|
Nippon Telegraph & Telephone Corp. (Japan, Telephone Services) |
2.3 |
1.6 |
|
Furukawa Electric Co. Ltd. |
2.1 |
2.9 |
|
Canon, Inc. (Japan, Computers & Office Equipment) |
2.0 |
1.2 |
|
News Corp. Ltd. |
1.9 |
2.0 |
|
Hutchison Whampoa Ltd. (Hong Kong, Electrical Equipment) |
1.9 |
2.9 |
|
China Mobile (Hong Kong) Ltd. (Hong Kong, Cellular) |
1.8 |
1.2 |
|
|
25.0 |
23.1 |
|
Top Ten Market Sectors as of October 31, 2000 |
||
|
|
% of fund's |
% of fund's net assets |
|
Technology |
18.7 |
28.6 |
|
Finance |
15.5 |
10.5 |
|
Durables |
15.0 |
12.1 |
|
Utilities |
7.7 |
8.8 |
|
Health |
7.6 |
5.1 |
|
Industrial Machinery & Equipment |
7.3 |
12.8 |
|
Construction & Real Estate |
6.6 |
3.6 |
|
Media & Leisure |
6.3 |
5.0 |
|
Basic Industries |
2.4 |
3.7 |
|
Retail & Wholesale |
2.2 |
3.4 |
Annual Report
Pacific Basin
Showing Percentage of Net Assets
|
Common Stocks - 92.1% |
|||
|
Shares |
Value (Note 1) |
||
|
Australia - 8.7% |
|||
|
AMP Ltd. |
356,000 |
$ 3,220,165 |
|
|
BHP Ltd. |
554,725 |
5,395,702 |
|
|
Billabong International Ltd. (a) |
243,300 |
522,662 |
|
|
Brambles Industries Ltd. |
34,053 |
885,970 |
|
|
BRL Hardy Ltd. |
146,600 |
577,243 |
|
|
Cable & Wireless Optus Ltd. (a) |
2,002,000 |
4,254,916 |
|
|
Cochlear Ltd. |
179,600 |
2,531,653 |
|
|
Commonwealth Bank of Australia |
149,200 |
2,228,002 |
|
|
F. H. Faulding & Co. Ltd. |
93,544 |
496,300 |
|
|
Fosters Brewing Group Ltd. |
573,100 |
1,302,688 |
|
|
National Australia Bank Ltd. |
370,658 |
5,166,980 |
|
|
News Corp. Ltd. |
931,609 |
10,014,799 |
|
|
Perpetual Trustees Australia Ltd. |
122,100 |
2,184,755 |
|
|
Publishing & Broadcasting Ltd. |
295,400 |
2,023,601 |
|
|
Tabcorp Holdings Ltd. |
246,900 |
1,346,922 |
|
|
Telstra Corp. Ltd. |
751,200 |
2,460,078 |
|
|
Westfield Holdings Ltd. |
81,900 |
530,374 |
|
|
TOTAL AUSTRALIA |
45,142,810 |
||
|
Hong Kong - 11.0% |
|||
|
APT Satellite Holdings Ltd. |
325,000 |
178,172 |
|
|
Asia Satellite Telecommunications Holdings Ltd. |
630,000 |
1,276,489 |
|
|
Cathay Pacific Airways Ltd. |
584,000 |
1,059,714 |
|
|
Cheung Kong Holdings Ltd. |
400,000 |
4,424,240 |
|
|
China Mobile (Hong Kong) Ltd. (a) |
1,499,500 |
9,184,437 |
|
|
Citic Pacific Ltd. |
342,000 |
1,372,745 |
|
|
Dah Sing Financial Holdings Ltd. |
342,000 |
1,469,232 |
|
|
Dao Heng Bank Group Ltd. |
294,000 |
1,485,467 |
|
|
Great Eagle Holdings Ltd. |
469,000 |
673,613 |
|
|
Hang Seng Bank Ltd. |
337,600 |
3,972,172 |
|
|
Hongkong Land Holdings Ltd. |
1,516,000 |
2,804,600 |
|
|
Hutchison Whampoa Ltd. |
795,700 |
9,872,335 |
|
|
Johnson Electric Holdings Ltd. |
3,060,000 |
6,082,368 |
|
|
Li & Fung Ltd. |
3,022,000 |
5,619,297 |
|
|
Sun Hung Kai Properties Ltd. |
418,000 |
3,457,447 |
|
|
Swire Pacific Ltd. (A Shares) |
345,500 |
2,131,143 |
|
|
Television Broadcasts Ltd. |
310,000 |
1,697,497 |
|
|
TOTAL HONG KONG |
56,760,968 |
||
|
India - 1.6% |
|||
|
Dr. Reddy's Laboratories Ltd. |
87,900 |
2,630,526 |
|
|
Hughes Software Systems Ltd. |
154,000 |
3,480,574 |
|
|
Infosys Technologies Ltd. |
15,320 |
2,344,652 |
|
|
TOTAL INDIA |
8,455,752 |
||
|
Indonesia - 0.4% |
|||
|
Gudang Garam PT Perusahaan |
320,000 |
344,048 |
|
|
PT Indofood Sukses Makmur (a) |
10,672,500 |
884,852 |
|
|
PT Matahari Putra Prima Tbk |
5,350,000 |
329,097 |
|
|
Sampoerna, Hanjaya Mandala |
356,500 |
419,522 |
|
|
TOTAL INDONESIA |
1,977,519 |
||
|
|
|||
|
Shares |
Value (Note 1) |
||
|
Japan - 60.1% |
|||
|
Aeon Credit Service Ltd. |
55,600 |
$ 3,118,614 |
|
|
Anritsu Corp. |
296,000 |
6,510,861 |
|
|
Asahi Techno Glass Corp. |
377,000 |
3,006,049 |
|
|
Canon, Inc. |
258,000 |
10,465,125 |
|
|
Capcom Co. Ltd. |
57,400 |
2,220,035 |
|
|
Central Glass Co. Ltd. |
448,000 |
2,048,868 |
|
|
Credit Saison Co. Ltd. |
61,500 |
1,302,035 |
|
|
Daito Trust Construction Co. |
135,000 |
2,276,602 |
|
|
Daiwa Securities Group, Inc. |
229,000 |
2,537,449 |
|
|
DDI Corp. |
73 |
342,553 |
|
|
Fujisawa Pharmaceutical Co. Ltd. |
116,000 |
3,646,595 |
|
|
Furukawa Co. Ltd. |
849,000 |
1,742,975 |
|
|
Furukawa Electric Co. Ltd. |
418,000 |
10,994,959 |
|
|
Hitachi Chemical Co. Ltd. |
150,000 |
3,766,841 |
|
|
Hitachi Zosen Corp. (a) |
1,993,000 |
1,516,076 |
|
|
Hogy Medical Co. |
20,700 |
1,328,018 |
|
|
Honda Motor Co. Ltd. (a) |
125,000 |
4,324,219 |
|
|
Hoya Corp. |
55,200 |
4,563,322 |
|
|
HUNET, Inc. |
68,000 |
573,366 |
|
|
Ines Corp. |
78,600 |
982,590 |
|
|
Japan Medical Dynamic Marketing, Inc. |
57,400 |
1,899,129 |
|
|
Kappa Create Co. Ltd. |
17,000 |
553,112 |
|
|
Konami Co. Ltd. |
84,400 |
7,116,488 |
|
|
Konica Corp. (a) |
393,000 |
3,036,376 |
|
|
Kyocera Corp. |
39,900 |
5,336,625 |
|
|
Matsushita Electric Industrial Co. Ltd. |
235,000 |
6,867,875 |
|
|
Mitsubishi Electric Corp. |
570,000 |
4,095,683 |
|
|
Mitsubishi Estate Co. Ltd. (a) |
242,000 |
2,572,816 |
|
|
Mitsui Fudosan Co. Ltd. |
121,000 |
1,466,062 |
|
|
Mitsumi Electric Co. Ltd. |
46,000 |
1,517,734 |
|
|
NEC Corp. |
423,000 |
8,063,789 |
|
|
Nidec Corp. |
10,300 |
631,537 |
|
|
Nikko Securities Co. Ltd. |
450,000 |
3,885,070 |
|
|
Nintendo Co. Ltd. |
18,800 |
3,110,072 |
|
|
Nippon Paper Industries Co. Ltd. |
217,000 |
1,237,045 |
|
|
Nippon Sheet Glass Co. Ltd. |
406,000 |
6,176,886 |
|
|
Nippon Telegraph & Telephone Corp. |
1,299 |
11,822,079 |
|
|
Nitto Denko Corp. |
126,000 |
4,261,204 |
|
|
Nomura Securities Co. Ltd. |
328,000 |
6,959,216 |
|
|
NTT DoCoMo, Inc. |
102 |
2,514,710 |
|
|
Oki Electric Industry Co. Ltd. (a) |
763,000 |
4,538,420 |
|
|
Omron Corp. |
165,000 |
4,067,913 |
|
|
ORIX Corp. |
31,800 |
3,337,091 |
|
|
Pioneer Corp. |
125,000 |
3,872,239 |
|
|
Ricoh Co. Ltd. |
217,000 |
3,341,215 |
|
|
Rohm Co. Ltd. |
26,500 |
6,681,468 |
|
|
Saizeriya Co. Ltd. |
64,200 |
3,589,222 |
|
|
Sakura Bank Ltd. |
1,205,000 |
8,779,901 |
|
|
Sanyo Electric Co. Ltd. |
1,061,000 |
8,071,029 |
|
|
Shin-Etsu Chemical Co. Ltd. |
64,000 |
2,627,807 |
|
|
Shiseido Co. Ltd. |
105,000 |
1,356,888 |
|
|
SKY Perfect Communications, Inc. (a) |
48 |
88,425 |
|
|
Common Stocks - continued |
|||
|
Shares |
Value (Note 1) |
||
|
Japan - continued |
|||
|
Skylark Co. Ltd. |
113,000 |
$ 3,987,261 |
|
|
Softbank Corp. |
17,300 |
1,038,539 |
|
|
Sony Corp. |
197,600 |
16,400,800 |
|
|
Sumitomo Bank Ltd. |
335,000 |
4,068,142 |
|
|
Sumitomo Trust & Banking Ltd. |
513,000 |
3,949,409 |
|
|
Takeda Chemical Industries Ltd. |
253,000 |
16,671,891 |
|
|
The Suruga Bank Ltd. |
249,000 |
3,418,587 |
|
|
THK Co. Ltd. |
67,700 |
1,675,282 |
|
|
Tokyo Broadcasting System, Inc. |
90,000 |
3,522,134 |
|
|
Tokyo Tomin Bank Ltd. |
80,400 |
2,247,457 |
|
|
Toshiba Corp. |
847,000 |
6,054,991 |
|
|
Toyoda Gosei Co. Ltd. |
201,000 |
12,305,747 |
|
|
Toyota Motor Corp. |
545,000 |
21,778,026 |
|
|
Tsubaki Nakashima Co. Ltd. |
62,500 |
783,040 |
|
|
Union Tool Co. (a) |
9,400 |
646,137 |
|
|
Yakult Honsha Co. Ltd. |
92,000 |
1,048,923 |
|
|
Yamada Denki Co. Ltd. |
58,000 |
5,103,107 |
|
|
Yamanouchi Pharmaceutical Co. Ltd. |
113,000 |
5,116,121 |
|
|
Yoshinoya D&C Co. Ltd. |
181 |
340,070 |
|
|
TOTAL JAPAN |
310,897,942 |
||
|
Korea (South) - 3.1% |
|||
|
Kookmin Bank |
266,000 |
3,040,000 |
|
|
Kookmin Credit Card Co. Ltd. |
51,930 |
1,132,188 |
|
|
Korea Electric Power Corp. |
116,500 |
2,601,407 |
|
|
Samsung Electronics Co. Ltd. |
26,080 |
3,267,165 |
|
|
Samsung Heavy Industries Ltd. (a) |
427,600 |
1,330,729 |
|
|
SK Telecom Co. Ltd. |
21,900 |
4,668,792 |
|
|
TOTAL KOREA (SOUTH) |
16,040,281 |
||
|
Malaysia - 0.7% |
|||
|
AMMB Holdings BHD |
752,400 |
843,480 |
|
|
Amway Holdings BHD |
240,000 |
429,474 |
|
|
Commerce Asset Holding BHD |
527,000 |
1,338,303 |
|
|
Tanjong PLC |
570,000 |
1,065,000 |
|
|
TOTAL MALAYSIA |
3,676,257 |
||
|
New Zealand - 0.1% |
|||
|
Warehouse Group Ltd. (The) |
278,100 |
692,730 |
|
|
Papua New Guinea - 0.1% |
|||
|
Oil Search Ltd. (a) |
397,800 |
320,719 |
|
|
Singapore - 4.1% |
|||
|
Datacraft Asia Ltd. |
441,000 |
3,020,850 |
|
|
DBS Group Holdings Ltd. |
145,239 |
1,713,564 |
|
|
DBS Land Ltd. |
701,000 |
1,066,783 |
|
|
Keppel Land Ltd. |
400,000 |
597,321 |
|
|
Oversea-Chinese Banking Corp. Ltd. |
220,000 |
1,404,389 |
|
|
Overseas Union Bank Ltd. |
588,452 |
2,850,865 |
|
|
Parkway Holdings Ltd. |
103,000 |
211,342 |
|
|
Singapore Airlines Ltd. |
155,000 |
1,554,859 |
|
|
|
|||
|
Shares |
Value (Note 1) |
||
|
Singapore Technologies Engineering Ltd. |
2,332,000 |
$ 3,761,505 |
|
|
United Overseas Bank Ltd. |
499,152 |
3,698,476 |
|
|
Venture Manufacturing Singapore Ltd. |
121,000 |
1,172,414 |
|
|
TOTAL SINGAPORE |
21,052,368 |
||
|
Taiwan - 1.9% |
|||
|
China Development Corp. (a) |
307,200 |
258,695 |
|
|
Hon Hai Precision Industries Co. Ltd. (a) |
456,300 |
2,387,452 |
|
|
Microelectronics Technology, Inc. (a) |
427,200 |
806,786 |
|
|
Taishin International Bank (a) |
2,810,500 |
1,313,887 |
|
|
Taiwan Semiconductor Manufacturing Co. Ltd. (a) |
1,028,886 |
3,121,697 |
|
|
United Microelectronics Corp. (a) |
1,062,100 |
1,874,294 |
|
|
TOTAL TAIWAN |
9,762,811 |
||
|
Thailand - 0.3% |
|||
|
Advanced Info Service PCL (For. Reg.) (a) |
101,500 |
837,447 |
|
|
Shin Corporations PCL (For. Reg.) (a) |
66,600 |
198,851 |
|
|
TelecomAsia Corp. PCL (a) |
598,000 |
361,185 |
|
|
TelecomAsia Corp. PCL rights 4/30/08 (a) |
206,113 |
47,078 |
|
|
TOTAL THAILAND |
1,444,561 |
||
|
TOTAL COMMON STOCKS (Cost $424,289,031) |
476,224,718 |
||
|
Nonconvertible Preferred Stocks - 0.0% |
|||
|
|
|
|
|
|
Taiwan - 0.0% |
|||
|
Taishin International Bank |
363,000 |
111,260 |
|
|
Cash Equivalents - 8.4% |
|||
|
|
|
|
|
|
Fidelity Cash Central Fund, 6.61% (b) |
35,809,760 |
35,809,760 |
|
|
Fidelity Securities Lending Cash |
7,434,375 |
7,434,375 |
|
|
TOTAL CASH EQUIVALENTS (Cost $43,244,135) |
43,244,135 |
||
|
TOTAL INVESTMENT PORTFOLIO - 100.5% (Cost $467,647,389) |
519,580,113 |
||
|
NET OTHER ASSETS - (0.5)% |
(2,810,964) |
||
|
NET ASSETS - 100% |
$ 516,769,149 |
||
|
Legend |
|
(a) Non-income producing |
|
(b) The rate quoted is the annualized seven-day yield of the fund at period end. A complete listing of the fund's holdings as of its most recent fiscal year end is available upon request. |
|
Other Information |
|
Purchases and sales of securities, other than short-term securities, aggregated $1,037,000,540 and $1,145,348,851, respectively. |
|
The fund placed a portion of its portfolio transactions with brokerage firms which are affiliates of Fidelity Management & Research Company. The commissions paid to these affiliated firms were $45,498 for the period. |
|
The fund participated in the security lending program. At period end, the value of securities loaned amounted to $7,151,384. The fund received cash collateral of $7,434,375 which was invested in cash equivalents and U.S. Treasury Obligations valued at $551,441. Cash collateral includes $415,000 received for unsettled security loans. |
|
The fund participated in the interfund lending program as a borrower. The average daily loan balance during the period for which loans were outstanding amounted to $10,139,500. The weighted average interest rate was 5.94%. Interest expense includes $33,436 paid under the interfund lending program. |
|
The fund participated in the bank borrowing program. The average daily loan balance during the period for which loans were outstanding amounted to $2,348,000. The weighted average interest rate was 6.19%. Interest expense includes $807 paid under the bank borrowing program. |
|
Income Tax Information |
|
At October 31, 2000, the aggregate cost of investment securities for income tax purposes was $470,088,906. Net unrealized appreciation aggregated $49,491,207, of which $98,216,604 related to appreciated investment securities and $48,725,397 related to depreciated investment securities. |
|
The fund hereby designates approximately $1,358,000 as a capital gain designation dividend for the purpose of the dividend paid deduction. |
See accompanying notes which are an integral part of the financial statements.
Annual Report
Pacific Basin
Statement of Assets and Liabilities
|
|
October 31, 2000 |
|
|
Assets |
|
|
|
Investment in securities, at value |
|
$ 519,580,113 |
|
Foreign currency held at value |
|
4,542,895 |
|
Receivable for investments sold |
|
3,315,226 |
|
Receivable for fund shares sold |
|
1,277,141 |
|
Dividends receivable |
|
603,014 |
|
Interest receivable |
|
202,695 |
|
Redemption fees receivable |
|
59 |
|
Other receivables |
|
12,050 |
|
Total assets |
|
529,533,193 |
|
Liabilities |
|
|
|
Payable for investments purchased |
$ 3,082,462 |
|
|
Payable for fund shares redeemed |
1,522,402 |
|
|
Accrued management fee |
405,538 |
|
|
Other payables and |
319,267 |
|
|
Collateral on securities loaned, |
7,434,375 |
|
|
Total liabilities |
|
12,764,044 |
|
Net Assets |
|
$ 516,769,149 |
|
Net Assets consist of: |
|
|
|
Paid in capital |
|
$ 434,262,878 |
|
Undistributed net investment income |
|
27,938,404 |
|
Accumulated undistributed net realized gain (loss) on investments and foreign currency transactions |
|
2,722,915 |
|
Net unrealized appreciation (depreciation) on investments |
|
51,844,952 |
|
Net Assets, for 25,437,232 |
|
$ 516,769,149 |
|
Net Asset Value and redemption price per share ($516,769,149 ÷ 25,437,232 shares) |
|
$20.32 |
|
Maximum offering price per share (100/97.00 of $20.32) |
|
$20.95 |
Statement of Operations
|
|
Year ended October 31, 2000 |
|
|
Investment Income Dividends |
|
$ 4,893,270 |
|
Interest |
|
1,586,410 |
|
Security lending |
|
148,095 |
|
|
|
6,627,775 |
|
Less foreign taxes withheld |
|
(514,453) |
|
Total income |
|
6,113,322 |
|
Expenses |
|
|
|
Management fee |
|
|
|
Basic fee |
$ 5,517,243 |
|
|
Performance adjustment |
762,495 |
|
|
Transfer agent fees |
1,977,326 |
|
|
Accounting and security lending fees |
414,620 |
|
|
Non-interested trustees' compensation |
2,410 |
|
|
Custodian fees and expenses |
581,351 |
|
|
Registration fees |
92,752 |
|
|
Audit |
47,840 |
|
|
Legal |
15,544 |
|
|
Interest |
34,243 |
|
|
Miscellaneous |
4,726 |
|
|
Total expenses before reductions |
9,450,550 |
|
|
Expense reductions |
(178,733) |
9,271,817 |
|
Net investment income (loss) |
|
(3,158,495) |
|
Realized and Unrealized Gain (Loss) Net realized gain (loss) on: |
|
|
|
Investment securities |
89,207,128 |
|
|
Foreign currency transactions |
(207,997) |
88,999,131 |
|
Change in net unrealized appreciation (depreciation) on: |
|
|
|
Investment securities |
(132,044,132) |
|
|
Assets and liabilities in |
(113,651) |
(132,157,783) |
|
Net gain (loss) |
|
(43,158,652) |
|
Net increase (decrease) in net assets resulting from operations |
|
$ (46,317,147) |
|
Other Information |
|
$ 985,156 |
|
Sales charges - Retained by FDC |
|
$ 985,078 |
|
Deferred sales charges withheld |
|
$ 11,618 |
|
Expense reductions |
|
|
|
Directed brokerage arrangements |
|
$ 137,161 |
|
Transfer agent credits |
|
41,572 |
|
|
|
$ 178,733 |
See accompanying notes which are an integral part of the financial statements.
Annual Report
Pacific Basin
Financial Statements - continued
Statement of Changes in Net Assets
|
Increase (Decrease) in Net Assets |
Year ended
October 31, |
Year ended
October 31, |
|
Operations |
$ (3,158,495) |
$ (832,843) |
|
Net realized gain (loss) |
88,999,131 |
54,809,796 |
|
Change in net unrealized appreciation (depreciation) |
(132,157,783) |
177,169,218 |
|
Net increase (decrease) in net assets resulting from operations |
(46,317,147) |
231,146,171 |
|
Distributions to shareholders in excess of net investment income |
(9,139,090) |
(345,403) |
|
Share transactions |
614,678,244 |
388,881,157 |
|
Reinvestment of distributions |
8,972,789 |
338,512 |
|
Cost of shares redeemed |
(713,633,183) |
(156,304,703) |
|
Net increase (decrease) in net assets resulting from share transactions |
(89,982,150) |
232,914,966 |
|
Redemption fees |
2,326,690 |
701,135 |
|
Total increase (decrease) in net assets |
(143,111,697) |
464,416,869 |
|
Net Assets |
|
|
|
Beginning of period |
659,880,846 |
195,463,977 |
|
End of period (including under (over) distributions of net investment income of $27,938,404 |
$ 516,769,149 |
$ 659,880,846 |
|
Other Information Shares |
|
|
|
Sold |
23,840,559 |
21,838,288 |
|
Issued in reinvestment of distributions |
352,256 |
26,201 |
|
Redeemed |
(28,114,949) |
(8,941,281) |
|
Net increase (decrease) |
(3,922,134) |
12,923,208 |
Financial Highlights
|
Years ended October 31, |
2000 |
1999 |
1998 |
1997 |
1996 |
|
Selected Per-Share Data |
|
|
|
|
|
|
Net asset value, beginning of period |
$ 22.48 |
$ 11.89 |
$ 13.41 |
$ 14.65 |
$ 14.88 |
|
Income from Investment Operations |
|
|
|
|
|
|
Net investment income (loss) C |
(.10) |
(.04) |
(.02) |
(.01) |
.05 |
|
Net realized and unrealized gain (loss) |
(1.86) |
10.62 |
(1.26) |
(1.16) |
(.29) |
|
Total from investment operations |
(1.96) |
10.58 |
(1.28) |
(1.17) |
(.24) |
|
Less Distributions |
|
|
|
|
|
|
From net investment income |
- |
- |
- |
(.01) |
- |
|
In excess of net investment income |
(.28) |
(.02) |
(.25) |
(.07) |
- |
|
Total distributions |
(.28) |
(.02) |
(.25) |
(.08) |
- |
|
Redemption fees added to paid in capital |
.08 |
.03 |
.01 |
.01 |
.01 |
|
Net asset value, end of period |
$ 20.32 |
$ 22.48 |
$ 11.89 |
$ 13.41 |
$ 14.65 |
|
Total Return A, B |
(8.61)% |
89.36% |
(9.52)% |
(7.97)% |
(1.55)% |
|
Ratios and Supplemental Data |
|
|
|
|
|
|
Net assets, end of period (000 omitted) |
$ 516,769 |
$ 659,881 |
$ 195,464 |
$ 239,517 |
$ 572,150 |
|
Ratio of expenses to average net assets |
1.25% |
1.37% |
1.73% |
1.32% |
1.26% |
|
Ratio of expenses to average net assets after expense reductions |
1.22% D |
1.36% D |
1.72% D |
1.31% D |
1.24% D |
|
Ratio of net investment income (loss) to average net assets |
(.42)% |
(.24)% |
(.16)% |
(.04)% |
.30% |
|
Portfolio turnover rate |
144% |
101% |
57% |
42% |
85% |
|
A The total returns would have been lower had certain expenses not been reduced during the periods shown. B Total returns do not include the one time sales charge. C Net investment income (loss) per share has been calculated based on average shares outstanding during the period. D FMR or the fund has entered into varying arrangements with third parties who either paid or reduced a portion of the fund's expenses. |
|||||
See accompanying notes which are an integral part of the financial statements.
Annual Report
There are several ways to evaluate a fund's historical performance. You can look at the total percentage change in value, the average annual percentage change or the growth of a hypothetical $10,000 investment. Total return reflects the change in the value of an investment, assuming reinvestment of the fund's dividend income and capital gains (the profits earned upon the sale of securities that have grown in value). If Fidelity had not reimbursed certain fund expenses, the life of fund total returns would have been lower.
Cumulative Total Returns
|
Periods ended |
|
Past 1 |
Past 5 |
Life of |
|
Fidelity Southeast Asia |
|
-3.24% |
-9.92% |
25.62% |
|
Fidelity Southeast Asia |
|
-6.14% |
-12.62% |
21.85% |
|
MSCI Far East Free ex-Japan |
|
-21.38% |
-33.88% |
0.90% |
|
Pacific Region ex-Japan |
|
-11.65% |
-17.16% |
n/a* |
Cumulative total returns show the fund's performance in percentage terms over a set period - in this case, one year, five years or since the fund started on April 19, 1993. For example, if you had invested $1,000 in a fund that had a 5% return over the past year, the value of your investment would be $1,050. You can compare the fund's returns to the performance of the Morgan Stanley Capital International AC Far East Free ex-Japan Index - a market capitalization-weighted index of over 395 stocks traded in eight Asian markets, excluding Japan. To measure how the fund's performance stacked up against its peers, you can compare it to the Pacific region ex-Japan funds average, which reflects the performance of mutual funds with similar objectives tracked by Lipper Inc. The past one year average represents a peer group of 84 mutual funds. These benchmarks include reinvested dividends and capital gains, if any, and exclude the effect of sales charges.
Average Annual Total Returns
|
Periods ended |
Past 1 |
Past 5 |
Life of |
|
Fidelity Southeast Asia |
-3.24% |
-2.07% |
3.07% |
|
Fidelity Southeast Asia |
-6.14% |
-2.66% |
2.66% |
|
MSCI Far East Free ex-Japan |
-21.38% |
-7.94% |
0.12% |
|
Pacific Region ex-Japan |
-11.65% |
-4.29% |
n/a* |
Average annual total returns take the fund's cumulative return and show you what would have happened if the fund had performed at a constant rate each year.
* Not available
$10,000 Over Life of Fund
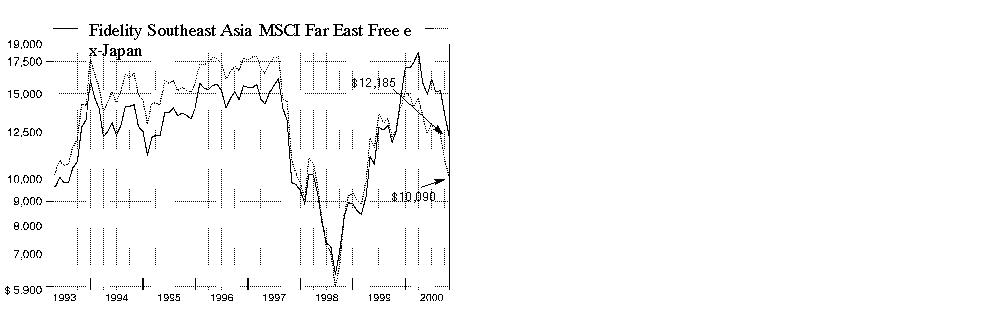
$10,000 Over Life of Fund: Let's say hypothetically that $10,000 was invested in Fidelity Southeast Asia Fund on April 19, 1993, when the fund started, and the current 3.00% sales charge was paid. As the chart shows, by October 31, 2000, the value of the investment would have been $12,185 - a 21.85% increase on the initial investment. For comparison, look at how the Morgan Stanley Capital International AC Far East Free ex-Japan Index did over the same period. With dividends and capital gains, if any, reinvested, the same $10,000 would have been $10,090 - a 0.90% increase.
Understanding Performance
Many markets around the globe offer the potential for significant growth over time; however, investing in foreign markets means assuming greater risks than investing in the United States. Factors like changes in a country's financial markets, its local political and economic climate, and the fluctuating value of its currency create these risks. For these reasons an international fund's performance may be more volatile than a fund that invests exclusively in the United States. Past performance is no guarantee of future results and you may have a gain or loss when you sell your shares.
3Semiannual Report
(Portfolio Manager photograph)
An interview with
Allan Liu, Portfolio
Manager of Fidelity
Southeast Asia Fund
Q. How did the fund perform, Allan?
A. Although the fund did very well compared with its benchmarks, its returns were negative. For the 12 months that ended October 31, 2000, the fund returned -3.24%, substantially ahead of the -21.38% return of the Morgan Stanley Capital International AC Far East Free ex-Japan Index and the -11.65% mark posted by the Pacific Region ex-Japan funds average tracked by Lipper Inc.
Q. Why was the fund's performance so much better than its index and peer group?
A. Most of the outperformance came in the first six months of the period, during which the fund benefited from overweightings in the technology and telecommunications sectors, as well as from strong stock selection in South Korea, Hong Kong, Taiwan, Singapore and Malaysia. Reflecting action in the U.S. market's NASDAQ Composite Index, technology and telecommunications stocks in Southeast Asia spearheaded a robust rally that crested around mid-March. However, there were rising concerns about the huge capital expenditure of telecommunications companies. From March through the third week of May, technology and telecommunications shares worldwide corrected sharply even though stocks in Southeast Asia were trading at substantially lower valuations than their U.S. counterparts. Since June I decreased the fund's technology and telecommunications exposure and increased the fund's holdings of banks and real estate companies, mostly in Hong Kong. The fund's stock selection and aggressively overweighted position in Hong Kong contributed positively to relative performance during the second half of the period.
Q. What attracted you to banks and real estate stocks in Hong Kong?
A. Around the time of the Federal Reserve Board's 0.50% interest-rate hike in May, the perception spread that rates had peaked and U.S. economic growth would begin to slow. Hong Kong interest rates are very sensitive to those in the U.S., so the belief that U.S. rates had peaked also eased upward pressure on Hong Kong rates. Historically, Hong Kong bank and real estate stocks have done well when interest rates have been stable or declining gradually, and a number of the fund's holdings in those groups did well from May through October.
Q. What stocks performed well for the fund?
A. China Telecom, now known as China Mobile, was the top contributor. The company is one of only two wireless communications licensees in China and therefore operates in a protected market for now. Hutchison Whampoa, the fund's largest holding, also helped performance. The company continued to demonstrate the ability to manage its various businesses effectively. Cheung Kong Holdings ably represented the rebounding real estate sector, while bank stock HSBC Holdings also reflected the positive influence of a more stable interest-rate environment in Hong Kong.
Q. What stocks detracted from performance?
A. Two manufacturers of integrated circuits, United Microelectronics and Taiwan Semiconductor, enjoyed good revenue and earnings growth but suffered from investors' recent aversion to technology stocks. Samsung Electronics, one of the world's leading DRAM (dynamic random access memory) manufacturers, declined in part because of downward pressure on DRAM prices in September stemming from weaker-than-expected demand for personal computers. Korea Electric Power's weak performance reflected renewed concern about the South Korean banking system. Consequently, many global investors avoided South Korea entirely.
Q. What's your outlook, Allan?
A. I will be carefully watching global demand in the next few quarters. A slowing U.S. economy could have a significant impact on demand for products from Taiwan and South Korea, especially in the technology sector. Another development that bears watching is the opening up of Chinese markets. Although there is considerable opportunity in China, there is excess capacity in many industries, making it difficult to do business profitably. Although we may see further short-term volatility in Southeast Asian markets, for now I am comfortable with the way the fund is positioned. Continued emphasis on well-managed companies with strong balance sheets, favorable market positions and concern for increasing shareholder value should serve the fund well in the future, as it has in the past.
The views expressed in this report reflect those of the portfolio manager only through the end of the period of the report as stated on the cover. The manager's views are subject to change at any time based on market or other conditions. For more information, see page A-3 .
Fund Facts
Goal: long-term capital appreciation by investing mainly in equity securities of Southeast Asian issuers
Fund number: 351
Trading symbol: FSEAX
Start date: April 19, 1993
Size: as of October 31, 2000, more than $290 million
Manager: Allan Liu, since inception; manager, various funds for non-U.S. investors; analyst, Southeast Asian markets, 1987-1990; joined Fidelity in 1987
3
Annual Report
Southeast Asia
|
Geographic Diversification (% of fund's net assets) |
|||
|
As of October 31, 2000 |
|||
|
Hong Kong |
53.9% |
|
|
Taiwan |
14.2% |
|
|
Singapore |
11.0% |
|
|
Korea (South) |
9.6% |
|
|
United States of America |
3.9% |
|
|
Malaysia |
2.8% |
|
|
China |
1.8% |
|
|
United Kingdom |
1.7% |
|
|
Thailand |
1.1% |
|
|
Other |
0.0% |
|

|
|
|||
|
As of April 30, 2000 |
|||
|
Hong Kong |
27.6% |
|
|
Korea (South) |
20.8% |
|
|
Taiwan |
18.6% |
|
|
Singapore |
9.8% |
|
|
Malaysia |
9.7% |
|
|
United States of America |
7.7% |
|
|
United Kingdom |
3.1% |
|
|
Thailand |
1.6% |
|
|
Indonesia |
0.5% |
|
|
Other |
0.6% |
|

|
Percentages are adjusted for the effect of futures contracts, if applicable. |
|
Asset Allocation |
||
|
|
% of fund's |
% of fund's net assets |
|
Stocks |
96.1 |
92.3 |
|
Short-Term Investments |
3.9 |
7.7 |
|
Top Ten Stocks as of October 31, 2000 |
||
|
|
% of fund's |
% of fund's net assets |
|
Hutchison Whampoa Ltd. (Hong Kong, Electrical Equipment) |
10.1 |
7.6 |
|
China Mobile (Hong Kong) Ltd. (Hong Kong, Cellular) |
8.0 |
6.5 |
|
Cheung Kong Holdings Ltd. |
6.6 |
4.4 |
|
Hang Seng Bank Ltd. |
4.0 |
0.0 |
|
SK Telecom Co. Ltd. |
3.7 |
3.0 |
|
Sun Hung Kai Properties Ltd. (Hong Kong, Real Estate) |
3.3 |
2.2 |
|
Taiwan Semiconductor Manufacturing Co. Ltd. |
3.2 |
6.5 |
|
Amoy Properties Ltd. |
2.9 |
0.0 |
|
Li & Fung Ltd. (Hong Kong, Trading Companies) |
2.6 |
1.8 |
|
Hysan Development Ltd. |
2.4 |
0.0 |
|
|
46.8 |
32.0 |
|
Top Ten Market Sectors as of October 31, 2000 |
||
|
|
% of fund's |
% of fund's net assets |
|
Construction & Real Estate |
20.7 |
7.7 |
|
Utilities |
20.5 |
16.2 |
|
Technology |
18.7 |
40.9 |
|
Industrial Machinery & Equipment |
11.8 |
11.6 |
|
Finance |
10.5 |
6.9 |
|
Transportation |
4.4 |
0.4 |
|
Retail & Wholesale |
2.6 |
2.2 |
|
Energy |
2.0 |
0.0 |
|
Media & Leisure |
1.9 |
3.4 |
|
Holding Companies |
1.3 |
0.0 |
Annual Report
Southeast Asia
Showing Percentage of Net Assets
|
Common Stocks - 96.1% |
|||
|
Shares |
Value (Note 1) |
||
|
China - 1.8% |
|||
|
Angang New Steel Co. Ltd. |
9,500,000 |
$ 901,519 |
|
|
China Petroleum & Chemical Corp. |
4,000,000 |
784,822 |
|
|
PetroChina Co. Ltd. (H Shares) |
8,000,000 |
1,682,493 |
|
|
Yanzhou Coal Mining Co. Ltd. (H Shares) |
6,750,000 |
1,796,145 |
|
|
TOTAL CHINA |
5,164,979 |
||
|
Hong Kong - 53.9% |
|||
|
Amoy Properties Ltd. |
9,290,000 |
8,458,505 |
|
|
Asat Holdings Ltd. sponsored ADR |
156,400 |
1,036,150 |
|
|
Cathay Pacific Airways Ltd. |
1,486,000 |
2,696,465 |
|
|
Cheung Kong Holdings Ltd. |
1,726,000 |
19,090,594 |
|
|
China Mobile (Hong Kong) Ltd. (a) |
3,813,000 |
23,354,623 |
|
|
China Unicom Ltd. |
750,000 |
1,505,203 |
|
|
Citic Pacific Ltd. |
936,000 |
3,756,987 |
|
|
CLP Holdings Ltd. |
1,300,000 |
6,068,262 |
|
|
Hang Seng Bank Ltd. |
988,000 |
11,624,722 |
|
|
Henderson Land Development Co. Ltd. |
502,000 |
2,163,030 |
|
|
Hong Kong & China Gas Co. Ltd. |
2,480,000 |
3,132,618 |
|
|
Hong Kong Electric Holdings Ltd. |
600,000 |
1,981,290 |
|
|
Hongkong Land Holdings Ltd. |
2,853,000 |
5,278,050 |
|
|
Hutchison Whampoa Ltd. |
2,361,700 |
29,301,868 |
|
|
Hysan Development Ltd. |
5,570,000 |
7,035,759 |
|
|
Johnson Electric Holdings Ltd. |
2,446,000 |
4,861,919 |
|
|
Kerry Properties Ltd. |
760,000 |
872,281 |
|
|
Li & Fung Ltd. |
4,028,000 |
7,489,917 |
|
|
Sun Hung Kai Properties Ltd. |
1,174,310 |
9,713,193 |
|
|
Swire Pacific Ltd. (A Shares) |
868,000 |
5,354,074 |
|
|
Television Broadcasts Ltd. |
399,000 |
2,184,843 |
|
|
TOTAL HONG KONG |
156,960,353 |
||
|
Indonesia - 0.0% |
|||
|
PT Lippo Bank Tbk |
36,000,000 |
0 |
|
|
warrants 5/1/02 (a) |
36,000,000 |
0 |
|
|
TOTAL INDONESIA |
0 |
||
|
Korea (South) - 9.6% |
|||
|
H&CB |
98,930 |
2,378,669 |
|
|
Korea Electric Power Corp. |
262,000 |
5,850,374 |
|
|
Korea Gas Corp. |
20,000 |
321,758 |
|
|
Korea Telecom |
44,700 |
2,632,879 |
|
|
Samsung Electronics Co. Ltd. |
48,034 |
6,017,447 |
|
|
SK Telecom Co. Ltd. |
49,960 |
10,650,815 |
|
|
TOTAL KOREA (SOUTH) |
27,851,942 |
||
|
Malaysia - 2.8% |
|||
|
British American Tobacco BHD |
260,000 |
2,377,632 |
|
|
DiGi.com BHD (a) |
1,000,000 |
1,500,000 |
|
|
Malayan Banking BHD |
400,000 |
1,600,000 |
|
|
Malaysia Airports Holdings BHD |
1,400,000 |
876,842 |
|
|
|
|||
|
Shares |
Value (Note 1) |
||
|
Nexnews.com BHD |
175,000 |
$ 239,474 |
|
|
Tanjong PLC |
450,000 |
840,789 |
|
|
Technology Resources Industries BHD (a) |
200,000 |
162,105 |
|
|
Telekom Malaysia BHD |
200,000 |
615,789 |
|
|
United Engineers BHD warrants 11/18/02 (a) |
170,000 |
109,605 |
|
|
TOTAL MALAYSIA |
8,322,236 |
||
|
Singapore - 11.0% |
|||
|
Allgreen Properties Ltd. |
1,800,000 |
1,159,305 |
|
|
City Developments Ltd. |
350,000 |
1,615,845 |
|
|
Datacraft Asia Ltd. |
431,400 |
2,955,090 |
|
|
DBS Group Holdings Ltd. |
239,605 |
2,826,916 |
|
|
DBS Land Ltd. |
800,000 |
1,217,441 |
|
|
Gul Technologies Singapore Ltd. |
1,000,000 |
512,967 |
|
|
Keppel Land Ltd. |
400,000 |
597,321 |
|
|
OMNI Industries Ltd. |
800,000 |
1,349,672 |
|
|
Singapore Airlines Ltd. |
400,000 |
4,012,539 |
|
|
Singapore Press Holdings Ltd. |
174,076 |
2,490,343 |
|
|
Singapore Technologies Engineering Ltd. |
2,106,175 |
3,397,250 |
|
|
Singapore Telecommunications Ltd. |
2,900,000 |
4,809,917 |
|
|
United Overseas Bank Ltd. |
480,000 |
3,556,569 |
|
|
Venture Manufacturing Singapore Ltd. |
150,000 |
1,453,406 |
|
|
TOTAL SINGAPORE |
31,954,581 |
||
|
Taiwan - 14.2% |
|||
|
Asustek Computer, Inc. (a) |
559,112 |
2,786,905 |
|
|
Bank Sinopac (a) |
3,000,000 |
1,249,226 |
|
|
Cathay Life Insurance Co. Ltd. |
722,000 |
1,296,471 |
|
|
Compal Electronics, Inc. |
1,200,000 |
1,831,579 |
|
|
Compeq Manufacturing Co. Ltd. (a) |
461,080 |
1,741,541 |
|
|
Episil Technologies, Inc. (a) |
1,568,500 |
2,112,376 |
|
|
Hon Hai Precision Industries Co. Ltd. (a) |
625,644 |
3,273,493 |
|
|
Nanya Technology Corp. |
1,661,000 |
1,275,319 |
|
|
Quanta Computer, Inc. |
590,000 |
2,009,288 |
|
|
Siliconware Precision Industries |
1,901,000 |
1,447,820 |
|
|
Stark Technology, Inc. |
689,000 |
4,223,591 |
|
|
Taishin International Bank (a) |
2,400,000 |
1,121,981 |
|
|
Taiwan Semiconductor Manufacturing Co. Ltd. (a) |
3,087,746 |
9,368,393 |
|
|
United Microelectronics Corp. (a) |
3,819,940 |
6,741,071 |
|
|
Winbond Electronics Corp. (a) |
800,000 |
775,232 |
|
|
TOTAL TAIWAN |
41,254,286 |
||
|
Thailand - 1.1% |
|||
|
Advanced Info Service PCL (For. Reg.) (a) |
120,500 |
994,211 |
|
|
PTT Exploration & Production |
470,000 |
1,146,211 |
|
|
Total Access Communication PCL (a) |
342,000 |
1,087,560 |
|
|
TOTAL THAILAND |
3,227,982 |
||
|
Common Stocks - continued |
|||
|
Shares |
Value (Note 1) |
||
|
United Kingdom - 1.7% |
|||
|
HSBC Holdings PLC (Hong Kong) (Reg.) |
348,350 |
$ 5,023,207 |
|
|
TOTAL COMMON STOCKS (Cost $223,250,683) |
279,759,566 |
||
|
Cash Equivalents - 3.8% |
|||
|
|
|
|
|
|
Fidelity Cash Central Fund, 6.61% (b) |
9,944,783 |
9,944,783 |
|
|
Fidelity Securities Lending Cash |
1,094,100 |
1,094,100 |
|
|
TOTAL CASH EQUIVALENTS (Cost $11,038,883) |
11,038,883 |
||
|
TOTAL INVESTMENT PORTFOLIO - 99.9% (Cost $234,289,566) |
290,798,449 |
||
|
NET OTHER ASSETS - 0.1% |
200,041 |
||
|
NET ASSETS - 100% |
$ 290,998,490 |
||
|
Legend |
|
(a) Non-income producing |
|
(b) The rate quoted is the annualized seven-day yield of the fund at period end. A complete listing of the fund's holdings as of its most recent fiscal year end is available upon request. |
|
Other Information |
|
Purchases and sales of securities, other than short-term securities, aggregated $364,433,725 and $438,764,490, respectively. |
|
The fund participated in the security lending program. At period end, the value of securities loaned amounted to $1,035,488. The fund received cash collateral of $1,094,100 which was invested in cash equivalents. |
|
The fund participated in the bank borrowing program. The average daily loan balance during the period for which loans were outstanding amounted to $1,016,667. The weighted average interest rate was 6.79%. |
|
Income Tax Information |
|
At October 31, 2000, the aggregate cost of investment securities for income tax purposes was $235,610,427. Net unrealized appreciation aggregated $55,188,022, of which $71,638,458 related to appreciated investment securities and $16,450,436 related to depreciated investment securities. |
|
At October 31, 2000, the fund had a capital loss carryforward of approximately $93,028,000 of which $92,704,000 and $324,000 will expire on October 31, 2006 and 2007, respectively. |
See accompanying notes which are an integral part of the financial statements.
Annual Report
Southeast Asia
Statement of Assets and Liabilities
|
|
October 31, 2000 |
|
|
Assets |
|
|
|
Investment in securities, at value |
|
$ 290,798,449 |
|
Foreign currency held at value |
|
1,726,202 |
|
Receivable for investments sold |
|
2,227,429 |
|
Receivable for fund shares sold |
|
194,019 |
|
Dividends receivable |
|
97,312 |
|
Interest receivable |
|
77,046 |
|
Redemption fees receivable |
|
164 |
|
Other receivables |
|
1,642 |
|
Total assets |
|
295,122,263 |
|
Liabilities |
|
|
|
Payable for investments purchased |
$ 1,661,504 |
|
|
Payable for fund shares redeemed |
520,841 |
|
|
Accrued management fee |
240,502 |
|
|
Other payables and |
606,826 |
|
|
Collateral on securities loaned, |
1,094,100 |
|
|
Total liabilities |
|
4,123,773 |
|
Net Assets |
|
$ 290,998,490 |
|
Net Assets consist of: |
|
|
|
Paid in capital |
|
$ 332,181,127 |
|
Accumulated undistributed net realized gain (loss) on |
|
(97,323,960) |
|
Net unrealized appreciation (depreciation) on investments |
|
56,141,323 |
|
Net Assets, for 24,778,029 |
|
$ 290,998,490 |
|
Net Asset Value and redemption price per share ($290,998,490 ÷ 24,778,029 shares) |
|
$11.74 |
|
Maximum offering price per share (100/97.00 of $11.74) |
|
$12.10 |
Statement of Operations
|
|
Year ended October 31, 2000 |
|
|
Investment Income Dividends |
|
$ 4,369,438 |
|
Interest |
|
782,618 |
|
Security lending |
|
102,284 |
|
|
|
5,254,340 |
|
Less foreign taxes withheld |
|
(330,106) |
|
Total income |
|
4,924,234 |
|
Expenses |
|
|
|
Management fee |
|
|
|
Basic fee |
$ 3,201,648 |
|
|
Performance adjustment |
677,854 |
|
|
Transfer agent fees |
1,158,668 |
|
|
Accounting and security lending fees |
263,034 |
|
|
Non-interested trustees' compensation |
1,819 |
|
|
Custodian fees and expenses |
597,273 |
|
|
Registration fees |
51,105 |
|
|
Audit |
66,944 |
|
|
Legal |
10,818 |
|
|
Interest |
1,151 |
|
|
Miscellaneous |
4,877 |
|
|
Total expenses before reductions |
6,035,191 |
|
|
Expense reductions |
(88,993) |
5,946,198 |
|
Net investment income (loss) |
|
(1,021,964) |
|
Realized and Unrealized Gain (Loss) Net realized gain (loss) on: |
|
|
|
Investment securities |
47,354,635 |
|
|
Foreign currency transactions |
(453,403) |
46,901,232 |
|
Change in net unrealized appreciation (depreciation) on: |
|
|
|
Investment securities |
(43,826,490) |
|
|
Assets and liabilities in |
(405,549) |
(44,232,039) |
|
Net gain (loss) |
|
2,669,193 |
|
Net increase (decrease) in net assets resulting from operations |
|
$ 1,647,229 |
|
Other Information |
|
$ 462,651 |
|
Sales charges - Retained by FDC |
|
$ 462,651 |
|
Expense reductions |
|
|
|
Directed brokerage arrangements |
|
$ 82,757 |
|
Custodian credits |
|
1,459 |
|
Transfer agent credits |
|
4,777 |
|
|
|
$ 88,993 |
See accompanying notes which are an integral part of the financial statements.
Annual Report
Southeast Asia
Financial Statements - continued
Statement of Changes in Net Assets
|
Increase (Decrease) in Net Assets |
Year ended
October 31, |
Year ended
October 31, |
|
Operations |
$ (1,021,964) |
$ 843,163 |
|
Net realized gain (loss) |
46,901,232 |
534,330 |
|
Change in net unrealized appreciation (depreciation) |
(44,232,039) |
103,803,682 |
|
Net increase (decrease) in net assets resulting from operations |
1,647,229 |
105,181,175 |
|
Distributions to shareholders from net investment income |
(596,056) |
(562,063) |
|
Share transactions |
186,667,900 |
212,535,353 |
|
Reinvestment of distributions |
573,854 |
540,135 |
|
Cost of shares redeemed |
(258,865,487) |
(181,366,771) |
|
Net increase (decrease) in net assets resulting from share transactions |
(71,623,733) |
31,708,717 |
|
Redemption fees |
889,166 |
1,014,716 |
|
Total increase (decrease) in net assets |
(69,683,394) |
137,342,545 |
|
Net Assets |
|
|
|
Beginning of period |
360,681,884 |
223,339,339 |
|
End of period (including undistributed net investment income of $0 and $566,245, respectively) |
$ 290,998,490 |
$ 360,681,884 |
|
Other Information Shares |
|
|
|
Sold |
11,795,989 |
19,445,097 |
|
Issued in reinvestment of distributions |
39,604 |
63,997 |
|
Redeemed |
(16,745,342) |
(17,300,454) |
|
Net increase (decrease) |
(4,909,749) |
2,208,640 |
Financial Highlights
|
Years ended October 31, |
2000 |
1999 |
1998 |
1997 |
1996 |
|
Selected Per-Share Data |
|
|
|
|
|
|
Net asset value, beginning of period |
$ 12.15 |
$ 8.13 |
$ 9.55 |
$ 14.69 |
$ 13.88 |
|
Income from Investment Operations |
|
|
|
|
|
|
Net investment income (loss) C |
(.04) |
.03 |
.09 |
.04 D |
.14 |
|
Net realized and unrealized gain (loss) |
(.38) |
3.97 |
(1.48) |
(4.62) |
.87 |
|
Total from investment operations |
(.42) |
4.00 |
(1.39) |
(4.58) |
1.01 |
|
Less Distributions |
|
|
|
|
|
|
From net investment income |
(.02) |
(.02) |
(.05) |
(.10) |
(.23) |
|
In excess of net investment income |
- |
- |
- |
(.07) |
- |
|
From net realized gain |
- |
- |
- |
(.40) |
- |
|
Total distributions |
(.02) |
(.02) |
(.05) |
(.57) |
(.23) |
|
Redemption fees added to paid in capital |
.03 |
.04 |
.02 |
.01 |
.03 |
|
Net asset value, end of period |
$ 11.74 |
$ 12.15 |
$ 8.13 |
$ 9.55 |
$ 14.69 |
|
Total Return A, B |
(3.24)% |
49.80% |
(14.44)% |
(32.48)% |
7.59% |
|
Ratios and Supplemental Data |
|
|
|
|
|
|
Net assets, end of period (000 omitted) |
$ 290,998 |
$ 360,682 |
$ 223,339 |
$ 278,847 |
$ 755,346 |
|
Ratio of expenses to average net assets |
1.37% |
1.46% |
1.83% |
1.32% |
1.13% |
|
Ratio of expenses to average net assets after expense reductions |
1.35% E |
1.43% E |
1.79% E |
1.32% |
1.12% E |
|
Ratio of net investment income (loss) to average net assets |
(.23)% |
.28% |
1.07% |
.22% |
.95% |
|
Portfolio turnover rate |
88% |
93% |
95% |
141% |
102% |
|
A The total returns would have been lower had certain expenses not been reduced during the periods shown. B Total returns do not include the one time sales charge. C Net investment income (loss) per share has been calculated based on average shares outstanding during the period. D Investment income per share reflects a special dividend which amounted to $.02 per share. E FMR or the fund has entered into varying arrangements with third parties who either paid or reduced a portion of the fund's expenses. |
|||||
See accompanying notes which are an integral part of the financial statements.
Annual Report
For the period ended October 31, 2000
1. Significant Accounting Policies.
Fidelity Canada Fund, Fidelity China Region Fund (formerly Fidelity Hong Kong and China Fund), Fidelity Emerging Markets Fund, Fidelity Europe Fund, Fidelity Europe Capital Appreciation Fund, Fidelity Japan Fund, Fidelity Japan Smaller Companies Fund, Fidelity Latin America Fund, Fidelity Nordic Fund, Fidelity Pacific Basin Fund, and Fidelity Southeast Asia Fund (the funds) are funds of Fidelity Investment Trust (the trust). The trust is registered under the Investment Company Act of 1940, as amended (the 1940 Act), as an open-end management investment company organized as a Massachusetts business trust. Each fund is authorized to issue an unlimited number of shares. Certain funds investments in emerging markets can be subject to social, economic, regulatory, and political uncertainties and can be extremely volatile. The financial statements have been prepared in conformity with generally accepted accounting principles which require management to make certain estimates and assumptions at the date of the financial statements. The following summarizes the significant accounting policies of the funds:
Security Valuation. Securities for which quotations are readily available are valued using the official closing price or at the last sale price in the principal market in which they are traded. If the last sale price (on the local exchange) is unavailable, the last evaluated quote or closing bid price normally is used. If trading or events occurring in other markets after the close of the principal market in which securities are traded are expected to materially affect the value of those securities, then they are valued at their fair value taking this trading or these events into account. Fair value is determined in good faith under consistently applied procedures under the general supervision of the Board of Trustees. Securities (including restricted securities) for which quotations are not readily available are valued primarily using dealer-supplied valuations or at their fair value. Short-term securities with remaining maturities of sixty days or less for which quotations are not readily available are valued at amortized cost or original cost plus accrued interest, both of which approximate current value. Investments in open-end investment companies are valued at their net asset value each business day.
Foreign Currency Translation. The accounting records of the funds are maintained in U.S. dollars. Investment securities and other assets and liabilities denominated in a foreign currency are translated into U.S. dollars at the prevailing rates of exchange at period end. Purchases and sales of securities, income receipts and expense payments are translated into U.S. dollars at the prevailing exchange rate on the respective dates of the transactions.
Net realized gains and losses on foreign currency transactions represent net gains and losses from sales and maturities of foreign currency contracts, disposition of foreign currencies, the difference between the amount of net investment income accrued and the U.S. dollar amount actually received, and gains and losses between trade and settlement date on purchases and sales of securities. The effects of changes in foreign currency exchange rates on investments in securities are included with the net realized and unrealized gain or loss on investment securities.
Income Taxes. As a qualified regulated investment company under Subchapter M of the Internal Revenue Code, each fund is not subject to U.S. federal income taxes to the extent that it distributes substantially all of its taxable income for its fiscal year. Each fund may be subject to foreign taxes on income and gains on investments which are accrued based upon each fund's understanding of the tax rules and regulations that exist in the markets in which they invest. Foreign governments may also impose taxes on other payments or transactions with respect to foreign securities. Each fund accrues such taxes as applicable. The schedules of investments include information regarding income taxes under the caption "Income Tax Information."
Investment Income. Dividend income is recorded on the ex-dividend date, except certain dividends from foreign securities where the ex-dividend date may have passed, are recorded as soon as the funds are informed of the ex-dividend date. Non-cash dividends included in dividend income, if any, are recorded at the fair market value of the securities received. Interest income is accrued as earned. Investment income is recorded net of foreign taxes withheld where recovery of such taxes is uncertain.
Expenses. Most expenses of the trust can be directly attributed to a fund. Expenses which cannot be directly attributed are apportioned among the funds in the trust.
Distributions to Shareholders. Distributions are recorded on the ex-dividend date.
Income and capital gain distributions are determined in accordance with income tax regulations which may differ from generally accepted accounting principles. These differences, which may result in distribution reclassifications, are primarily due to differing treatments for litigation proceeds, futures transactions, foreign currency transactions, passive foreign investment companies (PFIC), market discount, net operating losses, capital loss carryforwards and losses deferred due to wash sales and excise tax regulations. Certain funds also utilized earnings and profits distributed to shareholders on redemption of shares as a part of the dividends paid deduction for income tax purposes.
Permanent book and tax basis differences relating to shareholder distributions will result in reclassifications to paid in capital. Undistributed net investment income, distributions in excess of net investment income, accumulated net investment loss and accumulated undistributed net realized gain (loss) on investments and foreign currency transactions may include temporary book and tax basis differences which will reverse in a subsequent period. Any taxable income or gain remaining at fiscal year end is distributed in the following year.
Annual Report
Notes to Financial Statements - continued
1. Significant Accounting Policies - continued
Short-Term Trading (Redemption) Fees. Shares held in Canada, China Region, Emerging Markets, Japan, Japan Smaller Companies, Latin America, Nordic, Pacific Basin and Southeast Asia less than 90 days are subject to a short-term trading fee equal to 1.50% of the proceeds of the redeemed shares (1.00% for shares redeemed prior to May 31, 2000 for Pacific Basin). Shares held in Europe and Europe Capital Appreciation, less than 30 days are subject to a short-term trading fee equal to 1.00% of the proceeds of the redeemed shares. These fees, which are retained by the funds, are accounted for as an addition to paid in capital.
Security Transactions. Security transactions are accounted for as of trade date. Gains and losses on securities sold are determined on the basis of identified cost.
2. Operating Policies.
Foreign Currency Contracts. Certain funds use foreign currency contracts to facilitate transactions in foreign-denominated securities. Losses may arise from changes in the value of the foreign currency or if the counterparties do not perform under the contracts' terms. The U.S. dollar value of foreign currency contracts is determined using contractual currency exchange rates established at the time of each trade.
Joint Trading Account. Pursuant to an Exemptive Order issued by the Securities and Exchange Commission (the SEC), the funds, along with other affiliated entities of Fidelity Management & Research Company (FMR), may transfer uninvested cash balances into one or more joint trading accounts. These balances are invested in one or more repurchase agreements for U.S. Treasury or Federal Agency obligations.
Repurchase Agreements. The underlying U.S. Treasury, Federal Agency, or other obligations found to be satisfactory by FMR are transferred to an account of the funds, or to the Joint Trading Account, at a custodian bank. The securities are marked-to-market daily and maintained at a value at least equal to the principal amount of the repurchase agreement (including accrued interest). FMR, the funds' investment adviser, is responsible for determining that the value of the underlying securities remains in accordance with the market value requirements stated above.
Interfund Lending Program. Pursuant to an Exemptive Order issued by the SEC, the funds, along with other registered investment companies having management contracts with FMR, may participate in an interfund lending program. This program provides an alternative credit facility allowing the funds to borrow from, or lend money to, other participating funds. Information regarding each fund's participation in the program is included under the caption "Other Information" at the end of each applicable fund's schedule of investments.
When-Issued Securities. Each fund may purchase or sell securities on a when-issued basis. Payment and delivery may take place after the customary settlement period for that security. The price of the underlying securities is fixed at the time the transaction is negotiated. The market values of the securities purchased on a when-issued or forward commitment basis are identified as such in each applicable fund's schedule of investments. Each fund may receive compensation for interest forgone in the purchase of a when-issued security. With respect to purchase commitments, each fund identifies securities as segregated in its records with a value at least equal to the amount of the commitment. Losses may arise due to changes in the market value of the underlying securities, if the counterparty does not perform under the contract, or if the issuer does not issue the securities due to political, economic, or other factors.
Restricted Securities. Certain funds are permitted to invest in securities that are subject to legal or contractual restrictions on resale. These securities generally may be resold in transactions exempt from registration or to the public if the securities are registered. Disposal of these securities may involve time-consuming negotiations and expense, and prompt sale at an acceptable price may be difficult. At the end of the period, no funds had investments in restricted securities (excluding 144A issues).
3. Purchases and Sales of Investments.
Information regarding purchases and sales of securities (other than short-term securities) is included under the caption "Other Information" at the end of each applicable fund's schedule of investments.
4. Fees and Other Transactions with Affiliates.
Management Fee. As each fund's investment adviser, FMR receives a monthly basic fee that is calculated on the basis of a group fee rate plus a fixed individual fund fee rate applied to the average net assets of each fund. The group fee rate is the weighted average of a series of rates and is based on the monthly average net assets of all the mutual funds advised by FMR. The rates ranged from .2167% to .5200% for the period. The annual individual fund fee rate is .45%. In the event that these rates were lower than the contractual rates in effect during the period, FMR voluntarily implemented the above rates, as they resulted in the same or a lower management fee. The basic fee for Canada, Europe, Europe Capital Appreciation, Japan, Pacific Basin, and Southeast Asia is subject to a performance adjustment (up to a maximum of ±.20% of the fund's average net assets over the performance period) based on each fund's investment performance as compared to the appropriate index over a specified period of time. For the period,
Annual Report
Notes to Financial Statements - continued
4. Fees and Other Transactions with Affiliates - continued
Management Fee - continued
the management fees were equivalent to the following annual rates expressed as a percentage of average net assets after the performance adjustment, if applicable:
|
Canada |
.59% |
|
China Region |
.73% |
|
Emerging Markets |
.73% |
|
Europe |
.73% |
|
Europe Capital Appreciation |
.74% |
|
Japan |
.83% |
|
Japan Smaller Companies |
.73% |
|
Latin America |
.73% |
|
Nordic |
.72% |
|
Pacific Basin |
.83% |
|
Southeast Asia |
.88% |
Sub-Adviser Fee. Beginning January 1, 2001, FMR Co. (FMRC) will serve as a sub-adviser for the funds. FMRC may provide investment research and advice and may also provide investment advisory services for the funds. FMR, on behalf of the funds, entered into sub-advisory agreements with Fidelity Management & Research (U.K.) Inc., Fidelity Management & Research (Far East) Inc., and Fidelity International Investment Advisors (FIIA). Under the sub-advisory arrangements, FMR may receive investment advice and research services and may grant the sub-advisers investment management authority to buy and sell securities. FMR pays its sub-advisers either a portion of its management fee or a fee based on costs incurred for these services.
Sales Load. Fidelity Distributors Corporation (FDC), an affiliate of FMR, is the general distributor of the fund. FDC receives a sales charge of up to 3% for selling shares of each fund. Shares of Canada, Europe, and Pacific Basin purchased prior to October 12, 1990, are subject to a 1% deferred sales charge upon redemption. Effective March 1, 2000, Europe's and Europe Capital Appreciation's 3% sales charge was eliminated. The amounts received and retained by FDC for sales charges and deferred sales charges are shown under the caption "Other Information" on each fund's Statement of Operations.
Transfer Agent Fees. Fidelity Service Company, Inc. (FSC), an affiliate of FMR, is the funds' transfer, dividend disbursing and shareholder servicing agent. FSC receives account fees and asset-based fees that vary according to account size and type of account. FSC pays for typesetting, printing and mailing of all shareholder reports, except proxy statements. For the period, the transfer agent fees were equivalent to the following annual rates as a percentage of the average net assets:
|
Canada |
.27% |
|
China Region |
.29% |
|
Emerging Markets |
.36% |
|
Europe |
.24% |
|
Europe Capital Appreciation |
.22% |
|
Japan |
.22% |
|
Japan Smaller Companies |
.22% |
|
Latin America |
.30% |
|
Nordic |
.24% |
|
Pacific Basin |
.26% |
|
Southeast Asia |
.26% |
Accounting and Security Lending Fees. FSC maintains each fund's accounting records and administers the security lending program. The security lending fee is based on the number and duration of lending transactions. The accounting fee is based on the level of average net assets for the month plus out-of-pocket expenses.
Cash Central Funds. Pursuant to an Exemptive Order issued by the SEC, the funds may invest in the Fidelity Cash Central Fund and the Fidelity Securities Lending Cash Central Fund (the Cash Funds) managed by Fidelity Investments Money Management, Inc. (FIMM), an affiliate of FMR. The Cash Funds are open-end money market funds available only to investment companies and other accounts managed by FMR and its affiliates. The Cash Funds seek preservation of capital, liquidity, and current income. Income distributions from the Cash Funds are declared daily and paid monthly from net investment income. Income distributions earned by the funds are recorded as either interest income or security lending income in the accompanying financial statements.
Brokerage Commissions. Certain funds placed a portion of their portfolio transactions with brokerage firms which are affiliates of FMR. The commissions paid to these affiliated firms are shown under the caption "Other Information" at the end of each applicable fund's schedule of investments.
Annual Report
Notes to Financial Statements - continued
5. Security Lending.
Certain funds lend portfolio securities from time to time in order to earn additional income. Each applicable fund receives collateral (in the form of U.S. Treasury obligations, letters of credit and/or cash) against the loaned securities and maintains collateral in an amount not less than 100% of the market value of the loaned securities during the period of the loan. The market value of the loaned securities is determined at the close of business of the funds and any additional required collateral is delivered to the funds on the next business day. If the borrower defaults on its obligation to return the securities loaned because of insolvency or other reasons, a fund could experience delays and costs in recovering the securities loaned or in gaining access to the collateral. Information regarding the value of securities loaned and the value of collateral at period end is included under the caption "Other Information" at the end of each applicable fund's schedule of investments.
6. Bank Borrowings.
Each fund is permitted to have bank borrowings for temporary or emergency purposes to fund shareholder redemptions. Each fund has established borrowing arrangements with certain banks. The interest rate on the borrowings is the bank's base rate, as revised from time to time. Information regarding a fund's participation in the program is included under the caption "Other Information" at the end of each applicable fund's schedule of investments.
7. Expense Reductions.
FMR has directed certain portfolio trades to brokers who paid a portion of certain funds' expenses.
In addition, through arrangements with certain funds' custodian and transfer agent, credits realized as a result of uninvested cash balances were used to reduce a portion of each applicable fund's expenses.
For the period, the reductions under these arrangements are shown under the caption "Other Information" on each applicable fund's Statement of Operations.
8. Beneficial Interest.
At the end of the period, FMR and its affiliates were record owners of more than 5% of the outstanding shares of the following funds:
|
Fund |
|
% Ownership |
|
Fidelity Japan |
|
6% |
|
Fidelity Japan Smaller Companies |
16% |
|
9. Transactions with Affiliated Companies.
An affiliated company is a company which the fund has ownership of at least 5% of the voting securities. Information regarding transactions with affiliated companies is included in "Other Information" at the end of each applicable fund's schedule of investments.
10. Litigation.
The Fidelity Latin America Fund is engaged in litigation against the obligor on the inflation adjusted debt of Siderurgica Brasileiras SA, contesting the calculation of the principal adjustment. The probability of success of this litigation cannot be predicted and the amount of recovery cannot be estimated. Any recovery from this litigation would inure to the benefit of the fund. As of period end, the fund no longer holds Siderurgica Brasileiras SA debt securities.
11. Merger Information.
On July 24, 2000, July 26, 2000 and July 28, 2000, Fidelity Europe Fund acquired all of the assets and assumed all of the liabilities of Fidelity United Kingdom Fund, Fidelity Germany Fund and Fidelity France Fund (the acquired funds), respectively. The acquisitions, which were approved by the shareholders of the acquired funds on July 19, 2000, was accomplished by an exchange of 1,625,579 shares of the Fidelity Europe Fund for the 276,623 shares then outstanding (each valued at $13.31) of Fidelity United Kingdom Fund; for the 2,341,353 shares then outstanding (each valued at $19.94) of Fidelity Germany Fund; and for the 613,547 shares then outstanding (each valued at $20.22) of Fidelity France Fund.
The following table shows the net assets Europe Fund received in exchange for the shares issued from the following funds as a result of the merger:
|
Acquired Fund |
|
Net Asset Value |
|
Fidelity France Fund |
$12,405,920 |
|
|
Fidelity Germany Fund |
$46,686,578 |
|
|
Fidelity United Kingdom Fund |
$ 3,681,852 |
|
Based on the opinion of fund counsel, the reorganization qualified as a tax-free reorganization for federal income tax purposes with no gain or loss recognized to the funds or their shareholders. The acquired funds net assets, included $470,489, $5,561,612 and $2,749,870 of unrealized appreciation from Fidelity United Kingdom Fund, Fidelity Germany Fund and Fidelity France Fund, were combined with Fidelity Europe Fund. The total net assets of Fidelity Europe Fund were $1,558,908,897 after the acquisition of Fidelity United Kingdom Fund; $1,606,679,049 after the acquisition of Fidelity Germany Fund; and were $1,556,034,114 after the acquisition of Fidelity France Fund.
Annual Report
To the Trustees of Fidelity Investment Trust and the Shareholders of:
Fidelity Canada Fund,
Fidelity China Region Fund
(formerly Fidelity Hong Kong & China Fund),
Fidelity Emerging Markets Fund,
Fidelity Europe Fund,
Fidelity Japan Fund,
Fidelity Japan Smaller Companies Fund,
Fidelity Latin America Fund,
Fidelity Nordic Fund,
Fidelity Pacific Basin Fund,
Fidelity Southeast Asia Fund,
In our opinion, the accompanying statements of assets and liabilities, including the schedules of investments, and the related statements of operations and of changes in net assets and the financial highlights present fairly, in all material respects, the financial position of Fidelity Canada Fund, Fidelity China Region Fund (formerly Fidelity Hong Kong & China Fund), Fidelity Emerging Markets Fund, Fidelity Europe Fund, Fidelity Japan Fund, Fidelity Japan Smaller Companies Fund, Fidelity Latin America Fund, Fidelity Nordic Fund, Fidelity Pacific Basin Fund and Fidelity Southeast Asia Fund (funds of Fidelity Investment Trust) at October 31, 2000, and the results of their operations, the changes in their net assets and the financial highlights for the periods indicated, in conformity with accounting principles generally accepted in the United States of America. These financial statements and financial highlights (hereafter referred to as "financial statements") are the responsibility of the Fidelity Investment Trust's management; our responsibility is to express an opinion on these financial statements based on our audits. We conducted our audits of these financial statements in accordance with auditing standards generally accepted in the United States of America which require that we plan and perform the audit to obtain reasonable assurance about whether the financial statements are free of material misstatement. An audit includes examining, on a test basis, evidence supporting the amounts and disclosures in the financial statements, assessing the accounting principles used and significant estimates made by management, and evaluating the overall financial statement presentation. We believe that our audits, which included confirmation of securities at October 31, 2000 by correspondence with the custodian and brokers, provide a reasonable basis for our opinion.
/s/PricewaterhouseCoopers LLP
PricewaterhouseCoopers LLP
Boston, Massachusetts
December 18, 2000
Annual Report
To the Trustees of Fidelity Investment Trust and Shareholders of Fidelity Europe Capital Appreciation Fund:
We have audited the accompanying statement of assets and liabilities of Fidelity Europe Capital Appreciation Fund (the Fund), a fund of Fidelity Investment Trust (the Trust), including the portfolio of investments, as of October 31, 2000, and the related statement of operations for the year then ended, the statement of changes in net assets for each of the two years in the period then ended, and financial highlights for each of the five years in the period then ended. These financial statements and financial highlights are the responsibility of the Fund's management. Our responsibility is to express an opinion on these financial statements and financial highlights based on our audits.
We conducted our audits in accordance with auditing standards generally accepted in the United States of America. Those standards require that we plan and perform the audit to obtain reasonable assurance about whether the financial statements and financial highlights are free of material misstatement. An audit includes examining, on a test basis, evidence supporting the amounts and disclosures in the financial statements. Our procedures included confirmation of securities owned as of October 31, 2000, by correspondence with the custodian and brokers; where replies were not received from brokers, we performed other auditing procedures. An audit also includes assessing the accounting principles used and significant estimates made by management, as well as evaluating the overall financial statement presentation. We believe that our audits provide a reasonable basis for our opinion.
In our opinion, the financial statements and financial highlights referred to above present fairly, in all material respects, the financial position of Fidelity Europe Capital Appreciation Fund as of October 31, 2000, the results of its operations, the changes in its net assets, and the financial highlights for the respective stated periods, in conformity with accounting principles generally accepted in the United States of America.
/s/DELOITTE & TOUCHE LLP
DELOITTE & TOUCHE LLP
Boston, Massachusetts
December 8, 2000
Annual Report
The Board of Trustees of each fund voted to pay to shareholders of record at the opening of business on record date, the following distributions derived from capital gains realized from sales of portfolio securities, and dividends derived from net investment income:
|
Fund |
Pay Date |
\\\\\\ |
Record Date |
\\\\\\ |
Dividends |
\\\\\\ |
Capital Gains |
|
Canada |
12/11/00 |
|
12/08/00 |
|
$1.04 |
|
- |
|
China Region |
12/11/00 |
|
12/08/00 |
|
$.56 |
|
- |
|
Emerging Markets |
12/18/00 |
|
12/15/00 |
|
$.03 |
|
- |
|
Europe |
12/11/00 |
|
12/08/00 |
|
$.12 |
|
$4.09 |
|
Europe Capital Appreciation |
12/18/00 |
|
12/15/00 |
|
$.11 |
|
$.87 |
|
Japan |
12/11/00 |
|
12/08/00 |
|
- |
|
$4.07 |
|
Japan Smaller Companies |
12/18/00 |
|
12/15/00 |
|
- |
|
$4.46 |
|
Latin America |
12/18/00 |
|
12/15/00 |
|
$.05 |
|
- |
|
Nordic |
12/18/00 |
|
12/15/00 |
|
$.03 |
|
$.22 |
|
Pacific Basin |
12/18/00 |
|
12/15/00 |
|
$1.10 |
|
$.23 |
Each fund hereby designates 100% of the long-term capital gain dividends distributed during the fiscal year as 20%-rate capital gain dividends.
The amounts per share which represent income derived from sources within, and taxes paid to, foreign countries or possessions of the United States are as follows:
|
Fund |
Pay Date |
\\\\\\ |
Income |
\\\\\\ |
Taxes |
|
Canada |
12/06/99 |
|
$.054 |
|
$.024 |
|
China Region |
12/06/99 |
|
$.174 |
|
$.004 |
|
Europe |
12/06/99 |
|
$.248 |
|
$.068 |
|
Europe Capital Appreciation |
12/13/99 |
|
$.172 |
|
$.042 |
|
Germany |
7/24/00 |
|
$.083 |
|
$.023 |
|
Japan |
12/06/99 |
|
$.054 |
|
$.009 |
|
Japan Smaller Companies |
12/13/99 |
|
$.030 |
|
$.005 |
|
Latin America |
12/06/99 |
|
$.168 |
|
$.028 |
|
Nordic |
12/13/99 |
|
$.105 |
|
$.045 |
|
Pacific Basin |
12/13/99 |
|
$.101 |
|
$.010 |
|
Southeast Asia |
12/06/99 |
|
$.028 |
|
$.008 |
|
United Kingdom |
12/06/99 |
|
$.184 |
|
$.044 |
|
|
7/24/00 |
|
$.399 |
|
$.031 |
A percentage of the dividends distributed during the fiscal year for the following funds qualifies for the dividends-received deduction for corporate shareholders:
|
Canada |
8% |
The funds will notify shareholders in January 2001 of amounts for use in preparing 2000 income tax returns.
Annual Report
Investment Adviser
Fidelity Management & Research Company
Boston, MA
Investment Sub-Advisers
Fidelity Management & Research (U.K.) Inc.
Fidelity Management & Research (Far East) Inc.
Fidelity Investments Japan Limited
Fidelity International Investment Advisors
Fidelity International Investment Advisors
(U.K.) Limited
Officers
Edward C. Johnson 3d, President
Robert C. Pozen, Senior Vice President
Richard A. Spillane, Jr., Vice President
Stephen Binder, Jr., Vice President, Canada Fund
William Kennedy, Jr., Vice President, Pacific Basin Fund
Allan Liu, Vice President, Southeast Asia Fund
Patricia Satterthwaite, Vice President, Latin America Fund
and Emerging Markets Fund
Eric D. Roiter, Secretary
Robert A. Dwight, Treasurer
Maria F. Dwyer, Deputy Treasurer
Thomas J. Simpson, Assistant Treasurer
John H. Costello, Assistant Treasurer
Board of Trustees
Ralph F. Cox *
Phyllis Burke Davis *
Robert M. Gates *
Edward C. Johnson 3d
Donald J. Kirk *
Ned C. Lautenbach *
Peter S. Lynch
Marvin L. Mann *
William O. McCoy *
Gerald C. McDonough *
Robert C. Pozen
Thomas R. Williams *
Advisory Board
J. Michael Cook
Abigail P. Johnson
Marie L. Knowles
General Distributor
Fidelity Distributors Corporation
Boston, MA
Transfer and Shareholder Servicing Agent
Fidelity Service Company, Inc.
Boston, MA
* Independent trustees
Custodians
The Chase Manhattan Bank
New York, NY
Emerging Markets Fund, Europe Fund, Europe Capital Appreciation Fund, Japan Fund, Pacific Basin Fund, Southeast Asia Fund
Brown Brothers Harriman & Co.
Boston, MA
Canada Fund, China Region Fund, Japan Smaller Companies Fund, Latin America Fund, Nordic Fund
Fidelity's International Equity Funds
Aggressive International Fund
Canada Fund
China Region Fund
Diversified International Fund
Emerging Markets Fund
Europe Fund
Europe Capital Appreciation Fund
Global Balanced Fund
International Growth & Income Fund
Japan Fund
Japan Smaller Companies Fund
Latin America Fund
Nordic Fund
Overseas Fund
Pacific Basin Fund
Southeast Asia Fund
Worldwide Fund
Corporate Headquarters
82 Devonshire Street
Boston, MA 02109
www.fidelity.com
The Fidelity Telephone Connection
Mutual Fund 24-Hour Service
Exchanges/Redemptions
and Account Assistance 1-800-544-6666
Product Information 1-800-544-6666
Retirement Accounts 1-800-544-4774
(8 a.m. - 9 p.m.)
TDD Service 1-800-544-0118
for the deaf and hearing impaired
(9 a.m. - 9 p.m. Eastern time)
Fidelity Automated Service
Telephone (FAST®) (automated graphic) 1-800-544-5555
(automated graphic) Automated line for quickest service
Printed on Recycled Paper
TIF-ANN-1200 118839
1.538746.103
|
|