
|
|
|
|
|
|
|
|
|
|
Previous: IKOS SYSTEMS INC, DEF 14A, 2000-12-21 |
Next: IKOS SYSTEMS INC, 10-K405, EX-10.28, 2000-12-21 |
UNITED STATES
SECURITIES AND EXCHANGE COMMISSION
Washington, D.C. 20549
Form 10-K
| [X] | ANNUAL REPORT PURSUANT TO SECTION 13 OR 15(d) OF THE SECURITIES EXCHANGE ACT OF 1934 |
For the Fiscal Year Ended September 30, 2000
OR
| [ ] | TRANSITION REPORT PURSUANT TO SECTION 13 OR 15(d) OF THE SECURITIES EXCHANGE ACT OF 1934 |
For the transition period from _______________ to _______________
0-18623
(Commission File Number)
IKOS SYSTEMS, INC.
(Exact name of registrant as specified in its charter)
| Delaware (State or other jurisdiction of incorporation or organization) |
77-0100318 (IRS Employer Identification No.) |
| 19050 Pruneridge Avenue Cupertino, CA (Address of principal executive offices) |
95014 (Zip Code) |
(408) 255-4567
(Registrant’s telephone number, including area code)
Securities registered pursuant to Section 12(b) of the Act:
None
Securities registered pursuant to Section 12(g) of the Act:
Common Stock $.01 Par Value
Preferred Stock Purchase Rights
(Title of Class)
Indicate by check mark whether the registrant (1) has filed all reports required to be filed by Section 13 or 15(d) of the Securities Exchange Act of 1934 during the preceding 12 months (or such shorter period that the registrant was required to file such report), and (2) has been subject to such filing requirements for the past 90 days. Yes [x] No [ ]
Indicate by check mark if disclosure of delinquent filers pursuant to Item 405 of Regulation S-K is not contained herein, and will not be contained, to the best of registrant’s knowledge, in definitive proxy or information statements incorporated by reference in Part III of this Form 10-K or any amendment to this Form 10-K. [x]
The approximate aggregate market value of the registrant’s Common Stock held by non-affiliates as of November 10, 2000, was approximately $112,702,000.
As of November 10, 2000, approximately 8,796,246 shares of the registrant’s Common Stock were outstanding.
DOCUMENTS INCORPORATED BY REFERENCE
Portions of the Proxy Statement for the 2000 Annual Meeting of Stockholders are incorporated by reference in Part III hereof.
This report (excluding exhibits) contains 45 pages. The Index to Exhibits begins on Page 23 of this report.
Item 1. Business
Forward-looking statements in this report are made pursuant to the safe harbor provisions of Section 21E of the Securities Exchange Act of 1934. In this report, the words, “anticipates,” “believes,” “expects,” “future,” “intends’” and similar expressions identify forward-looking statements. Stockholders are cautioned that all forward-looking statements pertaining to the Company involve risks and uncertainties, including, without limitation, those contained under the caption, “Factors that May Affect Future Results of Operations” and other risks detailed from time to time in the Company’s periodic reports and other information filed with the Securities and Exchange Commission. Actual events and results may differ materially from the Company’s current expectations and beliefs.
General
IKOS Systems, Inc. (IKOS or the Company) develops, manufactures, markets, and supports acceleration and verification systems for the verification of integrated circuits (ICs). IKOS’ mission is to help customers realize their high complexity electronic systems through innovative design verification solutions. IKOS differentiates its verification solutions with hardware acceleration systems and emulation systems which compile and integrate both emulation and acceleration hardware into the design flow. IKOS also provides services to customers to assist in the integration and deployment of IKOS solutions.
The Company sells its products and services to a broad range of customers, including telecommunications, multimedia, semiconductor, computer, consumer electronics, and aerospace application segments. The Company’s customers include Lucent Technologies, ATI, Micron STMicroelectronics, Infineon, nVIDIA and SIS. Headquartered in Cupertino, California, IKOS has 4 development centers worldwide: Cupertino California, Waltham Massachusetts, Noida India and Minneapolis Minnesota; in addition IKOS supports direct sales operations in North America, the United Kingdom, the Netherlands, France, Germany, and Japan. The Company has a distributor network covering the remainder of Europe and parts of Asia. IKOS is publicly traded on the Nasdaq National Market under the symbol IKOS. IKOS was incorporated in Delaware in May 1990.
Background
The Electronic Design Automation (EDA) industry provides design automation tools and technology to the semiconductor industry. Computer-aided Engineering (CAE) and Integrated Circuit Computer-aided Design (ICCAD) are the largest segments in the EDA market and the Company is focused on the verification sub-segment of the CAE market. The demand for design automation tools in this segment continues to grow at a faster rate than the EDA industry in total. The fundamental drivers in this arena are the continuing trend toward increased design complexity, the inability of design engineering productivity to keep pace, and the resulting productivity gap. Using Moore’s law, the Company expects a 58% compounded annual growth rate in design complexity while, under the same assumptions, the Company expects design engineering productivity to grow at only 21% annually. This creates an ever-widening productivity gap that EDA tool vendors seek to address, which IKOS’ systems helps to resolve.
Design verification is the assessment of the functionality (both logic and system) and timing of a design prior to fabrication. Design engineers are looking for ways to cut verification time and therefore are moving toward a method of verifying a design at a “functional” level (referred to as the Register Transfer Level or RTL). This means performing verification in the earlier phases of the design cycle to boost productivity, manage design complexity, and reduce cycle times. The figure below illustrates IKOS’ value to customers as they attack the critical simulation bottlenecks. Note that on any given verification iteration, Software Simulation takes the longest. IKOS’ Nsim product can accelerate that portion of the design that is represented in gates, while IKOS’ ARES product can accelerate that portion of the circuit that is represented at the RTL level.
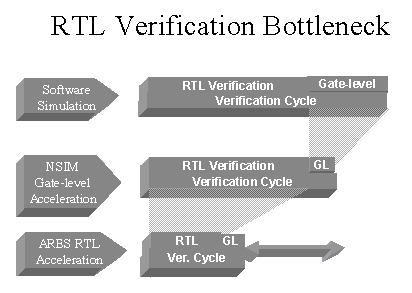
The verification cycle is a critical part of the design process with significant impact upon the design engineer’s productivity. Customers estimate that up to 70% of their total design cycle time is spent in the verification phases. The Company is focused on selling products and solutions for accelerating the RTL simulation and gate-level or sign-off timing simulation. As design sizes increase, the amount of testing required to thoroughly verify functionality also grows. Increasing design size and time to market pressures create more demand for throughput for thorough verification of these high-complexity designs, exceeding the performance capability of software simulators running on general purpose workstations. IKOS’ simulation solutions shrink the verification cycle by providing acceleration for gate-level acceleration and RTL acceleration.
In addition to the simulation bottleneck described above, high complexity system-on-chip (SoC) designs are facing a new verification challenge of system integration verification. The traditional approach to system integration was to develop the hardware and software separately and integrate the two at the end of the project when you have real hardware to run the newly developed software. An example would be the development of a 3D graphics chip used in PC’s. These chips require software drivers to interface them to the PC’s installed monitor. There are substantial advantages if the software driver can be run using an emulation of the chip while it is still being designed. It allows both the software and hardware developer to find bugs early in the design process and also allows the hardware developer to make performance trade-offs before the chip is actually manufactured.
With the advent of SoC designs, design teams are looking for ways to provide system integration verification early in the design cycle to prove system level functionality early. The figure below shows how early system integration shrinks the design cycle.
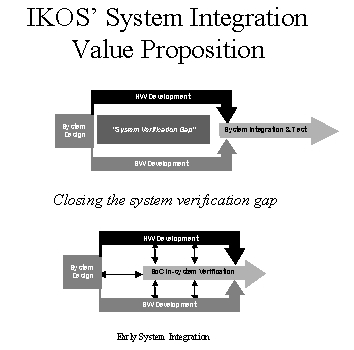
IKOS emulation products are ideal for tackling the challenge of early system integration. One of the key challenges with integration of hardware and software is performance. Simulation has proven to be too slow to allow for realistic system operation. IKOS emulation platforms offer up to 1 million cycles per second verification performance and deliver the level of performance necessary to verify system operation and run the system software for an integrated view of the system.
Company Solutions
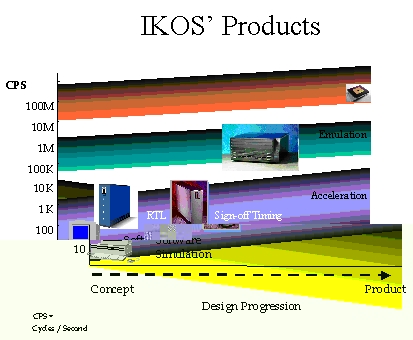
IKOS offers two different hardware technologies for verification, namely, 1) emulation and 2) hardware accelerated simulation. The emulation technology is utilized primarily for system-level verification where simulation and hardware accelerated simulation fall short of meeting customers’ verification requirements. The figure below positions three existing verification technologies in the EDA industry; software simulation, simulation acceleration, and emulation. These technologies are positioned from two perspectives: first where you are in the design cycle (i.e. early conceptual design and verification to implementation verification) and the second is the average performance of the solution measured in cycles per second.
IKOS’ products are comprised of patented simulation acceleration technology and patented emulation verification technology. The Company’s emulation solutions are differentiated from the competition through the Company’s patented VirtuaLogic compiler technology. VirtuaLogic allows the Company to deliver the lowest cost, high capacity solution available in emulation today and provides two to three orders of magnitude of higher performance than hardware accelerated simulation. The Company’s VLE and Avatar emulation platforms leverage the rapidly growing system-level verification requirements created by the growth in silicon complexity.
The hardware accelerated simulation technology is used for chip-level and sign-off level verification and provides one to two orders of magnitude more performance than software simulation. The Company’s Nsim and ARES simulation platforms leverage the growing bottleneck in RTL simulation created by the growth in silicon complexity.
The Company further augments its simulation and emulation products with consulting services for on-site support and design verification expertise to help customers achieve project goals. Verification services allow the customer to outsource the work needed to integrate new verification products into their design flow or deliver new verification capabilities to the design team. These services allow the customer to invest and focus on what differentiates them while benefiting from the custom integration of high performance verification to their design flow.
Maintenance and Support
The Company provides maintenance and support on a contractual basis. Hardware maintenance is provided on an on-site or on a return and repair basis. The Company also provides application support via a toll-free telephone line. Customers with software maintenance coverage also receive software upgrades, if any, from the Company. Foreign distributors generally provide customer training, service and support for the products they sell. Maintenance revenues, as a percent of total revenues, represented 25% in fiscal 2000, 27% in fiscal 1999 and 32% in fiscal 1998.
Competition
In emulation mainly used for system-level verification, the Company’s main competitors are Cadence Design Systems, Inc. (“Ca dence/Quickturn”) by virtue of their acquisition of Quickturn Design Systems, Inc. (“Quickturn”) in 1999 and Mentor Graphics Corporation (“Mentor”). Cadence/Quickturn continues to be the market leader. Mentor Graphics offers emulation solutions in Europe and Asia but is currently enjoined from selling in the United
States as a result of on-going litigation initiated by Cadence/Quickturn. The Cadence/Quickturn and Mentor Graphics legal proceedings have continued and still await rulings from several courts. In addition to its legal matters, Cadence/Quickturn continues to transition customers to their new hardware. In 1998, Cadence/Quickturn announced their next generation emulator “Mercury” and the end of life of their current System Realizer product. In fiscal 2000 Cadence/Quickturn announced an upgrade to their Mercury product called “Mercury Plus”.
Competitors in the chip-level and sign-off level verification market include software simulation providers such as Synopsys, Inc. (“ Synopsys”), Mentor Graphics, and Cadence Design Systems, Inc. (“Cadence”). Hardware accelerated simulation providers include a new company entering the market in the prior year, Axis Systems. For sign-off level verification the Company’ s strongest competition comes from static tools from providers such as: Chrysalis, Synopsys, and Cadence.
The Company expects competition in the verification market to continue to expand and change. Moreover, the Company competes, and expects that it will continue to compete, with established EDA companies. A number of these companies have longer operating histories, significantly greater financial, technical and marketing resources, greater name recognition and larger installed customer bases than the Company. In addition, many of these competitors and potential competitors have established relationships with current and potential customers of the Company and offer a broader and more comprehensive product line. Increased competition could result in price reductions, reduced margins and loss of market share, all of which could materially adversely affect the Company. In addition, current competitors or other entities may develop other products that have significant advantages over the Company’s products. There can be no assurance that the Company will be able to compete successfully against current and future competitors or that competitive pressures faced by the Company will not materially adversely affect its operating results.
The Company competes on the basis of certain factors, including product performance, price, support of industry standards, technical support and customer service, timely introduction of new products, ease of use and reputation. The Company believes that it currently competes favorably overall with respect to these factors.
Customers, Marketing and Sales
IKOS sells its products to a broad range of companies including those in the communications, multimedia/graphics, semiconductor, computer, aerospace and consumer electronics industries. The Company markets its products and services primarily through its direct sales and service organization. The Company employs a technically-oriented sales force and application engineering team to serve the needs of existing and prospective customers. The Company’s consulting services provide customers with a comprehensive solution that is tailored specifically to the needs of the design team. These services include education, application services, interface software support, custom library development and other on-site support through customized consulting partnerships to assist the customer in accomplishing key verification milestones.
IKOS’ direct sales strategy concentrates on those companies that it believes are key users and designers of complex ICs and IC-based systems for high-performance applications. For the fiscal year ended September 30, 2000, one customer Broadcom Corporation, Inc., accounted for approximately 12% of net revenues. For fiscal years ended October 2, 1999 and October 3, 1998, one customer Lucent Technologies, Inc., accounted for approximately 14% and 13% of net revenues, respectively.
Direct Sales. IKOS currently maintains direct sales and support offices in the following states: Arizona, California, Illinois, Massachusetts, New Jersey and Texas. IKOS makes direct sales internationally in Canada, in Japan through its wholly-owned subsidiary, IKOS K.K., in India through its wholly-owned subsidiary IKOS India Pvt. Ltd., and in central Europe through its wholly-owned subsidiaries, ICOS Systems GmbH (Germany), IKOS Systems, Ltd. (England) and IKOS Systems, S.A.R.L. (France). Direct sales, including maintenance fees, accounted for approximately 95% of the Company’s net revenues in fiscal year 2000. Direct sales, including maintenance fees, accounted for approximately 94% of the Company’s net revenues in fiscal year 1999. Direct sales for fiscal 1998 as a percentage of net revenues were more than 95% of the Company’s net revenues.
Distributors. IKOS believes that international markets are an important source of the Company’s revenues and while the bulk of its sales is through direct channels, the Company has developed distributor or outside sales relationships in ten foreign countries in Europe and Asia. In fiscal 1997, the Company terminated its distributor relationship in Japan and began selling directly in that market. In early fiscal 2000, the Company entered into a new distributor agreement for sales in Japan. The distributor relationship was later terminated as management concluded
this arrangement was not in the best interest of the Company. Revenues to distributors were less than 5% of the Company’s net revenues for the fiscal year 2000 and 1998, respectively. Distributor revenues for fiscal 1999 as a percentage of net revenues were less than 10%.
International Sales. International sales, including export sales and foreign operation net revenues, accounted for approximately 34%, 37% and 36% of the Company’s net revenues in fiscal 2000, 1999 and 1998, respectively. International revenues increased in absolute dollars by approximately 19%, however, decreased as a percentage of net revenues. The increase in sales dollars are a direct result of increasing demand in Europe and the Asia Pacific territories. International revenues increased during fiscal 1999 due to increased demand for the Company’s product, primarily in Europe and the South Asia territories. In fiscal 1998, international revenues decreased as a result of decreases in Voyager sales and limited availability of emulation product for shipment during fiscal 1998. With the exception of sales to customers through the Japan subsidiary, the Company has attempted to reduce the risk of fluctuations in exchange rates associated with international revenues by selling its systems, primarily denominated in U.S. dollars. The Company pays the expenses of its international operations in local currencies and has not engaged in hedging transactions with respect to such obligations. Sales through the Japan subsidiary are denominated in Japanese Yen. For those sales made in Japanese Yen, the Company may enter into foreign exchange contracts to minimize foreign exchange risk relating to the Japanese subsidiary’s sales.
Conducting business in international markets requires compliance with applicable laws and regulations, such as safety and telecommunication laws and regulations of foreign jurisdictions and import duties and quotas. To date, the Company has not experienced any difficulty in obtaining export licenses from the U.S. Department of Commerce for foreign sales; however, there can be no assurance that the Company will not experience difficulties in the future.
Manufacturing and Suppliers
The Company performs final assembly and test of all its products in its Cupertino, California facility. The Company utilizes third parties for all major subassembly manufacturing, including printed circuit boards and custom ICs. The Company has a testing and qualification program to ensure that all subassemblies meet the Company’s specifications before going into final assembly and test.
The capacity and speed of IKOS’ hardware results from its basic design and architecture, and includes certain proprietary components and components that are required to perform near technological limits. Certain key components used in the Company’s products are presently available from sole or limited sources. The Company believes that it could obtain alternative sources in a short period of time, although the inability to develop alternative sources for these sole or limited source components or to obtain sufficient quantities of these components could result in delays or reductions in product shipments which could adversely affect the Company’s operating results. The Company’s simulation and emulation systems use proprietary ASICs, FPGAs and certain subassemblies that are currently available from single sources. The Company generally purchases these components, including semiconductor memories used in the Company’s hardware simulators, pursuant to purchase orders placed from time to time in the ordinary course of business and has no supply arrangements with any of these source suppliers that require the suppliers to provide components in guaranteed quantities or at set prices. The Company endeavors to maintain an ample supply of such components at all times through order generation based on tracking of sales projections, production and inventories, and by ordering critical components for delivery over an extended period.
Product Development
The Company’s ongoing product development activities include the enhancement of current products, such as the ability to simulate, emulate and verify the design of higher gate count ICs and to offer a greater degree of integration with EDA tools. Furthermore these product development activities include the development of new product options and features, such as new library tools and the research and development of new technologies for use in future products.
The Company’s research and product development organization included 114 engineers at September 30, 2000. During fiscal 2000, 1999, and 1998, the Company spent approximately $15.9 million, $13.4 million and $14.4 million, respectively, on research and development. During fiscal 1998, the Company also spent approximately $9.0 million acquiring technology from Interra, Inc. In addition to acquiring this technology, the Company also obtained the services of approximately 52 engineers in establishing a research and development
subsidiary in India. The Company’s research and development costs, including costs of software development before technological feasibility, are expensed as incurred.
Proprietary Rights
Due to the rapid pace of technological advancement, the Company believes it is less dependent on the protection of proprietary product information than on its ability to develop and market new products. The Company protects its proprietary product information through the use of employee nondisclosure agreements and by limiting access to confidential information. The Company presently has 13 United States patents, that cover various aspects and features of its products, including its overall system architecture and certain features in the systems hardware for both simulation and emulation products. These licenses expire between November 22, 2005 and August 15, 2017. The Company also has licensed rights under certain patent applications relating to VirtualWires from MIT. This license is through December 2004, and thereafter becomes nonexclusive. MIT may terminate this license if the Company fails to meet certain minimum net sales milestones or upon certain other material breaches of the license agreement that remain uncured after 90 days’ notice of such breach. Although the Company may file additional patent applications in the future, it does not expect to rely extensively on patents to protect its products.
The Company also relies on certain software which it licenses from third parties, including software which is integrated with internally developed software and used in the Company’s systems to perform key functions.
From time to time the Company has received, and may receive in the future, notice of claims of infringement of other parties’ proprietary rights. Although the Company does not believe that its products infringe the proprietary rights of any third parties, there can be no assurance that infringement or invalidity claims (or claims for indemnification resulting from infringement claims) will not be asserted against the Company or that any such assertions will not materially adversely affect the Company’s business, financial condition or results of operations. Irrespective of the validity or the successful assertion of such claims, the Company could incur significant costs and diversion of management efforts with respect to the defense thereof which could have a material adverse effect on the Company’ business, financial condition or results of operations. If any claims or actions are asserted against the Company, the Company may seek to obtain a license under a third party’s intellectual property rights. There can be no assurance, however, that under such circumstances, a license would be available under reasonable terms or at all.
The Company’s tradename, “IKOS,” its facing parrots logo and its product series named “Voyager” are registered trademarks of the Company.
Employees
As of September 30 2000, the Company employed a total of 285 persons, consisting of 120 in marketing, sales and support, 16 in manufacturing, 114 in research, development and engineering, and 35 in finance, administration and other capacities. The Company has never had a work stoppage. None of its employees is represented by a labor organization, and the Company considers its relations with its employees to be good.
Item 2. Properties
The Company’s principal executive offices, as well as its principal manufacturing, marketing, research and development, and engineering facility, are located on approximately 57,000 square feet of leased office building space in Cupertino, California. The lease on this facility, which expired in September 2000, has been extended through December 31, 2000. The Company has completed negotiations for building space of 106,000 square feet in San Jose, California to replace the expiring lease. The Company plans to move into this new facility in December 2000. In addition, the Company leases research and development and sales office space domestically in Arizona, California, Illinois, Massachusetts, Minnesota, New Jersey and Texas and internationally in England, France, Germany, the Netherlands, Korea and Japan. The Company believes that its existing facilities are adequate for its current needs and that additional space will be available as needed.
Item 3. Legal Proceedings
None.
Item 4. Submission of Matters to a Vote of Security Holders
No matters were submitted to a vote of security holders during the fourth quarter of the fiscal year covered by this report.
Executive Officers of the Registrant
Set forth below is certain information with respect to age and background for each of the officers of the Company.
| Name | Age | Position With the Company | ||
| Gerald S. Casilli | 61 | Chairman of the Board | ||
| Ramon A. Nuñez | 46 | Chief Executive Officer, President and Director | ||
| Joseph W. Rockom | 61 | Chief Financial Officer, Vice President of Finance and Administration, and Secretary | ||
| Daniel R. Hafeman | 51 | Vice President of Advanced Research and Chief Technical Officer | ||
| Robert Hum | 48 | Senior Vice President of Product Operations | ||
| Nader Fathi | 41 | Vice President of International Sales | ||
| Tom Gardner | 52 | Vice President of North American Sales |
During the year, former executive officers, Mr. Larry Melling, Vice President of Business Development and Strategic Marketing and Steve McLaughlin, Vice President of Manufacturing terminated their positions as executive officers of the Company.
Mr. Casilli has served as Chairman of the Board of Directors of the Company since July 1989 and served as Chief Executive Officer from April 1989 to August 1995. He has served as a Director since 1986. Mr. Casilli is also currently a Director for Evans and Sutherland Computer Corporation. From January 1986 to December 1989, he was a general partner of Trinity Ventures, Ltd., a venture capital firm that was a former investor in the Company. Mr. Casilli was a general partner of Genesis Capital, a venture capital firm, from February 1982 to 1990. Mr. Casilli founded Millennium Systems, a manufacturer of microprocessor development systems, in 1973 and served as its President and Chief Executive Officer until 1982.
Mr. Nuñez was appointed Chief Executive Officer in August 1995. Mr. Nuñez had been President, Chief Operating Officer and Director of the Company since October 1994. He had served as Vice President of Worldwide Sales since July 1993. Mr. Nuñez joined the Company in April 1990 as Vice President of North American Sales after five years in sales management with Zycad Corporation. Earlier he was branch sales manager for Cadnetix (now part of Intergraph) in Southern California.
Mr. Rockom has served as Chief Financial Officer and Vice President of Finance since September 1986. Mr. Rockom has also served as the Company’s Secretary since April 1995. Before joining the Company, Mr. Rockom spent seventeen years at American Microsystems, Inc. (AMI), a semiconductor manufacturer, where he held a variety of administrative, operating and management positions, including Vice President of Finance.
Mr. Hafeman, a founder of the Company, has served as Vice President of Advance Research and Chief Technical Officer since March 1996. Mr. Hafeman served as Vice President of Engineering from August 1989 to March 1996. From December 1984 to August 1989, he served in various positions of engineering management with the Company. Mr. Hafeman was an engineering manager at Scientific Micro Systems, Inc. for eight years prior to his employment with the Company.
Mr. Hum was promoted to Senior Vice President of Product Operations in January of 1998. He came to IKOS as Vice President of Engineering in May of 1997 from Cadence Design Systems where he served in several senior business and technical management positions. Prior to joining Cadence, Mr. Hum held a variety of technical and business management roles during an 18-year tenure at Bell-Northern Research (NORTEL).
Mr. Fathi was promoted to Vice President of International Sales in June 1998. Prior to joining IKOS, Mr. Fathi served in several sales, marketing, program management and customer support management positions at Cadence, Daisy (now part of Intergraph), Silicon General and Xerox Microelectronics Center. Subsequent to the end of fiscal year 2000, Mr. Fathi was promoted to Vice President of World Operations.
Mr. Gardner was promoted to Vice President of North American Sales in June 1998. Earlier, he held senior sales management positions in the eastern and central US regions during the last two years. Most recently he held the position of director of sales for the central region. Prior to joining IKOS, Mr. Gardner held sales and sales management positions with Mentor Graphics, Quickturn, Cadence and Zycad. Subsequent to the end of fiscal year 2000, Mr. Gardner was promoted to Vice President of Worldwide Sales.
PART II
Item 5. Market for Registrant’s Common Equity and Related Stockholder Matters
The Company’s Common Stock is currently traded on the Nasdaq National Market under the symbol IKOS. The following table sets forth, for the fiscal period indicated, the high and low closing sales prices for the Common Stock as reported by Nasdaq.
| High | Low | ||||||
| Fiscal 1999 | |||||||
| First Quarter | $ | 3.63 | $ | 1.41 | |||
| Second Quarter | 6.06 | 3.63 | |||||
| Third Quarter | 9.88 | 5.00 | |||||
| Fourth Quarter | 11.00 | 6.38 | |||||
| Fiscal 2000 | |||||||
| First Quarter | $ | 9.69 | $ | 7.00 | |||
| Second Quarter | 14.94 | 8.88 | |||||
| Third Quarter | 12.38 | 8.63 | |||||
| Fourth Quarter | 13.00 | 9.69 | |||||
The approximate number of record holders of IKOS stock as of November 13, 2000 was 160. The approximate number of beneficial holders is estimated to be 3,900 as of that same date.
The Company has never declared or paid cash dividends on its stock. The Company currently anticipates that it will retain all future earnings for use in the operation and expansion of its business and does not anticipate paying any cash dividends in the foreseeable future.
During fiscal 1998, the Company announced its intention to repurchase up to 1,000,000 shares of its outstanding common stock on the open market. Through September 30, 2000, the Company had repurchased 516,500 shares at a weighted-average per share price of $5.96 and approximately 497,500 shares of this total have been reissued through the Company’s stock option and stock purchase plans.
Item 6. Selected Financial Data (In thousands, except per share data)
| Fiscal Years Ended | ||||||||||||||||
| Sep. 30, | Oct. 2, | Oct. 3, | Sept. 27, | Sept. 28, | ||||||||||||
| 2000 | 1999 | 1998 | 1997 | 1996 | ||||||||||||
| Consolidated Statement of Operations Data: |
||||||||||||||||
| Net revenues | $ | 72,796 | $ | 56,333 | $ | 40,893 | $ | 56,096 | $ | 45,341 | ||||||
| Cost of revenues | 16,031 | 13,778 | 14,734 | 12,452 | 9,852 | |||||||||||
| Gross profit | 56,765 | 42,555 | 26,159 | 43,644 | 35,489 | |||||||||||
| Operating expenses | 46,345 | 39,944 | 49,516 | 42,495 | 36,070 | |||||||||||
| Income (loss) from operations | 10,420 | 2,611 | (23,357 | ) | 1,149 | (581 | ) | |||||||||
| Other income | 618 | 495 | 1,031 | 1,269 | 1,140 | |||||||||||
| Income (loss) before provision for income taxes |
11,038 | 3,106 | (22,326 | ) | 2,418 | 559 | ||||||||||
| Provision (benefit) for income taxes | 2,750 | 650 | 4,928 | 1,023 | (1,892 | ) | ||||||||||
| Net income (loss) | $ | 8,288 | $ | 2,456 | $ | (27,254 | ) | $ | 1,395 | $ | 2,451 | |||||
| Basic net income (loss) per share | $ | 0.97 | $ | 0.30 | $ | (3.24 | ) | $ | 0.17 | $ | 0.33 | |||||
| Weighted-average shares used in computing basic per share amounts |
8,563 | 8,306 | 8,418 | 8,408 | 7,383 | |||||||||||
| Diluted net income (loss) per share | $ | 0.84 | $ | 0.27 | $ | (3.24 | ) | $ | 0.16 | $ | 0.30 | |||||
| Weighted-average shares used in computing diluted per share amounts |
9,836 | 9,140 | 8,418 | 8,927 | 8,114 | |||||||||||
| Consolidated Balance Sheet Data: | ||||||||||||||||
| Working capital | $ | 17,045 | $ | 8,278 | $ | 5,492 | $ | 31,608 | $ | 27,919 | ||||||
| Total assets | 52,005 | 31,790 | 33,344 | 56,550 | 53,471 | |||||||||||
| Long-term, debt, less current portion | — | — | — | — | 350 | |||||||||||
| Total stockholders’ equity | 24,864 | 15,031 | 12,613 | 41,990 | 38,144 | |||||||||||
See notes to consolidated financial statements, management discussion and
analysis of financial condition and results of operations.
Item 7. Management’s Discussion and Analysis of Financial Condition and Results of Operations
Cautionary Statement
The statements in this Annual Report, including those in the Management’s Discussion and Analysis of Financial Condition and Results of Operations contains forward looking statements within the meaning of the Private Securities Litigation Reform Act of 1995. These forward looking statements without limitation contain the words, “believes,” “anticipates,” “ estimates,” “expects,” “projections,” and words of similar import. These forward-looking statements involve risks and uncertainties, and the cautionary statements discussed under the caption “Factors that May Affect Future Results of Operations,” identify important factors that could cause actual results to differ materially from those indicated in the forward-looking statements. Such risks and uncertainties may be more fully described in other reports and information filed by the Company with the Securities and Exchange Commission.
Nature of Operations
The Company develops, manufactures, markets and supports electronic design automation tools for the verification of integrated circuit designs. IKOS’ mission is to help customers realize their high complexity electronic systems through innovative design verification solutions. The Company’s products are designed to enable its customers to verify their designs more rapidly and accurately than existing software-based simulation tools. In 1996, the Company broadened its spectrum of verification solutions to extend from the design concept stage to the prototype stage by introducing its first emulation system. The Company commercially released its first emulation system in 1997 and has completely redesigned its original emulation product to the current two million gate emulation solution. During fiscal 1999, the Company released its third generation emulation product, which provides a five million gate emulation solution.
The Company sells its products to a broad range of customers in the communications, multimedia/graphics, semiconductor, computer, aerospace and consumer electronics industries. The Company markets its products and services primarily through its direct sales and service organization as the Company has direct sales operations throughout the United States and in the United Kingdom, France, Germany and Japan. The Company also has a distribution network covering the remainder of Europe and in parts of Asia. In fiscal 1998, the Company opened a research and development operation in India.
Net Revenues
For the fiscal year ended September 30, 2000, net revenues increased 29% from $56,333,000 in fiscal 1999 to $72,796,000 in fiscal 2000. For the fiscal year ended October 2, 1999, net revenues increased 38% from $40,893,000 in fiscal 1998 to $56,333,000 in fiscal 1999. The year to year increases in net revenues was primarily the result of increased sales of the Company’s emulation product. Emulation revenues increased over 66% from 1999 to 2000 and 233% from 1998 to 1999. The increase from 1998 to 1999 was primarily the result of the less than expected sales of emulation units during 1998 due to a lengthy beta program for the Company’s two million gate system reducing the availability of units available for sale during 1998. The increase from 1999 to 2000 is the direct result of increasing acceptance and demand for the emulation product. During the year the Company realized several significant competitive wins in the market including a record $11 million order from one customer. The Company’s development effort has resulted in the introduction of a new and more robust emulation system every twelve to eighteen months since the Company’s initial emulation product introduction in 1997. This effort has led customers to realize the ability of the Company to deliver high quality emulation products to assist in verifying the increasingly complex IC designs. While emulation has grown substantially over the past three years, simulation has grown at a much slower rate. However, this growth is higher than the Company had anticipated and the Company expects that simulation revenues will decline over the next several years as a result of the evolution of the verification market. Simulation revenues for fiscal 2000 grew by approximately 5% over fiscal 1999. Simulation revenues for 1999 grew by 10% over fiscal 1998. The increases were higher than expected, as the Company has introduced new products. However, the Company believes the growth in the simulation product line is limited. The Company expects simulation revenues to decrease slightly during fiscal 2001, while emulation revenues are expected to increase as a result of the Company’s continued focus in this area coupled with growing industry demand.
Maintenance revenues increased 20% from $15,075,000 in fiscal 1999 to $18,144,000 in fiscal 2000. The growth in revenues is due to the increasing installed based of emulation system users who are on maintenance coupled with the on-going renewals of the Voyager systems installed base. The shifting base of simulation users and emulation users impacts the maintenance revenue rate of growth. As the simulation business declines, the base of users will decline, negatively impacting the rate of growth for maintenance, however, this impact is offset by the increasing base of emulation users. Maintenance revenues for fiscal 1999 increased 14% over the previous year to $15,075,000 from $13,169,000. The growth is primarily attributable to the current Voyager systems installed base and the increasing installed base of the Company’s emulation systems. However, the increase is offset by customers of older Voyager systems who are not renewing their maintenance on such systems at the same rate as in the past. In addition, the growth rate is lower than prior years due to the downturn in product revenues in fiscal 1998 that directly impacted the level of products due for maintenance renewals in the fiscal 1999. Also, lower growth rate is attributable to the overall transition of the Company’s installed based from primarily Voyager system holders to emulation system holders.
International sales (export sales and sales by the Company’s Japan and European operations) were $25,034,000, $21,076,000 and $14,532,000 for fiscal years 2000, 1999 and 1998, respectively. These sales represent 34%, 37% and 36% of net revenues, respectively. For fiscal 1999 and 2000, international revenues increased by $6,544,000 and $3,958,000, respectively and just slightly as a percentage of revenues in each year. The increases were primarily a result of the growth in sales in the Company’s European region and Asia. European revenues grew from $12,818,000 in fiscal 1999 to $14,151,000 in fiscal 2000 and from $9,620,000 in fiscal 1998 to $12,818,000 in fiscal 1999. The Company has seen higher demand in the Euorpean marketplace over the past year resulting in the increase in revenues. Revenues in Asia also increased significantly, increasing from $8,258,000 in fiscal 1999 to $10,883,000 in fiscal 2000 and $4,912,000 in fiscal 1998 to $8,258,000 in fiscal 1999. The increase is due to a resurgence in the Asia marketplace after several years of lower revenues due to problems in the Asian economy and the reorganization of the Company’s Japan operations. The Company will continue to focus its efforts on the international market and expects that international sales will increase in 2000. There can be no assurances that international sales will increase to the extent anticipated or that the growth that was obtained in fiscal 2000 can be repeated.
Gross Profit
Gross profit was $56,765,000, $42,555,000 and $26,159,000 or 78%, 76% and 64% of total net revenues for fiscal years 2000, 1999 and 1998, respectively. Overall gross margins and more specifically, product margins for fiscal 2000 and 1999 increased primarily as a result of higher revenues overall and increased sales of higher margin products. In addition, fiscal 1999 comparative with fiscal 1998 was impacted by the write-off of inventory related to obsolete verification products in 1998 reducing margins for that year. No similar write-off occurred in fiscal 1999 or fiscal 2000. Maintenance margins improved from fiscal 1999 to fiscal 2000 as a result of better controls over maintenance spending due to a full year under the new technical support organization that was reorganized in fiscal 1999. Fiscal 1999 margins were negatively impacted by higher maintenance costs associated with the new product introductions as well as the reorganization of the Company’s technical support team.
Research and Development Expenses
Research and development expenses were $15,912,000, $13,443,000 and $14,381,000 in fiscal 2000, 1999 and 1998, respectively. As a percentage of net revenues, research and development expenses were 22%, 24% and 35% for fiscal 2000, 1999 and 1998, respectively. In general, the increase in research and development expenses reflects our continued development of our emulation technology. More specifically, research and development expenses increased during the current year as a result of increased spending for consultants and temporary employees, salaries, profit sharing, and hardware prototyping expenses. Spending increases related to consultants and temporary help was directly related to the Company’s need to meet its resource needs using outside sources. The increases in payroll related expenses were a result of higher profits contributing to higher profit sharing and increasing salaries for employee retention purposes. Lastly, as the Company works to complete its next generation emulator, the Company incurred additional spending for prototype parts for the new system. For fiscal 1999, research and development expenses decreased in absolute dollars and as a percentage of revenues primarily due to non-recurring charges in fiscal 1998 associated with prototypes for completed product projects, including its revamping of the original emulation technology. There were fewer such costs in fiscal 1999 as fewer prototype projects were completed during the year. Higher consulting fees needed to complete the various projects also affected the fiscal 1998 spending. In addition, the decrease in fiscal 1999 as a percentage of revenues is a direct result of the lower revenues in fiscal 1998 when compared to spending in fiscal 1998. The Company expects research and development expenses to increase in absolute dollars as the Company expects to continue its on-going research and development efforts for completion of its current and future product development projects.
Sales and Marketing Expenses
Sales and marketing expenses were $24,913,000, $21,822,000 and $18,609,000 in fiscal 2000, 1999 and 1998, or 34%, 39% and 46% of net revenues, respectively. The increases in absolute dollars for fiscal 2000 and fiscal 1999 are due to salary and commission increases as a result of higher sales levels. The increase is also a result of higher spending for representative commissions, consultants, travel expenses and other marketing expenditures for new product introductions, particularly in 1999. As a percentage of revenues, sales and marketing expenses decreased from 1999 to 2000, primarily due to the lower revenue base in 1999 when compared to the level of spending. The Company expects sales and marketing expenses to increase in absolute dollars in fiscal 2001 as the Company continues to expand its field application engineering resources and to support increased activities domestically and at its foreign locations.
General and Administrative Expenses
General and administrative expenses were $5,311,000, $4,267,000 and $4,247,000 for fiscal 2000, 1999 and 1998, or 7%, 8% and 10% of net revenues, respectively. General and administrative expenses increased in absolute dollars over the prior year primarily due to increased headcount, salary adjustments, profit sharing, professional services, and allocated MIS expenses. The higher costs while lower as a percentage of revenues from the prior year, reflect the Company’s efforts to improve internal processes to increase on-going efficiencies. General and administrative expenses remained flat in 1999 when compared with 1998, as higher spending in payroll related costs were offset with lower consulting and professional fees. General and administrative expenses are expected to increase in absolute dollars in fiscal 2001 but remain approximately 7%-8% of net revenues.
Other Income
Net interest income in fiscal 2000 was $618,000, representing a 25% increase from the $495,000 earned in 1999. The increase in interest income is primarily attributable to increased cash, cash equivalents and short-term investments over the course of the year. These balances increased as result of higher sales bringing about higher cash levels generated from operations. For fiscal 1999, interest income decreased from $1,031,000 in 1998 to $495,000 as a result of lower cash, cash equivalent and short-term investment balances during fiscal 1999. Cash, cash equivalents and short-term investments decreased from $15,682,000 in 1998 to $10,534,000 in fiscal 1999. The decrease was primarily the result of an increase in accounts receivable, purchases of equipment, repurchases of common stock and reductions in accounts payable, accrued liabilities and deferred revenues.
Provision for Income Taxes
During fiscal 2000, the Company recorded a tax provision of $2,750,000, which primarily consisted of federal and state alternative minimum taxes and foreign taxes. For fiscal 1999, the Company recorded a tax provision of $650,000, which primarily consisted of federal and state alternative minimum taxes and foreign taxes. For fiscal 1998, the Company recorded a tax provision of $4,928,000. The provision primarily consisted of the write down of the Company’s net deferred tax assets because these deferred tax assets are not considered to be realizable on a more likely than not basis, as a result of the losses incurred in fiscal 1998.
Other
The Company has experienced minimal gains or losses on foreign currency translation. With the exception the Company’s Japan operations, substantially all of its international sales to date have been billed and collected in U.S. dollars. The Company pays the expenses of its international operations in local currencies and to date the Company has not engaged in hedging transactions with respect to such obligations. The Company has reorganized its operations at its Japan subsidiary and is engaging in transactions in the Japanese local currency. As such, the Company periodically enters into foreign exchange contracts to minimize foreign exchange risk relating to the Japanese subsidiary’s sales that are denominated in yen. A forward exchange contract obligates the Company to exchange predetermined amounts of a specified foreign currency at a specified exchange rate on a specified date or to make an equivalent US dollar payment equal to the value of such exchange. These contracts are accounted for as hedges of identifiable receivables denominated in Japanese yen. Realized gains or losses are recognized upon maturity of the contracts and offset the change in value of the underlying asset or liability. Through September 30, 2000, such hedging arrangements have been immaterial to the Company operations and results.
Factors that May Affect Future Results of Operations
Potential Fluctuations in Quarterly Results. The Company’s quarterly operating results have in the past and may in the future vary significantly depending on factors including the timing of customer development projects and purchase orders, new product announcements and releases by the Company and other companies, gain or loss of significant customers, price discounting of the Company’s products, the timing of expenditures, customer product delivery requirements, availability and cost of components or labor and economic conditions generally and in the electronics industry specifically. Any unfavorable change in these or other factors could have a material adverse effect on the Company’s operating results for a particular quarter. Many of the Company’s customers order on an as-needed basis and often delay issuance of firm purchase orders until their project commencement dates are determined. Quarterly revenue and operating results will therefore depend on the volume and timing of orders received during the quarter, which are difficult to forecast accurately. Moreover, a significant portion of the Company’s revenue may result from shipments during the last few weeks of the quarter from orders generally received in the last month of the quarter. Any concentration of sales at the end of the quarter may limit the Company’s ability to plan or adjust operating expenses and production and inventory levels. Therefore, if anticipated shipments in any quarter do not occur or are delayed, expenditure levels could be disproportionately high as a percentage of revenue, and the Company’s operating results for that quarter would be adversely affected. In addition, sales of individual systems with high average sales prices can constitute a significant percentage of the Company’s quarterly revenue. Operating results in any period should not be considered indicative of the results to be expected for any future period, and there can be no assurance that the Company’s net revenues will increase or that the Company will remain profitable in any future period.
Sales Trends. Over the past several years the marketplace for the Company’s products has evolved substantially. The Company has seen a significant reduction in sales of its simulation products as revenues have declined from approximately $37,044,000 in fiscal 1997 to approximately $21,719,000 in fiscal 2000. While the decrease is due in part to the evolution of the market, the primary cause of the decrease is the result of the Company’s focus on its new emerging product line of emulation solutions. The Company has seen its revenues from its emulation products increase from approximately $6,000,000 in fiscal 1997 to over $32,933,000 in fiscal 2000. There can be no assurance that the Company will be able to maintain these past trends. These trends will be dependent upon the Company introducing new products and methodologies. Furthermore, increased overall sales will also depend on an increasing number of complex ICs designed for electronic systems, integration of the Company’s products with other tools for IC design, the ability of the Company’s products to shorten overall customer design cycles and increased industry acceptance of the Company verifications solutions. Because the market for hardware-assisted verification products is evolving, it is difficult to predict with any assurance whether the markets for such solutions will continue to expand. There can be no assurances that such market will expand, or even if such market expands, that the Company’s products will achieve and maintain the market acceptance required to maintain revenue growth and profitability in the future.
New Product Development. To obtain the expected revenue growth, the Company needs to continue to invest in new product development. The Company has focused most of its development resources on its emulation products. The Company’s initial emulation product was commercially released in the first quarter of fiscal 1997. The Company encountered several product design issues with its second-generation emulation product, and in addition, the EDA marketplace for emulation products continued to evolve, impacting the original design. During 1998, the Company addressed its product design issues by completely redesigning the emulation product and released its third-generation during fiscal 1999. This third-generation emulation provides the customer of up to approximately five million-gates of emulation capacity. While the Company has seen favorable results with its latest release, there can be no assurance that the product will adequately meet the requirements of the marketplace. There continues to be further development of the emulation product as well as other verification products, and as the Company continues to develop such products which are based on the new technology, there can be no assurance that the enhanced products or other developed products resulting from this development will provide the necessary solutions to customer design verification needs, be of acceptable quality or achieve further market acceptance. The success of the Company in developing, introducing, selling and supporting verification products will depend on a variety of factors, including but not limited to, the timely and successful enhancement of current products, completion of product design and development of future products, the timely and efficient implementation of manufacturing processes, effective sales, marketing and customer service. Furthermore, the absence of performance problems or other difficulties that may require design modifications and related expenses will contribute to overall success otherwise such issues may hinder or damage market acceptance of the products. While the Company’s verification systems are designed to provide cost and ease of use advantages intended to broaden the market for hardware-assisted verification, there can be no assurance that its products will be able to achieve such goals. Moreover, there can be no assurance that the market for such verification solutions will broaden beyond the current set of users.
The Company currently maintains a research and development facility in India. Through the acquisition of this facility the Company has developed certain technology which has resulted in new products. The research and development facility has positively impacted the Company’s product development deadlines. However, the Company has significant development risk with respect to the continued incorporation of the acquired technology into future products. Such effort will result in increased spending on research and development as the Company attempts to continue to meet its goals and deadlines. There can be no assurance that such goals or deadlines will be achieved in a timely manner. Furthermore, should such goals and deadlines for the introduction of new products be attained, there can be no assurance that the resulting new products will adequately meet the requirements of the marketplace.
Competition. The EDA industry is highly competitive and rapidly changing. The Company’s products are specifically targeted at the emerging portion of the industry relating to complex designs that the Company believes benefit from its verification products. The Company currently competes with traditional software verification methodologies, including product offerings sold by Cadence, Synopsys and Mentor Graphics. The Company’s main competition for the sale of emulation systems is Quickturn/Cadence. The Company expects competition in the market for verification tools to increase as other companies attempt to introduce new products and product enhancements. Moreover, the Company competes, and expects that it will continue to compete, with established EDA companies. A number of these companies have longer operating histories, significantly greater financial,
technical and marketing resources, greater name recognition and larger installed customer bases than the Company. In addition, many of these competitors and potential competitors have established relationships with current and potential customers of the Company and offer a broader and more comprehensive product line. Increased competition could result in price reductions, reduced margins and loss of market share, all of which could materially adversely affect the Company. In addition, current competitors or other entities may develop other products that have significant advantages over the Company’s products. There can be no assurance that the Company will be able to compete successfully against current and future competitors or that competitive pressures faced by the Company will not materially adversely affect its operating results.
New Products and Technological Change. The EDA industry is characterized by extremely rapid technological change in both hardware and software development, frequent new product introductions, evolving industry standards and changing customer requirements. The introduction of products embodying new technologies and the emergence of new industry standards can render existing products obsolete and unmarketable. The Company’s future success will depend upon its ability to enhance its current series of simulation and emulation systems and to design, develop and support its future simulation and emulation products on a timely basis. These efforts require a high level of expenditures for research and development by the Company to address the increasingly sophisticated needs of the customers. There can be no assurance that the Company will be successful in developing and marketing product enhancements or new products that respond to technological change or evolving industry standards or changing customer requirements, that the Company will not experience difficulties that could delay or prevent the successful development, introduction and marketing of these products, or that its new products and product enhancements will adequately meet the requirements of the marketplace, will be of acceptable quality or will achieve market acceptance. If the Company is unable, for technological or other reasons, to develop and introduce products in a timely manner in response to changing market conditions or customer requirements, the Company’s business, operating results and financial condition will be materially and adversely affected. Moreover, from time to time, the Company may announce new products or technologies that have the potential to replace the Company’s existing product offerings. There can be no assurance that the announcement of new product offerings will not cause customers to defer purchases of existing Company products, which could adversely affect the Company’s results of operations for any particular quarter.
Dependence on Electronics Industry. The Company is dependent upon the electronics industry and, in particular, new system and IC design projects. The electronics industry is characterized by rapid technological change, short product life cycles, fluctuations in manufacturing capacity and pricing and margin pressures, all of which cause it to be volatile. As a result, the electronics industry has historically experienced sudden and unexpected downturns, at which time the number of new system and IC design projects decrease. Because most of the Company’s sales occur upon the commencement of new projects for system and IC products, the Company is dependent upon the rate of commencement of new system and IC design projects. Accordingly, negative factors affecting the electronics industry could have a material adverse effect on the Company’s results of operations.
Dependence Upon Certain Suppliers. Certain key components used in the Company’s products are presently available from sole or limited sources. The inability to develop alternative sources for these sole or limited source components or to obtain sufficient quantities of these components could result in delays or reductions in product shipments which could adversely affect the Company’s operating results. The Company’s systems use proprietary ASICs and FPGAs that are currently manufactured solely by American Microsystems, Inc. (‘‘AMI’’) and Xilinx, Inc. (“Xilinx”), respectively.
The Company generally purchases these components, including semiconductor memories used in the Company’s verification hardware, pursuant to purchase orders placed from time to time in the ordinary course of business and has no supply arrangements with any of its source suppliers that require the suppliers to provide components in guaranteed quantities or at set prices. Moreover, the manufacture of these components can be extremely complex, and the Company’s reliance on the suppliers of these components exposes the Company to production difficulties and quality variations that may be experienced by these suppliers. Therefore, the Company’s reliance on its sole and limited source suppliers involves several risks, including a potential inability to obtain an adequate supply of required components, reduced control over pricing and timely delivery and quality of acceptable components. While the timeliness and quality of deliveries to date from such suppliers have been acceptable, there can be no assurance that problems will not occur in the future. Any prolonged inability to obtain components or subassemblies in sufficient quantities or quality or on favorable pricing or delivery terms, or any other circumstances that would require the Company to seek alternative sources of supply, could have a material adverse effect on the Company’s operating results and could damage the Company’s relationships with its customers.
Customer Concentration. A relatively limited number of customers have historically accounted for a substantial portion of the Company’s net revenues. During fiscal 2000, 1999 and 1998, sales to the Company’s top ten customers accounted for approximately 66%, 60% and 45%, respectively, of the Company’s net revenues. The Company expects that sales of its products to a limited number of customers will continue to account for a high percentage of net revenues for the foreseeable future. The loss of a major customer or any reduction in orders by such customers, including reductions due to market or competitive conditions in the electronics or EDA industries, would have an adverse effect on the Company’s results of operations. Moreover, the Company’s ability to increase its sales will depend in part upon its ability to obtain orders from new customers, as well as the financial condition and success of its existing customers and the general economy. There can be no assurance that such increases will occur.
Euro Conversion. On January 1, 1999, certain member countries of the European Union established fixed conversion rates between their existing currencies and the Euro. The transition period for the introduction of the Euro ends June 30, 2002. Issues facing the Company as a result of the introduction of the Euro include converting information technology systems, reassessing currency risk, renegotiating vendor contracts, and processing tax and accounting records. We are addressing these issues and do not currently expect the Euro to have a material effect on our financial conditions or results of operations.
Liquidity and Capital Resources
Since inception, the Company has financed its operations, including increases in accounts receivable and inventory and capital equipment acquisitions, primarily through private and public sales of equity securities and a loan secured by capital equipment. The Company’s cash, cash equivalents and short-term investments increased to $19,803,000 at September 30, 2000 from $10,534,000 at October 2, 1999. The increase was a result of $10,363,000 cash provided by operating activities and $3,698,000 of cash provided by financing activities offset by $4,792,000 cash used in investing activities (excluding short-term investment activities).
Operating Activities. The Company’s operating activities provided cash of $10,363,000 in fiscal 2000 and $3,482,000 during fiscal 1998 and used cash of $3,064,000 during fiscal 1999. The cash provided by operating activities for fiscal 2000 were from net income, increases in accounts payable, accrued payroll and related expenses, accrued commissions, income taxes payable and deferred revenues. This increase in cash was primarily offset by increases in accounts receivable, inventories and a decrease in other accrued liabilities. For fiscal 1999, the use of cash for operating activities primarily consisted of an increase in accounts receivable and decreases in accounts payable, other accrued liabilities and deferred revenues partially offset by net income adjusted for depreciation and amortization and a decrease in inventories with increases in accrued payroll and accrued commissions. For fiscal 1998, the $3,482,000 cash provided by operations was primarily due to net loss adjusted for non-cash items, a decrease in accounts receivable and inventory and increases in accounts payable, income taxes payable and deferred revenues partially offset by a decrease in accrued payroll.
Investing Activities. Net cash used in investing activities for fiscal 2000 and 1998 was $9,693,000 and $2,413,000, respectively while net cash provided by investing activities for fiscal 1999 was $2,417,000. Net cash used in investment activities for fiscal 2000 primarily related to purchase of equipment and leasehold improvements and purchases of short-term investment instruments partially offset by maturities of short-term investments. During fiscal 1999, cash provided by investing activities primarily related to the net maturities of short-term investment that were converted to cash or cash equivalents offset by purchases of capital equipment. Net cash used in investing activities during fiscal 1998 consisted of approximately $3,235,000 in capital expenditures, $500,000 related to the acquisition of Deerbrook Systems, Inc. and $6,490,000 related to the acquisition of technology from Interra, Inc. partially offset by the net maturities of short-term investments totaling $7,812,000. For each period presented, capital expenditures were primarily for evaluation equipment and engineering workstations. Also included in the 1999 and 1998 capital expenditures were amounts related to leasehold improvements with respect to the new development facility in India. The Company expects continued capital expenditures during fiscal 2001 as the Company prepares for its move to its new facility coupled with expected headcount additions and computer upgrade requirements which will result in additional acquisitions of computers and engineering workstations.
Financing Activities. In fiscal 2000, net cash provided by financing activities of $3,698,000 was from sales of common stock under the Company’s Stock Option and Stock Purchase Plans. Financing activities provided net cash of approximately $146,000 during fiscal 1999. The net cash provided by financing activities were primarily related to the net sale of common stock under the Company’s Stock Option and Stock Purchase Plans. During fiscal 1999,
the Company repurchased approximately 130,000 shares of commons stock for approximately $407,000. Net cash used in financing activities for the year ended October 3, 1998, was $2,390,000 and was primarily related to the net purchases of the Company’s common stock during the year.
The Company’s primary unused sources of funds at September 30, 2000 consisted of $12,032,000 of cash and cash equivalents, in addition to $7,771,000 of short-term investments. During fiscal 2000, the Company obtained a general working line of credit and an equipment line of credit totaling $4,500,000. Approximately $1,500,000 of working line of credit is currently used as collateral against certain letter of credit arrangements the Company has with its new landlords and an additional $1,800,000 is being used to fund the leasehold improvements in the Company’s new headquarter facilities. As of September 30, 2000, approximately $1,200,000 remains available for use under the lines of credit. The Company believes that its current cash, cash equivalents and short-term investments, together with the remaining line of credit and cash and cash equivalents generated from operations will be sufficient to finance its operations for at least the next twelve months. There can be no assurances that should the Company need additional financing that such financing will be available on terms favorable or acceptable to the Company.
Item 7a. Quantitative and Qualitative Disclosures About Market Risk
As of September 30, 2000, the Company’s investment portfolio consists of money market funds, corporate-backed debt obligations and mortgaged-backed government obligations generally due within one year. The Company’s primary objective with its investment portfolio is to invest available cash while preserving principal and meeting liquidity needs. In accordance with the Company’s investment policy, the Company places investments with high credit quality issuers and limits the amount of credit exposure to any one issuer. These securities, which approximate $12,890,000 and have an average interest rate of approximately 5.52%, are subject to interest rate risks. However, based on the investment portfolio contents and the ability of the Company to hold these investments until maturity, the Company believes that if a significant change in interest rates were to occur, it would not have a material effect on the Company’s financial condition, although there can be no assurance of this.
In addition to its cash equivalents and short-term investments, the Company enters into derivative financial instruments such as forward exchange contracts to hedge certain identifiable receivables denominated in Japanese yen. The Company’s accounting policies for these contracts are based on the Company’s designation of the contracts as hedging transactions. The criteria the Company uses for designating a contract as a hedge includes the contract’s effectiveness in risk reduction and one-to-one matching of derivative instruments to underlying transactions. As such, the impact of exchange rate changes on these contracts is offset by the impact of the changes in the rate on the underlying transactions. Therefore, any market risks associated with these contracts and related underlying transactions are deemed minimal. As of September 30, 2000, the Company did not have any foreign forward contracts outstanding.
Item 8. Financial Statements and Supplementary Data
The Company’s Financial Statements and Schedules, and the report of the independent auditors appear on pages F-1 through F-17 and S-1 of this Form 10-K.
The Company’s Supplementary Data—Unaudited Selected Quarterly Financial Data appears on F-17 of this Form 10-K.
Item 9. Changes in and Disagreements with Accountants on Accounting and Financial Disclosure
Not applicable.
PART III
Item 10. Directors and Executive Officers of the Registrant
The information contained on pages 3, 4 and 5 of the Company’s Definitive Proxy Statement related to the Annual Meeting of Stockholders to be held January 23, 2001, to be filed by the Company with the Securities and Exchange Commission (the “Proxy Statement”) with respect to the directors of the Company is incorporated herein by reference. Information with respect to executive officers of the Company is contained in Part I of this report.
Item 11. Executive Compensation
The information required by this Item is incorporated by reference to the section captioned “EXECUTIVE COMPENSATION AND OTHER MATTERS” contained in the Proxy Statement.
Item 12. Security Ownership of Certain Beneficial Owners and Management
The information required by this Item is incorporated by reference to the section captioned “GENERAL INFORMATION—Security Ownership of Certain Beneficial Owners and Management” contained in the Proxy Statement.
Item 13. Certain Relationships and Related Transactions
Not applicable.
PART IV
Item 14. Exhibits, Financial Statement Schedules and Reports on Form 8-K
(a) The following financial documents of the Registrant are filed as part of this report:
(1) Financial Statements:
| Page | |||
| Report of Ernst & Young LLP, Independent Auditors | F-1 | ||
| Consolidated Balance Sheets, September 30, 2000 and October 2, 1999 |
F-2 | ||
| Consolidated Statements of Operations for the fiscal years ended September 30, 2000, October 2, 1999 and October 3, 1998 |
F-3 | ||
| Consolidated Statements of Stockholders’ Equity for the fiscal years ended September 30, 2000, October 2, 1999 and October 3, 1998 |
F-4 | ||
| Consolidated Statements of Cash Flows for the fiscal years ended September 30, 2000, October 2, 1999 and October 3, 1998 |
F-5 | ||
| Notes to Consolidated Financial Statements | F-6 |
(2) Financial Statement Schedule:
| Schedule II—Valuation and Qualifying Accounts | S-1 | ||
| All other schedules are omitted because they are not applicable or the required information is shown in the Financial Statements or notes thereto which are included herein. |
(3) Exhibits:
| See Index to Exhibits beginning on Page 23 of this report. |
(b) The Company filed no reports on Form 8-K during the fourth quarter ended September 30, 2000.
SIGNATURES
Pursuant to the requirements of Section 13 or 15(d) of the Securities Exchange Act of 1934, the Registrant has duly caused this report to be signed on its behalf by the undersigned, thereunto duly authorized.
| IKOS SYSTEMS, INC. | |||
| /s/Ramon Nuñez | |||
| December 18, 2000 | Ramon Nuñez, Chief Executive Officer, President and Director |
POWER OF ATTORNEY
Each of the officers and directors of IKOS Systems, Inc. whose signature appears below hereby constitutes and appoints Ramon A. Nuñez and Joseph W. Rockom and each of them, their true and lawful attorneys and agents, with full power of substitution, each with power to act alone, to sign and execute on behalf of the undersigned any amendment or amendments to this Report on Form 10-K and to perform any acts necessary in order to file such amendment or amendments and each of the undersigned does hereby ratify and confirm all that said attorneys and agents or their or his substitutes, shall do or cause to be done by virtue hereof.
Pursuant to requirements of the Securities Exchange Act of 1934, this report has been signed on behalf of the Registrant and in the capacities and on the date indicated.
| Signature | Title | Date | ||
| /s/ Ramon Nuñez |
Chief Executive Officer, President and Director |
December 18, 2000 | ||
| (Ramon Nuñez) | ||||
| /s/ Gerald S. Casilli |
Chairman of the Board | December 18, 2000 | ||
| (Gerald S. Casilli) | ||||
| /s/ Joseph W. Rockom |
Vice President of Finance and Chief Finance Officer (Principal Accounting and Financial Officer) and Secretary |
December 18, 2000 | ||
| (Joseph W. Rockom) | ||||
| /s/ James R. Oyler |
Director | December 18, 2000 | ||
| (James R. Oyler) | ||||
| /s/ Glenn E. Penisten |
Director | December 18, 2000 | ||
| (Glenn E. Penisten) | ||||
| /s/ Jackson Hu |
Director | December 18, 2000 | ||
| (Jackson Hu) | ||||
| /s/ William Stevens |
Director | December 18, 2000 | ||
| (William Stevens) |
INDEX TO EXHIBITS
| Exhibit Number | Description | ||
| 2.1 | Agreement and Plan of Reorganization among the Company, VMW Acquisition Corporation and VMW dated May 14, 1996 (Incorporated by reference to Exhibit 2.1 of the Company’s registration statement on Form S-3 effective June 26, 1996). | ||
| 2.2 | Technology Purchase Agreement dated May 12, 1998 by and between the Company and Interra, Inc. (Incorporated by reference to Exhibit 2.1 of the Company’s Current Report on Form 8-K filed May 20, 1998). | ||
| 3.1 | Certificate of Incorporation (Incorporated by reference to Exhibit 3.1 of the Company’s registration statement on Form S-1 effective July 25, 1990). | ||
| 3.2 | Certificate of Amendment of Certificate of Incorporation filed May 5, 1994 (Incorporated by reference to Exhibit 4.1 of the Company’s registration statement on Form S-2 effective October 12, 1995). | ||
| 3.3 | Certificate of Amendment of Certificate of Incorporation filed April 24, 1995 (Incorporated by reference to Exhibit 4.2 of the Company’s registration statement on Form S-2 effective October 12, 1995). | ||
| 3.4 | Certificate of Amendment of Certificate of Incorporation filed February 3, 1997 (Incorporated by reference to Exhibit 3.4 of the Company’s quarterly report on Form 10-Q for the quarter ending March 29, 1997). | ||
| 3.5 | By laws (Incorporated by reference to Exhibit 3.2 of the Company’s registration statement on Form S-1 effective July 25, 1990). | ||
| 4.1 | Rights agreement dated as of January 27, 1992 between the Company and Manufacturers Hanover Trust Company of California, Rights Agent. (Incorporated by reference to Exhibit (C)1, in the Company’s report on Form 8-K filed February 10, 1992). | ||
| 10.1 | Lease Agreement for the Company’s principal facility dated March 20, 1992, between Ames Avenue Associates and the Company, as amended. (Incorporated by reference to Exhibit 10.1 of the Company’s annual report on 10-K for the year ending September 26, 1992). | ||
| 10.2 | Form of Director and Officer Indemnity Agreement. (Incorporated by reference to Exhibit 10.6 of the Company’s registration statement on Form S-1 effective July 25, 1990). | ||
| 10.3 | 1988 Stock Option Plan. (Incorporated by reference to Exhibit 10.14 of the Company’s registration statement on Form S-1 effective July 25, 1990). | ||
| 10.4 | Patent Cross License Agreement dated May 17, 1989 with Zycad Corporation (Incorporated by reference to Exhibit 10.20 of the Company’s registration statement on Form S-1 effective July 25, 1990) . | ||
| 10.5 | International Distributorship Agreement dated April 11, 1988, with C. Itoh & Co., Ltd. (Incorporated by reference to Exhibit 10.24 of the Company’s registration statement on Form S-1 effective July 25, 1990). Confidential Treatment has been granted as to certain portions of this Exhibit. | ||
| 10.6 | OEM Software License Agreement between CAD Language Systems, Inc. and IKOS Systems, Inc. dated June 22, 1989 and amendment dated September 1991 (Incorporated by reference to Exhibit 10.18 of the Company’s Annual Report for the year ended September 28, 1991). | ||
| 10.7 | Technology Transfer and Joint Development Agreement with Racal-Redac, Inc. dated July 1, 1993 (Incorporated by reference to Exhibit 10.19 of the Company’s quarterly report on Form 10-Q for the quarter ended July 3, 1993). Confidential Treatment has been granted as to certain portions of this Exhibit. | ||
| 10.8 | Settlement Agreement and Release dated March 31, 1994 between Racal-Redac, Inc. and the Company (Incorporated by reference to Exhibit 10.13 of the Company’s registration statement on Form S-2 effective October 12, 1995). | ||
| 10.9 | Software License Agreement with Compass Design Automation dated December 31, 1993 (Incorporated by reference to Exhibit 10.17 of the Company’s quarterly report on Form 10-Q for the quarter ended January 1, 1994). | ||
| 10.10 | Agreement dated June 2, 1994, by and between the Company and Gerald S. Casilli (Incorporated by reference to Exhibit 10.18 of the Company’s quarterly report on Form 10-Q for the quarter ended July 2, 1994). |
| Exhibit Number | Description | ||
| 10.11 | Agreement dated June 2, 1994, by and between the Company and Daniel R. Hafeman (Incorporated by reference to Exhibit 10.18 of the Company’s quarterly report on Form 10-Q for the quarter ended July 2, 1994). | ||
| 10.12 | Agreement dated June 2, 1994, by and between the Company and Stephen McLaughlin. (Incorporated by reference to Exhibit 10.18 of the Company’s quarterly report on Form 10-Q for the quarter ended July 2, 1994). | ||
| 10.13 | Agreement dated June 2, 1994, by and between the Company and Larry A. Melling (Incorporated by reference to Exhibit 10.18 of the Company’s quarterly report on Form 10-Q for the quarter ended July 2, 1994). | ||
| 10.14 | Agreement dated June 2, 1994, by and between the Company and Ramon A. Nuñez (Incorporated by reference to Exhibit 10.18 of the Company’s quarterly report on Form 10-Q for the quarter ended July 2, 1994). | ||
| 10.15 | Agreement dated June 2, 1994, by and between the Company and Joseph W. Rockom (Incorporated by reference to Exhibit 10.18 of the Company’s quarterly report on Form 10-Q for the quarter ended July 2, 1994). | ||
| 10.16 | The Company’s 1995 Outside Directors Stock Option Plan (Incorporated by reference to Exhibit 10.22 of the Company’s registration statement on Form S-2 effective October 12, 1995). | ||
| 10.17 | Development and OEM Agreement for Verilog/IKOS Co-simulation Interface dated August 26, 1994 by and between the Company and Precedence Incorporated (Incorporated by reference to Exhibit 10.24 of the Company’s registration statement on Form S-2 effective October 12, 1995). | ||
| 10.18 | Amendment to OEM Agreement for the acquisition of certain software technology, by and between Compass Design Automation, Inc. and the Company dated December 27, 1995 (Incorporated by reference to Exhibit 10.20 of the Company’s quarterly report on Form 10-Q for the quarter ended December 30, 1995). | ||
| 10.19 | Amended and Restated Employment Agreement dated August 1, 1995 by and between the Company and Ramon Nuñez (Incorporated by reference to Exhibit 10.21 of the Company’s quarterly report on Form 10-Q for the quarter ended December 30, 1995). | ||
| 10.20 | Patent License Agreement dated December 22, 1993 between Massachusetts Institute of Technology and the Company (Incorporated by reference to Exhibit 10.20 of the Company’s quarterly report on Form 10-Q for the quarter ended June 29, 1996). Confidential treatment has be granted as to certain portions of this Exhibit. | ||
| 10.21 | The Company’s 1995 Stock Option Plan, as amended (Incorporated by reference to Exhibit 10.21 of the Company’s Quarterly Report on Form 10-Q for the quarter ended April 4, 1998). | ||
| 10.22 | The Company’s 1996 Employee Stock Purchase Plan, as amended (Incorporated by reference to Exhibit 10.22 of the Company’s Quarterly Report on Form 10-Q for the quarter ended April 4, 1998). | ||
| 10.23 | The Company’s amended and restated Rights Plan by and between the Company and Bank of Boston NA dated January 22, 1999 (Incorporated by reference to Exhibit 1 of the Company’s report on Form 8-A /a filed on January 29, 1999. | ||
| 10.24 | Agreement dated April 11, 1997, by and between the Company and Robert Hum (Incorporated by reference to Exhibit 1 of the Company’s report of Form 8-A as filed on January 29, 1999). | ||
| 10.25 | Agreement dated February 2, 1999, by and between the Company and Thomas N. Gardner (Incorporated by reference to Exhibit 10.25 of the Company’s quarterly report on Form 10-Q for the quarter ended July 3, 1999). | ||
| 10.26 | Agreement dated February 3, 1999, by and between the Company and Nader Fathi (Incorporated by reference to Exhibit 10.26 of the Company’s quarterly report on Form 10-Q for the quarter ended July 3, 1999). | ||
| 10.27 | Revolving Credit and Security Agreement dated as of March 31, 2000 by and between IKOS Systems, Inc. and Comerica Bank—California. (Incorporated by reference to Exhibit 10.27 of the Company’s quarterly report on Form 10-Q for the quarter ended July 1, 2000) | ||
| 10.28 | Lease Agreement for the Company’s principal facility dated January 14, 2000, by and between the Company and Pepper Lane—Great Oaks, LLC. |
| Exhibit Number | Description | ||
| 10.29 | Lease Agreement for the Company’s Waltham Research and Development facility dated July 28, 2000 by and between the Company and LGP Limited Partnership. | ||
| 21.1 | List of Subsidiaries. | ||
| 23.1 | Consent of Ernst & Young LLP, Independent Auditors. | ||
| 24.1 | Power of Attorney (Included on page 22 of this report). | ||
| 27.1 | Financial Data Schedule |
REPORT OF ERNST & YOUNG LLP, INDEPENDENT AUDITORS
Board of Directors and Stockholders
IKOS Systems, Inc.
We have audited the accompanying consolidated balance sheets of IKOS Systems, Inc., as of September 30, 2000 and October 2, 1999, and the related consolidated statements of operations, stockholders’ equity, and cash flows for each of the three fiscal years in the period ended September 30, 2000. Our audits also included the financial statement schedule listed in the Index at Item 14(a). These financial statements and schedule are the responsibility of the Company’s management. Our responsibility is to express an opinion on these financial statements and schedule based on our audits.
We conducted our audits in accordance with auditing standards generally accepted in the United States. Those standards require that we plan and perform the audit to obtain reasonable assurance about whether the financial statements are free of material misstatement. An audit includes examining, on a test basis, evidence supporting the amounts and disclosures in the financial statements. An audit also includes assessing the accounting principles used and significant estimates made by management, as well as evaluating the overall financial statement presentation. We believe that our audits provide a reasonable basis for our opinion.
In our opinion, the financial statements referred to above present fairly, in all material respects, the consolidated financial position of IKOS Systems, Inc., at September 30, 2000 and October 2, 1999, and the consolidated results of its operations and its cash flows for each of the three fiscal years in the period ended September 30, 2000, in conformity with accounting principles generally accepted in the United States. Also, in our opinion, the related financial statement schedule, when considered in relation to the basic financial statements taken as a whole, presents fairly in all material respects the information set forth herein.
| ERNST & YOUNG LLP | |||
| San Jose, California October 23, 2000 |
IKOS SYSTEMS, INC.
CONSOLIDATED BALANCE SHEETS
(In thousands, except per-share amounts)
| September 30, | October 2, | ||||||
| 2000 | 1999 | ||||||
| ASSETS | |||||||
| Current assets: | |||||||
| Cash and cash equivalents | $ | 12,032 | $ | 7,664 | |||
| Short-term investments | 7,771 | 2,870 | |||||
| Accounts receivable (net of allowances for doubtful accounts of $645 and $801, respectively) |
19,716 | 10,549 | |||||
| Inventories | 3,997 | 3,455 | |||||
| Prepaid expenses and other assets | 578 | 435 | |||||
| Total current assets | 44,094 | 24,973 | |||||
| Equipment and leasehold improvements | |||||||
| Office and evaluation equipment | 6,782 | 5,663 | |||||
| Machinery and equipment | 11,487 | 10,513 | |||||
| Leasehold improvements | 2,640 | 718 | |||||
| 20,909 | 16,894 | ||||||
| Less allowances for depreciation and amortization | (14,534 | ) | (11,832 | ) | |||
| 6,375 | 5,062 | ||||||
| Intangible assets (net of amortization of $924 and $716, respectively) | 883 | 1,146 | |||||
| Other assets | 653 | 609 | |||||
| $ | 52,005 | $ | 31,790 | ||||
| LIABILITIES AND STOCKHOLDERS’ EQUITY | |||||||
| Current liabilities: | |||||||
| Notes payable | $ | 1,809 | $ | — | |||
| Accounts payable | 5,446 | 3,763 | |||||
| Accrued payroll and related expenses | 3,549 | 2,709 | |||||
| Accrued commissions | 2,094 | 1,052 | |||||
| Income taxes payable | 3,252 | 1,019 | |||||
| Other accrued liabilities | 2,511 | 2,815 | |||||
| Deferred revenues | 8,388 | 5,337 | |||||
| Total current liabilities | 27,049 | 16,695 | |||||
| Accrued rent | 92 | 64 | |||||
| Commitments | |||||||
| Stockholders’ equity: | |||||||
| Preferred stock, $.01 par value; 10,000 shares authorized, none issued and outstanding |
— | — | |||||
| Common stock, $.01 par value; 50,000 shares authorized, 8,797 and 8,797 shares issued and 8,778 and 8,401 outstanding, respectively |
88 | 88 | |||||
| Additional paid-in capital | 57,791 | 58,312 | |||||
| Treasury stock, at cost, 19 shares in 2000 and 396 in 1999 | (126 | ) | (2,536 | ) | |||
| Accumulated adjustments to comprehensive income | (842 | ) | (498 | ) | |||
| Accumulated deficit | (32,047 | ) | (40,335 | ) | |||
| Total stockholders’ equity | 24,864 | 15,031 | |||||
| $ | 52,005 | $ | 31,790 | ||||
See notes to consolidated financial statements.
IKOS SYSTEMS INC.
CONSOLIDATED STATEMENTS OF OPERATIONS
(In thousands, except per-share amounts)
| Fiscal Years Ended | ||||||||||
| September 30, 2000 | October 2, 1999 | October 3, 1998 | ||||||||
| Net revenues: | ||||||||||
| Product | $ | 54,652 | $ | 41,258 | $ | 27,724 | ||||
| Maintenance | 18,144 | 15,075 | 13,169 | |||||||
| Total net revenues | 72,796 | 56,333 | 40,893 | |||||||
| Cost of revenues: | ||||||||||
| Product | 11,545 | 9,578 | 12,952 | |||||||
| Maintenance | 4,486 | 4,200 | 1,782 | |||||||
| Total cost of revenues | 16,031 | 13,778 | 14,734 | |||||||
| Gross profit | 56,765 | 42,555 | 26,159 | |||||||
| Operating expenses: | ||||||||||
| Research and development | 15,912 | 13,443 | 14,381 | |||||||
| Sales and marketing | 24,913 | 21,822 | 18,609 | |||||||
| General and administration | 5,311 | 4,267 | 4,247 | |||||||
| Acquired in process research and development and special charges | — | — | 7,600 | |||||||
| Amortization of intangibles | 209 | 412 | 4,679 | |||||||
| Total operating expenses | 46,345 | 39,944 | 49,516 | |||||||
| Income (loss) from operations | 10,420 | 2,611 | (23,357 | ) | ||||||
| Other income: | ||||||||||
| Interest income | 618 | 495 | 1,031 | |||||||
| Income (loss) before provision for income taxes | 11,038 | 3,106 | (22,326 | ) | ||||||
| Provision for income taxes | 2,750 | 650 | 4,928 | |||||||
| Net income (loss) | $ | 8,288 | $ | 2,456 | $ | (27,254 | ) | |||
| Earnings (loss) per share: | ||||||||||
| Basic net income (loss) | $ | 0.97 | $ | 0.30 | $ | (3.24 | ) | |||
| Common and common equivalent shares used in computing basic per share amounts |
8,563 | 8,306 | 8,418 | |||||||
| Diluted net income (loss) | $ | 0.84 | $ | 0.27 | $ | (3.24 | ) | |||
| Common and common equivalent shares used in computing basic per share amounts |
9,836 | 9,140 | 8,418 | |||||||
See notes to consolidated financial statements.
IKOS SYSTEMS, INC.
CONSOLIDATED STATEMENT OF STOCKHOLDERS’ EQUITY
(In thousands)
| Common Stock | Treasury Stock | Additional | Accumulated Adjustments to |
Total | ||||||||||||||||||||||||
| Comprehensive | Paid-in | Comprehensive | Accumulated | Stockholders' | ||||||||||||||||||||||||
| Income | Shares | Amount | Shares | Amount | Capital | Income | Deficit | Equity | ||||||||||||||||||||
| Balance at September 27, 1997 | 8,611 | $ | 85 | (32 | ) | $ | (341 | ) | $ | 58,014 | $ | (231 | ) | $ | (15,537 | ) | $ | 41,990 | ||||||||||
| Net issuance of stock under employee benefit plans |
186 | 2 | (17 | ) | (130 | ) | 761 | — | — | 633 | ||||||||||||||||||
| Acquisition of treasury stock | — | — | (387 | ) | (2,673 | ) | — | — | — | (2,673 | ) | |||||||||||||||||
| Net loss | $ | (27,254 | ) | — | — | — | — | — | — | (27,254 | ) | (27,254 | ) | |||||||||||||||
| Net accumulated translation losses | (83 | ) | — | — | — | — | — | (83 | ) | — | (83 | ) | ||||||||||||||||
| Total comprehensive income | $ | (27,337 | ) | |||||||||||||||||||||||||
| Balance at October 3, 1998 | 8,797 | 87 | (436 | ) | (3,144 | ) | 58,775 | (314 | ) | (42,791 | ) | 12,613 | ||||||||||||||||
| Net issuance of stock under employee benefit plans |
— | 1 | 170 | 1,015 | (463 | ) | — | — | 553 | |||||||||||||||||||
| Acquisition of treasury stock | — | — | (130 | ) | (407 | ) | — | — | — | (407 | ) | |||||||||||||||||
| Net income | $ | 2,456 | — | — | — | — | — | — | 2,456 | 2,456 | ||||||||||||||||||
| Net accumulated translation losses | (184 | ) | — | — | — | — | — | (184 | ) | — | (184 | ) | ||||||||||||||||
| Total comprehensive income | $ | 2,272 | ||||||||||||||||||||||||||
| Balance at October 2, 1999 | 8,797 | 88 | (396 | ) | (2,536 | ) | 58,312 | (498 | ) | (40,335 | ) | 15,031 | ||||||||||||||||
| Net issuance of stock under employee benefit plans |
— | — | 377 | 2,410 | (521 | ) | — | — | 1,889 | |||||||||||||||||||
| Net income | $ | 8,288 | — | — | — | — | — | — | 8,288 | 8,288 | ||||||||||||||||||
| Net accumulated translation losses | (344 | ) | — | — | — | — | — | (344 | ) | — | (344 | ) | ||||||||||||||||
| Total comprehensive income | $ | 7,944 | ||||||||||||||||||||||||||
| Balance at September 30, 2000 | 8,797 | $ | 88 | (19 | ) | $ | (126 | ) | $ | 57,791 | $ | (842 | ) | $ | (32,047 | ) | $ | 24,864 | ||||||||||
See notes to consolidated financial statements.
IKOS SYSTEMS, INC.
CONSOLIDATED STATEMENTS OF CASH FLOWS
Increase (decrease) in cash and cash equivalents in thousands
(In thousands)
| Fiscal Years Ended | ||||||||||
| September 30, 2000 |
October 2, 1999 |
October 3, 1998 |
||||||||
| Operating activities: | ||||||||||
| Net income (loss) | $ | 8,288 | $ | 2,456 | $ | (27,254 | ) | |||
| Adjustments to reconcile net income (loss) to net cash provided by (used in) operating activities: |
||||||||||
| Depreciation and amortization | 3,688 | 2,903 | 7,189 | |||||||
| Accumulated translation adjustments | (344 | ) | (184 | ) | (83 | ) | ||||
| Special charges | — | — | 7,600 | |||||||
| Deferred income taxes | — | — | 4,577 | |||||||
| Accrued rent | 28 | (92 | ) | (56 | ) | |||||
| Changes in operating assets and liabilities: | ||||||||||
| Accounts receivable | (9,167 | ) | (4,516 | ) | 6,195 | |||||
| Inventories | (542 | ) | 361 | 988 | ||||||
| Prepaid expenses and other current assets | (143 | ) | 101 | 123 | ||||||
| Other assets | (44 | ) | (213 | ) | 176 | |||||
| Accounts payable | 1,683 | (1,026 | ) | 1,716 | ||||||
| Accrued payroll and related expenses | 840 | 855 | (583 | ) | ||||||
| Accrued commissions | 1,042 | 251 | 59 | |||||||
| Income taxes payable | 2,233 | (166 | ) | 113 | ||||||
| Other accrued liabilities | (250 | ) | (1,535 | ) | 249 | |||||
| Deferred revenues | 3,051 | (2,259 | ) | 2,473 | ||||||
| Net cash provided by (used in) operating activities | 10,363 | (3,064 | ) | 3,482 | ||||||
| Investing activities: | ||||||||||
| Purchases of equipment and leasehold improvements | (4,792 | ) | (2,230 | ) | (3,235 | ) | ||||
| Purchase of Deerbrook Systems, Inc | — | — | (500 | ) | ||||||
| Purchase of Interra, Inc. technology | — | — | (6,490 | ) | ||||||
| Purchase of short-term investments | (8,744 | ) | (4,465 | ) | (14,047 | ) | ||||
| Maturities of short-term investments | 3,843 | 9,112 | 21,859 | |||||||
| Net provided by (cash used) investment activities | (9,693 | ) | 2,417 | (2,413 | ) | |||||
| Financing activities: | ||||||||||
| Proceeds from short-term borrowings | 1,809 | — | ||||||||
| Payments on long-term borrowings | — | — | (350 | ) | ||||||
| Net sale of common stock | 1,889 | 553 | 633 | |||||||
| Acquisition of treasury stock | — | (407 | ) | (2,673 | ) | |||||
| Net cash provided by (used in) financing activities | 3,698 | 146 | (2,390 | ) | ||||||
| Increase (decrease) in cash and cash equivalents | 4,368 | (501 | ) | (1,321 | ) | |||||
| Cash and cash equivalents at beginning of year | 7,664 | 8,165 | 9,486 | |||||||
| Cash and cash equivalents at end of year | $ | 12,032 | $ | 7,664 | $ | 8,165 | ||||
| Supplemental disclosures of cash flow information: | ||||||||||
| Net cash paid for income taxes | $ | 322 | $ | 817 | $ | 337 | ||||
| Supplemental disclosure of noncash financing activities: | ||||||||||
| Issuance of commons stock under employee benefit plans in exchange for common stock |
— | — | $ | 130 | ||||||
See notes to consolidated financial statements.
IKOS SYSTEMS, INC.
NOTES TO CONSOLIDATED FINANCIAL STATEMENTS
September 30, 2000
1. Nature of Operations and Summary of Significant Accounting Policies
Nature of operations. The Company develops, manufactures, markets and supports verification systems for integrated circuit designs. The Company’s strategy is to serve the needs of a growing universe of IC designers for fast, accurate verification of complex IC designs through its family of simulation and emulation systems. The Company performs final assembly and test of all of its products in its Cupertino, California facility and utilizes third parties for all major subassembly manufacturing. Certain key components used in the Company’s products are presently available from sole or limited sources. The Company is dependent upon these suppliers to provide these components on a timely basis. The Company sells its products to a broad range of customers in the communications, multimedia/graphics, semiconductor, computer, aerospace and consumer electronics industries.
Basis of presentation. The accompanying consolidated financial statements include the Company and its wholly owned subsidiaries after elimination of all significant inter-company accounts and transactions.
Fiscal year. The Company is on a 52-53 week fiscal year. Accordingly, September 30, 2000, October 2, 1999 and October 3, 1998 are the fiscal year-ends for 2000, 1999 and 1998, respectively. Fiscal 2000 and 1999 were 52 week fiscal years. Fiscal year 1998 was a 53 week fiscal year.
Cash Equivalents and Short-Term Investments. All liquid investments with original maturities of three months or less when purchased are considered to be cash equivalents and are stated at cost, which approximates their fair market value. At September 30, 2000, cash equivalents consisted of money market funds, certificates of deposits and U.S. corporate overnight securities. Short-term investments are stated at cost, which approximates fair market value, and consist primarily of U.S. corporate-backed securities and mortgage-backed government obligations all due within one year. The Company is exposed to credit risks in the event of default by the financial institutions or issuers of investments to the extent of amounts recorded on the balance sheet.
Under Statements of Financial Accounting Standards No. 115 (FAS 115), ‘‘Accounting for Certain Investments in Debt and Equity Securities,’’ debt securities that the Company has both positive intent and ability to hold to maturity are carried at amortized cost. Debt securities that the Company does not have the positive intent and ability to hold to maturity and all marketable equity securities are classified as available-for-sale or trading and carried at fair value. Unrealized holding gains and losses on securities classified as available-for-sale are reported as part of equity while unrealized holding gains and losses on securities classified as trading are reported in earnings. At September 30, 2000, all securities are designated as held to maturity.
The fair values for marketable debt securities are based on quoted market prices. The fair value of marketable securities is substantially equal to their carrying values as of September 30, 2000 and October 2, 1999.
The following is a summary of held-to-maturity securities at September 30, 2000 and October 2, 1999 (in thousands):
| September 30, 2000 |
October 2, 1999 |
||||||
| U.S. Treasury Securities | $ | 2,060 | — | ||||
| U.S. Corporate Securities | 6,804 | — | |||||
| Mortgage-Backed Securities | 4,026 | 2,870 | |||||
| $ | 12,890 | $ | 2,870 | ||||
| Amounts included in short-term investments | $ | 7,771 | $ | 2,870 | |||
| Amounts included in cash and cash equivalents | $ | 5,119 | $ | — | |||
IKOS SYSTEMS, INC.
NOTES TO CONSOLIDATED FINANCIAL STATEMENTS (Continued)
September 30, 2000
Inventories. Inventories are stated at the lower of cost (first-in, first-out method) or market (estimated net realizable value). Inventories consist of the following (in thousands):
| September 30, 2000 |
October 2, 1999 |
||||||
| Raw materials | $ | 951 | $ | 818 | |||
| Work-in-process | 1,386 | 1,435 | |||||
| Finished goods | 1,660 | 1,202 | |||||
| $ | 3,997 | $ | 3,455 | ||||
Equipment and Leasehold Improvements. Equipment and leasehold improvements are stated at cost and are depreciated or amortized using the straight-line method over the estimated useful life (generally two to five years) of the related asset, or in the case of leasehold improvements, the term of the lease, if shorter.
Goodwill, Software Development Costs and Other Long-Lived Assets. The Company periodically reviews and evaluates its recorded goodwill and other long-lived assets for impairment. During the fourth quarter of 1998, the Company evaluated and concluded that based on the strategic changes and the current form of the emulation technology, the original technology acquired from Virtual Machine Works, Inc. (VMW) would no longer be used, and thus, the unamortized intangibles associated with the original transaction were written off. The Company recorded a charge to operations of approximately $3,200,000. There were no write-downs of intangible assets in fiscal 1999 or 2000.
The Company capitalizes software development costs upon achievement of technological feasibility, subject to net realizable value considerations in accordance with Statement of Financial Accounting Standards No. 86. The Company has defined technological feasibility as completion of a working model. Such capitalized costs are amortized upon product release on a straight-line basis over the estimated useful life of two years or the ratio of current revenue to the total of current and anticipated future revenues, whichever is greater. For each of the three fiscal years ended September 30, 2000 capitalizable costs were insignificant and thus charged to research and development expenses for the respective periods in the accompanying financial statements.
Revenue Recognition. The Company recognizes revenue when the earning process is complete, evidenced by an agreement between the Company and the customer, delivery has occurred, collectibility is probable, and pricing is fixed or determinable. If significant obligations remain after delivery, revenue is deferred until such obligations are fulfilled. Revenues from maintenance arrangements are recognized ratably over the term of the related contract.
Warranty. The Company warrants products sold to customers for ninety days from shipment and such warranty covers repairs or replacement due to defects in the delivered product. A provision for the estimated future cost of warranty is recorded upon delivery.
Employee Stock Plans. The Company accounts for its stock option and employee stock purchase plans in accordance with provisions of the Accounting Principles Board’s Opinion No. 25 (APB 25), “Accounting for Stock Issued to Employees.” The Company provides additional pro forma disclosures as required under Statement of Financial Accounting Standard No. 123 “Accounting for Stock Based Compensation.”
Use of Estimates. The preparation of financial statements in conformity with generally accepted accounting principles requires management to make estimates and assumptions that affect the reported amounts of liabilities and disclosure of contingent assets and liabilities at the date of the financial statements and the reported amounts of revenues and expenses during the reporting period. Such estimates related to the useful lives of fixed assets, allowances for doubtful accounts and customer returns, inventory write-downs, other reserves and income tax valuation allowances. Actual results inevitably will differ from those estimates, and such differences may be material to the financial statements.
Translation of Foreign Currencies. For foreign operations with the local currency as the functional currency, the translation of the applicable foreign currencies into U.S. dollars is performed for balance sheet accounts using current exchange rates in effect at the balance sheet date and for revenue and expense accounts using an average
IKOS SYSTEMS, INC.
NOTES TO CONSOLIDATED FINANCIAL STATEMENTS (Continued)
September 30, 2000
exchange rate during the period. The gains or losses resulting from translation are included in accumulated other comprehensive income in the accompanying balance sheets. The Company also recognizes foreign currency transaction gains and losses from its international operations. Such gains or losses are charged to operations and have been immaterial to the Company’s operating results.
Derivative Financial Instruments. The Company enters into derivative financial instruments such as forward exchange contracts to hedge certain identifiable receivables denominated in Japanese yen against fluctuations in exchange rates until such receivables are collected. The Company does not enter into forward foreign contracts for speculative or trading purposes. The Company’s accounting policies for these contracts are based on the Company’s designation of the contracts as hedging transactions. The criteria the Company uses for designating a contract as a hedge includes the contract’s effectiveness in risk reduction and one-to-one matching of derivative instruments to underlying transactions. As such, the impact of exchange rate changes on these contracts is offset by the impact of the changes in the rate on the underlying transactions. Therefore, any market risks associated with these contracts and related underlying transactions are considered minimal. As of September 30, 2000, the Company did not have any foreign forward exchange contracts outstanding.
Net Income (Loss) Per Share. The Company computes earnings per share in accordance with the Financial Accounting Standards Board “(FASB) Statement of Financial Accounting Standards No. 128, Earnings Per Share. Basic earnings per share is computed using weighted options outstanding for the period and excluding the dilutive effect of stock options and warrants. Dilutive per share data is computed using the weighted-average common and dilutive common equivalent shares outstanding. The following table sets forth the computation of basic and dilutive per share data:
| Fiscal Years Ended | ||||||||||
| September 30, 2000 |
October 2, 1999 |
October 3, 1998 |
||||||||
| Basic Earnings (Loss) Per Share: | ||||||||||
| Net Income (loss) | $ | 8,288 | $ | 2,456 | $ | (27,254 | ) | |||
| Weighted-average common shares outstanding | 8,563 | 8,306 | 8,418 | |||||||
| Basic net income (loss) per share | $ | 0.97 | $ | 0.30 | $ | (3.24 | ) | |||
| Dilutive Earnings (Loss) Per Share: | ||||||||||
| Net Income (loss) | $ | 8,288 | $ | 2,456 | $ | (27,254 | ) | |||
| Weighted-average common shares outstanding | 8,563 | 8,306 | 8,418 | |||||||
| Common equivalent shares attributable to options (treasury stock method) |
1,273 | 834 | — | |||||||
| Total weighted-average common shares outstanding | 9,836 | 9,140 | 8,418 | |||||||
| Dilutive net income (loss) per share | $ | 0.84 | $ | 0.27 | $ | (3.24 | ) | |||
Outstanding options and warrants to purchase approximately 68,000, 214,000 and 1,706,000 shares, for the fiscal years 2000, 1999 and 1998, respectively, Plan were not included in the treasury stock calculation to derive diluted net income (loss) per share as their inclusion would have had an anti-dilutive effect.
Impact of Recently Issued Accounting Standards. In December 1999, the Securities and Exchange Commission (SEC) issued Staff Accounting Bulletin No. 101 (SAB 101), “Revenue Recognition in Financial Statements”. In March 2000, SAB 101 was amended by SAB 101A which delayed the implementation date of SAB 101 for calendar year end reporting companies, including IKOS, to the quarter ending September 30, 2000. In June 2000, SAB 101 was amended a second time by SAB101B further delaying the implementation date to no later than the quarter ending September 29, 2001. The Company is currently evaluating the impact of SAB 101 and is uncertain as to what impact, if any, SAB 101 will have on its revenues and results of operations. The impact of SAB 101, if any, will be reported as a change in accounting principle in accrodance with FASB Statement No. 3. This may result in a significant cumulative effect change in accounting adjustment that would be reflected in the Company’s results of operations for the fiscal year ended September 29, 2001.
IKOS SYSTEMS, INC.
NOTES TO CONSOLIDATED FINANCIAL STATEMENTS (Continued)
September 30, 2000
In March 2000, the Financial Accounting Standards Board issued FASB Interpretation No. 44 (FIN 44), “Accounting for Certain Transactions Involving Stock Compensation—an Interpretation of APB Opinion No. 25.” FIN 44 clarifies the application of APB Opinion No. 25 and among other issues clarifies the following: the definition of an employee for purposes of applying APB Opinion No. 25; the criteria for determining whether a plan qualifies as a noncompensatory plan; the accounting consequence of various modifications to the terms of the previously fixed stock options or awards; and the accounting for an exchange of stock compensation awards in a business combination. FIN 44 is effective July 1, 2000, but certain conclusions in FIN 44 cover specific events that occurred after either December 15, 1998 or January 12, 2000. The application of FIN 44 did not have a material impact on the company’s financial position or results of operations.
In June 1998, the Financial Accounting Standards Board issued SFAS No. 133, “Accounting for Derivative Instruments and Hedging Activities,” which establishes accounting and reporting standards for derivative instruments and hedging activities. It requires the Company to recognize all derivatives as either assets or liabilities in the balance sheet and measure those instruments at fair value. It further provides criteria for derivative instruments to be designated as fair value, cash flow, or foreign currency hedges, and establishes accounting standards for reporting changes in the fair value of the derivative instruments. Upon adoption, the Company will be required to adjust hedging instruments to fair value in the balance sheet and recognize the offsetting gains or losses as adjustments to be reported in net income or other comprehensive income, as appropriate. The Company will adopt SFAS No. 1 33 in fiscal 2001. Management does not believe the adoption of SFAS No. 133 will have a material effect on the Company’s results of operations or financial position.
2. Acquisition
Interra, Inc. In May 1998, the Company acquired certain technology and research and development expertise from Interra, Inc. and its affiliate, Delsoft India Pvt. Limited. The purchase price paid, including costs of the transaction, was approximately $9,040,000. All amounts due under this purchase agreement have been paid. During 1998, the Company recorded a charge of approximately $7,600,000 related to the acquired technology to in-process research and development. The evaluation of the underlying technology acquired considered the inherent difficulties and uncertainties in completing the development of the technology, and thereby achieving technological feasibility, and the risks related to the viability of and potential changes in future target markets. The underlying technology had no alternative use (in other research and development projects or otherwise) since the technology was acquired for the sole purpose of developing simulation and emulation products. In connection with the technology acquisition, the Company recorded as an asset approximately $1,400,000 for the acquired workforce and other intangibles, which are to be amortized over 8 years. As of September 30, 2000, approximately $883,000 remains to be amortized.
3. Borrowing Arrangements
In March 2000, the Company negotiated a $3,000,000 working capital line of credit and $1,500,000 equipment line of credit with its bank. The agreement expires one year from the commencement date of March 31, 2000 and is renewable at the option of both parties. The lines are collateralized by the assets of the Company. Any borrowings under the line of credit and equipment line bear interest at the rate of 9.50% and 9.75%, respectively. At September 30, 2000, the total amount utilized under the lines was approximately $3,309,000. Of the total amount utilized, approximately $1,500,000 of the working capital line is reserved as collateral against certain letter of credit arrangements the Company has with its new landlords and approximately $1,809,000 was utilized to fund its leasehold improvements at the Company’s new headquarter facility. At September 30, 2000, approximately $1,200,000 remained availa ble for use by the Company. Subsequent to the September 2000, the Company repaid the entire outstanding balance. Under the terms of the credit facility, the Company is required to maintain certain financial covenants. At September 30, 2000, the Company was in compliance with all covenants.
4. Operating Leases
The Company’s current building lease was originally scheduled to expire in September 2000, but was extended through December 31, 2000. The Company will then move to its new headquarters located in San Jose, California. The new lease is a ten year lease commencing in January 2001. The Company has the option to renew
IKOS SYSTEMS, INC.
NOTES TO CONSOLIDATED FINANCIAL STATEMENTS (Continued)
September 30, 2000
this building lease at its principal offices for up to an additional ten years, commencing in December 2010, at approximately the fair market value at the time of renewal.
Rent expense approximated $1,961,885, $1,632,000 and $1,633,000, in fiscal 2000, 1999, 1998, respectively.
Future minimum payments (*) under non cancelable operating leases at September 30, 2000 are as follows (in thousands):
| Fiscal Year | Amount | |||
| 2001 | $ | 2,829 | ||
| 2002 | 3,190 | |||
| 2003 | 3,001 | |||
| 2004 | 3,232 | |||
| 2005 | 3,183 | |||
| 2006 and thereafter | 16,088 | |||
| Total | $ | 31,523 | ||
(*) Includes the new headquarters operating lease which commences on January 1, 2001.
5. Stockholders’ Equity
Preferred Stock Purchase Rights Plan. The Company has a Preferred Stock Purchase Rights Plan (the ‘‘Rights Plan’’), which provides existing shareholders with the right to purchase 1/100 preferred share for each common share held in the event of certain changes in the Company’s ownership. The Rights Plan may serve as a deterrent to takeover tactics, which are not in the best interests of shareholders. Of the 10,000,000 preferred shares authorized, the Board of Directors of the Company has designated 500,000 shares as Series G Preferred Stock, $0.01 par value per share, and has reserved such shares for issuance pursuant to the Company’s Rights Plan.
Stock Repurchase. During fiscal 1998, the Company announced its intention to repurchase up to 1,000,000 shares of its outstanding common stock on the open market. Through September 30, 2000, the Company had repurchased 516,500 shares at a weighted-average per share price of $5.96.
VMW Acquisition. In connection with the acquisition of (Virtual Machine Works, Inc.) VMW in May 1996, the Company granted options to purchase approximately 84,000 shares of common stock in exchange for VMW options. The option prices range from $0.85 - $2.54 and are included in the grants in the table below. In connection with the acquisition, the Company also issued warrants to purchase 25,000 shares of common stock at $23.50 per share in return for professional services rendered. These warrants, which were valued at approximately $200,000, were included as consideration in connection with the acquisition. These warrants expire on April 19, 2001.
At September 30, 2000, options to purchase approximately 4,700 shares of common stock and warrants to purchase 25,000 shares of common stock remain outstanding. The Company has reserved approximately 29,700 shares of common stock for issuance in connection with these options and warrants.
Stock Option Plans. In 1988, the Company established a Stock Option Plan (the Plan) which provides for the granting of options to employees or directors to purchase shares of the Company’s common stock. During fiscal 1996, the Company replaced the 1988 Stock Option Plan by establishing the 1995 Stock Option Plan (the “1995 Plan”). The terms of the 1995 Plan are similar to the 1988 Plan. Any shares remaining available for grant under the 1988 Plan were converted to the 1995 Plan, and an additional 750,000 shares were reserved for future grants under the 1995 Plan. In connection with its 1997 Annual Shareholders meeting, the Company obtained approval whereby on the first day of each fiscal year of the Company beginning after October 4, 1998, the maximum aggregate number of shares of common stock issuable under the Company’s 1995 plan will increase automatically by that number of s hares of common stock of the Company equal to 4.9% of the number of shares of the Company issued and outstanding on the last day of the preceding fiscal year. During 1998, 1999 and 2000 an additional 430,000, 410,000 and 412,000, shares were reserved for future grants under the 1995 Plan, respectively.
IKOS SYSTEMS, INC.
NOTES TO CONSOLIDATED FINANCIAL STATEMENTS (Continued)
September 30, 2000
In September 1998, the Board of Directors authorized the Company to offer all employees the opportunity to cancel certain previously granted options in exchange for new options with three year cliff vesting and a three year expiration term at the then fair market value prices of $1.78 per share. In connection with this offer, options to purchase 531,022 shares of common stock with a weighted-average price of $6.93 were exchanged for new options.
The following table summarizes the activity for the stock option plans (in thousands, except per share data):
| Options and Rights Outstanding | ||||||||||
| Number of Shares |
Aggregate Exercise Price |
Price Per Share |
||||||||
| (in thousands, except per share data) | ||||||||||
| Balance at September 27, 1997 | 1,484 | $ | 17,635 | $0.850-28.375 | ||||||
| Granted | 2,232 | 10,329 | 1.438-12.688 | |||||||
| Exercised | (88 | ) | (359 | ) | 0.850-6.000 | |||||
| Forfeitures | (1,707 | ) | (19,748 | ) | 0.850-28.375 | |||||
| Balance at October 3,1998 | 1,921 | 7,857 | 0.850-28.375 | |||||||
| Granted | 777 | 2,863 | 1.406-11.000 | |||||||
| Exercised | (29 | ) | (59 | ) | 0.850-9.125 | |||||
| Forfeitures | (260 | ) | (1,111 | ) | 1.438-28.375 | |||||
| Balance at October 2, 1999 | 2,409 | 9,550 | 0.850-25.00 | |||||||
| Granted | 589 | 5,565 | 7.375-14.938 | |||||||
| Exercised | (226 | ) | (849 | ) | 0.850-9.6875 | |||||
| Forfeitures | (250 | ) | (1,227 | ) | 1.438-10.875 | |||||
| Balance at September 30, 2000 | 2,522 | $ | 13,039 | $0.850-25.000 | ||||||
The following table summarizes information about options outstanding at September 30, 2000:
| Options Outstanding | Options Exercisable | ||||||||||||||||||
| Range of Exercise Prices | Number Outstanding at September 30, 2000 |
Weighted- Average Remaining Contractual Life (Years) |
Weighted Average Exercise Price |
Number Exercisable at September 30, 2000 |
Weighted- Average Exercise Price |
||||||||||||||
| $0.8500 - $1.7500 | 206,661 | 7.88 | $ | 1.73 | 7,130 | $ | 1.34 | ||||||||||||
| $1.7813 - $1.7813 | 407,622 | 7.95 | 1.78 | — | — | ||||||||||||||
| $1.8125 - $3.6250 | 397,626 | 6.39 | 2.80 | 358,180 | 2.77 | ||||||||||||||
| $3.9063 - $5.3750 | 346,517 | 7.95 | 4.59 | 151,423 | 4.54 | ||||||||||||||
| $5.5000 - $5.7500 | 451,990 | 7.09 | 5.74 | 338,279 | 5.73 | ||||||||||||||
| $6.0000 - $9.8125 | 502,842 | 8.53 | 8.42 | 162,548 | 8.30 | ||||||||||||||
| $9.8750 - $12.0000 | 167,400 | 9.59 | 10.68 | 3,627 | 10.93 | ||||||||||||||
| $12.3750 - $15.250 | 35,750 | 8.82 | 12.70 | 9,164 | 12.90 | ||||||||||||||
| $18.125 - $25.0000 | 5,500 | 6.28 | $ | 24.38 | 500 | 18.13 | |||||||||||||
| $0.8500 - $25.0000 | 2,521,908 | 7.78 | $ | 5.15 | 1,030,851 | $ | 4.98 | ||||||||||||
Exercisable options were approximately 1,030,000, 745,000 and 489,000 at fiscal year end for 2000, 1999 and 1998, respectively. At September 30, 2000, there were no shares that were exercised and subject to repurchase.
Vesting provisions with respect to the Stock Option Plans are determined by the Board of Directors at the date of grant. Generally, shares issued pursuant to the Plan vest at 12 1/2% upon an employee’s six-month employment date and ratably thereafter in monthly installments over three and one-half years.
Included in the table above are options to purchase approximately 73,000 shares of common stock which were granted outside of the Plans during fiscal 1995. These options were granted to various employees and have rights
IKOS SYSTEMS, INC.
NOTES TO CONSOLIDATED FINANCIAL STATEMENTS (Continued)
September 30, 2000
and vesting provisions which are the same as those granted pursuant to the Plan. At September 30, 2000 options to purchase approximately 13,000 shares of common stock remain outstanding.
Total shares reserved for grant under option plans total 4,594,000 (excluding options subject to grant under the 1995 Outside Directors Stock Option Plan), of which approximately 4,410,000 shares were granted, leaving approximately 184,000 shares available for grant at September 30, 2000.
The Company has reserved 2,706,000 shares of common stock for future issuance under the stock option plans for outstanding options and options available for grant at September 30, 2000 and for future issuance of shares granted outside of the option plans.
1995 Outside Directors Stock Plan. Under its 1995 Directors Stock Option Plan (the ‘‘Directors Plan’’), the Company has established an option pool of 200,000 shares for granting to outside directors. The Company has reserved 200,000 shares of common stock for issuance under the plan. As of September 30, 2000, 152,000 shares had been granted to Directors, no shares had been exercised and 18,000 shares had been canceled. As of September 30, 2000 options to purchase 134,000 shares are outstanding and are included in the table presented above.
1996 Stock Purchase Plan. In fiscal 1996, the 1996 Employee Stock Purchase Plan (ESPP) was approved and 100,000 shares of common stock were reserved for issuance under this plan. The ESPP provides that substantially all employees may purchase stock at 85% of the lower price on either the first or last day of the six-month offering period via a payroll deduction plan. During 1998 and 1999, the maximum aggregate number of shares of common stock issuable under the Company’s ESPP was increased by 150,000 and 400,000, respectively. Through September 30, 2000 approximately 472,000 shares have been issued under this plan. A summary of stock purchased under the plan is shown below (in thousands, except employee participants).
| 2000 | 1999 | 1998 | ||||||||
| Aggregate purchase price | $ | 1,039,000 | $ | 470,000 | $ | 476,000 | ||||
| Shares purchased | 149,787 | 141,216 | 97,768 | |||||||
| Employee participants | 134 | 123 | 132 | |||||||
Stock Based Compensation. Pro forma information regarding net income (loss) and net income (loss) per share is required by Statement of Financial Accounting Standards No. 123 (SFAS 123) for awards granted after October 1, 1995 as if the Company had accounted for its stock-based awards to employees under the fair value method of SFAS 123. The fair value of the Company’s stock-based awards to employees was estimated using a Black-Scholes option-pricing model. The Black-Scholes option valuation model was developed for use in estimating the fair value of traded options, which have no vesting restrictions and are fully transferable. In addition, the Black-Scholes model requires the input of highly subjective assumptions including the expected stock price volatility. Because the Company’s stock-based awards to employees have characteristics significantly different from those of traded options, and because changes in the subjective input assumptions can materially affect the fair value estimate, in management’s opinion, the existing models do not necessarily provide a reliable single measure of the fair value of its stock-based awards to employees. The fair value of the Company’s stock-based awards to employees was estimated assuming no expected dividends and the following weighted-average assumptions:
| Options | ESPP | ||||||||||||||||||
| 2000 | 1999 | 1998 | 2000 | 1999 | 1998 | ||||||||||||||
| Expected life (years) | 3.49 | 3.40 | 3.57 | 0.5 | 0.5 | 0.5 | |||||||||||||
| Expected stock price volatility | 83.47 | % | 81.28 | % | 70.98 | % | 82.31 | % | 88.62 | % | 65.22 | % | |||||||
| Risk-free interest rate | 6.22 | % | 4.95 | % | 5.47 | % | 6.19 | % | 4.95 | % | 5.58 | % | |||||||
For pro forma purposes, the estimated fair value of the Company’s stock based awards to employees is amortized over the options’ vesting period (for options) and the six month purchase period (for stock purchased under the ESPP). The weighted-average fair value of stock options and employee stock purchase rights granted during 2000 was $5.64 and $2.97 per share, respectively. The weighted-average fair value of stock options and employee stock purchase rights granted during 1999 was $2.24 and $1.57 per share, respectively. The
IKOS SYSTEMS, INC.
NOTES TO CONSOLIDATED FINANCIAL STATEMENTS (Continued)
September 30, 2000
weighted-average fair value of stock options and employee stock purchase rights granted during 1998 was $2.31 and $3.93 per share, respectively.
The Company’s pro forma information follows (in thousands, except per share amounts):
| 2000 | 1999 | 1998 | ||||||||
| Net income—as reported | $ | 8,288 | $ | 2,456 | $ | (27,254 | ) | |||
| Net income (loss)—pro forma | 6,389 | 123 | (30,242 | ) | ||||||
| Diluted net income per share—as reported | 0.84 | 0.27 | (3.24 | ) | ||||||
| Diluted net income (loss) per share—pro forma | $ | 0.65 | $ | 0.01 | $ | (3.59 | ) | |||
6. Employee Savings and Investment Plan
The Company offers all of its employees the opportunity to participate in its 401(k) savings and investment plan. The amended plan allows for the Company to make matching contributions based on an employee’s elective deferrals. For fiscal 2000, the matching contributions could not exceed $1,800 per employee, and for the three fiscal years ended September 30, 2000 the matching contributions were approximately $317,000, $290,000 for fiscal 1999, and $299,000 in fiscal 1998.
7. Income Taxes
The tax provision (benefit) consists of the following (in thousands):
| Fiscal Year Ended | ||||||||||
| September 30, | October 2, | October 3, | ||||||||
| 2000 | 1999 | 1998 | ||||||||
| Federal: | ||||||||||
| Current | $ | 2,210 | $ | 110 | $ | — | ||||
| Deferred | — | — | 3,584 | |||||||
| 2,210 | 110 | 3,584 | ||||||||
| State: | ||||||||||
| Current | 40 | 40 | — | |||||||
| Deferred | — | — | 993 | |||||||
| 40 | 40 | 993 | ||||||||
| Foreign: | ||||||||||
| Current | 500 | 500 | 351 | |||||||
| $ | 2,750 | $ | 650 | $ | 4,928 | |||||
Pretax income (loss) from foreign operations was $(1,330,000) in 2000, $360,000 in 1999 and ($775,000) in 1998.
A reconciliation between the Company’s effective tax rate and the U.S. statutory rate of 35% follows (in thousands):
| Fiscal Year Ended | ||||||||||
| September 30, 2000 |
October 2, 1999 |
October 3, 1998 |
||||||||
| Tax provision (benefit) at U.S. statutory rate | $ | 4,089 | $ | 1,090 | $ | (7,814 | ) | |||
| Change in valuation allowance | — | — | 10,923 | |||||||
| Utilization of losses not previously benefited | (2,001 | ) | (756 | ) | — | |||||
| Goodwill amortization | 73 | — | 1,468 | |||||||
| Foreign taxes | 500 | 240 | 351 | |||||||
| Other | 63 | 50 | — | |||||||
| State taxes | 26 | 26 | — | |||||||
| 2,750 | $ | 650 | $ | 4,928 | ||||||
IKOS SYSTEMS, INC.
NOTES TO CONSOLIDATED FINANCIAL STATEMENTS (Continued)
September 30, 2000
As of September 30, 2000 the Company had California research and development tax credit carryforwards of approximately $900,000. The Company also has federal alternative minimum tax credit carryforwards of approximately $700,000. The state research credit carryforwards and alternative minimum tax credit carryforwards have no expiration date.
Utilization of the net operating losses and credits may be subject to an annual limitation due to the ownership change limitations provided by the Internal Revenue Code of 1986, as amended, and similar state provisions. The annual limitation could result in the expiration of net operating losses and credits before utilization.
Significant components of the Company’s deferred tax assets and liabilities are as follows (in thousands):
| September 30, 2000 |
October 2, 1999 |
||||||
| Deferred tax assets: | |||||||
| Net operating loss carryforwards | $ | — | $ | 2,320 | |||
| Research credits and alternative minimum tax credit | 1,390 | 3,130 | |||||
| Capitalized software | 350 | 450 | |||||
| Deferred revenue | 2,870 | 1,820 | |||||
| Purchased technology | 5,110 | 5,640 | |||||
| Accrued expenses and reserves | 5,500 | 3,936 | |||||
| Total deferred tax assets | 15,220 | 17,296 | |||||
| Valuation allowance for deferred tax assets | (15,220 | ) | (17,296 | ) | |||
| Net deferred tax assets | $ | — | $ | — | |||
As of September 30, 2000, the Company had fully offset deferred tax assets by a valuation allowance. Management believes that such net deferred tax assets are not realizable on a more likely than not basis. The valuation allowance decreased by $2,076,000 and $1,609,000 for the years ended September 30, 2000 and October 2, 1999, respectively. Approximately $4,500,000 of the valuation allowance is attributable to stock options which will be credited to equity when realized.
8. Segment Information
The Company adopted the Financial Accounting Standards Board’s Statement No. 131 (SFAS 131), “Disclosures about Segments of an Enterprise and Related Information.” The standard revises the way operating segments are reported. The Company operates and tracks its results in one operating segment. The Company’s operating segment is principally the development, manufacture, sale and service of high performance systems for design verification of integrated circuits (ICs) and IC-based electronic systems.
Enterprise wide information is provided in accordance with SFAS 131. Geographic revenue information for the fiscal years 2000, 1999 and 1998 is based on the shipping destination. Long-lived assets include primarily property, plant and equipment as well as, intangible assets including goodwill. Property, plant and equipment information is based on the physical location of the asset at the end of each fiscal year while the intangibles are based on the location of the owning entity.
Net revenues from unaffiliated customers by geographic region are as follows (in thousands):
| Fiscal Year Ended | ||||||||||
| September 30, 2000 |
October 2, 1999 |
October 3, 1998 |
||||||||
| North America | $ | 47,762 | $ | 35,257 | $ | 26,361 | ||||
| Far East | 10,883 | 8,258 | 4,912 | |||||||
| Europe | 14,151 | 12,818 | 9,620 | |||||||
| $ | 72,796 | $ | 56,333 | $ | 40,893 | |||||
IKOS SYSTEMS, INC.
NOTES TO CONSOLIDATED FINANCIAL STATEMENTS (Continued)
September 30, 2000
Net long-lived assets by country are as follows (in thousands):
| September 30, 2000 |
October 2, 1999 |
||||||
| United States | $ | 5,266 | $ | 5,052 | |||
| India | 542 | 563 | |||||
| France | 95 | 110 | |||||
| United Kingdom | 173 | 240 | |||||
| Germany | 92 | 48 | |||||
| Japan | 207 | 155 | |||||
| $ | 6,375 | $ | 6,208 | ||||
For fiscal years 2000, one customer, Broadcom Corporation, accounted for approximately 12% of net revenues, respectively. For fiscal years 1999 and 1998 one customer, Lucent Technologies, Inc., accounted for approximately 14% and 13% of net revenues, respectively.
9. Concentration of Credit Risks and Other Risks
The Company sells its products to a broad range of customers in the communications, multimedia/graphics, semiconductor, computer, aerospace and consumer electronics industries. The Company performs ongoing credit evaluations of its customers and generally does not require collateral.
The Company maintains reserves for potential credit losses and such losses have been within management’s expectations.
The electronic design automation (EDA) industry is characterized by rapid technological changes, intense competitive pressures and cyclical market patterns. The Company’s results are affected by a wide variety of factors, including general economic patterns, conditions specifically relating to technology companies and the semiconductor and EDA industries.
The Company’s results are also affected by decreases in average selling prices over the life of any particular product, the timing of new product introductions (by the Company, its competitors and others), the evolution of the electronic design community, the ability to manufacture new products, and the ability to safeguard patents and intellectual property from competitors. Based on the factors noted herein, the Company may experience substantial period-to-period fluctuations in future operating results.
IKOS SYSTEMS, INC.
NOTES TO CONSOLIDATED FINANCIAL STATEMENTS (Continued)
September 30, 2000
10. Unaudited Quarterly Consolidated Financial Data
| Fiscal Quarters Ended | |||||||||||||
| Jan. 1, 2000 |
April 1, 2000 |
July 1, 2000 |
Sep. 30, 2000 |
||||||||||
| Net revenues | $ | 15,405 | $ | 16,799 | $ | 18,443 | $ | 22,149 | |||||
| Gross profit | 11,677 | 13,128 | 14,507 | 17,453 | |||||||||
| Total operating expenses | 10,311 | 11,043 | 11,632 | 13,359 | |||||||||
| Income from operations | 1,366 | 2,085 | 2,875 | 4,094 | |||||||||
| Net income | 1,093 | 1,644 | 2,303 | 3,248 | |||||||||
| Basic income per share (*) | $ | 0.13 | $ | 0.19 | $ | 0.27 | $ | 0.37 | |||||
| Weighted-average shares used in computing per share amounts |
8,417 | 8,531 | 8,611 | 8,694 | |||||||||
| Diluted income per share (*) | $ | 0.11 | $ | 0.17 | $ | 0.23 | $ | 0.32 | |||||
| Weighted-average shares used in computing per share amounts |
9,519 | 9,926 | 9,897 | 10,000 | |||||||||
| Fiscal Quarters Ended | |||||||||||||
| Jan. 2, 1999 |
April 3, 1999 |
July 3, 1999 |
Oct. 2, 1999 |
||||||||||
| Net revenues | $ | 11,344 | $ | 13,682 | $ | 15,012 | $ | 16,295 | |||||
| Gross profit | 8,529 | 10,263 | 11,274 | 12,489 | |||||||||
| Total operating expenses | 8,625 | 10,083 | 10,336 | 10,900 | |||||||||
| Income (loss) from operations | (96 | ) | 180 | 938 | 1,589 | ||||||||
| Net income | 52 | 258 | 784 | 1,362 | |||||||||
| Basic income per share (*) | $ | 0.01 | $ | 0.03 | $ | 0.09 | $ | 0.16 | |||||
| Weighted-average shares used in computing per share amounts |
8,302 | 8,265 | 8,288 | 8,369 | |||||||||
| Diluted income per share (*) | $ | 0.01 | $ | 0.03 | $ | 0.08 | $ | 0.14 | |||||
| Weighted-average shares used in computing per share amounts |
8,644 | 8,974 | 9,406 | 9,533 | |||||||||
______________
(*) Quarterly per share amounts do not equal the annual per share total as a result of rounding.
Schedule II
IKOS SYSTEMS, INC.
VALUATION AND QUALIFYING ACCOUNTS
(In thousands)
| Balance at Beginning of Period |
Charged to Costs and Expenses |
Deduction Write-offs |
Balance at End of Period |
||||||||||
| Allowance for doubtful accounts: | |||||||||||||
| Year ended October 3, 1998 | $ | 501 | $ | 300 | $ | — | $ | 801 | |||||
| Year ended October 2, 1999 | $ | 801 | $ | 108 | $ | 108 | $ | 801 | |||||
| Year ended September 30, 2000 | $ | 801 | $ | 100 | $ | 256 | $ | 645 | |||||
|
|